HP Pavilion Gaming 15 in Review: Cheap gaming laptop with good battery life

The Pavilion Gaming 15 series contains 15.6-inch gaming laptops that offer good value for their price. Today's test device is powered by a Ryzen 5 3550H APU and a GeForce GTX 1050 GPU. With a price of ~$699, it is one of the cheapest models within the series. We are not unfamiliar with this laptop. With the HP Pavilion Gaming 15-ec0017ng, we have already tested its physically identical sibling. Competitors include devices such as the Asus TUF FX505DY, Lenovo Ideapad L340-15IRH, Dell G3 3590, and the MSI GF63 Thin 9SC.
Rating | Date | Model | Weight | Height | Size | Resolution | Price |
|---|---|---|---|---|---|---|---|
| 75.4 % v7 (old) | 03 / 2020 | HP Pavilion Gaming 15-ec0002ng R5 3550H, GeForce GTX 1050 Mobile | 2.3 kg | 23.5 mm | 15.60" | 1920x1080 | |
| 79.5 % v6 (old) | 03 / 2019 | Asus TUF FX505DY R5 3550H, Radeon RX 560X (Laptop) | 2.2 kg | 26.8 mm | 15.60" | 1920x1080 | |
| 77 % v7 (old) | 09 / 2019 | Lenovo IdeaPad L340-15IRH 81LK00BMGE i5-9300H, GeForce GTX 1650 Mobile | 2.1 kg | 23.9 mm | 15.60" | 1920x1080 | |
| 79.3 % v7 (old) | 10 / 2019 | Dell G3 3590 i5-9300H, GeForce GTX 1650 Mobile | 2.5 kg | 21.6 mm | 15.60" | 1920x1080 | |
| 77.6 % v7 (old) | 01 / 2020 | MSI GF63 Thin 9SC i5-9300H, GeForce GTX 1650 Max-Q | 1.8 kg | 22 mm | 15.60" | 1920x1080 |
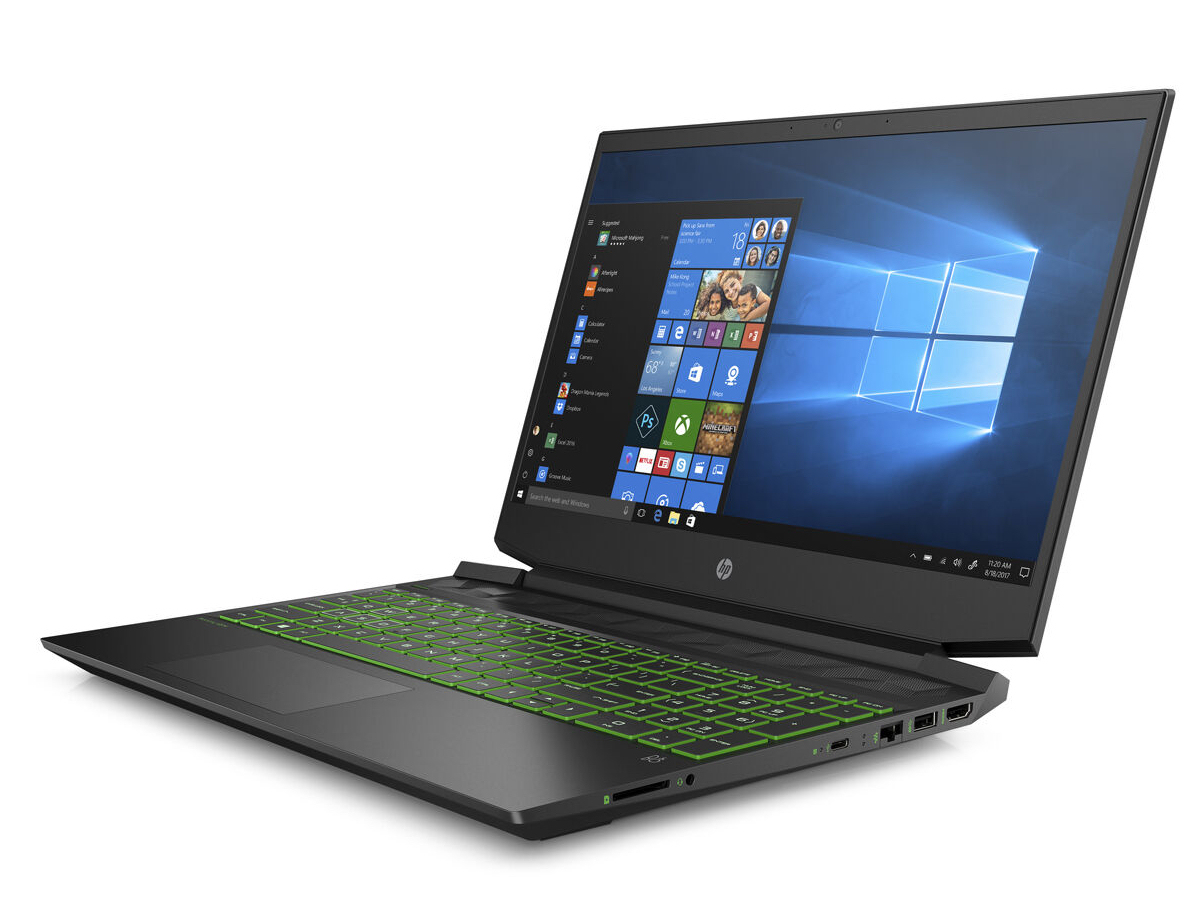
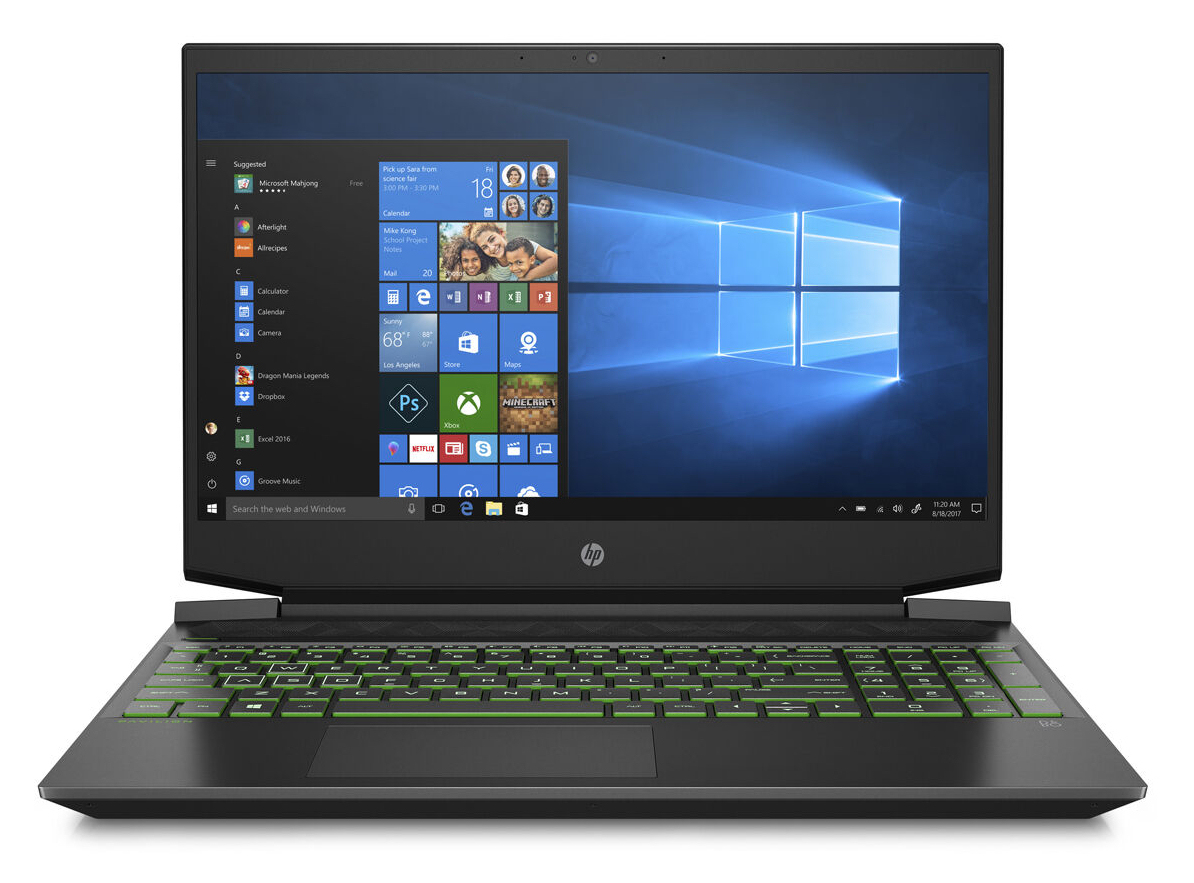
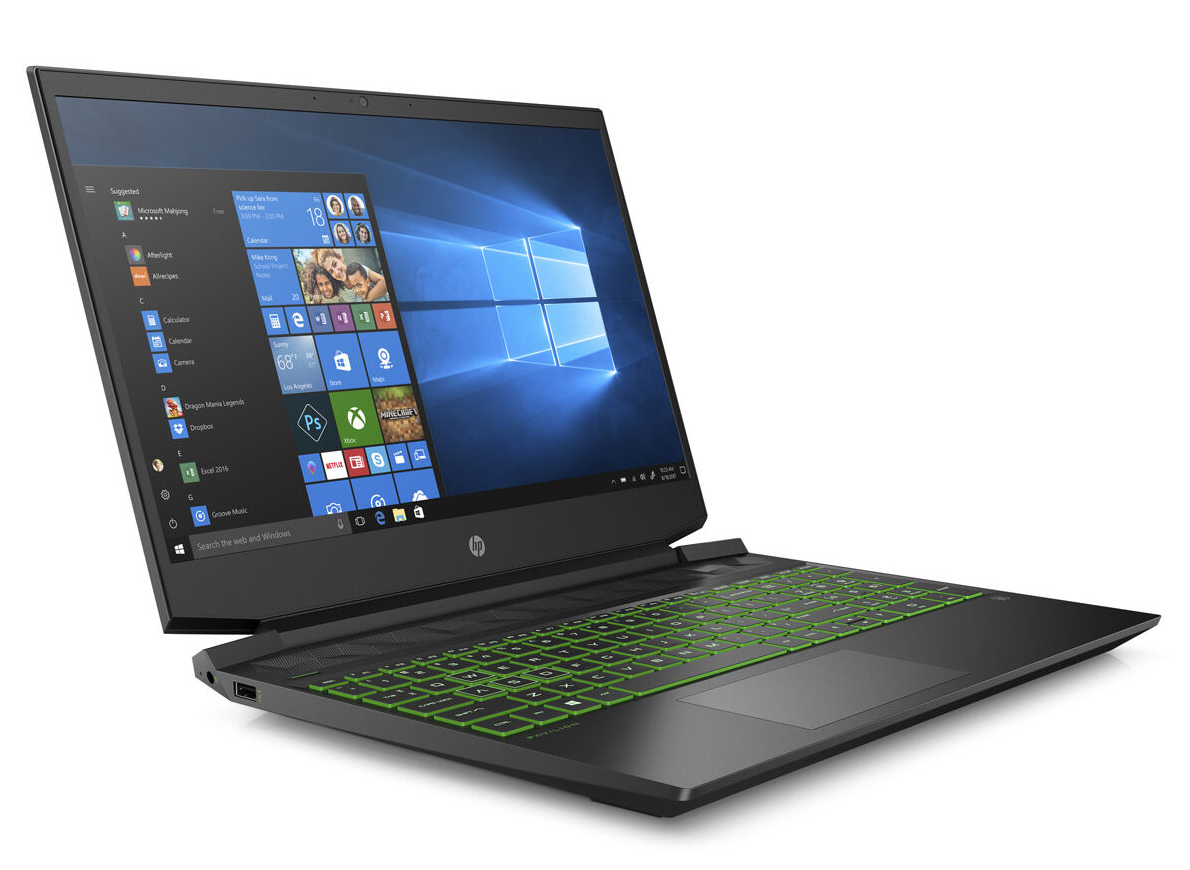
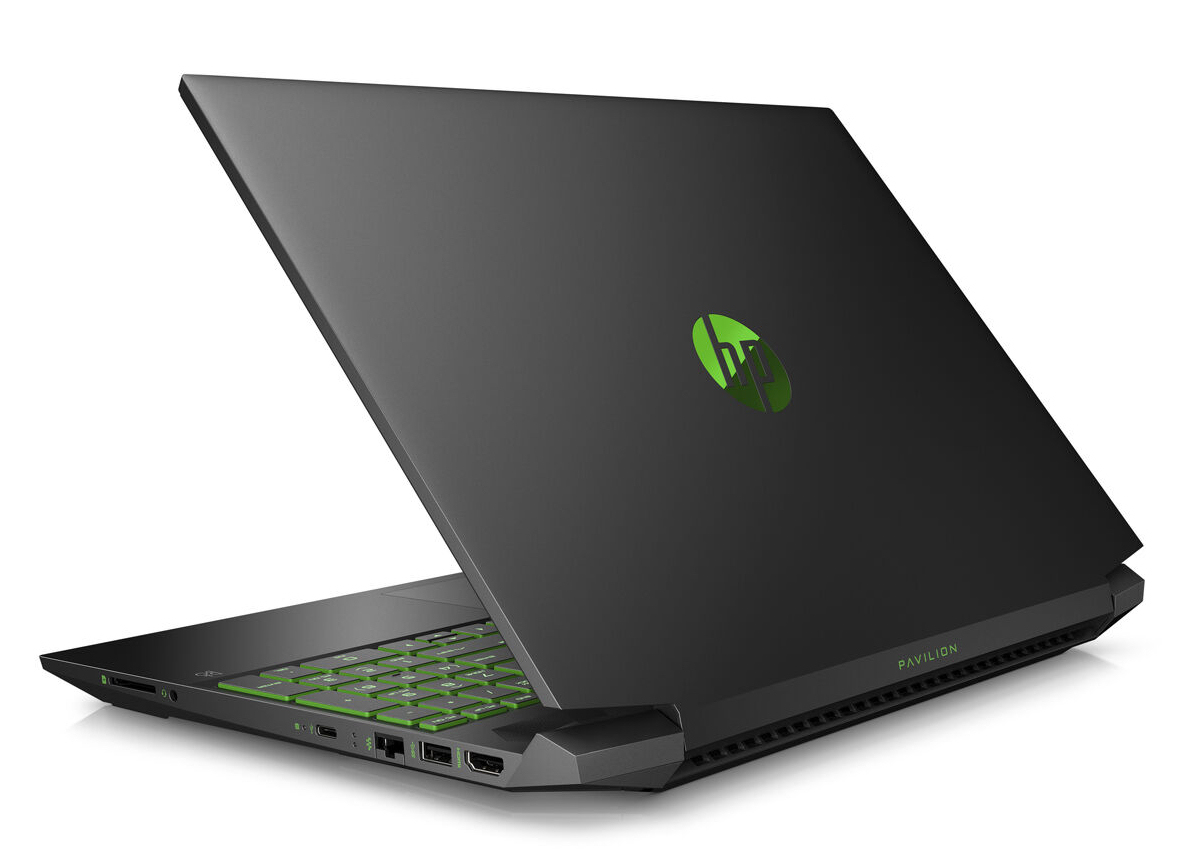
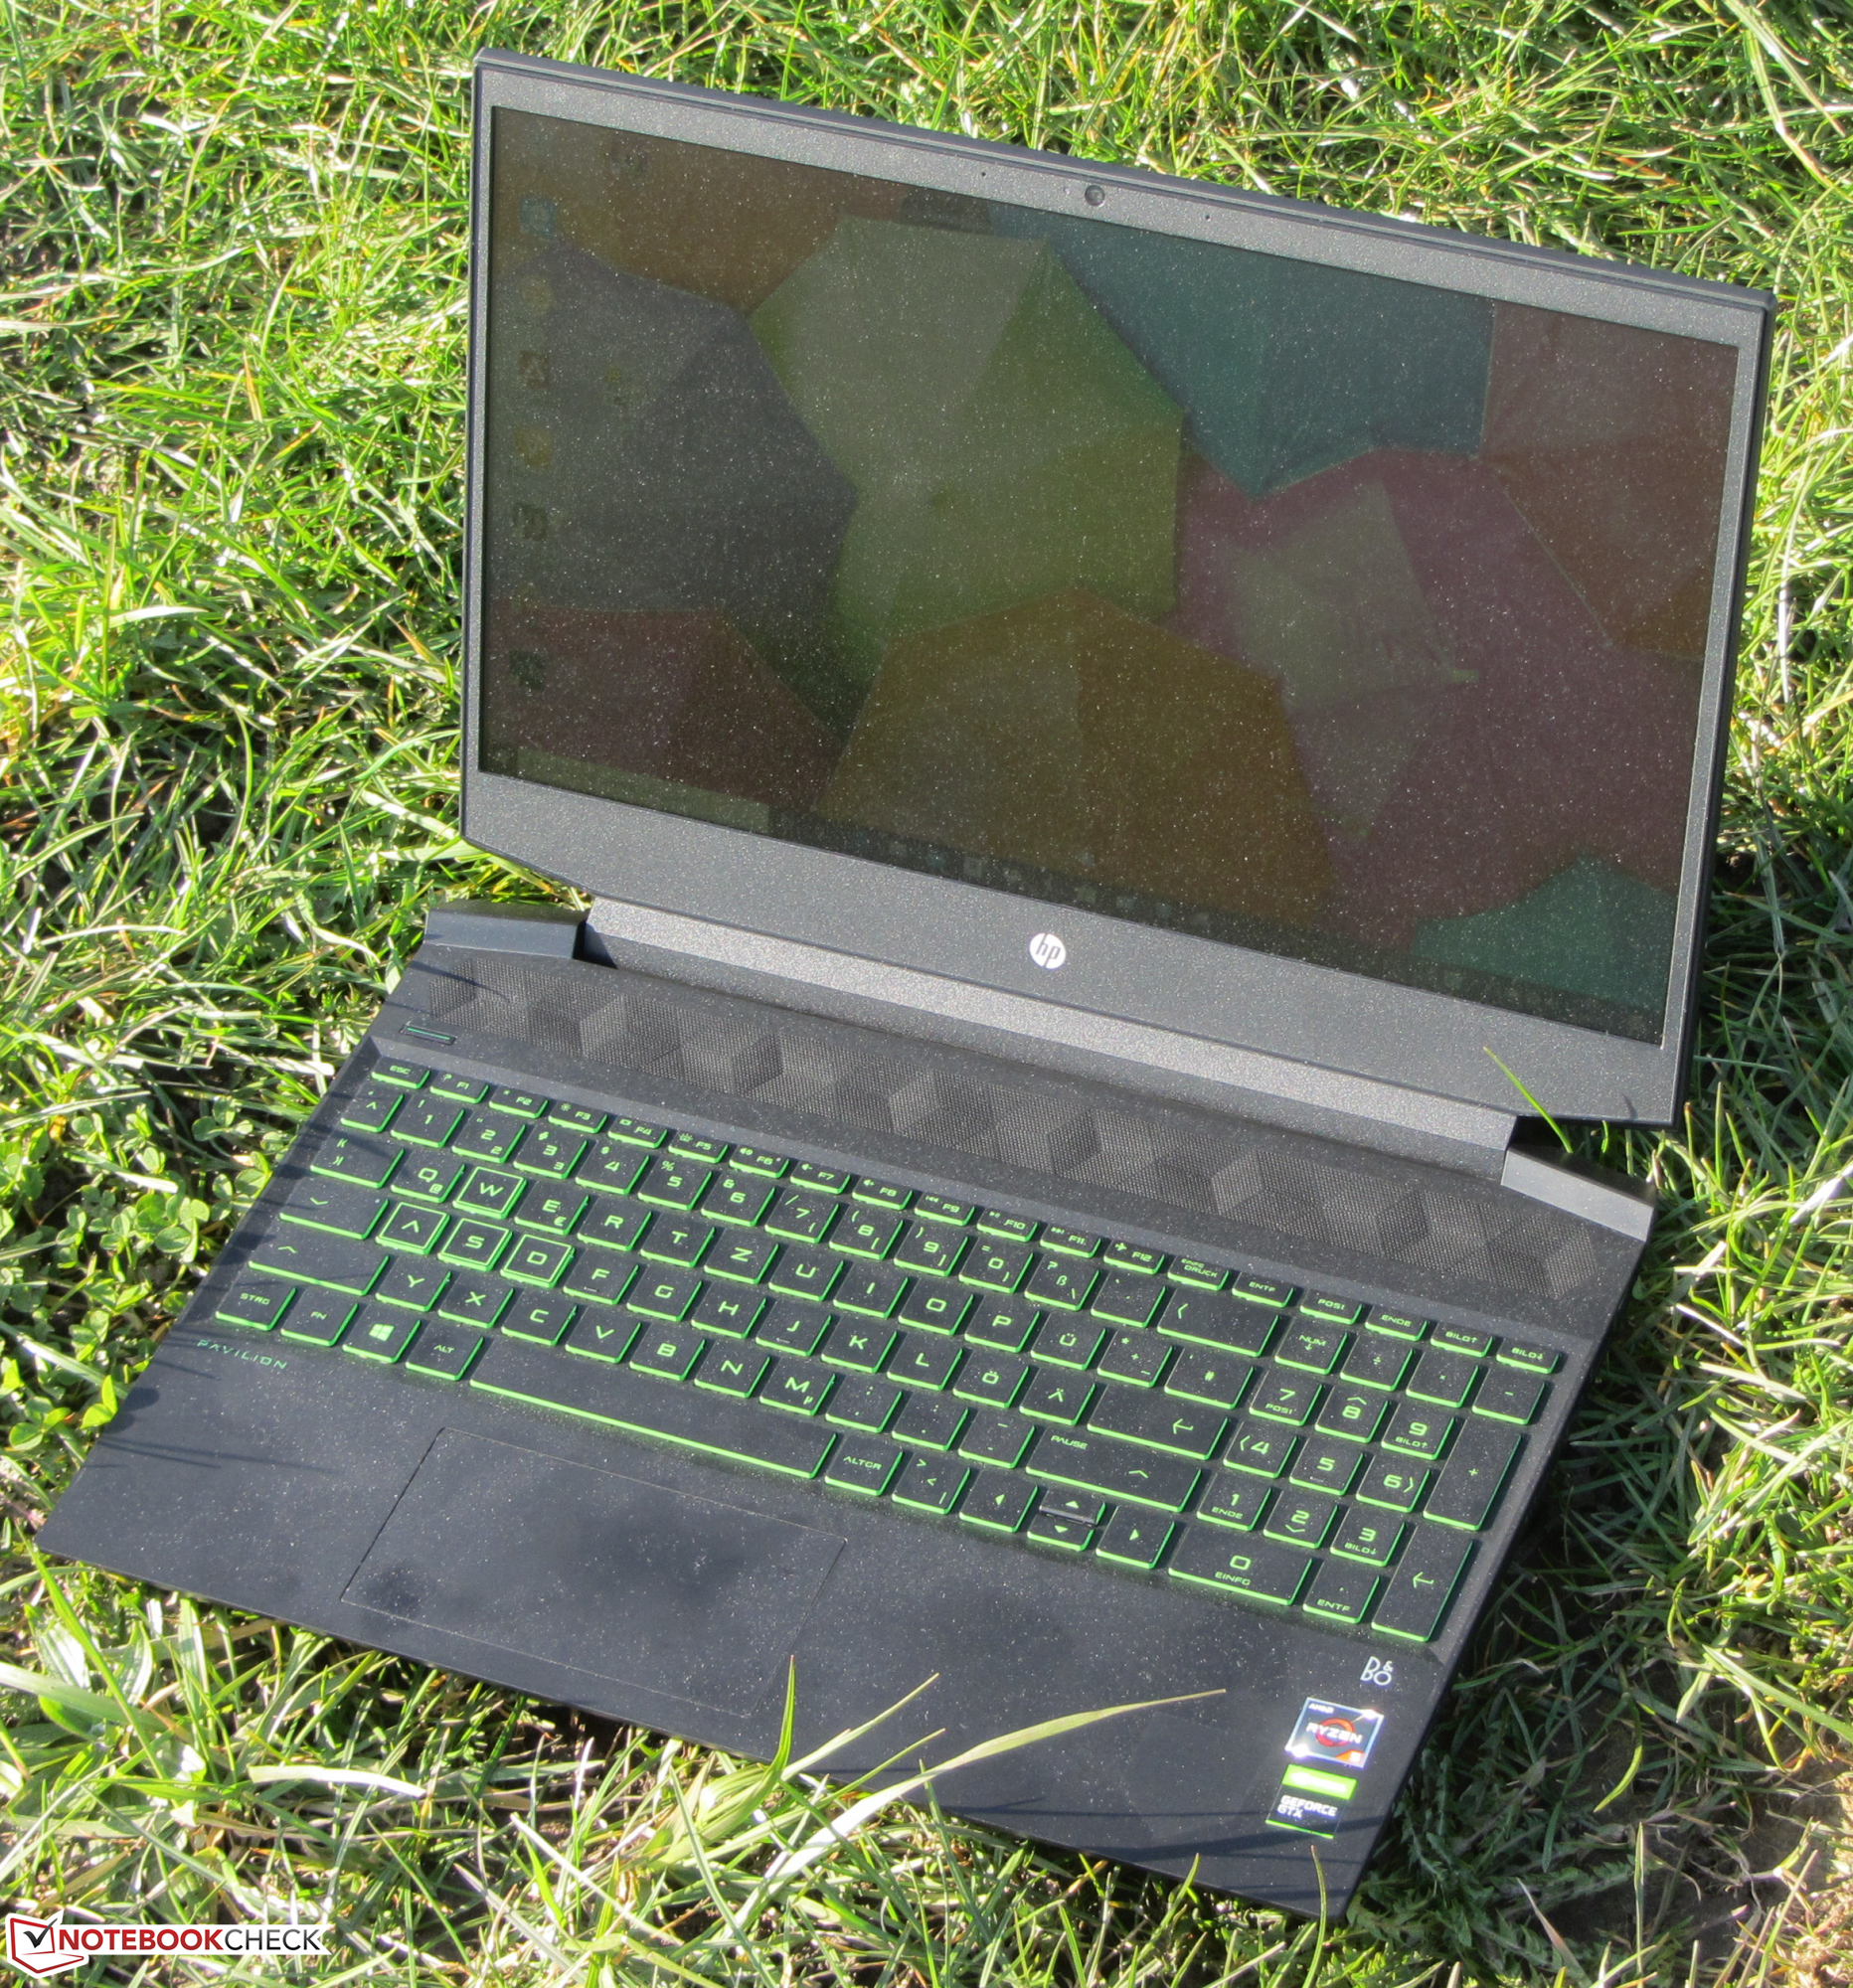
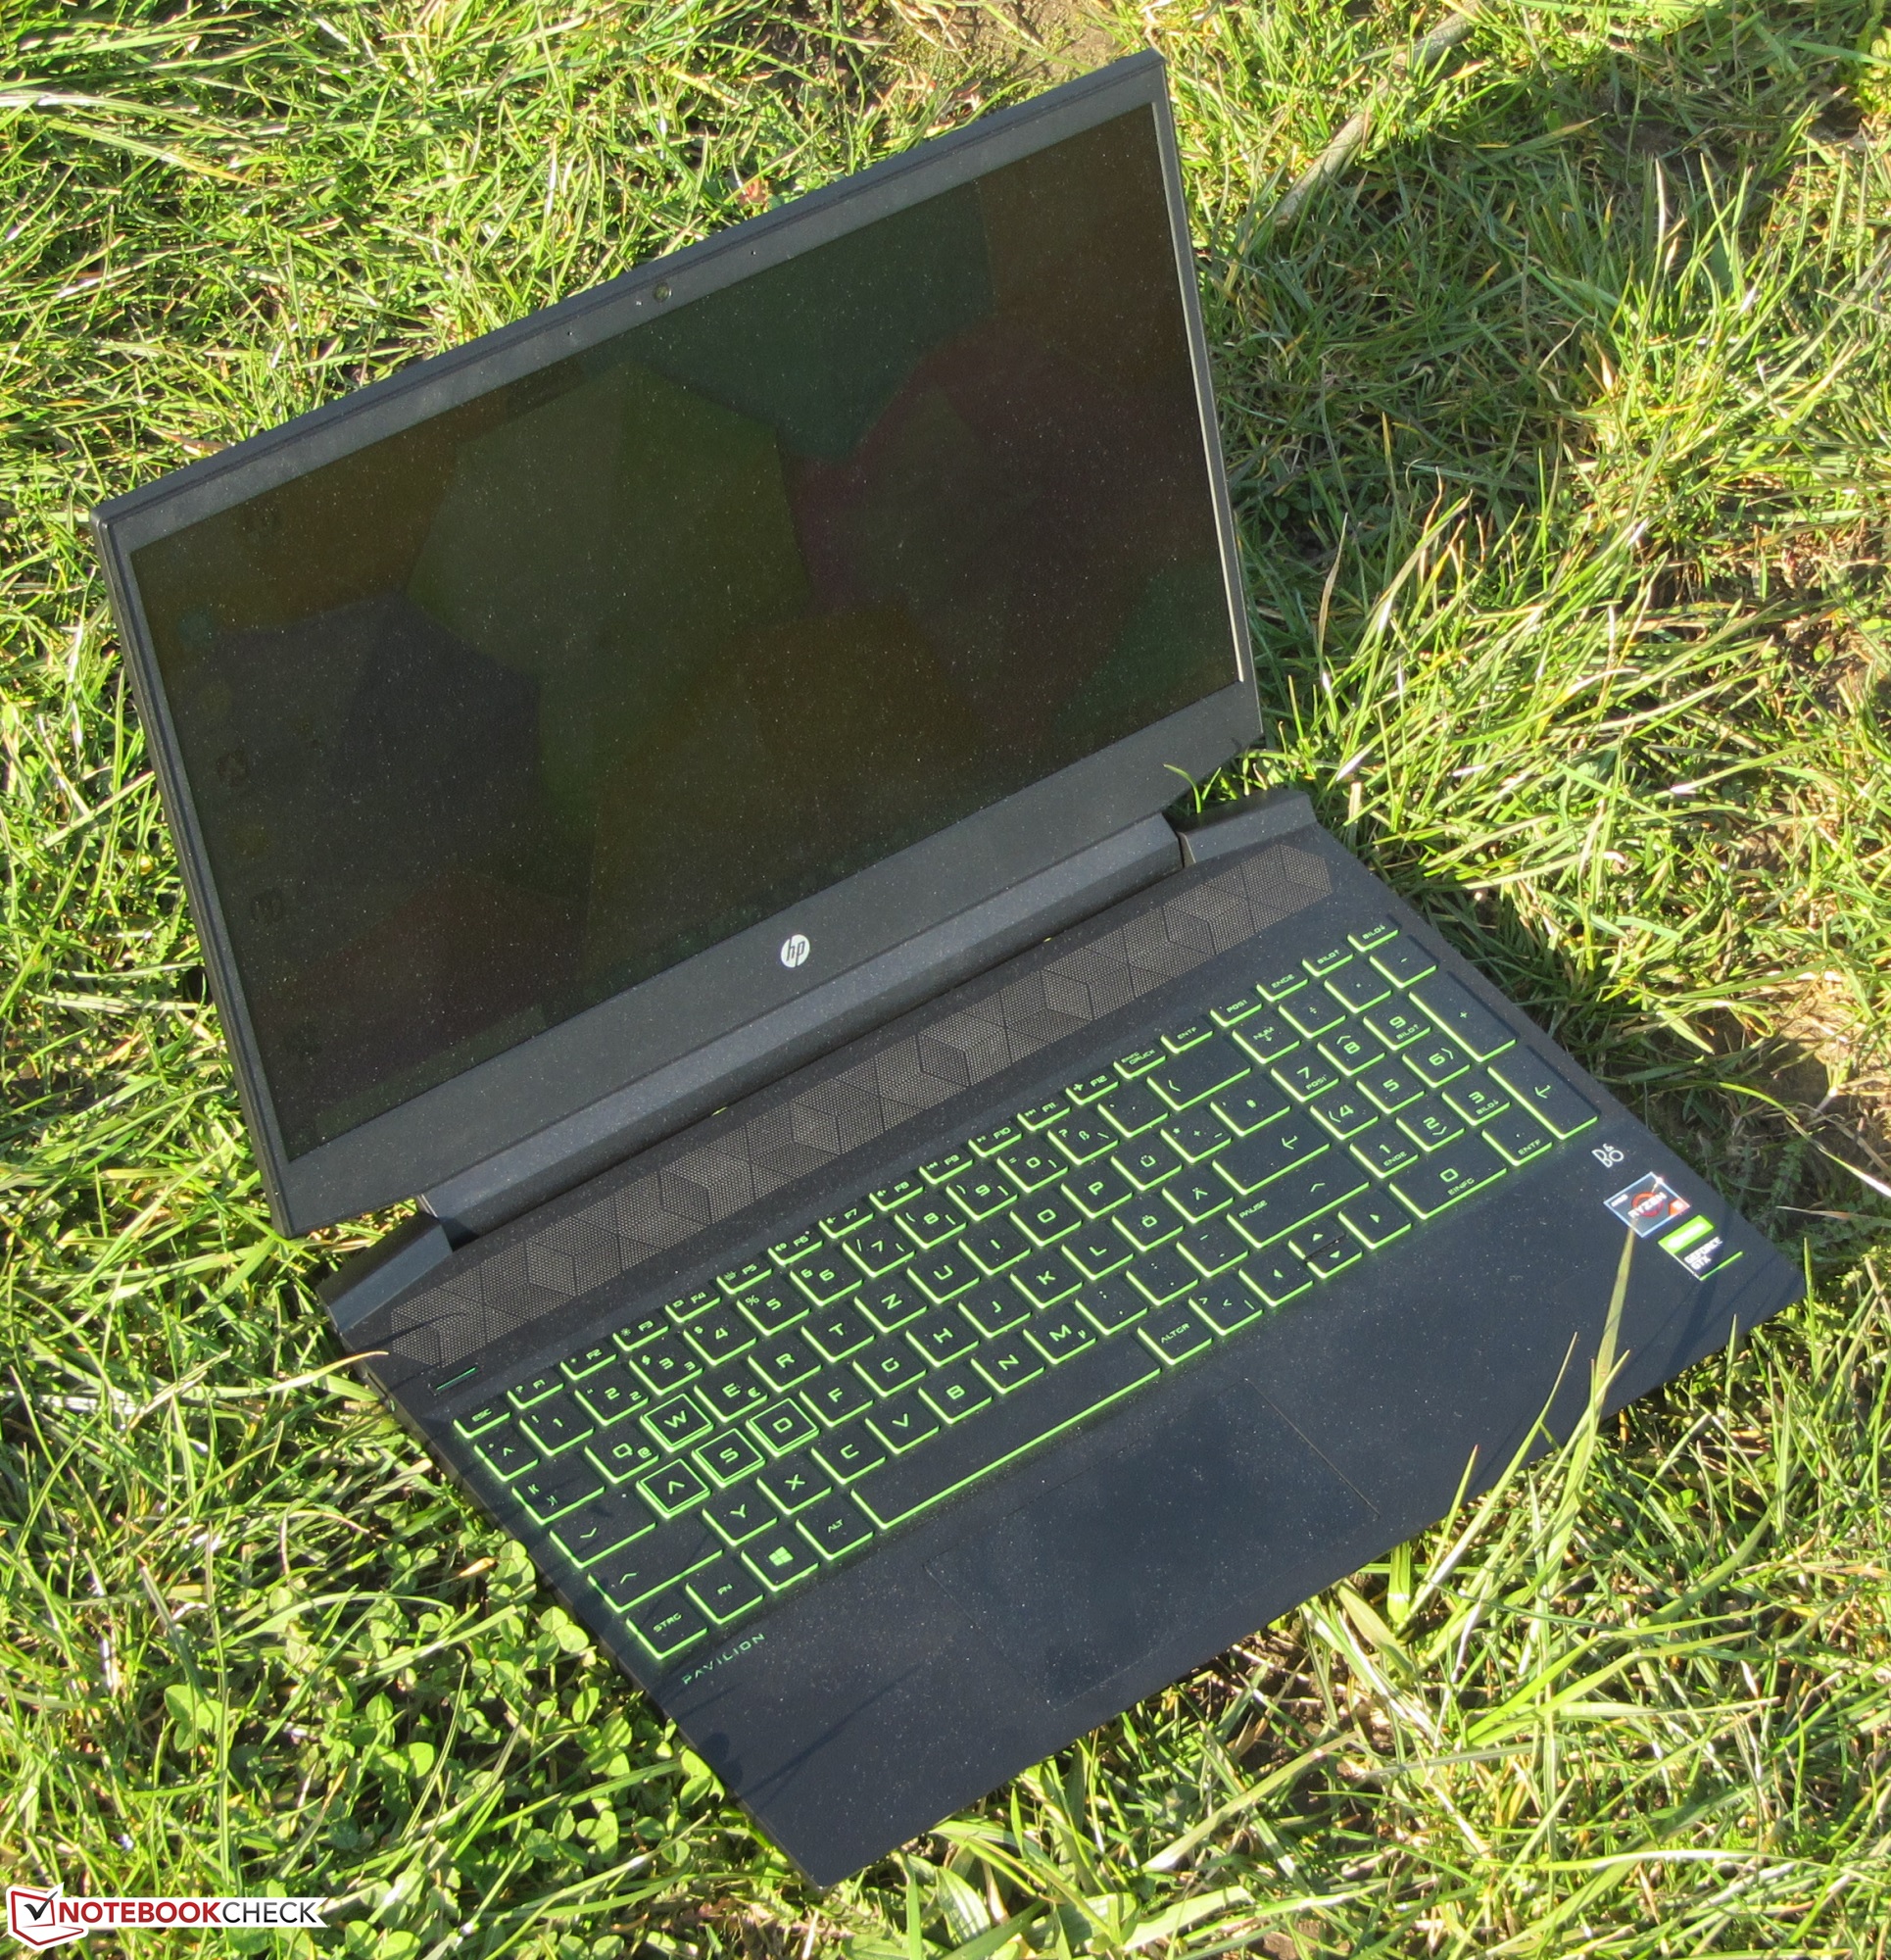
Case & Features - Pavilion Computer with A Plastic Chassis
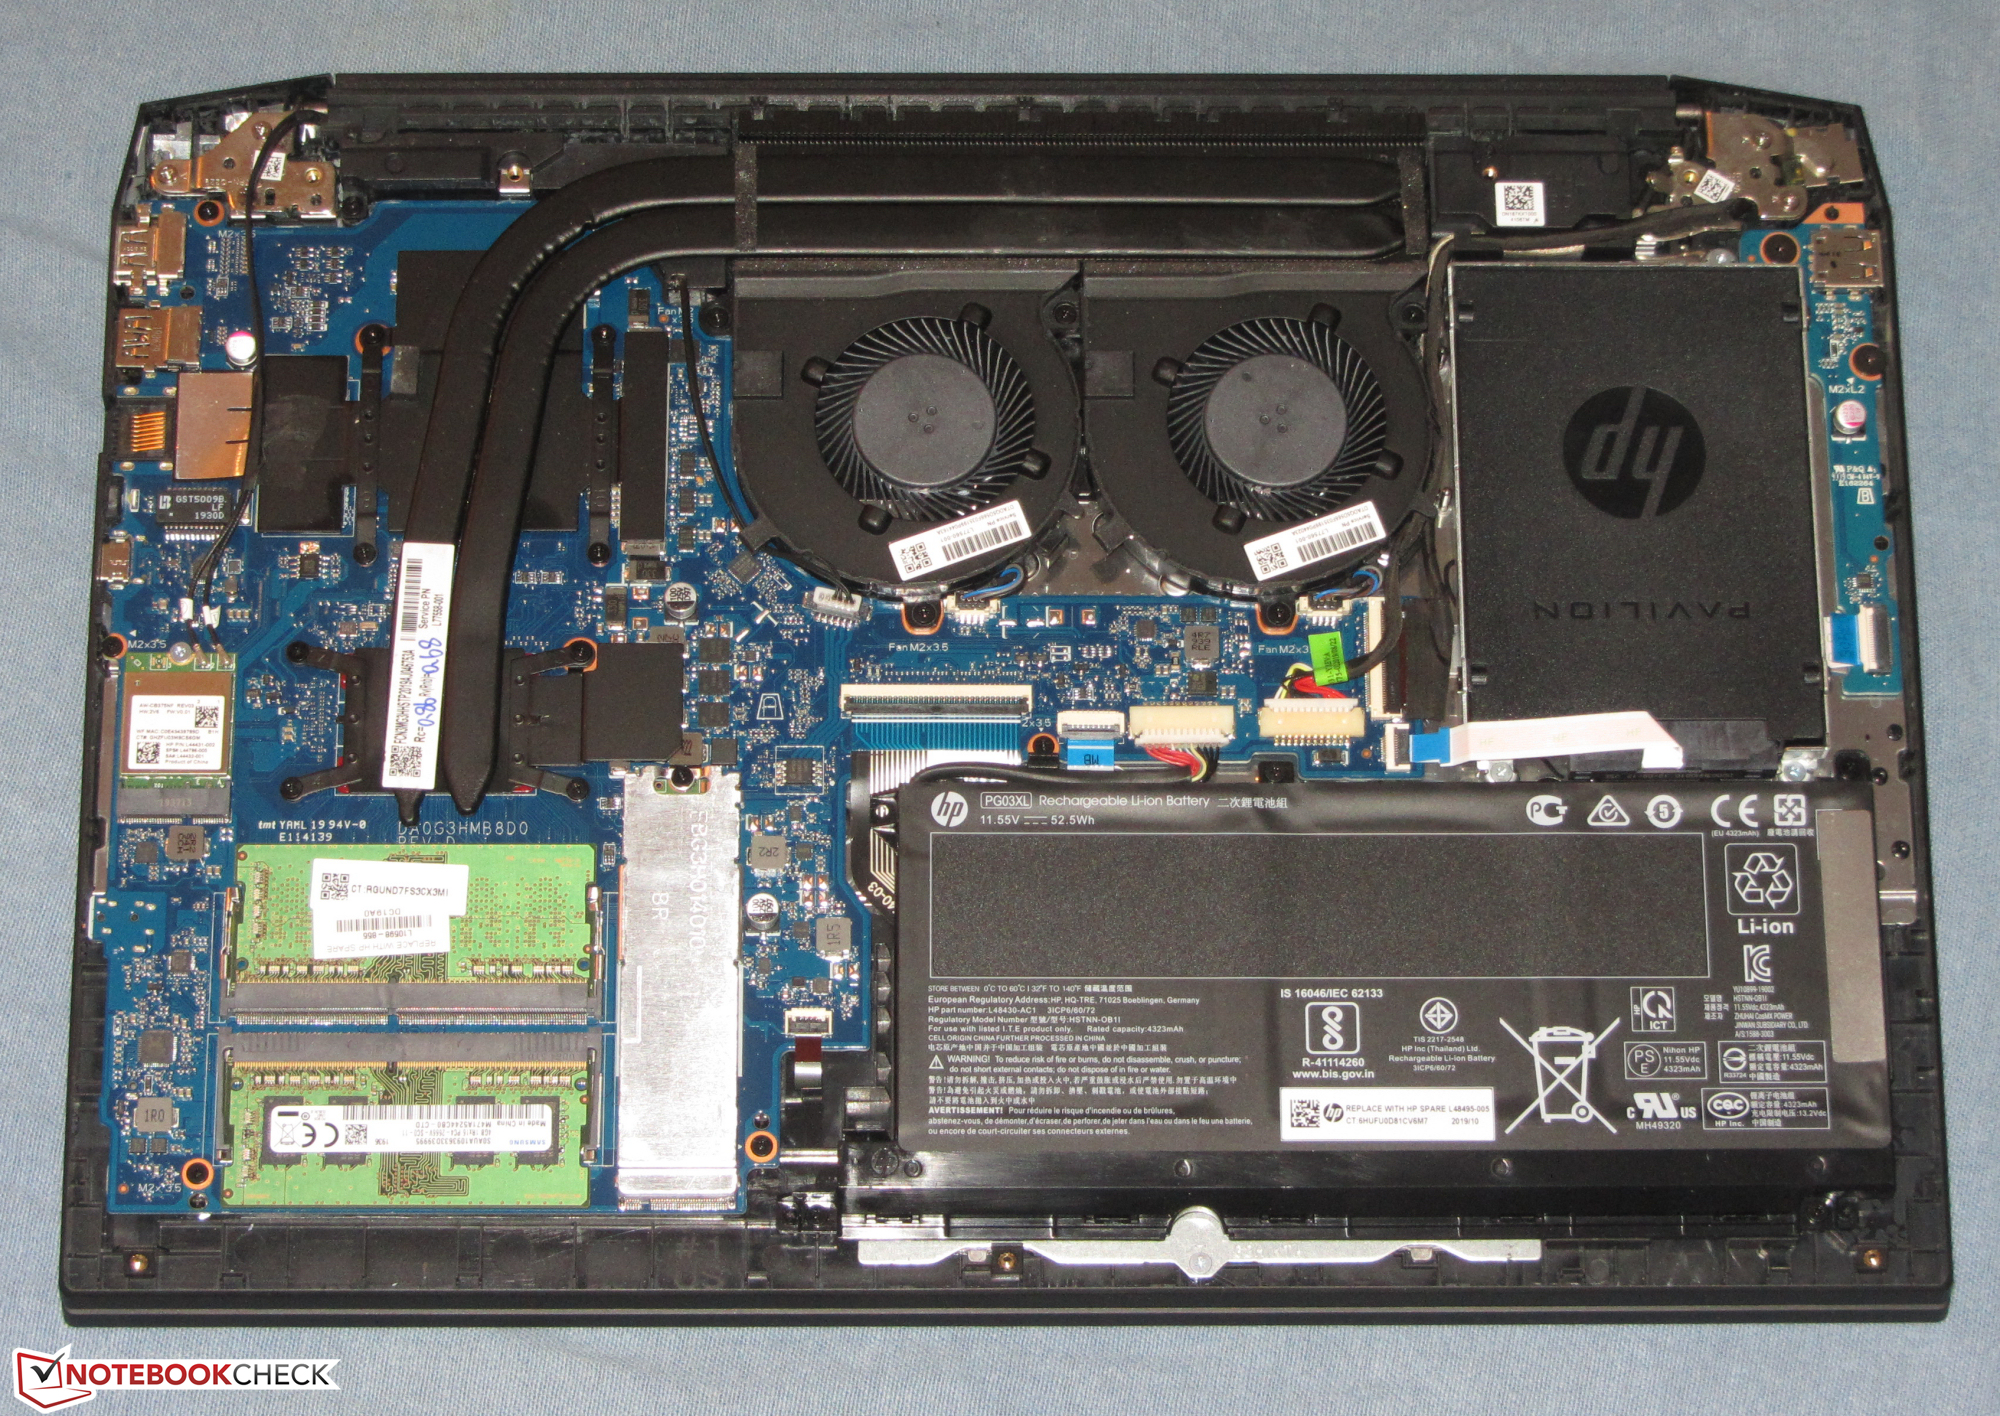
HP has opted for a matte, black plastic chassis. Green elements (keyboard backlight, power LED, HP logo on the back) serve to accentuate the overall design. While there are no flaws in terms of the build quality, the case does not exactly shine in terms of rigidity, either. Both the base unit and the lid can be twisted too easily and too far. Furthermore, there is no maintenance hatch and the battery is fixed.
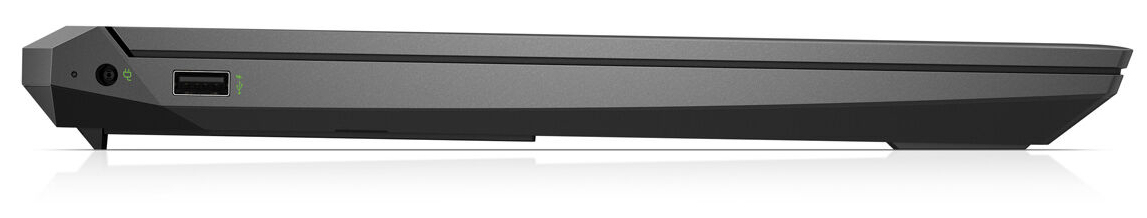
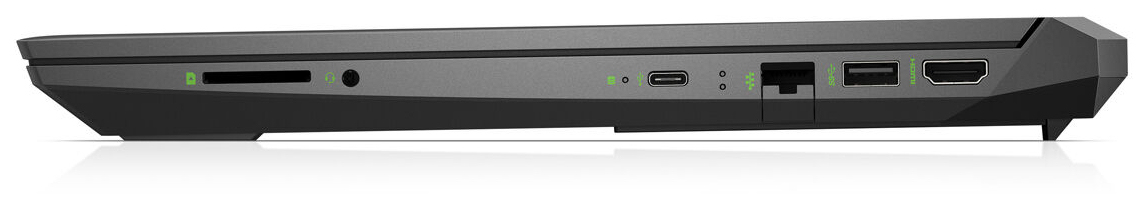
The laptop comes with two USB Type-A ports (1x USB 2.0, 1x USB 3.2 Gen 1) and one USB Type-C port (USB 3.2 Gen 1). The latter does not support DisplayPort via USB Type-C. Additionally, there is an HDMI port, a headset jack and a gigabit Ethernet port.
SD cards can be fully inserted into the card reader, which locks them in place. At 35.1 MB/s (transferring 250 jpg image files with around 5 MB each) and 37.2 MB/s (copying large data blocks), its transfer rates belong to the lower end of the spectrum. We test card readers with the help of our reference memory card (Toshiba Exceria Pro SDXC 64 GB UHS-II).
As for the Wi-Fi, the Realtek chip (RTL8822CE) supports the Wi-Fi standards 802.11 a/b/g/n/ac. The transfer speeds recorded under optimal conditions (no other Wi-Fi devices in proximity, small distance between the laptop and the server) are good.
Port Selection
| SD Card Reader | |
| average JPG Copy Test (av. of 3 runs) | |
| Average of class Gaming (20.9 - 210, n=54, last 2 years) | |
| HP Pavilion Gaming 15-ec0017ng (Toshiba Exceria Pro SDXC 64 GB UHS-II) | |
| HP Pavilion Gaming 15-ec0002ng (Toshiba Exceria Pro SDXC 64 GB UHS-II) | |
| Dell G3 3590 (Toshiba Exceria Pro SDXC 64 GB UHS-II) | |
| maximum AS SSD Seq Read Test (1GB) | |
| Average of class Gaming (25.5 - 261, n=51, last 2 years) | |
| HP Pavilion Gaming 15-ec0017ng (Toshiba Exceria Pro SDXC 64 GB UHS-II) | |
| HP Pavilion Gaming 15-ec0002ng (Toshiba Exceria Pro SDXC 64 GB UHS-II) | |
| Dell G3 3590 (Toshiba Exceria Pro SDXC 64 GB UHS-II) | |


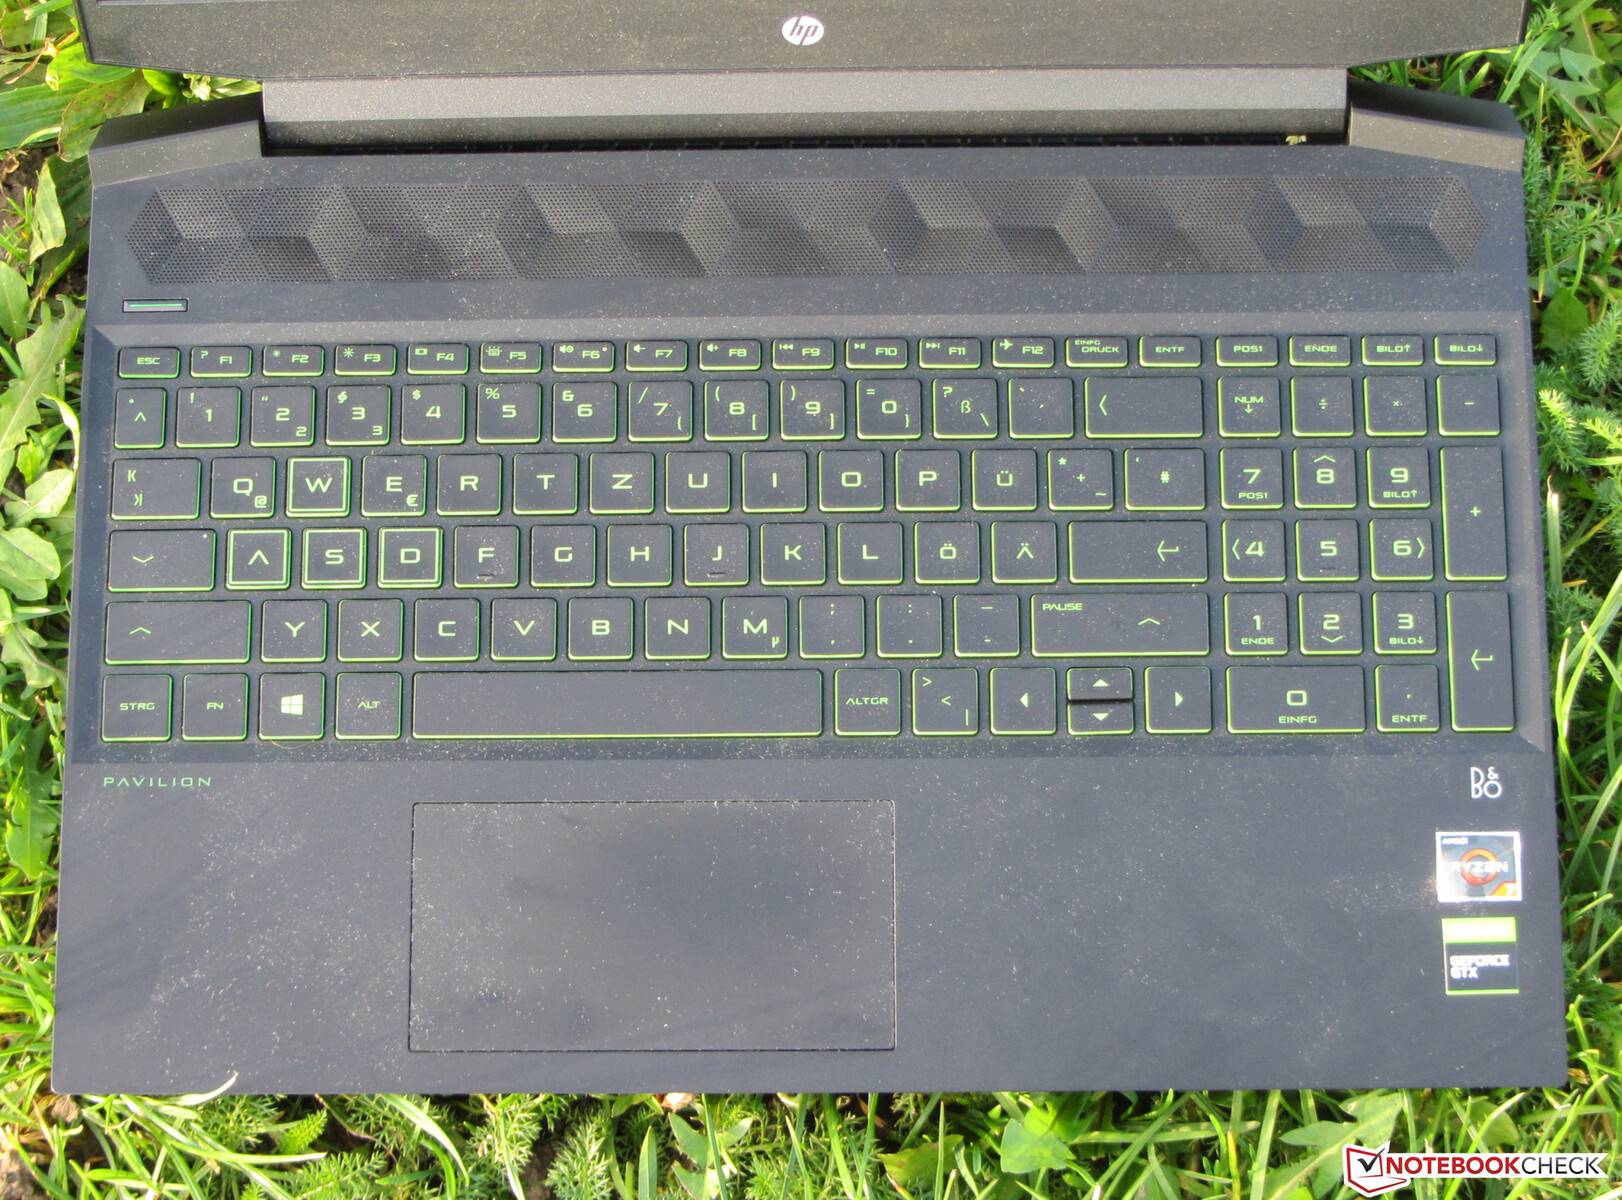
Input Devices - Integrated Keyboard Backlight
The keys of the backlit (two steps) chiclet keyboard offer medium travel and a distinct actuation point. The keys could have been firmer, however. Although the keyboard area can become slightly warped while typing, this has not proven to be disruptive. Overall, HP has delivered a decent keyboard that is suitable for day-to-day use.
Meanwhile, the multi-touch enabled ClickPad has a surface area of around 11.4 x 5 cm (~4.5 x 2 inches). Its smooth surface offers good gliding properties. Furthermore, the touchpad is sensitive all the way to the edges. The key travel is shallow with a distinct actuation point.
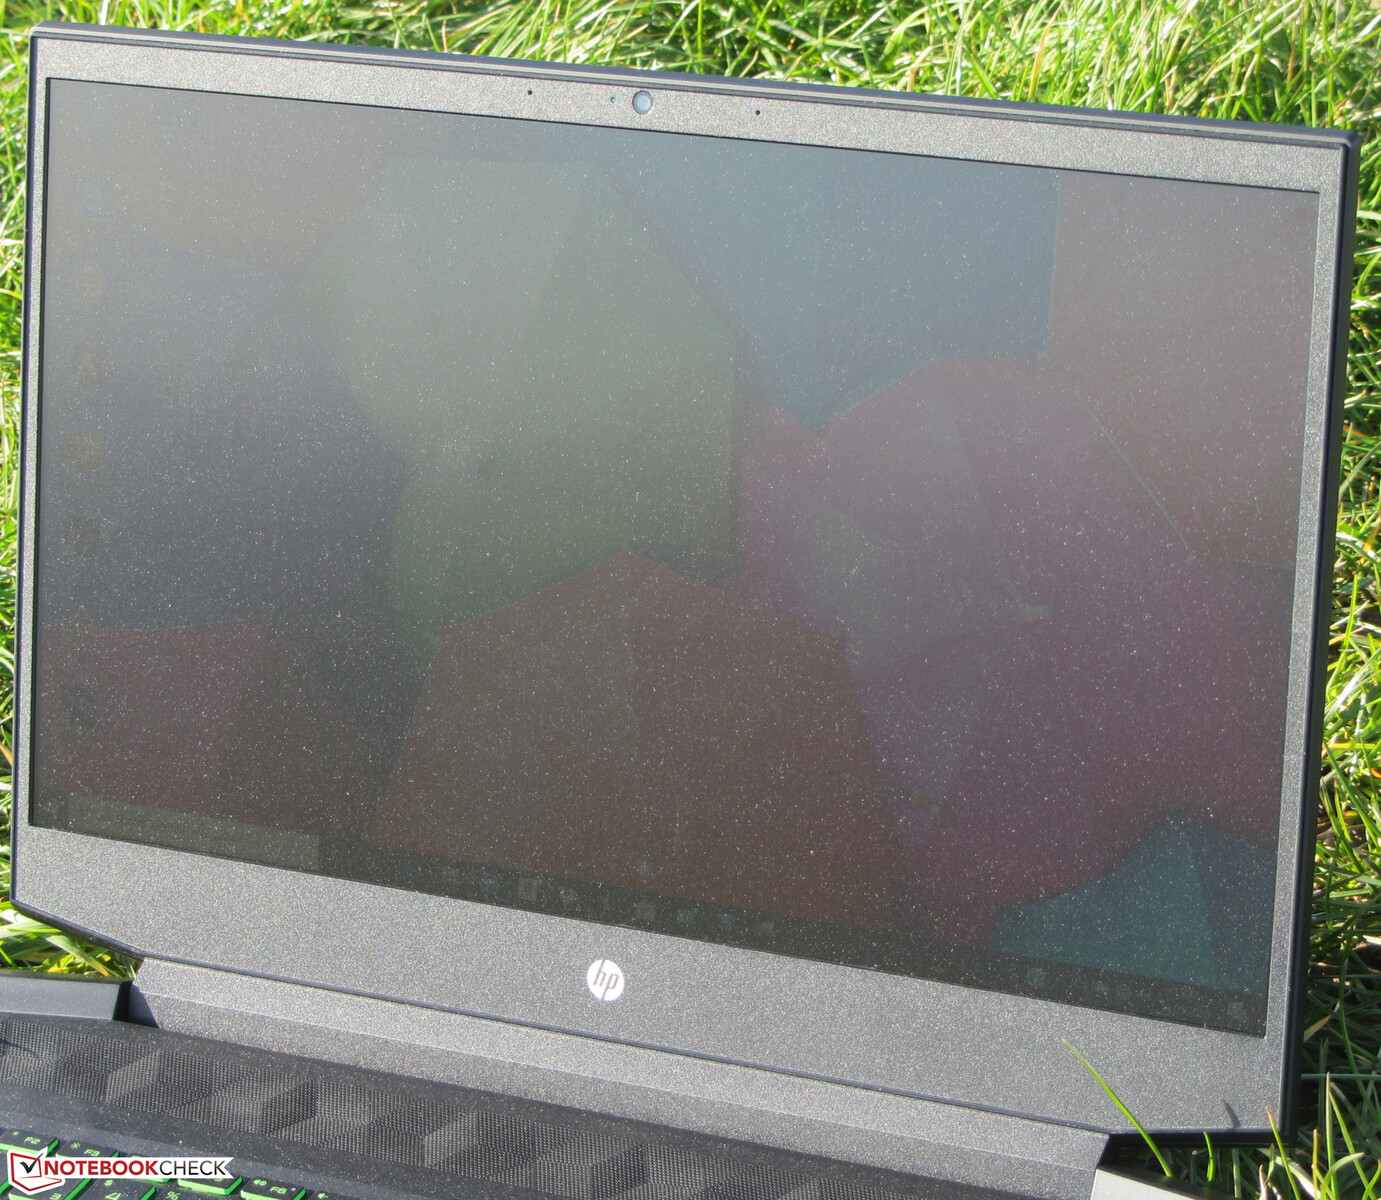
Display - HP Pavilion with a Mediocre Model

The matte 15.6-inch display of the HP Gaming Pavilion has a native resolution of 1920x1080 pixels. Both the brightness (211.3 cd/m²) and the contrast ratio (575:1) are too low. We regard values above 300 cd/m² and 1000:1, respectively, as good.
The screen flickers with a frequency of 250 Hz at a brightness setting of 30 percent or lower. Due to the low frequency, sensitive users may experience headaches and/or eyestrain.
| |||||||||||||||||||||||||
Brightness Distribution: 82 %
Center on Battery: 233 cd/m²
Contrast: 575:1 (Black: 0.405 cd/m²)
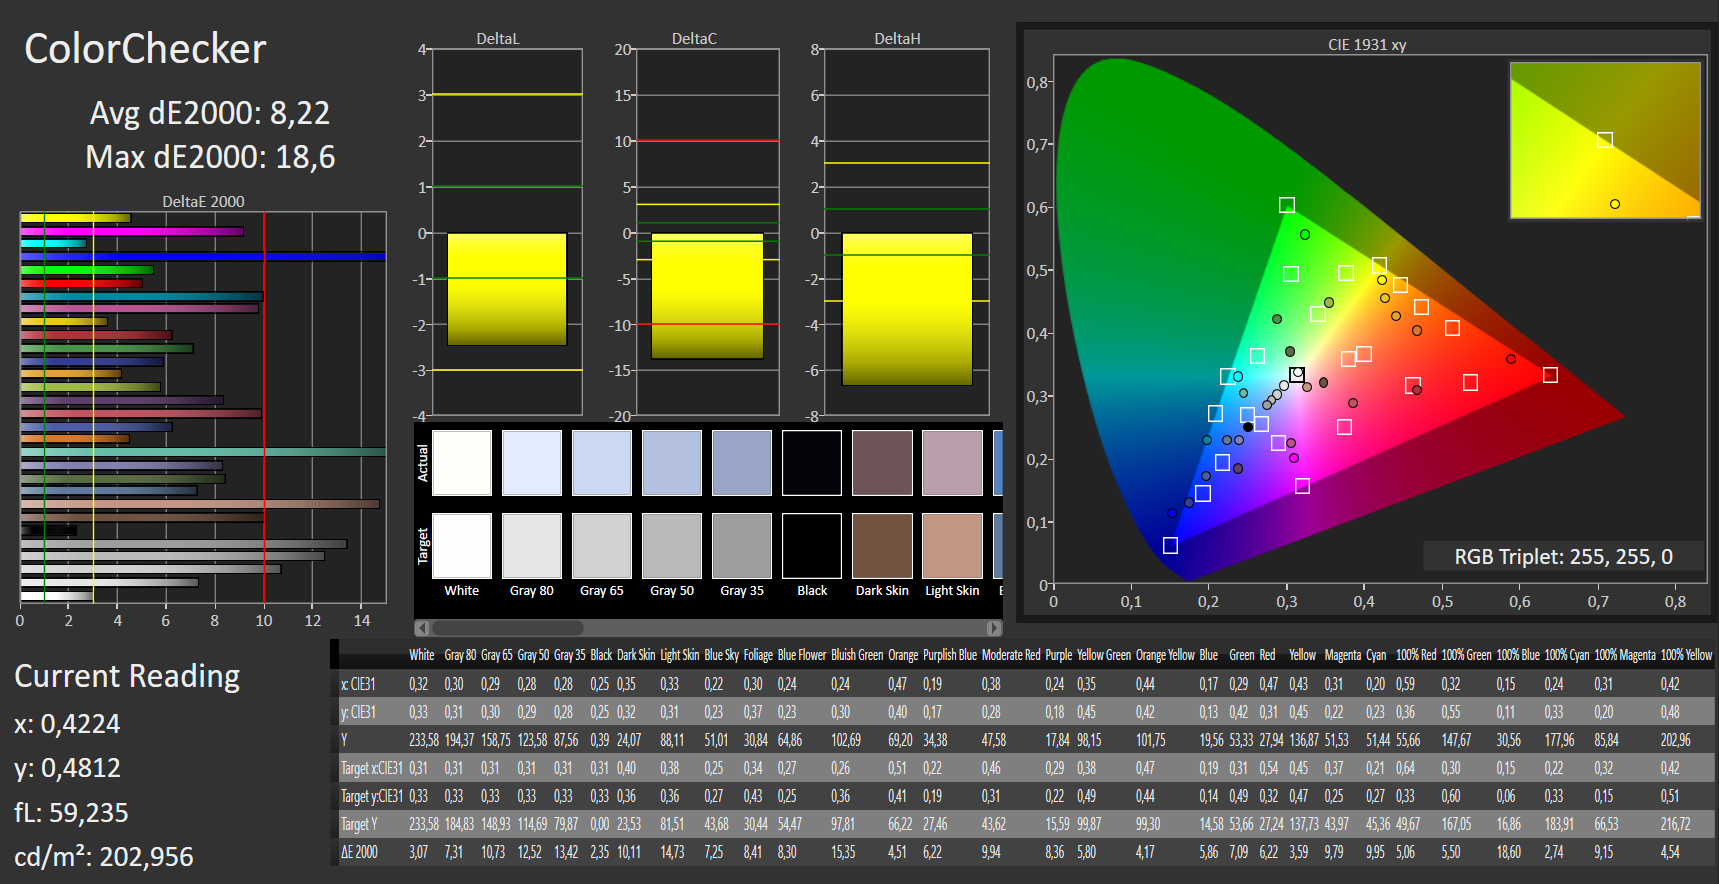
ΔE ColorChecker Calman: 8.22 | ∀{0.5-29.43 Ø4.72}
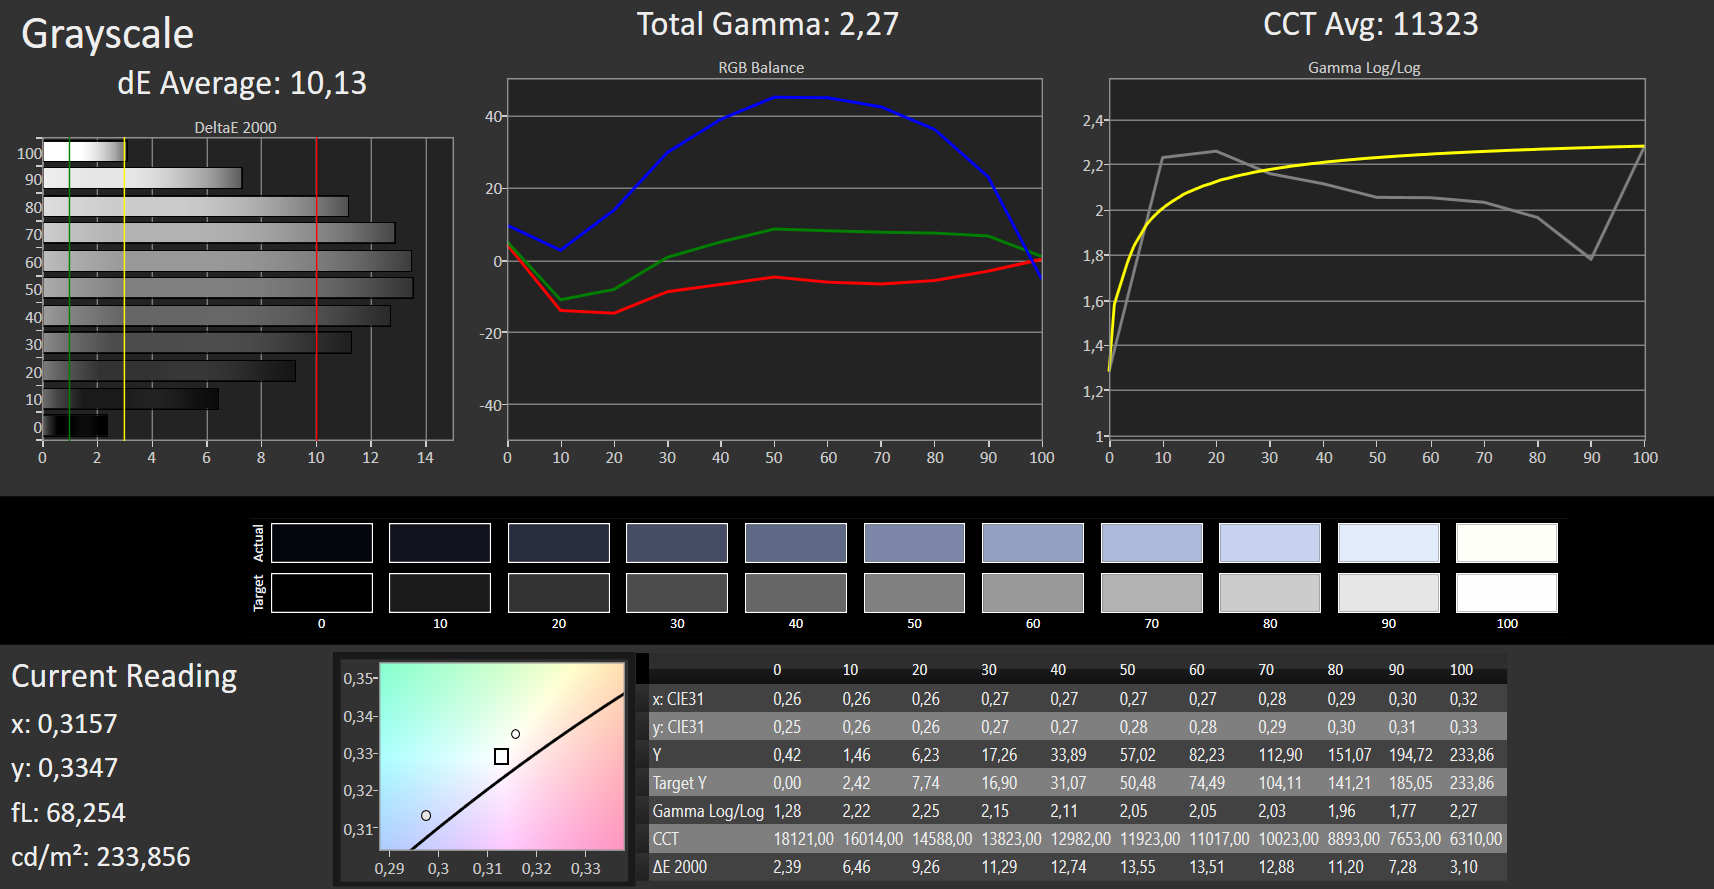
ΔE Greyscale Calman: 10.13 | ∀{0.09-98 Ø4.97}
62% sRGB (Argyll 1.6.3 3D)
39% AdobeRGB 1998 (Argyll 1.6.3 3D)
42.62% AdobeRGB 1998 (Argyll 3D)
61.8% sRGB (Argyll 3D)
41.22% Display P3 (Argyll 3D)
Gamma: 2.27
CCT: 11323 K
| HP Pavilion Gaming 15-ec0002ng TN LED, 1920x1080, 15.6" | HP Pavilion Gaming 15-ec0017ng IPS, 1920x1080, 15.6" | Asus TUF FX505DY IPS, 1920x1080, 15.6" | Lenovo IdeaPad L340-15IRH 81LK00BMGE IPS, 1920x1080, 15.6" | Dell G3 3590 IPS, 1920x1080, 15.6" | MSI GF63 Thin 9SC IPS, 1920x1080, 15.6" | |
|---|---|---|---|---|---|---|
| Display | 49% | -3% | 4% | -3% | -8% | |
| Display P3 Coverage (%) | 41.22 | 62.8 52% | 40.04 -3% | 42.81 4% | 40.13 -3% | 37.76 -8% |
| sRGB Coverage (%) | 61.8 | 89.2 44% | 60.2 -3% | 63.8 3% | 59.8 -3% | 56.5 -9% |
| AdobeRGB 1998 Coverage (%) | 42.62 | 63.8 50% | 41.4 -3% | 44.31 4% | 41.47 -3% | 39.01 -8% |
| Response Times | -42% | -54% | -55% | -61% | -57% | |
| Response Time Grey 50% / Grey 80% * (ms) | 44 ? | 40 ? 9% | 44.8 ? -2% | 45.6 ? -4% | 46 ? -5% | 44.8 ? -2% |
| Response Time Black / White * (ms) | 15 ? | 29 ? -93% | 30.8 ? -105% | 30.8 ? -105% | 32.4 ? -116% | 31.6 ? -111% |
| PWM Frequency (Hz) | 250 ? | 20830 ? | 25910 ? | 200 ? | ||
| Screen | 47% | 21% | 35% | 26% | 34% | |
| Brightness middle (cd/m²) | 233 | 302 30% | 211.5 -9% | 275 18% | 276.2 19% | 260 12% |
| Brightness (cd/m²) | 211 | 291 38% | 200 -5% | 253 20% | 261 24% | 249 18% |
| Brightness Distribution (%) | 82 | 84 2% | 82 0% | 83 1% | 86 5% | 92 12% |
| Black Level * (cd/m²) | 0.405 | 0.25 38% | 0.23 43% | 0.18 56% | 0.24 41% | 0.23 43% |
| Contrast (:1) | 575 | 1208 110% | 920 60% | 1528 166% | 1151 100% | 1130 97% |
| Colorchecker dE 2000 * | 8.22 | 4.84 41% | 3.92 52% | 5.4 34% | 5.56 32% | 4.1 50% |
| Colorchecker dE 2000 max. * | 18.6 | 8.18 56% | 17.63 5% | 21.3 -15% | 23.45 -26% | 7.93 57% |
| Greyscale dE 2000 * | 10.13 | 4.31 57% | 3.1 69% | 3.7 63% | 2.8 72% | 2.83 72% |
| Gamma | 2.27 97% | 2.56 86% | 2.23 99% | 2.12 104% | 2.37 93% | 2.53 87% |
| CCT | 11323 57% | 7318 89% | 6578 99% | 6376 102% | 6710 97% | 6158 106% |
| Color Space (Percent of AdobeRGB 1998) (%) | 39 | 58 49% | 38.1 -2% | 40.8 5% | 37.8 -3% | 36 -8% |
| Color Space (Percent of sRGB) (%) | 62 | 89 44% | 60 -3% | 63.6 3% | 59 -5% | 56 -10% |
| Colorchecker dE 2000 calibrated * | 2.63 | 4.16 | 4.4 | 5.23 | 3.56 | |
| Total Average (Program / Settings) | 18% /
35% | -12% /
6% | -5% /
17% | -13% /
9% | -10% /
14% |
* ... smaller is better
Display Response Times
| ↔ Response Time Black to White | ||
|---|---|---|
| 15 ms ... rise ↗ and fall ↘ combined | ↗ 11 ms rise | 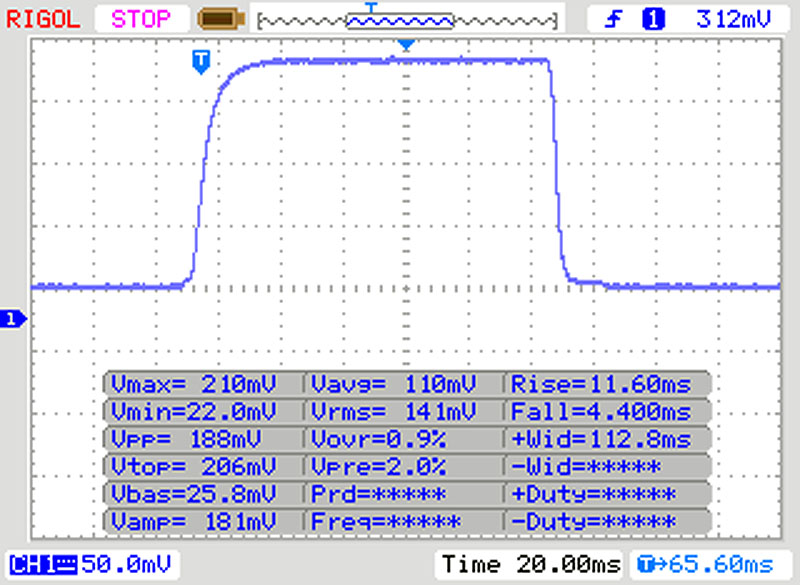 |
| ↘ 4 ms fall | ||
| The screen shows good response rates in our tests, but may be too slow for competitive gamers. In comparison, all tested devices range from 0.1 (minimum) to 240 (maximum) ms. » 36 % of all devices are better. This means that the measured response time is better than the average of all tested devices (19.8 ms). | ||
| ↔ Response Time 50% Grey to 80% Grey | ||
| 44 ms ... rise ↗ and fall ↘ combined | ↗ 23 ms rise | 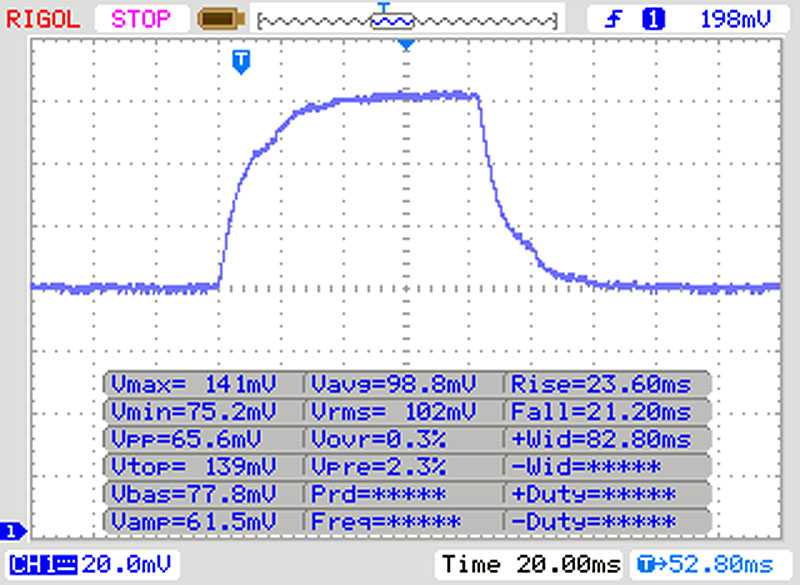 |
| ↘ 21 ms fall | ||
| The screen shows slow response rates in our tests and will be unsatisfactory for gamers. In comparison, all tested devices range from 0.165 (minimum) to 636 (maximum) ms. » 73 % of all devices are better. This means that the measured response time is worse than the average of all tested devices (31 ms). | ||
Screen Flickering / PWM (Pulse-Width Modulation)
| Screen flickering / PWM detected | 250 Hz | ≤ 30 % brightness setting | 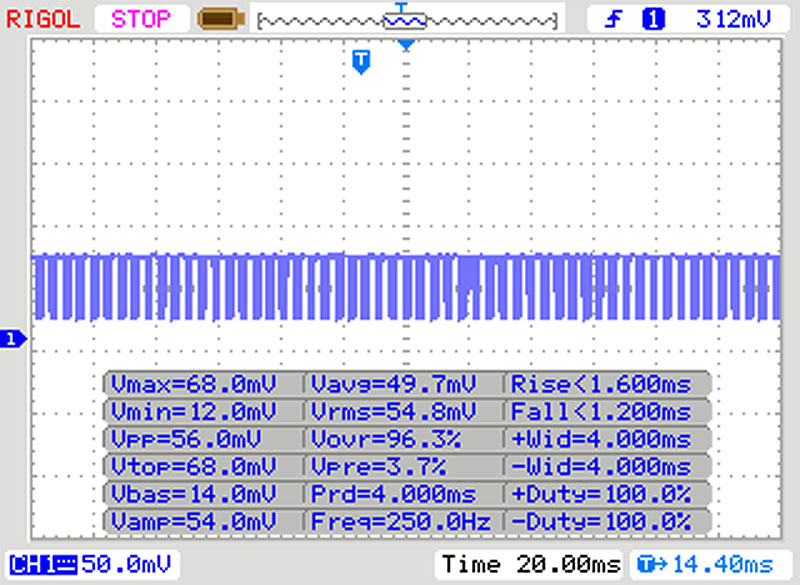 |
The display backlight flickers at 250 Hz (worst case, e.g., utilizing PWM) Flickering detected at a brightness setting of 30 % and below. There should be no flickering or PWM above this brightness setting. The frequency of 250 Hz is relatively low, so sensitive users will likely notice flickering and experience eyestrain at the stated brightness setting and below. In comparison: 52 % of all tested devices do not use PWM to dim the display. If PWM was detected, an average of 7781 (minimum: 5 - maximum: 343500) Hz was measured. | |||
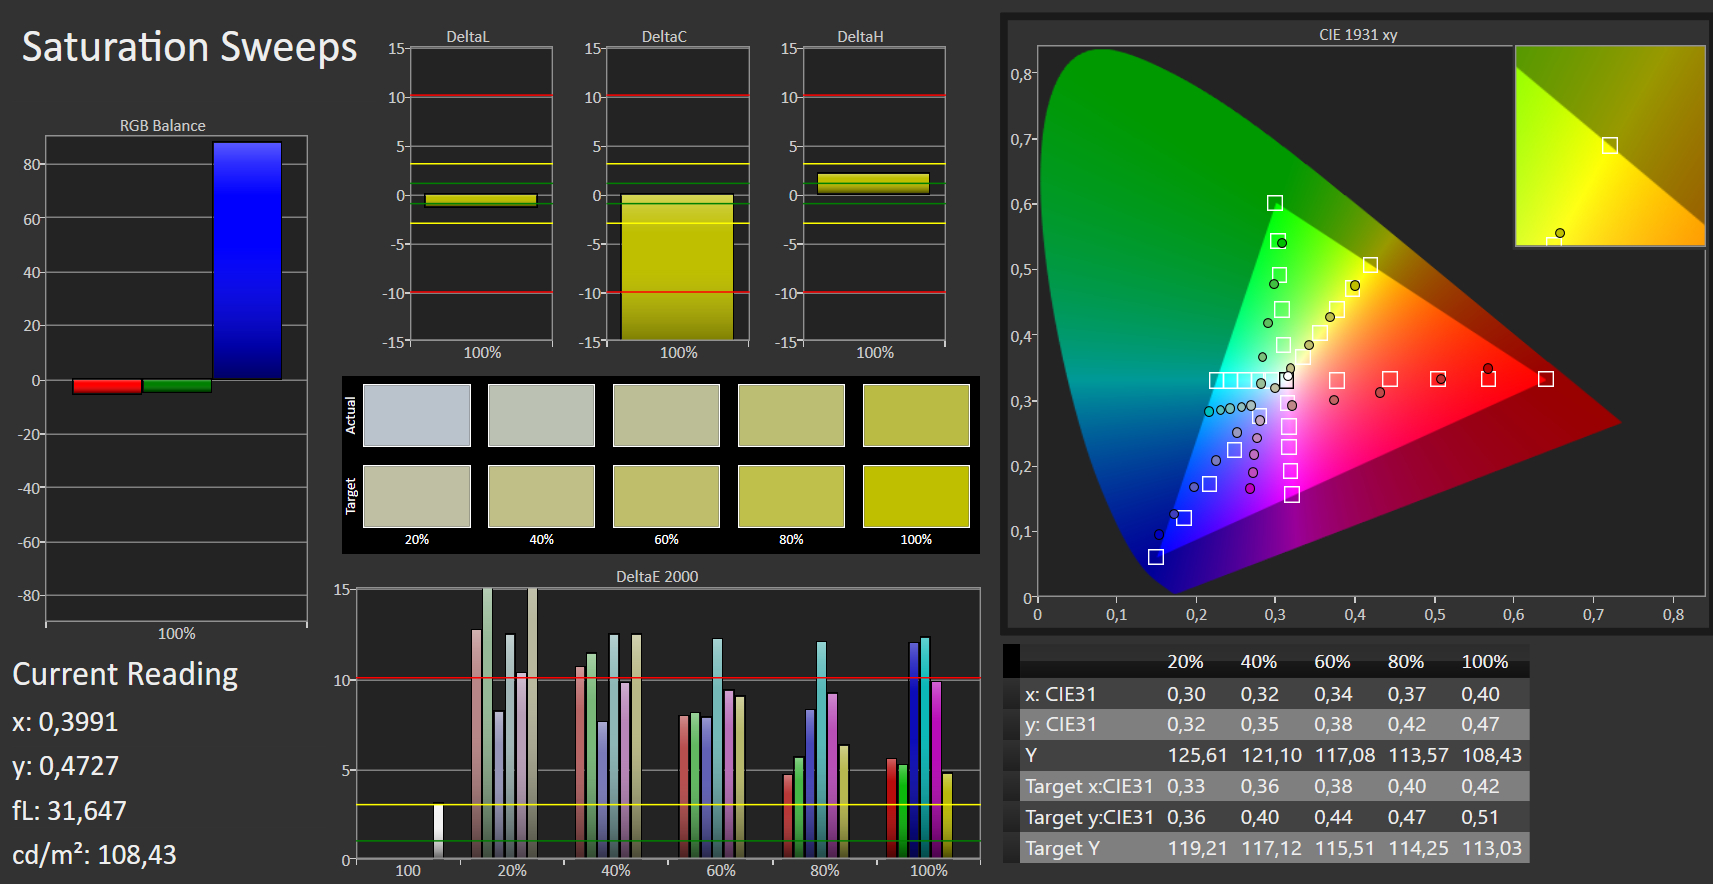
The panel is lacking in terms of the color accuracy ex-factory. With a DeltaE-2000 color deviation of 8.22, it misses the mark (DeltaE of less than 3) by a substantial margin. Additionally, the display suffers from a noticeable blue tint. Lastly, it is unable to fully display both the AdobeRGB (39 percent) and the sRGB (62 percent) color space.
HP has equipped the Pavilion with a TN panel that offers narrow viewing angles. Thus, the display cannot be read from any position. Outdoors, the screen content is readable only when the sun does not shine too brightly.
Performance - Hardware of the Pavilion 15 Performs Well
With the Pavilion Gaming 15, HP has delivered a 15.6-inch gaming laptop with enough computing power to satisfy all common use cases as well as the requirements for playing all current PC games smoothly. Our test model can be purchased for ~$699. Other configurations are also available.
Processor
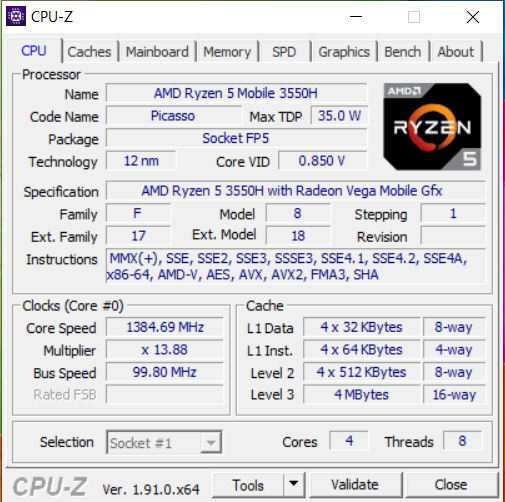
The HP gaming laptop is powered by a Ryzen 5 3550H (Picasso) APU from AMD. The CPU portion of the APU consists of a four-core processor with a base clock of 2.1 GHz. Via Turbo, the clock speed can be increased to up to 3.7 GHz. The processor supports simultaneous multithreading (processing two threads per core).
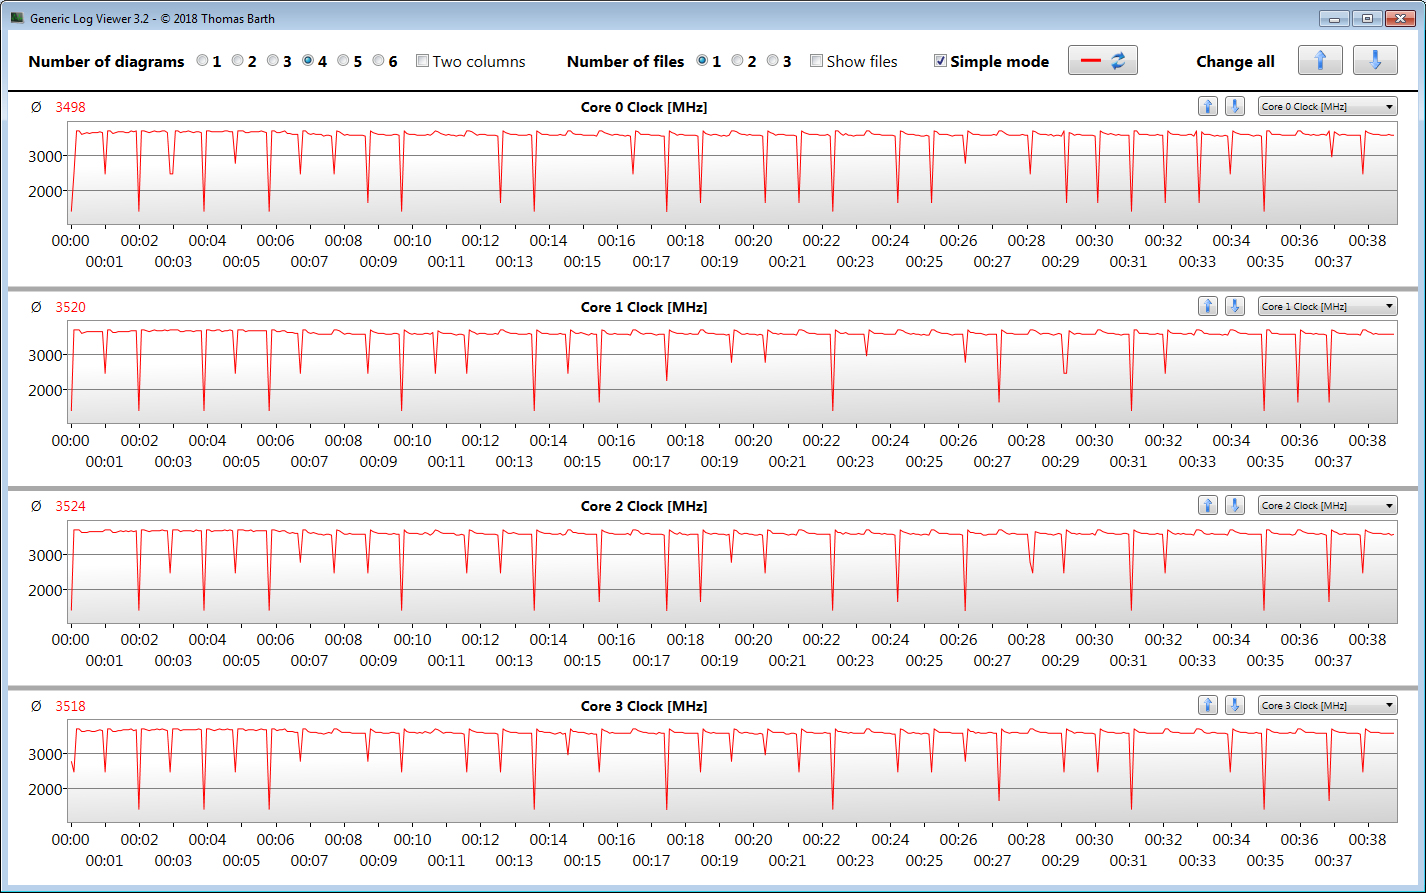
During the Cinebench CPU benchmark tests, the CPU runs at 3.7 GHz (multi-thread) and 1.7 to 3.7 GHz (single-thread). In battery mode, the initial CPU frequency is 2.4 GHz. Subsequently, the clock speed increases to the 3.1 to 3.2 GHz range. A clock speed of between 1.4 and 2.4 GHz can be observed during the single-thread tests.
By running Cinebench R15's multi-thread test in a loop for at least 30 minutes, we determine whether the CPU turbo is permanently active while on mains. By the 8th loop, the scores drop slightly and remain consistent afterwards. During this, the CPU turbo is active.
| Geekbench 3 | |
| 32 Bit Multi-Core Score | |
| HP Pavilion Gaming 15-ec0002ng | |
| HP Pavilion Gaming 15-ec0017ng | |
| Average AMD Ryzen 5 3550H (13474 - 15114, n=3) | |
| 32 Bit Single-Core Score | |
| HP Pavilion Gaming 15-ec0017ng | |
| HP Pavilion Gaming 15-ec0002ng | |
| Average AMD Ryzen 5 3550H (3348 - 3558, n=3) | |
| Mozilla Kraken 1.1 - Total | |
| Lenovo IdeaPad L340-15IRH 81LK00BMGE | |
| HP Pavilion Gaming 15-ec0002ng (Edge 44) | |
| Asus TUF FX505DY (Edge 44.17763.1.0) | |
| HP Pavilion Gaming 15-ec0017ng (Edge 44) | |
| Average AMD Ryzen 5 3550H (1042 - 1229, n=8) | |
| Dell G3 3590 (Edge 44.18362.387.0) | |
| Average of class Gaming (391 - 590, n=105, last 2 years) | |
| Octane V2 - Total Score | |
| Average of class Gaming (89353 - 139447, n=29, last 2 years) | |
| Dell G3 3590 (Edge 44.18362.387.0) | |
| HP Pavilion Gaming 15-ec0017ng (Edge 44) | |
| HP Pavilion Gaming 15-ec0002ng (Edge 44) | |
| Average AMD Ryzen 5 3550H (28324 - 29361, n=4) | |
| Asus TUF FX505DY (Edge 44.17763.1.0) | |
| Lenovo IdeaPad L340-15IRH 81LK00BMGE | |
| JetStream 1.1 - 1.1 Total | |
| Average of class Gaming (533 - 647, n=4, last 2 years) | |
| Dell G3 3590 (Edge 44.18362.387.0) | |
| HP Pavilion Gaming 15-ec0017ng (Edge 44) | |
| Asus TUF FX505DY (Edge 44.17763.1.0) | |
| HP Pavilion Gaming 15-ec0002ng (Edge 44) | |
| Average AMD Ryzen 5 3550H (190.9 - 210, n=4) | |
| Lenovo IdeaPad L340-15IRH 81LK00BMGE | |
* ... smaller is better
System Performance
The Pavilion Gaming offers enough computing power for all common use cases. Playing games is also possible thanks to the dedicated GPU. The system is smooth and responsive overall. No issues arose during our tests. The PCMark benchmarks results are good as well.
| PCMark 8 Home Score Accelerated v2 | 2832 points | |
| PCMark 8 Creative Score Accelerated v2 | 3826 points | |
| PCMark 8 Work Score Accelerated v2 | 4797 points | |
| PCMark 10 Score | 3952 points | |
Help | ||
Storage Solution
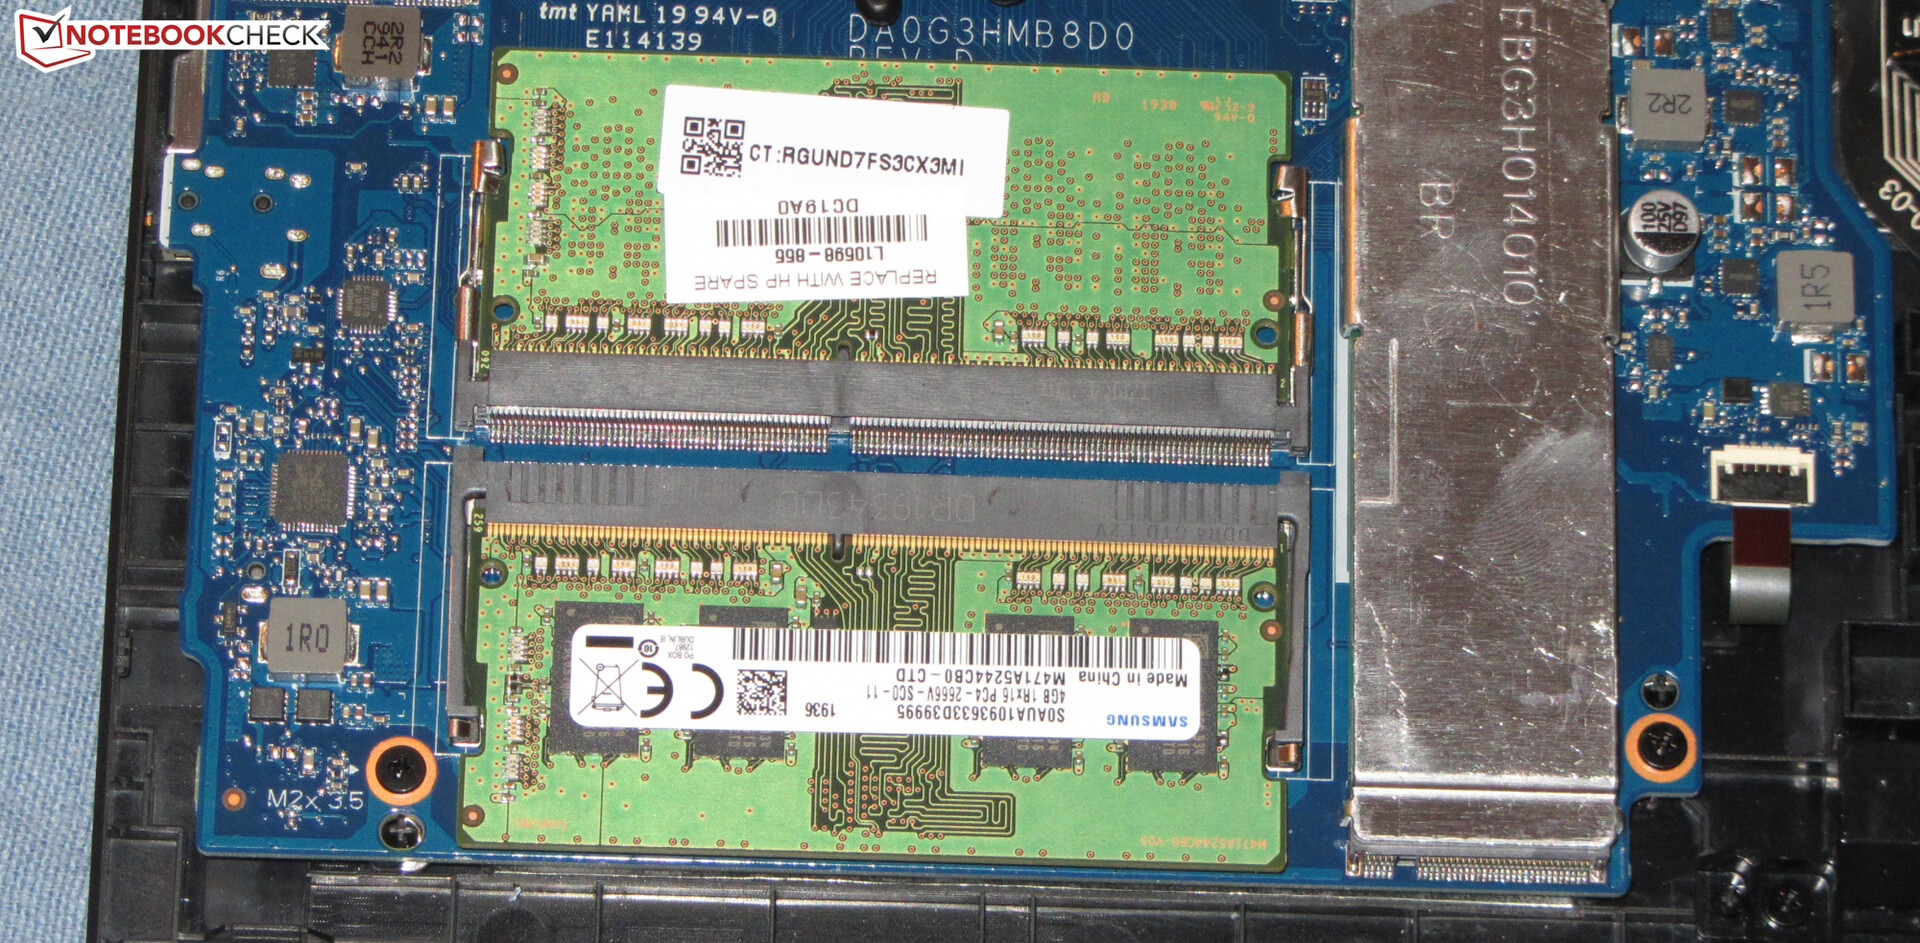
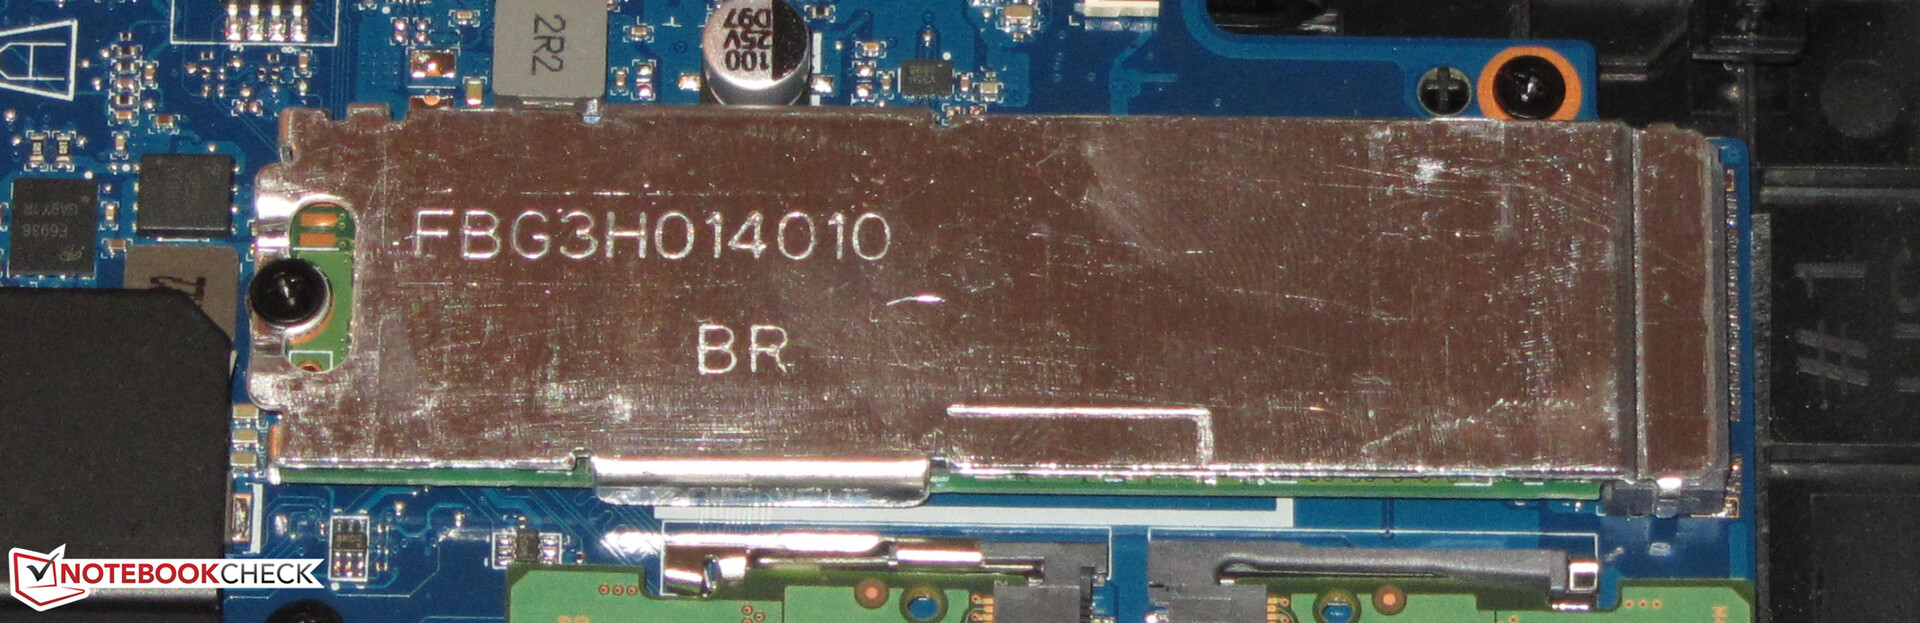
An Intel NVMe SSD (M.2 2280) with a capacity of 512 GB serves as the system drive. While its transfer rates are good, it is not a top-end SSD. On the inside of the laptop, there is space for an additional 2.5-inch drive. The required SATA connector and the mounting frame are included.

| HP Pavilion Gaming 15-ec0002ng Intel SSD 660p SSDPEKNW512G8 | HP Pavilion Gaming 15-ec0017ng WDC PC SN720 SDAPNTW-256G | Asus TUF FX505DY WDC PC SN520 SDAPNUW-256G | Lenovo IdeaPad L340-15IRH 81LK00BMGE WDC PC SN520 SDAPMUW-512 | MSI GF63 Thin 9SC Toshiba KBG30ZMV512G | Average Intel SSD 660p SSDPEKNW512G8 | Average of class Gaming | |
|---|---|---|---|---|---|---|---|
| CrystalDiskMark 5.2 / 6 | 25% | 0% | -1% | -24% | 5% | 185% | |
| Write 4K (MB/s) | 136.9 | 148 8% | 129.8 -5% | 103.6 -24% | 80.6 -41% | 136 ? -1% | 201 ? 47% |
| Read 4K (MB/s) | 57 | 43.73 -23% | 45.19 -21% | 39.91 -30% | 41.82 -27% | 55.2 ? -3% | 78 ? 37% |
| Write Seq (MB/s) | 968 | 1617 67% | 1302 35% | 1160 20% | 597 -38% | 926 ? -4% | 3718 ? 284% |
| Read Seq (MB/s) | 1631 | 1753 7% | 1373 -16% | 990 -39% | 963 -41% | 1523 ? -7% | 3611 ? 121% |
| Write 4K Q32T1 (MB/s) | 237 | 246.3 4% | 207.6 -12% | 283.4 20% | 188.8 -20% | 380 ? 60% | 612 ? 158% |
| Read 4K Q32T1 (MB/s) | 337.1 | 368 9% | 311.9 -7% | 344.5 2% | 403.7 20% | 334 ? -1% | 713 ? 112% |
| Write Seq Q32T1 (MB/s) | 963 | 1618 68% | 1302 35% | 1455 51% | 689 -28% | 987 ? 2% | 5221 ? 442% |
| Read Seq Q32T1 (MB/s) | 1863 | 3027 62% | 1734 -7% | 1690 -9% | 1583 -15% | 1744 ? -6% | 6989 ? 275% |
GPU Performance
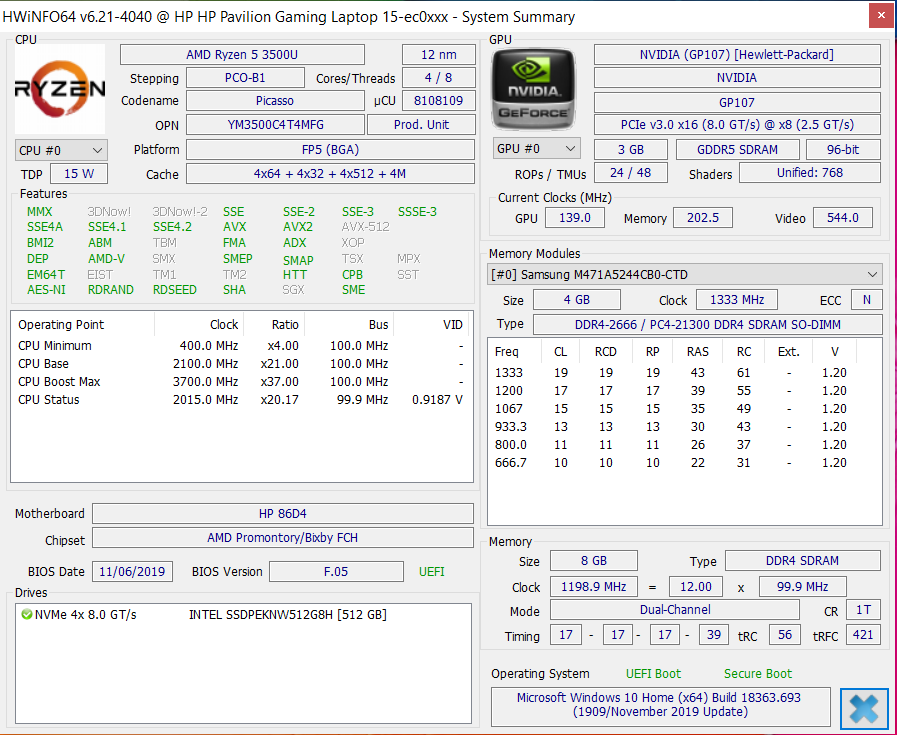
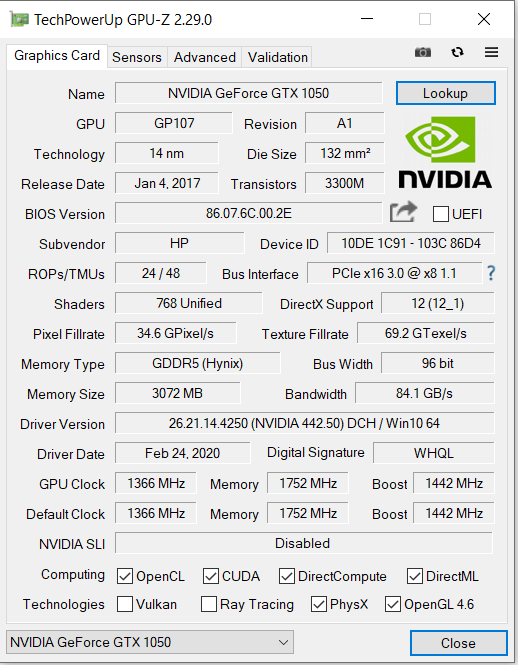
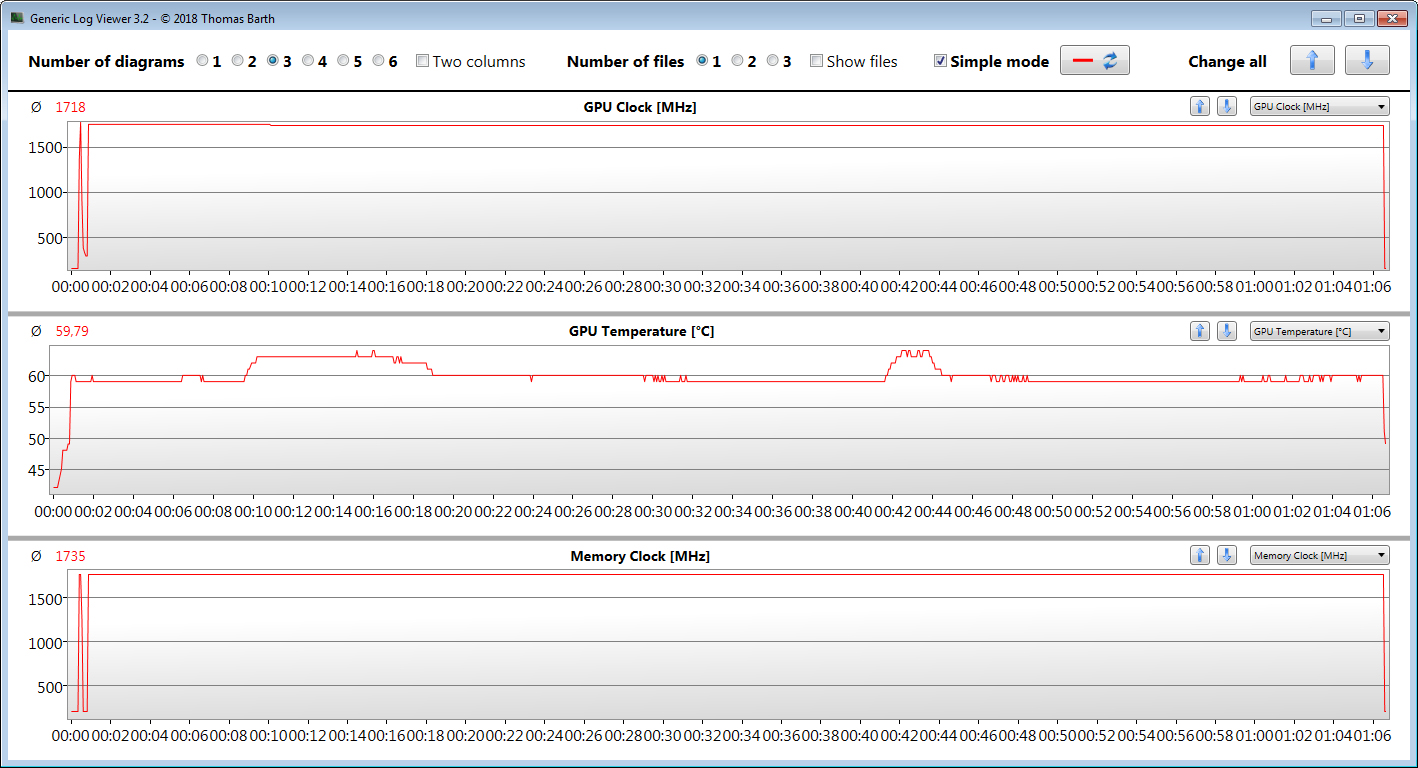
The dedicated GeForce-GTX-1050 GPU (mid-range; Pascal) has a core clock of 1366 MHz (base) to 1442 MHz (boost). Assuming the GPU does not cross a predefined temperature and/or energy consumption threshold, even higher speeds are possible. During our The Witcher 3 test, the clock speed reaches 1718 MHz on average. The maximum recorded clock speed was 1774 MHz. The GPU has access to fast GDDR5 video memory (3.072 GB).
The 3DMark benchmark results match our expectations for this particular GPU. In battery mode, the graphics performance drops by about 50 percent.
The integrated Vega 8 GPU inside the APU is active and the laptop uses Nvidia's graphics switching technology Optimus.
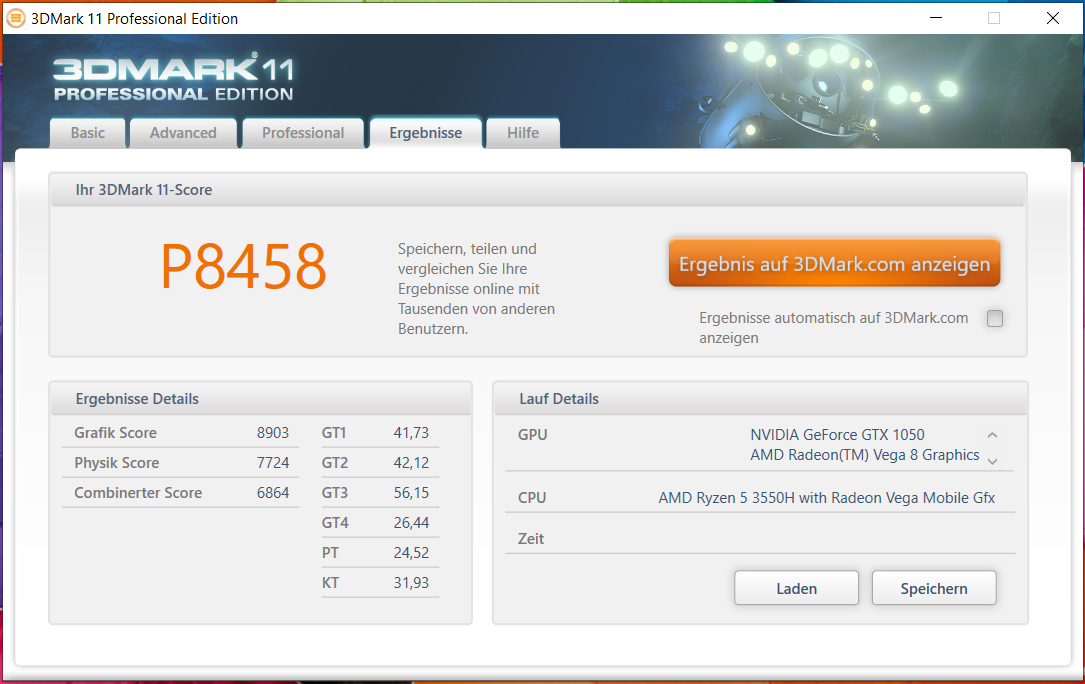
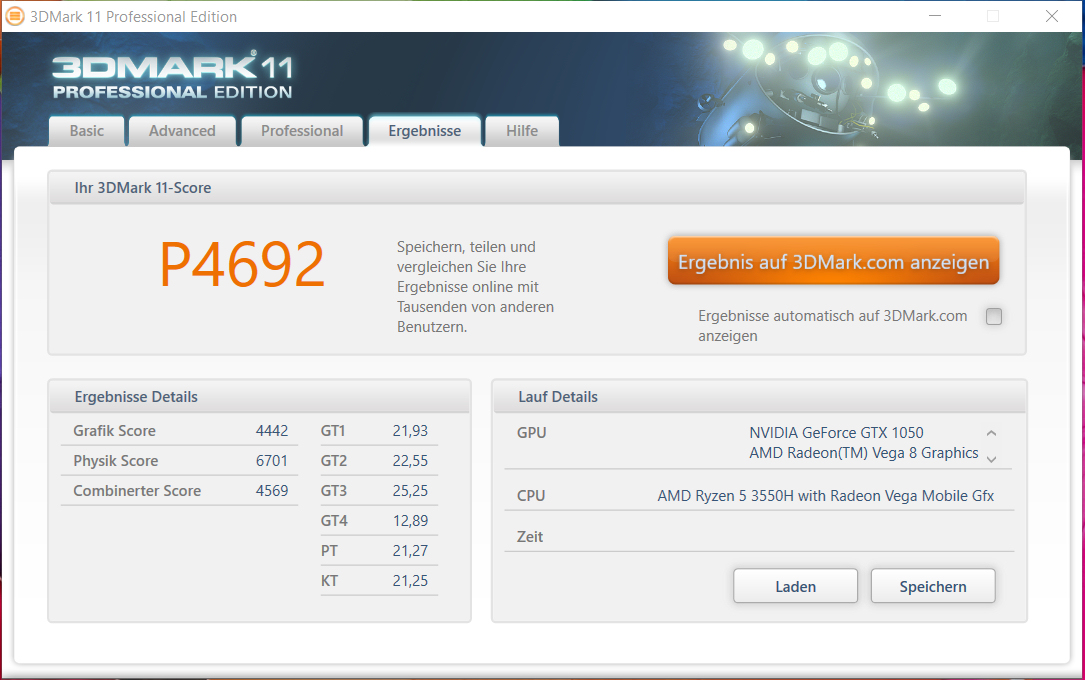

| 3DMark 11 Performance | 8458 points | |
| 3DMark Ice Storm Standard Score | 71886 points | |
| 3DMark Cloud Gate Standard Score | 20800 points | |
| 3DMark Fire Strike Score | 5862 points | |
| 3DMark Time Spy Score | 2258 points | |
Help | ||
Gaming Performance
The laptop displays all the games in our database smoothly on its screen. In most cases, choosing the Full HD resolution and medium to high quality settings is possible. Many recent, demanding AAA titles require users to reduce the resolution and/or quality settings in order for the frame rates to remain sufficiently high.
| BioShock Infinite - 1920x1080 Ultra Preset, DX11 (DDOF) | |
| HP Pavilion Gaming 15-ec0017ng | |
| Dell G3 3590 | |
| Lenovo IdeaPad L340-15IRH 81LK00BMGE | |
| Average NVIDIA GeForce GTX 1050 Mobile (48.6 - 67.5, n=35) | |
| HP Pavilion Gaming 15-ec0002ng | |
| Asus TUF FX505DY | |
| The Witcher 3 - 1920x1080 High Graphics & Postprocessing (Nvidia HairWorks Off) | |
| Average of class Gaming (181 - 341, n=3, last 2 years) | |
| HP Pavilion Gaming 15-ec0017ng | |
| Dell G3 3590 | |
| MSI GF63 Thin 9SC | |
| HP Pavilion Gaming 15-ec0002ng | |
| Asus TUF FX505DY | |
| Average NVIDIA GeForce GTX 1050 Mobile (29.1 - 43, n=29) | |
| FIFA 20 - 1920x1080 Ultra Preset AA:4xMS | |
| HP Pavilion Gaming 15-ec0017ng | |
| MSI GF63 Thin 9SC | |
| Average NVIDIA GeForce GTX 1050 Mobile (99 - 108, n=3) | |
| HP Pavilion Gaming 15-ec0002ng | |
| Need for Speed Heat - 1920x1080 Medium Preset | |
| MSI GF63 Thin 9SC | |
| HP Pavilion Gaming 15-ec0002ng | |
| Average NVIDIA GeForce GTX 1050 Mobile (36.8 - 39.7, n=2) | |
| Metro Exodus - 1280x720 Low Quality AF:4x | |
| HP Pavilion Gaming 15-ec0017ng | |
| MSI GF63 Thin 9SC | |
| HP Pavilion Gaming 15-ec0002ng | |
| Average NVIDIA GeForce GTX 1050 Mobile (45.1 - 60.4, n=3) | |
By running the title The Witcher 3 for about 60 minutes at Full HD and maximum graphics settings, we check the frame rates for consistency over a prolonged period of time. During the entire duration of the test, the character portrayed by the player is not moved. Thankfully, we did not observe frame rate dips.
| low | med. | high | ultra | |
|---|---|---|---|---|
| BioShock Infinite (2013) | 202.4 | 162.2 | 146.2 | 61.4 |
| The Witcher 3 (2015) | 118.3 | 73.1 | 42.1 | 24.3 |
| World of Warships (2015) | 128.1 | 107.6 | 92 | 83.1 |
| Rainbow Six Siege (2015) | 171.8 | 139.6 | 88.7 | 75.9 |
| For Honor (2017) | 137 | 56.8 | 54.1 | 43 |
| Ghost Recon Wildlands (2017) | 80.8 | 39.5 | 37.5 | 19.4 |
| X-Plane 11.11 (2018) | 59.1 | 51.9 | 44.6 | |
| Far Cry 5 (2018) | 67 | 42 | 39 | 37 |
| Shadow of the Tomb Raider (2018) | 64 | 35 | 33 | 29 |
| Assassin´s Creed Odyssey (2018) | 55 | 38 | 29 | 17 |
| Battlefield V (2018) | 84.4 | 52.6 | 45.5 | 38.4 |
| Farming Simulator 19 (2018) | 133.2 | 100.3 | 75.9 | 55.3 |
| Apex Legends (2019) | 124.1 | 53.2 | 42.5 | 39.1 |
| Metro Exodus (2019) | 60.4 | 28.4 | 21.9 | 17.4 |
| Anthem (2019) | 45.9 | 31.1 | 28.8 | 24 |
| Dirt Rally 2.0 (2019) | 142.5 | 62.2 | 51.7 | 28.3 |
| The Division 2 (2019) | 83 | 41 | 32 | 23 |
| Anno 1800 (2019) | 54.9 | 46.1 | 30.9 | 16.2 |
| Rage 2 (2019) | 79.9 | 34.1 | 27.8 | 28.2 |
| Total War: Three Kingdoms (2019) | 117.4 | 43.2 | 25.5 | 15.3 |
| F1 2019 (2019) | 128 | 71 | 61 | 53 |
| Control (2019) | 78.6 | 26.3 | 19.1 | |
| Borderlands 3 (2019) | 79.3 | 40.2 | 26 | 19.3 |
| FIFA 20 (2019) | 134.9 | 115.6 | 110.5 | 100.5 |
| Ghost Recon Breakpoint (2019) | 61 | 35 | 31 | 4 |
| GRID 2019 (2019) | 93.7 | 50.1 | 40.9 | 13.7 |
| Call of Duty Modern Warfare 2019 (2019) | 66.8 | 40.7 | 36.2 | 29.8 |
| Need for Speed Heat (2019) | 57.2 | 39.7 | 33.9 | 32.6 |
| Star Wars Jedi Fallen Order (2019) | 47.8 | 39.6 | 34.5 | |
| Red Dead Redemption 2 (2019) | 51.8 | 28.1 | 17 | |
| Hunt Showdown (2020) | 89.7 | 36.3 | 27.9 |
Emissions & Energy Management - HP Laptop Does Not Lack Stamina
System Noise
During idle, the fans often do not spin at all. When they do occasionally spin, they produce an acceptable amount of noise. Under load (stress test), we recorded a maximum noise level of 43.3 dB(A).
Noise level
| Idle |
| 30.3 / 30.3 / 31 dB(A) |
| Load |
| 39.3 / 43.3 dB(A) |
 | ||
30 dB silent 40 dB(A) audible 50 dB(A) loud |
||
min: | ||
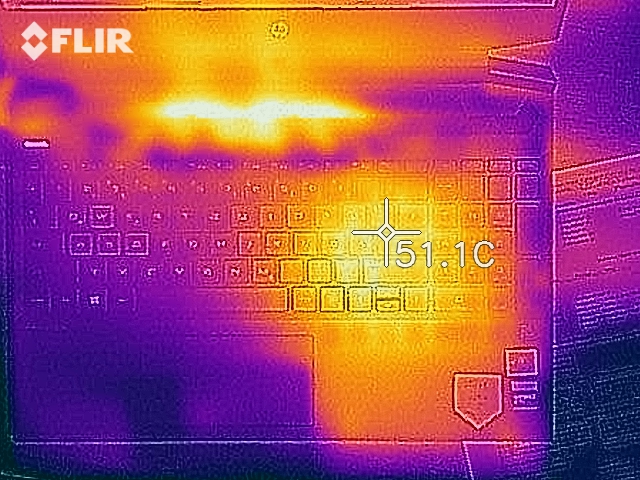
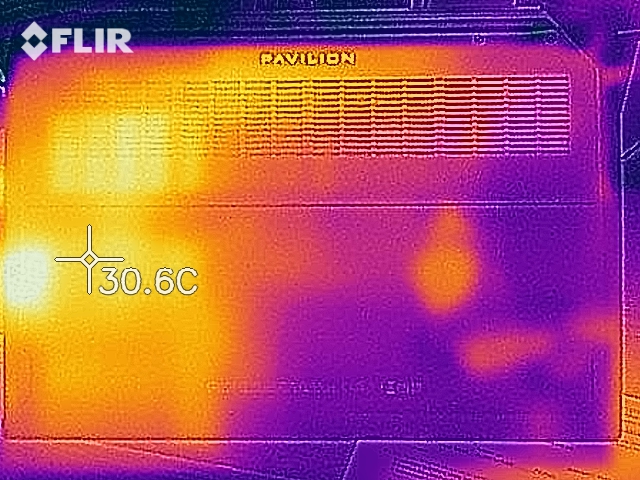
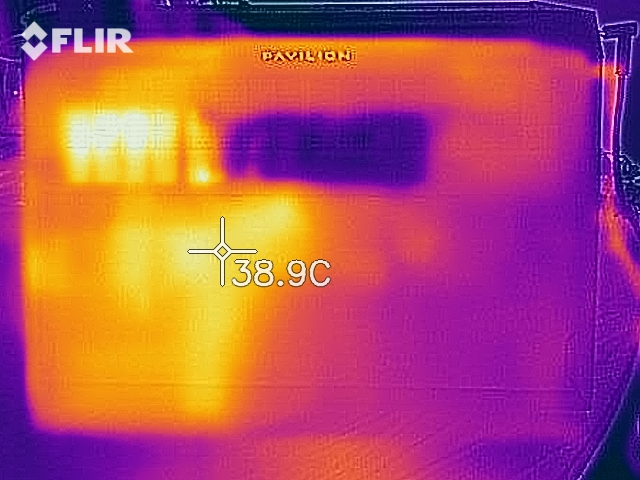
Temperature
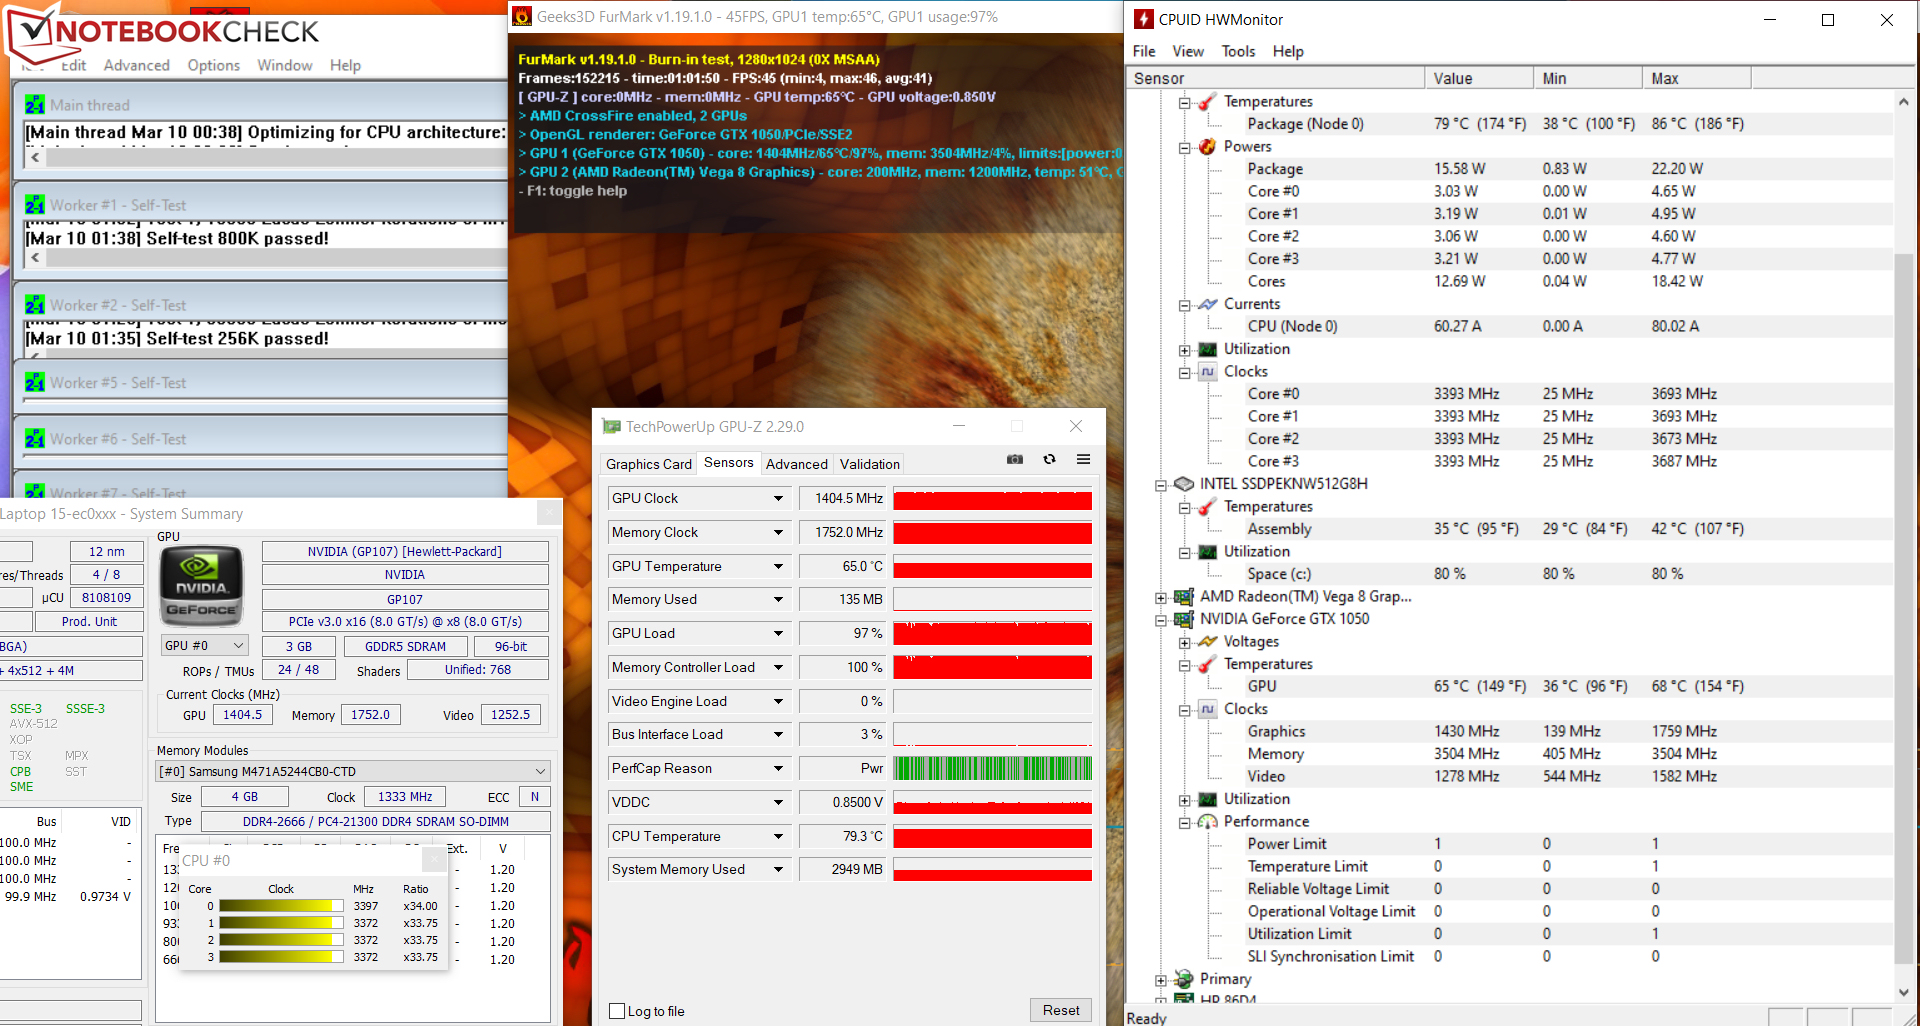
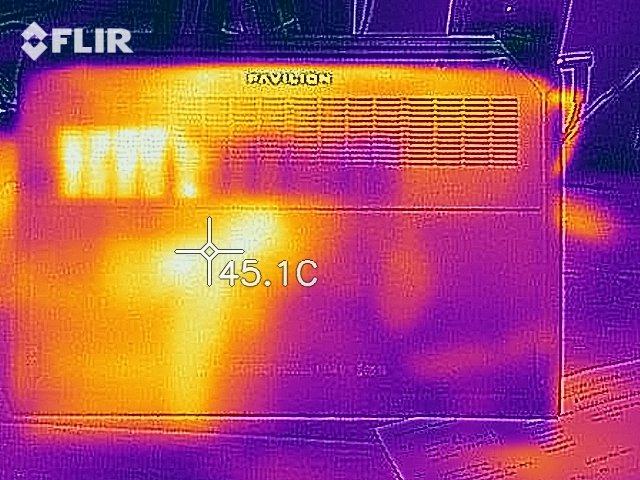
During our stress test (running Prime95 and FurMark for at least one hour), the CPU and GPU clock rates range from 3.4 GHz to 3.5 GHz and 1400 MHz to 1500 MHz, respectively, while on mains. In battery mode, the clock rates stabilize at 400 MHz to 2.9 GHz (CPU) and 900 MHz to 1700 MHz (GPU). The stress test represents an extreme case that does not occur during daily use. We use this test to determine whether the system is stable while under maximum load.
Both under maximum load (stress test) and while gaming (The Witcher 3 test), the heat development remains moderate. We registered maximum temperatures of just above 40 °C (104 °F). Similarly, users will not have to worry about the temperatures during day-to-day use.
(±) The maximum temperature on the upper side is 41 °C / 106 F, compared to the average of 40.4 °C / 105 F, ranging from 21.2 to 68.8 °C for the class Gaming.
(+) The bottom heats up to a maximum of 39.1 °C / 102 F, compared to the average of 43.2 °C / 110 F
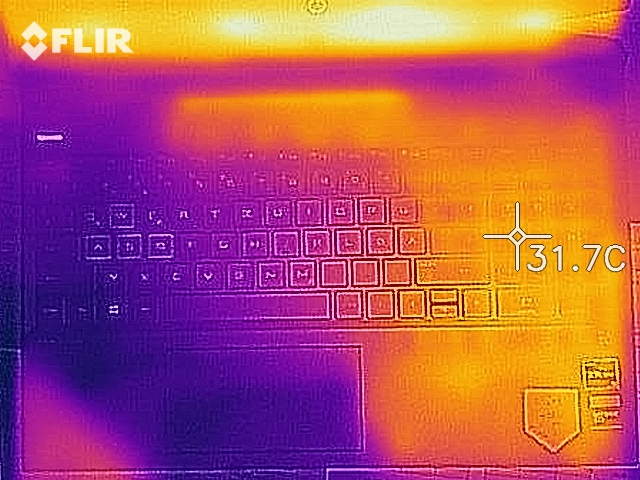
(+) In idle usage, the average temperature for the upper side is 24.2 °C / 76 F, compared to the device average of 33.9 °C / 93 F.
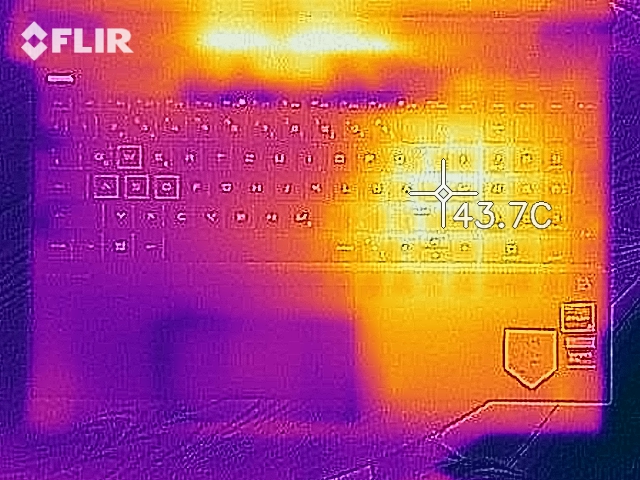
(+) Playing The Witcher 3, the average temperature for the upper side is 29.1 °C / 84 F, compared to the device average of 33.9 °C / 93 F.
(+) The palmrests and touchpad are cooler than skin temperature with a maximum of 31.6 °C / 88.9 F and are therefore cool to the touch.
(-) The average temperature of the palmrest area of similar devices was 28.8 °C / 83.8 F (-2.8 °C / -5.1 F).
Speakers
The stereo speakers are located above the keyboard behind a perforated cover. They produce an acceptable sound that lacks bass.
HP Pavilion Gaming 15-ec0002ng audio analysis
(-) | not very loud speakers (66.3 dB)
Bass 100 - 315 Hz
(-) | nearly no bass - on average 23.9% lower than median
(±) | linearity of bass is average (10% delta to prev. frequency)
Mids 400 - 2000 Hz
(+) | balanced mids - only 4% away from median
(±) | linearity of mids is average (10.4% delta to prev. frequency)
Highs 2 - 16 kHz
(±) | higher highs - on average 6.8% higher than median
(±) | linearity of highs is average (7.7% delta to prev. frequency)
Overall 100 - 16.000 Hz
(±) | linearity of overall sound is average (29.7% difference to median)
Compared to same class
» 95% of all tested devices in this class were better, 2% similar, 3% worse
» The best had a delta of 6%, average was 18%, worst was 132%
Compared to all devices tested
» 88% of all tested devices were better, 3% similar, 10% worse
» The best had a delta of 4%, average was 24%, worst was 134%
Energy Consumption
The energy consumption of the HP laptop is nothing out of the ordinary. While idling, we recorded a maximum consumption of 9.6 watts. This value increases to up to 124 watts during our stress test. While gaming (The Witcher 3 test) we measured an average consumption of 75 watts (69 watts to 82 watts). The AC adapter is rated for 135 watts.
| Off / Standby | |
| Idle | |
| Load |
|
Key:
min: | |
Battery Life
Our real-world Wi-Fi test simulates a web browsing load with the help of a script. For this test, we set the display brightness to about 150 cd/m². Here, the HP laptop achieves a runtime of 8:25 h.
Pros
Cons
Verdict
At ~$699, the Pavilion Gaming 15 is one of the cheaper gaming laptops. Here, the Ryzen 5 3550H APU and the GeForce GTX 1050 GPU allow for a smooth gaming experience. That said, the hardware struggles at higher resolutions or graphics quality settings.
The inexpensive gaming laptop Pavilion Gaming 15-ec0002ng is a well-rounded package from Hewlett Packard.
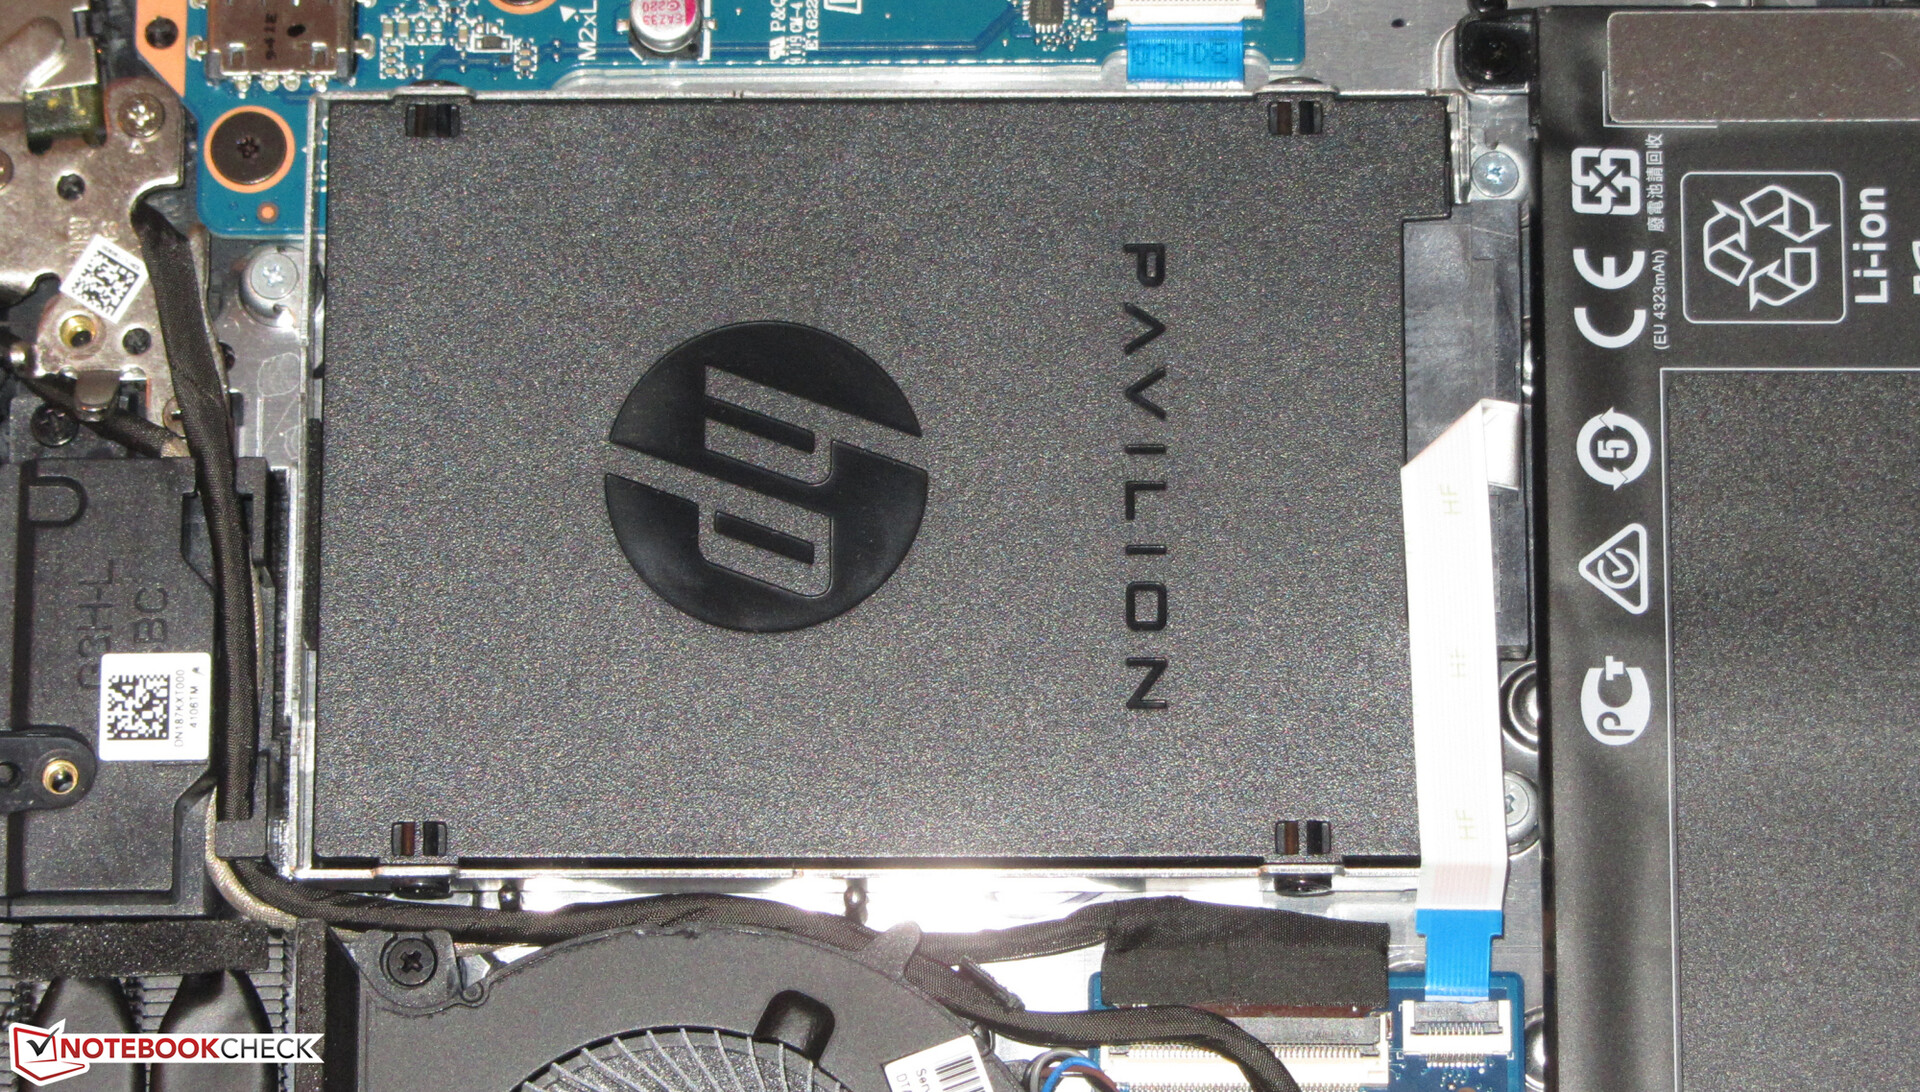
The plastic case lacks rigidity, even though the build quality is good overall. A maintenance hatch is not available. Instead, the bottom plate has to be removed in order to upgrade or swap out the components (SSD, RAM, second storage drive, Wi-Fi module) - this task can be accomplished relatively easily. The chiclet keyboard (green backlight with two steps) has proven to be well suited to daily use.
The relatively low price manifests in the quality of the display. The matte Full HD model only offers a low contrast ratio, brightness and narrow viewing angles. The color accuracy is lackluster as well.
By contrast, the very good battery life is a welcome surprise. In our Wi-Fi test, the Pavilion lasts for 8:25 h - more than many office laptops.
HP Pavilion Gaming 15-ec0002ng
- 03/24/2020 v7 (old)
Sascha Mölck
Price comparison

