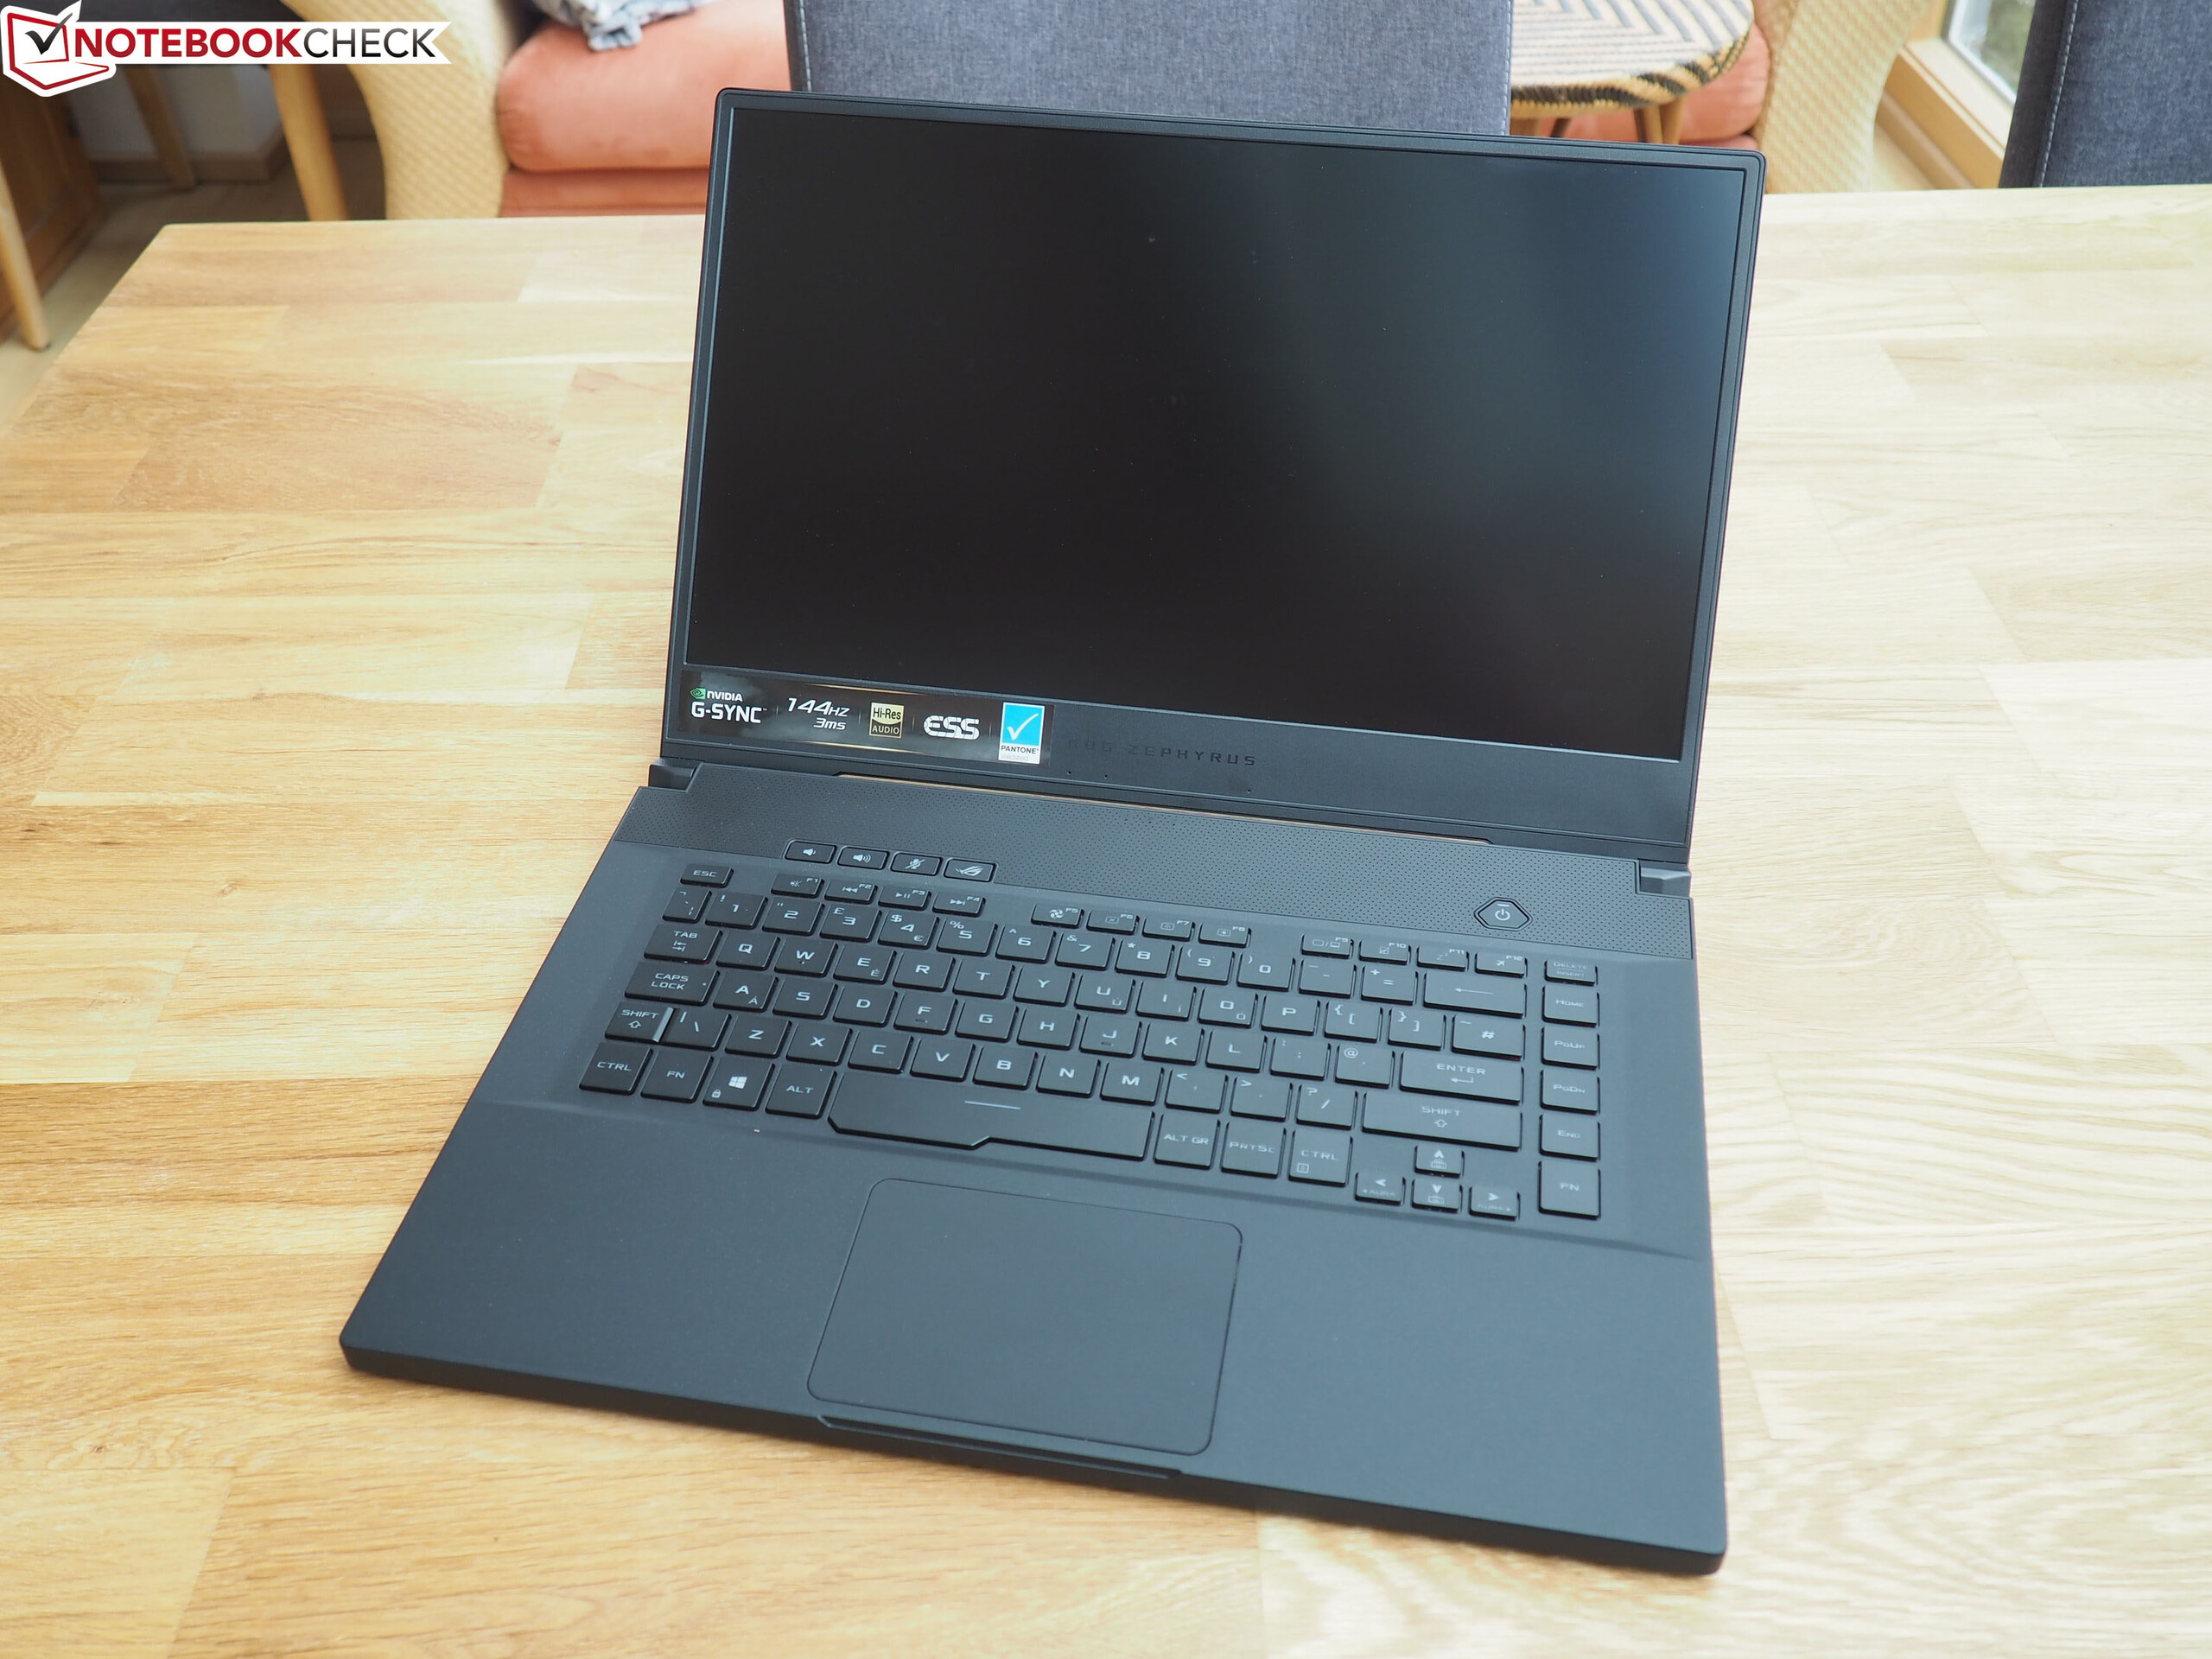
Asus ROG Zephyrus S15 GX502L laptop in review: Gaming laptop updated to Comet Lake

With the Zephyrus S15 GX502L, Asus is mainly doing a model update. As a result, many features of the Zephyrus S GX502GW predecessor model have been preserved, which is why we will point you to its review article at the appropriate places. Here, we'll focus on the differences that result from the 300 Hz panel as well as the Intel Core i7-10875H and the Nvidia GeForce RTX 2070 Super that have now been installed.
With this configuration, not only does the gaming laptop from Asus have to assert itself against its predecessor, but it will be compared to the competition listed below as well. You can also add more laptops from our database under each section.
Rating | Date | Model | Weight | Height | Size | Resolution | Price |
|---|---|---|---|---|---|---|---|
| 82.9 % v7 (old) | 09 / 2020 | Asus Zephyrus S15 GX502L i7-10875H, GeForce RTX 2070 Super Mobile | 2.1 kg | 19 mm | 15.60" | 1920x1080 | |
| 81.3 % v7 (old) | 05 / 2019 | Asus Zephyrus S GX502GW i7-9750H, GeForce RTX 2070 Mobile | 2.1 kg | 19 mm | 15.60" | 1920x1080 | |
| 84.6 % v7 (old) | 07 / 2020 | MSI GE66 Raider 10SFS i9-10980HK, GeForce RTX 2070 Super Mobile | 2.4 kg | 23 mm | 15.60" | 1920x1080 | |
| 86.9 % v7 (old) | 08 / 2020 | Razer Blade 15 RTX 2070 Super Max-Q i7-10875H, GeForce RTX 2070 Super Max-Q | 2.1 kg | 17.8 mm | 15.60" | 1920x1080 | |
| 86.5 % v7 (old) | 08 / 2020 | Aorus 15G XB i7-10875H, GeForce RTX 2070 Super Max-Q | 2.3 kg | 25 mm | 15.60" | 1920x1080 |
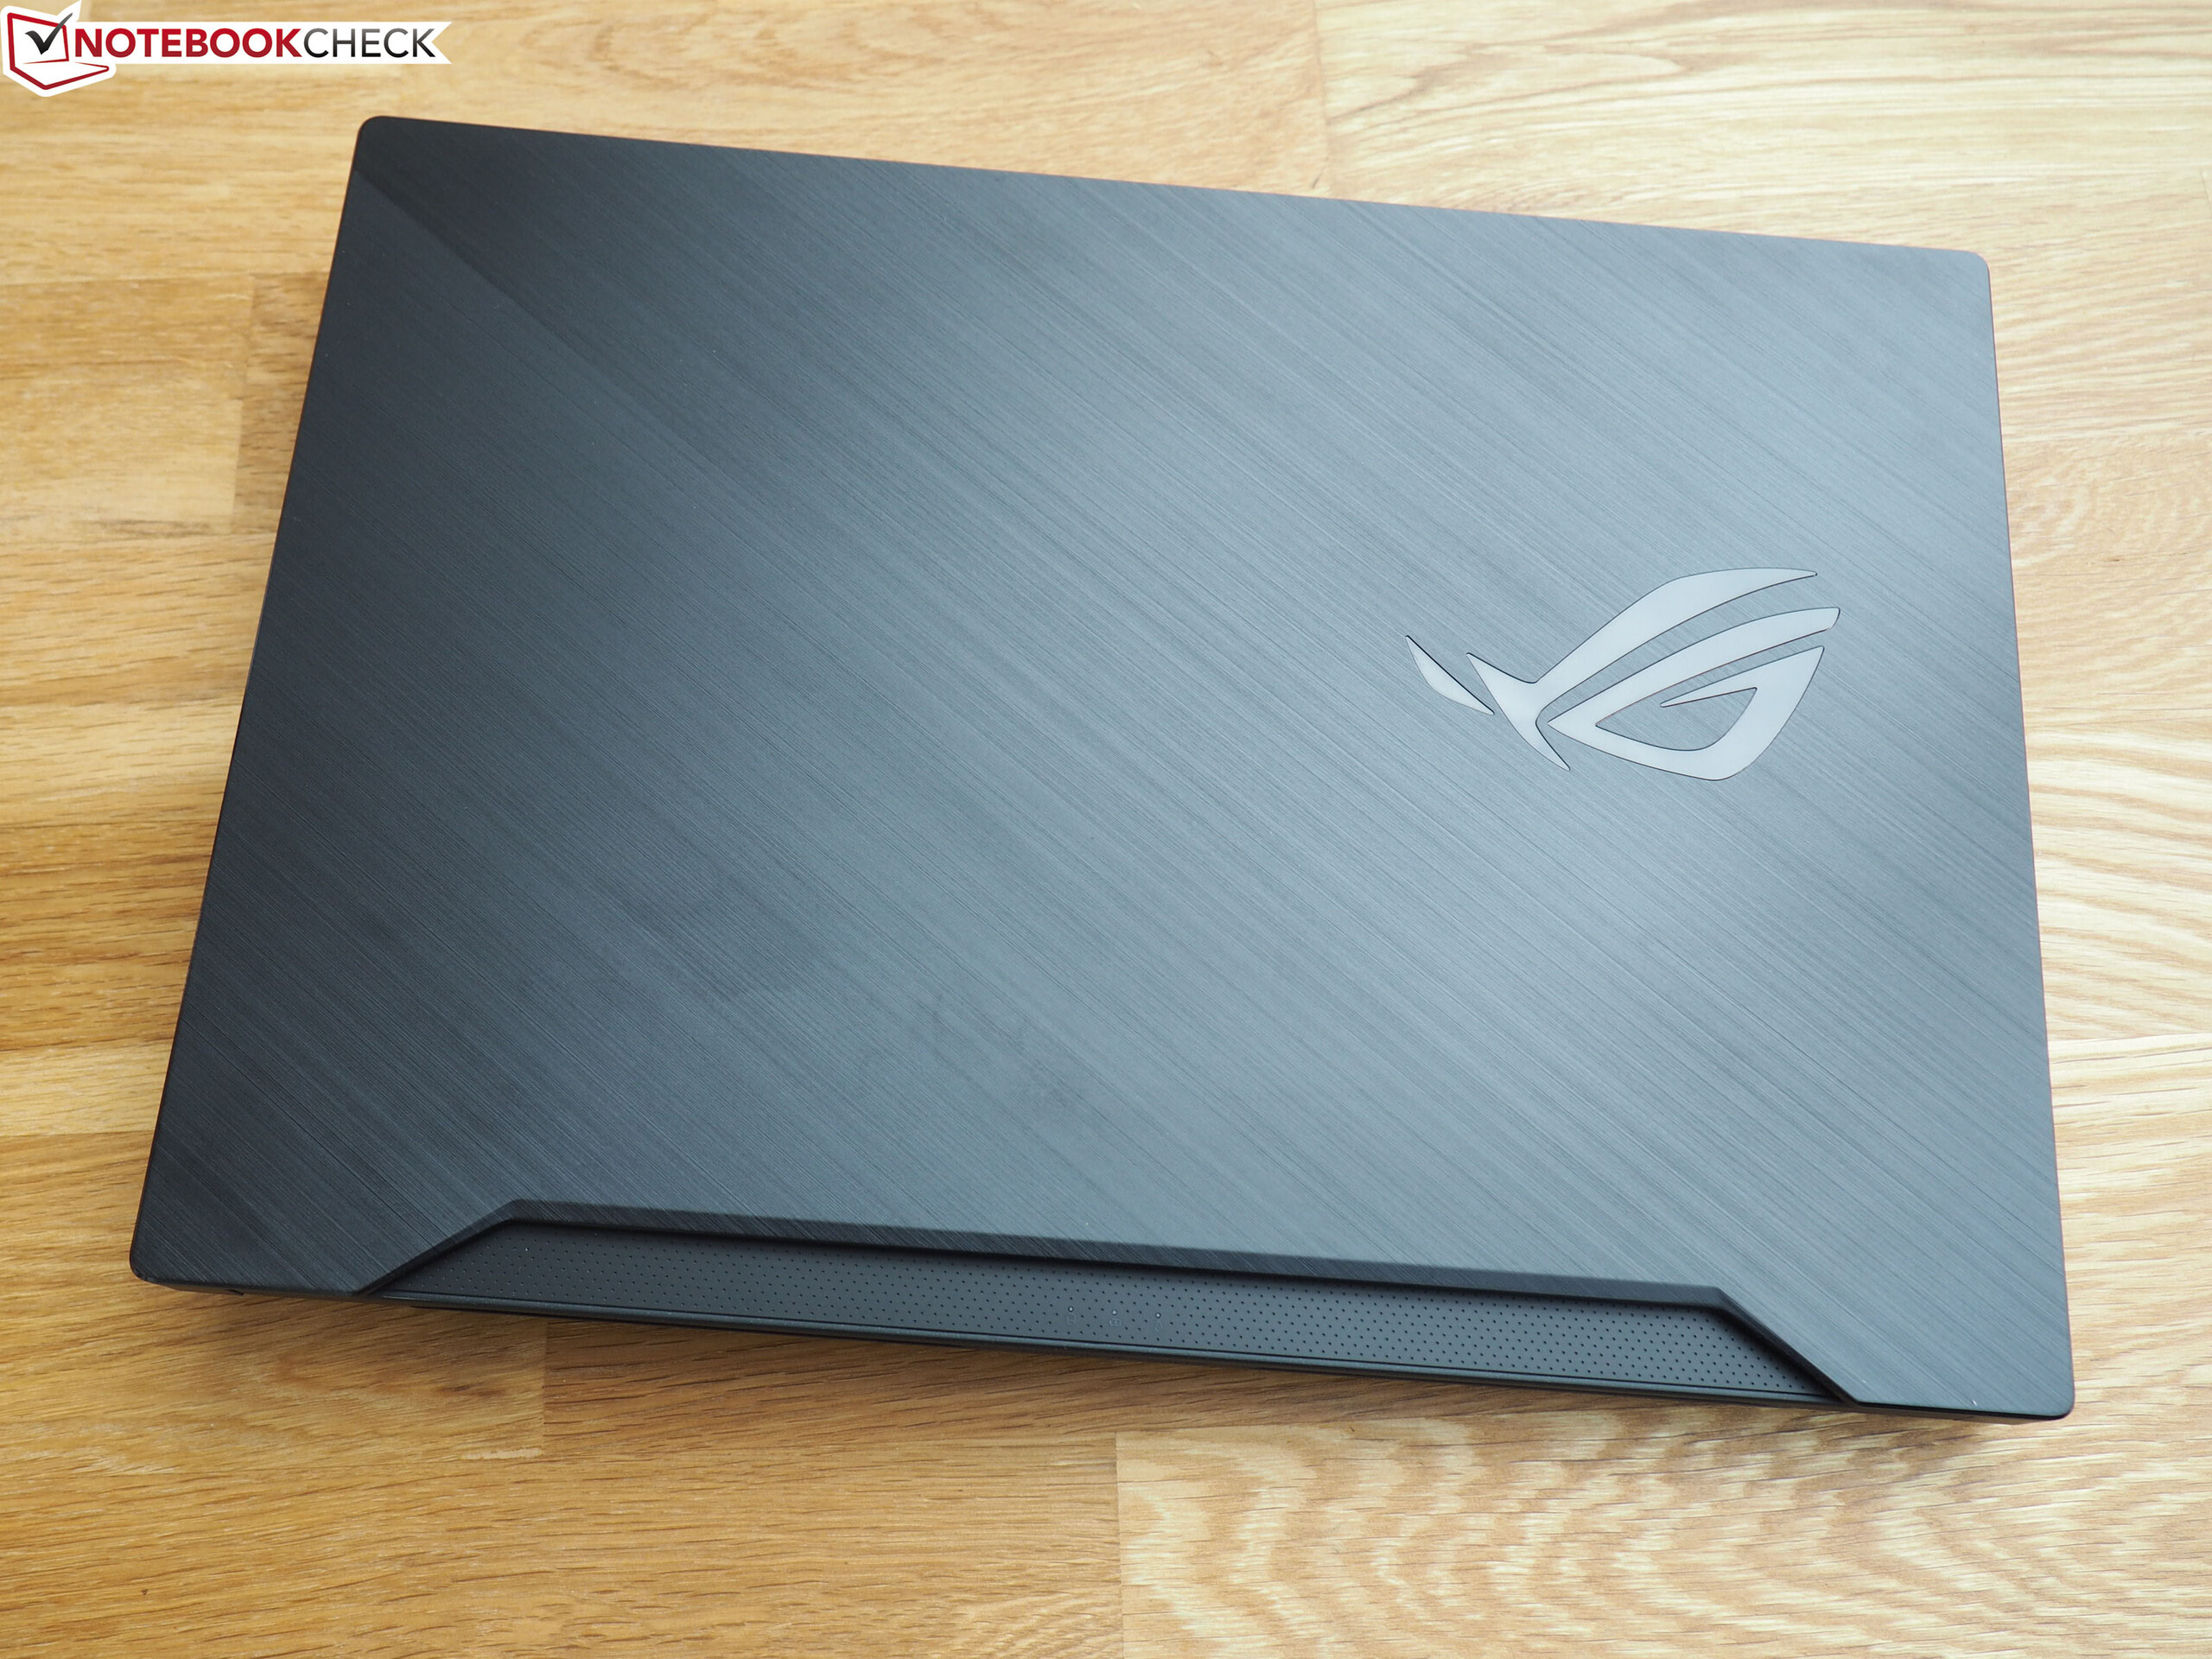
Case - Slim gaming laptop from Asus
Since the Zephyrus S15's case hasn't changed, please refer to the Zephyrus S GX502GW review article for a detailed description.
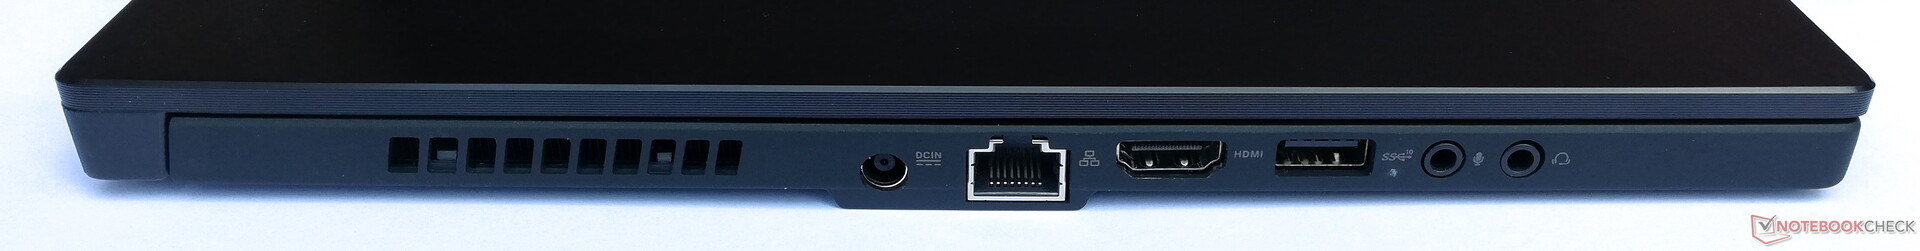
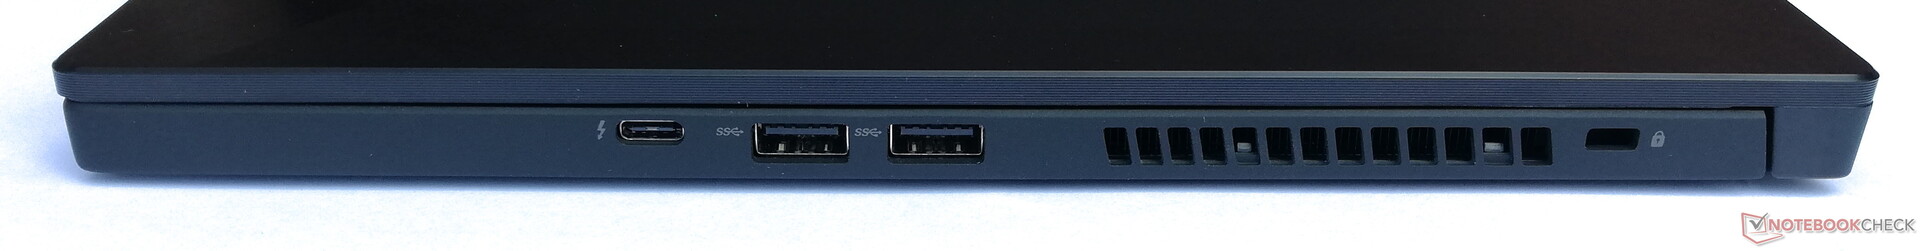
Connectivity - The Zephyrus S15 comes with Thunderbolt 3
The connectivity of the Asus ROG Zephyrus S15 also remains unchanged whereby the USB Type-C port now provides a Thunderbolt 3 connection.
Communication
In addition to the wired Gigabit LAN port, the ASUS laptop can also establish connections over wireless networks. The Wi-Fi 6 standard is now available, with which the Zephyrus S15 reaches speeds of 1,420 Mb/s for receiving data and 1,310 Mb/s for sending data in our test with our reference router, the Netgear Nighthawk AX12. This puts it in second place in our test field.
Accessories
The Asus ROG Zephyrus S15 comes with a 240-watt power adapter and a 65-watt power adapter with a USB Type-C plug. Additional accessories, such as the "ROG Eye" webcam, can be purchased on the manufacturer's website.
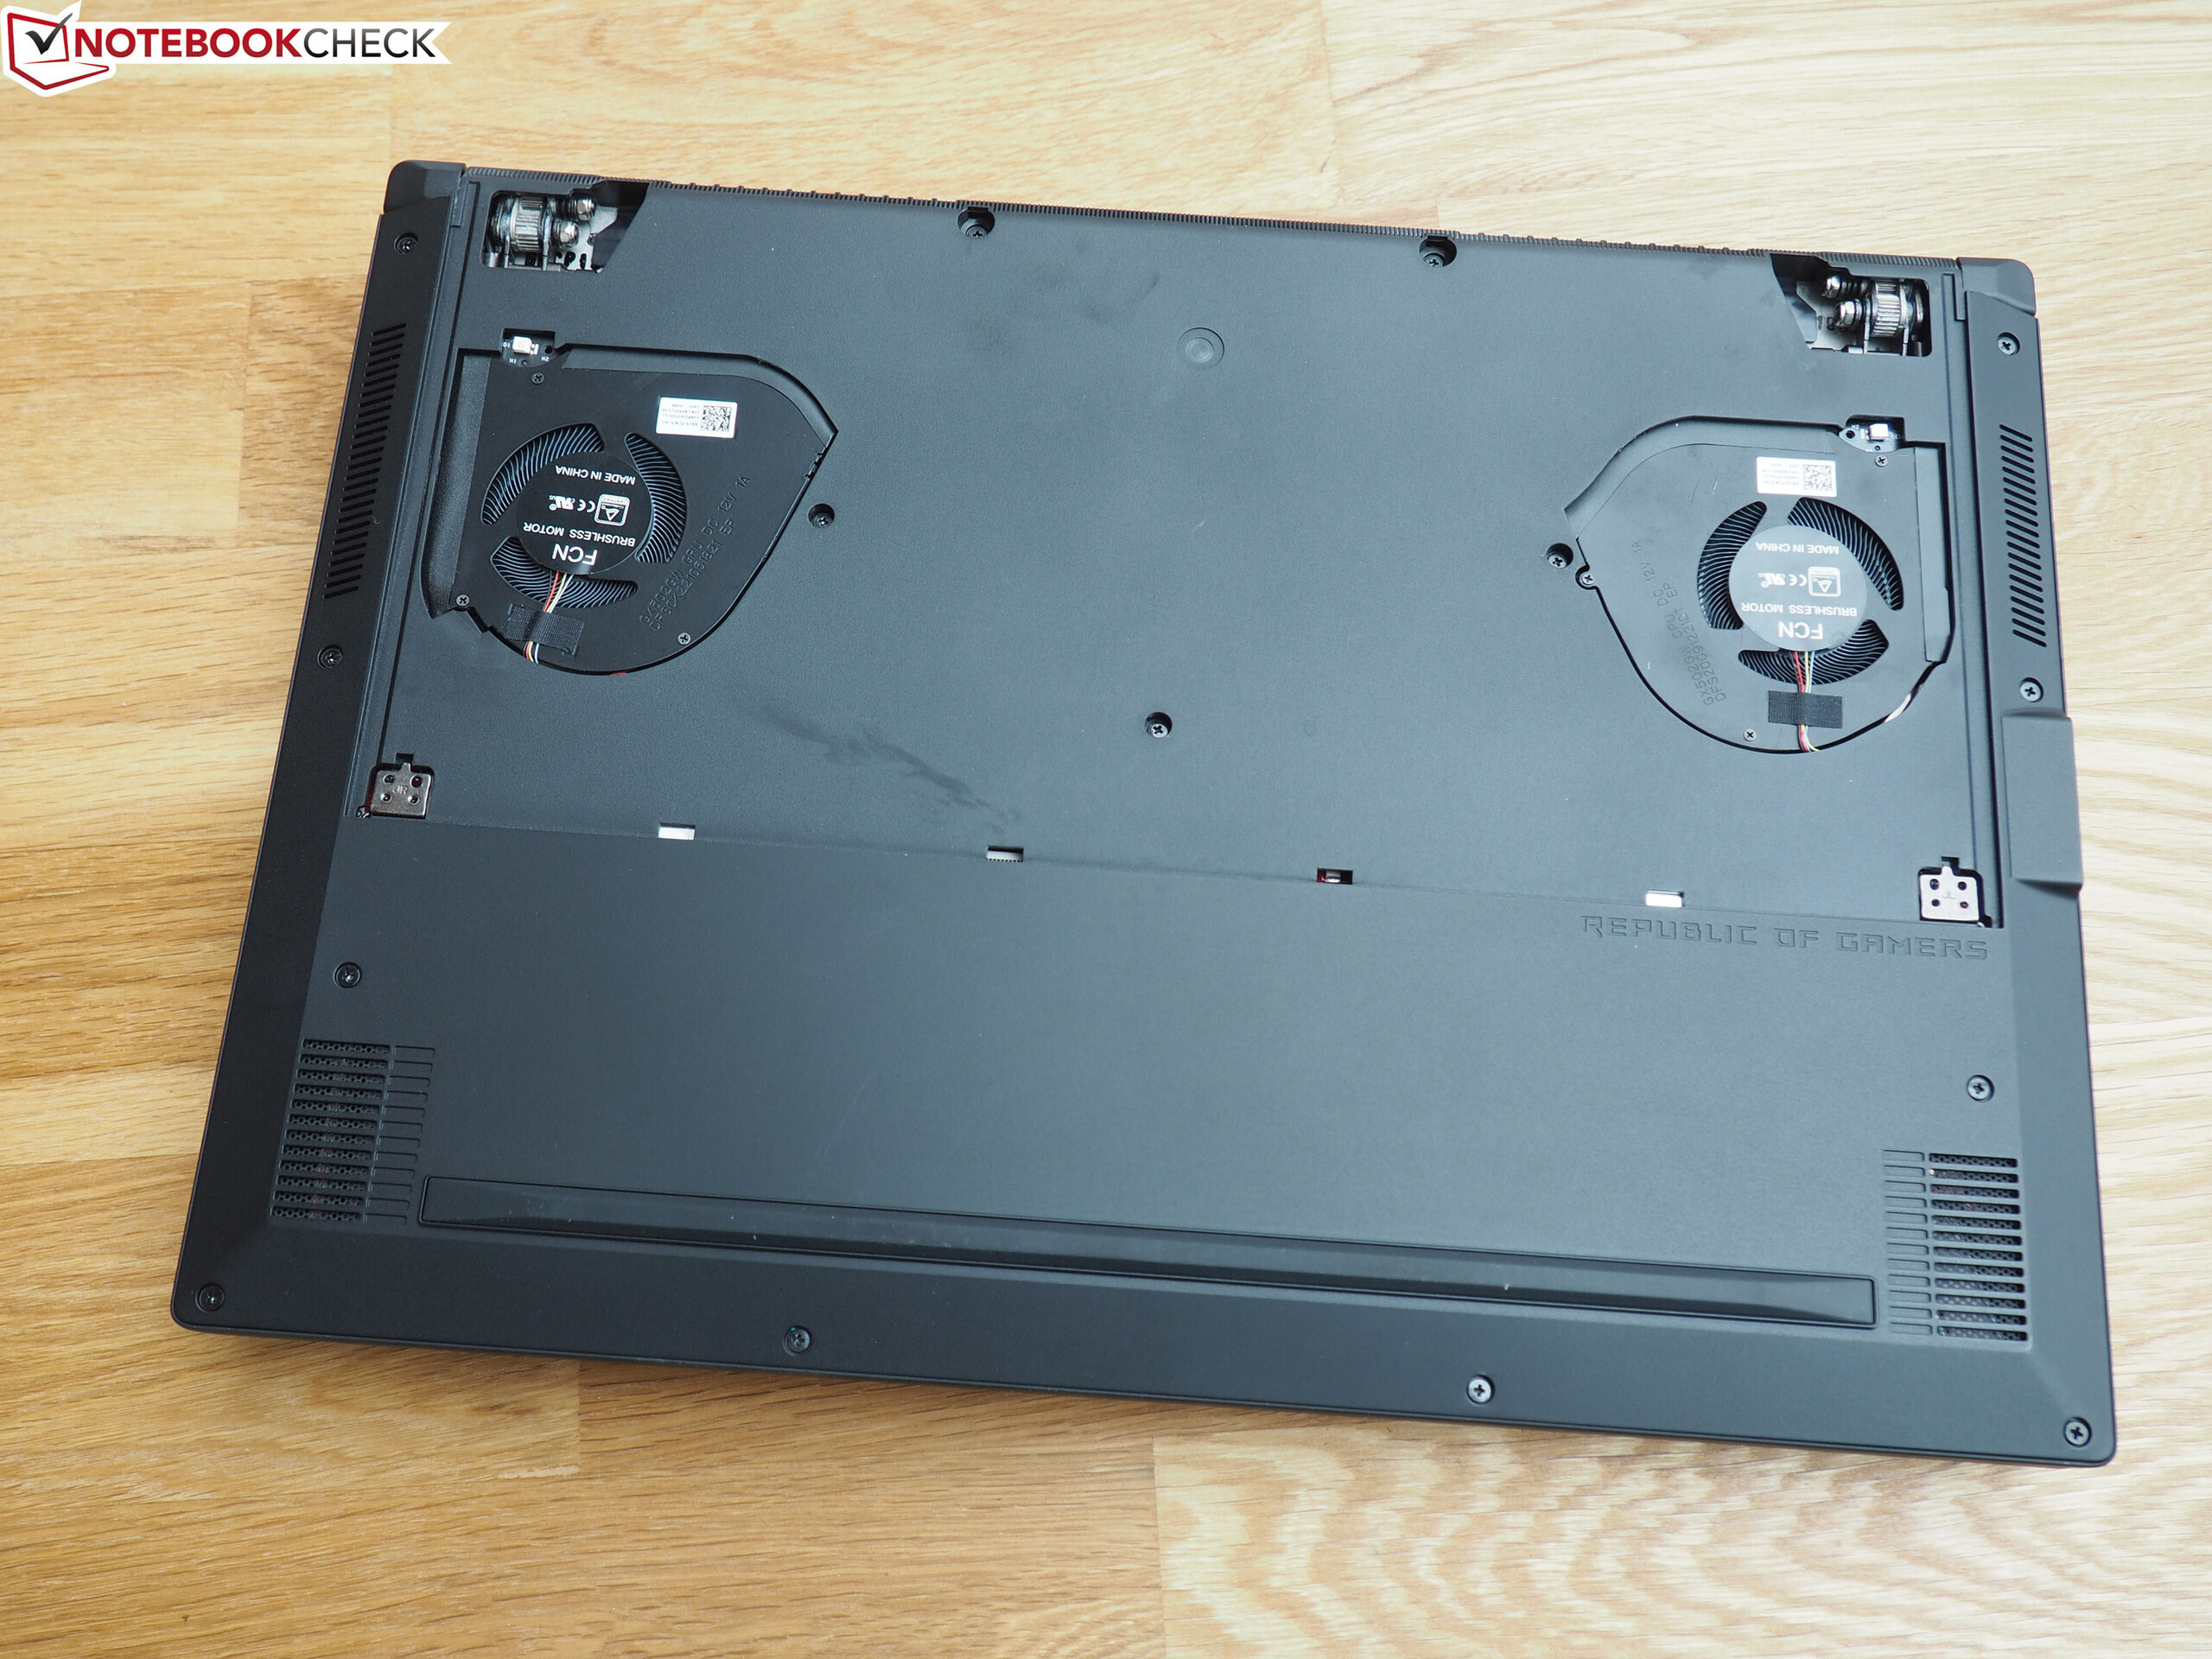
Maintenance
The Asus Zephyrus S15 does not offer any maintenance options. Although users can remove the base cover, this only makes the fans accessible.
Warranty
Asus grants buyers of the ROG Zephyrus S15 GX502L a warranty period of 24 months.
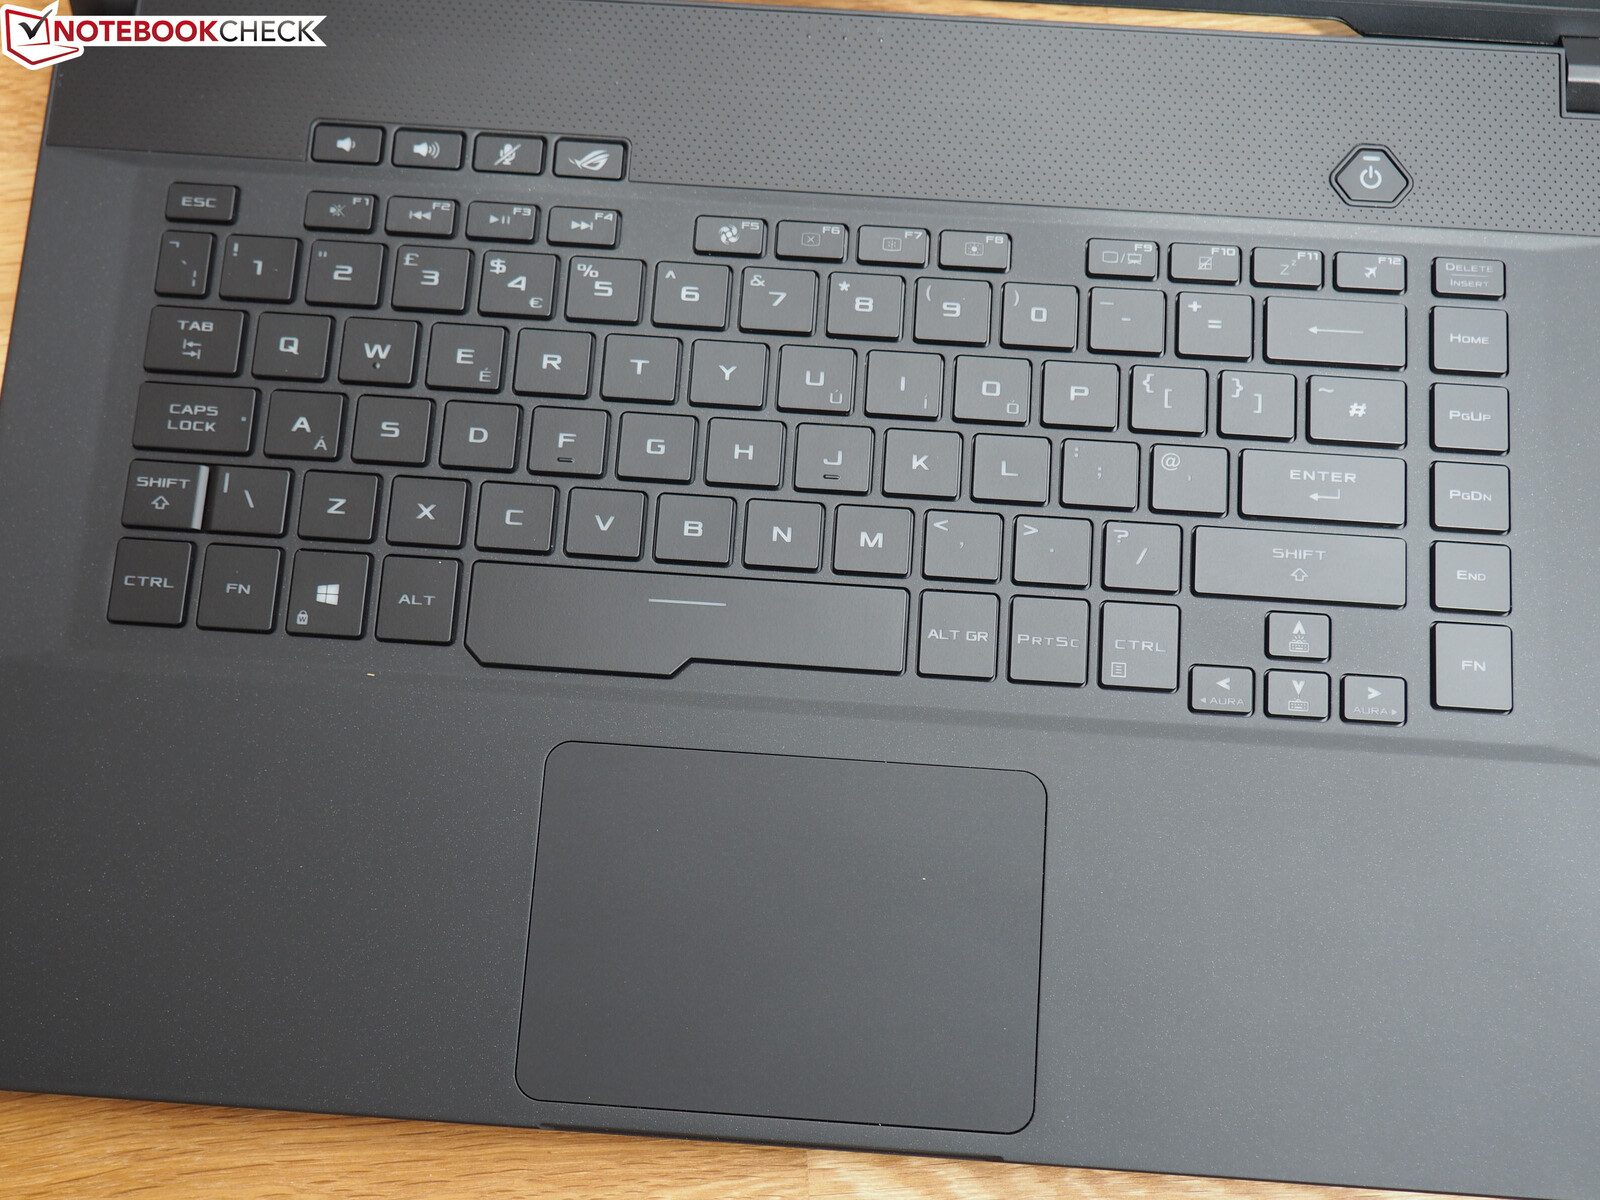
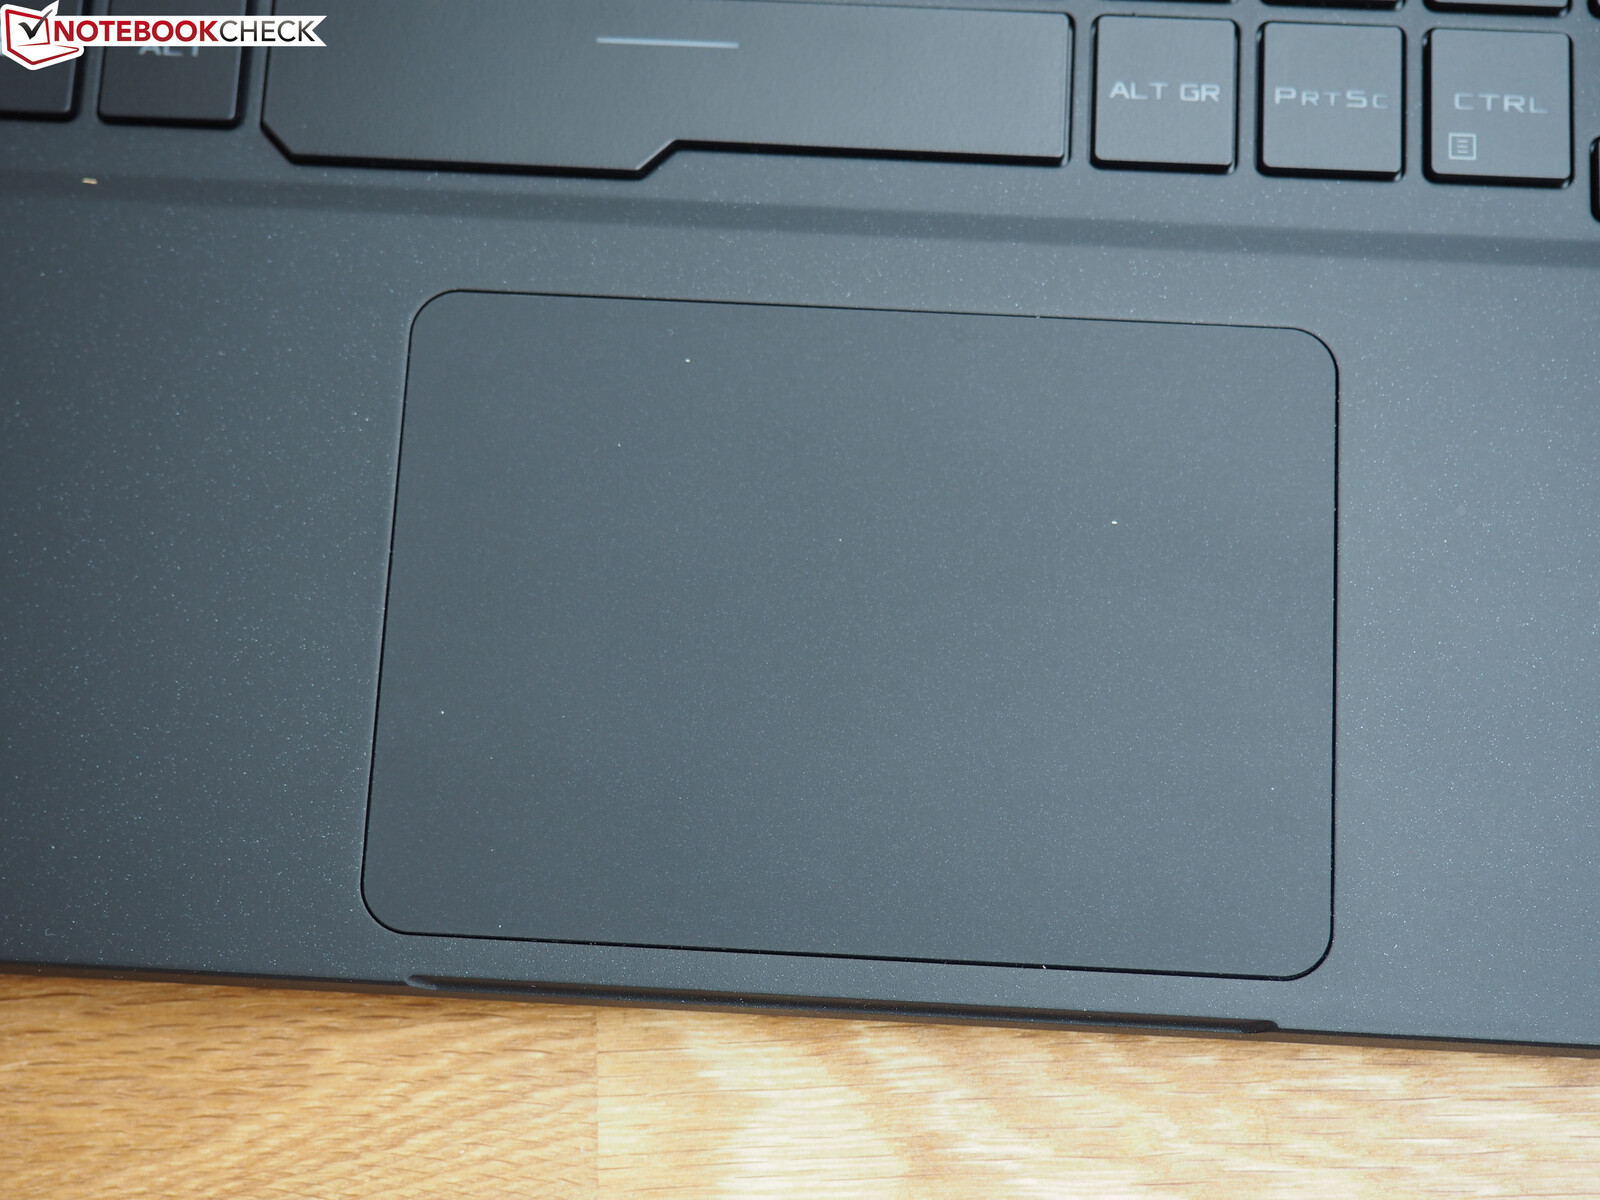
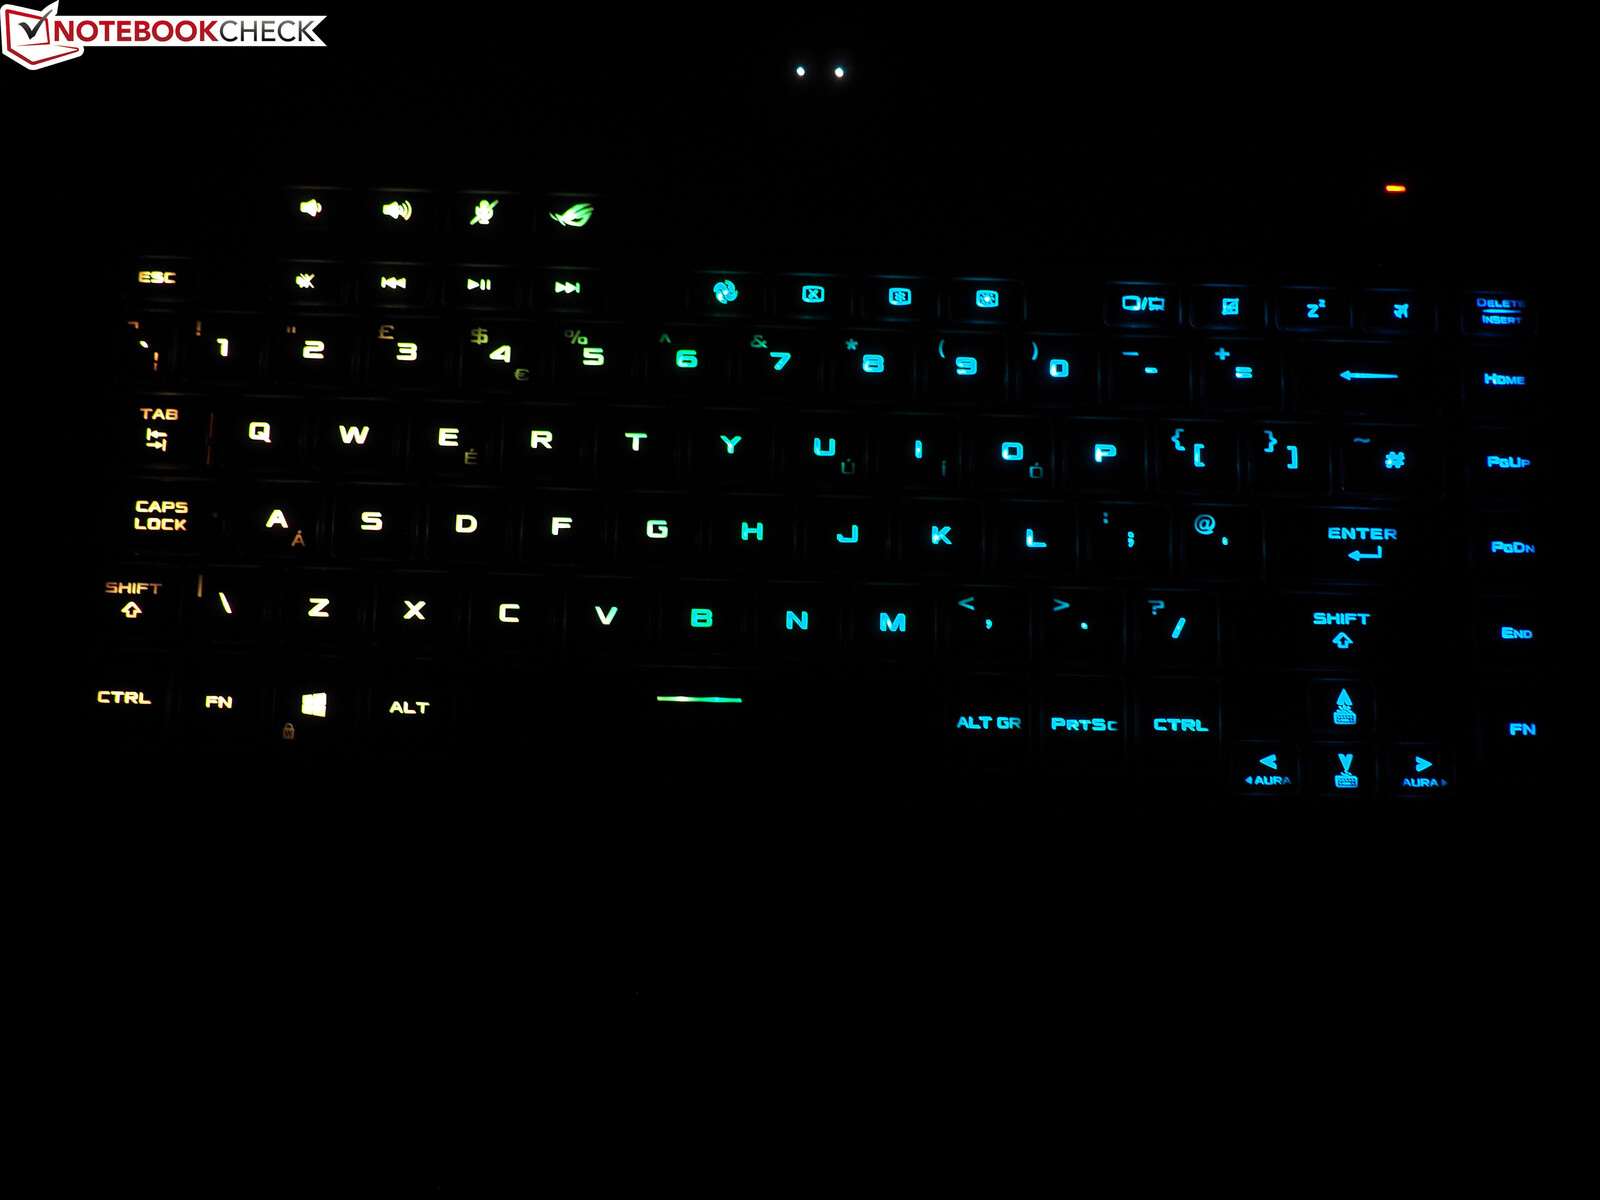
Input devices - Laptop keyboard with RGB backlighting
You can find a detailed description of the input devices in the review article of the identically built Zephyrus S GX502GW.
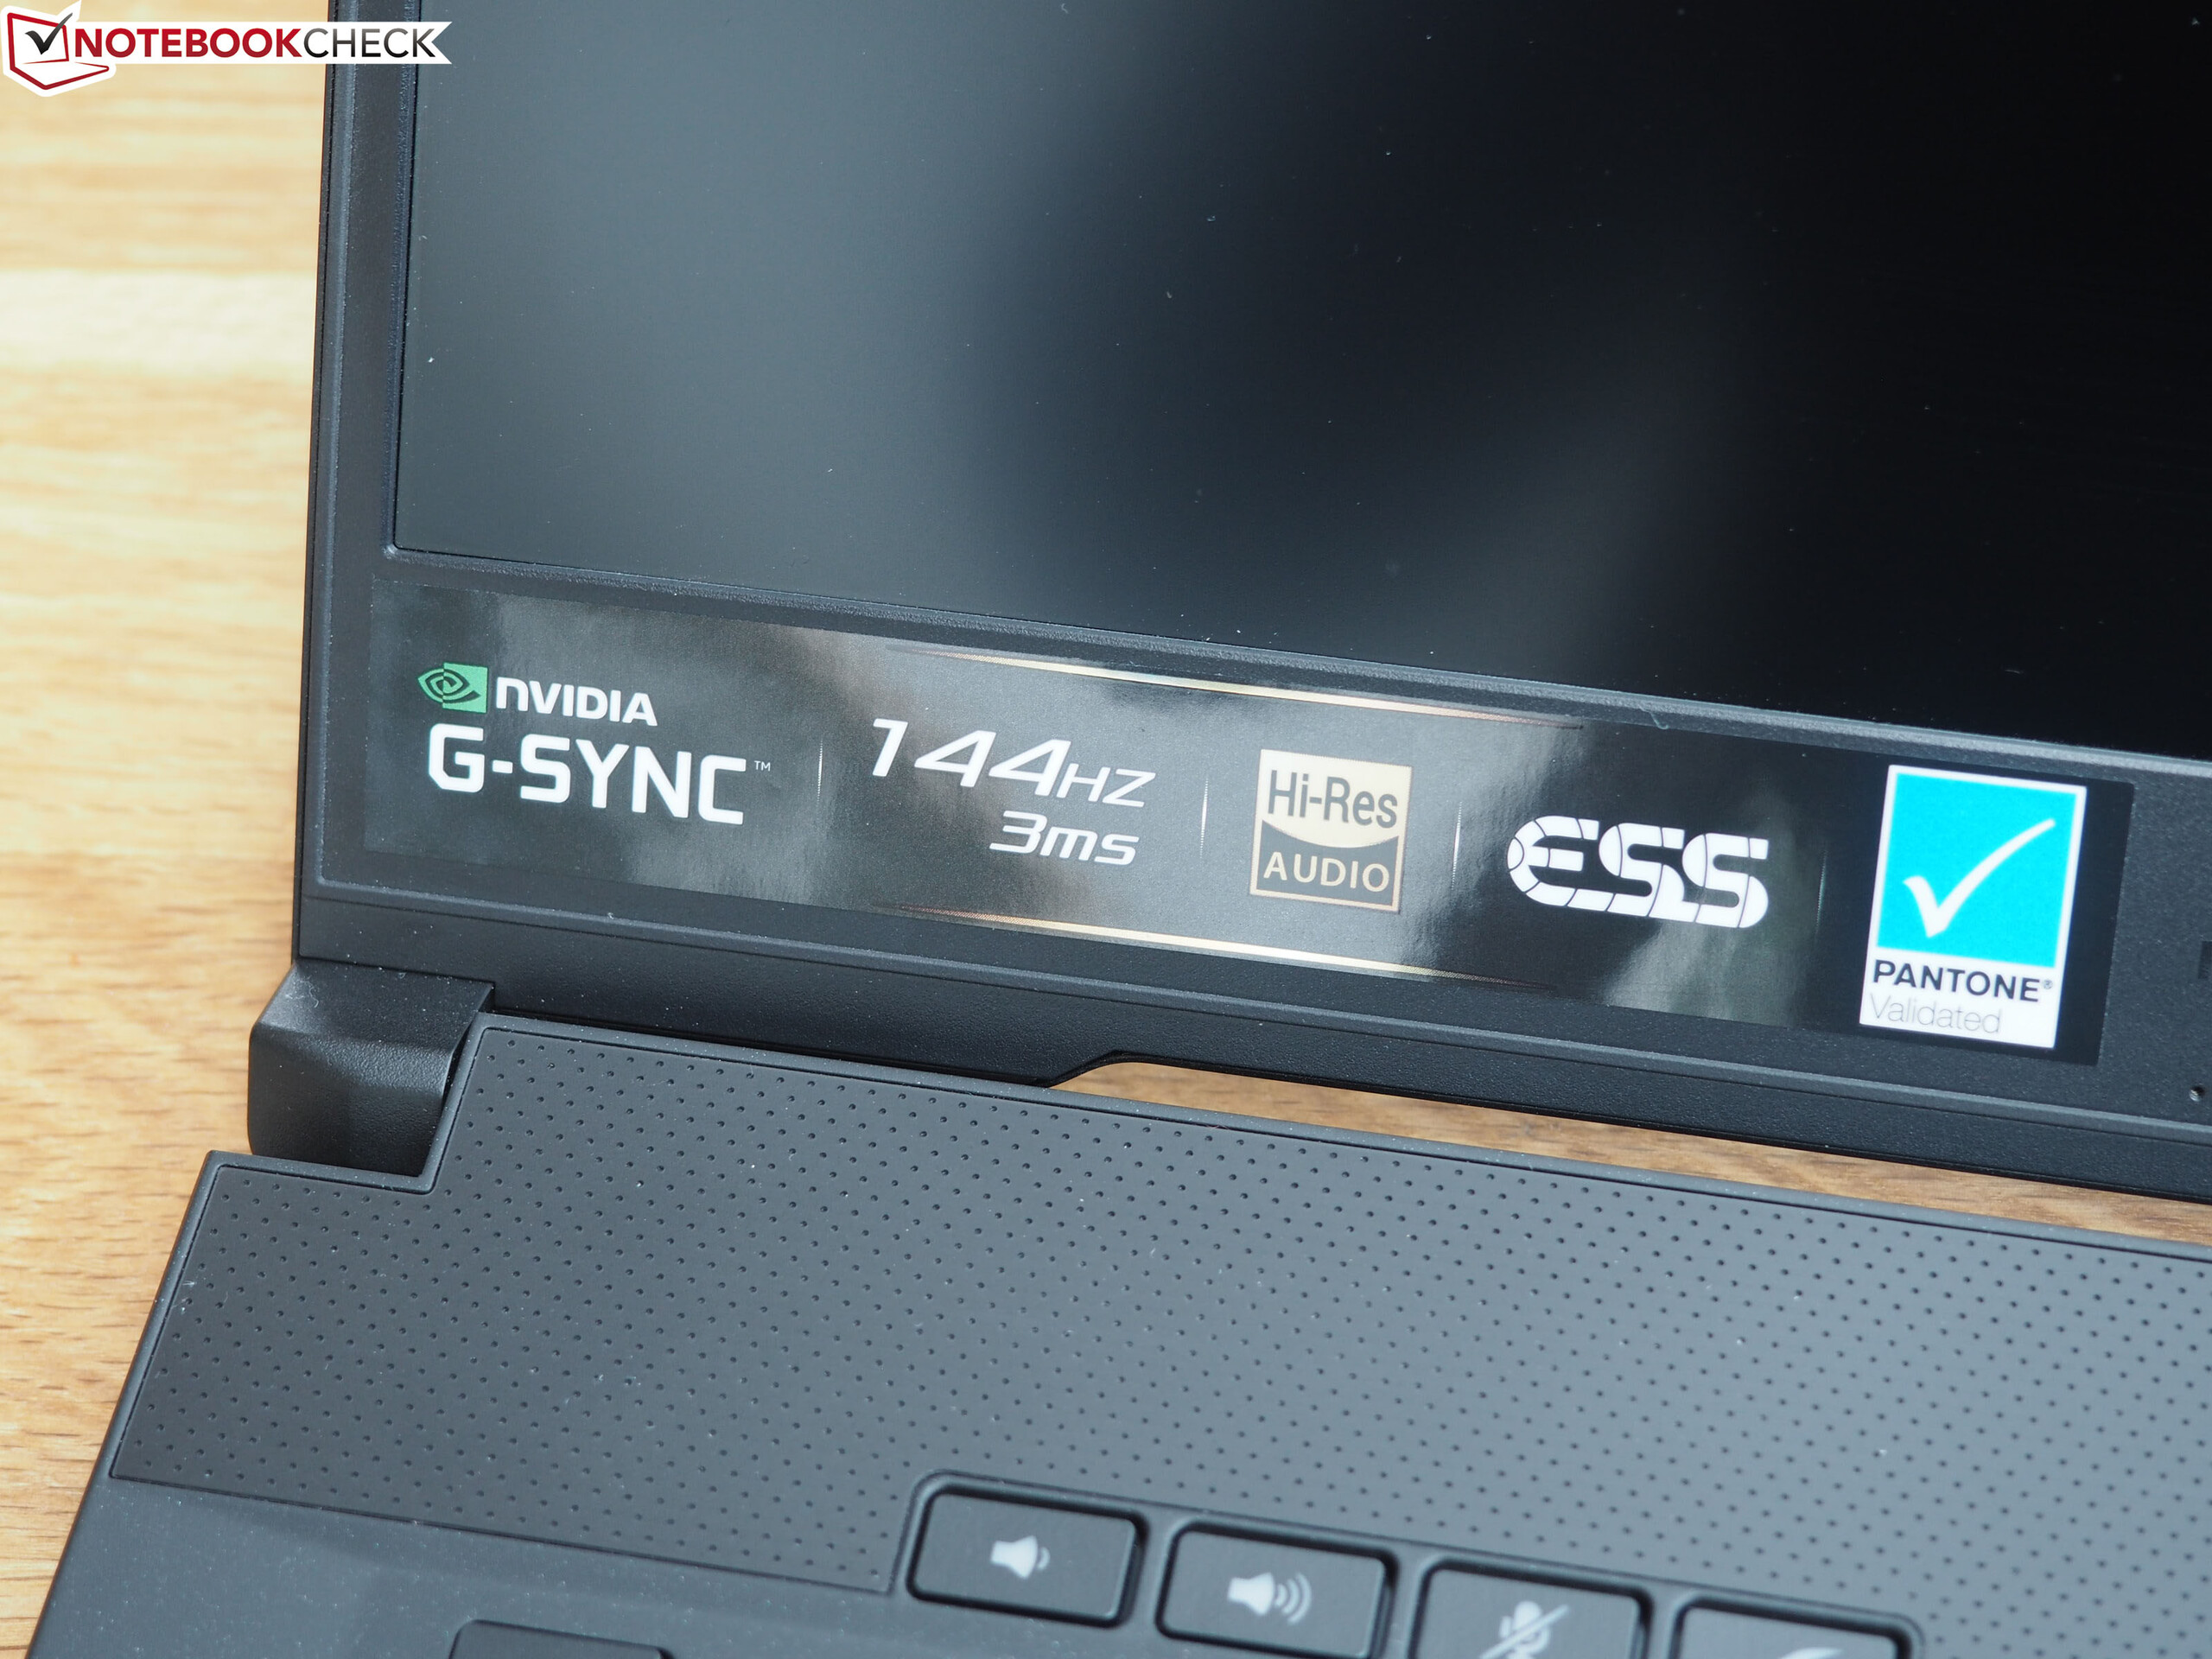
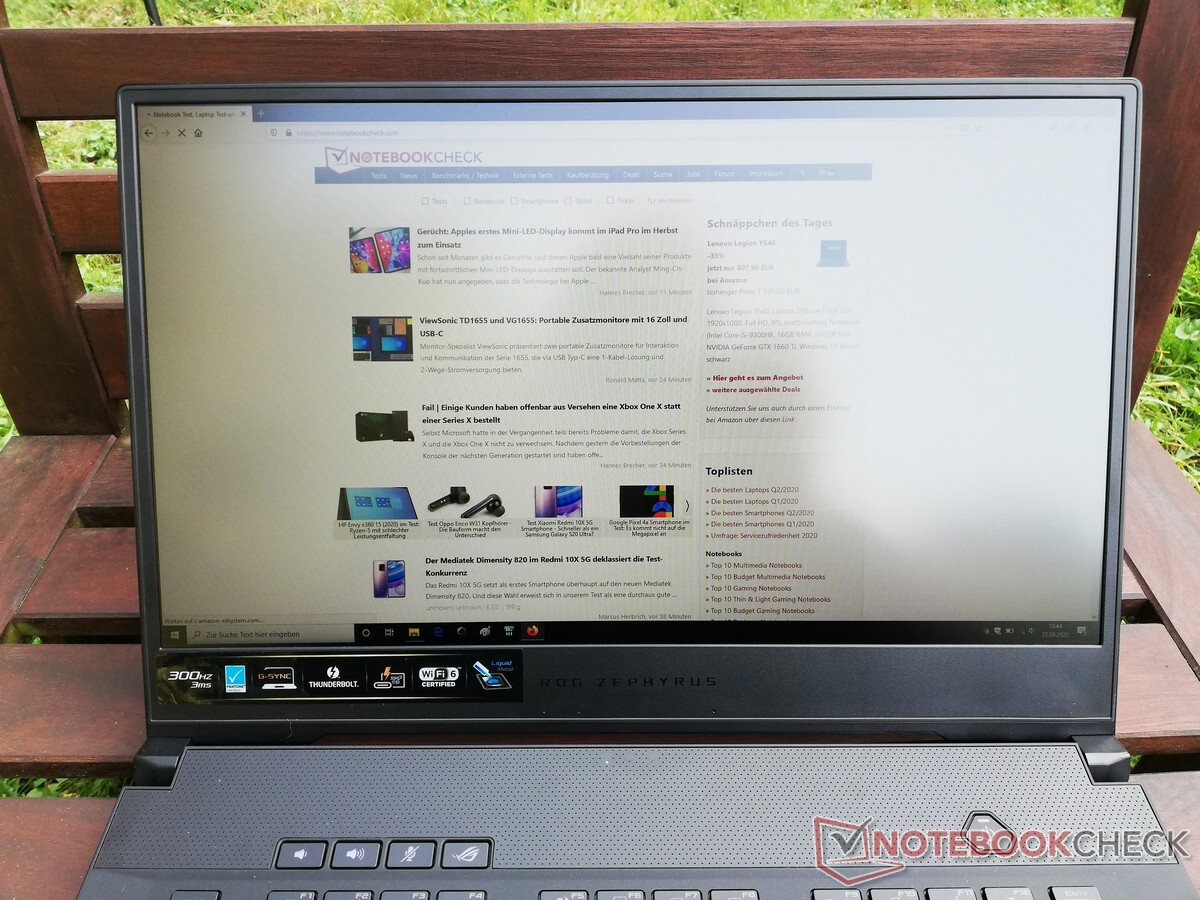
Display - Flicker-free 300 Hz panel

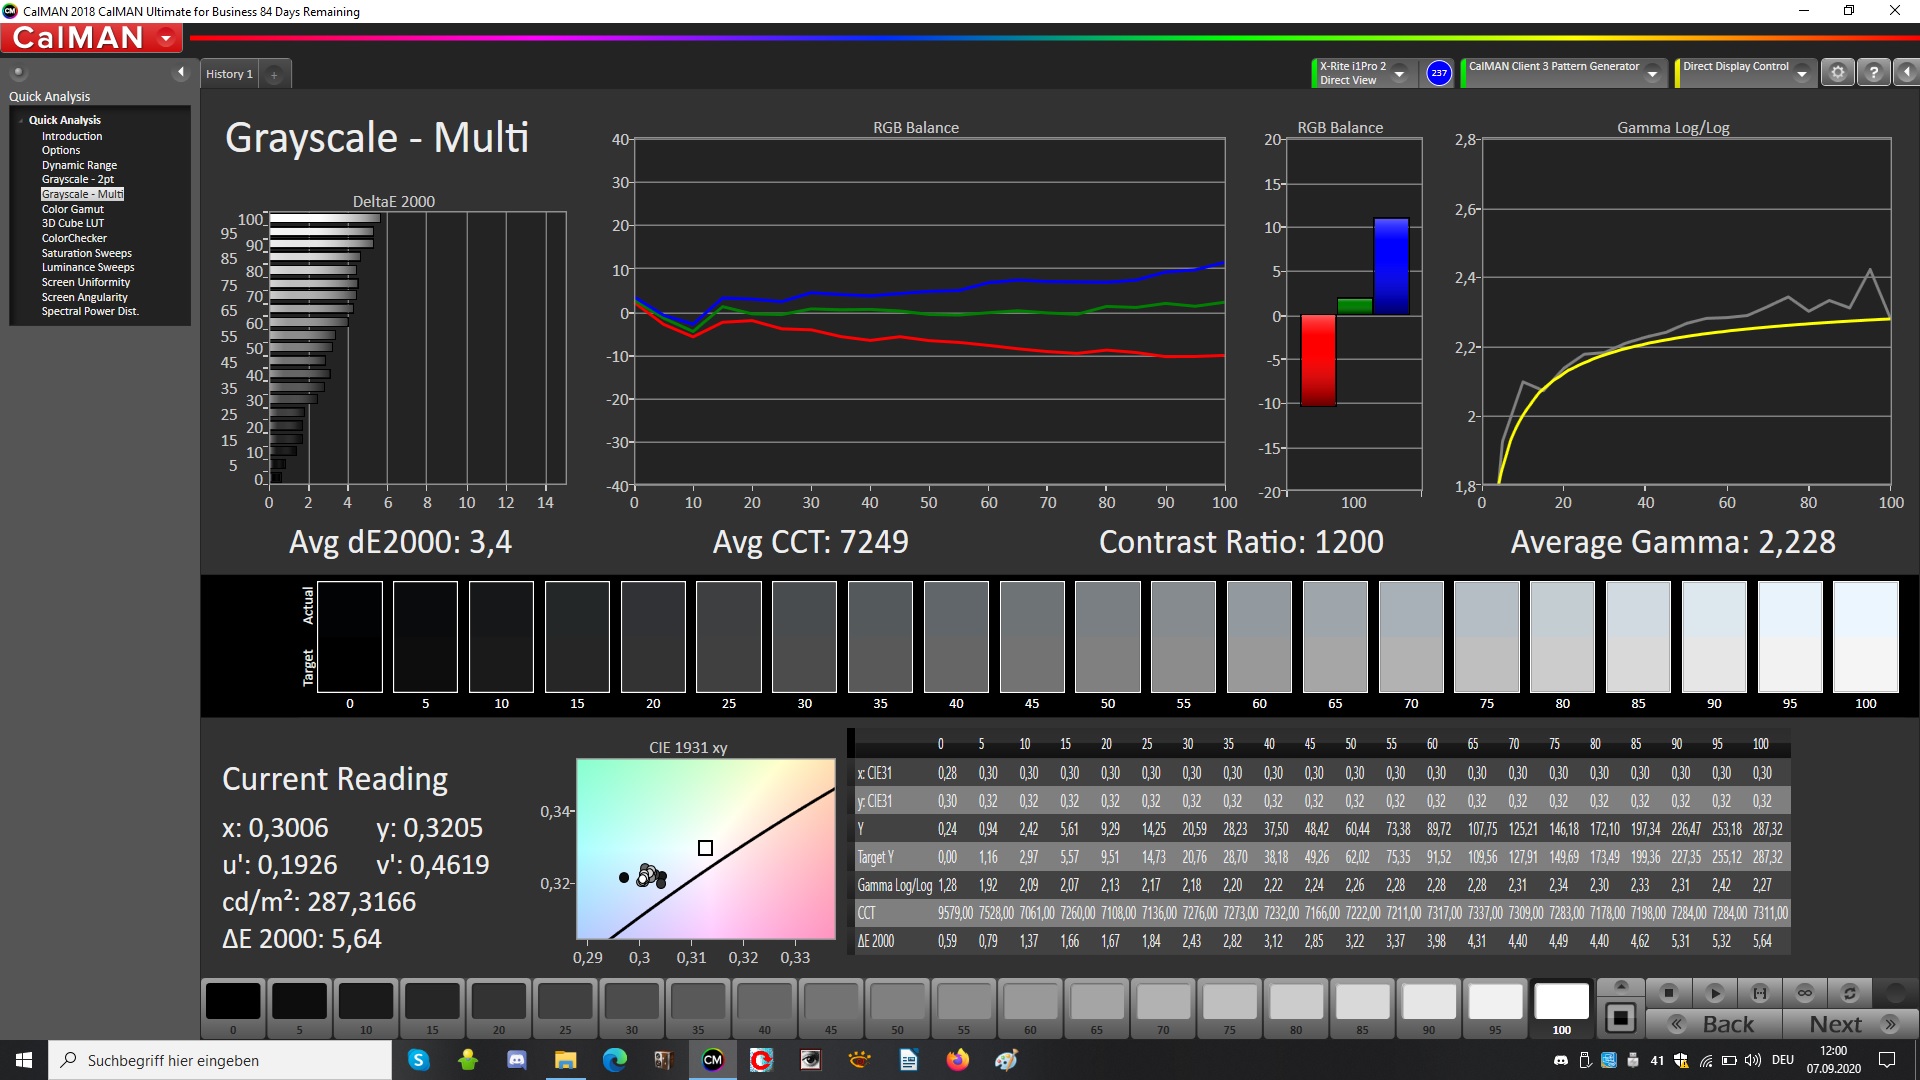
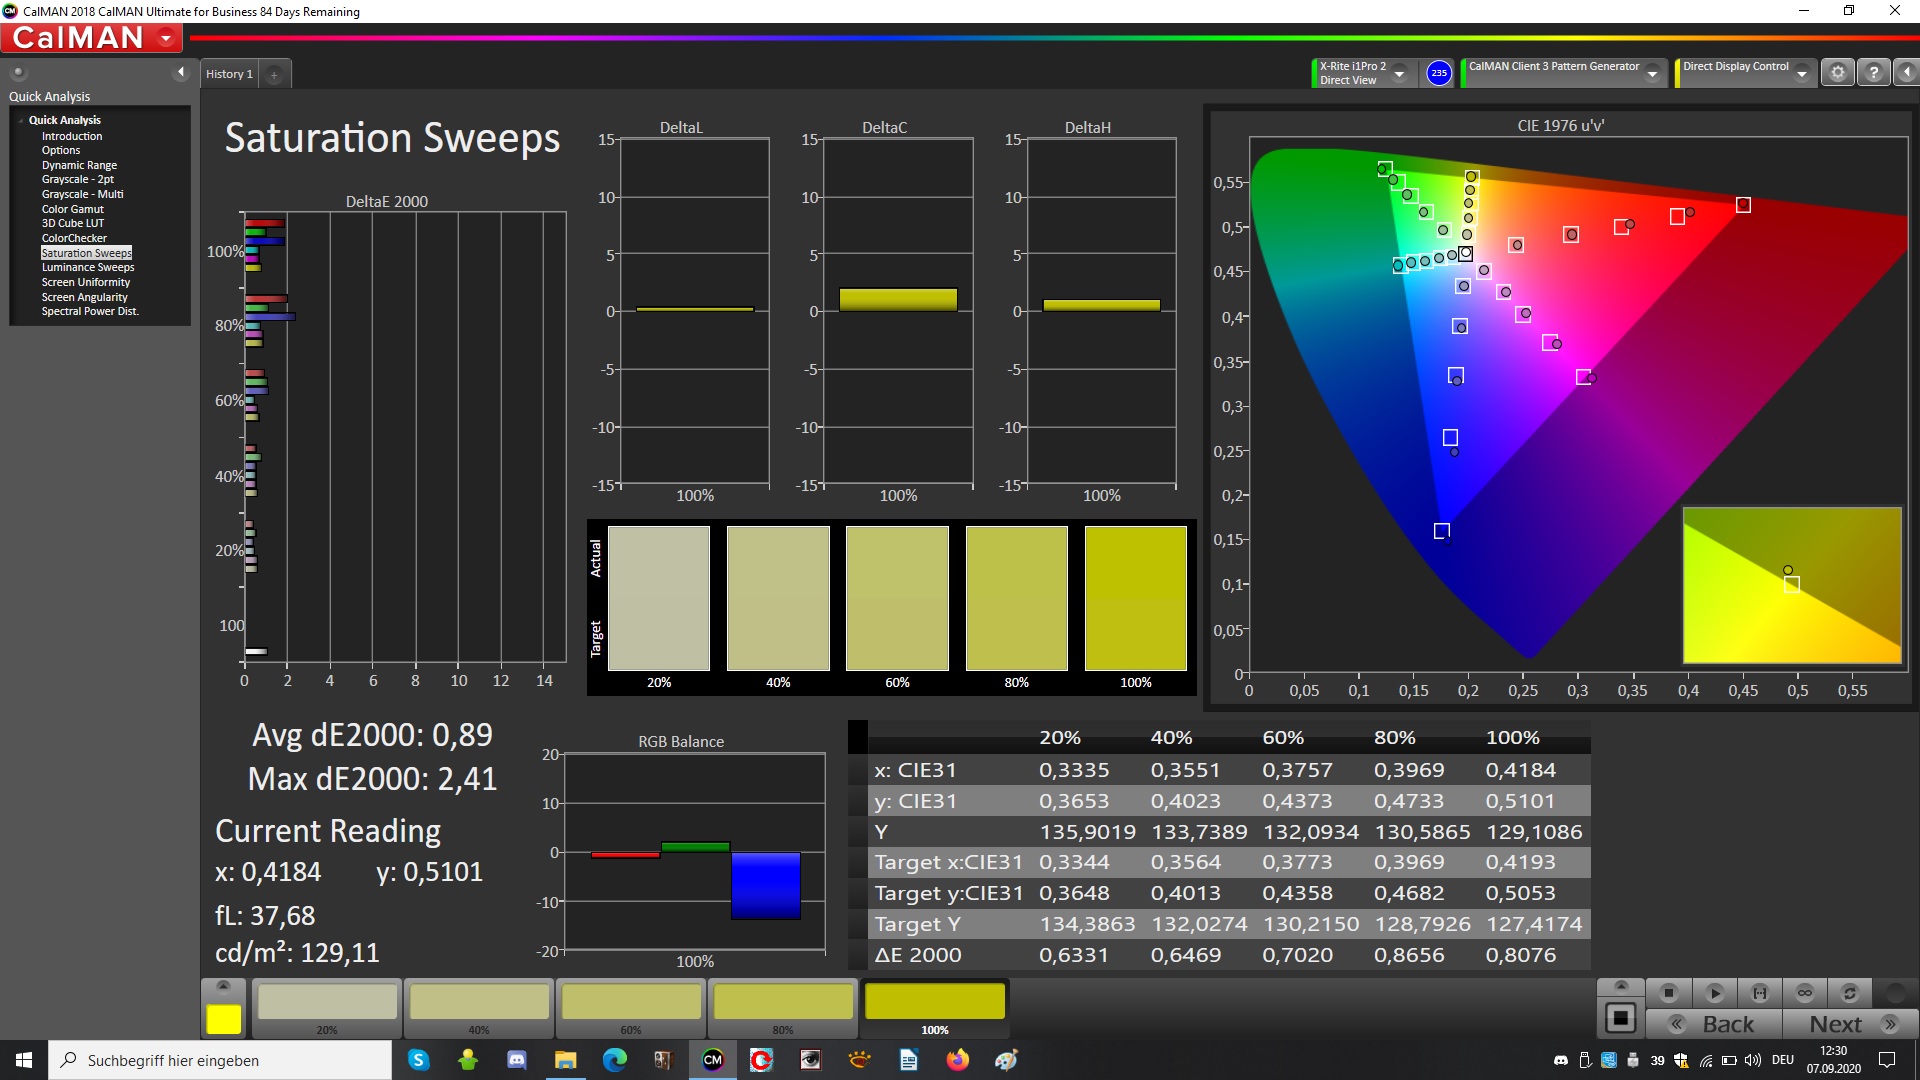
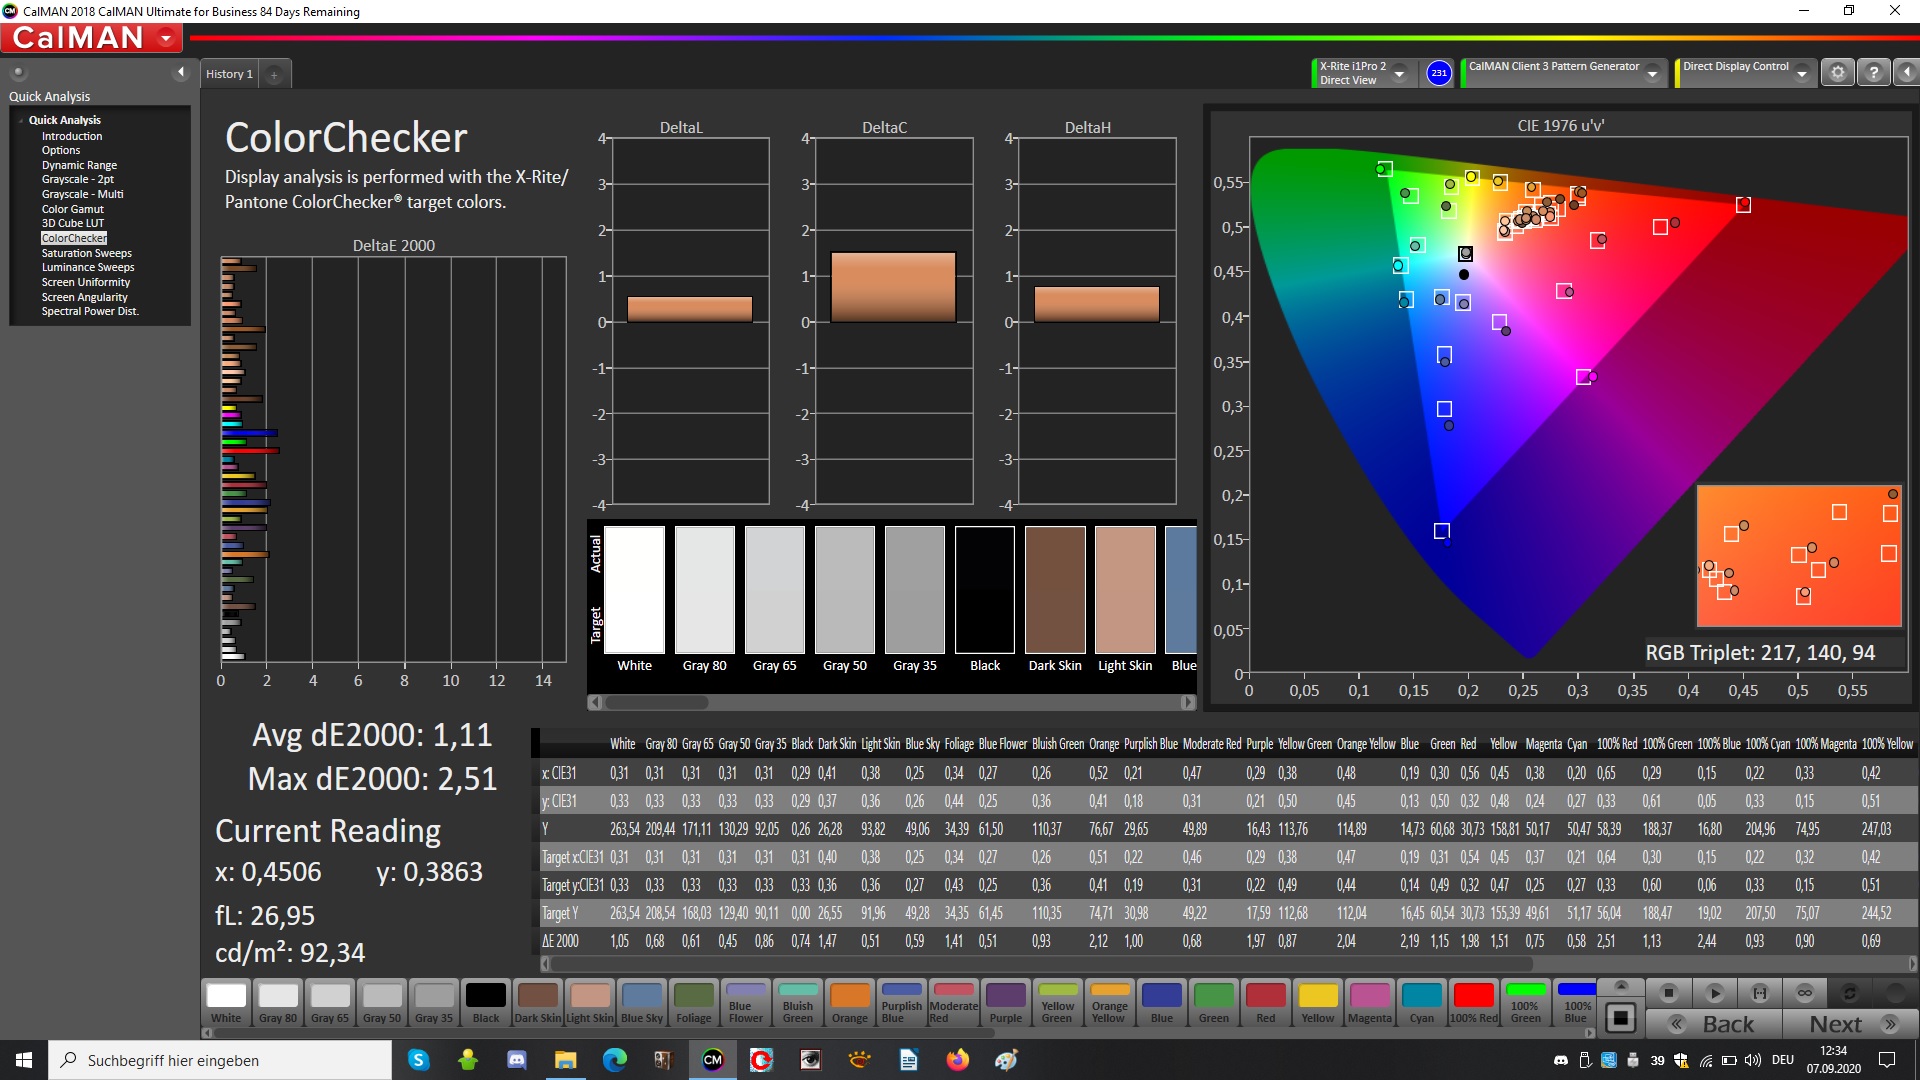
The Zephyrus S15 screen consists of a 15.6-inch IPS panel and offers a resolution of 1920x1080 pixels as well as a refresh rate of 300 Hz. With an average brightness of 289 cd/m², it sits in the middle of our test field. The same applies to the brightness distribution of 90%. In addition, Asus has forgone the use of PWM for brightness control, which is beneficial to users with sensitive eyes.
| |||||||||||||||||||||||||
Brightness Distribution: 90 %
Center on Battery: 283 cd/m²
Contrast: 1179:1 (Black: 0.24 cd/m²)
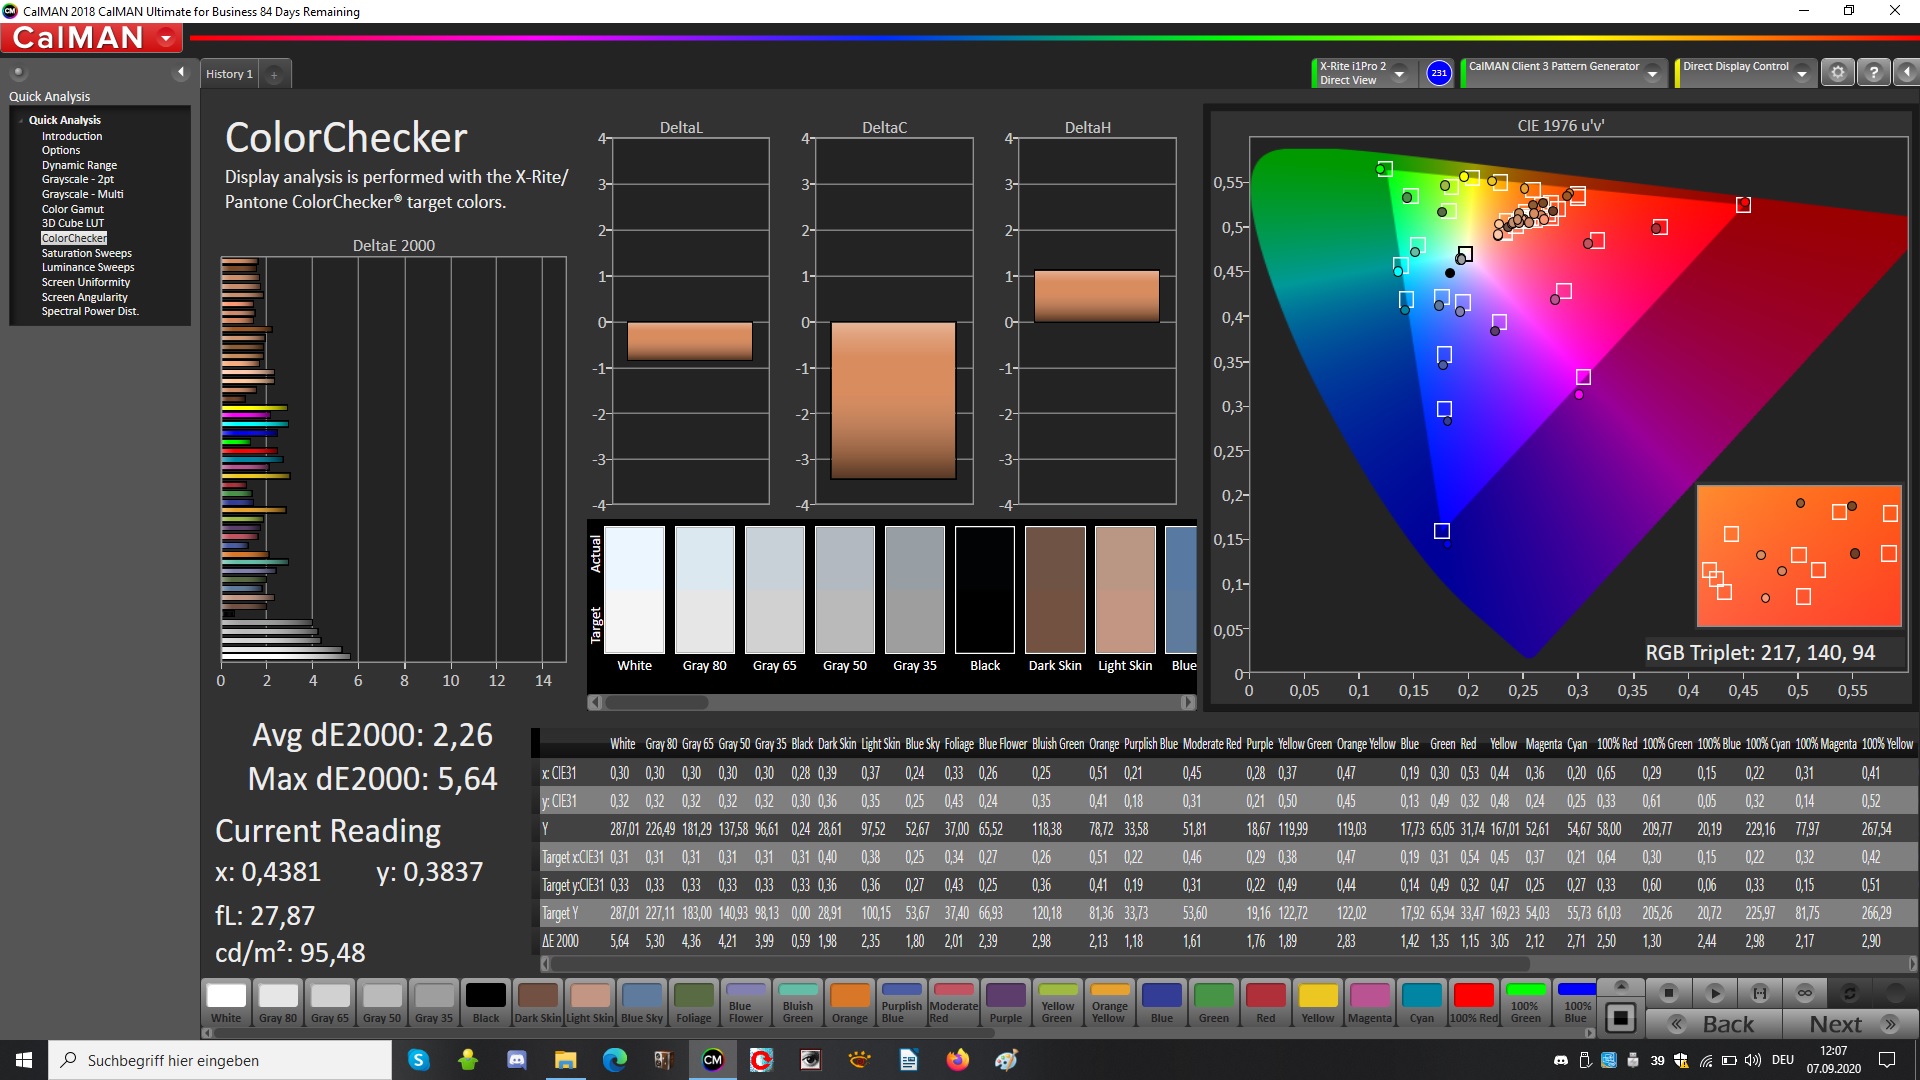
ΔE ColorChecker Calman: 2.26 | ∀{0.5-29.43 Ø4.72}
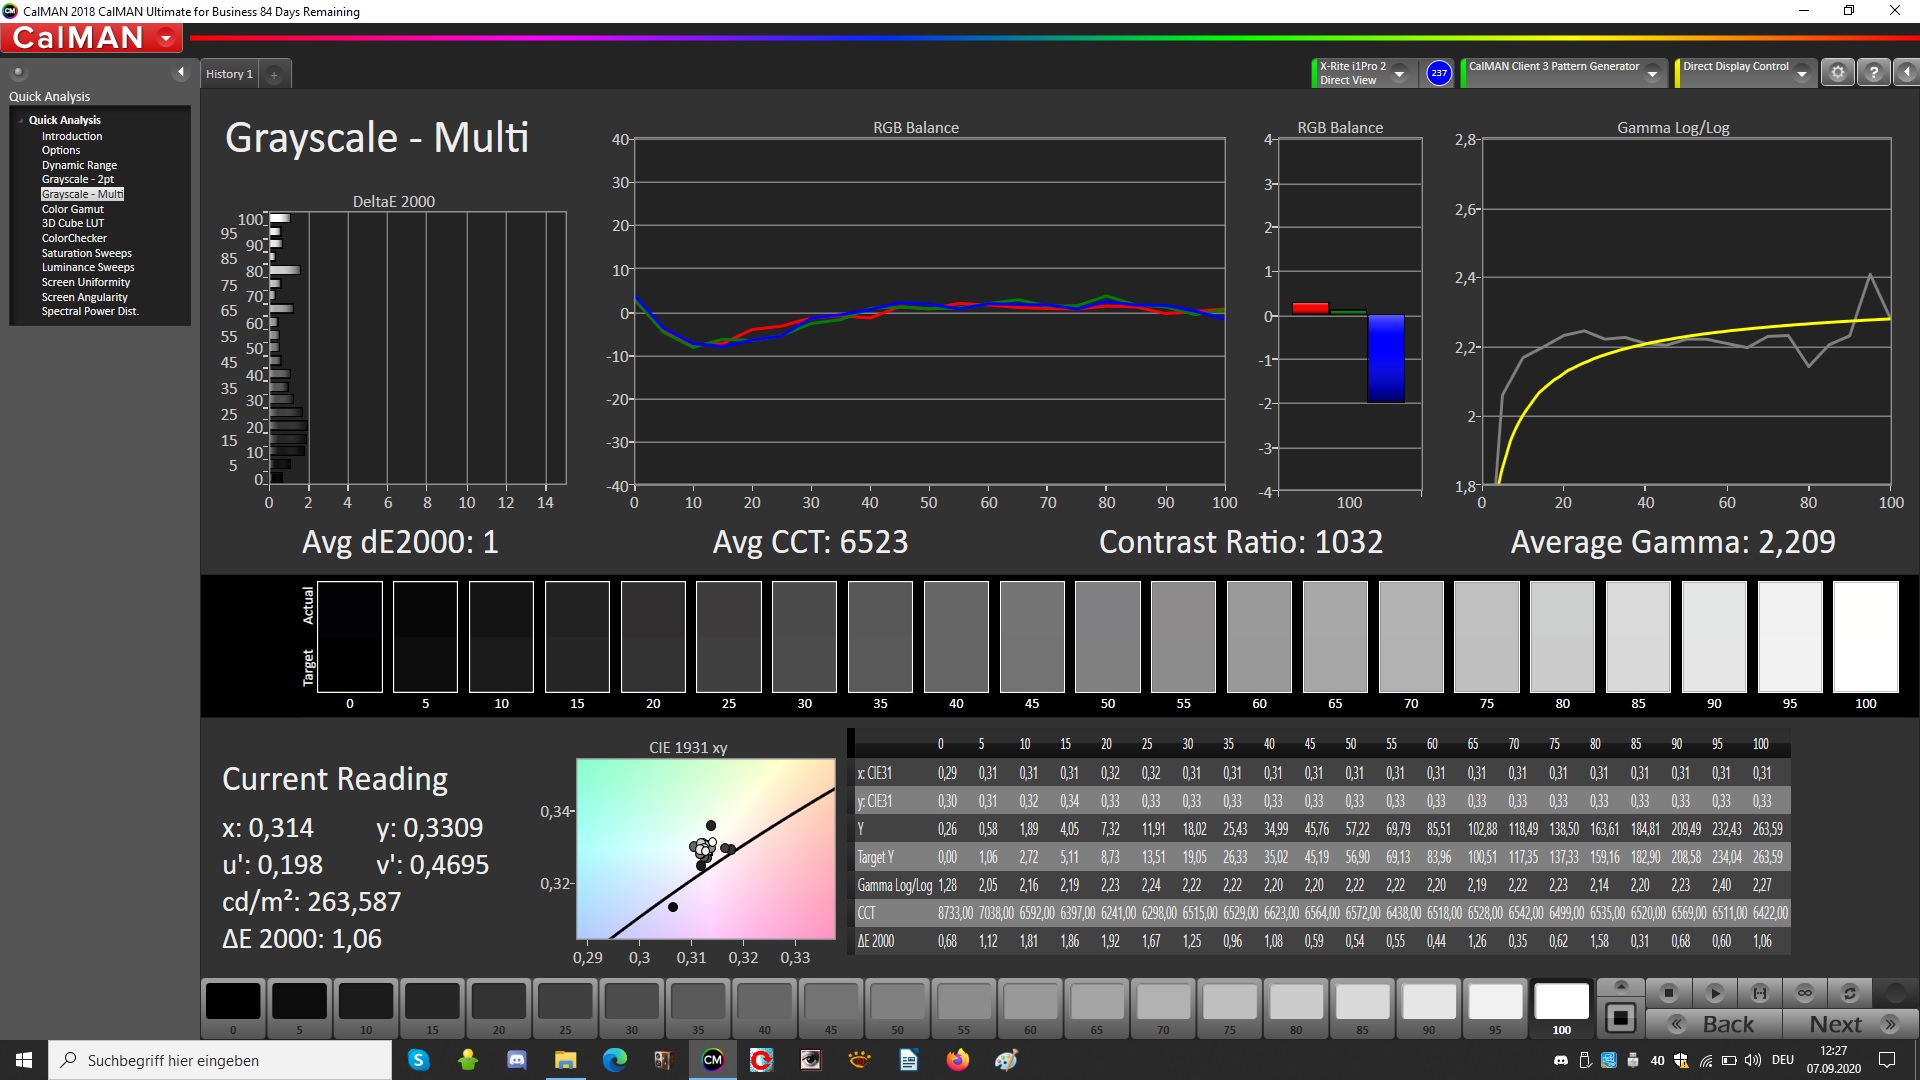
calibrated: 1.11
ΔE Greyscale Calman: 3.4 | ∀{0.09-98 Ø4.97}
93% sRGB (Argyll 1.6.3 3D)
71% AdobeRGB 1998 (Argyll 1.6.3 3D)
71.1% AdobeRGB 1998 (Argyll 3D)
99.7% sRGB (Argyll 3D)
69.7% Display P3 (Argyll 3D)
Gamma: 2.228
CCT: 7249 K
| Asus Zephyrus S15 GX502L B156HAN12.0 (AUOBC8C), IPS, 1920x1080, 15.6" | Asus Zephyrus S GX502GW AU Optronics B156HAN08.2 (AUO82ED), IPS, 1920x1080, 15.6" | MSI GE66 Raider 10SFS Sharp LQ156M1JW03 (SHP14C5), IPS-Level, 1920x1080, 15.6" | Razer Blade 15 RTX 2070 Super Max-Q AU Optronics B156HAN12.0, IPS, 1920x1080, 15.6" | Aorus 15G XB Sharp LQ156M1JW03, IGZO, 1920x1080, 15.6" | |
|---|---|---|---|---|---|
| Display | -8% | -2% | -1% | -3% | |
| Display P3 Coverage (%) | 69.7 | 64.9 -7% | 68 -2% | 69.4 0% | 67.2 -4% |
| sRGB Coverage (%) | 99.7 | 91 -9% | 99 -1% | 98.8 -1% | 97.8 -2% |
| AdobeRGB 1998 Coverage (%) | 71.1 | 65.9 -7% | 69.8 -2% | 70.5 -1% | 68 -4% |
| Response Times | 29% | -13% | 47% | -16% | |
| Response Time Grey 50% / Grey 80% * (ms) | 14 ? | 7.2 ? 49% | 16.4 ? -17% | 3.2 ? 77% | 16 ? -14% |
| Response Time Black / White * (ms) | 9.6 ? | 8.8 ? 8% | 10.4 ? -8% | 8 ? 17% | 11.2 ? -17% |
| PWM Frequency (Hz) | 23580 ? | 23580 ? | |||
| Screen | -14% | 13% | -13% | 8% | |
| Brightness middle (cd/m²) | 283 | 286 1% | 291 3% | 345.4 22% | 264 -7% |
| Brightness (cd/m²) | 289 | 275 -5% | 278 -4% | 342 18% | 248 -14% |
| Brightness Distribution (%) | 90 | 90 0% | 91 1% | 90 0% | 89 -1% |
| Black Level * (cd/m²) | 0.24 | 0.37 -54% | 0.25 -4% | 0.34 -42% | 0.3 -25% |
| Contrast (:1) | 1179 | 773 -34% | 1164 -1% | 1016 -14% | 880 -25% |
| Colorchecker dE 2000 * | 2.26 | 2.19 3% | 1.19 47% | 3.18 -41% | 1.21 46% |
| Colorchecker dE 2000 max. * | 5.64 | 4.4 22% | 3.04 46% | 6.57 -16% | 3.07 46% |
| Colorchecker dE 2000 calibrated * | 1.11 | 2.27 -105% | 1.77 -59% | 0.92 17% | |
| Greyscale dE 2000 * | 3.4 | 2.2 35% | 1.9 44% | 3.8 -12% | 1.6 53% |
| Gamma | 2.228 99% | 2.41 91% | 2.216 99% | 2.15 102% | 2.192 100% |
| CCT | 7249 90% | 6405 101% | 7018 93% | 7109 91% | 6340 103% |
| Color Space (Percent of AdobeRGB 1998) (%) | 71 | 59 -17% | 70 -1% | 64.3 -9% | 68 -4% |
| Color Space (Percent of sRGB) (%) | 93 | 91 -2% | 92 -1% | 99 6% | 90 -3% |
| Total Average (Program / Settings) | 2% /
-8% | -1% /
7% | 11% /
-3% | -4% /
3% |
* ... smaller is better
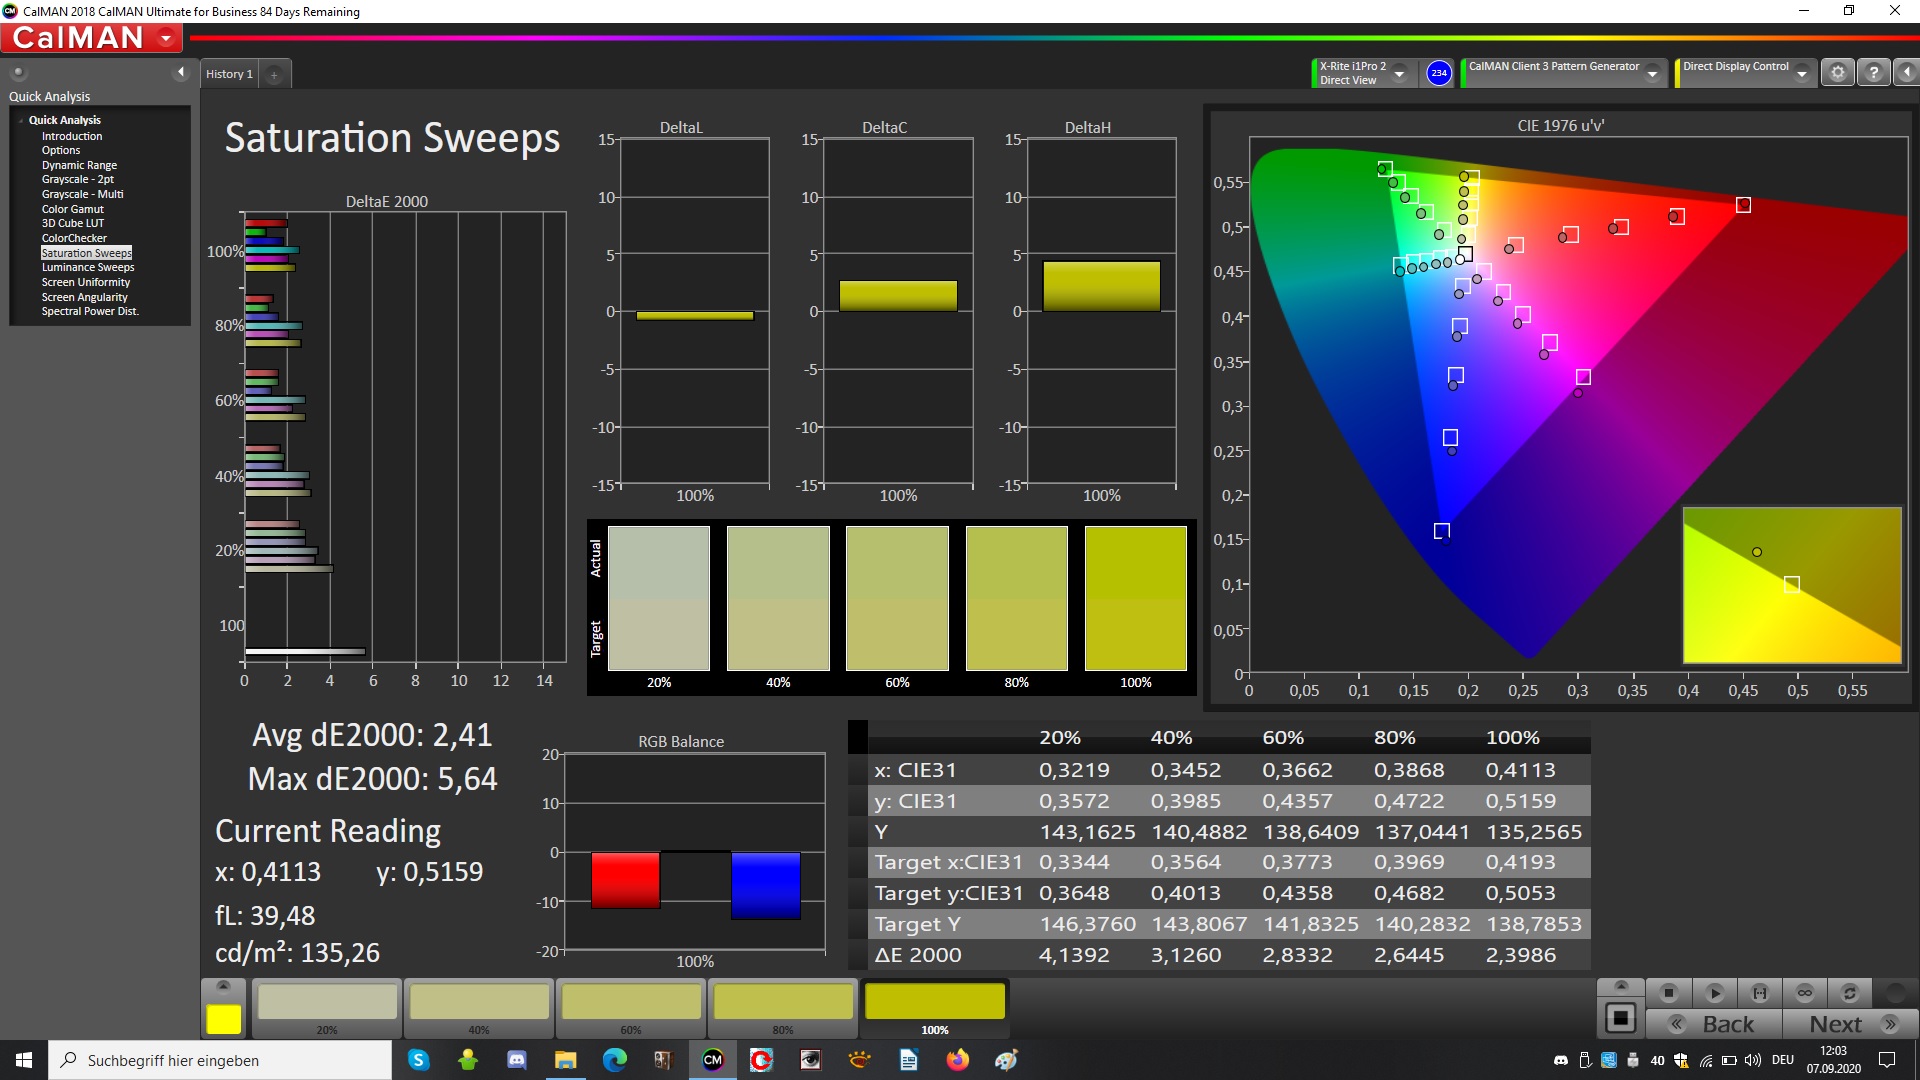
With a contrast ratio of 1,179:1 and a black level of 0.24 cd/m², the colors on the screen appear well separated from each other, and black image content looks deep and saturated. This is accompanied by a good color-space coverage of 93% (sRGB) and 71% (AdobeRGB), respectively.
The CalMAN analysis also shows that colors are displayed out of the box with a slightly too high blue component and a red component that's too low. These conditions can be almost completely compensated for by calibration. The corresponding ICC file can be downloaded in the window located at the top, to the right of the display's brightness distribution graph.
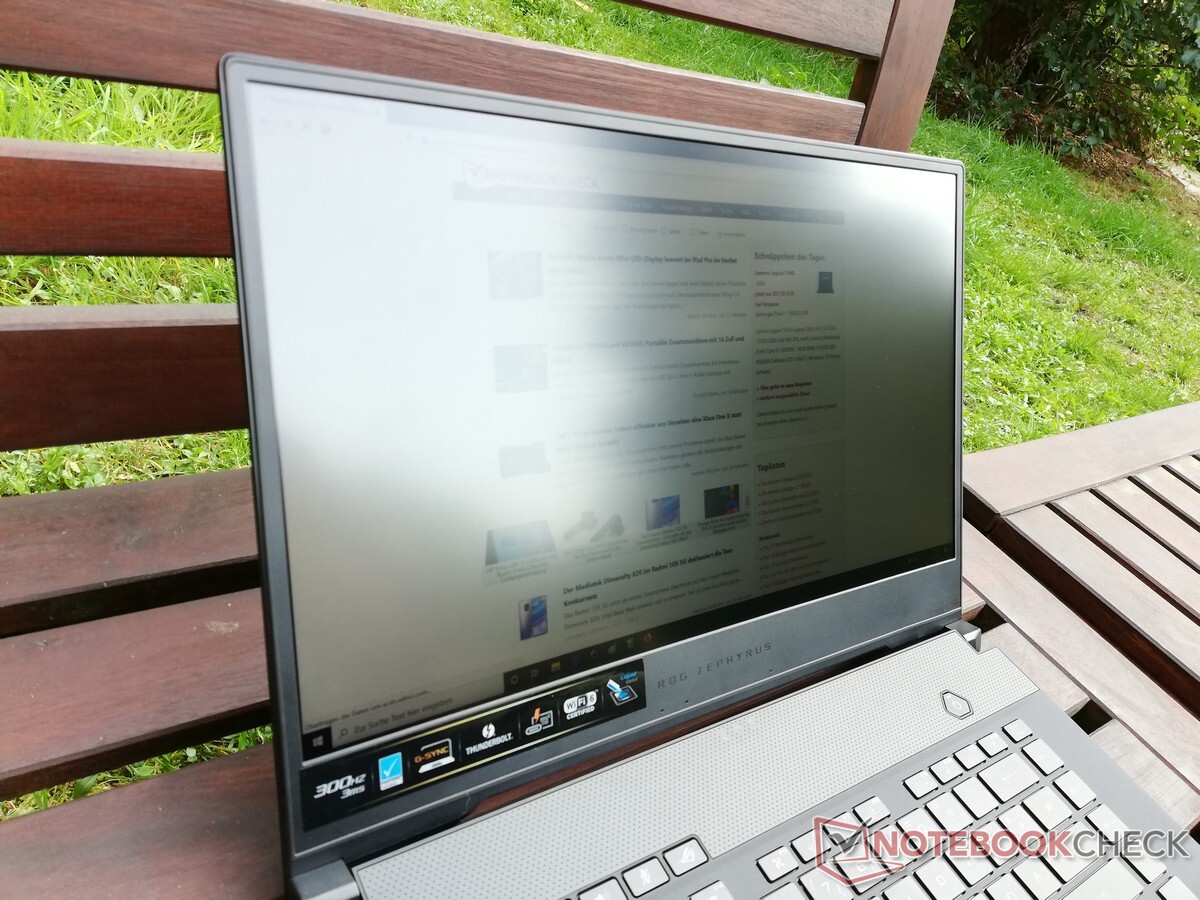
Outdoors, the Zehpyrus S15 can only be used in places under the shade. Despite the matte screen surface, some image content is difficult to read.
Display Response Times
| ↔ Response Time Black to White | ||
|---|---|---|
| 9.6 ms ... rise ↗ and fall ↘ combined | ↗ 5.2 ms rise | 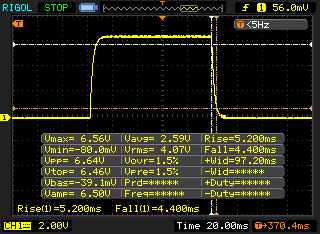 |
| ↘ 4.4 ms fall | ||
| The screen shows fast response rates in our tests and should be suited for gaming. In comparison, all tested devices range from 0.1 (minimum) to 240 (maximum) ms. » 26 % of all devices are better. This means that the measured response time is better than the average of all tested devices (19.8 ms). | ||
| ↔ Response Time 50% Grey to 80% Grey | ||
| 14 ms ... rise ↗ and fall ↘ combined | ↗ 6.8 ms rise | 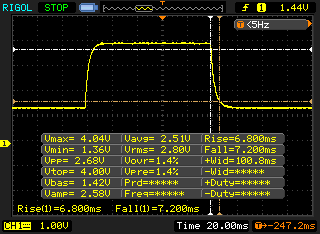 |
| ↘ 7.2 ms fall | ||
| The screen shows good response rates in our tests, but may be too slow for competitive gamers. In comparison, all tested devices range from 0.165 (minimum) to 636 (maximum) ms. » 28 % of all devices are better. This means that the measured response time is better than the average of all tested devices (31 ms). | ||
Screen Flickering / PWM (Pulse-Width Modulation)
| Screen flickering / PWM not detected | 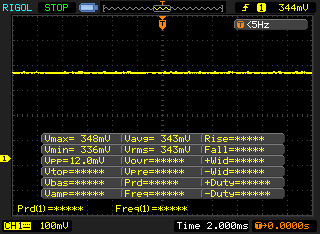 | ||
In comparison: 52 % of all tested devices do not use PWM to dim the display. If PWM was detected, an average of 7753 (minimum: 5 - maximum: 343500) Hz was measured. | |||
The Asus gaming laptop's IPS panel is very viewing-angle stable. Image content can be read from almost any angle without becoming distorted or displaying the wrong colors.

Performance - Gaming laptop for demanding games
With the Zephyrus S15, Asus is aiming at gamers who want to run modern titles at high graphics levels and are looking for a device that is as slim as possible. Asus's gaming laptop meets these demands with the hardware installed here, but the ROG Zephyrus S GX502GW predecessor model is still able to do so as well.


Processor
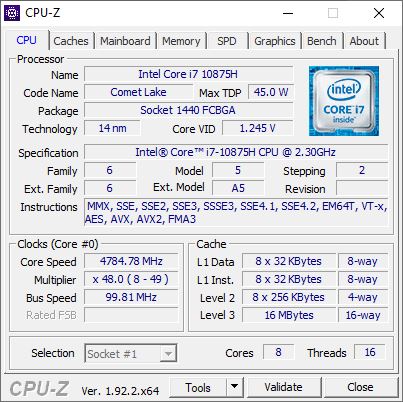
With its eight cores and clock rates between 2.3 and 5.1 GHz, the Intel Core i7-10875H used here offers about 10% more performance compared to the Intel Core i7-9750H found in the ROG Zephyrus S GX502GW. In comparison with the rest of the test field, the CPU installed here achieves a slightly above-average result.
In our Cinebench R15 endurance test, the Core i7-10875H can maintain its performance even over a longer period of time. Therefore, users don't have to expect a drop in CPU performance even under heavy load.
* ... smaller is better
System performance
The Zephyrus S15 achieves a place in the middle of our test field in the PCMark 10 system performance test. In everyday use, programs run smoothly, the system starts quickly, and files are accessed without delays.
You can read about the performance reached in our tests by other laptops in our CPU Benchmarks article.
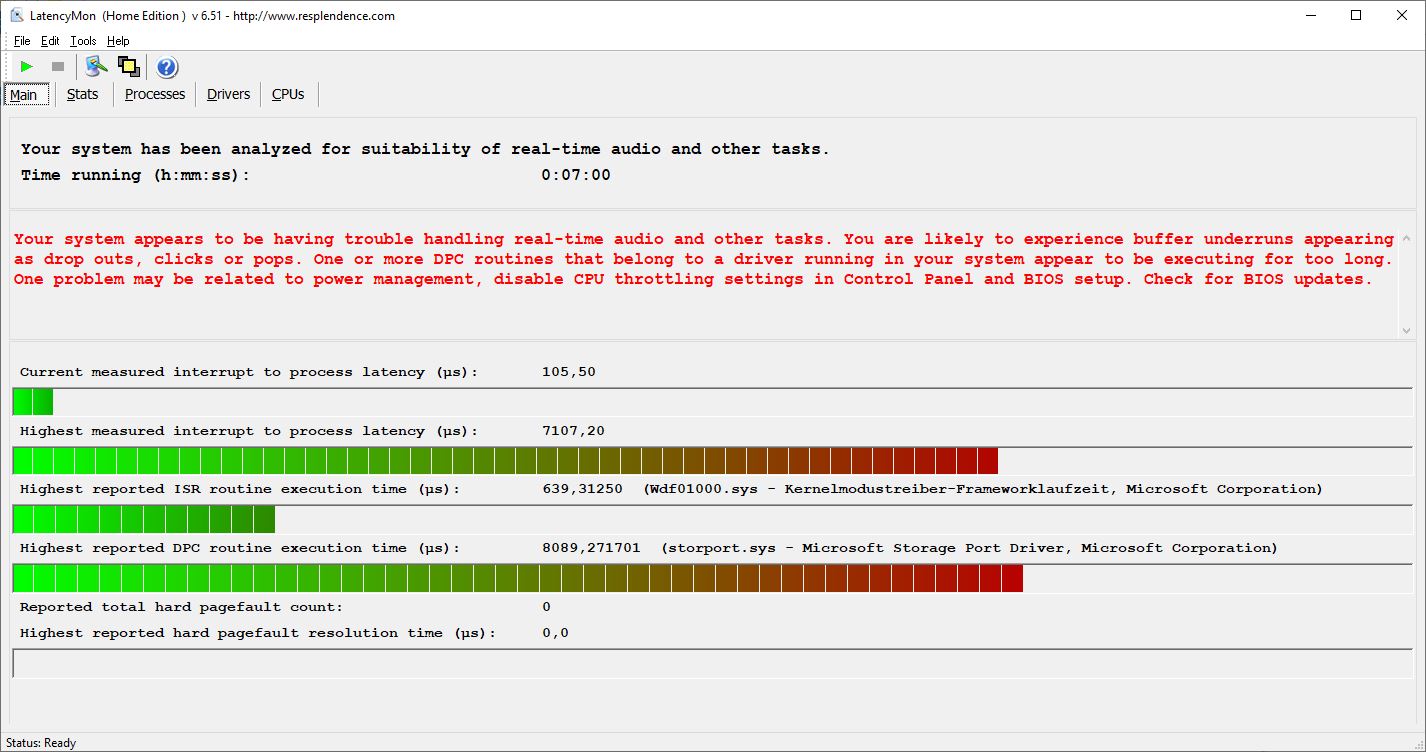
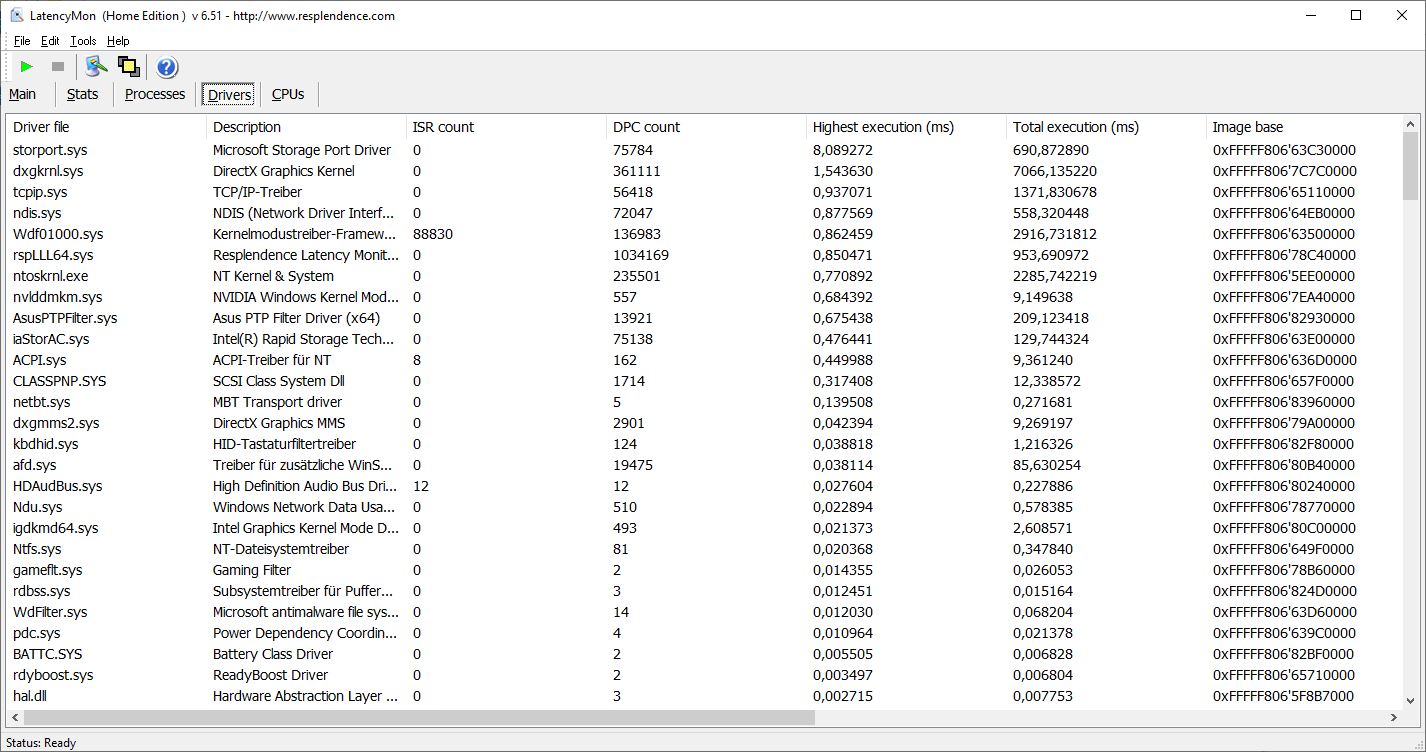
DPC latencies
In the test with LatencyMon, the Asus laptop shows clearly increased interruption times. Therefore, it's not suitable for certain real-time applications.
| DPC Latencies / LatencyMon - interrupt to process latency (max), Web, Youtube, Prime95 | |
| Asus Zephyrus S15 GX502L | |
| Aorus 15G XB | |
| Razer Blade 15 RTX 2070 Super Max-Q | |
| MSI GE66 Raider 10SFS | |
* ... smaller is better
Storage
Asus built a 1 TB SSD into our test configuration of the Zephyrus S15. It offers good read and write speeds that are on par with other laptops in this class.
The performance achieved in our tests by different storage devices can be found in our HDD/SSD Benchmarks article.
| Asus Zephyrus S15 GX502L WDC PC SN730 SDBPNTY-1T00 | Asus Zephyrus S GX502GW 2x Intel SSD 660p SSDPEKNW512G8 (RAID 0) | MSI GE66 Raider 10SFS WDC PC SN730 SDBPNTY-1T00 | Razer Blade 15 RTX 2070 Super Max-Q Samsung SSD PM981a MZVLB512HBJQ | Aorus 15G XB Samsung SSD PM981a MZVLB512HBJQ | Average WDC PC SN730 SDBPNTY-1T00 | |
|---|---|---|---|---|---|---|
| CrystalDiskMark 5.2 / 6 | -11% | 15% | 12% | 7% | 7% | |
| Write 4K (MB/s) | 127.4 | 97 -24% | 158.2 24% | 139.8 10% | 121.6 -5% | 139.9 ? 10% |
| Read 4K (MB/s) | 46.38 | 49.58 7% | 50.7 9% | 48.62 5% | 44.37 -4% | 44.5 ? -4% |
| Write Seq (MB/s) | 2034 | 1838 -10% | 1790 -12% | 2260 11% | 2617 29% | 2346 ? 15% |
| Read Seq (MB/s) | 2172 | 2421 11% | 2469 14% | 2135 -2% | 1297 -40% | 2102 ? -3% |
| Write 4K Q32T1 (MB/s) | 413.7 | 326.9 -21% | 503 22% | 499.3 21% | 499 21% | 442 ? 7% |
| Read 4K Q32T1 (MB/s) | 354 | 372.9 5% | 579 64% | 552 56% | 557 57% | 460 ? 30% |
| Write Seq Q32T1 (MB/s) | 3063 | 1894 -38% | 3102 1% | 2960 -3% | 2978 -3% | 3049 ? 0% |
| Read Seq Q32T1 (MB/s) | 3396 | 2828 -17% | 3413 1% | 3269 -4% | 3360 -1% | 3285 ? -3% |
| AS SSD | -18% | 33% | -9% | 13% | 0% | |
| Seq Read (MB/s) | 2714 | 2506 -8% | 2979 10% | 1957 -28% | 1795 -34% | 2606 ? -4% |
| Seq Write (MB/s) | 928 | 1712 84% | 2581 178% | 2092 125% | 2724 194% | 1935 ? 109% |
| 4K Read (MB/s) | 42.83 | 48.32 13% | 47.33 11% | 50.2 17% | 49.67 16% | 42.9 ? 0% |
| 4K Write (MB/s) | 120.5 | 103.6 -14% | 140 16% | 96.5 -20% | 109.3 -9% | 129.1 ? 7% |
| 4K-64 Read (MB/s) | 978 | 624 -36% | 1710 75% | 1594 63% | 1284 31% | 1361 ? 39% |
| 4K-64 Write (MB/s) | 2797 | 1253 -55% | 2188 -22% | 2005 -28% | 1962 -30% | 1920 ? -31% |
| Access Time Read * (ms) | 0.057 | 0.08 -40% | 0.05 12% | 0.057 -0% | 0.063 -11% | 0.0689 ? -21% |
| Access Time Write * (ms) | 0.032 | 0.04 -25% | 0.026 19% | 0.112 -250% | 0.034 -6% | 0.06215 ? -94% |
| Score Read (Points) | 1292 | 923 -29% | 2055 59% | 1840 42% | 1513 17% | 1664 ? 29% |
| Score Write (Points) | 3011 | 1528 -49% | 2586 -14% | 2310 -23% | 2344 -22% | 2242 ? -26% |
| Score Total (Points) | 4881 | 2896 -41% | 5673 16% | 5103 5% | 4685 -4% | 4726 ? -3% |
| Total Average (Program / Settings) | -15% /
-15% | 24% /
25% | 2% /
-0% | 10% /
10% | 4% /
3% |
* ... smaller is better

Continuous load read: DiskSpd Read Loop, Queue Depth 8
Graphics card
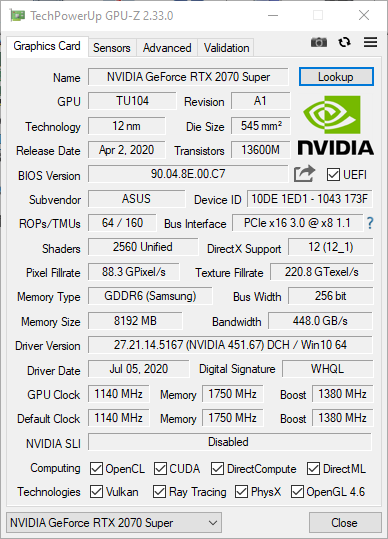
The Nvidia GeForce RTX 2070 Super installed here is the successor to the GeForce RTX 2070 Mobile and offers an approximately 10 to 20% higher performance. But overall, the RTX 2070 Super performs slightly under average for its conditions.
The performance offered by other graphics cards is listed in our GPU Benchmarks article.
| 3DMark 11 Performance | 23795 points | |
| 3DMark Cloud Gate Standard Score | 48072 points | |
| 3DMark Fire Strike Score | 19416 points | |
| 3DMark Time Spy Score | 8293 points | |
Help | ||
Gaming performance
The performance of the Nvidia GeForce RTX 2070 Super installed here is sufficient to run modern games smoothly at Full HD resolution, high detail levels, and frame rates beyond 60 fps. The titles that we tested ran without any problems.
The gaming performance that can be expected in other titles can be found in our GPU Games article.
| The Witcher 3 - 1920x1080 Ultra Graphics & Postprocessing (HBAO+) | |
| Average of class Gaming (104.7 - 240, n=6, last 2 years) | |
| Average NVIDIA GeForce RTX 2070 Super Mobile (76.3 - 94.6, n=8) | |
| MSI GE66 Raider 10SFS | |
| Asus Zephyrus S15 GX502L | |
| Aorus 15G XB | |
| Razer Blade 15 RTX 2070 Super Max-Q | |
| Asus Zephyrus S GX502GW | |
| Far Cry 5 - 1920x1080 Ultra Preset AA:T | |
| Average of class Gaming (70 - 151, n=7, last 2 years) | |
| Average NVIDIA GeForce RTX 2070 Super Mobile (98 - 112, n=2) | |
| Asus Zephyrus S15 GX502L | |
| Final Fantasy XV Benchmark - 1920x1080 High Quality | |
| Average of class Gaming (41 - 215, n=95, last 2 years) | |
| MSI GE66 Raider 10SFS | |
| Average NVIDIA GeForce RTX 2070 Super Mobile (79.7 - 91.1, n=2) | |
| Razer Blade 15 RTX 2070 Super Max-Q | |
| Asus Zephyrus S15 GX502L | |
| X-Plane 11.11 - 1920x1080 high (fps_test=3) | |
| Average of class Gaming (52.1 - 143.5, n=109, last 2 years) | |
| Razer Blade 15 RTX 2070 Super Max-Q | |
| MSI GE66 Raider 10SFS | |
| Average NVIDIA GeForce RTX 2070 Super Mobile (78.5 - 87, n=4) | |
| Asus Zephyrus S15 GX502L | |
Our The Witcher 3 continuous load test was performed at "Ultra" graphics settings, and it showed that the actually very high frame rates of about 80 fps are occasionally marked by significant drops that can lead to disturbances in gameplay.
| low | med. | high | ultra | |
|---|---|---|---|---|
| The Witcher 3 (2015) | 76.3 | |||
| Dota 2 Reborn (2015) | 156 | 136 | 111 | 104 |
| Final Fantasy XV Benchmark (2018) | 79.7 | |||
| X-Plane 11.11 (2018) | 107 | 89.4 | 78.5 | |
| Far Cry 5 (2018) | 98 | |||
| Doom Eternal (2020) | 190.4 |
Emissions - Good speakers and occasional coil whine
Noise emissions
The Asus ROG Zephyrus S15's fans can be very bothersome under load at a noise level of up to 57 dB(A). However, since most games also deliver smooth frame rates in the "Quiet" performance profile, the noise level can be significantly reduced in everyday use.
When accessing files, a clear coil whine can be heard.
Noise level
| Idle |
| 28 / 31 / 36 dB(A) |
| Load |
| 56 / 57 dB(A) |
 | ||
30 dB silent 40 dB(A) audible 50 dB(A) loud |
||
min: | ||
Temperature
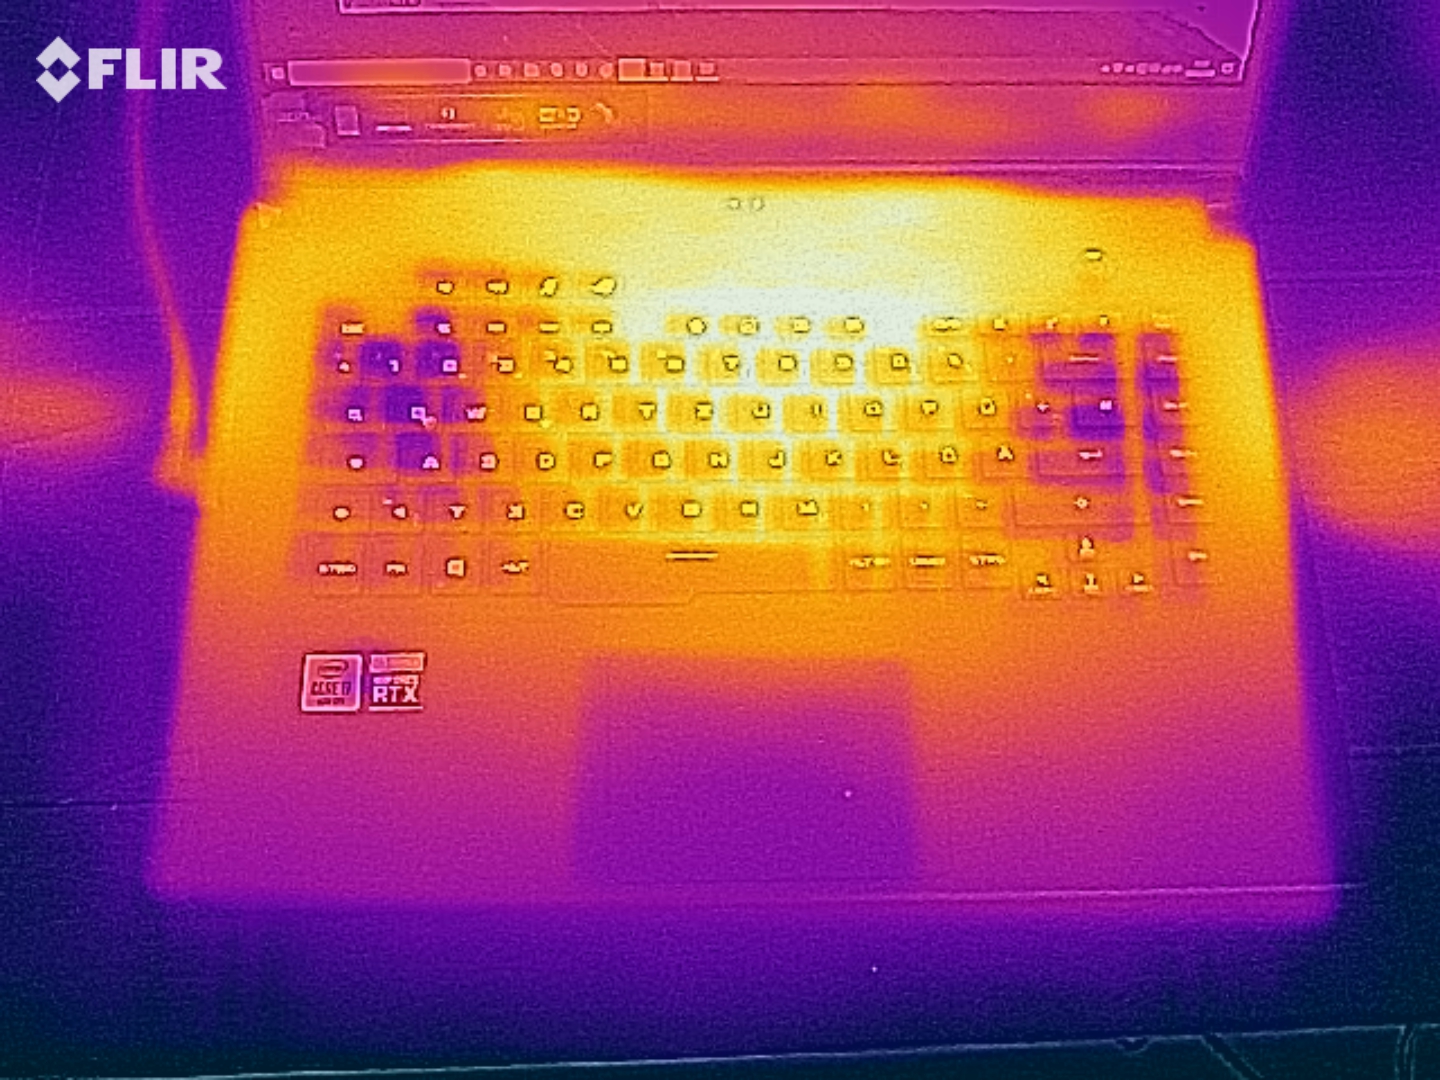
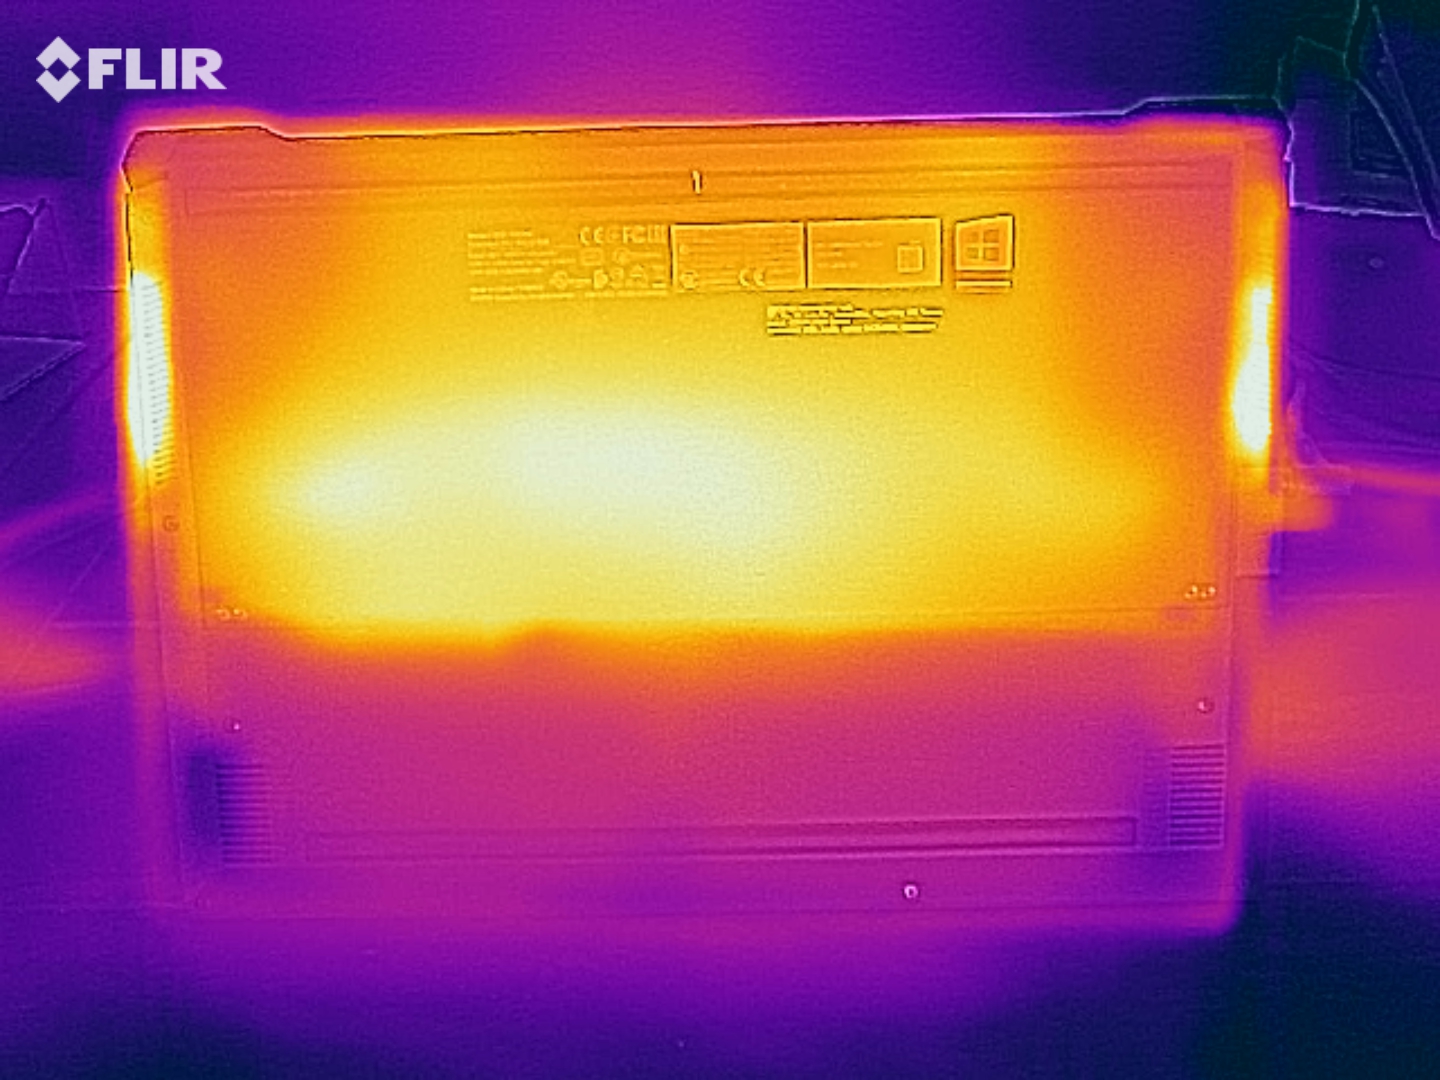
The surfaces of the Zephyrus S15 heat up to 51 °C (~124 °F) in our test. Because this temperature occurs primarily in the rear area of the top side, the gaming laptop from Asus can still be used without any problems on the lap, for example.
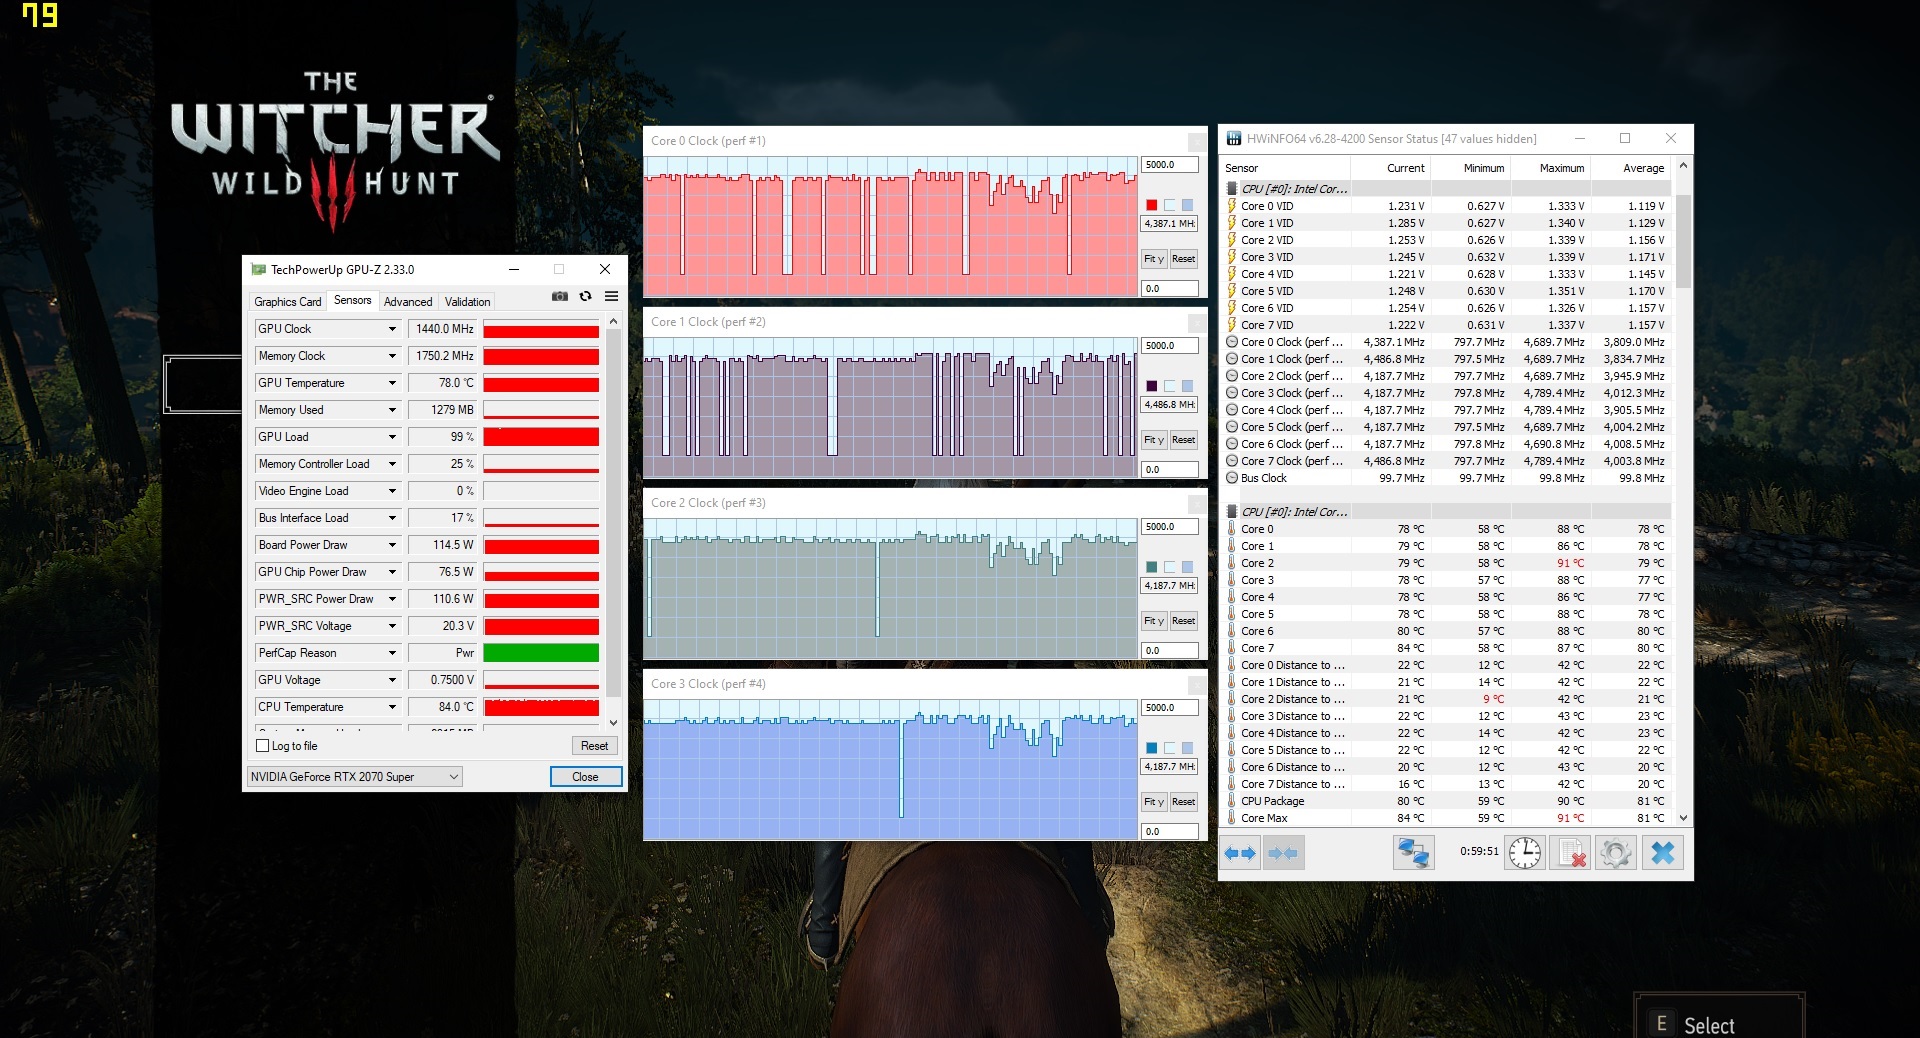
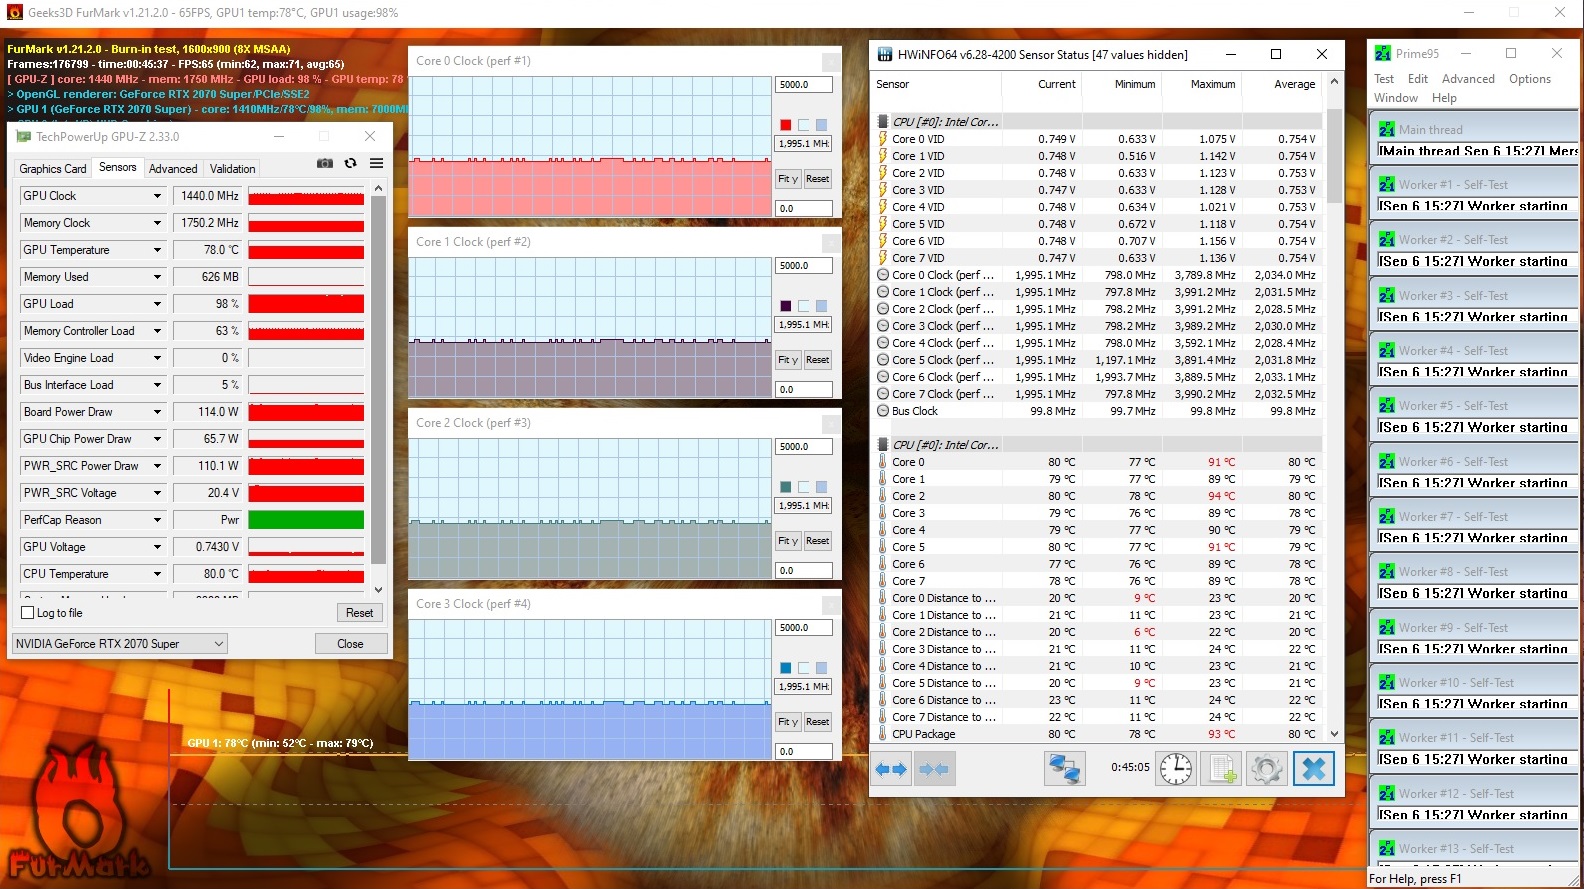
During our stress test, which lasted about an hour, the internal temperatures rose up to 94 °C (~201 °F), and the clock rates dropped to an average value of about 2 GHz, which is below the base clock speed of the i7-10875H. In our The Witcher 3 endurance test, however, the clock rates could be maintained at an average of 3.9 GHz while temperatures remained moderate; therefore, players don't have to fear any performance drops due to excessive temperatures in everyday use.
(-) The maximum temperature on the upper side is 51 °C / 124 F, compared to the average of 40.4 °C / 105 F, ranging from 21.2 to 68.8 °C for the class Gaming.
(±) The bottom heats up to a maximum of 44 °C / 111 F, compared to the average of 43.2 °C / 110 F
(+) In idle usage, the average temperature for the upper side is 28.3 °C / 83 F, compared to the device average of 33.9 °C / 93 F.
(-) Playing The Witcher 3, the average temperature for the upper side is 44.1 °C / 111 F, compared to the device average of 33.9 °C / 93 F.
(±) The palmrests and touchpad can get very hot to the touch with a maximum of 37 °C / 98.6 F.
(-) The average temperature of the palmrest area of similar devices was 28.8 °C / 83.8 F (-8.2 °C / -14.8 F).
Speakers
The speakers in the Zephyrus S15 offer high volume and a broad sound spectrum. This allows for the consumption of both games and media content without the absolute need for external speakers or headphones.
Asus Zephyrus S15 GX502L audio analysis
(+) | speakers can play relatively loud (83 dB)
Bass 100 - 315 Hz
(±) | reduced bass - on average 12.1% lower than median
(±) | linearity of bass is average (7.9% delta to prev. frequency)
Mids 400 - 2000 Hz
(+) | balanced mids - only 2.9% away from median
(+) | mids are linear (3.3% delta to prev. frequency)
Highs 2 - 16 kHz
(+) | balanced highs - only 2.4% away from median
(+) | highs are linear (6% delta to prev. frequency)
Overall 100 - 16.000 Hz
(+) | overall sound is linear (10.5% difference to median)
Compared to same class
» 6% of all tested devices in this class were better, 2% similar, 92% worse
» The best had a delta of 6%, average was 18%, worst was 132%
Compared to all devices tested
» 5% of all tested devices were better, 1% similar, 93% worse
» The best had a delta of 4%, average was 23%, worst was 134%
Asus Zephyrus S GX502GW audio analysis
(+) | speakers can play relatively loud (90 dB)
Bass 100 - 315 Hz
(±) | reduced bass - on average 12.7% lower than median
(±) | linearity of bass is average (8.5% delta to prev. frequency)
Mids 400 - 2000 Hz
(+) | balanced mids - only 4.5% away from median
(+) | mids are linear (4.1% delta to prev. frequency)
Highs 2 - 16 kHz
(±) | higher highs - on average 6.7% higher than median
(±) | linearity of highs is average (10.8% delta to prev. frequency)
Overall 100 - 16.000 Hz
(+) | overall sound is linear (14.6% difference to median)
Compared to same class
» 28% of all tested devices in this class were better, 7% similar, 65% worse
» The best had a delta of 6%, average was 18%, worst was 132%
Compared to all devices tested
» 19% of all tested devices were better, 4% similar, 77% worse
» The best had a delta of 4%, average was 23%, worst was 134%
Energy management - Short battery life
Energy consumption
With a consumption of up to 232 watts under load, the Asus ROG Zephyrus S15 shows a comparatively high energy consumption. However, the included 240-watt power adapter has sufficient capacity to provide it with the necessary energy.
A 65-watt power adapter is also included in the box, which has enough capacity to supply the device with energy over USB Type-C in office usage.
| Off / Standby | |
| Idle | |
| Load |
|
Key:
min: | |
| Asus Zephyrus S15 GX502L i7-10875H, GeForce RTX 2070 Super Mobile | Asus Zephyrus S GX502GW i7-9750H, GeForce RTX 2070 Mobile | MSI GE66 Raider 10SFS i9-10980HK, GeForce RTX 2070 Super Mobile | Razer Blade 15 RTX 2070 Super Max-Q i7-10875H, GeForce RTX 2070 Super Max-Q | Aorus 15G XB i7-10875H, GeForce RTX 2070 Super Max-Q | Average of class Gaming | |
|---|---|---|---|---|---|---|
| Power Consumption | -61% | 0% | -31% | -29% | -22% | |
| Idle Minimum * (Watt) | 7 | 24 -243% | 6 14% | 14.3 -104% | 16 -129% | 13 ? -86% |
| Idle Average * (Watt) | 13 | 27 -108% | 14 -8% | 22.3 -72% | 20 -54% | 18.6 ? -43% |
| Idle Maximum * (Watt) | 25 | 33 -32% | 25 -0% | 36.9 -48% | 30 -20% | 24.2 ? 3% |
| Load Average * (Watt) | 148 | 129 13% | 108 27% | 118.4 20% | 102 31% | 108.7 ? 27% |
| Witcher 3 ultra * (Watt) | 175 | 176 -1% | 195 -11% | 153.7 12% | 156 11% | |
| Load Maximum * (Watt) | 232 | 216 7% | 280 -21% | 220.8 5% | 256 -10% | 255 ? -10% |
* ... smaller is better
Battery life
The Zephyrus S15 from Asus achieves a runtime of about three hours in our practical WLAN test. Consequently, it has shorter battery life than the predecessor model with the same battery capacity. It's also the gaming laptop with the shortest battery life in our test field.
| Asus Zephyrus S15 GX502L i7-10875H, GeForce RTX 2070 Super Mobile, 76 Wh | Asus Zephyrus S GX502GW i7-9750H, GeForce RTX 2070 Mobile, 76 Wh | MSI GE66 Raider 10SFS i9-10980HK, GeForce RTX 2070 Super Mobile, 99.99 Wh | Razer Blade 15 RTX 2070 Super Max-Q i7-10875H, GeForce RTX 2070 Super Max-Q, 80 Wh | Aorus 15G XB i7-10875H, GeForce RTX 2070 Super Max-Q, 94 Wh | Average of class Gaming | |
|---|---|---|---|---|---|---|
| Battery runtime | -14% | 37% | 110% | 70% | 45% | |
| Reader / Idle (h) | 8.7 | 5.9 -32% | 7.6 -13% | 9.7 11% | 8.71 ? 0% | |
| WiFi v1.3 (h) | 3 | 3.7 23% | 6.1 103% | 6.3 110% | 7 133% | 7.07 ? 136% |
| Load (h) | 1.5 | 1 -33% | 1.8 20% | 2.5 67% | 1.502 ? 0% |
Pros
Cons
Verdict - Shorter battery life with a "Super" GPU
The Asus ROG Zephyrus S15 GX502L is, without a doubt, a powerful gaming laptop. The slim design also makes it a quite mobile device if you're willing to regularly look for an outlet for the smaller of the two power adapters. In gaming mode, the ventilation system ensures good frame rates, even without the fans having to be turned all the way up.
With the Asus ROG Zephyrus S15, modern games can be played at maximum details without any issues.
But this raises the question for prospective buyers of why they should choose this model. The predecessor device is available for a similar price, offers a comparable gaming performance, and lasts a bit longer on battery power. The increase in performance is not too big despite the more current CPU and the inclusion of the RTX 2070 Super instead of "only" the RTX 2070. But if you value maximum performance over battery life, you will be very satisfied with the Zephyrus S15.
Asus Zephyrus S15 GX502L
- 09/27/2020 v7 (old)
Mike Wobker
Price comparison

