MSI GE66 Raider 10SFS Laptop Review: Premiere for the RTX 2070 Super

Those interested in the GE66 are spoilt for choice between three different basic versions. While the Raider 10SF comes with a GeForce RTX 2070, the Raider 10SFS has the Super version of the RTX 2070 built in. The top end of the food chain is formed by the Raider 10SGS, which is fueled by an RTX 2080 Super Max-Q. Depending on the model, either a Full HD screen with 144, 240 or 300 Hz or a UHD screen with 60 Hz takes care of the image reproduction. The processor is a six- or eight-core chip from Intel's Comet Lake series. The selection is rounded off by a maximum of 64 GB DDR4 RAM and up to two M.2 SSDs.
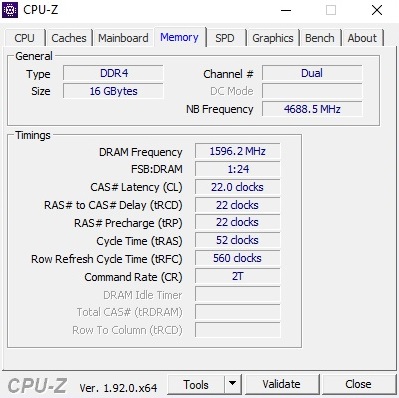
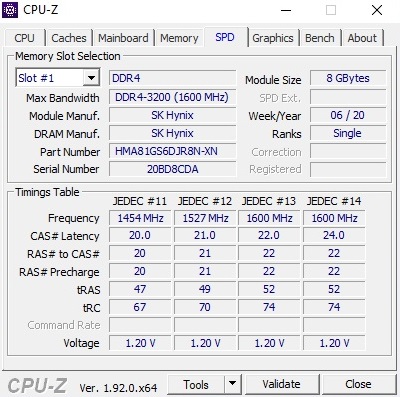
For our test configuration, which includes a 240 Hz panel, a Core i9-10980HK, a GeForce RTX 2070 Super, 2x 8 GB DDR4-3,200 RAM and a 1 TB SSD, you'd have to pay almost 2,700 Euros (~$3,090) at the moment.
Competitors of the GE66 Raider include other 15-inch gaming laptops based on the Core i9 and RTX 2070 such as the Asus Strix G531GW, the Eurocom Nightsky RX15 and the in-house GE65 Raider. These notebooks appear in the tables as comparison devices.
Rating | Date | Model | Weight | Height | Size | Resolution | Price |
|---|---|---|---|---|---|---|---|
| 84.6 % v7 (old) | 07 / 2020 | MSI GE66 Raider 10SFS i9-10980HK, GeForce RTX 2070 Super Mobile | 2.4 kg | 23 mm | 15.60" | 1920x1080 | |
| 84.7 % v7 (old) | 12 / 2019 | MSI GE65 Raider 9SF-049US i9-9880H, GeForce RTX 2070 Mobile | 2.3 kg | 26.9 mm | 15.60" | 1920x1080 | |
| 86 % v6 (old) | 06 / 2019 | Asus Strix Scar III G531GW i9-9880H, GeForce RTX 2070 Mobile | 2.3 kg | 25 mm | 15.60" | 1920x1080 | |
| 85.9 % v6 (old) | 08 / 2019 | Eurocom Nightsky RX15 i9-9980HK, GeForce RTX 2070 Mobile | 2.5 kg | 29.9 mm | 15.60" | 3840x2160 |
Case
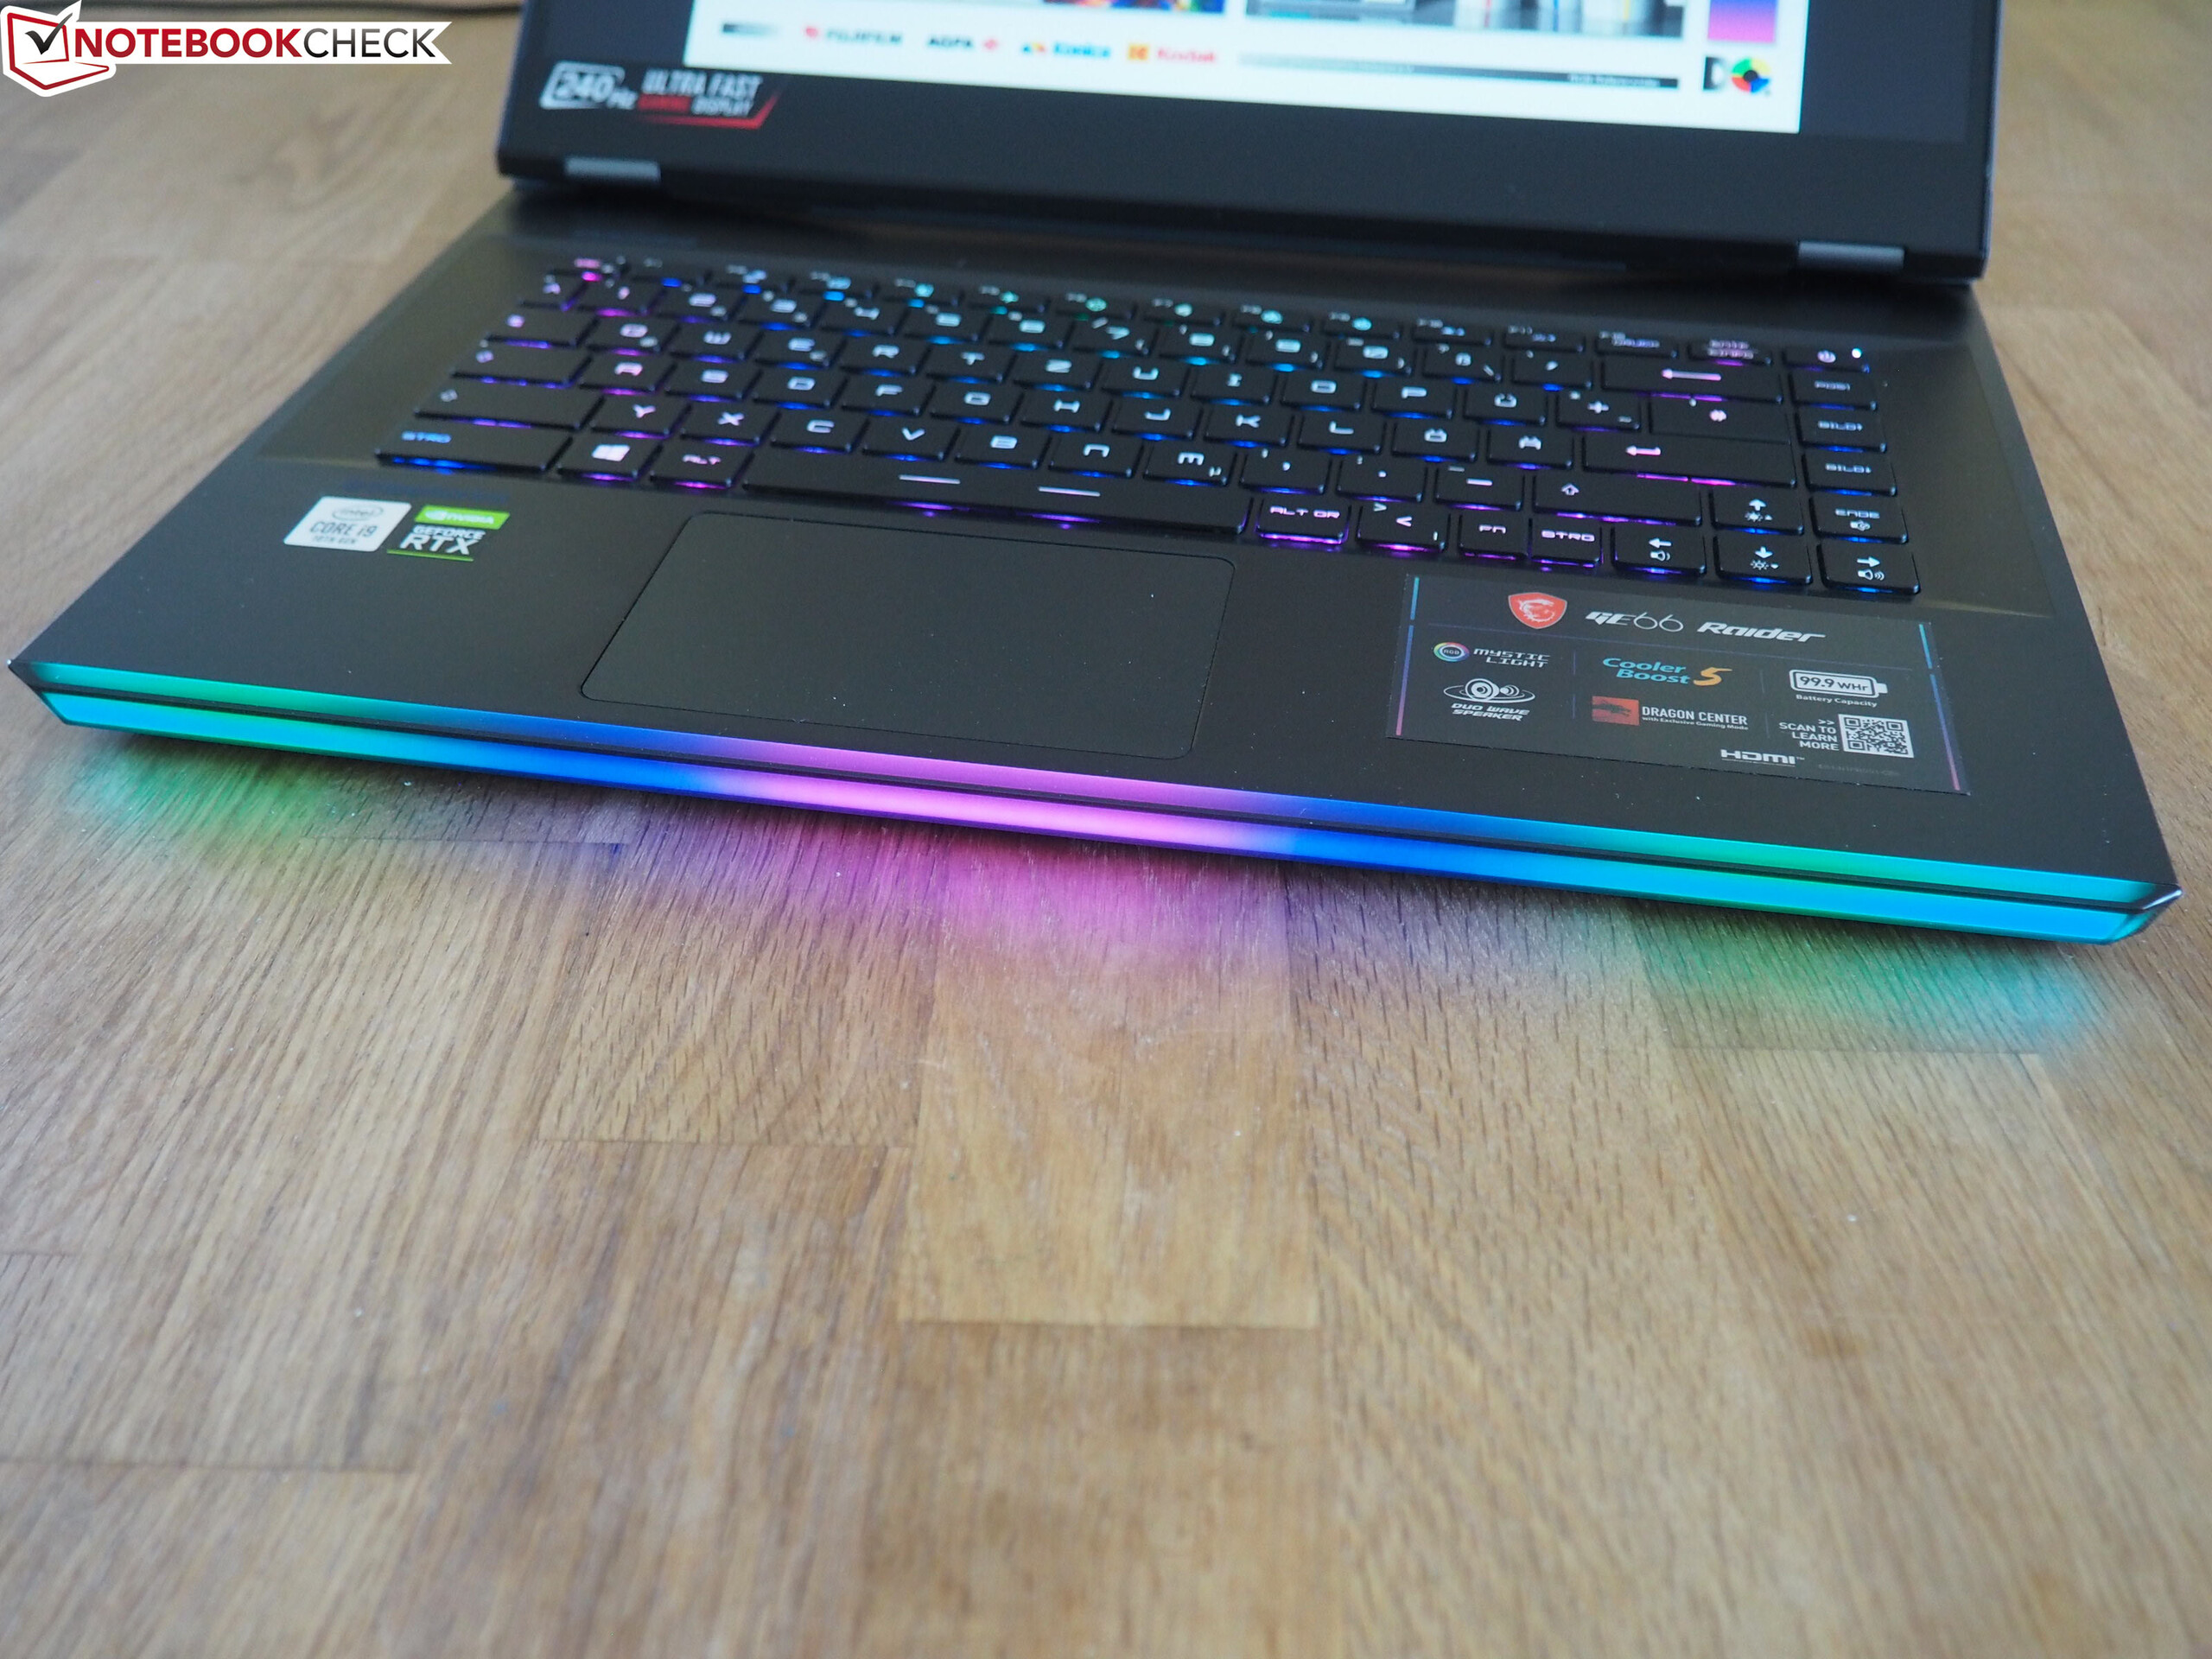
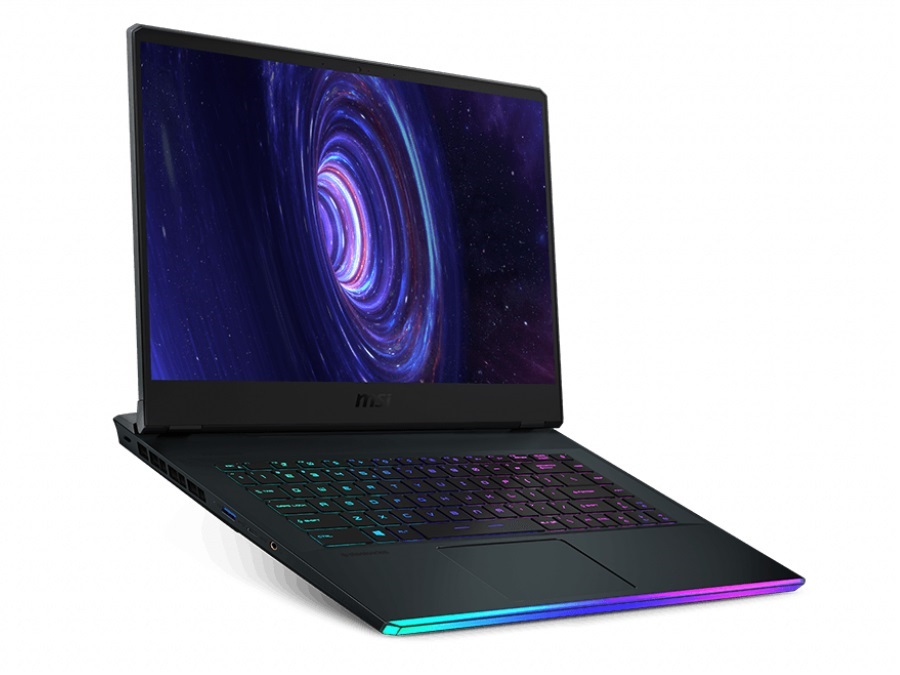
Visually, the GE66 differs very much from its 15-inch stablemate, the GE65. The form and design language are more oriented towards the 17-inch GT76 Titan, which we tested extensively in 2019. The gray lid stands out nicely from the rest of the surfaces, which are designed in a much darker color tone.
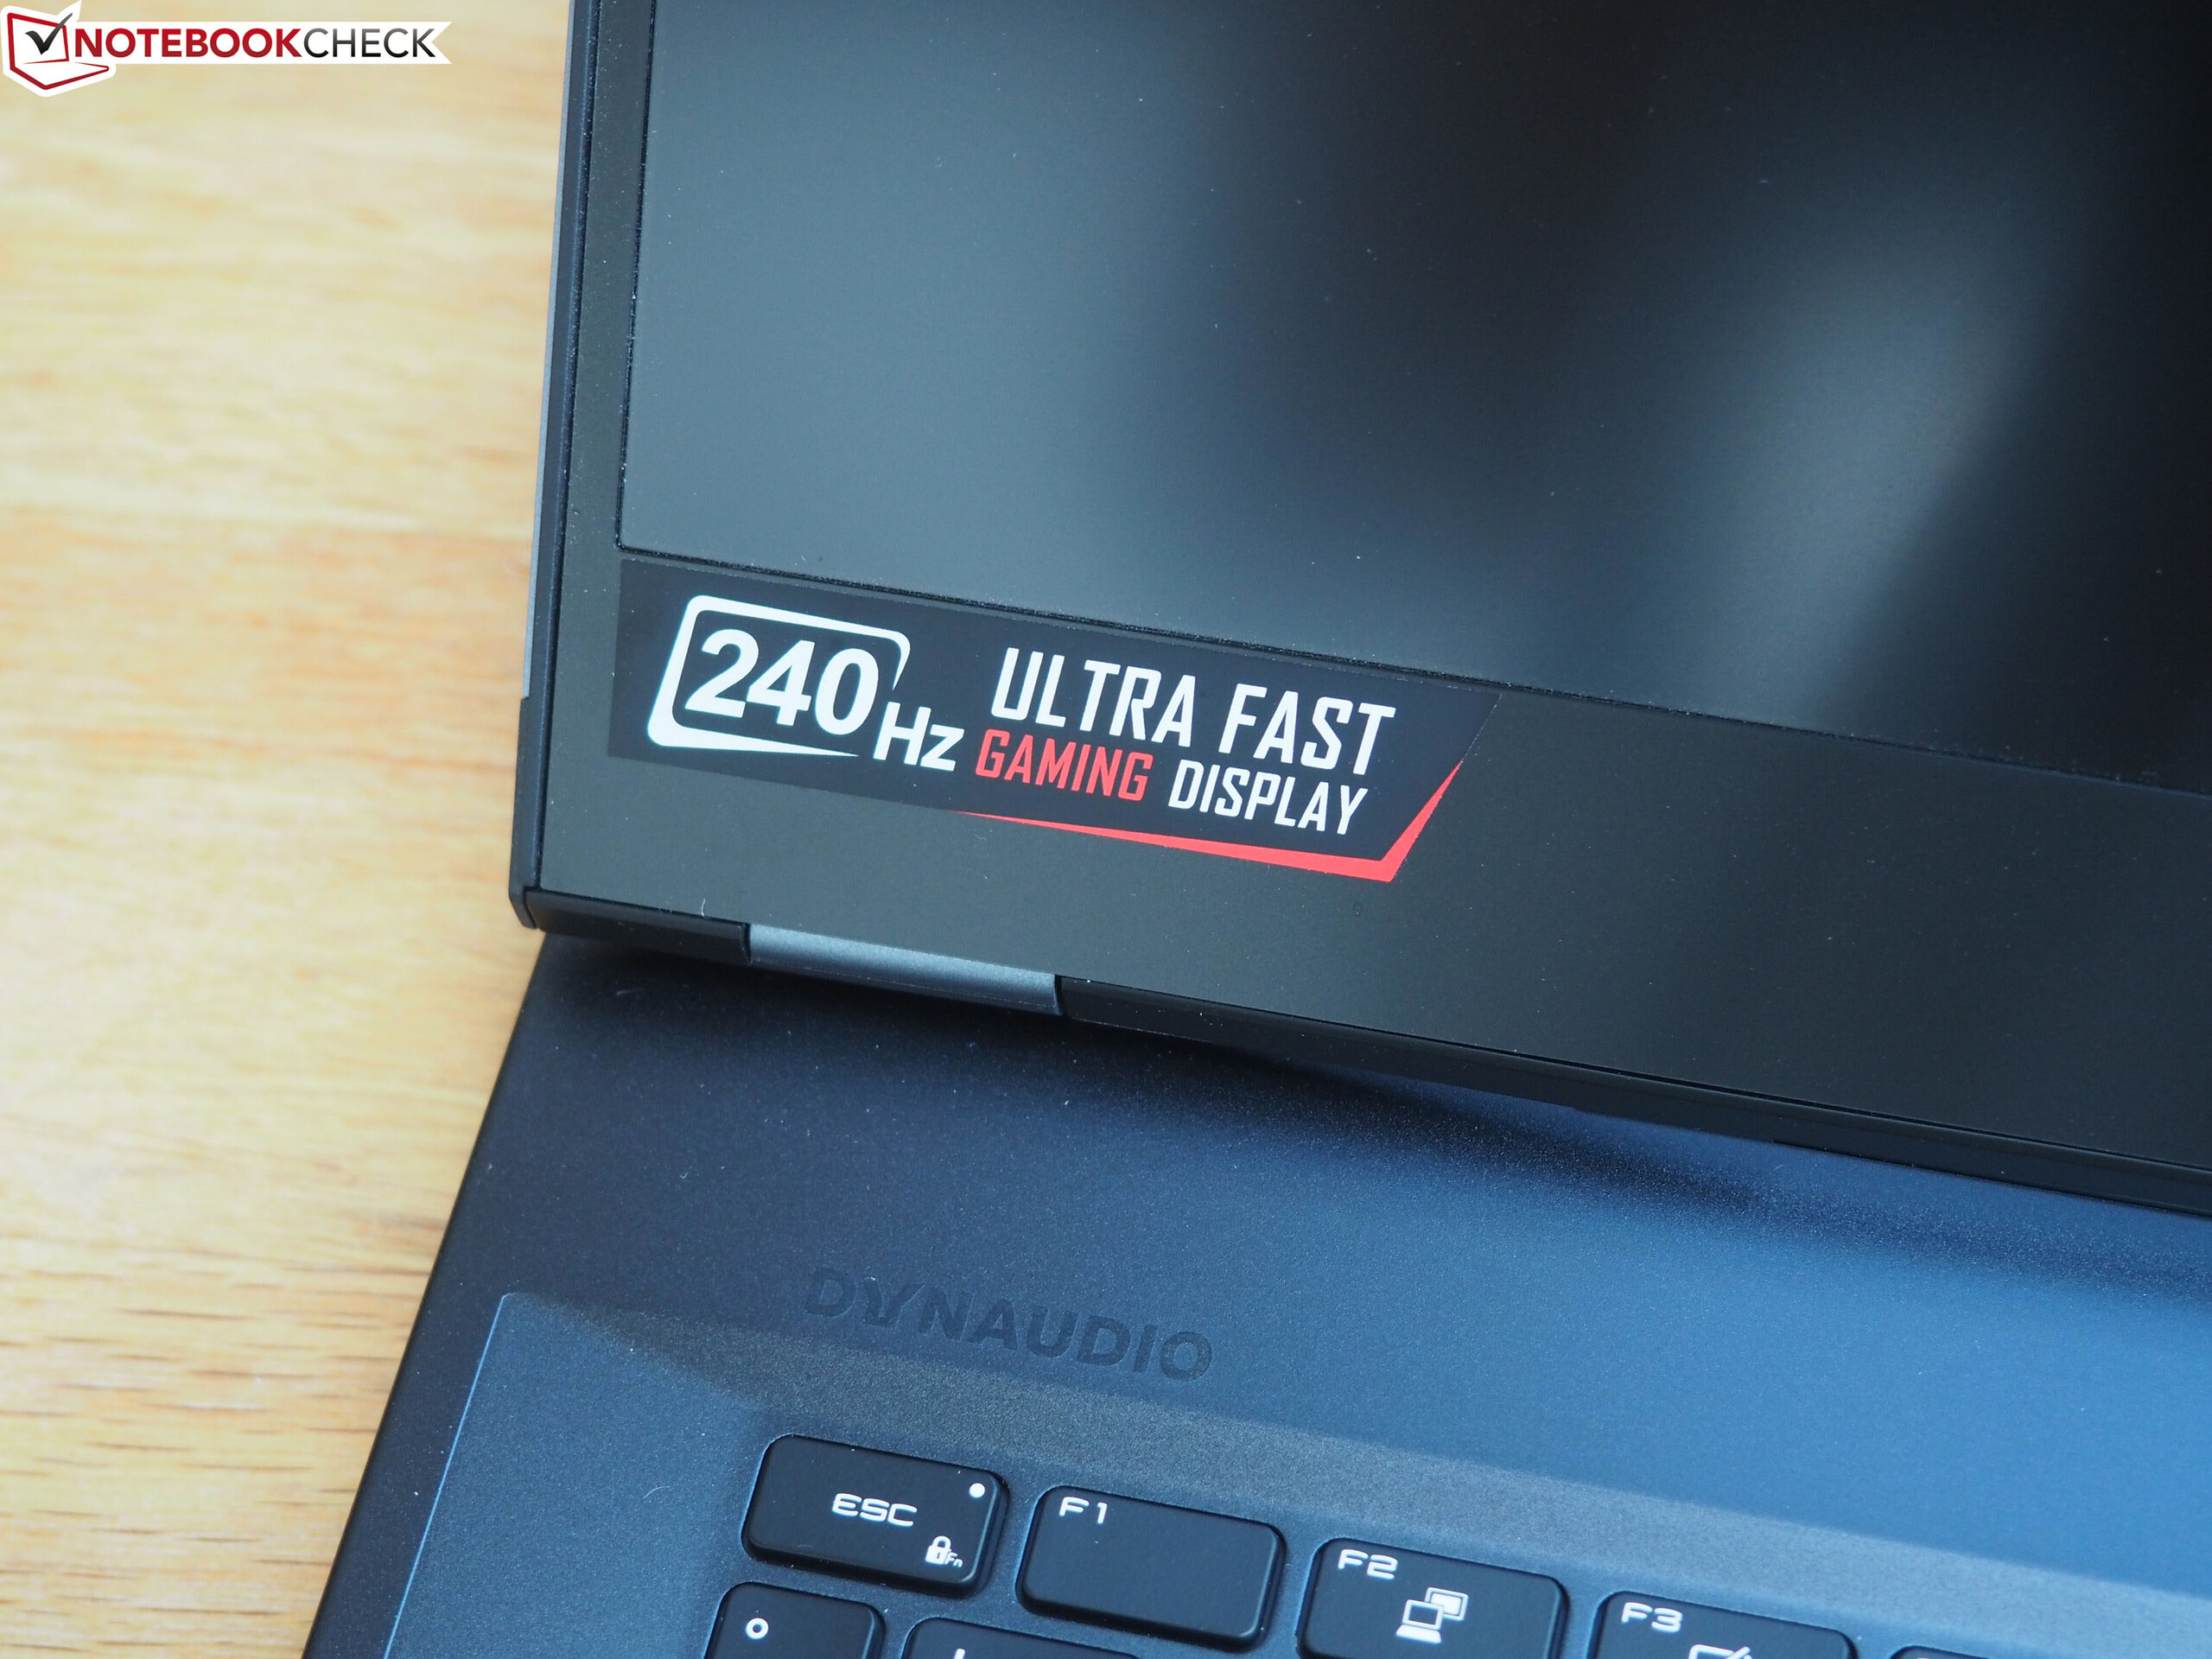
The numerous edges/curves and design elements make the GE66 look more playful than many of its MSI colleagues, which is of course a matter of taste. The LED strip on the laptop's front is particularly striking and can be illuminated in different colors to match the keyboard (or can be deactivated if desired). The case's workmanship and stability hardly give cause for criticism - except maybe for the LED strip that does not perfectly disappear into the frame.
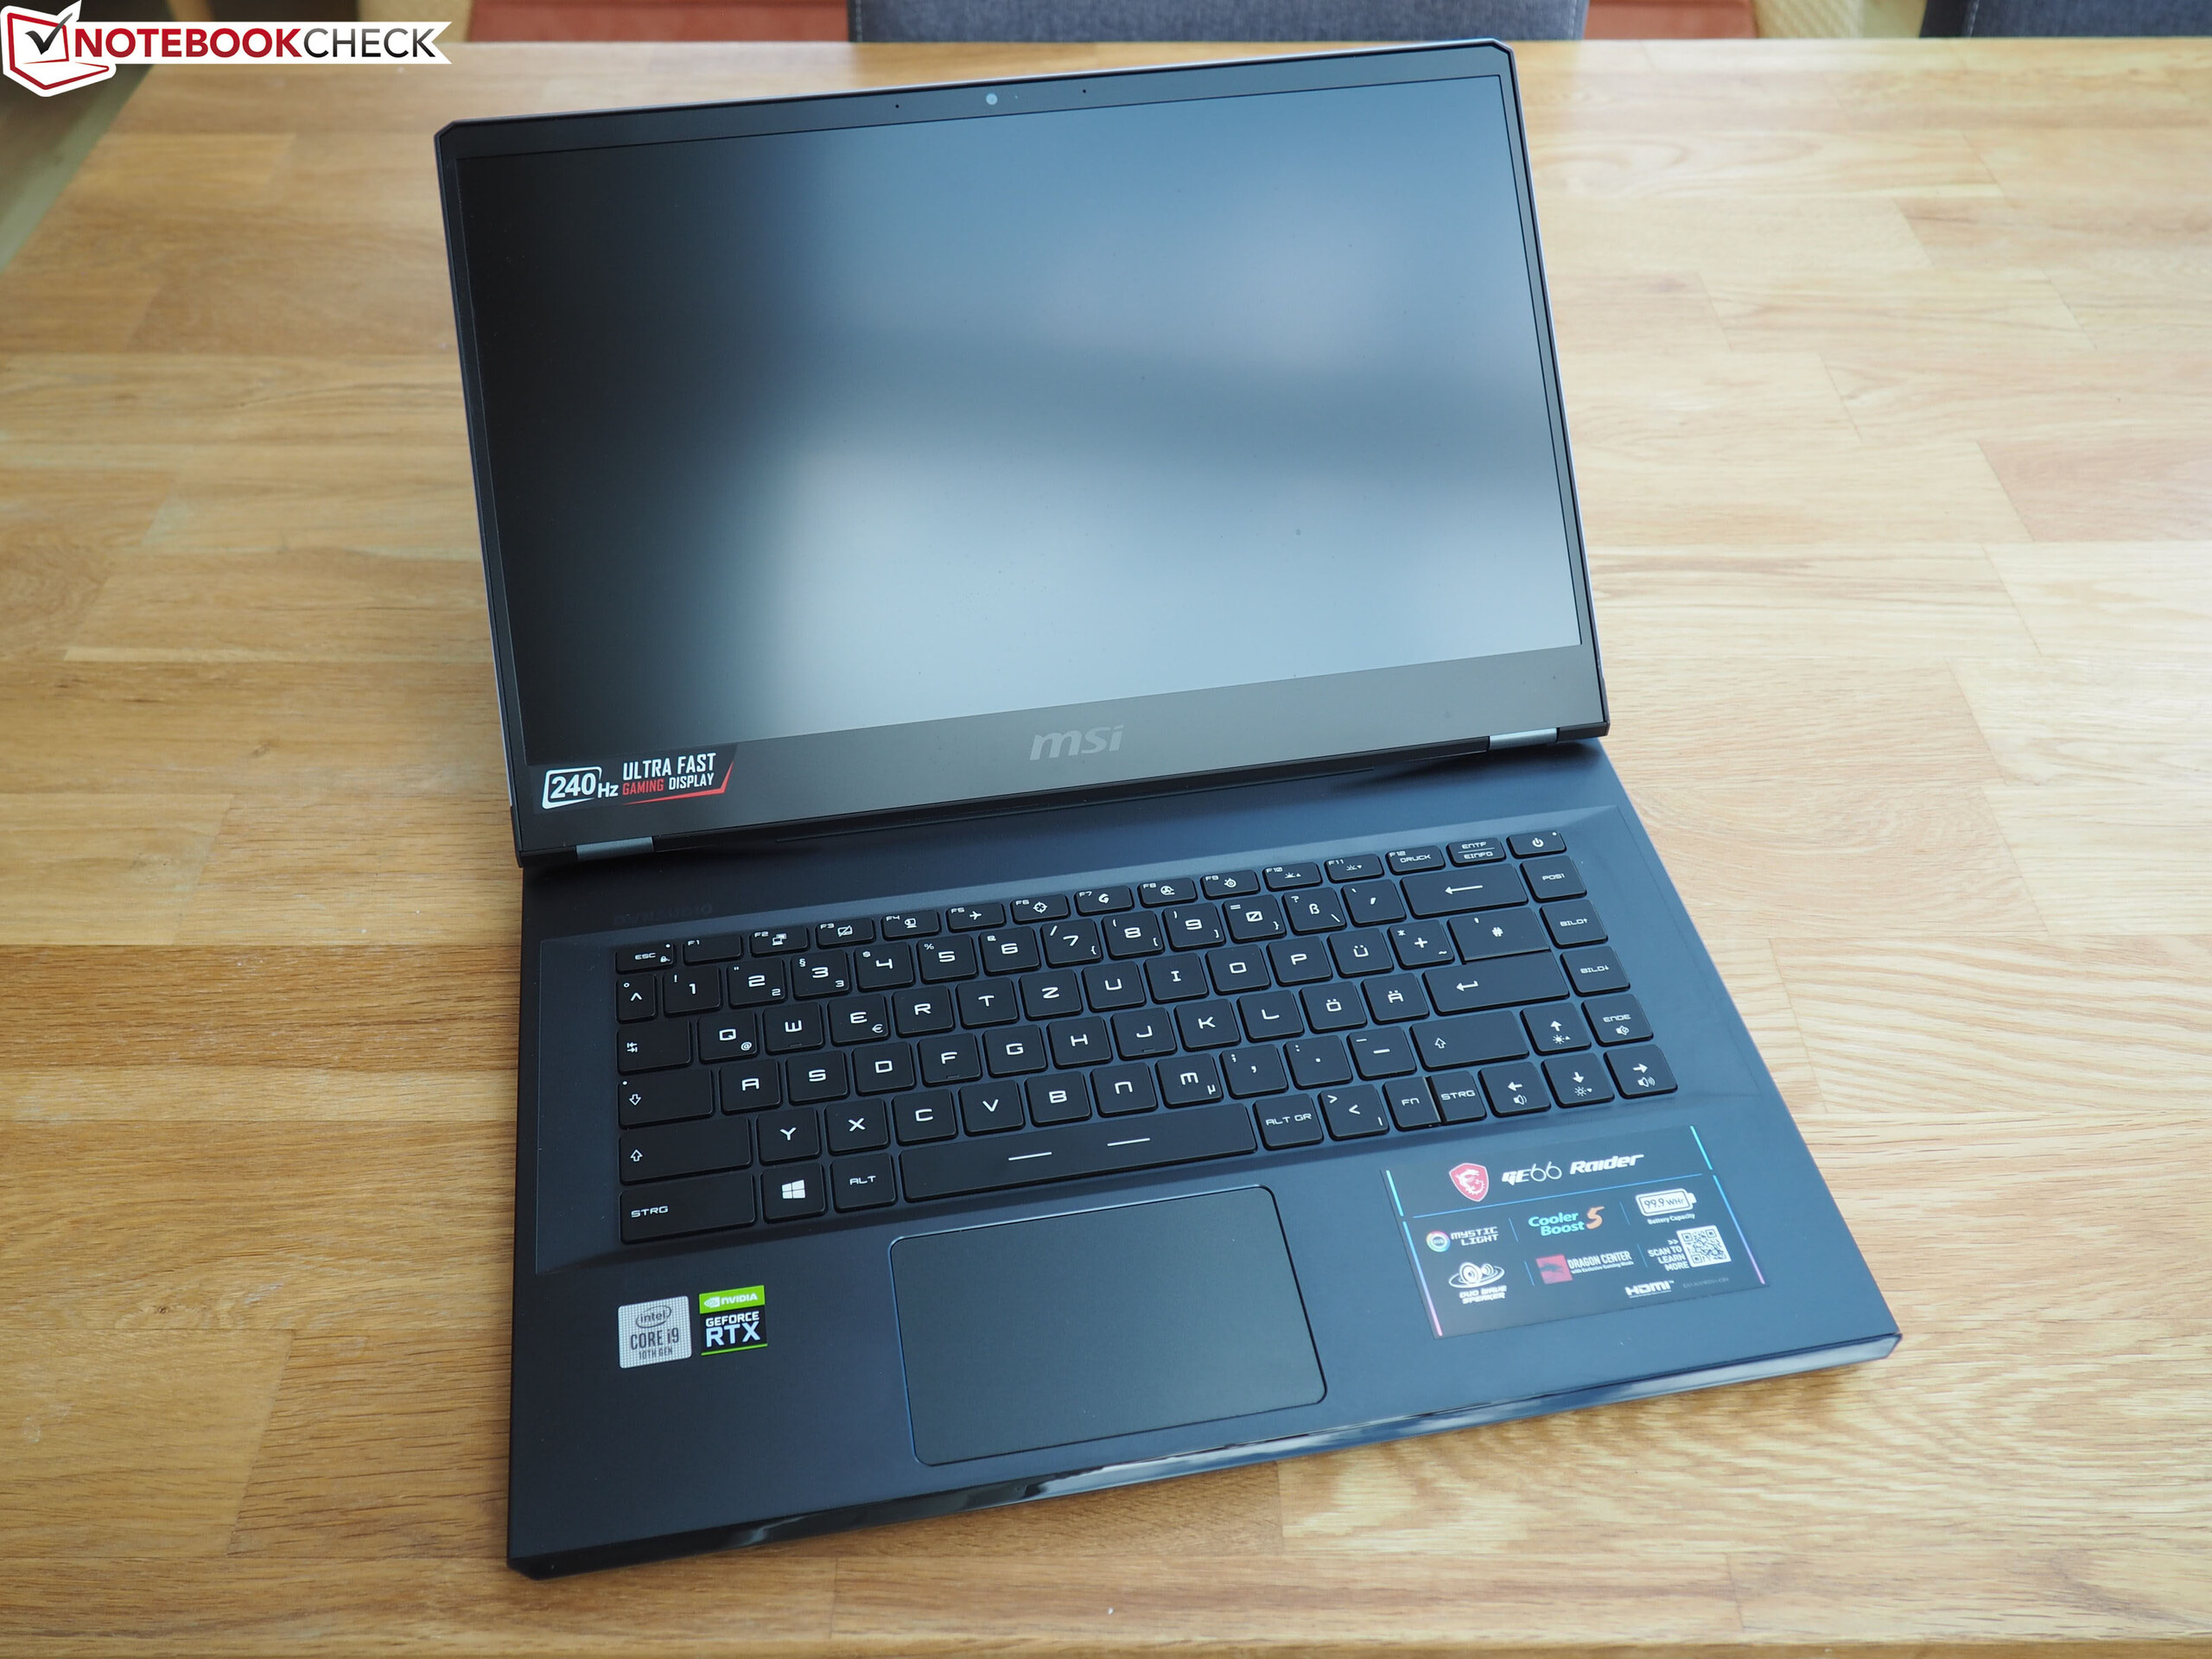
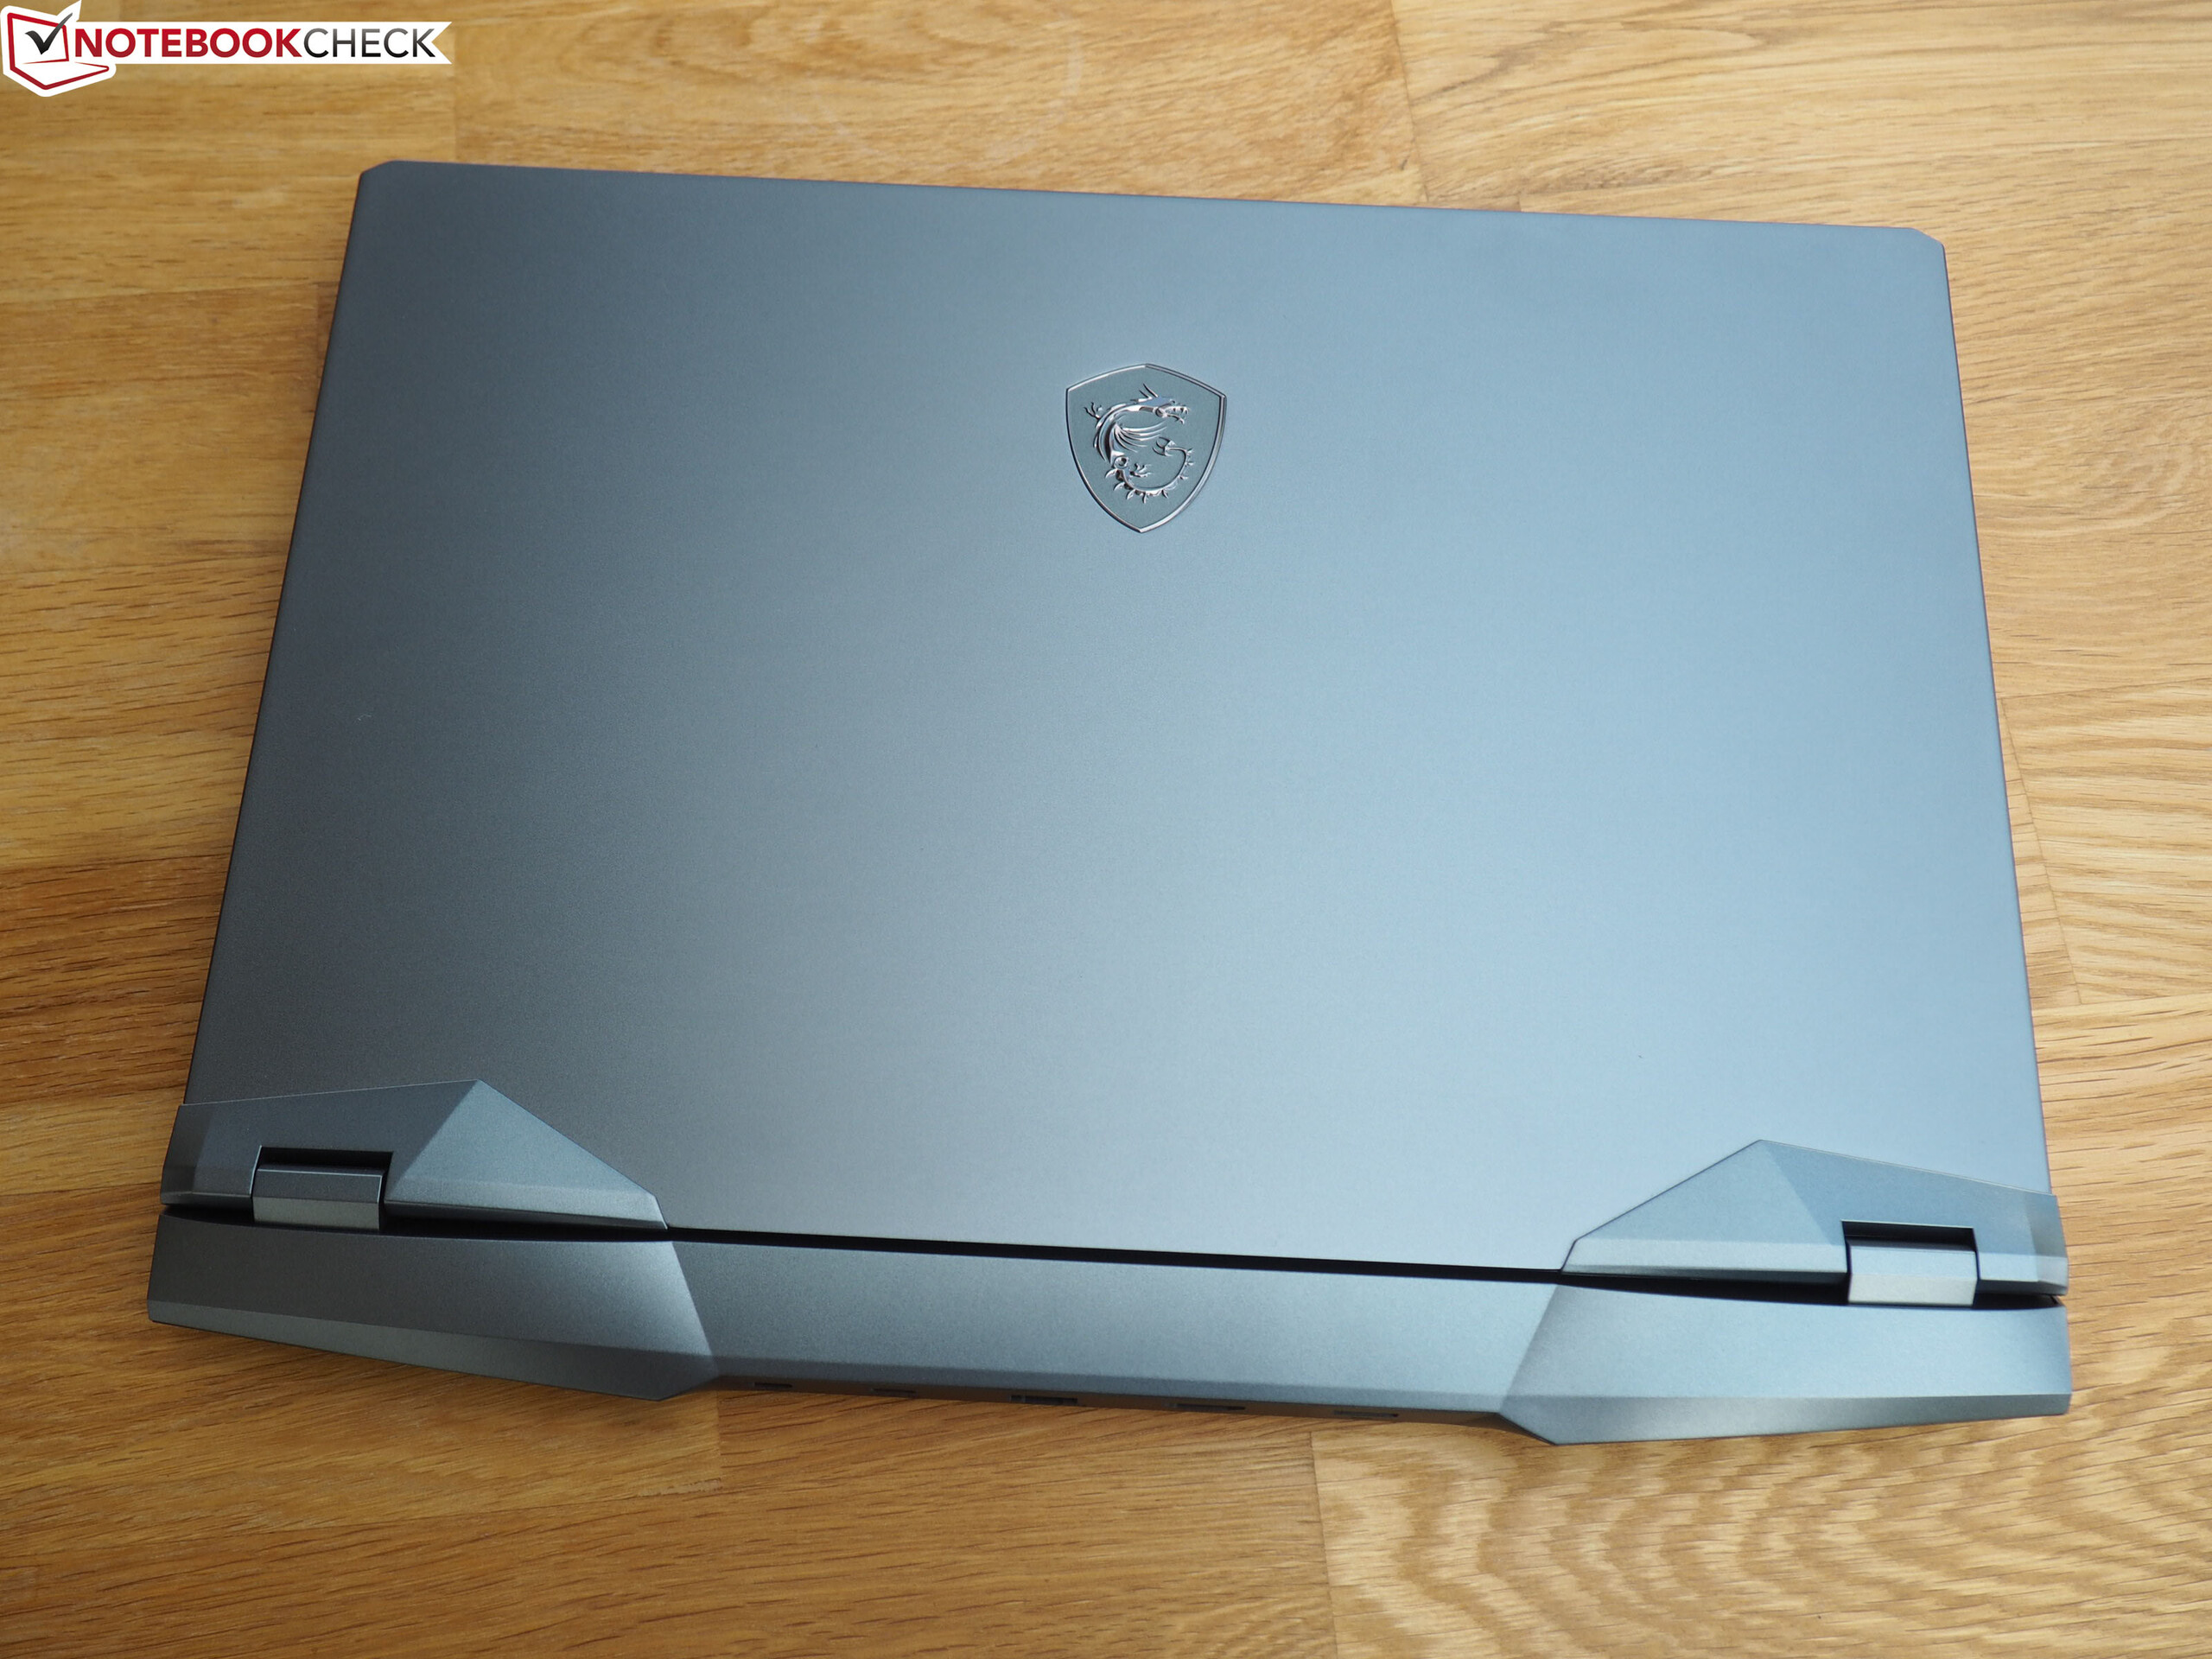
The 15 incher cuts a fine figure in terms of quality. Apart from the lid (A-cover), the base unit's upper side (C-cover) is also made of metal. The laptop's weight of about 2.4 kg is on par with its rivals. The overall height turns out to be a bit lower than in the competition. The GE66 only reaches 2.3 cm instead of 2.5 cm to 3.0 cm. The base area size is about average (35.8 x 26.7 cm). Following the current trend, MSI uses a slim bezel design.
Connectivity
Ports
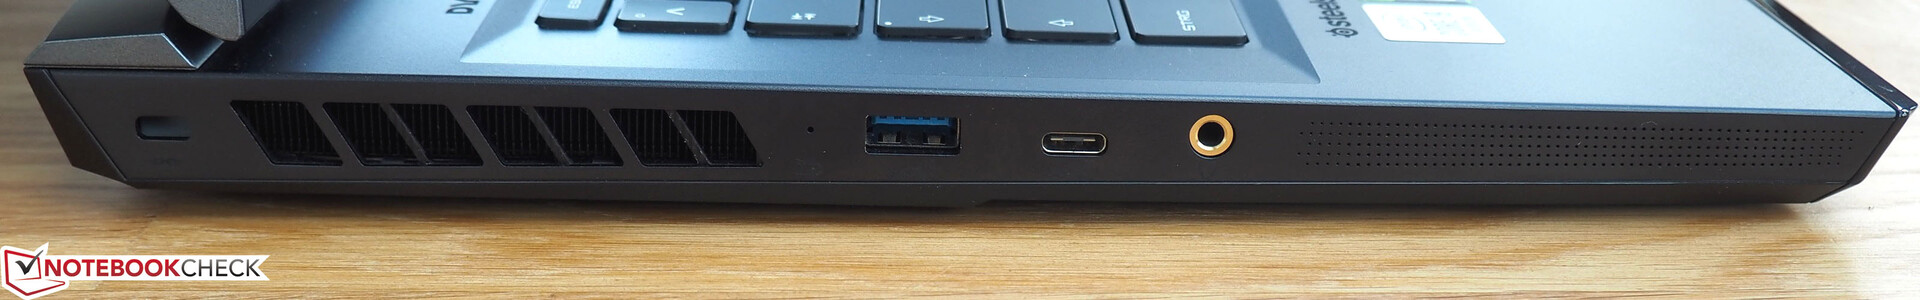
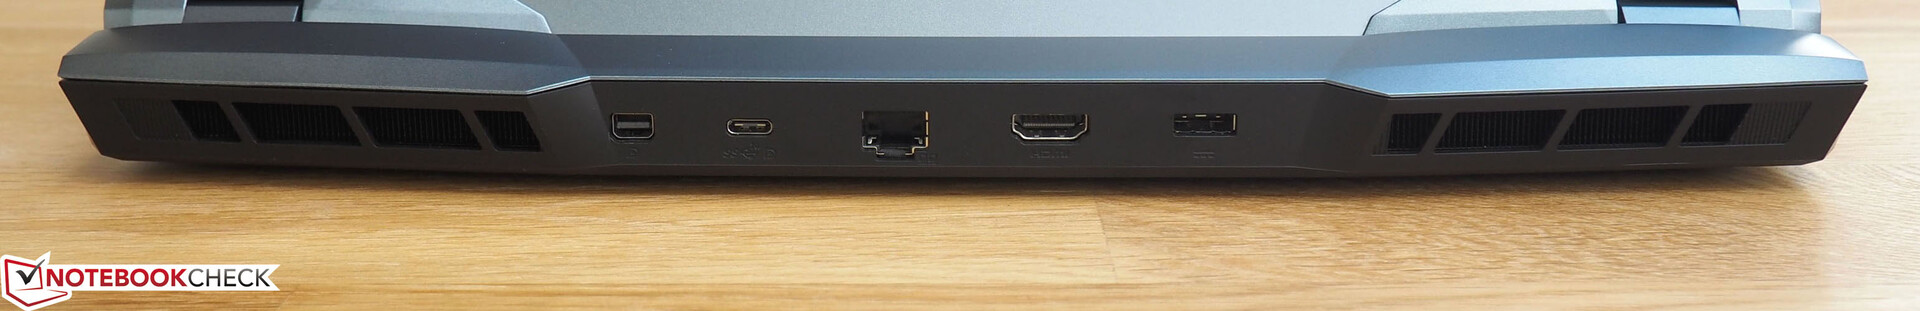
If you overlook the missing Thunderbolt 3 port, the connectivity is on a good level. MSI uses three Type-A sockets and two Type-C sockets as USB ports. Of the latter, one supports DisplayPort and the other supports the modern 3.2 Gen 2x2 standard (up to 20 Gb/s). External displays can also be connected to the dedicated Mini DisplayPort or the HDMI 2.0 output (4K @60 Hz). Additionally you will find an RJ45 port, an audio jack and a card reader.
Since the most important interfaces are located on the back, both left- and right-handed users don't have to worry about movement restrictions when using a mouse.

SD card reader
The built-in SD card reader delivers very high transfer speeds. In our test with our reference card about 200 MB/s is right on par with the Eurocom Nightsky RX15. The GE65 9SF is far behind at almost 30 MB/s (USB 2.0 speed only).
| SD Card Reader | |
| average JPG Copy Test (av. of 3 runs) | |
| MSI GE66 Raider 10SFS (Toshiba Exceria Pro SDXC 64 GB UHS-II) | |
| Eurocom Nightsky RX15 (Toshiba Exceria Pro SDXC 64 GB UHS-II) | |
| Average of class Gaming (20.9 - 210, n=54, last 2 years) | |
| MSI GE65 Raider 9SF-049US (Toshiba Exceria Pro SDXC 64 GB UHS-II) | |
| maximum AS SSD Seq Read Test (1GB) | |
| Eurocom Nightsky RX15 (Toshiba Exceria Pro SDXC 64 GB UHS-II) | |
| MSI GE66 Raider 10SFS (Toshiba Exceria Pro SDXC 64 GB UHS-II) | |
| Average of class Gaming (25.5 - 261, n=51, last 2 years) | |
| MSI GE65 Raider 9SF-049US (Toshiba Exceria Pro SDXC 64 GB UHS-II) | |
Communication
The WLAN speed is also very convincing, although you can't compare the values here to the competition (we recently updated our router). From a distance of one meter, the GE66 achieved an average of 1,150 Mb/s (sending) and 1,670 Mb/s (receiving). No wonder, the Killer Wi-Fi 6 AX1650i is a cutting-edge wireless module. The E3100G, another very fast Killer product, is responsible for cable connections.
| Networking | |
| iperf3 transmit AX12 | |
| MSI GE66 Raider 10SFS | |
| Eurocom Nightsky RX15 | |
| Asus Strix Scar III G531GW | |
| iperf3 receive AX12 | |
| MSI GE66 Raider 10SFS | |
| Eurocom Nightsky RX15 | |
| Asus Strix Scar III G531GW | |
Webcam
Even though the webcam produces somewhat sharper images than many competitors, the quality offered does not do justice to the laptop's price.


Accessories
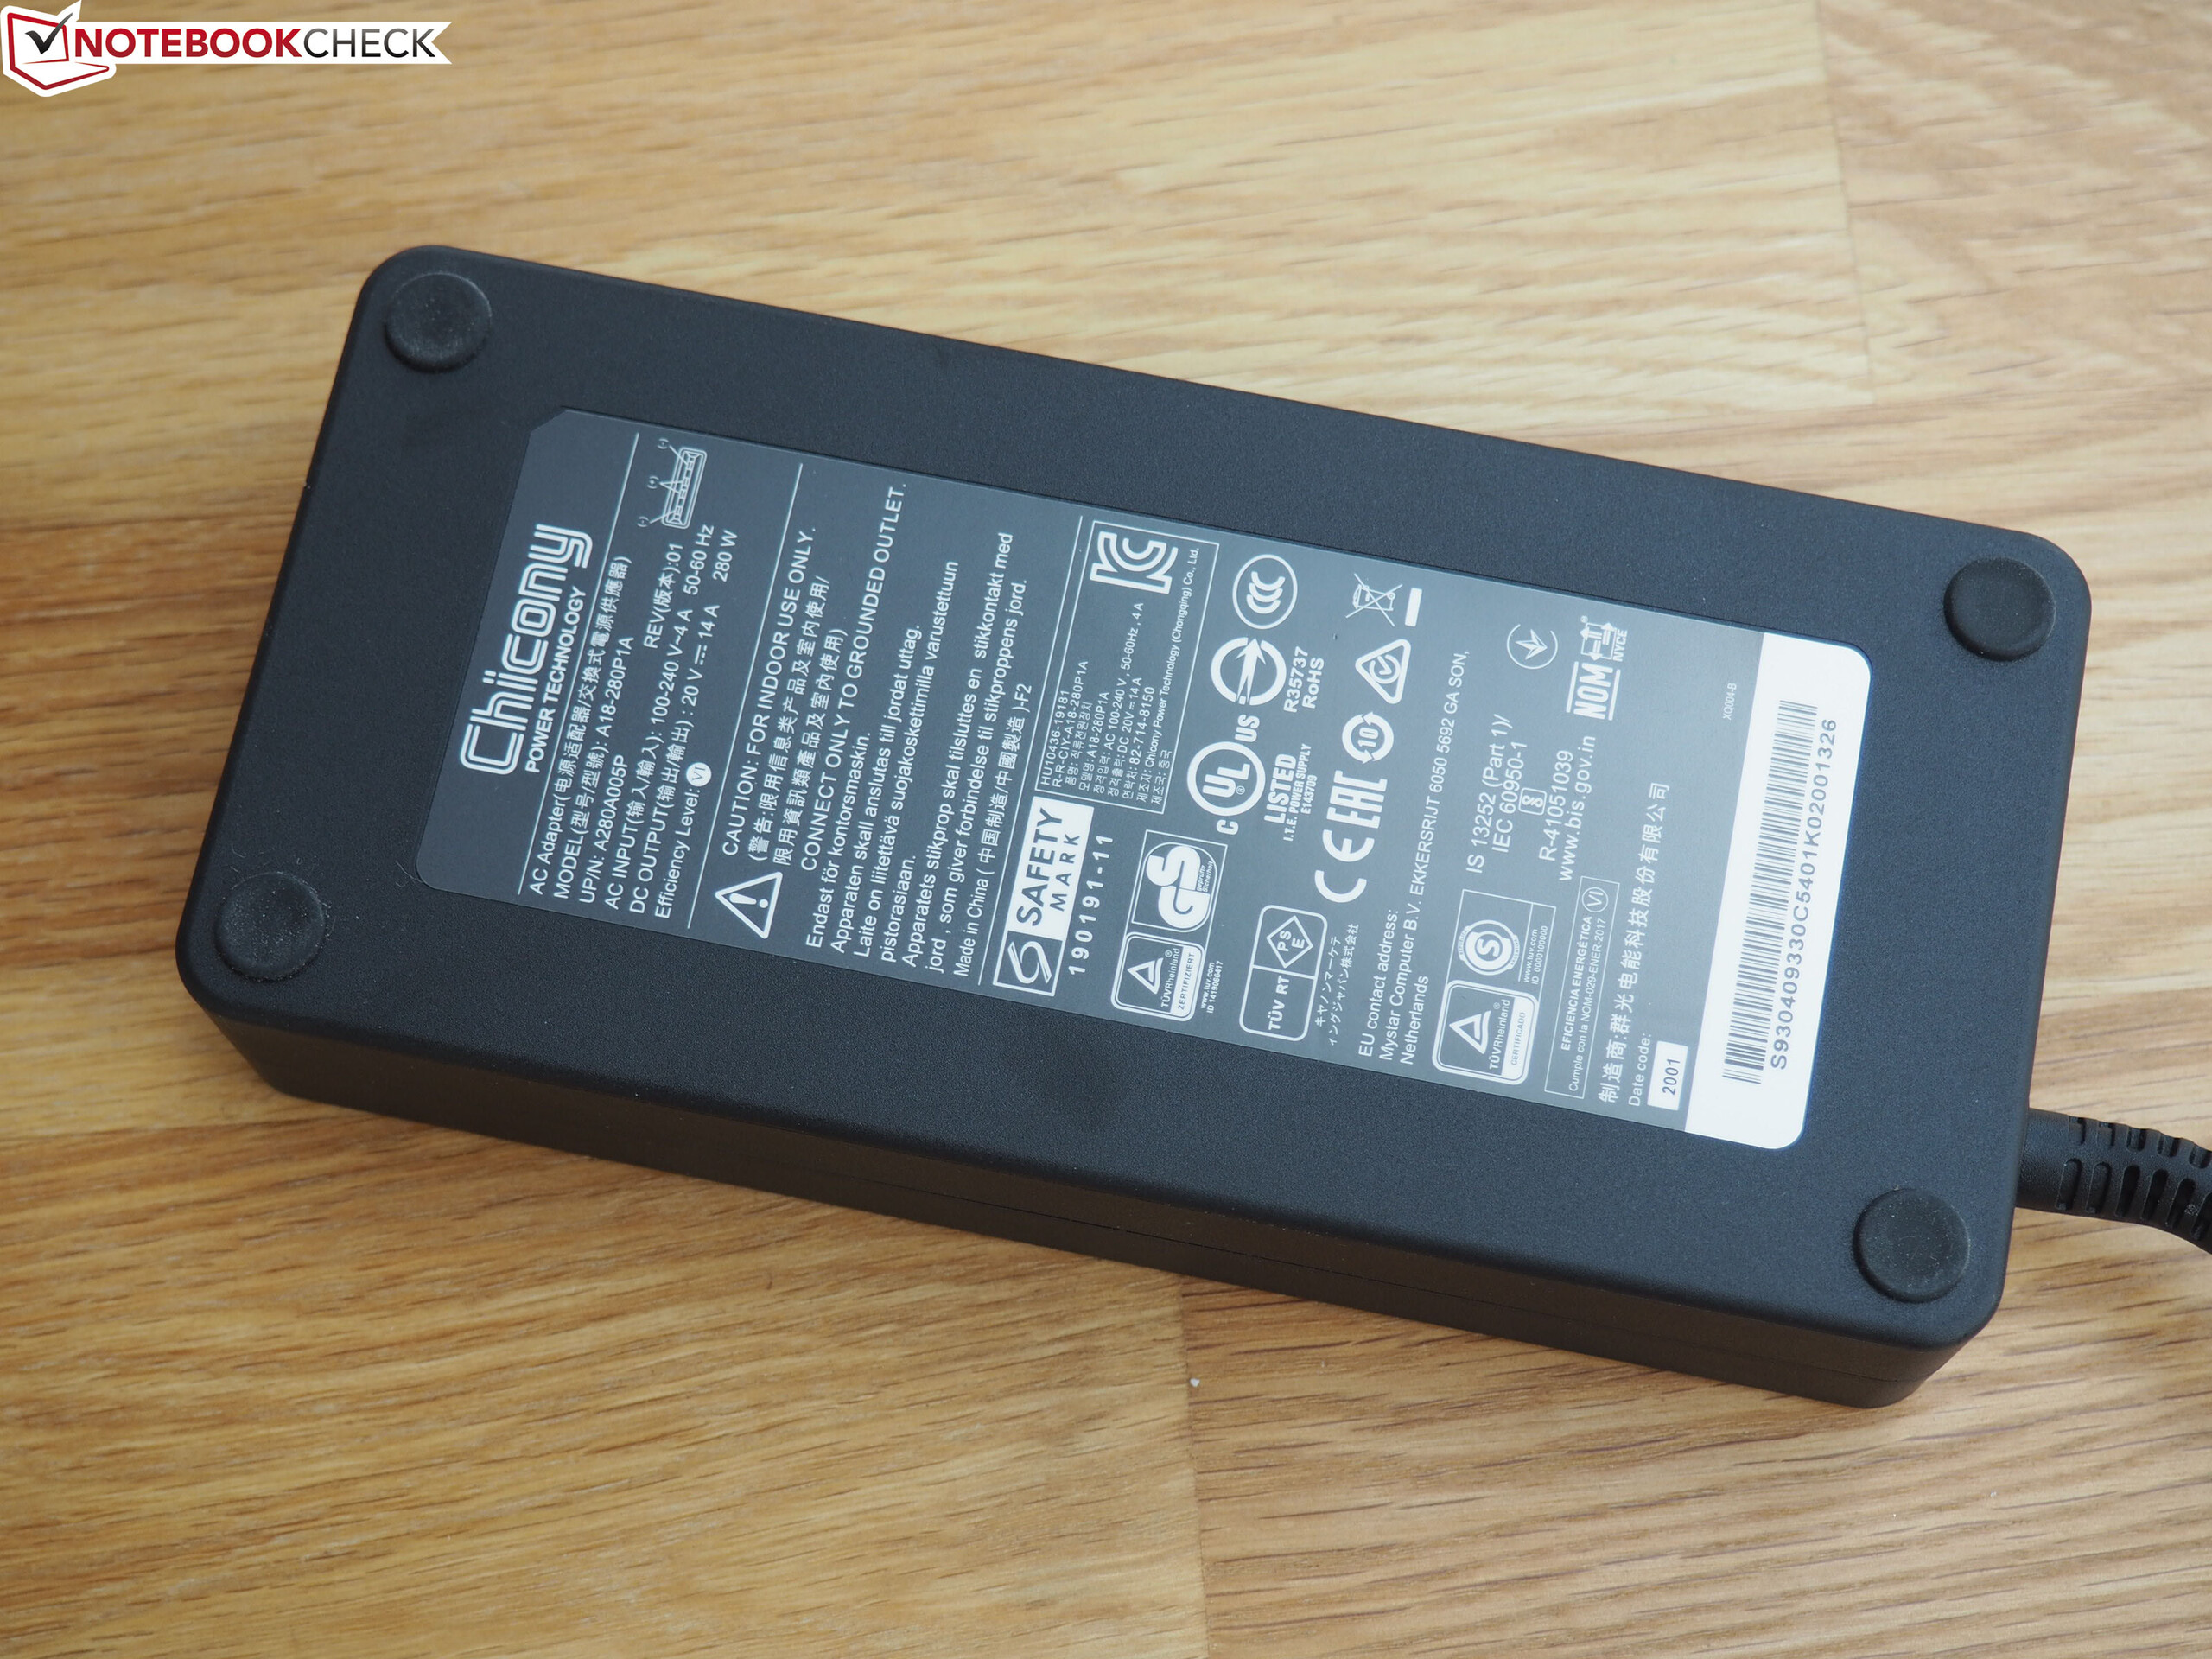
To ensure that the high-end components receive sufficient power, MSI includes a powerful 280-Watt power supply unit in the test configuration, which weighs almost 0.9 kg and measures 18 x 8.5 x 3.5 cm.
Maintenance
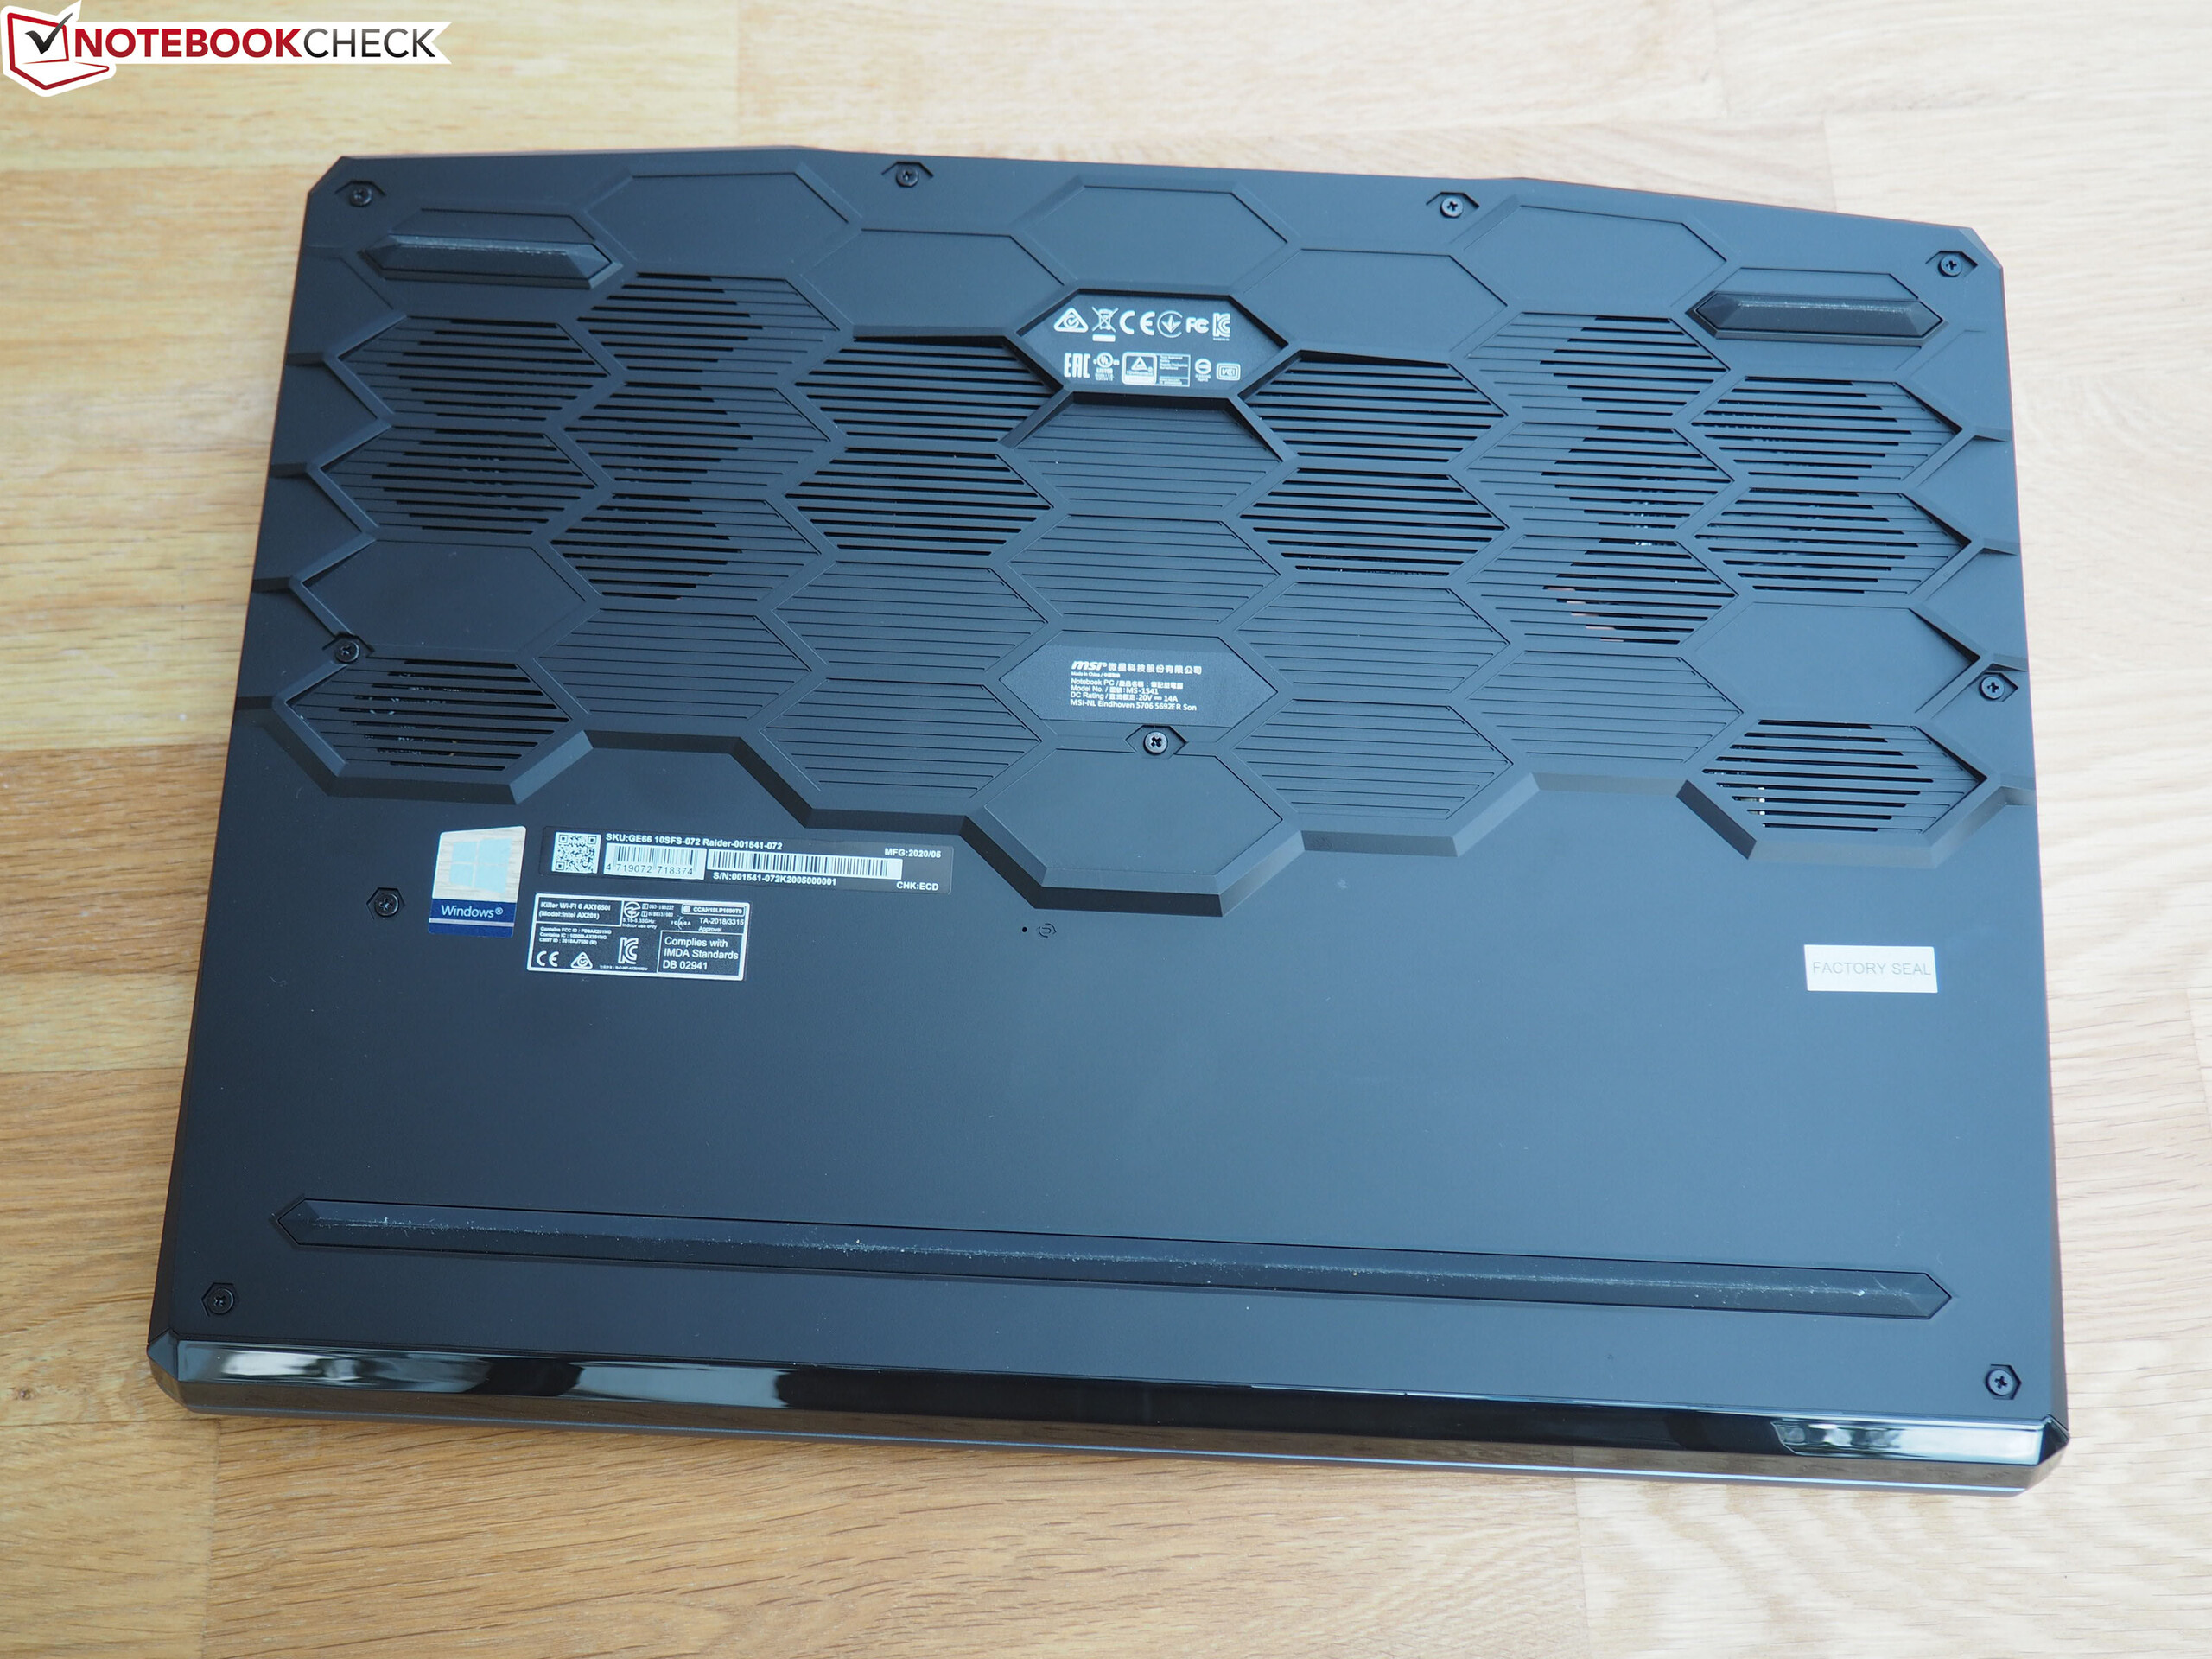
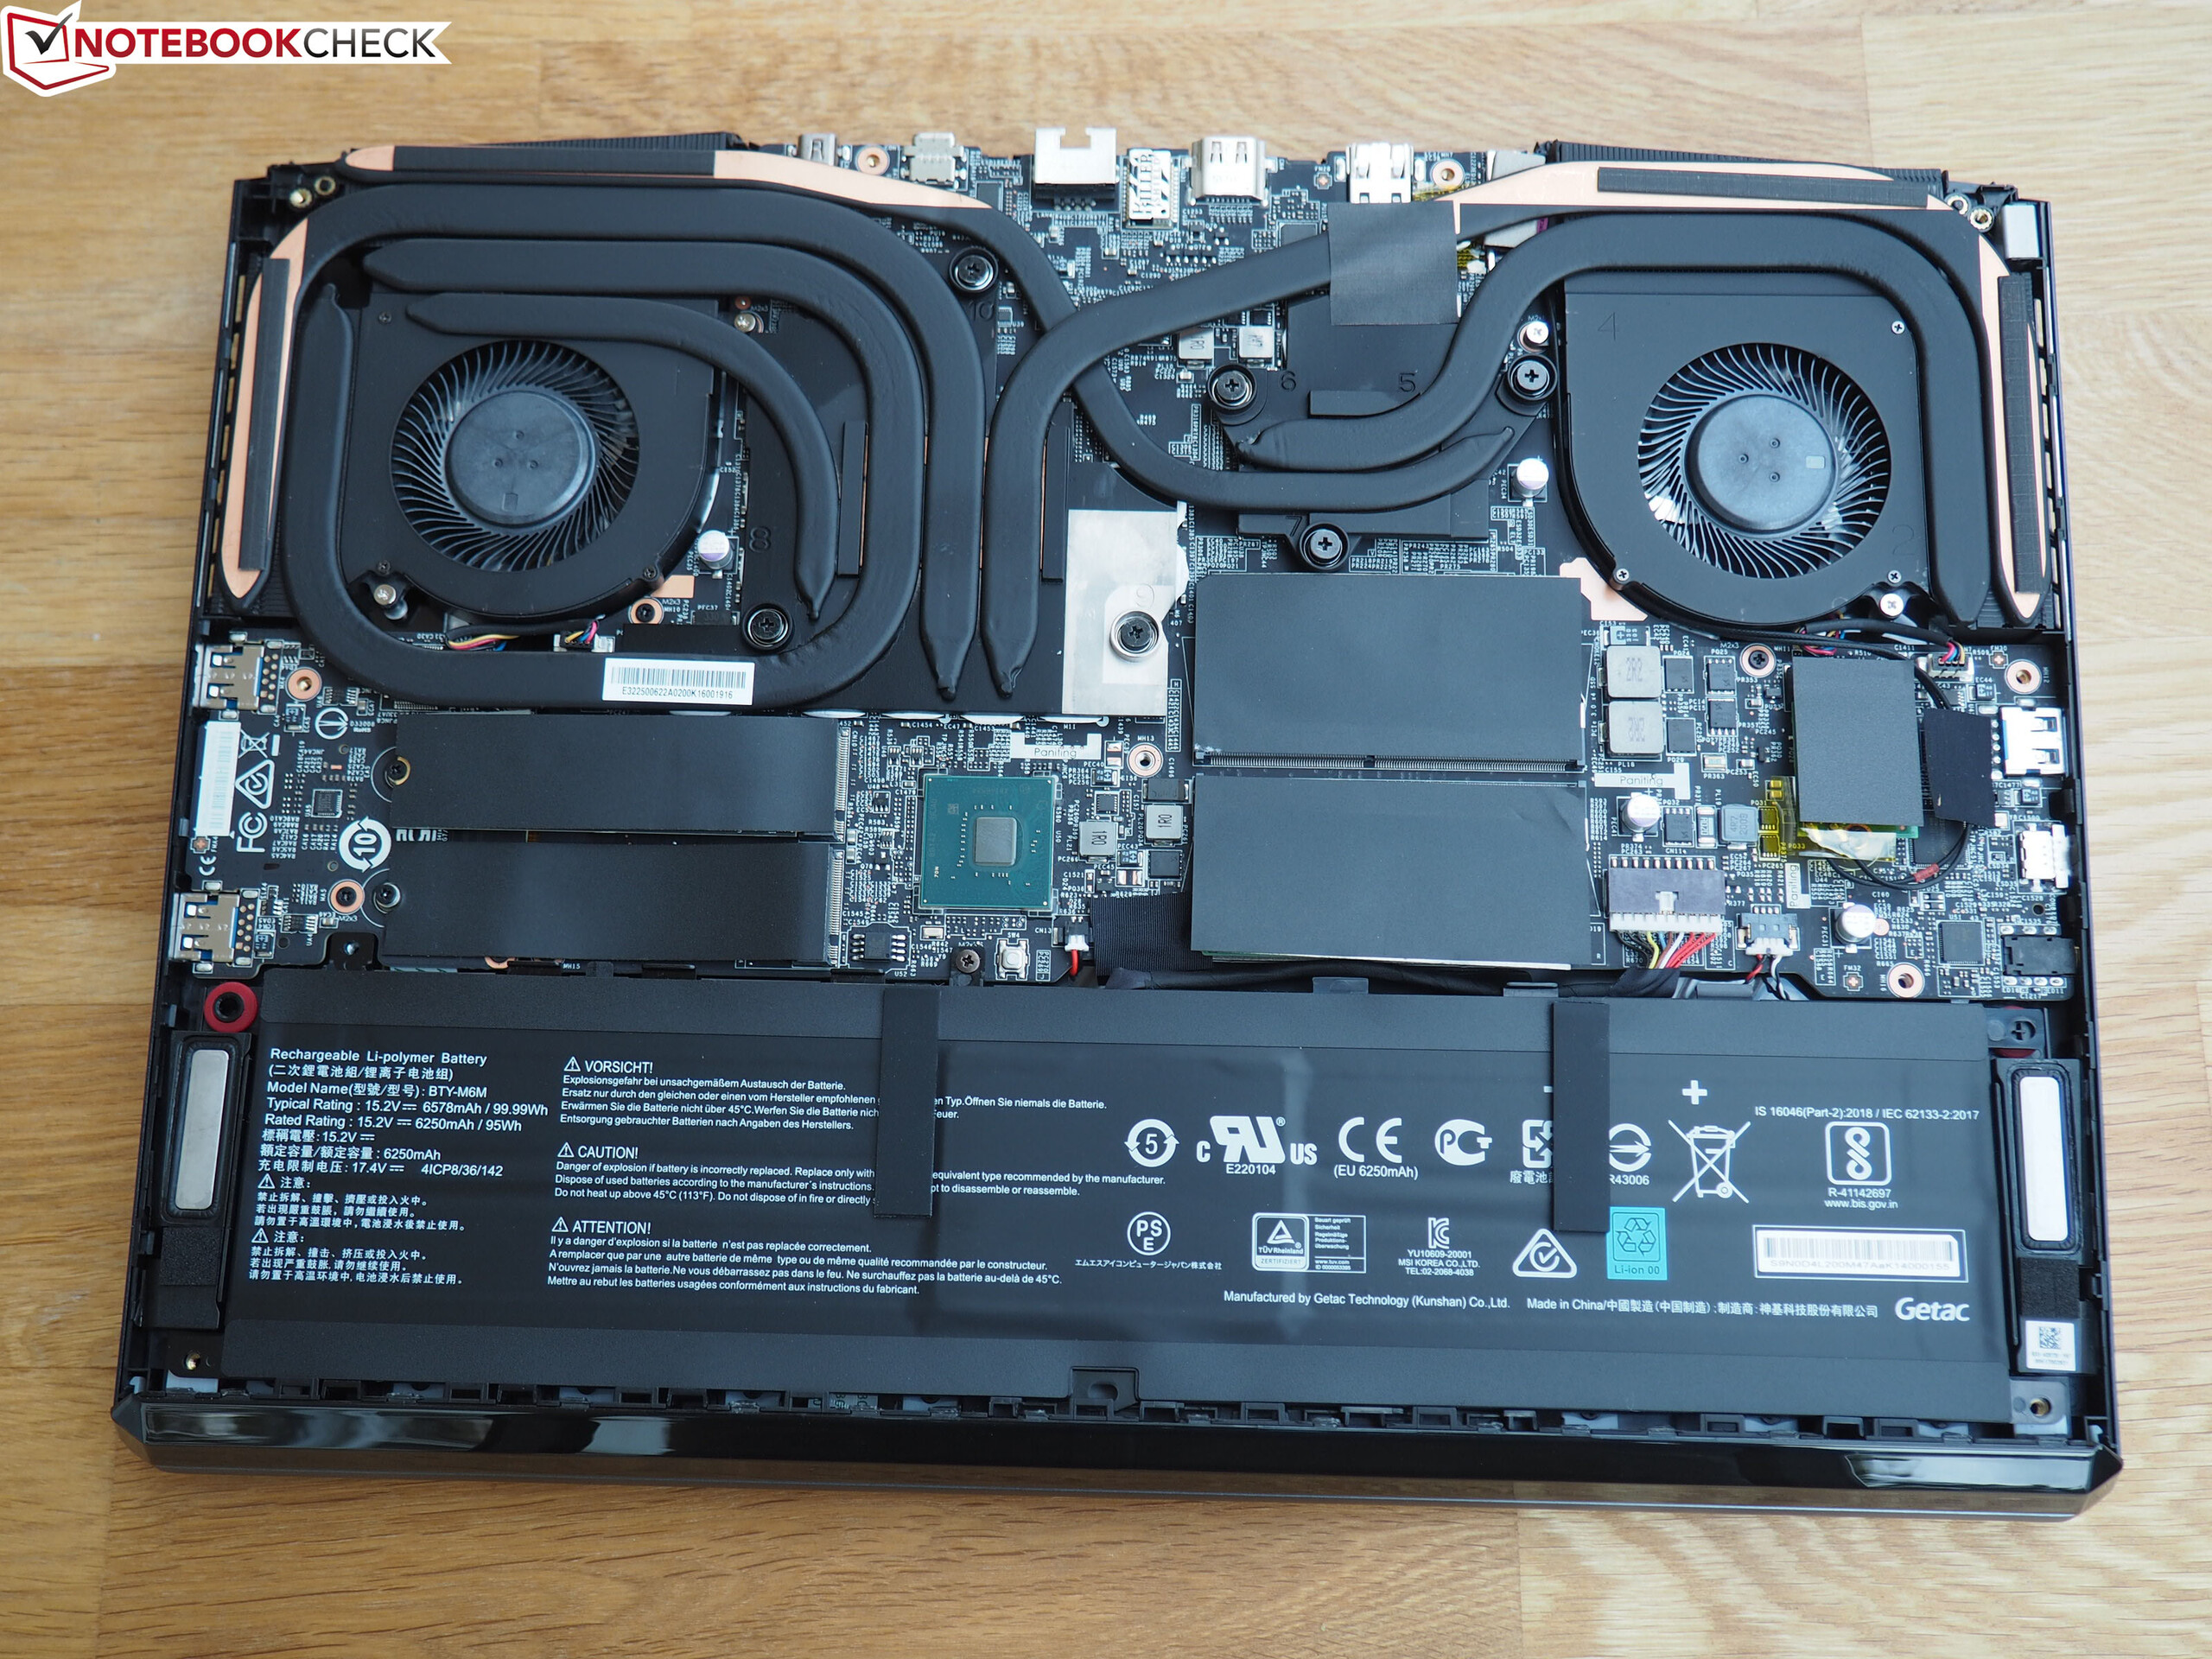
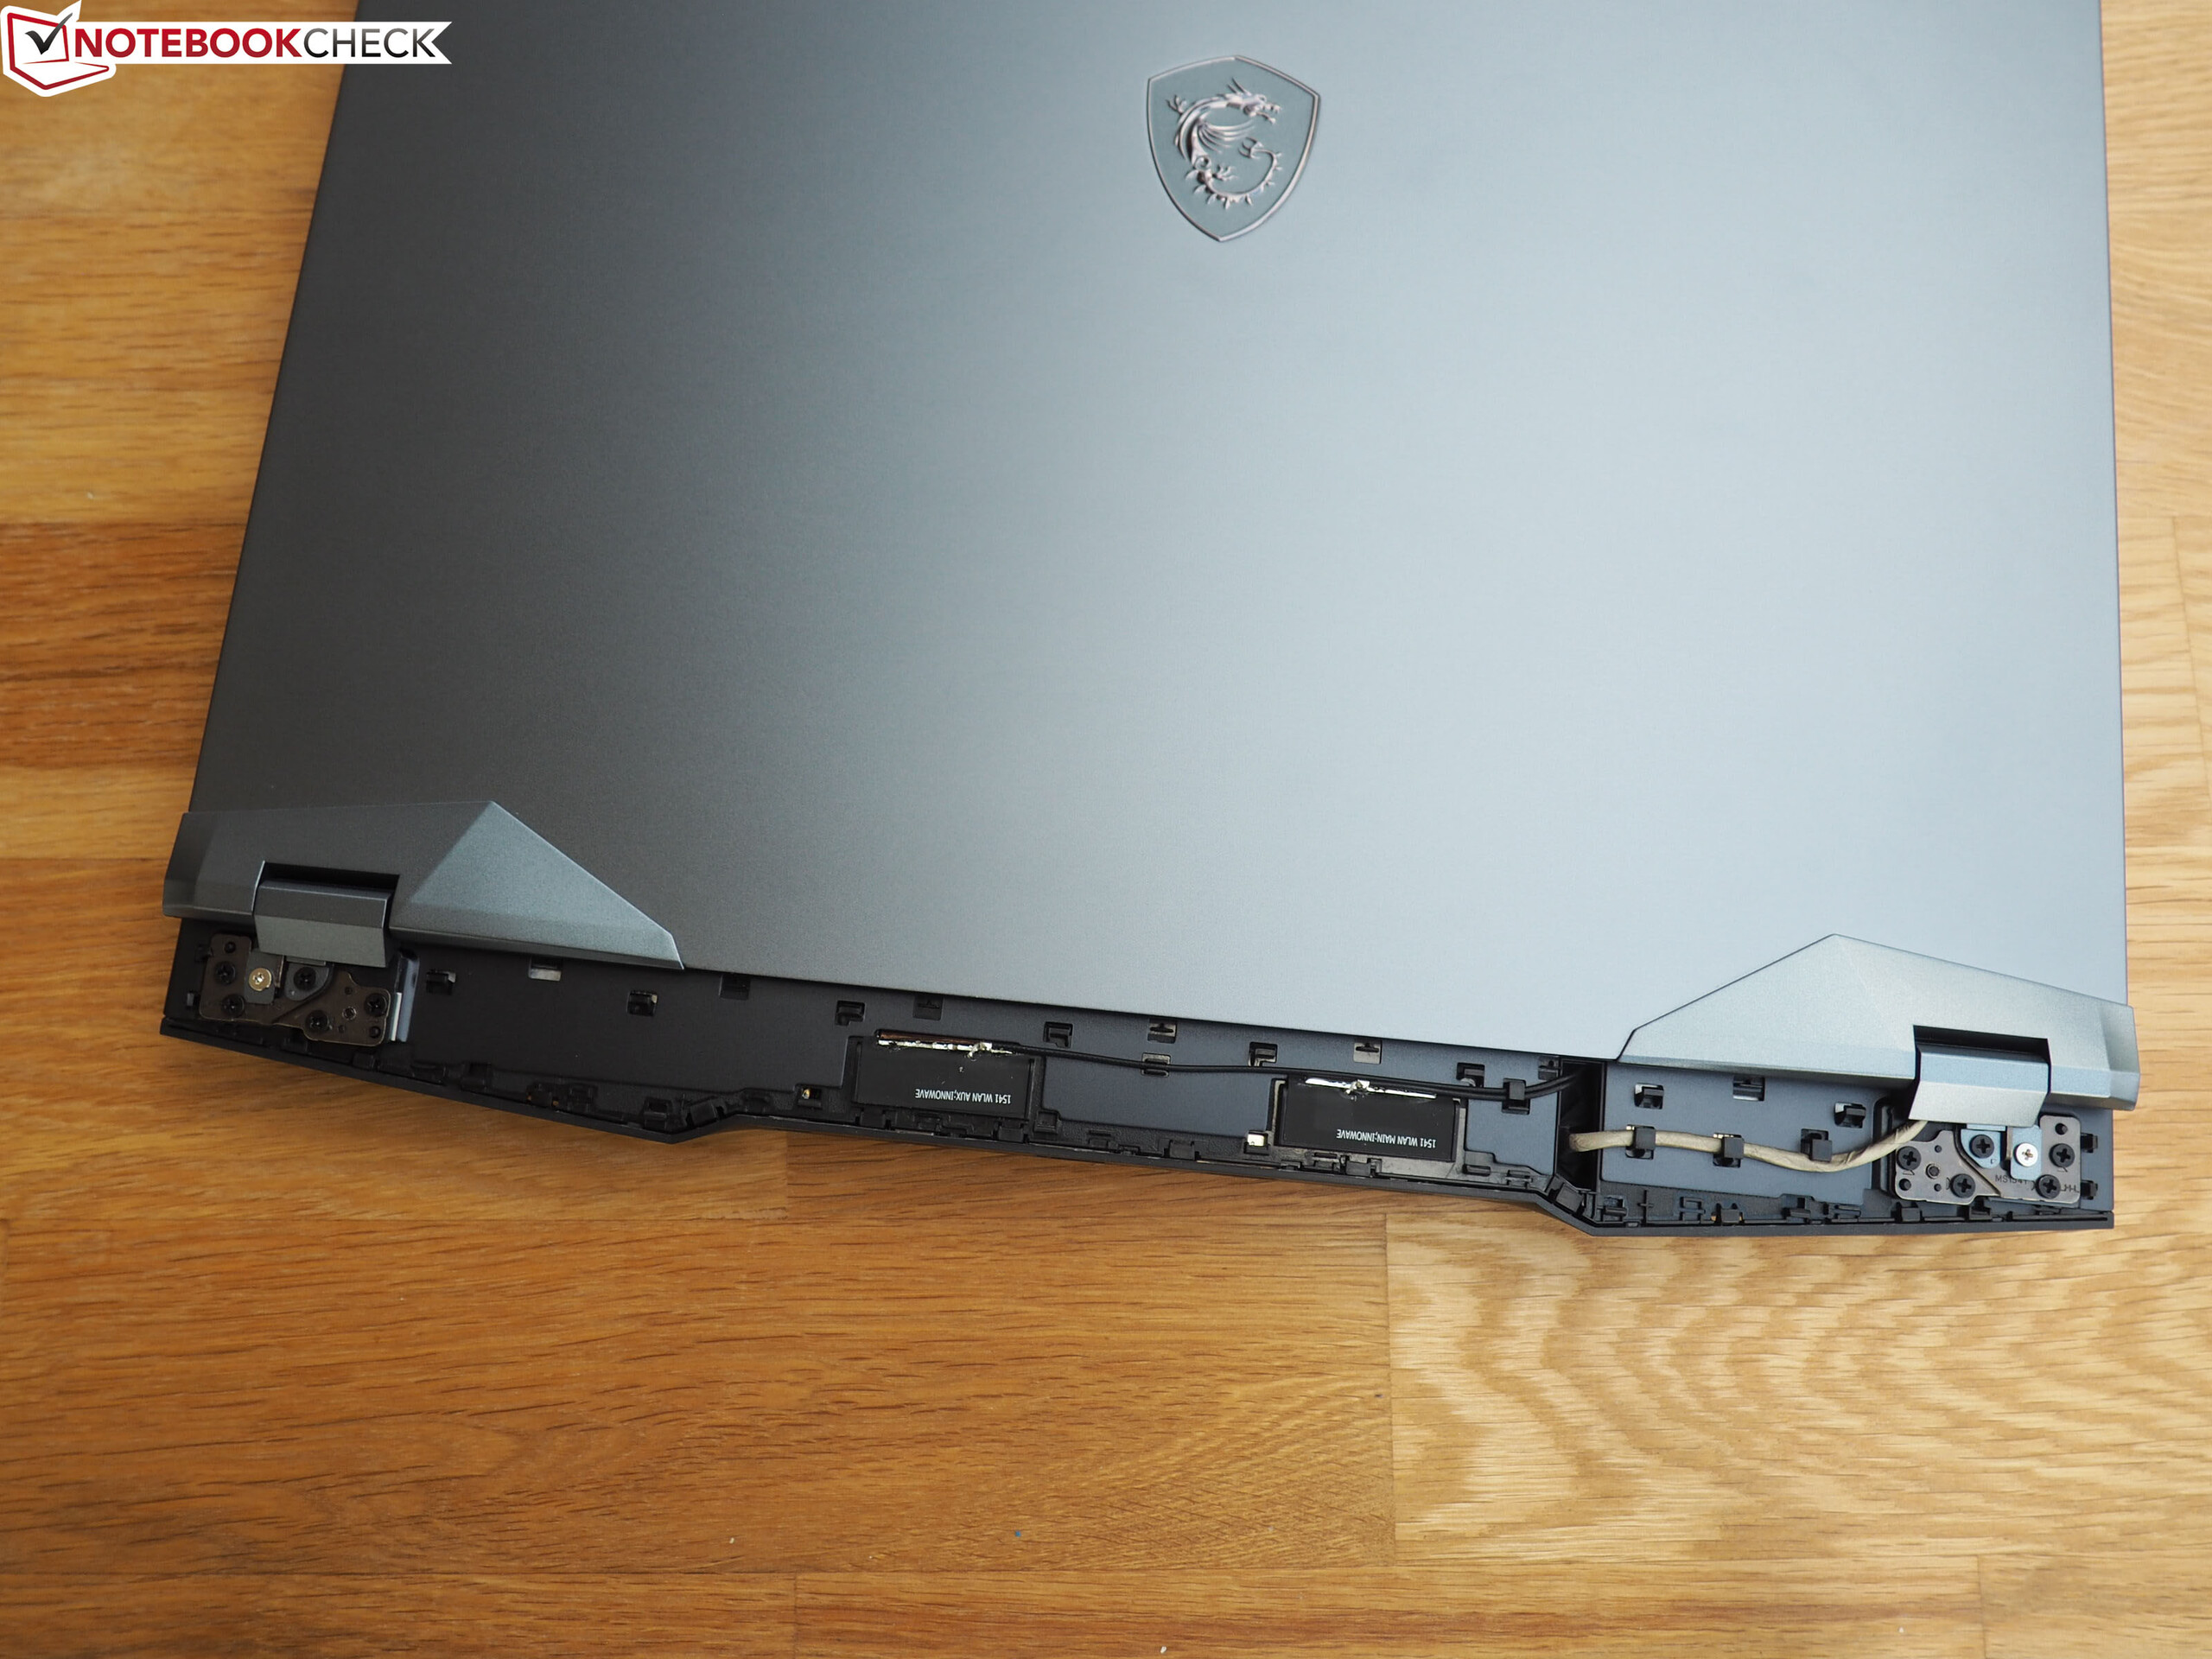
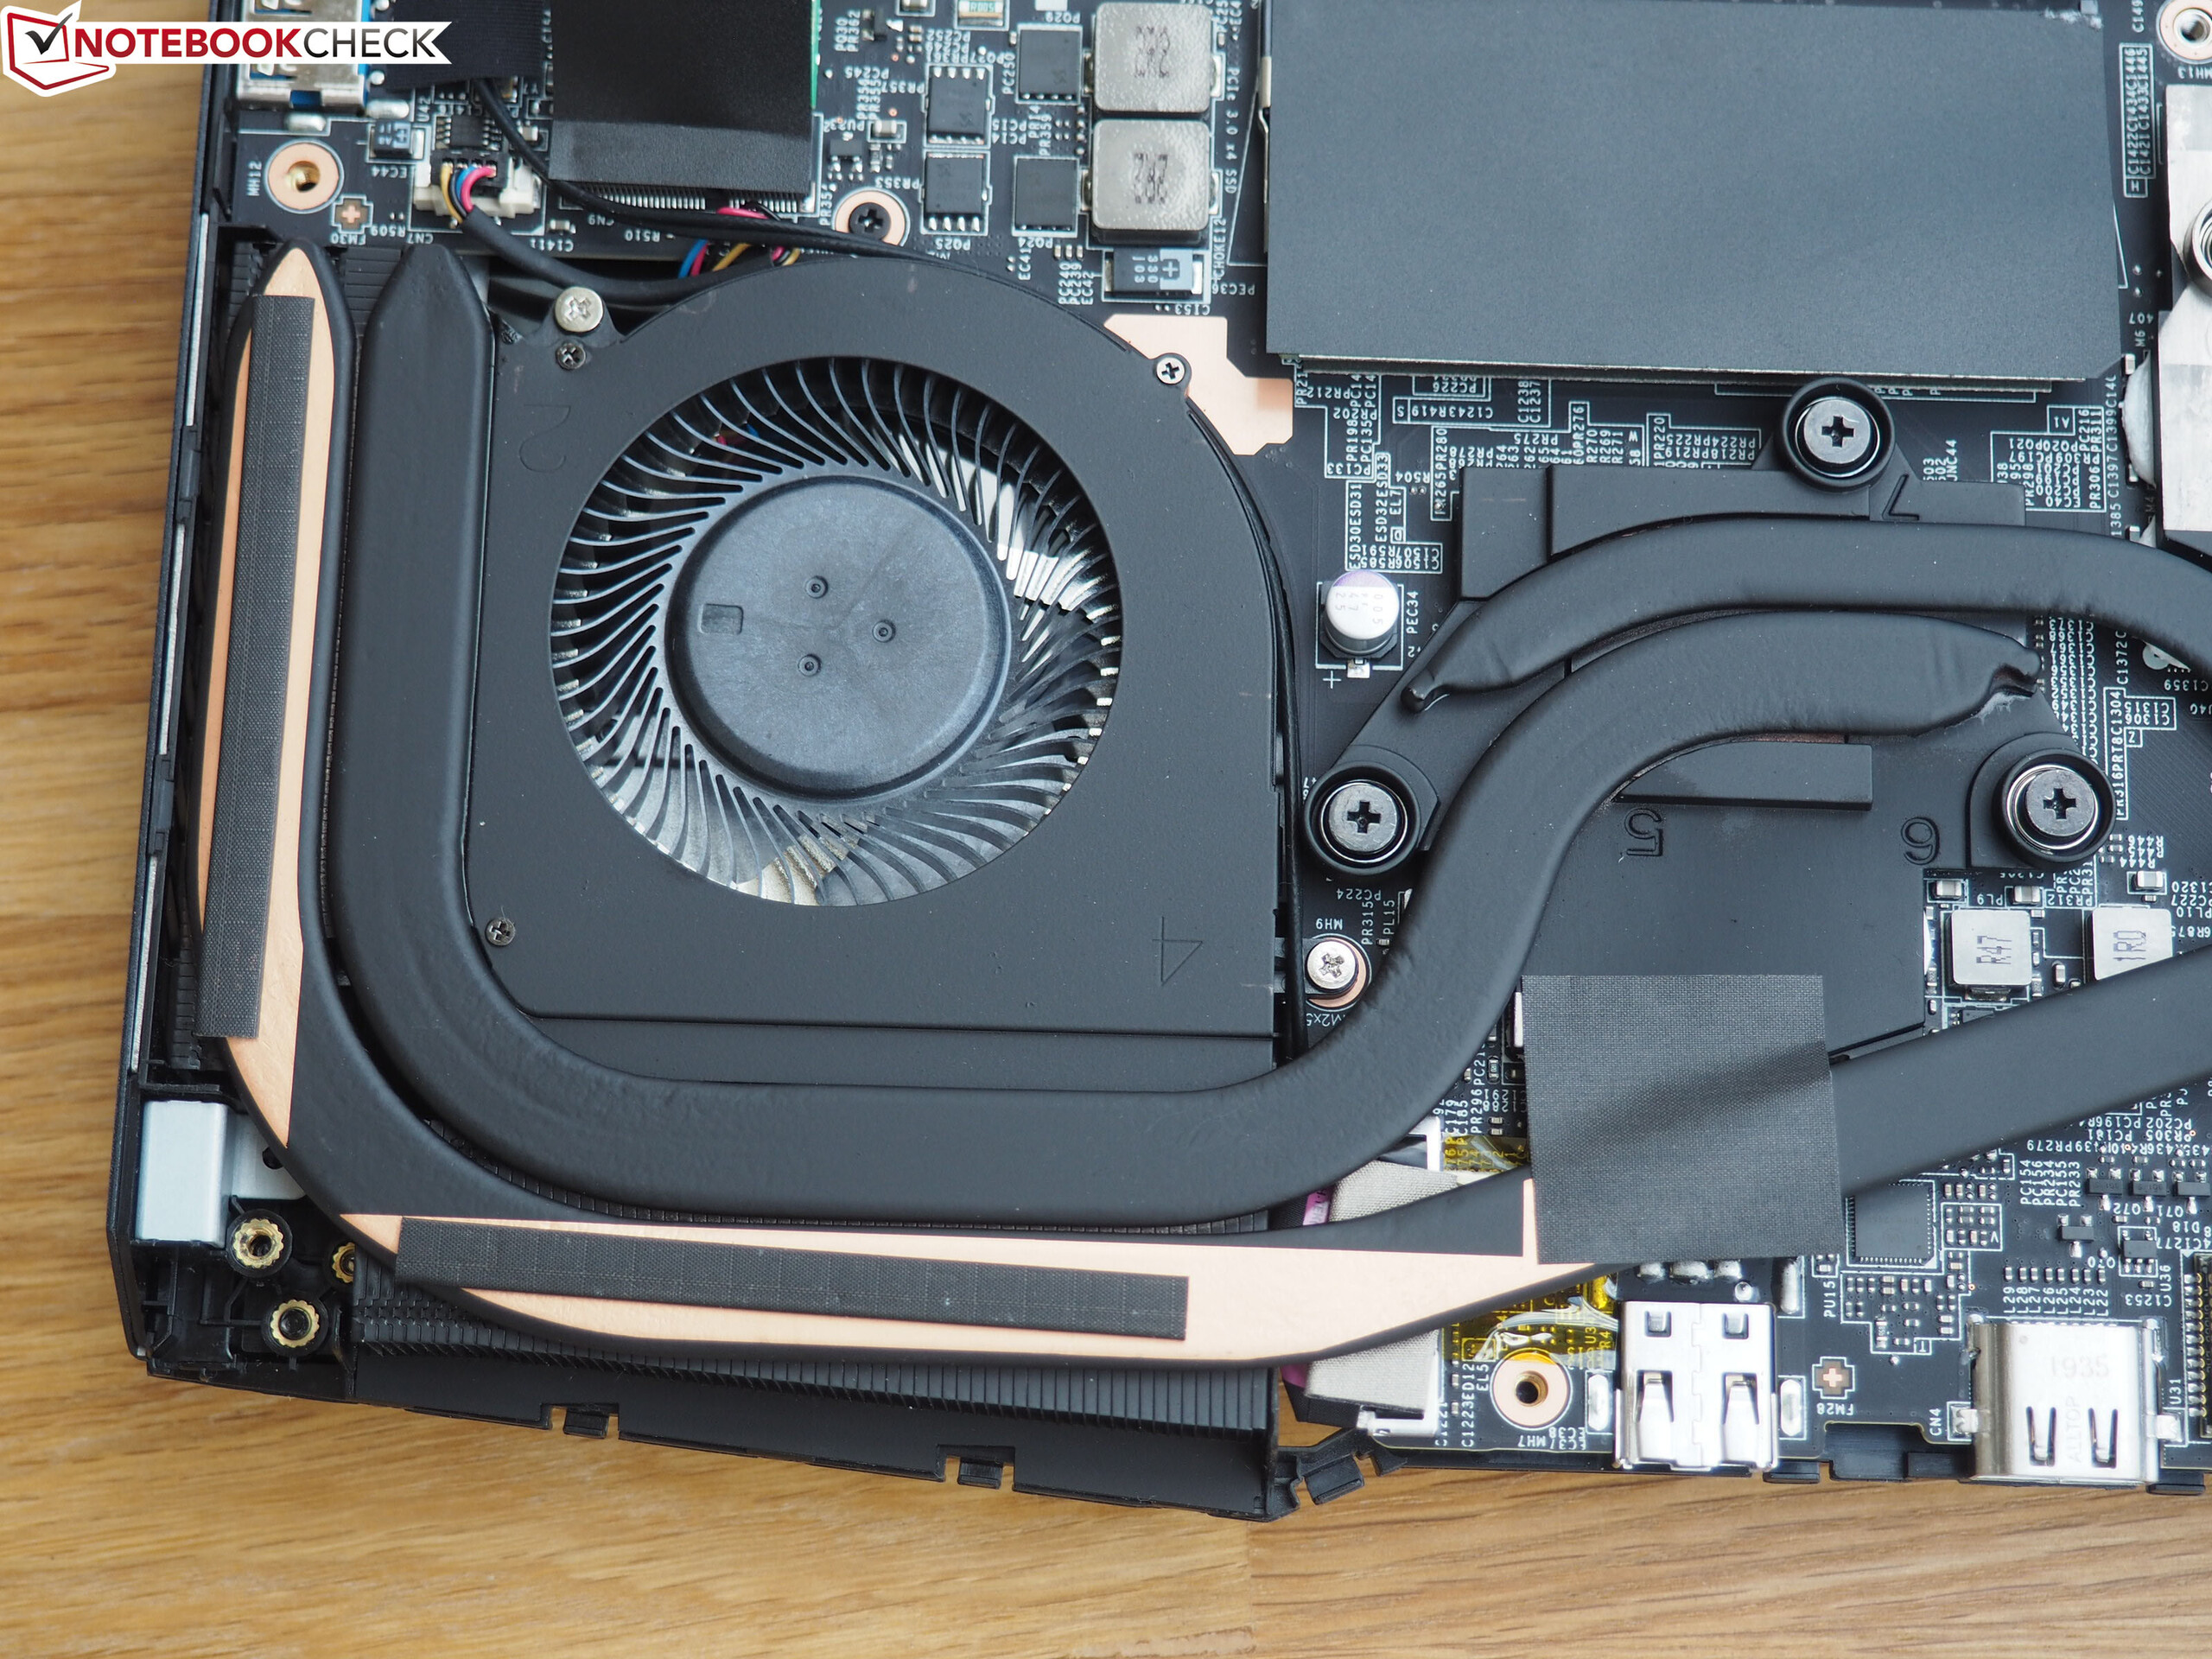
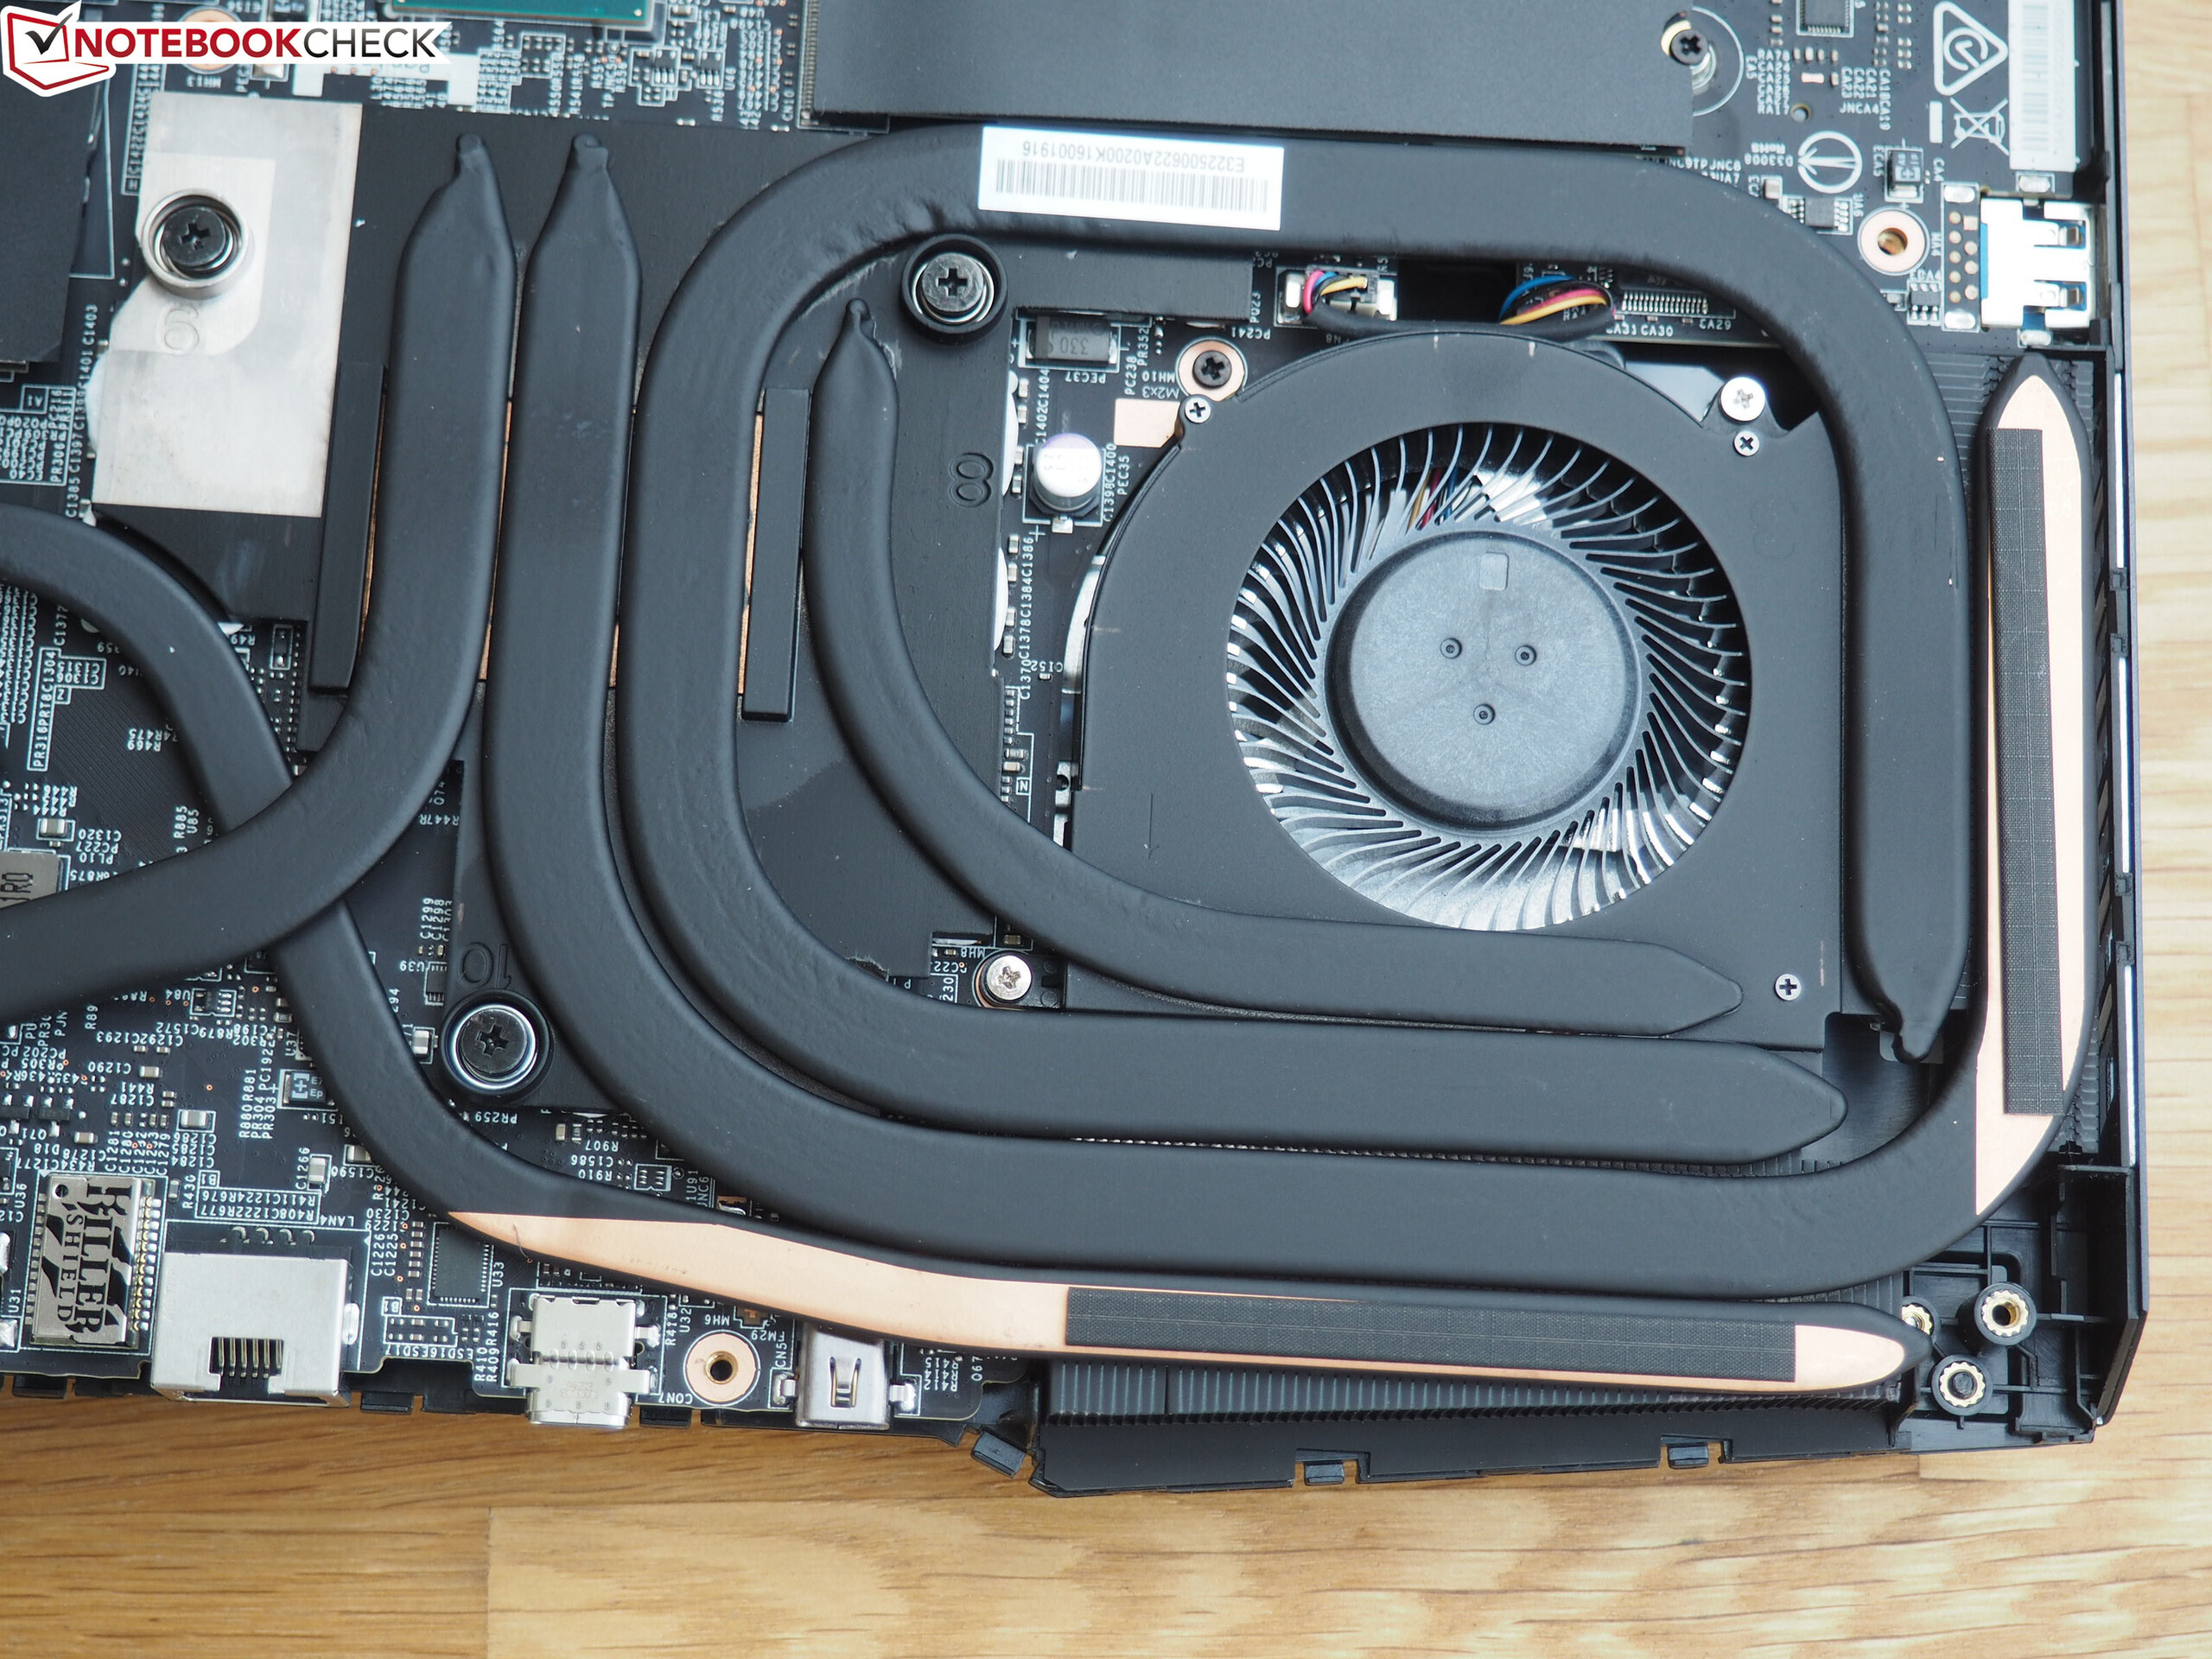
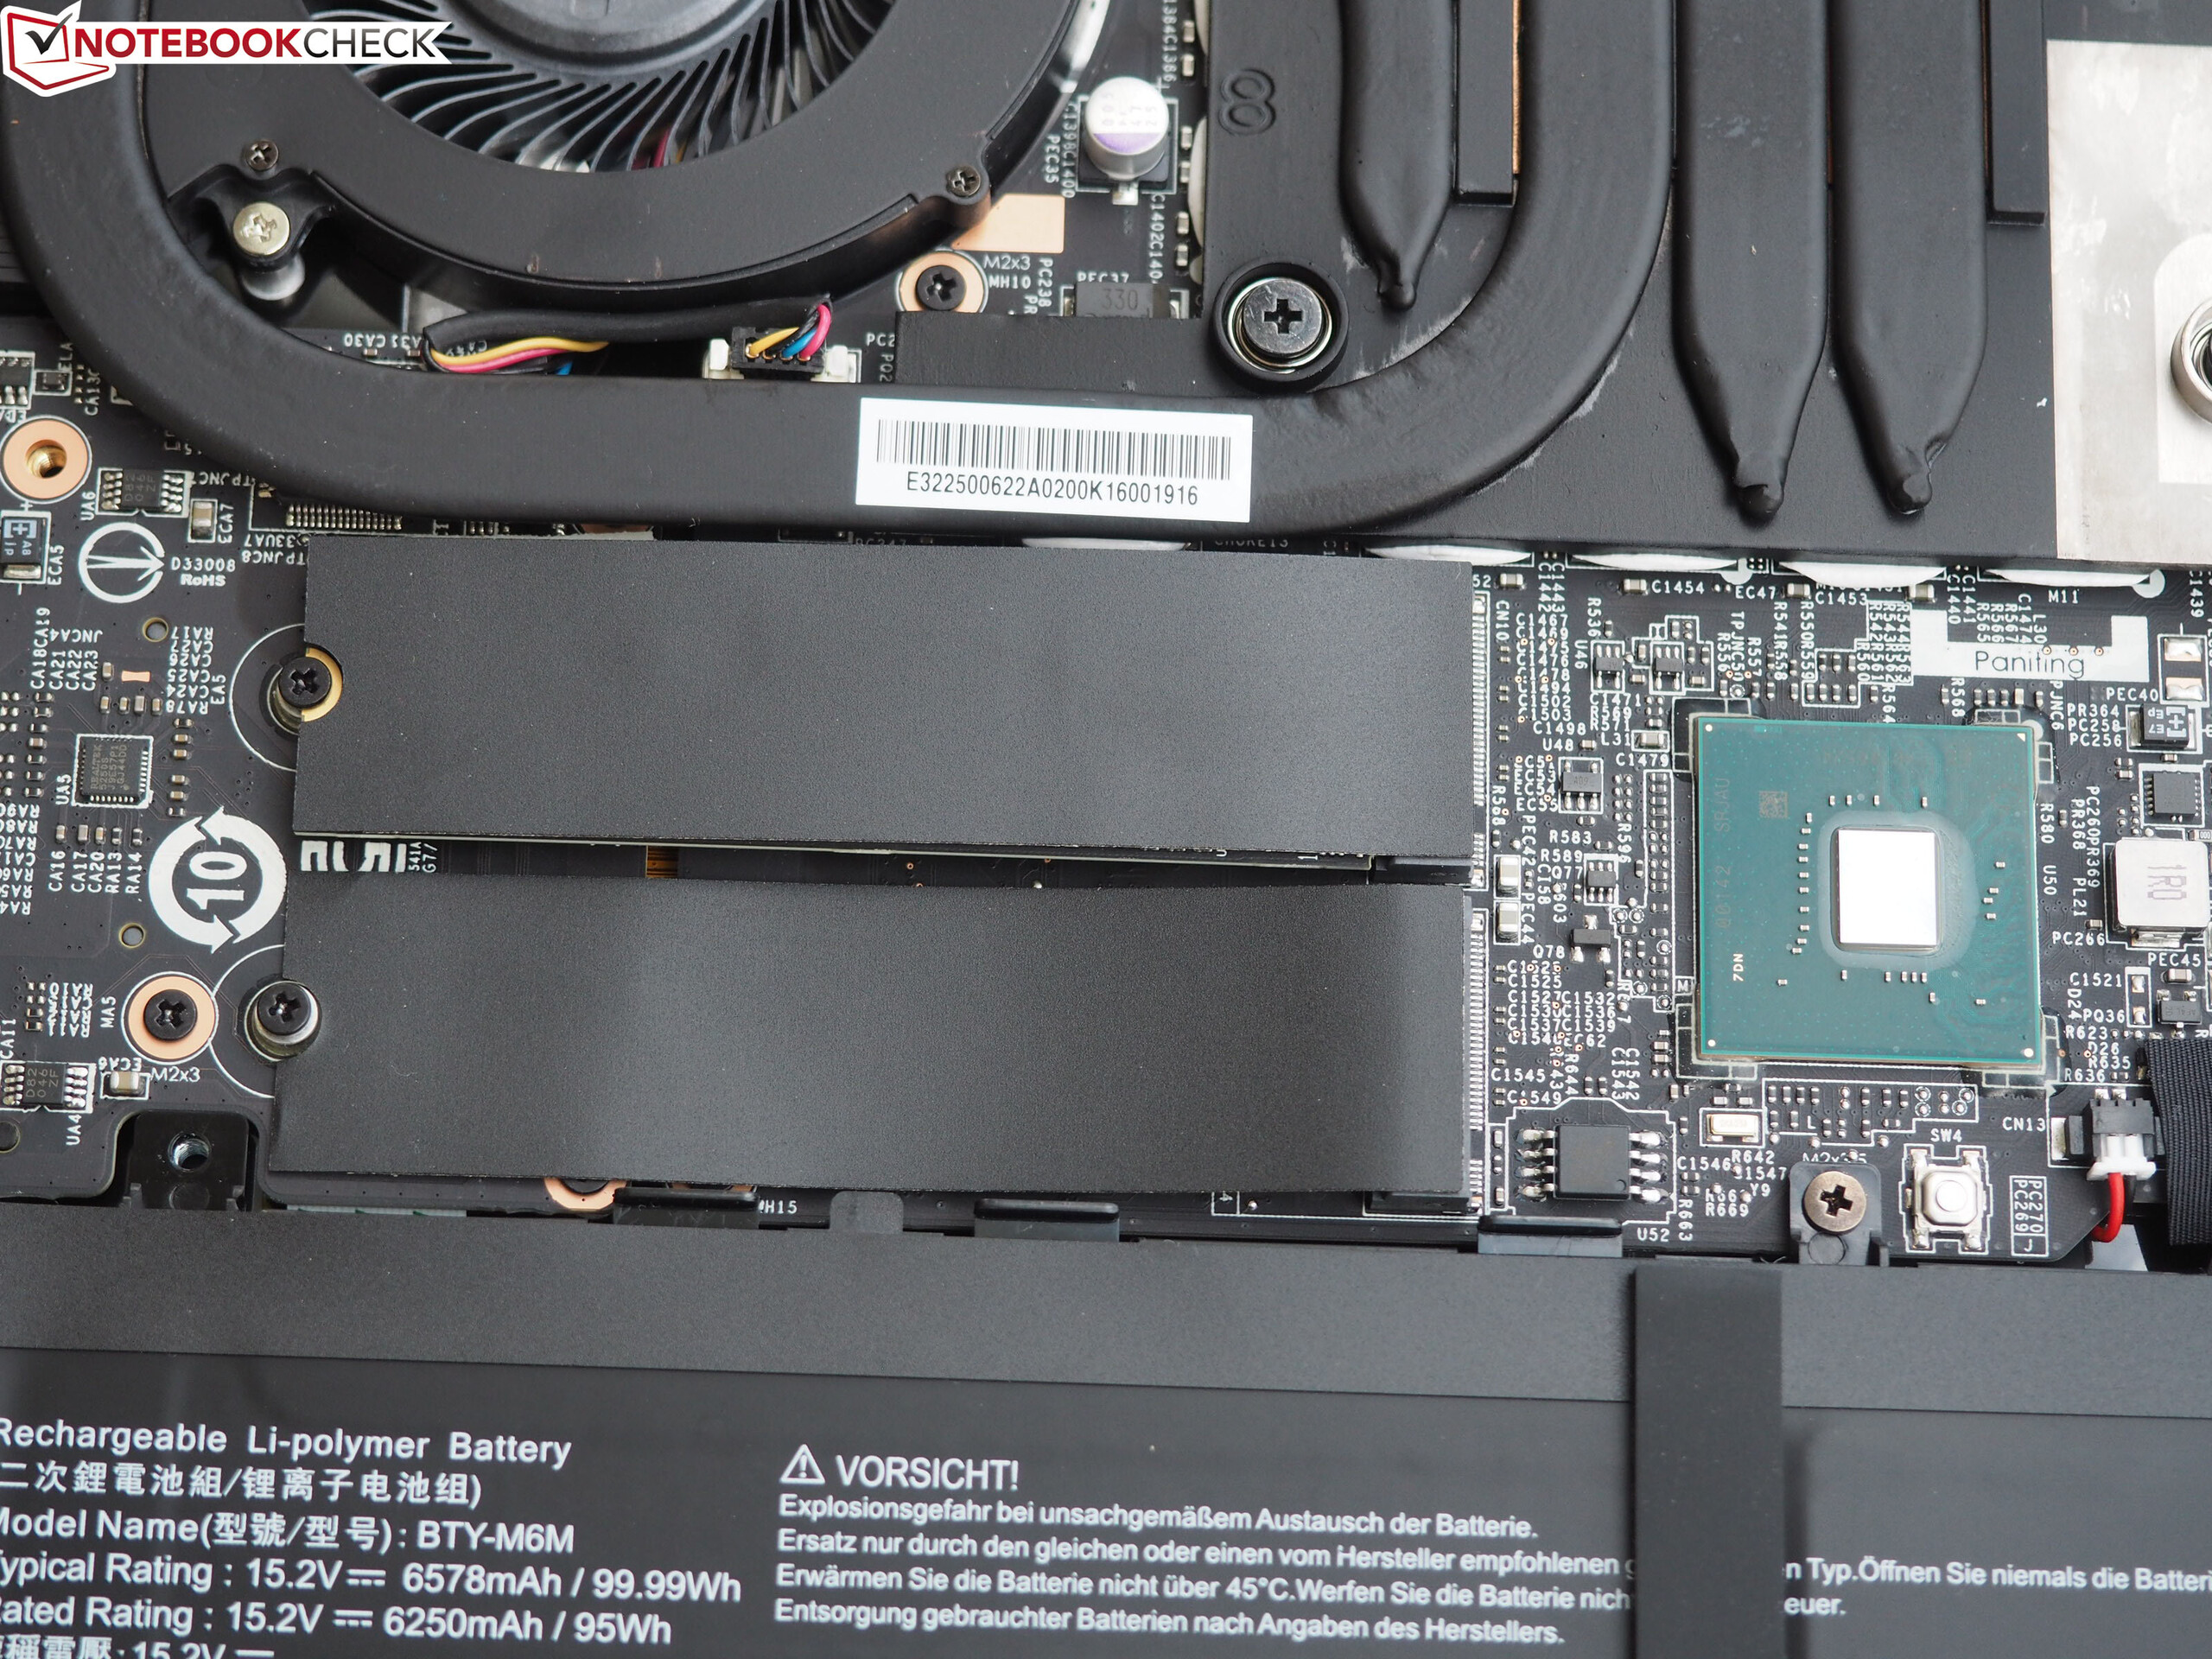
Maintenance is quite complicated. To lever the bottom of the case out of its anchorage, not only 11 screws have to be loosened but also the plastic strip behind the lid has to be removed. This procedure turns out to be a bit fiddly and is unnecessary in our opinion. Various other gaming laptops (also from MSI itself) show how it can be done more easily.
Anyway, the wireless module, two SO-DIMM banks and two M.2 slots of type 2280 (1x free) wait inside the case. Not surprisingly, the cooling system consists of two fans and several heatpipes. The front area of the GE66 is taken over by the huge battery.

Warranty
MSI grants a 24-month warranty with pick-up & return service on the 15-inch model.
Input devices
Keyboard
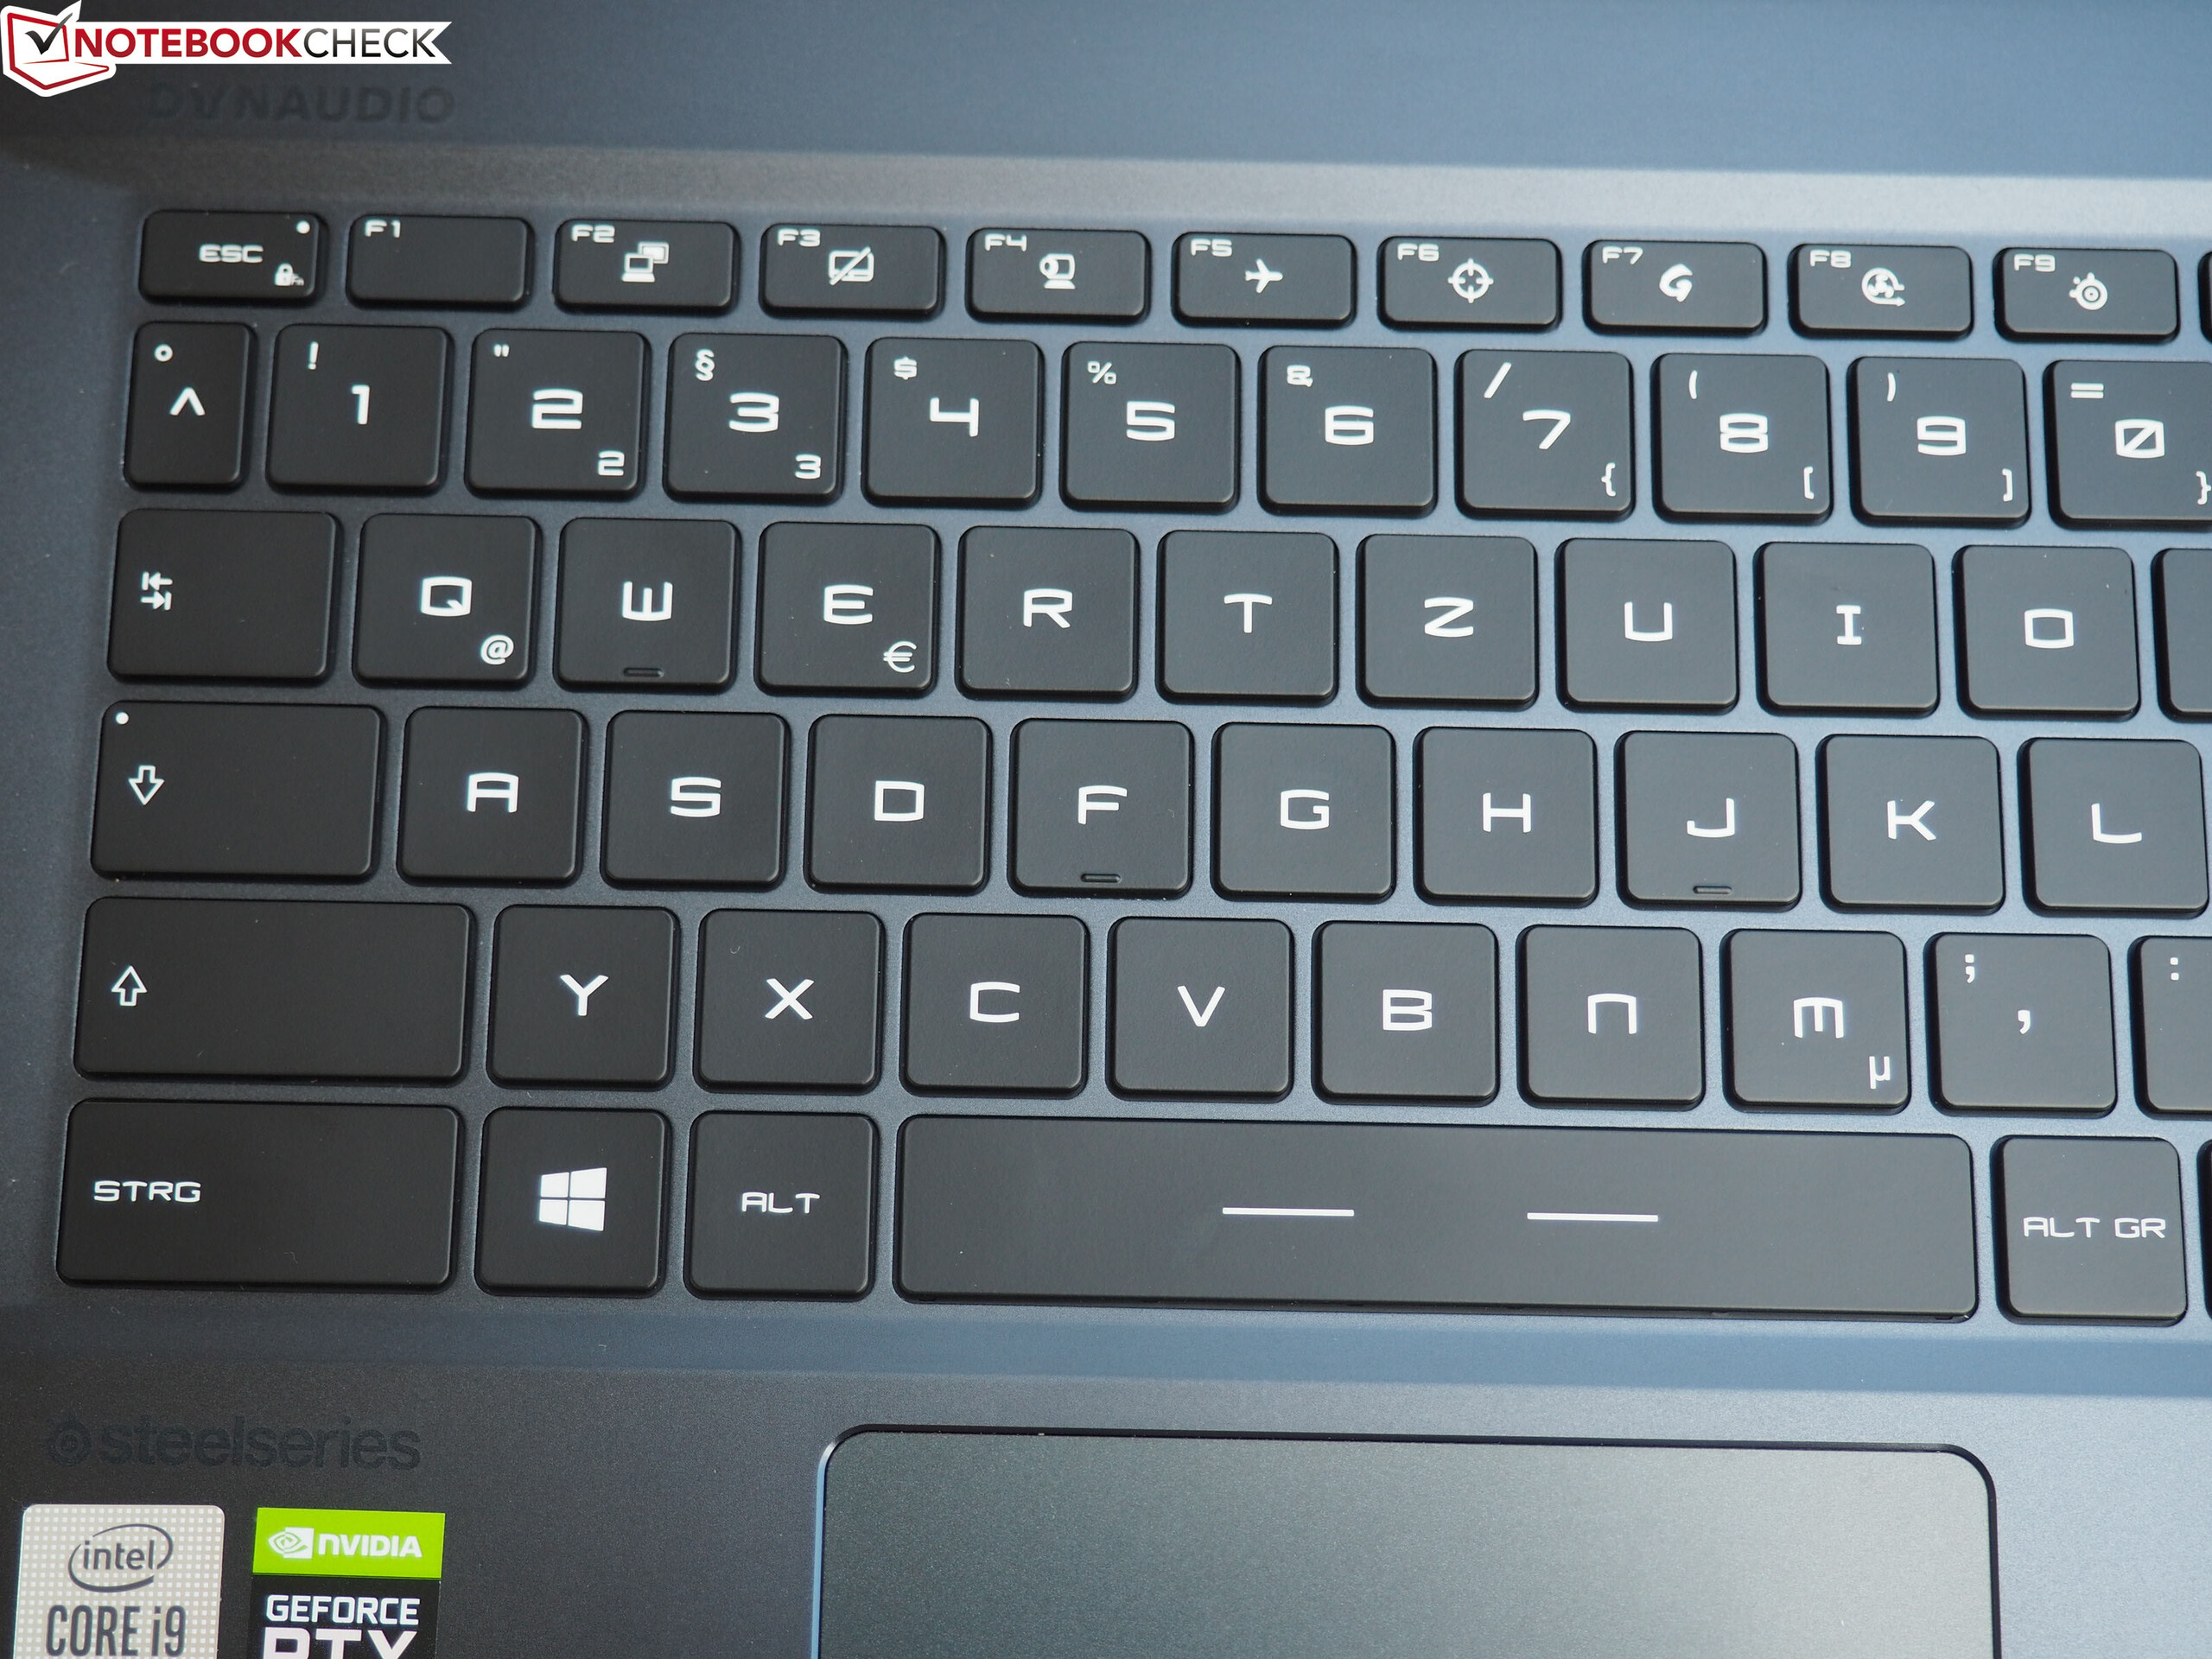
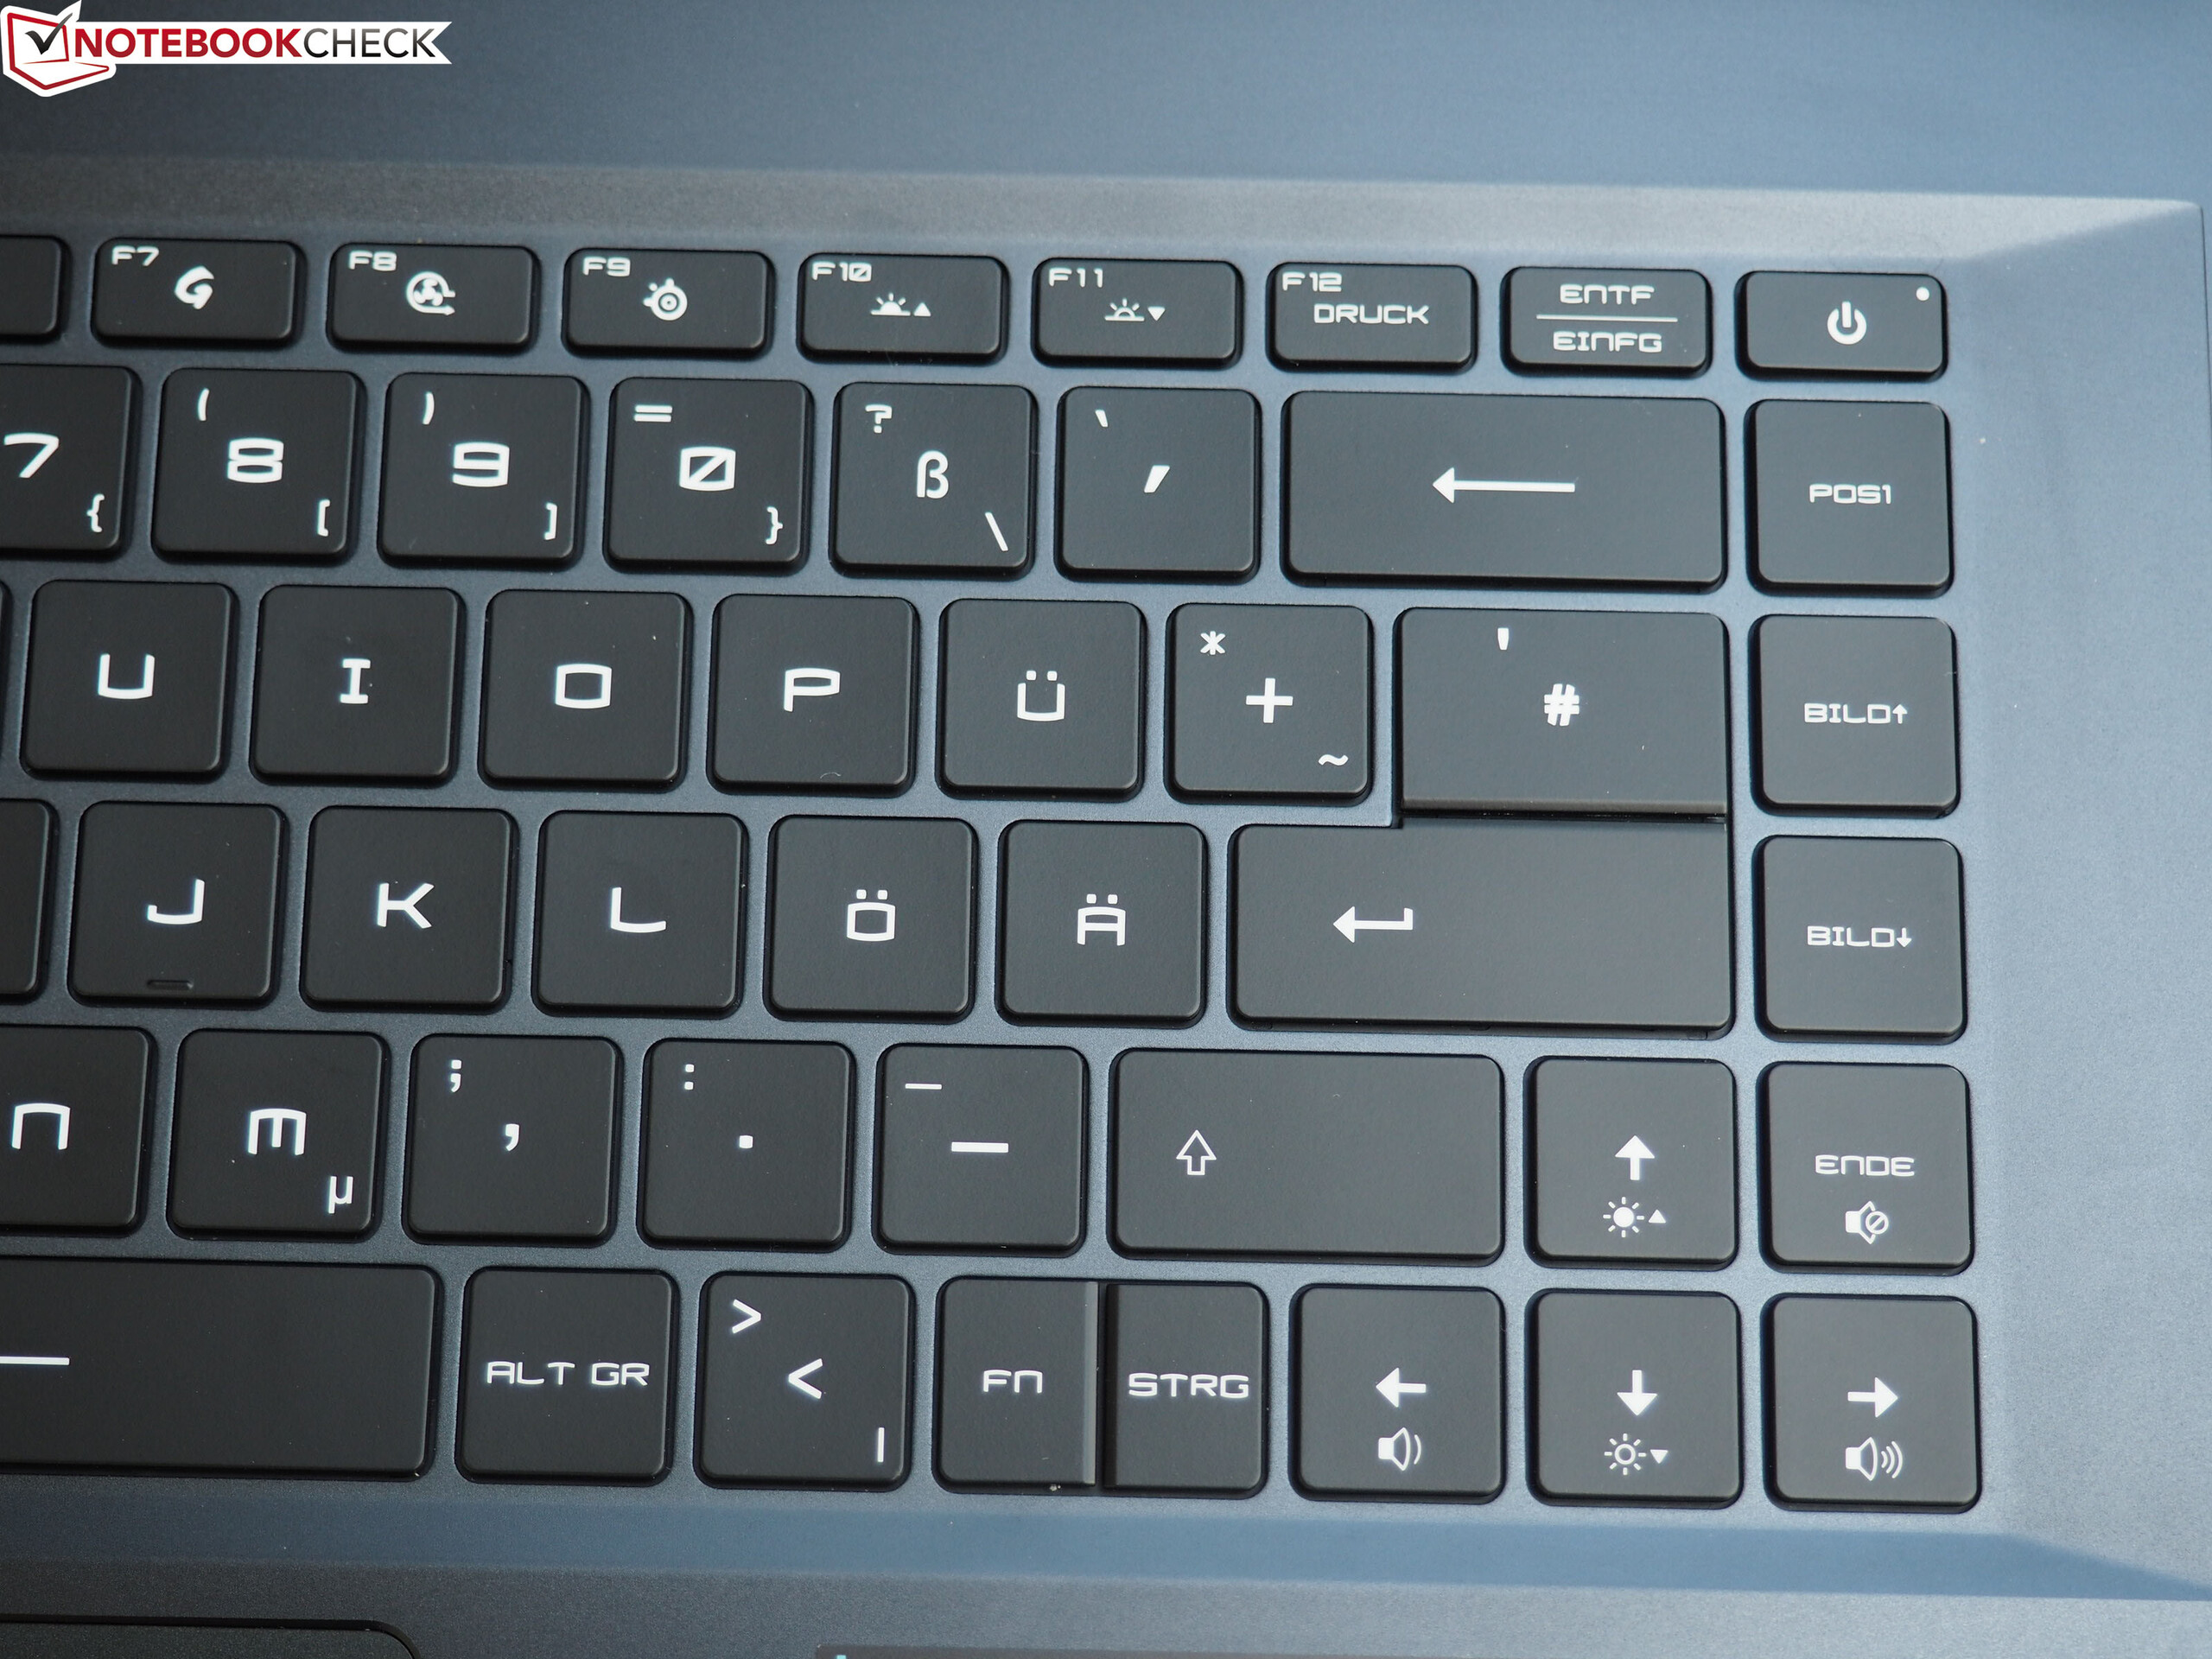
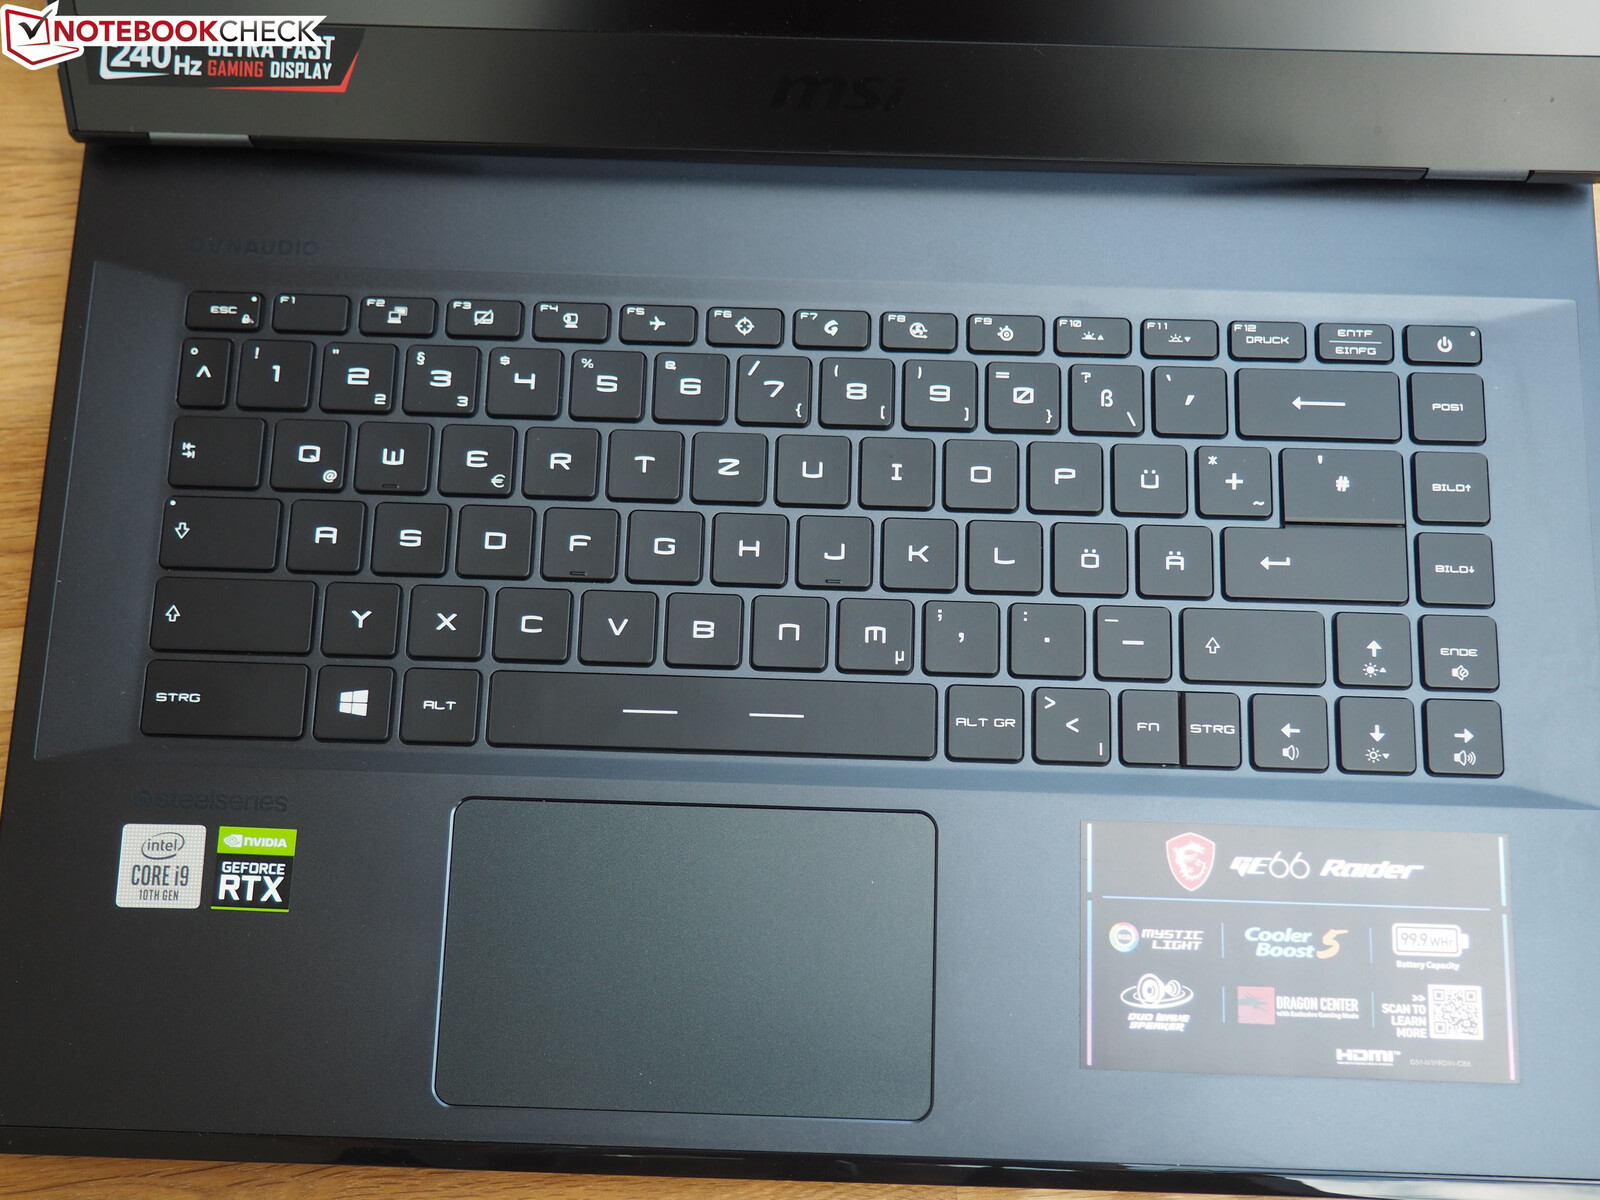
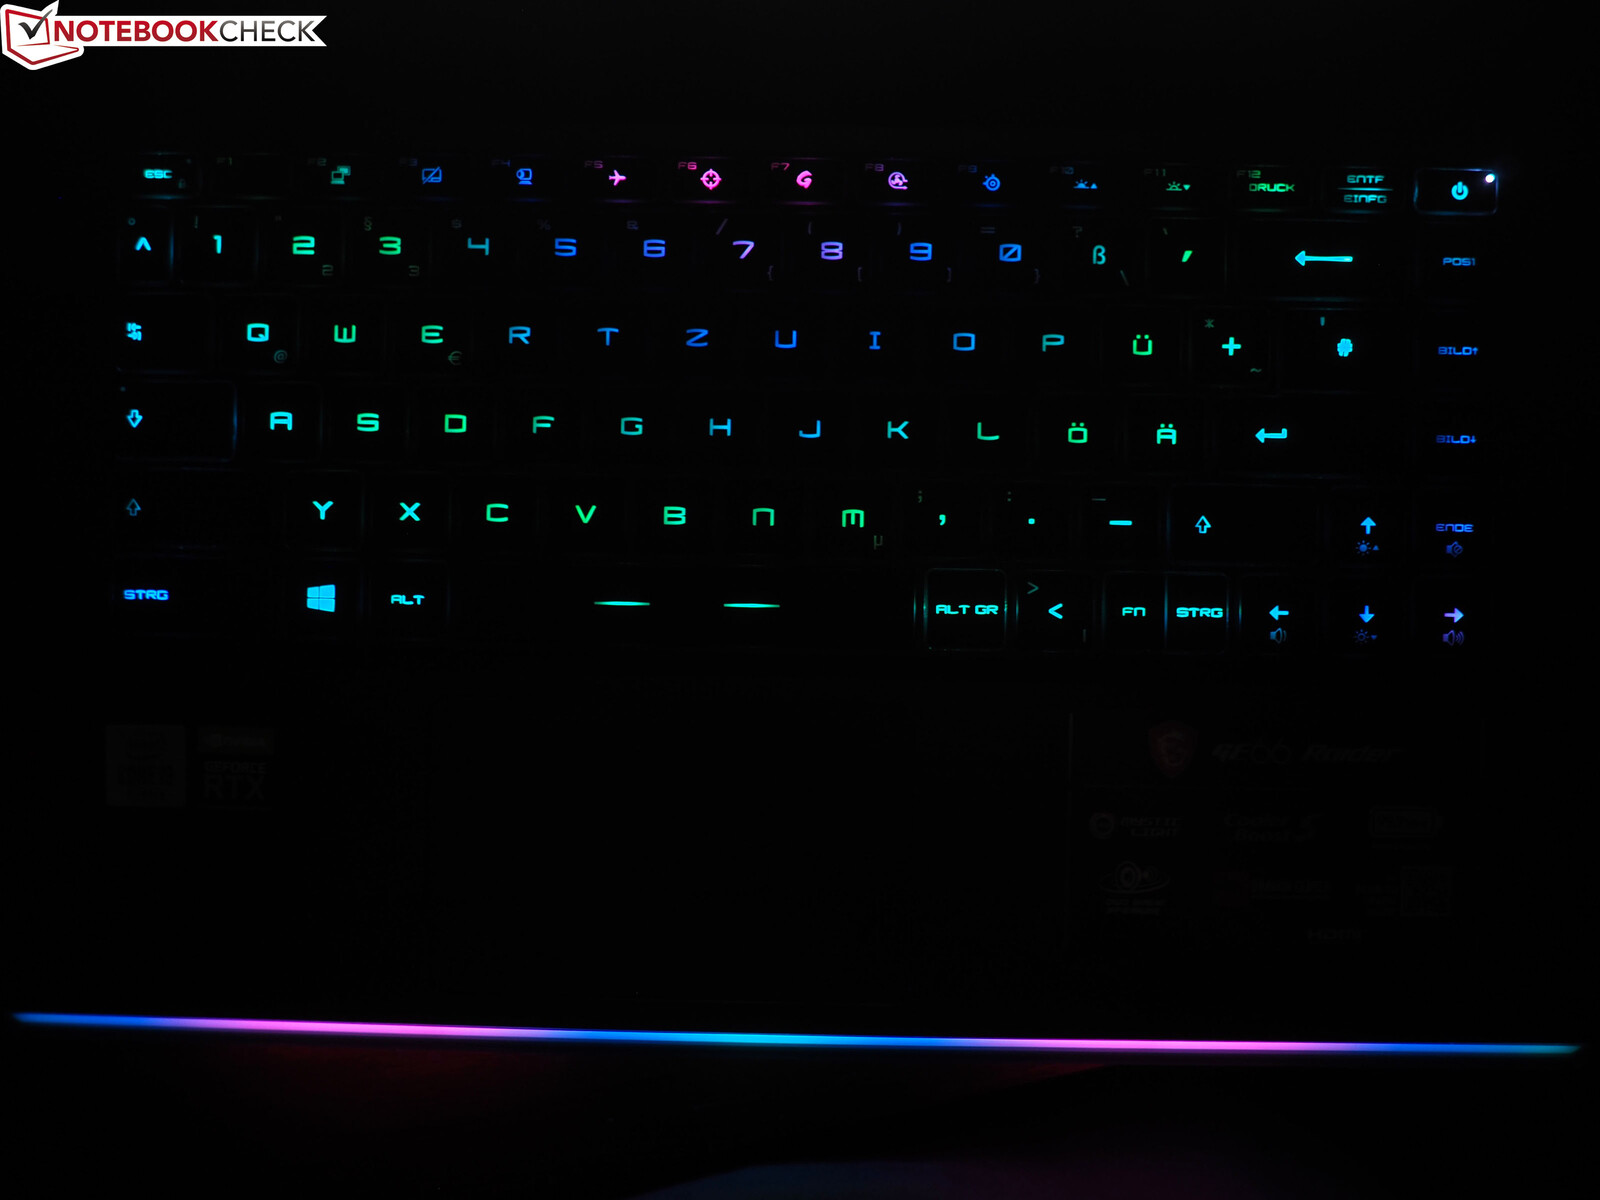
The keyboard, which is tailored to gamers, offers a good and relatively well-defined typing feel that will satisfy most buyers. Worthy of discussion is - as so often with MSI - once again the layout. For one thing, the position of some keys deviates from the (German) standard (<>| & #'). On the other hand, there are some unfavorable combinations (F12 + Print, Del + Ins). The single-line Enter and the lack of a dedicated numeric keypad could also disturb frequent writers. In addition, the Fn key and the right Ctrl are very narrow and clumped together. So there is a lot of time required to get used to the GE66 keyboard. The stylish RGB-illumination, however, which can be adjusted individually (colors, modes etc.), is a plus.
Touchpad
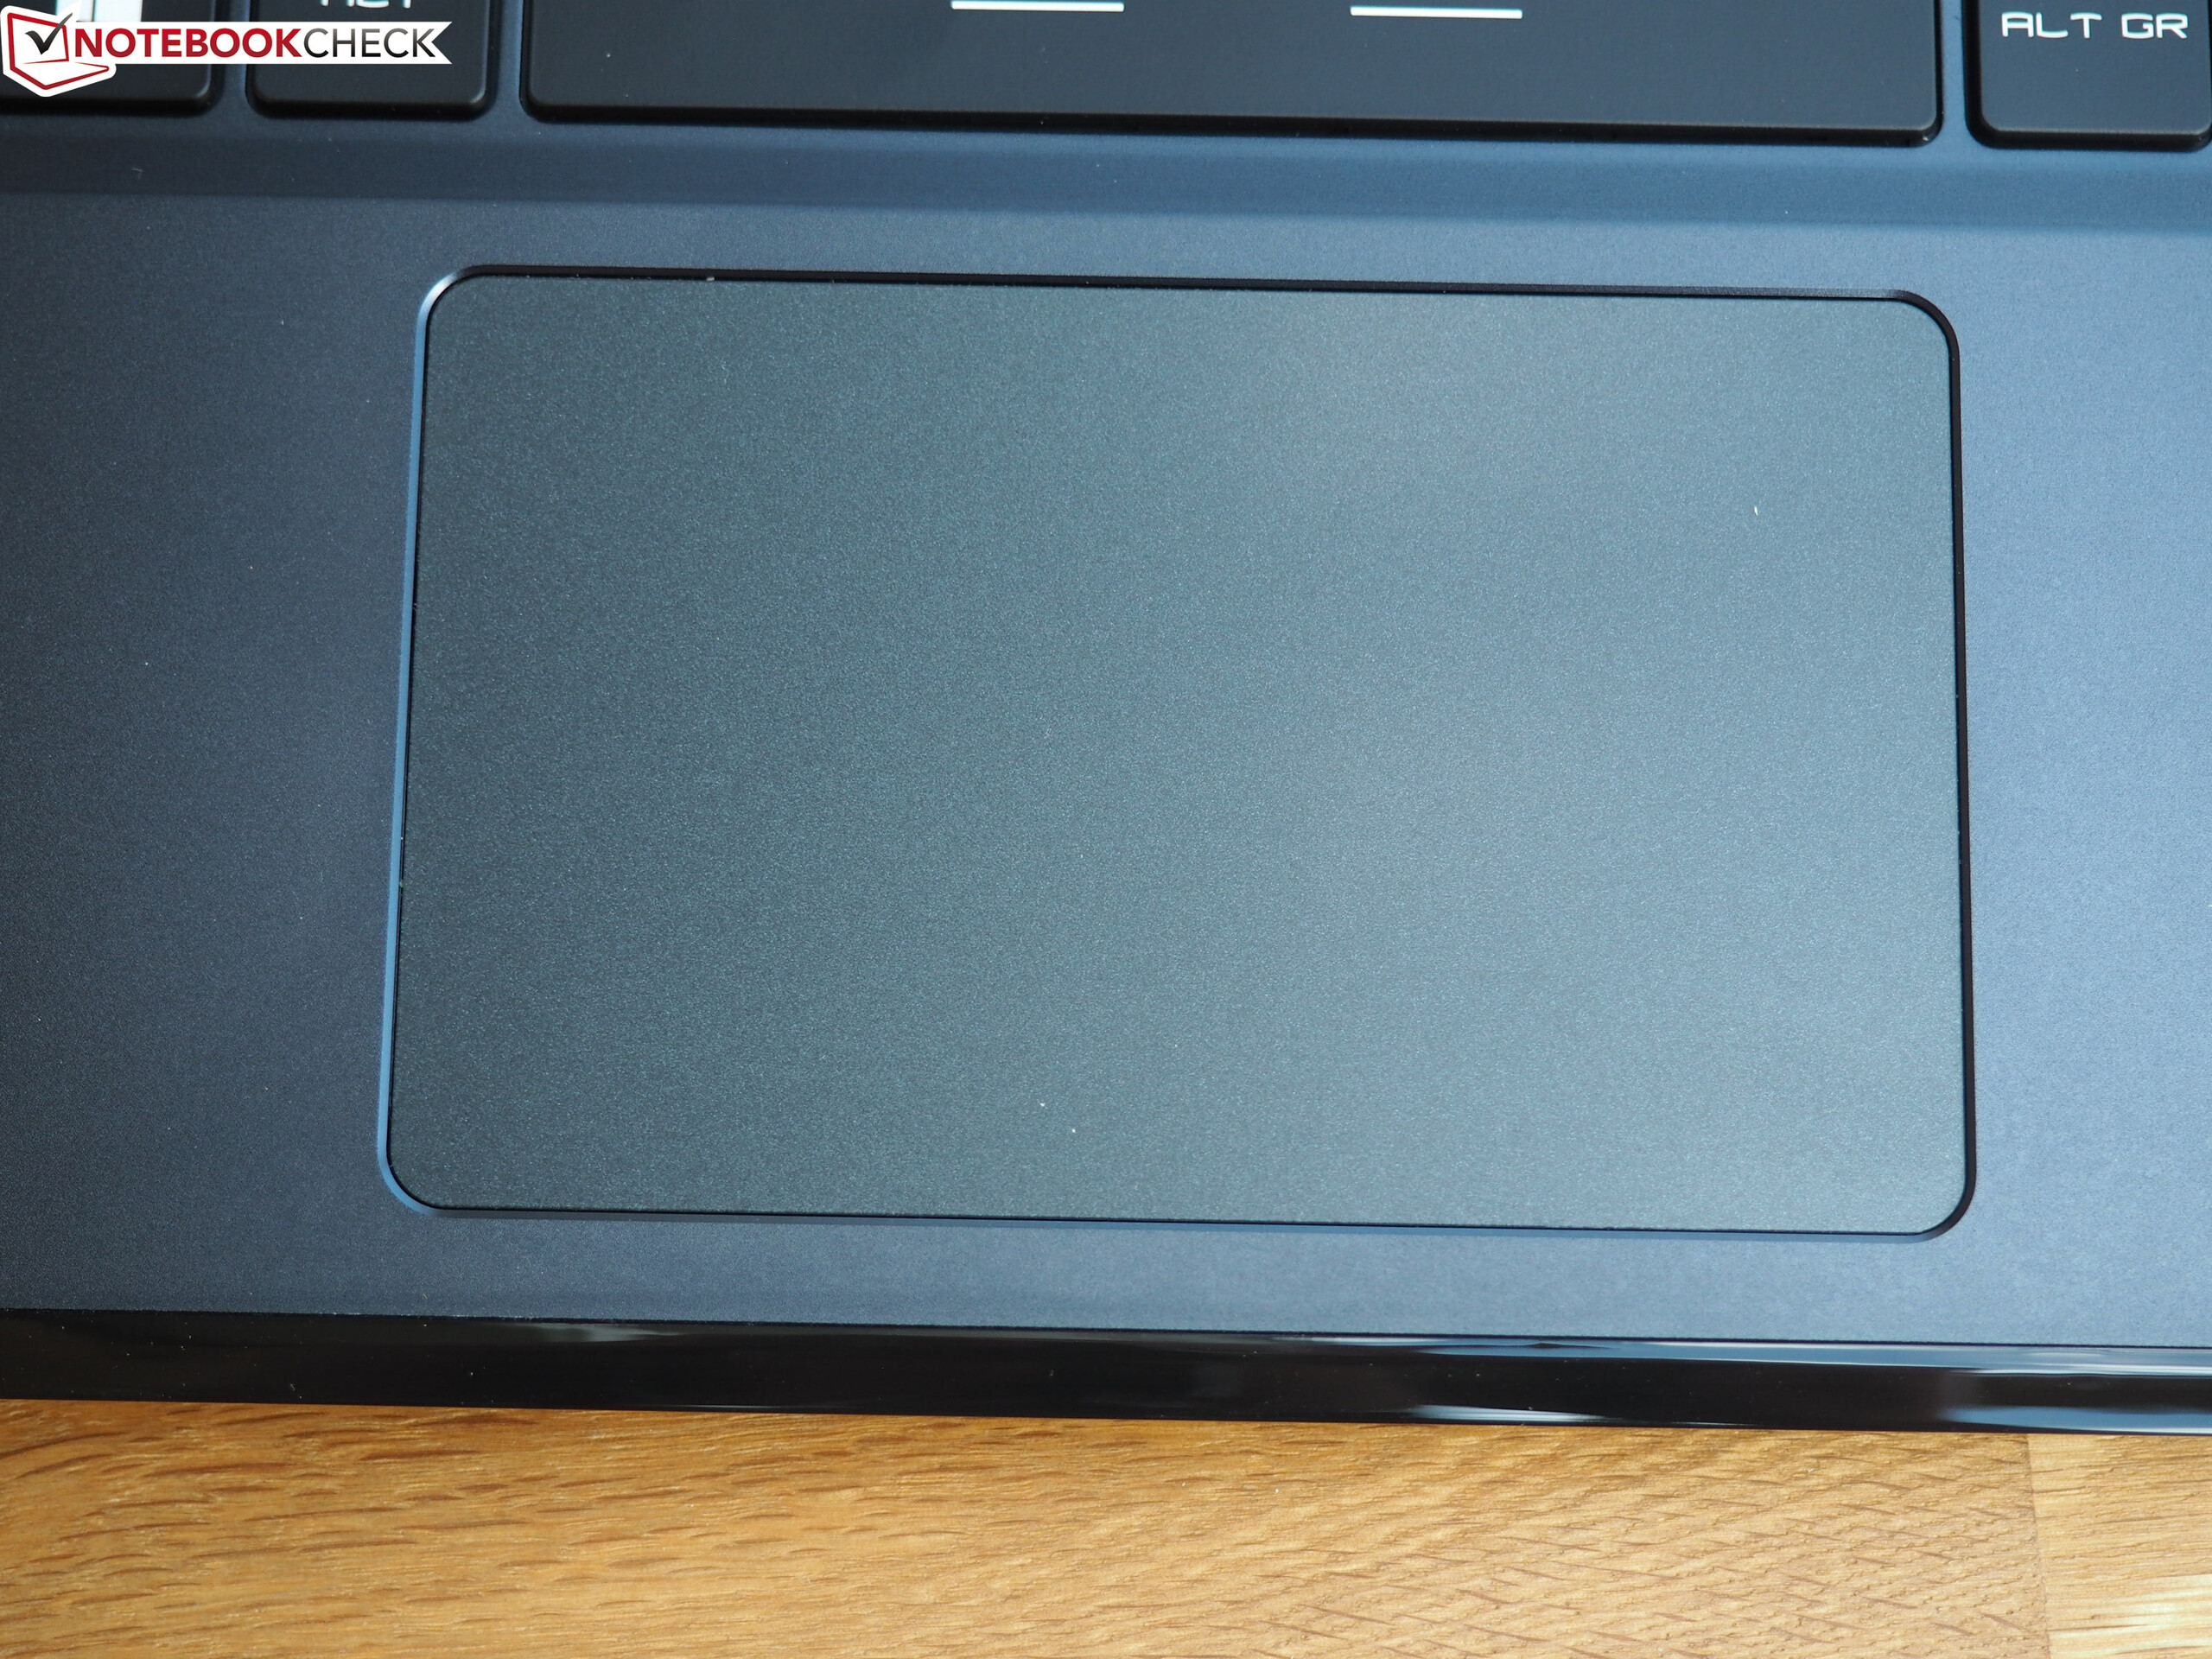
With a width of 10.5 cm and a height of 6.5 cm, the touchpad is neatly dimensioned for a 15-inch device. The smooth finish ensures quick inputs, which are usually recognized cleanly and reliably. The same applies to the multi-touch support. Content can be comfortably zoomed and scrolled with a two-finger gesture. Since dedicated mouse buttons are missing, left and right clicks are triggered by pressing the bottom surface.
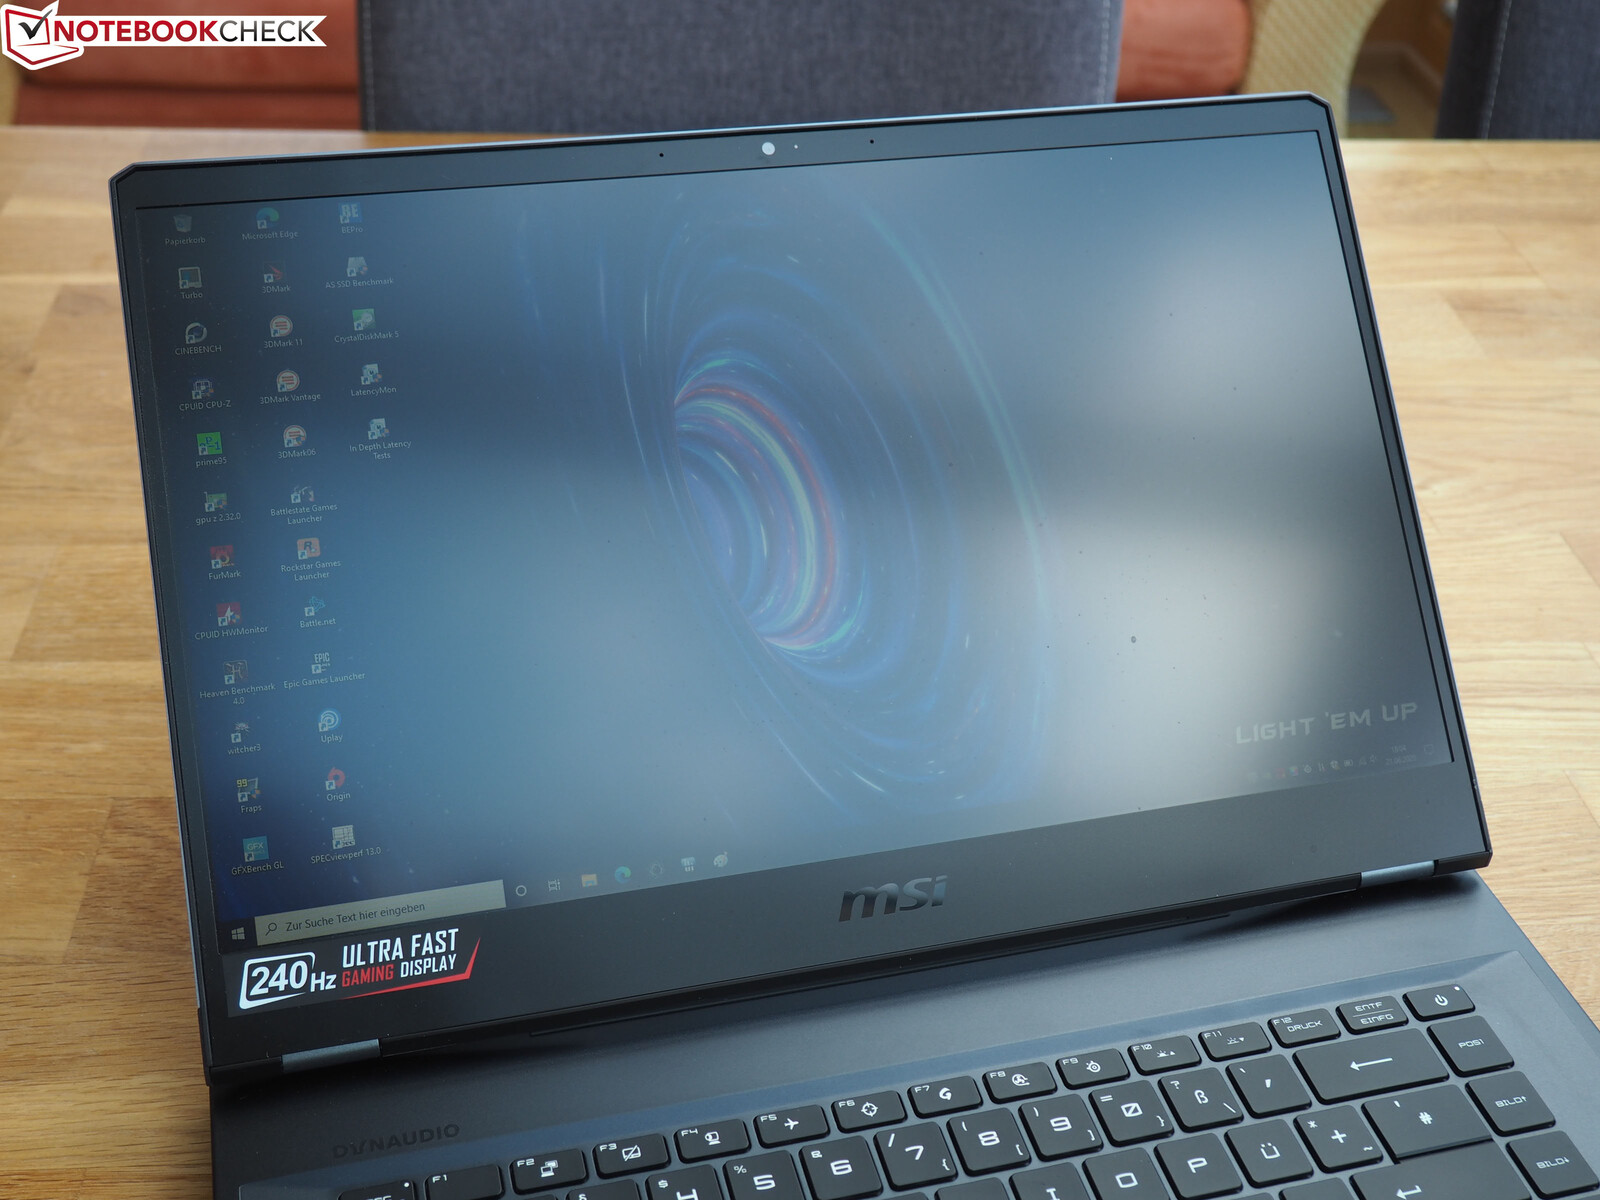
Display
As mentioned at the beginning, the test configuration boasts a 240 Hz display. In this case, MSI decided on the Sharp LQ156M1JW03 panel, which also does its work in the GE65 and has already attracted attention with a good performance there.
| |||||||||||||||||||||||||
Brightness Distribution: 91 %
Center on Battery: 291 cd/m²
Contrast: 1164:1 (Black: 0.25 cd/m²)
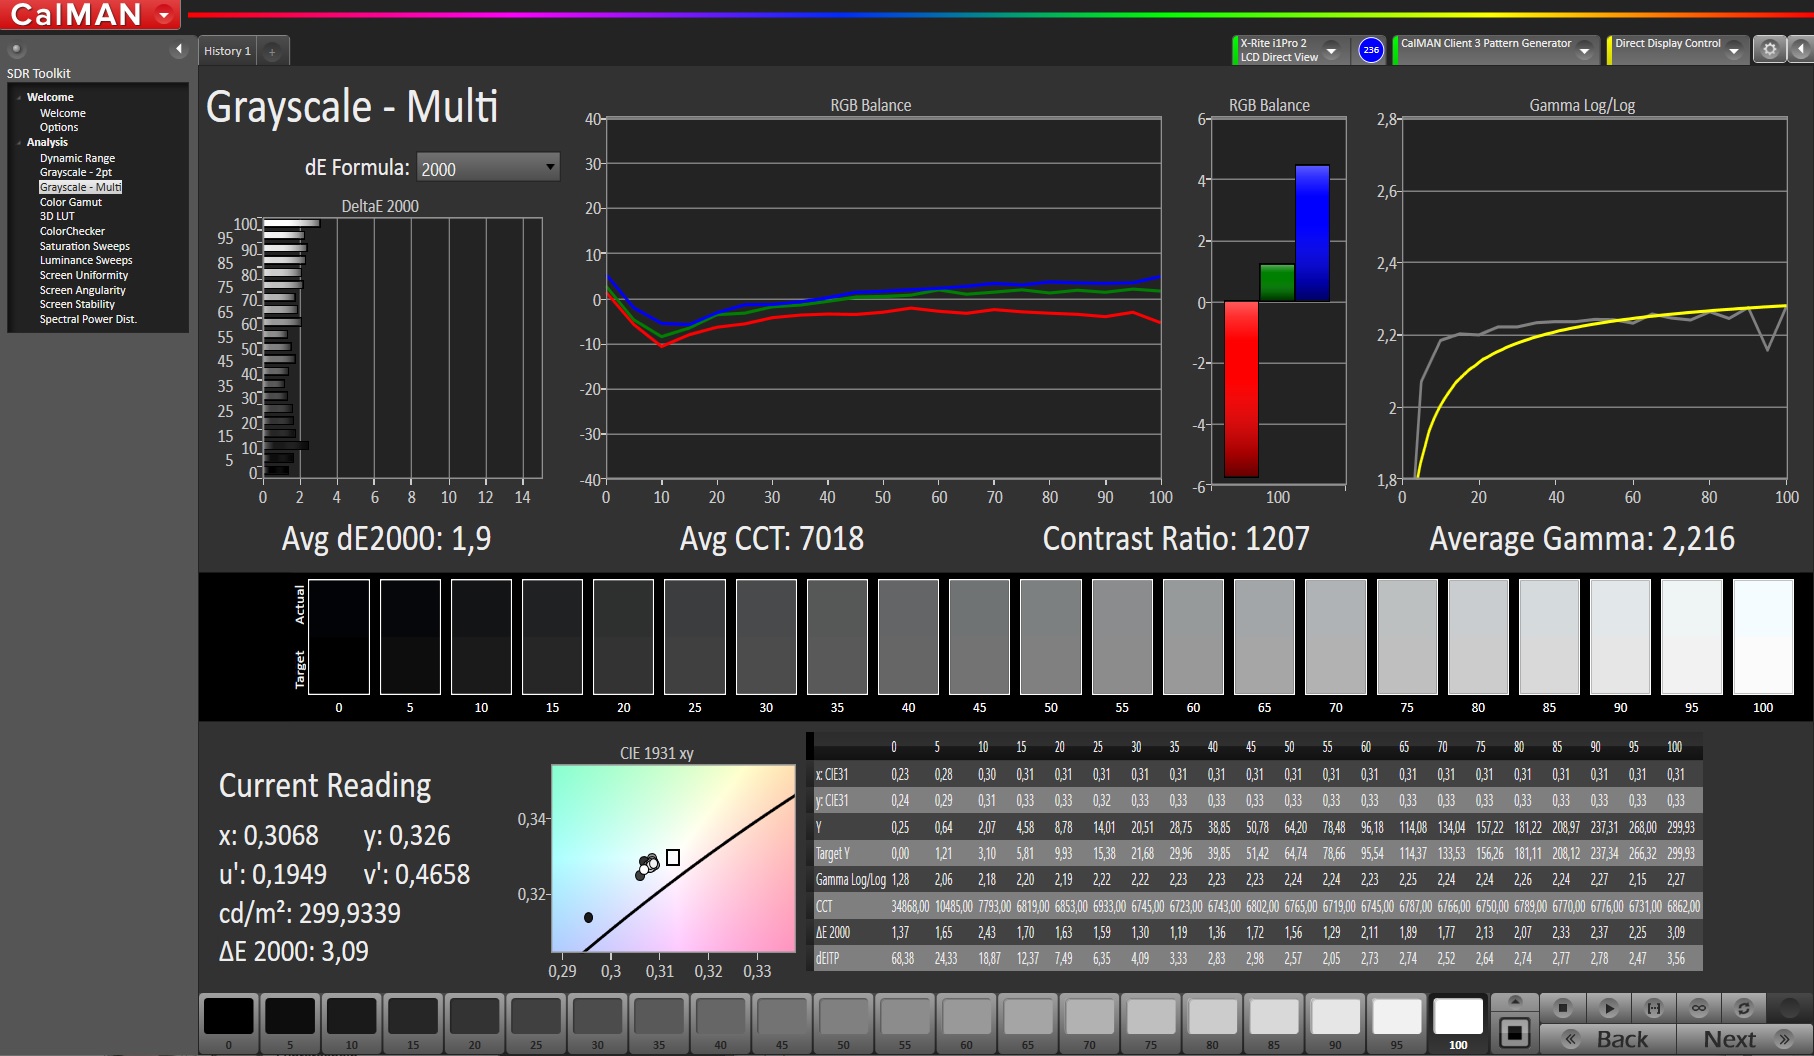
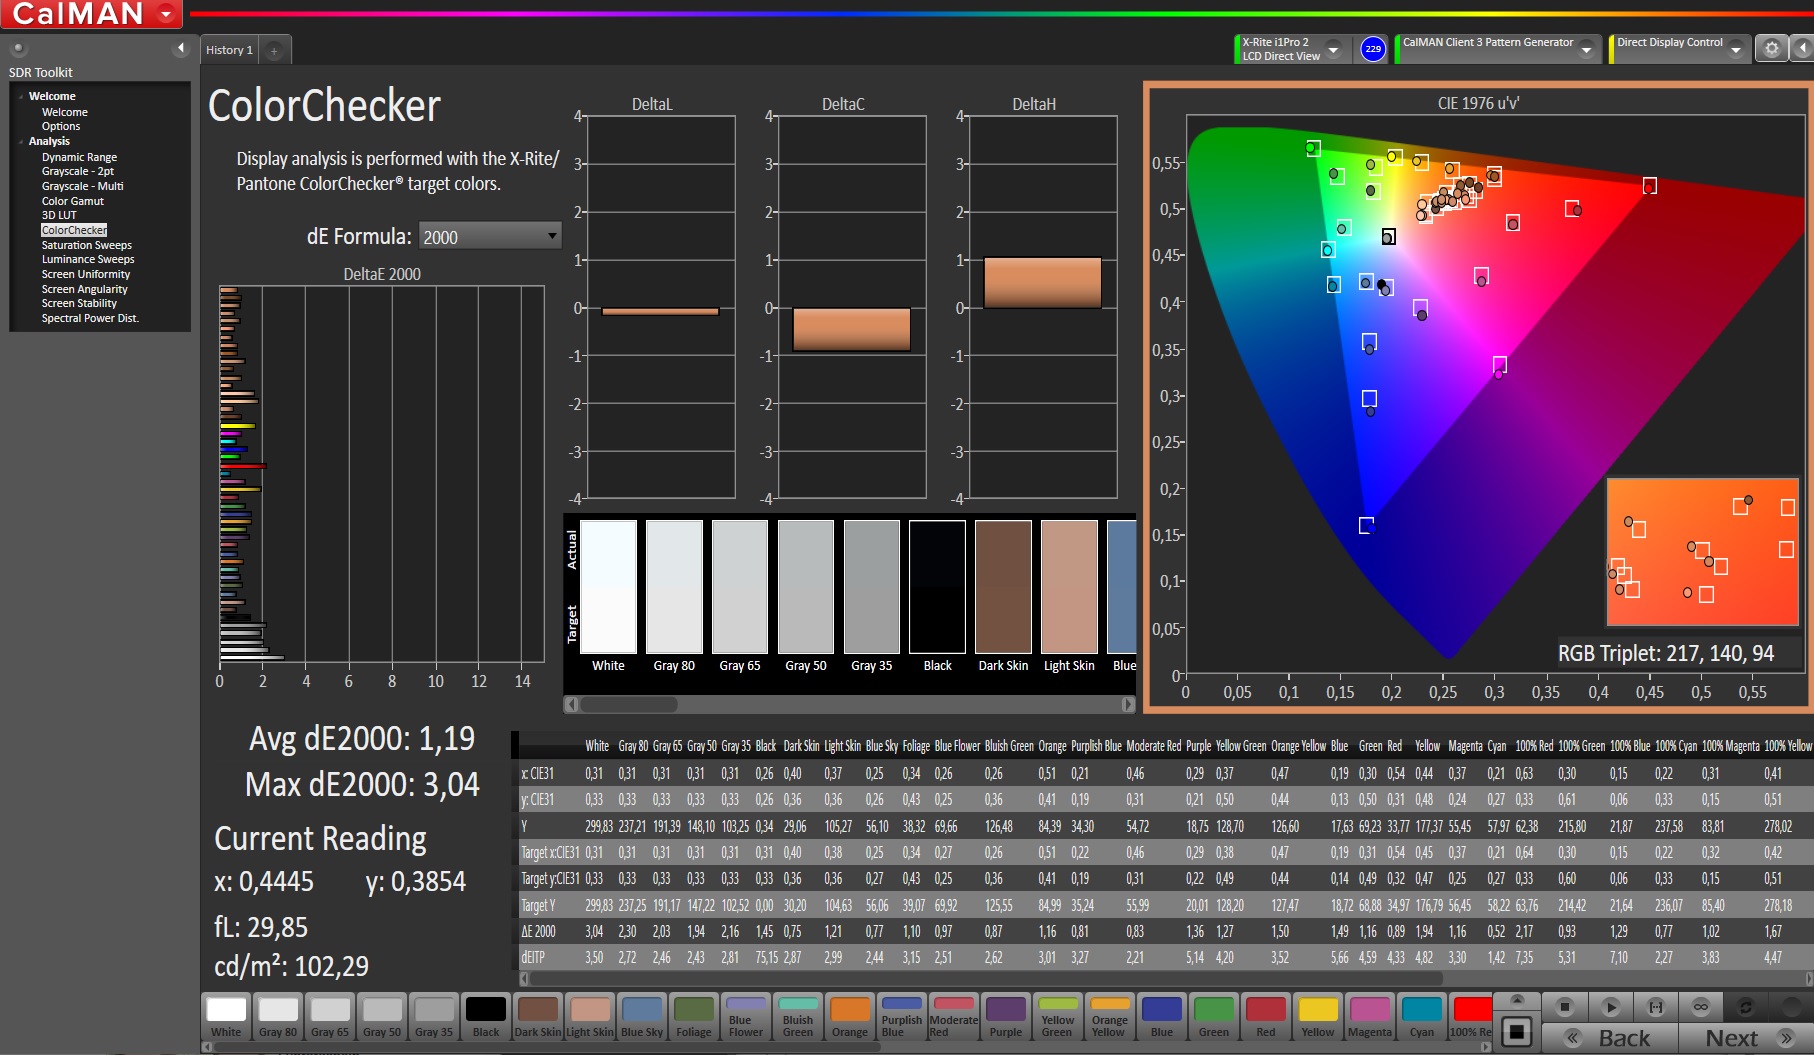
ΔE ColorChecker Calman: 1.19 | ∀{0.5-29.43 Ø4.71}
ΔE Greyscale Calman: 1.9 | ∀{0.09-98 Ø4.96}
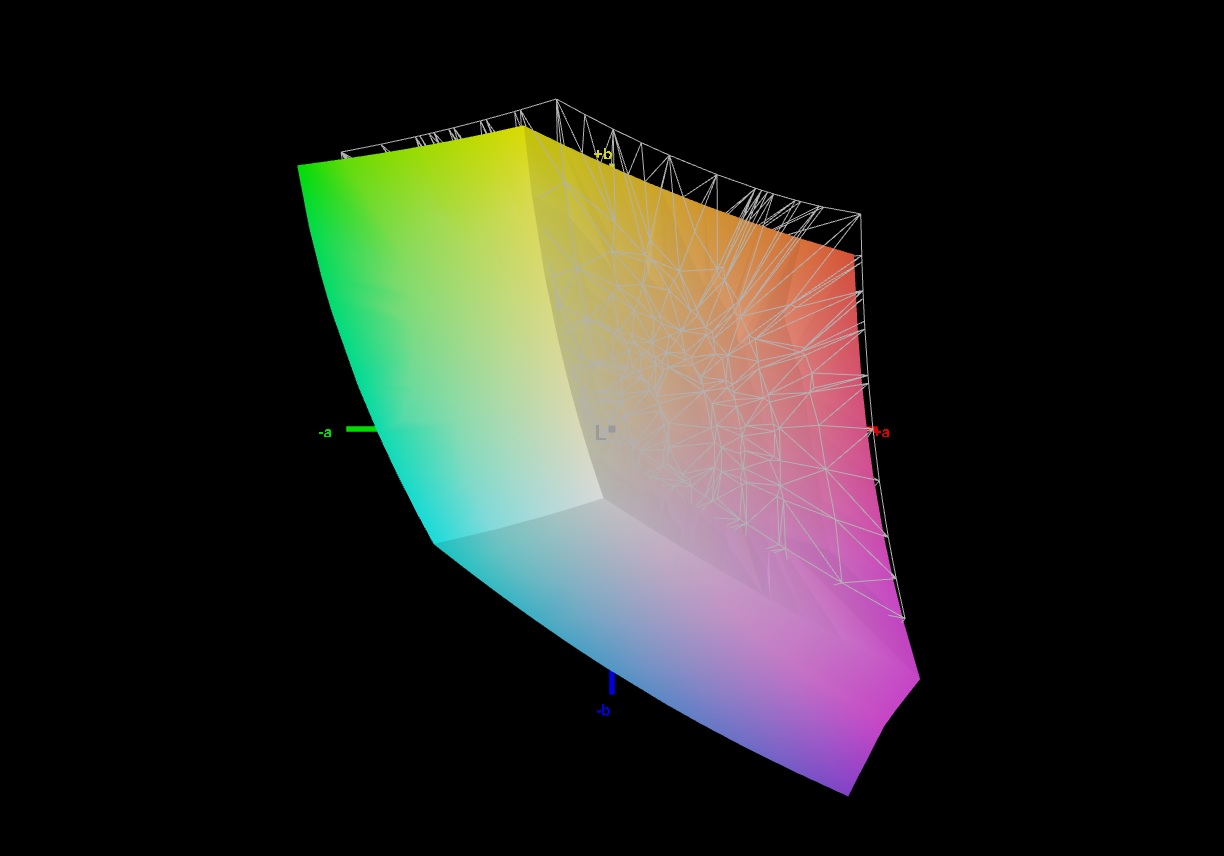
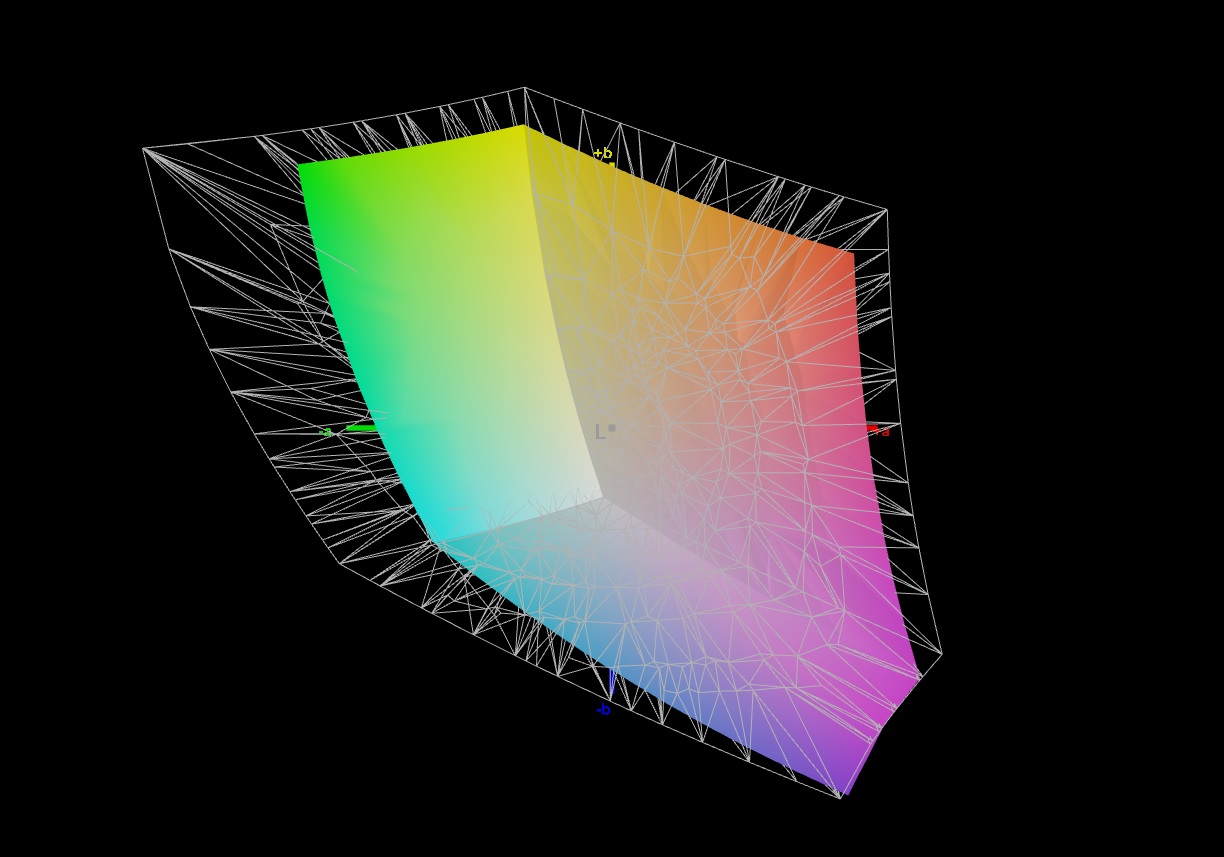
92% sRGB (Argyll 1.6.3 3D)
70% AdobeRGB 1998 (Argyll 1.6.3 3D)
69.8% AdobeRGB 1998 (Argyll 3D)
99% sRGB (Argyll 3D)
68% Display P3 (Argyll 3D)
Gamma: 2.216
CCT: 7018 K
| MSI GE66 Raider 10SFS Sharp LQ156M1JW03 (SHP14C5), IPS-Level, 1920x1080 | MSI GE65 Raider 9SF-049US Sharp LQ156M1JW03, IPS, 1920x1080 | Asus Strix Scar III G531GW Sharp LQ156M1JW09 (SHP14D3), IPS, 1920x1080 | Eurocom Nightsky RX15 Samsung SDCA029, OLED, 3840x2160 | |
|---|---|---|---|---|
| Display | 1% | -3% | 30% | |
| Display P3 Coverage (%) | 68 | 69.3 2% | 66.2 -3% | 99.9 47% |
| sRGB Coverage (%) | 99 | 98.9 0% | 96.5 -3% | 100 1% |
| AdobeRGB 1998 Coverage (%) | 69.8 | 70.7 1% | 67.5 -3% | 99.1 42% |
| Response Times | 6% | -7% | 80% | |
| Response Time Grey 50% / Grey 80% * (ms) | 16.4 ? | 13.2 ? 20% | 17.2 ? -5% | 2.4 ? 85% |
| Response Time Black / White * (ms) | 10.4 ? | 11.2 ? -8% | 11.2 ? -8% | 2.6 ? 75% |
| PWM Frequency (Hz) | 23580 ? | 23150 ? | 24040 ? | 59.5 ? |
| Screen | -19% | -14% | -107% | |
| Brightness middle (cd/m²) | 291 | 277.4 -5% | 266 -9% | 414.9 43% |
| Brightness (cd/m²) | 278 | 264 -5% | 252 -9% | 404 45% |
| Brightness Distribution (%) | 91 | 90 -1% | 88 -3% | 88 -3% |
| Black Level * (cd/m²) | 0.25 | 0.24 4% | 0.27 -8% | |
| Contrast (:1) | 1164 | 1156 -1% | 985 -15% | |
| Colorchecker dE 2000 * | 1.19 | 1.51 -27% | 1.81 -52% | 7.58 -537% |
| Colorchecker dE 2000 max. * | 3.04 | 4.93 -62% | 3.23 -6% | 14.85 -388% |
| Greyscale dE 2000 * | 1.9 | 3.7 -95% | 2.44 -28% | 2.9 -53% |
| Gamma | 2.216 99% | 2.23 99% | 2.42 91% | 2.05 107% |
| CCT | 7018 93% | 7061 92% | 7005 93% | 6538 99% |
| Color Space (Percent of AdobeRGB 1998) (%) | 70 | 65.1 -7% | 62 -11% | 88.2 26% |
| Color Space (Percent of sRGB) (%) | 92 | 99.1 8% | 97 5% | 100 9% |
| Colorchecker dE 2000 calibrated * | 1.77 | 1.03 | ||
| Total Average (Program / Settings) | -4% /
-12% | -8% /
-11% | 1% /
-47% |
* ... smaller is better
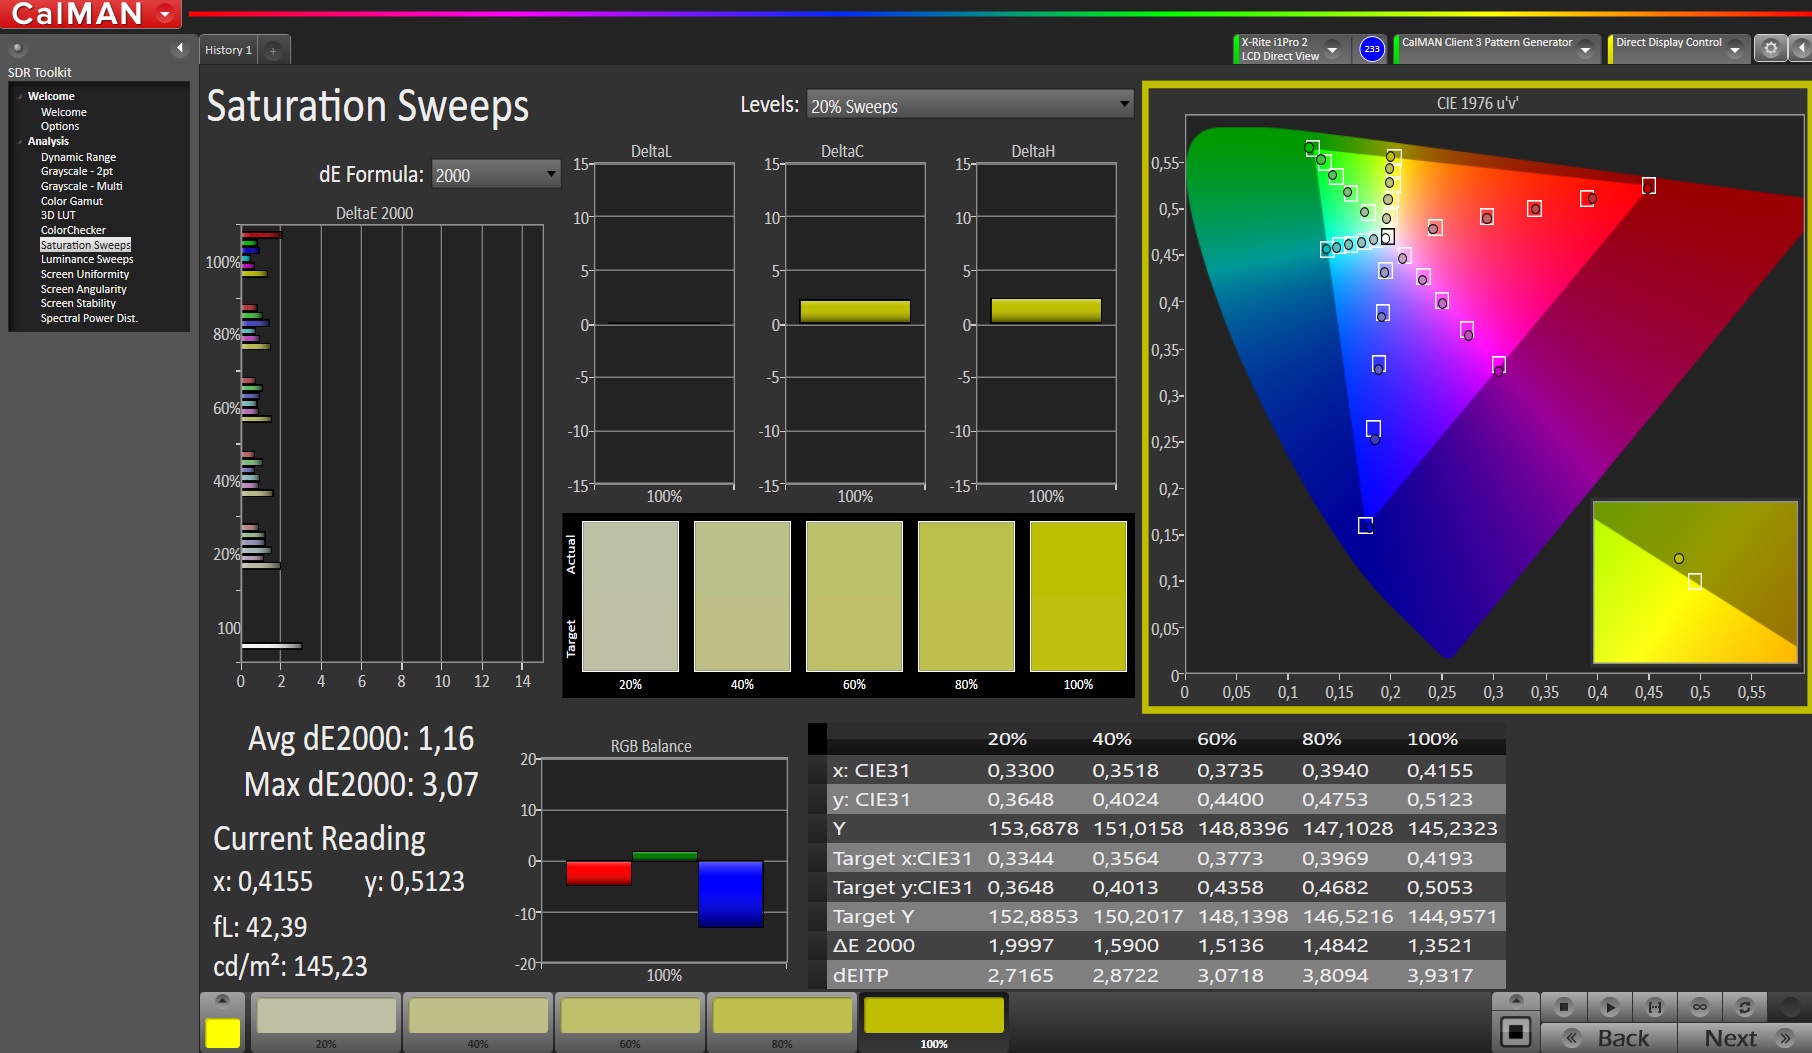
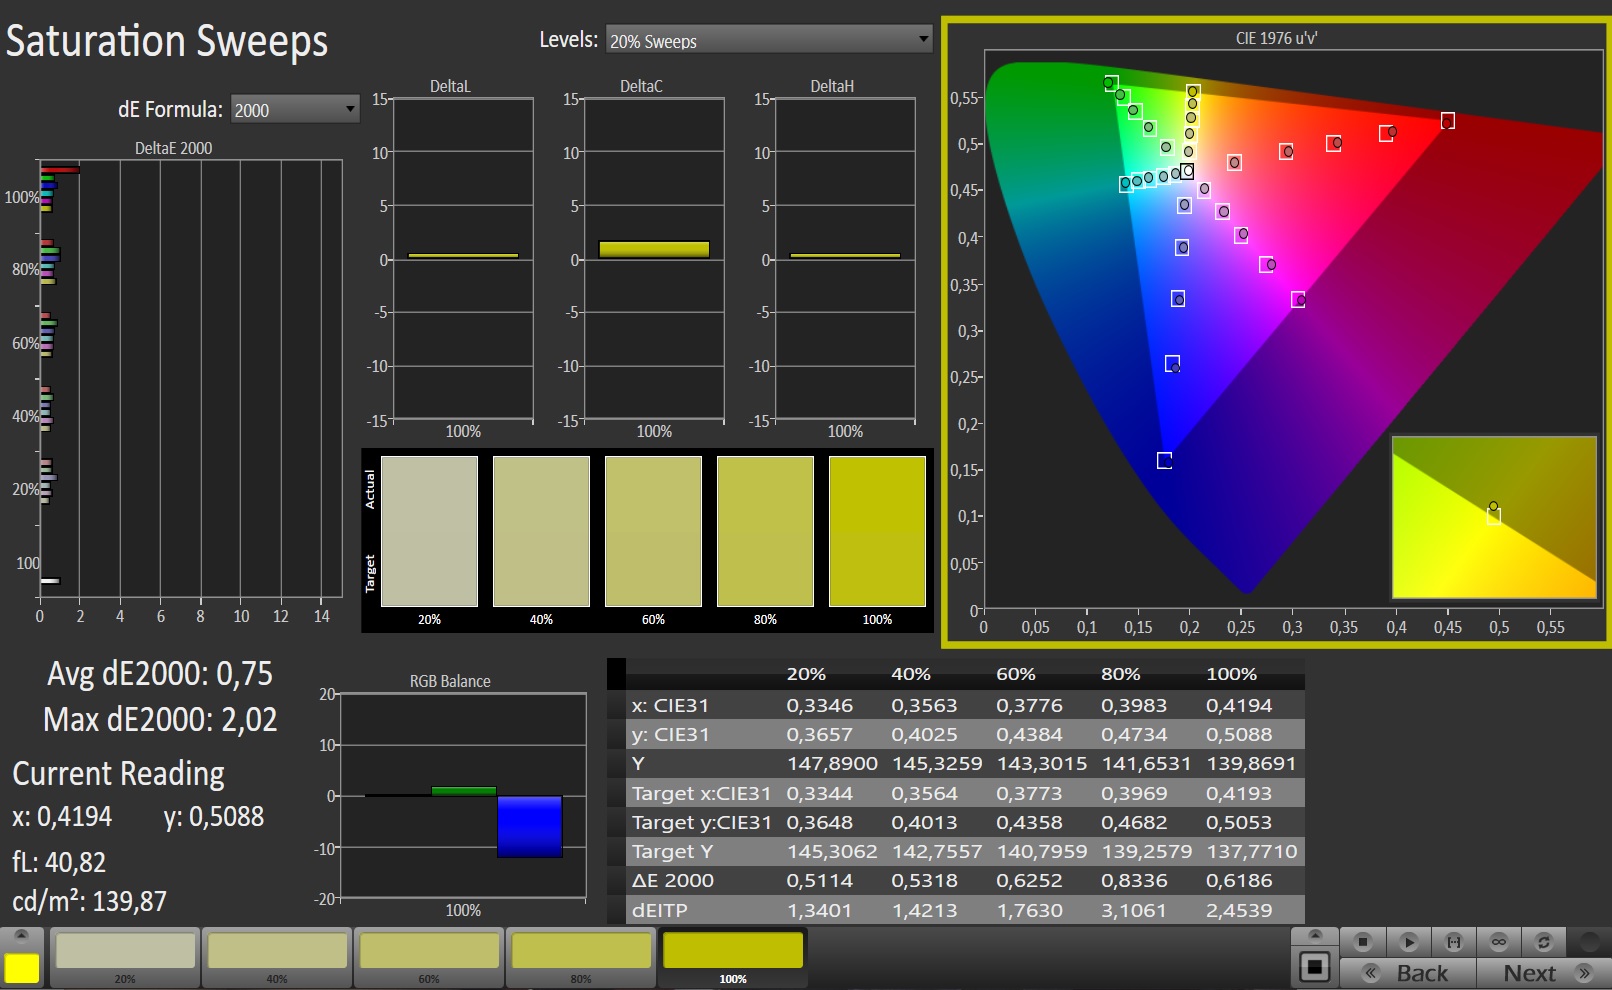
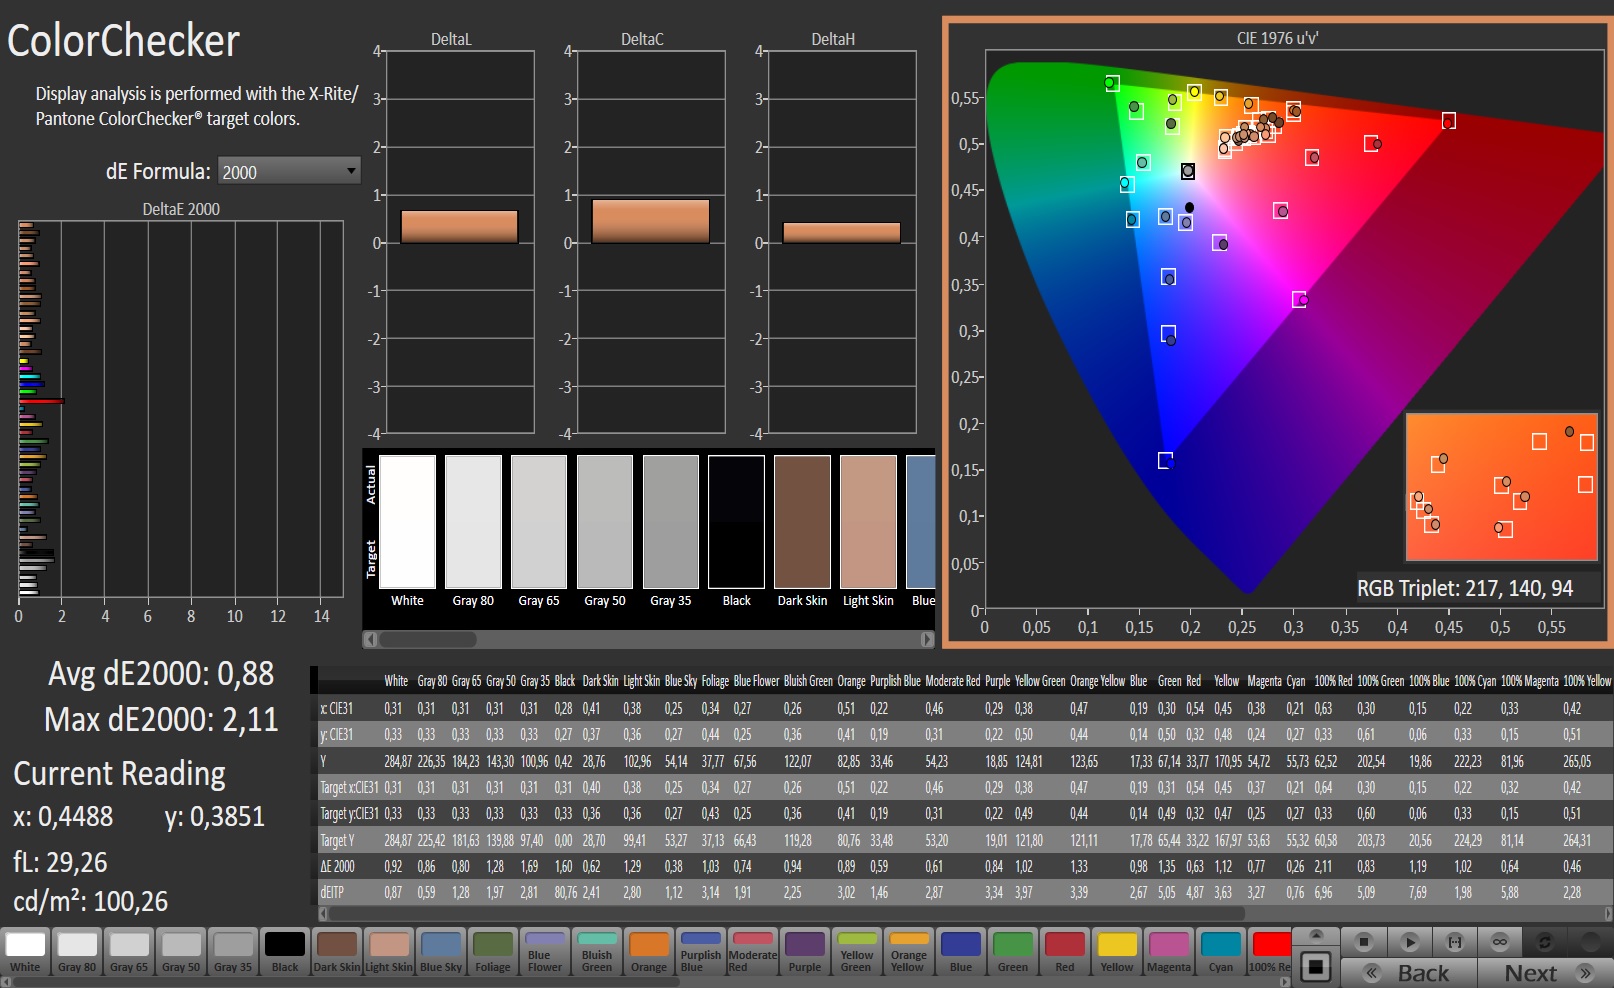
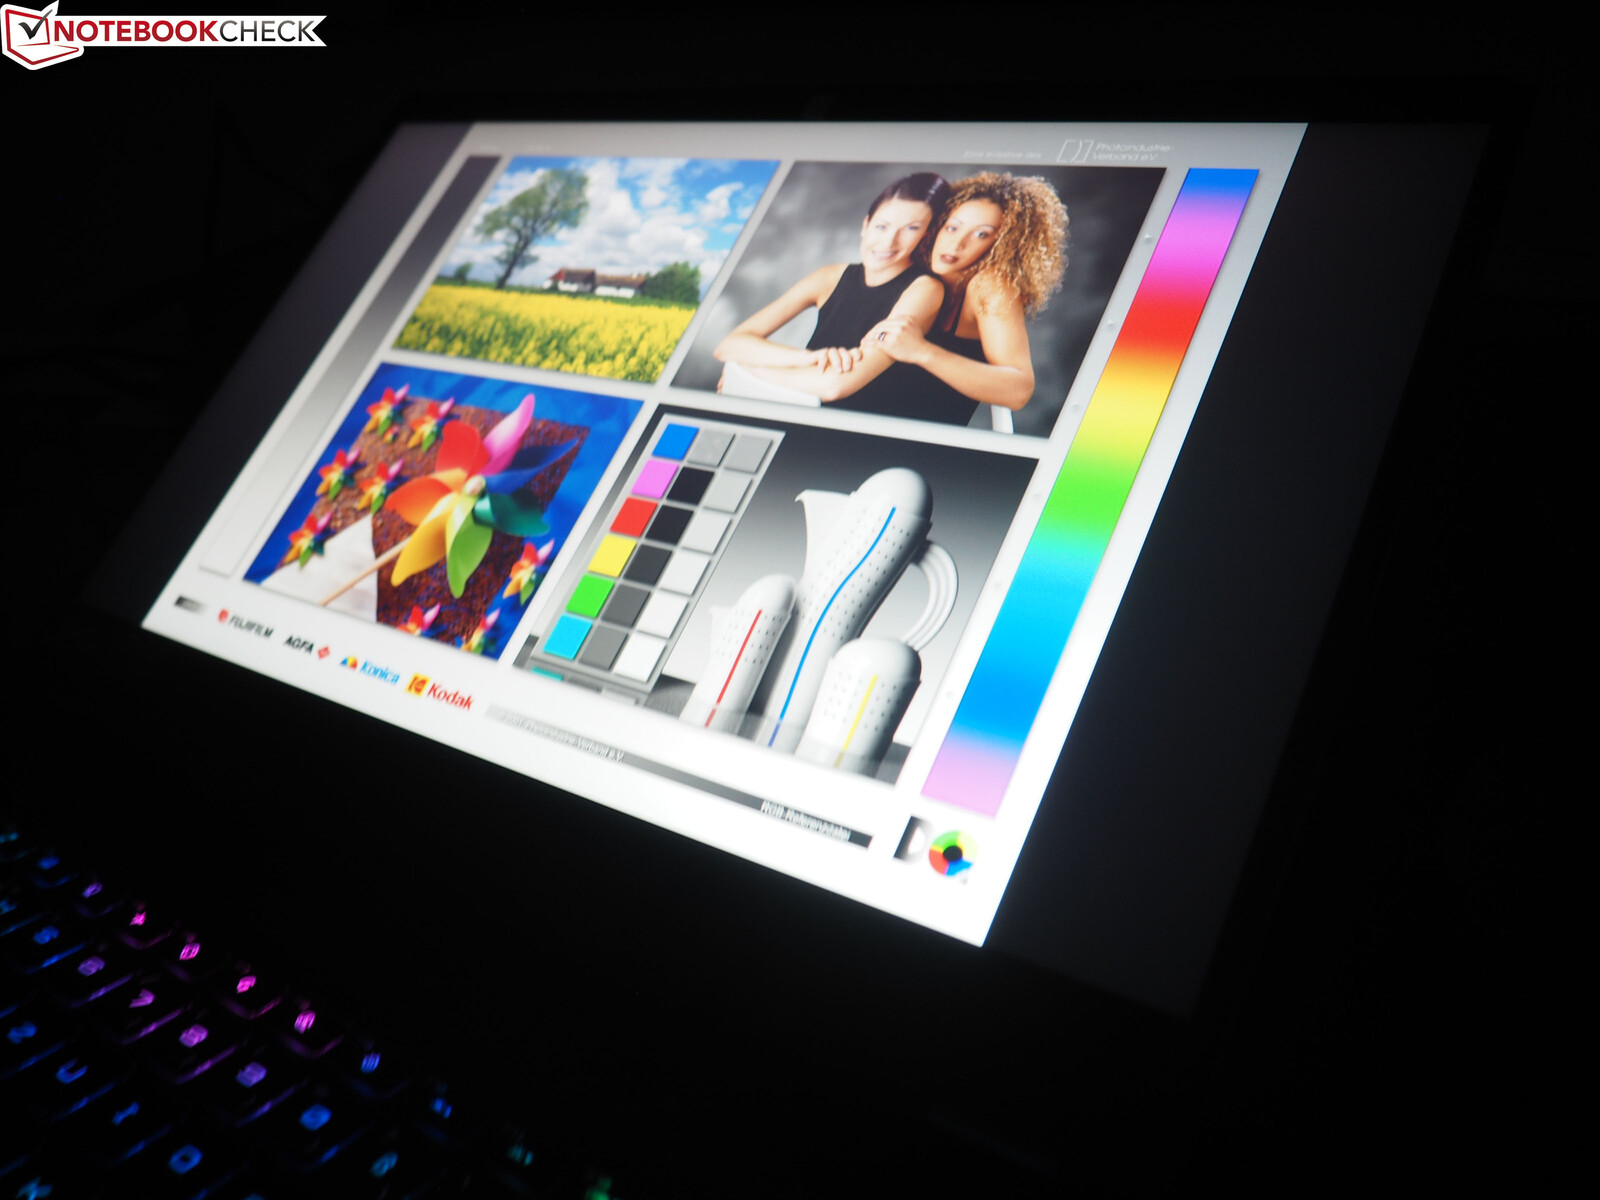
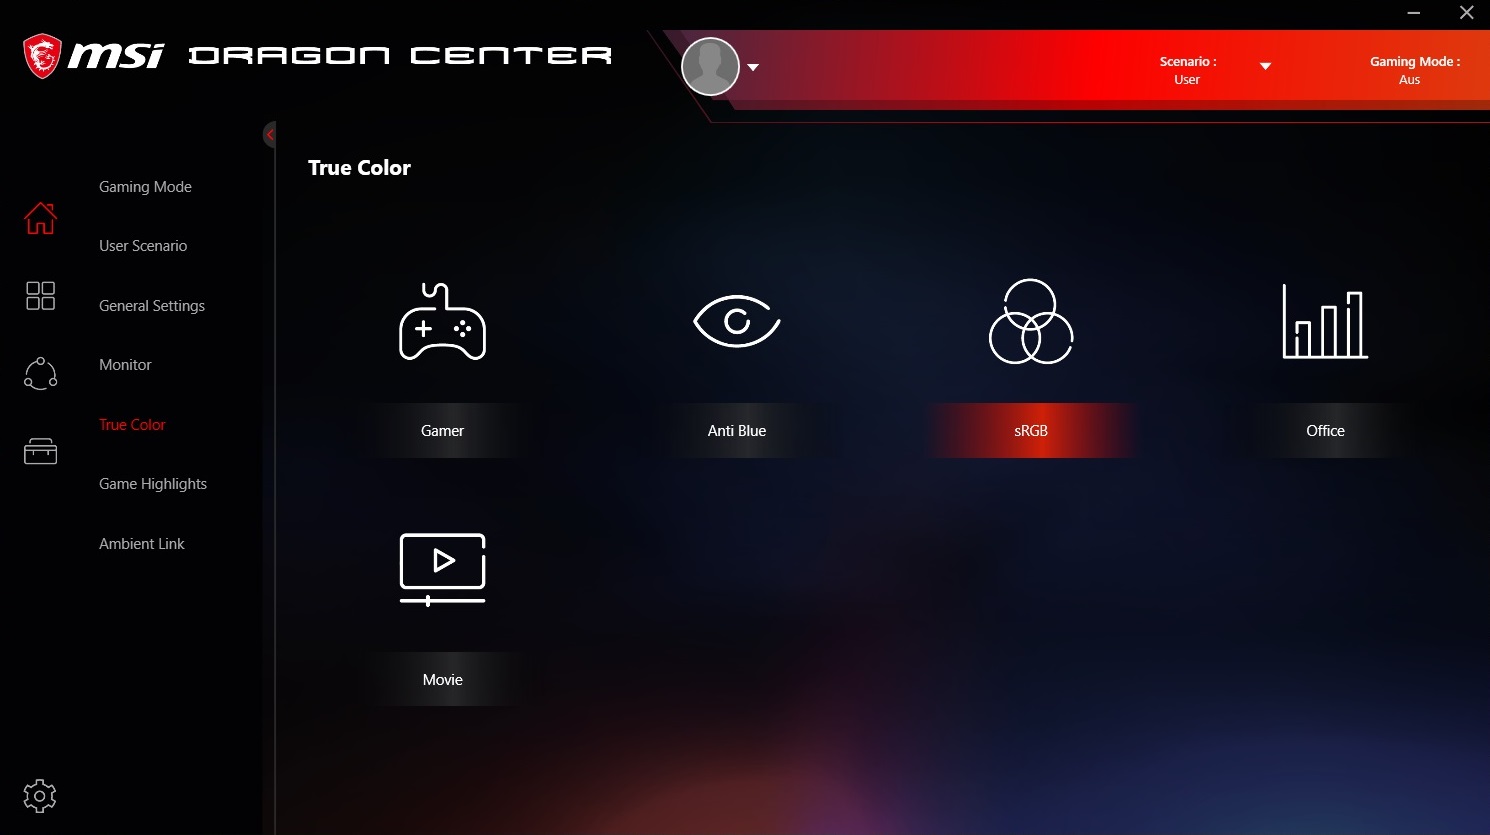
The GE66 inherits the strengths and weaknesses of the 15-inch screen. While the luminosity is only moderately impressive at around 280 cd/m², the contrast cracks the 1,000:1 mark due to the relatively low black value (0.25 cd/m²). The color accuracy also doesn't have to hide behind the competition. Thanks to the True Color software (the "sRGB" mode was tested), grayscales and colors are in the ideal range. Thus, subsequent calibration can be skipped.
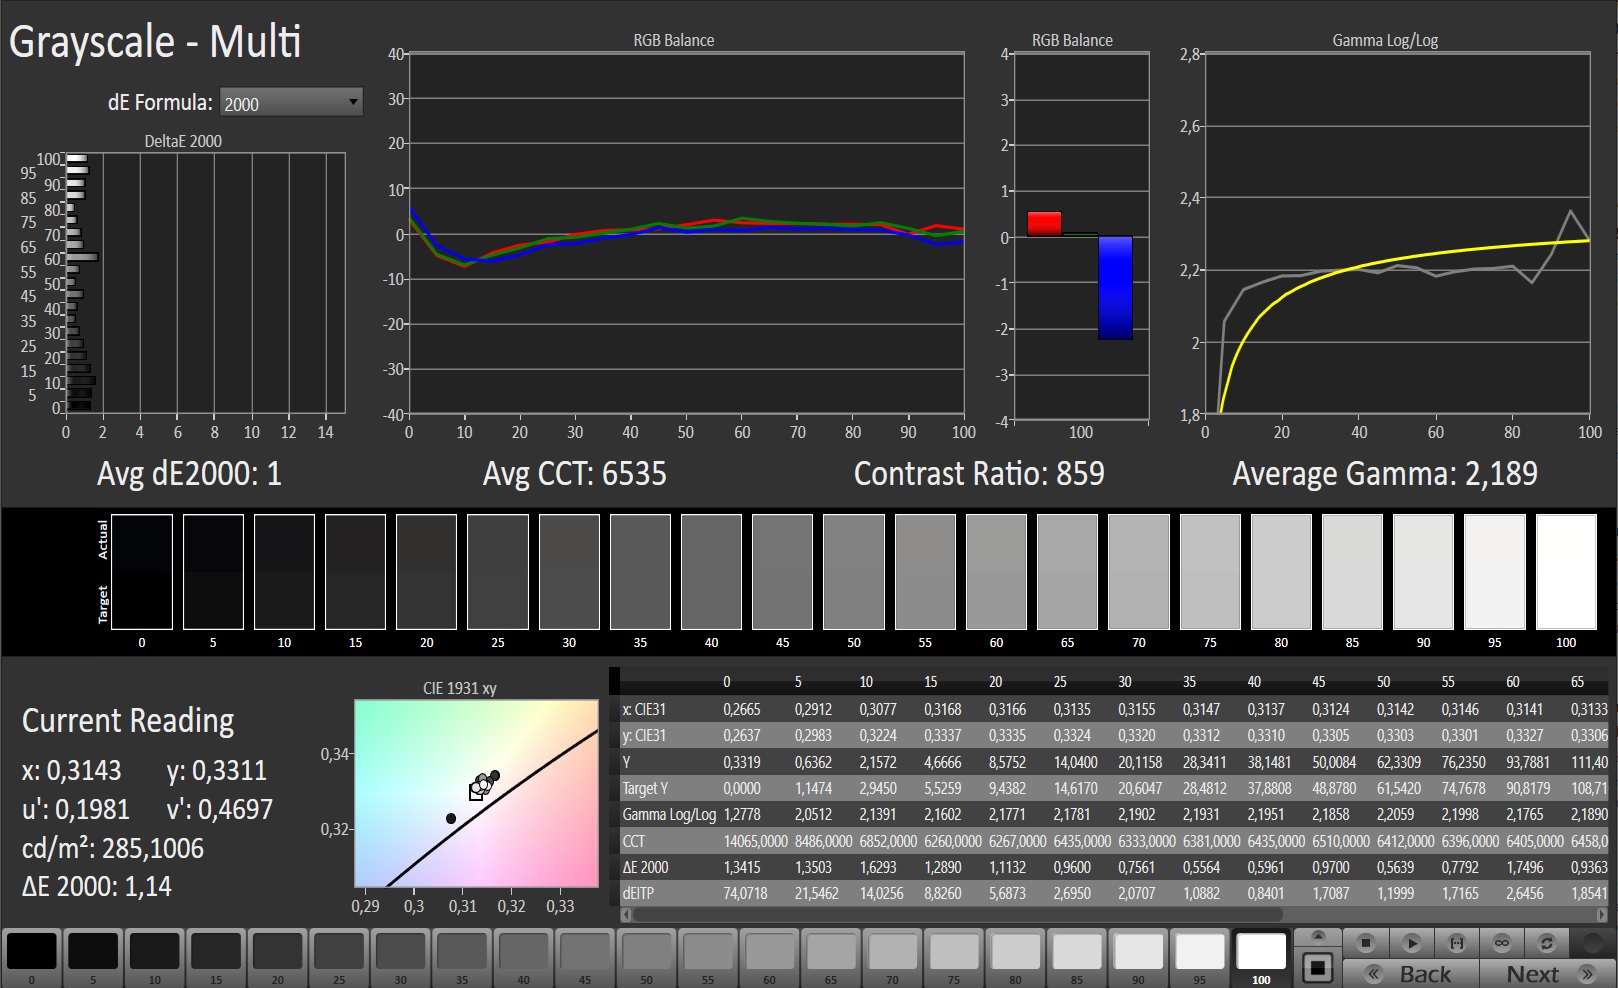
When it comes to viewing angles, the GE66 is in line with typical IPS levels. In addition to the high frame rate, the response time is also impressive. According to our measurements, the 15-incher comes up to 10 ms black-to-white and 16 ms gray-to-gray.
That the screen flickers up to a brightness of 19% shouldn't be a problem even for sensitive people (see info window below). However, buyers have to live without G-Sync image enhancement. For a longer battery life, the GE66 offers Optimus technology.
Display Response Times
| ↔ Response Time Black to White | ||
|---|---|---|
| 10.4 ms ... rise ↗ and fall ↘ combined | ↗ 6 ms rise | 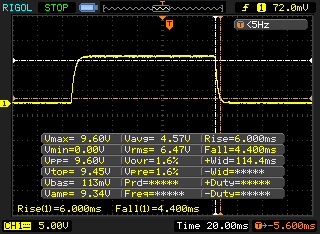 |
| ↘ 4.4 ms fall | ||
| The screen shows good response rates in our tests, but may be too slow for competitive gamers. In comparison, all tested devices range from 0.1 (minimum) to 240 (maximum) ms. » 28 % of all devices are better. This means that the measured response time is better than the average of all tested devices (19.8 ms). | ||
| ↔ Response Time 50% Grey to 80% Grey | ||
| 16.4 ms ... rise ↗ and fall ↘ combined | ↗ 6.8 ms rise | 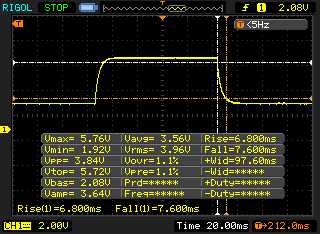 |
| ↘ 7.6 ms fall | ||
| The screen shows good response rates in our tests, but may be too slow for competitive gamers. In comparison, all tested devices range from 0.165 (minimum) to 636 (maximum) ms. » 31 % of all devices are better. This means that the measured response time is better than the average of all tested devices (30.9 ms). | ||
Screen Flickering / PWM (Pulse-Width Modulation)
| Screen flickering / PWM detected | 23580 Hz | ≤ 19 % brightness setting | 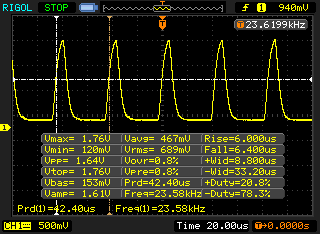 |
The display backlight flickers at 23580 Hz (worst case, e.g., utilizing PWM) Flickering detected at a brightness setting of 19 % and below. There should be no flickering or PWM above this brightness setting. The frequency of 23580 Hz is quite high, so most users sensitive to PWM should not notice any flickering. In comparison: 52 % of all tested devices do not use PWM to dim the display. If PWM was detected, an average of 7741 (minimum: 5 - maximum: 343500) Hz was measured. | |||
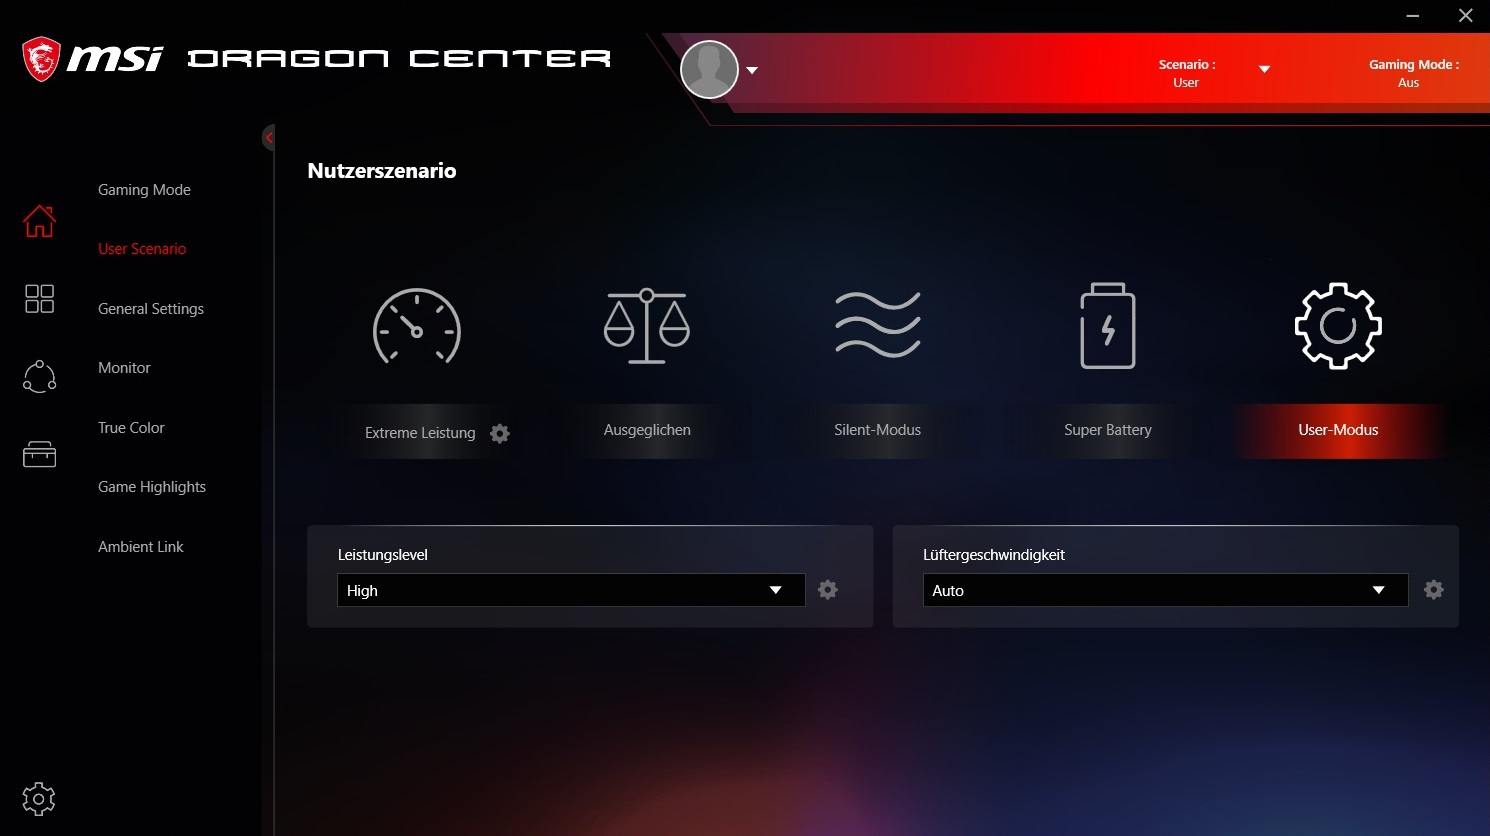
Testing conditions
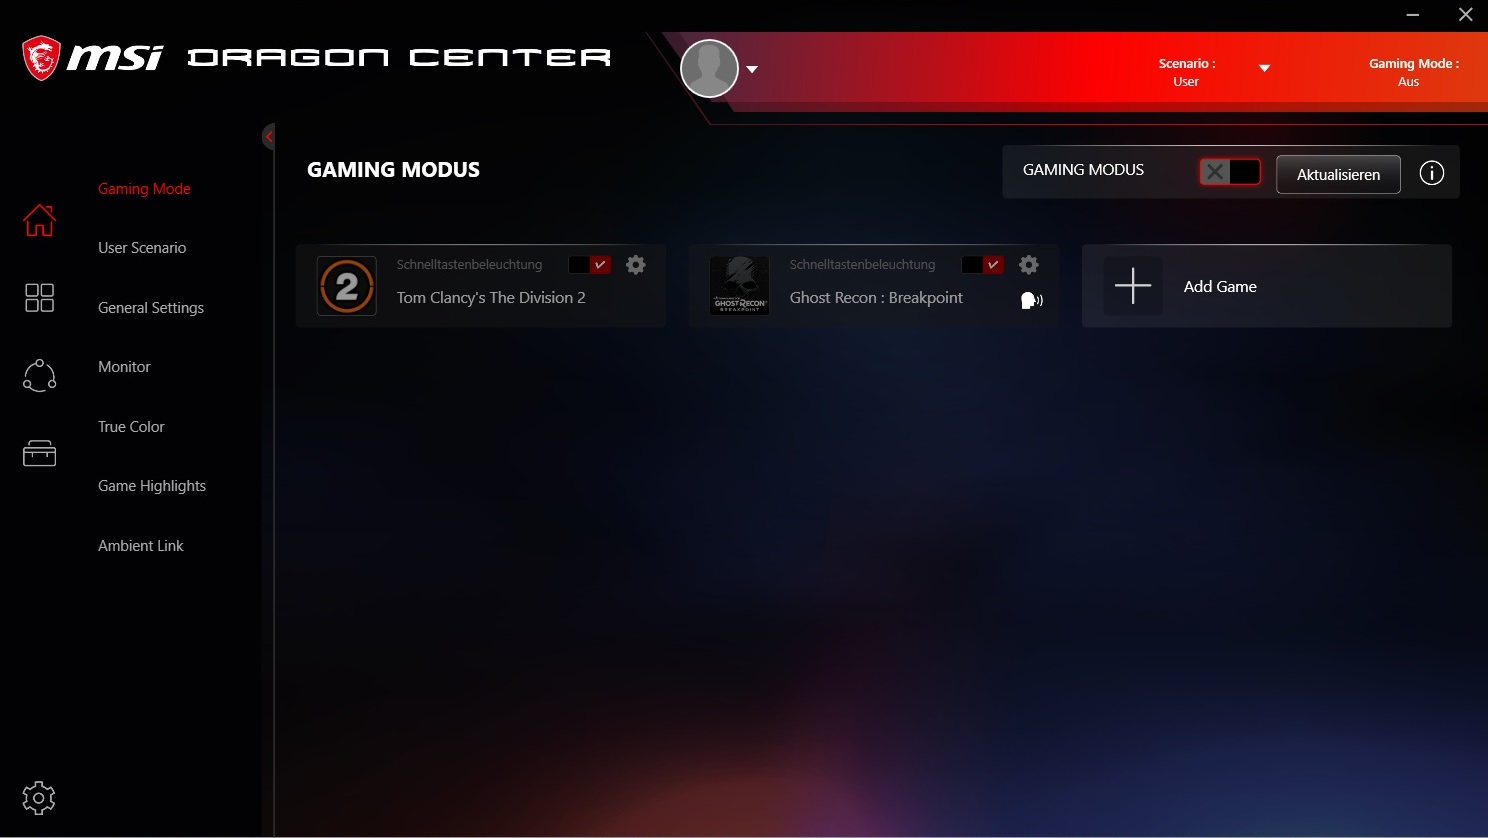
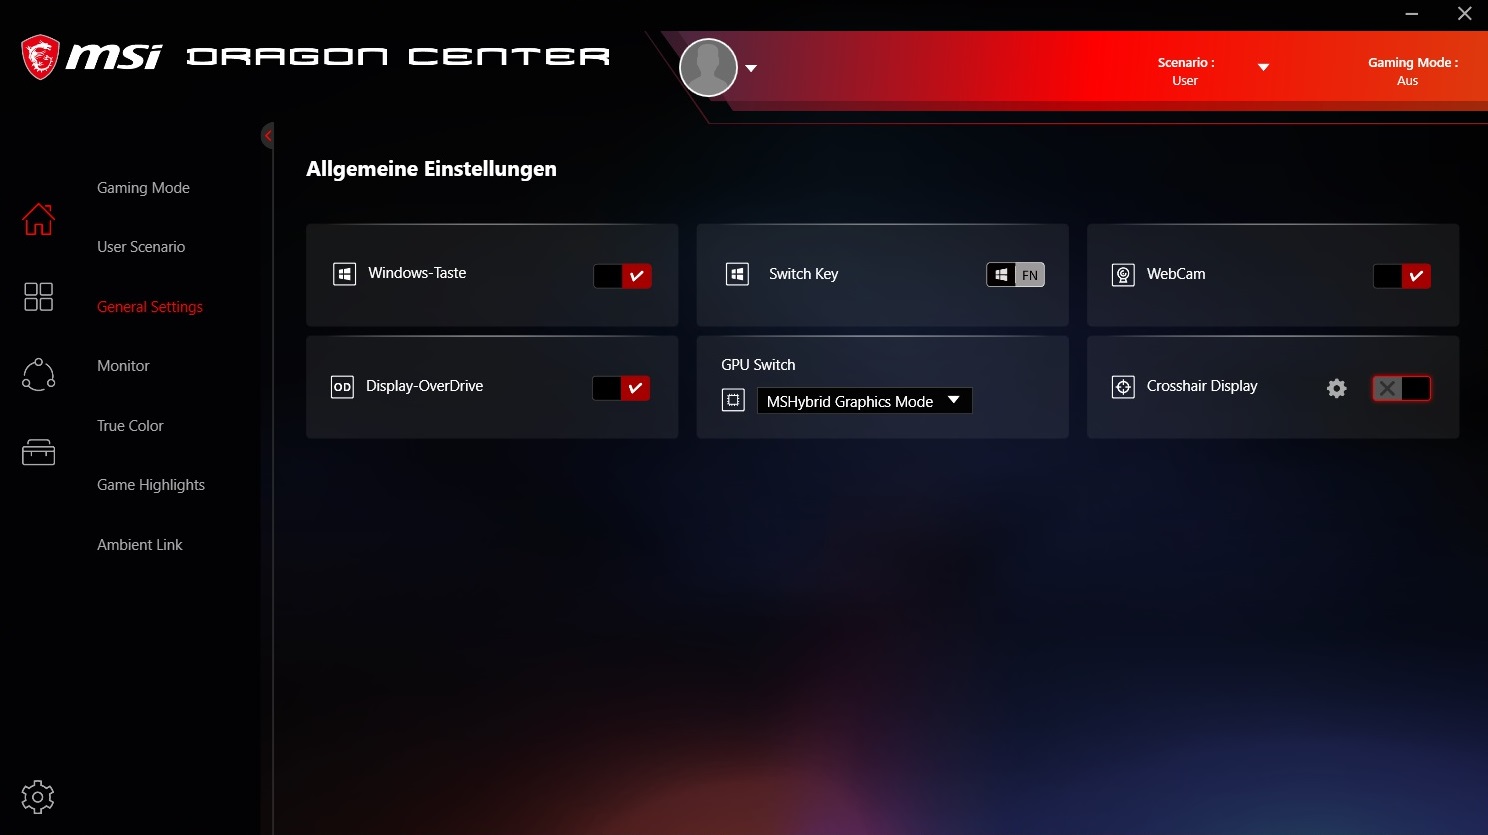
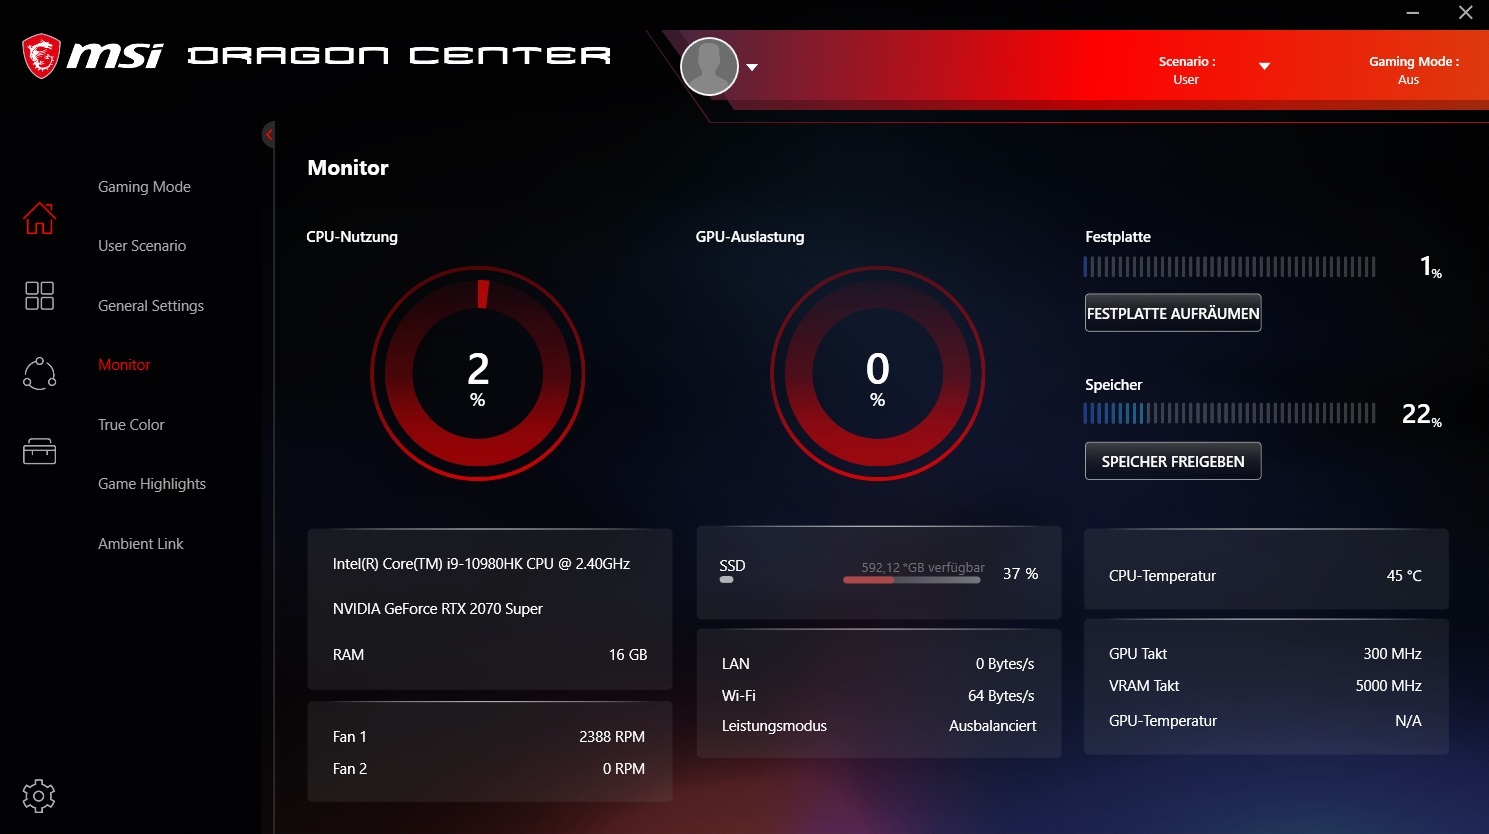
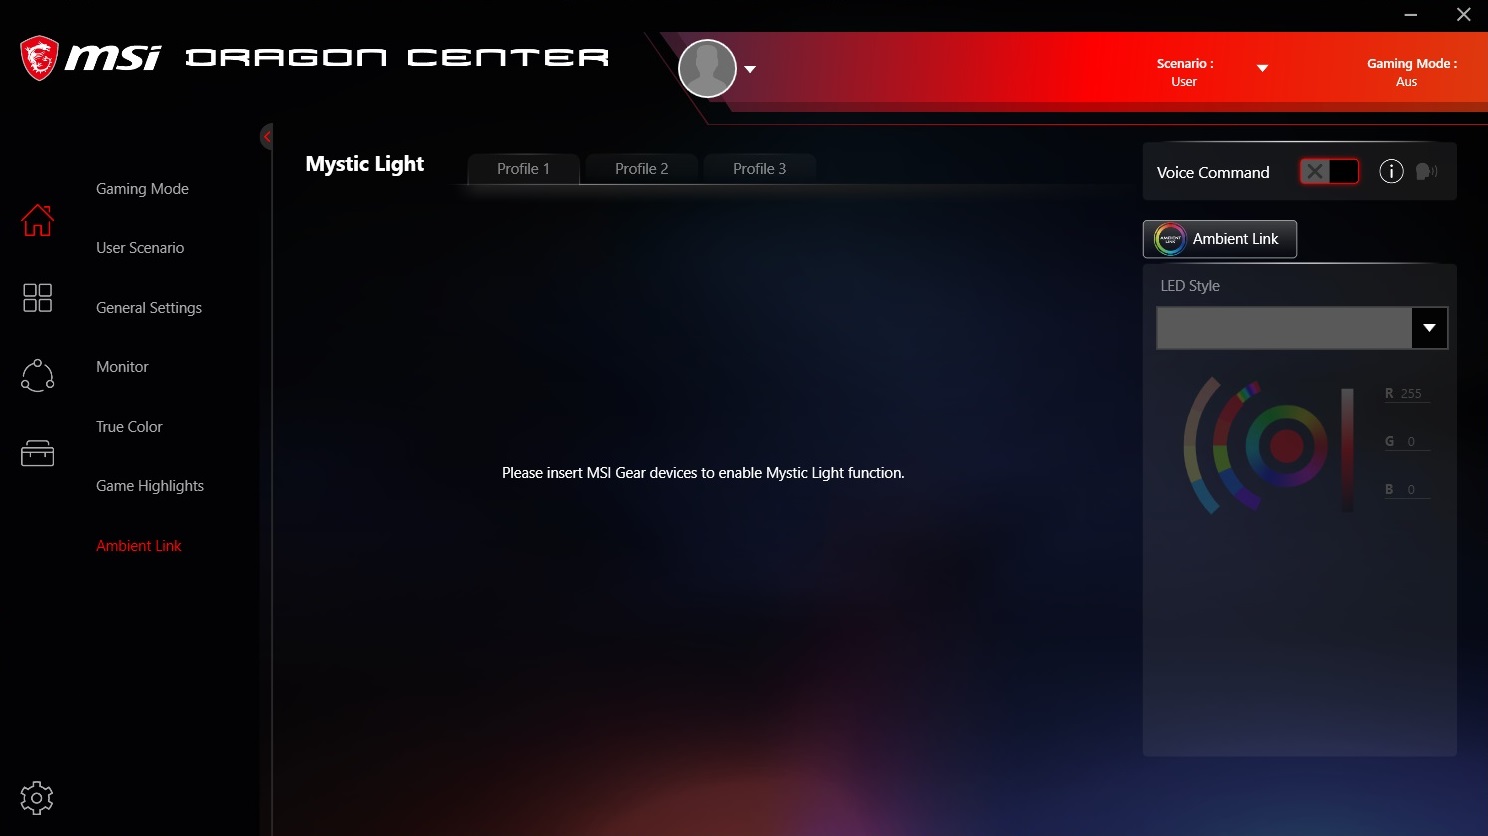
Tuning fans will be pleased with the extensive Dragon Center, which MSI preinstalls on its gaming laptops. Especially the tab "User Scenario" is worth mentioning, which contains several profiles. Our tests were conducted in "User" mode with "High" performance level and automatic fan speed. The determined results (performance, emissions, etc.) could deviate considerably in other modes.
Performance
Despite its compact dimensions, we would describe the GE66 Raider as a genuine high-end laptop that can definitely be used as a desktop replacement. Just like the eight-core processor, neither the 16 GB RAM nor the NVMe SSD should reach their performance limits quickly. The GeForce RTX 2070 Super is also an extremely good option for gamers.
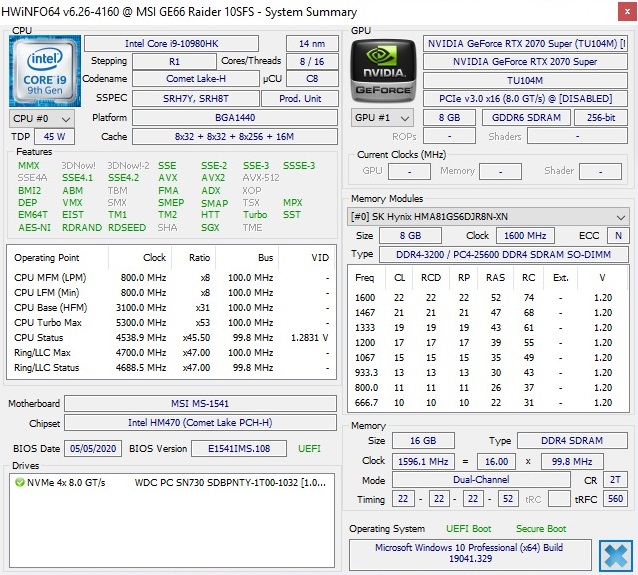
Processor
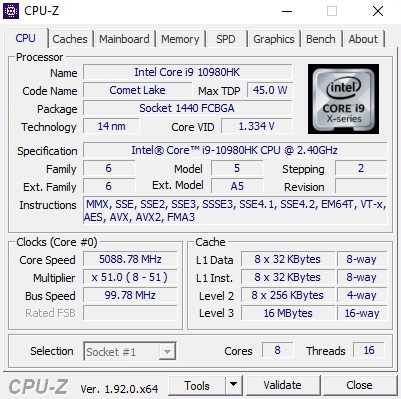
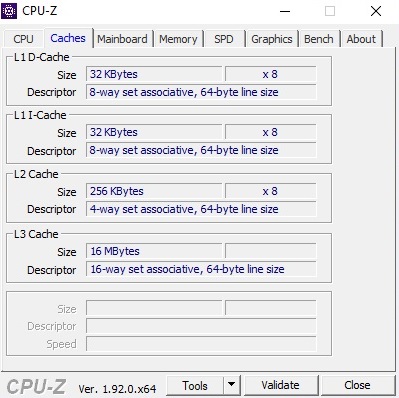
The more expensive variants of the GE66 are equipped with Intel's currently strongest laptop CPU, the Core i9-10980HK. The octa-core model from the Comet Lake generation offers 16 MB L3 cache, an open multiplier and becomes dangerous for the (in terms of price far more attractive) AMD eight-core Ryzen 7 4800H, which is built in the 7 nm process instead of the 14 nm process. Per SMT both chips can process up to 16 threads in parallel.
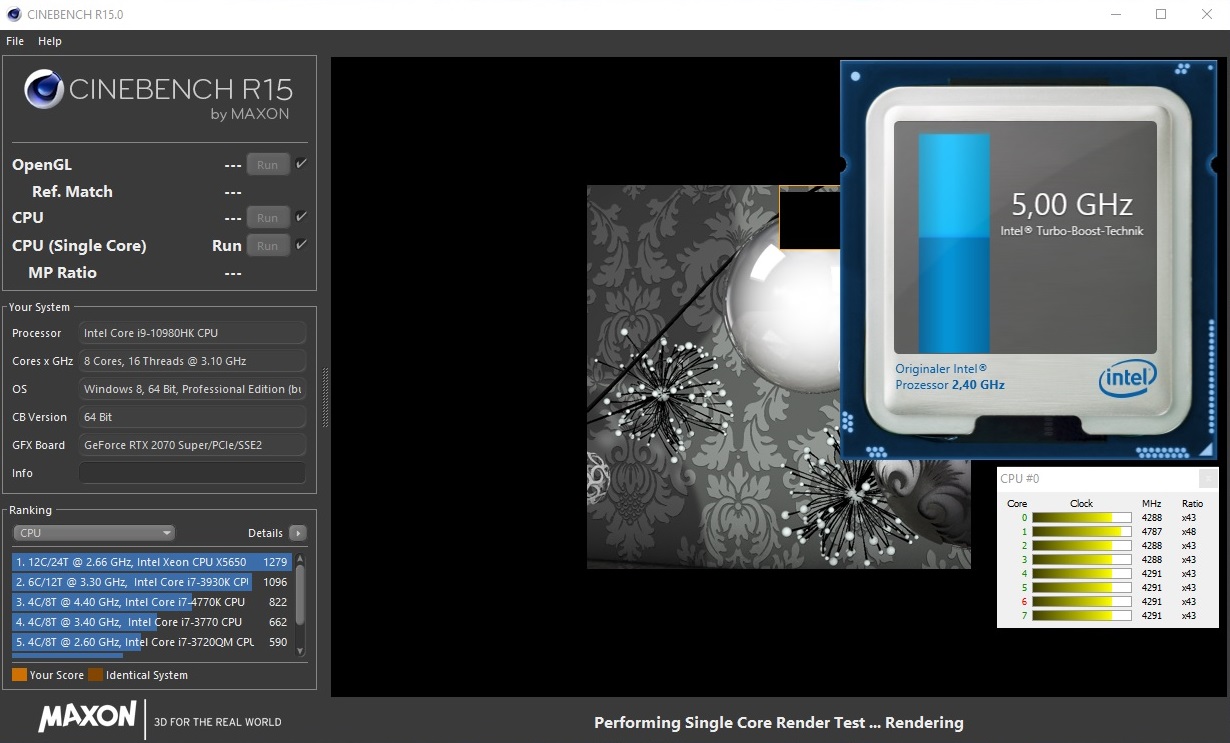
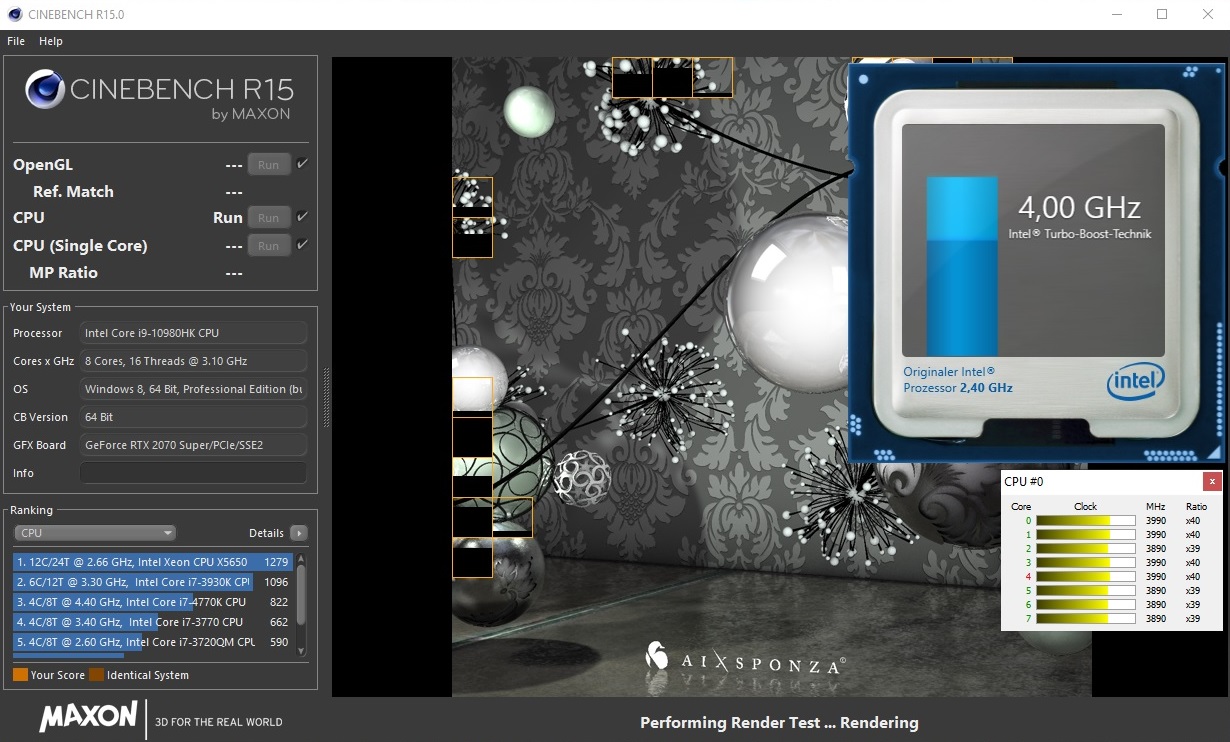
Intel lists 2.4 GHz as the base clock for the Core i9-10980HK. However, up to 5.3 GHz is possible under load thanks to the Turbo Boost function. What the GE66 gets out of the existing clock rate range, we have tested with Cinebench R15. While the single core test is performed at 4.2 to 5.0 GHz, the Comet Lake chip manages between 3.8 and 4.2 GHz under load on all cores.
Although the performance drops a bit in the course of the Cinebench loop - a common behavior for laptops - the GE66 overtakes the competing devices with Core i9-9980HK or Core i9-9880H processors in the long run. Overall, the turbo performance of the i9-10980HK is neither particularly good nor particularly bad.
| Blender - v2.79 BMW27 CPU | |
| Eurocom Nightsky RX15 | |
| MSI GE66 Raider 10SFS | |
| Average of class Gaming (79 - 330, n=101, last 2 years) | |
| Geekbench 5.5 | |
| Single-Core | |
| Average of class Gaming (1403 - 2474, n=102, last 2 years) | |
| MSI GE66 Raider 10SFS | |
| Multi-Core | |
| Average of class Gaming (6460 - 28263, n=102, last 2 years) | |
| MSI GE66 Raider 10SFS | |
| HWBOT x265 Benchmark v2.2 - 4k Preset | |
| Average of class Gaming (11.5 - 44.4, n=102, last 2 years) | |
| MSI GE66 Raider 10SFS | |
| Eurocom Nightsky RX15 | |
| LibreOffice - 20 Documents To PDF | |
| MSI GE66 Raider 10SFS | |
| Average of class Gaming (33.2 - 88.8, n=102, last 2 years) | |
| R Benchmark 2.5 - Overall mean | |
| MSI GE66 Raider 10SFS | |
| Average of class Gaming (0.3439 - 0.59, n=102, last 2 years) | |
* ... smaller is better
System Performance
The system performance fully meets the expectations. Especially because of the very fast solid state drive, the operating system (Windows 10) responds very quickly.
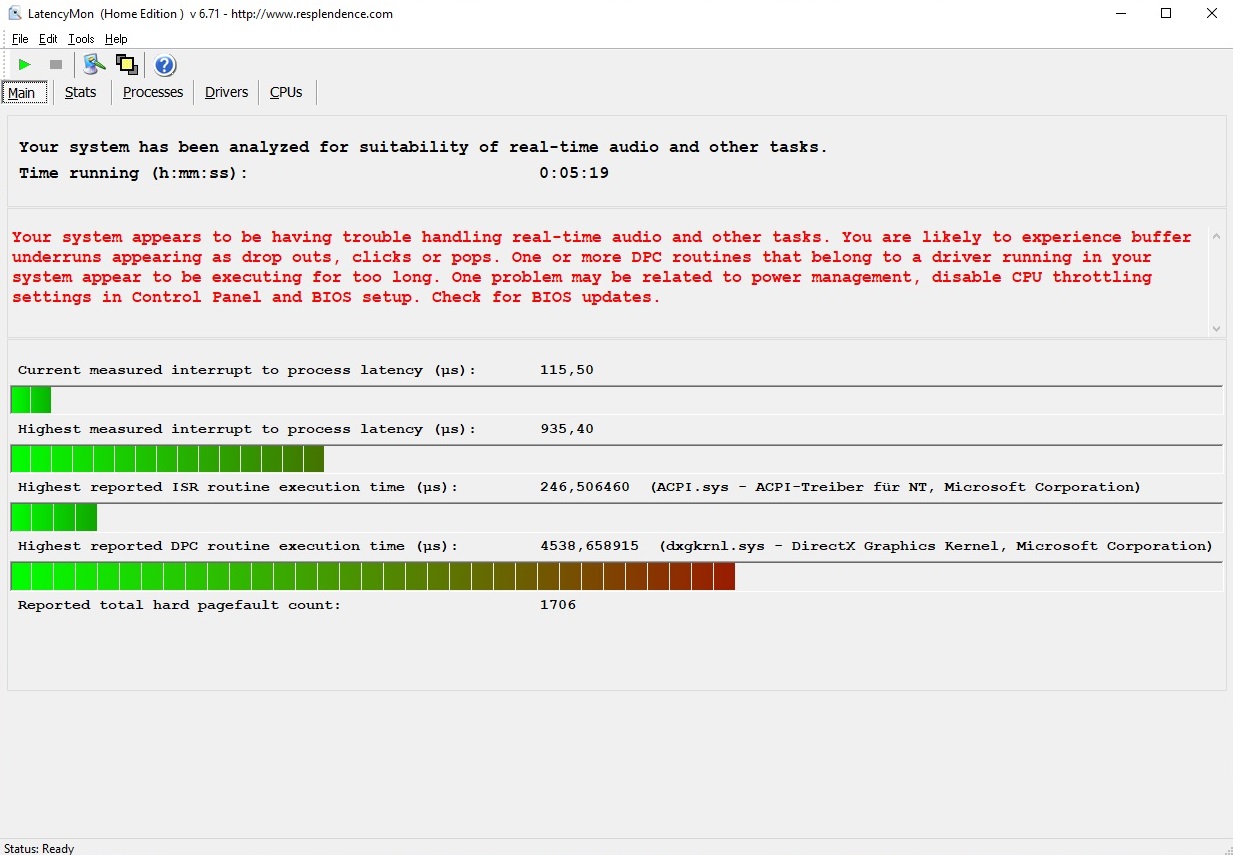
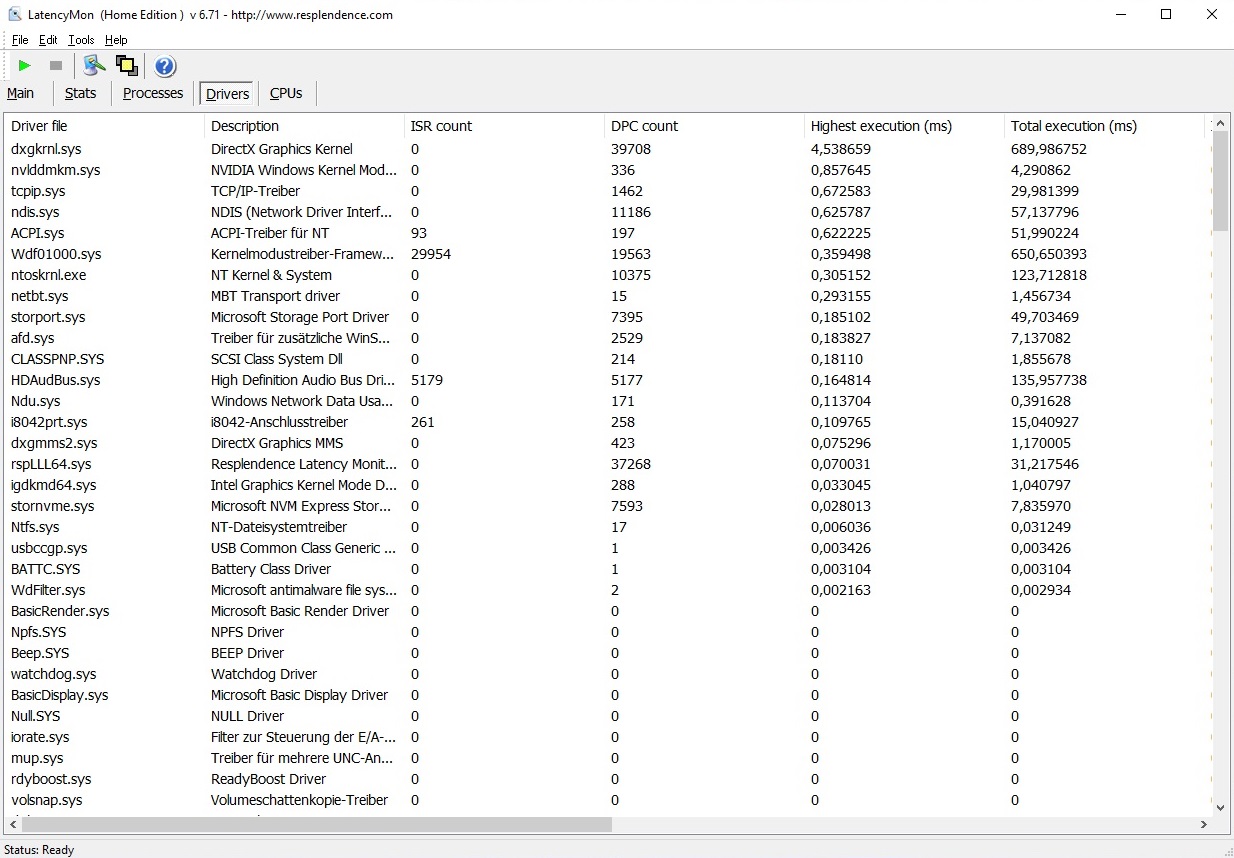
DPC Latencies
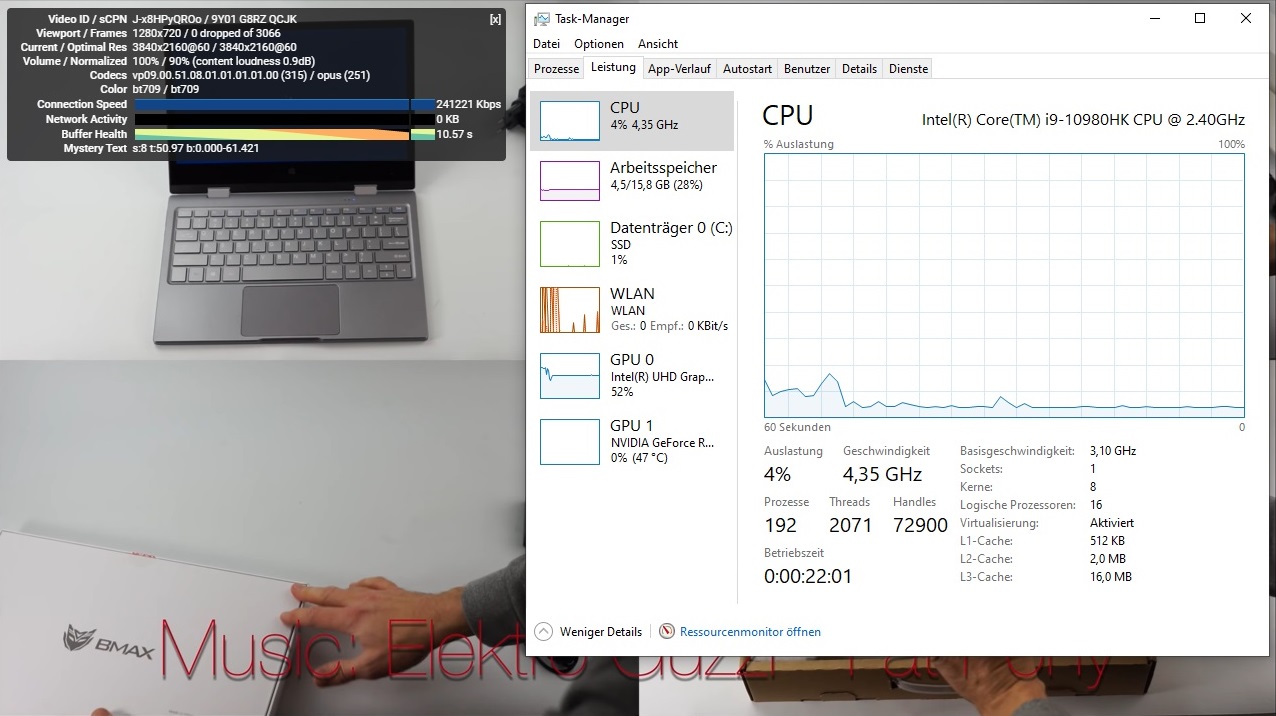
MSI could improve a bit on the subject of latencies. According to LatencyMon the values are suboptimal. Our 4K YouTube video, however, ran perfectly.
| DPC Latencies / LatencyMon - interrupt to process latency (max), Web, Youtube, Prime95 | |
| MSI GE66 Raider 10SFS | |
* ... smaller is better
Mass storage
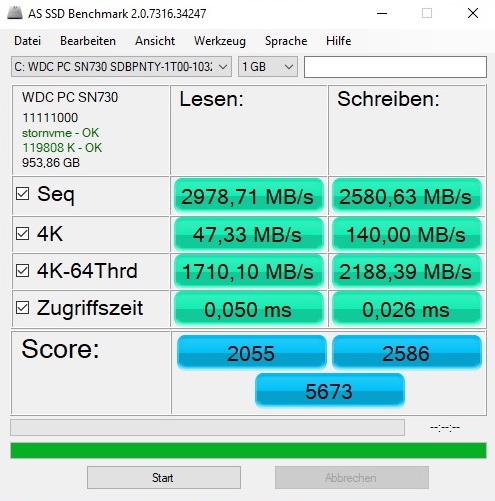
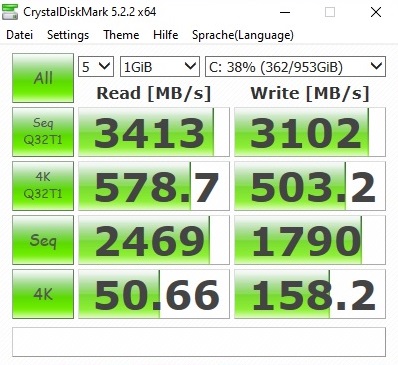
SSDs based on PCIe or NVMe are now almost a must for gaming laptops. The 1 TB drive from WDC built into the GE66 can hold its own very well against the Samsung and Intel competition in CrystalDiskMark. No matter if reading or writing, large or small files: The PC SN730 leads the pack.
| MSI GE66 Raider 10SFS WDC PC SN730 SDBPNTY-1T00 | MSI GE65 Raider 9SF-049US Samsung SSD PM981 MZVLB1T0HALR | Asus Strix Scar III G531GW Intel SSD 660p 1TB SSDPEKNW010T8 | Eurocom Nightsky RX15 Samsung SSD 970 Pro 512GB | |
|---|---|---|---|---|
| CrystalDiskMark 5.2 / 6 | -9% | -18% | -3% | |
| Write 4K (MB/s) | 158.2 | 125.7 -21% | 135 -15% | 153 -3% |
| Read 4K (MB/s) | 50.7 | 45.04 -11% | 54.9 8% | 60.5 19% |
| Write Seq (MB/s) | 1790 | 2361 32% | 1649 -8% | 1938 8% |
| Read Seq (MB/s) | 2469 | 1987 -20% | 1449 -41% | 1932 -22% |
| Write 4K Q32T1 (MB/s) | 503 | 407.1 -19% | 508 1% | 482.5 -4% |
| Read 4K Q32T1 (MB/s) | 579 | 537 -7% | 559 -3% | 594 3% |
| Write Seq Q32T1 (MB/s) | 3102 | 2398 -23% | 1759 -43% | 2324 -25% |
| Read Seq Q32T1 (MB/s) | 3413 | 3309 -3% | 1826 -46% | 3539 4% |

Continuous load read: DiskSpd Read Loop, Queue Depth 8
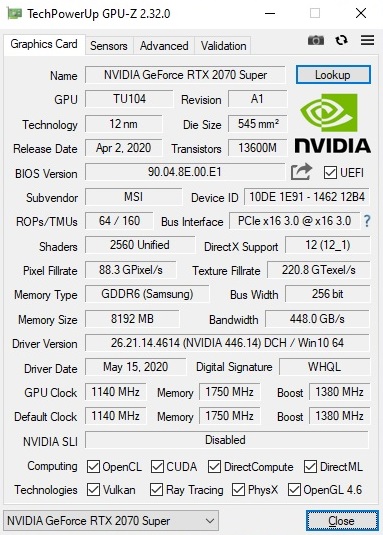
Graphics card
While most of the "Super"-laptops tested so far rely on a power-saving Max-Q chip, the GE66 10SFS comes with a full-fledged GeForce RTX 2070 Super. Compared to the old standard model, Nvidia has, among other things, increased the amount of shader units. So instead of 2,304 there are now 2,560 CUDA cores, which promises a certain performance plus. The GDDR6 video memory is once again 8 GB in size and connected via a 256-bit interface.
| 3DMark 06 Standard Score | 43041 points | |
| 3DMark Vantage P Result | 70601 points | |
| 3DMark 11 Performance | 24989 points | |
| 3DMark Cloud Gate Standard Score | 50695 points | |
| 3DMark Fire Strike Score | 19884 points | |
| 3DMark Time Spy Score | 8419 points | |
Help | ||
On the benchmark course, the GE66 is positioned at the top of the field thanks to its somewhat faster GPU. Depending on the benchmark and device, the lead of the Super variant is between 4 and 30%.
| 3DMark 11 - 1280x720 Performance GPU | |
| Average of class Gaming (21841 - 80022, n=103, last 2 years) | |
| MSI GE66 Raider 10SFS | |
| Eurocom Nightsky RX15 | |
| MSI GE65 Raider 9SF-049US | |
| Asus Strix Scar III G531GW | |
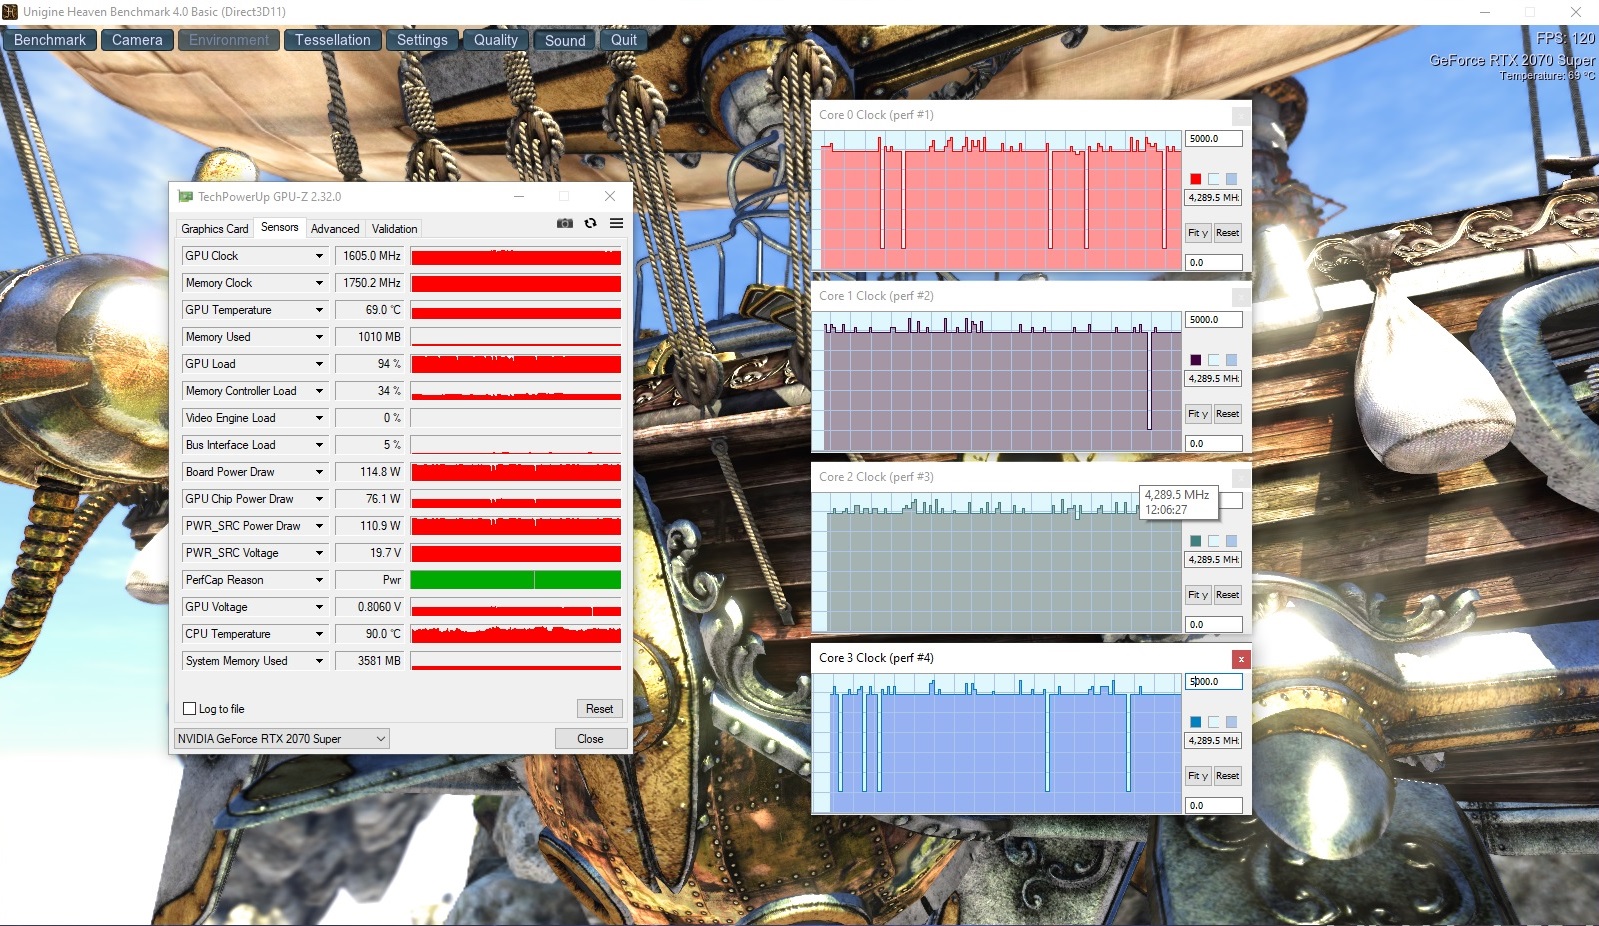
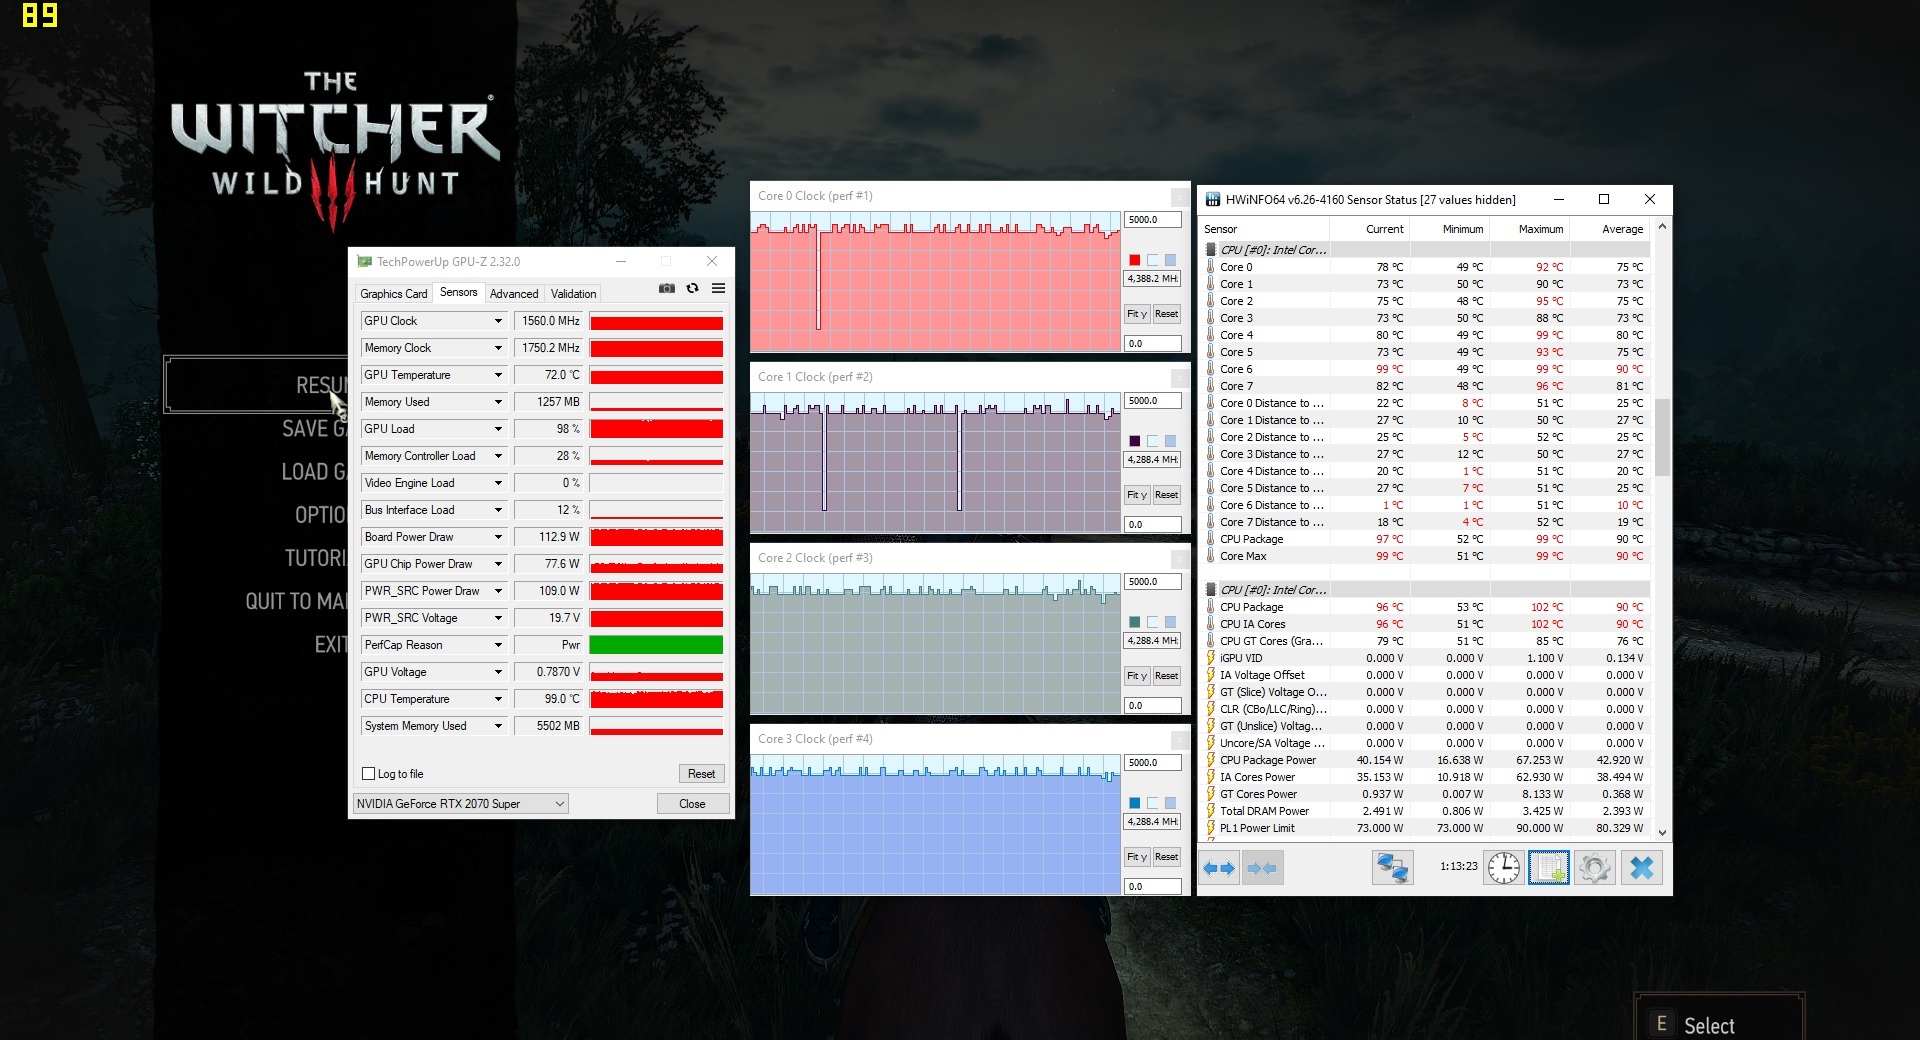
As you can see from the graph below, 3D performance remains fairly constant over time. During the 60-minute test with The Witcher 3, there were no performance drops or the like. The RTX 2070 Super's core clock rate leveled off at about 1,560 MHz on average (base clock: 1,140 MHz).
Gaming Performance
The GE66 Raider is fast enough to run all the latest games in the native Full HD resolution (1920x1080) with maximum detail. Even extremely demanding titles like Red Dead Redemption 2 are displayed with more than 40 FPS.
| The Witcher 3 - 1920x1080 Ultra Graphics & Postprocessing (HBAO+) | |
| Average of class Gaming (104.7 - 240, n=7, last 2 years) | |
| MSI GE66 Raider 10SFS | |
| Eurocom Nightsky RX15 | |
| MSI GE65 Raider 9SF-049US | |
| Asus Strix Scar III G531GW | |
With 2560x1440 pixels, the RTX 2070 Super would usually have no problems. It only gets tight in the 4K range, i.e. when using 3840x2160 pixels. In general, the performance leap from the RTX 2070 is measurable in games but is not always noticeable.
| low | med. | high | ultra | QHD | 4K | |
|---|---|---|---|---|---|---|
| GTA V (2015) | 182 | 177 | 163 | 94 | ||
| The Witcher 3 (2015) | 268 | 161 | 85.1 | 57.6 | ||
| Dota 2 Reborn (2015) | 155 | 141 | 133 | 126 | ||
| Fortnite (2018) | 164 | 156 | 129 | 93.4 | 47.9 | |
| Final Fantasy XV Benchmark (2018) | 121 | 91.1 | 37.7 | |||
| Kingdom Come: Deliverance (2018) | 146 | 119 | 82.5 | 59.7 | 31.1 | |
| X-Plane 11.11 (2018) | 117 | 103 | 87 | |||
| Monster Hunter World (2018) | 130 | 120 | 98.9 | 63.9 | 32.1 | |
| Shadow of the Tomb Raider (2018) | 123 | 118 | 108 | 73 | 37 | |
| Assassin´s Creed Odyssey (2018) | 104 | 90 | 63 | 56 | 36 | |
| Hitman 2 (2018) | 98.8 | 89.7 | 82.5 | 78.8 | 46.4 | |
| Battlefield V (2018) | 166 | 152 | 141 | 110 | 62.7 | |
| Darksiders III (2018) | 166 | 141 | 127 | 88.3 | 44 | |
| Just Cause 4 (2018) | 162 | 119 | 105 | 75 | 41.2 | |
| Apex Legends (2019) | 144 | 144 | 144 | 121 | 66.6 | |
| Far Cry New Dawn (2019) | 111 | 104 | 94 | 89 | 50 | |
| Metro Exodus (2019) | 112 | 82.7 | 65.5 | 54.4 | 31.9 | |
| Dirt Rally 2.0 (2019) | 211 | 178 | 97.7 | 72.4 | ||
| The Division 2 (2019) | 150 | 124 | 87 | 61 | 32 | |
| Anno 1800 (2019) | 116 | 90.4 | 51 | 44 | 23.9 | |
| Rage 2 (2019) | 143 | 121 | 119 | 74.2 | 36.7 | |
| F1 2019 (2019) | 203 | 178 | 170 | 116 | 73 | |
| Control (2019) | 107 | 80.8 | 52.6 | 25.6 | ||
| Borderlands 3 (2019) | 127 | 92.1 | 70.6 | 49.8 | 26.8 | |
| FIFA 20 (2019) | 280 | 267 | 264 | 262 | 211 | |
| Ghost Recon Breakpoint (2019) | 115 | 101 | 75 | 55 | 32 | |
| GRID 2019 (2019) | 160 | 119 | 80.7 | 70.2 | 47.2 | |
| Call of Duty Modern Warfare 2019 (2019) | 141 | 134 | 107 | 75.3 | 41.6 | |
| Need for Speed Heat (2019) | 105 | 97 | 92.4 | 81.7 | 48.1 | |
| Star Wars Jedi Fallen Order (2019) | 119 | 114 | 108 | 84 | 42.5 | |
| Red Dead Redemption 2 (2019) | 110 | 73.1 | 47.6 | 38.1 | 24.8 | |
| Escape from Tarkov (2020) | 121 | 121 | 121 | 81 | 41.4 | |
| Hunt Showdown (2020) | 136 | 113 | 74 | 34.1 | ||
| Doom Eternal (2020) | 198 | 176 | 170 | 118 | 61.6 | |
| Gears Tactics (2020) | 215 | 144 | 103 | 64.5 | 33.3 |
Emissions
Noise emissions
The GE66 has to take criticism for its high noise level. Although the system works silently in places, every now and then the fans start up heavily (over 40 dB) while idling. 53 to 55 dB under load is also a statement and almost forces you to use headphones. However, in MSI's defense, the Asus Strix G531GW and the Eurocom Nightsky RX15 become similarly loud in 3D mode.
Noise level
| Idle |
| 30 / 35 / 44 dB(A) |
| Load |
| 53 / 55 dB(A) |
 | ||
30 dB silent 40 dB(A) audible 50 dB(A) loud |
||
min: | ||
| MSI GE66 Raider 10SFS i9-10980HK, GeForce RTX 2070 Super Mobile | MSI GE65 Raider 9SF-049US i9-9880H, GeForce RTX 2070 Mobile | Asus Strix Scar III G531GW i9-9880H, GeForce RTX 2070 Mobile | Eurocom Nightsky RX15 i9-9980HK, GeForce RTX 2070 Mobile | Average of class Gaming | |
|---|---|---|---|---|---|
| Noise | 7% | 1% | 8% | 18% | |
| off / environment * (dB) | 30 | 28.8 4% | 29 3% | 28.2 6% | 24.1 ? 20% |
| Idle Minimum * (dB) | 30 | 33 -10% | 30 -0% | 28.2 6% | 25.9 ? 14% |
| Idle Average * (dB) | 35 | 33 6% | 37 -6% | 28.2 19% | 27.4 ? 22% |
| Idle Maximum * (dB) | 44 | 33.1 25% | 39 11% | 31.7 28% | 30.1 ? 32% |
| Load Average * (dB) | 53 | 38 28% | 54 -2% | 53.7 -1% | 43.7 ? 18% |
| Witcher 3 ultra * (dB) | 53 | 52.9 -0% | 54 -2% | 53.7 -1% | |
| Load Maximum * (dB) | 55 | 57.8 -5% | 54 2% | 53.7 2% | 54.3 ? 1% |
* ... smaller is better
Temperature
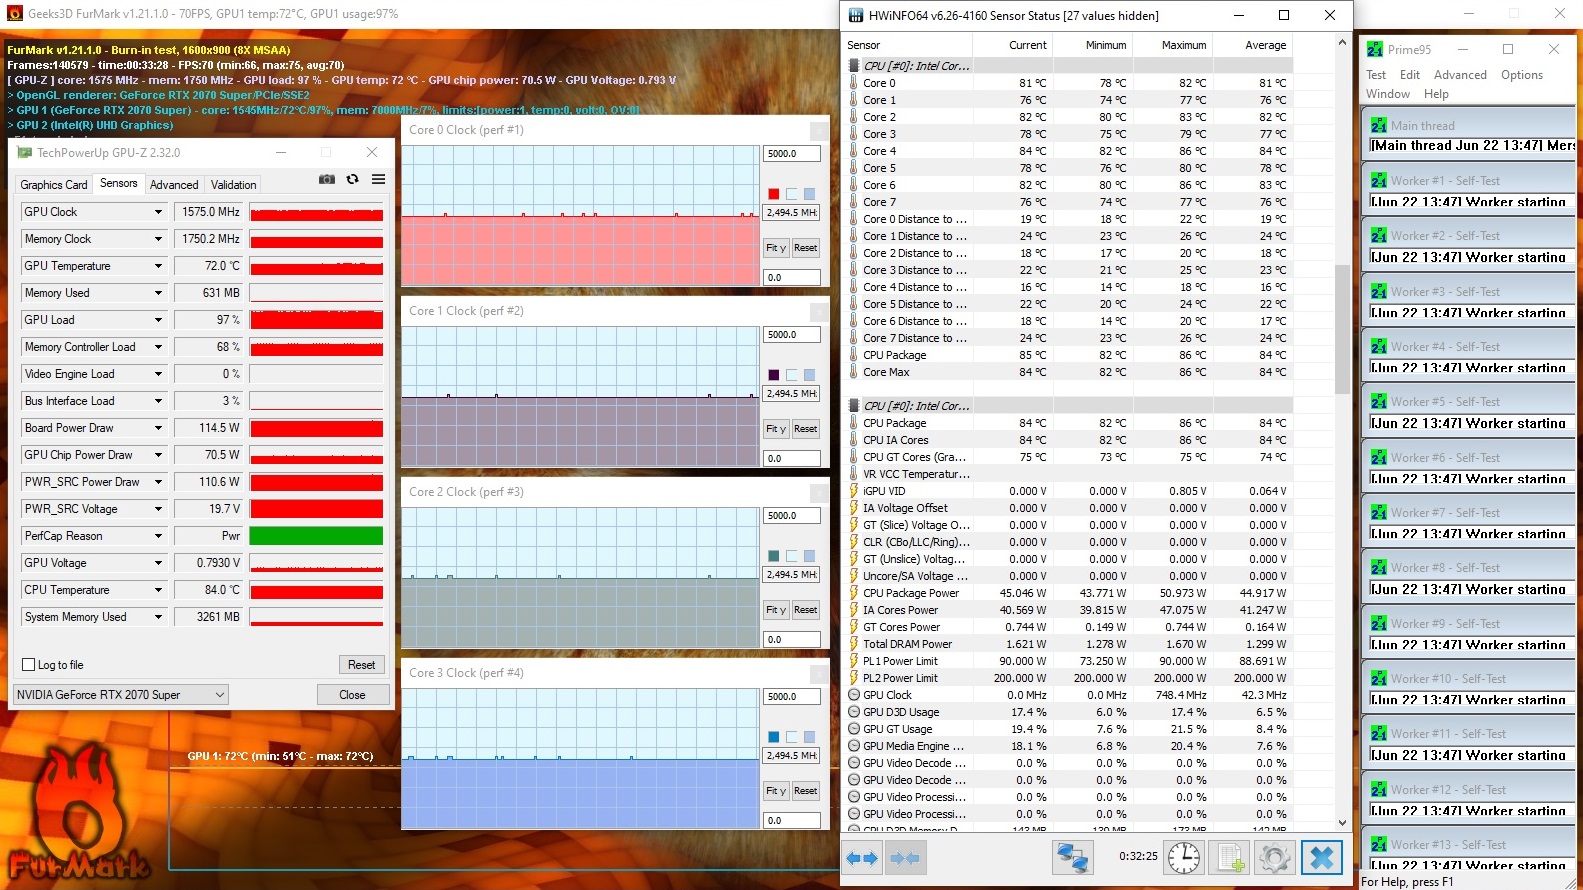
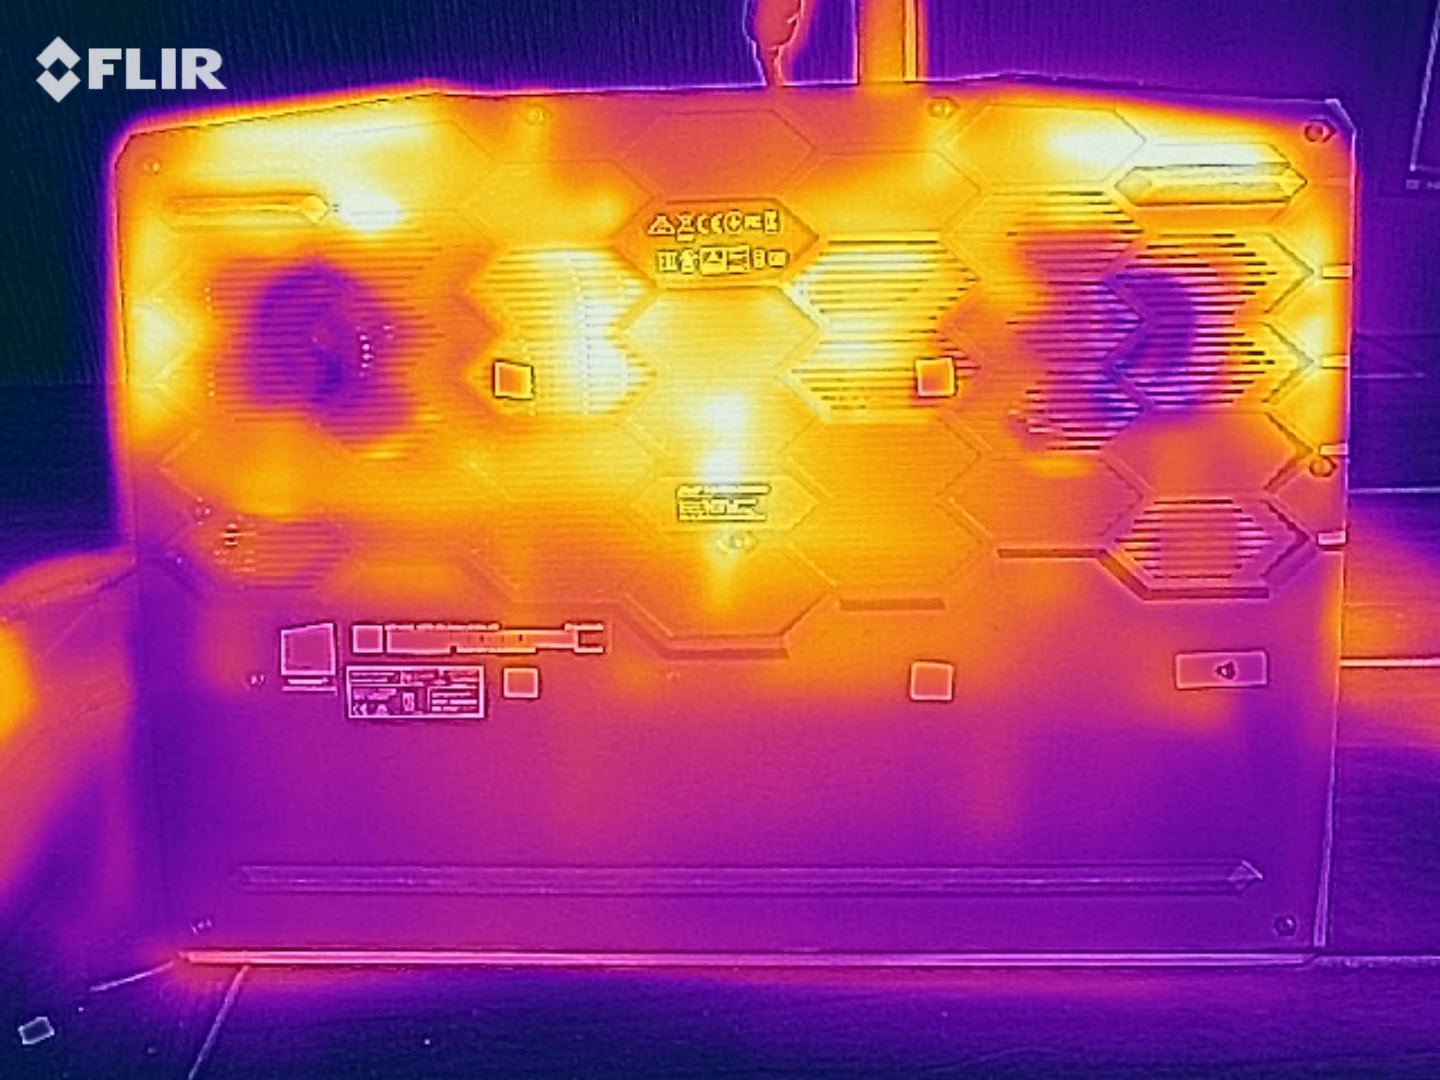
The word "unspectacular" fits the temperature development of the GE66. Both in the stress test with Furmark and Prime95 and in The Witcher 3 test, the CPU and GPU made themselves comfortable at around 70 to 80 °C (with short deviations to the top). The case doesn't get excessively hot either, although a maximum of 52 °C on the case bottom tends to advise against gaming sessions on the lap. The wrist-rest area stays quite cool in any situation (less than 35 °C).
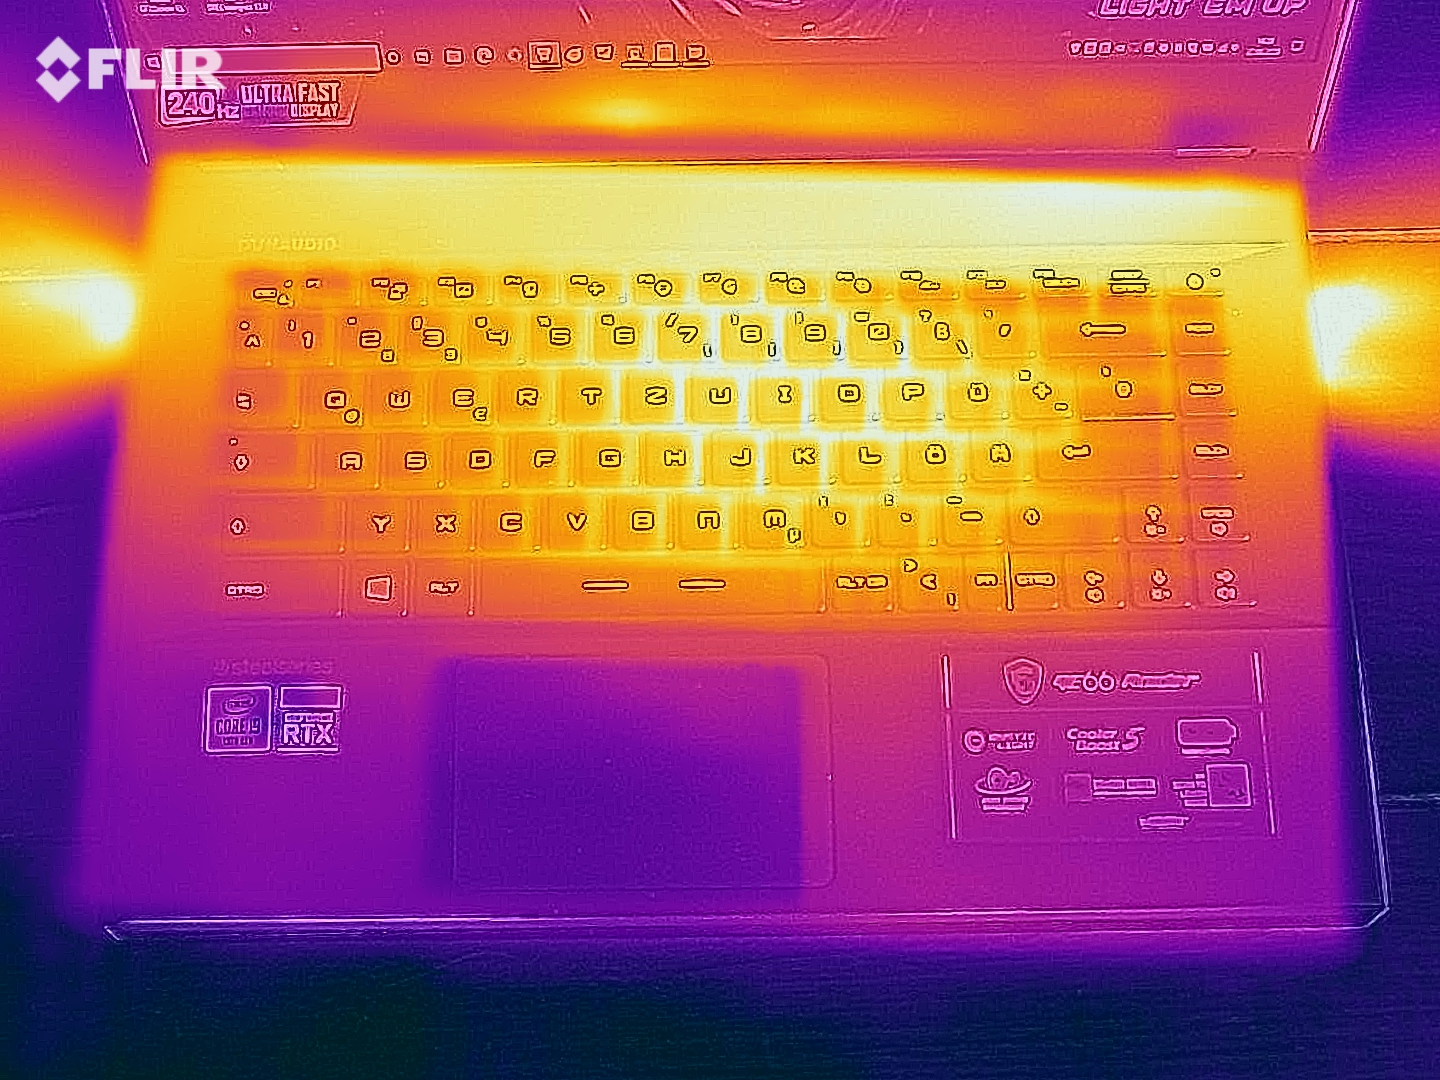
(-) The maximum temperature on the upper side is 49 °C / 120 F, compared to the average of 40.4 °C / 105 F, ranging from 21.2 to 68.8 °C for the class Gaming.
(-) The bottom heats up to a maximum of 52 °C / 126 F, compared to the average of 43.2 °C / 110 F
(+) In idle usage, the average temperature for the upper side is 29.1 °C / 84 F, compared to the device average of 33.9 °C / 93 F.
(-) Playing The Witcher 3, the average temperature for the upper side is 41.1 °C / 106 F, compared to the device average of 33.9 °C / 93 F.
(+) The palmrests and touchpad are reaching skin temperature as a maximum (34 °C / 93.2 F) and are therefore not hot.
(-) The average temperature of the palmrest area of similar devices was 28.8 °C / 83.8 F (-5.2 °C / -9.4 F).
| MSI GE66 Raider 10SFS i9-10980HK, GeForce RTX 2070 Super Mobile | MSI GE65 Raider 9SF-049US i9-9880H, GeForce RTX 2070 Mobile | Asus Strix Scar III G531GW i9-9880H, GeForce RTX 2070 Mobile | Eurocom Nightsky RX15 i9-9980HK, GeForce RTX 2070 Mobile | Average of class Gaming | |
|---|---|---|---|---|---|
| Heat | -3% | -0% | -4% | 3% | |
| Maximum Upper Side * (°C) | 49 | 45 8% | 51 -4% | 40.2 18% | 45.1 ? 8% |
| Maximum Bottom * (°C) | 52 | 53 -2% | 49 6% | 53 -2% | 48.1 ? 7% |
| Idle Upper Side * (°C) | 30 | 31.2 -4% | 30 -0% | 34.2 -14% | 31 ? -3% |
| Idle Bottom * (°C) | 34 | 39 -15% | 35 -3% | 39.6 -16% | 34.2 ? -1% |
* ... smaller is better
Speakers
The sound quality is somewhat disappointing considering the laptop's price. Even cheap external solutions should provide a better sound. Our audio analysis sees room for improvement in almost every segment (lows, mids, highs). Especially at higher volumes, the speakers, which are placed behind the side surfaces, tend to fray and produce a tinny sound image.
MSI GE66 Raider 10SFS audio analysis
(+) | speakers can play relatively loud (84 dB)
Bass 100 - 315 Hz
(-) | nearly no bass - on average 32.4% lower than median
(+) | bass is linear (5.9% delta to prev. frequency)
Mids 400 - 2000 Hz
(±) | higher mids - on average 7.4% higher than median
(±) | linearity of mids is average (8.9% delta to prev. frequency)
Highs 2 - 16 kHz
(±) | higher highs - on average 5.3% higher than median
(±) | linearity of highs is average (8.9% delta to prev. frequency)
Overall 100 - 16.000 Hz
(±) | linearity of overall sound is average (26.7% difference to median)
Compared to same class
» 93% of all tested devices in this class were better, 1% similar, 6% worse
» The best had a delta of 6%, average was 18%, worst was 132%
Compared to all devices tested
» 82% of all tested devices were better, 4% similar, 14% worse
» The best had a delta of 4%, average was 23%, worst was 134%
MSI GE65 Raider 9SF-049US audio analysis
(+) | speakers can play relatively loud (93 dB)
Bass 100 - 315 Hz
(-) | nearly no bass - on average 20.5% lower than median
(±) | linearity of bass is average (8.8% delta to prev. frequency)
Mids 400 - 2000 Hz
(+) | balanced mids - only 3.3% away from median
(+) | mids are linear (4.6% delta to prev. frequency)
Highs 2 - 16 kHz
(+) | balanced highs - only 1.4% away from median
(+) | highs are linear (5% delta to prev. frequency)
Overall 100 - 16.000 Hz
(±) | linearity of overall sound is average (15.6% difference to median)
Compared to same class
» 36% of all tested devices in this class were better, 6% similar, 58% worse
» The best had a delta of 6%, average was 18%, worst was 132%
Compared to all devices tested
» 23% of all tested devices were better, 5% similar, 72% worse
» The best had a delta of 4%, average was 23%, worst was 134%
Power management
Power consumption
The graphics switching ensures low power consumption while idling. With 6 to 25 watts, the GE66 is more efficient than the competition, which in part exceeds 30 watts. Under load, the RTX-2070 laptops are closer together. Here the MSI needs between 108 and 280 watts. Thus, the power supply unit is sufficient.
| Off / Standby | |
| Idle | |
| Load |
|
Key:
min: | |
| MSI GE66 Raider 10SFS i9-10980HK, GeForce RTX 2070 Super Mobile | MSI GE65 Raider 9SF-049US i9-9880H, GeForce RTX 2070 Mobile | Asus Strix Scar III G531GW i9-9880H, GeForce RTX 2070 Mobile | Eurocom Nightsky RX15 i9-9980HK, GeForce RTX 2070 Mobile | Average of class Gaming | |
|---|---|---|---|---|---|
| Power Consumption | -26% | -95% | -34% | -30% | |
| Idle Minimum * (Watt) | 6 | 15 -150% | 29 -383% | 12.6 -110% | 13.1 ? -118% |
| Idle Average * (Watt) | 14 | 18.5 -32% | 32 -129% | 21.4 -53% | 19 ? -36% |
| Idle Maximum * (Watt) | 25 | 20.2 19% | 37 -48% | 34.4 -38% | 24.6 ? 2% |
| Load Average * (Watt) | 108 | 110.9 -3% | 157 -45% | 123.2 -14% | 111.3 ? -3% |
| Witcher 3 ultra * (Watt) | 195 | 187.3 4% | 173 11% | 192.4 1% | |
| Load Maximum * (Watt) | 280 | 260 7% | 217 22% | 246.6 12% | 260 ? 7% |
* ... smaller is better
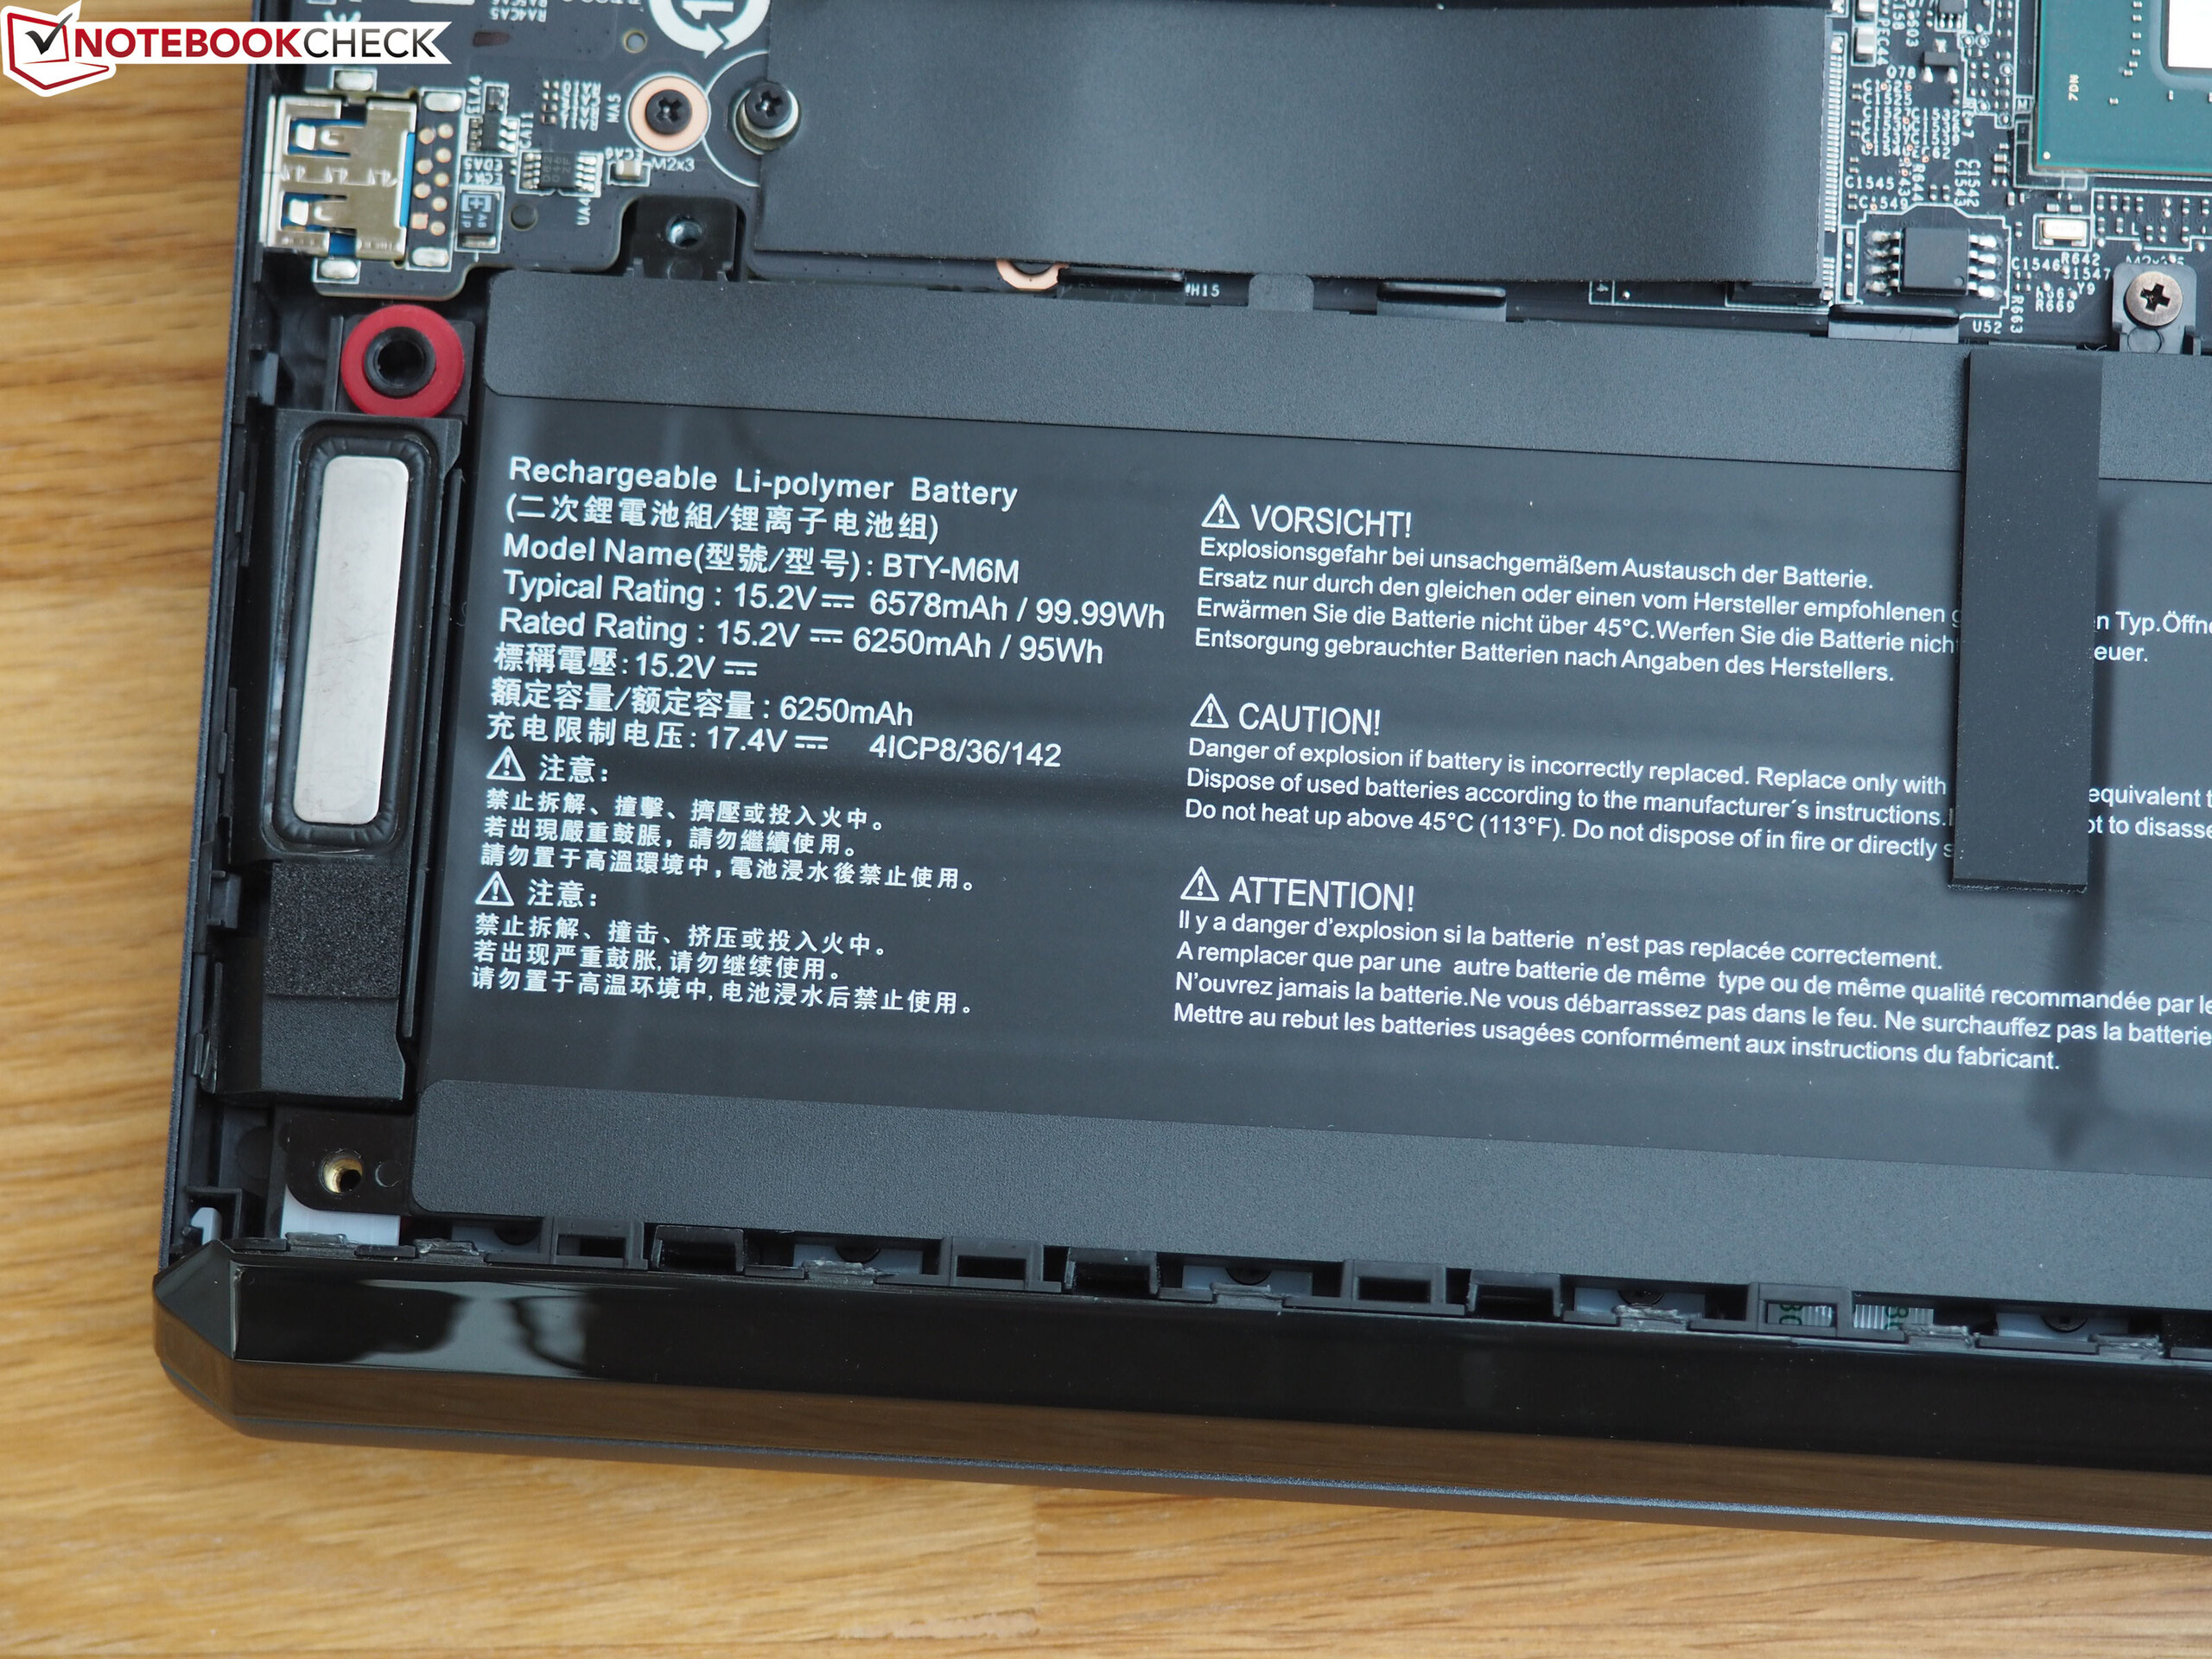
Battery life
One of the biggest highlights of the laptop is the gigantic battery. With 99.9 Wh, the opponents can't even begin to compete (51 to 66 Wh). Despite the Optimus technology and the ample battery capacity, the GE66 is not an ultra long runner, though. More than 7.5 hours can hardly be squeezed out of the device. The system lasted about 6 hours without a power supply in our WLAN test with medium brightness. The 3D performance drops by a good 40% in battery mode (tested with The Witcher 3) - a typical value.
| MSI GE66 Raider 10SFS i9-10980HK, GeForce RTX 2070 Super Mobile, 99.99 Wh | MSI GE65 Raider 9SF-049US i9-9880H, GeForce RTX 2070 Mobile, 51 Wh | Asus Strix Scar III G531GW i9-9880H, GeForce RTX 2070 Mobile, 66 Wh | Eurocom Nightsky RX15 i9-9980HK, GeForce RTX 2070 Mobile, 62 Wh | Average of class Gaming | |
|---|---|---|---|---|---|
| Battery runtime | -42% | -34% | -44% | 1% | |
| Reader / Idle (h) | 7.6 | 6.2 -18% | 5.5 -28% | 7.84 ? 3% | |
| WiFi v1.3 (h) | 6.1 | 3.6 -41% | 3 -51% | 3.4 -44% | 7.08 ? 16% |
| Load (h) | 1.8 | 0.6 -67% | 1.4 -22% | 1.496 ? -17% |
Pros
Cons
Verdict
With the GE66 Raider 10SFS, MSI offers a compact and very high-performance 15-inch gamer that not only appeals to lighting fans (LED strips on the front) but also supporters of fast displays.
The 240 Hz screen could be a bit brighter, but it otherwise convinces in almost all categories. You also don't have to worry about 3D power. The Super version of the GeForce RTX 2070 brings high levels of performance. Further selling points are the 99 Wh battery, the ample connectivity (whereby there is unfortunately no Thunderbolt 3 port), and the excellent chassis.
It's not quite enough for a "Very Good" as an overall mark due to the steep noise development, the modest webcam, and the poor speakers.
MSI GE66 Raider 10SFS
- 07/05/2020 v7 (old)
Florian Glaser
Price comparison
