MSI GE63 Raider 8SG Laptop Review: GeForce RTX 2080 for Cheap
The mid-range MSI GE series sits in between the low-end GP series and high-end GT series. It carries many of the same features as the GT series but in a smaller and more affordable chassis design.
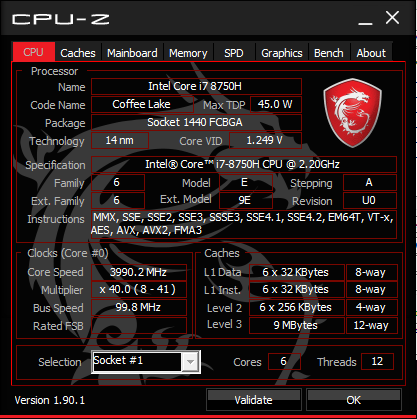
Our unit here is the 15.6-inch MSI GE63 equipped with an Intel 8th gen Core i7-8750H CPU and the latest Nvidia GeForce RTX 2080. This particular model has since been succeeded by the GE65, but the GE63 is still a lucrative purchase especially since it carries the same high refresh rate display and graphics options that many newer gaming laptops also offer. Our test unit, for example, can be found on Xotic PC for $1750 USD compared to over $2000 for other laptops with the same GPU.
The MSI GE63 competes directly with other mid-range to high-end gaming laptops including the Razer Blade 15, Lenovo Legion Y740 15, Asus ROG Strix III or Scar III, Gigabyte Aorus 15, or the Dell Alienware m15. We recommend checking out our existing reviews on the older Pascal-powered GE63 since the chassis remains unchanged.
More MSI reviews:
Rating | Date | Model | Weight | Height | Size | Resolution | Price |
|---|---|---|---|---|---|---|---|
| 83.4 % v7 (old) | 12 / 2019 | MSI GE63 Raider 8SG i7-8750H, GeForce RTX 2080 Mobile | 2.6 kg | 29.5 mm | 15.60" | 1920x1080 | |
| 84.8 % v7 (old) | 10 / 2019 | Lenovo Legion Y740-15ICHg i7-9750H, GeForce RTX 2070 Max-Q | 2.3 kg | 25 mm | 15.60" | 1920x1080 | |
| 82.3 % v7 (old) | 10 / 2019 | Dell G7 7590 i7-9750H, GeForce RTX 2060 Mobile | 2.5 kg | 19.9 mm | 15.60" | 1920x1080 | |
| 82.1 % v7 (old) | 10 / 2019 | Asus Strix Scar III G531GW-AZ062T i7-9750H, GeForce RTX 2070 Mobile | 2.4 kg | 25 mm | 15.60" | 1920x1080 | |
| 84.7 % v7 (old) | 02 / 2019 | Razer Blade 15 RTX 2070 Max-Q i7-8750H, GeForce RTX 2070 Max-Q | 2.1 kg | 17.8 mm | 15.60" | 1920x1080 |
Case
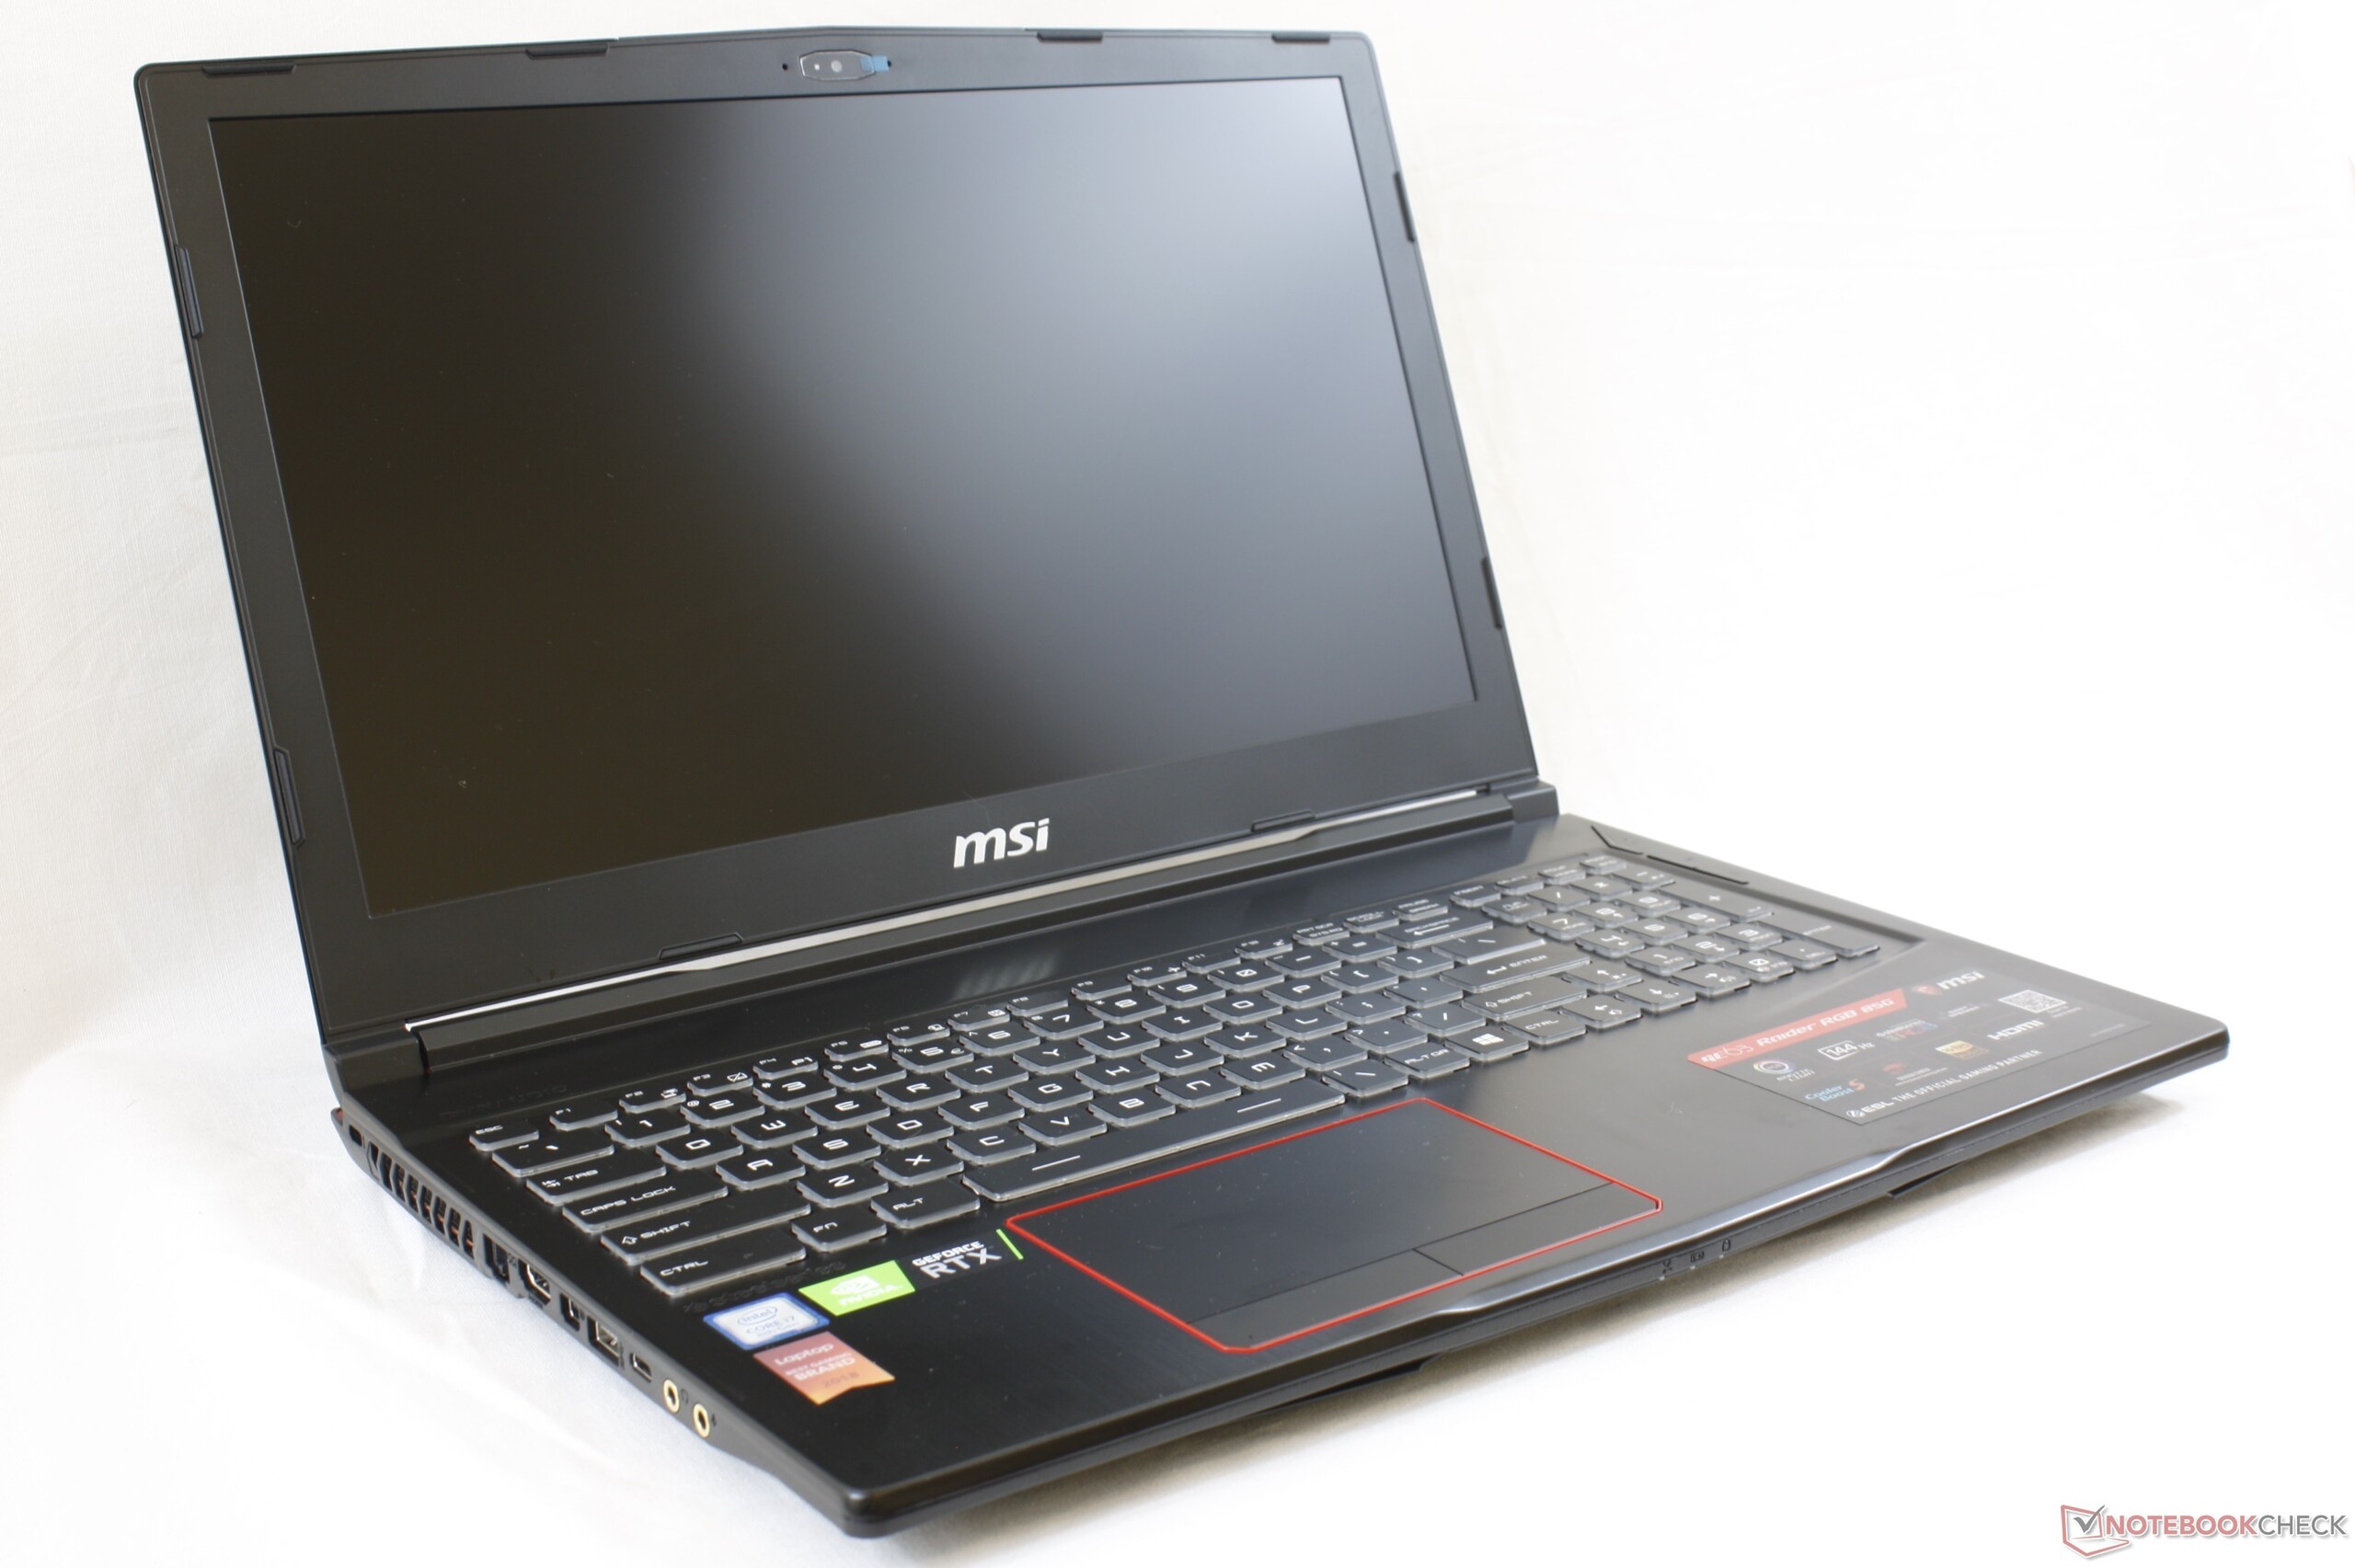
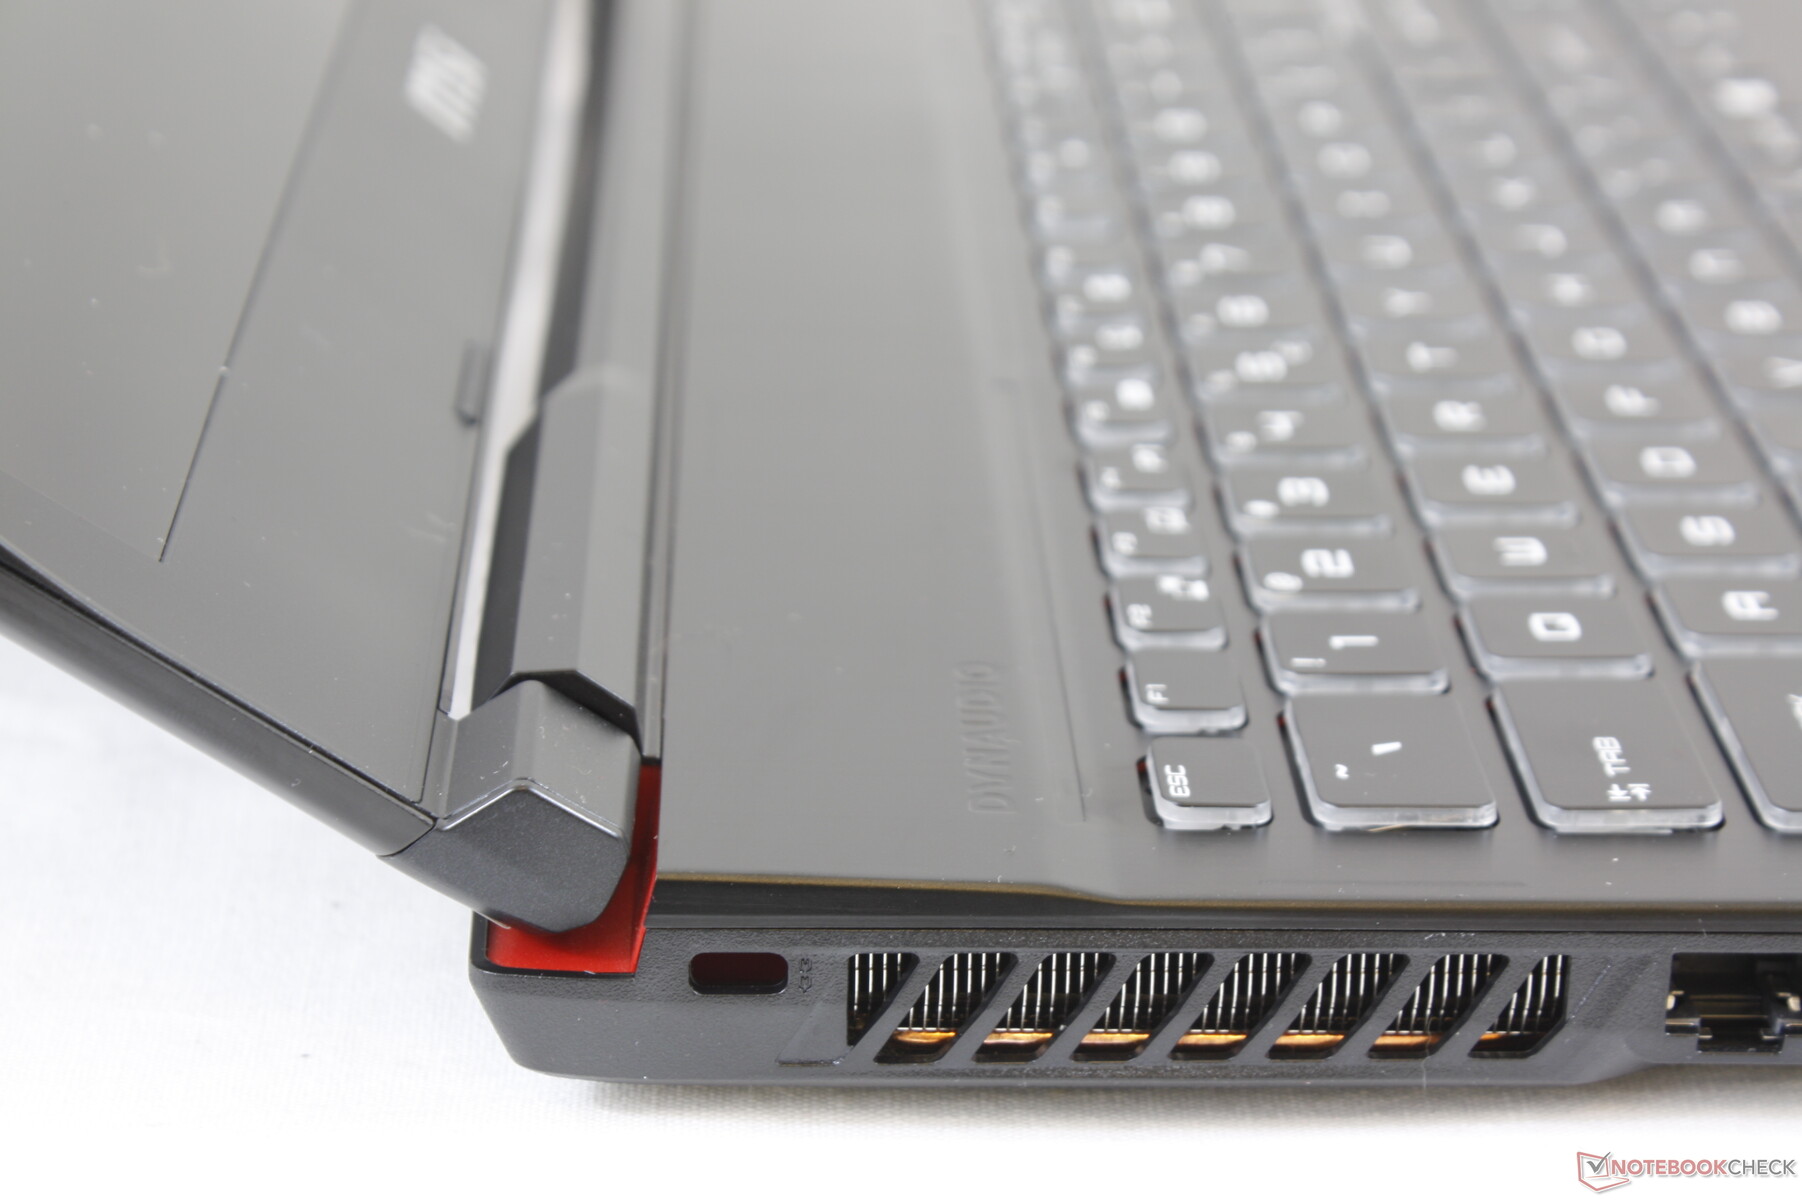
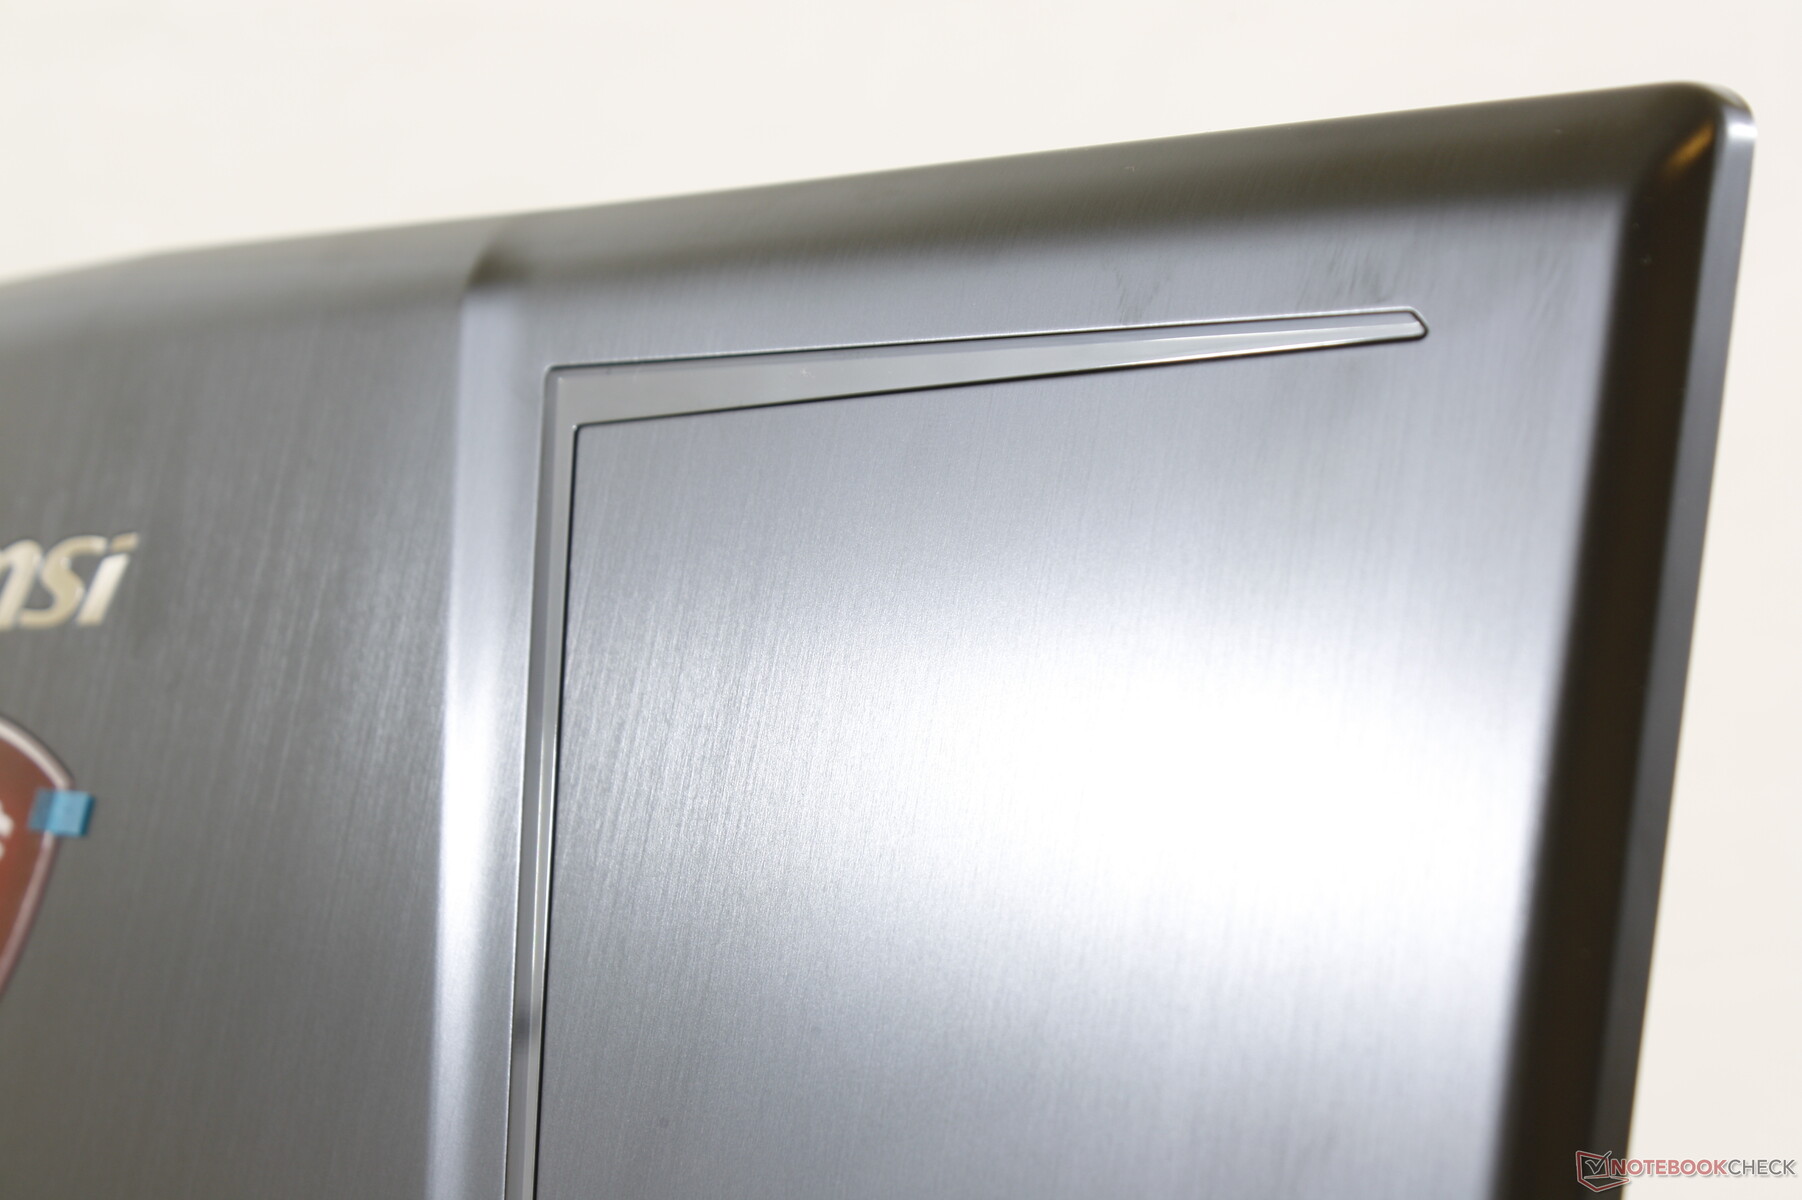
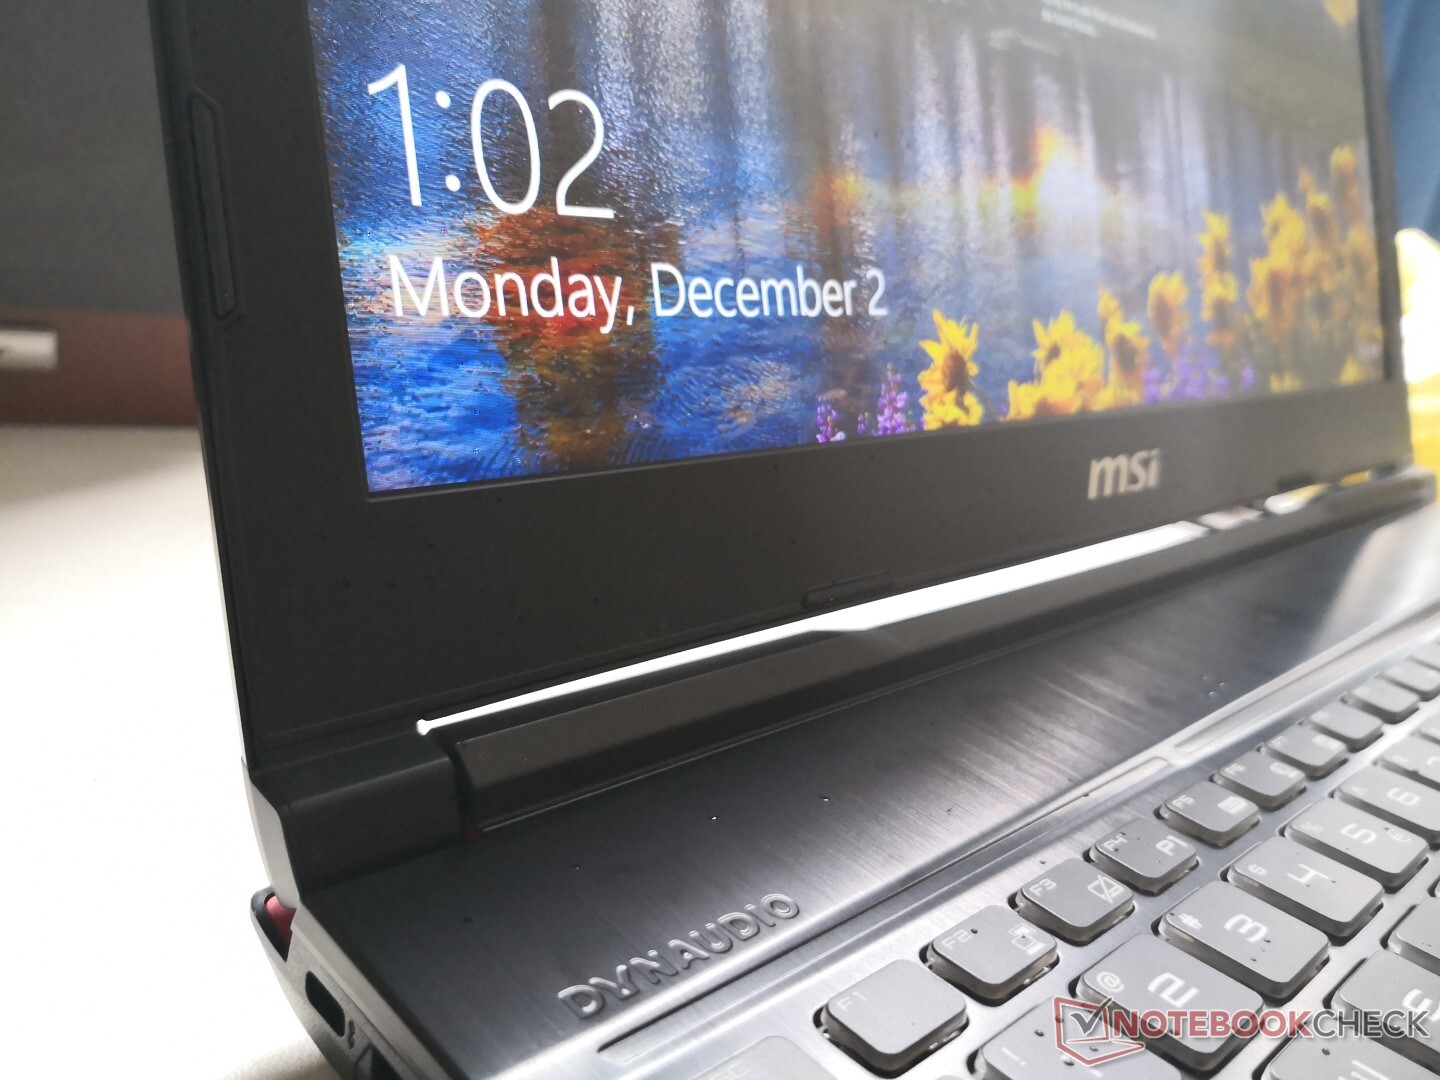
The GE63 is now over two years old and it really shows. The thick bezels, flashy outer lid RGB colors, myriad angles, and LED-lit USB ports are the opposite of what you find on many newer ultra-thin laptops where minimalism has become a stronger focus. The newer GE65, for example, has omitted many of these gamer-y aesthetics for a smoother and more professional look.
Of course, an older chassis doesn't mean a weaker laptop. The GE63 lies in between the GS65 and GT63 in terms of rigidity with slight-to-moderate warping when applying pressure and only minimal creaking. Its lid feels stiffer than the lids of the GS65, Asus Zephyrus S, and Lenovo Legion Y740 to be on par with the lid of the Razer Blade 15.
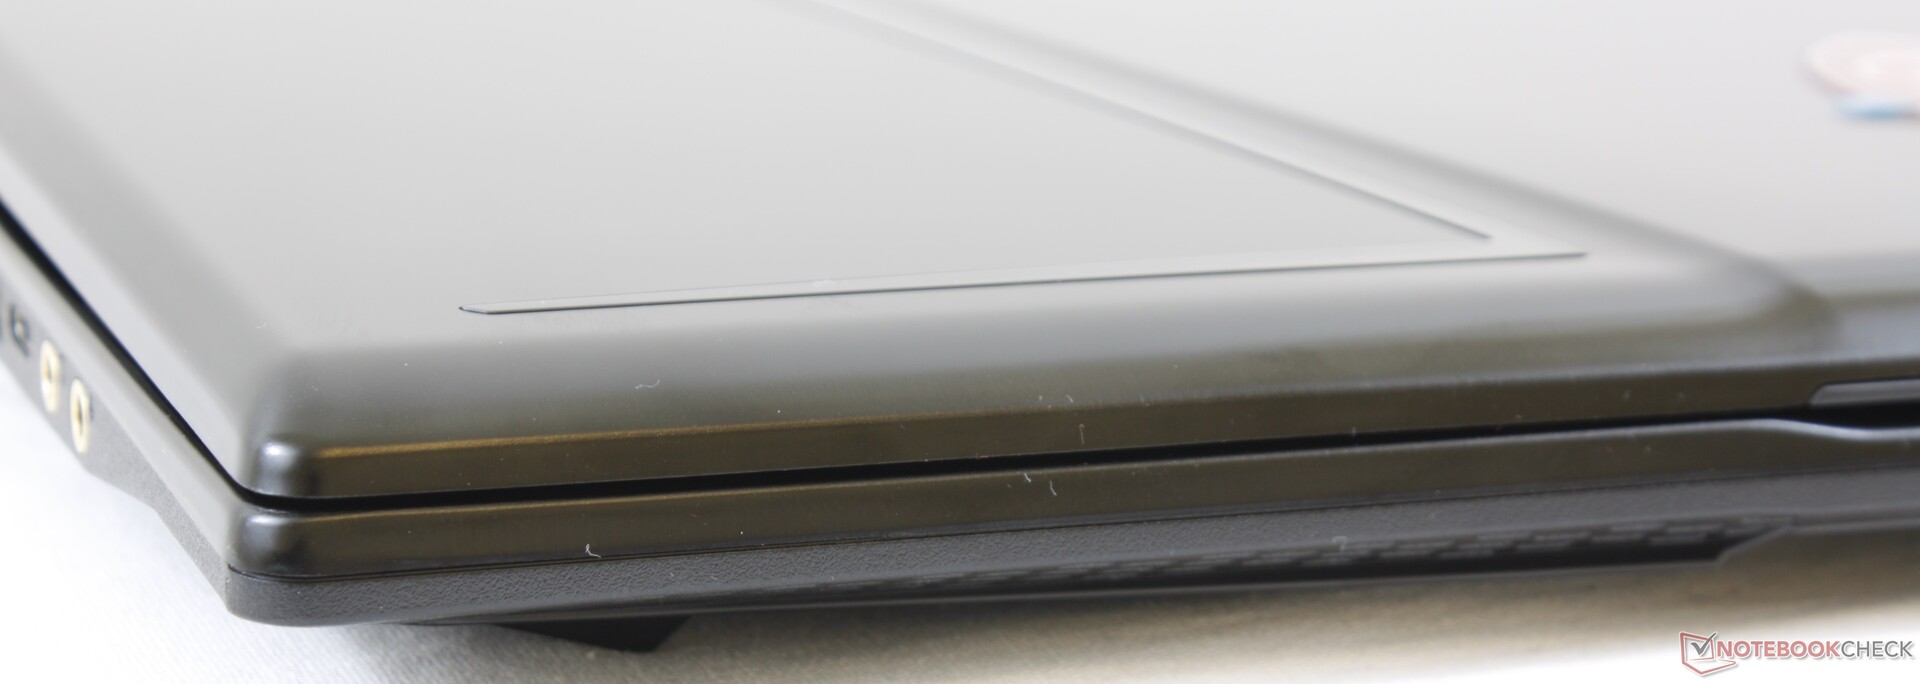
Build quality is excellent on our test unit as it exhibits no unintended gaps or defects. Nonetheless, the red trims and plastic rear look cheap on system as do the finicky latches around the edges of the bottom panel when servicing.
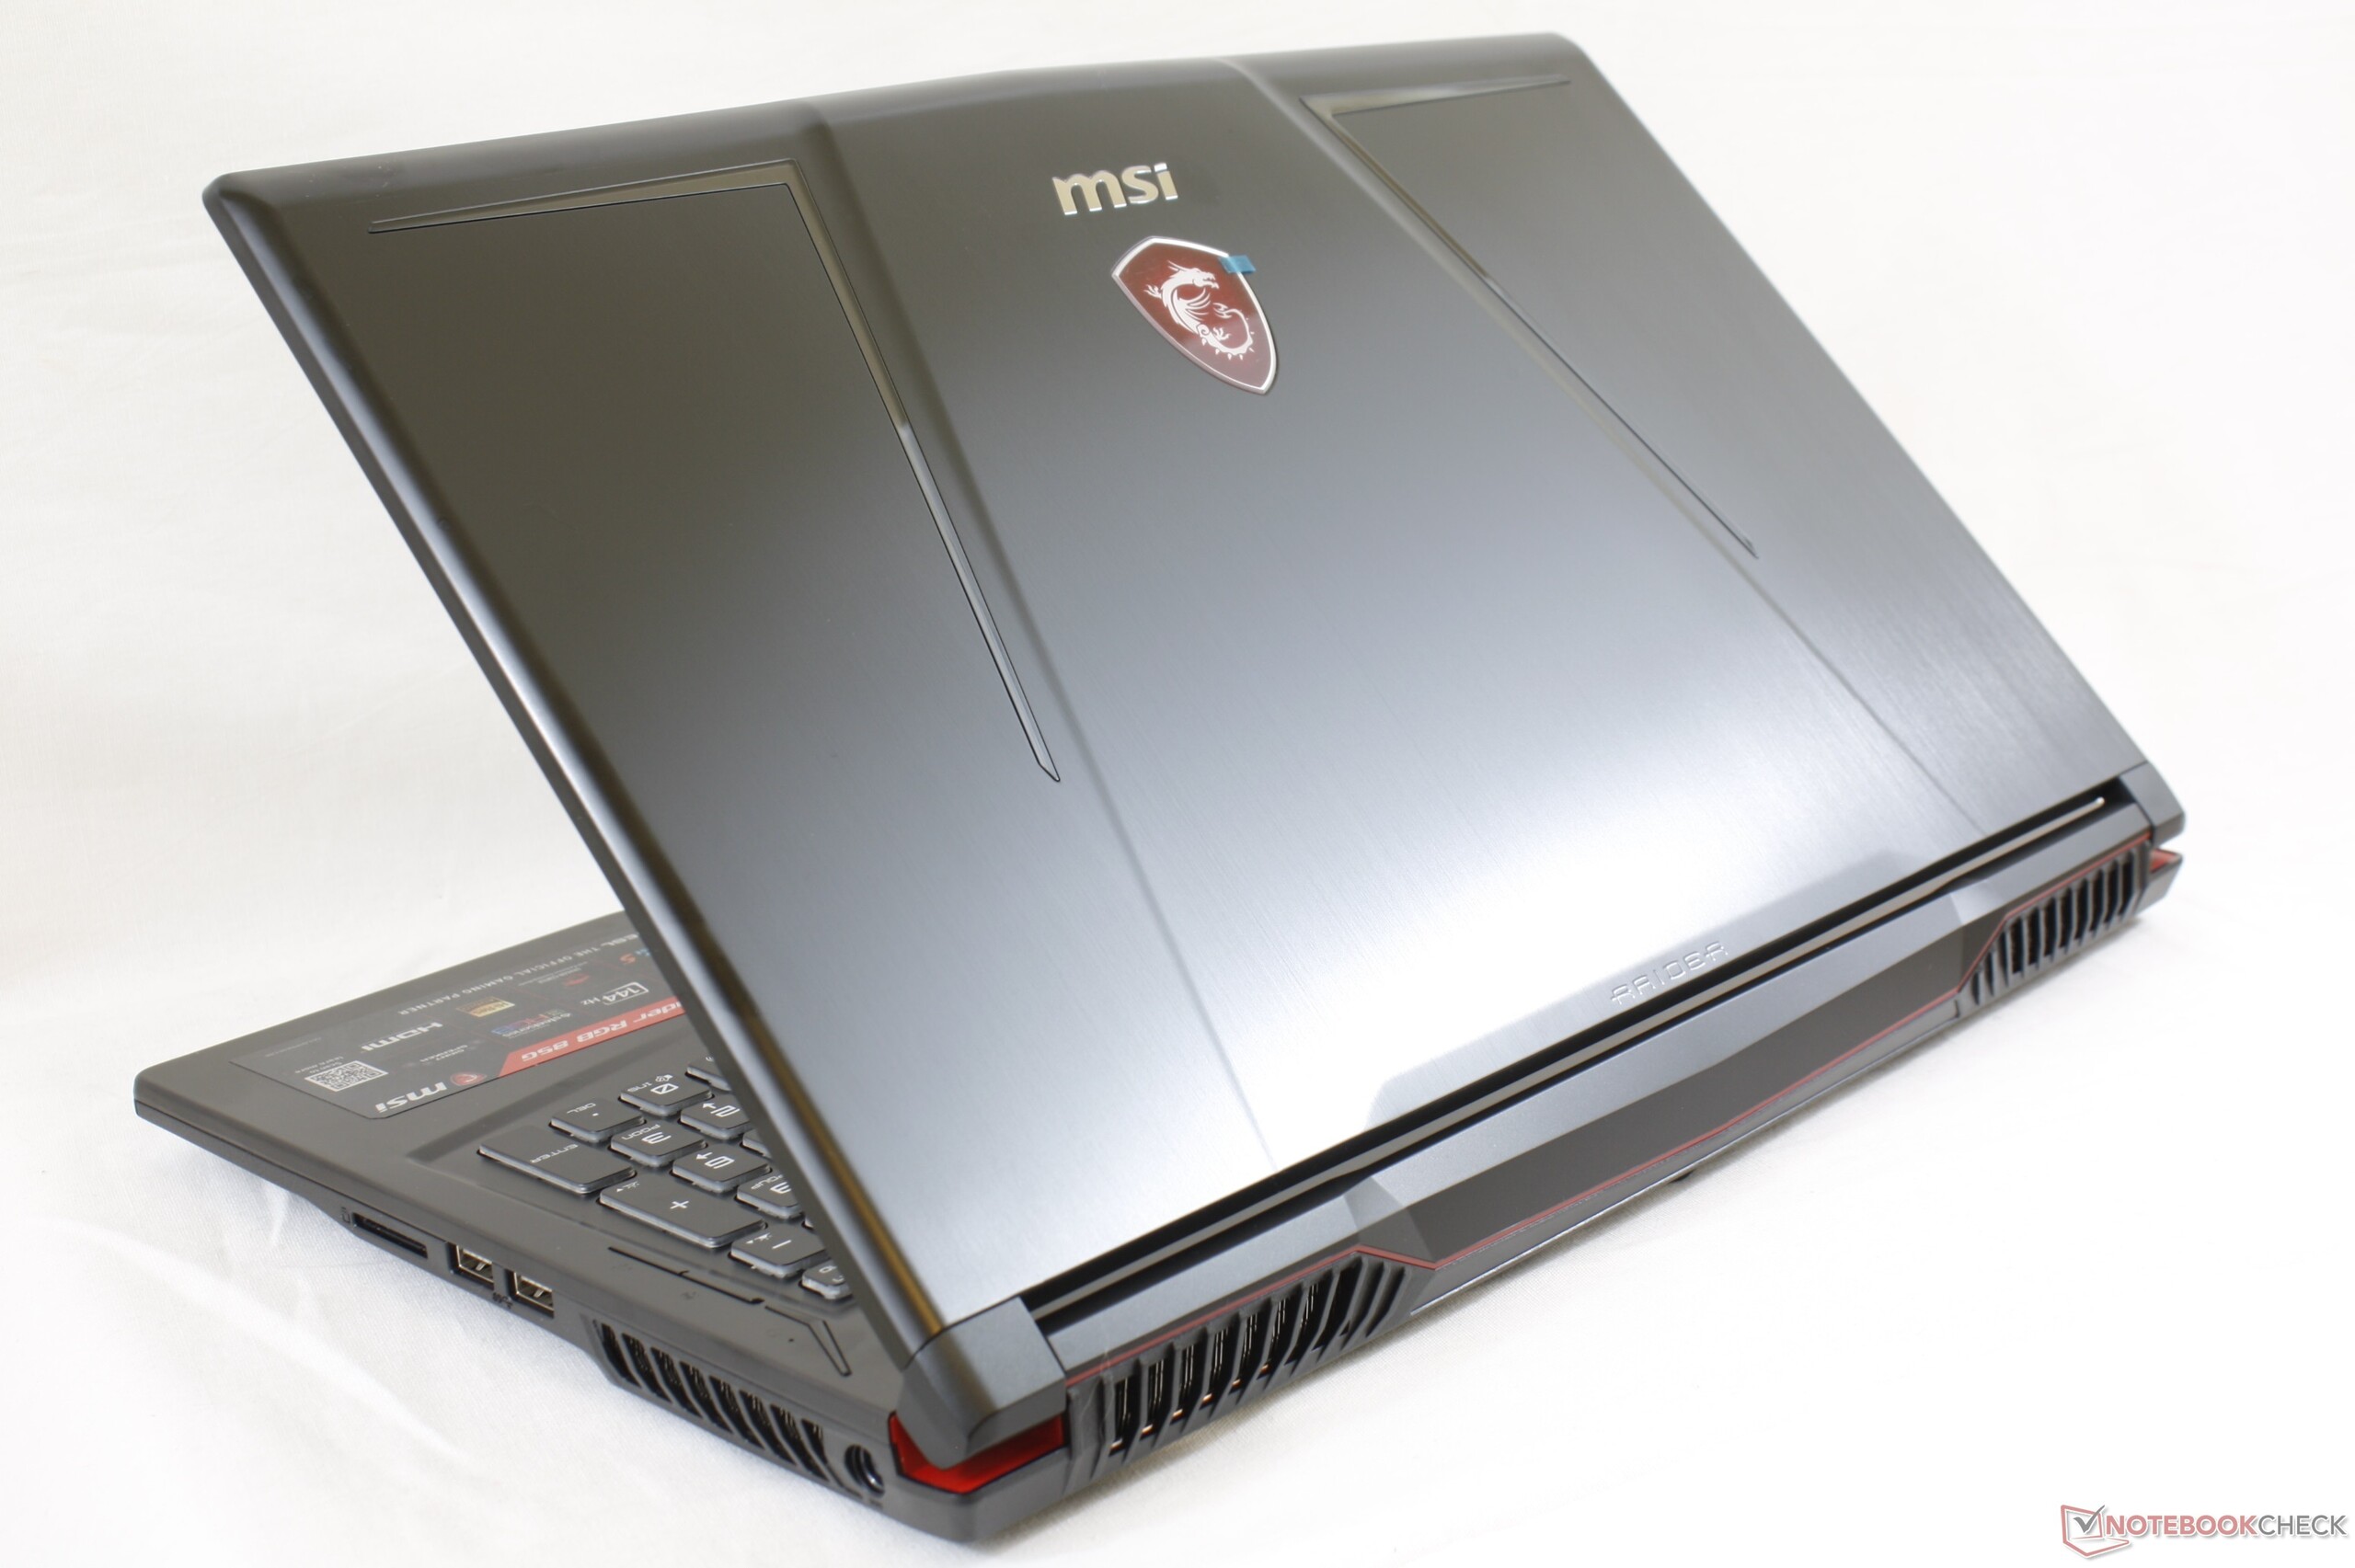
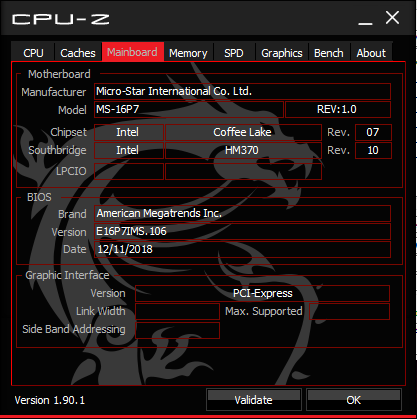
The chassis is wider and heavier than the latest 15.6-inch gaming laptops like the Lenovo Legion Y740 or Razer Blade 15 because of its thicker bezels. It wasn't until the launch of the GE65 did MSI fully refresh the 15.6-inch GE series with a smaller, thinner, and lighter look. We expect the company to eventually phase out the GE63 by 2020.


Connectivity
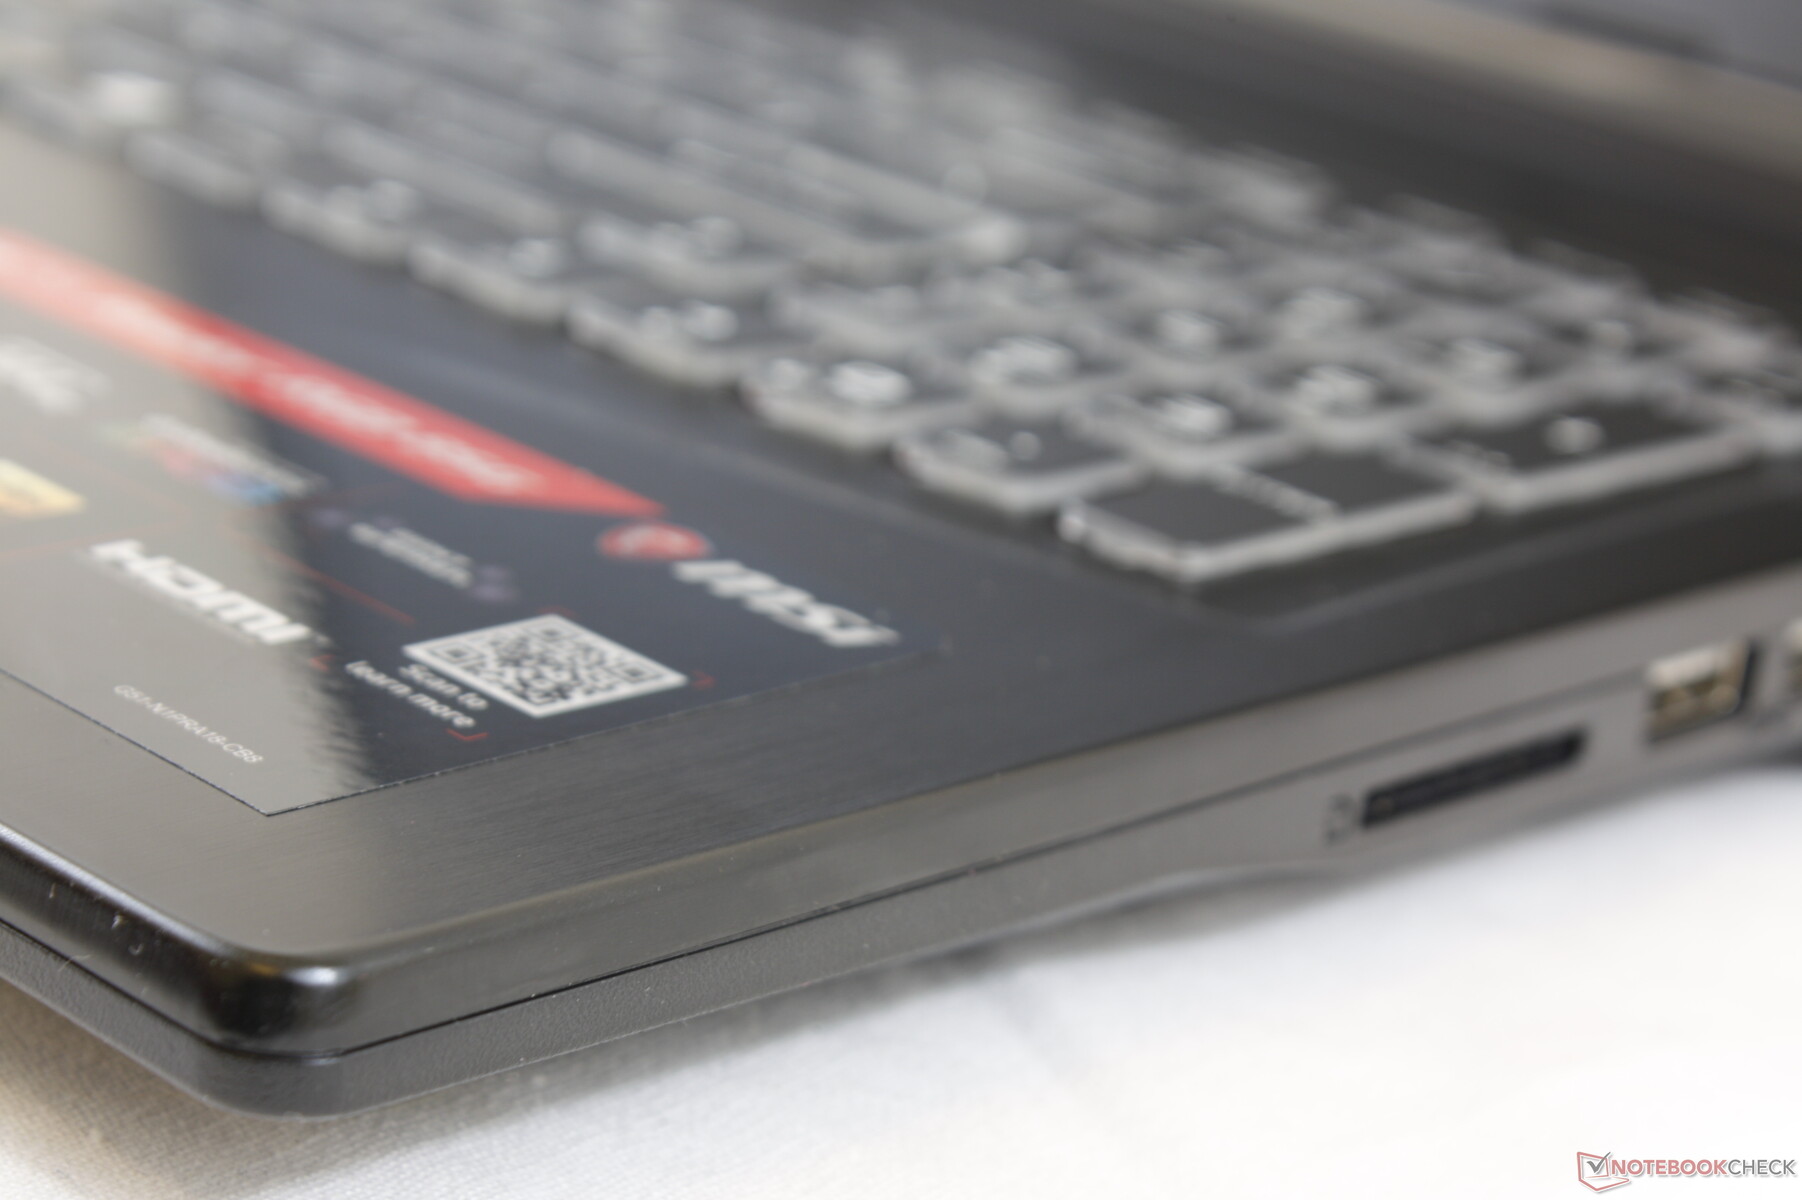
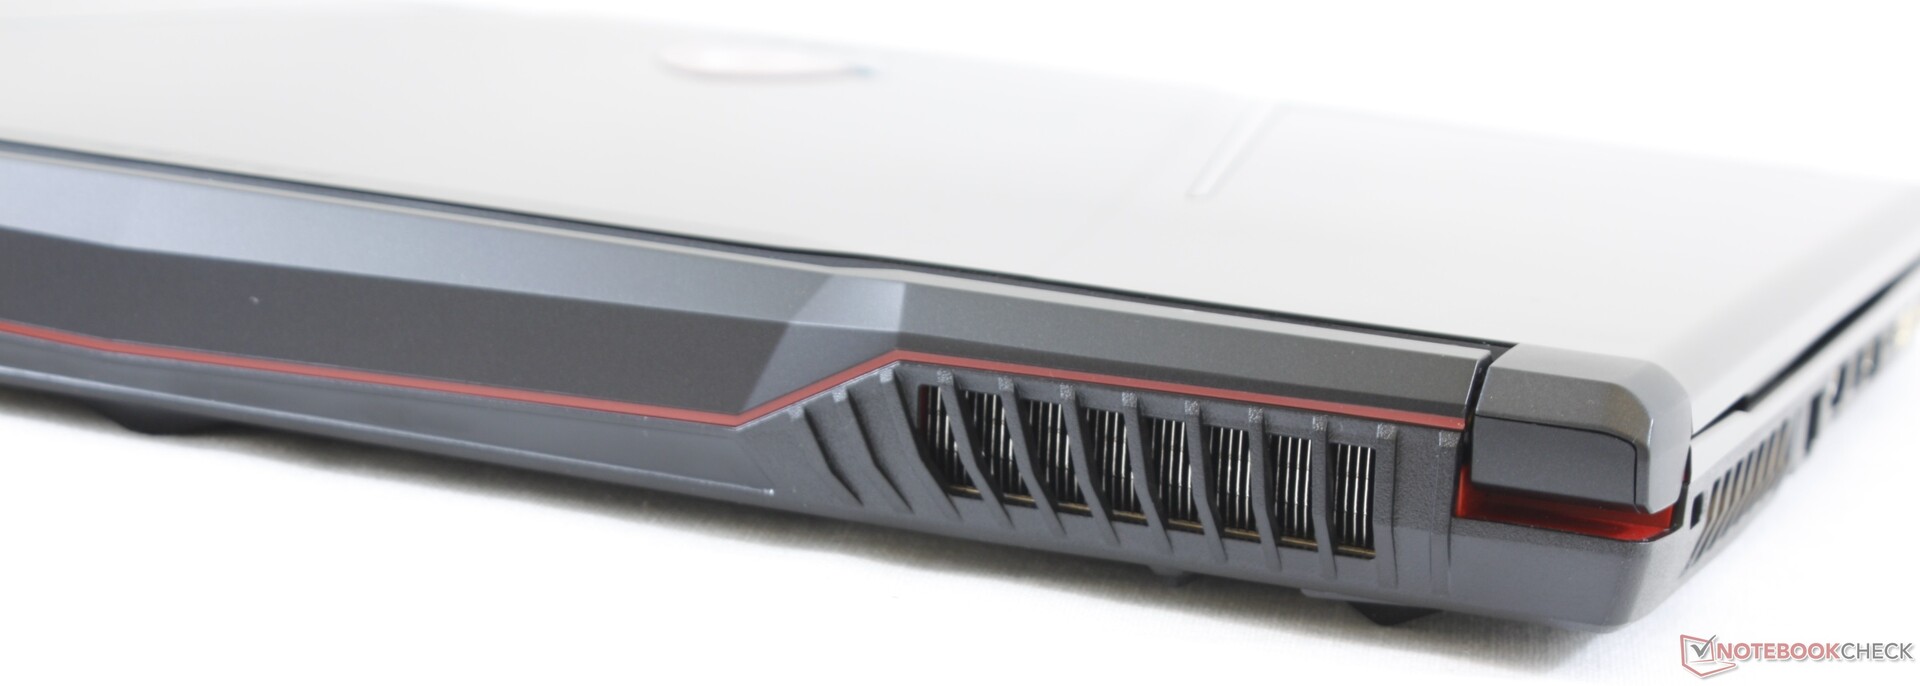
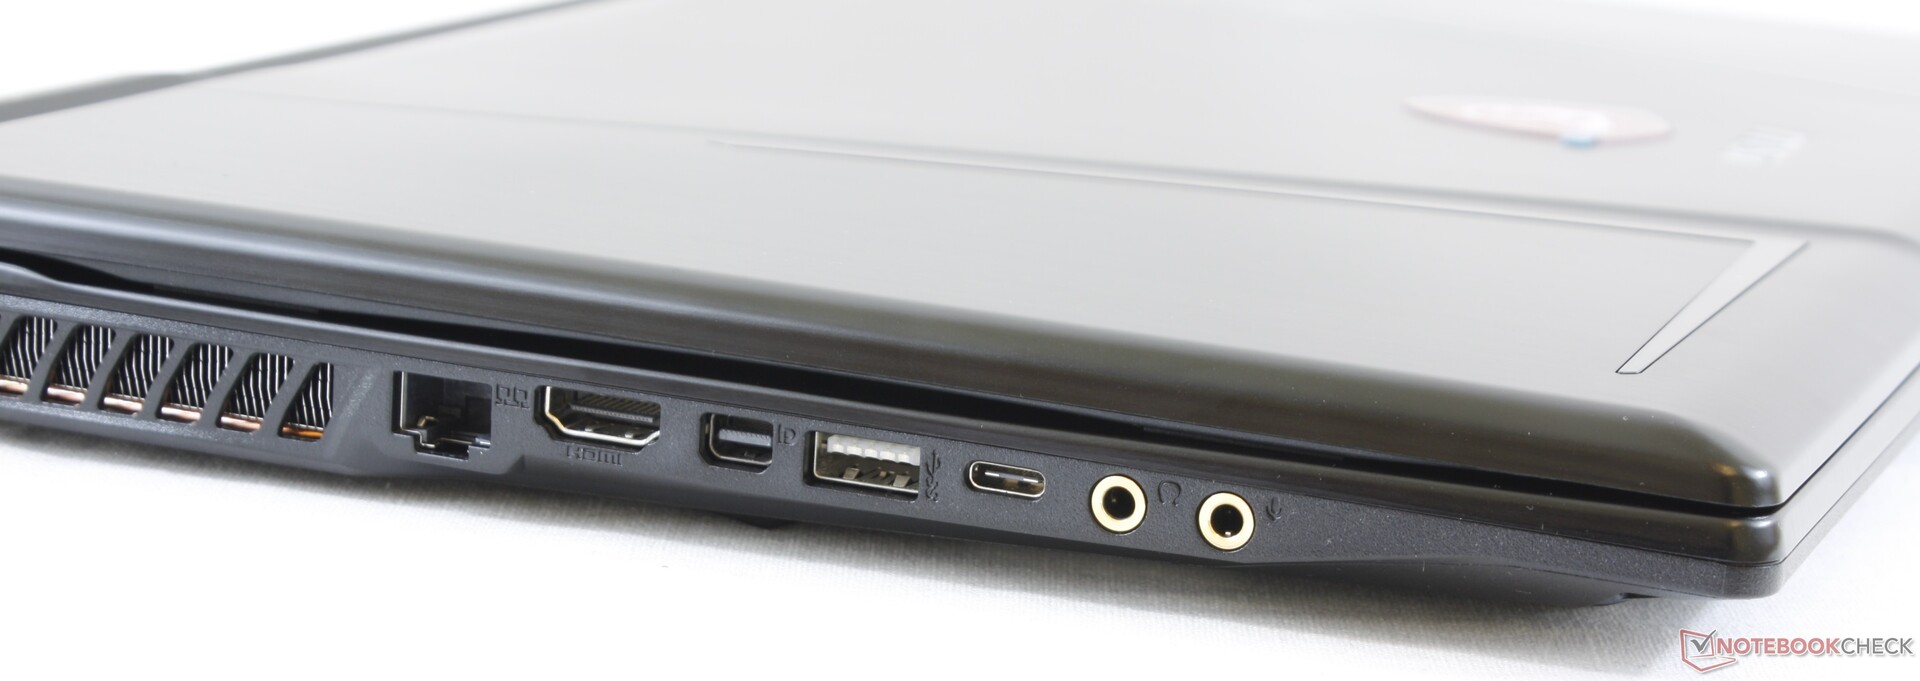
Port options haven't changed for better or worse. While the variety is great for a gaming laptop, the ports are tightly packed especially along the left edge and so any connected cables will occupy valuable desk space. In contrast, competing laptops like the Lenovo Legion Y740 have ports with thicker cables along the rear edge.
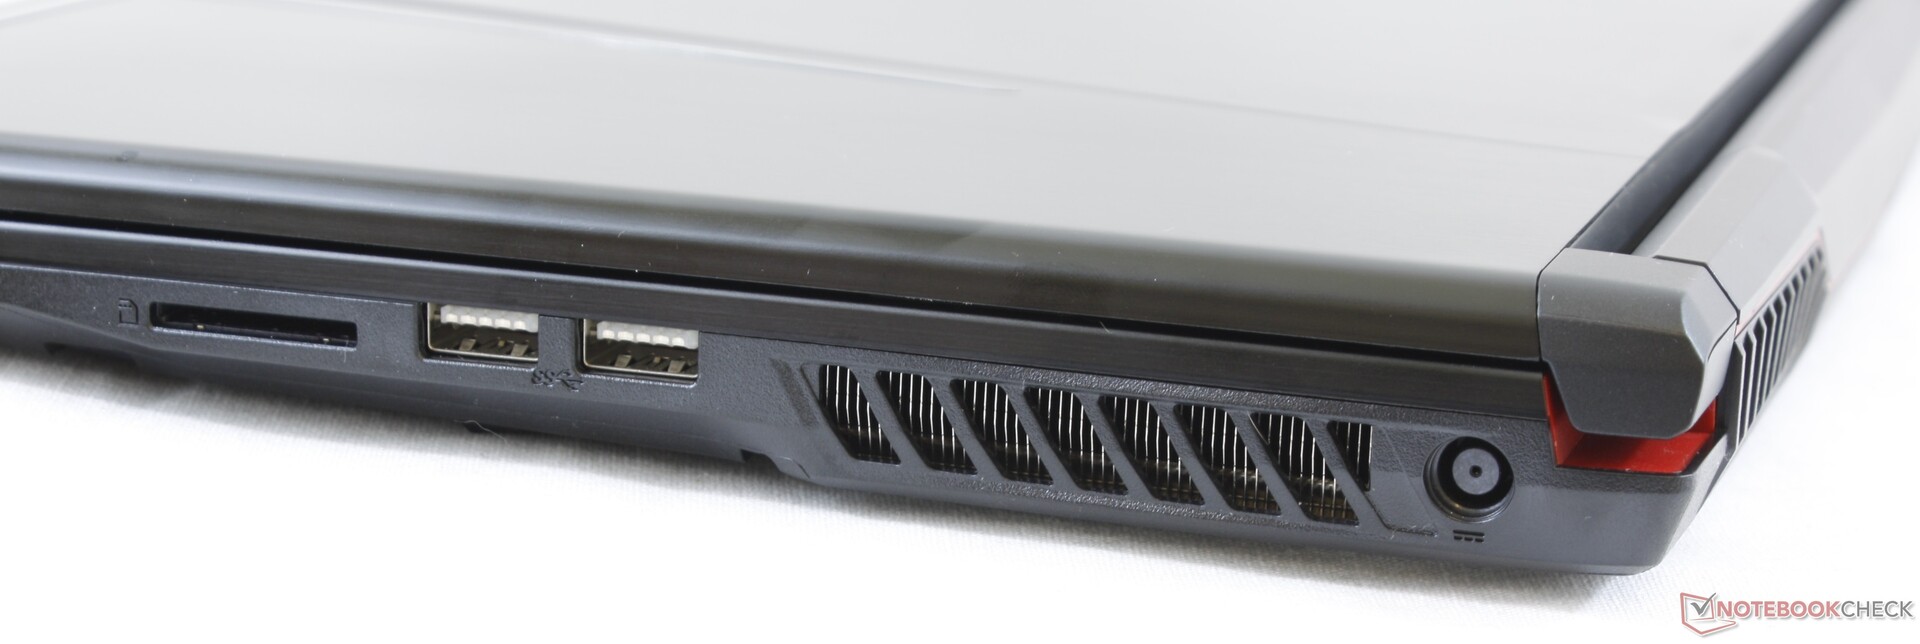
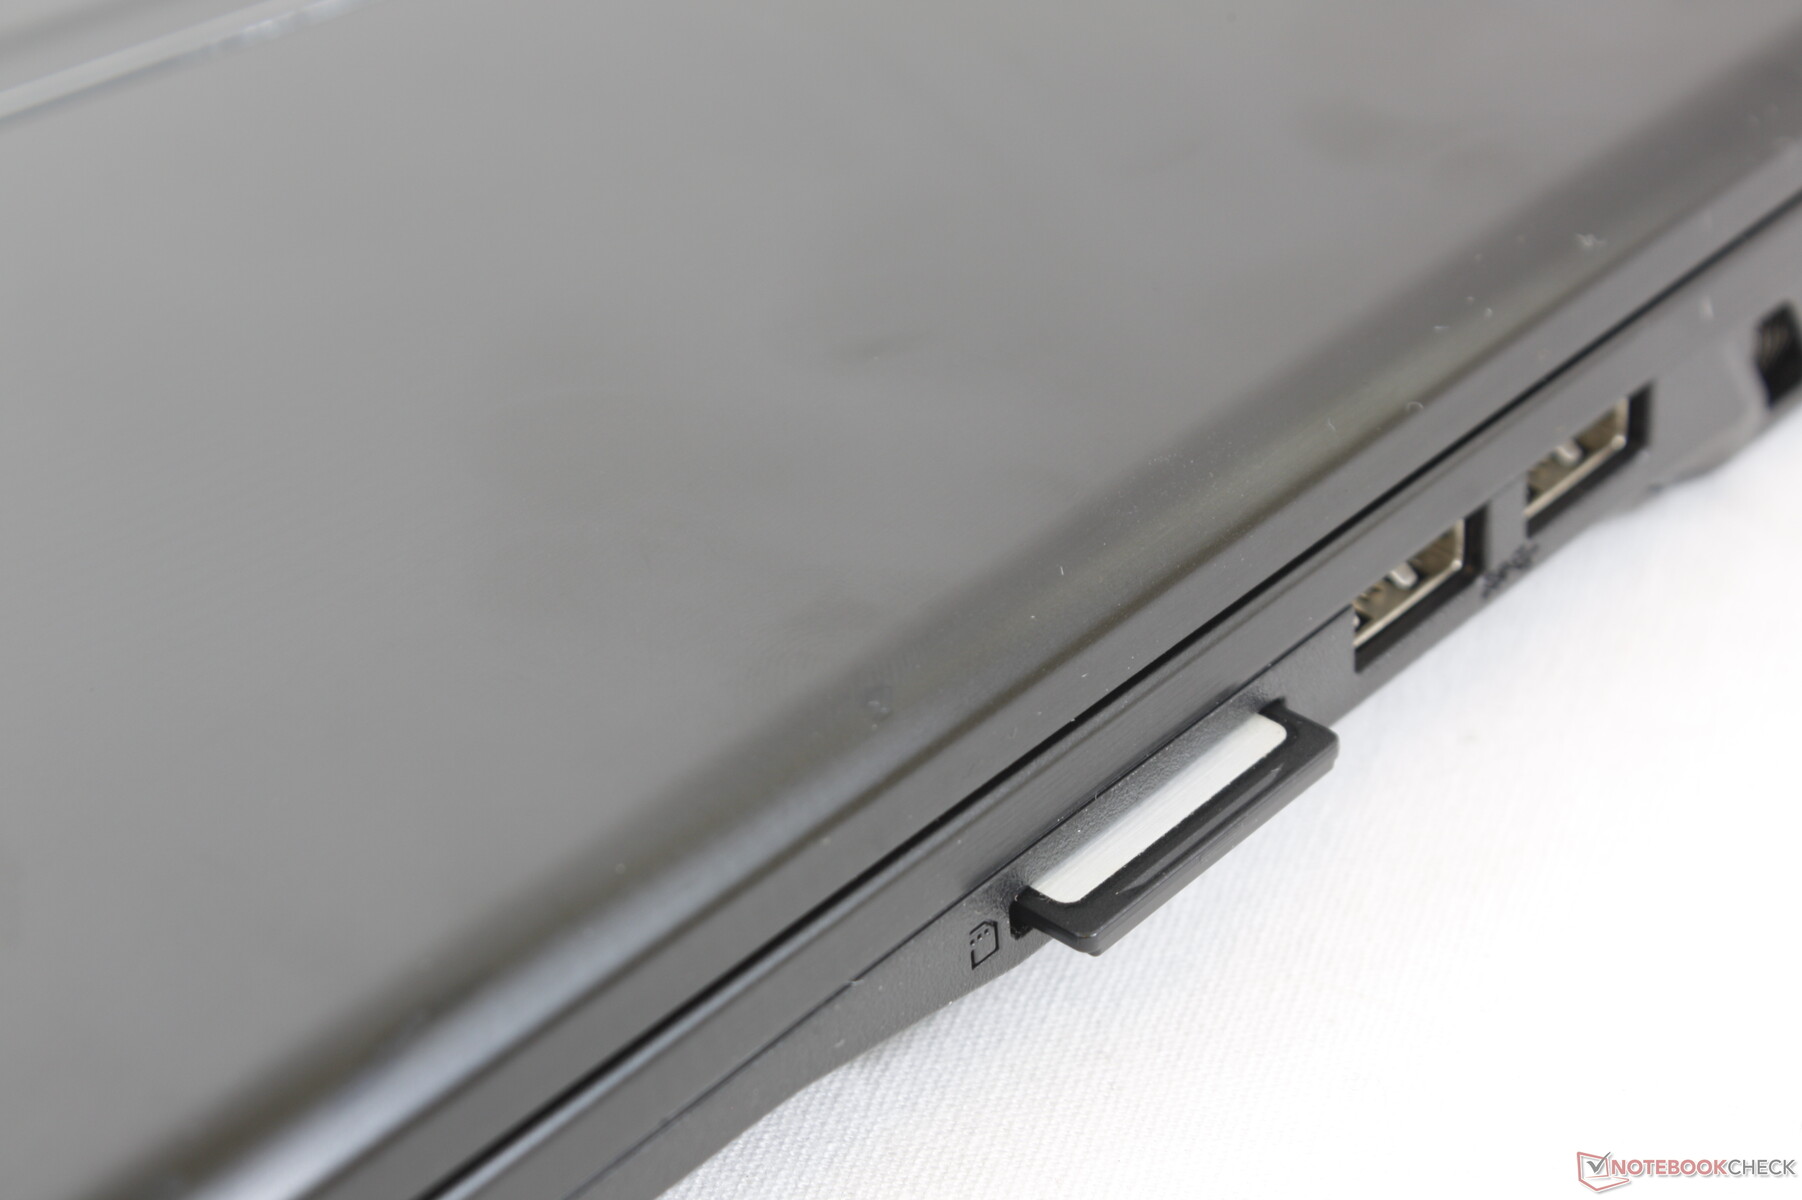
SD Card Reader
The spring-loaded SD card reader is slow not unlike on many other MSI laptops. Moving 1 GB worth of pictures from our UHS-II test card to desktop takes about 38 seconds compared to just 8 seconds on the Dell XPS 15.
| SD Card Reader | |
| average JPG Copy Test (av. of 3 runs) | |
| MSI GT75 8RG-090 Titan (Toshiba Exceria Pro SDXC 64 GB UHS-II) | |
| MSI GE63 Raider 8SG (Toshiba Exceria Pro SDXC 64 GB UHS-II) | |
| MSI GL65 9SEK (Toshiba Exceria Pro SDXC 64 GB UHS-II) | |
| MSI GT63 Titan 8RG-046 (Toshiba Exceria Pro SDXC 64 GB UHS-II) | |
| maximum AS SSD Seq Read Test (1GB) | |
| MSI GT75 8RG-090 Titan (Toshiba Exceria Pro SDXC 64 GB UHS-II) | |
| MSI GE63 Raider 8SG (Toshiba Exceria Pro SDXC 64 GB UHS-II) | |
| MSI GL65 9SEK (Toshiba Exceria Pro SDXC 64 GB UHS-II) | |
| MSI GT63 Titan 8RG-046 (Toshiba Exceria Pro SDXC 64 GB UHS-II) | |
Communication
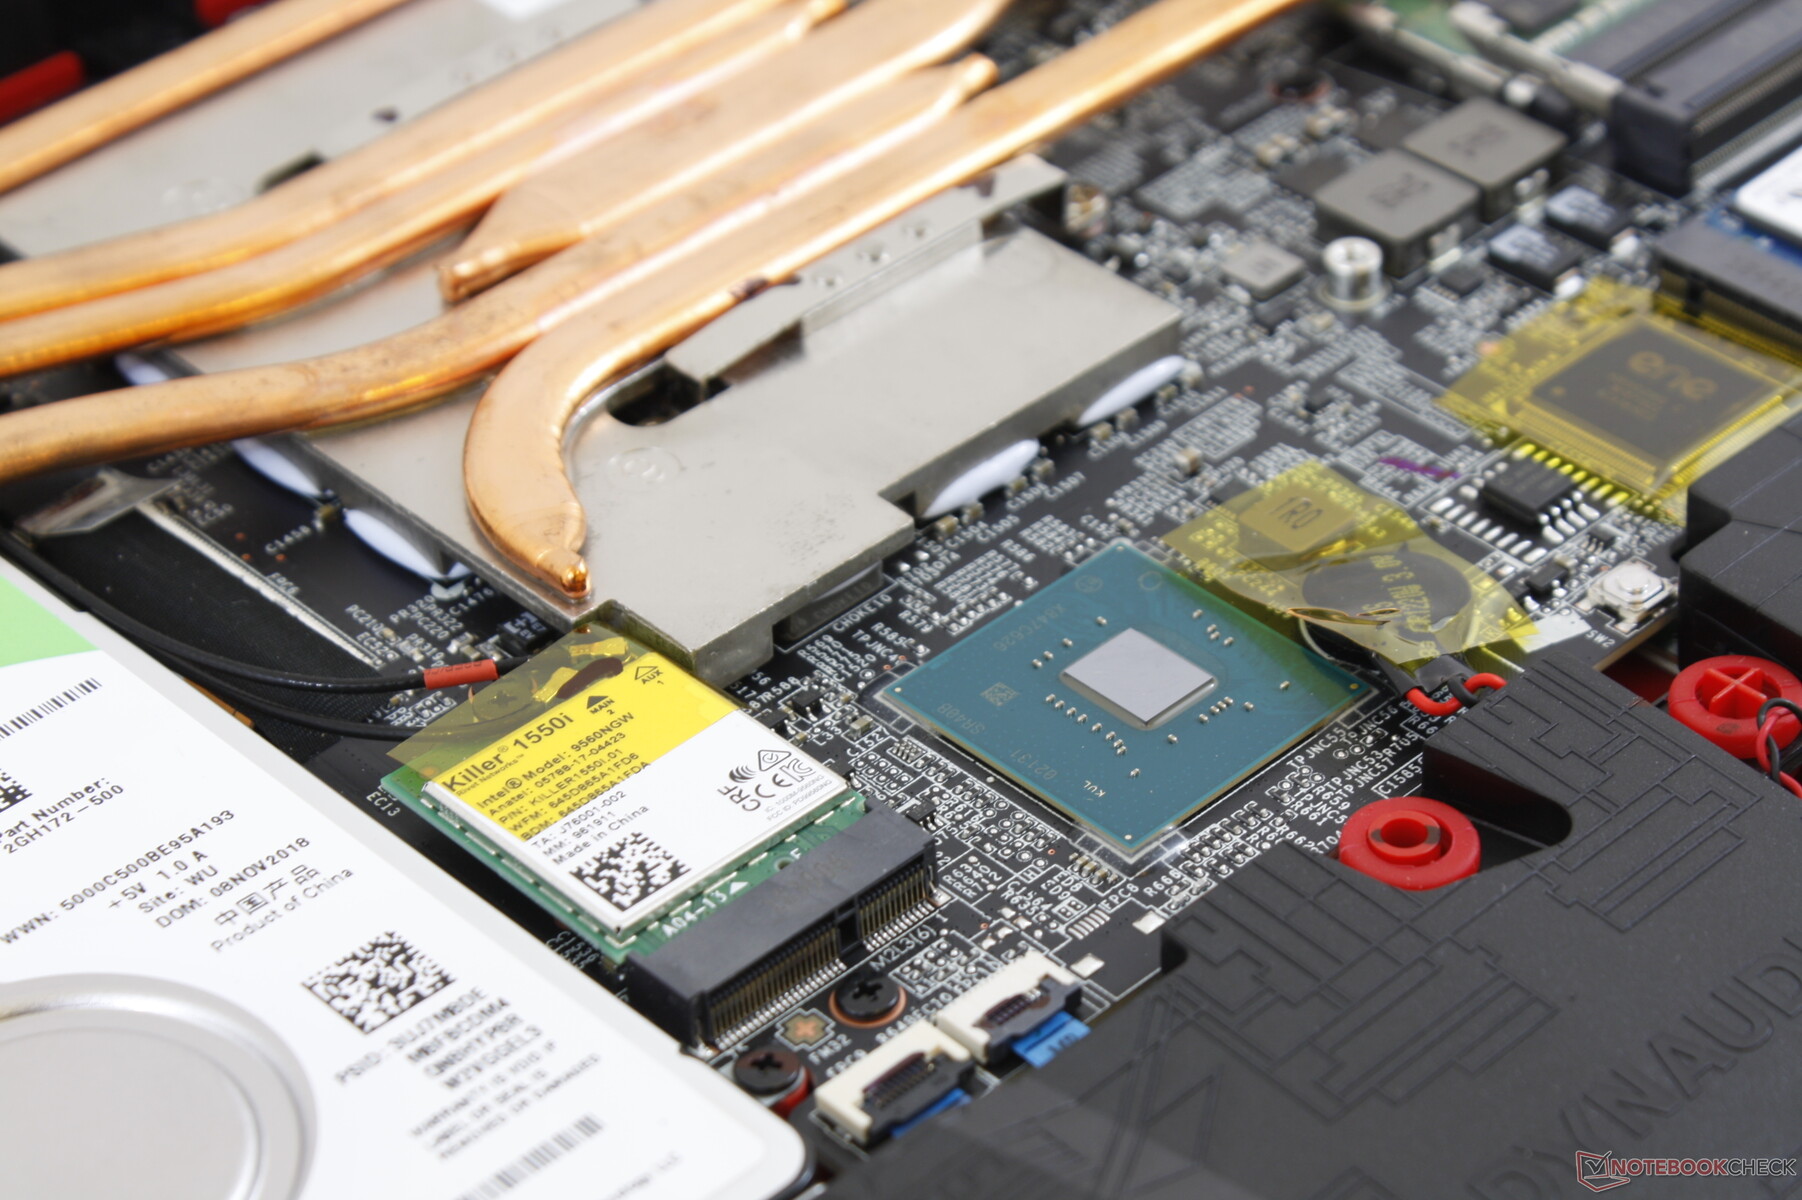
The Killer 1550i module is included for integrated Bluetooth 5.0 and WLAN transfer rates of up to 1.73 Gbps. It is essentially identical to the Intel 9560 except with added support for Killer's Control Center software.
| Networking | |
| iperf3 transmit AX12 | |
| MSI Prestige 15 A10SC | |
| Lenovo Legion Y740-15ICHg | |
| MSI GT63 Titan 8RG-046 | |
| MSI GL65 9SEK | |
| iperf3 receive AX12 | |
| MSI Prestige 15 A10SC | |
| MSI GL65 9SEK | |
| MSI GT63 Titan 8RG-046 | |
| Lenovo Legion Y740-15ICHg | |
Maintenance
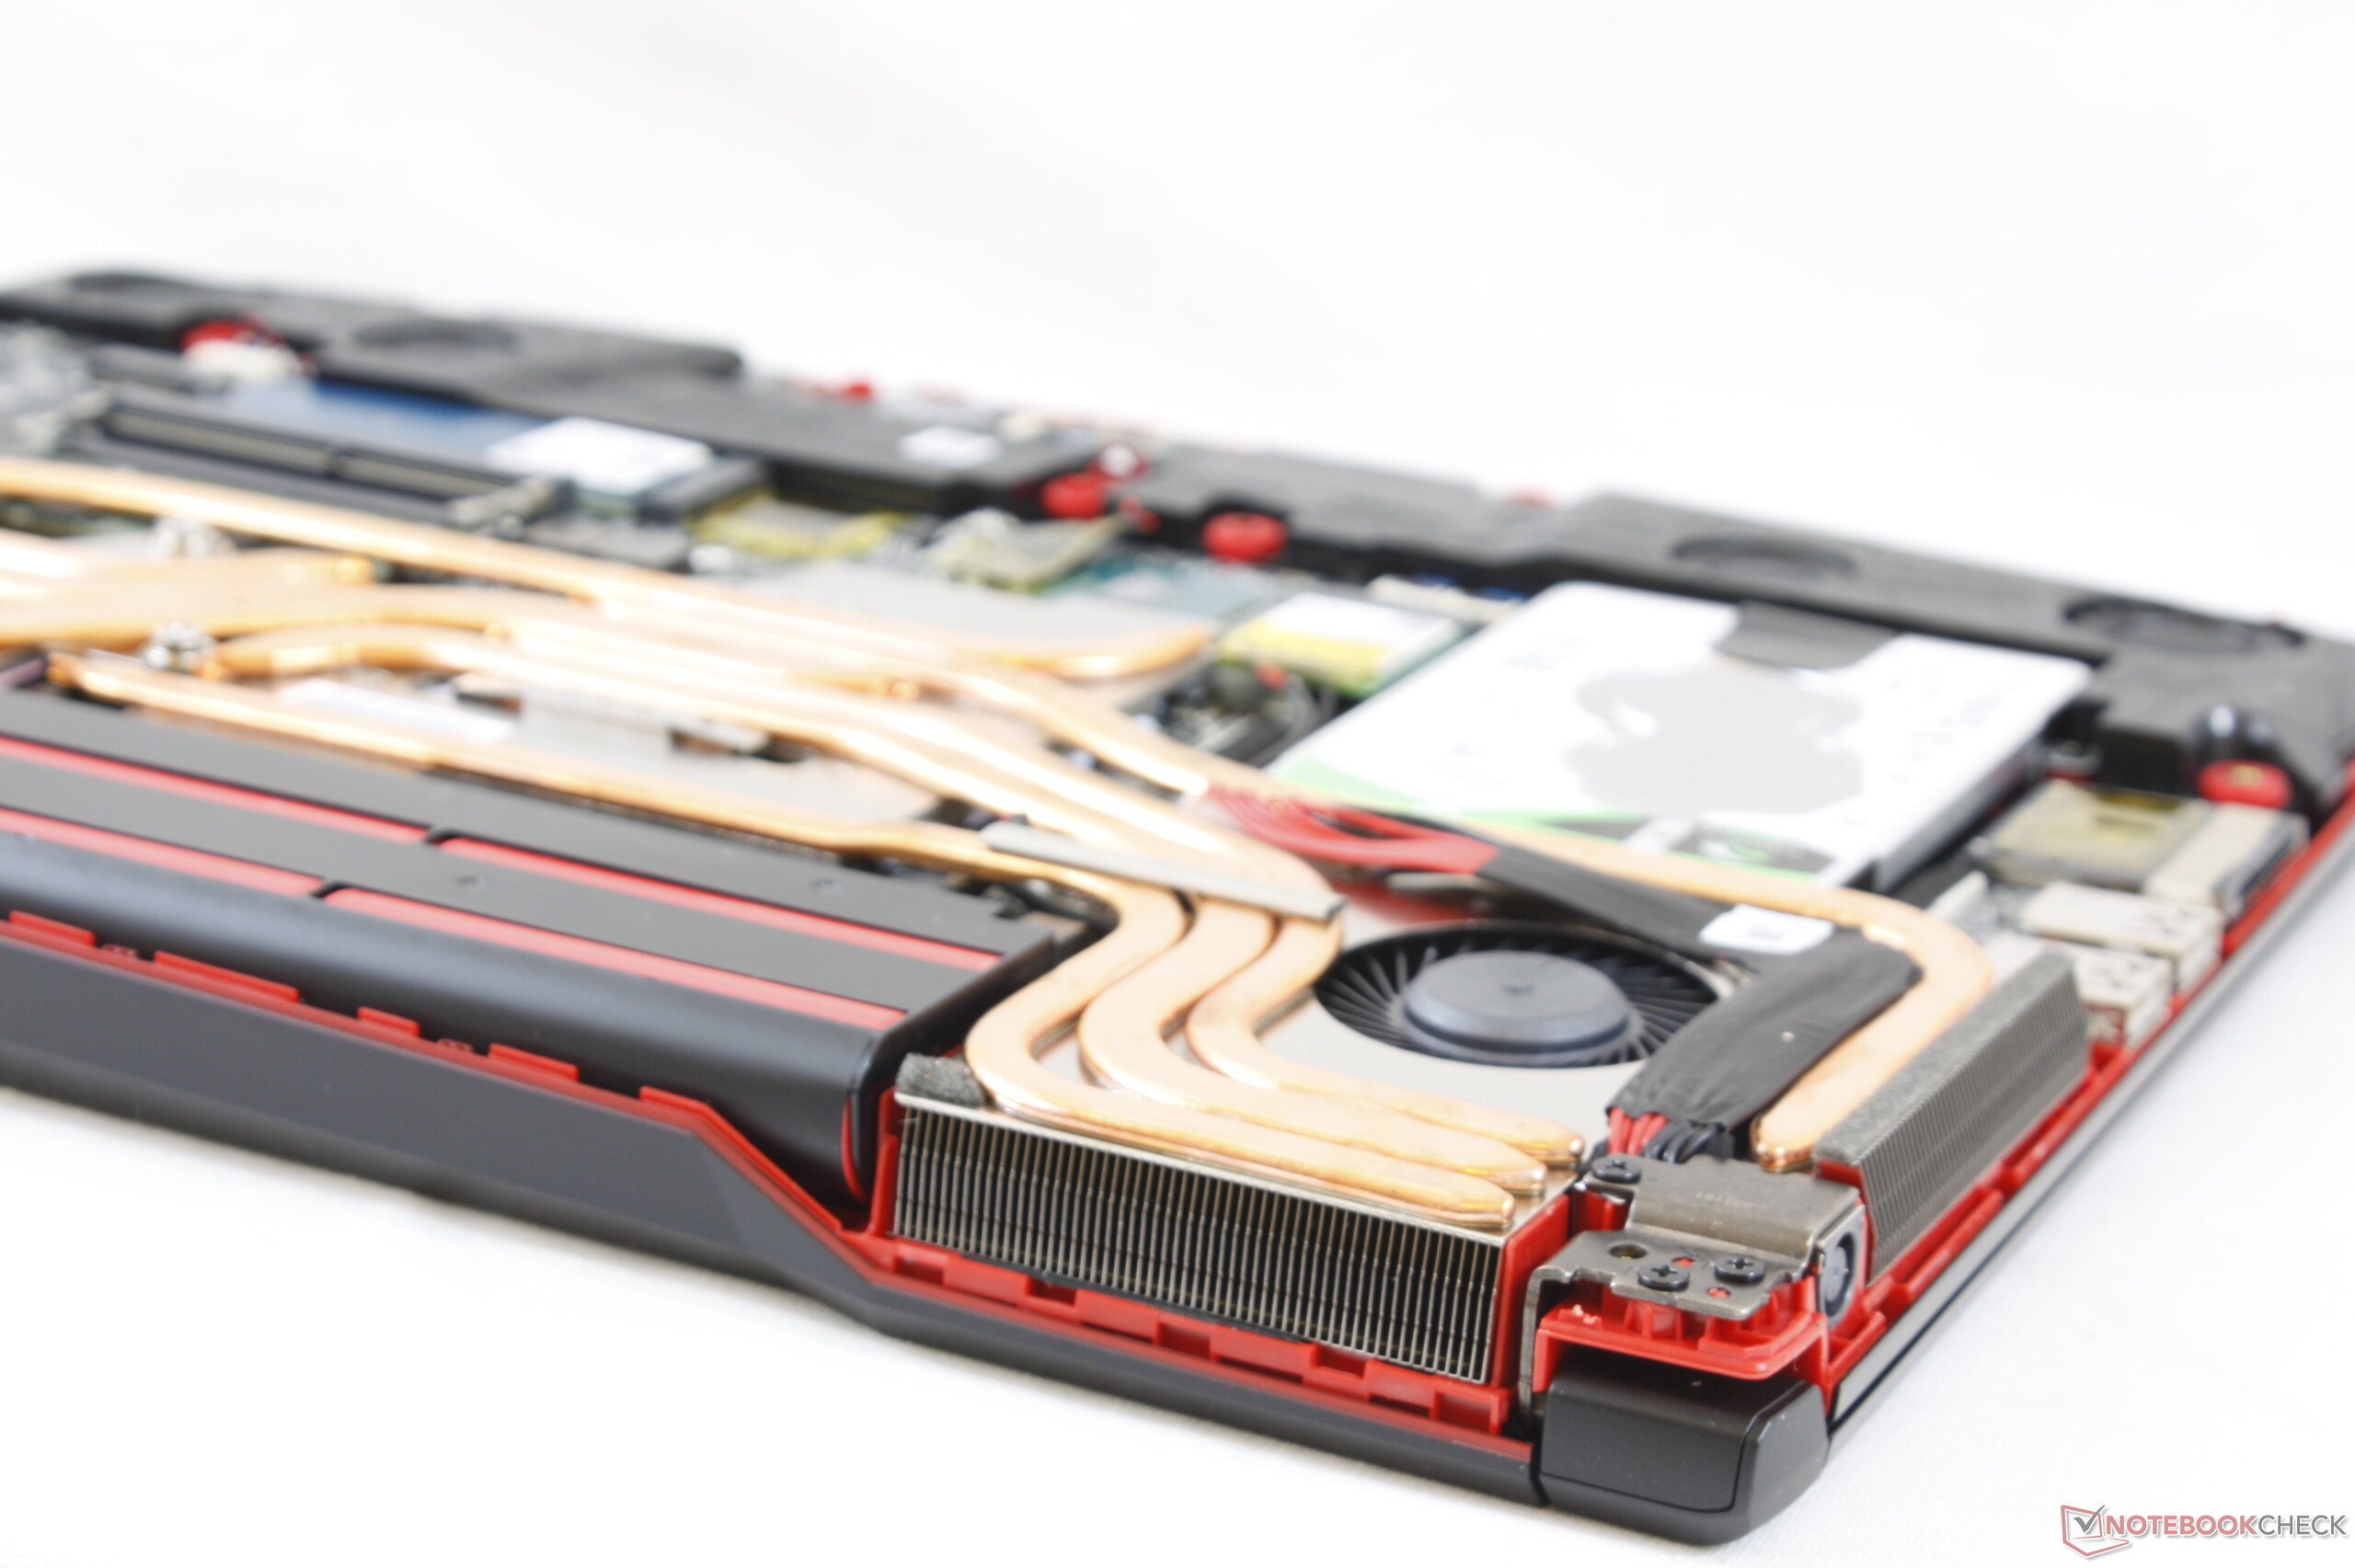
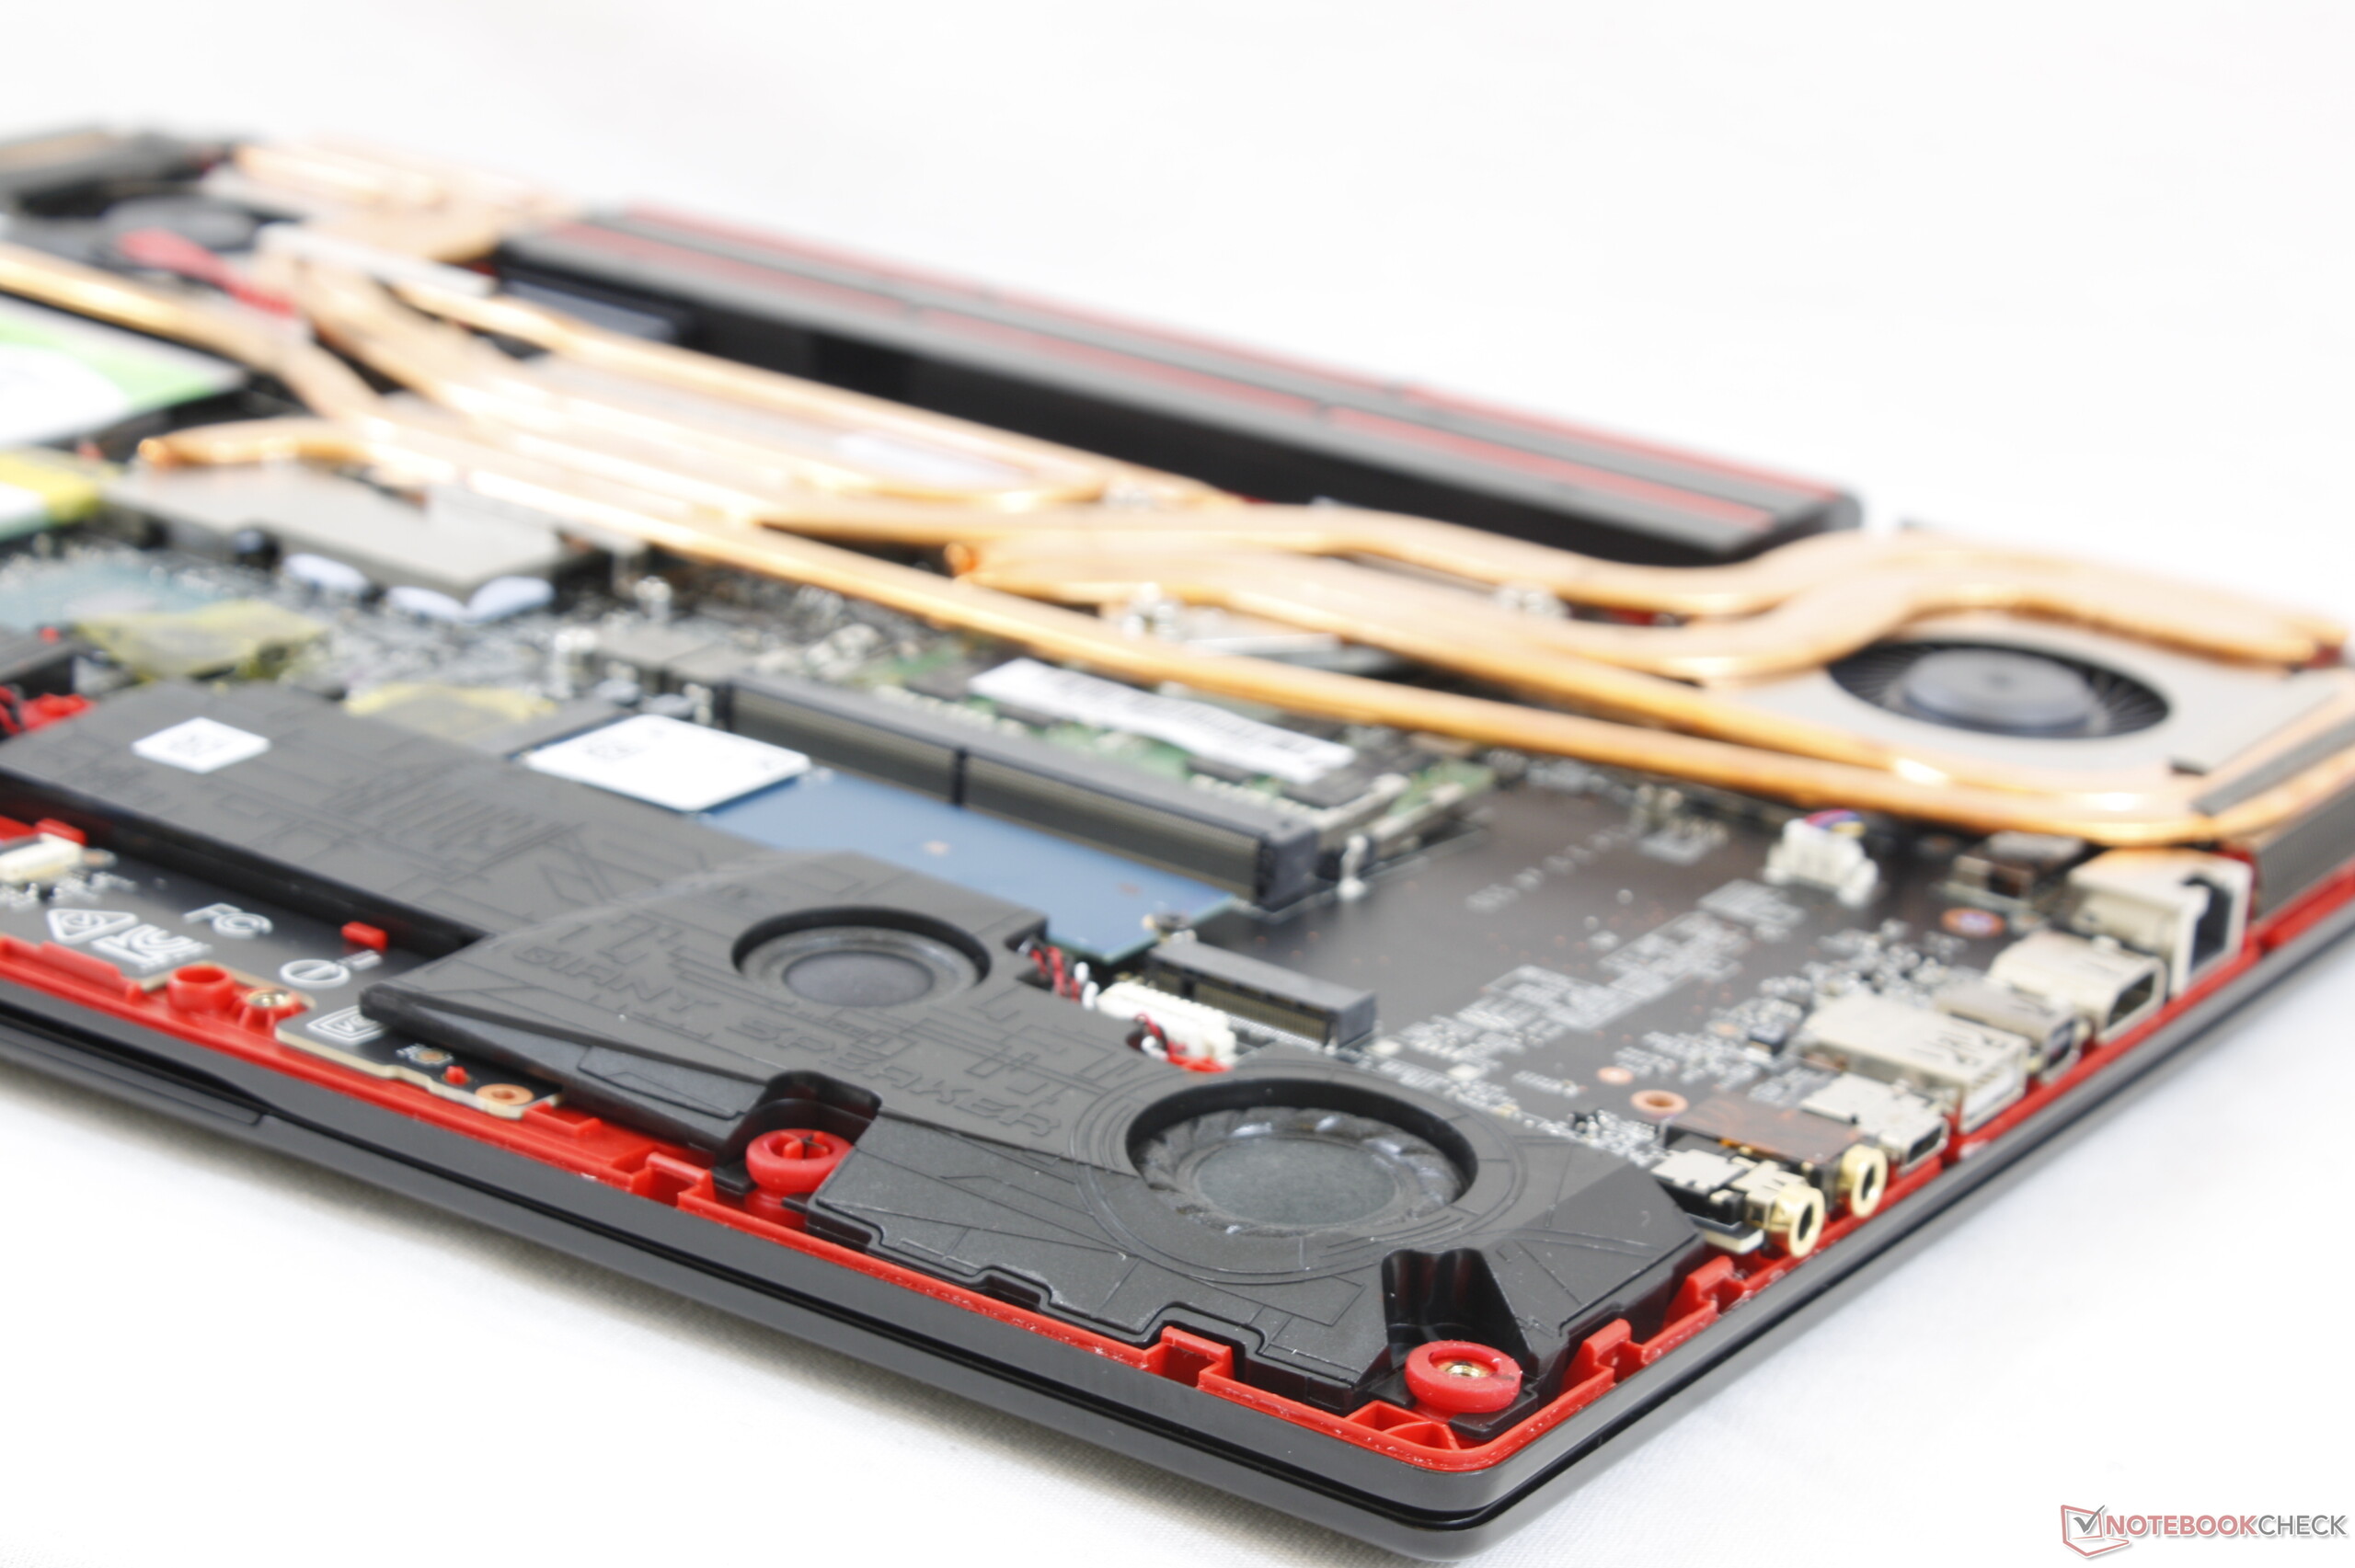
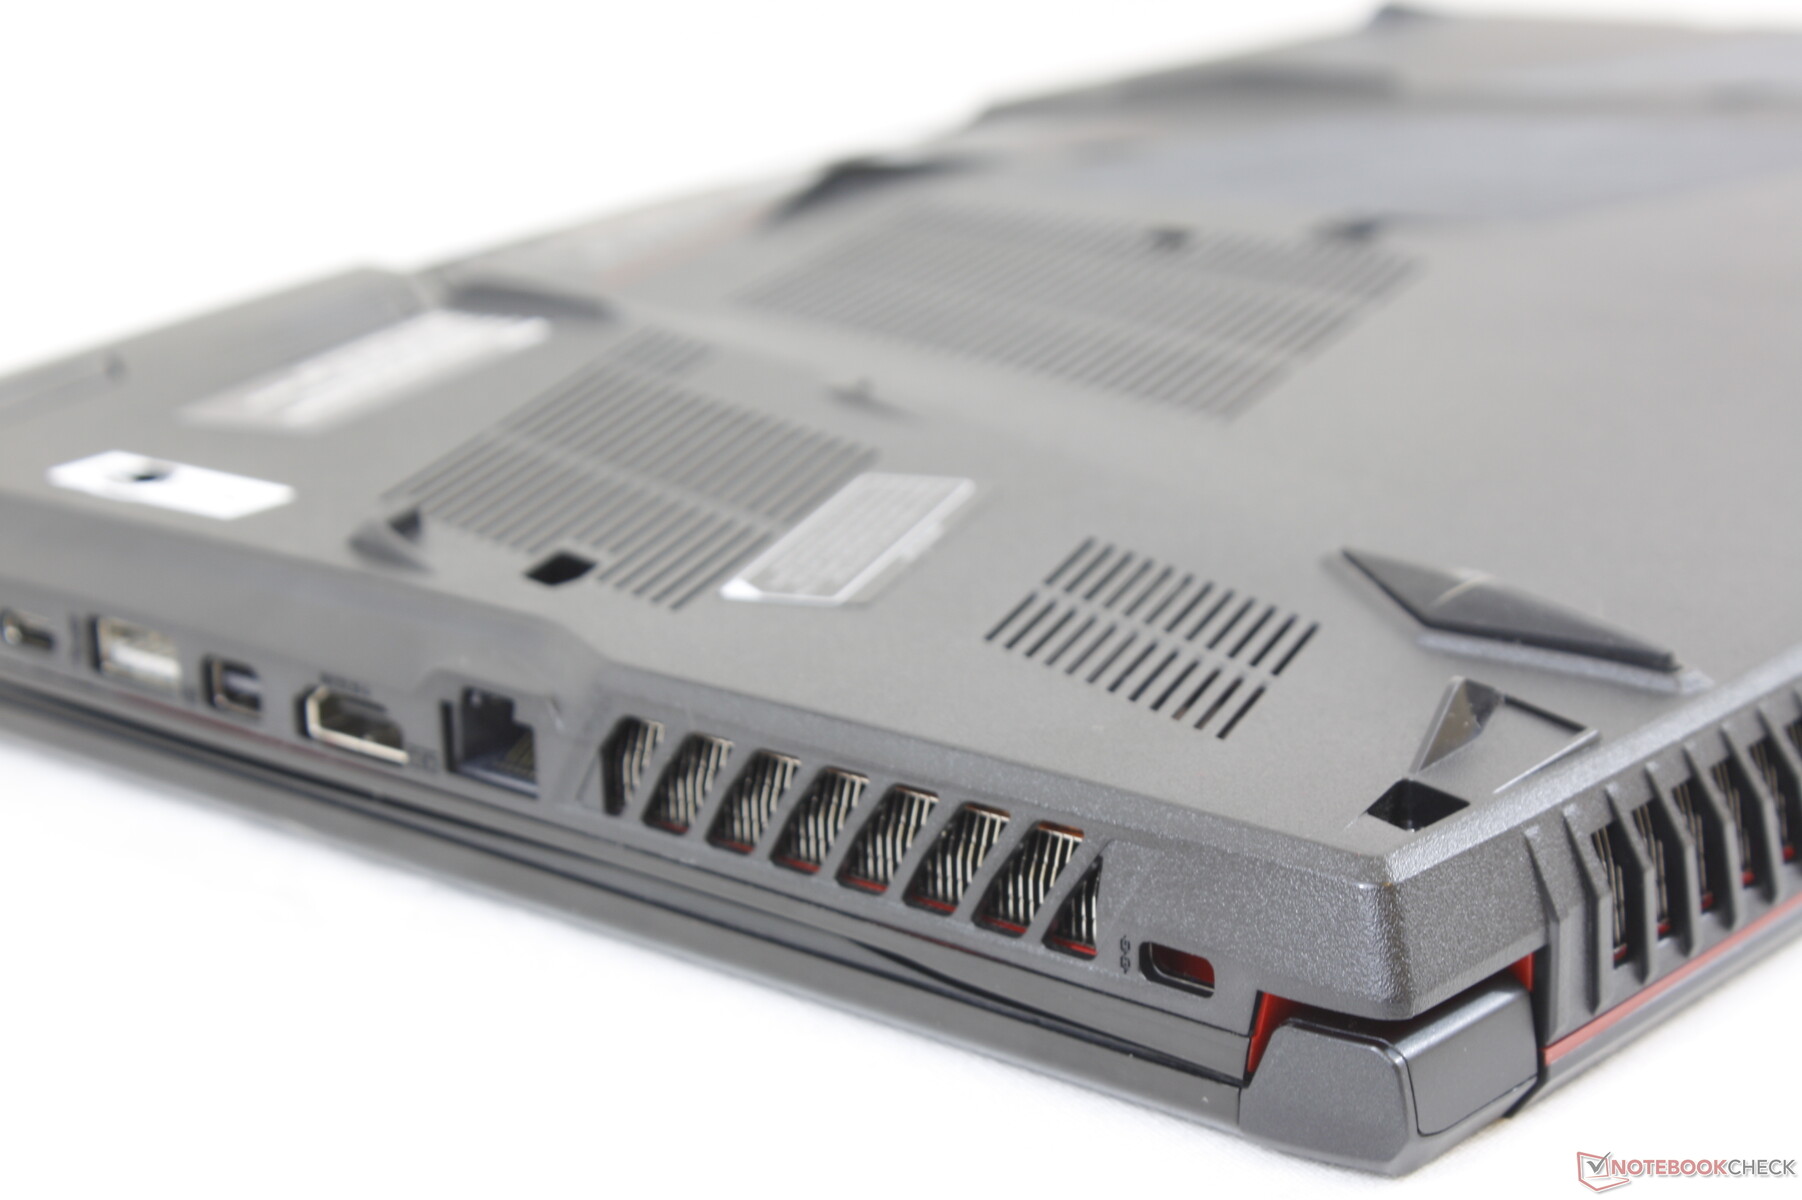
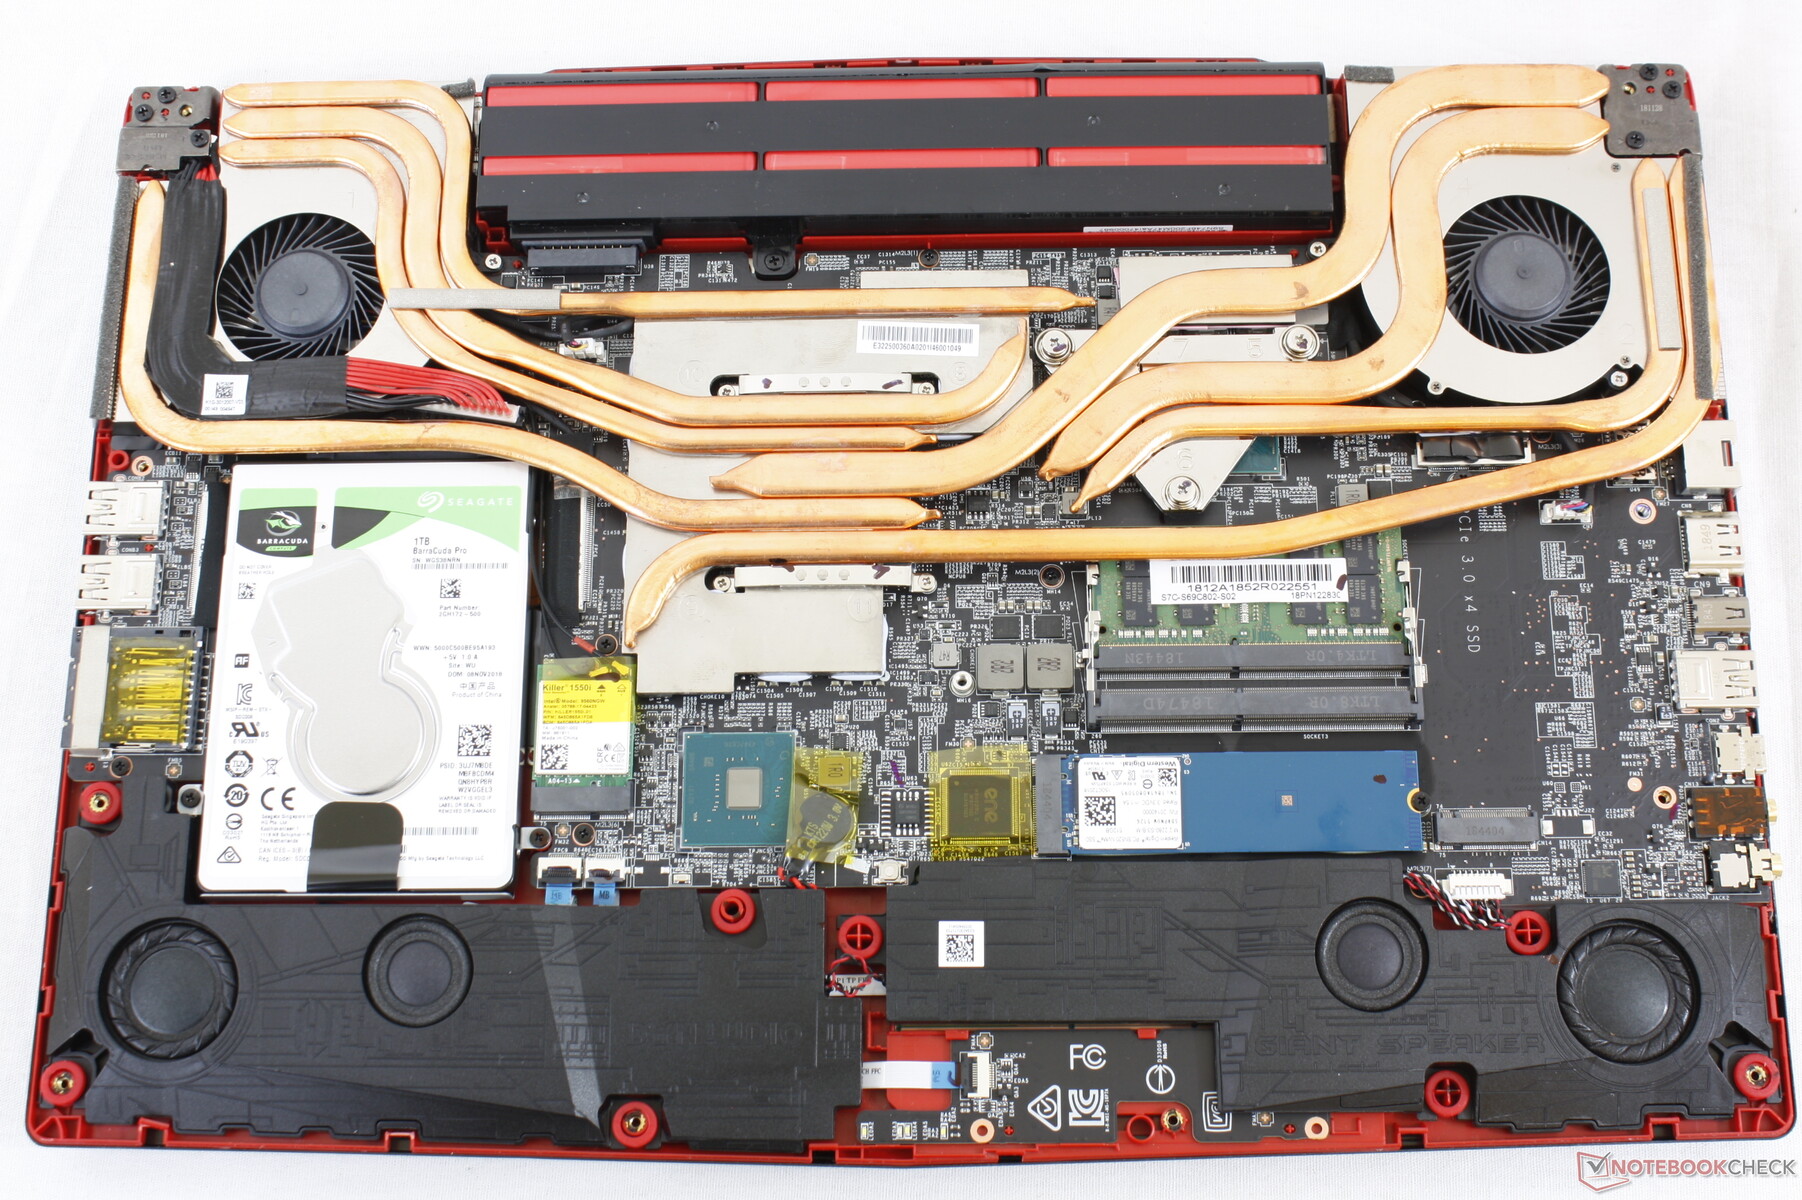
Servicing requires a Philips screwdriver and a sharp edge. The bottom plate is moderately difficult to remove especially around the rear and edge where the audio ports can be caught on the plate. Keep in mind that a Factory Seal sticker must be broken if servicing the system.
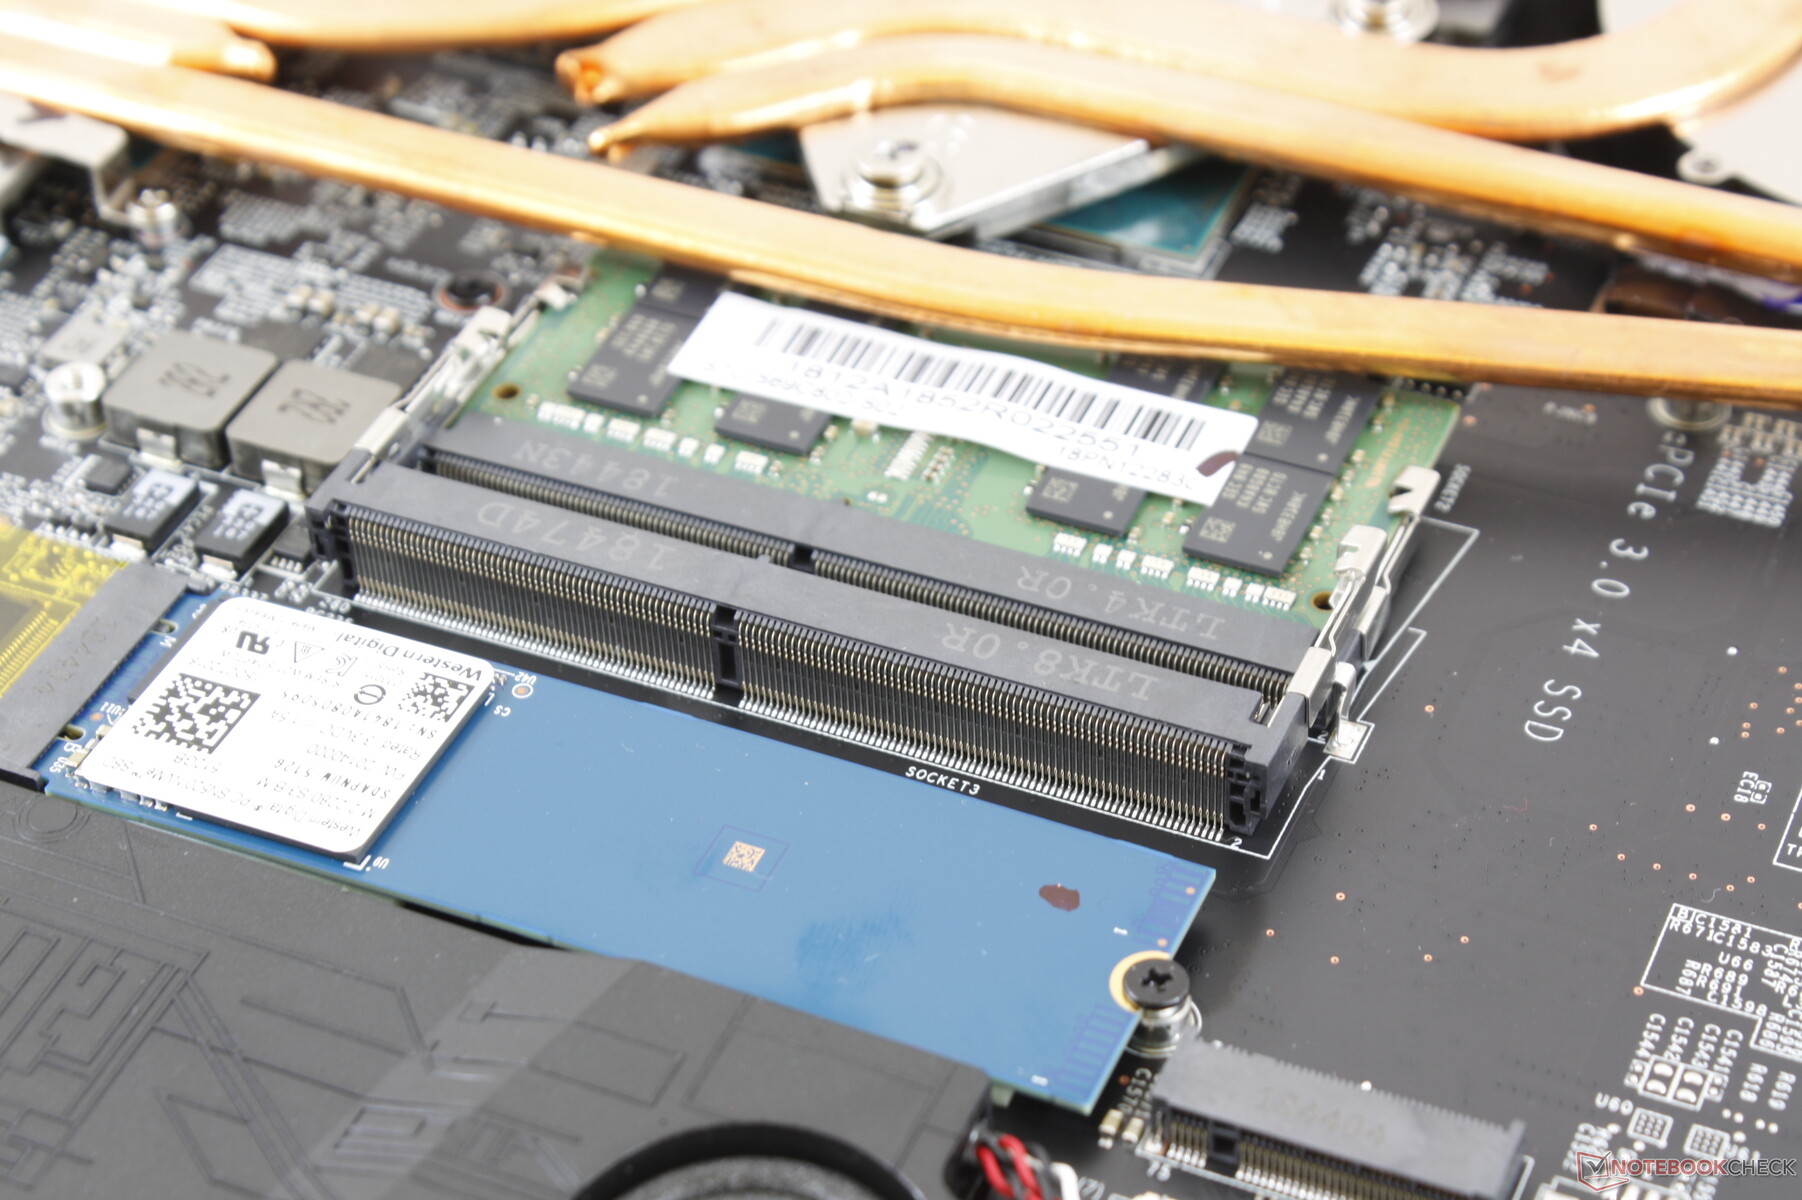
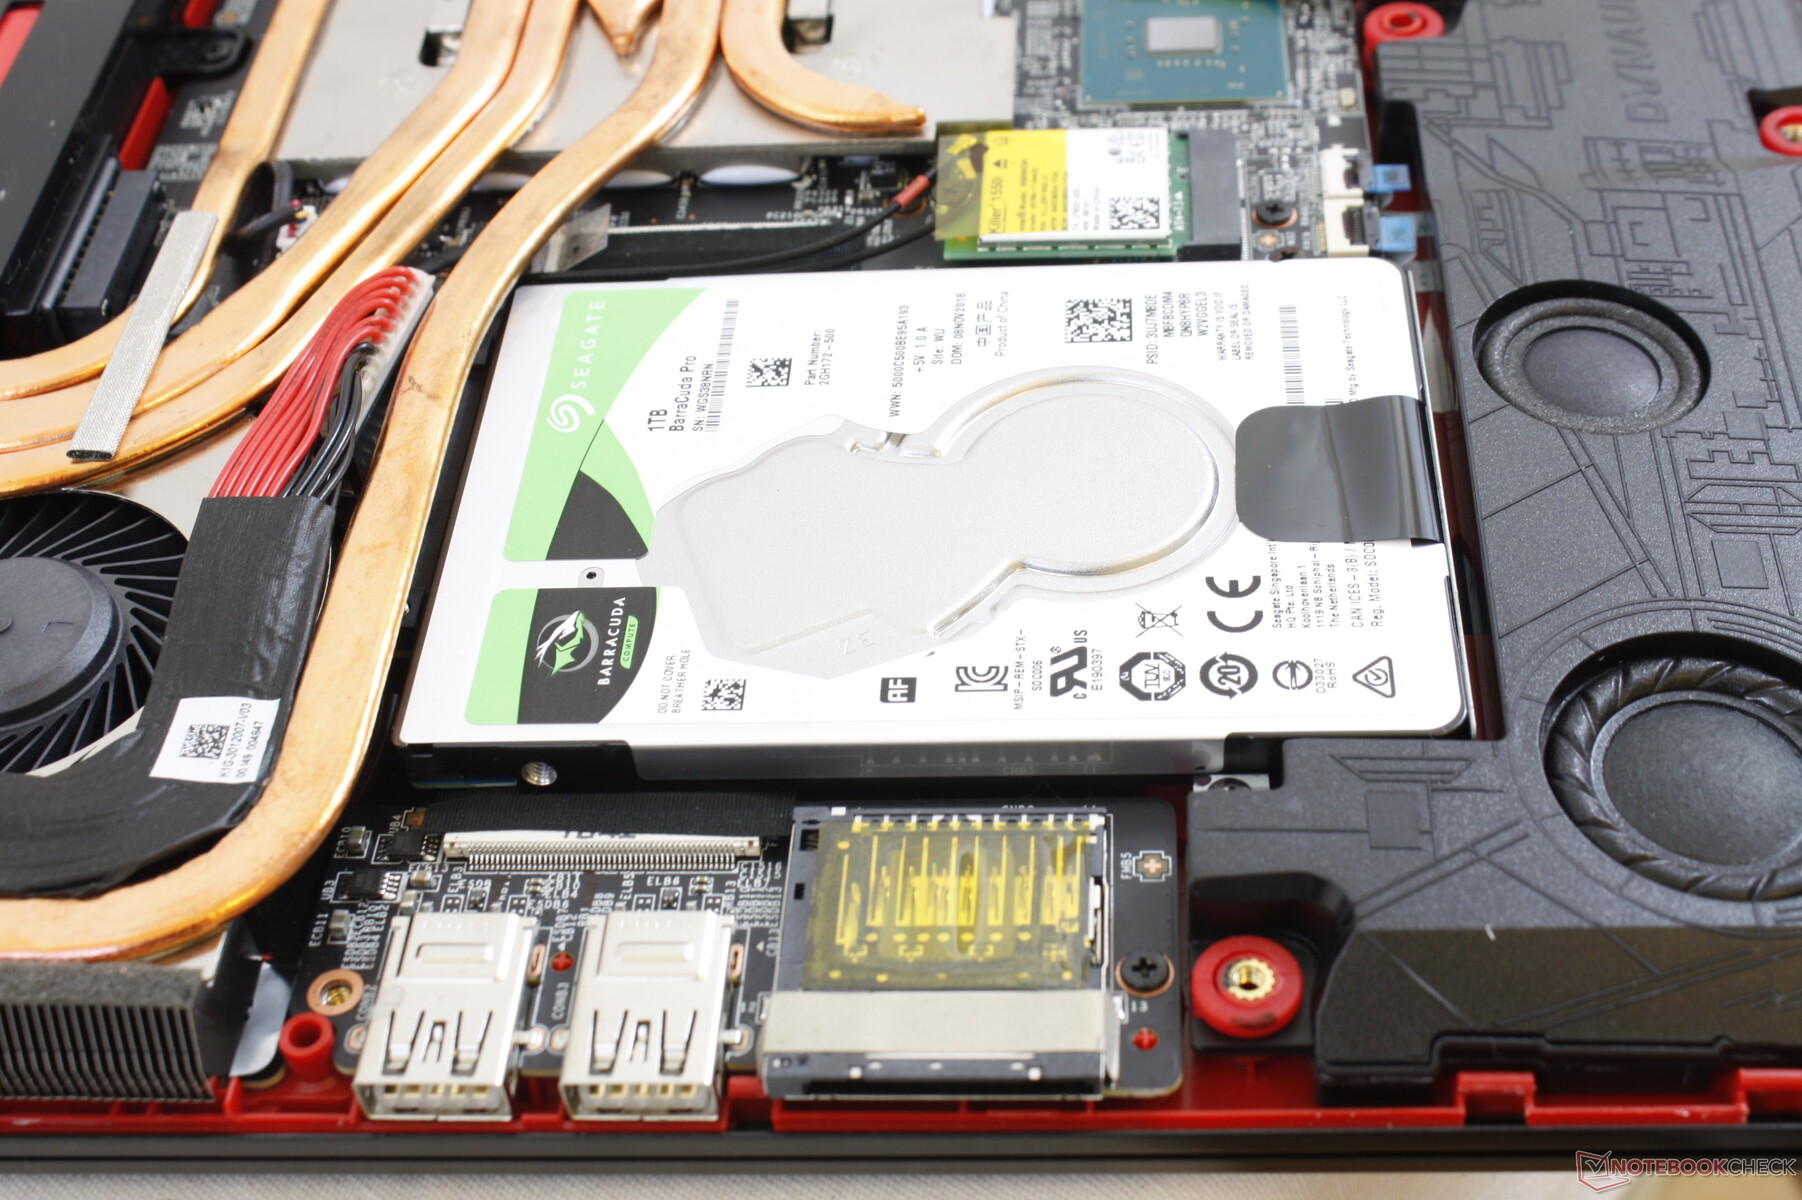
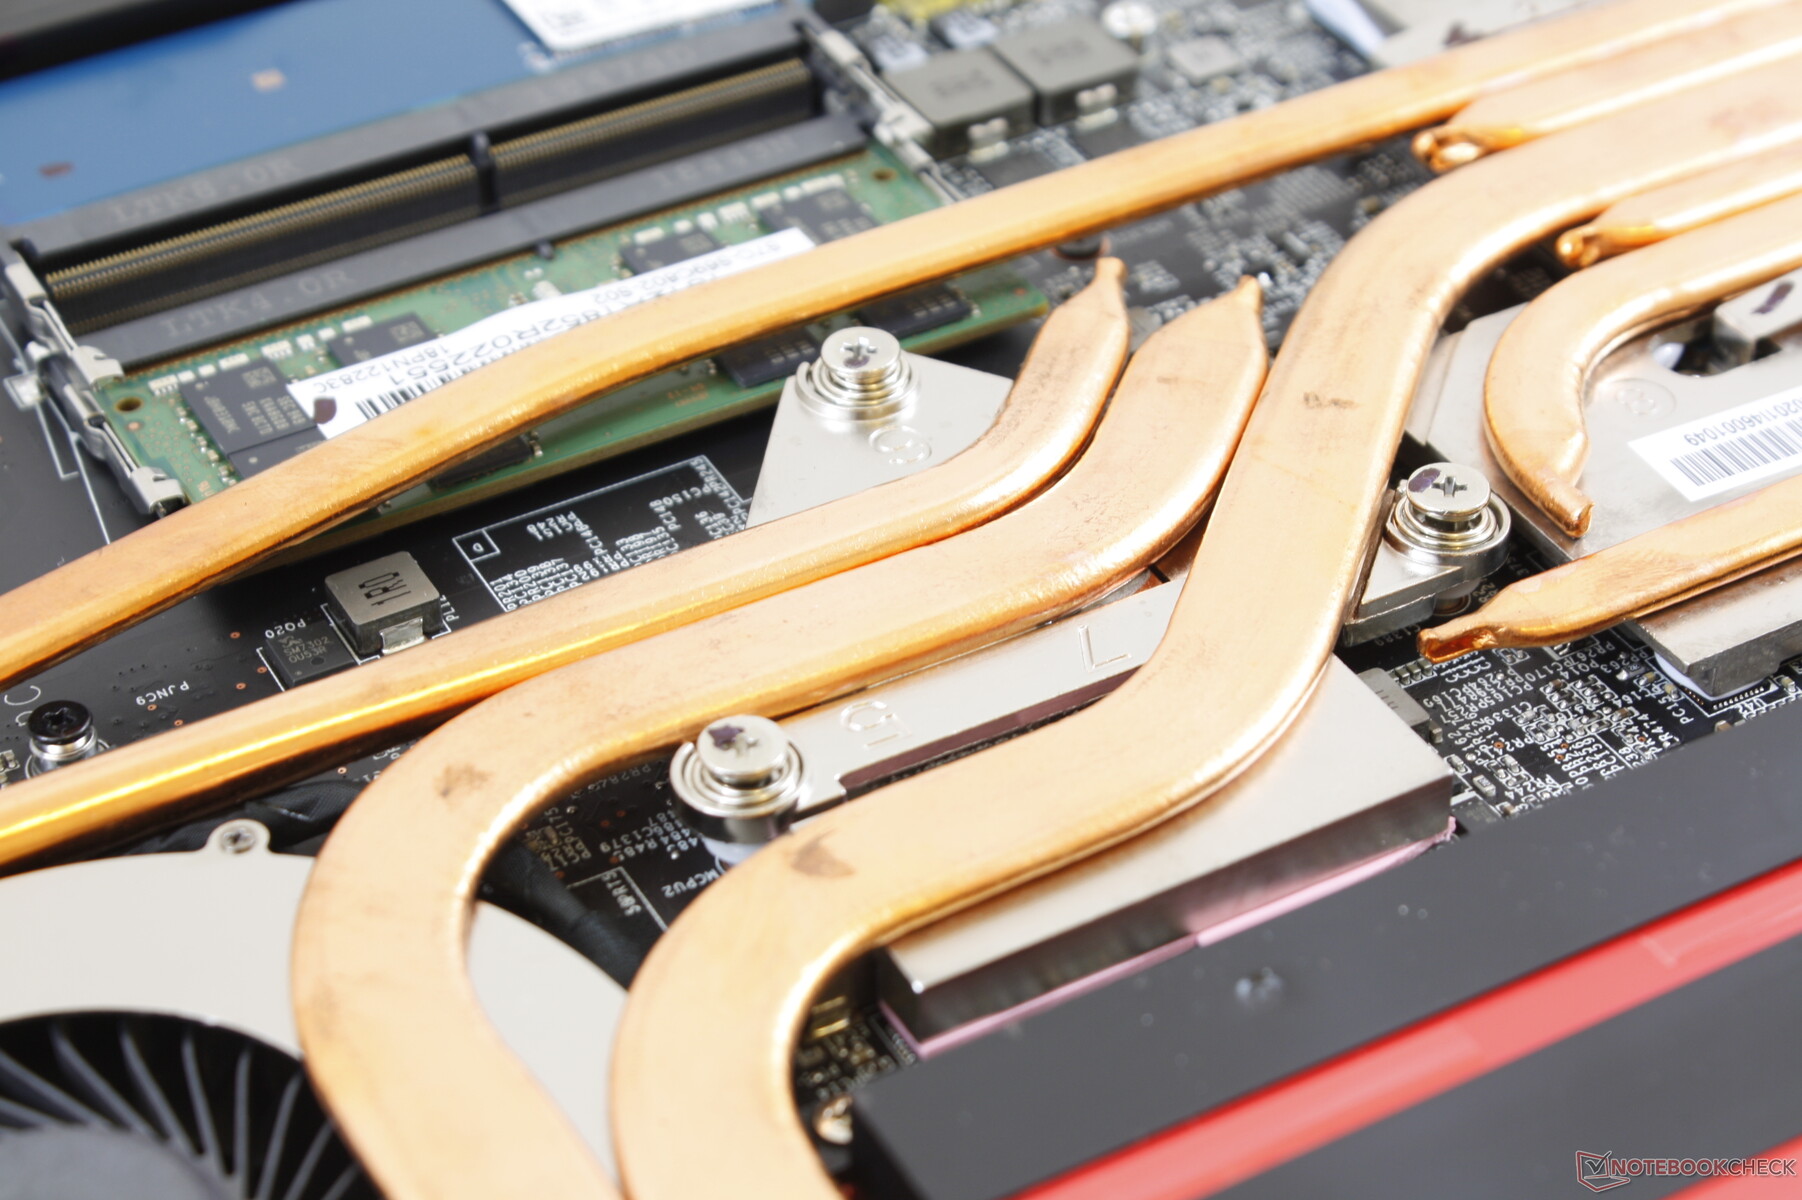
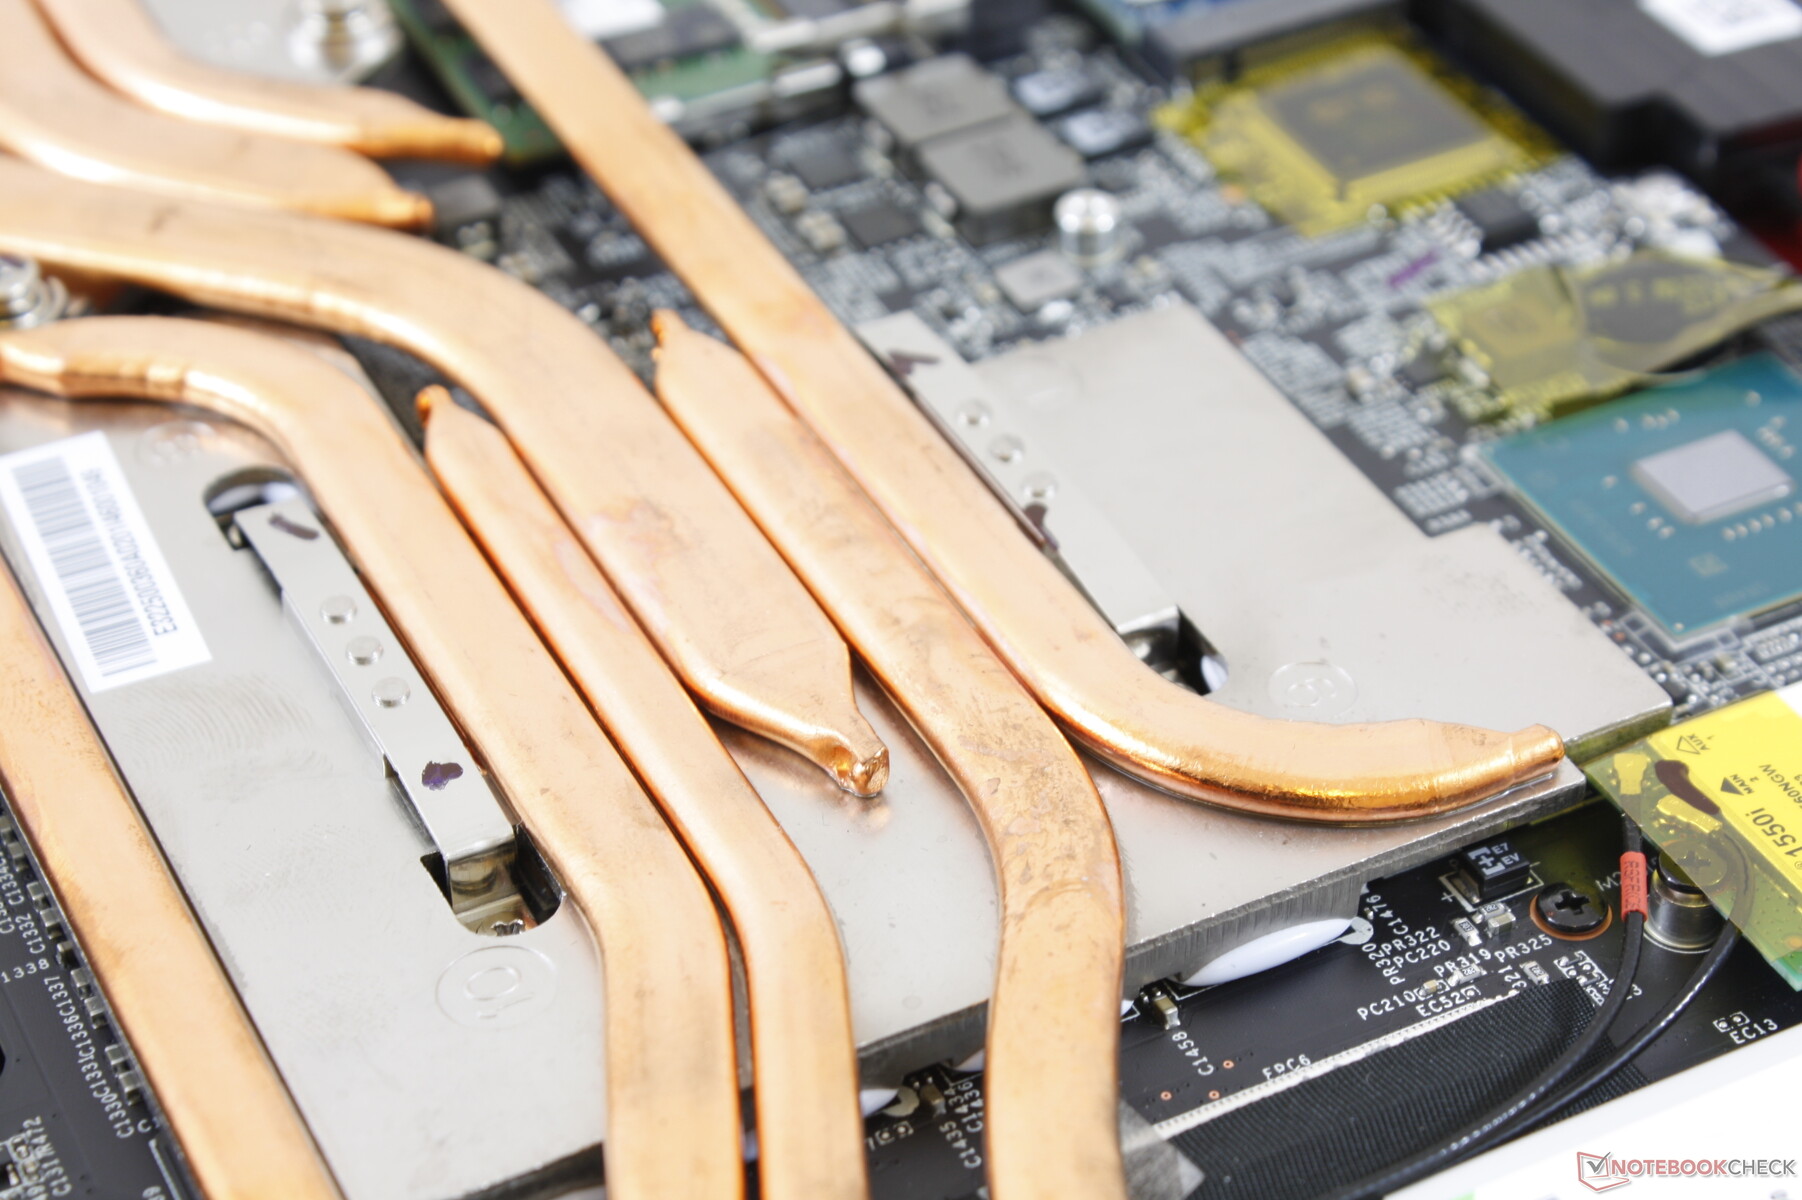
Users have direct access to both DDR4 SODIMM slots, both M.2 2280 slots, and the single 2.5-inch SATA III bay. There is a 6-cell Li-Ion battery pack in contrast to the Li-Polymer battery packs on most other laptops.
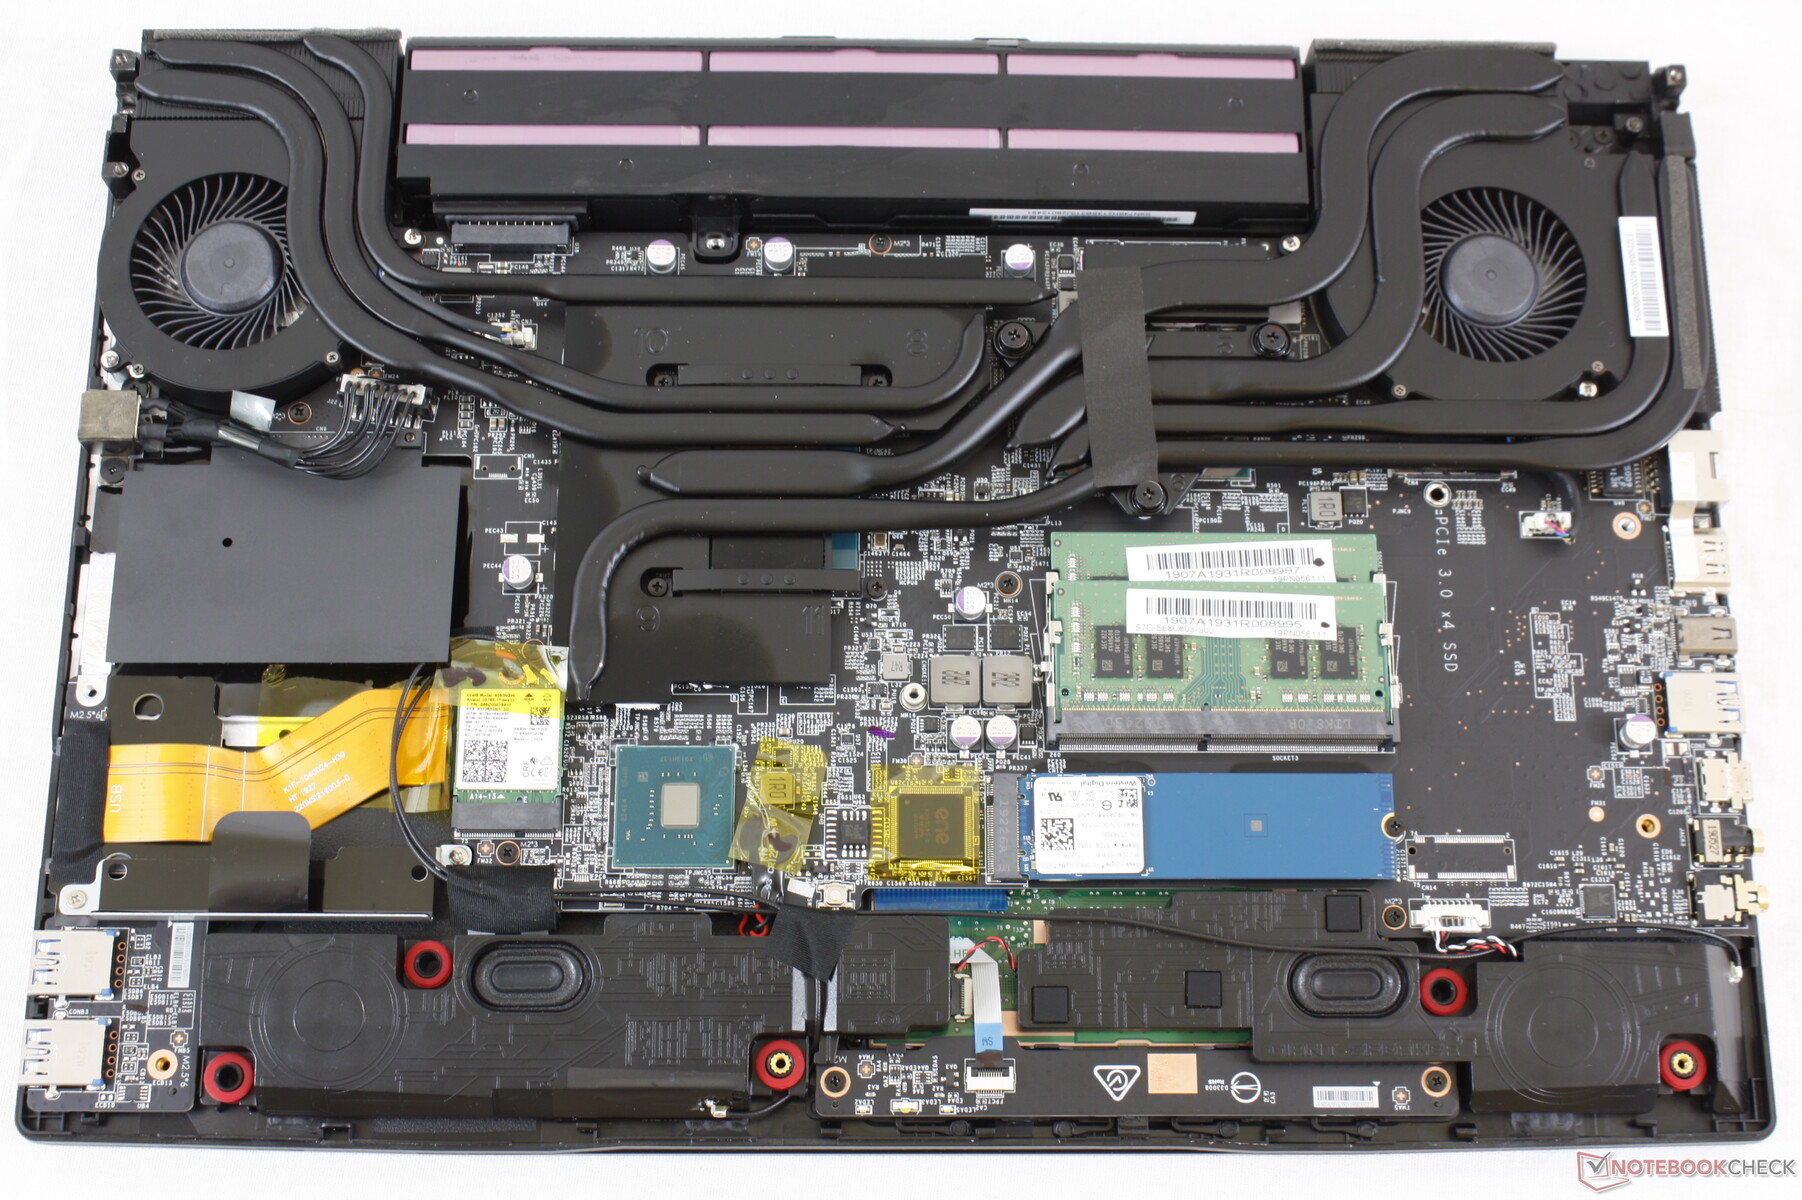
The internal layout is very similar to the cheaper MSI GL65 as shown below.
Accessories and Warranty
A Quick Start guide and velvet cleaning cloth are included in the box.
The standard one-year limited manufacturer warranty applies. Registering your purchase with MSI may net another few months of extended warranty or accidental damage protection depending on region.
Input Devices
Keyboard
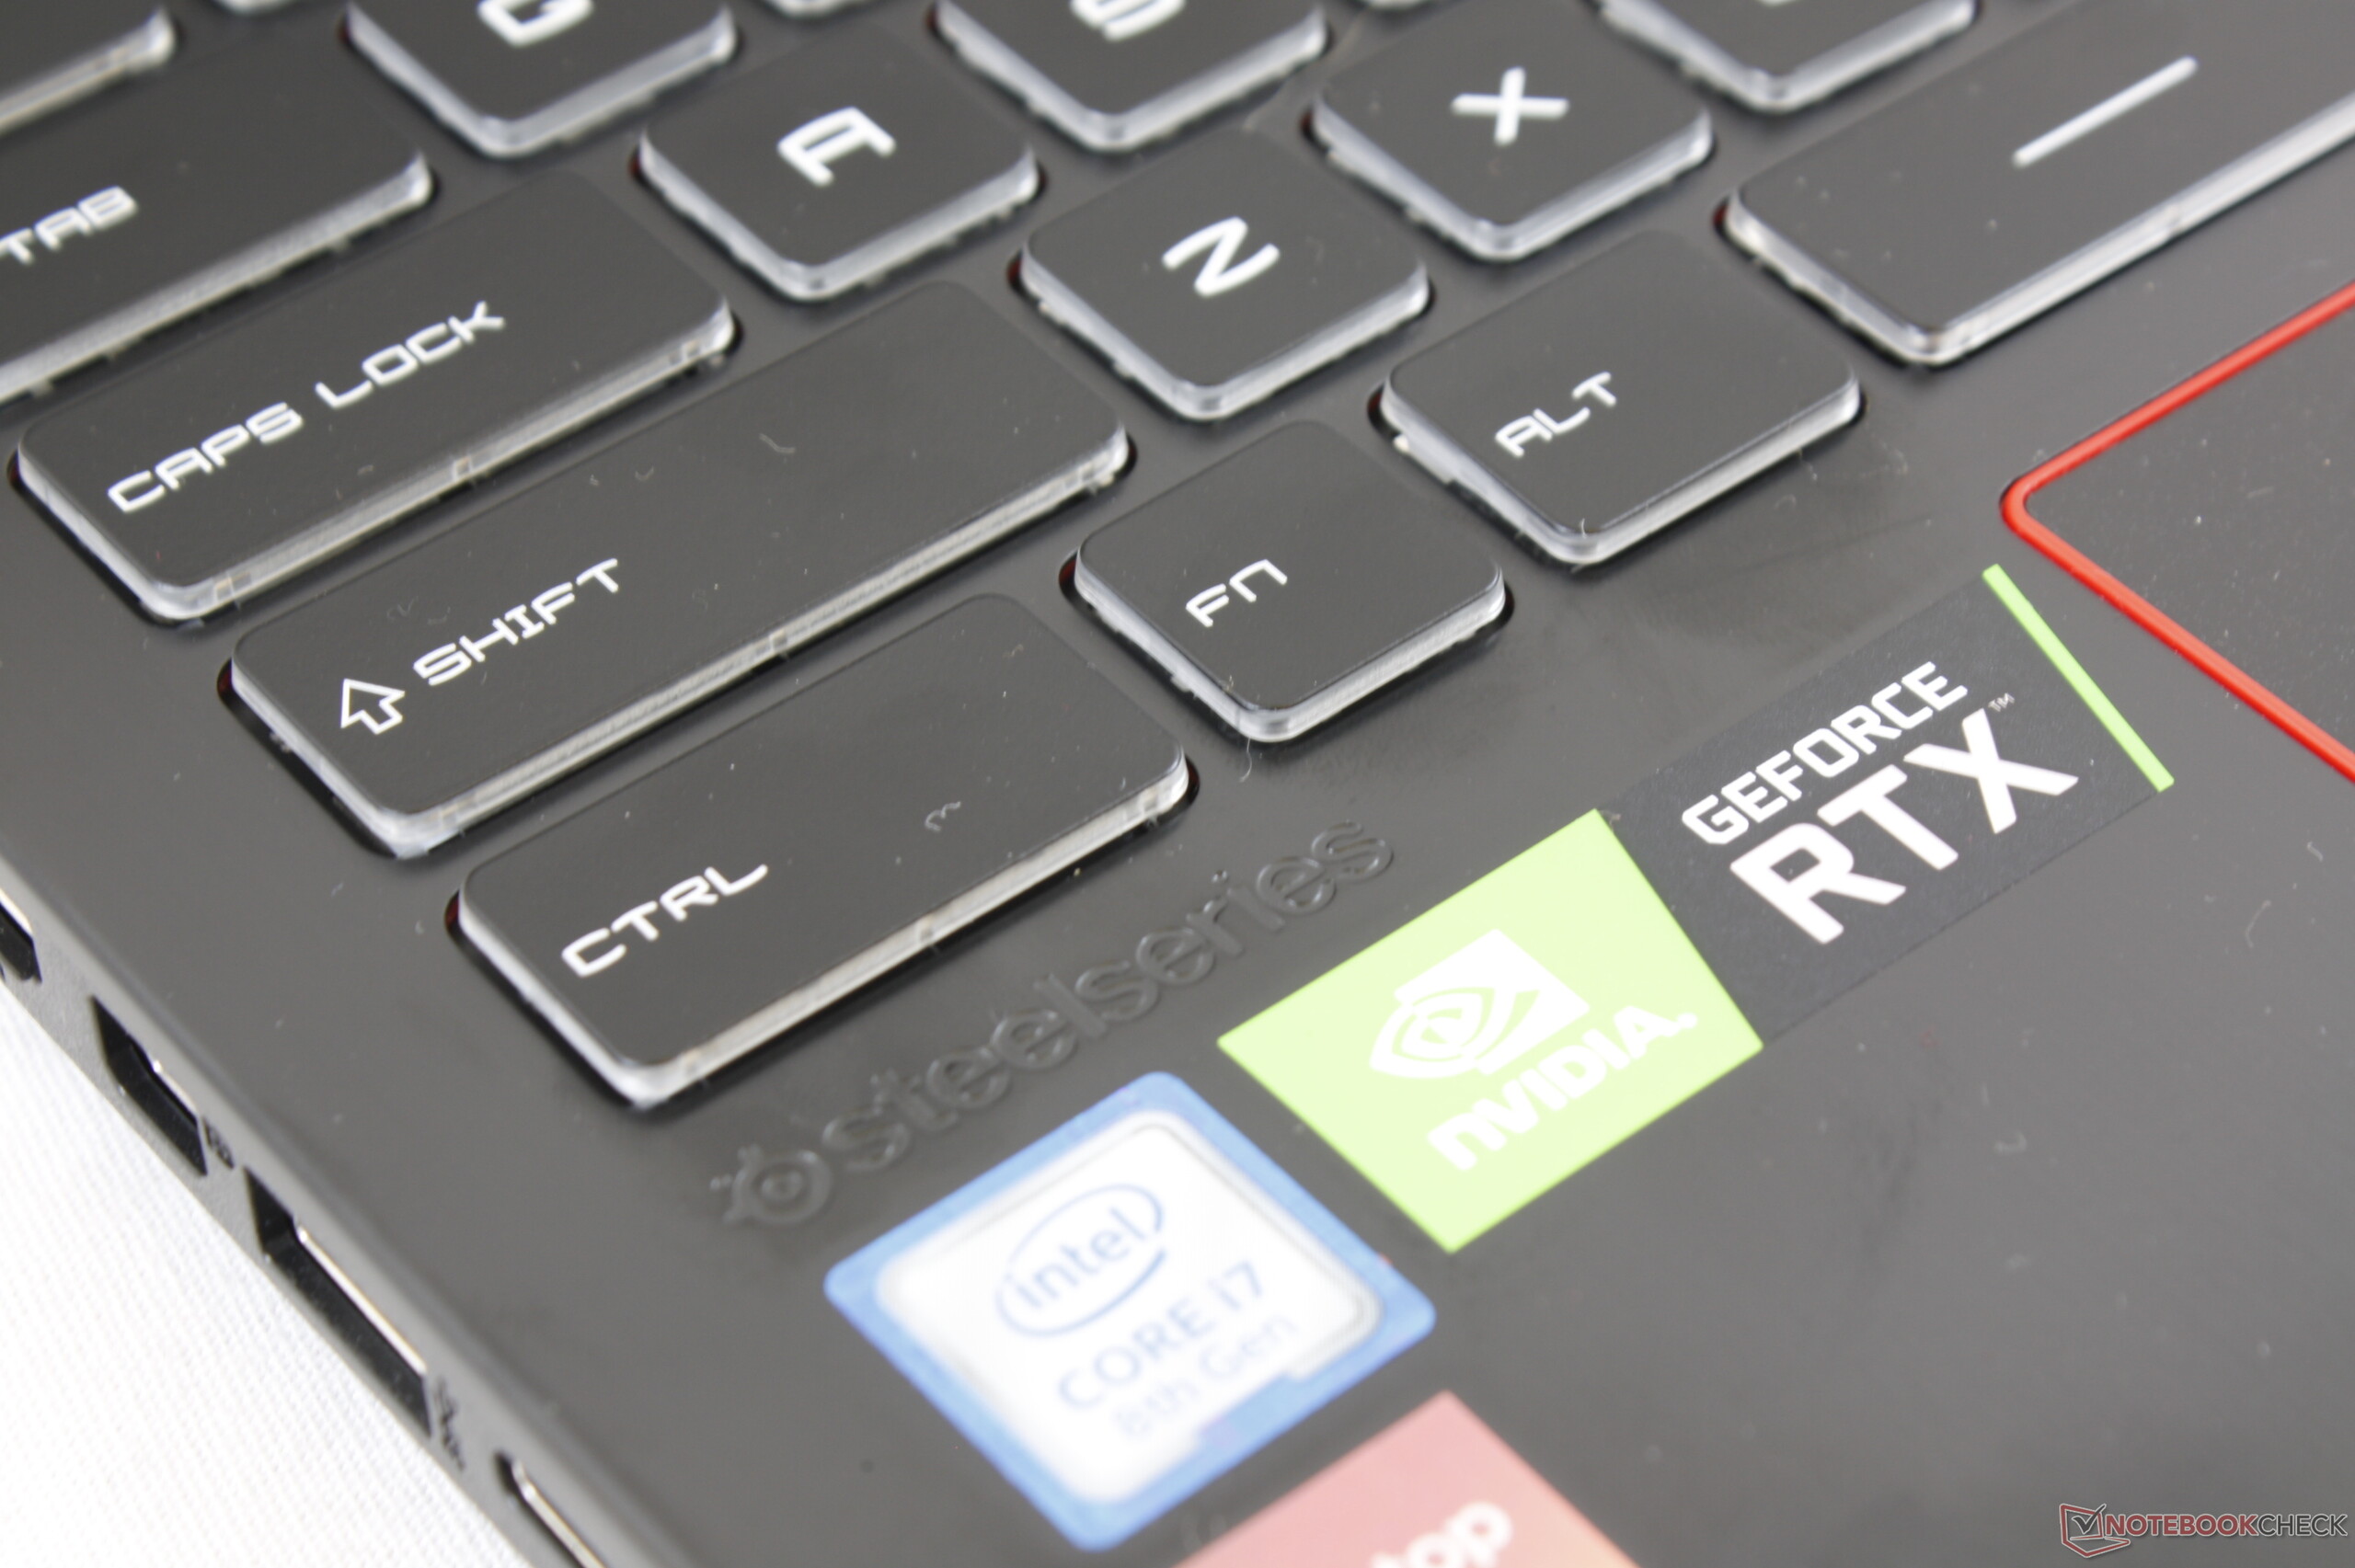
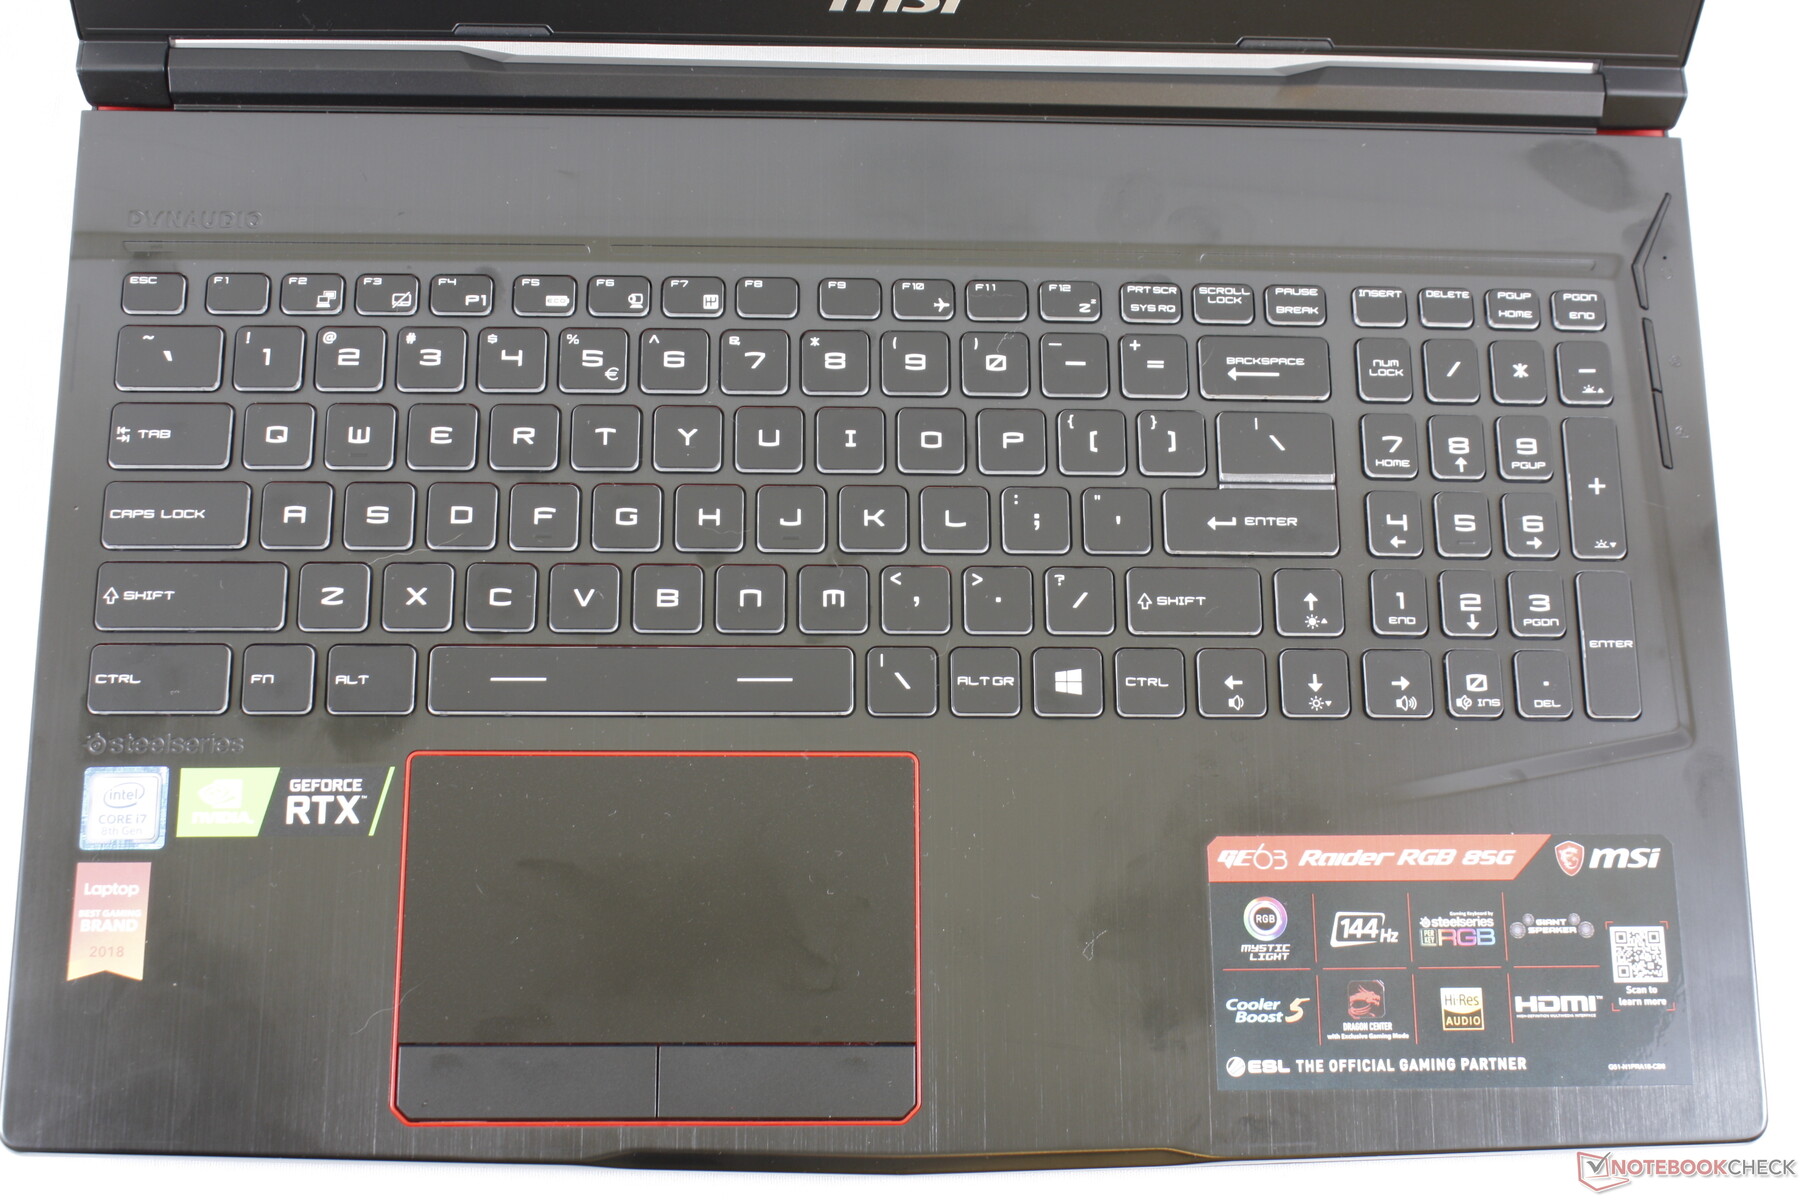
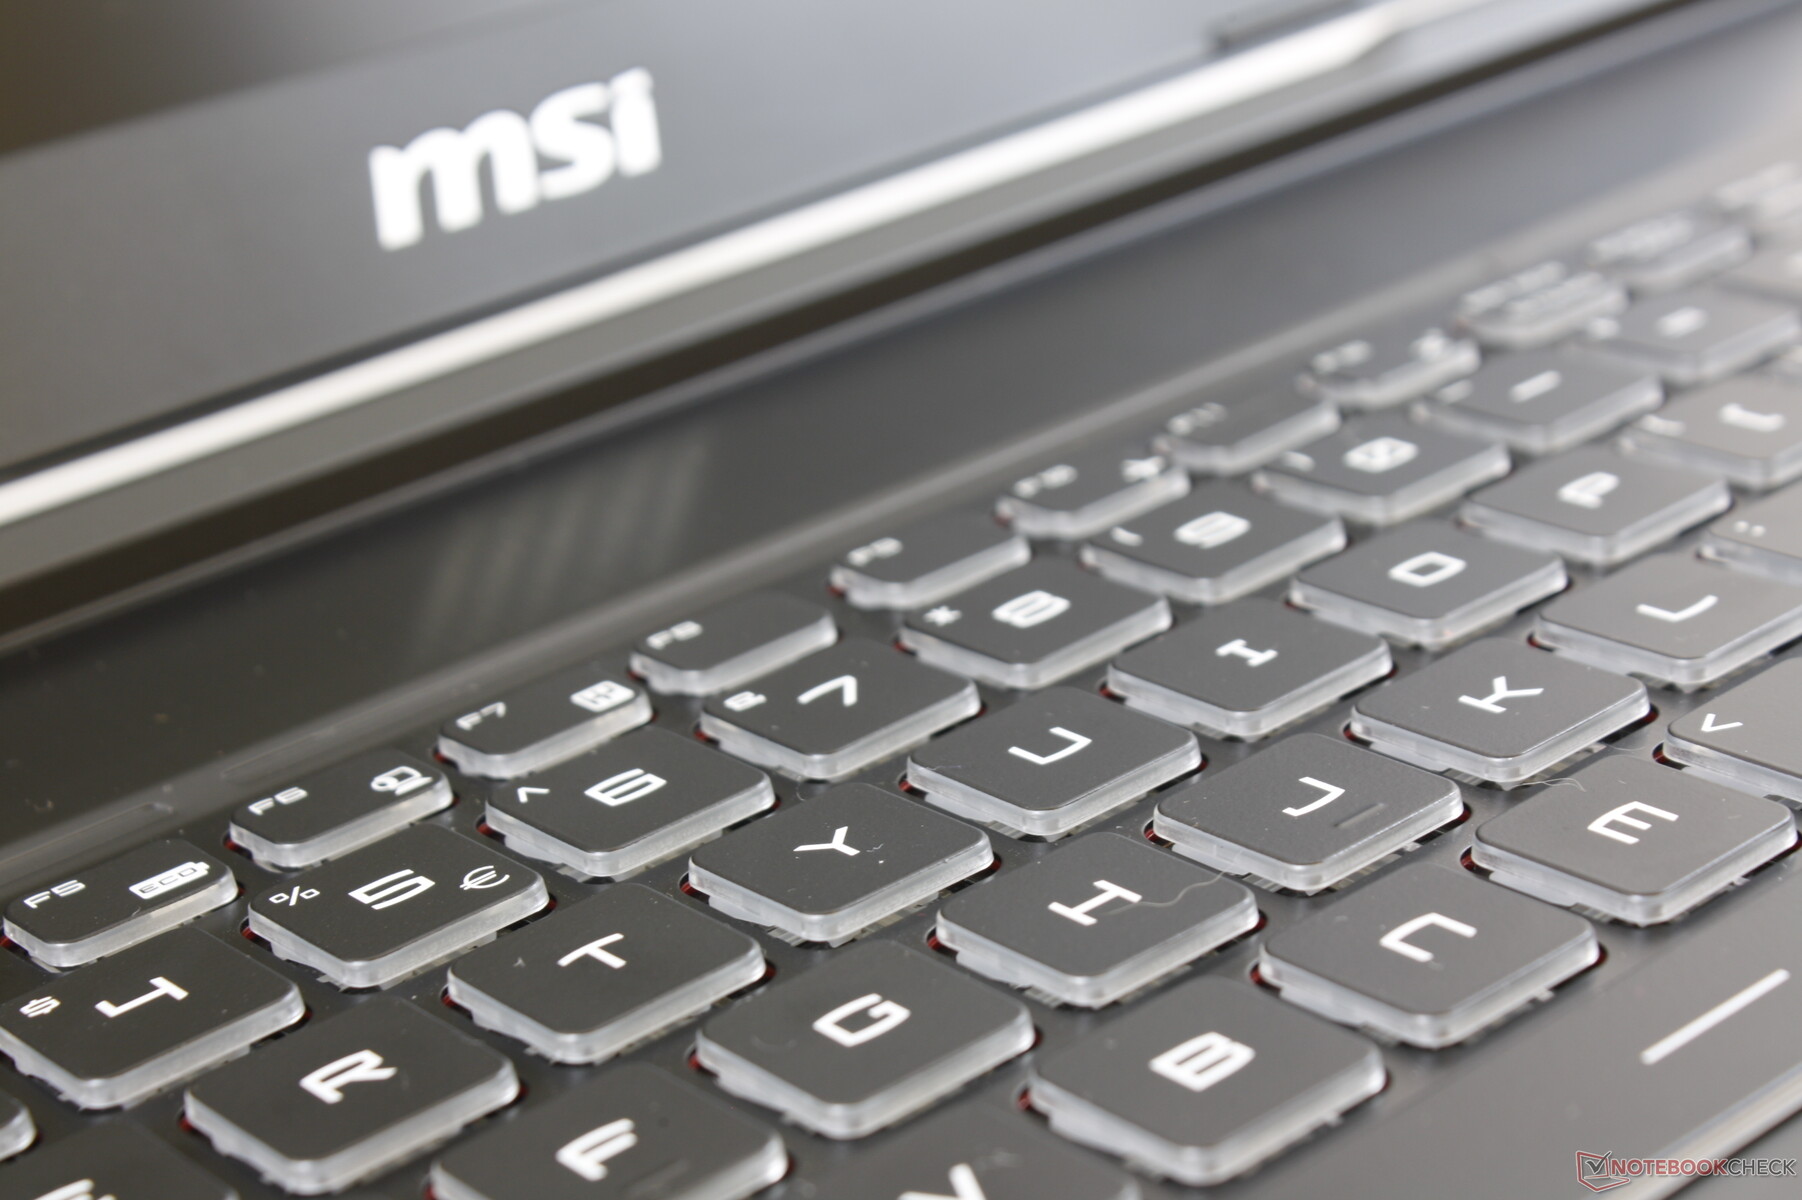
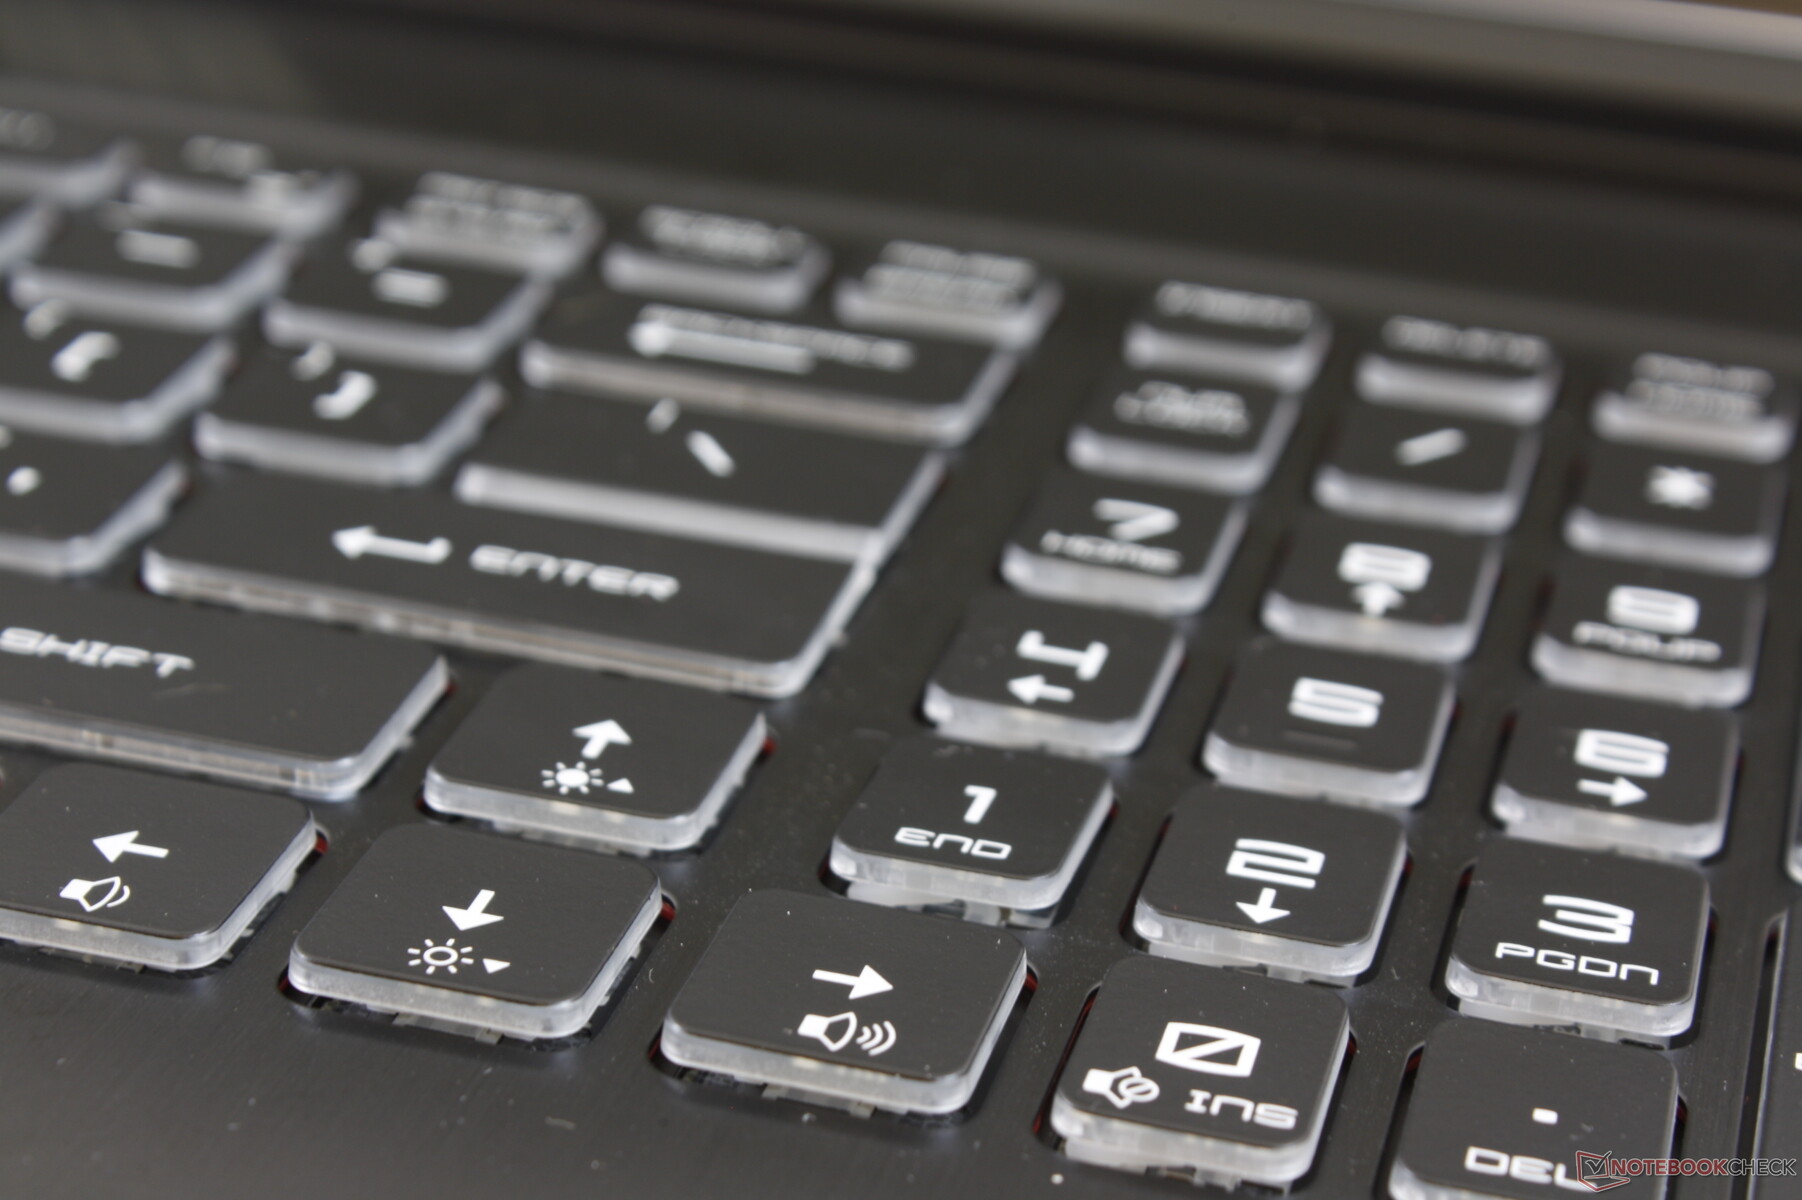
We applaud MSI for its consistency when it comes to keyboards. Most G series laptops integrate SteelSeries keyboards for a similar level feedback, travel, and clatter across the lineup. If you have ever typed on a laptop from the MSI GS, GP, or GT series, then you will already be familiar with the typing experience on the GE63. Feedback from the main QWERTY keys is firm and quieter than on many other laptops for a satisfactory typing experience. The Space key and narrow NumPad keys, however, are louder and more cramped, respectively.
Per-key RGB lighting is back and all printed text are lit. Some other laptops with per-key RGB lighting do not light up secondary key texts like on the Gigabyte Aero series or the Asus ROG Strix III.
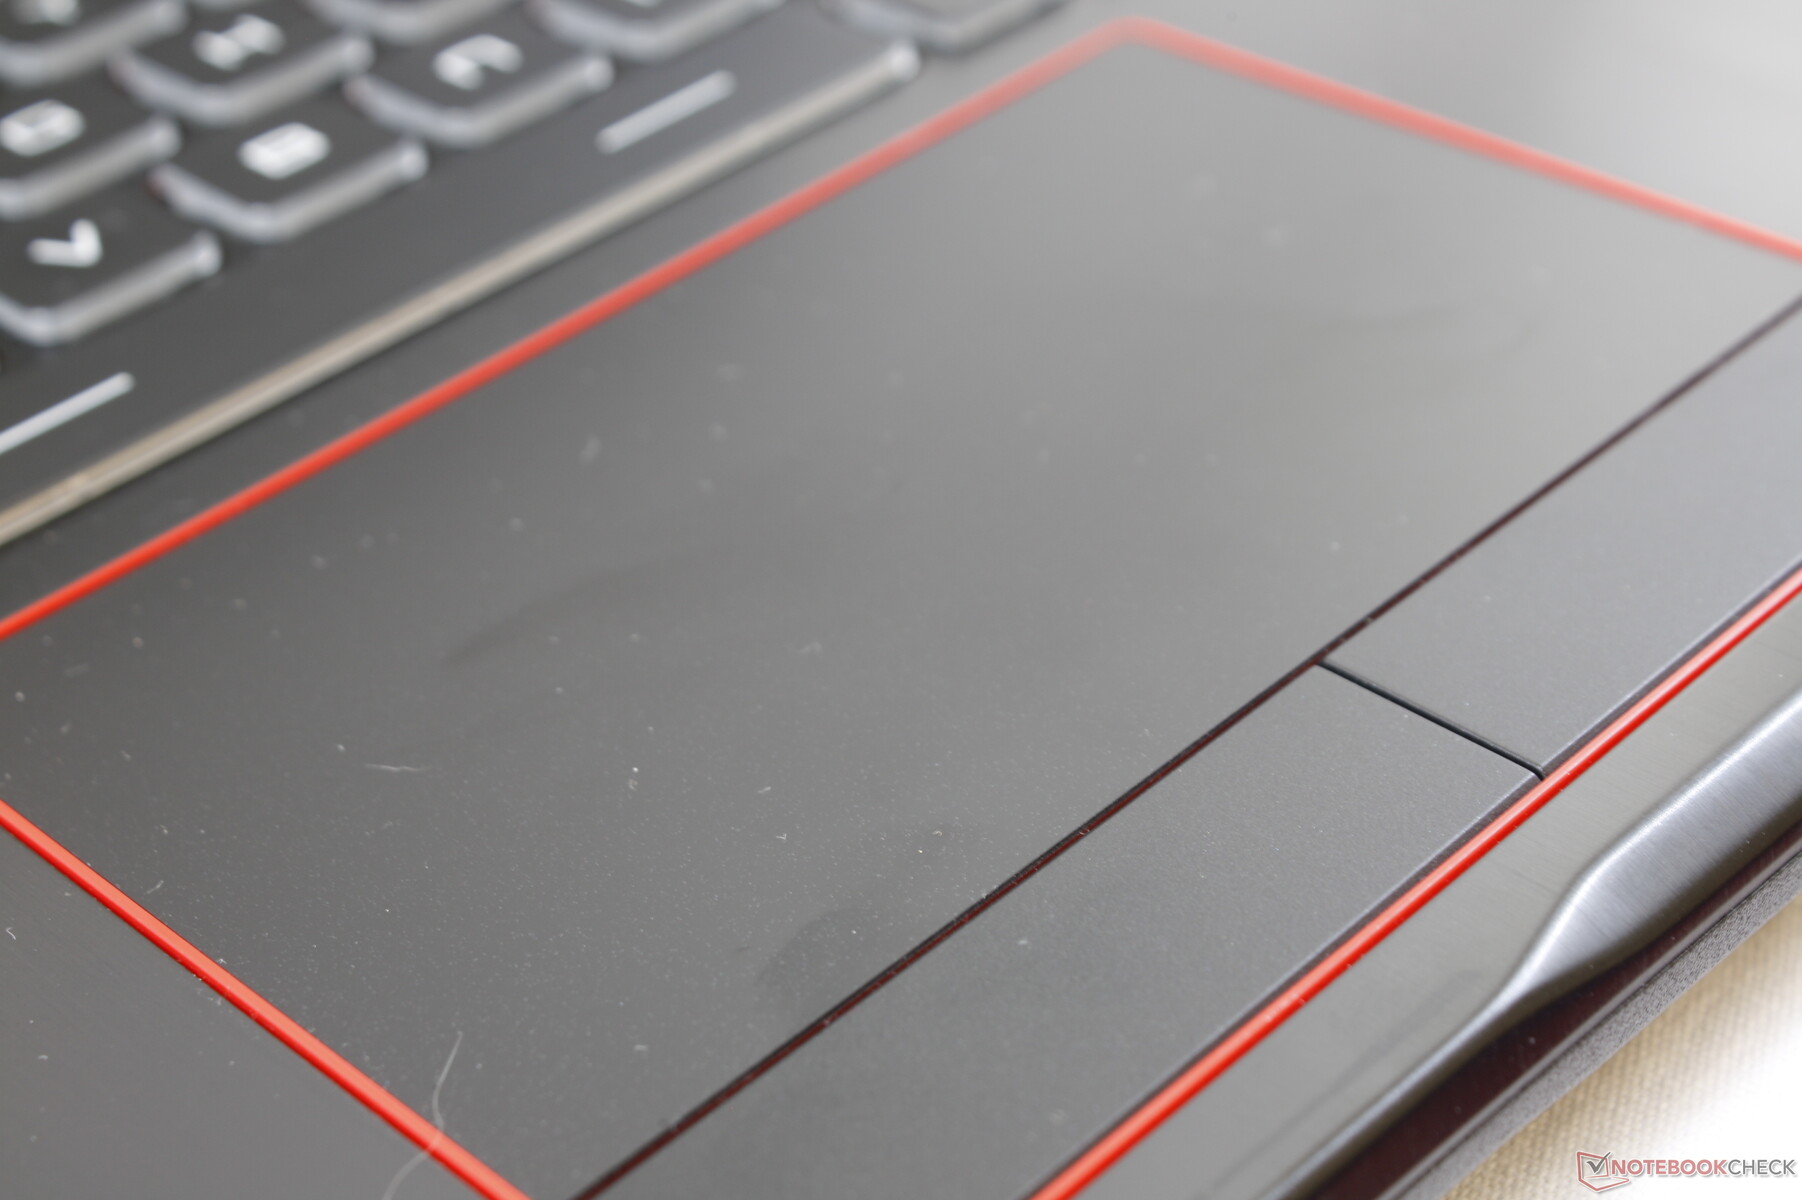
Touchpad
The touchpad (11 x 6.3 cm) is smaller than the touchpad on the Dell XPS 15 (10.5 x 8.5 cm) but with dedicated mouse keys for better precision and feedback. Though the surface is smooth, it seems to have responsiveness issues when gliding a finger slowly. The onscreen cursor, for example, would sometimes stop even though our finger continues to move. We observed a similar phenomenon on the recent WE75 workstation.
The dedicated mouse keys offer both shallow travel and firm, clicky feedback. However, pressing on the sides of each key feels spongier than if pressing down their center. Feedback could have been more uniform as it shouldn't vary depending on where you push the key.
Display
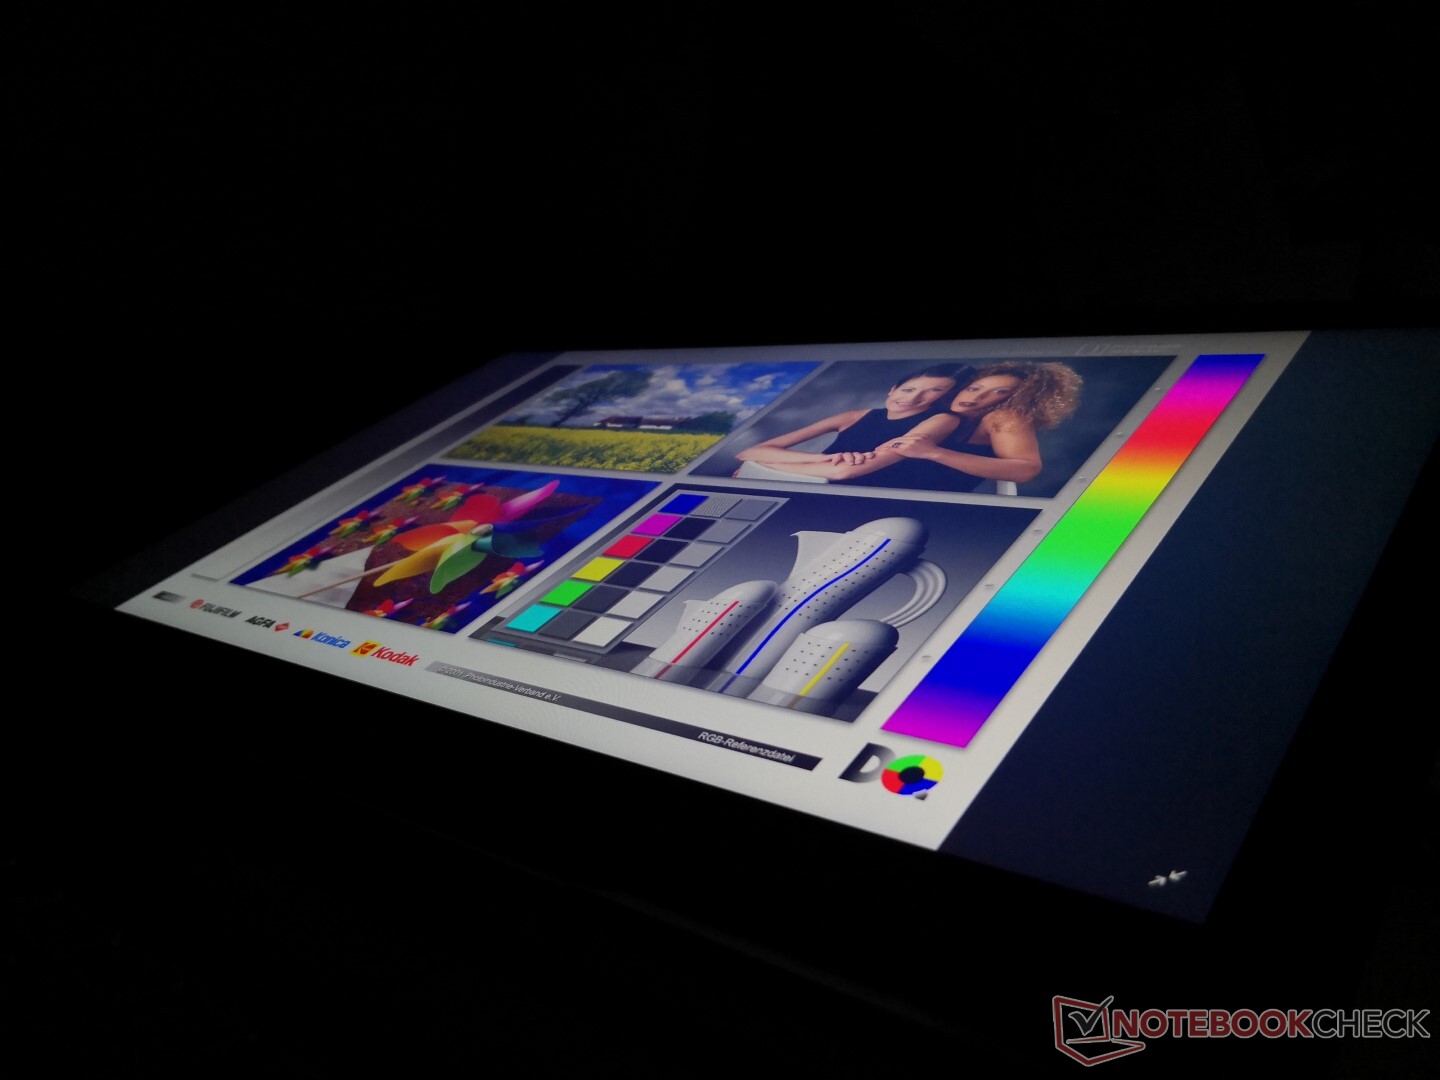
The 144 Hz AU Optronics B156HAN07.1 IPS panel here can also be found on the Asus Zephyrus M GM501. As a result, the MSI GE63 shares similar response times, contrast levels, color coverage, and overall visual experience as the Asus alternative. It's hard to go back to standard 60 Hz displays once you become accustomed to the fast 120 Hz or 144 Hz refresh rate. When compared to the Chi Mei N156HHE-GA1 TN panel on our last GE63 test unit, the newer AU Optronics panel offers faster response times and wider viewing angles but with a slightly narrower gamut.
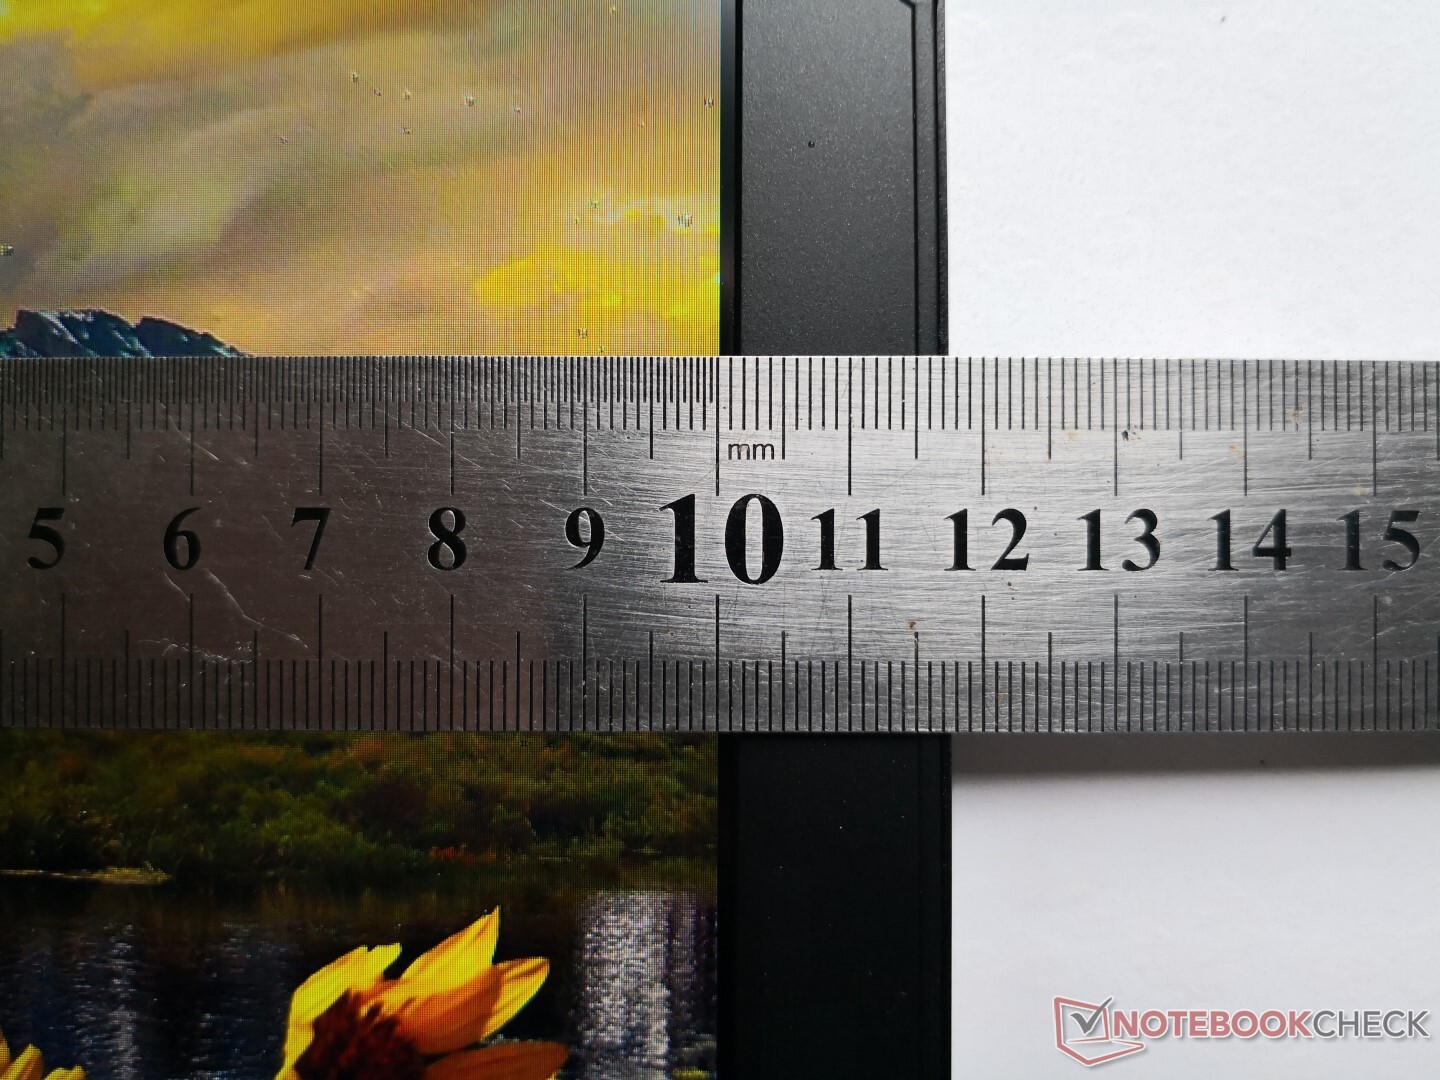
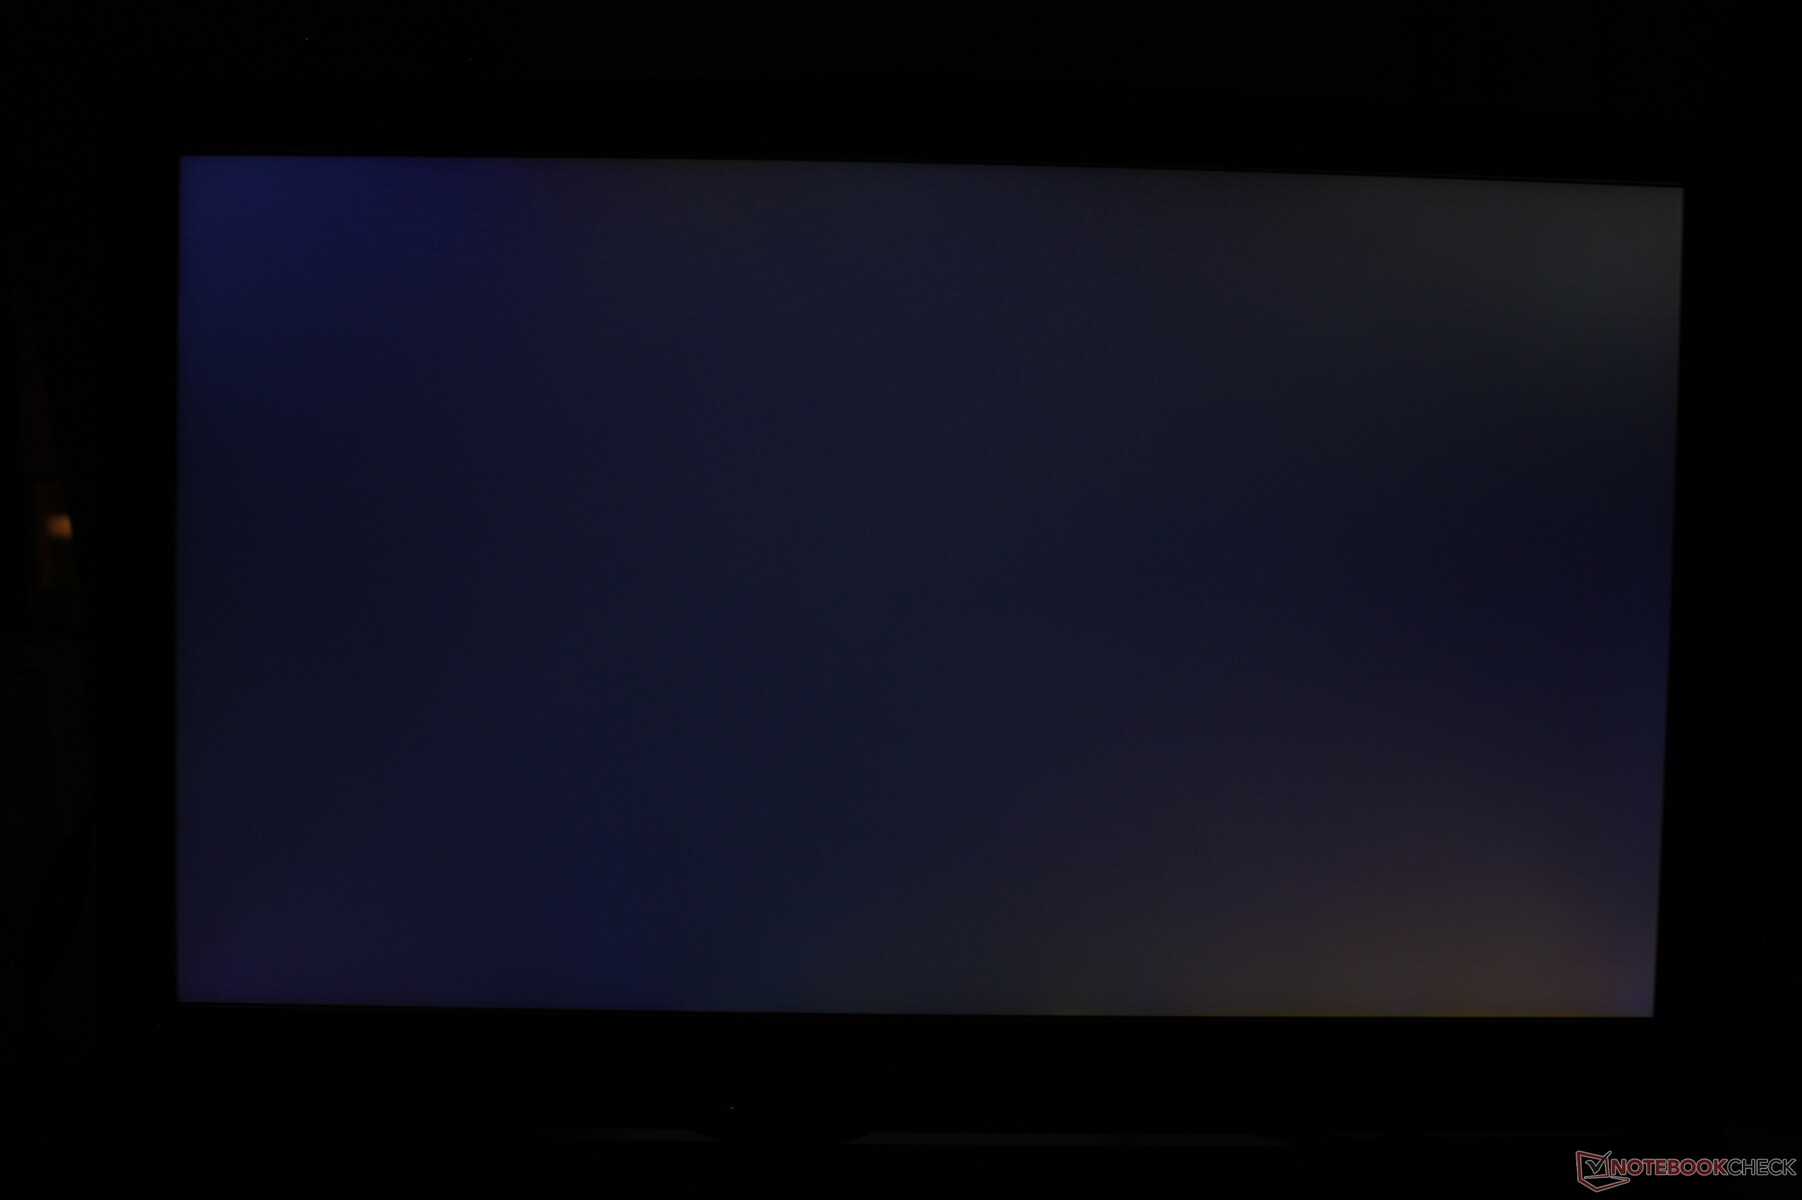
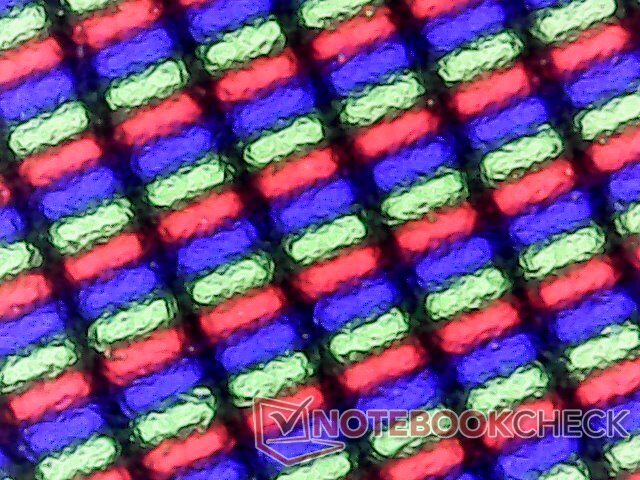
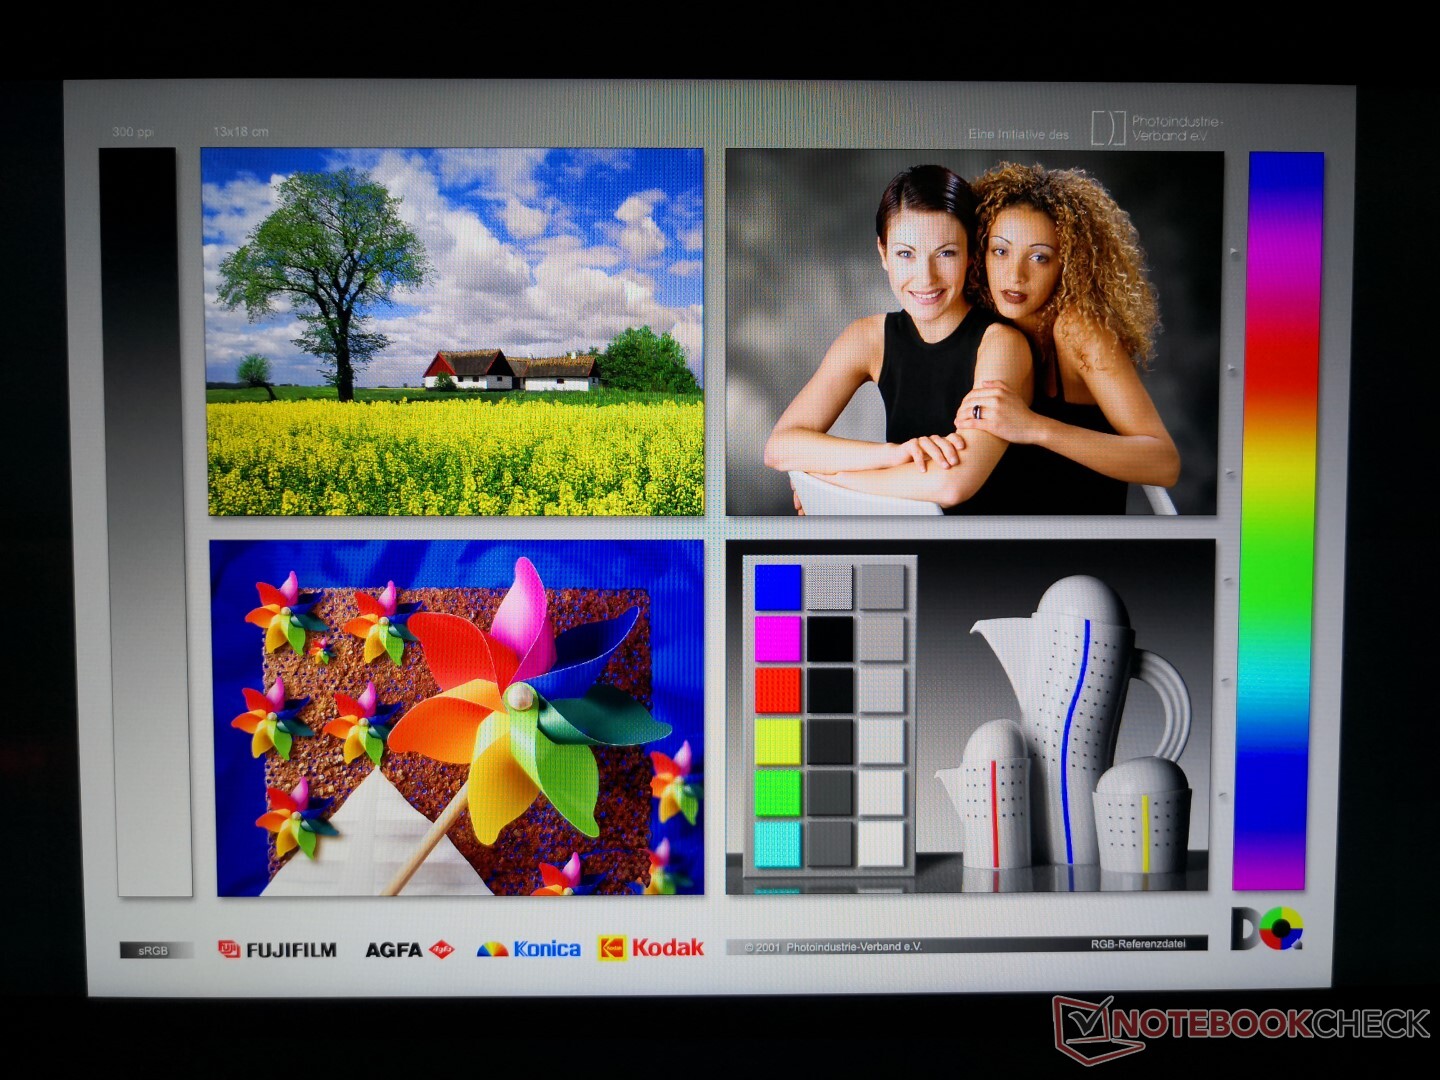
Our main complaint about the display is its moderate graininess. Texts and images do not appear as crisp as they do on the Walmart EVOO Gaming 17 or most glossy alternatives. Uneven backlight bleeding is also present on our unit and could have been better considering the price range.
| |||||||||||||||||||||||||
Brightness Distribution: 84 %
Center on Battery: 268.3 cd/m²
Contrast: 1342:1 (Black: 0.2 cd/m²)
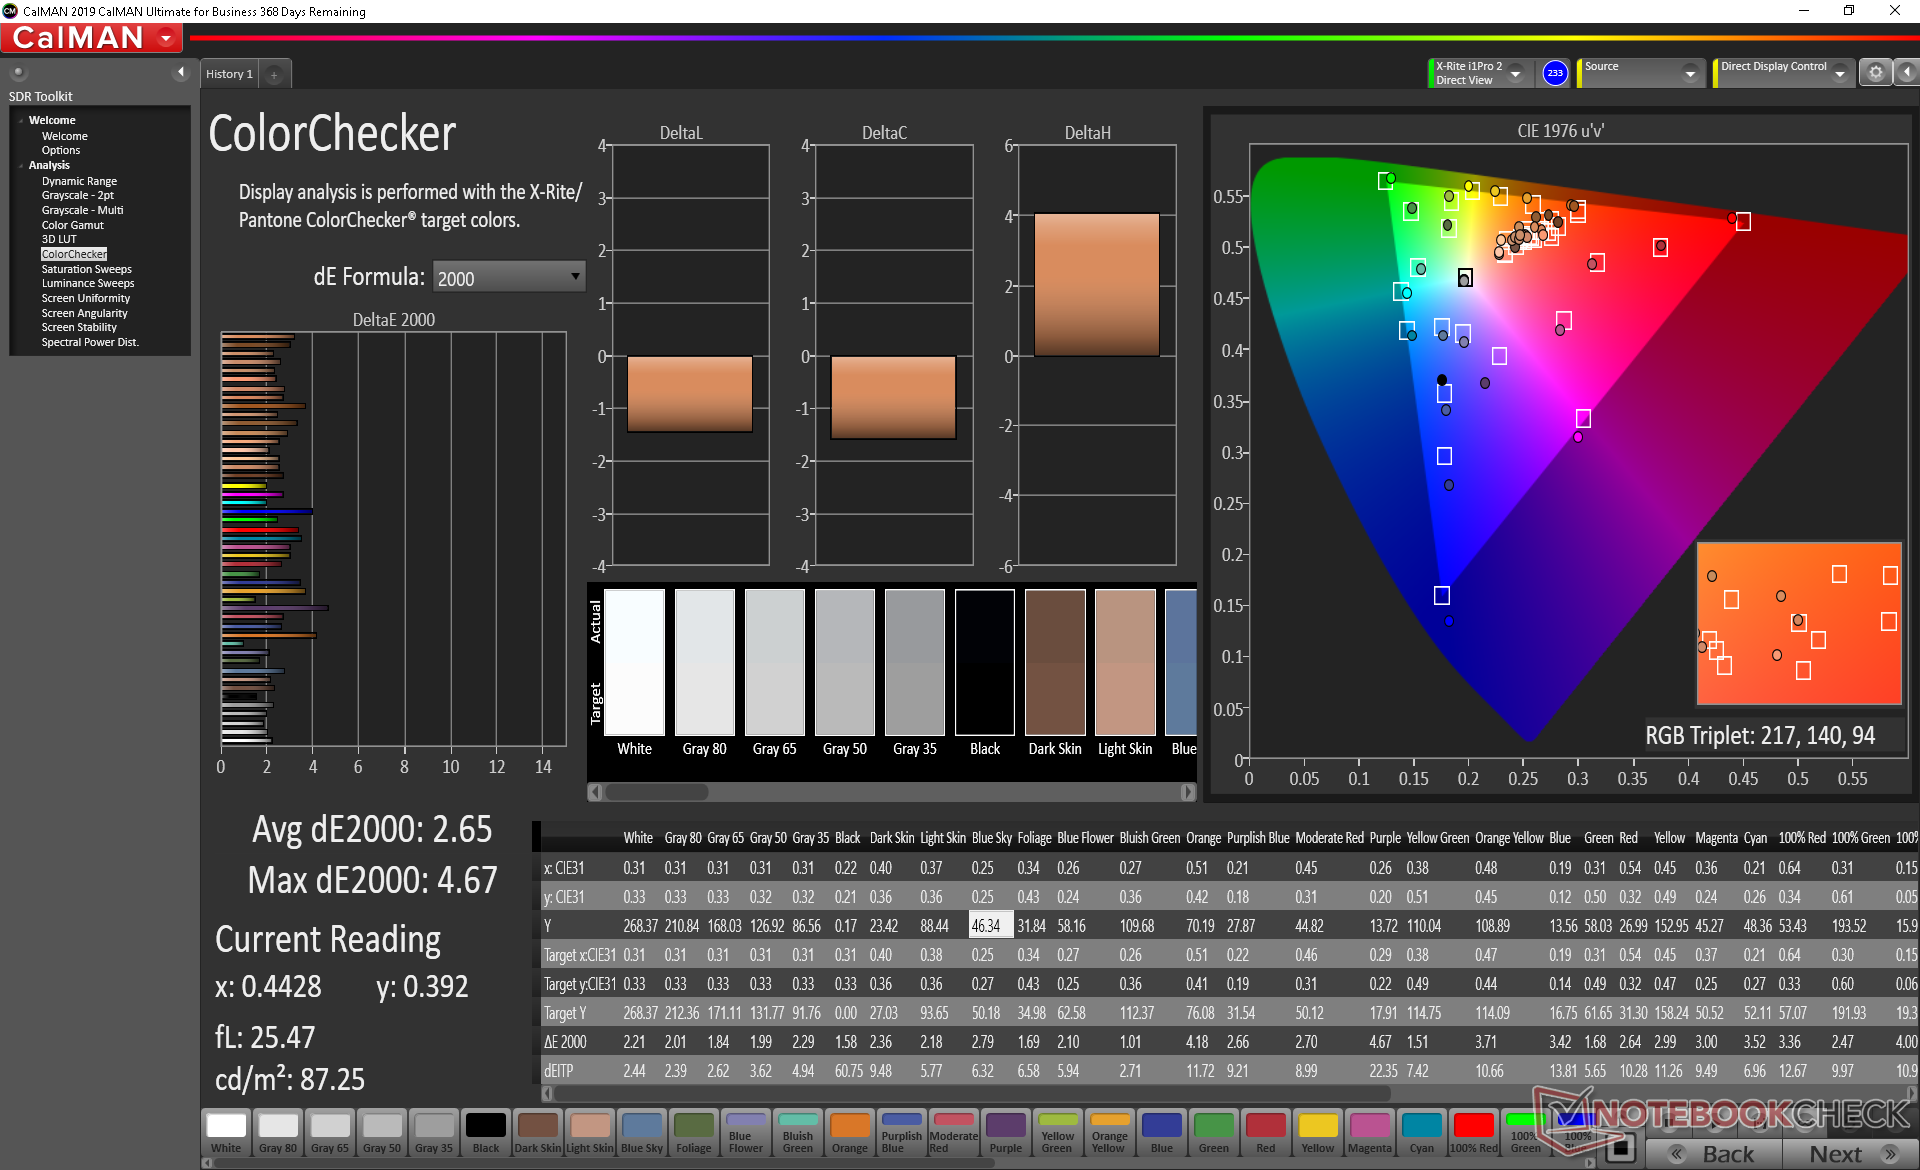
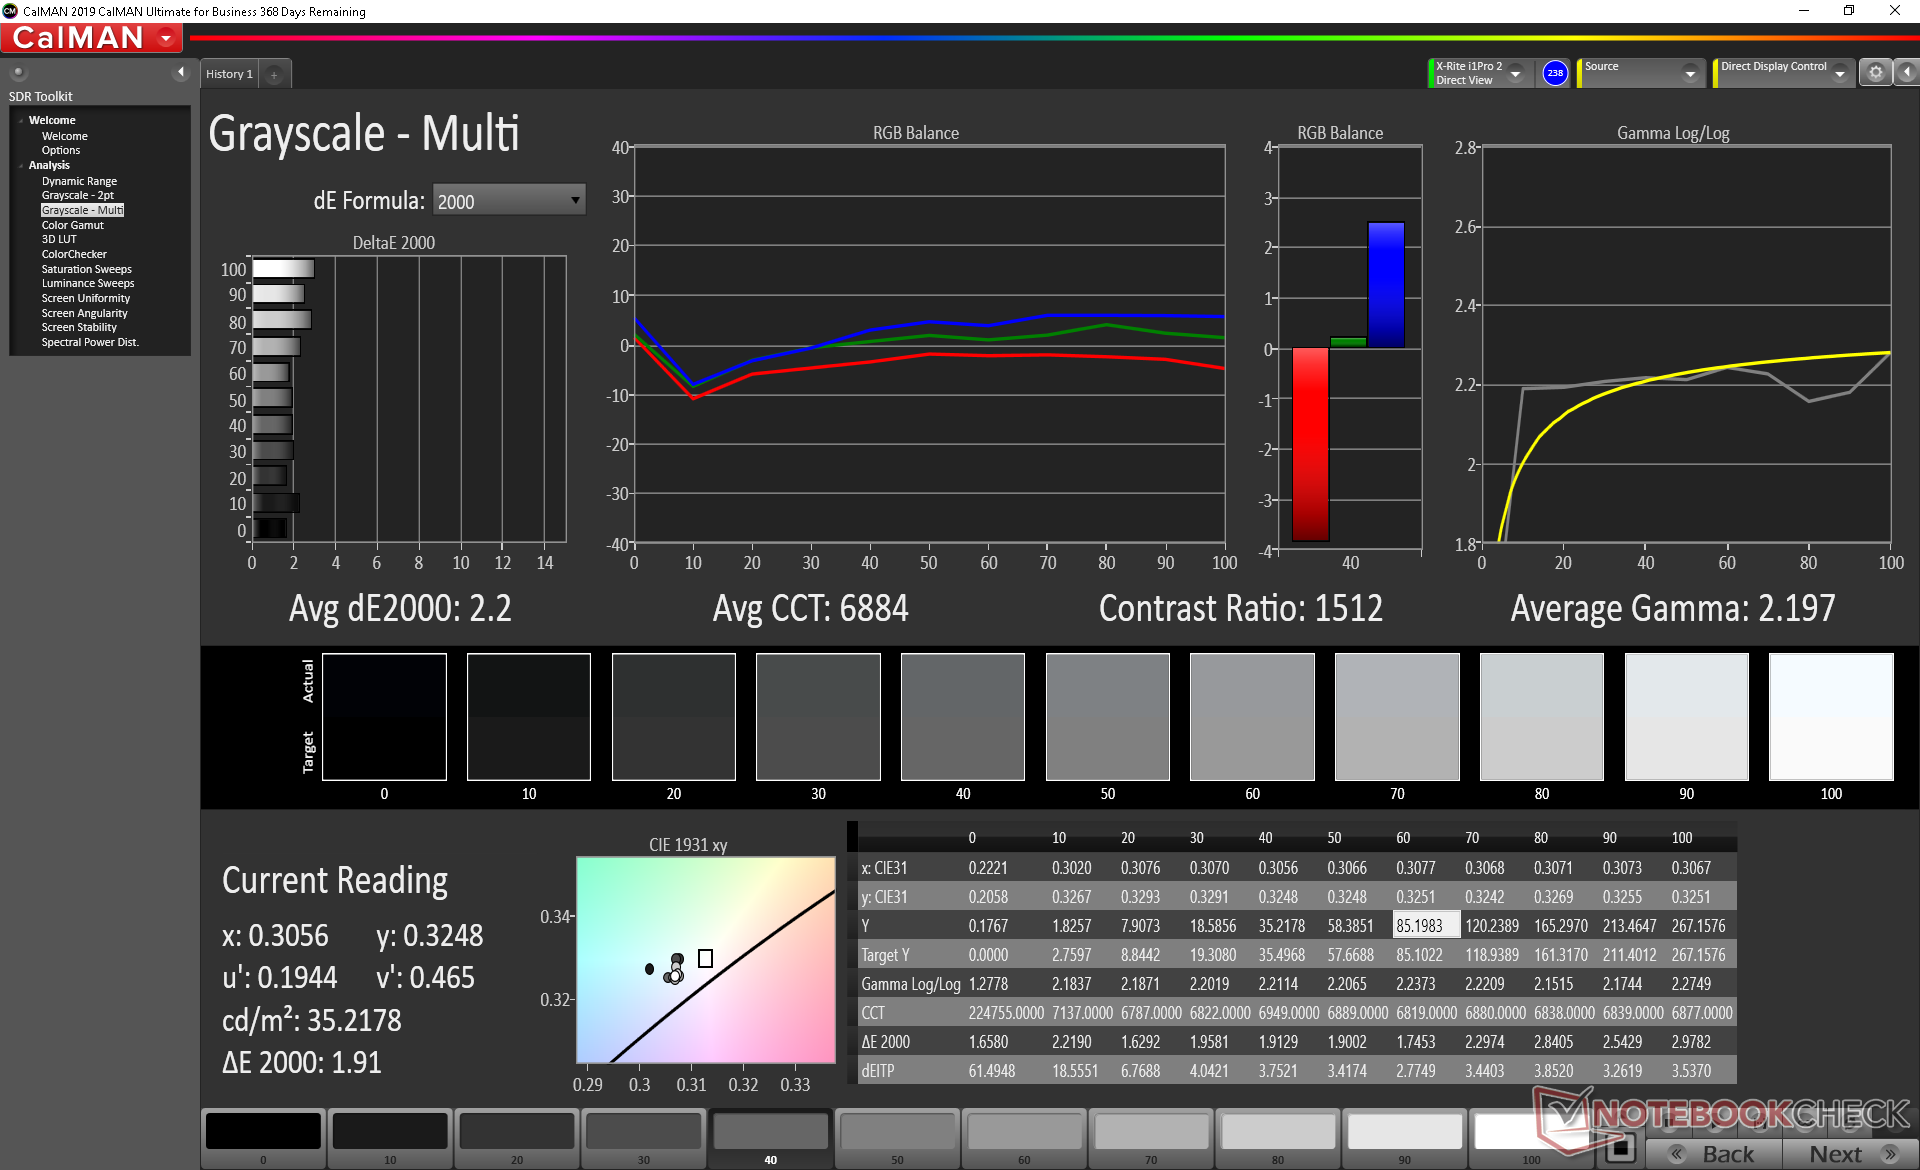
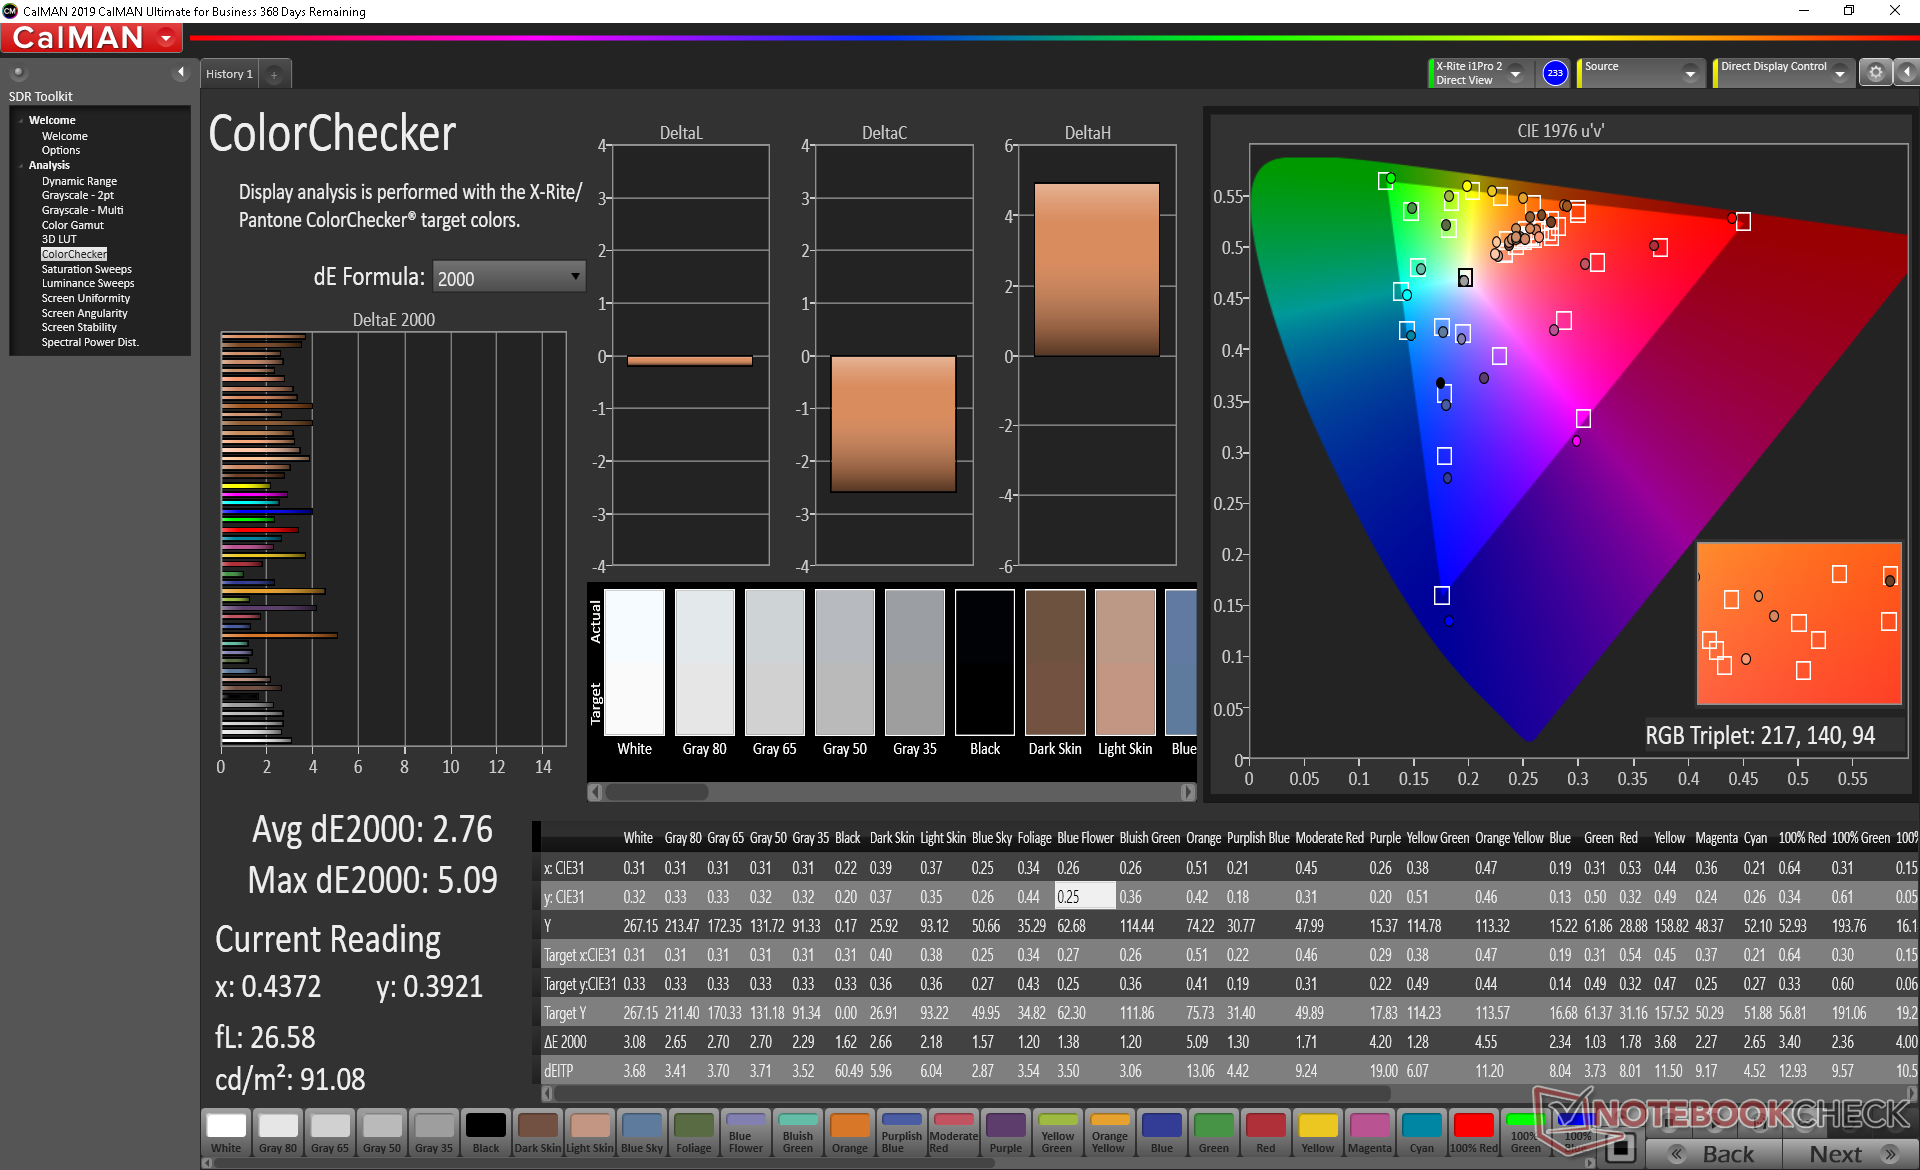
ΔE ColorChecker Calman: 2.65 | ∀{0.5-29.43 Ø4.71}
calibrated: 2.76
ΔE Greyscale Calman: 2.2 | ∀{0.09-98 Ø4.96}
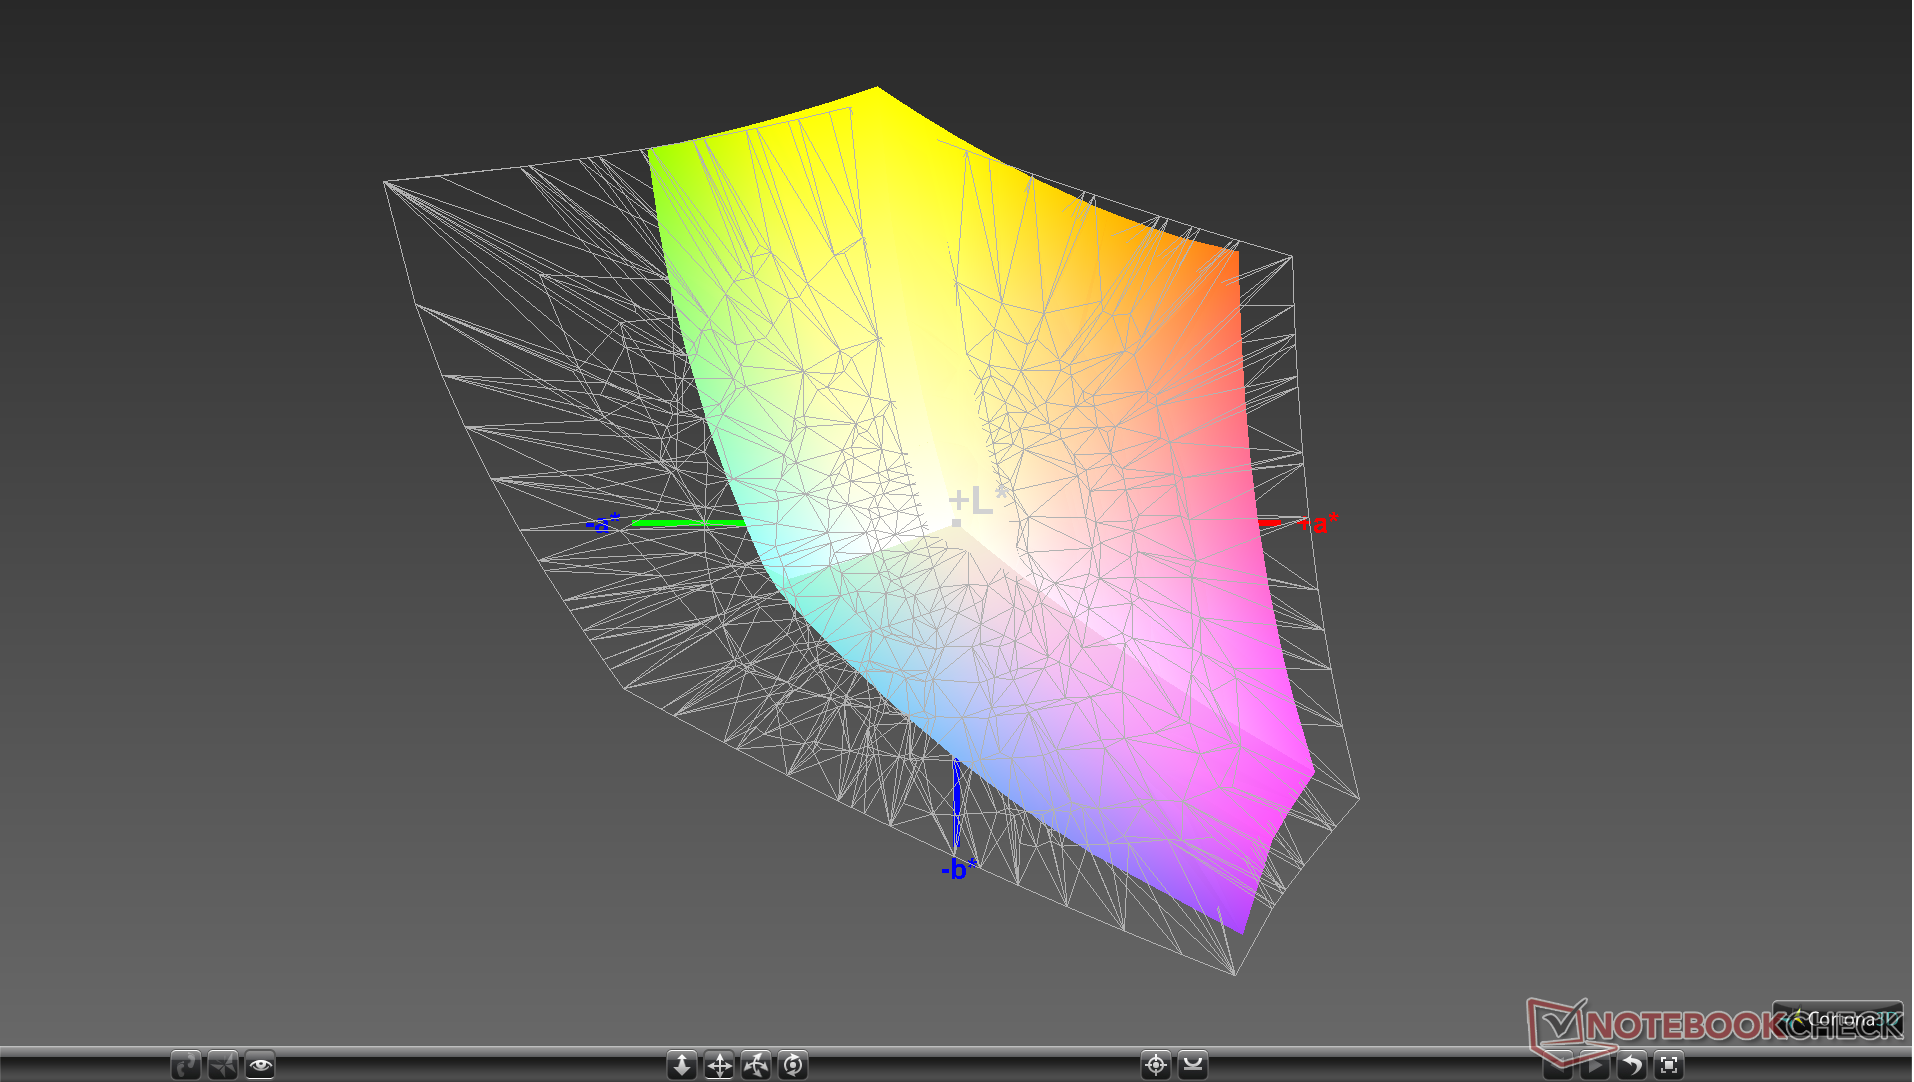
93.3% sRGB (Argyll 1.6.3 3D)
59.3% AdobeRGB 1998 (Argyll 1.6.3 3D)
65.9% AdobeRGB 1998 (Argyll 3D)
91.7% sRGB (Argyll 3D)
65.1% Display P3 (Argyll 3D)
Gamma: 2.33
CCT: 6862 K
| MSI GE63 Raider 8SG AU Optronics B156HAN07.1, IPS, 15.6", 1920x1080 | MSI GL65 9SEK AU Optronics B156HAN13.0, IPS, 15.6", 1920x1080 | Lenovo Legion Y740-15ICHg BOE NV156FHM-N4J, IPS, 15.6", 1920x1080 | MSI GT63 Titan 8RG-046 N156HHE-GA1, TN, 15.6", 1920x1080 | Asus Strix Scar III G531GW-AZ062T Sharp LQ156M1JW09 (SHP14D3), IPS, 15.6", 1920x1080 | MSI GE63 Raider RGB 8RF-008 CMN N156HHE-GA1 (CMN15F4), TN, 15.6", 1920x1080 | |
|---|---|---|---|---|---|---|
| Display | -42% | 2% | 26% | 4% | 26% | |
| Display P3 Coverage (%) | 65.1 | 36.63 -44% | 67.7 4% | 91.3 40% | 66.2 2% | 90 38% |
| sRGB Coverage (%) | 91.7 | 55 -40% | 91.6 0% | 99.9 9% | 97.1 6% | 100 9% |
| AdobeRGB 1998 Coverage (%) | 65.9 | 37.85 -43% | 67.1 2% | 85.7 30% | 67.6 3% | 86 31% |
| Response Times | -184% | -53% | 27% | -25% | -109% | |
| Response Time Grey 50% / Grey 80% * (ms) | 8.8 ? | 26.4 ? -200% | 19 ? -116% | 8.4 ? 5% | 15 ? -70% | 24.4 ? -177% |
| Response Time Black / White * (ms) | 11.2 ? | 30 ? -168% | 10 ? 11% | 5.8 ? 48% | 9 ? 20% | 15.8 ? -41% |
| PWM Frequency (Hz) | 25510 ? | 250 ? | 25510 ? | |||
| Screen | -55% | 9% | -4% | -30% | -28% | |
| Brightness middle (cd/m²) | 268.3 | 277.3 3% | 477 78% | 307.1 14% | 309 15% | 292 9% |
| Brightness (cd/m²) | 261 | 256 -2% | 431 65% | 276 6% | 284 9% | 258 -1% |
| Brightness Distribution (%) | 84 | 86 2% | 84 0% | 80 -5% | 88 5% | 81 -4% |
| Black Level * (cd/m²) | 0.2 | 0.2 -0% | 0.175 13% | 0.37 -85% | 0.42 -110% | 0.23 -15% |
| Contrast (:1) | 1342 | 1387 3% | 2726 103% | 830 -38% | 736 -45% | 1270 -5% |
| Colorchecker dE 2000 * | 2.65 | 5.25 -98% | 4.17 -57% | 2.53 5% | 3.99 -51% | 5.82 -120% |
| Colorchecker dE 2000 max. * | 4.67 | 19.43 -316% | 6.97 -49% | 4.66 -0% | 8.3 -78% | 9.05 -94% |
| Colorchecker dE 2000 calibrated * | 2.76 | 4.39 -59% | 2.51 9% | 2.82 -2% | 1.12 59% | 2.82 -2% |
| Greyscale dE 2000 * | 2.2 | 3.5 -59% | 3.49 -59% | 1.7 23% | 5.43 -147% | 4.61 -110% |
| Gamma | 2.33 94% | 2.1 105% | 2.5 88% | 2.194 100% | 2.57 86% | 2.65 83% |
| CCT | 6862 95% | 6895 94% | 7076 92% | 6893 94% | 7767 84% | 6950 94% |
| Color Space (Percent of AdobeRGB 1998) (%) | 59.3 | 35 -41% | 60 1% | 76 28% | 63 6% | 76 28% |
| Color Space (Percent of sRGB) (%) | 93.3 | 55 -41% | 91 -2% | 100 7% | 97 4% | 100 7% |
| Total Average (Program / Settings) | -94% /
-69% | -14% /
0% | 16% /
5% | -17% /
-23% | -37% /
-28% |
* ... smaller is better
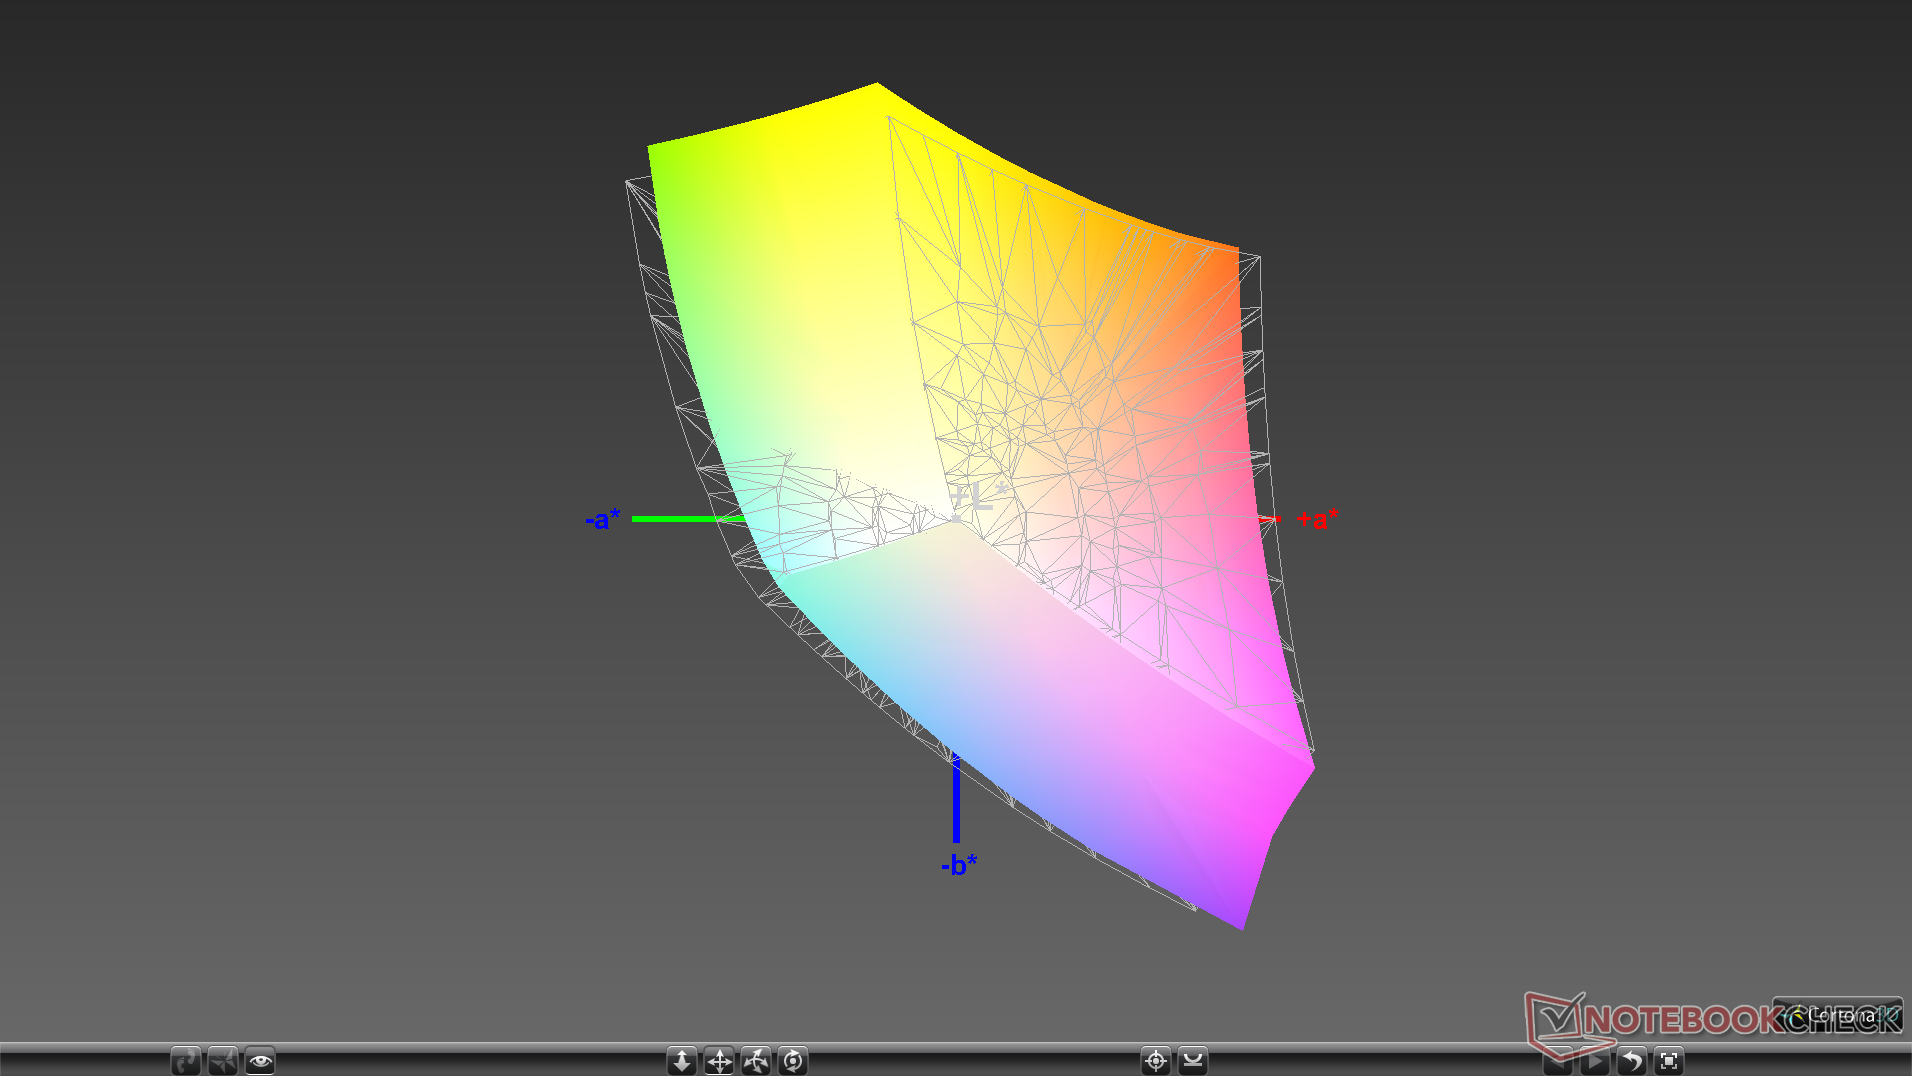
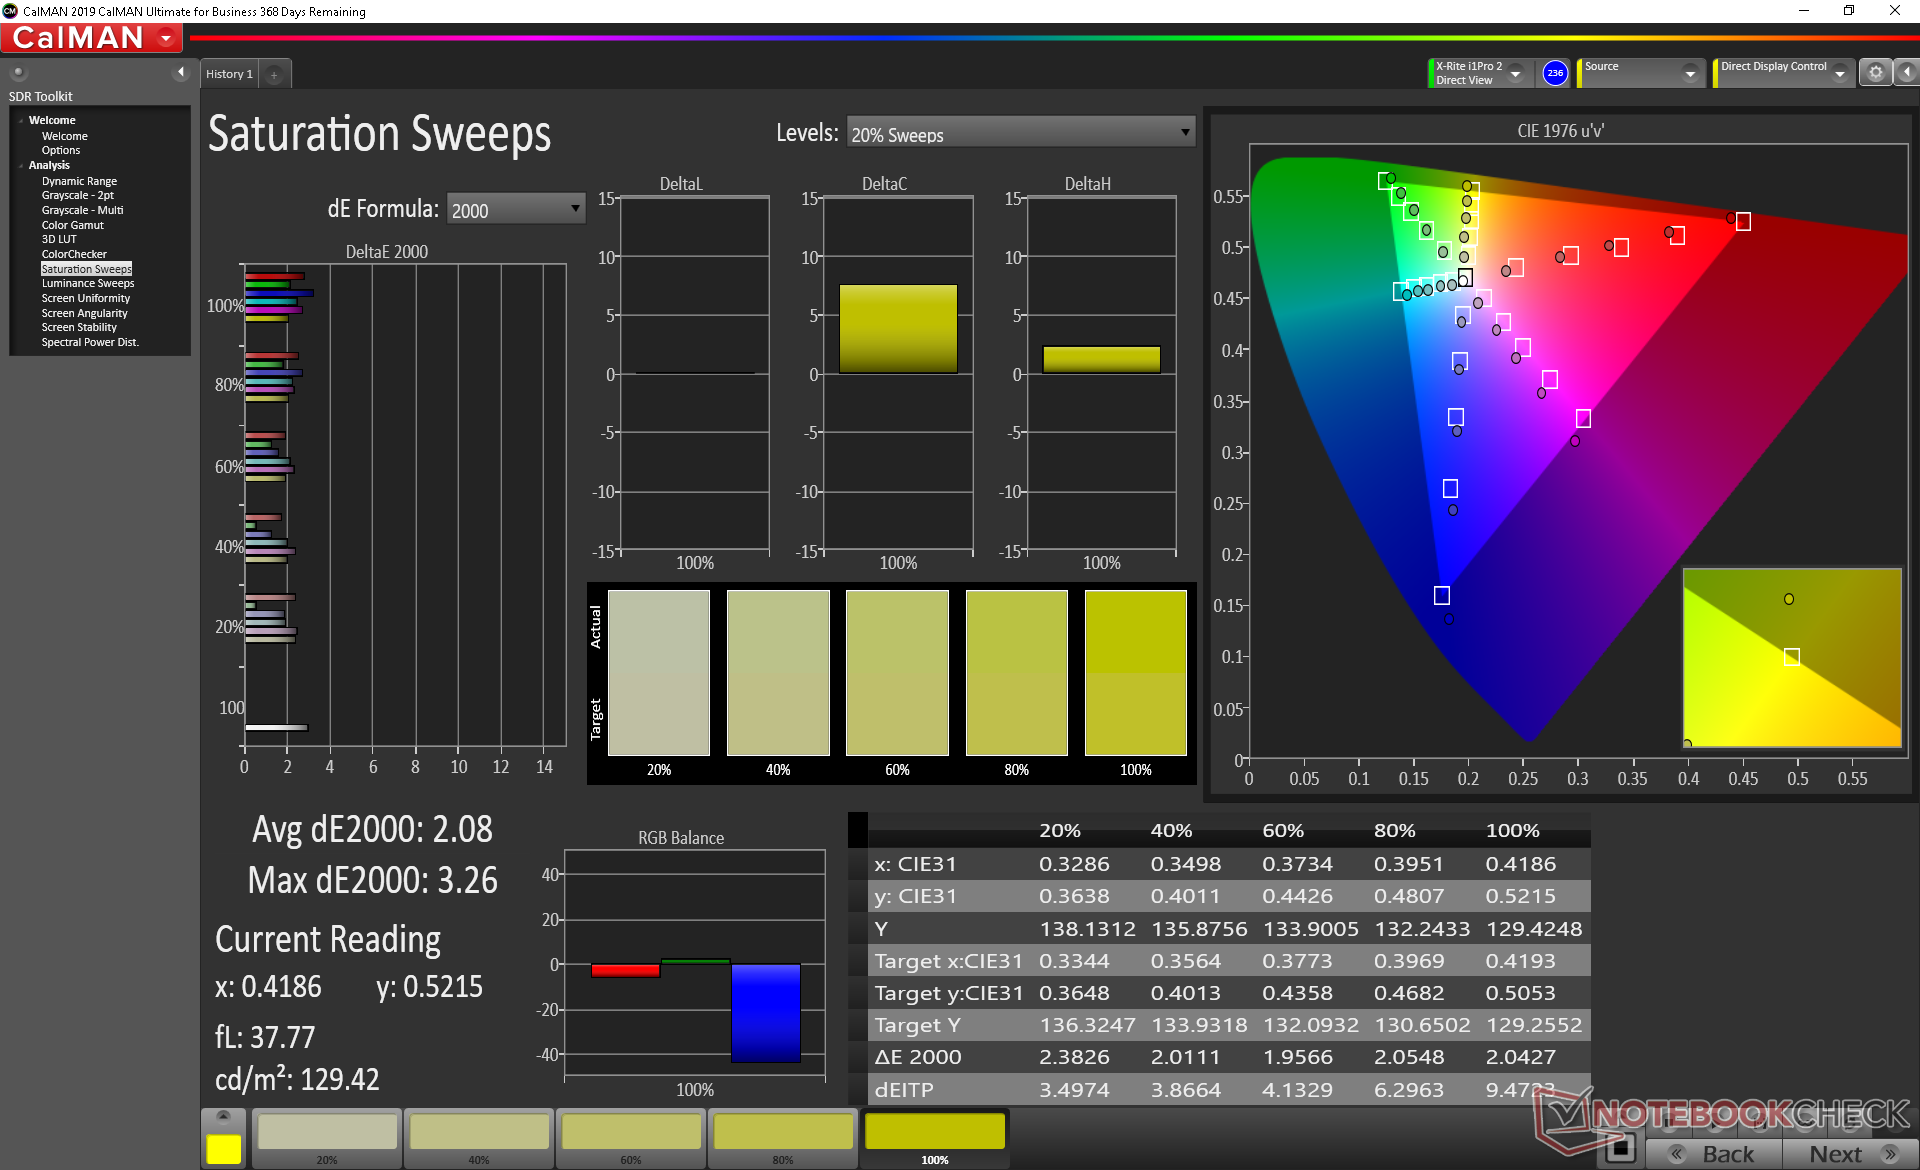
Color space is approximately 93 percent and 59 percent of the sRGB and AdobeRGB standards, respectively, to be not unlike every other 15.6-inch 144 Hz panel at the moment. High refresh rate panels with wider gamuts are only now becoming available.
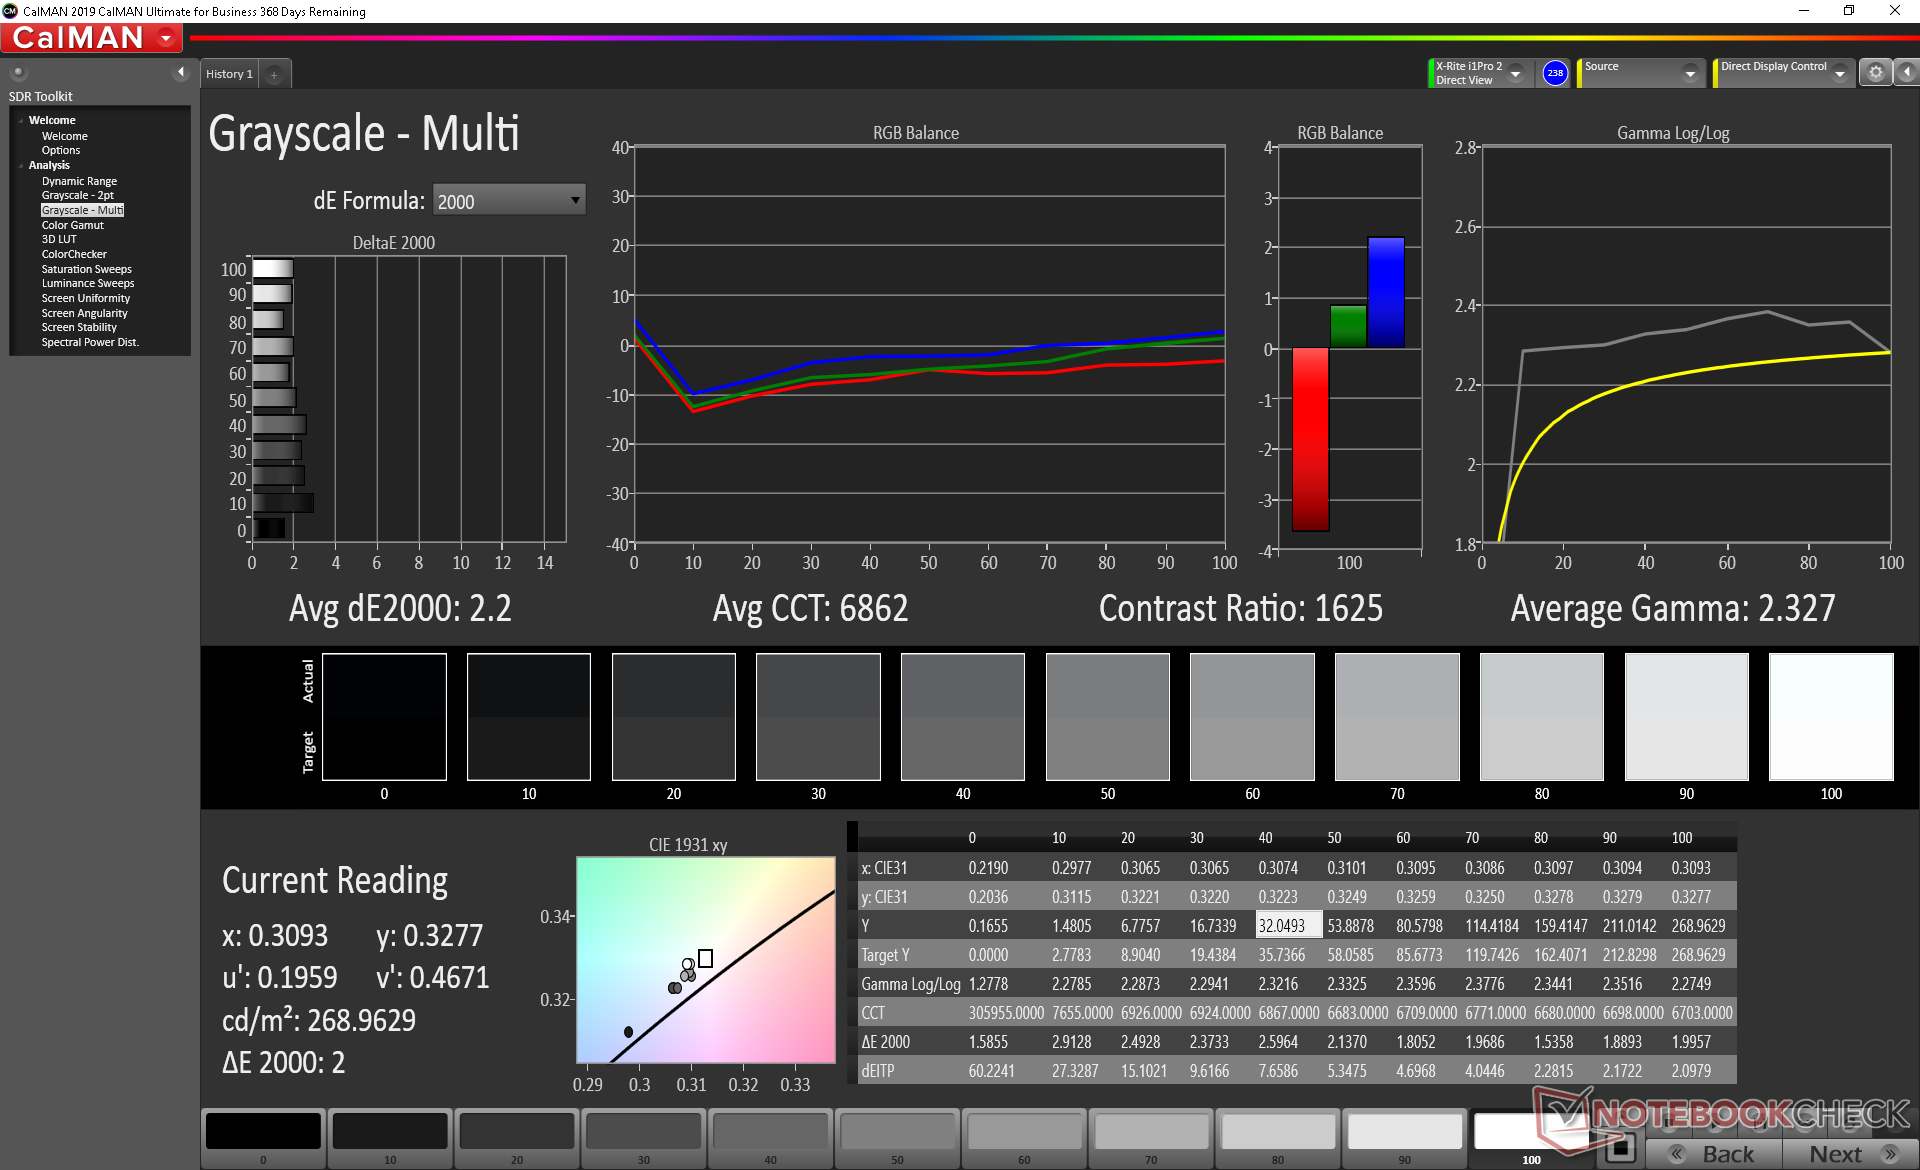
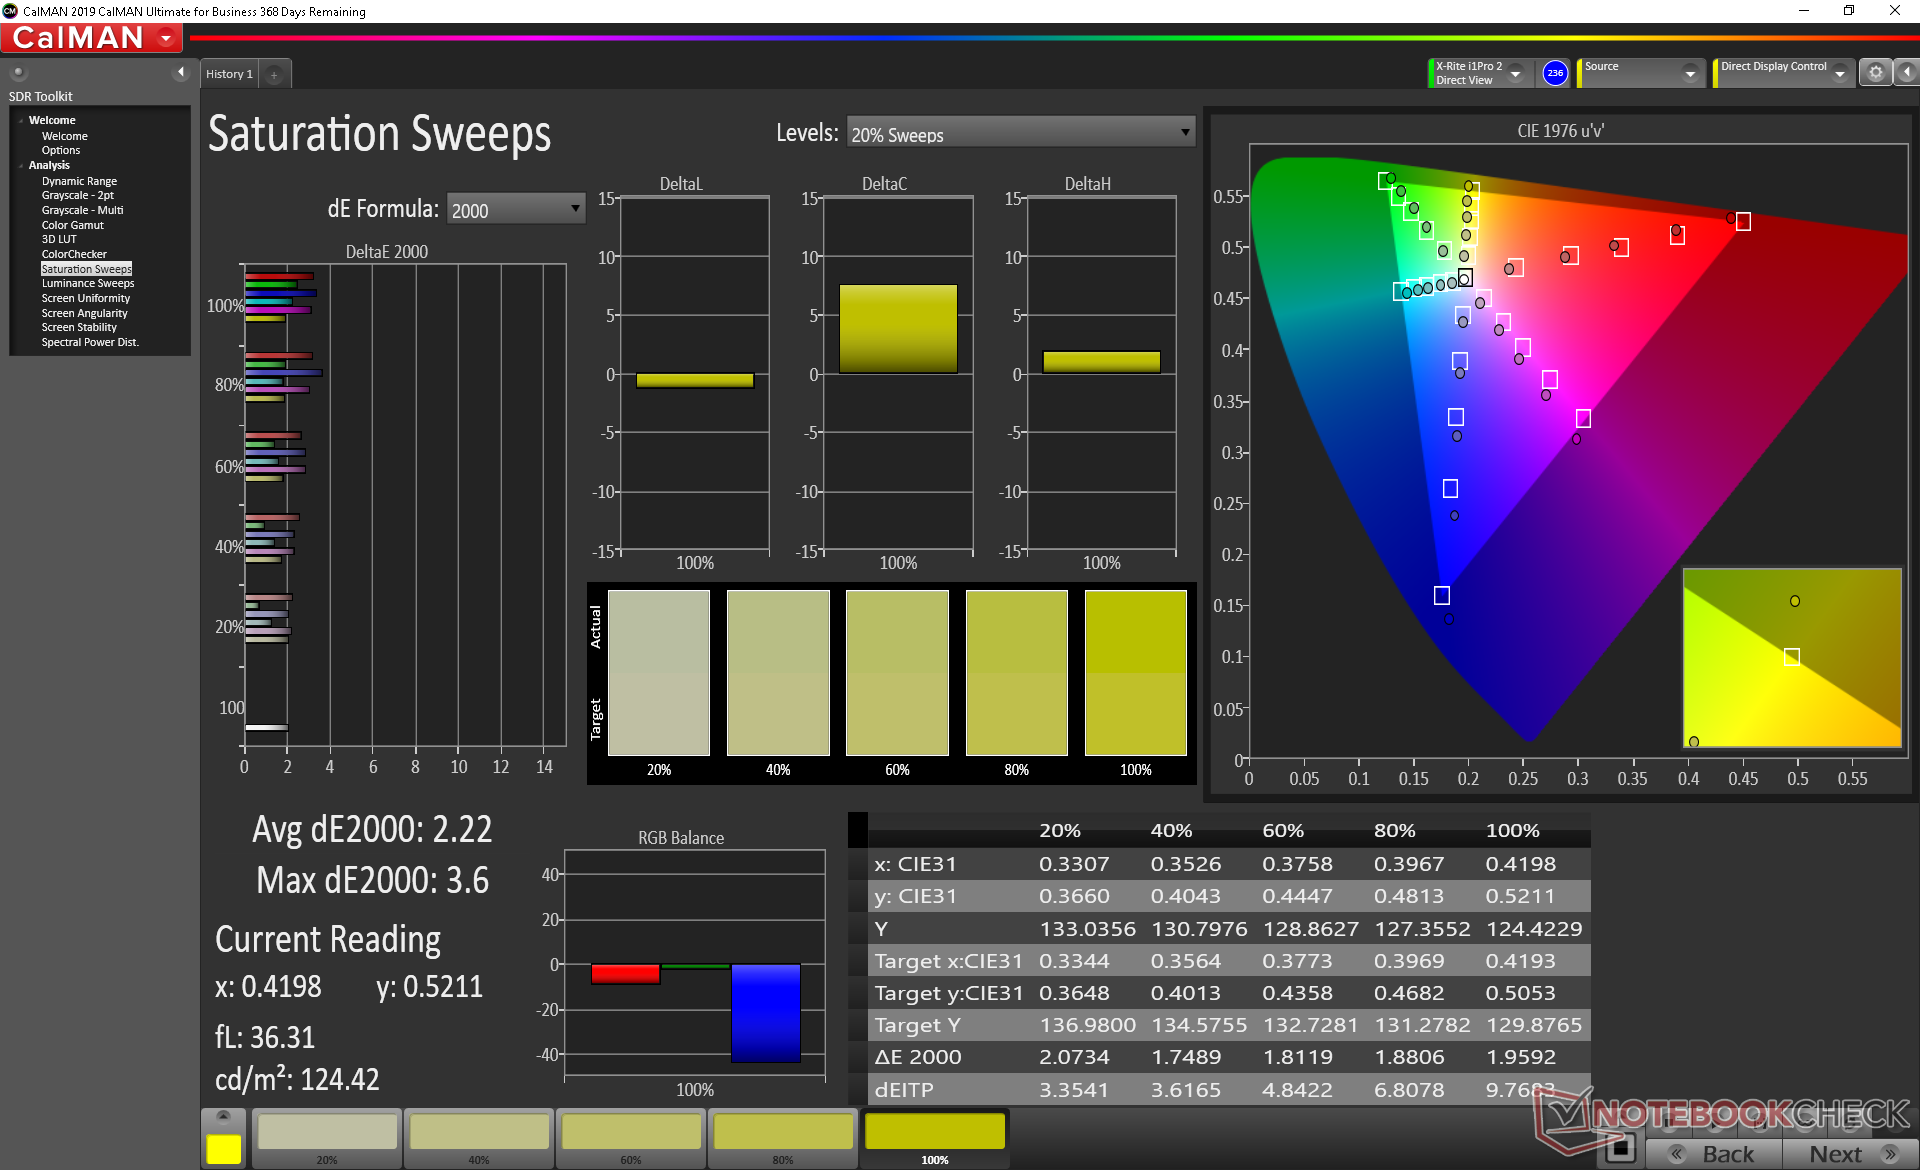
The panel is well-calibrated out of the box with average grayscale and color DeltaE values of just 2.2 each. Attempting to calibrate the display even further ourselves resulted in almost no improvements.
Display Response Times
| ↔ Response Time Black to White | ||
|---|---|---|
| 11.2 ms ... rise ↗ and fall ↘ combined | ↗ 5.2 ms rise | 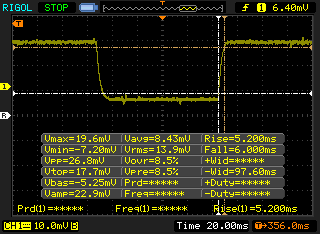 |
| ↘ 6 ms fall | ||
| The screen shows good response rates in our tests, but may be too slow for competitive gamers. In comparison, all tested devices range from 0.1 (minimum) to 240 (maximum) ms. » 30 % of all devices are better. This means that the measured response time is better than the average of all tested devices (19.8 ms). | ||
| ↔ Response Time 50% Grey to 80% Grey | ||
| 8.8 ms ... rise ↗ and fall ↘ combined | ↗ 4.4 ms rise | 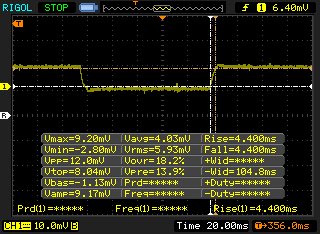 |
| ↘ 4.4 ms fall | ||
| The screen shows fast response rates in our tests and should be suited for gaming. In comparison, all tested devices range from 0.165 (minimum) to 636 (maximum) ms. » 22 % of all devices are better. This means that the measured response time is better than the average of all tested devices (30.9 ms). | ||
Screen Flickering / PWM (Pulse-Width Modulation)
| Screen flickering / PWM not detected | 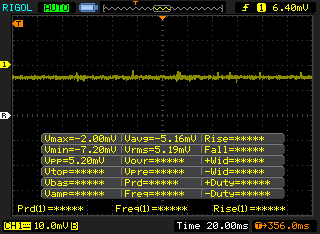 | ||
In comparison: 52 % of all tested devices do not use PWM to dim the display. If PWM was detected, an average of 7741 (minimum: 5 - maximum: 343500) Hz was measured. | |||
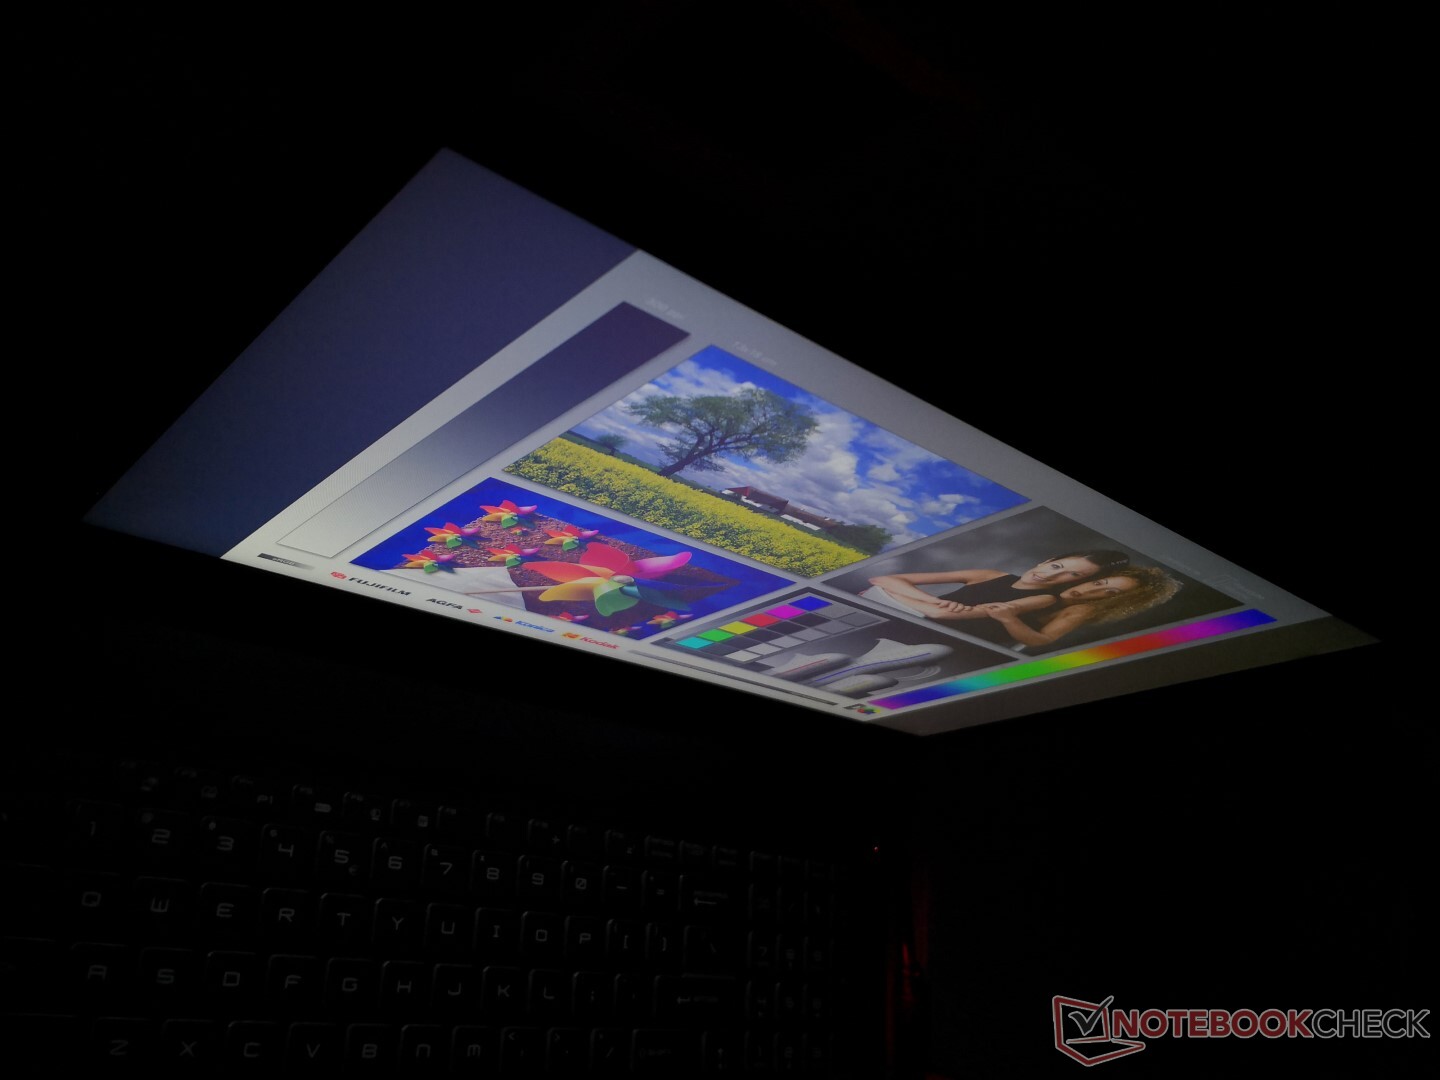
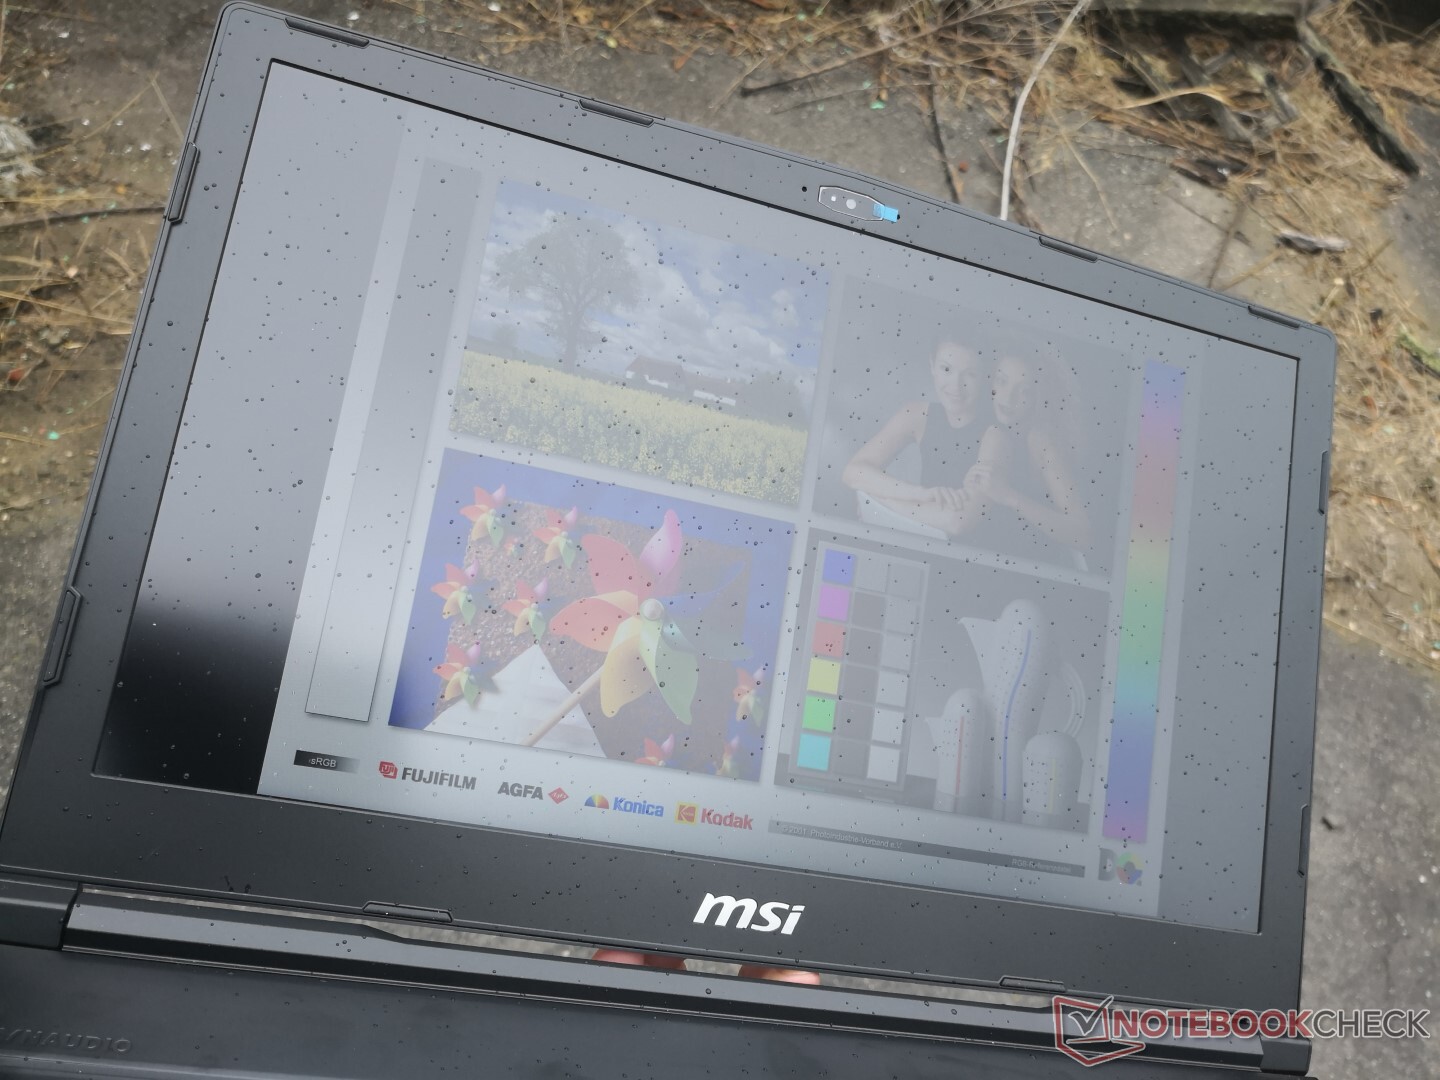
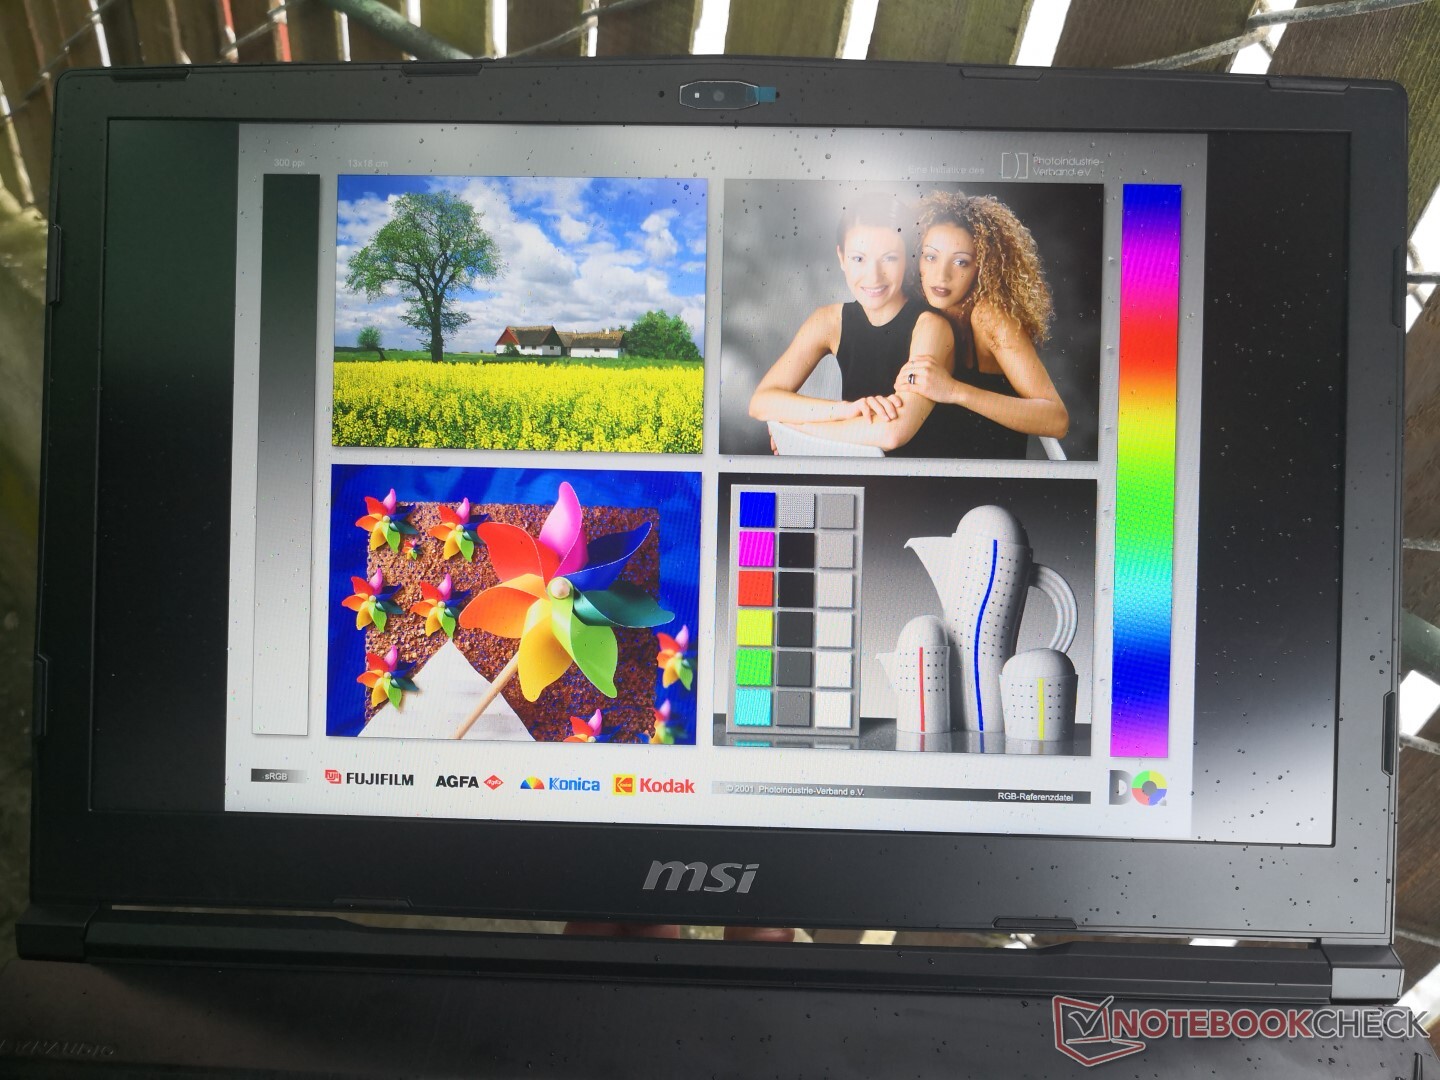
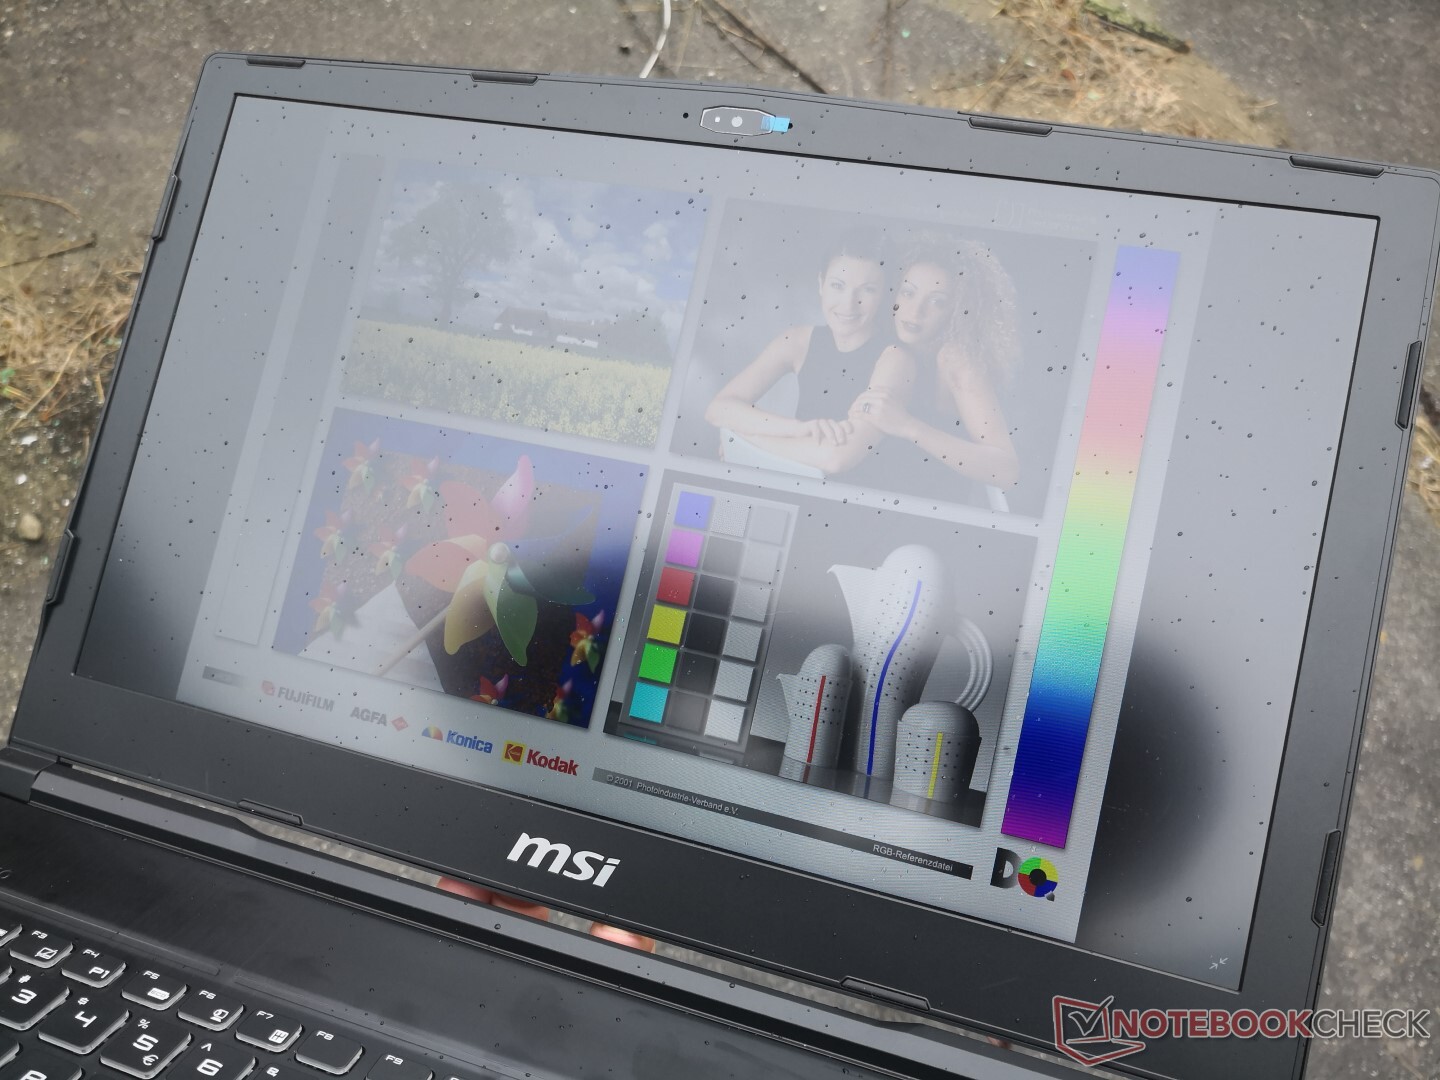
Outdoor visibility is not any better or worse than most other gaming laptops because the backlight is merely average for the category. Sunlight or overcast will wash out the matte screen even if glare is minimal. Viewing angles are wider than on our last GE63 with its TN panel.
Performance
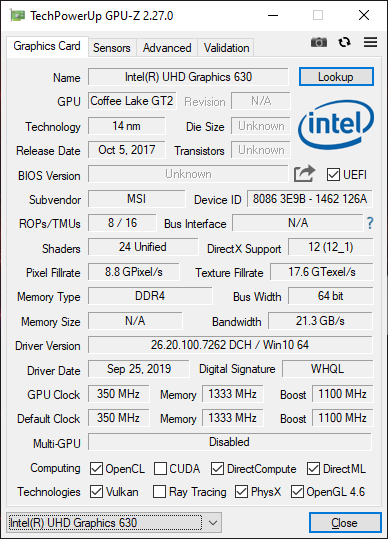
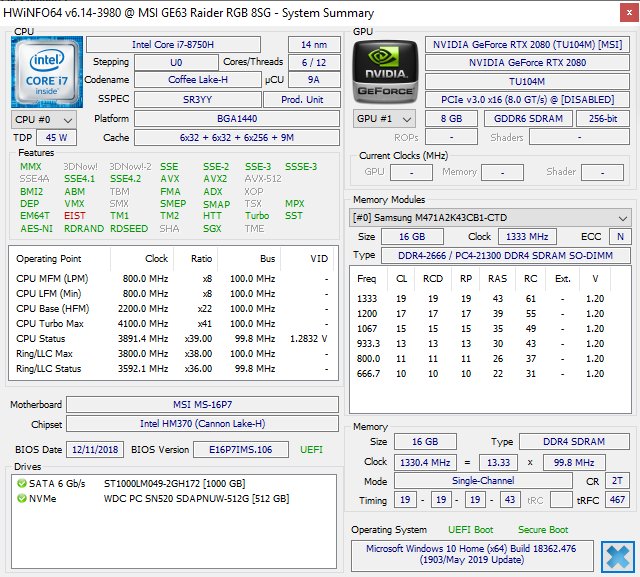
The GE63 is available in a wide variety of SKUs ranging from the Core i7-8750H to the i7-9750H CPU, GeForce RTX 2060 to the RTX 2080 GPU, and 120 Hz to 144 Hz 1080p displays. Note that there are no Core i9, GeForce Max-Q, or 4K UHD options as these are instead reserved for the GT or GS series. Nvidia Optimus is present to automatically exclude G-Sync features.
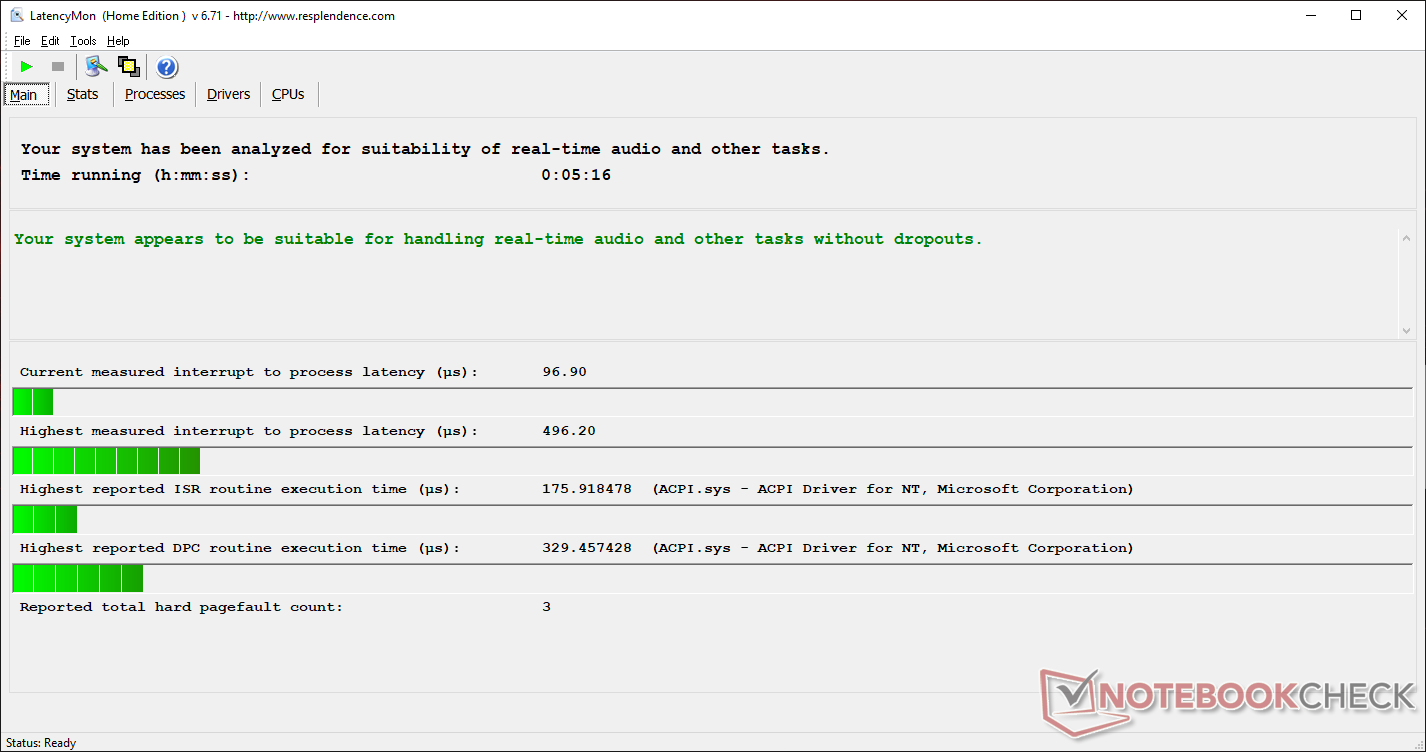
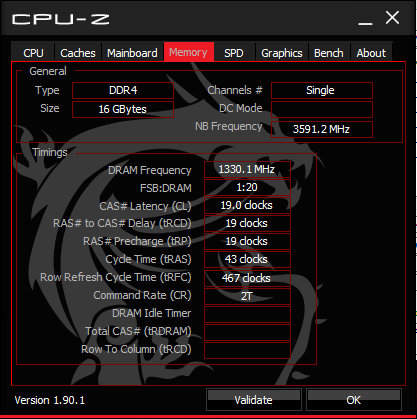
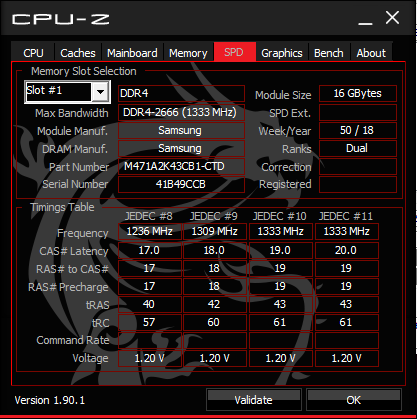
While the GE63 supports dual-channel RAM, our test unit comes with just a single 16 GB module for a single-channel setup. Unfortunately, simple storage and RAM upgrades will require breaking a factory sticker which may impact your warranty. LatencyMon shows no DPC latency issues when wireless is enabled or disabled.
Processor
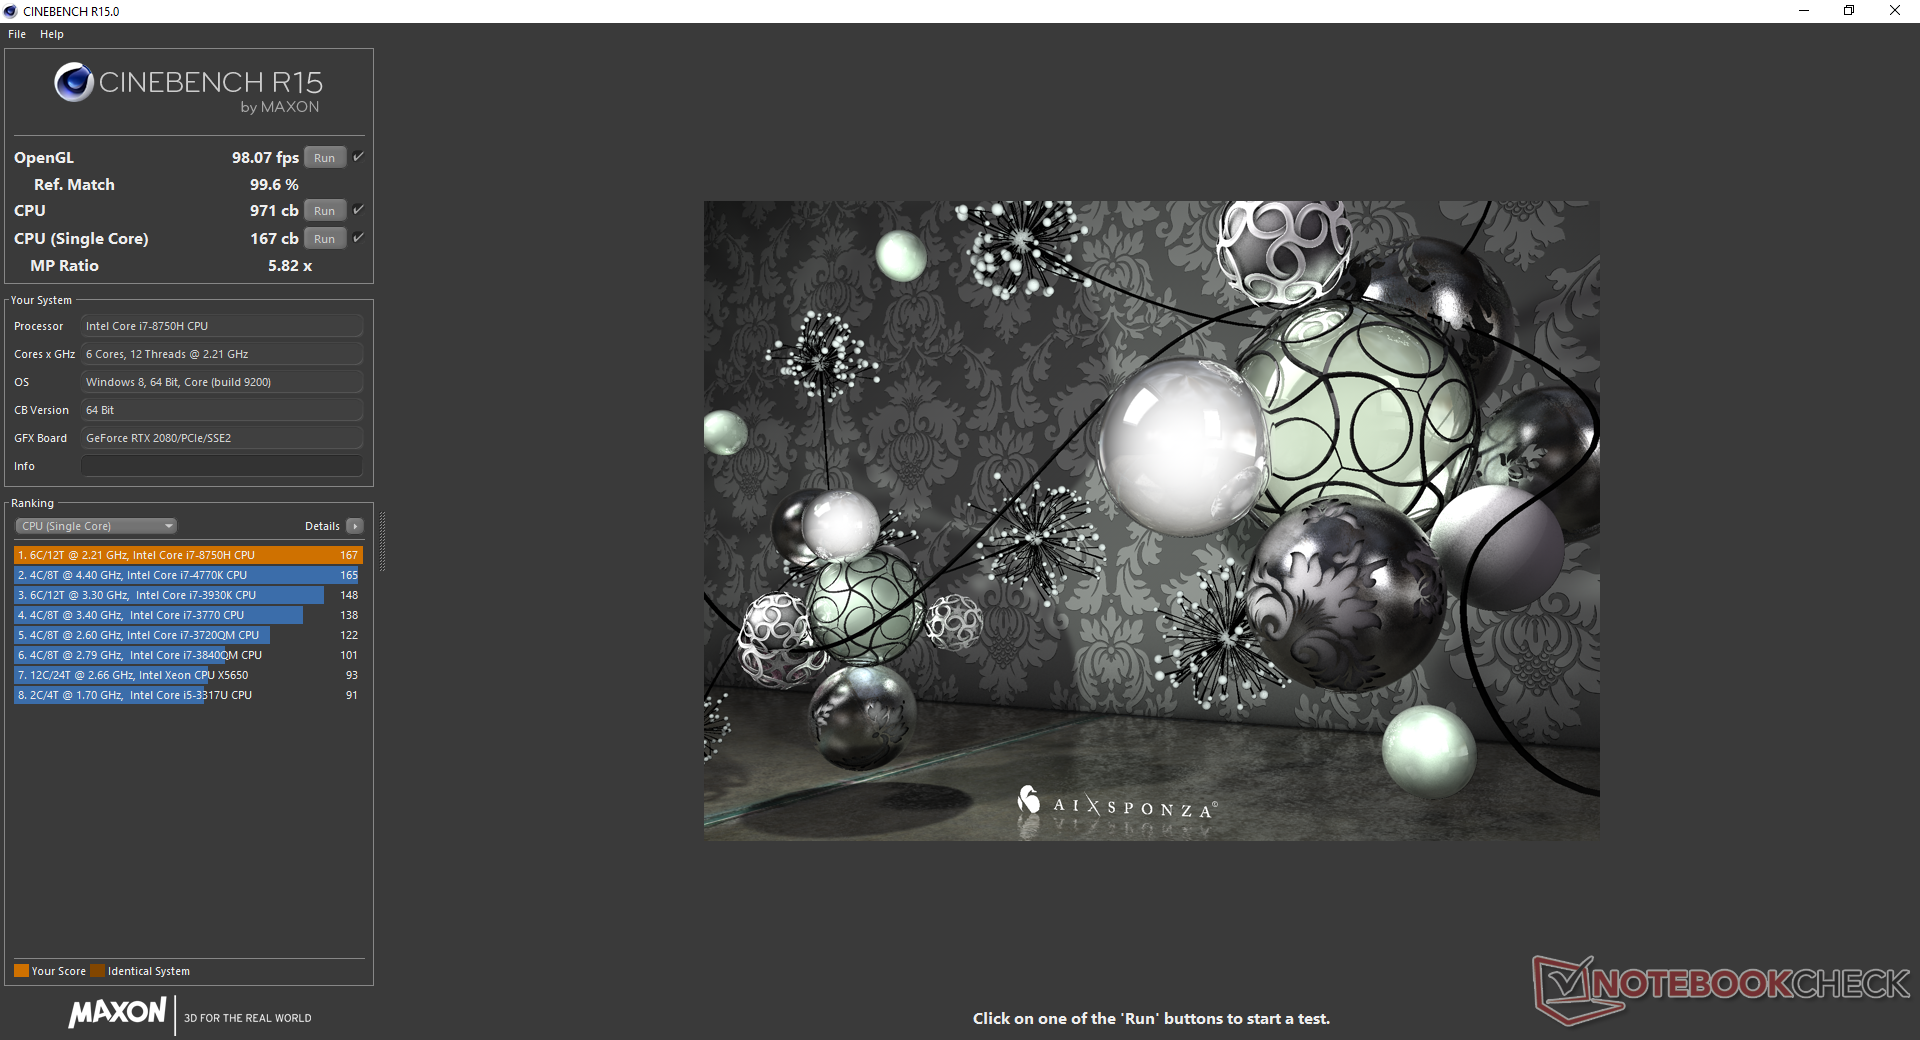
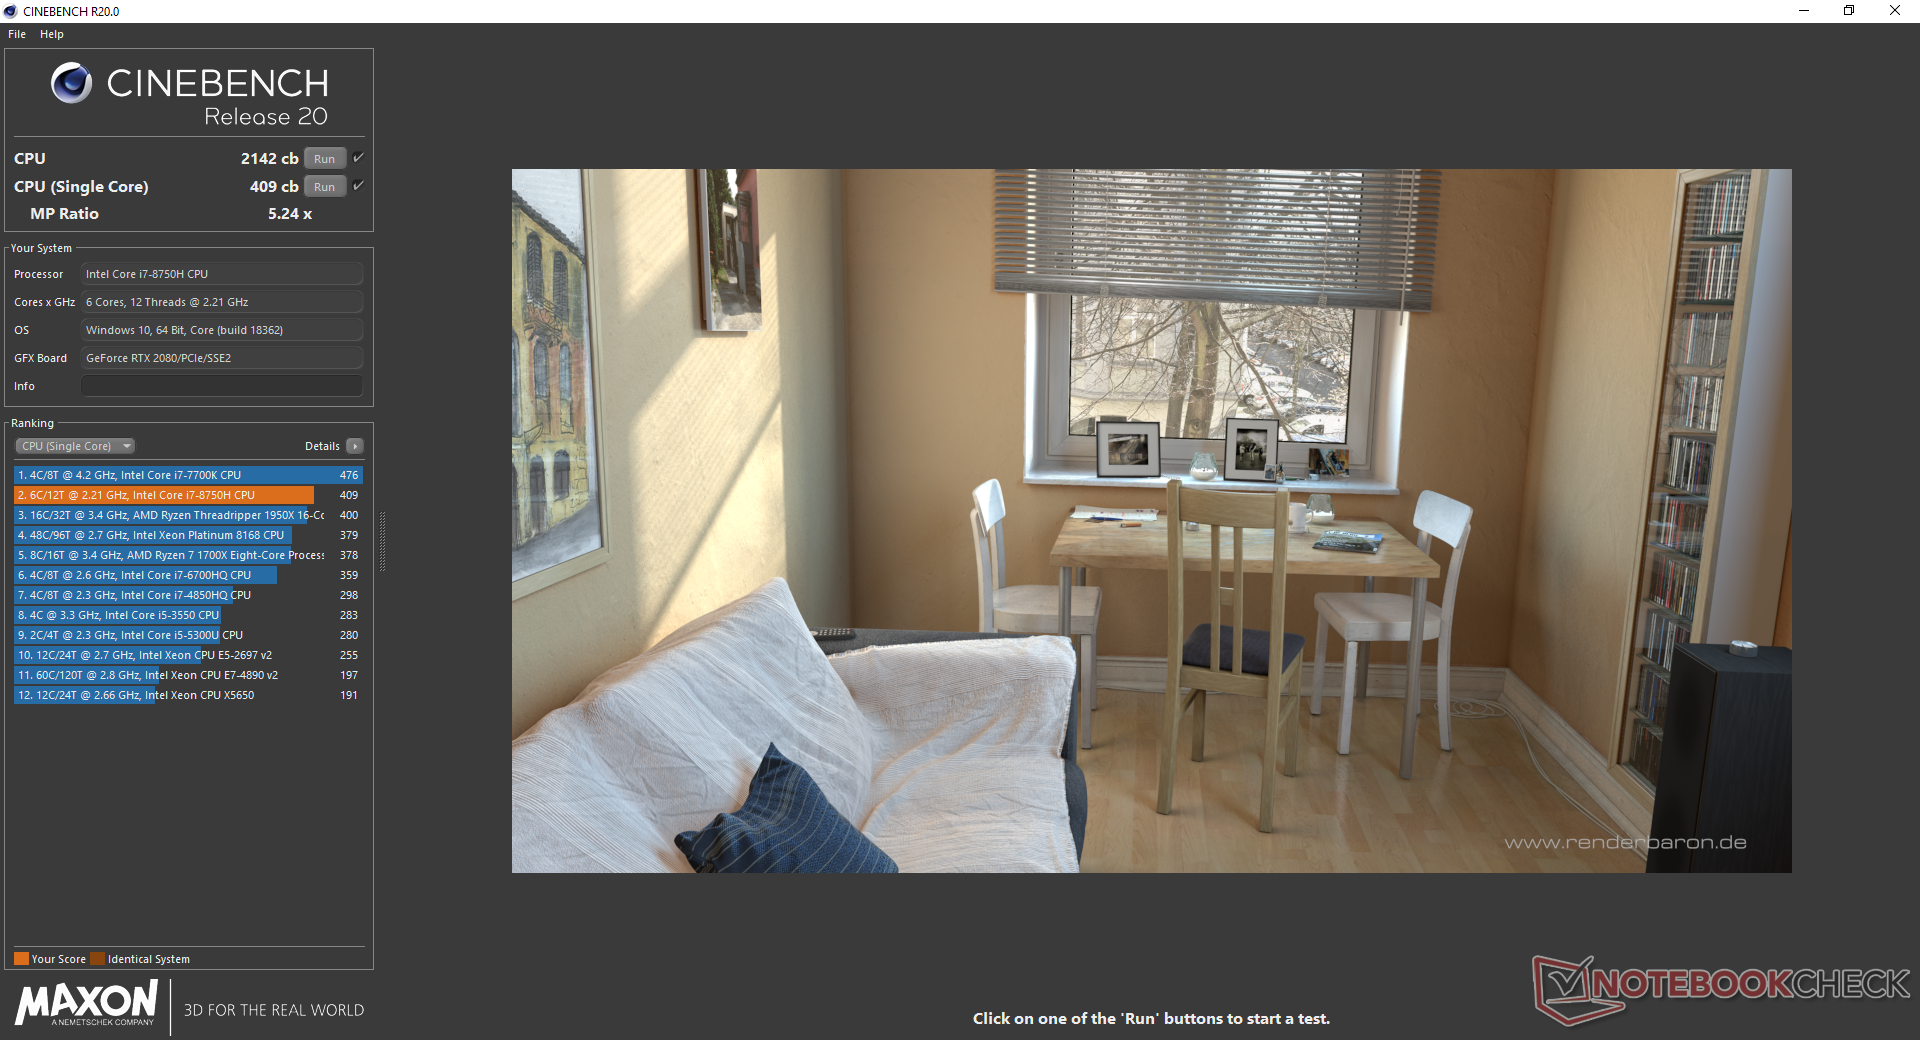
CPU performance is below average. The i7-8750H in our MSI performs 10 to 12 percent slower than the average i7-8750H in our database taken from 93 other laptops. Enabling Cooler Boost mode (a.k.a. Turbo Mode) does not appear to improve CPU performance by any significant margin.
Running CineBench R15 Multi-Thread in a loop shows that our GE63 8SG is slower than the GE63 8RF by about 10 percent even after accounting for throttling. We're not sure why this is happening, but it occurs consistently enough in our testing to be worth mentioning. The Walmart EVOO Gaming 17 with the newer Core i7-9750H can perform 30 to 40 percent faster than the i7-8750H in our GE63 even though the i7-8750H and i7-9750H perform similarly on average.
See our dedicated page on the Core i7-8750H for more technical information and benchmark comparisons.
System Performance
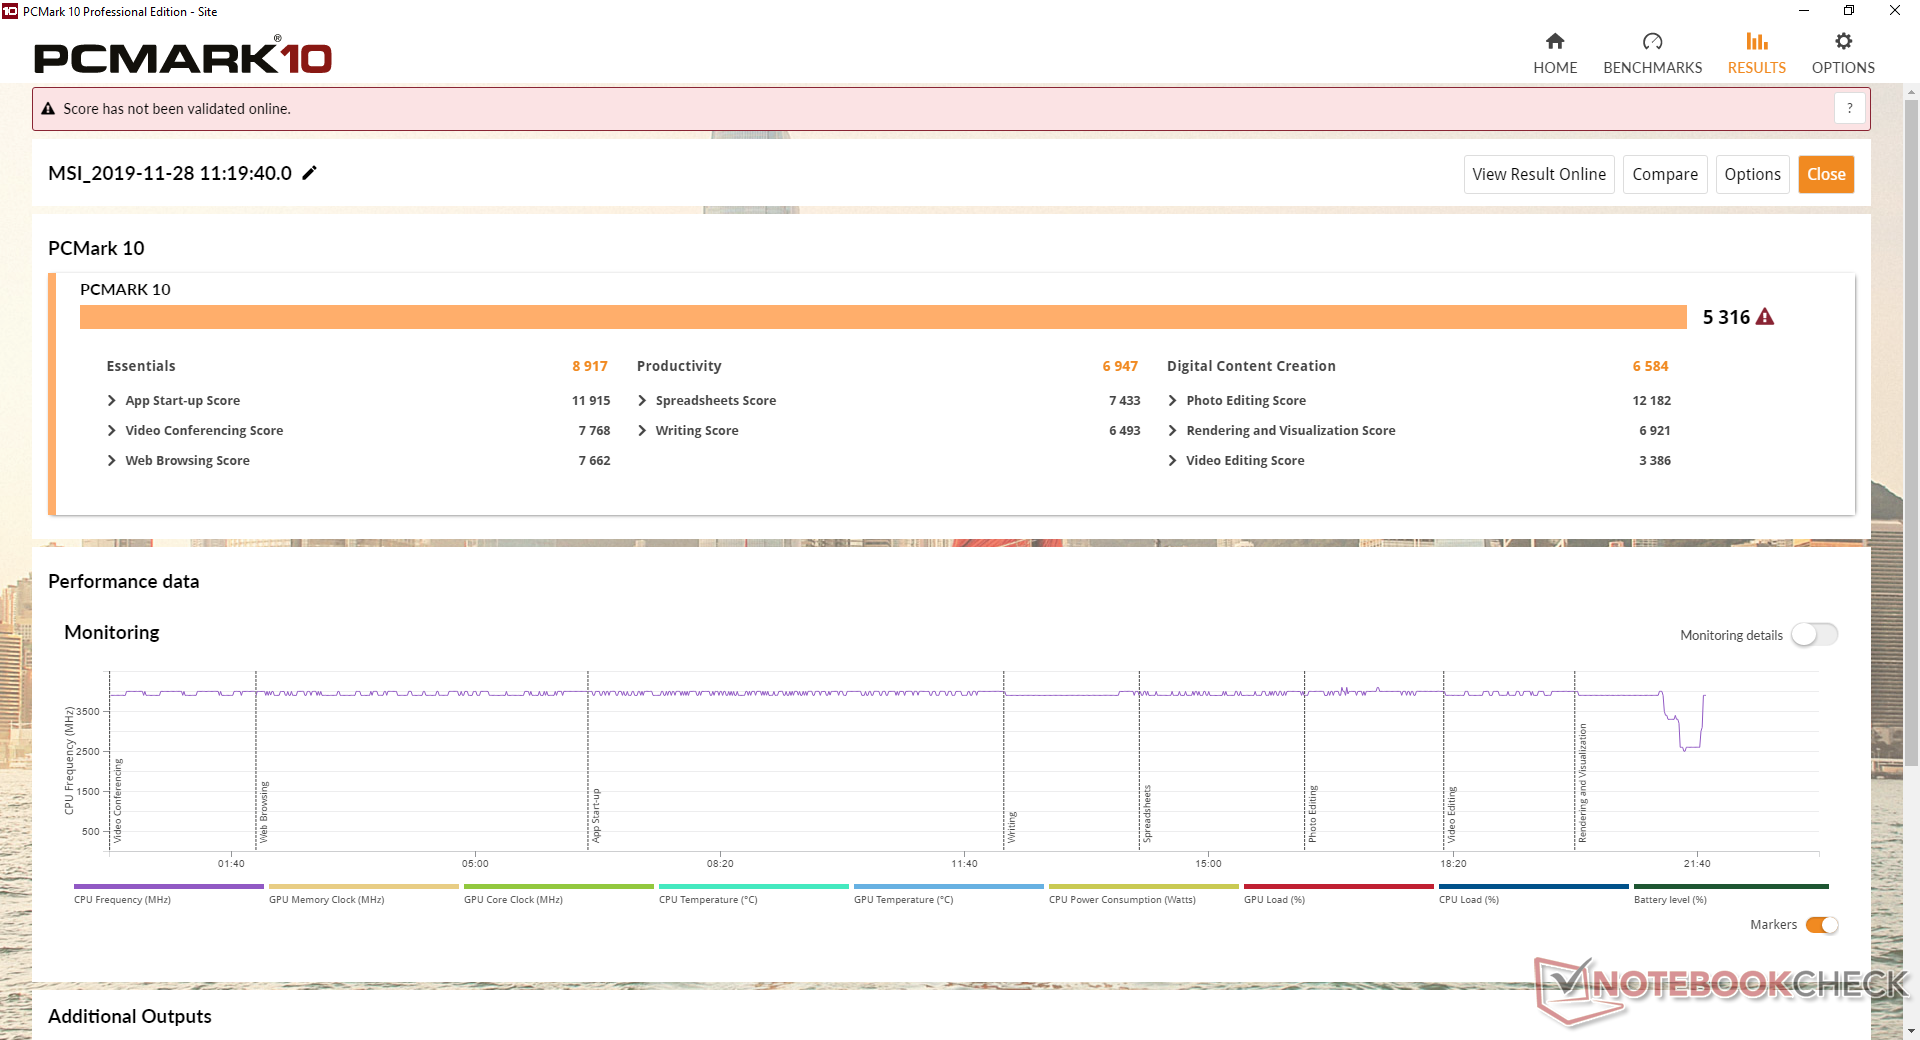
PCMark benchmarks rank our system slightly lower than expected. The cheaper MSI GL65 with the Core i7-9750H, dual-channel RAM and slower RTX 2060 GPU, for example, scores 5 percent higher on average.
We experienced no issues with out test unit other than the touchpad responsiveness problems mentioned above.
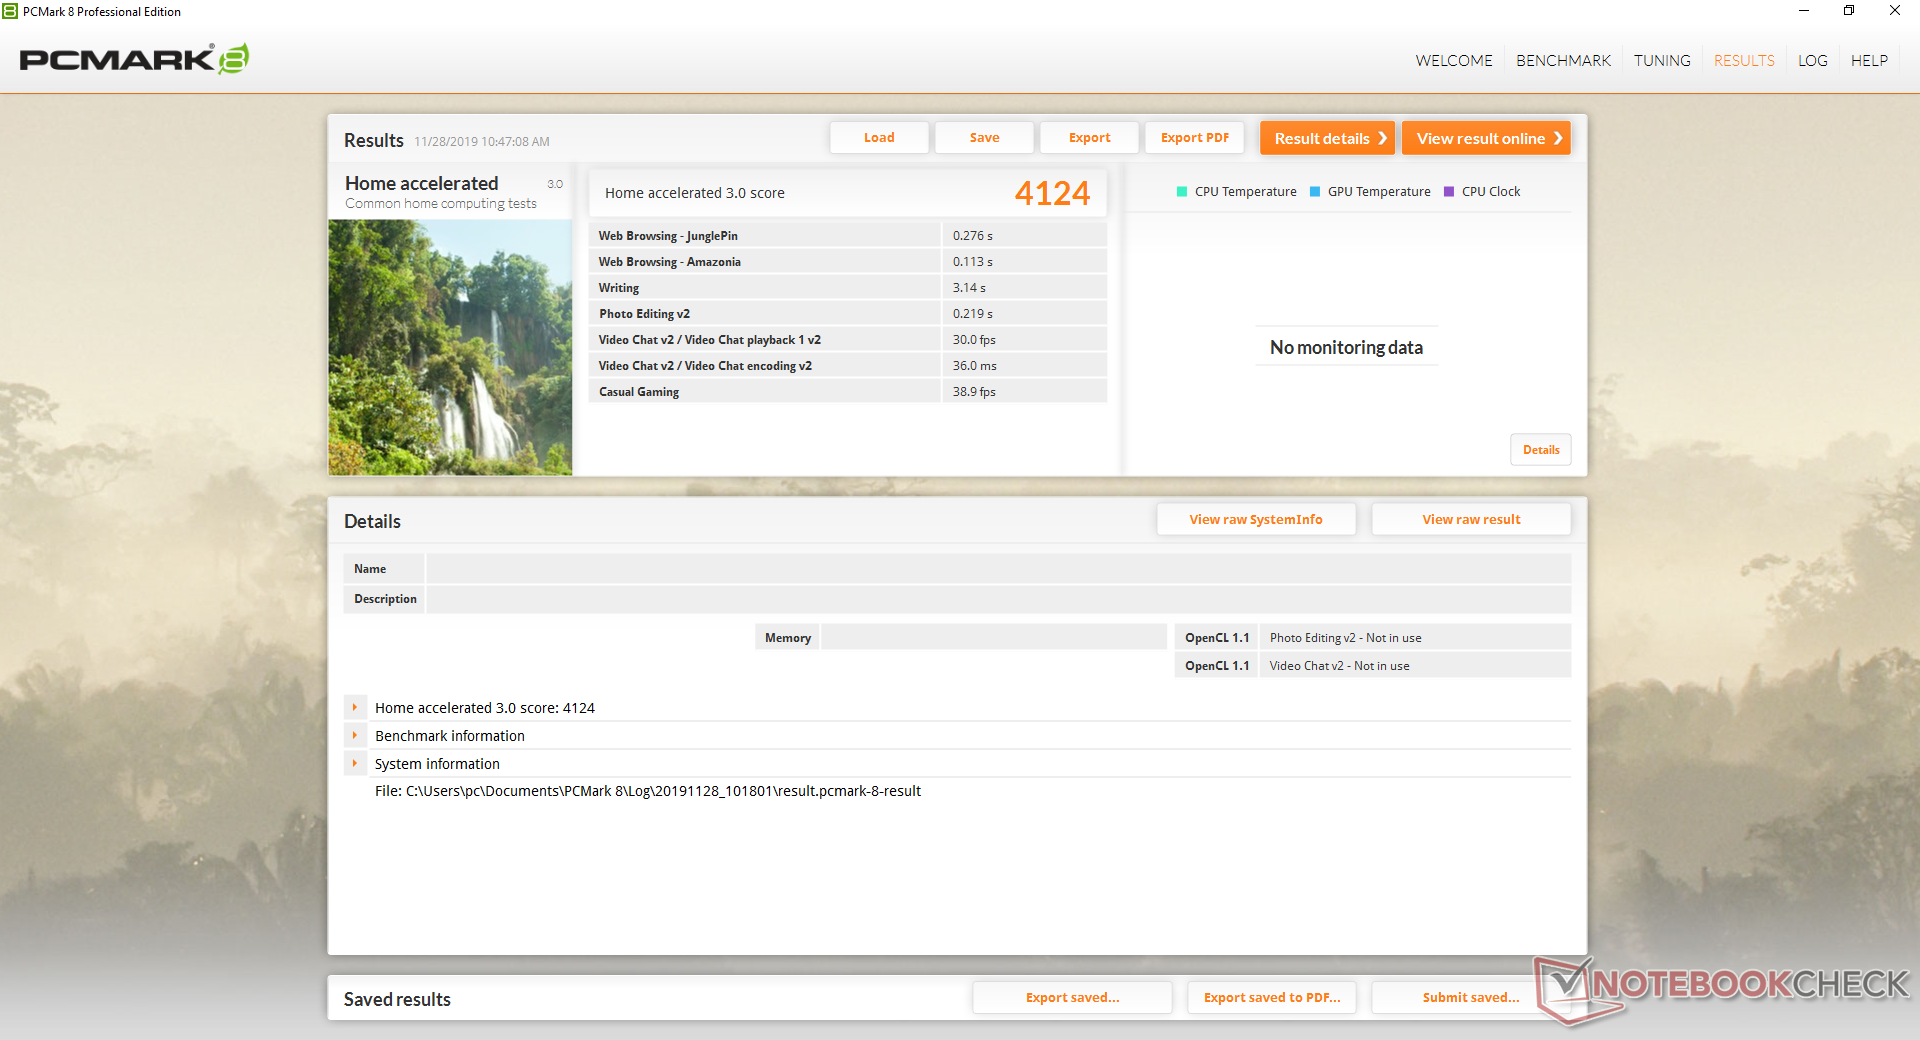
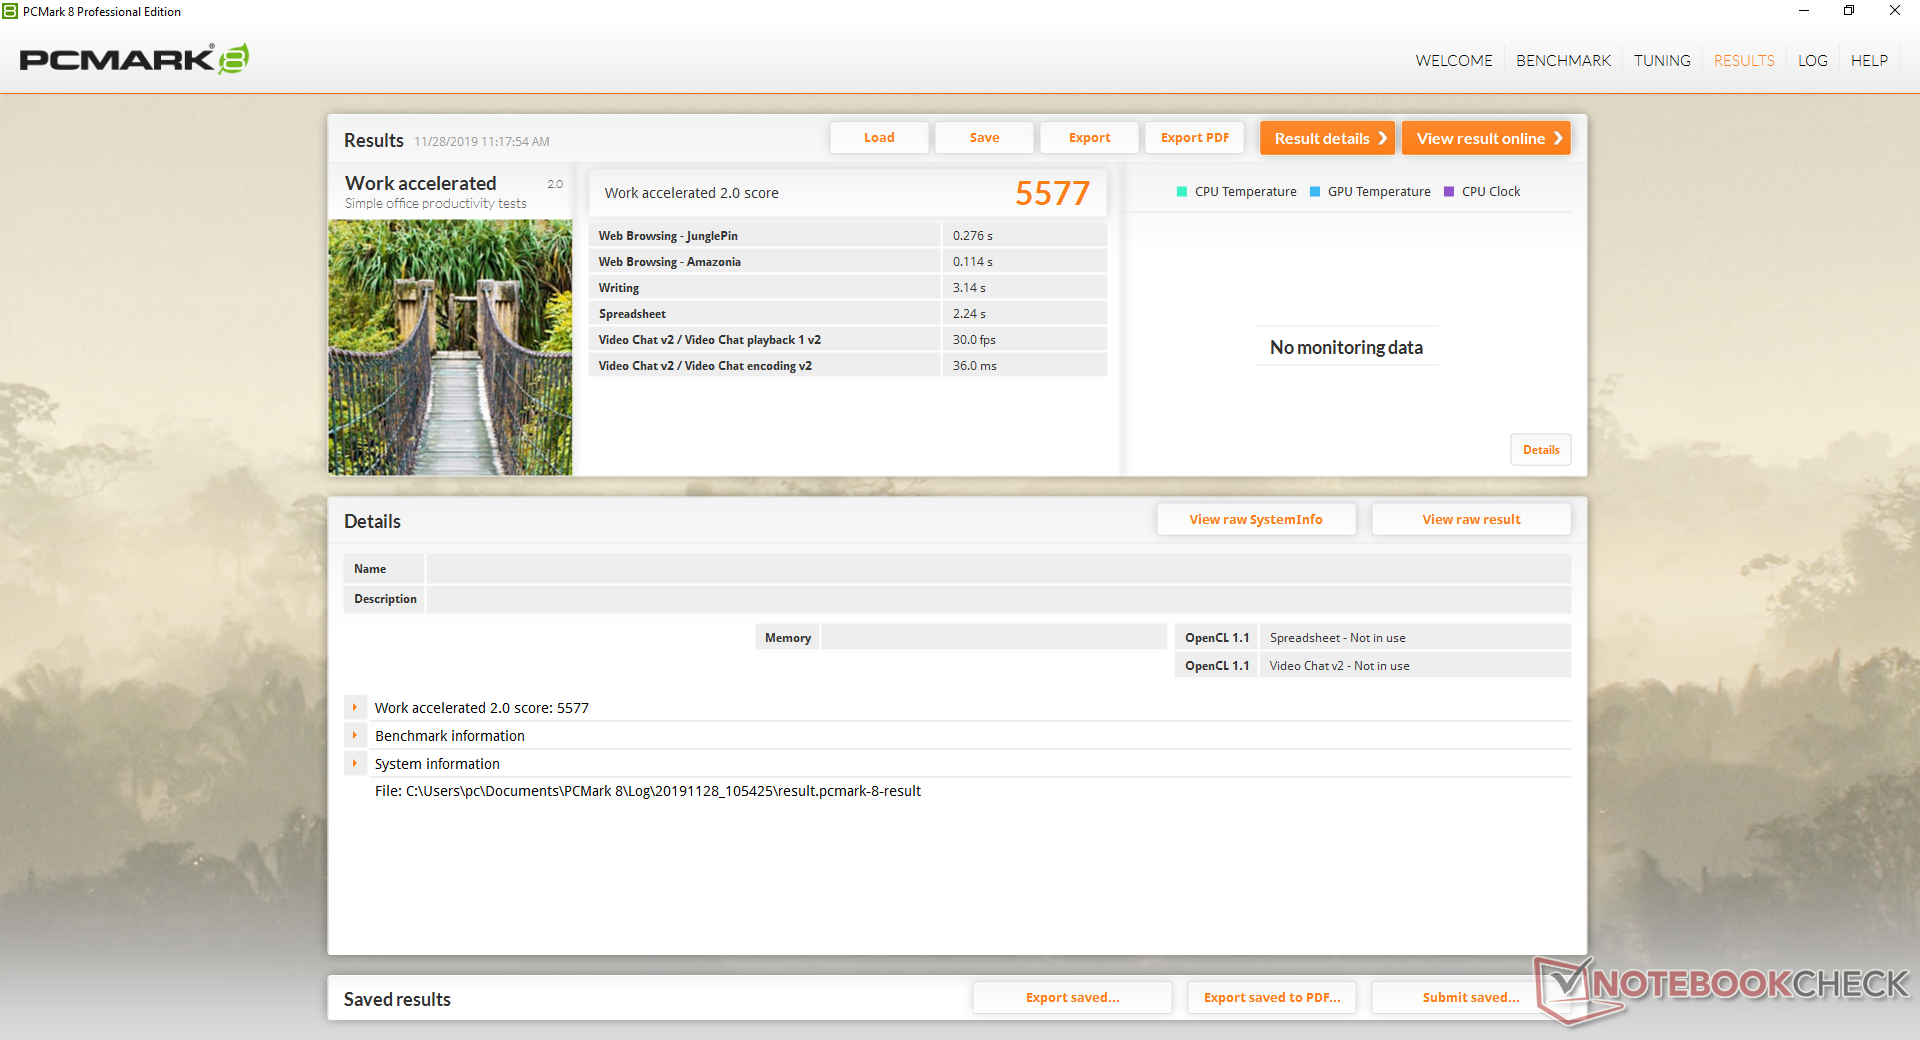
| PCMark 8 Home Score Accelerated v2 | 4124 points | |
| PCMark 8 Work Score Accelerated v2 | 5577 points | |
| PCMark 10 Score | 5316 points | |
Help | ||
Storage Devices
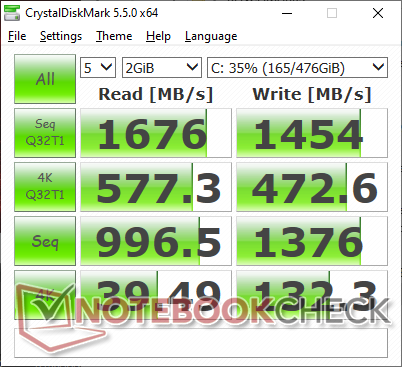
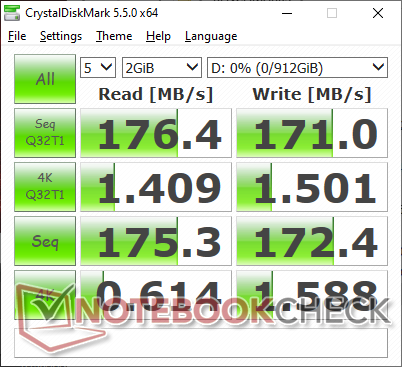
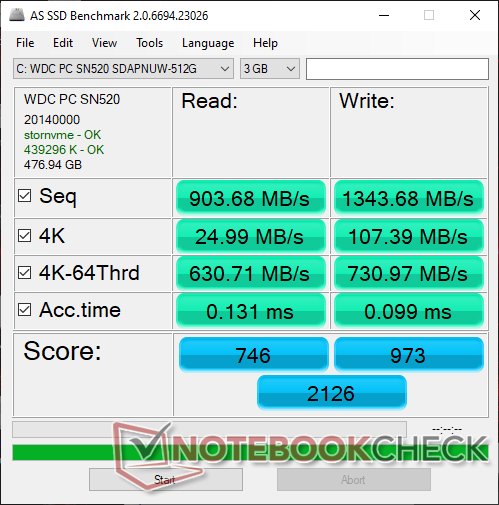
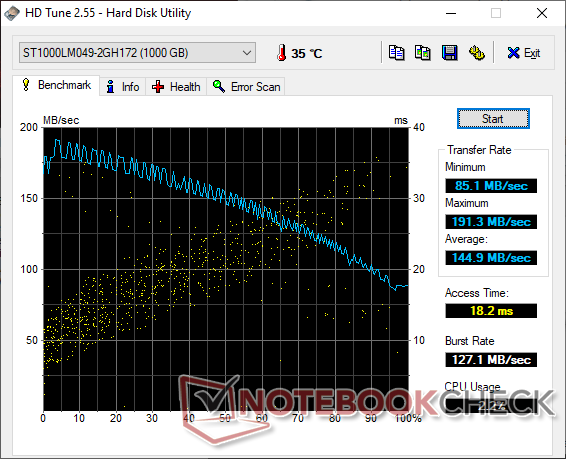
Users have access to two M.2 PCIx x4 slots and one 2.5-inch SATA III drive unlike the Razer Blade 15 which has just one or two storage bays maximum. Our test unit ships with the same mid-range 512 GB Western Digital PC SN520 NVMe drive as on the MSI GL65. The costlier Samsung PM981 series can offer two times faster sequential read and write performances.
See our table of HDDs and SSDs for more benchmark comparisons.
| MSI GE63 Raider 8SG WDC PC SN520 SDAPNUW-512G | MSI GL65 9SEK WDC PC SN520 SDAPNUW-512G | Lenovo Legion Y740-15ICHg WDC PC SN520 SDAPMUW-128G | MSI GT63 Titan 8RG-046 CUK Cyclone 500GB M.2 NVMe | Asus Strix Scar III G531GW-AZ062T Intel SSD 660p SSDPEKNW512G8 | MSI GE63 Raider RGB 8RF-008 Samsung SSD PM871a MZNLN256HMHQ | |
|---|---|---|---|---|---|---|
| AS SSD | 14% | -19% | 53% | -16% | -27% | |
| Seq Read (MB/s) | 904 | 1315 45% | 1372 52% | 2399 165% | 1163 29% | 512 -43% |
| Seq Write (MB/s) | 1344 | 1378 3% | 746 -44% | 1665 24% | 919 -32% | 462.8 -66% |
| 4K Read (MB/s) | 24.99 | 25.31 1% | 35.42 42% | 49.17 97% | 48.88 96% | 32.36 29% |
| 4K Write (MB/s) | 107.4 | 118.2 10% | 99.9 -7% | 87.7 -18% | 90.1 -16% | 68.6 -36% |
| 4K-64 Read (MB/s) | 631 | 839 33% | 302.1 -52% | 1144 81% | 323.8 -49% | 348.6 -45% |
| 4K-64 Write (MB/s) | 731 | 720 -2% | 191.4 -74% | 648 -11% | 403.8 -45% | 294.3 -60% |
| Access Time Read * (ms) | 0.131 | 0.116 11% | 0.132 -1% | 0.05 62% | 0.24 -83% | 0.101 23% |
| Access Time Write * (ms) | 0.099 | 0.091 8% | 0.037 63% | 0.042 58% | 0.046 54% | 0.051 48% |
| Score Read (Points) | 746 | 996 34% | 475 -36% | 1433 92% | 489 -34% | 432 -42% |
| Score Write (Points) | 973 | 976 0% | 366 -62% | 902 -7% | 586 -40% | 409 -58% |
| Score Total (Points) | 2126 | 2485 17% | 1065 -50% | 3040 43% | 1332 -37% | 1071 -50% |
| Copy ISO MB/s (MB/s) | 1187 | 1279 8% | 1062 -11% | 1269 7% | ||
| Copy Program MB/s (MB/s) | 673 | 889 32% | 426 -37% | 452.8 -33% | ||
| Copy Game MB/s (MB/s) | 1295 | 1218 -6% | 650 -50% | 755 -42% |
* ... smaller is better

GPU Performance
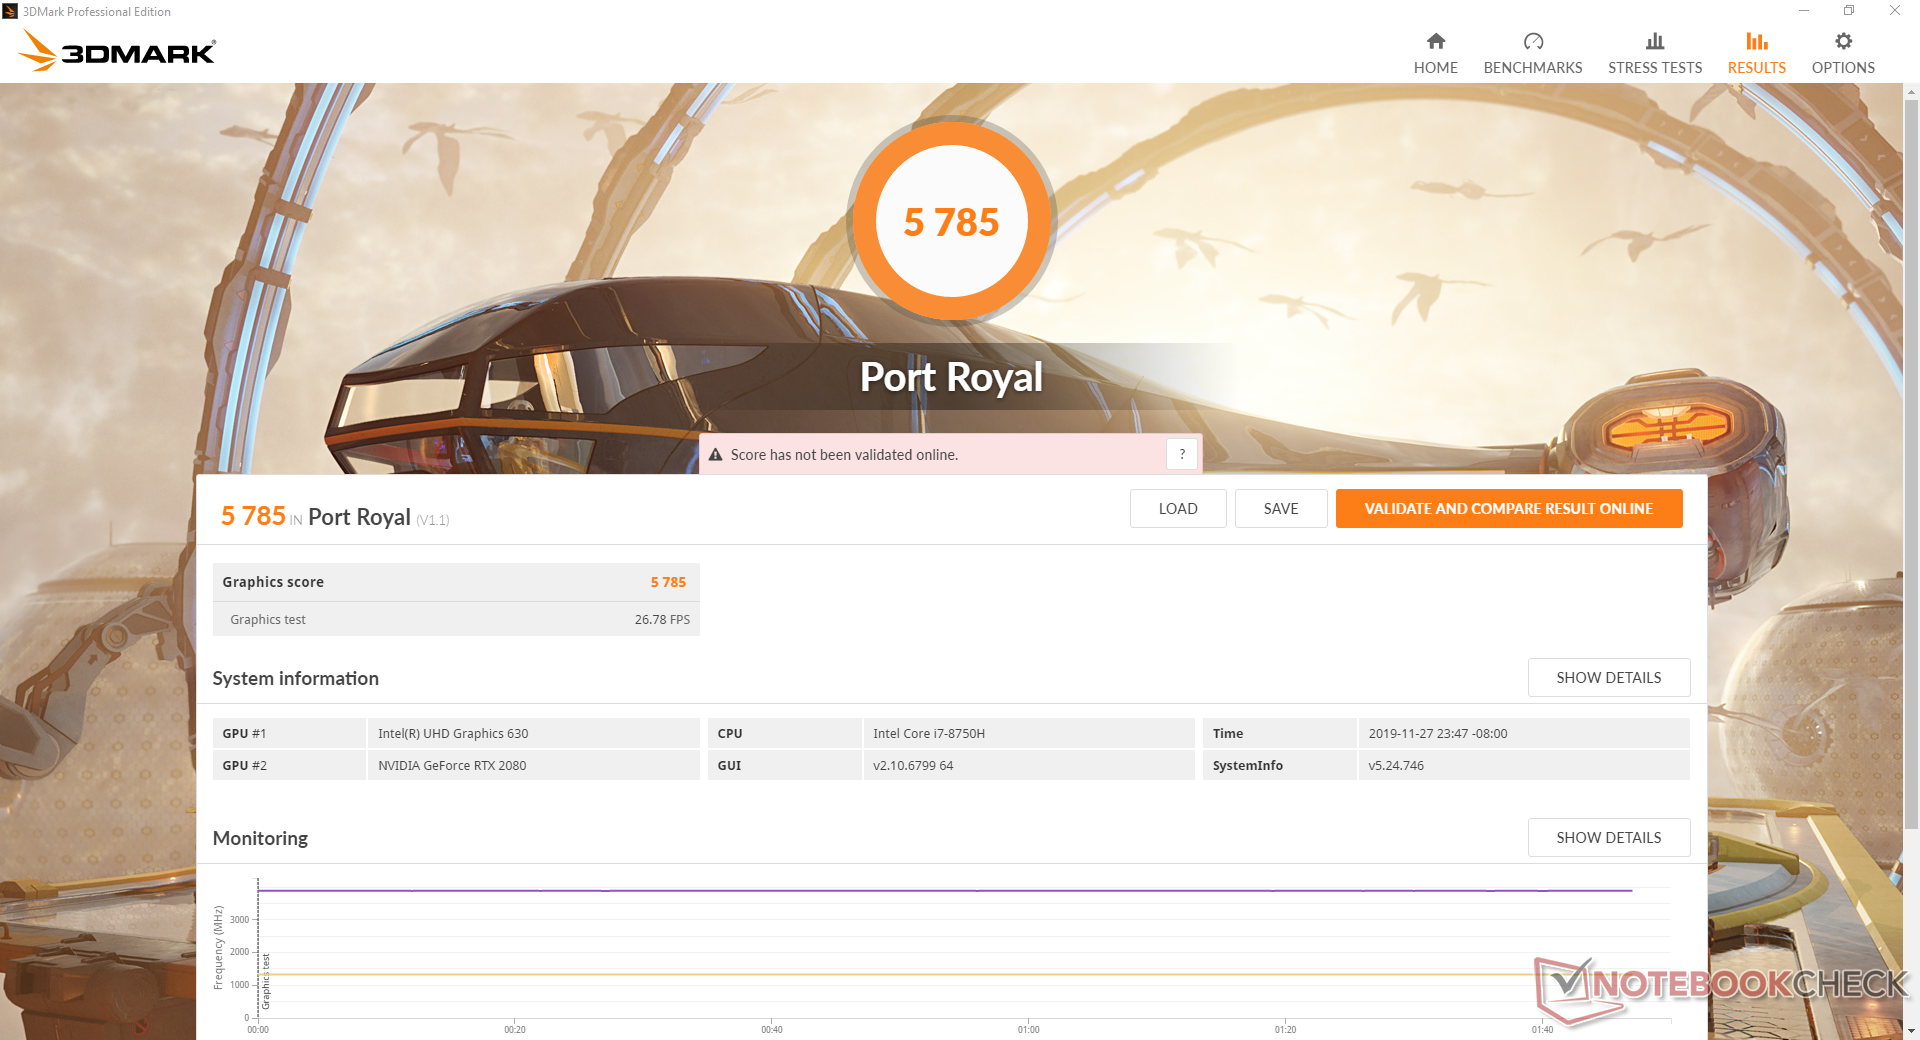
The RTX 2060 in our MSI scores 4 to 6 percent higher than the average mobile RTX 2060 in our database taken from 15 other gaming laptops. At the same time, however, Cloud Gate scores are the lowest we've recorded on any laptop with RTX 2080 graphics. We suspect that both the under-performing CPU and single-channel RAM are responsible for the significantly lower scores here.
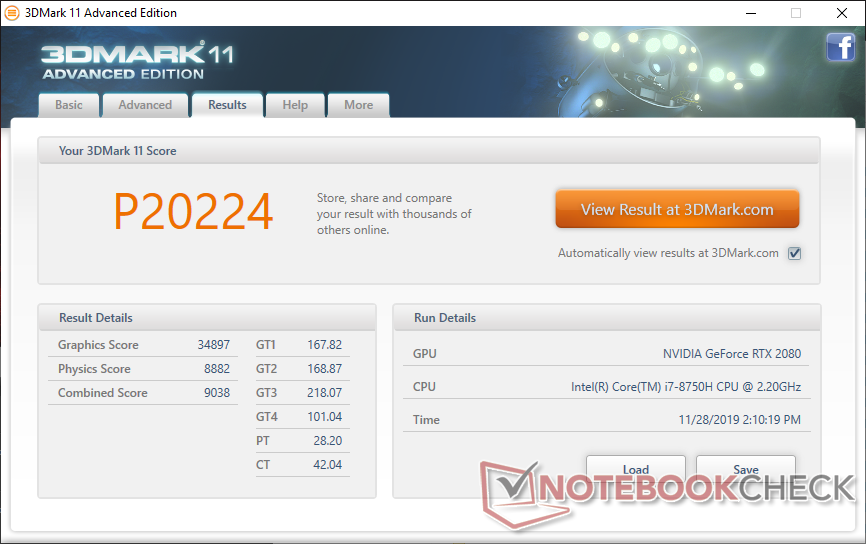
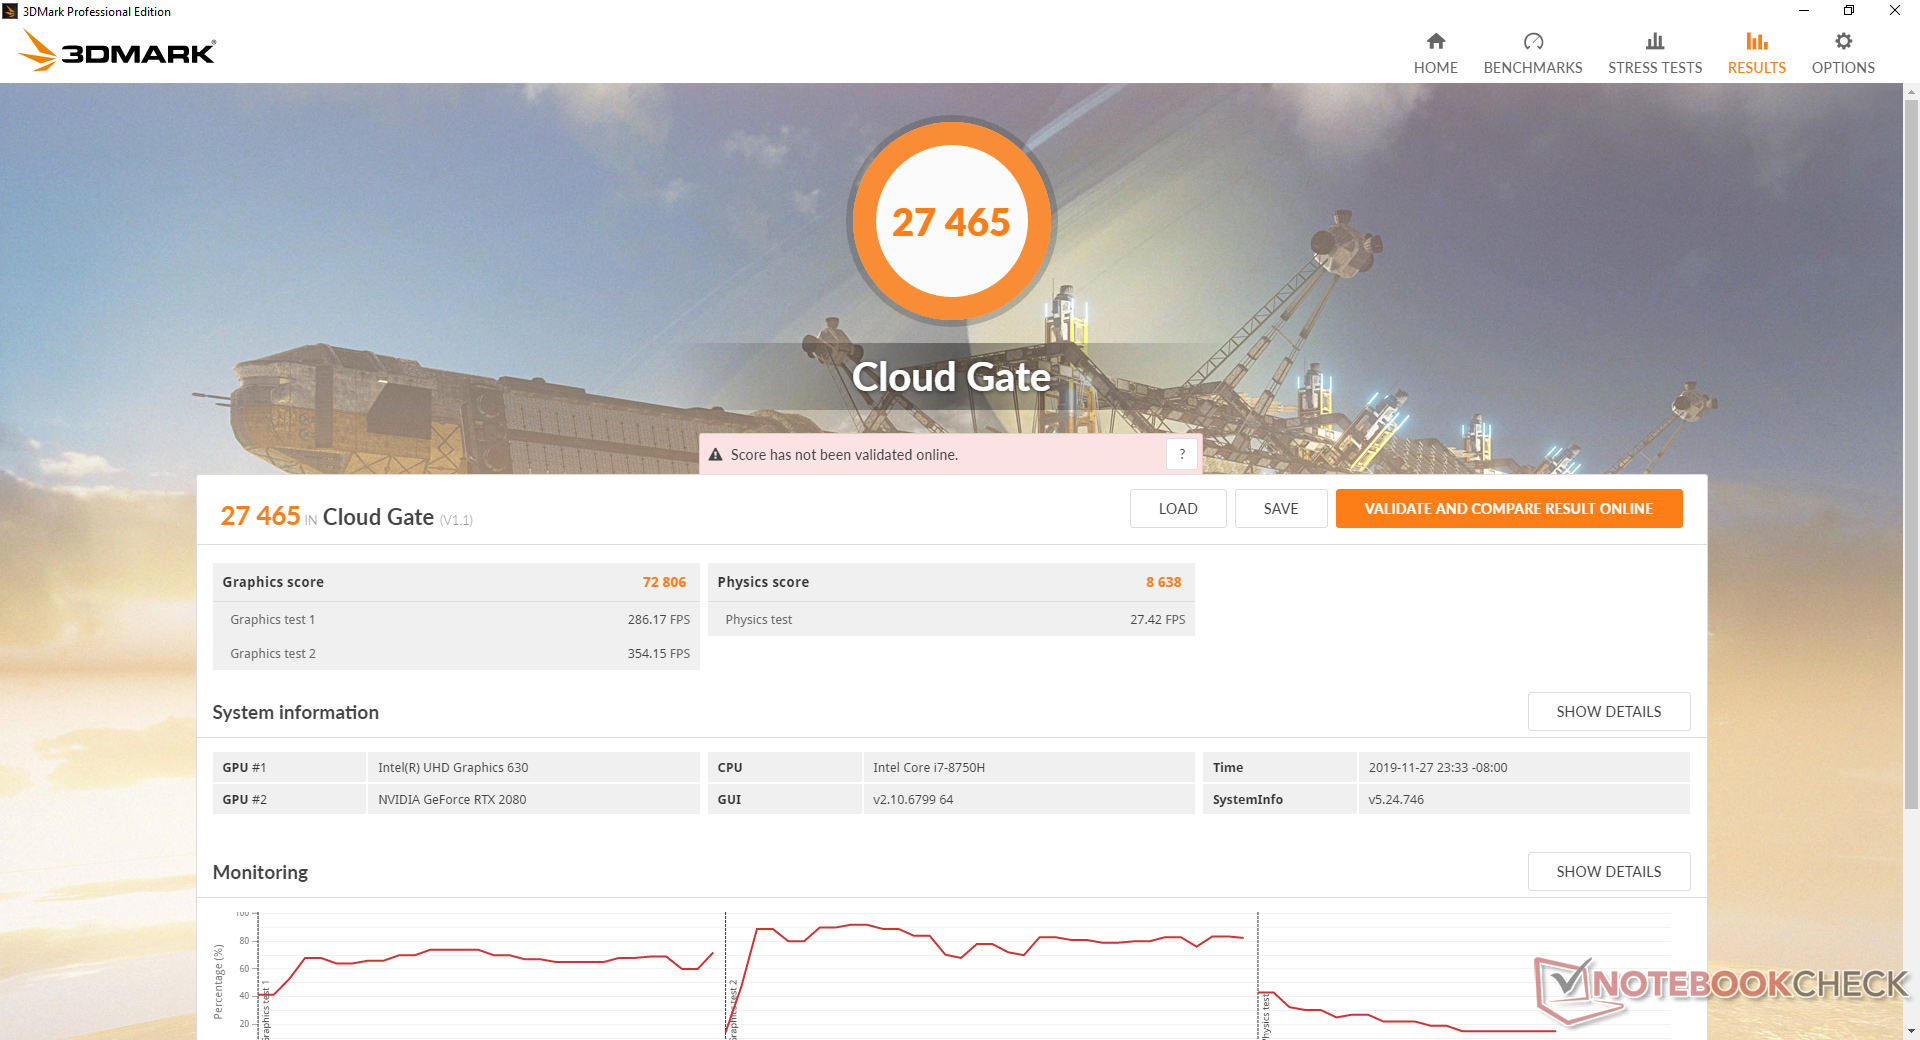
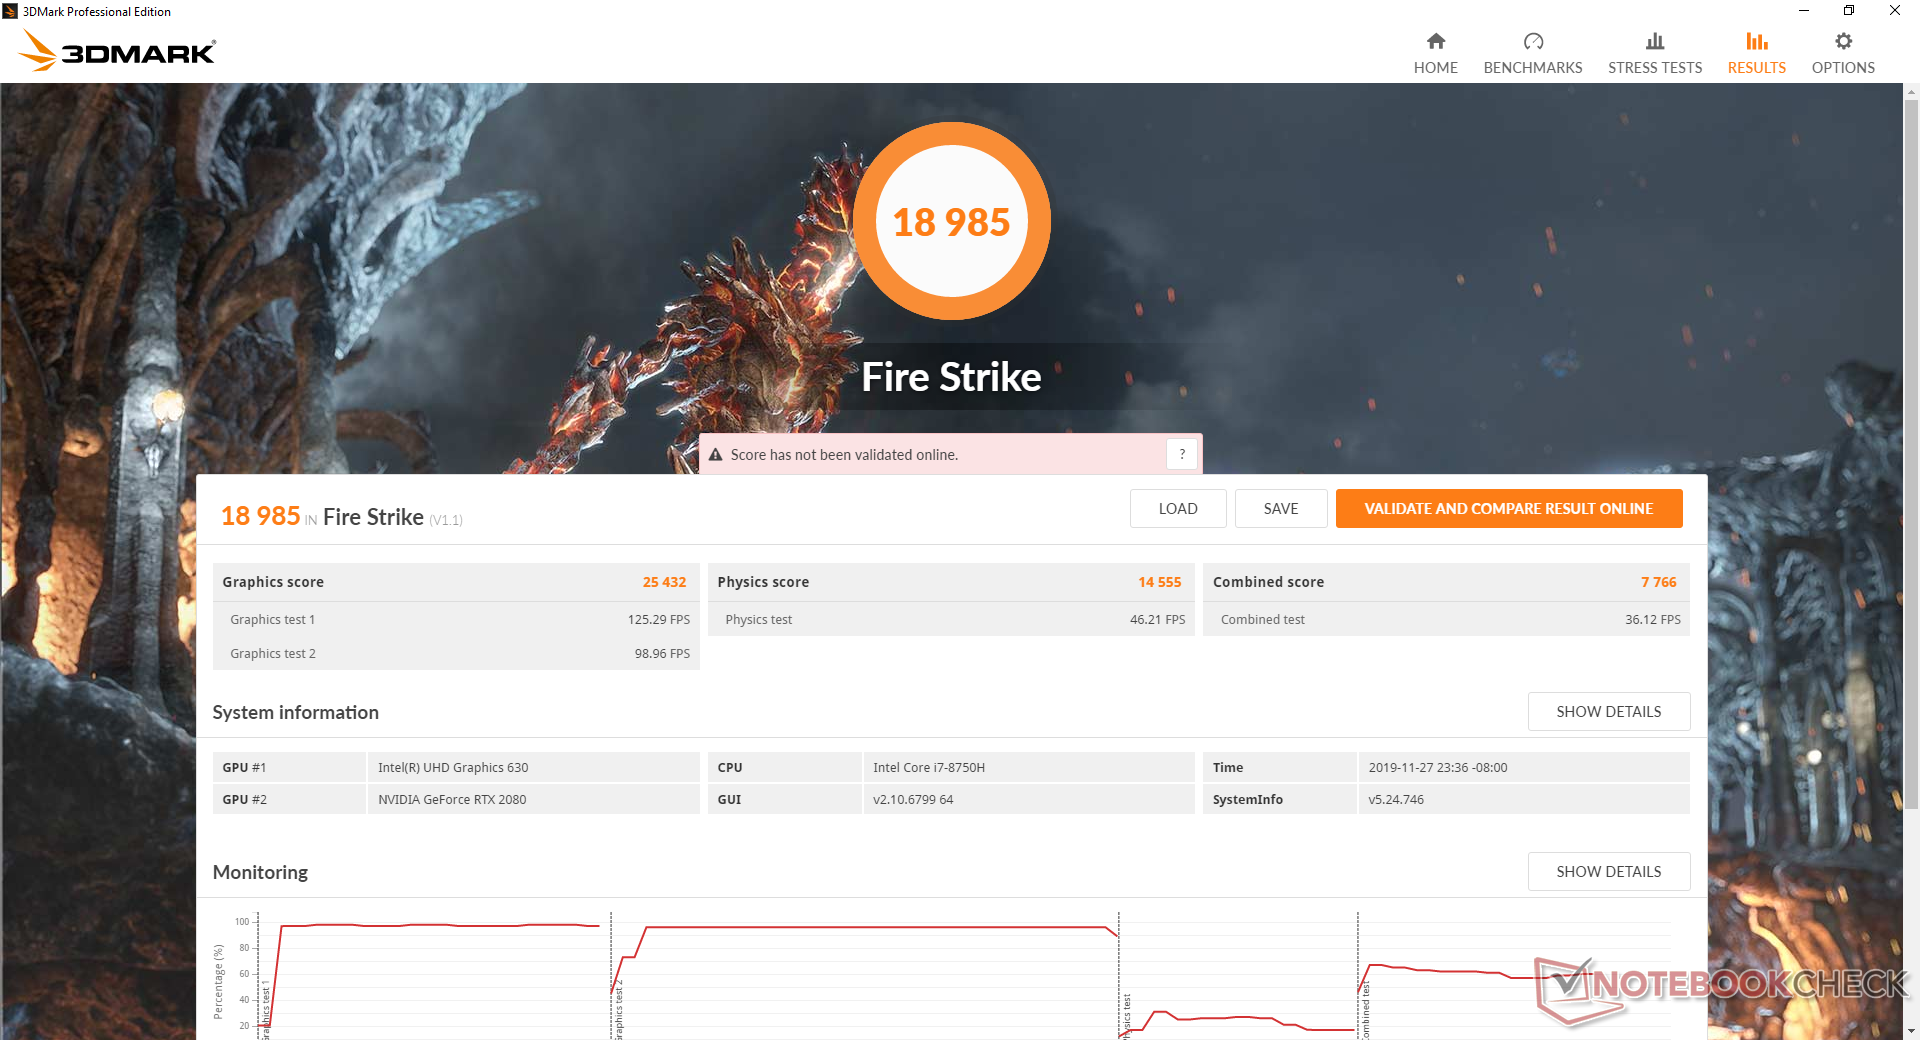
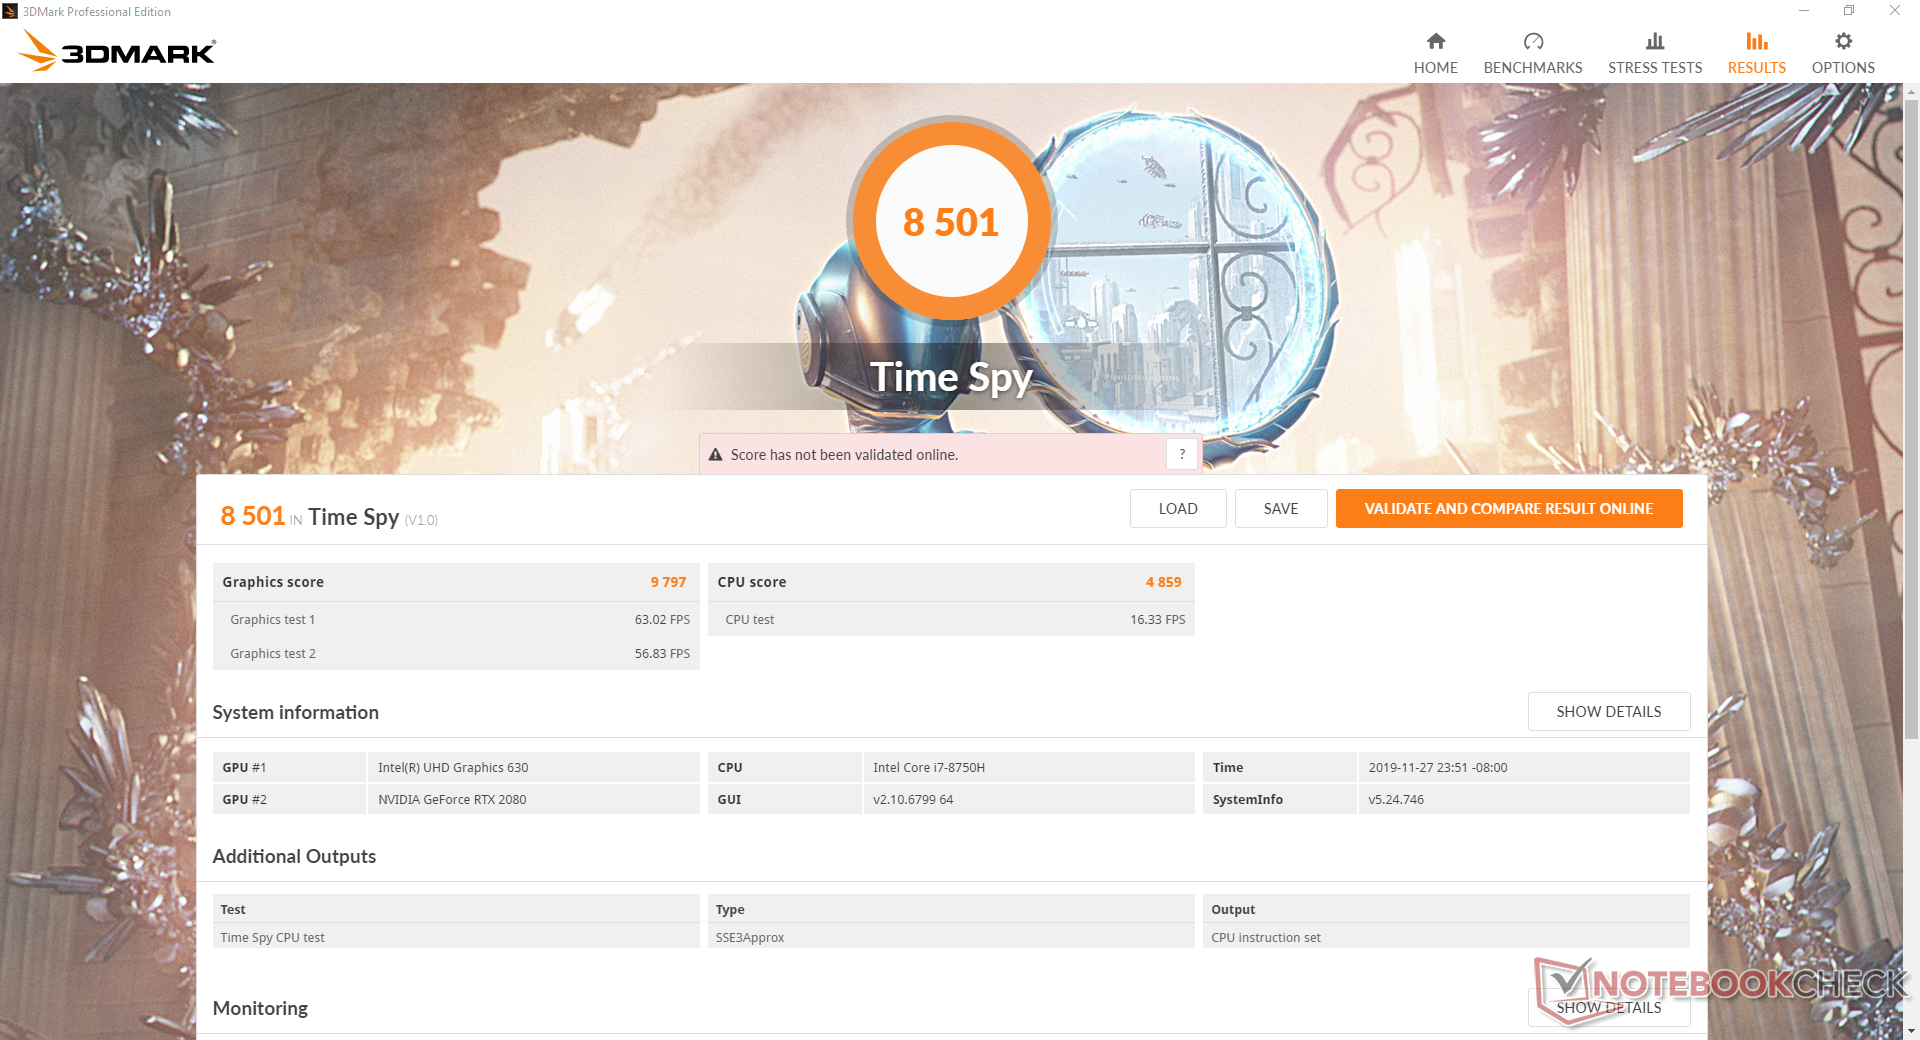
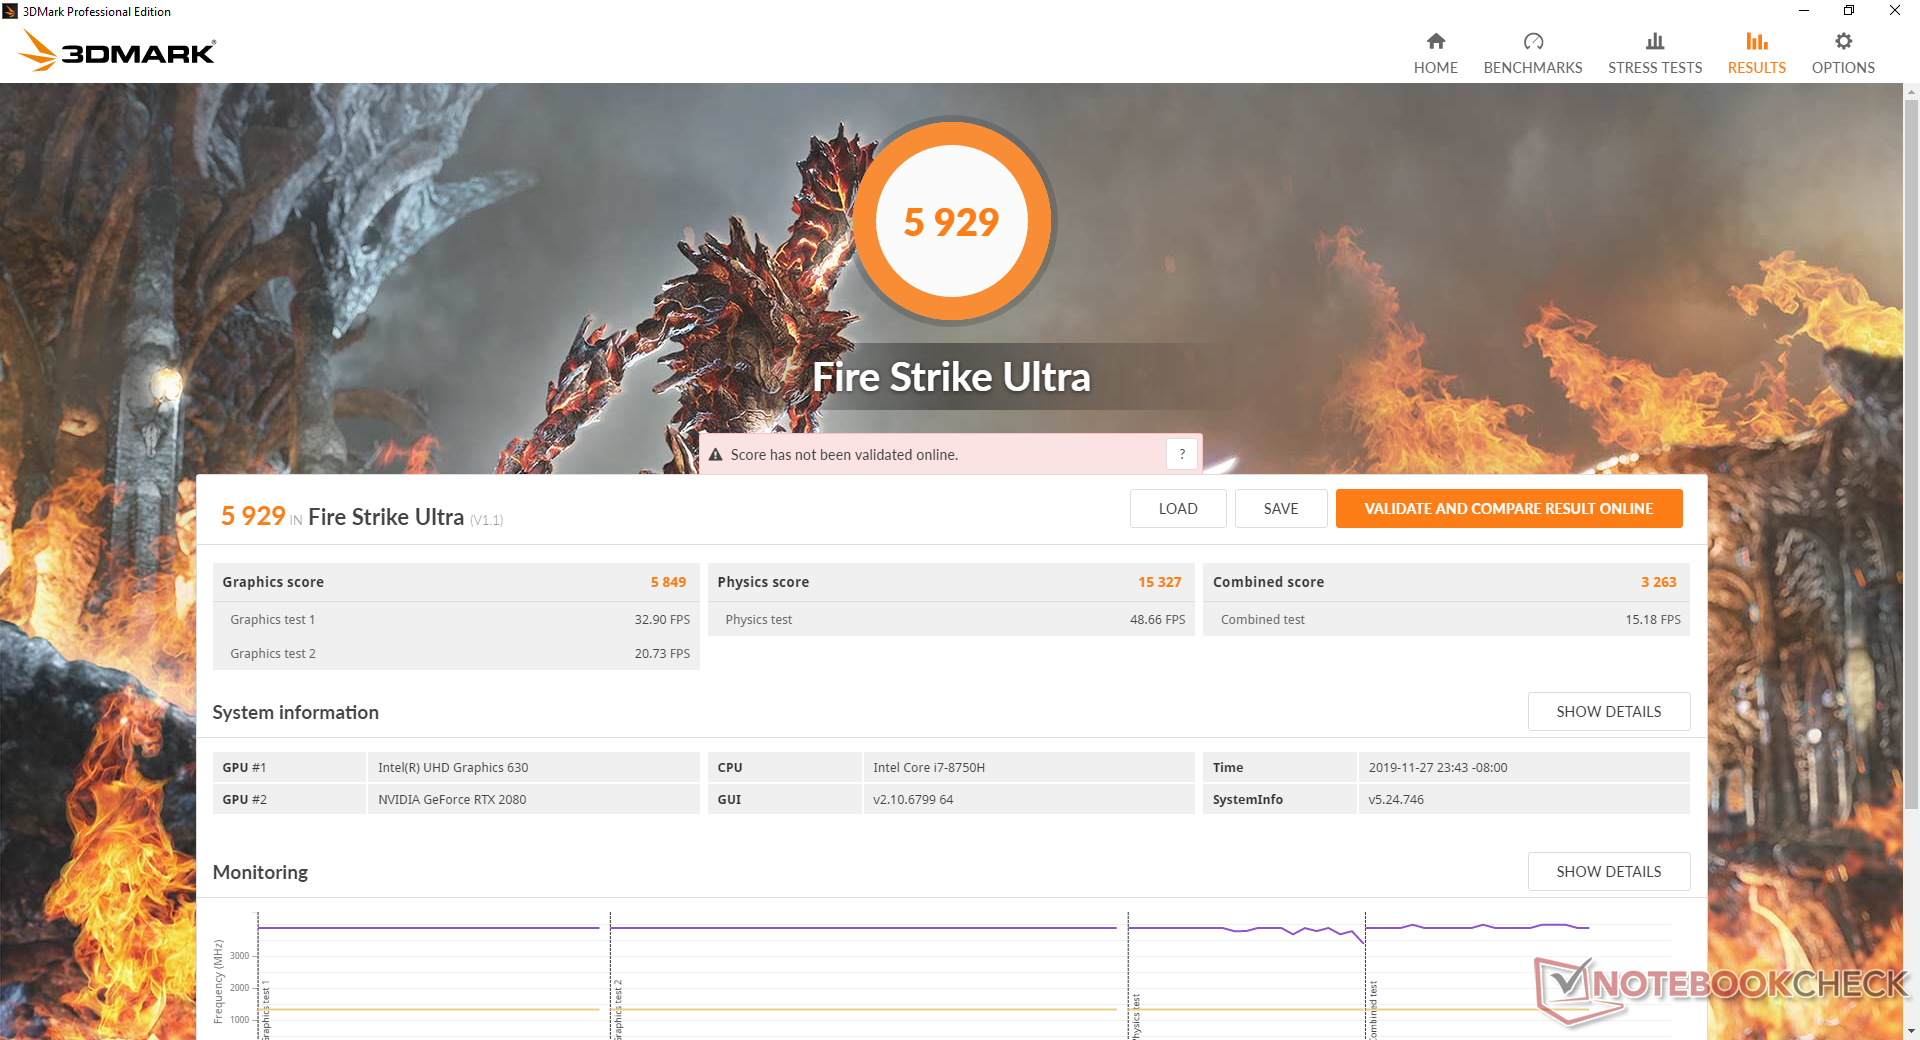
| 3DMark 11 Performance | 20224 points | |
| 3DMark Cloud Gate Standard Score | 27465 points | |
| 3DMark Fire Strike Score | 18985 points | |
| 3DMark Time Spy Score | 8501 points | |
Help | ||
Gaming Performance
So, how do the low Cloud Gate scores and great Fire Strike/Time Spy scores translate to real-world gaming? Unfortunately, frame rates are significantly slower than they should be especially for a GeForce RTX 2080. Shadow of the Tomb Riader on maximum 1080p settings, for example, averages just 69 FPS compared to 99 FPS on the MSI GE75 with the exact same CPU and GPU but with dual-channel RAM. Even the Walmart EVOO Gaming 17 and its RTX 2060 is able to pump out faster frame rates than our MSI.
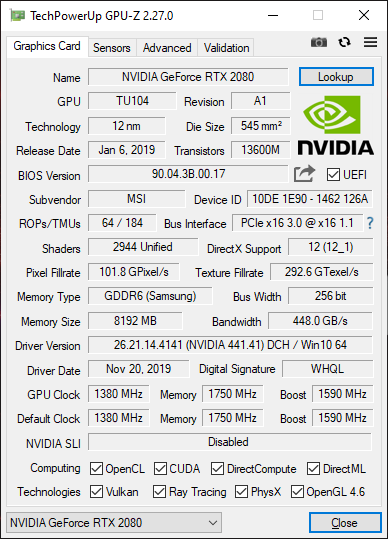
The GPU itself does not appear to be responsible for the subpar gaming performance of the laptop. GPU-Z reveals the RTX 2080 in our MSI to be the same as the RTX 2080 in the MSI GE75 and yet the latter offers nearly 45 percent faster frame rates. Rerunning the same benchmarks in Turbo Fan mode would not significantly improve our results.
See our dedicated page on the mobile GeForce RTX 2080 for more technical information and benchmark comparisons.
| low | med. | high | ultra | |
|---|---|---|---|---|
| BioShock Infinite (2013) | 240.2 | 208.3 | 202 | 148.6 |
| The Witcher 3 (2015) | 195.8 | 157.5 | 126.1 | 82.2 |
| Shadow of the Tomb Raider (2018) | 85 | 73 | 69 | 69 |
Emissions
System Noise
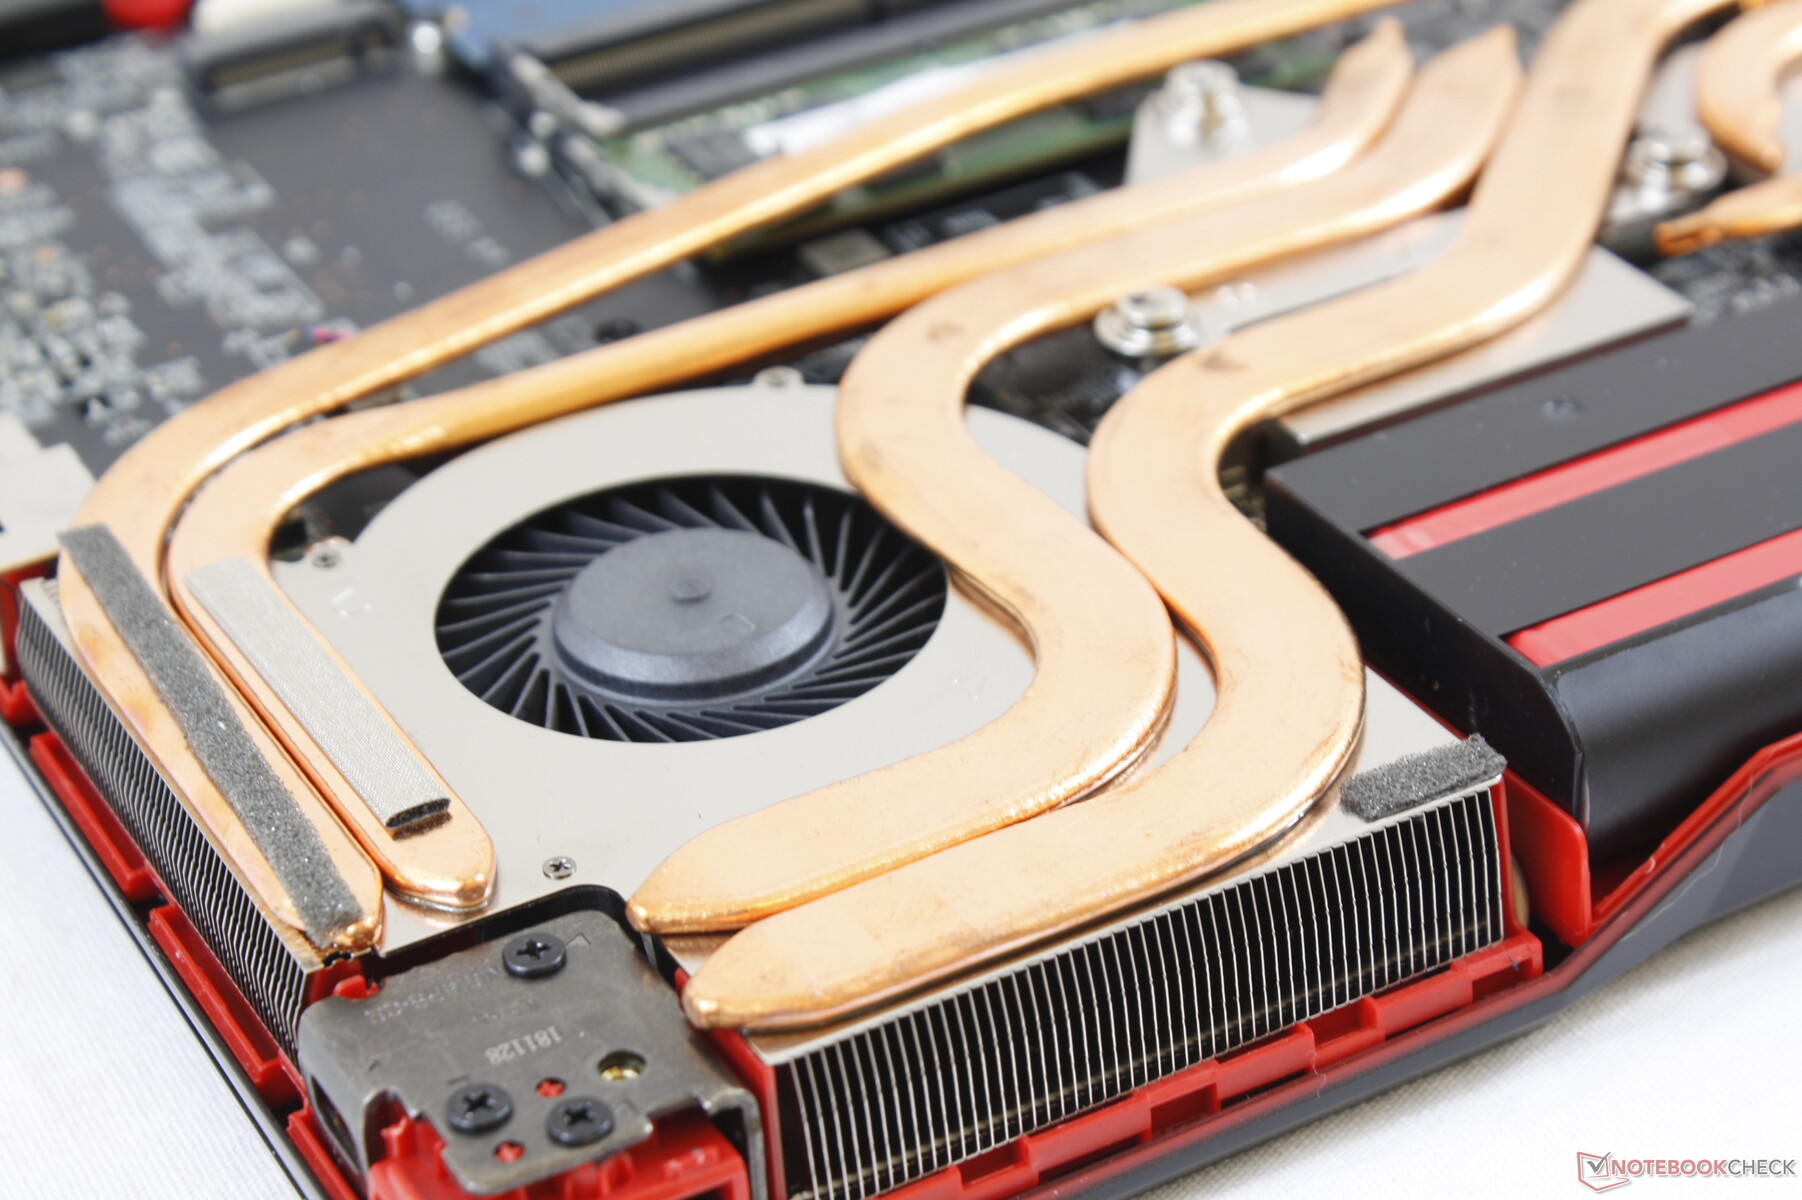
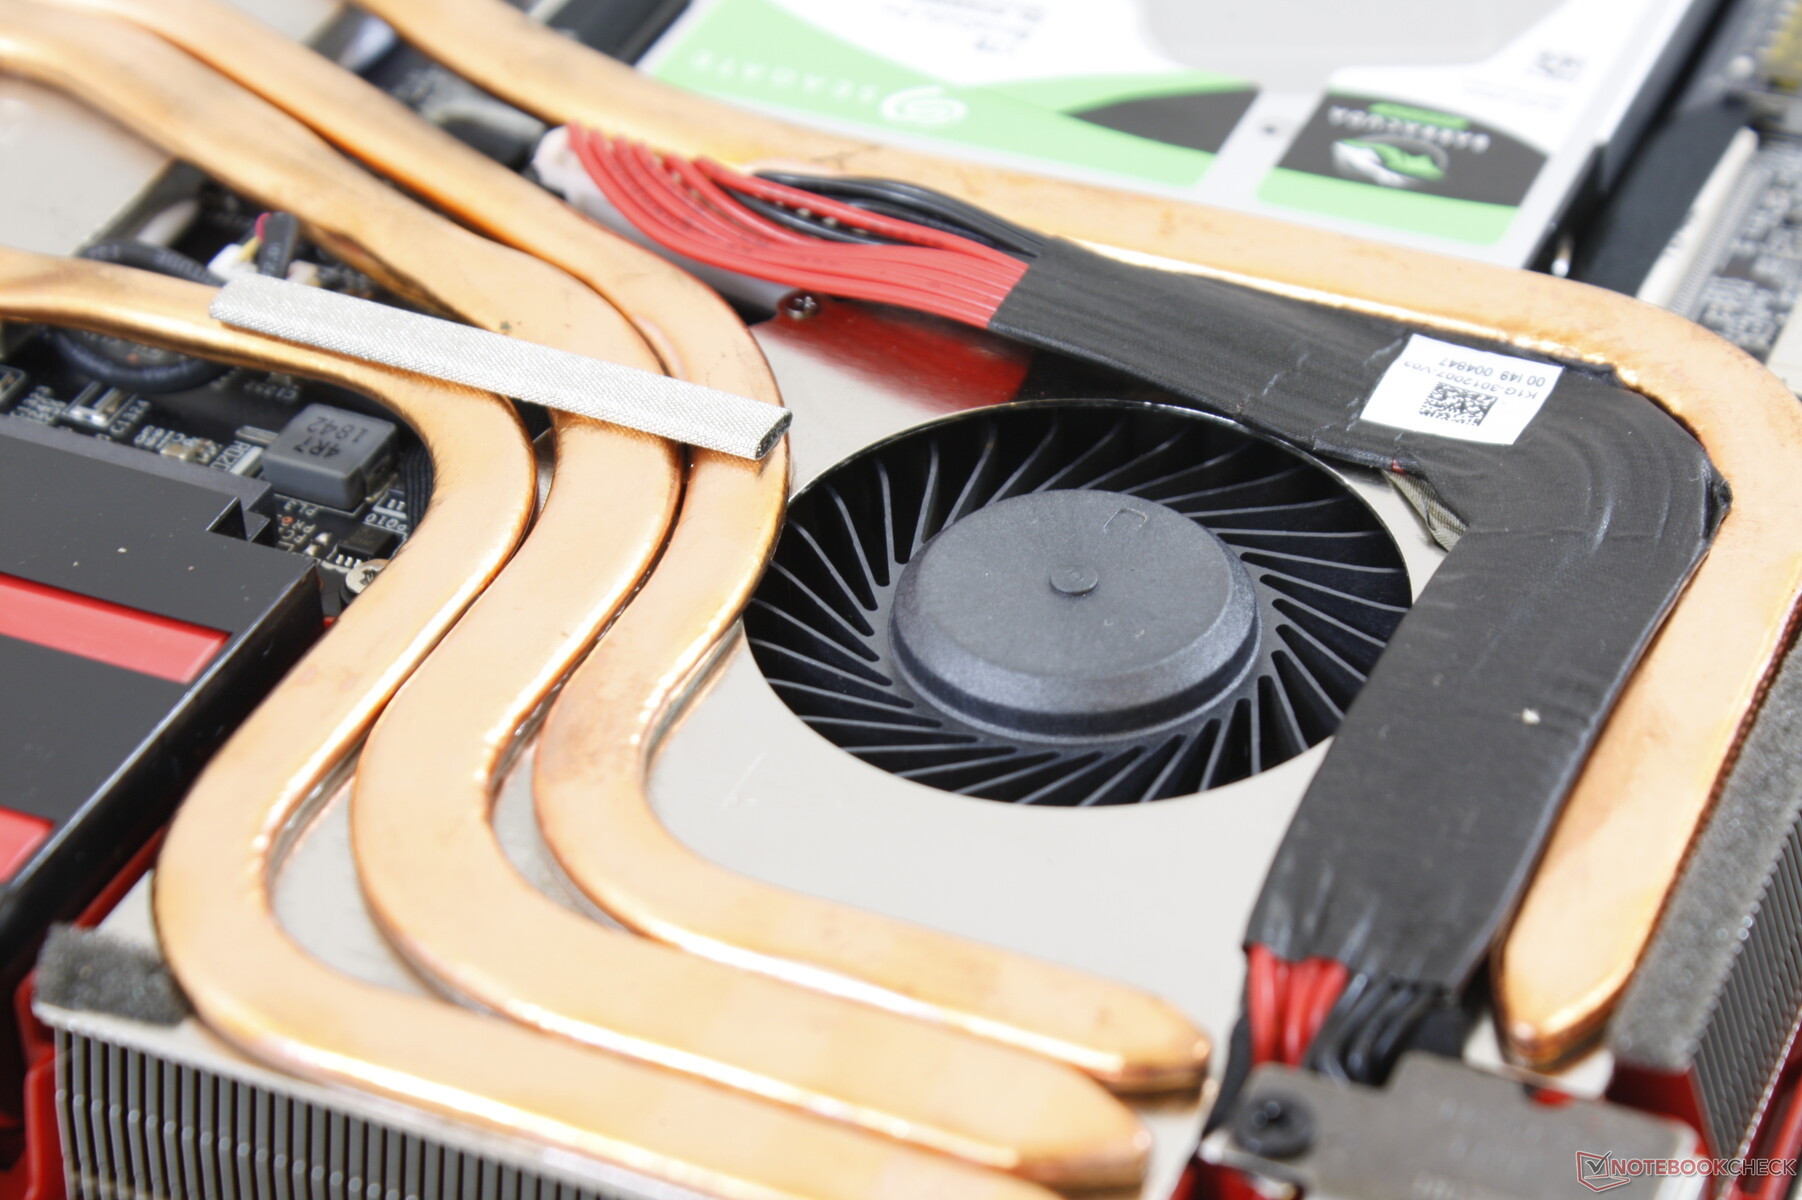
The cooling solution consists of two identical fans and eight copper heat pipes. Fan noise and behavior are not unlike what we recorded on the older GE63 8RF with GTX 1070 graphics. When idling on desktop, the fans will almost always be active at around 33 to 35 dB(A) against a background of 28.5 dB(A). Thus, expect a low level of fan noise to always be present when web browsing or word processing even when set to the Power Saver profile. Some other gaming laptops like the Lenovo Legion Y740 or Razer Blade 15 are able to remain silent during these same conditions.
When gaming, fan noise becomes steady at about 56 dB(A) to be close to what we recorded on the GE63 8RF. This means that fan noise is not any louder despite the much more powerful RTX 2080 GPU. Unfortunately, 56 dB(A) is significantly louder than most other gaming laptop with the RTX 2070 or RTX 2080. The larger Asus ROG G703, for example, tops out at 50 dB(A) when under the same gaming conditions.
Enabling Cooler Boost mode will lift the fan noise ceiling to 57.2 dB(A). Keep in mind that this feature will reduce core temperatures more so than actually improving performance.
We're not able to notice any coil whine or electronic noise from our test unit.
| MSI GE63 Raider 8SG GeForce RTX 2080 Mobile, i7-8750H, WDC PC SN520 SDAPNUW-512G | MSI GL65 9SEK GeForce RTX 2060 Mobile, i7-9750H, WDC PC SN520 SDAPNUW-512G | Lenovo Legion Y740-15ICHg GeForce RTX 2070 Max-Q, i7-9750H, WDC PC SN520 SDAPMUW-128G | Dell G7 7590 GeForce RTX 2060 Mobile, i7-9750H, Toshiba BG3 KBG30ZMS256G | MSI GT63 Titan 8RG-046 GeForce GTX 1080 Mobile, i7-8750H, CUK Cyclone 500GB M.2 NVMe | MSI GE63 Raider RGB 8RF-008 GeForce GTX 1070 Mobile, i7-8750H, Samsung SSD PM871a MZNLN256HMHQ | |
|---|---|---|---|---|---|---|
| Noise | 0% | 8% | 6% | 8% | -0% | |
| off / environment * (dB) | 28.5 | 28.1 1% | 30 -5% | 28.4 -0% | 28 2% | 30 -5% |
| Idle Minimum * (dB) | 33.9 | 31.4 7% | 31.3 8% | 29.5 13% | 31.4 7% | 30 12% |
| Idle Average * (dB) | 33.9 | 31.5 7% | 31.3 8% | 29.6 13% | 31.4 7% | 35 -3% |
| Idle Maximum * (dB) | 34.3 | 33.5 2% | 31.3 9% | 29.6 14% | 32.2 6% | 36 -5% |
| Load Average * (dB) | 39.5 | 49.3 -25% | 42 -6% | 45 -14% | 35.5 10% | 42 -6% |
| Witcher 3 ultra * (dB) | 56.2 | 51.3 9% | 42.1 25% | 51.5 8% | 47.6 15% | 54 4% |
| Load Maximum * (dB) | 57.2 | 58 -1% | 46.5 19% | 53 7% | 50.8 11% | 56 2% |
* ... smaller is better
Noise level
| Idle |
| 33.9 / 33.9 / 34.3 dB(A) |
| Load |
| 39.5 / 57.2 dB(A) |
 | ||
30 dB silent 40 dB(A) audible 50 dB(A) loud |
||
min: | ||
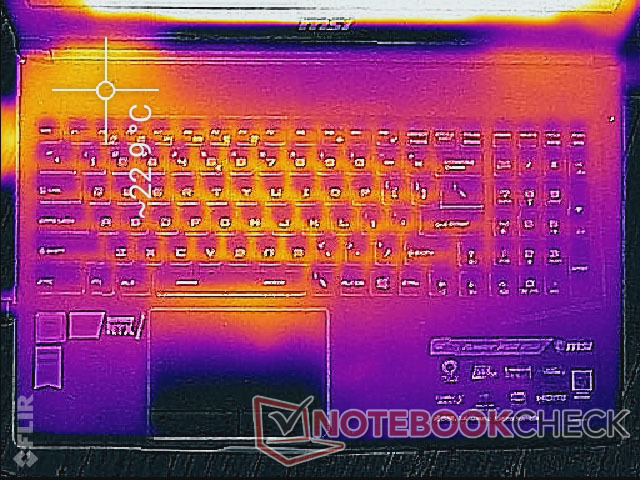
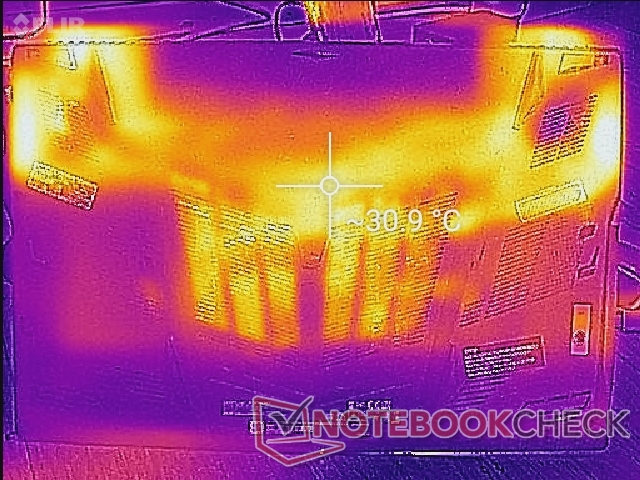
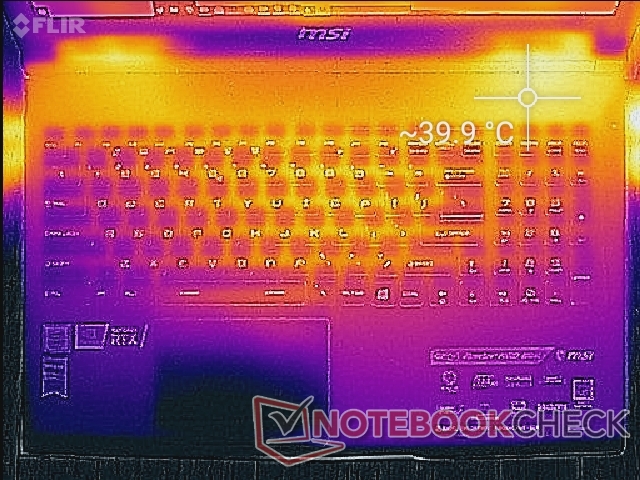
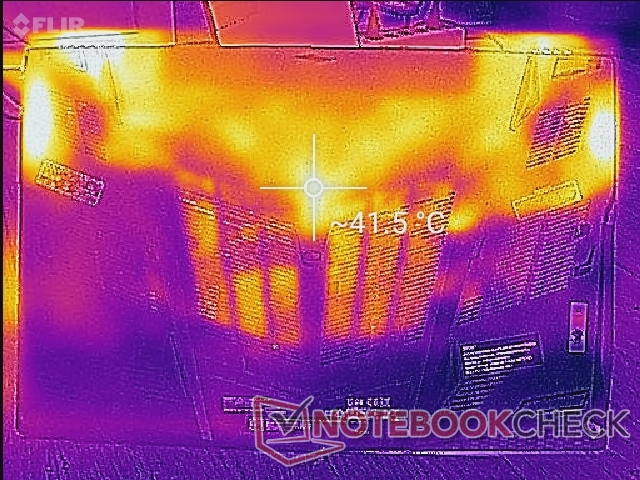
Temperature
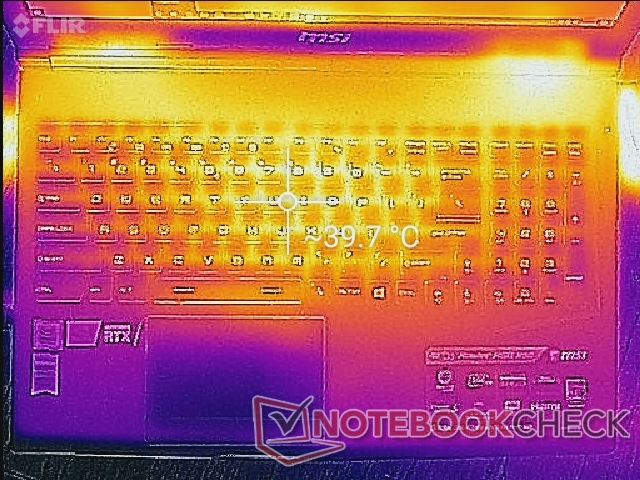
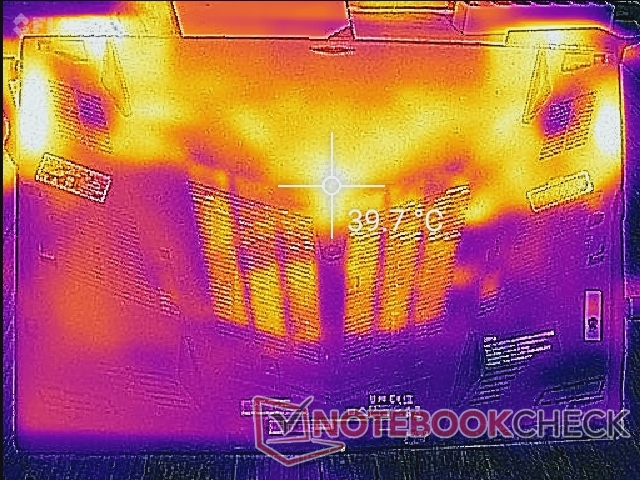
Surface temperatures are generally flat when idling on desktop. When gaming or under high loads, hot spots can become as warm as 40 C on both the center of the keyboard and center of the underside as shown by the temperature maps below. The thinner MSI GS65 with the RTX 2080 Max-Q can be even warmer at almost 45 C or 58 C on the keyboard center and underside, respectively. Surfaces never become uncomfortably warm on the GE63 no matter the load.
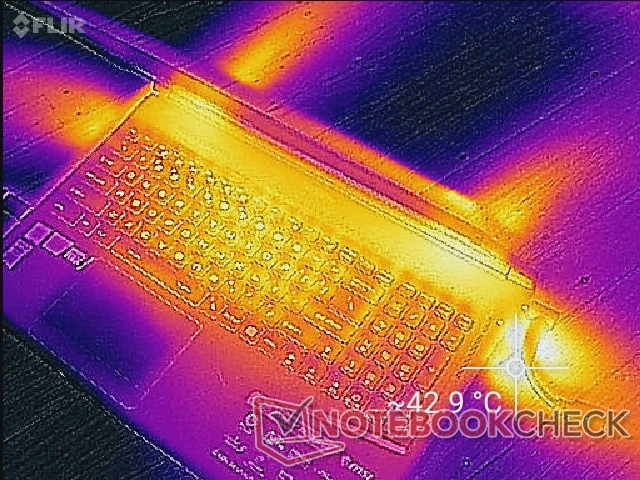
(+) The maximum temperature on the upper side is 39.8 °C / 104 F, compared to the average of 40.4 °C / 105 F, ranging from 21.2 to 68.8 °C for the class Gaming.
(±) The bottom heats up to a maximum of 42.6 °C / 109 F, compared to the average of 43.2 °C / 110 F
(+) In idle usage, the average temperature for the upper side is 20.5 °C / 69 F, compared to the device average of 33.9 °C / 93 F.
(+) Playing The Witcher 3, the average temperature for the upper side is 30.2 °C / 86 F, compared to the device average of 33.9 °C / 93 F.
(+) The palmrests and touchpad are cooler than skin temperature with a maximum of 27.4 °C / 81.3 F and are therefore cool to the touch.
(±) The average temperature of the palmrest area of similar devices was 28.8 °C / 83.8 F (+1.4 °C / 2.5 F).
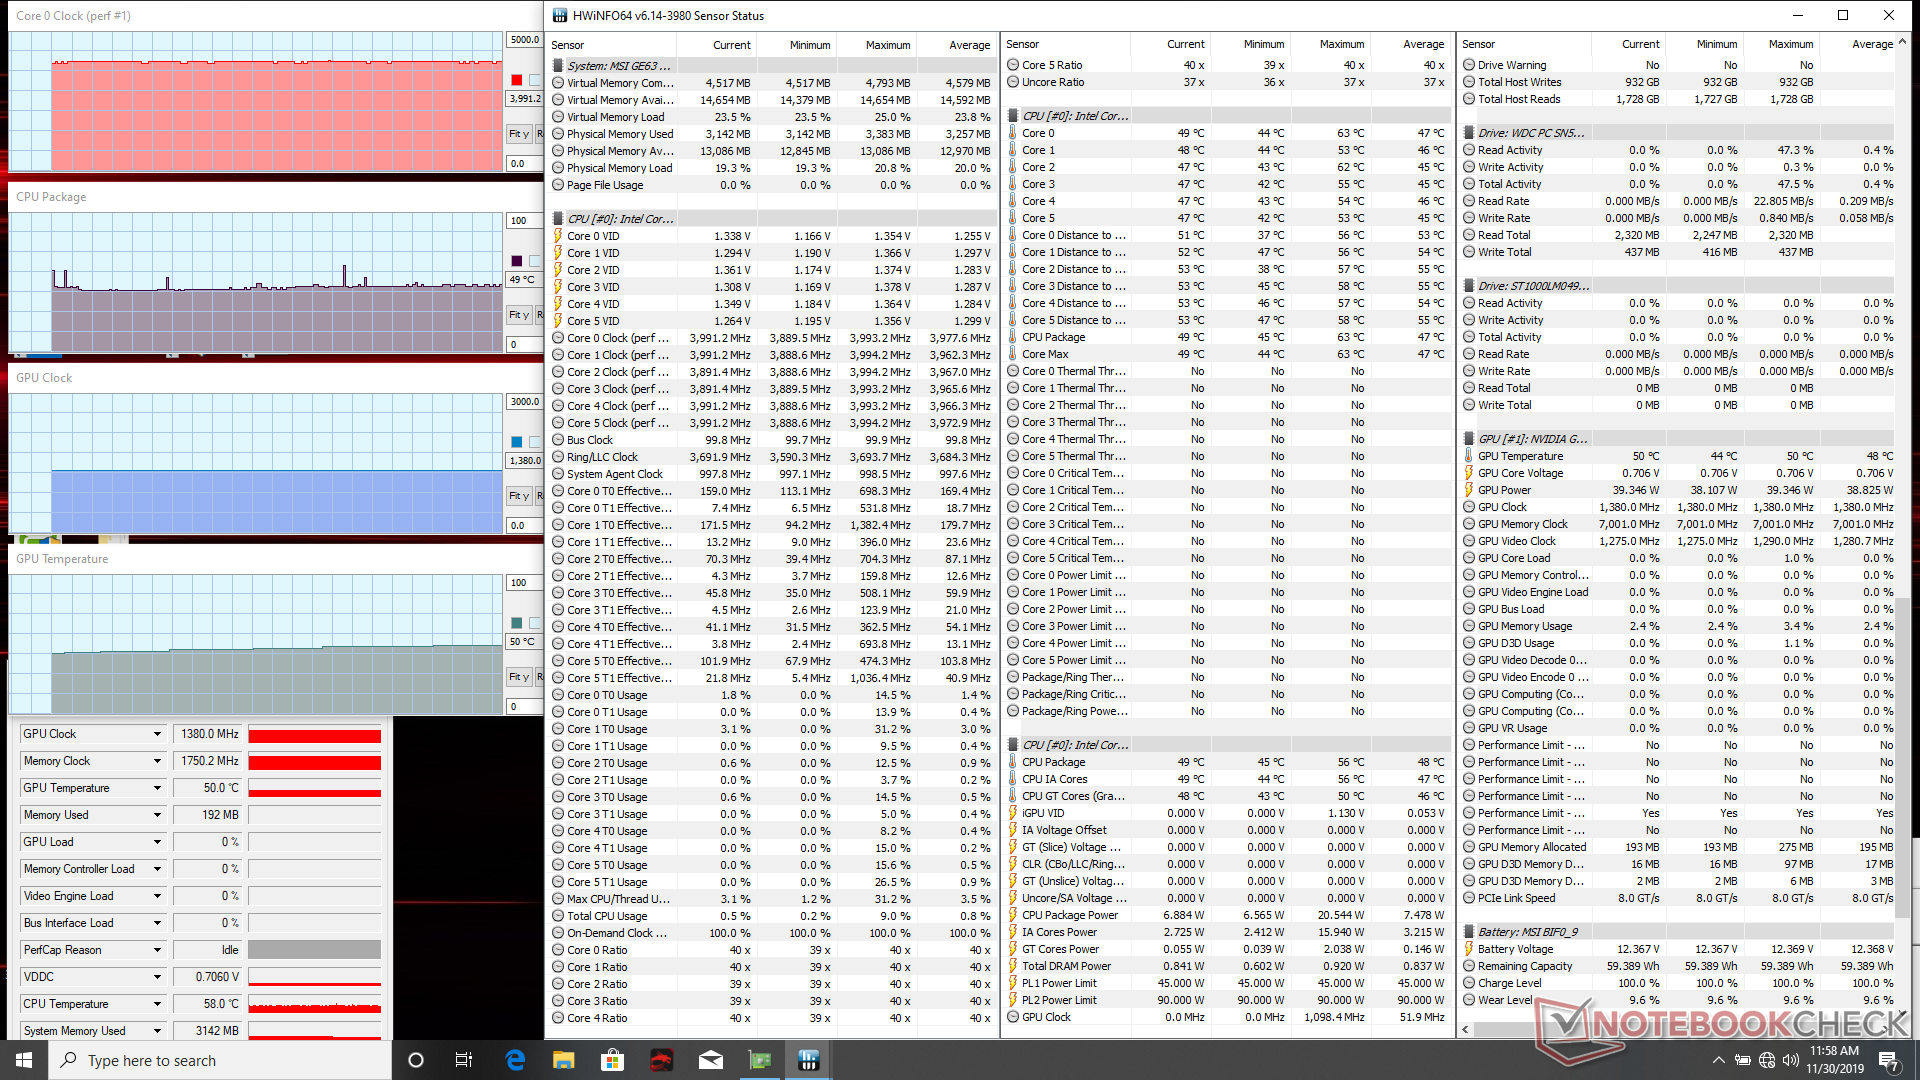
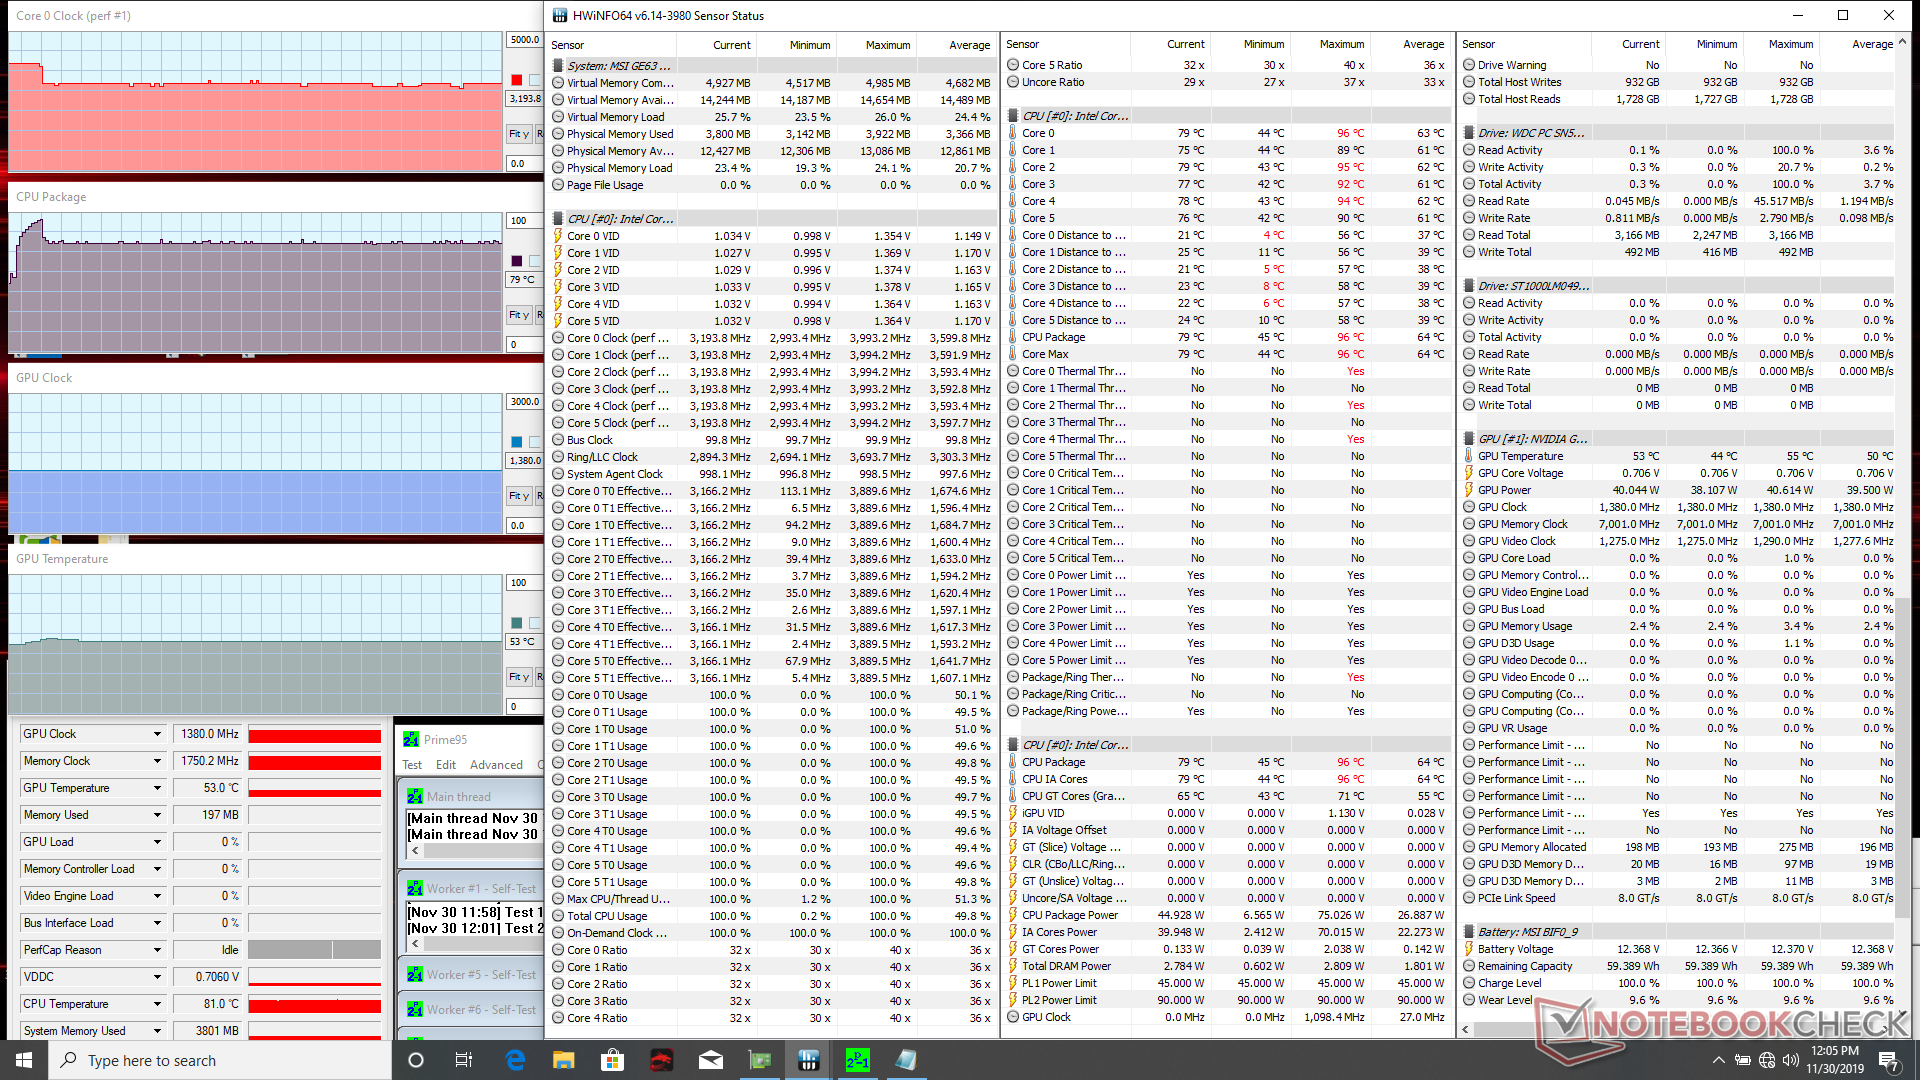
Stress Test
We stress the system with synthetic loads to identify for any potential throttling or stability issues. When running Prime95, the CPU can be observed running at 4 GHz for about 20 seconds before hitting a core temperature of 96 C. Thereafter, clock rate drops to just 3.1 to 3.2 GHz in order to maintain a cooler core temperature of 79 C. In comparison, the Asus Zephyrus S GX531 with the same CPU will stabilize at a higher clock rate of 3.4 GHz but at slightly higher clock rates and core temperatures of 3.3 to 3.4 GHz and 81 C, respectively.
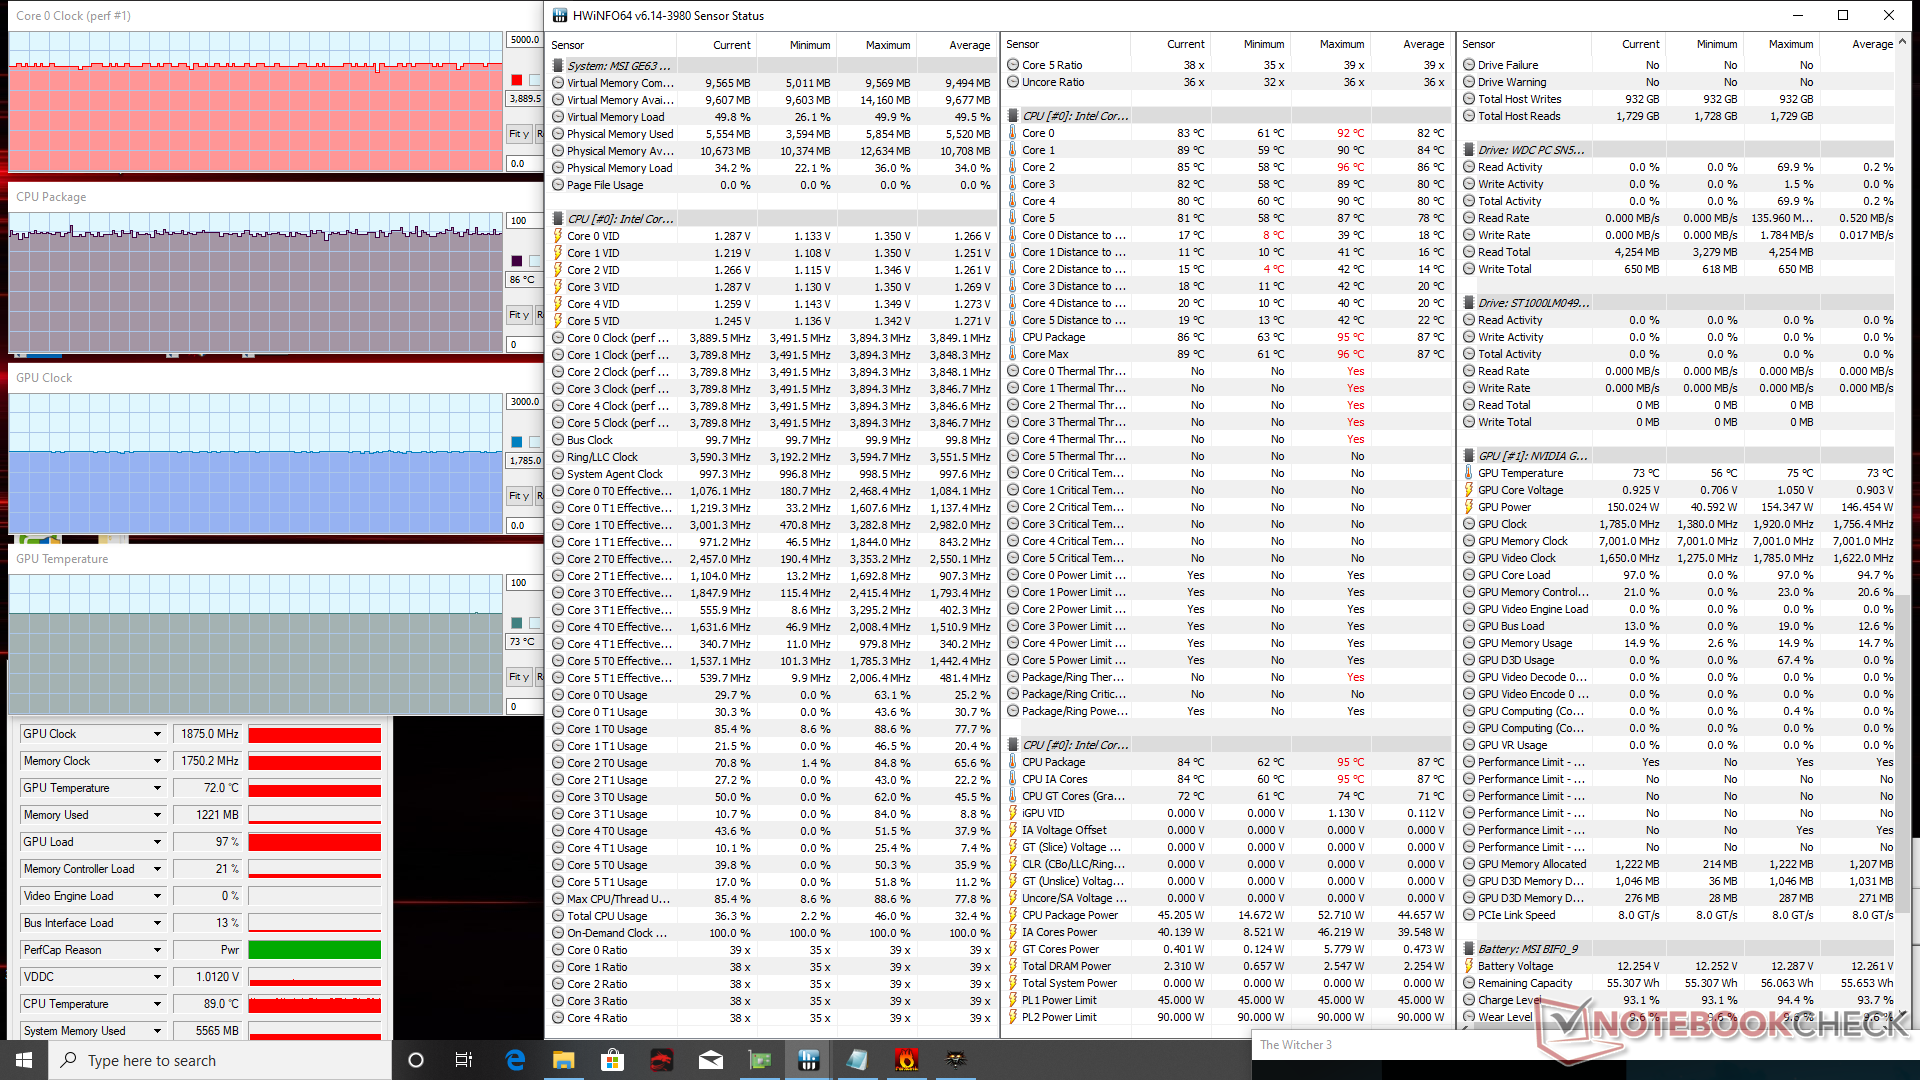
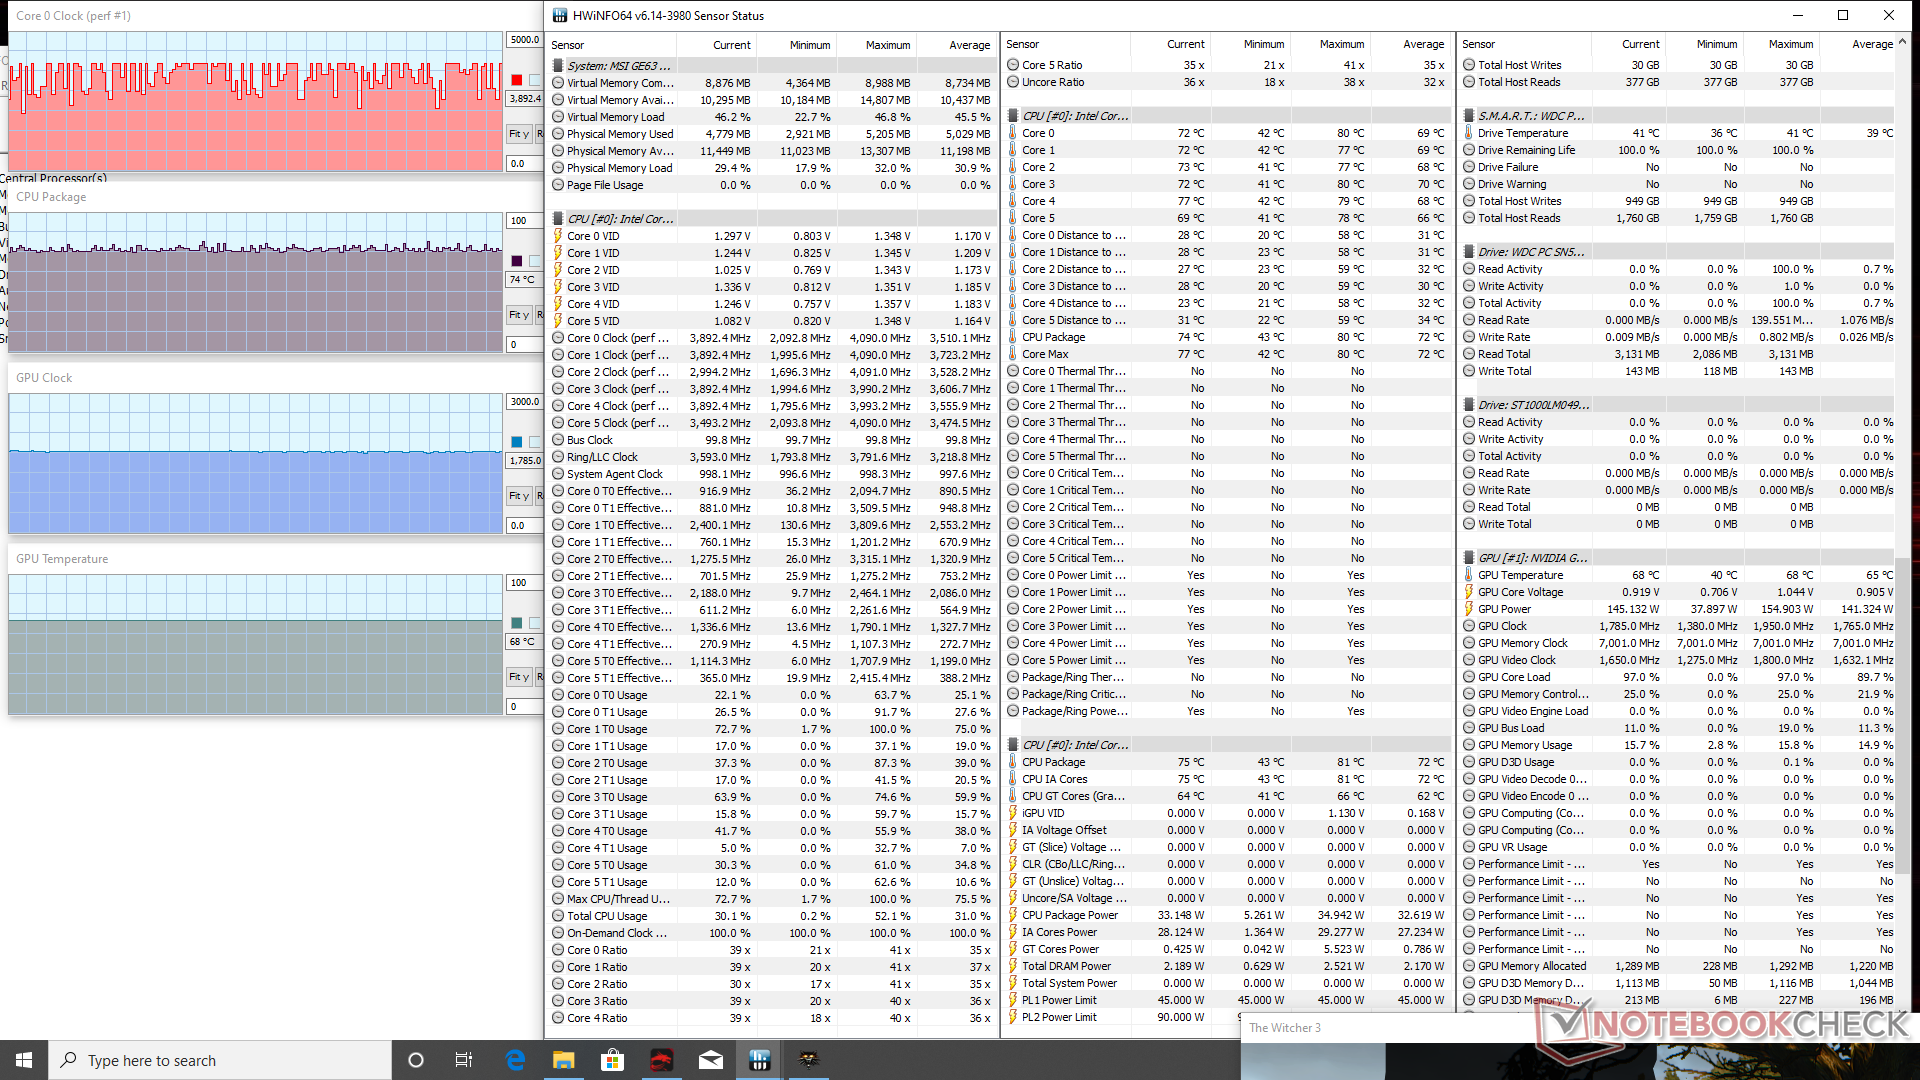
Running Witcher 3 is more representative of real-world gaming conditions. The CPU and GPU will stabilize at 86 C and 73 C, respectively, when under such conditions. Enabling Cooler Boost or maximum fan mode will reduce the CPU and GPU temperatures to 74 C and 68 C, respectively, without affecting core clock rates.
Running on battery power will impact performance. A 3DMark Fire Strike run on batteries returns Physics and Graphics scores of only 9026 and 6871 points, respectively, compared to 14555 and 25432 points when on mains. The "Sport" power profile is automatically disabled when on battery power.
| CPU Clock (GHz) | GPU Clock (MHz) | Average CPU Temperature (°C) | Average GPU Temperature (°C) | |
| System Idle | -- | -- | 49 | 50 |
| Prime95 Stress | 3.1 - 3.2 | -- | 79 | 53 |
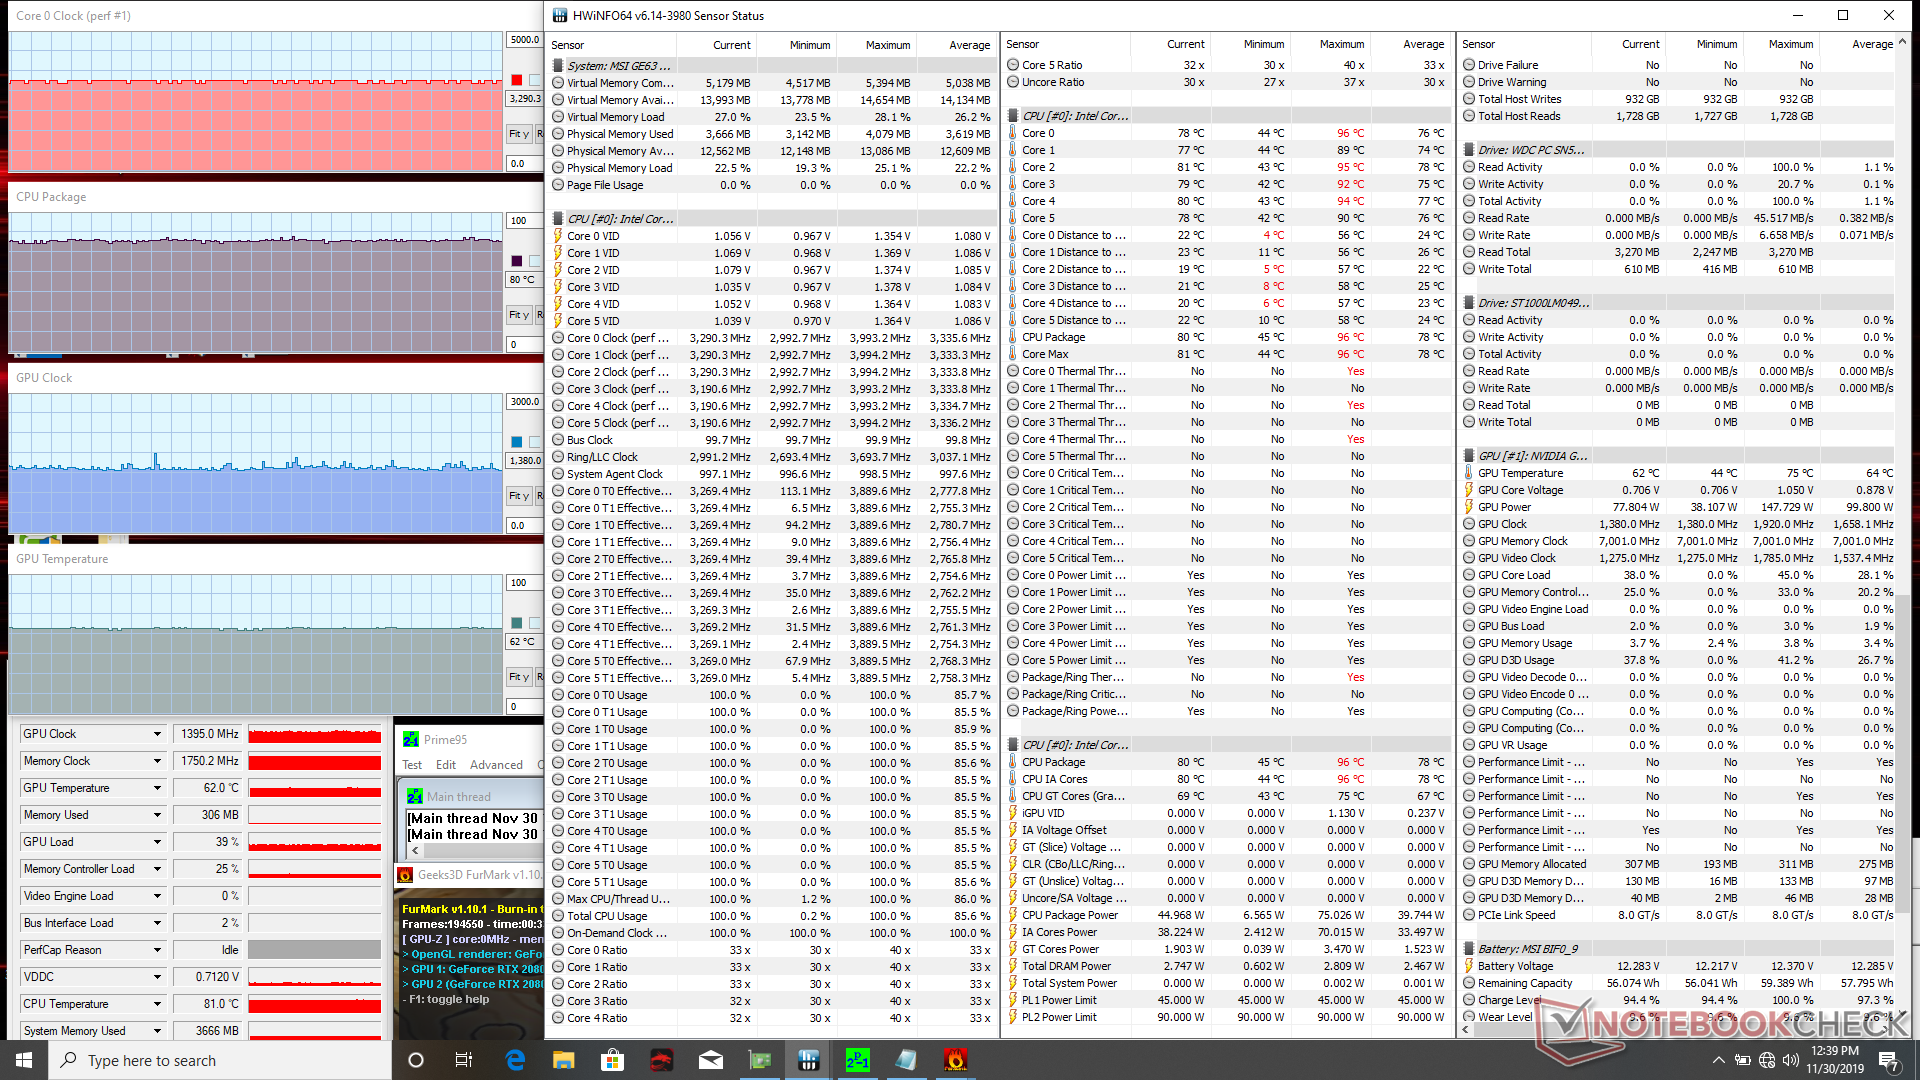
| Prime95 + FurMark Stress | 3.2 - 3.3 | 1395 | 80 | 62 |
| Witcher 3 Stress | 3.8 - 3.9 | 1785 | ~86 | 73 |
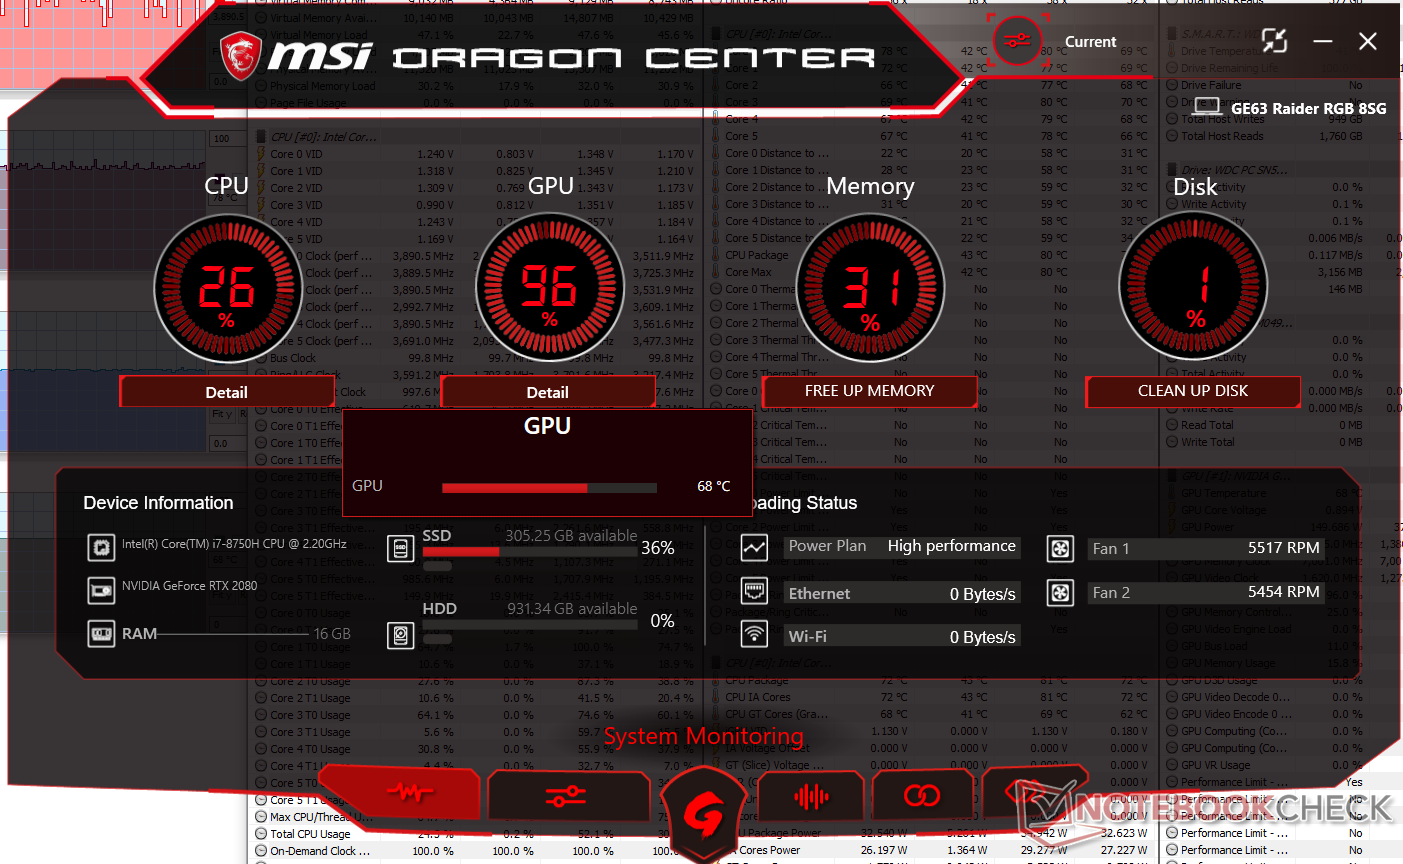
| Witcher 3 Stress (Cooler Boost on) | 3.8 - 3.9 | 1785 | ~74 | 68 |
Speakers
MSI went all in with the audio experience and it really shows. There are two subwoofers inside compared to zero on most other gaming laptops for a total of four 3 W speakers. Maximum volume is much louder than on most other laptops as a result and audio quality is excellent for a laptop. The palm rests will vibrate to the touch, but there is thankfully no rattling or static.
")

MSI GE63 Raider 8SG audio analysis
(+) | speakers can play relatively loud (93.1 dB)
Bass 100 - 315 Hz
(±) | reduced bass - on average 8% lower than median
(±) | linearity of bass is average (7.4% delta to prev. frequency)
Mids 400 - 2000 Hz
(+) | balanced mids - only 2.4% away from median
(+) | mids are linear (4.7% delta to prev. frequency)
Highs 2 - 16 kHz
(+) | balanced highs - only 3.1% away from median
(+) | highs are linear (5.5% delta to prev. frequency)
Overall 100 - 16.000 Hz
(+) | overall sound is linear (11.3% difference to median)
Compared to same class
» 8% of all tested devices in this class were better, 4% similar, 88% worse
» The best had a delta of 6%, average was 18%, worst was 132%
Compared to all devices tested
» 7% of all tested devices were better, 2% similar, 91% worse
» The best had a delta of 4%, average was 23%, worst was 134%
Apple MacBook 12 (Early 2016) 1.1 GHz audio analysis
(+) | speakers can play relatively loud (83.6 dB)
Bass 100 - 315 Hz
(±) | reduced bass - on average 11.3% lower than median
(±) | linearity of bass is average (14.2% delta to prev. frequency)
Mids 400 - 2000 Hz
(+) | balanced mids - only 2.4% away from median
(+) | mids are linear (5.5% delta to prev. frequency)
Highs 2 - 16 kHz
(+) | balanced highs - only 2% away from median
(+) | highs are linear (4.5% delta to prev. frequency)
Overall 100 - 16.000 Hz
(+) | overall sound is linear (10.2% difference to median)
Compared to same class
» 7% of all tested devices in this class were better, 2% similar, 90% worse
» The best had a delta of 5%, average was 18%, worst was 53%
Compared to all devices tested
» 5% of all tested devices were better, 1% similar, 94% worse
» The best had a delta of 4%, average was 23%, worst was 134%
Energy Management
Power Consumption
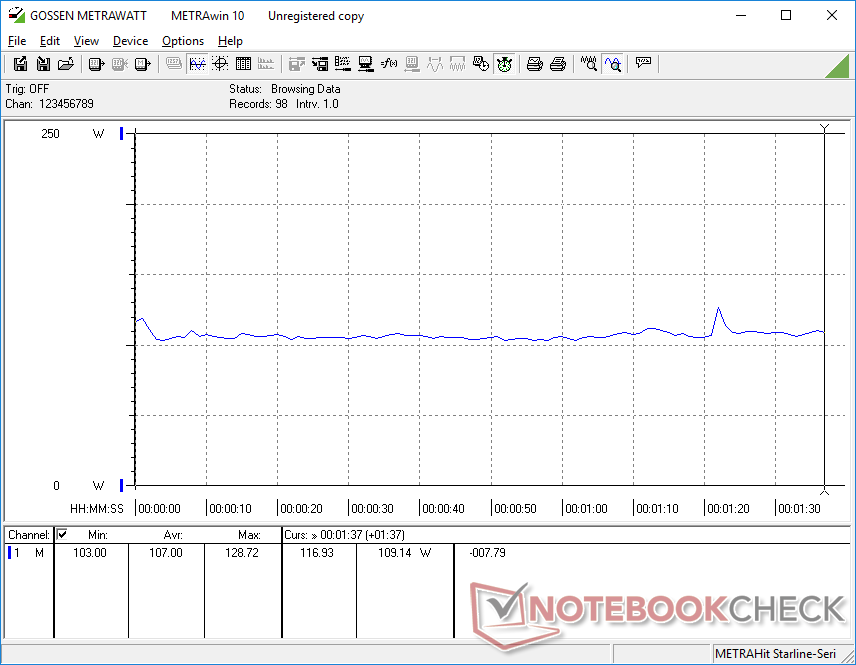
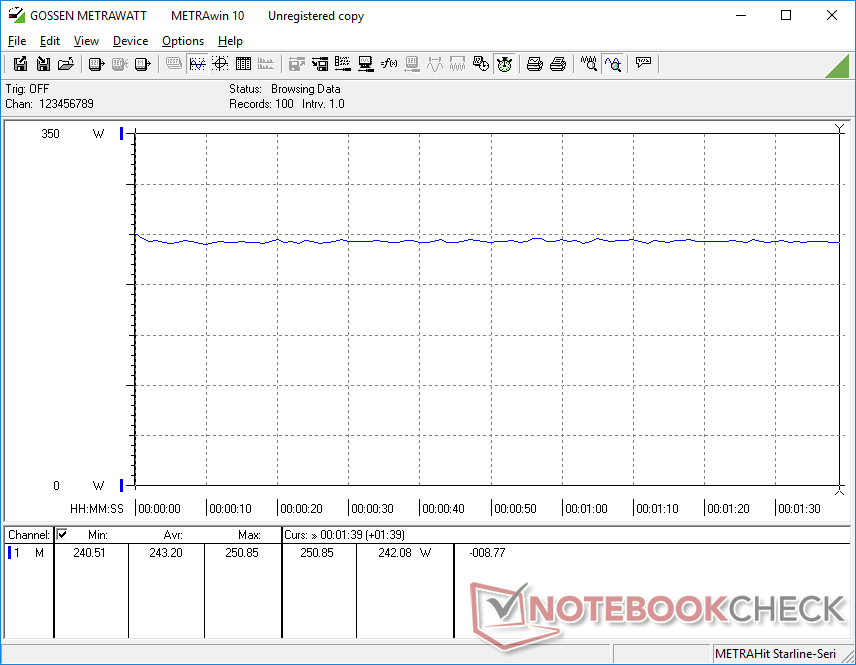
Idling on desktop can demand as much as 70 W when set to the High performance profile compared to less than half that on other gaming laptops. Thus, we recommend setting the system to Balanced mode or activating the integrated GPU if the extra horsepower is not needed. When gaming, power consumption becomes steady at 243 W to be nearly the same as the MSI GT63 with the slower last generation GTX 1080.
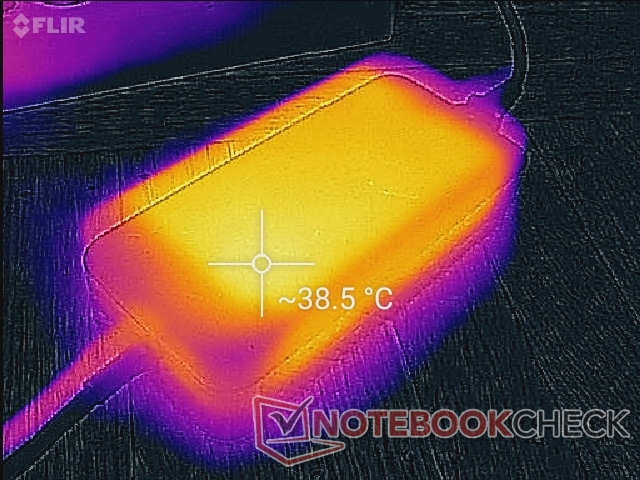
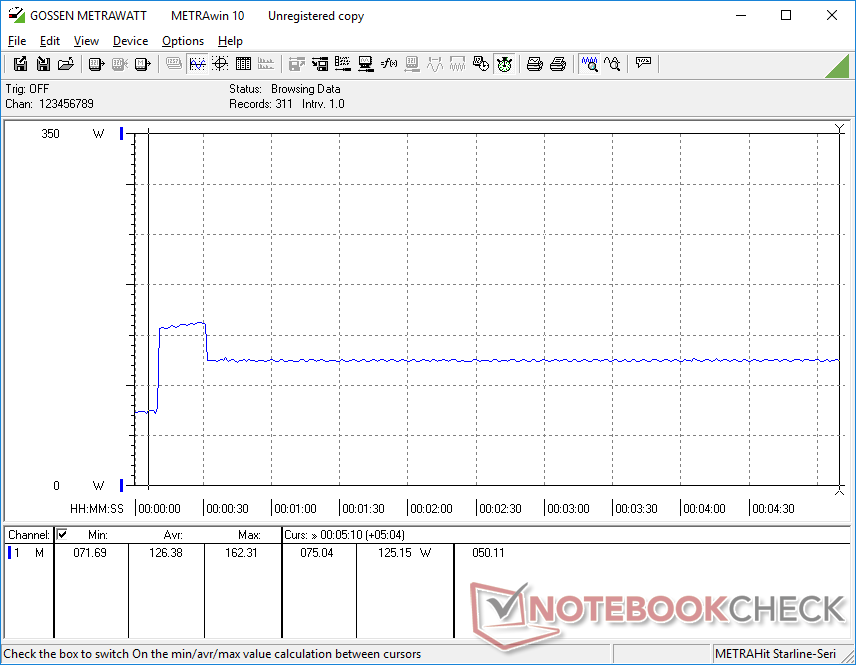
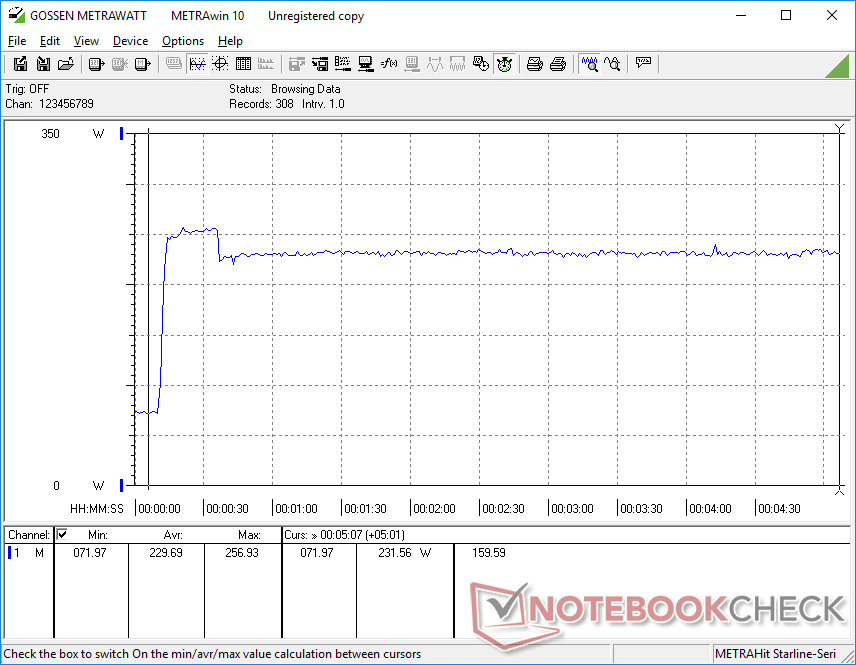
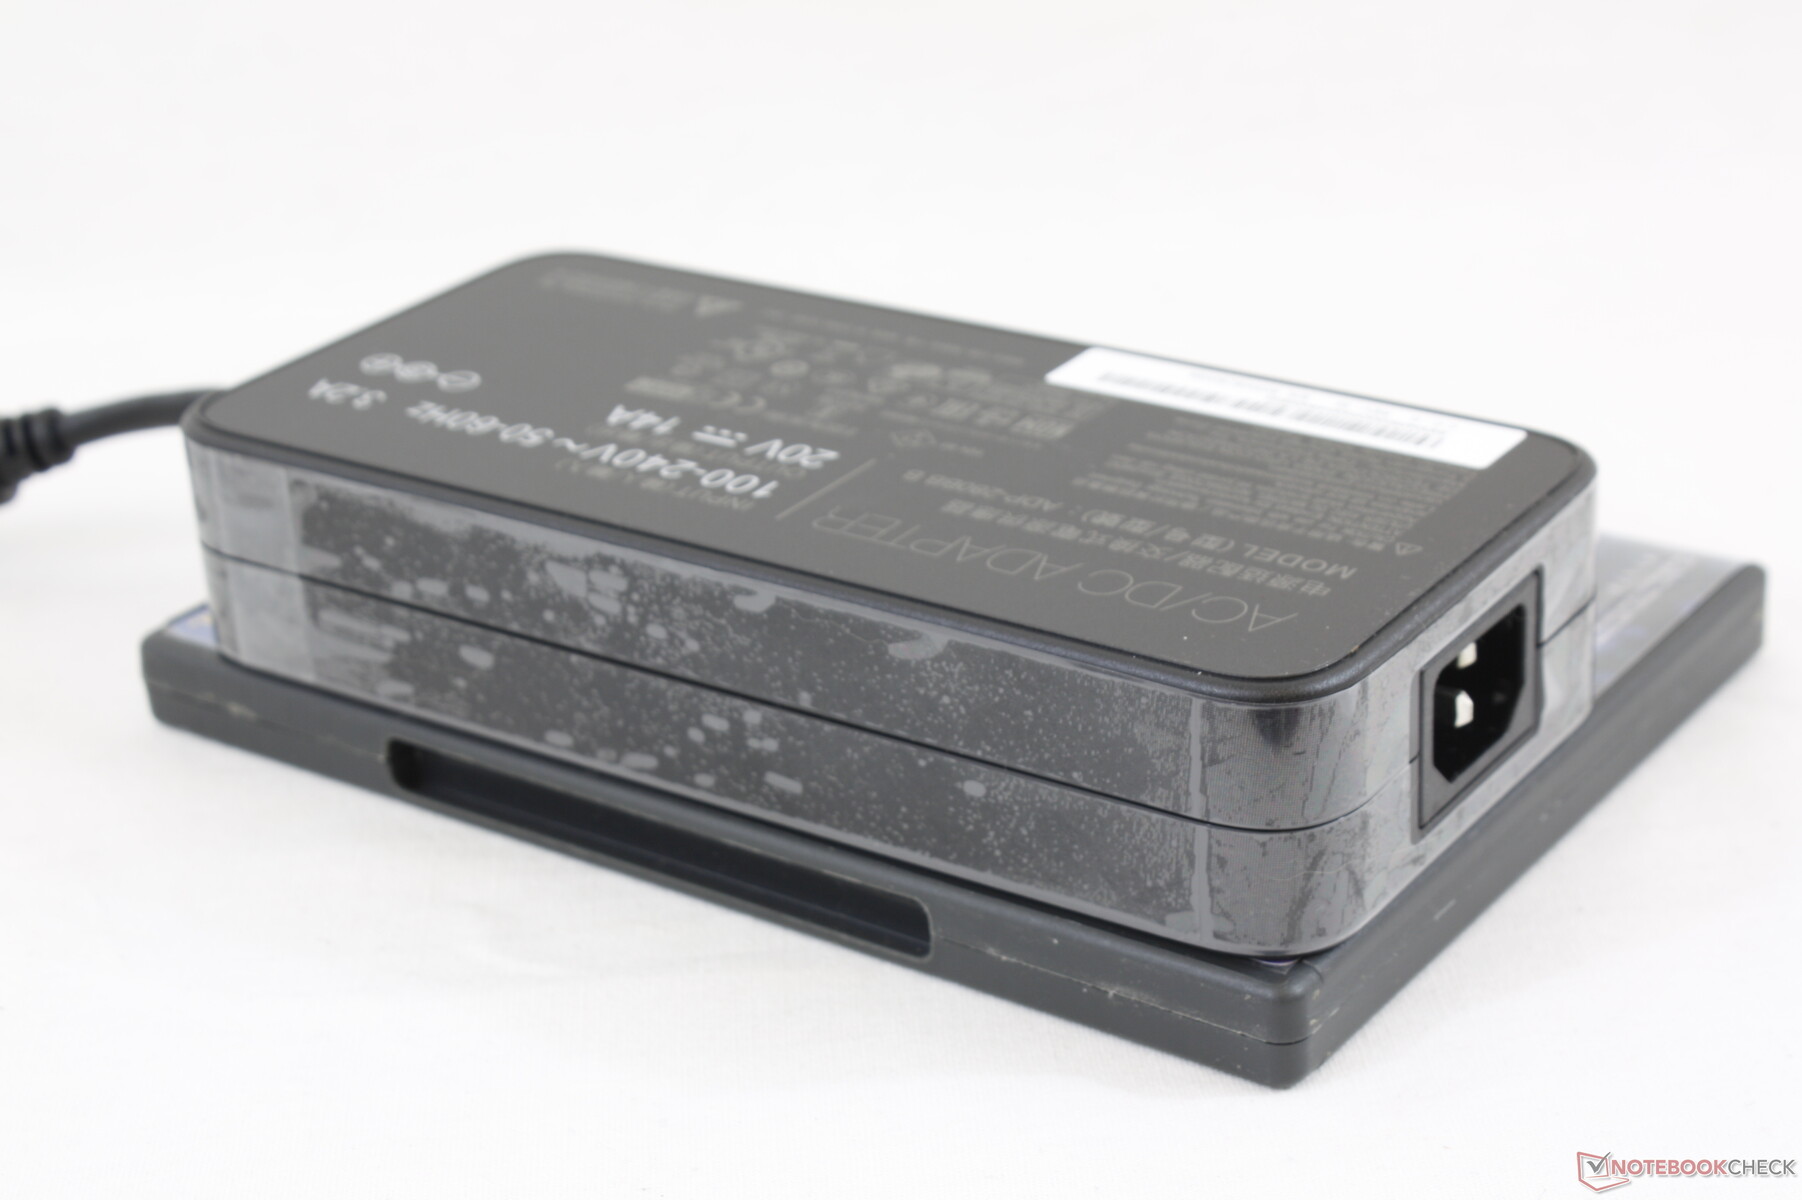
We're able to record a maximum consumption of 257 W when running both Prime95 and FurMark simultaneously from the medium-sized (~18 x 8.5 x 3.5 cm) 280 W AC adapter. This high of a draw eventually falls after about 20 seconds to be similar to our clock rate observations during the Prime95 stress test above.
| Off / Standby | |
| Idle | |
| Load |
|
Key:
min: | |
| MSI GE63 Raider 8SG i7-8750H, GeForce RTX 2080 Mobile, WDC PC SN520 SDAPNUW-512G, IPS, 1920x1080, 15.6" | MSI GL65 9SEK i7-9750H, GeForce RTX 2060 Mobile, WDC PC SN520 SDAPNUW-512G, IPS, 1920x1080, 15.6" | Lenovo Legion Y740-15ICHg i7-9750H, GeForce RTX 2070 Max-Q, WDC PC SN520 SDAPMUW-128G, IPS, 1920x1080, 15.6" | MSI GT63 Titan 8RG-046 i7-8750H, GeForce GTX 1080 Mobile, CUK Cyclone 500GB M.2 NVMe, TN, 1920x1080, 15.6" | Asus Strix Scar III G531GW-AZ062T i7-9750H, GeForce RTX 2070 Mobile, Intel SSD 660p SSDPEKNW512G8, IPS, 1920x1080, 15.6" | MSI GE63 Raider RGB 8RF-008 i7-8750H, GeForce GTX 1070 Mobile, Samsung SSD PM871a MZNLN256HMHQ, TN, 1920x1080, 15.6" | |
|---|---|---|---|---|---|---|
| Power Consumption | -26% | 14% | -3% | 31% | 34% | |
| Idle Minimum * (Watt) | 16 | 41 -156% | 22.2 -39% | 26.4 -65% | 11.4 29% | 9 44% |
| Idle Average * (Watt) | 22.8 | 45.3 -99% | 24.9 -9% | 30 -32% | 13.5 41% | 14 39% |
| Idle Maximum * (Watt) | 69.4 | 47.1 32% | 30.6 56% | 30.6 56% | 21.6 69% | 19 73% |
| Load Average * (Watt) | 107 | 94.9 11% | 101 6% | 90.4 16% | 106 1% | 91 15% |
| Witcher 3 ultra * (Watt) | 243.2 | 149.4 39% | 143 41% | 255.6 -5% | 186 24% | 182 25% |
| Load Maximum * (Watt) | 256.9 | 214.2 17% | 186 28% | 224.4 13% | 196 24% | 238 7% |
* ... smaller is better
Battery Life
Runtimes are essentially identical to the GL65 and our last GE63 8RF despite the faster RTX 2080 GPU in our GE63 8SG since all these models have the same 51 Wh Li-Ion battery packs. Expect just four hours of real-world WLAN use to be average for a 15.6-inch gaming laptop.
Recharging from empty to full capacty takes just over two hours. The laptop cannot be recharged via USB Type-C unlike on the Asus Zephyrus M GU502.
| MSI GE63 Raider 8SG i7-8750H, GeForce RTX 2080 Mobile, 51 Wh | MSI GL65 9SEK i7-9750H, GeForce RTX 2060 Mobile, 51 Wh | Lenovo Legion Y740-15ICHg i7-9750H, GeForce RTX 2070 Max-Q, 57 Wh | MSI GT63 Titan 8RG-046 i7-8750H, GeForce GTX 1080 Mobile, 75.24 Wh | Asus Strix Scar III G531GW-AZ062T i7-9750H, GeForce RTX 2070 Mobile, 66 Wh | MSI GE63 Raider RGB 8RF-008 i7-8750H, GeForce GTX 1070 Mobile, 51 Wh | |
|---|---|---|---|---|---|---|
| Battery runtime | -3% | -25% | -20% | 40% | -3% | |
| Reader / Idle (h) | 6.2 | 4.4 -29% | 5.7 -8% | |||
| WiFi v1.3 (h) | 4 | 3.8 -5% | 3 -25% | 3.2 -20% | 5.6 40% | 4 0% |
| Load (h) | 0.8 | 1 25% | 0.8 0% |
Pros
Cons
Verdict

Our specific GE63 configuration is a mixed bag. While GPU performance in 3DMark is excellent, both the below average CPU performance and the single-channel RAM are bottlenecks to an otherwise powerful gaming laptop. Frame rates when gaming are lower than expected and so we strongly suggest configuring with dual-channel RAM instead if possible. Attempting to upgrade RAM or storage yourself will require tearing an anti-tamper sticker.
Aside from the key drawbacks mentioned above, the GE63 will likely continue to be one of the better laptop deals you can find with the full-power (i.e., non-Max-Q) GeForce RTX 2080 GPU. This particular chassis design is reaching end-of-life status even though the display, per-key RGB keyboard, and GPU are as good or better than most newer gaming laptops. It's also one of the few 15.6-inch gaming laptops outside of Clevo with three internal storage options to maximize storage capacity.
If you can configure with dual-channel RAM and can deal with the loud fans when gaming, then the MSI GE63 will be a relatively inexpensive roadway to mobile GeForce RTX 2080 graphics. You'll lose out on the sleek narrow bezels and lighter weight offered by newer laptop designs, but the GE63 will not feel more fragile to hold or carry.
MSI GE63 Raider 8SG
- 12/03/2019 v7 (old)
Allen Ngo
Price comparison
