Schenker XMG Fusion 15 in Review: Intel's reference design challenges the competition

(Editor's note: The Schenker XMG Fusion 15 utilizes the same Intel-designed chassis as the Maingear Element and Eluktronics MAG 15. Thus, our comments, measurements, and conclusions on this page also apply to the Maingear and Eluktronics systems.)
Schenker has been making a name for itself for years, producing high-performance laptops mostly for gamers and also for professional users. Before us now we have something created in cooperation with Intel: The XMG Fusion 15. It features a screen size of 15 inches and the powerful i7-9750H with a GTX 1660 Ti or alternatively an RTX 2070 Max-Q.
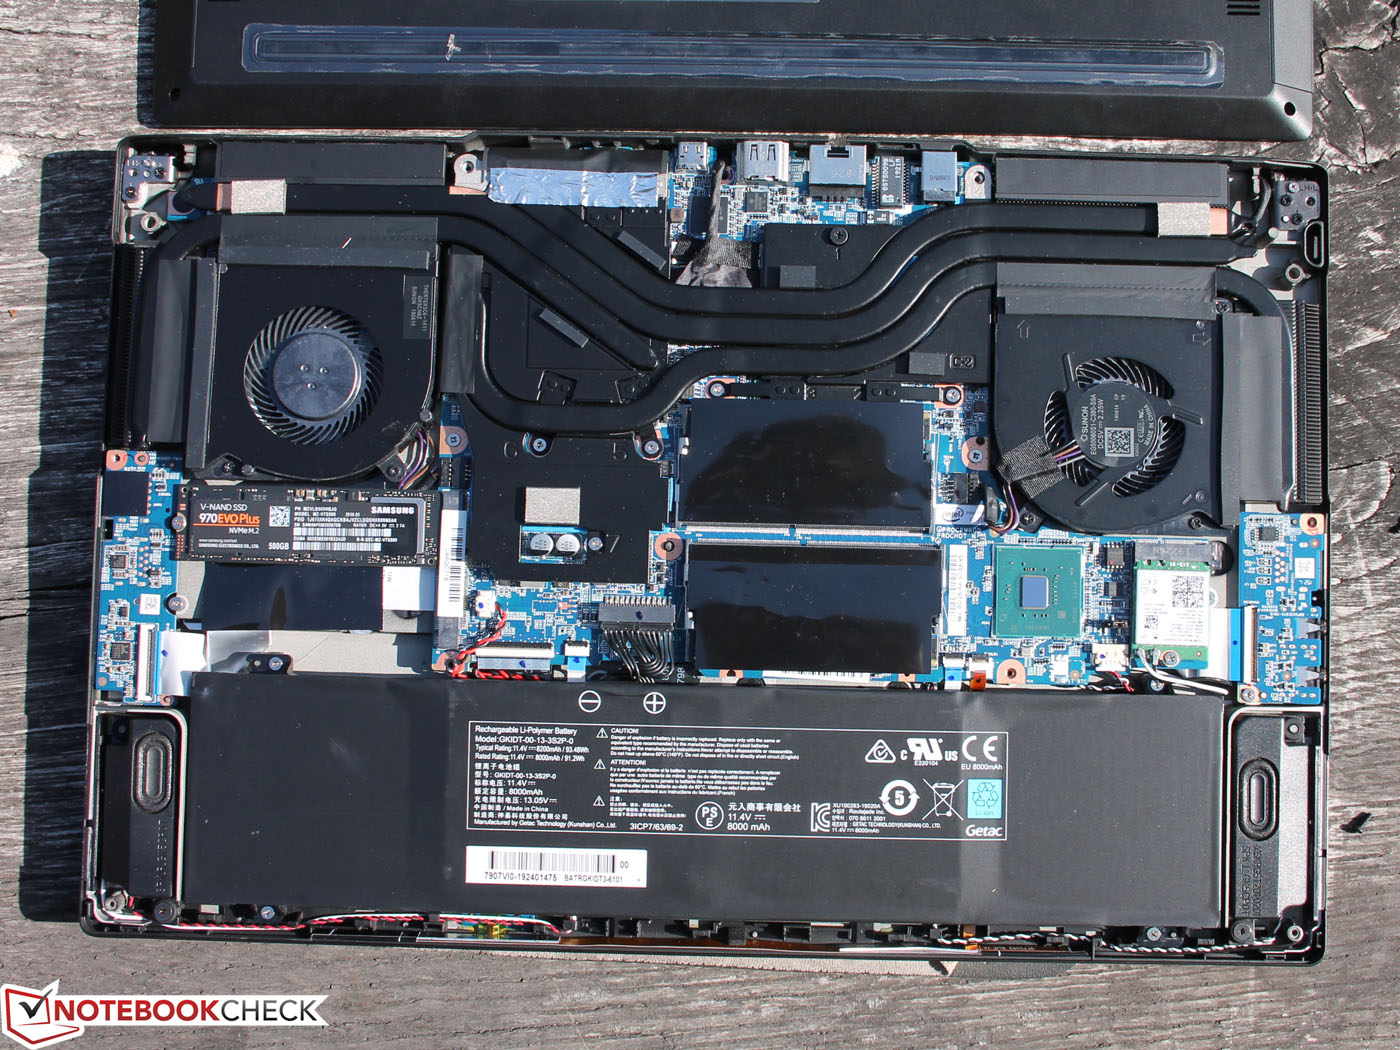
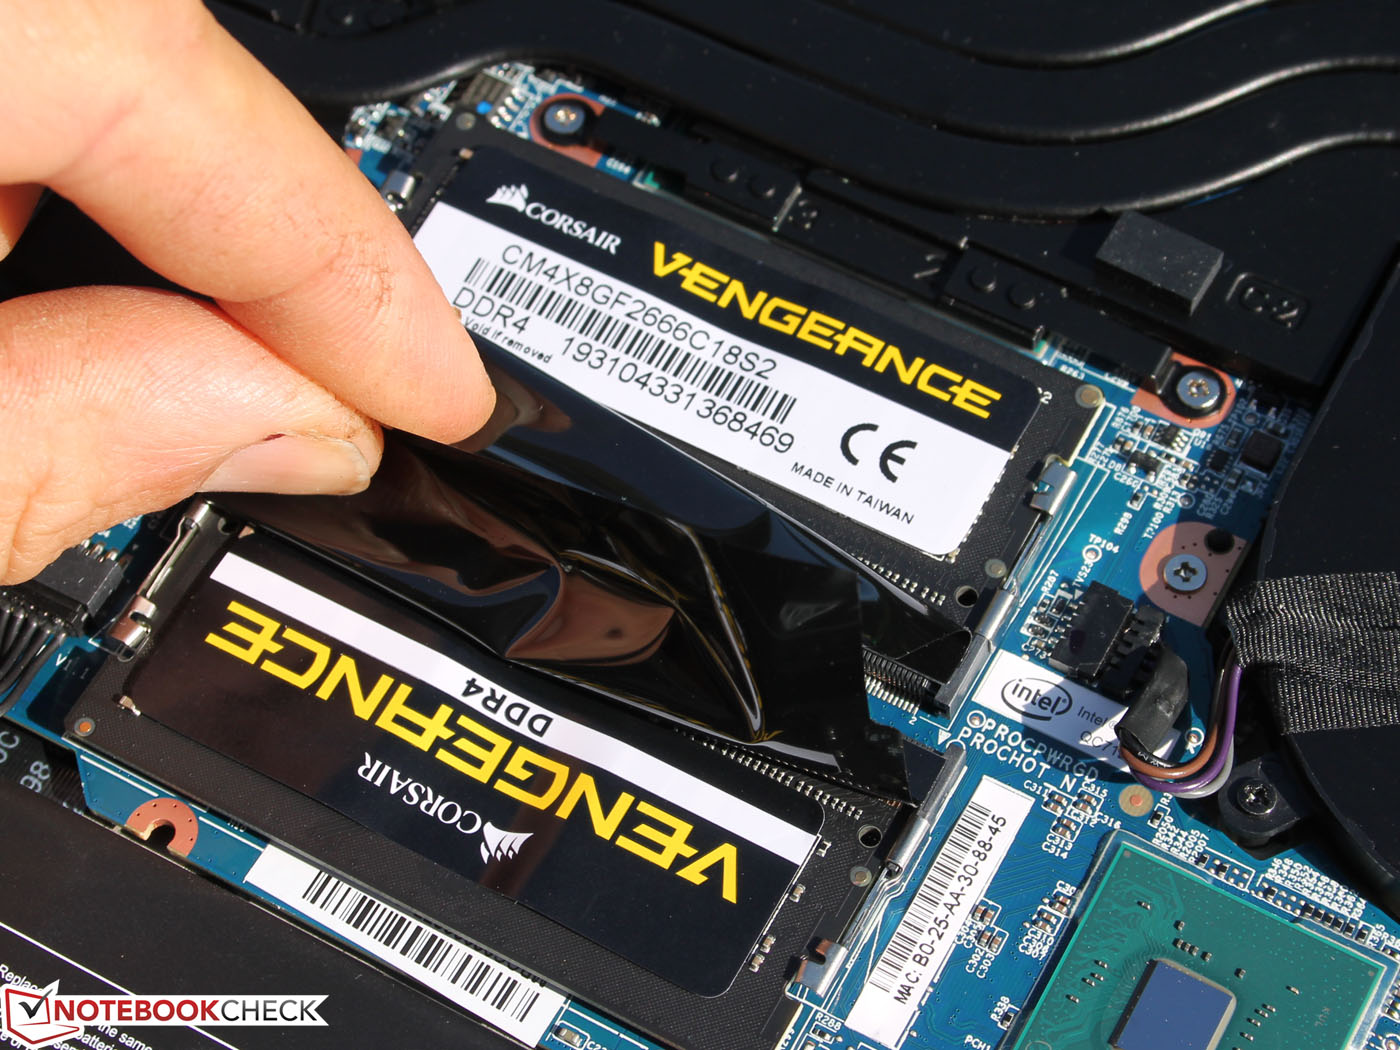
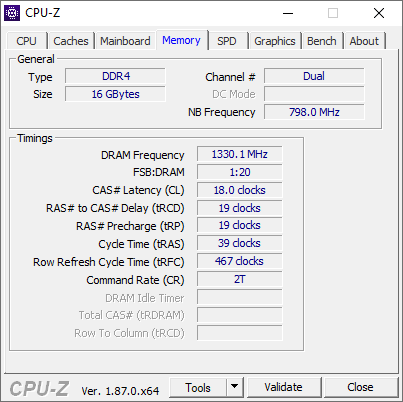
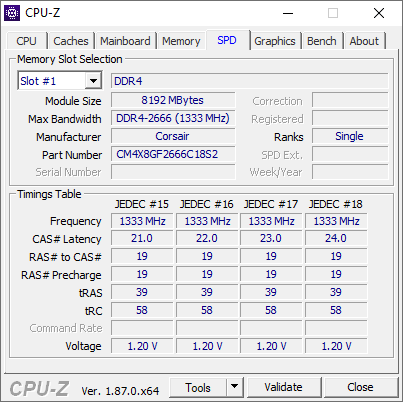
The Fusion 15 is not just made for gamers, but instead also addresses the content creation market. The latter constitutes a growing segment and one that Lenovo, Acer, and Razer are targeting as well. With 93 Wh, the Fusion offers excellent battery life and the high-quality keyboard as well as the abundance of ports should also satisfy users. The memory configuration offers a lot of flexibility thanks to two M.2-2280 and two RAM slots.
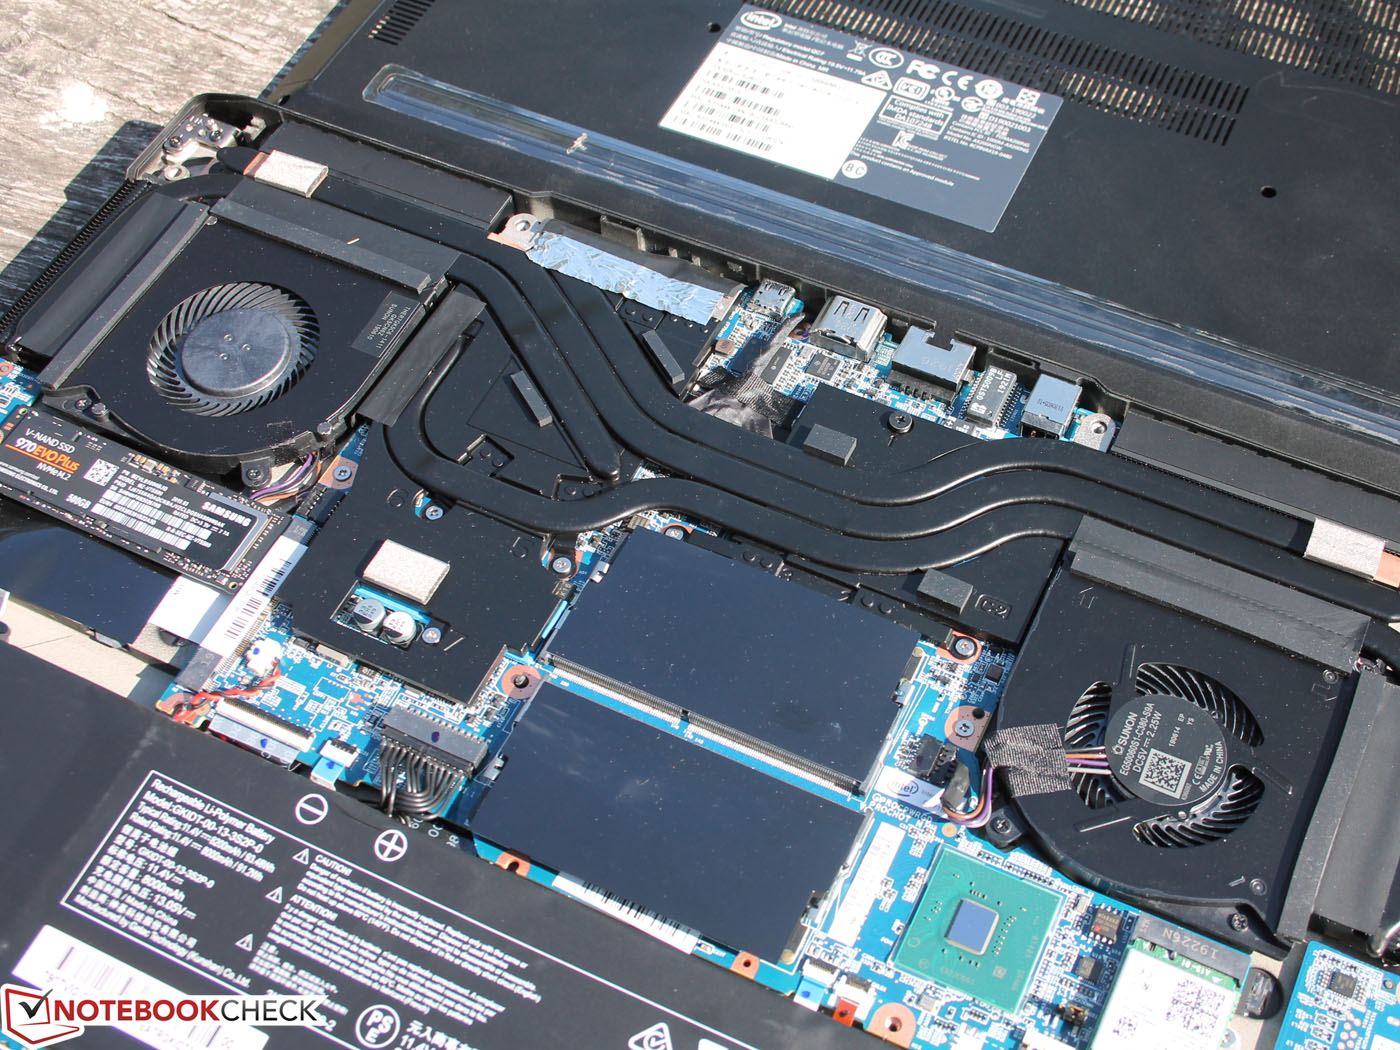
The dynamic cooling solution is the most interesting aspect however, since it not only allows the hardware to reach its maximum performance potential, but it also allows for a runtime of an entire day. While Intel has managed to fully exhaust the GPU Boost potential of the graphics card, the GPU still remains below the 75 °C mark under load. Meanwhile, the processor can limit its clock rate in order to increase the graphics performance.
Users may choose between three different power modes that offer maximum performance, a balanced noise profile, or almost silent operation and long battery life. We were surprised by how long the laptop lasted in battery mode despite the powerful components inside.
It should also be noted that the laptop was imported through Intel's distribution channels. According to Schenker, this reduces order times and grants users a three-year replacement parts warranty. Final assembly, support, and service continue to take place in Leipzig.
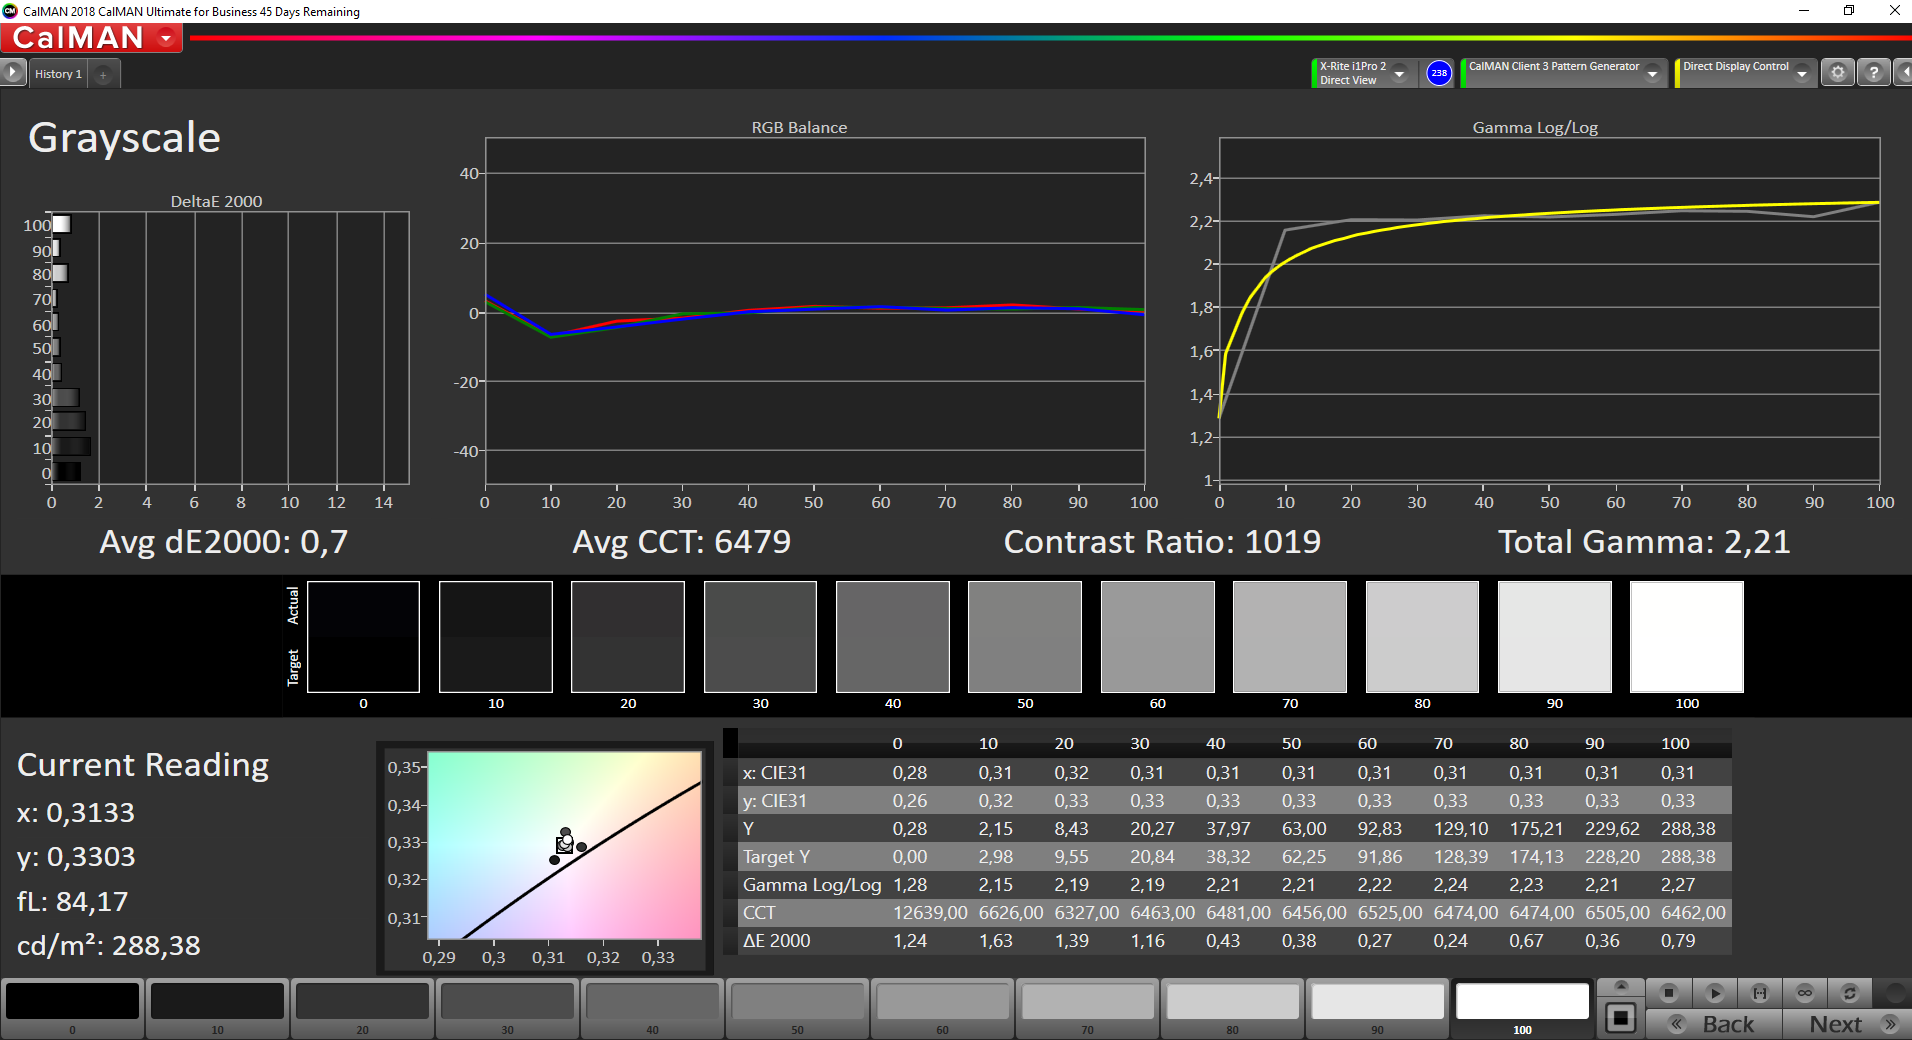
Update 10/18/2019: We repeated the display measurements of the Fusion due to a defective measuring device and implemented the new results below. The display sub-rating improves from 80.7 to 84.3 %, but the overall score of the Fusion is still 84 % (after the rounding of the decimal place). We can now confirm the advertised contrast ratio of >1000:1.
Case
The case is made of a magnesium alloy, making the device up to 30% lighter than an aluminum chassis of equal size. Visually, the matte and relatively easy to grip case is reminiscent of plastic. However, the case feels like metal. Of course, the aluminum surface does not remain cool after hours of gaming and the associated, high heat development.
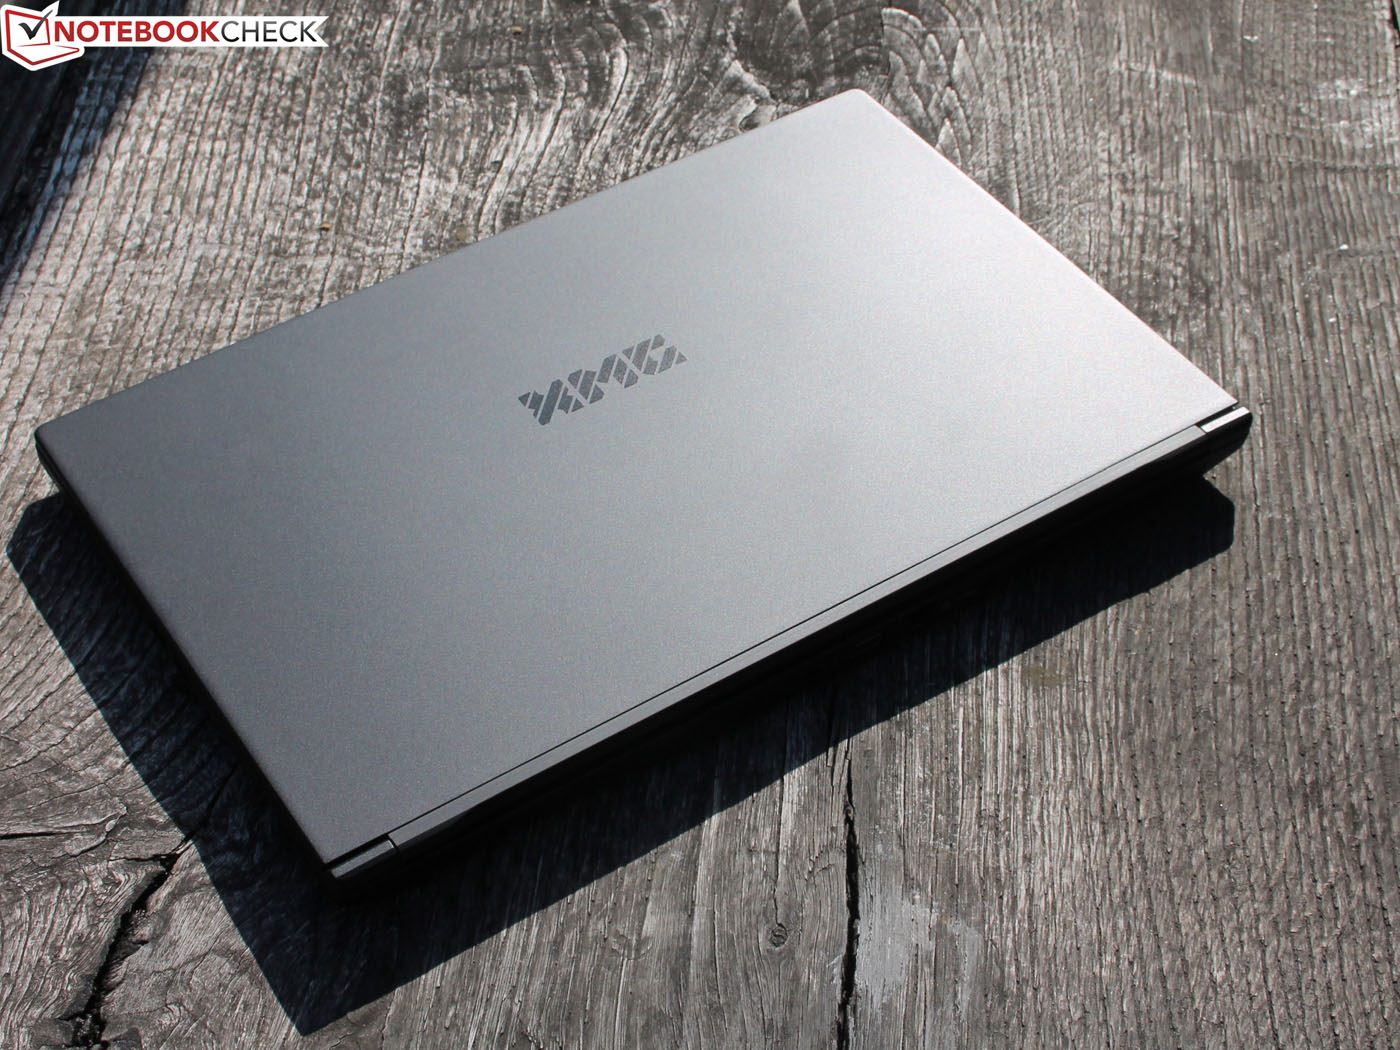
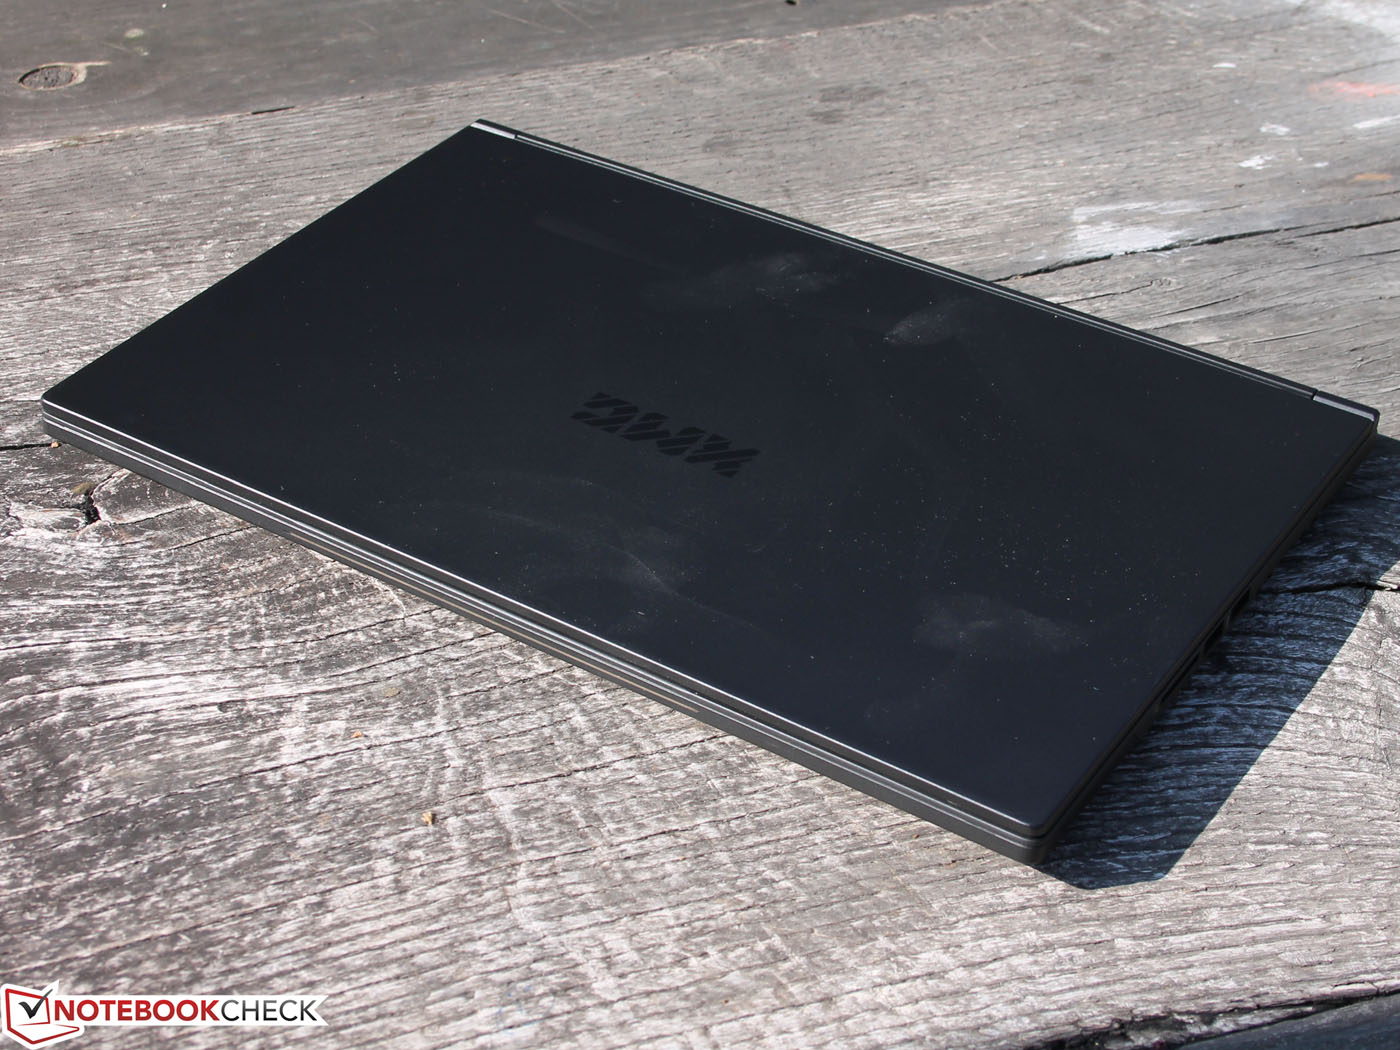
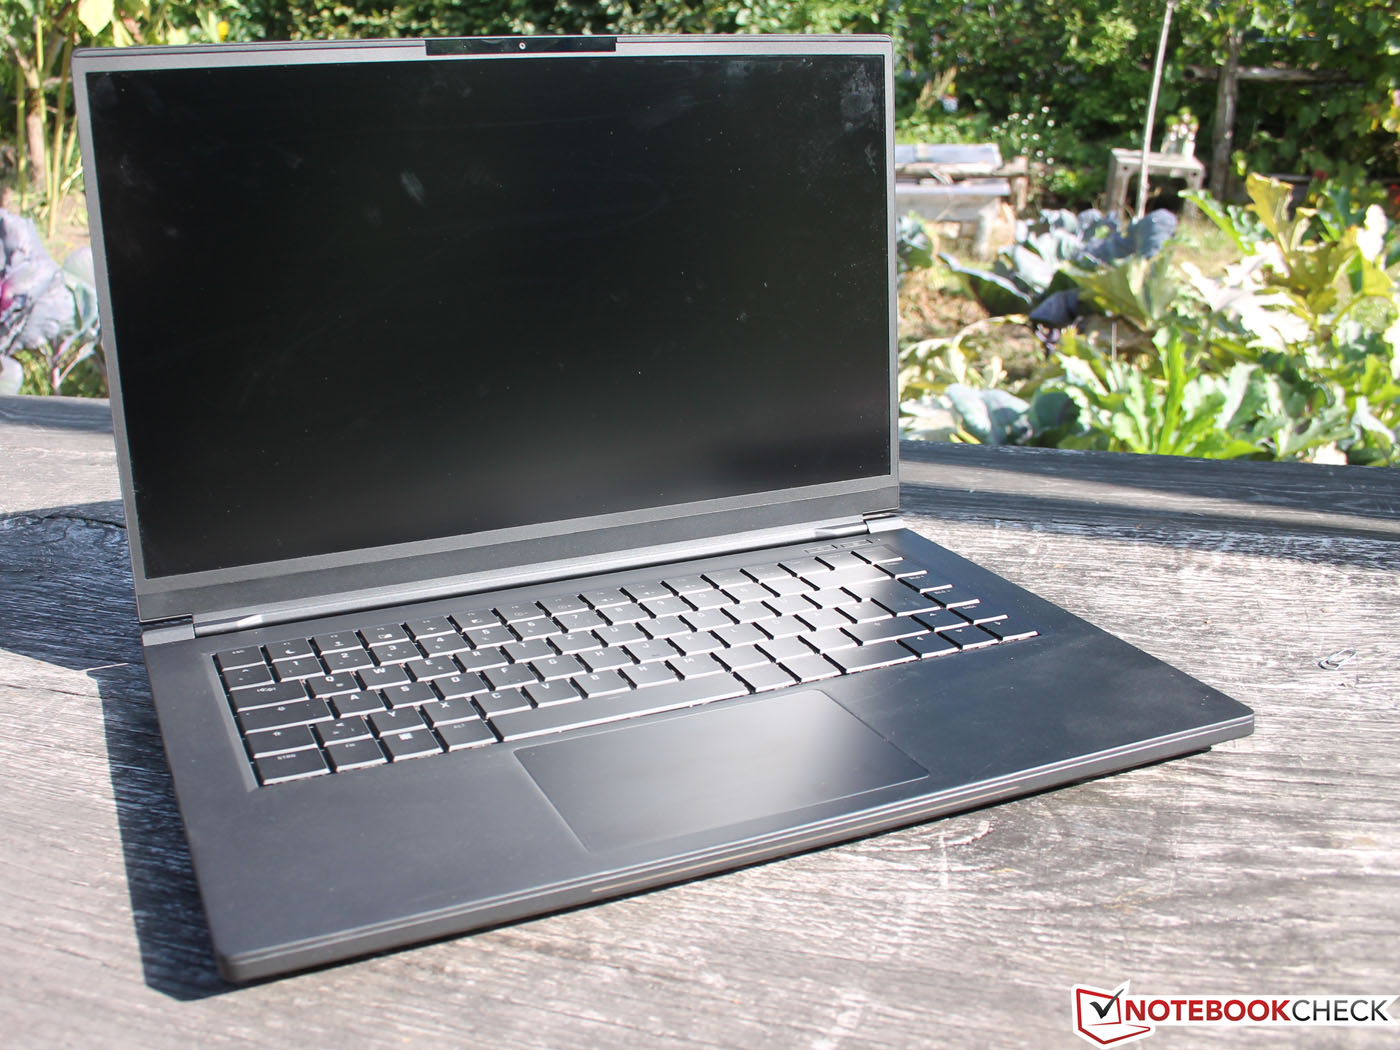
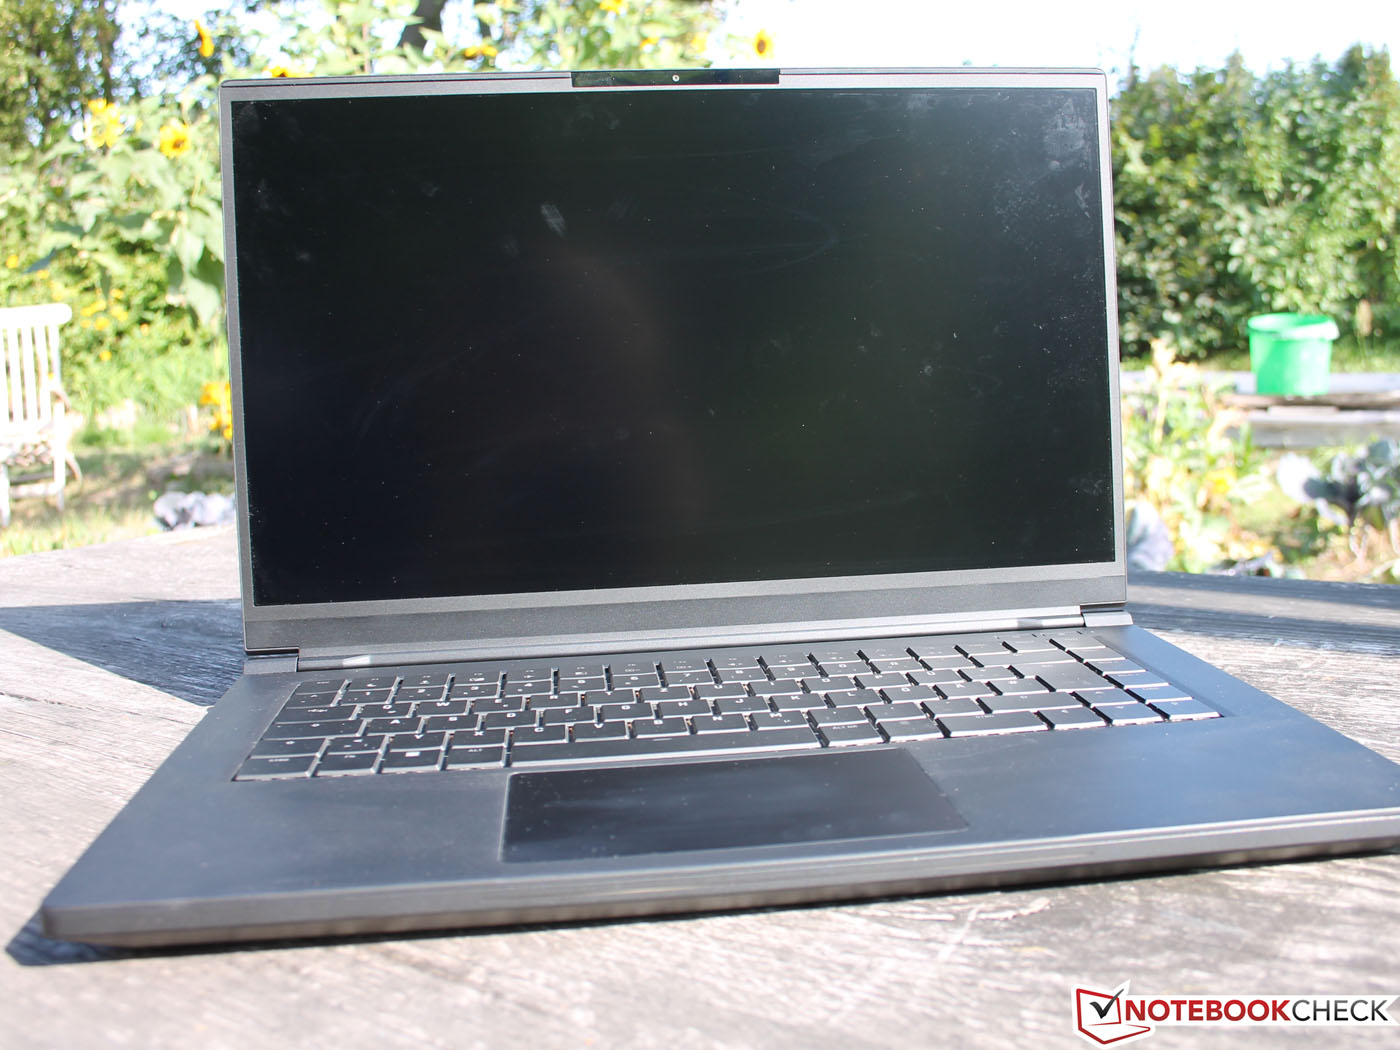
The twisting resistance of the lightweight case is good and it should be mentioned that it weighs around 200 g less than the other devices in our comparison. The measurements are similar to those of a Razer Blade 15 and all of the other competitors are much larger, particularly in depth. On the other hand, the Fusion 15 (20 mm) is not the thinnest gaming laptop either: The competitors' thicknesses are only 18-19 mm.
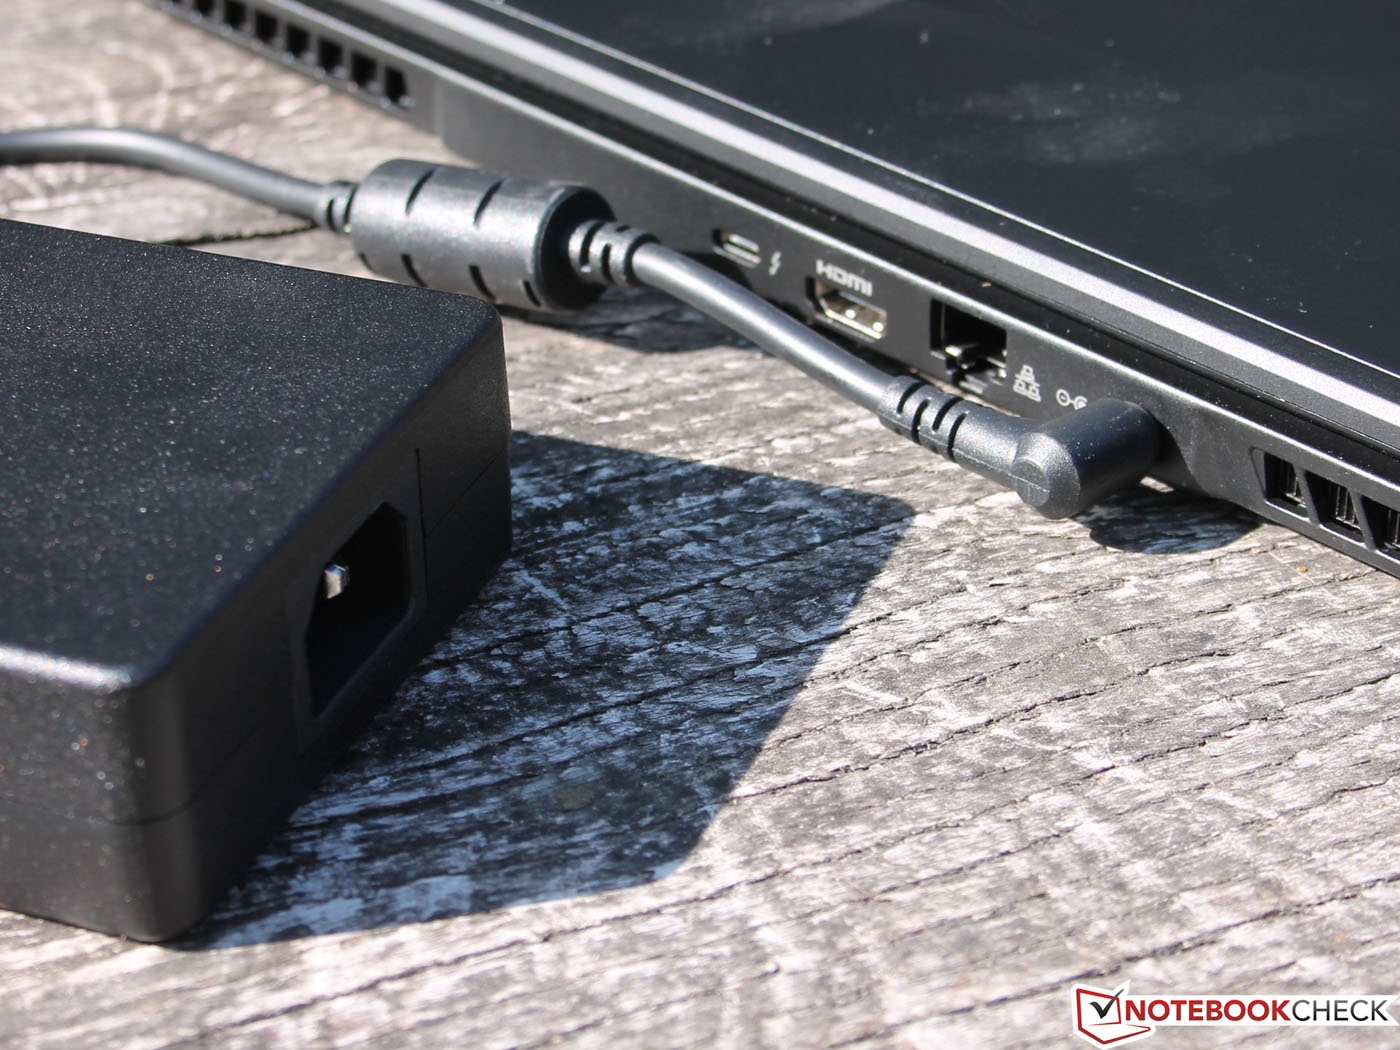
Connectivity
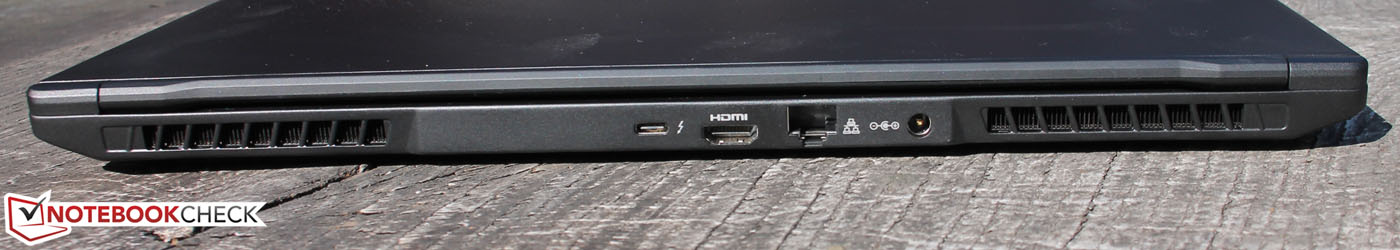
The ports are distributed across three sides, which means there are ports available on the back of the device. Here, HDMI 2.0 and Thunderbolt 3 with dual-link DP 1.4 output are available, but there is no USB Type-A. The adapter cable's DisplayPort is G-Sync compatible.
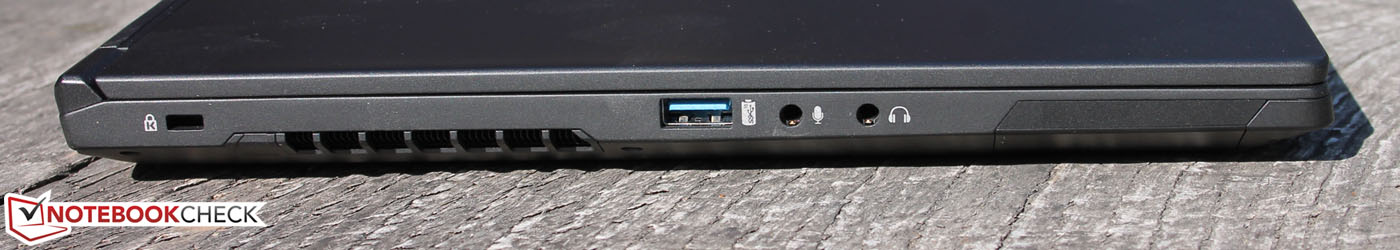
Conveniently, a Type-C dock or a Thunderbolt dual display cable configuration can be plugged in on the back for improved ergonomics. The Type-C port does not support Power Delivery. One USB port adheres to the USB-A 3.1 Gen 2 standard, enabling faster file transfers in conjunction with appropriate external storage devices.

SD Card Reader
The card reader does not appear to be in a hurry. While around 80 MB/s for copying or writing is not bad per se, we have seen gaming and business laptops reach 190-240 MB/s.
| SD Card Reader | |
| average JPG Copy Test (av. of 3 runs) | |
| Gigabyte Aero 15 Classic-XA (Toshiba Exceria Pro SDXC 64 GB UHS-II) | |
| Lenovo ThinkPad P1 2019-20QT000RGE (Toshiba Exceria Pro SDXC 64 GB UHS-II) | |
| Average of class Gaming (20.9 - 210, n=54, last 2 years) | |
| Schenker XMG Fusion 15 XFU15L19 (Toshiba Exceria Pro SDXC 64 GB UHS-II) | |
| maximum AS SSD Seq Read Test (1GB) | |
| Gigabyte Aero 15 Classic-XA (Toshiba Exceria Pro SDXC 64 GB UHS-II) | |
| Lenovo ThinkPad P1 2019-20QT000RGE (Toshiba Exceria Pro SDXC 64 GB UHS-II) | |
| Average of class Gaming (25.5 - 261, n=51, last 2 years) | |
| Schenker XMG Fusion 15 XFU15L19 (Toshiba Exceria Pro SDXC 64 GB UHS-II) | |
Communication
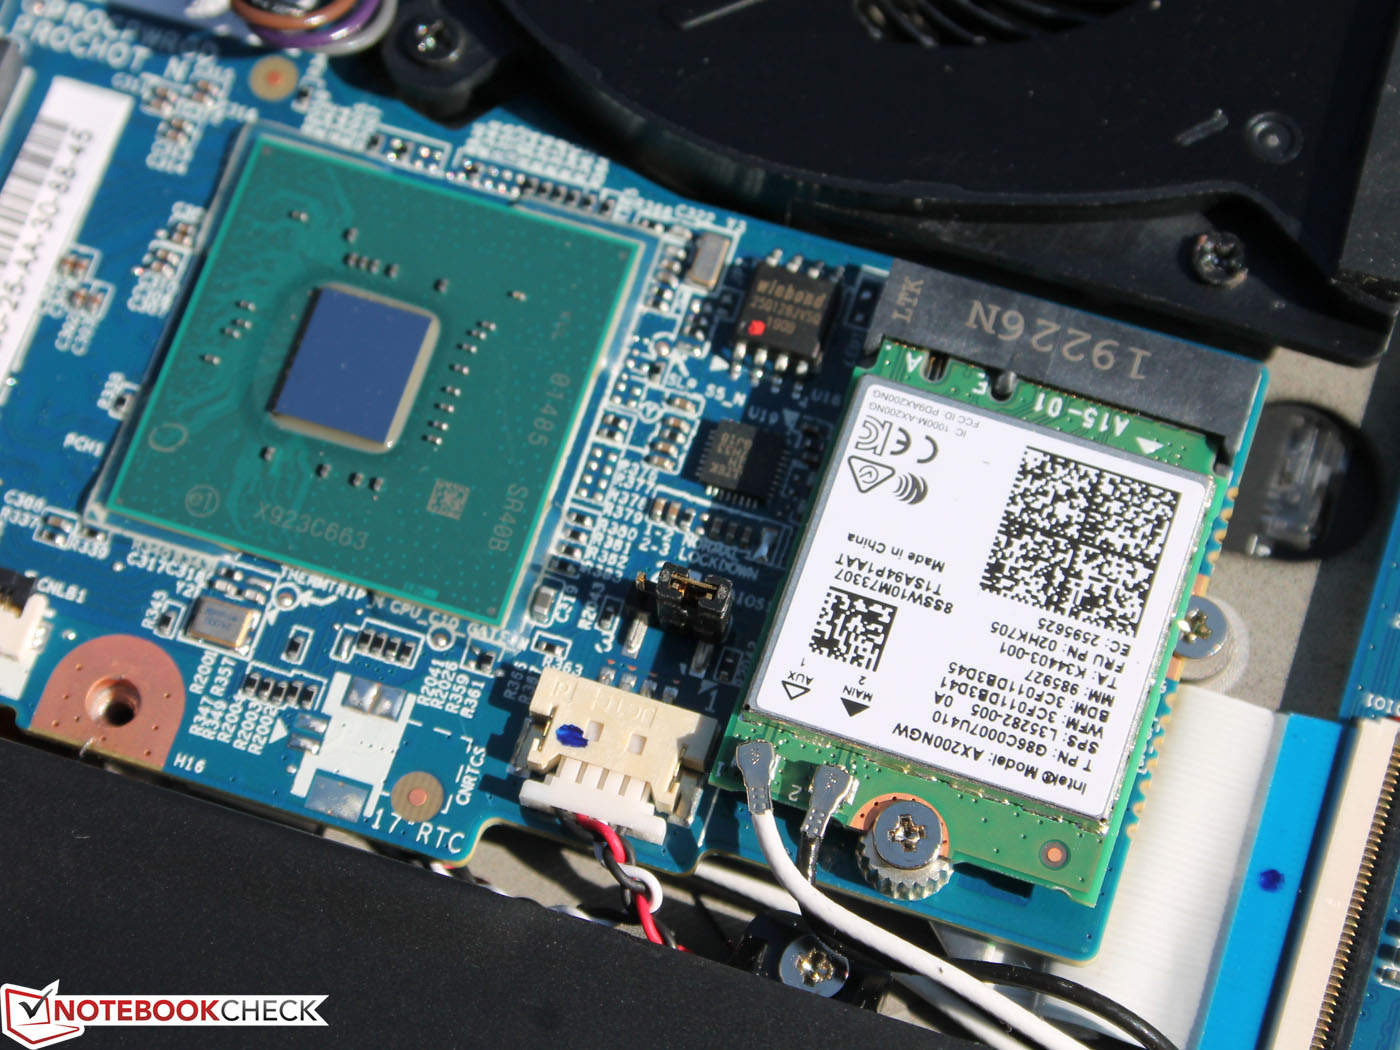
Connectivity options include Ethernet and the latest AX Wi-Fi. Conveniently, the Gigabit-LAN cable can be plugged in at the back. Wi-Fi and Bluetooth 5 (802.11a/b/g/n/ac/ax) are provided by the Intel Wi-Fi 6 AX200. It supports the latest generation Wi-Fi standard. In order to achieve maximum throughput, a matching router is required.
Although the transfer speeds were not crazy high, only an AC router was available for testing. It will be replaced by an AX router in the near future.
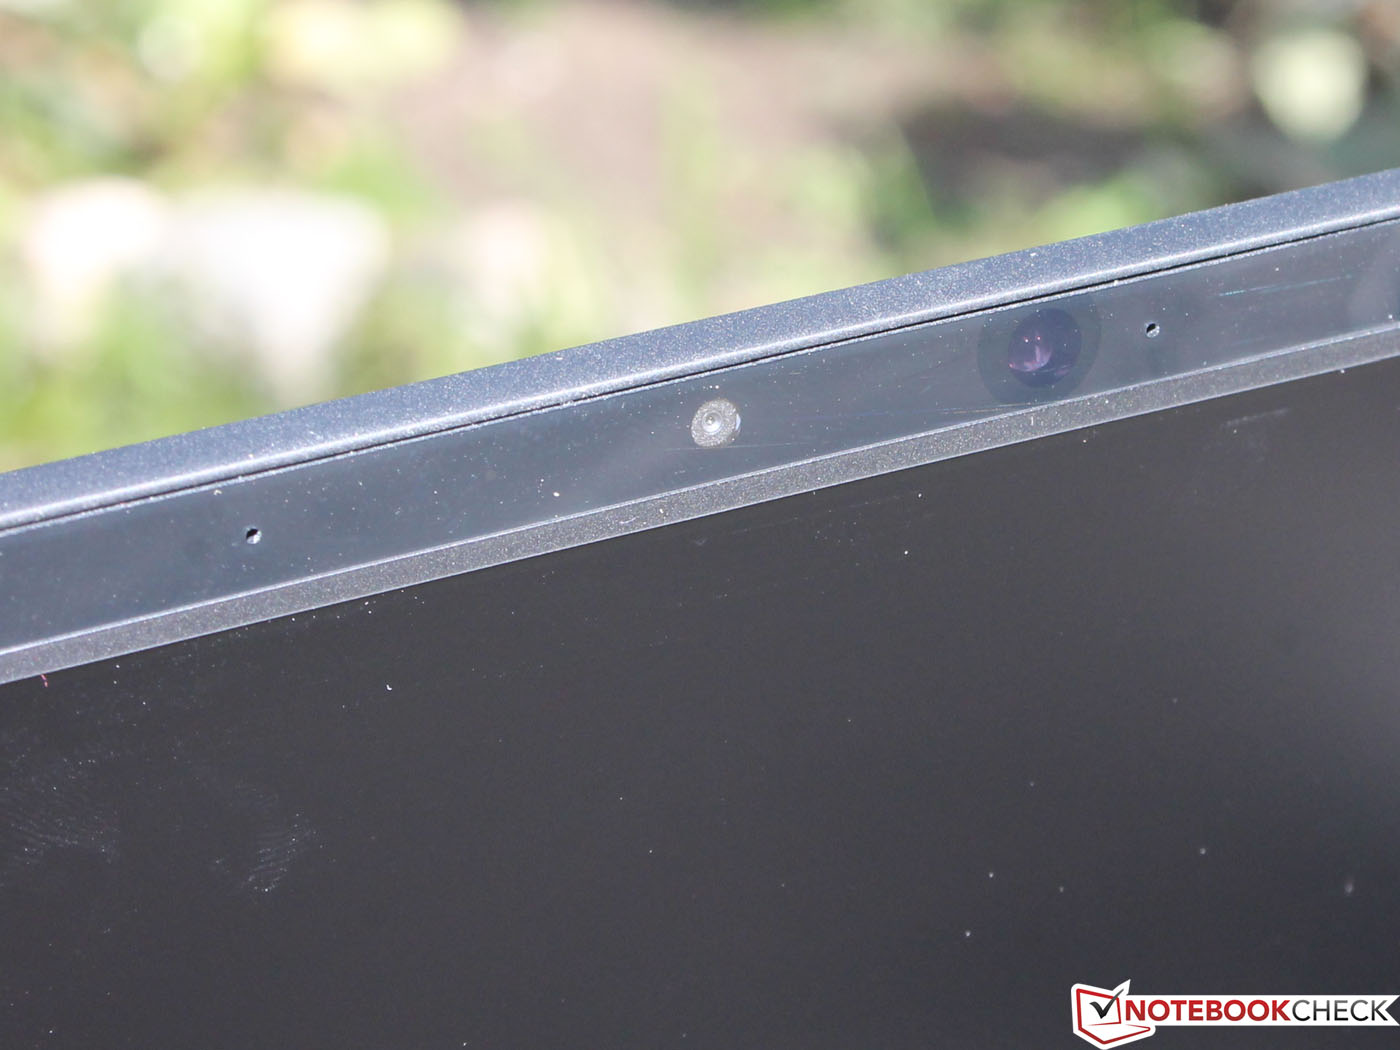
The HD webcam is Windows Hello compatible. As the pictures show, resolution, color accuracy, and sharpness fall on the lower end of the spectrum.


Security
With a Kensington lock and an integrated TPM 2.0 (via Intel PTT), the security aspect has not been neglected. However, there is no fingerprint scanner.
Software
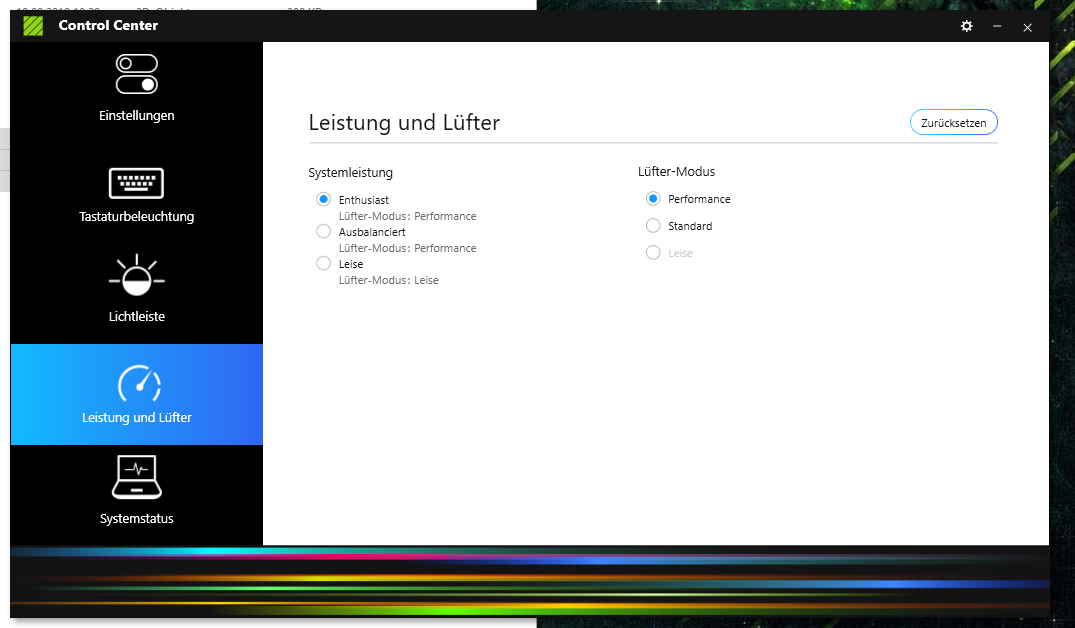
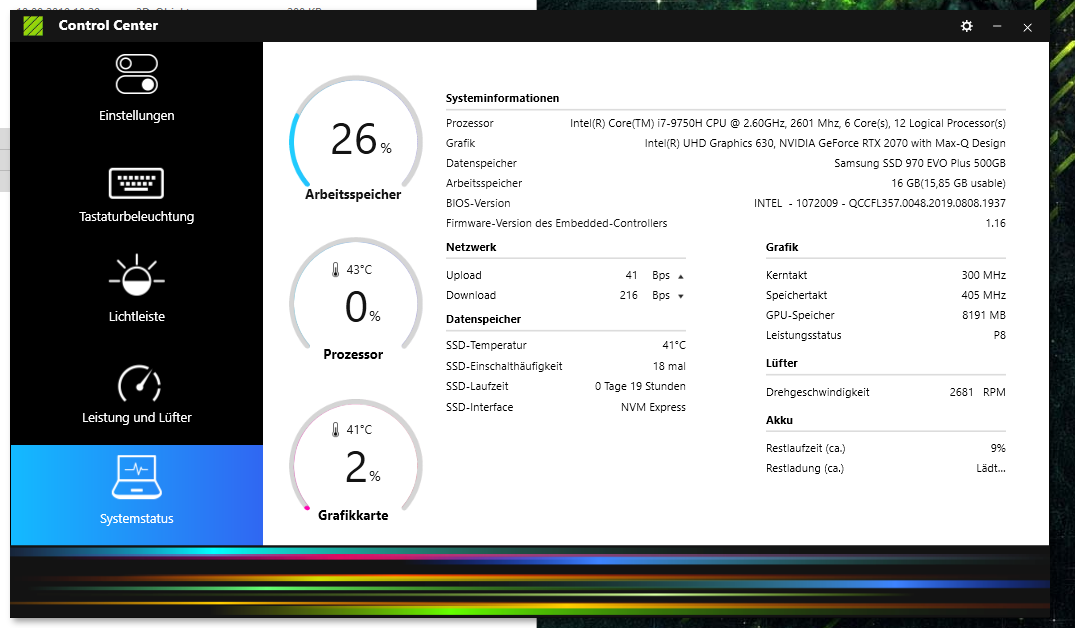
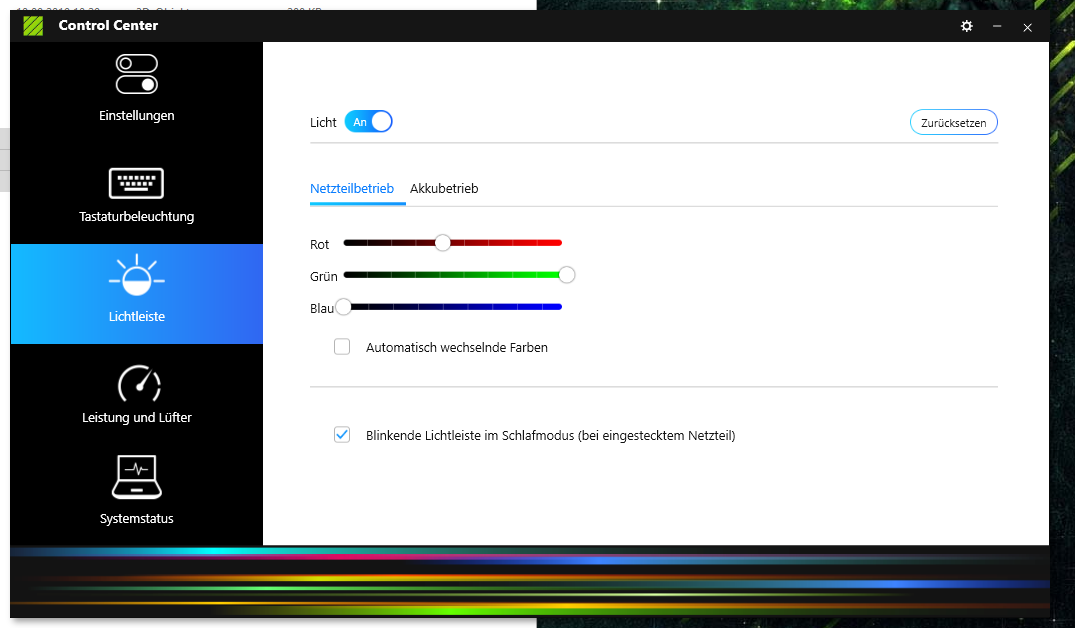
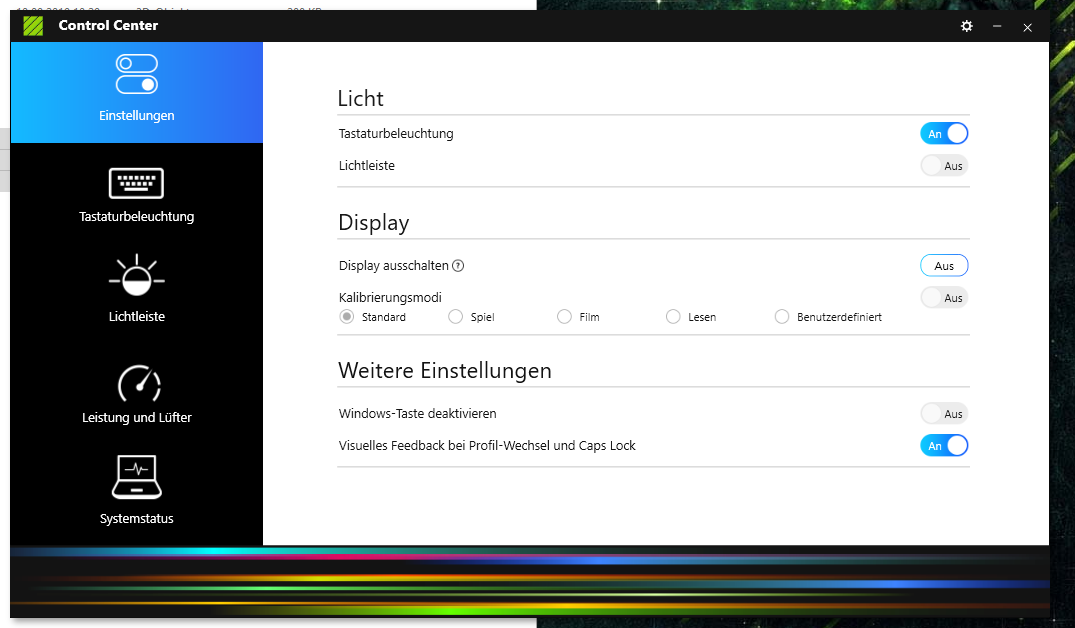
The Control Center unites all of the system and hardware settings. The power profiles, which can also be switched using the hardware button, are available here as well.
Accessories
Schenker includes a USB-C/DP adapter free of charge. It allows for connecting a DisplayPort display. The Thunderbolt port supports dual-link DP, which means up to 2x4K over one cable. Conveniently, the Thunderbolt port is located on the back of the device, which prevents the cable from interfering on the sides.
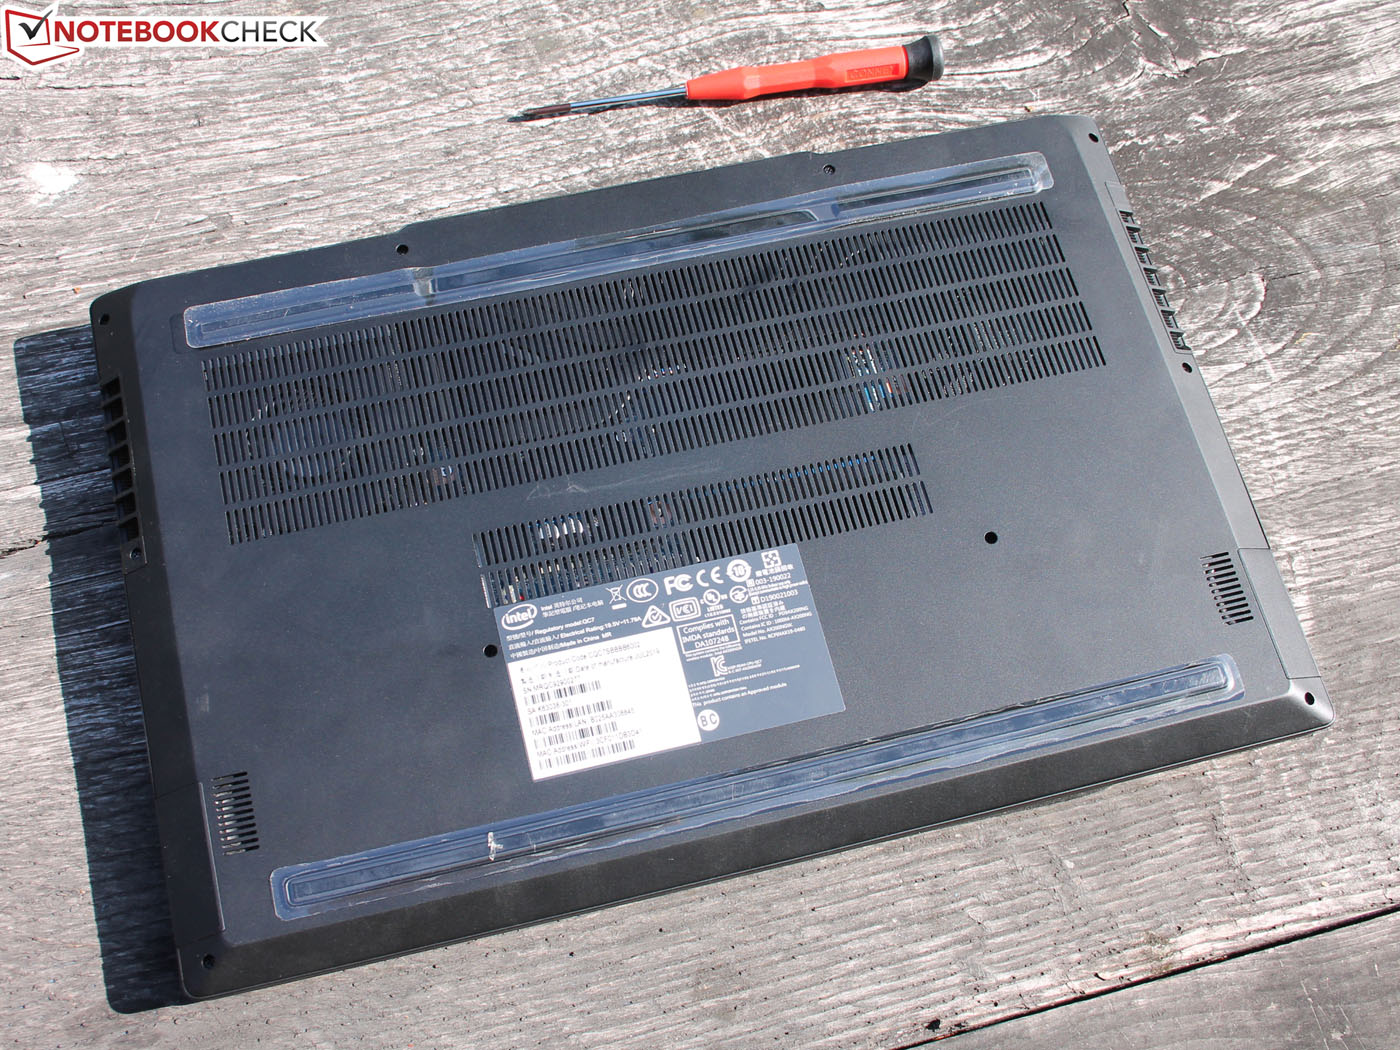
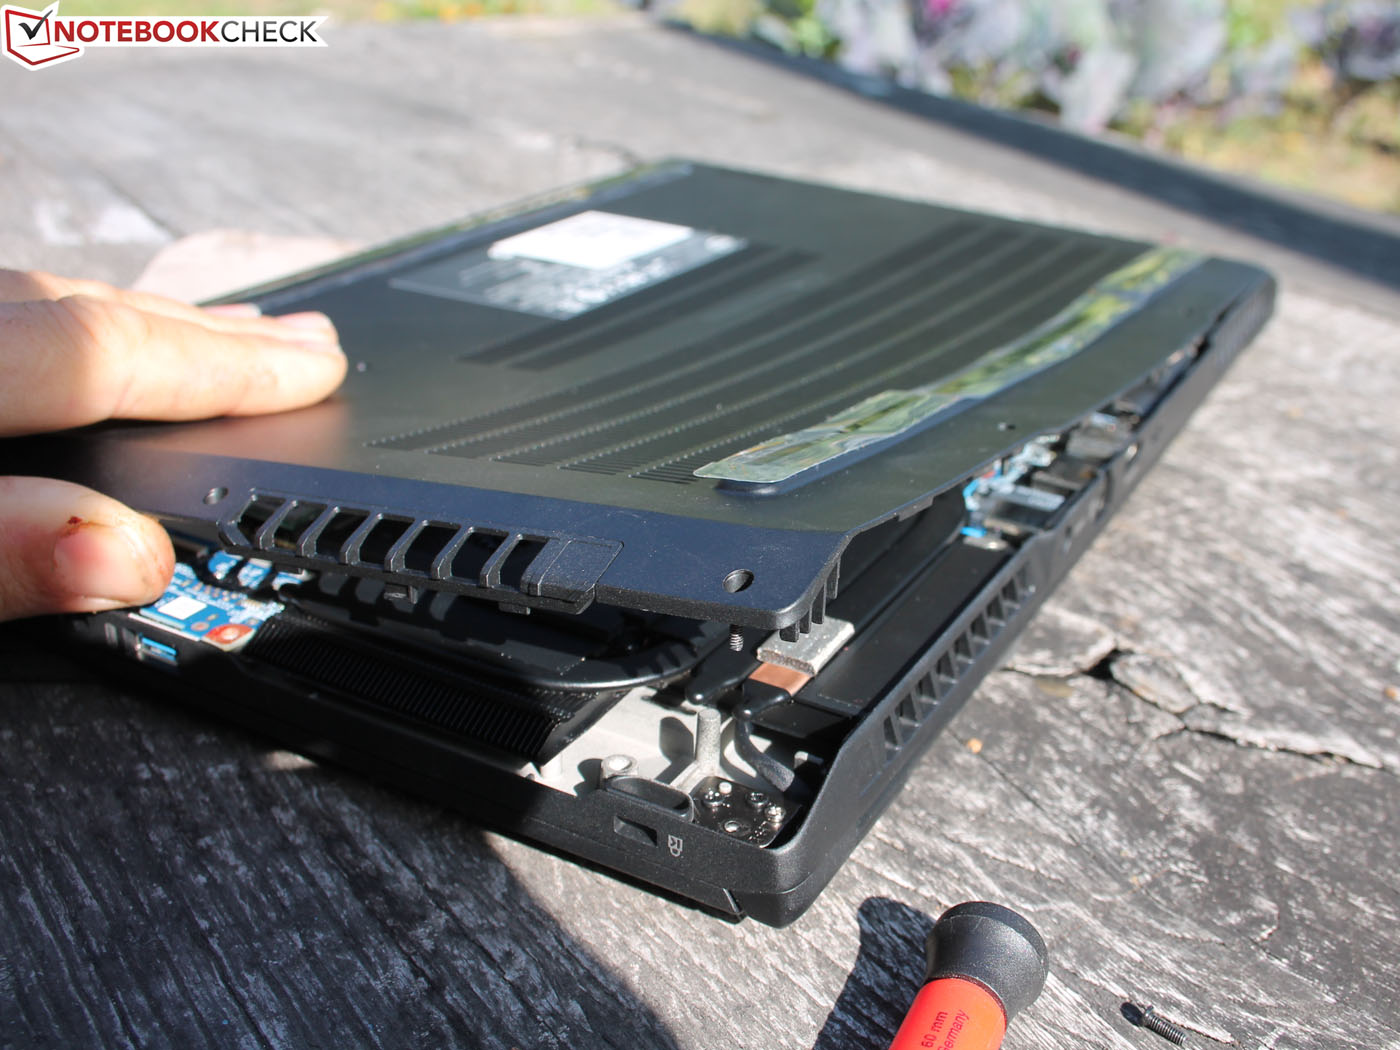
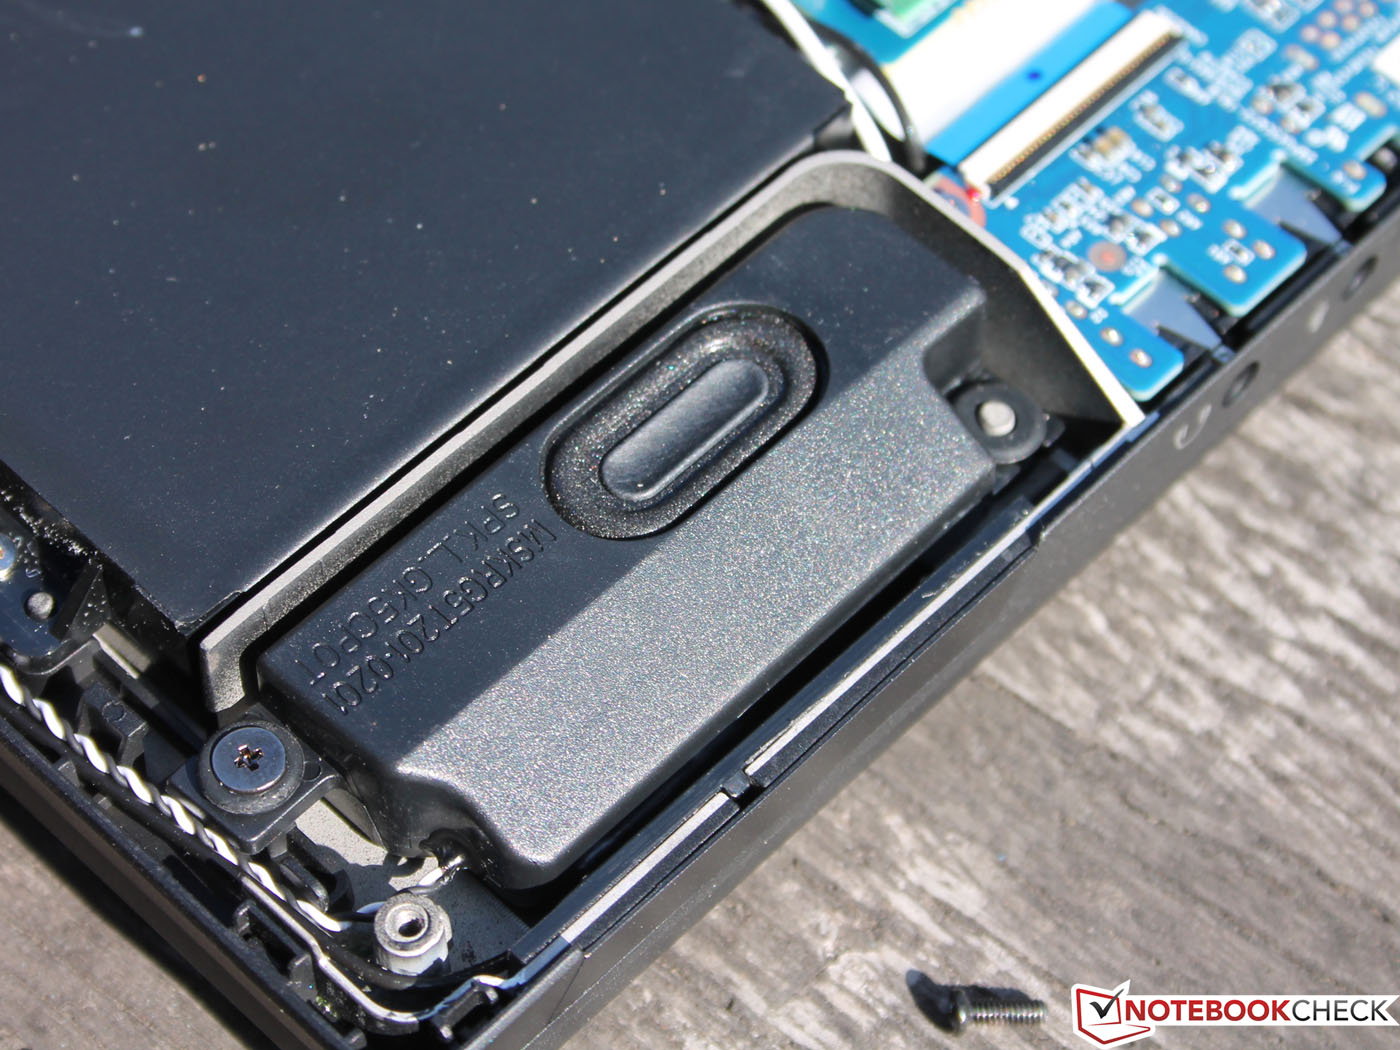
Maintenance
Warranty
As per usual, the desired warranty option can be selected after the purchase, with options for two or three years. Within this time, users can opt for a quick repair warranty (for a premium).
Input Devices
Keyboard
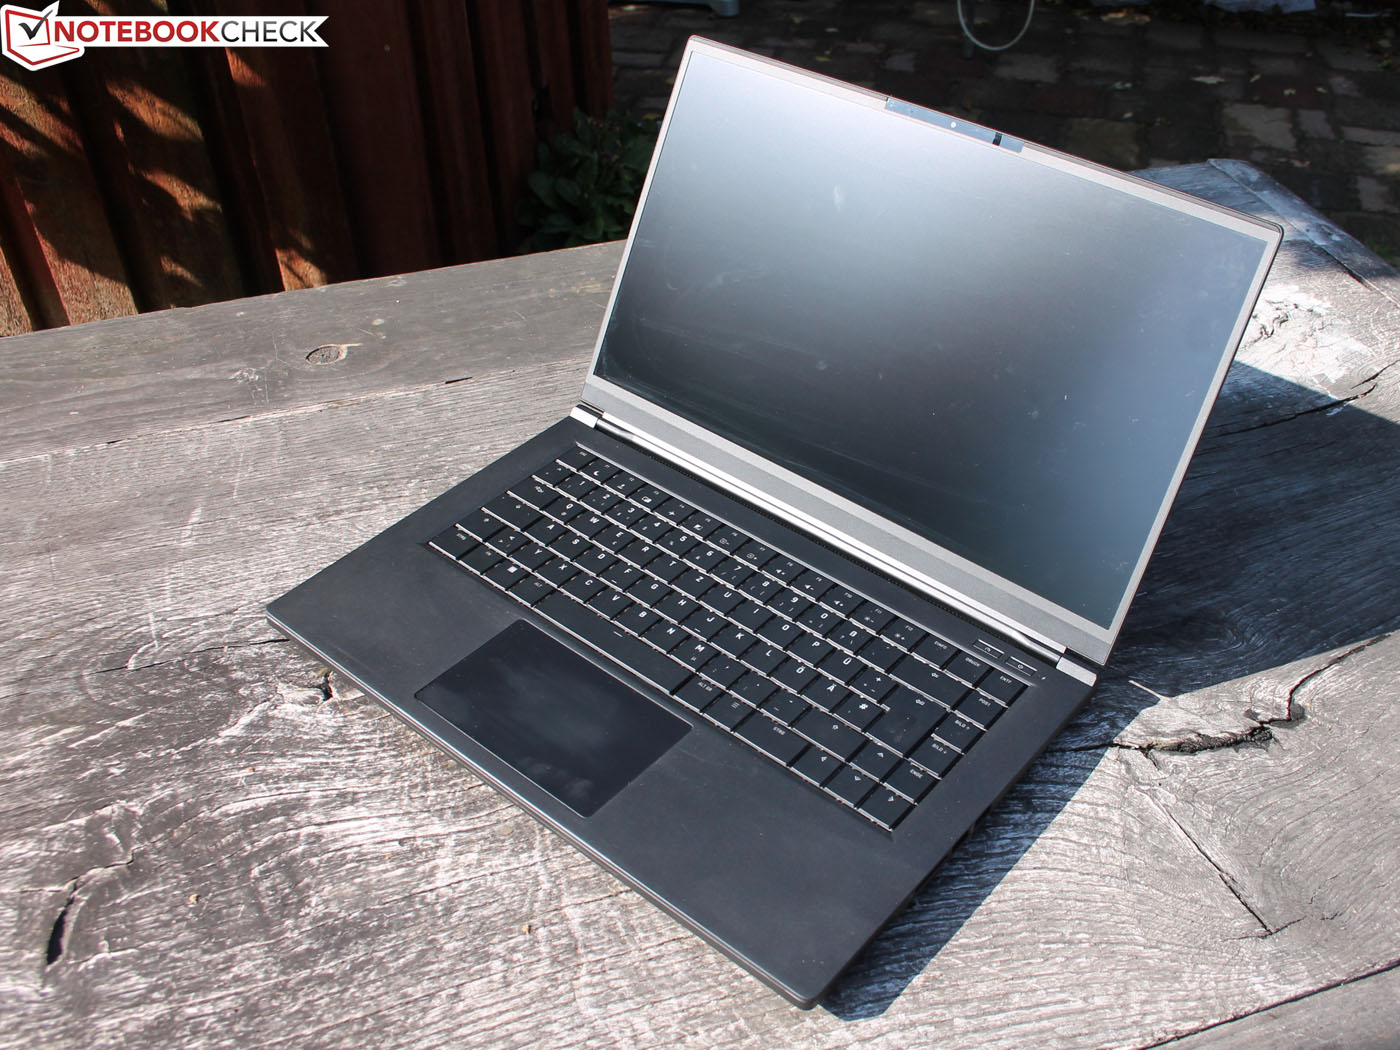
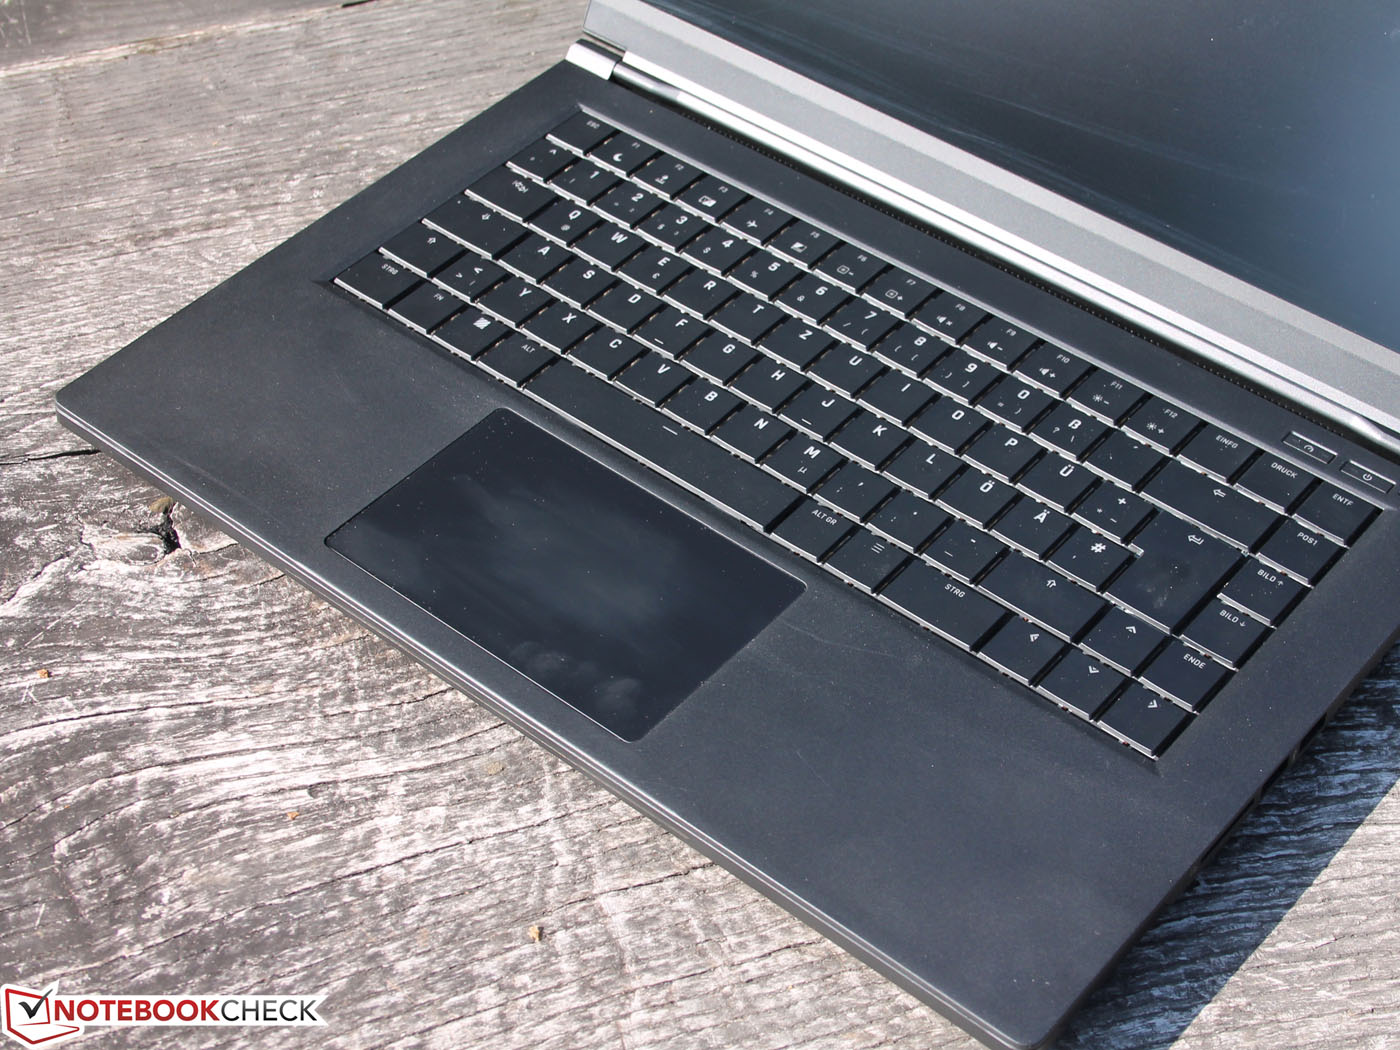
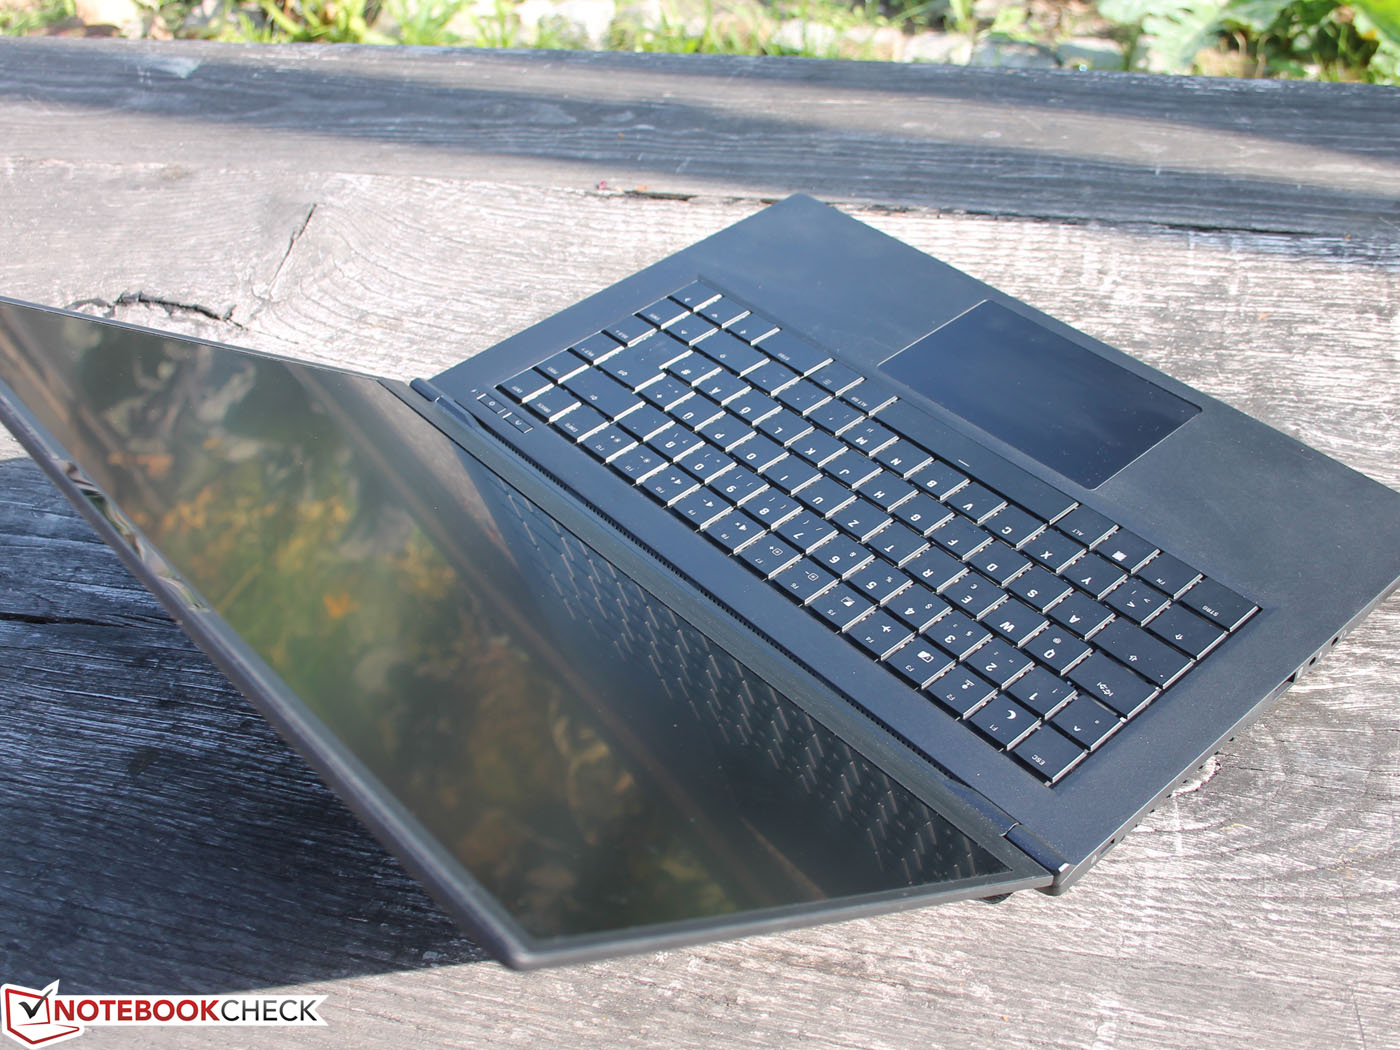
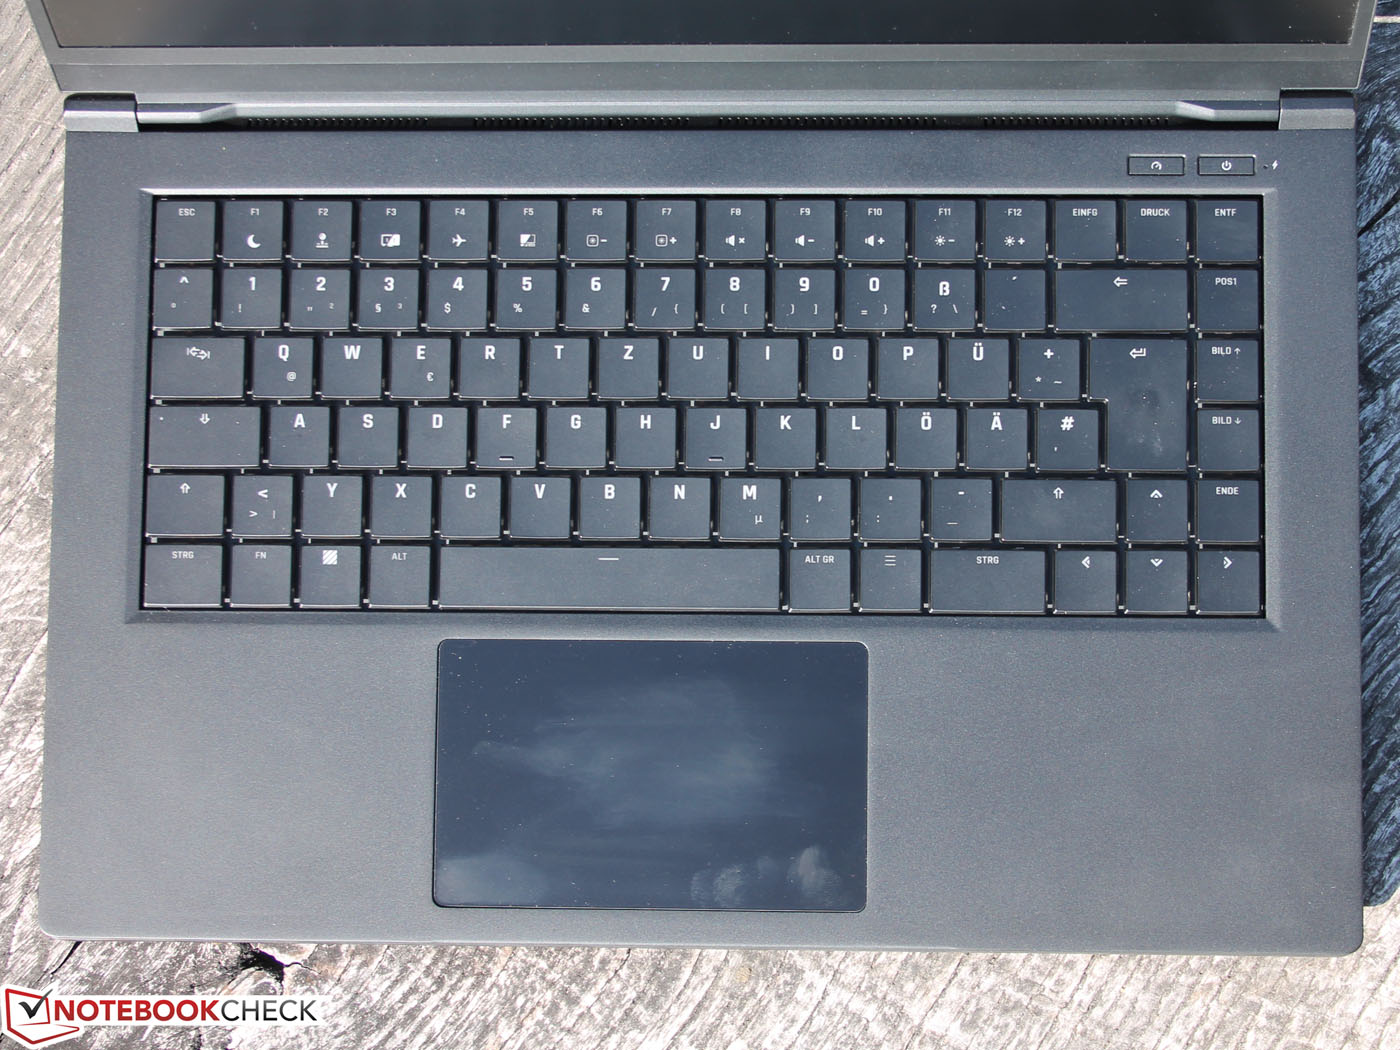
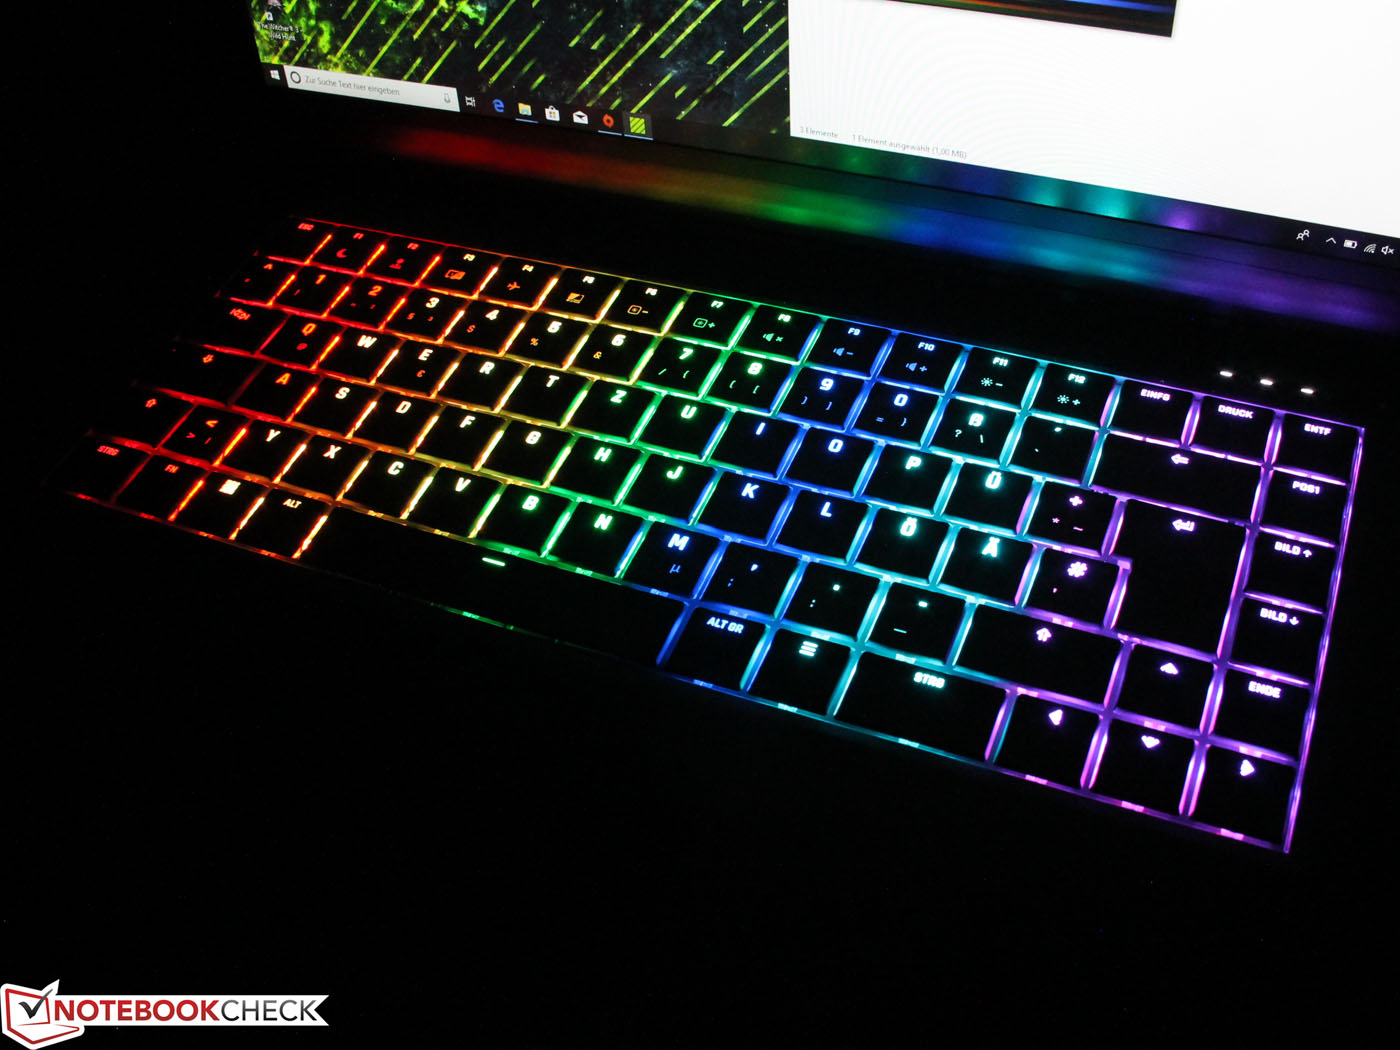
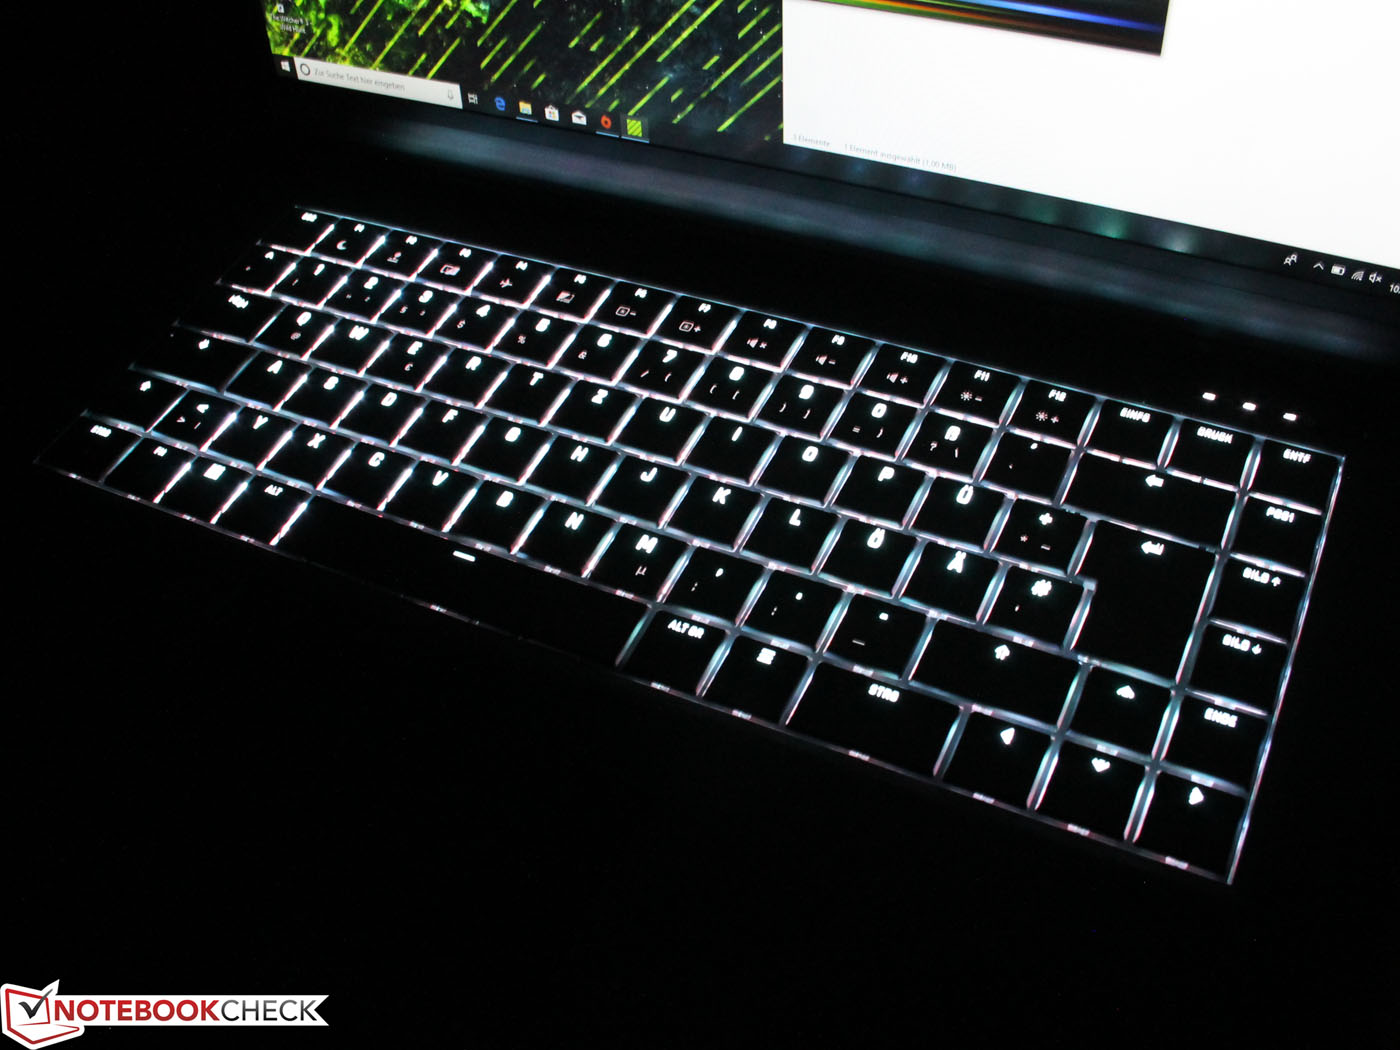
Schenker and Intel did not cut corners when it comes to the mechanical keyboard with per-key lighting. The key clatter is not as loud as on a mechanical desktop equivalent. The silent switches and the shallow travel of 2 mm make the keyboard suitable for quieter environments.
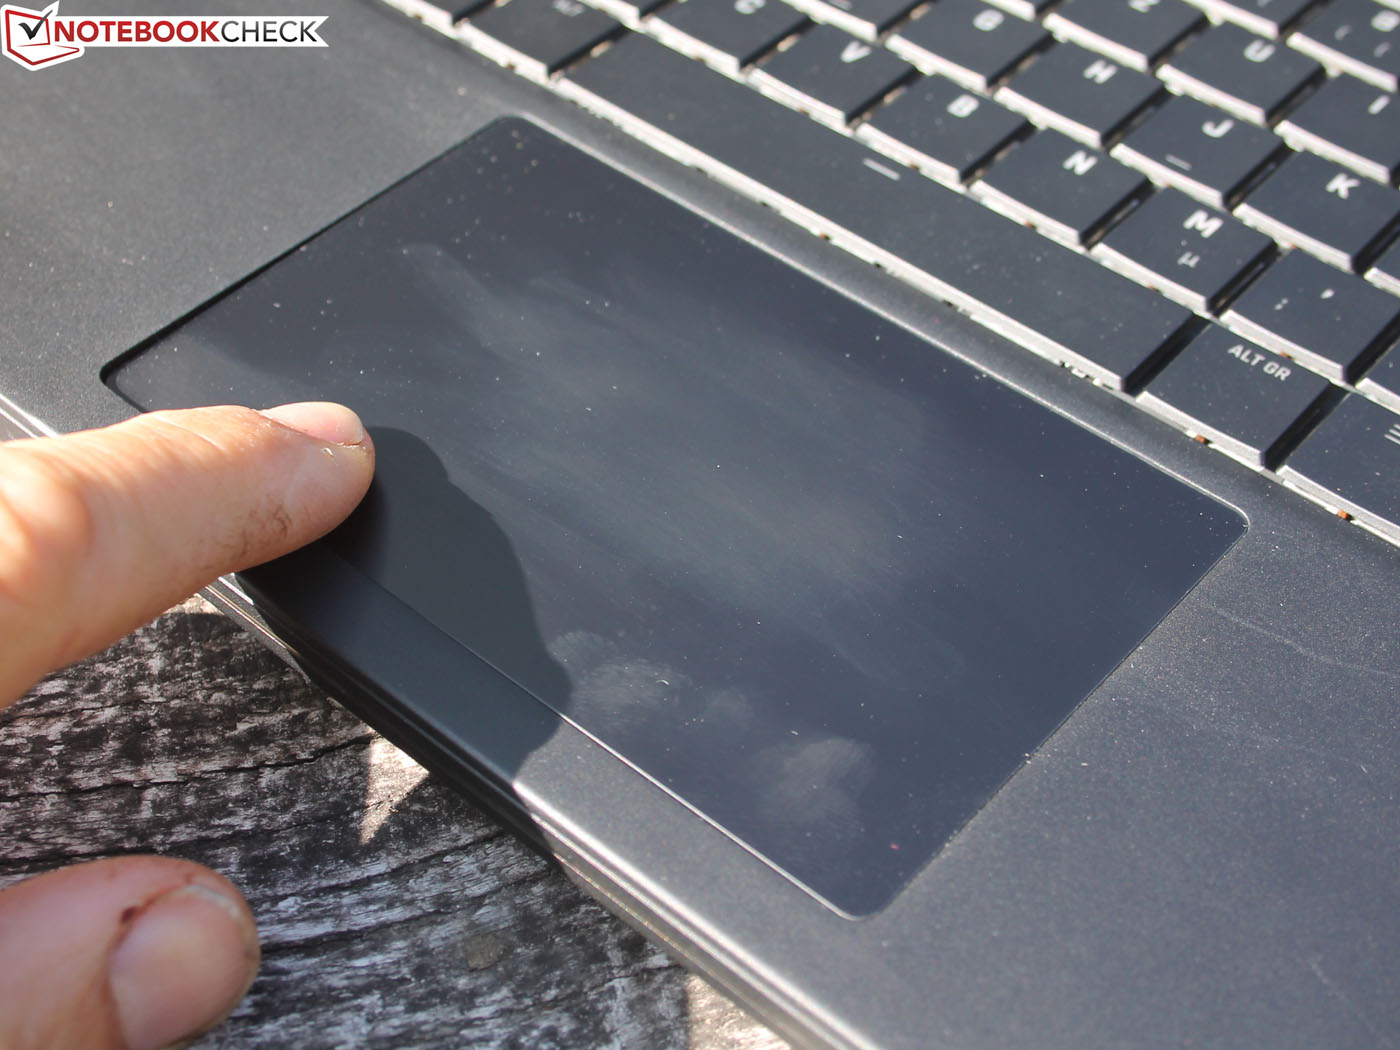
Touchpad
The large ClickPad offers moderate key travel and a distinct acoustic feedback. It measures 13.5 centimeters diagonally and 11.7 cm in width. The smooth surface has excellent gliding properties.
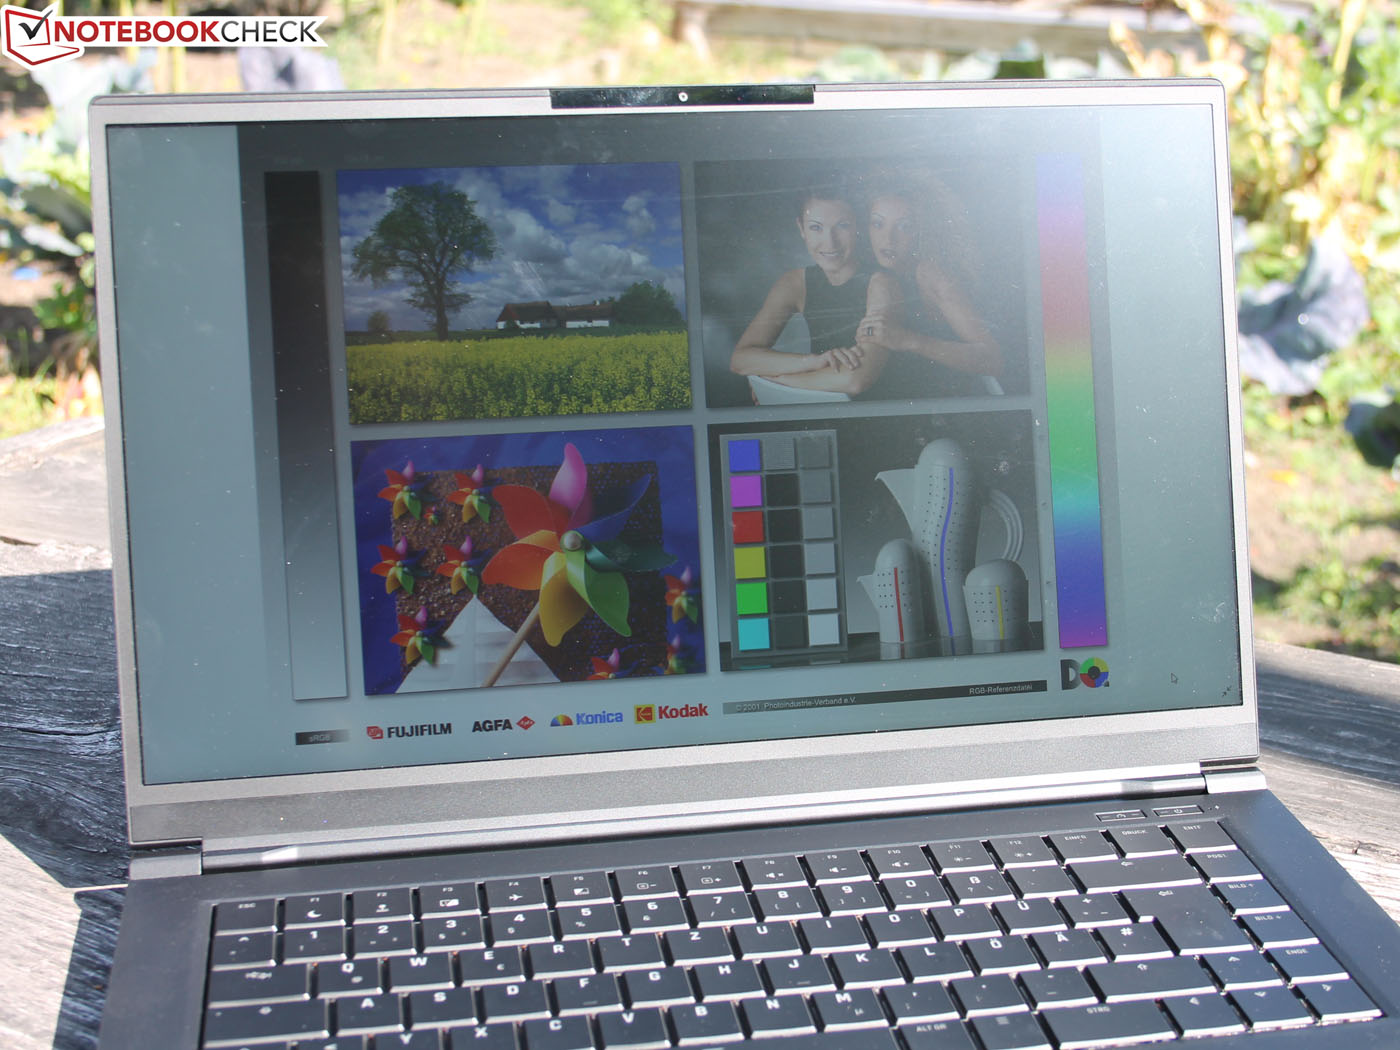
Display

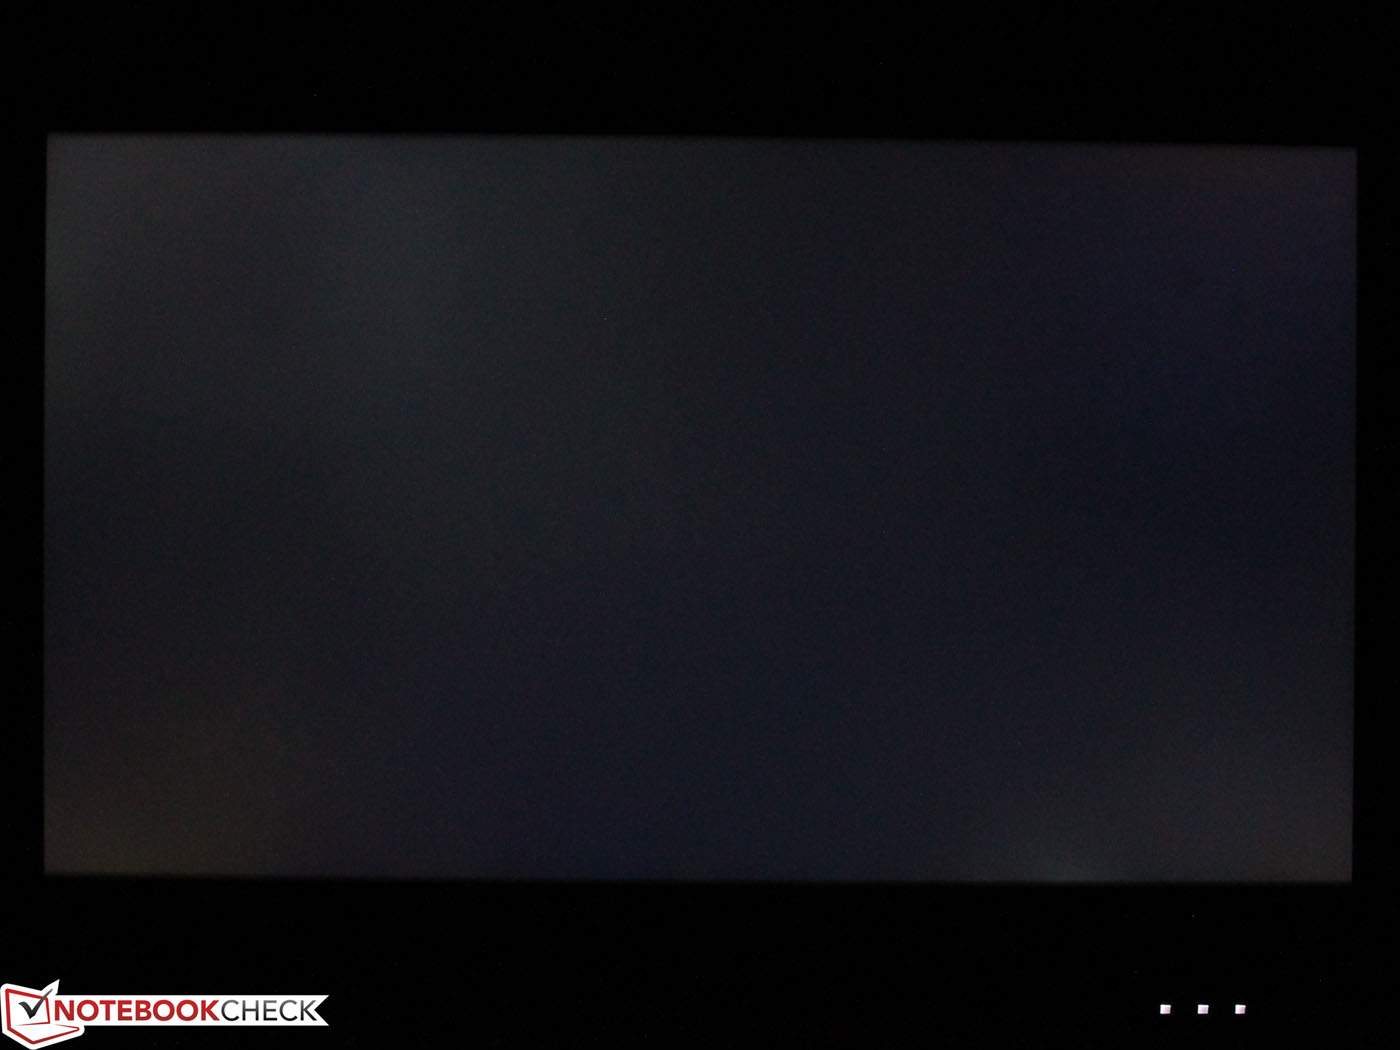
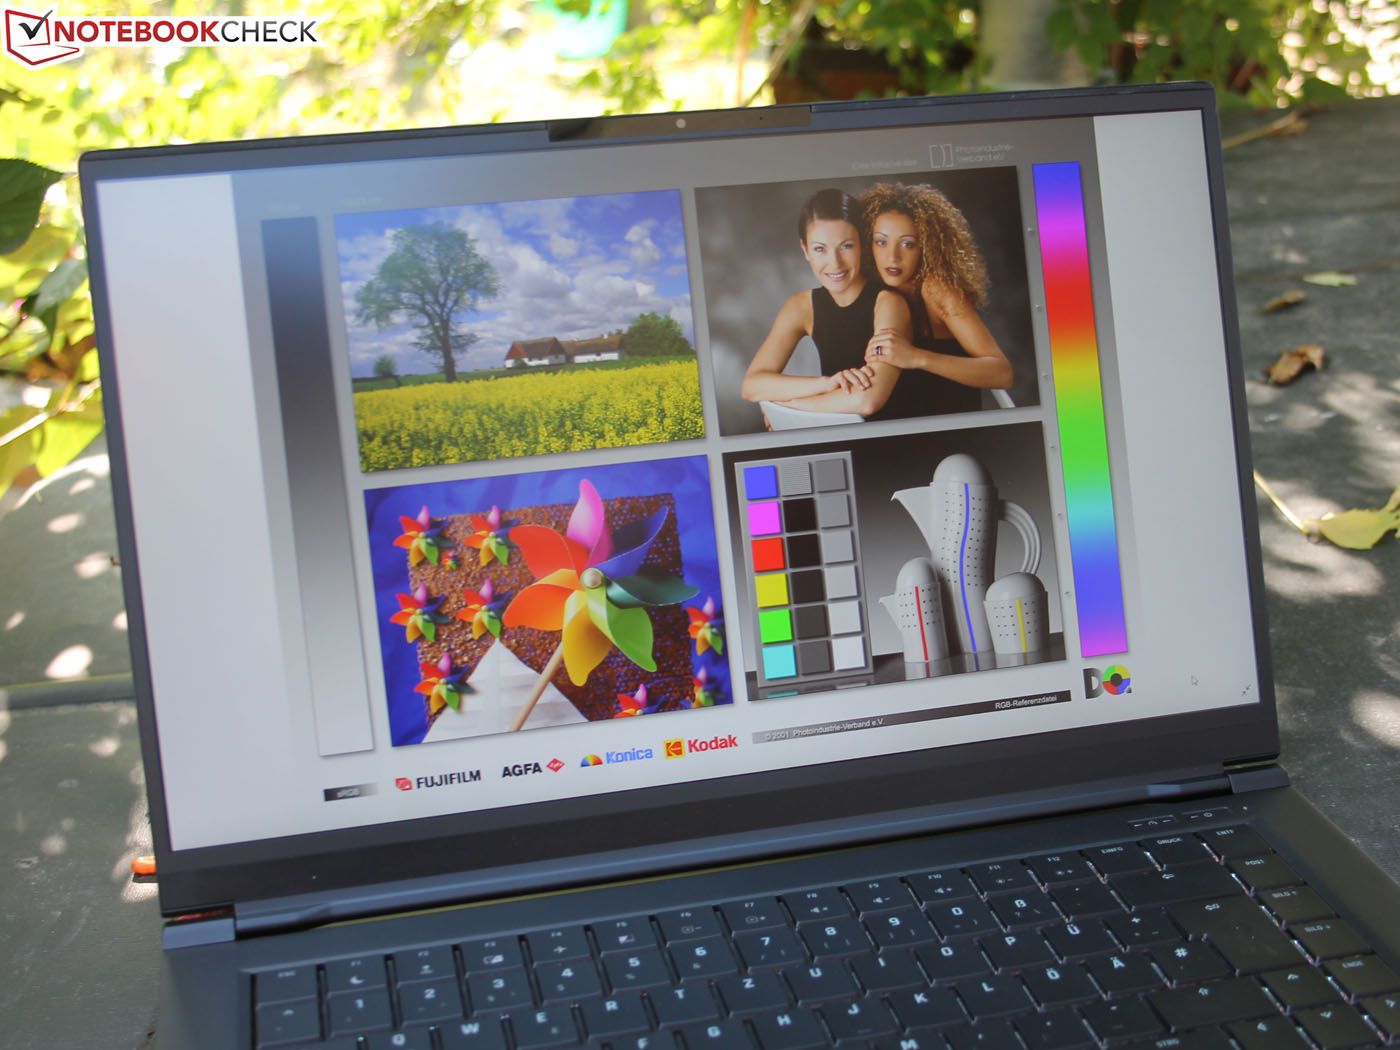
The matte BOE panel has a native resolution of 1920x1080 pixels. The contrast ratio of 690:1 is nothing to write home about and the competitors all offer more in this regard. On an entirely black image the screen's inability to display true black can be seen with the naked eye. However, the 144-Hz panel has a measured response time of just 8 and 9 milliseconds (black and gray, respectively). This makes it equal to the Asus Zephyrus S GX502GW, which scored the reference result in this exercise. The contrast ratio of the Zephyrus S is similarly low.
At 279 candela, the average brightness is not exactly great. The brightness in battery mode is almost identical. Illumination is very even at 91% and the brightness distribution is homogeneous. Backlight bleeding, which is depicted below with increased exposure, is minor and only slightly noticeable in a fully black image.
| |||||||||||||||||||||||||
Brightness Distribution: 85 %
Center on Battery: 331 cd/m²
Contrast: 1034:1 (Black: 0.32 cd/m²)
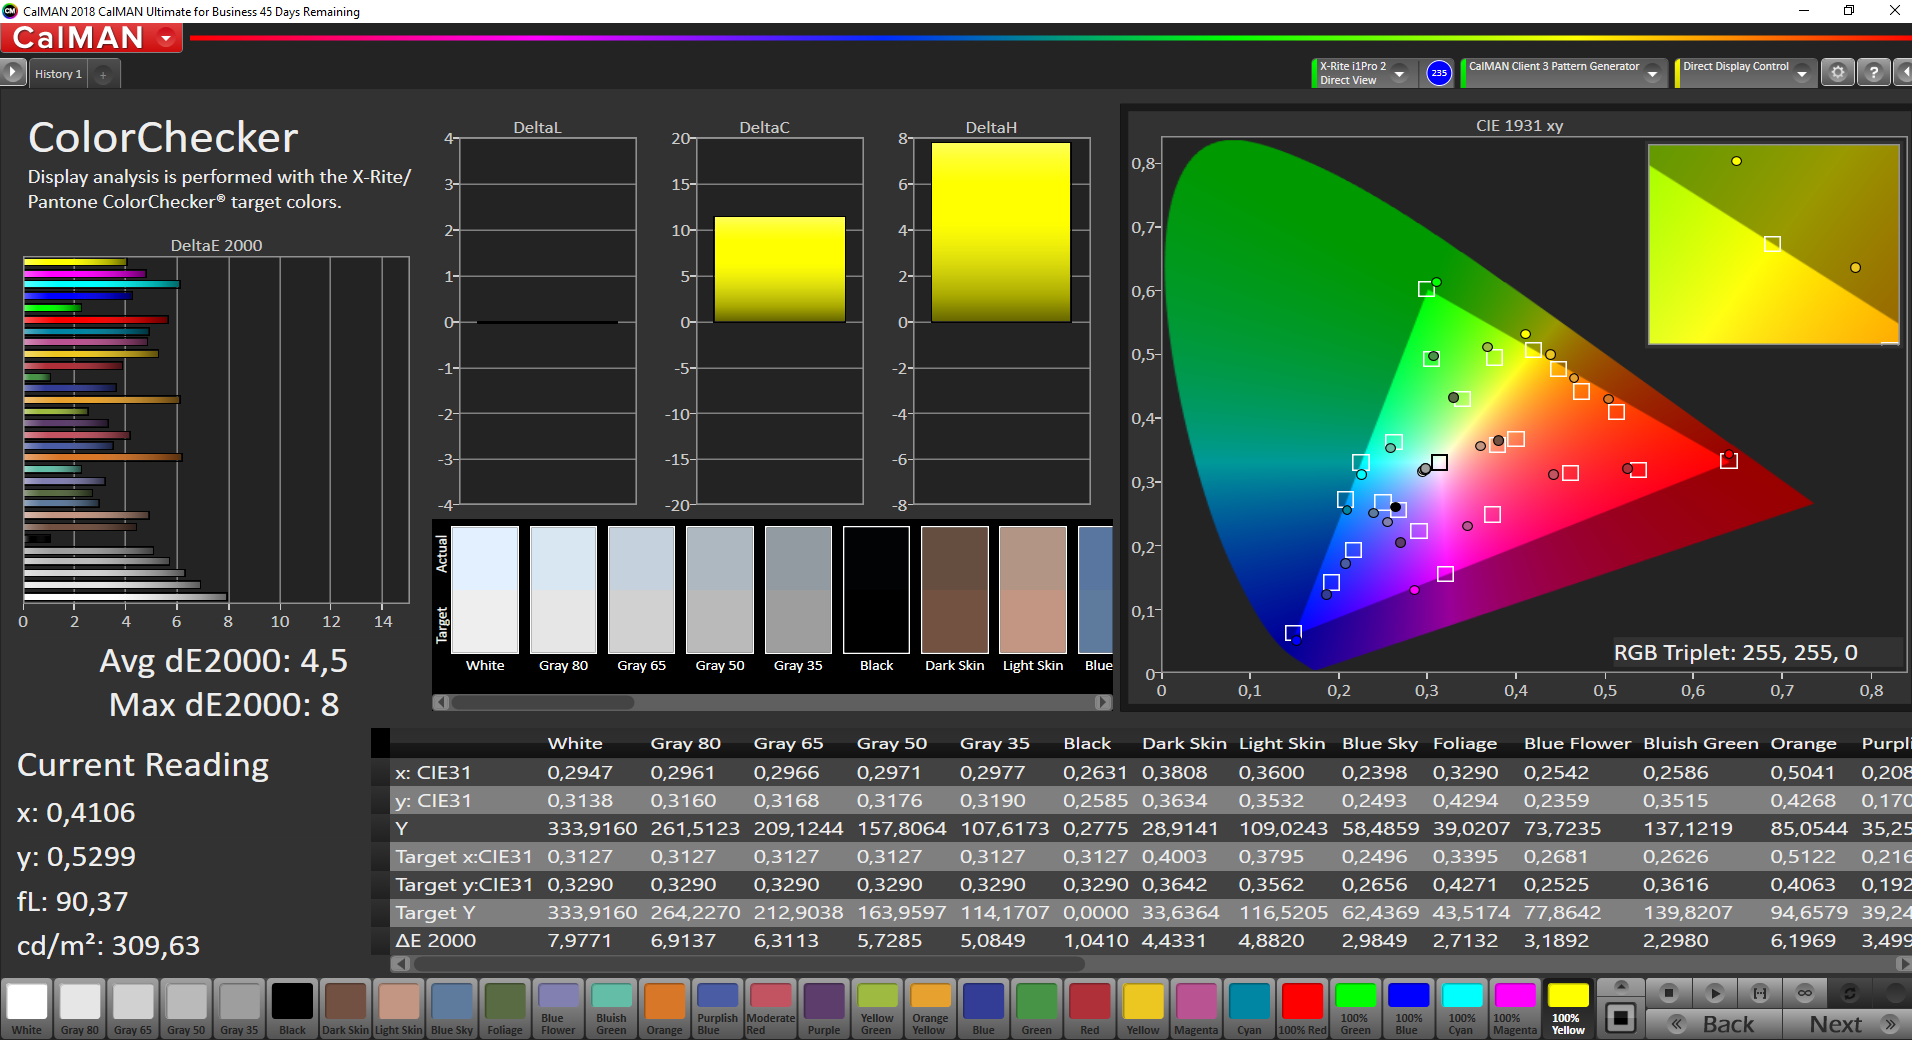
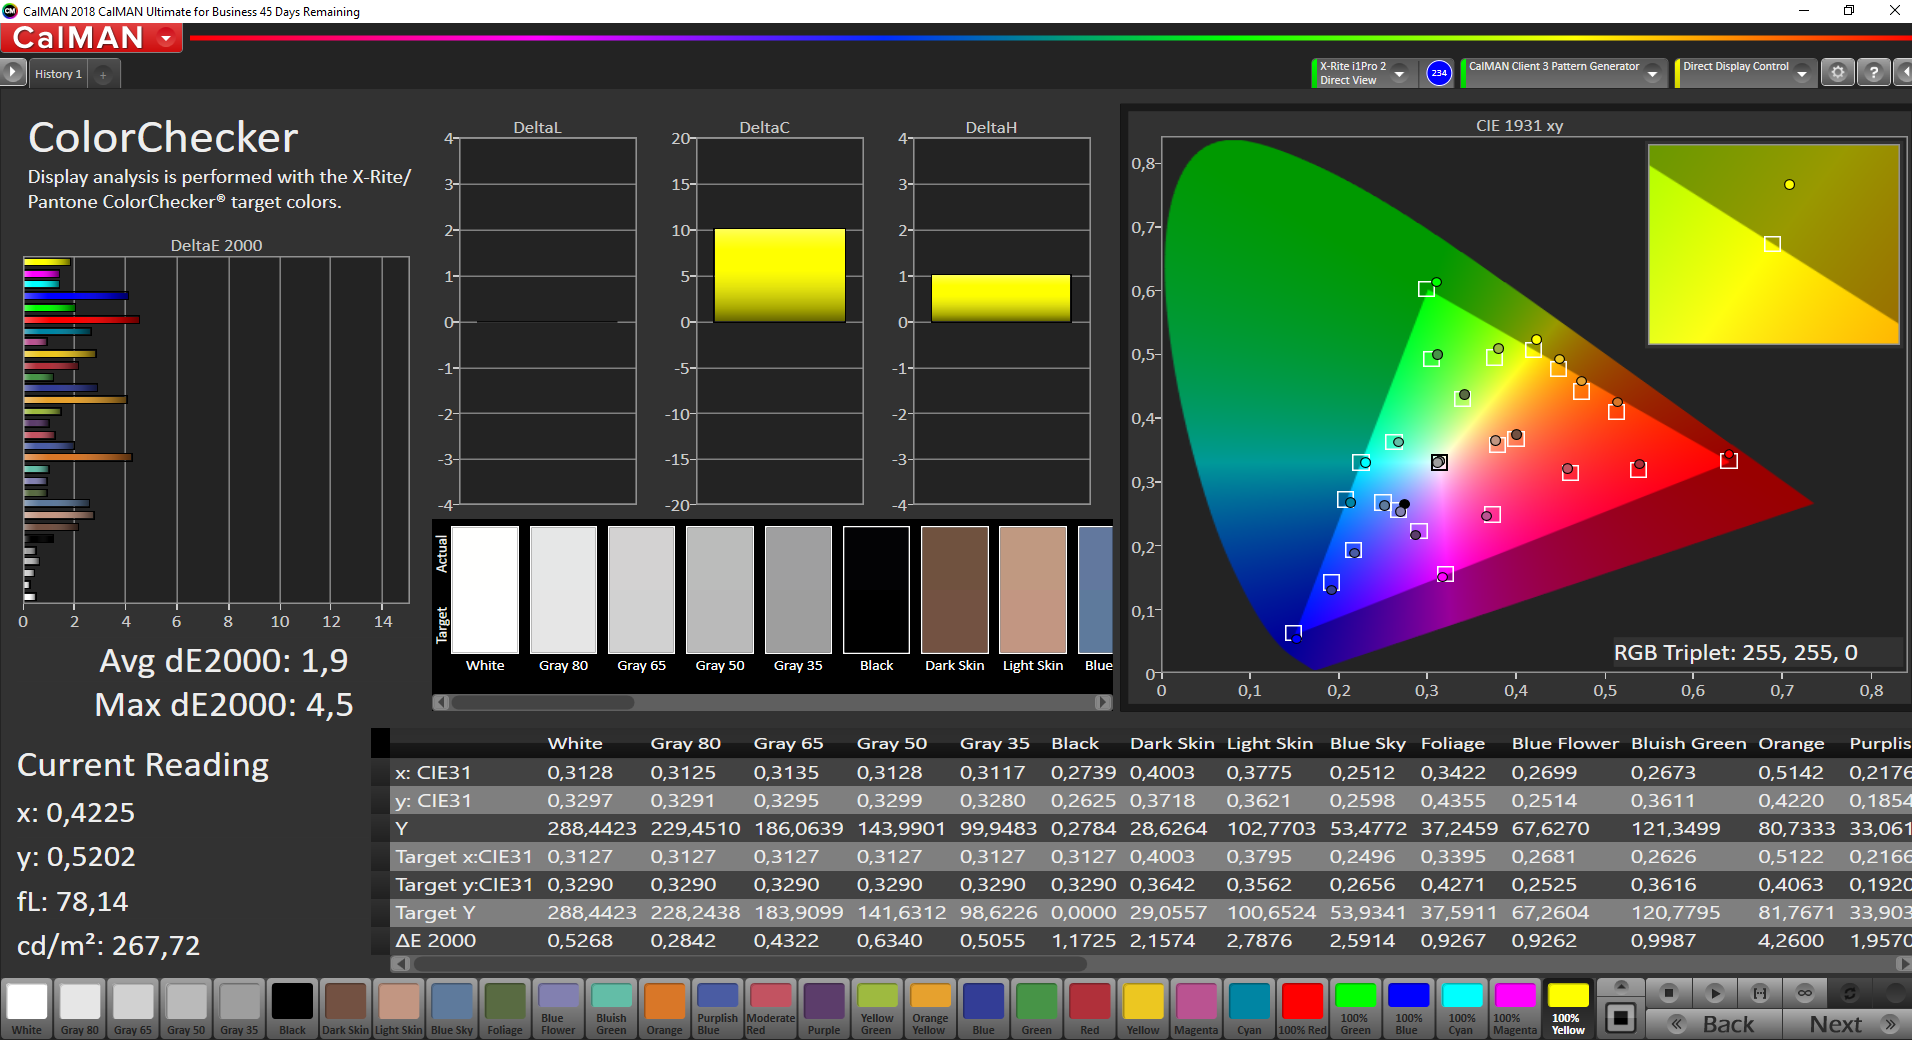
ΔE ColorChecker Calman: 4.5 | ∀{0.5-29.43 Ø4.73}
calibrated: 1.9
ΔE Greyscale Calman: 4.7 | ∀{0.09-98 Ø4.97}
91% sRGB (Argyll 1.6.3 3D)
59% AdobeRGB 1998 (Argyll 1.6.3 3D)
65% AdobeRGB 1998 (Argyll 3D)
91% sRGB (Argyll 3D)
63.8% Display P3 (Argyll 3D)
Gamma: 2.31
CCT: 7537 K
| Schenker XMG Fusion 15 XFU15L19 BOE NV156FHM-N4G, , 1920x1080, 15.6" | Asus Zephyrus S GX502GW AU Optronics B156HAN08.2 (AUO82ED), , 1920x1080, 15.6" | Acer Predator Triton 500 PT515-51-71PZ NV156FHM-N4K (BOE082A), , 1920x1080, 15.6" | Gigabyte Aero 15 Classic-XA Sharp LQ156M1JW03 (SHP14C5), , 1920x1080, 15.6" | Razer Blade 15 RTX 2070 Max-Q LG Philips LGD05C0, , 1920x1080, 15.6" | |
|---|---|---|---|---|---|
| Display | 1% | 2% | 3% | 3% | |
| Display P3 Coverage (%) | 63.8 | 64.9 2% | 64.6 1% | 65.3 2% | 65.3 2% |
| sRGB Coverage (%) | 91 | 91 0% | 92.6 2% | 95.5 5% | 94.9 4% |
| AdobeRGB 1998 Coverage (%) | 65 | 65.9 1% | 66 2% | 66.5 2% | 66.3 2% |
| Response Times | 6% | 6% | -57% | -70% | |
| Response Time Grey 50% / Grey 80% * (ms) | 8 ? | 7.2 ? 10% | 5.2 ? 35% | 15.2 ? -90% | 16.8 ? -110% |
| Response Time Black / White * (ms) | 9 ? | 8.8 ? 2% | 11.2 ? -24% | 11.2 ? -24% | 11.6 ? -29% |
| PWM Frequency (Hz) | 23580 ? | ||||
| Screen | 6% | 12% | 9% | 8% | |
| Brightness middle (cd/m²) | 331 | 286 -14% | 288 -13% | 266 -20% | 314.7 -5% |
| Brightness (cd/m²) | 309 | 275 -11% | 265 -14% | 248 -20% | 312 1% |
| Brightness Distribution (%) | 85 | 90 6% | 84 -1% | 89 5% | 90 6% |
| Black Level * (cd/m²) | 0.32 | 0.37 -16% | 0.22 31% | 0.31 3% | 0.38 -19% |
| Contrast (:1) | 1034 | 773 -25% | 1309 27% | 858 -17% | 828 -20% |
| Colorchecker dE 2000 * | 4.5 | 2.19 51% | 3.22 28% | 2.78 38% | 2.56 43% |
| Colorchecker dE 2000 max. * | 8 | 4.4 45% | 6.26 22% | 5.96 25% | 4.89 39% |
| Colorchecker dE 2000 calibrated * | 1.9 | 2.27 -19% | 1.5 21% | 0.91 52% | 1.71 10% |
| Greyscale dE 2000 * | 4.7 | 2.2 53% | 3.43 27% | 3.58 24% | 3.4 28% |
| Gamma | 2.31 95% | 2.41 91% | 2.41 91% | 2.46 89% | 2.3 96% |
| CCT | 7537 86% | 6405 101% | 7290 89% | 7186 90% | 6435 101% |
| Color Space (Percent of AdobeRGB 1998) (%) | 59 | 59 0% | 60 2% | 62 5% | 60.7 3% |
| Color Space (Percent of sRGB) (%) | 91 | 91 0% | 93 2% | 96 5% | 94.6 4% |
| Total Average (Program / Settings) | 4% /
5% | 7% /
9% | -15% /
-0% | -20% /
-3% |
* ... smaller is better
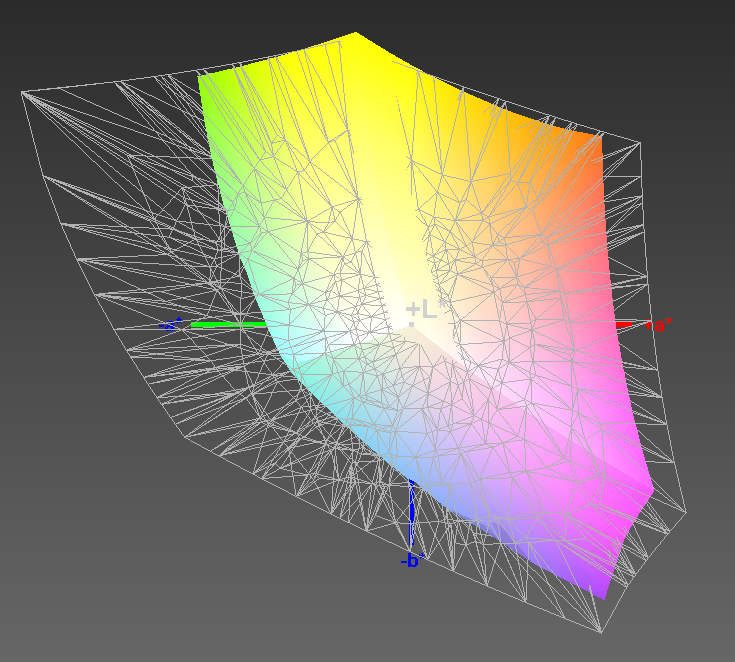
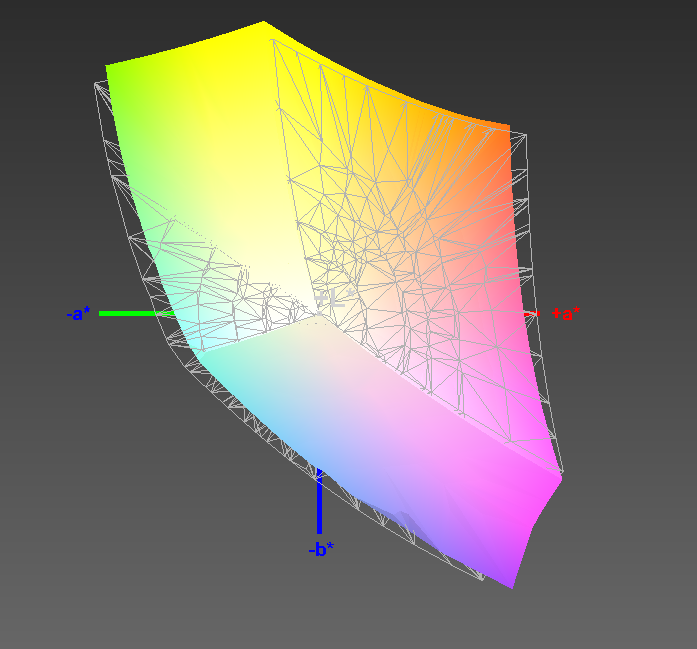
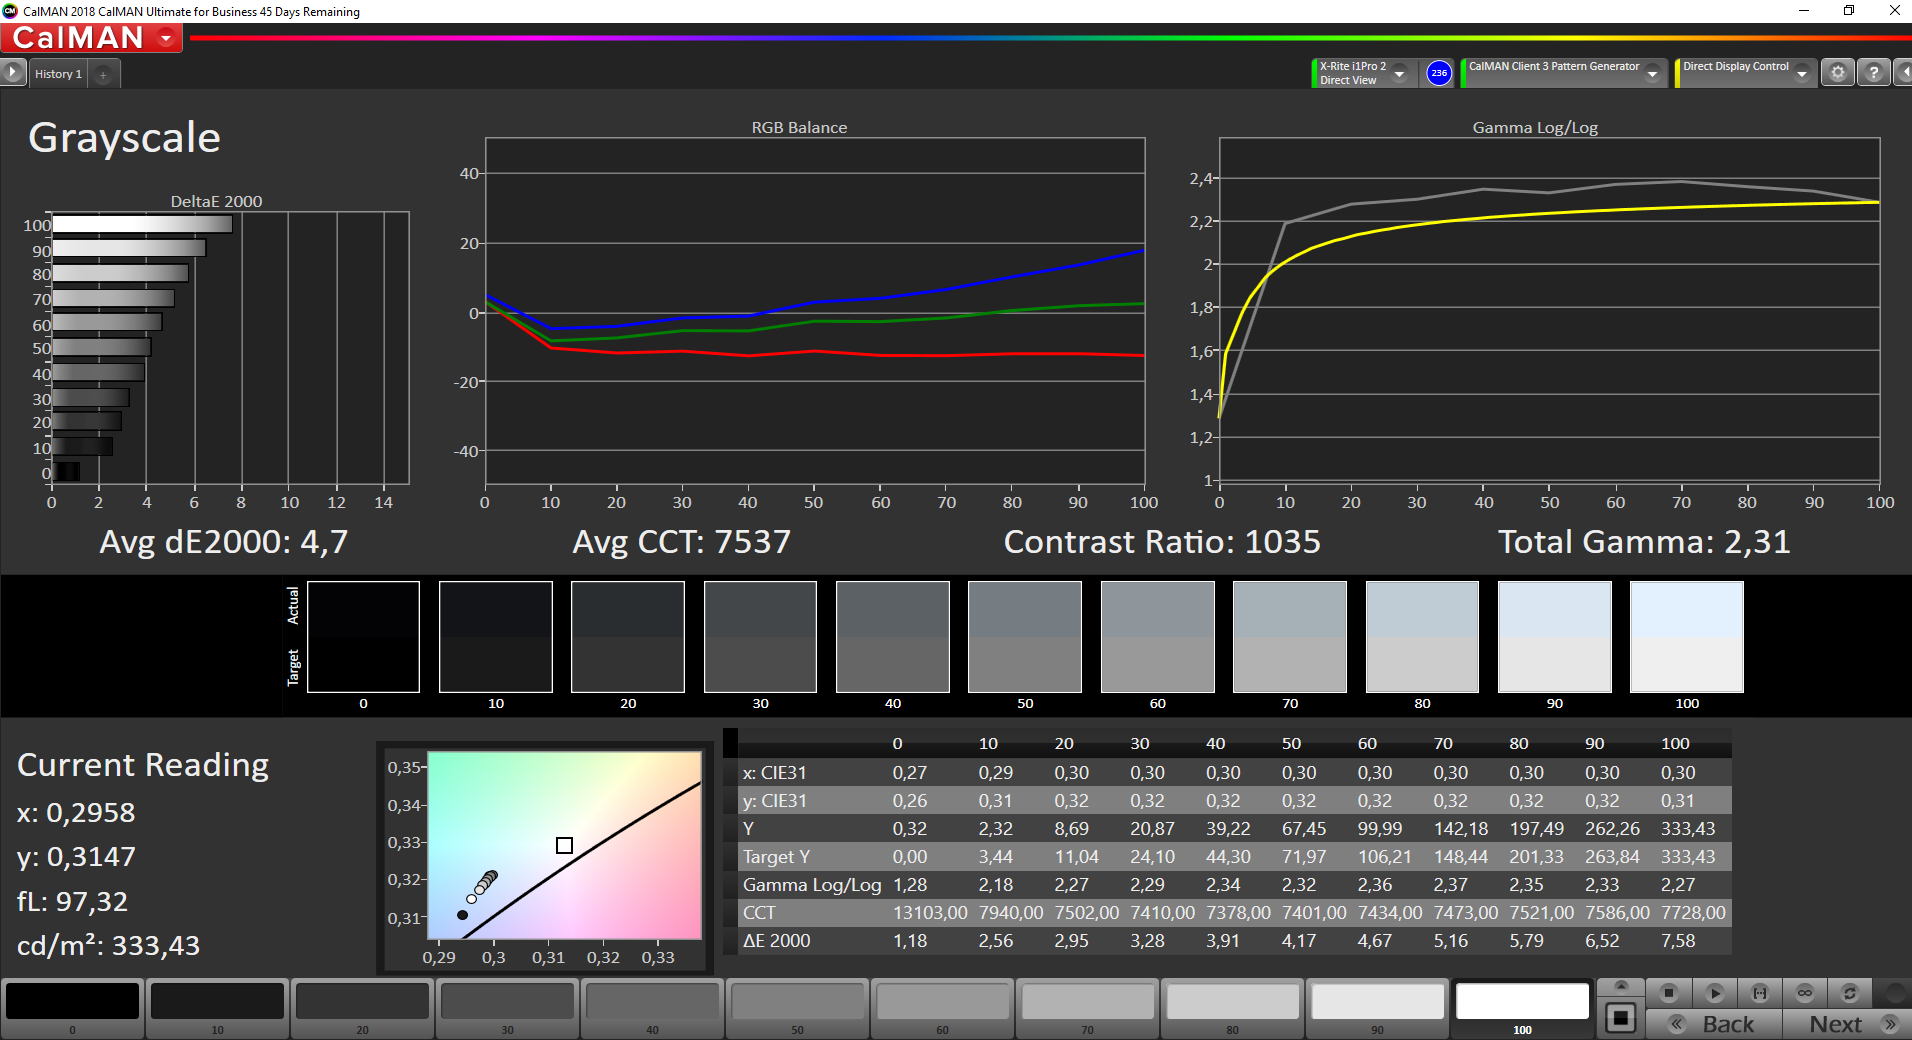
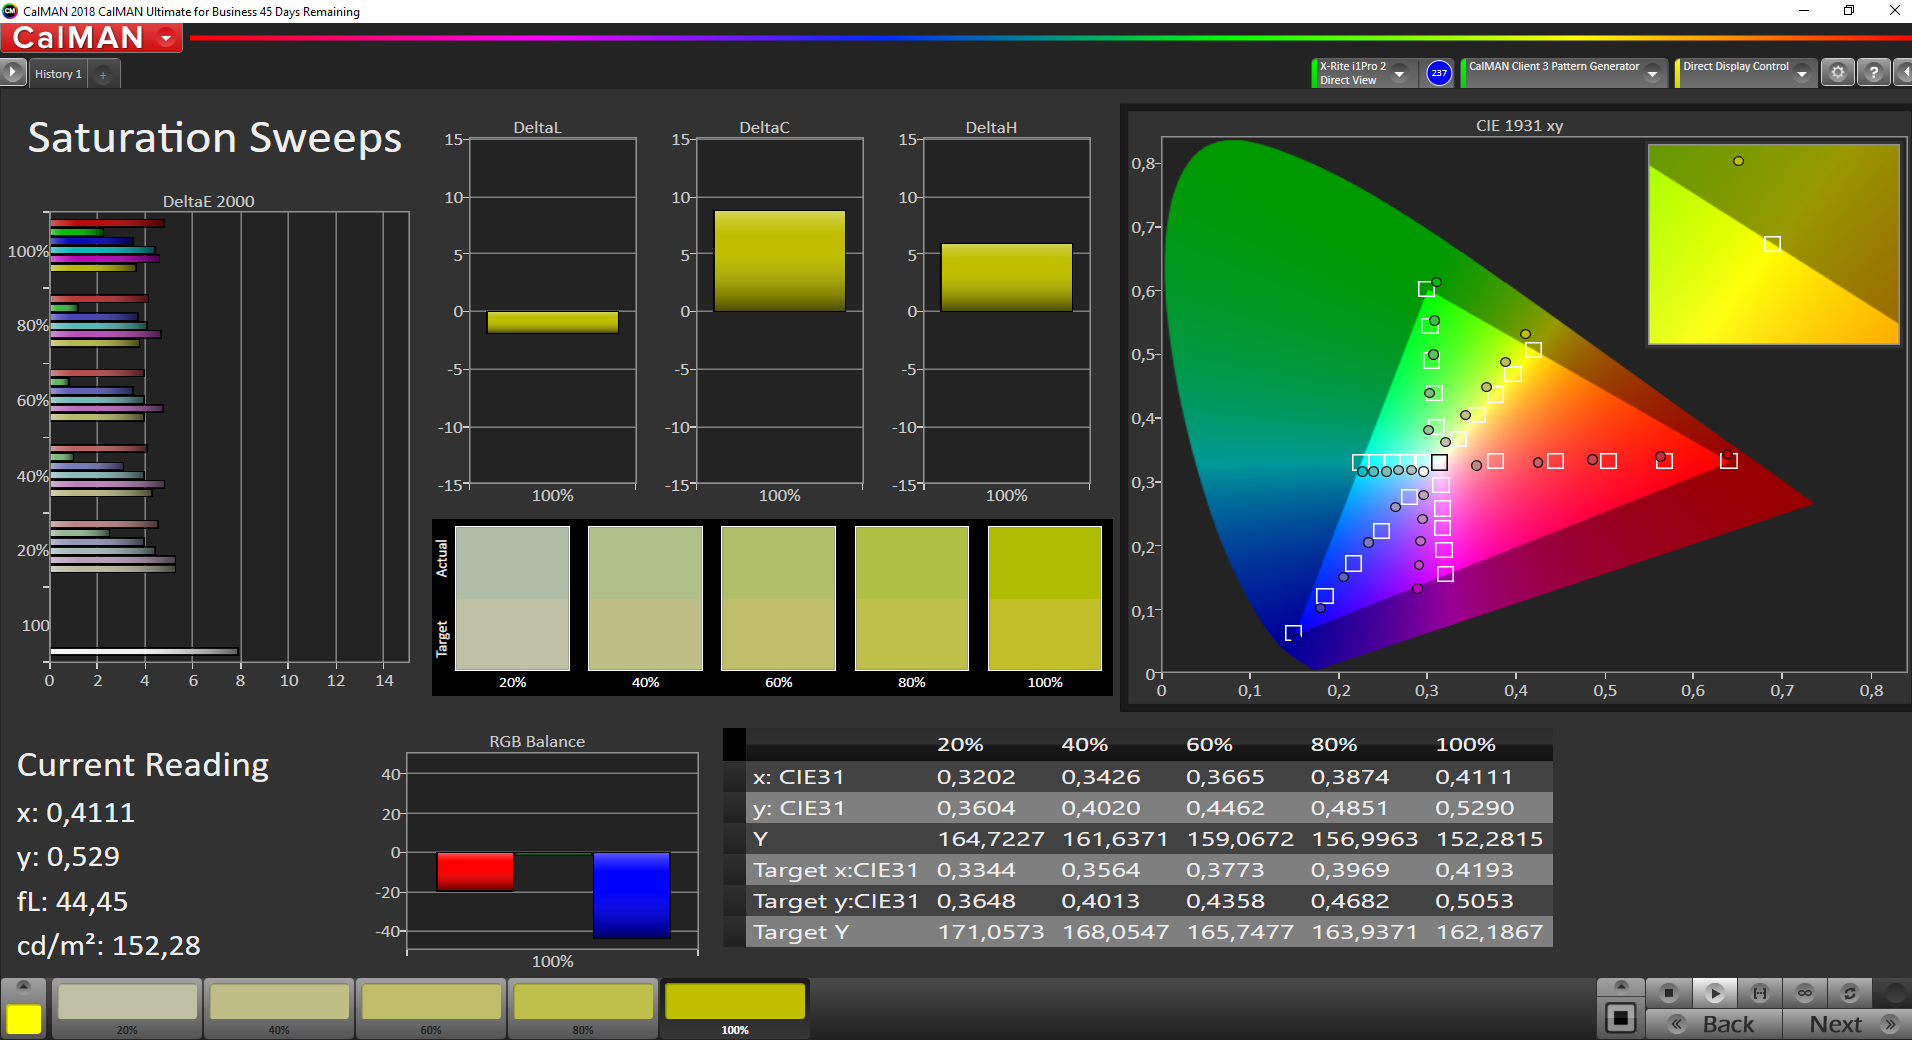
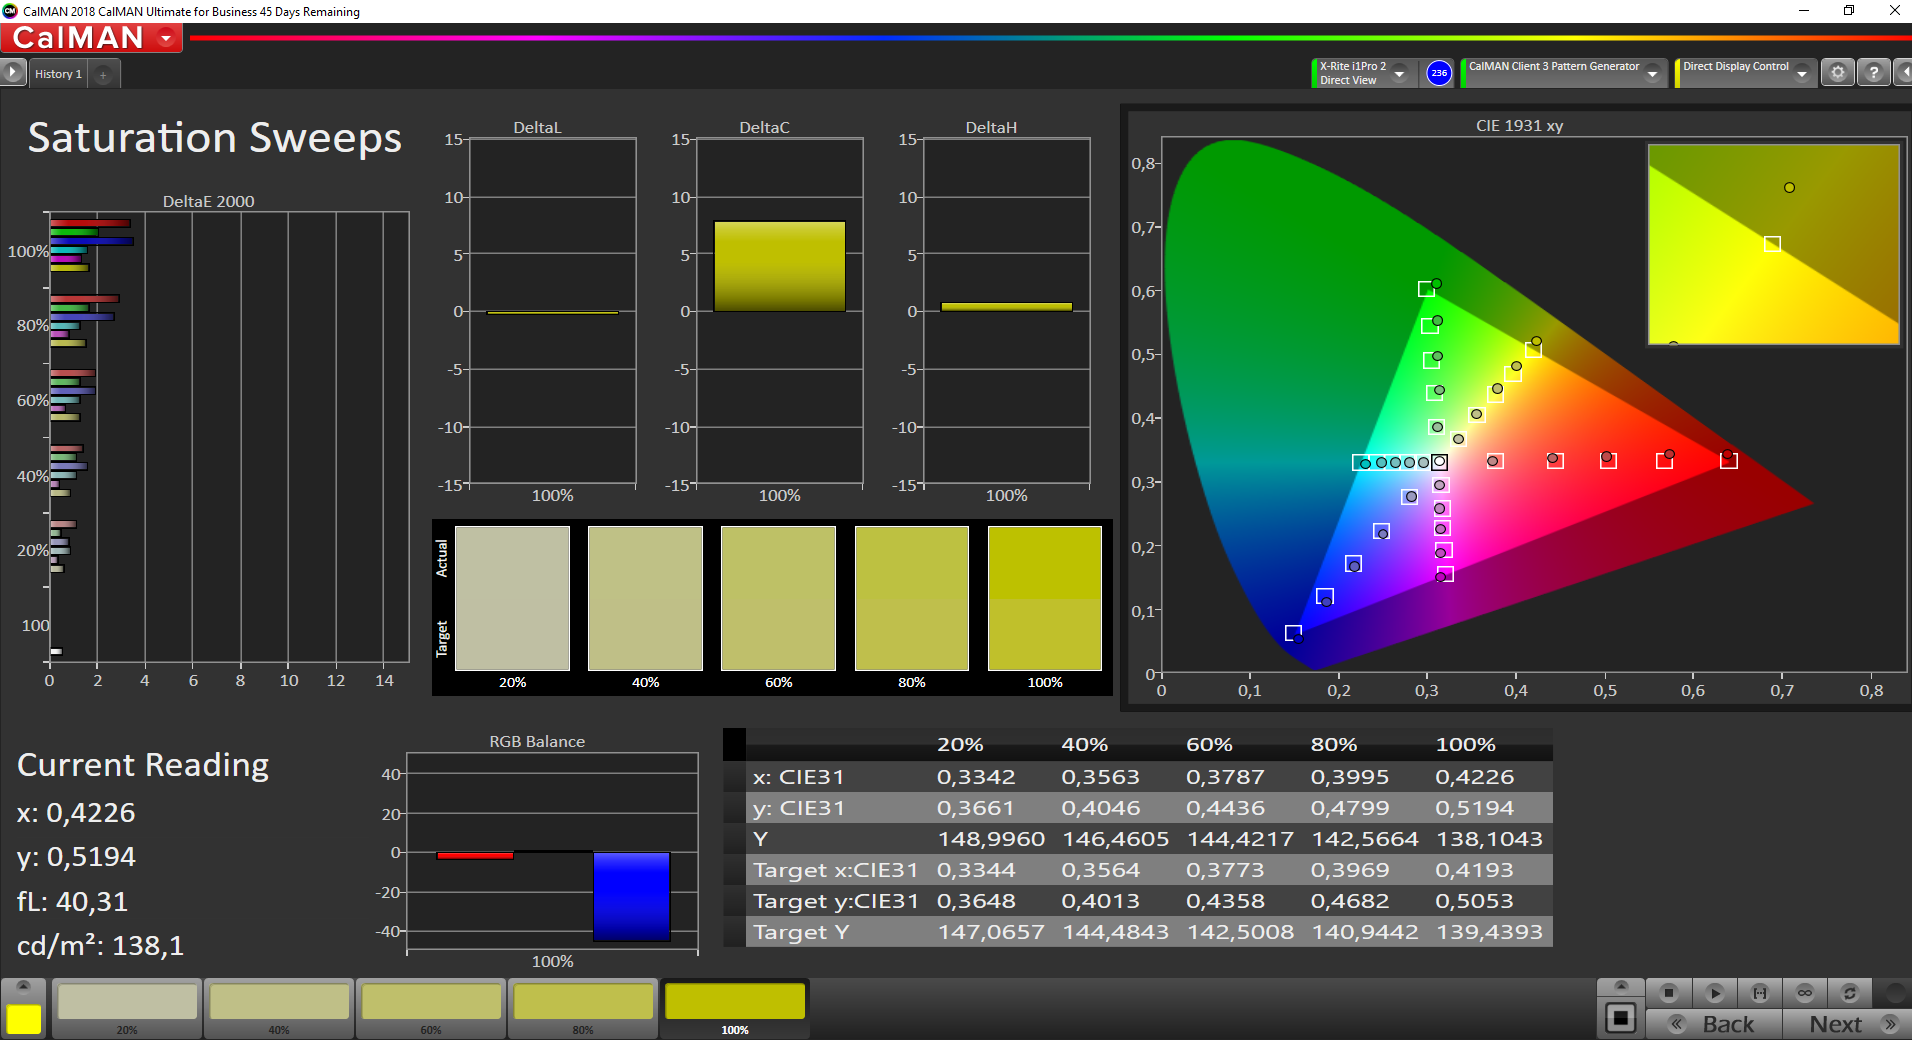
The BOE only manages to cover 91% of the sRGB color space. Competitors do not do a better job or at least not a much better job. The more important question is, whether or not there is a blue tint ex-factory. Unfortunately, a blue tint caused by a deltaE of almost six is indeed present. The blue tint can be fixed entirely with calibration for a deltaE of 1.0 and perfect color parity.
Schenker offers an appropriate color profile in the download section, which eliminates the blue tint. A color temperature (standard, gaming, video, reading) can be selected from the Control Center. We left the color temperature adjustments disabled for our measurements. The pre-configured modes do not offer better color accuracy.
Display Response Times
| ↔ Response Time Black to White | ||
|---|---|---|
| 9 ms ... rise ↗ and fall ↘ combined | ↗ 5 ms rise | 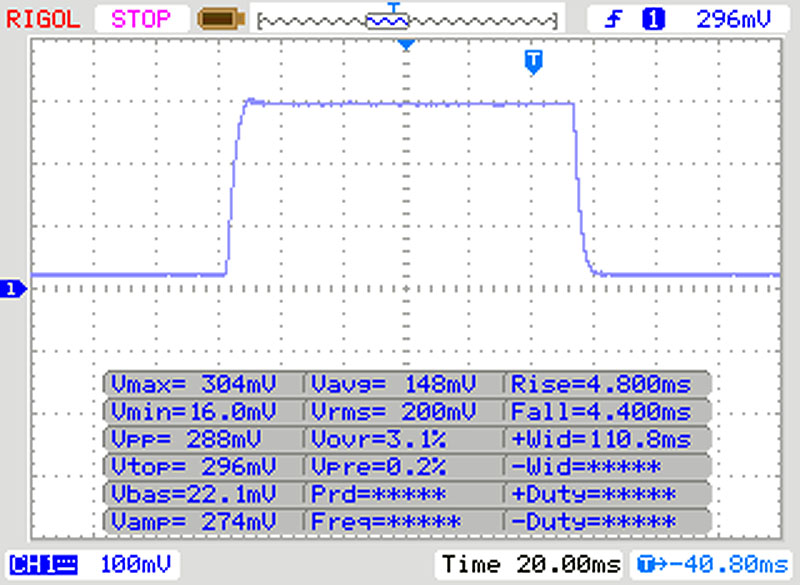 |
| ↘ 4 ms fall | ||
| The screen shows fast response rates in our tests and should be suited for gaming. In comparison, all tested devices range from 0.1 (minimum) to 240 (maximum) ms. » 25 % of all devices are better. This means that the measured response time is better than the average of all tested devices (19.9 ms). | ||
| ↔ Response Time 50% Grey to 80% Grey | ||
| 8 ms ... rise ↗ and fall ↘ combined | ↗ 4 ms rise | 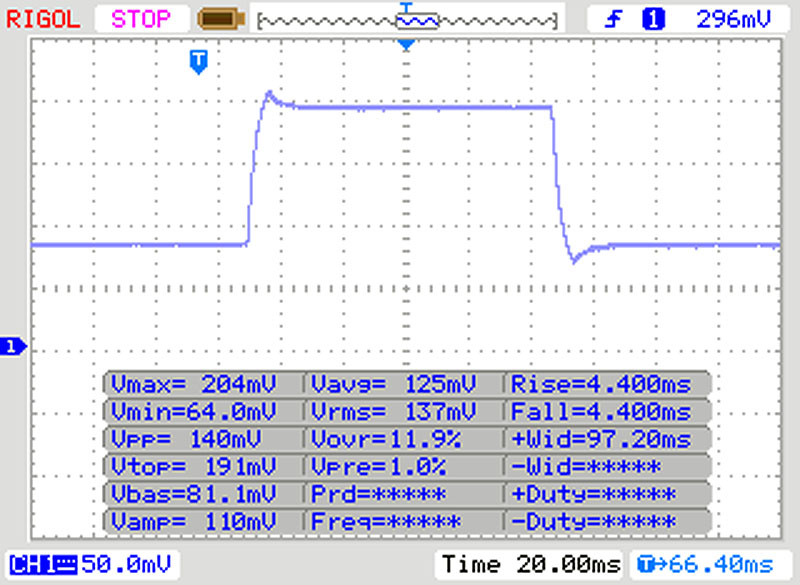 |
| ↘ 4 ms fall | ||
| The screen shows fast response rates in our tests and should be suited for gaming. In comparison, all tested devices range from 0.165 (minimum) to 636 (maximum) ms. » 21 % of all devices are better. This means that the measured response time is better than the average of all tested devices (31.1 ms). | ||
Screen Flickering / PWM (Pulse-Width Modulation)
| Screen flickering / PWM not detected | 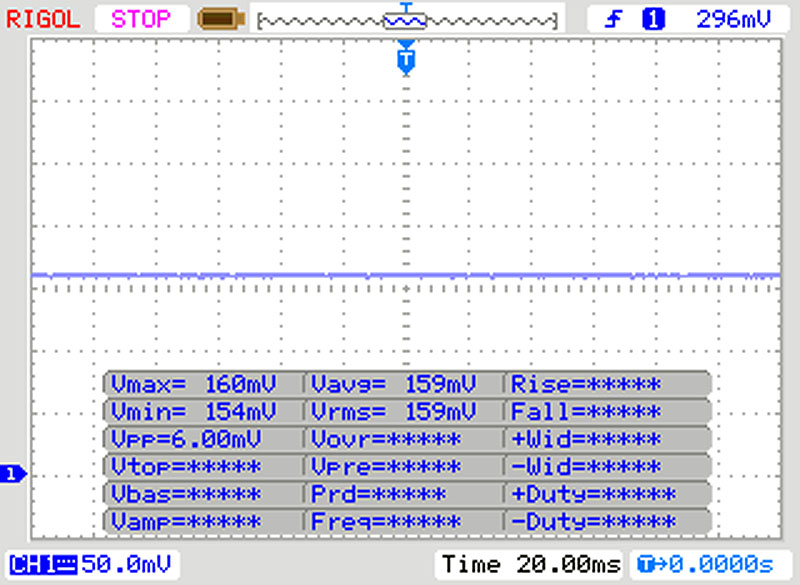 | ||
In comparison: 52 % of all tested devices do not use PWM to dim the display. If PWM was detected, an average of 7794 (minimum: 5 - maximum: 343500) Hz was measured. | |||

Performance
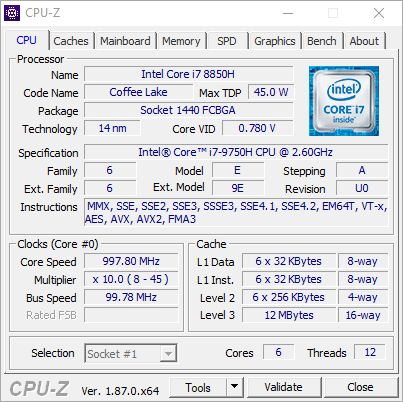
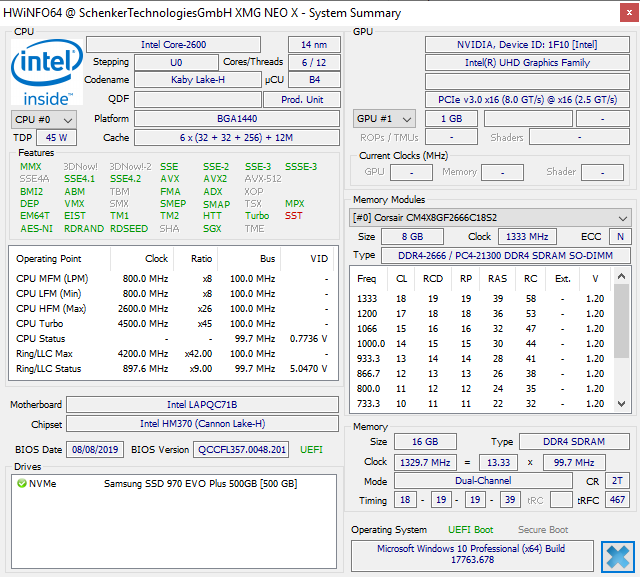
The gaming laptop's datasheet is impressive: The Intel Core i7-9750H (Coffee Lake) and GeForce RTX 2070 Max-Q are powerful components, the likes of which can also be found in many other high-end gaming laptops. While the SoC and the GPU are nothing out of the ordinary, it is interesting to see how much performance the Intel reference model is able to squeeze out of the components.
The SoC, which is rated for a TDP of 45 watts, was designed for large and heavy laptops. For thinner devices, the configurable TDP can be reduced to 35 watts. However, this is not the case with our Schenker and even though things get crowded, the CPU package has a budget of around 50 watts.
Alternatively, the Fusion 15 can be equipped with a GeForce GTX 1660 Ti (6 GB GDDR6). Since the display is connected via Nvidia Optimus, the RTX card can be disabled in favor of the integrated UHD Graphics 630.
Performance Profiles
In the Control Center, Intel lets users choose between three different performance profiles, which are comprised of the building blocks CPU, GPU, and fan profile. This allows the CPU to run in balanced mode (TDP 63 W) and the GPU at 100% while gaming.
Enthusiast mode is supposed to satisfy gamers' needs: The graphics card runs at full power, while the processor runs in balanced mode in order to allow it to reduce the clock speed when the temperature rises too high.


Processor
As the Cinebench R15 loop confirms, the processor is able to unfold its full Turbo Boost potential even in mode 2 (balanced). The clock speeds fluctuate between 3.7 and 4.0 GHz. The core temperature rises to just below 90 °C, causing the clock speed to temporarily drop to 3.7 GHz. This translates to a performance deficit of 5% overall, although the Fusion starts out with a much higher score than competing devices with an identical SoC.
System Performance
In terms of application performance, the Fusion 15 leaves its opposition in the dust and claims first place. That being said, the performance lead of just +1 % relative to the Acer Predator Triton 500 is small. Meanwhile, our test device cannot claim the top spot when it comes to productivity, falling behind by 3% compared to the first place Gigabyte Aero 15 Classic.
| PCMark 8 Home Score Accelerated v2 | 4890 points | |
| PCMark 8 Creative Score Accelerated v2 | 5931 points | |
| PCMark 8 Work Score Accelerated v2 | 5694 points | |
| PCMark 10 Score | 5784 points | |
Help | ||
Storage Solution
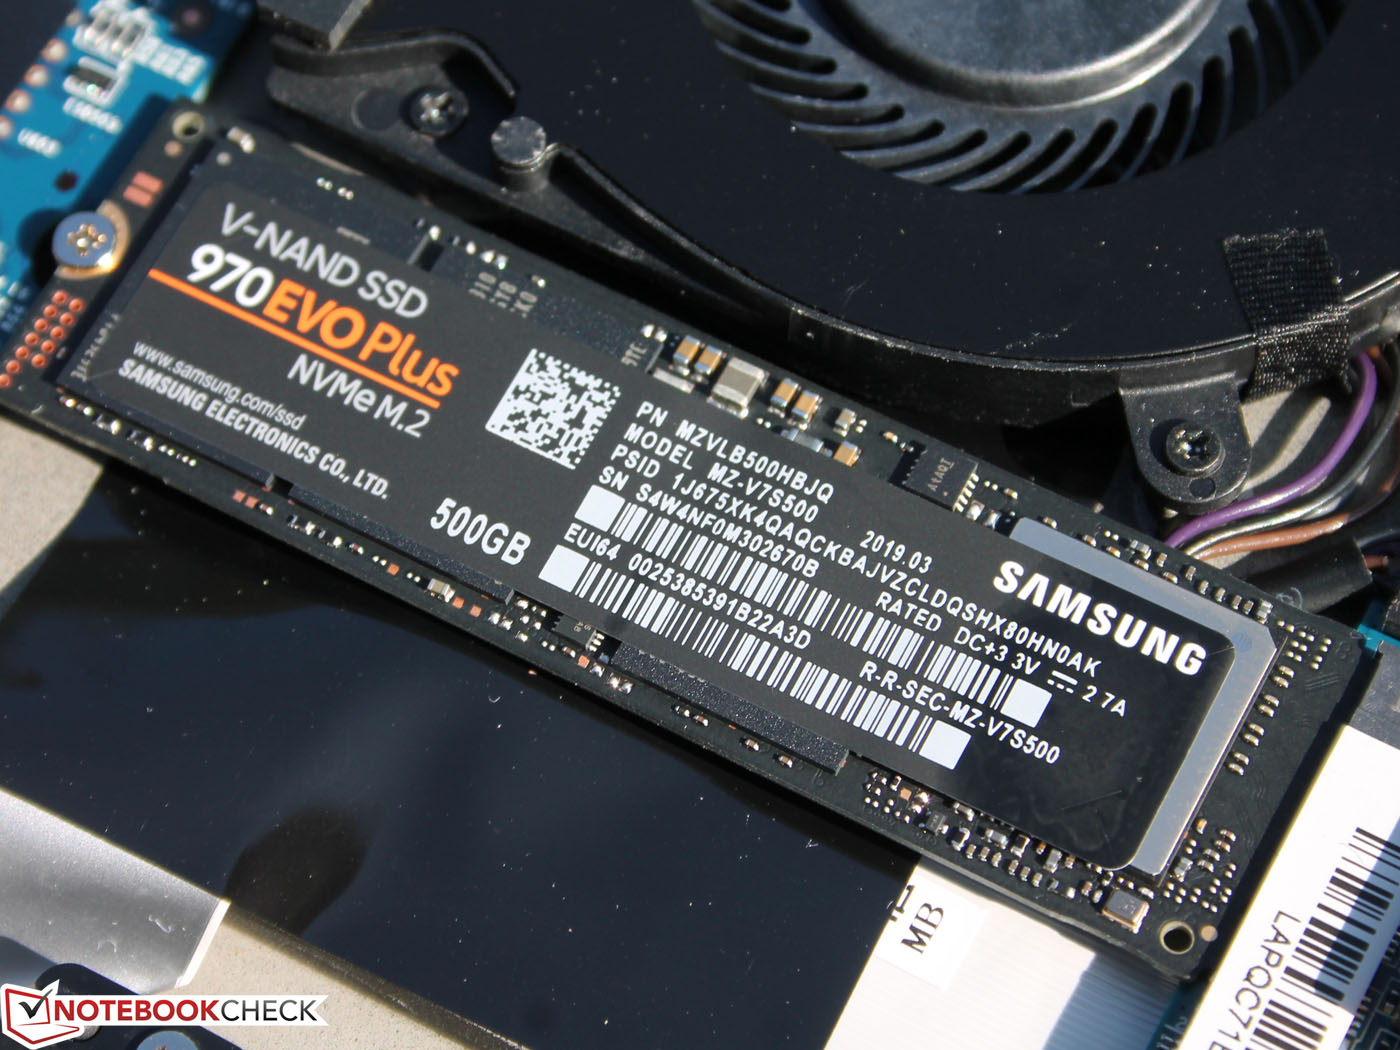
The Samsung SSD 970 Evo Plus (500 GB) can be used in a RAID 1 (redundant) or RAID 0 configuration. For users who do not need redundance, 400 GB of storage space is available. Since a second M.2-2280 slot for an additional SSD (PCI Express x4) is available, storage capacity is not a problem.
| Schenker XMG Fusion 15 XFU15L19 Samsung SSD 970 EVO Plus 500GB | Asus Zephyrus S GX502GW 2x Intel SSD 660p SSDPEKNW512G8 (RAID 0) | Acer Predator Triton 500 PT515-51-71PZ WDC PC SN720 SDAPNTW-512G | Gigabyte Aero 15 Classic-XA Intel SSD 760p SSDPEKKW512G8 | Razer Blade 15 RTX 2070 Max-Q Samsung SSD PM981 MZVLB512HAJQ | Average Samsung SSD 970 EVO Plus 500GB | |
|---|---|---|---|---|---|---|
| CrystalDiskMark 5.2 / 6 | 7% | 15% | 13% | -8% | 29% | |
| Write 4K (MB/s) | 106.5 | 97 -9% | 108.8 2% | 115.5 8% | 93.9 -12% | 159.2 ? 49% |
| Read 4K (MB/s) | 42.24 | 49.58 17% | 40.31 -5% | 58 37% | 40.56 -4% | 48.5 ? 15% |
| Write Seq (MB/s) | 1466 | 1838 25% | 2488 70% | 1555 6% | 1468 0% | 2114 ? 44% |
| Read Seq (MB/s) | 1337 | 2421 81% | 1916 43% | 2590 94% | 1540 15% | 2044 ? 53% |
| Write 4K Q32T1 (MB/s) | 337.3 | 326.9 -3% | 382.4 13% | 369.3 9% | 293.5 -13% | 435 ? 29% |
| Read 4K Q32T1 (MB/s) | 407.6 | 372.9 -9% | 421.8 3% | 441.7 8% | 346 -15% | 508 ? 25% |
| Write Seq Q32T1 (MB/s) | 2933 | 1894 -35% | 2542 -13% | 1547 -47% | 1941 -34% | 3238 ? 10% |
| Read Seq Q32T1 (MB/s) | 3235 | 2828 -13% | 3320 3% | 2969 -8% | 3266 1% | 3499 ? 8% |
| AS SSD | -28% | -2% | -23% | -7% | 6% | |
| Seq Read (MB/s) | 2438 | 2506 3% | 2888 18% | 2517 3% | 1840 -25% | 2640 ? 8% |
| Seq Write (MB/s) | 2179 | 1712 -21% | 2374 9% | 924 -58% | 1822 -16% | 2500 ? 15% |
| 4K Read (MB/s) | 50.6 | 48.32 -5% | 42.95 -15% | 59.1 17% | 52.3 3% | 54.8 ? 8% |
| 4K Write (MB/s) | 117.2 | 103.6 -12% | 143.6 23% | 126.5 8% | 110.7 -6% | 141.2 ? 20% |
| 4K-64 Read (MB/s) | 1159 | 624 -46% | 1272 10% | 876 -24% | 1126 -3% | 1345 ? 16% |
| 4K-64 Write (MB/s) | 2359 | 1253 -47% | 1546 -34% | 922 -61% | 1717 -27% | 2116 ? -10% |
| Access Time Read * (ms) | 0.063 | 0.08 -27% | 0.042 33% | 0.047 25% | 0.0475 ? 25% | |
| Access Time Write * (ms) | 0.031 | 0.04 -29% | 0.065 -110% | 0.033 -6% | 0.02775 ? 10% | |
| Score Read (Points) | 1454 | 923 -37% | 1604 10% | 1186 -18% | 1362 -6% | 1664 ? 14% |
| Score Write (Points) | 2694 | 1528 -43% | 1927 -28% | 1141 -58% | 2010 -25% | 2507 ? -7% |
| Score Total (Points) | 4886 | 2896 -41% | 4329 -11% | 2870 -41% | 4079 -17% | 5023 ? 3% |
| Copy ISO MB/s (MB/s) | 1998 | 2086 4% | 1975 -1% | 1989 ? 0% | ||
| Copy Program MB/s (MB/s) | 511 | 454.2 -11% | 526 3% | 442 ? -14% | ||
| Copy Game MB/s (MB/s) | 1216 | 1141 -6% | 1200 -1% | 1121 ? -8% | ||
| Total Average (Program / Settings) | -11% /
-13% | 7% /
6% | -5% /
-10% | -8% /
-7% | 18% /
14% |
* ... smaller is better

Graphics Performance

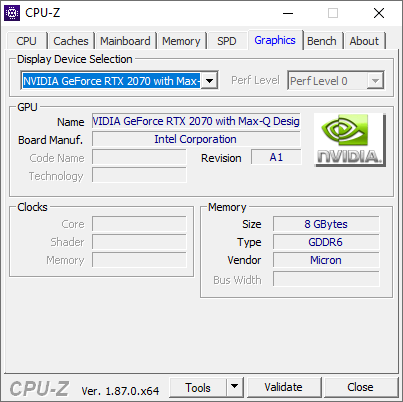
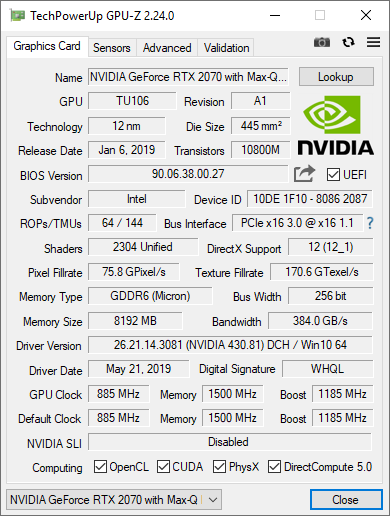
The GeForce RTX 2070 Max-Q (TU106) is equipped with 8 GB of GDDR6 video memory. The GPU cores run at 885 MHz and can boost to up to 1,478 MHz.
The video memory is accessed through a 256-bit interface.
Max-Q denotes a more economical version of the mobile RTX 2070. Reduced clock speeds result in significantly lower power consumption and make the card suitable for thin laptops. As the clock speed readings during our The Witcher 3 ultra test confirm (1,478 MHz average; 1,700 MHz maximum), the installed Max-Q card is the powerful 90-watt TDP variant. Meanwhile, HWiNFO indicates a GPU power of just 80 watts.
In 3DMark, the Fusion 15 leaps ahead of competing devices in the comparison and is able to claim a sizeable performance lead of 6-9%.
| 3DMark 11 Performance | 20181 points | |
| 3DMark Cloud Gate Standard Score | 39529 points | |
| 3DMark Fire Strike Score | 17593 points | |
Help | ||
Gaming Performance
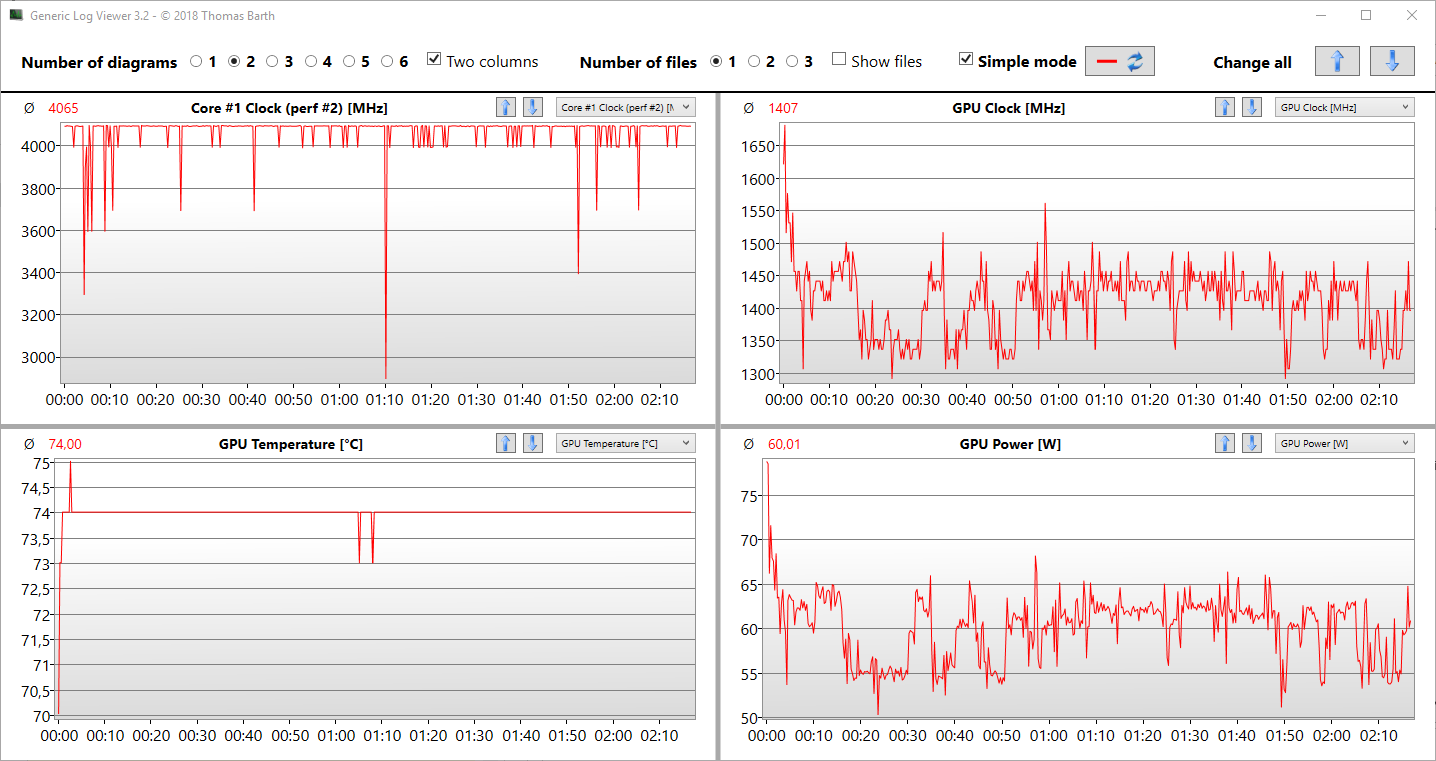
In order to evaluate the gaming performance, we performed our The Witcher 3 ultra test without the 60-FPS limit. During the test, the laptop consistently shows a high consumption of around 190 W and the GPU runs at 1,350 to 1,450 MHz. While this makes the Fusion 15 as good as the best thin gaming laptops, it does not make it better than them.
| The Witcher 3 - 1920x1080 Ultra Graphics & Postprocessing (HBAO+) | |
| Average of class Gaming (95 - 240, n=8, last 2 years) | |
| Asus Zephyrus S GX502GW | |
| Razer Blade 15 RTX 2070 Max-Q | |
| Average NVIDIA GeForce RTX 2070 Max-Q (56 - 83.8, n=31) | |
| Schenker XMG Fusion 15 XFU15L19 | |
| Acer Predator Triton 500 PT515-51-71PZ | |
| Gigabyte Aero 15 Classic-XA | |
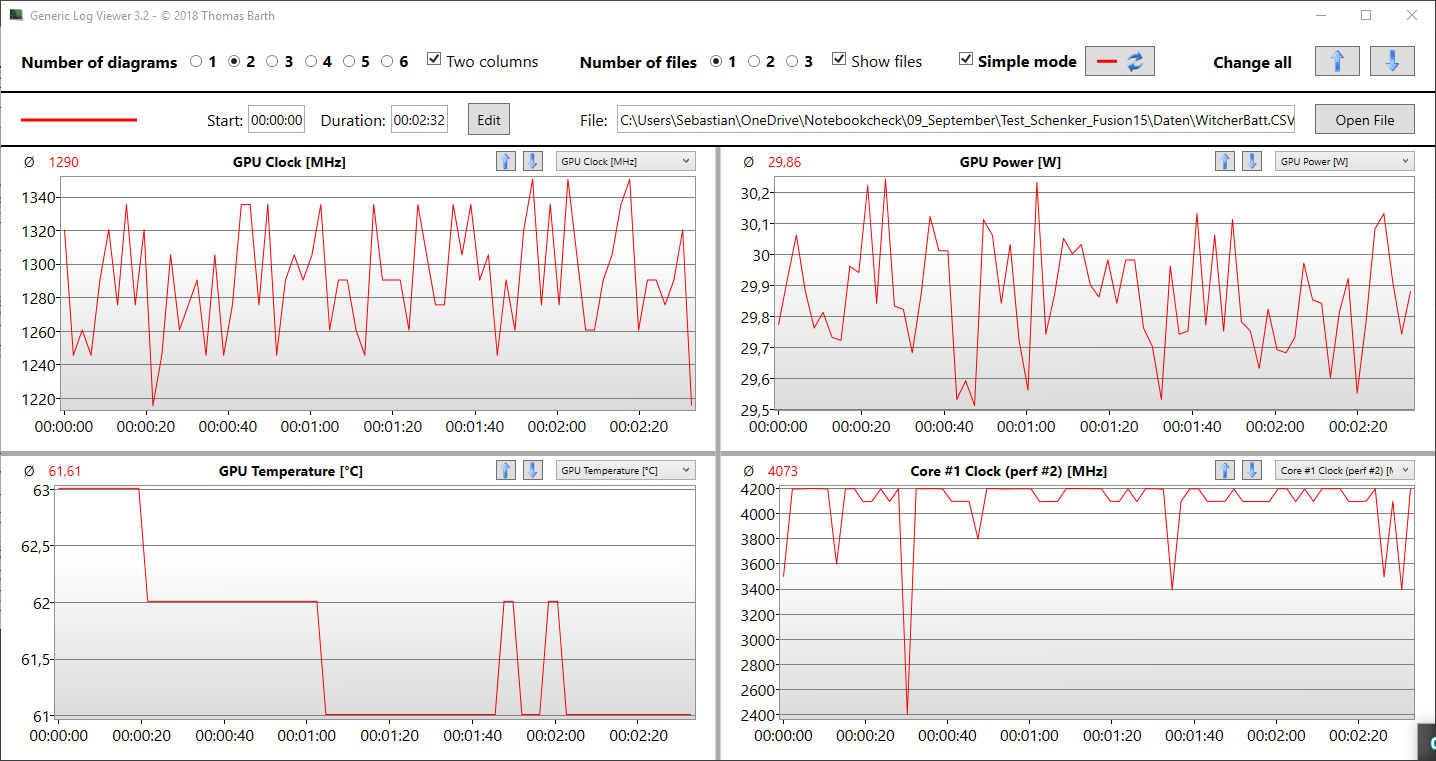
The following screenshots show the clock speeds of the CPU and GPU during The Witcher 3 ultra during battery mode and while on mains. The performance is limited in battery mode, where the GPU clock falls from 1,400 MHz (mains) to 1,300 MHz. In turn, the GPU's power draw drops to 30 watts (from 60 watts) and the temperature decreases to 63 °C (from 74 °C).
| F1 2019 - 1920x1080 Ultra High Preset AA:T AF:16x | |
| Schenker XMG Fusion 15 XFU15L19 | |
| Average NVIDIA GeForce RTX 2070 Max-Q (97 - 112, n=5) | |
| Acer Predator Triton 500 PT515-51-71PZ | |
| Dirt Rally 2.0 - 1920x1080 Ultra Preset AA:T AF:16x | |
| Acer Predator Triton 500 PT515-51-71PZ | |
| Schenker XMG Fusion 15 XFU15L19 | |
| Asus Zephyrus S GX502GW | |
| Average NVIDIA GeForce RTX 2070 Max-Q (68.8 - 79.1, n=4) | |
| Anthem - 1920x1080 Ultra Preset | |
| Asus Zephyrus S GX502GW | |
| Acer Predator Triton 500 PT515-51-71PZ | |
| Average NVIDIA GeForce RTX 2070 Max-Q (67.8 - 75.7, n=4) | |
| Schenker XMG Fusion 15 XFU15L19 | |
| Farming Simulator 19 - 1920x1080 Very High Preset | |
| Schenker XMG Fusion 15 XFU15L19 | |
| Average NVIDIA GeForce RTX 2070 Max-Q (106 - 128.1, n=2) | |
| Shadow of the Tomb Raider - 1920x1080 Highest Preset AA:T | |
| Average of class Gaming (96 - 116, n=2, last 2 years) | |
| Average NVIDIA GeForce RTX 2070 Max-Q (57 - 89, n=12) | |
| Asus Zephyrus S GX502GW | |
| Schenker XMG Fusion 15 XFU15L19 | |
| The Witcher 3 - 1920x1080 Ultra Graphics & Postprocessing (HBAO+) | |
| Average of class Gaming (95 - 240, n=8, last 2 years) | |
| Asus Zephyrus S GX502GW | |
| Razer Blade 15 RTX 2070 Max-Q | |
| Average NVIDIA GeForce RTX 2070 Max-Q (56 - 83.8, n=31) | |
| Schenker XMG Fusion 15 XFU15L19 | |
| Acer Predator Triton 500 PT515-51-71PZ | |
| Gigabyte Aero 15 Classic-XA | |
In order to check whether the frame rates remain consistent over a prolonged period of time, we played The Witcher 3 for around 60 minutes in Full HD resolution and with maximum detail settings. The character controlled by the player was not moved during this time. The frame rate does not decrease over time and there is no drop in performance.
| low | med. | high | ultra | |
|---|---|---|---|---|
| The Witcher 3 (2015) | 66 | |||
| Shadow of the Tomb Raider (2018) | 77 | 72 | ||
| Farming Simulator 19 (2018) | 128.1 | |||
| Anthem (2019) | 70.6 | |||
| Dirt Rally 2.0 (2019) | 77.4 | |||
| F1 2019 (2019) | 105 |
Emissions
Noise Emissions
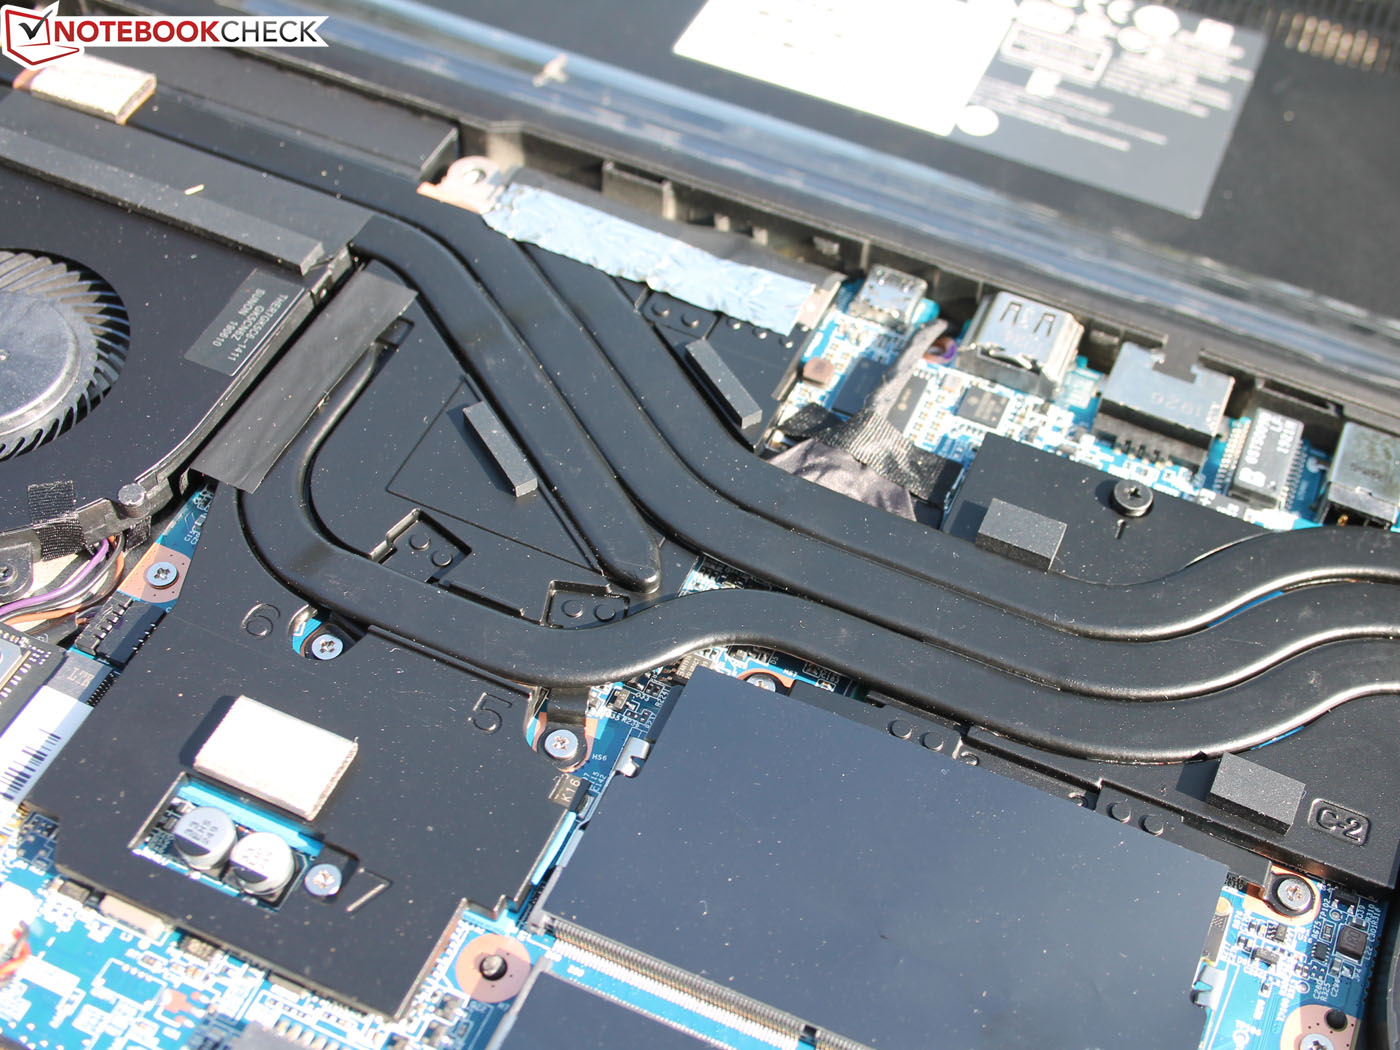
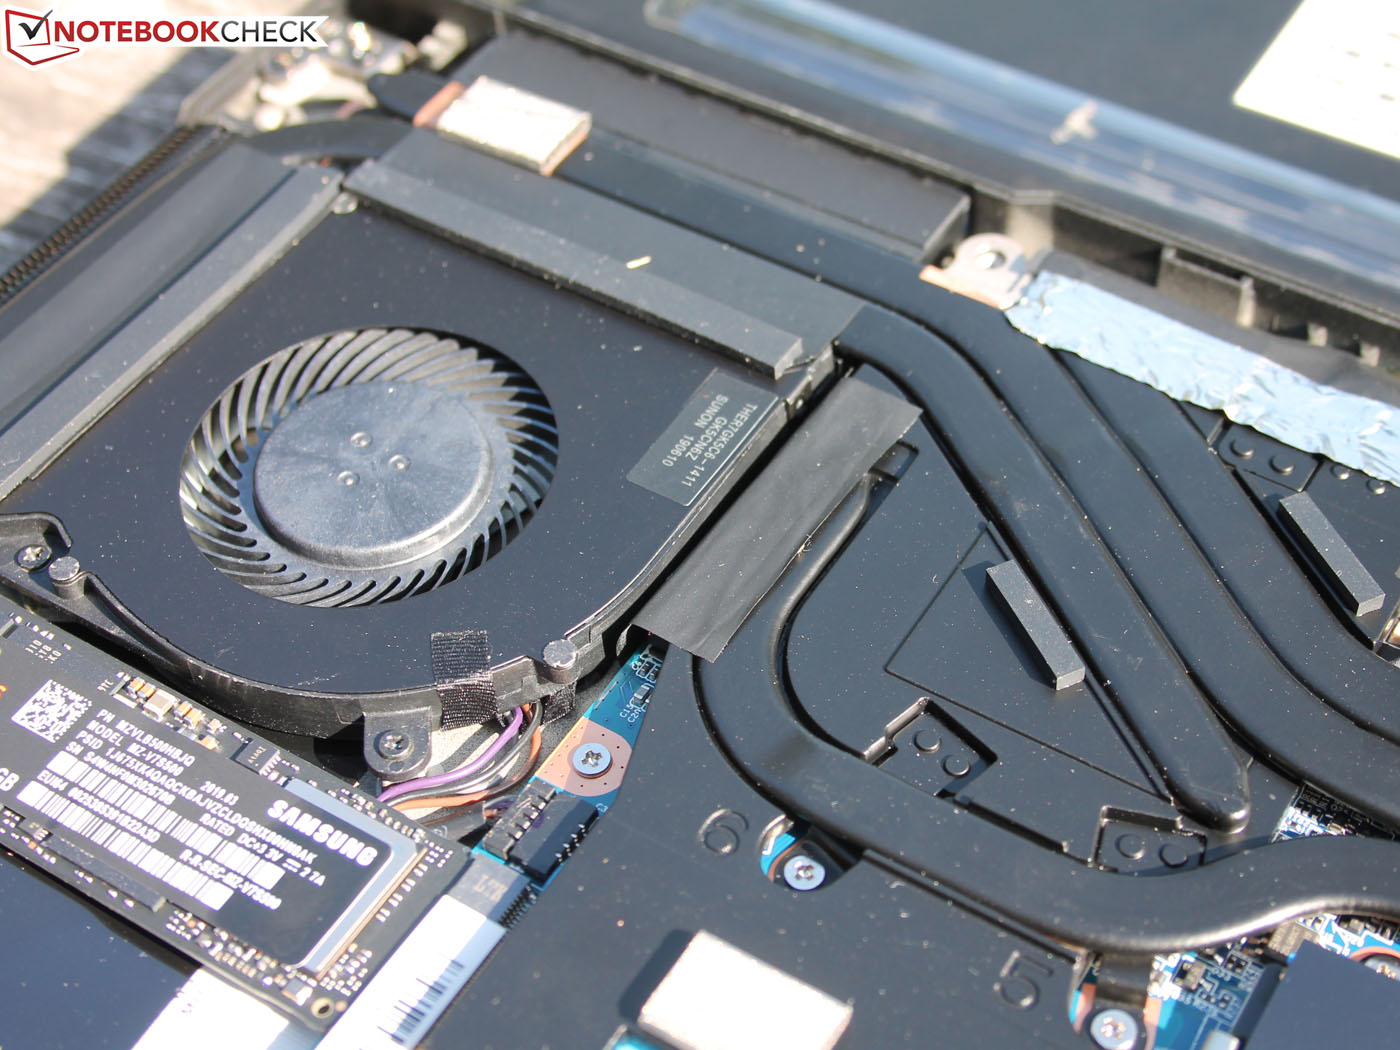
The cooling solutions of the graphics card and the SoC are interconnected, which allows the graphics card fan to dissipate heat that originates from the processor and vice versa.
Both the most demanding gaming scenarios as well as the stress test (Prime95 and FurMark) result in a noise level of 52 dB(A). While this is very loud, users generally will not have to deal with quite such a high noise level when gaming: We recorded up to 49.7 dB(A) in our The Witcher 3 ultra benchmark.
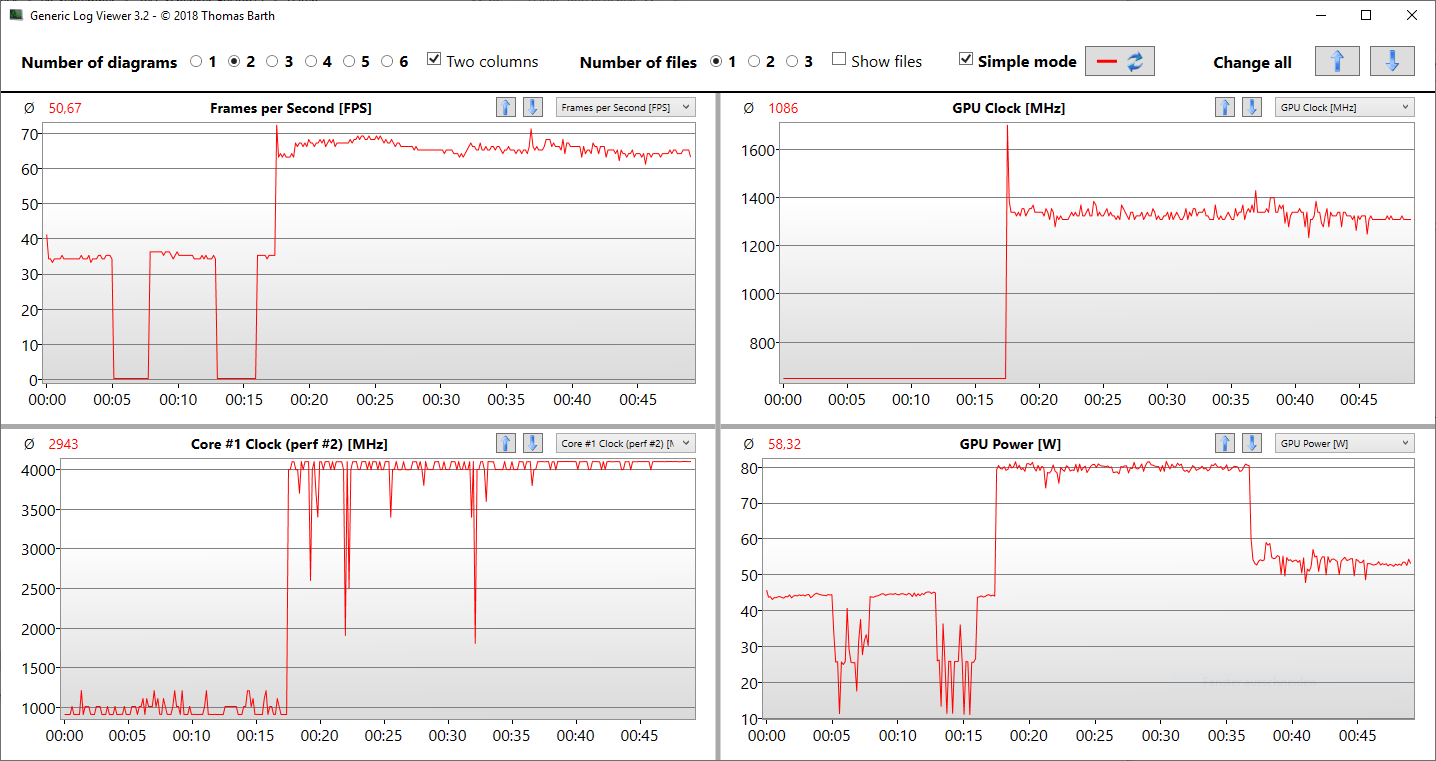
Demanding games will usually be played in either balanced or enthusiast mode. In this case, users can expect up to 49.7 dB(A). The two modes are separated by only marginal differences in terms of energy consumption and equal in terms of the noise level in The Witcher 3 ultra. In return, the game runs at 67 and 65 FPS when using balanced or enthusiast mode, respectively. Oddly, the GPU's energy consumption drops from 80 to 55 watts in enthusiast mode. Note: The two FPS drops before minute 15 were caused by the screen turning off.
Silent mode is required for noticeably quieter operation. Although at 35.5 dB(A), the laptop only reaches 35 FPS. Less-demanding games can absolutely run smoothly in quiet mode.
| Watts | Noise | FPS | |
|---|---|---|---|
| Silent | 76 W | 35.5 dB(A) | 35 FPS |
| Balanced | 136 W | 49.7 dB(A) | 67 FPS |
| Enthusiast | 139 W | 49.7 dB(A) | 65 FPS |
There is no sugarcoating it: Fan noise is very loud. The competitors do not achieve great results in this particular discipline either: The Zephyrus S emits 50-56 dB(A), for example. While the Razer Blade is quieter, it also performs worse in the R15 loop. Positive: The fan characteristics are indistinguishable and we are unable to tell whether the right or the left fan is spinning.
Noise level
| Idle |
| 30 / 30 / 30 dB(A) |
| Load |
| 46 / 51.6 dB(A) |
 | ||
30 dB silent 40 dB(A) audible 50 dB(A) loud |
||
min: | ||
| Schenker XMG Fusion 15 XFU15L19 GeForce RTX 2070 Max-Q, i7-9750H, Samsung SSD 970 EVO Plus 500GB | Asus Zephyrus S GX502GW GeForce RTX 2070 Mobile, i7-9750H, 2x Intel SSD 660p SSDPEKNW512G8 (RAID 0) | Acer Predator Triton 500 PT515-51-71PZ GeForce RTX 2070 Max-Q, i7-9750H, WDC PC SN720 SDAPNTW-512G | Gigabyte Aero 15 Classic-XA GeForce RTX 2070 Max-Q, i7-9750H, Intel SSD 760p SSDPEKKW512G8 | Razer Blade 15 RTX 2070 Max-Q GeForce RTX 2070 Max-Q, i7-8750H, Samsung SSD PM981 MZVLB512HAJQ | |
|---|---|---|---|---|---|
| Emissions | |||||
| Fan Noise (dB(A)) | 51.6 | ||||
| Noise | -9% | -5% | -8% | 9% | |
| off / environment * (dB) | 30 | 30 -0% | 30 -0% | 30 -0% | 28.8 4% |
| Idle Minimum * (dB) | 30 | 31 -3% | 30 -0% | 31 -3% | 28.8 4% |
| Idle Average * (dB) | 30 | 33 -10% | 33 -10% | 34 -13% | 28.8 4% |
| Idle Maximum * (dB) | 30 | 38 -27% | 39 -30% | 39 -30% | 29.4 2% |
| Load Average * (dB) | 46 | 50 -9% | 45 2% | 46 -0% | 35.7 22% |
| Witcher 3 ultra * (dB) | 51.5 | 53 -3% | 49 5% | 53 -3% | 42.5 17% |
| Load Maximum * (dB) | 51.6 | 56 -9% | 51 1% | 55 -7% | 45 13% |
| Total Average (Program / Settings) | -9% /
-9% | -5% /
-5% | -8% /
-8% | 9% /
9% |
* ... smaller is better
Temperature
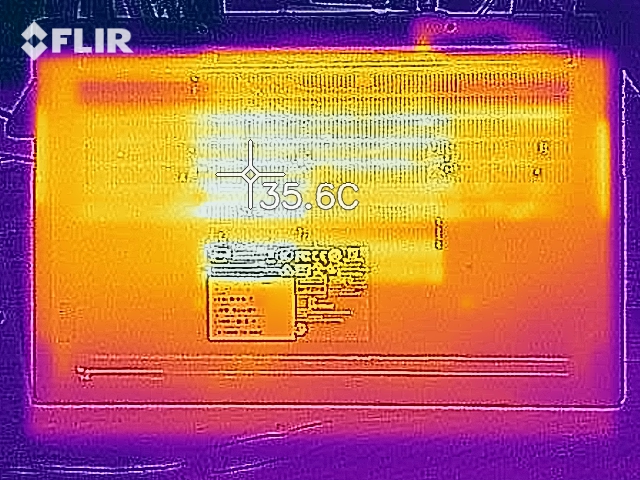
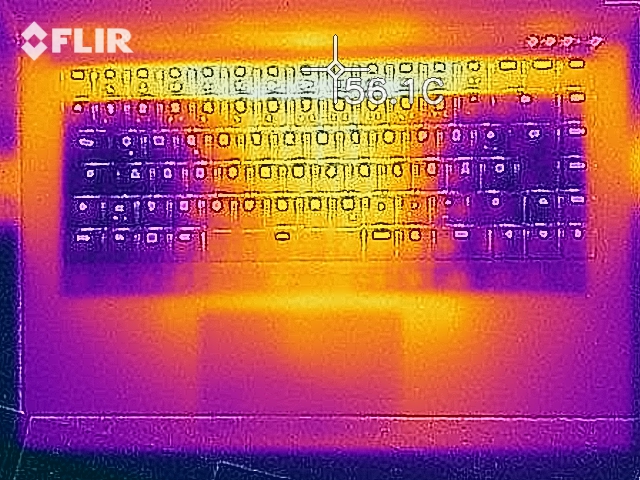
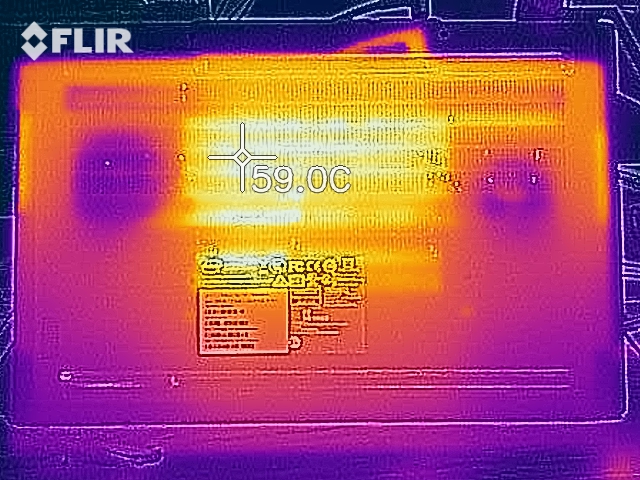
During idle in silent mode, the two fans are consistently inactive. Due to this, the surface temperatures are not exactly cool and hover around 32 °C on average (top and bottom).
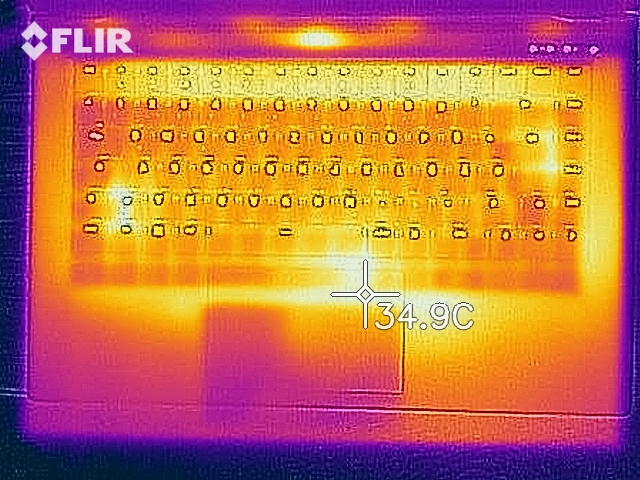
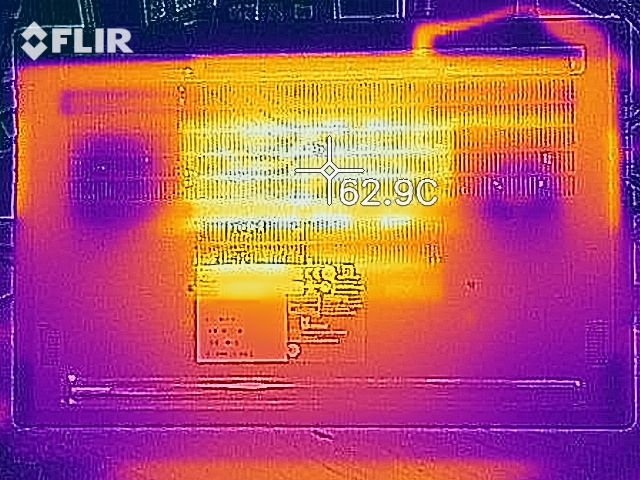
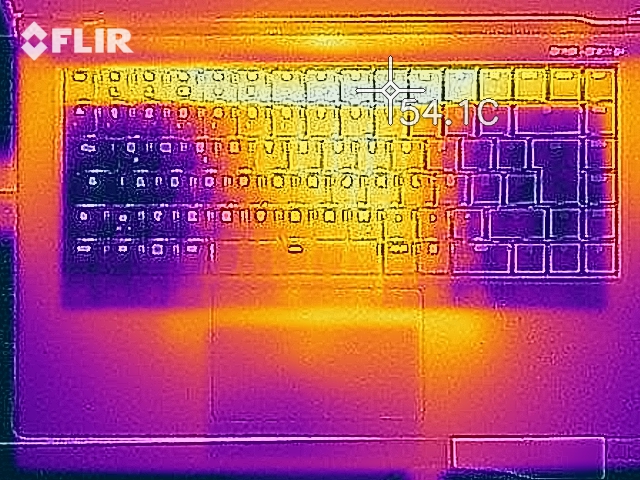
Our stress test (maximum load) pushes the CPU and GPU to their limits. The fans then spin very fast and the temperature inside of the case rises to 38 °C. Individual spots can reach up to 53 °C (top).
The Witcher 3 ultra represents prolonged, demanding gaming. Here, the temperatures climb even higher and settle at an average of 42 °C with individual spots reaching up to 57 °C (top).
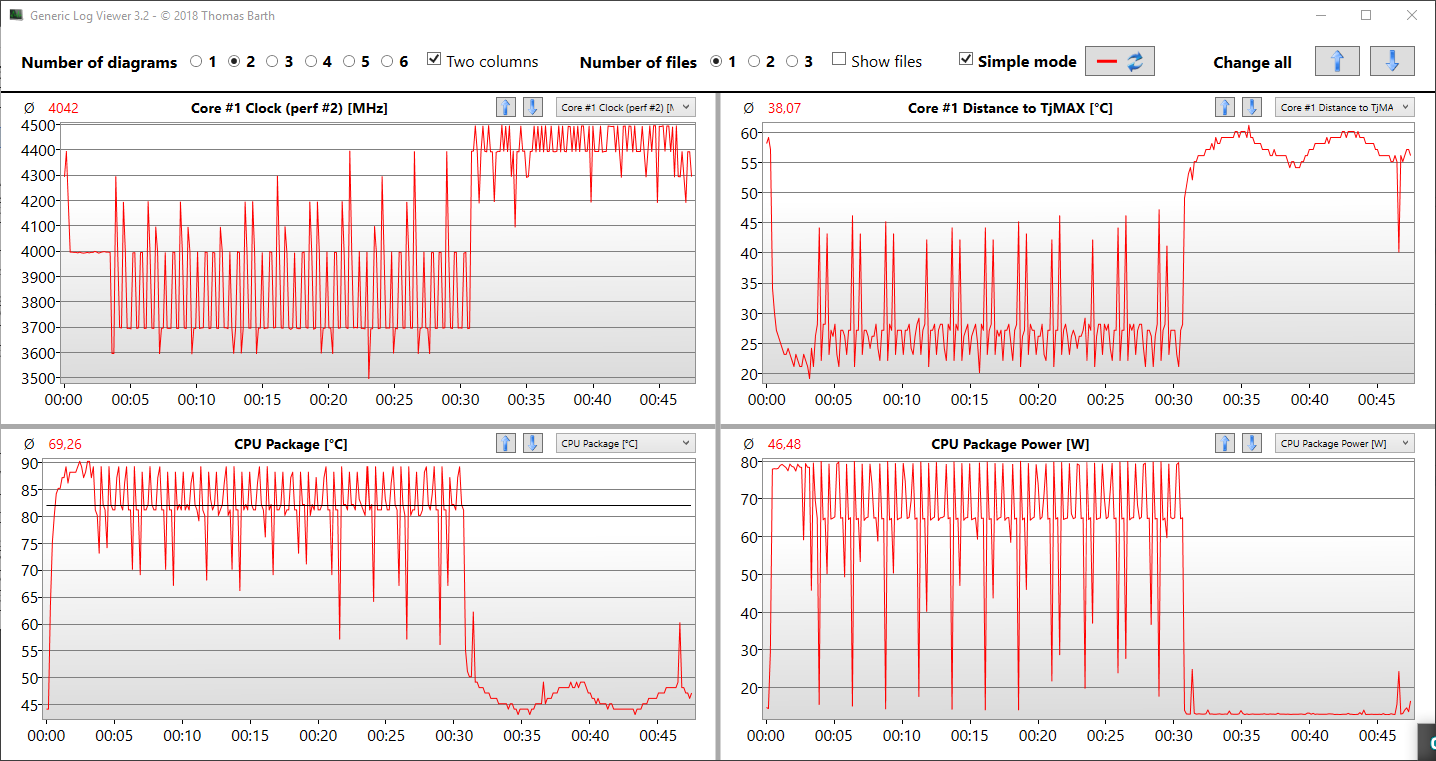
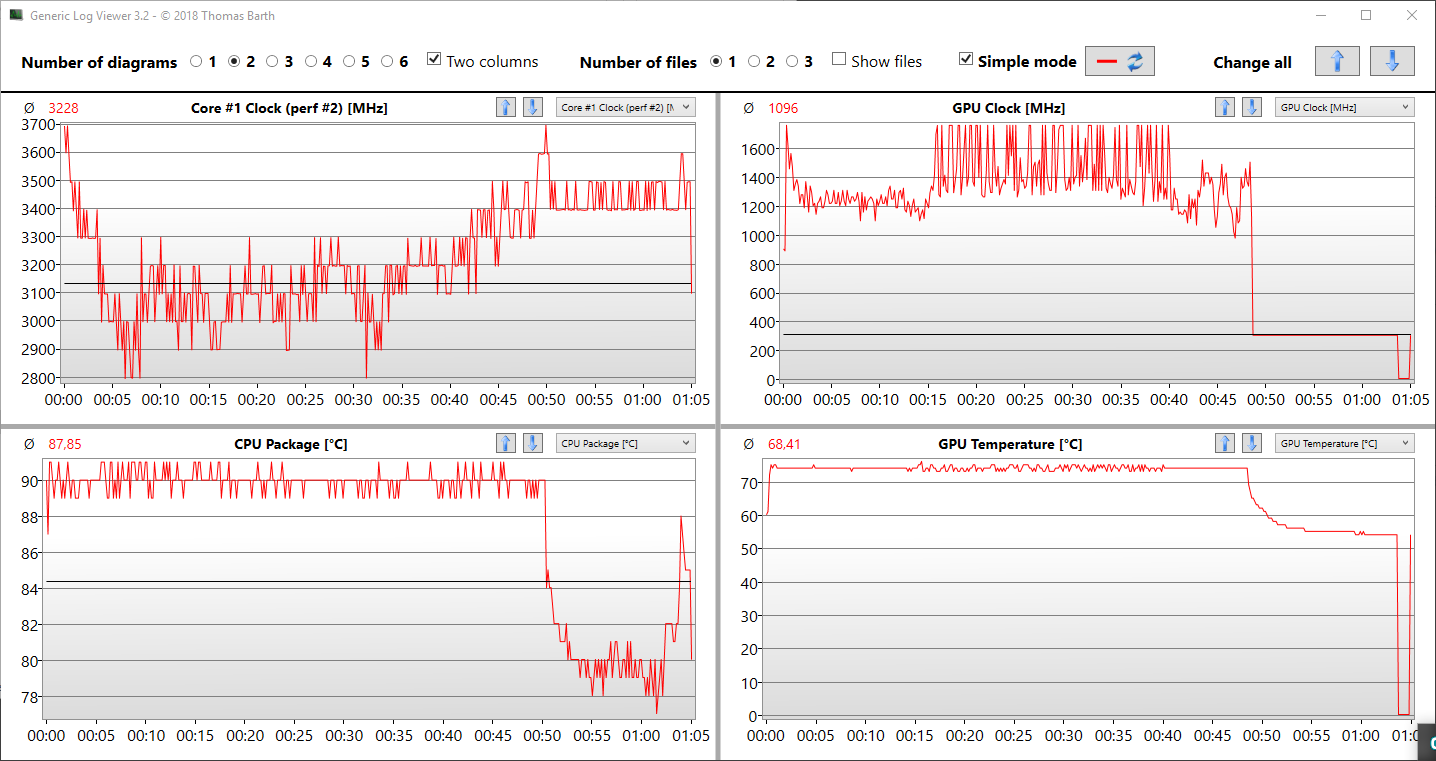
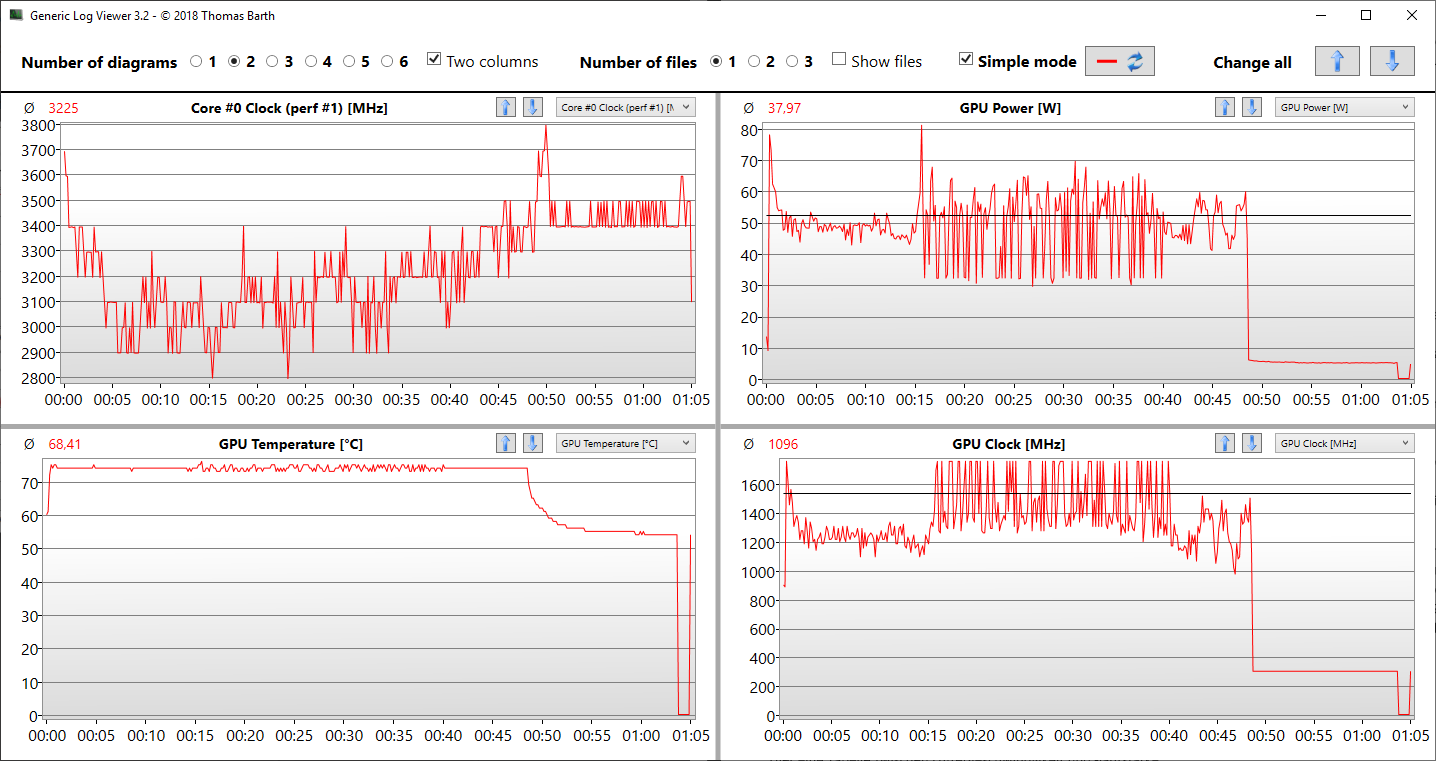
We selected the Fusion 15's enthusiast mode for our stress test. Here, the core temperature of the CPU hovers around 90 °C. The clock speed lingers at around 3.1 GHz. Meanwhile, HWiNFO reports a CPU package power of about 50 watts.
The GPU clock in the second picture confirms that the thermals were optimized with the GPU in mind: FurMark demands maximum performance, making the GTX card run at 1,300-1,700 MHz. Meanwhile the temperature does not exceed 75 °C. According to HWiNFO, the GPU demands between 40 and 60 watts. The Witcher 3 ultra increases this value to a good 60 watts.
(-) The maximum temperature on the upper side is 52.7 °C / 127 F, compared to the average of 40.4 °C / 105 F, ranging from 21.2 to 68.8 °C for the class Gaming.
(-) The bottom heats up to a maximum of 52.2 °C / 126 F, compared to the average of 43.2 °C / 110 F
(±) In idle usage, the average temperature for the upper side is 32.3 °C / 90 F, compared to the device average of 33.9 °C / 93 F.
(-) Playing The Witcher 3, the average temperature for the upper side is 42.1 °C / 108 F, compared to the device average of 33.9 °C / 93 F.
(±) The palmrests and touchpad can get very hot to the touch with a maximum of 37.1 °C / 98.8 F.
(-) The average temperature of the palmrest area of similar devices was 28.8 °C / 83.8 F (-8.3 °C / -15 F).
Speakers & Microphone
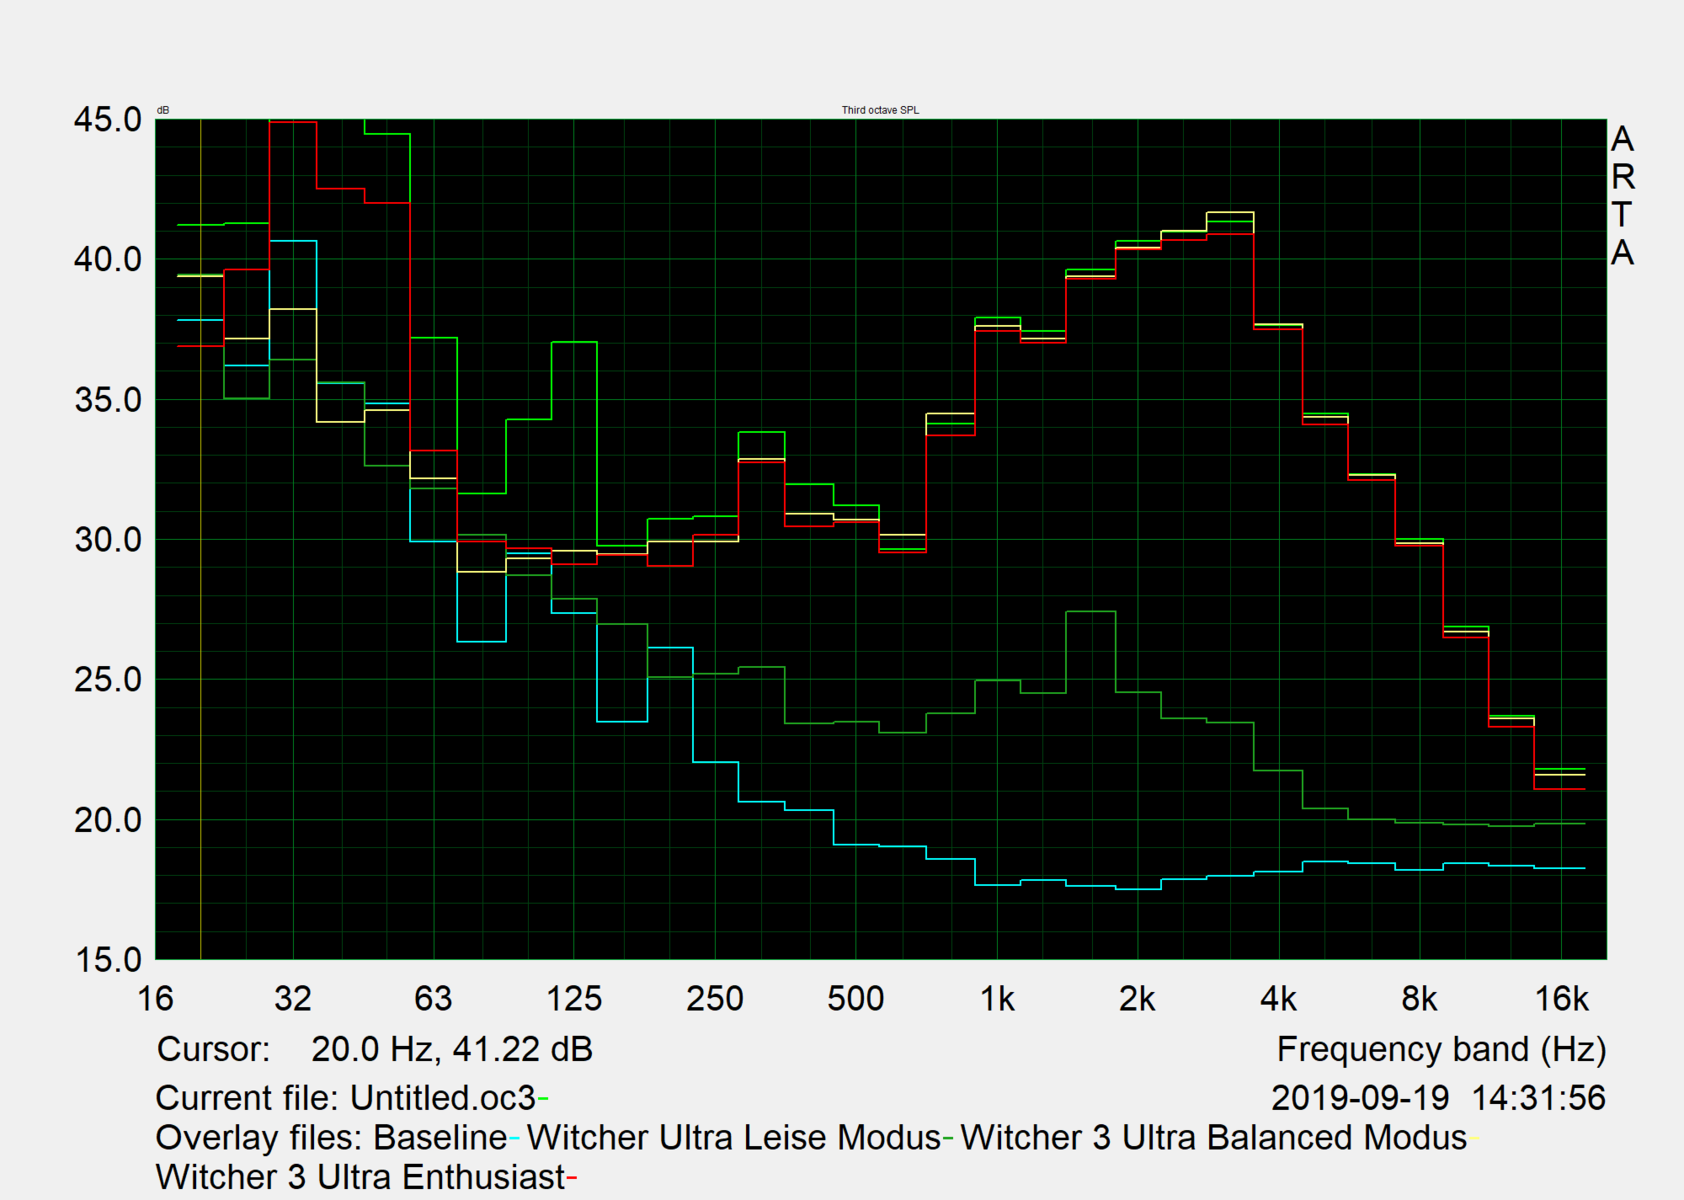
The speakers are one of the worst features of the laptop. They are not only relatively quiet, but they also lack any kind of bass and depth. As the comparison with the Asus Zephyrus S GX502GW shows, the sound spectrum is relatively unbalanced.
By contrast, we were impressed by the microphone: Sound recordings are crystal clear, regardless of whether we are within 60 cm or 3 meters of the device. These are optimal conditions for phone calls and voice chats.
Schenker XMG Fusion 15 XFU15L19 audio analysis
(-) | not very loud speakers (67 dB)
Bass 100 - 315 Hz
(-) | nearly no bass - on average 17.3% lower than median
(±) | linearity of bass is average (11.3% delta to prev. frequency)
Mids 400 - 2000 Hz
(±) | higher mids - on average 6% higher than median
(±) | linearity of mids is average (12.9% delta to prev. frequency)
Highs 2 - 16 kHz
(+) | balanced highs - only 3.1% away from median
(±) | linearity of highs is average (12% delta to prev. frequency)
Overall 100 - 16.000 Hz
(±) | linearity of overall sound is average (26.9% difference to median)
Compared to same class
» 93% of all tested devices in this class were better, 2% similar, 6% worse
» The best had a delta of 6%, average was 18%, worst was 132%
Compared to all devices tested
» 82% of all tested devices were better, 4% similar, 14% worse
» The best had a delta of 4%, average was 24%, worst was 134%
Asus Zephyrus S GX502GW audio analysis
(+) | speakers can play relatively loud (90 dB)
Bass 100 - 315 Hz
(±) | reduced bass - on average 12.7% lower than median
(±) | linearity of bass is average (8.5% delta to prev. frequency)
Mids 400 - 2000 Hz
(+) | balanced mids - only 4.5% away from median
(+) | mids are linear (4.1% delta to prev. frequency)
Highs 2 - 16 kHz
(±) | higher highs - on average 6.7% higher than median
(±) | linearity of highs is average (10.8% delta to prev. frequency)
Overall 100 - 16.000 Hz
(+) | overall sound is linear (14.6% difference to median)
Compared to same class
» 28% of all tested devices in this class were better, 7% similar, 65% worse
» The best had a delta of 6%, average was 18%, worst was 132%
Compared to all devices tested
» 19% of all tested devices were better, 4% similar, 77% worse
» The best had a delta of 4%, average was 24%, worst was 134%
Energy Management
Energy Consumption
The energy consumption is modest during idle and demanding under load. Since powerful systems tend to draw a lot of power even during idle, this is good news. The Schenker, on the other hand, only demands 7.5 watts in silent mode (brightness reduced, flight mode). In balanced and enthusiast mode, 14 and 17 watts are consumed, respectively. In terms of being economical, it beats most competitors.
The consumption under load and the maximum consumption also reflect well on the laptop. 243 watts at the beginning of the stress test (Prime95 + FurMark) indicates that the Fusion 15 is running at full power. The R15 loop in the performance section confirms this.
The Witcher 3 on ultra settings shifts the focus to graphics stress and demands an average of 170 W, which is a higher rate than on competing devices as well. High frame rates confirm a consistent performance level.
| Off / Standby | |
| Idle | |
| Load |
|
Key:
min: | |
| Schenker XMG Fusion 15 XFU15L19 i7-9750H, GeForce RTX 2070 Max-Q, Samsung SSD 970 EVO Plus 500GB, IPS, 1920x1080, 15.6" | Asus Zephyrus S GX502GW i7-9750H, GeForce RTX 2070 Mobile, 2x Intel SSD 660p SSDPEKNW512G8 (RAID 0), IPS, 1920x1080, 15.6" | Acer Predator Triton 500 PT515-51-71PZ i7-9750H, GeForce RTX 2070 Max-Q, WDC PC SN720 SDAPNTW-512G, IPS, 1920x1080, 15.6" | Gigabyte Aero 15 Classic-XA i7-9750H, GeForce RTX 2070 Max-Q, Intel SSD 760p SSDPEKKW512G8, IGZO, 1920x1080, 15.6" | Razer Blade 15 RTX 2070 Max-Q i7-8750H, GeForce RTX 2070 Max-Q, Samsung SSD PM981 MZVLB512HAJQ, IPS, 1920x1080, 15.6" | Average NVIDIA GeForce RTX 2070 Max-Q | Average of class Gaming | |
|---|---|---|---|---|---|---|---|
| Power Consumption | -61% | 15% | -43% | 8% | -28% | -23% | |
| Idle Minimum * (Watt) | 7.5 | 24 -220% | 7 7% | 21 -180% | 10.4 -39% | 15.4 ? -105% | 13.2 ? -76% |
| Idle Average * (Watt) | 14.6 | 27 -85% | 12 18% | 23 -58% | 14.6 -0% | 20 ? -37% | 18.9 ? -29% |
| Idle Maximum * (Watt) | 17 | 33 -94% | 22 -29% | 32 -88% | 16.3 4% | 26.7 ? -57% | 24.3 ? -43% |
| Load Average * (Watt) | 181 | 129 29% | 86 52% | 97 46% | 88.5 51% | 105.2 ? 42% | 108 ? 40% |
| Witcher 3 ultra * (Watt) | 170 | 176 -4% | 144 15% | 148 13% | 155.4 9% | ||
| Load Maximum * (Watt) | 243 | 216 11% | 177 27% | 213 12% | 182.4 25% | 201 ? 17% | 254 ? -5% |
* ... smaller is better
Battery Life
Our Wi-Fi test accurately portrays real-world web-browsing conditions. The script, which periodically accesses web pages with multimedia content, depletes the battery in eight hours. We performed the test in silent mode and with the brightness reduced by five steps to 150 cd/m².
During idle, the runtimes should be longer. Our test, during which the laptop finally automatically shuts down after 9 h 19 m, confirms this. For this test, we chose silent mode, minimum brightness and flight mode.
The number of devices on the market with incredible performance on mains and long battery life are exceedingly rare. While the Gigabyte models Aero 15 Classic-XA & 15-X9 as well as the Acer Predator Triton 500 and Razer Blade 15 offer even longer battery life, their performance while on mains is lower, as evidenced by Cinebench R15.
| Schenker XMG Fusion 15 XFU15L19 i7-9750H, GeForce RTX 2070 Max-Q, 93 Wh | Asus Zephyrus S GX502GW i7-9750H, GeForce RTX 2070 Mobile, 76 Wh | Acer Predator Triton 500 PT515-51-71PZ i7-9750H, GeForce RTX 2070 Max-Q, Wh | Gigabyte Aero 15 Classic-XA i7-9750H, GeForce RTX 2070 Max-Q, 94.24 Wh | Razer Blade 15 RTX 2070 Max-Q i7-8750H, GeForce RTX 2070 Max-Q, 80 Wh | Gigabyte Aero 15-X9 i7-8750H, GeForce RTX 2070 Max-Q, 94.24 Wh | Acer Predator Triton 500 i7-8750H, GeForce RTX 2080 Max-Q, 82 Wh | MSI GS65 8RF-019DE Stealth Thin i7-8750H, GeForce GTX 1070 Max-Q, 82 Wh | Average of class Gaming | |
|---|---|---|---|---|---|---|---|---|---|
| Battery runtime | -36% | 20% | 38% | 10% | 33% | -31% | -5% | 3% | |
| Reader / Idle (h) | 9.3 | 5.9 -37% | 11.1 19% | 9.1 -2% | 11.4 23% | 9.2 -1% | 5.6 -40% | 8.5 -9% | 8.71 ? -6% |
| WiFi v1.3 (h) | 6 | 3.7 -38% | 8 33% | 7 17% | 6.5 8% | 6.4 7% | 3.2 -47% | 6 0% | 7.02 ? 17% |
| Load (h) | 1.5 | 1 -33% | 1.6 7% | 3 100% | 1.5 0% | 2.9 93% | 1.4 -7% | 1.4 -7% | 1.47 ? -2% |
| H.264 (h) | 6.8 | 6.1 | 5.9 | 8.26 ? |
Pros
Cons
Verdict
The technical side of things has benefitted greatly from the Intel-Schenker cooperation: The Fusion 15 offers more performance than competing thin gaming laptops, even though it is equipped with the same hardware. The CPU's performance benefits the most, whereas the differences in games are marginal. This not only reflects well on the cooling solution but also speaks for a good balance between the SoC's and the GPU's power limits.
Our configuration of the Fusion 15 (RTX 2070) combines portability and performance, which are often mutually exclusive, like almost no other device.
On the other hand, the thin 15-inch laptop has surprisingly good battery life: We were able to record runtimes of six and just above nine hours in our Wi-Fi test and during idle, respectively. While there are other devices that can match these numbers (Acer Predator Triton 500), they are unable to get the same kind of performance out of the components while on mains.
The aluminum-magnesium alloy case weighs a full 200 grams less than its aluminum counterparts. Despite this, the construction quality of the modest, matte, easy-to-handle case is good.
Schenker makes no compromises when it comes to connectivity, maintenance, and upgradeability either. The DisplayPort-enabled Thunderbolt connector and the two M.2-2280 slots are equally impressive.
The drawbacks first and foremost include the high noise levels during gaming and under load. For creative work, the lack of full sRGB coverage may also be an issue. On the other hand, gamers will be affected less and can enjoy 144-Hz and low response times. These features almost make up for the subpar contrast.
If you're looking for even more performance, thin & light may not be the right category for you. Schenker and Intel have created a very good mix of portability and performance.
Schenker XMG Fusion 15 XFU15L19
- 10/17/2019 v7 (old)
Sebastian Jentsch
Price comparison

