MSI GE63 Raider RGB 8RF (i7-8750H, GTX 1070, FHD) Laptop Review

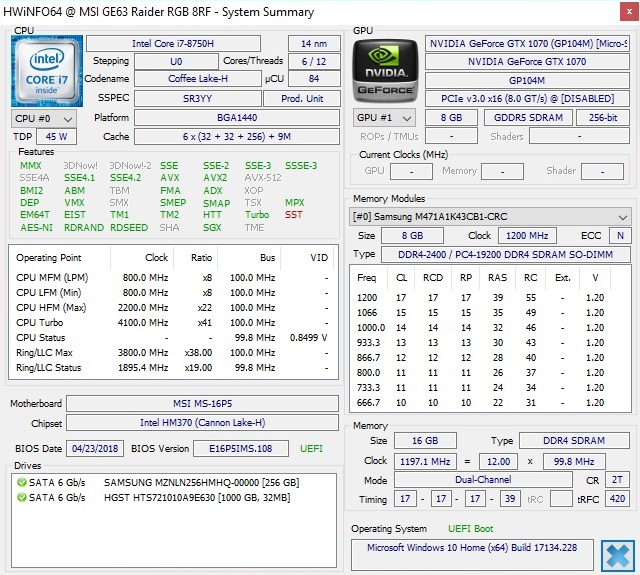
MSI positions its venerable GE series as its midrange offering between its more premium GS and GT series and the more affordable GL, GF and GP series. While the case remains largely the same, except for the inclusion of RGB strips on the display lid and improved port selection, there is an important change under the hood. The 8RF is powered by an Intel Core i7-8750H six-core processor instead of the quad-core CPU found in its predecessor. The i7-8750H should make this device suitable for practically every imaginable task.
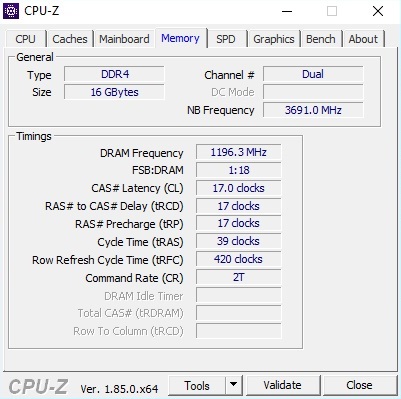
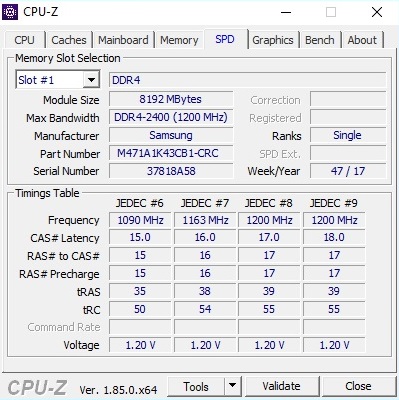
The new GE63 also packs decent graphics options. MSI offers either an Nvidia GeForce GTX 1060 which is in the GE63 8RE or a GeForce GTX 1070 that is found in the GE63 8RF. These are complemented by either 8 or 16 GB of DDR4 RAM and a choice of either a 128 GB or a 256 GB SSD. Some 256 GB SSD configurations also come with a 1 TB HDD for added storage.
The device is paired with a 120 Hz matte Full HD (1080p) display that is based on TN technology. There is also a 4K IPS option, but this sacrifices the high refresh rate of which the TN panel is capable. While the 4K configuration is listed on MSI.com, we could not find any German online retailers that currently stocked this variant. It is also worth bearing in mind that not all configurations come with Windows 10 installed, so you will need to buy a license unless you already have one.
The GE63 Raider RGB costs between 1,500 and 2,000 Euros (~$1730 and ~$2307). Our test device with its GeForce GTX 1070 GPU, 16 GB RAM, 256 GB SSD and 1 TB HDD sits near the top of that pricing.
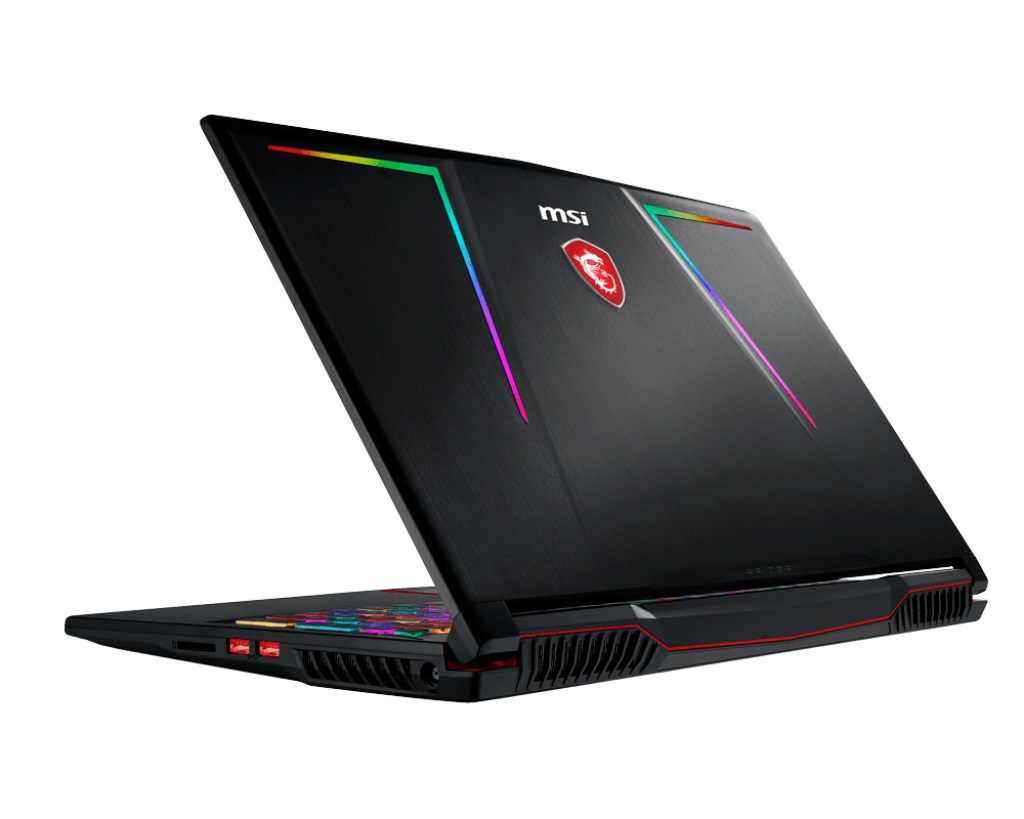
We will not be covering the chassis, the I/O or the input devices in this review as they are practically the same as those found in last year’s GE63. The only minor exterior change with this year’s device is the inclusion of a second USB 3.1 Type-C Gen2 port. Please see our MSI GE63VR Raider review for our views on these areas.
We have chosen to compare the GE63 8RF against other 15.6-inch laptops equipped with an Intel Coffee Lake CPU like the ASUS ROG Zephyrus M GM501, the Aorus X5 v8 and the Alienware 15 R4.
| SD Card Reader | |
| average JPG Copy Test (av. of 3 runs) | |
| Aorus X5 v8 (Toshiba Exceria Pro SDXC 64 GB UHS-II) | |
| MSI GE63VR 7RF Raider (Toshiba Exceria Pro SDXC 64 GB UHS-II) | |
| Average of class Gaming (20.9 - 210, n=54, last 2 years) | |
| MSI GE63 Raider RGB 8RF-008 (Toshiba Exceria Pro SDXC 64 GB UHS-II) | |
| maximum AS SSD Seq Read Test (1GB) | |
| Aorus X5 v8 (Toshiba Exceria Pro SDXC 64 GB UHS-II) | |
| MSI GE63VR 7RF Raider (Toshiba Exceria Pro SDXC 64 GB UHS-II) | |
| Average of class Gaming (25.5 - 261, n=51, last 2 years) | |
| MSI GE63 Raider RGB 8RF-008 (Toshiba Exceria Pro SDXC 64 GB UHS-II) | |
| Networking | |
| iperf3 transmit AX12 | |
| MSI GE63 Raider RGB 8RF-008 | |
| Alienware 15 R4 | |
| Aorus X5 v8 | |
| Asus Zephyrus M GM501 | |
| MSI GE63VR 7RF Raider | |
| iperf3 receive AX12 | |
| MSI GE63 Raider RGB 8RF-008 | |
| Alienware 15 R4 | |
| MSI GE63VR 7RF Raider | |
| Asus Zephyrus M GM501 | |
| Aorus X5 v8 | |
Display
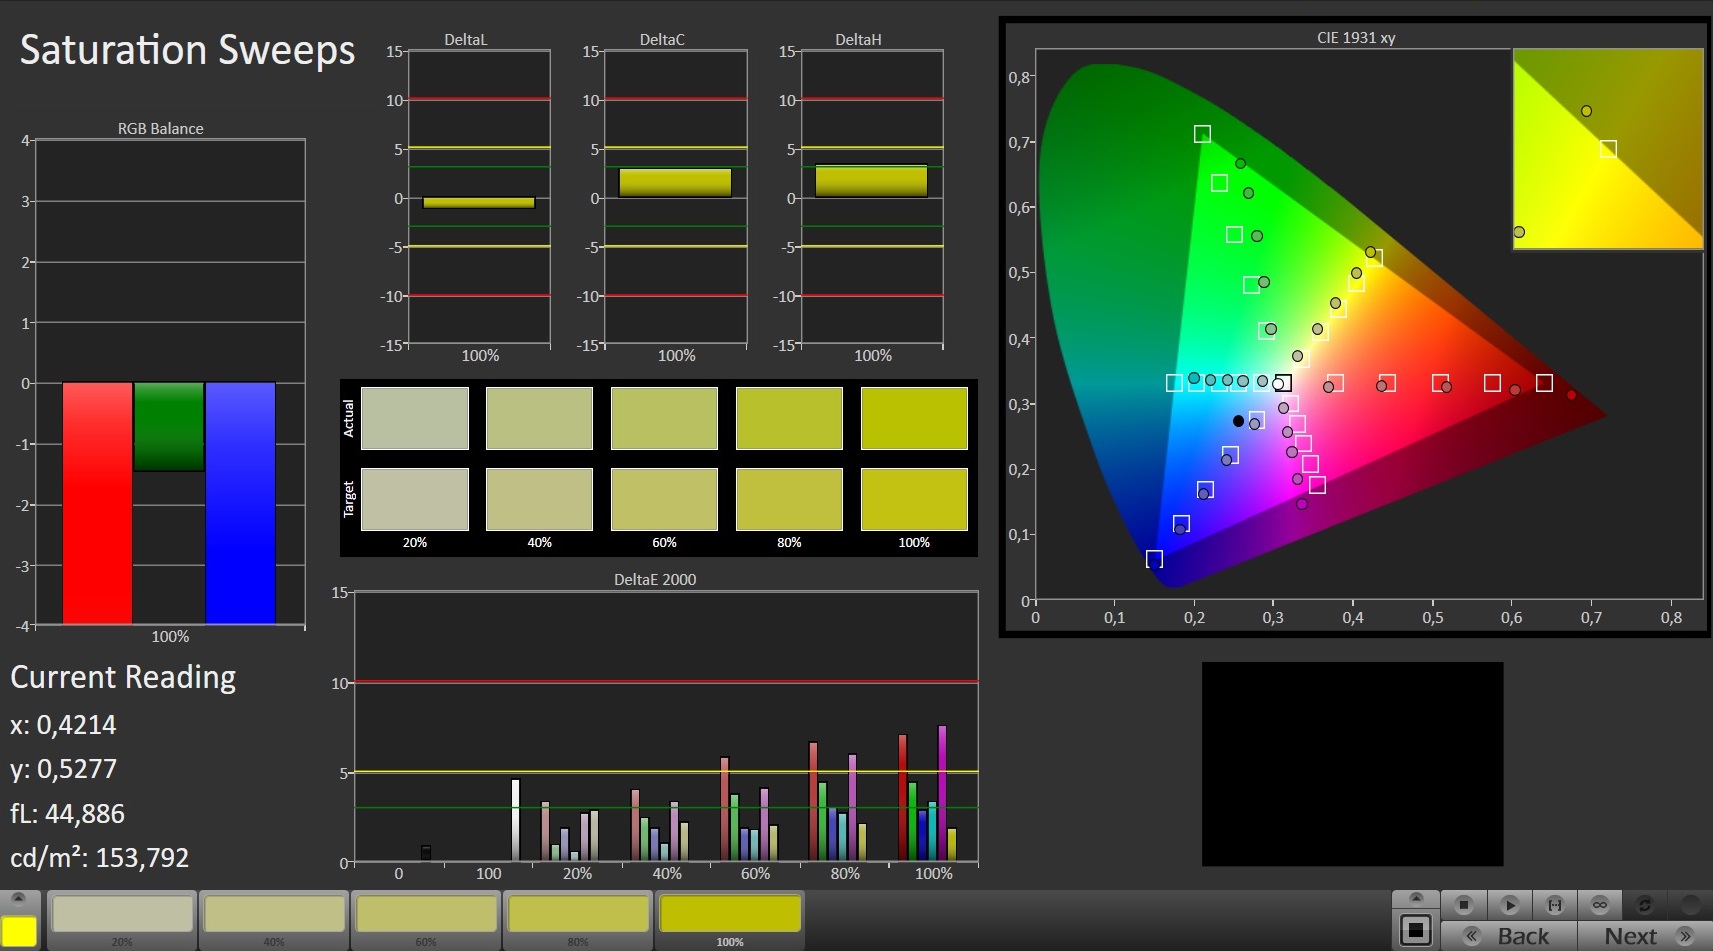
MSI has played it safe with the display and used the same 120 Hz TN panel that we have seen in the last GE63. This display has the model number CMN N156HHE-GA1 for reference. The differences between the two panels in our tests are probably to do with the TrueColor software used. While we used the same sRGB mode for our tests, the quality of TrueColor optimizations varies between notebooks to the extent that it can lead to different results in our tests.
| |||||||||||||||||||||||||
Brightness Distribution: 81 %
Center on Battery: 292 cd/m²
Contrast: 1270:1 (Black: 0.23 cd/m²)
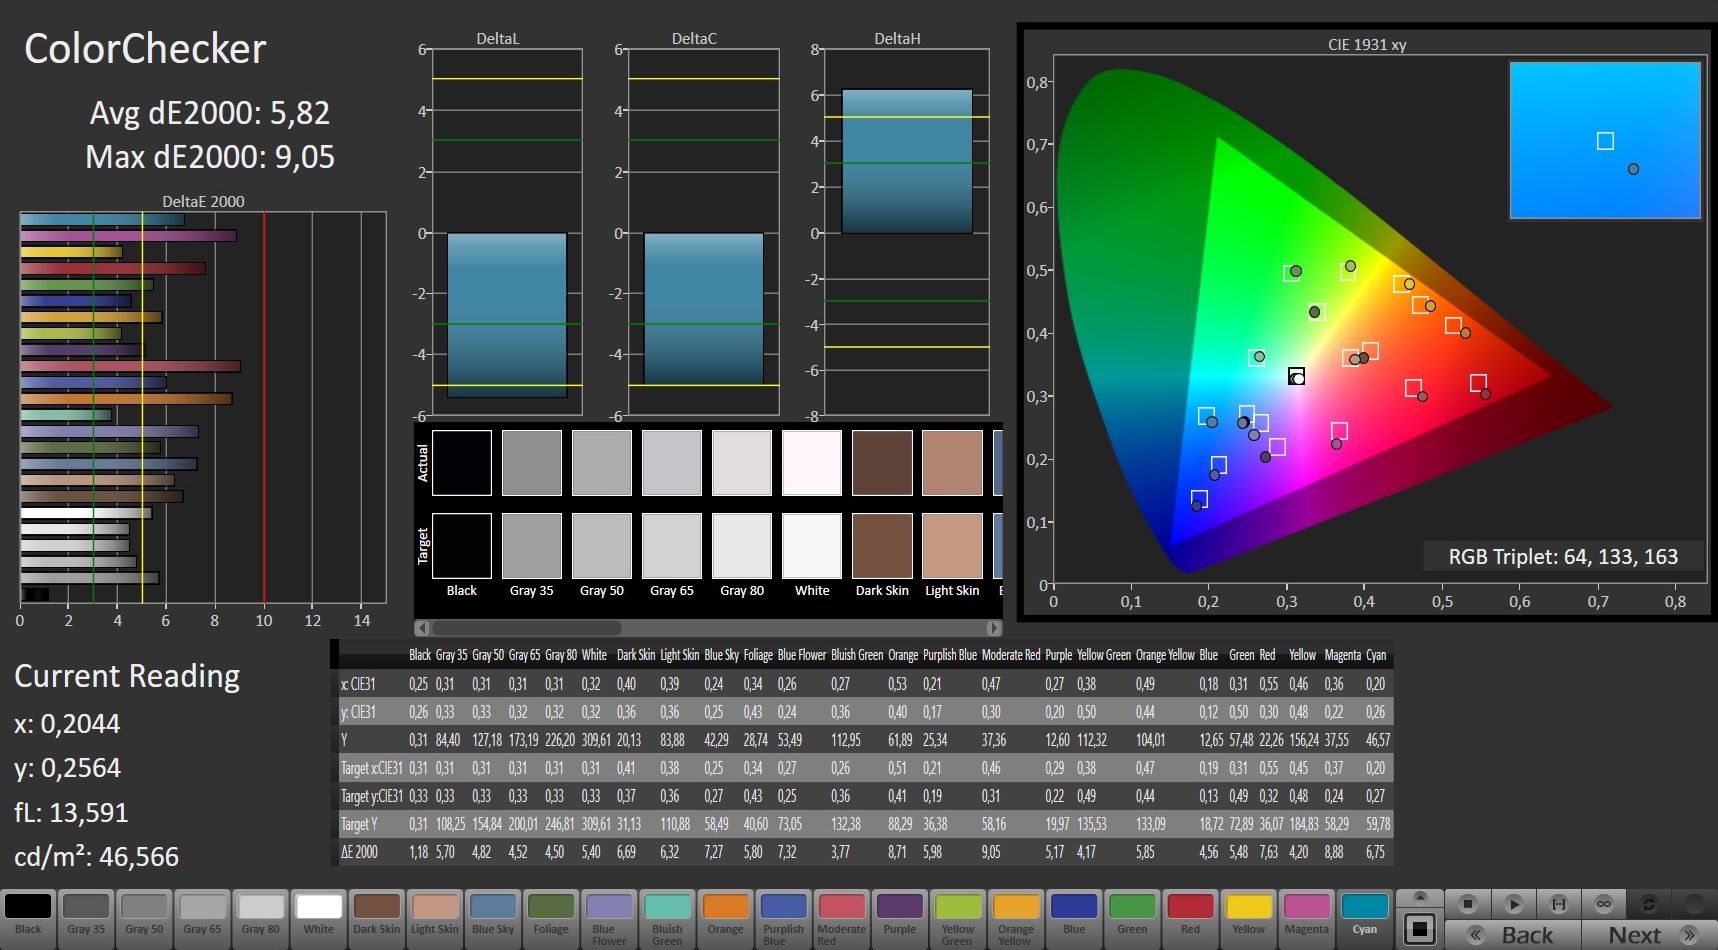
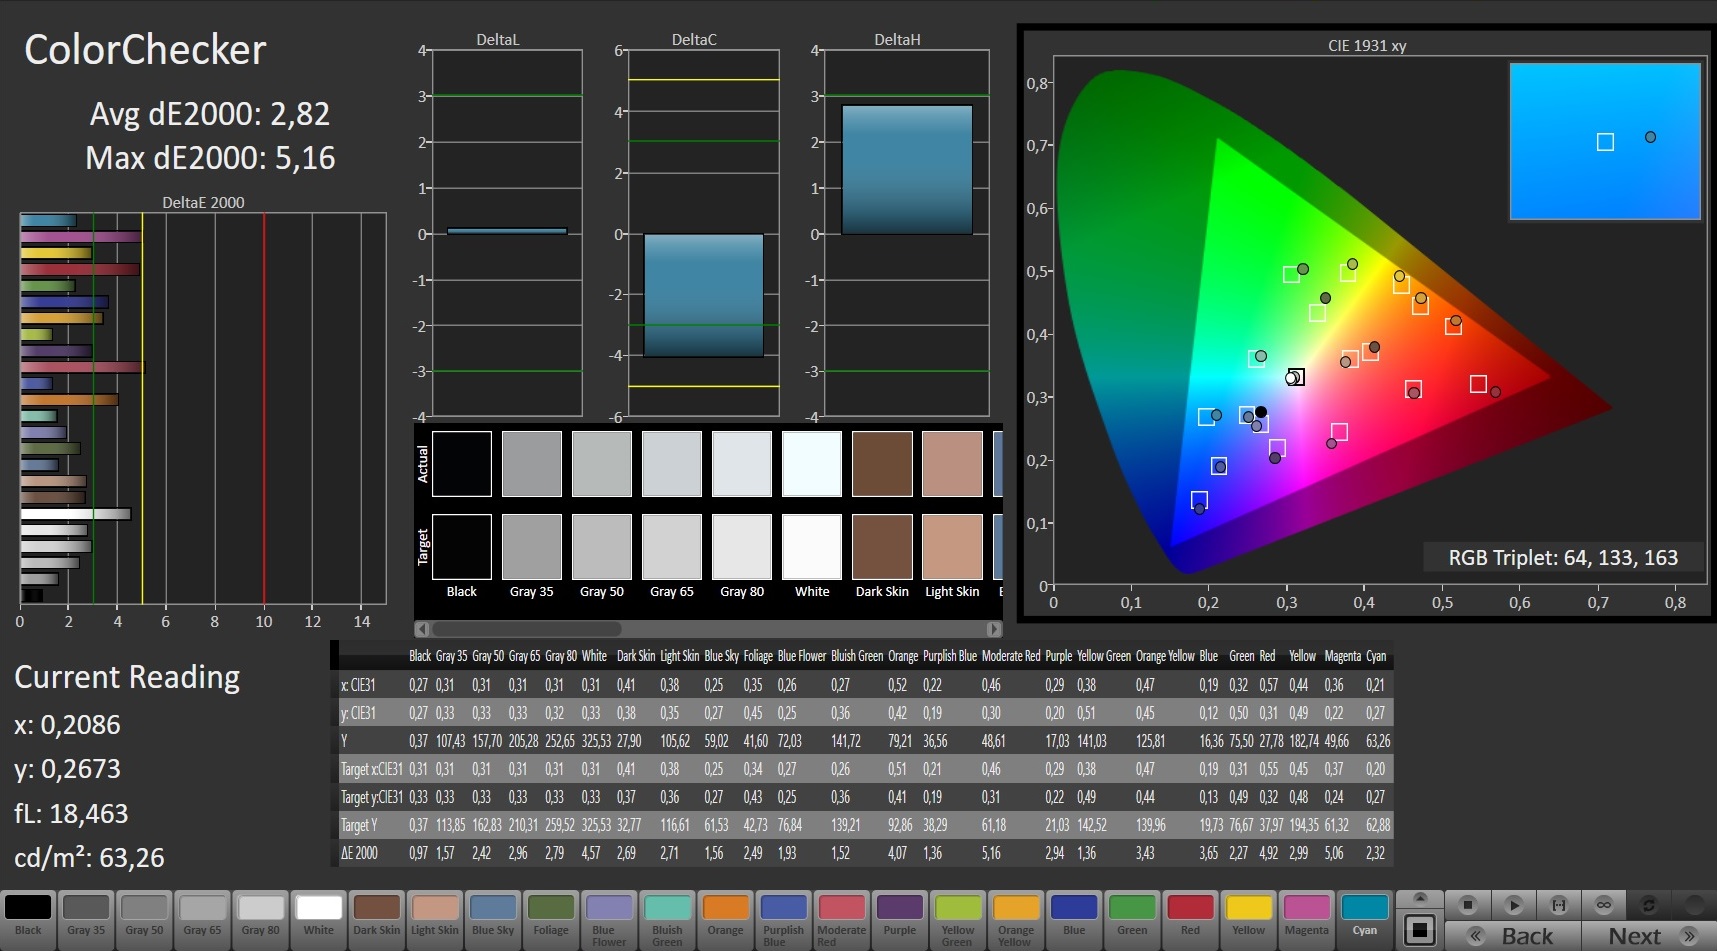
ΔE ColorChecker Calman: 5.82 | ∀{0.5-29.43 Ø4.73}
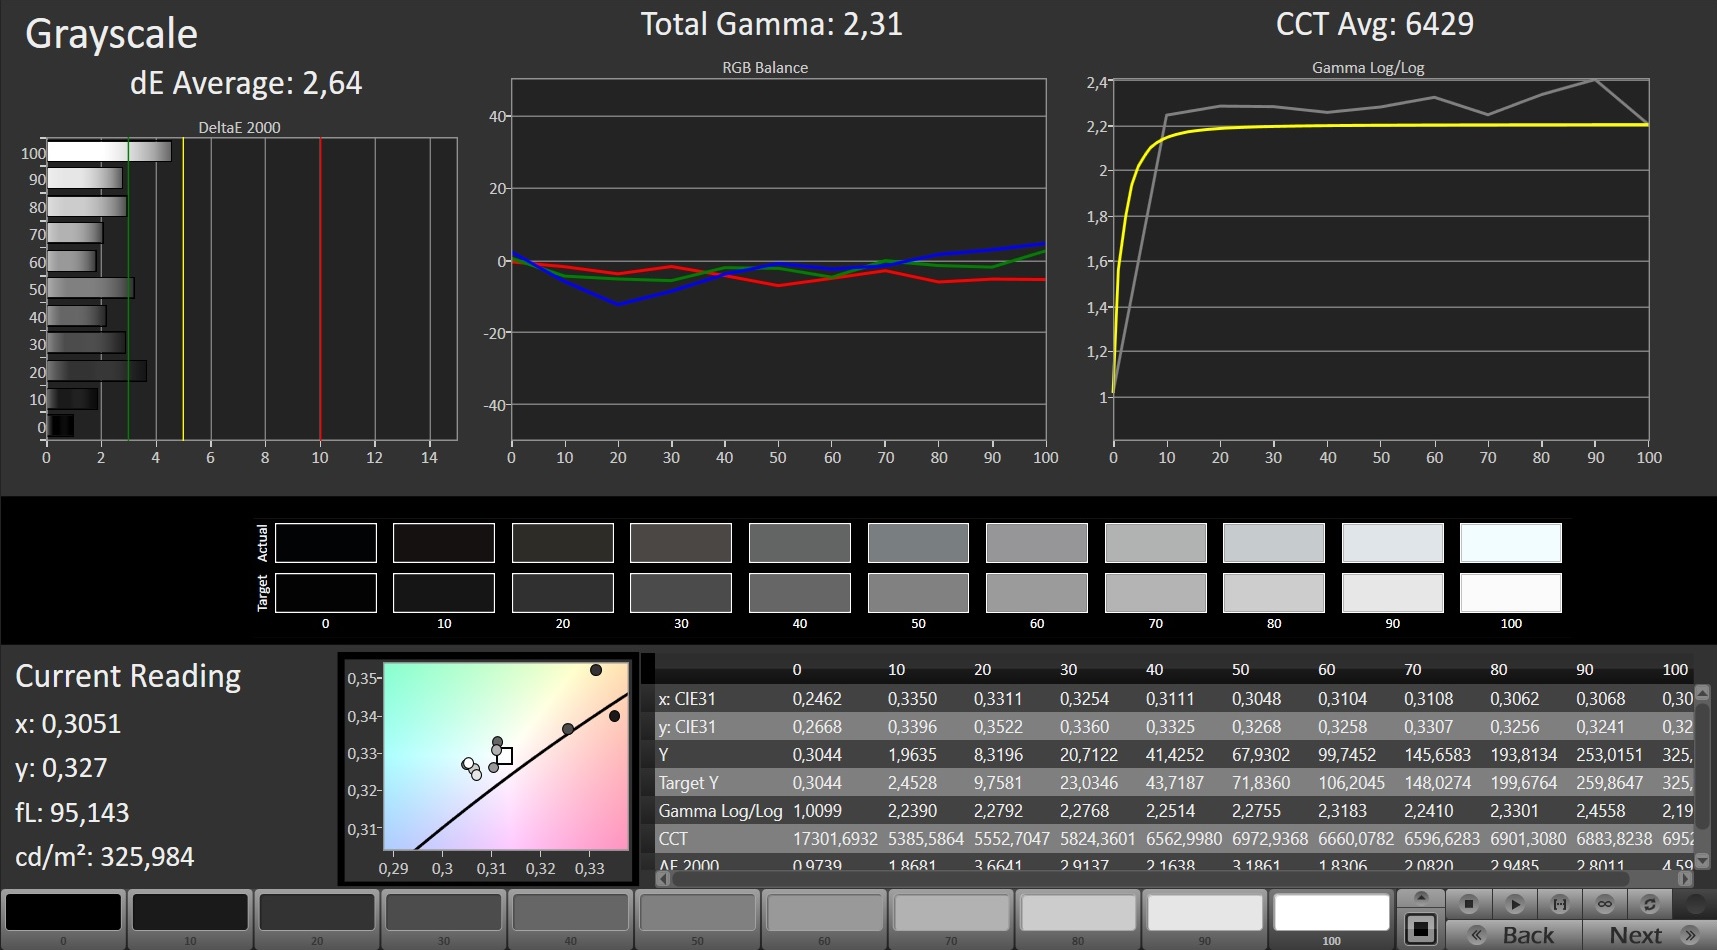
calibrated: 2.82
ΔE Greyscale Calman: 4.61 | ∀{0.09-98 Ø4.97}
100% sRGB (Argyll 1.6.3 3D)
76% AdobeRGB 1998 (Argyll 1.6.3 3D)
86% AdobeRGB 1998 (Argyll 3D)
100% sRGB (Argyll 3D)
90% Display P3 (Argyll 3D)
Gamma: 2.65
CCT: 6950 K
| MSI GE63 Raider RGB 8RF-008 CMN N156HHE-GA1 (CMN15F4), TN, 1920x1080 | MSI GE63VR 7RF Raider Chi Mei N156HHE-GA1 (CMN15F4), TN LED, 1920x1080 | Asus Zephyrus M GM501 AUO B156HAN07.1 (AUO71ED), IPS, 1920x1080 | Aorus X5 v8 AU Optronics B156HAN07.0 (AUO70ED), IPS, 1920x1080 | Alienware 15 R4 LG Philips LP156WF6 (LGD0540), IPS, 1920x1080 | |
|---|---|---|---|---|---|
| Display | 1% | -19% | -18% | -23% | |
| Display P3 Coverage (%) | 90 | 91.3 1% | 66.1 -27% | 67.1 -25% | 65.7 -27% |
| sRGB Coverage (%) | 100 | 100 0% | 92.7 -7% | 93.4 -7% | 86.4 -14% |
| AdobeRGB 1998 Coverage (%) | 86 | 86.7 1% | 67.2 -22% | 68.1 -21% | 63.1 -27% |
| Response Times | 58% | 54% | 24% | -53% | |
| Response Time Grey 50% / Grey 80% * (ms) | 24.4 ? | 9.6 ? 61% | 6.6 ? 73% | 18.8 ? 23% | 37.6 ? -54% |
| Response Time Black / White * (ms) | 15.8 ? | 7.2 ? 54% | 10.4 ? 34% | 12 ? 24% | 24 ? -52% |
| PWM Frequency (Hz) | 25510 ? | 26000 ? | 20830 ? | ||
| Screen | 12% | -4% | 14% | -5% | |
| Brightness middle (cd/m²) | 292 | 285 -2% | 307 5% | 271 -7% | 292 0% |
| Brightness (cd/m²) | 258 | 273 6% | 296 15% | 259 0% | 278 8% |
| Brightness Distribution (%) | 81 | 84 4% | 89 10% | 87 7% | 88 9% |
| Black Level * (cd/m²) | 0.23 | 0.23 -0% | 0.25 -9% | 0.27 -17% | 0.29 -26% |
| Contrast (:1) | 1270 | 1239 -2% | 1228 -3% | 1004 -21% | 1007 -21% |
| Colorchecker dE 2000 * | 5.82 | 3.52 40% | 5.74 1% | 1.81 69% | 4.9 16% |
| Colorchecker dE 2000 max. * | 9.05 | 5.18 43% | 11.32 -25% | 3.33 63% | 10.08 -11% |
| Colorchecker dE 2000 calibrated * | 2.82 | 1.94 31% | 2.27 20% | ||
| Greyscale dE 2000 * | 4.61 | 3.41 26% | 6.44 -40% | 1.09 76% | 4.89 -6% |
| Gamma | 2.65 83% | 2.05 107% | 2.48 89% | 2.45 90% | 2.36 93% |
| CCT | 6950 94% | 7077 92% | 8395 77% | 6435 101% | 7598 86% |
| Color Space (Percent of AdobeRGB 1998) (%) | 76 | 77 1% | 60 -21% | 61 -20% | 56 -26% |
| Color Space (Percent of sRGB) (%) | 100 | 100 0% | 93 -7% | 93 -7% | 86 -14% |
| Total Average (Program / Settings) | 24% /
16% | 10% /
1% | 7% /
9% | -27% /
-14% |
* ... smaller is better
The display is reasonably color accurate, but the default manufacturer settings are mediocre. Color and grayscale accuracy leave plenty to be desired, which can be vastly improved with further calibration. This can be done using MSI’s additional settings program. Our test device achieved 100% sRGB and 76% AdobeRGB once calibrated, which is impressive for a gaming laptop and makes the new GE63 competitive with high-end workstations in this regard. Our test device has a good 1,270:1 contrast ratio too thanks to its relatively low 0.23 cd/m² black value.
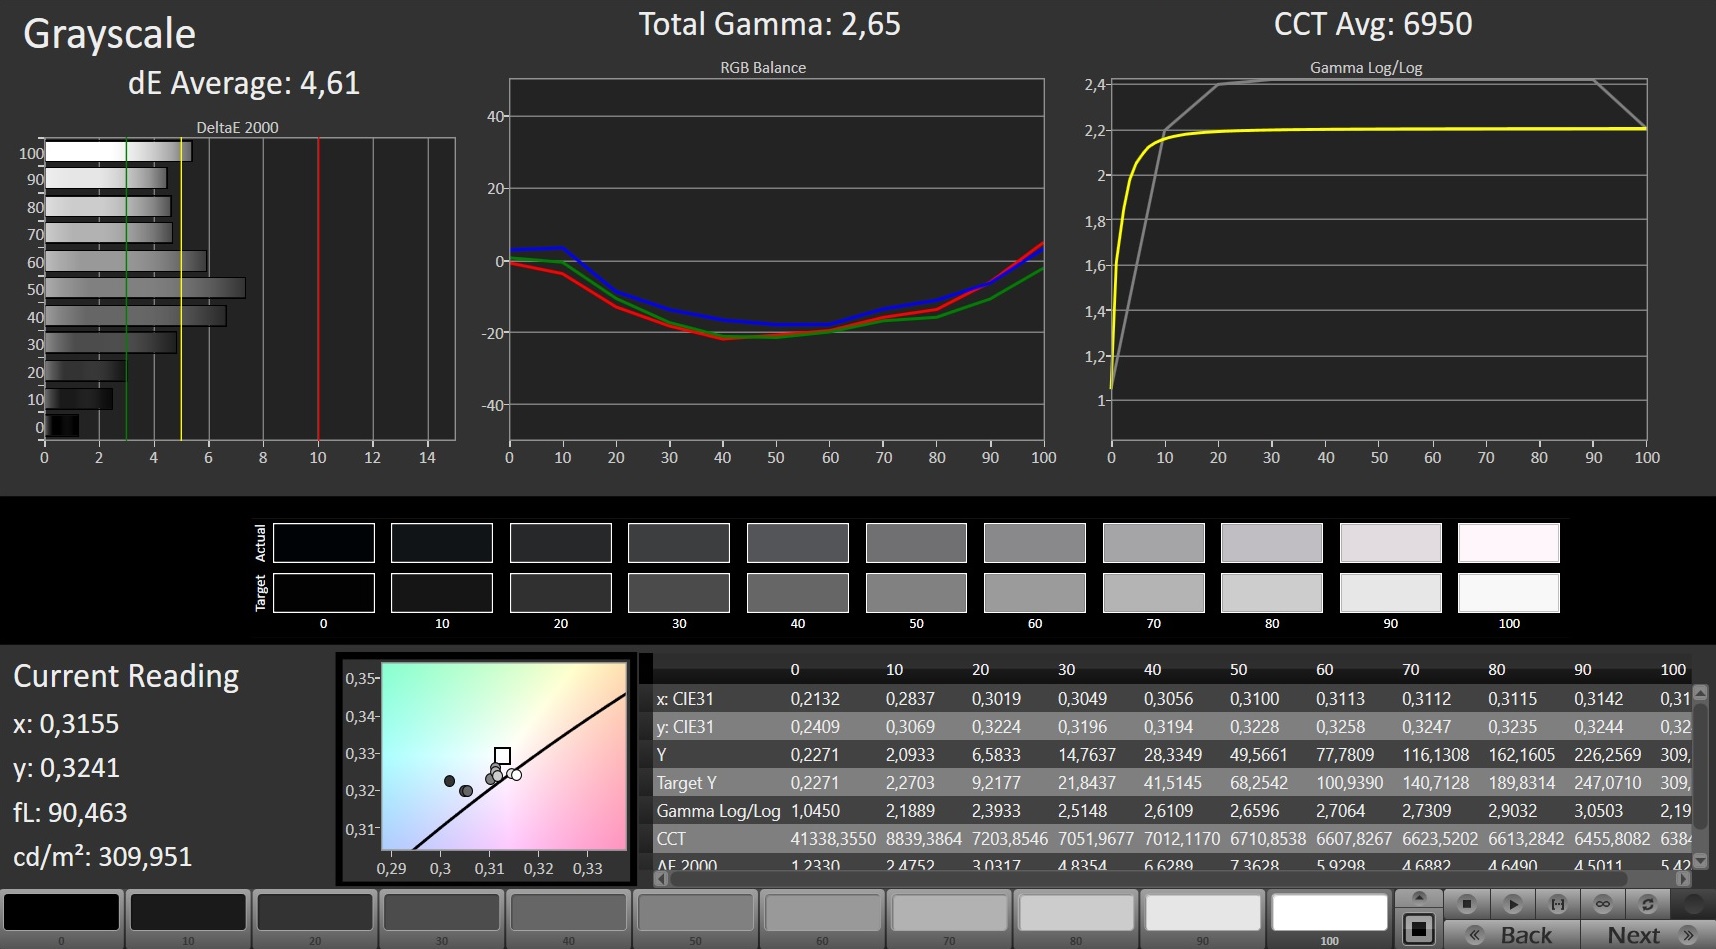
Our only gripe with the display is its maximum brightness. At just under 260 cd/m², our test device’s maximum brightness is too low for outdoor use. Hence, we would recommend using the device indoors whenever possible. Our test device has below average brightness uniformity too at 81%. Positively, there is no backlight bleeding.
Display reaction times are respectable too. Our test device achieved 16 ms black-to-white and 24 ms gray-to-gray reaction times, which is much faster than most IPS panels. By contrast, the Alienware 15 R4 only achieved 24 ms black-to-white and 38 ms gray-to-gray. However, the Aorus X5 v8 scored better even with its IPS panel. The main issues with TN panels are their poor viewing angles. The TN panel in our test device suffers from this too, particularly when looking down on the device from various angles.
It is also worth bearing in mind that our test device uses pulse-width modulation (PWM) to regulate luminosity at below 20% brightness. Fortunately, this is at 25 KHz, which should be high enough to negate any eye strain or headaches even for those who are PWM sensitive.
Display Response Times
| ↔ Response Time Black to White | ||
|---|---|---|
| 15.8 ms ... rise ↗ and fall ↘ combined | ↗ 13.8 ms rise | 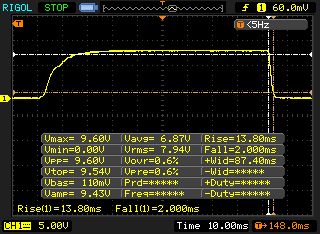 |
| ↘ 2 ms fall | ||
| The screen shows good response rates in our tests, but may be too slow for competitive gamers. In comparison, all tested devices range from 0.1 (minimum) to 240 (maximum) ms. » 37 % of all devices are better. This means that the measured response time is better than the average of all tested devices (19.9 ms). | ||
| ↔ Response Time 50% Grey to 80% Grey | ||
| 24.4 ms ... rise ↗ and fall ↘ combined | ↗ 14.4 ms rise | 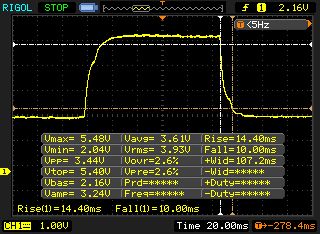 |
| ↘ 10 ms fall | ||
| The screen shows good response rates in our tests, but may be too slow for competitive gamers. In comparison, all tested devices range from 0.165 (minimum) to 636 (maximum) ms. » 35 % of all devices are better. This means that the measured response time is better than the average of all tested devices (31.1 ms). | ||
Screen Flickering / PWM (Pulse-Width Modulation)
| Screen flickering / PWM detected | 25510 Hz | ≤ 19 % brightness setting | 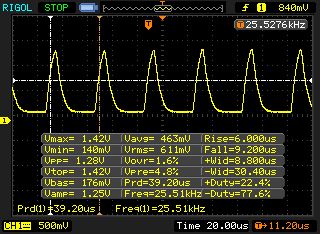 |
The display backlight flickers at 25510 Hz (worst case, e.g., utilizing PWM) Flickering detected at a brightness setting of 19 % and below. There should be no flickering or PWM above this brightness setting. The frequency of 25510 Hz is quite high, so most users sensitive to PWM should not notice any flickering. In comparison: 52 % of all tested devices do not use PWM to dim the display. If PWM was detected, an average of 7784 (minimum: 5 - maximum: 343500) Hz was measured. | |||
Performance
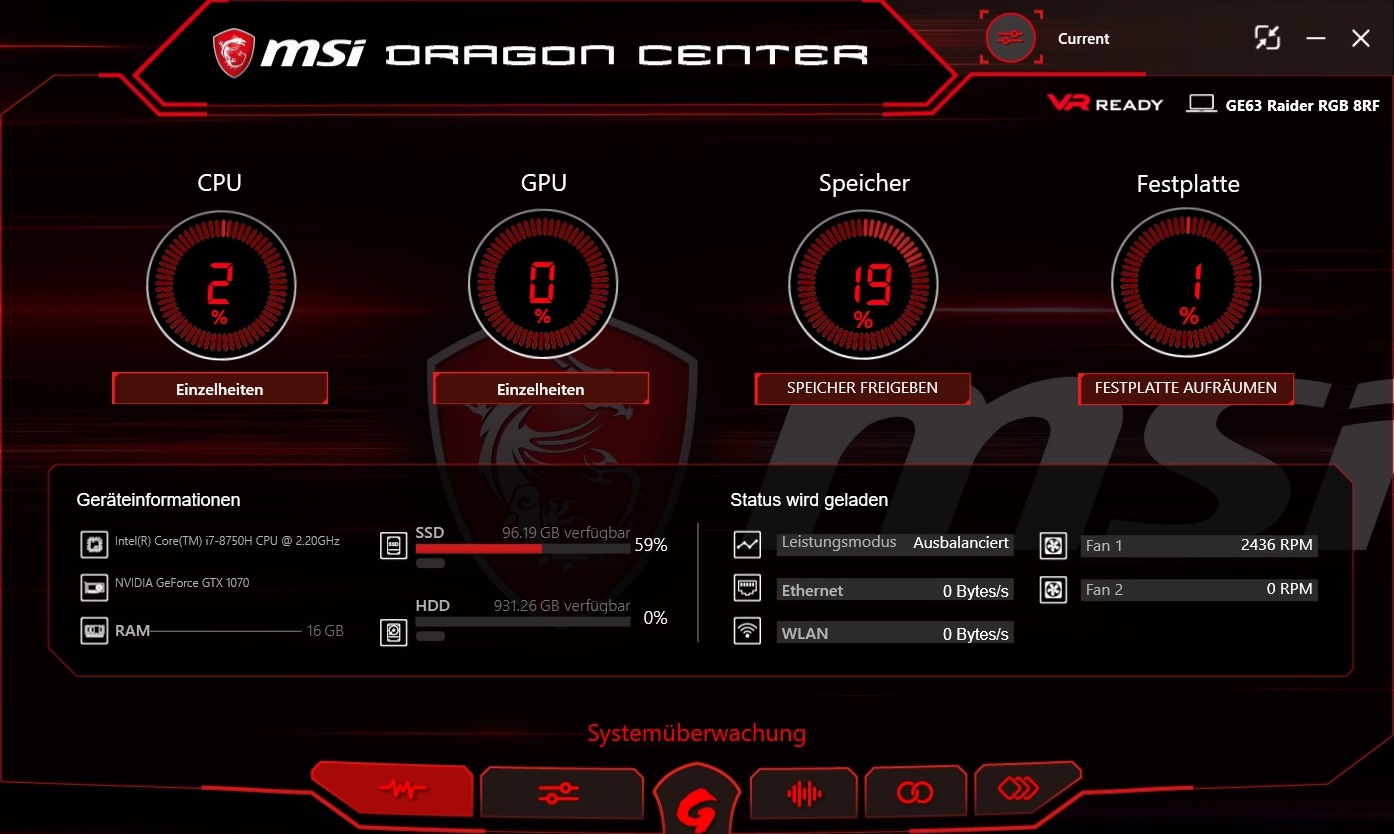
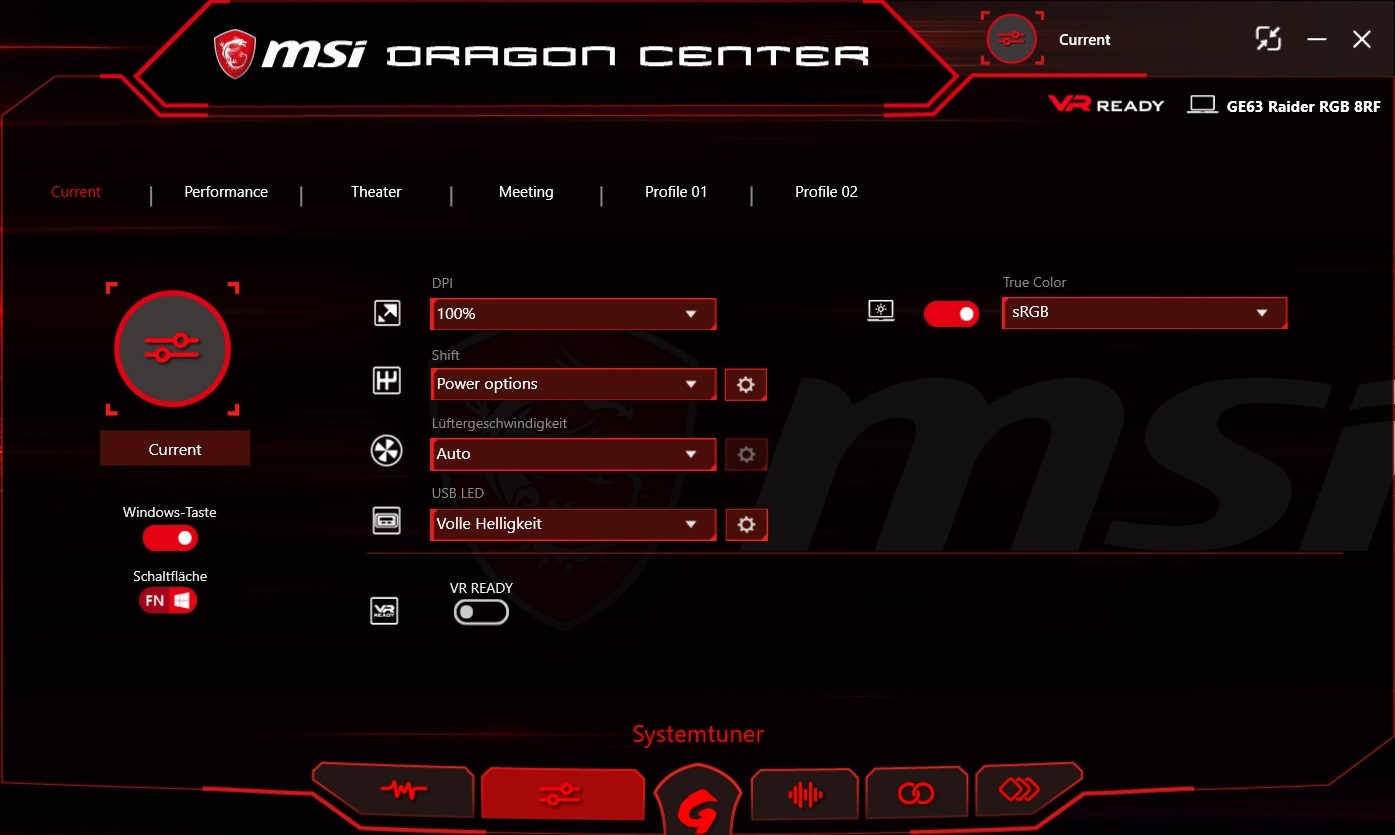
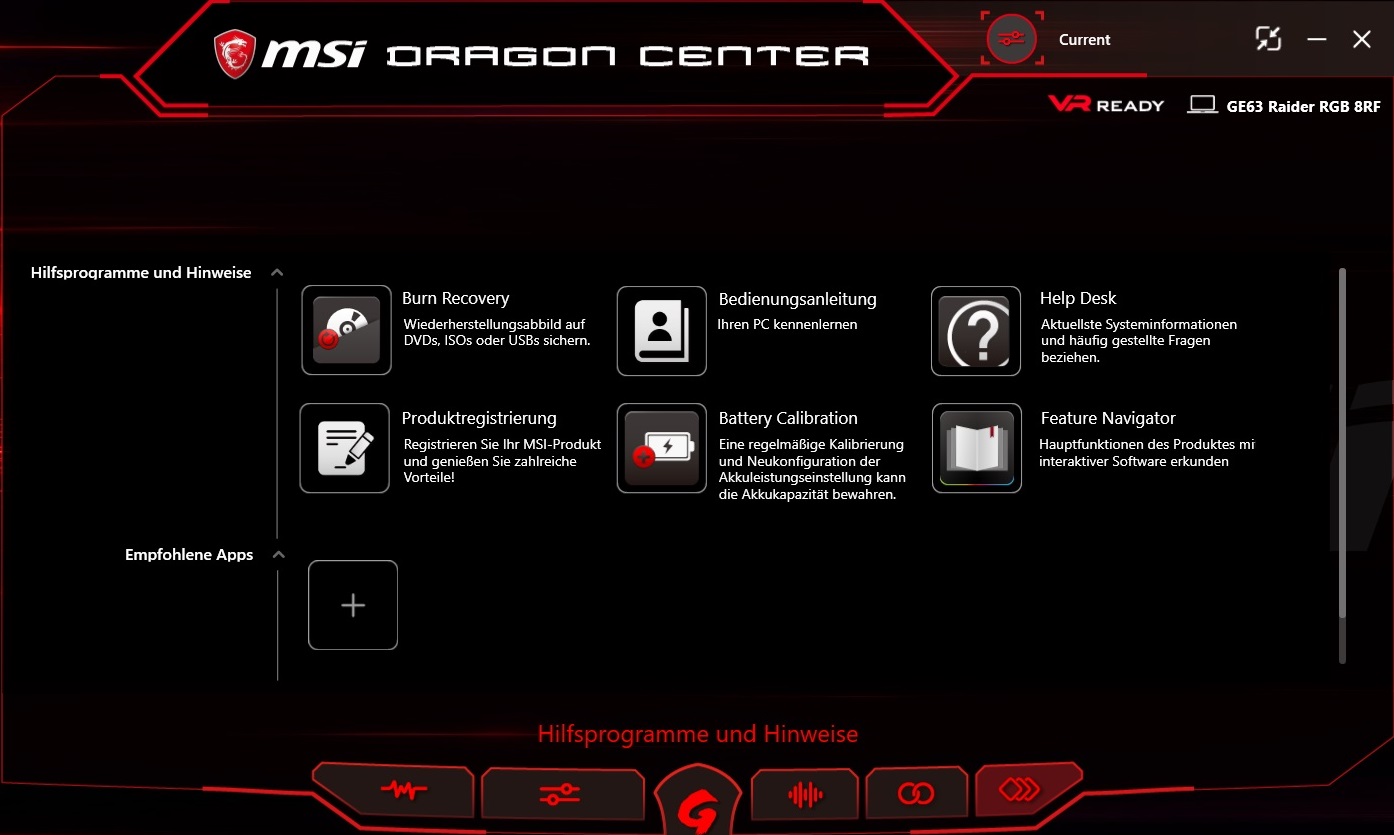
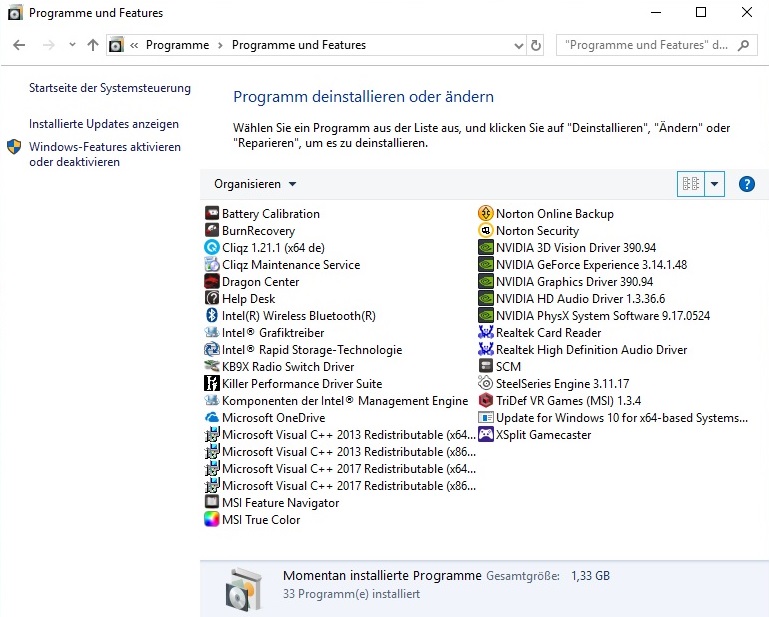
MSI includes its usual monitoring and tuning software with the GE63. These preinstalled programs allow you to adjust the keyboard lighting, display values, fan behavior and power settings. We set the fan control to ‘Auto’ and the shift mode to ‘Power Options’ for our tests. Setting the GE63 to these settings makes the device use Windows power settings instead. The MSI settings can be seen in screenshot #2.
The GE63 is one of the strongest gaming notebooks thanks to its high-end GPU and its hexa-core CPU. The 16 GB DDR4 RAM and 256 GB SSD assist in this regard too and help the GE63 reach its potential.
Processor
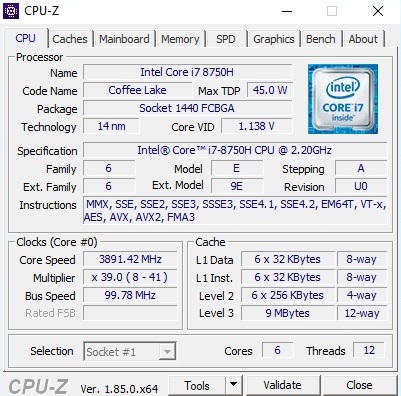
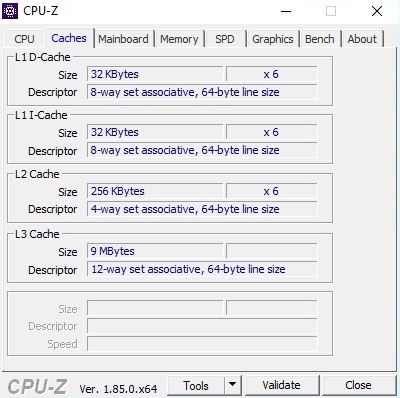
The Intel Core i7-8750H has become the standard for all powerful laptops in the last few months. Its six cores, 12 simultaneous threads and 9 MB L3 cache currently offer the best gaming experience of all mobile CPUs. GPU performance remains as important as ever though. Nevertheless, the Core i7-8750H and its hexa-core counterparts should be suitable for many years to come.
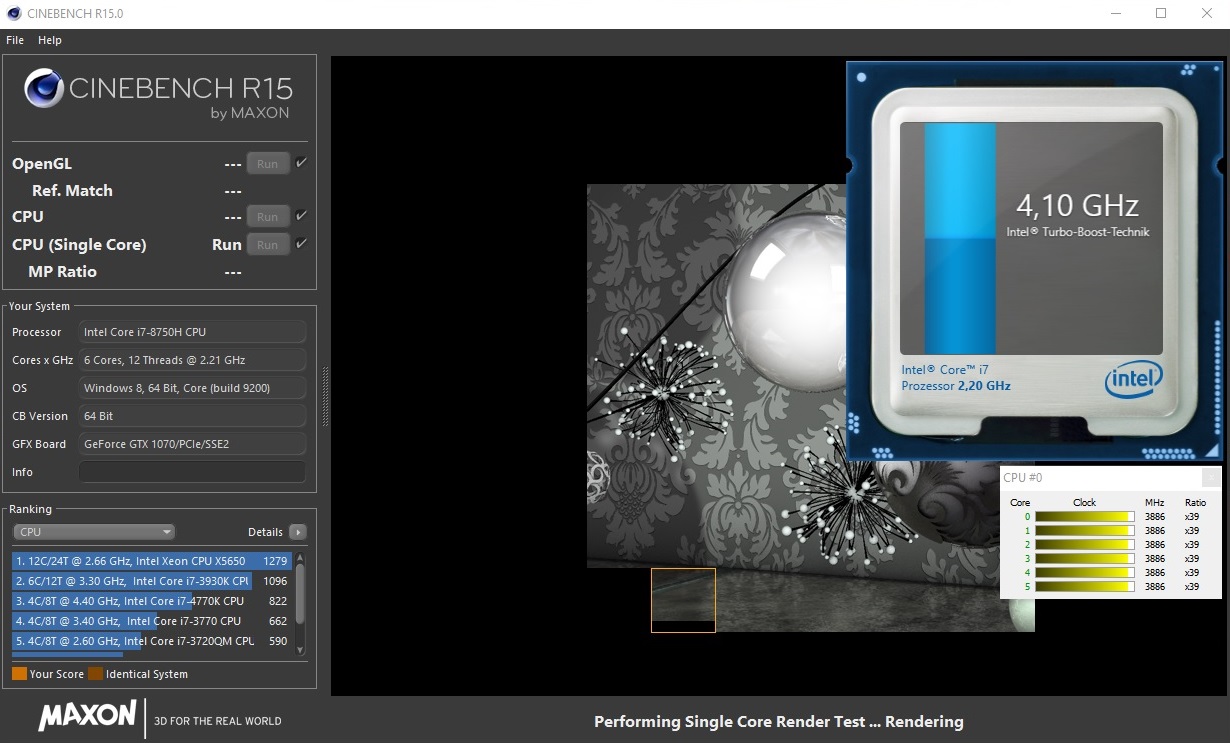
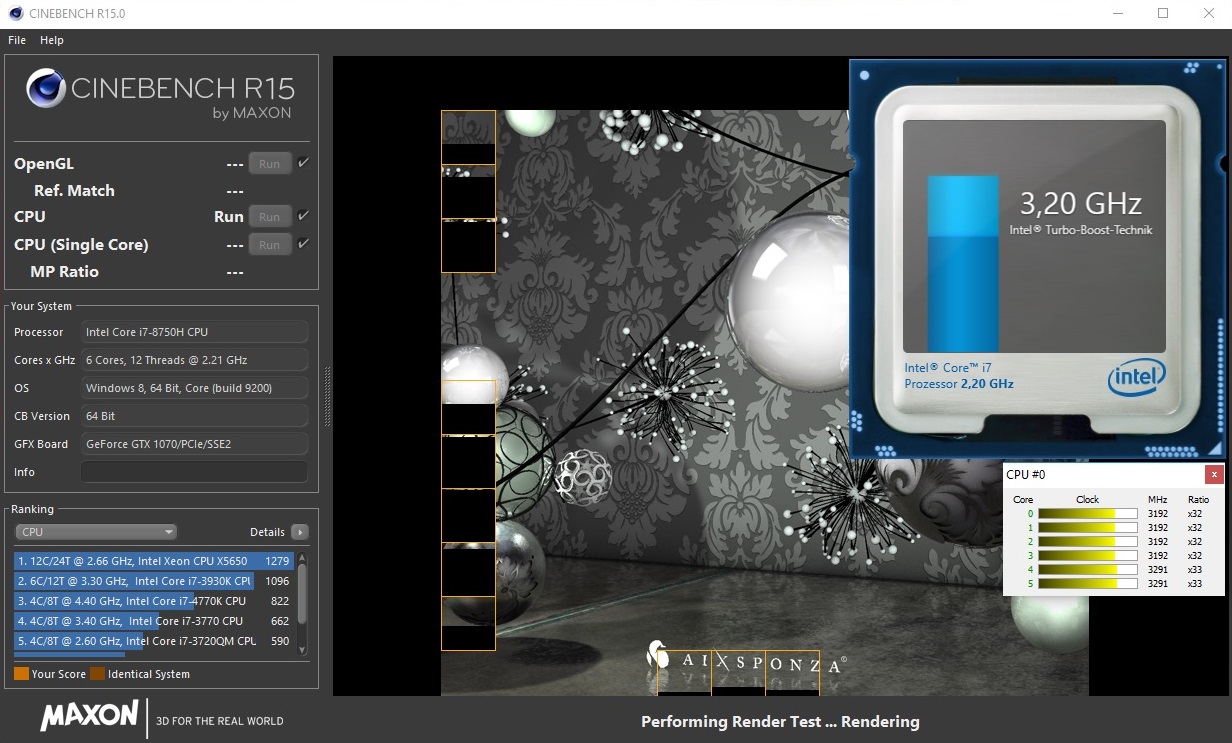
The GE63 Raider RGB performs well in benchmarks, with our test device scoring on par with other i7-8750H-powered devices in both single-core and multi-core rendering.
Unfortunately, as is known from the volume of other Coffee Lake-powered devices currently on the market, the i7-8750H can only sustain its high clock speed for a relatively short period. The best example of this behavior is in our Cinebench loop, during which the CPU performance drops from an initial clock speed of 3.9 GHz across all cores to an average of 3.2 GHz. This represents around a 10% performance drop from the start to the end of the looped benchmark.
System Performance
While MSI provided us with neither a PCIe nor an NVMe drive, system performance is still at a high level. It is worth noting that PCMark 8 has a SATA III limitation, which is why our test device finished in last place.
Also, there is a known bug with Nvidia Optimus, which means that many laptops that are equipped with the technology temporarily freeze when the GeForce GPU wakes up unnecessarily. We have included a link to an Intel support page for more information.
| PCMark 8 Home Score Accelerated v2 | 4271 points | |
| PCMark 8 Work Score Accelerated v2 | 5210 points | |
Help | ||
Storage Devices
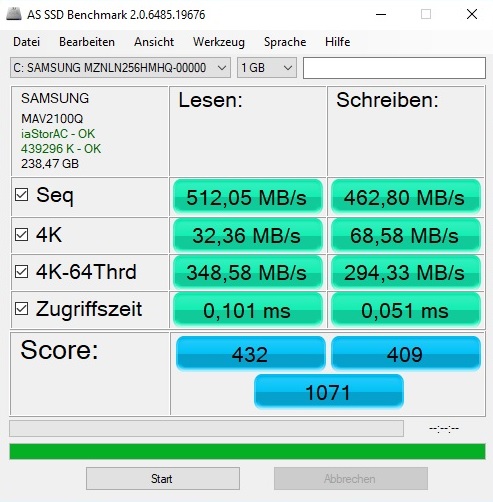
MSI has included a SATA III SSD with our test device, which is probably a cost-saving exercise. While SATA III SSDs are much slower than NVMe SSDs, this is hardly noticeable in practice; during most activities, compact file performance is more important than sequential read and write performance where NVMe SSDs particularly excel.
Our test device is equipped with a Samsung PM871a SSD, which is around 11% slower than the Toshiba HG6 SSD used in the MSI GE63VR. The benchmark differences between our test device and the ASUS ROG Zephyrus M GM501, the Aorus X5 v8 and the Alienware 15 R4 demonstrate the difference between SATA III and NVMe SSDs.
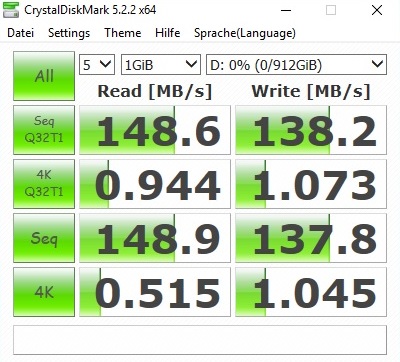
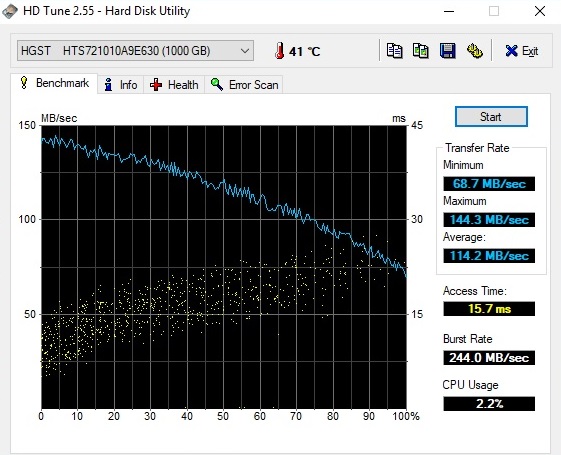
The GE63 has two M.2-2280 slots, which means that the device can be equipped with a second SSD. Our test device also includes an HGST Travelstar 7K1000 7,200 RPM 2.5-inch HDD for storing large files like films and TV series.
| MSI GE63 Raider RGB 8RF-008 Samsung SSD PM871a MZNLN256HMHQ | MSI GE63VR 7RF Raider Toshiba HG6 THNSNJ256G8NY | Asus Zephyrus M GM501 Samsung SM961 MZVKW512HMJP m.2 PCI-e | Aorus X5 v8 Toshiba NVMe THNSN5512GPU7 | Alienware 15 R4 Toshiba XG5 KXG50ZNV256G | |
|---|---|---|---|---|---|
| AS SSD | -11% | 193% | 110% | 69% | |
| Seq Read (MB/s) | 512 | 506 -1% | 2091 308% | 1813 254% | 2441 377% |
| Seq Write (MB/s) | 462.8 | 447 -3% | 1580 241% | 966 109% | 300.4 -35% |
| 4K Read (MB/s) | 32.36 | 19.55 -40% | 43.42 34% | 23.21 -28% | 32.87 2% |
| 4K Write (MB/s) | 68.6 | 77.3 13% | 90.2 31% | 84.5 23% | 94.8 38% |
| Score Read (Points) | 432 | 420 -3% | 1471 241% | 1061 146% | 714 65% |
| Score Write (Points) | 409 | 293 -28% | 1446 254% | 954 133% | 435 6% |
| Score Total (Points) | 1071 | 930 -13% | 3649 241% | 2515 135% | 1416 32% |

Graphics Card
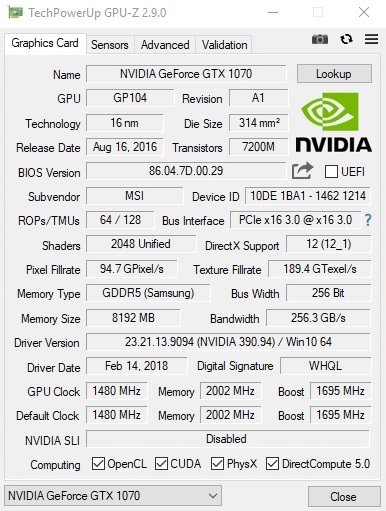
Either the GeForce GTX 1060 or the GeForce GTX 1070 will provide enough graphics performance to play games comfortably at Full HD. We would only recommend getting the more expensive GPU if you don’t want to compromise on image quality years down the line. The GTX 1070 has considerably more power thanks to its 2,048 shaders and 8 GB GDDR5 VRAM compared to the GTX 1060’s 1,280 shaders and 6 GB GDDR5 VRAM.
| 3DMark - 1920x1080 Fire Strike Graphics | |
| Average of class Gaming (12242 - 62849, n=118, last 2 years) | |
| MSI GE63VR 7RF Raider | |
| MSI GE63 Raider RGB 8RF-008 | |
| Alienware 15 R4 | |
| Aorus X5 v8 | |
| Asus Zephyrus M GM501 | |
| 3DMark 11 - 1280x720 Performance GPU | |
| Average of class Gaming (21841 - 80022, n=106, last 2 years) | |
| Alienware 15 R4 | |
| MSI GE63VR 7RF Raider | |
| MSI GE63 Raider RGB 8RF-008 | |
| Asus Zephyrus M GM501 | |
| Aorus X5 v8 | |
Our test device performed as expected for a GTX 1070-powered device in benchmarks, with our test device on par with our comparison devices.
| 3DMark 11 Performance | 18503 points | |
| 3DMark Cloud Gate Standard Score | 34274 points | |
| 3DMark Fire Strike Score | 15461 points | |
Help | ||
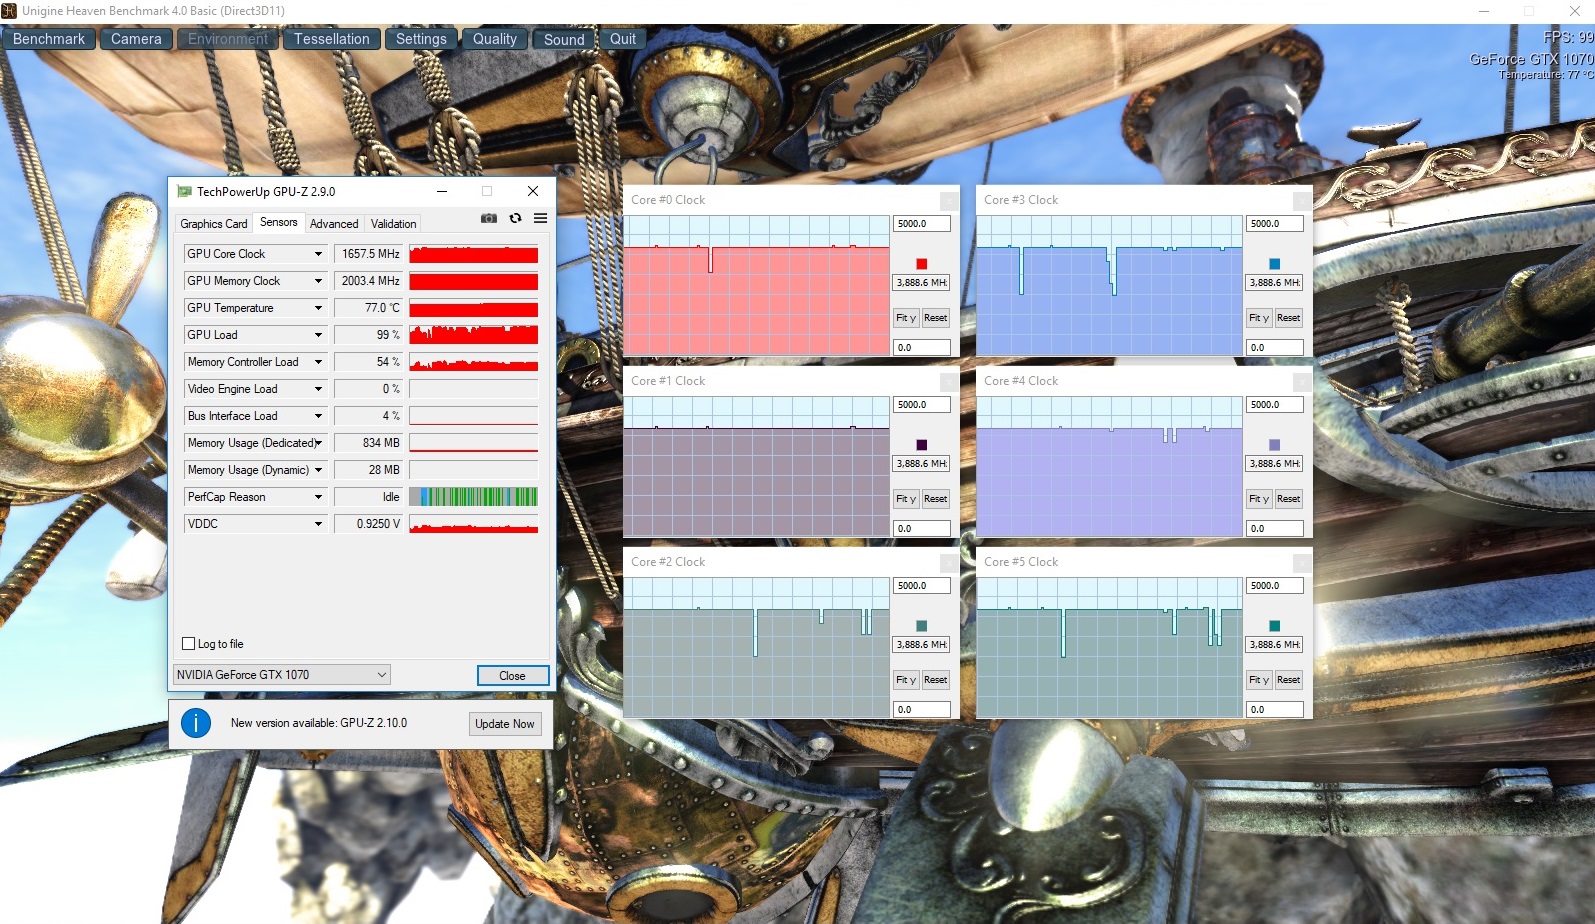
A glance at GPU clock speeds confirms this positive impression. The GPU averaged around 1,645 MHz after an hour of playing The Witcher 3 at Full HD and at ultra graphics settings. This is considerably higher than its 1,480 MHz base clock speed, speaking volumes for its turbo boost capabilities. We managed to get the GPU to clock up to 1,848 MHz too, but only when running GPU-Z’s rendering test.
Gaming Performance
The GE63 can make use of its high refresh rate display when paired with the GeForce GTX 1070. Practically all the games against which we tested our test device ran averaged above 60 FPS at Full HD and with graphics set to maximum. Simpler games like Farming Simulator 17 perform at higher FPS than even the 120 Hz supports, which is something that the GeForce GTX 1060 would struggle to achieve.
| The Witcher 3 - 1920x1080 Ultra Graphics & Postprocessing (HBAO+) | |
| MSI GE63VR 7RF Raider | |
| MSI GE63 Raider RGB 8RF-008 | |
| Aorus X5 v8 | |
| Alienware 15 R4 | |
| Asus Zephyrus M GM501 | |
A GeForce GTX 1080 would not be worth the extra cost for the most part as the higher performance would increase power consumption and put greater strain on the cooling system. We would only recommend a GeForce GTX 1080 when gaming at either 2560x1440 or 3840x2160 resolutions.
You should perhaps also consider that the GE63 does not support Nvidia G-Sync as it uses Nvidia Optimus; the two are not currently compatible.
| low | med. | high | ultra | |
|---|---|---|---|---|
| The Witcher 3 (2015) | 111 | 60.6 | ||
| Farming Simulator 17 (2016) | 174 | 164 | ||
| Rocket League (2017) | 206 | |||
| Dirt 4 (2017) | 129 | 86.4 | ||
| Middle-earth: Shadow of War (2017) | 103 | 85 | ||
| The Evil Within 2 (2017) | 56.5 | 55.5 | ||
| ELEX (2017) | 104 | 79.3 | ||
| Wolfenstein II: The New Colossus (2017) | 116 | 109 |
Emissions
Fan Noise
The GE63 gets loud under load, with fan noise reaching a higher peak volume than all our comparison devices and the average for the gaming devices that we have currently tested. While our test device is quieter when running 3DMark06 than most of our comparison devices, our test device is a few decibels louder than them when playing The Witcher 3 and when running a combined FurMark and Prime95 stress test. Overall, we would recommend using headphones when gaming for extended periods as you will struggle to hear the speakers over 50+ dB(A) fan noise.
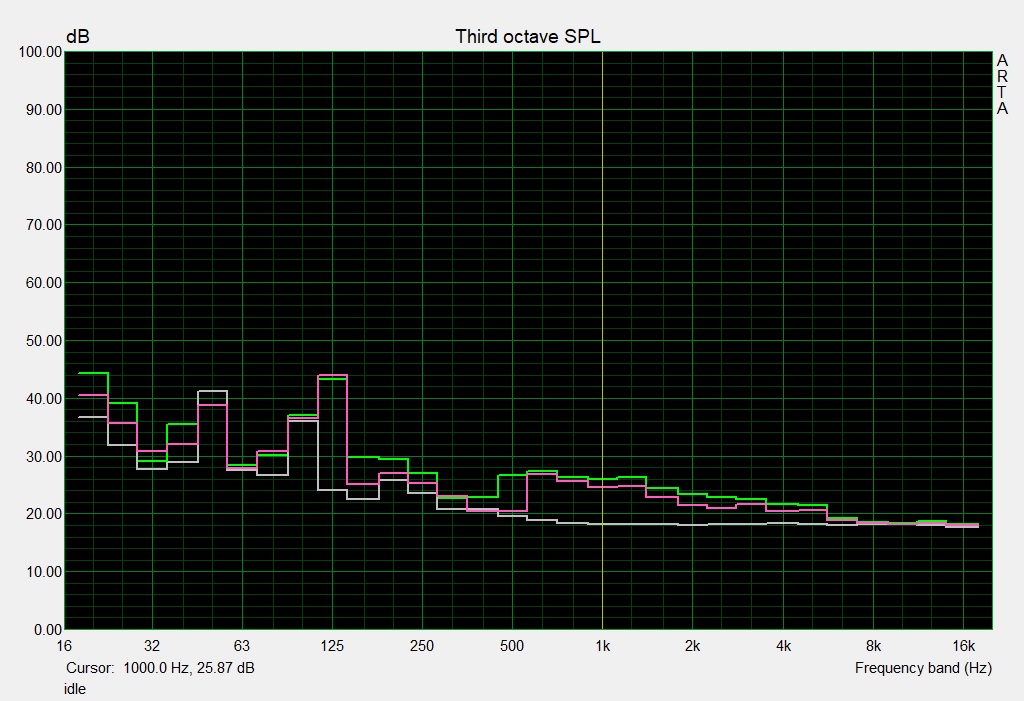
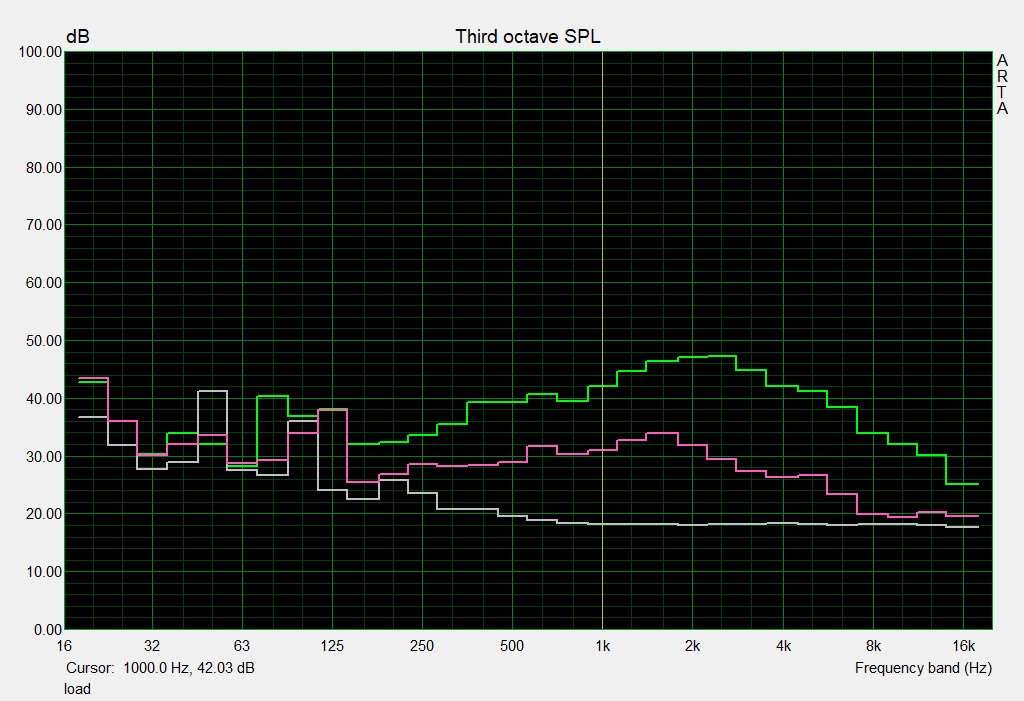
Fan noise is much more relaxed at idle. However, the included 1 TB HDD adds to the din. We measured the HDD reaching 35 dB(A) when around 15 cm from the device. Positively, sometimes there is no fan or HDD noise at all, which is a rarity with gaming laptops.
Noise level
| Idle |
| 30 / 35 / 36 dB(A) |
| HDD |
| 35 dB(A) |
| Load |
| 42 / 56 dB(A) |
 | ||
30 dB silent 40 dB(A) audible 50 dB(A) loud |
||
min: | ||
| MSI GE63 Raider RGB 8RF-008 i7-8750H, GeForce GTX 1070 Mobile | MSI GE63VR 7RF Raider i7-7700HQ, GeForce GTX 1070 Mobile | Asus Zephyrus M GM501 i7-8750H, GeForce GTX 1070 Mobile | Aorus X5 v8 i7-8850H, GeForce GTX 1070 Mobile | Alienware 15 R4 i9-8950HK, GeForce GTX 1070 Mobile | Average of class Gaming | |
|---|---|---|---|---|---|---|
| Noise | -4% | 3% | -3% | -6% | 13% | |
| off / environment * (dB) | 30 | 30 -0% | 29 3% | 30 -0% | 29 3% | 24.1 ? 20% |
| Idle Minimum * (dB) | 30 | 33 -10% | 30 -0% | 33 -10% | 32 -7% | 25.8 ? 14% |
| Idle Average * (dB) | 35 | 35 -0% | 31 11% | 35 -0% | 33 6% | 27.4 ? 22% |
| Idle Maximum * (dB) | 36 | 40 -11% | 33 8% | 40 -11% | 50 -39% | 29.9 ? 17% |
| Load Average * (dB) | 42 | 48 -14% | 49 -17% | 45 -7% | 50 -19% | 43 ? -2% |
| Witcher 3 ultra * (dB) | 54 | 50 7% | 50 7% | 50 7% | 51 6% | |
| Load Maximum * (dB) | 56 | 55 2% | 52 7% | 55 2% | 51 9% | 54 ? 4% |
* ... smaller is better
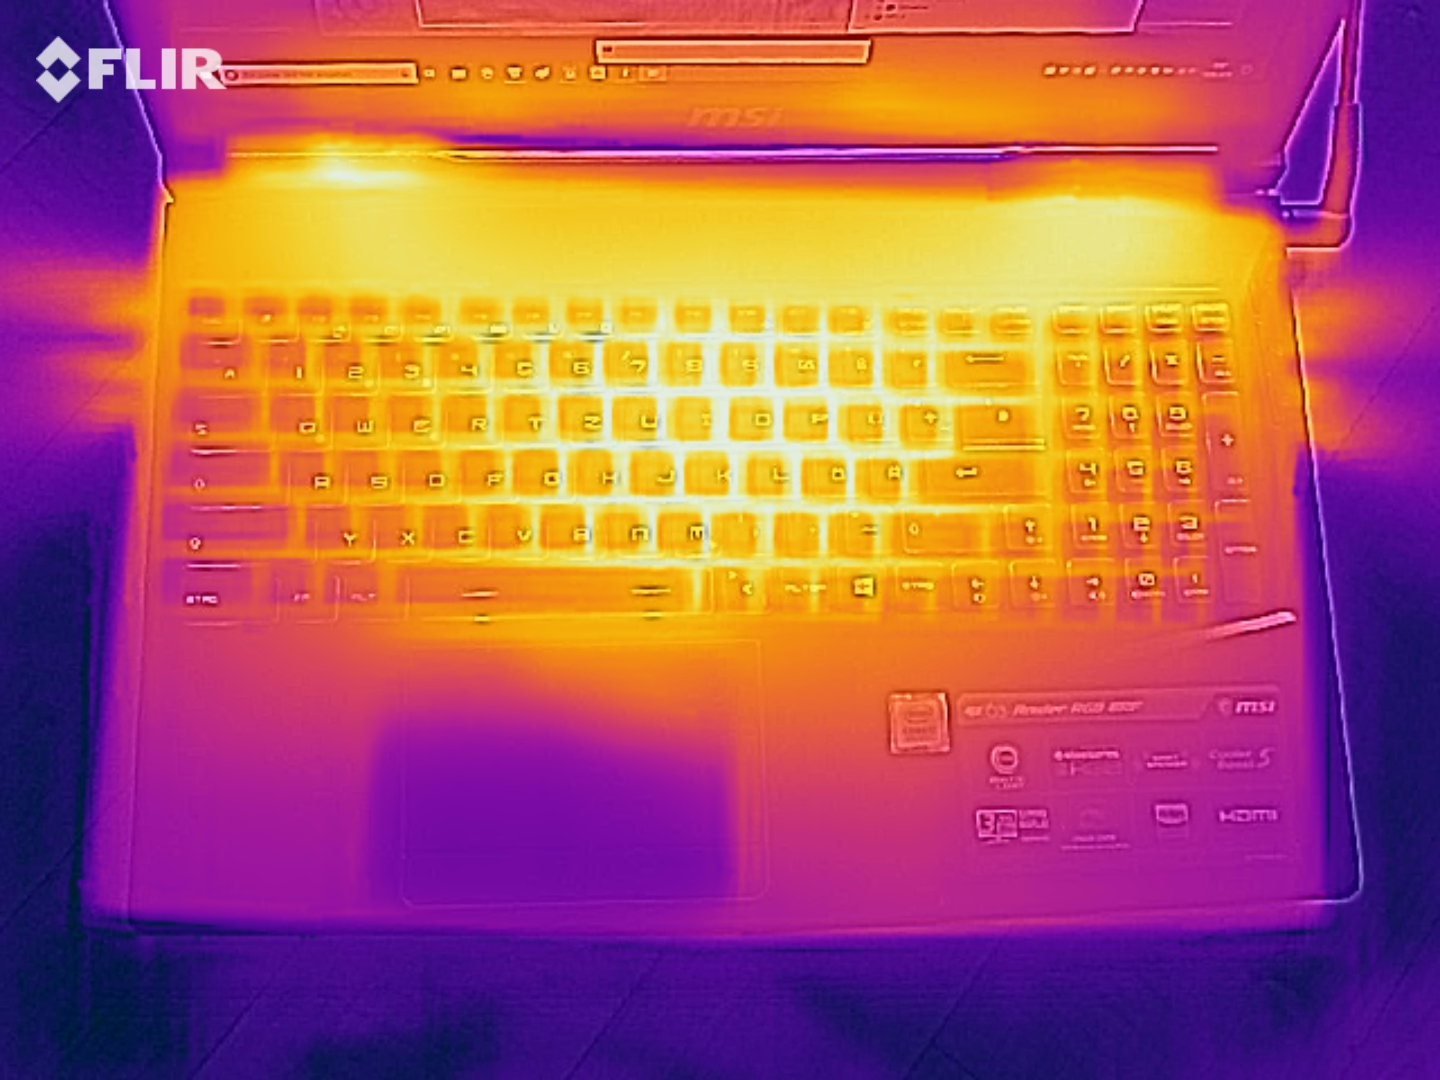
Temperature
Surface temperatures are largely unremarkable. Maximums of 48 °C on the top case and 49 °C on the underside after an hour at full load are hot, but this is typical for gaming laptops. The GE63 is on par in this regard with its predecessor and with the Asus ROG Zephyrus M GM501. By contrast, the Aorus X5 v8 and the Alienware 15 R4 get far hotter on their bottom cases. However, we would recommend using any of these devices on a hard surface instead of your lap, as these surface temperatures will feel hot to the touch.
Bear in mind that 3D performance reduces by about two-thirds when using the device on battery. Conversely, our test device is pleasantly cool at idle, with surface temperatures generally averaging below 30 °C.
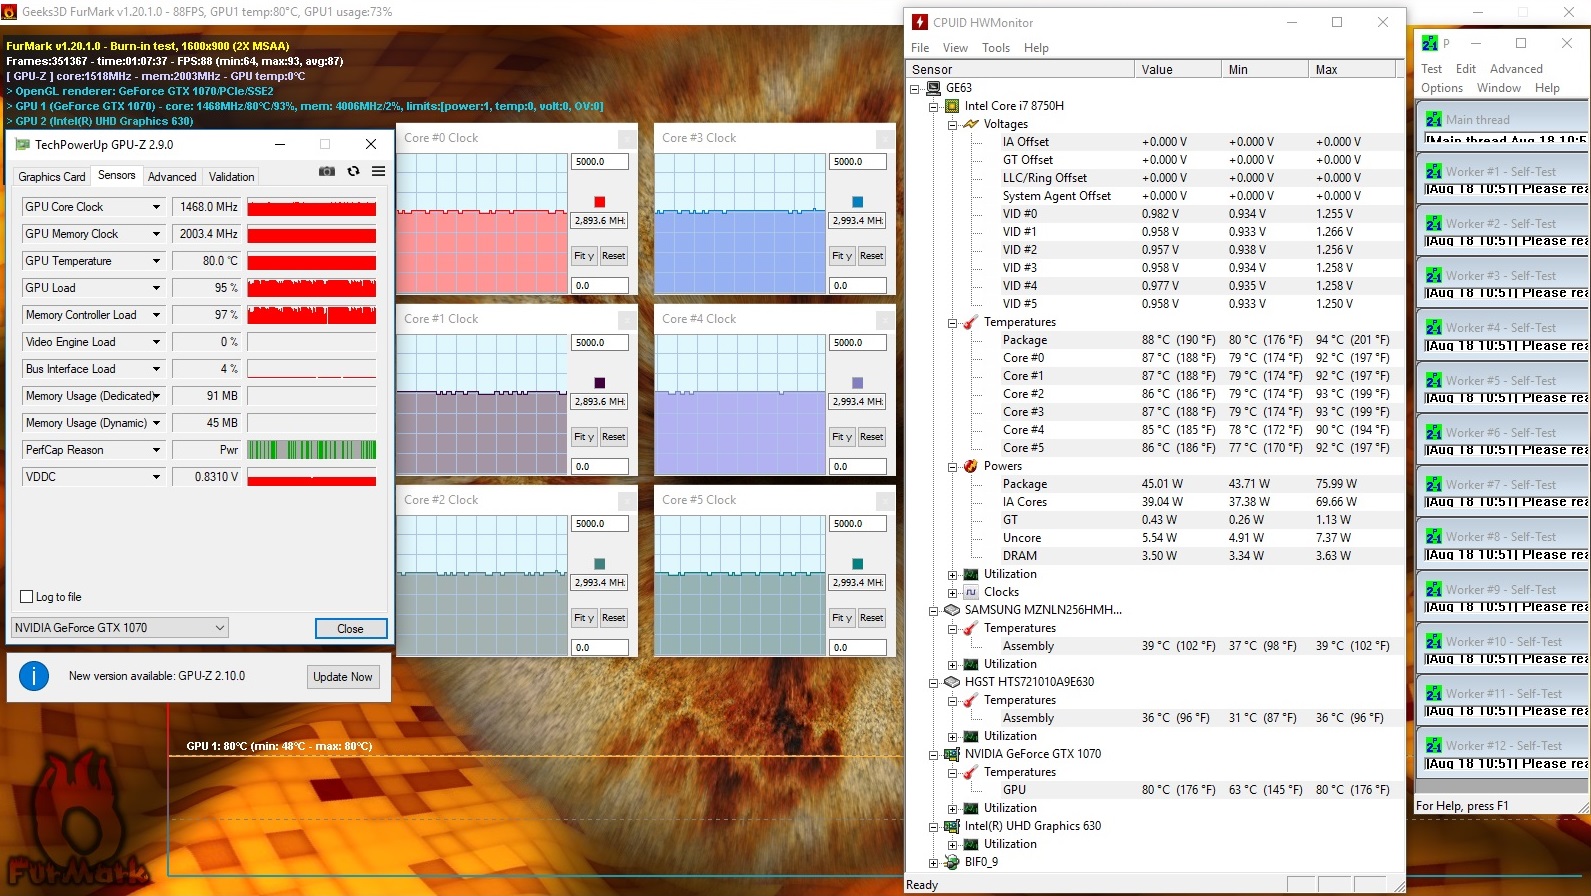
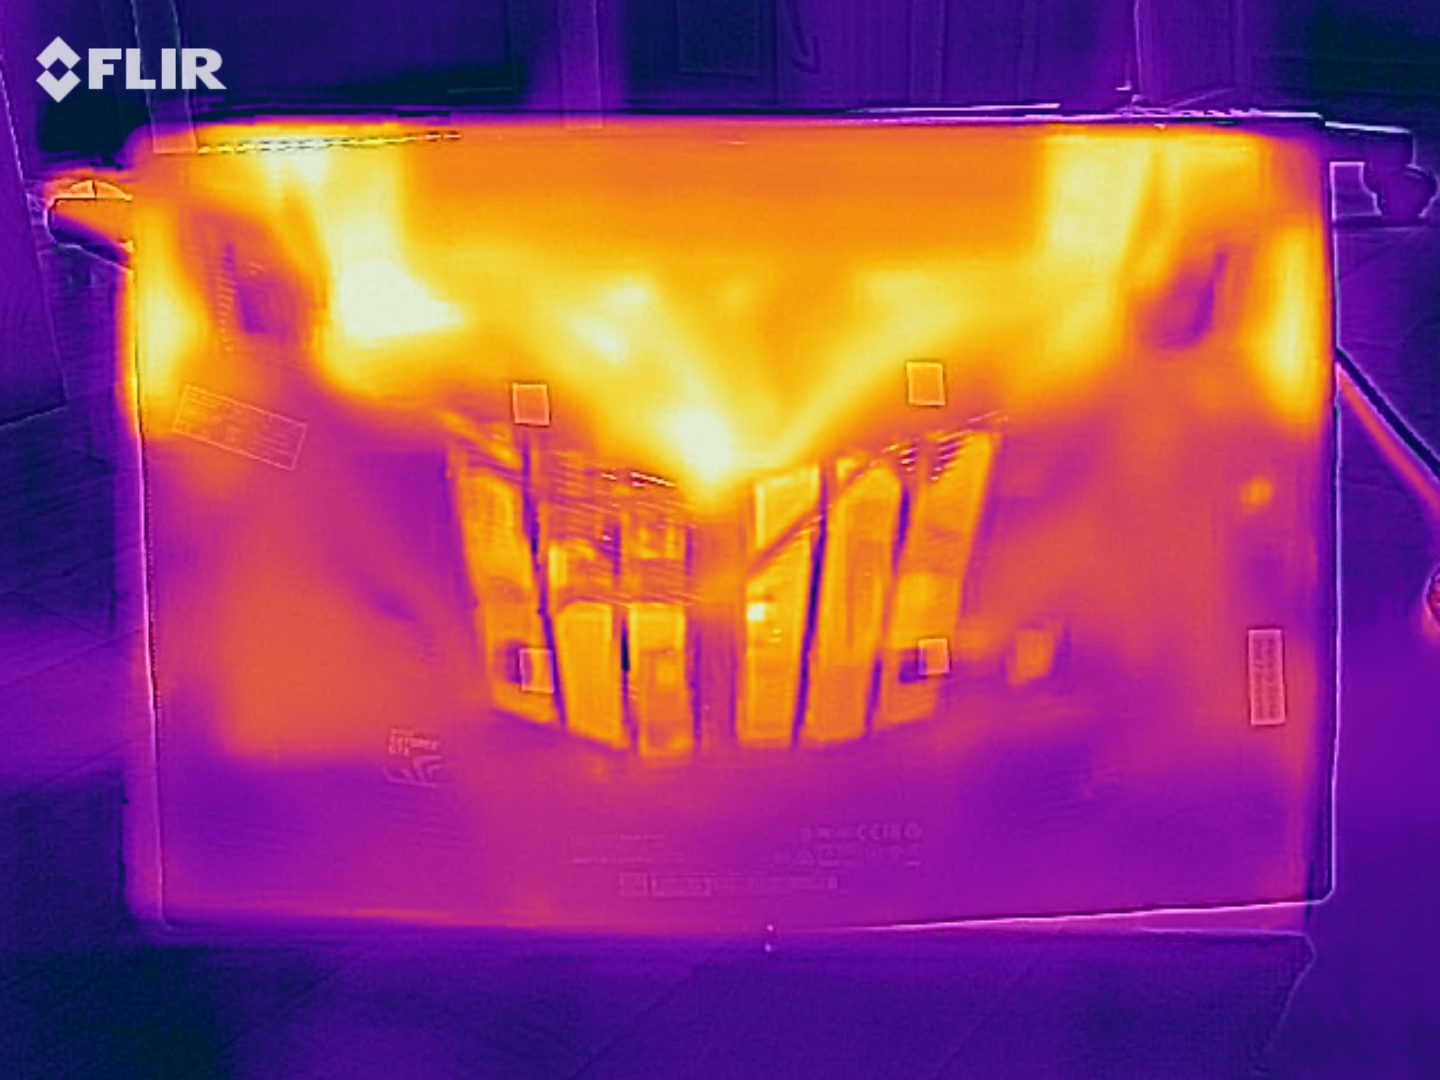
Core temperatures are much higher inside though. The GTX 1070 reached an average of 80 °C when working at full load while the Core i7-8750H hit 90 °C. However, the CPU and GPU run much cooler when gaming, with neither component exceeding an average of 80 °C when playing The Witcher 3.
(-) The maximum temperature on the upper side is 48 °C / 118 F, compared to the average of 40.4 °C / 105 F, ranging from 21.2 to 68.8 °C for the class Gaming.
(-) The bottom heats up to a maximum of 49 °C / 120 F, compared to the average of 43.2 °C / 110 F
(+) In idle usage, the average temperature for the upper side is 28.4 °C / 83 F, compared to the device average of 33.9 °C / 93 F.
(-) Playing The Witcher 3, the average temperature for the upper side is 43.9 °C / 111 F, compared to the device average of 33.9 °C / 93 F.
(-) The palmrests and touchpad can get very hot to the touch with a maximum of 41 °C / 105.8 F.
(-) The average temperature of the palmrest area of similar devices was 28.8 °C / 83.8 F (-12.2 °C / -22 F).
| MSI GE63 Raider RGB 8RF-008 i7-8750H, GeForce GTX 1070 Mobile | MSI GE63VR 7RF Raider i7-7700HQ, GeForce GTX 1070 Mobile | Asus Zephyrus M GM501 i7-8750H, GeForce GTX 1070 Mobile | Aorus X5 v8 i7-8850H, GeForce GTX 1070 Mobile | Alienware 15 R4 i9-8950HK, GeForce GTX 1070 Mobile | Average of class Gaming | |
|---|---|---|---|---|---|---|
| Heat | -1% | -4% | -5% | -27% | -2% | |
| Maximum Upper Side * (°C) | 48 | 48 -0% | 52 -8% | 50 -4% | 53 -10% | 45.2 ? 6% |
| Maximum Bottom * (°C) | 49 | 47 4% | 49 -0% | 62 -27% | 68 -39% | 47.9 ? 2% |
| Idle Upper Side * (°C) | 29 | 29 -0% | 31 -7% | 27 7% | 39 -34% | 31.1 ? -7% |
| Idle Bottom * (°C) | 31 | 33 -6% | 31 -0% | 29 6% | 39 -26% | 34.2 ? -10% |
* ... smaller is better
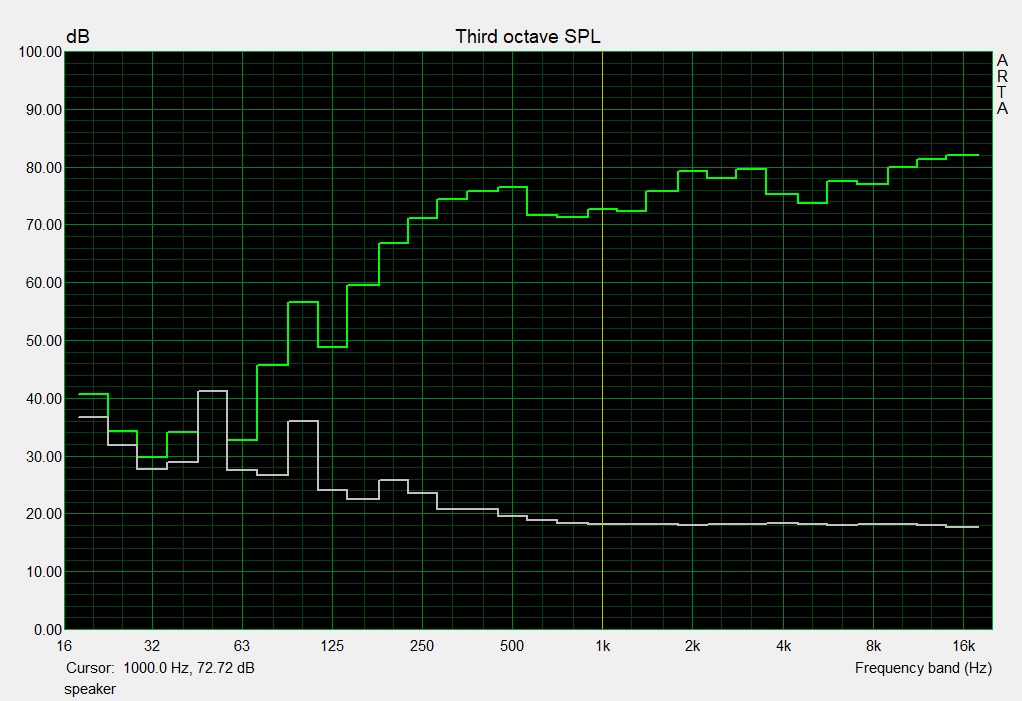
Speakers
MSI GE63 Raider RGB 8RF-008 audio analysis
(+) | speakers can play relatively loud (89 dB)
Bass 100 - 315 Hz
(±) | reduced bass - on average 12.8% lower than median
(±) | linearity of bass is average (12.8% delta to prev. frequency)
Mids 400 - 2000 Hz
(+) | balanced mids - only 2.4% away from median
(+) | mids are linear (3.5% delta to prev. frequency)
Highs 2 - 16 kHz
(+) | balanced highs - only 2.3% away from median
(+) | highs are linear (4% delta to prev. frequency)
Overall 100 - 16.000 Hz
(+) | overall sound is linear (10.1% difference to median)
Compared to same class
» 5% of all tested devices in this class were better, 2% similar, 93% worse
» The best had a delta of 6%, average was 18%, worst was 132%
Compared to all devices tested
» 5% of all tested devices were better, 1% similar, 94% worse
» The best had a delta of 4%, average was 24%, worst was 134%
Asus Zephyrus M GM501 audio analysis
(+) | speakers can play relatively loud (86 dB)
Bass 100 - 315 Hz
(+) | good bass - only 4.8% away from median
(±) | linearity of bass is average (8.3% delta to prev. frequency)
Mids 400 - 2000 Hz
(+) | balanced mids - only 3.2% away from median
(+) | mids are linear (3.6% delta to prev. frequency)
Highs 2 - 16 kHz
(±) | higher highs - on average 5.8% higher than median
(+) | highs are linear (6.5% delta to prev. frequency)
Overall 100 - 16.000 Hz
(+) | overall sound is linear (11.5% difference to median)
Compared to same class
» 10% of all tested devices in this class were better, 3% similar, 87% worse
» The best had a delta of 6%, average was 18%, worst was 132%
Compared to all devices tested
» 8% of all tested devices were better, 2% similar, 90% worse
» The best had a delta of 4%, average was 24%, worst was 134%
Power Management
Power consumption
The GE63 is an economic device at idle thanks to Nvidia Optimus graphics-switching technology. 9-19 W at idle is particularly good for a gaming laptop and is much lower than our comparison devices that rely on Nvidia G-Sync. The Aorus X5 v8, for example, consumes between 25 and 33 W at idle, which is more than double our test device. This gap shrinks significantly when the GE63 starts running at full load though, with our test device consuming between 91 and 238 W, a higher maximum power draw than all but one of our comparison devices. We measure power consumption directly from the wall, so any efficiencies that the power supply introduces are not measured. Hence, the included 230 W power supply should still charge the device even when it is operating under full load.
| Off / Standby | |
| Idle | |
| Load |
|
Key:
min: | |
| MSI GE63 Raider RGB 8RF-008 i7-8750H, GeForce GTX 1070 Mobile | MSI GE63VR 7RF Raider i7-7700HQ, GeForce GTX 1070 Mobile | Asus Zephyrus M GM501 i7-8750H, GeForce GTX 1070 Mobile | Aorus X5 v8 i7-8850H, GeForce GTX 1070 Mobile | Alienware 15 R4 i9-8950HK, GeForce GTX 1070 Mobile | Average of class Gaming | |
|---|---|---|---|---|---|---|
| Power Consumption | -7% | -25% | -65% | -53% | -27% | |
| Idle Minimum * (Watt) | 9 | 11 -22% | 16 -78% | 25 -178% | 23 -156% | 13.2 ? -47% |
| Idle Average * (Watt) | 14 | 16 -14% | 19 -36% | 31 -121% | 26 -86% | 18.9 ? -35% |
| Idle Maximum * (Watt) | 19 | 21 -11% | 26 -37% | 33 -74% | 30 -58% | 24.3 ? -28% |
| Load Average * (Watt) | 91 | 92 -1% | 103 -13% | 102 -12% | 111 -22% | 108.3 ? -19% |
| Witcher 3 ultra * (Watt) | 182 | 185 -2% | 164 10% | 194 -7% | 182 -0% | |
| Load Maximum * (Watt) | 238 | 224 6% | 223 6% | 239 -0% | 222 7% | 254 ? -7% |
* ... smaller is better
Battery life
The GE63 does not have particularly good battery life despite its power-saving graphics-switching. A four-hour runtime on our Wi-Fi battery test with brightness at medium is passable. By contrast, the ASUS ROG Zephyrus M GM501 does not even manage three hours. The main downfall here is the GE63’s 51 Wh battery, which is considerably smaller than the 92 Wh battery powering the Aorus X5 v8 and the 99 Wh battery found in the Alienware 15 R4. Both of these devices lack Nvidia Optimus though, so their battery runtimes are not vastly longer than our test device.
| MSI GE63 Raider RGB 8RF-008 i7-8750H, GeForce GTX 1070 Mobile, 51 Wh | MSI GE63VR 7RF Raider i7-7700HQ, GeForce GTX 1070 Mobile, 51 Wh | Asus Zephyrus M GM501 i7-8750H, GeForce GTX 1070 Mobile, 55 Wh | Aorus X5 v8 i7-8850H, GeForce GTX 1070 Mobile, 92.24 Wh | Alienware 15 R4 i9-8950HK, GeForce GTX 1070 Mobile, 99 Wh | Average of class Gaming | |
|---|---|---|---|---|---|---|
| Battery runtime | -11% | -4% | 37% | 20% | 71% | |
| Reader / Idle (h) | 5.7 | 5.4 -5% | 4 -30% | 4.9 -14% | 6.2 9% | 8.71 ? 53% |
| WiFi v1.3 (h) | 4 | 3.4 -15% | 2.7 -32% | 5.1 27% | 7.04 ? 76% | |
| Load (h) | 0.8 | 0.7 -13% | 1.2 50% | 1.5 88% | 1 25% | 1.47 ? 84% |
| H.264 (h) | 2.7 | 3.6 | 8.26 ? |
Verdict
Pros
Cons
The MSI GE63 Raider RGB 8RF is a successful high-end notebook that is only let down by its loud fans.
The device is a good all-round performer thanks to its high-end hardware and comes with an RGB keyboard, a stylish metal case, decent speakers and powerful manufacturer software.
Other arguments for buying the new GE63 include the 120 Hz display, which has both a high-contrast ratio and strong color accuracy. The only drawback with the 120 Hz display is its poor viewing angles associated with being a TN panel. We would love to see MSI rectify these drawbacks with a successor that included a Thunderbolt 3 port, a larger battery and a display with better viewing angles.
If these drawbacks are not an issue for you, then we would highly recommend you check out the MSI GE63 Raider RGB 8RF.
MSI GE63 Raider RGB 8RF-008
- 08/20/2018 v6 (old)
Florian Glaser
Price comparison

