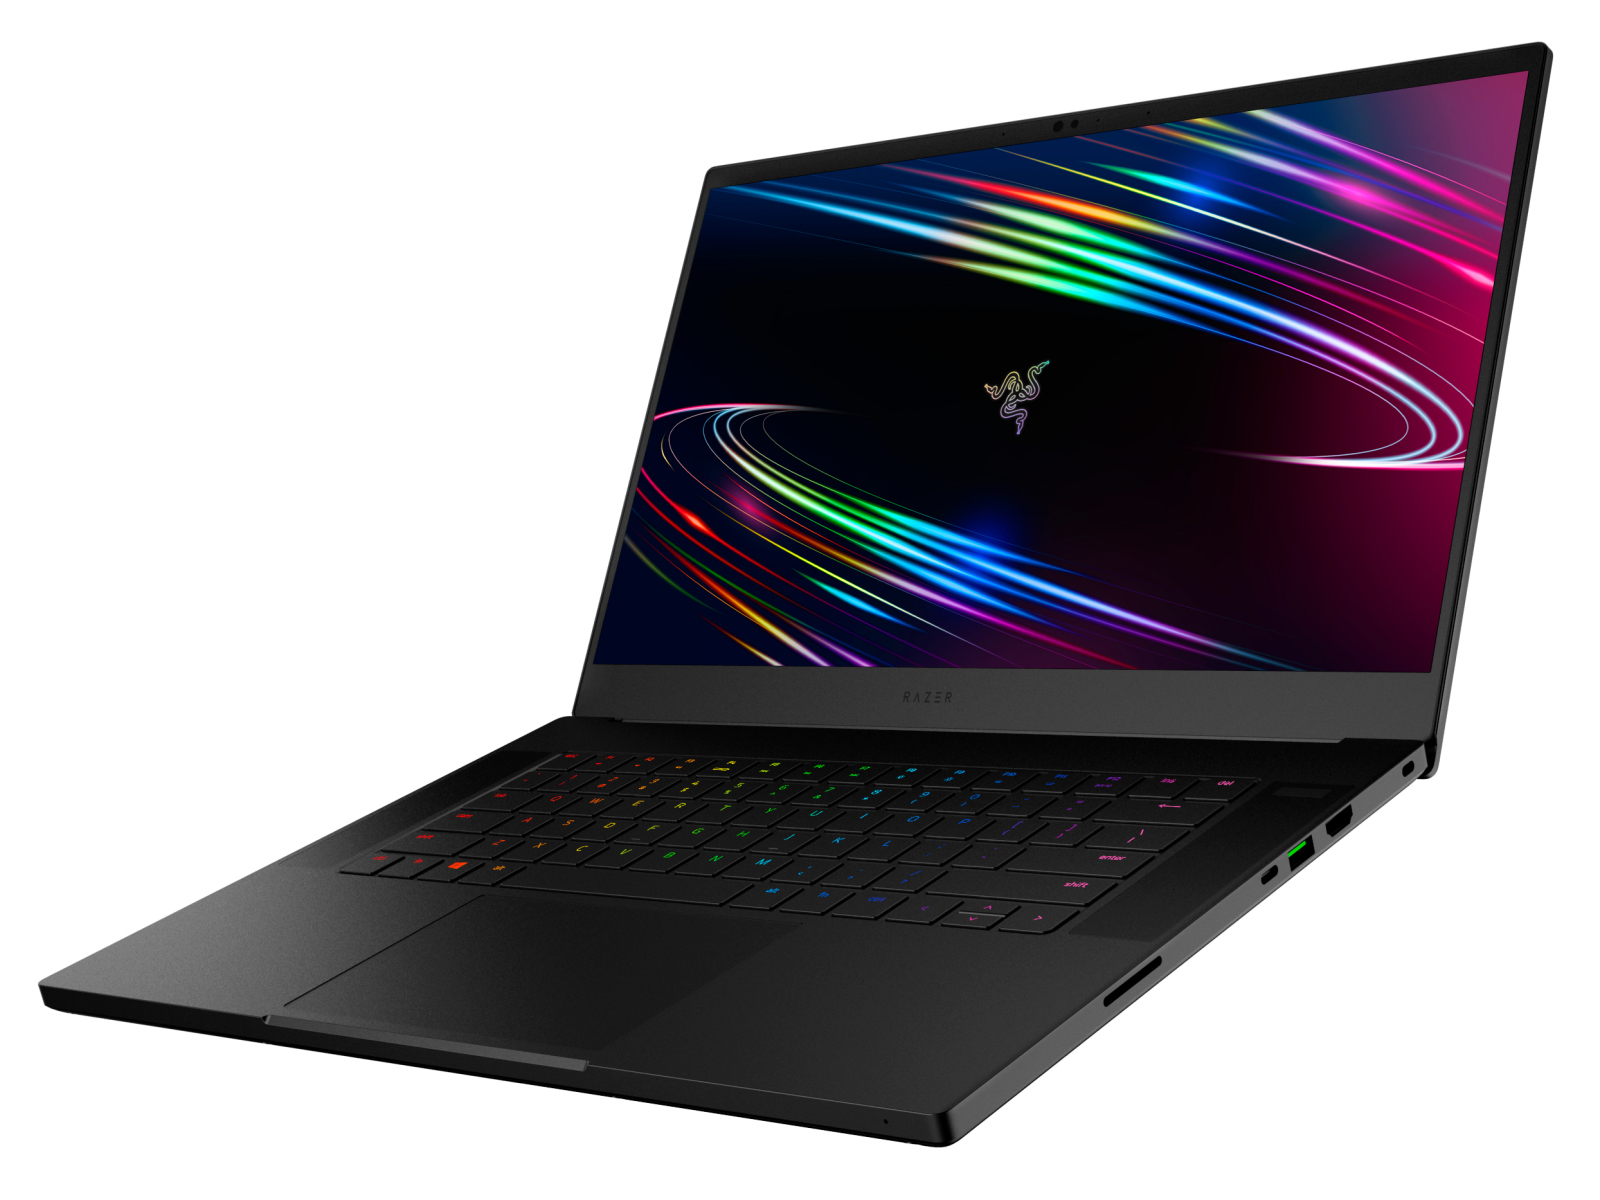
Razer Blade 15 Advanced Model (2020) in review: Detail improvements pay off

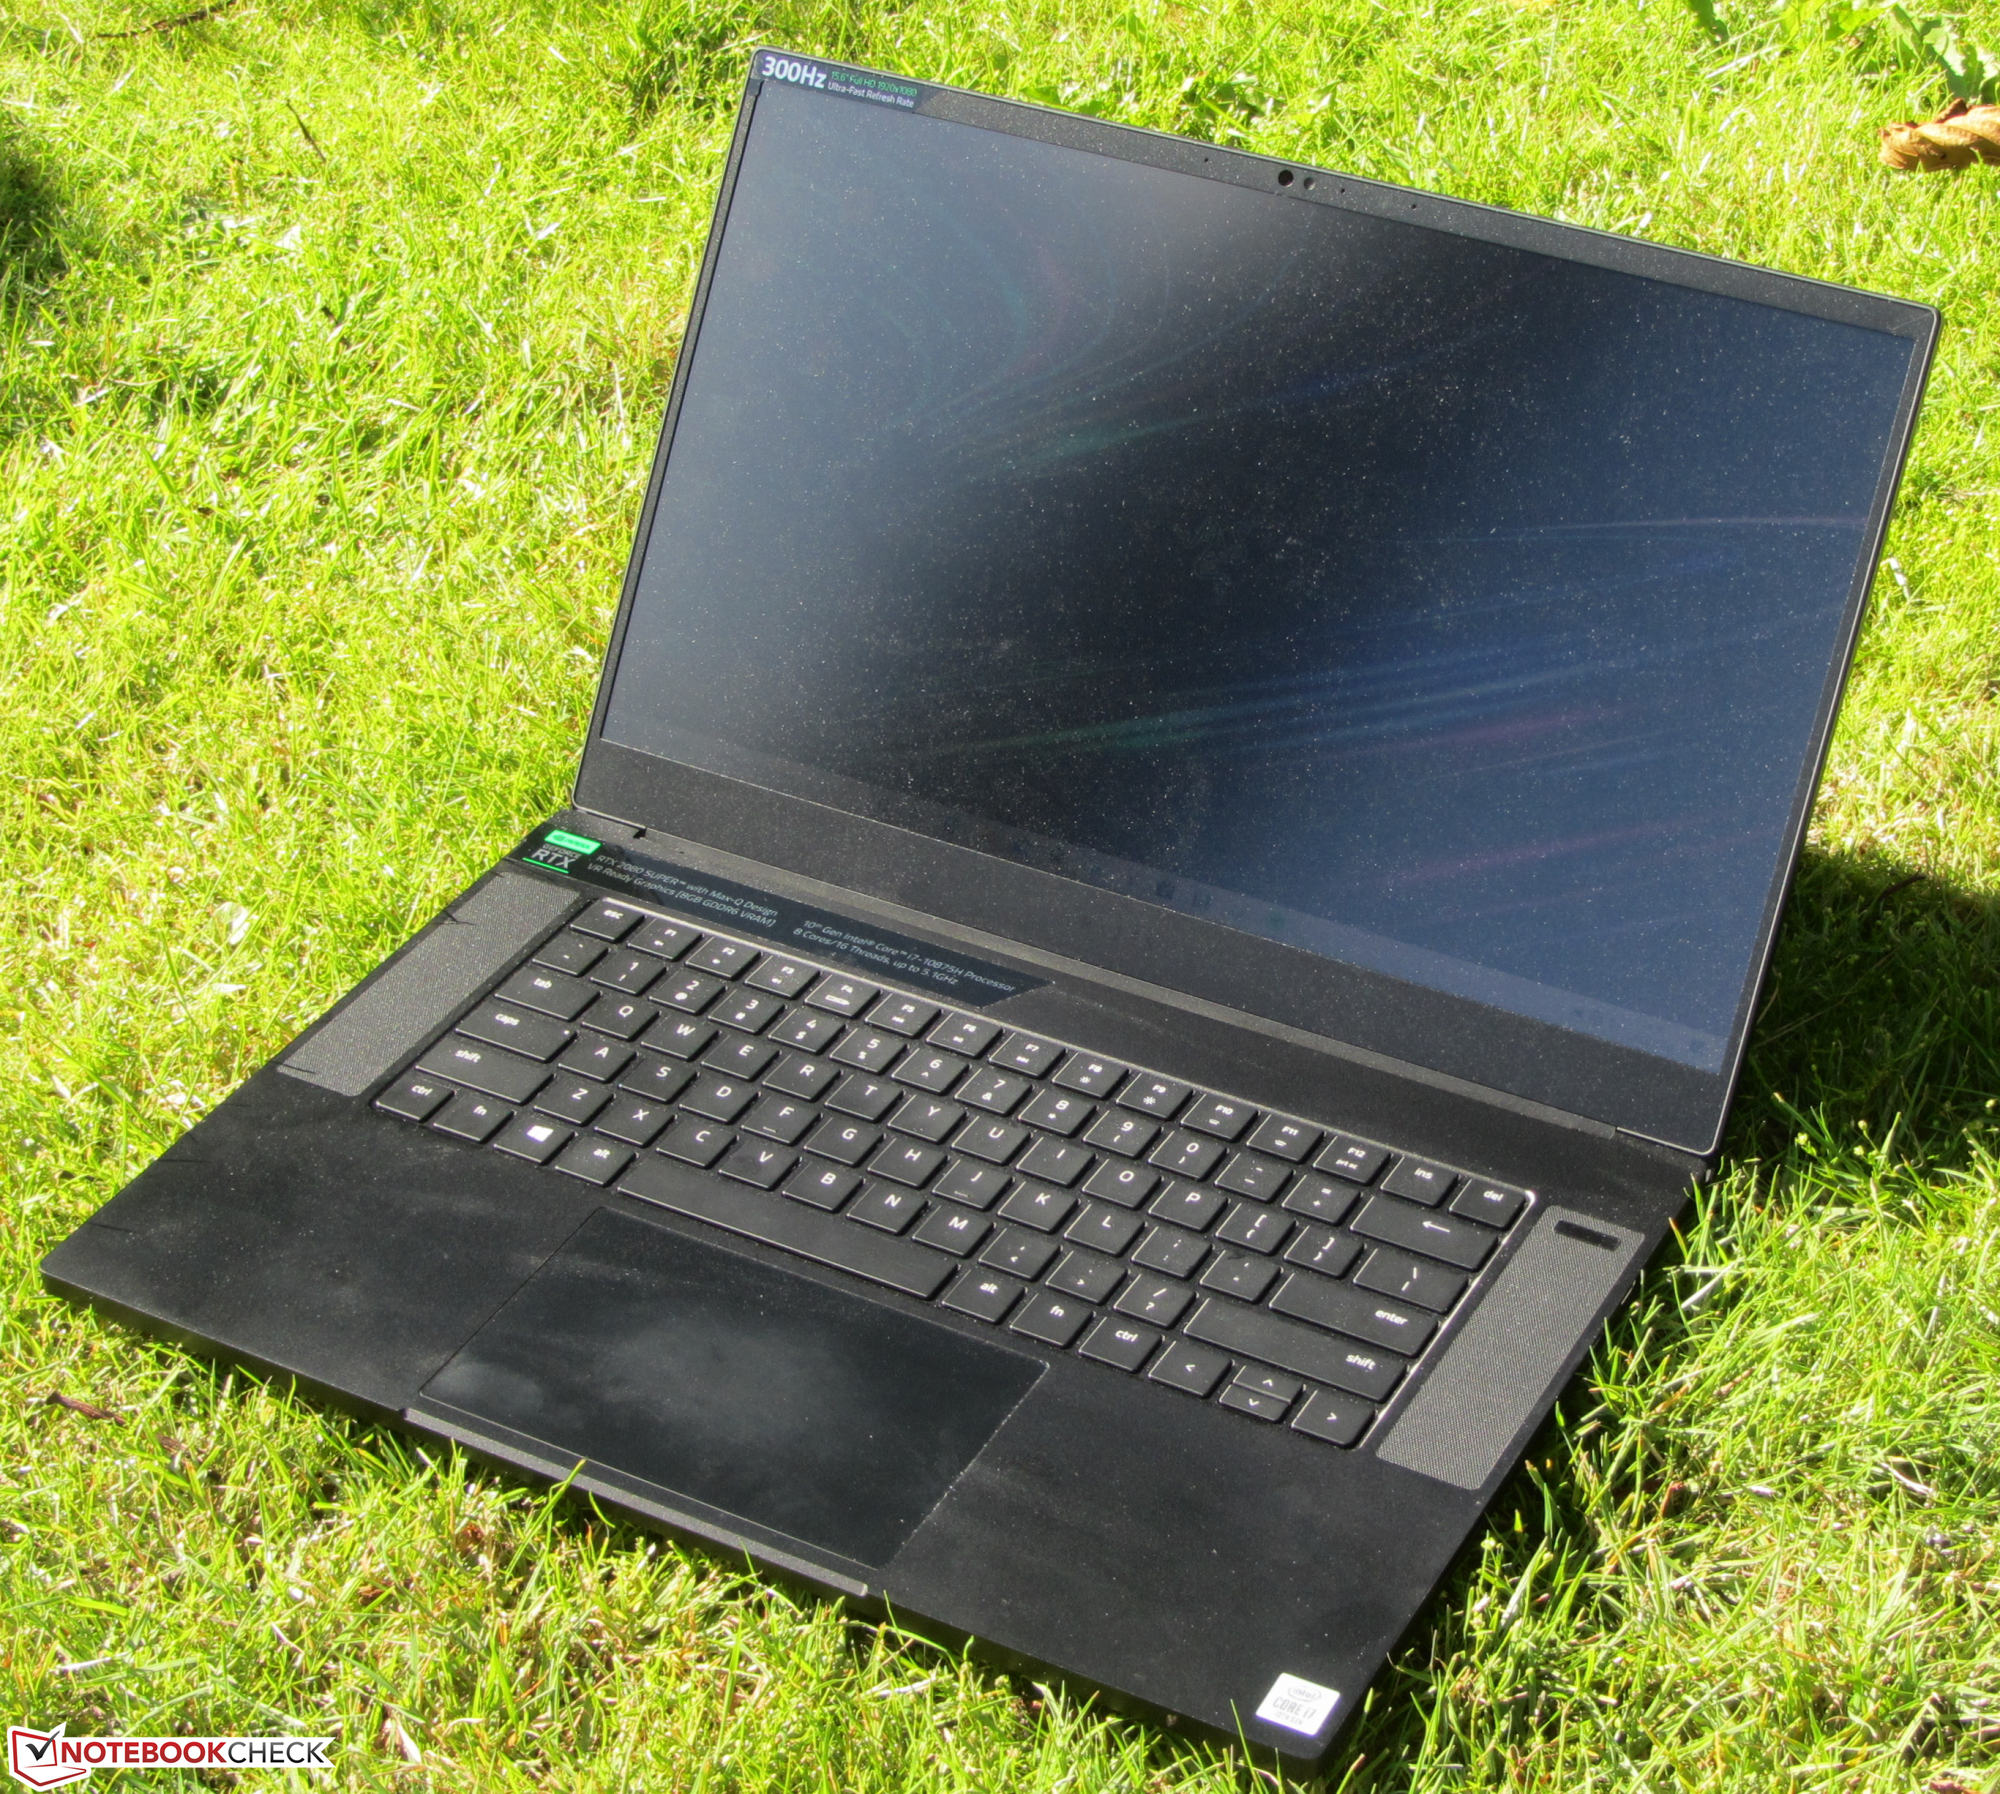
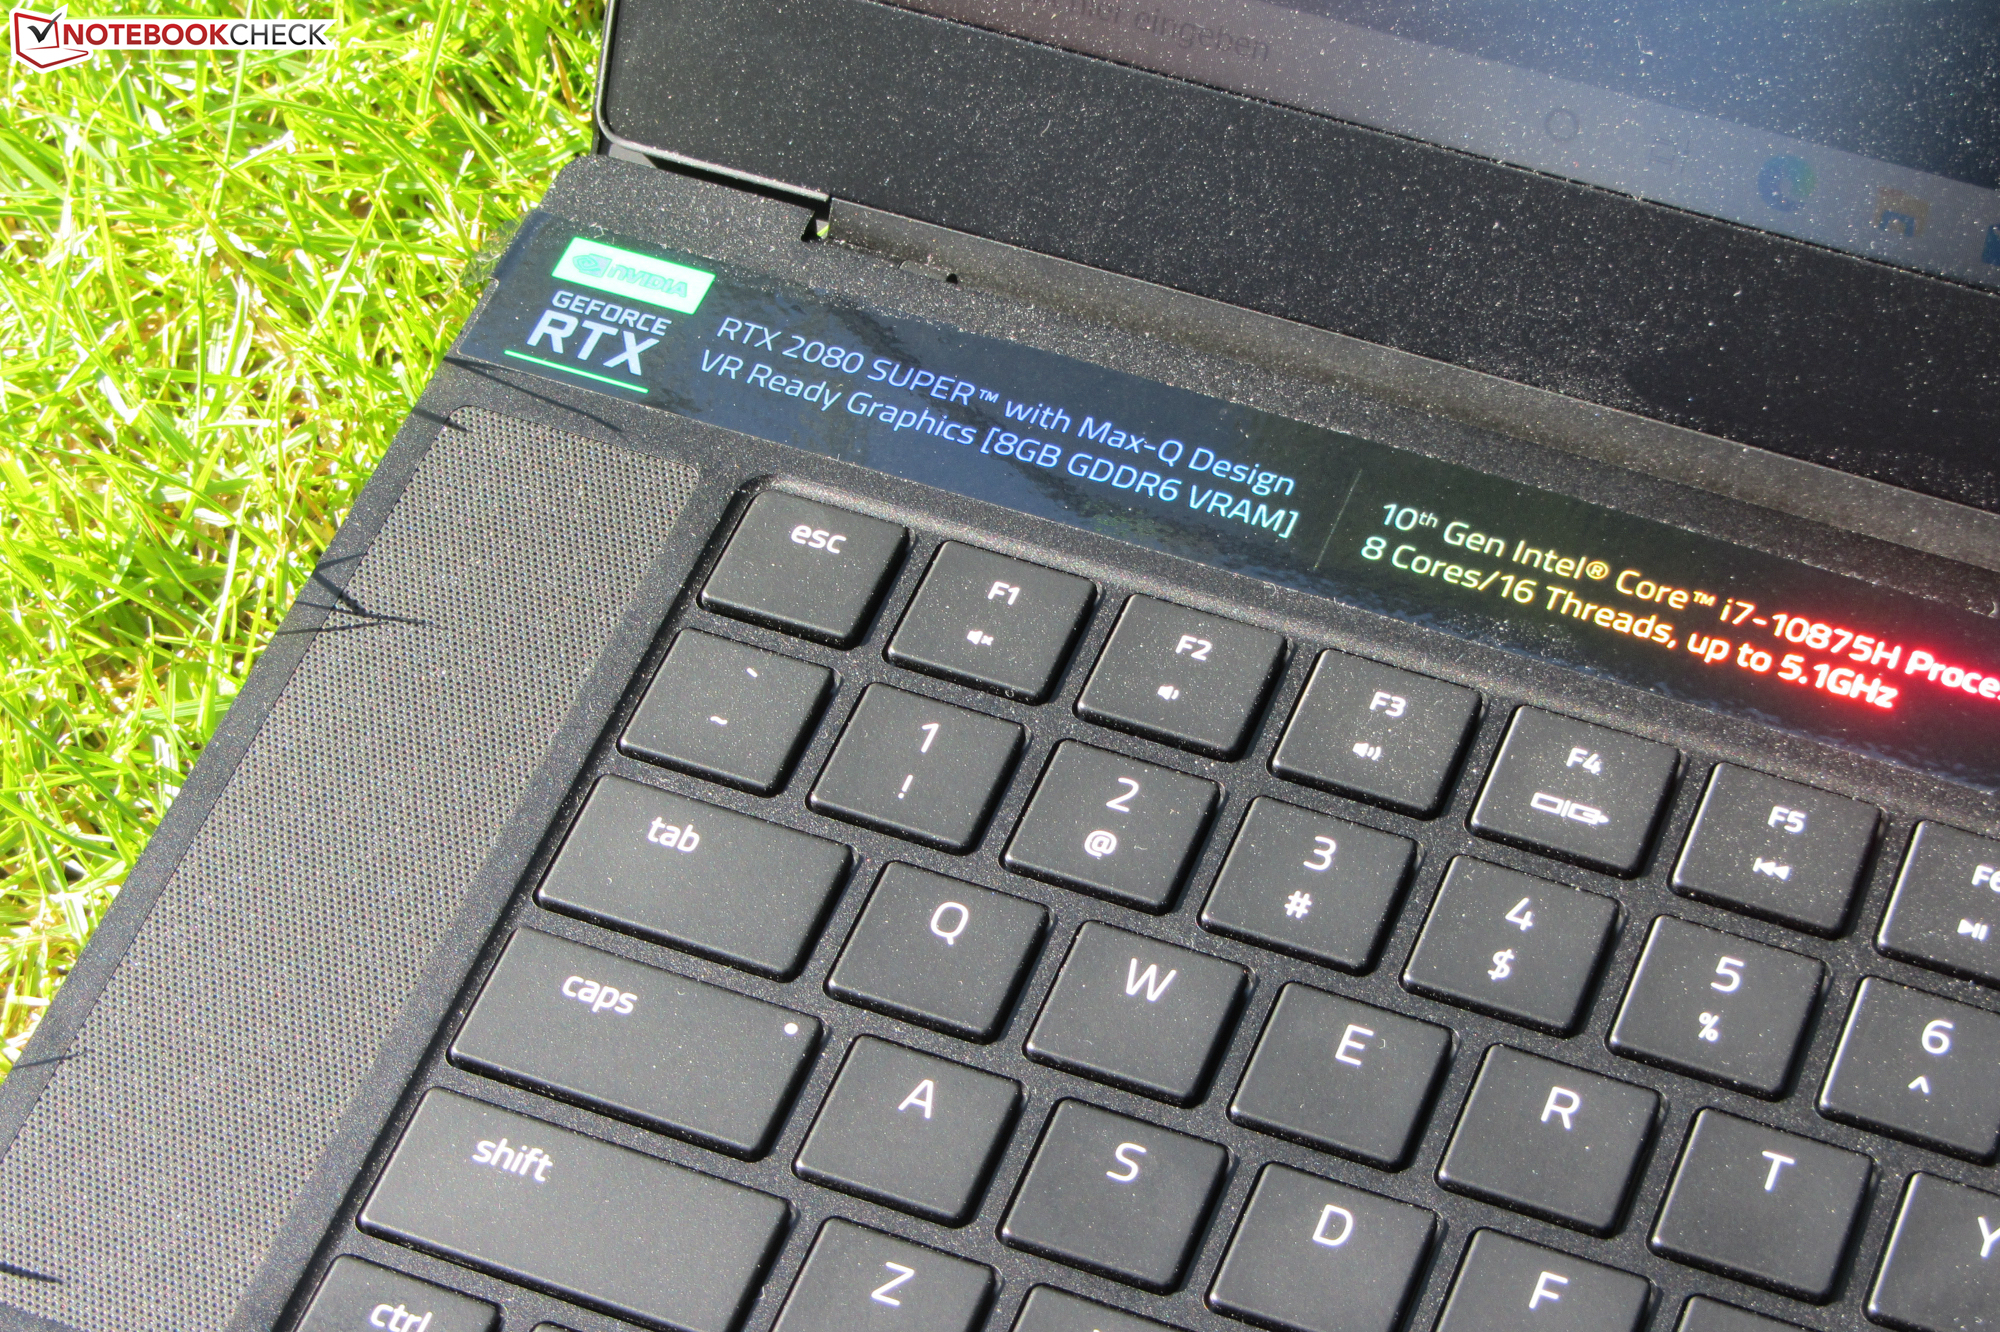
With the Blade 15 Advanced Model (2020), Razer delivers a classy, slim 15.6-inch gaming laptop equipped with powerful hardware. Our test device comes with a Core i7-10875H octa-core processor and a GeForce RTX 2080 Super Max-Q GPU. Since the computer is identical in construction to its predecessor, we won't go into the case, connectivity, input devices, and speakers in this review - unless there are differences. The corresponding information can be found in the review of the Blade 15 Advanced Model (2019).
The laptop's competitors are devices like the Asus Zephyrus S GX531GX, the Gigabyte Aero 15 XB, the MSI GE66 Raider 10SFS, and the Schenker XMG Neo 15.
Rating | Date | Model | Weight | Height | Size | Resolution | Price |
|---|---|---|---|---|---|---|---|
| 85.9 % v7 (old) | 08 / 2020 | Razer Blade 15 RTX 2080 Super Max-Q i7-10875H, GeForce RTX 2080 Super Max-Q | 2.2 kg | 17.8 mm | 15.60" | 1920x1080 | |
| 81.5 % v7 (old) | 04 / 2019 | Asus Zephyrus S GX531GX i7-8750H, GeForce RTX 2080 Max-Q | 2.1 kg | 15.75 mm | 15.60" | 1920x1080 | |
| 85.8 % v7 (old) | 05 / 2020 | Gigabyte Aero 15 OLED XB-8DE51B0SP i7-10875H, GeForce RTX 2070 Super Max-Q | 2.2 kg | 20 mm | 15.60" | 3840x2160 | |
| 84.6 % v7 (old) | 07 / 2020 | MSI GE66 Raider 10SFS i9-10980HK, GeForce RTX 2070 Super Mobile | 2.4 kg | 23 mm | 15.60" | 1920x1080 | |
| 82.8 % v7 (old) | 11 / 2019 | Schenker XMG Neo 15 XNE15M19 i7-9750H, GeForce RTX 2070 Max-Q | 2.1 kg | 22 mm | 15.60" | 1920x1080 |
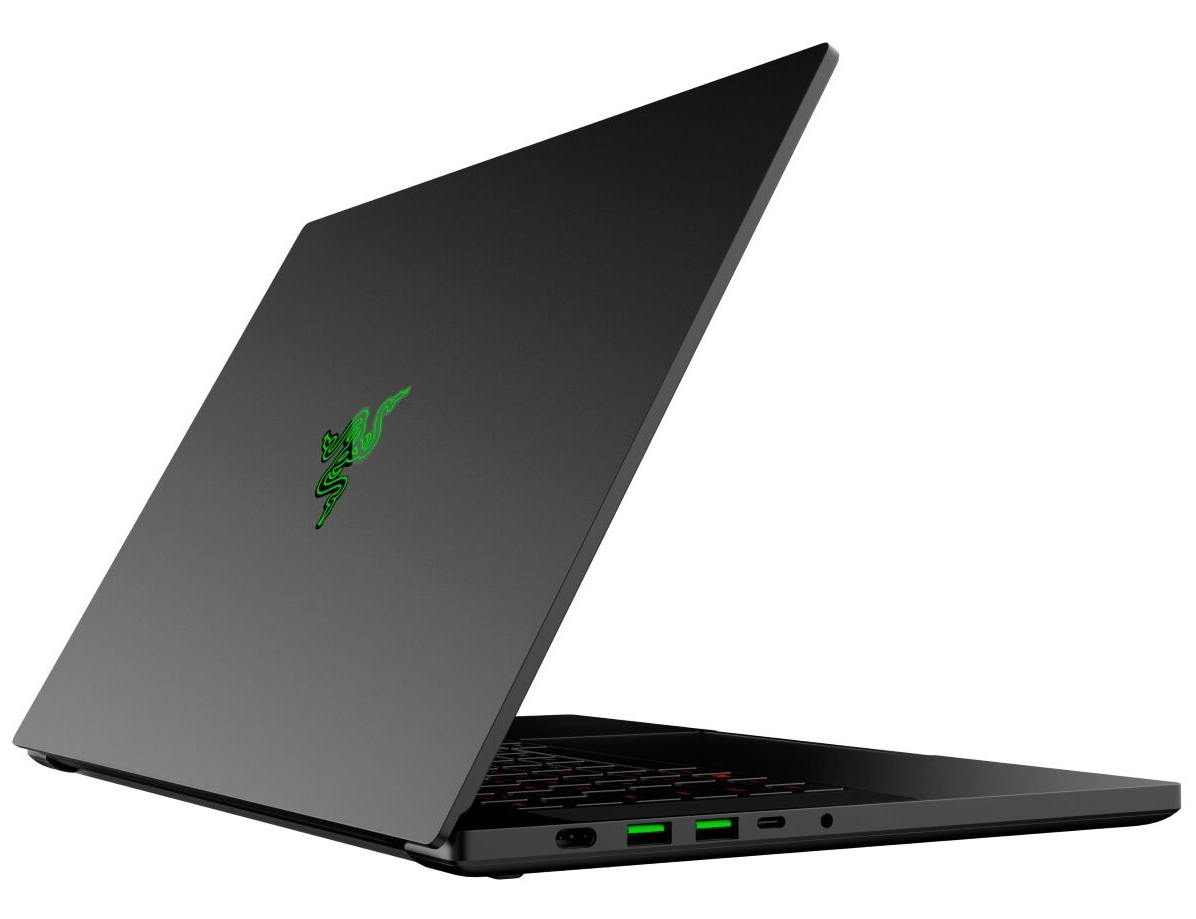
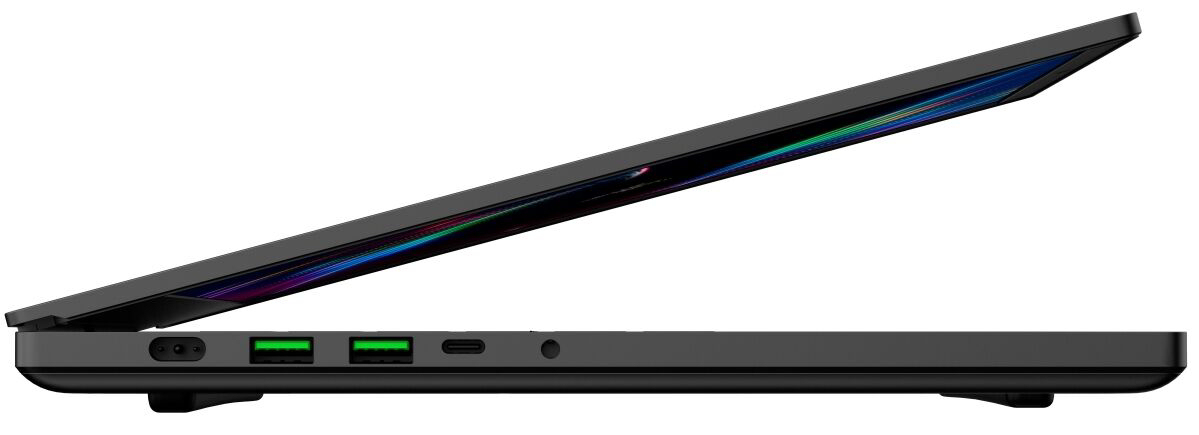
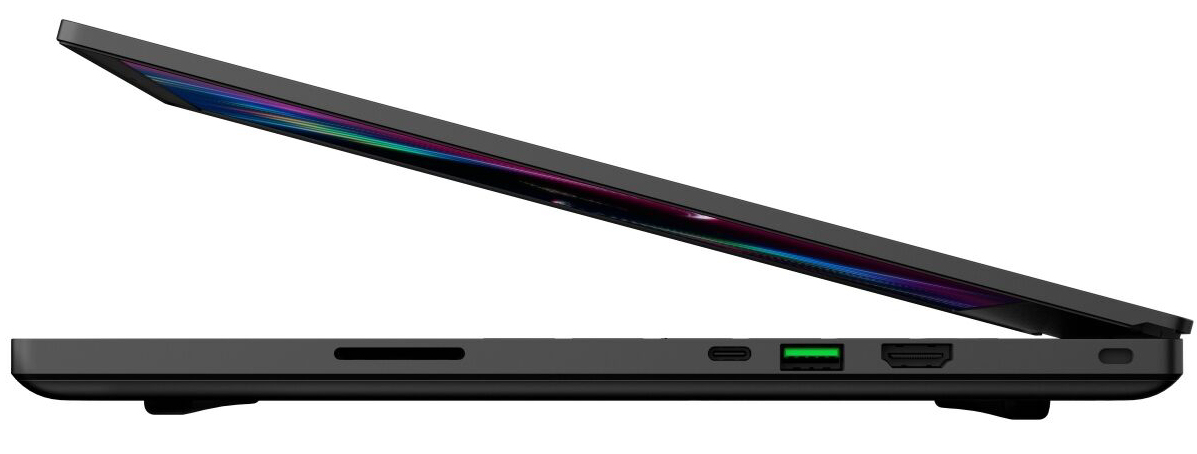
Connectivity - USB Type-C 3.2 Gen 2 substitutes the Mini DisplayPort
In terms of connections, a bit has changed compared to the 2019 Blade 15. The Mini DisplayPort has been replaced by a USB Type-C 3.2 Gen 2 port (DisplayPort, Power Delivery). The three USB Type-A ports now also work according to the USB 3.2 Gen 2 standard. The laptop has also gained a memory card reader (SD).
| SD Card Reader | |
| average JPG Copy Test (av. of 3 runs) | |
| Gigabyte Aero 15 OLED XB-8DE51B0SP (Toshiba Exceria Pro SDXC 64 GB UHS-II) | |
| Razer Blade 15 RTX 2080 Super Max-Q (Toshiba Exceria Pro SDXC 64 GB UHS-II) | |
| MSI GE66 Raider 10SFS (Toshiba Exceria Pro SDXC 64 GB UHS-II) | |
| Average of class Gaming (20.9 - 210, n=54, last 2 years) | |
| Schenker XMG Neo 15 XNE15M19 (Toshiba Exceria Pro SDXC 64 GB UHS-II) | |
| maximum AS SSD Seq Read Test (1GB) | |
| Gigabyte Aero 15 OLED XB-8DE51B0SP (Toshiba Exceria Pro SDXC 64 GB UHS-II) | |
| Razer Blade 15 RTX 2080 Super Max-Q (Toshiba Exceria Pro SDXC 64 GB UHS-II) | |
| MSI GE66 Raider 10SFS (Toshiba Exceria Pro SDXC 64 GB UHS-II) | |
| Average of class Gaming (25.5 - 261, n=51, last 2 years) | |
| Schenker XMG Neo 15 XNE15M19 (Toshiba Exceria Pro SDXC 64 GB UHS-II) | |


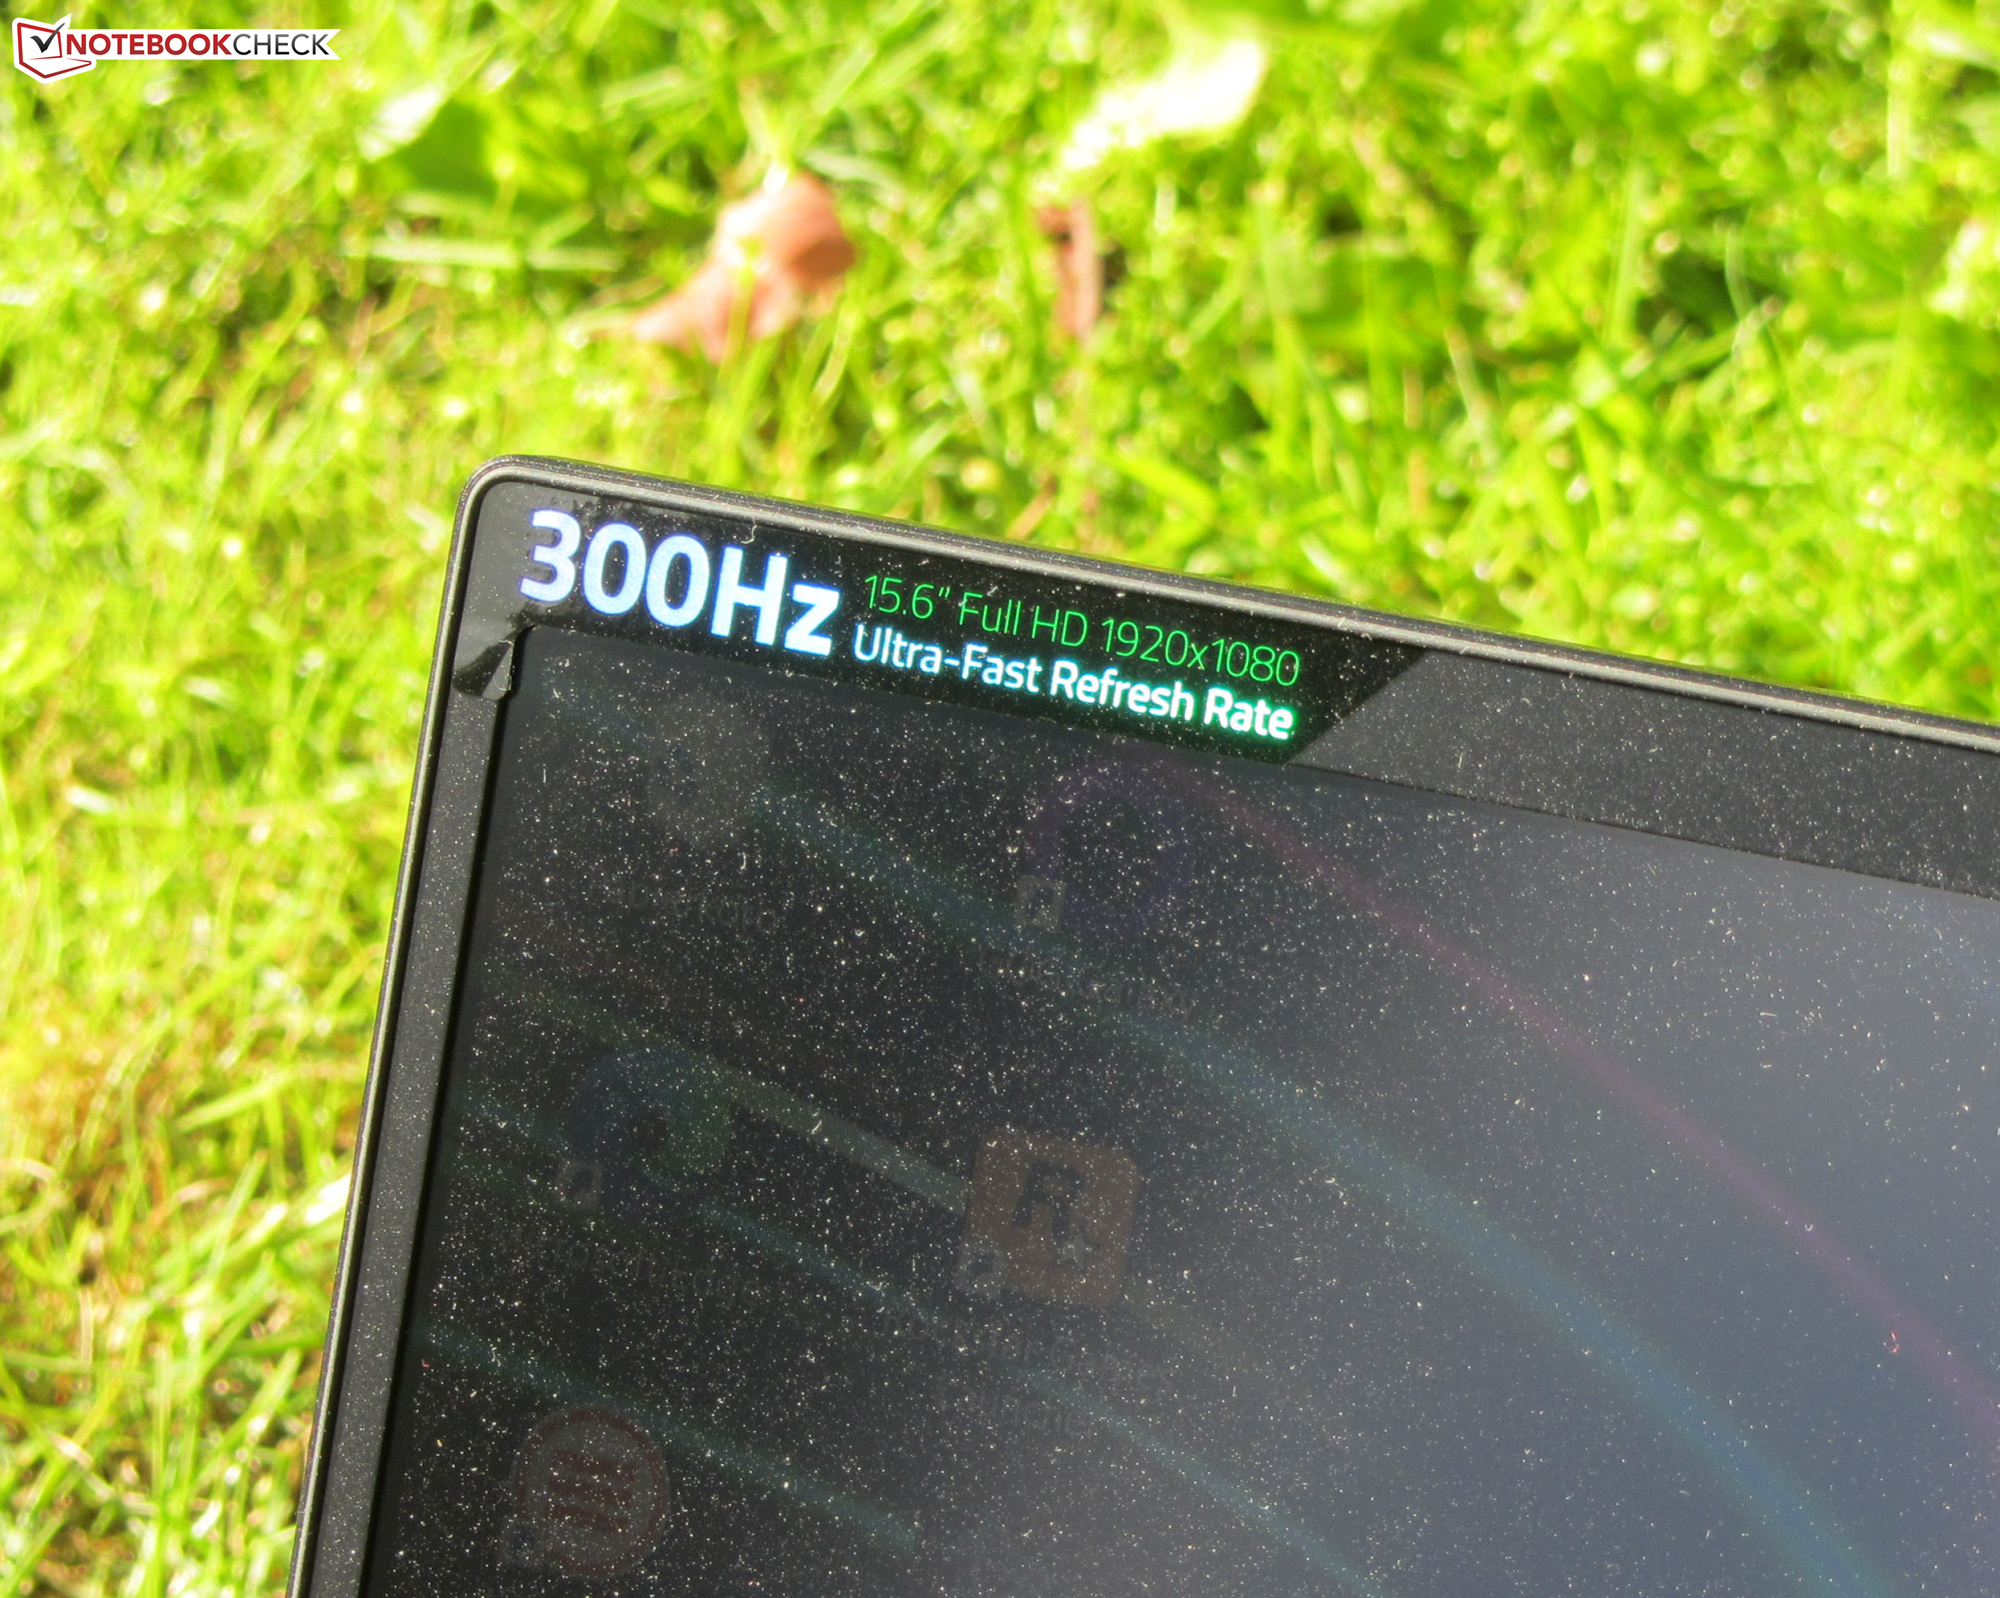
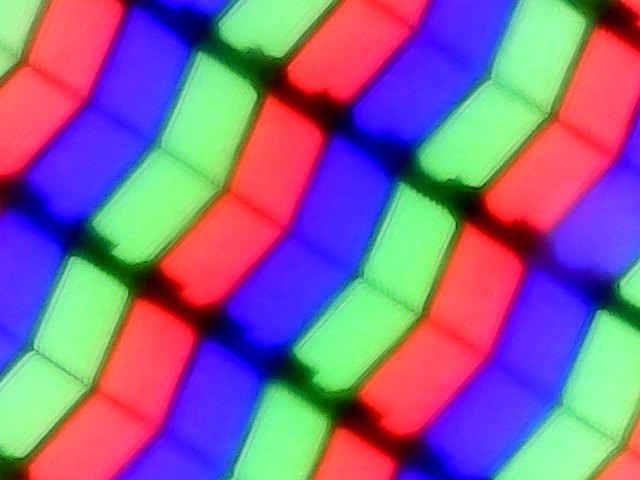
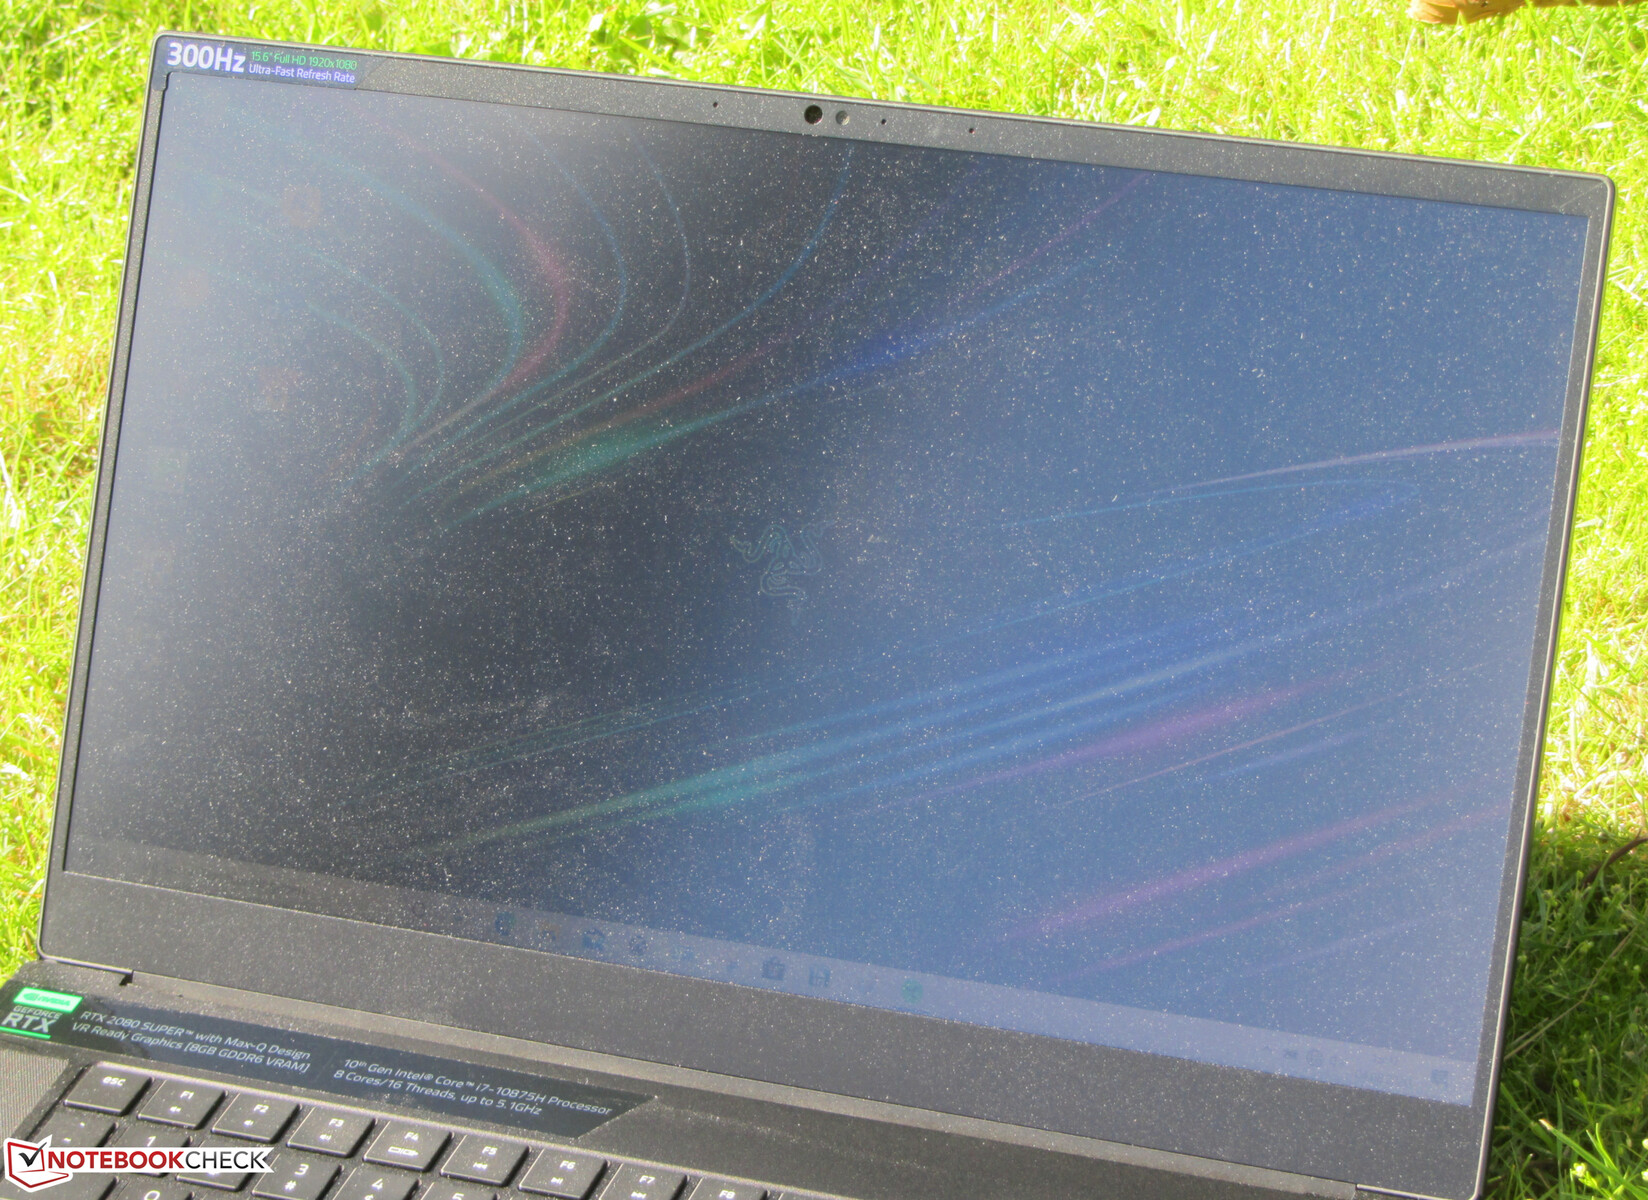
Display - 300 Hz IPS
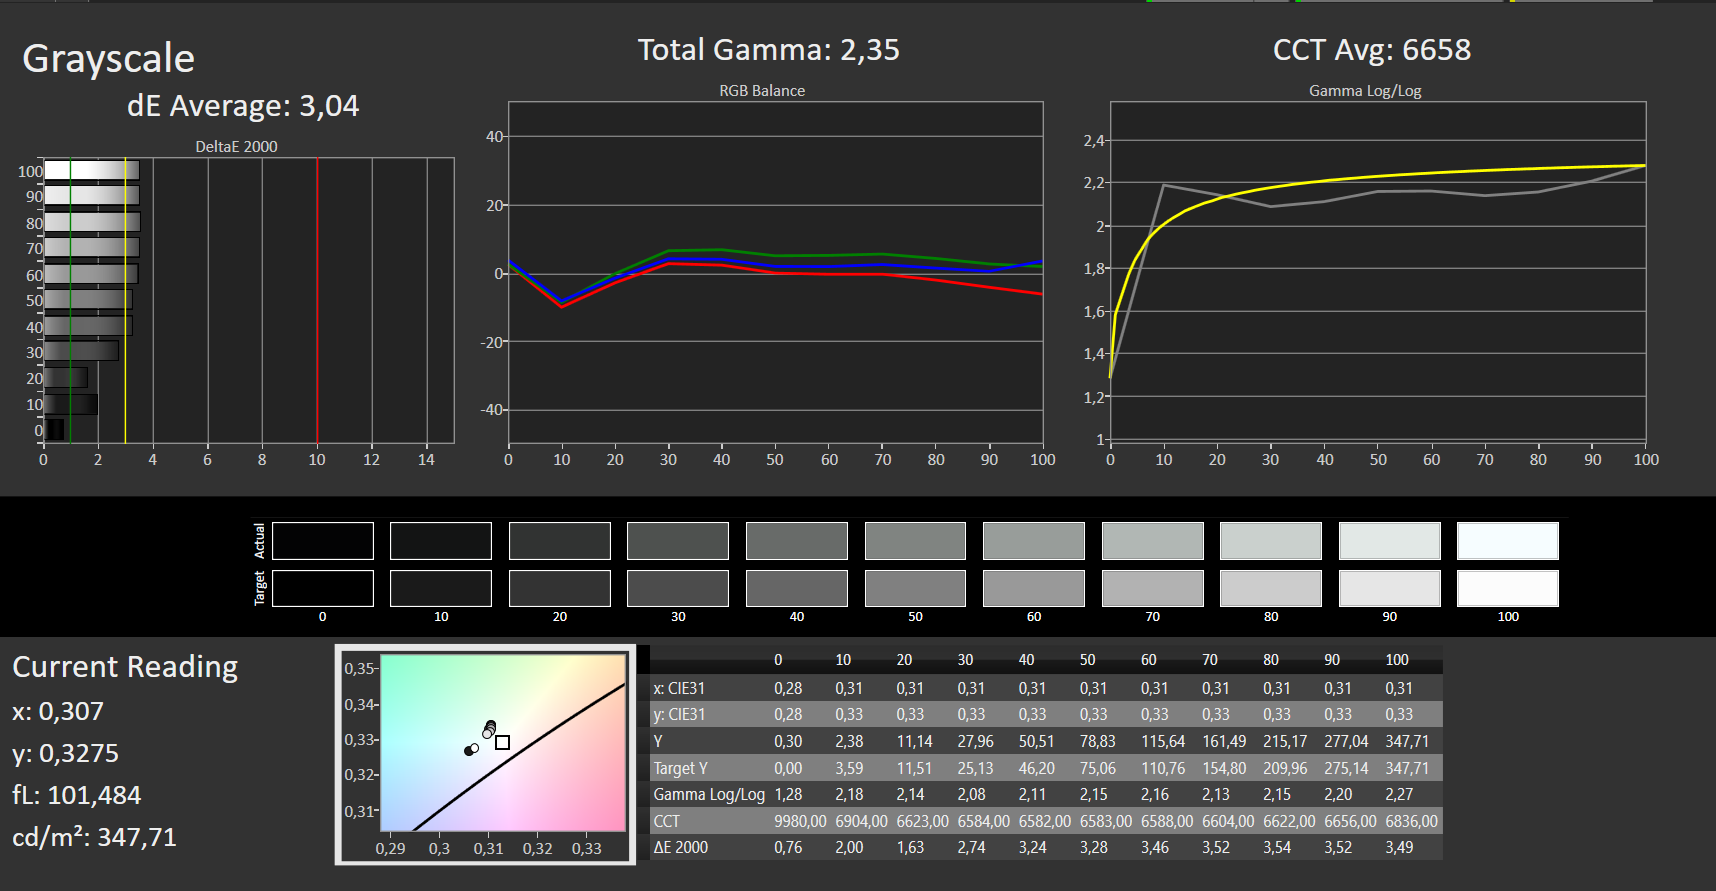
The matte 15.6-inch display has a native resolution of 1920x1080 pixels. It's a 300 Hz panel that features quick response times. The brightness (327.8 cd/m²) and contrast (1,218:1) meet the ideal targets. Positive: The screen shows no PWM flickering.

| |||||||||||||||||||||||||
Brightness Distribution: 89 %
Center on Battery: 347 cd/m²
Contrast: 1218:1 (Black: 0.285 cd/m²)
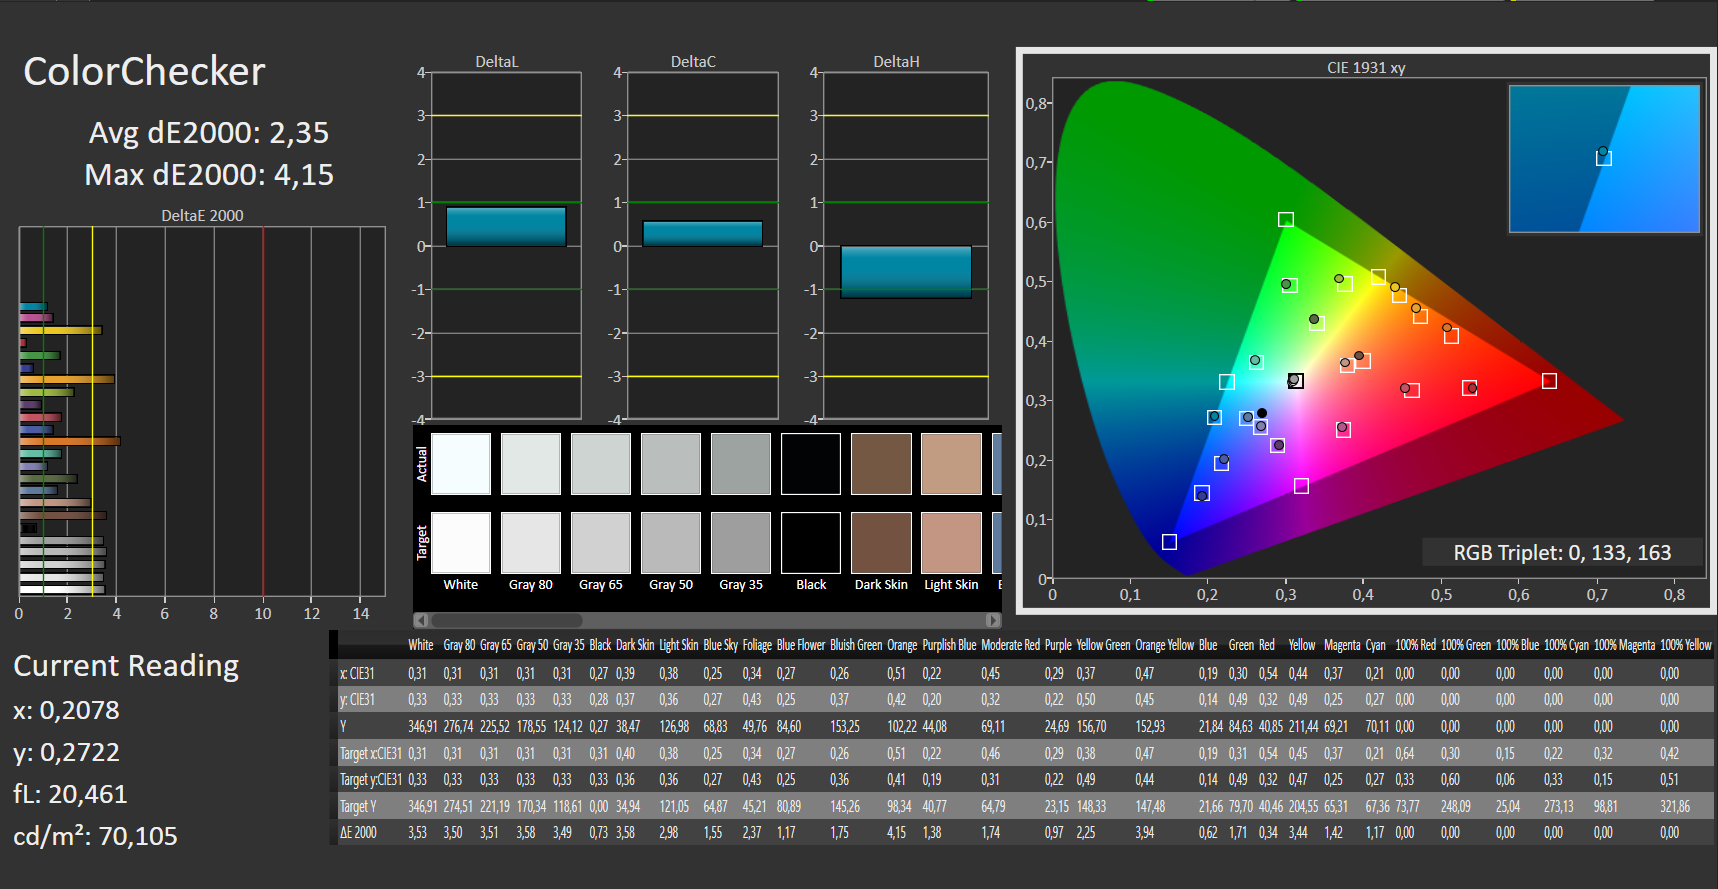
ΔE ColorChecker Calman: 2.35 | ∀{0.5-29.43 Ø4.73}
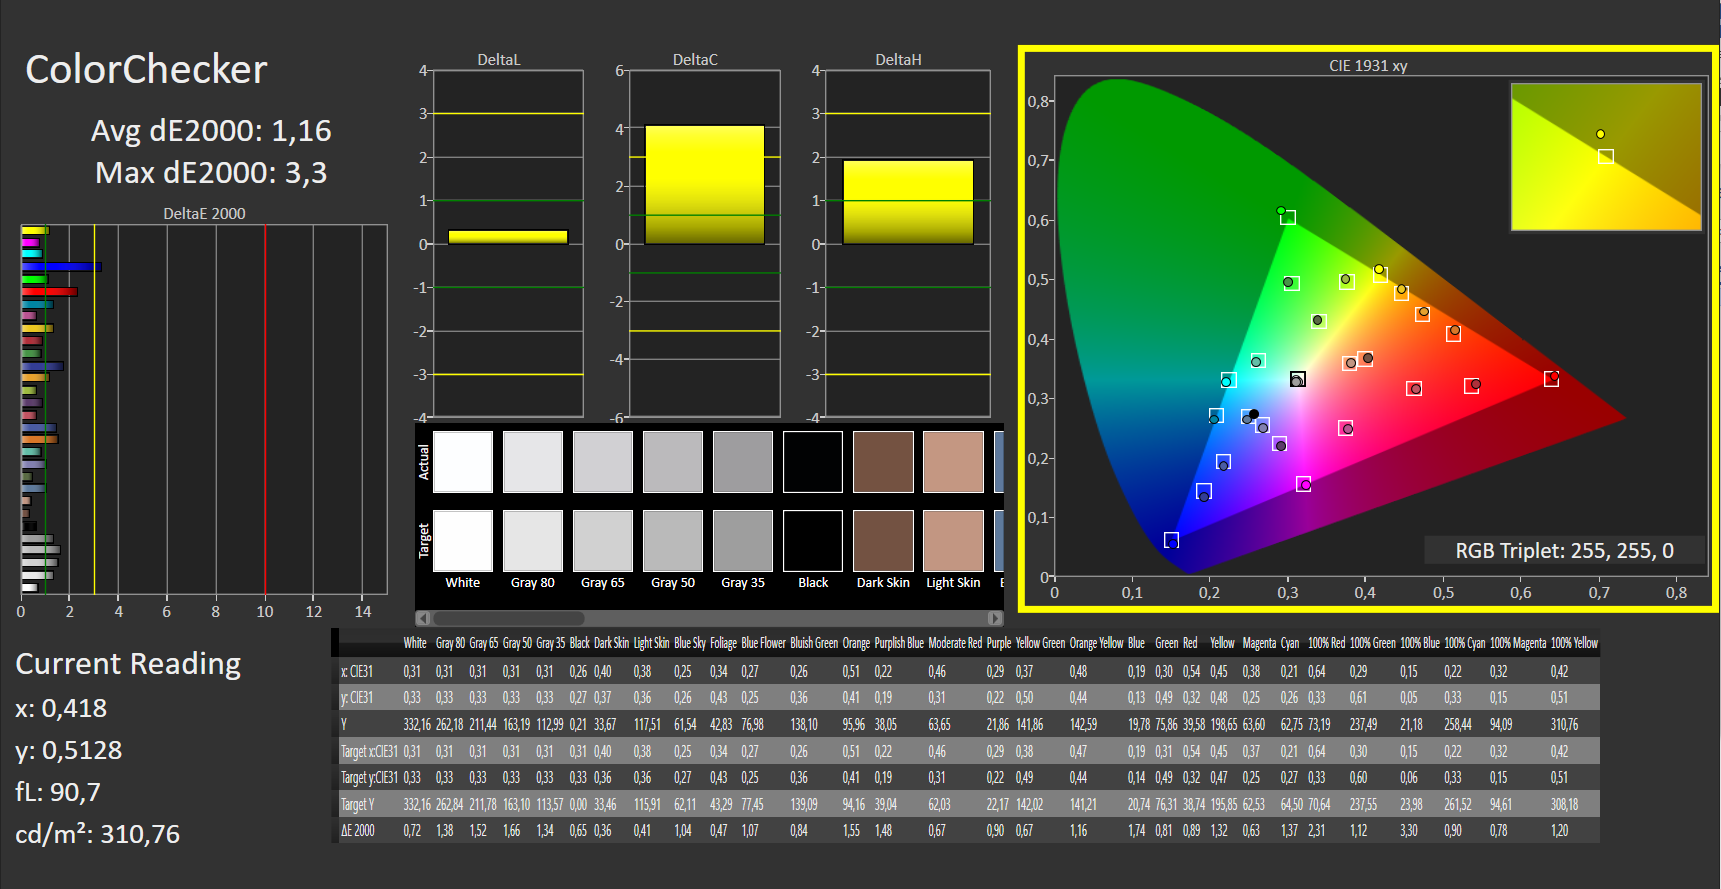
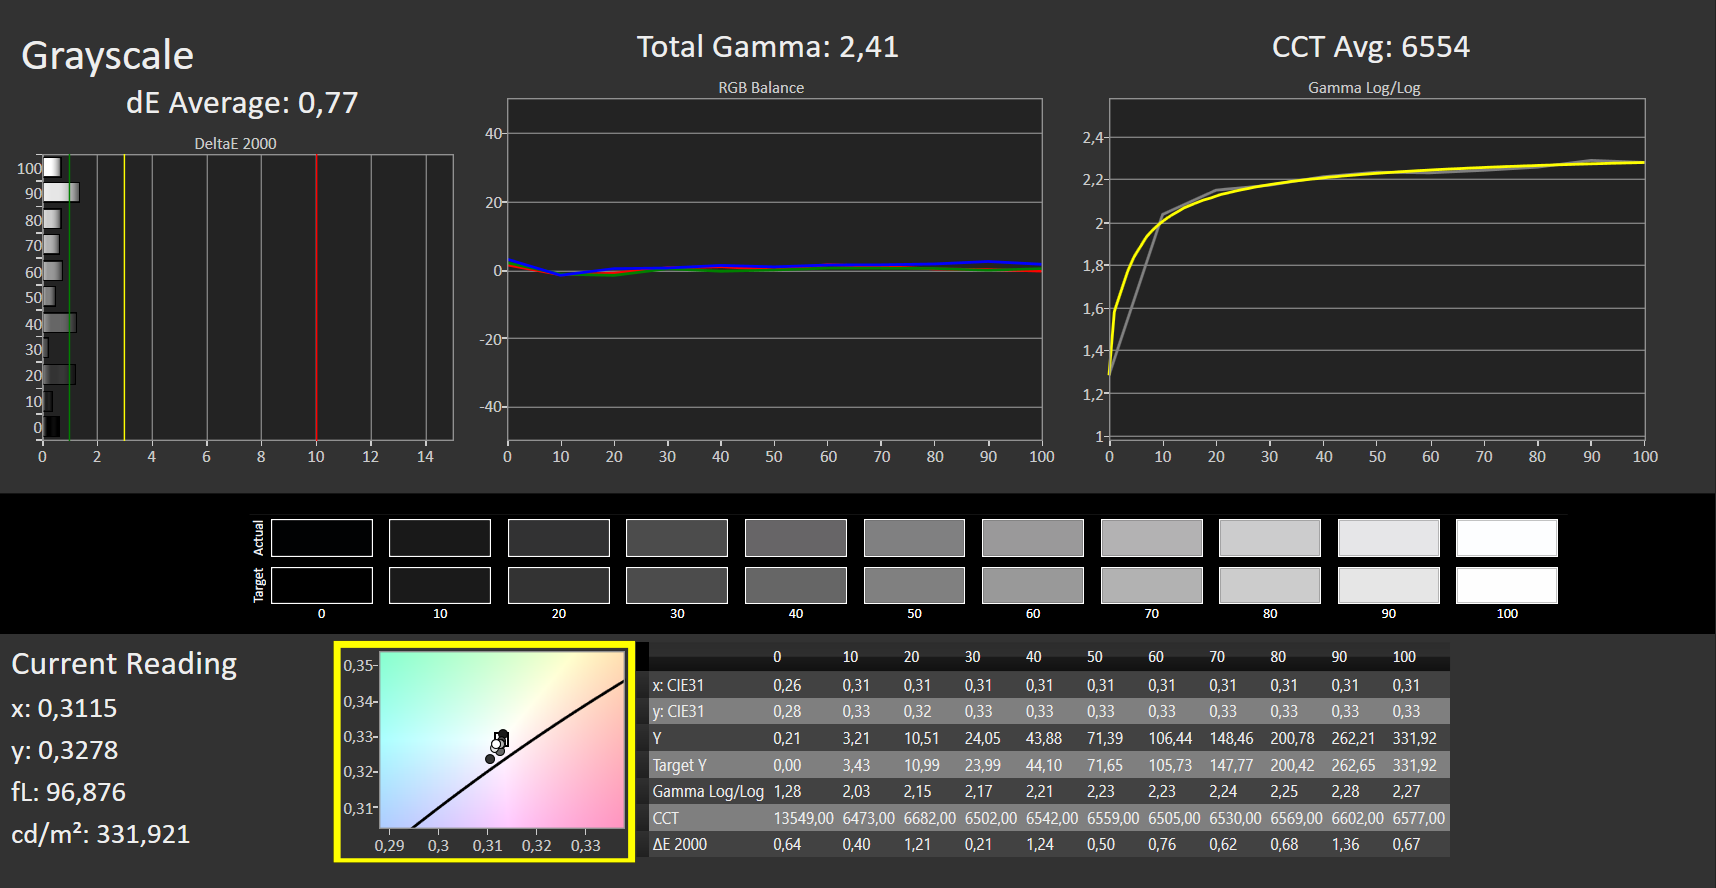
calibrated: 1.16
ΔE Greyscale Calman: 3.04 | ∀{0.09-98 Ø4.97}
99% sRGB (Argyll 1.6.3 3D)
65% AdobeRGB 1998 (Argyll 1.6.3 3D)
71.4% AdobeRGB 1998 (Argyll 3D)
99% sRGB (Argyll 3D)
70.2% Display P3 (Argyll 3D)
Gamma: 2.35
CCT: 6658 K
| Razer Blade 15 RTX 2080 Super Max-Q AU Optronics B156HAN12.0, IPS, 1920x1080, 15.6" | Razer Blade 15 RTX 2080 Max-Q Sharp LQ156M1JW03 (SHP14C5), IPS, 1920x1080, 15.6" | Asus Zephyrus S GX531GX AU Optronics B156HAN08.2, IPS, 1920x1080, 15.6" | Gigabyte Aero 15 OLED XB-8DE51B0SP Samsung SDCA029, OLED, 3840x2160, 15.6" | MSI GE66 Raider 10SFS Sharp LQ156M1JW03 (SHP14C5), IPS-Level, 1920x1080, 15.6" | Schenker XMG Neo 15 XNE15M19 NV156FHM-N4G (BOE084D), IPS, 1920x1080, 15.6" | |
|---|---|---|---|---|---|---|
| Display | -3% | -7% | 27% | -2% | -9% | |
| Display P3 Coverage (%) | 70.2 | 66.9 -5% | 65.6 -7% | 99.9 42% | 68 -3% | 64 -9% |
| sRGB Coverage (%) | 99 | 98.1 -1% | 92.2 -7% | 100 1% | 99 0% | 90.3 -9% |
| AdobeRGB 1998 Coverage (%) | 71.4 | 68.5 -4% | 66.9 -6% | 98.2 38% | 69.8 -2% | 65.4 -8% |
| Response Times | -65% | -12% | 72% | -95% | -47% | |
| Response Time Grey 50% / Grey 80% * (ms) | 6 ? | 12.8 ? -113% | 7 ? -17% | 2.2 ? 63% | 16.4 ? -173% | 9.6 ? -60% |
| Response Time Black / White * (ms) | 9 ? | 10.4 ? -16% | 9.6 ? -7% | 1.8 ? 80% | 10.4 ? -16% | 12 ? -33% |
| PWM Frequency (Hz) | 23810 ? | 60 ? | 23580 ? | |||
| Screen | 0% | -22% | 2% | 9% | -19% | |
| Brightness middle (cd/m²) | 347 | 293 -16% | 323.6 -7% | 385 11% | 291 -16% | 313 -10% |
| Brightness (cd/m²) | 328 | 270 -18% | 315 -4% | 390 19% | 278 -15% | 295 -10% |
| Brightness Distribution (%) | 89 | 87 -2% | 91 2% | 93 4% | 91 2% | 89 0% |
| Black Level * (cd/m²) | 0.285 | 0.29 -2% | 0.29 -2% | 0.25 12% | 0.3 -5% | |
| Contrast (:1) | 1218 | 1010 -17% | 1116 -8% | 1164 -4% | 1043 -14% | |
| Colorchecker dE 2000 * | 2.35 | 1.69 28% | 3.31 -41% | 2.46 -5% | 1.19 49% | 3.33 -42% |
| Colorchecker dE 2000 max. * | 4.15 | 3.37 19% | 5.74 -38% | 4.01 3% | 3.04 27% | 6.25 -51% |
| Colorchecker dE 2000 calibrated * | 1.16 | 1.24 -7% | 2.73 -135% | 2.6 -124% | 1.77 -53% | |
| Greyscale dE 2000 * | 3.04 | 2.3 24% | 2.9 5% | 1.39 54% | 1.9 37% | 3.1 -2% |
| Gamma | 2.35 94% | 2.3 96% | 2.29 96% | 2.31 95% | 2.216 99% | 2.51 88% |
| CCT | 6658 98% | 6758 96% | 6765 96% | 6395 102% | 7018 93% | 6930 94% |
| Color Space (Percent of AdobeRGB 1998) (%) | 65 | 63 -3% | 59.7 -8% | 98 51% | 70 8% | 59 -9% |
| Color Space (Percent of sRGB) (%) | 99 | 98.5 -1% | 91.8 -7% | 100 1% | 92 -7% | 90 -9% |
| Total Average (Program / Settings) | -23% /
-8% | -14% /
-18% | 34% /
17% | -29% /
-7% | -25% /
-20% |
* ... smaller is better
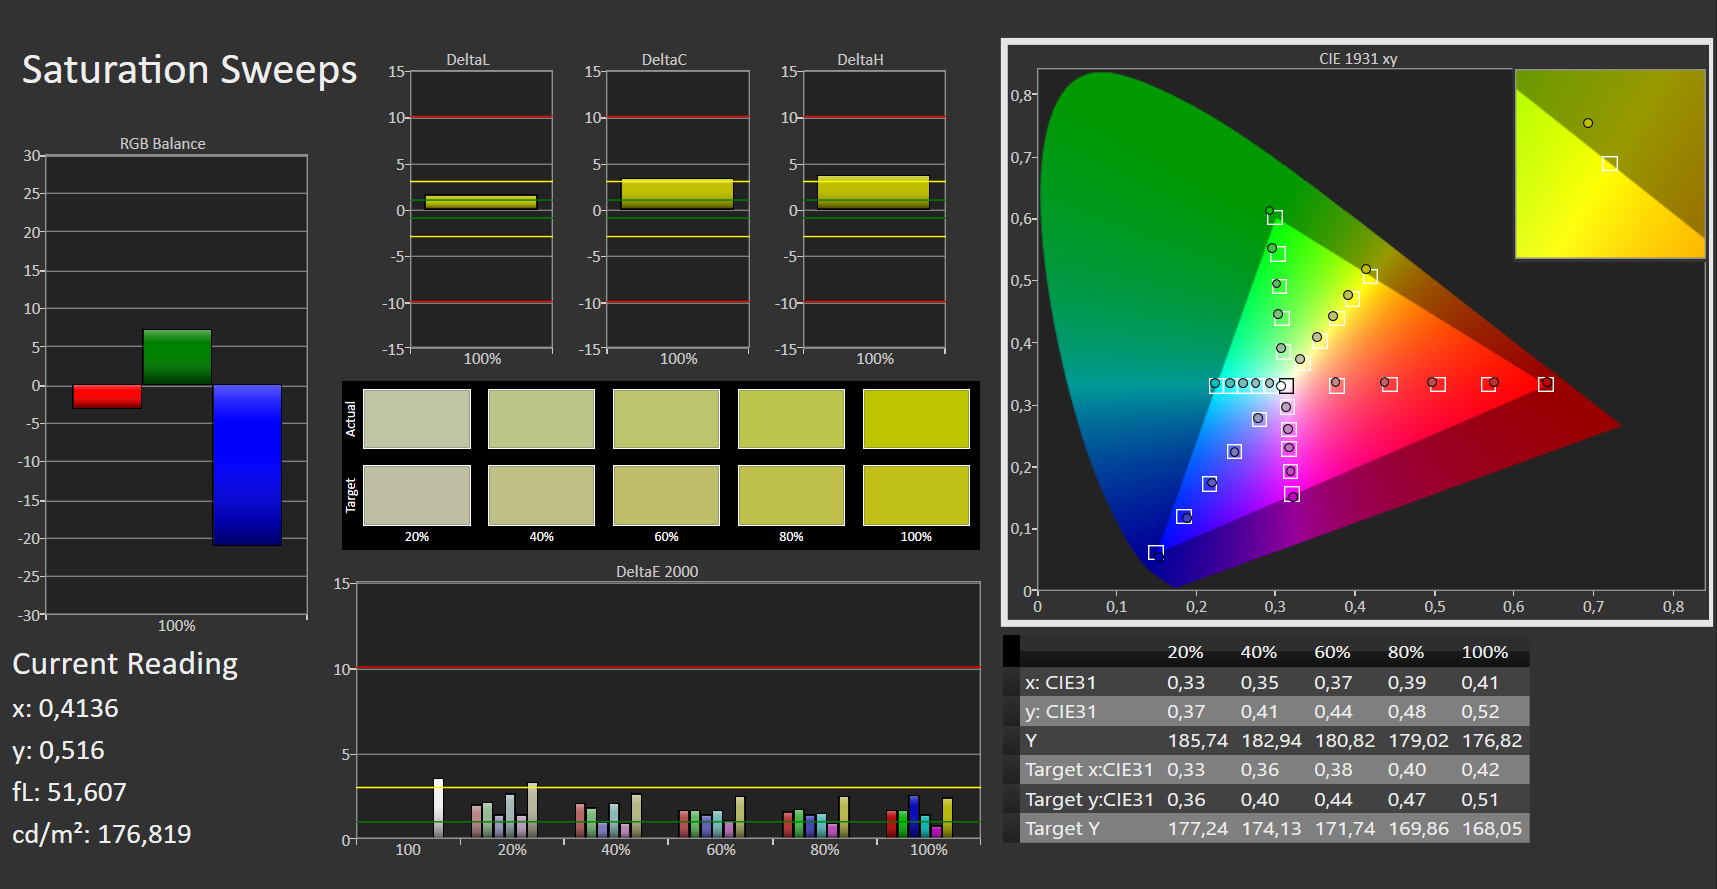
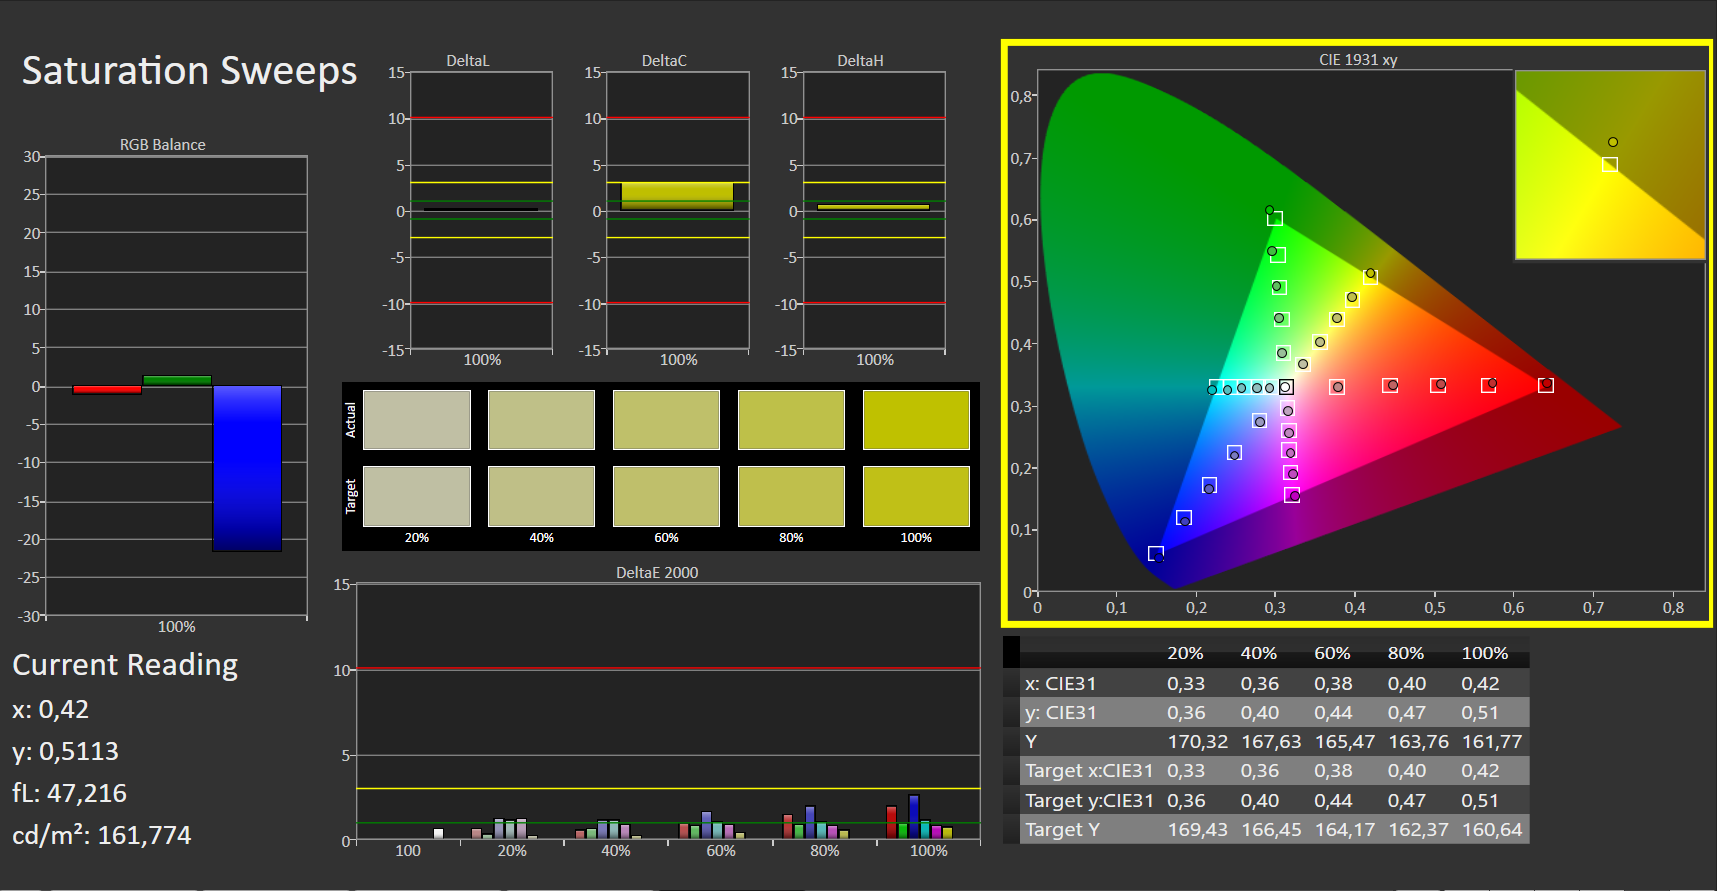
Out of the box, the display already shows a great color reproduction. With a Delta E 2000 color deviation of just under 2.4, the target (Delta E less than 3) is met. The display doesn't suffer from a blue tint. Moreover, calibration provides for improvements in terms of color reproduction. As a result, the color deviation is reduced to 1.16, and the grayscales are displayed in a more balanced way. The AdobeRGB color space (65%) is not fully mapped. The situation looks better with the sRGB color space (99%) though.
Display Response Times
| ↔ Response Time Black to White | ||
|---|---|---|
| 9 ms ... rise ↗ and fall ↘ combined | ↗ 5 ms rise | 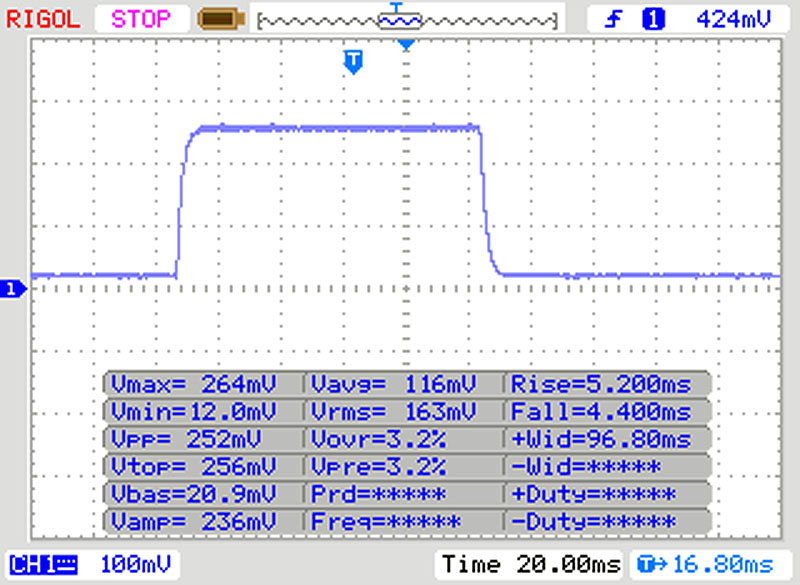 |
| ↘ 4 ms fall | ||
| The screen shows fast response rates in our tests and should be suited for gaming. In comparison, all tested devices range from 0.1 (minimum) to 240 (maximum) ms. » 25 % of all devices are better. This means that the measured response time is better than the average of all tested devices (19.9 ms). | ||
| ↔ Response Time 50% Grey to 80% Grey | ||
| 6 ms ... rise ↗ and fall ↘ combined | ↗ 3 ms rise | 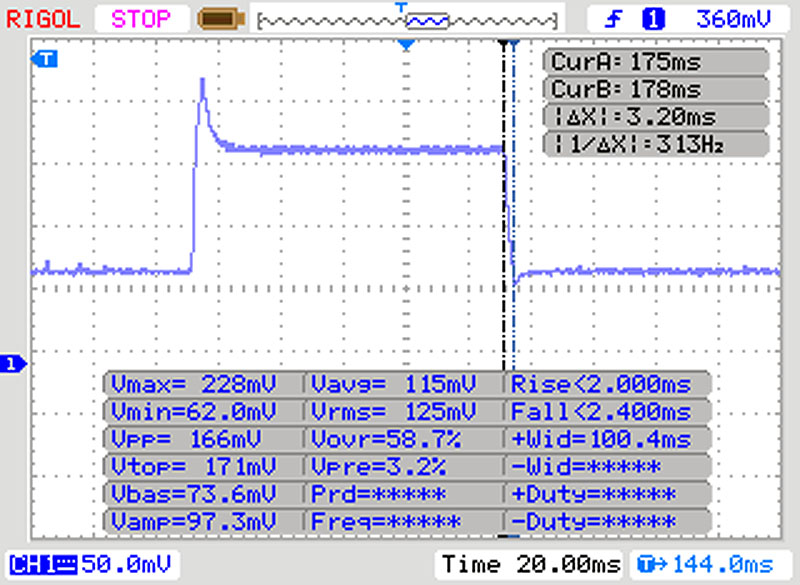 |
| ↘ 3 ms fall | ||
| The screen shows very fast response rates in our tests and should be very well suited for fast-paced gaming. In comparison, all tested devices range from 0.165 (minimum) to 636 (maximum) ms. » 18 % of all devices are better. This means that the measured response time is better than the average of all tested devices (31.1 ms). | ||
Screen Flickering / PWM (Pulse-Width Modulation)
| Screen flickering / PWM not detected | 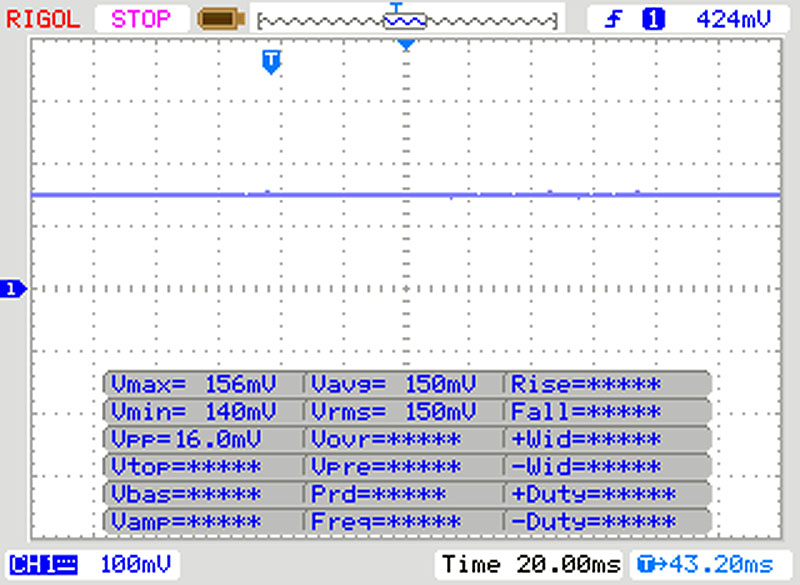 | ||
In comparison: 52 % of all tested devices do not use PWM to dim the display. If PWM was detected, an average of 7798 (minimum: 5 - maximum: 343500) Hz was measured. | |||
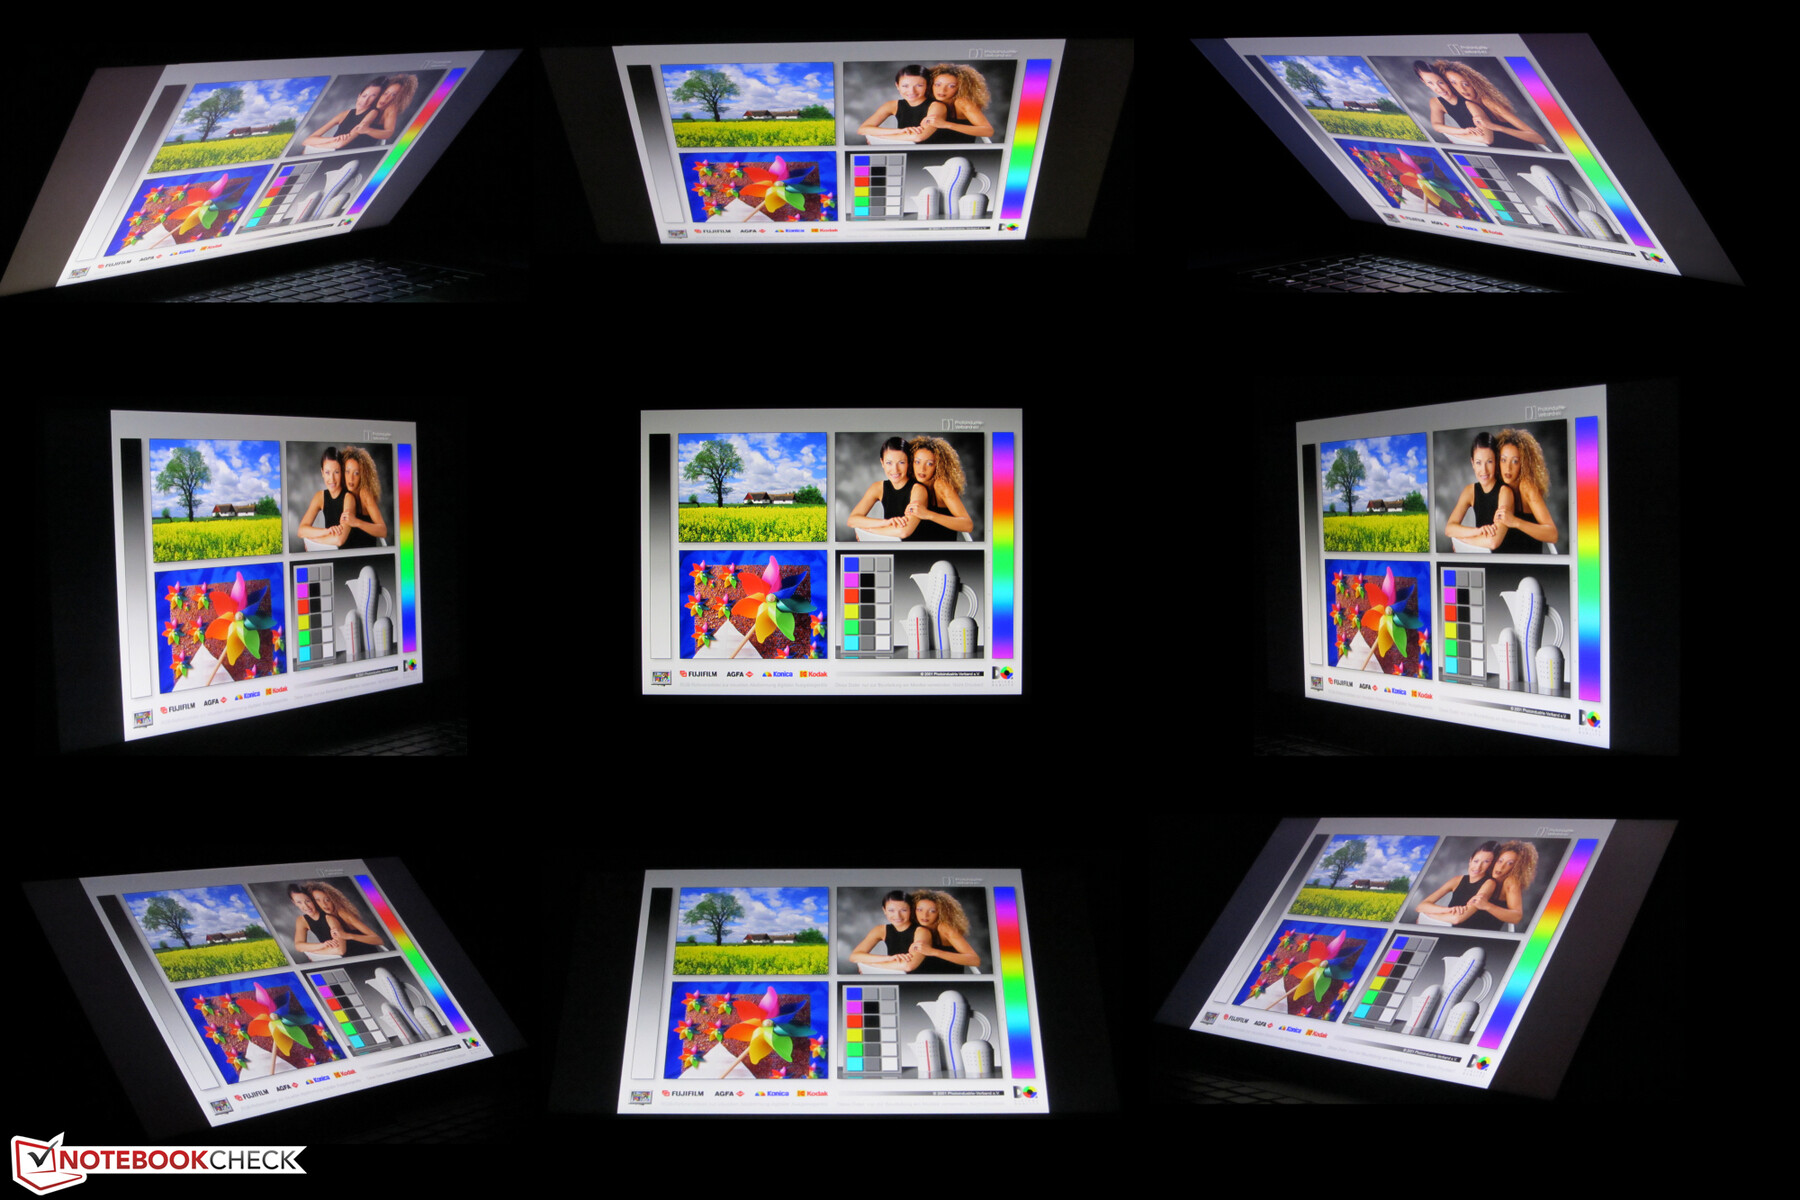
The laptop is equipped with a viewing-angle-stable IPS panel. Consequently, the screen can be read from any position. Outdoors, reading the display is possible when the sun is not too bright.
Performance - Blade offers a new Boost option
With the Blade 15 Advanced Model 2020, Razer has a 15.6-inch gaming laptop in its range that brings every modern game smoothly onto the screen and also cuts a fine figure in all other application areas. Our test device will set you back about 3,300 Euros (~$3,876).

Test conditions
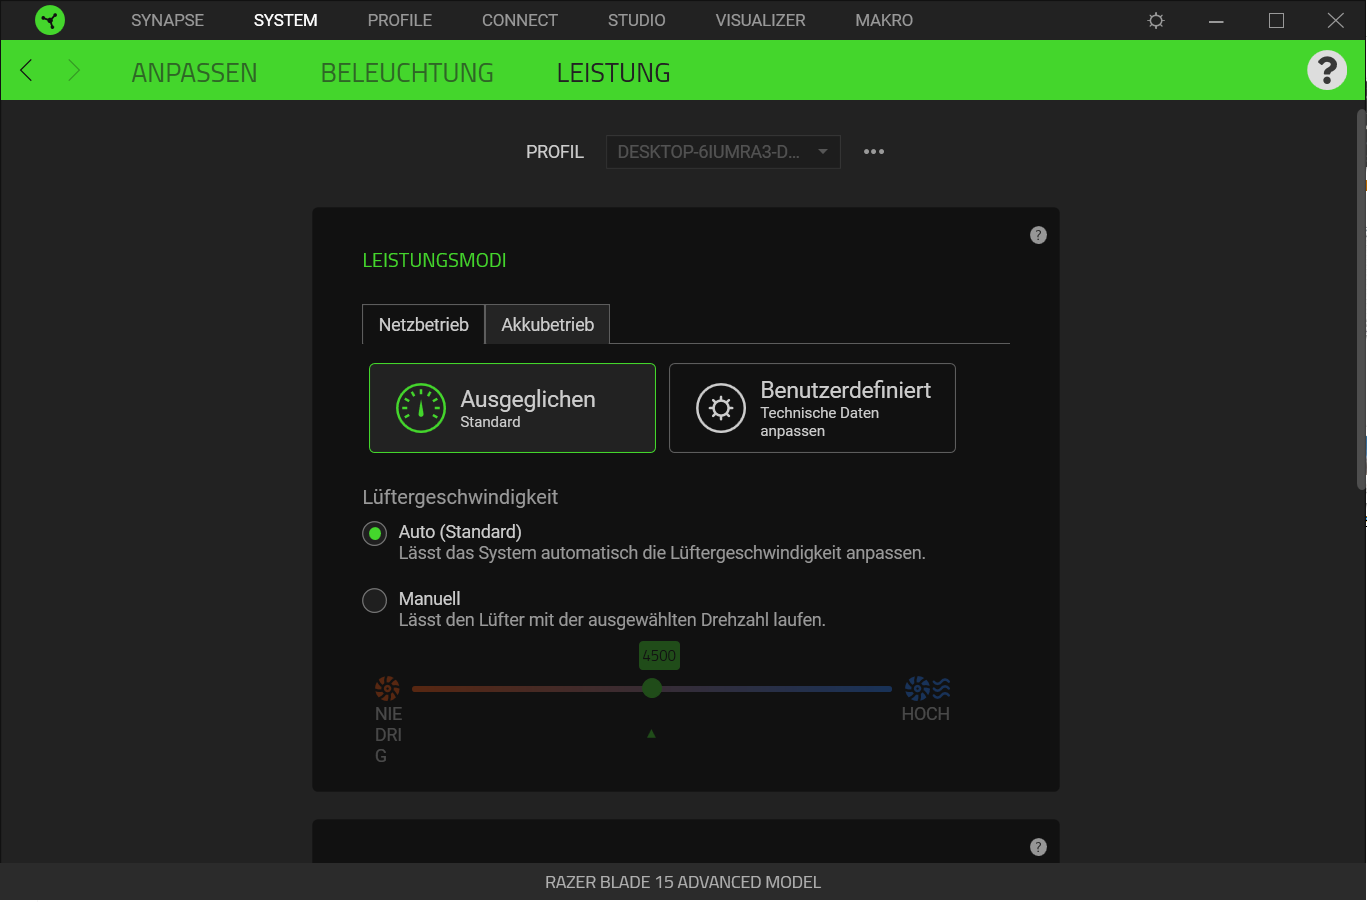
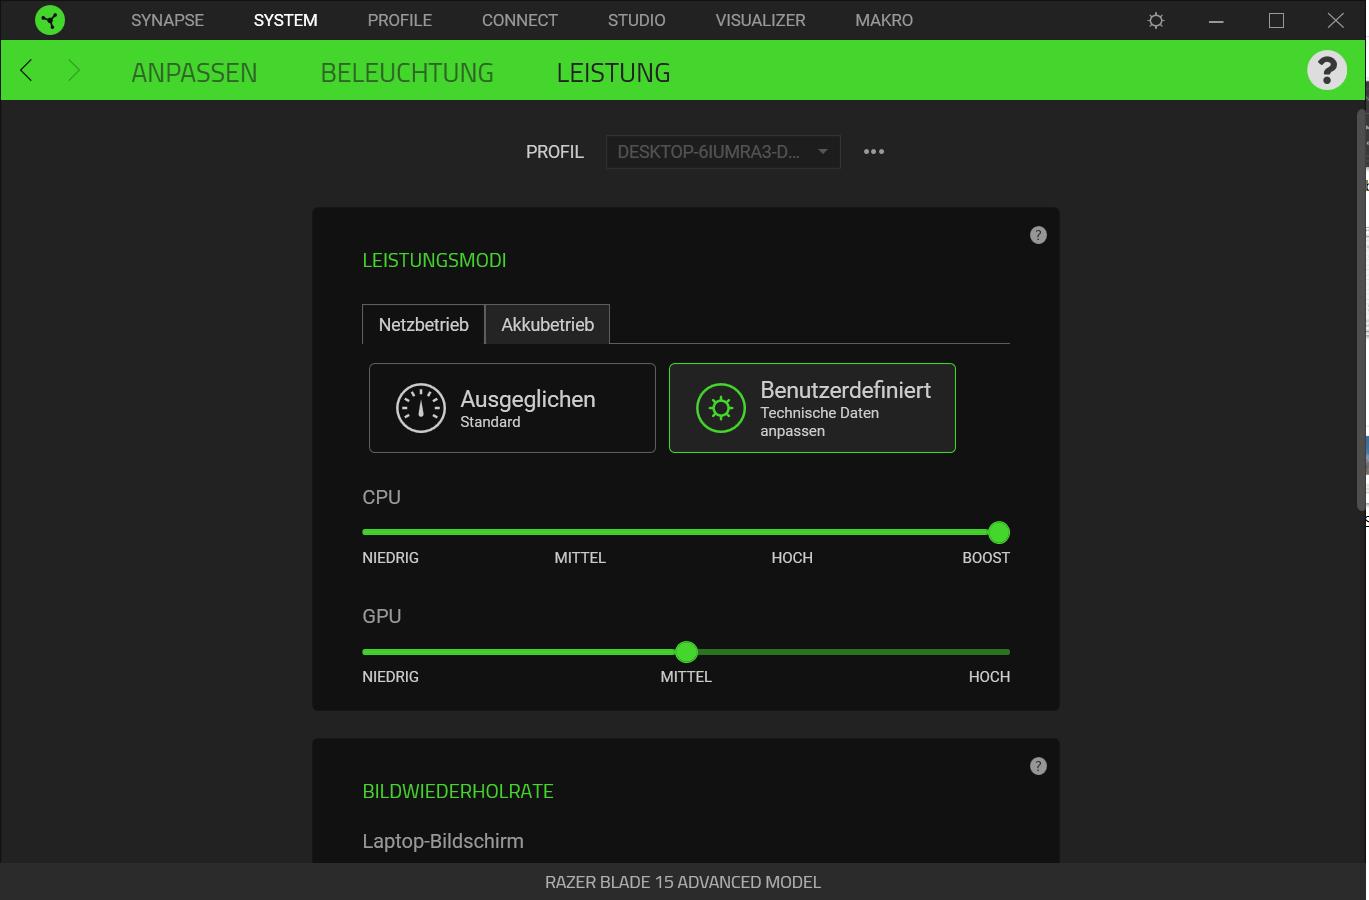
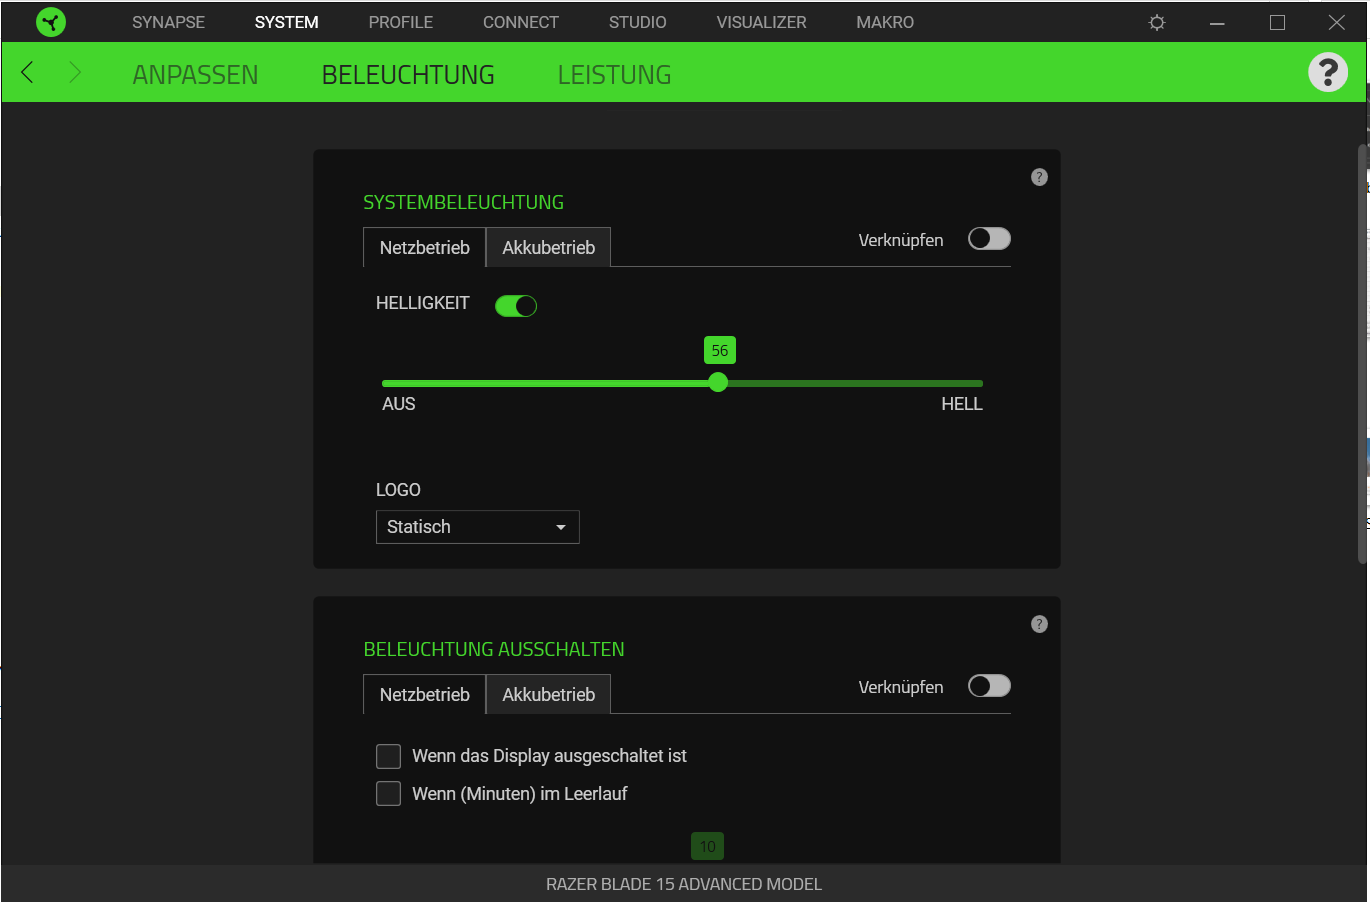
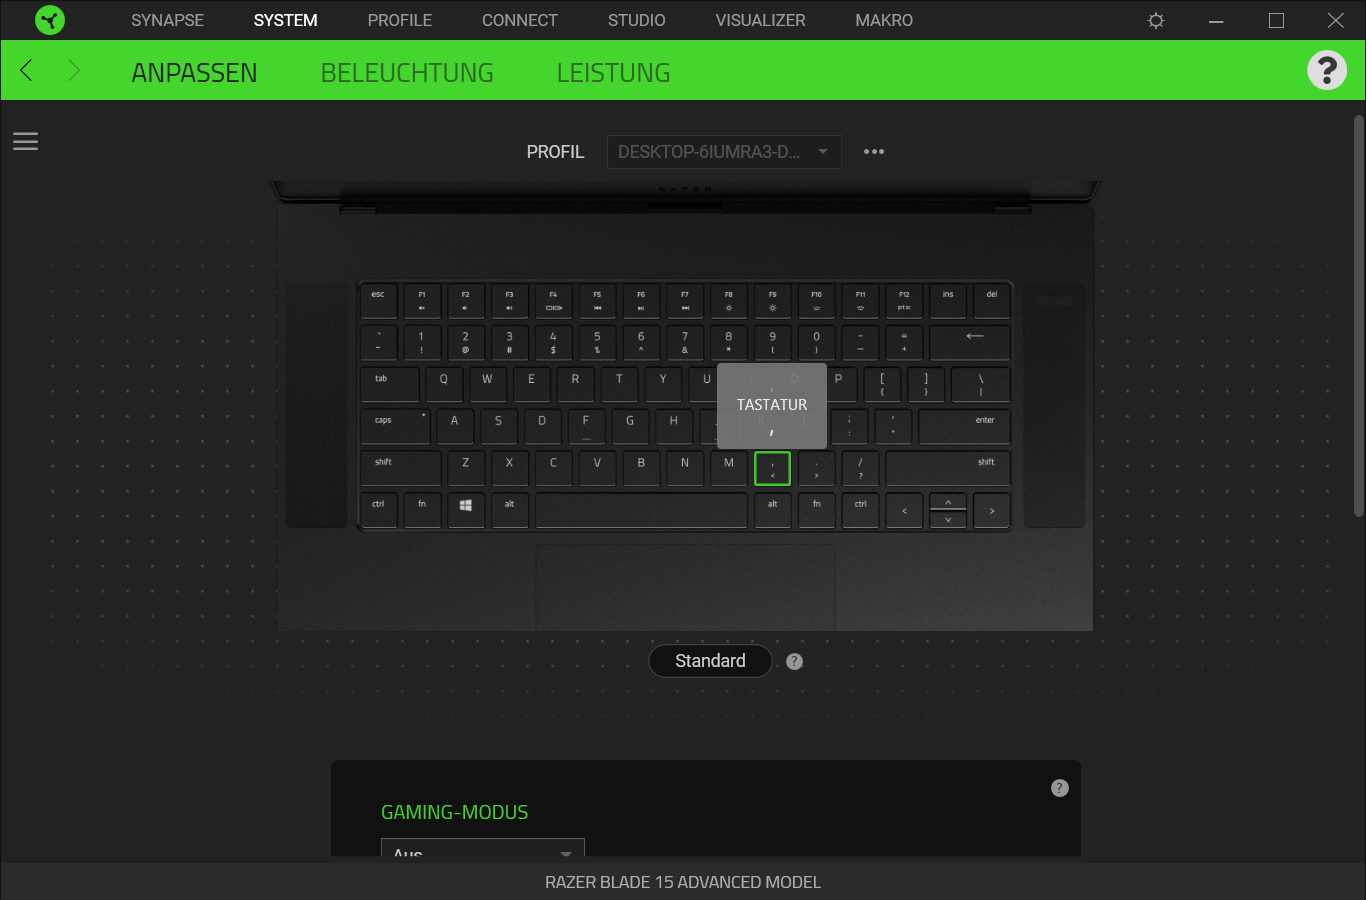
The preinstalled Razer Synapse software provides options for adjusting fan control as well as CPU or GPU performance. We conducted our test with automatic fan control and the "Balanced" performance mode.
The performance level of the CPU or the GPU can also be set manually. The options "Low", "Medium", and "High" are available here. The new version of the Synapse software released during our test additionally introduces the "Boost" CPU performance mode.
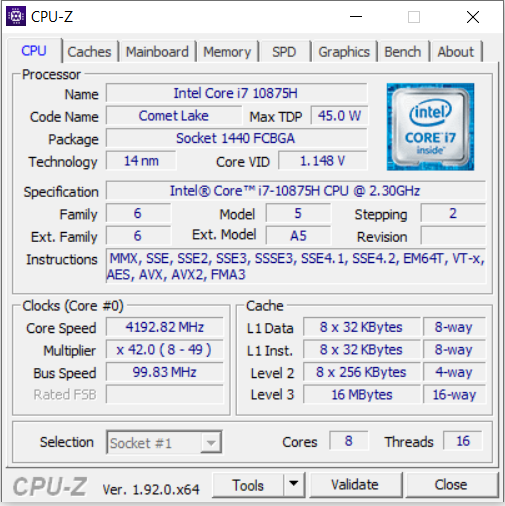
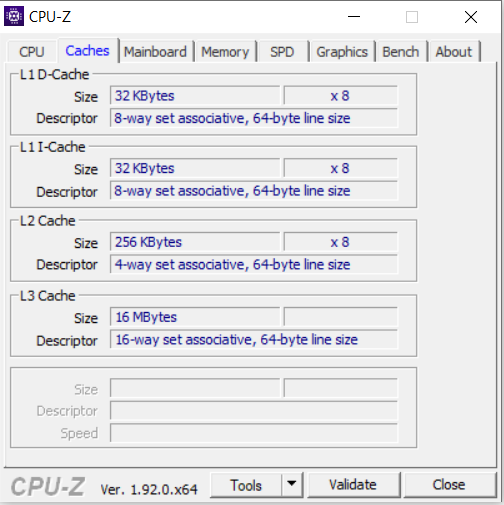
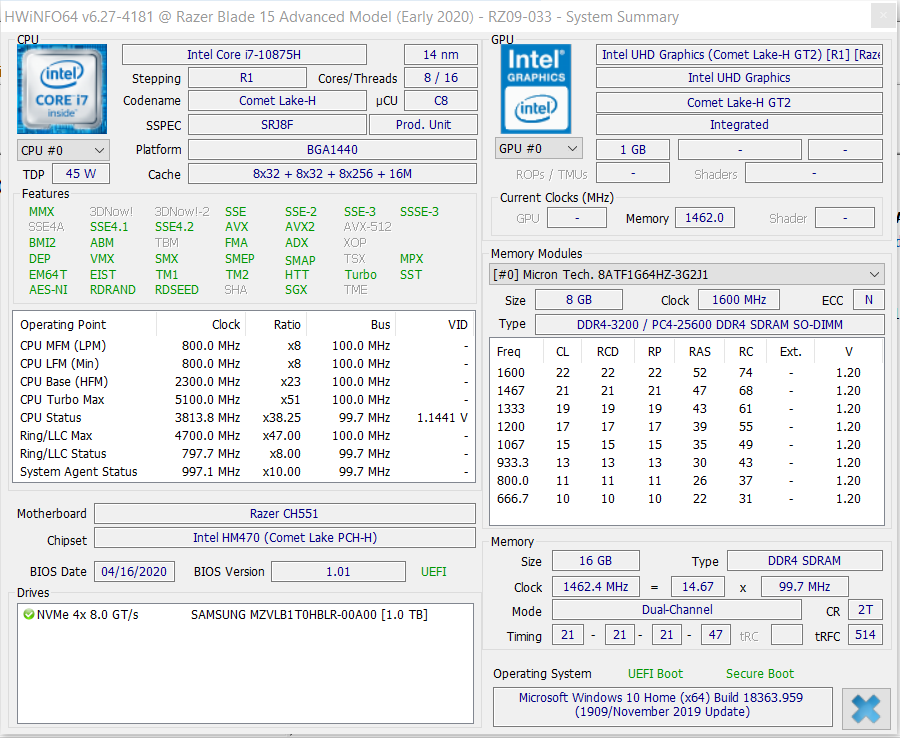
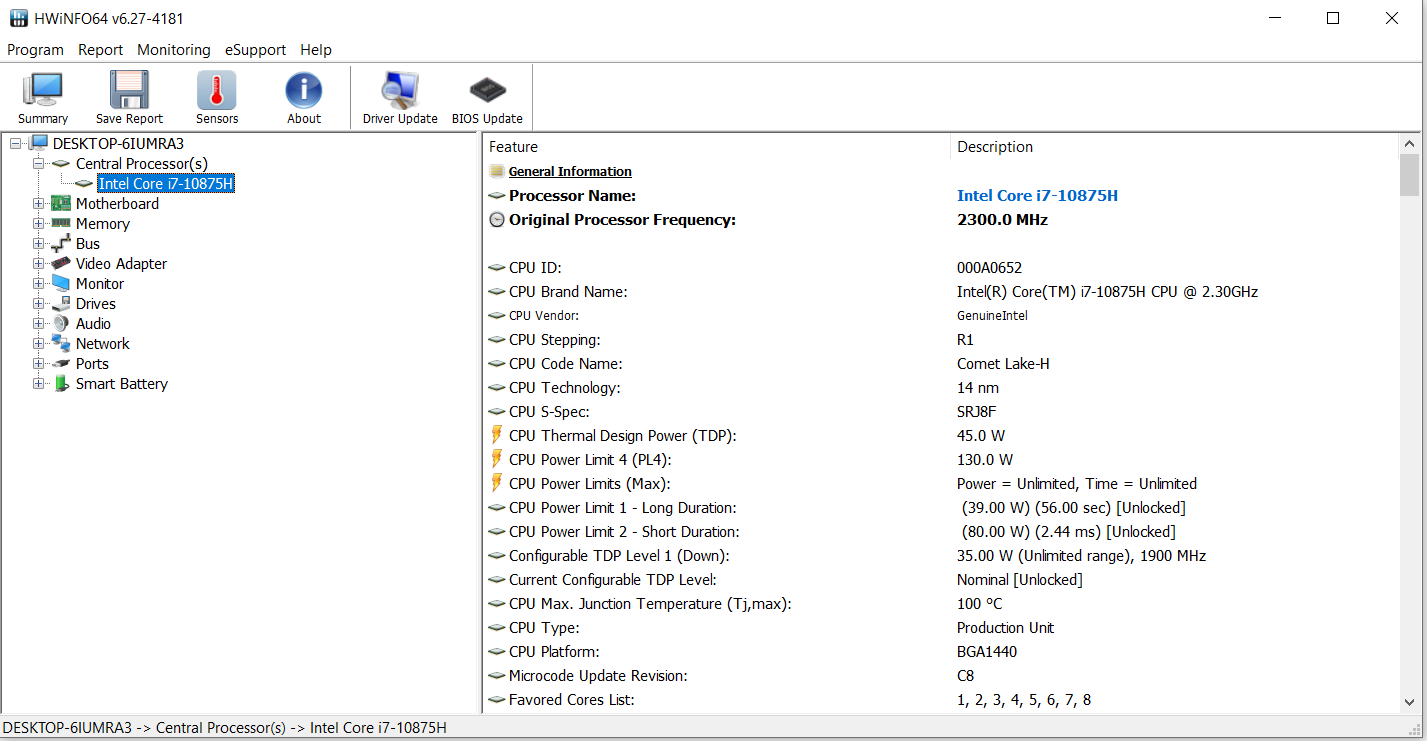
Processor
The built-in Core i7-10875H octa-core processor is from Intel's Comet Lake generation. The CPU runs at a base speed of 2.3 GHz. In addition, the clock rate can be increased to 4.3 GHz (eight cores) or to 5.1 GHz (one core) via Turbo. Hyper-Threading (two threads per core) is supported.
The processor runs the Cinebench R15 benchmark's multithread test at 2.5 to 3 GHz. The single-thread test is run at 3.6 to 4.9 GHz. Furthermore, the speeds are 2.3 GHz (multithread) and 2.2 to 3.6 GHz (single-thread), respectively, on battery power.
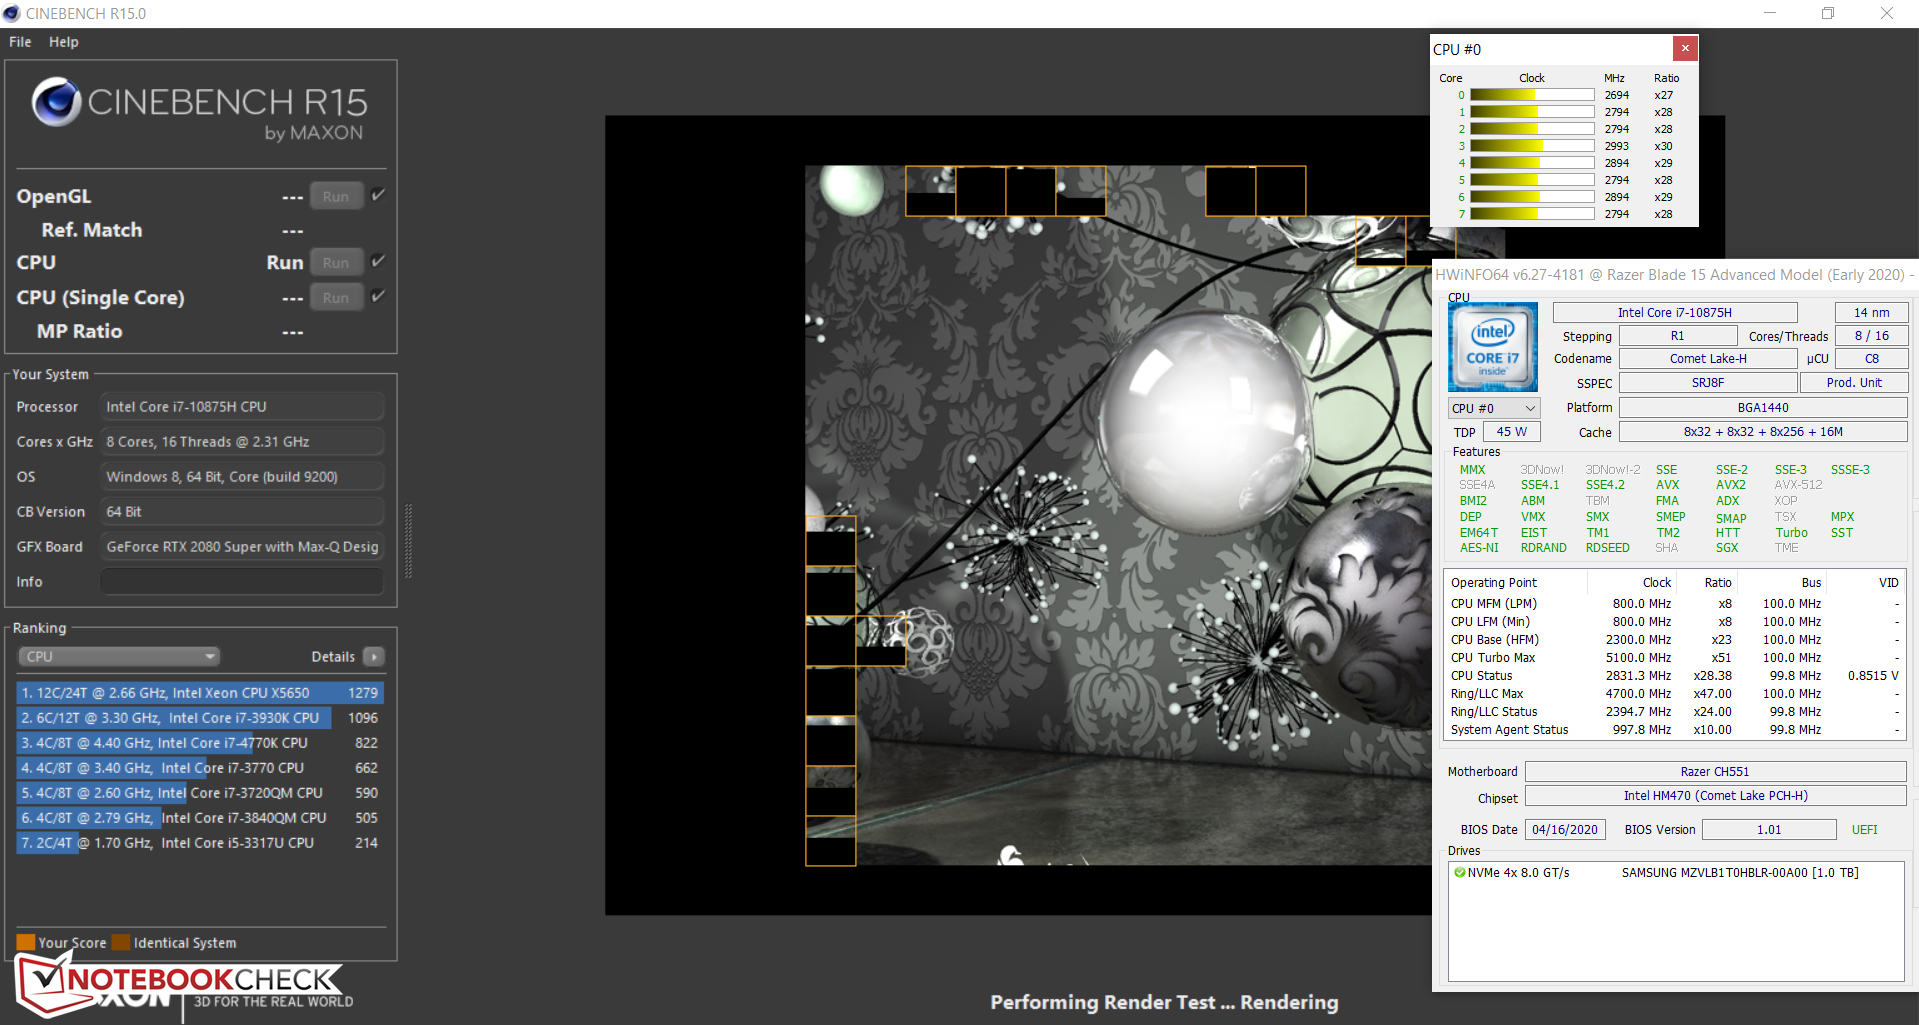
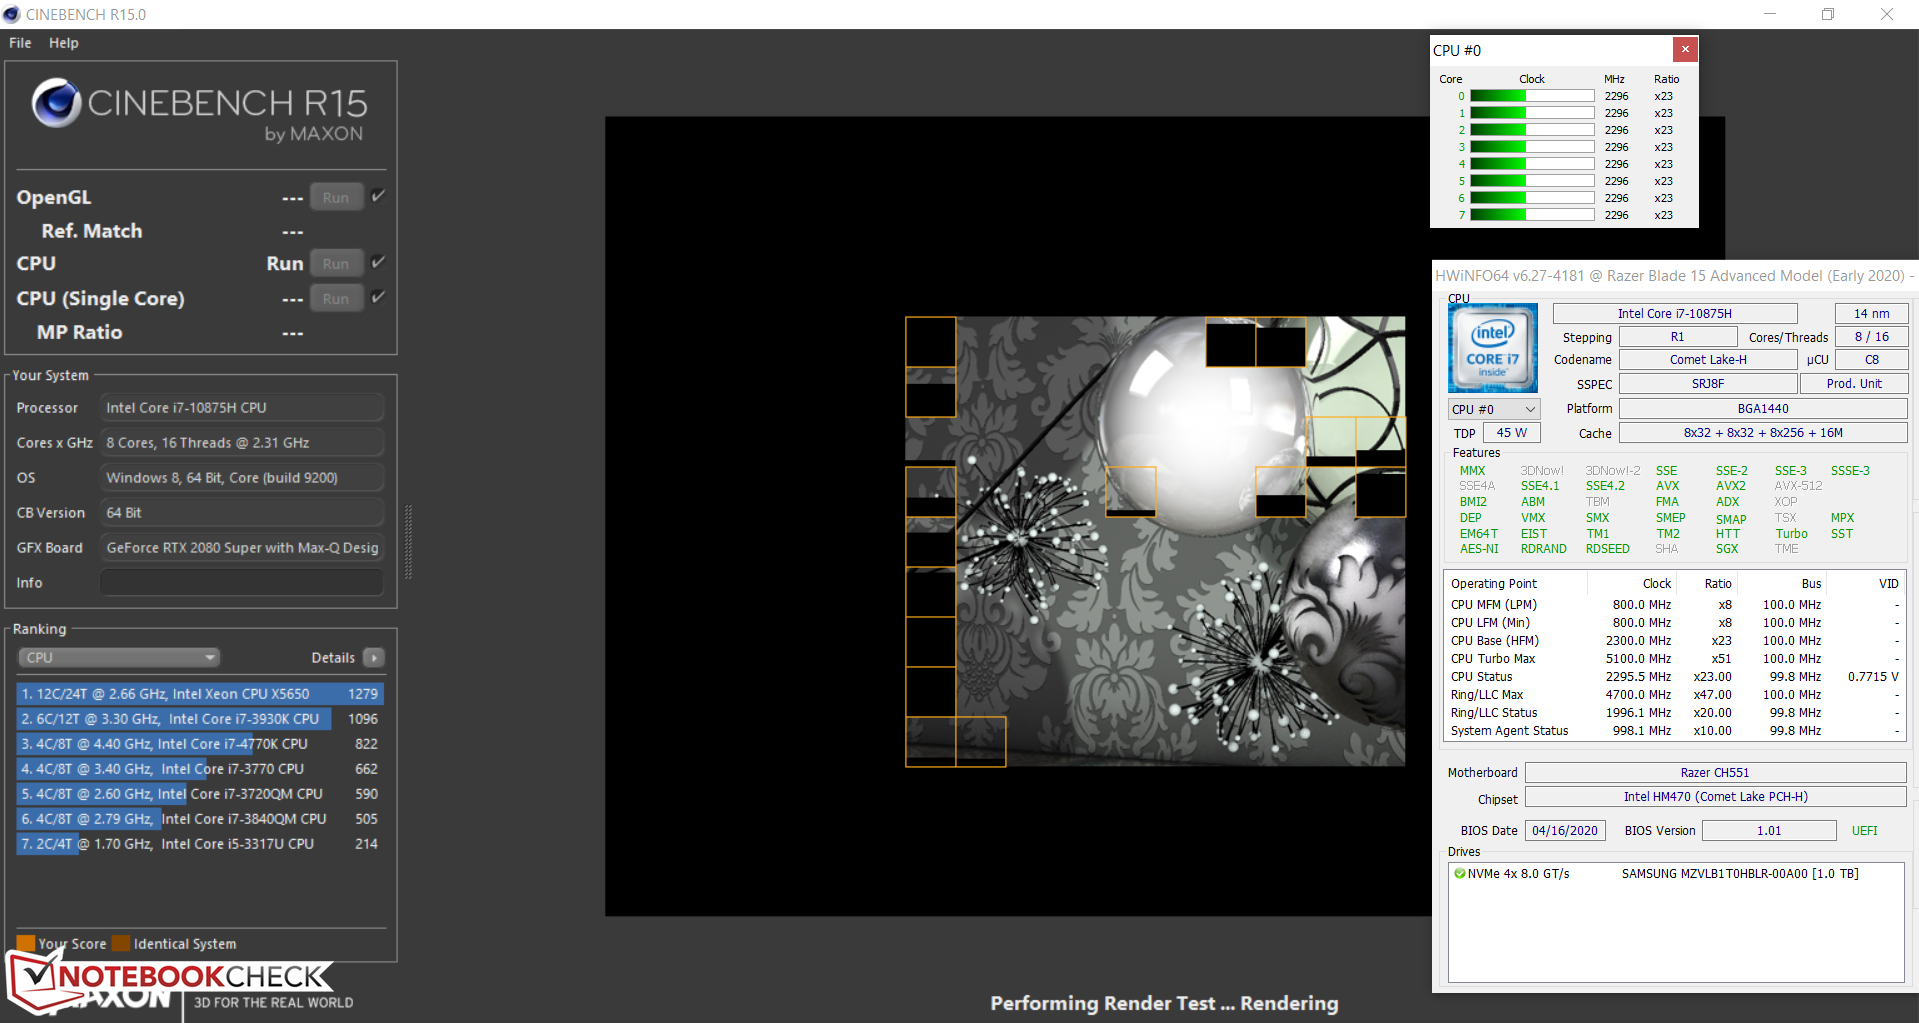
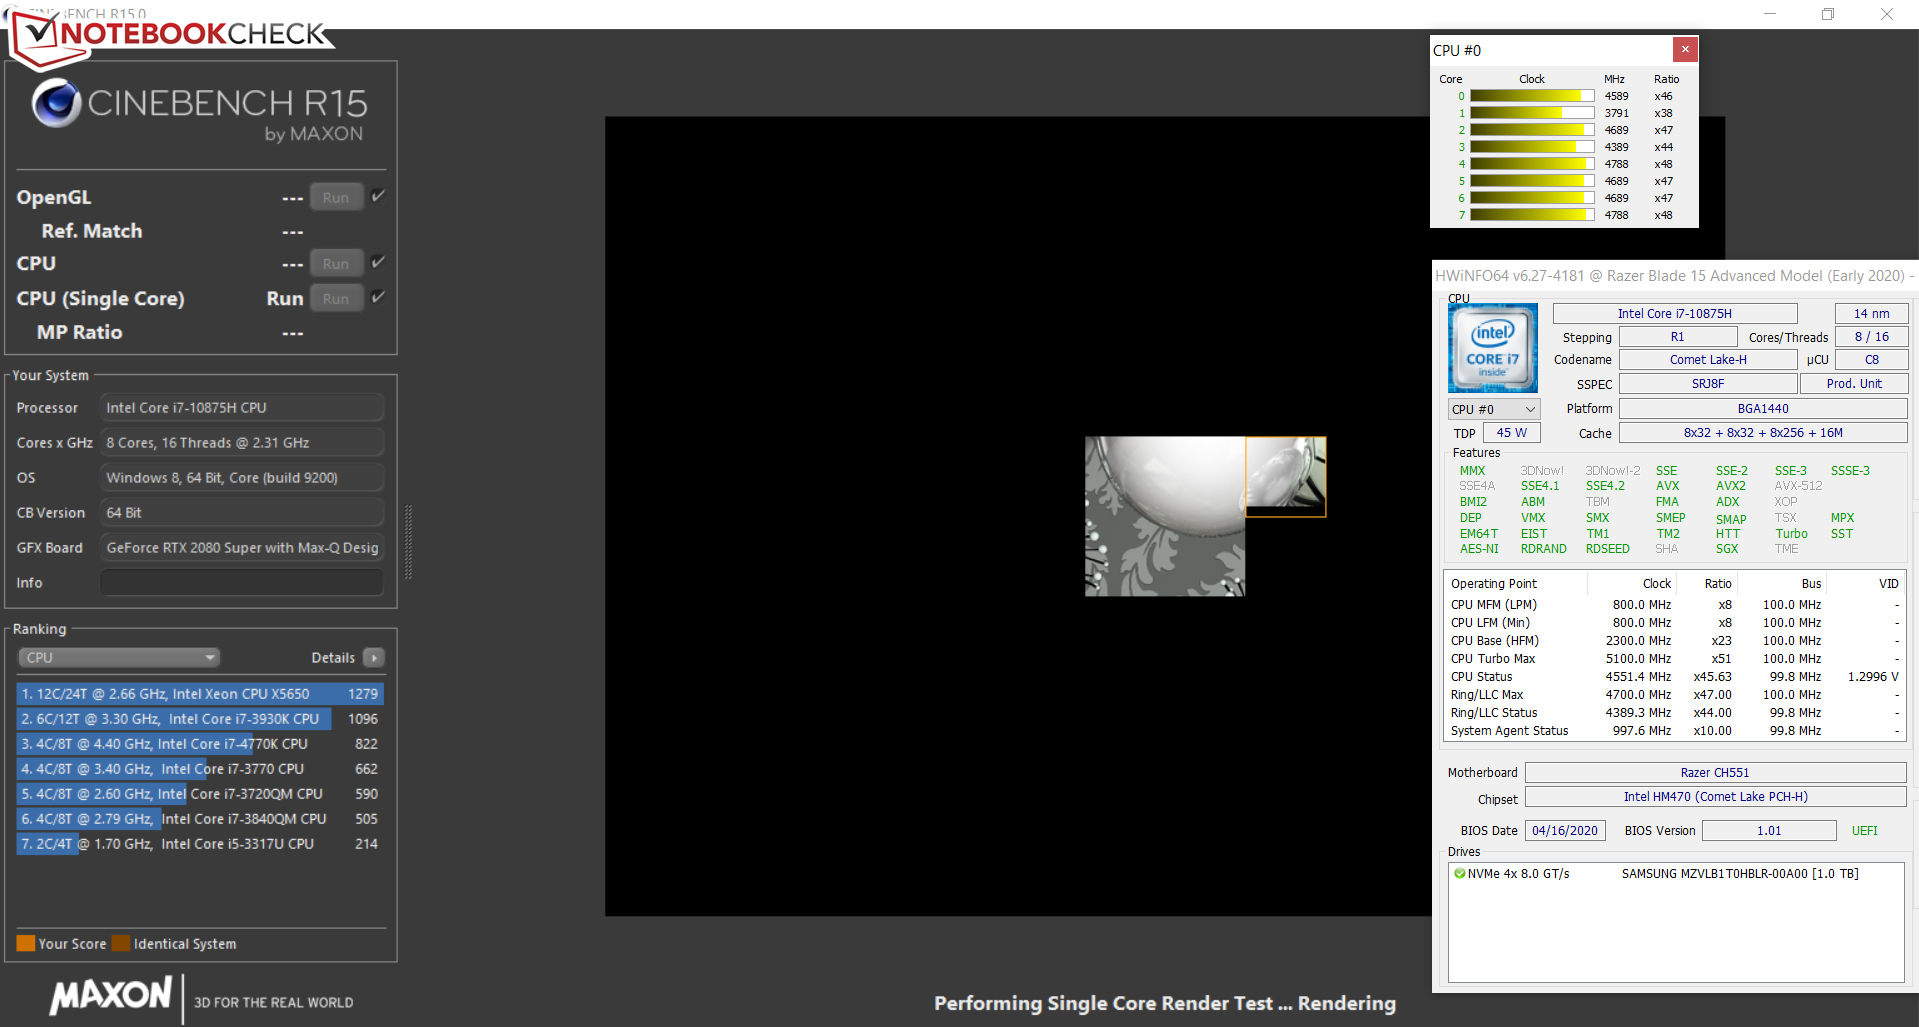

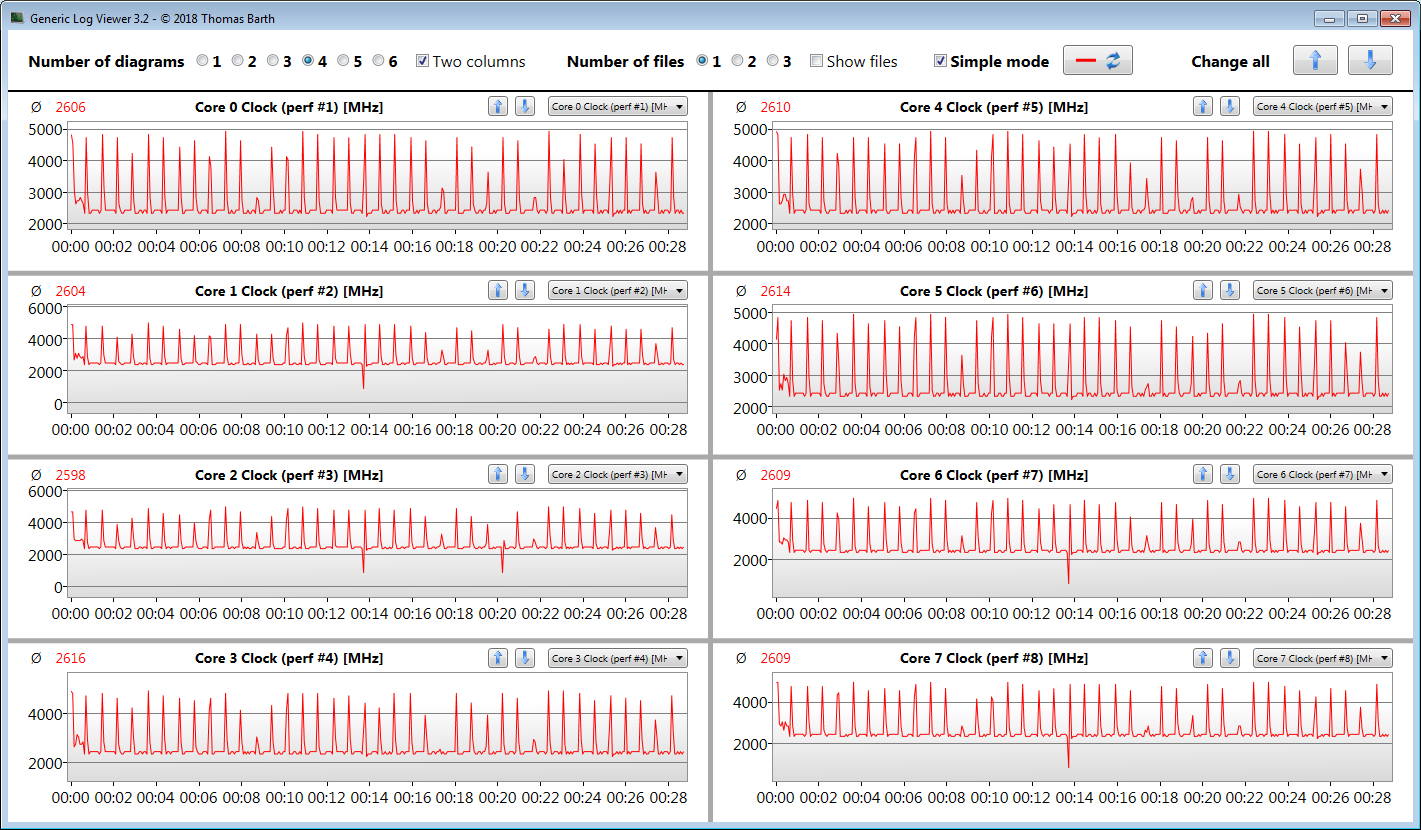
We verify if the CPU Turbo is also consistently used when plugged in by running the Cinebench R15 benchmark's multithread test in a continuous loop for at least 30 minutes. The results drop towards the second run and then remain at a constant level. Turbo is used to a small extent.
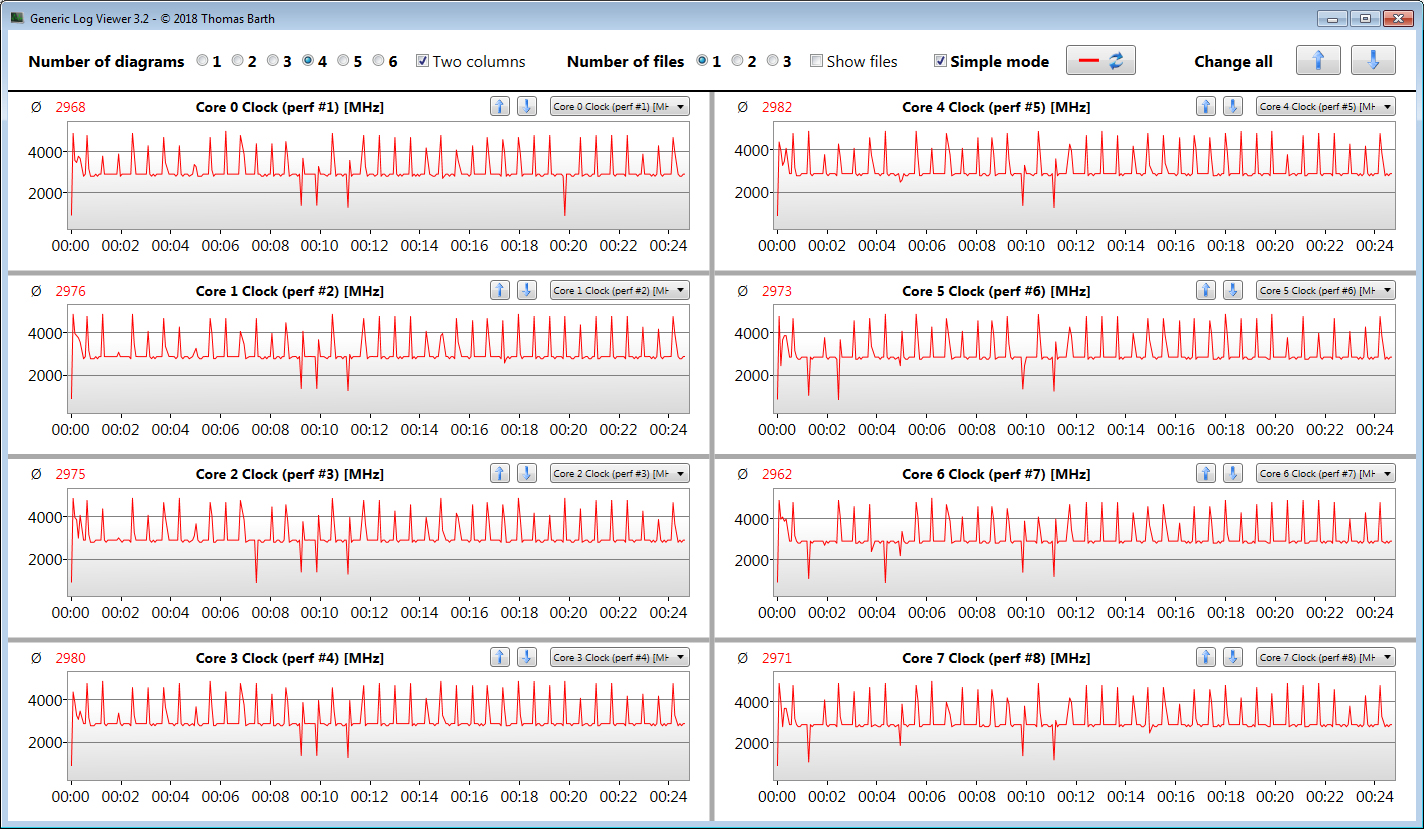
If the "High" or "Boost" CPU performance modes are selected within the Synapse software, the Turbo speed increases and consequently the results as well. There is a difference between "High" and "Boost".

| Cinebench R15 | |
| CPU Single 64Bit | |
| Average of class Gaming (188.8 - 343, n=111, last 2 years) | |
| Gigabyte Aero 15 OLED XB-8DE51B0SP | |
| MSI GE66 Raider 10SFS | |
| Average Intel Core i7-10875H (190 - 220, n=37) | |
| Razer Blade 15 RTX 2080 Super Max-Q (Boost) | |
| Razer Blade 15 RTX 2080 Super Max-Q (Hoch) | |
| Razer Blade 15 RTX 2080 Super Max-Q | |
| Razer Blade 15 RZ09-0328 | |
| Schenker XMG Neo 15 XNE15M19 | |
| Razer Blade 15 RTX 2080 Max-Q | |
| Asus Zephyrus S GX531GX | |
| CPU Multi 64Bit | |
| Average of class Gaming (1578 - 6271, n=111, last 2 years) | |
| Gigabyte Aero 15 OLED XB-8DE51B0SP | |
| MSI GE66 Raider 10SFS | |
| Average Intel Core i7-10875H (1003 - 1833, n=38) | |
| Razer Blade 15 RTX 2080 Super Max-Q (Boost) | |
| Razer Blade 15 RTX 2080 Super Max-Q (Hoch) | |
| Razer Blade 15 RTX 2080 Super Max-Q | |
| Schenker XMG Neo 15 XNE15M19 | |
| Razer Blade 15 RTX 2080 Max-Q | |
| Razer Blade 15 RZ09-0328 | |
| Asus Zephyrus S GX531GX | |
* ... smaller is better
System performance
There's nothing to criticize about the system performance. The system works well and smoothly, and we didn't encounter any problems. The PCMark results prove that the laptop has enough computing power for all common application areas.
| PCMark 8 Home Score Accelerated v2 | 4665 points | |
| PCMark 8 Creative Score Accelerated v2 | 4352 points | |
| PCMark 8 Work Score Accelerated v2 | 6340 points | |
| PCMark 10 Score | 5093 points | |
Help | ||
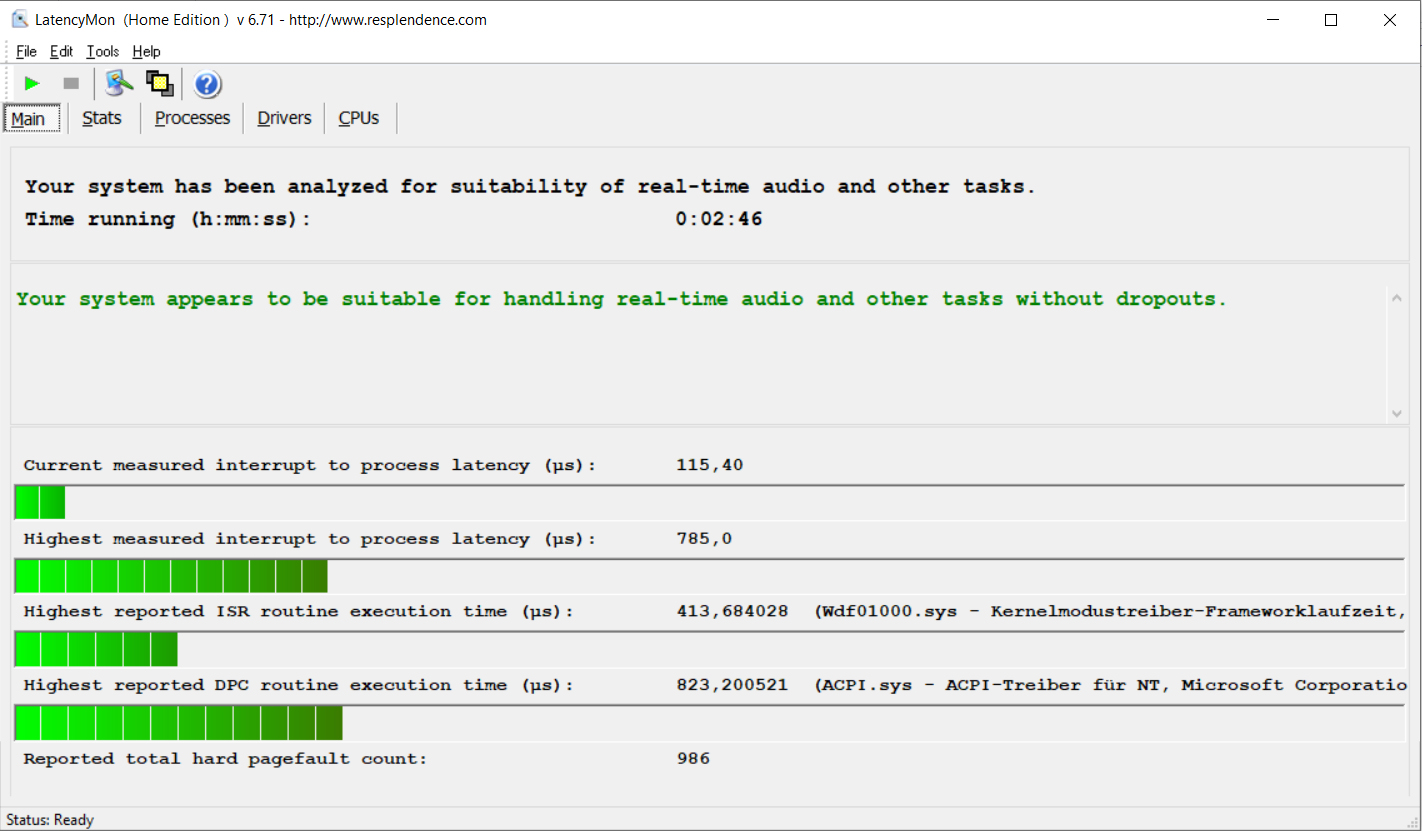
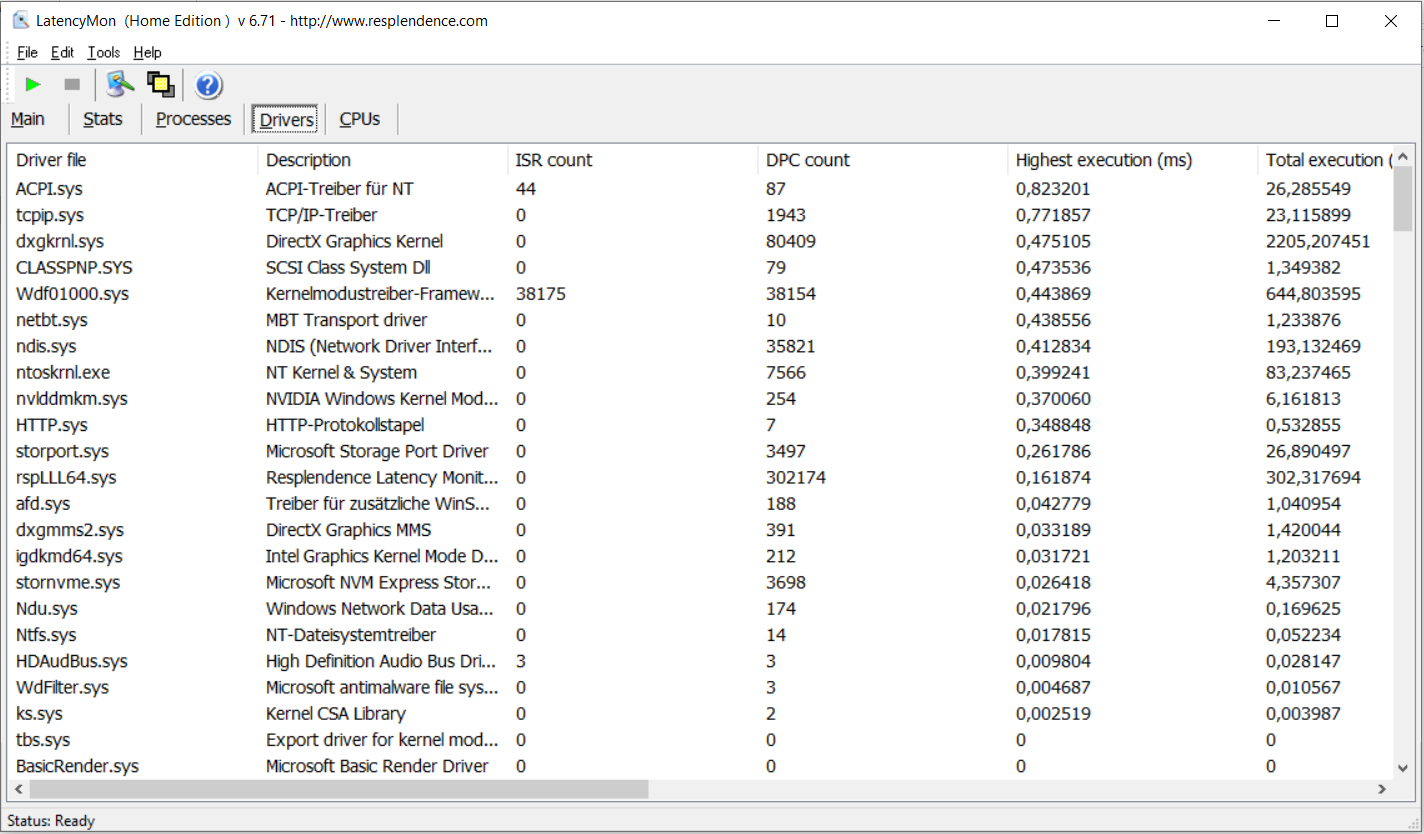
DPC latencies
In our standardized latency monitor test (web surfing, 4K video rendering, high-load Prime95), we couldn't observe any issues with the DPC latencies. As a result, the system seems to be suitable for video and audio-editing in real time.
| DPC Latencies / LatencyMon - interrupt to process latency (max), Web, Youtube, Prime95 | |
| Gigabyte Aero 15 OLED XB-8DE51B0SP | |
| MSI GE66 Raider 10SFS | |
| Razer Blade 15 RZ09-0328 | |
| Razer Blade 15 RTX 2080 Super Max-Q | |
* ... smaller is better
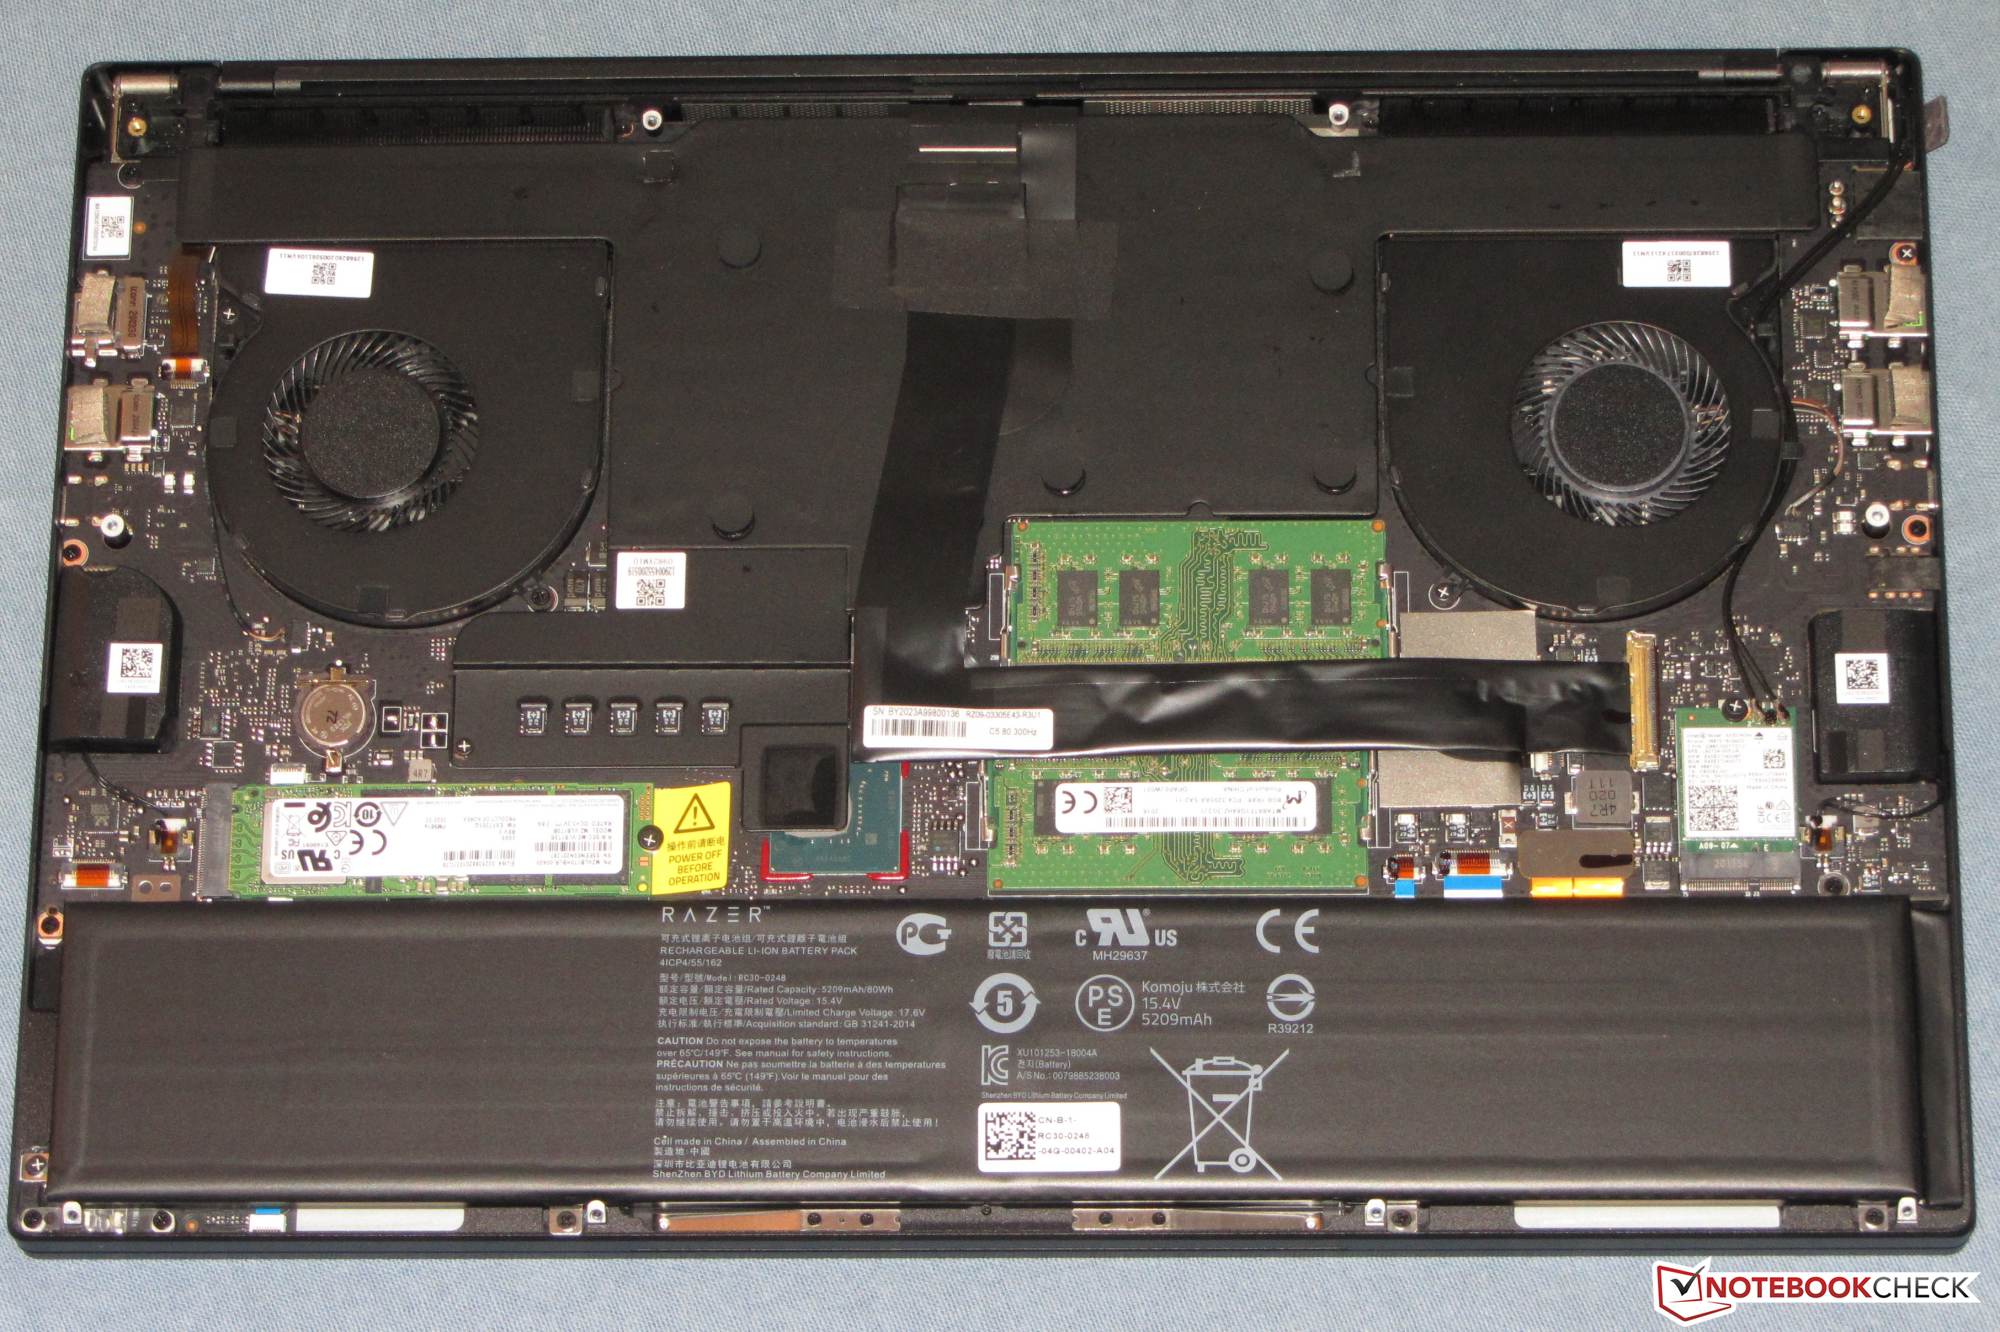
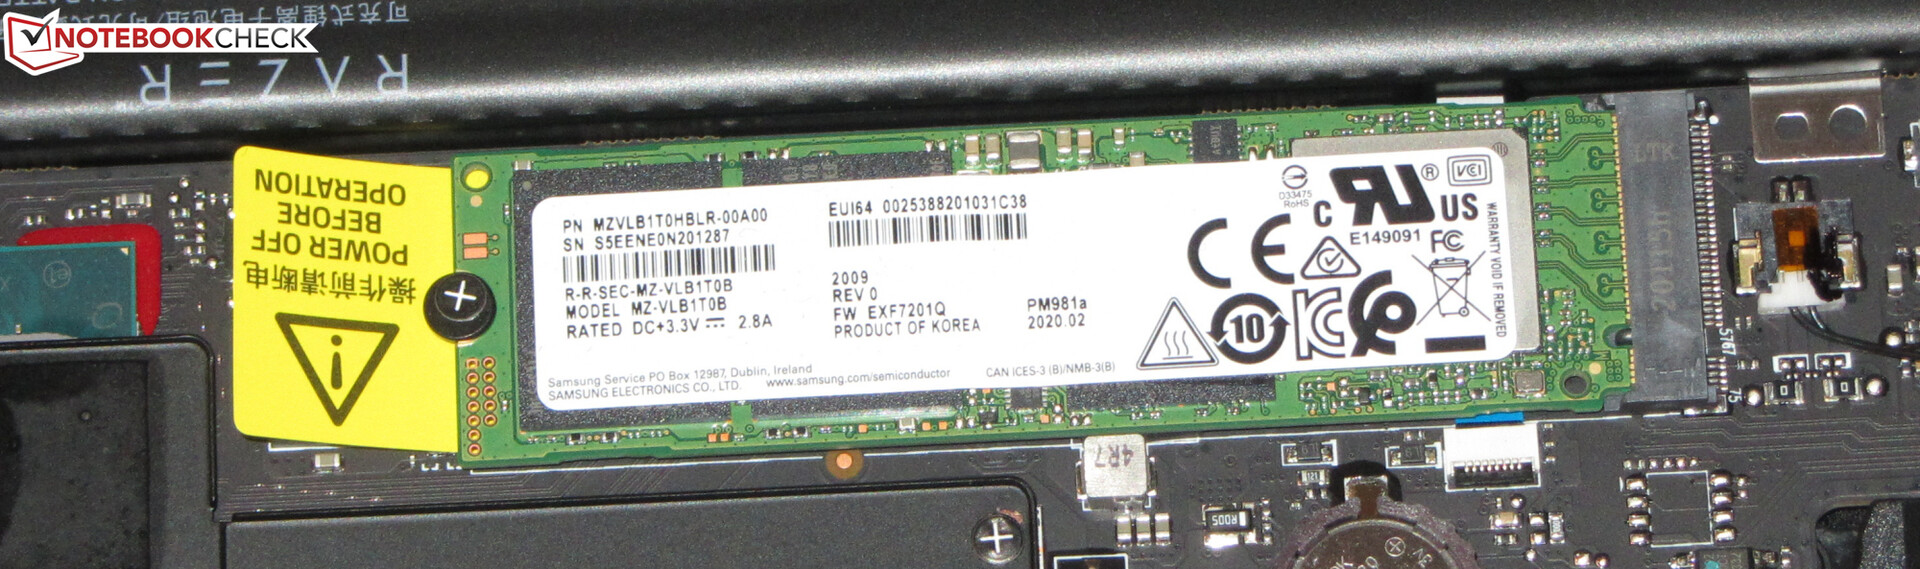
Storage
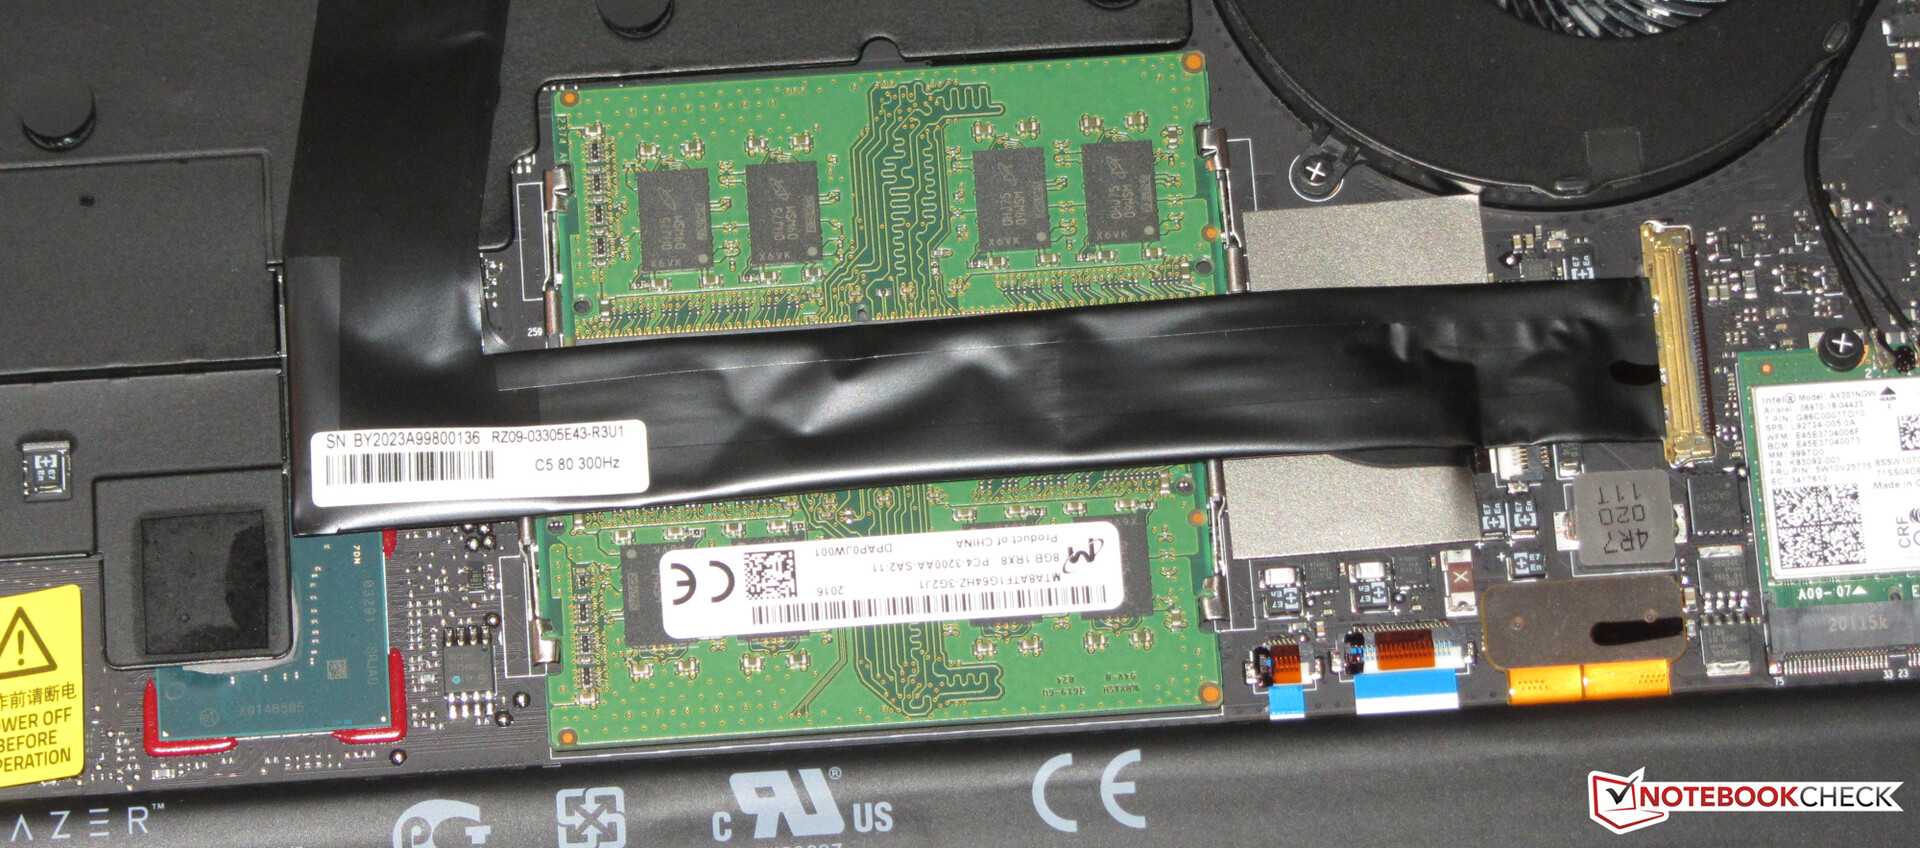
Razer has installed an NVMe SSD (M.2 2280) from Samsung in the Blade. The 1 TB model delivers excellent transfer speeds. On the other hand, the laptop doesn't offer any room for additional storage devices.

| Razer Blade 15 RTX 2080 Super Max-Q Samsung PM981a MZVLB1T0HBLR | Razer Blade 15 RTX 2080 Max-Q Samsung SSD PM981 MZVLB512HAJQ | Asus Zephyrus S GX531GX Intel SSD 660p SSDPEKNW512G8 | Gigabyte Aero 15 OLED XB-8DE51B0SP Intel Optane Memory H10 with Solid State Storage 32GB + 512GB HBRPEKNX0202A(L/H) | MSI GE66 Raider 10SFS WDC PC SN730 SDBPNTY-1T00 | Schenker XMG Neo 15 XNE15M19 Seagate FireCuda 510 SSD ZP1000GM30001 | Razer Blade 15 RZ09-0328 Lite-On CA5-8D512 | Average Samsung PM981a MZVLB1T0HBLR | |
|---|---|---|---|---|---|---|---|---|
| CrystalDiskMark 5.2 / 6 | -13% | -41% | 0% | 6% | -18% | -1% | -2% | |
| Write 4K (MB/s) | 135.7 | 137.2 1% | 93.9 -31% | 127.4 -6% | 158.2 17% | 108.7 -20% | 118.7 -13% | 139.7 ? 3% |
| Read 4K (MB/s) | 46.98 | 46.82 0% | 46.29 -1% | 147.5 214% | 50.7 8% | 41.4 -12% | 52.4 12% | 49.9 ? 6% |
| Write Seq (MB/s) | 2180 | 1221 -44% | 974 -55% | 485.9 -78% | 1790 -18% | 1083 -50% | 2247 3% | 2036 ? -7% |
| Read Seq (MB/s) | 1949 | 1217 -38% | 1425 -27% | 1352 -31% | 2469 27% | 917 -53% | 2234 15% | 2014 ? 3% |
| Write 4K Q32T1 (MB/s) | 510 | 527 3% | 259.4 -49% | 476.5 -7% | 503 -1% | 468.5 -8% | 515 1% | 461 ? -10% |
| Read 4K Q32T1 (MB/s) | 569 | 614 8% | 296.5 -48% | 531 -7% | 579 2% | 530 -7% | 584 3% | 499 ? -12% |
| Write Seq Q32T1 (MB/s) | 2984 | 1986 -33% | 977 -67% | 1061 -64% | 3102 4% | 3057 2% | 2235 -25% | 2903 ? -3% |
| Read Seq Q32T1 (MB/s) | 3238 | 3234 0% | 1666 -49% | 2552 -21% | 3413 5% | 3422 6% | 3171 -2% | 3479 ? 7% |
| AS SSD | -4% | -37% | -37% | 21% | 14% | -24% | 5% | |
| Seq Read (MB/s) | 1950 | 1832 -6% | 1239 -36% | 1200 -38% | 2979 53% | 2341 20% | 2021 4% | 2553 ? 31% |
| Seq Write (MB/s) | 2322 | 1864 -20% | 920 -60% | 836 -64% | 2581 11% | 2575 11% | 2090 -10% | 2084 ? -10% |
| 4K Read (MB/s) | 45.48 | 52.1 15% | 45.74 1% | 65.8 45% | 47.33 4% | 51 12% | 47.71 5% | 53.1 ? 17% |
| 4K Write (MB/s) | 95.4 | 108.3 14% | 95.7 0% | 103.8 9% | 140 47% | 118.6 24% | 101.1 6% | 131.2 ? 38% |
| 4K-64 Read (MB/s) | 1484 | 1159 -22% | 322 -78% | 789 -47% | 1710 15% | 1637 10% | 856 -42% | 1477 ? 0% |
| 4K-64 Write (MB/s) | 1887 | 1807 -4% | 722 -62% | 929 -51% | 2188 16% | 2442 29% | 1041 -45% | 1805 ? -4% |
| Access Time Read * (ms) | 0.051 | 0.05 2% | 0.073 -43% | 0.103 -102% | 0.05 2% | 0.066 -29% | 0.052 -2% | 0.04983 ? 2% |
| Access Time Write * (ms) | 0.038 | 0.034 11% | 0.047 -24% | 0.045 -18% | 0.026 32% | 0.028 26% | 0.111 -192% | 0.04222 ? -11% |
| Score Read (Points) | 1725 | 1394 -19% | 492 -71% | 975 -43% | 2055 19% | 1922 11% | 1105 -36% | 1786 ? 4% |
| Score Write (Points) | 2215 | 2102 -5% | 910 -59% | 1117 -50% | 2586 17% | 2818 27% | 1351 -39% | 2144 ? -3% |
| Score Total (Points) | 4843 | 4221 -13% | 1654 -66% | 2594 -46% | 5673 17% | 5738 18% | 3037 -37% | 4826 ? 0% |
| Copy ISO MB/s (MB/s) | 1903 | 2083 9% | 1236 -35% | 2474 30% | 2098 ? 10% | |||
| Copy Program MB/s (MB/s) | 505 | 496.5 -2% | 703 39% | 679 34% | 500 ? -1% | |||
| Copy Game MB/s (MB/s) | 1113 | 977 -12% | 812 -27% | 1037 -7% | 1132 ? 2% | |||
| Total Average (Program / Settings) | -9% /
-7% | -39% /
-39% | -19% /
-21% | 14% /
15% | -2% /
1% | -13% /
-15% | 2% /
3% |
* ... smaller is better
Continuous load read: DiskSpd Read Loop, Queue Depth 8
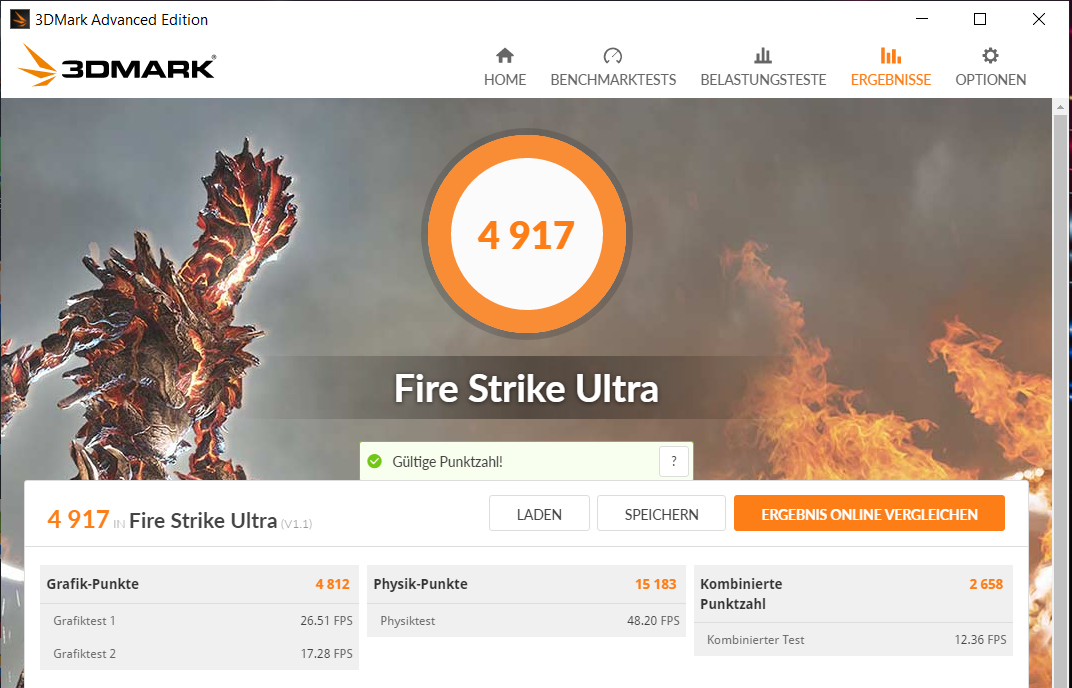
Graphics card
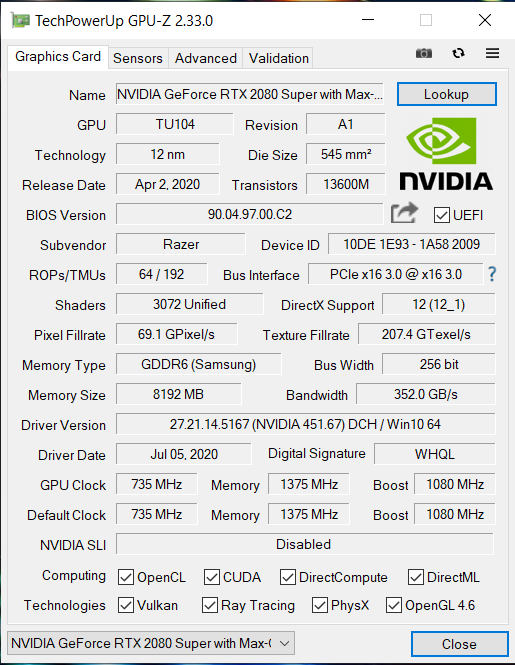
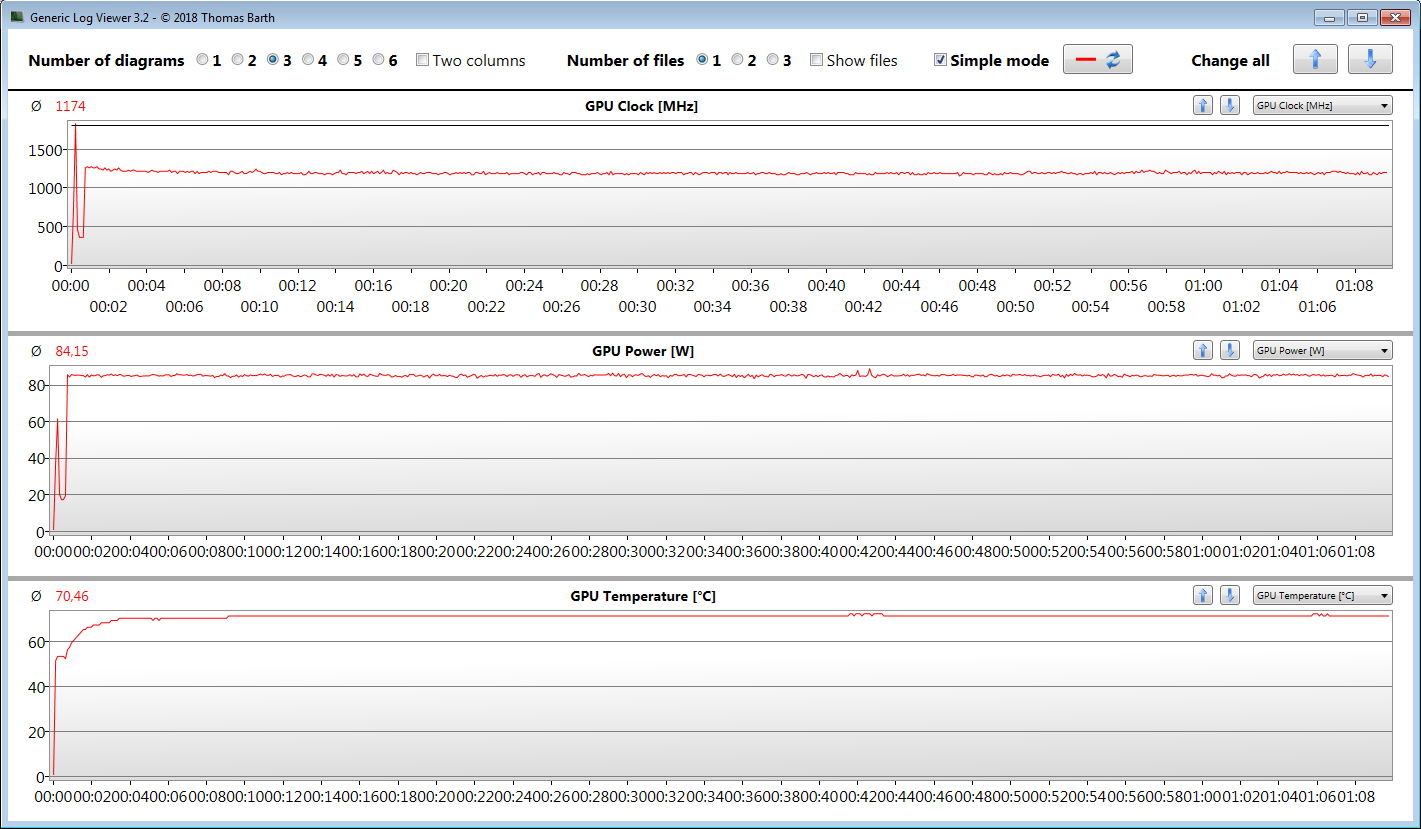
The GeForce RTX 2080 Super Max-Q graphics core supports DirectX 12 and runs at a base speed of 775 MHz. An increase to up to 1,080 MHz is possible when boosted. Higher speeds are feasible if the GPU doesn't reach a specified temperature and/or energy threshold. In this way, we register a maximum of 1,783 MHz. Our The Witcher 3 test is run at an average speed of 1,174 MHz. In addition, the GPU has access to fast GDDR6 graphics memory (8,192 MB).
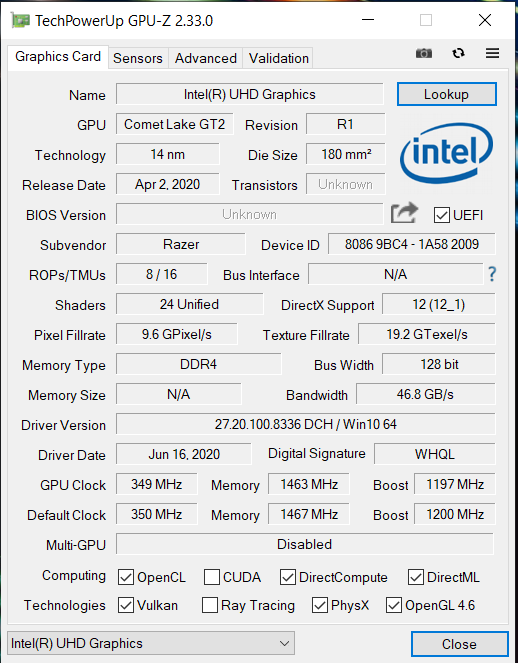
The results in the 3DMark benchmarks are at a normal level for the GPU. A slight increase in graphics performance can be achieved by setting the graphics performance slider within the Razer Synapse software to "High". The UHD Graphics 630 GPU that's integrated into the processor is active, and the laptop works with Nvidia's Optimus graphics-switching solution. Optimus can be disabled within the Razer Synapse software if necessary.

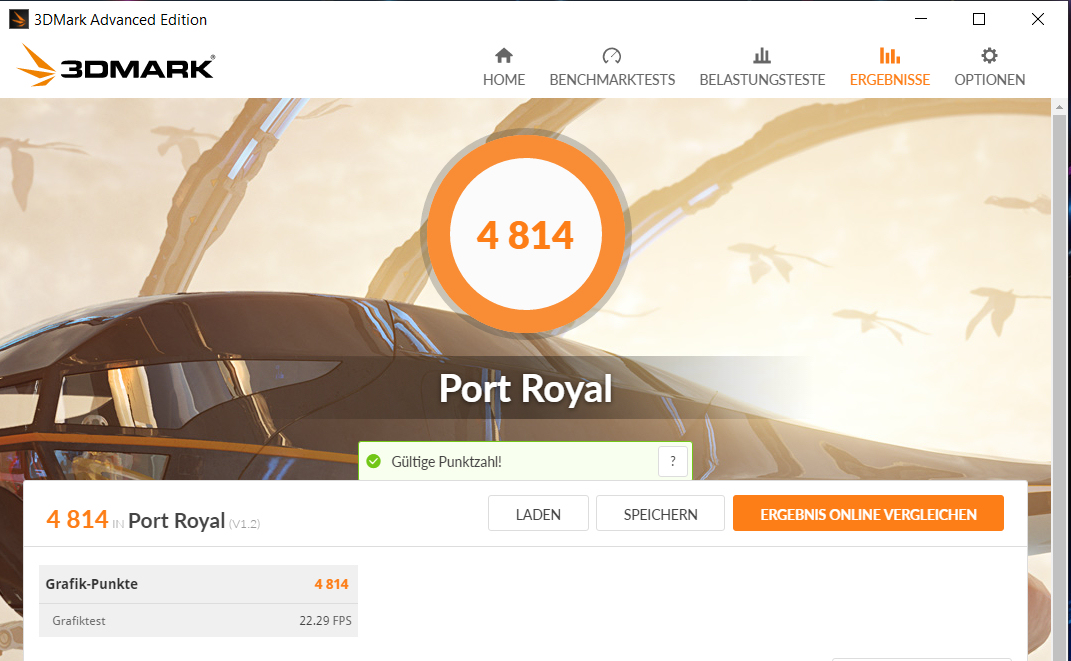
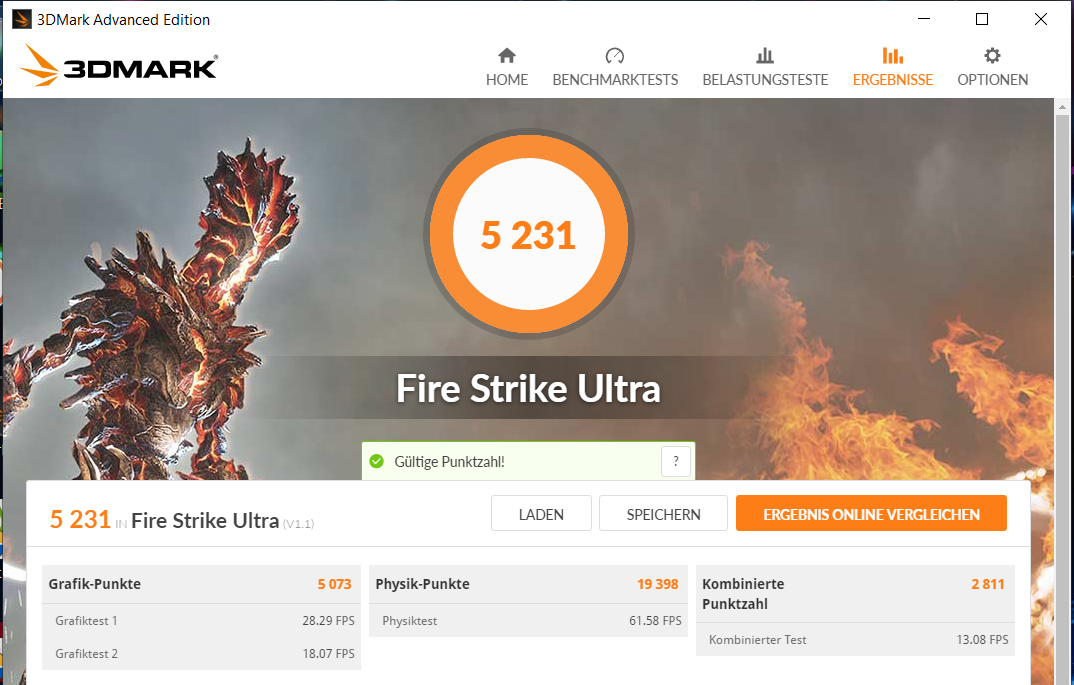
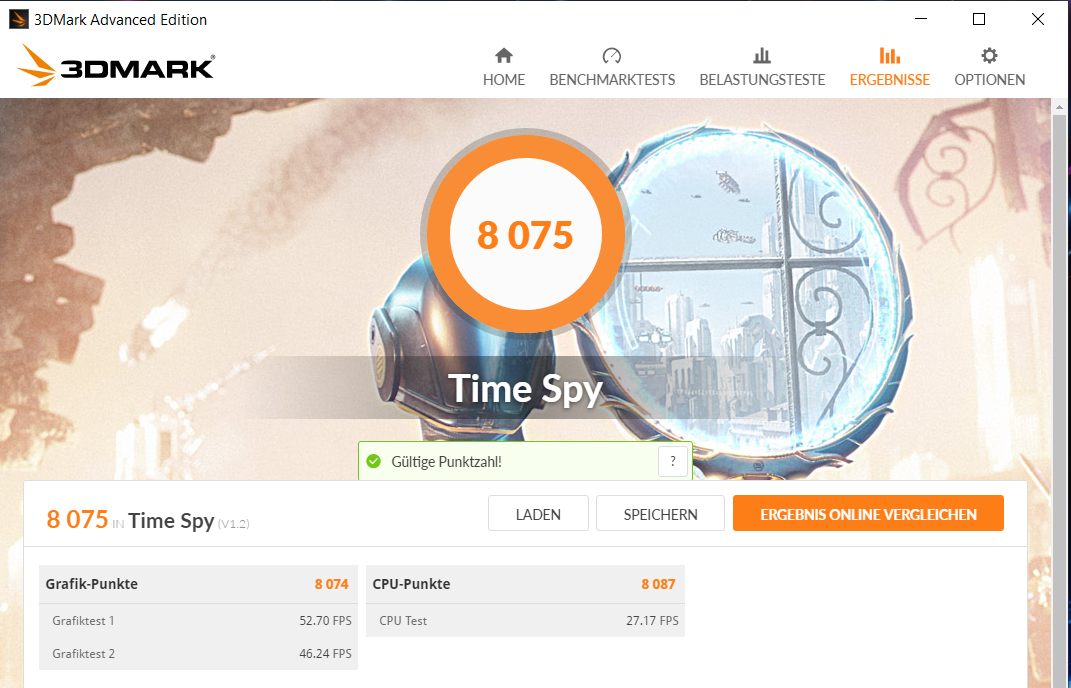

| 3DMark 11 Performance | 20888 points | |
| 3DMark Cloud Gate Standard Score | 32880 points | |
| 3DMark Fire Strike Score | 17148 points | |
| 3DMark Time Spy Score | 7683 points | |
Help | ||
Gaming performance
The Razer laptop brings all the latest games smoothly onto the screen. Full HD resolution and maximum quality settings can usually be selected. Moreover, the GPU can also handle resolutions beyond Full HD (an appropriate monitor would have to be connected for this). However, the quality controls shouldn't be turned up quite as high in that case - especially at 4K level.
| The Witcher 3 - 1920x1080 Ultra Graphics & Postprocessing (HBAO+) | |
| Average of class Gaming (95 - 240, n=8, last 2 years) | |
| Razer Blade 15 RTX 2080 Super Max-Q (GPU: Hoch) | |
| Razer Blade 15 RTX 2080 Super Max-Q | |
| Average NVIDIA GeForce RTX 2080 Super Max-Q (74.3 - 96, n=11) | |
| MSI GE66 Raider 10SFS | |
| Asus Zephyrus S GX531GX | |
| Gigabyte Aero 15 OLED XB-8DE51B0SP | |
| Razer Blade 15 RTX 2080 Max-Q | |
| Razer Blade 15 RZ09-0328 | |
| Schenker XMG Neo 15 XNE15M19 | |
| BioShock Infinite - 1920x1080 Ultra Preset, DX11 (DDOF) | |
| Average NVIDIA GeForce RTX 2080 Super Max-Q (170.2 - 181.1, n=4) | |
| Razer Blade 15 RTX 2080 Super Max-Q | |
| Razer Blade 15 RTX 2080 Max-Q | |
| Asus Zephyrus S GX531GX | |
| Shadow of the Tomb Raider - 1920x1080 Highest Preset AA:T | |
| MSI GE66 Raider 10SFS | |
| Average of class Gaming (96 - 116, n=2, last 2 years) | |
| Gigabyte Aero 15 OLED XB-8DE51B0SP | |
| Average NVIDIA GeForce RTX 2080 Super Max-Q (89 - 106, n=10) | |
| Razer Blade 15 RTX 2080 Super Max-Q | |
| Razer Blade 15 RTX 2080 Super Max-Q (GPU: Hoch) | |
| Razer Blade 15 RZ09-0328 | |
| Far Cry 5 - 1920x1080 Ultra Preset AA:T | |
| Average of class Gaming (70 - 151, n=10, last 2 years) | |
| Average NVIDIA GeForce RTX 2080 Super Max-Q (91 - 110, n=4) | |
| Razer Blade 15 RTX 2080 Super Max-Q | |
| Battlefield V - 1920x1080 Ultra Preset | |
| MSI GE66 Raider 10SFS | |
| Gigabyte Aero 15 OLED XB-8DE51B0SP | |
| Average NVIDIA GeForce RTX 2080 Super Max-Q (109.7 - 125, n=4) | |
| Razer Blade 15 RTX 2080 Super Max-Q | |
| Borderlands 3 - 1920x1080 Badass Overall Quality (DX11) | |
| MSI GE66 Raider 10SFS | |
| Average NVIDIA GeForce RTX 2080 Super Max-Q (62.5 - 71.6, n=4) | |
| Gigabyte Aero 15 OLED XB-8DE51B0SP | |
| Razer Blade 15 RTX 2080 Super Max-Q | |
| Razer Blade 15 RZ09-0328 | |
| Schenker XMG Neo 15 XNE15M19 | |
| Red Dead Redemption 2 - 1920x1080 Maximum Settings | |
| MSI GE66 Raider 10SFS | |
| Average NVIDIA GeForce RTX 2080 Super Max-Q (40.6 - 45, n=5) | |
| Gigabyte Aero 15 OLED XB-8DE51B0SP | |
| Razer Blade 15 RTX 2080 Super Max-Q | |
| Doom Eternal - 1920x1080 Ultra Preset | |
| MSI GE66 Raider 10SFS | |
| Average NVIDIA GeForce RTX 2080 Super Max-Q (140 - 177.7, n=8) | |
| Razer Blade 15 RTX 2080 Super Max-Q | |
In order to verify whether the frame rates remain largely constant even over a prolonged period of time, we let the game The Witcher 3 run for about 60 minutes at Full HD resolution and maximum quality settings. The character embodied by the player is not moved during this whole period. A drop in frame rates wasn't found.
| low | med. | high | ultra | |
|---|---|---|---|---|
| BioShock Infinite (2013) | 347.4 | 330.2 | 300.5 | 173 |
| The Witcher 3 (2015) | 308.4 | 239.9 | 153.2 | 87.7 |
| Dota 2 Reborn (2015) | 134.3 | 128.7 | 117.4 | 115 |
| X-Plane 11.11 (2018) | 109 | 95.8 | 80.8 | |
| Far Cry 5 (2018) | 111 | 100 | 96 | 91 |
| Shadow of the Tomb Raider (2018) | 117 | 104 | 100 | 93 |
| Battlefield V (2018) | 154.3 | 124.7 | 116.2 | 109.7 |
| Metro Exodus (2019) | 131 | 93.2 | 70.3 | 57.2 |
| Total War: Three Kingdoms (2019) | 227.8 | 123.8 | 83.8 | 61 |
| Control (2019) | 221.7 | 96.6 | 71 | |
| Borderlands 3 (2019) | 128.3 | 101.6 | 78.2 | 62.5 |
| Ghost Recon Breakpoint (2019) | 130 | 95 | 88 | 66 |
| Call of Duty Modern Warfare 2019 (2019) | 165.5 | 114.1 | 96.4 | 93.8 |
| Star Wars Jedi Fallen Order (2019) | 99.5 | 94.1 | 88.7 | |
| Red Dead Redemption 2 (2019) | 113.3 | 96.5 | 62.7 | 40.6 |
| Doom Eternal (2020) | 212.2 | 165.1 | 147.9 | 144.4 |
| Gears Tactics (2020) | 188.8 | 171.6 | 122.2 | 82.9 |
| F1 2020 (2020) | 219 | 174 | 150 | 115 |
| Death Stranding (2020) | 139.8 | 118.7 | 108.6 | 104.5 |
Emissions - Moderate heat and noise development
Noise emissions
In idle usage, the fans are often quiet, and silence prevails. This all ends under load. In this way, we register maximum sound pressure levels of 46.8 dB(A) (medium load), 46 dB(A) (stress test), and 48.4 dB(A) (The Witcher 3 test), respectively. Gaming is no fun without a headset here.
Noise level
| Idle |
| 30.1 / 30.1 / 30.1 dB(A) |
| Load |
| 46.8 / 46 dB(A) |
 | ||
30 dB silent 40 dB(A) audible 50 dB(A) loud |
||
min: | ||
| Razer Blade 15 RTX 2080 Super Max-Q i7-10875H, GeForce RTX 2080 Super Max-Q | Razer Blade 15 RTX 2080 Max-Q i7-9750H, GeForce RTX 2080 Max-Q | Asus Zephyrus S GX531GX i7-8750H, GeForce RTX 2080 Max-Q | Gigabyte Aero 15 OLED XB-8DE51B0SP i7-10875H, GeForce RTX 2070 Super Max-Q | MSI GE66 Raider 10SFS i9-10980HK, GeForce RTX 2070 Super Mobile | Schenker XMG Neo 15 XNE15M19 i7-9750H, GeForce RTX 2070 Max-Q | Average NVIDIA GeForce RTX 2080 Super Max-Q | Average of class Gaming | |
|---|---|---|---|---|---|---|---|---|
| Noise | 8% | -7% | -13% | -15% | -9% | -4% | 6% | |
| off / environment * (dB) | 30.1 | 28.3 6% | 28.7 5% | 30 -0% | 30 -0% | 31 -3% | 27.9 ? 7% | 24.1 ? 20% |
| Idle Minimum * (dB) | 30.1 | 28.8 4% | 29.8 1% | 34 -13% | 30 -0% | 31 -3% | 29.7 ? 1% | 25.8 ? 14% |
| Idle Average * (dB) | 30.1 | 28.8 4% | 32.4 -8% | 36 -20% | 35 -16% | 34 -13% | 30.8 ? -2% | 27.4 ? 9% |
| Idle Maximum * (dB) | 30.1 | 29 4% | 38 -26% | 41 -36% | 44 -46% | 37 -23% | 35.4 ? -18% | 30 ? -0% |
| Load Average * (dB) | 46.8 | 33.5 28% | 38.2 18% | 48 -3% | 53 -13% | 47 -0% | 47.2 ? -1% | 43 ? 8% |
| Witcher 3 ultra * (dB) | 48.4 | 45 7% | 56.6 -17% | 48 1% | 53 -10% | 50 -3% | ||
| Load Maximum * (dB) | 46 | 45.2 2% | 56.6 -23% | 54 -17% | 55 -20% | 54 -17% | 49.6 ? -8% | 54 ? -17% |
* ... smaller is better
Temperature
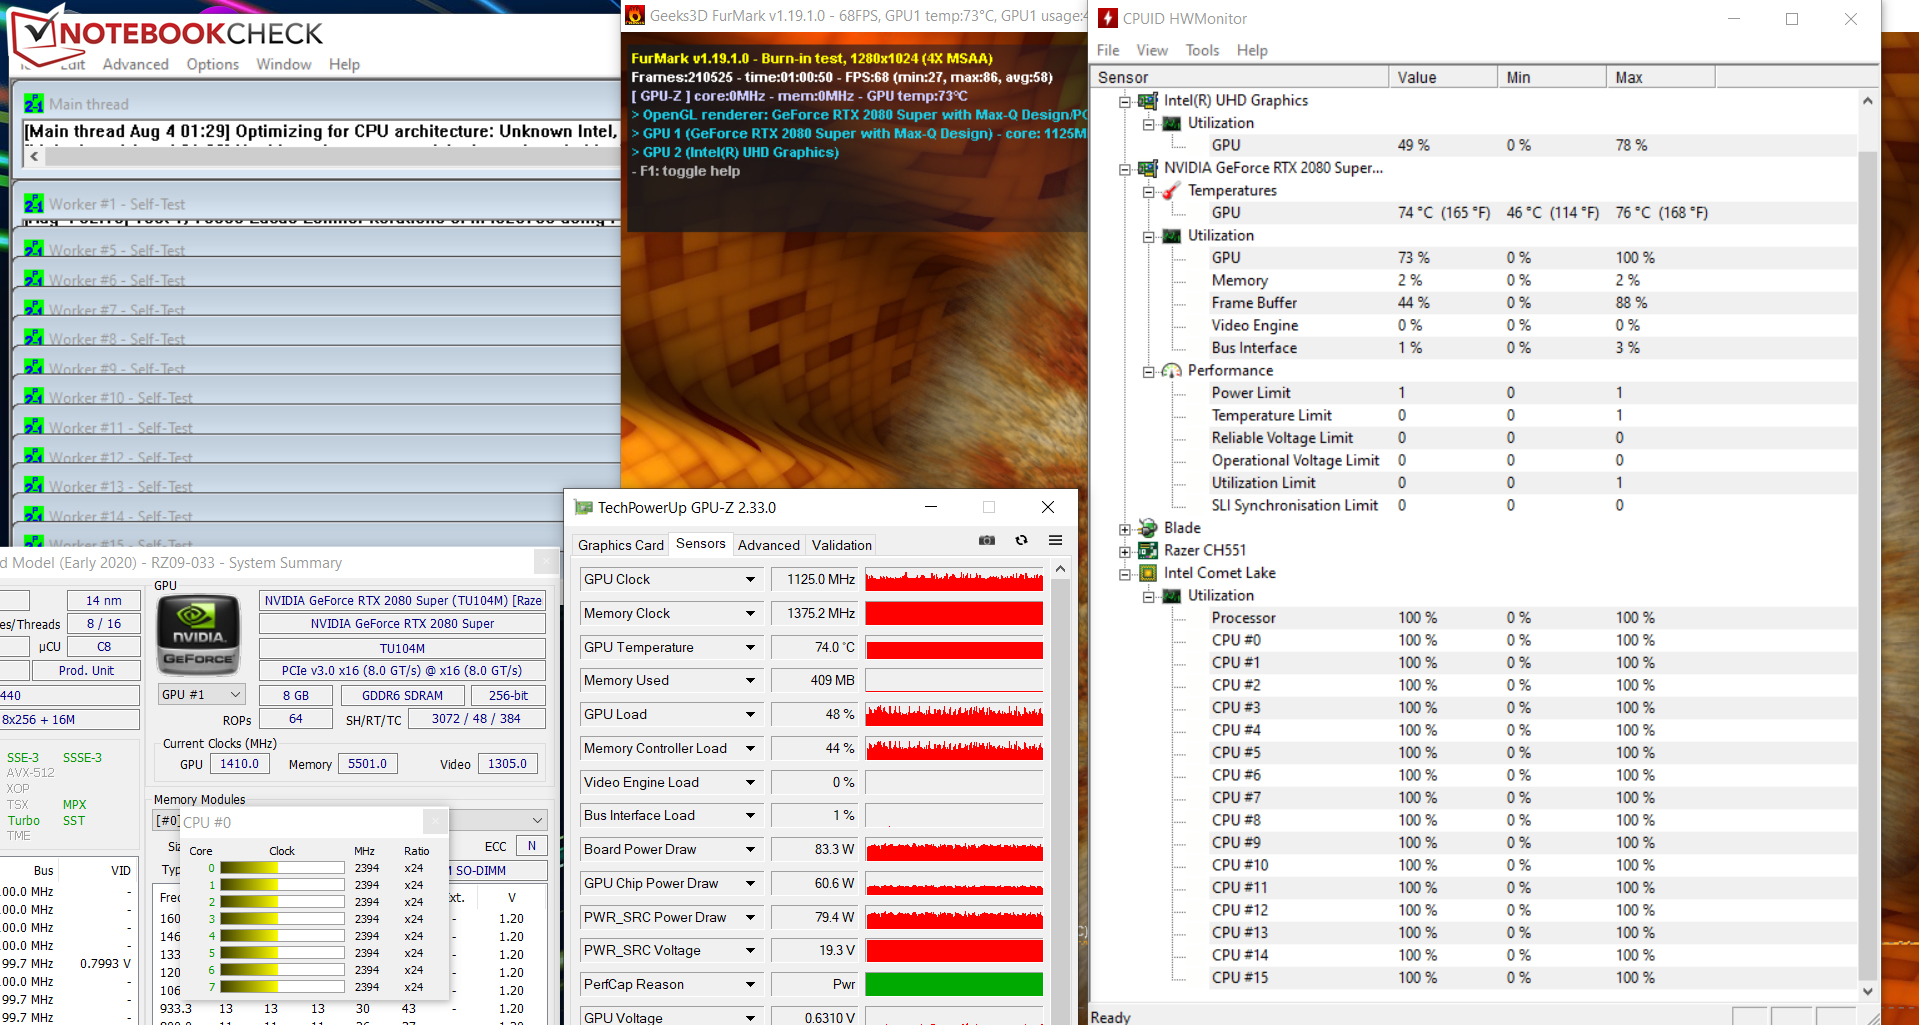
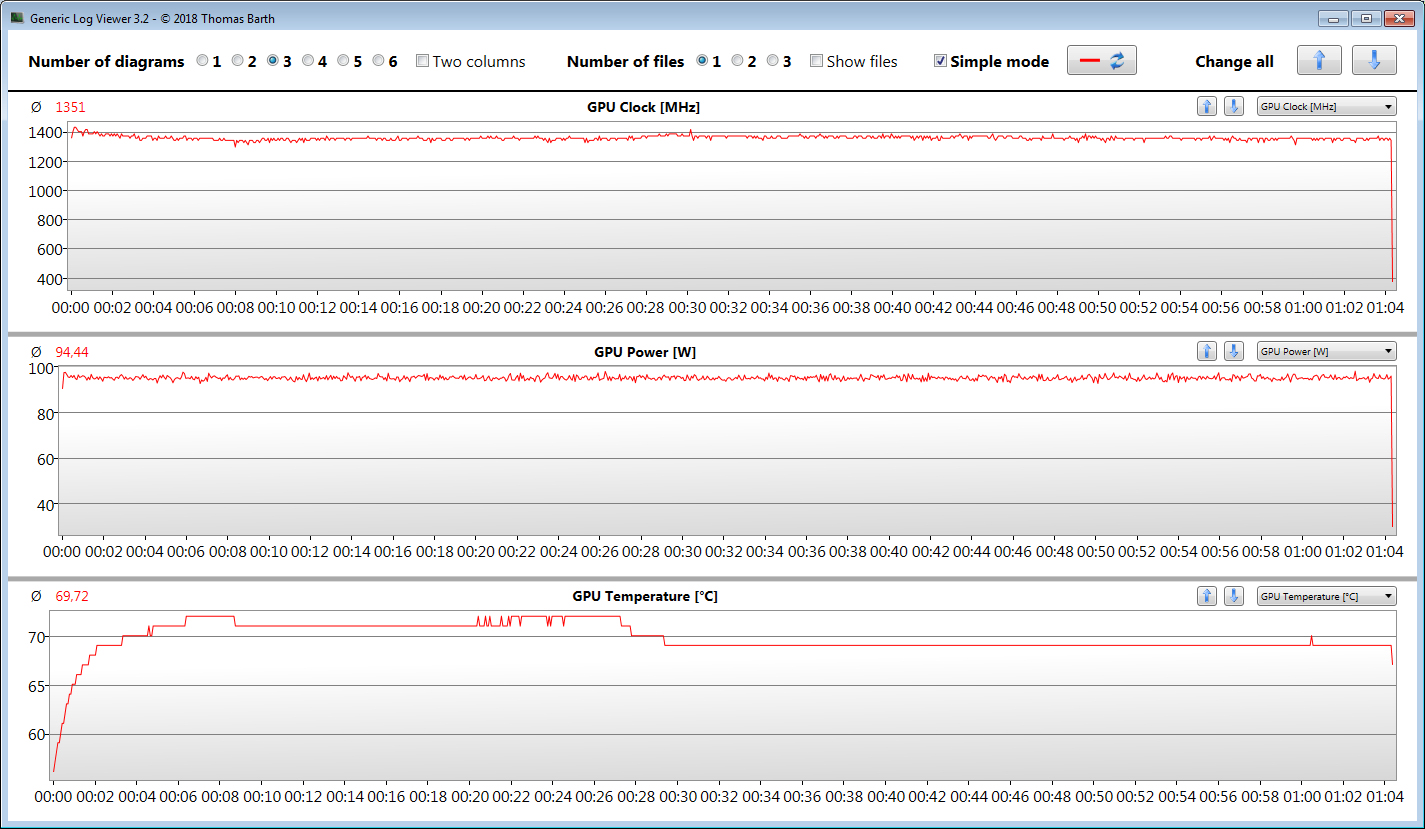
Our stress test (Prime95 and FurMark run for at least an hour) is run by the CPU at 2.1 to 2.4 GHz. The GPU clock speed drops from about 1,500-1,700 MHz to 1,100-1,200 MHz during the test. Furthermore, the speeds are 800 to 2,100 MHz (CPU) and 300 MHz (GPU), respectively, on battery power. The stress test represents an extreme scenario that doesn't occur in everyday life. We use this test to check if the system remains stable even under full load.
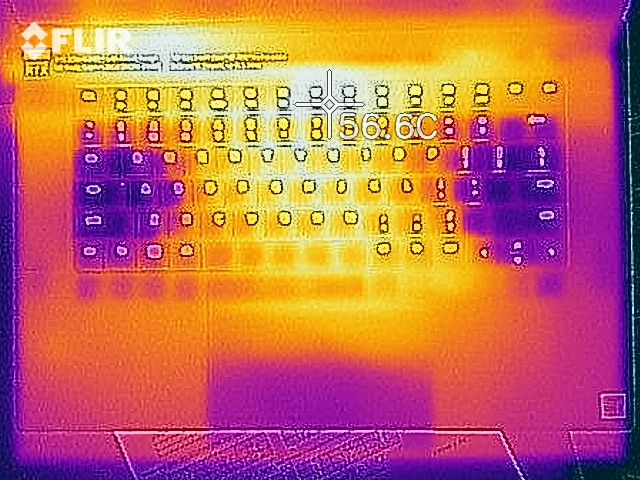
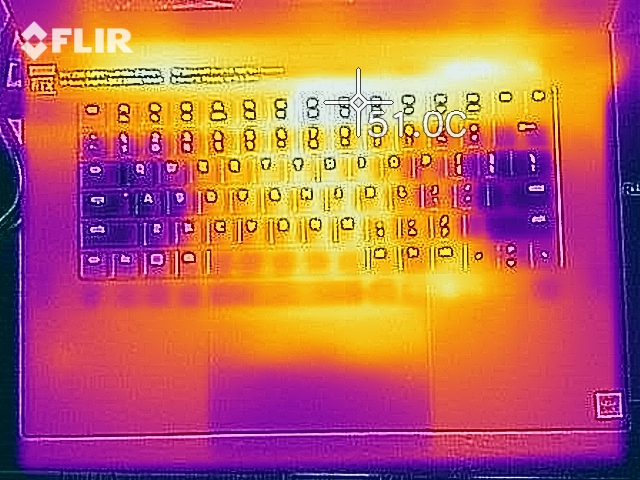
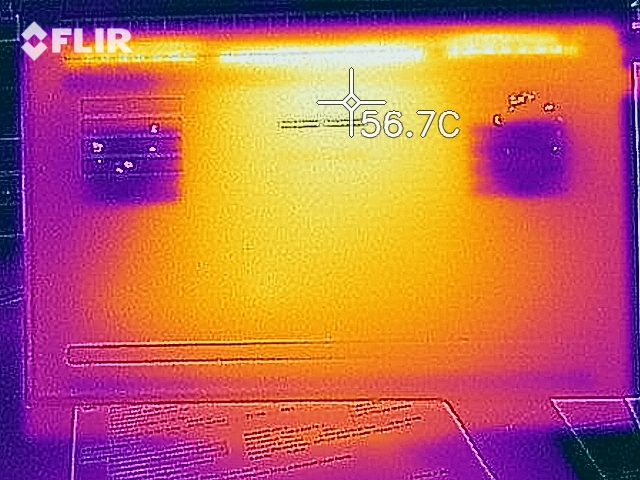
The Blade Advanced heats up noticeably but not excessively. During the stress test, we register temperatures above 50 °C (~122 °F) at two measuring points. Furthermore, heat development is less when performing our The Witcher 3 test. The temperatures are in the green range in everyday use.
(-) The maximum temperature on the upper side is 52 °C / 126 F, compared to the average of 40.4 °C / 105 F, ranging from 21.2 to 68.8 °C for the class Gaming.
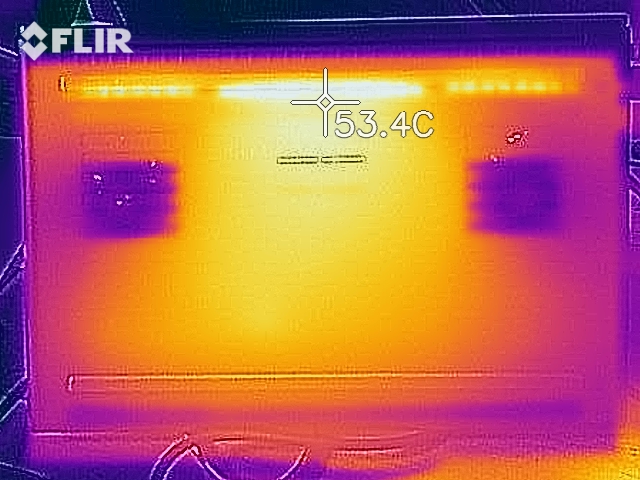
(-) The bottom heats up to a maximum of 53 °C / 127 F, compared to the average of 43.2 °C / 110 F
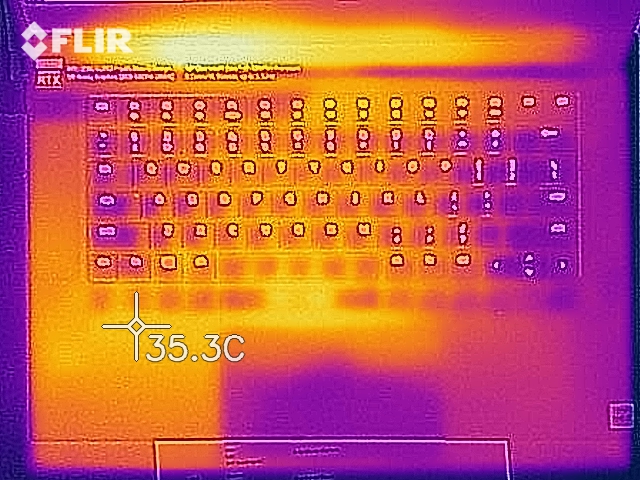
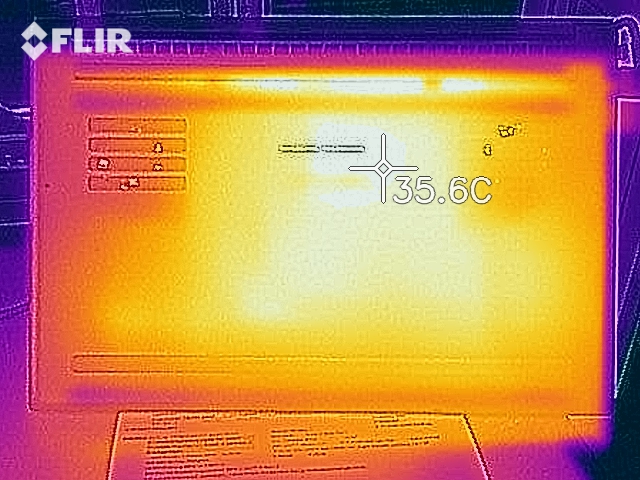
(+) In idle usage, the average temperature for the upper side is 28.3 °C / 83 F, compared to the device average of 33.9 °C / 93 F.
(-) Playing The Witcher 3, the average temperature for the upper side is 39.9 °C / 104 F, compared to the device average of 33.9 °C / 93 F.
(-) The palmrests and touchpad can get very hot to the touch with a maximum of 41.2 °C / 106.2 F.
(-) The average temperature of the palmrest area of similar devices was 28.8 °C / 83.8 F (-12.4 °C / -22.4 F).
| Razer Blade 15 RTX 2080 Super Max-Q i7-10875H, GeForce RTX 2080 Super Max-Q | Razer Blade 15 RTX 2080 Max-Q i7-9750H, GeForce RTX 2080 Max-Q | Asus Zephyrus S GX531GX i7-8750H, GeForce RTX 2080 Max-Q | Gigabyte Aero 15 OLED XB-8DE51B0SP i7-10875H, GeForce RTX 2070 Super Max-Q | MSI GE66 Raider 10SFS i9-10980HK, GeForce RTX 2070 Super Mobile | Schenker XMG Neo 15 XNE15M19 i7-9750H, GeForce RTX 2070 Max-Q | Average NVIDIA GeForce RTX 2080 Super Max-Q | Average of class Gaming | |
|---|---|---|---|---|---|---|---|---|
| Heat | 4% | 3% | 1% | -2% | -12% | 1% | 1% | |
| Maximum Upper Side * (°C) | 52 | 47 10% | 47 10% | 49 6% | 49 6% | 60 -15% | 47.9 ? 8% | 45.2 ? 13% |
| Maximum Bottom * (°C) | 53 | 49.2 7% | 48.6 8% | 61 -15% | 52 2% | 66 -25% | 51.9 ? 2% | 48 ? 9% |
| Idle Upper Side * (°C) | 29.3 | 28.6 2% | 28.8 2% | 27 8% | 30 -2% | 30 -2% | 30 ? -2% | 31.1 ? -6% |
| Idle Bottom * (°C) | 30.2 | 31.4 -4% | 33.2 -10% | 29 4% | 34 -13% | 32 -6% | 31 ? -3% | 34.2 ? -13% |
* ... smaller is better
Speakers
Razer Blade 15 RTX 2080 Super Max-Q audio analysis
(±) | speaker loudness is average but good (74.9 dB)
Bass 100 - 315 Hz
(-) | nearly no bass - on average 15.1% lower than median
(±) | linearity of bass is average (10.9% delta to prev. frequency)
Mids 400 - 2000 Hz
(±) | higher mids - on average 7.2% higher than median
(+) | mids are linear (6.9% delta to prev. frequency)
Highs 2 - 16 kHz
(+) | balanced highs - only 2.4% away from median
(+) | highs are linear (5.1% delta to prev. frequency)
Overall 100 - 16.000 Hz
(±) | linearity of overall sound is average (19.5% difference to median)
Compared to same class
» 67% of all tested devices in this class were better, 7% similar, 26% worse
» The best had a delta of 6%, average was 18%, worst was 132%
Compared to all devices tested
» 48% of all tested devices were better, 7% similar, 44% worse
» The best had a delta of 4%, average was 24%, worst was 134%
Energy management - Blade Advanced with decent battery life
Energy consumption
We register a maximum power consumption of 15.8 watts in idle usage. The stress test and our The Witcher 3 test, respectively, let the demand increase to up to 169 watts and 146 watts on average (141 to 151 watts). The power adapter's rated output is 230 watts.
| Off / Standby | |
| Idle | |
| Load |
|
Key:
min: | |
| Razer Blade 15 RTX 2080 Super Max-Q i7-10875H, GeForce RTX 2080 Super Max-Q | Razer Blade 15 RTX 2080 Max-Q i7-9750H, GeForce RTX 2080 Max-Q | Asus Zephyrus S GX531GX i7-8750H, GeForce RTX 2080 Max-Q | Gigabyte Aero 15 OLED XB-8DE51B0SP i7-10875H, GeForce RTX 2070 Super Max-Q | MSI GE66 Raider 10SFS i9-10980HK, GeForce RTX 2070 Super Mobile | Schenker XMG Neo 15 XNE15M19 i7-9750H, GeForce RTX 2070 Max-Q | Average NVIDIA GeForce RTX 2080 Super Max-Q | Average of class Gaming | |
|---|---|---|---|---|---|---|---|---|
| Power Consumption | -12% | -33% | -52% | -17% | -4% | -28% | -31% | |
| Idle Minimum * (Watt) | 10.6 | 12.5 -18% | 16.1 -52% | 18 -70% | 6 43% | 11 -4% | 12.9 ? -22% | 13.2 ? -25% |
| Idle Average * (Watt) | 13.1 | 15.3 -17% | 20.9 -60% | 21 -60% | 14 -7% | 15 -15% | 17.3 ? -32% | 18.9 ? -44% |
| Idle Maximum * (Watt) | 15.8 | 20.7 -31% | 27 -71% | 38 -141% | 25 -58% | 21 -33% | 26.9 ? -70% | 24.3 ? -54% |
| Load Average * (Watt) | 131 | 90.2 31% | 93.4 29% | 113 14% | 108 18% | 94 28% | 123.9 ? 5% | 108 ? 18% |
| Witcher 3 ultra * (Watt) | 146 | 162 -11% | 168.2 -15% | 149 -2% | 195 -34% | 143 2% | ||
| Load Maximum * (Watt) | 169 | 209.3 -24% | 215.3 -27% | 256 -51% | 280 -66% | 173 -2% | 205 ? -21% | 254 ? -50% |
* ... smaller is better
Battery life
The gaming laptop achieves a runtime of 6:06 h in our practical WLAN test (accessing websites using a script). Furthermore, the 15.6-incher completes our video test after 7:17 h. We let the short film Big Buck Bunny (H.264 encoding, 1920x1080 pixels) run in a continuous loop here. Test conditions: The energy-saving functions and the wireless modules (only during the video test) are deactivated; the display brightness is regulated to about 150 cd/m².
| Razer Blade 15 RTX 2080 Super Max-Q i7-10875H, GeForce RTX 2080 Super Max-Q, 80 Wh | Razer Blade 15 RTX 2080 Max-Q i7-9750H, GeForce RTX 2080 Max-Q, 80 Wh | Asus Zephyrus S GX531GX i7-8750H, GeForce RTX 2080 Max-Q, 50 Wh | Gigabyte Aero 15 OLED XB-8DE51B0SP i7-10875H, GeForce RTX 2070 Super Max-Q, 94.2 Wh | MSI GE66 Raider 10SFS i9-10980HK, GeForce RTX 2070 Super Mobile, 99.99 Wh | Schenker XMG Neo 15 XNE15M19 i7-9750H, GeForce RTX 2070 Max-Q, 62 Wh | Razer Blade 15 RZ09-0328 i7-10750H, GeForce RTX 2070 Max-Q, 65 Wh | Average of class Gaming | |
|---|---|---|---|---|---|---|---|---|
| Battery runtime | 27% | -51% | 15% | -6% | -18% | -34% | 1% | |
| Reader / Idle (h) | 8.7 | 15.9 83% | 8.6 -1% | 7.6 -13% | 7.3 -16% | 8.71 ? 0% | ||
| H.264 (h) | 7.3 | 8.26 ? 13% | ||||||
| WiFi v1.3 (h) | 6.1 | 6.6 8% | 3 -51% | 6.1 0% | 6.1 0% | 5.7 -7% | 4 -34% | 7.02 ? 15% |
| Load (h) | 1.9 | 1.7 -11% | 2.8 47% | 1.8 -5% | 1.3 -32% | 1.47 ? -23% |
Pros
Cons
Verdict
Razer packs a lot of computing power into a classy, slim metal case. Thanks to the Core i7-10875H processor and the GeForce RTX 2080 Super Max-Q GPU, the laptop can handle all the latest games. No compromises have to be made in terms of quality settings. Should the GPU at some point no longer meet your requirements, an external GPU could be connected via the Thunderbolt 3 port.
With the Blade 15 Advanced Model (2020), Razer has opted to carry out detail improvements that pay off.
The 2020 Blade 15 features USB 3.2 Gen 2 technology, and all USB Type-A ports work according to this standard. This also applies to the newly added USB Type-C port (DisplayPort, Power Delivery). The latter replaced the old Mini DisplayPort. Moreover, both the Thunderbolt 3 port as well as the USB Type-C 3.2 Gen 2 port allow you to charge the battery. We were able to trigger a charging process with a 45-watt power adapter in each case. Using the two ports to fully supply the laptop with energy isn't possible since a maximum of 100 watts of power can be transferred.
The matte 300 Hz Full HD IPS display is also one of the innovations in comparison to the predecessor model. The display scores points with stable viewing angles, sufficient brightness, good contrast, quick response times, and great color reproduction. The color-space coverage is pleasing too.
Razer Blade 15 RTX 2080 Super Max-Q
- 08/10/2020 v7 (old)
Sascha Mölck
Price comparison

