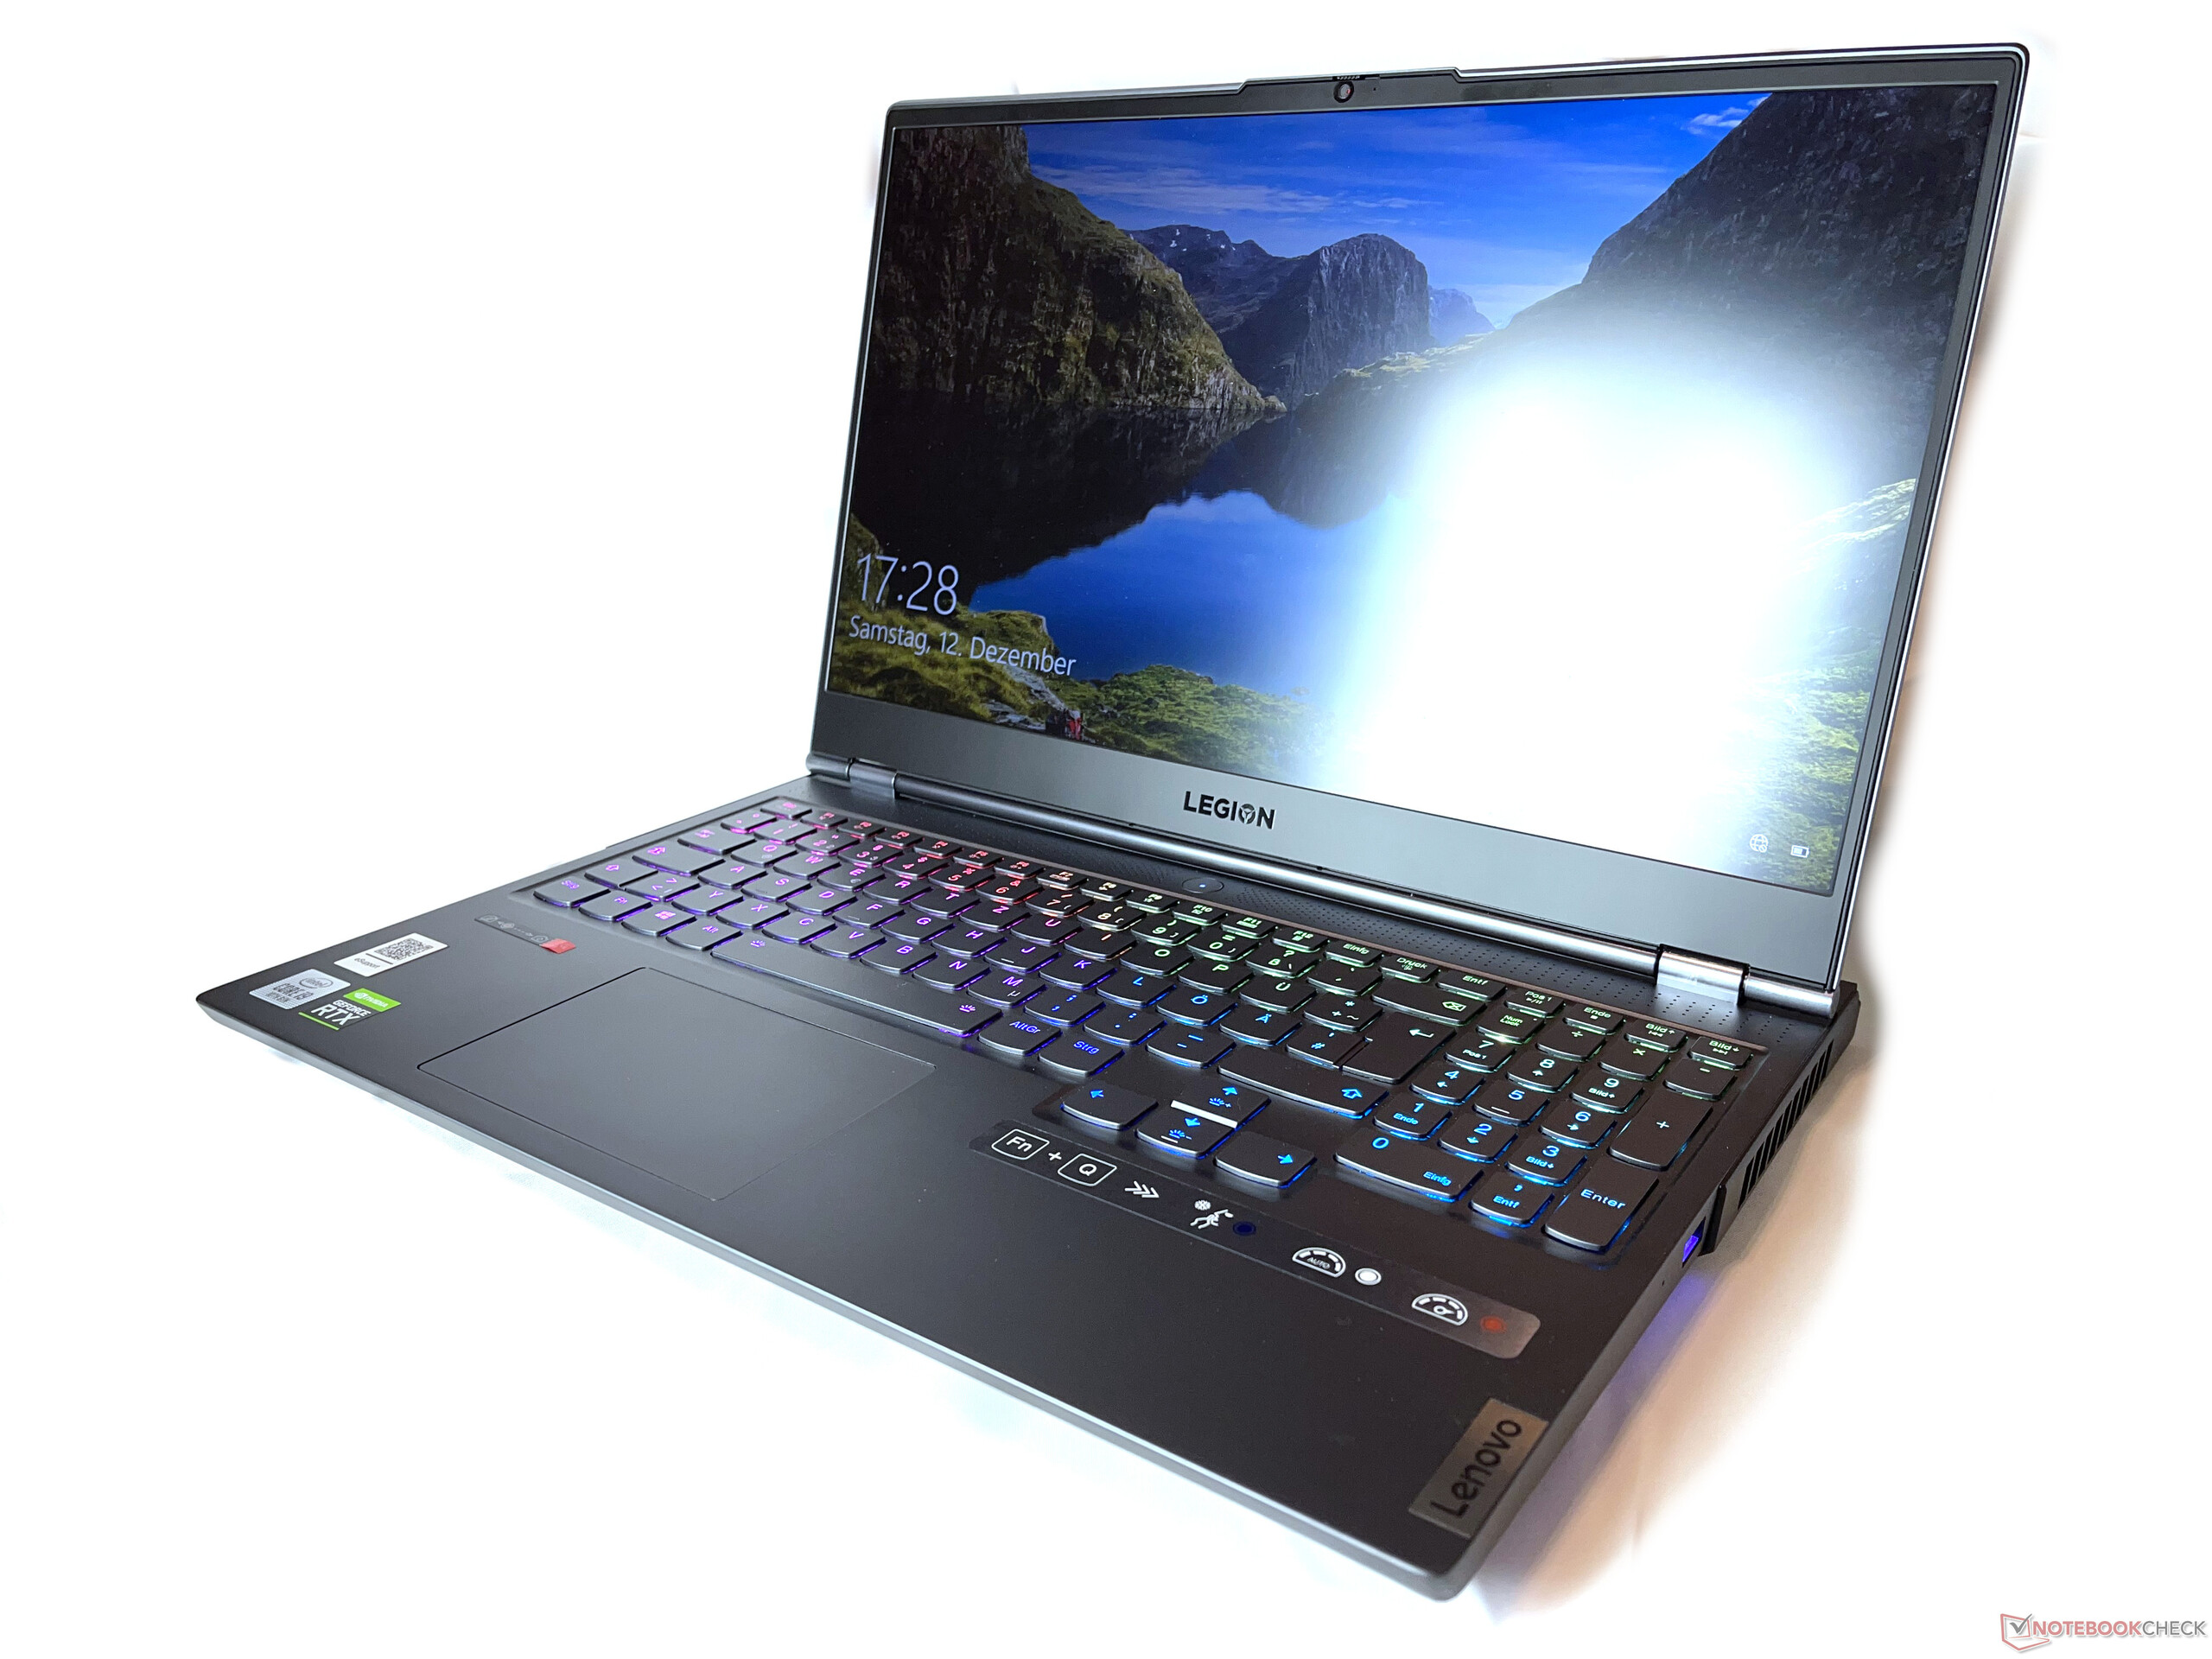
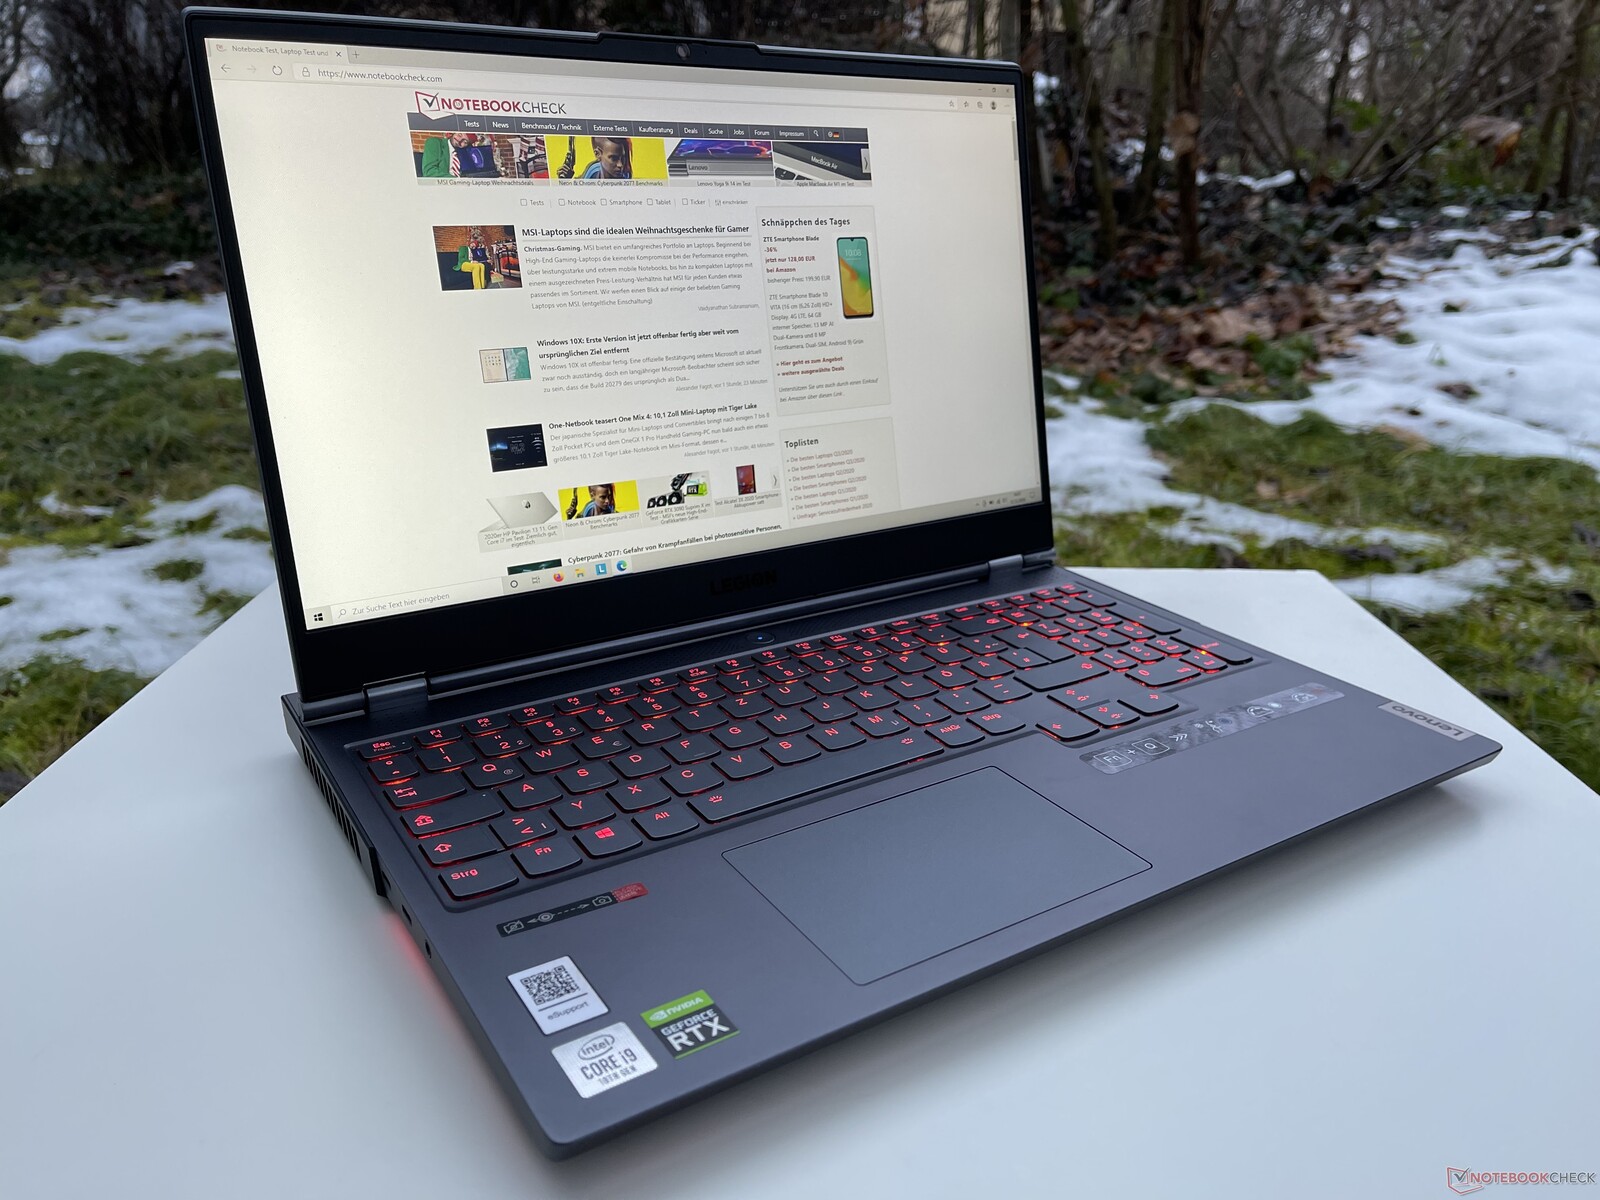
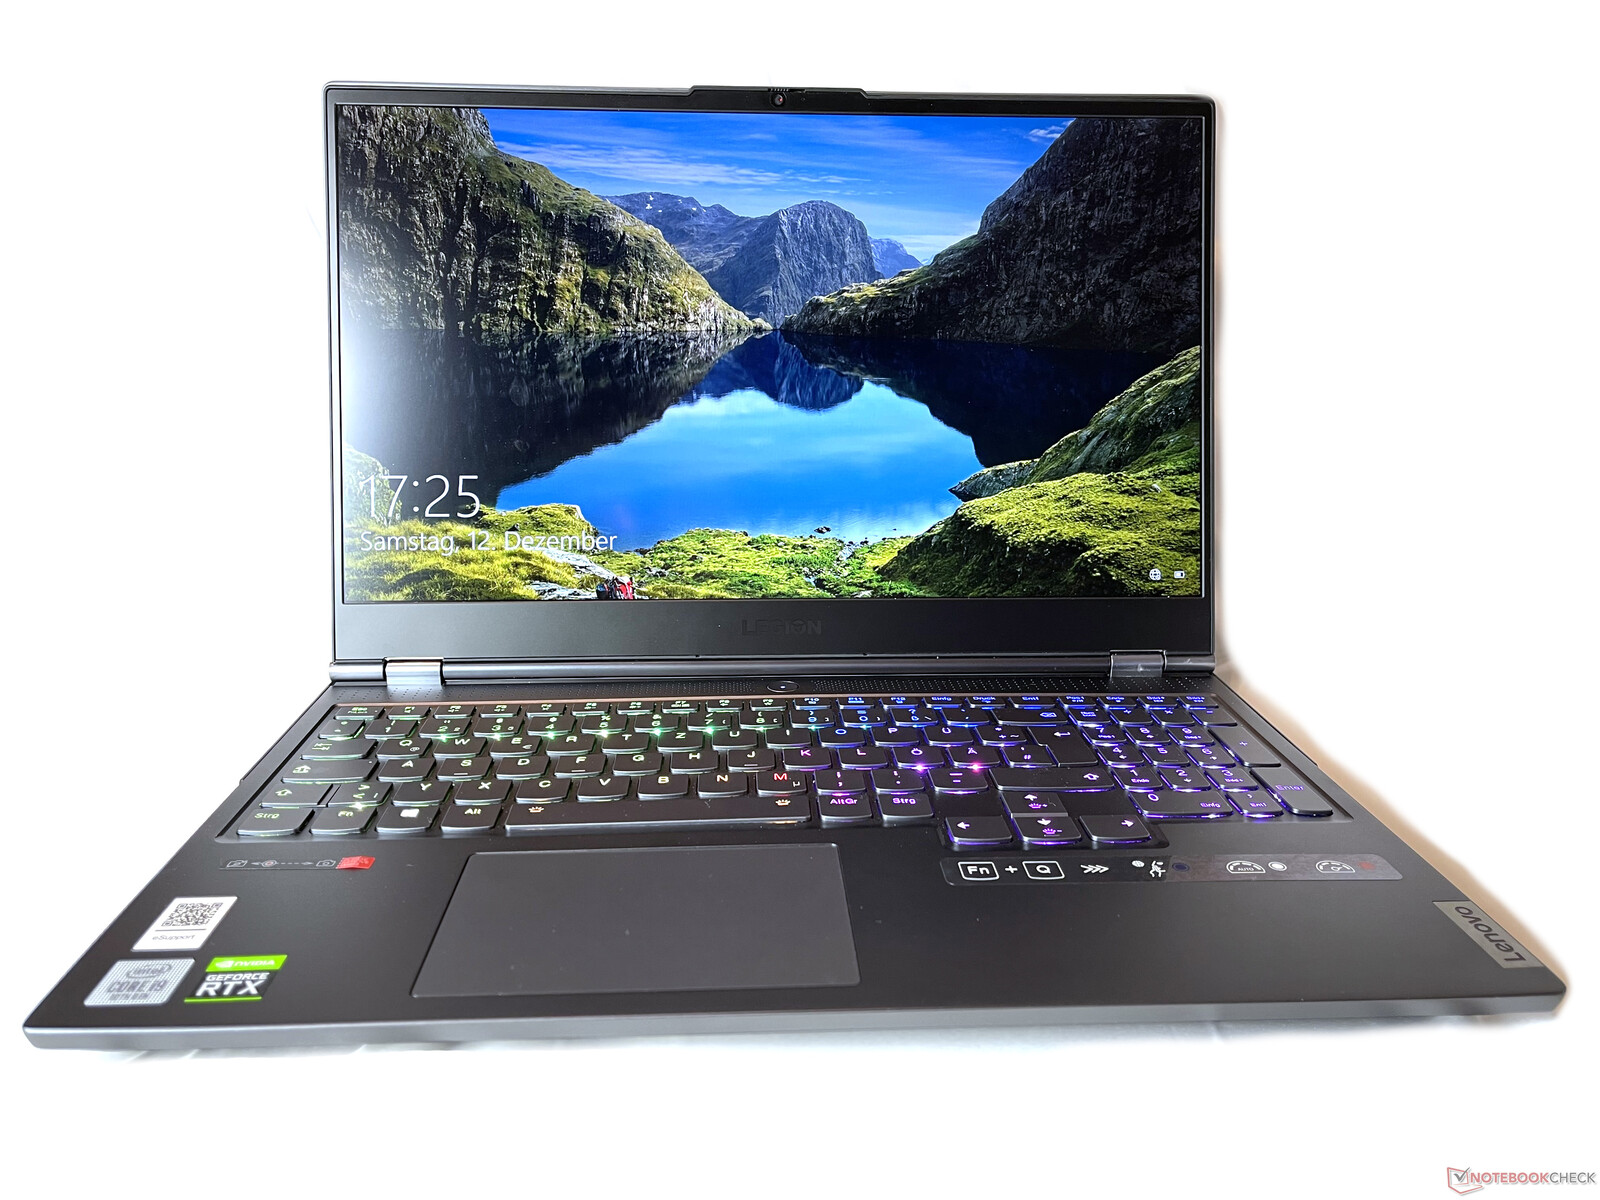
Lenovo Legion 7 15IMH05 (Legion 7i) Laptop Review: Top performance and display
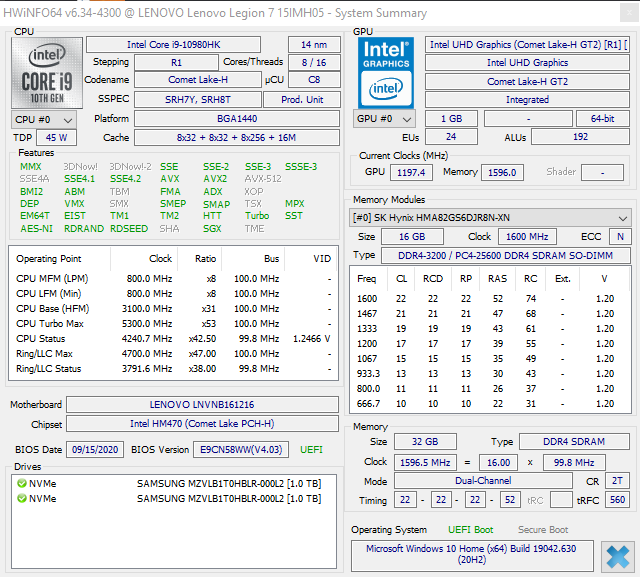
The Lenovo Legion 7 is a high-end laptop from Lenovo's most powerful product series. With configuration options such as the GeForce RTX 2080 Super, the Intel Core i9-10980HK, and the 240-Hz display, it is clearly targeted toward gamers that don't want any compromises even on the road. Our test unit represents the top model, which at a price of 3200 Euros (~$3893) offers 2 TB of RAID-0 storage space and 32 GB of RAM, in addition to the components mentioned above. Although you don't immediately think about Lenovo when mentioning a gaming laptop, the specs themselves are a challenge to the competitors. However, since the new generation of mobile graphics cards might already be introduced in January, the timing is extremely disadvantageous.
Possible Competitors for Comparison
Rating | Date | Model | Weight | Height | Size | Resolution | Price |
|---|---|---|---|---|---|---|---|
| 86.3 % v7 (old) | 12 / 2020 | Lenovo Legion 7 15IMH05-81YT001VGE i9-10980HK, GeForce RTX 2080 Super Max-Q | 2.4 kg | 19.9 mm | 15.60" | 1920x1080 | |
| 84 % v7 (old) | 05 / 2020 | MSI GS66 10SGS i7-10750H, GeForce RTX 2080 Super Max-Q | 2.2 kg | 20 mm | 15.60" | 1920x1080 | |
v (old) | 04 / 2020 | Acer Predator Triton 500 PT515-52-70N3 i7-10750H, GeForce RTX 2080 Super Max-Q | 2.1 kg | 18 mm | 15.60" | 1920x1080 | |
| 84.8 % v7 (old) | 07 / 2020 | Alienware m15 R3 P87F i7-10750H, GeForce RTX 2070 Mobile | 2.3 kg | 19.9 mm | 15.60" | 1920x1080 | |
| 84.4 % v7 (old) | 07 / 2020 | Asus ROG Strix Scar 15 G532LWS i9-10980HK, GeForce RTX 2070 Super Mobile | 2.4 kg | 24.9 mm | 15.60" | 1920x1080 | |
| 85.9 % v7 (old) | 08 / 2020 | Razer Blade 15 RTX 2080 Super Max-Q i7-10875H, GeForce RTX 2080 Super Max-Q | 2.2 kg | 17.8 mm | 15.60" | 1920x1080 |
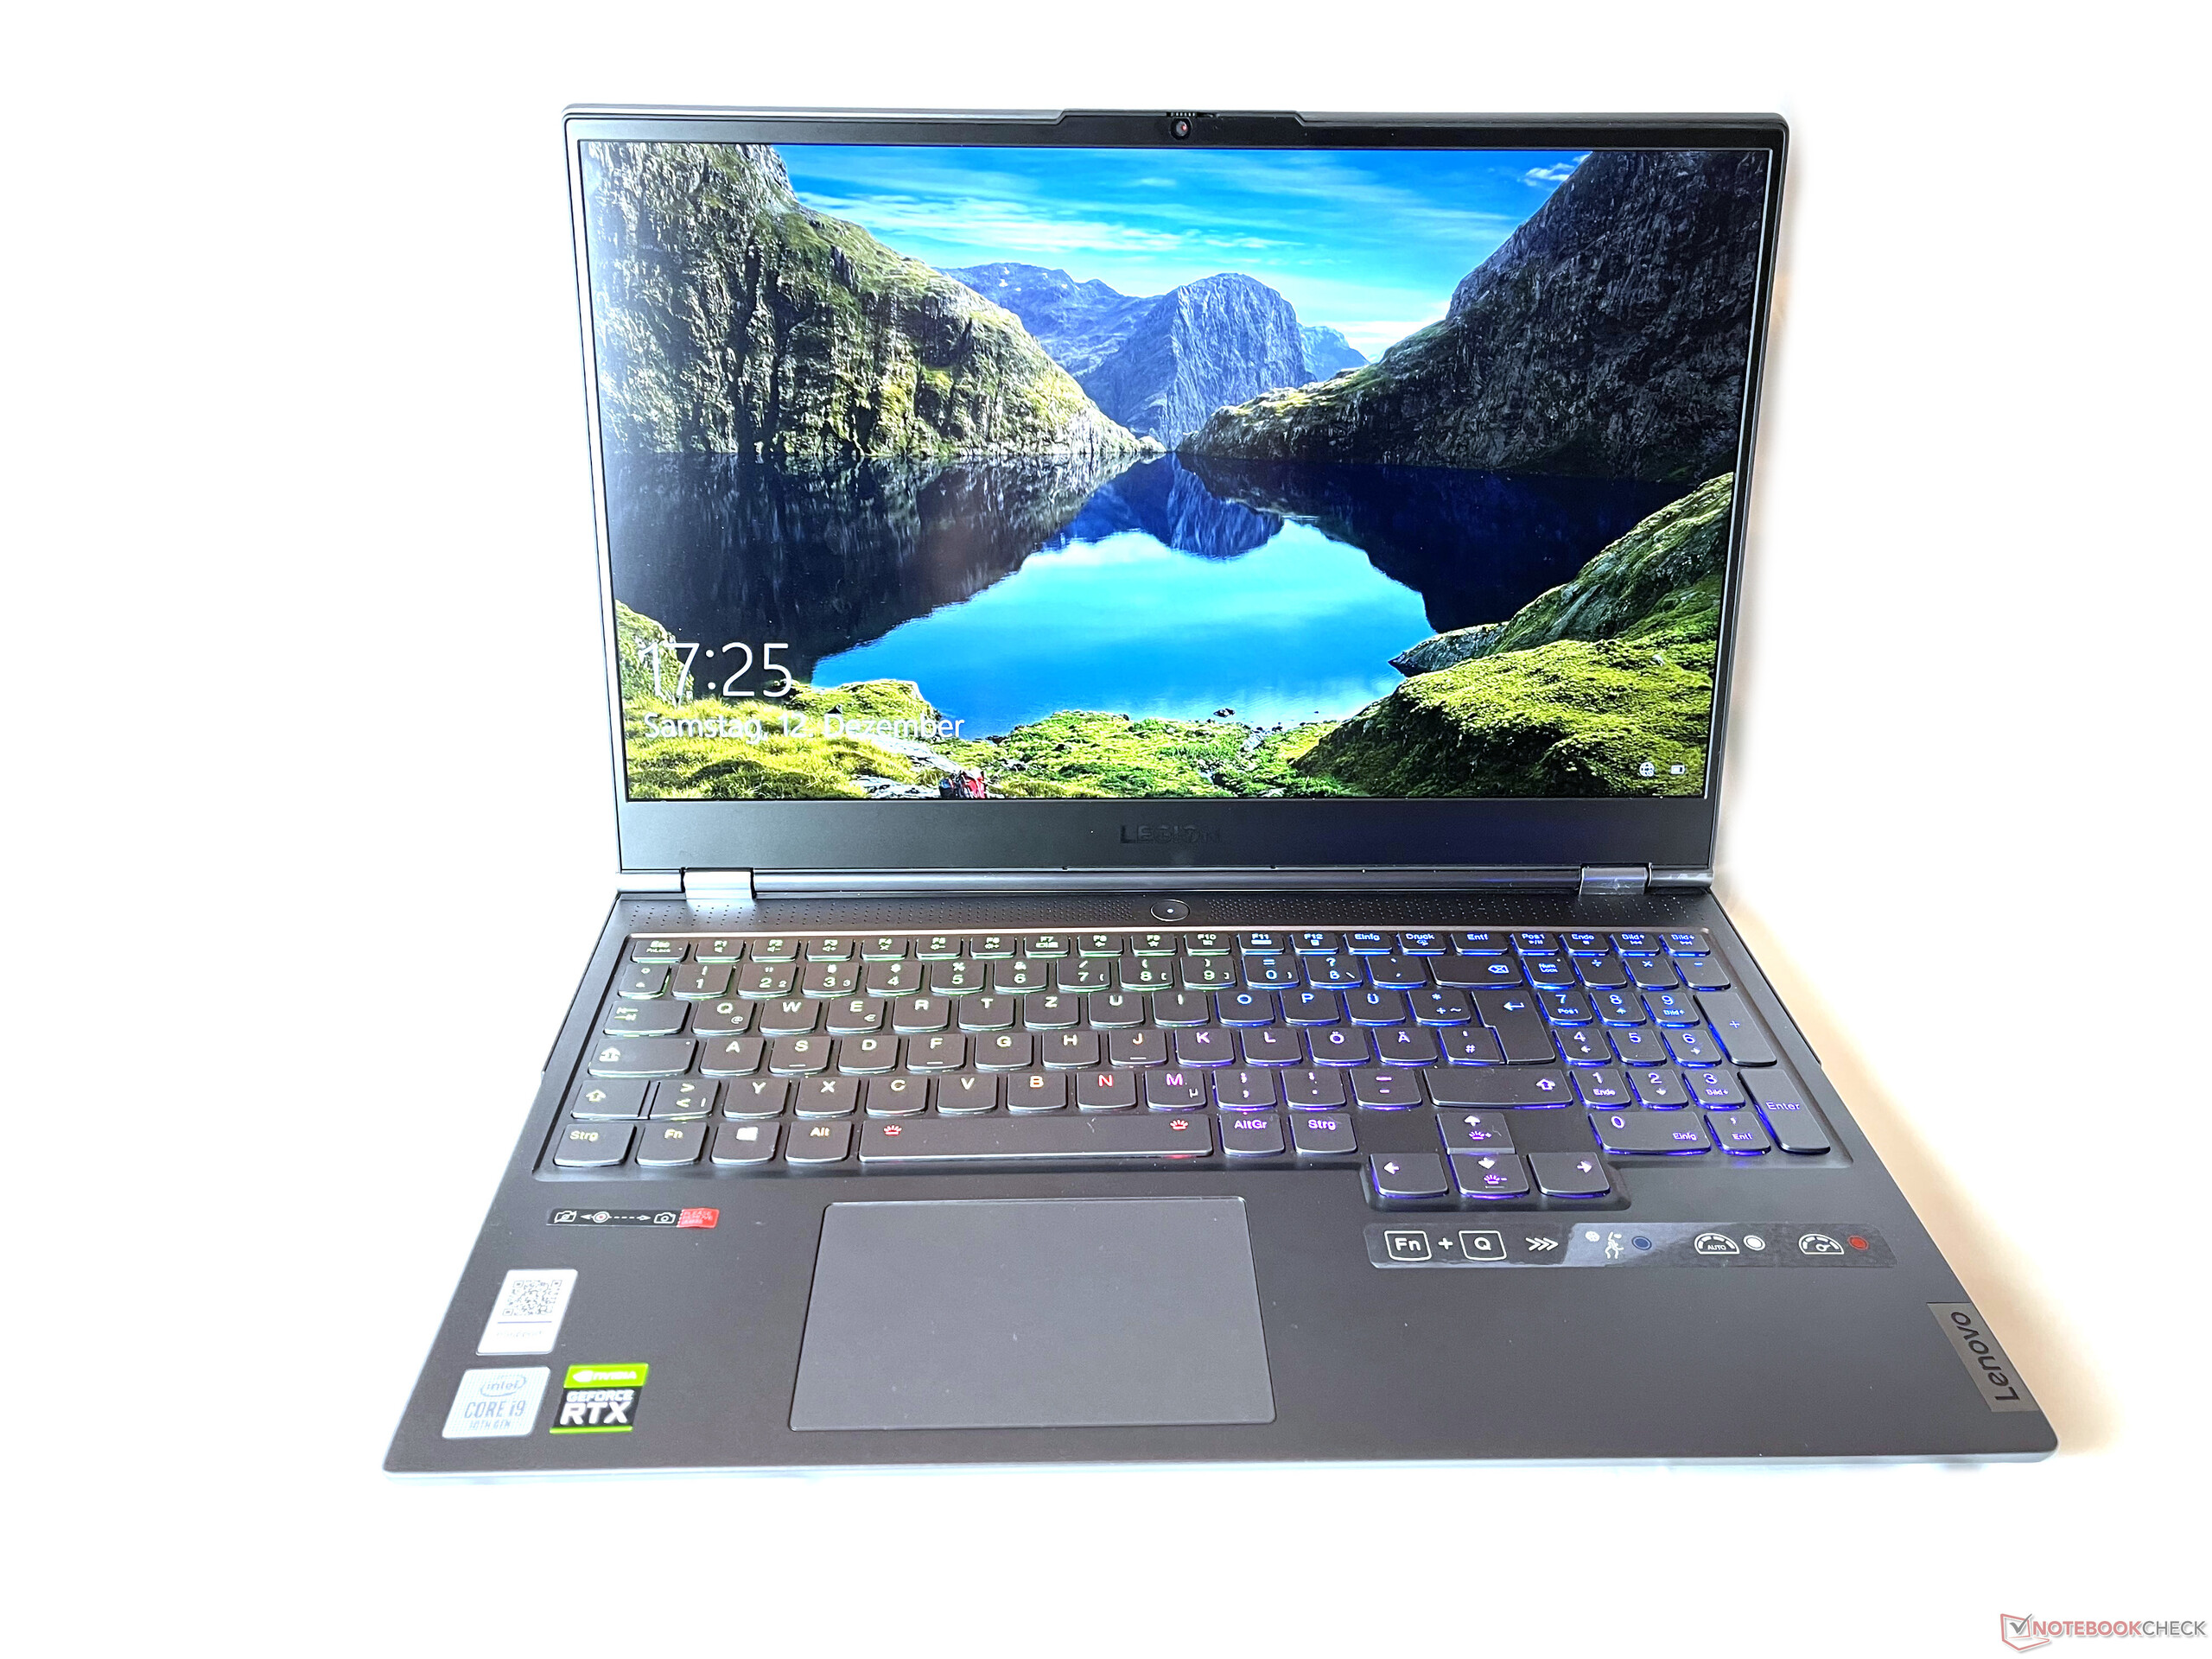
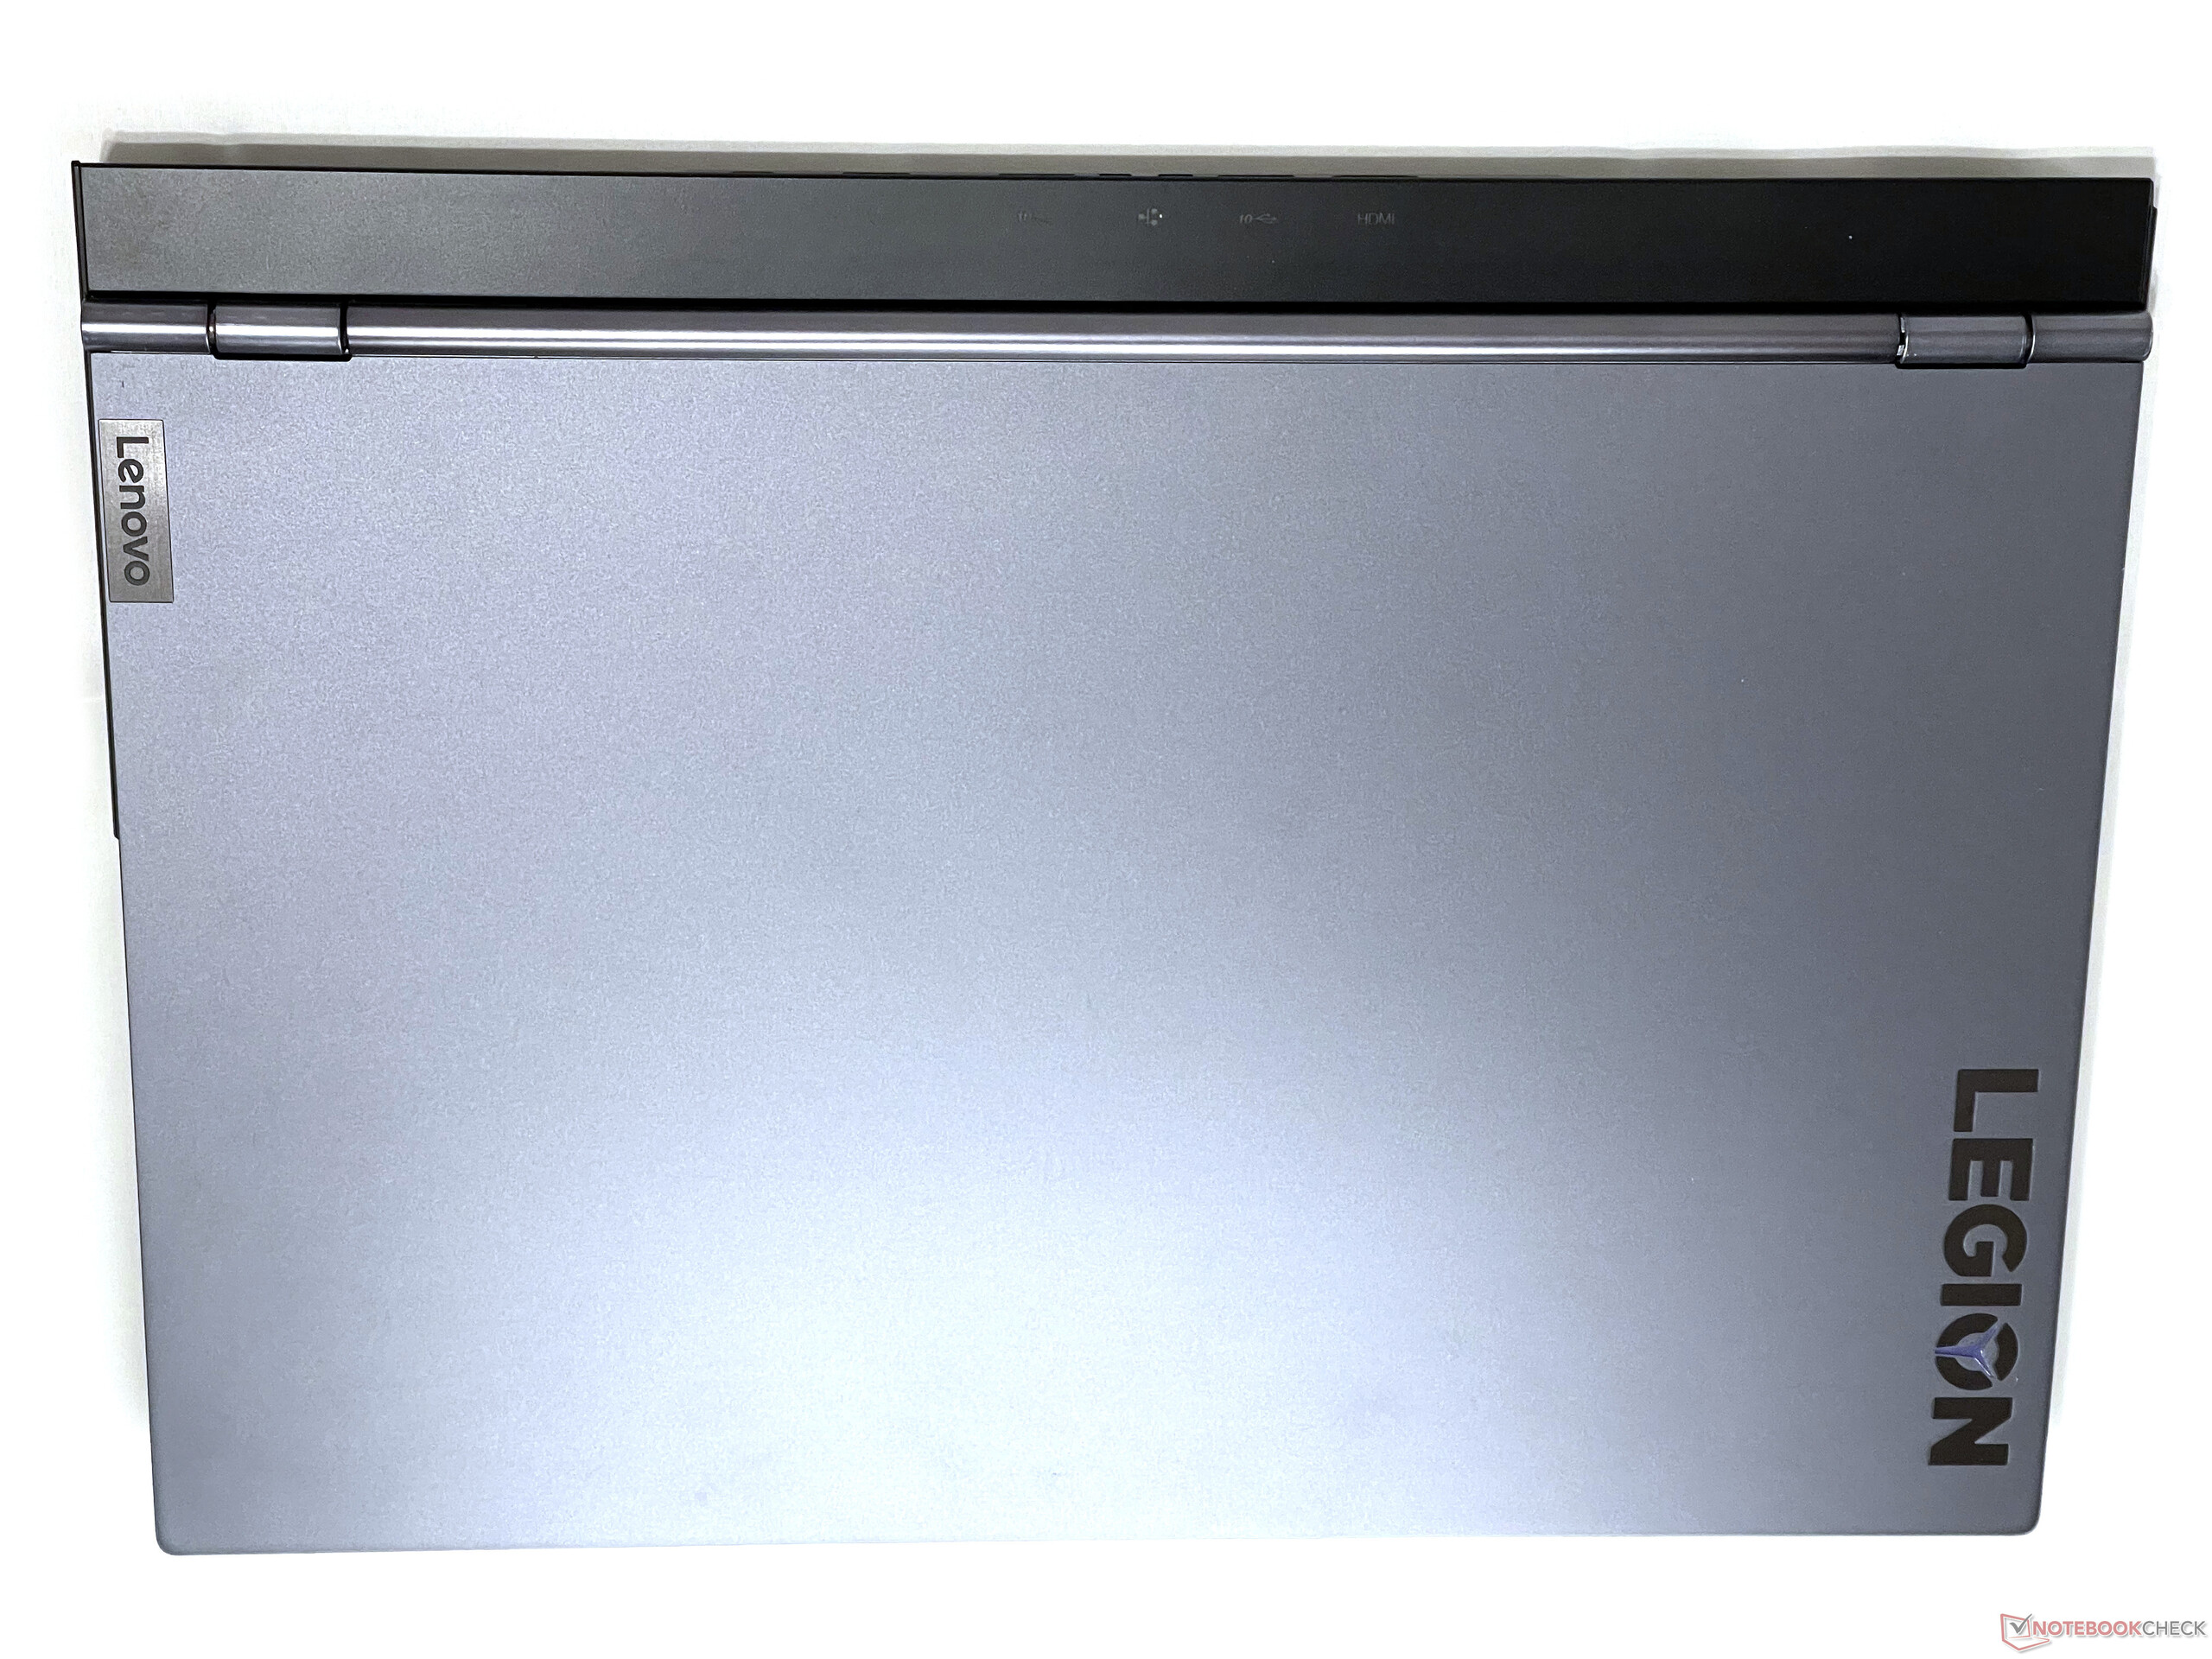
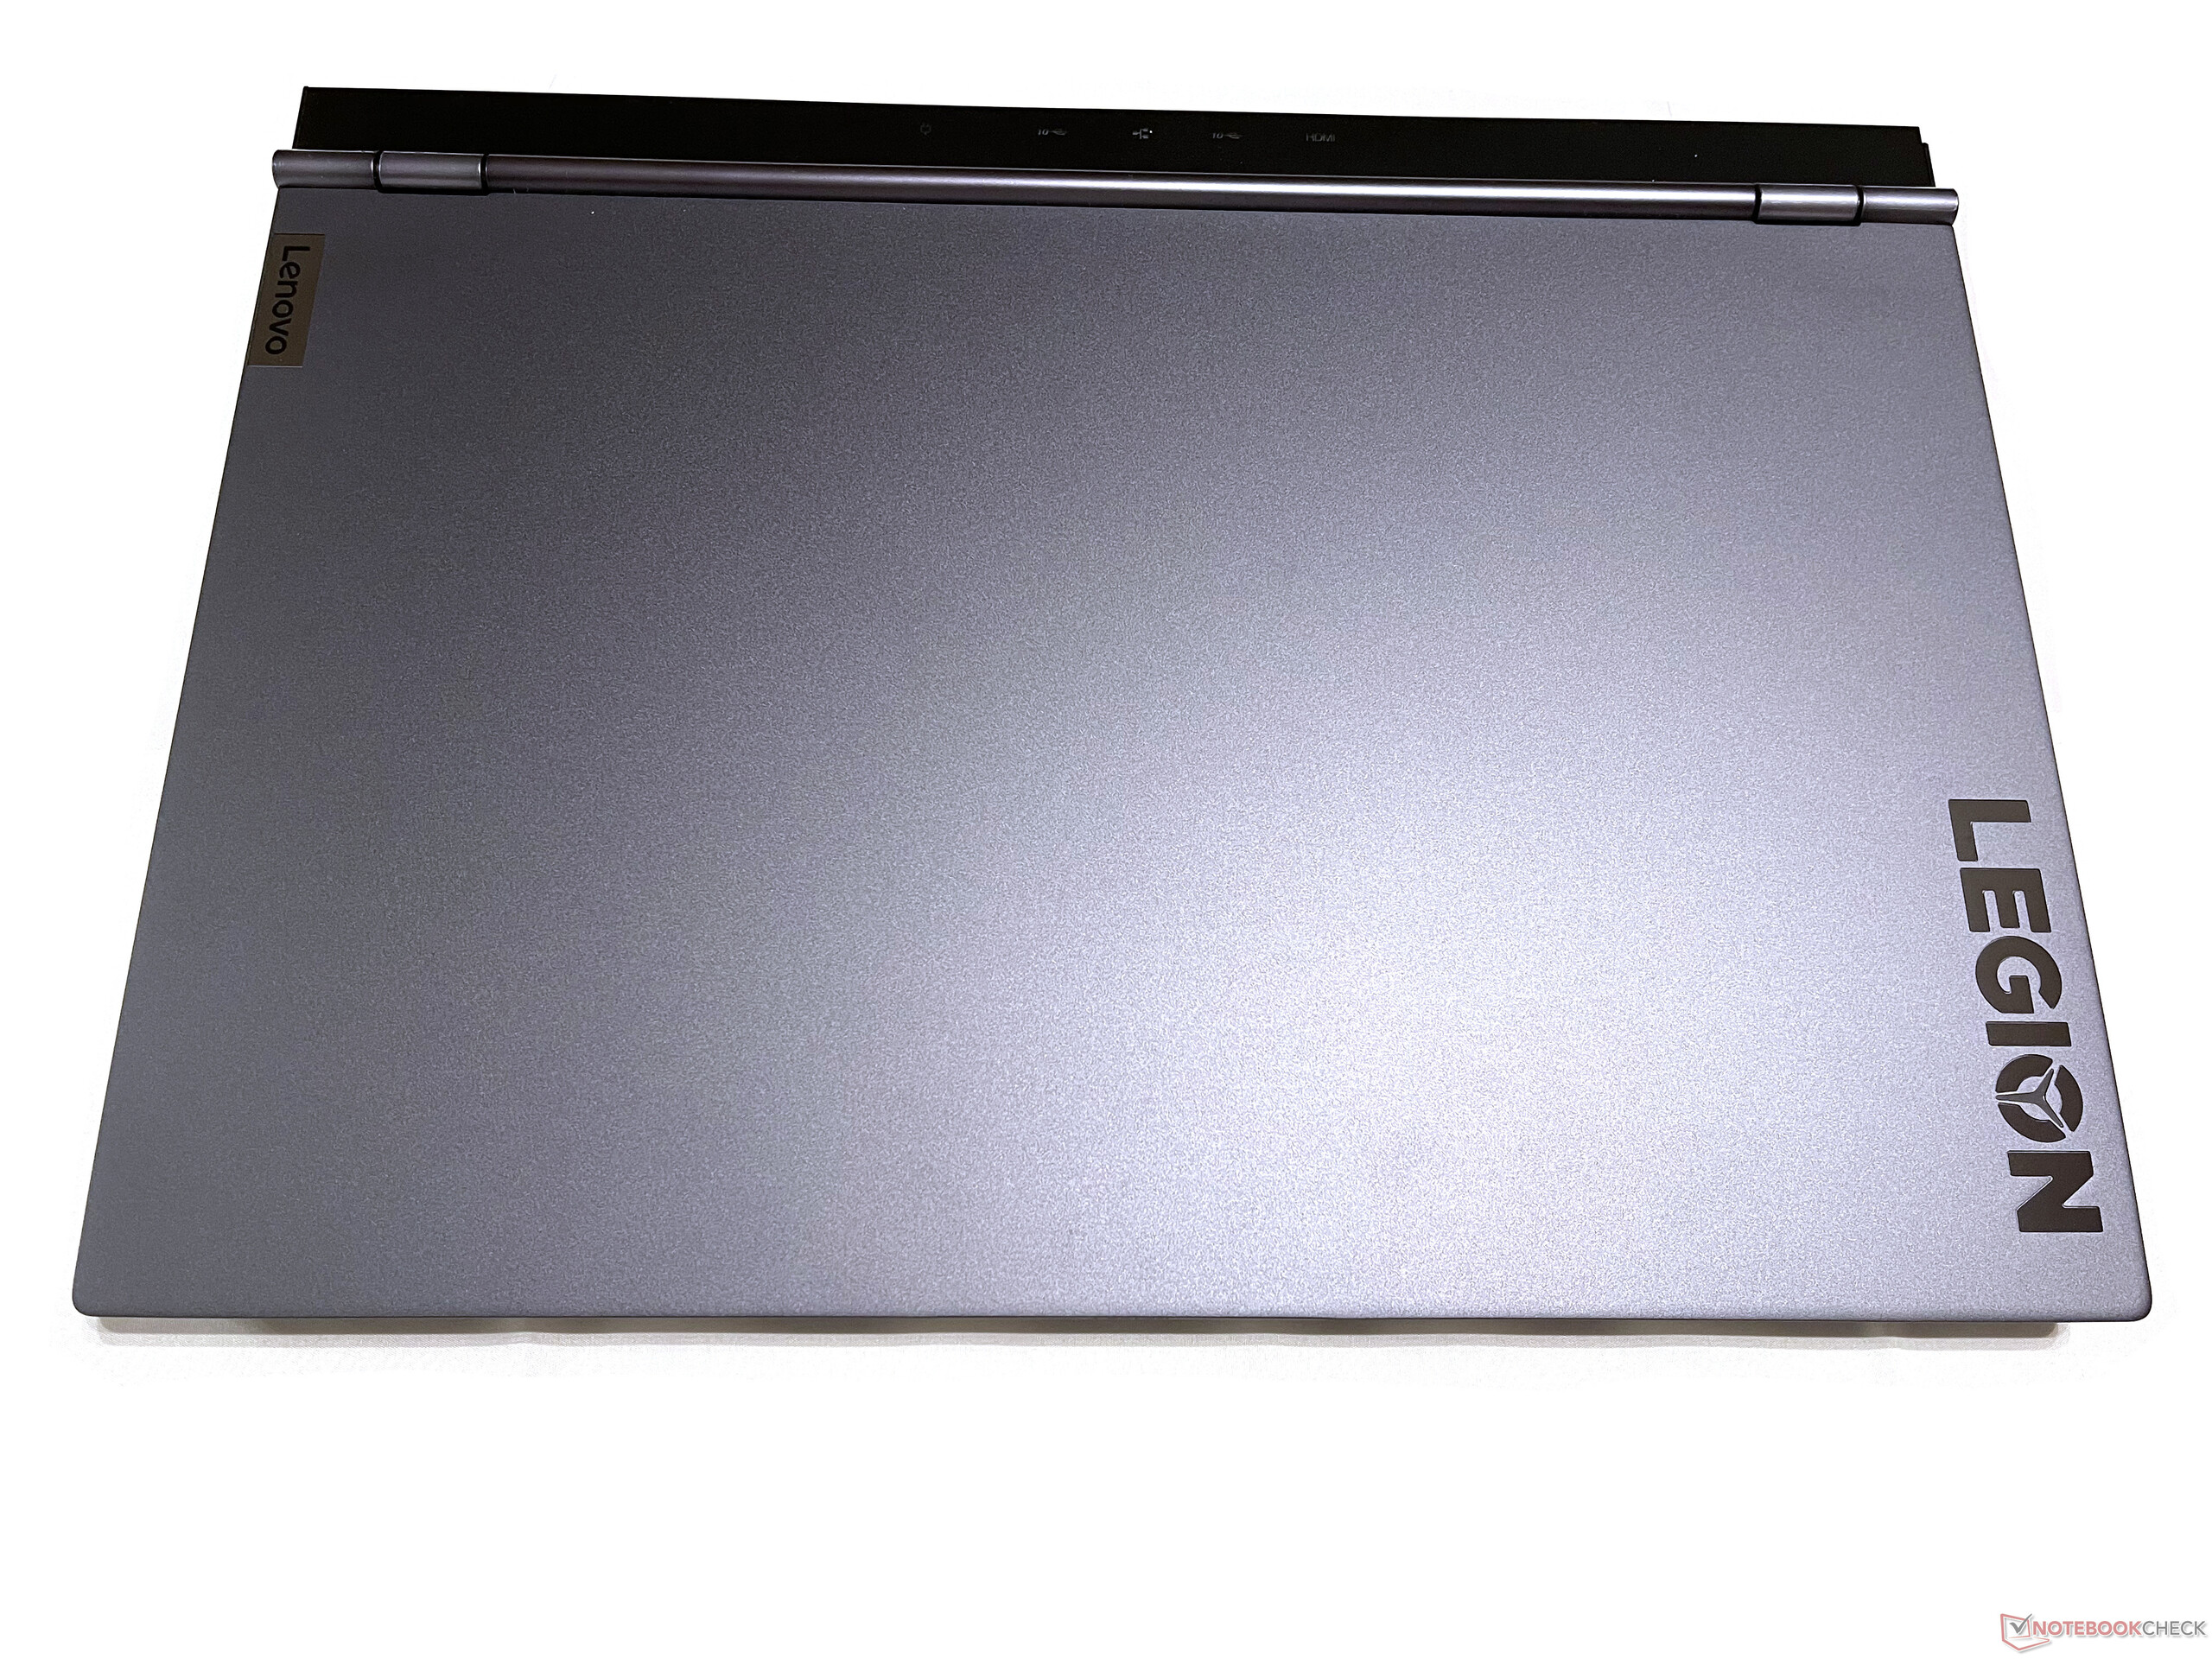
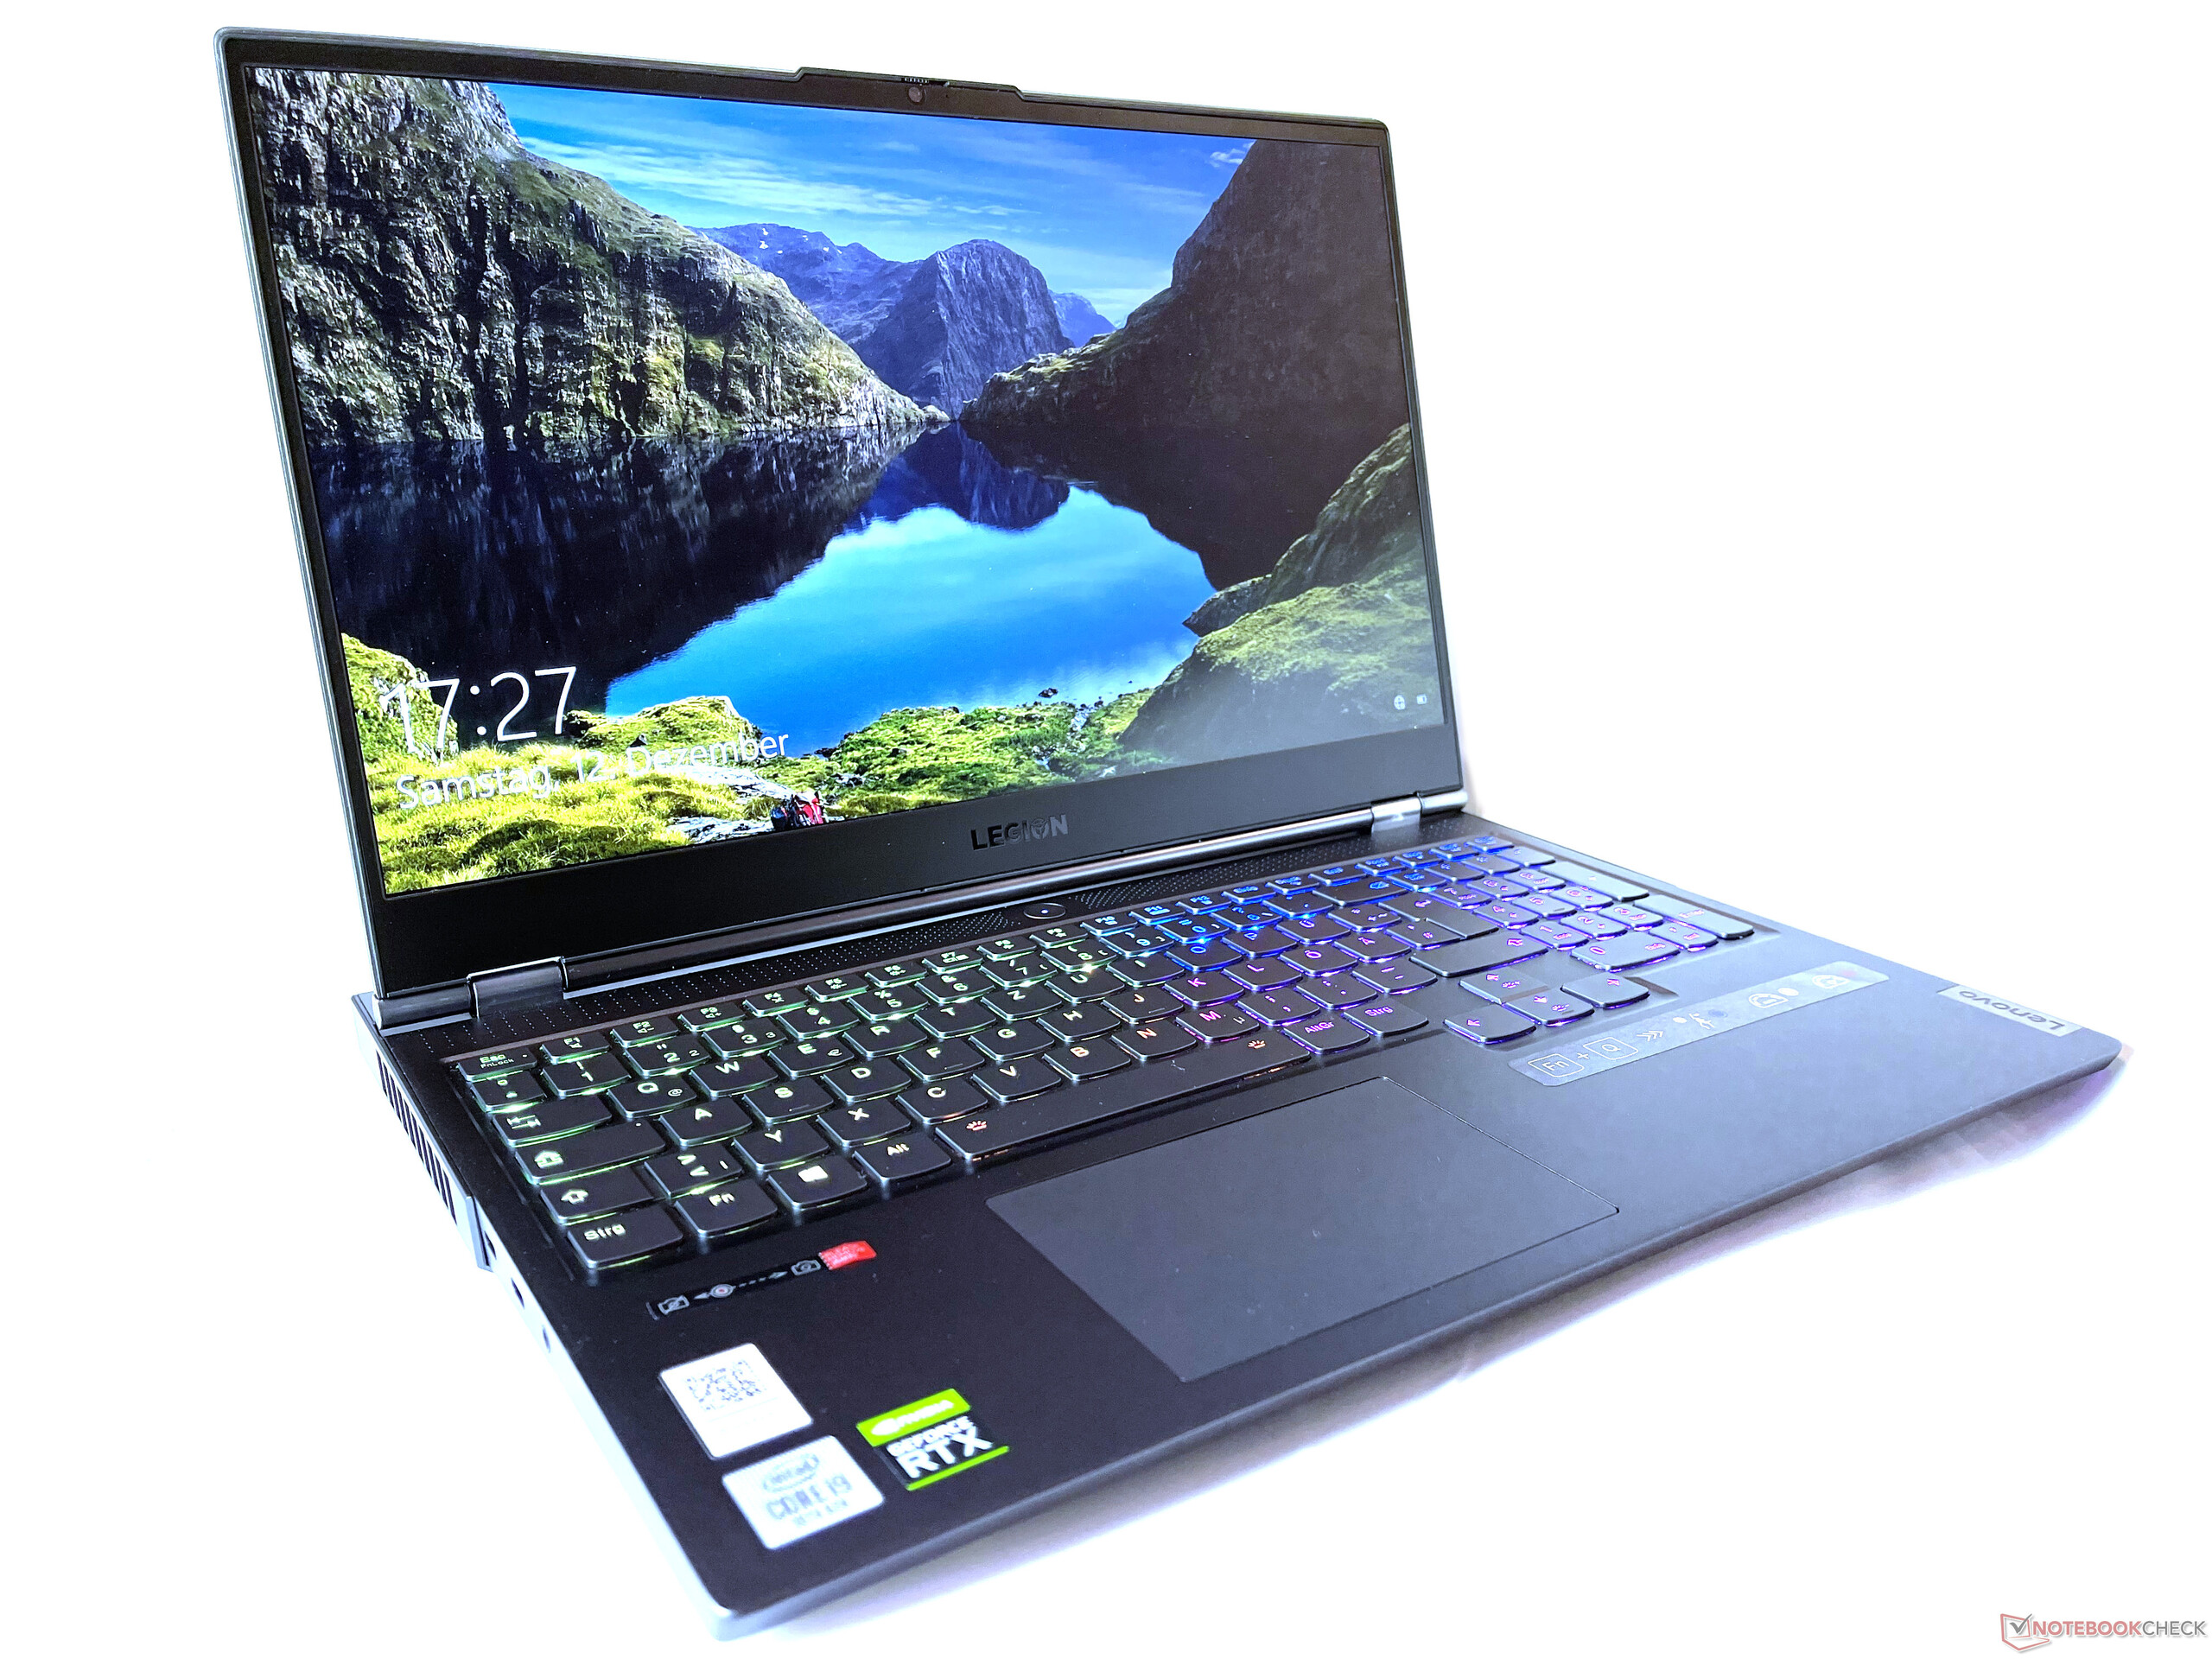
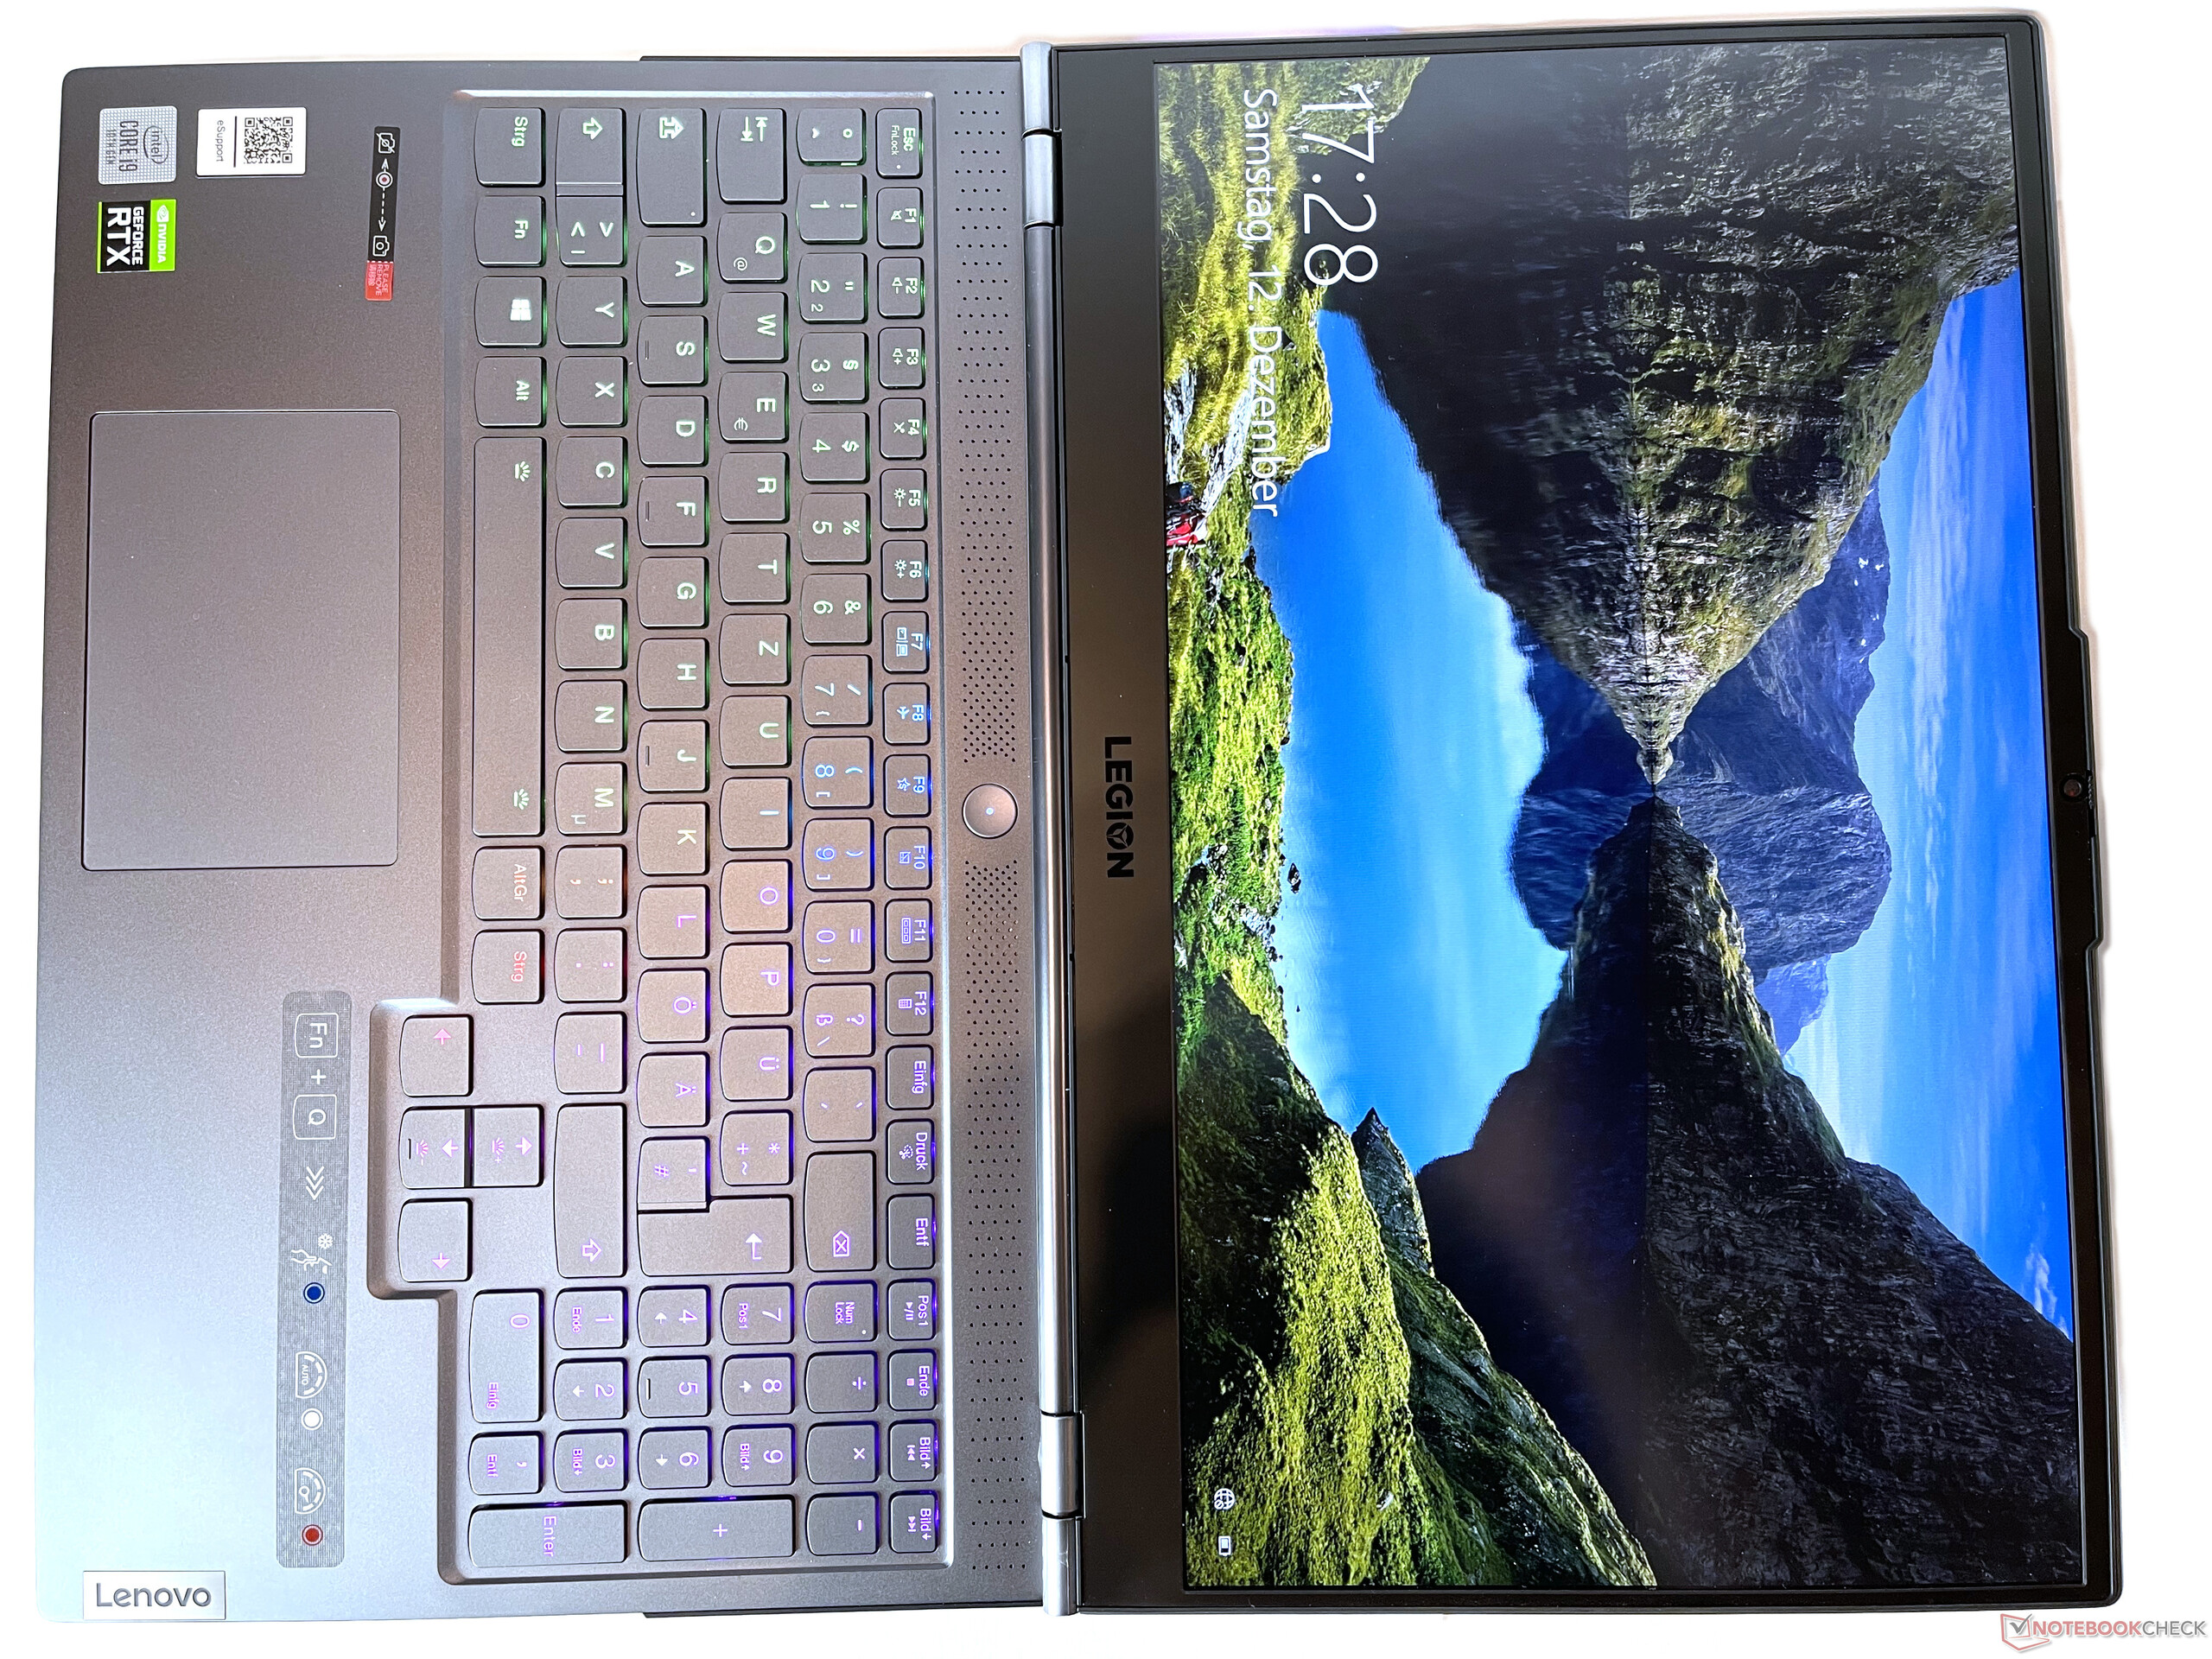
Case - A gaming laptop made of aluminum
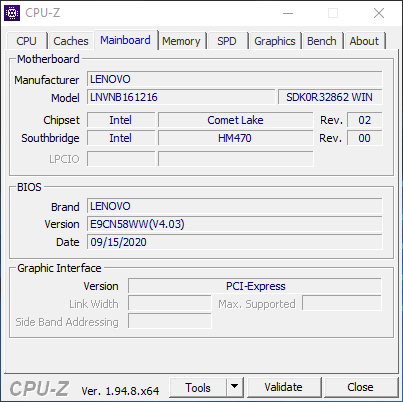
For the case, Lenovo uses a metal construction that is completed by some plastic elements (bottom case plate and back). Other devices in this price class such as the Razer Blade 15 have a unibody base unit, which gives the appearance of a higher quality. However, the lid as well as the base unit, which clearly differs from that of a so-called "slim" gaming laptop, are very sturdy overall. A pleasant side effect of this is that you can open the Legion 7 with a single hand, despite the robust hinges. While the edge sticking out from the back may be a matter of taste, it clearly marks the connections on the back with the help of illuminated indicators.
In addition, the case is covered by many RGB LEDs, which can optionally light up the notebook in many colors and modes.
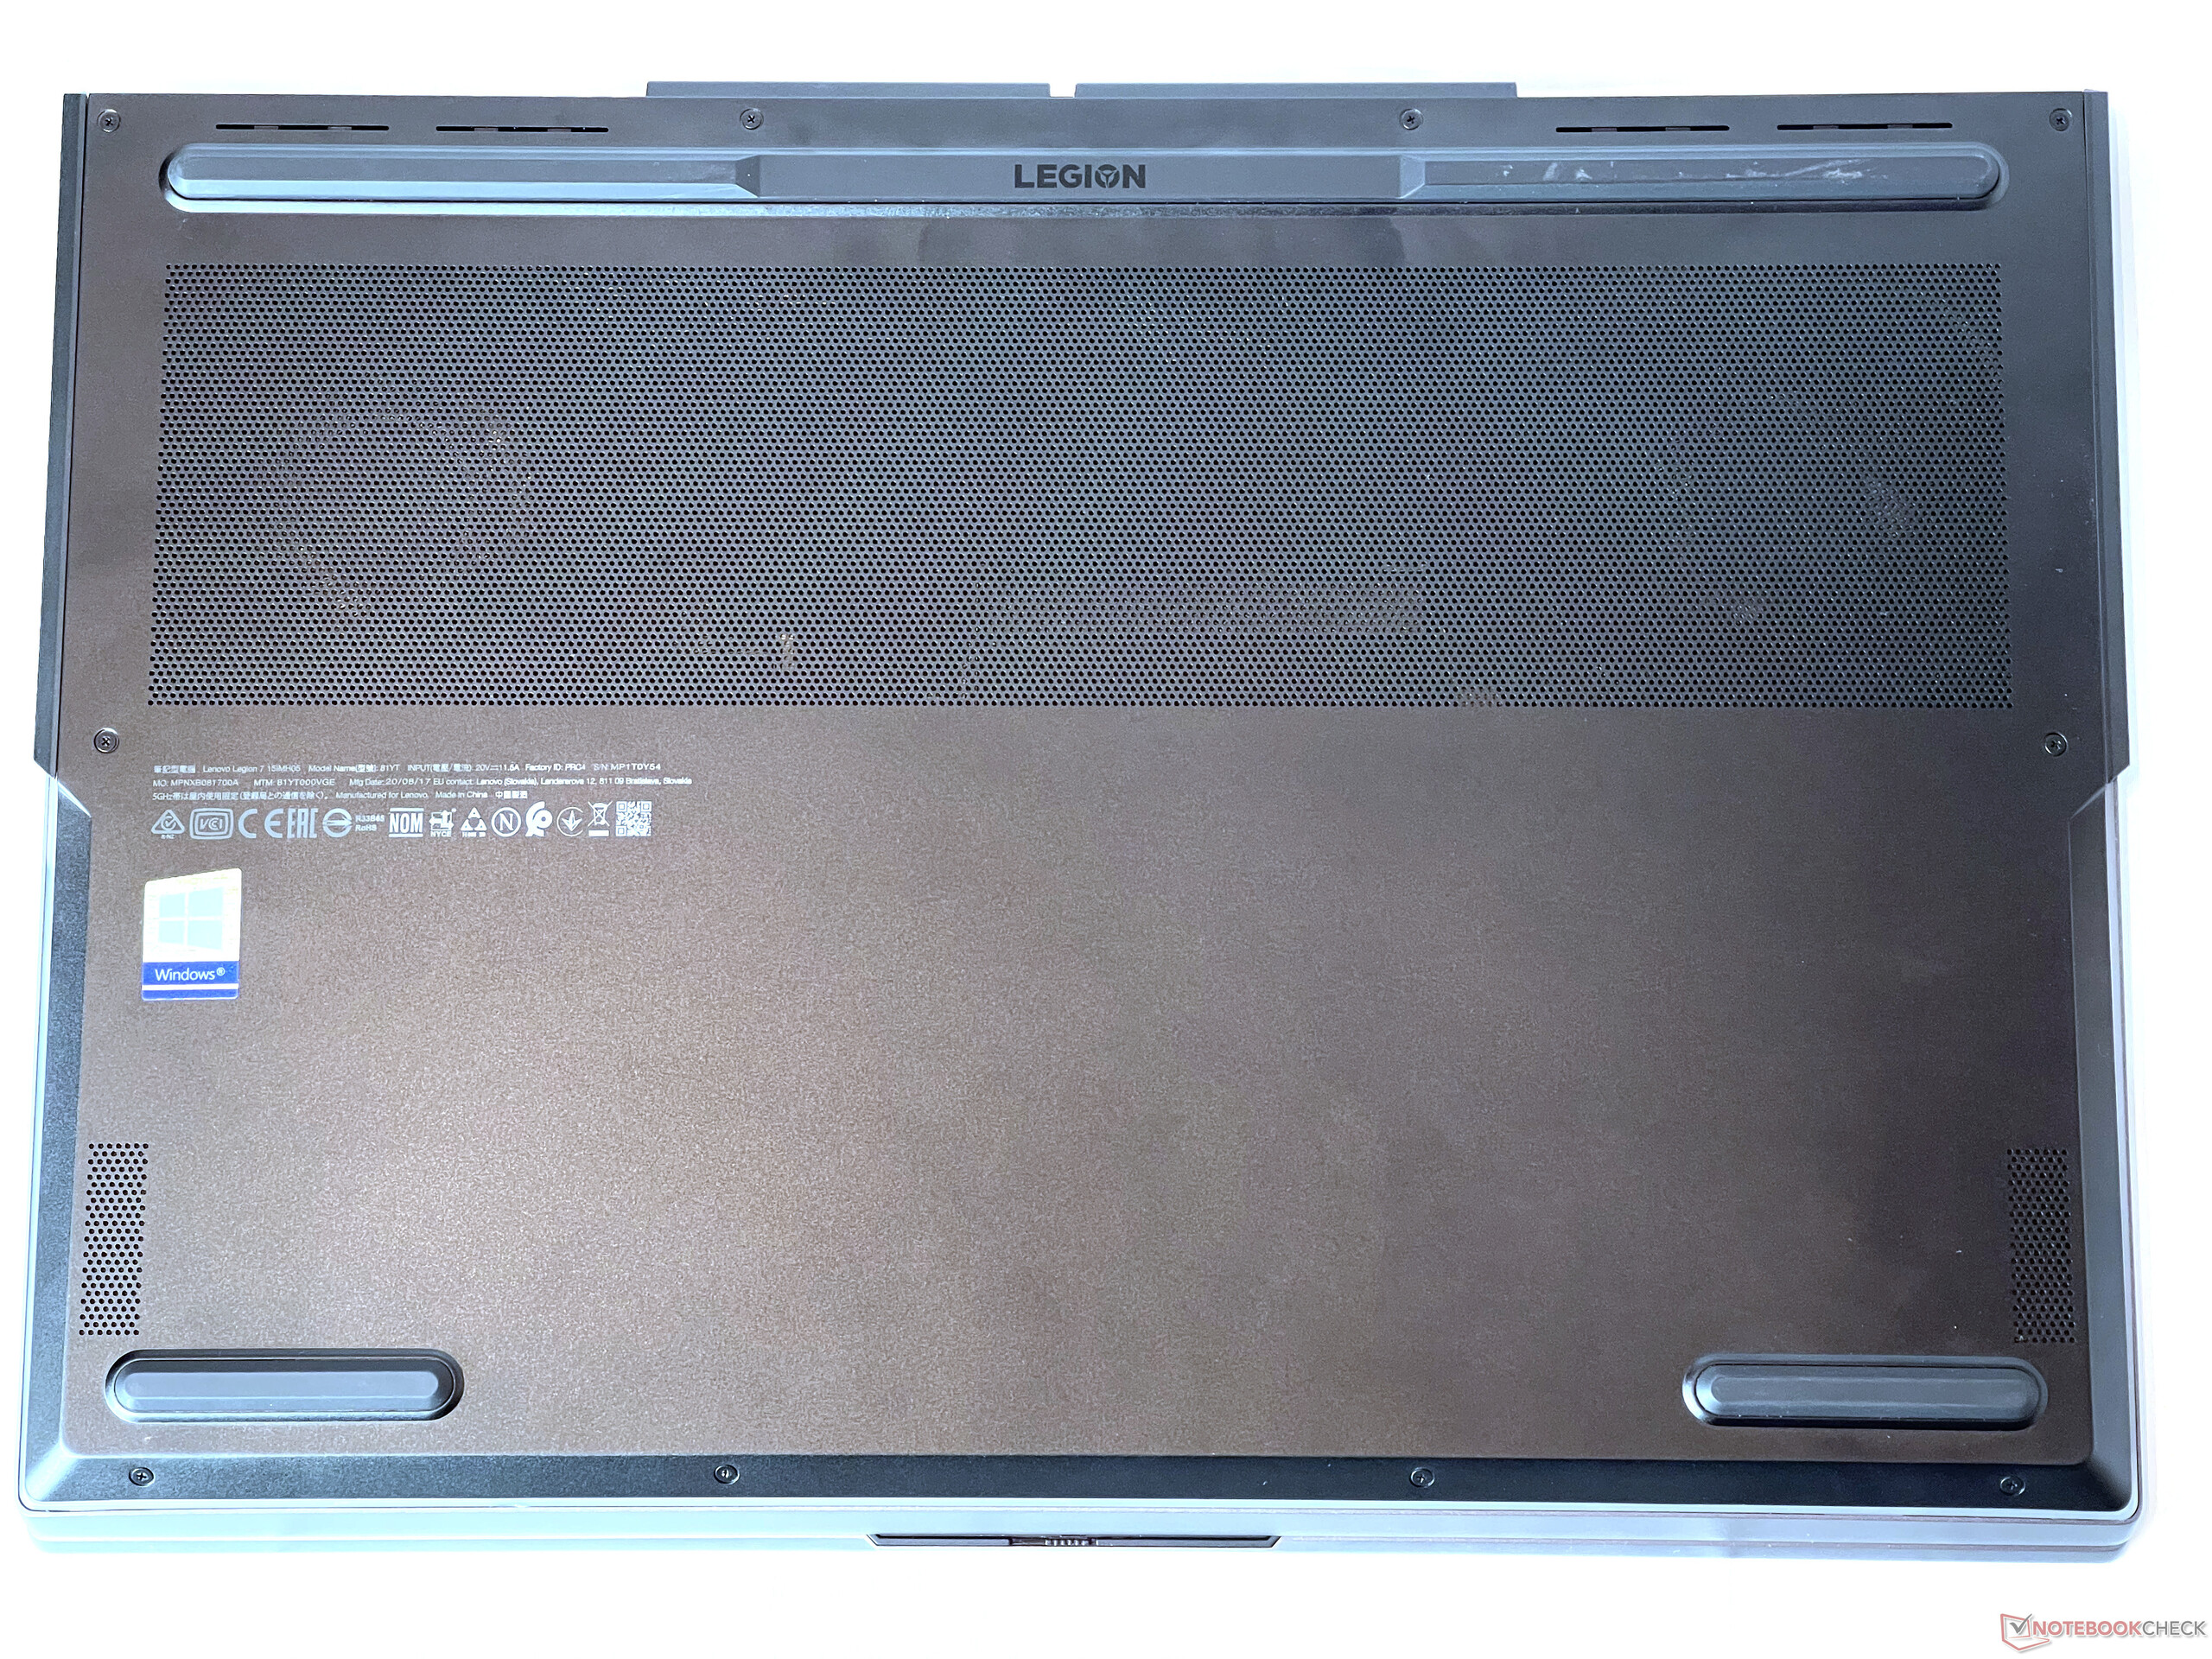
At almost 2.4 kg (~5.3 lb), the Legion 7 is definitely not a feather weight. 15-inch gaming laptops can be distinguished into two types: while some models prioritize a slim construction, others such as our test unit try to make use of the performance potential to the fullest. This makes our test unit one of the heaviest notebooks in our comparison, but the dimensions are within the middle range. For example, the Asus Rog Strix Scar 15 is again much thicker at 24.9 mm (0.98 in), while the Acer Predator Triton 500 is the smallest and lightest notebook in our comparison field.
Connection Equipment - Legion 7 with Thunderbolt 3
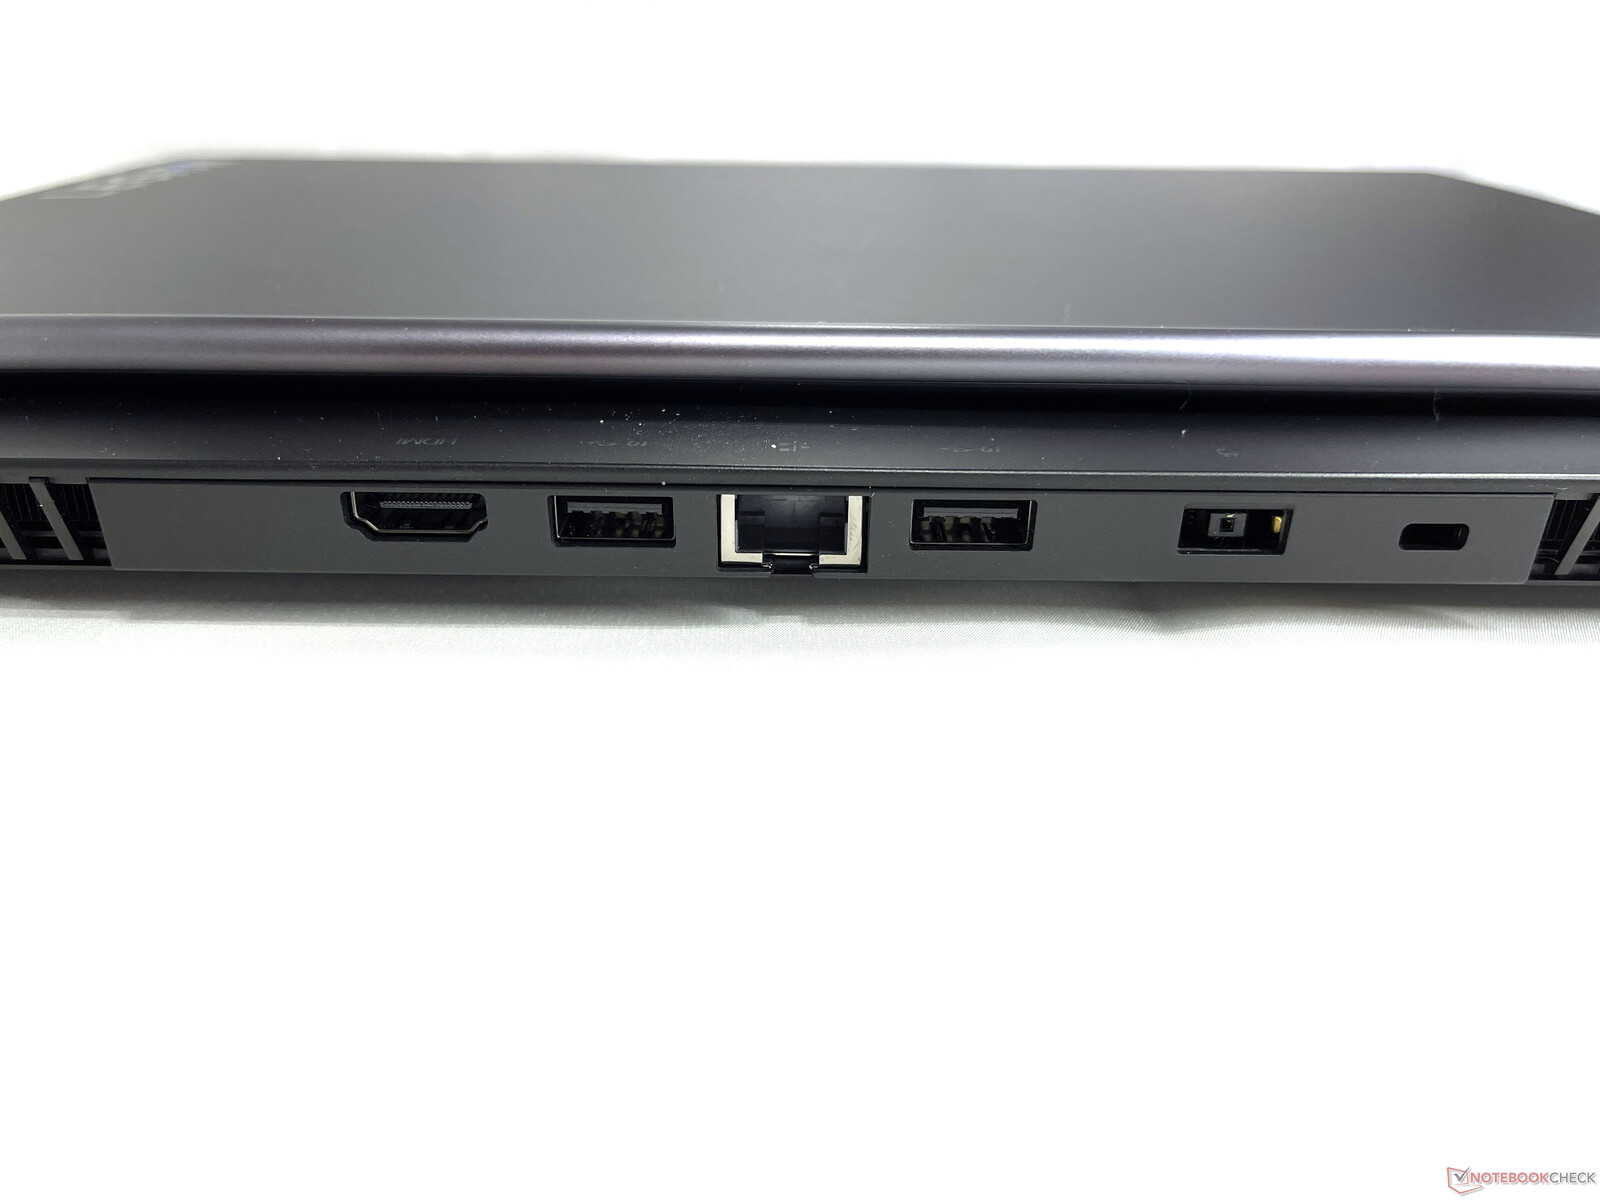
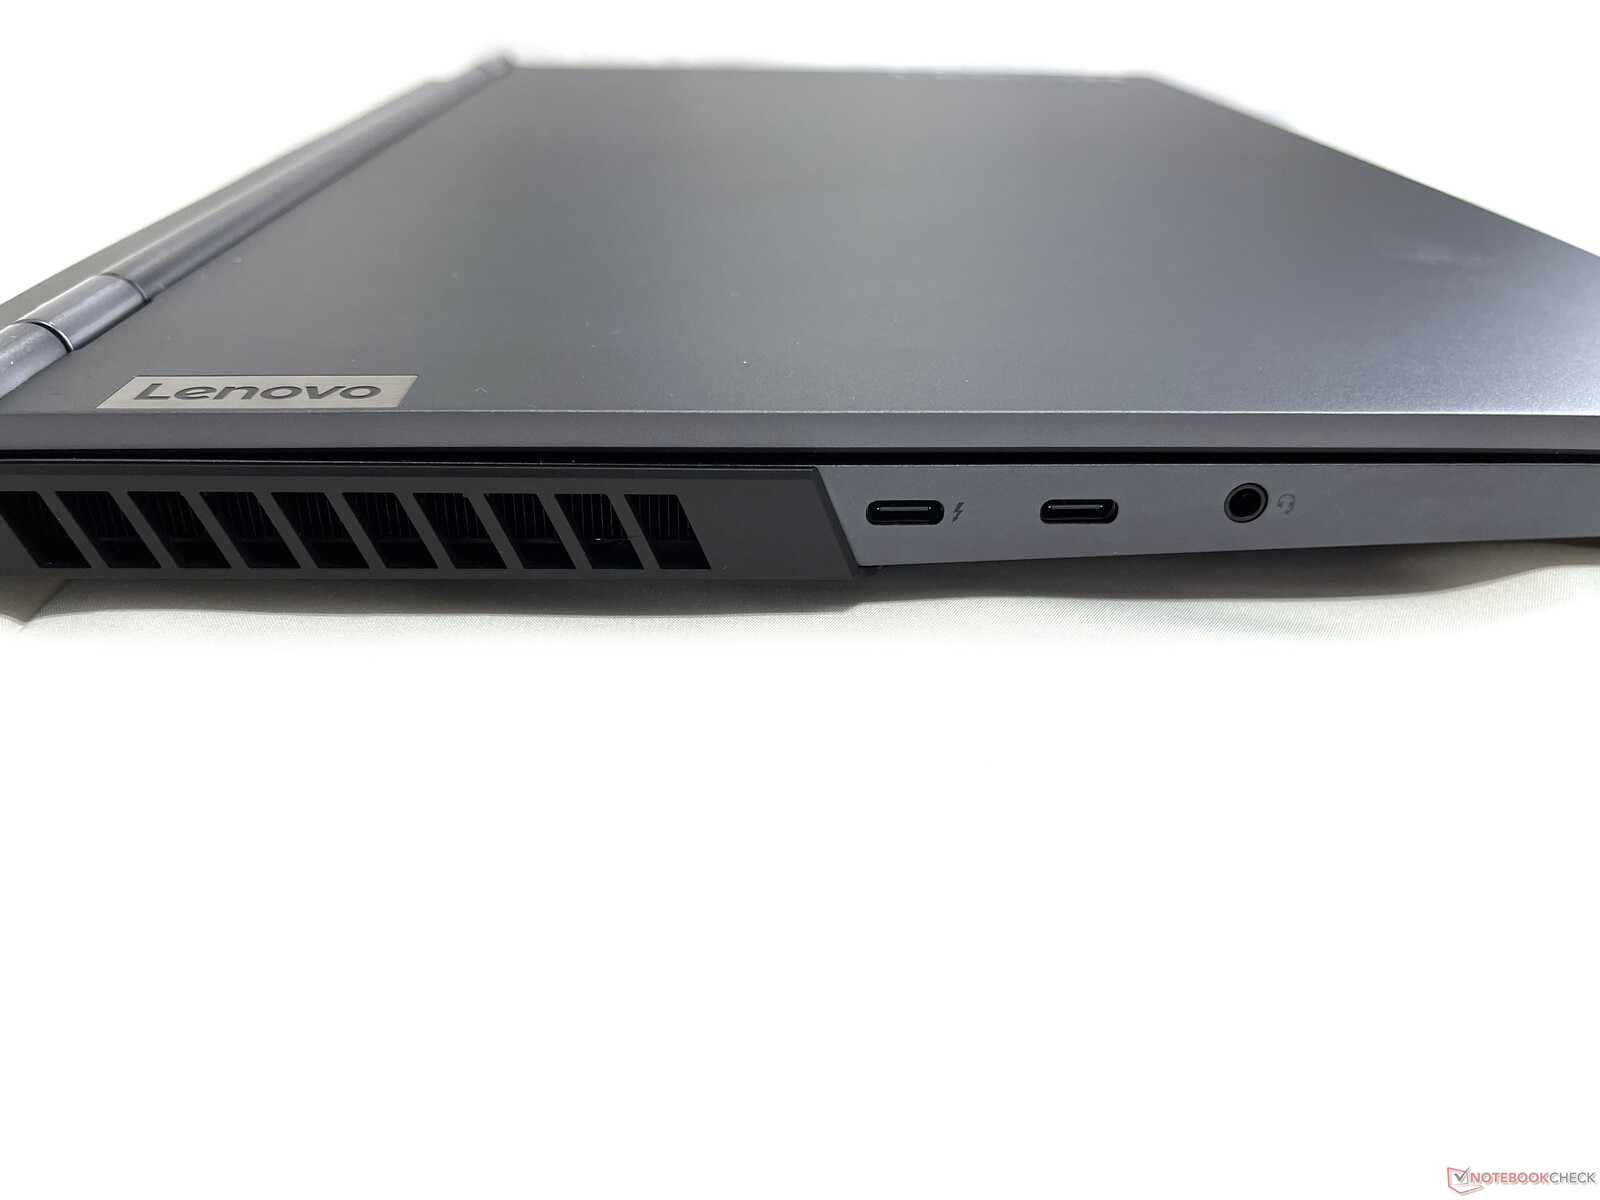
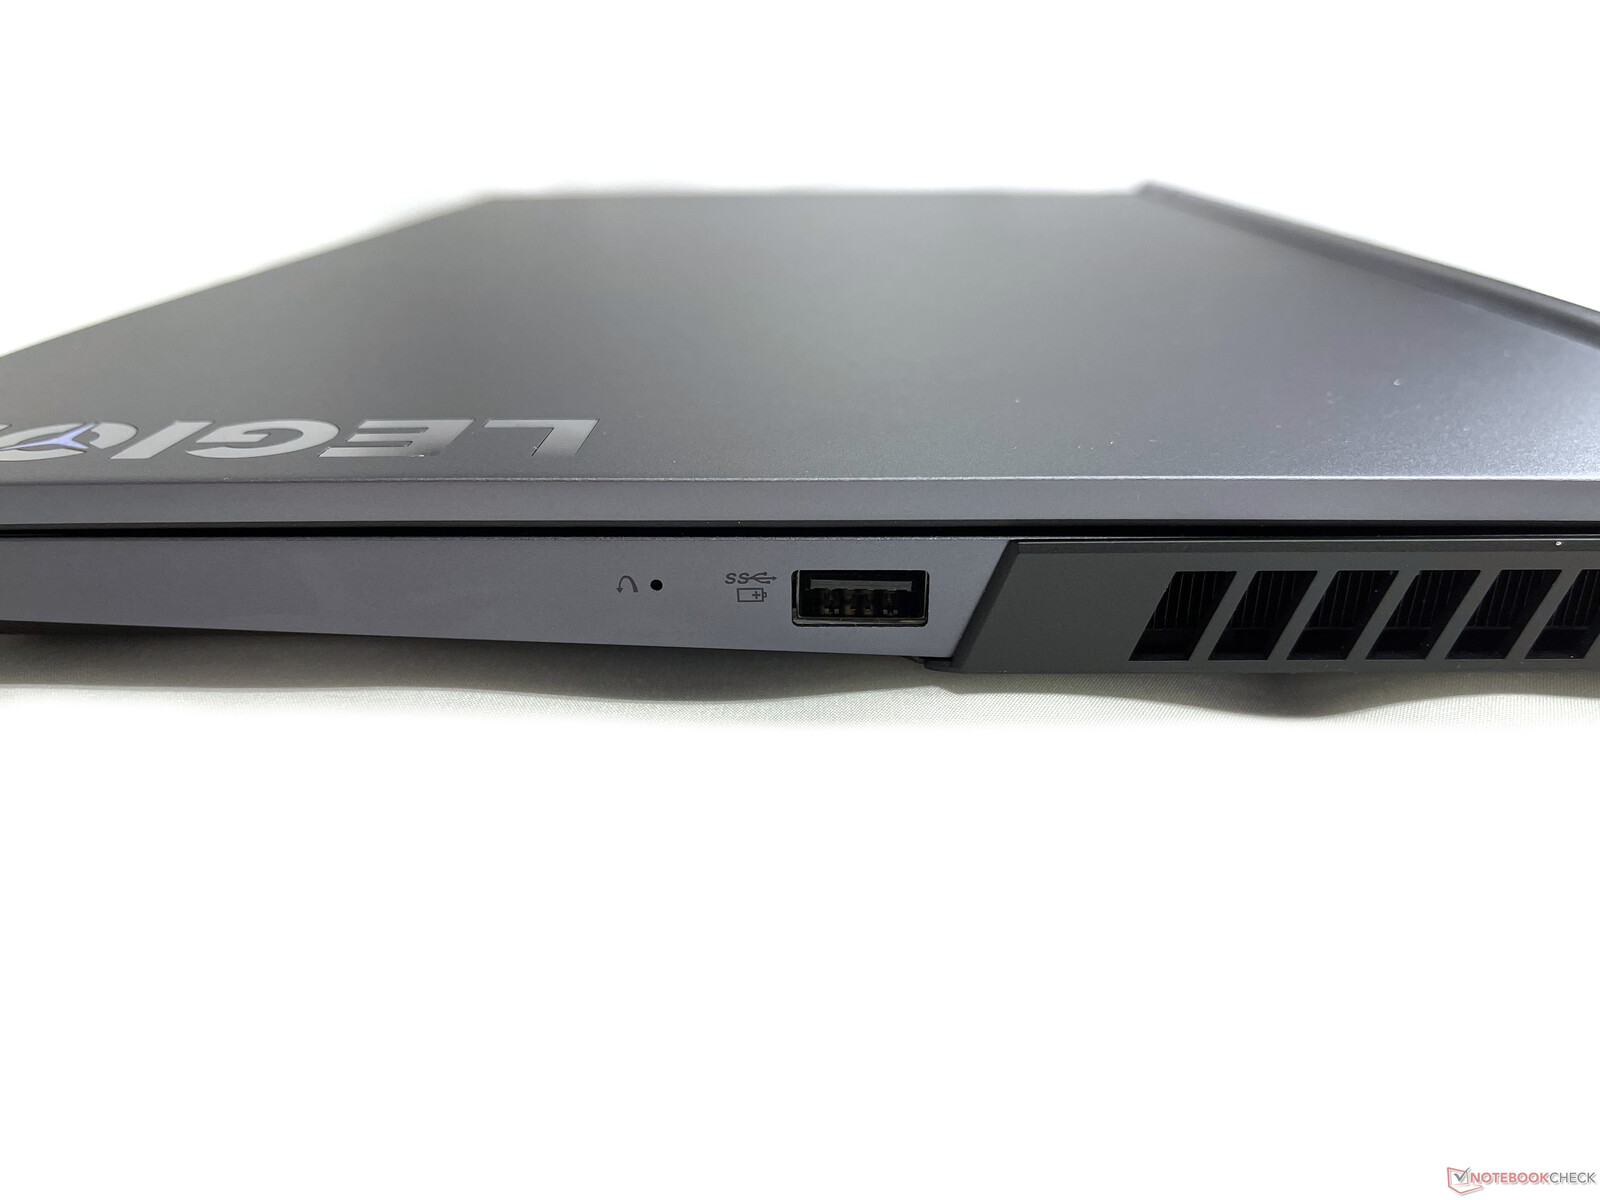
In addition to a standard-sized HDMI port, the connections also include one Thunderbolt-3 port, two DisplayPort connections, and one Gigabit Ethernet port. There is sufficient space between the ports, so that even large plugs should not block any of the neighboring ports. The only awkward position is that of the USB-A port, which is placed in the center of the right side. Most right-handed users from the target group will probably need this space for mouse movements.
Communication
Bluetooth 5 and WLAN 6 are supported by Intel's AX201 WLAN module. In our test, the Legion 7 achieved top values during sending as well as receiving. There were no connection problems during the whole testing period.
Webcam
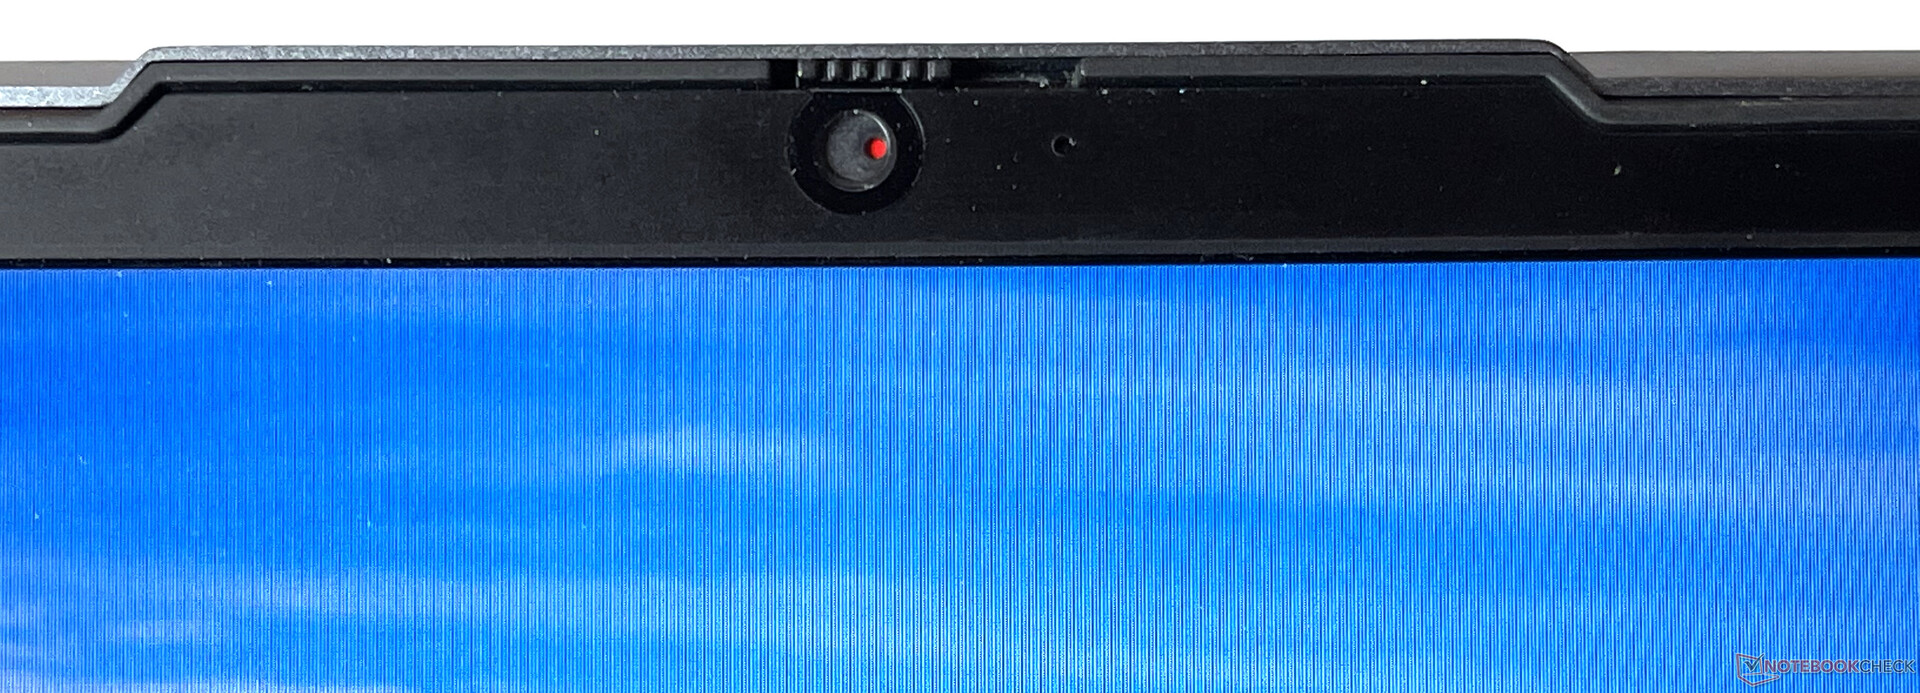

")
")
Security
There is nothing preventing buyers to also use the Lenovo Legion 7 as a work laptop, since in addition to the provision for a security lock, various software security solutions and even TPM 2.0 are available.
Accessories
There are no extras in the box besides the charger. While there are also no accessories from the manufacturer, many compatible adapters and bags are available from third-party vendors.
Maintenance
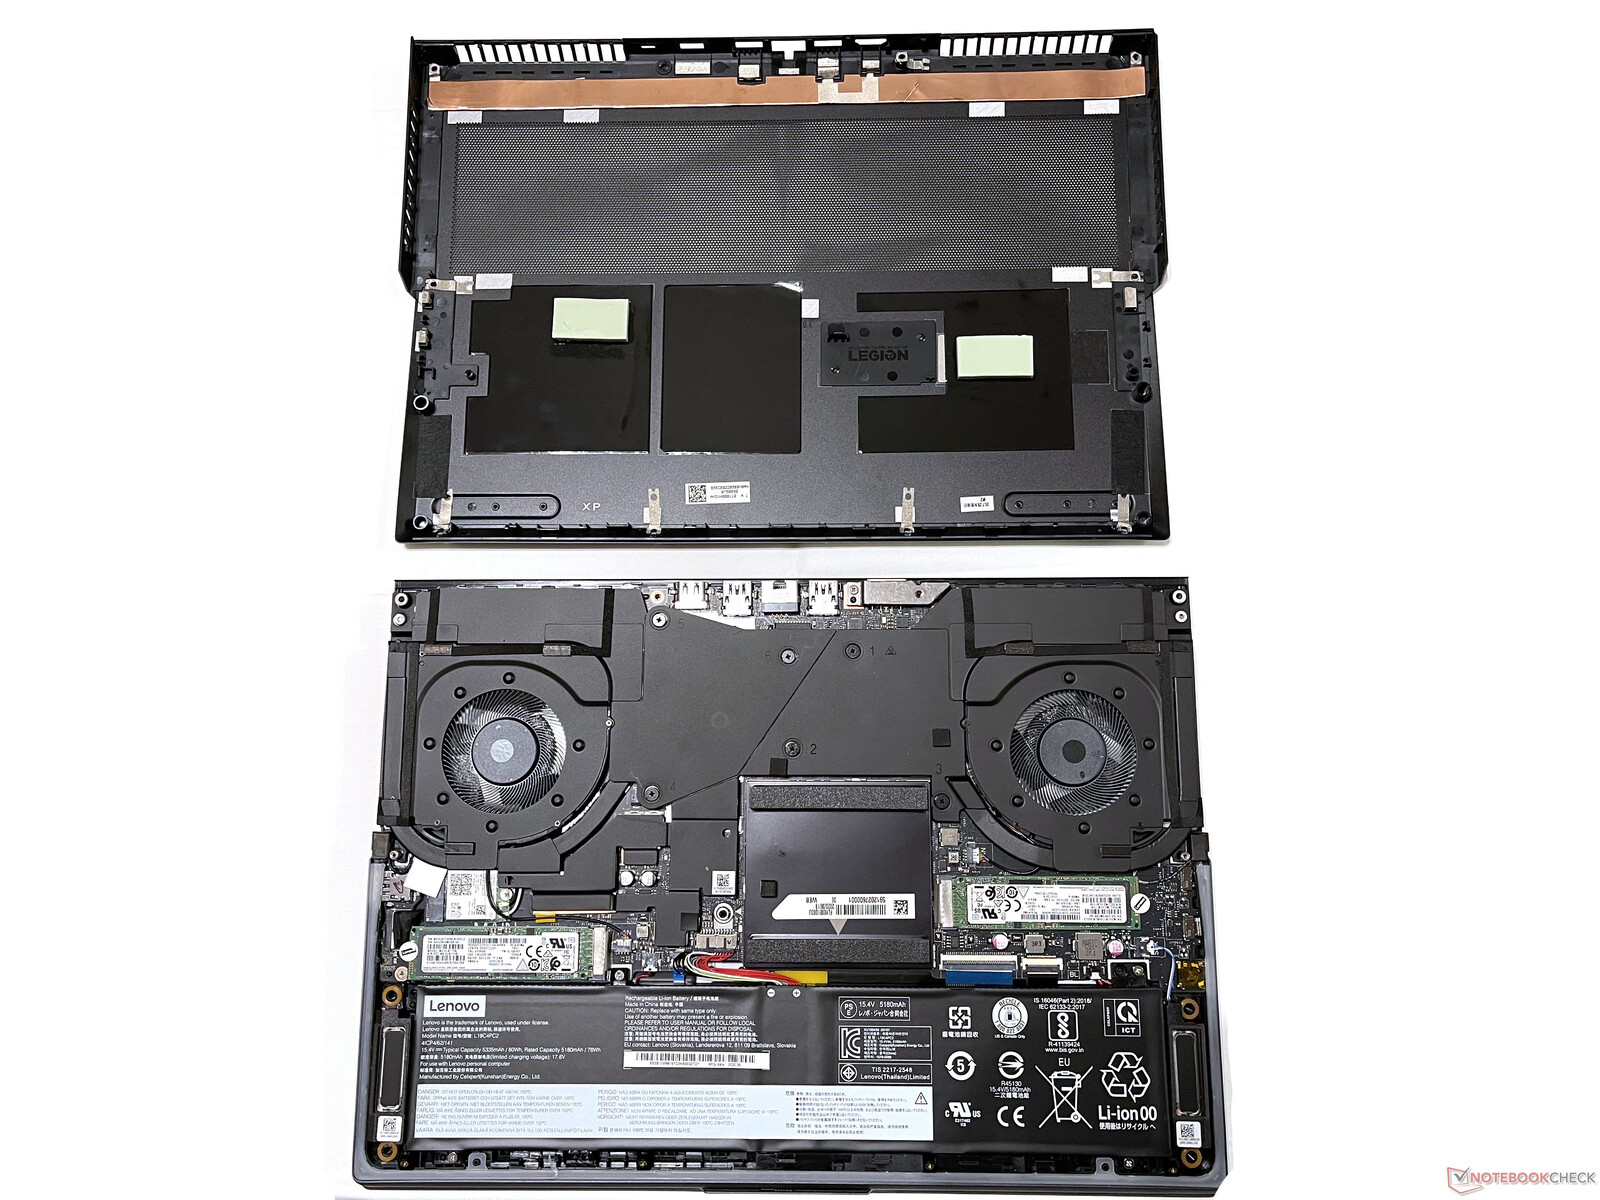
To get access to the components, you not only have to remove 10 Philips screws, but also loosen many small plastic clips around the case. Although those are probably meant to keep the bottom of the case tightly fixed on the base unit, they make the maintenance more difficult - particularly for non-professionals. Once inside, you get access to the two M.2 SSDs, the fans, the battery, the WLAN module, and the two RAM slots (underneath an additional black cover to the left of the SSD on the right side in the picture).
Warranty
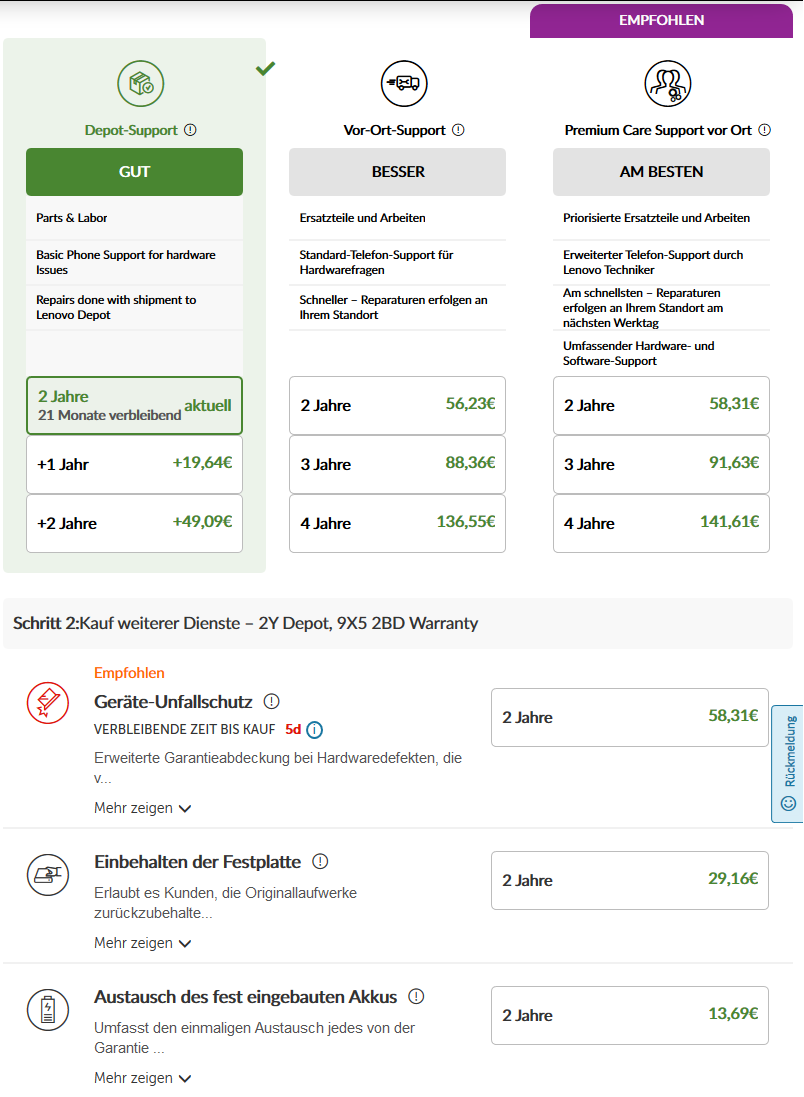
Lenovo offers buyers a standard warranty of two years, which can be extended up to four years with various options.
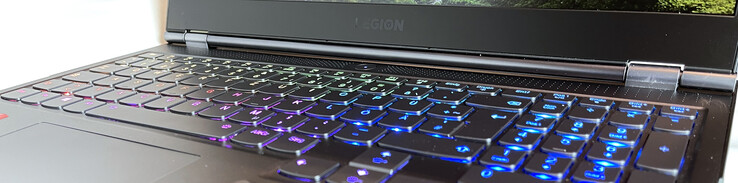
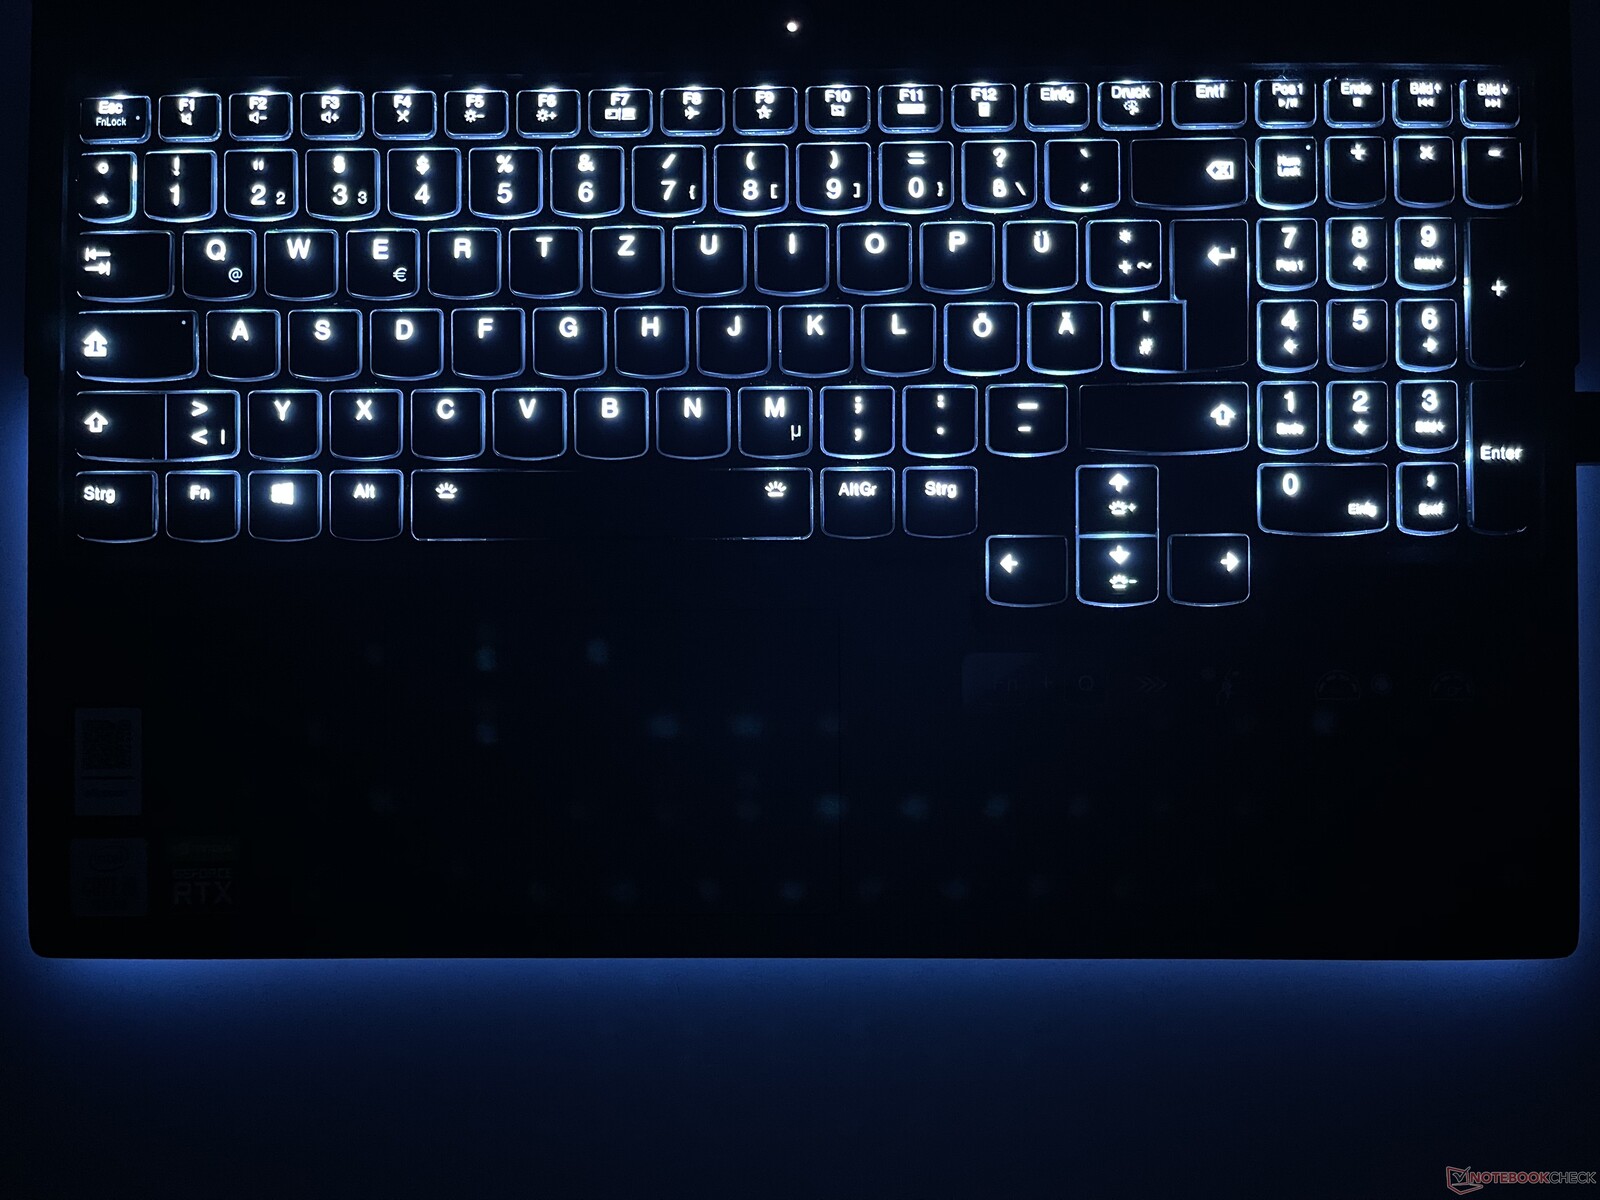
Input Devices - Lenovo Laptop with iCue illumination
Keyboard
The chiclet keyboard contains a number block and standard-sized arrow keys. Lenovo has used the available space well, so the keyboard is spread across the whole width of the laptop. The integrated RGB illumination can be controlled either via keyboard shortcuts or Corsair's iCue software, which offers numerous user-defined and preset illumination effects. The keyboard has a slight give and produces very quiet typing noises.
The feedback from the keys and their stroke are only average, so the keyboard isn't really designed for longer typing tasks. During our testing, the space key got stuck several times, which made it appear particularly cheap. The fact that Lenovo is also able to produce better laptop keyboards is demonstrated by the ThinkPad series, for example. But apparently the keyboard wasn't a priority in the Legion 7. It is still usable, as long as you limit yourself to gaming and brief inputs. In addition, the keyboard short cuts are extremely helpful for switching between the performance and RGB profiles, among other things.
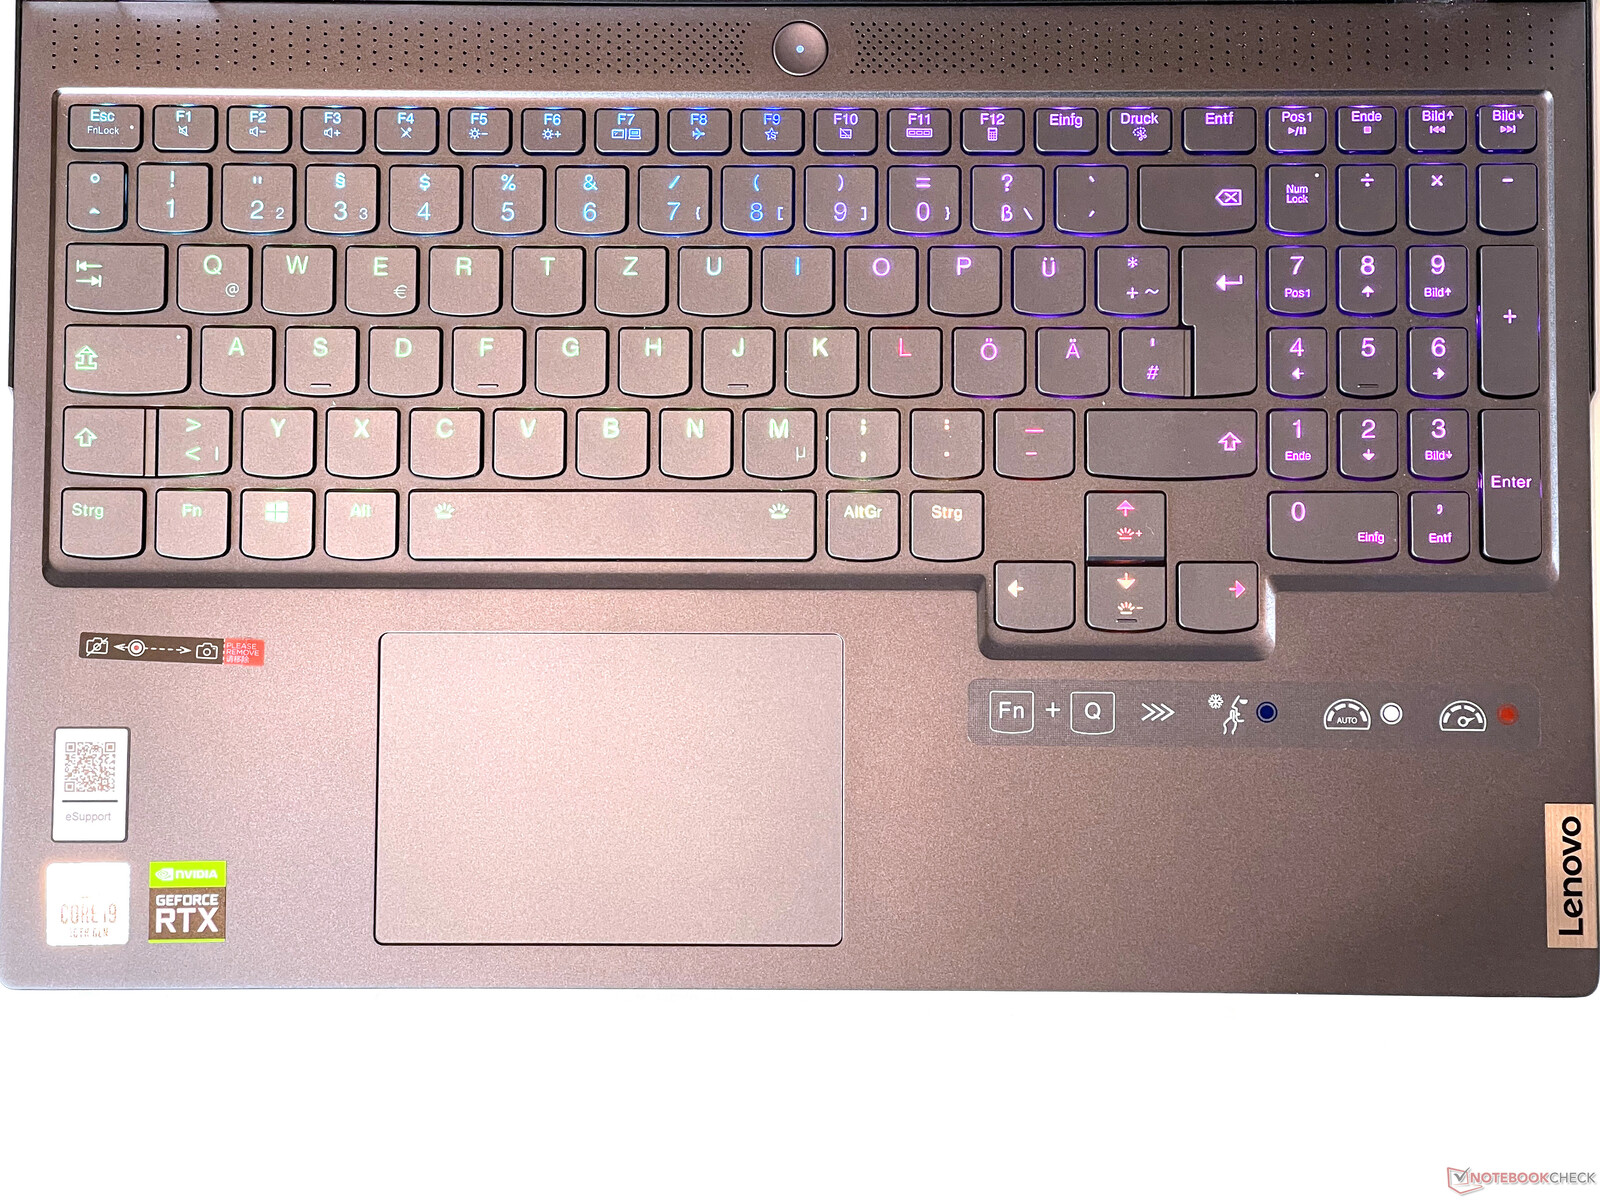
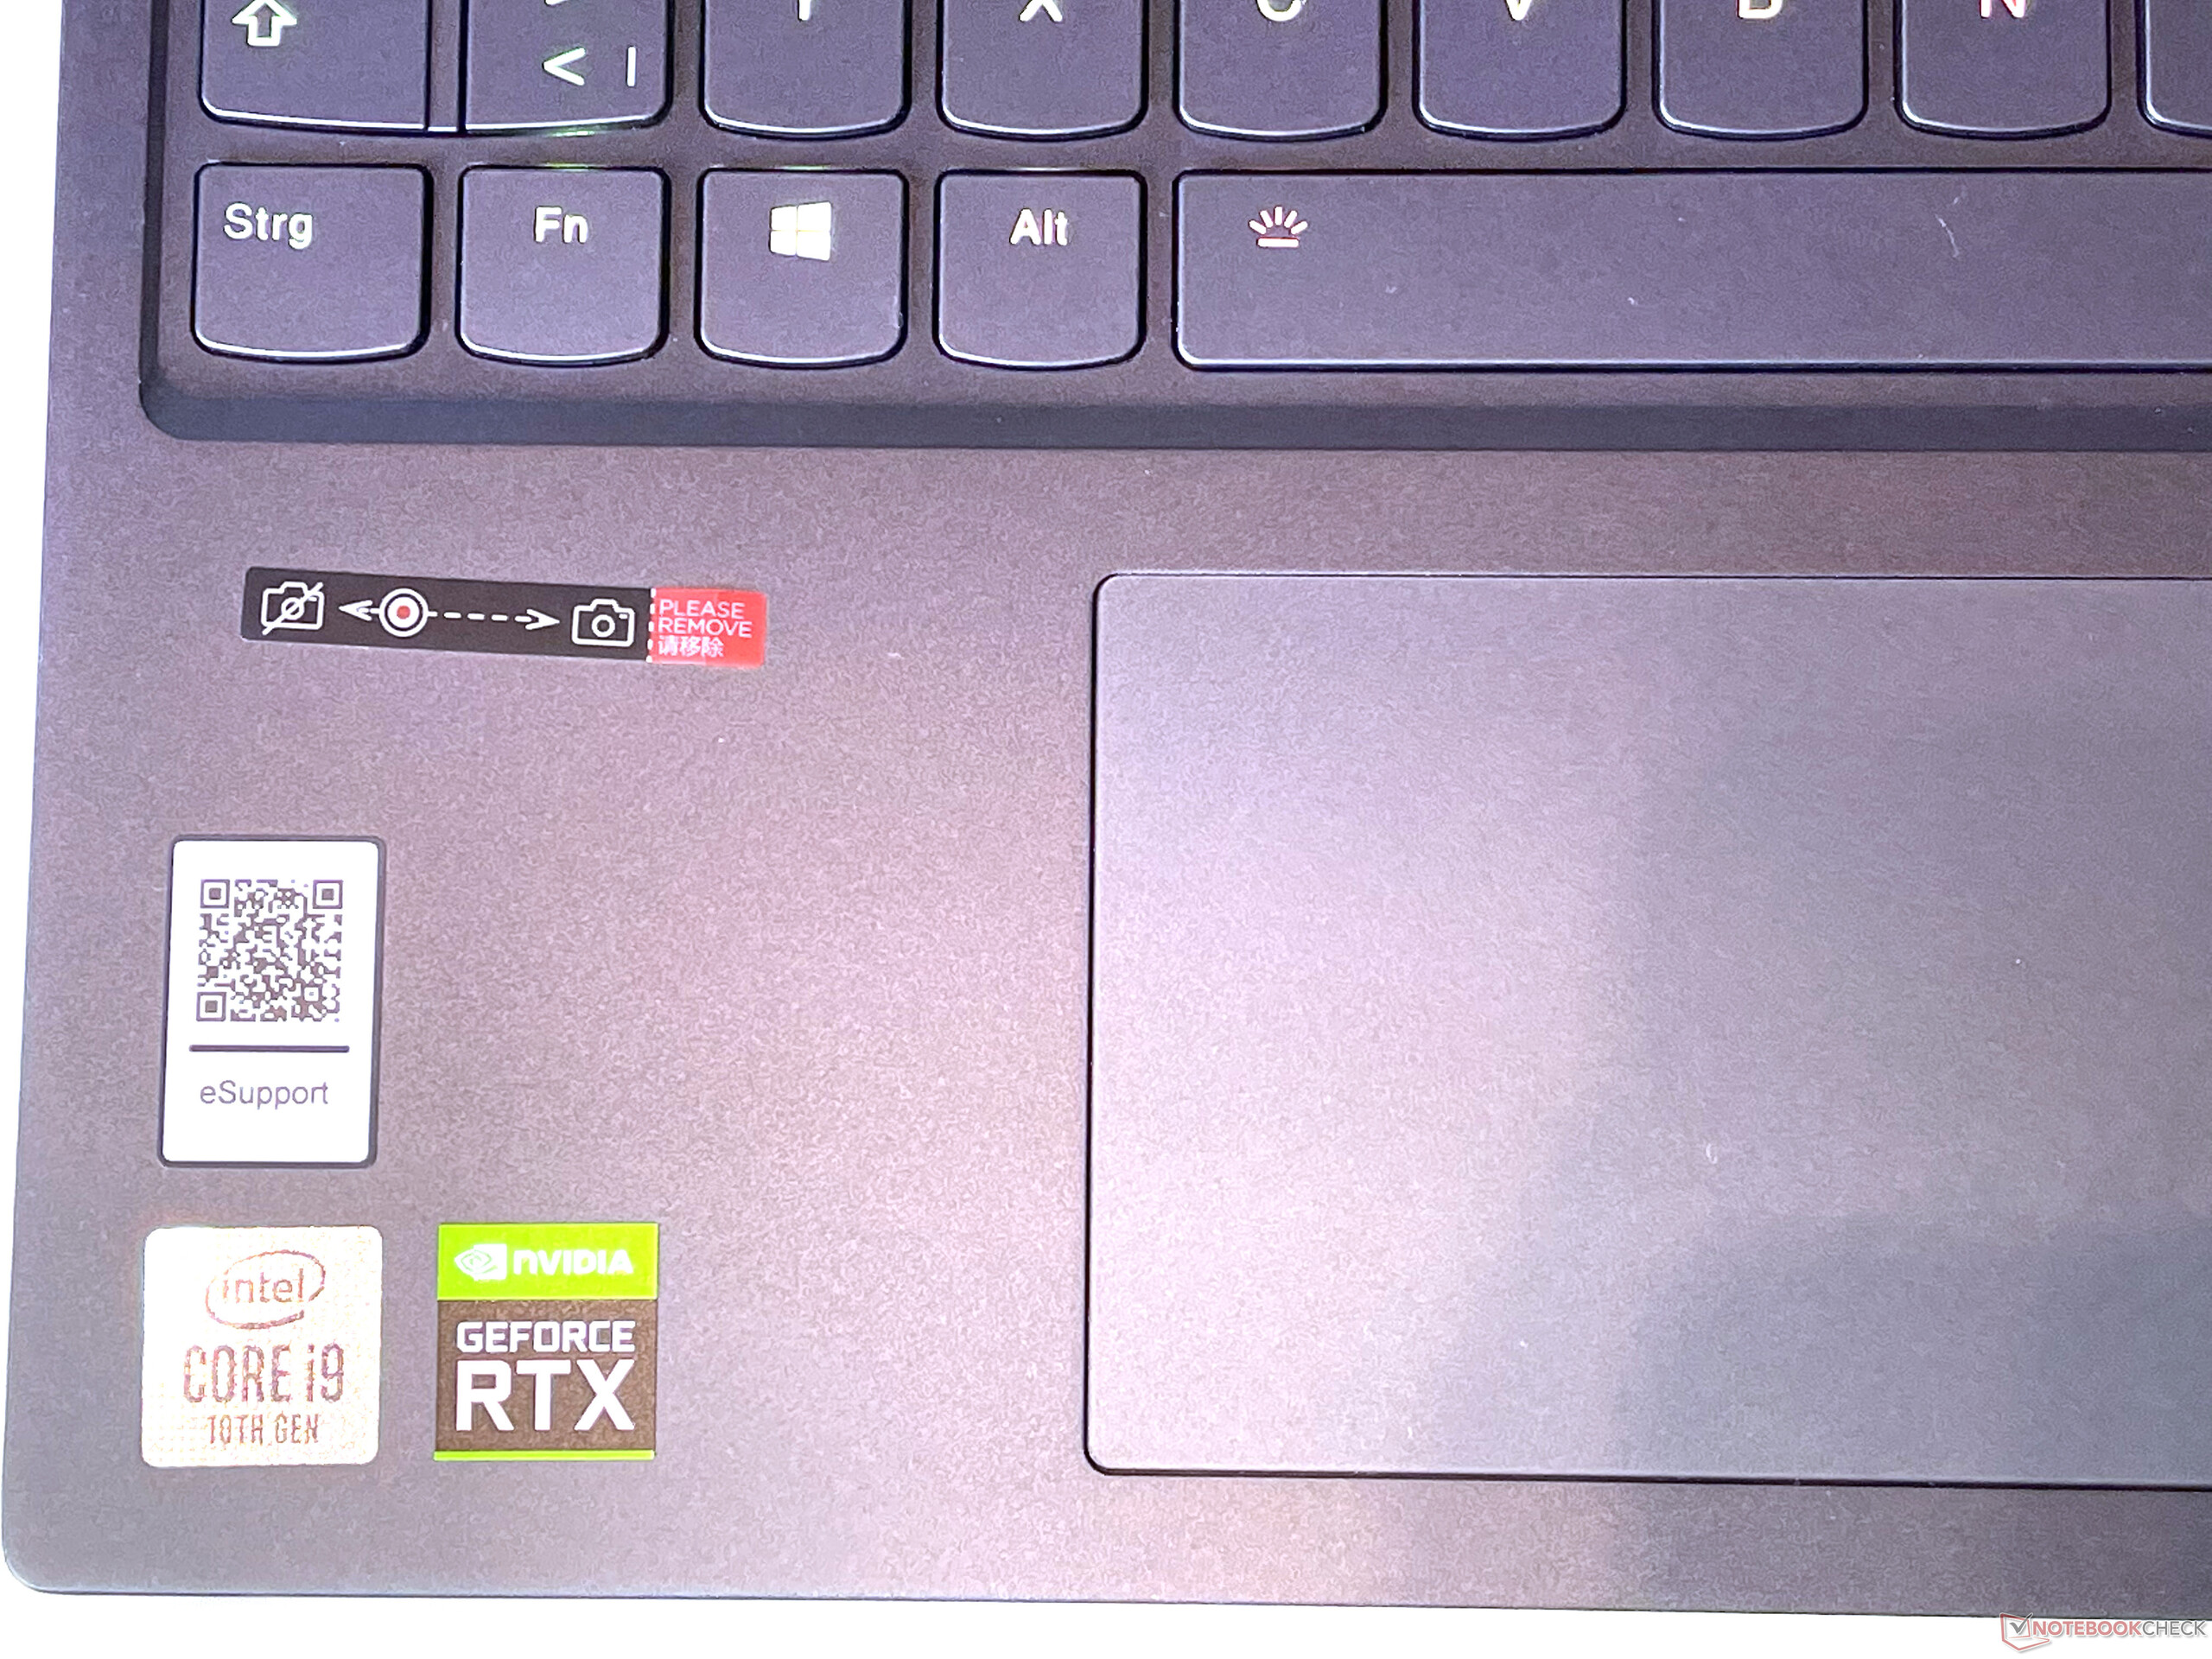
Touchpad
The touchpad covers an area of 10.5 x 7 cm (~4.1 x 2.8 in) and only offers integrated mouse keys that appear cheap and are only suited for simple tasks. This is not a surprise, since buyers of the Legion 7 will probably connect an external mouse anyways. The sliding characteristics of the ClickPad are good and hardly differ from those of other plastic-covered touchpads. The pointer control is precise and inconspicuous. In addition, the usual gestures that facilitate laptop operation are available.
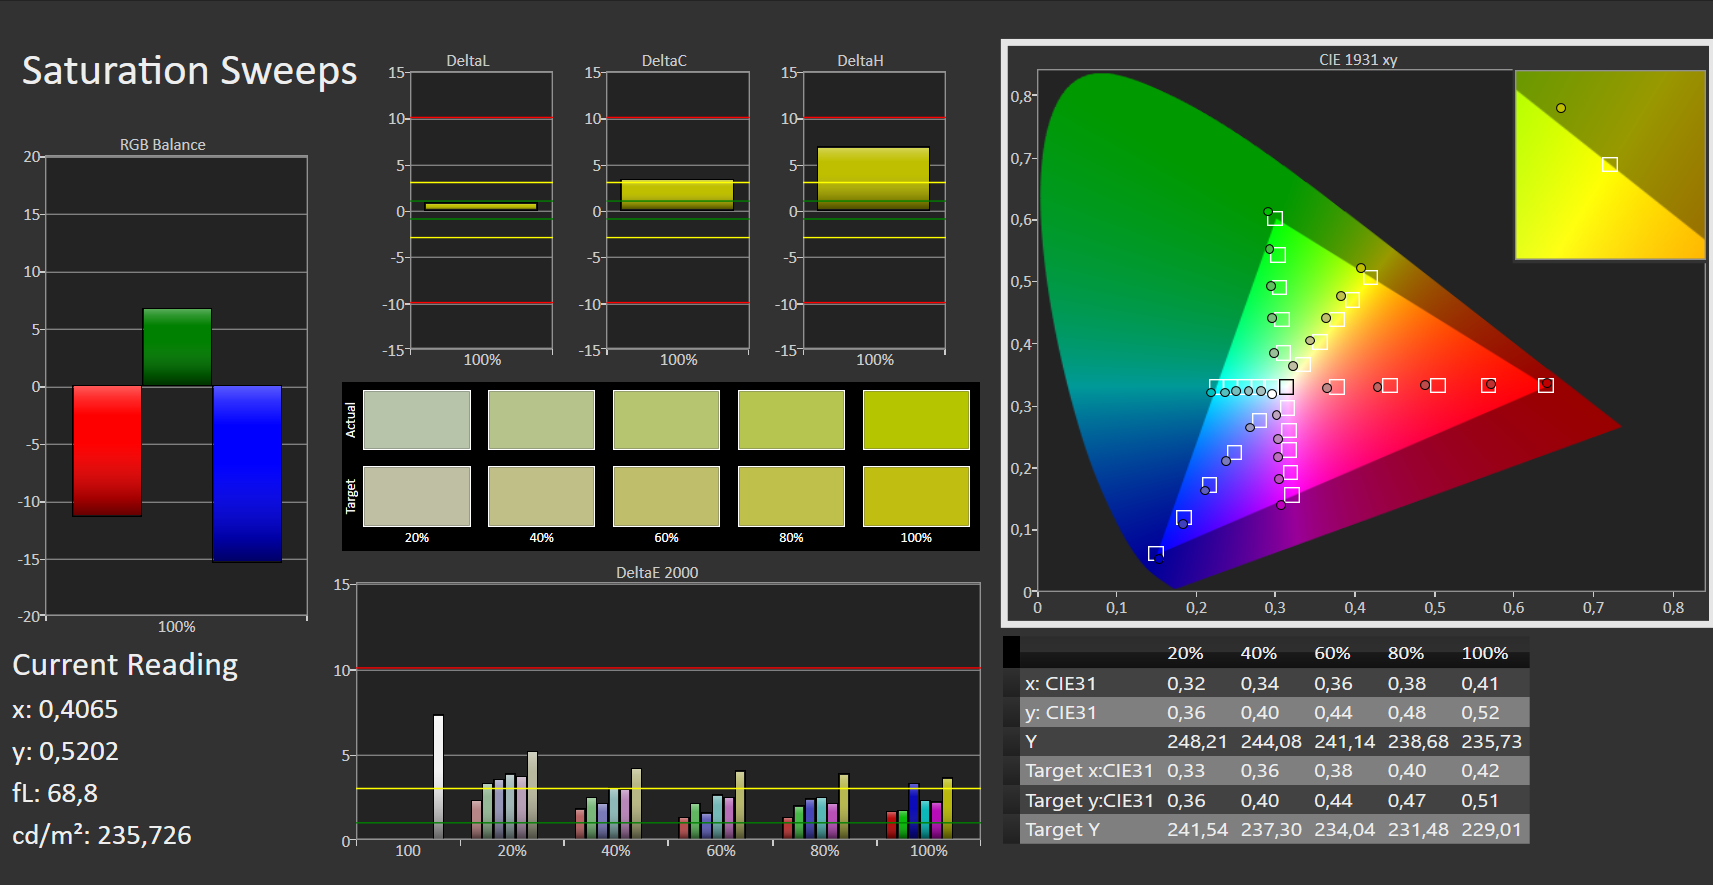
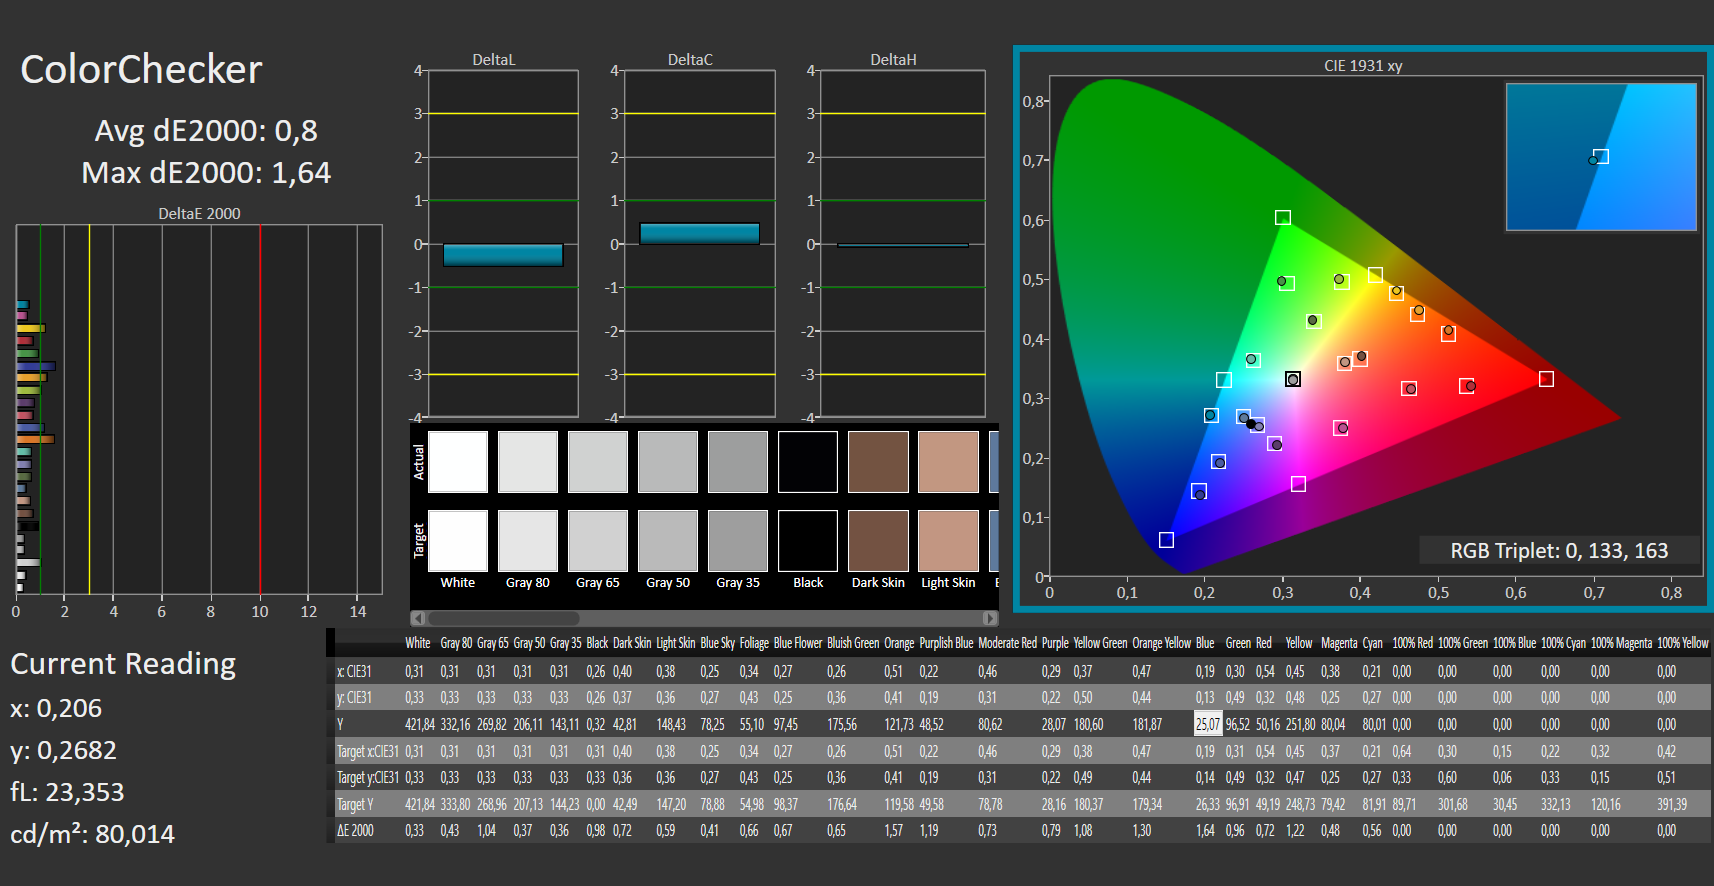
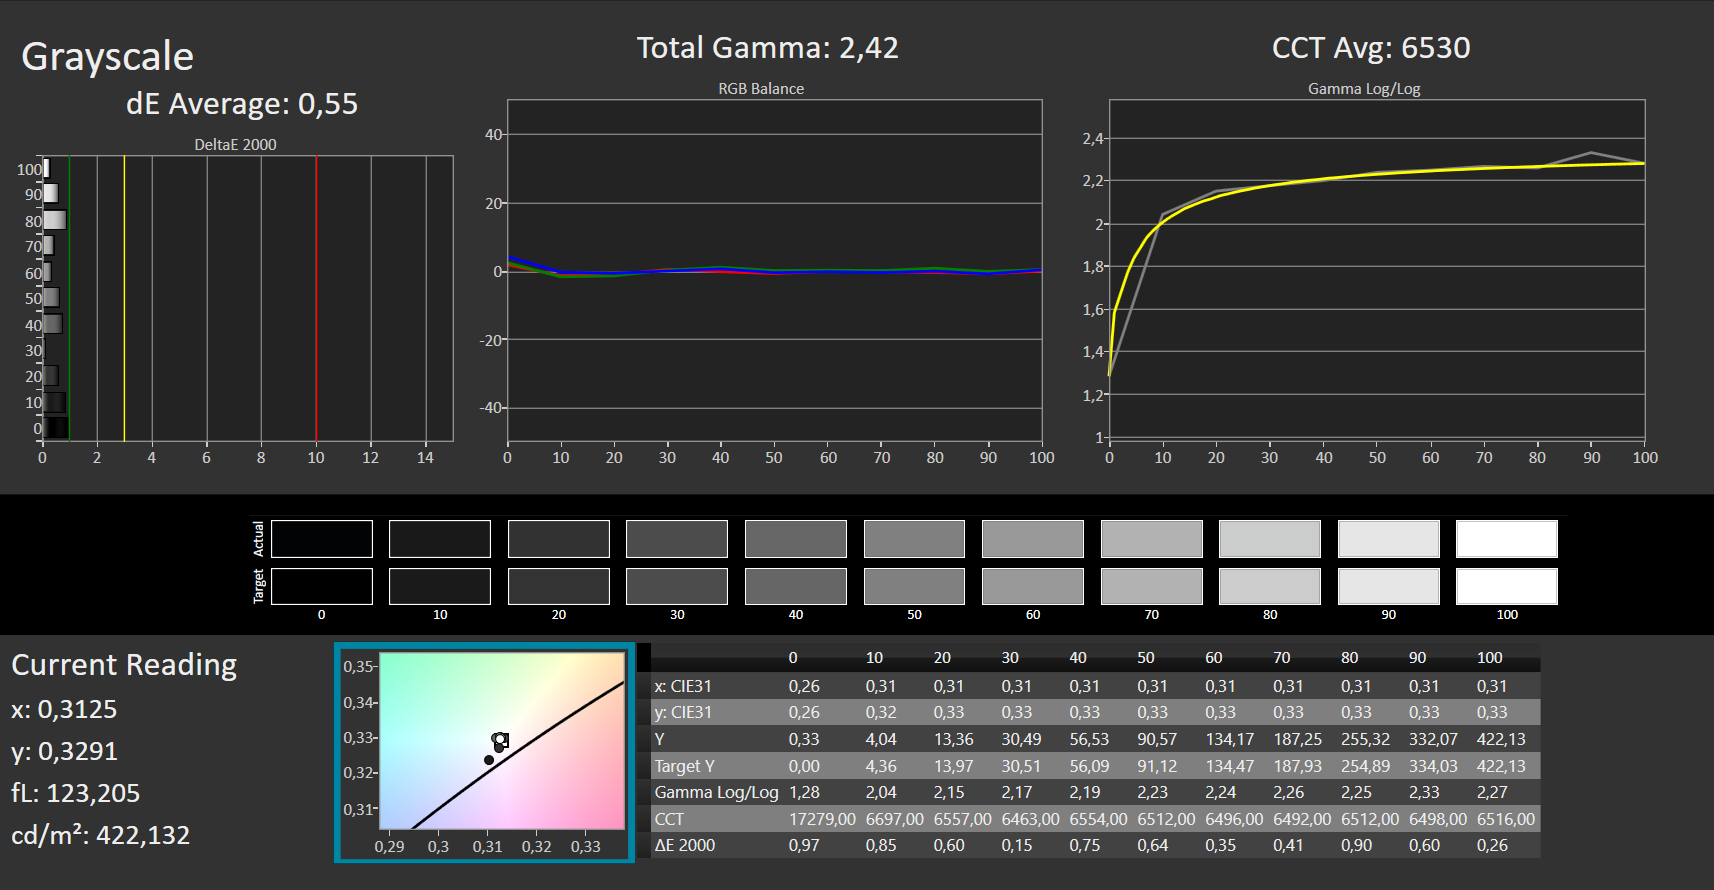
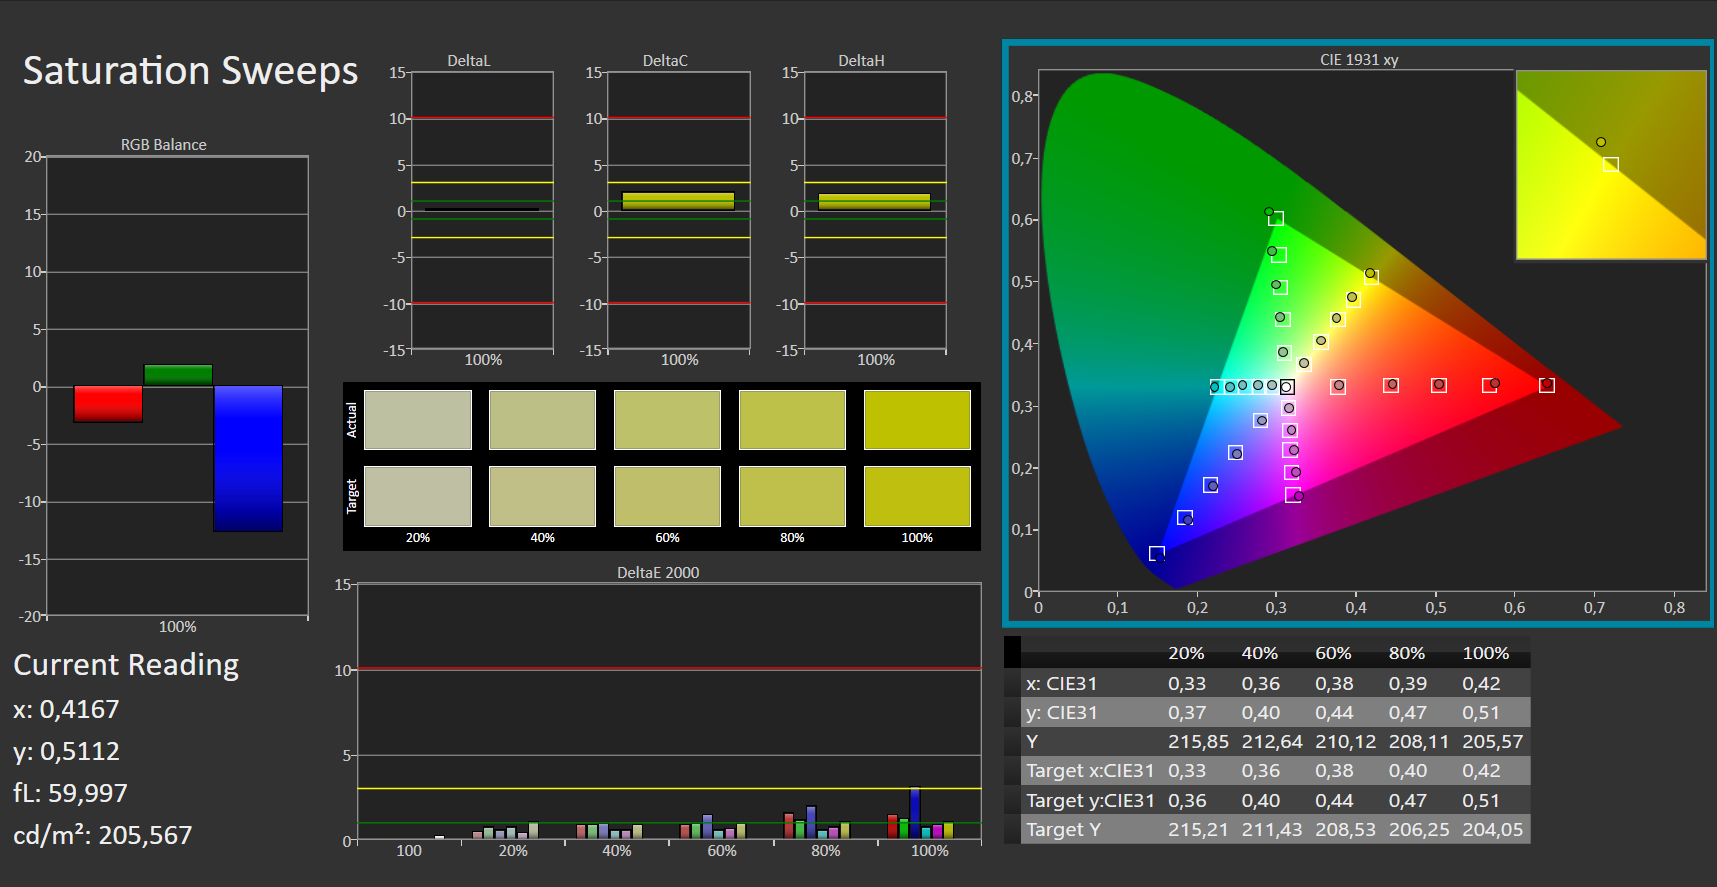
Display - A first-rate 240-Hz display

Our model uses a 15.6-inch IPS display with a resolution of 1920 x 1080 pixels (Full-HD) and a refresh rate of 240 Hz. The latter ensures that mouse and Window movements on the desktop as well as action-rich games appear extremely smooth. The matte panel is also Dolby Vision and HDR400 certified, which ensures a decent display of the corresponding HDR contents. For the Core-i5 version of the Legion 7, you have the choice between a 144-Hz panel with a 300 cd/m² brightness and a 144-Hz panel with Dolby Vision, HDR400, and 500 cd/m² brightness. In contrast, the display option of our test unit is reserved for the Core-i7 and i9 devices.
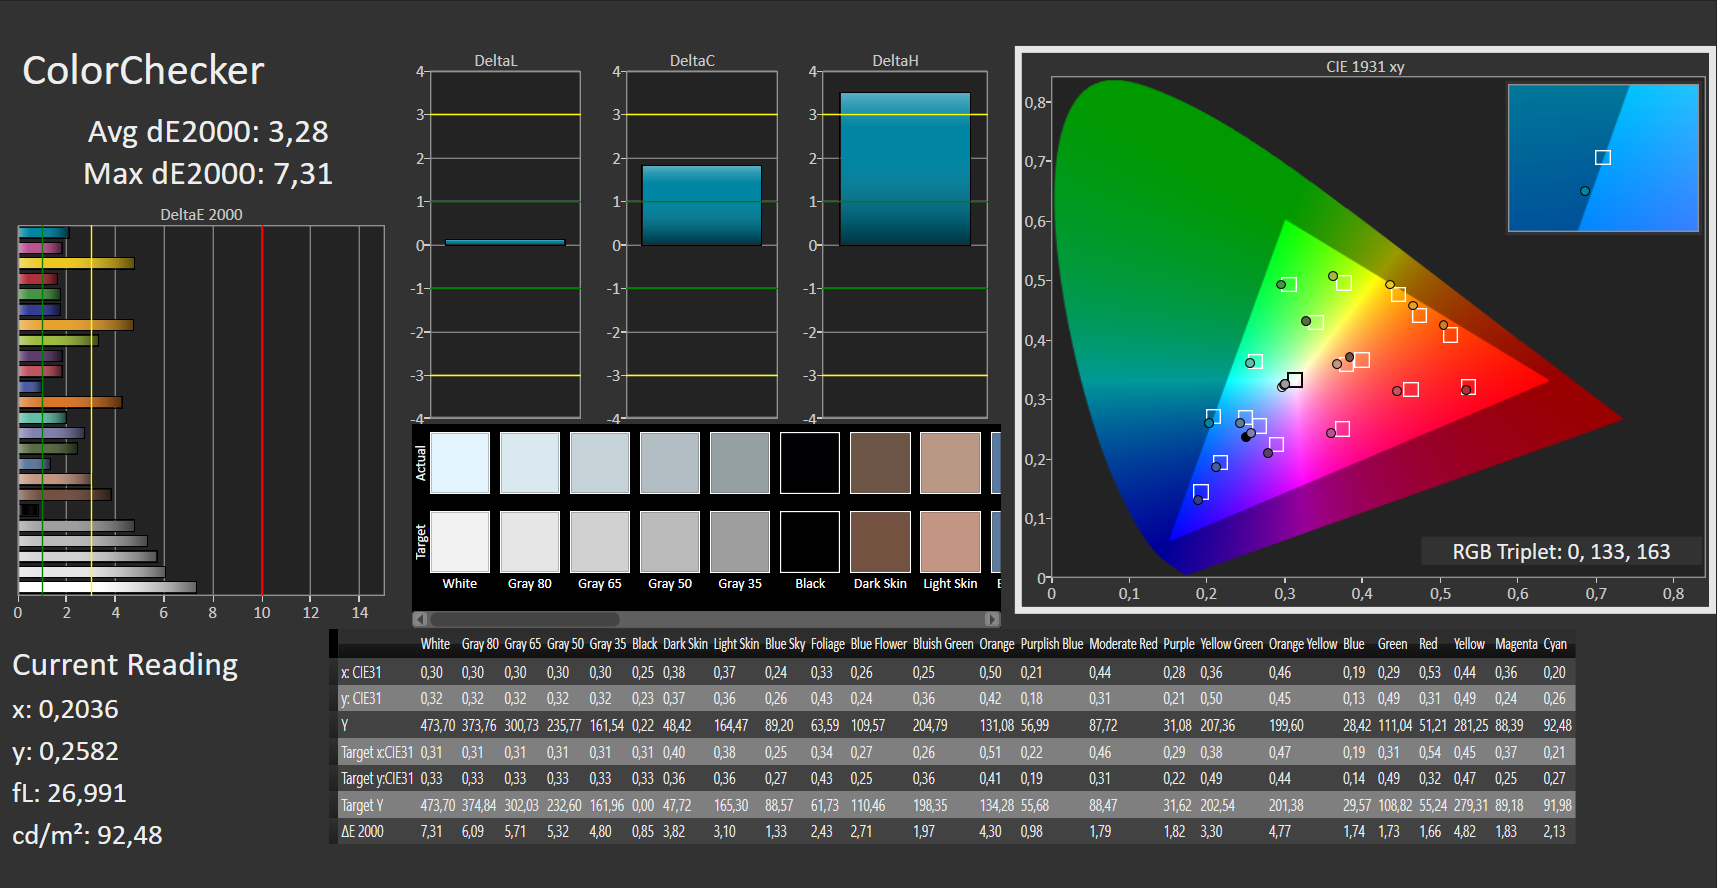
Compared to the competing devices, the display of the Lenovo Legion 7 does exceptionally well and is able to score with good response times and a high maximum brightness among other things. The brightness distribution of 85%, on the other hand, is the lowest in the whole comparison field.
| |||||||||||||||||||||||||
Brightness Distribution: 85 %
Center on Battery: 472 cd/m²
Contrast: 2238:1 (Black: 0.21 cd/m²)
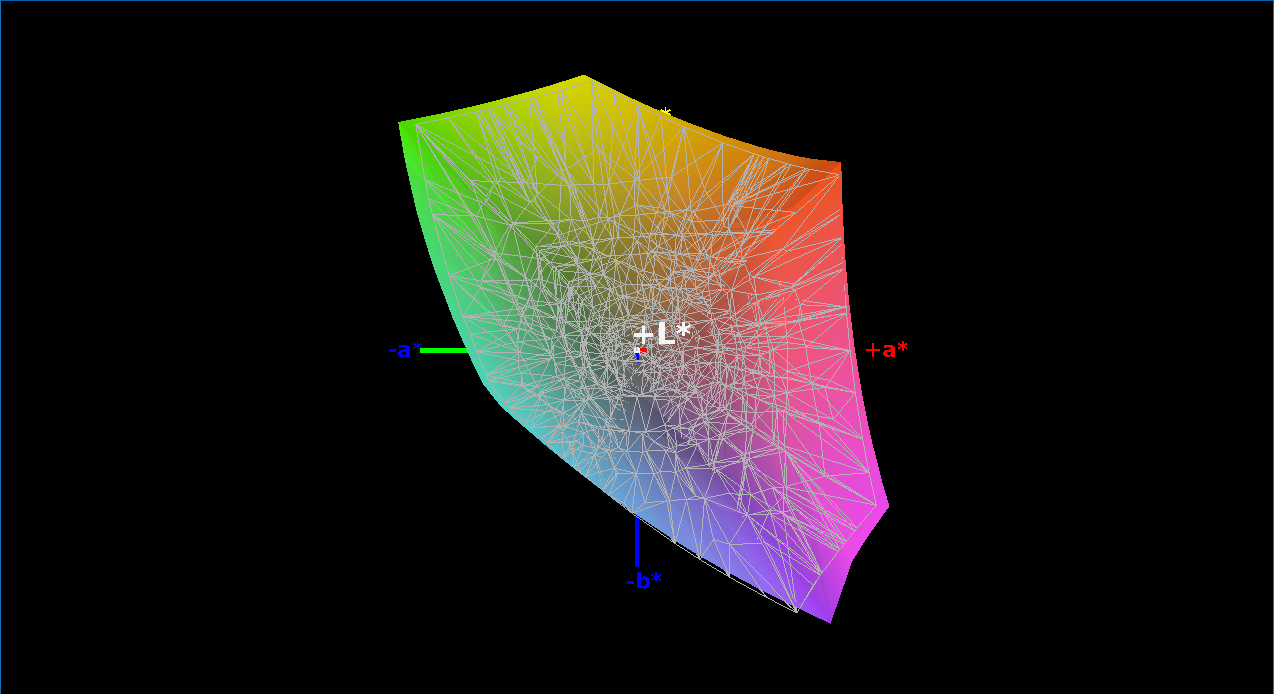
ΔE ColorChecker Calman: 3.28 | ∀{0.5-29.43 Ø4.72}
calibrated: 0.8
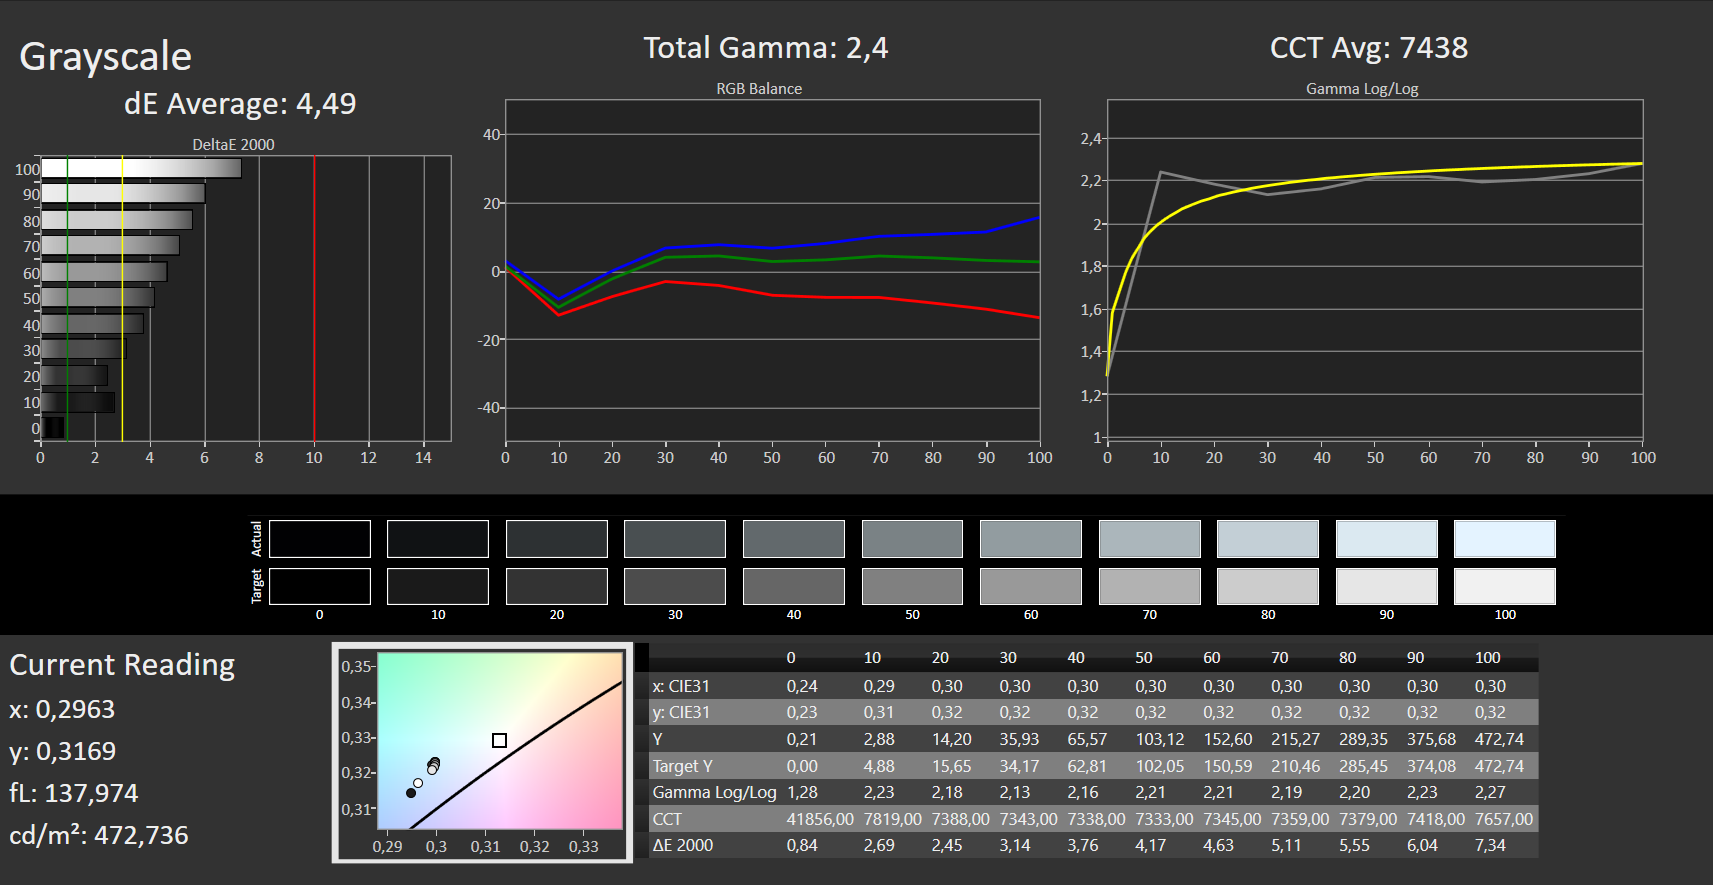
ΔE Greyscale Calman: 4.49 | ∀{0.09-98 Ø4.97}
99% sRGB (Argyll 1.6.3 3D)
65% AdobeRGB 1998 (Argyll 1.6.3 3D)
71.3% AdobeRGB 1998 (Argyll 3D)
99.4% sRGB (Argyll 3D)
70.3% Display P3 (Argyll 3D)
Gamma: 2.4
CCT: 7438 K
| Lenovo Legion 7 15IMH05-81YT001VGE AUO048E, IPS, 1920x1080, 15.6" | MSI GS66 10SGS AU Optronics B156HAN12.0, IPS, 1920x1080, 15.6" | Acer Predator Triton 500 PT515-52-70N3 AUO B156HAN12.0 (AUO7A8C), IPS, 1920x1080, 15.6" | Alienware m15 R3 P87F AU Optronics B156HAN, IPS, 1920x1080, 15.6" | Asus ROG Strix Scar 15 G532LWS AU Optronics B156HAN12.0, IPS, 1920x1080, 15.6" | Razer Blade 15 RTX 2080 Super Max-Q AU Optronics B156HAN12.0, IPS, 1920x1080, 15.6" | |
|---|---|---|---|---|---|---|
| Display | -0% | 0% | -2% | -0% | 0% | |
| Display P3 Coverage (%) | 70.3 | 69.9 -1% | 70.3 0% | 68.6 -2% | 69.9 -1% | 70.2 0% |
| sRGB Coverage (%) | 99.4 | 99.1 0% | 99.5 0% | 98.9 -1% | 99.6 0% | 99 0% |
| AdobeRGB 1998 Coverage (%) | 71.3 | 71.1 0% | 72.2 1% | 69.8 -2% | 71.4 0% | 71.4 0% |
| Response Times | -33% | -55% | 8% | -48% | 6% | |
| Response Time Grey 50% / Grey 80% * (ms) | 8 ? | 11.2 ? -40% | 14.4 ? -80% | 4 ? 50% | 14.4 ? -80% | 6 ? 25% |
| Response Time Black / White * (ms) | 8 ? | 10 ? -25% | 10.4 ? -30% | 10.8 ? -35% | 9.2 ? -15% | 9 ? -13% |
| PWM Frequency (Hz) | ||||||
| Screen | -3% | -19% | -17% | -1% | -7% | |
| Brightness middle (cd/m²) | 470 | 339.4 -28% | 320 -32% | 326.7 -30% | 307.2 -35% | 347 -26% |
| Brightness (cd/m²) | 468 | 331 -29% | 318 -32% | 316 -32% | 301 -36% | 328 -30% |
| Brightness Distribution (%) | 85 | 92 8% | 88 4% | 87 2% | 91 7% | 89 5% |
| Black Level * (cd/m²) | 0.21 | 0.24 -14% | 0.24 -14% | 0.33 -57% | 0.21 -0% | 0.285 -36% |
| Contrast (:1) | 2238 | 1414 -37% | 1333 -40% | 990 -56% | 1463 -35% | 1218 -46% |
| Colorchecker dE 2000 * | 3.28 | 1.58 52% | 4.03 -23% | 2.4 27% | 1.85 44% | 2.35 28% |
| Colorchecker dE 2000 max. * | 7.31 | 3.8 48% | 8.43 -15% | 6.06 17% | 3.92 46% | 4.15 43% |
| Colorchecker dE 2000 calibrated * | 0.8 | 1.47 -84% | 0.98 -22% | 1.51 -89% | 1.26 -58% | 1.16 -45% |
| Greyscale dE 2000 * | 4.49 | 2.3 49% | 5.94 -32% | 3.2 29% | 2 55% | 3.04 32% |
| Gamma | 2.4 92% | 2.24 98% | 2.42 91% | 2.13 103% | 2.15 102% | 2.35 94% |
| CCT | 7438 87% | 6952 93% | 6751 96% | 7129 91% | 6479 100% | 6658 98% |
| Color Space (Percent of AdobeRGB 1998) (%) | 65 | 64.8 0% | 66 2% | 63.7 -2% | 65 0% | 65 0% |
| Color Space (Percent of sRGB) (%) | 99 | 99.4 0% | 99 0% | 99.2 0% | 99.7 1% | 99 0% |
| Total Average (Program / Settings) | -12% /
-6% | -25% /
-20% | -4% /
-11% | -16% /
-7% | -0% /
-4% |
* ... smaller is better
The HDR certifications attest the display with a good contrast, which we are also able to confirm with our independent measurement. The black value is only 0.21, resulting a contrast ratio of 2238:1. Dark movie sequences are reproduced well and the image appears sharp, despite the matte panel.
The color space coverage lies at 99% of the sRGB and 65% of the AdobeRGB color space, which is similar to the other competitors. These values are more than sufficient for gaming, and the display is also suited for image processing to a limited extent.
Due to the high brightness and matte panel technology, the display is also well-suited for outdoor use. While you should still avoid direct sunlight, the display is still readable without any problems even on bright but cloudy days outdoors.
Display Response Times
| ↔ Response Time Black to White | ||
|---|---|---|
| 8 ms ... rise ↗ and fall ↘ combined | ↗ 4 ms rise | 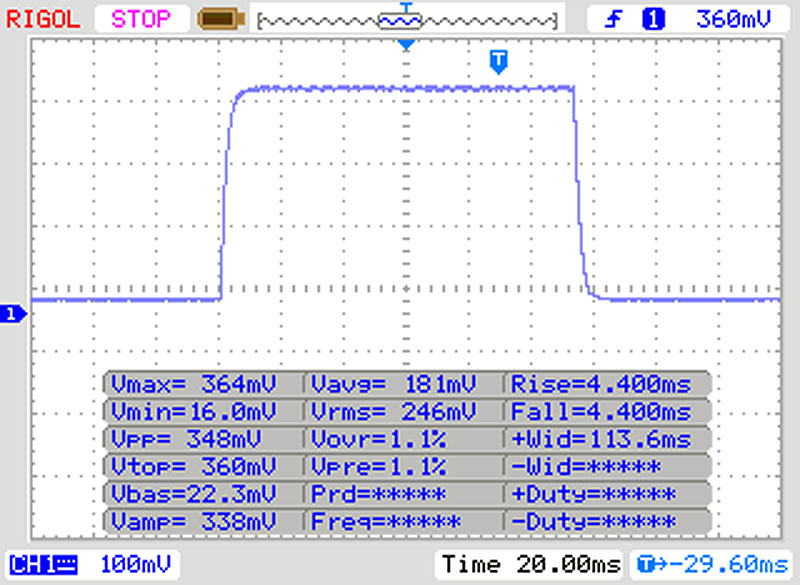 |
| ↘ 4 ms fall | ||
| The screen shows fast response rates in our tests and should be suited for gaming. In comparison, all tested devices range from 0.1 (minimum) to 240 (maximum) ms. » 22 % of all devices are better. This means that the measured response time is better than the average of all tested devices (19.8 ms). | ||
| ↔ Response Time 50% Grey to 80% Grey | ||
| 8 ms ... rise ↗ and fall ↘ combined | ↗ 4 ms rise | 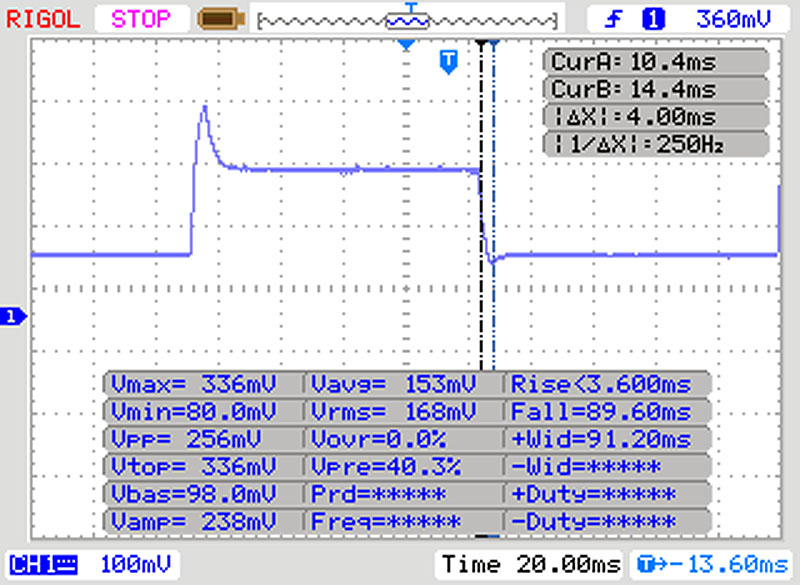 |
| ↘ 4 ms fall | ||
| The screen shows fast response rates in our tests and should be suited for gaming. In comparison, all tested devices range from 0.165 (minimum) to 636 (maximum) ms. » 21 % of all devices are better. This means that the measured response time is better than the average of all tested devices (31 ms). | ||
Screen Flickering / PWM (Pulse-Width Modulation)
| Screen flickering / PWM not detected | 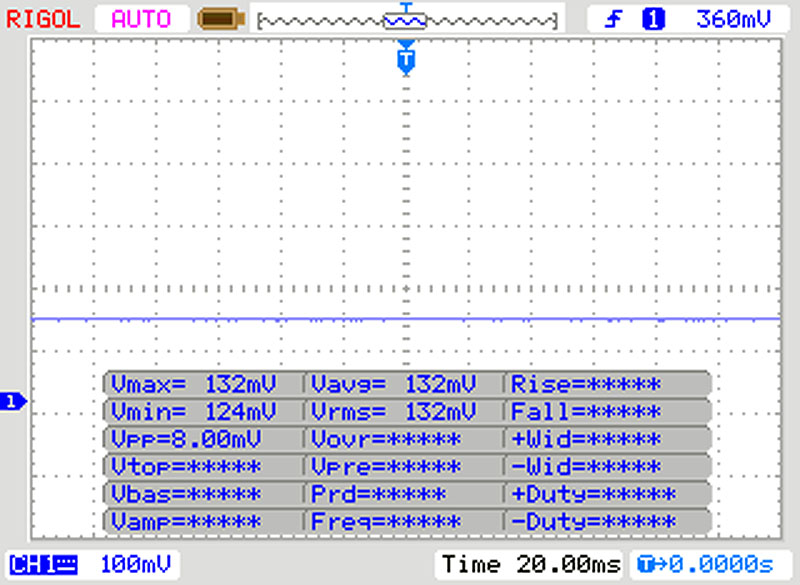 | ||
In comparison: 52 % of all tested devices do not use PWM to dim the display. If PWM was detected, an average of 7750 (minimum: 5 - maximum: 343500) Hz was measured. | |||

The stability of the viewing angles is very good as typical for IPS panels, and the observed brightness only decreases slightly when viewing from extremely steep angles.
Performance - The Lenovo notebook offers an enormous amount of power
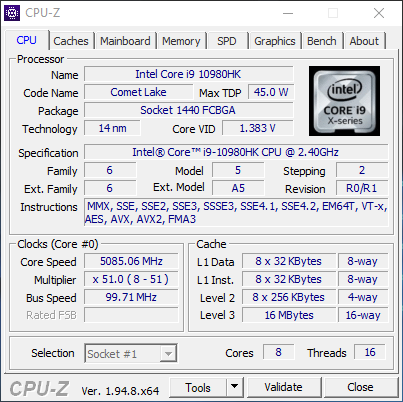
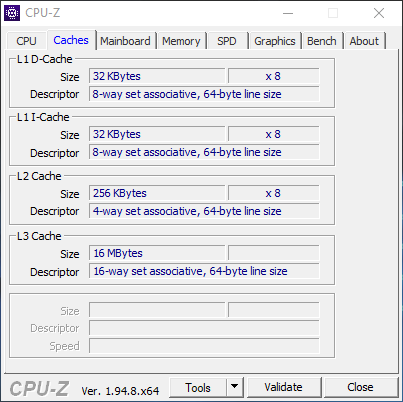
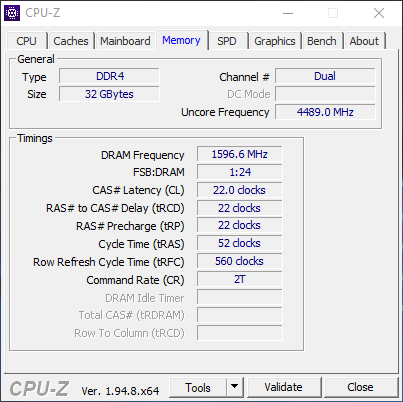
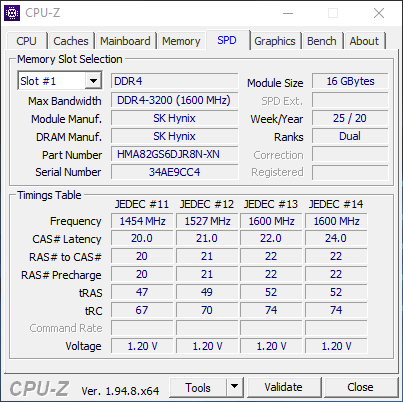
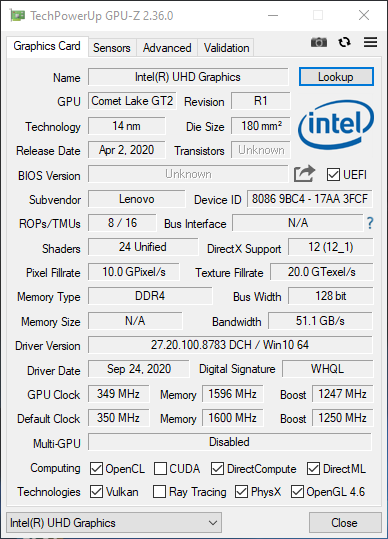
Our test unit is equipped with an Intel Core i9-10980HK with integrated UHD Graphics 630 as well as a dedicated Nvidia GeForce RTX 2080 Super Max-Q. With this combination, our Legion 7 is one of the fastest laptops that are currently available on the market. Alternatively, there are also some models with the Core i7-10750H. The Core-i9 models are equipped with two 16-GB DDR4-3200 RAM modules, and the Core-i7 models, with two 8-GB DDR4-2933 modules. For such powerful hardware, the daily tasks of course represent no challenge at all.
Processor
The Intel Core i9-10980HK is an octa-core processor from Intel's current Comet Lake generation. The basic clock speed of the processor is 2.4 GHz and it can achieve a maximum of up to 5.3 GHz. With load on all 8 cores, the maximum clock speed is 4.4 GHz.
The performance in the Cinebench loop test corresponds to our expectations and lies minimally above that of the Asus Rog Strix Scar 15, which is equipped with the same CPU. The performance remains relatively constant during the whole Cinebench R15 loop test. In battery mode, the CPU performance is throttled.
In the application-specific performance, our Legion 7 finishes head-to-head with the Asus Rog Strix Scar 15, while the CPUs of the rest of the comparison devices are not quite as powerful. Overall, the performance is about at the level of an average Core i9-10980HK that is often also used in larger 17-inch laptops.
You can find additional information and benchmark comparisons on our page on the Intel Core i9-10980HK.
Cinebench R15: CPU Single 64Bit | CPU Multi 64Bit
Blender: v2.79 BMW27 CPU
7-Zip 18.03: 7z b 4 -mmt1 | 7z b 4
Geekbench 5.5: Single-Core | Multi-Core
HWBOT x265 Benchmark v2.2: 4k Preset
LibreOffice : 20 Documents To PDF
R Benchmark 2.5: Overall mean
| Cinebench R20 / CPU (Single Core) | |
| Average of class Gaming (442 - 904, n=105, last 2 years) | |
| Lenovo Legion 7 15IMH05-81YT001VGE | |
| Asus ROG Strix Scar 15 G532LWS | |
| Average Intel Core i9-10980HK (465 - 507, n=13) | |
| Razer Blade 15 RTX 2080 Super Max-Q | |
| Alienware m15 R3 P87F | |
| Acer Predator Triton 500 PT515-52-70N3 | |
| MSI GS66 10SGS | |
| Cinebench R20 / CPU (Multi Core) | |
| Average of class Gaming (4029 - 16108, n=105, last 2 years) | |
| Lenovo Legion 7 15IMH05-81YT001VGE | |
| Average Intel Core i9-10980HK (3526 - 4487, n=13) | |
| Asus ROG Strix Scar 15 G532LWS | |
| Alienware m15 R3 P87F | |
| Acer Predator Triton 500 PT515-52-70N3 | |
| MSI GS66 10SGS | |
| Razer Blade 15 RTX 2080 Super Max-Q | |
| Cinebench R15 / CPU Single 64Bit | |
| Average of class Gaming (188.8 - 344, n=105, last 2 years) | |
| Asus ROG Strix Scar 15 G532LWS | |
| Average Intel Core i9-10980HK (198 - 219, n=15) | |
| Lenovo Legion 7 15IMH05-81YT001VGE | |
| Alienware m15 R3 P87F | |
| Razer Blade 15 RTX 2080 Super Max-Q | |
| Acer Predator Triton 500 PT515-52-70N3 | |
| MSI GS66 10SGS | |
| Cinebench R15 / CPU Multi 64Bit | |
| Average of class Gaming (1578 - 6271, n=104, last 2 years) | |
| Average Intel Core i9-10980HK (1606 - 1862, n=15) | |
| Asus ROG Strix Scar 15 G532LWS | |
| Lenovo Legion 7 15IMH05-81YT001VGE | |
| Alienware m15 R3 P87F | |
| Acer Predator Triton 500 PT515-52-70N3 | |
| MSI GS66 10SGS | |
| Razer Blade 15 RTX 2080 Super Max-Q | |
| Blender / v2.79 BMW27 CPU | |
| Razer Blade 15 RTX 2080 Super Max-Q | |
| MSI GS66 10SGS | |
| Acer Predator Triton 500 PT515-52-70N3 | |
| Alienware m15 R3 P87F | |
| Asus ROG Strix Scar 15 G532LWS | |
| Average Intel Core i9-10980HK (239 - 299, n=13) | |
| Lenovo Legion 7 15IMH05-81YT001VGE | |
| Average of class Gaming (80 - 330, n=103, last 2 years) | |
| 7-Zip 18.03 / 7z b 4 -mmt1 | |
| Average of class Gaming (4199 - 7436, n=104, last 2 years) | |
| Lenovo Legion 7 15IMH05-81YT001VGE | |
| Asus ROG Strix Scar 15 G532LWS | |
| Razer Blade 15 RTX 2080 Super Max-Q | |
| Average Intel Core i9-10980HK (5081 - 5542, n=13) | |
| Acer Predator Triton 500 PT515-52-70N3 | |
| MSI GS66 10SGS | |
| Alienware m15 R3 P87F | |
| 7-Zip 18.03 / 7z b 4 | |
| Average of class Gaming (33491 - 148086, n=104, last 2 years) | |
| Lenovo Legion 7 15IMH05-81YT001VGE | |
| Asus ROG Strix Scar 15 G532LWS | |
| Average Intel Core i9-10980HK (43786 - 49275, n=13) | |
| Razer Blade 15 RTX 2080 Super Max-Q | |
| MSI GS66 10SGS | |
| Alienware m15 R3 P87F | |
| Acer Predator Triton 500 PT515-52-70N3 | |
| Geekbench 5.5 / Single-Core | |
| Average of class Gaming (986 - 2474, n=104, last 2 years) | |
| Asus ROG Strix Scar 15 G532LWS | |
| Lenovo Legion 7 15IMH05-81YT001VGE | |
| Average Intel Core i9-10980HK (1283 - 1401, n=12) | |
| Razer Blade 15 RTX 2080 Super Max-Q | |
| Alienware m15 R3 P87F | |
| Acer Predator Triton 500 PT515-52-70N3 | |
| MSI GS66 10SGS | |
| Geekbench 5.5 / Multi-Core | |
| Average of class Gaming (6460 - 27010, n=104, last 2 years) | |
| Asus ROG Strix Scar 15 G532LWS | |
| Lenovo Legion 7 15IMH05-81YT001VGE | |
| Average Intel Core i9-10980HK (7634 - 8666, n=12) | |
| Razer Blade 15 RTX 2080 Super Max-Q | |
| MSI GS66 10SGS | |
| Alienware m15 R3 P87F | |
| Acer Predator Triton 500 PT515-52-70N3 | |
| HWBOT x265 Benchmark v2.2 / 4k Preset | |
| Average of class Gaming (11.5 - 44.3, n=104, last 2 years) | |
| Lenovo Legion 7 15IMH05-81YT001VGE | |
| Asus ROG Strix Scar 15 G532LWS | |
| Average Intel Core i9-10980HK (12 - 14.6, n=13) | |
| Alienware m15 R3 P87F | |
| Razer Blade 15 RTX 2080 Super Max-Q | |
| Acer Predator Triton 500 PT515-52-70N3 | |
| MSI GS66 10SGS | |
| LibreOffice / 20 Documents To PDF | |
| Alienware m15 R3 P87F | |
| MSI GS66 10SGS | |
| Lenovo Legion 7 15IMH05-81YT001VGE | |
| Average Intel Core i9-10980HK (44 - 89, n=13) | |
| Acer Predator Triton 500 PT515-52-70N3 | |
| Average of class Gaming (33.2 - 88.8, n=104, last 2 years) | |
| Asus ROG Strix Scar 15 G532LWS | |
| Razer Blade 15 RTX 2080 Super Max-Q | |
| R Benchmark 2.5 / Overall mean | |
| Alienware m15 R3 P87F | |
| MSI GS66 10SGS | |
| Acer Predator Triton 500 PT515-52-70N3 | |
| Razer Blade 15 RTX 2080 Super Max-Q | |
| Average Intel Core i9-10980HK (0.561 - 0.596, n=13) | |
| Lenovo Legion 7 15IMH05-81YT001VGE | |
| Asus ROG Strix Scar 15 G532LWS | |
| Average of class Gaming (0.3439 - 0.759, n=105, last 2 years) | |
* ... smaller is better
System Performance
Due to the extremely fast CPU and the RAID-0 configuration, the system performance of the Legion 7 is excellent, causing it to achieve top values all across the board in the PCMark benchmark, except for the Essentials test, where the Acer Triton 500 finishes first. Our test model also needs not fear the comparison with other laptops that are equipped with the same CPU-GPU combination. In everyday usage, those relatively small differences of a few percentage points are hardly noticeable, and subjectively all of the comparison devices perform at a very high level in terms of the speed.
| PCMark 10 Score | 6574 points | |
Help | ||
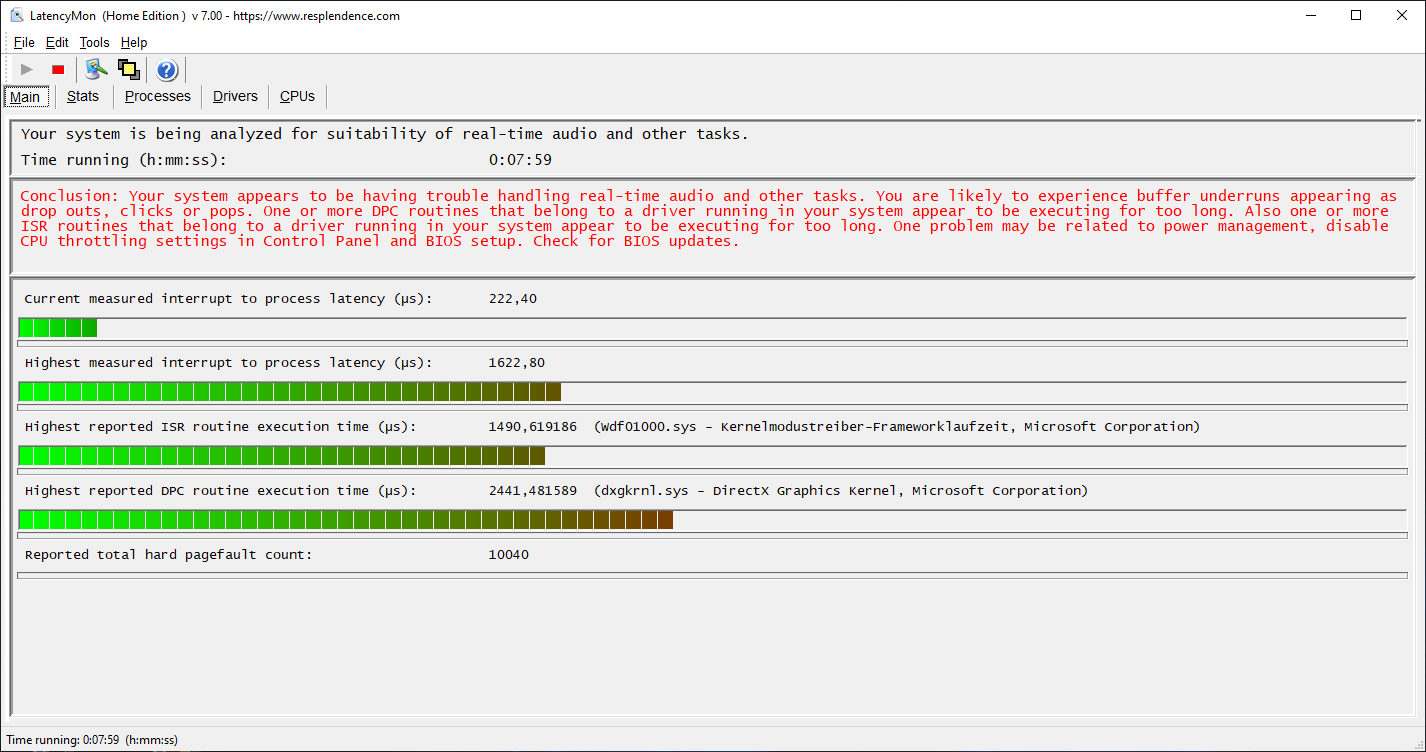
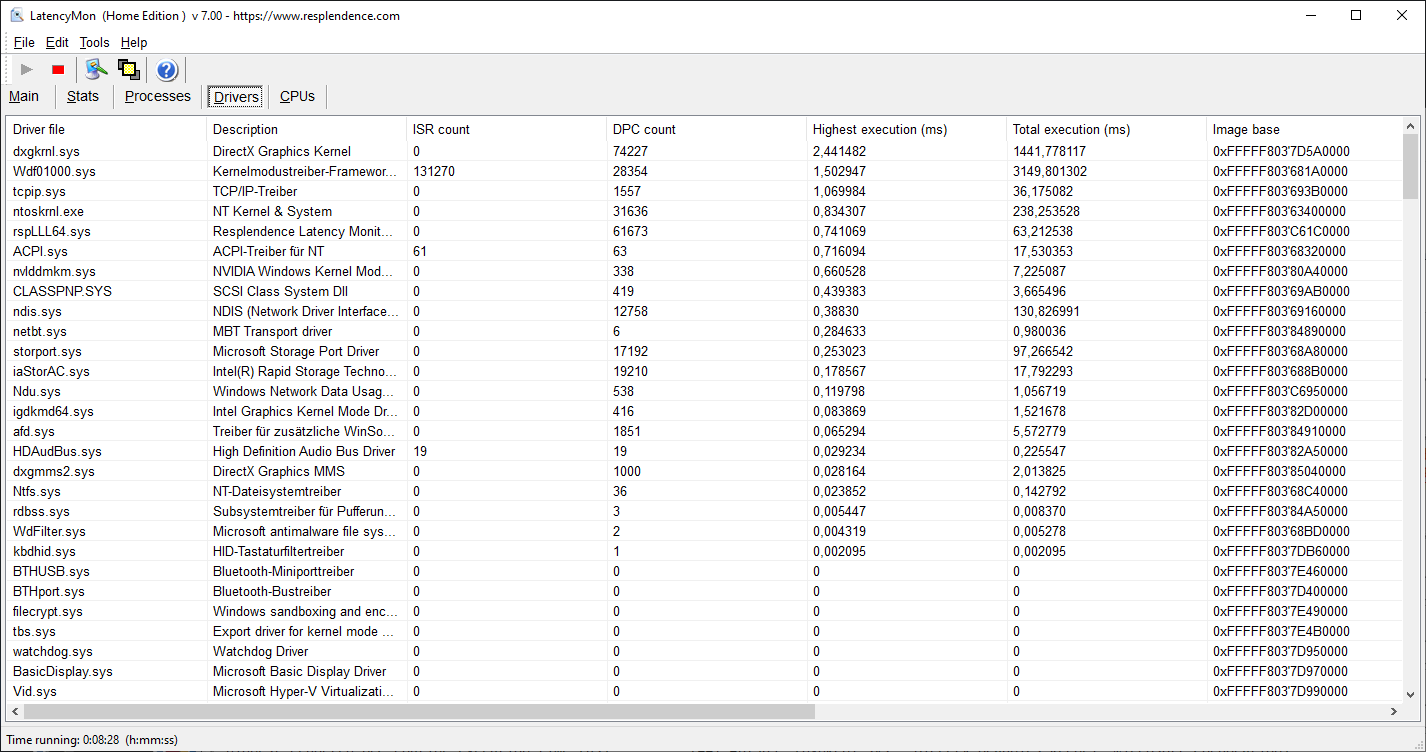
DPC Latencies
In our standardized test, LatencyMon reveals some problematic DPC latencies, which means that the Legion 7 we are using is not suitable as is for real-time processing of video and audio files.
| DPC Latencies / LatencyMon - interrupt to process latency (max), Web, Youtube, Prime95 | |
| Acer Predator Triton 500 PT515-52-70N3 | |
| Lenovo Legion 7 15IMH05-81YT001VGE | |
| Asus ROG Strix Scar 15 G532LWS | |
| MSI GS66 10SGS | |
| Alienware m15 R3 P87F | |
| Razer Blade 15 RTX 2080 Super Max-Q | |
* ... smaller is better
Storage Solution
The two built-in Samsung PM981 SSDs run in RAID 0 configuration and are thus able to increase their very high performance even more. However, compared to a single PM981, this is only possible in some particular situations, so the PM981s in the Razer Blade 15 and Acer Predator Triton 500 do similarly well overall. The RAID 0 Micron SSDs in the Alienware m15 R3 place last.
You can find additional benchmark comparisons in our hard drive and SSD table.
| Lenovo Legion 7 15IMH05-81YT001VGE 2x Samsung PM981a MZVLB1T0HBLR (RAID 0) | MSI GS66 10SGS Samsung SSD PM981 MZVLB512HAJQ | Acer Predator Triton 500 PT515-52-70N3 Samsung SSD PM981a MZVLB512HBJQ | Alienware m15 R3 P87F 2x Micron 2200S 512 GB (RAID 0) | Asus ROG Strix Scar 15 G532LWS 2x Intel SSD 660p 1TB SSDPEKNW010T8 (RAID 0) | Razer Blade 15 RTX 2080 Super Max-Q Samsung PM981a MZVLB1T0HBLR | Average 2x Samsung PM981a MZVLB1T0HBLR (RAID 0) | |
|---|---|---|---|---|---|---|---|
| CrystalDiskMark 5.2 / 6 | -7% | -5% | -14% | -7% | 1% | 17% | |
| Write 4K (MB/s) | 110.4 | 132.5 20% | 131.7 19% | 67.3 -39% | 128.4 16% | 135.7 23% | 175.9 ? 59% |
| Read 4K (MB/s) | 55.1 | 45.03 -18% | 47.34 -14% | 41.47 -25% | 53.7 -3% | 46.98 -15% | 49.7 ? -10% |
| Write Seq (MB/s) | 1987 | 2884 | 2239 | 1875 | 2180 | 4078 ? | |
| Read Seq (MB/s) | 1434 | 2303 | 2112 | 2315 | 1949 | 3653 ? | |
| Write 4K Q32T1 (MB/s) | 466.6 | 467.5 0% | 423.9 -9% | 488.9 5% | 427.2 -8% | 510 9% | 540 ? 16% |
| Read 4K Q32T1 (MB/s) | 517 | 536 4% | 487.7 -6% | 557 8% | 440.7 -15% | 569 10% | 456 ? -12% |
| Write Seq Q32T1 (MB/s) | 3424 | 2003 -42% | 2822 -18% | 2654 -22% | 2793 -18% | 2984 -13% | 4457 ? 30% |
| Read Seq Q32T1 (MB/s) | 3519 | 3306 -6% | 3478 -1% | 3137 -11% | 3101 -12% | 3238 -8% | 5307 ? 51% |
| Write 4K Q8T8 (MB/s) | 1496 | 1496 ? 0% | |||||
| Read 4K Q8T8 (MB/s) | 1597 | 1597 ? 0% | |||||
| AS SSD | -12% | 1% | -79% | -15% | -2% | 12% | |
| Seq Read (MB/s) | 3088 | 1086 -65% | 2767 -10% | 2058 -33% | 1982 -36% | 1950 -37% | 3515 ? 14% |
| Seq Write (MB/s) | 2561 | 1901 -26% | 2613 2% | 2316 -10% | 1444 -44% | 2322 -9% | 2878 ? 12% |
| 4K Read (MB/s) | 43.01 | 51 19% | 47.55 11% | 39.72 -8% | 50.3 17% | 45.48 6% | 48.4 ? 13% |
| 4K Write (MB/s) | 102 | 117.3 15% | 98.9 -3% | 62.9 -38% | 120.1 18% | 95.4 -6% | 165.6 ? 62% |
| 4K-64 Read (MB/s) | 1549 | 1503 -3% | 1205 -22% | 1334 -14% | 1016 -34% | 1484 -4% | 1419 ? -8% |
| 4K-64 Write (MB/s) | 1378 | 1721 25% | 2007 46% | 1271 -8% | 1351 -2% | 1887 37% | 1348 ? -2% |
| Access Time Read * (ms) | 0.051 | 0.059 -16% | 0.065 -27% | 0.062 -22% | 0.044 14% | 0.051 -0% | 0.0455 ? 11% |
| Access Time Write * (ms) | 0.037 | 0.1 -170% | 0.038 -3% | 0.388 -949% | 0.109 -195% | 0.038 -3% | 0.04375 ? -18% |
| Score Read (Points) | 1901 | 1662 -13% | 1529 -20% | 1580 -17% | 1264 -34% | 1725 -9% | 1818 ? -4% |
| Score Write (Points) | 1737 | 2029 17% | 2367 36% | 1565 -10% | 1615 -7% | 2215 28% | 1801 ? 4% |
| Score Total (Points) | 4583 | 4588 0% | 4677 2% | 3968 -13% | 3510 -23% | 4843 6% | 4521 ? -1% |
| Copy ISO MB/s (MB/s) | 2684 | 2155 -20% | 1685 -37% | 3474 29% | 1903 -29% | 2919 ? 9% | |
| Copy Program MB/s (MB/s) | 544 | 715 31% | 669 23% | 751 38% | 505 -7% | 706 ? 30% | |
| Copy Game MB/s (MB/s) | 1116 | 1506 35% | 1493 34% | 1684 51% | 1113 0% | 1560 ? 40% | |
| Total Average (Program / Settings) | -10% /
-11% | -2% /
-1% | -47% /
-59% | -11% /
-12% | -1% /
-1% | 15% /
13% |
* ... smaller is better

Constant Performance Reads: DiskSpd Read Loop, Queue Depth 8
Graphics Card
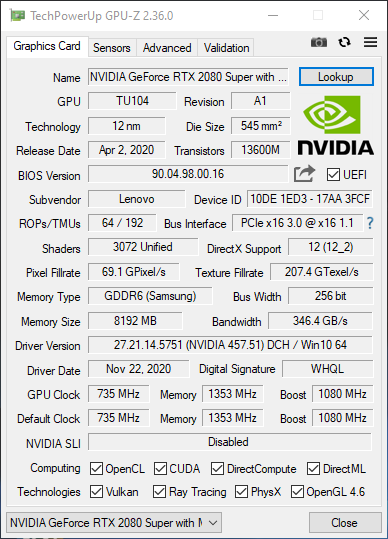
In addition to the integrated UHD Graphics 630, our test unit also uses the Nvidia GeForce RTX 2080 Super Max-Q. The long name promises a very large measure of performance for games, as well as raytracing support. Alternatively, other models with the GeForce RTX 2070 Max-Q or the RTX 2070 Super Max-Q are also available.
In the 3DMark benchmarks, the Legion 7 succeeds in moving far ahead of the competitors. This is probably partly due to its slightly unusual combination of top CPU and GPU, since all the comparison devices are equipped with a Core i7 or mobile version of the GeForce RTX 2070. The GeForce RTX 2080 Max-Q used here is also able to use its performance particularly well, making it about 4 to 5% faster than the average RTX 2080 Super Max-Q. In battery mode, the graphics performance is slightly limited.
You can find additional information and benchmark comparisons on our page on the Nvidia GeForce RTX 2080 Super Max-Q.
| 3DMark 11 Performance | 26066 points | |
| 3DMark Fire Strike Score | 19229 points | |
| 3DMark Fire Strike Extreme Score | 10158 points | |
| 3DMark Time Spy Score | 8621 points | |
Help | ||
Gaming Performance
The gaming performance of the Lenovo Legion 7 is considerable. Even current games run in the highest settings and at high frame rates most of the time. While you then won't be able to use the full potential of the 240-Hz display anymore, its advantages still remain to some extent, even in this case. Alternatively, you can also chase after frame rates in less demanding e-sports shooters such as "CS:GO" or "Overwatch" and enjoy some extraordinarily smooth gaming action.
In our "The Witcher 3" stability test where the gaming character is not moved, the frame rate does not drop noticeably. You therefore do not have to expect any limitations due to annoying background activities.
| low | med. | high | ultra | |
|---|---|---|---|---|
| The Witcher 3 (2015) | 345 | 245 | 160 | 88.8 |
| Dota 2 Reborn (2015) | 156 | 141 | 134 | 128 |
| X-Plane 11.11 (2018) | 114 | 104 | 87.6 | |
| Far Cry 5 (2018) | 154 | 122 | 116 | 110 |
| Shadow of the Tomb Raider (2018) | 150 | 120 | 116 | 106 |
| Battlefield V (2018) | 173 | 148 | 135 | 125 |
Emissions - The Legion 7 with an effective cooling solution
Noise Emissions
During idle operation and under low load, the fans mostly remain turned off and the laptop is completely silent. However, the fact that the Legion can become very loud under load and during gaming operation will hardly surprise anyone. The fans will then produce a clearly audible whirring noise with a frequency that could be considered somewhere between the middle and high frequencies. You could only call that quiet, when you compare it to the competitors. The Asus Rog Strix Scar 15 and also MSI's GS66 are even louder.
If you place your ear close to the keyboard of our test unit, you can hear some quiet electronic noises. However, they are not audible in normal operation and from a regular distance to the laptop.
Noise level
| Idle |
| 24.4 / 24.4 / 24.4 dB(A) |
| Load |
| 49.3 / 46.6 dB(A) |
 | ||
30 dB silent 40 dB(A) audible 50 dB(A) loud |
||
min: | ||
Temperature
In our model, the cooling solution consists of a vapor chamber and two fans with a particularly large amount of fan blades that are supposed to ensure a better cooling performance. In idle operation, the temperature development remains within limits. The palm rests remain cool even while playing "The Witcher 3," and the warmest spot on the top then reaches a temperature of 36.5 °C (98 °F). Overall, the cooling solution gives the impression of being able to handle the hardware, which is enormously powerful, particularly for a 15-inch laptop.
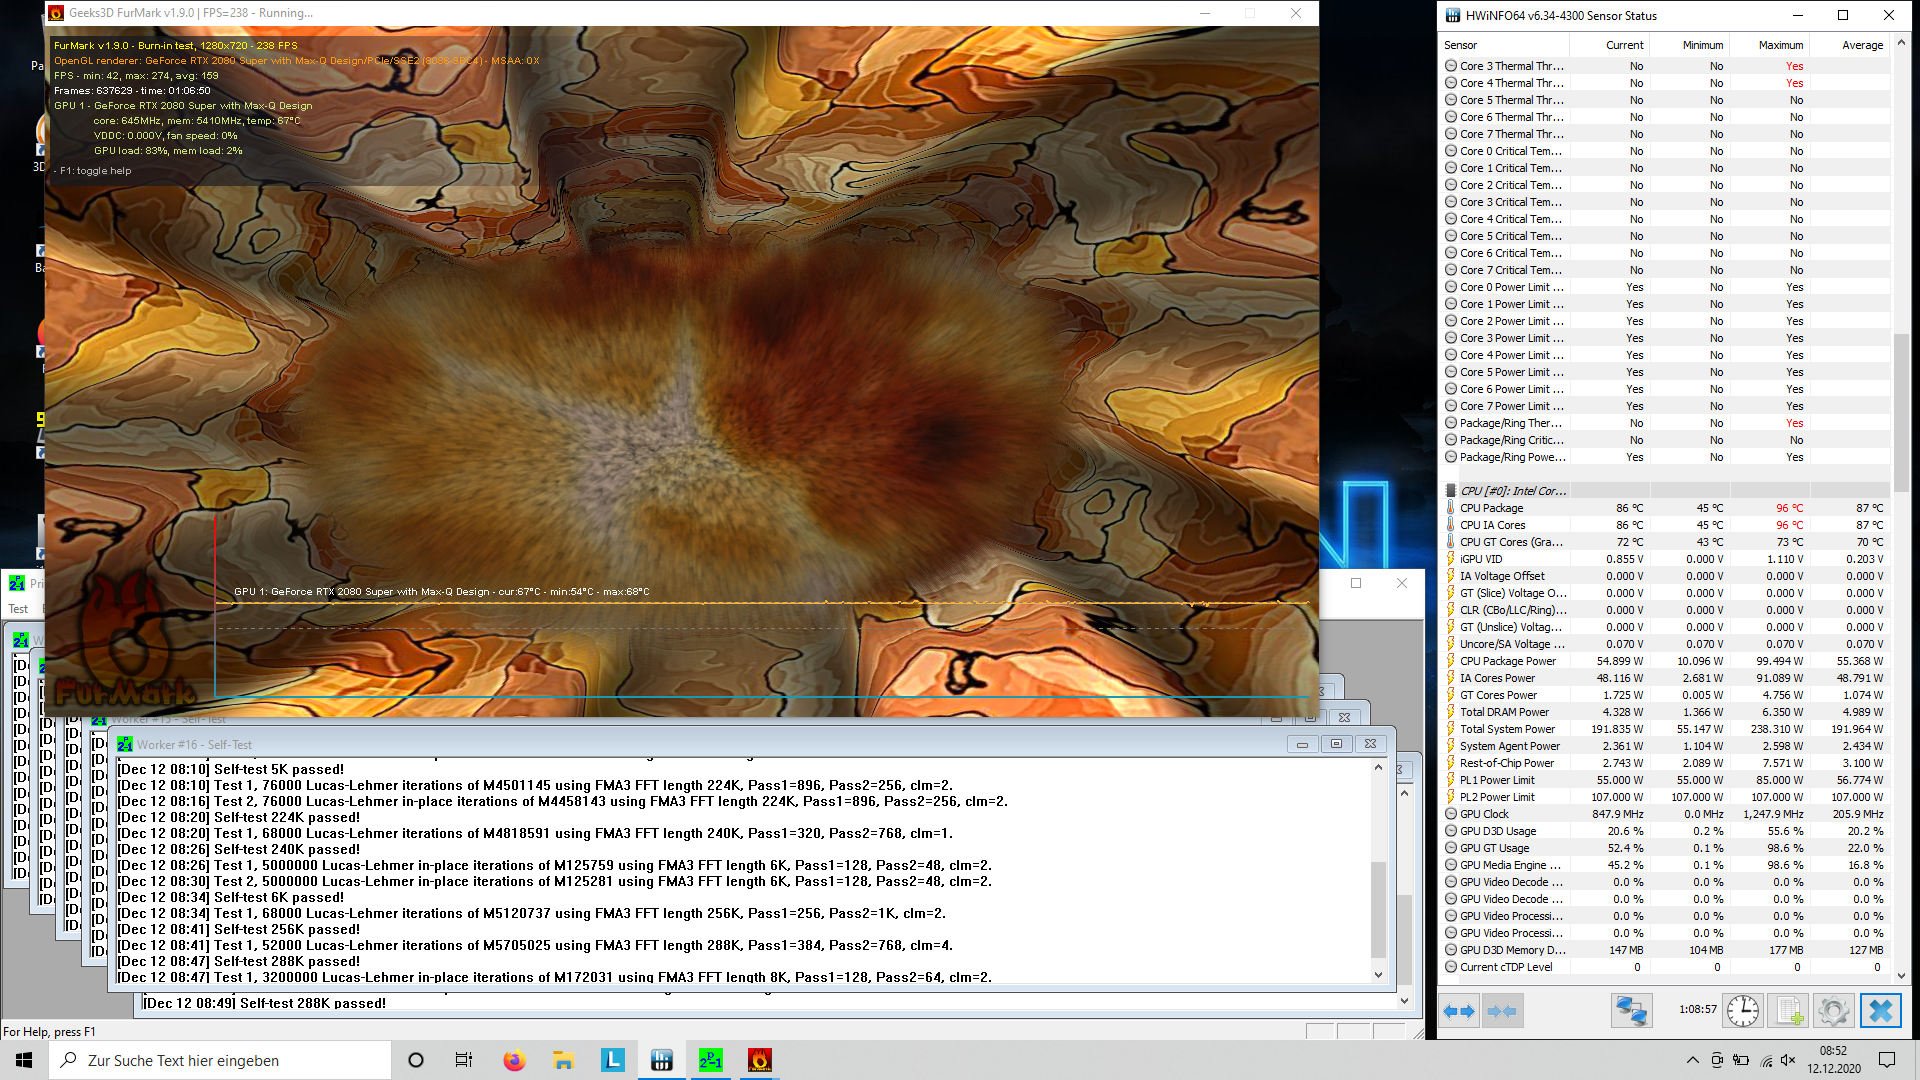
In the stress test with Prime95 and FurMark, the CPU clock speed initially jumps to about 4.8 GHz and then drops into the 3.7 to 3.8-GHz range after a short time, before it finally stabilizes at around 2.7 to 2.8 GHz. The CPU initially reaches a temperature of 96 °C (205 °F), but then starts dropping to finally level out at 86 °C (187 °F). The speed does not go below the basic clock speed. In the beginning, the GPU speed varies strongly in the range from 1100 to 1590 MHz, while the core temperature slowly increases from 65 to 70 °C (149 to 158 °F). As time goes on, the GPU lowers its speed and then stabilizes at 1100 to 1200 MHz - and for short time periods the clock speed also drops to lower values.
(+) The maximum temperature on the upper side is 35.2 °C / 95 F, compared to the average of 40.4 °C / 105 F, ranging from 21.2 to 68.8 °C for the class Gaming.
(+) The bottom heats up to a maximum of 32.5 °C / 91 F, compared to the average of 43.2 °C / 110 F
(+) In idle usage, the average temperature for the upper side is 27.3 °C / 81 F, compared to the device average of 33.9 °C / 93 F.
(+) Playing The Witcher 3, the average temperature for the upper side is 31.9 °C / 89 F, compared to the device average of 33.9 °C / 93 F.
(+) The palmrests and touchpad are cooler than skin temperature with a maximum of 30.2 °C / 86.4 F and are therefore cool to the touch.
(±) The average temperature of the palmrest area of similar devices was 28.8 °C / 83.8 F (-1.4 °C / -2.6 F).
Speakers
The stereo speakers integrated above the keyboard are nothing special. They lack bass, and the sound is only able to convince in the high frequency range at most. However, the sound stage appears relatively wide, so that they deserve the label "stereo speakers." Since the maximum volume is also decent, the laptop is also well-suited to watch the occasional movie. External audio devices can be connected via the audio port, USB, or Bluetooth.
Lenovo Legion 7 15IMH05-81YT001VGE audio analysis
(-) | not very loud speakers (70 dB)
Bass 100 - 315 Hz
(±) | reduced bass - on average 12.9% lower than median
(±) | linearity of bass is average (10.4% delta to prev. frequency)
Mids 400 - 2000 Hz
(+) | balanced mids - only 3.5% away from median
(+) | mids are linear (4.8% delta to prev. frequency)
Highs 2 - 16 kHz
(+) | balanced highs - only 2.5% away from median
(+) | highs are linear (6.1% delta to prev. frequency)
Overall 100 - 16.000 Hz
(+) | overall sound is linear (12.4% difference to median)
Compared to same class
» 15% of all tested devices in this class were better, 4% similar, 82% worse
» The best had a delta of 6%, average was 18%, worst was 132%
Compared to all devices tested
» 11% of all tested devices were better, 2% similar, 87% worse
» The best had a delta of 4%, average was 23%, worst was 134%
Asus ROG Strix Scar 15 G532LWS audio analysis
(+) | speakers can play relatively loud (84.1 dB)
Bass 100 - 315 Hz
(±) | reduced bass - on average 9.7% lower than median
(±) | linearity of bass is average (7.8% delta to prev. frequency)
Mids 400 - 2000 Hz
(±) | higher mids - on average 6.4% higher than median
(+) | mids are linear (4.8% delta to prev. frequency)
Highs 2 - 16 kHz
(+) | balanced highs - only 1.9% away from median
(+) | highs are linear (5.5% delta to prev. frequency)
Overall 100 - 16.000 Hz
(+) | overall sound is linear (14.4% difference to median)
Compared to same class
» 27% of all tested devices in this class were better, 7% similar, 66% worse
» The best had a delta of 6%, average was 18%, worst was 132%
Compared to all devices tested
» 18% of all tested devices were better, 4% similar, 78% worse
» The best had a delta of 4%, average was 23%, worst was 134%
Power Management - RTX 2080 Super and Core i9 demand their due
Power Consumption
With an average consumption of only 12.6 watts in idle operation, the Lenovo Legion 7 is one of the two most efficient devices in the comparison field. Only the Asus Rog Strix Scar 15 consumes even less power at 9.8 watts on average in idle operation. While our test unit doesn't really demonstrate a really high consumption under load either, the MSI GS66 10SGS and the Acer Predator Triton 500 are slightly more efficient on average here.
When playing "The Witcher 3" with the "Ultra" graphics preset, which represents a more realistic load scenario, the power consumption lies at 159 watts, which is higher than for the other RTX 2080 Super Max Q based models. This is probably due to the faster CPU. In contrast, the RTX 2070 Mobile and 2070 Super Mobile in the Alienware m15 R3 and Asus Rog Strix Scar 15 are slightly more power hungry. Since we measured the maximum consumption at 216 watts, the performance of the large power supply rated at 230 watts is more than sufficient.
| Off / Standby | |
| Idle | |
| Load |
|
Key:
min: | |
| Lenovo Legion 7 15IMH05-81YT001VGE i9-10980HK, GeForce RTX 2080 Super Max-Q, 2x Samsung PM981a MZVLB1T0HBLR (RAID 0), IPS, 1920x1080, 15.6" | MSI GS66 10SGS i7-10750H, GeForce RTX 2080 Super Max-Q, Samsung SSD PM981 MZVLB512HAJQ, IPS, 1920x1080, 15.6" | Acer Predator Triton 500 PT515-52-70N3 i7-10750H, GeForce RTX 2080 Super Max-Q, Samsung SSD PM981a MZVLB512HBJQ, IPS, 1920x1080, 15.6" | Alienware m15 R3 P87F i7-10750H, GeForce RTX 2070 Mobile, 2x Micron 2200S 512 GB (RAID 0), IPS, 1920x1080, 15.6" | Asus ROG Strix Scar 15 G532LWS i9-10980HK, GeForce RTX 2070 Super Mobile, 2x Intel SSD 660p 1TB SSDPEKNW010T8 (RAID 0), IPS, 1920x1080, 15.6" | Razer Blade 15 RTX 2080 Super Max-Q i7-10875H, GeForce RTX 2080 Super Max-Q, Samsung PM981a MZVLB1T0HBLR, IPS, 1920x1080, 15.6" | Average NVIDIA GeForce RTX 2080 Super Max-Q | Average of class Gaming | |
|---|---|---|---|---|---|---|---|---|
| Power Consumption | -25% | -10% | -146% | -20% | 0% | -28% | -30% | |
| Idle Minimum * (Watt) | 9 | 14.9 -66% | 11 -22% | 34 -278% | 8 11% | 10.6 -18% | 12.9 ? -43% | 13 ? -44% |
| Idle Average * (Watt) | 12.6 | 17.5 -39% | 15 -19% | 48.6 -286% | 9.8 22% | 13.1 -4% | 17.3 ? -37% | 18.7 ? -48% |
| Idle Maximum * (Watt) | 17 | 29.5 -74% | 25 -47% | 58.2 -242% | 25.8 -52% | 15.8 7% | 26.9 ? -58% | 24.3 ? -43% |
| Load Average * (Watt) | 115 | 94.8 18% | 95 17% | 129.4 -13% | 169 -47% | 131 -14% | 123.9 ? -8% | 110.2 ? 4% |
| Witcher 3 ultra * (Watt) | 159 | 146.1 8% | 140 12% | 214.5 -35% | 201 -26% | 146 8% | ||
| Load Maximum * (Watt) | 216 | 210.9 2% | 211 2% | 257.3 -19% | 271.6 -26% | 169 22% | 205 ? 5% | 258 ? -19% |
* ... smaller is better
Battery Life
With a gaming laptop from the high-end segment, your expectations shouldn't be too high in terms of the battery life. Here the powerful processors demand their due, so the WLAN runtime of only 3:24 h is relatively low compared to other gaming laptops. Aside from the Alienware m15 R3 that is equipped with the higher-performance Geforce RTX 2070 Max-P, the other comparison devices last for almost 5 hours at least. In our video test (Big Buck Bunny, h.264, 150 cd/m²), the Legion 7 gives up after barely 1:32 h. On the other hand, with a runtime of 1:25 under full load, it achieved an average result.
While at 80 Wh, the battery is relatively small, even the comparison devices with larger batteries are only suitable for mobile usage to a limited extent.
| Lenovo Legion 7 15IMH05-81YT001VGE i9-10980HK, GeForce RTX 2080 Super Max-Q, 80 Wh | MSI GS66 10SGS i7-10750H, GeForce RTX 2080 Super Max-Q, 99.99 Wh | Acer Predator Triton 500 PT515-52-70N3 i7-10750H, GeForce RTX 2080 Super Max-Q, 84 Wh | Alienware m15 R3 P87F i7-10750H, GeForce RTX 2070 Mobile, 86 Wh | Asus ROG Strix Scar 15 G532LWS i9-10980HK, GeForce RTX 2070 Super Mobile, 66 Wh | Razer Blade 15 RTX 2080 Super Max-Q i7-10875H, GeForce RTX 2080 Super Max-Q, 80 Wh | Average of class Gaming | |
|---|---|---|---|---|---|---|---|
| Battery runtime | 59% | 39% | -34% | 26% | 167% | 198% | |
| H.264 (h) | 1.5 | 7.3 387% | 8.64 ? 476% | ||||
| WiFi v1.3 (h) | 3.4 | 6.9 103% | 6.3 85% | 2.8 -18% | 4.9 44% | 6.1 79% | 7.15 ? 110% |
| Load (h) | 1.4 | 1.6 14% | 1.3 -7% | 0.7 -50% | 1.5 7% | 1.9 36% | 1.502 ? 7% |
| Reader / Idle (h) | 10.2 | 8.3 | 5 | 8.1 | 8.7 | 8.71 ? |
Pros
Cons
Verdict - Top performance and display
In the Lenovo Legion 7, the main emphasis is on the pure performance. In games, the Core i9-10980HK and the GeForce RTX 2080 Super Max-Q ensure particularly high frame rates, which can be maintained even under load, thanks to the good cooling system. The 240-Hz display offers a high maximum brightness and has no equal in terms of the display quality. While some of the competitors offer an even higher level of workmanship, our test unit still gives a solid impression due to the metal case, and is also visually attractive. So there are really no reasons for complaint in terms of the fundamental qualities of the laptop.
On the other hand, the input devices leave a lot to be desired. They are a bitter disappointment, particularly if you hope for any similarities to Lenovo's ThinkPads. While it probably isn't absolutely necessary to equip a gaming laptop with the best of touchpads, you should be able to expect a better keyboard in this price class. Even the many user-definable illumination effects don't make up for this.
The Lenovo Legion 7 concentrates on the essential.
However, the largest weakness of the Legion 7 is represented by the timing of its release: The new generation of mobile graphics cards, which will probably bring a large performance jump, might already be introduced as soon as January of next year. So whether you want to get the performance jump or hope for a price reduction, waiting might be worthwhile in either case. In the second case, it might also be worthwhile to observe development the price of the Legion 7, since it is basically an impressive gaming laptop with good workmanship and a first-rate display.
Lenovo Legion 7 15IMH05-81YT001VGE
- 12/23/2020 v7 (old)
Marius Schell
Price comparison

