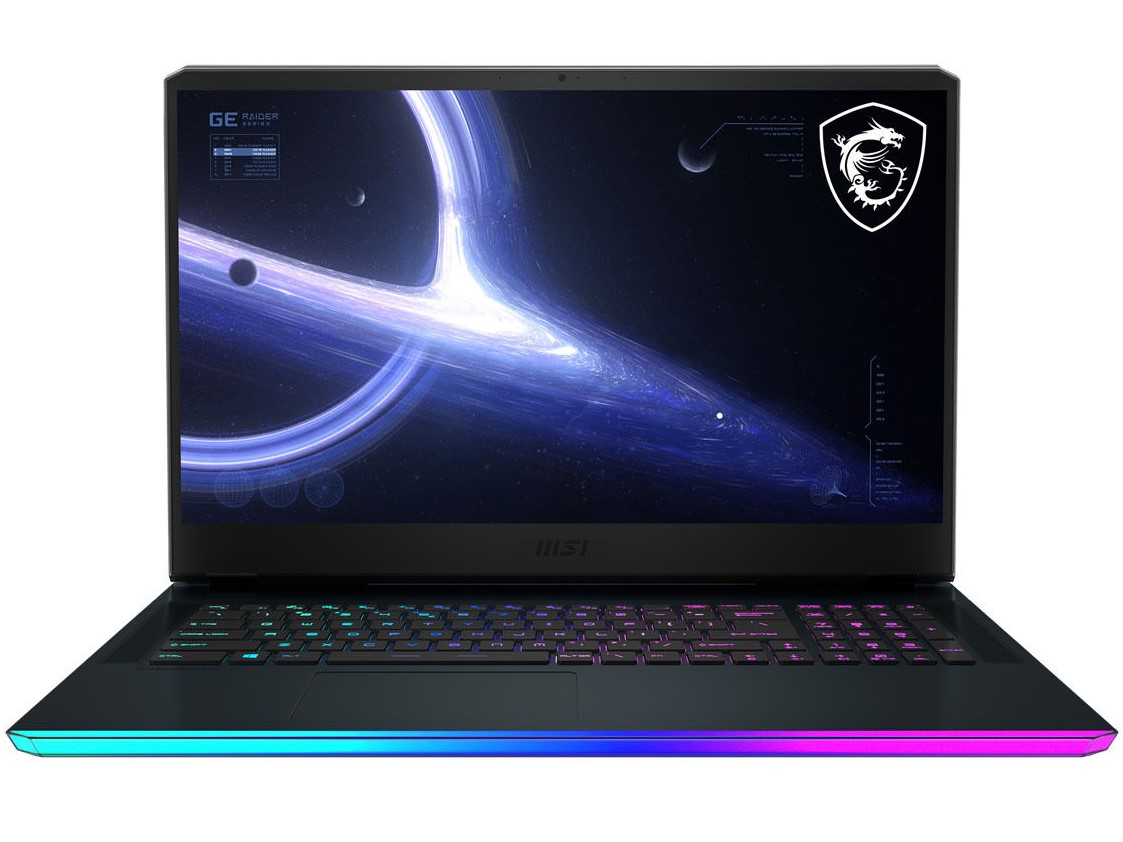
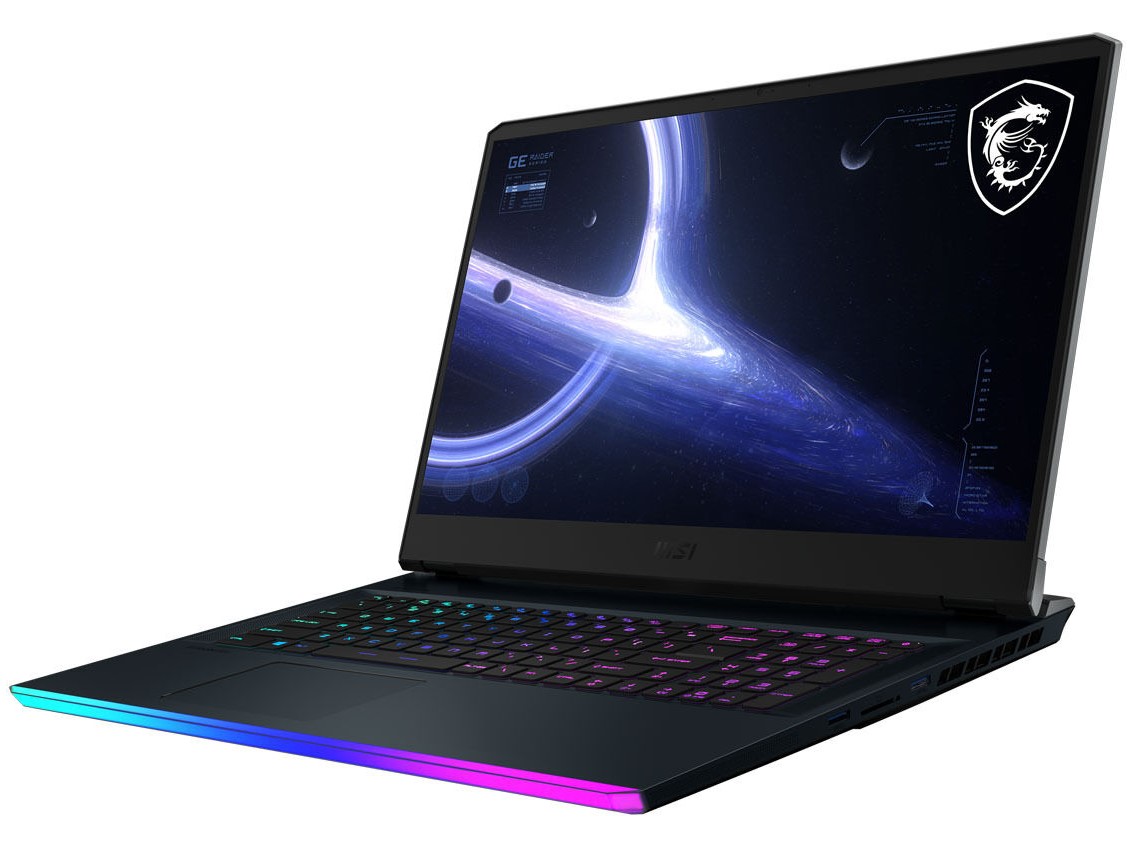
MSI GE76 Raider 11UH in review: High-end gaming laptop offers fast 360 Hz display

We were already able to get an impression of the identical predecessor of the GE76 Raider 11UH with the MSI GE76 Raider 10UH. We expect to find its good characteristics in our current review sample as well, which is equipped with a more up-to-date CPU in the form of an Intel Core i9-11980HK and the same graphics unit in the form of the Nvidia GeForce RTX 3080. In addition, there's 64 GB of RAM, and a 2 TB SSD.
Since nothing has changed externally, we point to the review of the MSI GE76 Raider 10UH in the corresponding sections of the review. Furthermore, we choose the competing devices listed below for the comparison, to which additional laptops from our database can be added under each section.
Update on 08/16/2021: Assessment of the CPU performance of the production model in the "Performance" section.
Possible contenders in comparison
Rating | Date | Model | Weight | Height | Size | Resolution | Price |
|---|---|---|---|---|---|---|---|
| 86.2 % v7 (old) | 09 / 2021 | MSI GE76 Raider 11UH-472US i9-11980HK, GeForce RTX 3080 Laptop GPU | 3 kg | 27.4 mm | 17.30" | 1920x1080 | |
| 87.1 % v7 (old) | 03 / 2021 | MSI GE76 Raider 10UH i7-10870H, GeForce RTX 3080 Laptop GPU | 3 kg | 27.4 mm | 17.30" | 1920x1080 | |
| 88 % v7 (old) | 05 / 2021 | Gigabyte Aero 17 HDR YD i9-11980HK, GeForce RTX 3080 Laptop GPU | 2.8 kg | 22 mm | 17.30" | 3840x2160 | |
| 85.3 % v7 (old) | 04 / 2021 | Alienware m17 R4 i9-10980HK, GeForce RTX 3080 Laptop GPU | 3 kg | 22 mm | 17.30" | 1920x1080 |
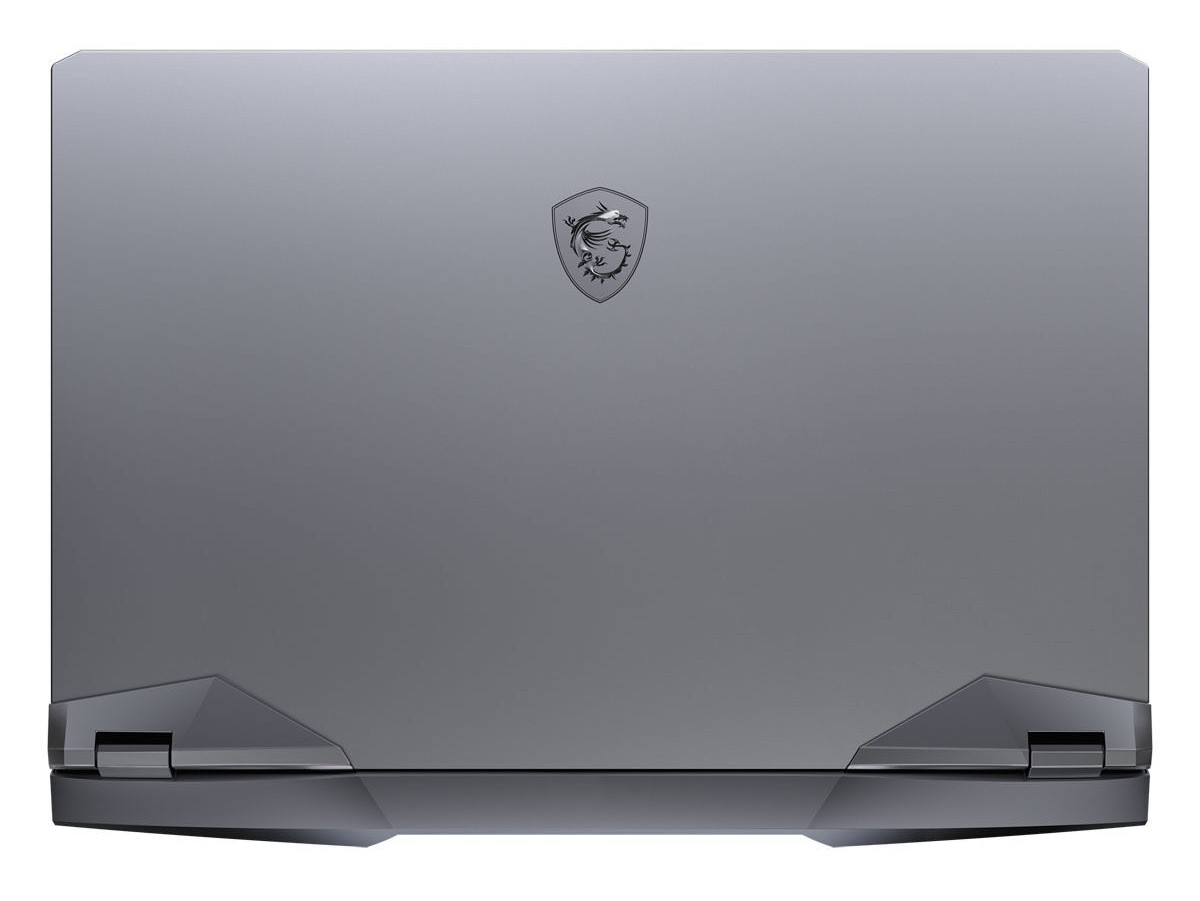
Case - Large and sturdy gaming laptop
A detailed description of the case can be found in the review of the MSI GE76 Raider 10UH.

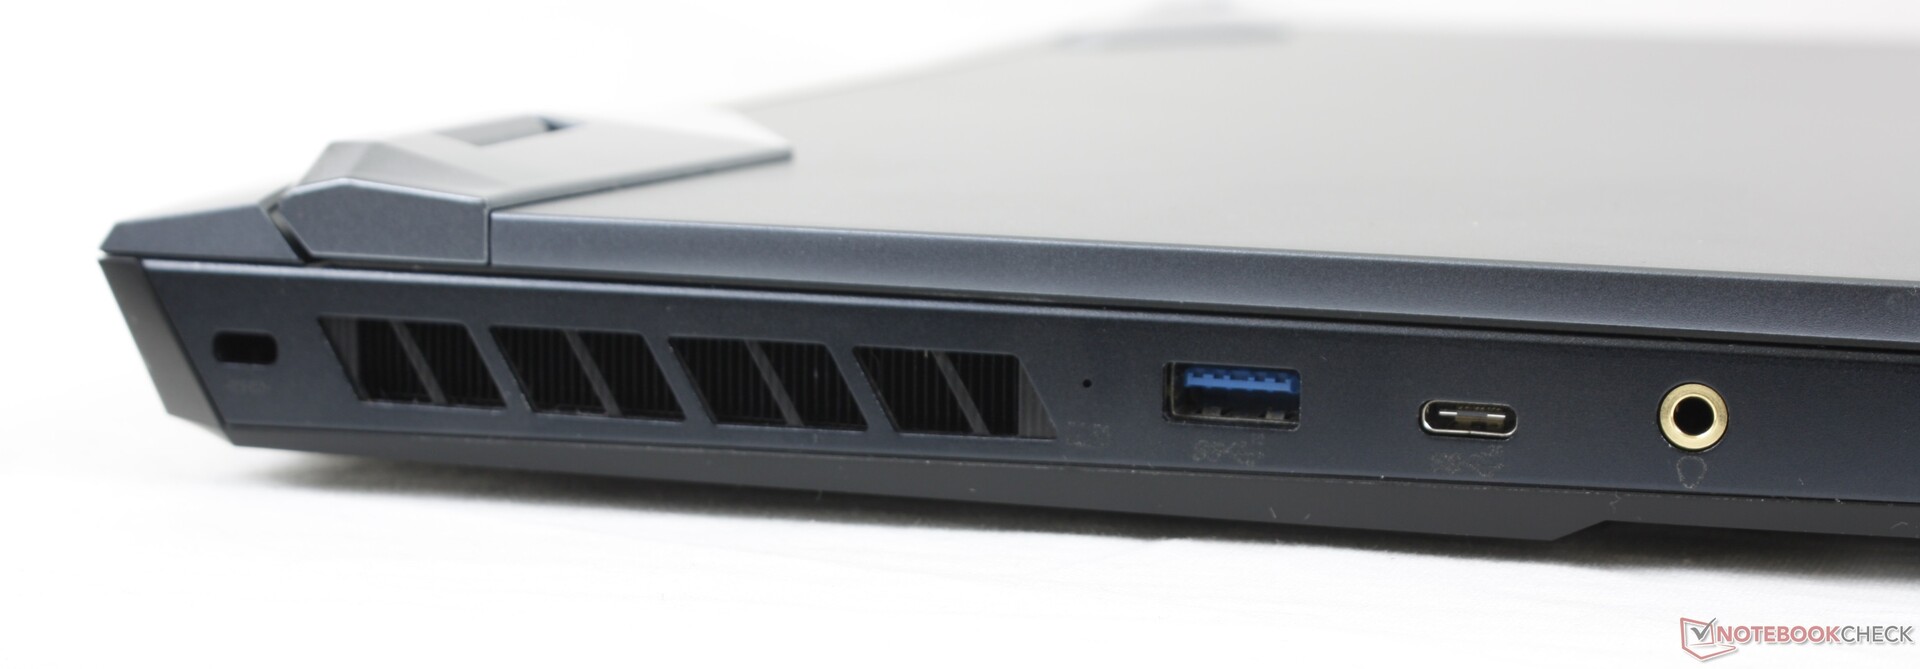
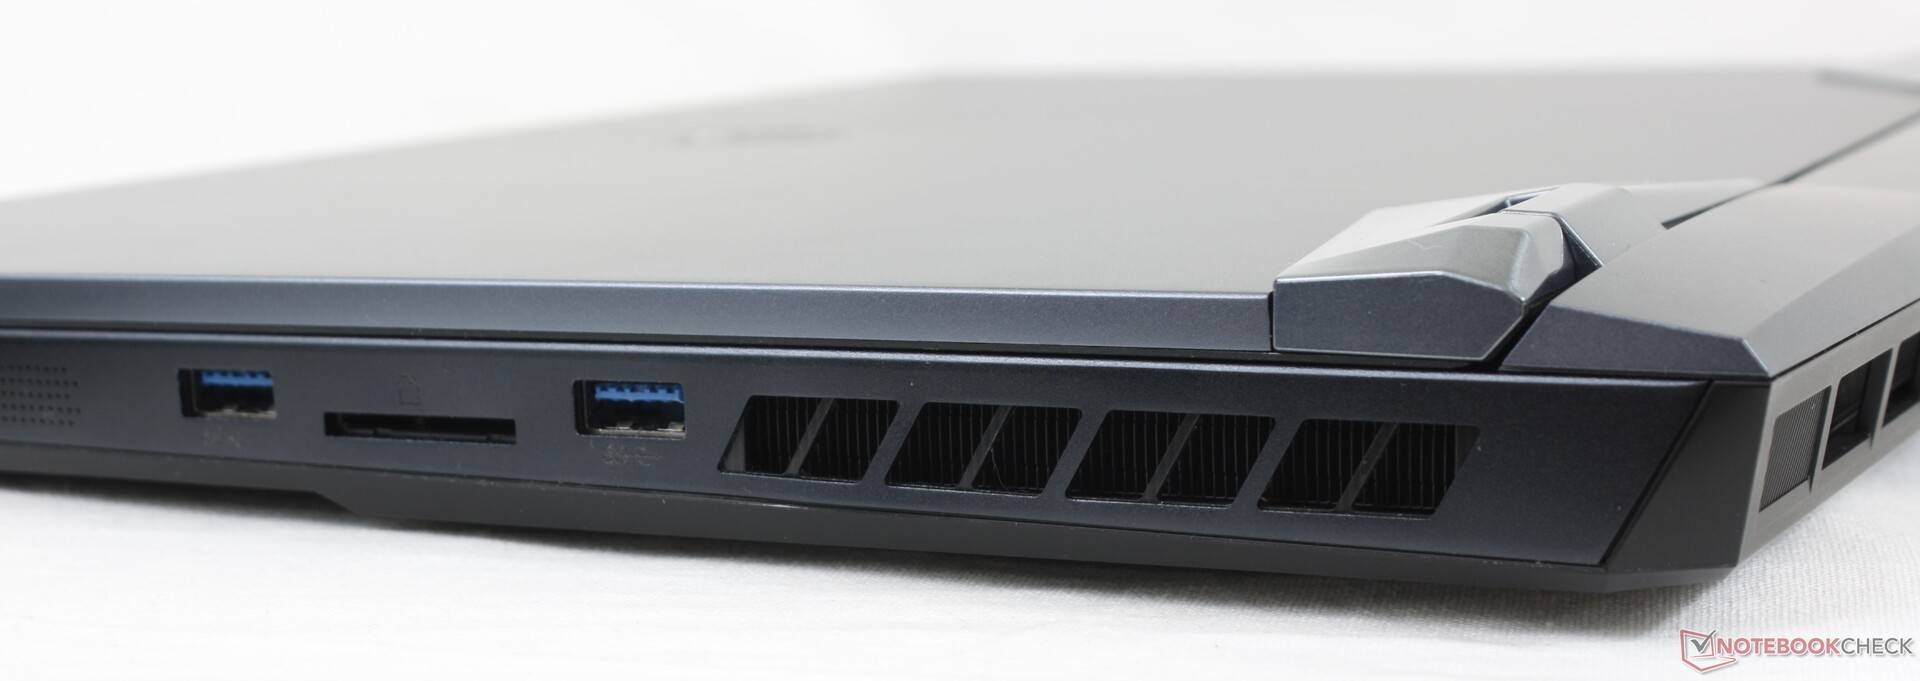
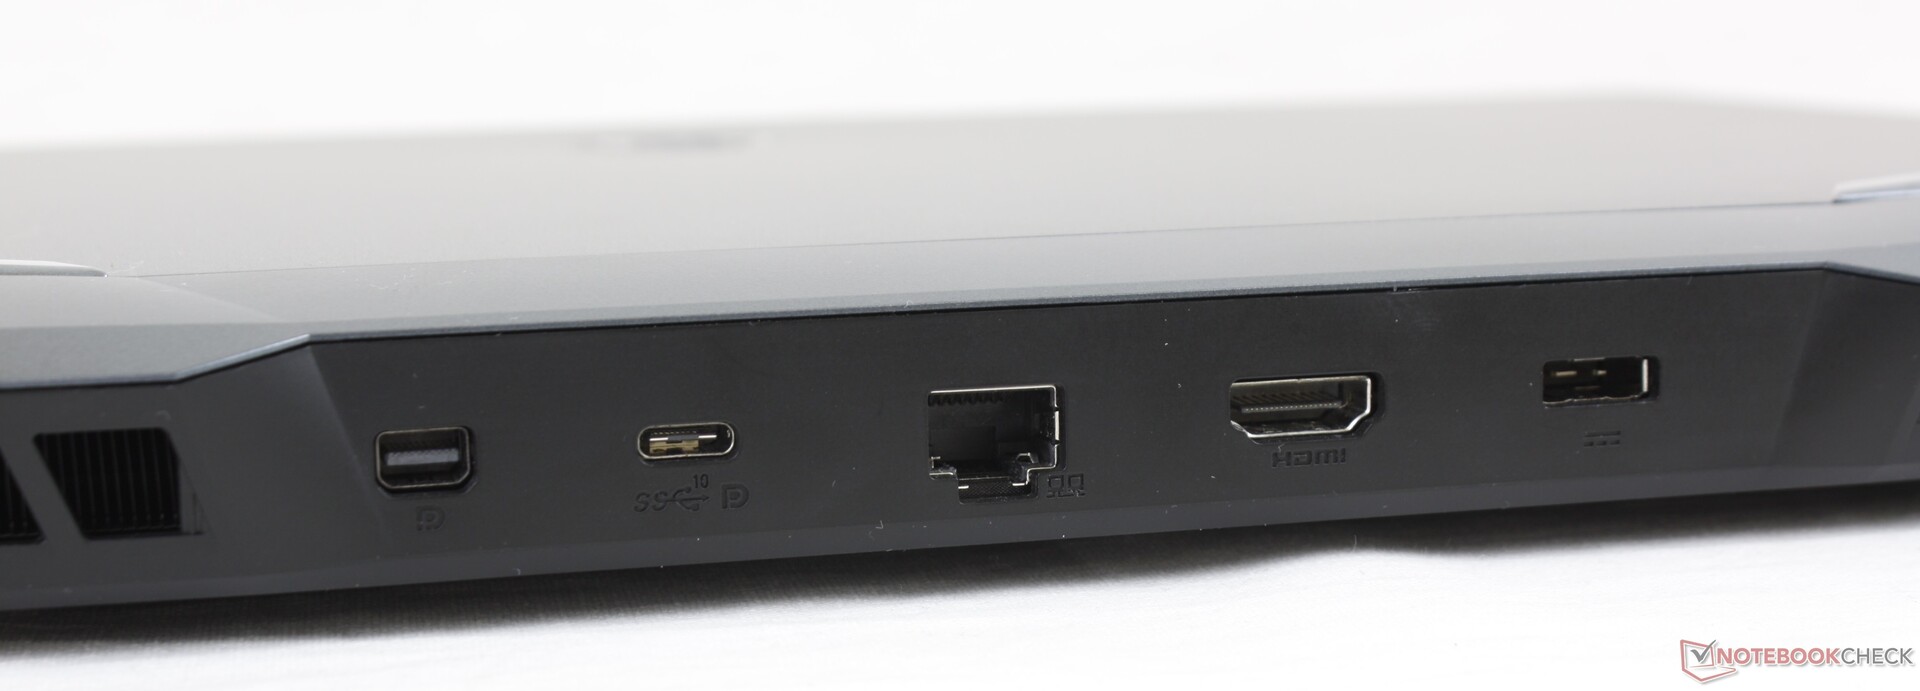
Connectivity - GE76 Raider offers Thunderbolt 4 and Wi-Fi 6E
While the port selection has remained the same compared to the GE76 Raider 10UH, the rear USB-C port now features the Thunderbolt 4 standard.
SD card reader
The SD card reader in the GE76 Raider 11UH achieves 77 MB/s for copying and 88 MB/s for reading data with our reference memory card, the 128 GB AV Pro V60 microSD. Although these rates are passable, they are significantly lower than in the predecessor.
| SD Card Reader | |
| average JPG Copy Test (av. of 3 runs) | |
| MSI GE76 Raider 10UH (Toshiba Exceria Pro SDXC 64 GB UHS-II) | |
| Alienware m17 R4 (AV PRO microSD 128 GB V60) | |
| Gigabyte Aero 17 HDR YD (AV PRO microSD 128 GB V60) | |
| Average of class Gaming (20.9 - 210, n=54, last 2 years) | |
| MSI GE76 Raider 11UH-472US (AV PRO microSD 128 GB V60) | |
| maximum AS SSD Seq Read Test (1GB) | |
| Alienware m17 R4 (AV PRO microSD 128 GB V60) | |
| MSI GE76 Raider 10UH (Toshiba Exceria Pro SDXC 64 GB UHS-II) | |
| Gigabyte Aero 17 HDR YD (AV PRO microSD 128 GB V60) | |
| Average of class Gaming (25.5 - 261, n=51, last 2 years) | |
| MSI GE76 Raider 11UH-472US (AV PRO microSD 128 GB V60) | |
Communication
The MSI GE76 Raider 11UH can establish wireless connections via Bluetooth 5.2 and Wi-Fi 6E. With our Netgear Nighthawk AX12 reference router, very good speeds of 1,396 Mb/s are achieved for transmitting data and 1,343 Mb/s for receiving data. This makes the MSI gaming laptop slightly faster than the predecessor.
Webcam
With a resolution of 2.1 MP, MSI has installed a slightly stronger webcam than most laptop manufacturers, but the image quality is rather mediocre even under good lighting conditions.


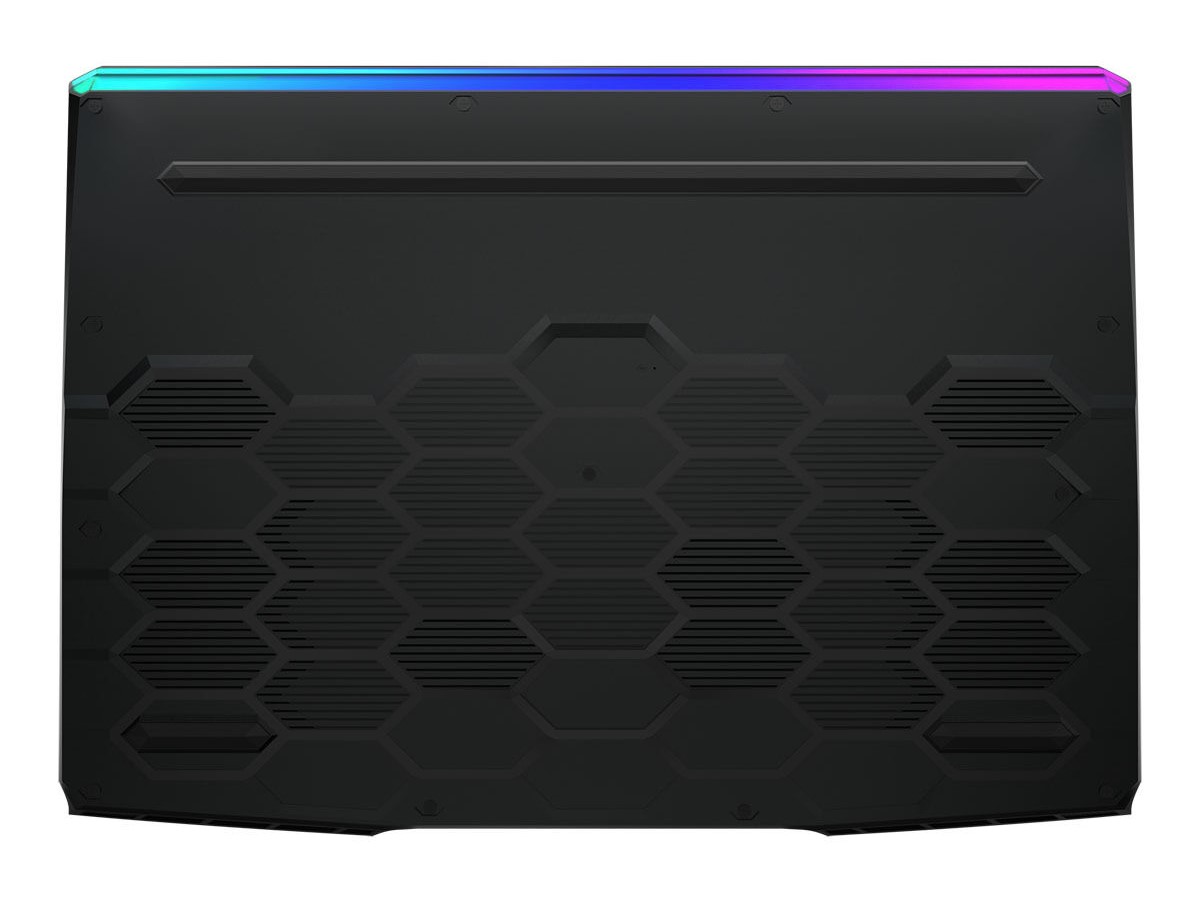
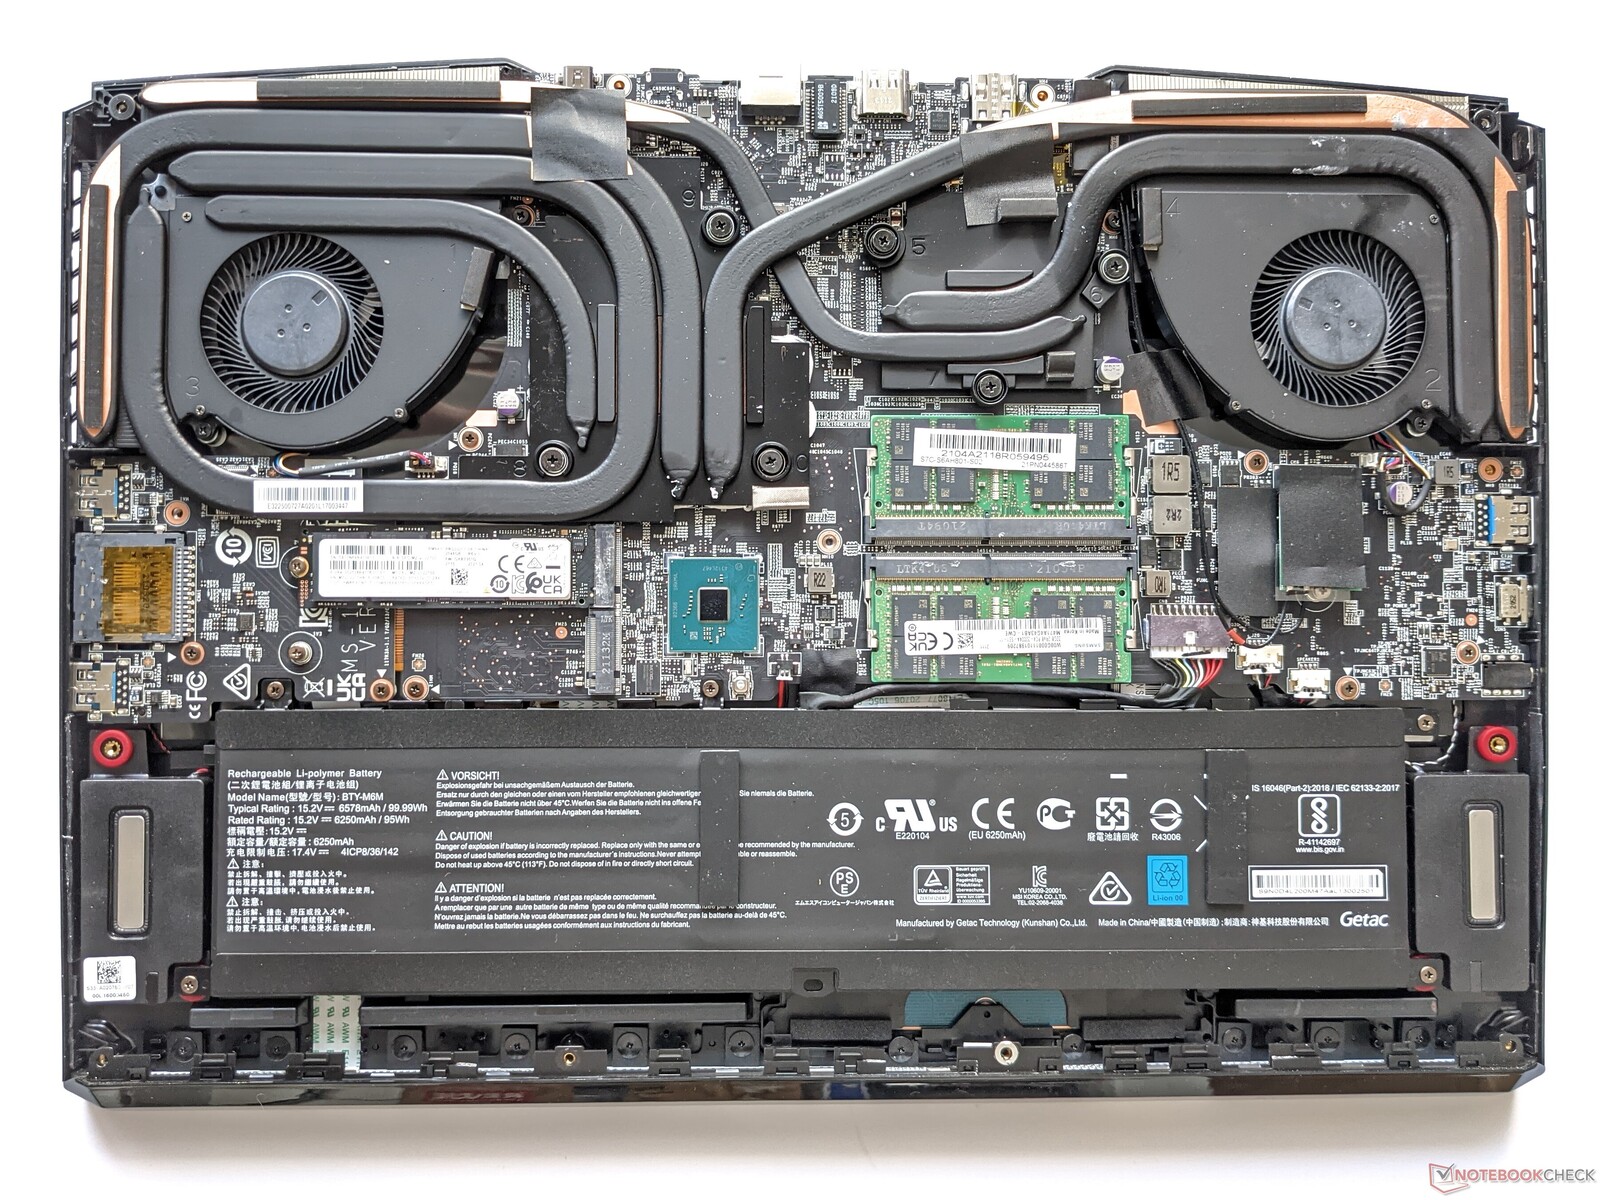
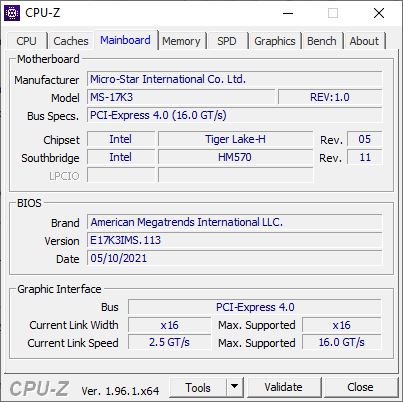
Maintenance
The MSI GE76 Raider 11UH can be opened after removing all screws on the bottom. This gives access to two SSD and two RAM slots.
Warranty
In addition to the laptop itself, the GE76 Raider 11UH comes with the appropriate power adapter. The manufacturer also provides a warranty period of 24 months.
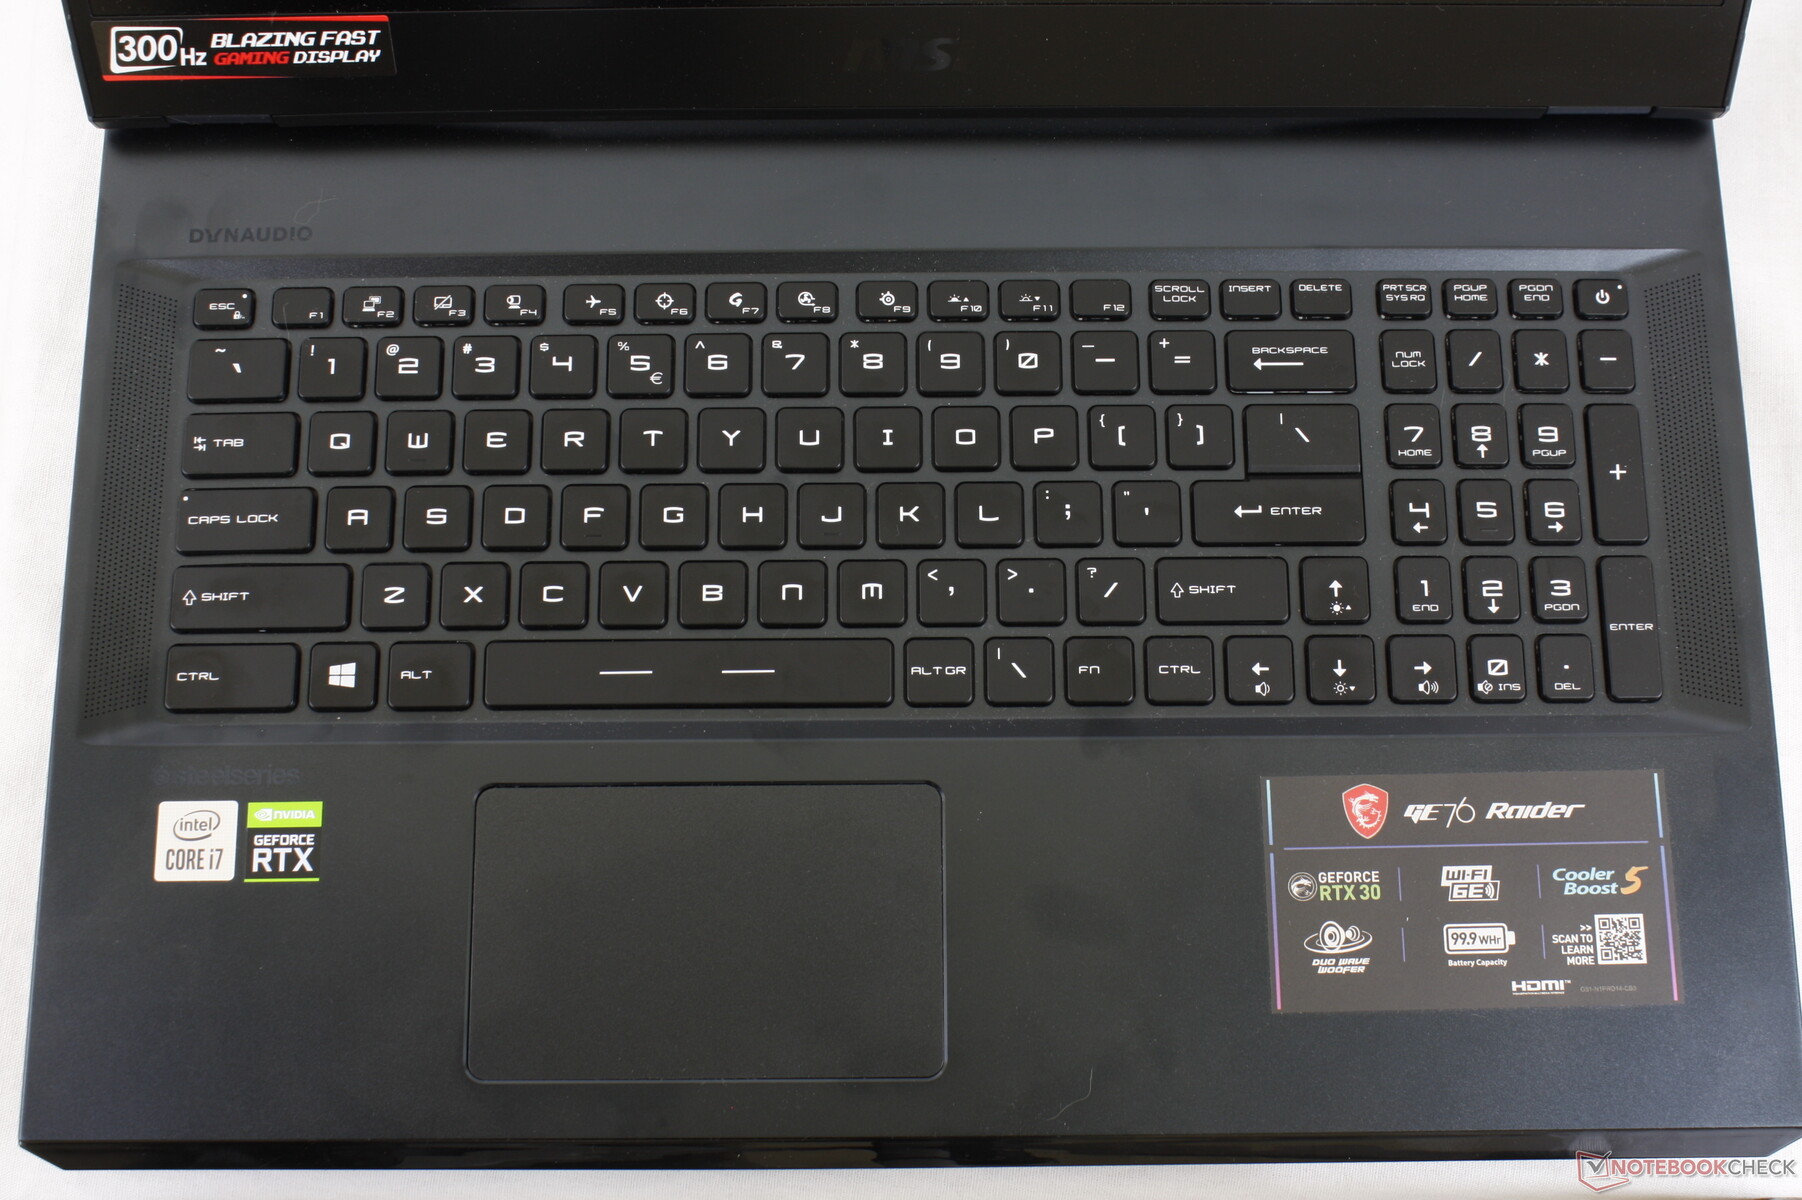
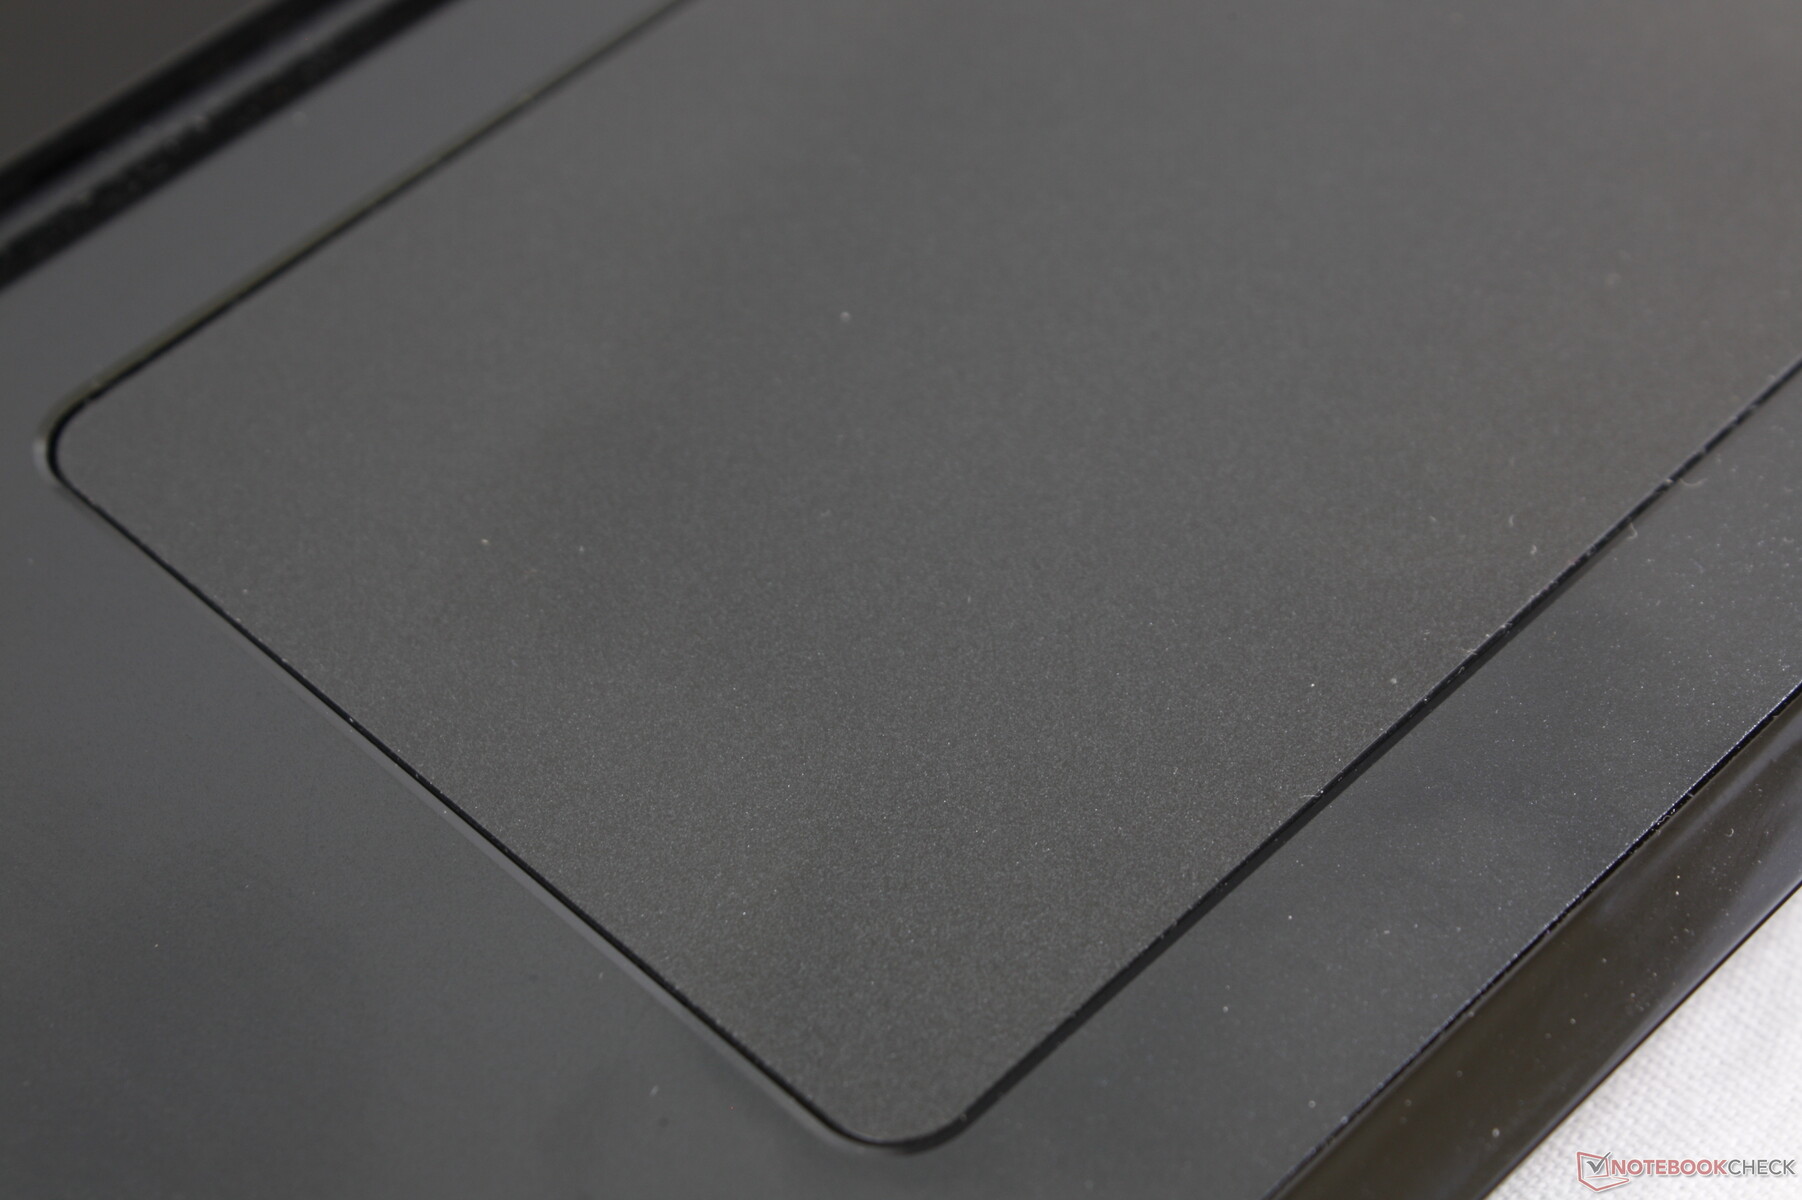
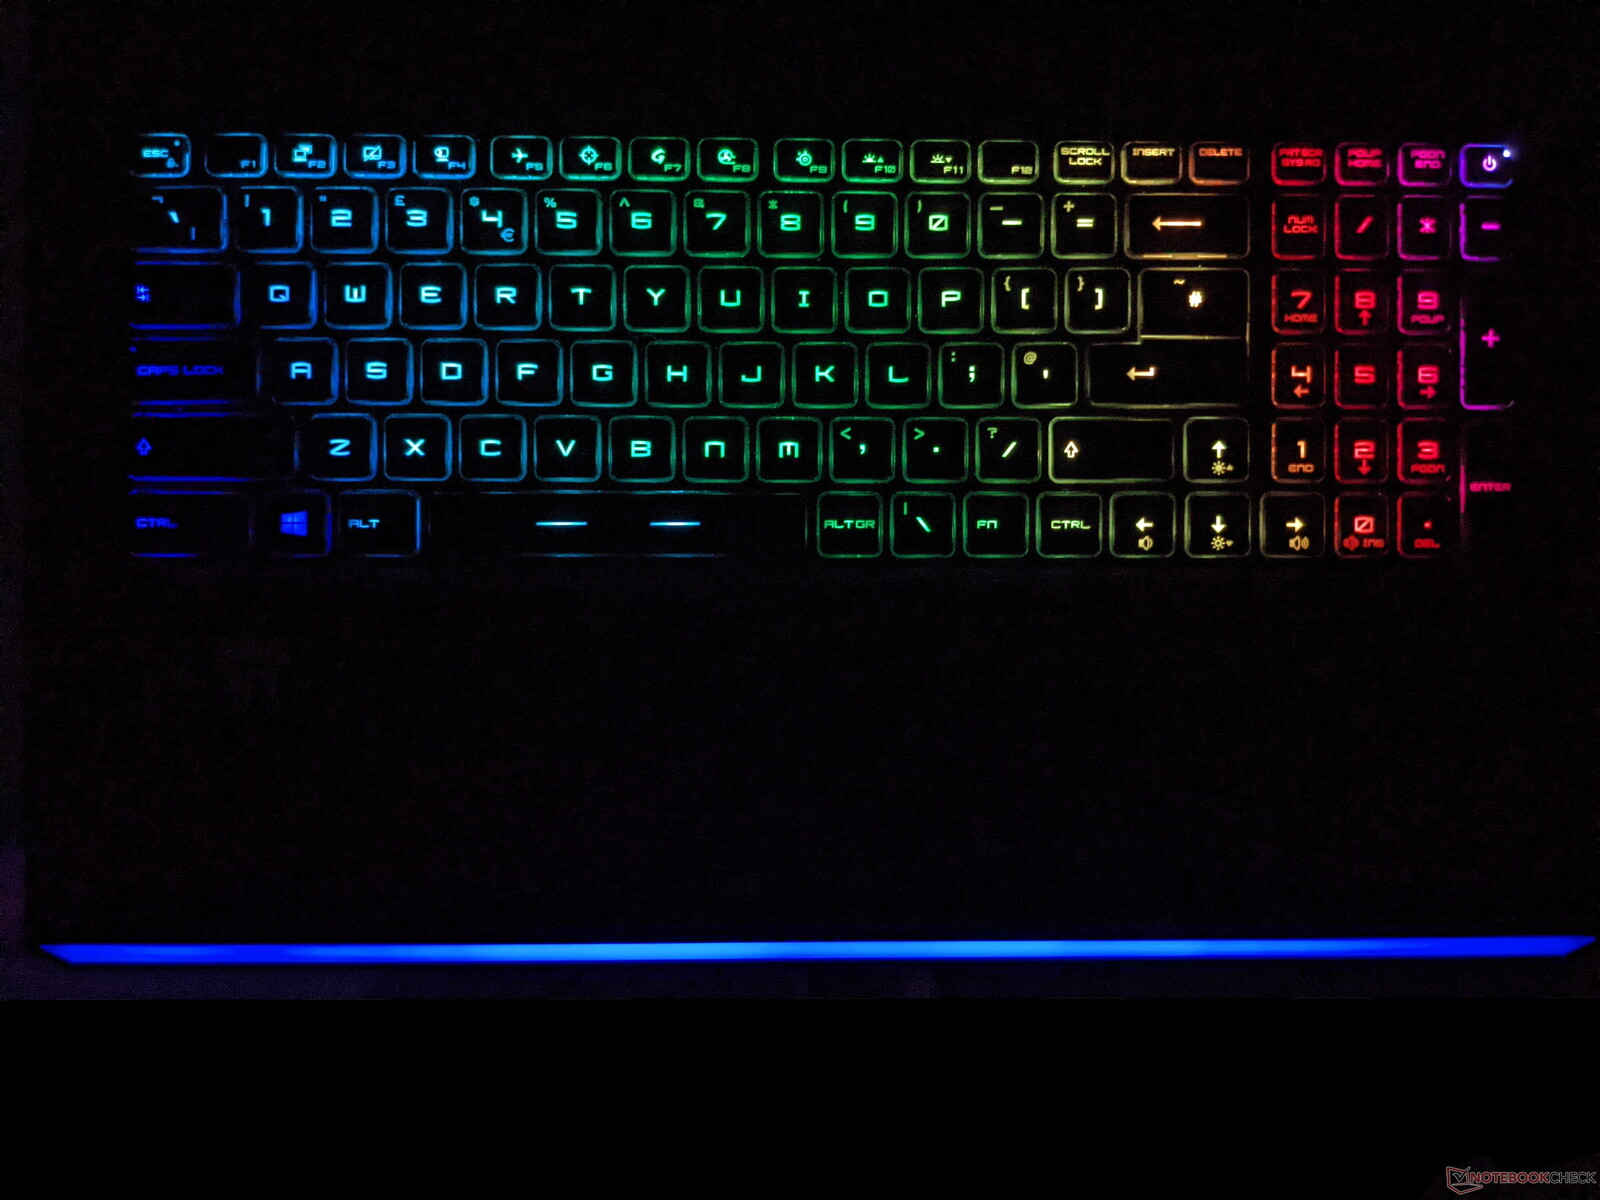
Input devices - Good keyboard and accurate ClickPad
A detailed description of the input devices can be found in the review of the MSI GE76 Raider 10UH.
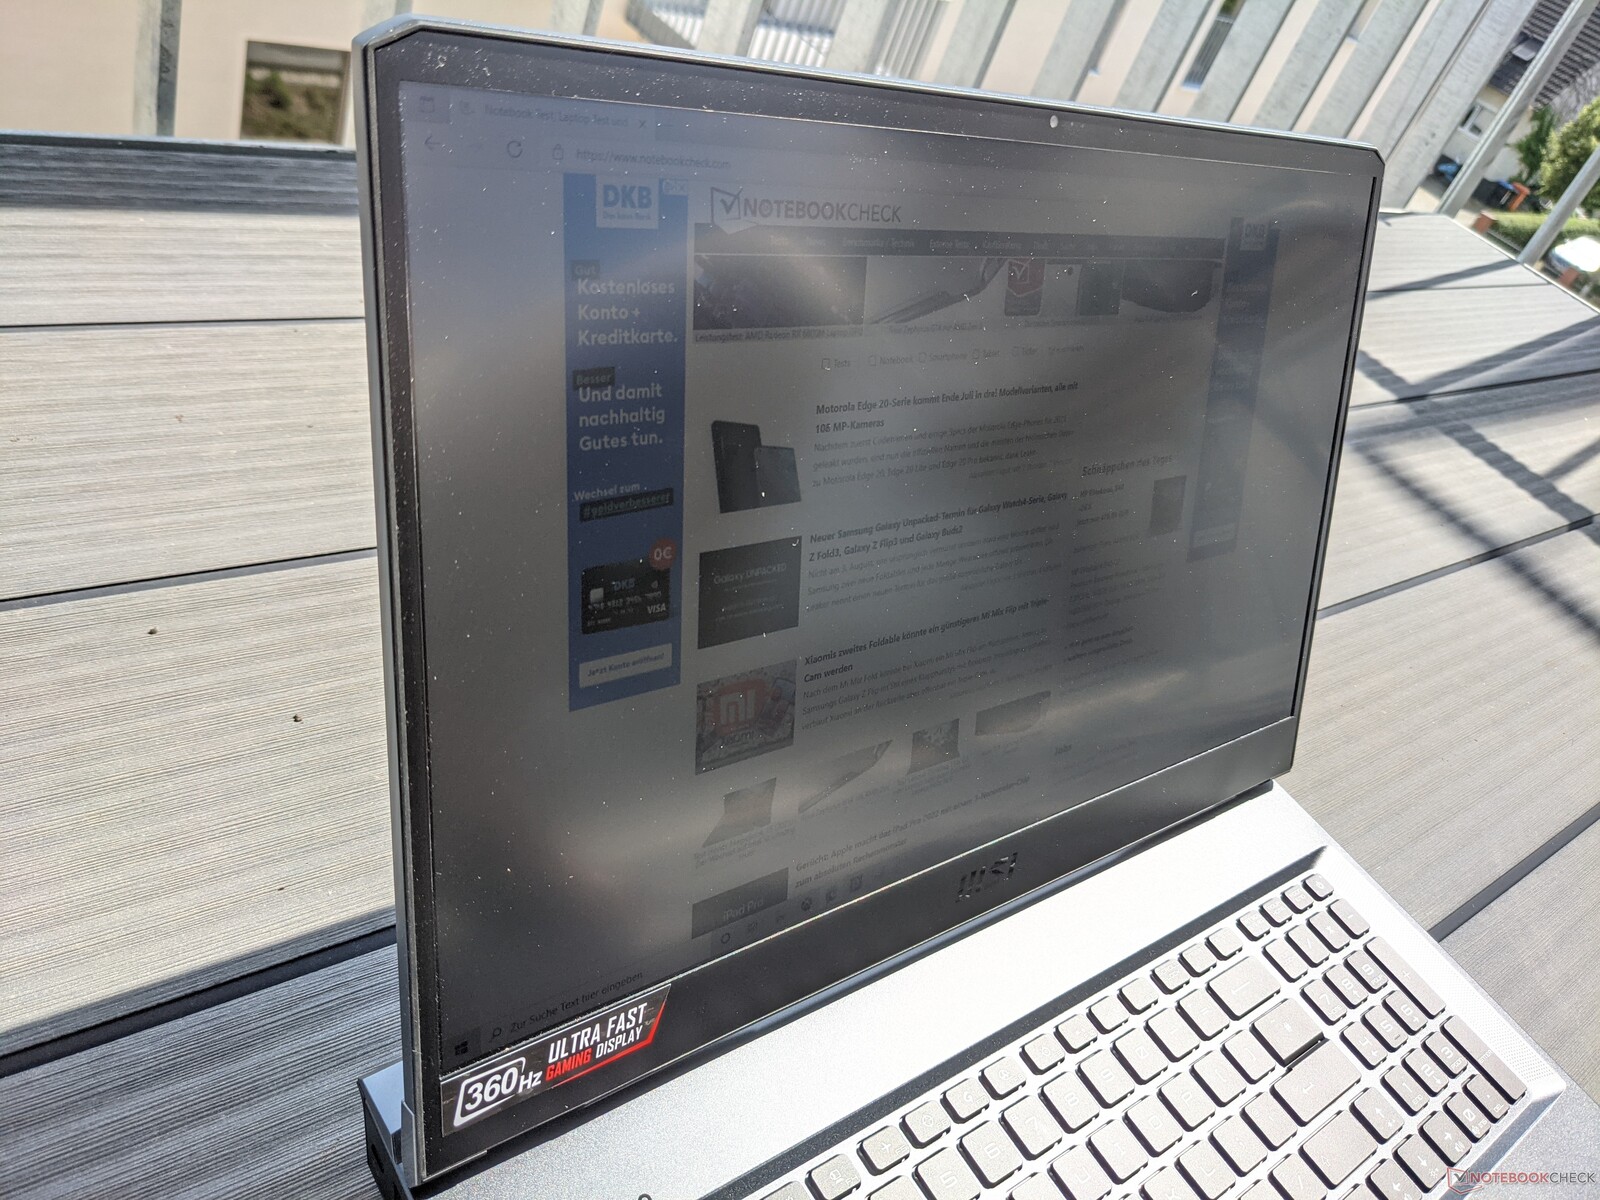
Display - IPS panel with 360 Hz
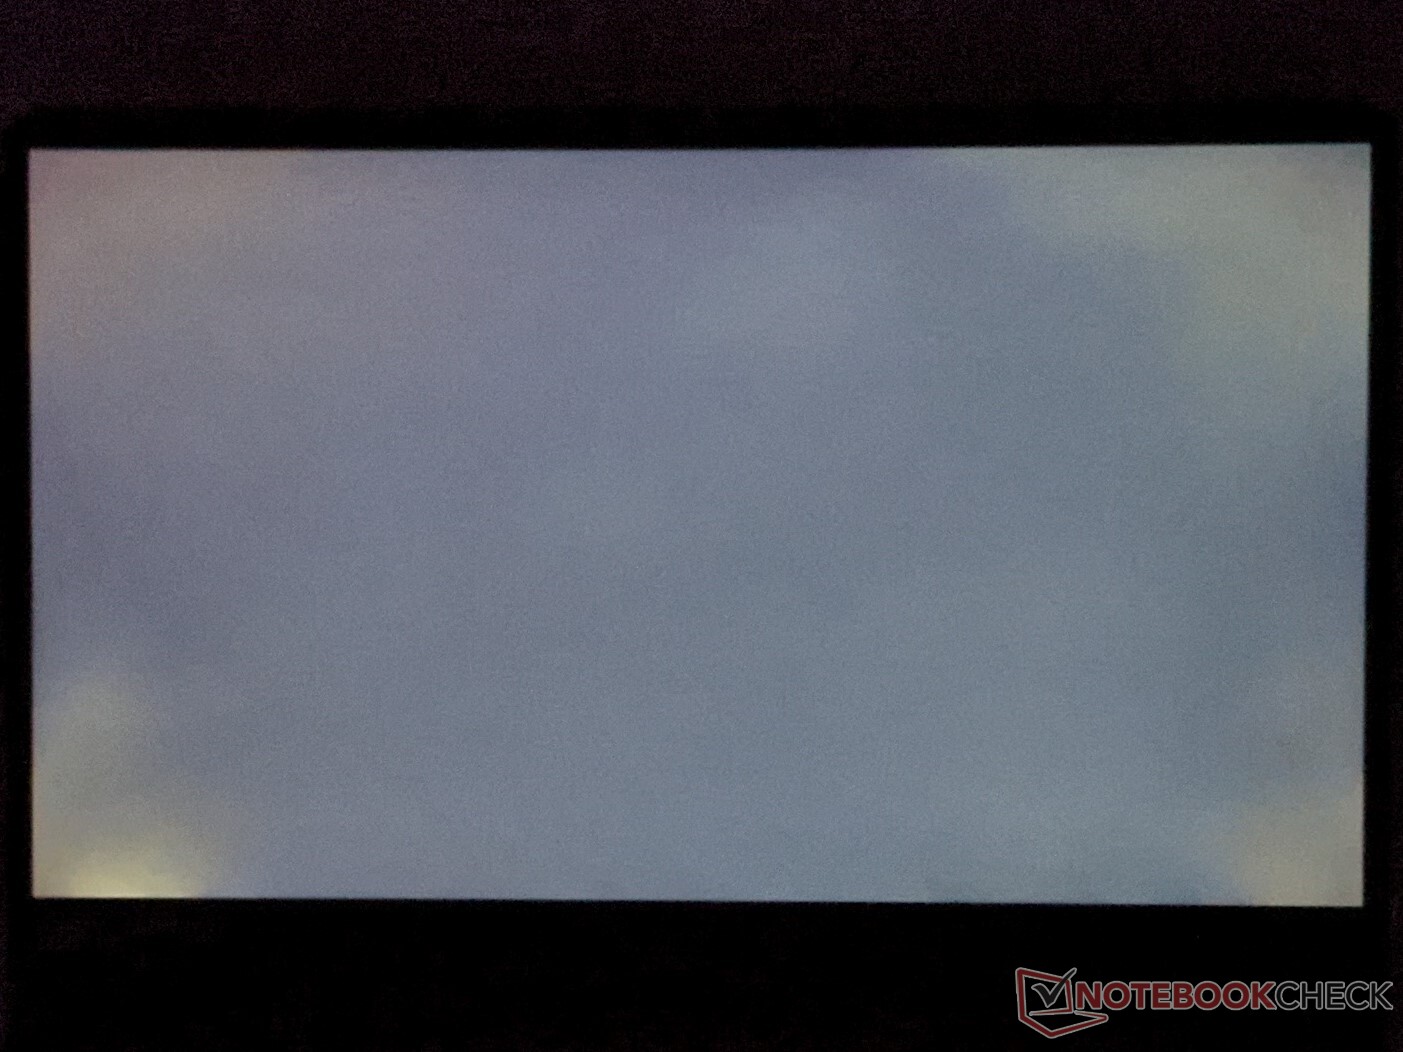
The screen of the MSI GE76 Raider 11UH consists of a 17.3-inch IPS panel with a resolution of 1920x1080 pixels and a refresh rate of 360 Hz. Although the maximum brightness of 295 cd/m² is decent, it's still the lowest in our test field. The brightness distribution of 96% is very good. Furthermore, MSI refrains from using PWM for brightness control.
In addition to the panel installed here, the GE76 Raider 11UH is also offered with UHD resolution (3840x2160 pixels) and 120 Hz, as well as QHD resolution (2560x1440 pixels) and 165 Hz or 240 Hz.
| |||||||||||||||||||||||||
Brightness Distribution: 96 %
Center on Battery: 301 cd/m²
Contrast: 1204:1 (Black: 0.25 cd/m²)
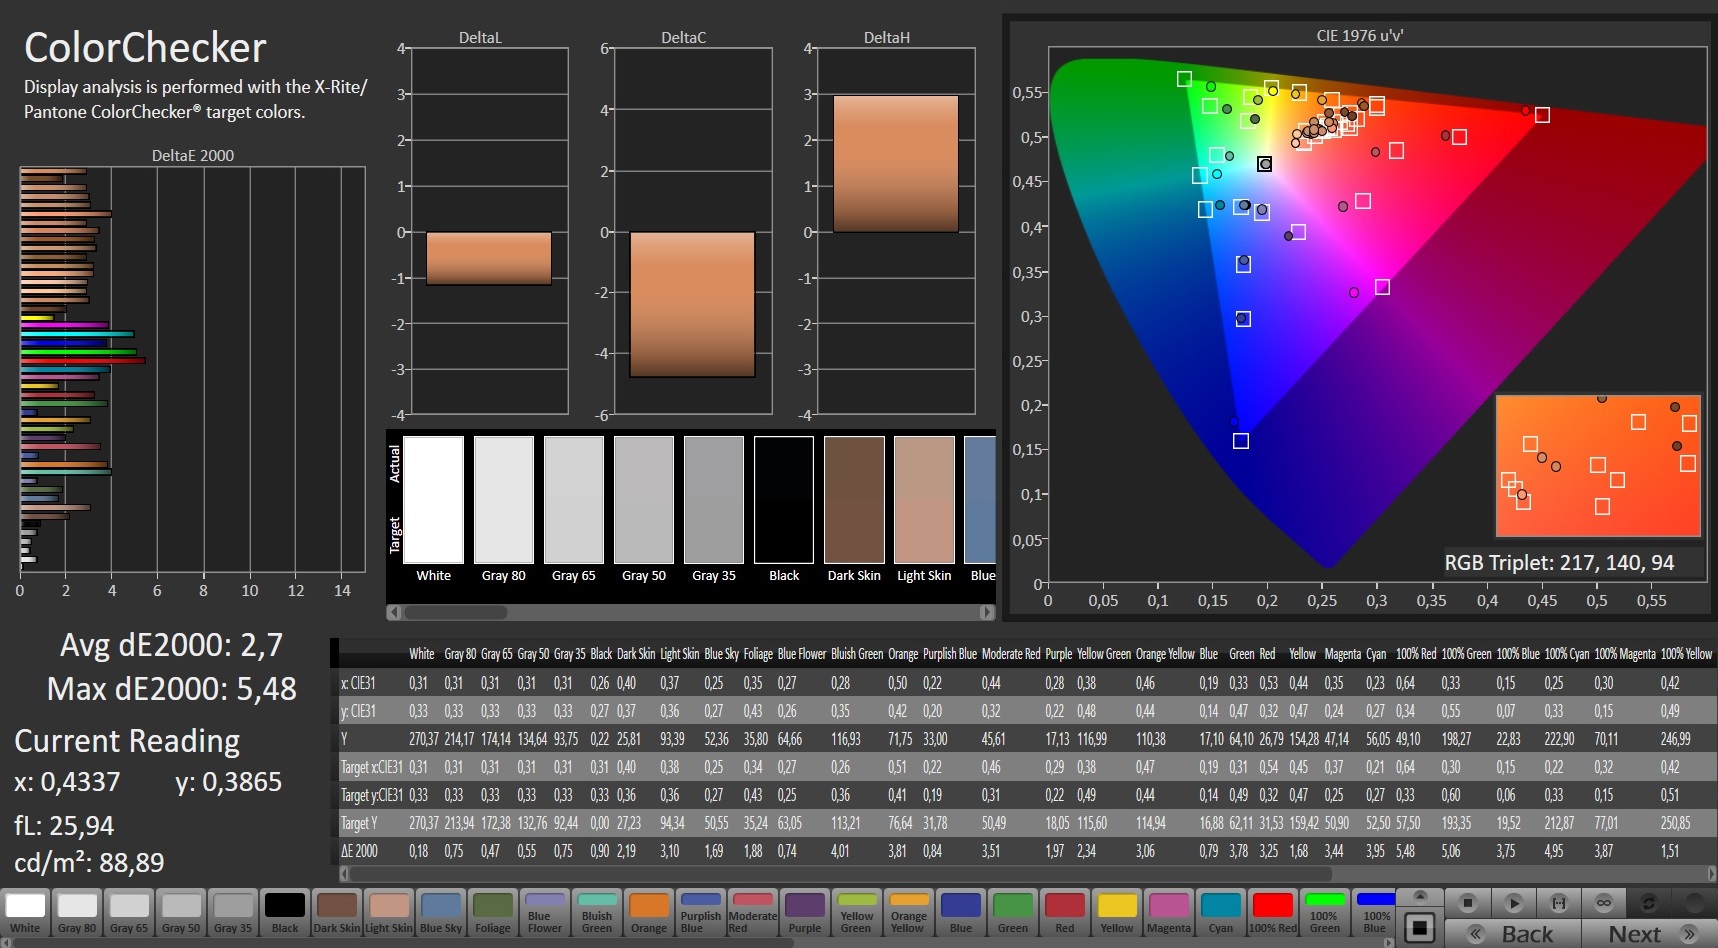
ΔE ColorChecker Calman: 5.66 | ∀{0.5-29.43 Ø4.73}
calibrated: 2.7
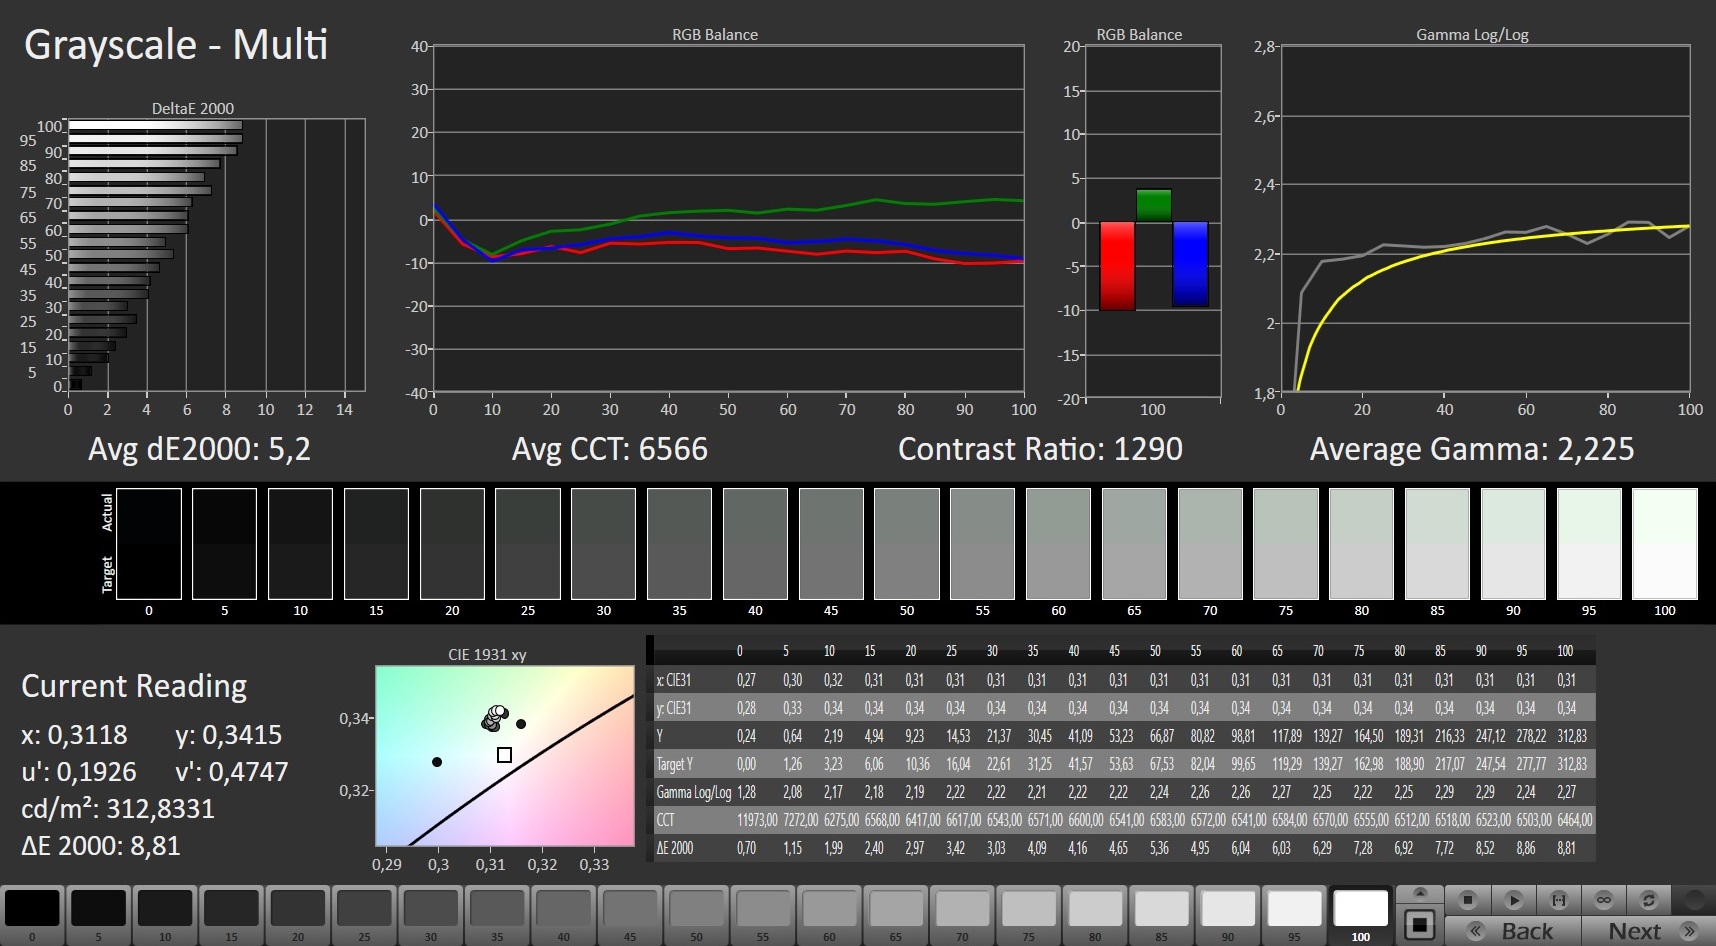
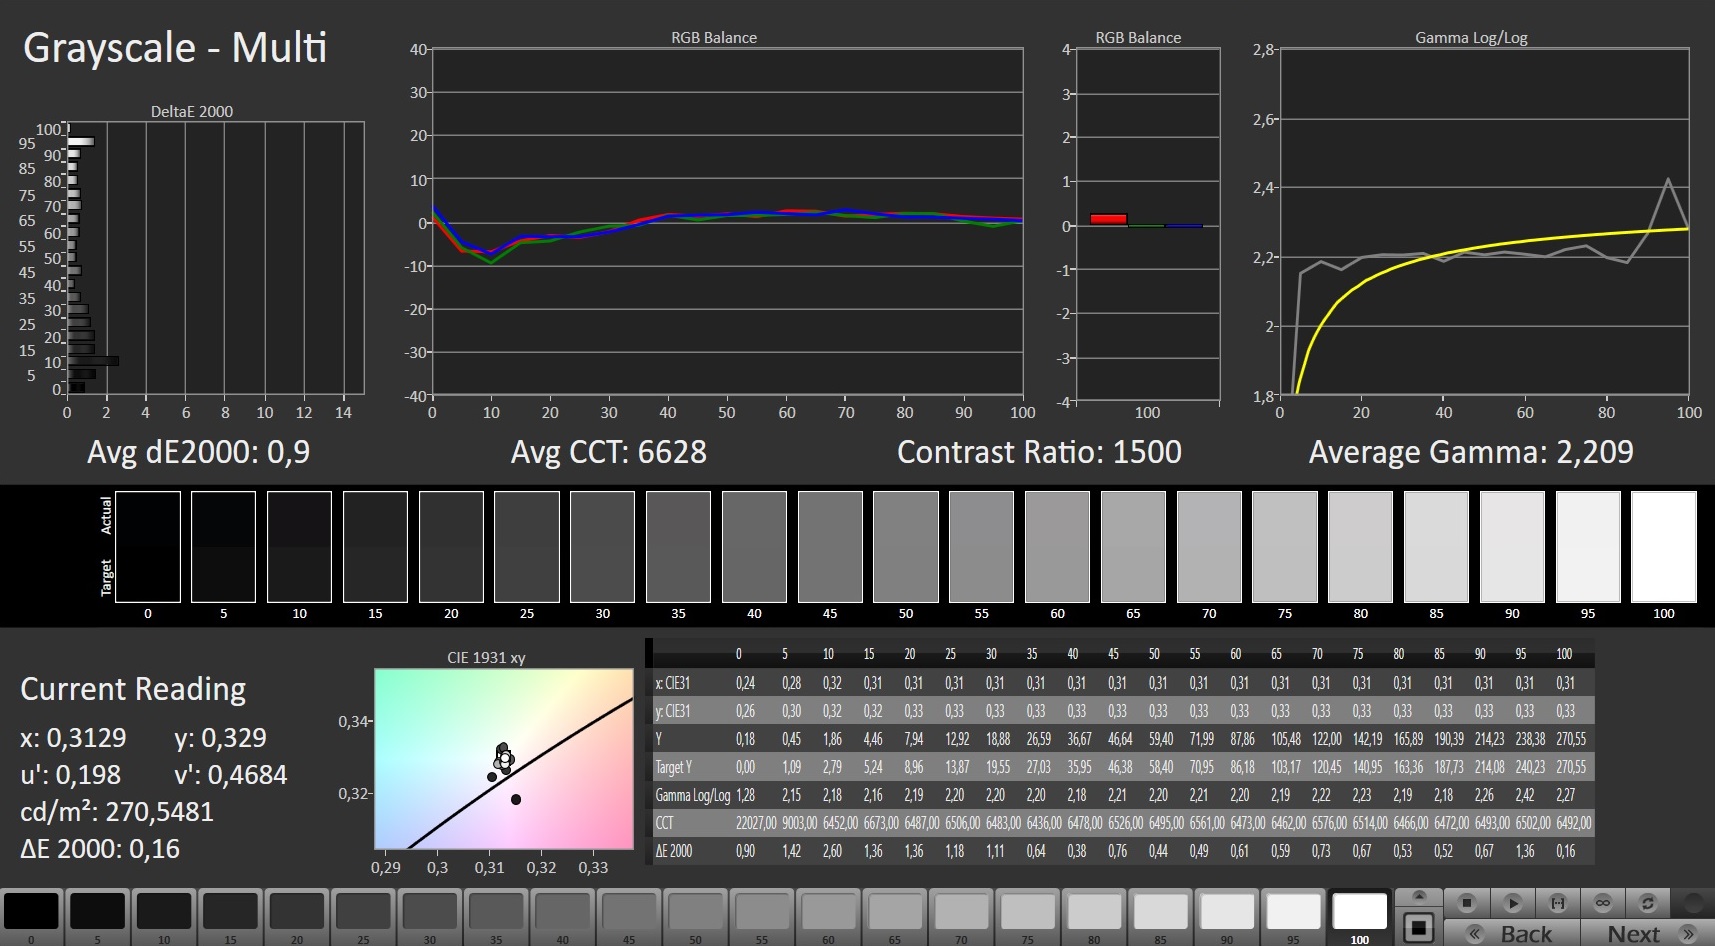
ΔE Greyscale Calman: 5.2 | ∀{0.09-98 Ø4.97}
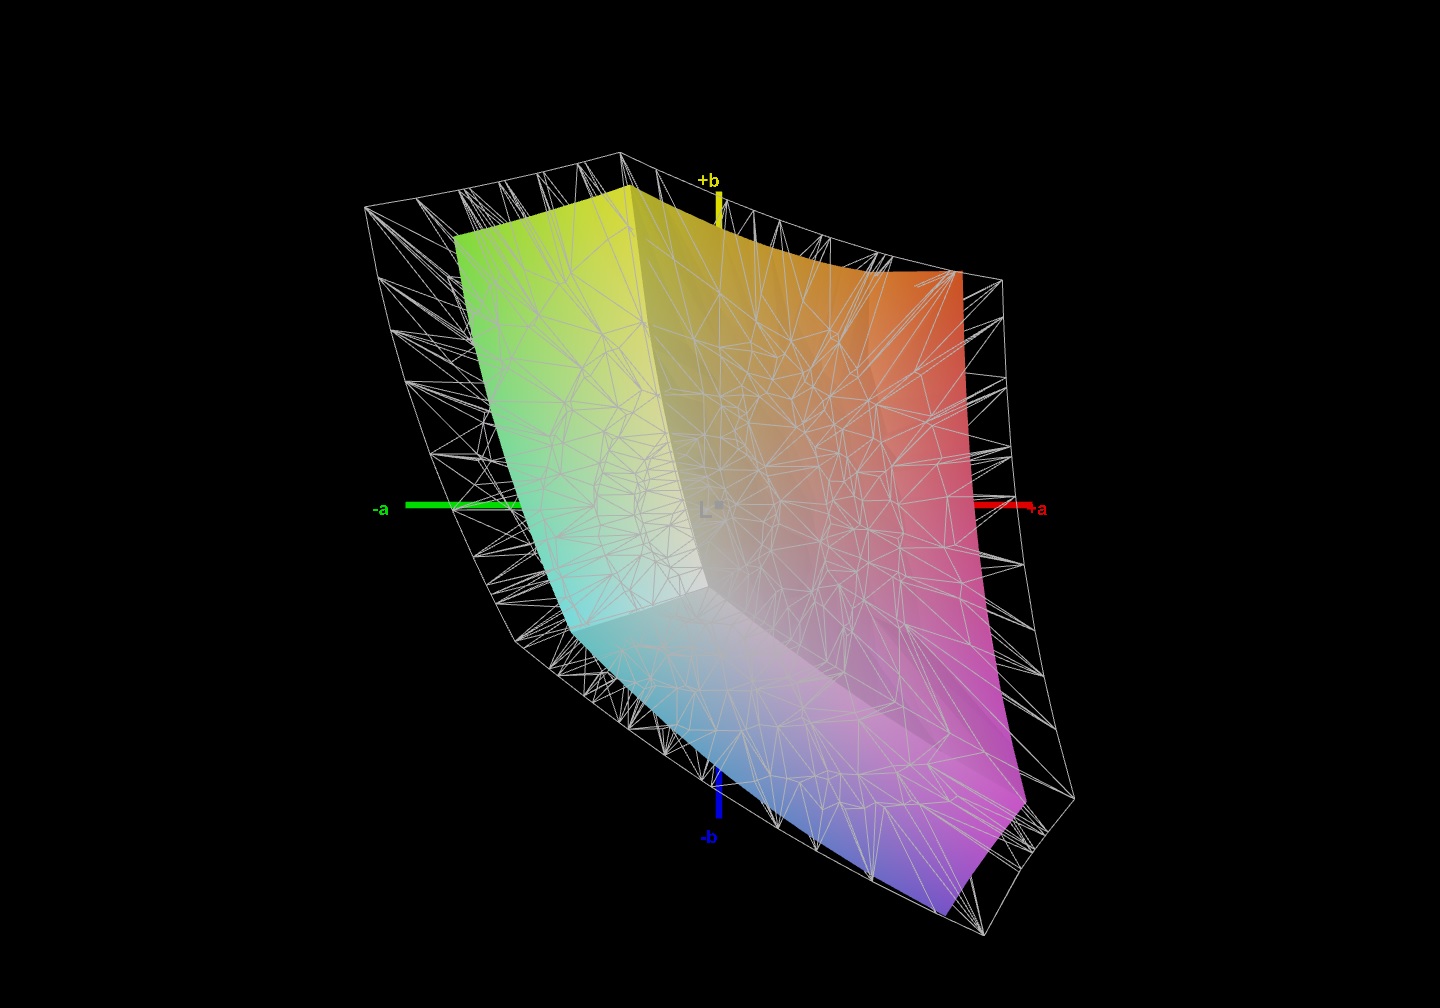
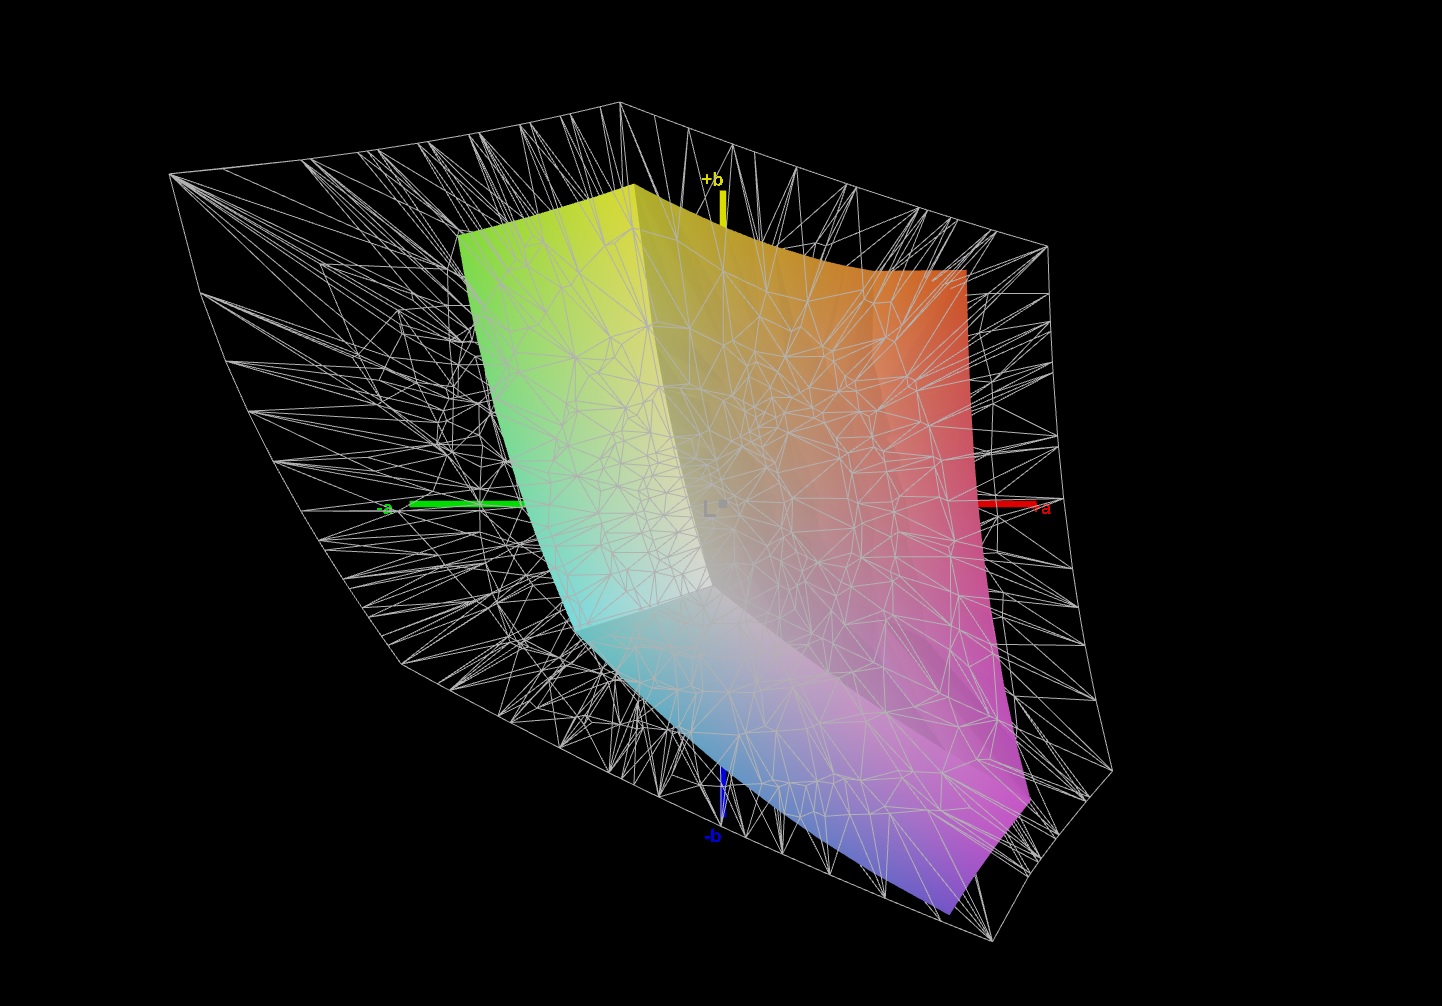
51.2% AdobeRGB 1998 (Argyll 3D)
74.4% sRGB (Argyll 3D)
49.6% Display P3 (Argyll 3D)
Gamma: 2.225
CCT: 6566 K
| MSI GE76 Raider 11UH-472US AU Optronics AUOE295, IPS, 1920x1080, 17.3" | MSI GE76 Raider 10UH AU Optronics B173HAN05.1, IPS, 1920x1080, 17.3" | Gigabyte Aero 17 HDR YD AU Optronics AUO329B, IPS, 3840x2160, 17.3" | Alienware m17 R4 AU Optronics AUOEC91, IPS, 1920x1080, 17.3" | |
|---|---|---|---|---|
| Display | 40% | 68% | 38% | |
| Display P3 Coverage (%) | 49.6 | 71.8 45% | 86.9 75% | 69.8 41% |
| sRGB Coverage (%) | 74.4 | 98.1 32% | 100 34% | 99.7 34% |
| AdobeRGB 1998 Coverage (%) | 51.2 | 73.9 44% | 99.6 95% | 71.6 40% |
| Response Times | -108% | -432% | -47% | |
| Response Time Grey 50% / Grey 80% * (ms) | 6.4 ? | 20.4 ? -219% | 52 ? -713% | 13.2 ? -106% |
| Response Time Black / White * (ms) | 10.4 ? | 10 ? 4% | 26 ? -150% | 9.2 ? 12% |
| PWM Frequency (Hz) | 151500 | |||
| Screen | 5% | 43% | 37% | |
| Brightness middle (cd/m²) | 301 | 324.6 8% | 488 62% | 305 1% |
| Brightness (cd/m²) | 295 | 312 6% | 467 58% | 301 2% |
| Brightness Distribution (%) | 96 | 87 -9% | 86 -10% | 93 -3% |
| Black Level * (cd/m²) | 0.25 | 0.28 -12% | 0.33 -32% | 0.19 24% |
| Contrast (:1) | 1204 | 1159 -4% | 1479 23% | 1605 33% |
| Colorchecker dE 2000 * | 5.66 | 3.87 32% | 1.23 78% | 1.31 77% |
| Colorchecker dE 2000 max. * | 9.75 | 9.35 4% | 2.94 70% | 2.32 76% |
| Colorchecker dE 2000 calibrated * | 2.7 | 1.42 47% | 0.77 71% | 0.91 66% |
| Greyscale dE 2000 * | 5.2 | 6.5 -25% | 1.5 71% | 2.3 56% |
| Gamma | 2.225 99% | 2.23 99% | 2.169 101% | 2.281 96% |
| CCT | 6566 99% | 5702 114% | 6614 98% | 6449 101% |
| Color Space (Percent of AdobeRGB 1998) (%) | 66.3 | 99 | 72 | |
| Color Space (Percent of sRGB) (%) | 98 | 99 | 94 | |
| Total Average (Program / Settings) | -21% /
-3% | -107% /
-19% | 9% /
25% |
* ... smaller is better
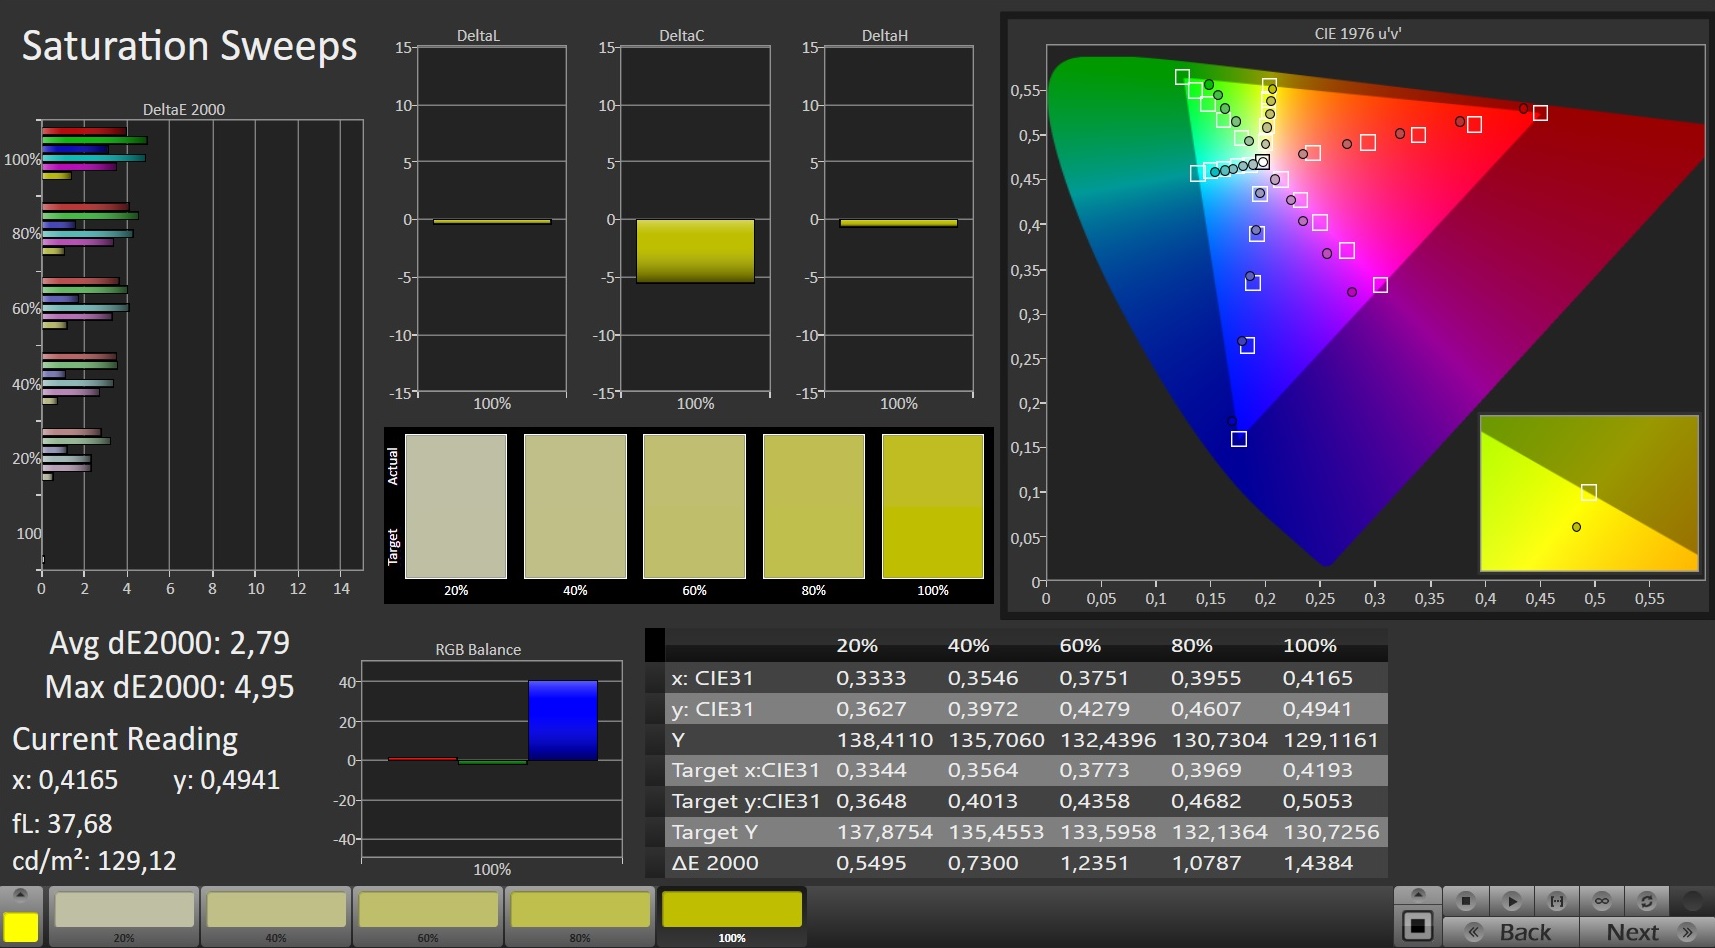
Our measurements show that the GE76 Raider 11UH's display has a good contrast ratio of 1,204:1 and an equally good black level of 0.25 cd/m². The color-space coverage of 74.4% (sRGB) and 51.2% (AdobeRGB) is rather disappointing and is below the rates of the remaining devices in our test field.
The CalMAN analysis also shows that colors are displayed with a DeltaE 2000 deviation of 5.66. This value can be reduced to 2.7 through calibration. The corresponding ICC file can be downloaded in the top right window next to the screen illumination graphic.


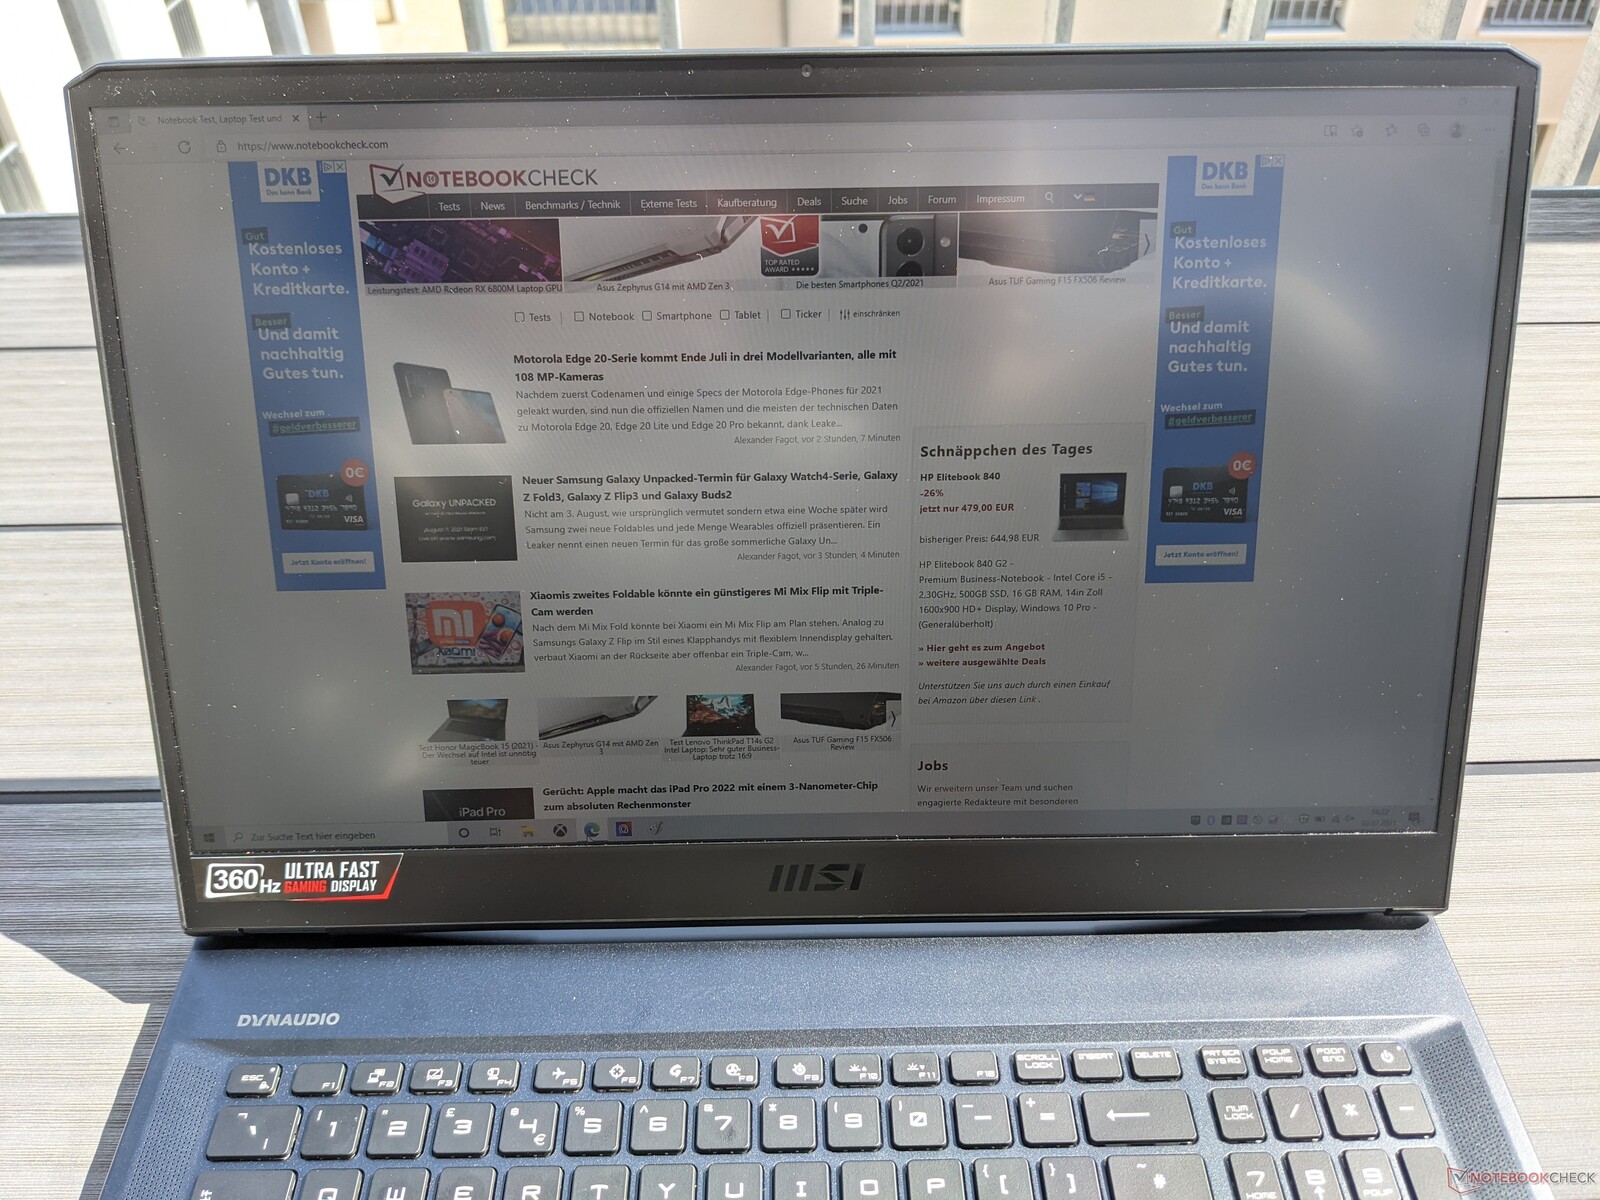
The MSI GE76 Raider 11UH can be used outdoors as long as places in the shade are preferred. The screen's content can still just be read, but the brightness isn't high enough for prolonged outdoor gaming.
Display Response Times
| ↔ Response Time Black to White | ||
|---|---|---|
| 10.4 ms ... rise ↗ and fall ↘ combined | ↗ 6 ms rise | 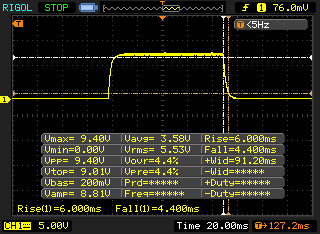 |
| ↘ 4.4 ms fall | ||
| The screen shows good response rates in our tests, but may be too slow for competitive gamers. In comparison, all tested devices range from 0.1 (minimum) to 240 (maximum) ms. » 28 % of all devices are better. This means that the measured response time is better than the average of all tested devices (19.9 ms). | ||
| ↔ Response Time 50% Grey to 80% Grey | ||
| 6.4 ms ... rise ↗ and fall ↘ combined | ↗ 2.8 ms rise | 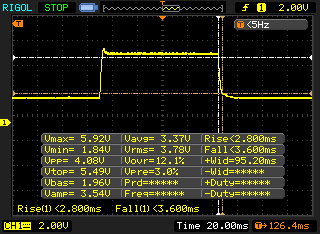 |
| ↘ 3.6 ms fall | ||
| The screen shows very fast response rates in our tests and should be very well suited for fast-paced gaming. In comparison, all tested devices range from 0.165 (minimum) to 636 (maximum) ms. » 19 % of all devices are better. This means that the measured response time is better than the average of all tested devices (31.1 ms). | ||
Screen Flickering / PWM (Pulse-Width Modulation)
| Screen flickering / PWM not detected | 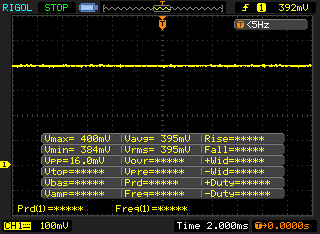 | ||
In comparison: 52 % of all tested devices do not use PWM to dim the display. If PWM was detected, an average of 7791 (minimum: 5 - maximum: 343500) Hz was measured. | |||
The IPS panel in the MSI GE76 Raider is very viewing-angle stable. Image content can be read from nearly every angle without it becoming distorted or displayed with inaccurate colors.

Performance - Equipped for all games
With the GE76 Raider 11UH, MSI targets ambitious gamers who are looking for a powerful gaming laptop that's equipped with the best possible hardware at the moment. However, besides our test configuration, the Raider 11UH is also available with the Nvidia GeForce RTX 3070 and varying memory configurations.
The following benchmarks were executed using the performance level setting "High" and the fan profile "Auto". Furthermore, our test device is a pre-production model, so we might see an increase in performance in the production version.
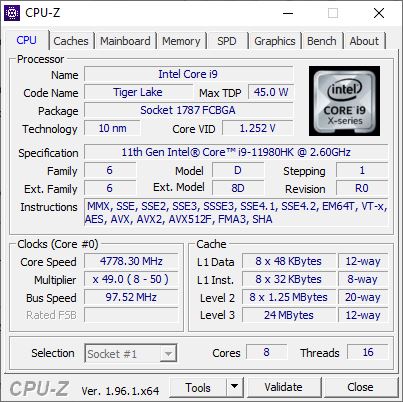
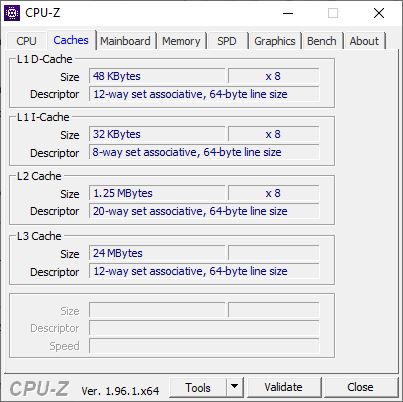
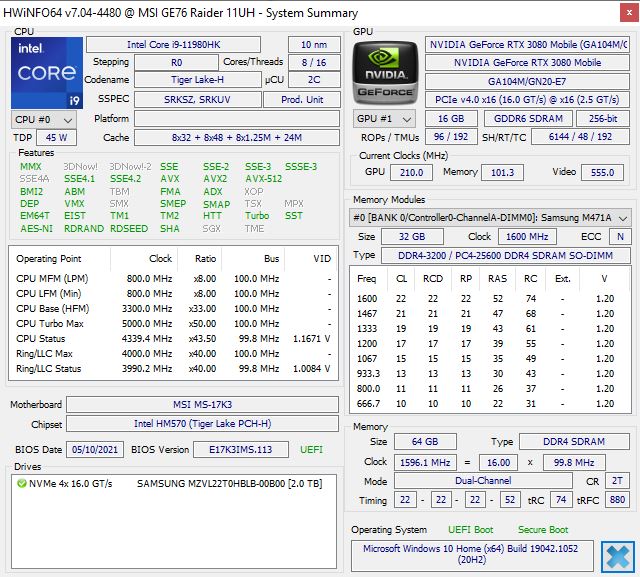
Processor
The Intel Core i9-11980HK used here is a processor with eight cores that can process up to 16 tasks simultaneously. The clock rates are between 2.6 and 5 GHz, with the actual performance depending on the cooling system and the predefined TDP. MSI configures the latter with a short-term value (PL2) of 200 watts and a long-term value (PL1) of 91.75 watts.
Using these parameters, the long-term performance in Cinebench R15 is on par with the GE76 Raider 10UH, and no drops in performance can be observed. However, it should be noted that the predecessor was tested using the "Extreme" performance setting in our review, and that the 11UH is still a pre-production device. Therefore, the performance in the production version can still be a bit better.
In the individual tests, the CPU of the GE76 Raider 11UH achieves very good single-core rates, which result in the device ranking in the upper range of the test field. On the other hand, the multi-core results are below average.
Update: MSI was able to increase the gaming laptop's multi-core performance considerably in some respects in the production model of the GE76 Raider 11UH. In the individual benchmarks of Cinebench R15, Cinebench R20, 7zip, x265, and Blender, results were improved by about 20%. In Geekbench 5.3, there's a 12% increase. In contrast, the single-core performance only changes within the usual tolerances. Performance under prolonged load is also significantly higher now as our Cinebench R15 continuous load graph shows.
As a result, the performance of the Intel Core i9-11980HK in the MSI GE76 Raider 11UH is now at an above-average level and can keep up with or surpass competitors like the Gigabyte Aero 17 HDR YD.
| Cinebench R20 | |
| CPU (Single Core) | |
| Average of class Gaming (442 - 895, n=109, last 2 years) | |
| MSI GE76 Raider 11UH-472US (Vorserie) | |
| MSI GE76 Raider 11UH-472US (Serienmodell) | |
| Average Intel Core i9-11980HK (572 - 622, n=7) | |
| Gigabyte Aero 17 HDR YD | |
| Alienware m17 R4 | |
| MSI GE76 Raider 10UH | |
| CPU (Multi Core) | |
| Average of class Gaming (4029 - 16108, n=109, last 2 years) | |
| Gigabyte Aero 17 HDR YD | |
| MSI GE76 Raider 11UH-472US (Serienmodell) | |
| MSI GE76 Raider 11UH-472US (Vorserie) | |
| Average Intel Core i9-11980HK (3779 - 5256, n=8) | |
| Alienware m17 R4 | |
| MSI GE76 Raider 10UH | |
| Cinebench R15 | |
| CPU Single 64Bit | |
| Average of class Gaming (188.8 - 343, n=109, last 2 years) | |
| Average Intel Core i9-11980HK (224 - 244, n=6) | |
| Gigabyte Aero 17 HDR YD | |
| MSI GE76 Raider 11UH-472US (Vorserie) | |
| MSI GE76 Raider 11UH-472US (Serienmodell) | |
| Alienware m17 R4 | |
| MSI GE76 Raider 10UH | |
| CPU Multi 64Bit | |
| Average of class Gaming (1578 - 6271, n=109, last 2 years) | |
| MSI GE76 Raider 11UH-472US (Serienmodell) | |
| MSI GE76 Raider 11UH-472US (Vorserie) | |
| Gigabyte Aero 17 HDR YD | |
| Average Intel Core i9-11980HK (1696 - 2287, n=7) | |
| Alienware m17 R4 | |
| MSI GE76 Raider 10UH | |
| Blender - v2.79 BMW27 CPU | |
| MSI GE76 Raider 11UH-472US (Vorserie) | |
| MSI GE76 Raider 11UH-472US (Serienmodell) | |
| MSI GE76 Raider 10UH | |
| Average Intel Core i9-11980HK (231 - 284, n=4) | |
| Alienware m17 R4 | |
| Gigabyte Aero 17 HDR YD | |
| Average of class Gaming (80 - 330, n=107, last 2 years) | |
| HWBOT x265 Benchmark v2.2 - 4k Preset | |
| Average of class Gaming (11.5 - 44.3, n=108, last 2 years) | |
| MSI GE76 Raider 11UH-472US (Serienmodell) | |
| MSI GE76 Raider 11UH-472US (Vorserie) | |
| Gigabyte Aero 17 HDR YD | |
| Average Intel Core i9-11980HK (13.1 - 16.3, n=5) | |
| Alienware m17 R4 | |
| MSI GE76 Raider 10UH | |
| LibreOffice - 20 Documents To PDF | |
| Alienware m17 R4 | |
| Average of class Gaming (19 - 88.8, n=108, last 2 years) | |
| MSI GE76 Raider 10UH | |
| Average Intel Core i9-11980HK (40.6 - 47.7, n=5) | |
| Gigabyte Aero 17 HDR YD | |
| MSI GE76 Raider 11UH-472US (Serienmodell) | |
| MSI GE76 Raider 11UH-472US (Vorserie) | |
| R Benchmark 2.5 - Overall mean | |
| MSI GE76 Raider 10UH | |
| Alienware m17 R4 | |
| MSI GE76 Raider 11UH-472US (Serienmodell) | |
| MSI GE76 Raider 11UH-472US (Vorserie) | |
| Gigabyte Aero 17 HDR YD | |
| Average Intel Core i9-11980HK (0.545 - 0.565, n=5) | |
| Average of class Gaming (0.3439 - 0.759, n=109, last 2 years) | |
* ... smaller is better
System performance
In the PCMark 10 test for evaluating system performance, the MSI GE76 Raider 11UH achieves a good result and the second place in our test field. The "Essentials" individual score in particular stands out here. The biggest competitor is the Gigabyte Aero 17 HDR YD.
The gaming laptop can be operated very smoothly in everyday use. Programs are launched quickly, and accessing files is possible without delays. How other laptops were able to perform in comparison can be found in our CPU Benchmarks article.
| PCMark 10 / Score | |
| Average of class Gaming (5828 - 11574, n=94, last 2 years) | |
| Gigabyte Aero 17 HDR YD | |
| MSI GE76 Raider 11UH-472US (Serienmodell) | |
| MSI GE76 Raider 11UH-472US | |
| Average Intel Core i9-11980HK, NVIDIA GeForce RTX 3080 Laptop GPU (6937 - 7088, n=3) | |
| Alienware m17 R4 | |
| MSI GE76 Raider 10UH | |
| PCMark 10 / Essentials | |
| Average of class Gaming (8810 - 12600, n=98, last 2 years) | |
| MSI GE76 Raider 11UH-472US | |
| MSI GE76 Raider 11UH-472US (Serienmodell) | |
| Gigabyte Aero 17 HDR YD | |
| Average Intel Core i9-11980HK, NVIDIA GeForce RTX 3080 Laptop GPU (9665 - 10291, n=3) | |
| MSI GE76 Raider 10UH | |
| Alienware m17 R4 | |
| PCMark 10 / Productivity | |
| Average of class Gaming (6845 - 18766, n=96, last 2 years) | |
| MSI GE76 Raider 11UH-472US (Serienmodell) | |
| MSI GE76 Raider 11UH-472US | |
| Gigabyte Aero 17 HDR YD | |
| Average Intel Core i9-11980HK, NVIDIA GeForce RTX 3080 Laptop GPU (8934 - 9107, n=3) | |
| Alienware m17 R4 | |
| MSI GE76 Raider 10UH | |
| PCMark 10 / Digital Content Creation | |
| Average of class Gaming (7602 - 19657, n=96, last 2 years) | |
| MSI GE76 Raider 11UH-472US (Serienmodell) | |
| MSI GE76 Raider 11UH-472US | |
| Gigabyte Aero 17 HDR YD | |
| Average Intel Core i9-11980HK, NVIDIA GeForce RTX 3080 Laptop GPU (9855 - 10823, n=3) | |
| MSI GE76 Raider 10UH | |
| Alienware m17 R4 | |
| PCMark 10 Score | 7054 points | |
Help | ||
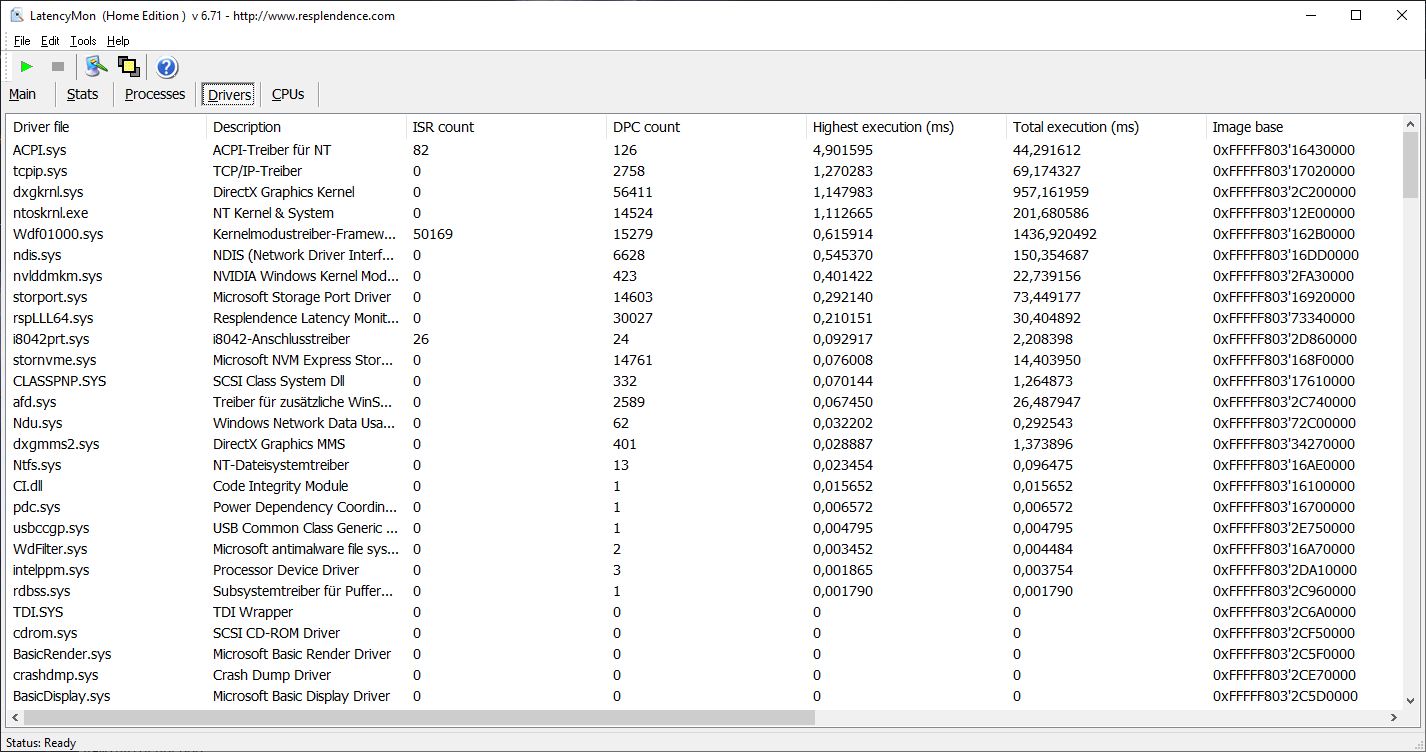
DPC latencies
In the test with LatencyMon, the MSI GE76 Raider 11UH shows high interruption times. This means that it isn't suitable for real-time audio applications or the like.

| DPC Latencies / LatencyMon - interrupt to process latency (max), Web, Youtube, Prime95 | |
| MSI GE76 Raider 10UH | |
| MSI GE76 Raider 11UH-472US | |
| Gigabyte Aero 17 HDR YD | |
| Alienware m17 R4 | |
* ... smaller is better
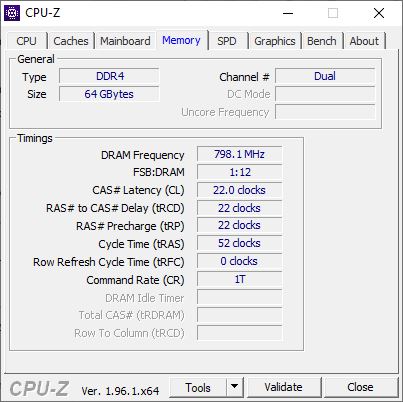
Storage
MSI installs a 2 TB SSD from Samsung in our test configuration of the GE76 Raider 11UH. It achieves very good write and read rates in the storage benchmarks, which are usually above the level of the rest of our test field.
The performance that can be expected from other mass storage devices can be found in our HDD/SSD Benchmarks article.
| MSI GE76 Raider 11UH-472US Samsung PM9A1 MZVL21T0HCLR | MSI GE76 Raider 10UH WDC PC SN730 SDBPNTY-1T00 | Gigabyte Aero 17 HDR YD Samsung PM9A1 MZVL2512HCJQ | Alienware m17 R4 2x Micron 2300 512 GB (RAID 0) | Average Samsung PM9A1 MZVL21T0HCLR | |
|---|---|---|---|---|---|
| CrystalDiskMark 5.2 / 6 | -42% | -2% | -42% | -14% | |
| Write 4K (MB/s) | 238.8 | 157.1 -34% | 230.4 -4% | 93.1 -61% | 194.2 ? -19% |
| Read 4K (MB/s) | 88 | 46.3 -47% | 91.6 4% | 46.79 -47% | 80.6 ? -8% |
| Write Seq (MB/s) | 4306 | 2396 -44% | 4216 -2% | 2853 -34% | 3638 ? -16% |
| Read Seq (MB/s) | 4549 | 2245 -51% | 4543 0% | 2556 -44% | 3838 ? -16% |
| Write 4K Q32T1 (MB/s) | 699 | 436.1 -38% | 667 -5% | 475 -32% | 500 ? -28% |
| Read 4K Q32T1 (MB/s) | 752 | 524 -30% | 728 -3% | 529 -30% | 605 ? -20% |
| Write Seq Q32T1 (MB/s) | 5119 | 3086 -40% | 5043 -1% | 3331 -35% | 4898 ? -4% |
| Read Seq Q32T1 (MB/s) | 7086 | 3363 -53% | 6821 -4% | 3319 -53% | 6775 ? -4% |
| AS SSD | -70% | 0% | -68% | -7% | |
| Seq Read (MB/s) | 5435 | 2967 -45% | 5438 0% | 2733 -50% | 4901 ? -10% |
| Seq Write (MB/s) | 3954 | 2604 -34% | 3904 -1% | 2822 -29% | 3334 ? -16% |
| 4K Read (MB/s) | 52.9 | 42.97 -19% | 56.2 6% | 45.04 -15% | 72.4 ? 37% |
| 4K Write (MB/s) | 158.8 | 107.8 -32% | 165.8 4% | 88.4 -44% | 186 ? 17% |
| 4K-64 Read (MB/s) | 2551 | 1684 -34% | 2489 -2% | 1388 -46% | 1871 ? -27% |
| 4K-64 Write (MB/s) | 3155 | 2164 -31% | 3480 10% | 1227 -61% | 2764 ? -12% |
| Access Time Read * (ms) | 0.044 | 0.116 -164% | 0.054 -23% | 0.079 -80% | 0.0377 ? 14% |
| Access Time Write * (ms) | 0.026 | 0.106 -308% | 0.026 -0% | 0.095 -265% | 0.03431 ? -32% |
| Score Read (Points) | 3148 | 2023 -36% | 3089 -2% | 1706 -46% | 2433 ? -23% |
| Score Write (Points) | 3709 | 2532 -32% | 4036 9% | 1598 -57% | 3284 ? -11% |
| Score Total (Points) | 8383 | 5571 -34% | 8620 3% | 4184 -50% | 6892 ? -18% |
| Total Average (Program / Settings) | -56% /
-58% | -1% /
-1% | -55% /
-57% | -11% /
-10% |
* ... smaller is better

Continuous load read: DiskSpd Read Loop, Queue Depth 8
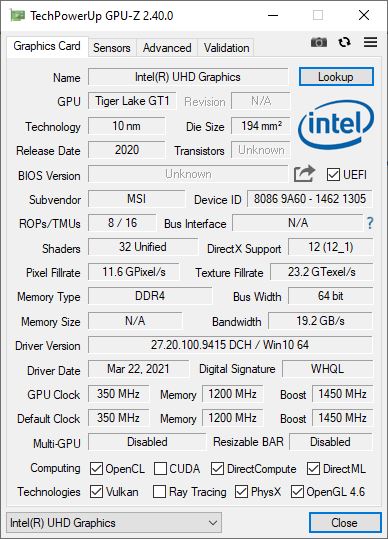
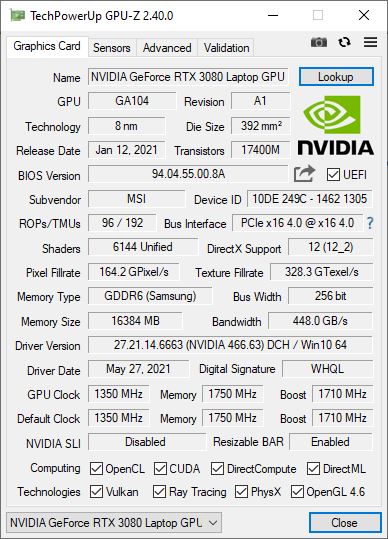
Graphics card
The Nvidia GeForce RTX 3080 used here is currently the strongest mobile graphics card. Nevertheless, its performance depends on the TGP setting, which has been set by MSI to the maximum possible value of 165 watts. The performance results in the benchmarks are correspondingly good. Once again, it should be noted that the GE76 Raider 10UH was tested with the "Extreme" setting and the GE76 Raider 11UH with the "High Performance" setting.
Our GPU Benchmarks article shows how other graphics cards perform in comparison.
| 3DMark 11 Performance | 30194 points | |
| 3DMark Cloud Gate Standard Score | 47525 points | |
| 3DMark Fire Strike Score | 21608 points | |
Help | ||
Gaming performance
The MSI GE76 Raider 11UH is outstandingly well suited for gaming. The built-in Nvidia GeForce RTX 3080 provides very high frame rates and even displays demanding titles smoothly at high resolutions and maximum detail levels. Compared to our chosen competition, MSI's gaming laptop performs at a similar level.
The performance that can be expected from the Nvidia GeForce RTX 3080 in other titles is listed in our GPU Games article.
| The Witcher 3 - 1920x1080 Ultra Graphics & Postprocessing (HBAO+) | |
| Average of class Gaming (95 - 240, n=8, last 2 years) | |
| MSI GE76 Raider 10UH | |
| Alienware m17 R4 | |
| MSI GE76 Raider 11UH-472US | |
| Average NVIDIA GeForce RTX 3080 Laptop GPU (85.1 - 123, n=40) | |
| Gigabyte Aero 17 HDR YD | |
| Cyberpunk 2077 1.0 - 1920x1080 Ultra Preset | |
| Alienware m17 R4 | |
| MSI GE76 Raider 11UH-472US | |
| Average NVIDIA GeForce RTX 3080 Laptop GPU (52.9 - 84.3, n=9) | |
| Gigabyte Aero 17 HDR YD | |
| X-Plane 11.11 - 1920x1080 high (fps_test=3) | |
| Average of class Gaming (52.1 - 143.5, n=113, last 2 years) | |
| Gigabyte Aero 17 HDR YD | |
| Alienware m17 R4 | |
| MSI GE76 Raider 11UH-472US | |
| Average NVIDIA GeForce RTX 3080 Laptop GPU (65.6 - 113, n=44) | |
| MSI GE76 Raider 10UH | |
| GTA V - 1920x1080 High/On (Advanced Graphics Off) AA:2xMSAA + FX AF:8x | |
| Average of class Gaming (110.7 - 189, n=70, last 2 years) | |
| Gigabyte Aero 17 HDR YD | |
| MSI GE76 Raider 11UH-472US | |
| Average NVIDIA GeForce RTX 3080 Laptop GPU (137 - 176, n=30) | |
| MSI GE76 Raider 10UH | |
| Alienware m17 R4 | |
| Final Fantasy XV Benchmark - 1920x1080 High Quality | |
| Average of class Gaming (41 - 215, n=101, last 2 years) | |
| MSI GE76 Raider 10UH | |
| MSI GE76 Raider 11UH-472US | |
| Average NVIDIA GeForce RTX 3080 Laptop GPU (55.5 - 115, n=34) | |
| Gigabyte Aero 17 HDR YD | |
| Alienware m17 R4 | |
| Dota 2 Reborn - 1920x1080 ultra (3/3) best looking | |
| Average of class Gaming (84.8 - 248, n=110, last 2 years) | |
| Gigabyte Aero 17 HDR YD | |
| MSI GE76 Raider 11UH-472US | |
| Alienware m17 R4 | |
| Average NVIDIA GeForce RTX 3080 Laptop GPU (98 - 156, n=45) | |
| MSI GE76 Raider 10UH | |
Our continuous load test with The Witcher 3 using the "Ultra" graphics settings also shows that frame rates remain stable even over prolonged periods of time despite there being slight fluctuations. Consequently, performance limitations are not to be expected during long gaming sessions.
The Witcher 3 FPS diagram
| low | med. | high | ultra | QHD | 4K | |
|---|---|---|---|---|---|---|
| GTA V (2015) | 182 | 177 | 164 | |||
| The Witcher 3 (2015) | 112 | |||||
| Dota 2 Reborn (2015) | 173 | 159 | 148 | 138 | ||
| Final Fantasy XV Benchmark (2018) | 183 | 136 | 108 | |||
| X-Plane 11.11 (2018) | 122 | 104 | 84.2 | |||
| Far Cry 5 (2018) | 136 | 115 | 113 | 110 | ||
| Strange Brigade (2018) | 446 | 265 | 219 | 196 | ||
| Cyberpunk 2077 1.0 (2020) | 105 | 99.2 | 90.6 | 80.1 | ||
| Diablo 4 (2023) | 184.6 | 124 | 65.5 |
Emissions - Good speakers in the 17-inch laptop
Noise emissions

The fans of the MSI GE76 Raider 11UH can get pretty loud under load with up to 55 dB(A). In the "Auto" fan profile, this noise level is only reached in very demanding titles, but the uniform fan noise is clearly audible even under lower load. Compared to other gaming laptops, the GE76 Raider has a medium noise level.
We were unable to detect other background noises, such as coil whine or the like, in our test device.
Noise level
| Idle |
| 25 / 27 / 35 dB(A) |
| Load |
| 54 / 55 dB(A) |
 | ||
30 dB silent 40 dB(A) audible 50 dB(A) loud |
||
min: | ||
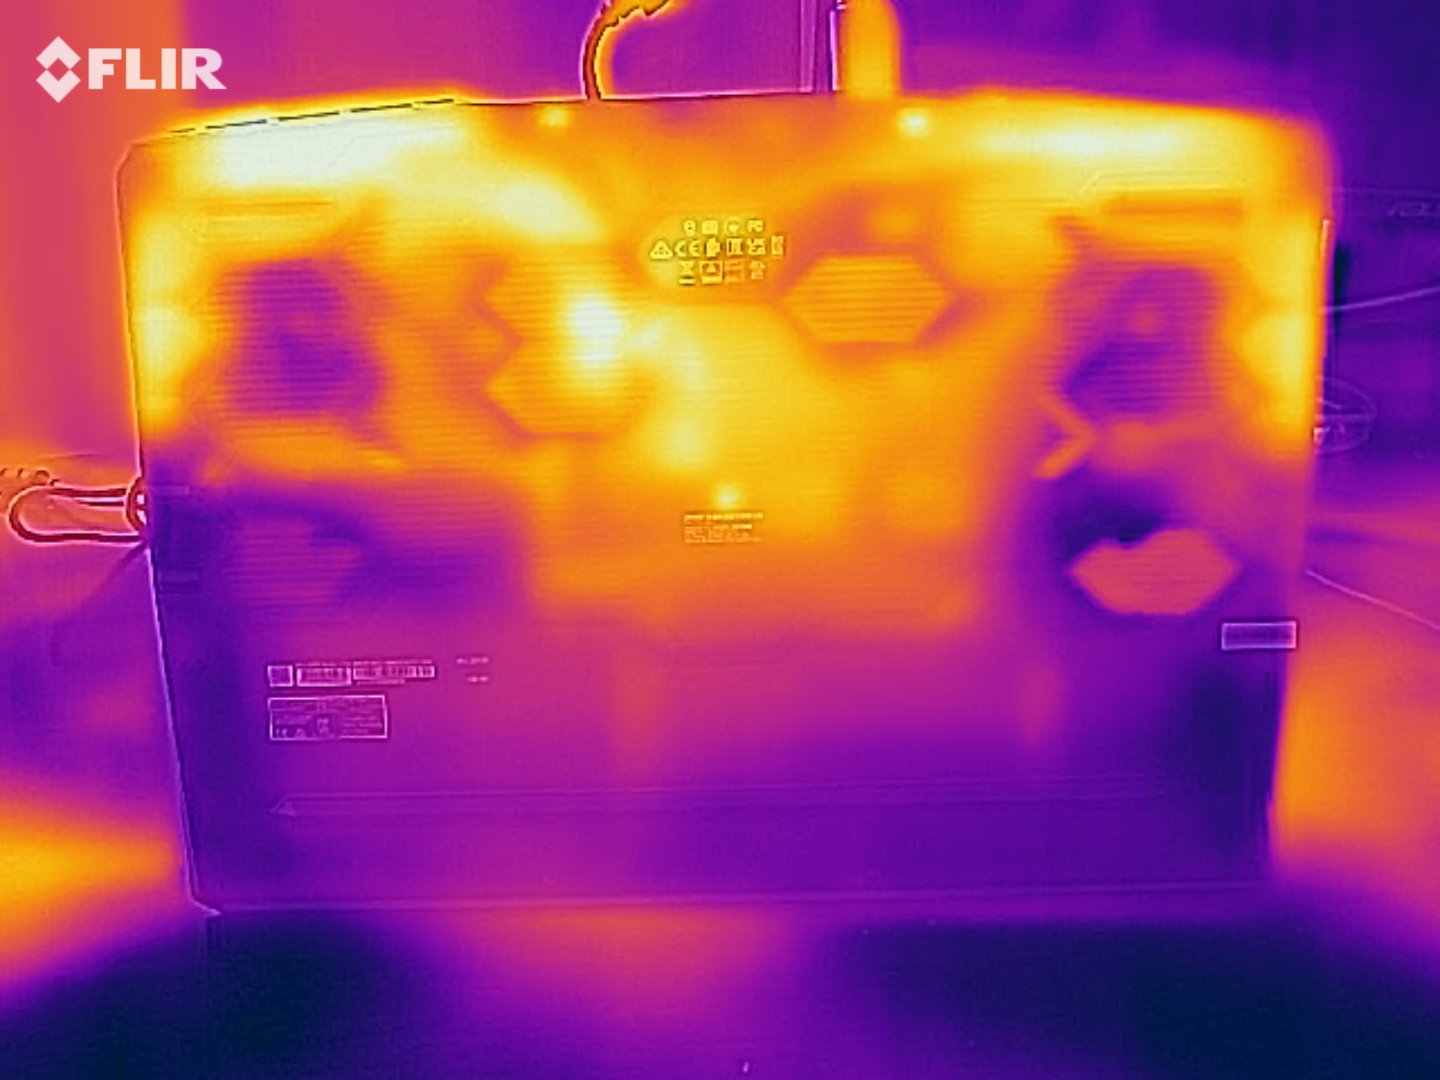
Temperature
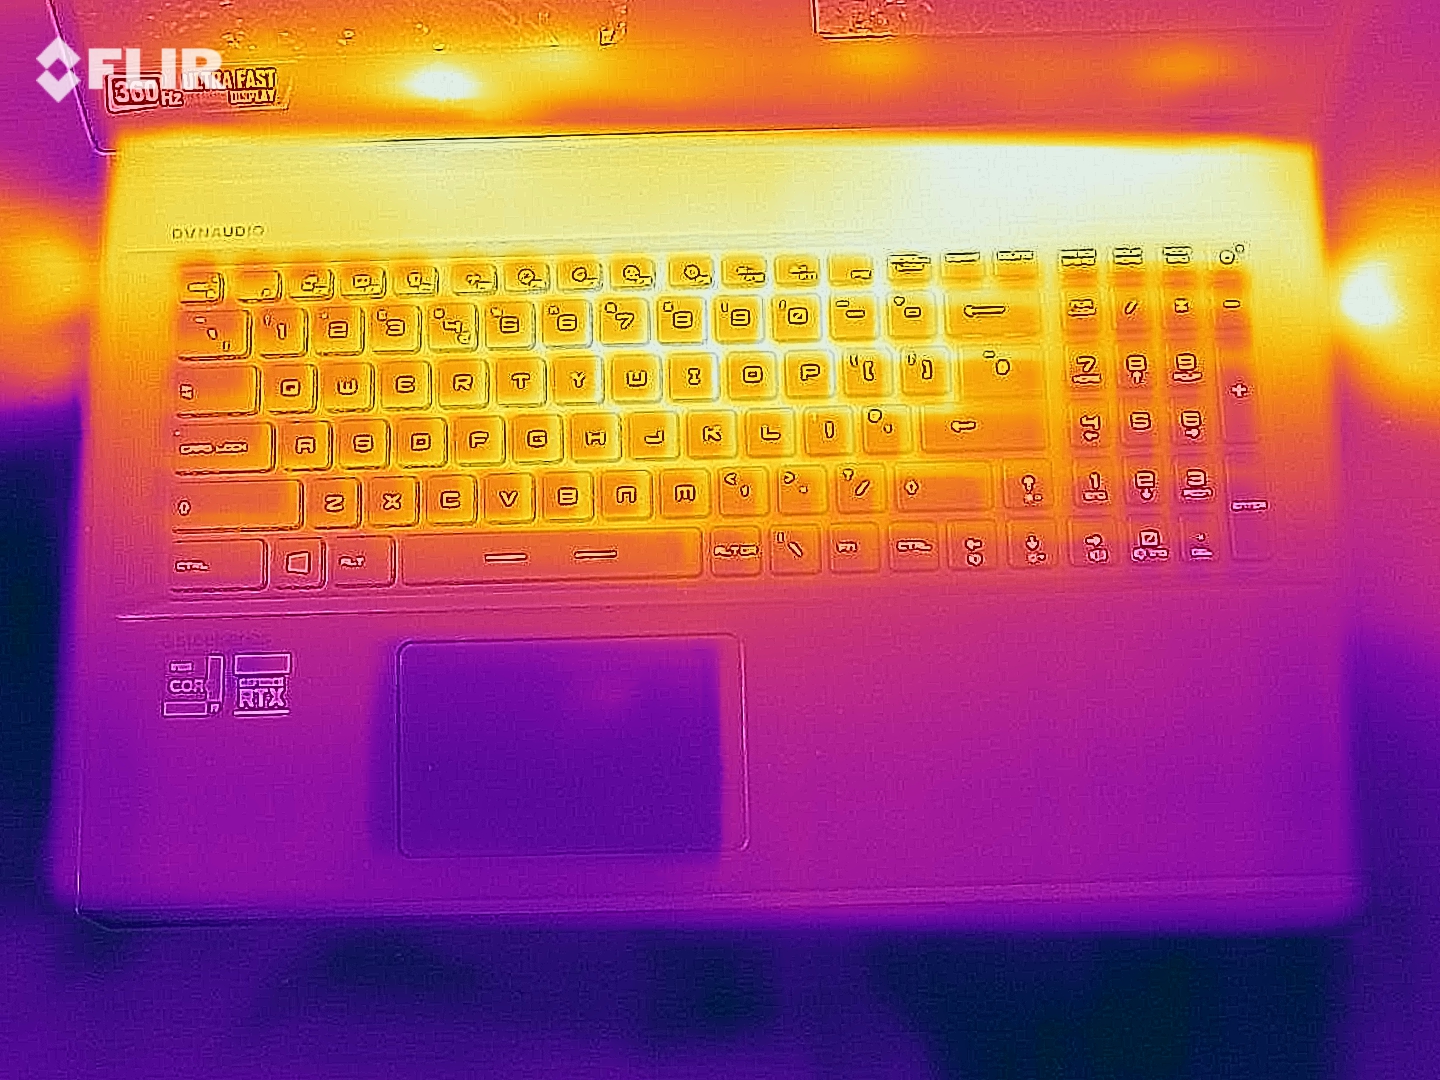
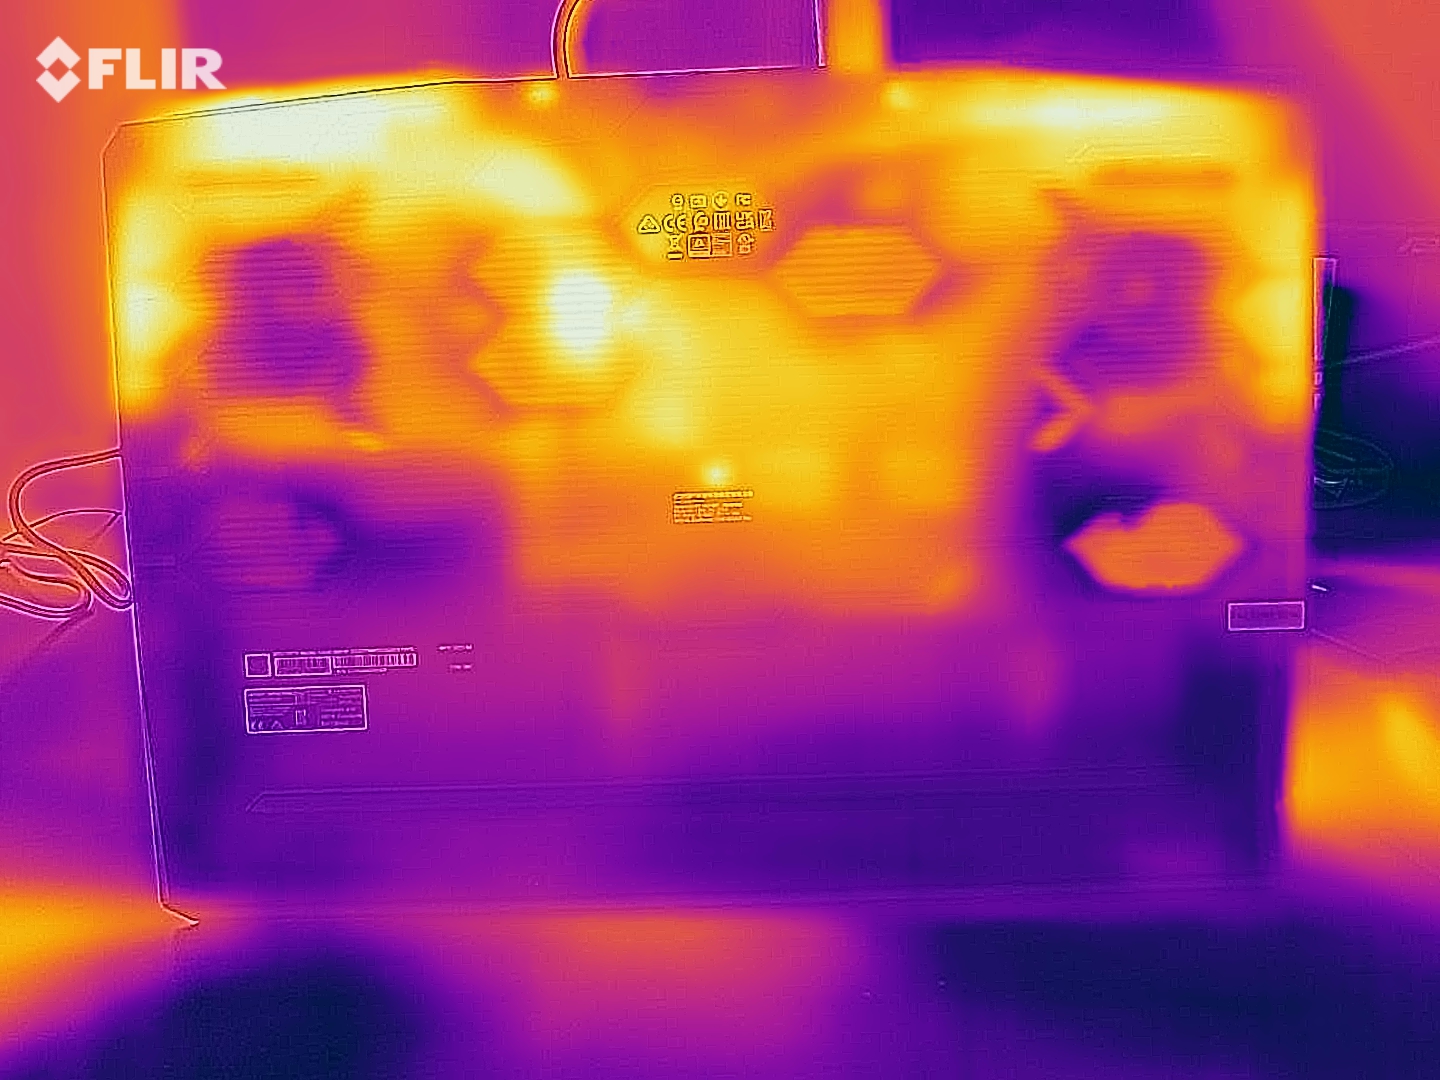
According to our measurements, the surfaces of the MSI laptop heat up to 50 °C (~122 °F) under load. The warmest spot is at the rear left corner of the underside. The temperature of the palm rests remains moderate at all times at up to 34 °C (~93 °F).
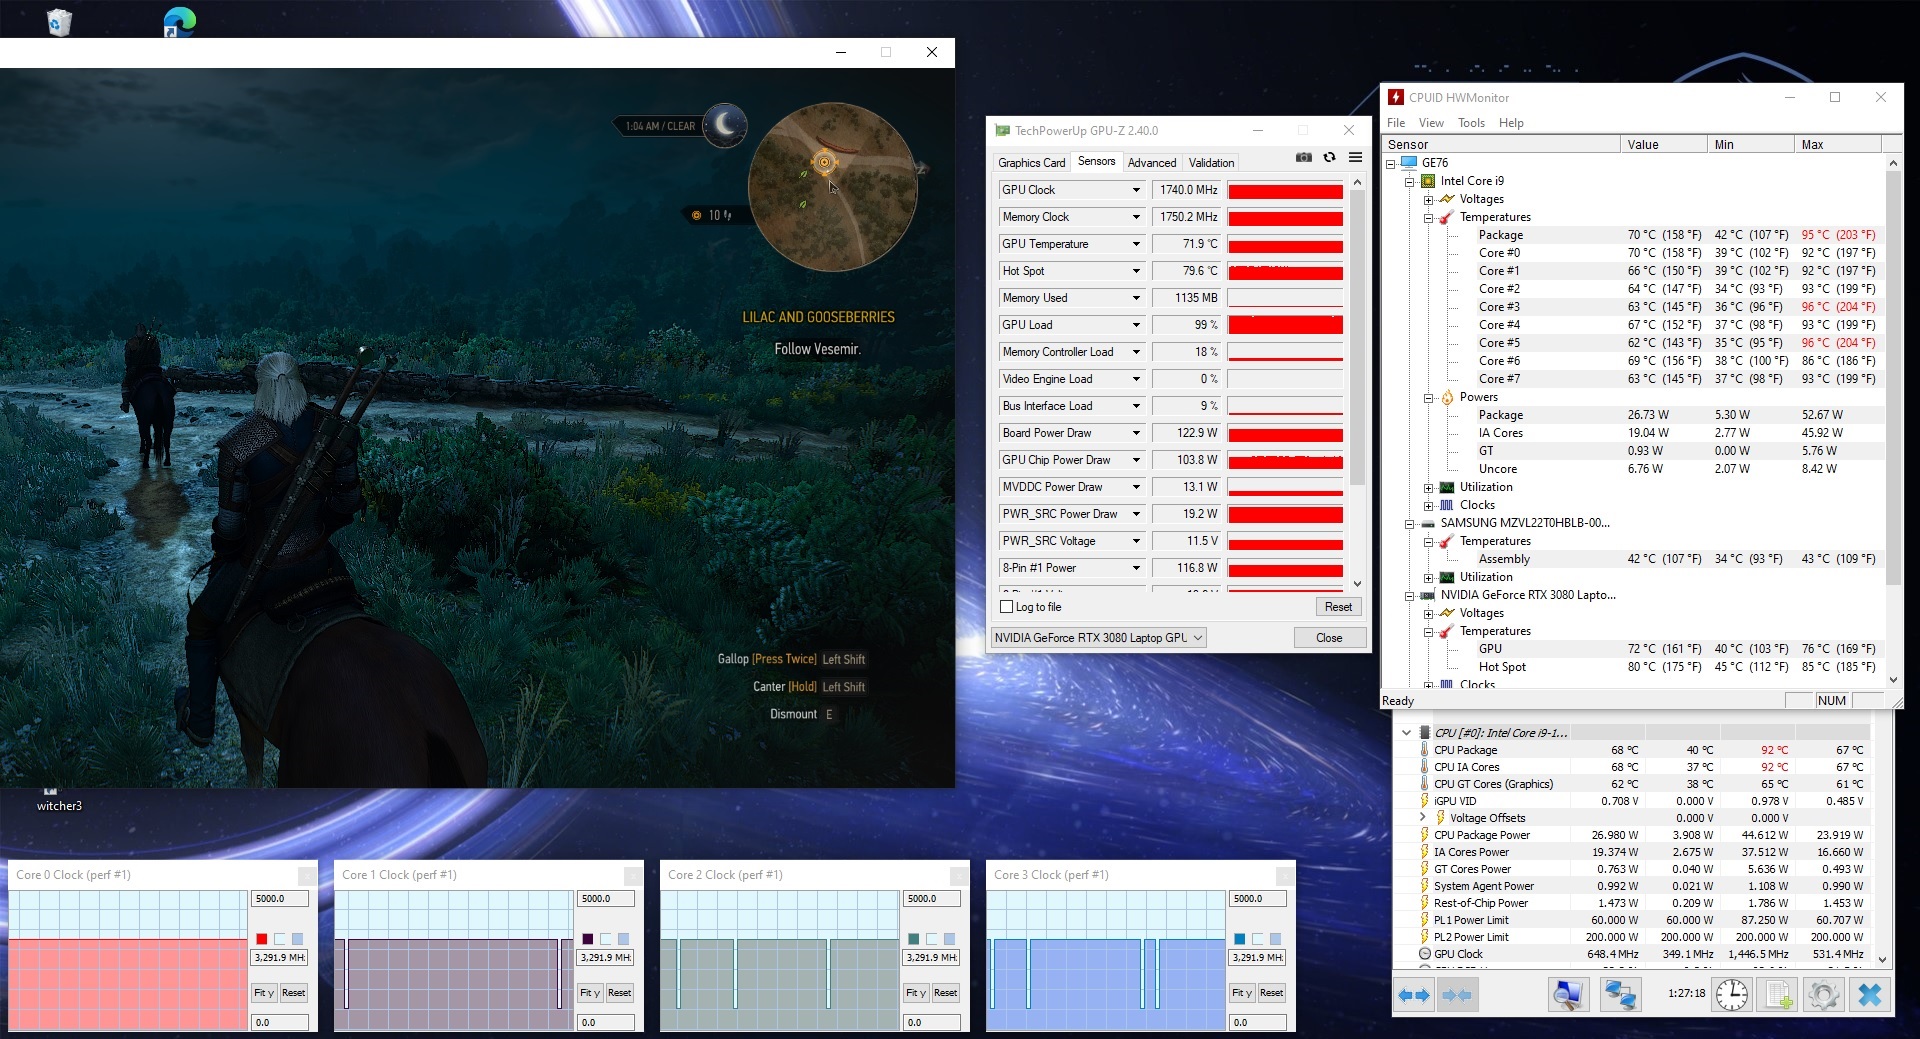
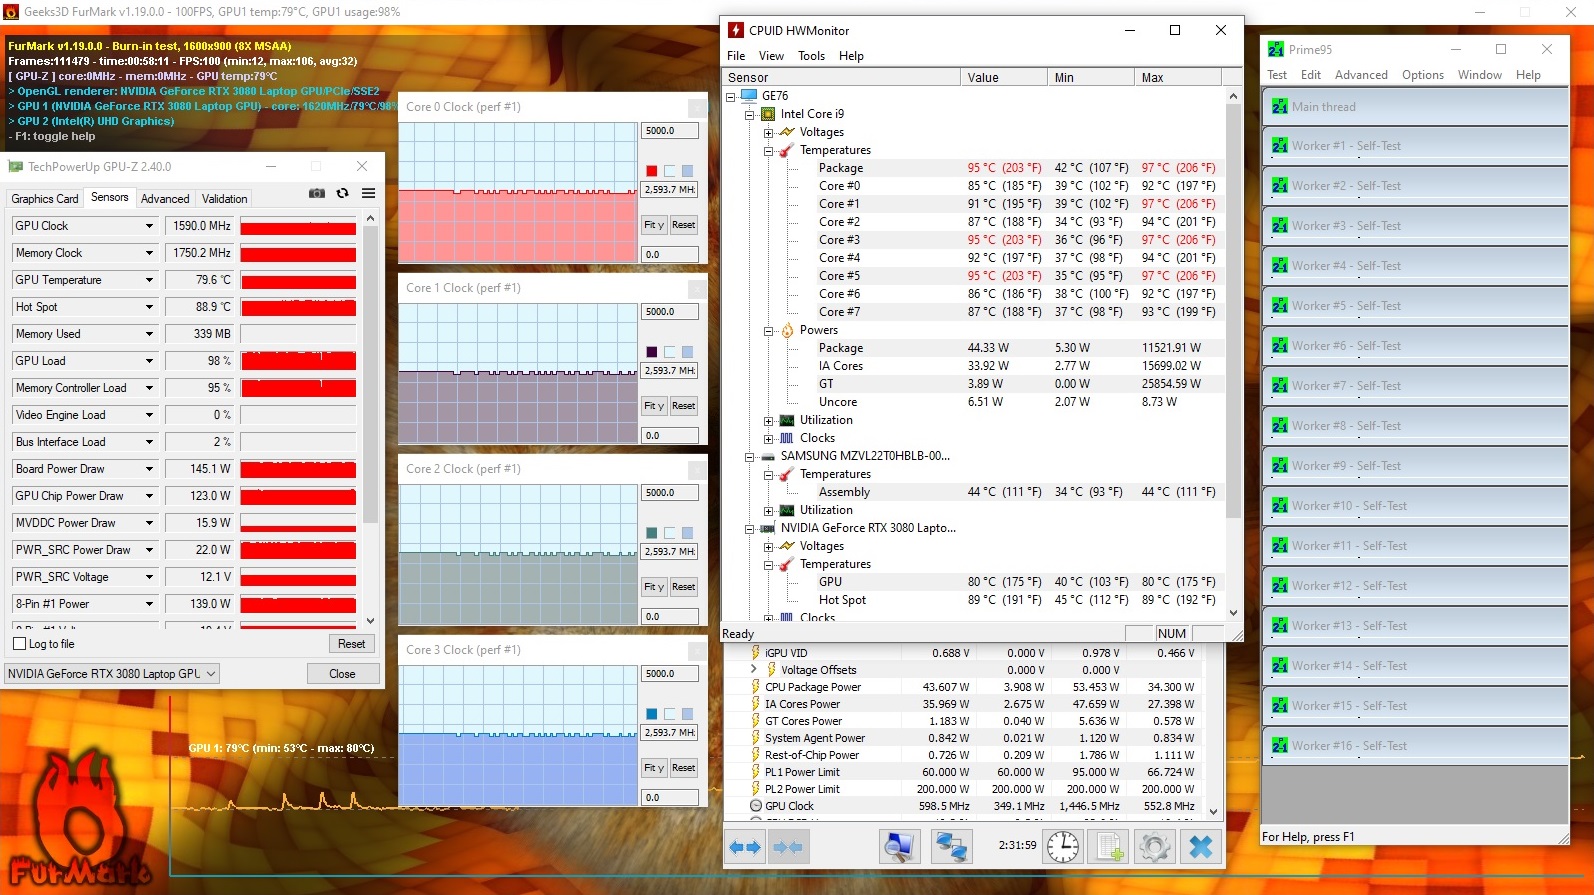
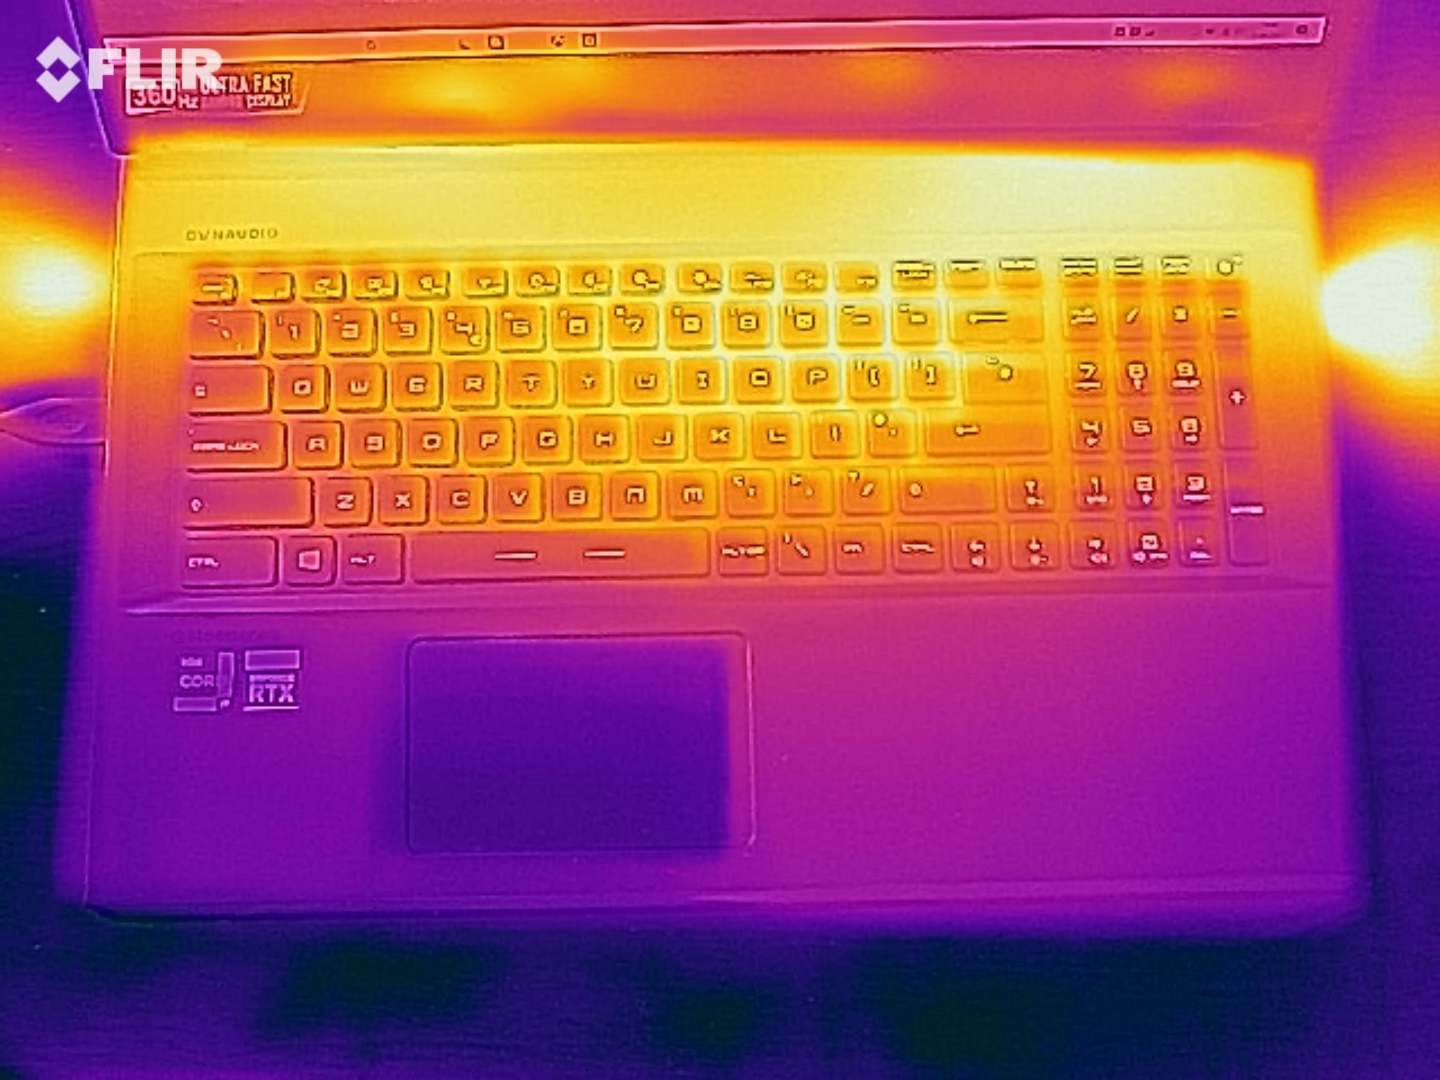
During our endurance stress test, the temperatures inside climbed up to 97 °C (~207 °F), but at around 2.6 GHz, the CPU clock rates didn't drop below the base clock speed. Temperatures of up to 96 °C (~205 °F) were reached during our The Witcher 3 endurance test, but the clock rates didn't fall below 3.3 GHz here. Consequently, performance limitations or throttling don't have to be expected even under prolonged load.
(-) The maximum temperature on the upper side is 46 °C / 115 F, compared to the average of 40.4 °C / 105 F, ranging from 21.2 to 68.8 °C for the class Gaming.
(-) The bottom heats up to a maximum of 48 °C / 118 F, compared to the average of 43.2 °C / 110 F
(+) In idle usage, the average temperature for the upper side is 29.3 °C / 85 F, compared to the device average of 33.9 °C / 93 F.
(-) Playing The Witcher 3, the average temperature for the upper side is 40.7 °C / 105 F, compared to the device average of 33.9 °C / 93 F.
(+) The palmrests and touchpad are reaching skin temperature as a maximum (34 °C / 93.2 F) and are therefore not hot.
(-) The average temperature of the palmrest area of similar devices was 28.8 °C / 83.8 F (-5.2 °C / -9.4 F).
Speakers
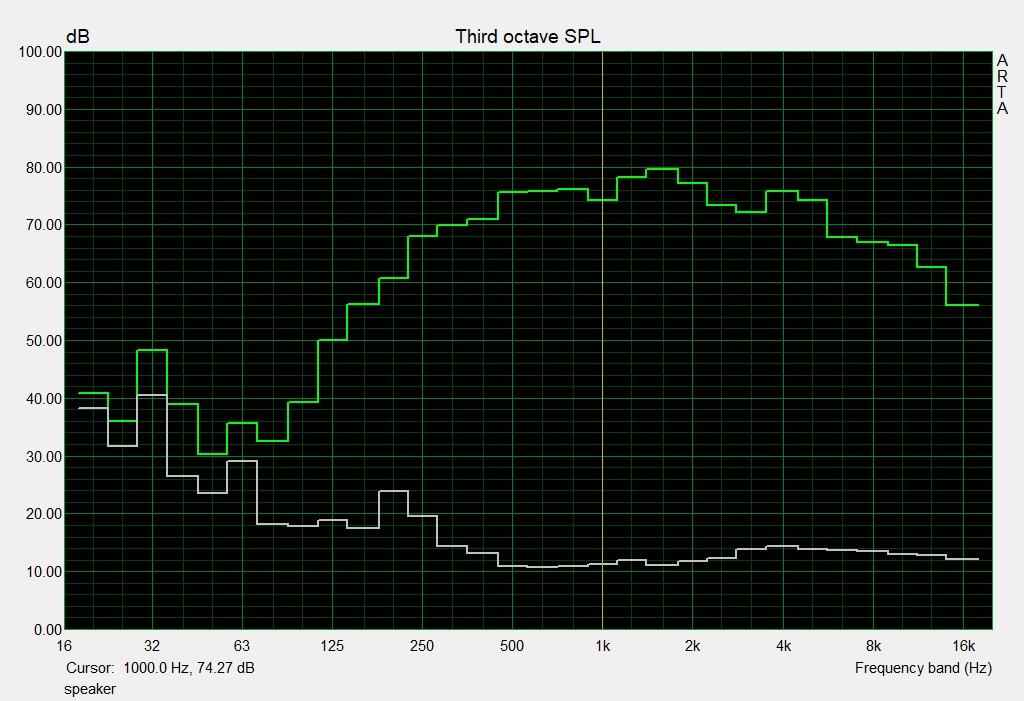
The speakers of the MSI GE76 Raider UH11 offer relatively high volume and a fairly broad sound spectrum. This makes them well suited for playing media content. Nevertheless, external speakers or headphones are still recommended when gaming due to the somewhat strong noise level of the fans.
MSI GE76 Raider 11UH-472US audio analysis
(+) | speakers can play relatively loud (87 dB)
Bass 100 - 315 Hz
(±) | reduced bass - on average 14.8% lower than median
(±) | linearity of bass is average (10.5% delta to prev. frequency)
Mids 400 - 2000 Hz
(+) | balanced mids - only 4.1% away from median
(+) | mids are linear (3.3% delta to prev. frequency)
Highs 2 - 16 kHz
(+) | balanced highs - only 3.2% away from median
(+) | highs are linear (4.3% delta to prev. frequency)
Overall 100 - 16.000 Hz
(+) | overall sound is linear (12.6% difference to median)
Compared to same class
» 16% of all tested devices in this class were better, 3% similar, 81% worse
» The best had a delta of 6%, average was 18%, worst was 132%
Compared to all devices tested
» 11% of all tested devices were better, 2% similar, 86% worse
» The best had a delta of 4%, average was 24%, worst was 134%
Gigabyte Aero 17 HDR YD audio analysis
(+) | speakers can play relatively loud (88 dB)
Bass 100 - 315 Hz
(-) | nearly no bass - on average 33.9% lower than median
(±) | linearity of bass is average (9.6% delta to prev. frequency)
Mids 400 - 2000 Hz
(+) | balanced mids - only 2.9% away from median
(+) | mids are linear (6.5% delta to prev. frequency)
Highs 2 - 16 kHz
(±) | higher highs - on average 5.1% higher than median
(+) | highs are linear (4.7% delta to prev. frequency)
Overall 100 - 16.000 Hz
(±) | linearity of overall sound is average (19.8% difference to median)
Compared to same class
» 69% of all tested devices in this class were better, 6% similar, 24% worse
» The best had a delta of 6%, average was 18%, worst was 132%
Compared to all devices tested
» 50% of all tested devices were better, 7% similar, 43% worse
» The best had a delta of 4%, average was 24%, worst was 134%
Energy management - Over 5 hours of battery life
Energy consumption
With an average power consumption of 16 watts in idle usage, the MSI GE76 Raider UH11 proves to be more frugal than our chosen competitors. Under load, consumption is between 103 and 266 watts.
The included power adapter offers an output capacity of 280 watts; therefore, it has a sufficiently high rating.
| Off / Standby | |
| Idle | |
| Load |
|
Key:
min: | |
| MSI GE76 Raider 11UH-472US i9-11980HK, GeForce RTX 3080 Laptop GPU | MSI GE76 Raider 10UH i7-10870H, GeForce RTX 3080 Laptop GPU | Gigabyte Aero 17 HDR YD i9-11980HK, GeForce RTX 3080 Laptop GPU | Alienware m17 R4 i9-10980HK, GeForce RTX 3080 Laptop GPU | Average of class Gaming | |
|---|---|---|---|---|---|
| Power Consumption | -29% | -44% | -116% | -9% | |
| Idle Minimum * (Watt) | 10 | 15.5 -55% | 25 -150% | 42 -320% | 13.2 ? -32% |
| Idle Average * (Watt) | 16 | 31.3 -96% | 28 -75% | 48 -200% | 18.9 ? -18% |
| Idle Maximum * (Watt) | 26 | 31.7 -22% | 40 -54% | 58 -123% | 24.3 ? 7% |
| Load Average * (Watt) | 103 | 93.6 9% | 114 -11% | 124 -20% | 108.3 ? -5% |
| Witcher 3 ultra * (Watt) | 204 | 233 -14% | 176 14% | 219 -7% | |
| Load Maximum * (Watt) | 266 | 260.3 2% | 236 11% | 337 -27% | 254 ? 5% |
* ... smaller is better
Energy consumption during The Witcher 3 / Stress test
Battery life
The MSI GE76 Raider UH11 achieves a runtime of 5:30 hours in our real-world Wi-Fi test. This means that it uses its 99.9 Wh battery similarly well as comparable devices.
| MSI GE76 Raider 11UH-472US i9-11980HK, GeForce RTX 3080 Laptop GPU, 99.9 Wh | MSI GE76 Raider 10UH i7-10870H, GeForce RTX 3080 Laptop GPU, 99.9 Wh | Gigabyte Aero 17 HDR YD i9-11980HK, GeForce RTX 3080 Laptop GPU, 99 Wh | Alienware m17 R4 i9-10980HK, GeForce RTX 3080 Laptop GPU, 86 Wh | Average of class Gaming | |
|---|---|---|---|---|---|
| Battery runtime | 11% | -9% | -38% | 13% | |
| Reader / Idle (h) | 7.8 | 8.2 5% | 8.71 ? 12% | ||
| WiFi v1.3 (h) | 5.5 | 6.3 15% | 5.6 2% | 2.4 -56% | 7.04 ? 28% |
| Load (h) | 1.5 | 1.7 13% | 1.2 -20% | 1.2 -20% | 1.47 ? -2% |
Pros
Cons
Verdict - State-of-the-art gaming laptop
The MSI GE76 Raider 11UH provides nearly all the features of its predecessor. With the new CPU and the same Nvidia GeForce RTX 3080, performance is at least on par with the GE76 Raider 10UH and is consequently well suited for all the latest games. The port selection remains the same as well, but one of the USB-C ports also supports Thunderbolt 4 now. Thanks to good maintenance options, both the RAM and the storage device can be upgraded later on.
With the GE76 Raider UH11, MSI delivers a strong laptop that is optimally suited for all modern games.
In contrast to the GE76 Raider 10UH, the 11UH is now also offered with higher-resolution displays. Our test configuration features the highest refresh rate of 360 Hz, which is only available in Full HD. The panel's limited color space deserves criticism, since it's not acceptable in view of the price. Overall, the GE76 is one of the best gaming laptops with the RTX 3080.
The fact that the 2.1 MP webcam captures images at a slightly higher resolution is hardly noticeable in everyday use, unfortunately. However, the MSI GE76 Raider UH11 also differs in terms of dimensions compared with devices like the Gigabyte Aero 17 HDR YD and the Alienware m17 R4. If you're looking for a slim case, the competition is a better choice.
Update: The production model's CPU performance is now significantly higher than that of the GE76 Raider 10UH predecessor.
Price and availability
At the time of writing, the MSI GE76 Raider 11UH with the Core i9-11980HK seems to be mostly out of stock. Nonetheless, you can keep tabs on Amazon, and newegg, for example, or MSI's online store where the device shows a price of $3,399.99 configured with 32 GB of RAM and 1 TB of SSD storage. If you're okay with having a less powerful processor, the version with the Core i7-11800H is in stock on Amazon for $3,099.
MSI GE76 Raider 11UH-472US
- 08/16/2021 v7 (old)
Mike Wobker
Price comparison

