Asus ProArt StudioBook Pro 16 W7600 laptop in review: Powerful and light workstation
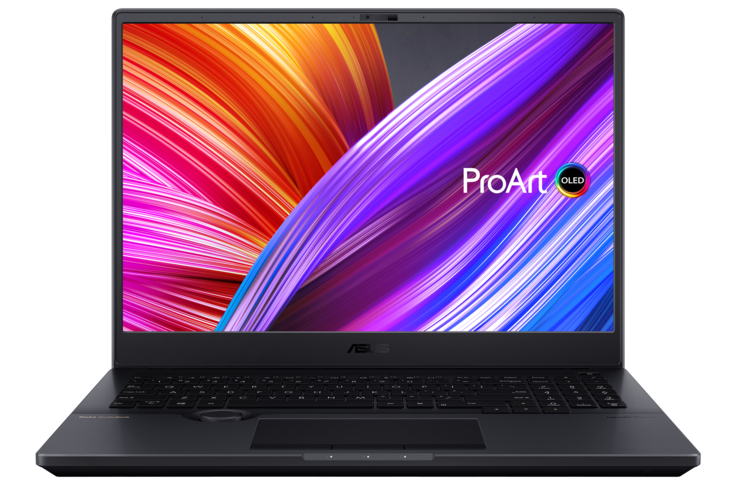
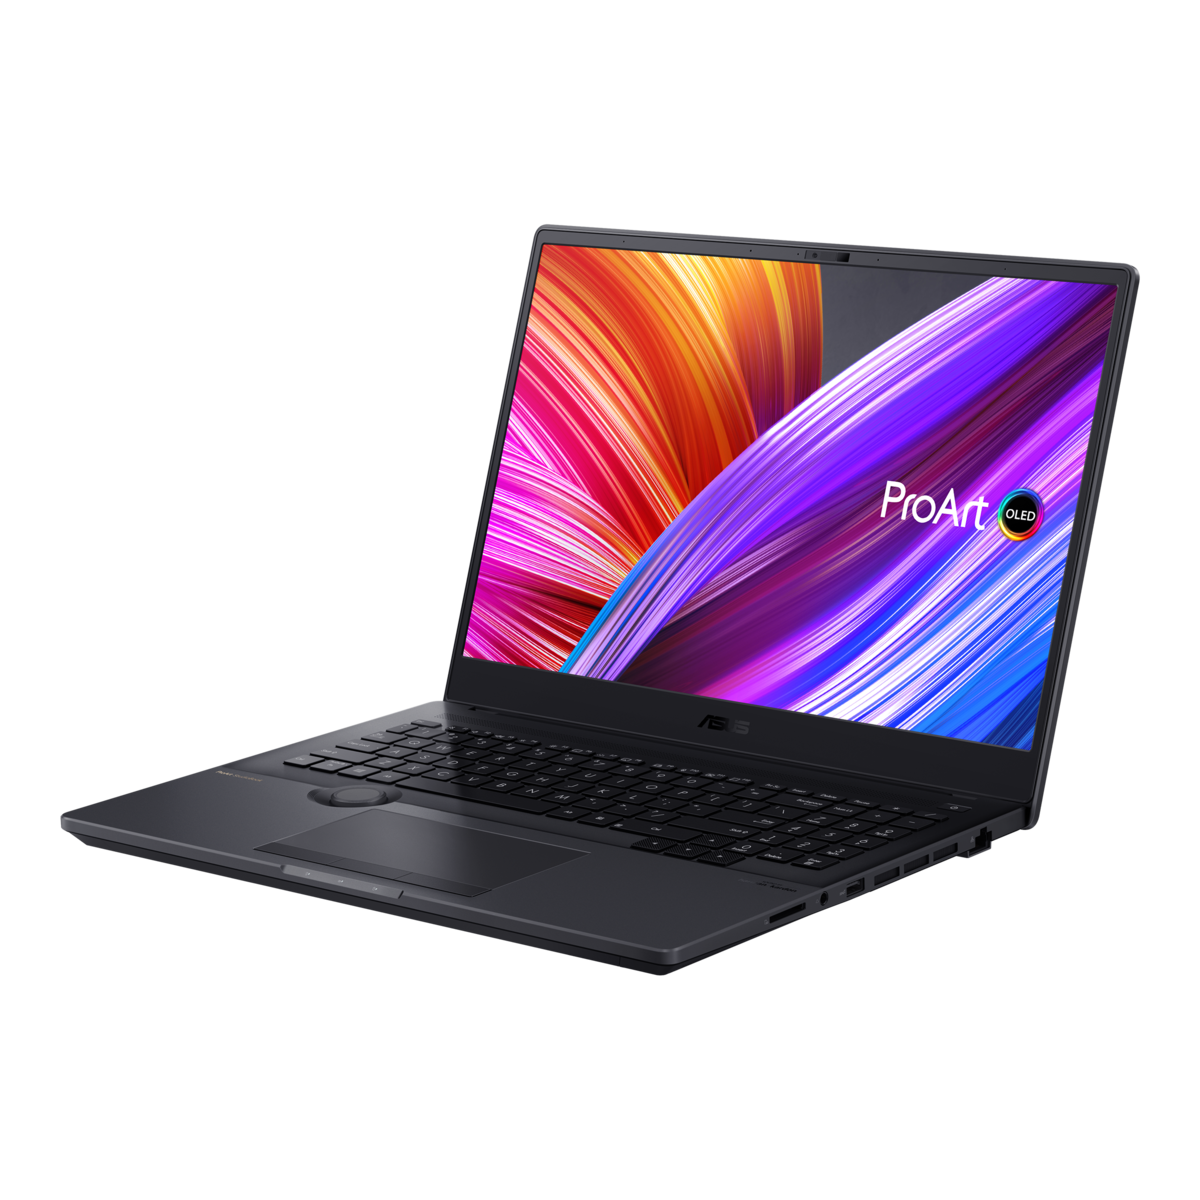
With the ProArt Studiobook Pro 16, Asus introduces a new notebook series for creative professionals. The creator notebook features a 4K OLED HDR display with 16:10 aspect ratio, which thus offers a larger work surface. In addition, there is a Asus Dial, which can be used to control a variety of creative tools and is thus supposed to simplify working for designers. The manufacturer brings out the big guns in terms of equipment, because not only the Intel's 3rd generation Xeon CPU is on board, but also the workstation GPU Nvidia RTX A5000. The series is thus aimed at professional users and is supposed to handle complex tasks like 3D rendering or high-resolution video editing. Since the test unit that was provided to us by Asus Germany is a pre-sample, the device does not get a rating from us yet.
Competitors include the HP ZBook Fury 15 G8, which is an identically equipped workstation, as well as the HP ZBook Studio 15 G8 and the Dell Precision 5560.
Possible competitors in comparison
Rating | Date | Model | Weight | Height | Size | Resolution | Price |
|---|---|---|---|---|---|---|---|
v (old) | 12 / 2021 | Asus ProArt StudioBook 16 W7600H5A-2BL2 W-11955M, RTX A5000 Laptop GPU | 2.4 kg | 21.4 mm | 16.00" | 3840x2400 | |
| 90.3 % v7 (old) | 10 / 2021 | HP ZBook Fury 15 G8 i9-11950H, RTX A5000 Laptop GPU | 2.5 kg | 25.9 mm | 15.60" | 3840x2160 | |
| 87.8 % v7 (old) | 08 / 2021 | HP ZBook Studio 15 G8 i9-11950H, GeForce RTX 3070 Laptop GPU | 1.9 kg | 18 mm | 15.60" | 3840x2160 | |
| 88.3 % v7 (old) | 10 / 2021 | Dell Precision 5000 5560 i7-11850H, RTX A2000 Laptop GPU | 2 kg | 18 mm | 15.60" | 3840x2400 |
Case
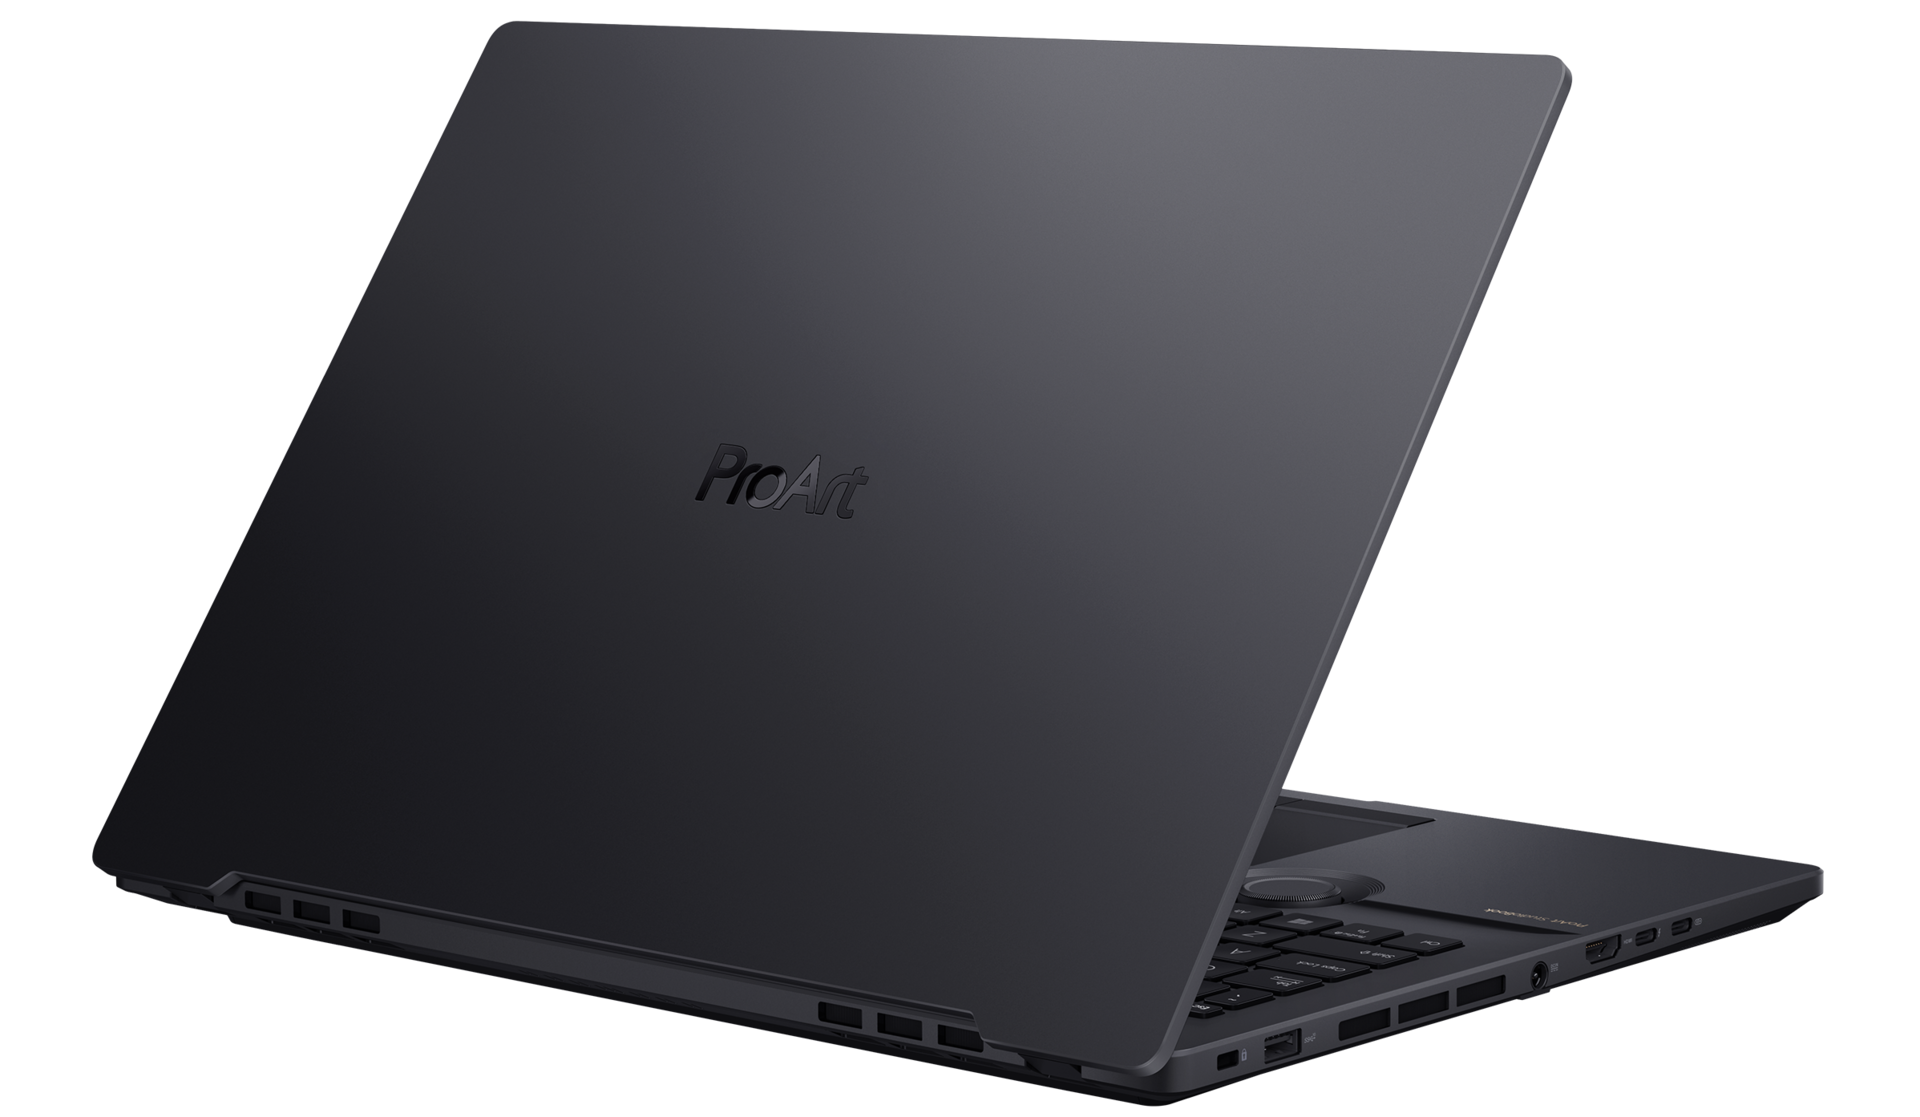
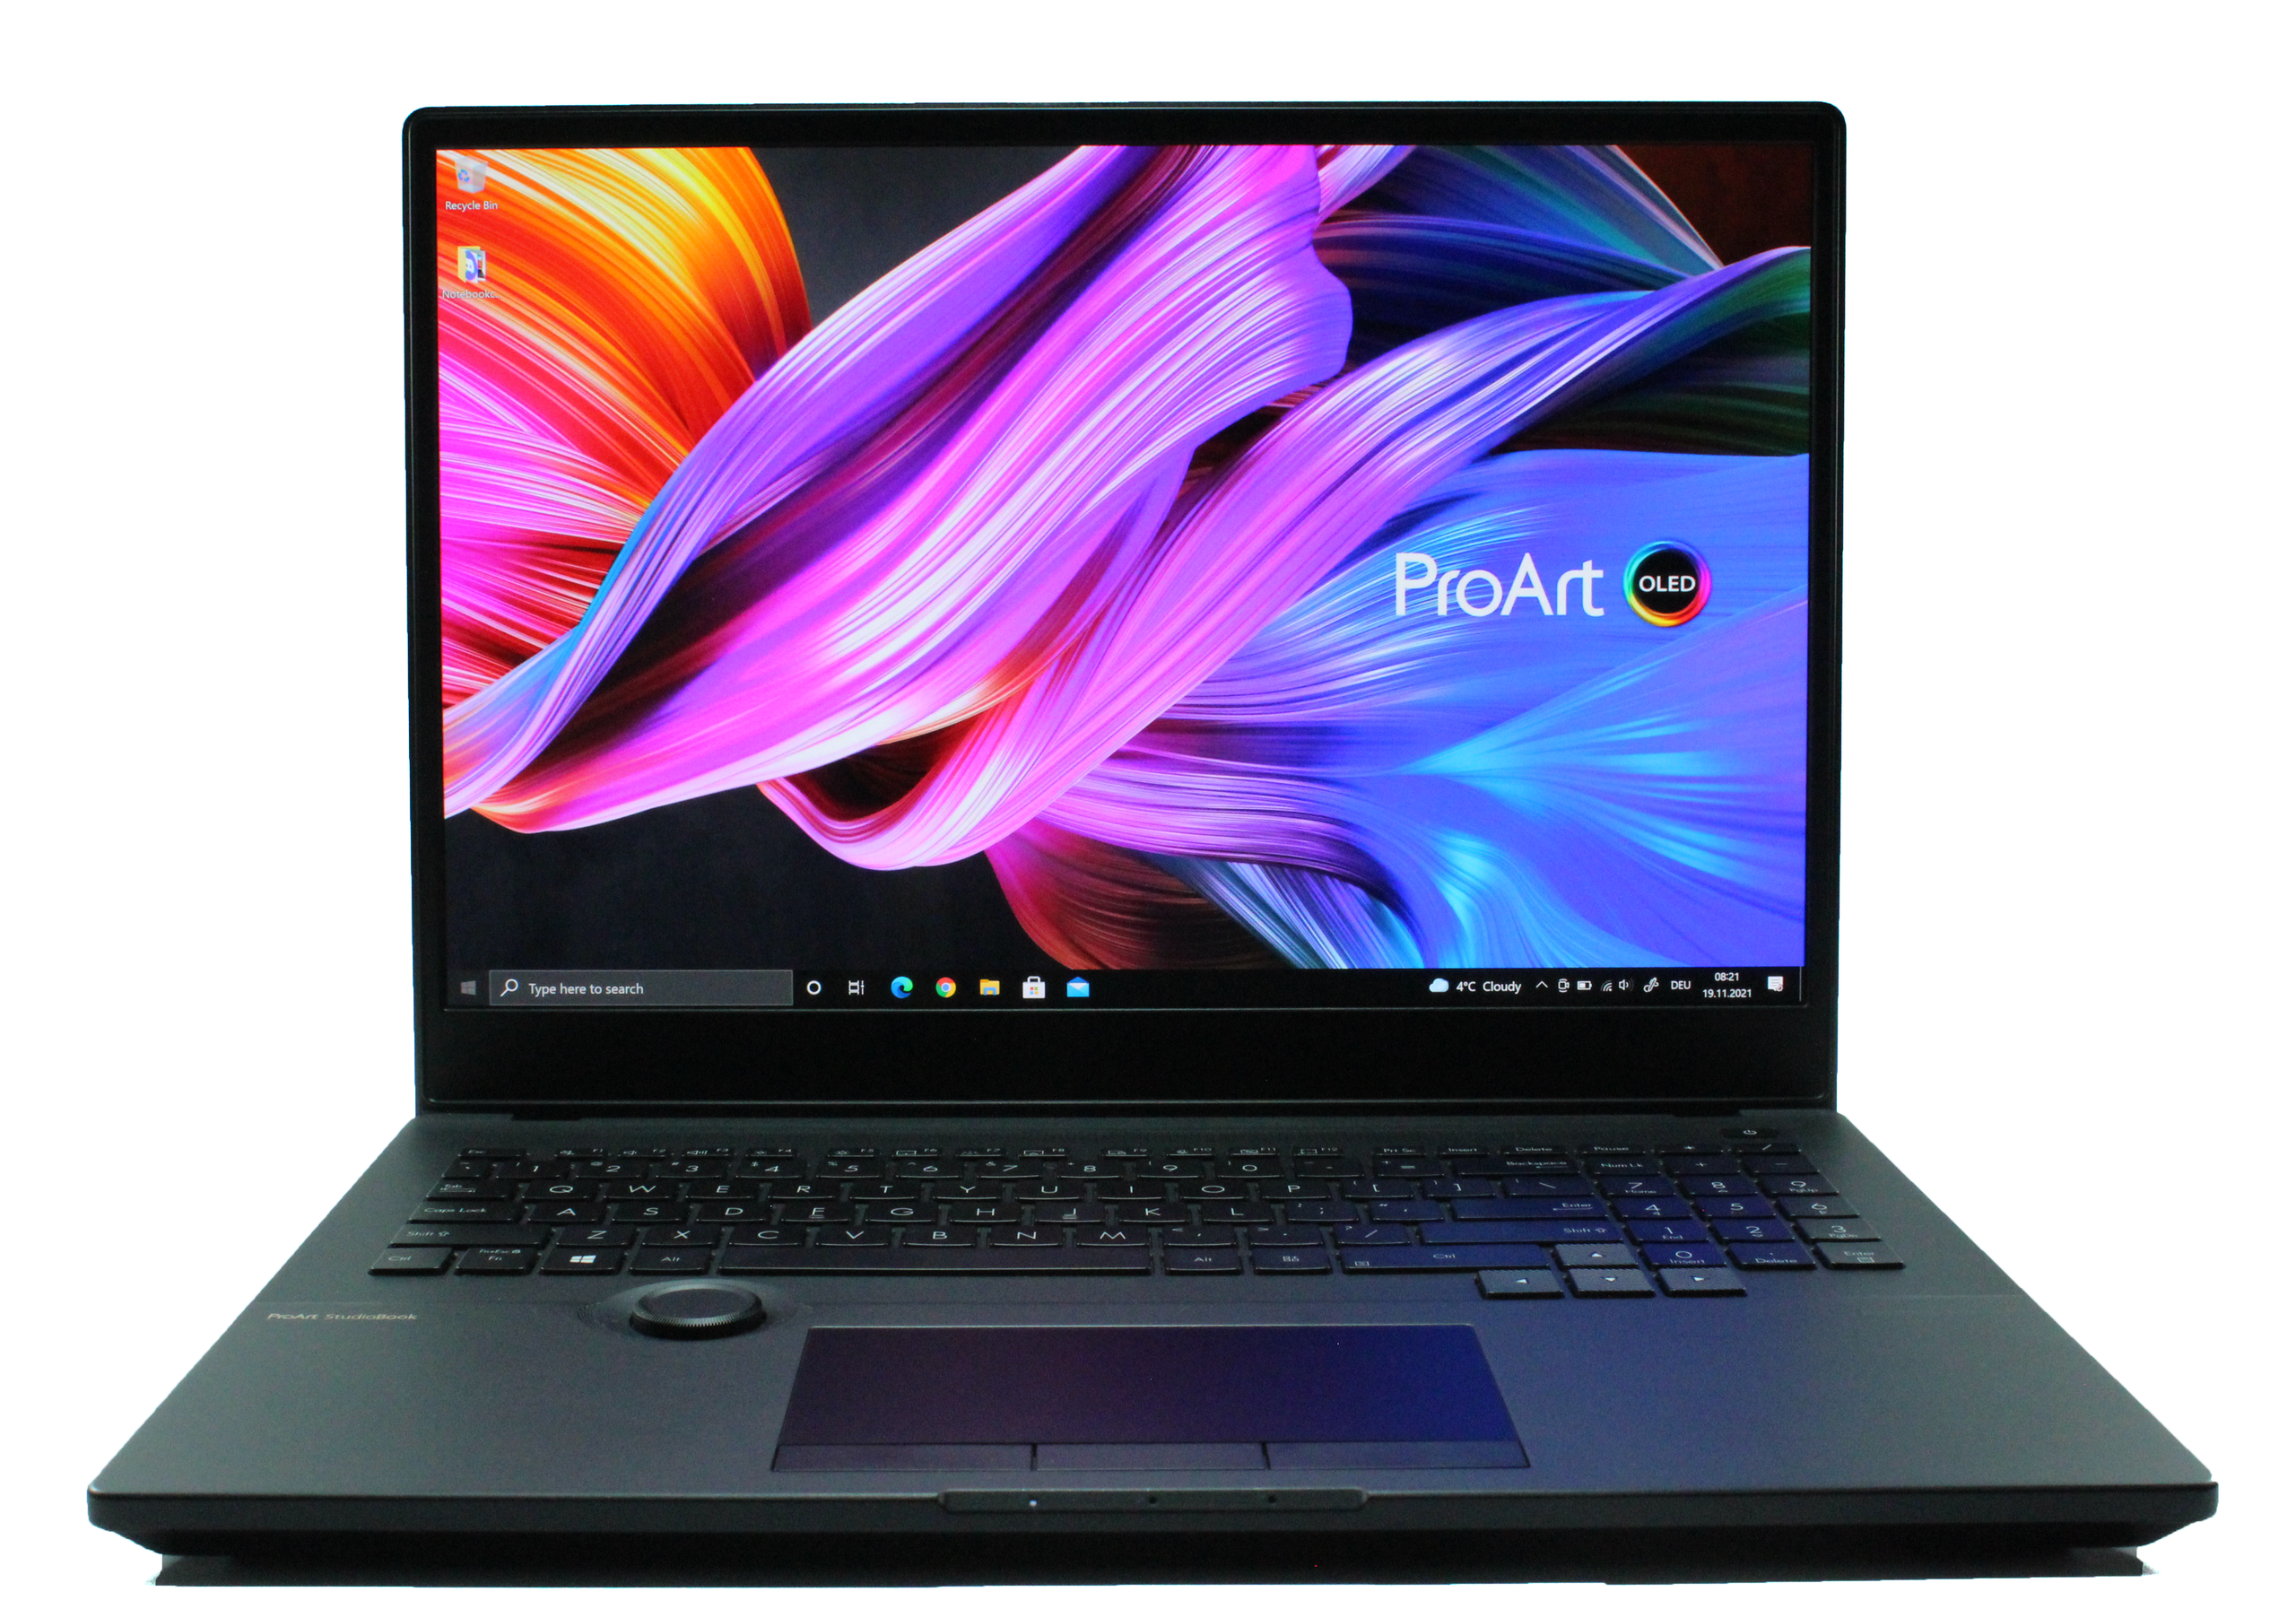
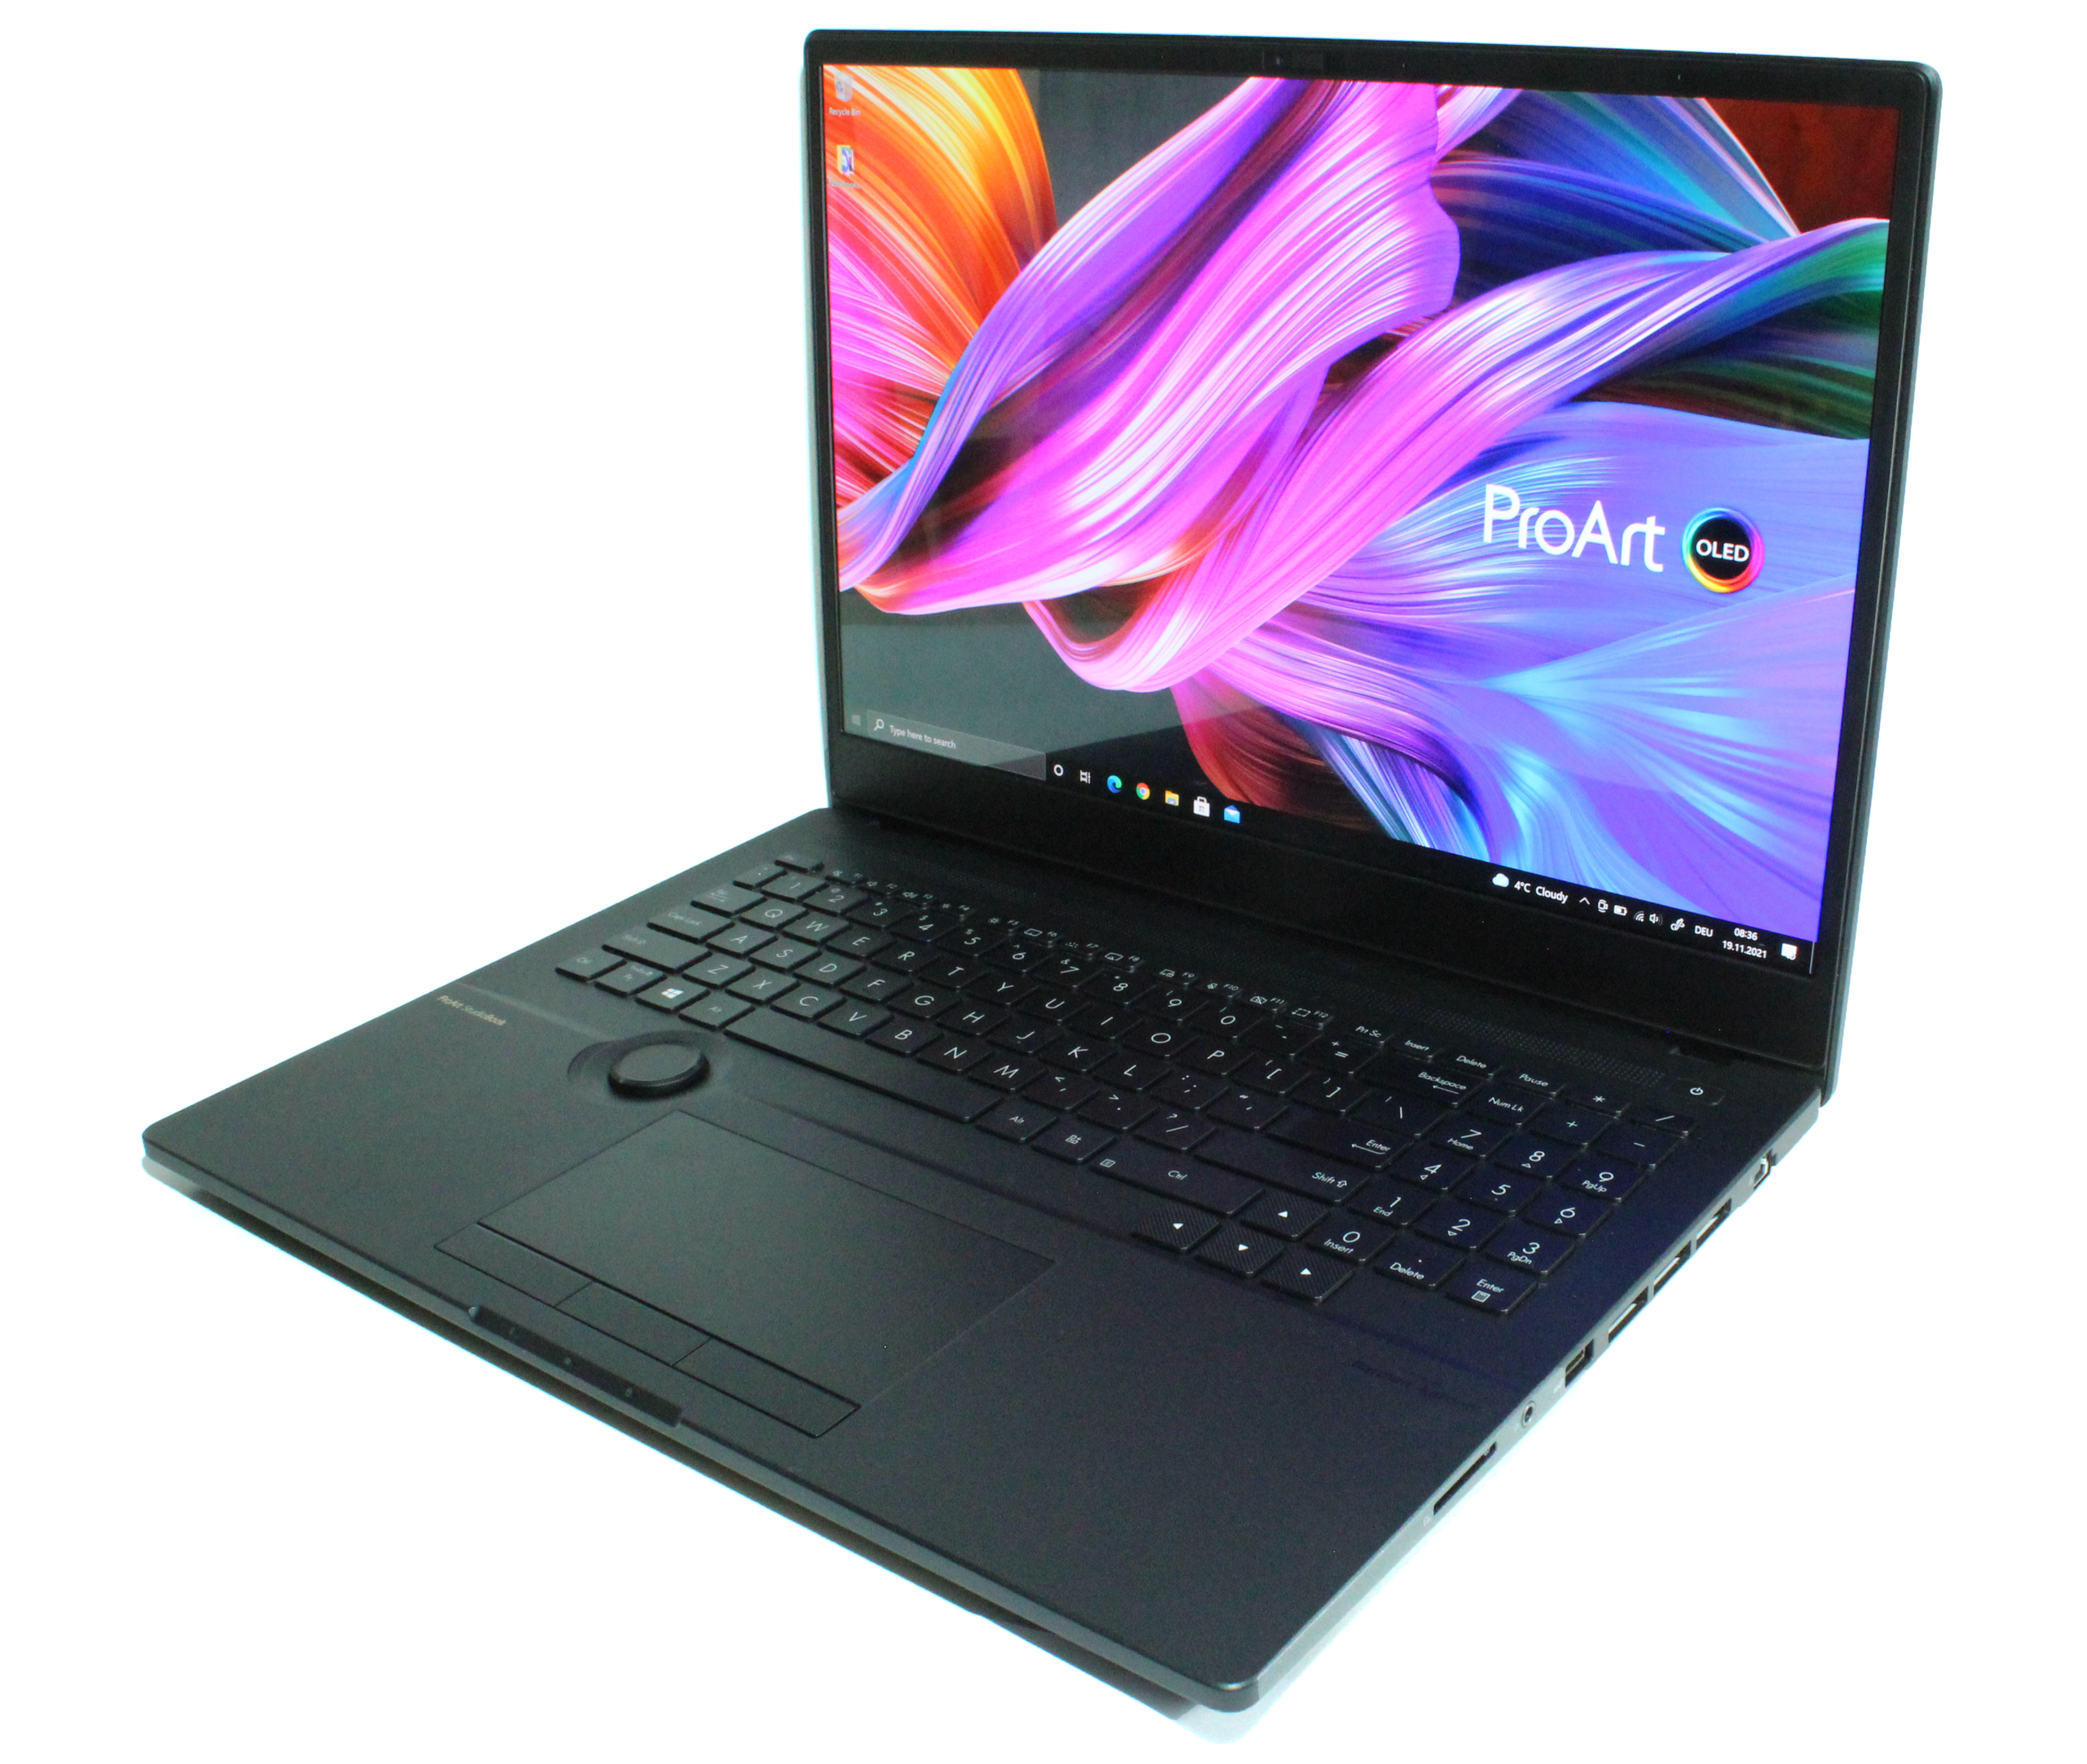
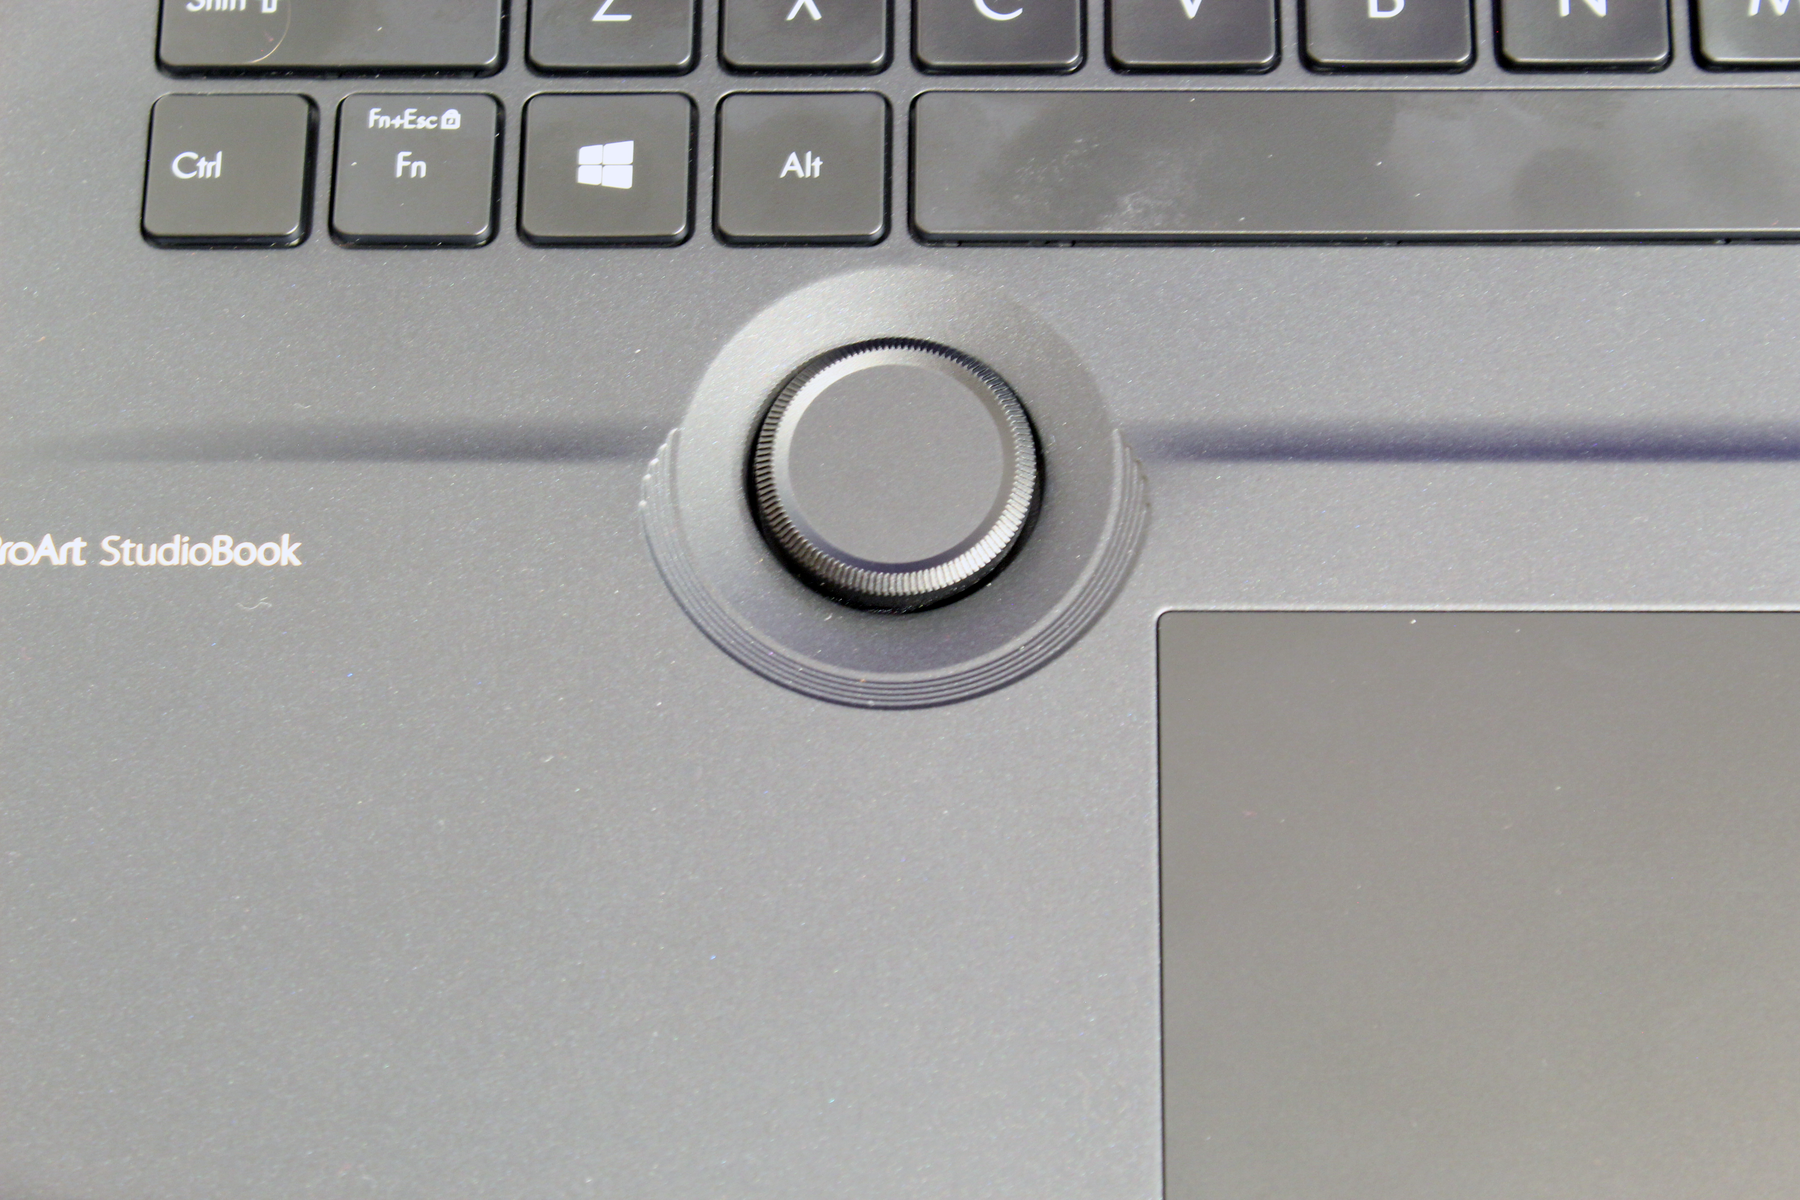
The case of the Asus ProArt StudioBook 16 is very sturdy and with 2.4 kg it's relatively light for its size. The case is made of coated magnesium alloy, which gives it a matte, glittery and also rougher surface. A special feature of the device is the Asus Dial Controller, which is embedded next to the trackpad and can, for example, make controlling some functions in image and video editing programs particularly precise. In addition, the Asus Dial Controller can be used for faster adjustment of the brightness or volume of the system. The design of the Asus ProArt StudioBook 16 is decent and looks very neat with the arrangement of the keyboard, trackpad and Asus Dial. What also stands out about the case are the high feet, which are supposed to provide the user with more comfort while typing. These higher feet cause the keyboard to be higher than the palm rest. Asus has also made a recess in the back center of the stand that allows more fresh air to pass through in order to optimize the cooling of the device.
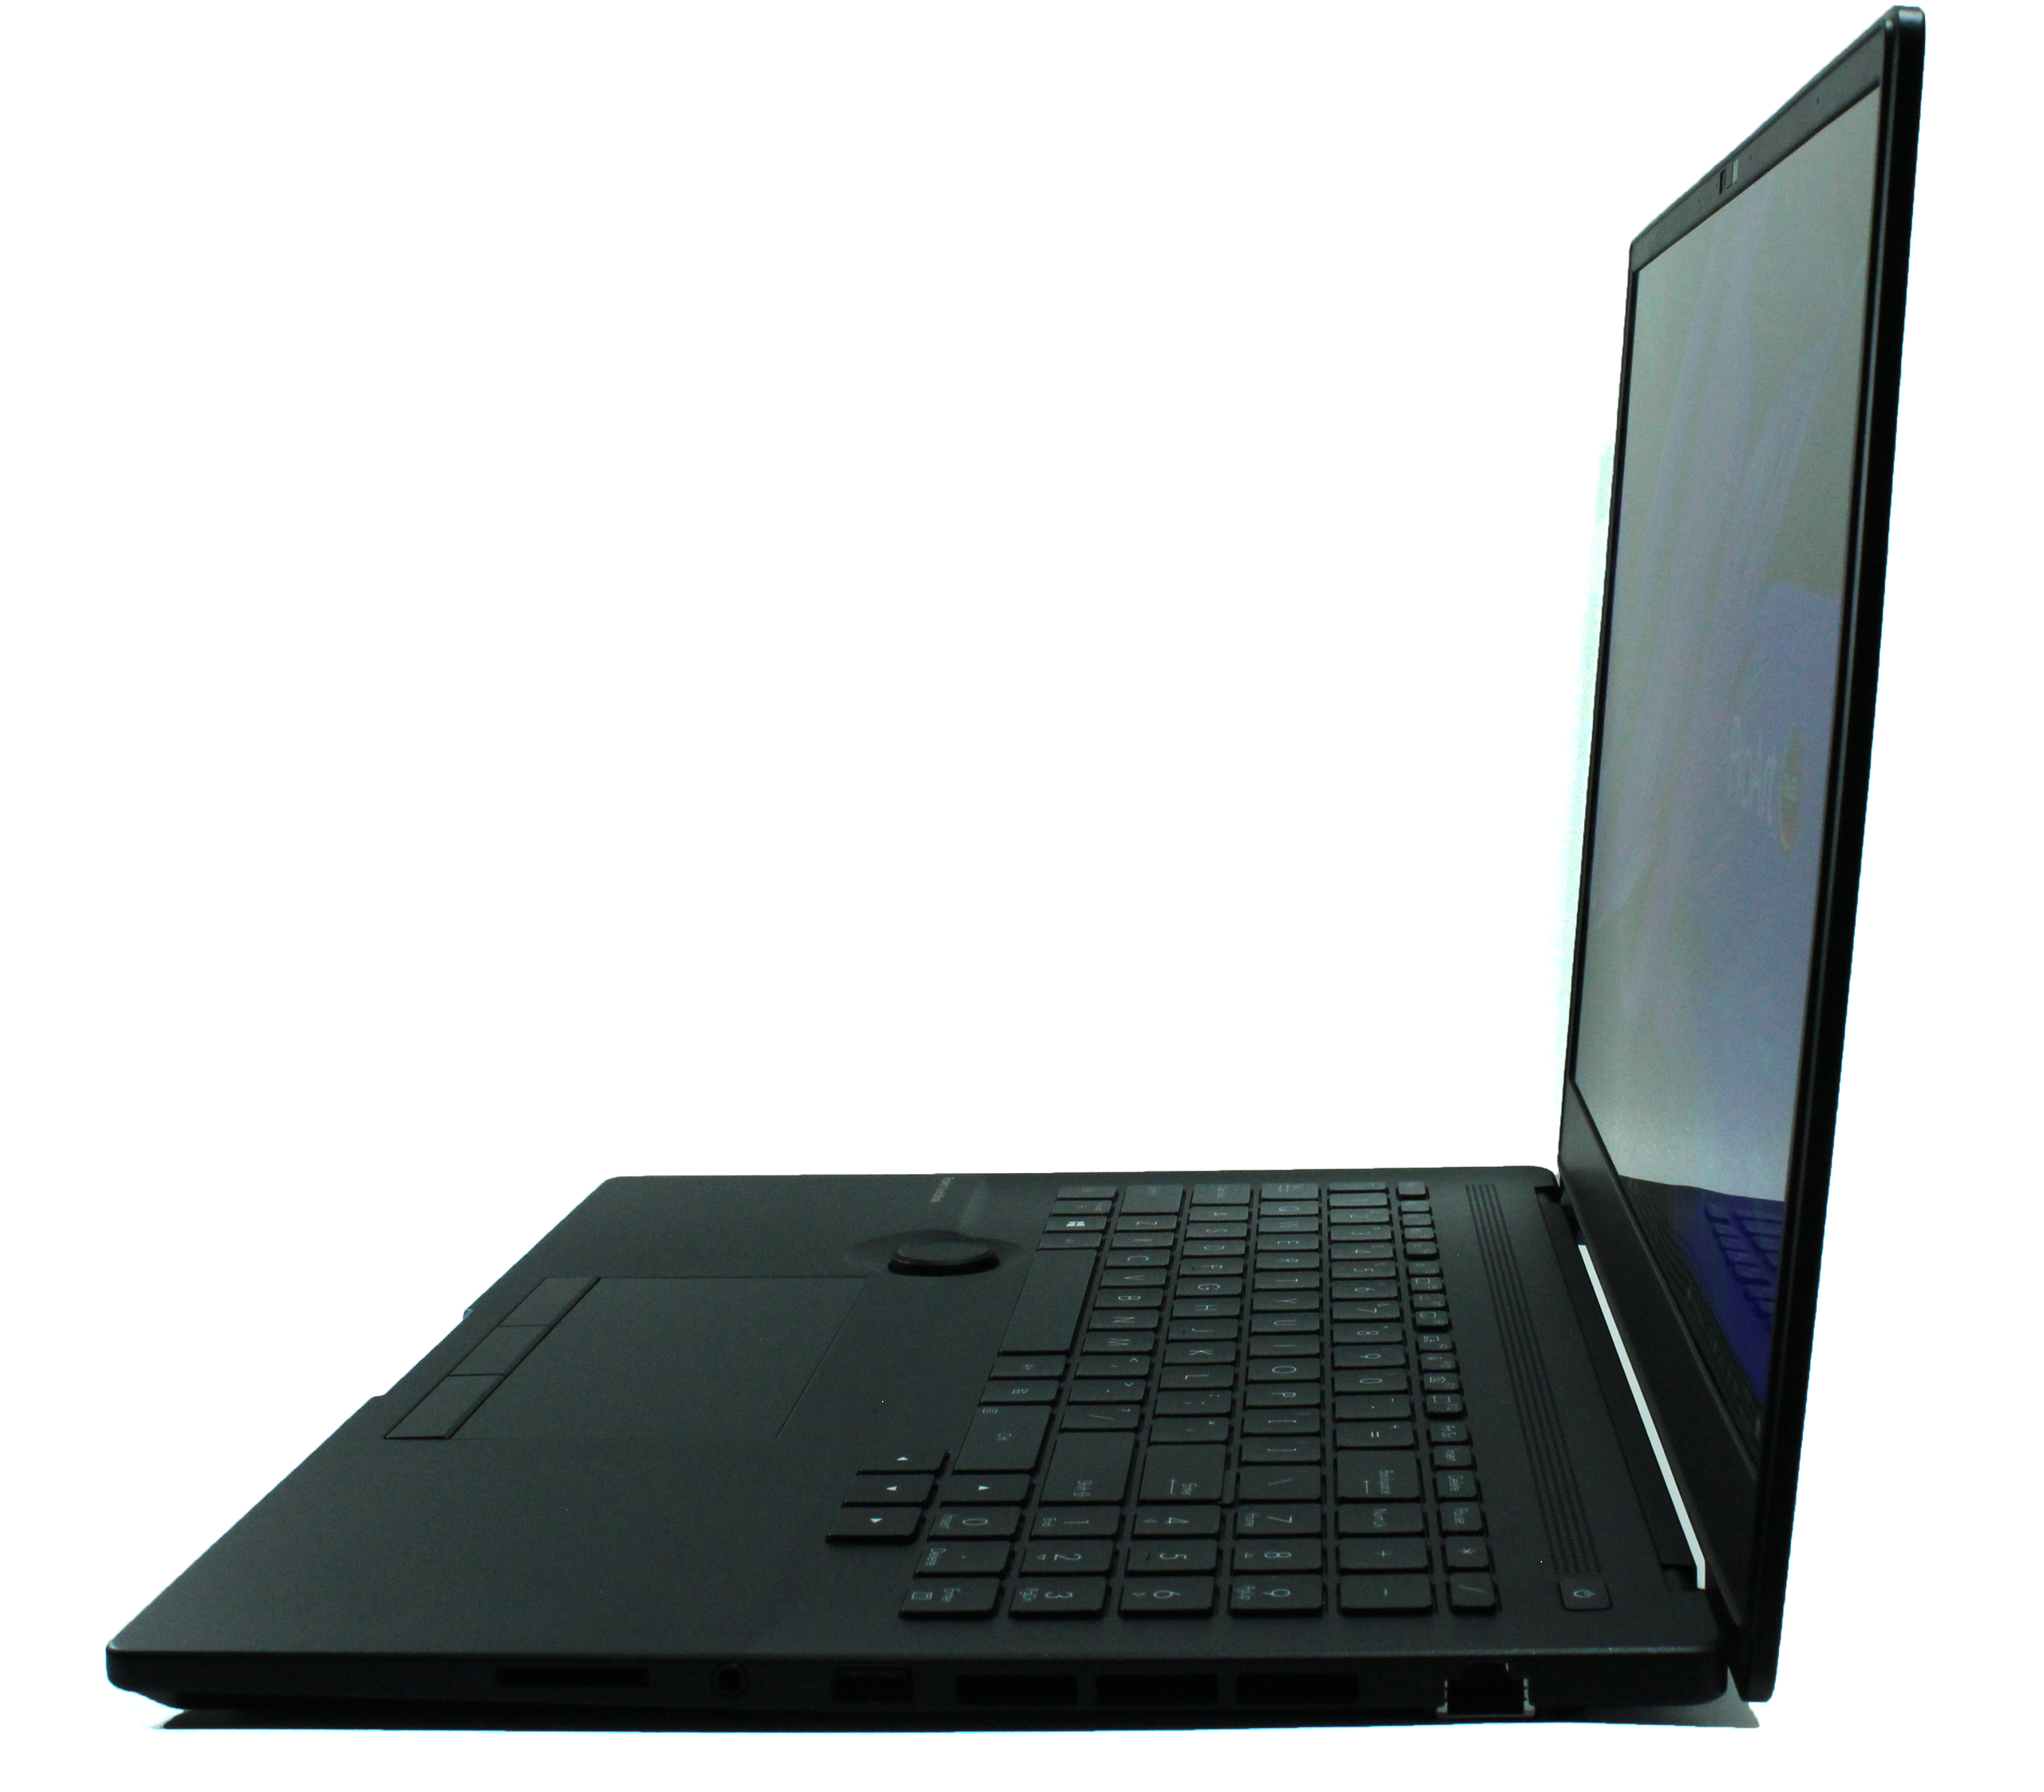
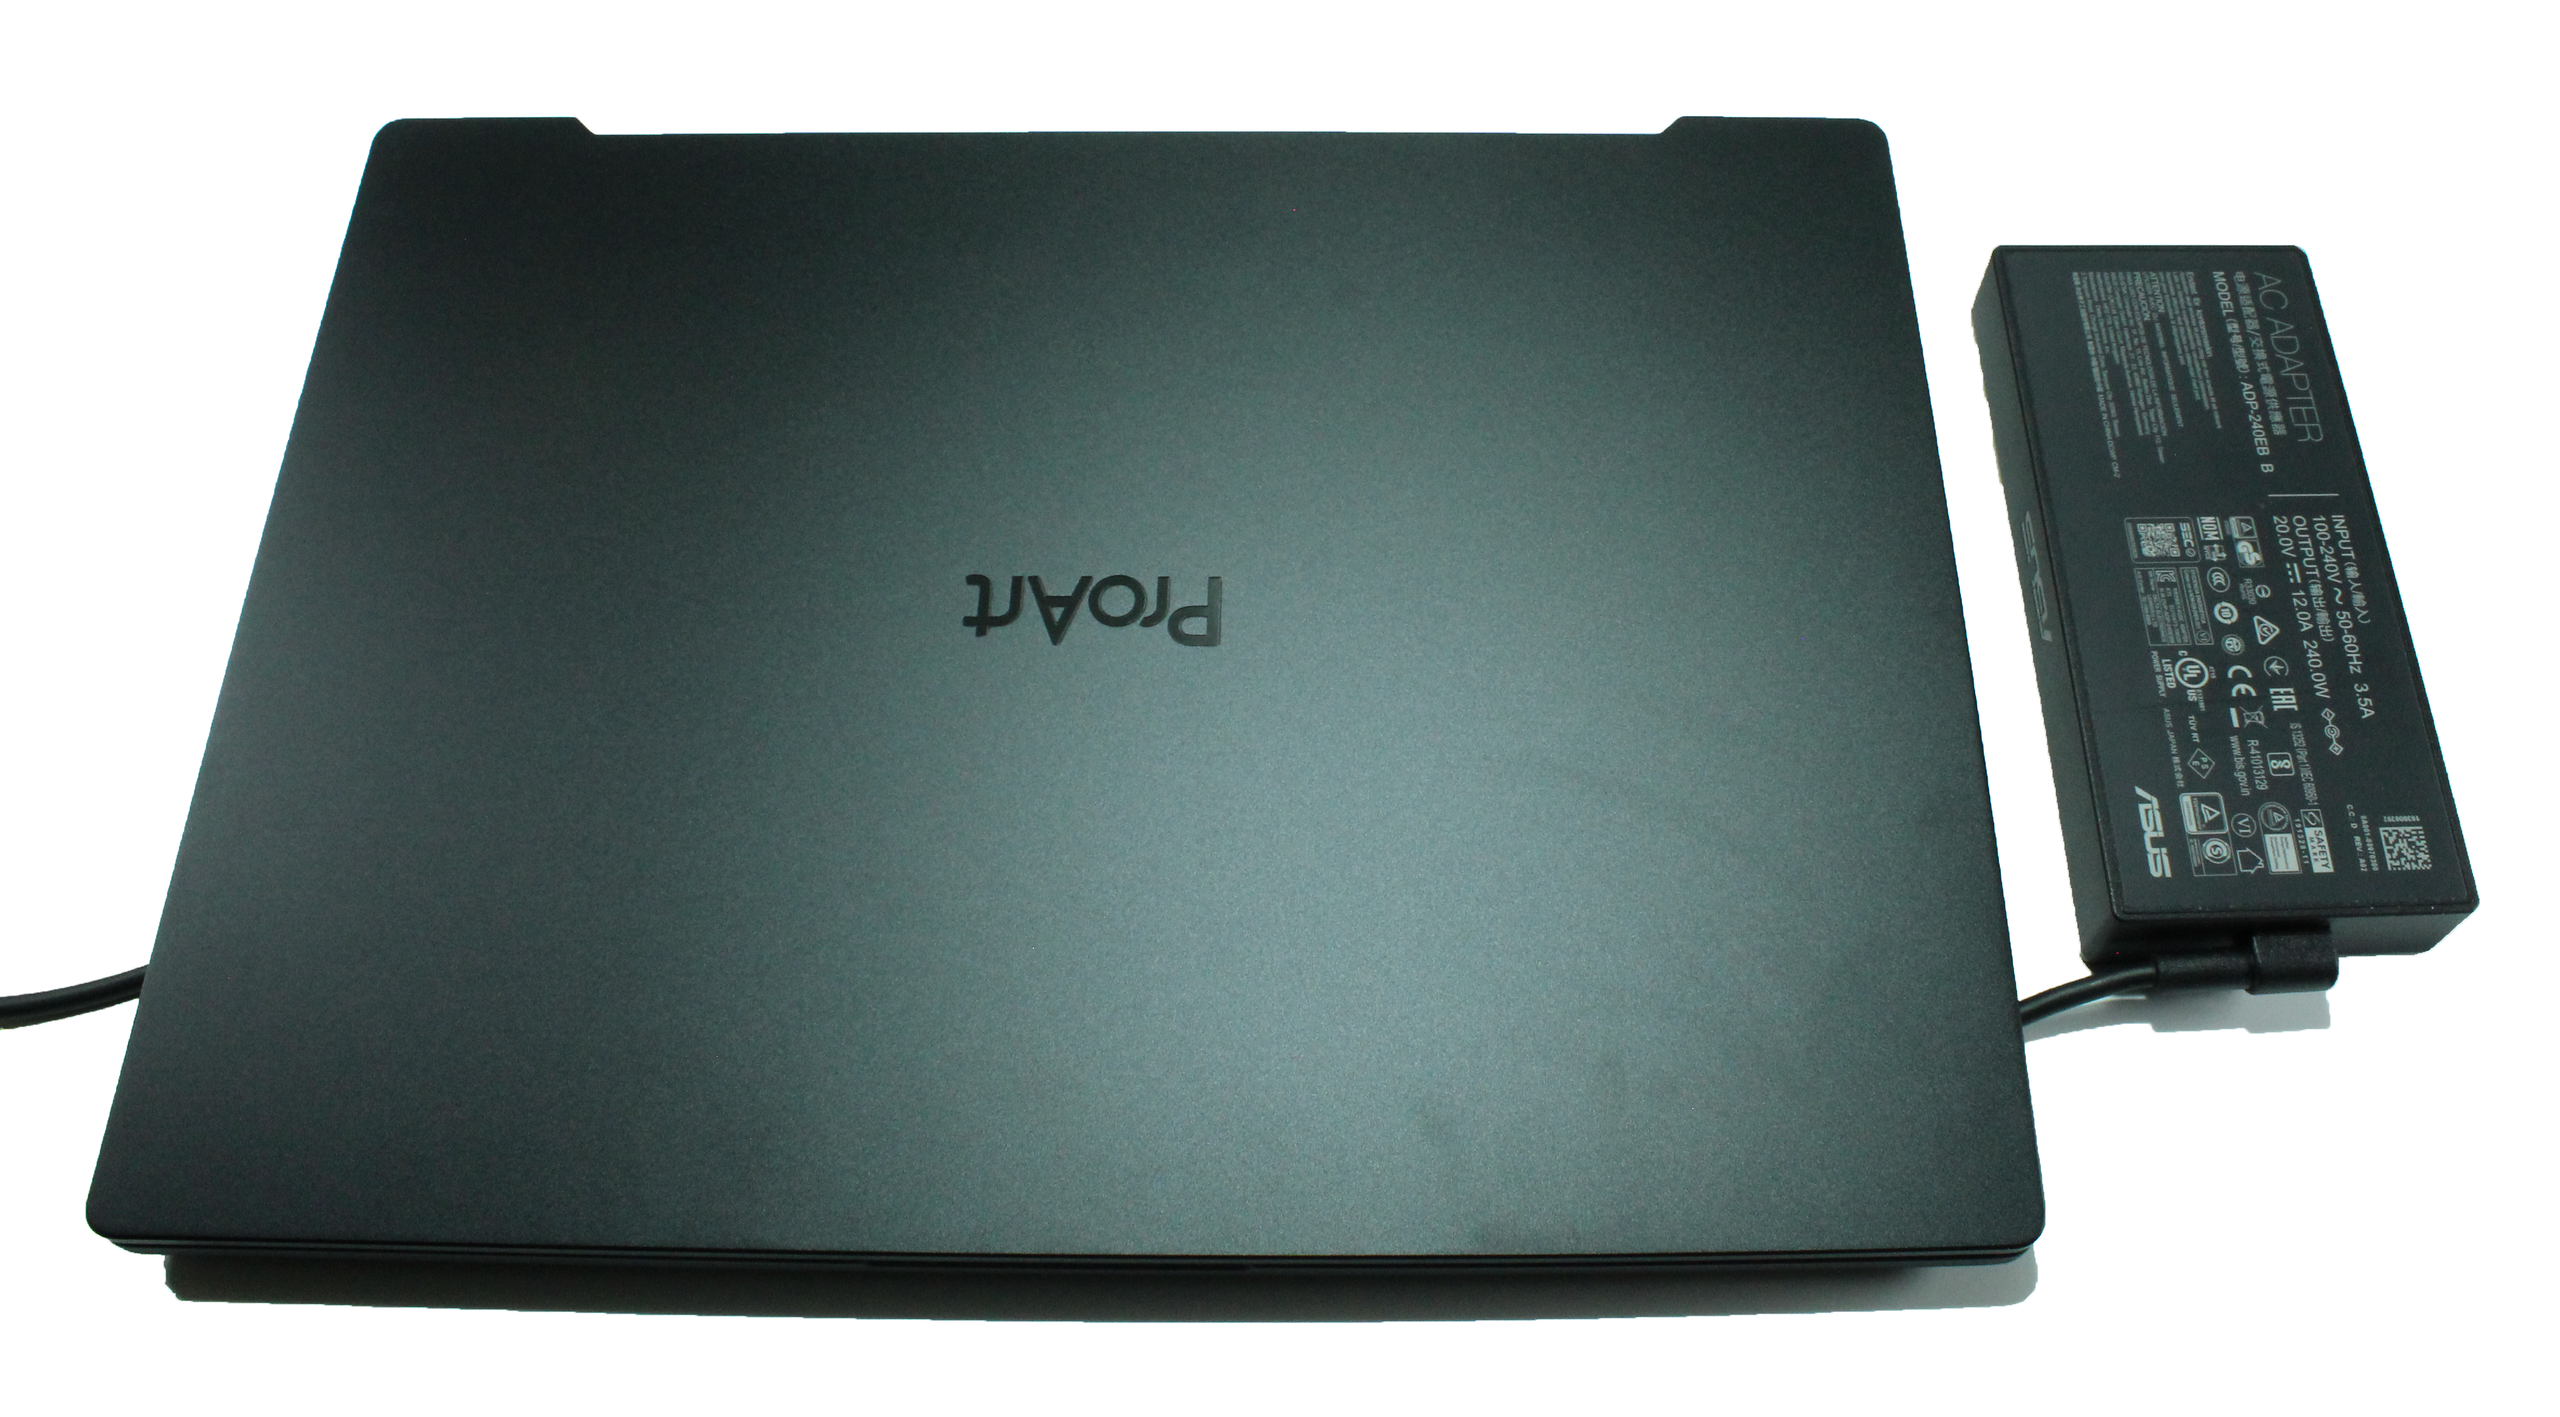
With its 16-inch display and an overall height of only 2.1 centimeters, the Asus ProArt StudioBook is surprisingly slim. While the HP ZBook Fury with its smaller display is slightly narrower on the outside, it is almost half a centimeter taller than our device. Weight-wise, the competition is noticeably lighter than our Asus, with the ZBook Fury being the only exception.
Equipment
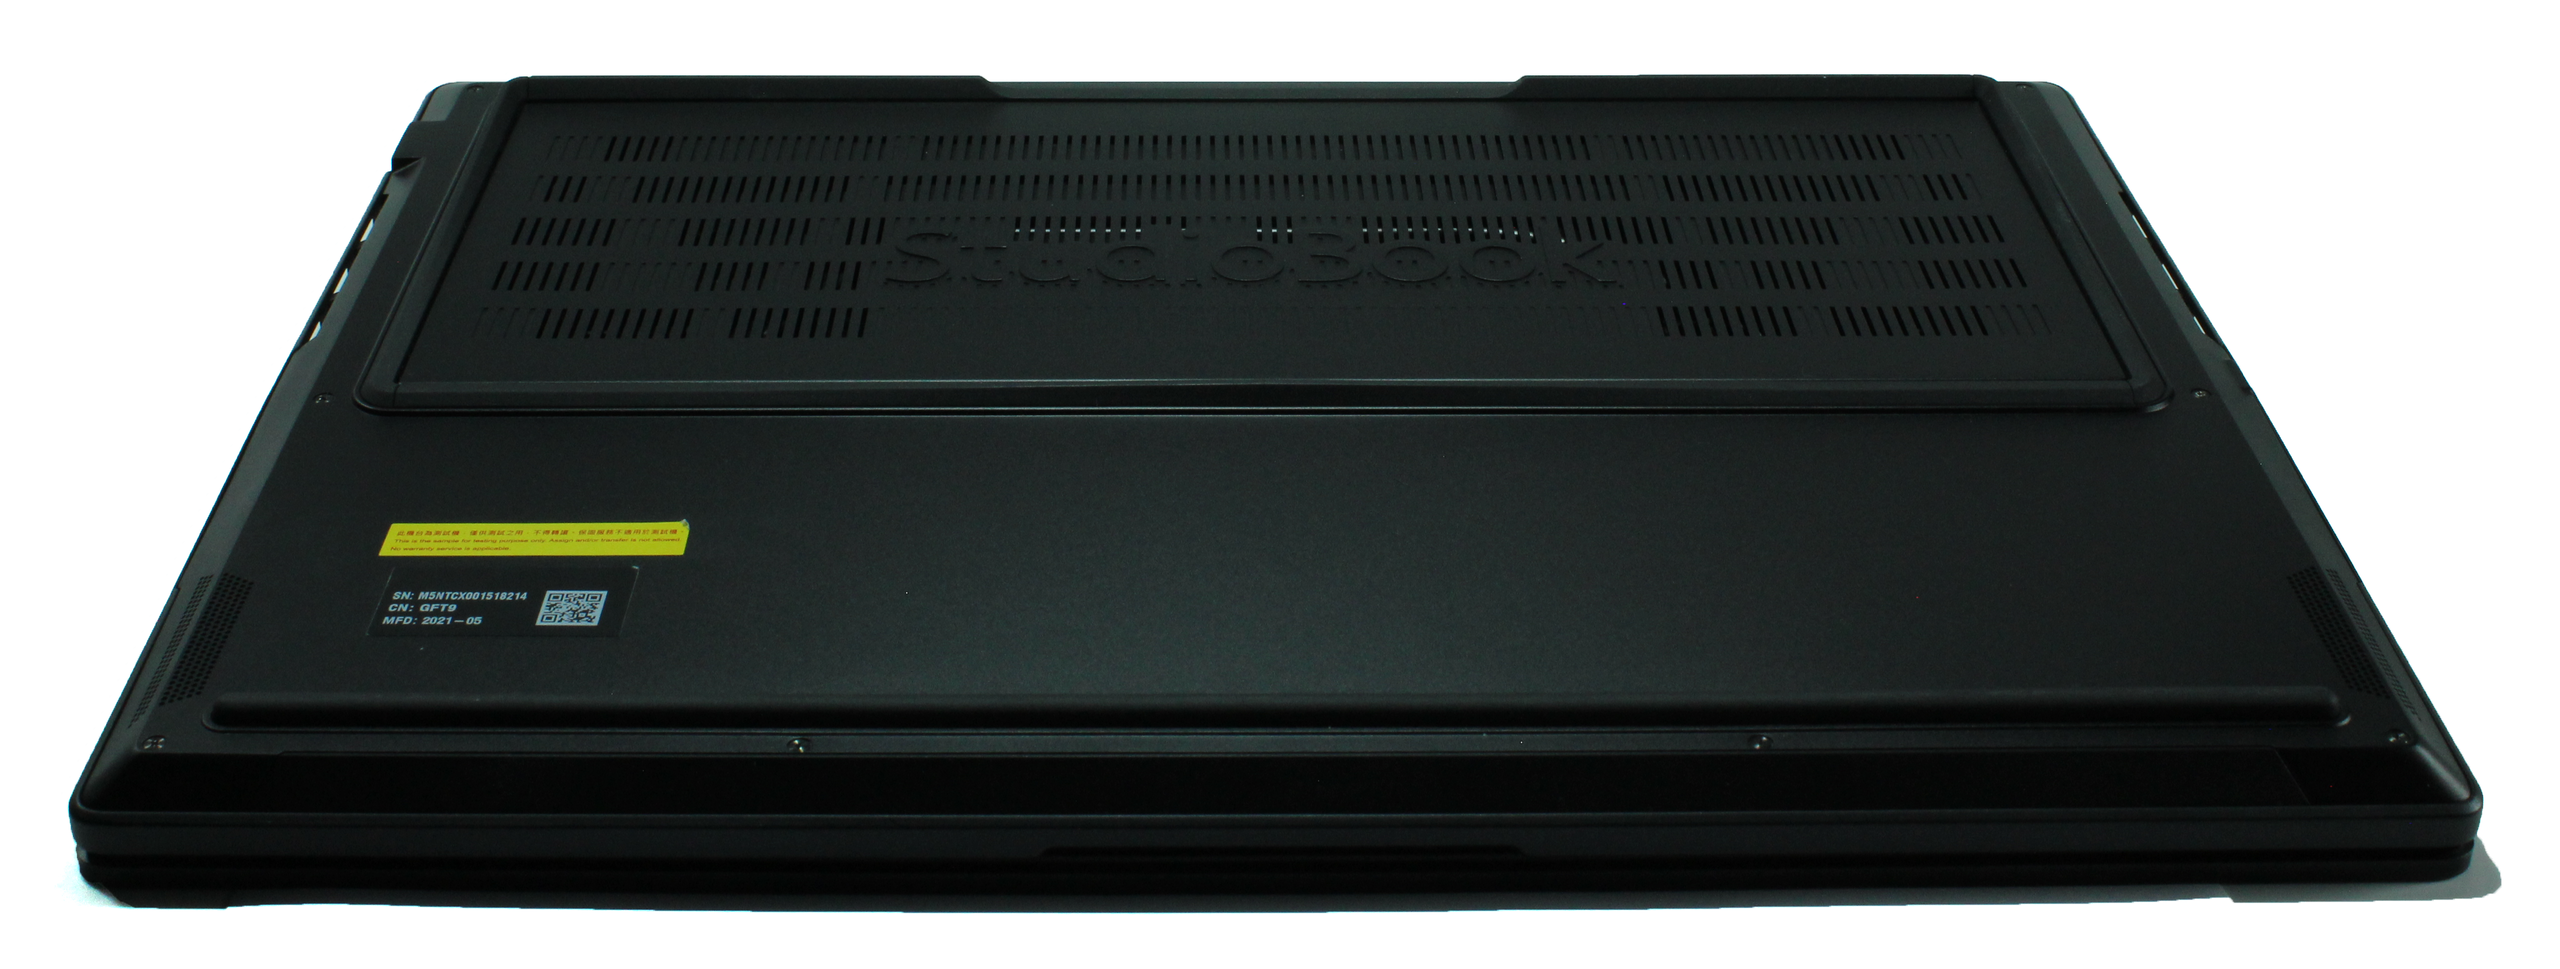
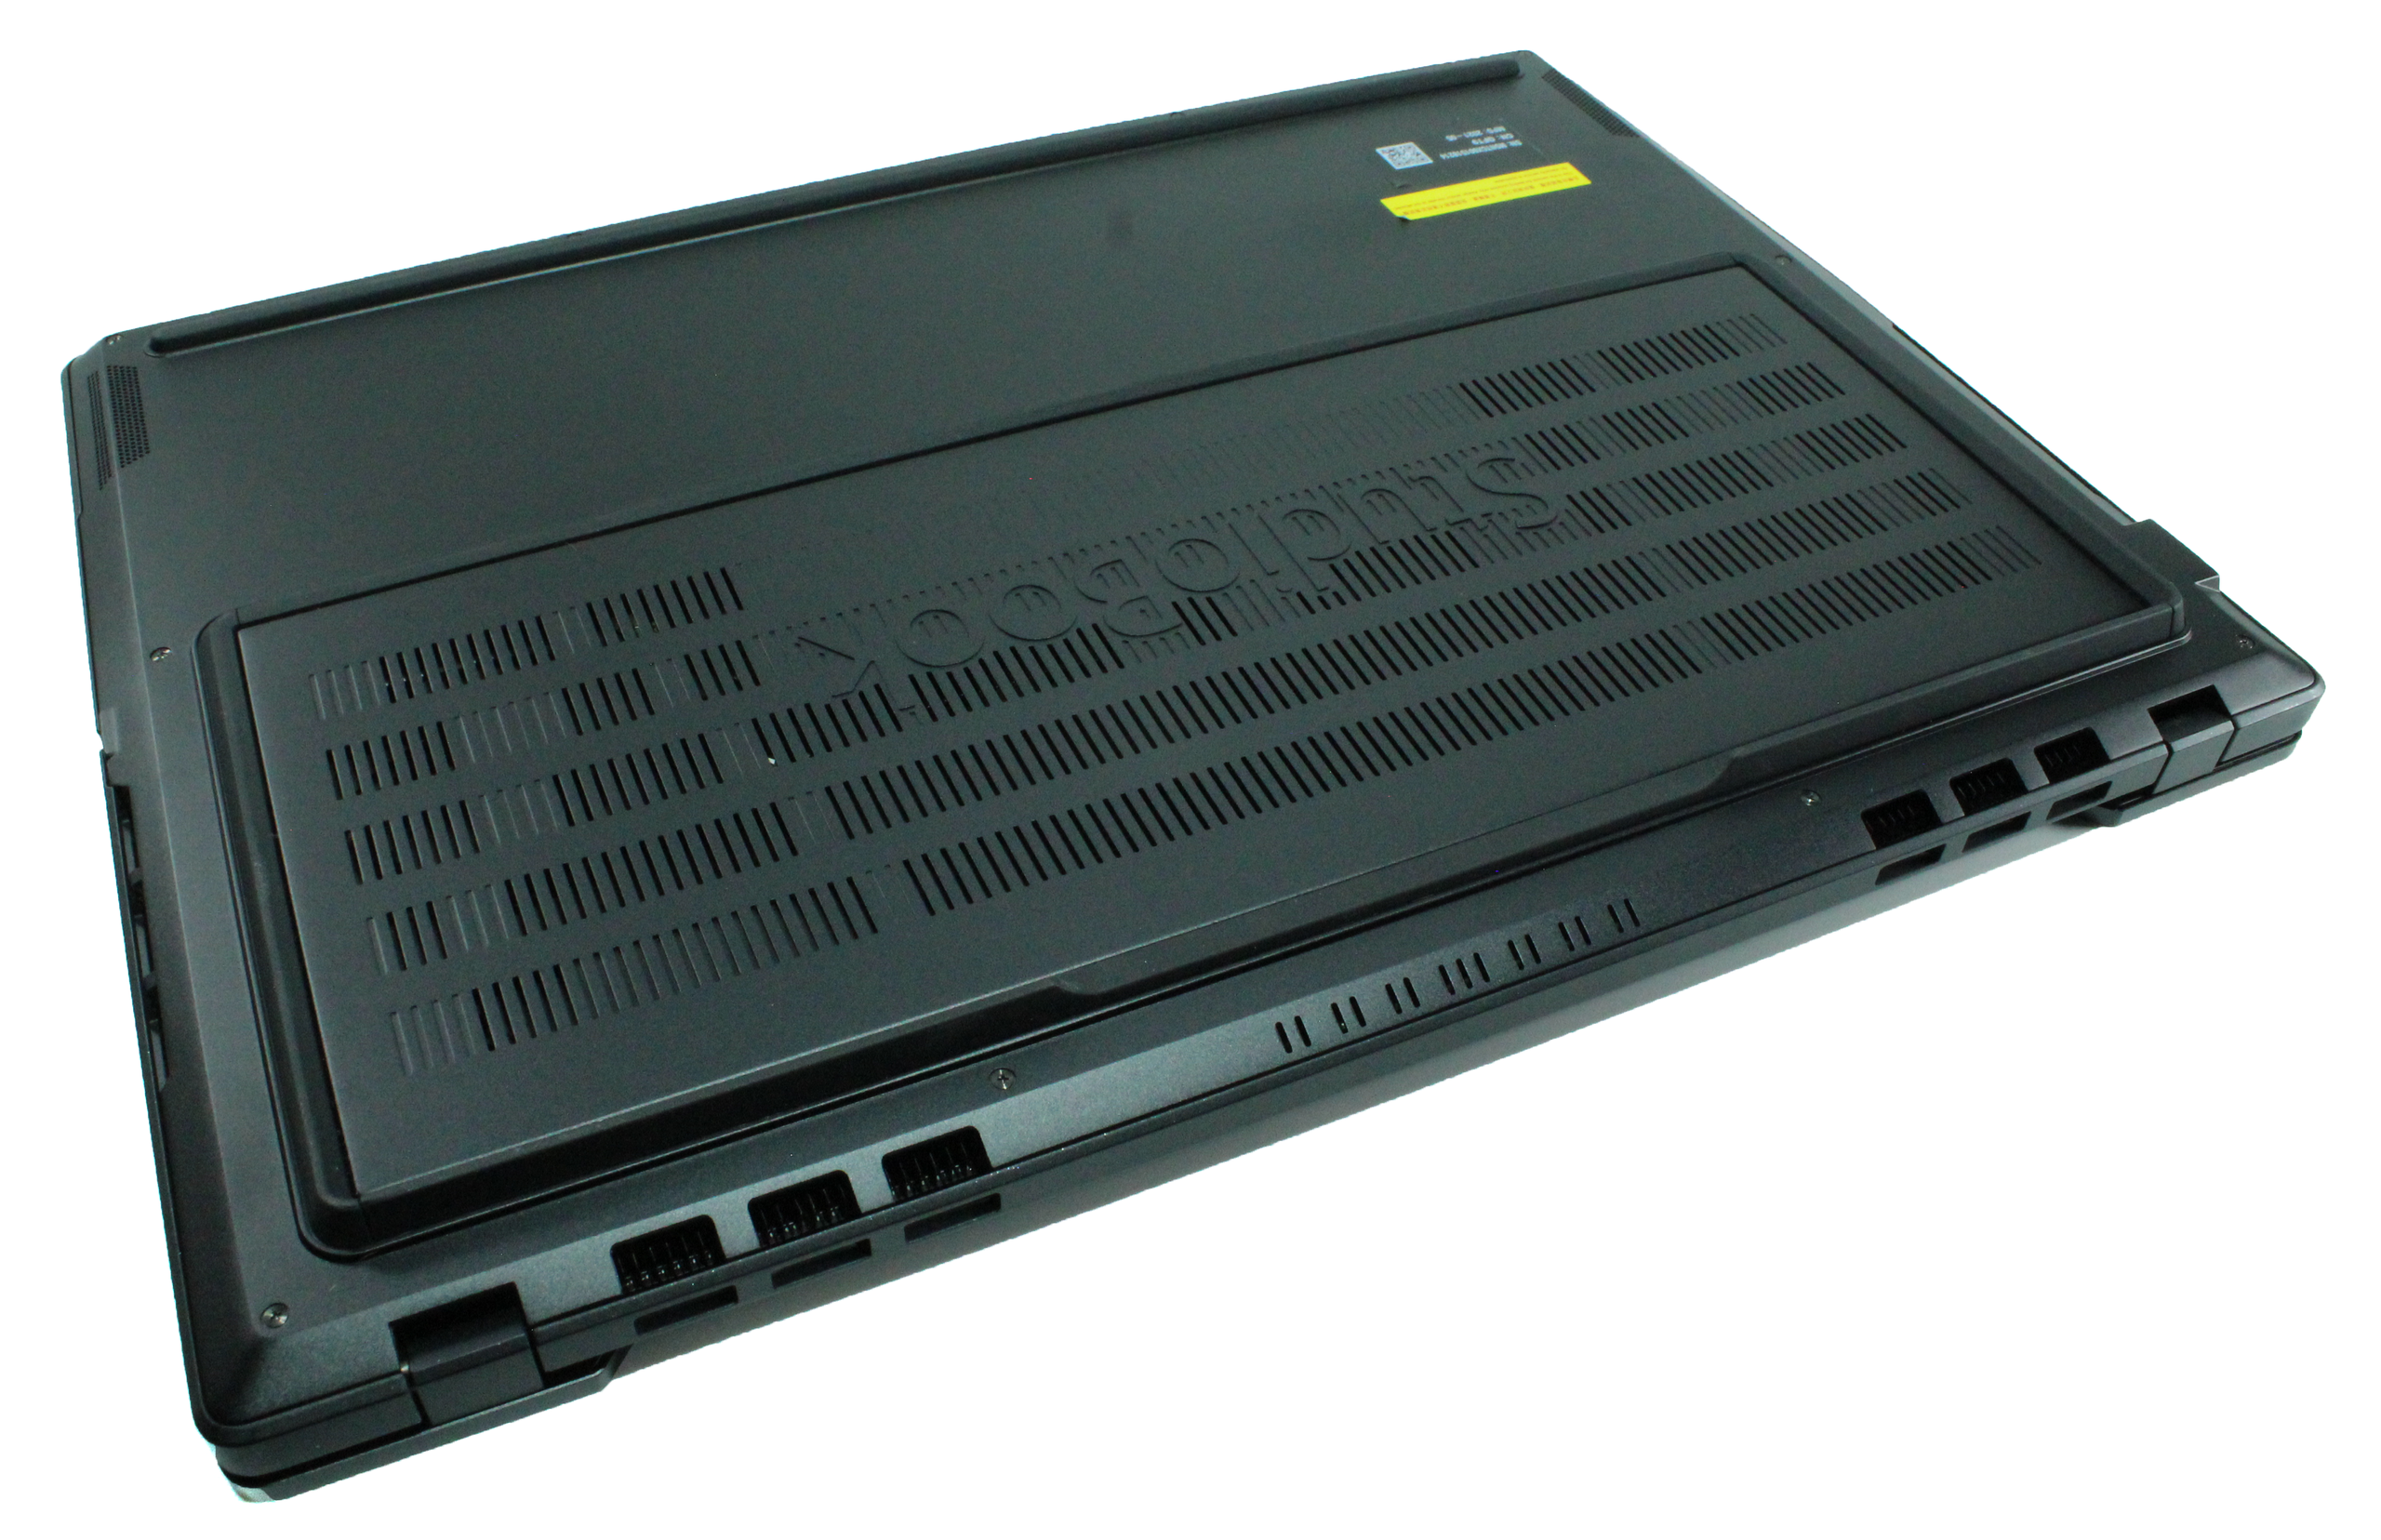
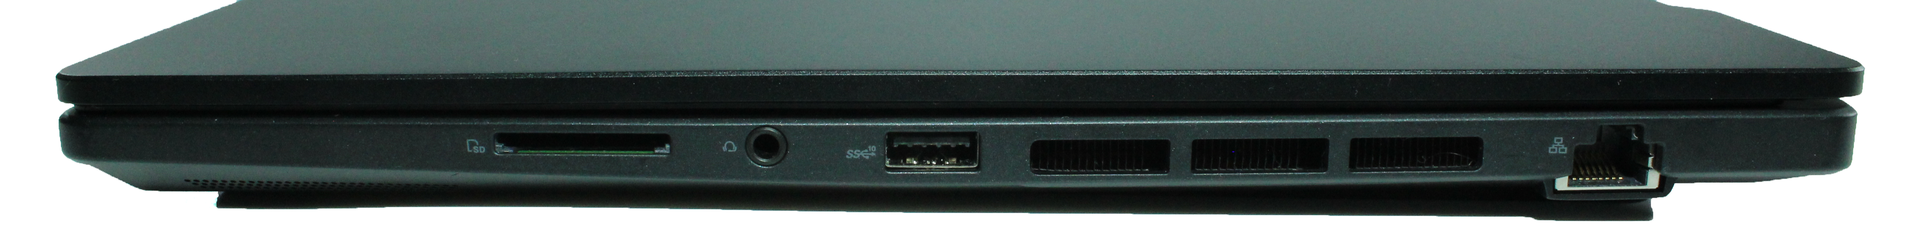
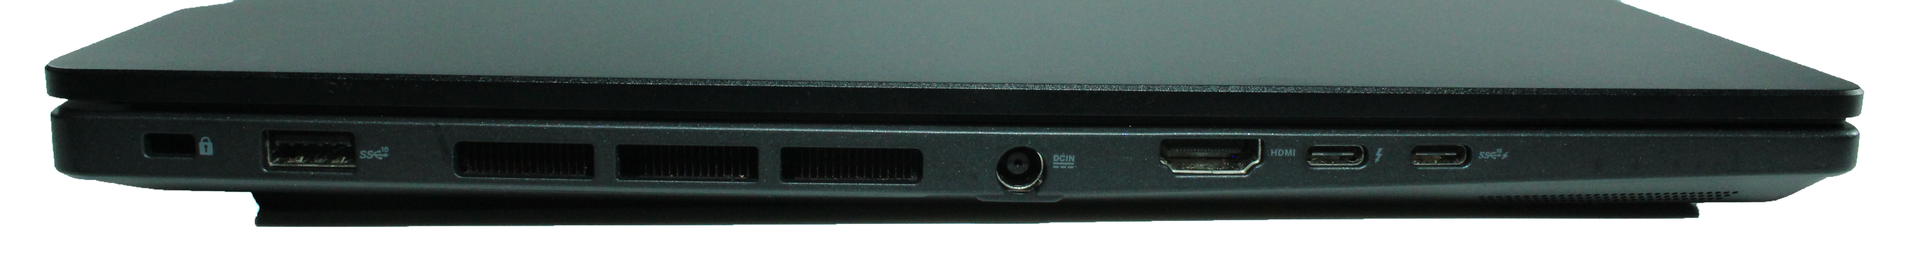
The notebook's ports are distributed on two sides: on the left side, there are Kensington Lock, USB-A 3.2 Gen.2, the power connector, HDMI 2.1, Thunderbolt 4, and a USB-C 3.2 Gen 2 port in addition to the cooling system's air vents. Air vents extend over the right side just like on the left. There is also a full-sized SD card reader, a 3.5 mm combo jack, USB-A 3.2 Gen.2 and Gigabit LAN on the right side. Both Thunderbolt 4 and the USB-C port support Power Delivery and allow connecting one display each. The ports are spaced far enough apart and do not affect user's comfort when all ports are occupied. Only the cooling system's air vents are located on the notebook's back side.
SD Card Reader
The transfer rate of the integrated SD card reader is lower than expected in our pre-production device. Even the average data throughput is not achieved with our 128 GB Angelbird AV PRO V60 reference memory card.
| SD Card Reader | |
| average JPG Copy Test (av. of 3 runs) | |
| Dell Precision 5000 5560 (AV Pro V60) | |
| Average of class Workstation (49.6 - 681, n=14, last 2 years) | |
| HP ZBook Fury 15 G8 (AV Pro V60) | |
| HP ZBook Studio 15 G8 (AV Pro V60) | |
| Asus ProArt StudioBook 16 W7600H5A-2BL2 (AV Pro SD microSD 128 GB V60) | |
| maximum AS SSD Seq Read Test (1GB) | |
| Average of class Workstation (87.6 - 1455, n=14, last 2 years) | |
| Dell Precision 5000 5560 (AV Pro V60) | |
| HP ZBook Studio 15 G8 (AV Pro V60) | |
| HP ZBook Fury 15 G8 (AV Pro V60) | |
| Asus ProArt StudioBook 16 W7600H5A-2BL2 (AV Pro SD microSD 128 GB V60) | |
Communication
The Intel Wi-Fi AX201 installed in our pre-production device cannot exploit its performance potential in our performance test and ends up 20 to 60 percent behind the average.
Webcam
The camera quality of the 720p webcam in our test device is very poor. Like most laptop cameras, it lacks image sharpness and color accuracy.

")
")


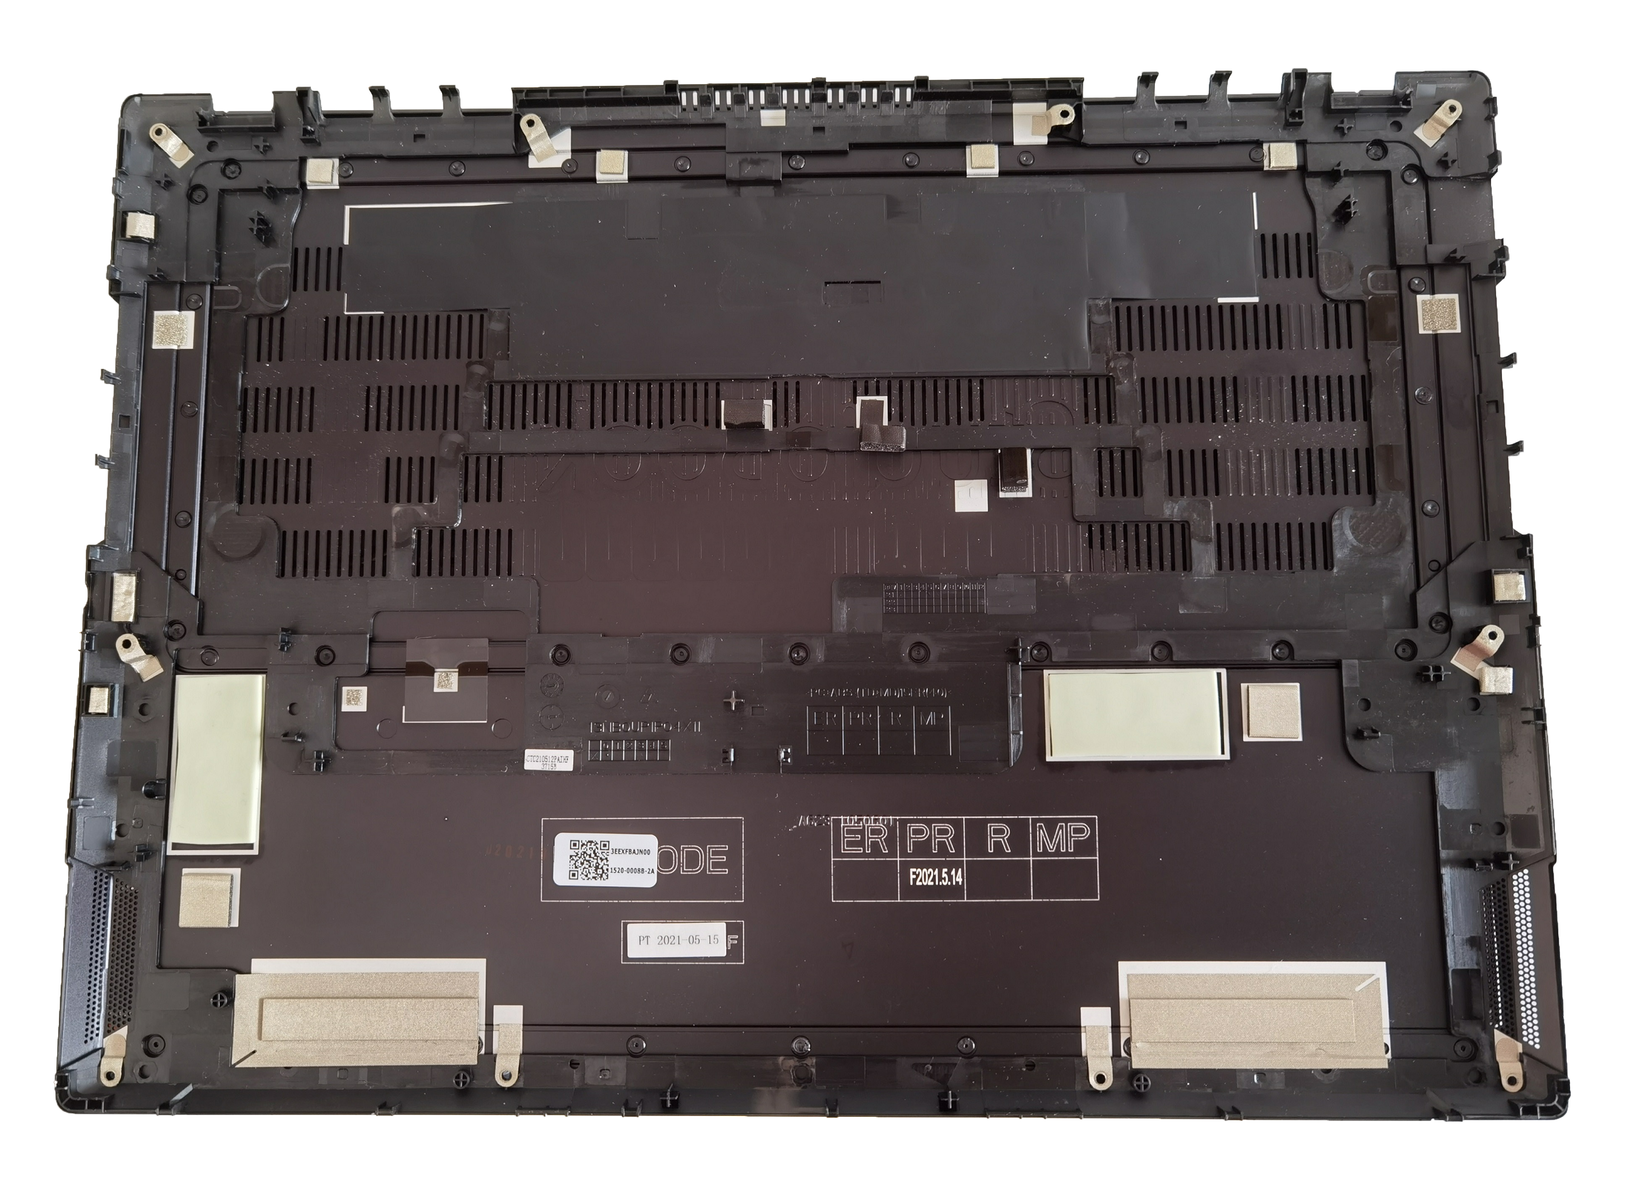
Maintenance
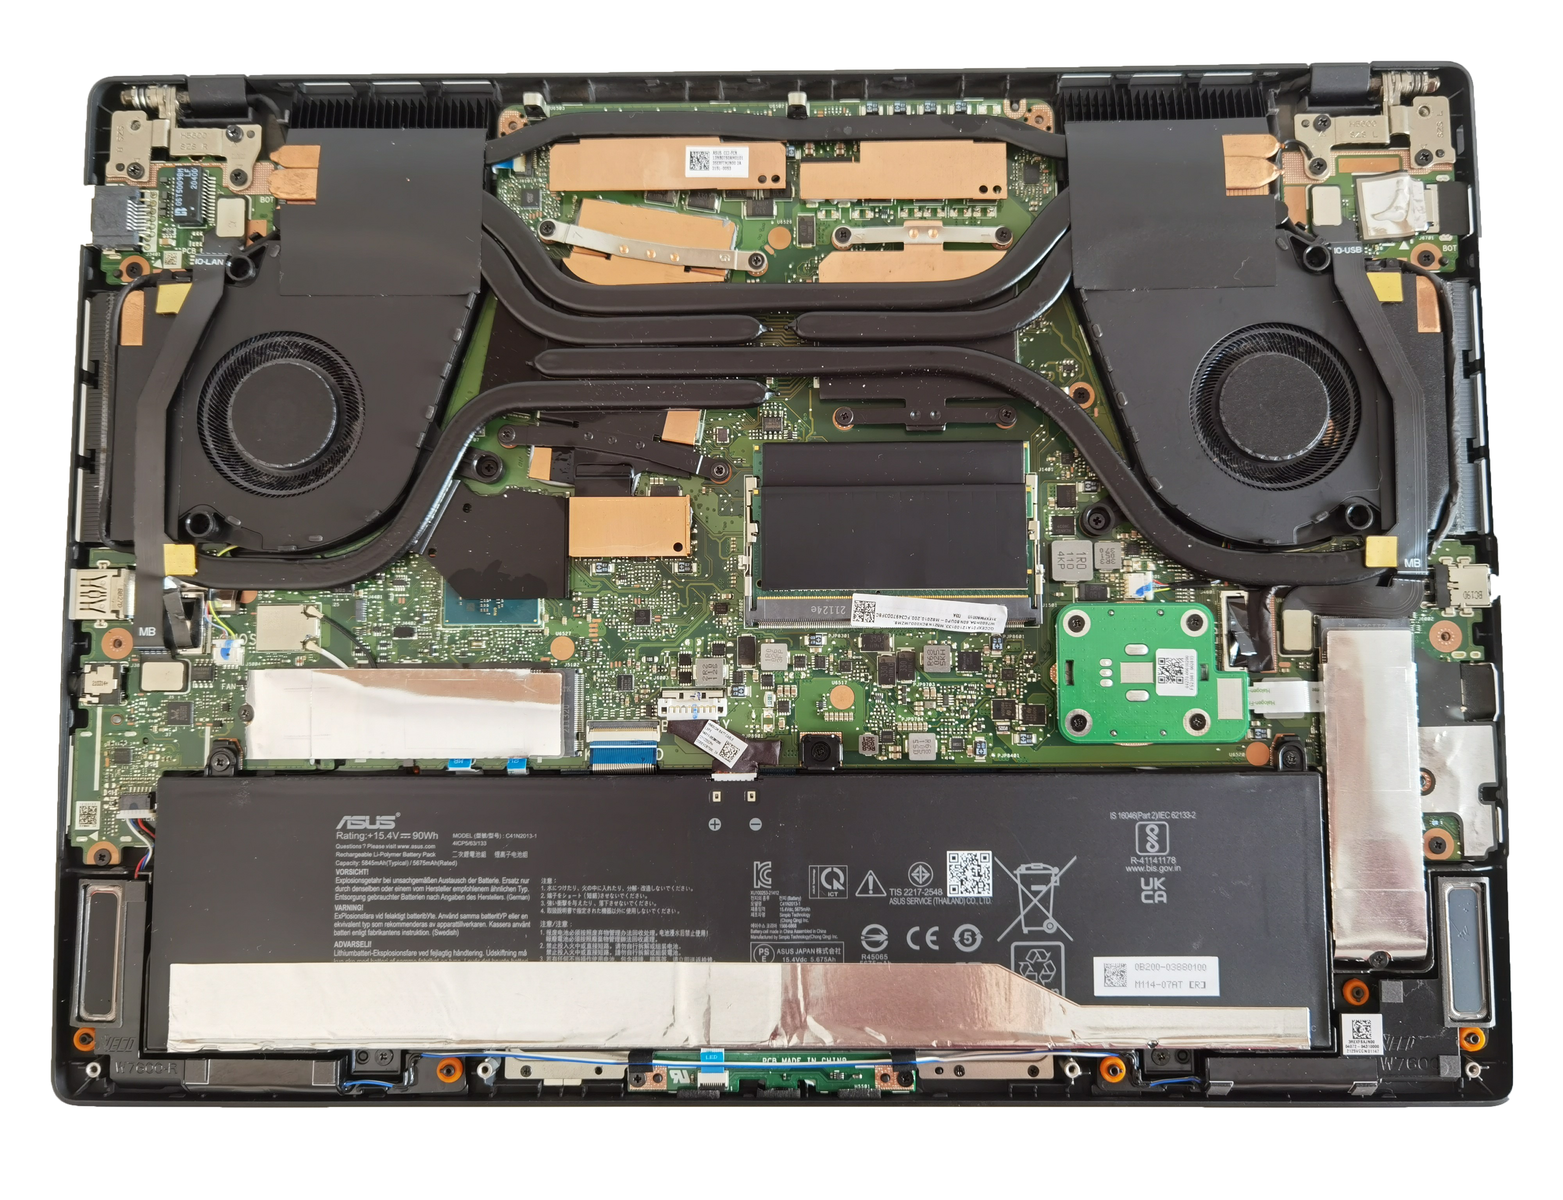
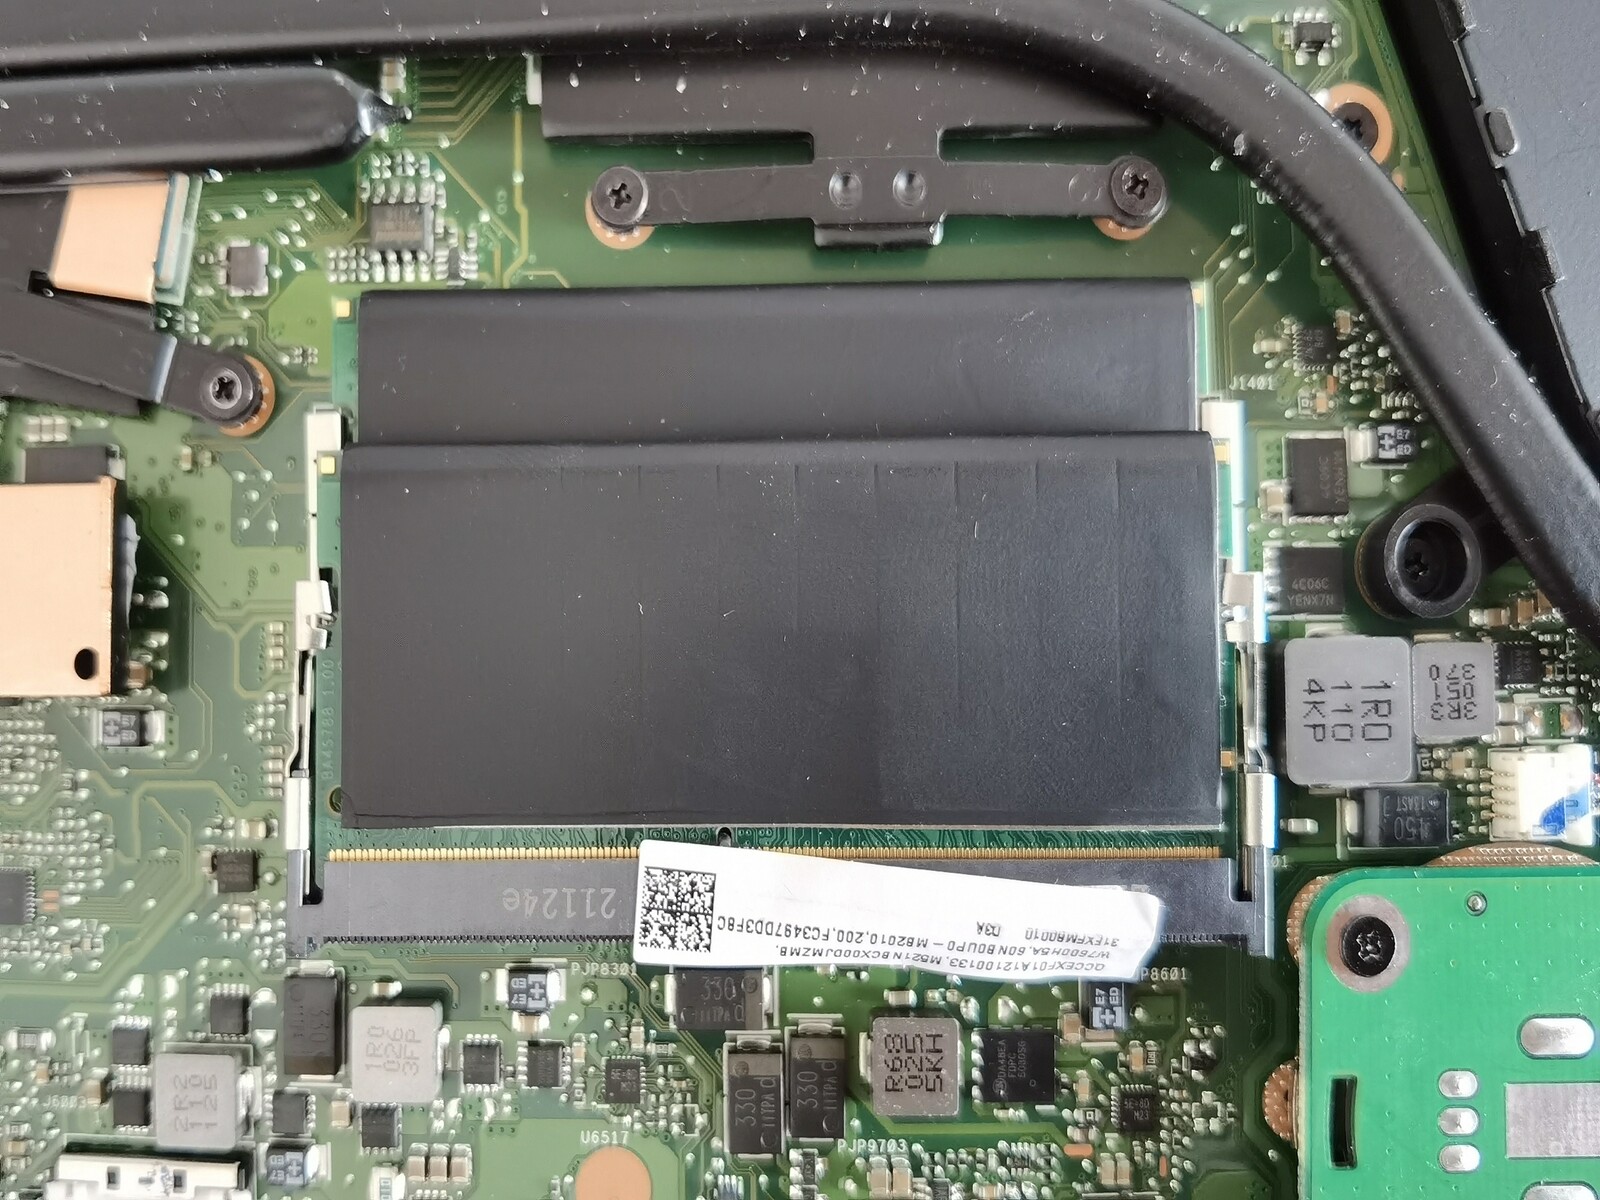
The base plate can be easily removed by loosening ten cross screws. Inside, users will have direct access to both RAM and SSD slots, which are fully occupied in our review unit. Accordingly, the fans can also be cleaned this way. It is worth mentioning that the cooling circuit also covers the chipset and even the RAM and SSDs have passive cooling. For the latter, there are additional heat conduction pads on the base plate.
Input devices: Professional work with Asus Dial
Keyboard
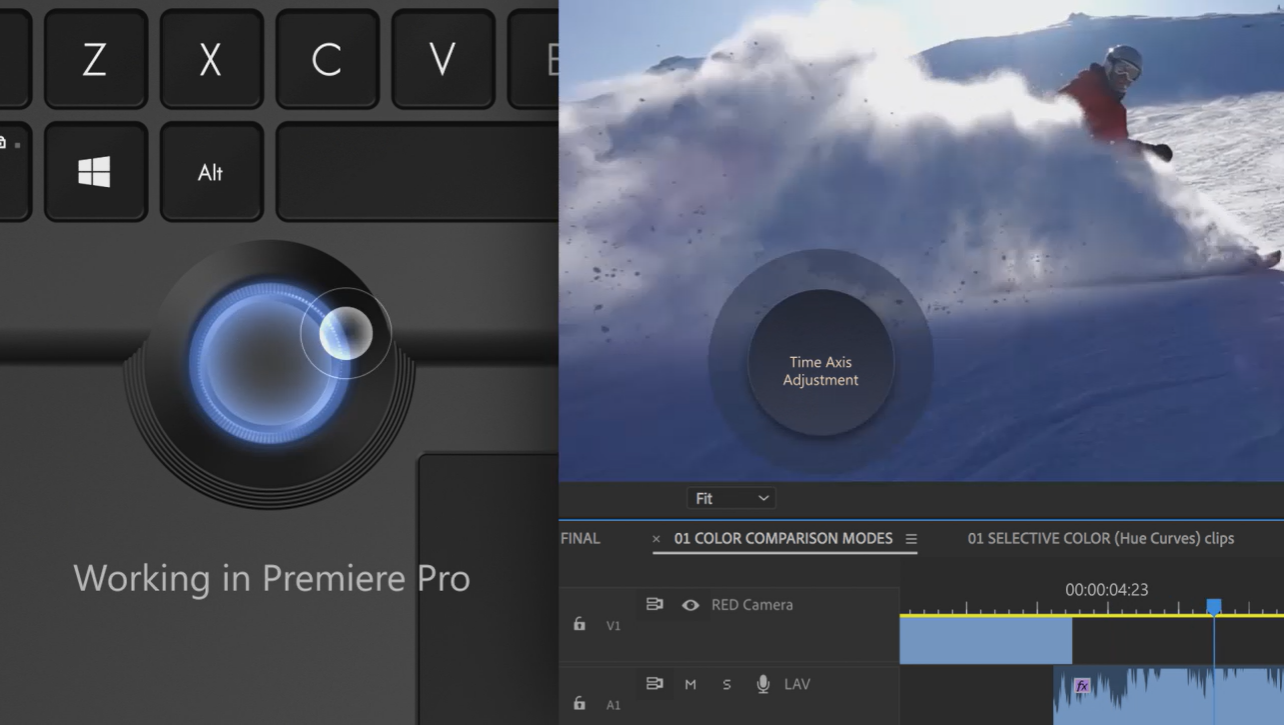
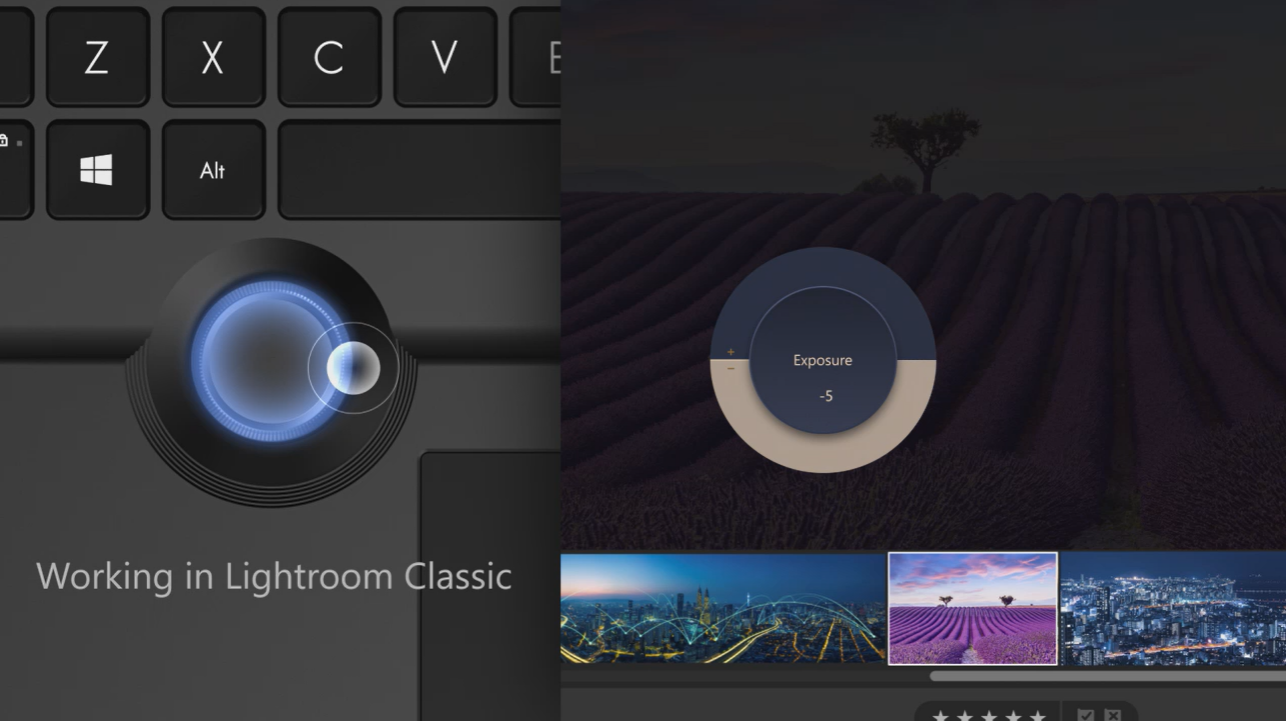
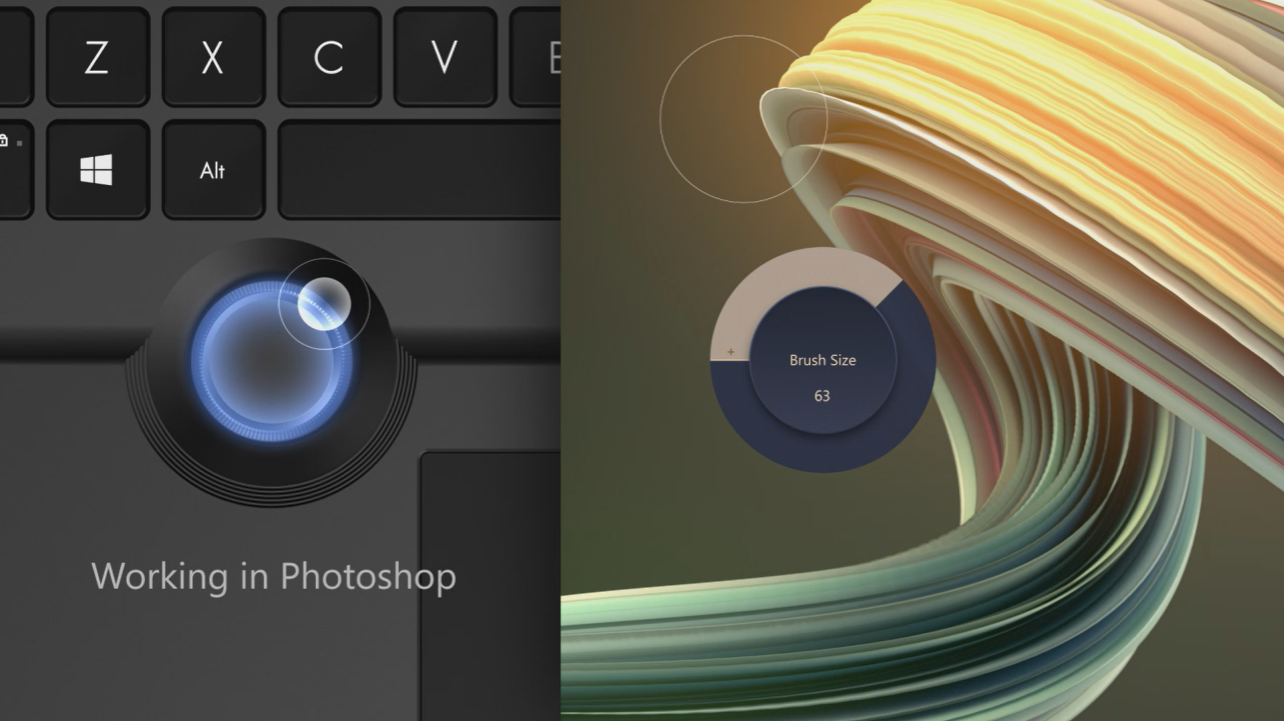
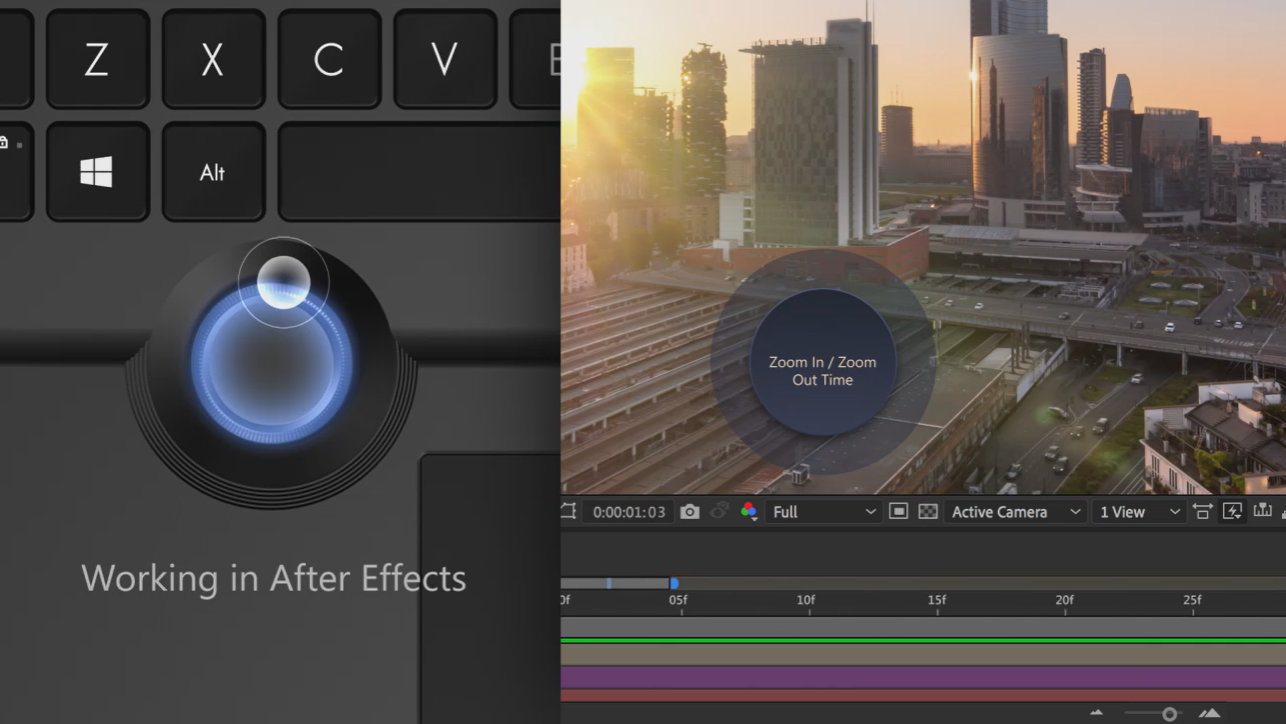
The keyboard of the Asus ProArt Studiobook 16 is characterized by a good pressure point. The keys have a normal size and feel very comfortable when typing despite the rougher surface. The keystroke clatter is rather discreet and is not perceived as annoying. The keyboard illumination can be adjusted in three levels. In addition, there is the Asus Dial Controller: thanks to the ergonomic edges of the round controller, settings can be made very precisely and also very quietly. For example, you can intuitively control the brush in Photoshop or easily change the layer via the dial. Zooming, navigating or adjusting the color balance or hue should be easy with the Dial Controller. Our image gallery shows a few examples of using the Dial Controller.
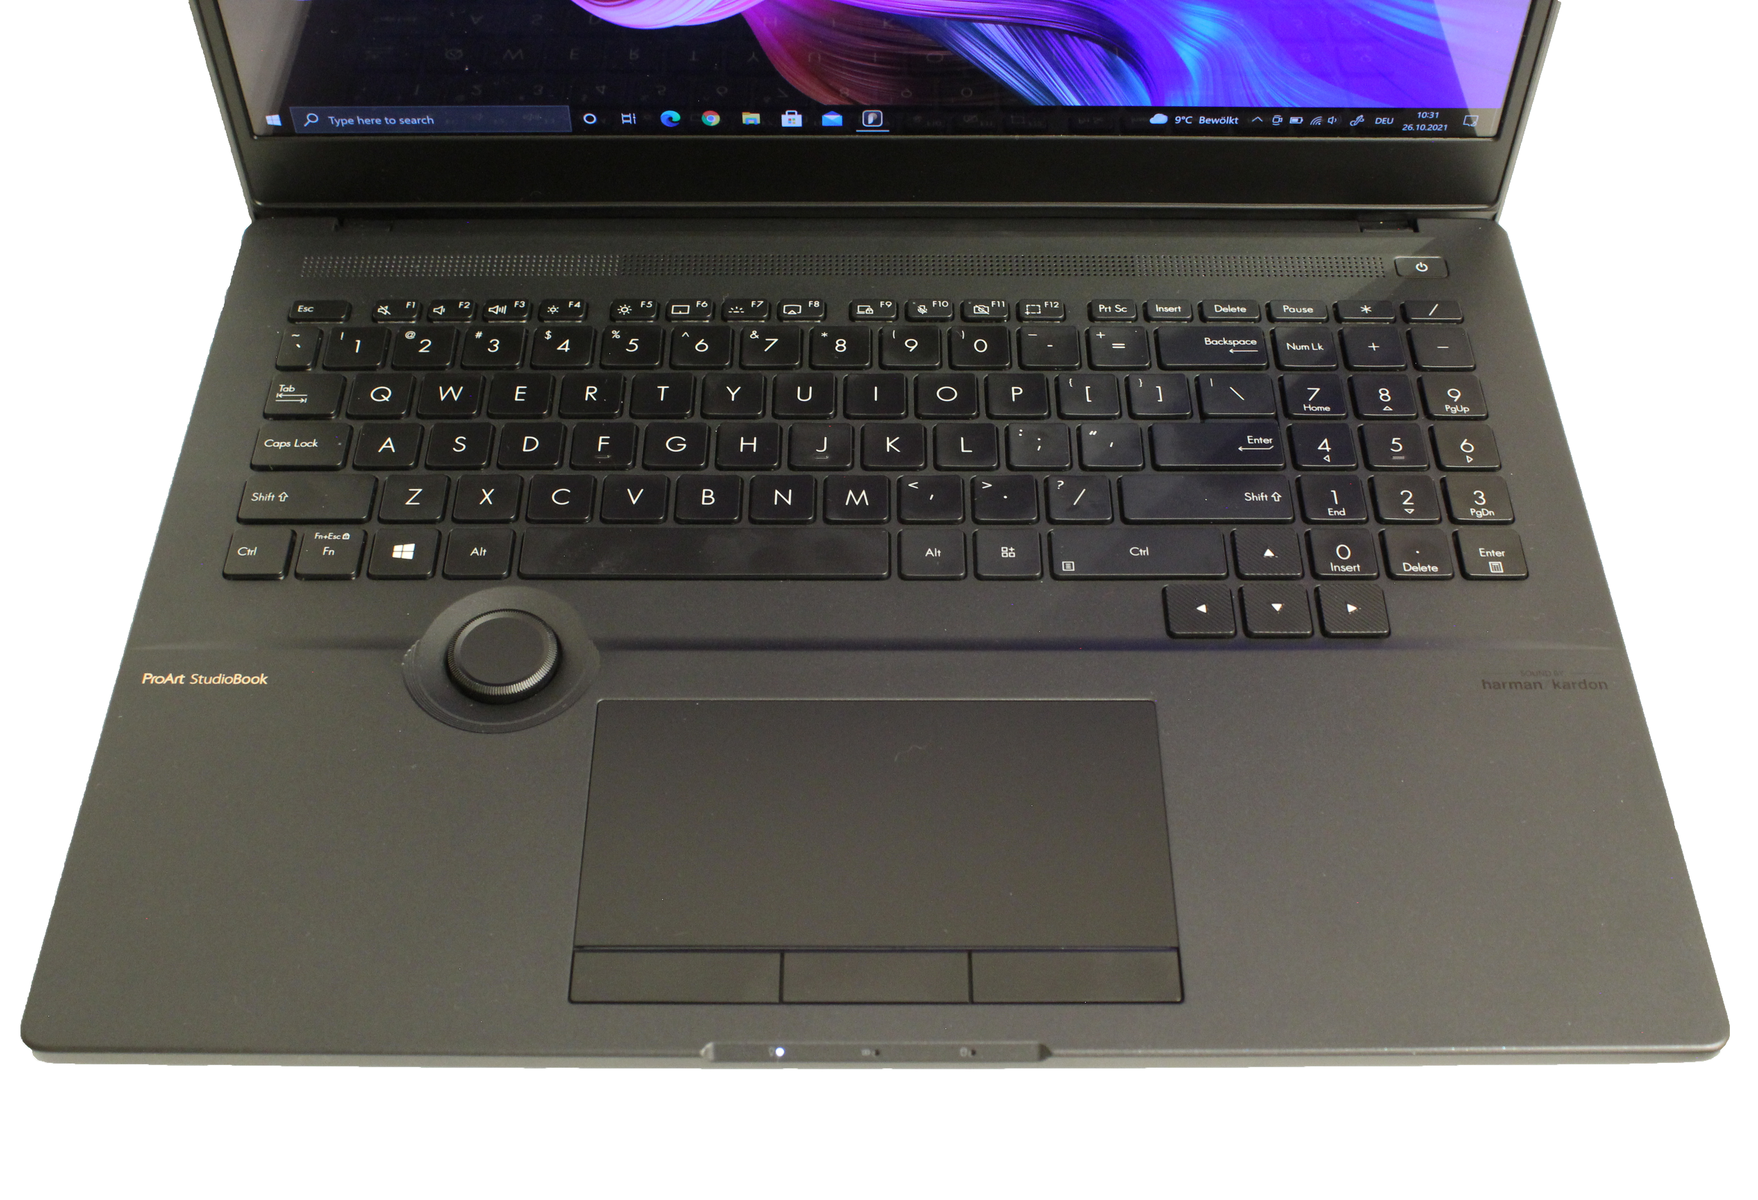
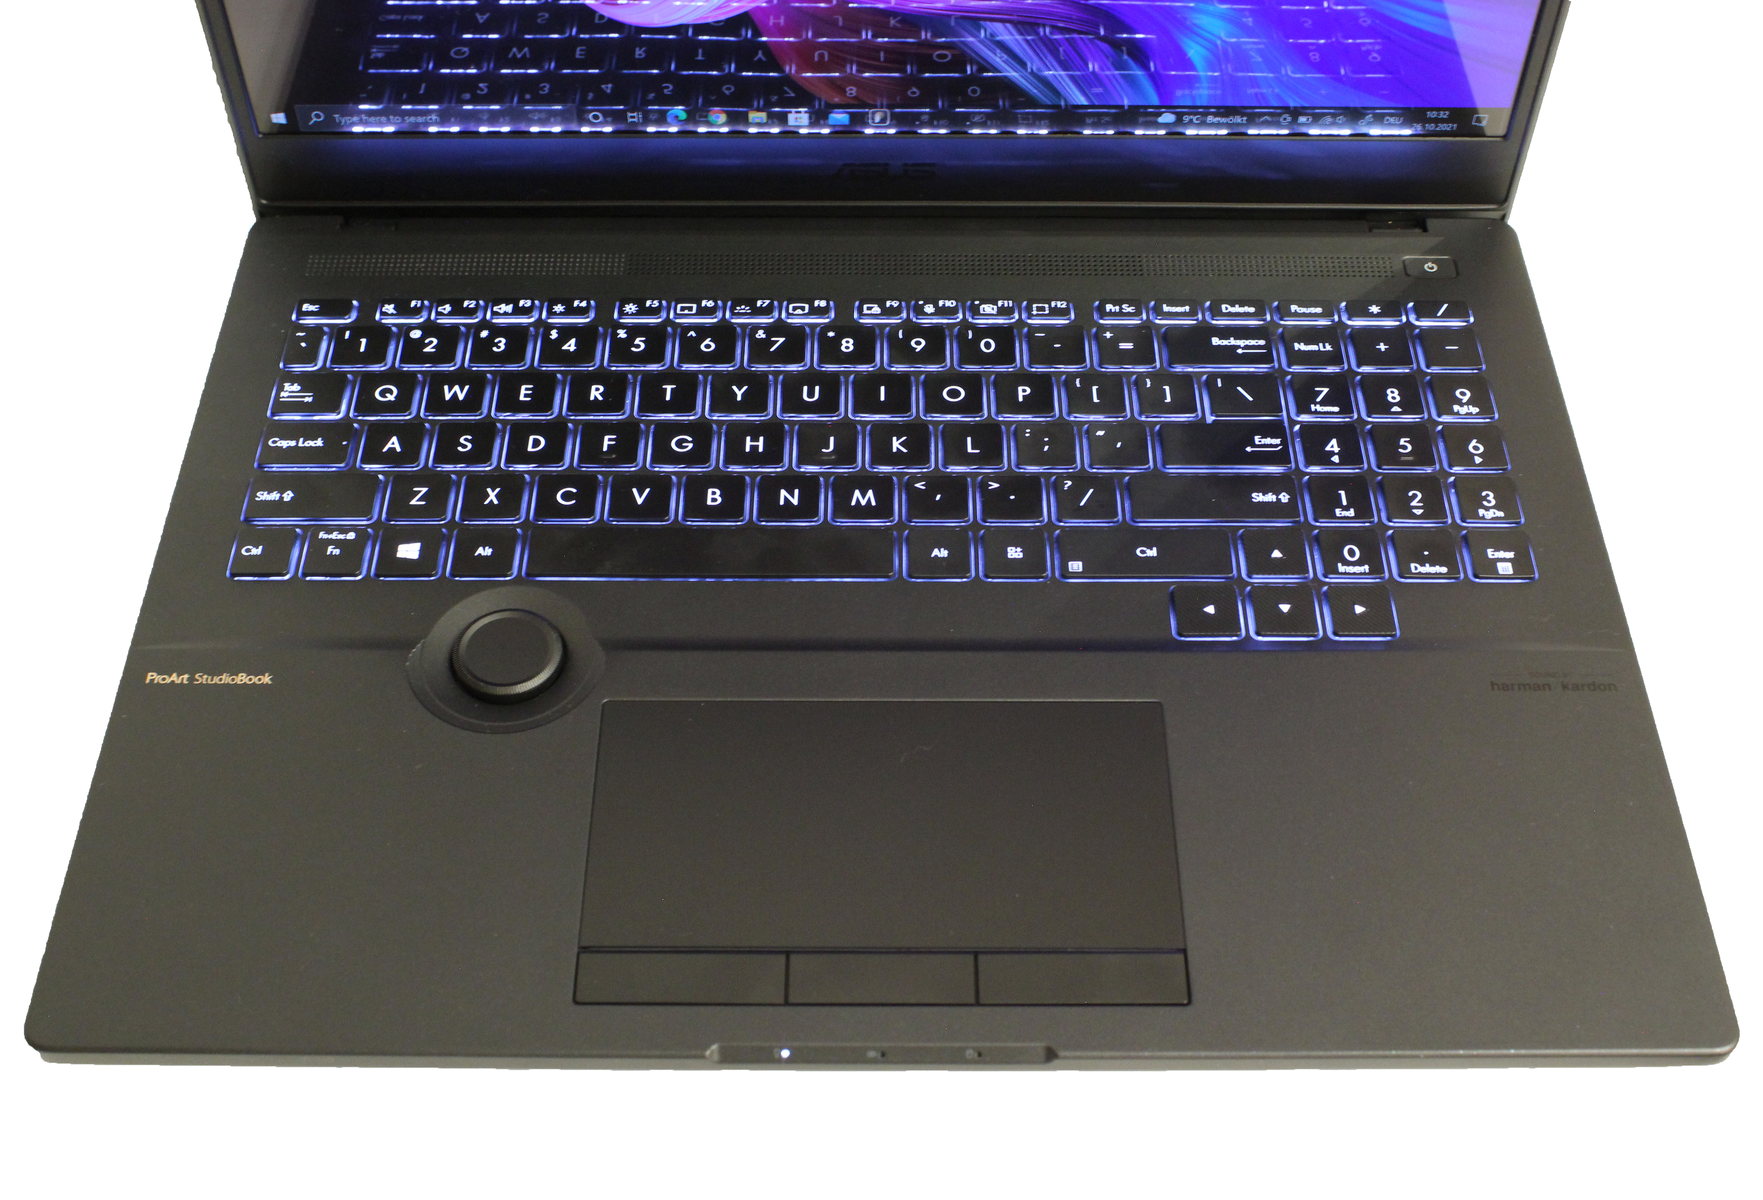
Touchpad
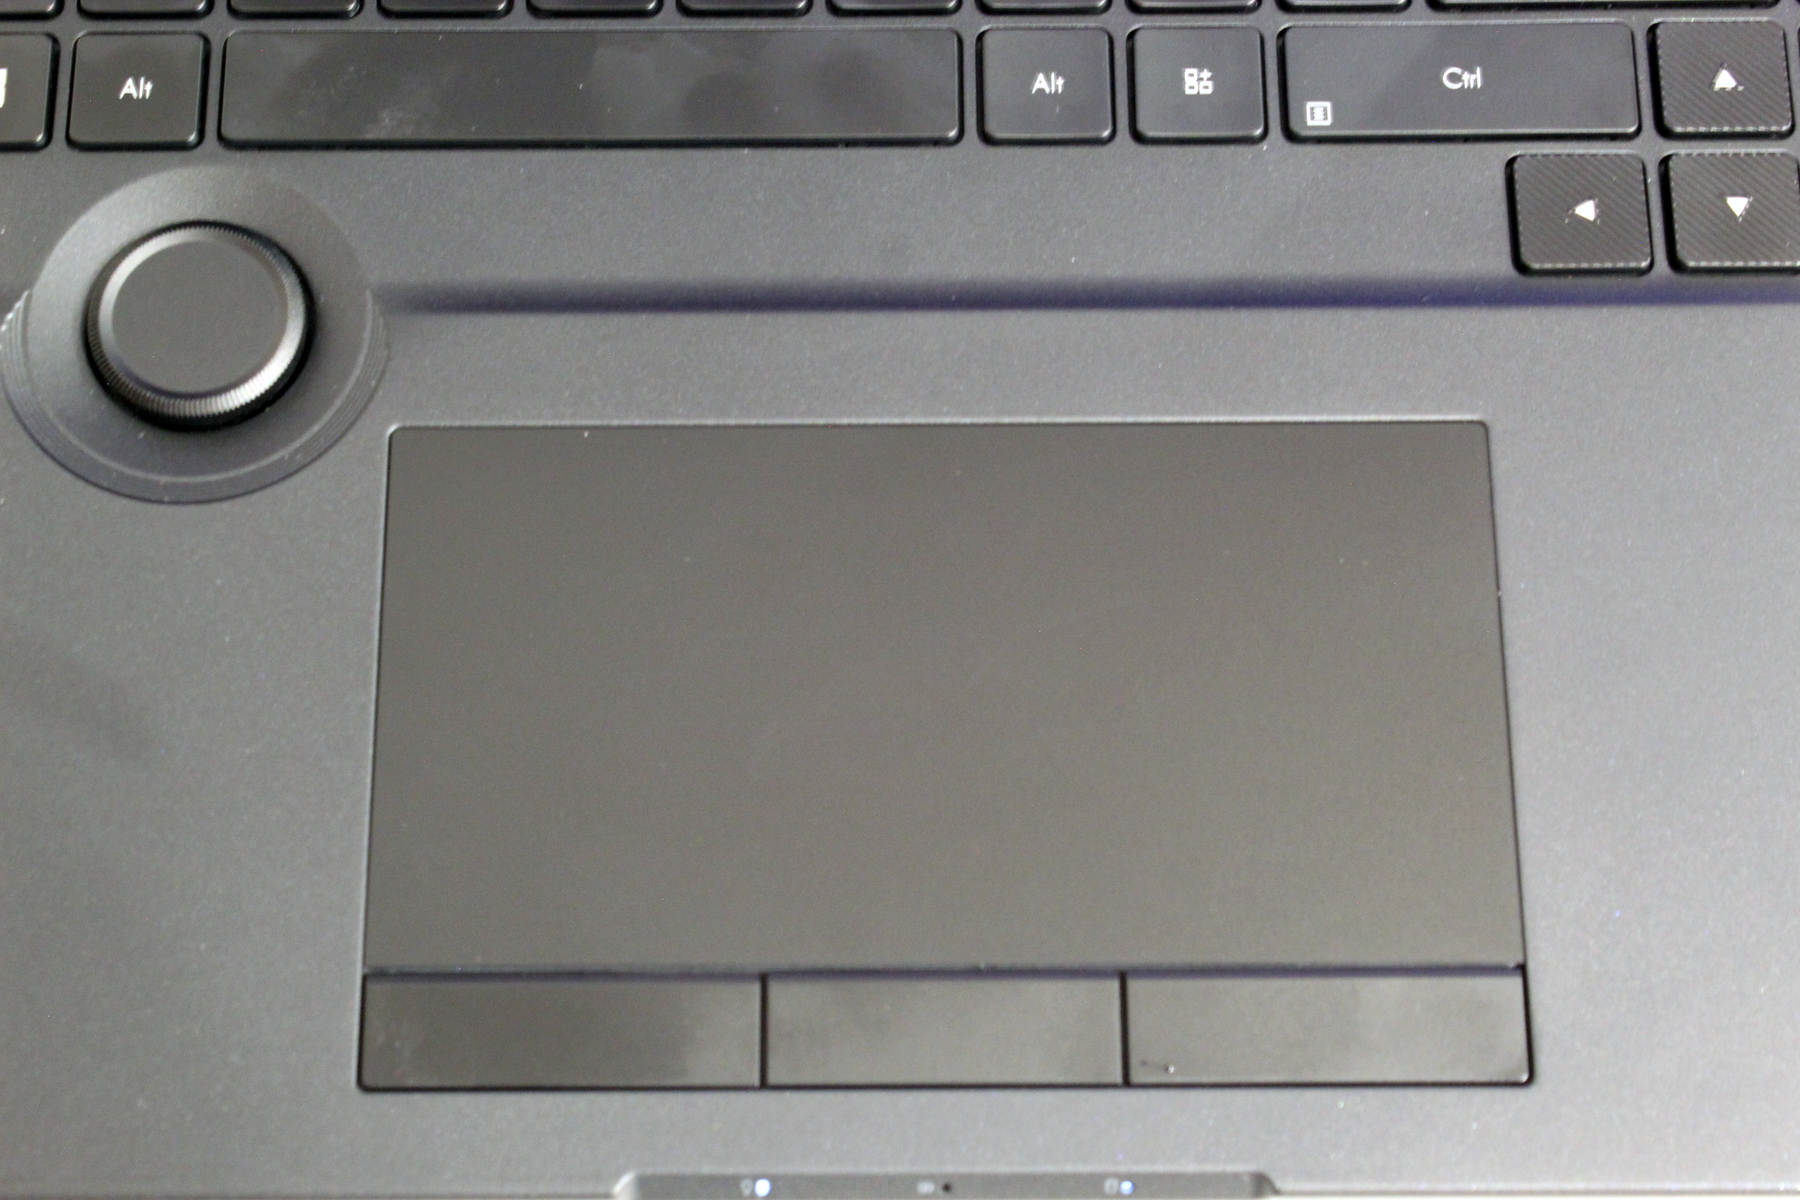
The touchpad of our pre-production sample offers the user a large surface as well as very good gliding properties. Similarly, multi-touch features such as scrolling or switching tabs work smoothly here. The special 3-button touchpad is suitable for 3D designers who need centered control for application functions such as panning, rotating or circling. Combined with the Asus Dial, these two features are a real dream team for creative professionals.
Display: World's first 4K OLED HDR panel in 16:10 format

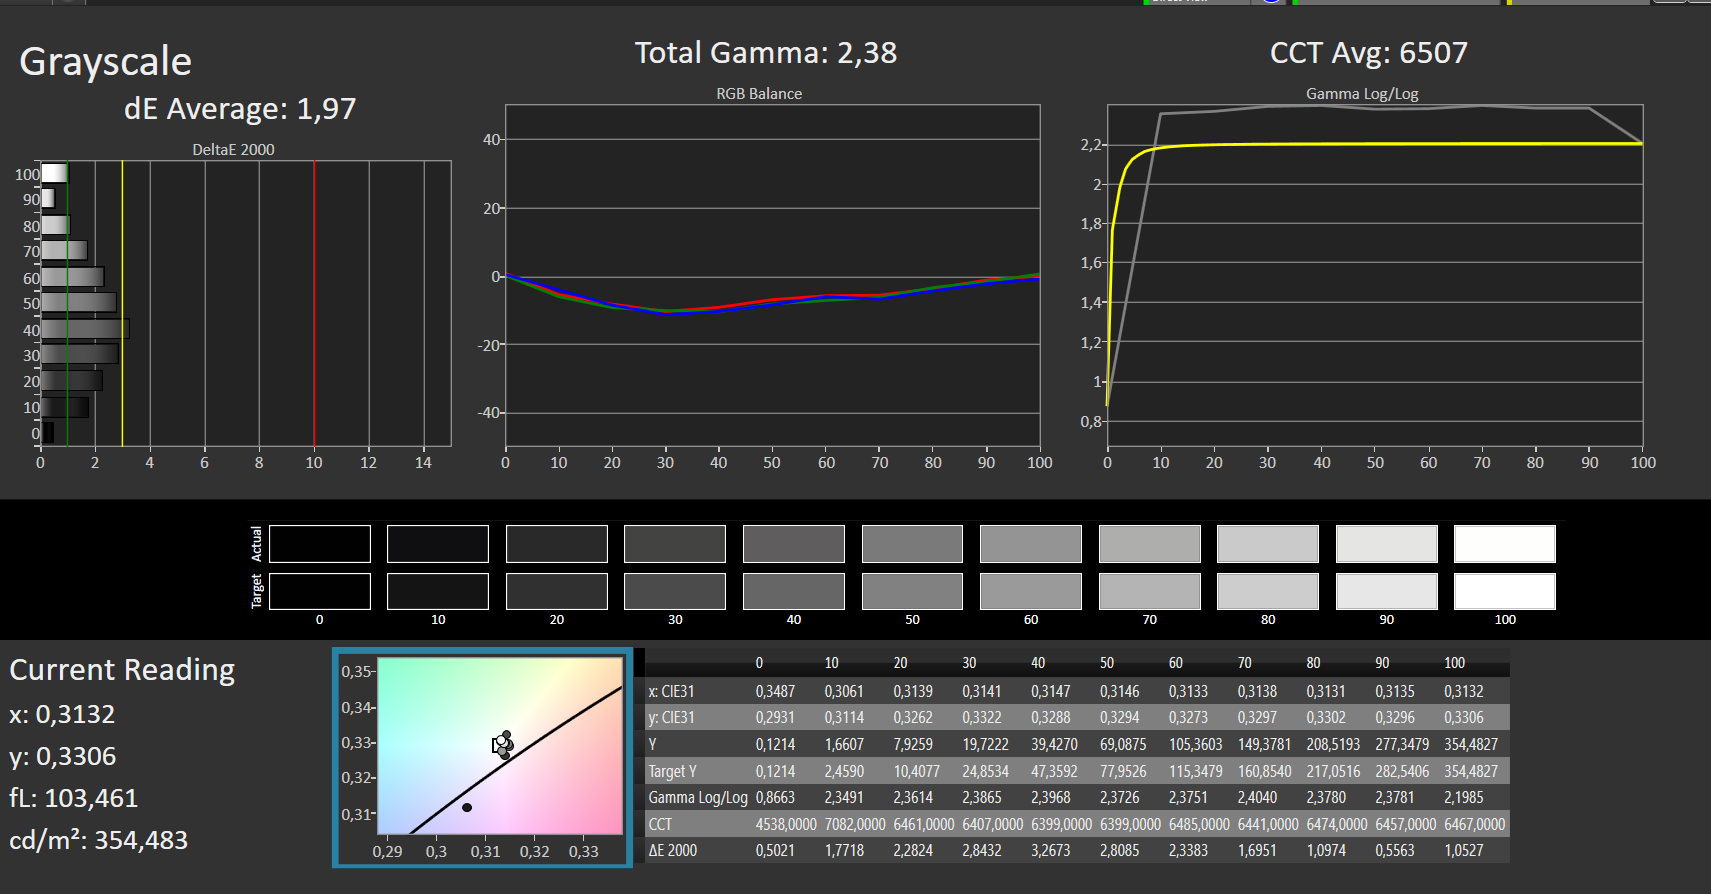
Our review sample features a 4K OLED HDR panel with a 16-inch screen diagonal and 16:10 aspect ratio. It makes a good impression at first glance and offers the typical advantages of OLED panels. Furthermore, it have very good factory calibration due to the Pantone certification and is thus perfectly suited for editing pictures and videos. The backlight is very even at 96%, only the maximum brightness could be better. Apart from that, PWM at a frequency of 240 Hz is present at brightness levels of 80 percent and lower. Competition can score some points too: for example, HP ZBook Fury is equipped with a non-reflective, 120 Hz and much brighter panel. However, it also has some drawbacks, such as graininess, halos and a poorer calibration.
Since our pre-production sample has an OLED panel, there is no screen bleeding.
| |||||||||||||||||||||||||
Brightness Distribution: 96 %
Center on Battery: 354 cd/m²
Contrast: ∞:1 (Black: 0 cd/m²)
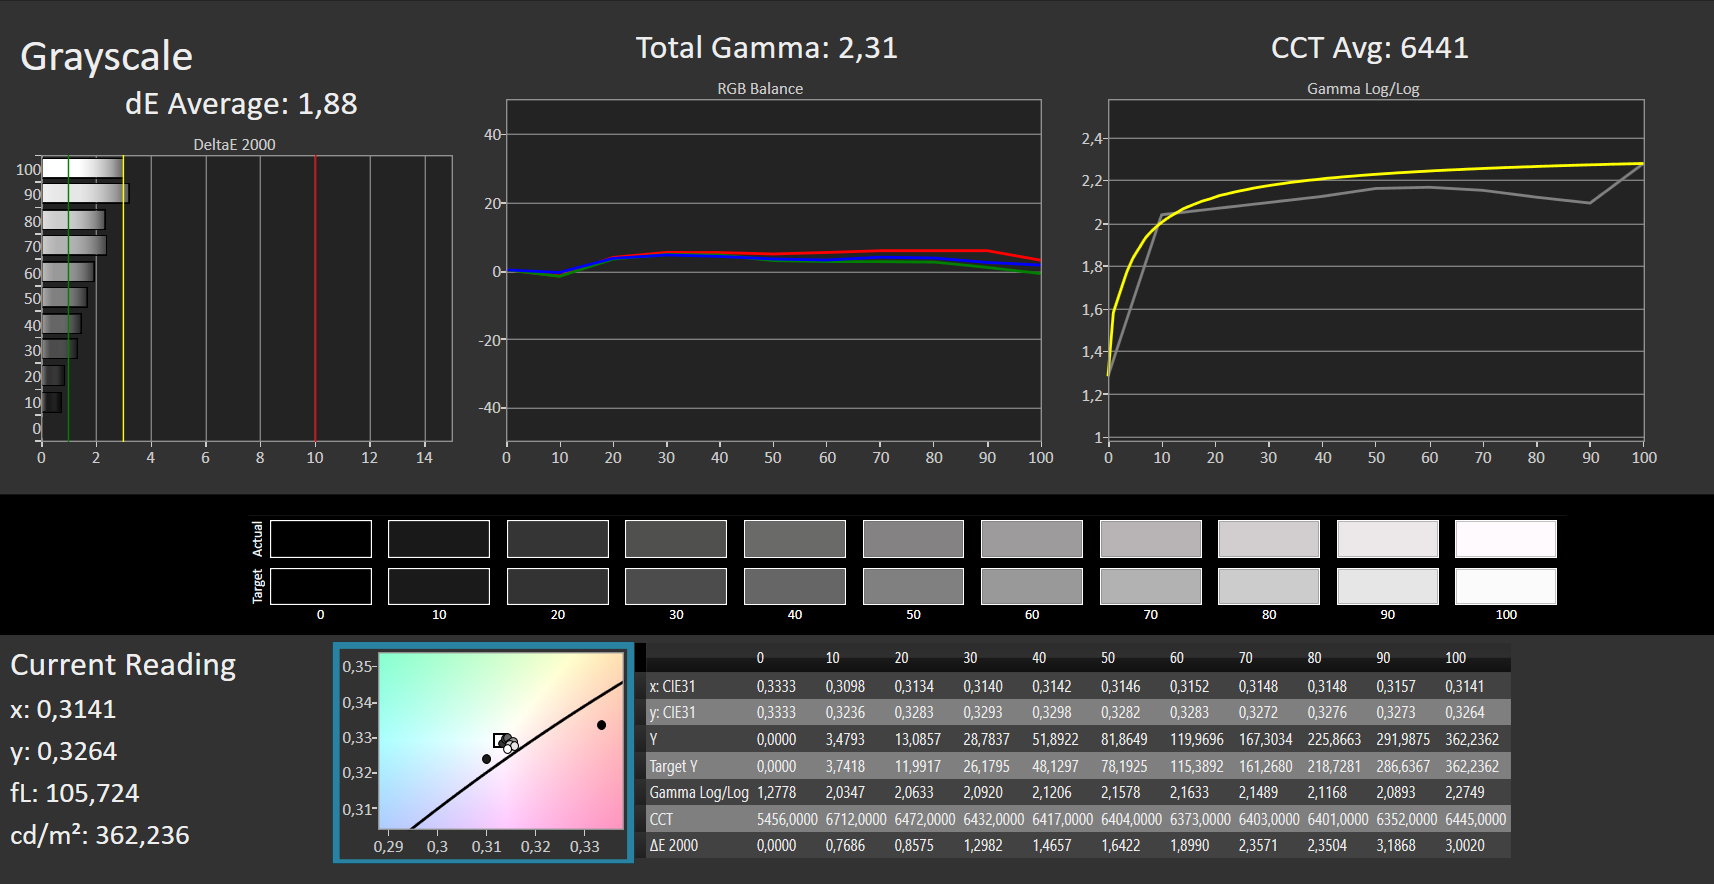
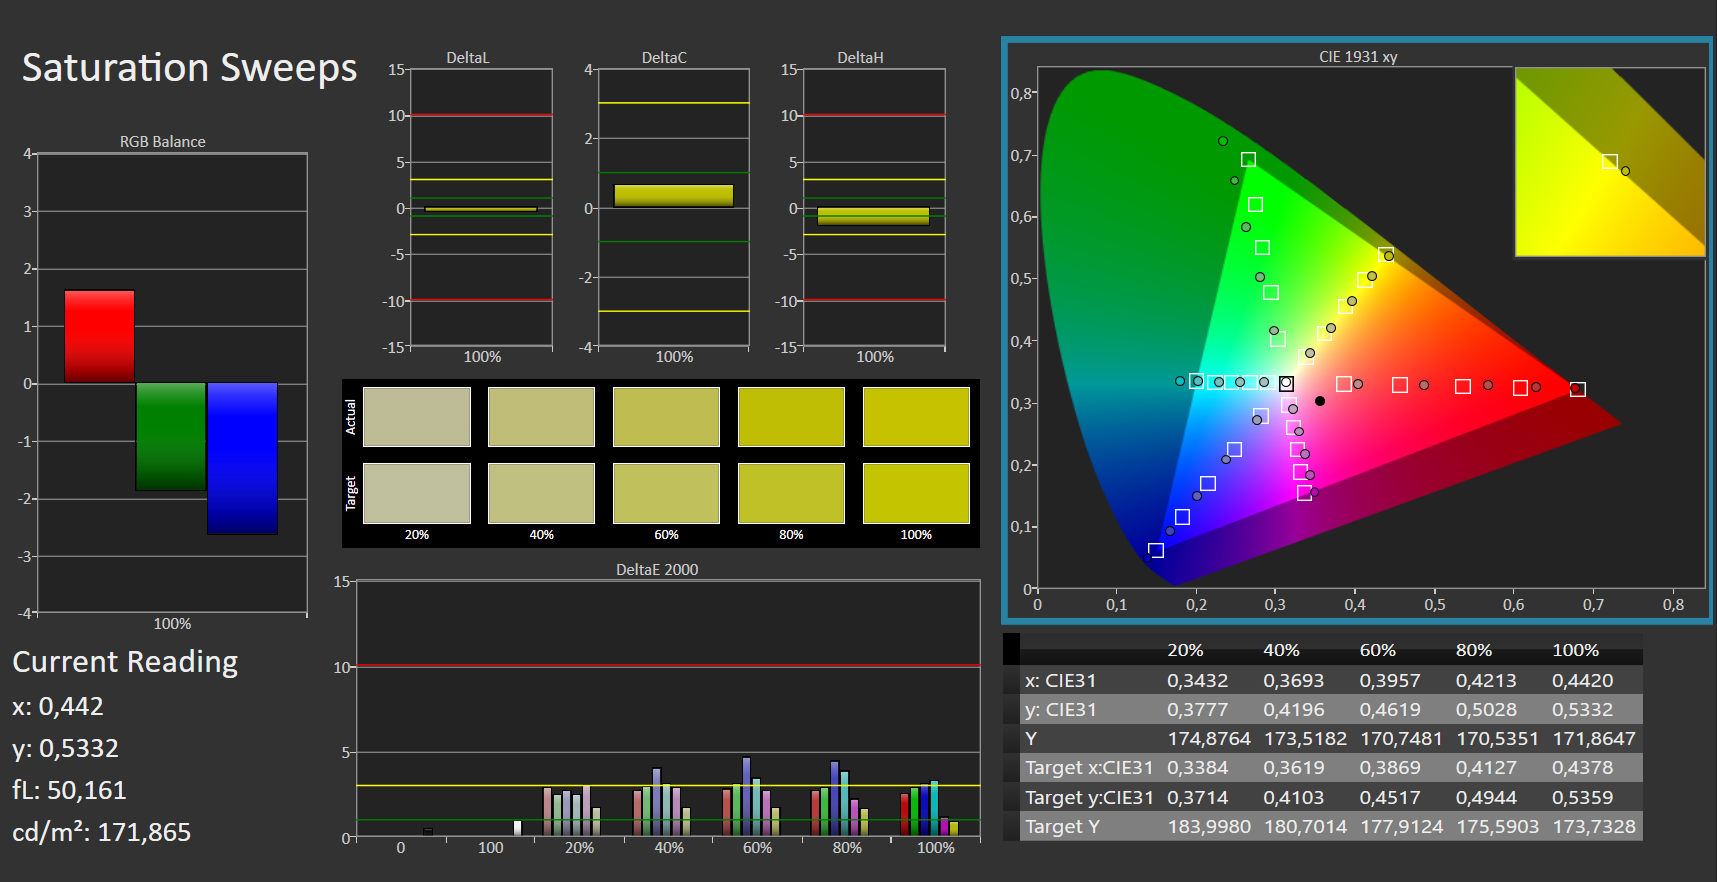
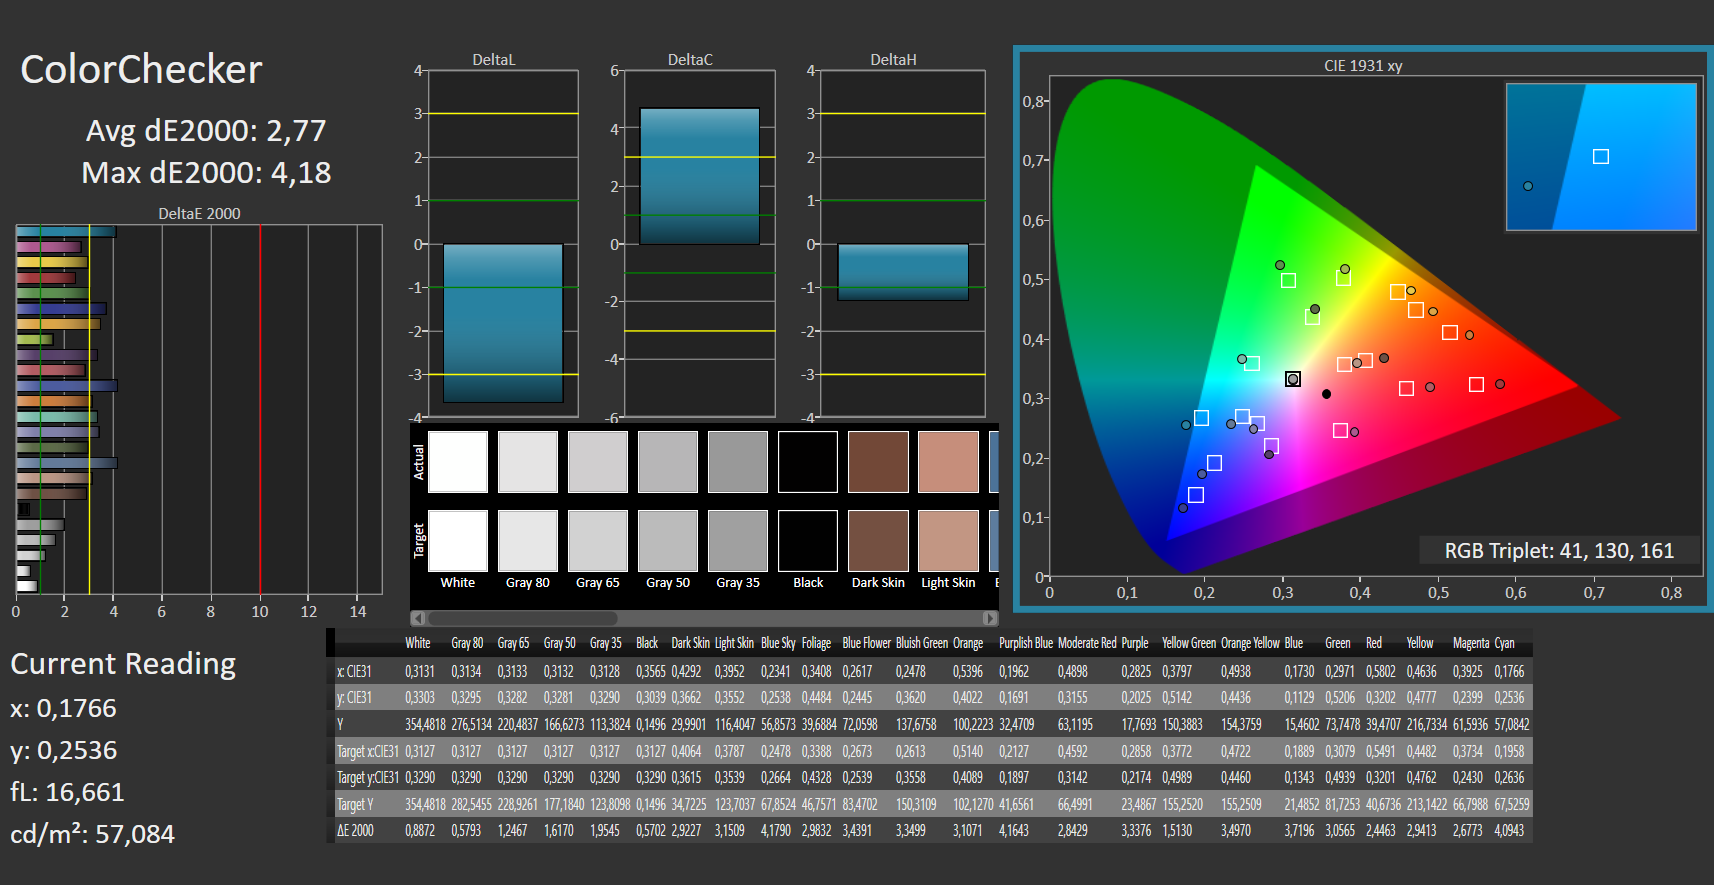
ΔE ColorChecker Calman: 2.45 | ∀{0.5-29.43 Ø4.72}
calibrated: 2.77
ΔE Greyscale Calman: 1.88 | ∀{0.09-98 Ø4.97}
98.6% AdobeRGB 1998 (Argyll 3D)
100% sRGB (Argyll 3D)
99.9% Display P3 (Argyll 3D)
Gamma: 2.31
CCT: 6441 K
| Asus ProArt StudioBook 16 W7600H5A-2BL2 ATNA60YV02-0, OLED, 3840x2400, 16" | HP ZBook Fury 15 G8 BOE0969, IPS, 3840x2160, 15.6" | HP ZBook Studio 15 G8 SDC4145, OLED, 3840x2160, 15.6" | Dell Precision 5000 5560 Sharp LQ156R1, IPS, 3840x2400, 15.6" | |
|---|---|---|---|---|
| Display | -5% | -1% | -1% | |
| Display P3 Coverage (%) | 99.9 | 95.9 -4% | 99.9 0% | 94.9 -5% |
| sRGB Coverage (%) | 100 | 100 0% | 100 0% | 100 0% |
| AdobeRGB 1998 Coverage (%) | 98.6 | 87.3 -11% | 95.3 -3% | 100 1% |
| Response Times | -545% | -20% | -1840% | |
| Response Time Grey 50% / Grey 80% * (ms) | 2 ? | 14.8 ? -640% | 2.4 ? -20% | 47.2 ? -2260% |
| Response Time Black / White * (ms) | 2 ? | 11 ? -450% | 2.4 ? -20% | 30.4 ? -1420% |
| PWM Frequency (Hz) | 240 ? | 240.4 ? | ||
| Screen | -40% | -36% | -24% | |
| Brightness middle (cd/m²) | 353 | 626 77% | 379.6 8% | 501.5 42% |
| Brightness (cd/m²) | 360 | 589 64% | 380 6% | 467 30% |
| Brightness Distribution (%) | 96 | 87 -9% | 95 -1% | 83 -14% |
| Black Level * (cd/m²) | 0.58 | 0.44 | ||
| Colorchecker dE 2000 * | 2.45 | 5.41 -121% | 5.15 -110% | 4.73 -93% |
| Colorchecker dE 2000 max. * | 3.75 | 9.05 -141% | 7.79 -108% | 8.45 -125% |
| Colorchecker dE 2000 calibrated * | 2.77 | 0.6 78% | 3.1 -12% | 0.51 82% |
| Greyscale dE 2000 * | 1.88 | 6.2 -230% | 2.6 -38% | 3.6 -91% |
| Gamma | 2.31 95% | 2.66 83% | 1.99 111% | 2.08 106% |
| CCT | 6441 101% | 6101 107% | 6166 105% | 6447 101% |
| Contrast (:1) | 1079 | 1140 | ||
| Total Average (Program / Settings) | -197% /
-116% | -19% /
-25% | -622% /
-321% |
* ... smaller is better
Thanks to the 4K OLED HDR display, our pre-production sample offers an extremely high contrast and rich, deep blacks. The panel covers the DCI-P3 and sRGB color spaces completely and also delivers very good values in the AdobeRGB 1998 color space with 98.6%. In addition, there is a very high image sharpness which delivers a very good picture, which means that the display meets the requirements for professional graphics editing.


Our pre-production test sample is only suitable for outdoor use to a limited extent. With a brightness of 350 cd/m² and the glossy display, you already have a poor view even in the shade. Among the competition HP ZBook Fury can do better thanks to the installed IPS panel with a brightness of over 600 cd/m².
Display Response Times
| ↔ Response Time Black to White | ||
|---|---|---|
| 2 ms ... rise ↗ and fall ↘ combined | ↗ 1 ms rise |  |
| ↘ 1 ms fall | ||
| The screen shows very fast response rates in our tests and should be very well suited for fast-paced gaming. In comparison, all tested devices range from 0.1 (minimum) to 240 (maximum) ms. » 11 % of all devices are better. This means that the measured response time is better than the average of all tested devices (19.8 ms). | ||
| ↔ Response Time 50% Grey to 80% Grey | ||
| 2 ms ... rise ↗ and fall ↘ combined | ↗ 1 ms rise |  |
| ↘ 1 ms fall | ||
| The screen shows very fast response rates in our tests and should be very well suited for fast-paced gaming. In comparison, all tested devices range from 0.165 (minimum) to 636 (maximum) ms. » 10 % of all devices are better. This means that the measured response time is better than the average of all tested devices (31 ms). | ||
Screen Flickering / PWM (Pulse-Width Modulation)
| Screen flickering / PWM detected | 240 Hz | ≤ 80 % brightness setting |  |
The display backlight flickers at 240 Hz (worst case, e.g., utilizing PWM) Flickering detected at a brightness setting of 80 % and below. There should be no flickering or PWM above this brightness setting. The frequency of 240 Hz is relatively low, so sensitive users will likely notice flickering and experience eyestrain at the stated brightness setting and below. In comparison: 52 % of all tested devices do not use PWM to dim the display. If PWM was detected, an average of 7747 (minimum: 5 - maximum: 343500) Hz was measured. | |||
Thanks to the built-in OLED HDR panel, the viewing angles of our Asus ProArt Studiobook Pro 16 OLED are super-wide with no image degradation whatsoever.
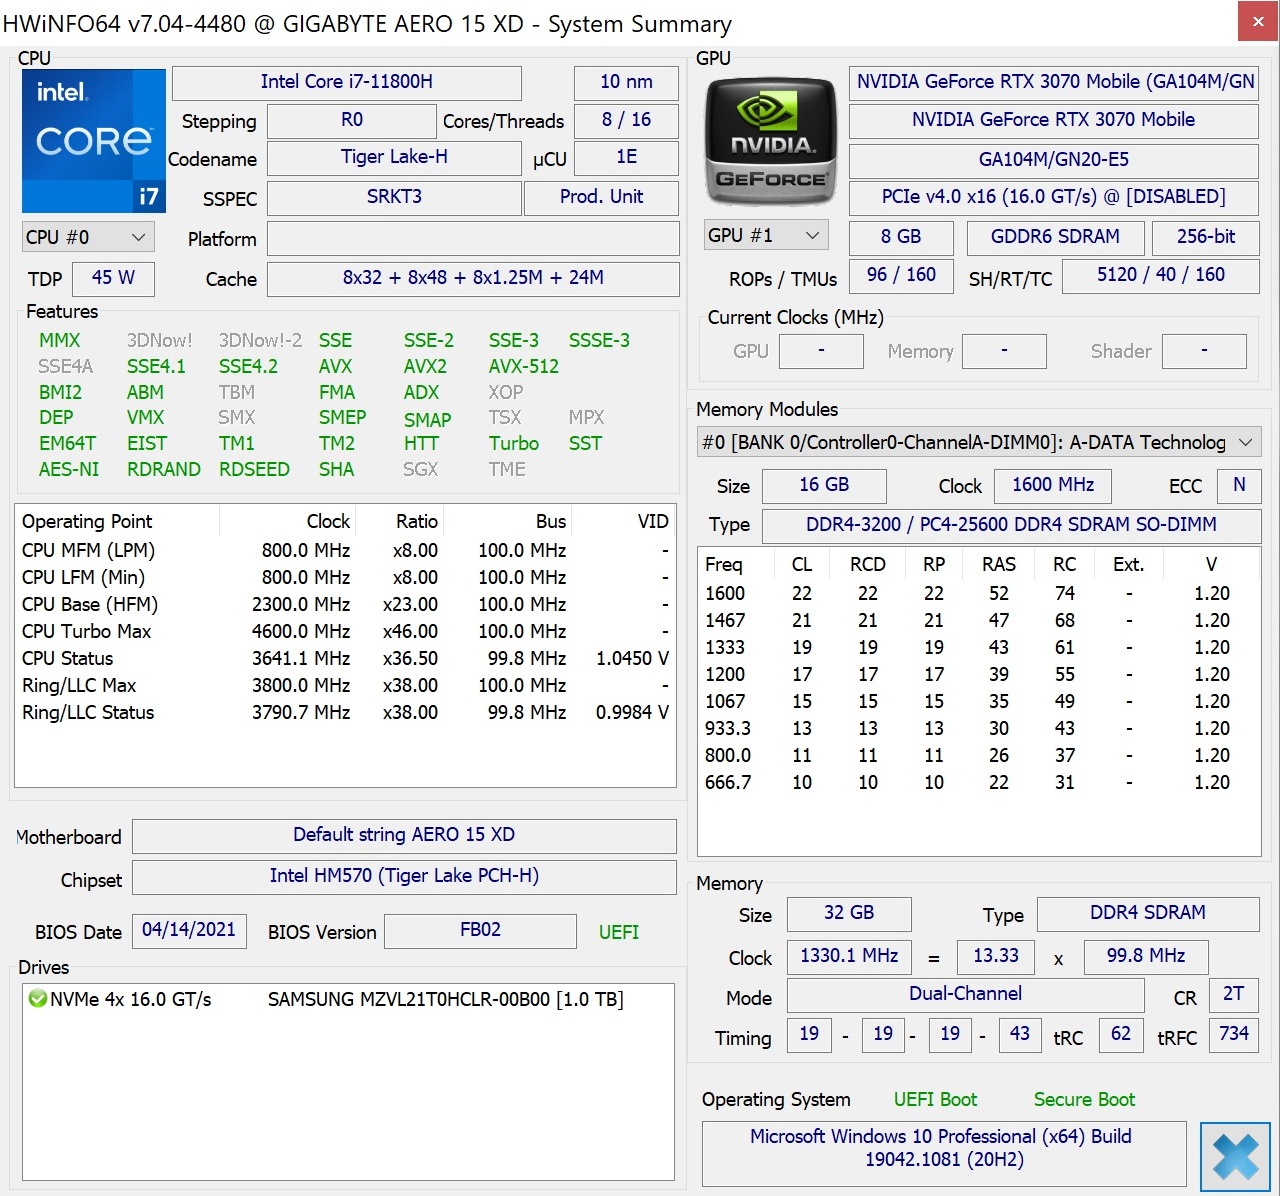
Performance: Upper-class performance with sophisticated cooling
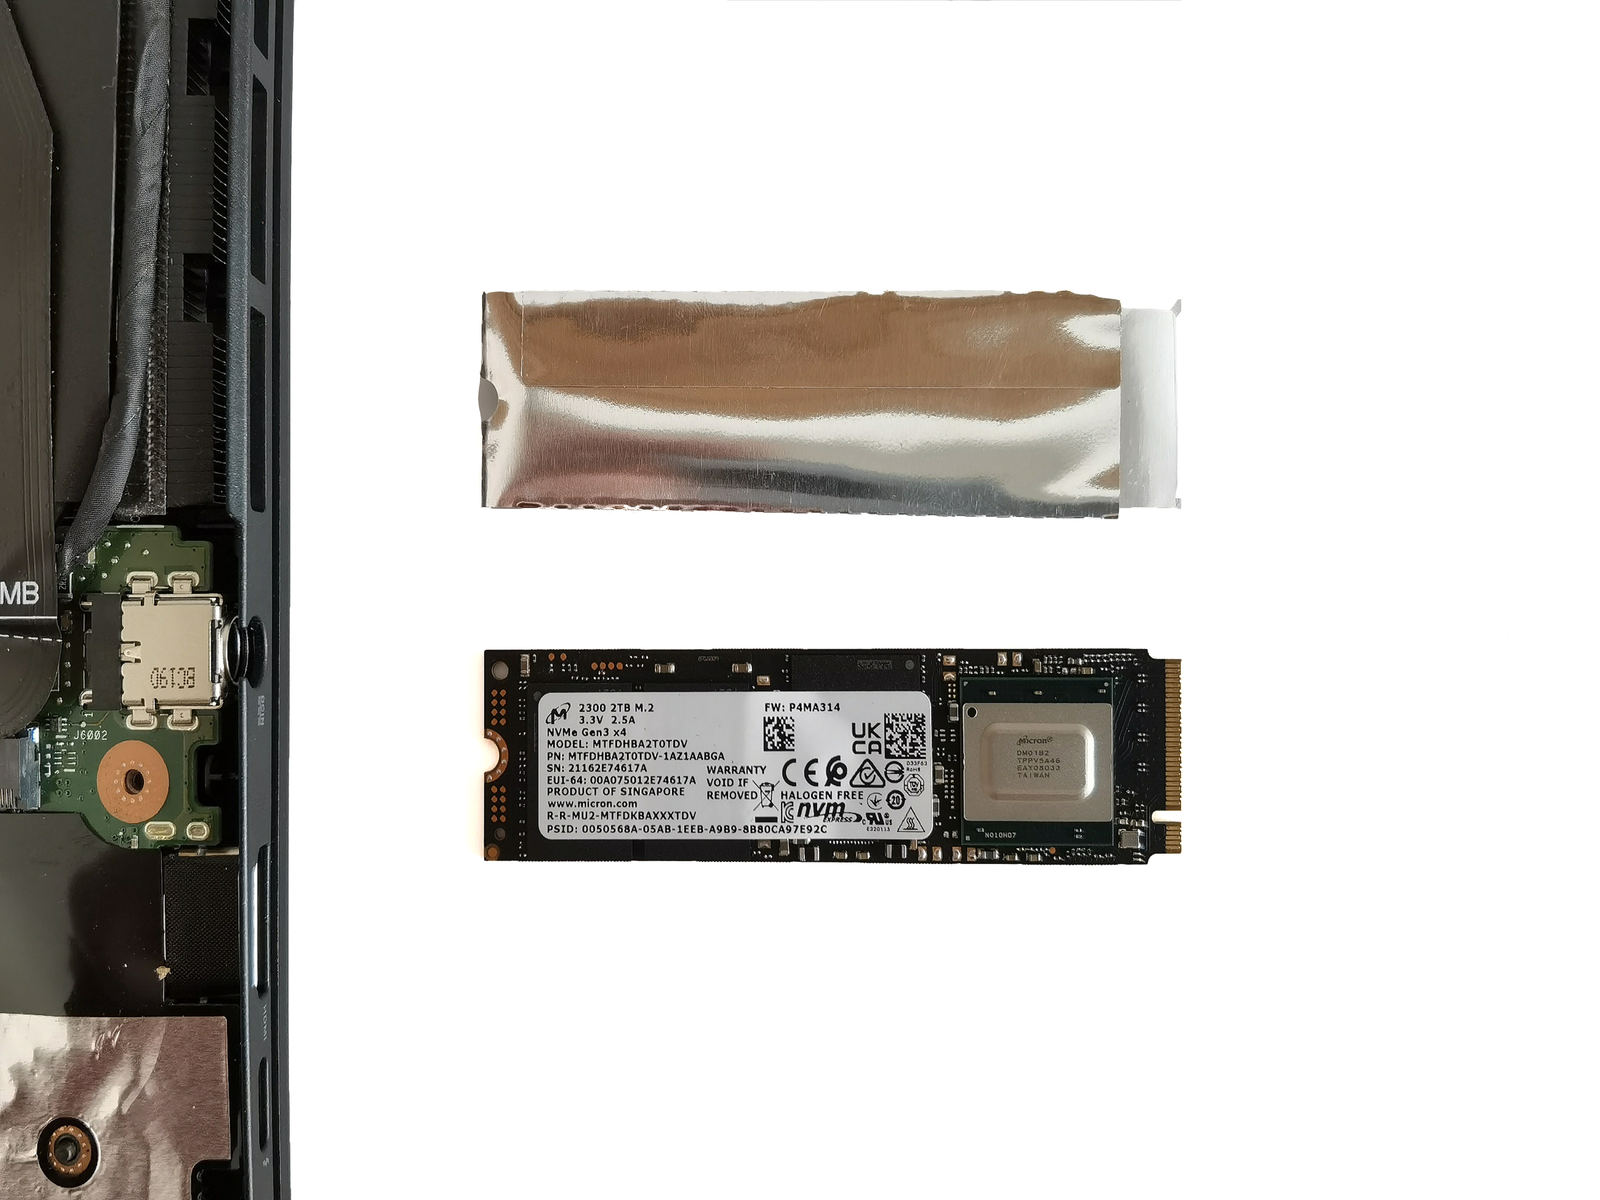
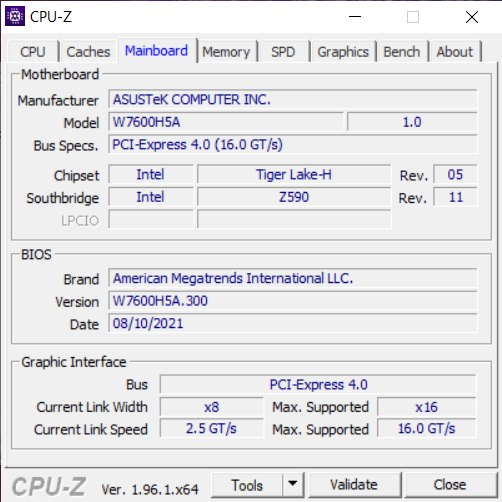
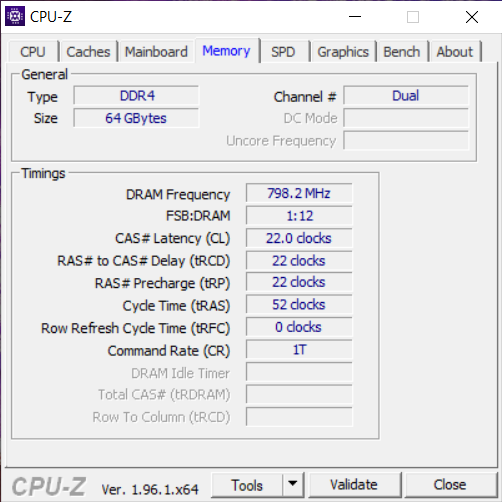
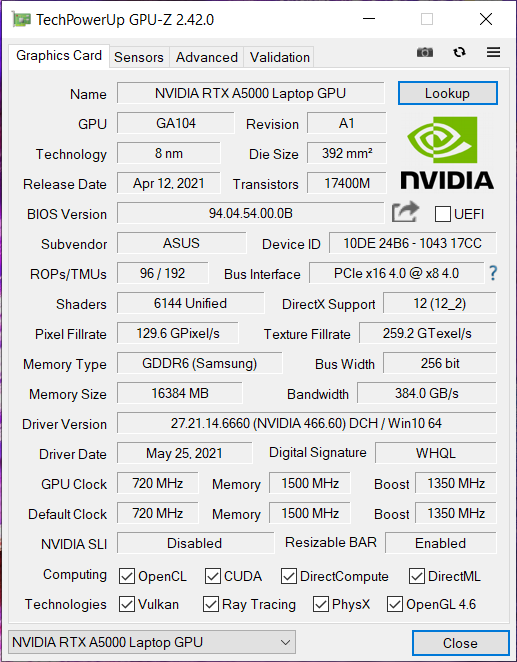
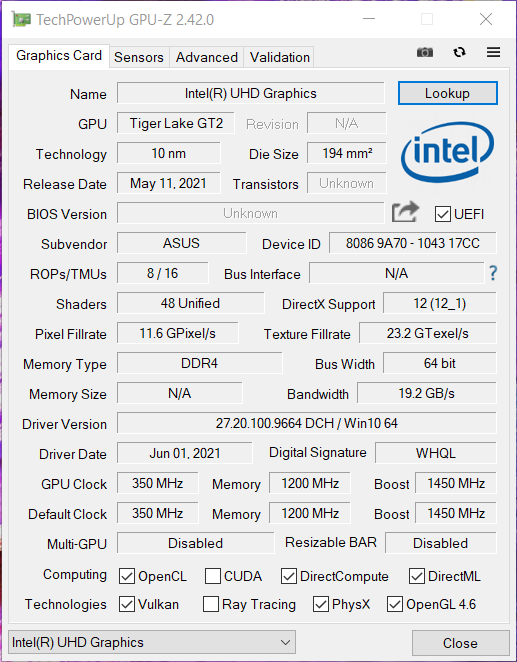
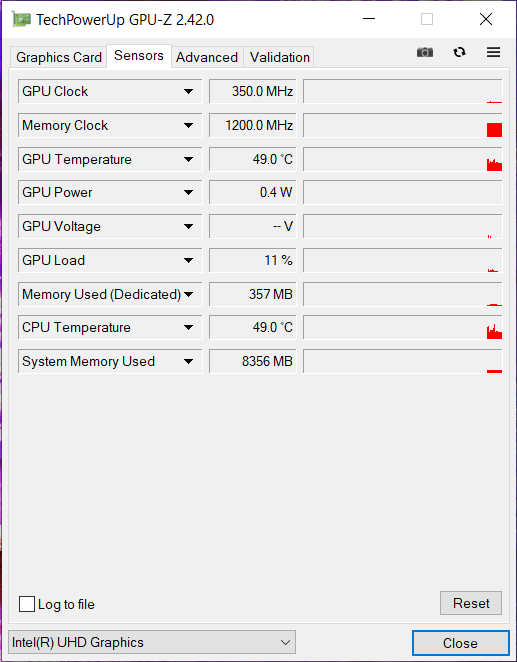
Asus does not make any compromises and relies on the latest and most powerful components that Intel and Nvidia currently offer for workstations. Therefore, a Intel Xeon W-11955M is at work inside in combination with 64 GB DDR4 RAM and two 2 TB NVMe SSDs in a Raid 0 array. The graphics load is distributed between Nvidia RTX A5000 and the Intel UHD Graphics based on the XE architecture. The installed working memory in our device is ECC RAM clocked at 3200 MHz. Unfortunately, the SSD slots are occupied by two PCI-Express 3.0 SSDs. In view of the rest of the configuration, PCIe Gen.4 could have been more apropriate. It is questionable whether other configurations will be available, but that remains to be seen.
Processor
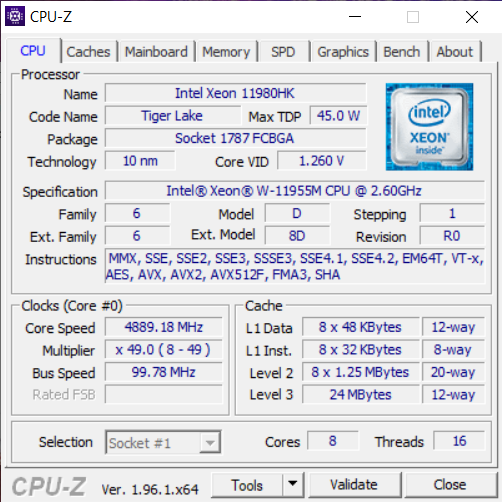
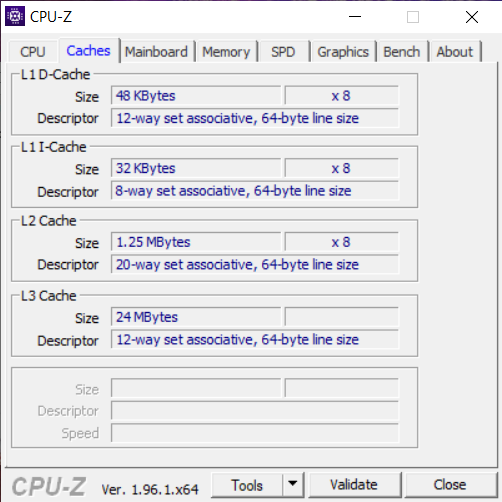
Let's now talk about the Tiger-Lake octa-core CPU, which was introduced in the 2nd quarter of 2021. The Intel Xeon W11955M, which is designed for mobile workstations, is manufactured on the new 10 nm SuperFin process and, in comparison to the Intel Core i9-11950H additionally offers support for ECC memory. The chip has a TDP of 45 watts, which was however configured higher in our test sample and increases to a permanent 54 watts depending on the application scenario. The processor cores can clock from 2.6 to 5 GHz and support DDR4-3200 memory.
In our Cinebench Multi endurance test, the performance is on the expected level and thus easily outperforms the HP ZBook Fury's Intel Core i9-11950H. On the one hand, this is also due to the installed cooling system, which is also designed for a combined TDP of 140W. We tested the device in the performance mode, which is available in Asus ProArt Creator Hub and dynamically adapts the cooling to the required tasks. For everyday tasks there is the standard mode, and app also allows to set the fans to full speed. However, this did not represent much added value in tests, apart from the necessity to wear the headset when the fans run at a permanently high 5,600 RPM. In battery mode, the system slows our device down from 54 to 15 watts, which is also noticeable in the performance. More details about the processor can be found in our CPU section
Cinebench R15 Multi endurance test
Cinebench R20: CPU (Multi Core) | CPU (Single Core)
Cinebench R15: CPU Multi 64Bit | CPU Single 64Bit
Blender: v2.79 BMW27 CPU
7-Zip 18.03: 7z b 4 | 7z b 4 -mmt1
Geekbench 5.5: Multi-Core | Single-Core
HWBOT x265 Benchmark v2.2: 4k Preset
LibreOffice : 20 Documents To PDF
R Benchmark 2.5: Overall mean
SPECviewperf 2020: 1920x1080 Solidworks (solidworks-05) | 1920x1080 Siemens NX (snx-04) | 1920x1080 Medical (medical-03) | 1920x1080 Maya (maya-06) | 1920x1080 Energy (energy-03) | 1920x1080 Creo (creo-03) | 1920x1080 CATIA (catia-06) | 1920x1080 3ds Max (3dsmax-07) | 3840x2160 Solidworks (solidworks-05) | 3840x2160 Siemens NX (snx-04) | 3840x2160 Medical (medical-03) | 3840x2160 Maya (maya-06) | 3840x2160 Energy (energy-03) | 3840x2160 Creo (creo-03) | 3840x2160 CATIA (catia-06) | 3840x2160 3ds Max (3dsmax-07)
| Cinebench R23 / Multi Core | |
| Average of class Workstation (14621 - 38520, n=23, last 2 years) | |
| Schenker XMG Ultra 17 Rocket Lake | |
| MSI GS76 Stealth 11UH | |
| HP ZBook Fury 15 G8 | |
| HP ZBook Studio 15 G8 | |
| Average Intel Xeon W-11955M (10862 - 12412, n=2) | |
| Asus ProArt StudioBook 16 W7600H5A-2BL2 | |
| Dell Precision 5000 5560 | |
| Cinebench R23 / Single Core | |
| Average of class Workstation (1712 - 2228, n=23, last 2 years) | |
| Schenker XMG Ultra 17 Rocket Lake | |
| HP ZBook Fury 15 G8 | |
| MSI GS76 Stealth 11UH | |
| HP ZBook Studio 15 G8 | |
| Average Intel Xeon W-11955M (1480 - 1621, n=2) | |
| Dell Precision 5000 5560 | |
| Asus ProArt StudioBook 16 W7600H5A-2BL2 | |
| Cinebench R20 / CPU (Multi Core) | |
| Average of class Workstation (5760 - 15043, n=23, last 2 years) | |
| Schenker XMG Ultra 17 Rocket Lake | |
| MSI GS76 Stealth 11UH | |
| HP ZBook Fury 15 G8 | |
| HP ZBook Studio 15 G8 | |
| Asus ProArt StudioBook 16 W7600H5A-2BL2 | |
| Average Intel Xeon W-11955M (n=1) | |
| Dell Precision 5000 5560 | |
| Cinebench R20 / CPU (Single Core) | |
| Average of class Workstation (671 - 857, n=23, last 2 years) | |
| Schenker XMG Ultra 17 Rocket Lake | |
| HP ZBook Fury 15 G8 | |
| HP ZBook Studio 15 G8 | |
| MSI GS76 Stealth 11UH | |
| Dell Precision 5000 5560 | |
| Asus ProArt StudioBook 16 W7600H5A-2BL2 | |
| Average Intel Xeon W-11955M (n=1) | |
| Cinebench R15 / CPU Multi 64Bit | |
| Average of class Workstation (2489 - 5810, n=23, last 2 years) | |
| Schenker XMG Ultra 17 Rocket Lake | |
| MSI GS76 Stealth 11UH | |
| Asus ProArt StudioBook 16 W7600H5A-2BL2 | |
| Average Intel Xeon W-11955M (n=1) | |
| HP ZBook Studio 15 G8 | |
| HP ZBook Fury 15 G8 | |
| Dell Precision 5000 5560 | |
| Cinebench R15 / CPU Single 64Bit | |
| Average of class Workstation (191.4 - 328, n=23, last 2 years) | |
| Schenker XMG Ultra 17 Rocket Lake | |
| HP ZBook Fury 15 G8 | |
| MSI GS76 Stealth 11UH | |
| HP ZBook Studio 15 G8 | |
| Dell Precision 5000 5560 | |
| Asus ProArt StudioBook 16 W7600H5A-2BL2 | |
| Average Intel Xeon W-11955M (n=1) | |
| Blender / v2.79 BMW27 CPU | |
| Dell Precision 5000 5560 | |
| Asus ProArt StudioBook 16 W7600H5A-2BL2 | |
| Average Intel Xeon W-11955M (n=1) | |
| HP ZBook Fury 15 G8 | |
| HP ZBook Studio 15 G8 | |
| MSI GS76 Stealth 11UH | |
| Schenker XMG Ultra 17 Rocket Lake | |
| Average of class Workstation (91 - 222, n=23, last 2 years) | |
| 7-Zip 18.03 / 7z b 4 | |
| Average of class Workstation (60489 - 116969, n=23, last 2 years) | |
| Schenker XMG Ultra 17 Rocket Lake | |
| MSI GS76 Stealth 11UH | |
| HP ZBook Fury 15 G8 | |
| HP ZBook Studio 15 G8 | |
| Asus ProArt StudioBook 16 W7600H5A-2BL2 | |
| Average Intel Xeon W-11955M (n=1) | |
| Dell Precision 5000 5560 | |
| 7-Zip 18.03 / 7z b 4 -mmt1 | |
| Average of class Workstation (5126 - 6960, n=23, last 2 years) | |
| Schenker XMG Ultra 17 Rocket Lake | |
| HP ZBook Studio 15 G8 | |
| HP ZBook Fury 15 G8 | |
| Dell Precision 5000 5560 | |
| MSI GS76 Stealth 11UH | |
| Asus ProArt StudioBook 16 W7600H5A-2BL2 | |
| Average Intel Xeon W-11955M (n=1) | |
| Geekbench 5.5 / Multi-Core | |
| Average of class Workstation (11542 - 25554, n=23, last 2 years) | |
| Schenker XMG Ultra 17 Rocket Lake | |
| MSI GS76 Stealth 11UH | |
| Average Intel Xeon W-11955M (8349 - 9766, n=2) | |
| Asus ProArt StudioBook 16 W7600H5A-2BL2 | |
| HP ZBook Studio 15 G8 | |
| Geekbench 5.5 / Single-Core | |
| Average of class Workstation (1783 - 2183, n=23, last 2 years) | |
| Schenker XMG Ultra 17 Rocket Lake | |
| HP ZBook Studio 15 G8 | |
| MSI GS76 Stealth 11UH | |
| Average Intel Xeon W-11955M (1487 - 1686, n=2) | |
| Asus ProArt StudioBook 16 W7600H5A-2BL2 | |
| HWBOT x265 Benchmark v2.2 / 4k Preset | |
| Average of class Workstation (17.8 - 40.5, n=23, last 2 years) | |
| Schenker XMG Ultra 17 Rocket Lake | |
| MSI GS76 Stealth 11UH | |
| HP ZBook Studio 15 G8 | |
| HP ZBook Fury 15 G8 | |
| Asus ProArt StudioBook 16 W7600H5A-2BL2 | |
| Average Intel Xeon W-11955M (n=1) | |
| Dell Precision 5000 5560 | |
| LibreOffice / 20 Documents To PDF | |
| HP ZBook Fury 15 G8 | |
| MSI GS76 Stealth 11UH | |
| HP ZBook Studio 15 G8 | |
| Dell Precision 5000 5560 | |
| Average of class Workstation (37.1 - 74.7, n=23, last 2 years) | |
| Schenker XMG Ultra 17 Rocket Lake | |
| Asus ProArt StudioBook 16 W7600H5A-2BL2 | |
| Average Intel Xeon W-11955M (n=1) | |
| R Benchmark 2.5 / Overall mean | |
| Asus ProArt StudioBook 16 W7600H5A-2BL2 | |
| Average Intel Xeon W-11955M (n=1) | |
| HP ZBook Studio 15 G8 | |
| HP ZBook Fury 15 G8 | |
| Dell Precision 5000 5560 | |
| MSI GS76 Stealth 11UH | |
| Schenker XMG Ultra 17 Rocket Lake | |
| Average of class Workstation (0.3825 - 0.603, n=23, last 2 years) | |
| SPECviewperf 2020 / Solidworks (solidworks-05) | |
| Asus ProArt StudioBook 16 W7600H5A-2BL2 | |
| Average Intel Xeon W-11955M (n=1) | |
| Average of class Workstation (50.6 - 542, n=9, last 2 years) | |
| HP ZBook Fury 15 G8 | |
| Dell Precision 5000 5560 | |
| SPECviewperf 2020 / Siemens NX (snx-04) | |
| Average of class Workstation (22.3 - 903, n=23, last 2 years) | |
| Asus ProArt StudioBook 16 W7600H5A-2BL2 | |
| Average Intel Xeon W-11955M (n=1) | |
| HP ZBook Fury 15 G8 | |
| Dell Precision 5000 5560 | |
| SPECviewperf 2020 / Medical (medical-03) | |
| Average of class Workstation (28.8 - 227, n=23, last 2 years) | |
| Asus ProArt StudioBook 16 W7600H5A-2BL2 | |
| Average Intel Xeon W-11955M (n=1) | |
| HP ZBook Fury 15 G8 | |
| Dell Precision 5000 5560 | |
| SPECviewperf 2020 / Maya (maya-06) | |
| Average of class Workstation (117.8 - 724, n=22, last 2 years) | |
| Asus ProArt StudioBook 16 W7600H5A-2BL2 | |
| Average Intel Xeon W-11955M (n=1) | |
| HP ZBook Fury 15 G8 | |
| Dell Precision 5000 5560 | |
| SPECviewperf 2020 / Energy (energy-03) | |
| Average of class Workstation (17.3 - 176.7, n=23, last 2 years) | |
| Asus ProArt StudioBook 16 W7600H5A-2BL2 | |
| Average Intel Xeon W-11955M (n=1) | |
| HP ZBook Fury 15 G8 | |
| Dell Precision 5000 5560 | |
| SPECviewperf 2020 / Creo (creo-03) | |
| Asus ProArt StudioBook 16 W7600H5A-2BL2 | |
| Average Intel Xeon W-11955M (n=1) | |
| Average of class Workstation (49.2 - 261, n=23, last 2 years) | |
| HP ZBook Fury 15 G8 | |
| Dell Precision 5000 5560 | |
| SPECviewperf 2020 / CATIA (catia-06) | |
| Asus ProArt StudioBook 16 W7600H5A-2BL2 | |
| Average Intel Xeon W-11955M (n=1) | |
| HP ZBook Fury 15 G8 | |
| Average of class Workstation (27.1 - 182.2, n=23, last 2 years) | |
| Dell Precision 5000 5560 | |
| SPECviewperf 2020 / 3ds Max (3dsmax-07) | |
| Asus ProArt StudioBook 16 W7600H5A-2BL2 | |
| Average Intel Xeon W-11955M (n=1) | |
| Average of class Workstation (24.7 - 251, n=23, last 2 years) | |
| HP ZBook Fury 15 G8 | |
| Dell Precision 5000 5560 | |
| SPECviewperf 2020 / Solidworks (solidworks-05) | |
| Asus ProArt StudioBook 16 W7600H5A-2BL2 | |
| Average Intel Xeon W-11955M (n=1) | |
| HP ZBook Fury 15 G8 | |
| Dell Precision 5000 5560 | |
| SPECviewperf 2020 / Siemens NX (snx-04) | |
| Average of class Workstation (30.6 - 561, n=11, last 2 years) | |
| Asus ProArt StudioBook 16 W7600H5A-2BL2 | |
| Average Intel Xeon W-11955M (n=1) | |
| HP ZBook Fury 15 G8 | |
| Dell Precision 5000 5560 | |
| SPECviewperf 2020 / Medical (medical-03) | |
| Average of class Workstation (20.3 - 96.8, n=12, last 2 years) | |
| Average Intel Xeon W-11955M (n=1) | |
| Asus ProArt StudioBook 16 W7600H5A-2BL2 | |
| HP ZBook Fury 15 G8 | |
| Dell Precision 5000 5560 | |
| SPECviewperf 2020 / Maya (maya-06) | |
| Average of class Workstation (132 - 380, n=12, last 2 years) | |
| Asus ProArt StudioBook 16 W7600H5A-2BL2 | |
| Average Intel Xeon W-11955M (n=1) | |
| HP ZBook Fury 15 G8 | |
| Dell Precision 5000 5560 | |
| SPECviewperf 2020 / Energy (energy-03) | |
| Asus ProArt StudioBook 16 W7600H5A-2BL2 | |
| Average Intel Xeon W-11955M (n=1) | |
| Average of class Workstation (15.8 - 74.3, n=12, last 2 years) | |
| HP ZBook Fury 15 G8 | |
| Dell Precision 5000 5560 | |
| SPECviewperf 2020 / Creo (creo-03) | |
| Average of class Workstation (47.2 - 185.7, n=12, last 2 years) | |
| HP ZBook Fury 15 G8 | |
| Asus ProArt StudioBook 16 W7600H5A-2BL2 | |
| Average Intel Xeon W-11955M (n=1) | |
| Dell Precision 5000 5560 | |
| SPECviewperf 2020 / CATIA (catia-06) | |
| Average of class Workstation (44 - 106, n=12, last 2 years) | |
| Asus ProArt StudioBook 16 W7600H5A-2BL2 | |
| Average Intel Xeon W-11955M (n=1) | |
| HP ZBook Fury 15 G8 | |
| Dell Precision 5000 5560 | |
| SPECviewperf 2020 / 3ds Max (3dsmax-07) | |
| Average of class Workstation (47.4 - 154.7, n=12, last 2 years) | |
| Asus ProArt StudioBook 16 W7600H5A-2BL2 | |
| Average Intel Xeon W-11955M (n=1) | |
| HP ZBook Fury 15 G8 | |
| Dell Precision 5000 5560 | |
* ... smaller is better
System performance
The system performance is also - according to expectations - above that of all rivals. Asus ProArt Studiobook 16 has to admit defeat only to the desktop counterpart Schenker XMG Ultra 17 with the Intel Core i9 11900K and the Lenovo Thinkpad P1. We couldn't determine any problems with the system in everyday use and all tasks were implemented without delays. Only the slight difference between mains and battery operation is noticeable when opening and closing programs.
| PCMark 10 / Score | |
| Average of class Workstation (6563 - 10409, n=19, last 2 years) | |
| Schenker XMG Ultra 17 Rocket Lake | |
| Lenovo ThinkPad P1 G4-20Y4S0KS00 | |
| Asus ProArt StudioBook 16 W7600H5A-2BL2 | |
| Average Intel Xeon W-11955M, NVIDIA RTX A5000 Laptop GPU (n=1) | |
| HP ZBook Fury 15 G8 | |
| HP ZBook Studio 15 G8 | |
| Dell Precision 5000 5560 | |
| PCMark 10 / Essentials | |
| Schenker XMG Ultra 17 Rocket Lake | |
| Lenovo ThinkPad P1 G4-20Y4S0KS00 | |
| Dell Precision 5000 5560 | |
| Average of class Workstation (9622 - 11157, n=19, last 2 years) | |
| Asus ProArt StudioBook 16 W7600H5A-2BL2 | |
| Average Intel Xeon W-11955M, NVIDIA RTX A5000 Laptop GPU (n=1) | |
| HP ZBook Fury 15 G8 | |
| HP ZBook Studio 15 G8 | |
| PCMark 10 / Productivity | |
| Average of class Workstation (8789 - 20616, n=19, last 2 years) | |
| Schenker XMG Ultra 17 Rocket Lake | |
| Dell Precision 5000 5560 | |
| Asus ProArt StudioBook 16 W7600H5A-2BL2 | |
| Average Intel Xeon W-11955M, NVIDIA RTX A5000 Laptop GPU (n=1) | |
| Lenovo ThinkPad P1 G4-20Y4S0KS00 | |
| HP ZBook Fury 15 G8 | |
| HP ZBook Studio 15 G8 | |
| PCMark 10 / Digital Content Creation | |
| Average of class Workstation (8108 - 15631, n=19, last 2 years) | |
| Schenker XMG Ultra 17 Rocket Lake | |
| Lenovo ThinkPad P1 G4-20Y4S0KS00 | |
| Asus ProArt StudioBook 16 W7600H5A-2BL2 | |
| Average Intel Xeon W-11955M, NVIDIA RTX A5000 Laptop GPU (n=1) | |
| HP ZBook Fury 15 G8 | |
| HP ZBook Studio 15 G8 | |
| Dell Precision 5000 5560 | |
| PCMark 10 Score | 6951 points | |
Help | ||
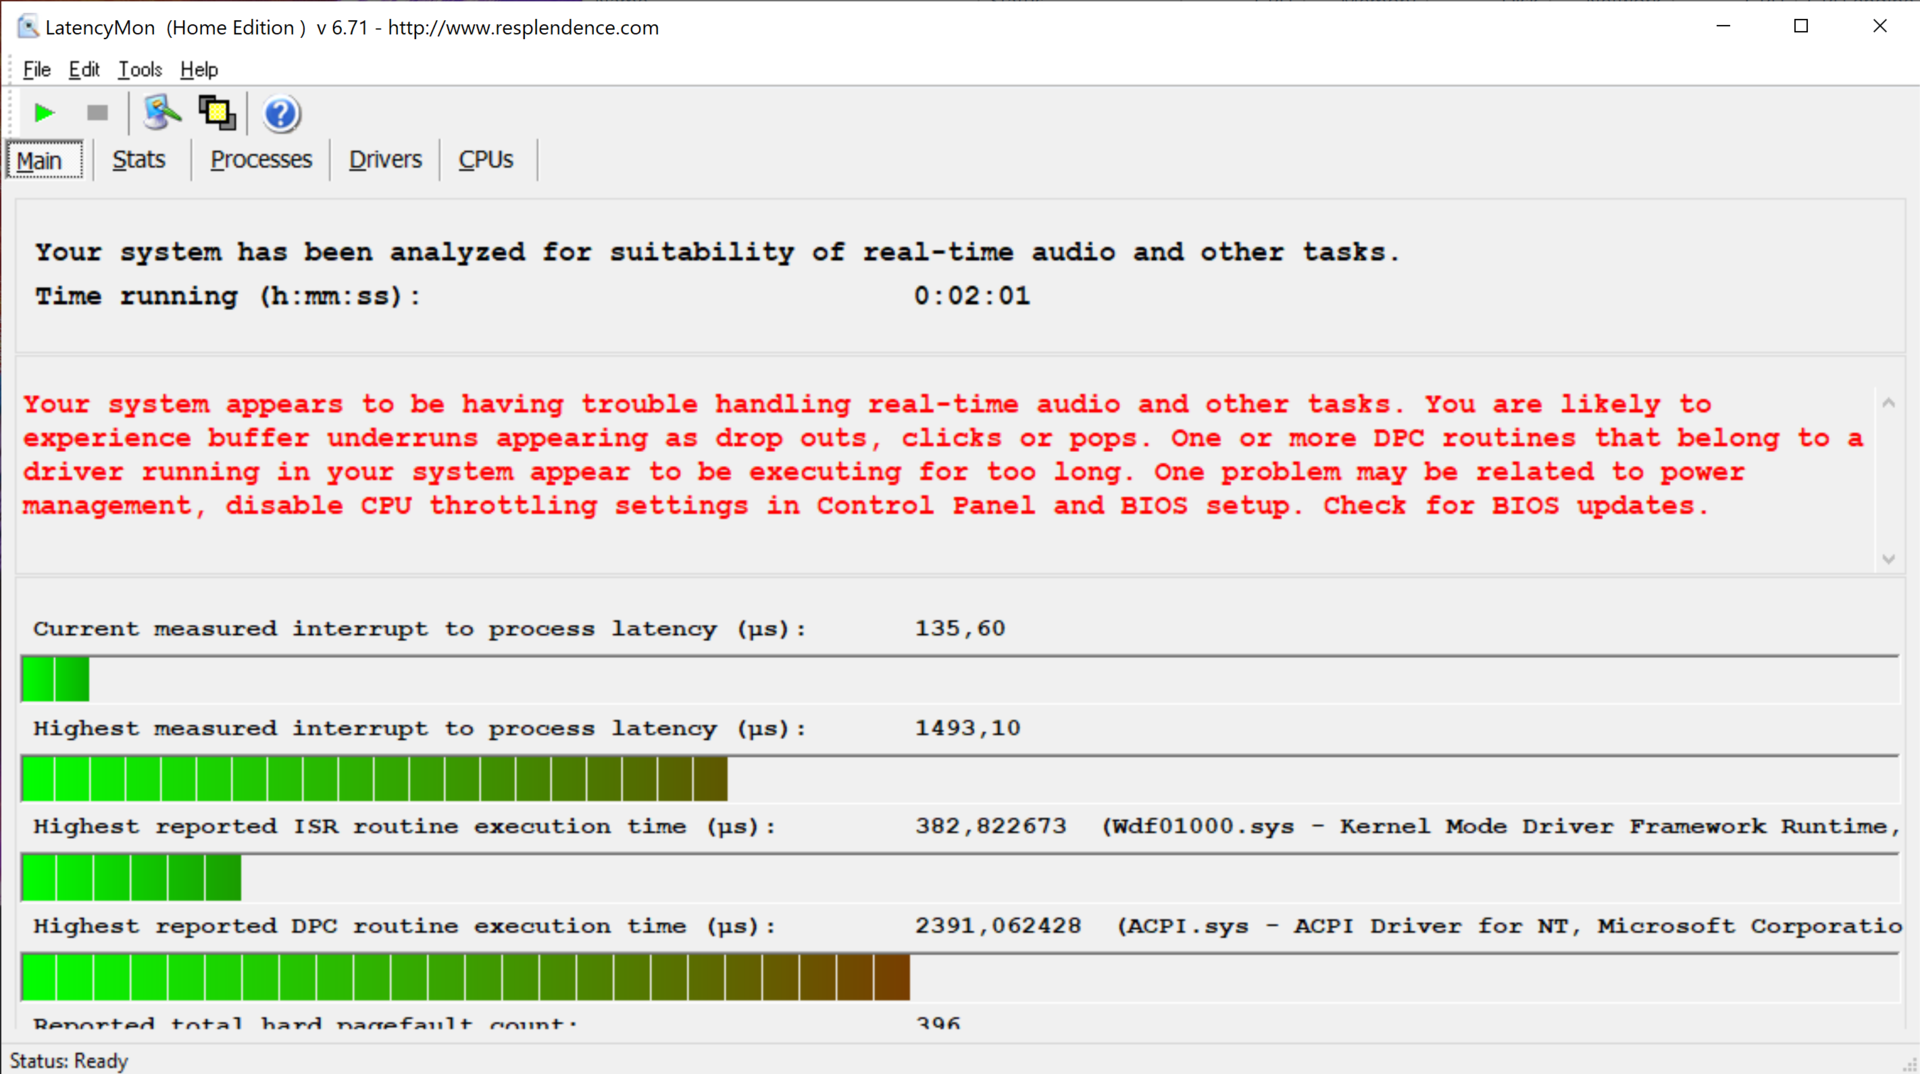
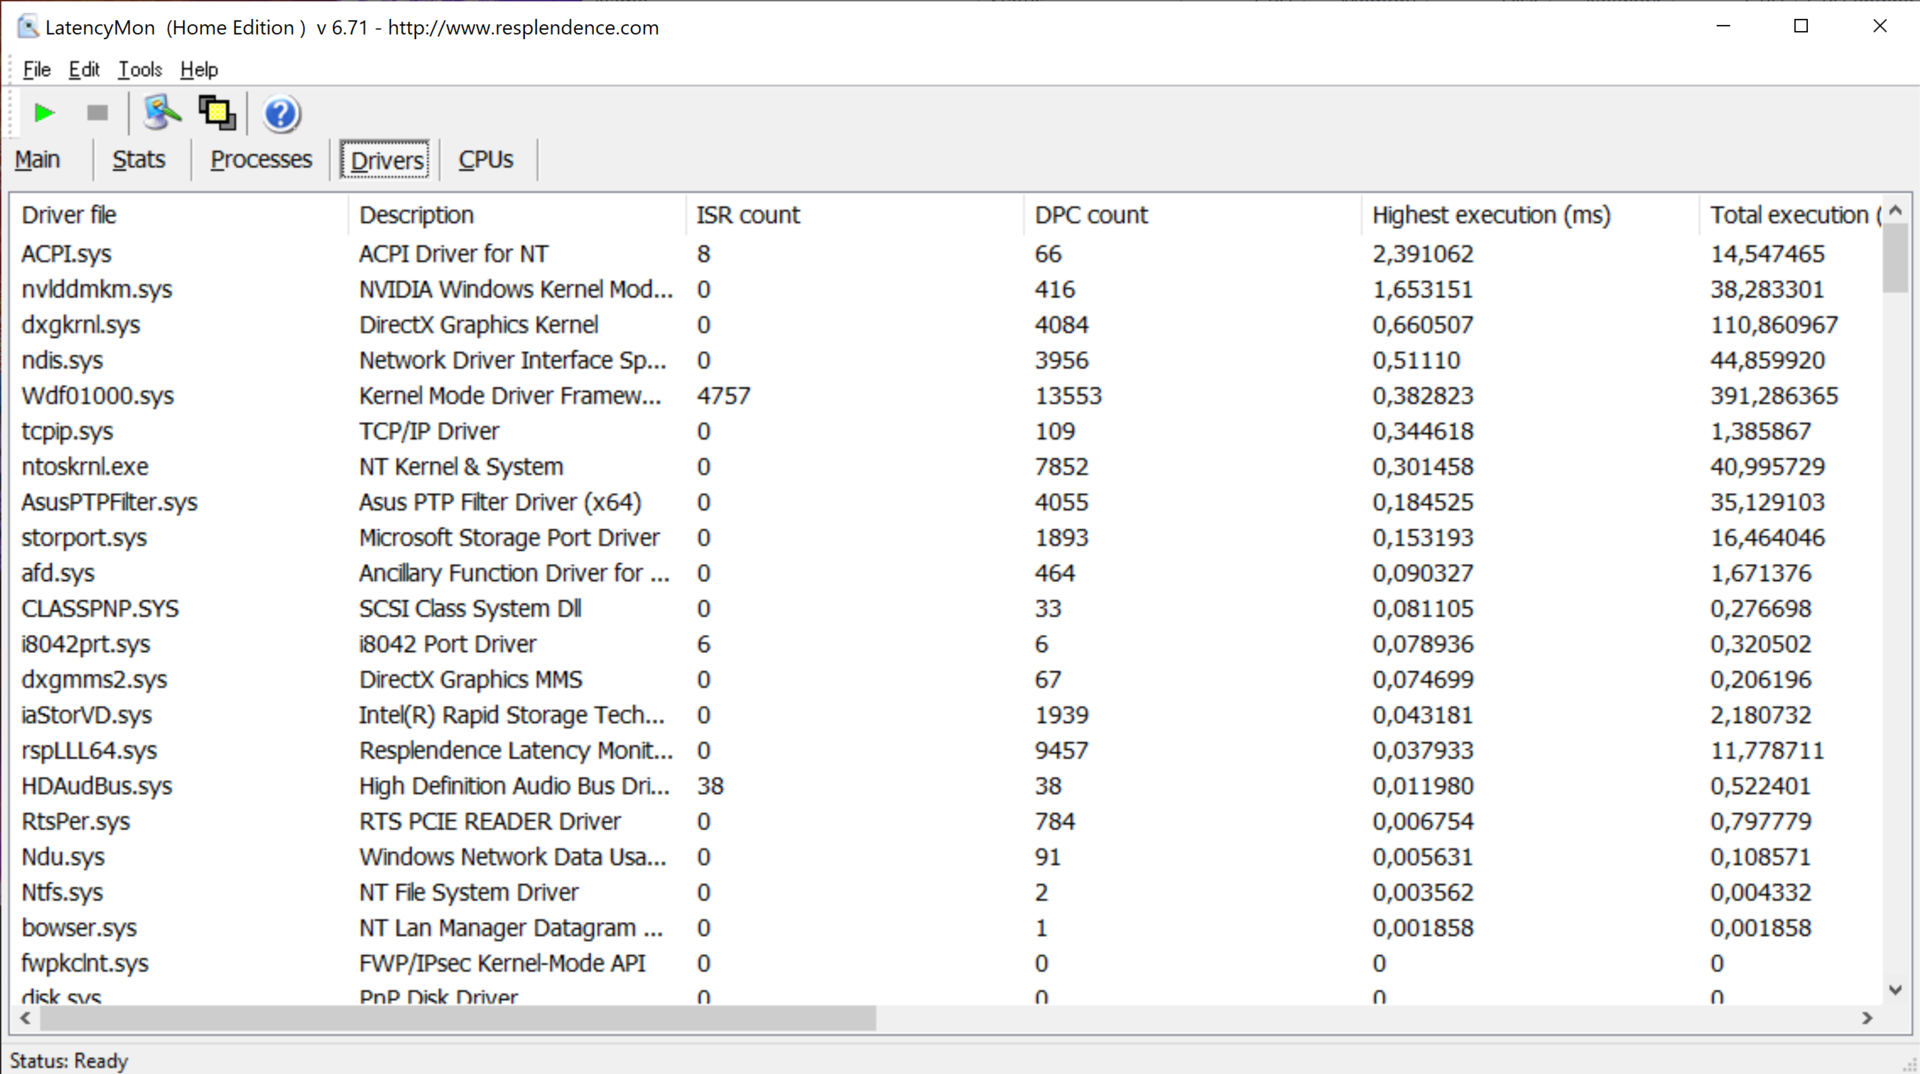
DPC latencies
Since the intended use of our test device includes working with audio and video files, the DPC latencies could cause problems. The test showed a need for optimization in terms of latencies, and our device itself had dropped frames during our Youtube video test.
| DPC Latencies / LatencyMon - interrupt to process latency (max), Web, Youtube, Prime95 | |
| HP ZBook Studio 15 G8 | |
| Asus ProArt StudioBook 16 W7600H5A-2BL2 | |
| Dell Precision 5000 5560 | |
| HP ZBook Fury 15 G8 | |
* ... smaller is better
Storage
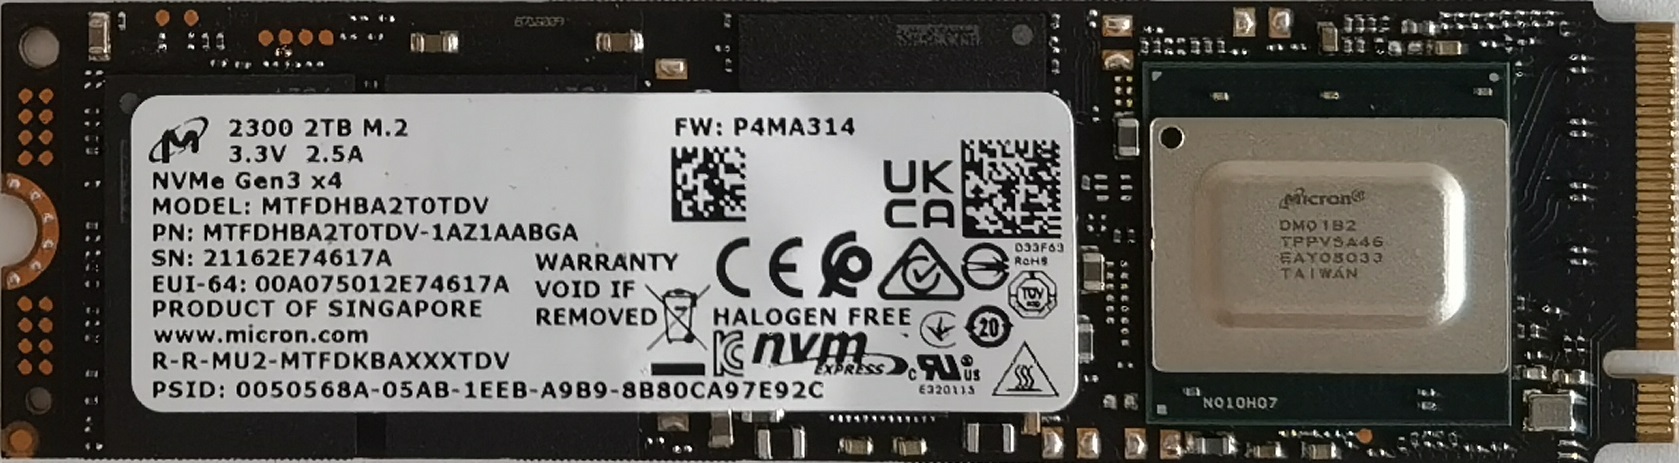
The pre-production device theoretically supports up to two M.2 PCI-Express 4.0 NVMe SSDs, so it is questionable why Asus installs two SSDs with PCIe 3.0 in a RAID 0 configuration here. These perform rather mediocre in the AS SSD benchmark and Crystal DiskMark, and even the single PCIe 3.0 SSD in HP Zbook Fury is behind our configuration in some benchmark sections. Here, too, we see a need for optimization: Asus should either rely on PCIe 4.0 drives, or get busy optimizing their drivers.
| Asus ProArt StudioBook 16 W7600H5A-2BL2 2x Micron 2300 2TB MTFDHBA2T0TDV (RAID 0) | HP ZBook Fury 15 G8 Samsung PM981a MZVLB1T0HBLR | Schenker XMG Ultra 17 Rocket Lake Samsung SSD 980 Pro 2TB MZ-V8P2T0 | HP ZBook Studio 15 G8 Samsung PM981a MZVLB2T0HALB | Dell Precision 5000 5560 Samsung PM9A1 MZVL22T0HBLB | Lenovo ThinkPad P1 G4-20Y4S0KS00 Samsung PM9A1 MZVL21T0HCLR | Average 2x Micron 2300 2TB MTFDHBA2T0TDV (RAID 0) | |
|---|---|---|---|---|---|---|---|
| CrystalDiskMark 5.2 / 6 | 38% | 174% | 44% | 110% | 0% | ||
| Write 4K (MB/s) | 105.6 | 96.3 -9% | 240 127% | 110.5 5% | 172.4 63% | 105.6 ? 0% | |
| Read 4K (MB/s) | 50.2 | 51.5 3% | 87.8 75% | 51.8 3% | 78.8 57% | 50.2 ? 0% | |
| Write Seq (MB/s) | 445.6 | 1942 336% | 4281 861% | 2071 365% | 2991 571% | 446 ? 0% | |
| Read Seq (MB/s) | 753 | 2504 233% | 4228 461% | 2505 233% | 3351 345% | 753 ? 0% | |
| Write 4K Q32T1 (MB/s) | 2713 | 346.6 -87% | 696 -74% | 429.8 -84% | 459.2 -83% | 2713 ? 0% | |
| Read 4K Q32T1 (MB/s) | 2399 | 408 -83% | 778 -68% | 418.3 -83% | 484.3 -80% | 2399 ? 0% | |
| Write Seq Q32T1 (MB/s) | 5378 | 3019 -44% | 5195 -3% | 3060 -43% | 4761 -11% | 5378 ? 0% | |
| Read Seq Q32T1 (MB/s) | 6189 | 3514 -43% | 7099 15% | 3539 -43% | 7071 14% | 6189 ? 0% | |
| AS SSD | -21% | 80% | 14% | 35% | 85% | 0% | |
| Seq Read (MB/s) | 4317 | 2937 -32% | 5010 16% | 2953 -32% | 5169 20% | 4526 5% | 4317 ? 0% |
| Seq Write (MB/s) | 2037 | 1688 -17% | 3974 95% | 1691 -17% | 1986 -3% | 3988 96% | 2037 ? 0% |
| 4K Read (MB/s) | 48.97 | 44.27 -10% | 51.9 6% | 43.98 -10% | 78 59% | 82.9 69% | 49 ? 0% |
| 4K Write (MB/s) | 112.4 | 105.8 -6% | 156.8 40% | 105.4 -6% | 214.6 91% | 207.5 85% | 112.4 ? 0% |
| 4K-64 Read (MB/s) | 1253 | 873 -30% | 2611 108% | 1065 -15% | 1232 -2% | 2751 120% | 1253 ? 0% |
| 4K-64 Write (MB/s) | 1473 | 1996 36% | 3859 162% | 1957 33% | 2719 85% | 3270 122% | 1473 ? 0% |
| Access Time Read * (ms) | 0.045 | 0.048 -7% | 0.072 -60% | 0.04 11% | 0.024 47% | 0.024 47% | 0.045 ? -0% |
| Access Time Write * (ms) | 0.083 | 0.107 -29% | 0.026 69% | 0.105 -27% | 0.059 29% | 0.021 75% | 0.083 ? -0% |
| Score Read (Points) | 1765 | 1211 -31% | 3164 79% | 1404 -20% | 1827 4% | 3287 86% | 1765 ? 0% |
| Score Write (Points) | 1722 | 2271 32% | 4414 156% | 2232 30% | 3133 82% | 3876 125% | 1722 ? 0% |
| Score Total (Points) | 4256 | 4046 -5% | 9134 115% | 4297 1% | 5753 35% | 8821 107% | 4256 ? 0% |
| Copy ISO MB/s (MB/s) | 2441 | 901 -63% | 3424 40% | 2474 1% | 3201 31% | 2441 ? 0% | |
| Copy Program MB/s (MB/s) | 395.7 | 118.7 -70% | 1091 176% | 1074 171% | 415.8 5% | 396 ? 0% | |
| Copy Game MB/s (MB/s) | 1115 | 372 -67% | 2365 112% | 1929 73% | 1212 9% | 1115 ? 0% | |
| Total Average (Program / Settings) | 9% /
0% | 127% /
114% | 29% /
25% | 73% /
62% | 85% /
85% | 0% /
0% |
* ... smaller is better

Constant Performance Reading: DiskSpd Read Loop, Queue Depth 8
Graphics card
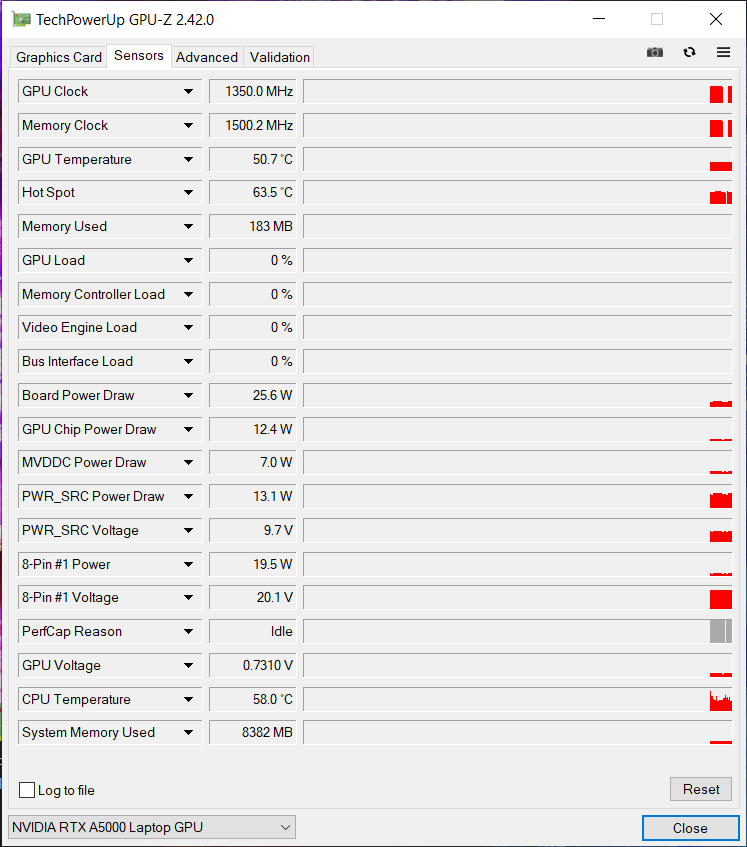
Thanks to the installed cooling system and a TDP of up to 110 watts, the RTX A5000 with its 16 GB VRAM is convincing in terms of pure graphics performance and thus ranks 15 to 20 percent ahead of the HP ZBook Fury in the synthetic benchmarks.
| 3DMark Fire Strike Score | 22819 points | |
| 3DMark Fire Strike Extreme Score | 12825 points | |
| 3DMark Time Spy Score | 10157 points | |
Help | ||
Gaming performance
Although our pre-production device is not optimized for gaming, it still handles most titles in QHD. However, the display is limited to 60 Hz. Among the competitors only real gaming powerhouses - like the Schenker XMG Ultra - can clearly outperform our review sample. Overall, the gaming performance of the Asus ProArt Studiobook Pro 16 is on the lower level of an RTX 3080.
As expected, the gaming performance is very limited on battery power.
| The Witcher 3 | |
| 1920x1080 High Graphics & Postprocessing (Nvidia HairWorks Off) | |
| Schenker XMG Ultra 17 Rocket Lake | |
| MSI GS76 Stealth 11UH | |
| Average of class Workstation (n=1last 2 years) | |
| HP ZBook Studio 15 G8 | |
| Average NVIDIA RTX A5000 Laptop GPU (124 - 179, n=3) | |
| HP ZBook Fury 15 G8 | |
| Asus ProArt StudioBook 16 W7600H5A-2BL2 | |
| Dell Precision 5000 5560 | |
| 1920x1080 Ultra Graphics & Postprocessing (HBAO+) | |
| Schenker XMG Ultra 17 Rocket Lake | |
| MSI GS76 Stealth 11UH | |
| Average of class Workstation (n=1last 2 years) | |
| Average NVIDIA RTX A5000 Laptop GPU (81.7 - 98.3, n=3) | |
| Asus ProArt StudioBook 16 W7600H5A-2BL2 | |
| HP ZBook Fury 15 G8 | |
| HP ZBook Studio 15 G8 | |
| Dell Precision 5000 5560 | |
| Metro Exodus | |
| 3840x2160 Ultra Quality AF:16x | |
| HP ZBook Fury 15 G8 | |
| Average NVIDIA RTX A5000 Laptop GPU (24 - 28.5, n=2) | |
| Asus ProArt StudioBook 16 W7600H5A-2BL2 | |
| 2560x1440 Ultra Quality AF:16x | |
| HP ZBook Fury 15 G8 | |
| Average NVIDIA RTX A5000 Laptop GPU (41 - 46.3, n=2) | |
| Asus ProArt StudioBook 16 W7600H5A-2BL2 | |
| Dell Precision 5000 5560 | |
| 1920x1080 Ultra Quality AF:16x | |
| HP ZBook Fury 15 G8 | |
| Average NVIDIA RTX A5000 Laptop GPU (55 - 59.8, n=2) | |
| Asus ProArt StudioBook 16 W7600H5A-2BL2 | |
| Dell Precision 5000 5560 | |
| 1920x1080 High Quality AF:16x | |
| HP ZBook Fury 15 G8 | |
| Average NVIDIA RTX A5000 Laptop GPU (69 - 74.5, n=2) | |
| Asus ProArt StudioBook 16 W7600H5A-2BL2 | |
| Dell Precision 5000 5560 | |
| F1 2020 | |
| 3840x2160 Ultra High Preset AA:T AF:16x | |
| Asus ProArt StudioBook 16 W7600H5A-2BL2 | |
| Average NVIDIA RTX A5000 Laptop GPU (n=1) | |
| 1920x1080 Ultra High Preset AA:T AF:16x | |
| Asus ProArt StudioBook 16 W7600H5A-2BL2 | |
| Average NVIDIA RTX A5000 Laptop GPU (n=1) | |
| 1920x1080 High Preset AA:T AF:16x | |
| Asus ProArt StudioBook 16 W7600H5A-2BL2 | |
| Average NVIDIA RTX A5000 Laptop GPU (n=1) | |
| F1 2021 | |
| 3840x2160 Ultra High Preset + Raytracing AA:T AF:16x | |
| Asus ProArt StudioBook 16 W7600H5A-2BL2 | |
| MSI GS76 Stealth 11UH | |
| Average NVIDIA RTX A5000 Laptop GPU (38 - 53.6, n=3) | |
| HP ZBook Fury 15 G8 | |
| 2560x1440 Ultra High Preset + Raytracing AA:T AF:16x | |
| MSI GS76 Stealth 11UH | |
| Asus ProArt StudioBook 16 W7600H5A-2BL2 | |
| Average NVIDIA RTX A5000 Laptop GPU (59 - 88.2, n=3) | |
| HP ZBook Fury 15 G8 | |
| Dell Precision 5000 5560 | |
| 1920x1080 Ultra High Preset + Raytracing AA:T AF:16x | |
| MSI GS76 Stealth 11UH | |
| Asus ProArt StudioBook 16 W7600H5A-2BL2 | |
| Average NVIDIA RTX A5000 Laptop GPU (85 - 109, n=3) | |
| HP ZBook Fury 15 G8 | |
| Dell Precision 5000 5560 | |
| 1920x1080 High Preset AA:T AF:16x | |
| MSI GS76 Stealth 11UH | |
| Asus ProArt StudioBook 16 W7600H5A-2BL2 | |
| Average NVIDIA RTX A5000 Laptop GPU (122 - 161, n=3) | |
| HP ZBook Fury 15 G8 | |
| Dell Precision 5000 5560 | |
| Cyberpunk 2077 1.0 | |
| 3840x2160 Ultra Preset | |
| Average NVIDIA RTX A5000 Laptop GPU (16.7 - 25, n=2) | |
| Asus ProArt StudioBook 16 W7600H5A-2BL2 | |
| 2560x1440 Ultra Preset | |
| Average NVIDIA RTX A5000 Laptop GPU (37.1 - 51, n=2) | |
| Asus ProArt StudioBook 16 W7600H5A-2BL2 | |
| 1920x1080 Ultra Preset | |
| Schenker XMG Ultra 17 Rocket Lake | |
| Average NVIDIA RTX A5000 Laptop GPU (58.6 - 78, n=2) | |
| Asus ProArt StudioBook 16 W7600H5A-2BL2 | |
| 1920x1080 High Preset | |
| Schenker XMG Ultra 17 Rocket Lake | |
| Average NVIDIA RTX A5000 Laptop GPU (68.1 - 90, n=2) | |
| Asus ProArt StudioBook 16 W7600H5A-2BL2 | |
In our 60-minute test with The Witcher 3 (FHD/Ultra), the performance remains relatively constant throughout the test.
Witcher 3 FPS Diagramm
| low | med. | high | ultra | QHD | 4K | |
|---|---|---|---|---|---|---|
| GTA V (2015) | 180 | 175 | 158 | 85.8 | 82.2 | 76.3 |
| The Witcher 3 (2015) | 321 | 217.9 | 124 | 89.9 | 54.8 | |
| Dota 2 Reborn (2015) | 144 | 136 | 124 | 117 | 118 | |
| Final Fantasy XV Benchmark (2018) | 184 | 123 | 91.8 | 70.6 | 41 | |
| X-Plane 11.11 (2018) | 117 | 102 | 81.6 | 52 | ||
| Far Cry 5 (2018) | 76 | 69 | 62 | 60 | 58 | 36 |
| Strange Brigade (2018) | 419 | 231 | 192 | 160 | 129 | |
| Metro Exodus (2019) | 148 | 126 | 69 | 55 | 41 | 24 |
| F1 2020 (2020) | 253 | 181 | 164 | 133 | 63.1 | |
| Cyberpunk 2077 1.0 (2020) | 114.6 | 83.1 | 68.1 | 58.6 | 37.1 | 16.7 |
| F1 2021 (2021) | 269 | 171 | 159 | 104 | 82.8 | 48.7 |
Emissions: High performance takes its toll
Noise emissions
Even in idle, the fans have their say and almost never stand still. Under load, the fans are clearly audible and adapt to the required performance. Various settings for the fan speed can be made in the ProArt Creator Hub. Users can choose between three modes: Standard mode, Performance mode and Full fan speed. In the test, it turned out that the advantages under full fan speed are very marginal.
Noise level
| Idle |
| 26 / 26 / 26.5 dB(A) |
| Load |
| 42 / 43 dB(A) |
 | ||
30 dB silent 40 dB(A) audible 50 dB(A) loud |
||
min: | ||
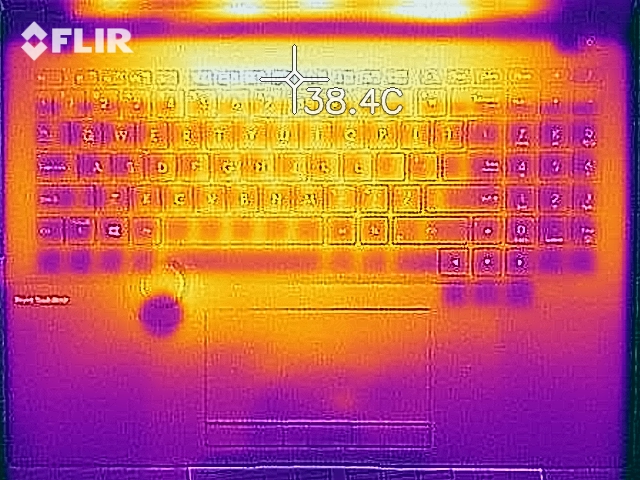
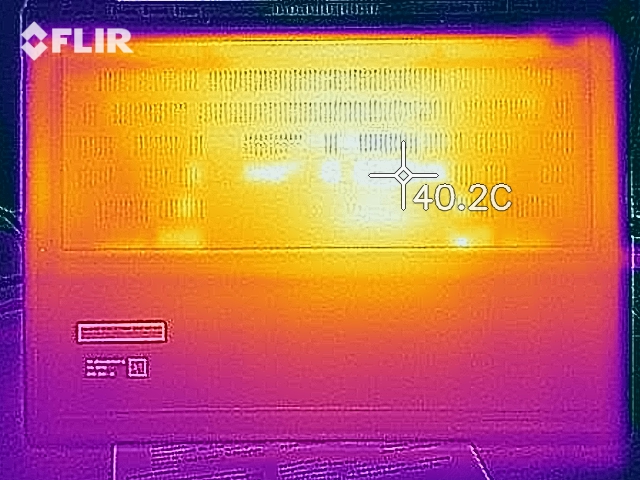
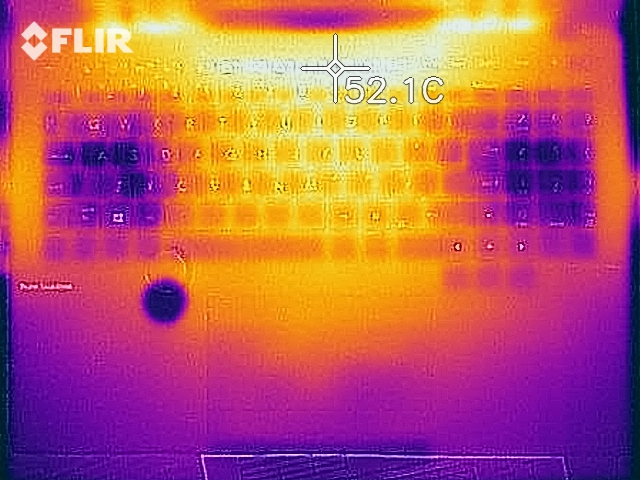
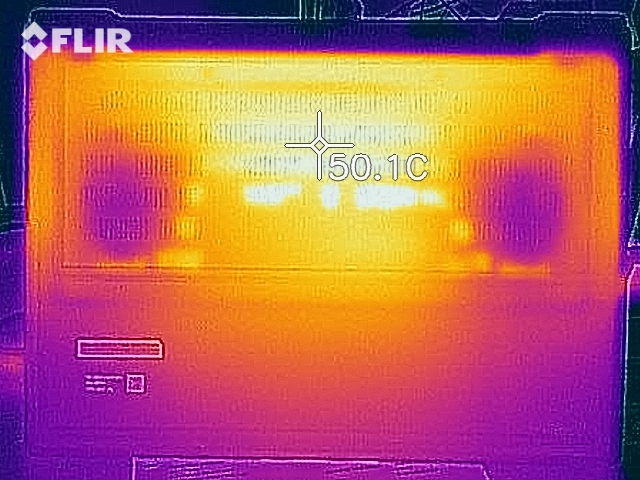
Temperature
A lot of power generates a lot of waste heat. This is also the case in our pre-production sample, because the device never really stays cool. With a lot of load on the CPU, its temperature quickly exceeds 100 °C. The GPU, on the other hand, does a bit better and only reaches just over 80 °C. Surface temperatures are fairly moderate despite the high temperatures inside.
(-) The maximum temperature on the upper side is 45.7 °C / 114 F, compared to the average of 38.2 °C / 101 F, ranging from 22.2 to 69.8 °C for the class Workstation.
(-) The bottom heats up to a maximum of 48.3 °C / 119 F, compared to the average of 41.1 °C / 106 F
(+) In idle usage, the average temperature for the upper side is 31.6 °C / 89 F, compared to the device average of 32 °C / 90 F.
(+) The palmrests and touchpad are reaching skin temperature as a maximum (35.2 °C / 95.4 F) and are therefore not hot.
(-) The average temperature of the palmrest area of similar devices was 27.8 °C / 82 F (-7.4 °C / -13.4 F).
Speakers
The audio quality of the ProArt Studiobook Pro 16 is very good and very balanced. The good, clean and full sound at lower and higher volumes as well as the rich bass are particularly impressive.
Asus ProArt StudioBook 16 W7600H5A-2BL2 audio analysis
(±) | speaker loudness is average but good (76 dB)
Bass 100 - 315 Hz
(-) | nearly no bass - on average 17% lower than median
(±) | linearity of bass is average (10.4% delta to prev. frequency)
Mids 400 - 2000 Hz
(+) | balanced mids - only 1.2% away from median
(+) | mids are linear (5.1% delta to prev. frequency)
Highs 2 - 16 kHz
(±) | higher highs - on average 5.1% higher than median
(+) | highs are linear (4.9% delta to prev. frequency)
Overall 100 - 16.000 Hz
(±) | linearity of overall sound is average (16.5% difference to median)
Compared to same class
» 46% of all tested devices in this class were better, 7% similar, 47% worse
» The best had a delta of 7%, average was 17%, worst was 35%
Compared to all devices tested
» 28% of all tested devices were better, 6% similar, 66% worse
» The best had a delta of 4%, average was 23%, worst was 134%
HP ZBook Fury 15 G8 audio analysis
(±) | speaker loudness is average but good (79.8 dB)
Bass 100 - 315 Hz
(±) | reduced bass - on average 10.6% lower than median
(±) | linearity of bass is average (8.8% delta to prev. frequency)
Mids 400 - 2000 Hz
(+) | balanced mids - only 3.9% away from median
(+) | mids are linear (4.8% delta to prev. frequency)
Highs 2 - 16 kHz
(+) | balanced highs - only 2.9% away from median
(+) | highs are linear (5.3% delta to prev. frequency)
Overall 100 - 16.000 Hz
(+) | overall sound is linear (11.9% difference to median)
Compared to same class
» 17% of all tested devices in this class were better, 4% similar, 79% worse
» The best had a delta of 7%, average was 17%, worst was 35%
Compared to all devices tested
» 9% of all tested devices were better, 2% similar, 89% worse
» The best had a delta of 4%, average was 23%, worst was 134%
Power management: Poor battery runtimes of the Studiobook
Energy consumption
The idle power consumption with a minimum of 12.4 and a maximum of 25 watts is slightly higher than on the HP ZBook Fury.
While the 240 W power supply is more than adequate for the job, the laptop's maximum energy consumption is only 134 watts. This discrepancy becomes even more obvious with The Witcher 3, where the power consumption sits at 132 watts. Since this is a pre-production sample, we assume that the maximum power consumption will still be adjusted in favor of the performance.
| Off / Standby | |
| Idle | |
| Load |
|
Key:
min: | |
| Asus ProArt StudioBook 16 W7600H5A-2BL2 W-11955M, RTX A5000 Laptop GPU, 2x Micron 2300 2TB MTFDHBA2T0TDV (RAID 0), OLED, 3840x2400, 16" | HP ZBook Fury 15 G8 i9-11950H, RTX A5000 Laptop GPU, Samsung PM981a MZVLB1T0HBLR, IPS, 3840x2160, 15.6" | HP ZBook Studio 15 G8 i9-11950H, GeForce RTX 3070 Laptop GPU, Samsung PM981a MZVLB2T0HALB, OLED, 3840x2160, 15.6" | Dell Precision 5000 5560 i7-11850H, RTX A2000 Laptop GPU, Samsung PM9A1 MZVL22T0HBLB, IPS, 3840x2400, 15.6" | Lenovo ThinkPad P1 G4-20Y4S0KS00 i7-11850H, GeForce RTX 3070 Laptop GPU, Samsung PM9A1 MZVL21T0HCLR, IPS LED, 3840x2400, 16" | Schenker XMG Ultra 17 Rocket Lake i9-11900K, GeForce RTX 3080 Laptop GPU, Samsung SSD 980 Pro 2TB MZ-V8P2T0, IPS, 1920x1080, 17.3" | Average NVIDIA RTX A5000 Laptop GPU | Average of class Workstation | |
|---|---|---|---|---|---|---|---|---|
| Power Consumption | -2% | -8% | 22% | 3% | -201% | -5% | 13% | |
| Idle Minimum * (Watt) | 12.4 | 8.3 33% | 11 11% | 6.2 50% | 8.1 35% | 62 -400% | 10.4 ? 16% | 9.11 ? 27% |
| Idle Average * (Watt) | 16.5 | 19.9 -21% | 18.8 -14% | 13.9 16% | 20.2 -22% | 64 -288% | 18.3 ? -11% | 13.8 ? 16% |
| Idle Maximum * (Watt) | 25 | 21.8 13% | 31.7 -27% | 23.8 5% | 21.9 12% | 69 -176% | 22.3 ? 11% | 17.9 ? 28% |
| Load Average * (Watt) | 132 | 110.9 16% | 105.2 20% | 95.7 27% | 88.2 33% | 183 -39% | 125.1 ? 5% | 96 ? 27% |
| Witcher 3 ultra * (Watt) | 132 | 165 -25% | 148 -12% | 87 34% | 149 -13% | 297 -125% | ||
| Load Maximum * (Watt) | 134 | 171.8 -28% | 171.8 -28% | 132.6 1% | 170.6 -27% | 368 -175% | 195.8 ? -46% | 180.3 ? -35% |
* ... smaller is better
Energy consumption during The Witcher 3 / stress test
Battery life
The battery runtime of our pre-production device leaves mixed impression and lags behind the entire competition. In our standardized WLAN test the test device runs out of breath after 300 minutes.
| Asus ProArt StudioBook 16 W7600H5A-2BL2 W-11955M, RTX A5000 Laptop GPU, 90 Wh | HP ZBook Fury 15 G8 i9-11950H, RTX A5000 Laptop GPU, 94 Wh | HP ZBook Studio 15 G8 i9-11950H, GeForce RTX 3070 Laptop GPU, 83 Wh | Dell Precision 5000 5560 i7-11850H, RTX A2000 Laptop GPU, 86 Wh | Lenovo ThinkPad P1 G4-20Y4S0KS00 i7-11850H, GeForce RTX 3070 Laptop GPU, 90 Wh | Average of class Workstation | |
|---|---|---|---|---|---|---|
| Battery runtime | 24% | 24% | 26% | 170% | 266% | |
| H.264 (h) | 1.8 | 7.2 300% | 10.1 ? 461% | |||
| WiFi v1.3 (h) | 5 | 6.2 24% | 6.2 24% | 6.3 26% | 7 40% | 8.55 ? 71% |
| Witcher 3 ultra (h) | 1.6 | |||||
| Load (h) | 1.8 | 1.8 | 1.2 | 1.441 ? | ||
| Reader / Idle (h) | 12.9 | 12 | 26.1 ? |
Verdict
The first impression of the Asus ProArt Studiobook Pro 16 is quite solid. The light and elegant case convinces with its magnesium alloy. A special feature here is the embedded Asus Dial Controller, which allows the user to execute some particular functions in image and video editing programs very precisely. The keyboard can not only hold its own with a good pressure point, but also with the generally comfortable typing. The touchpad offers good gliding properties and has a sufficient surface, even if it's not too large. The ports are well placed and fulfill the modern requirements.
The first performance tests of the pre-production sample leave some questions unanswered, but they give us a clear picture of the expected performance. Graphics performance is on par with a low-TDP RTX 3080. System performance is consistently good and did not give us any cause for criticism in everyday use. Nevertheless, we think that Asus still has some things to optimize until the product release. The maximum power consumption of around 134 watts is striking, which does not do justice to the 240 watt power supply.
The Asus ProArt Studiobook Pro 16 sets new standards for mobile workstations in terms of image quality and color space coverage. Particularly impressive are the high-quality and lightweight case, 4K OLED HDR panel in 16:10 format as well as features like the Asus Dial Controller.
The OLED display on the other hand is first-rate and boasts various certifications and the 16:10 format. The very good factory calibration also stands out positively here and make this panel suitable for professional editing of pictures and videos. The audio quality of the Asus ProArt Studiobook Pro 16 is also surprising: it is very good and stands out with the clean sound and rich bass. The fan characteristic is quite impulsive in our preproduction unit: the fans almost never stand still and behave adaptively to the demanded performance. Nevertheless, they are clearly audible and produce a high, but acceptable background noise for the performance and size of the device.
Price and availability
Since it is a pre-series device, we do not give a rating for this test. We would like to point out that a lot of specifications can still be adjusted by the manufacturer until the release of the series. An expected delivery date and price are not yet known.
Price comparison
