Schenker XMG Ultra 17 (Clevo X170KM-G) in review: Massive powerhouse with lush equipment

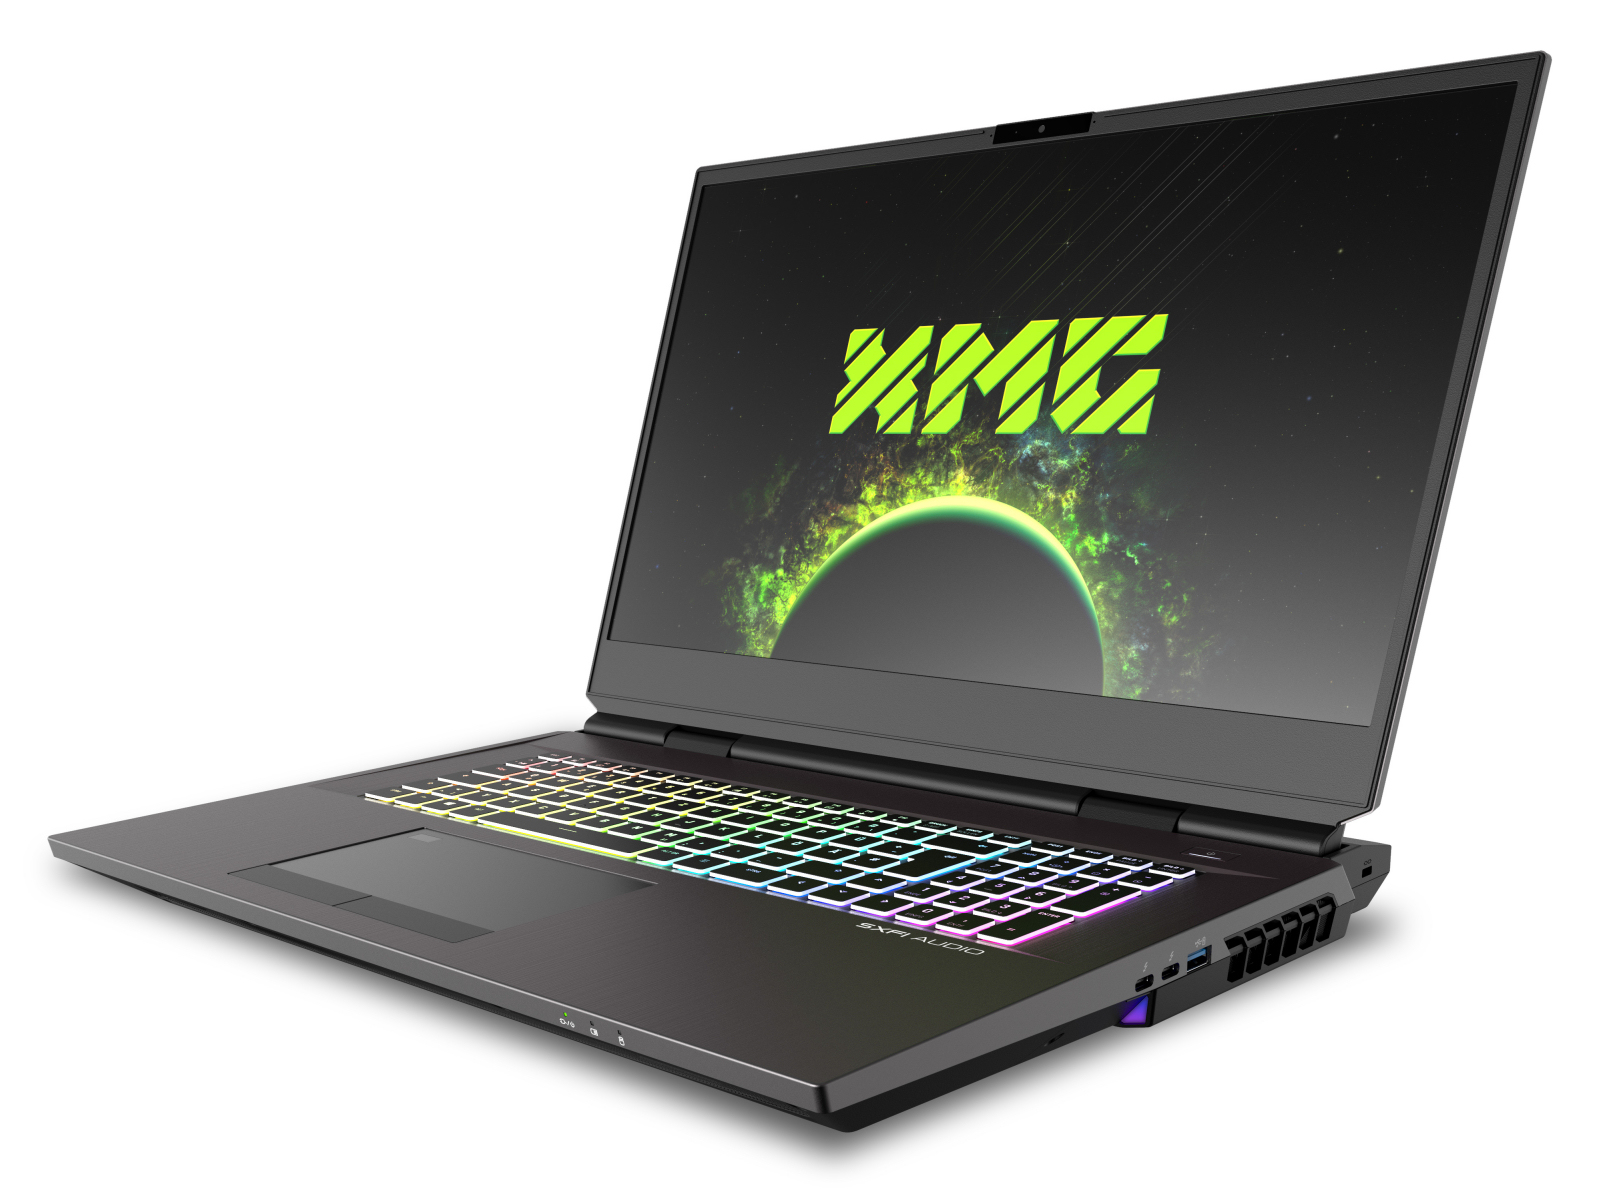
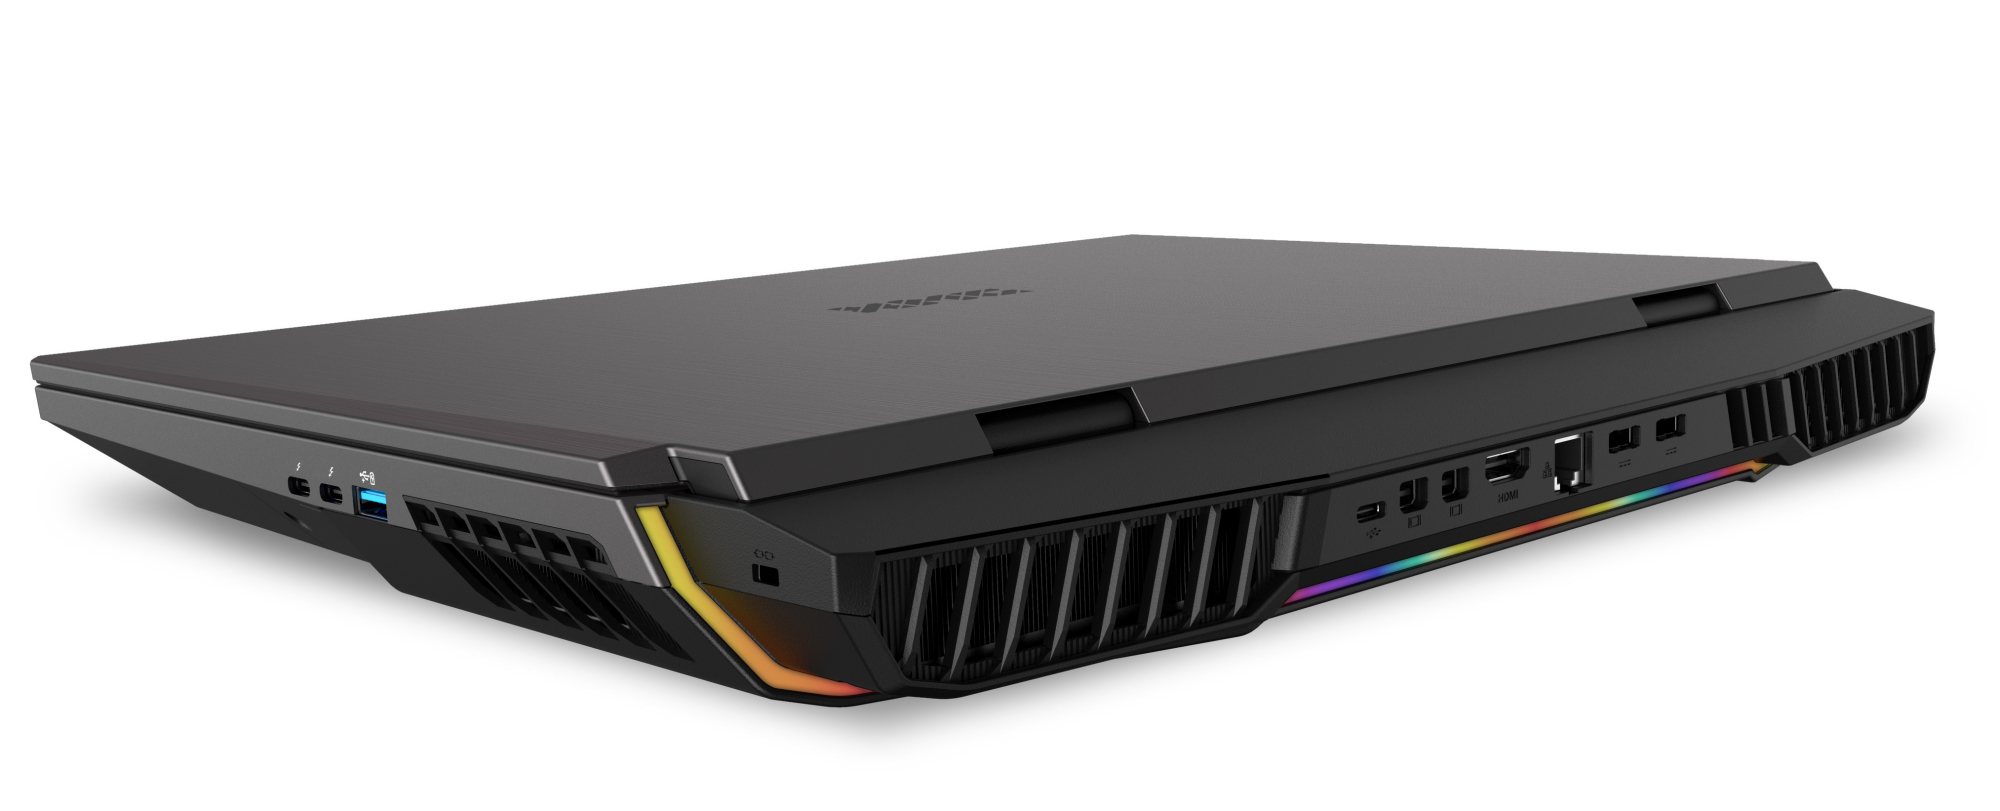
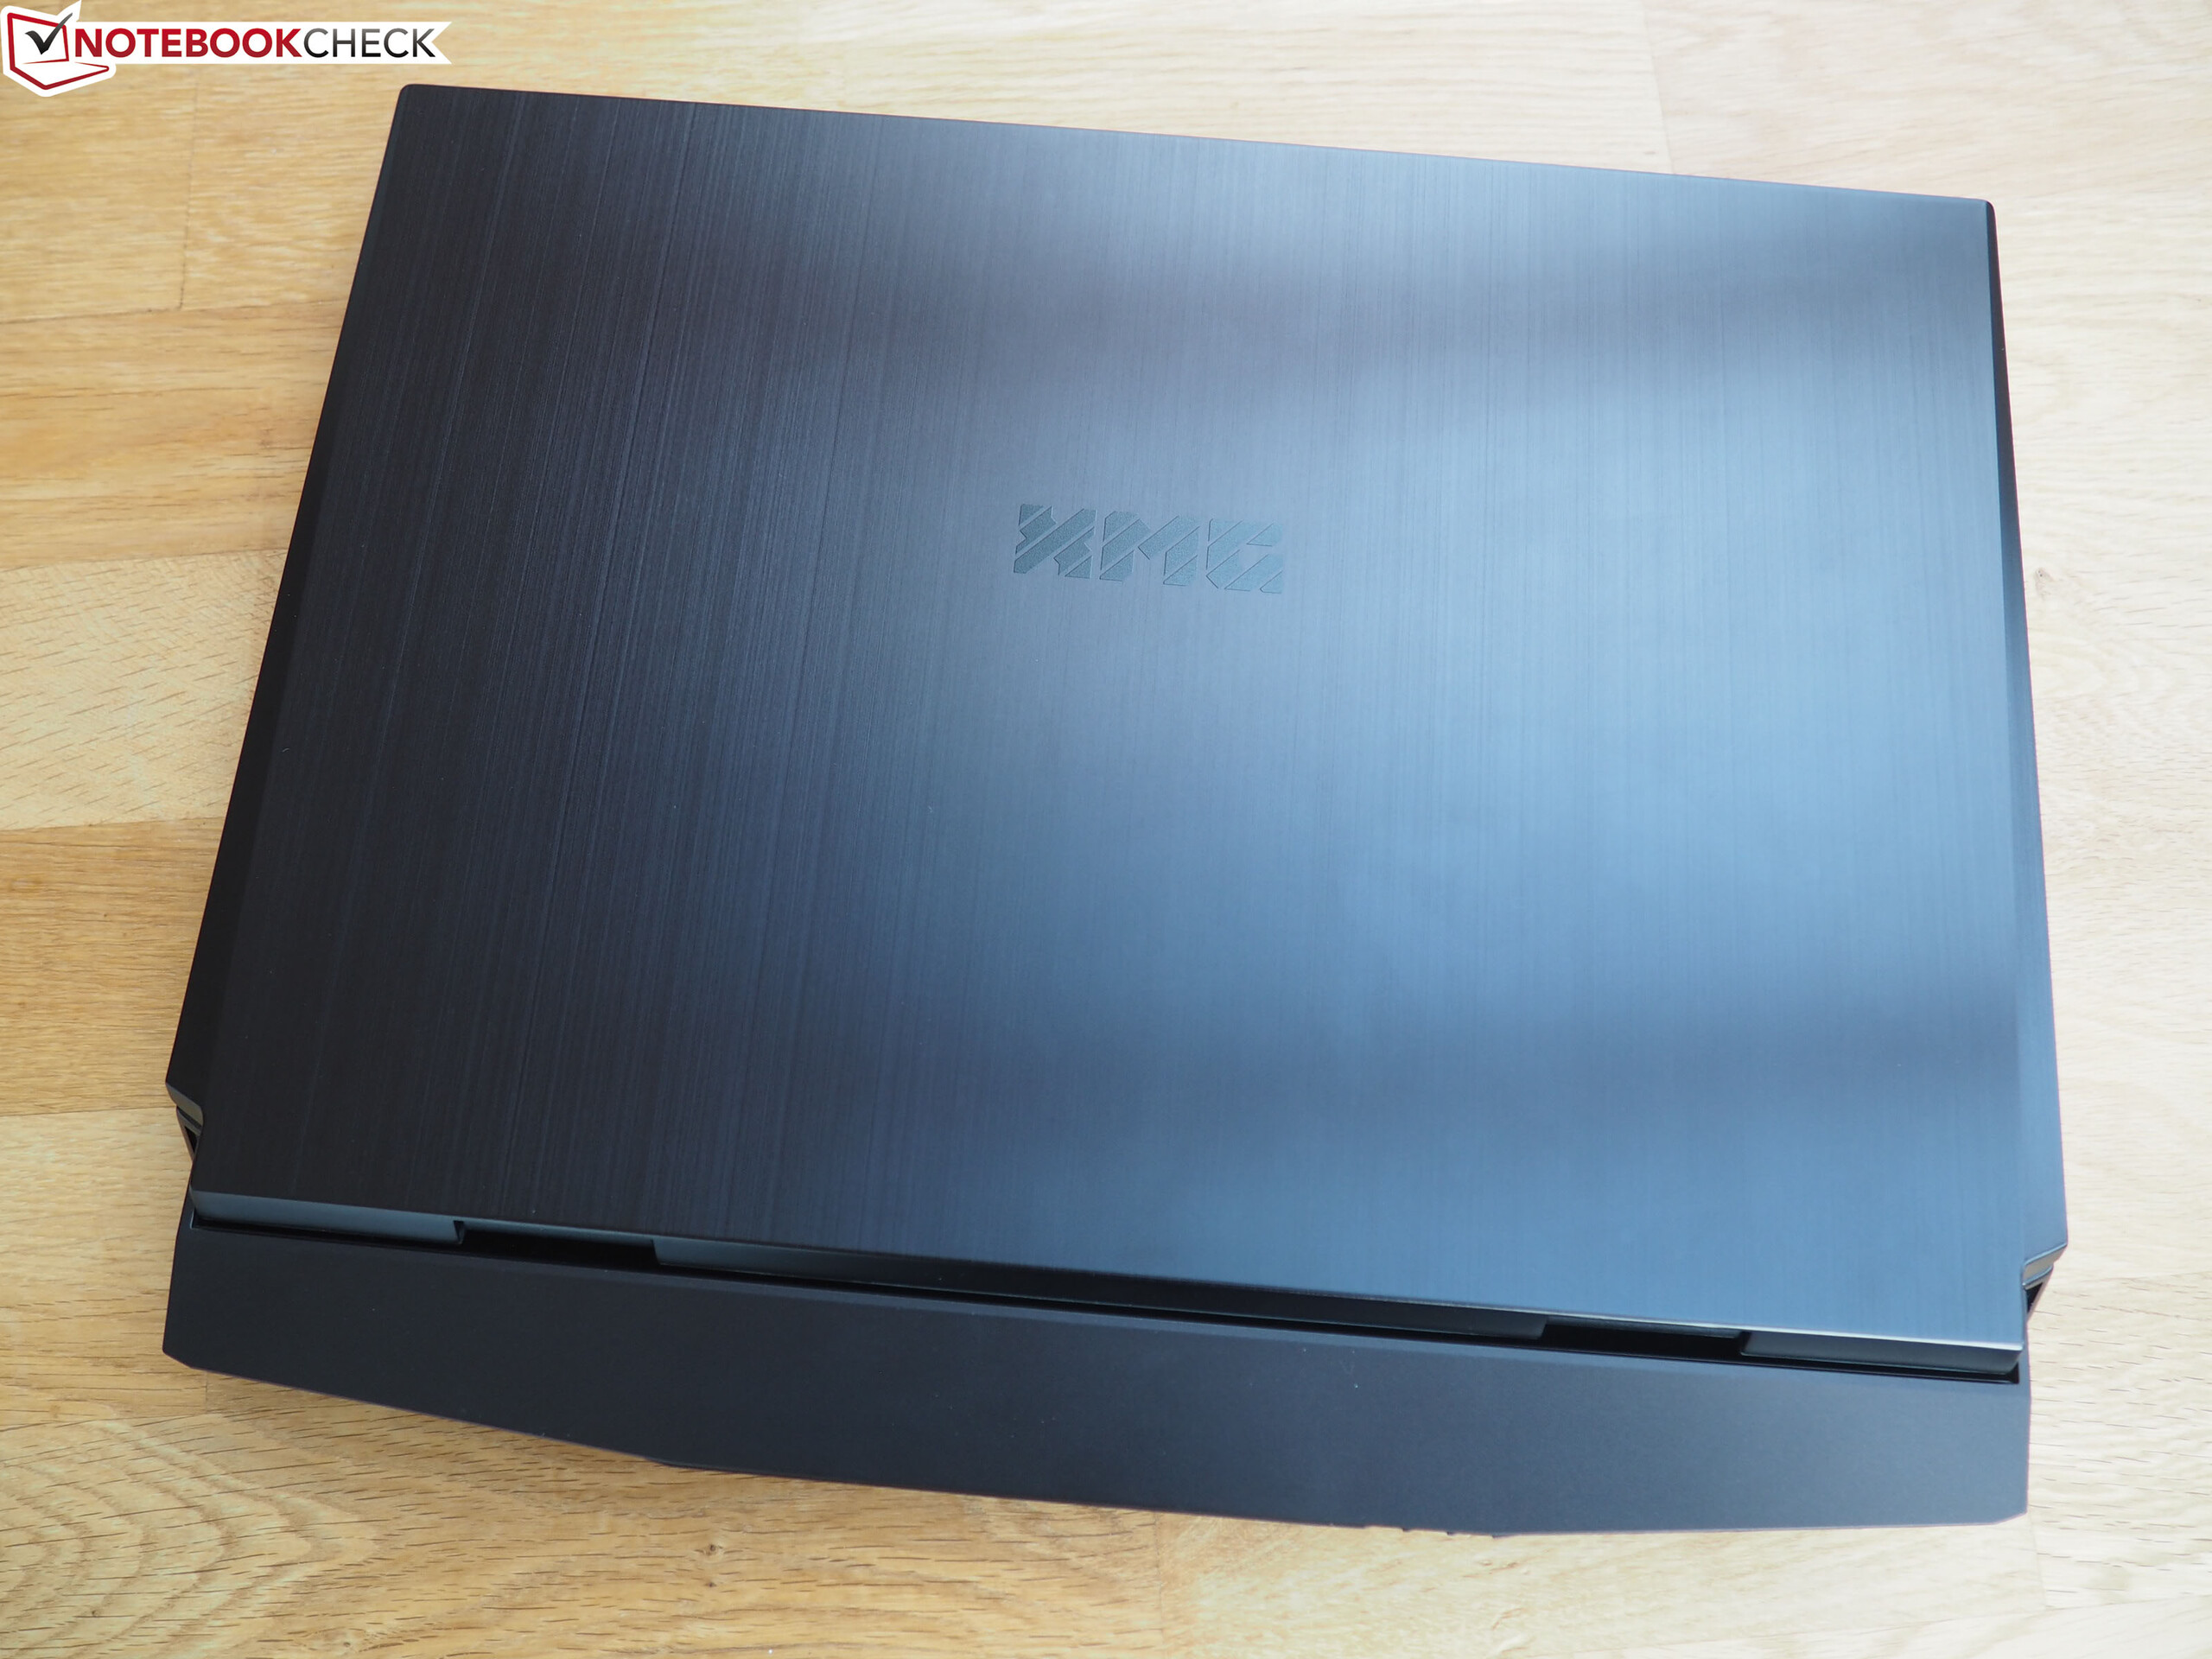
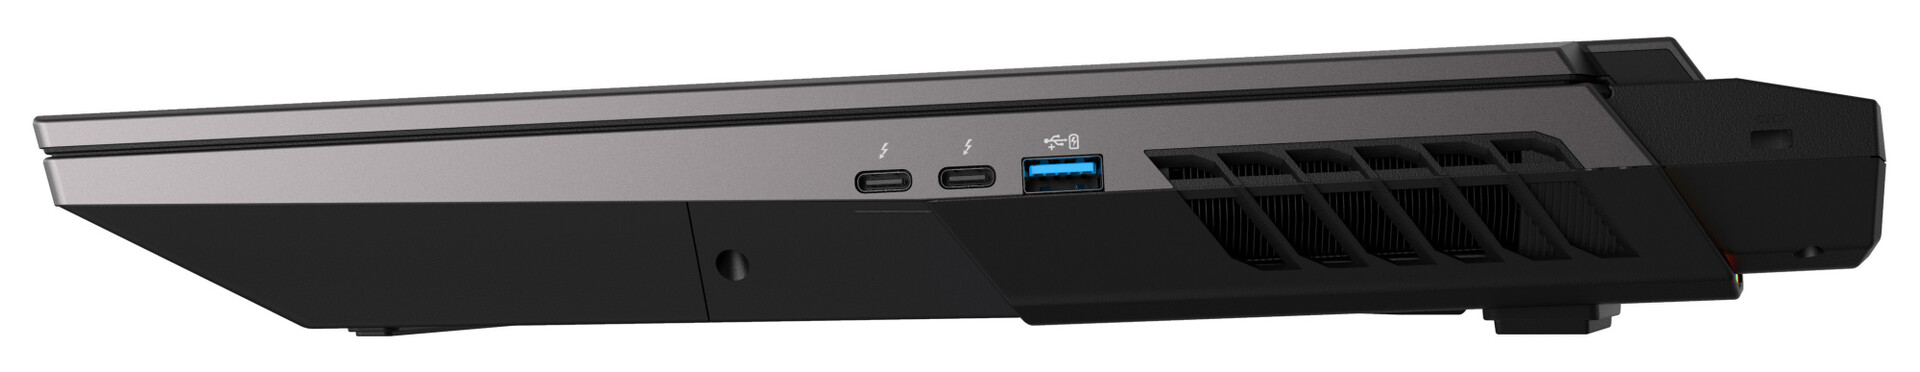
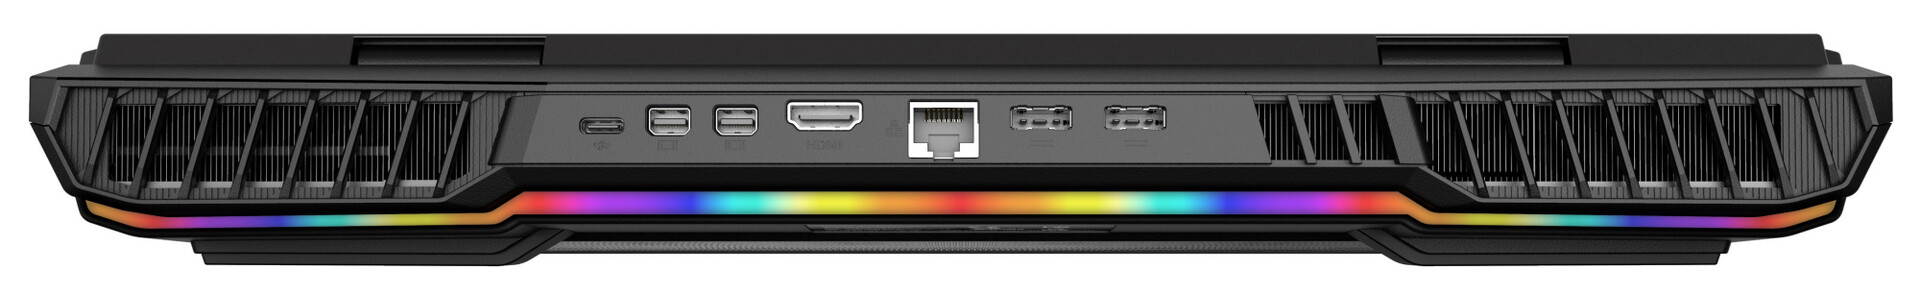
Visually, the 2021 model of the XMG Ultra 17 has not changed compared to its Predecessor. Innovations are found on the technical side. Rocket Lake processors (Comet Lake CPUs are still available) and Ampere GPUs are now used. Instead of one Thunderbolt 3 slot, two Thunderbolt 4/USB 4 slots are used. Competitors include devices like the MSI GT76 Titanium DT 10SGS, the Alienware m17 R4 and the Asus Strix Scar 17 G732LXS.
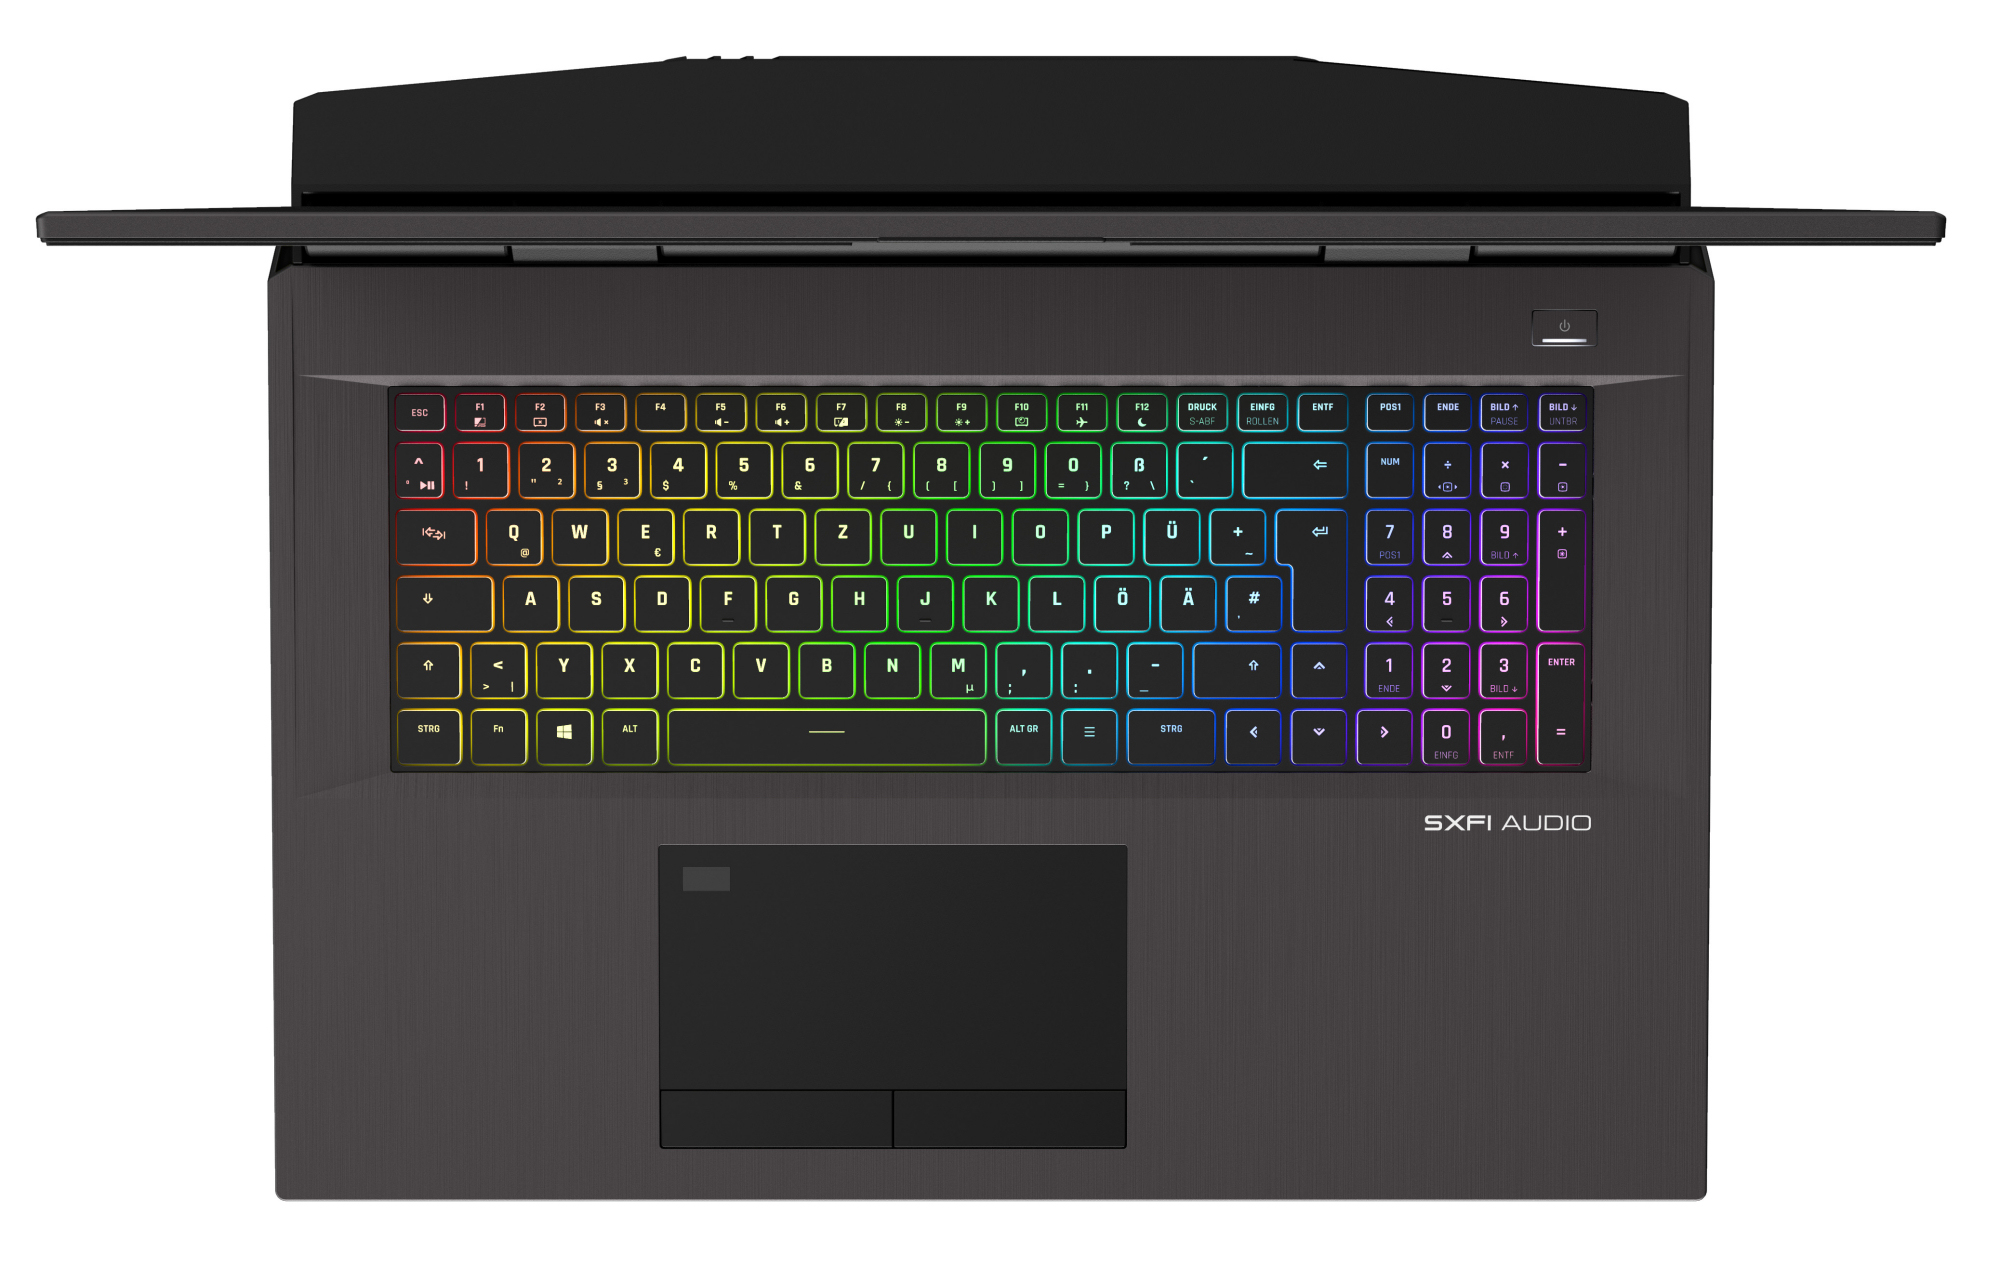
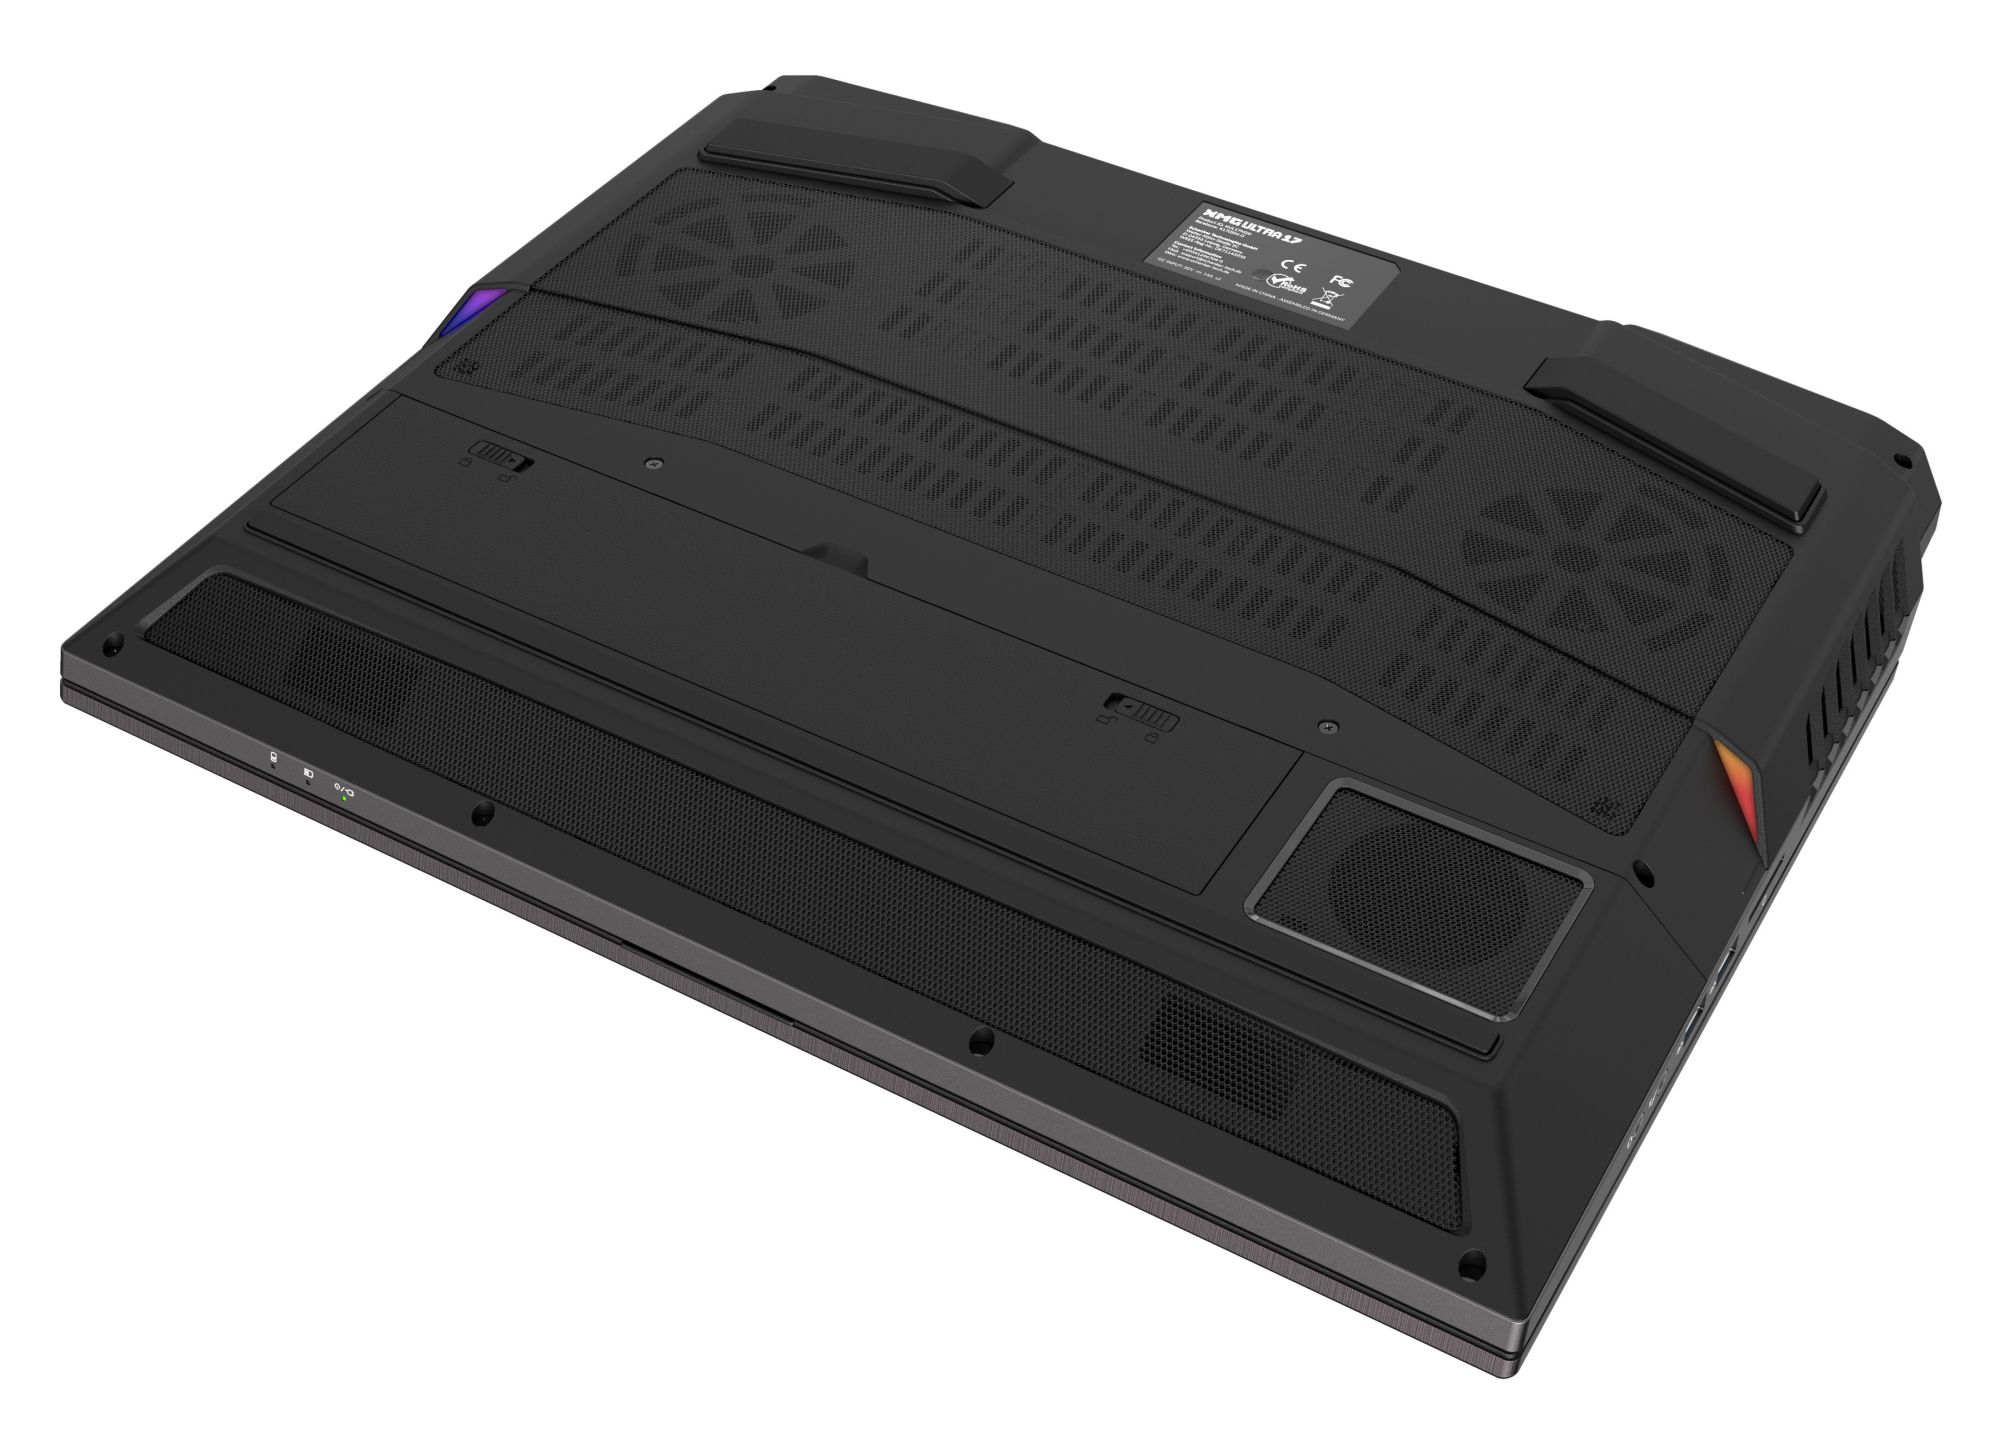
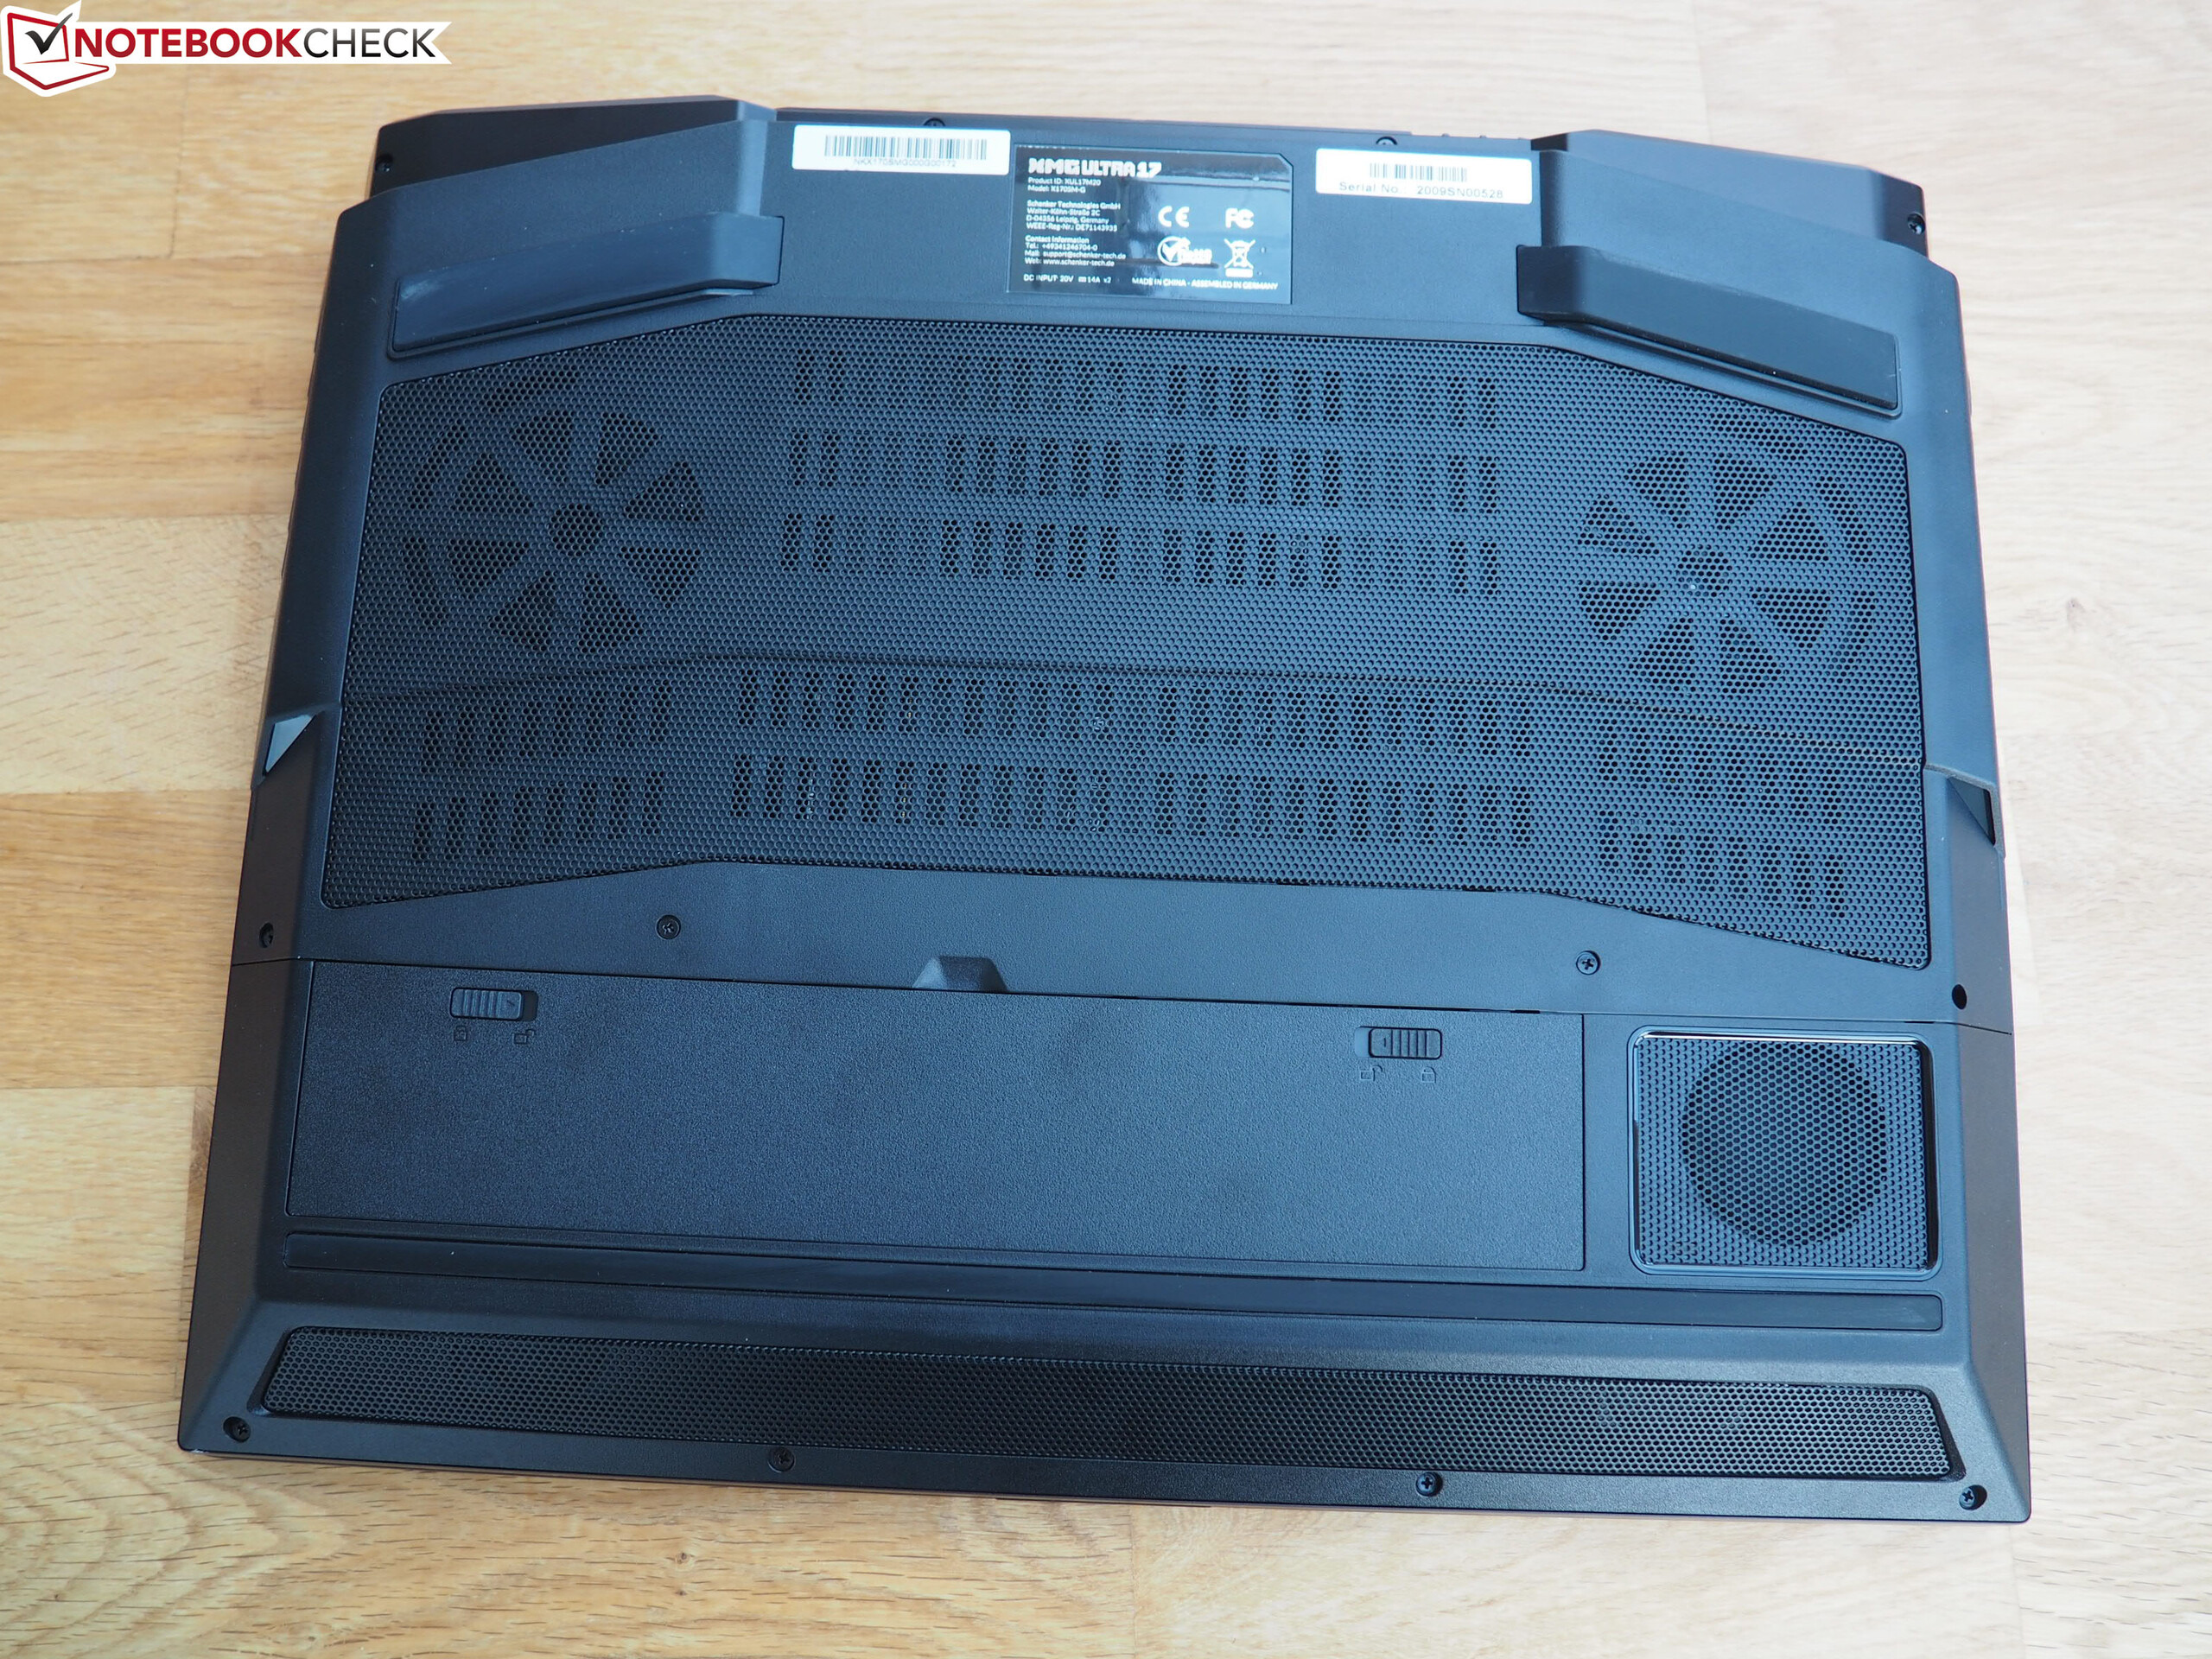
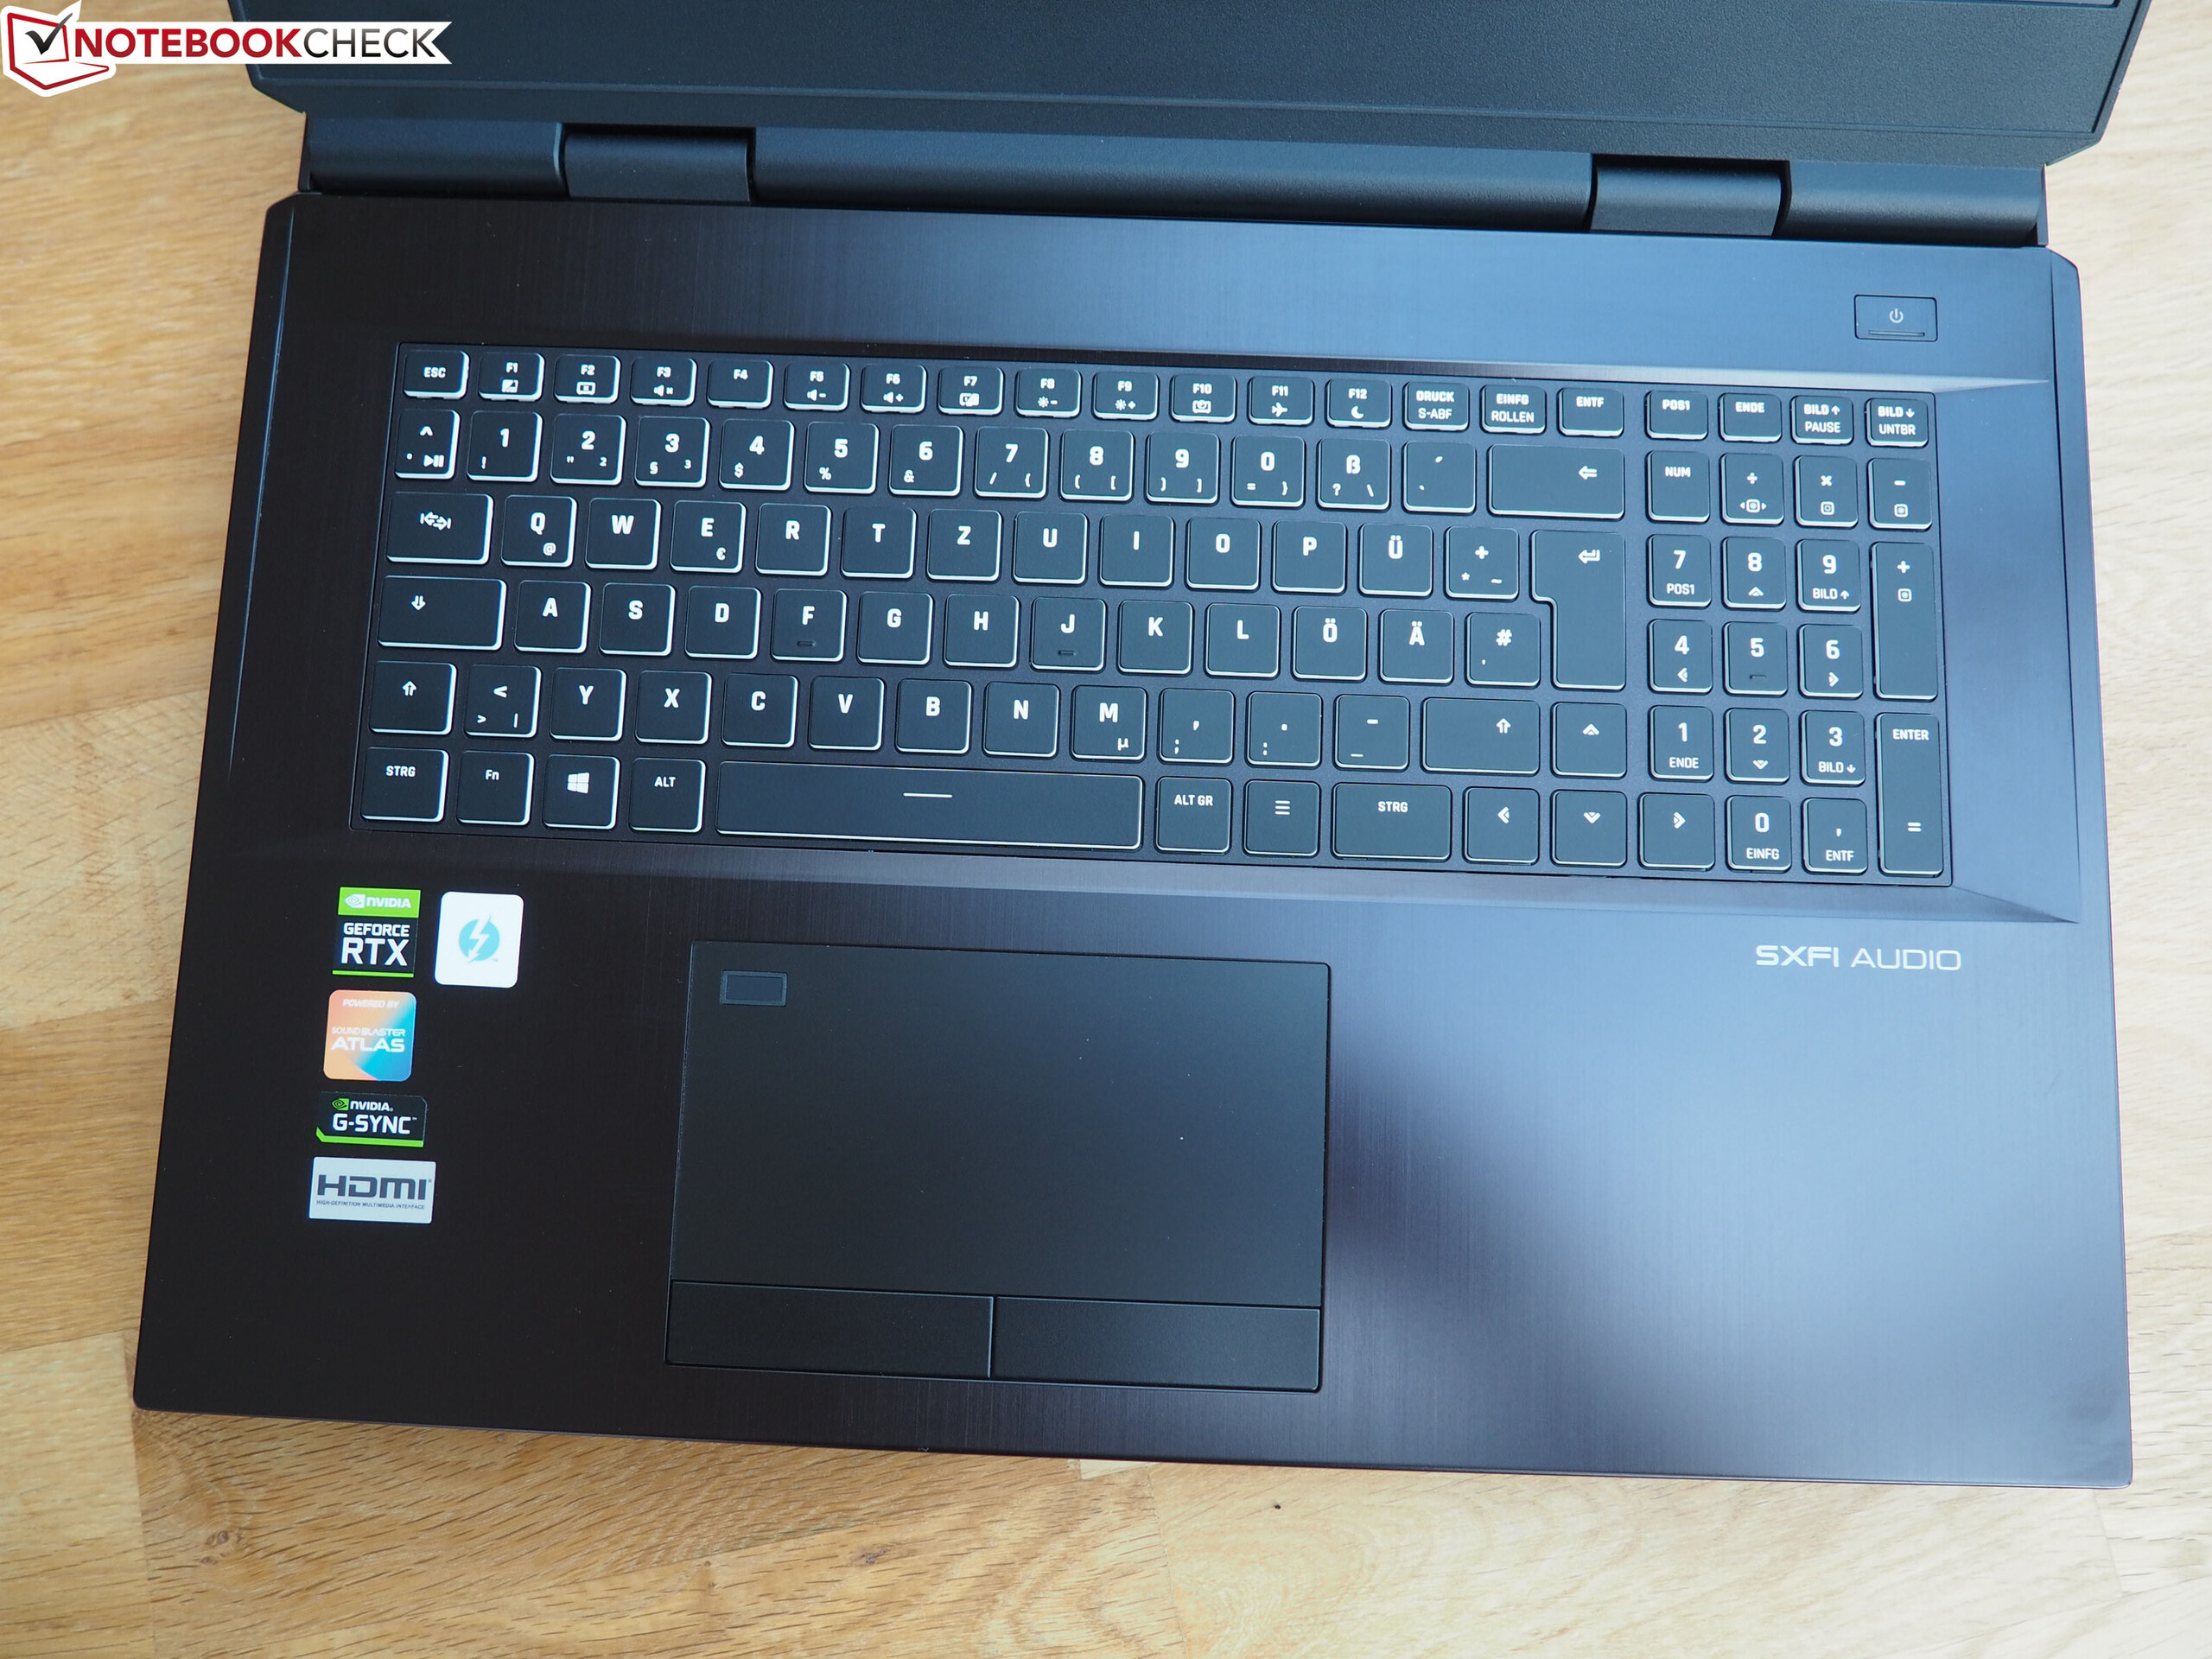
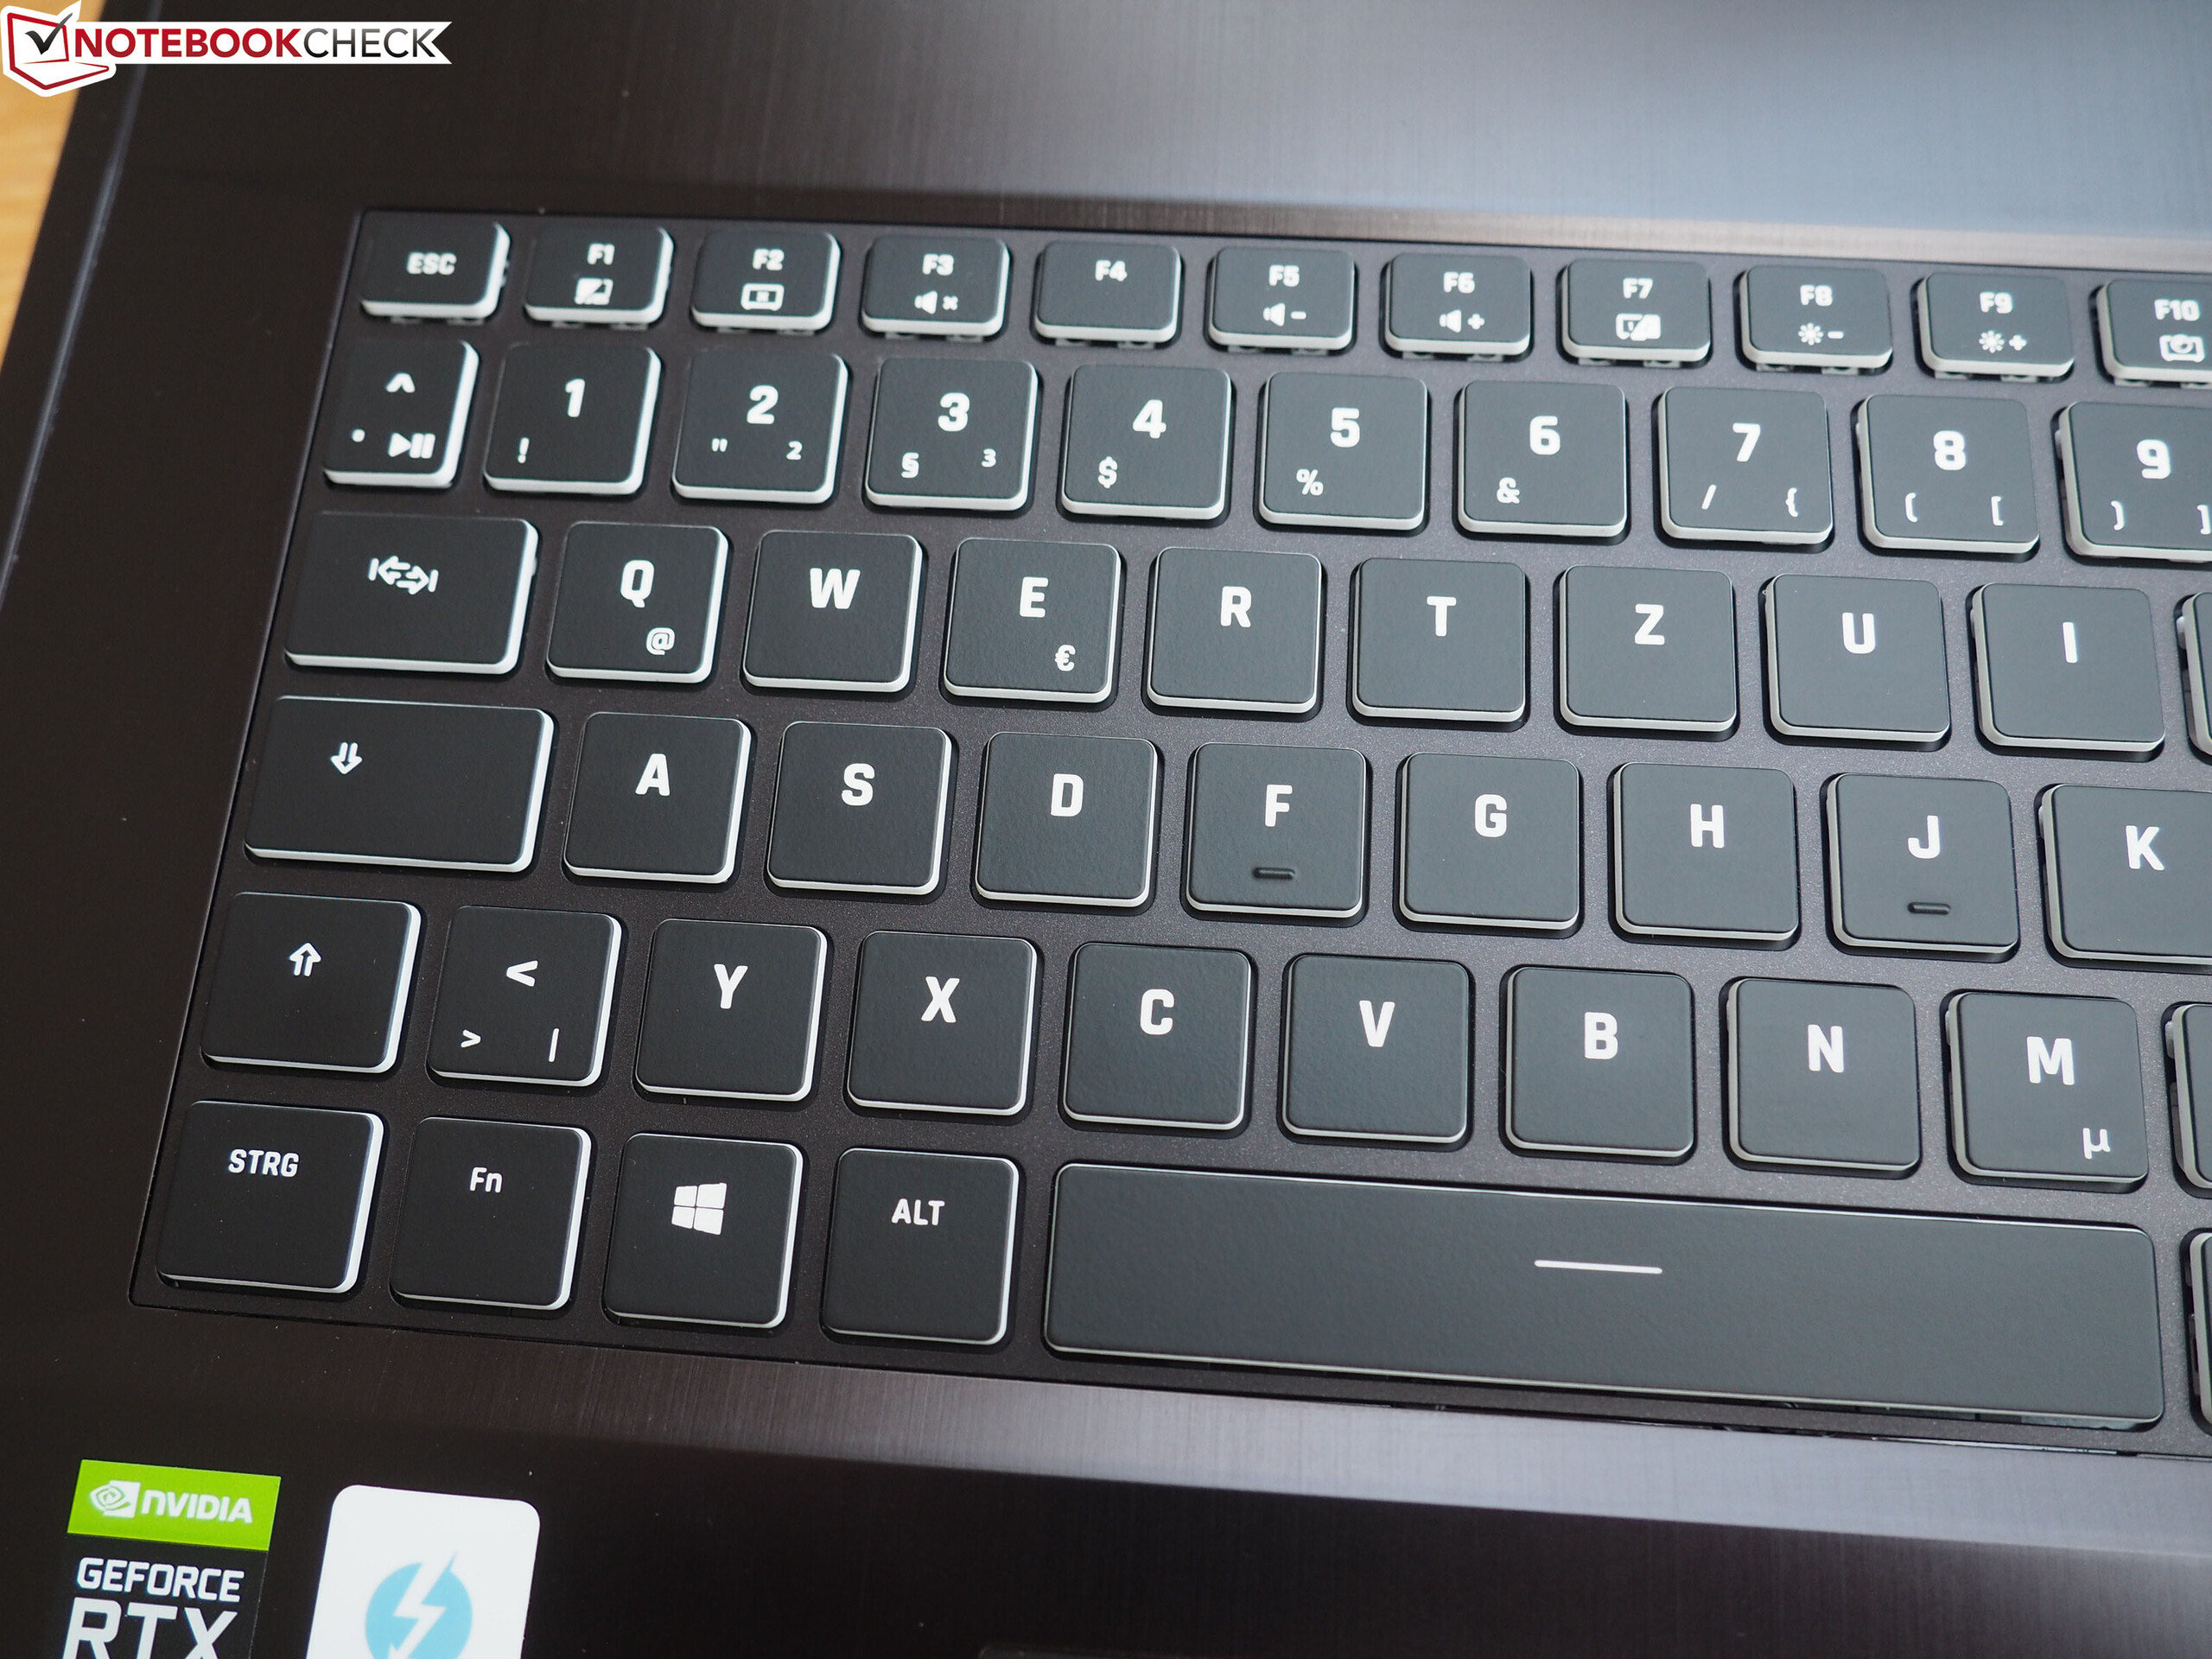
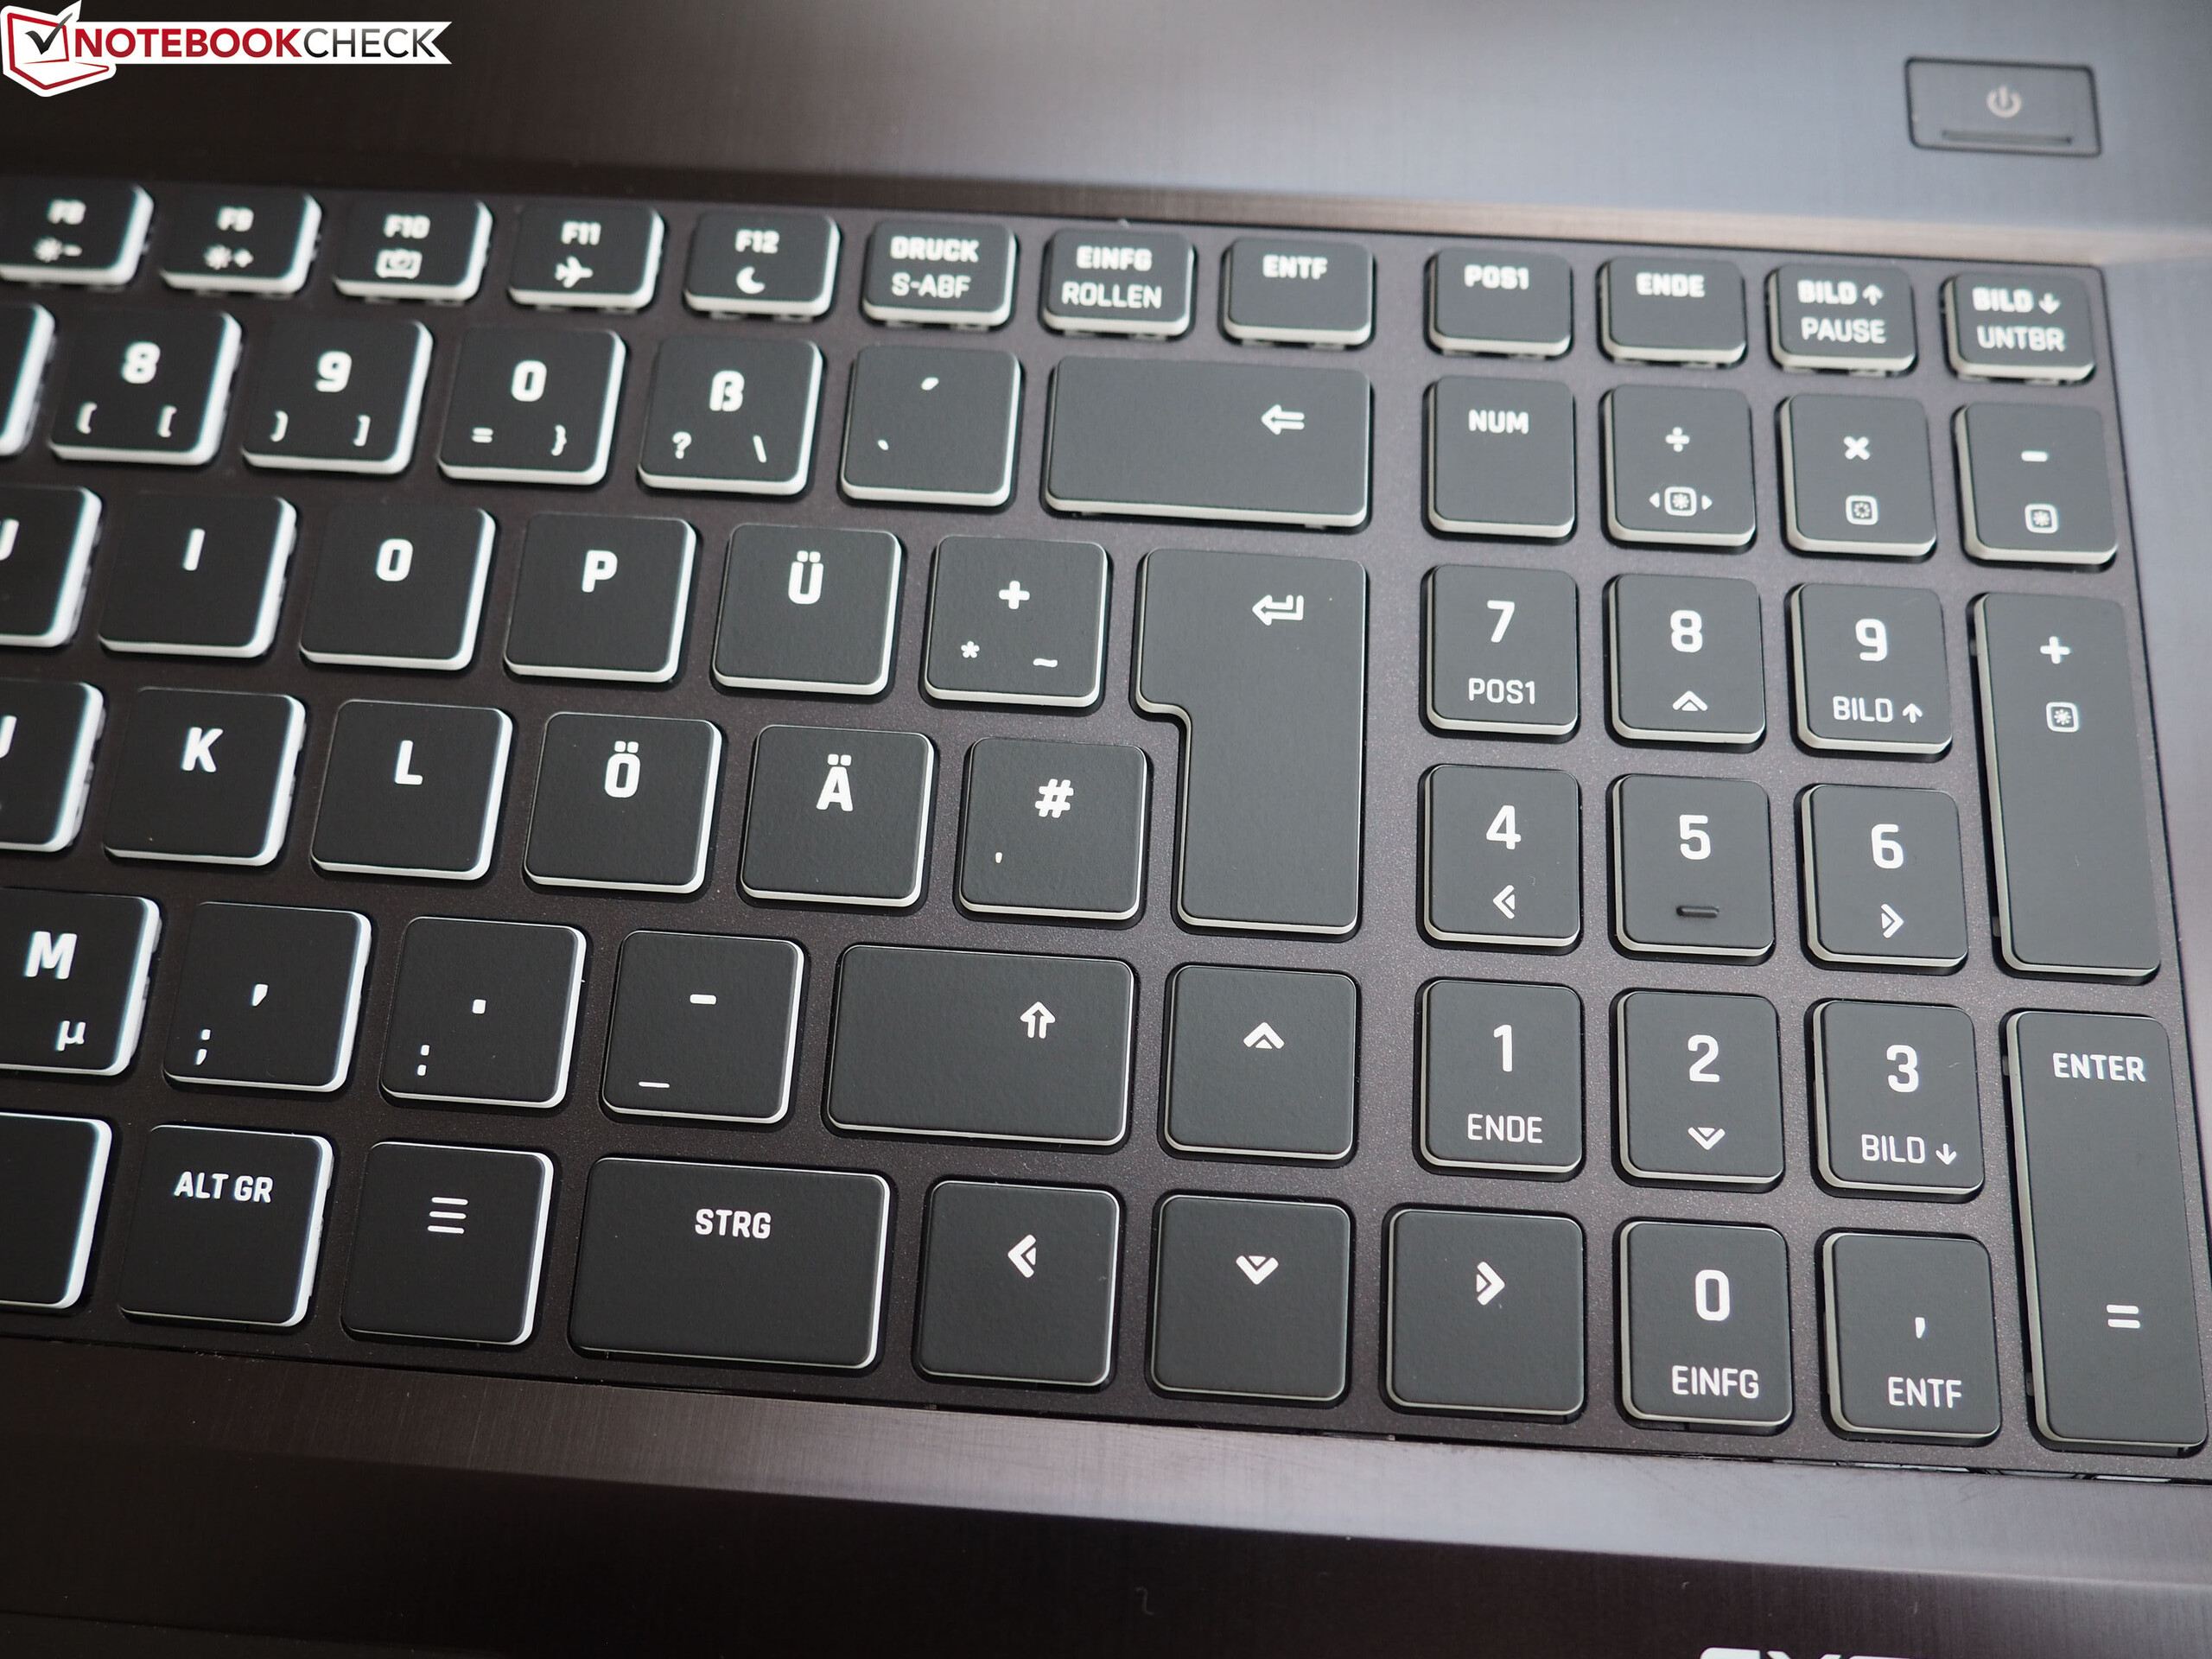
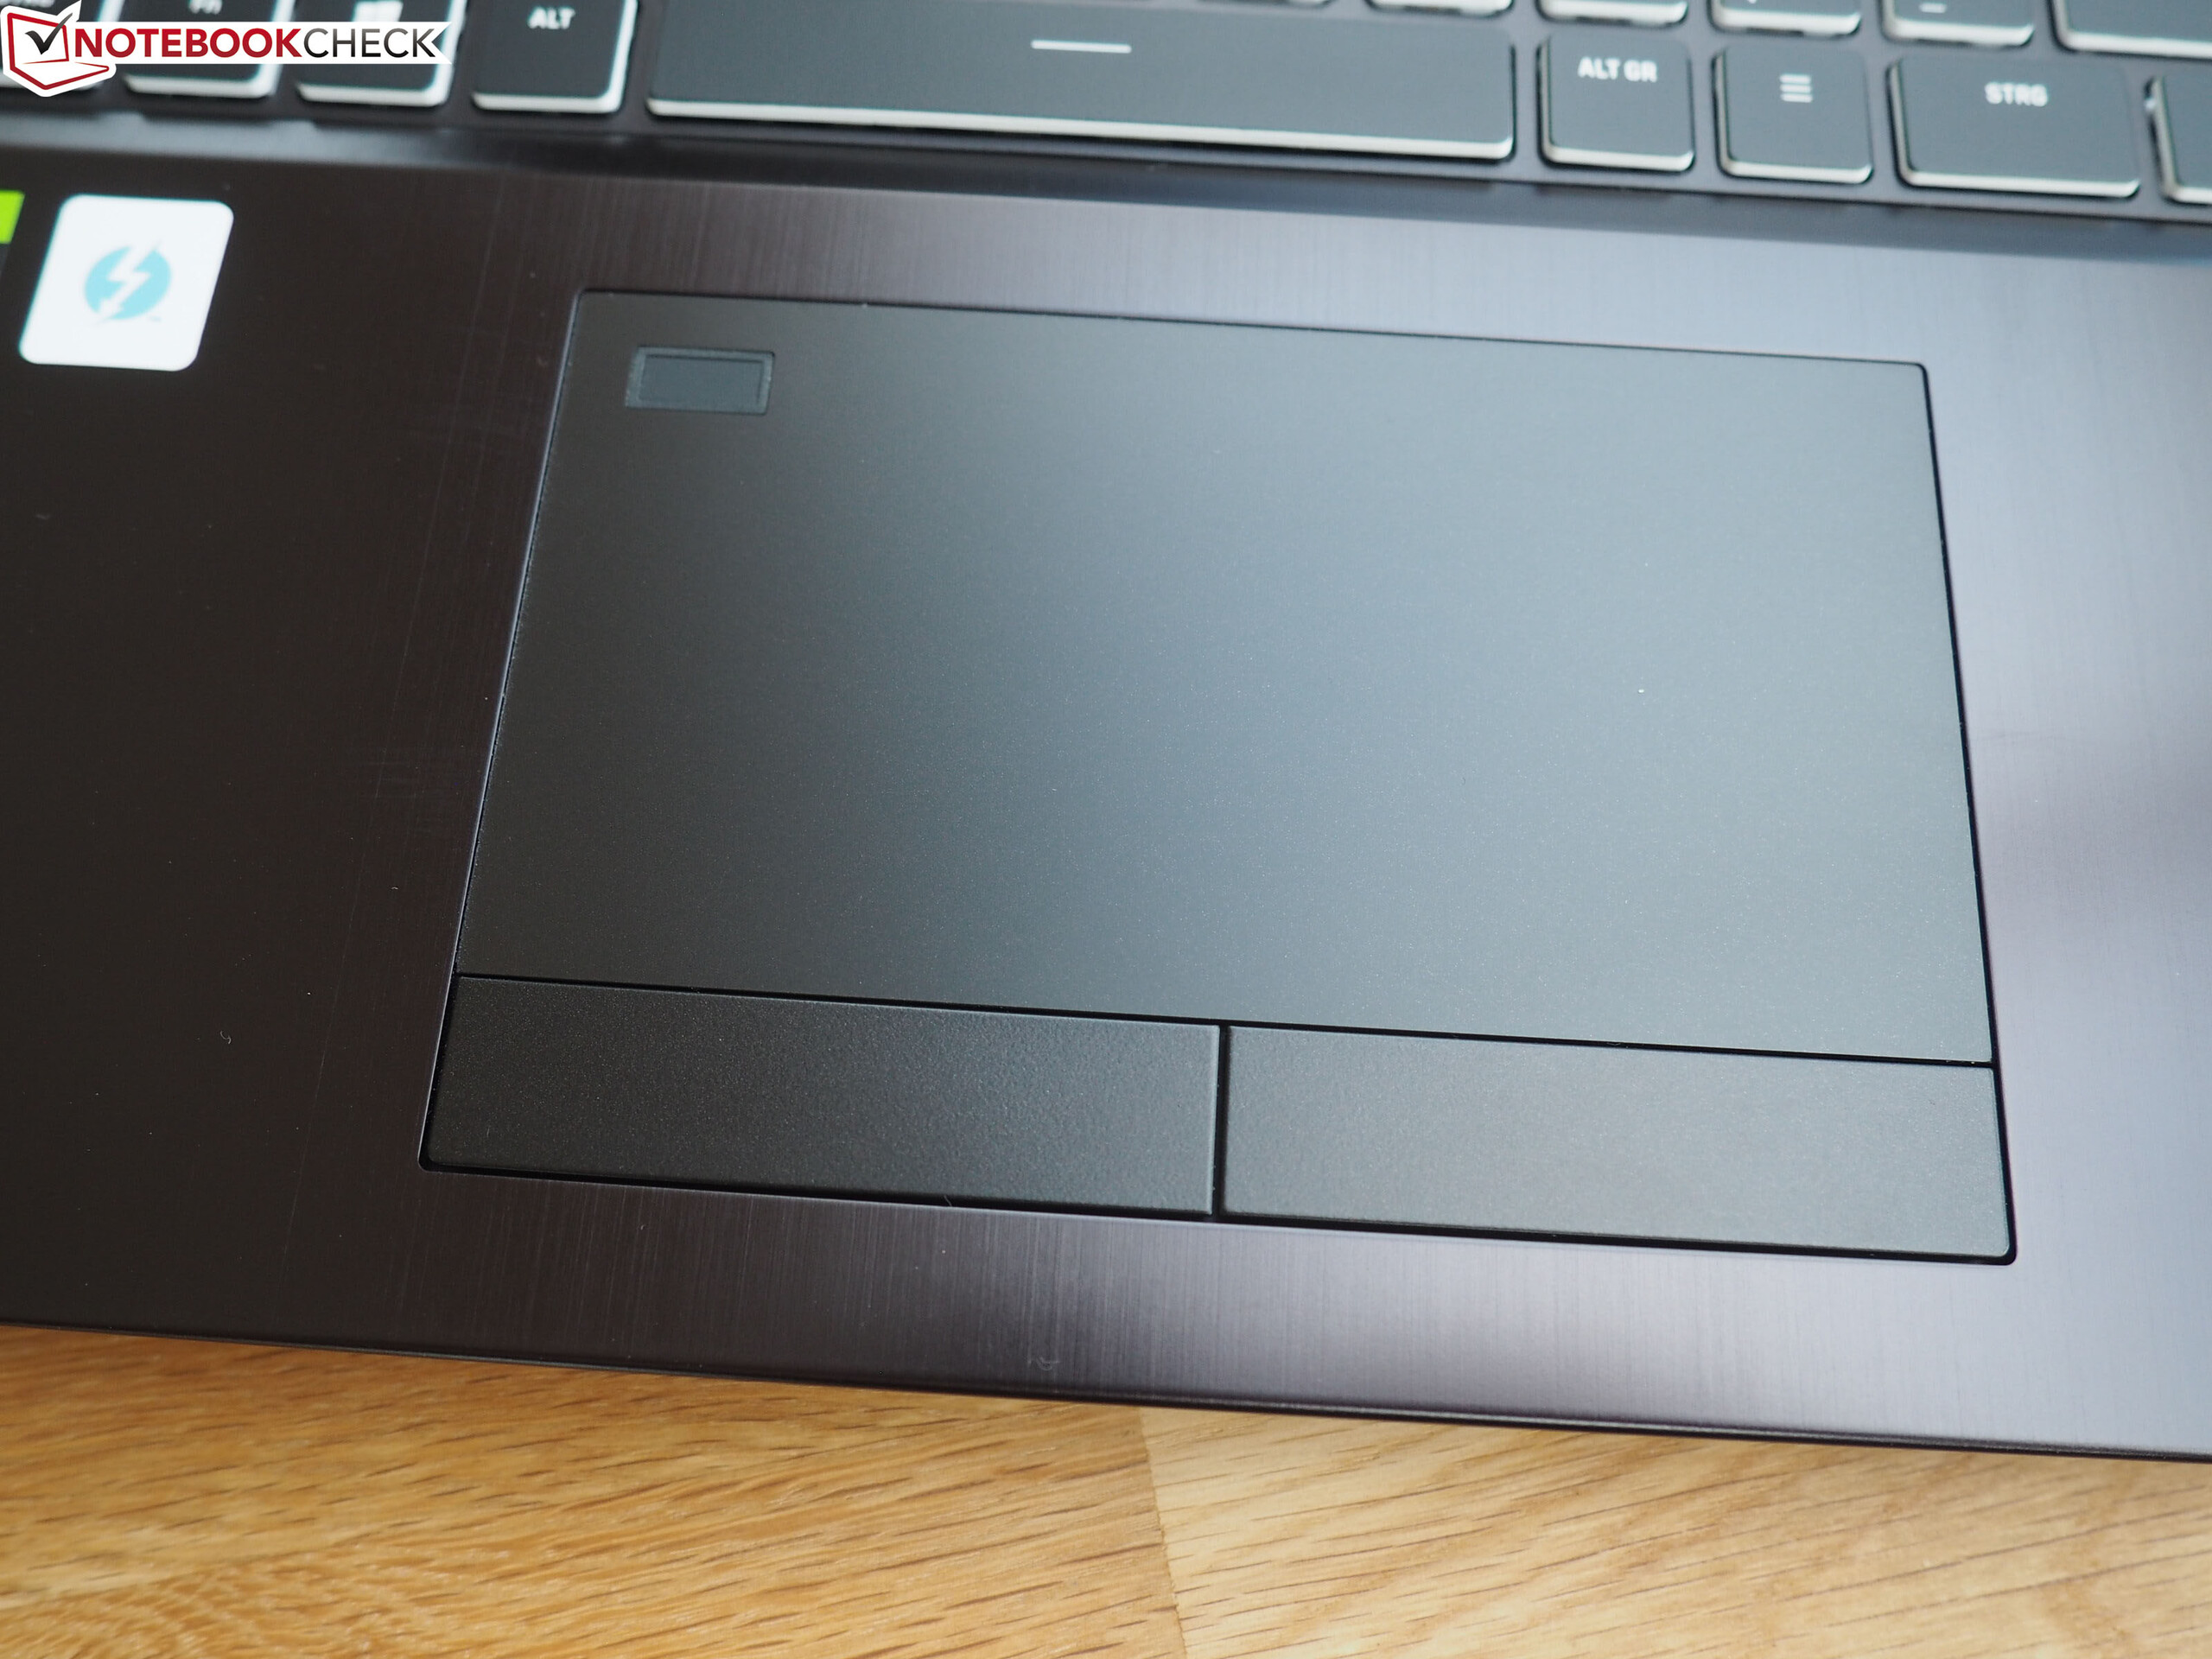
Since the XMG Ultra 17 is identical in construction to the 2020 model, we will not go further into the case, the equipment, the input devices and the speakers. The corresponding information can be found in the Review of the Schenker XMG Ultra 17 (2020).
Possible competitors in comparison
Rating | Date | Model | Weight | Height | Size | Resolution |
|---|---|---|---|---|---|---|
| 84.9 % v7 (old) | 04 / 2021 | Schenker XMG Ultra 17 Rocket Lake i9-11900K, GeForce RTX 3080 Laptop GPU | 4.7 kg | 43.5 mm | 17.30" | 1920x1080 |
| 87.4 % v7 (old) | 10 / 2020 | MSI GT76 Titan DT 10SGS i9-10900K, GeForce RTX 2080 Super Mobile | 4.2 kg | 42 mm | 17.30" | 3840x2160 |
| 82.7 % v7 (old) | 07 / 2020 | Asus Strix Scar 17 G732LXS i9-10980HK, GeForce RTX 2080 Super Mobile | 2.9 kg | 26.5 mm | 17.30" | 1920x1080 |
| 85.3 % v7 (old) | 04 / 2021 | Alienware m17 R4 i9-10980HK, GeForce RTX 3080 Laptop GPU | 3 kg | 22 mm | 17.30" | 1920x1080 |
| SD Card Reader | |
| average JPG Copy Test (av. of 3 runs) | |
| Schenker XMG Ultra 17 Rocket Lake | |
| Schenker XMG Ultra 17 Comet Lake (Toshiba Exceria Pro SDXC 64 GB UHS-II) | |
| Alienware m17 R4 (AV PRO microSD 128 GB V60) | |
| MSI GT76 Titan DT 10SGS (Toshiba Exceria Pro M501 UHS-II) | |
| Average of class Gaming (20.9 - 210, n=54, last 2 years) | |
| maximum AS SSD Seq Read Test (1GB) | |
| Alienware m17 R4 (AV PRO microSD 128 GB V60) | |
| Schenker XMG Ultra 17 Comet Lake (Toshiba Exceria Pro SDXC 64 GB UHS-II) | |
| Schenker XMG Ultra 17 Rocket Lake (AV PRO microSD 128 GB V60) | |
| MSI GT76 Titan DT 10SGS (Toshiba Exceria Pro M501 UHS-II) | |
| Average of class Gaming (25.5 - 261, n=51, last 2 years) | |


")
")


")
")


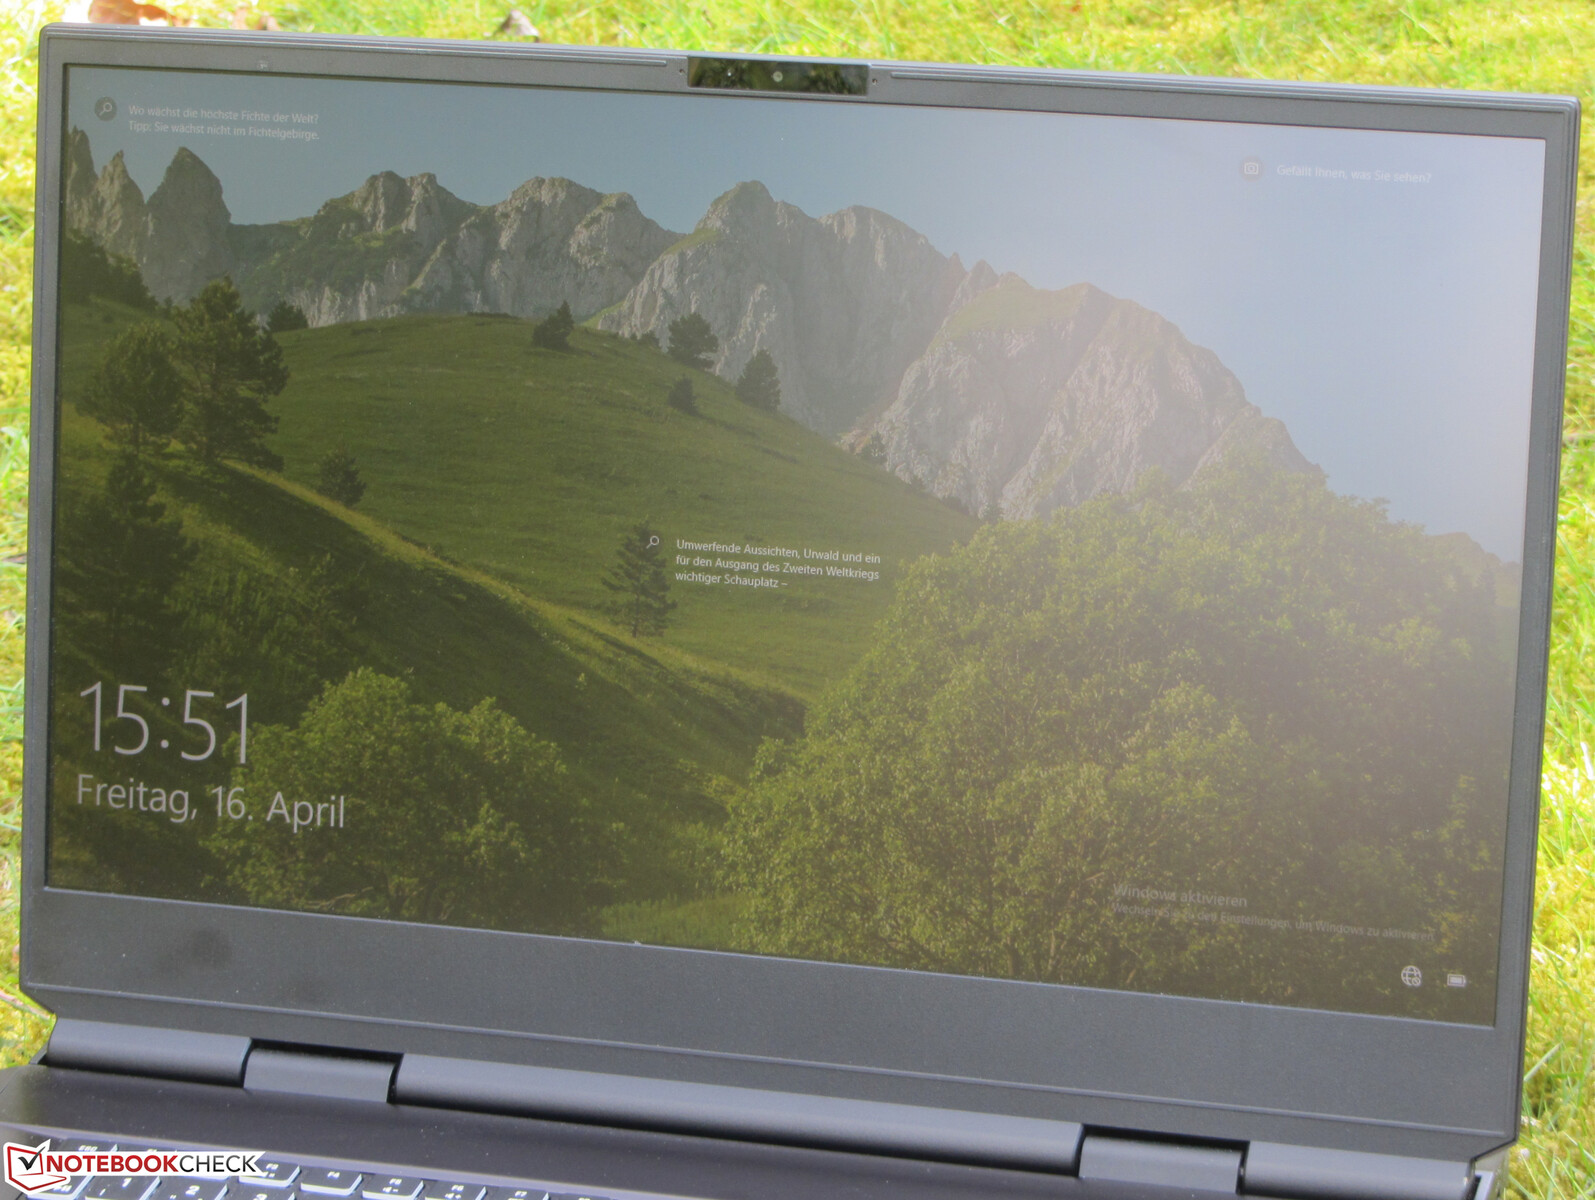
Display - 300 Hz IPS
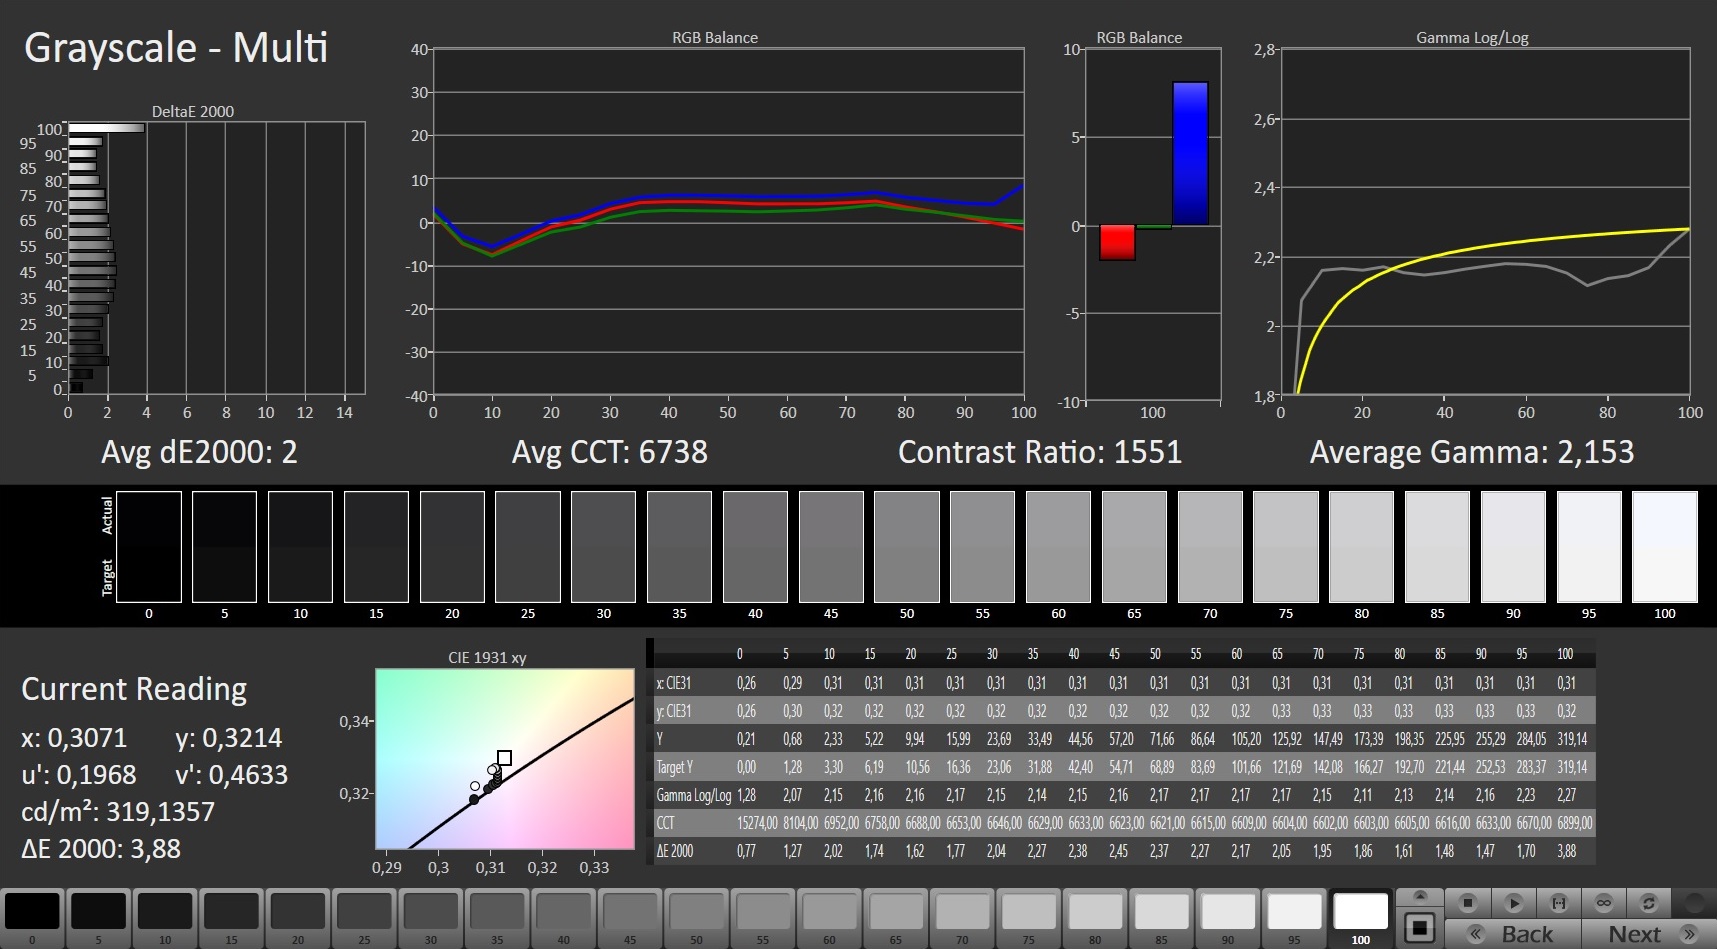
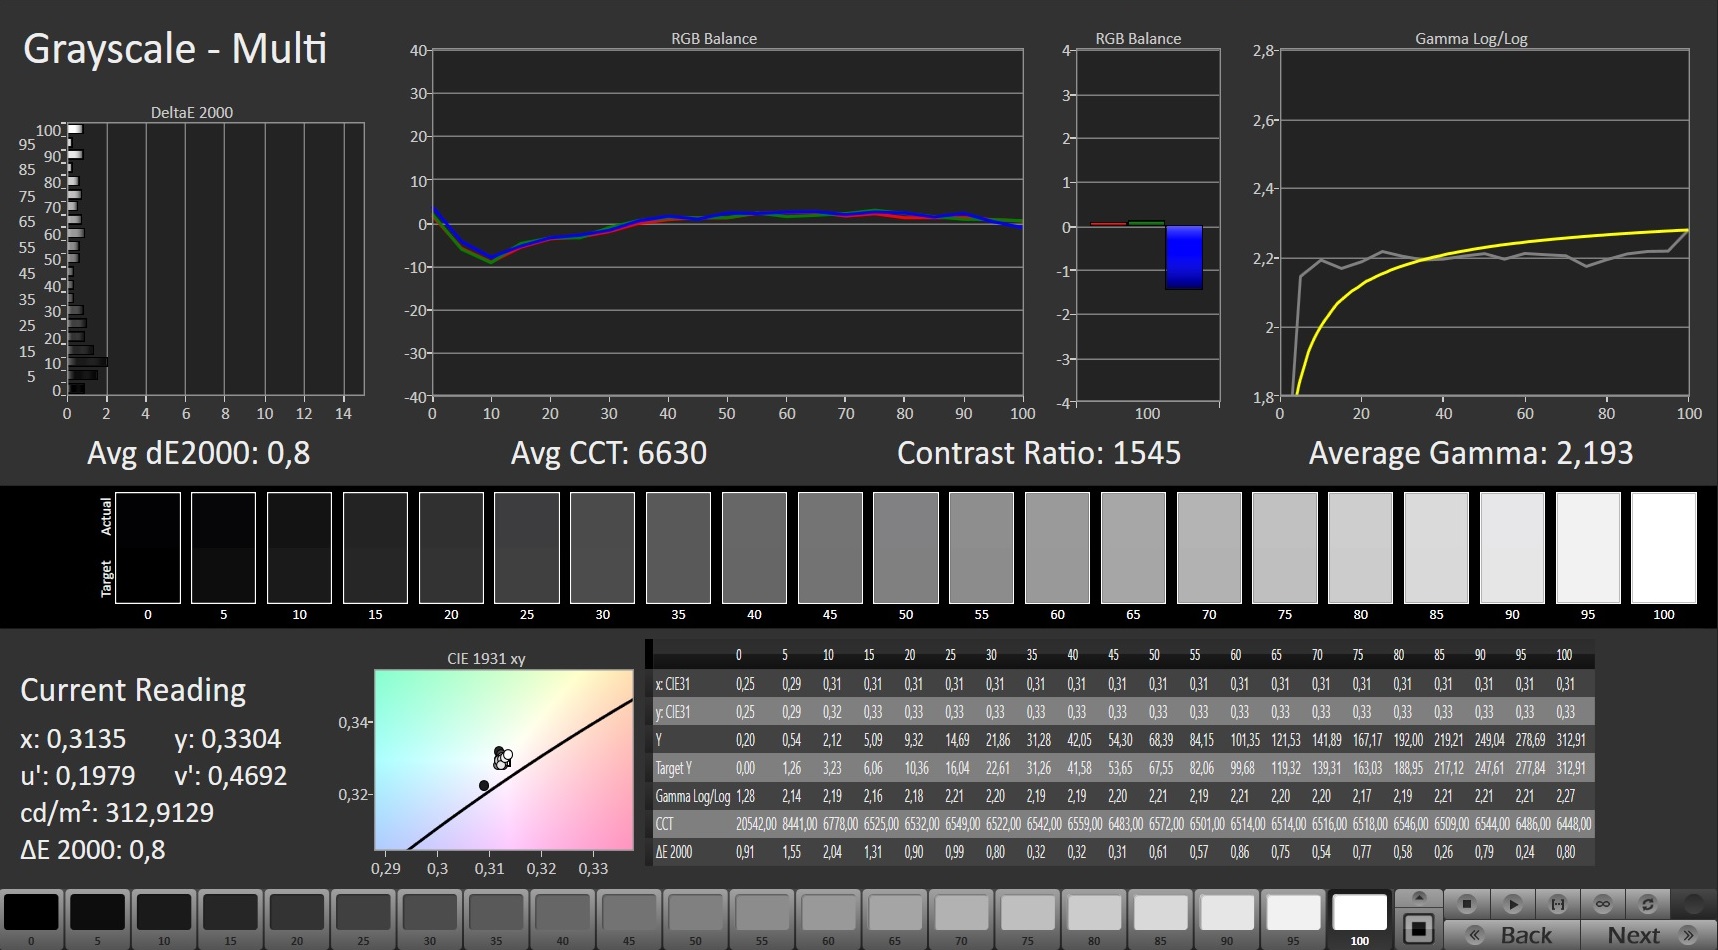
While the matte 17.3-inch screen (1,920 x 1,080 pixels) delivers a good contrast (1,391:1), the brightness (299.3 cd/m²) barely meets the target (> 300 cd/m²). The 300 Hz panel offers short response times and does not show PWM flickering.
The display supports Nvidia's G-Sync technology. This dynamically adjusts the refresh rates of the display and GPU to each other. This is supposed to create the smoothest possible picture - especially in computer games.
| |||||||||||||||||||||||||
Brightness Distribution: 93 %
Center on Battery: 306 cd/m²
Contrast: 1391:1 (Black: 0.22 cd/m²)
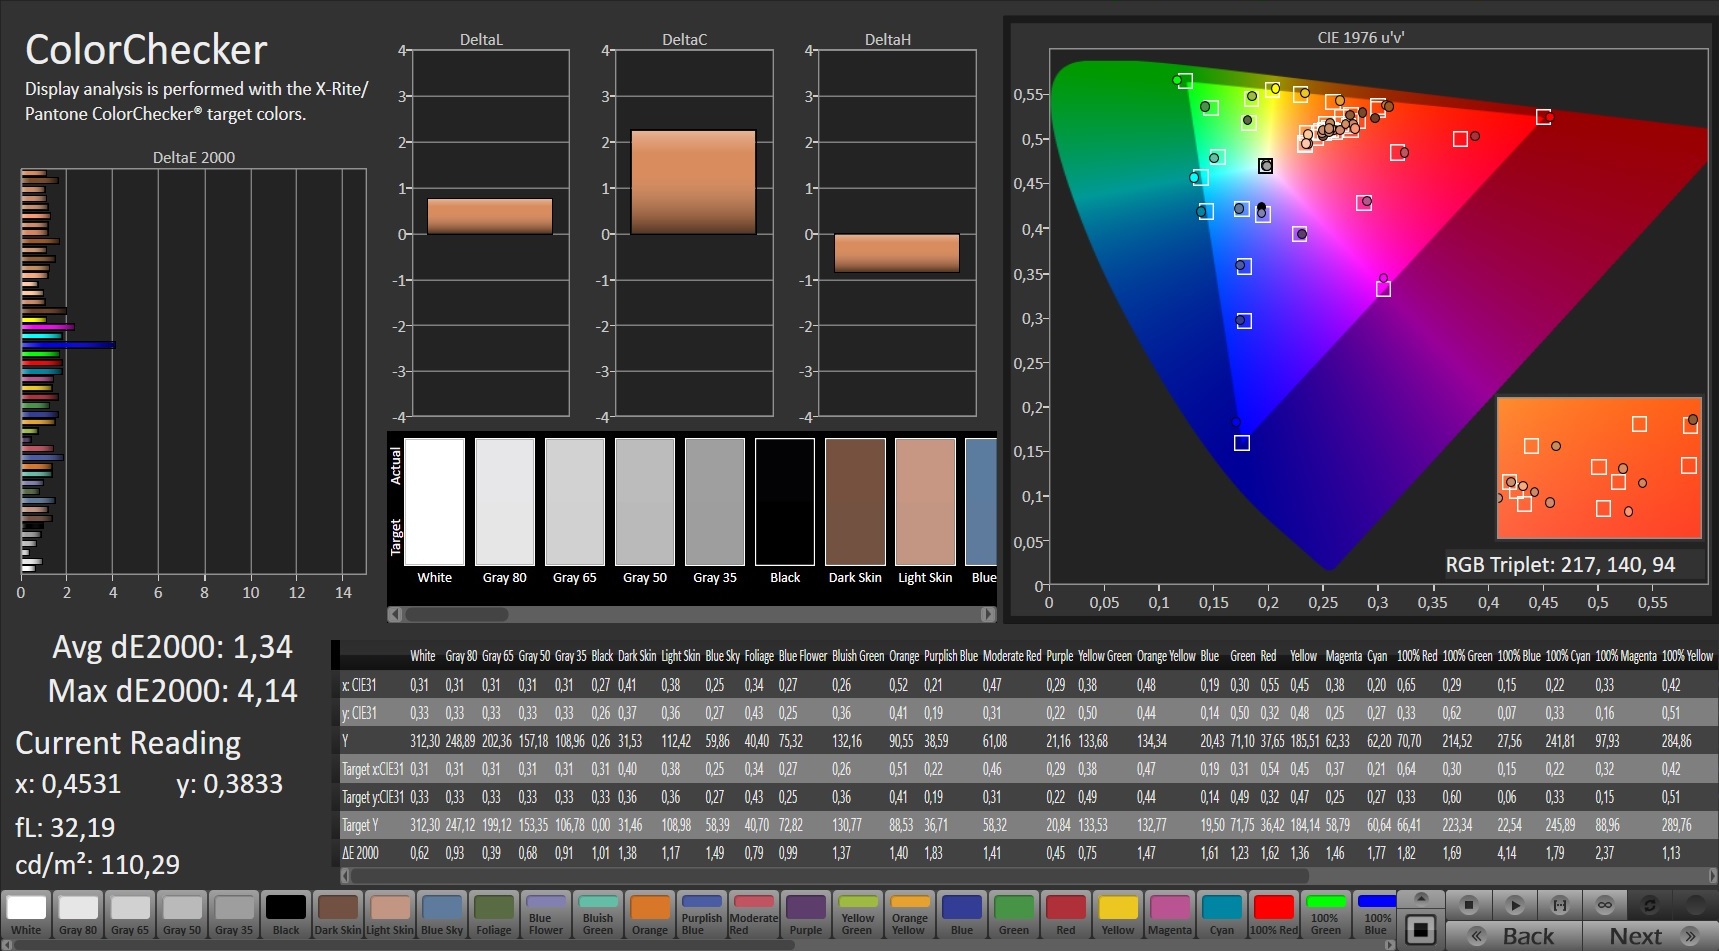
ΔE ColorChecker Calman: 1.92 | ∀{0.5-29.43 Ø4.71}
calibrated: 1.34
ΔE Greyscale Calman: 2 | ∀{0.09-98 Ø4.96}
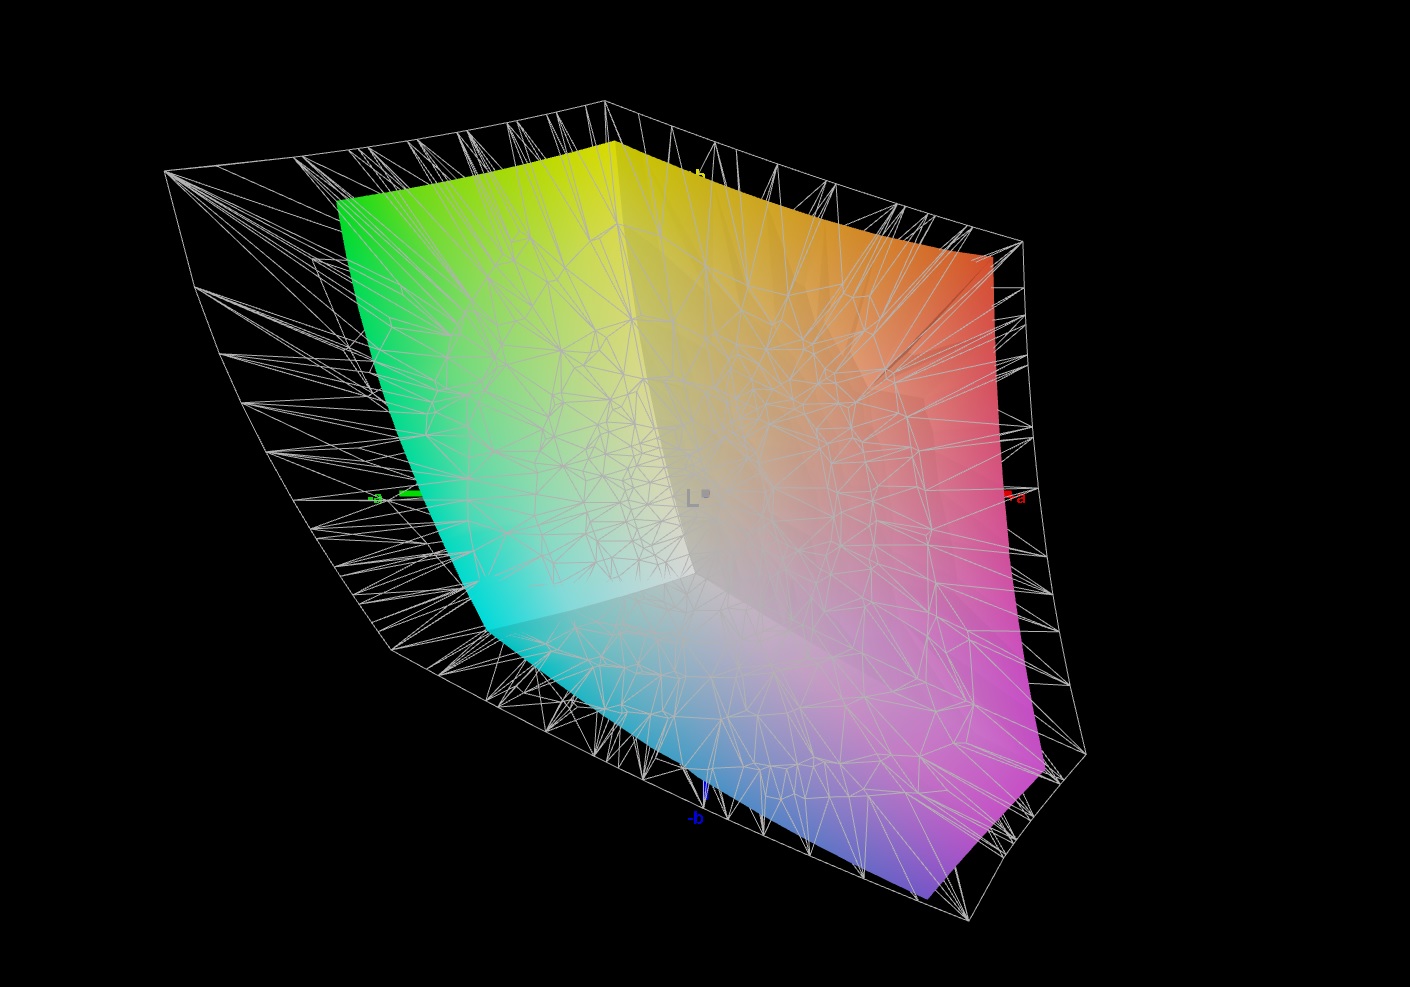
93% sRGB (Argyll 1.6.3 3D)
72% AdobeRGB 1998 (Argyll 1.6.3 3D)
72% AdobeRGB 1998 (Argyll 3D)
97.2% sRGB (Argyll 3D)
69.8% Display P3 (Argyll 3D)
Gamma: 2.153
CCT: 6738 K
| Schenker XMG Ultra 17 Rocket Lake AU Optronics B173HAN05.1, IPS, 1920x1080, 17.3" | MSI GT76 Titan DT 10SGS AU Optronics B173ZAN03.3, IPS, 3840x2160, 17.3" | Asus Strix Scar 17 G732LXS LQ173M1JW03 (SHP14DC), IPS, 1920x1080, 17.3" | Schenker XMG Ultra 17 Comet Lake AUO B173ZAN03.0 (AUO309B), IPS, 3840x2160, 17.3" | Alienware m17 R4 AU Optronics AUOEC91, IPS, 1920x1080, 17.3" | |
|---|---|---|---|---|---|
| Display | 18% | 1% | 19% | 1% | |
| Display P3 Coverage (%) | 69.8 | 82.5 18% | 71 2% | 83 19% | 69.8 0% |
| sRGB Coverage (%) | 97.2 | 98 1% | 99 2% | 99.1 2% | 99.7 3% |
| AdobeRGB 1998 Coverage (%) | 72 | 96.6 34% | 71.6 -1% | 97.9 36% | 71.6 -1% |
| Response Times | -170% | 3% | -468% | -68% | |
| Response Time Grey 50% / Grey 80% * (ms) | 5.6 ? | 23.2 ? -314% | 5.8 ? -4% | 50.4 ? -800% | 13.2 ? -136% |
| Response Time Black / White * (ms) | 9.2 ? | 11.6 ? -26% | 8.4 ? 9% | 21.6 ? -135% | 9.2 ? -0% |
| PWM Frequency (Hz) | |||||
| Screen | -26% | -31% | -38% | 12% | |
| Brightness middle (cd/m²) | 306 | 419.5 37% | 310 1% | 442 44% | 305 0% |
| Brightness (cd/m²) | 299 | 413 38% | 311 4% | 423 41% | 301 1% |
| Brightness Distribution (%) | 93 | 93 0% | 82 -12% | 92 -1% | 93 0% |
| Black Level * (cd/m²) | 0.22 | 0.4 -82% | 0.41 -86% | 0.36 -64% | 0.19 14% |
| Contrast (:1) | 1391 | 1049 -25% | 756 -46% | 1228 -12% | 1605 15% |
| Colorchecker dE 2000 * | 1.92 | 3.4 -77% | 2.41 -26% | 4.38 -128% | 1.31 32% |
| Colorchecker dE 2000 max. * | 4.78 | 7.4 -55% | 8.59 -80% | 10.85 -127% | 2.32 51% |
| Colorchecker dE 2000 calibrated * | 1.34 | 3.28 -145% | 1.13 16% | 0.66 51% | 0.91 32% |
| Greyscale dE 2000 * | 2 | 2 -0% | 4.3 -115% | 7.3 -265% | 2.3 -15% |
| Gamma | 2.153 102% | 2.14 103% | 2.149 102% | 2.17 101% | 2.281 96% |
| CCT | 6738 96% | 6858 95% | 7059 92% | 6906 94% | 6449 101% |
| Color Space (Percent of AdobeRGB 1998) (%) | 72 | 84.6 17% | 72 0% | 98 36% | 72 0% |
| Color Space (Percent of sRGB) (%) | 93 | 97.9 5% | 94 1% | 98 5% | 94 1% |
| Total Average (Program / Settings) | -59% /
-36% | -9% /
-21% | -162% /
-81% | -18% /
-0% |
* ... smaller is better
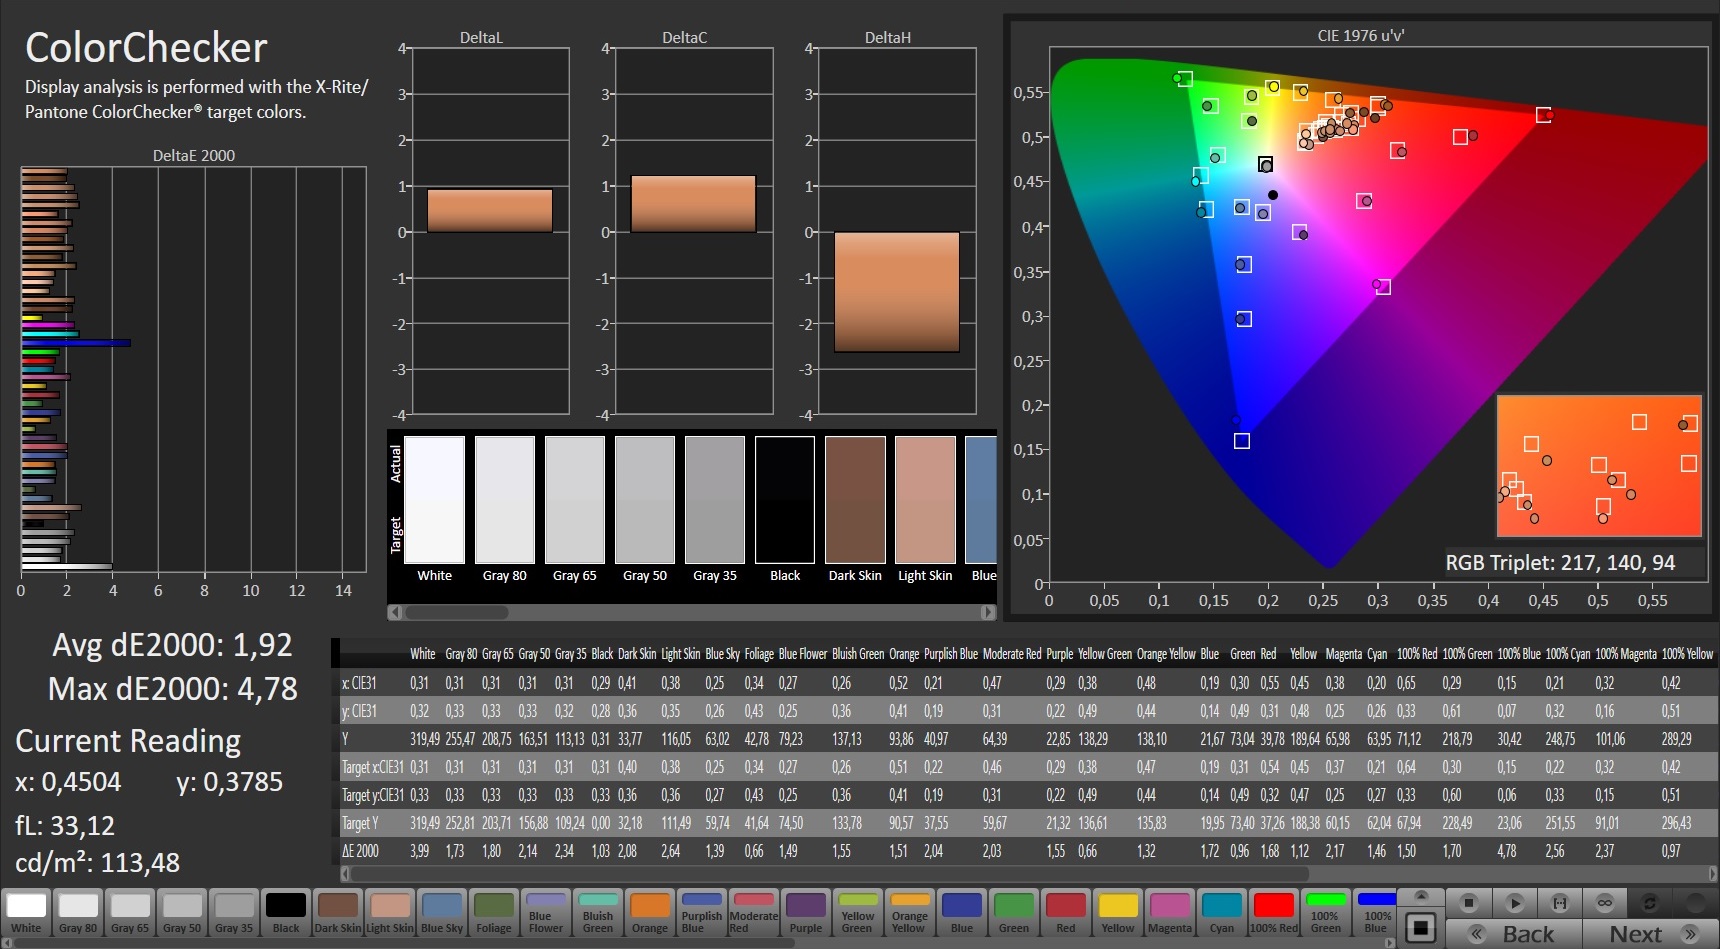
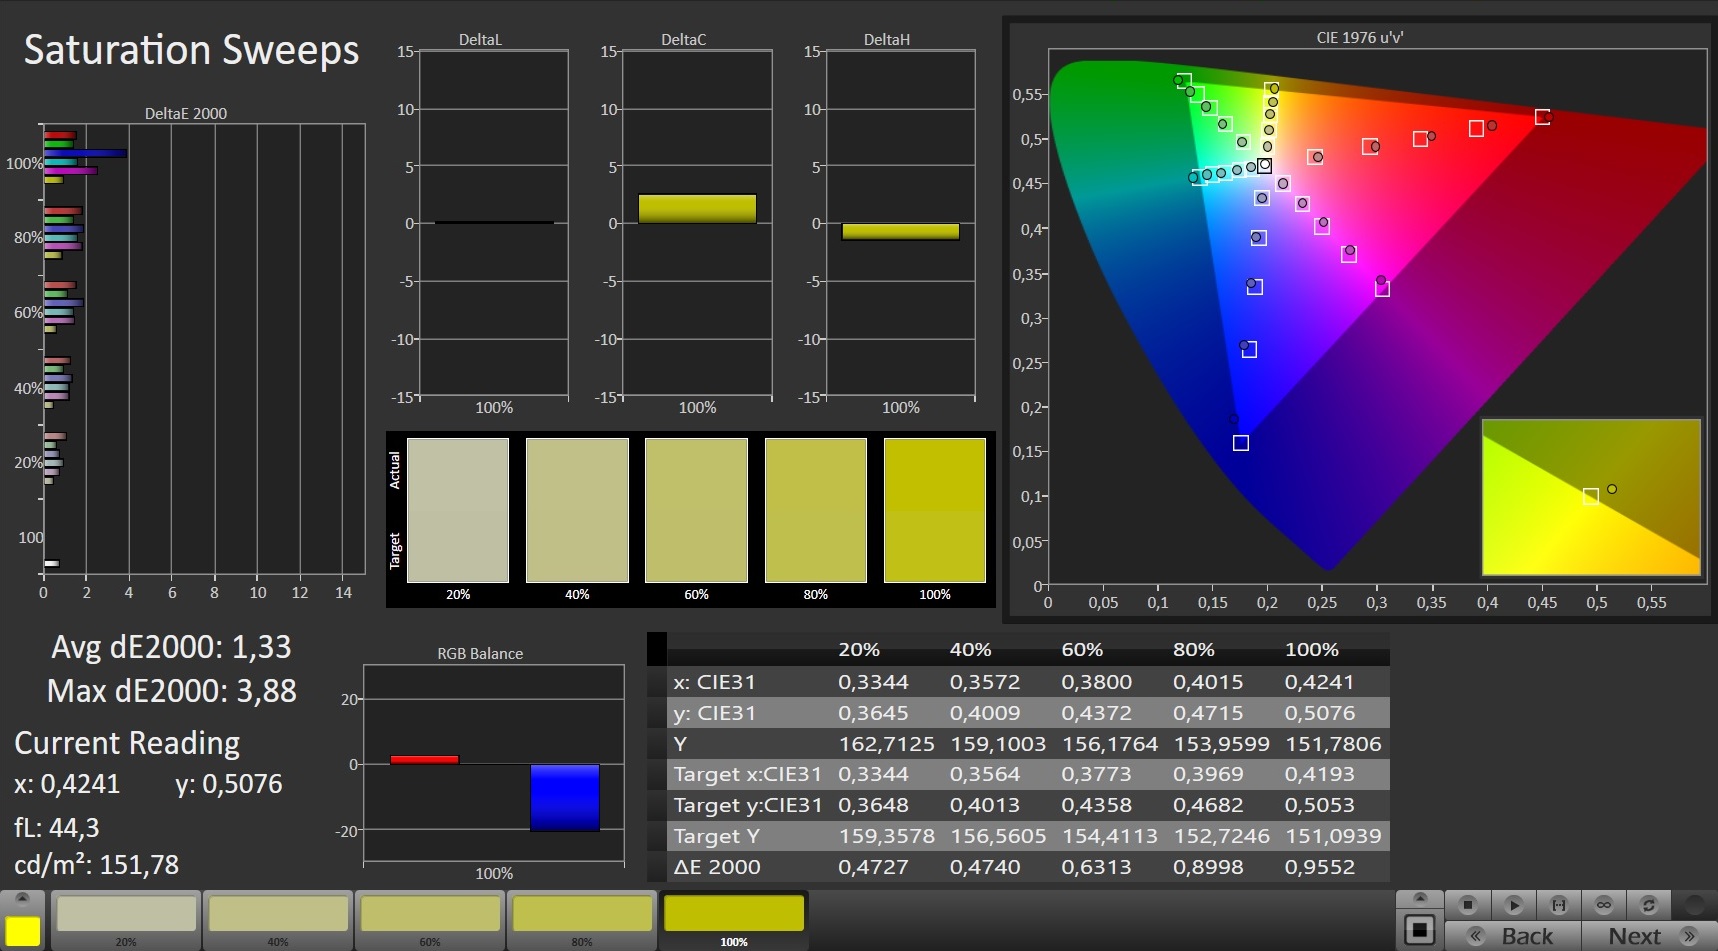
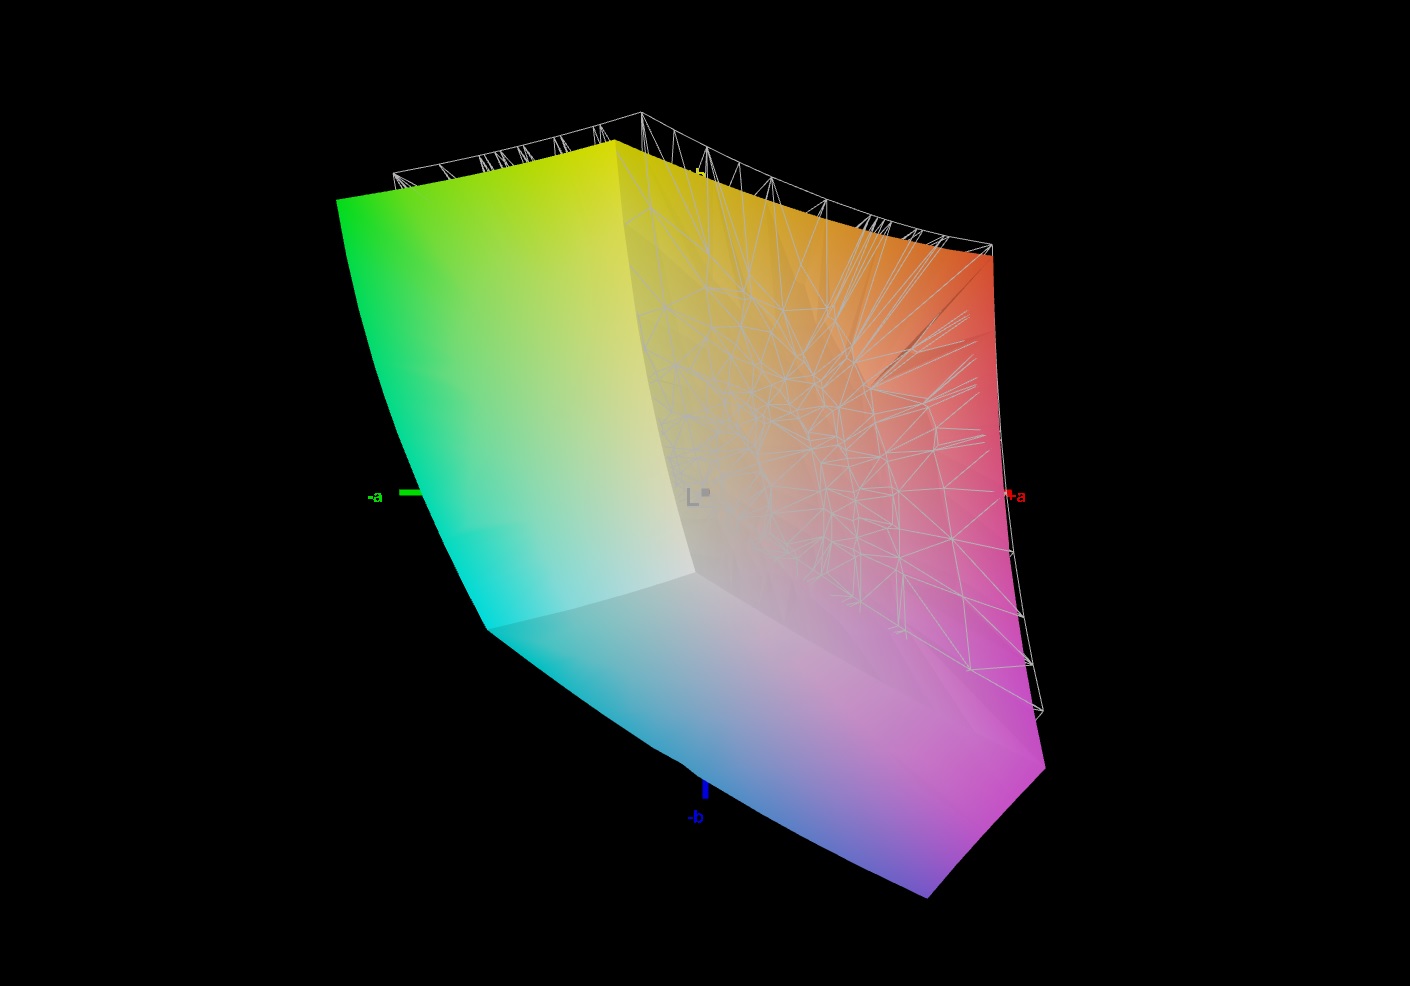
The screen already shows a good color reproduction in its state of delivery and meets the target with a deviation of just under 2 (Delta E less than 3). It does not suffer from a blue cast. A calibration provides improvements: The color deviation drops to 1.34 and the grayscale levels are displayed more balanced. The display cannot completely reproduce the AdobeRGB (72%) and sRGB (93%) color spaces.

Display Response Times
| ↔ Response Time Black to White | ||
|---|---|---|
| 9.2 ms ... rise ↗ and fall ↘ combined | ↗ 4.8 ms rise | 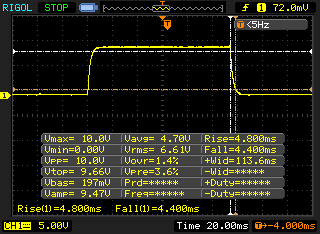 |
| ↘ 4.4 ms fall | ||
| The screen shows fast response rates in our tests and should be suited for gaming. In comparison, all tested devices range from 0.1 (minimum) to 240 (maximum) ms. » 26 % of all devices are better. This means that the measured response time is better than the average of all tested devices (19.8 ms). | ||
| ↔ Response Time 50% Grey to 80% Grey | ||
| 5.6 ms ... rise ↗ and fall ↘ combined | ↗ 2.8 ms rise | 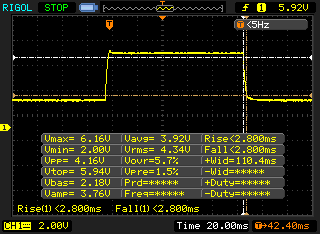 |
| ↘ 2.8 ms fall | ||
| The screen shows very fast response rates in our tests and should be very well suited for fast-paced gaming. In comparison, all tested devices range from 0.165 (minimum) to 636 (maximum) ms. » 18 % of all devices are better. This means that the measured response time is better than the average of all tested devices (30.9 ms). | ||
Screen Flickering / PWM (Pulse-Width Modulation)
| Screen flickering / PWM not detected | 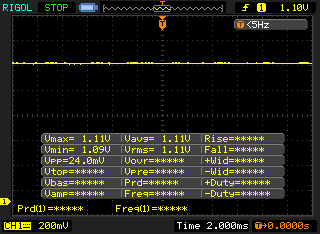 | ||
In comparison: 52 % of all tested devices do not use PWM to dim the display. If PWM was detected, an average of 7741 (minimum: 5 - maximum: 343500) Hz was measured. | |||
The viewing-angle stable IPS panel can be read from any position. It is quite possible to read the display outdoors if the sun is not too bright.

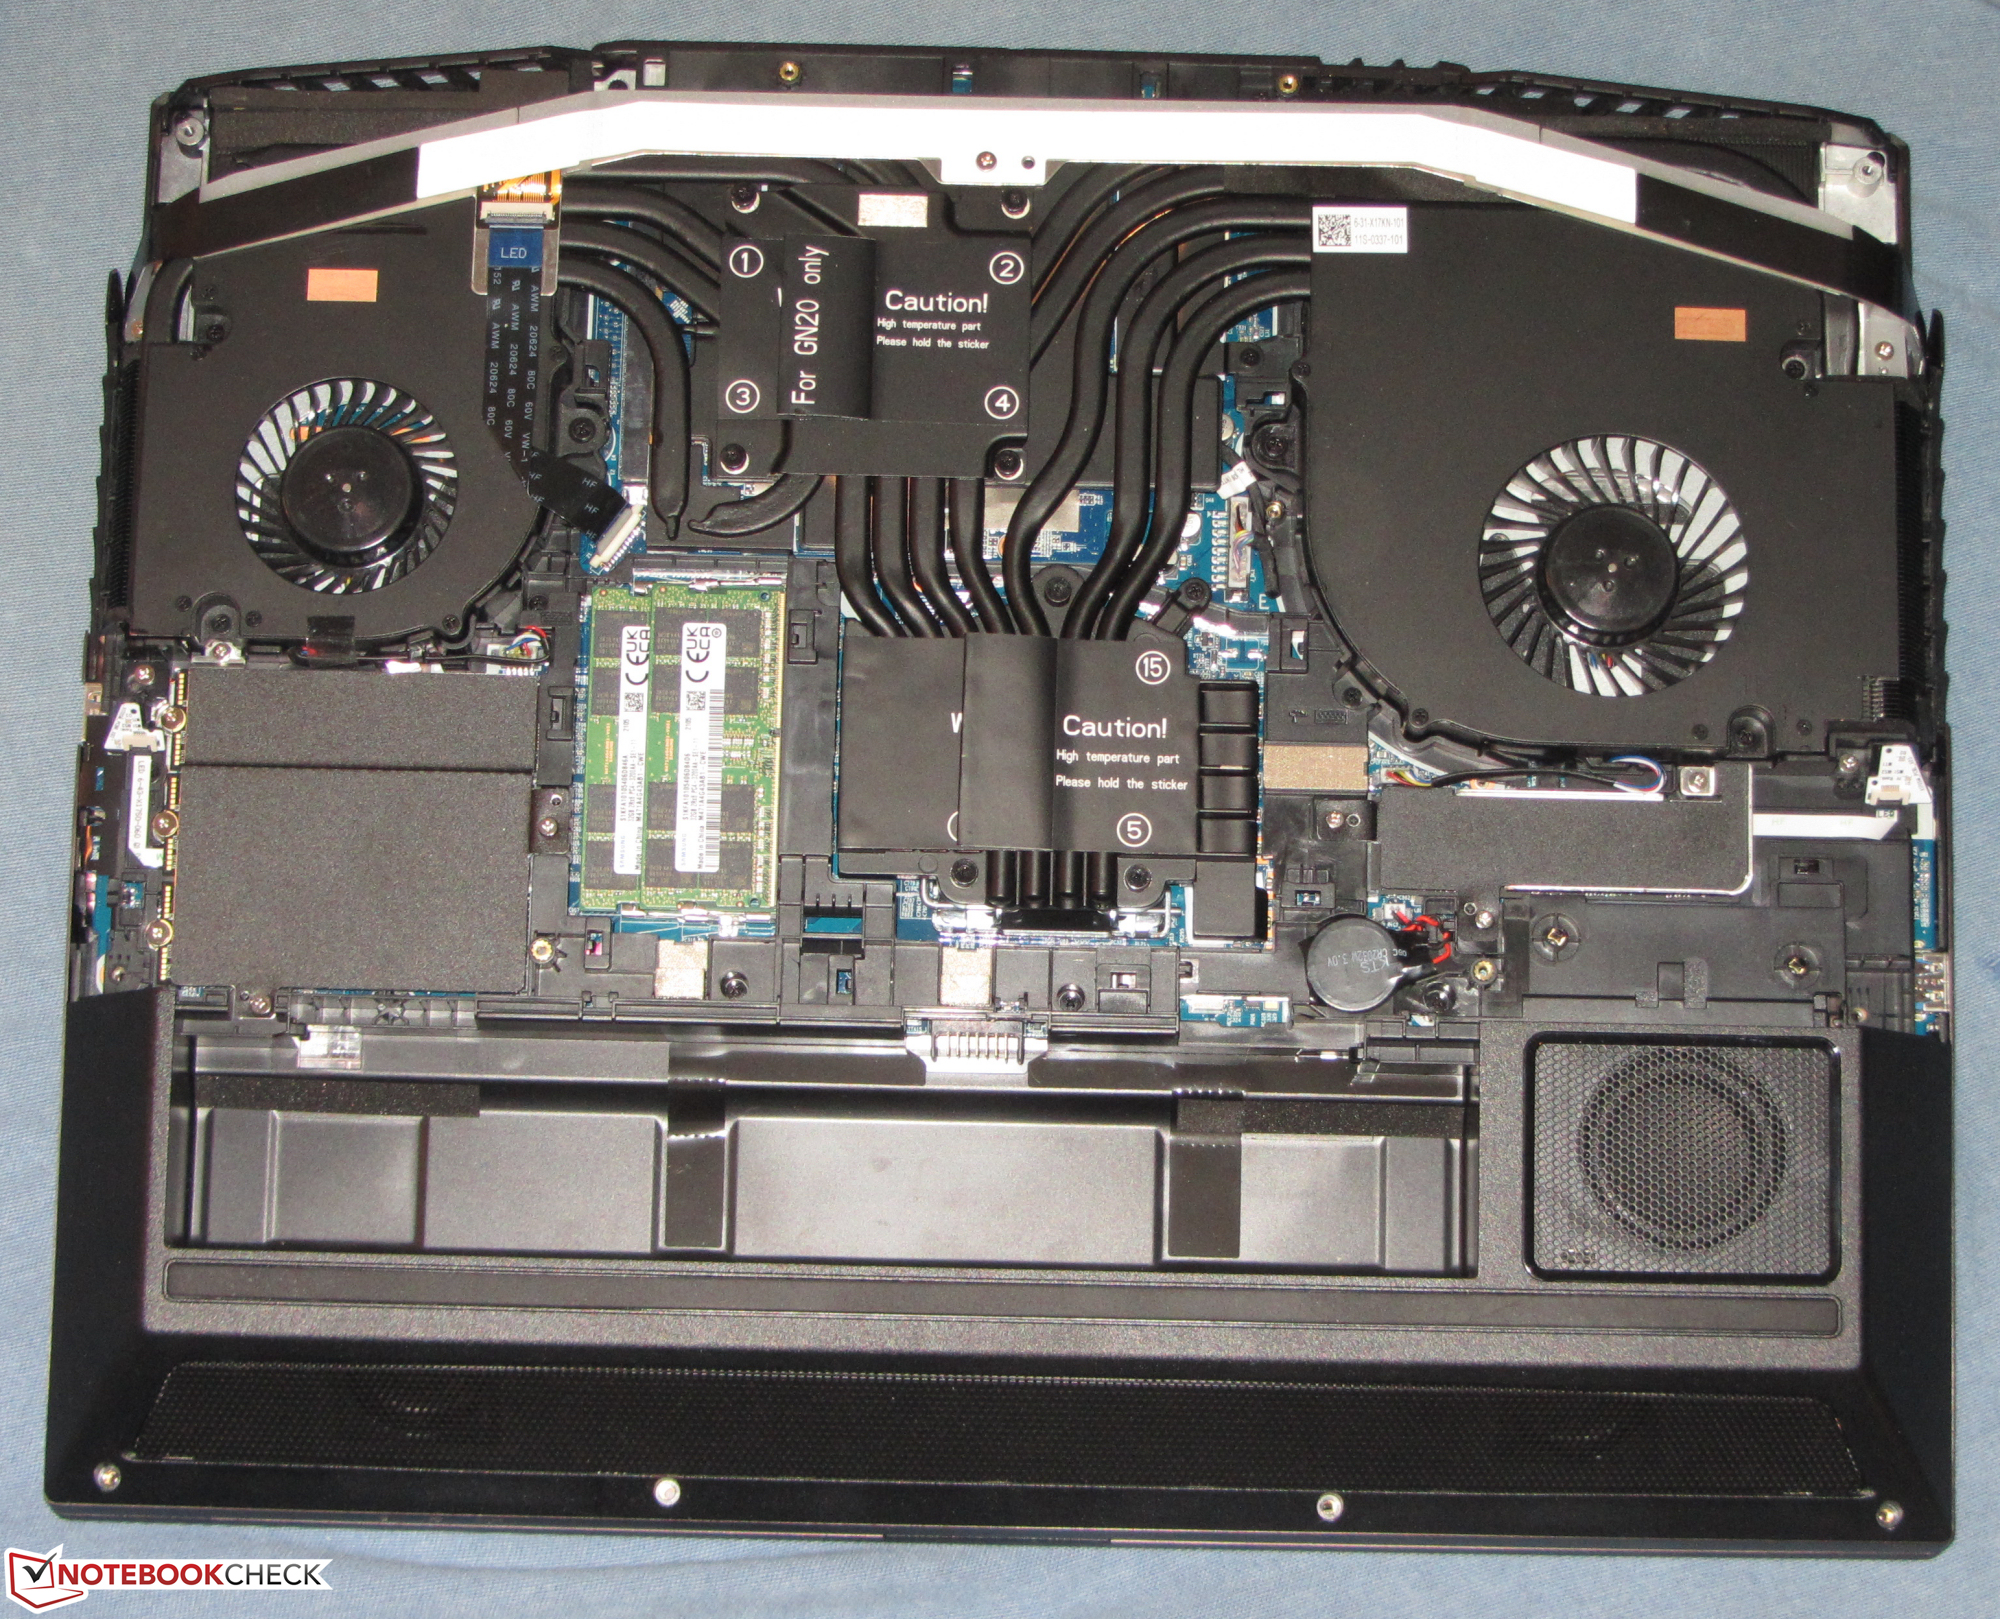
Performance - XMG Ultra 17 allows CPU and GPU swap
Schenker's desktop replacement notebook offers a lot of computing power and performs accordingly in all common application areas. The device can be configured very individually.
Test conditions
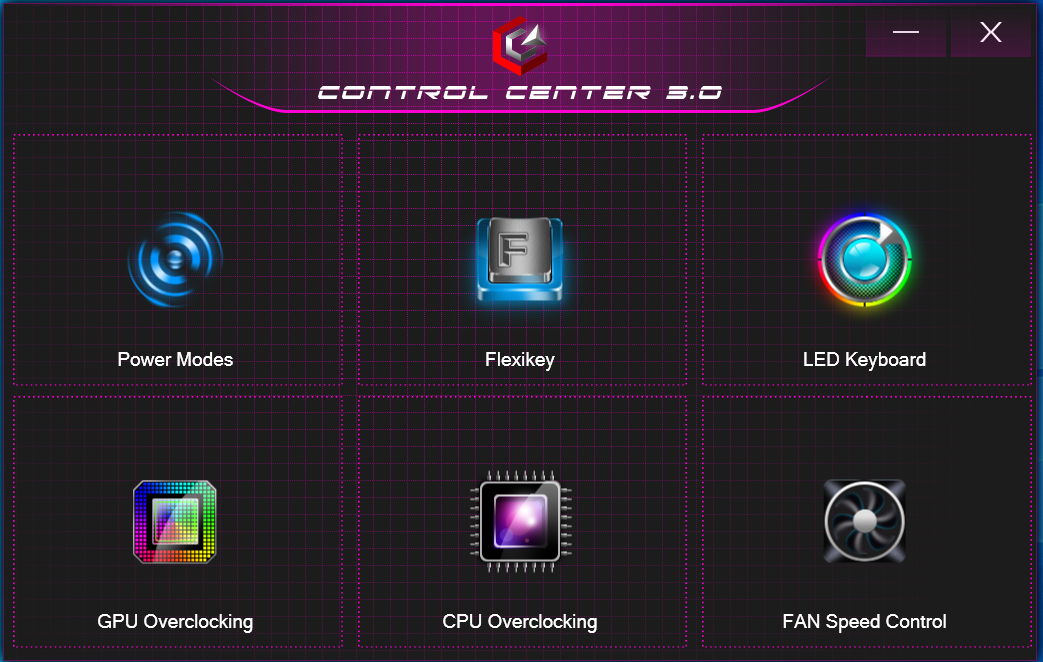
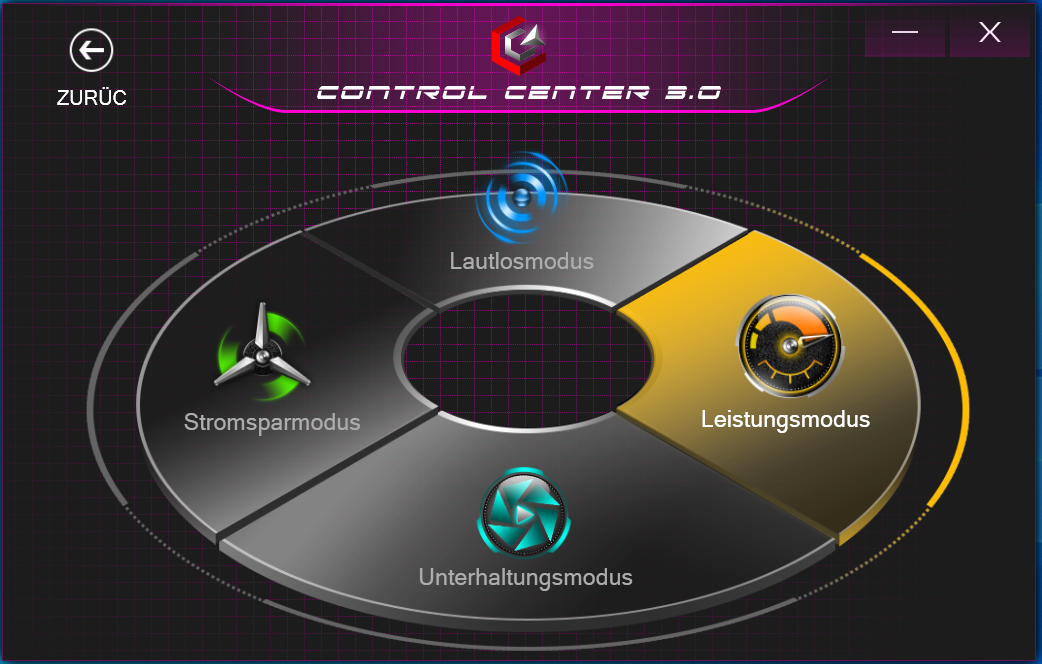
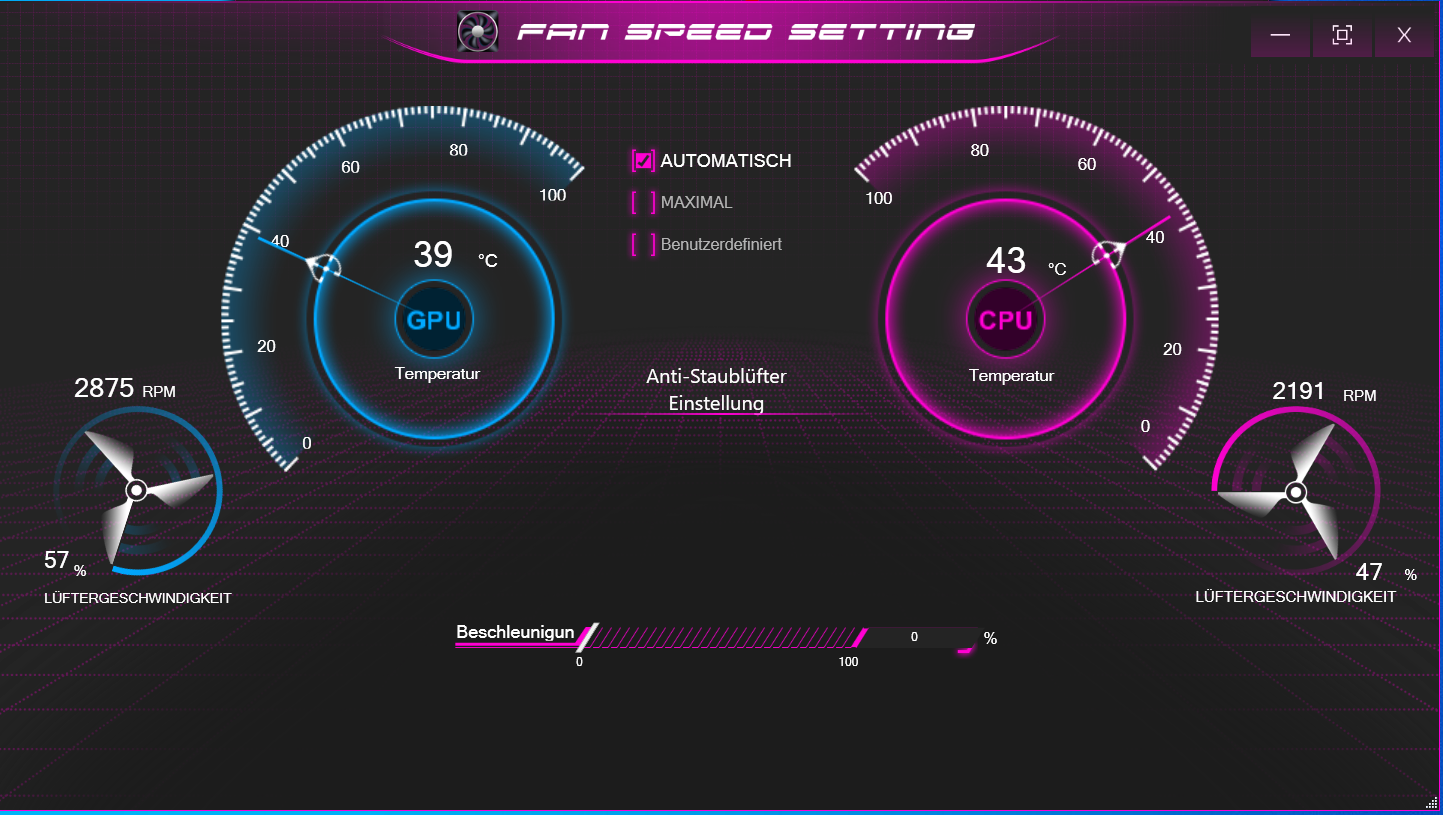
The pre-installed Control Center allows selecting a performance profile, among other things. We performed our 3D tests with an active "Performance Mode" profile and automatic fan control. We used the "Entertainment Mode" profile for the idle and battery tests.
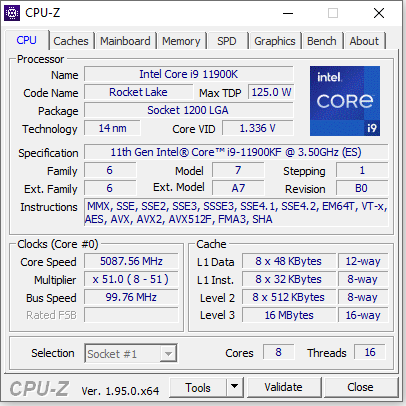
Processor
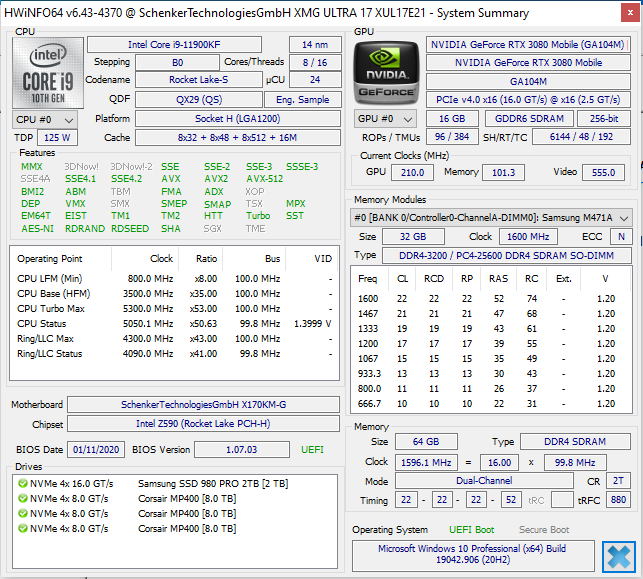
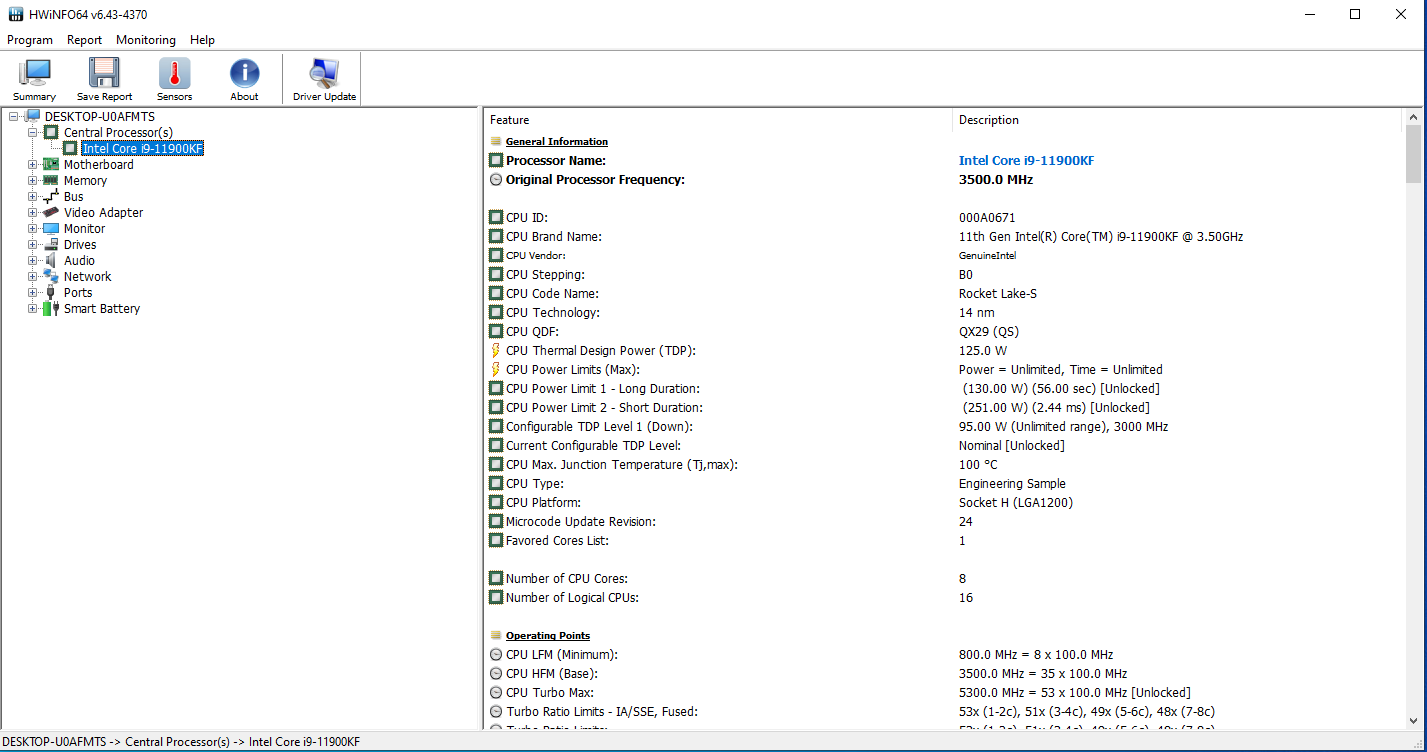
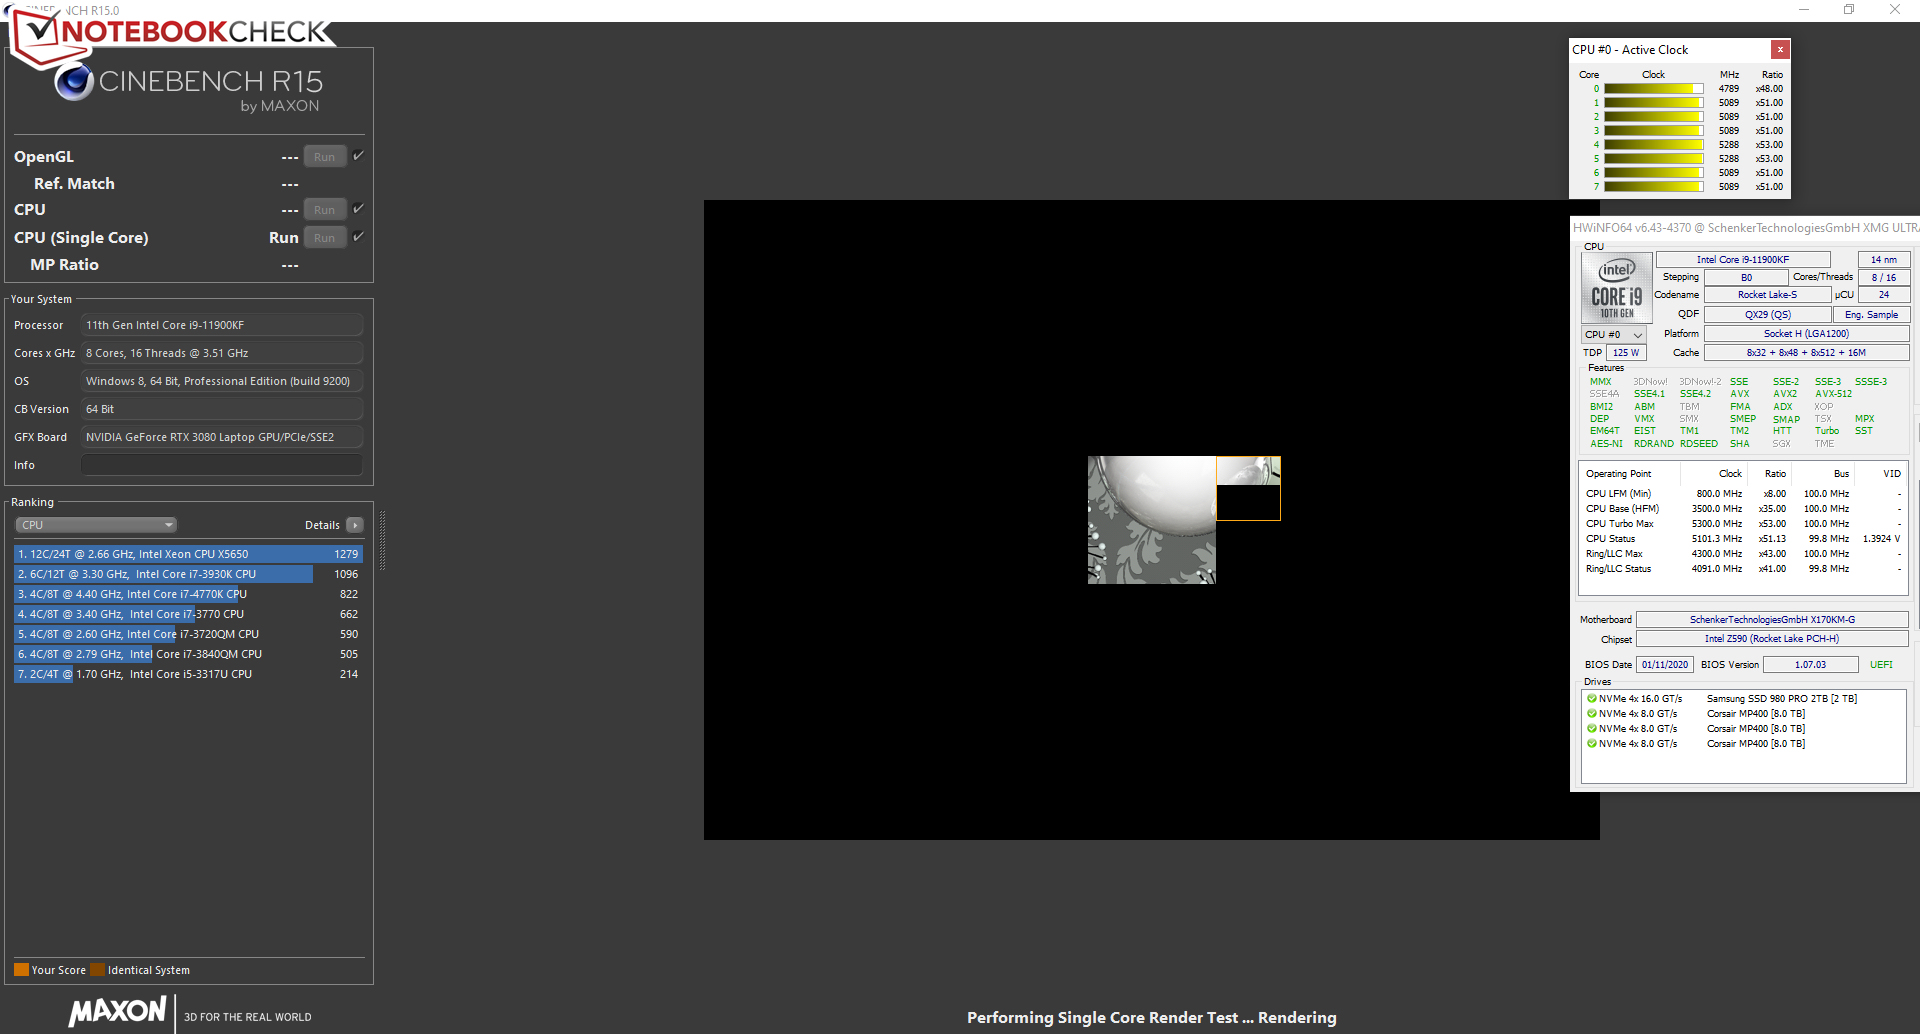
The Core-i9-11900K eight-core processor (Rocket Lake) works with a base clock of 3.5 GHz. The clock can be increased to 4.8 GHz (eight cores) up to 5.3 GHz (single core) via Turbo. Hyperthreading (two threads per core) is supported. Thanks to the free multiplier, the processor could be overclocked quite easily. The CPU is in a socket and could thus be swapped.
The CPU tests of the Cinebench R15 benchmark are run with 4.6 to 4.8 GHz (multi-thread) and 4.8 to 5.3 GHz (single-thread). On battery power, the CPU runs at 800 MHz to 4.8 GHz (multi-thread) or 3.6 to 5.1 GHz (single-thread).
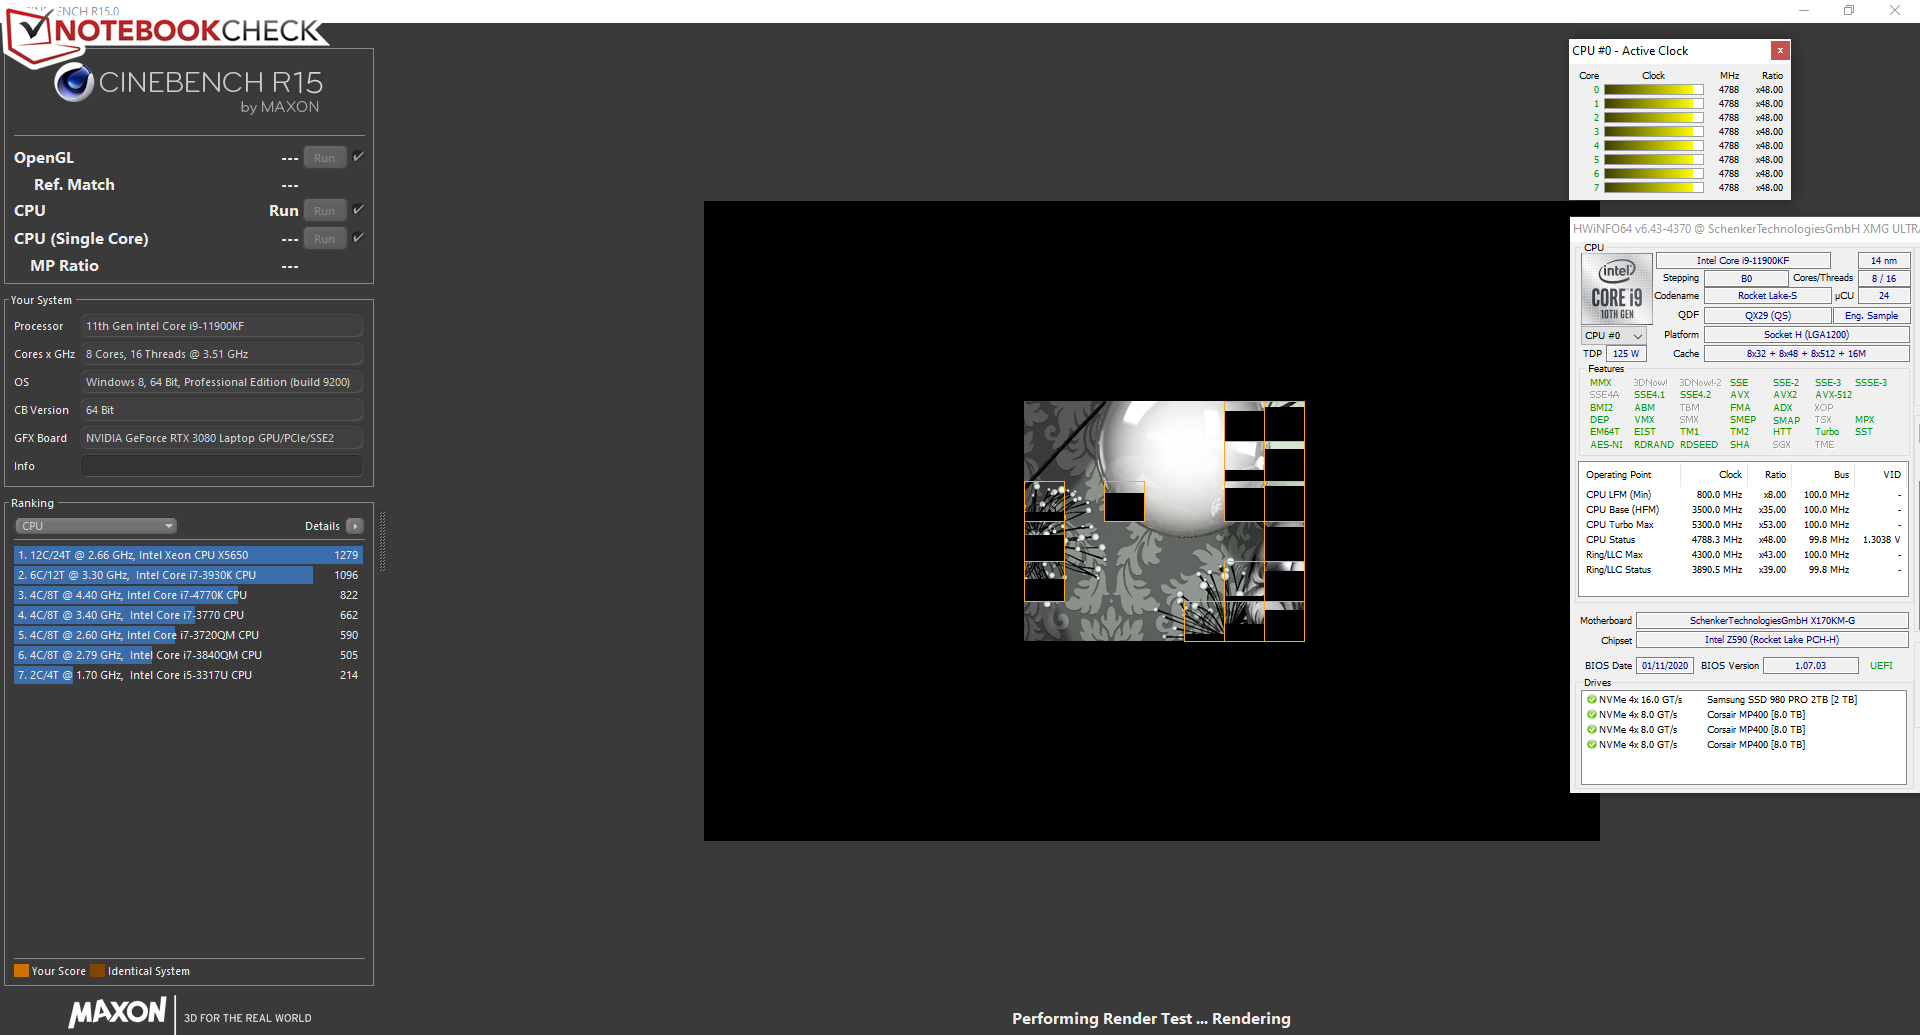
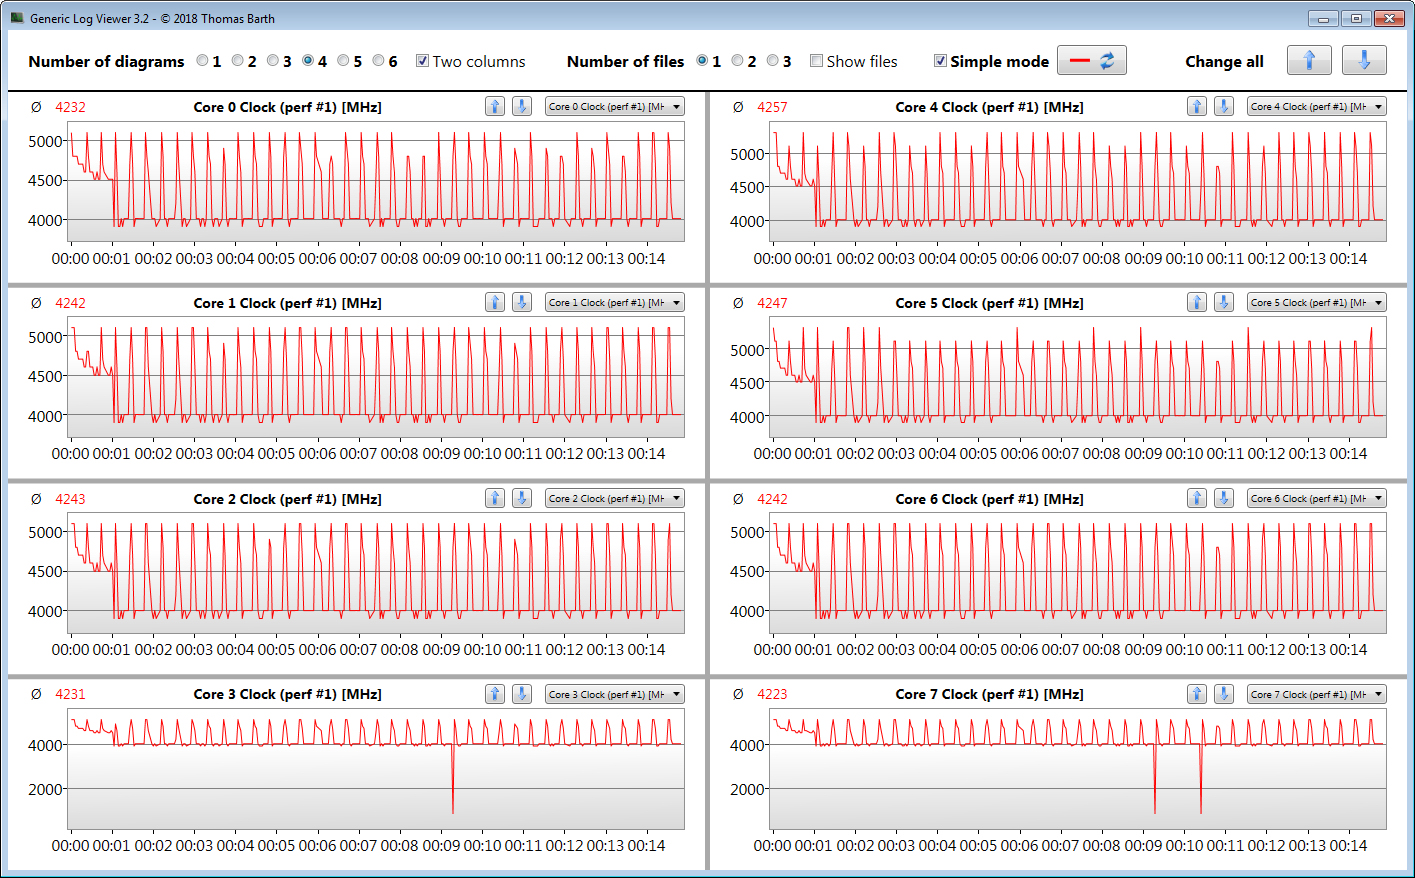
We check whether the CPU Turbo is also used permanently in mains operation by running the multi-thread test of the Cinebench R15 benchmark in a loop. High speeds are achieved within the first minute of the test. Then, the clock drops to values around 4 GHz.
Rocket Lake leaves a good impression. Intel was able to increase the per-MHz performance significantly. As a result, the lack of two CPU cores compared to the Comet Lake predecessor (Core i9-10900K) can be compensated to a certain degree in multi-thread applications.The11900K can show off in terms of single-thread performance. It is ahead of its predecessor here.
* ... smaller is better
System performance
The fact that there is no lack of computing power should not be surprising in view of the hardware equipment. The laptop is impressive in all common application areas. The very good PCMark results confirm this.
| PCMark 8 Home Score Accelerated v2 | 5529 points | |
| PCMark 8 Creative Score Accelerated v2 | 7020 points | |
| PCMark 8 Work Score Accelerated v2 | 6151 points | |
| PCMark 10 Score | 7884 points | |
Help | ||
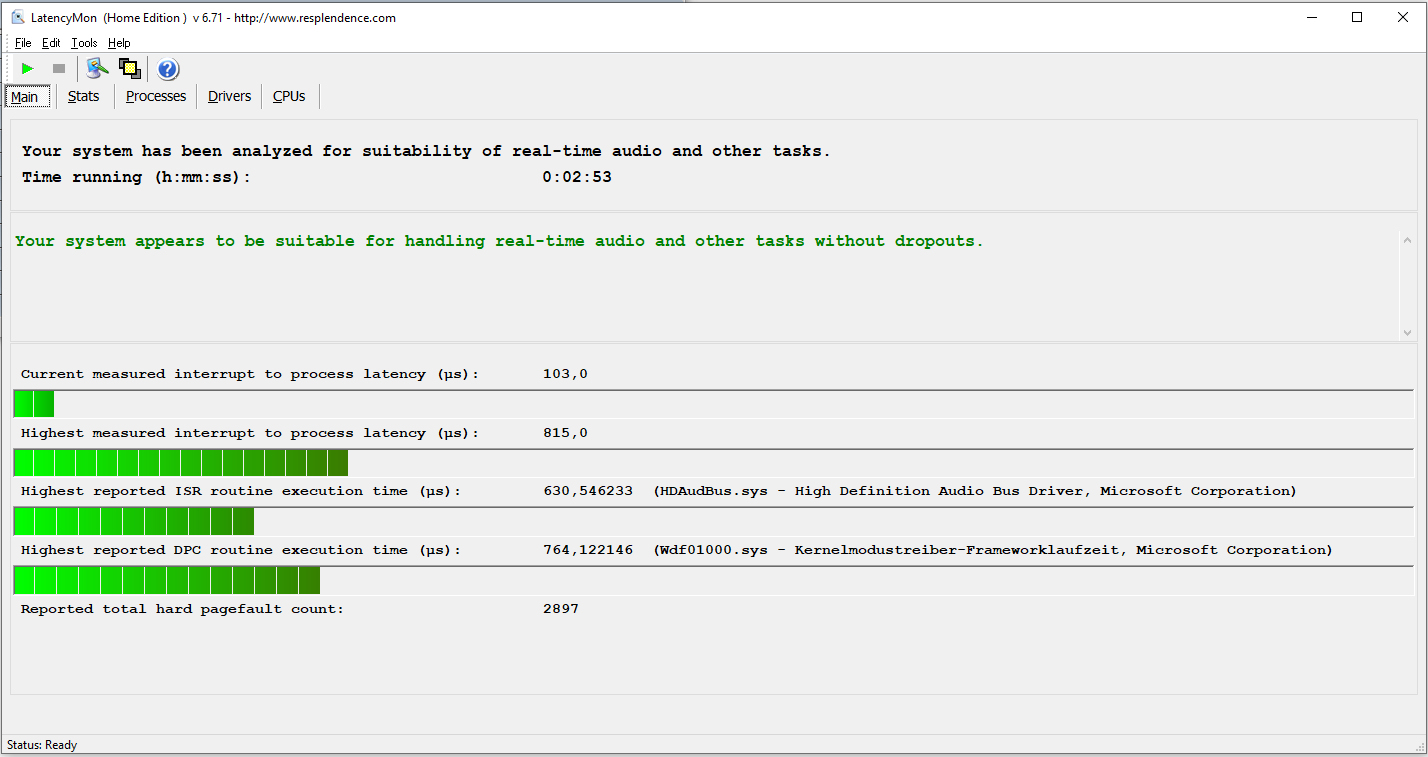
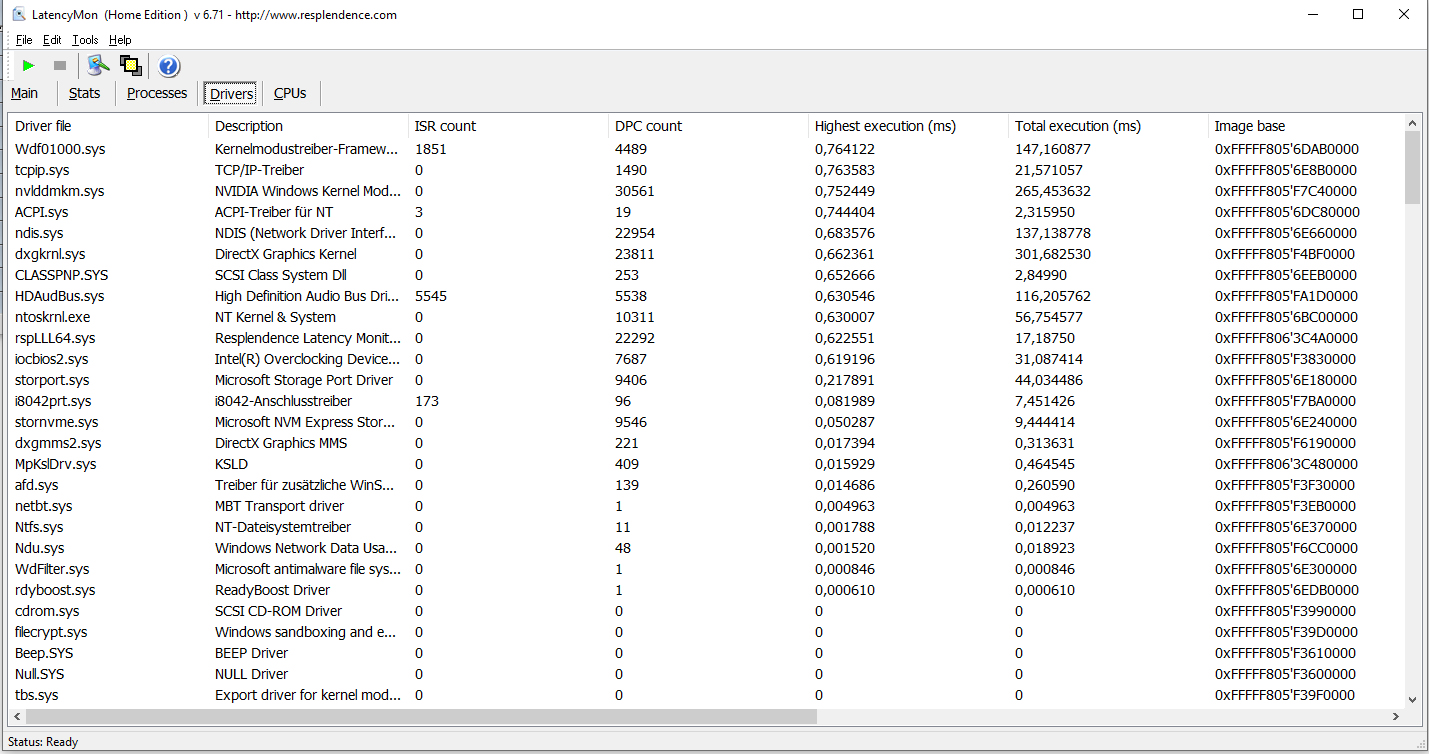
DPC latencies
In our standardized latency monitor test (web surfing, 4K video playback, Prime95 high-load), we did not observe any abnormalities in the DPC latencies. The system seems to be suitable for real-time video and audio editing.
| DPC Latencies / LatencyMon - interrupt to process latency (max), Web, Youtube, Prime95 | |
| MSI GT76 Titan DT 10SGS | |
| Asus Strix Scar 17 G732LXS | |
| Schenker XMG Ultra 17 Rocket Lake | |
| Alienware m17 R4 | |
| Schenker XMG Ultra 17 Comet Lake | |
* ... smaller is better
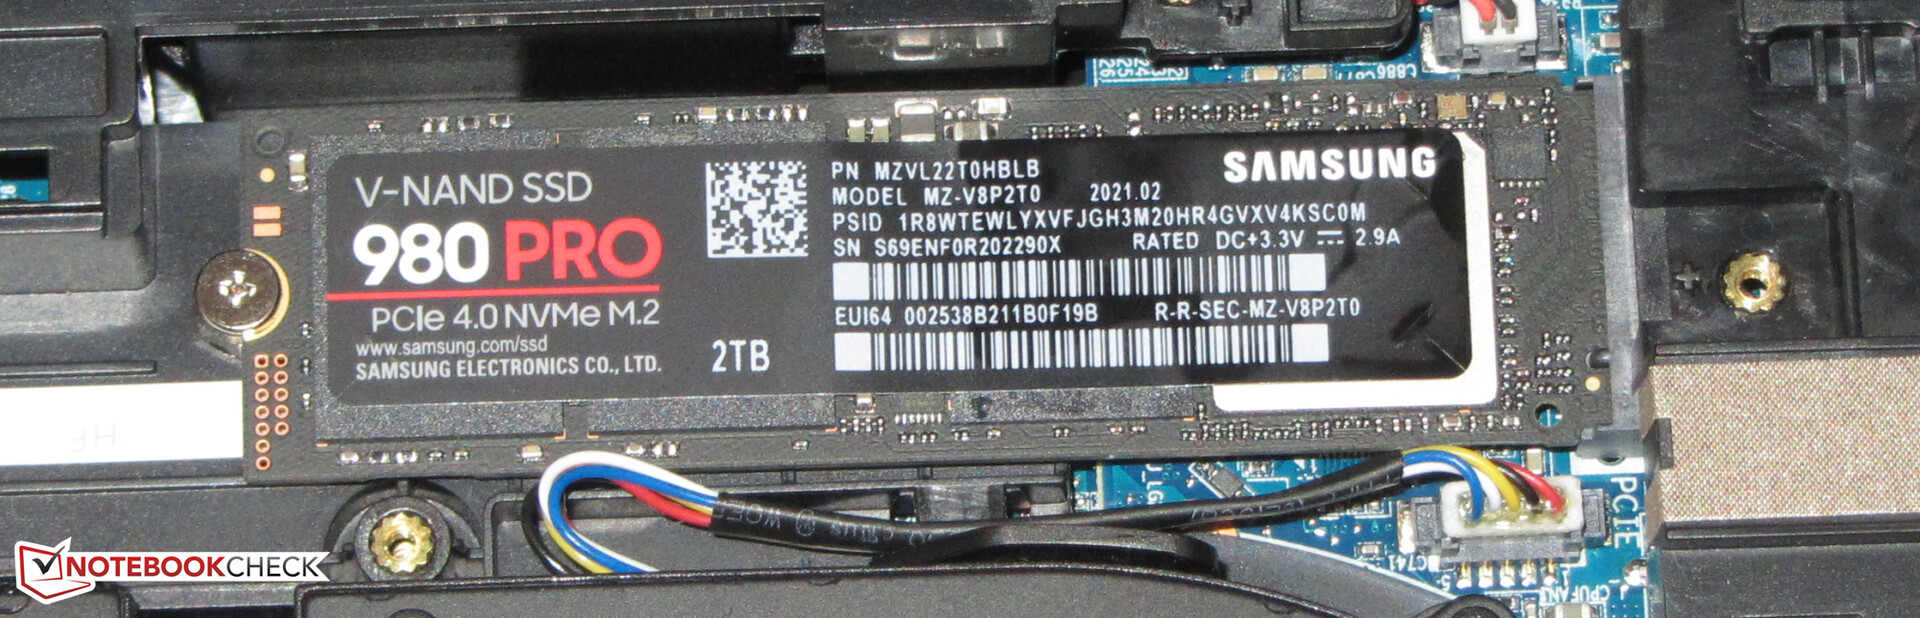
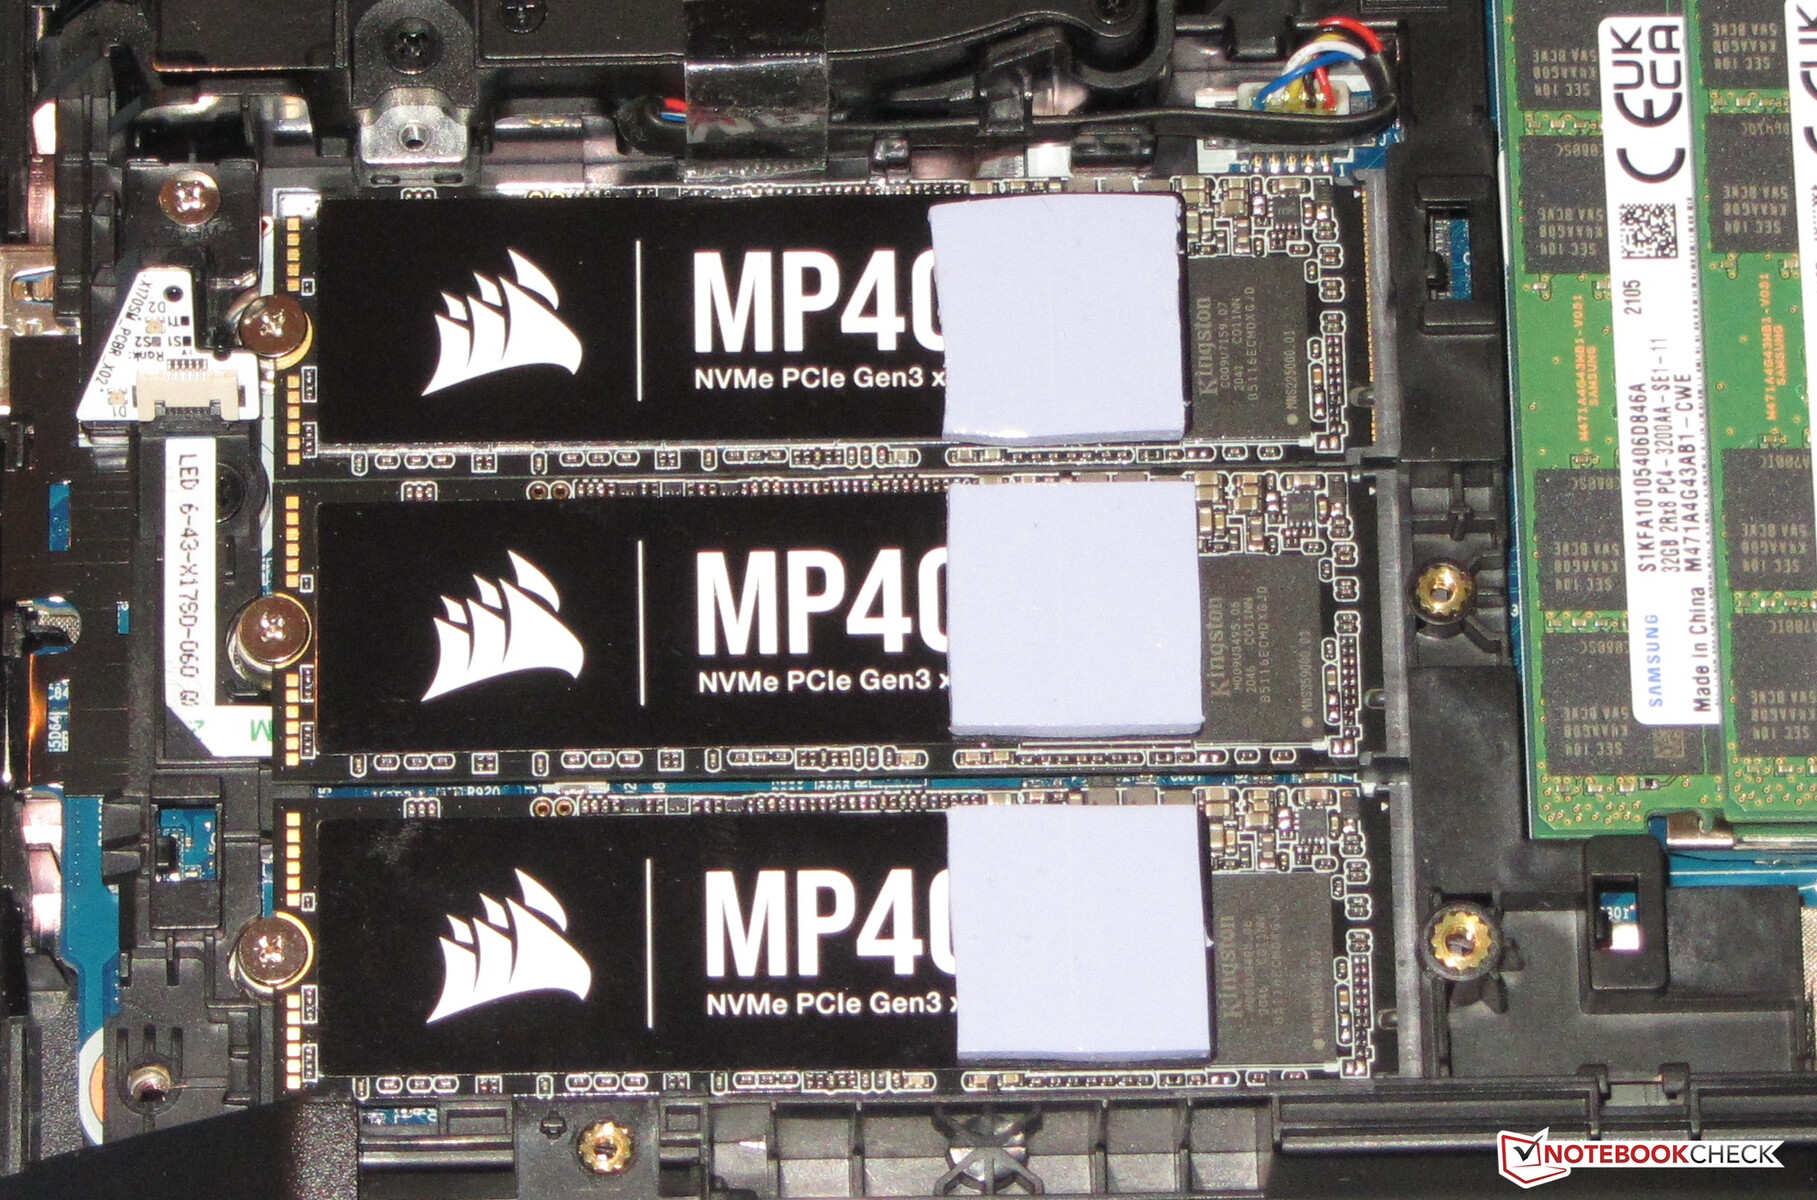
Mass storage
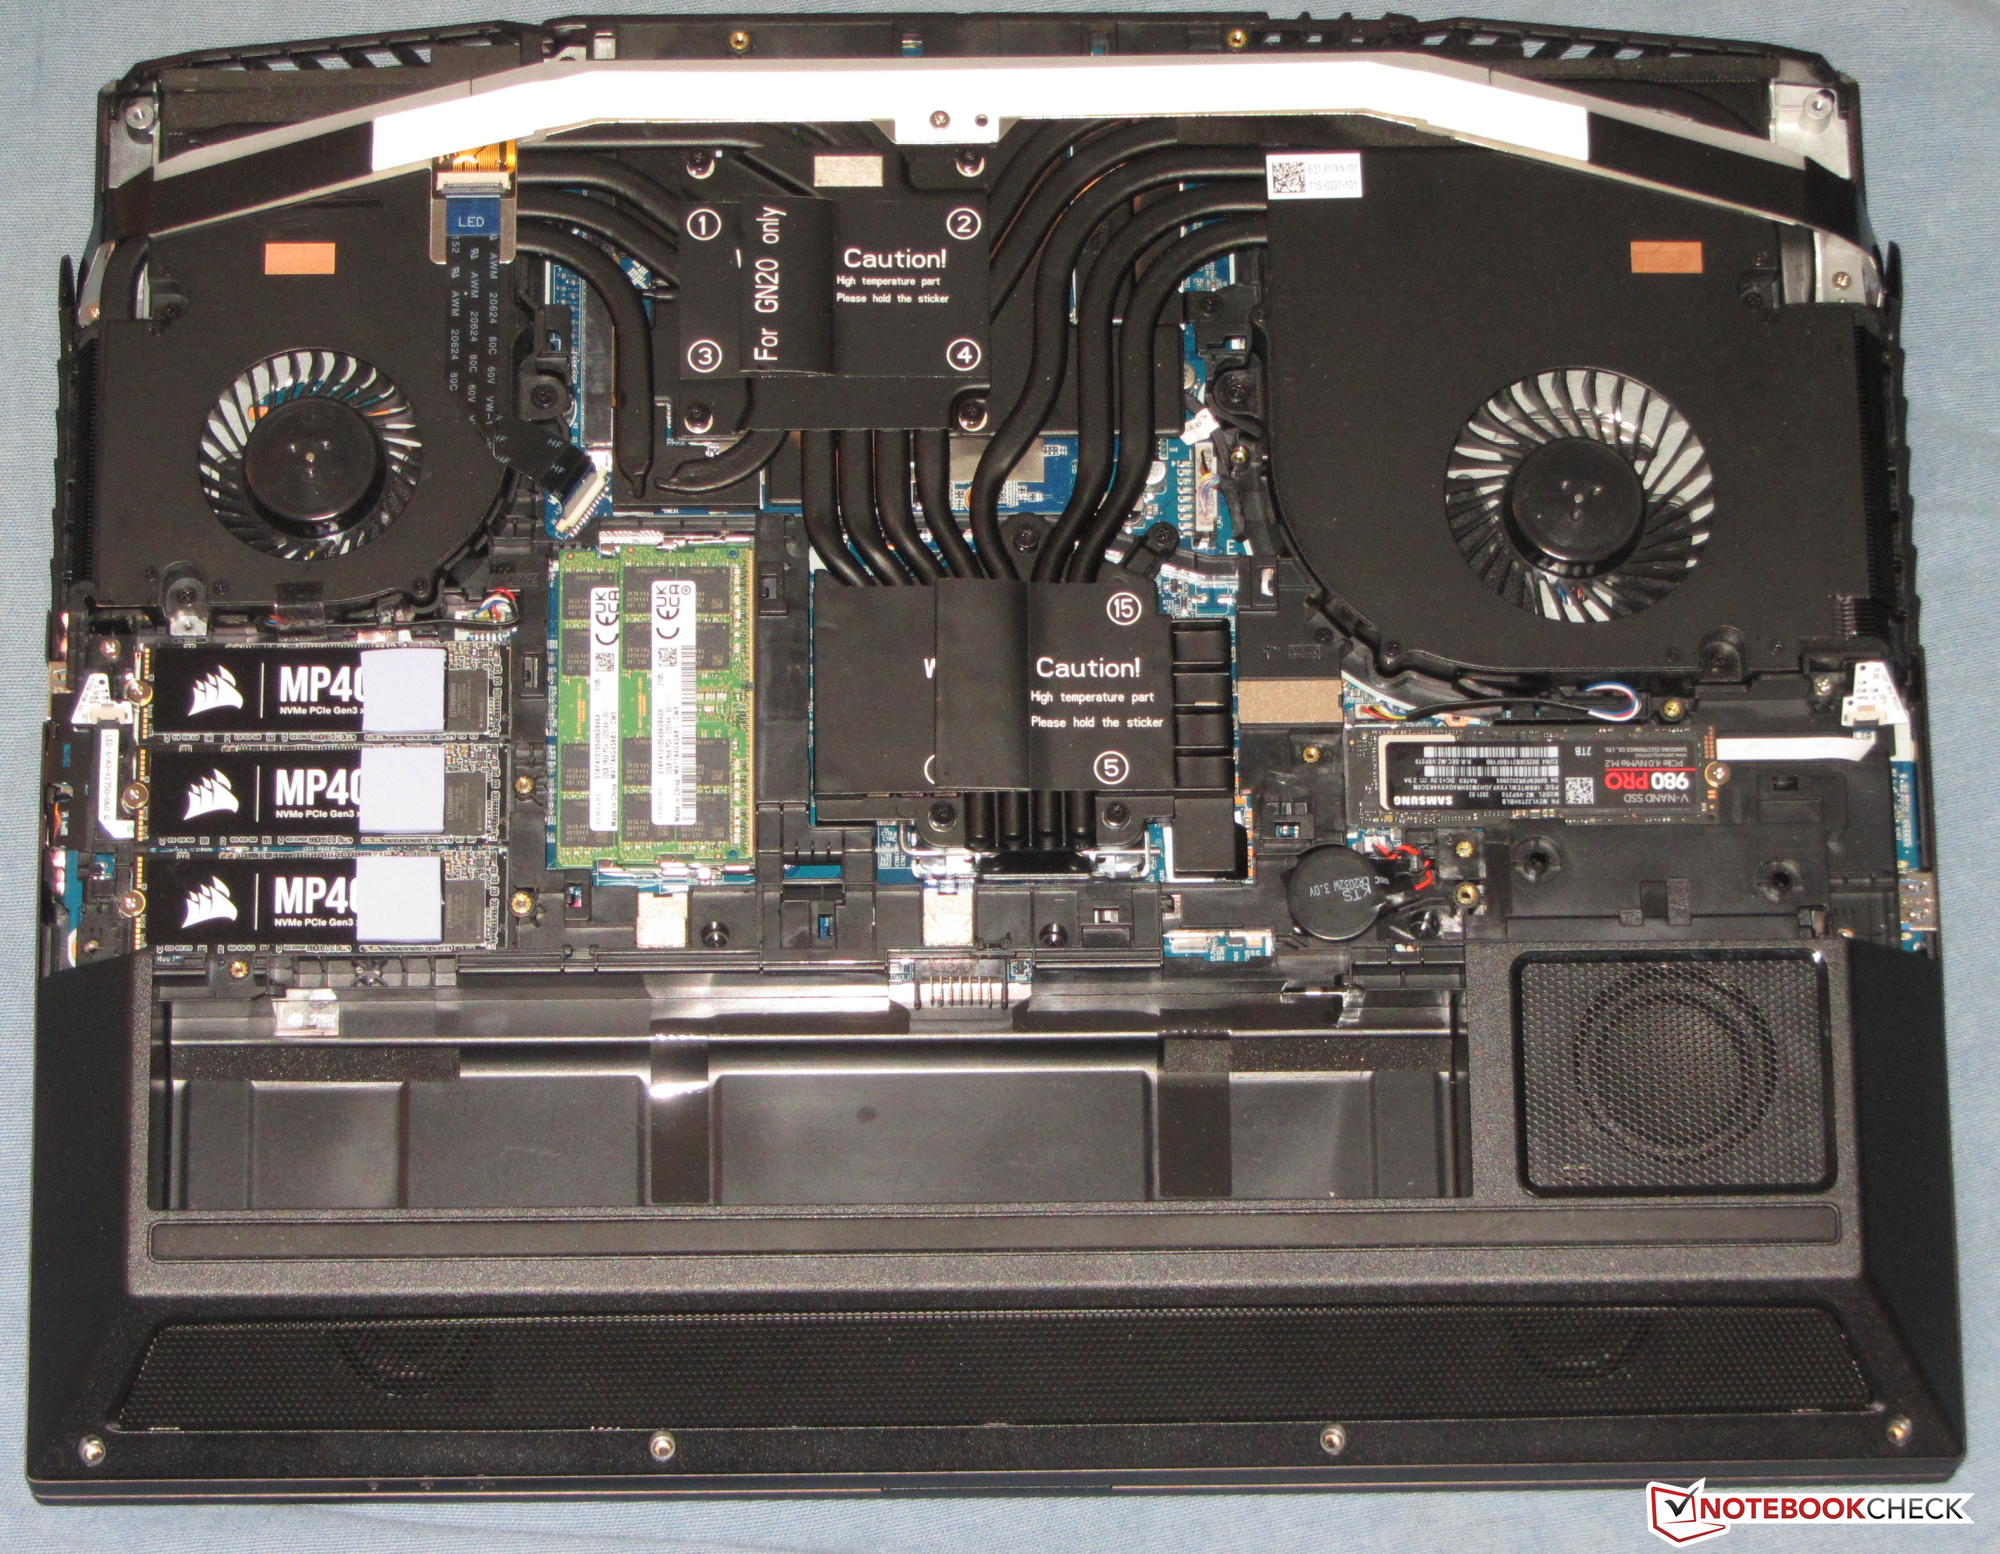
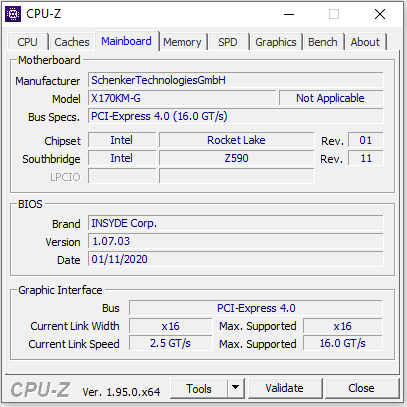
An NVMe SSD (M.2-2280) from Samsung serves as the system drive. It provides 2 TB of storage space and delivers excellent transfer rates thanks to the PCI Express 4 connection. The notebook has three additional M.2-2280 slots that can be equipped with NVMe-SSDs (connection via PCI Express 3.0). Two of the three slots could alternatively accommodate SATA SSDs. RAID 0/1/5 is supported.

| Schenker XMG Ultra 17 Rocket Lake Samsung SSD 980 Pro 2TB MZ-V8P2T0 | MSI GT76 Titan DT 10SGS 2x WDC PC SN730 SDBPNTY-1T00 (RAID 0) | Asus Strix Scar 17 G732LXS 2x Intel SSD 660p 1TB SSDPEKNW010T8 (RAID 0) | Schenker XMG Ultra 17 Comet Lake Samsung SSD 970 EVO Plus 2TB | Alienware m17 R4 2x Micron 2300 512 GB (RAID 0) | |
|---|---|---|---|---|---|
| CrystalDiskMark 5.2 / 6 | -42% | -48% | -35% | -42% | |
| Write 4K (MB/s) | 240 | 116.4 -51% | 125.8 -48% | 172 -28% | 93.1 -61% |
| Read 4K (MB/s) | 87.8 | 43.85 -50% | 52.9 -40% | 47.3 -46% | 46.79 -47% |
| Write Seq (MB/s) | 4281 | 2927 -32% | 1795 -58% | 2980 -30% | 2853 -33% |
| Read Seq (MB/s) | 4228 | 1997 -53% | 2315 -45% | 2790 -34% | 2556 -40% |
| Write 4K Q32T1 (MB/s) | 696 | 467.6 -33% | 407.1 -42% | 481.8 -31% | 475 -32% |
| Read 4K Q32T1 (MB/s) | 778 | 538 -31% | 411.9 -47% | 565 -27% | 529 -32% |
| Write Seq Q32T1 (MB/s) | 5195 | 3362 -35% | 2844 -45% | 3295 -37% | 3331 -36% |
| Read Seq Q32T1 (MB/s) | 7099 | 3558 -50% | 3130 -56% | 3550 -50% | 3319 -53% |
| AS SSD | -52% | -54% | -16% | -53% | |
| Seq Read (MB/s) | 5010 | 2406 -52% | 2450 -51% | 2980 -41% | 2733 -45% |
| Seq Write (MB/s) | 3974 | 2867 -28% | 1436 -64% | 2585 -35% | 2822 -29% |
| 4K Read (MB/s) | 51.9 | 41.51 -20% | 49.48 -5% | 52.7 2% | 45.04 -13% |
| 4K Write (MB/s) | 156.8 | 108.8 -31% | 119.4 -24% | 163.1 4% | 88.4 -44% |
| 4K-64 Read (MB/s) | 2611 | 1525 -42% | 1032 -60% | 1954 -25% | 1388 -47% |
| 4K-64 Write (MB/s) | 3859 | 1424 -63% | 1229 -68% | 2347 -39% | 1227 -68% |
| Access Time Read * (ms) | 0.072 | 0.041 43% | 0.145 -101% | 0.039 46% | 0.079 -10% |
| Access Time Write * (ms) | 0.026 | 0.102 -292% | 0.036 -38% | 0.023 12% | 0.095 -265% |
| Score Read (Points) | 3164 | 1807 -43% | 1327 -58% | 2304 -27% | 1706 -46% |
| Score Write (Points) | 4414 | 1819 -59% | 1492 -66% | 2768 -37% | 1598 -64% |
| Score Total (Points) | 9134 | 4573 -50% | 3456 -62% | 6232 -32% | 4184 -54% |
| Copy ISO MB/s (MB/s) | 3424 | 2605 -24% | 2414 -29% | ||
| Copy Program MB/s (MB/s) | 1091 | 651 -40% | 1030 -6% | ||
| Copy Game MB/s (MB/s) | 2365 | 1709 -28% | 1991 -16% | ||
| Total Average (Program / Settings) | -47% /
-48% | -51% /
-51% | -26% /
-24% | -48% /
-49% |
* ... smaller is better
Continuous reading: DiskSpd Read Loop, Queue Depth 8
Graphics card
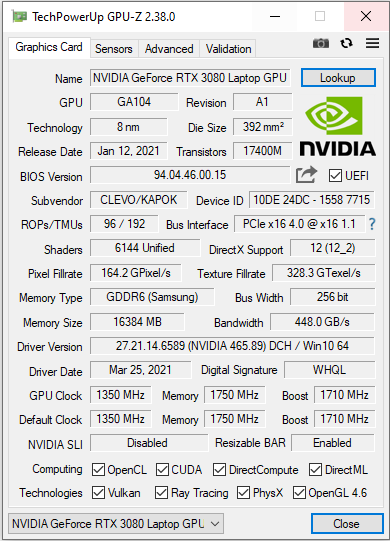
The GeForce RTX-3080 laptop graphics core represents Nvidia's currently most powerful notebook GPU. It can draw on fast GDDR6 graphics memory (16,384 MB). GPU and memory are not permanently soldered to the motherboard, but sit on an MXM plug-in card. Swapping the card would be possible. The processor-integrated UHD Graphics Xe-750-32EUs GPU is disabled ex-factory and the notebook does not work with Nvidia's switching graphics solution Optimus.
Notebook manufacturers can choose the TGP and thus the maximum available computing power of an RTX-3000 graphics core quite freely within the limits defined by Nvidia (Overview of all RTX-3080 laptops including the TGPs) Schenker chooses the maximum of 165 watts (150 watts + 15 watts Dynamic Boost). As a result, the Ultra 17 performs very well in the GPU and gaming tests.
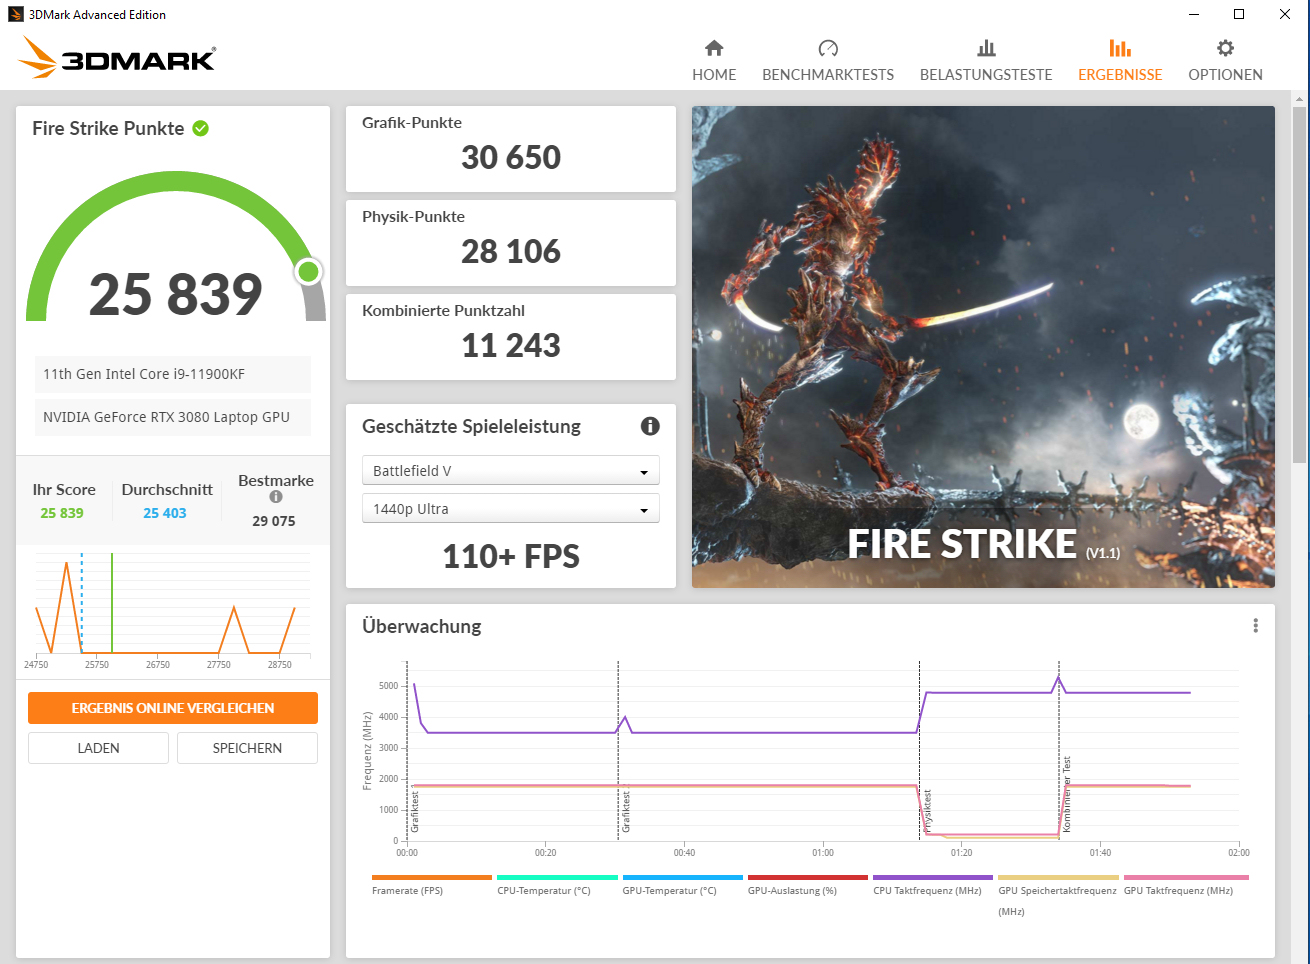
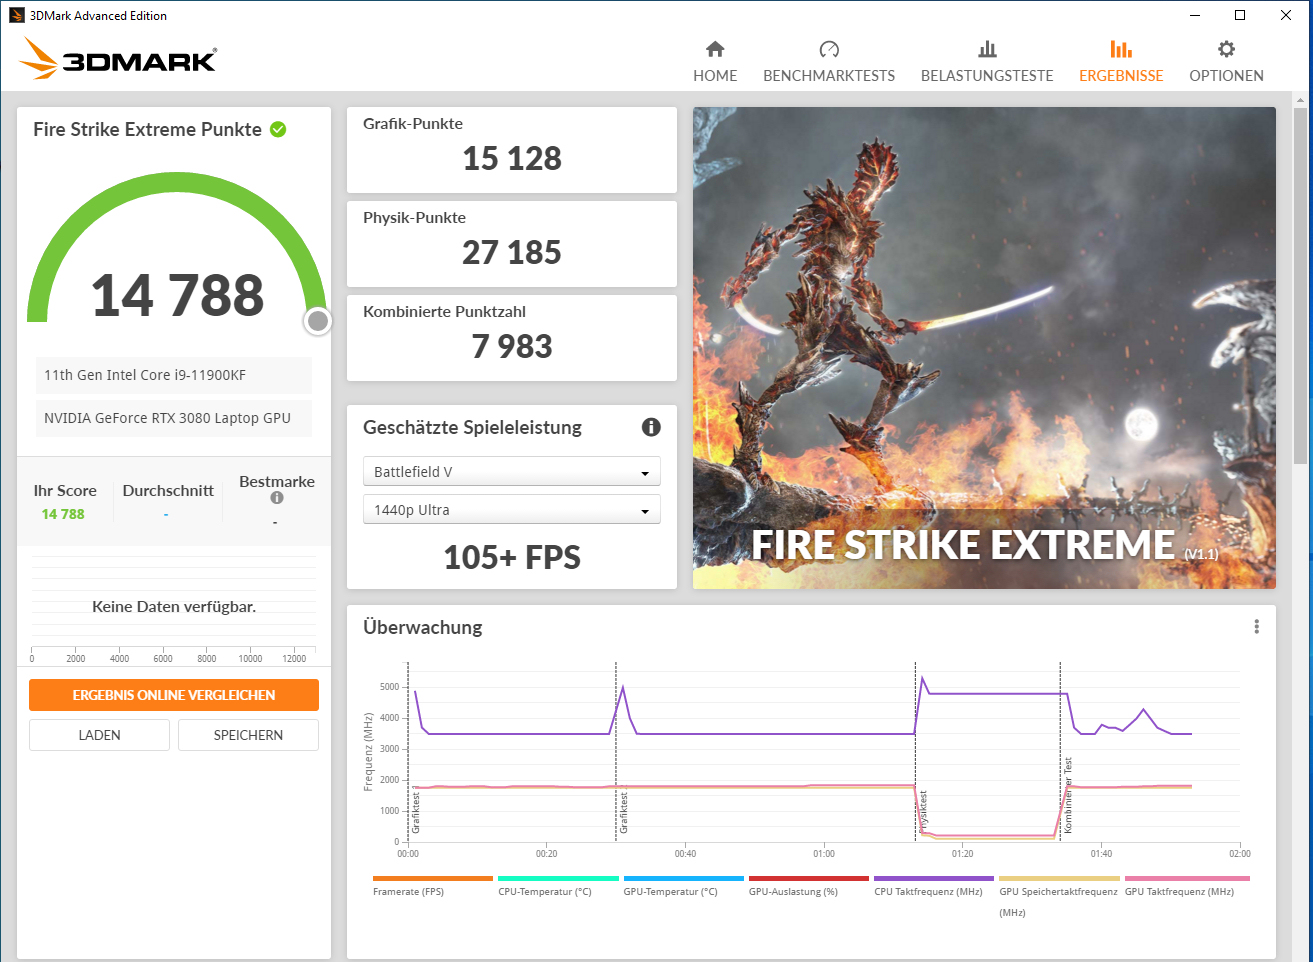
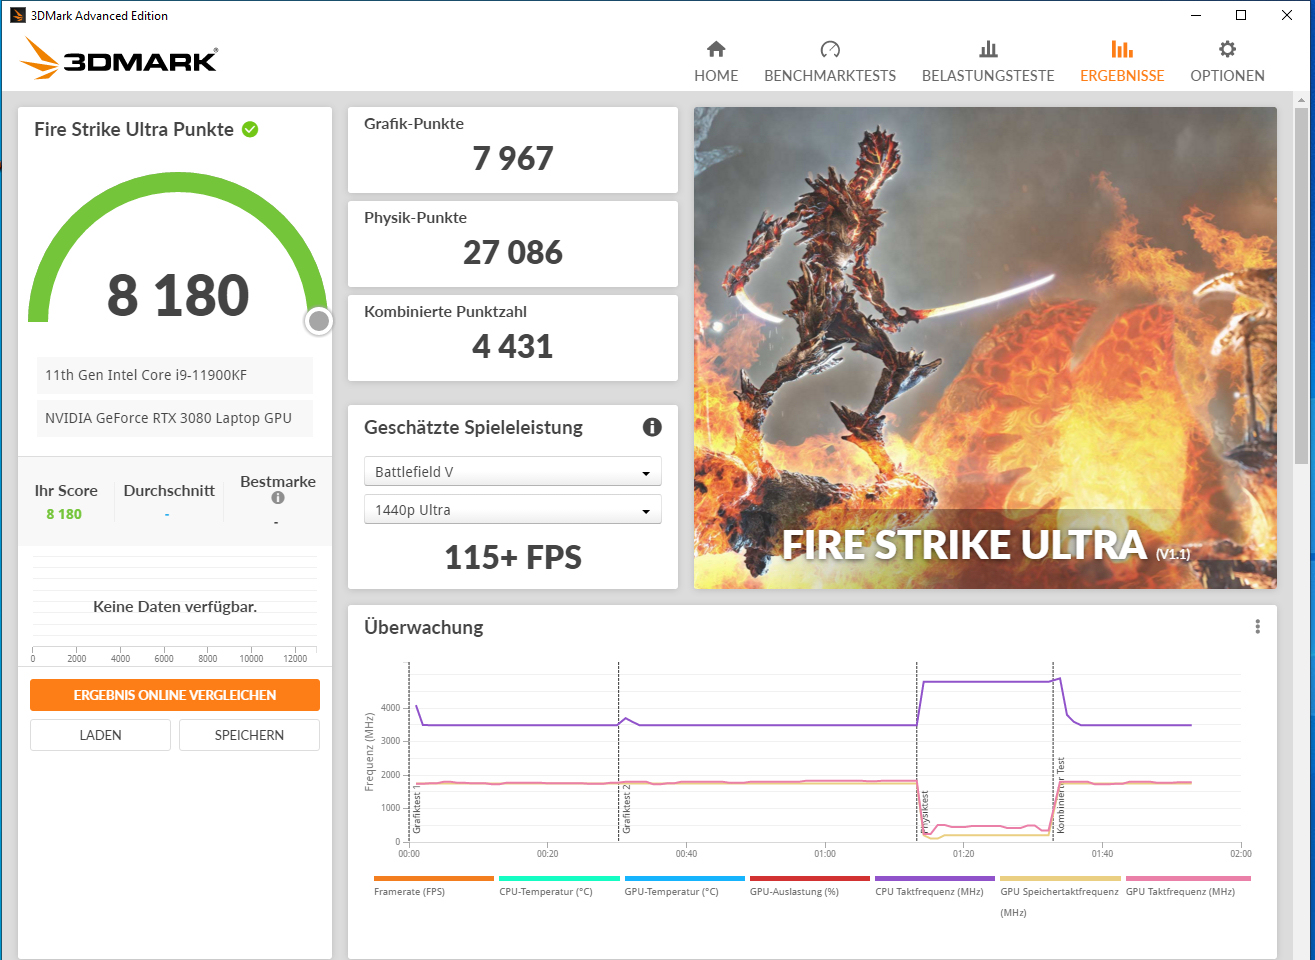
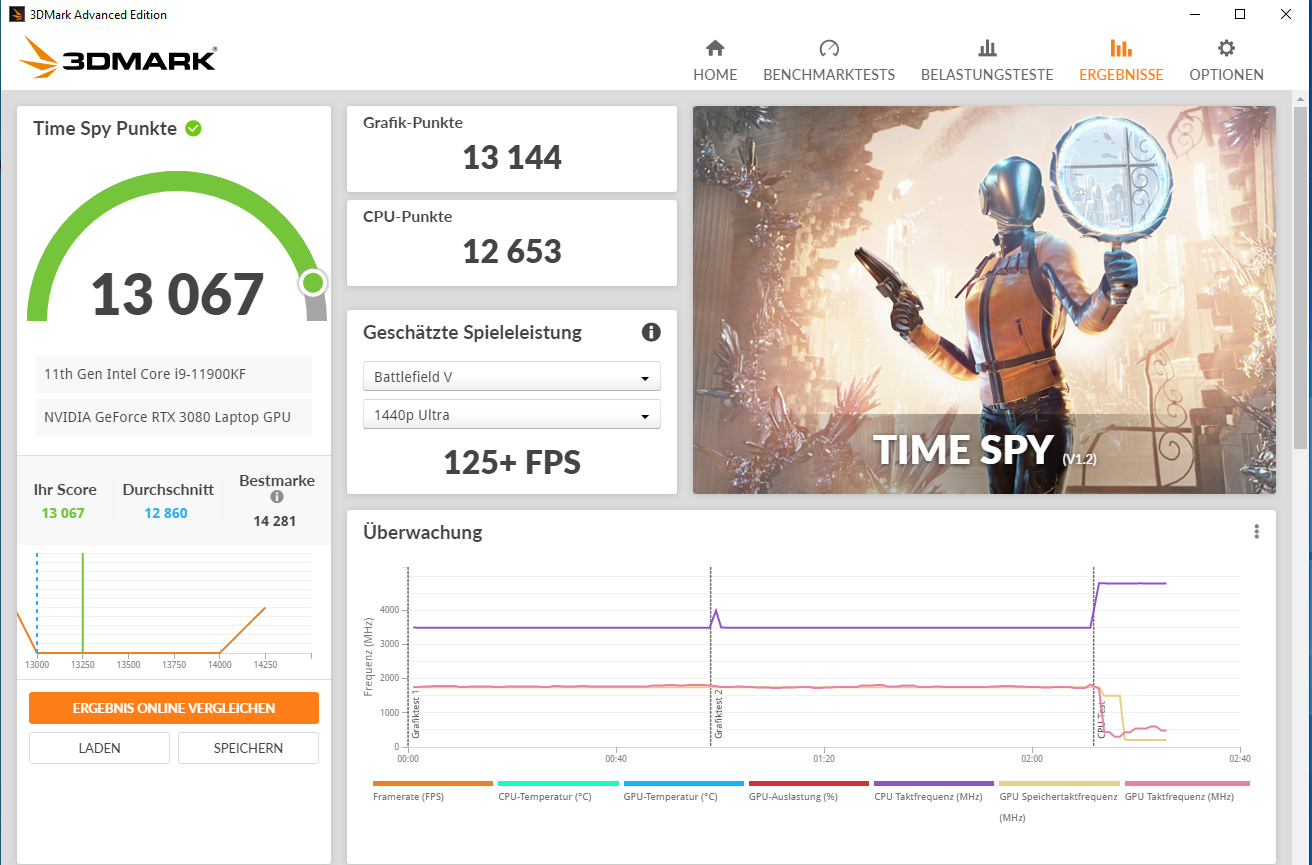
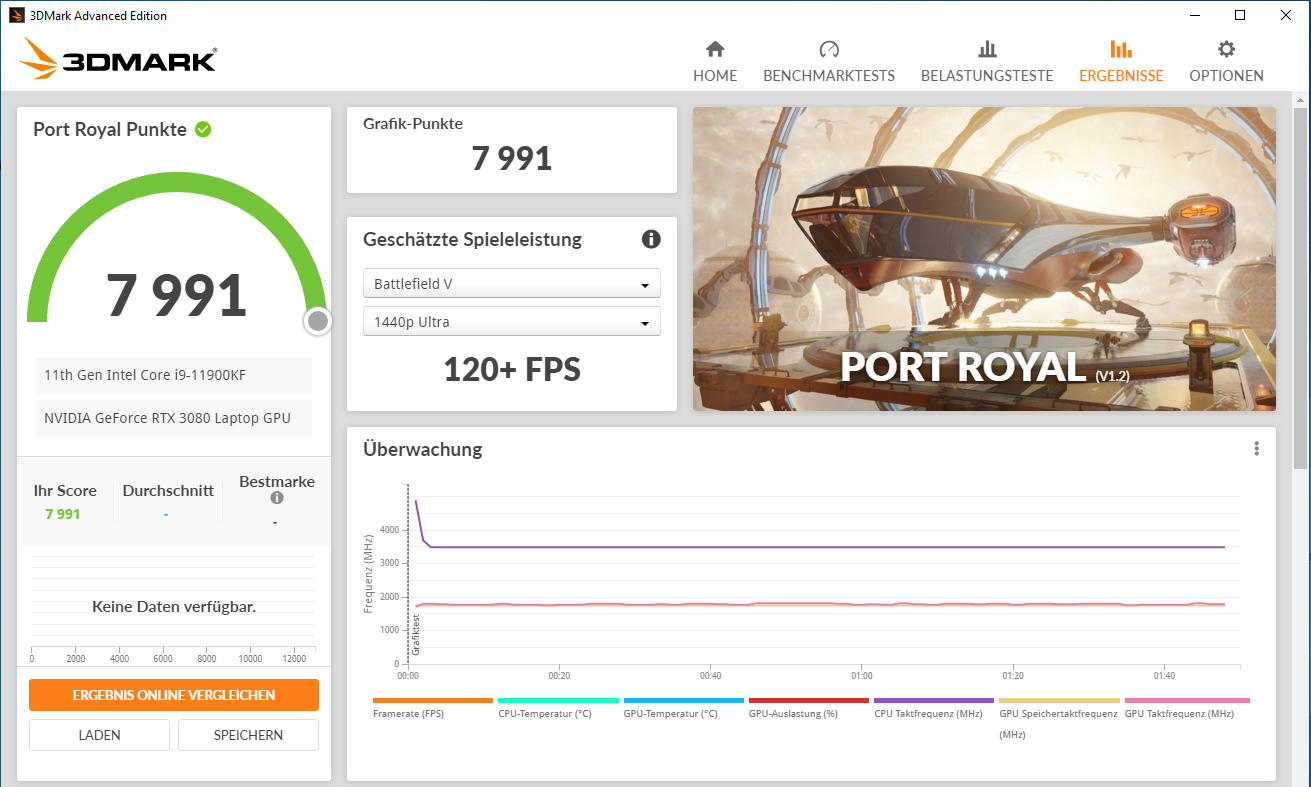
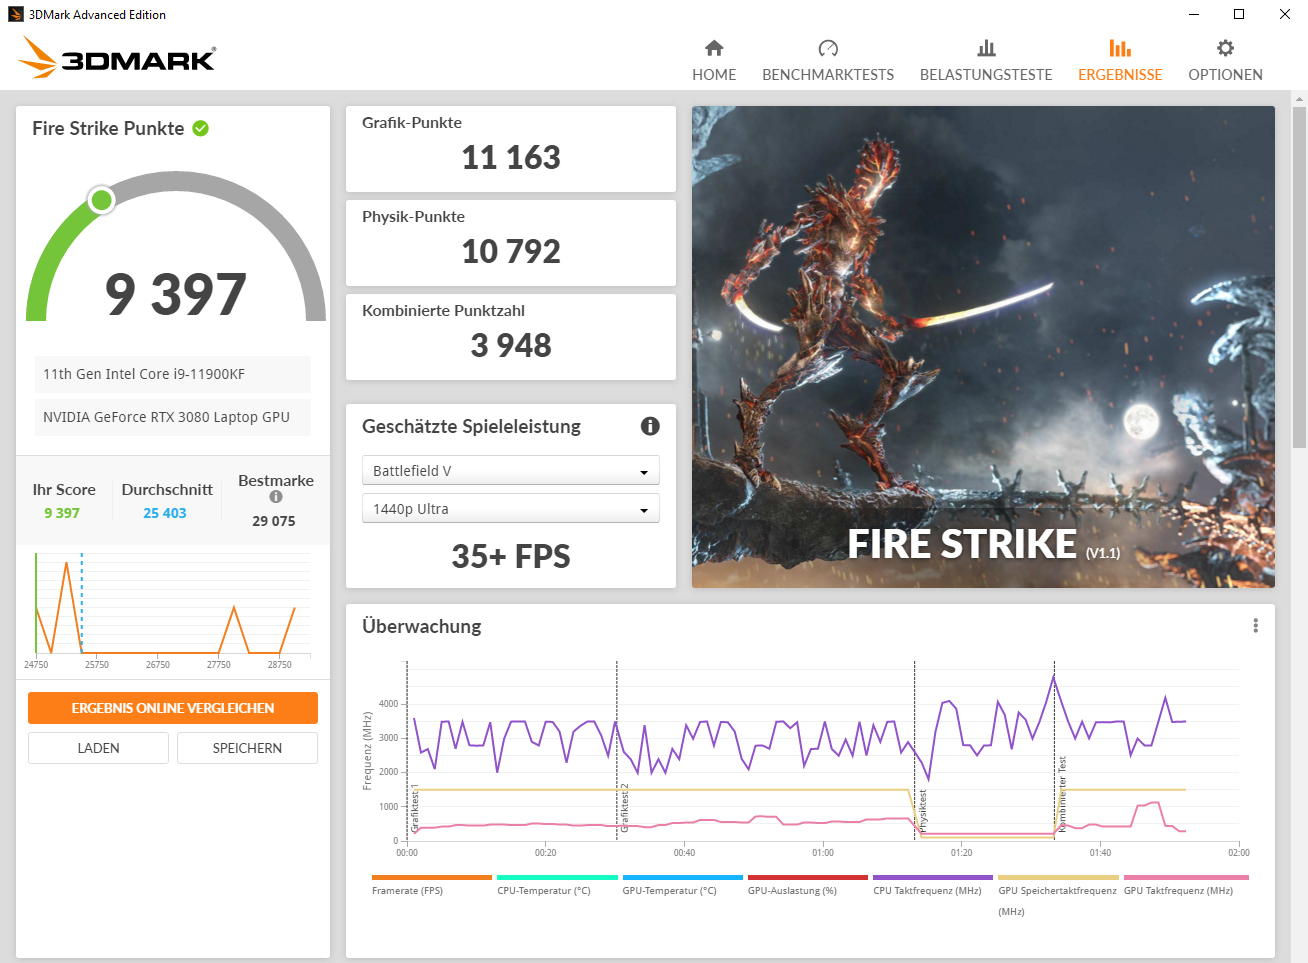
| 3DMark 11 Performance | 32922 points | |
| 3DMark Cloud Gate Standard Score | 65479 points | |
| 3DMark Fire Strike Score | 25839 points | |
| 3DMark Fire Strike Extreme Score | 14788 points | |
| 3DMark Time Spy Score | 13067 points | |
Help | ||
Gaming performance
The computer brings all current games smoothly to the screen. Usually, FHD resolution and maximum quality settings can be selected. Higher resolutions (a corresponding monitor would have to be connected for this) are also handled by the GPU.
| The Witcher 3 - 1920x1080 Ultra Graphics & Postprocessing (HBAO+) | |
| Average of class Gaming (104.7 - 240, n=7, last 2 years) | |
| Schenker XMG Ultra 17 Rocket Lake | |
| Alienware m17 R4 | |
| MSI GT76 Titan DT 10SGS | |
| Schenker XMG Ultra 17 Comet Lake | |
| Average NVIDIA GeForce RTX 3080 Laptop GPU (85.1 - 123, n=40) | |
| Asus Strix Scar 17 G732LXS | |
| Far Cry 5 - 1920x1080 Ultra Preset AA:T | |
| Schenker XMG Ultra 17 Rocket Lake | |
| Alienware m17 R4 | |
| Average of class Gaming (70 - 151, n=6, last 2 years) | |
| Average NVIDIA GeForce RTX 3080 Laptop GPU (75 - 146, n=33) | |
| Shadow of the Tomb Raider - 1920x1080 Highest Preset AA:T | |
| Schenker XMG Ultra 17 Rocket Lake | |
| Schenker XMG Ultra 17 Comet Lake | |
| Asus Strix Scar 17 G732LXS | |
| Average NVIDIA GeForce RTX 3080 Laptop GPU (76.6 - 151, n=13) | |
| Average of class Gaming (96 - 116, n=2, last 2 years) | |
| Doom Eternal - 1920x1080 Ultra Preset | |
| Schenker XMG Ultra 17 Comet Lake | |
| Asus Strix Scar 17 G732LXS | |
| Schenker XMG Ultra 17 Rocket Lake | |
| Average NVIDIA GeForce RTX 3080 Laptop GPU (163 - 190, n=4) | |
| Serious Sam 4 - 1920x1080 Ultra (DX12) AA:2xMS | |
| Schenker XMG Ultra 17 Rocket Lake | |
| Schenker XMG Ultra 17 Comet Lake | |
| Average NVIDIA GeForce RTX 3080 Laptop GPU (72.6 - 107, n=5) | |
| Cyberpunk 2077 1.0 | |
| 1920x1080 Ultra Preset | |
| Schenker XMG Ultra 17 Rocket Lake | |
| Alienware m17 R4 | |
| Average NVIDIA GeForce RTX 3080 Laptop GPU (52.9 - 84.3, n=9) | |
| 1920x1080 Ray Tracing Ultra Preset (DLSS off) | |
| Schenker XMG Ultra 17 Rocket Lake | |
| Alienware m17 R4 | |
| Average NVIDIA GeForce RTX 3080 Laptop GPU (30.6 - 43.2, n=5) | |
| Watch Dogs Legion | |
| 1920x1080 Ultra Preset (DX12) | |
| Schenker XMG Ultra 17 Rocket Lake | |
| Average NVIDIA GeForce RTX 3080 Laptop GPU (65 - 91.1, n=6) | |
| 1920x1080 Ultra Preset + Ultra Ray Tracing (DX12) | |
| Schenker XMG Ultra 17 Rocket Lake | |
| Average NVIDIA GeForce RTX 3080 Laptop GPU (41 - 61, n=6) | |
| Hitman 3 - 1920x1080 Maximum Settings AF:16x | |
| Schenker XMG Ultra 17 Rocket Lake | |
| Average NVIDIA GeForce RTX 3080 Laptop GPU (129.1 - 201, n=3) | |
To check whether the frame rates remain largely constant over a longer period, we run the game "The Witcher 3" for about 60 minutes with Full HD resolution and maximum quality settings. The game character is not moved. A drop in the frame rates is not noticed.

| low | med. | high | ultra | |
|---|---|---|---|---|
| The Witcher 3 (2015) | 453 | 374 | 242 | 123 |
| Dota 2 Reborn (2015) | 183 | 170 | 161 | 156 |
| X-Plane 11.11 (2018) | 156 | 139 | 113 | |
| Far Cry 5 (2018) | 189 | 162 | 155 | 146 |
| Shadow of the Tomb Raider (2018) | 181 | 164 | 160 | 151 |
| Doom Eternal (2020) | 211 | 199 | 193 | 190 |
| Serious Sam 4 (2020) | 162 | 118 | 111 | 107 |
| Watch Dogs Legion (2020) | 127 | 123 | 110 | 91.1 |
| Dirt 5 (2020) | 110 | 97.1 | 93.3 | 92.4 |
| Immortals Fenyx Rising (2020) | 172 | 125 | 116 | 108 |
| Cyberpunk 2077 1.0 (2020) | 147 | 116 | 96.1 | 84.3 |
| Hitman 3 (2021) | 255.1 | 216.6 | 207.7 | 200.5 |
Emissions - The Schenker computer can get very loud
Noise emissions
When idling and under low load, the fans are usually quiet and barely audible. Nonetheless, every now and then, they also rev up strongly for a short time in idle, reaching a noise level that is almost the same as under full load. In other words: It gets very loud. With maximum sound pressure levels of 63 dB(A) (stress test) and 61 dB(A) (Witcher 3 test), you can hardly avoid using a headset. The energy profiles "Silent Mode" and "Power Saving Mode" reduce the noise development - but at the expense of the computing power.
Noise level
| Idle |
| 30 / 31 / 57 dB(A) |
| Load |
| 63 / 63 dB(A) |
 | ||
30 dB silent 40 dB(A) audible 50 dB(A) loud |
||
min: | ||
| Schenker XMG Ultra 17 Rocket Lake i9-11900K, GeForce RTX 3080 Laptop GPU | MSI GT76 Titan DT 10SGS i9-10900K, GeForce RTX 2080 Super Mobile | Asus Strix Scar 17 G732LXS i9-10980HK, GeForce RTX 2080 Super Mobile | Schenker XMG Ultra 17 Comet Lake i9-10900K, GeForce RTX 2080 Super Mobile | Alienware m17 R4 i9-10980HK, GeForce RTX 3080 Laptop GPU | Average of class Gaming | |
|---|---|---|---|---|---|---|
| Noise | 15% | 4% | 4% | 21% | 20% | |
| off / environment * (dB) | 24 | 26.4 -10% | 25 -4% | 25 -4% | 24 -0% | 24.1 ? -0% |
| Idle Minimum * (dB) | 30 | 27.5 8% | 33 -10% | 27 10% | 24 20% | 25.9 ? 14% |
| Idle Average * (dB) | 31 | 27.5 11% | 38 -23% | 32 -3% | 25 19% | 27.4 ? 12% |
| Idle Maximum * (dB) | 57 | 29.8 48% | 45 21% | 57 -0% | 36 37% | 30.1 ? 47% |
| Load Average * (dB) | 63 | 30.9 51% | 54 14% | 56 11% | 45 29% | 43.7 ? 31% |
| Witcher 3 ultra * (dB) | 61 | 60.7 -0% | 50 18% | 55 10% | 47 23% | |
| Load Maximum * (dB) | 63 | 66.6 -6% | 55 13% | 62 2% | 50 21% | 54.3 ? 14% |
* ... smaller is better
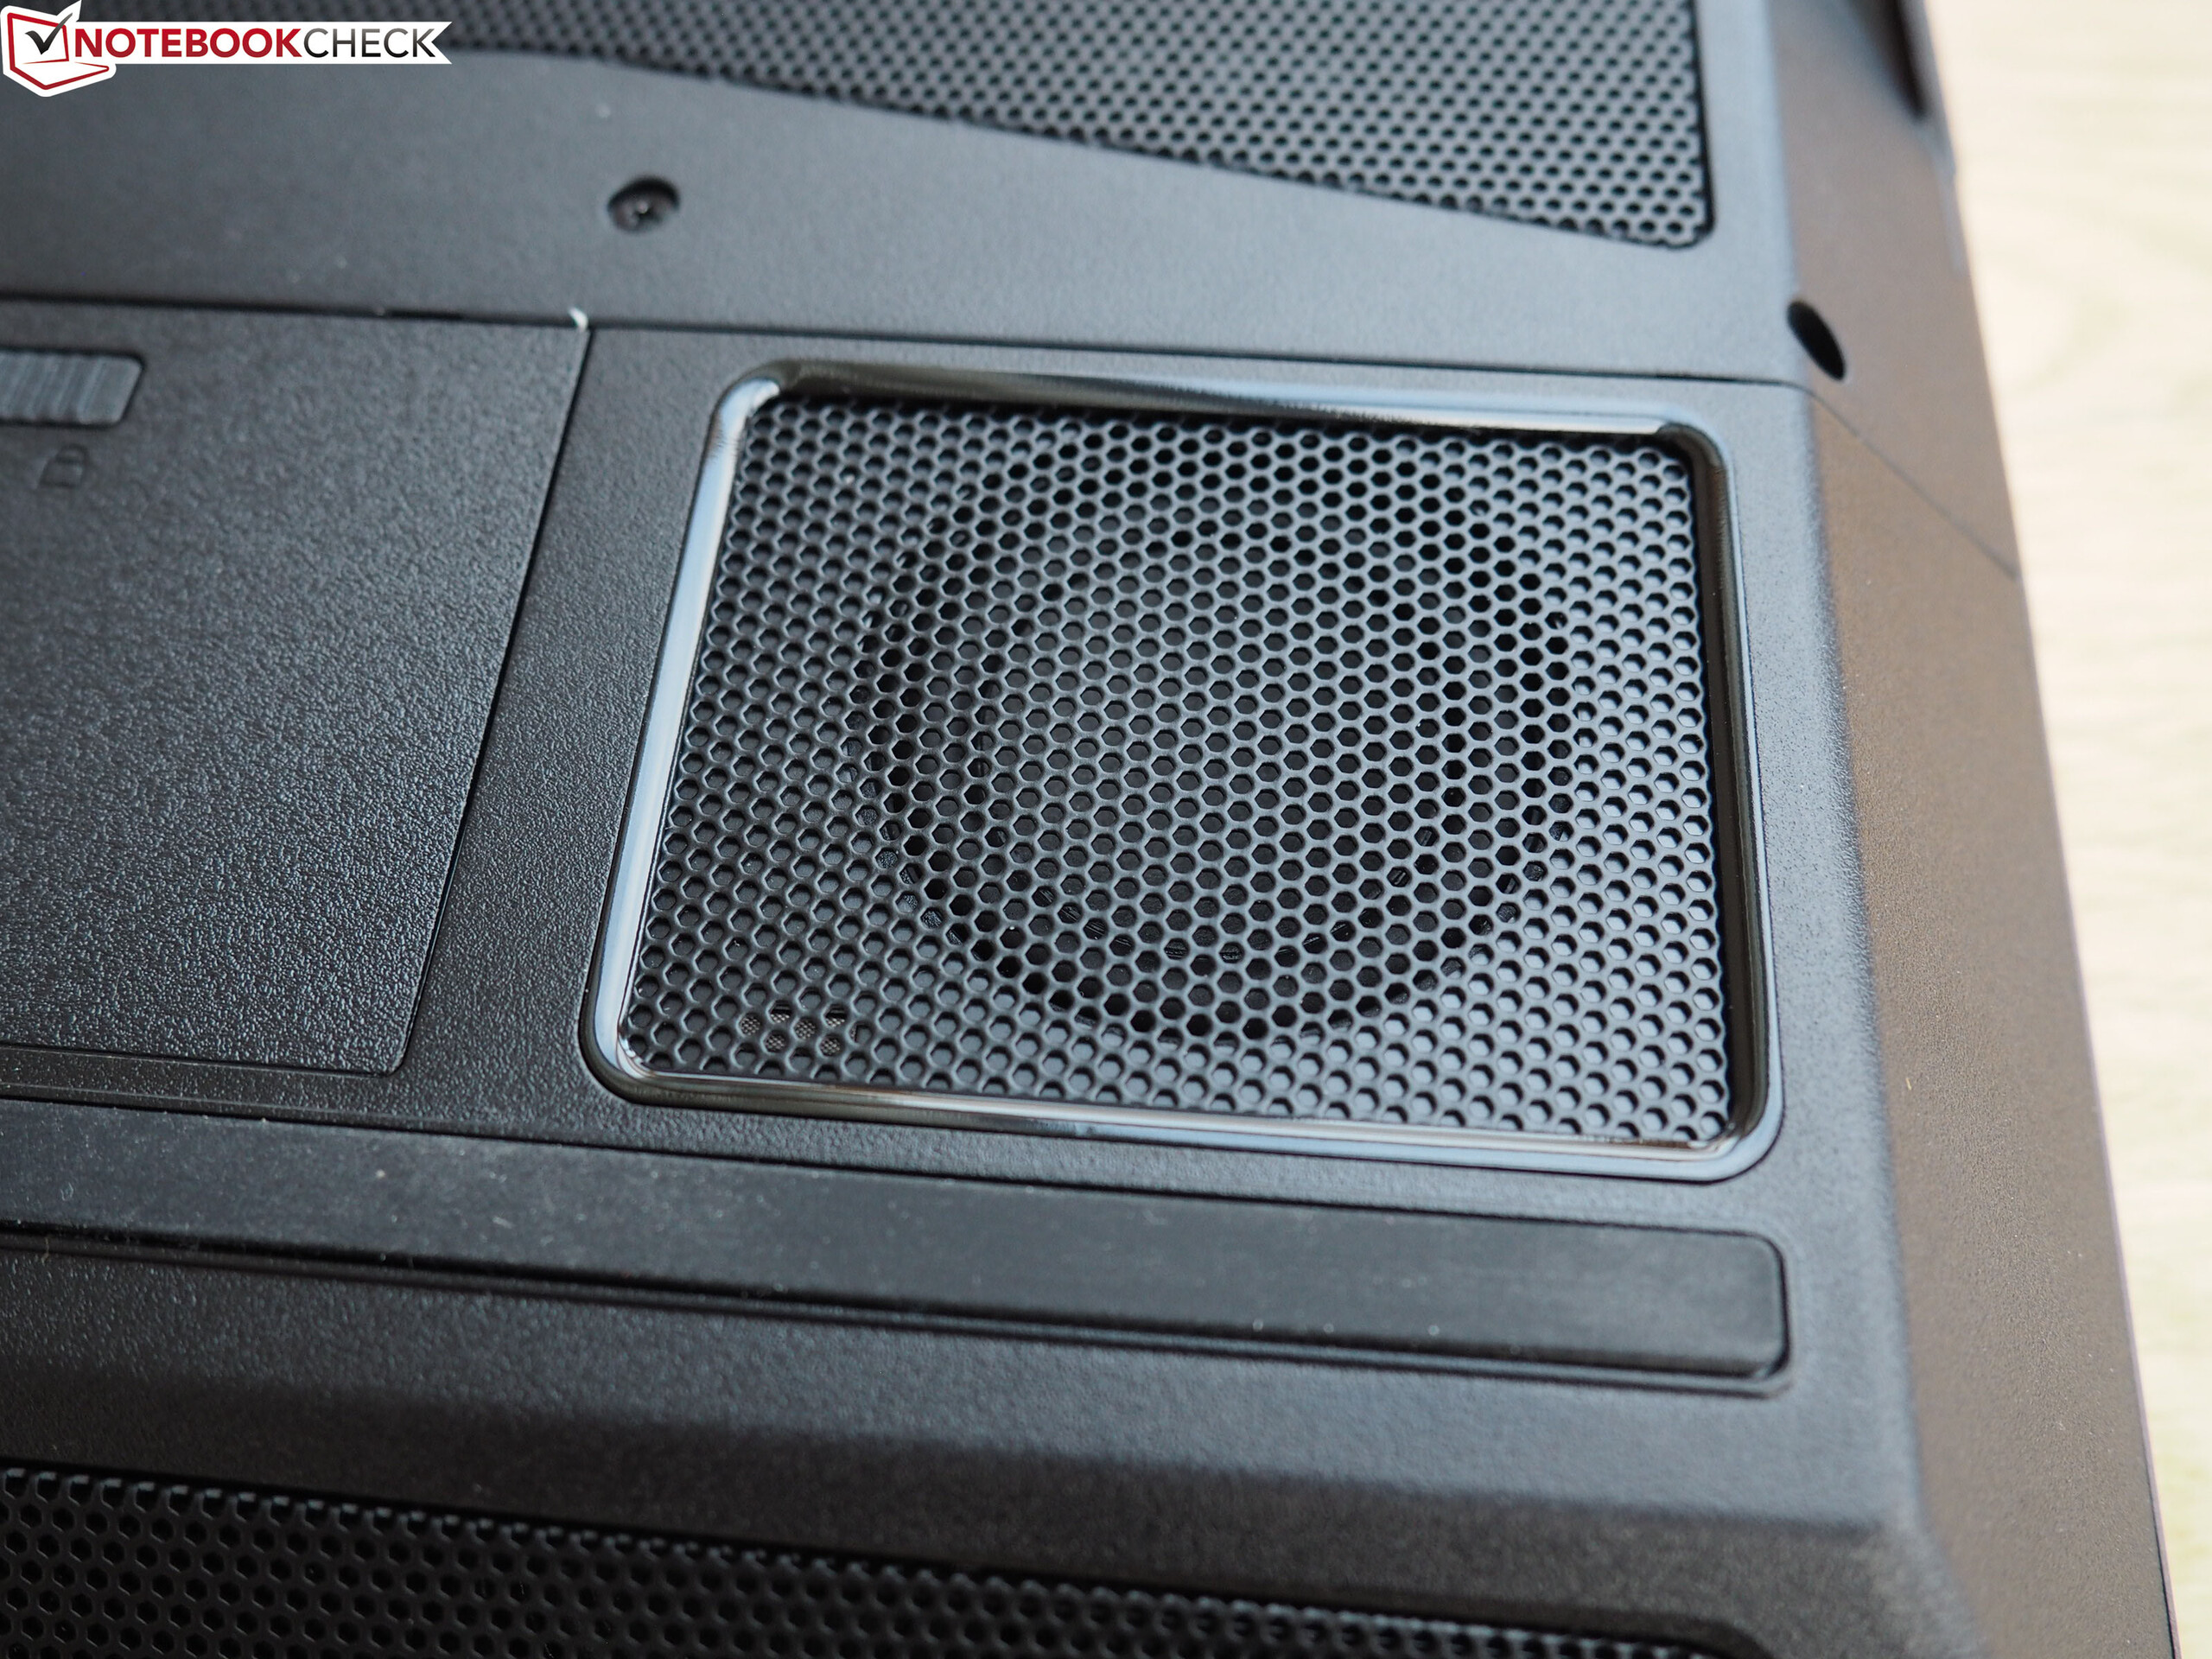
Temperature
In our stress test (Prime95 and FurMark run for at least one hour), the CPU and GPU run at 3.4 GHz and 1,725 MHz, respectively. The stress test is an extreme scenario that does not occur in everyday use. We use this test to check whether the system runs stably even under full load.
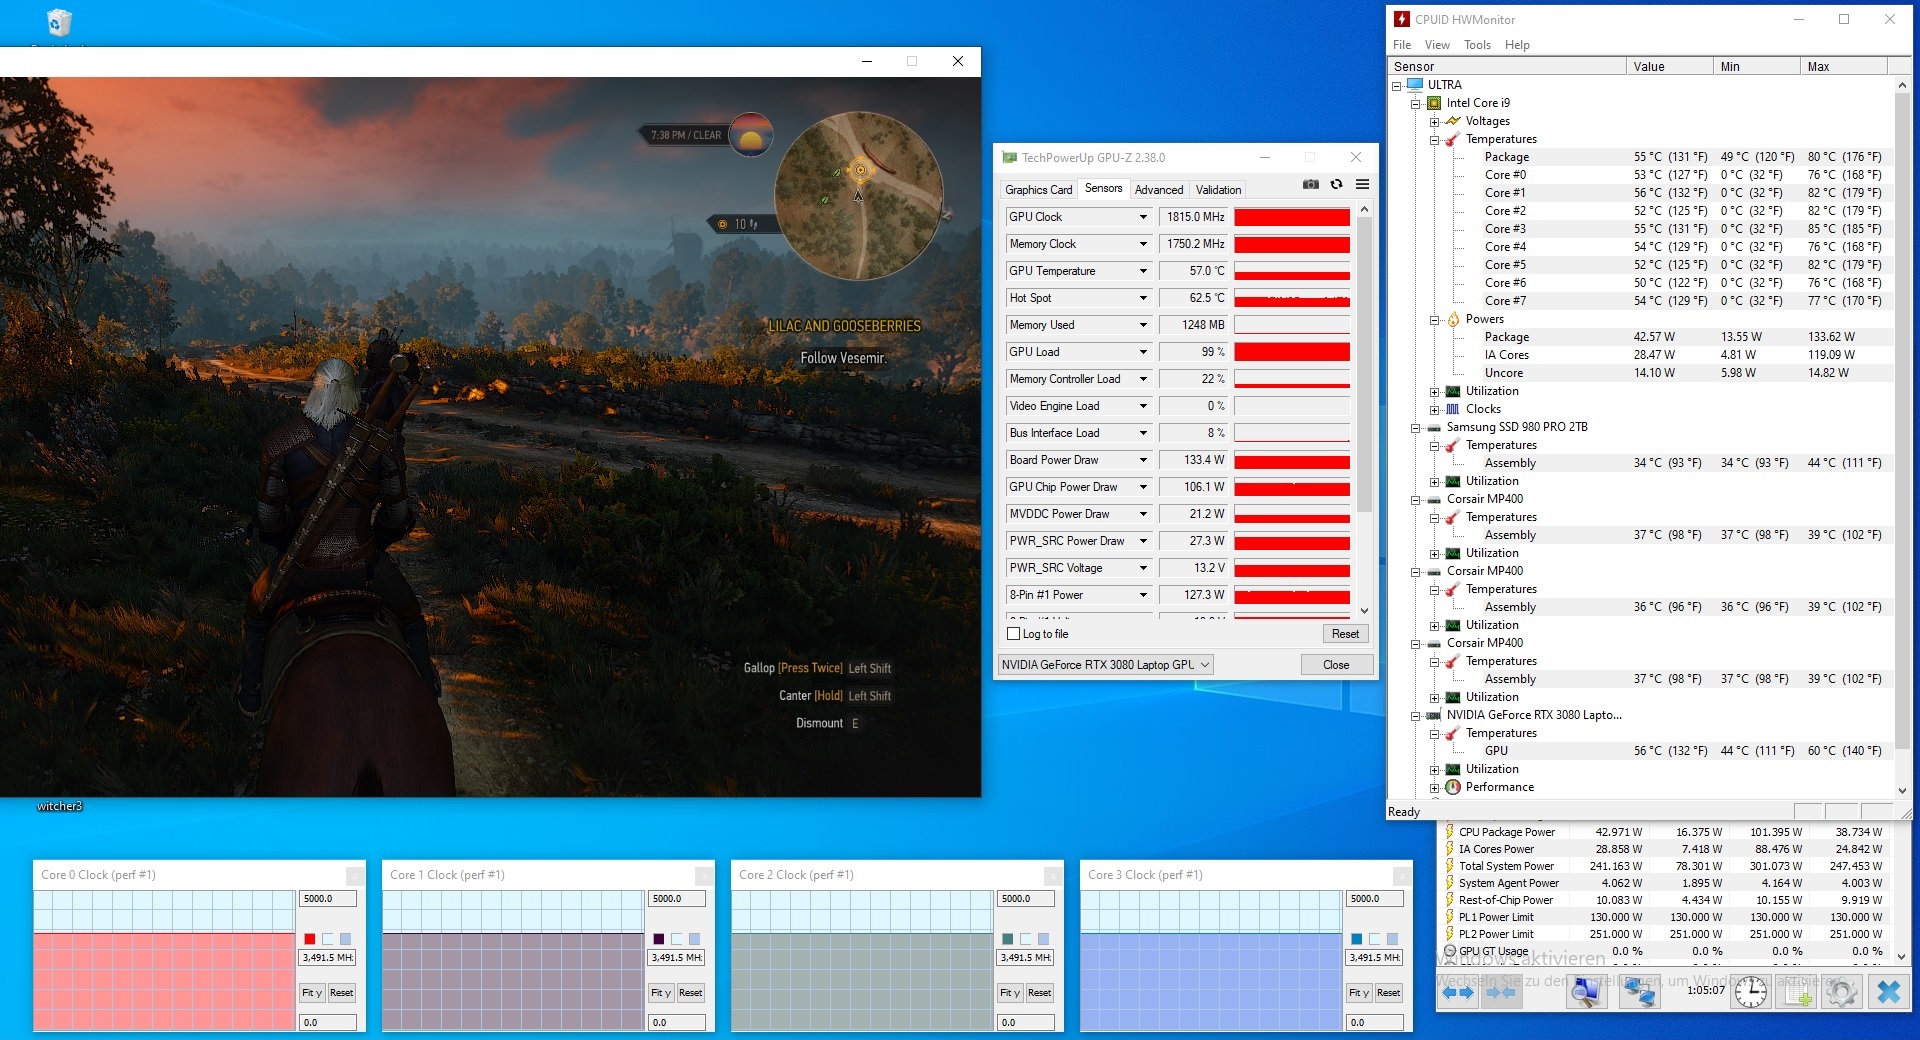
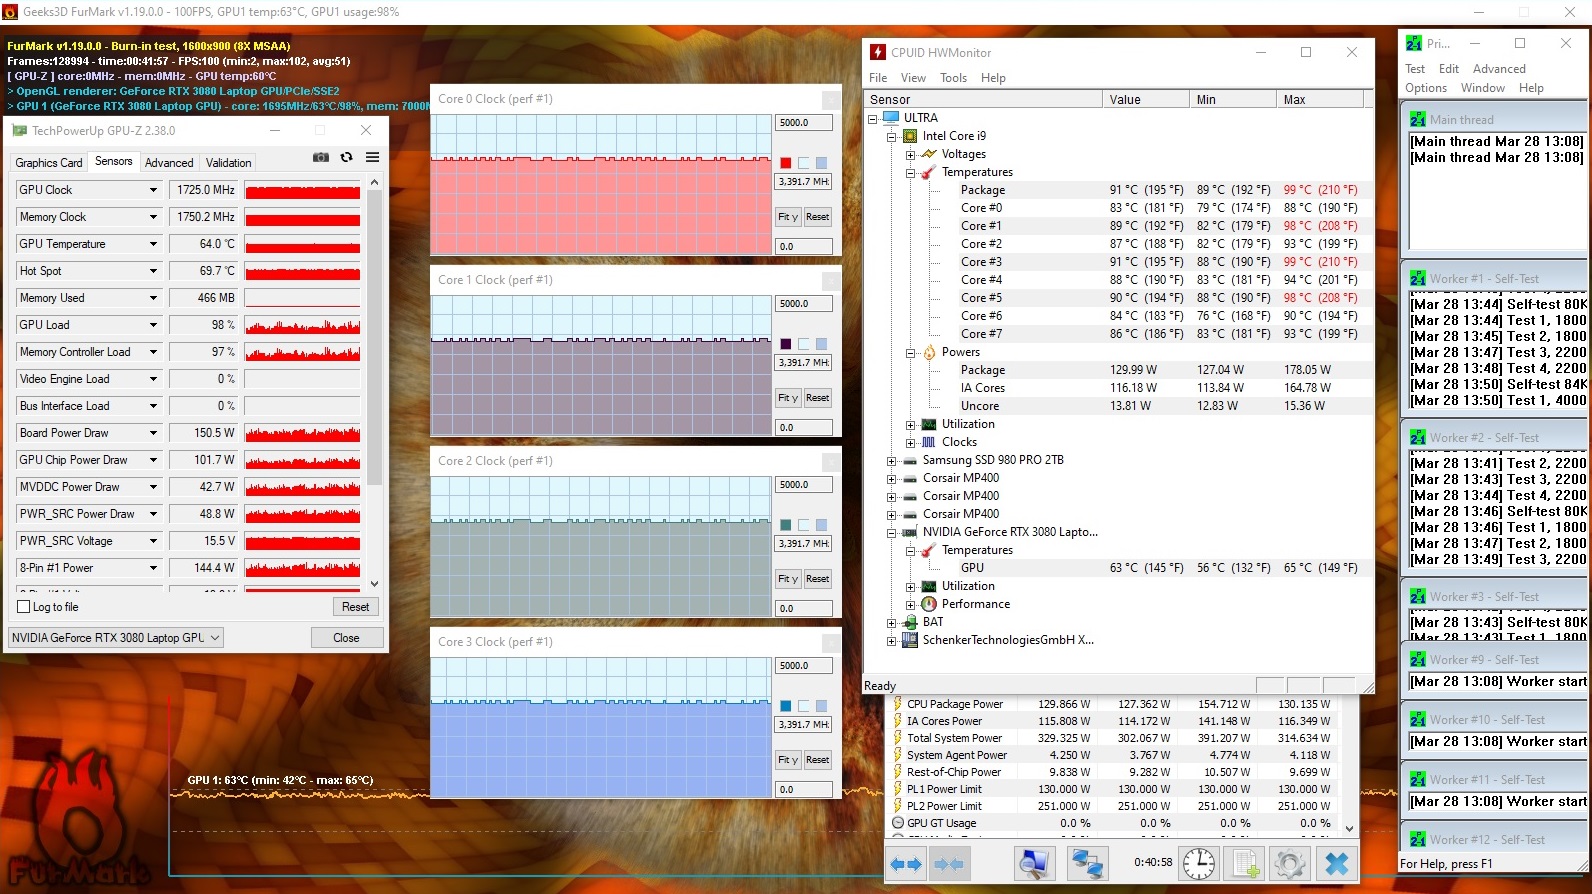
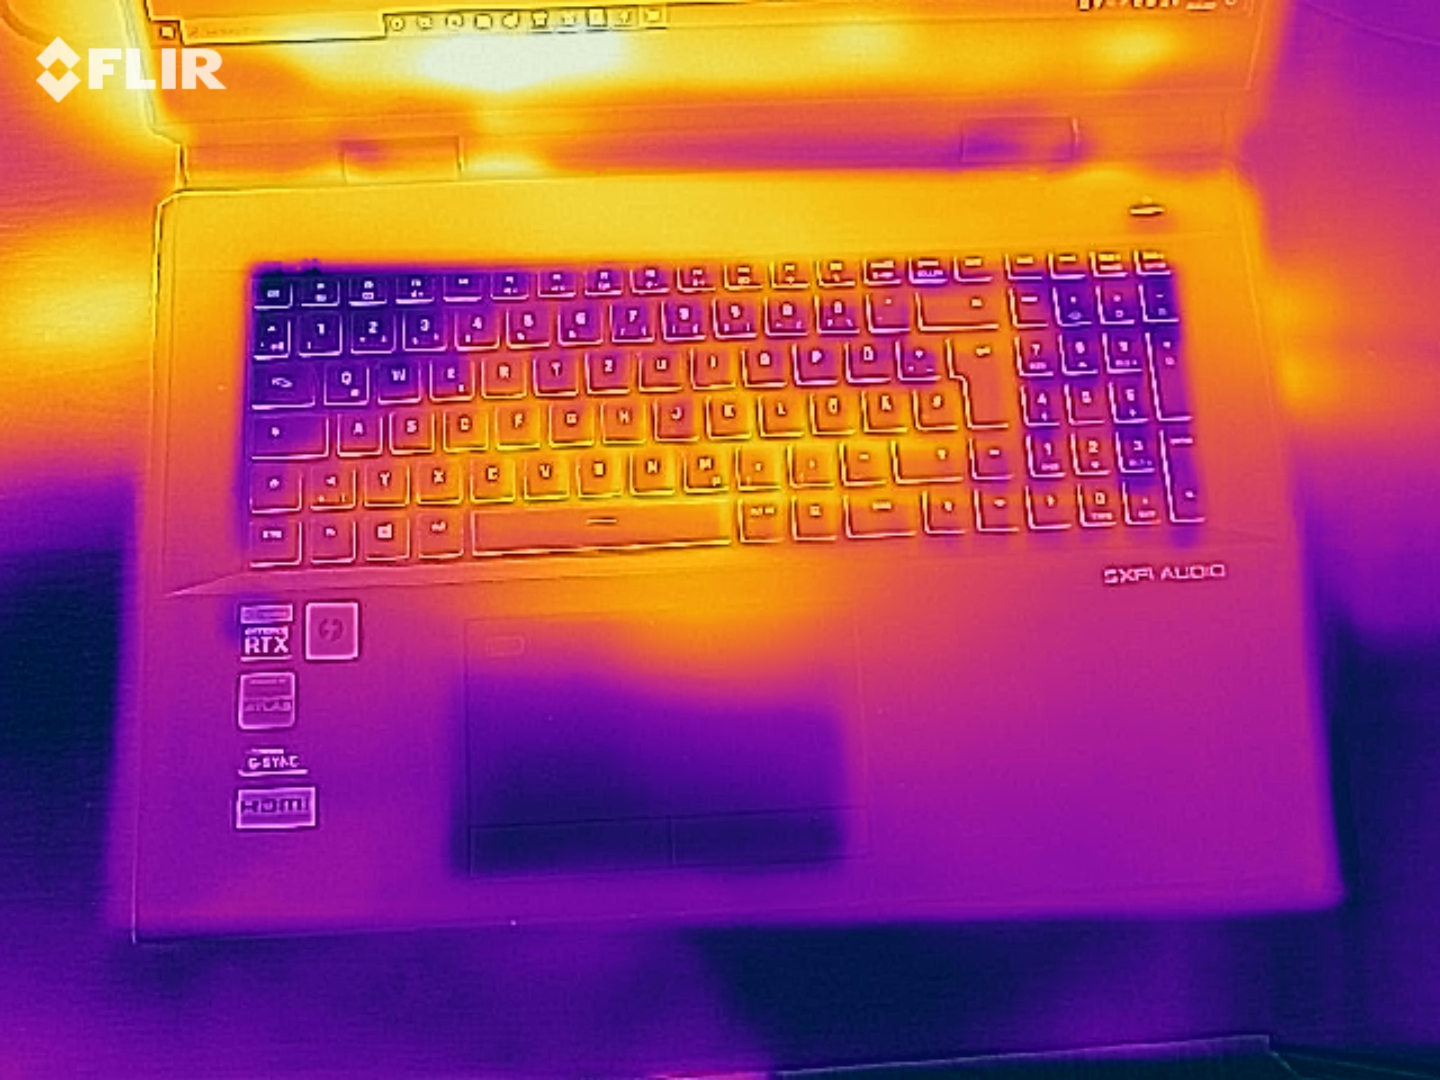
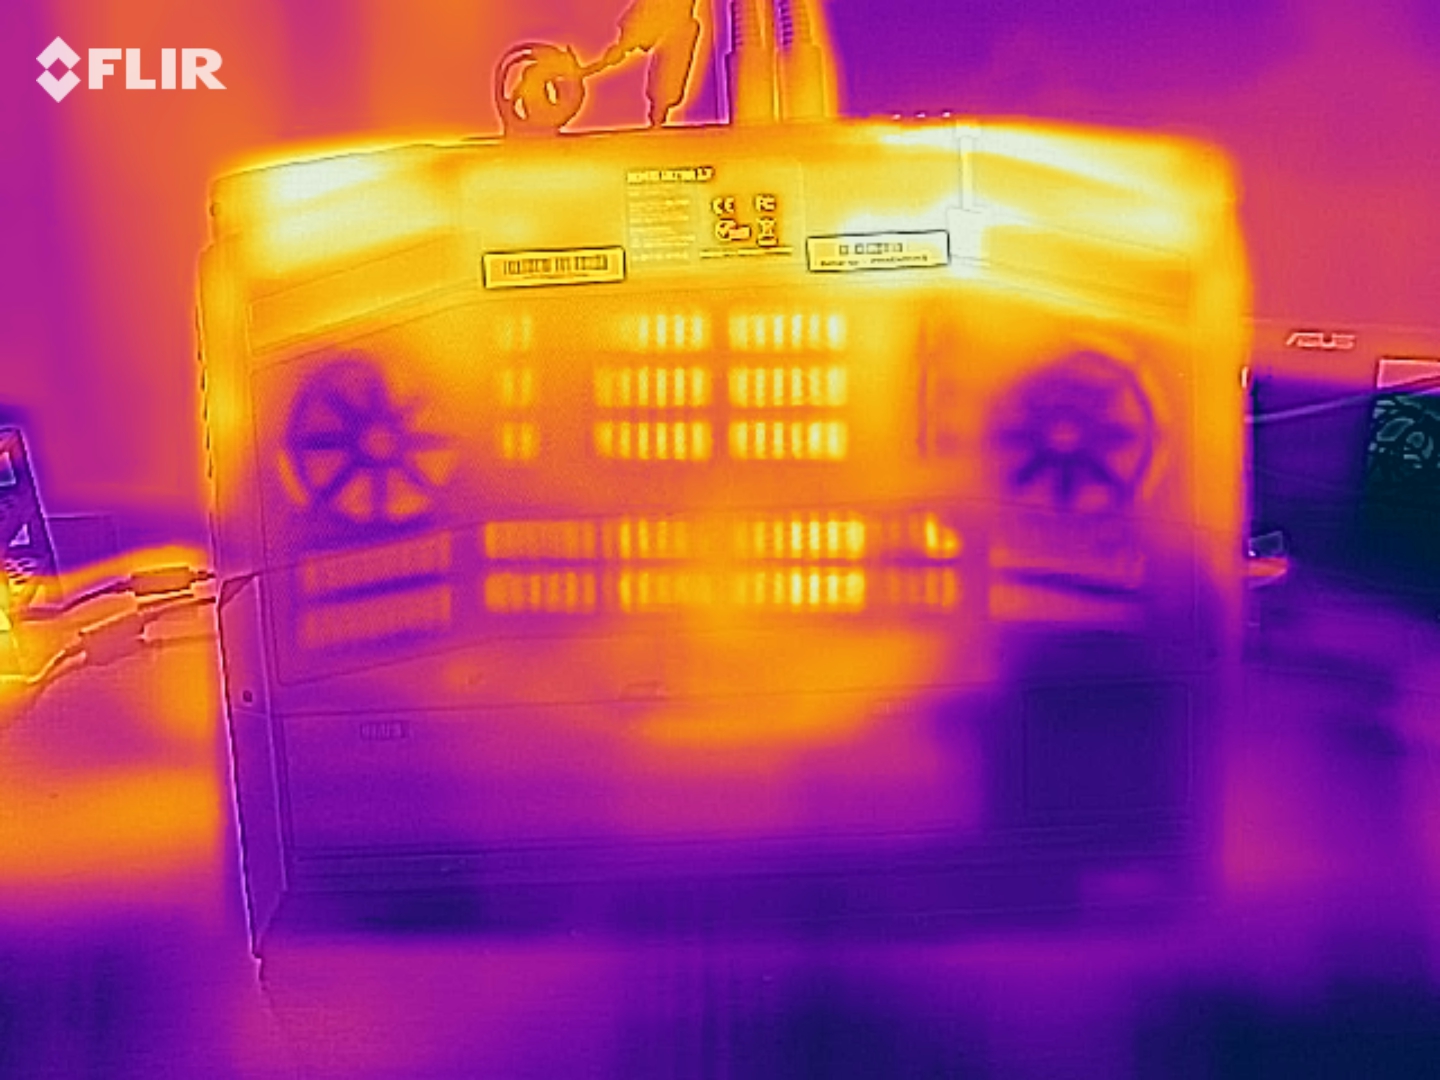
The XMG Ultra does not heat up very much. We recorded temperatures in the lower 40 degrees Celsius (104 degrees Fahrenheit) range at three measuring points during the stress test. The heating is lower when we run the Witcher 3 test. The idle temperatures are sometimes higher than under load because the fans only run at low speeds.
(+) The maximum temperature on the upper side is 34 °C / 93 F, compared to the average of 40.4 °C / 105 F, ranging from 21.2 to 68.8 °C for the class Gaming.
(±) The bottom heats up to a maximum of 43 °C / 109 F, compared to the average of 43.2 °C / 110 F
(±) In idle usage, the average temperature for the upper side is 33 °C / 91 F, compared to the device average of 33.9 °C / 93 F.
(+) Playing The Witcher 3, the average temperature for the upper side is 28.2 °C / 83 F, compared to the device average of 33.9 °C / 93 F.
(+) The palmrests and touchpad are cooler than skin temperature with a maximum of 30 °C / 86 F and are therefore cool to the touch.
(±) The average temperature of the palmrest area of similar devices was 28.8 °C / 83.8 F (-1.2 °C / -2.2 F).
| Schenker XMG Ultra 17 Rocket Lake i9-11900K, GeForce RTX 3080 Laptop GPU | MSI GT76 Titan DT 10SGS i9-10900K, GeForce RTX 2080 Super Mobile | Asus Strix Scar 17 G732LXS i9-10980HK, GeForce RTX 2080 Super Mobile | Schenker XMG Ultra 17 Comet Lake i9-10900K, GeForce RTX 2080 Super Mobile | Alienware m17 R4 i9-10980HK, GeForce RTX 3080 Laptop GPU | Average of class Gaming | |
|---|---|---|---|---|---|---|
| Heat | 8% | -12% | 1% | -29% | -4% | |
| Maximum Upper Side * (°C) | 34 | 36.4 -7% | 59 -74% | 39 -15% | 58 -71% | 45.1 ? -33% |
| Maximum Bottom * (°C) | 43 | 43 -0% | 52 -21% | 46 -7% | 46 -7% | 48.1 ? -12% |
| Idle Upper Side * (°C) | 38 | 28 26% | 30 21% | 32 16% | 45 -18% | 31 ? 18% |
| Idle Bottom * (°C) | 39 | 33.4 14% | 29 26% | 35 10% | 46 -18% | 34.2 ? 12% |
* ... smaller is better
Speaker
Schenker XMG Ultra 17 Rocket Lake audio analysis
(+) | speakers can play relatively loud (91 dB)
Bass 100 - 315 Hz
(±) | reduced bass - on average 8.1% lower than median
(+) | bass is linear (5.9% delta to prev. frequency)
Mids 400 - 2000 Hz
(+) | balanced mids - only 3.4% away from median
(+) | mids are linear (3.8% delta to prev. frequency)
Highs 2 - 16 kHz
(±) | higher highs - on average 5.2% higher than median
(+) | highs are linear (6.4% delta to prev. frequency)
Overall 100 - 16.000 Hz
(+) | overall sound is linear (10.3% difference to median)
Compared to same class
» 6% of all tested devices in this class were better, 2% similar, 93% worse
» The best had a delta of 6%, average was 18%, worst was 132%
Compared to all devices tested
» 5% of all tested devices were better, 1% similar, 94% worse
» The best had a delta of 4%, average was 23%, worst was 134%
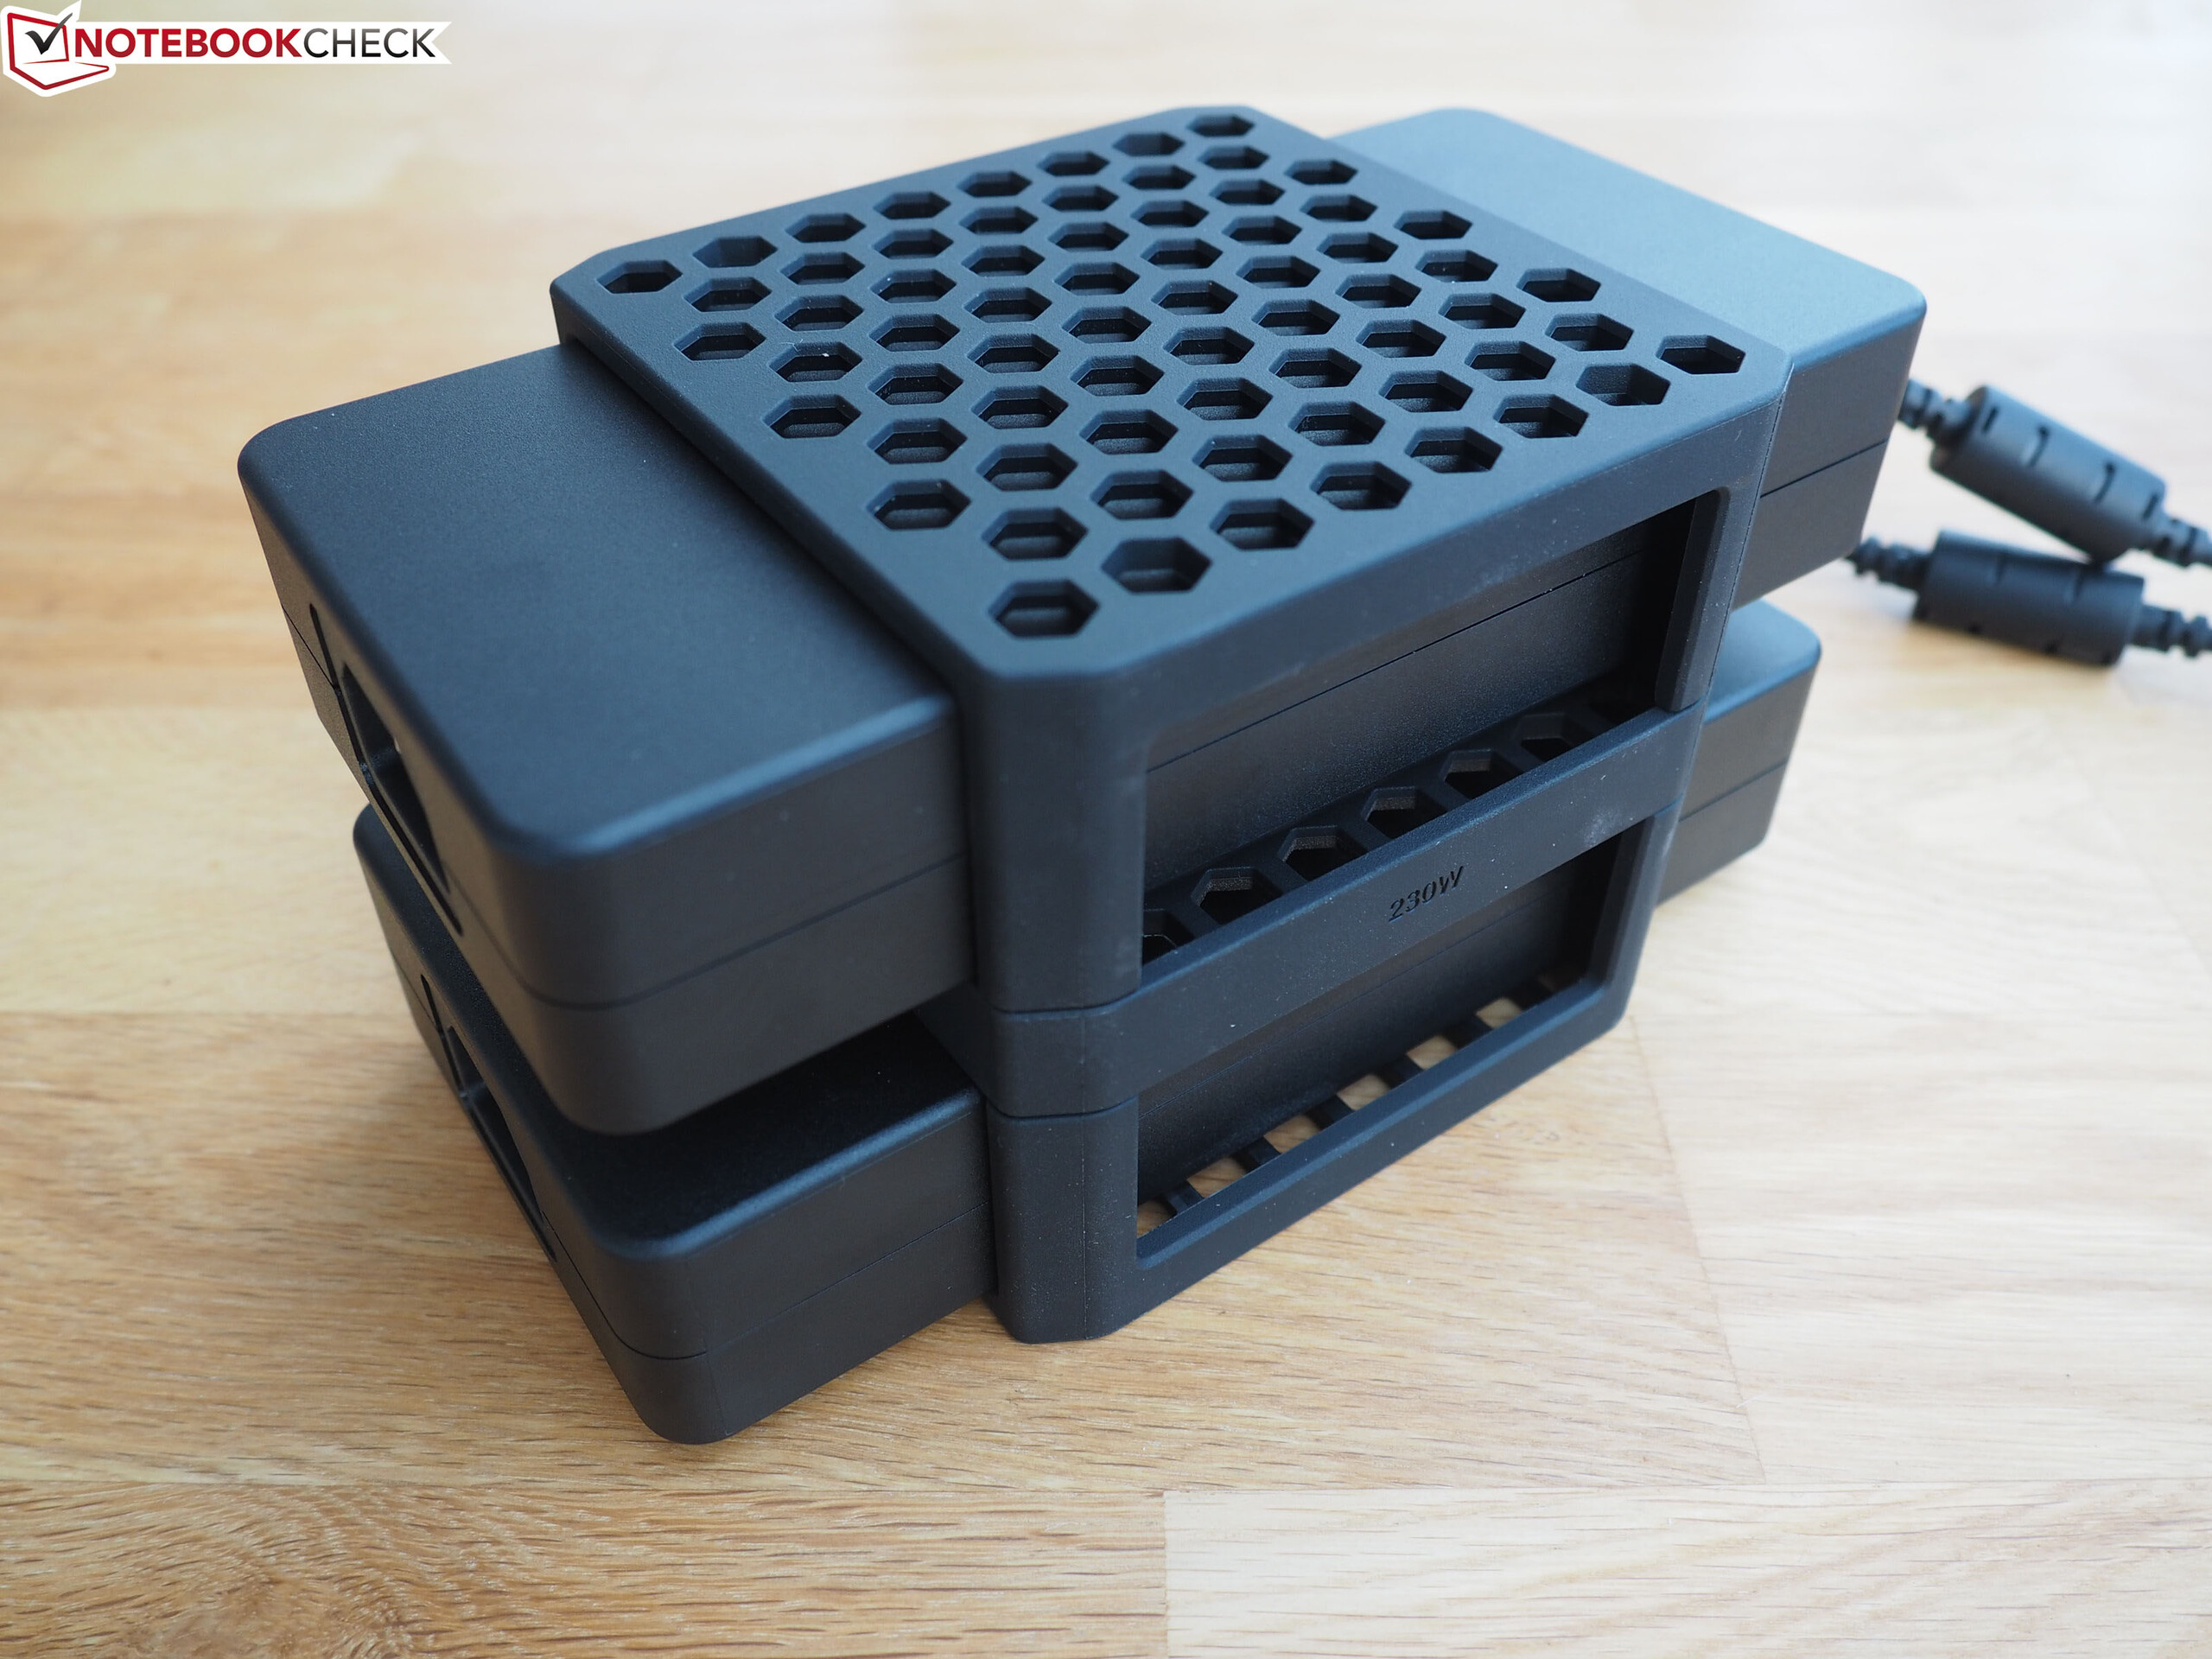
Energy management - Schenker DTR with a big energy appetite
Energy consumption
We recorded a maximum power consumption of 69 watts in idle - a value that many office notebooks do not reach under full load. The combination of a high-performance CPU and a permanently active GeForce GPU is noticeable here. The stress test and Witcher 3 test increase the demand up to 368 watts and 297 watts on average, respectively. The two power supplies deliver a nominal power of 280 watts each.
| Off / Standby | |
| Idle | |
| Load |
|
Key:
min: | |
| Schenker XMG Ultra 17 Rocket Lake i9-11900K, GeForce RTX 3080 Laptop GPU | MSI GT76 Titan DT 10SGS i9-10900K, GeForce RTX 2080 Super Mobile | Asus Strix Scar 17 G732LXS i9-10980HK, GeForce RTX 2080 Super Mobile | Schenker XMG Ultra 17 Comet Lake i9-10900K, GeForce RTX 2080 Super Mobile | Alienware m17 R4 i9-10980HK, GeForce RTX 3080 Laptop GPU | Average of class Gaming | |
|---|---|---|---|---|---|---|
| Power Consumption | 21% | 39% | 16% | 23% | 56% | |
| Idle Minimum * (Watt) | 62 | 25.9 58% | 16 74% | 34 45% | 42 32% | 13.1 ? 79% |
| Idle Average * (Watt) | 64 | 38 41% | 25 61% | 40 37% | 48 25% | 19 ? 70% |
| Idle Maximum * (Watt) | 69 | 53.2 23% | 35 49% | 47 32% | 58 16% | 24.6 ? 64% |
| Load Average * (Watt) | 183 | 123.8 32% | 177 3% | 130 29% | 124 32% | 111.3 ? 39% |
| Witcher 3 ultra * (Watt) | 297 | 312.5 -5% | 227 24% | 318 -7% | 219 26% | |
| Load Maximum * (Watt) | 368 | 459.8 -25% | 280 24% | 512 -39% | 337 8% | 260 ? 29% |
* ... smaller is better
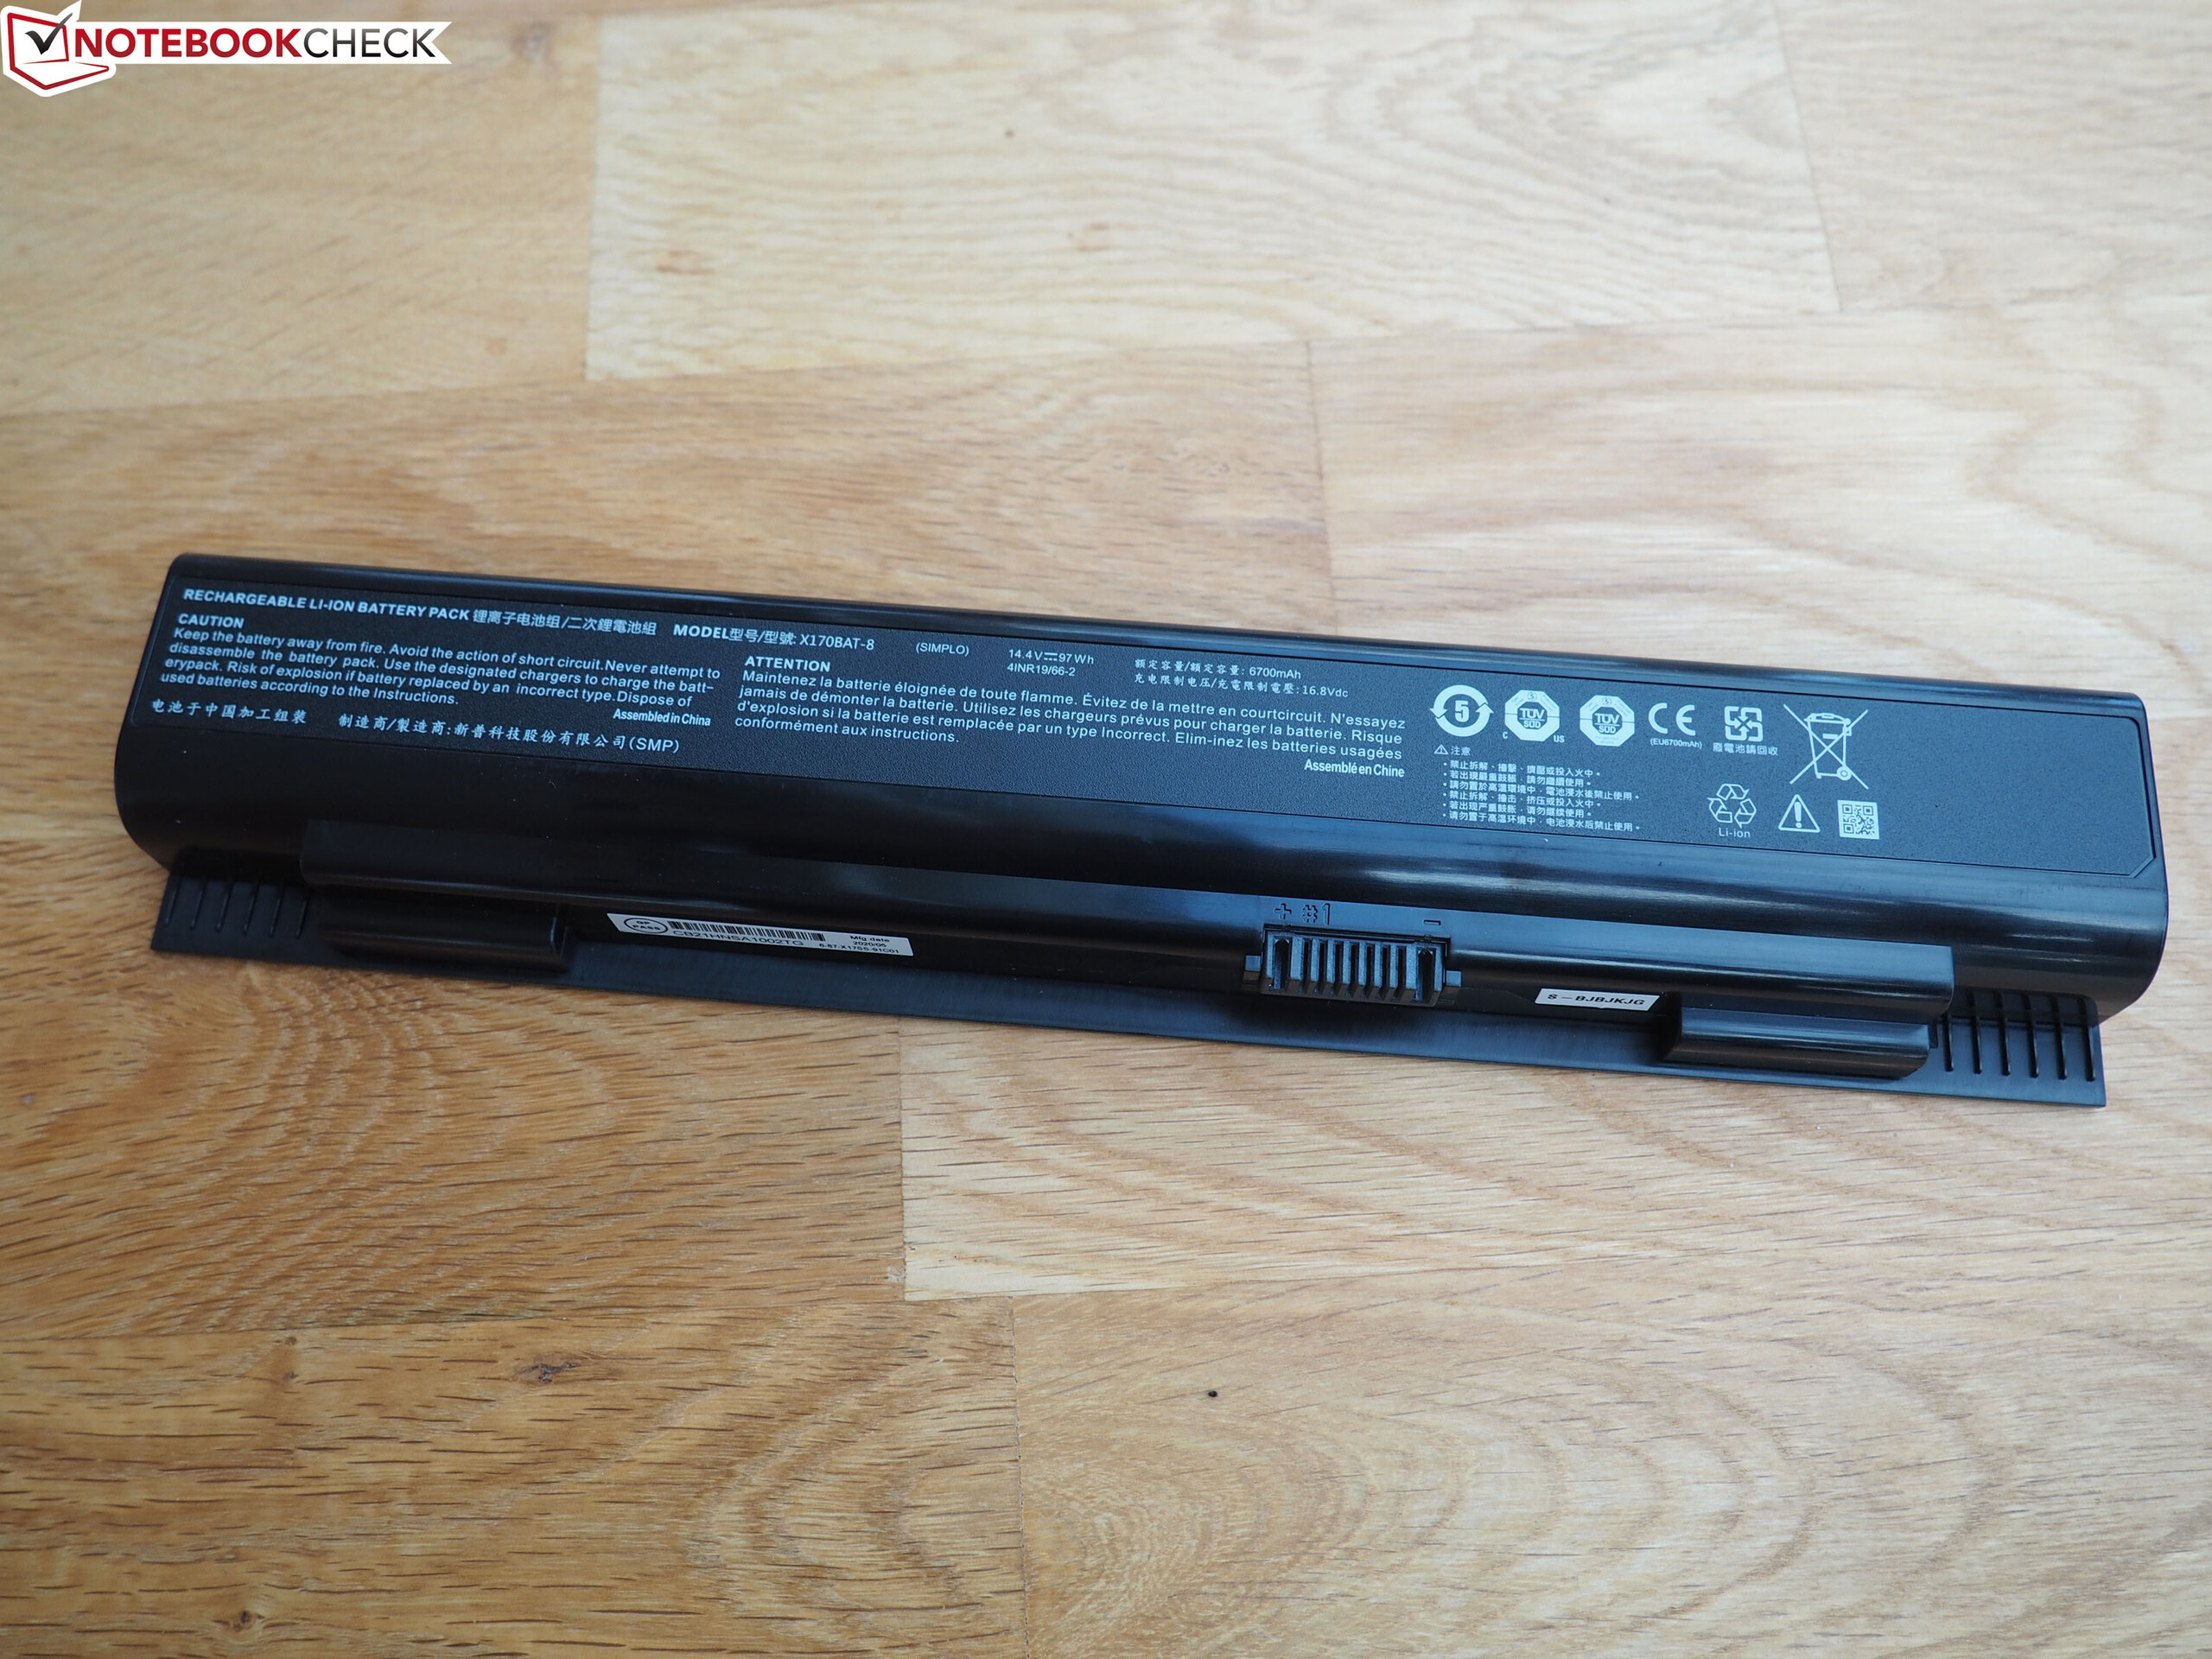
Battery life
The hardware's unbridled hunger for energy means that even the installed 97 Wh battery is only good for measly runtimes. The 17.3 incher achieves runtimes of 1:50 h and 1:55 h in the WLAN test (calling up websites via a script) and video test (short film Big Buck Bunny (H.264 encoding, FHD) in loop), respectively. The battery serves more as an emergency power supply than as a mobility factor in a device like the Ultra 17.
| Schenker XMG Ultra 17 Rocket Lake i9-11900K, GeForce RTX 3080 Laptop GPU, 97 Wh | MSI GT76 Titan DT 10SGS i9-10900K, GeForce RTX 2080 Super Mobile, 90 Wh | Asus Strix Scar 17 G732LXS i9-10980HK, GeForce RTX 2080 Super Mobile, 66 Wh | Schenker XMG Ultra 17 Comet Lake i9-10900K, GeForce RTX 2080 Super Mobile, 97 Wh | Alienware m17 R4 i9-10980HK, GeForce RTX 3080 Laptop GPU, 86 Wh | Average of class Gaming | |
|---|---|---|---|---|---|---|
| Battery runtime | 33% | 166% | 61% | 19% | 206% | |
| Reader / Idle (h) | 3 | 10 233% | 4.9 63% | 7.84 ? 161% | ||
| H.264 (h) | 1.9 | 2.2 16% | 8.27 ? 335% | |||
| WiFi v1.3 (h) | 1.8 | 2.4 33% | 5.9 228% | 3.8 111% | 2.4 33% | 7.08 ? 293% |
| Load (h) | 1.1 | 1.5 36% | 1.2 9% | 1.2 9% | 1.496 ? 36% |
Pros
Cons
Verdict
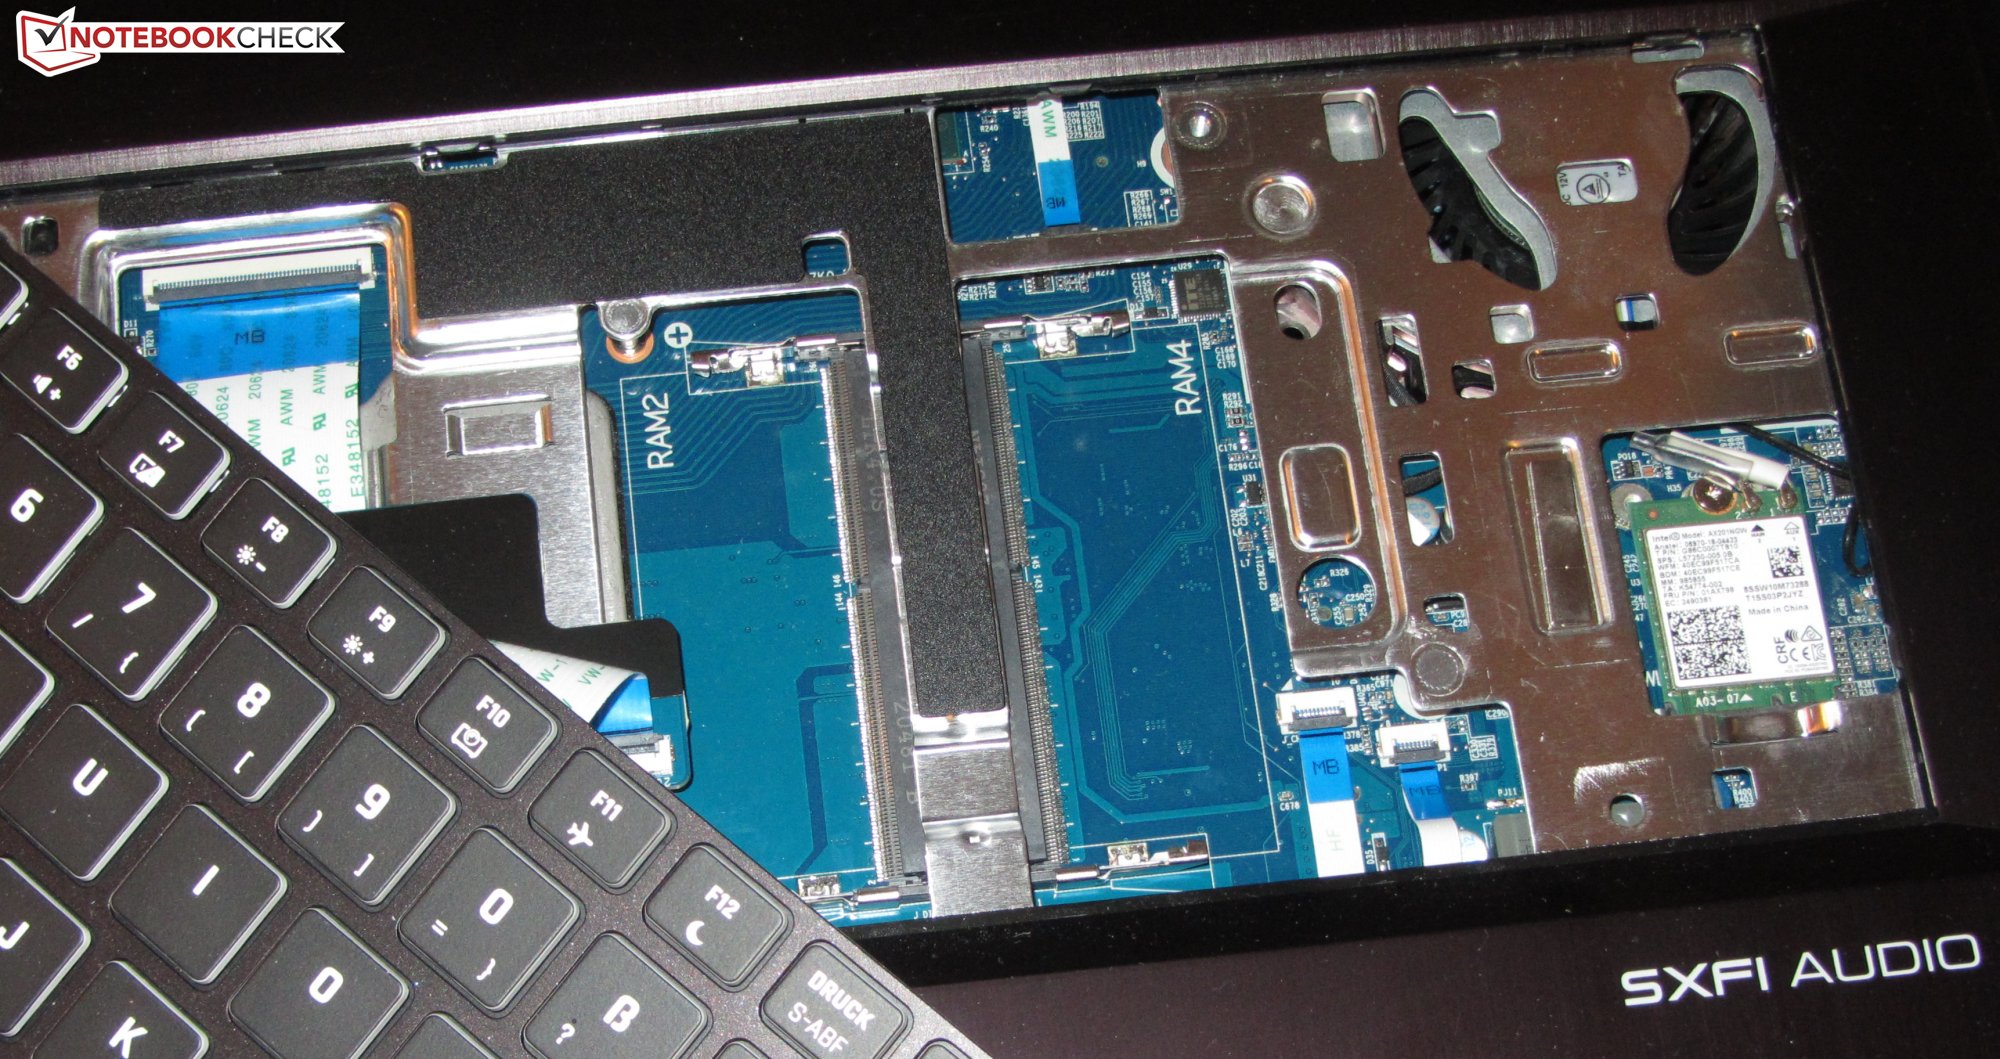
Schenker's massive desktop replacement notebook does not compromise in terms of equipment and computing power. Since not only RAM and storage media, but also CPU (socketed) and GPU (MXM) are exchangeable, the notebook can be individually tailored according to need. There are three GPUs (Ampere) and ten CPUs (Comet Lake, Rocket Lake) to choose from.
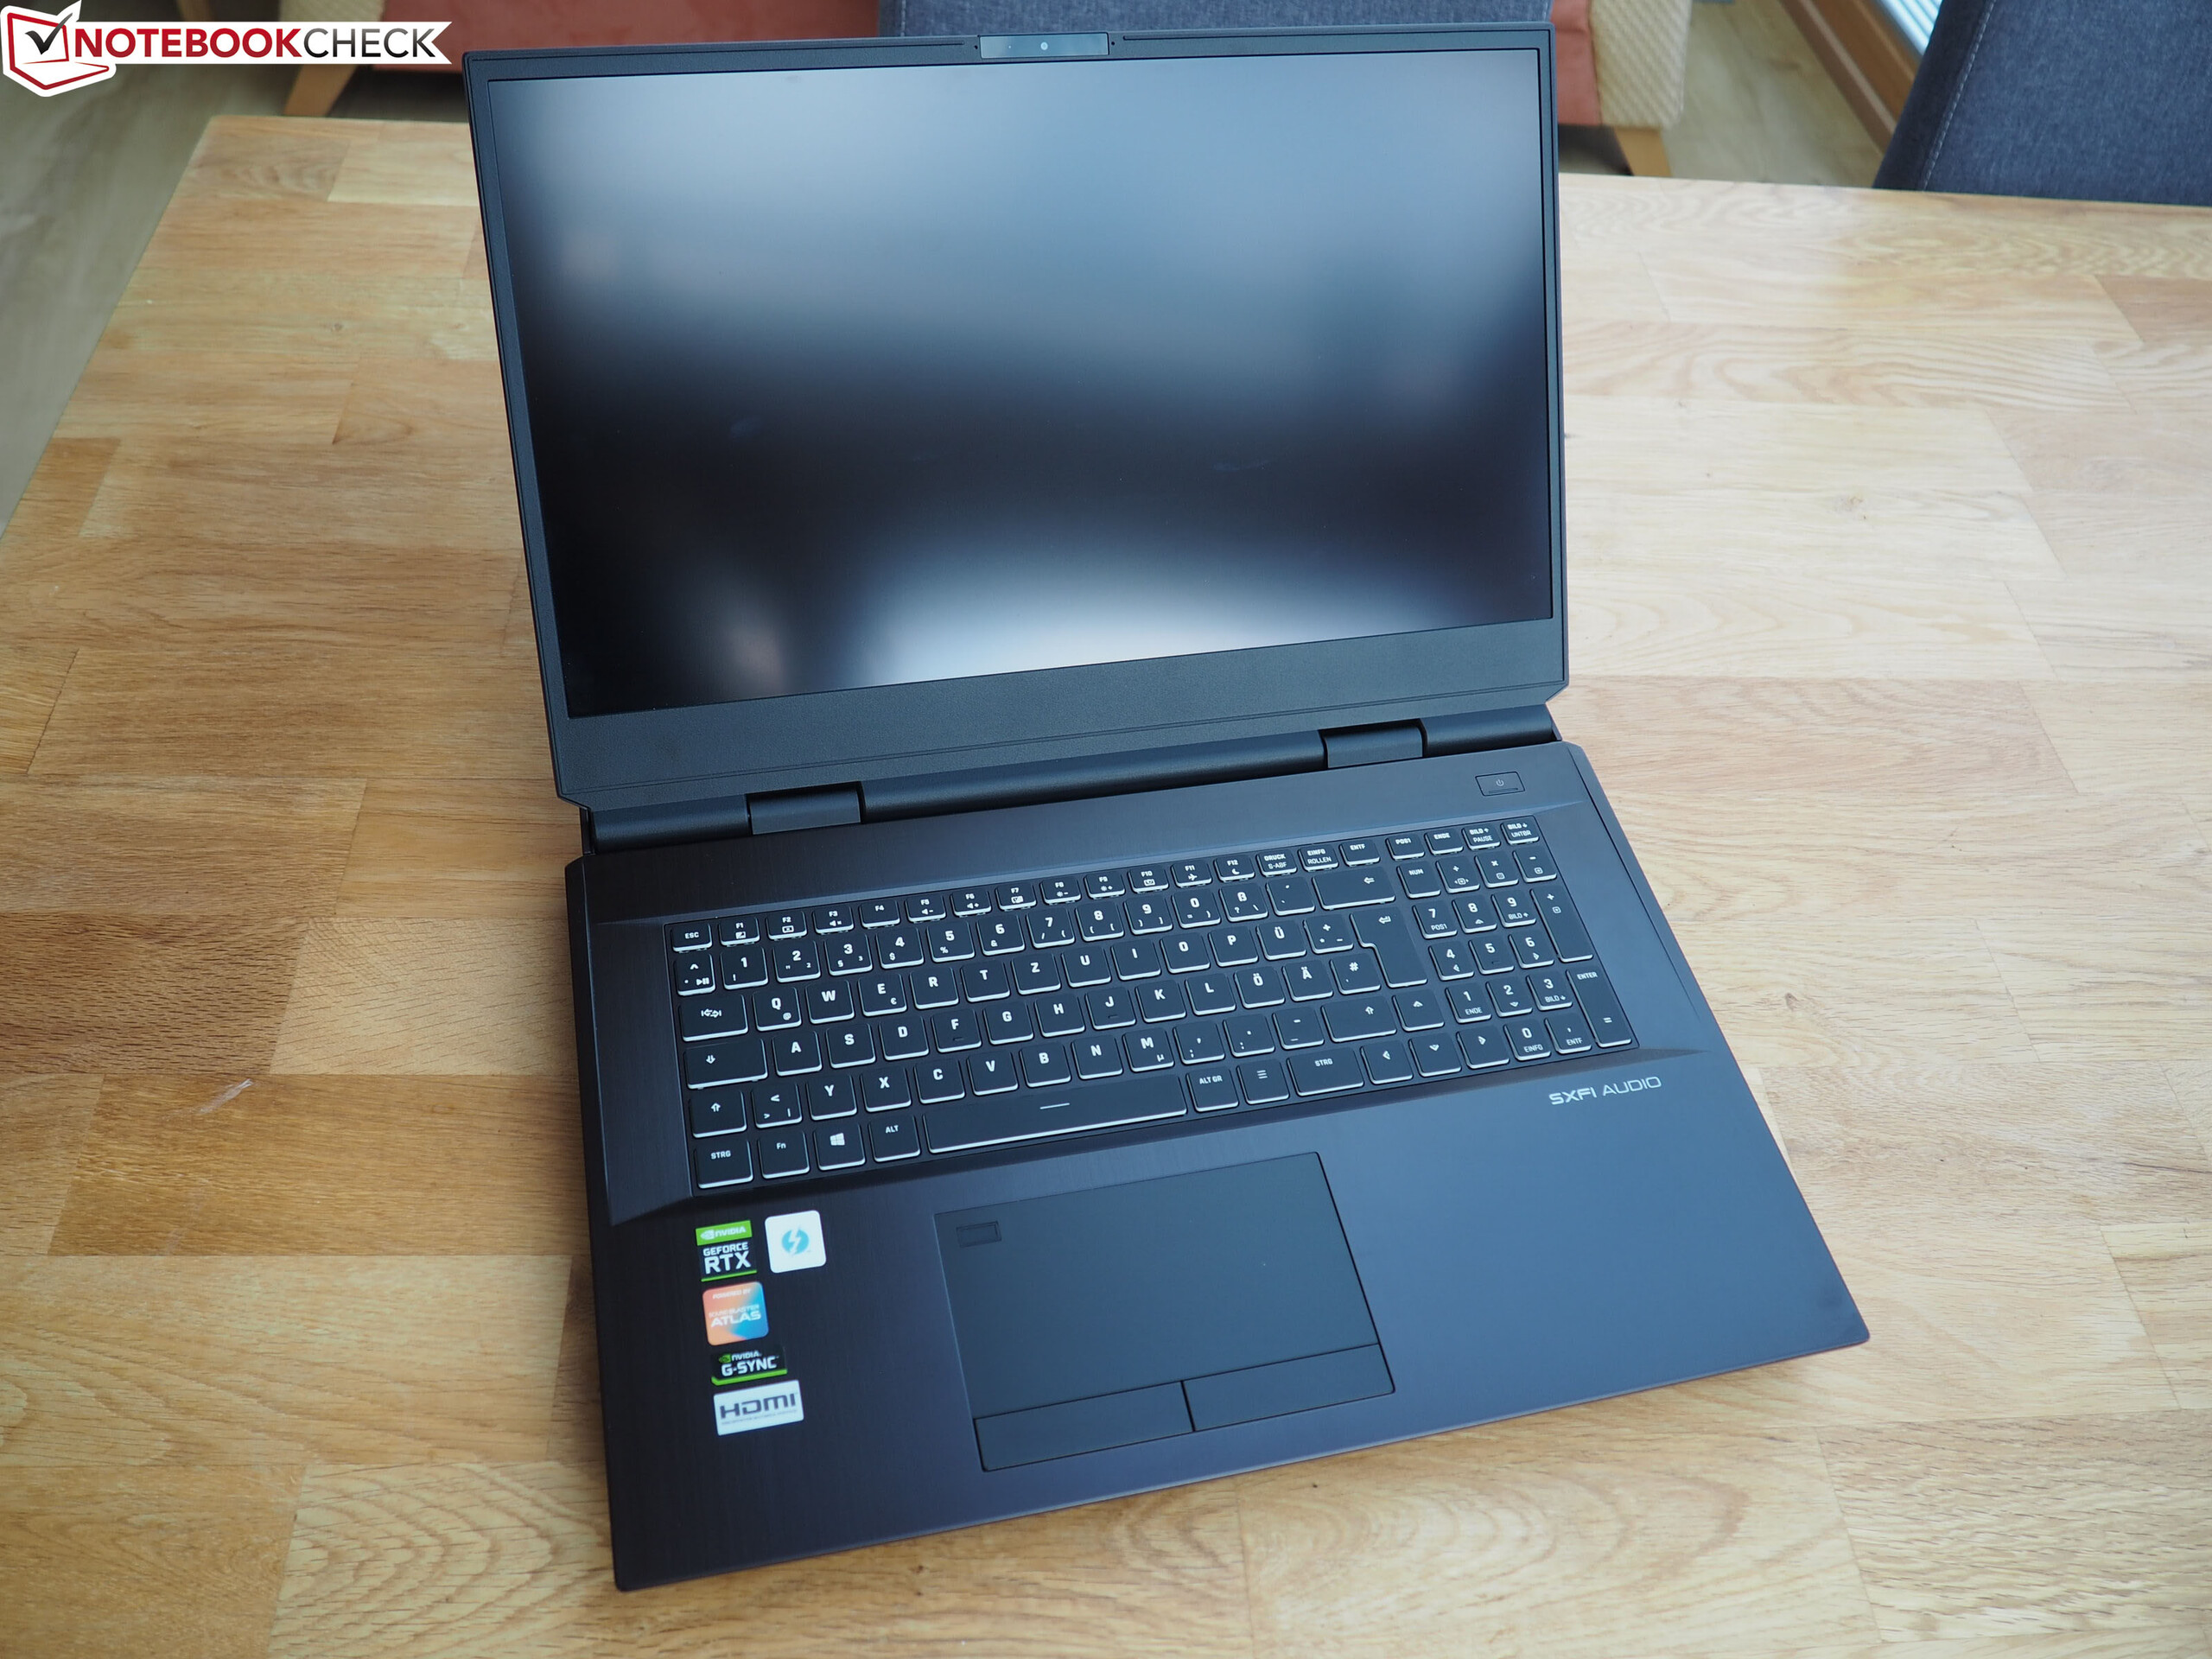
The Schenker XMG Ultra 17 offers a lot of computing power, numerous interfaces and plenty of expansion options.
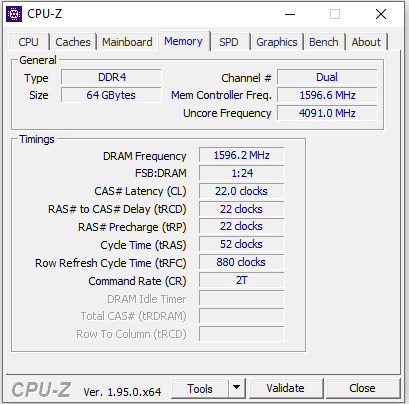
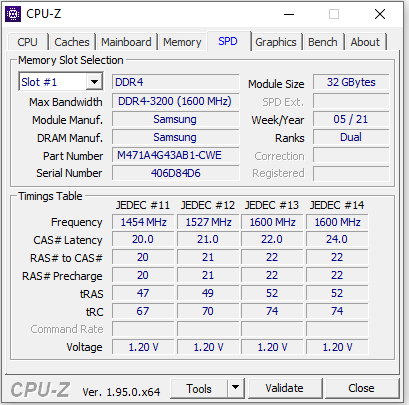
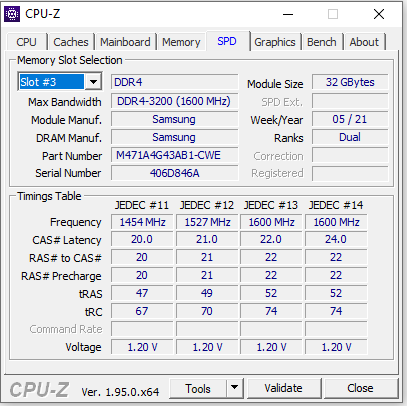
The review sample provided to us is very good thanks to the combination of the Core-i9-11900K processor, GeForce RTX-3080 laptop GPU, 64 GB working memory (max. 128 GB) and 4 NVMe SSDs with a total of 26 TB storage space, the test device provided to us is more than equipped for all common application areas. Office, Internet, video editing, image processing, streaming and gaming are all handled without any problems.
Nvidia's G-Sync technology ensures a smooth image display on the 300 Hz IPS screen. The latter scores with a matte surface, good contrast, short response times, stable viewing angles, great color reproduction and decent color space coverage. However, the maximum brightness should be a bit higher. Since the device will primarily be used indoors due to its low mobility, it is acceptable.
Price and availability
The Schenker XMG Ultra 17 (2021) can be configured individually in the Schenker online shop. The configuration variant provided to us is available for just under 9,000 Euros (~$10,887). Entry-level models are available from about 2,500 Euros (~$3,024).
Schenker XMG Ultra 17 Rocket Lake
- 04/19/2021 v7 (old)
Sascha Mölck
Price comparison

