Schenker XMG Ultra 17 (Clevo X170SM-G) laptop review: Power without end
As is usual for Schenker Technologies, the XMG Ultra 17 can be extensively configured and adapted on the company's own website, bestware.com. While a Full HD panel at 240 Hz or a UHD panel at 60 Hz (G-Sync included in each case) is used as the display, a high-end chip from Nvidia's Turing generation takes care of incoming graphics calculations. Besides the GeForce RTX 2070 (Super), Schenker also offers the RTX 2080 Super top model. For the processor, you have to choose between a hexa-core (Core i5), octa-core (Core i7) or ten-core (Core i9) CPU. But no matter which model you choose, all CPUs are based on Intel's Comet Lake architecture, which is quite old compared to AMD's Ryzen CPUs because of its 14 nm size.
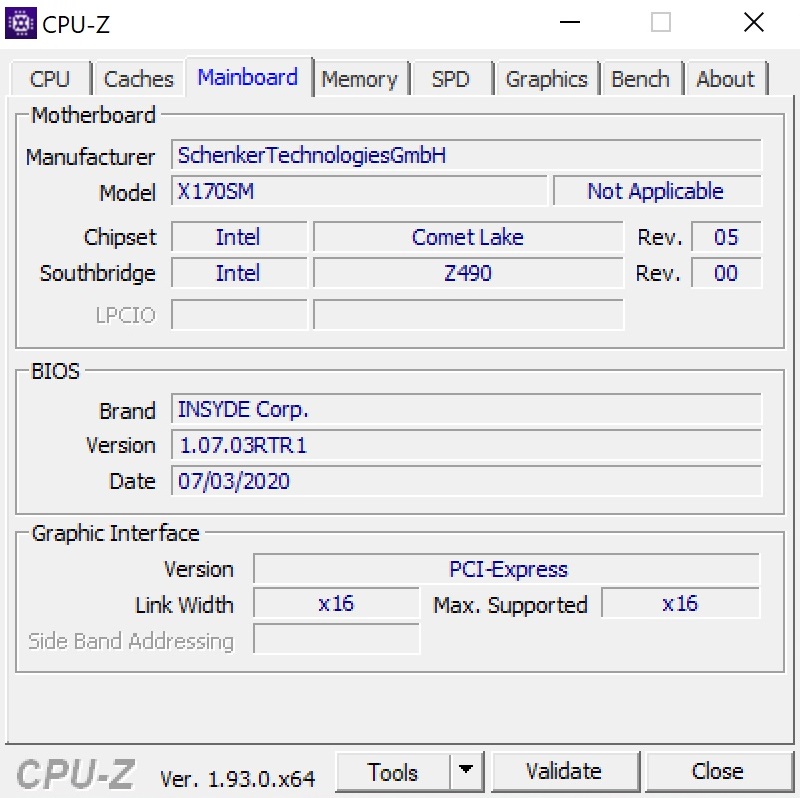
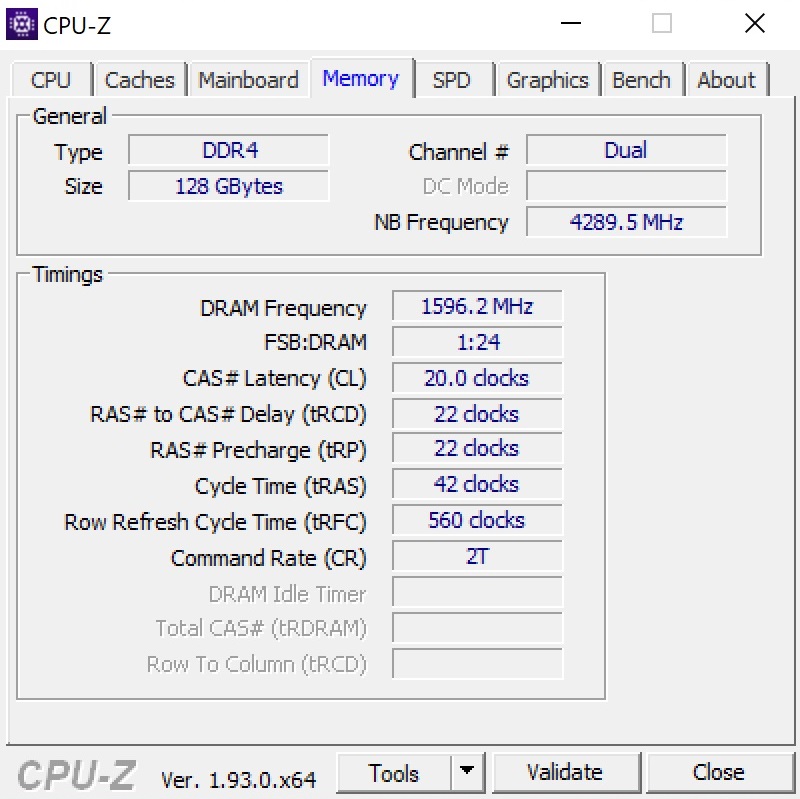
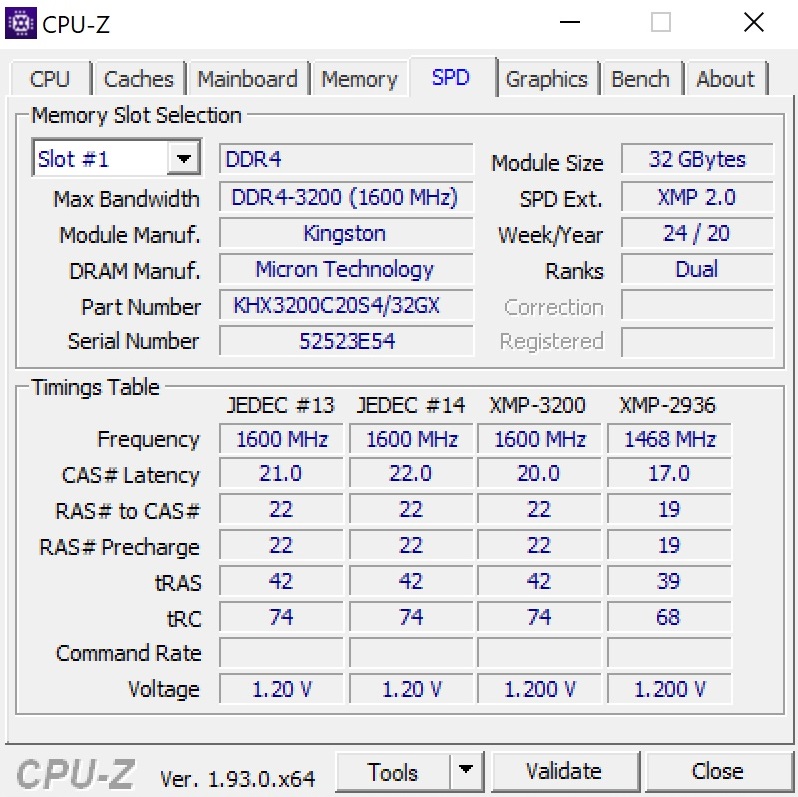
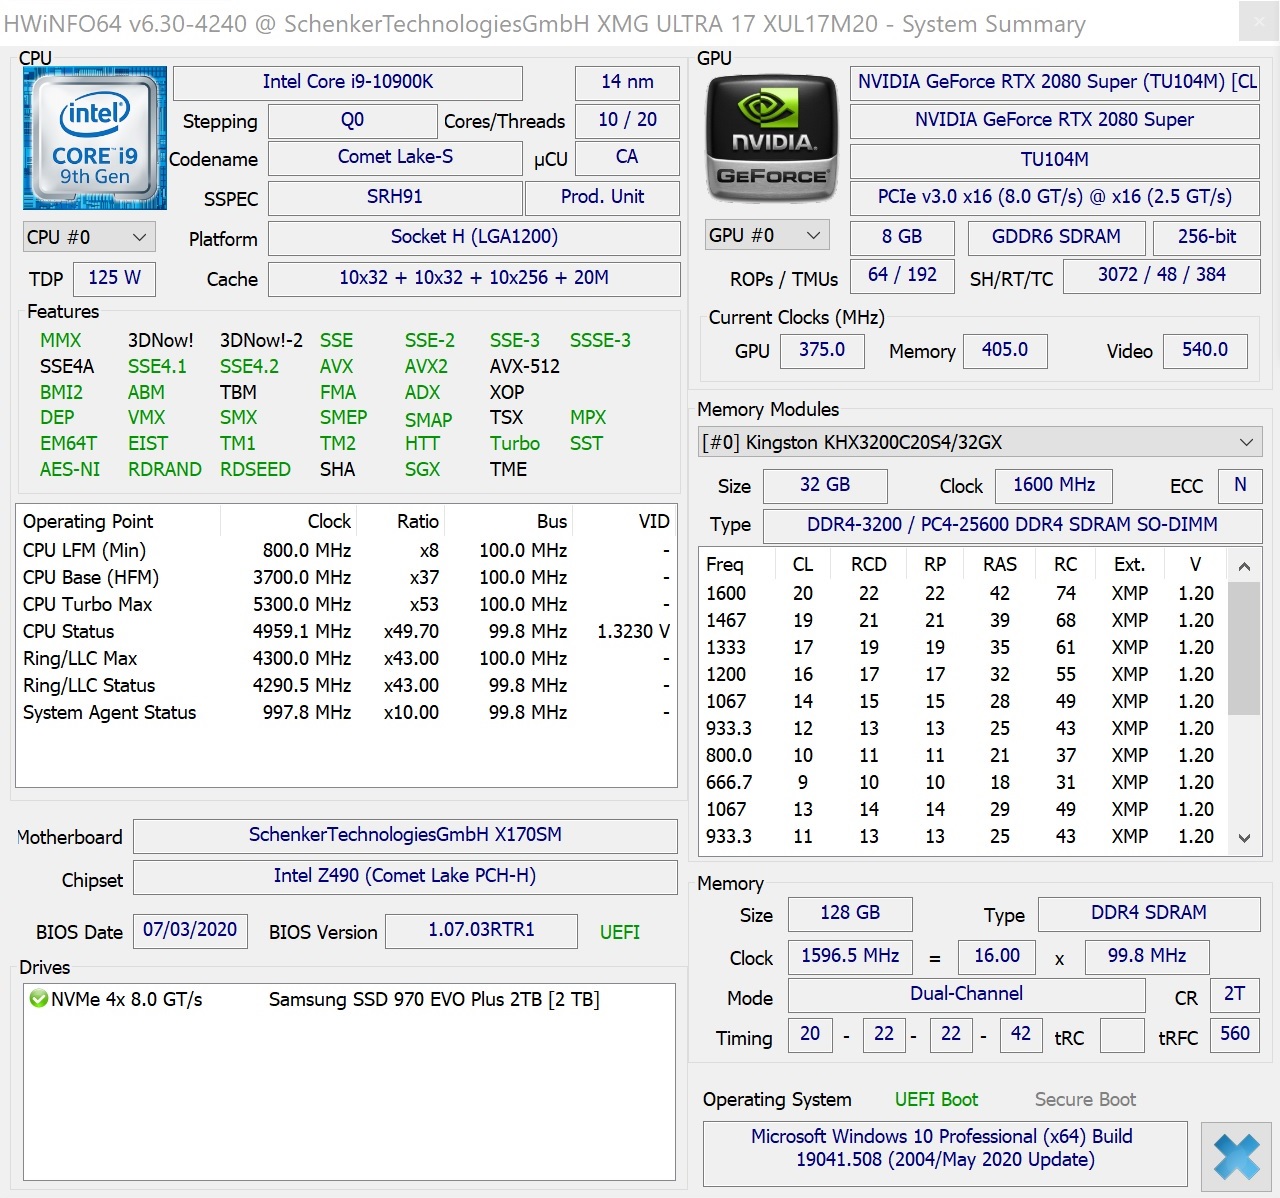
Four SO-DIMM slots are available for memory, supporting a maximum of 128 GB. Mass storage is no less generous. In this way, the XMG Ultra 17 accommodates up to four M.2 SSDs (the manufacturer has forgone a 2.5-inch slot in favor of battery capacity). You can also have an influence on the WLAN module, the keyboard variant, the operating system, and the warranty period. In terms of price, the 17-incher starts at just under 2,700 Euros (~$3,170). Meanwhile, our optimally equipped test configuration that comes with a Core i9-10900K, a GeForce RTX 2080 Super, 128 GB of RAM (4x 32 GB DDR4 3200), a 2 TB SSD, and Windows 10 Pro 64-bit costs almost 5,000 Euros (~$5,870).
The XMG Ultra 17's competitors include other desktop replacements in the 17-inch range that are also available with an RTX 2080 Super such as the MSI GT76 Titan DT 10SGS, the Alienware m17 R3, and the Asus Strix Scar 17 G732LXS.
Rating | Date | Model | Weight | Height | Size | Resolution | Price |
|---|---|---|---|---|---|---|---|
| 85 % v7 (old) | 10 / 2020 | Schenker XMG Ultra 17 Comet Lake i9-10900K, GeForce RTX 2080 Super Mobile | 4.7 kg | 43.5 mm | 17.30" | 3840x2160 | |
| 87.4 % v7 (old) | 10 / 2020 | MSI GT76 Titan DT 10SGS i9-10900K, GeForce RTX 2080 Super Mobile | 4.2 kg | 42 mm | 17.30" | 3840x2160 | |
| 85.3 % v7 (old) | 09 / 2020 | Alienware m17 R3 P45E i9-10980HK, GeForce RTX 2080 Super Mobile | 3 kg | 20.7 mm | 17.30" | 1920x1080 | |
| 82.7 % v7 (old) | 07 / 2020 | Asus Strix Scar 17 G732LXS i9-10980HK, GeForce RTX 2080 Super Mobile | 2.9 kg | 26.5 mm | 17.30" | 1920x1080 |
Case
The case is extremely massive for a device from 2020. The 39.9 x 31.9 cm footprint is just as huge as the overall height of 4.35 cm. In combination with the extremely high weight (4.7 kg) and the two power adapters (more on this later), the 17-incher is difficult to transport. The competition is between 500 g (MSI GT76) and 1,800 g (Asus Strix Scar 17) lighter.
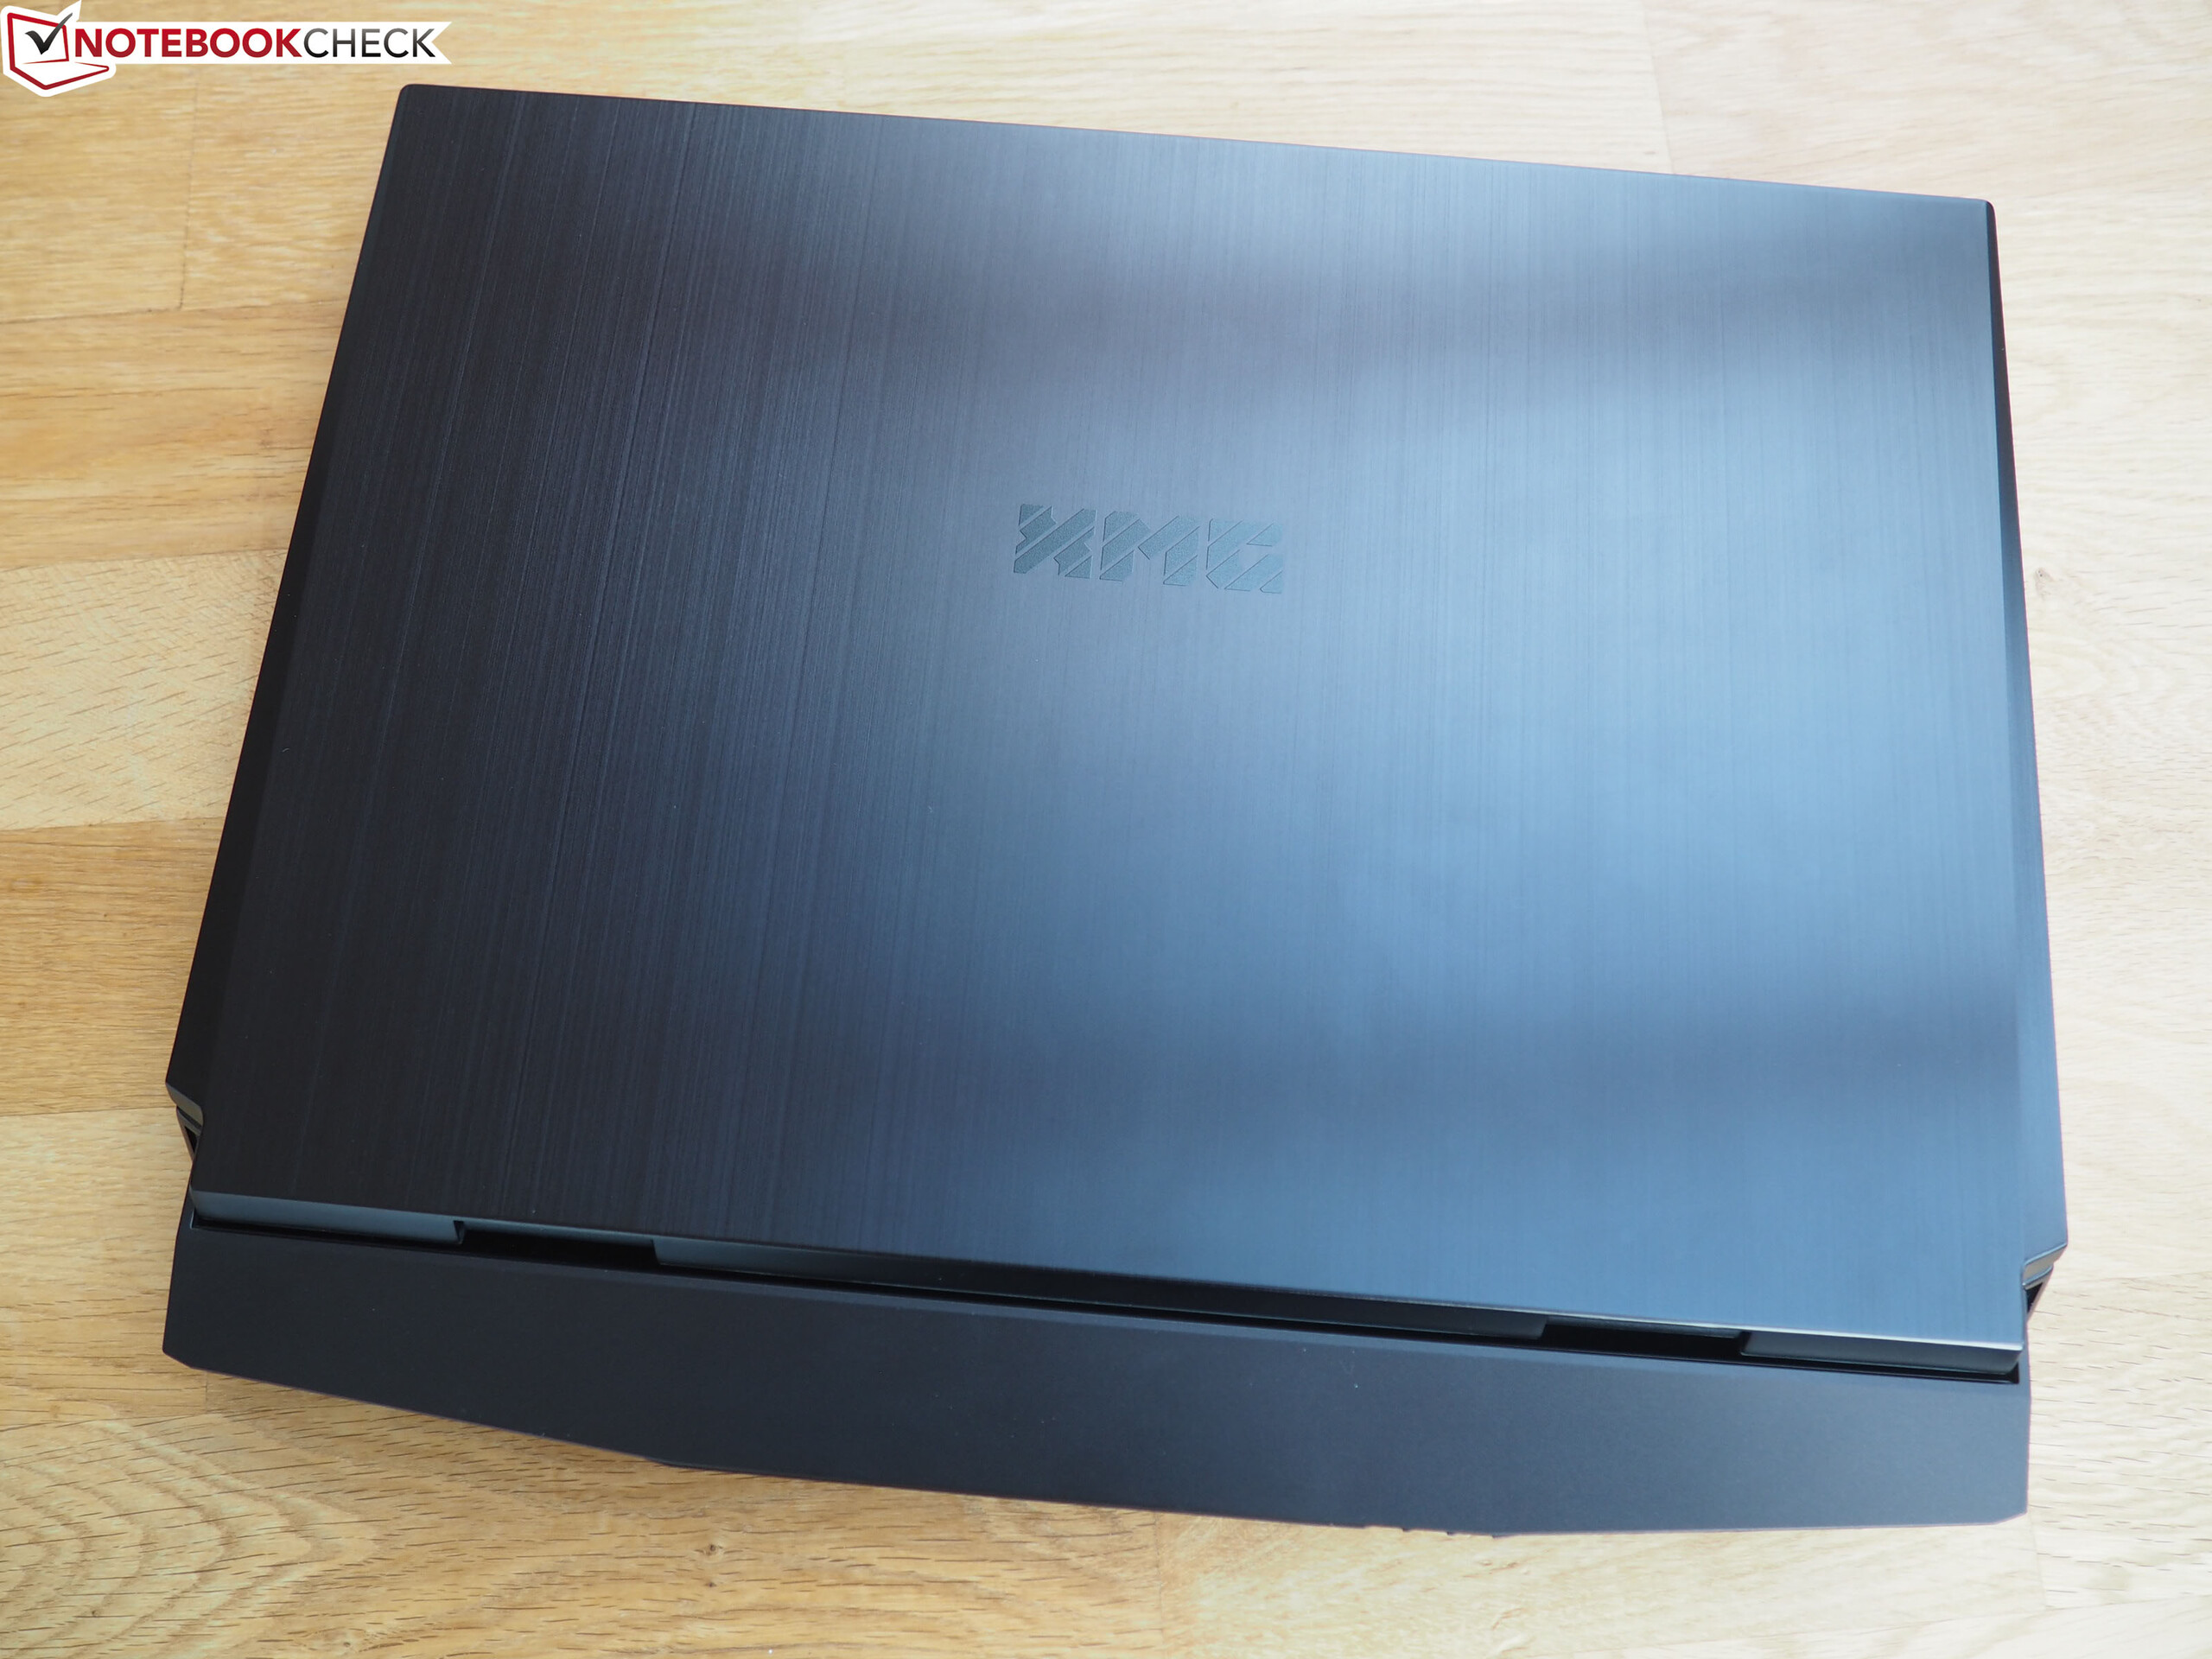
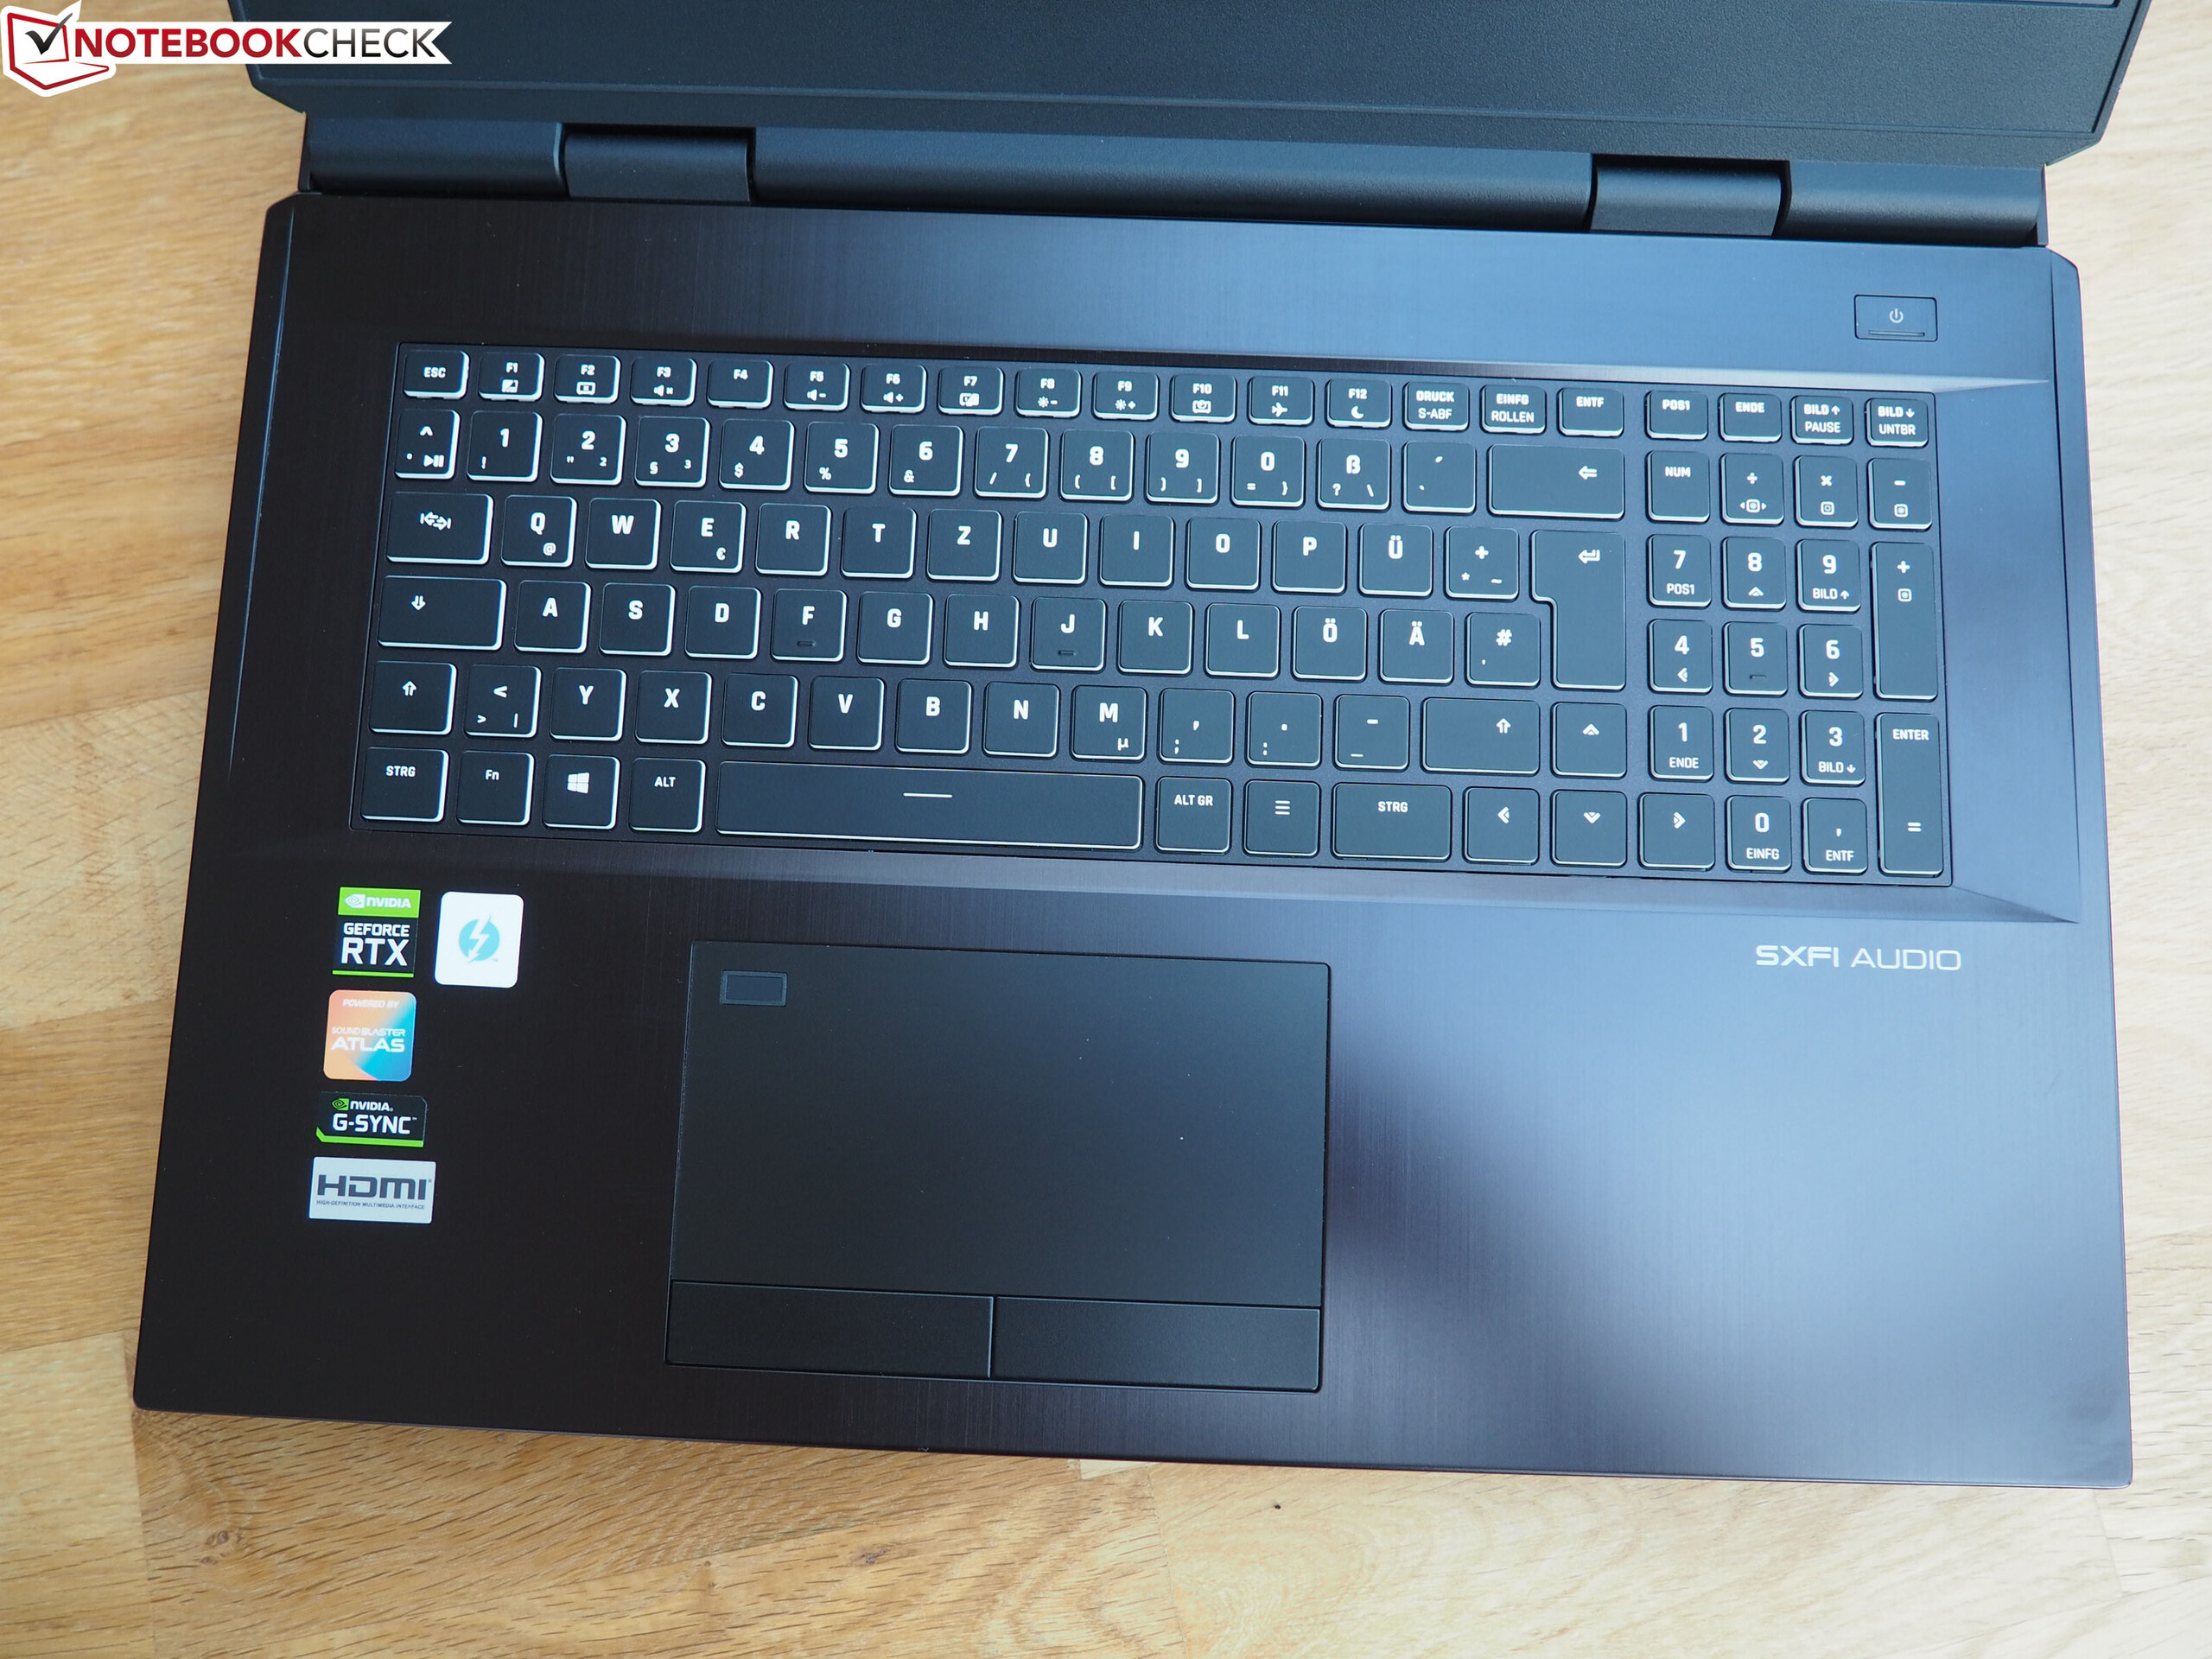
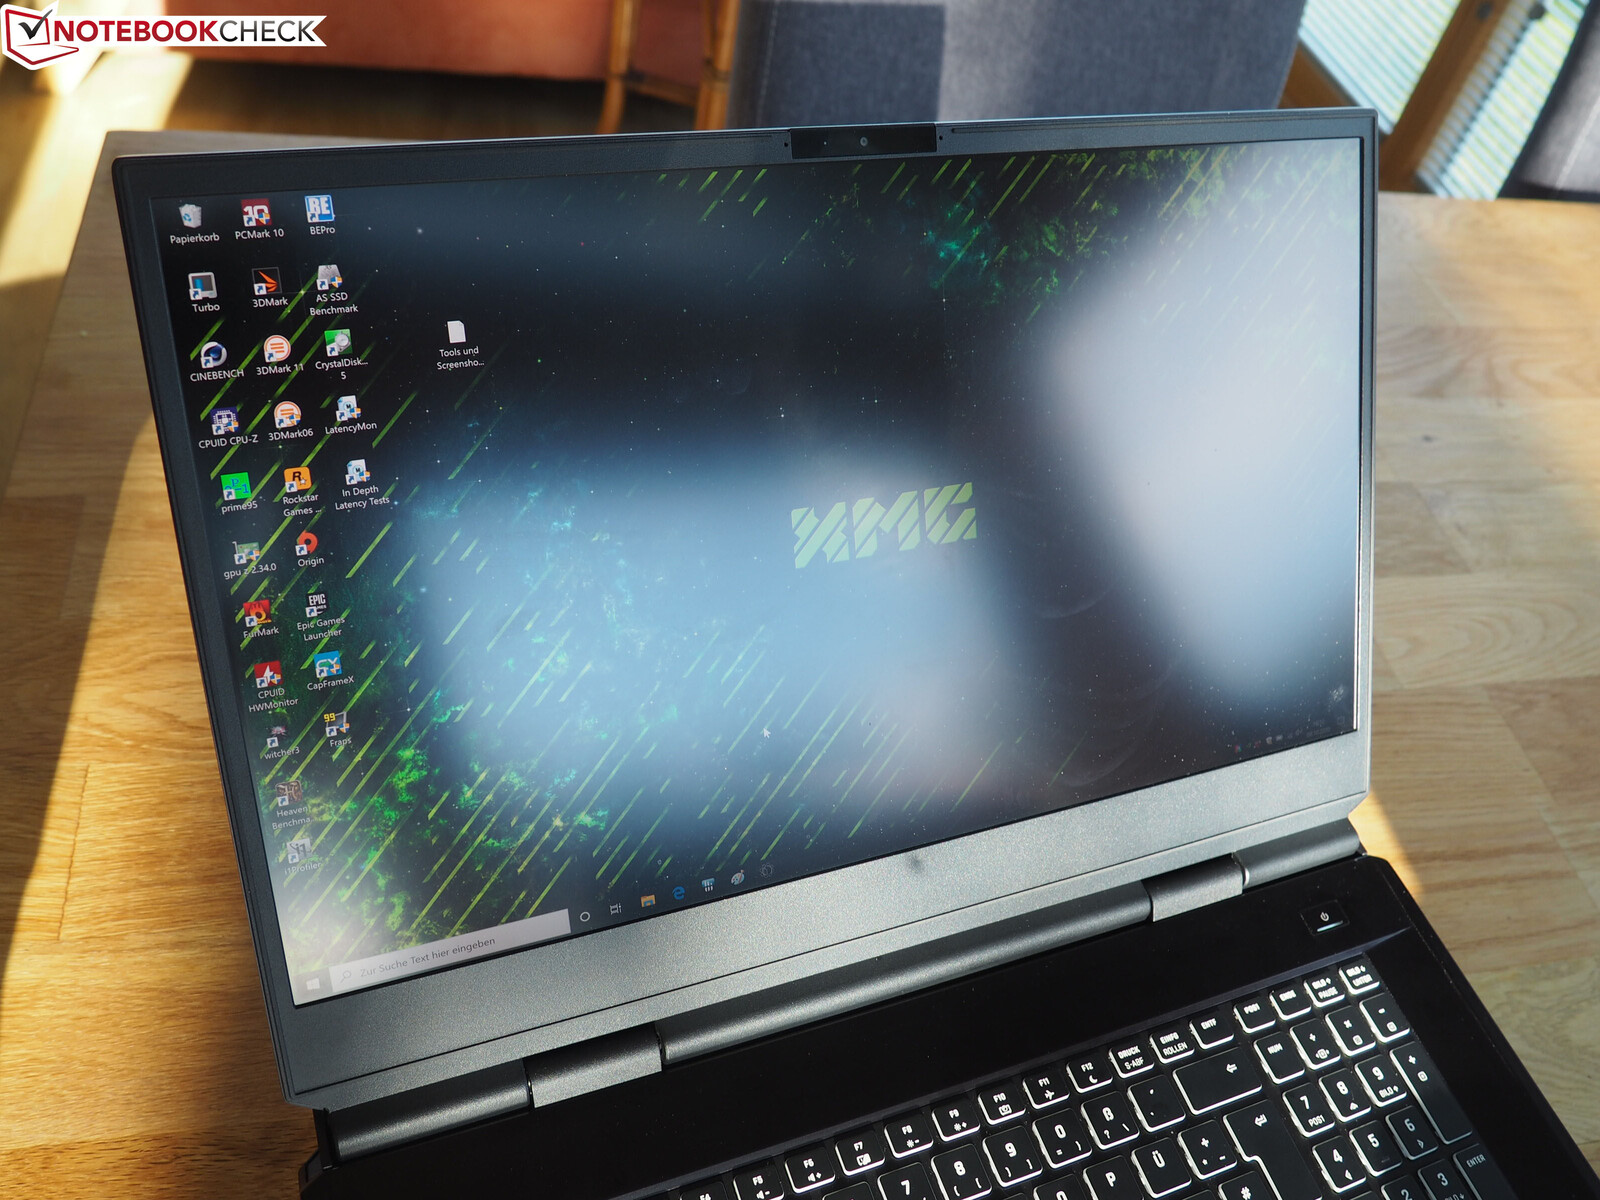
Qualitatively, there is hardly anything to criticize about the case. The underlying X170SM-G Clevo barebone impresses with its clean workmanship and good materials. While the display frame and the bottom cover are made of plastic, the lid and the keyboard area are made of metal (brushed aluminum), which gives the Ultra 17 a certain perceived quality.
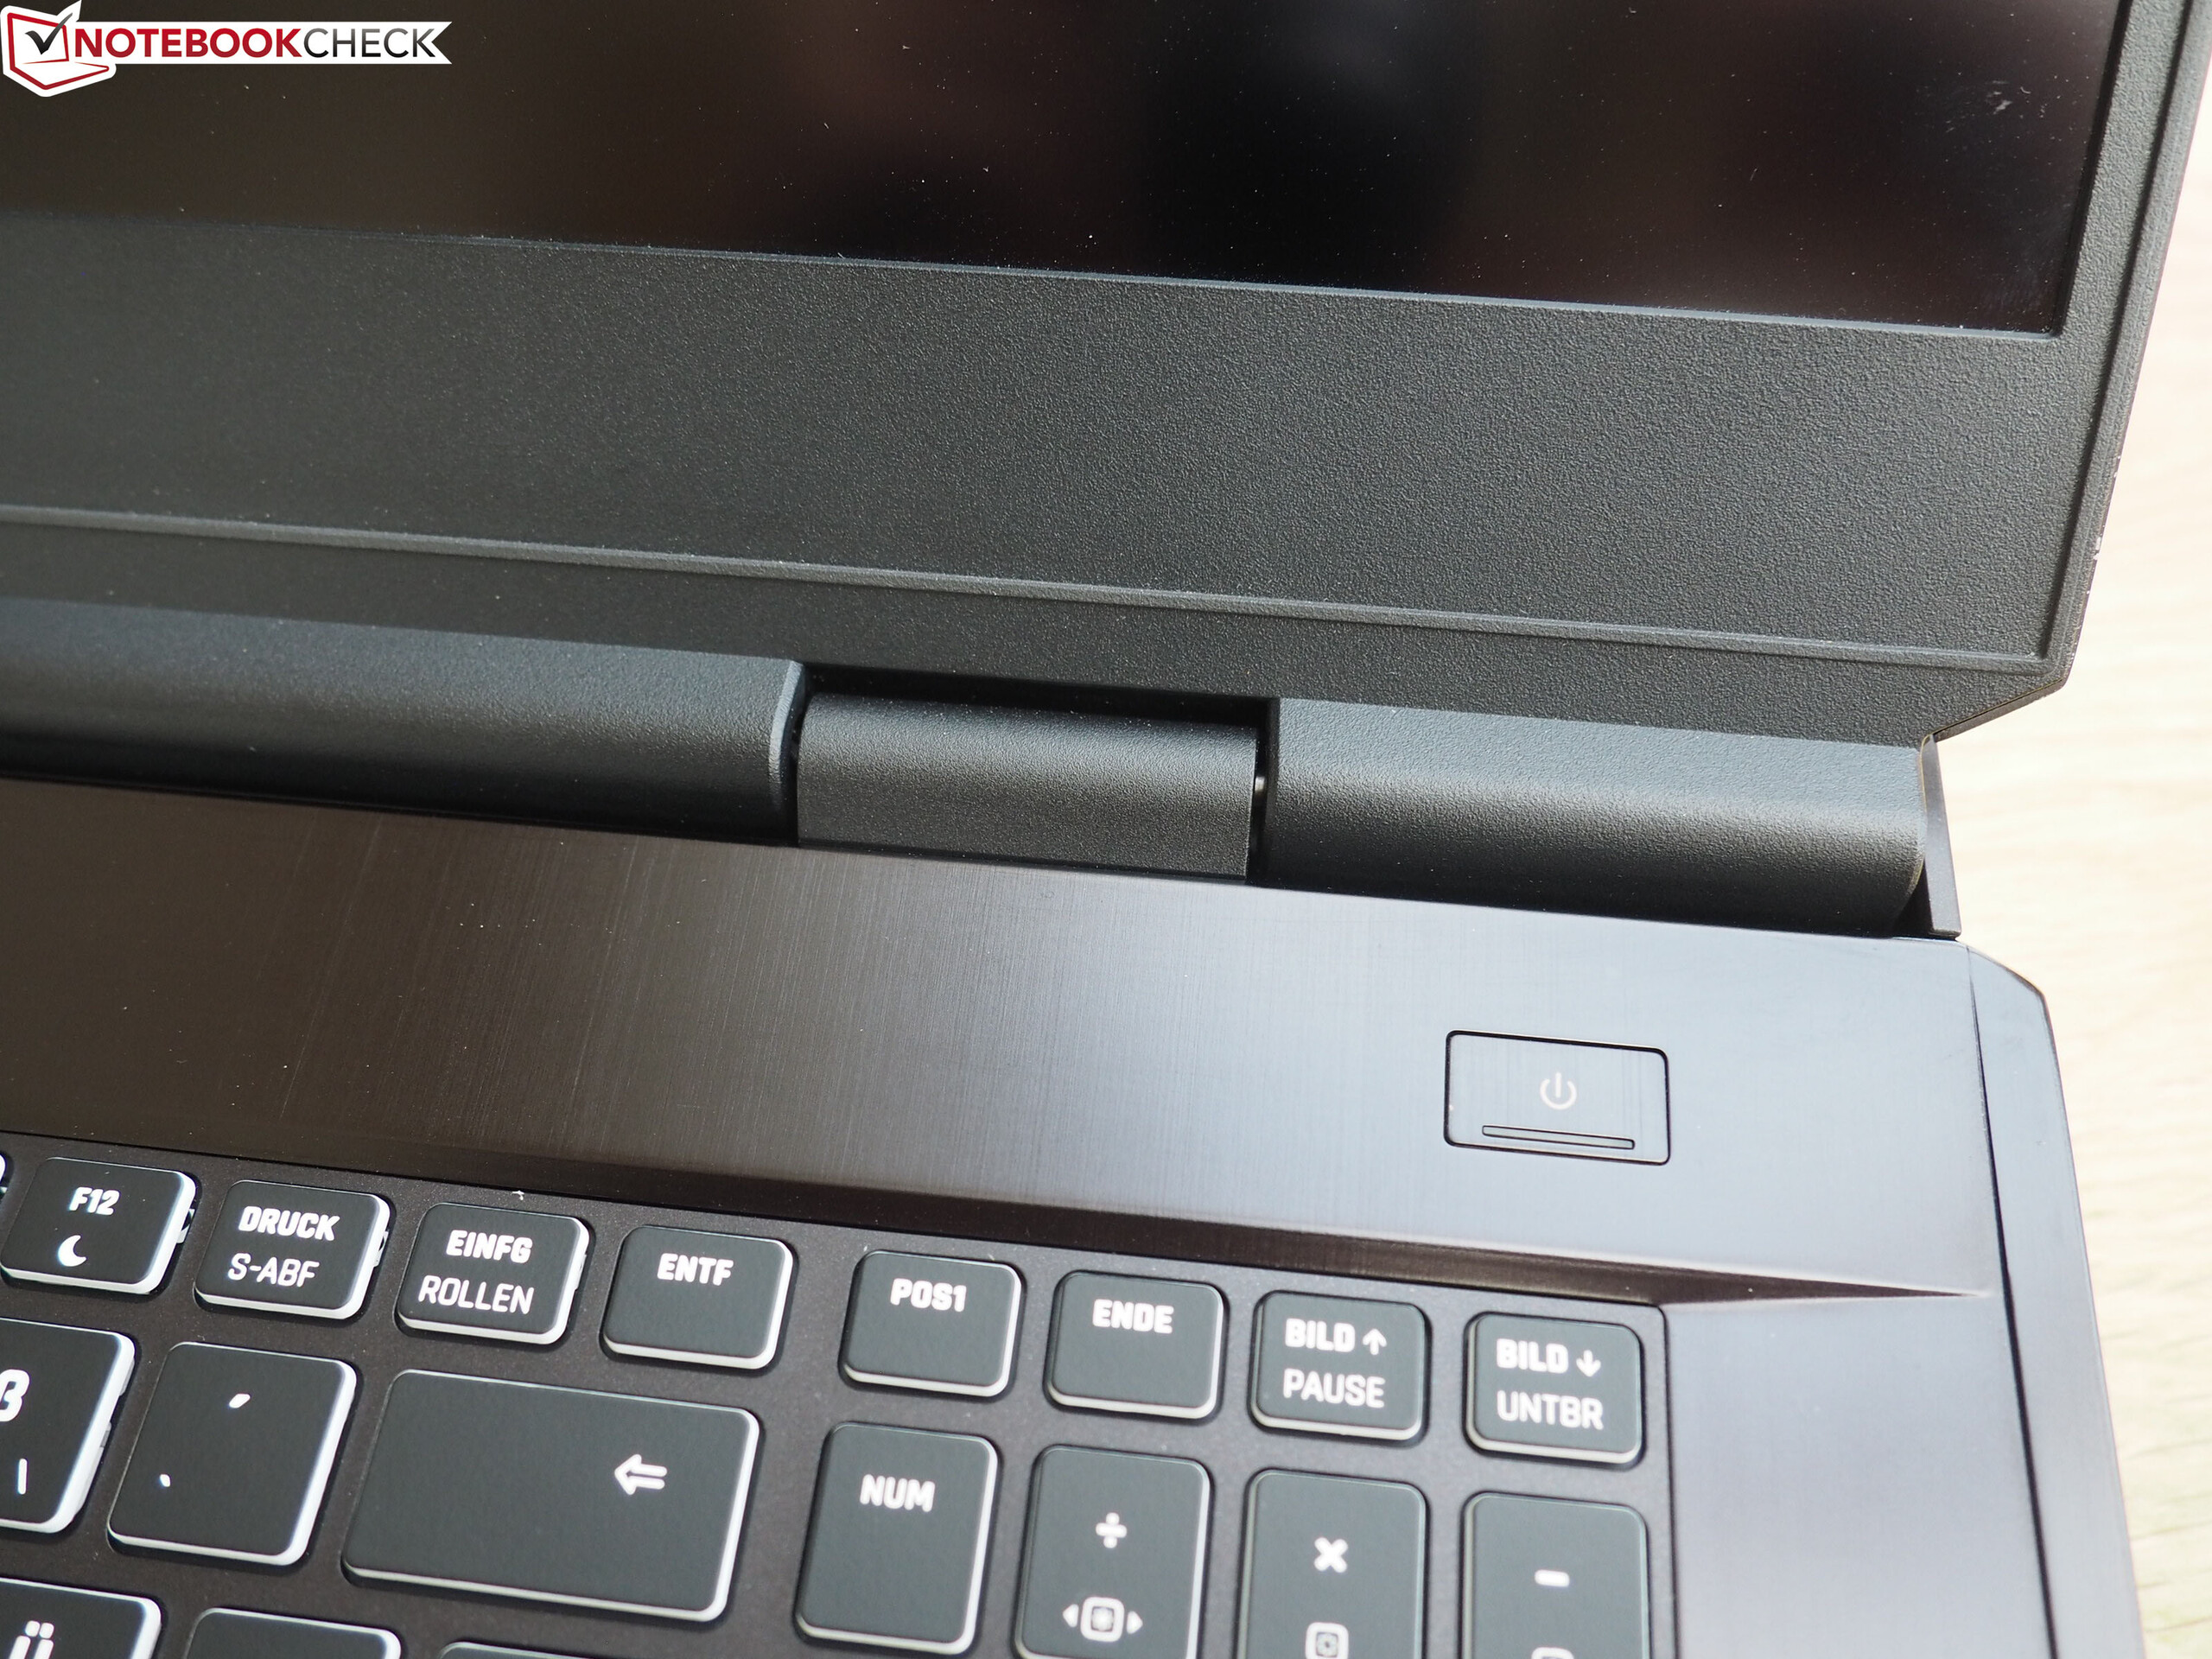
Stability is also pretty good. If you factor out the middle of the keyboard, the case doesn't yield even under strong pressure. The two hinges do their job inconspicuously. The word "inconspicuous" also fits the design. As is typical for Clevo, the case is very discreet if you exclude the LED strip at the back. Since the fan area is not quite as protruding as on the MSI GT76, the case also looks less clunky compared to its main competitor - despite it having little more height.
Connectivity
Ports
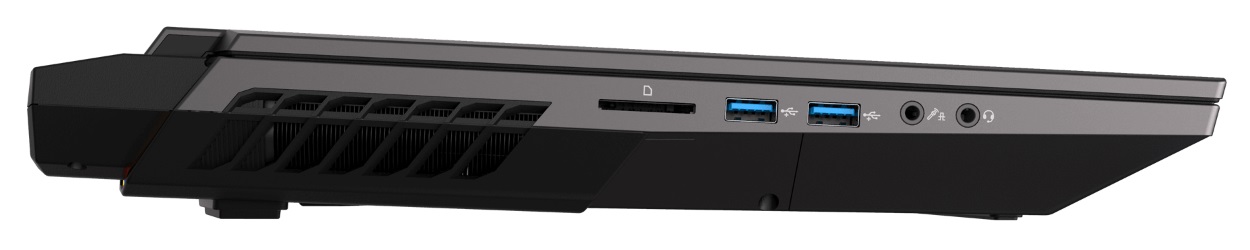
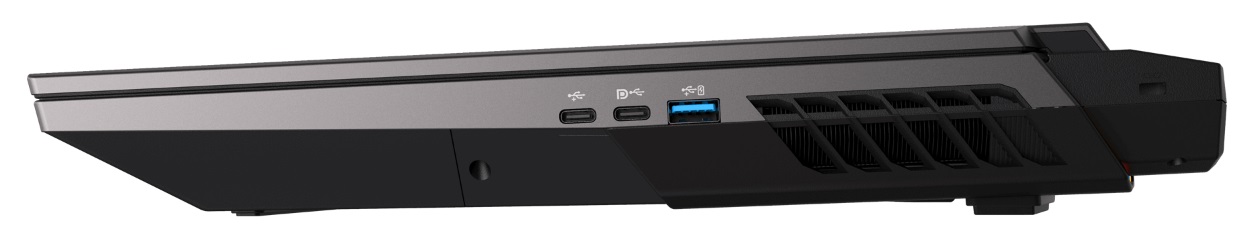
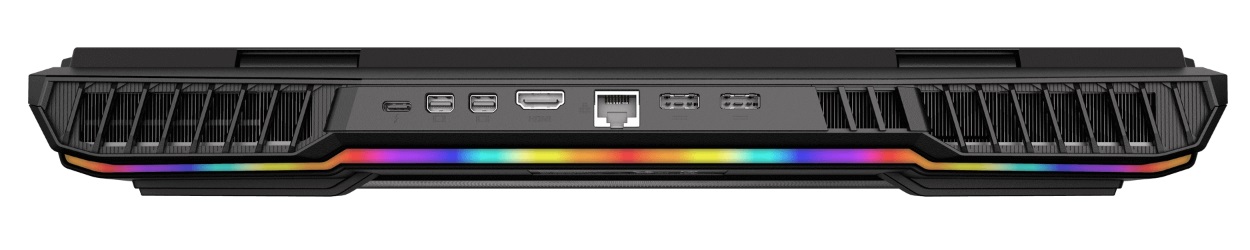
When it comes to connections, the manufacturer goes full throttle. In this way, not only can buyers look forward to six modern USB 3.2 Gen 2 ports (including 1x Thunderbolt) but also to three digital video outputs (HDMI 2.0 + 2x Mini DisplayPort 1.4). One of the USB Type-C ports supports DisplayPort as well, which allows you to connect any number of displays if necessary. The interface range is rounded off by a card reader, two audio connections, an RJ45 port, and a slot for Kensington locks. Since many ports are located on the back, the freedom of movement when using an external mouse is usually not restricted.
SD card reader
The SD card reader delivers very high speeds. Just under 220 MB/s almost completely maxes out the potential of our Toshiba reference card (maximum 260 MB/s), whereby the Alienware m17 R3 and the MSI GT76 10SGS score similarly well here.
| SD Card Reader | |
| average JPG Copy Test (av. of 3 runs) | |
| Schenker XMG Ultra 17 Comet Lake (Toshiba Exceria Pro SDXC 64 GB UHS-II) | |
| Alienware m17 R3 P45E (Toshiba Exceria Pro M501 UHS-II) | |
| MSI GT76 Titan DT 10SGS (Toshiba Exceria Pro M501 UHS-II) | |
| Average of class Gaming (20.9 - 210, n=54, last 2 years) | |
| maximum AS SSD Seq Read Test (1GB) | |
| Alienware m17 R3 P45E (Toshiba Exceria Pro M501 UHS-II) | |
| Schenker XMG Ultra 17 Comet Lake (Toshiba Exceria Pro SDXC 64 GB UHS-II) | |
| MSI GT76 Titan DT 10SGS (Toshiba Exceria Pro M501 UHS-II) | |
| Average of class Gaming (25.5 - 261, n=51, last 2 years) | |
Communication
There's nothing to criticize about the WLAN performance either. 1,350 Mb/s for sending and 1,560 Mb/s for receiving data are the top values in each case. Our test device had the AX1650x Wi-Fi 6 Killer chip on board, which costs only a few Euros more than the AX200 Intel module.
Webcam
The image quality of the webcam doesn't do justice to the laptop's price. Although the image sharpness is acceptable, the color accuracy leaves a lot to be desired.


Security
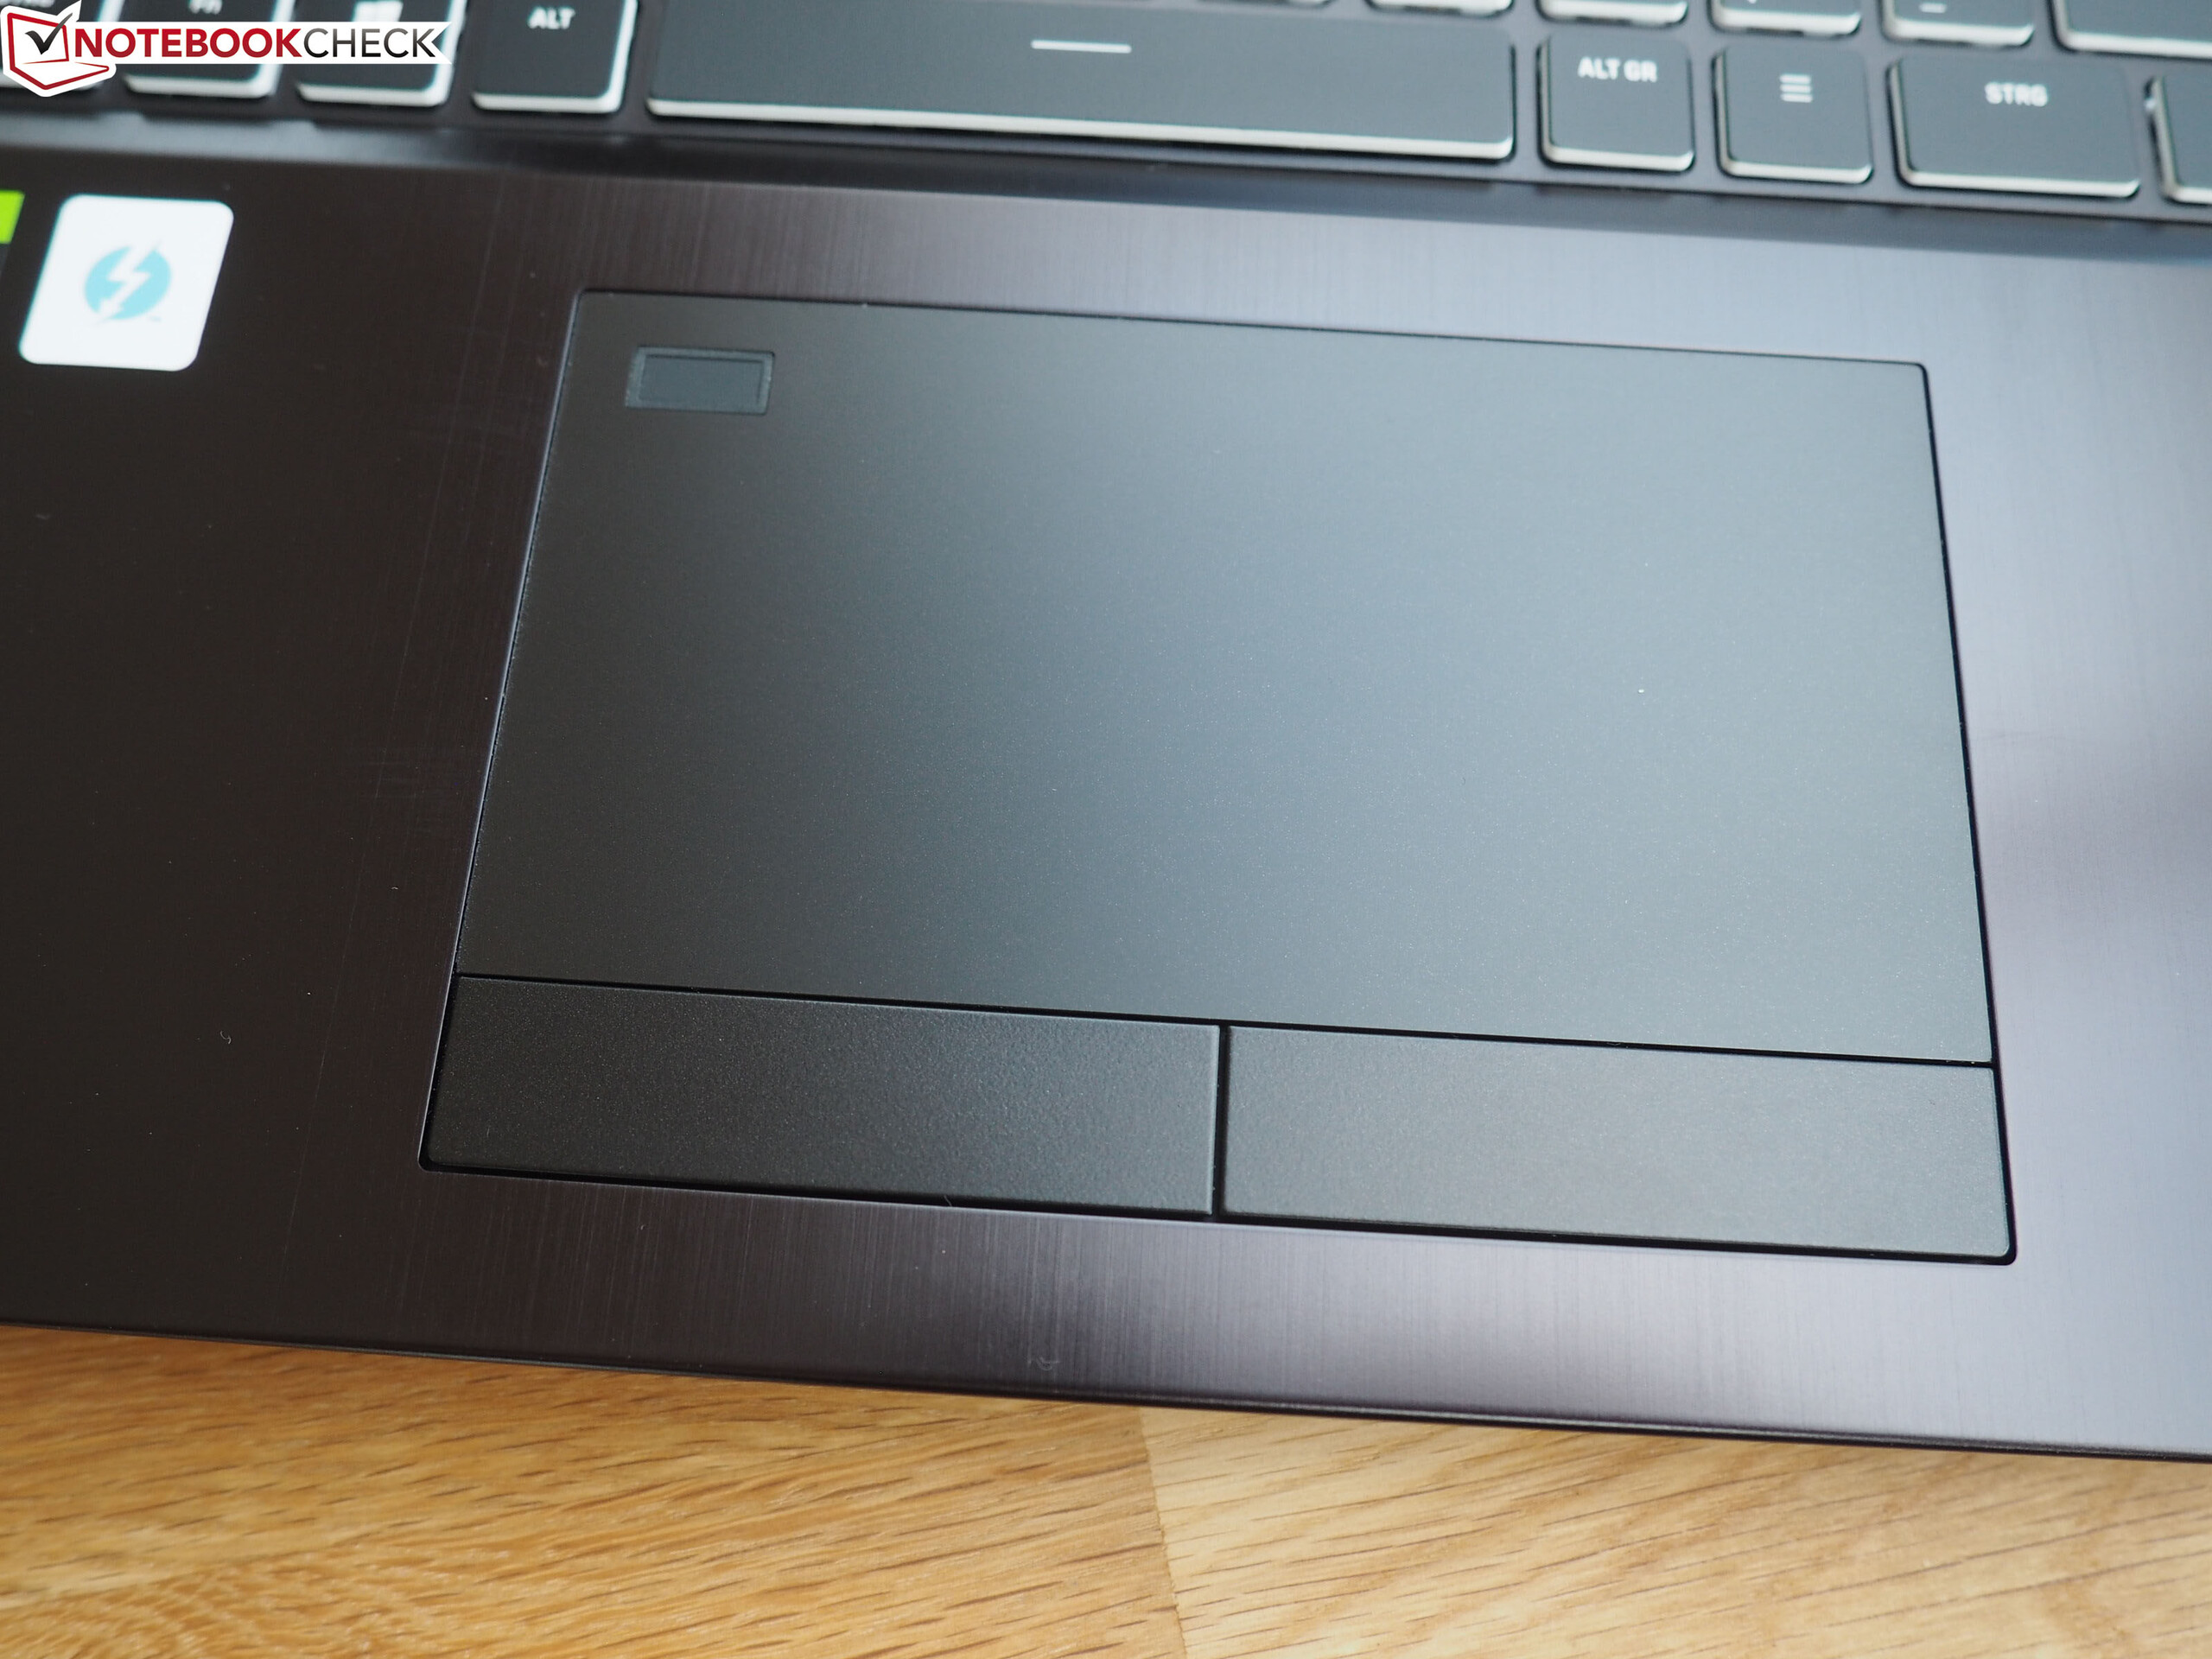
The XMG Ultra 17 contains a fingerprint scanner that is located in the upper left corner of the touchpad.
Accessories
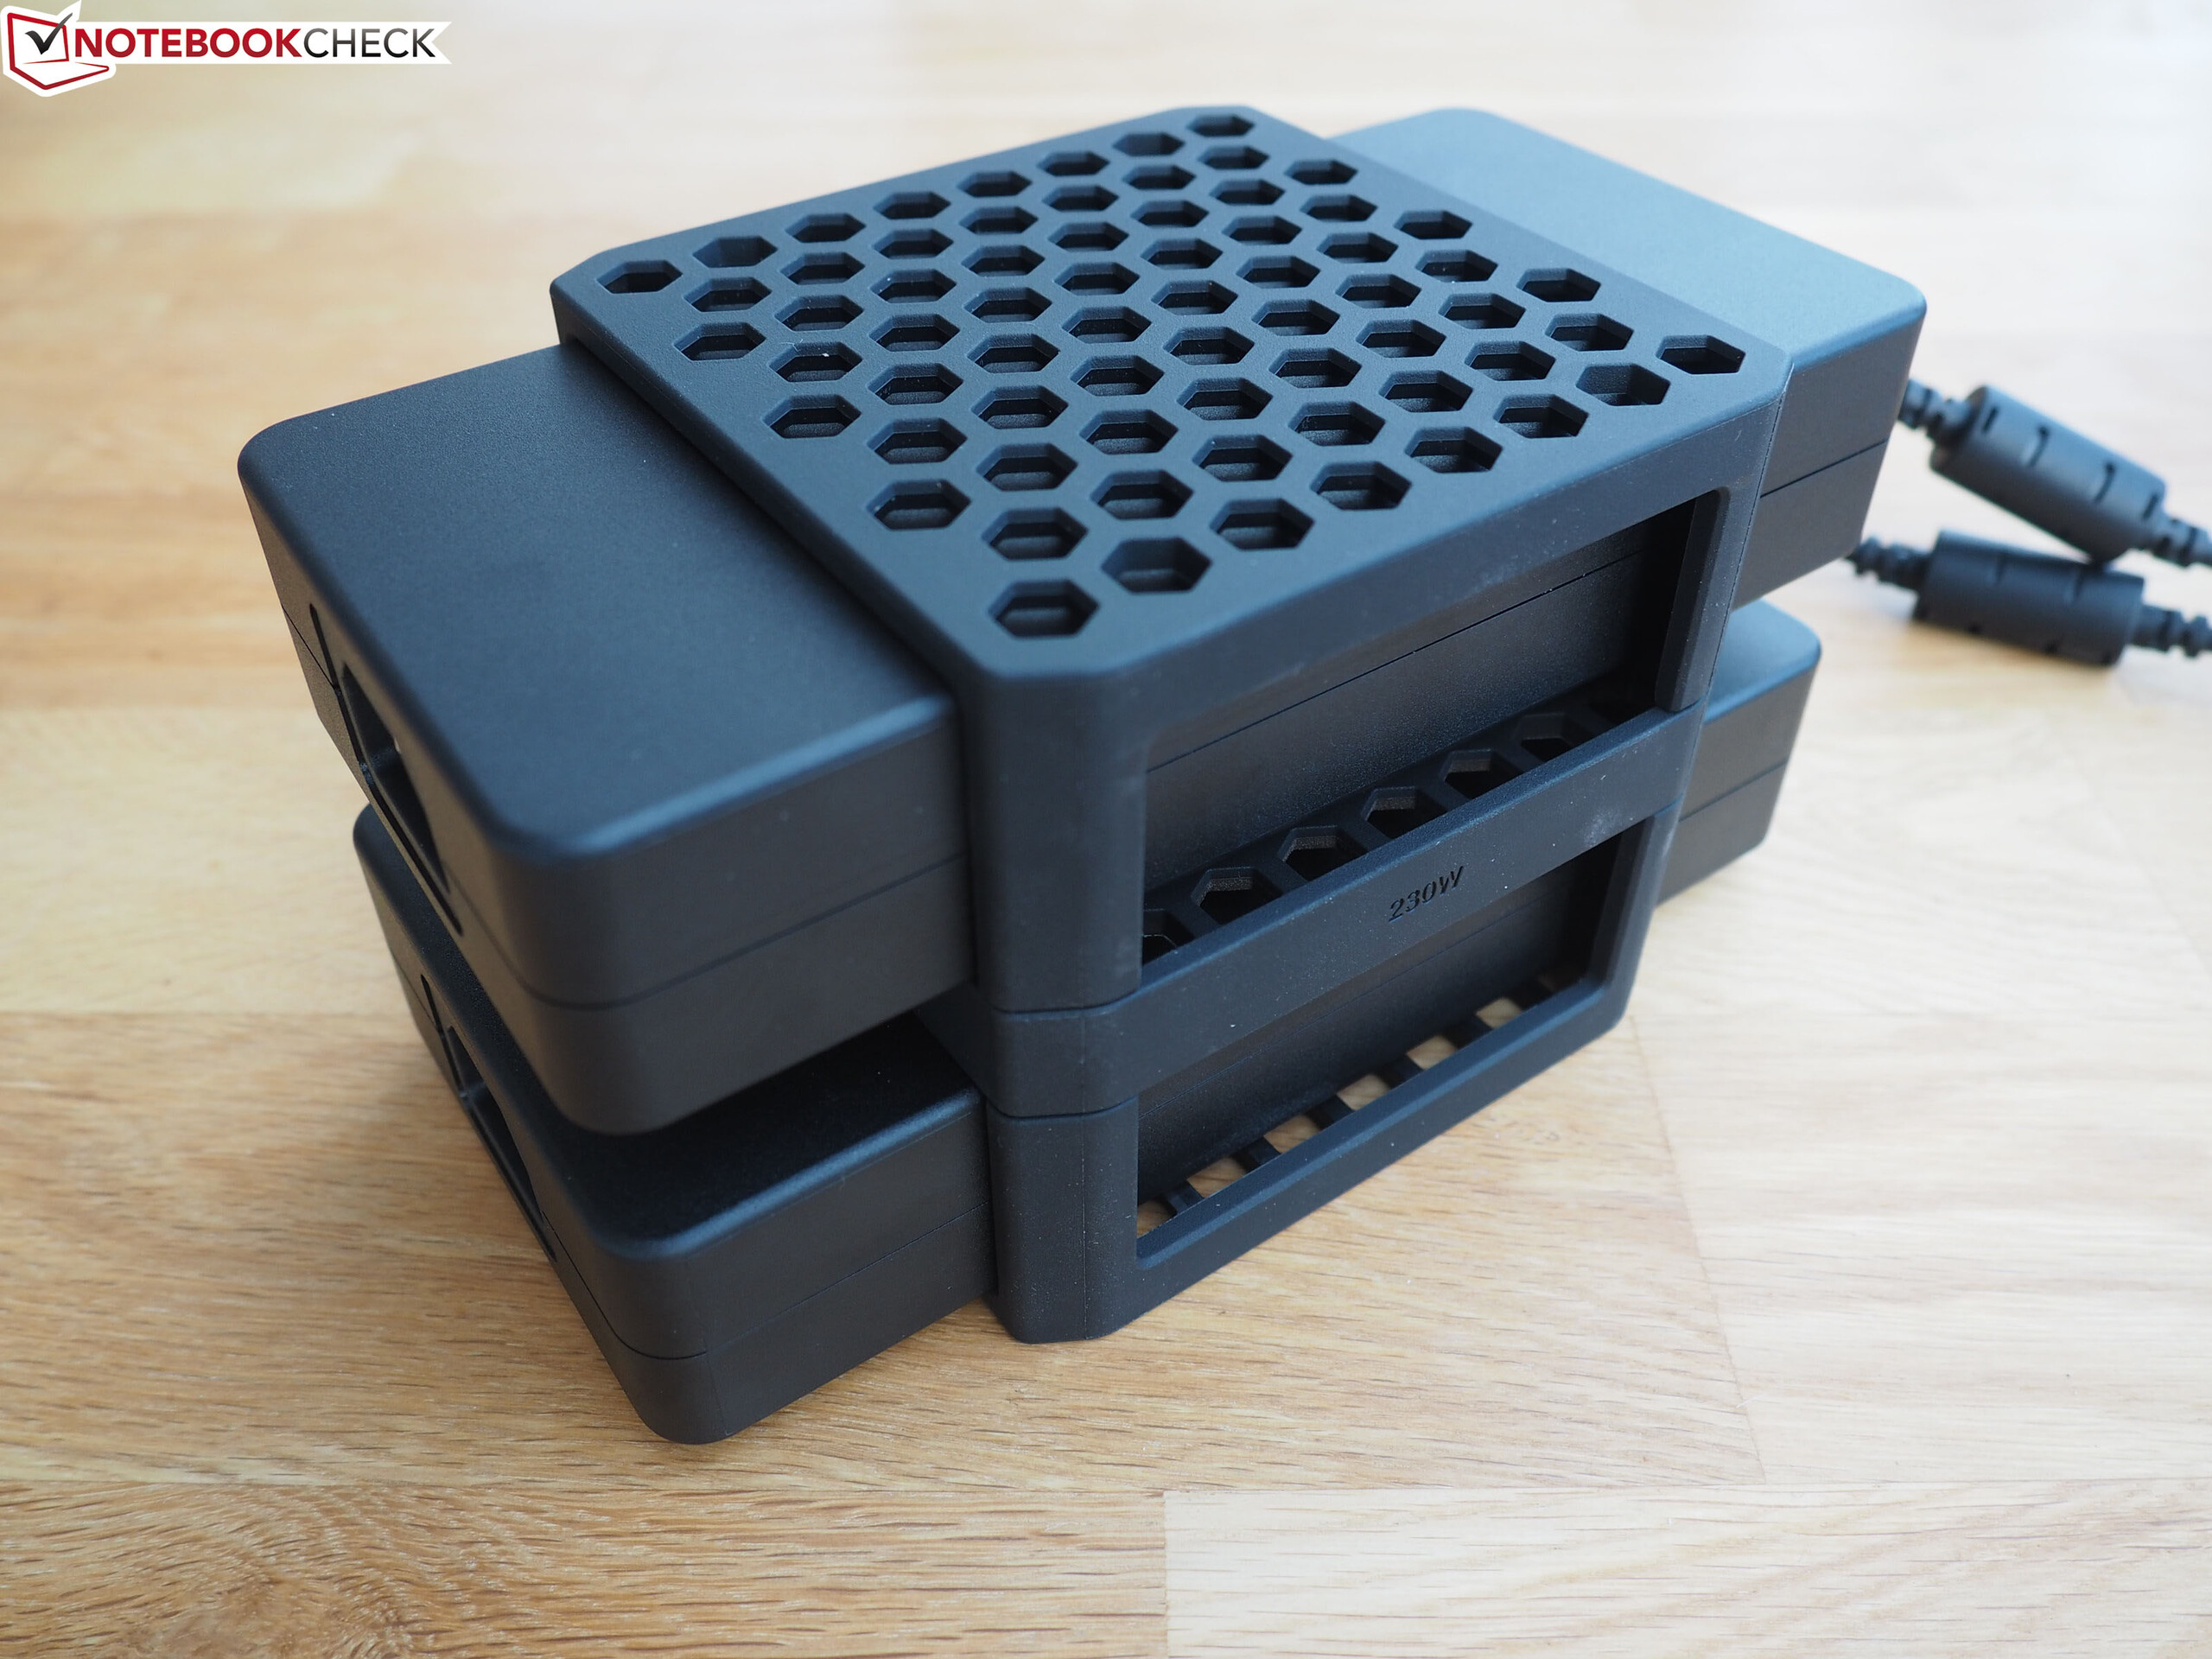
Due to the enormous power consumption, the 17-incher needs two power adapters at the same time. The 280-watt models weigh just under 900 g each and measure 18 x 8.5 x 3 cm. At least the laptop comes with a small case in which the two power adapters can be stacked and don't take up quite as much space as a result. Other accessories include a driver DVD, a USB stick with software, a manual, a warranty card, and screws as well as covers for the M.2 slots.
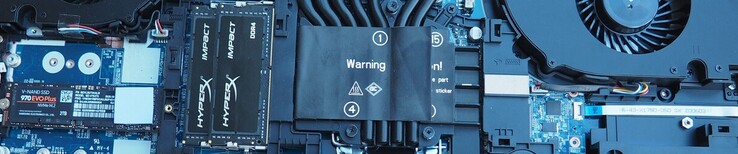
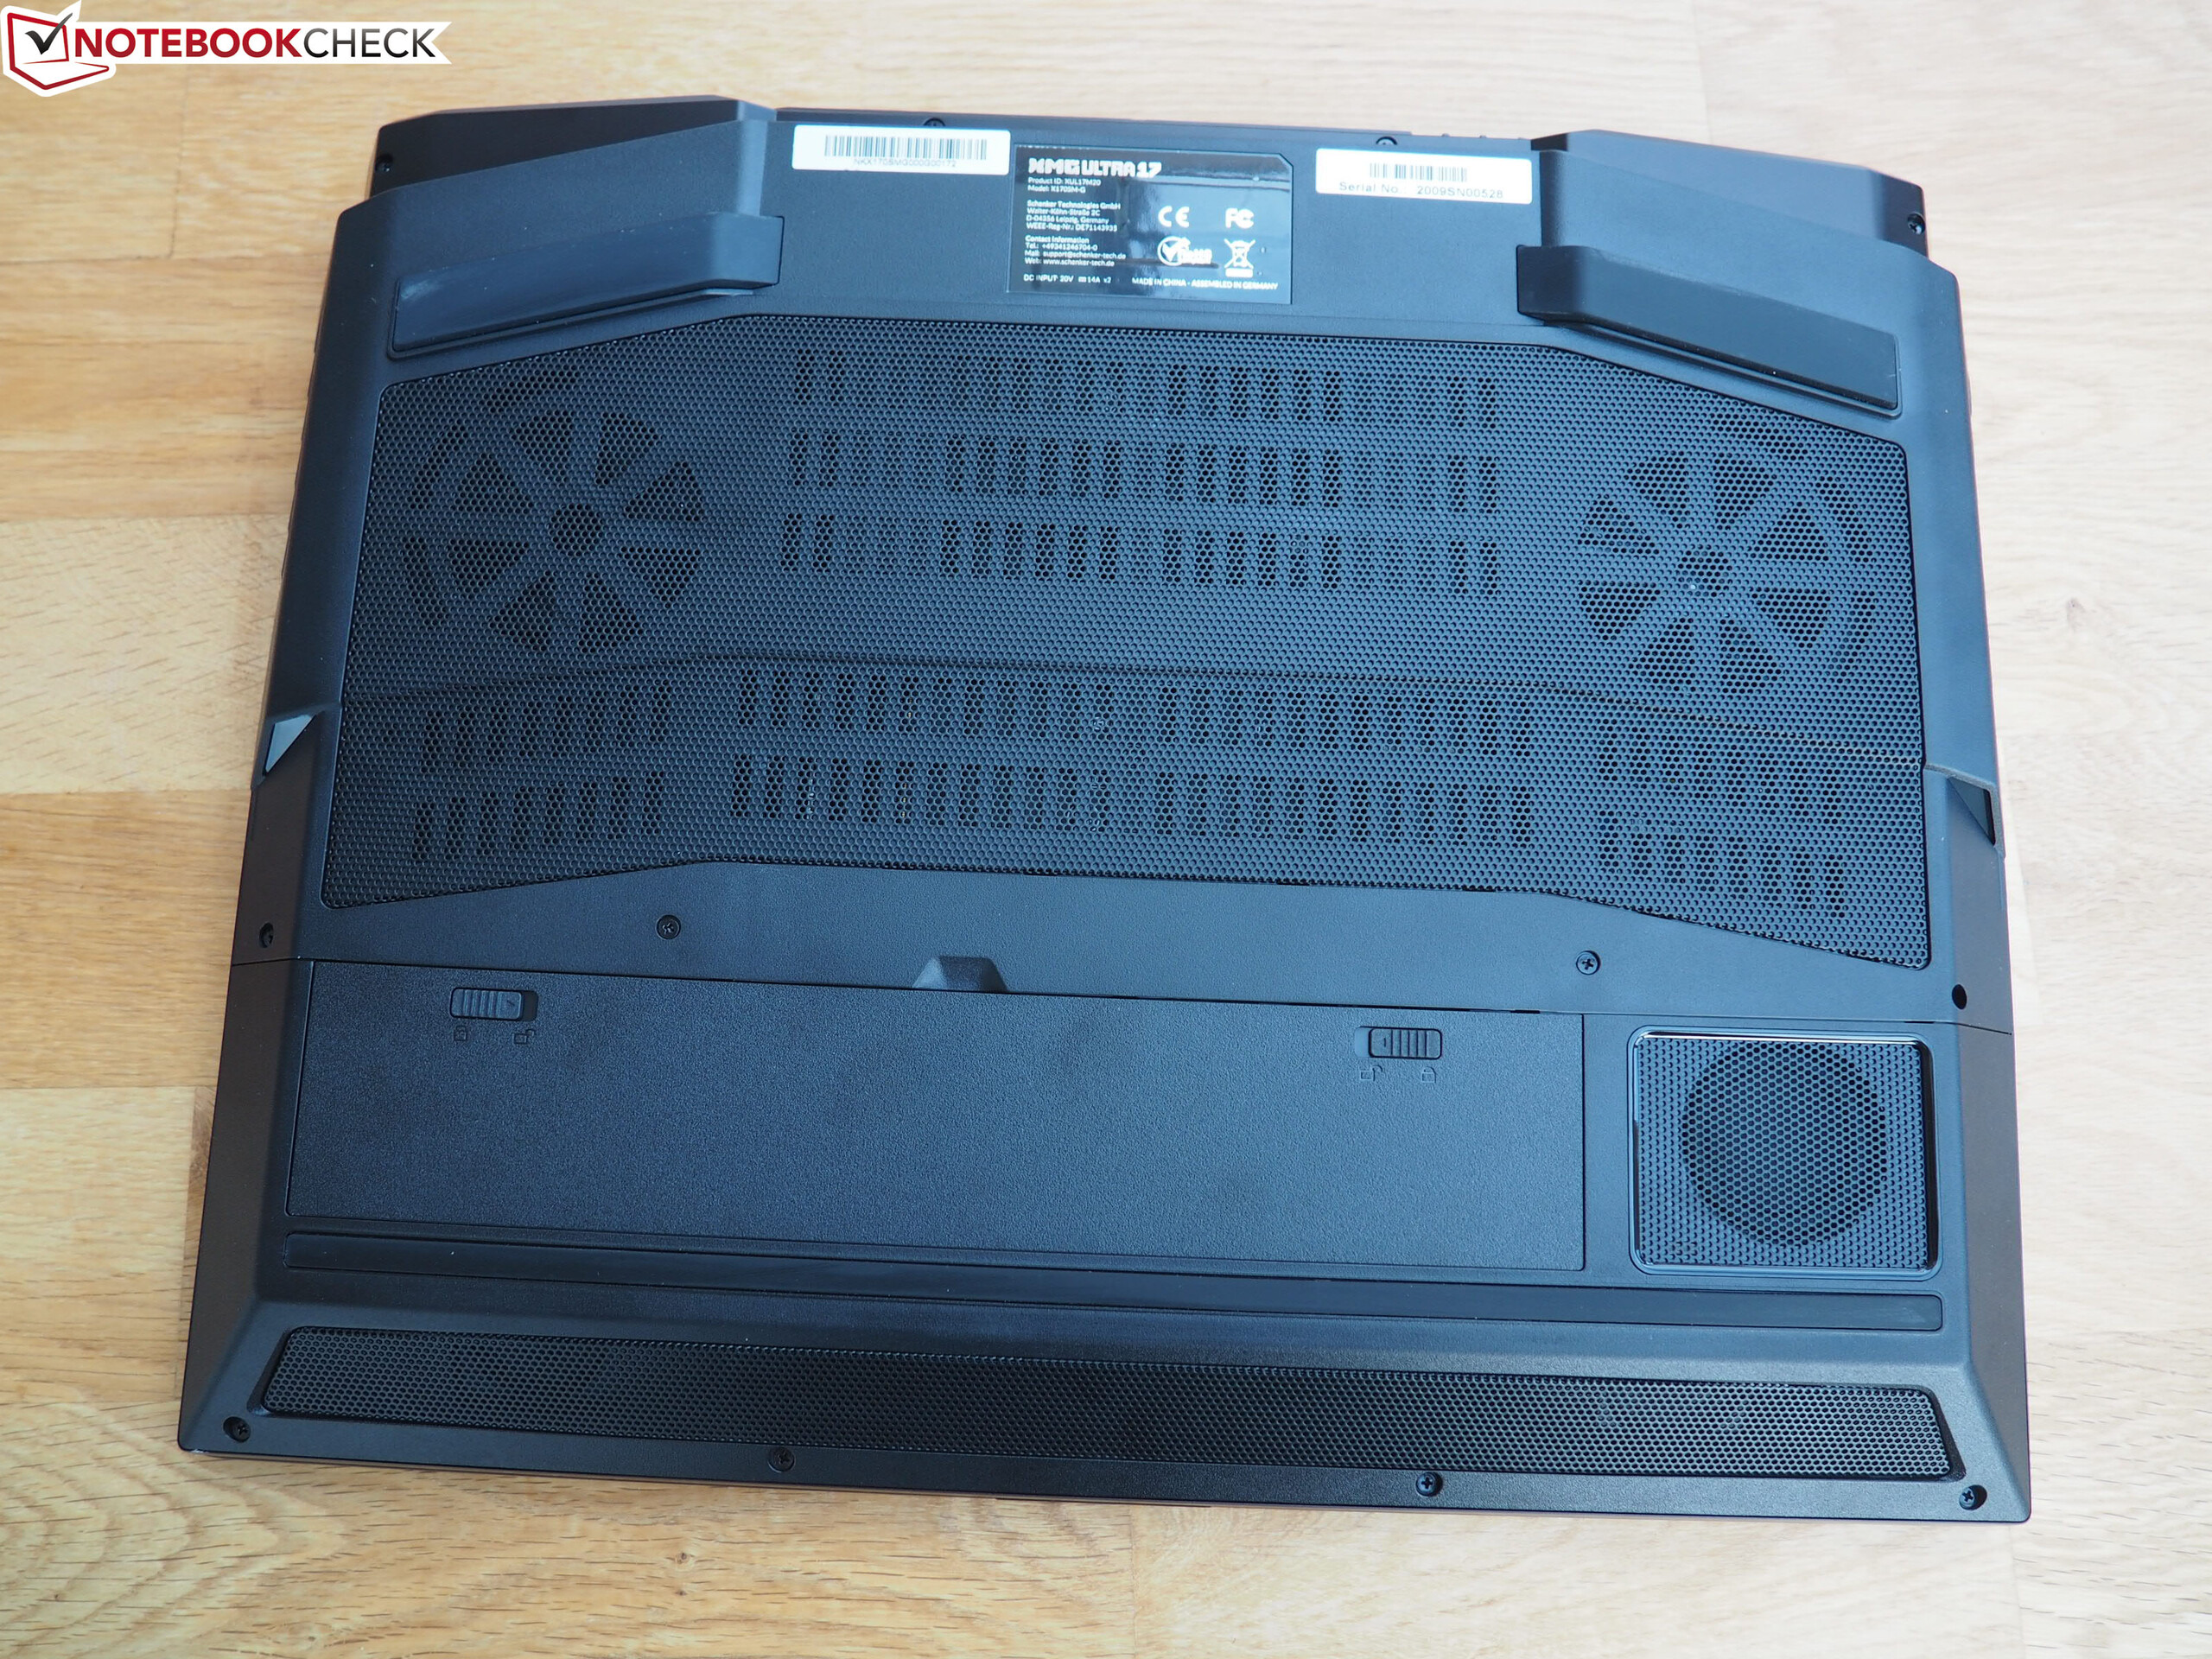
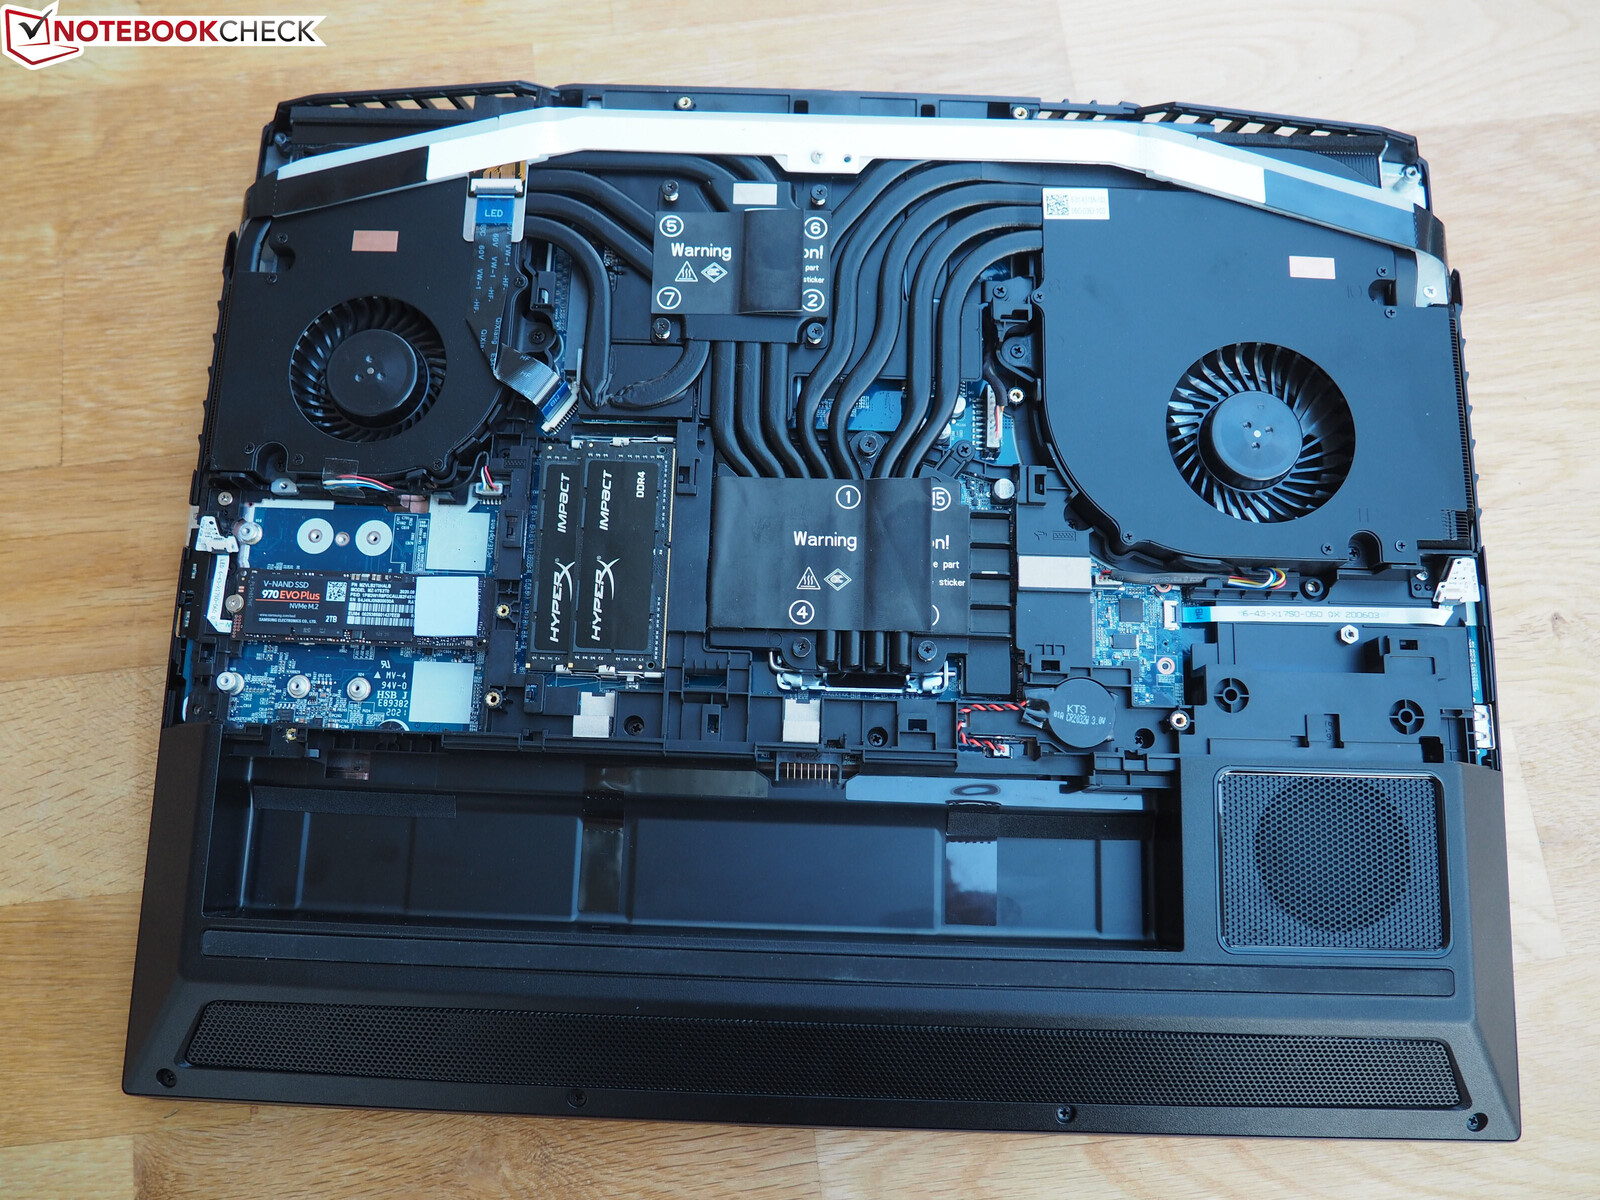
Maintenance
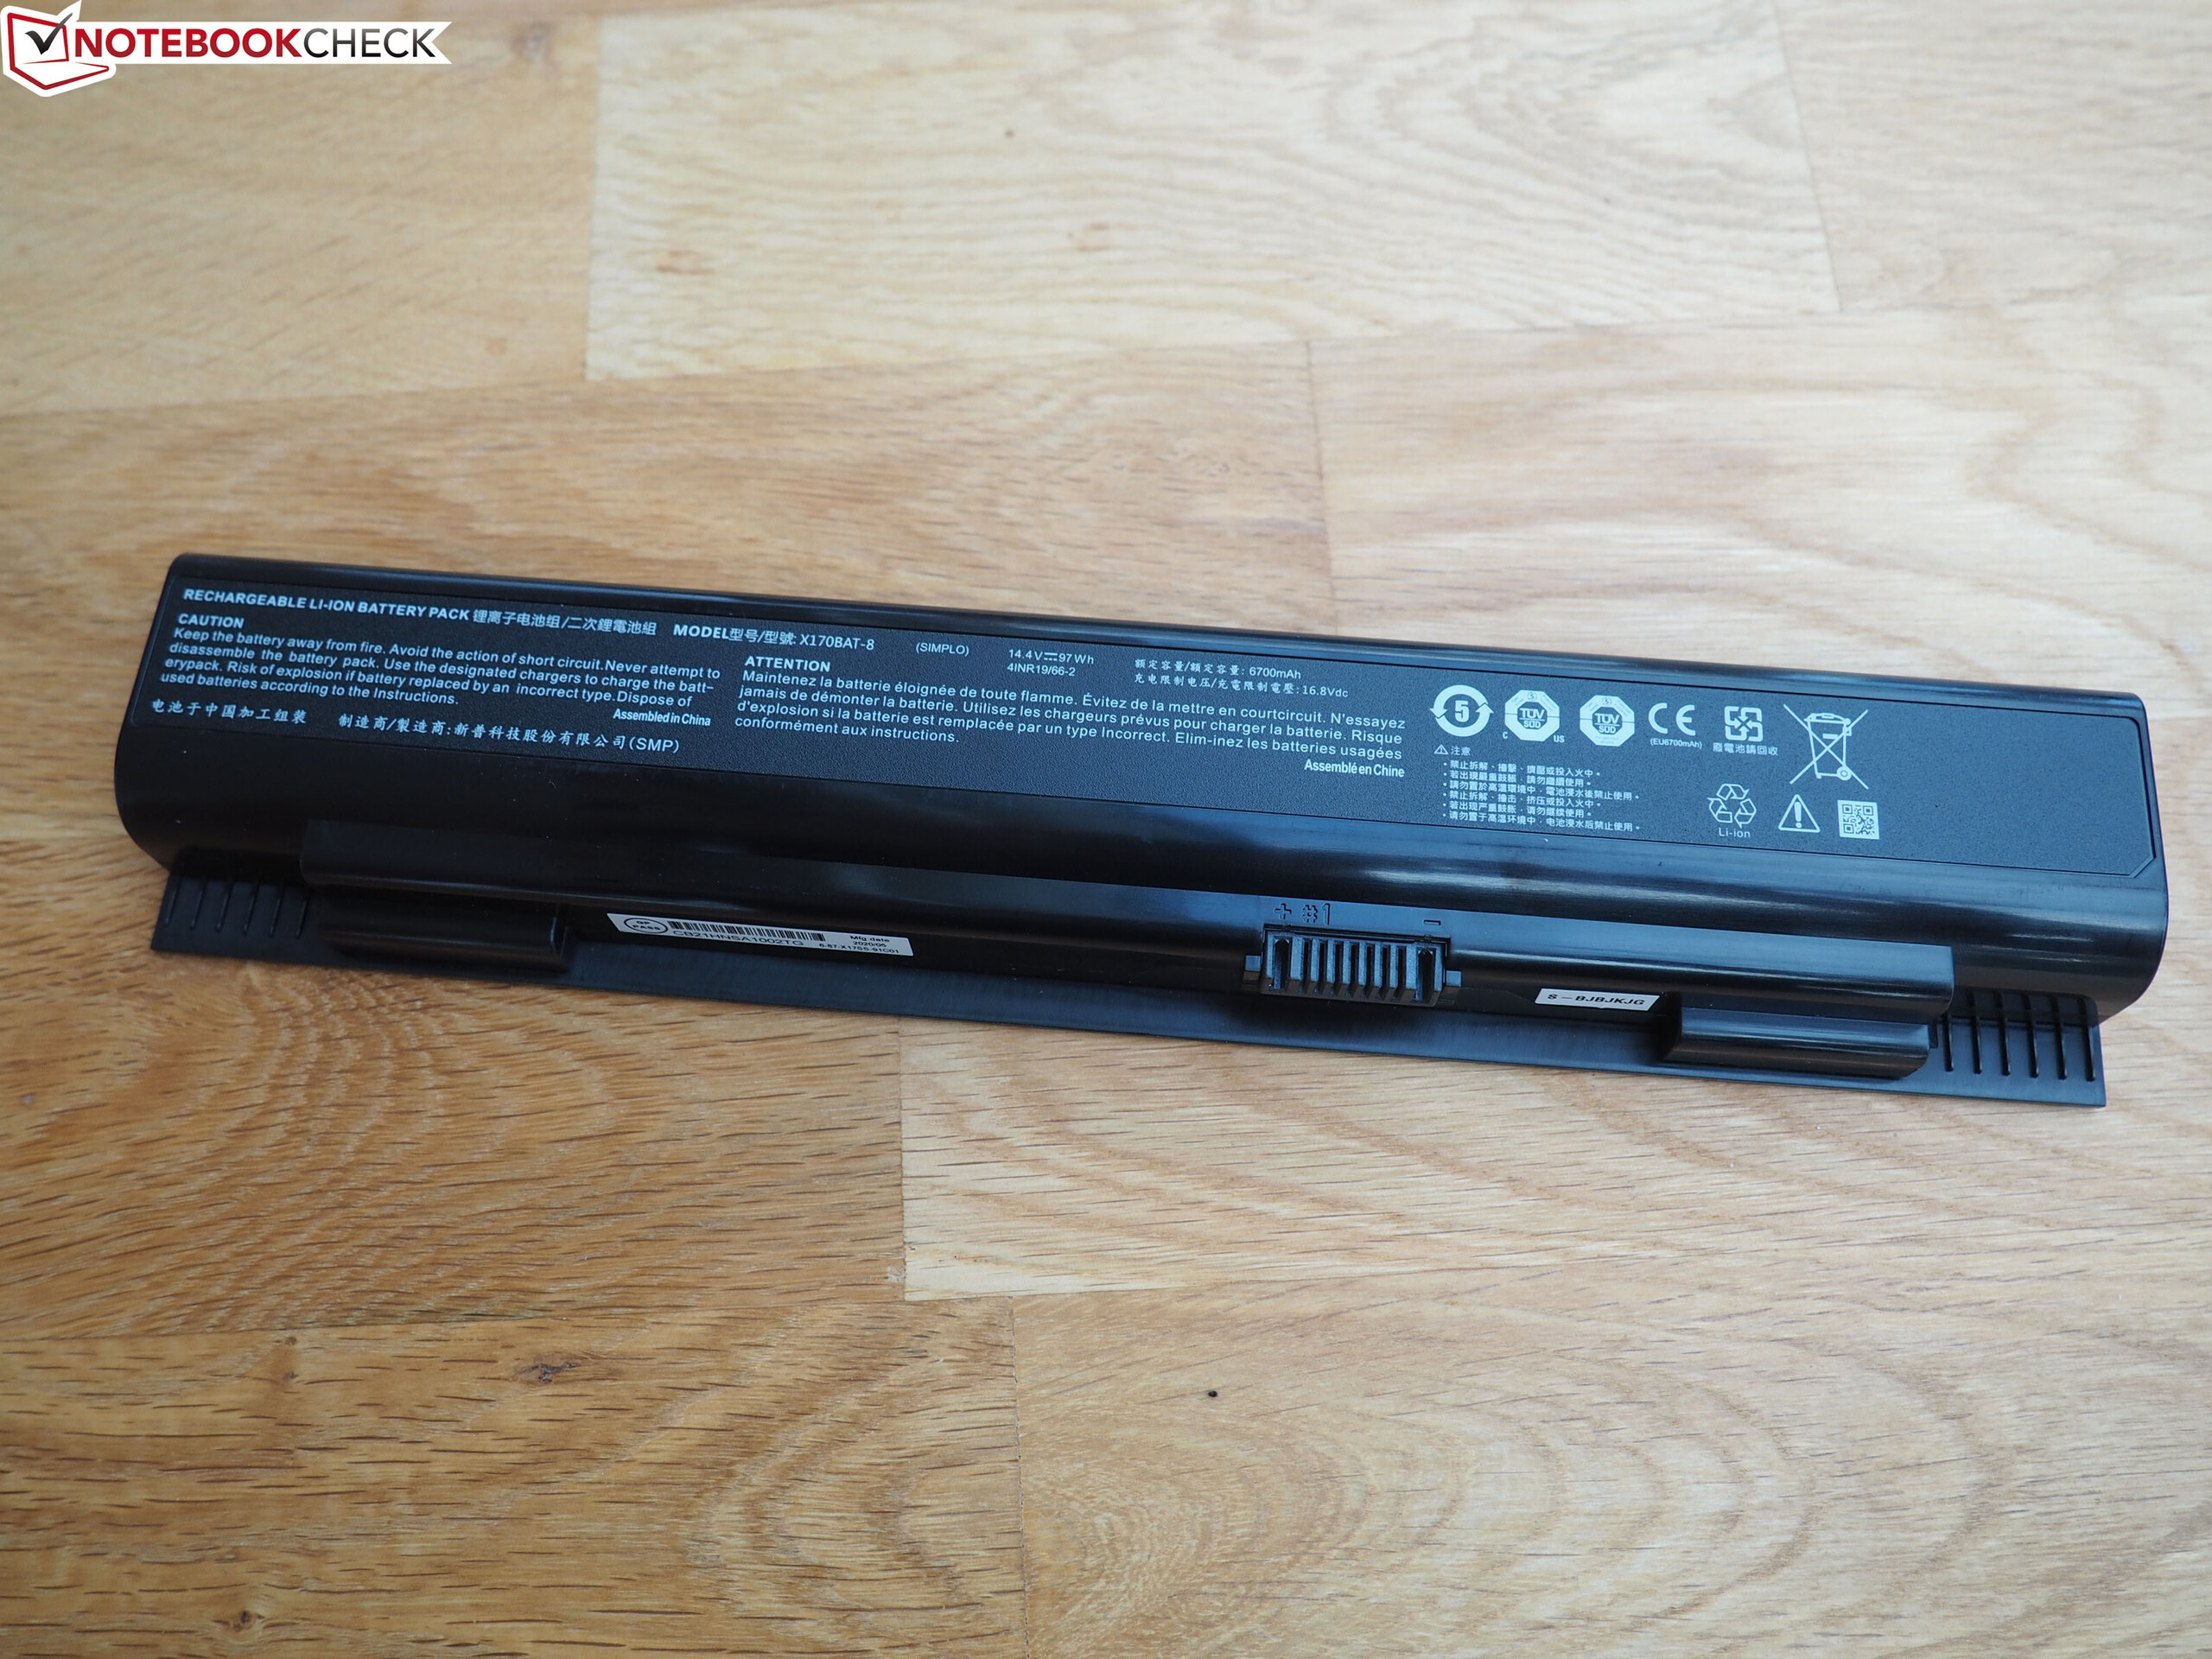
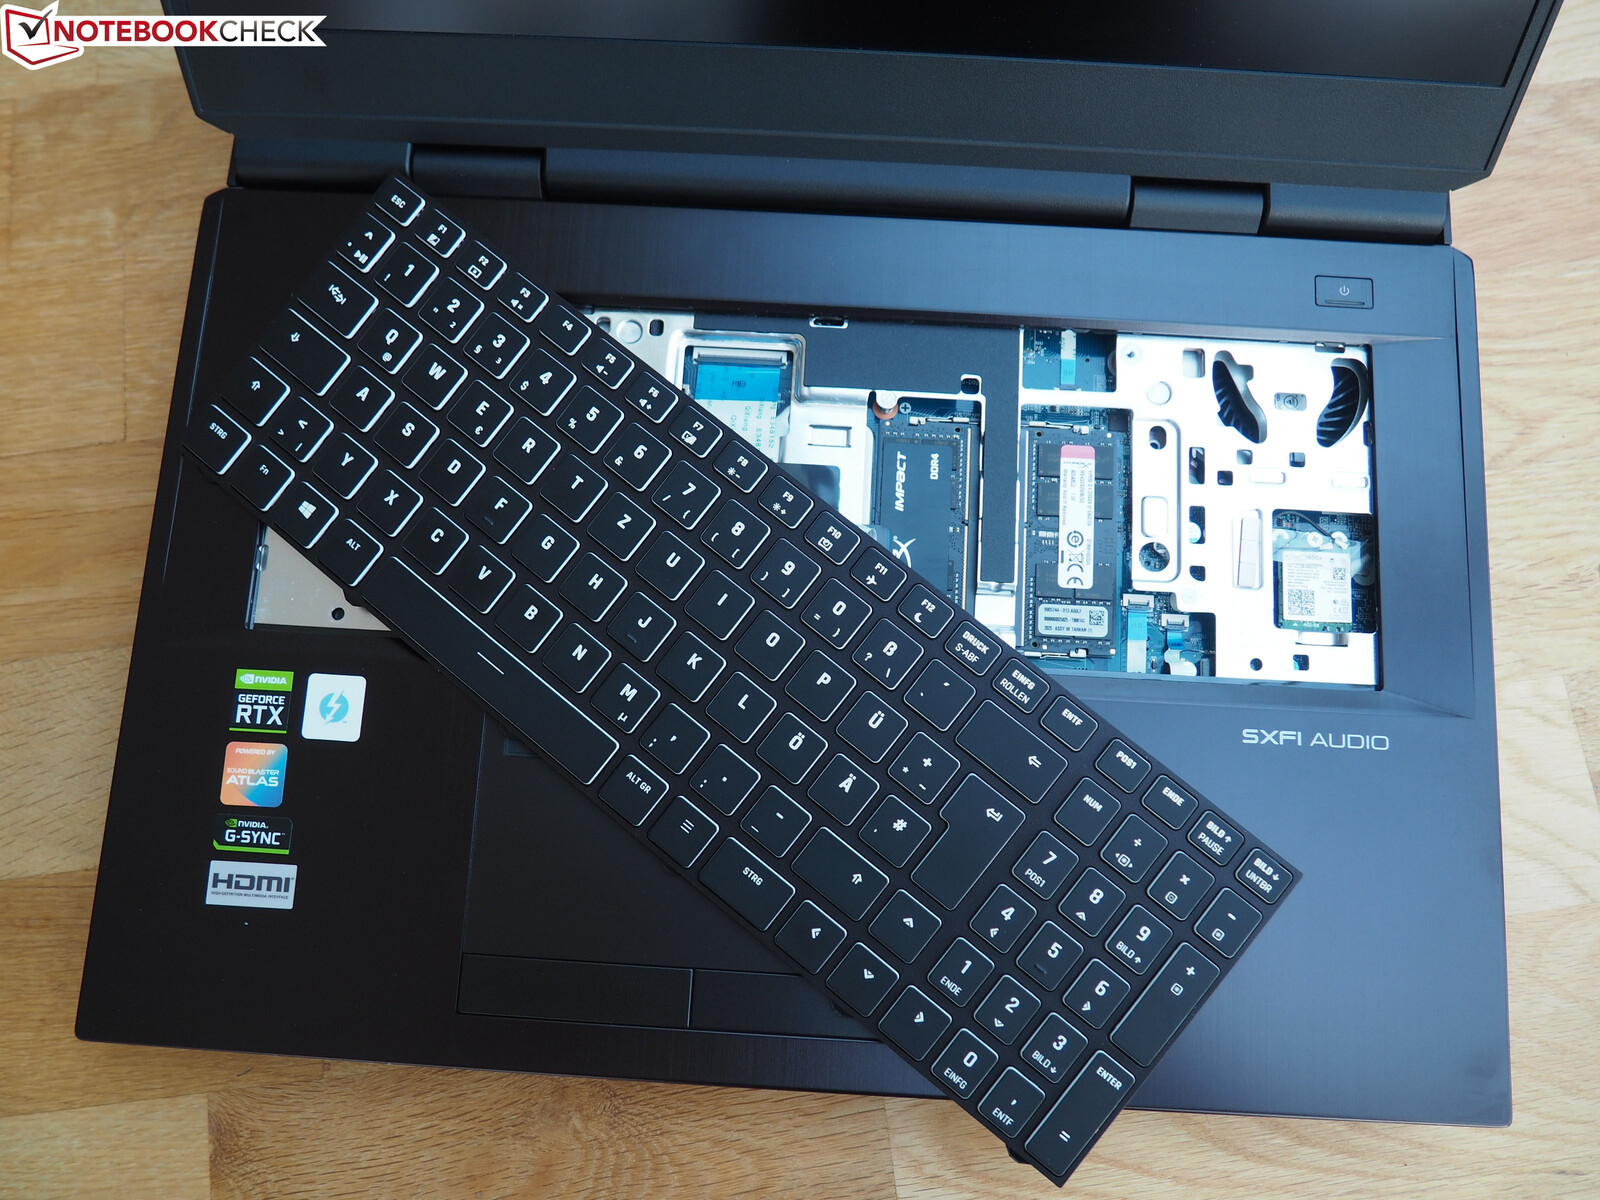
Maintenance of the X170SM chassis is quite convenient. There's no maintenance hatch, but the bottom cover, which is retained with eight screws, can be removed relatively quickly. Afterwards, almost all components are accessible inside the case. You only need to detach the keyboard as an additional step (retained with two screws on the bottom side) when it comes to the wireless adapter and two of the four RAM slots, but this is not a big deal if you pay attention to the cables. The fact that the battery is directly accessible from the outside deserves general praise.
Warranty
There's a standard two-year warranty. Up to three years is possible for an additional charge. Furthermore, you can also select the length of the quick-repair availability period.
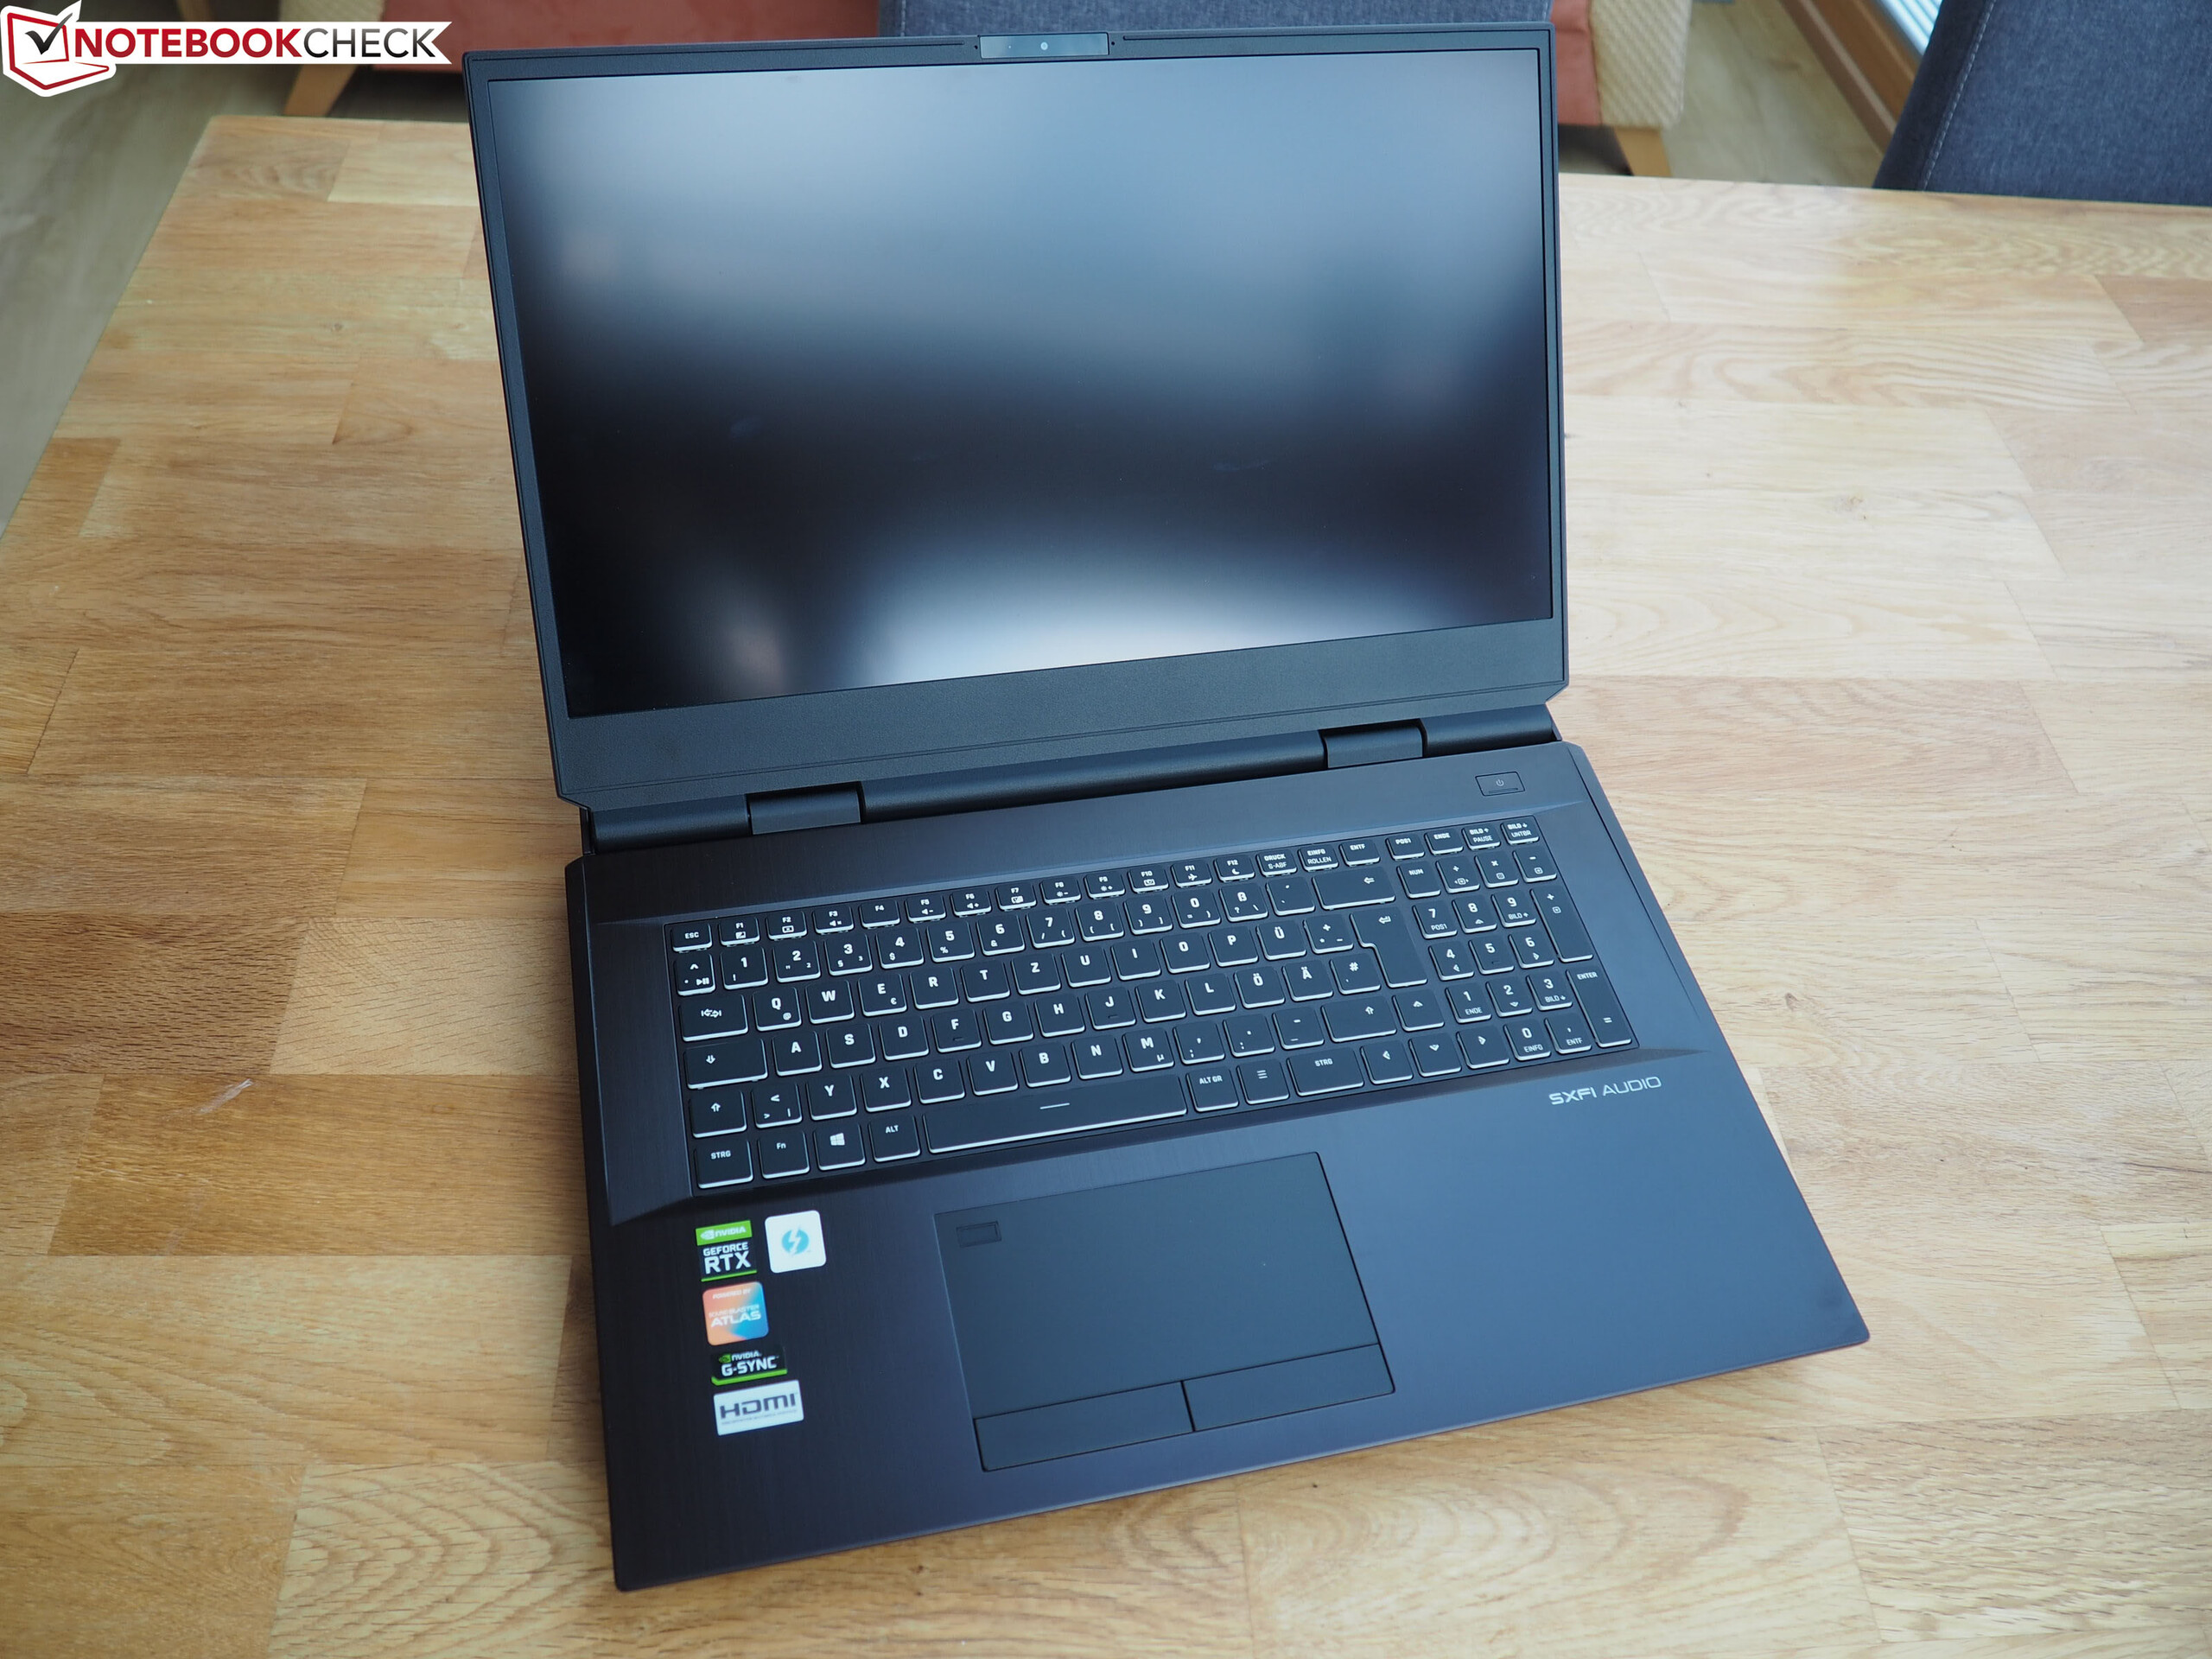
Input devices
Keyboard
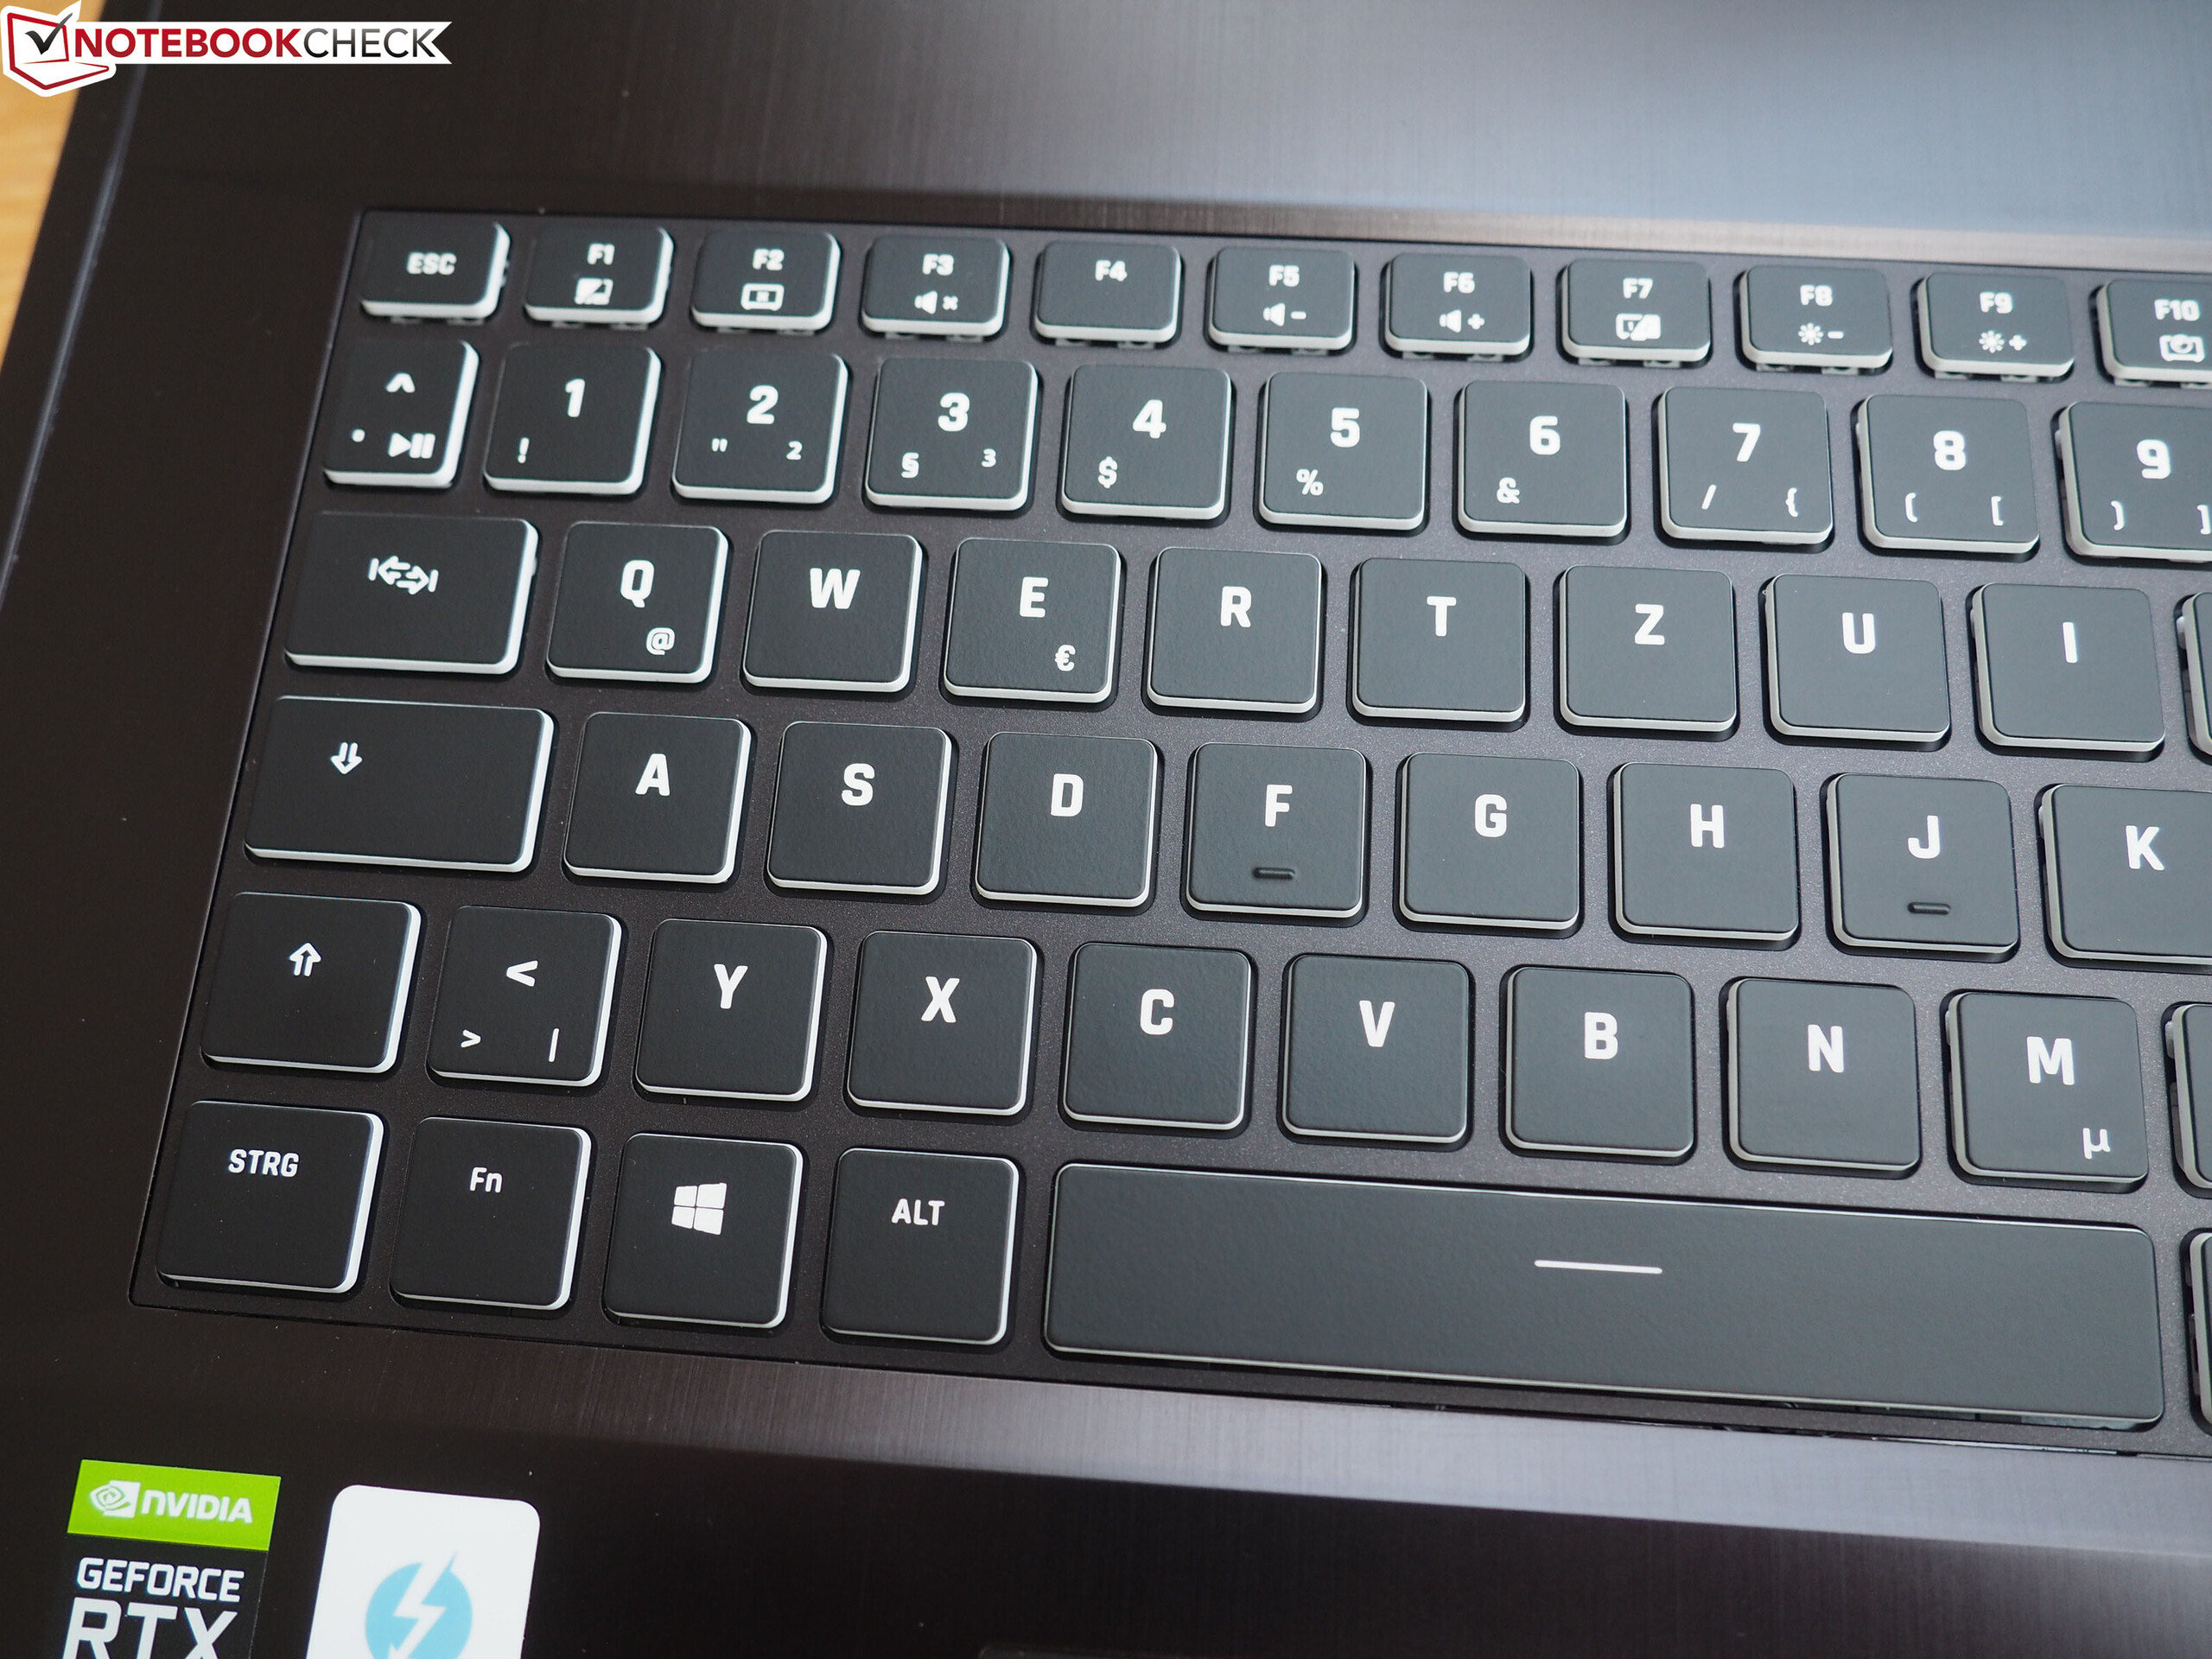
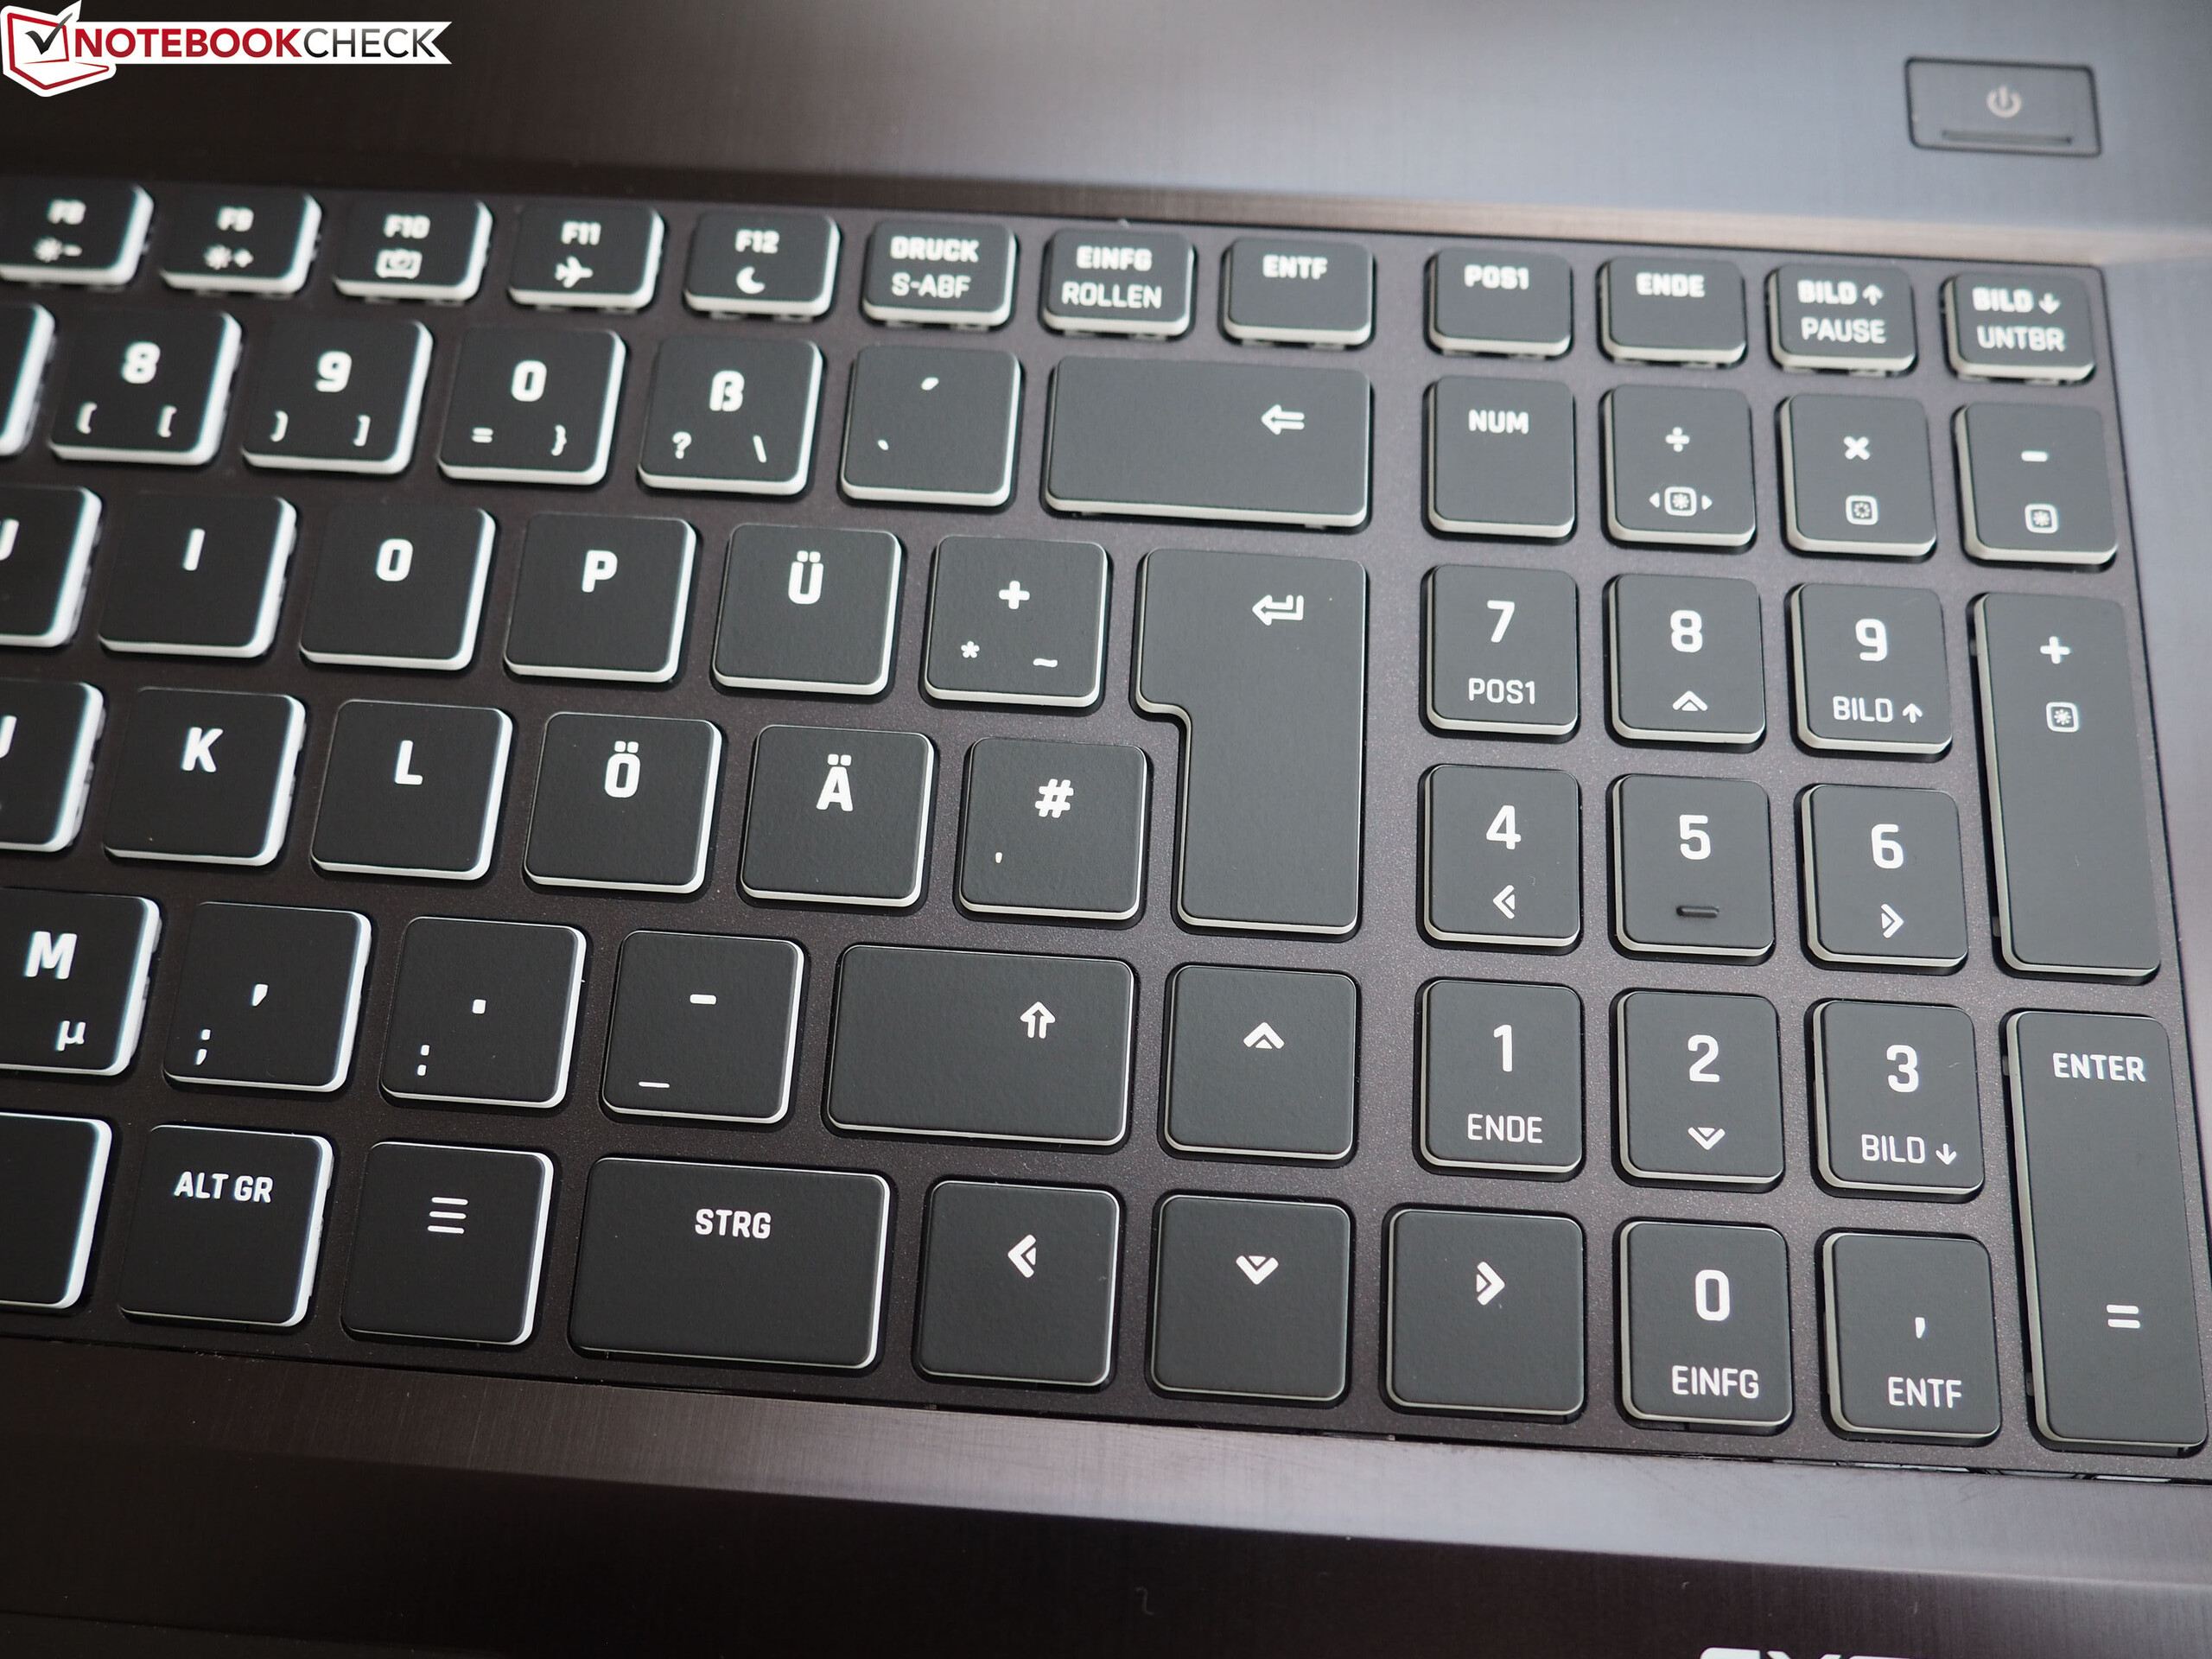
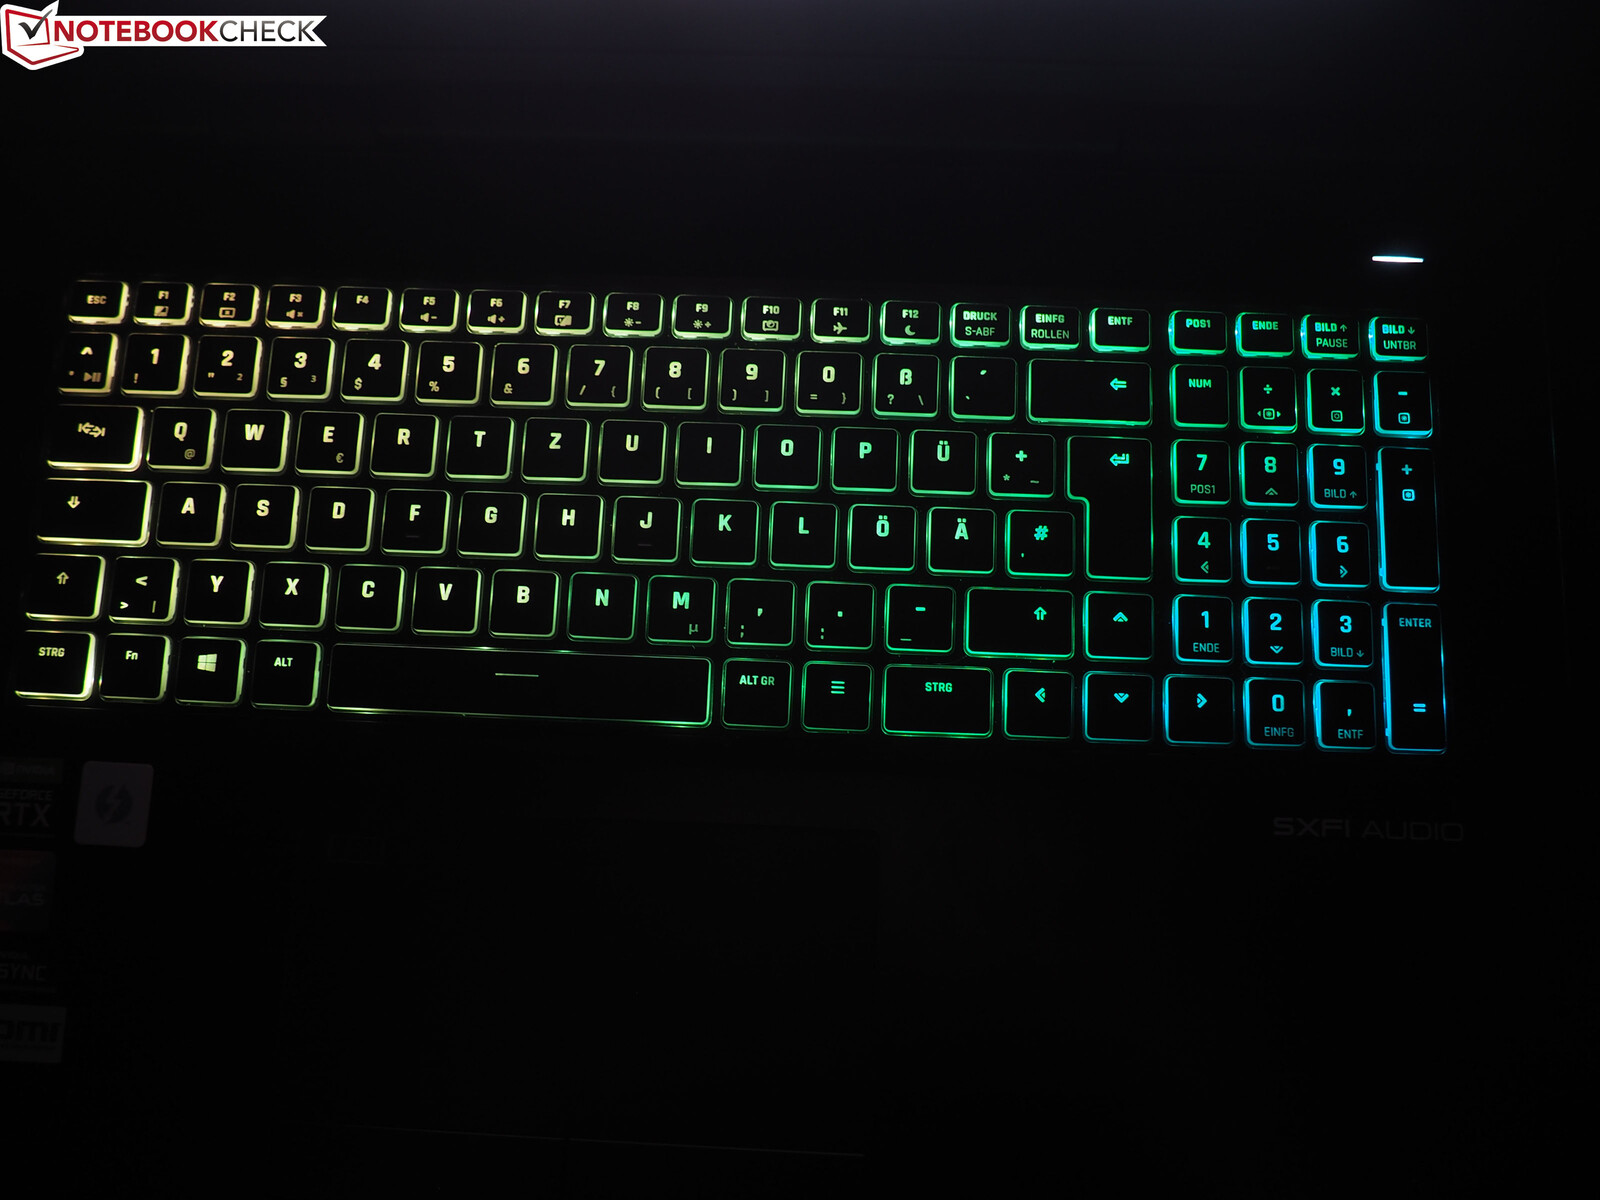
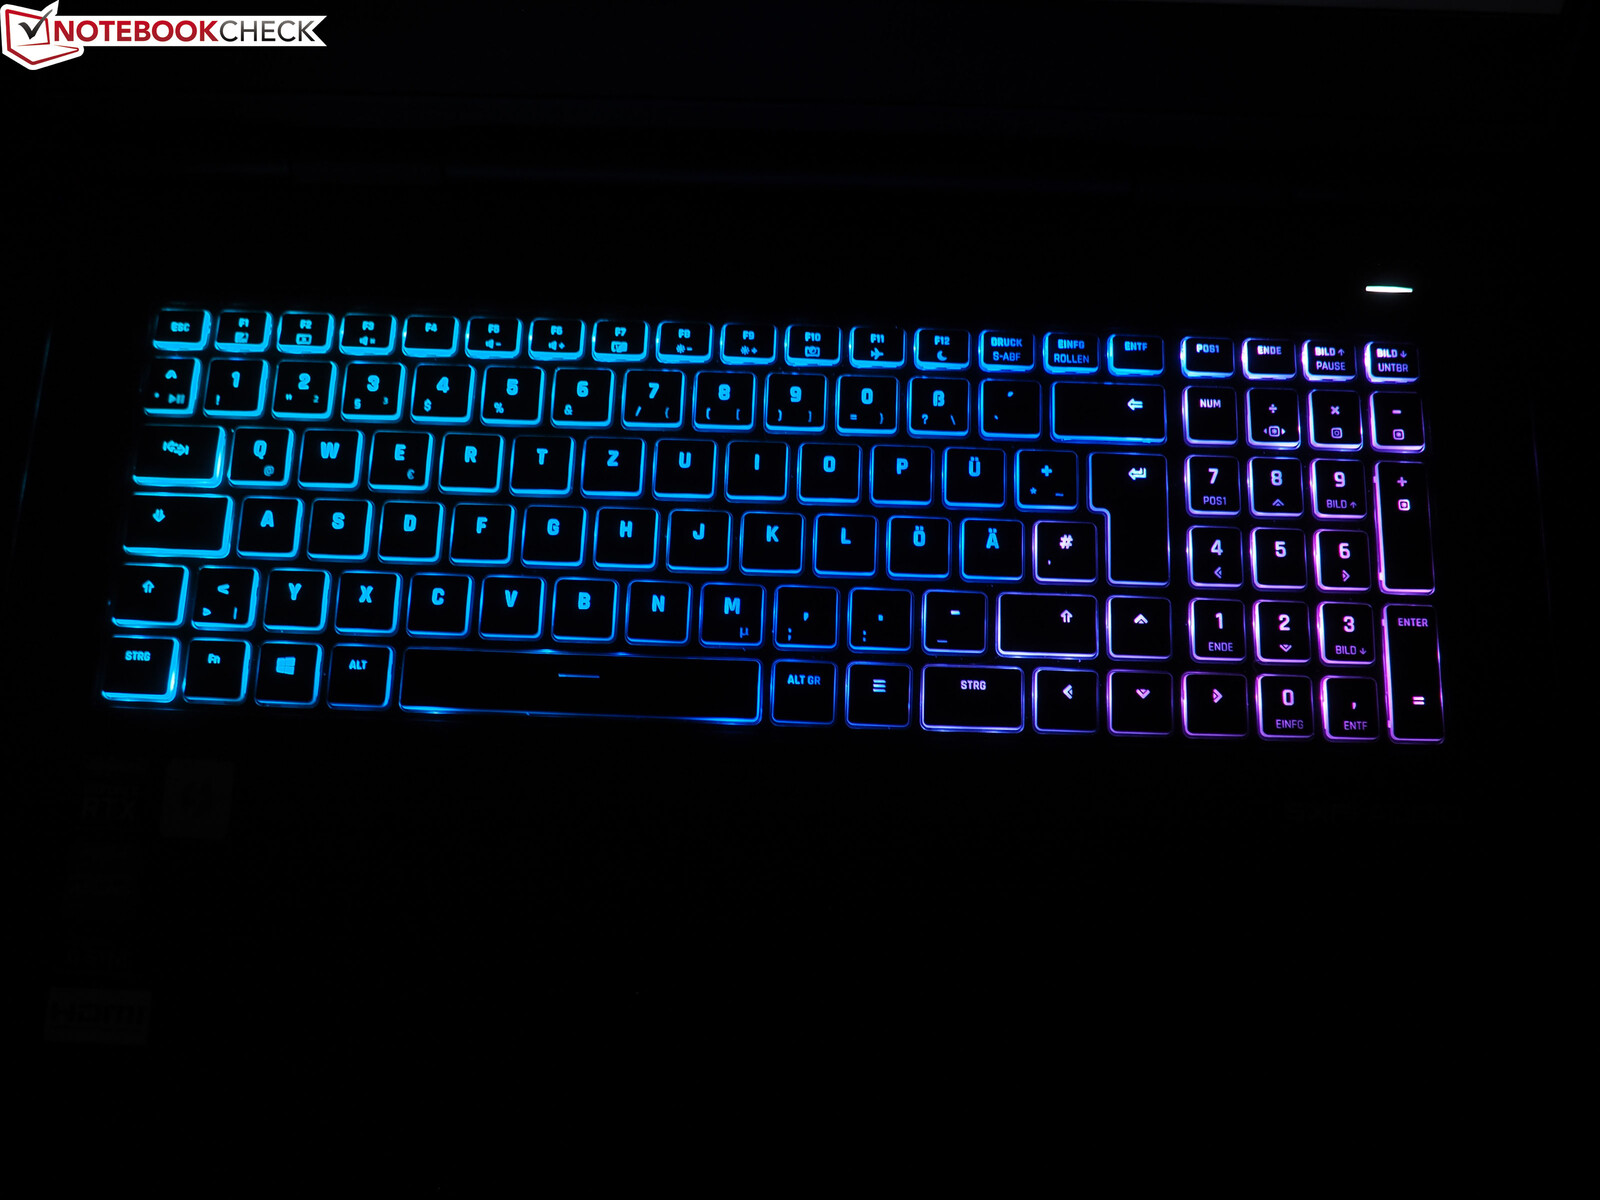
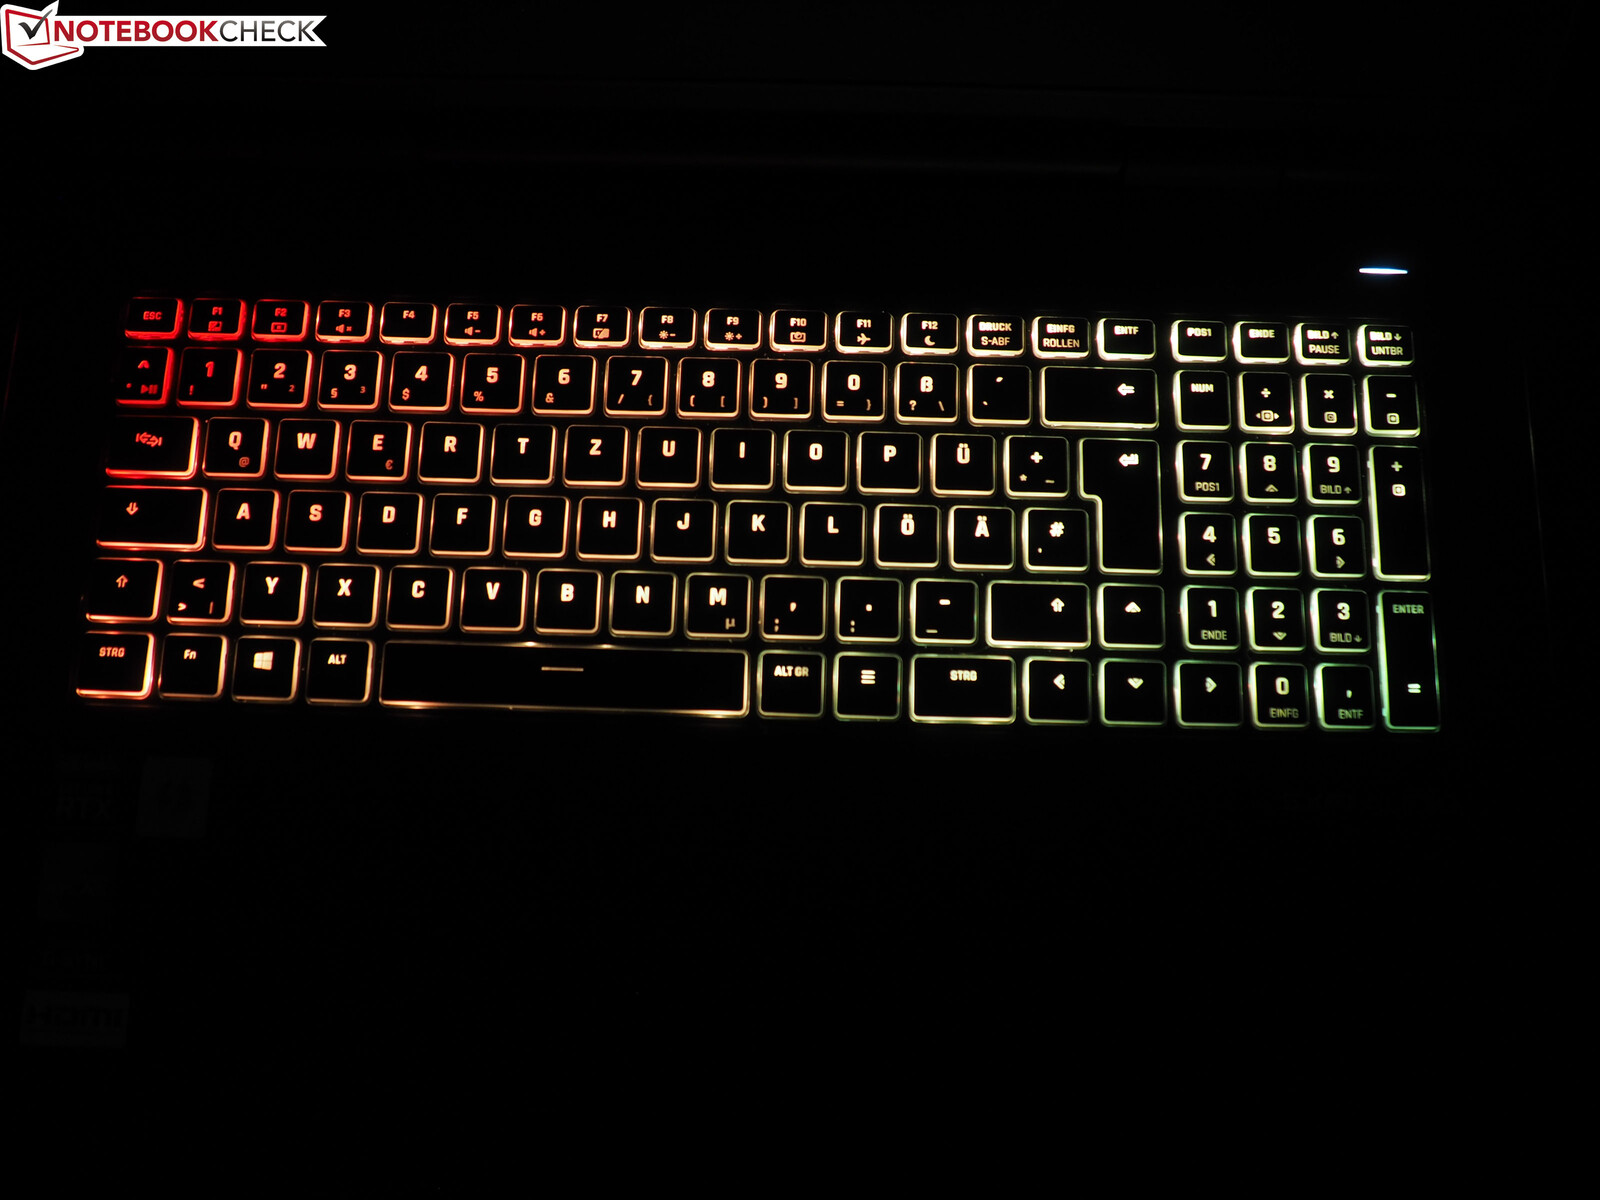
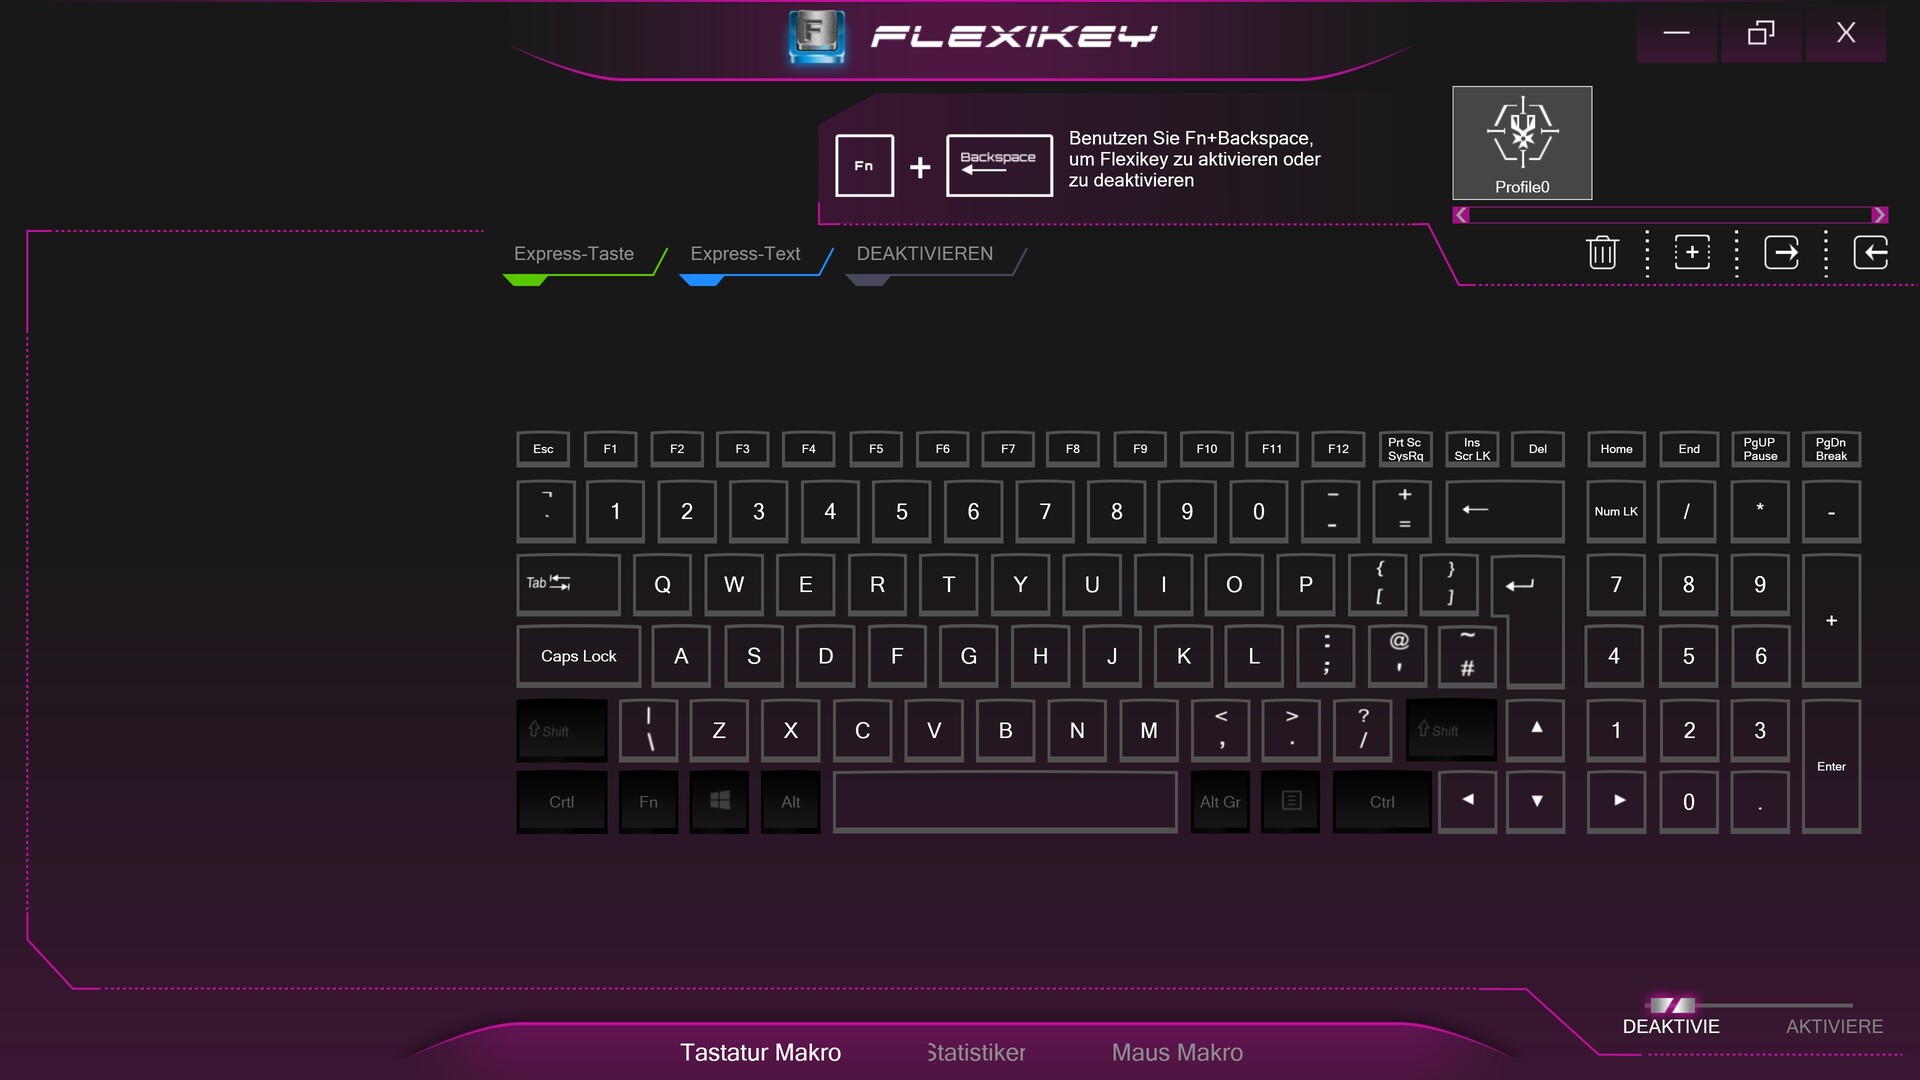
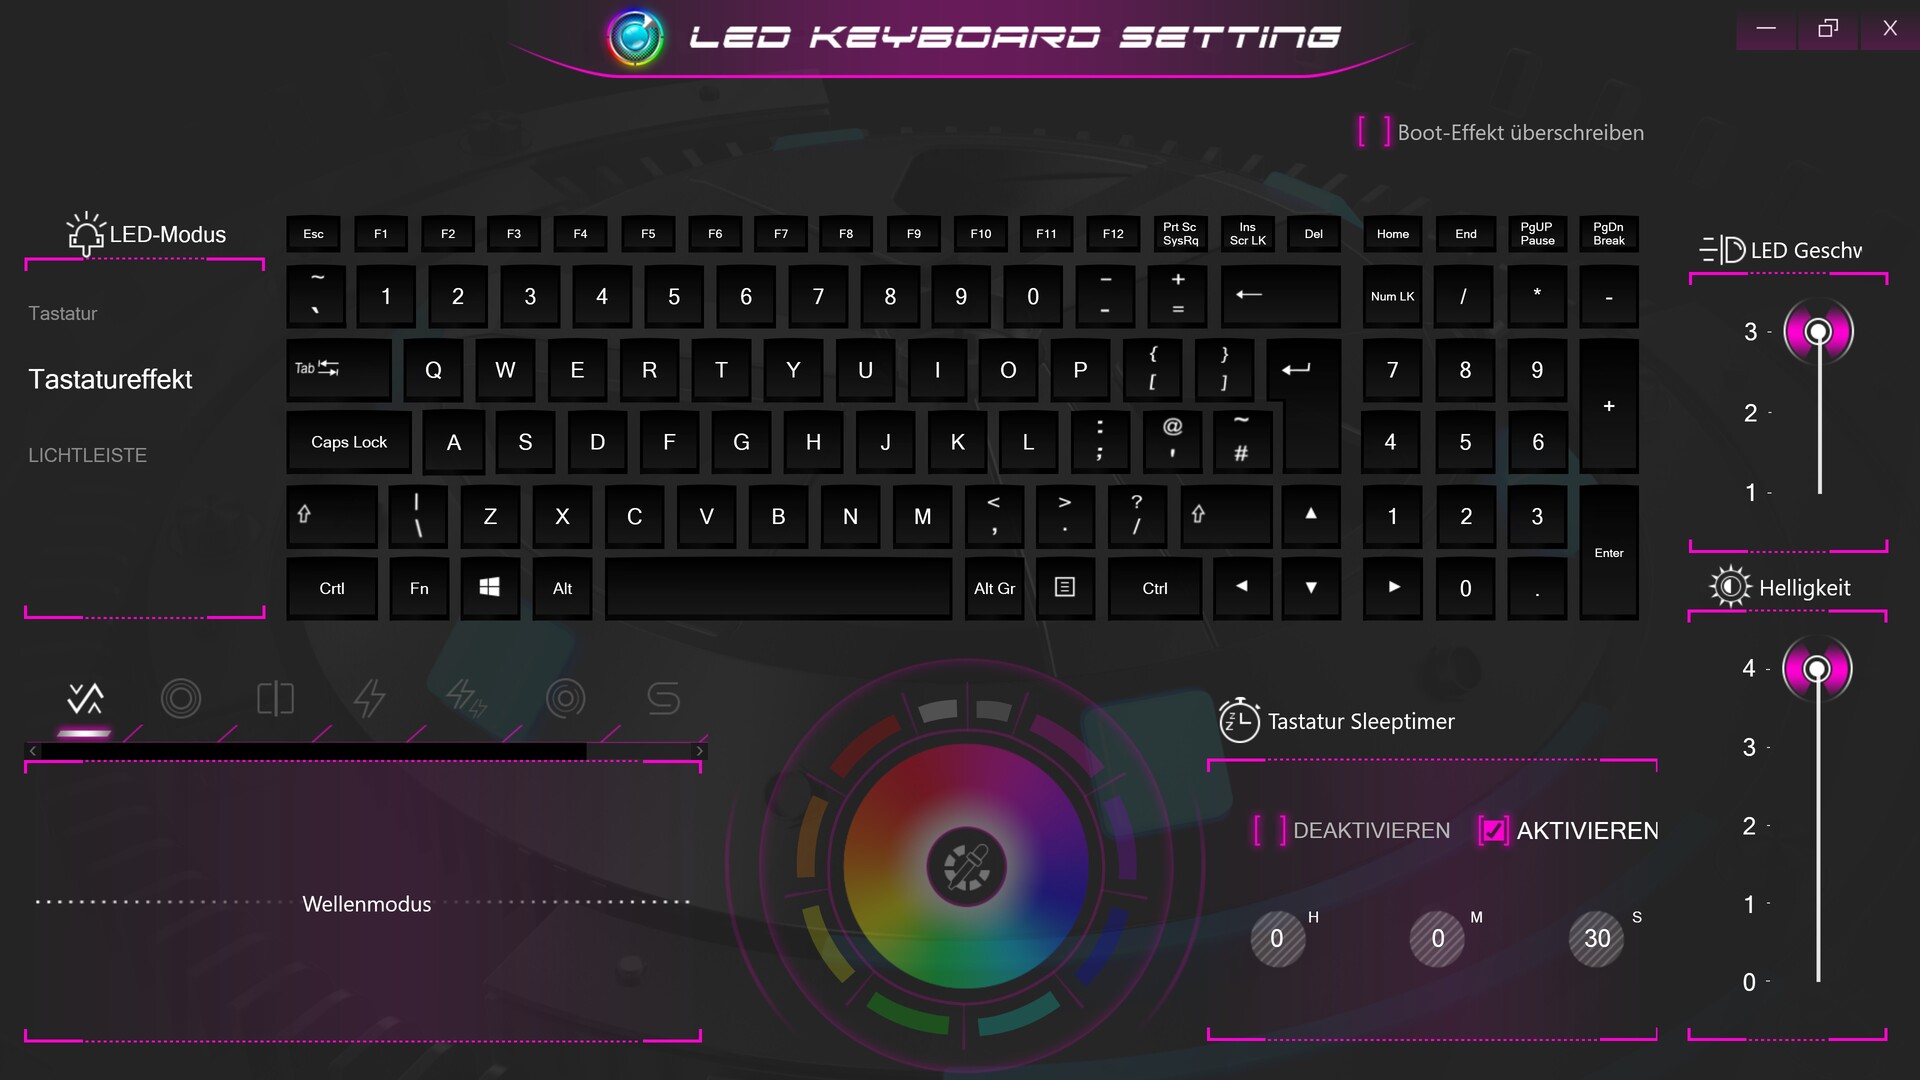
The keyboard left us with mixed feelings. While the successful layout and the individually adjustable RGB lighting should be mentioned as pros, we would mainly highlight the poor key size as a negative aspect. Alongside the F-row, the number pad is also quite narrow. This circumstance is somewhat surprising, since there would actually be more than enough space for larger keys. Clevo probably just adopted the keyboard from another barebone (to save costs and development effort). We would describe the typing noise and typing experience (pressure point, stroke, ...) as ranging from decent to good.
Touchpad
Unlike the keyboard, the touchpad offers generous dimensions. A size of approximately 13 x 7 cm is comfortable to use and leaves enough space for longer mouse movements on the display. Thanks to the smooth surface, it ensures excellent gliding properties too. We also see the presence of dedicated mouse buttons as a plus or advantage. The multi-touch support works perfectly. As usual, the touchpad supports zooming and scrolling with two-finger gestures.
Display
Our test device was equipped with the optional UHD display. 3840x2160 pixels provide a crisp and sharp image. As mentioned at the beginning, the 4K panel only supports 60 Hz instead of 240 Hz, which isn't really up to date anymore, especially since there are definitely more modern options in the UHD range (120 Hz on the MSI GT76 Titan DT).
| |||||||||||||||||||||||||
Brightness Distribution: 92 %
Center on Battery: 442 cd/m²
Contrast: 1228:1 (Black: 0.36 cd/m²)
ΔE ColorChecker Calman: 4.38 | ∀{0.5-29.43 Ø4.71}
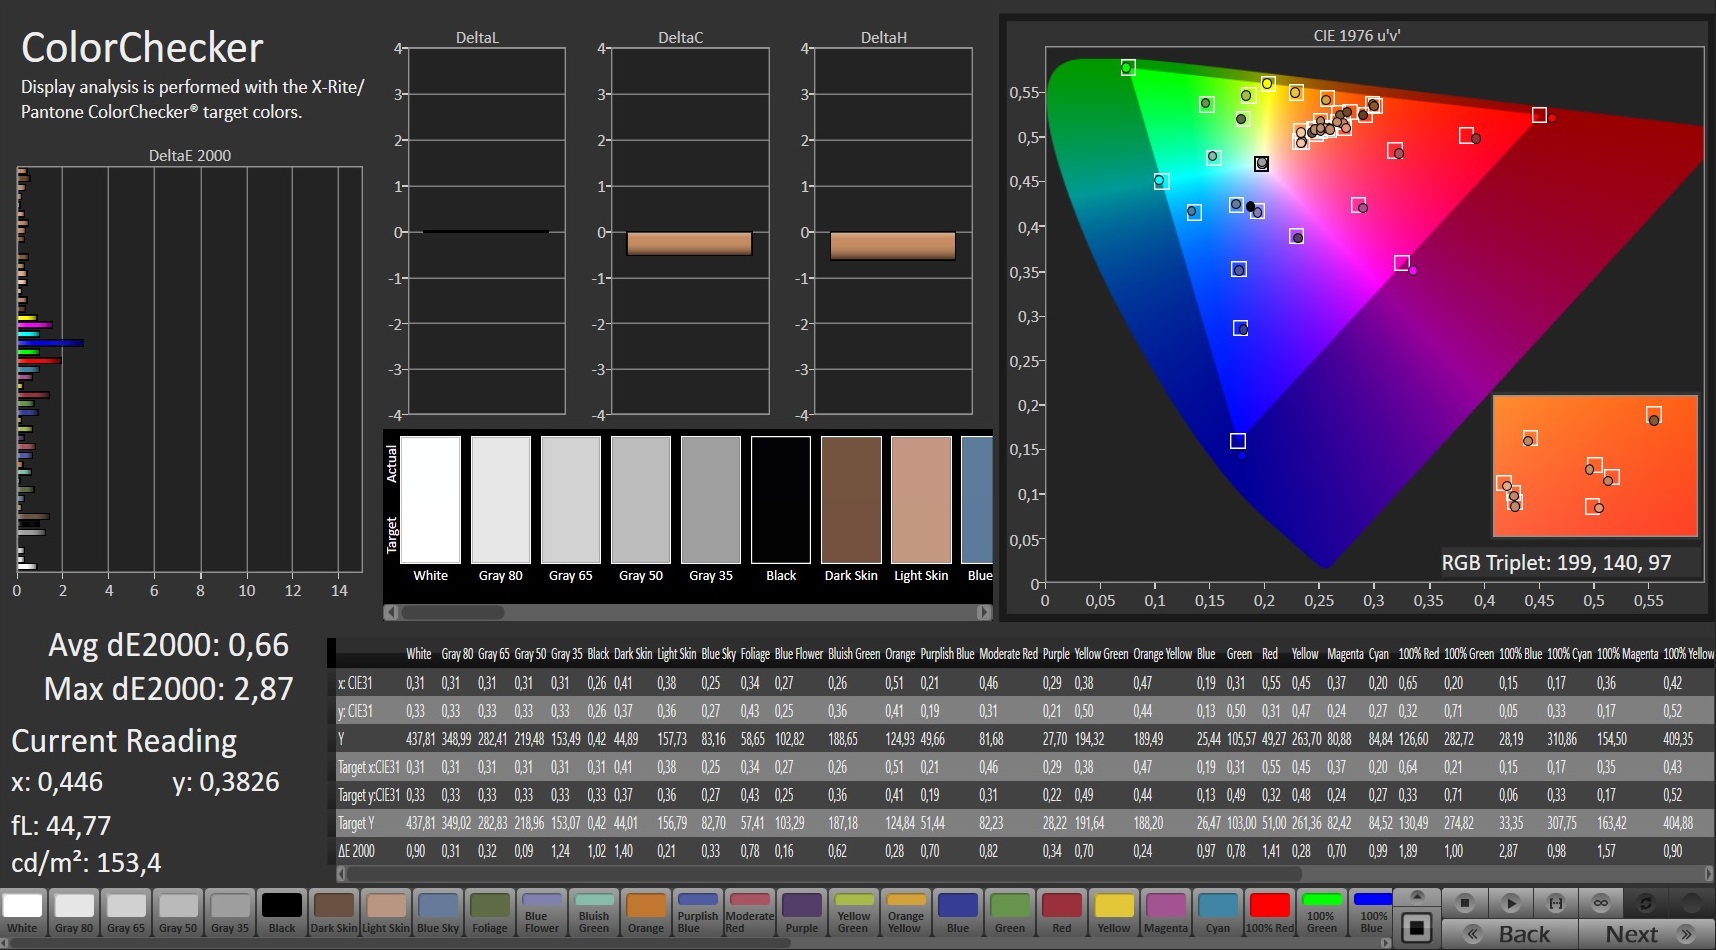
calibrated: 0.66
ΔE Greyscale Calman: 7.3 | ∀{0.09-98 Ø4.96}
98% sRGB (Argyll 1.6.3 3D)
98% AdobeRGB 1998 (Argyll 1.6.3 3D)
97.9% AdobeRGB 1998 (Argyll 3D)
99.1% sRGB (Argyll 3D)
83% Display P3 (Argyll 3D)
Gamma: 2.17
CCT: 6906 K
| Schenker XMG Ultra 17 Comet Lake AUO B173ZAN03.0 (AUO309B), IPS, 3840x2160, 17.3" | MSI GT76 Titan DT 10SGS AU Optronics B173ZAN03.3, IPS, 3840x2160, 17.3" | Alienware m17 R3 P45E AU Optronics B173HAN, IPS, 1920x1080, 17.3" | Asus Strix Scar 17 G732LXS LQ173M1JW03 (SHP14DC), IPS, 1920x1080, 17.3" | |
|---|---|---|---|---|
| Display | -1% | -15% | -14% | |
| Display P3 Coverage (%) | 83 | 82.5 -1% | 69.2 -17% | 71 -14% |
| sRGB Coverage (%) | 99.1 | 98 -1% | 97.9 -1% | 99 0% |
| AdobeRGB 1998 Coverage (%) | 97.9 | 96.6 -1% | 71.4 -27% | 71.6 -27% |
| Response Times | 50% | 51% | 75% | |
| Response Time Grey 50% / Grey 80% * (ms) | 50.4 ? | 23.2 ? 54% | 16.8 ? 67% | 5.8 ? 88% |
| Response Time Black / White * (ms) | 21.6 ? | 11.6 ? 46% | 14 ? 35% | 8.4 ? 61% |
| PWM Frequency (Hz) | ||||
| Screen | -29% | 4% | -10% | |
| Brightness middle (cd/m²) | 442 | 419.5 -5% | 338.3 -23% | 310 -30% |
| Brightness (cd/m²) | 423 | 413 -2% | 325 -23% | 311 -26% |
| Brightness Distribution (%) | 92 | 93 1% | 91 -1% | 82 -11% |
| Black Level * (cd/m²) | 0.36 | 0.4 -11% | 0.27 25% | 0.41 -14% |
| Contrast (:1) | 1228 | 1049 -15% | 1253 2% | 756 -38% |
| Colorchecker dE 2000 * | 4.38 | 3.4 22% | 1.88 57% | 2.41 45% |
| Colorchecker dE 2000 max. * | 10.85 | 7.4 32% | 3.23 70% | 8.59 21% |
| Colorchecker dE 2000 calibrated * | 0.66 | 3.28 -397% | 1.32 -100% | 1.13 -71% |
| Greyscale dE 2000 * | 7.3 | 2 73% | 2.4 67% | 4.3 41% |
| Gamma | 2.17 101% | 2.14 103% | 2.39 92% | 2.149 102% |
| CCT | 6906 94% | 6858 95% | 6572 99% | 7059 92% |
| Color Space (Percent of AdobeRGB 1998) (%) | 98 | 84.6 -14% | 64.7 -34% | 72 -27% |
| Color Space (Percent of sRGB) (%) | 98 | 97.9 0% | 97.8 0% | 94 -4% |
| Total Average (Program / Settings) | 7% /
-14% | 13% /
6% | 17% /
-0% |
* ... smaller is better
The same applies to the response time: Just under 50 ms (gray-to-gray) is clearly undercut by competing laptops. Despite having an identical resolution, the MSI laptop mentioned earlier only takes about half as long. So as not to discourage gamers, Clevo should make improvements here.

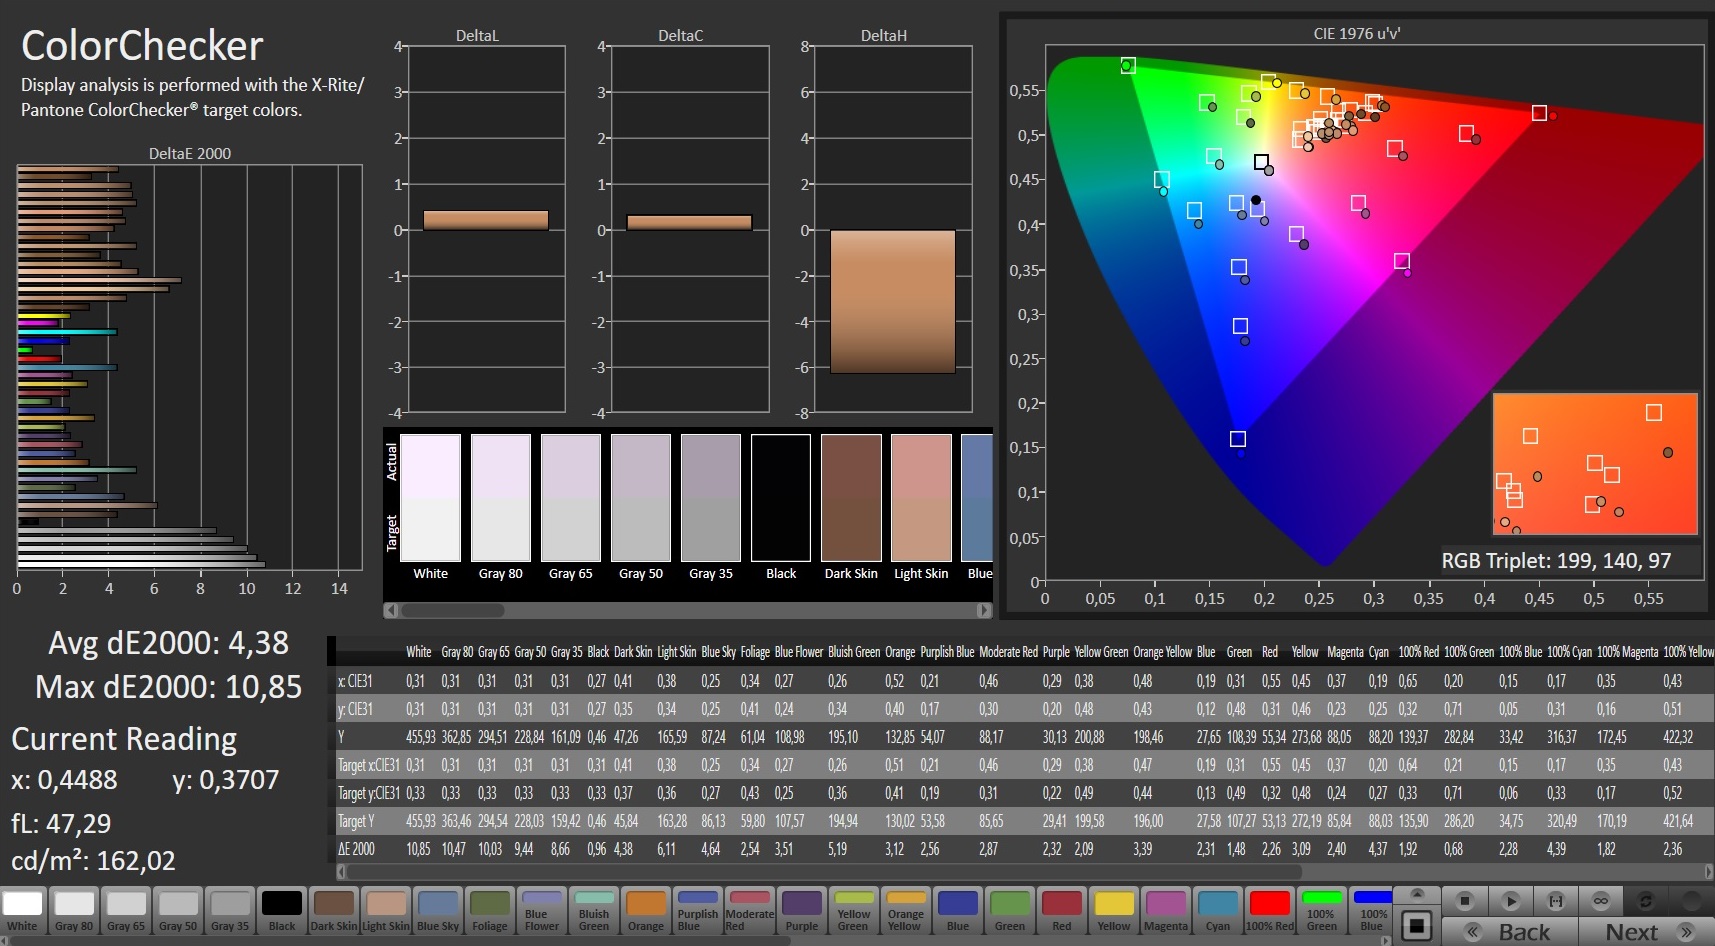
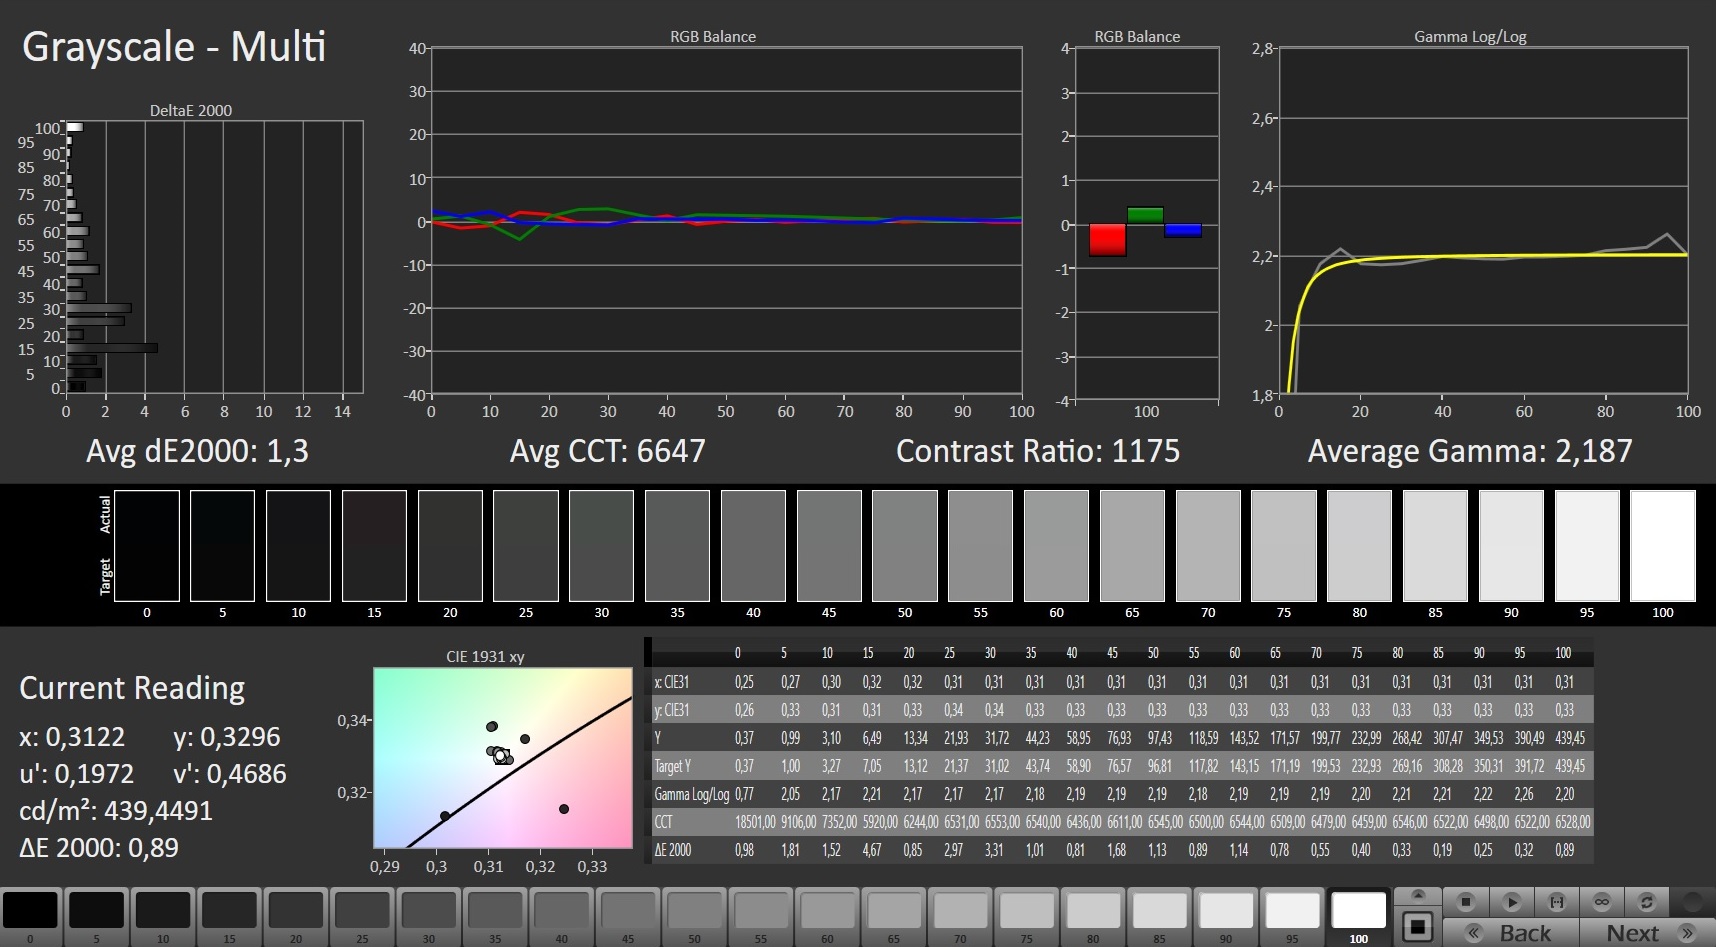
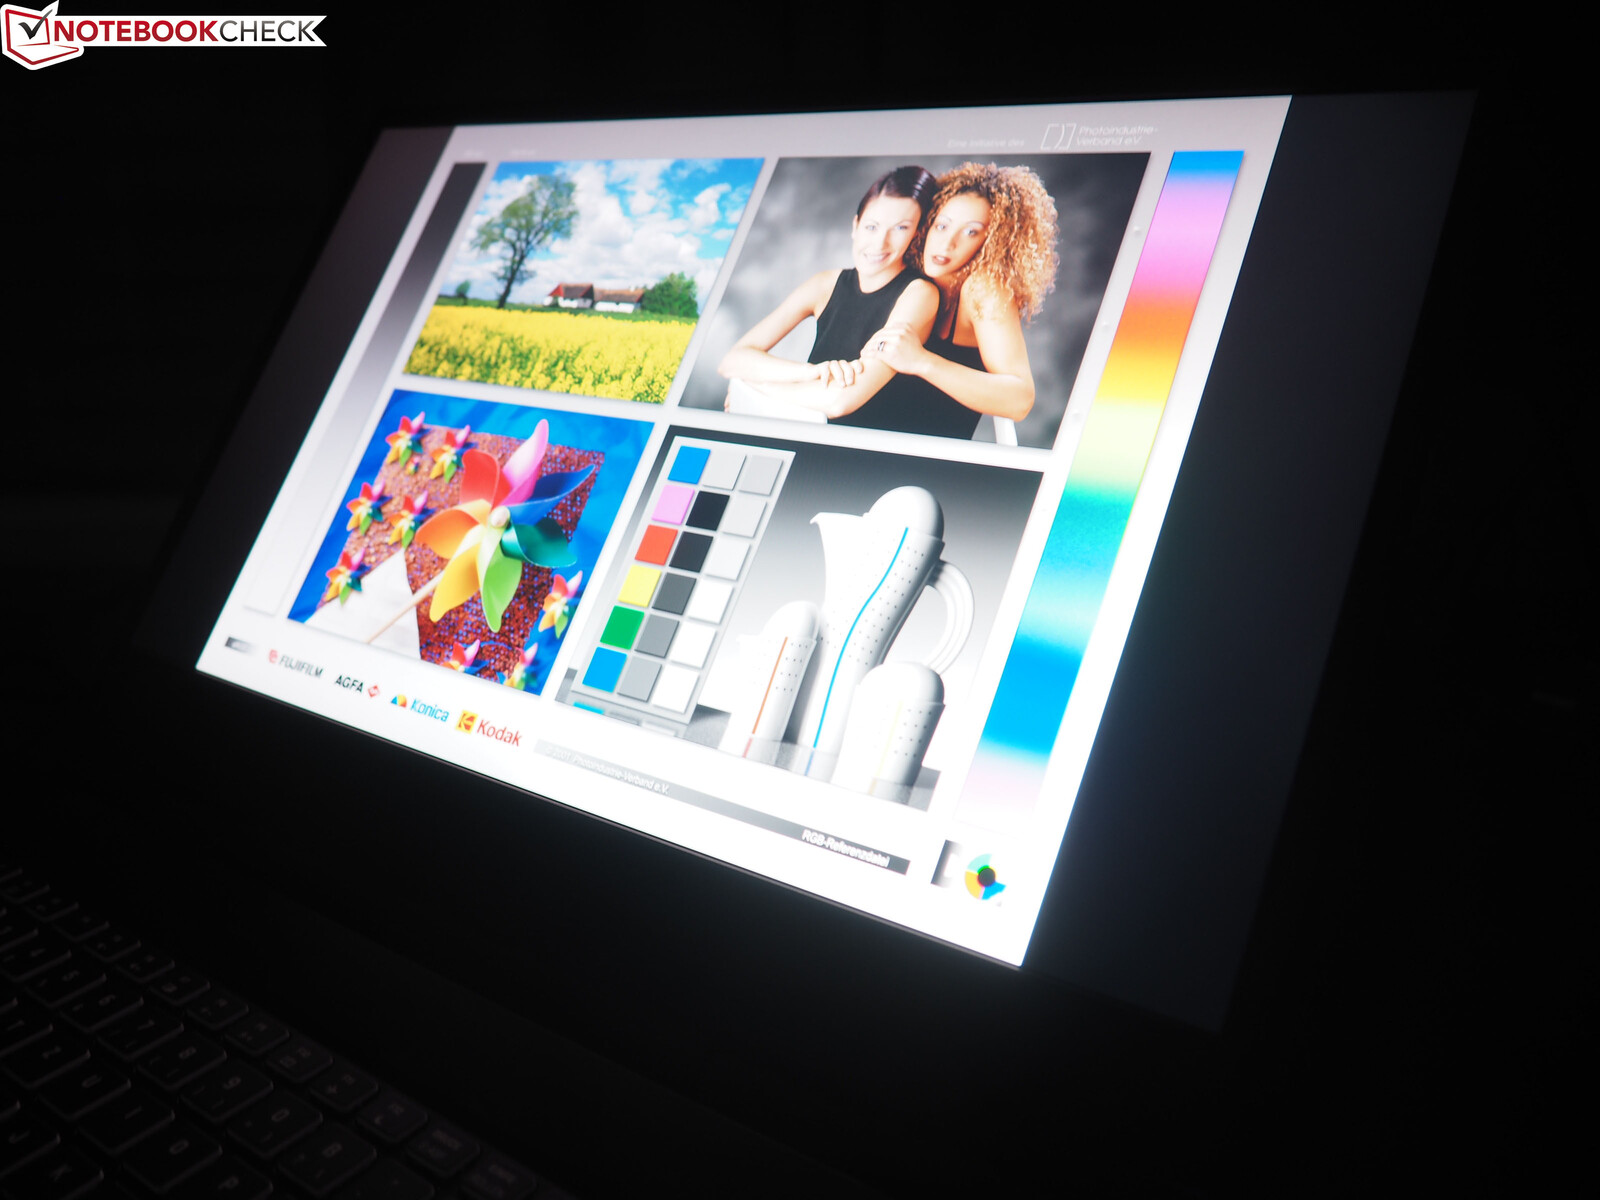
The remaining display values are convincing - with the exception of the grayscales. More than 400 cd/m² of brightness and a contrast ratio of over 1,200:1 will satisfy most buyers. The black level (0.36 cd/m²) doesn't need to hide behind the values of the competition either. In addition - thanks to IPS technology - there's good viewing-angle stability.
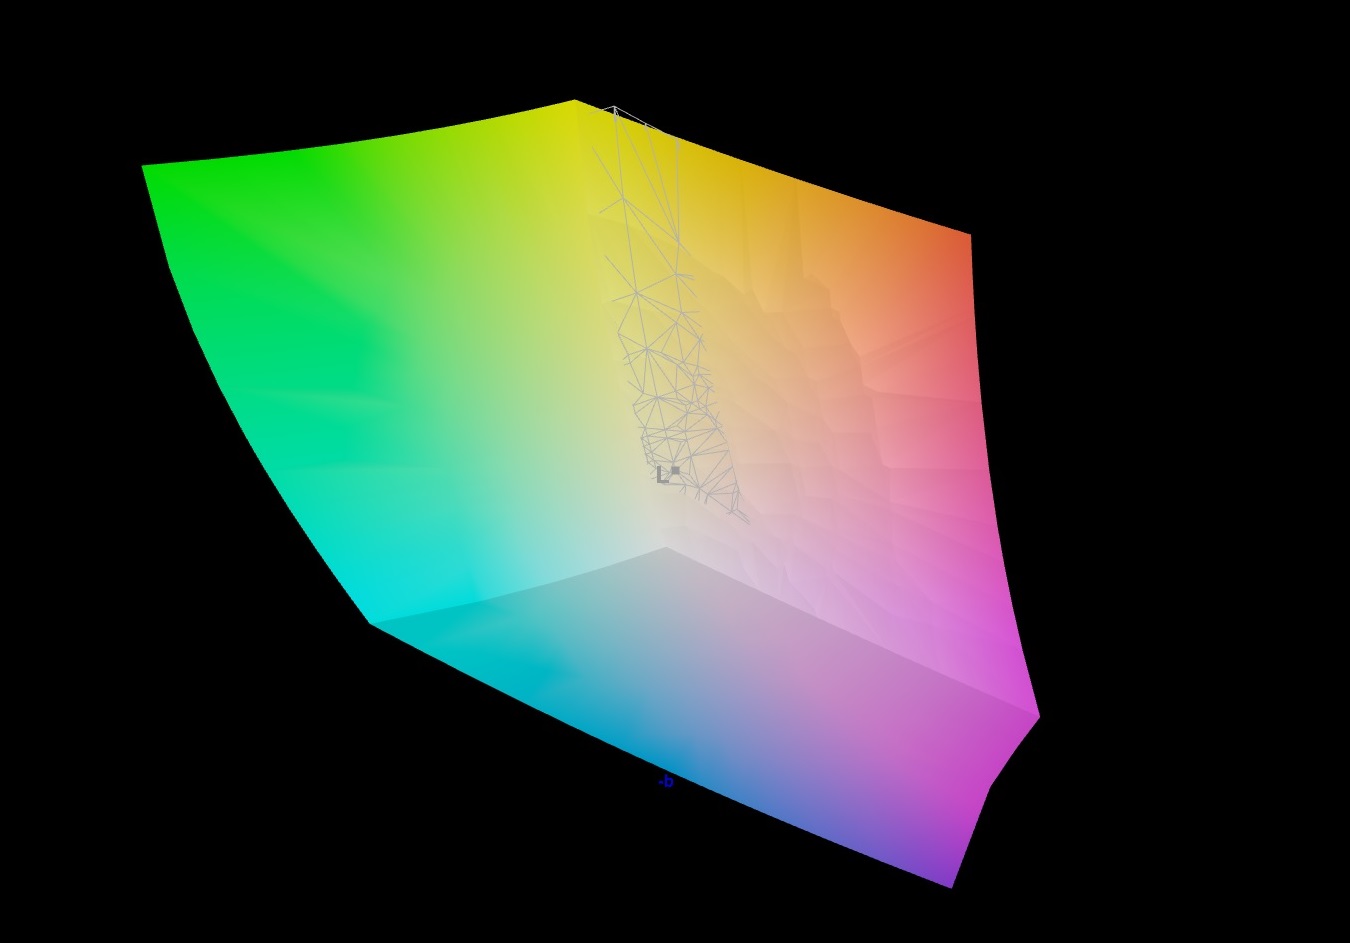
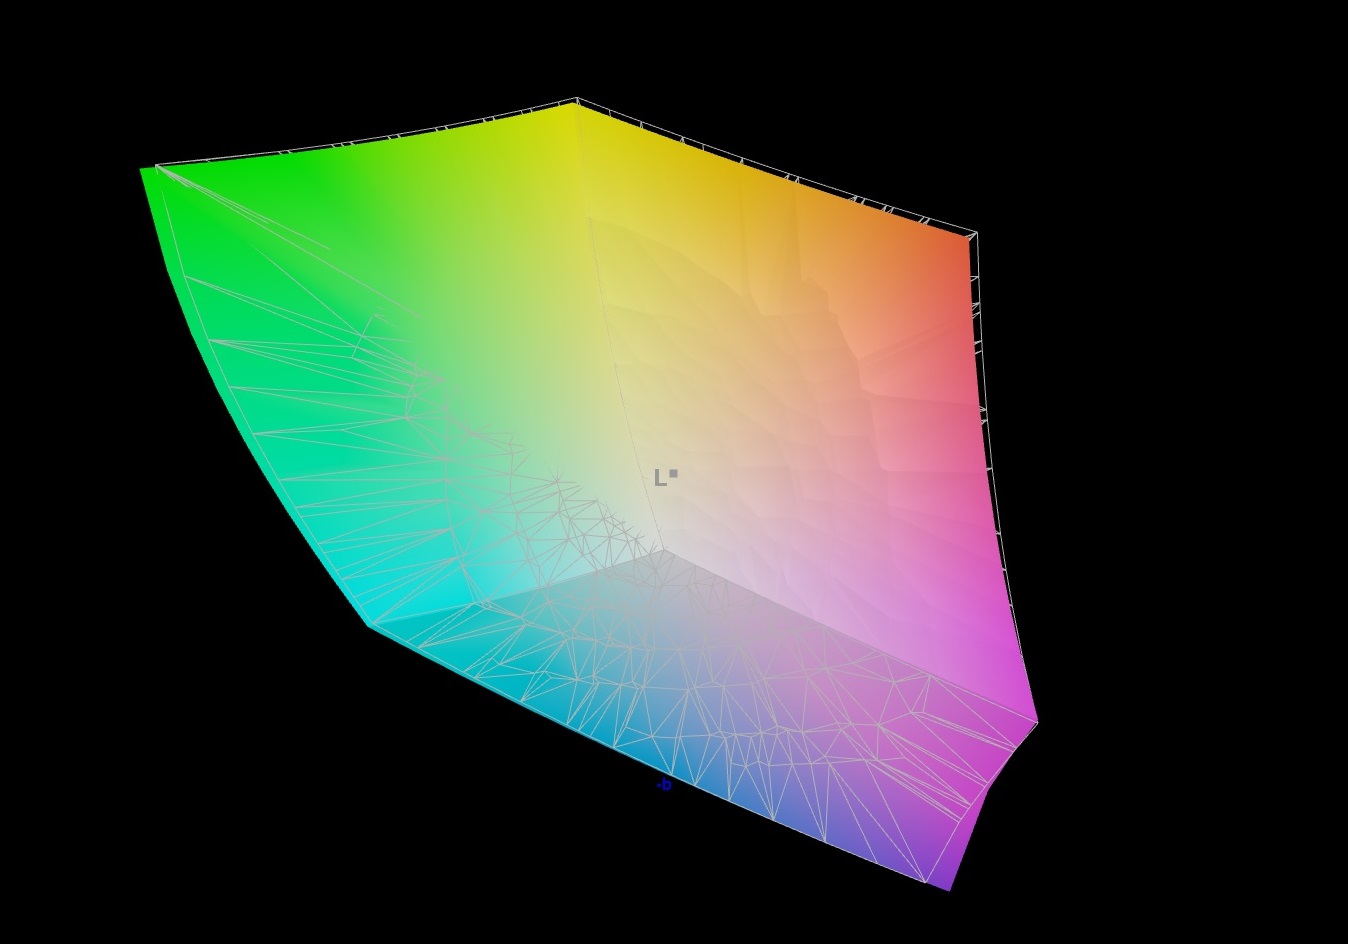
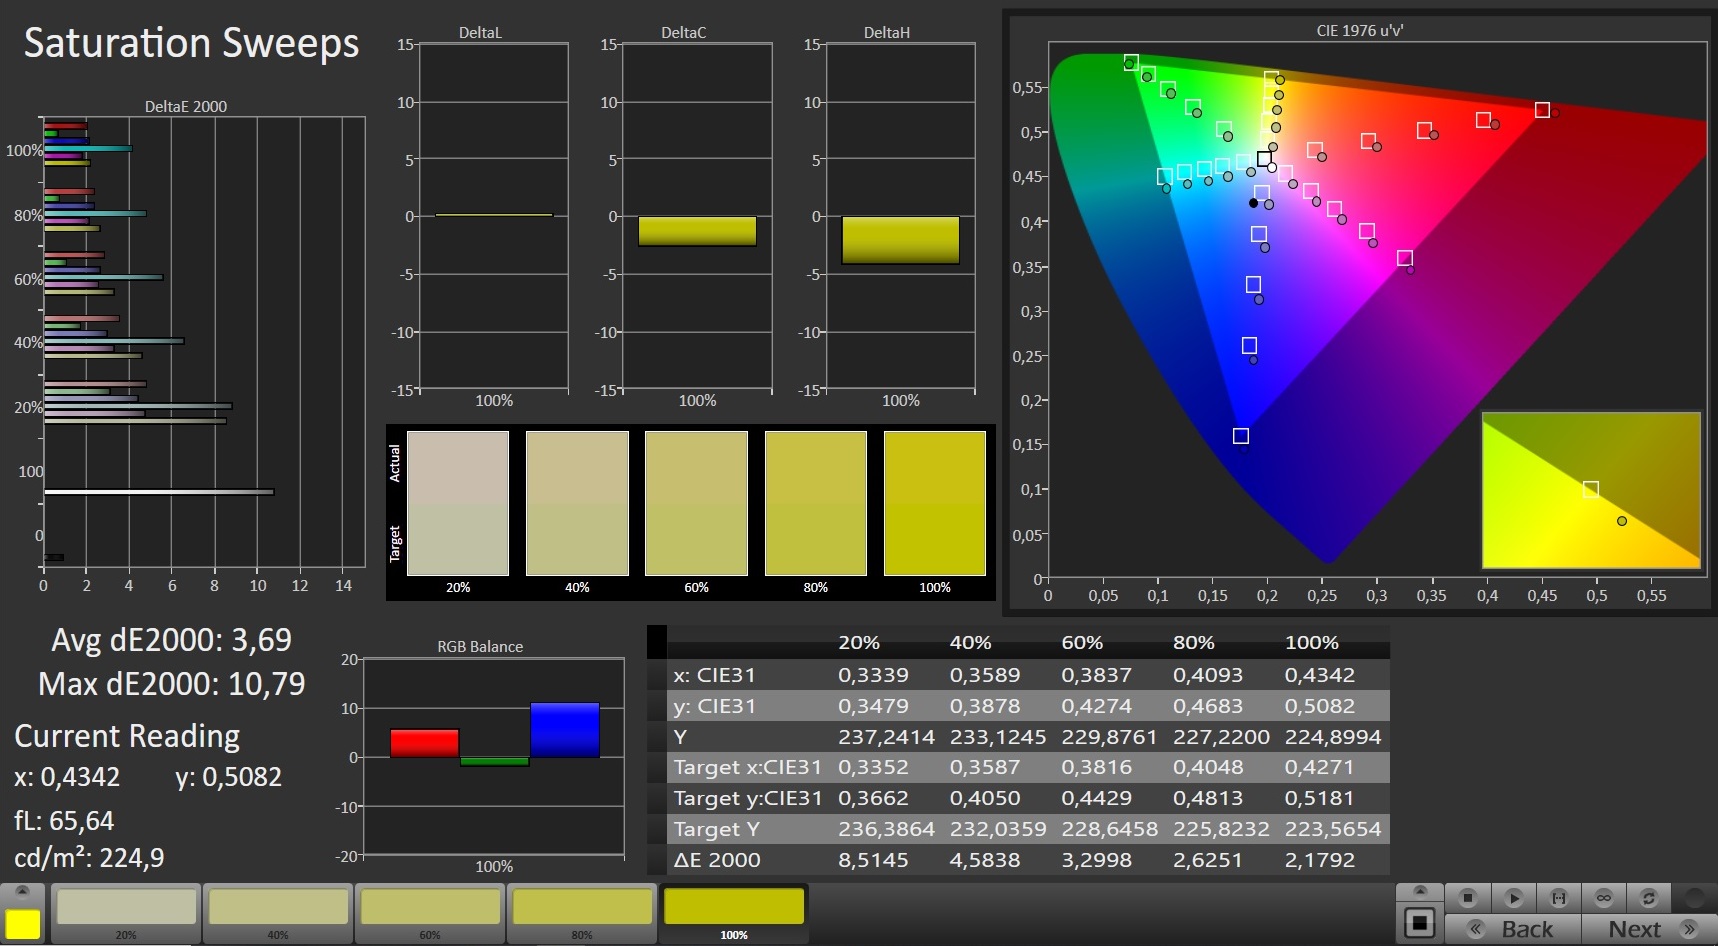
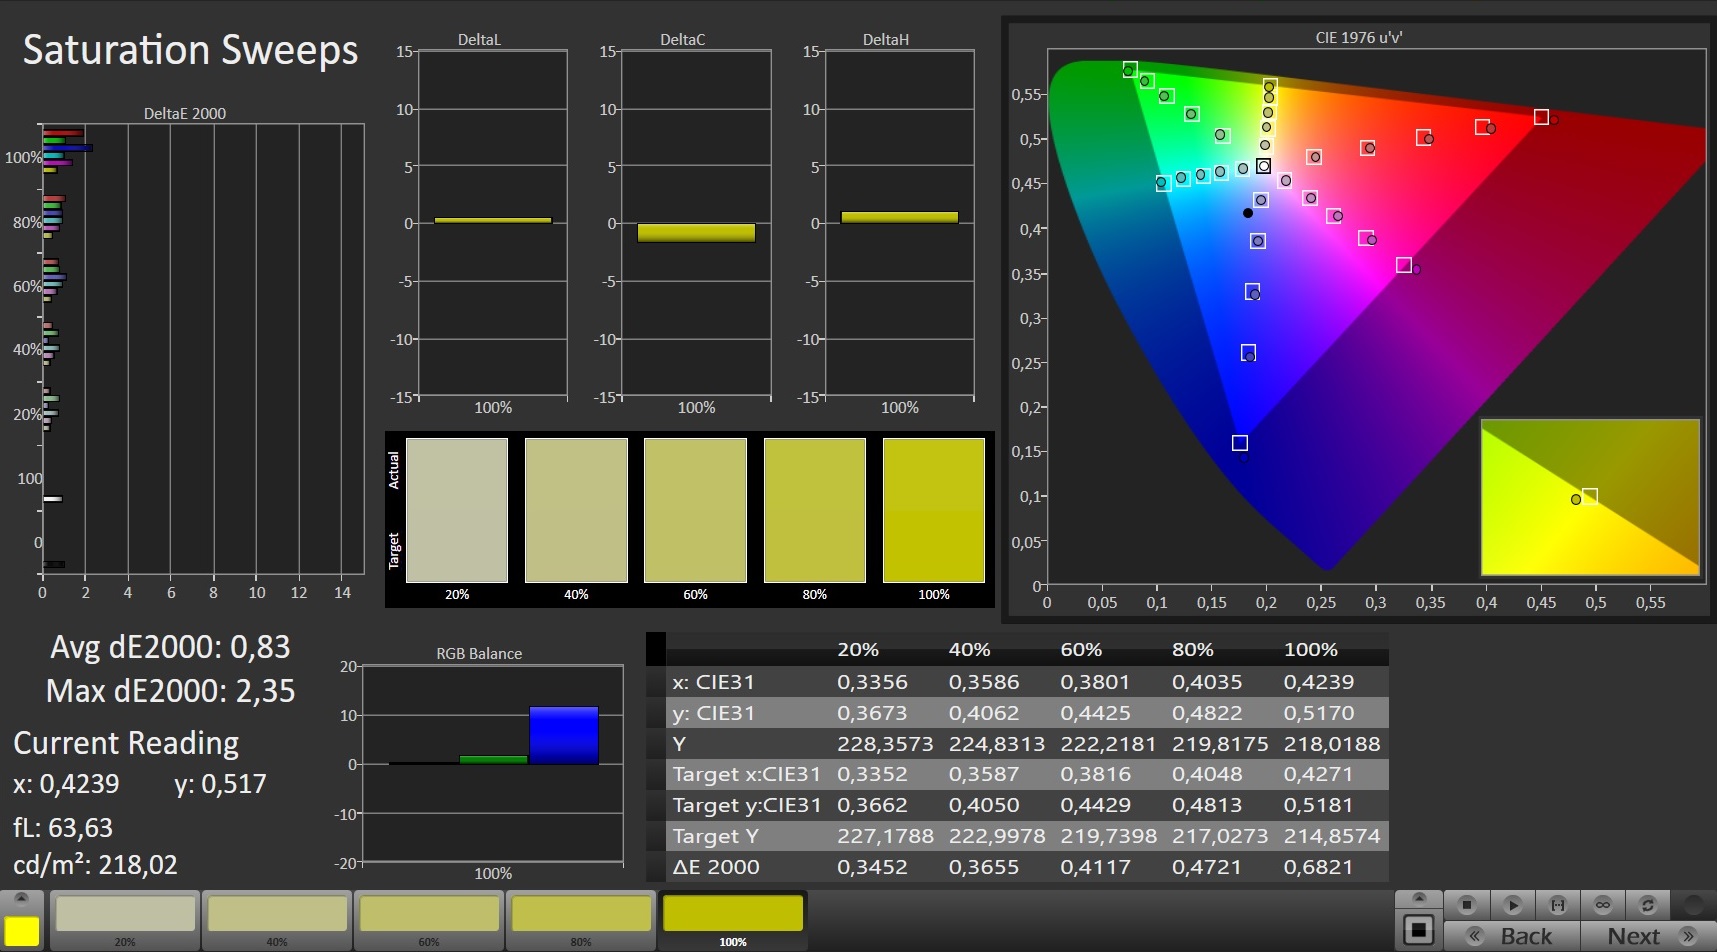
But the biggest highlight of the 4K display is the gigantic color space. We usually see a 98% coverage of the AdobeRGB color space rather in workstations and creator-oriented laptops.
Display Response Times
| ↔ Response Time Black to White | ||
|---|---|---|
| 21.6 ms ... rise ↗ and fall ↘ combined | ↗ 7.6 ms rise | 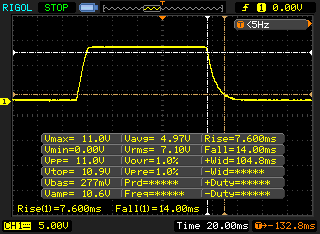 |
| ↘ 14 ms fall | ||
| The screen shows good response rates in our tests, but may be too slow for competitive gamers. In comparison, all tested devices range from 0.1 (minimum) to 240 (maximum) ms. » 48 % of all devices are better. This means that the measured response time is similar to the average of all tested devices (19.8 ms). | ||
| ↔ Response Time 50% Grey to 80% Grey | ||
| 50.4 ms ... rise ↗ and fall ↘ combined | ↗ 23.6 ms rise | 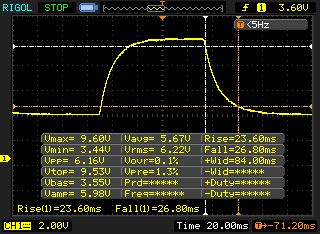 |
| ↘ 26.8 ms fall | ||
| The screen shows slow response rates in our tests and will be unsatisfactory for gamers. In comparison, all tested devices range from 0.165 (minimum) to 636 (maximum) ms. » 87 % of all devices are better. This means that the measured response time is worse than the average of all tested devices (30.9 ms). | ||
Screen Flickering / PWM (Pulse-Width Modulation)
| Screen flickering / PWM not detected | 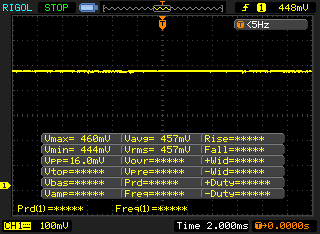 | ||
In comparison: 52 % of all tested devices do not use PWM to dim the display. If PWM was detected, an average of 7744 (minimum: 5 - maximum: 343500) Hz was measured. | |||
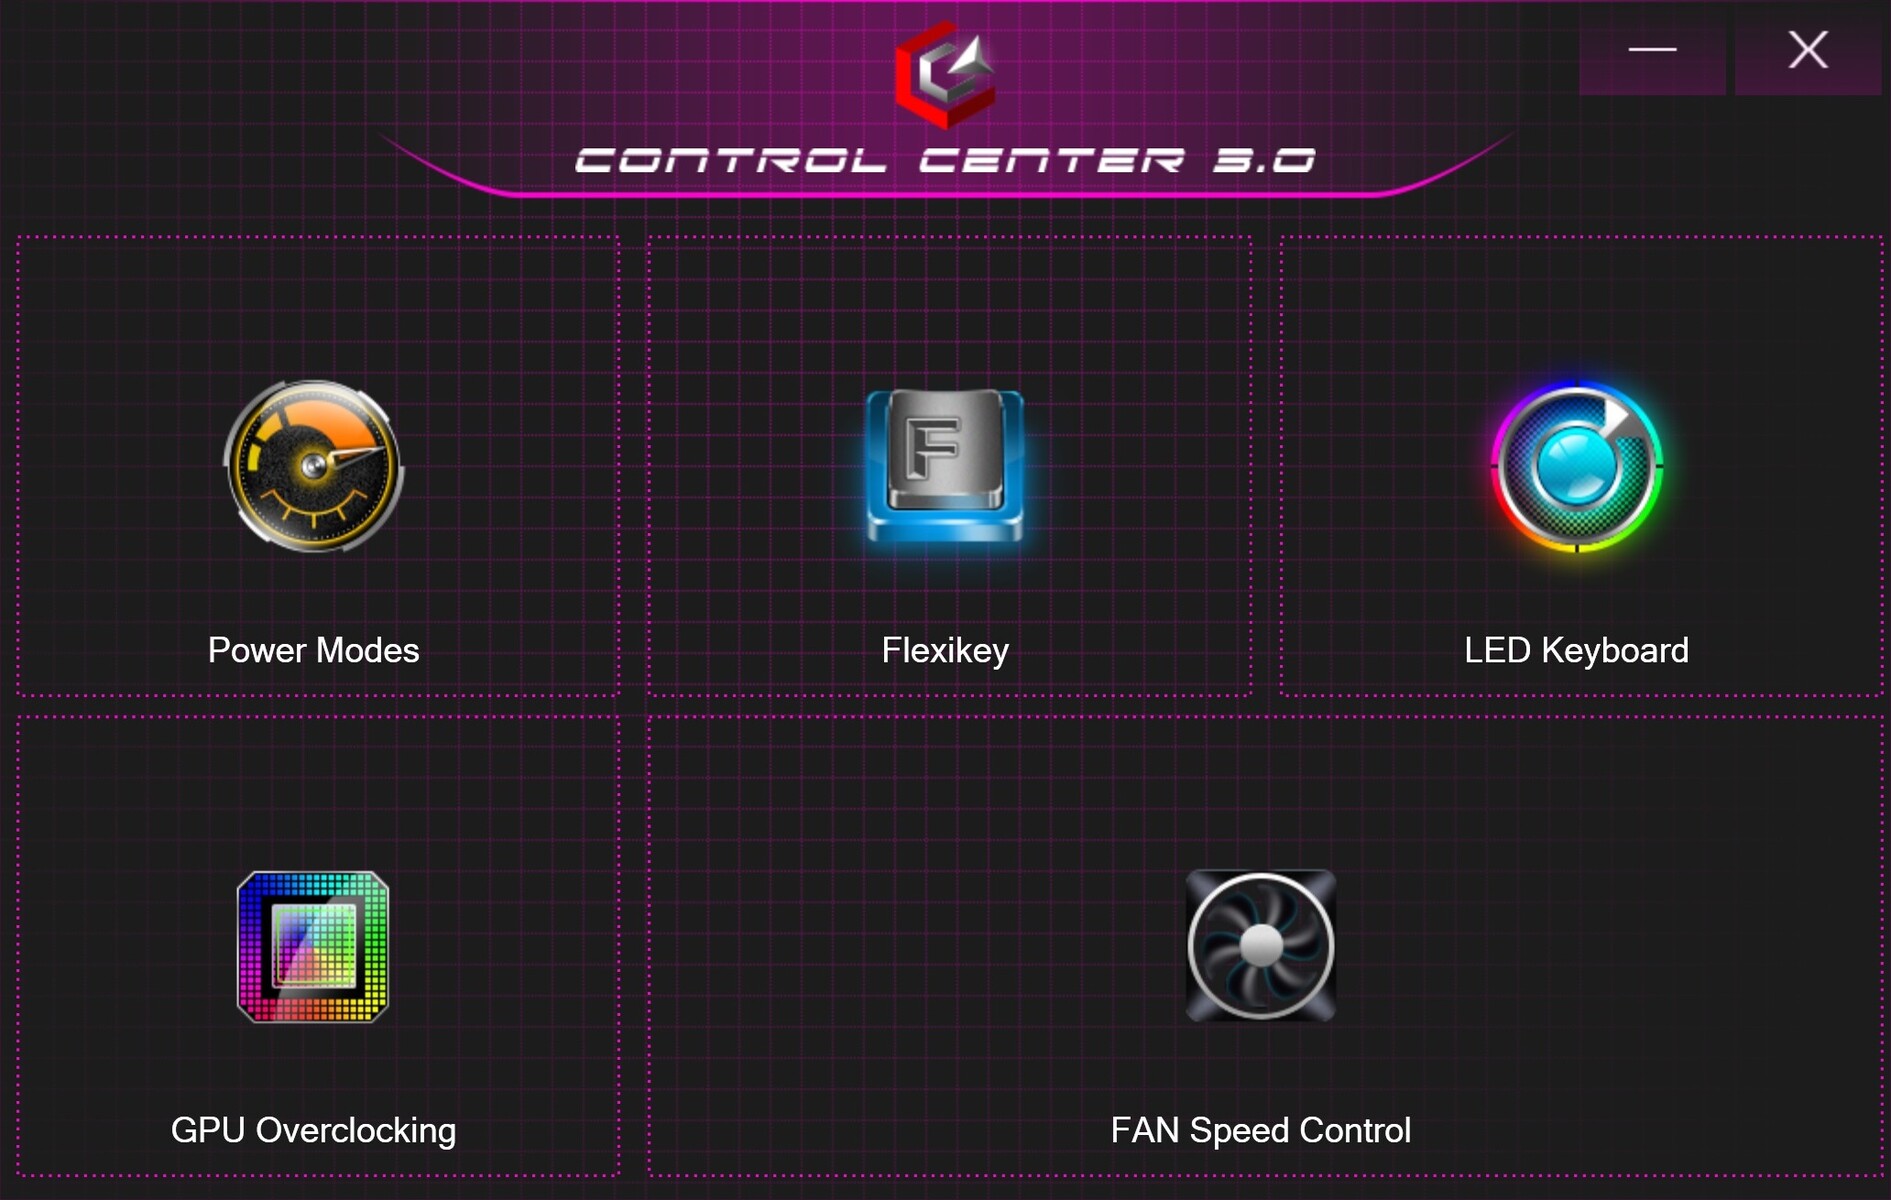
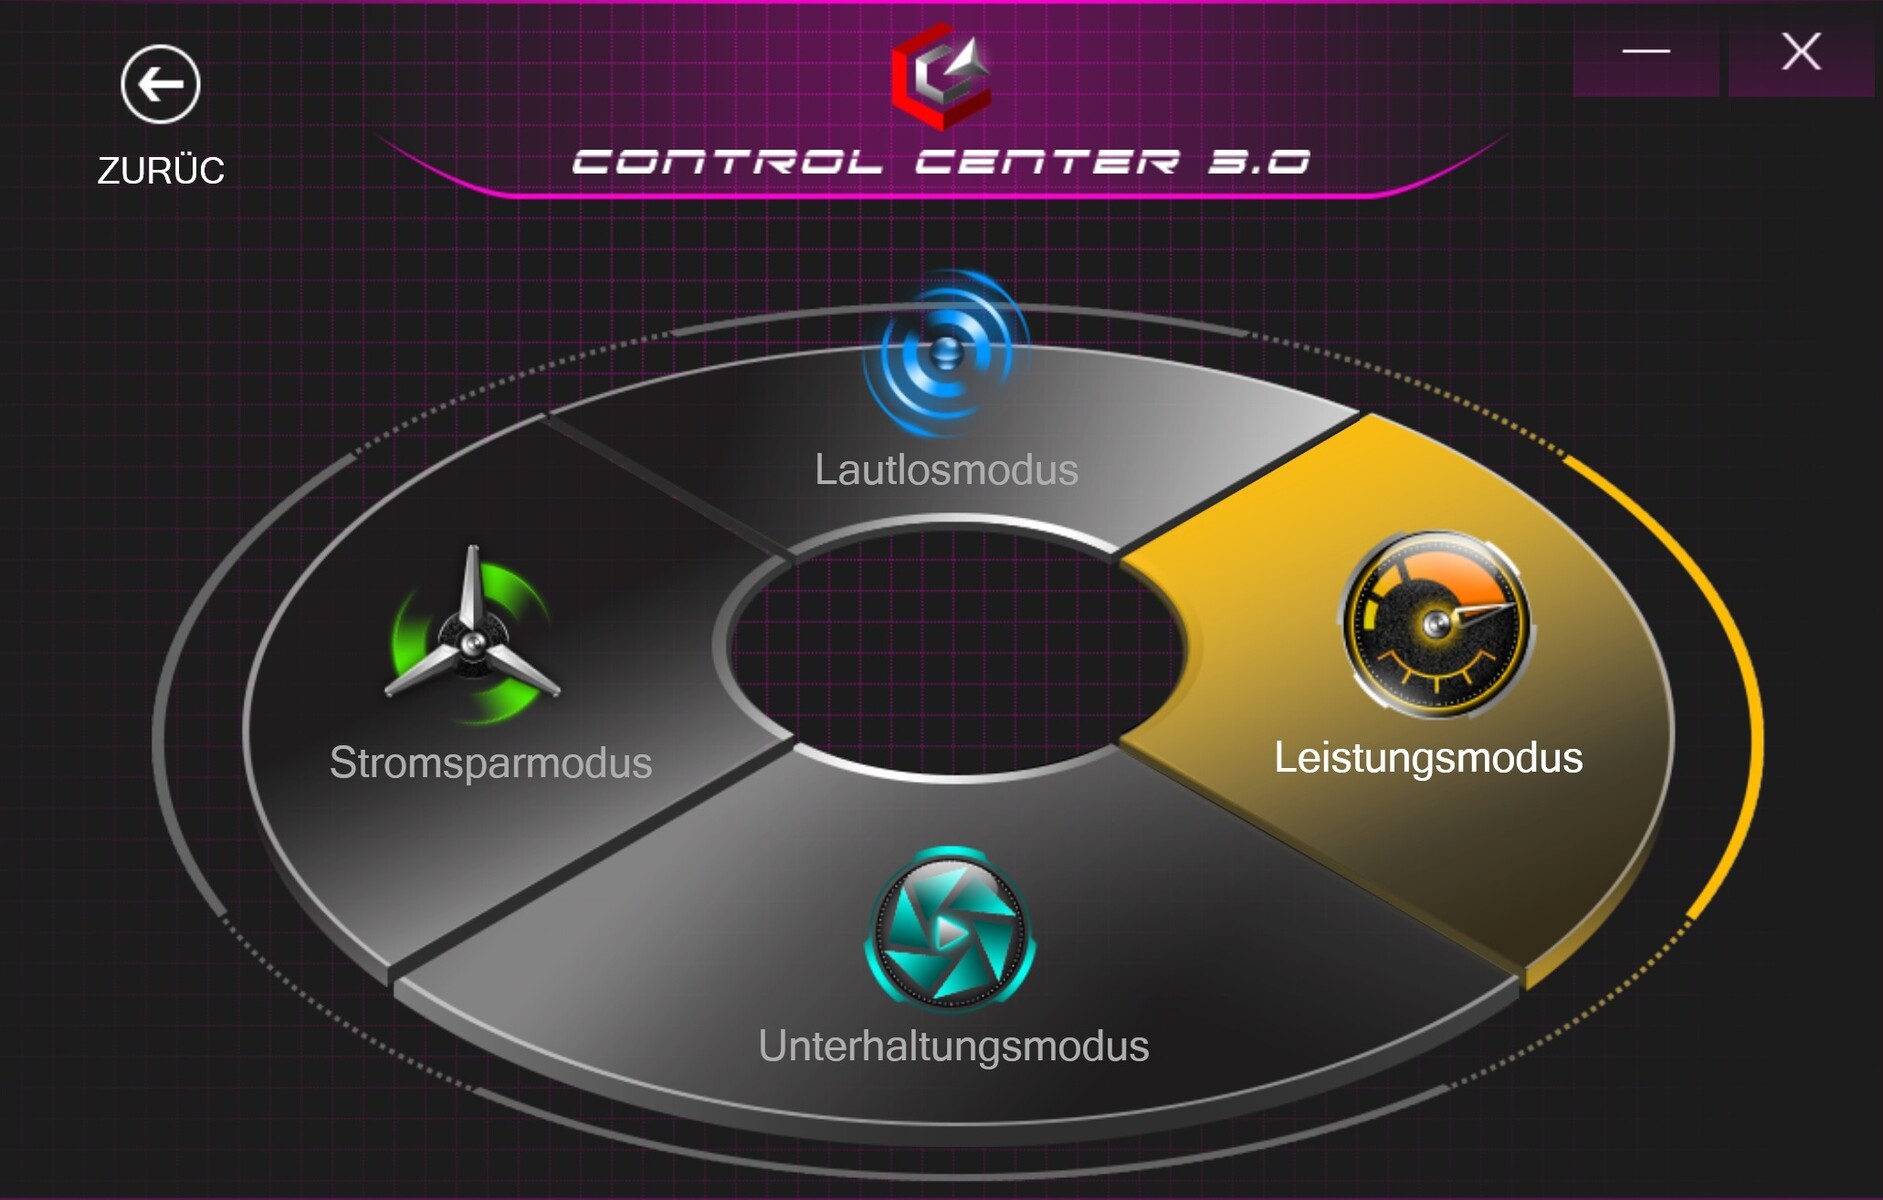
Test conditions
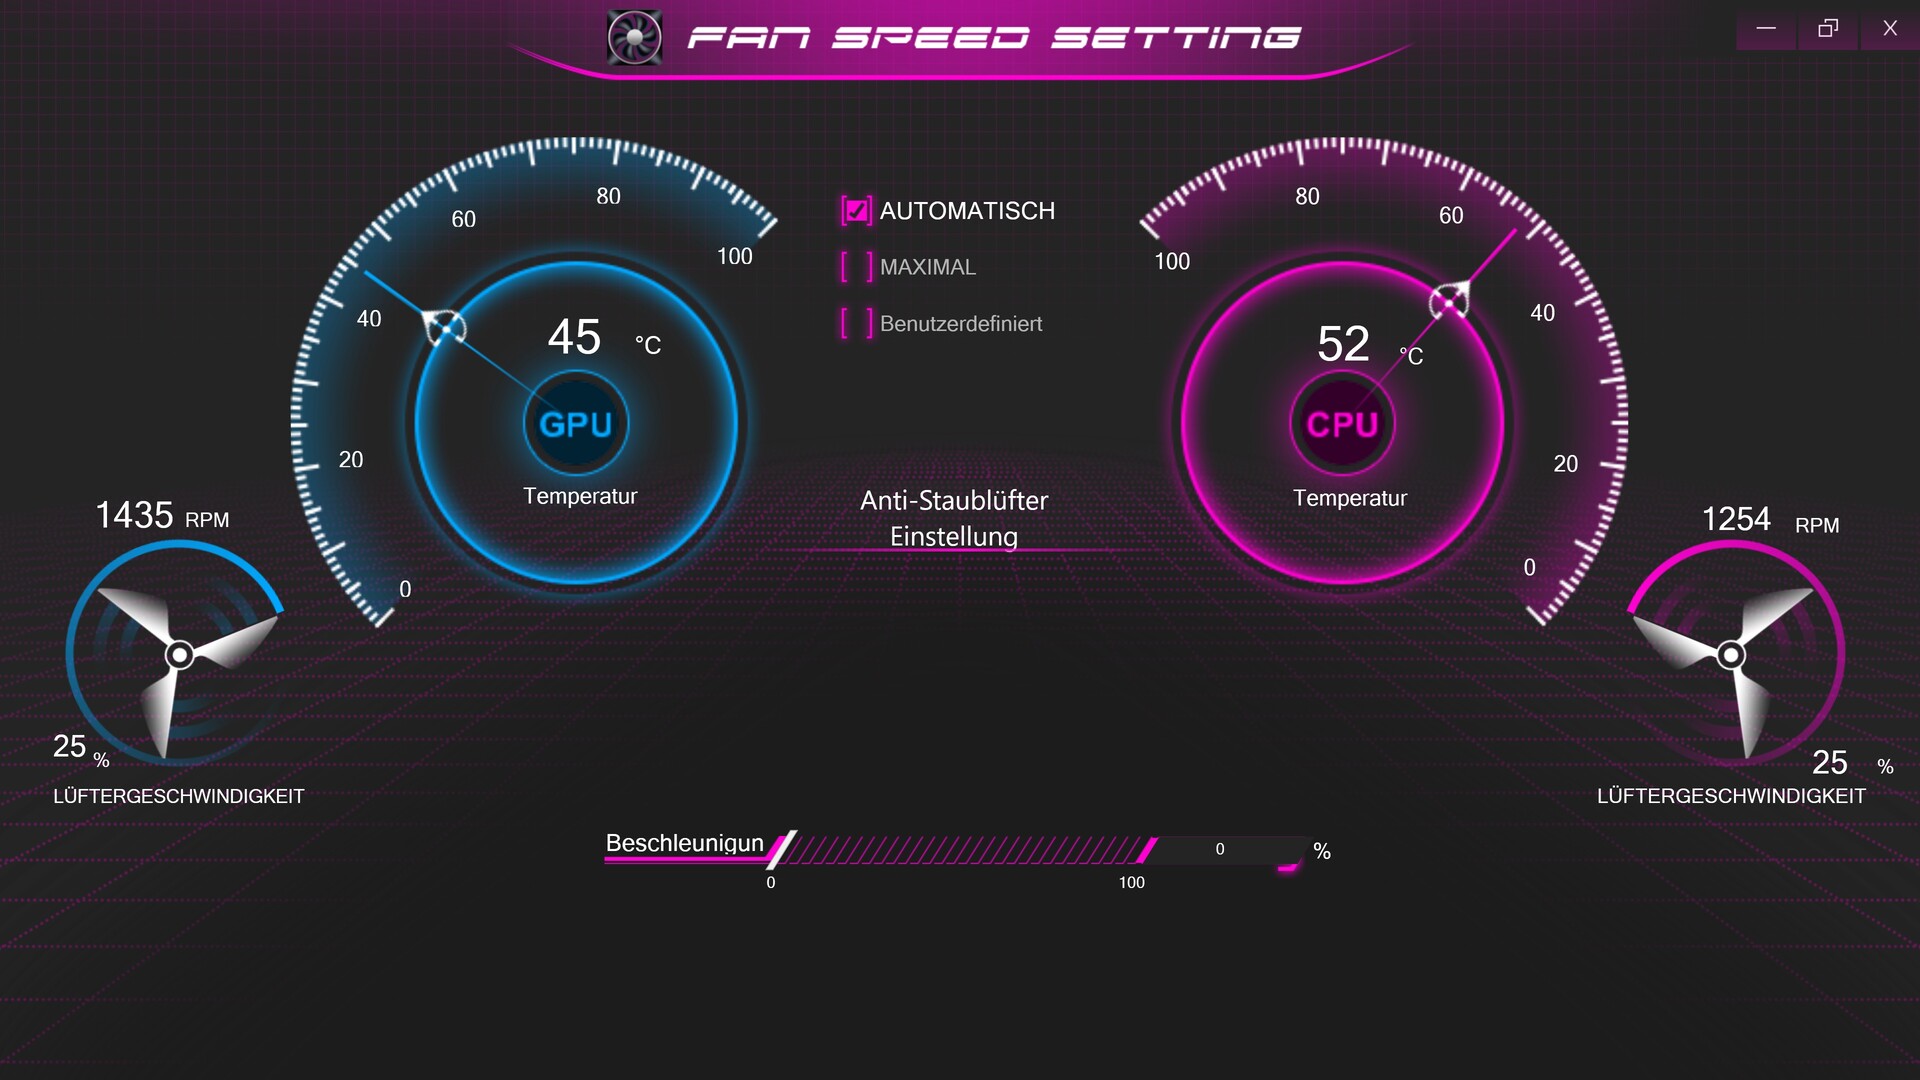
Among other things, you can choose between various power modes within the preinstalled Control Center. Our tests were performed under the "Performance" profile that was active out of the box. The automatic system was always used as the fan speed setting.
Performance
The XMG Ultra 17 is very clearly a representative of the upper class. In particular, our test configuration with a ten-core CPU, top GPU, and 128 GB of RAM should provide enough power for the coming years, provided that the resolution is reduced for demanding 3D applications (keyword "games") if needed.
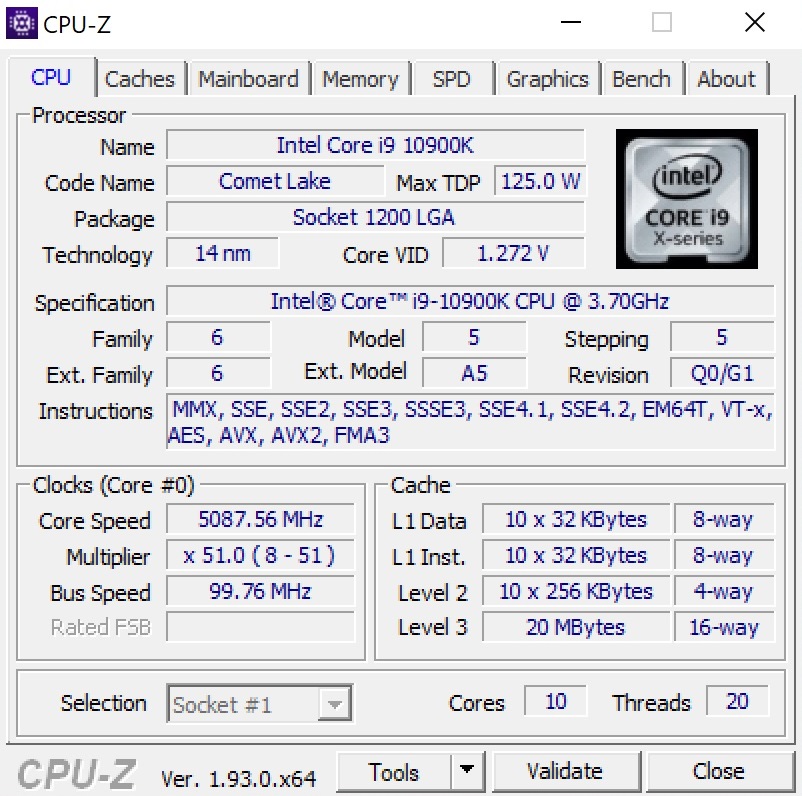
Processor
The Core i9-10900K is currently the strongest Comet Lake CPU from Intel. The desktop model can process up to 20 threads in parallel thanks to Hyper-Threading. Laptop chips are currently limited to 8 cores and 16 threads. The clock rate of the 10900K is also top at a maximum of 5.3 GHz, although some of this is lost in practice. In this way, we were "only" able to get 4.9 to 5.2 GHz out of the ten-core CPU for single-core applications and 4.5 to 4.6 GHz for multi-core applications.
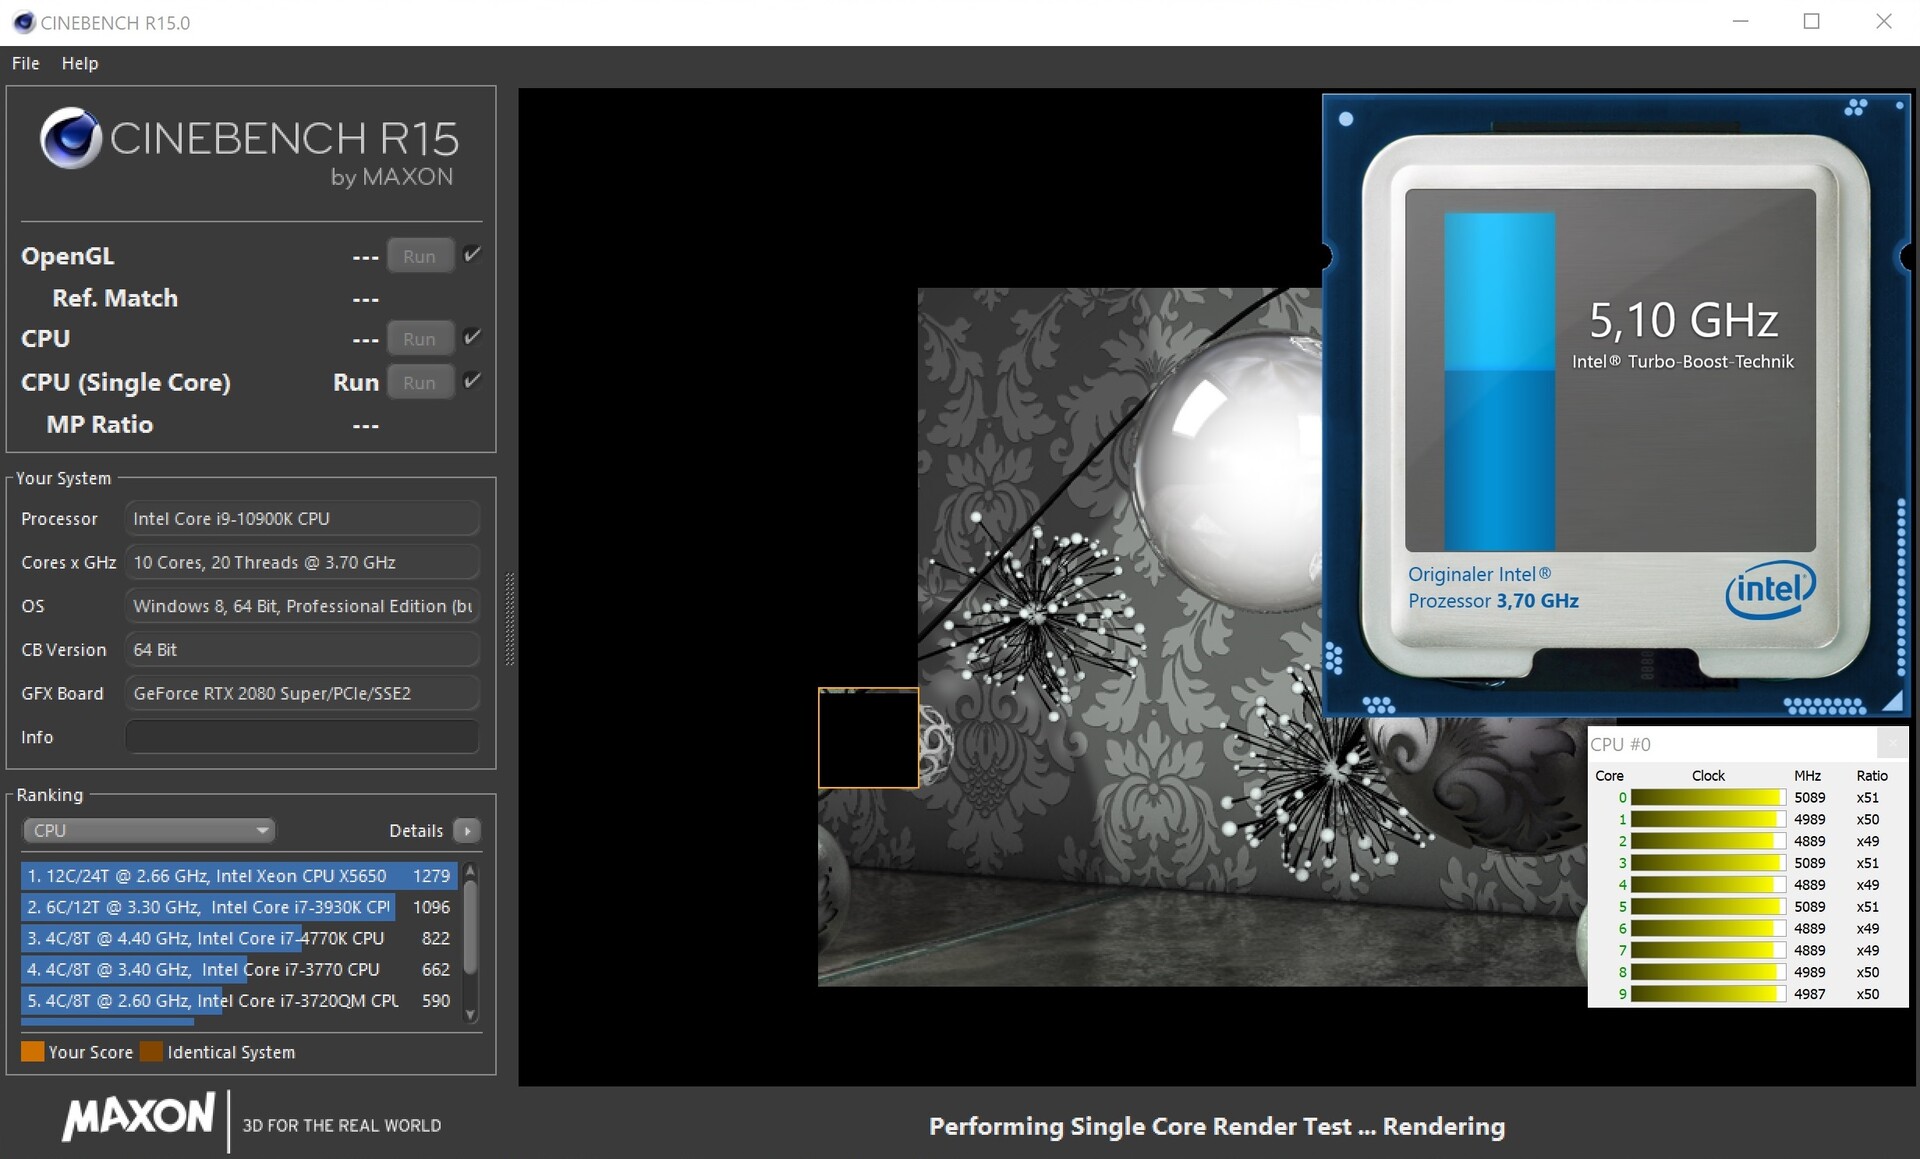
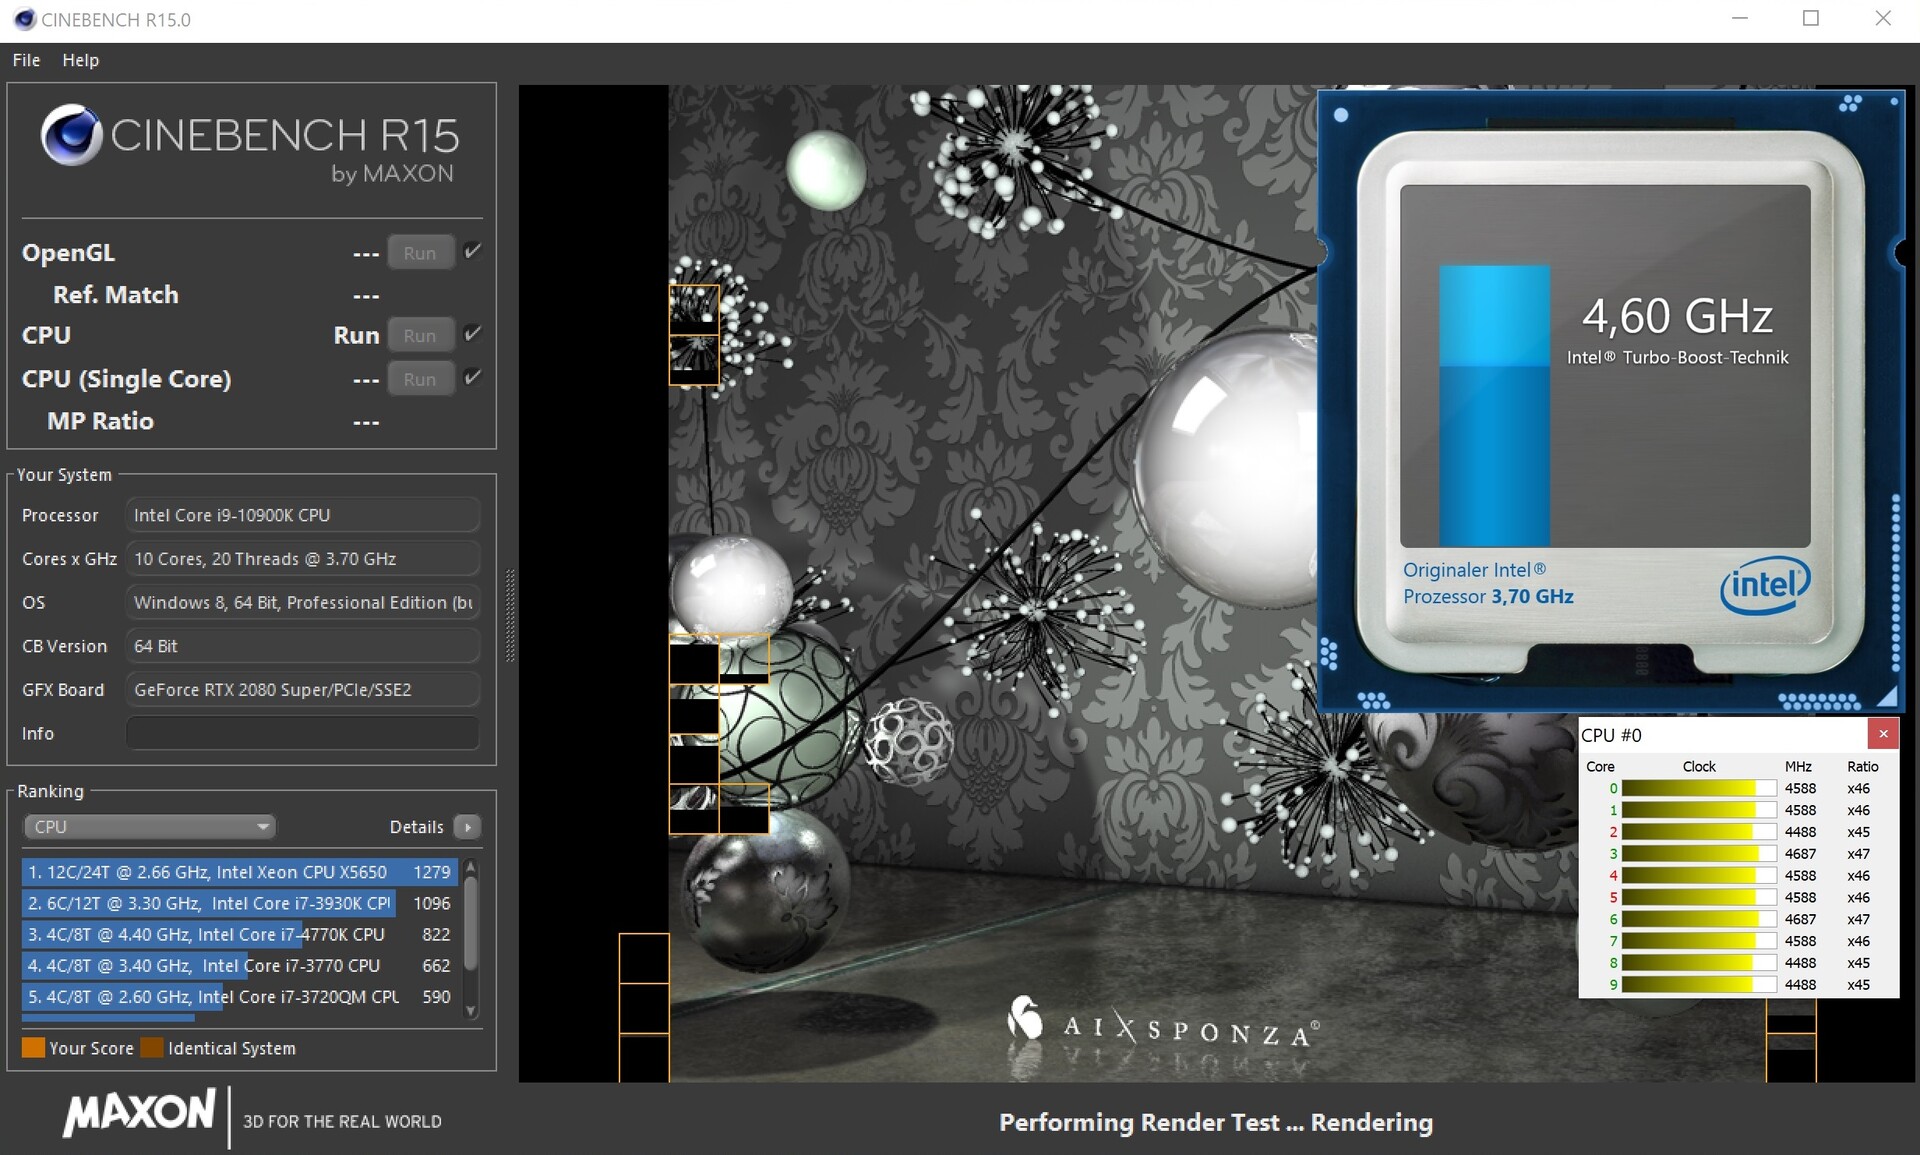
In addition, prolonged CPU load causes the clock speed to drop disproportionately. In our Cinebench R15 loop, the overall score dropped from just under 2,500 points to around 2,300 points after a few runs, which corresponds to a decrease of about 10%. The competing MSI GT76 offers a much more constant performance and Turbo development, although the values are minimally lower after a cold boot. Despite the limited Turbo, the desktop CPU in the XMG Ultra 17 noticeably surpasses the laptop models in the Alienware m17 R3 and the Asus Strix Scar 17. The Core i9-10980HK drops by around 30% in the Cinebench R15's multi-core test.
* ... smaller is better
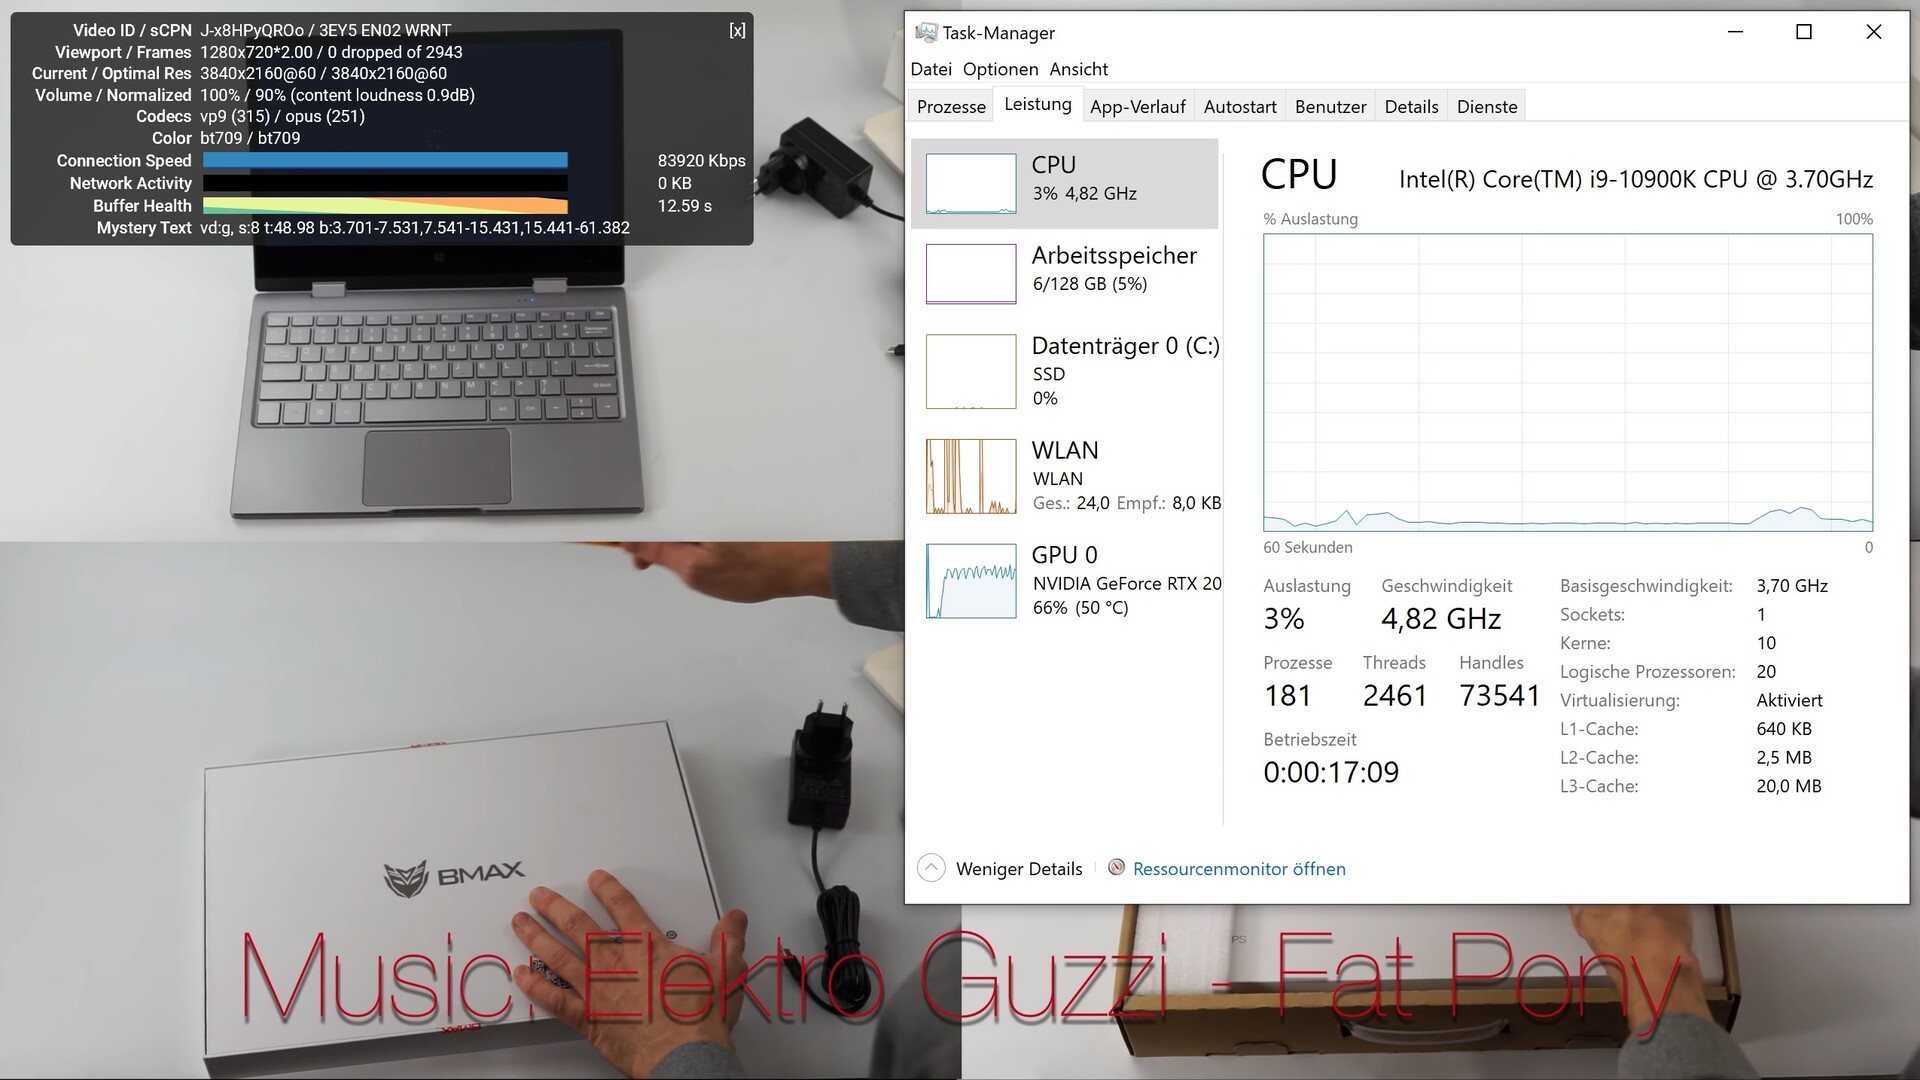
System performance
The Schenker device also snatches the top position in the test field in terms of system performance. 7,461 points in the PCMark 10 benchmark is 40% better than the average score for the gaming laptop class. Subjectively, the operating system runs lightning fast. Loading times are also pleasingly short, provided that applications are well programmed and optimized. The fact that the boot time is comparatively high (just under 30 seconds) is, unfortunately, common for a laptop with a desktop CPU.
| PCMark 10 Score | 7461 points | |
Help | ||
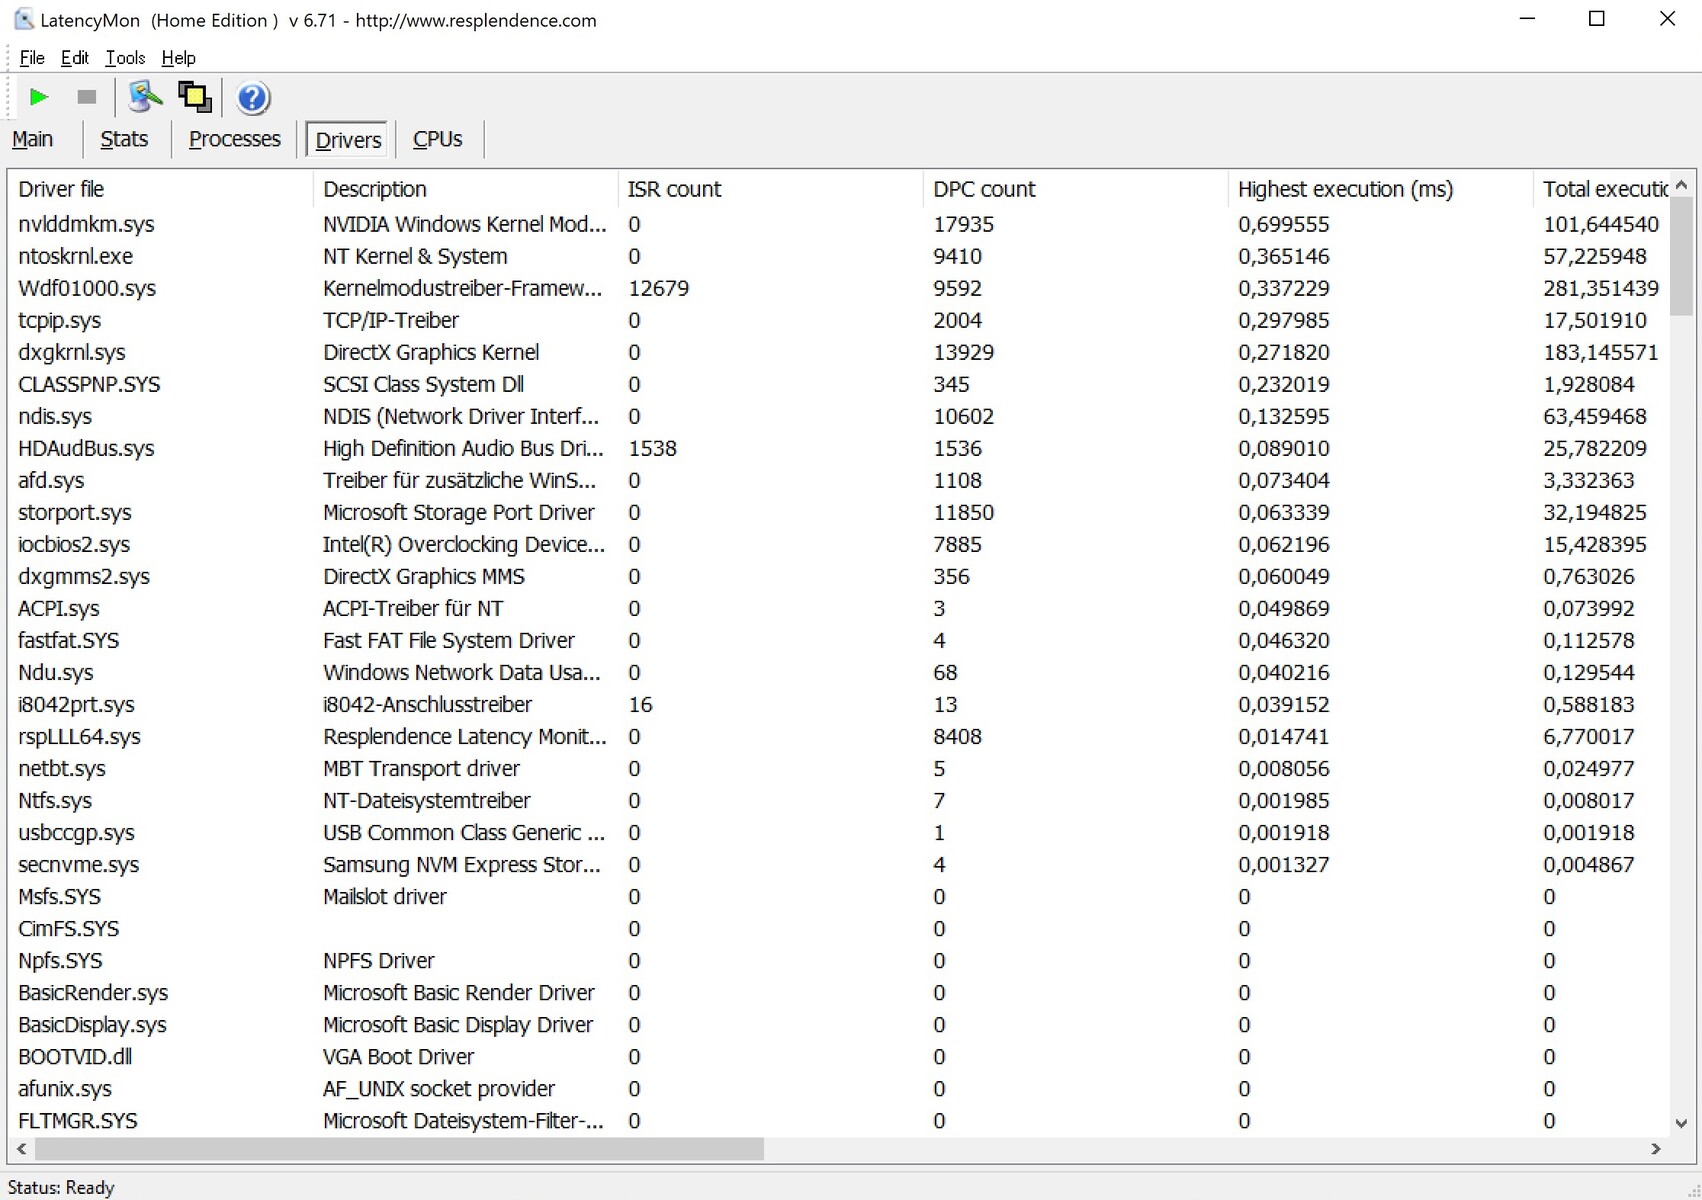
DPC latencies
There were no abnormalities in the latency test. The Ultra 17 seems to be suitable for real-time video and audio-editing.
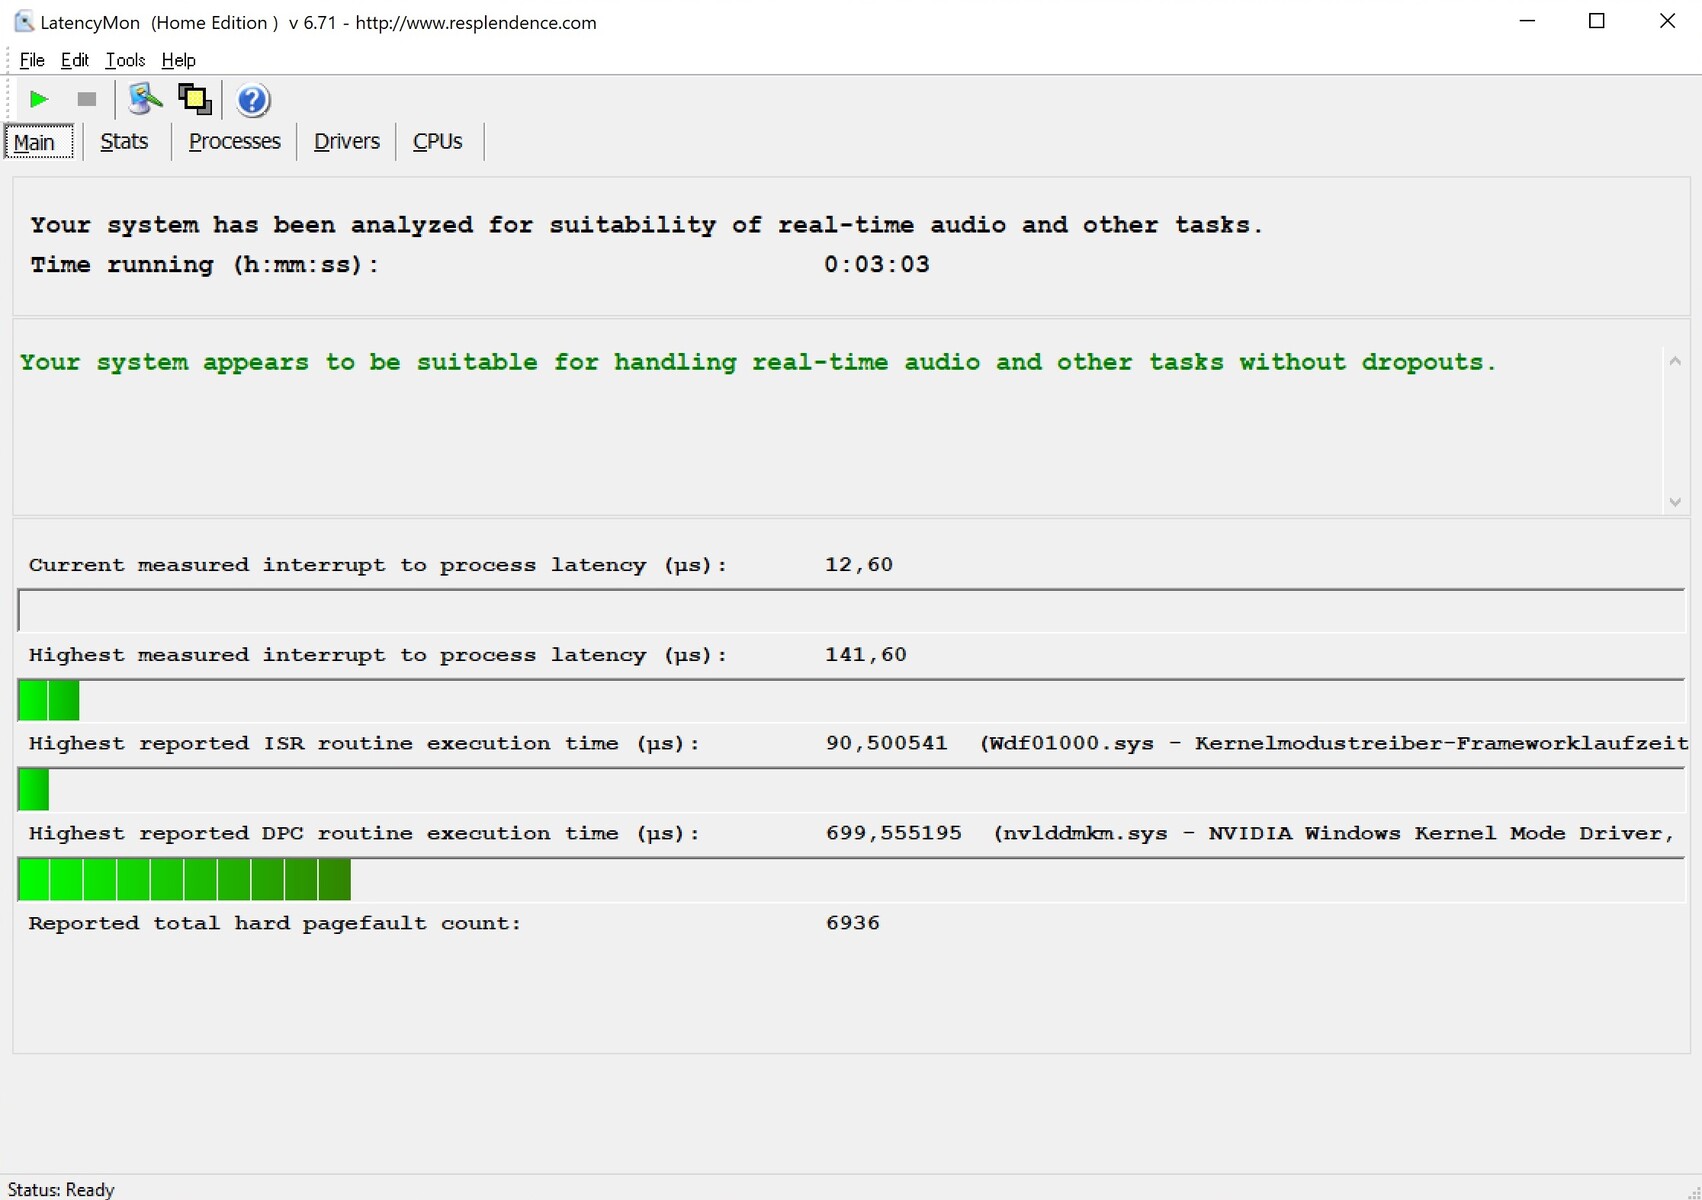
| DPC Latencies / LatencyMon - interrupt to process latency (max), Web, Youtube, Prime95 | |
| MSI GT76 Titan DT 10SGS | |
| Asus Strix Scar 17 G732LXS | |
| Alienware m17 R3 P45E | |
| Schenker XMG Ultra 17 Comet Lake | |
* ... smaller is better
Storage
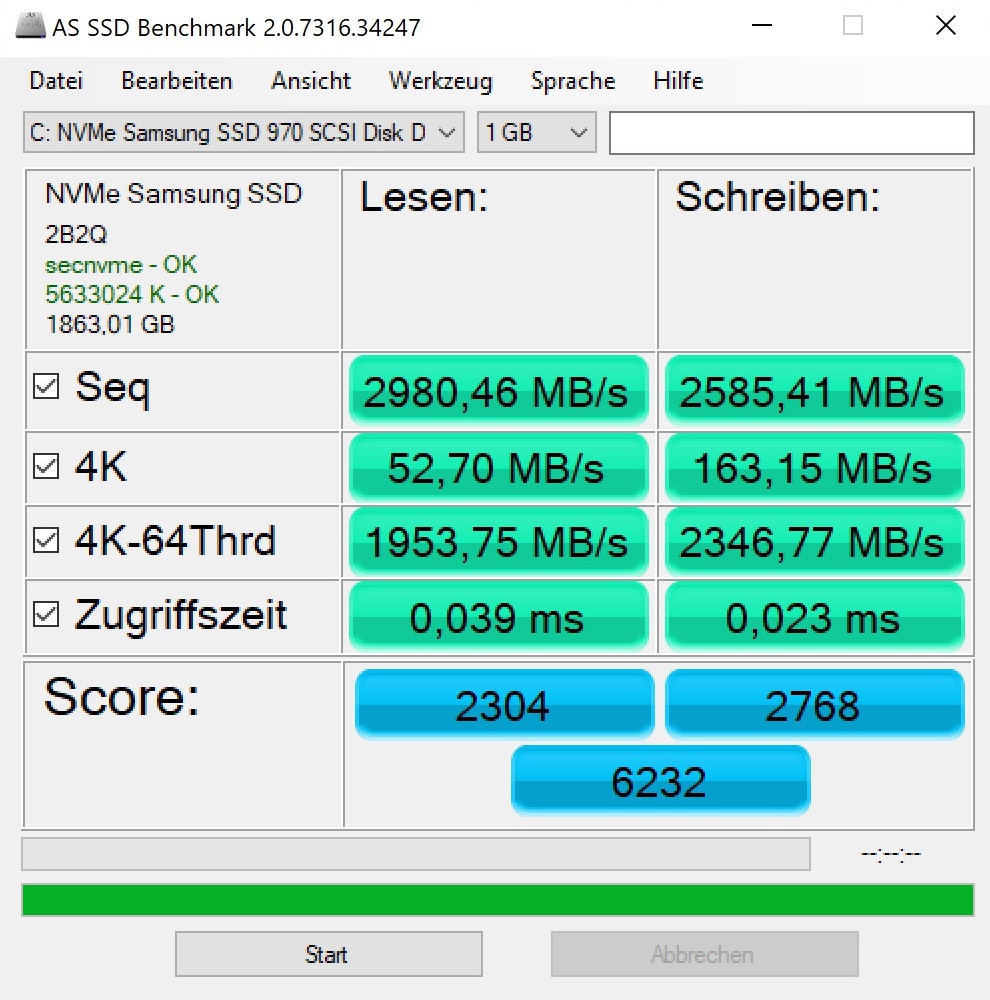
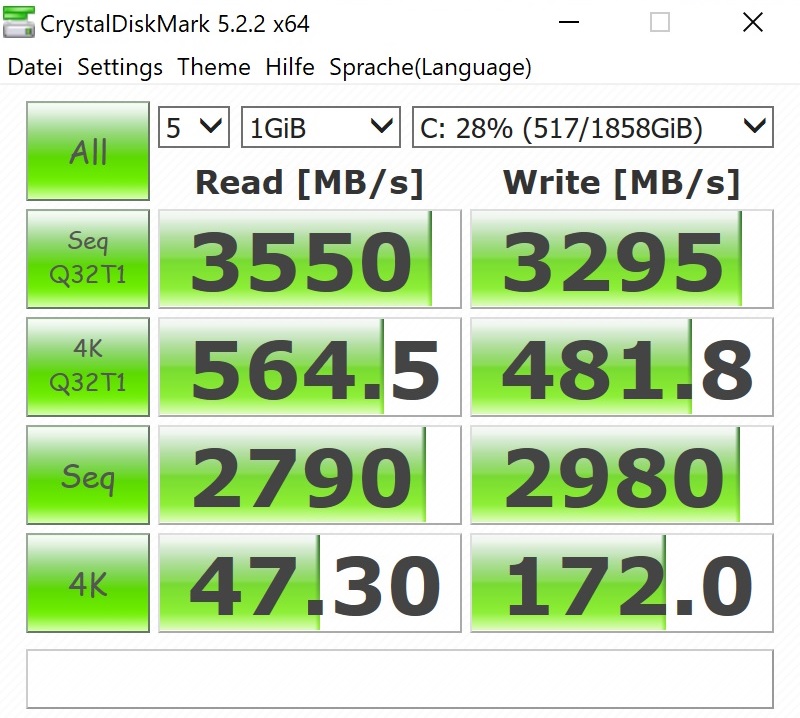
Schenker installed a 2 TB M.2 SSD from Samsung in our test device. The 970 EVO Plus NVMe model offers excellent speeds for both reading and writing data (sequentially about 3,000 MB/s). In the CrystalDiskMark and the AS SSD benchmarks, the competition has to admit defeat despite having SSD RAIDs.
| Schenker XMG Ultra 17 Comet Lake Samsung SSD 970 EVO Plus 2TB | MSI GT76 Titan DT 10SGS 2x WDC PC SN730 SDBPNTY-1T00 (RAID 0) | Alienware m17 R3 P45E 2x Micron 2200S 512 GB (RAID 0) | Asus Strix Scar 17 G732LXS 2x Intel SSD 660p 1TB SSDPEKNW010T8 (RAID 0) | |
|---|---|---|---|---|
| CrystalDiskMark 5.2 / 6 | -9% | -19% | -18% | |
| Write 4K (MB/s) | 172 | 116.4 -32% | 68 -60% | 125.8 -27% |
| Read 4K (MB/s) | 47.3 | 43.85 -7% | 42.04 -11% | 52.9 12% |
| Write Seq (MB/s) | 2980 | 2927 -2% | 2221 -25% | 1795 -40% |
| Read Seq (MB/s) | 2790 | 1997 -28% | 2202 -21% | 2315 -17% |
| Write 4K Q32T1 (MB/s) | 481.8 | 467.6 -3% | 494.5 3% | 407.1 -16% |
| Read 4K Q32T1 (MB/s) | 565 | 538 -5% | 540 -4% | 411.9 -27% |
| Write Seq Q32T1 (MB/s) | 3295 | 3362 2% | 2623 -20% | 2844 -14% |
| Read Seq Q32T1 (MB/s) | 3550 | 3558 0% | 3159 -11% | 3130 -12% |
| AS SSD | -50% | -187% | -59% | |
| Seq Read (MB/s) | 2980 | 2406 -19% | 2060 -31% | 2450 -18% |
| Seq Write (MB/s) | 2585 | 2867 11% | 2297 -11% | 1436 -44% |
| 4K Read (MB/s) | 52.7 | 41.51 -21% | 35.39 -33% | 49.48 -6% |
| 4K Write (MB/s) | 163.1 | 108.8 -33% | 63.1 -61% | 119.4 -27% |
| 4K-64 Read (MB/s) | 1954 | 1525 -22% | 1337 -32% | 1032 -47% |
| 4K-64 Write (MB/s) | 2347 | 1424 -39% | 1307 -44% | 1229 -48% |
| Access Time Read * (ms) | 0.039 | 0.041 -5% | 0.057 -46% | 0.145 -272% |
| Access Time Write * (ms) | 0.023 | 0.102 -343% | 0.411 -1687% | 0.036 -57% |
| Score Read (Points) | 2304 | 1807 -22% | 1578 -32% | 1327 -42% |
| Score Write (Points) | 2768 | 1819 -34% | 1600 -42% | 1492 -46% |
| Score Total (Points) | 6232 | 4573 -27% | 3997 -36% | 3456 -45% |
| Total Average (Program / Settings) | -30% /
-33% | -103% /
-116% | -39% /
-42% |
* ... smaller is better

Continuous load read: DiskSpd Read Loop, Queue Depth 8
Graphics card
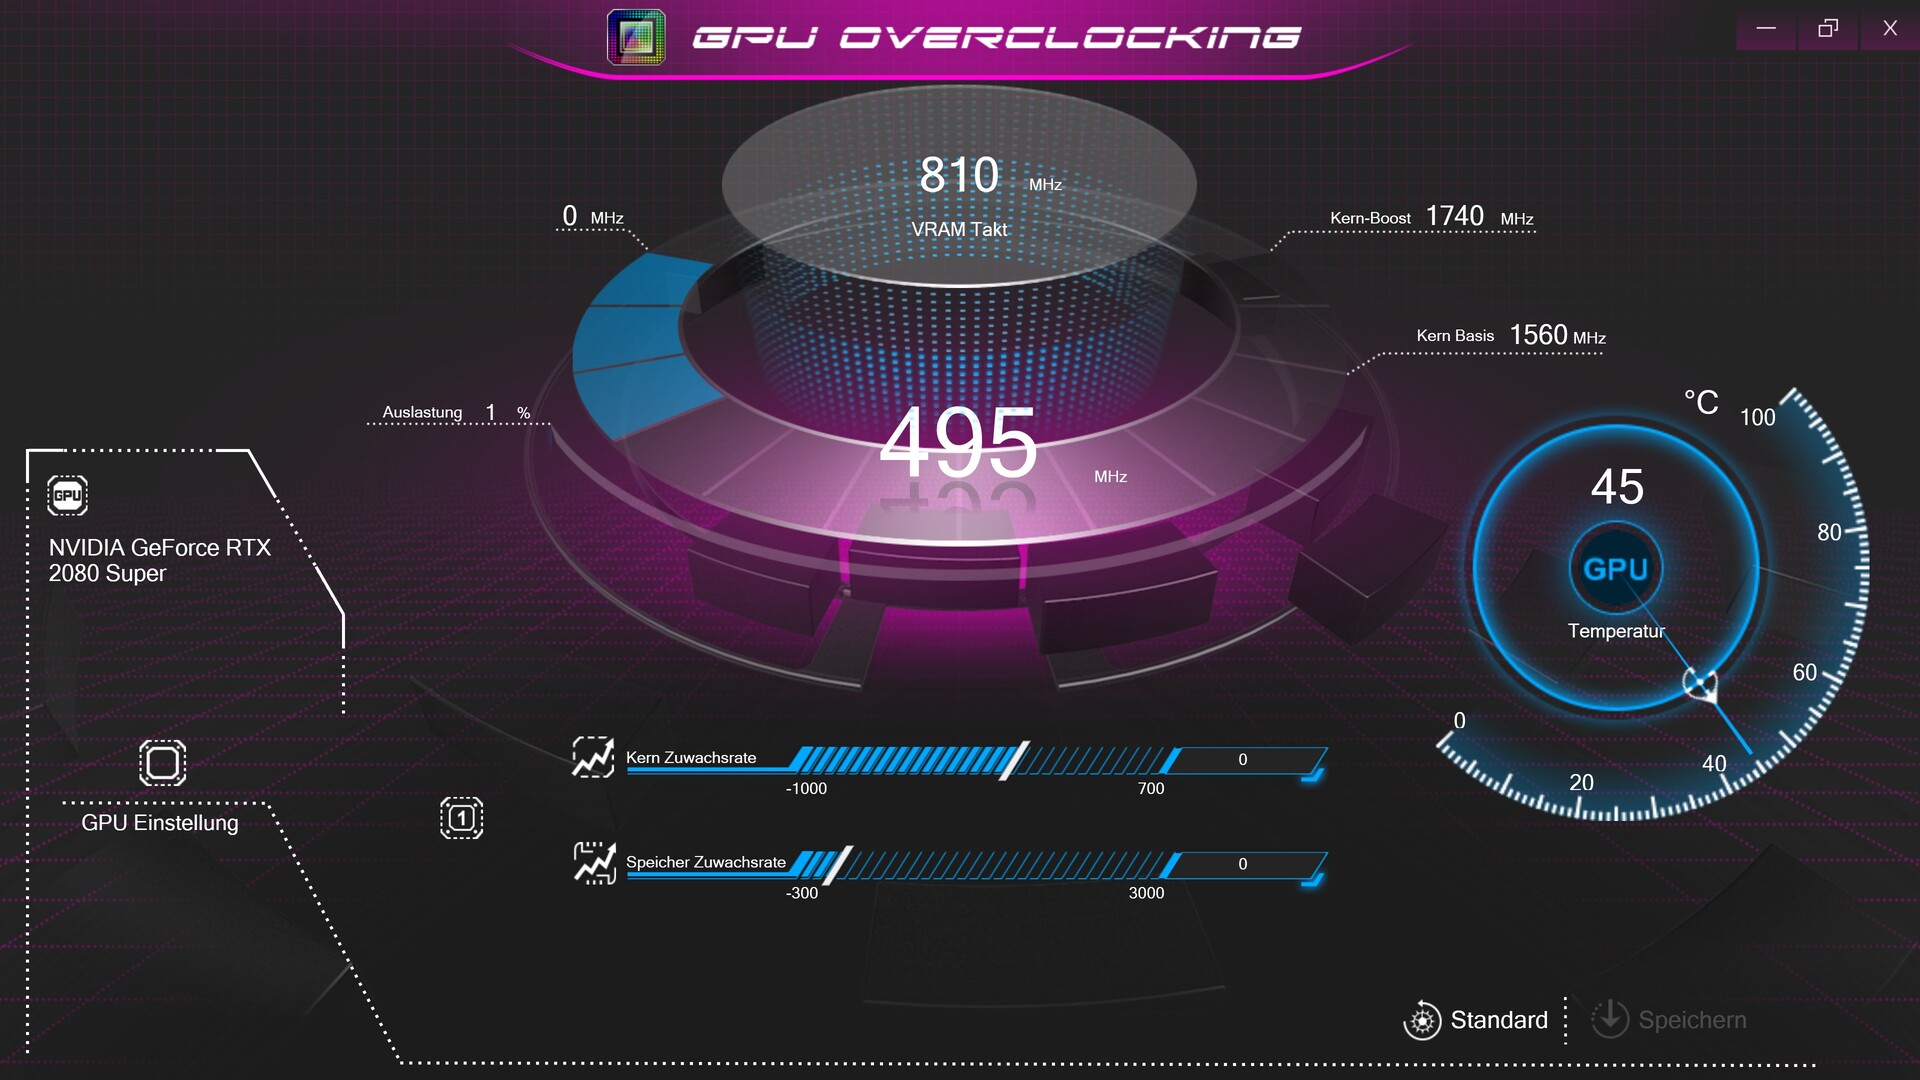
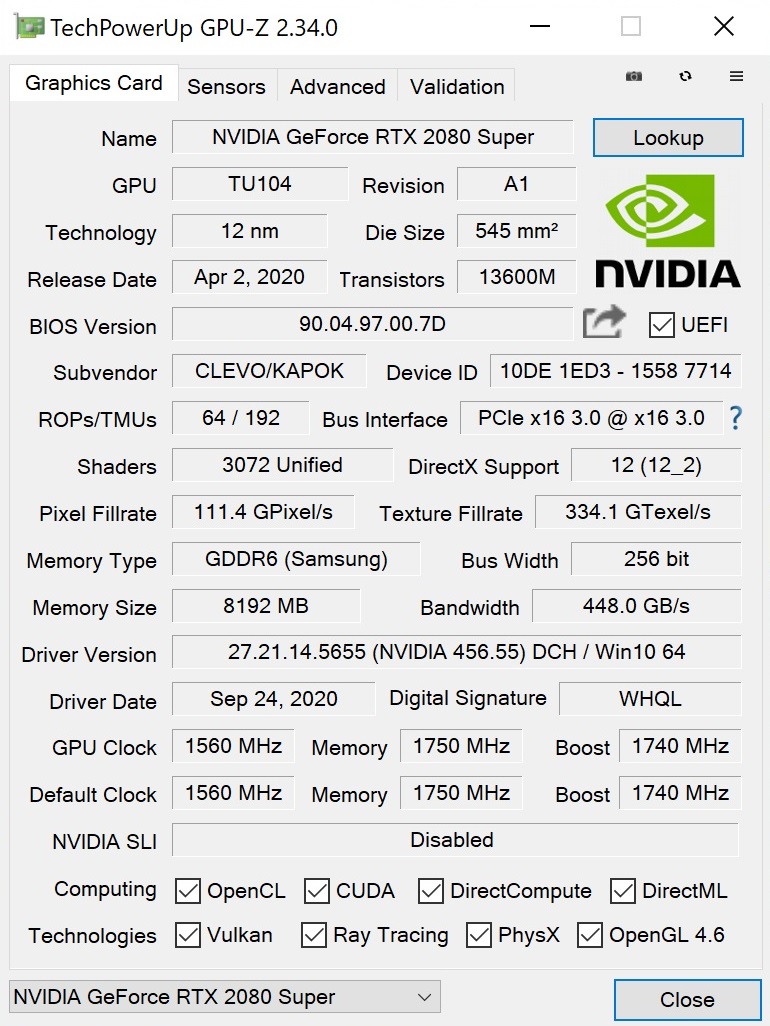
Currently, nothing comes close to the GeForce RTX 2080 Super in the laptop segment. The Turing model is equipped with 3,072 shaders and an 8 GB GDDR6 video memory (256-bit interface). Thanks to the powerful cooling system, the DirectX 12 chip can develop its performance level well. The XMG Ultra 17 is usually a few percent ahead of competing laptops with identical GPUs in our benchmark course.
| 3DMark 11 Performance | 31493 points | |
| 3DMark Fire Strike Score | 22606 points | |
| 3DMark Time Spy Score | 11211 points | |
Help | ||
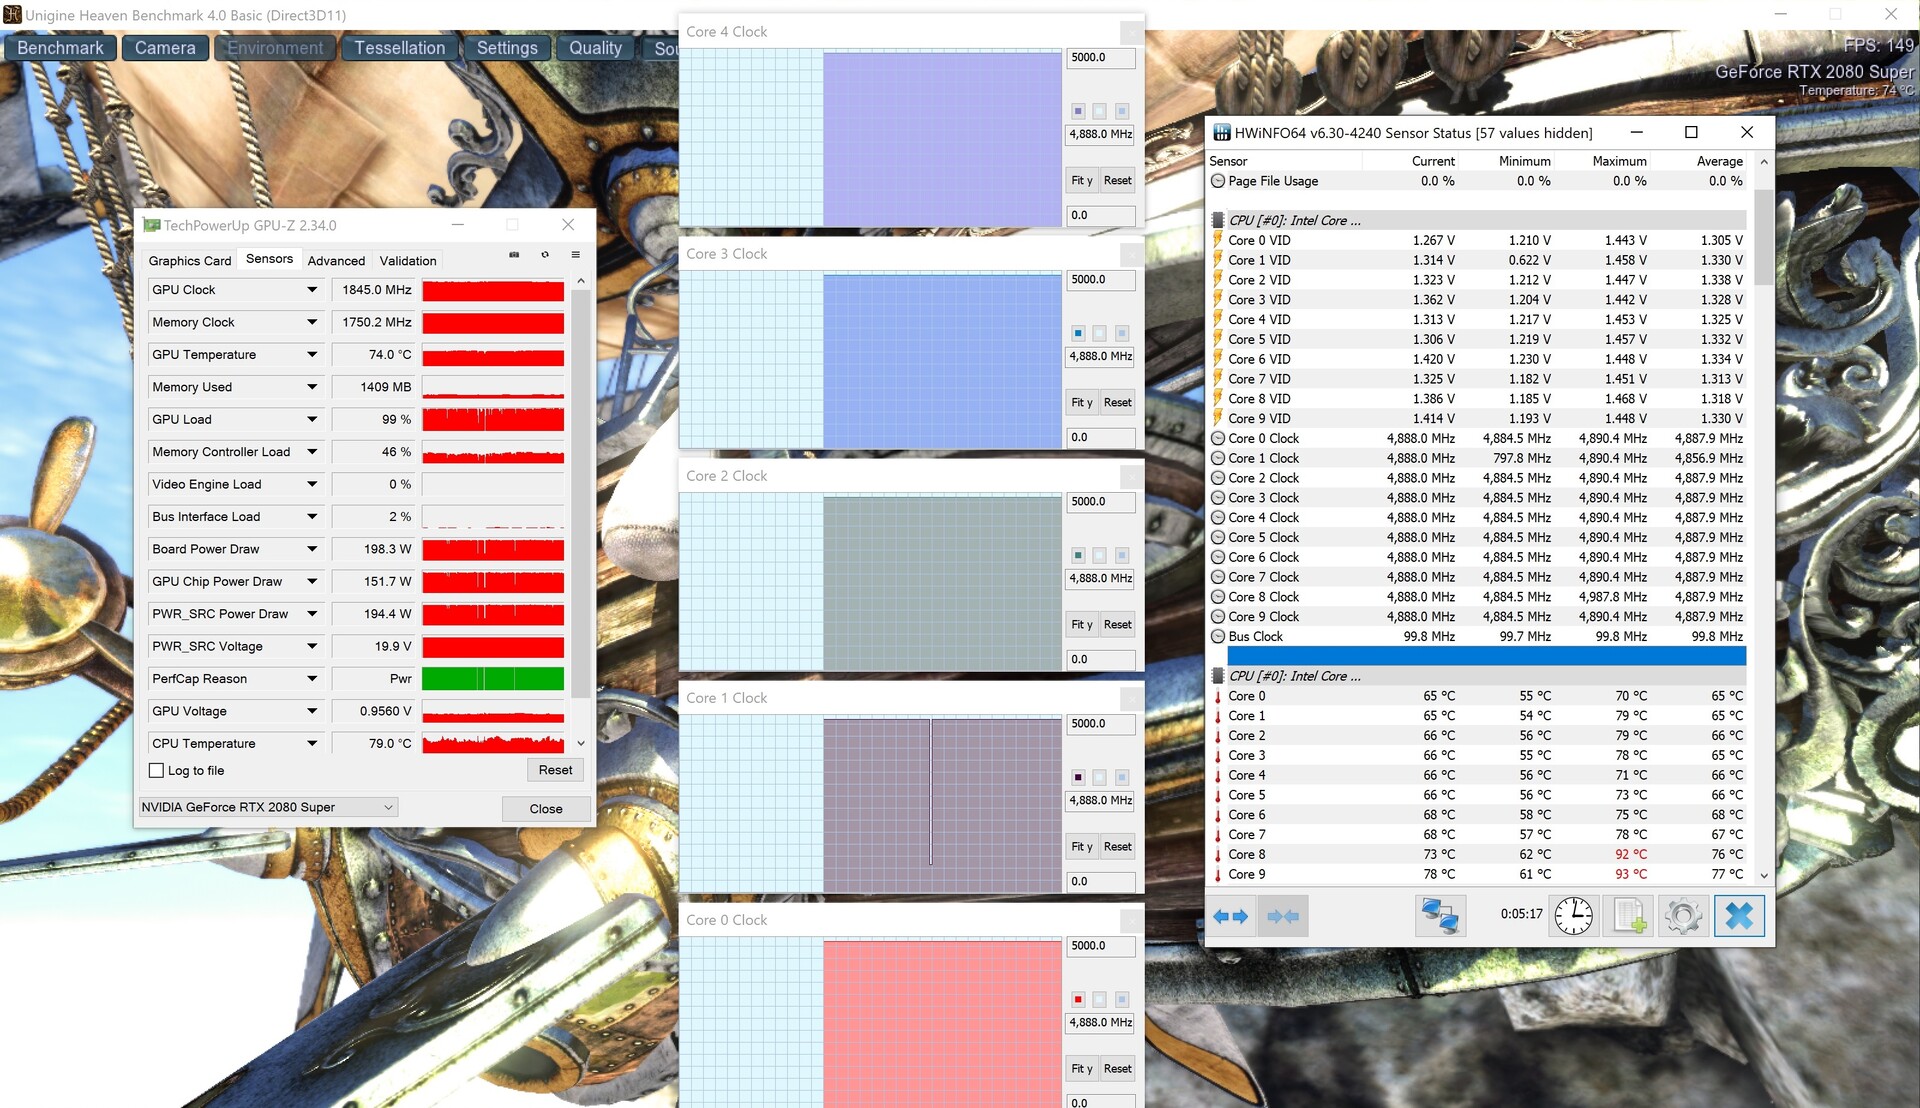
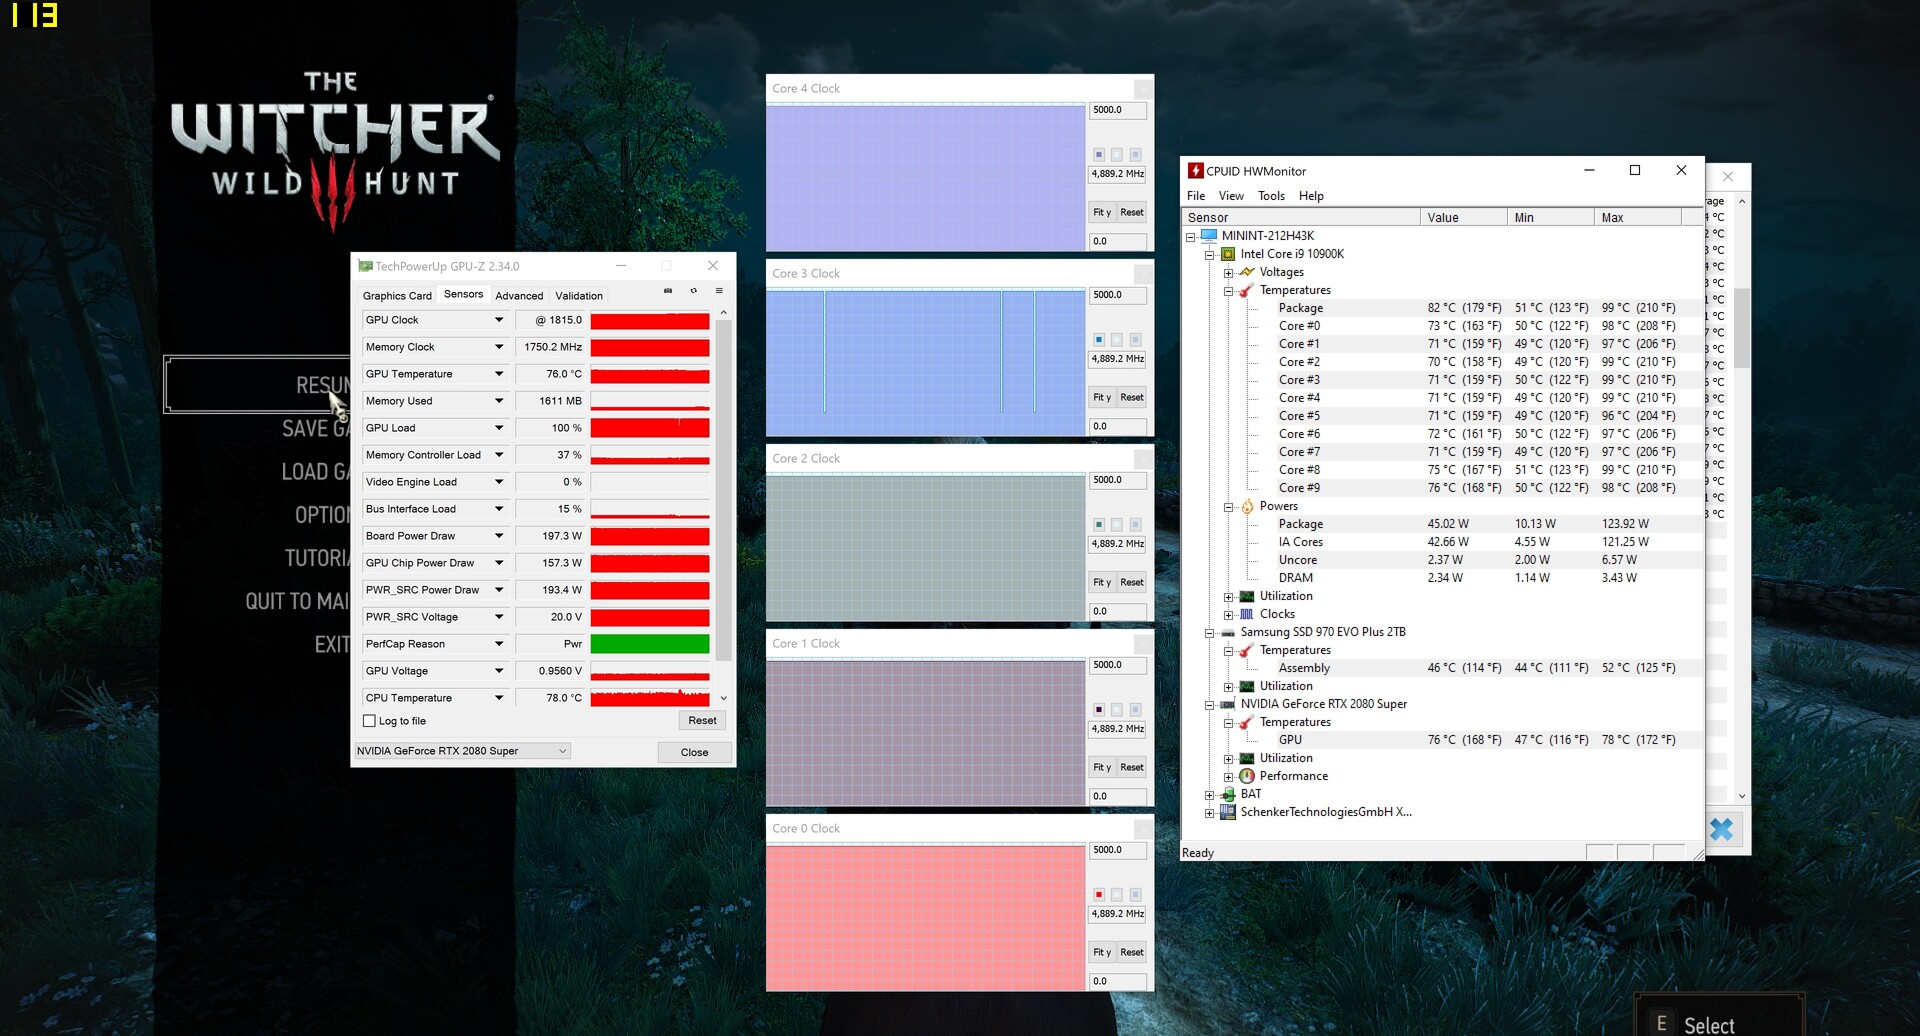
We tested how the graphics card behaves under prolonged 3D load for a good 60 minutes with the role-playing game The Witcher 3. In contrast to the CPU performance (Cinebench loop), the GPU performance remains quite constant. An average core speed of 1,815 MHz is a very good value for the RTX 2080 Super.
Gaming performance
With Nvidia's top model, all modern titles can be played smoothly at maximum details. Even 3840x2160 pixels are displayed at over 40 FPS - apart from very computationally intensive games like Borderlands 3 and Flight Simulator. You can see in the table below that the 100-FPS mark is often surpassed in the QHD and FHD ranges.
| The Witcher 3 | |
| 1920x1080 Ultra Graphics & Postprocessing (HBAO+) | |
| Average of class Gaming (104.7 - 240, n=7, last 2 years) | |
| MSI GT76 Titan DT 10SGS | |
| Schenker XMG Ultra 17 Comet Lake | |
| Average NVIDIA GeForce RTX 2080 Super Mobile (93.4 - 113.2, n=4) | |
| Alienware m17 R3 P45E | |
| Asus Strix Scar 17 G732LXS | |
| 3840x2160 High Graphics & Postprocessing (Nvidia HairWorks Off) | |
| Average of class Gaming (114 - 170.9, n=4, last 2 years) | |
| MSI GT76 Titan DT 10SGS | |
| Schenker XMG Ultra 17 Comet Lake | |
| Average NVIDIA GeForce RTX 2080 Super Mobile (66.4 - 80.5, n=3) | |
| Asus Strix Scar 17 G732LXS | |
| low | med. | high | ultra | QHD | 4K | |
|---|---|---|---|---|---|---|
| GTA V (2015) | 187 | 182 | 179 | 98.9 | ||
| The Witcher 3 (2015) | 209 | 109 | 75.6 | |||
| Dota 2 Reborn (2015) | 190 | 172 | 167 | 156 | 145 | |
| X-Plane 11.11 (2018) | 145 | 127 | 103 | 88.2 | ||
| Shadow of the Tomb Raider (2018) | 142 | 126 | 87.5 | 47.1 | ||
| Battlefield V (2018) | 168 | 152 | 126 | 76.2 | ||
| Borderlands 3 (2019) | 107 | 89.8 | 65.4 | 37.1 | ||
| Hunt Showdown (2020) | 133 | 92.4 | 85.6 | |||
| Doom Eternal (2020) | 222 | 219 | 176 | 96.5 | ||
| Gears Tactics (2020) | 154 | 125 | 82.1 | 43.2 | ||
| F1 2020 (2020) | 234 | 161 | 122 | 72.5 | ||
| Death Stranding (2020) | 149 | 147 | 108 | 60 | ||
| Horizon Zero Dawn (2020) | 127 | 104 | 80 | 45 | ||
| Flight Simulator 2020 (2020) | 64.6 | 47.1 | 37.8 | 23.8 | ||
| Serious Sam 4 (2020) | 113 | 95 | 84.2 | 54.4 | ||
| Mafia Definitive Edition (2020) | 122 | 83.4 | 45.2 | |||
| Star Wars Squadrons (2020) | 263 | 243 | 175 | 105 | ||
| FIFA 21 (2020) | 278 | 278 | 274 | 238 |
Emissions
Noise emissions
One of the biggest weaknesses of the XMG Ultra 17 is its extreme noise level. 55 to 62 dB under load more or less force you to use a headset. In any case, games are no fun without headphones. The MSI GT76 Titan DT gets even louder in most 3D scenarios, which puts the better Turbo performance of the CPU into perspective.
In idle usage, the Schenker laptop's noise development isn't optimal either. Although the two case fans completely stand still at times or only rotate at a discreet level of around 32 dB(A), the cooling reaches over 50 dB every now and then for no reason, which will annoy many users. The device reaches almost 60 dB for a short time even when being booted.
Noise level
| Idle |
| 27 / 32 / 57 dB(A) |
| Load |
| 56 / 62 dB(A) |
 | ||
30 dB silent 40 dB(A) audible 50 dB(A) loud |
||
min: | ||
| Schenker XMG Ultra 17 Comet Lake i9-10900K, GeForce RTX 2080 Super Mobile | MSI GT76 Titan DT 10SGS i9-10900K, GeForce RTX 2080 Super Mobile | Alienware m17 R3 P45E i9-10980HK, GeForce RTX 2080 Super Mobile | Asus Strix Scar 17 G732LXS i9-10980HK, GeForce RTX 2080 Super Mobile | Average of class Gaming | |
|---|---|---|---|---|---|
| Noise | 12% | 10% | 1% | 17% | |
| off / environment * (dB) | 25 | 26.4 -6% | 26.5 -6% | 25 -0% | 24.1 ? 4% |
| Idle Minimum * (dB) | 27 | 27.5 -2% | 27.8 -3% | 33 -22% | 25.9 ? 4% |
| Idle Average * (dB) | 32 | 27.5 14% | 27.8 13% | 38 -19% | 27.4 ? 14% |
| Idle Maximum * (dB) | 57 | 29.8 48% | 27.8 51% | 45 21% | 30.1 ? 47% |
| Load Average * (dB) | 56 | 30.9 45% | 52.1 7% | 54 4% | 43.7 ? 22% |
| Witcher 3 ultra * (dB) | 55 | 60.7 -10% | 51.8 6% | 50 9% | |
| Load Maximum * (dB) | 62 | 66.6 -7% | 59.1 5% | 55 11% | 54.3 ? 12% |
* ... smaller is better
Temperature
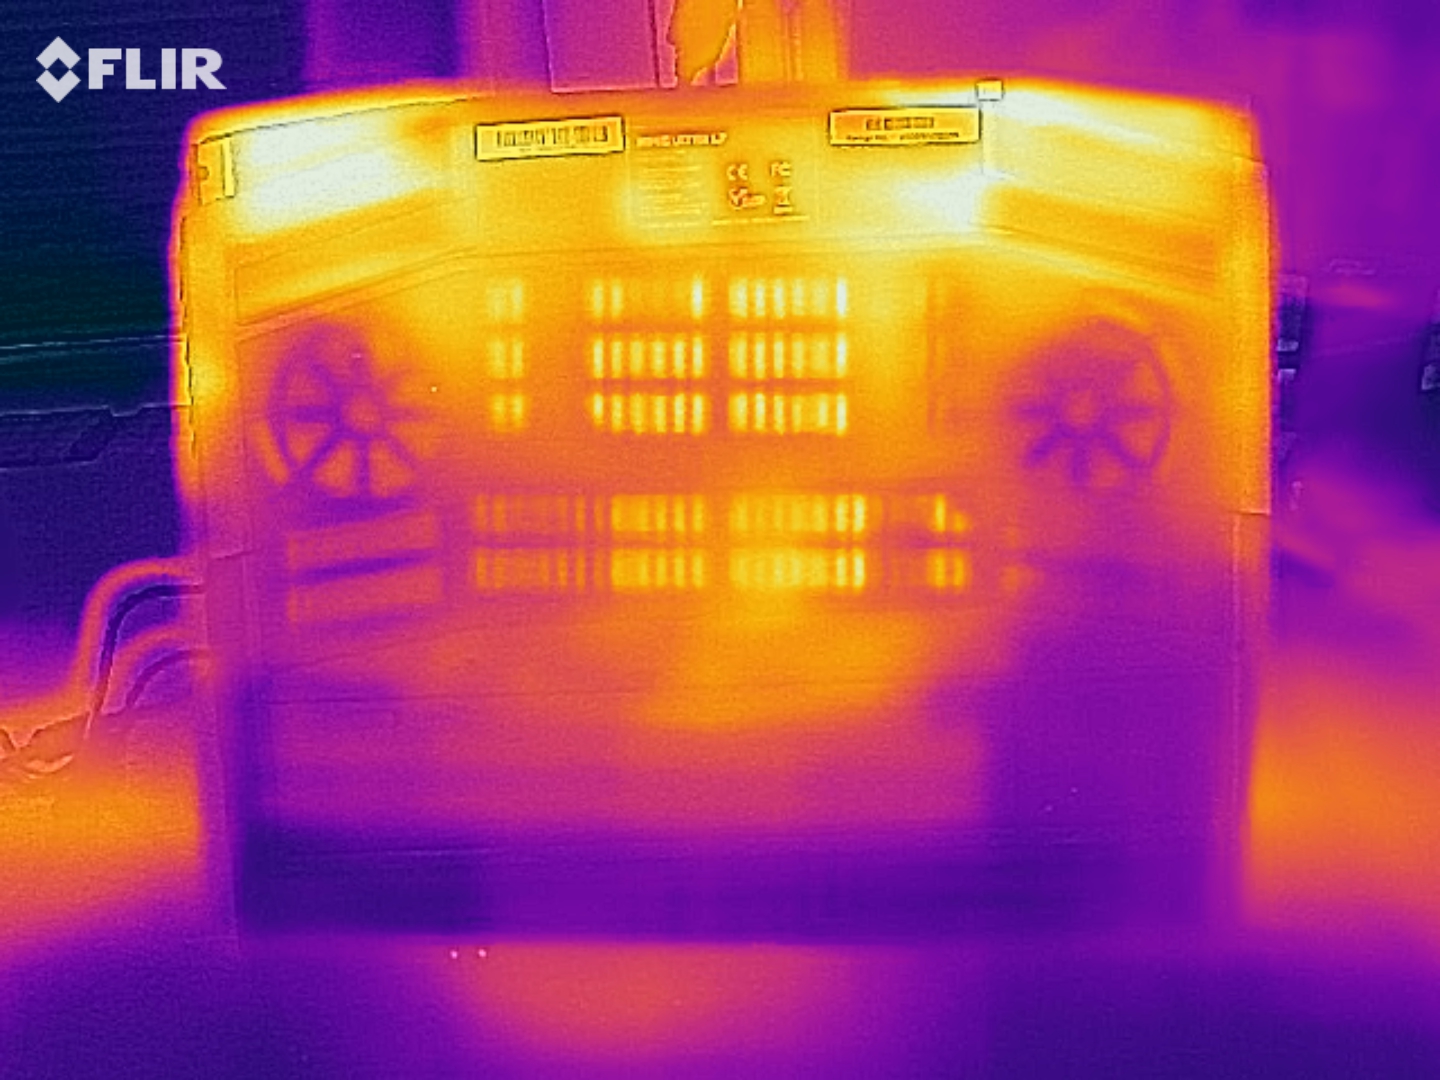
The higher the noise level, the lower the case temperatures. Even under full load, the bottom of the base unit only heats up to a maximum of 46 °C (~115 °F). The top side heats up to a maximum of 39 °C (~102 °F) - also a good value for a gaming laptop.
The components work up a sweat much more. After an hour of stress testing with the FurMark and Prime95 tools, the RTX 2080 Super made itself comfortable at almost 80 °C (~176 °F), whereas the Core i9-10900K reached almost 100 °C (~212 °F). Fortunately, the CPU doesn't get that hot in everyday gaming. With The Witcher 3, the temperature was a reasonably moderate 70 to 80 °C (~158 to ~176 °F).
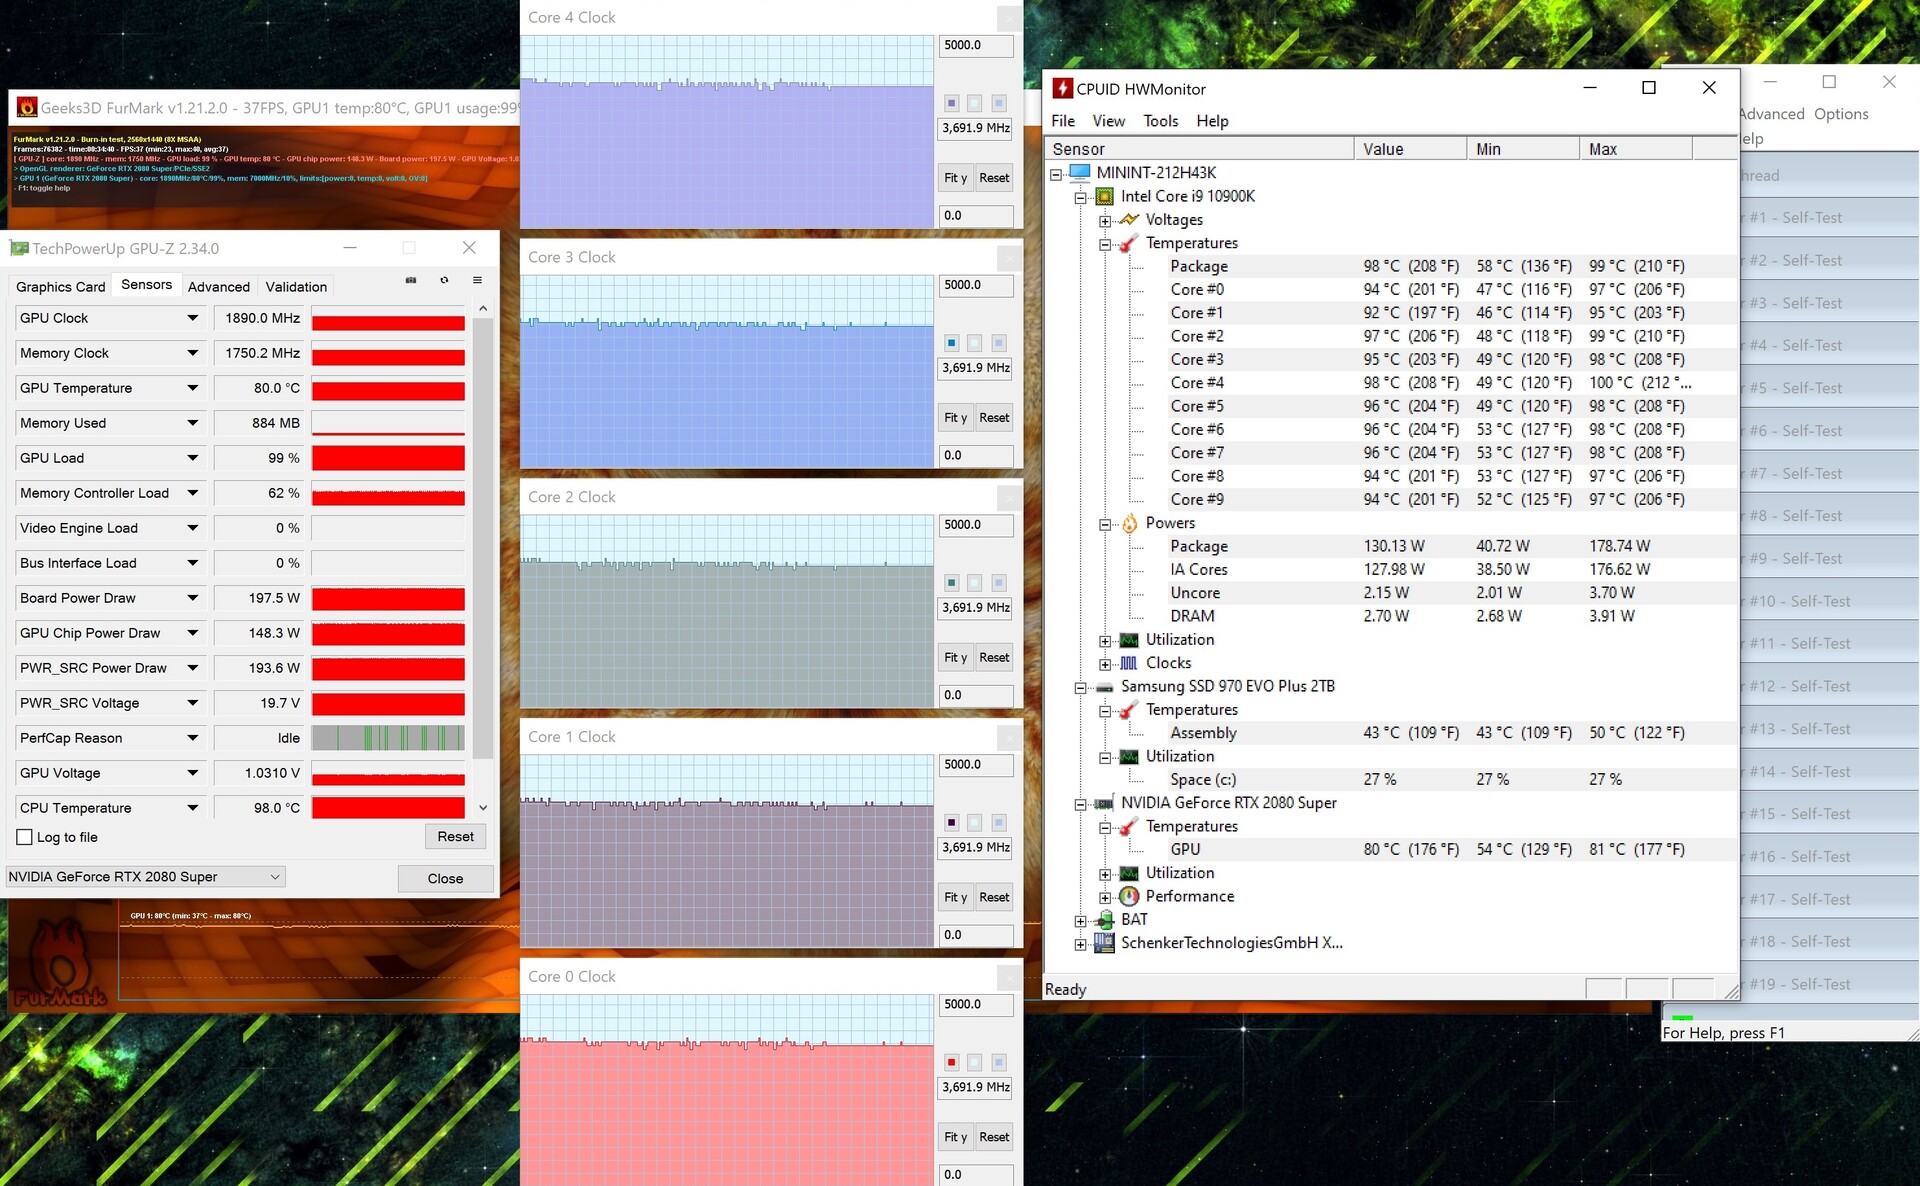
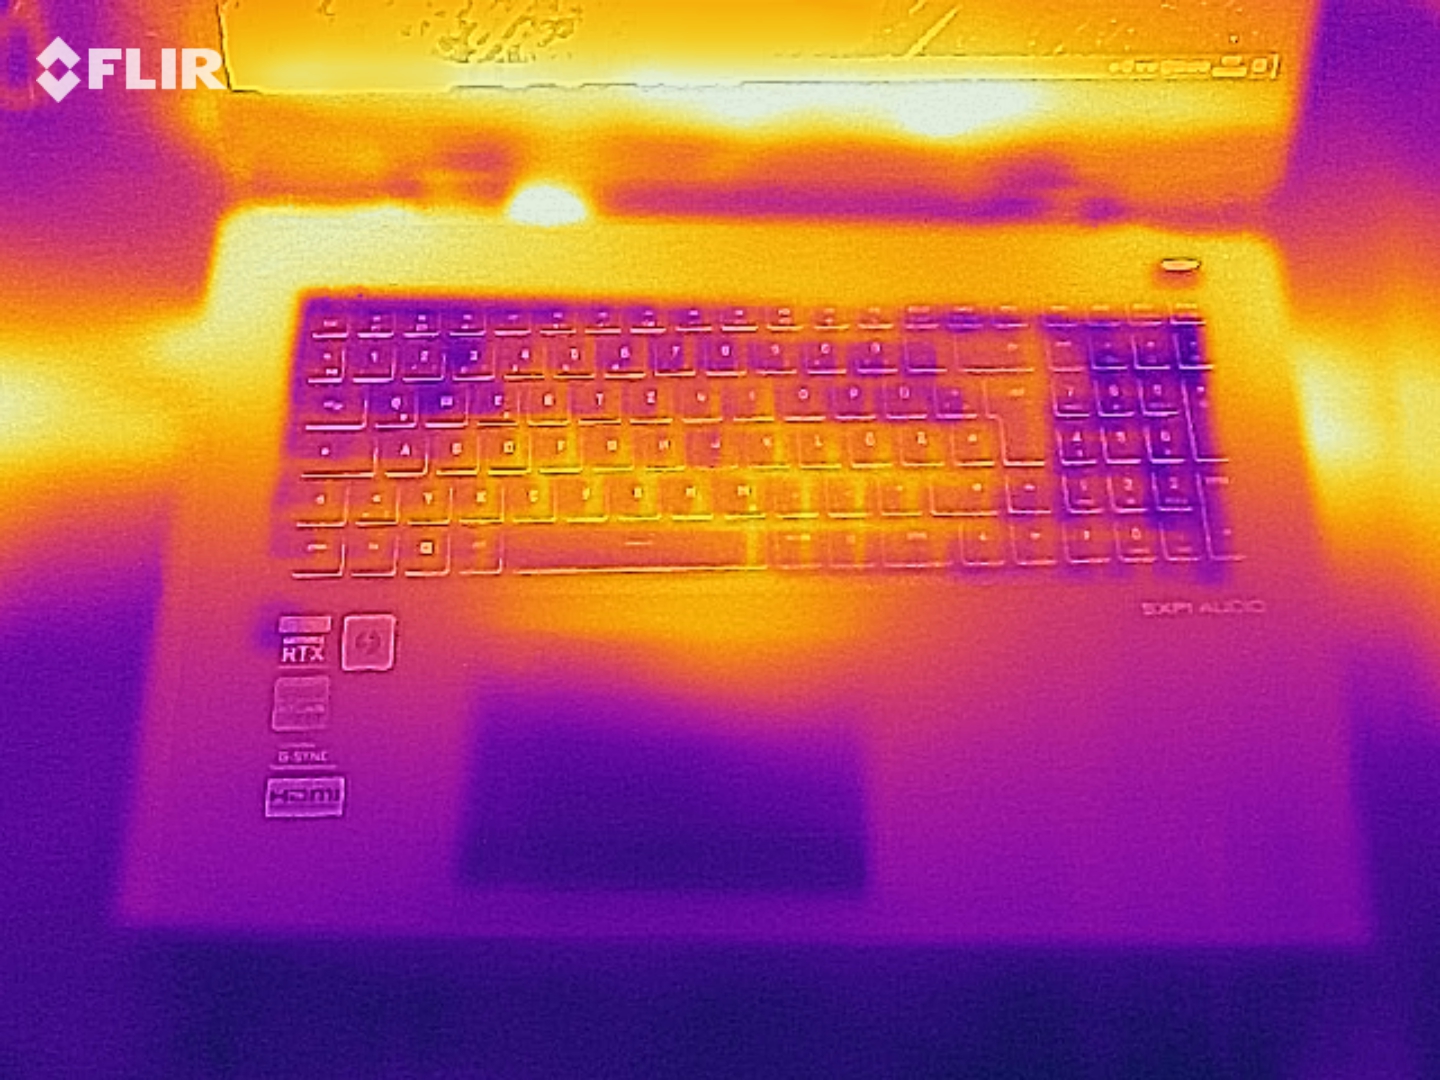
(+) The maximum temperature on the upper side is 39 °C / 102 F, compared to the average of 40.4 °C / 105 F, ranging from 21.2 to 68.8 °C for the class Gaming.
(-) The bottom heats up to a maximum of 46 °C / 115 F, compared to the average of 43.2 °C / 110 F
(+) In idle usage, the average temperature for the upper side is 29.3 °C / 85 F, compared to the device average of 33.9 °C / 93 F.
(±) Playing The Witcher 3, the average temperature for the upper side is 33.2 °C / 92 F, compared to the device average of 33.9 °C / 93 F.
(+) The palmrests and touchpad are cooler than skin temperature with a maximum of 31 °C / 87.8 F and are therefore cool to the touch.
(-) The average temperature of the palmrest area of similar devices was 28.8 °C / 83.8 F (-2.2 °C / -4 F).
| Schenker XMG Ultra 17 Comet Lake i9-10900K, GeForce RTX 2080 Super Mobile | MSI GT76 Titan DT 10SGS i9-10900K, GeForce RTX 2080 Super Mobile | Alienware m17 R3 P45E i9-10980HK, GeForce RTX 2080 Super Mobile | Asus Strix Scar 17 G732LXS i9-10980HK, GeForce RTX 2080 Super Mobile | Average of class Gaming | |
|---|---|---|---|---|---|
| Heat | 8% | -26% | -10% | -4% | |
| Maximum Upper Side * (°C) | 39 | 36.4 7% | 54 -38% | 59 -51% | 45.1 ? -16% |
| Maximum Bottom * (°C) | 46 | 43 7% | 58.4 -27% | 52 -13% | 48.1 ? -5% |
| Idle Upper Side * (°C) | 32 | 28 12% | 40 -25% | 30 6% | 31 ? 3% |
| Idle Bottom * (°C) | 35 | 33.4 5% | 39.4 -13% | 29 17% | 34.2 ? 2% |
* ... smaller is better
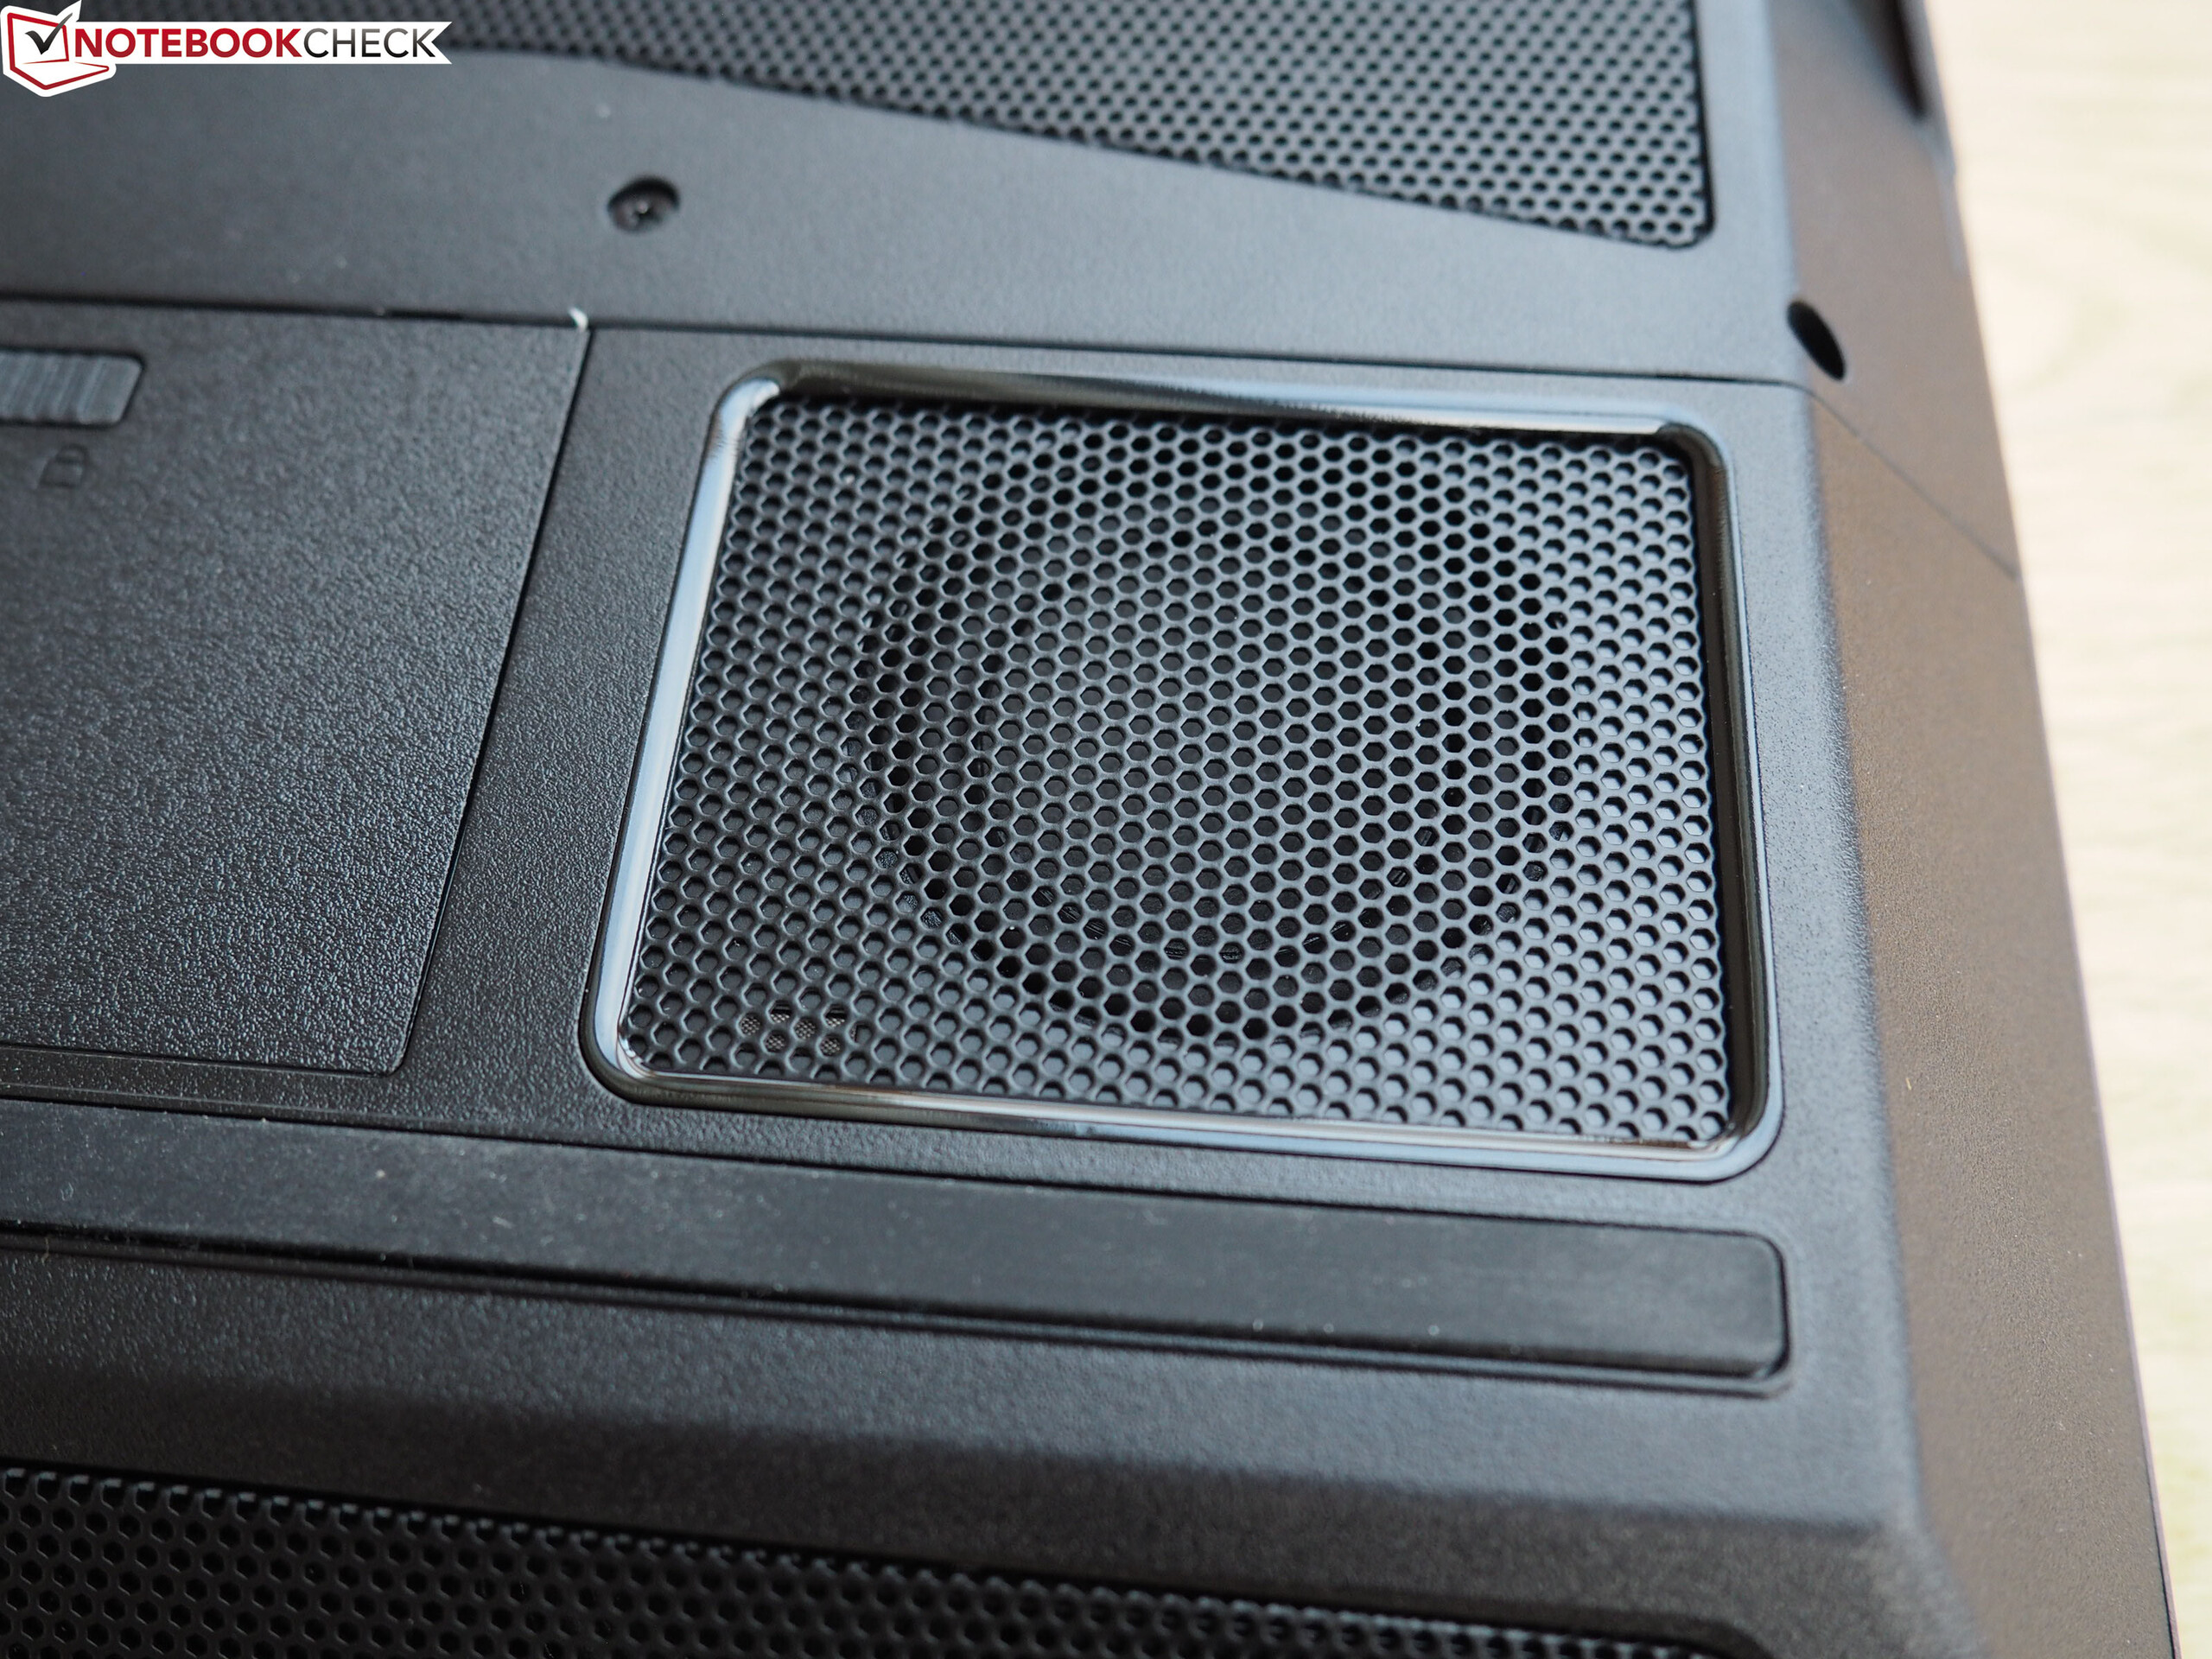
Speakers
Barebone manufacturer Clevo uses the existing case volume for a good 2.1 system that is also suitable for sound reproduction in larger rooms at a maximum of 94 dB(A). The sound is relatively powerful and well-balanced for a laptop, so that you don't necessarily have to plug in external speakers when you're listening to media.
Schenker XMG Ultra 17 Comet Lake audio analysis
(+) | speakers can play relatively loud (94 dB)
Bass 100 - 315 Hz
(±) | reduced bass - on average 8.6% lower than median
(±) | linearity of bass is average (7% delta to prev. frequency)
Mids 400 - 2000 Hz
(+) | balanced mids - only 1.7% away from median
(+) | mids are linear (3% delta to prev. frequency)
Highs 2 - 16 kHz
(+) | balanced highs - only 4.7% away from median
(+) | highs are linear (4.9% delta to prev. frequency)
Overall 100 - 16.000 Hz
(+) | overall sound is linear (9.8% difference to median)
Compared to same class
» 5% of all tested devices in this class were better, 1% similar, 94% worse
» The best had a delta of 6%, average was 18%, worst was 132%
Compared to all devices tested
» 4% of all tested devices were better, 1% similar, 95% worse
» The best had a delta of 4%, average was 23%, worst was 134%
MSI GT76 Titan DT 10SGS audio analysis
(+) | speakers can play relatively loud (83.2 dB)
Bass 100 - 315 Hz
(±) | reduced bass - on average 8.6% lower than median
(±) | linearity of bass is average (11% delta to prev. frequency)
Mids 400 - 2000 Hz
(+) | balanced mids - only 3.1% away from median
(+) | mids are linear (6.9% delta to prev. frequency)
Highs 2 - 16 kHz
(+) | balanced highs - only 3% away from median
(+) | highs are linear (5.5% delta to prev. frequency)
Overall 100 - 16.000 Hz
(+) | overall sound is linear (9.9% difference to median)
Compared to same class
» 5% of all tested devices in this class were better, 2% similar, 94% worse
» The best had a delta of 6%, average was 18%, worst was 132%
Compared to all devices tested
» 4% of all tested devices were better, 1% similar, 95% worse
» The best had a delta of 4%, average was 23%, worst was 134%
Energy management
Energy consumption
Not only do the high-end components lead to a high level of noise but also to high energy consumption. Since the Ultra 17 doesn't offer graphics switching, power consumption is over 30 watts even in idle mode. Under load, the consumption climbs up to 512 watts - a new negative record. According to The Witcher 3, you can expect about 320 watts in games.
| Off / Standby | |
| Idle | |
| Load |
|
Key:
min: | |
| Schenker XMG Ultra 17 Comet Lake i9-10900K, GeForce RTX 2080 Super Mobile | MSI GT76 Titan DT 10SGS i9-10900K, GeForce RTX 2080 Super Mobile | Alienware m17 R3 P45E i9-10980HK, GeForce RTX 2080 Super Mobile | Asus Strix Scar 17 G732LXS i9-10980HK, GeForce RTX 2080 Super Mobile | Average of class Gaming | |
|---|---|---|---|---|---|
| Power Consumption | 6% | 4% | 26% | 45% | |
| Idle Minimum * (Watt) | 34 | 25.9 24% | 33.6 1% | 16 53% | 13.1 ? 61% |
| Idle Average * (Watt) | 40 | 38 5% | 43.9 -10% | 25 37% | 19 ? 52% |
| Idle Maximum * (Watt) | 47 | 53.2 -13% | 59 -26% | 35 26% | 24.6 ? 48% |
| Load Average * (Watt) | 130 | 123.8 5% | 134.9 -4% | 177 -36% | 111.3 ? 14% |
| Witcher 3 ultra * (Watt) | 318 | 312.5 2% | 242 24% | 227 29% | |
| Load Maximum * (Watt) | 512 | 459.8 10% | 320 37% | 280 45% | 260 ? 49% |
* ... smaller is better
Battery life
Despite the huge 97-Wh battery, the runtimes are rather modest. Depending on the load and display brightness, the 17-incher lasts between 1 and 5 hours without the power adapters. While the Alienware m17 R3 performs worse, the Asus Strix Scar 17 manages higher runtimes.
| Schenker XMG Ultra 17 Comet Lake i9-10900K, GeForce RTX 2080 Super Mobile, 97 Wh | MSI GT76 Titan DT 10SGS i9-10900K, GeForce RTX 2080 Super Mobile, 90 Wh | Alienware m17 R3 P45E i9-10980HK, GeForce RTX 2080 Super Mobile, 86 Wh | Asus Strix Scar 17 G732LXS i9-10980HK, GeForce RTX 2080 Super Mobile, 66 Wh | Average of class Gaming | |
|---|---|---|---|---|---|
| Battery runtime | -37% | -27% | 61% | 57% | |
| Reader / Idle (h) | 4.9 | 3.7 -24% | 10 104% | 7.84 ? 60% | |
| WiFi v1.3 (h) | 3.8 | 2.4 -37% | 3.2 -16% | 5.9 55% | 7.08 ? 86% |
| Load (h) | 1.2 | 0.7 -42% | 1.5 25% | 1.496 ? 25% |
Pros
Cons
Verdict
The XMG Ultra 17 is a desktop replacement in a class of its own.
High-end power in a large case with many connections: This is how Schenker wants to win over power-hungry users for whom money is a secondary consideration. The colorful (albeit with somewhat weaker response times) UHD display and the input devices are also pleasing.
However, you'll have to say goodbye to the idea of mobility. The large dimensions, the heavy weight, and the relatively short battery life chain users to their desks. In the end, the XMG Ultra 17 was designed for stationary use only; this raises the question of why one shouldn't directly resort to an actual desktop PC, which is cheaper and, above all, quieter.
Schenker XMG Ultra 17 Comet Lake
- 10/13/2020 v7 (old)
Florian Glaser
Price comparison

