Dell Precision 5560 workstation review: The Quadro RTX A2000 boost
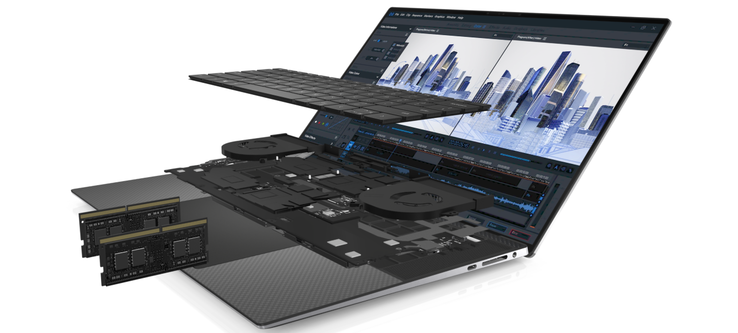
The Dell Precision 5560 is an internal refresh of last year's Precision 5550. Both models are based on the new XPS 15 9500/9510 chassis and so all models carry similar 16:10 panels and other physical features. As such, we recommend checking out our reviews on the Precision 5550, XPS 15 9500, or XPS 15 9510 since many of our comments still apply here for the Precision 5560.
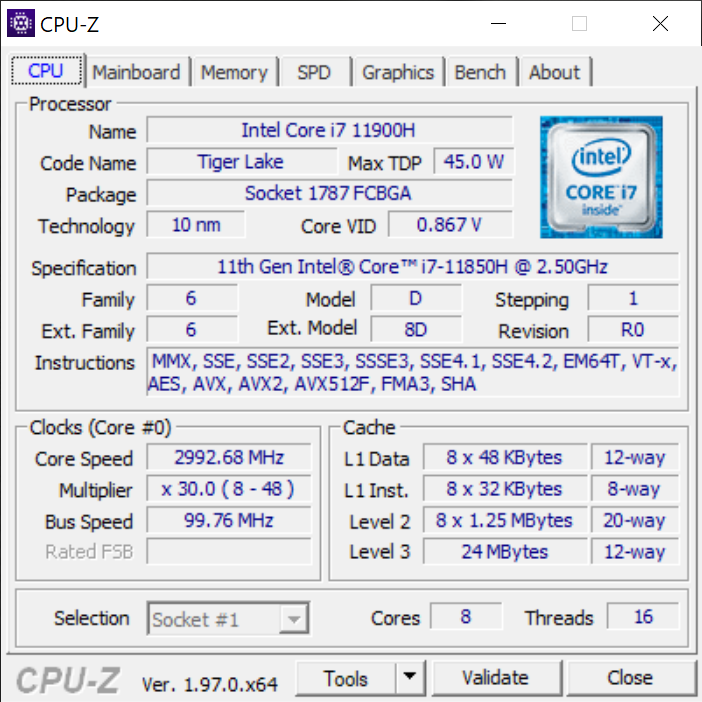
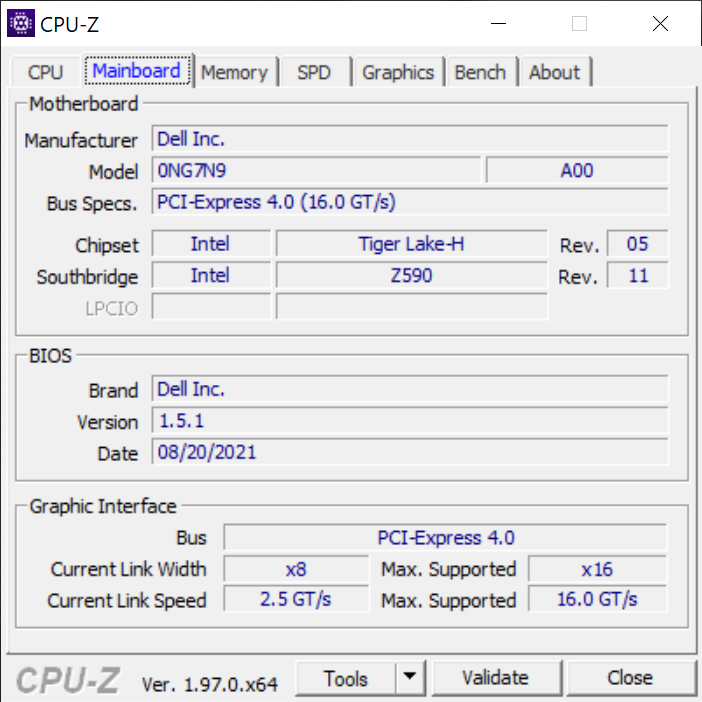
When compared to the Precision 5550, the Precision 5560 comes with 11th gen Tiger Lake-H CPUs and Nvidia Ampere GPUs to replace the older 10th gen Comet Lake-H CPUs and Turing GPUs, respectively. SKUs range from the base Core i5-11500H with Quadro T1200 graphics, 1200p display, and 8 GB of RAM for $2000 USD up to the i9-11950H or Xeon W-11955M vPro CPU with Quadro RTX A2000 graphics, 2400p touchscreen, and 64 GB ECC RAM for over $4000 USD. Our specific test unit is a mid-range configuration retailing for just over $3000 USD.
Competitors in this space include other ultra-thin 15.6-inch mobile workstations like the HP ZBook Studio 15 G8, Asus ProArt StudioBook Pro 15, Lenovo ThinkPad P15 Gen 2, MSI WS66, or Razer Blade 15 Studio Edition. A 17-inch version of our model is available called the Precision 5750 based on the XPS 17.
More Dell reviews:
potential competitors in comparison
Rating | Date | Model | Weight | Height | Size | Resolution | Price |
|---|---|---|---|---|---|---|---|
| 88.3 % v7 (old) | 10 / 2021 | Dell Precision 5000 5560 i7-11850H, RTX A2000 Laptop GPU | 2 kg | 18 mm | 15.60" | 3840x2400 | |
| 87.2 % v7 (old) | 10 / 2021 | Lenovo ThinkPad P15 G2-20YQ001JGE i7-11800H, RTX A3000 Laptop GPU | 2.9 kg | 31.5 mm | 15.60" | 1920x1080 | |
| 87.8 % v7 (old) | 08 / 2021 | HP ZBook Studio 15 G8 i9-11950H, GeForce RTX 3070 Laptop GPU | 1.9 kg | 18 mm | 15.60" | 3840x2160 | |
| 83.1 % v7 (old) | 11 / 2020 | Asus ProArt StudioBook Pro 15 W500G5T i7-9750H, Quadro RTX 5000 Max-Q | 2 kg | 18.9 mm | 15.60" | 3840x2160 | |
| 87.8 % v7 (old) | 08 / 2020 | Dell Precision 7550 W-10885M, Quadro RTX 5000 Max-Q | 2.8 kg | 27.36 mm | 15.60" | 3840x2160 | |
| 86.3 % v7 (old) | 08 / 2020 | Dell Precision 5550 P91F i7-10875H, Quadro T2000 Max-Q | 2 kg | 18 mm | 15.60" | 3840x2400 | |
| 87 % v7 (old) | 08 / 2020 | Razer Blade 15 Studio Edition 2020 i7-10875H, Quadro RTX 5000 Max-Q | 2.2 kg | 13.98 mm | 15.60" | 3840x2160 |
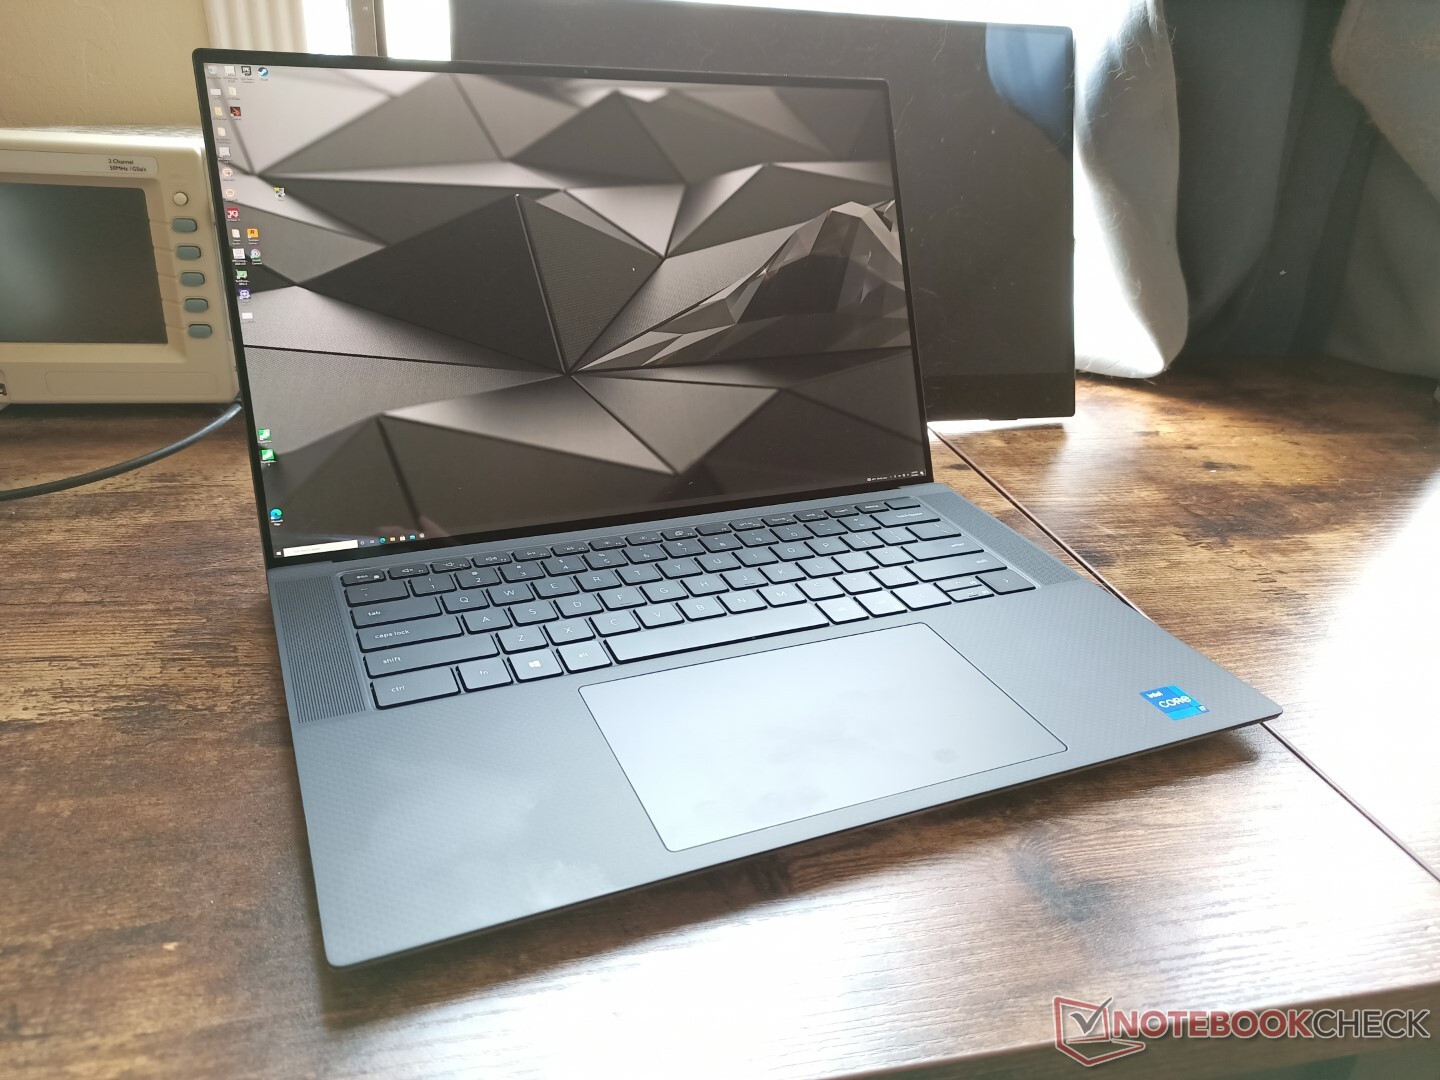
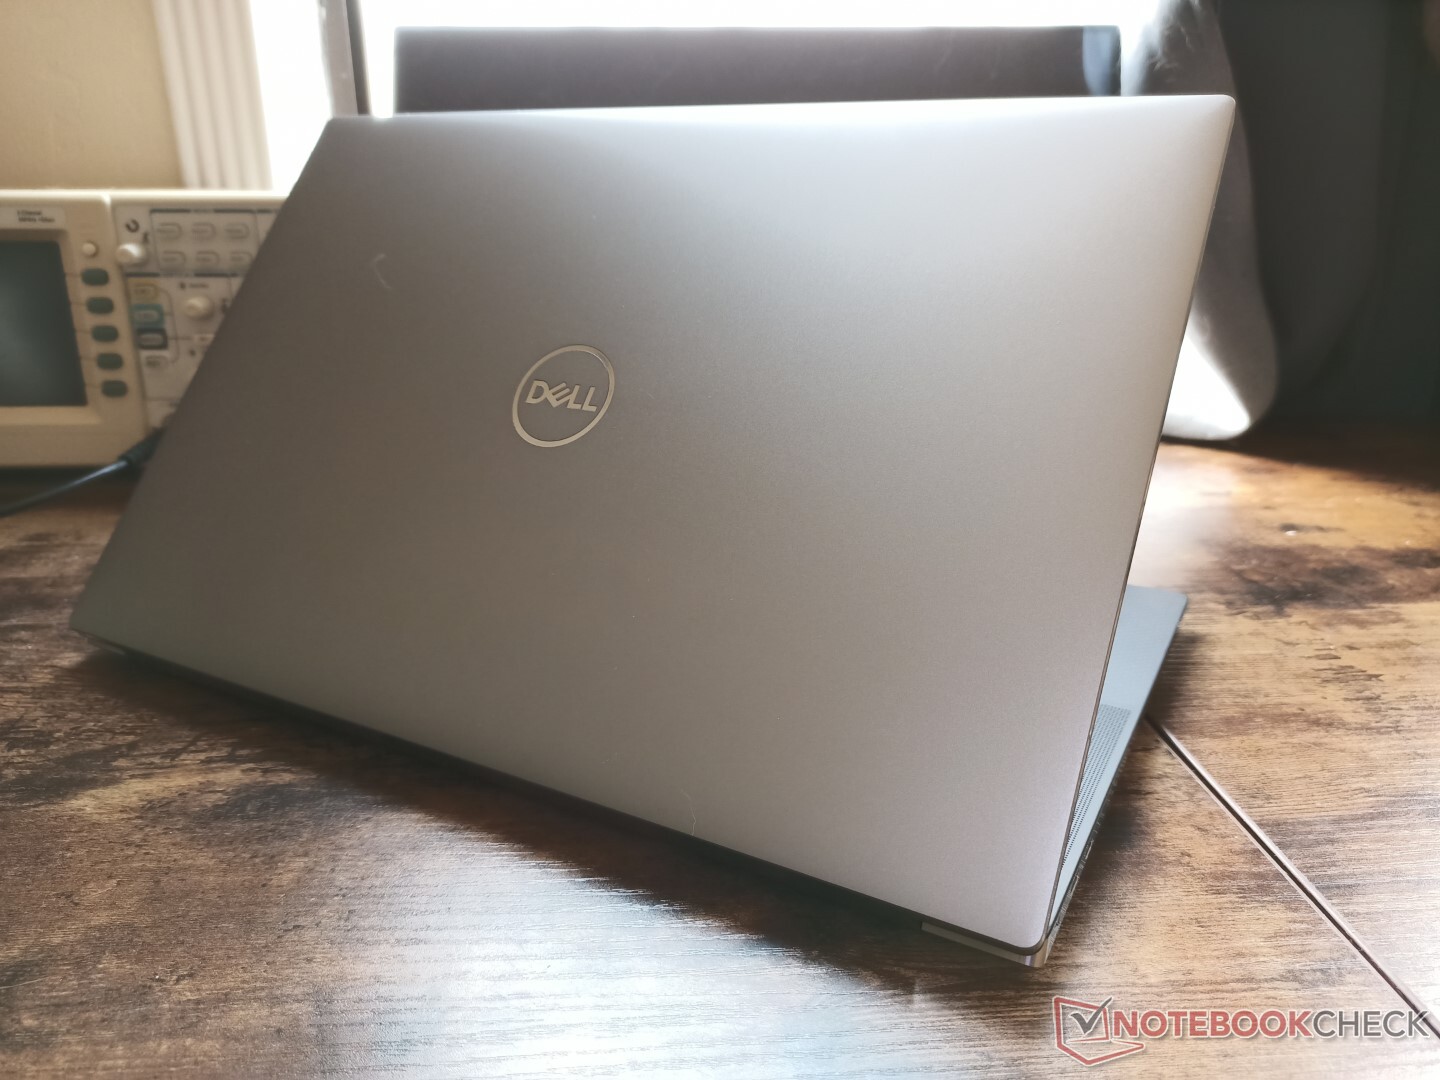
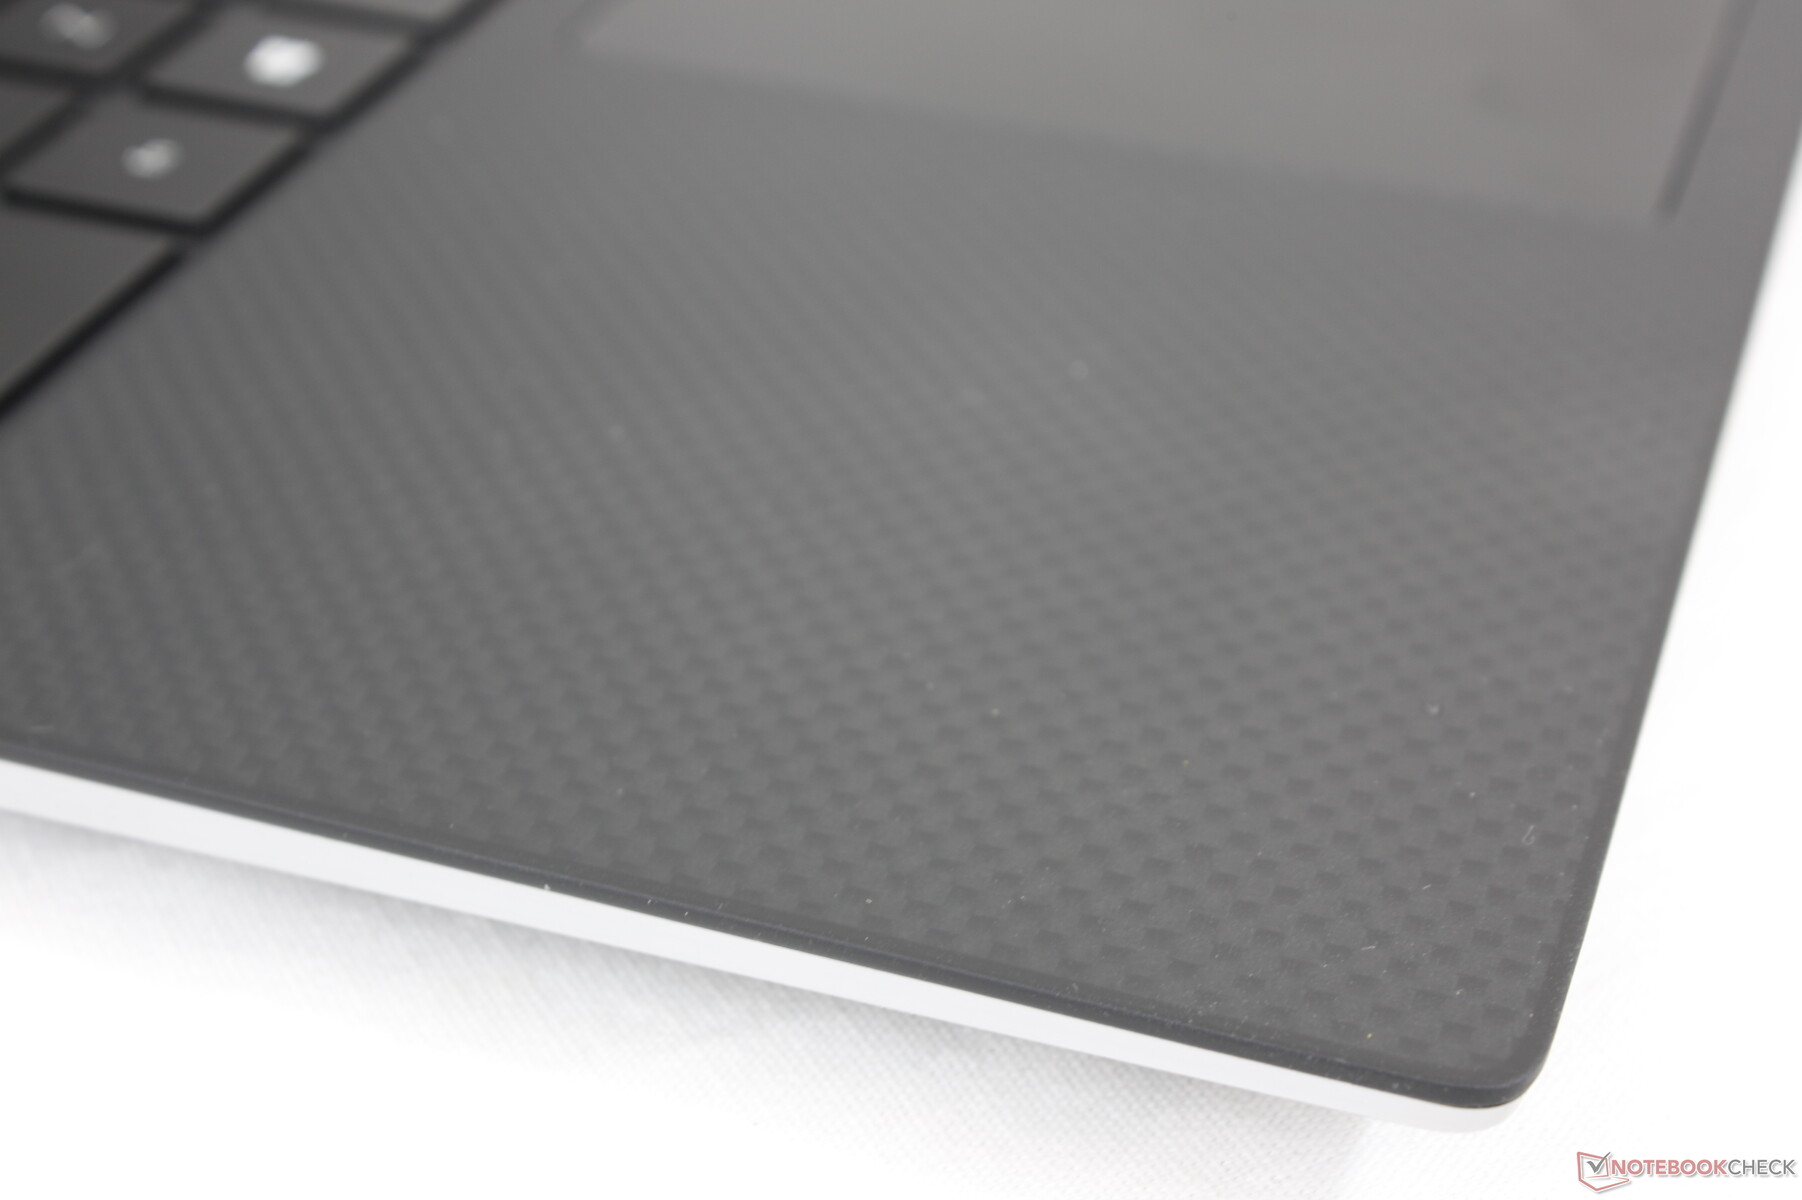
Case — Professional XPS
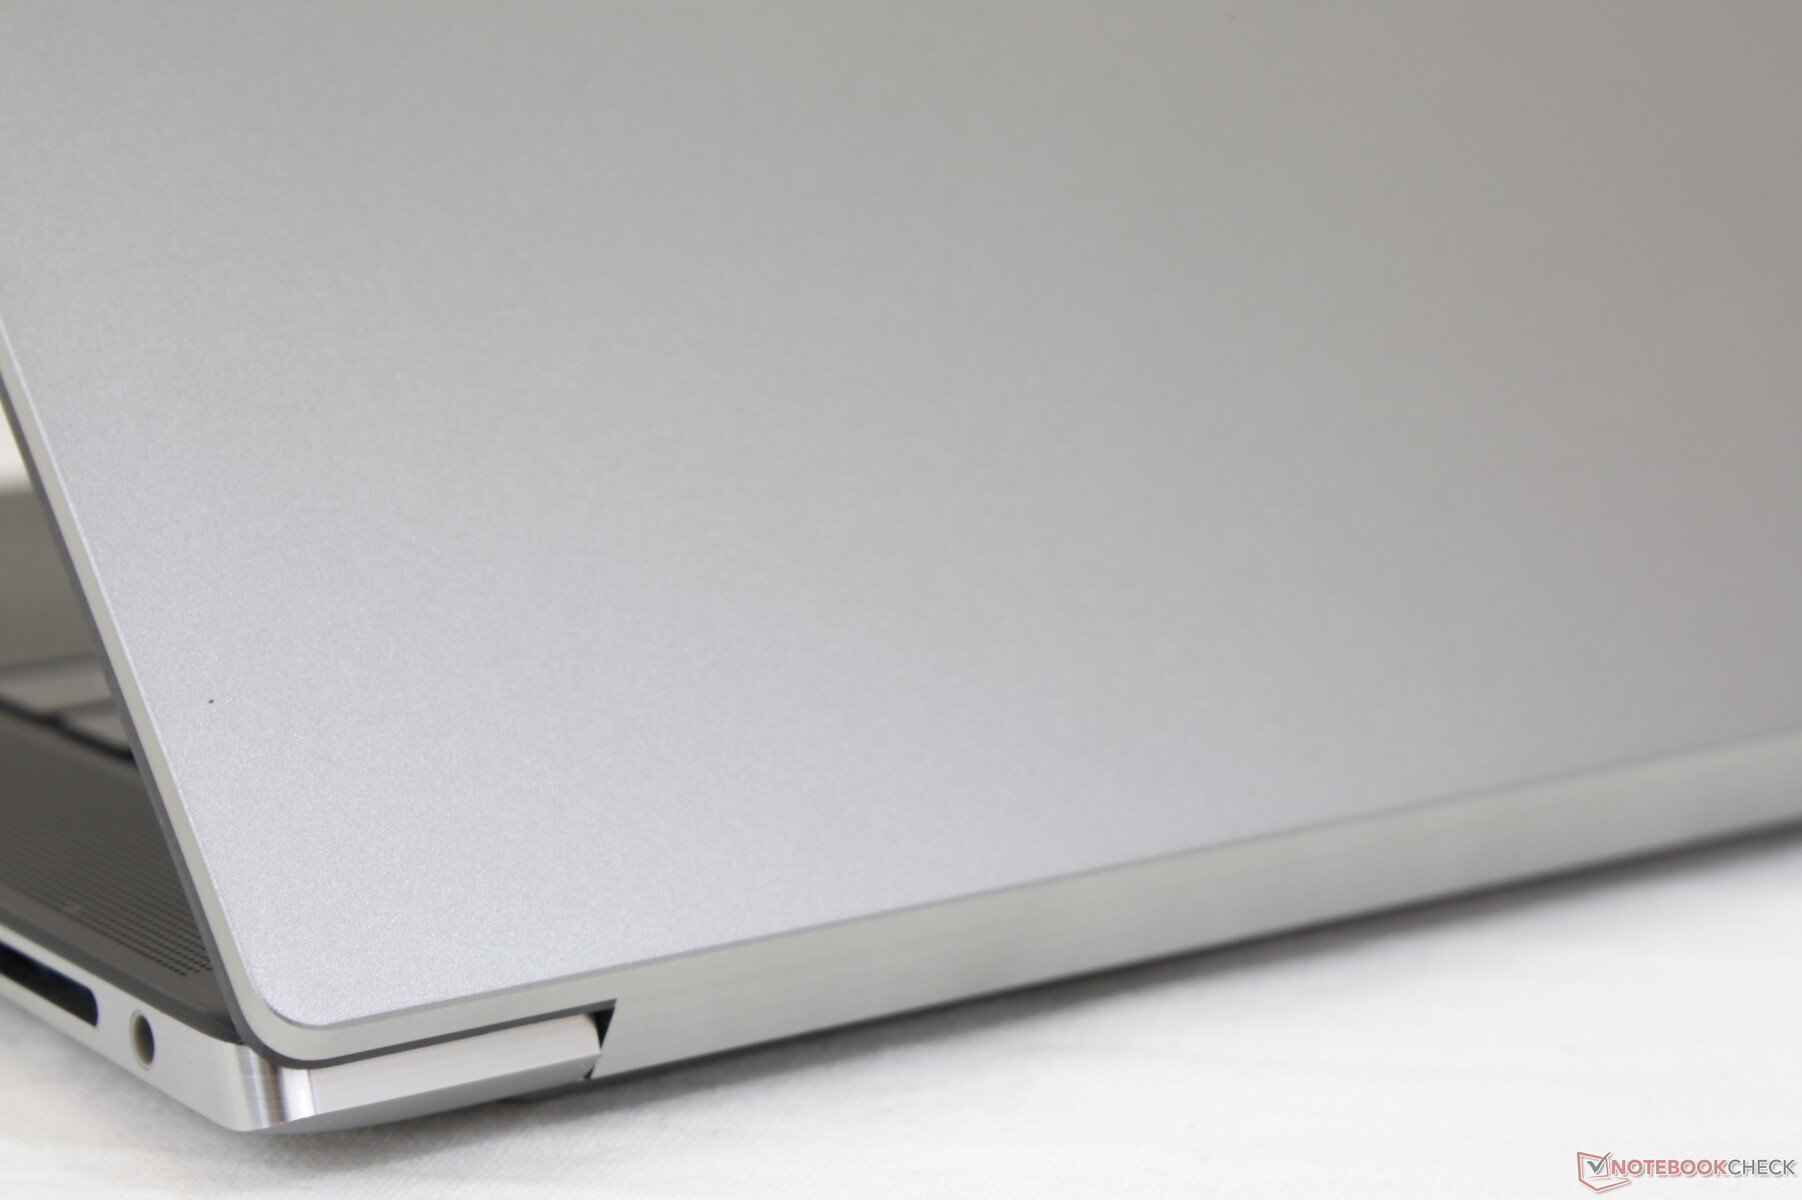
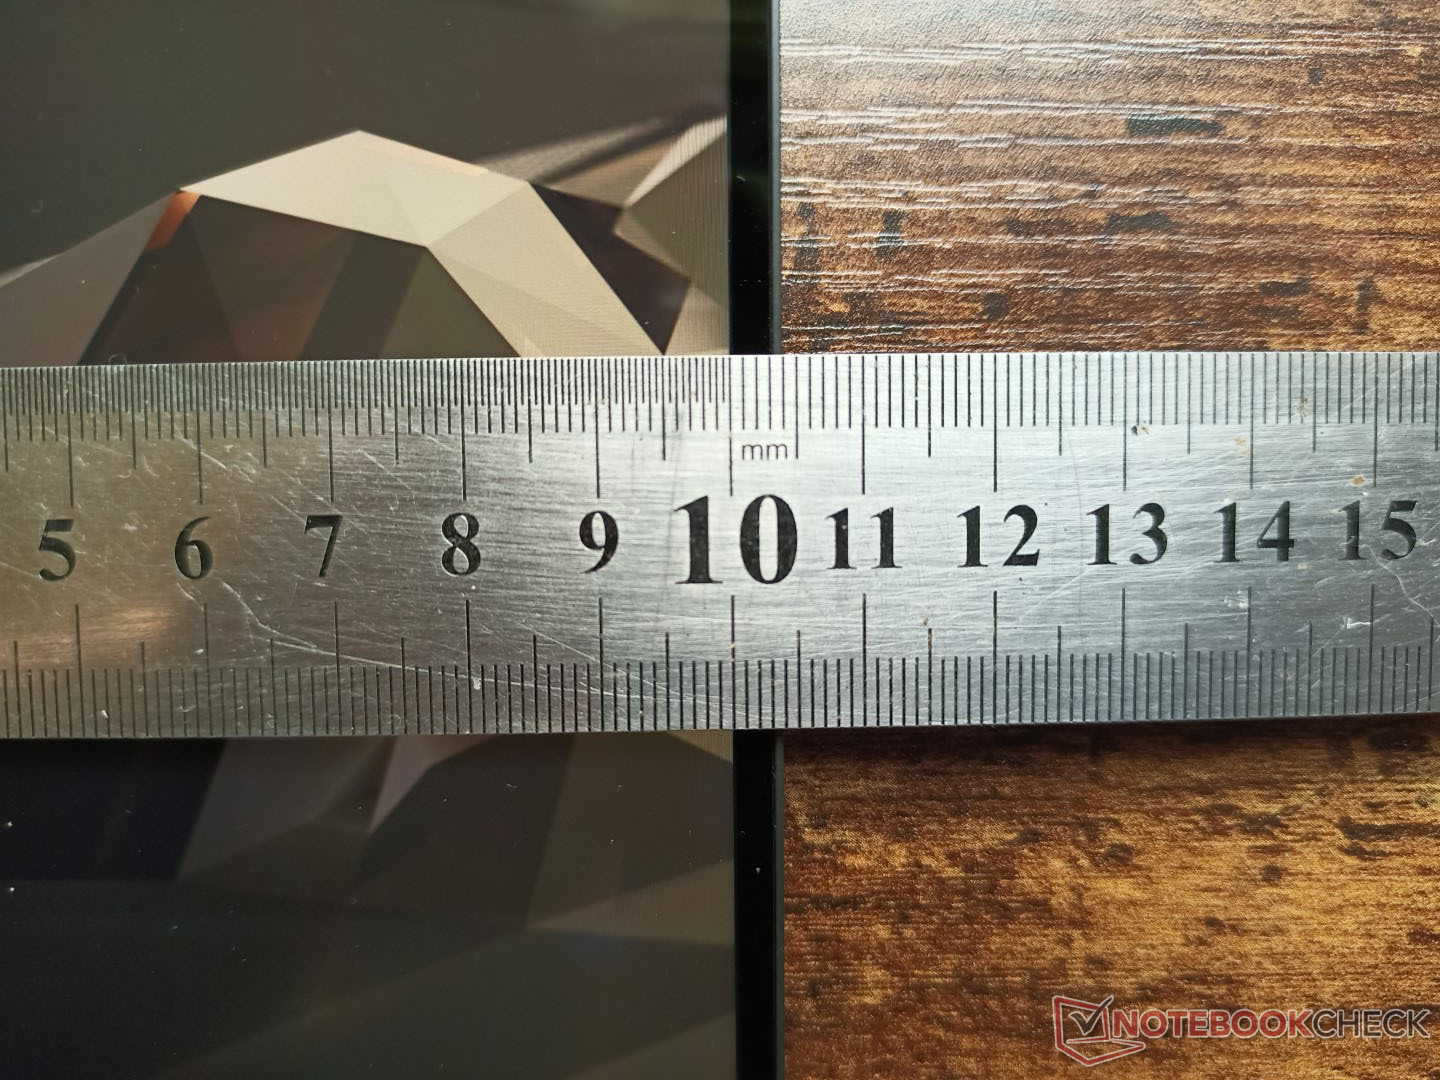
Chassis and dimensions are identical to the XPS 15 9500 or 9510 at 18 x 344.72 x 230.14 mm. However, the official Dell product page claims that the Precision 5560 is much thinner at 11.64 mm from its thickest point which is absolutely false. We suspect that Dell has changed the way they measure thickness which can be very misleading to consumers. We observed a similar thickness discrepancy between the identical XPS 13 7390 2-in-1 and XPS 13 9310 2-in-1 as well.
As usual. the magnesium alloy outer lid is a slightly darker tone of gray when compared to the typical XPS 15 to help visually identify the Precision 55x0 series from the XPS 15 series.
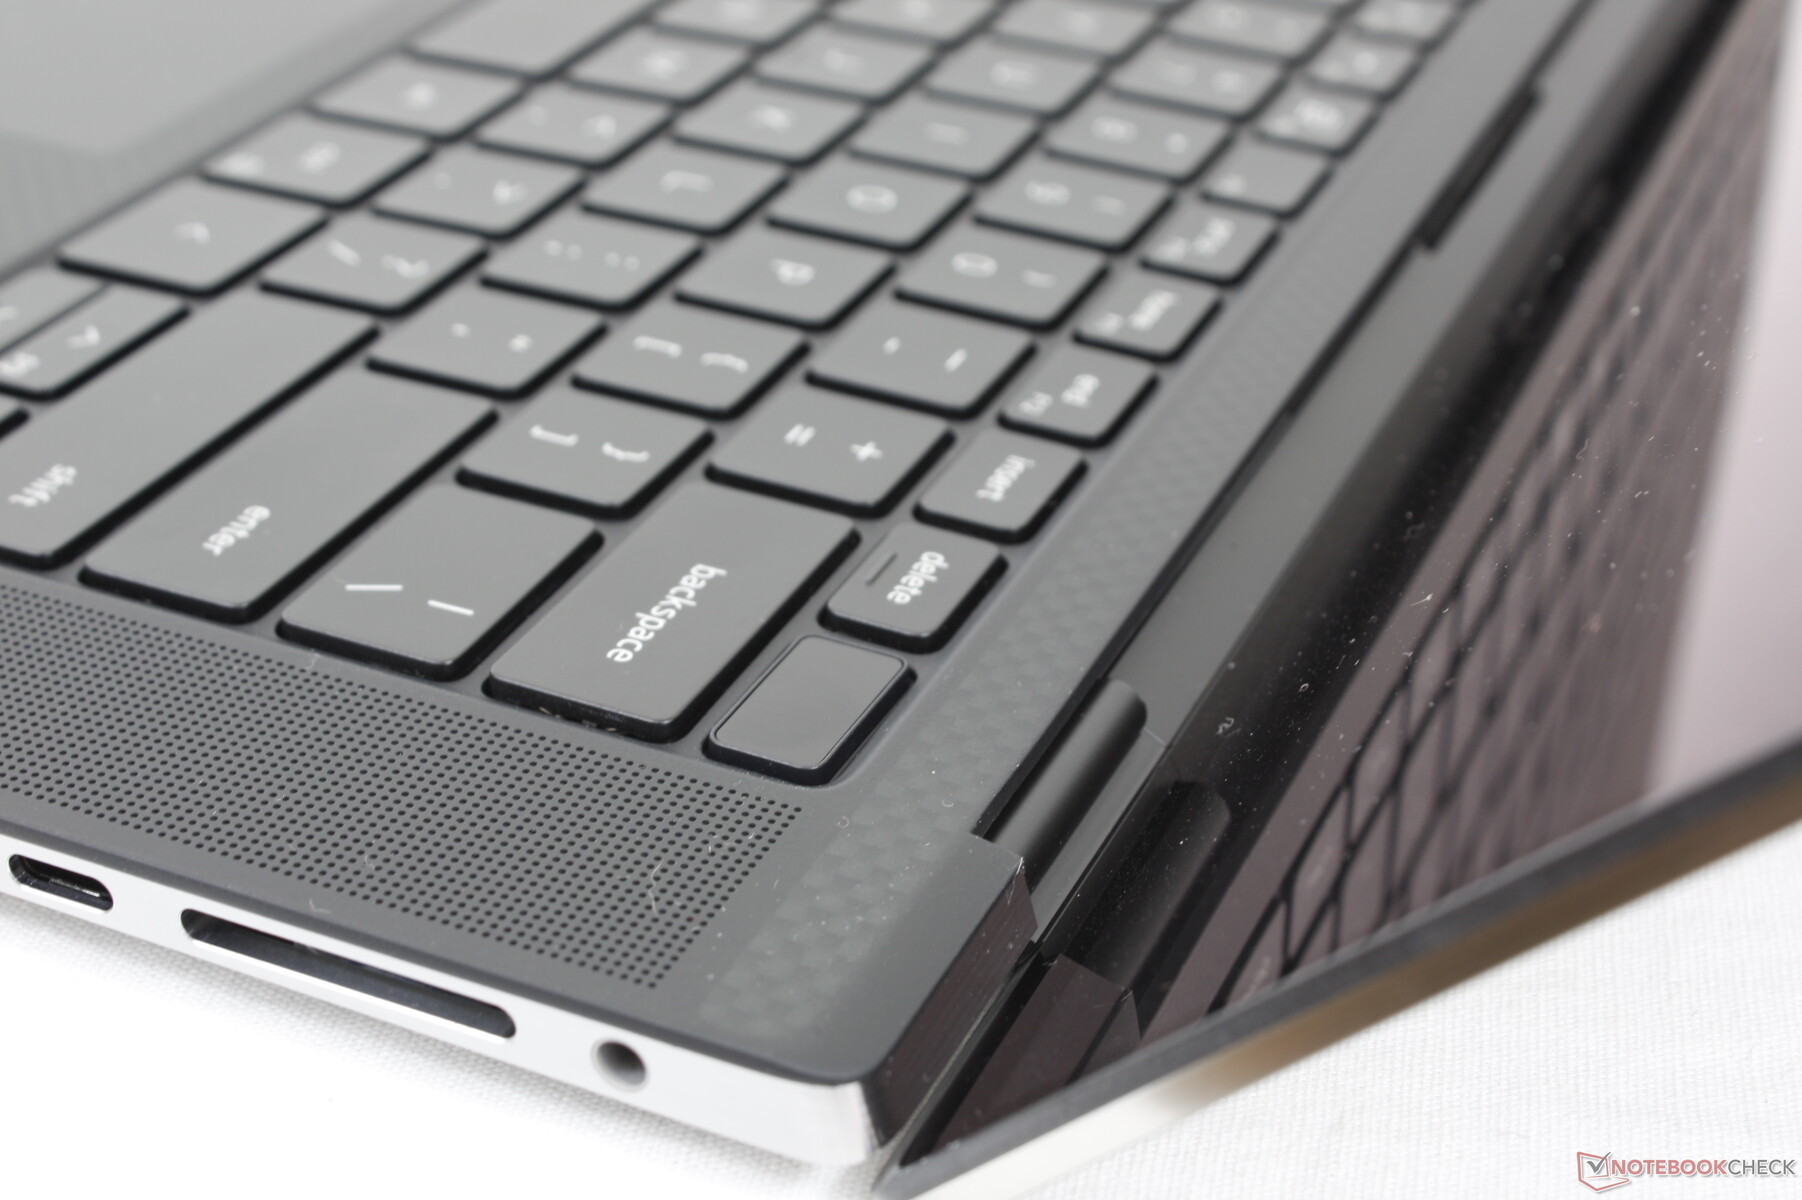
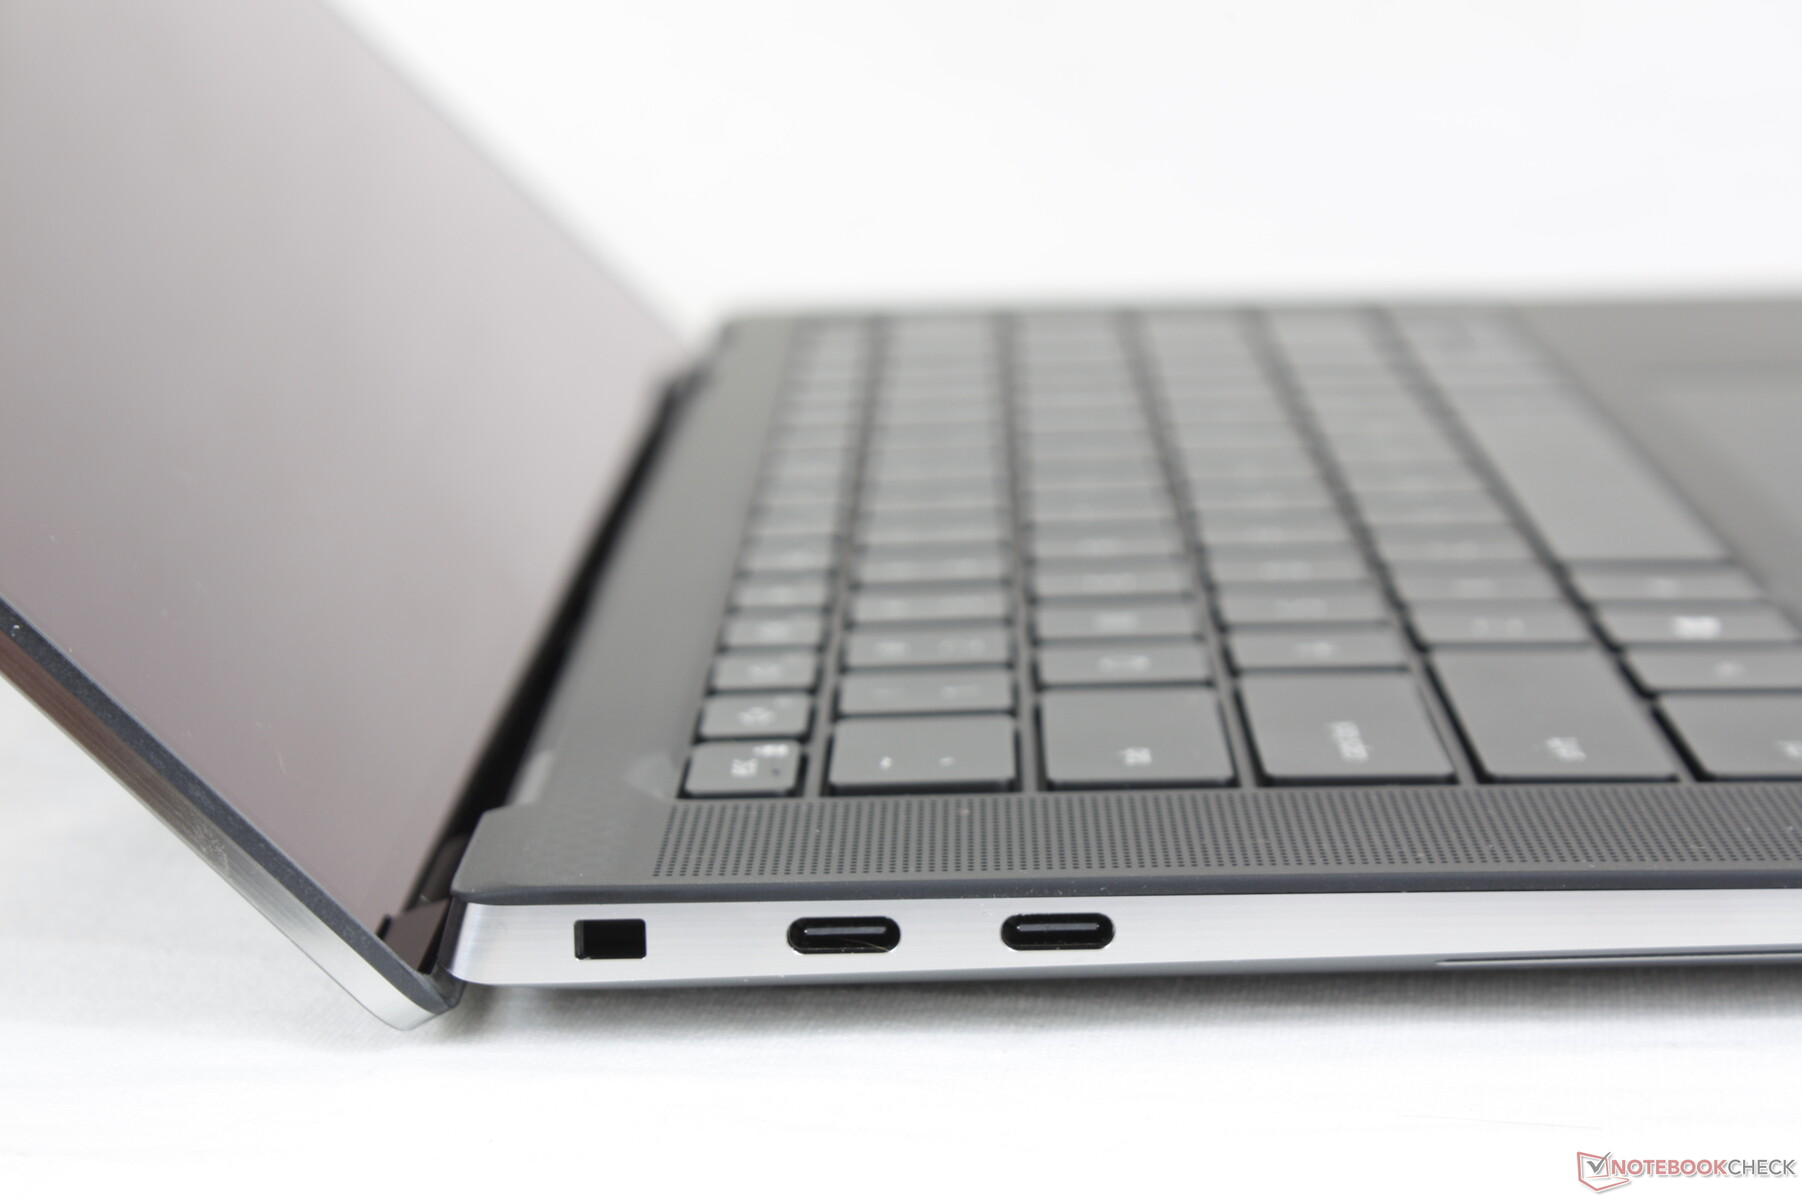
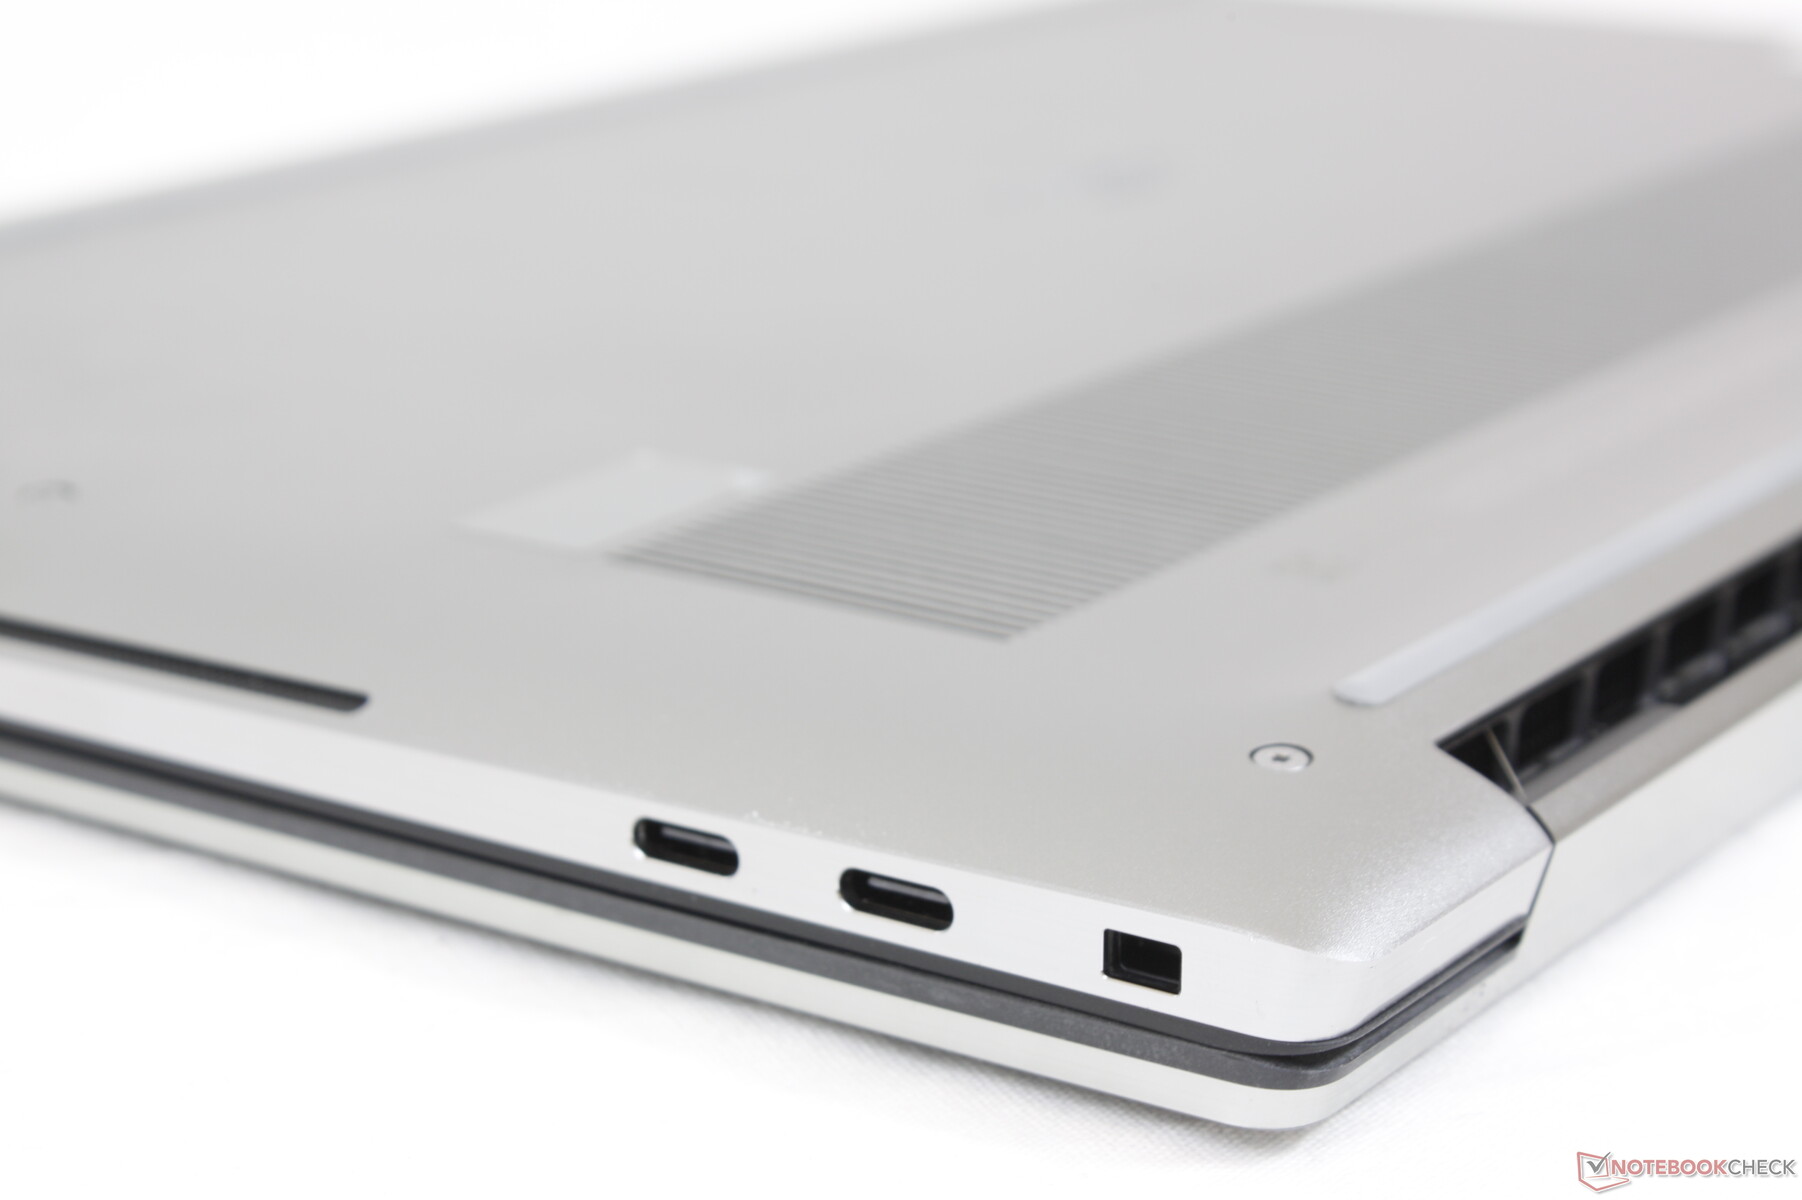
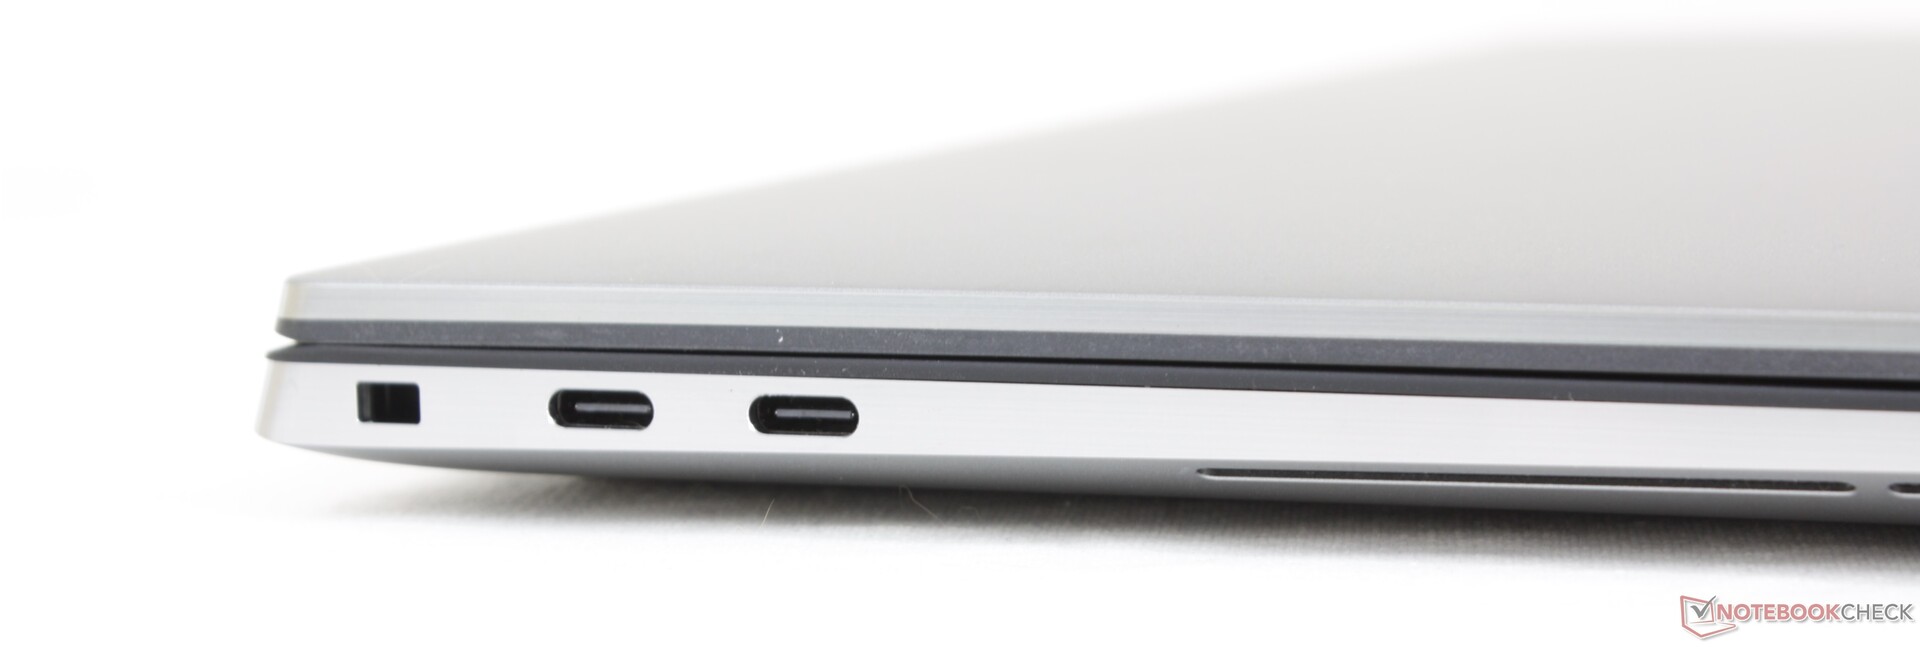
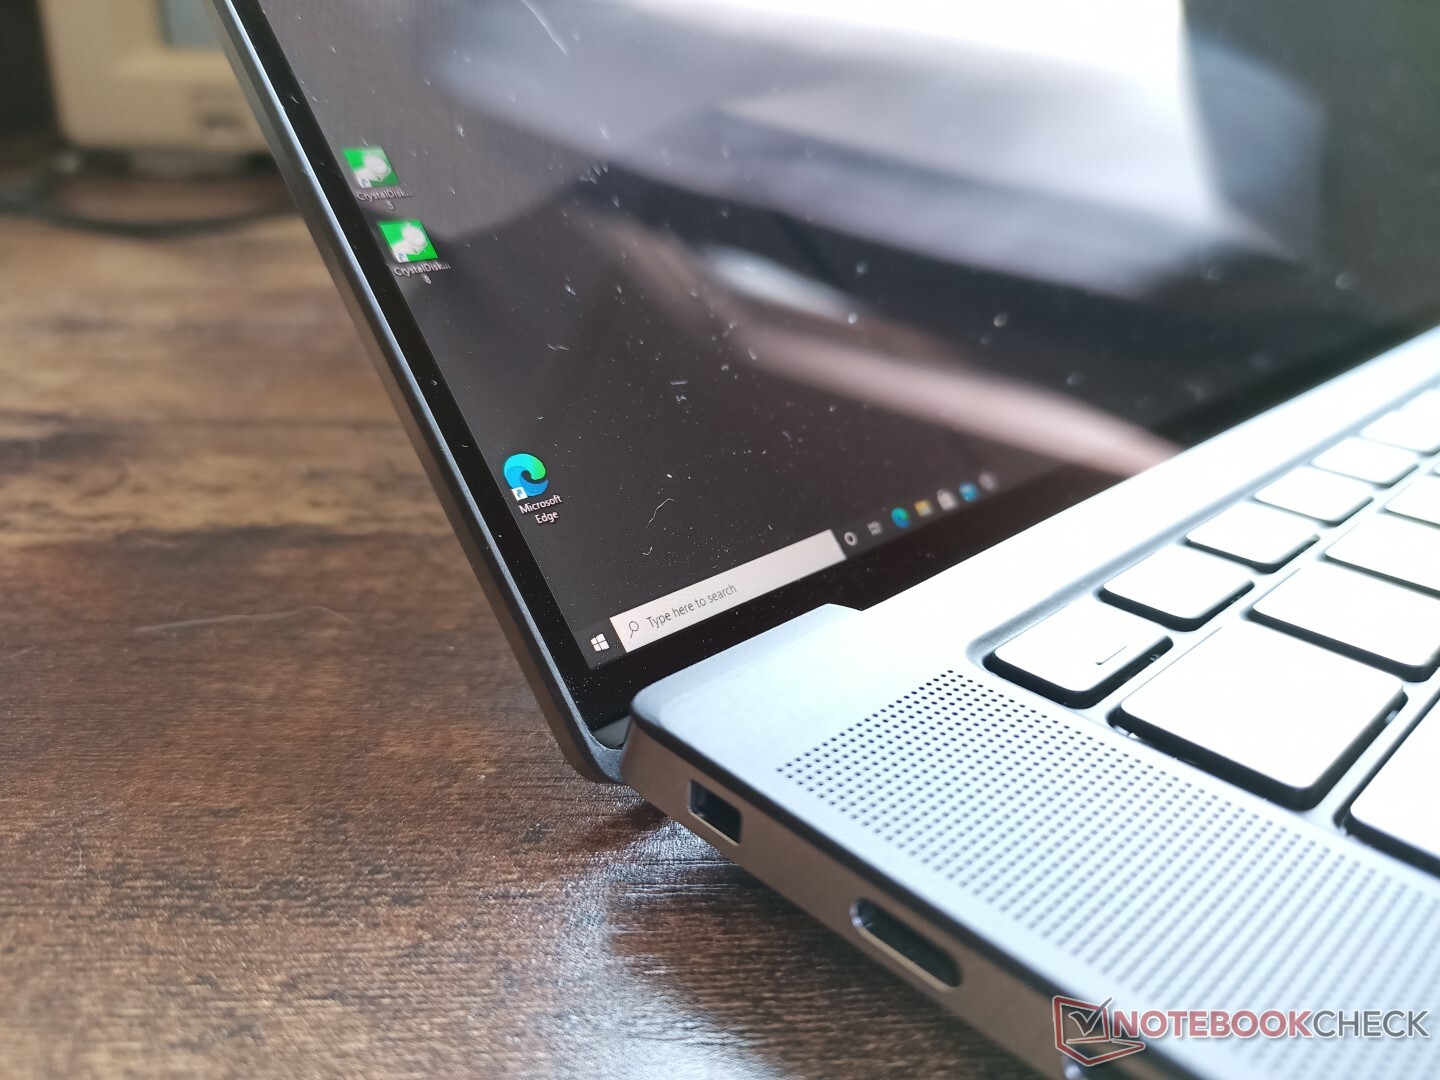
Connectivity — Thunderbolt 4 Ready to Go
Port options include only USB-C so be prepared to have adapters everywhere you go. All three USB-C ports support both DisplayPort and Power Delivery but only the left two USB-C ports support Thunderbolt devices. These two ports in particular have been upgraded from Thunderbolt 3 on the Precision 5550 to Thunderbolt 4 on the Precision 5560.
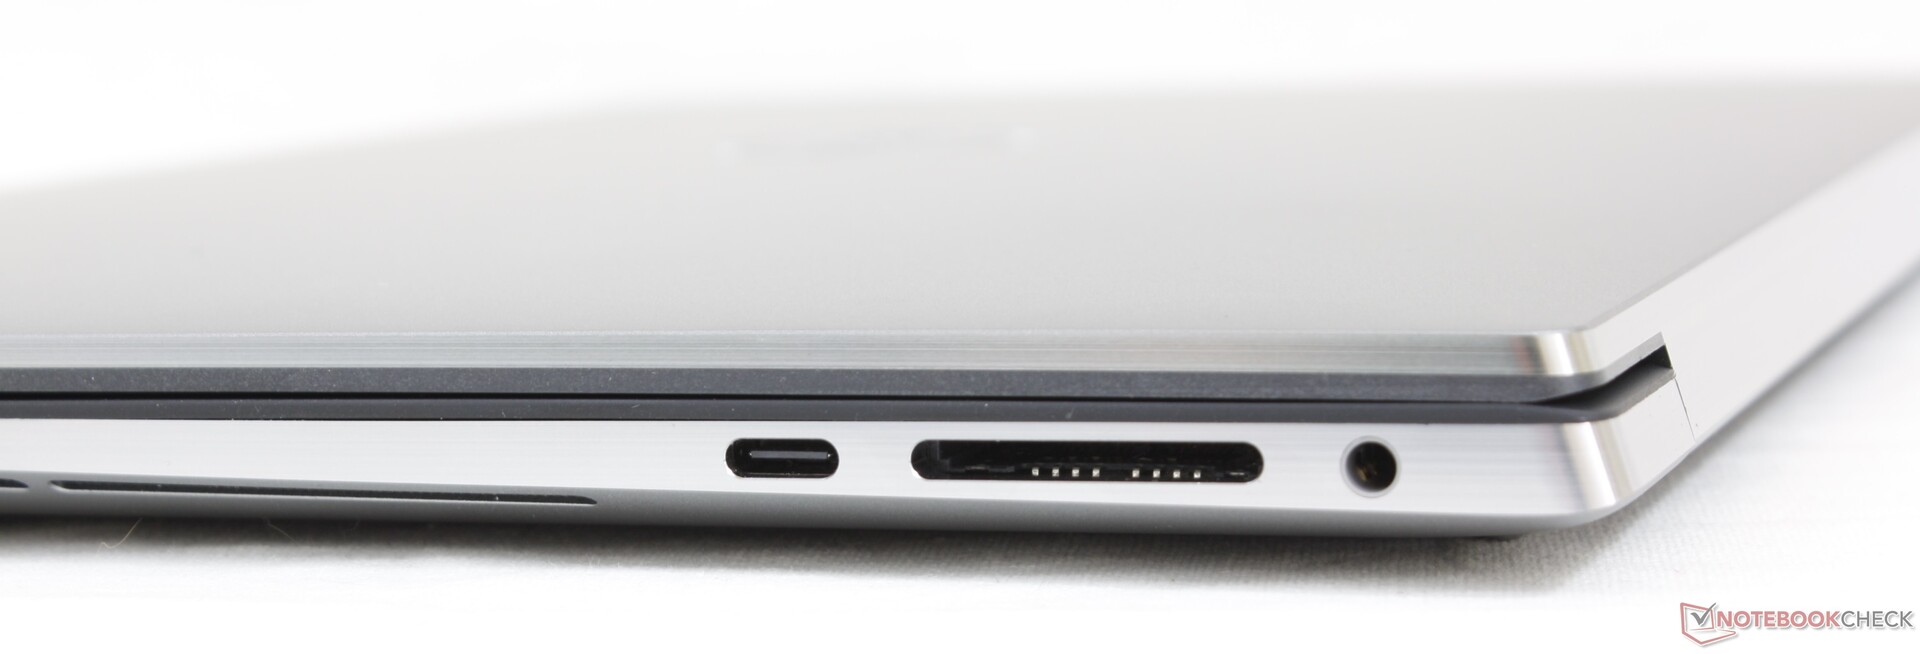
SD Card Reader
Transfer rates are very fast approaching almost 200 MB/s on our UHS-II test card. The slot is not spring-loaded and so the SD card will protrude over the edge.
| SD Card Reader | |
| average JPG Copy Test (av. of 3 runs) | |
| Lenovo ThinkPad P15 G2-20YQ001JGE (AV Pro V60) | |
| Dell Precision 5000 5560 (AV Pro V60) | |
| Dell Precision 5550 P91F (Toshiba Exceria Pro SDXC 64 GB UHS-II) | |
| Dell Precision 7550 (Toshiba Exceria Pro SDXC 64 GB UHS-II) | |
| Razer Blade 15 Studio Edition 2020 (Toshiba Exceria Pro SDXC 64 GB UHS-II) | |
| HP ZBook Studio 15 G8 (AV Pro V60) | |
| maximum AS SSD Seq Read Test (1GB) | |
| Lenovo ThinkPad P15 G2-20YQ001JGE (AV Pro V60) | |
| Dell Precision 5000 5560 (AV Pro V60) | |
| Dell Precision 5550 P91F (Toshiba Exceria Pro SDXC 64 GB UHS-II) | |
| Dell Precision 7550 (Toshiba Exceria Pro SDXC 64 GB UHS-II) | |
| HP ZBook Studio 15 G8 (AV Pro V60) | |
Communication
Webcam — Still no Privacy Shutter


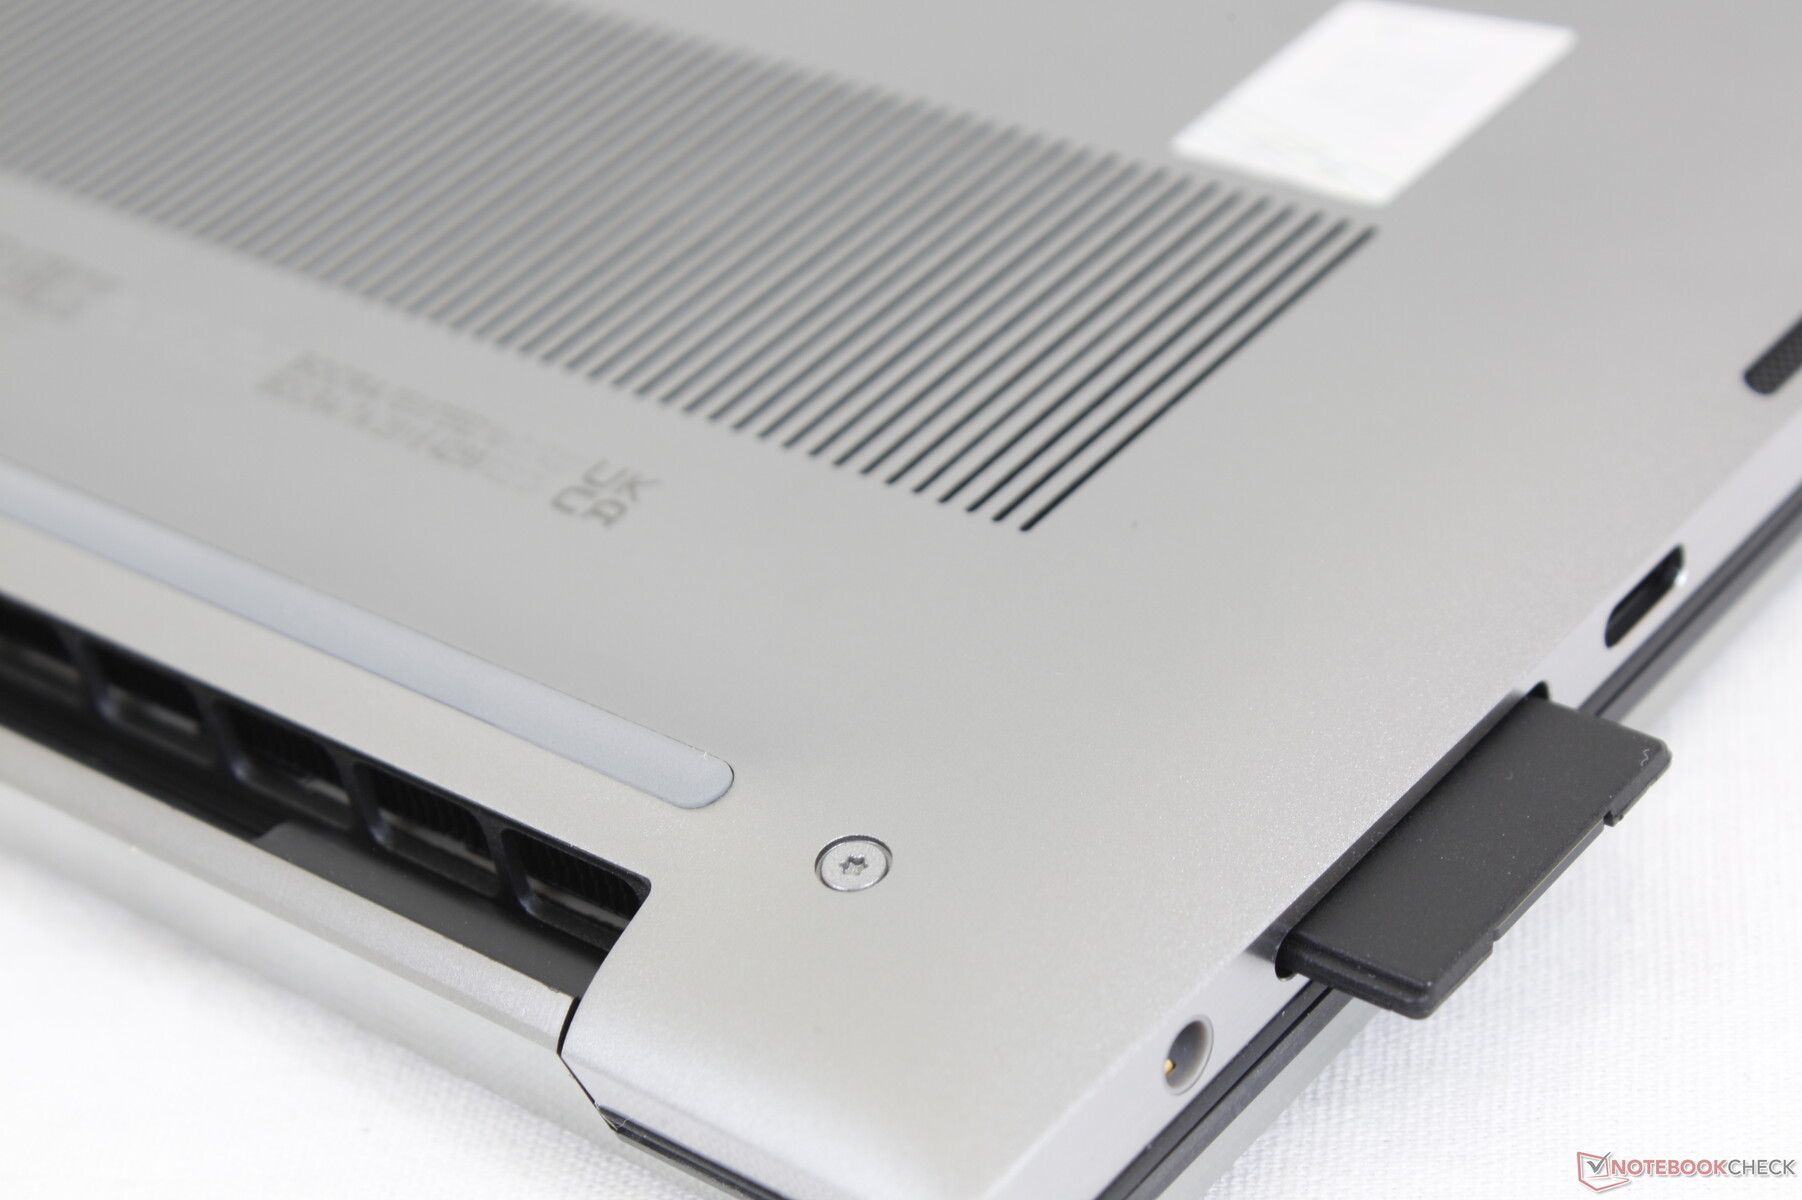
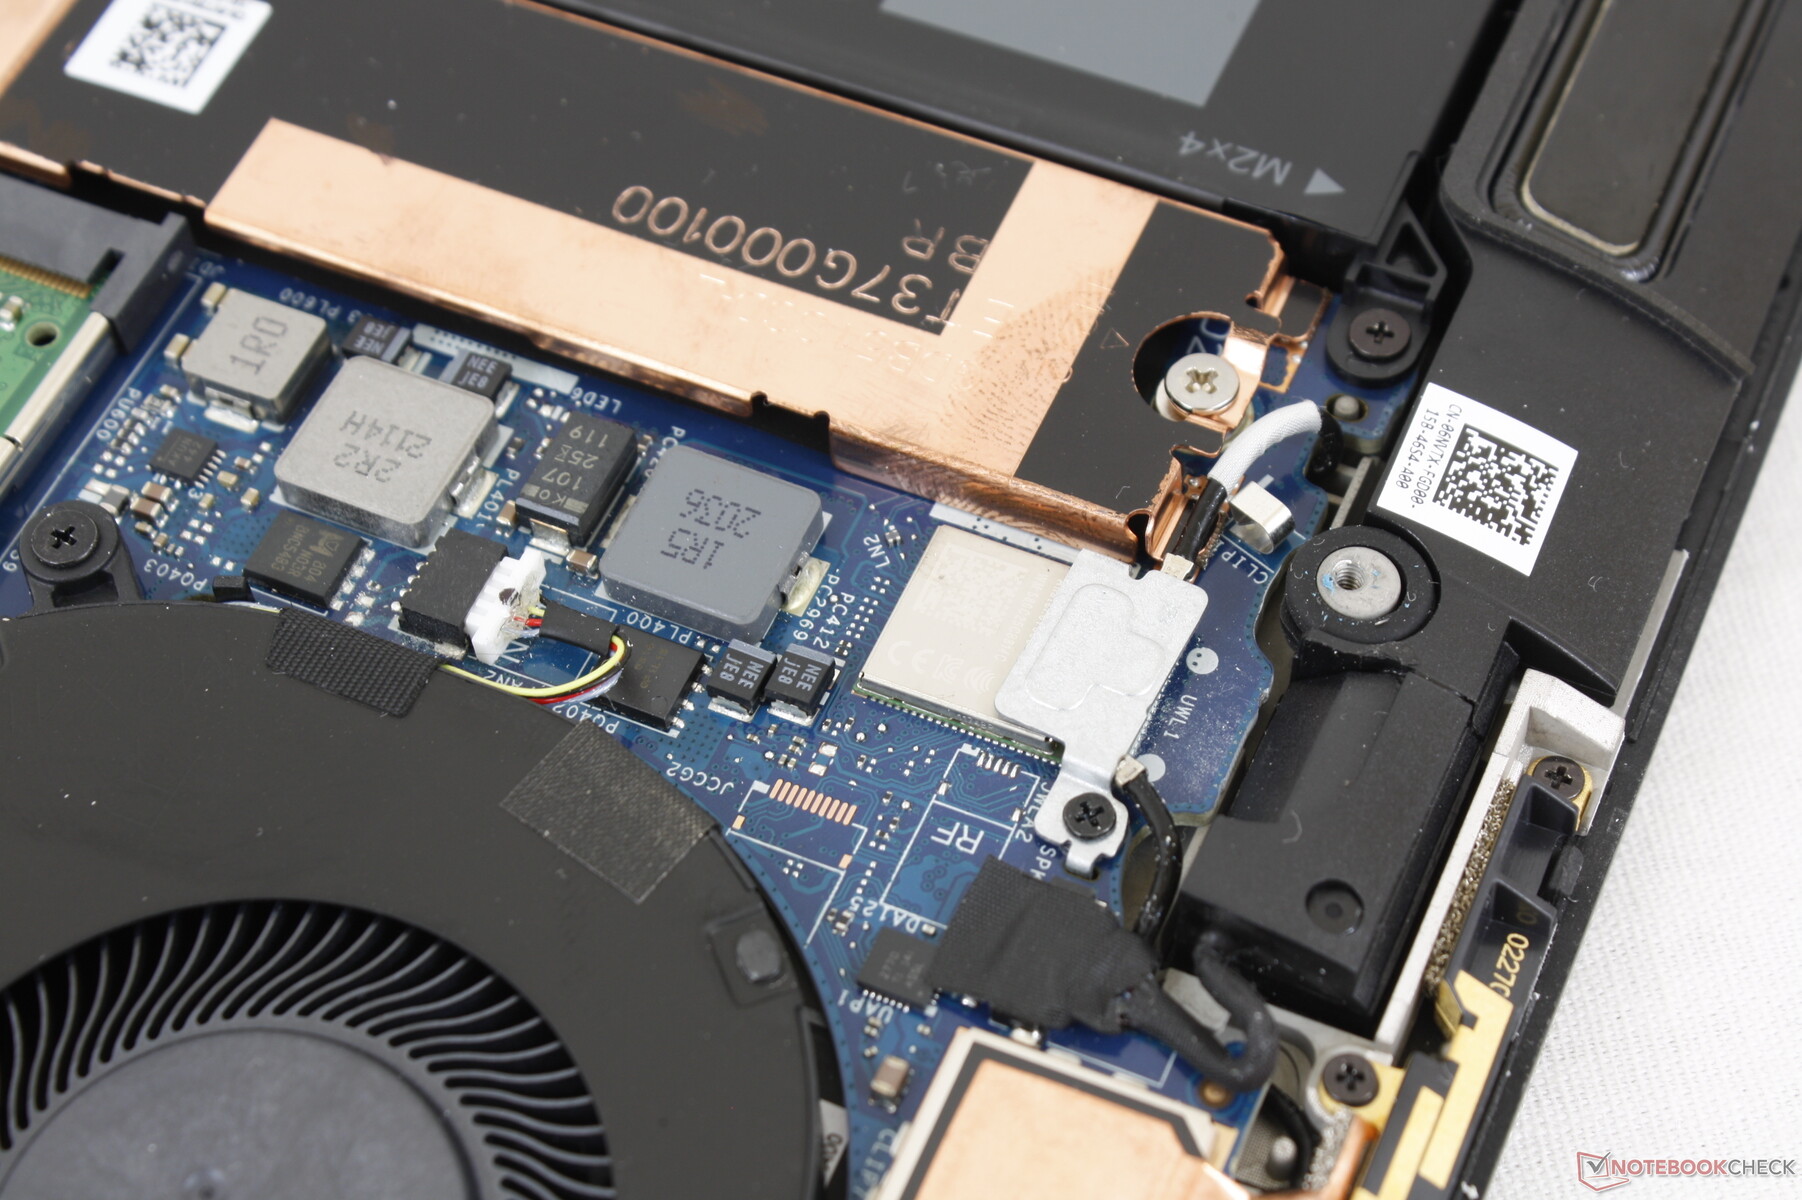
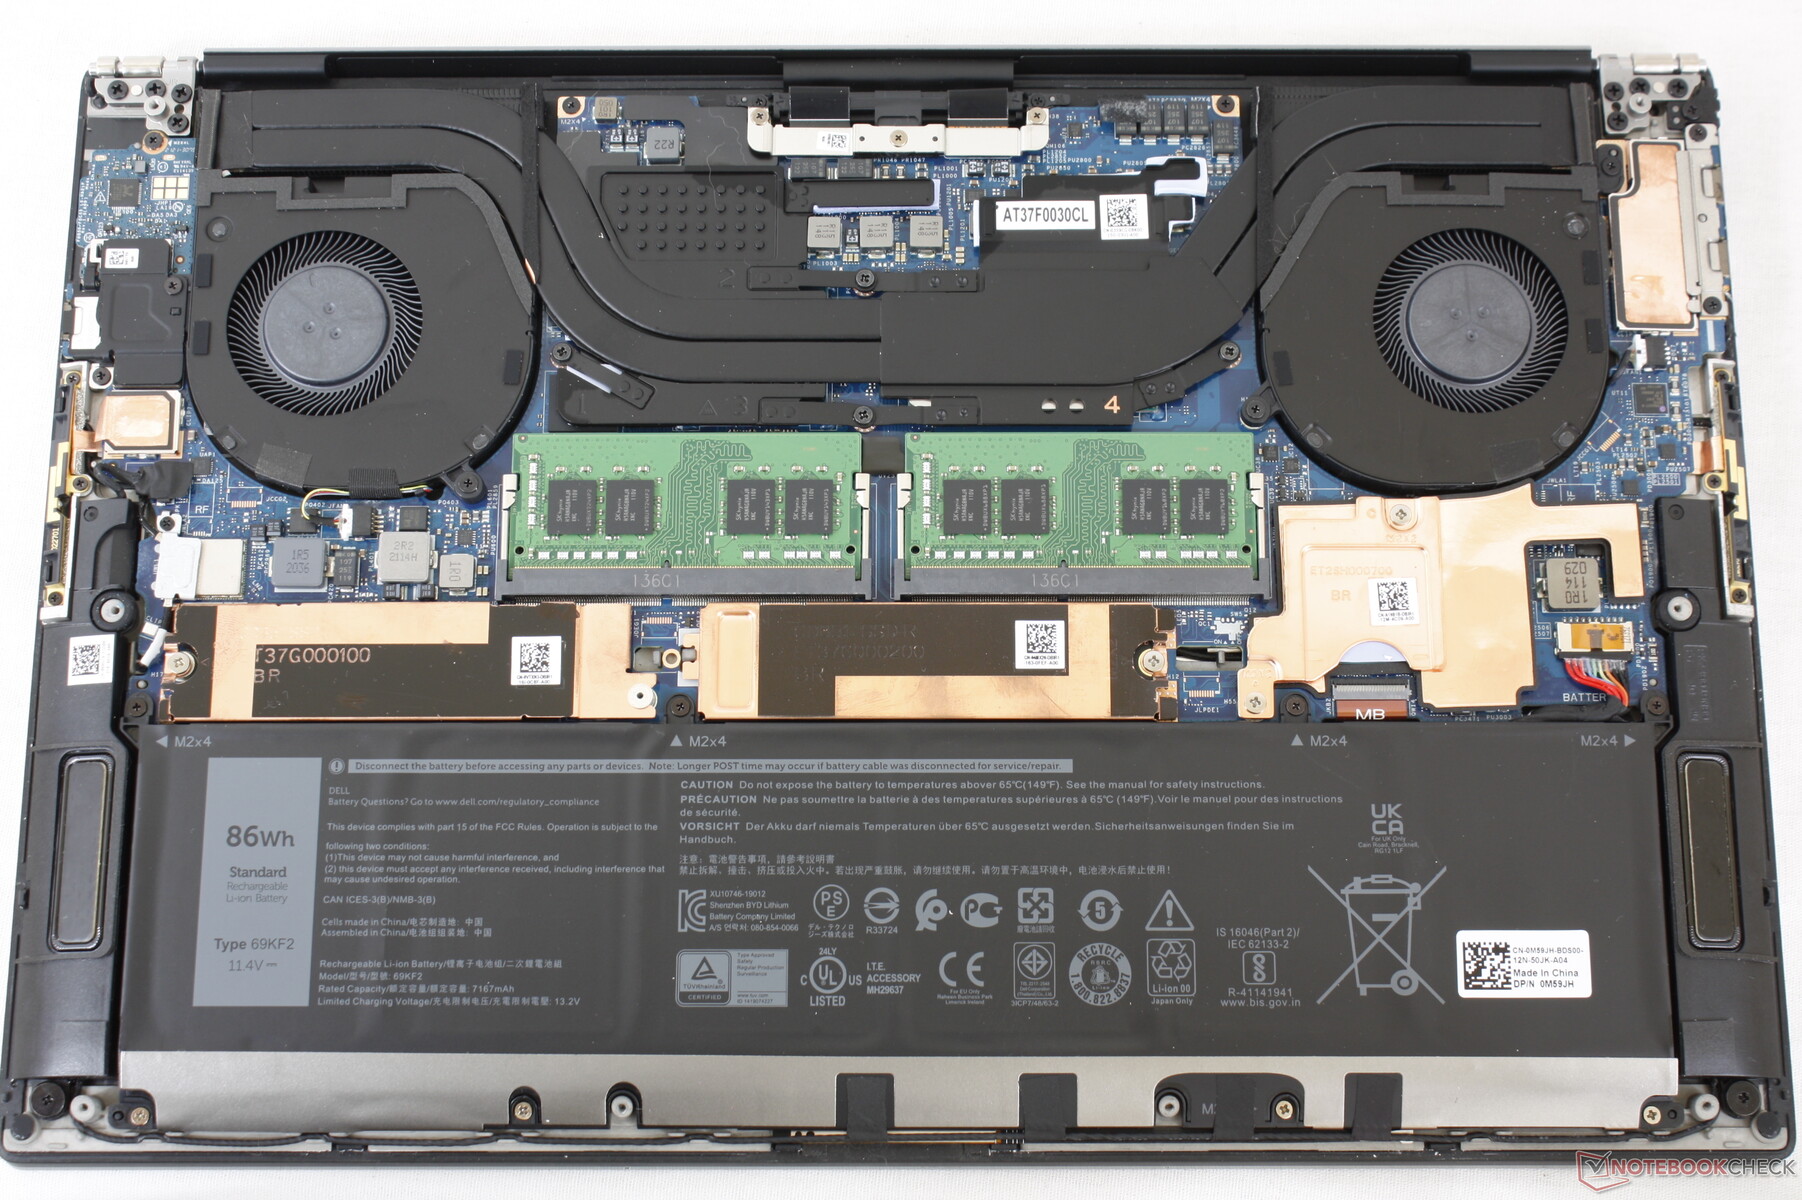
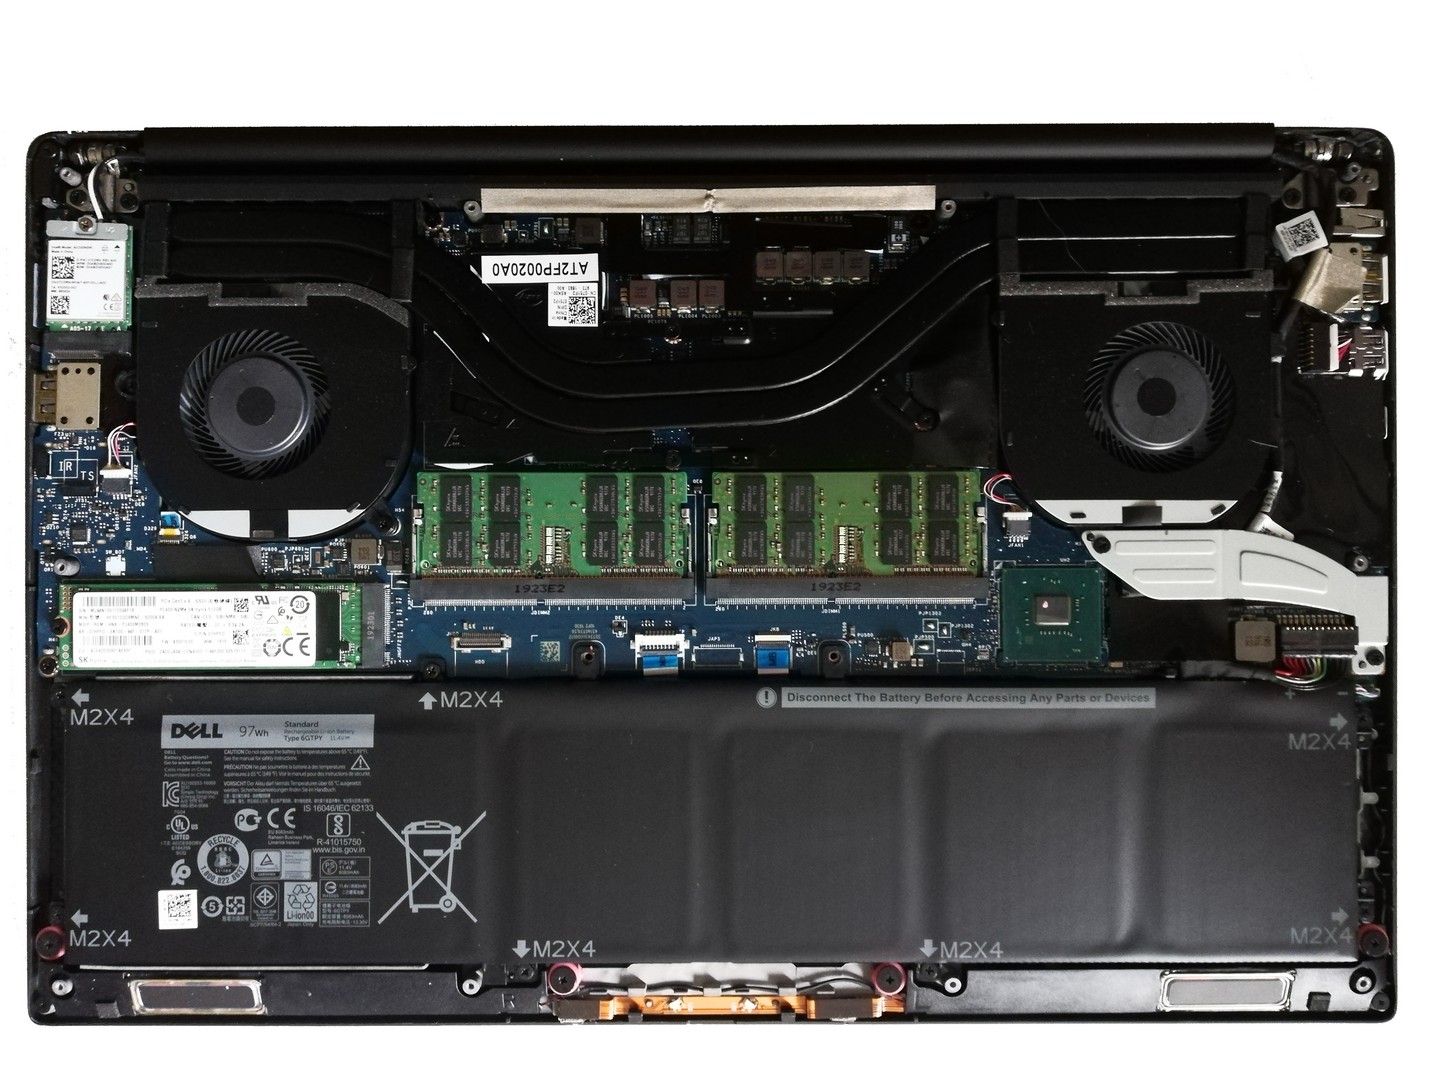
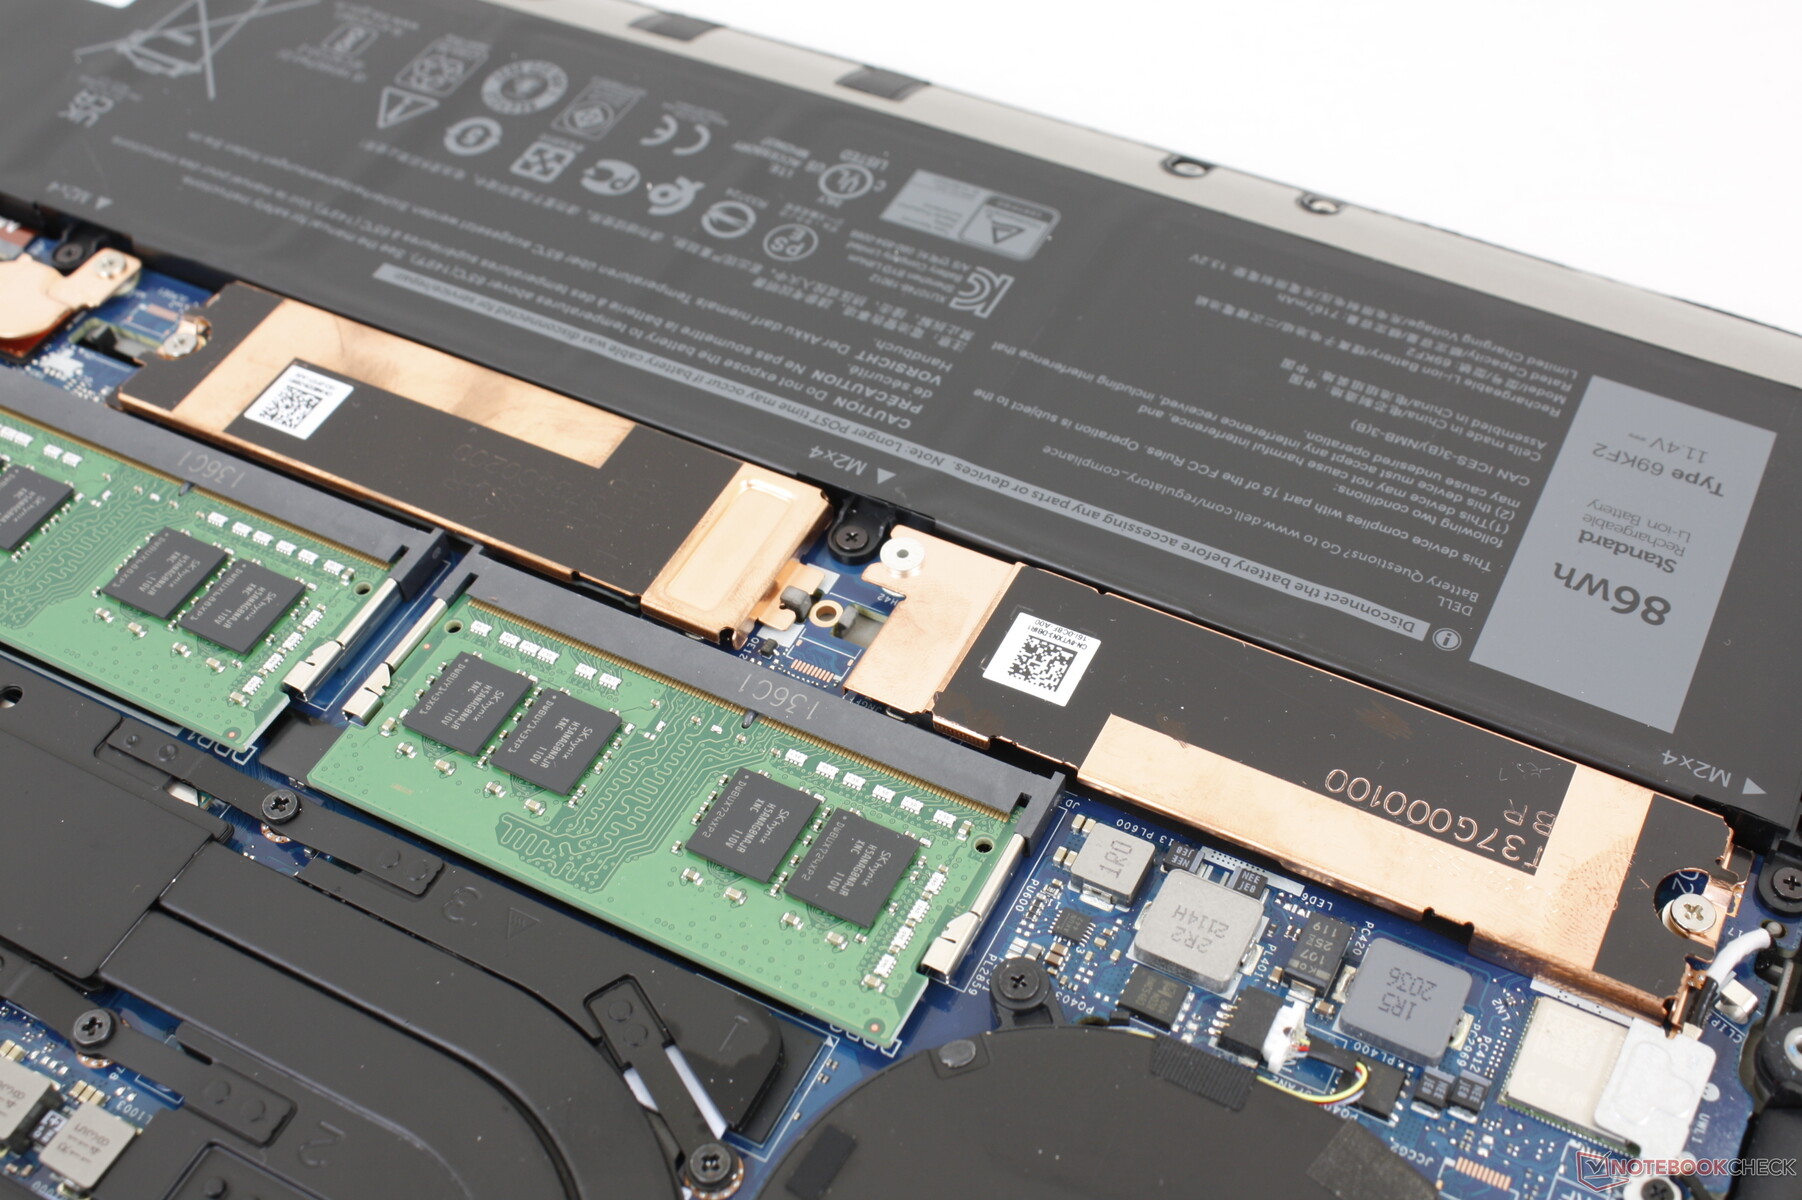
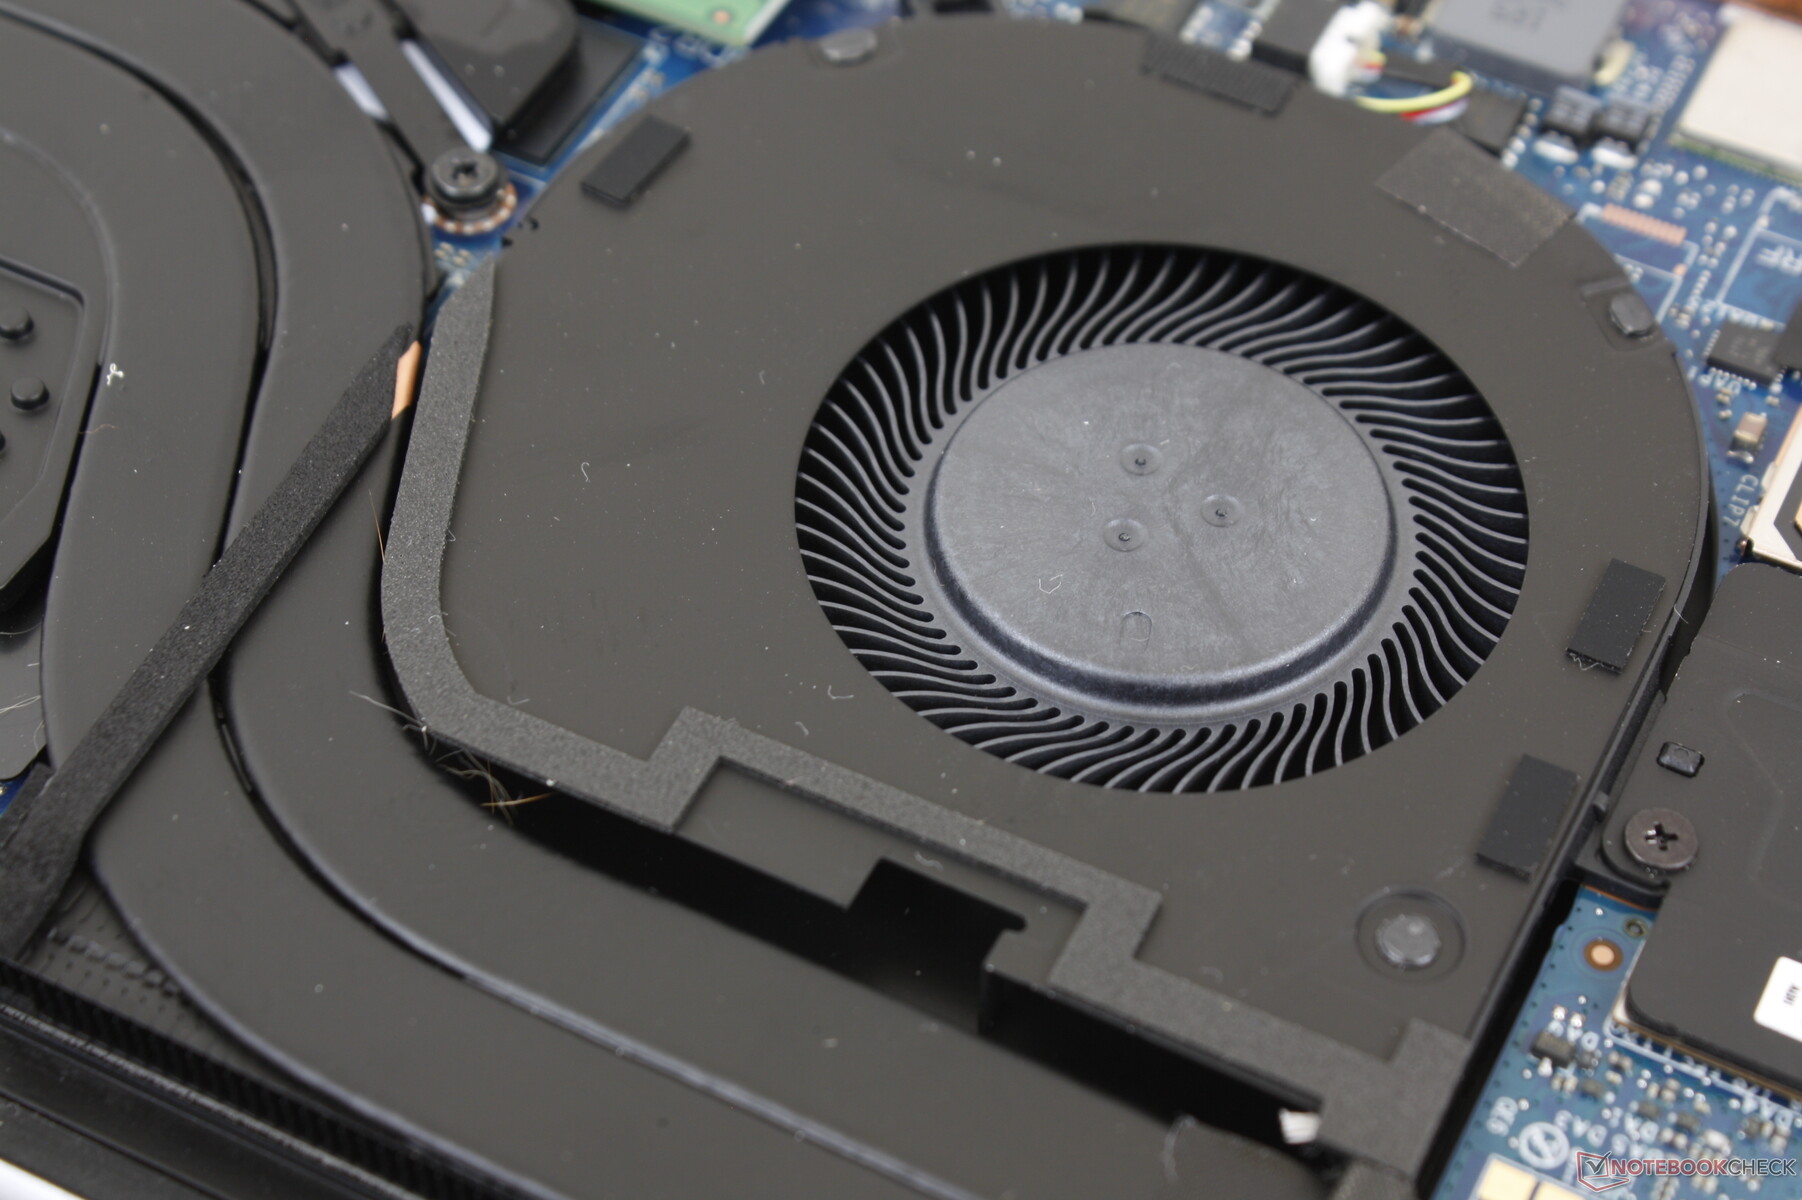
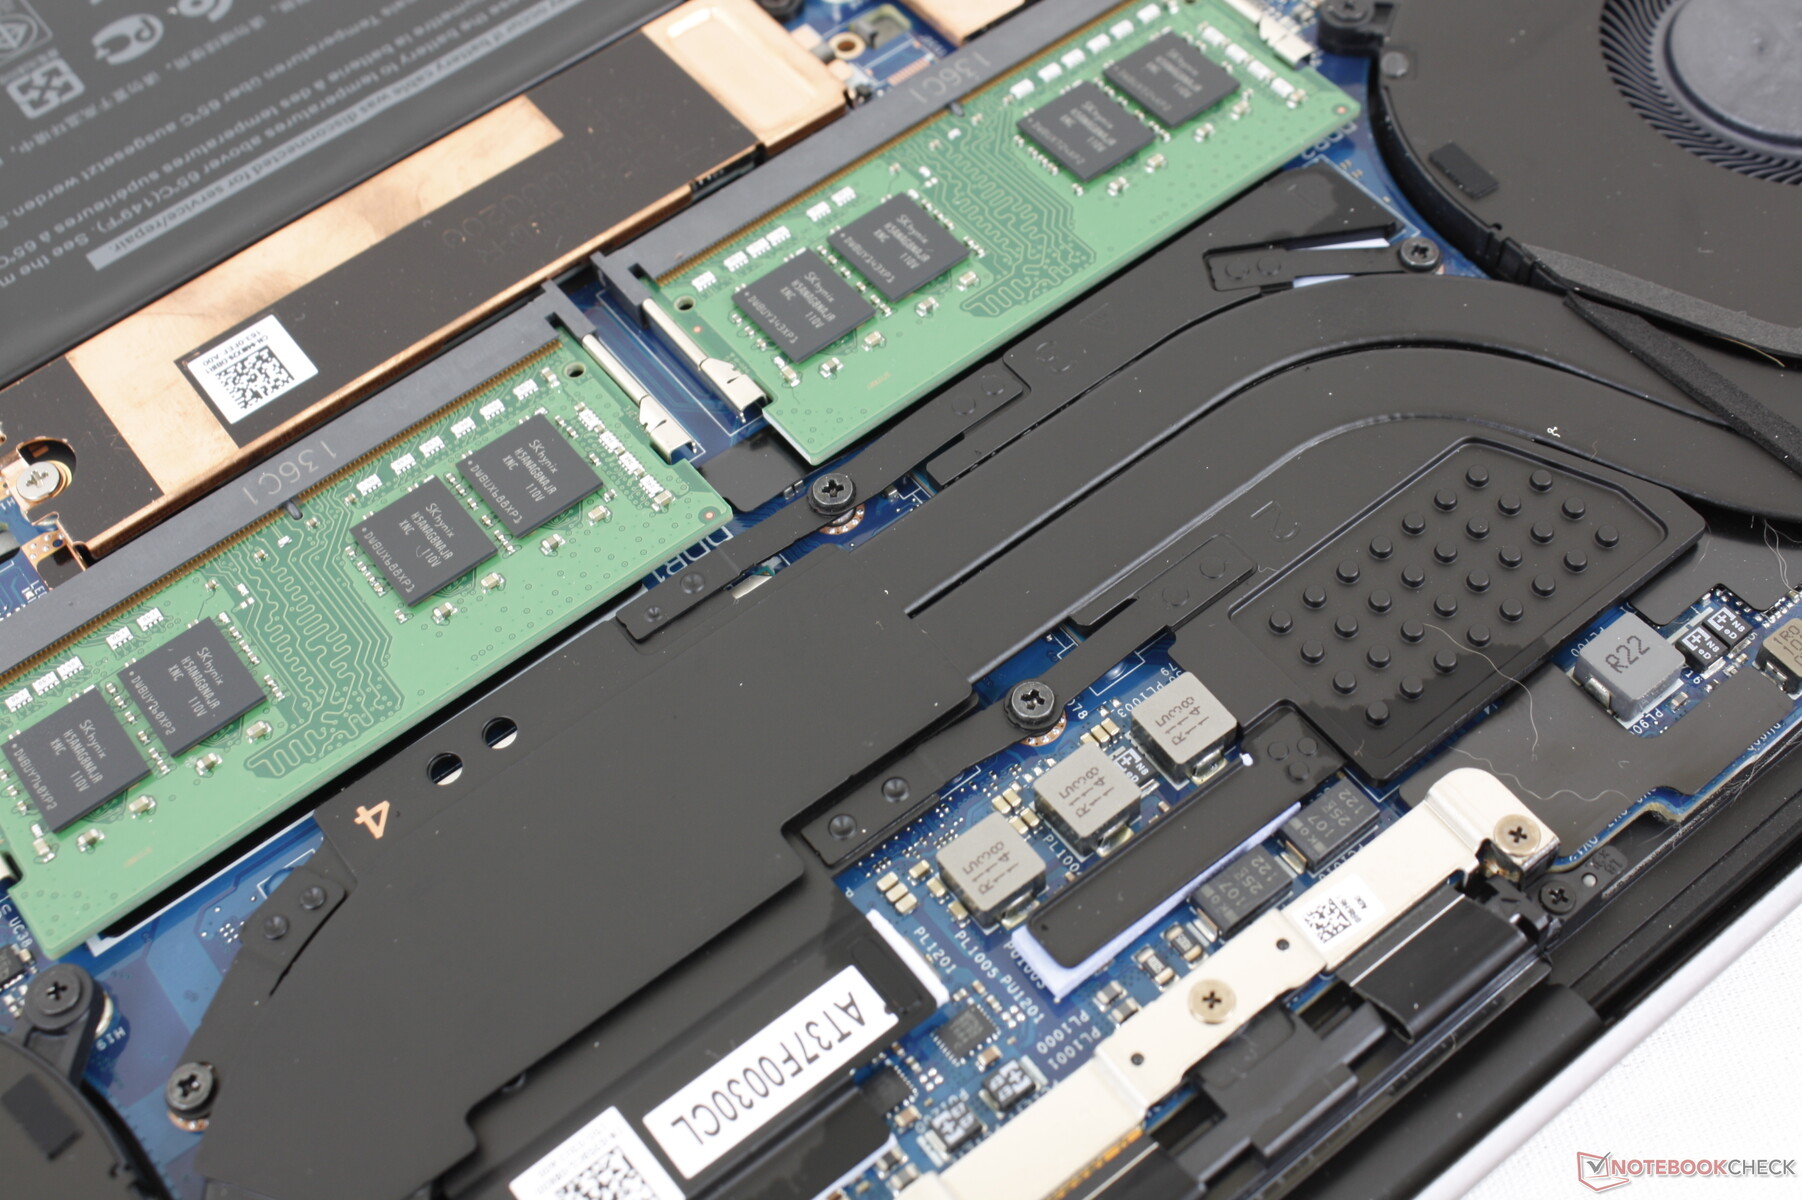
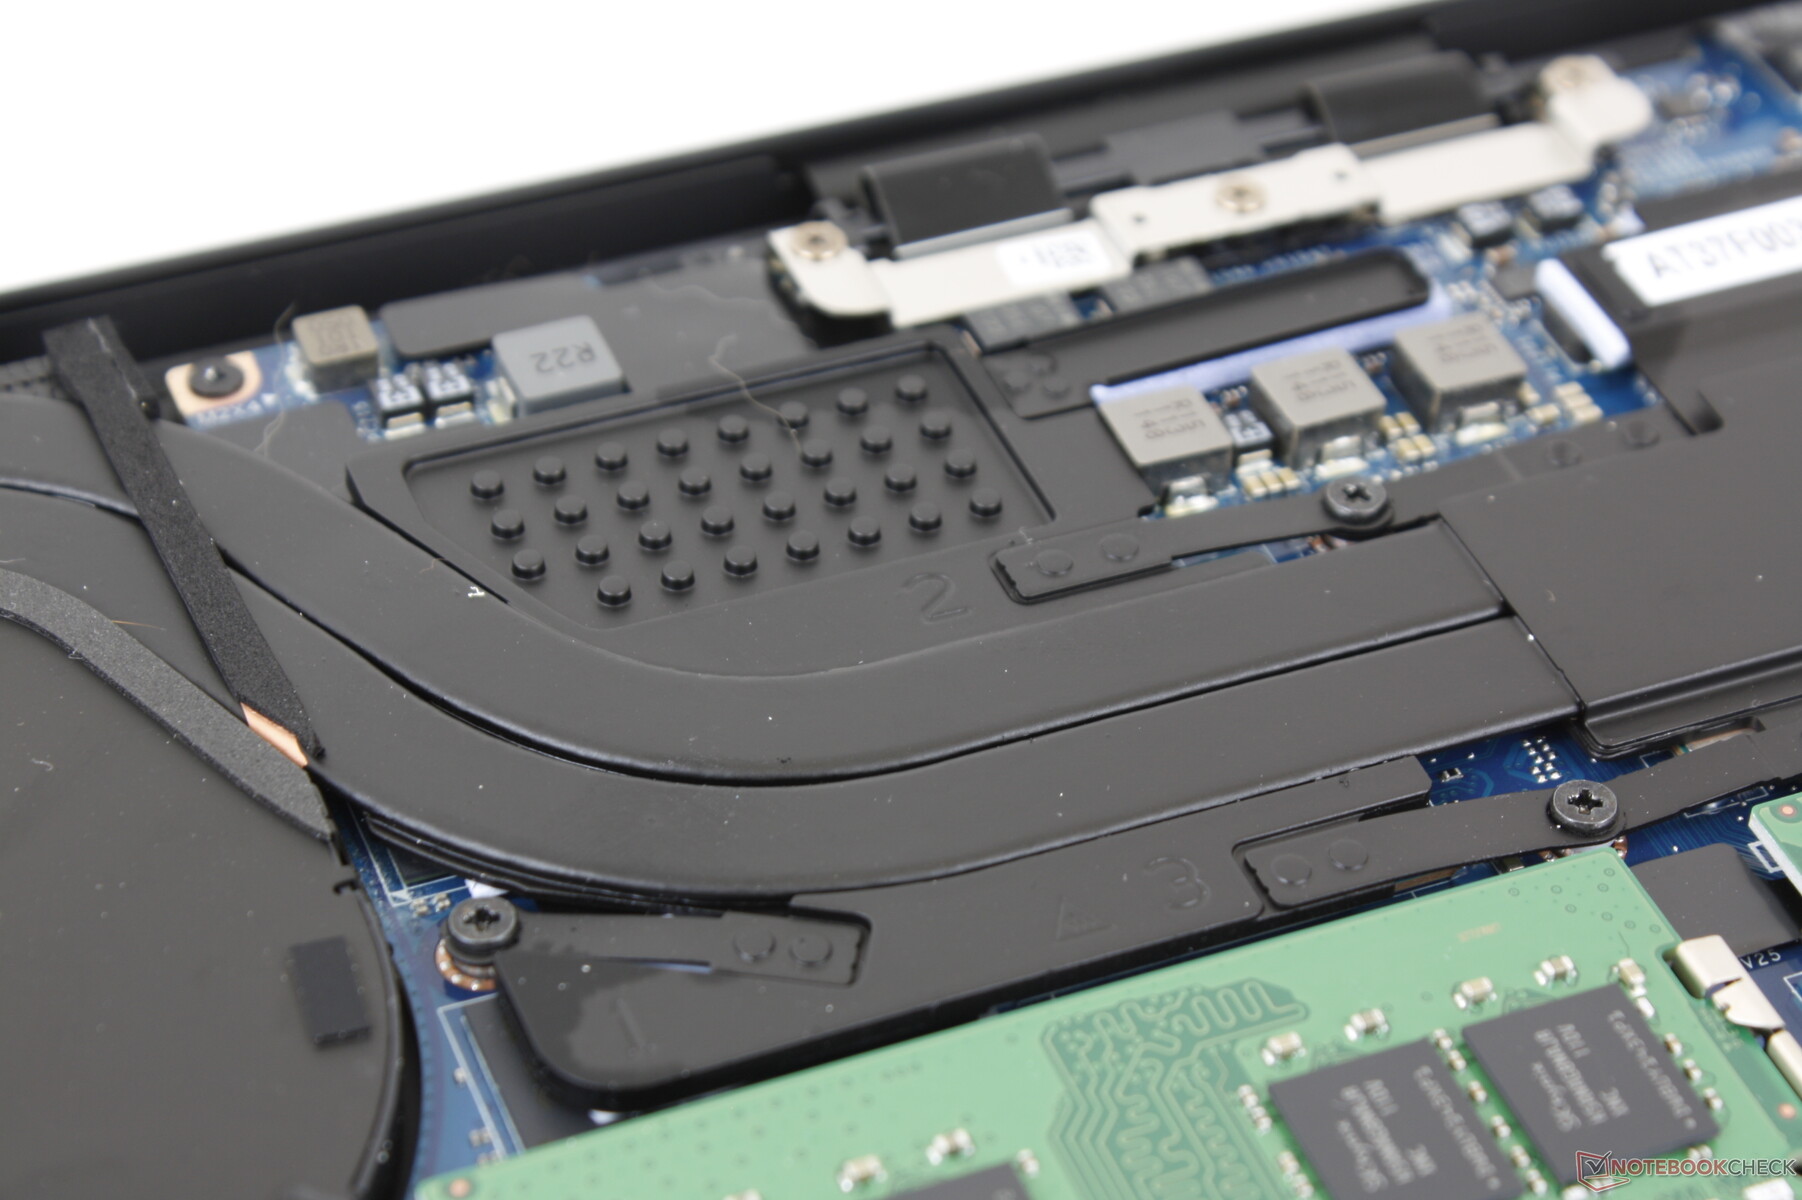
Maintenance
The bottom panel is more difficult to remove when compared to the old Precision 5540 design. The internal layout is otherwise essentially identical to the Precision 5550.
Accessories and Warranty
The retail box includes a handy USB-C to full-size USB-A and HDMI adapter much like for the XPS 15.
Disappointingly, the base warranty is only one year instead of two or three years on many other mobile workstations. Users would have to upgrade to the higher-end Precision 7000 series for the longer base warranty.
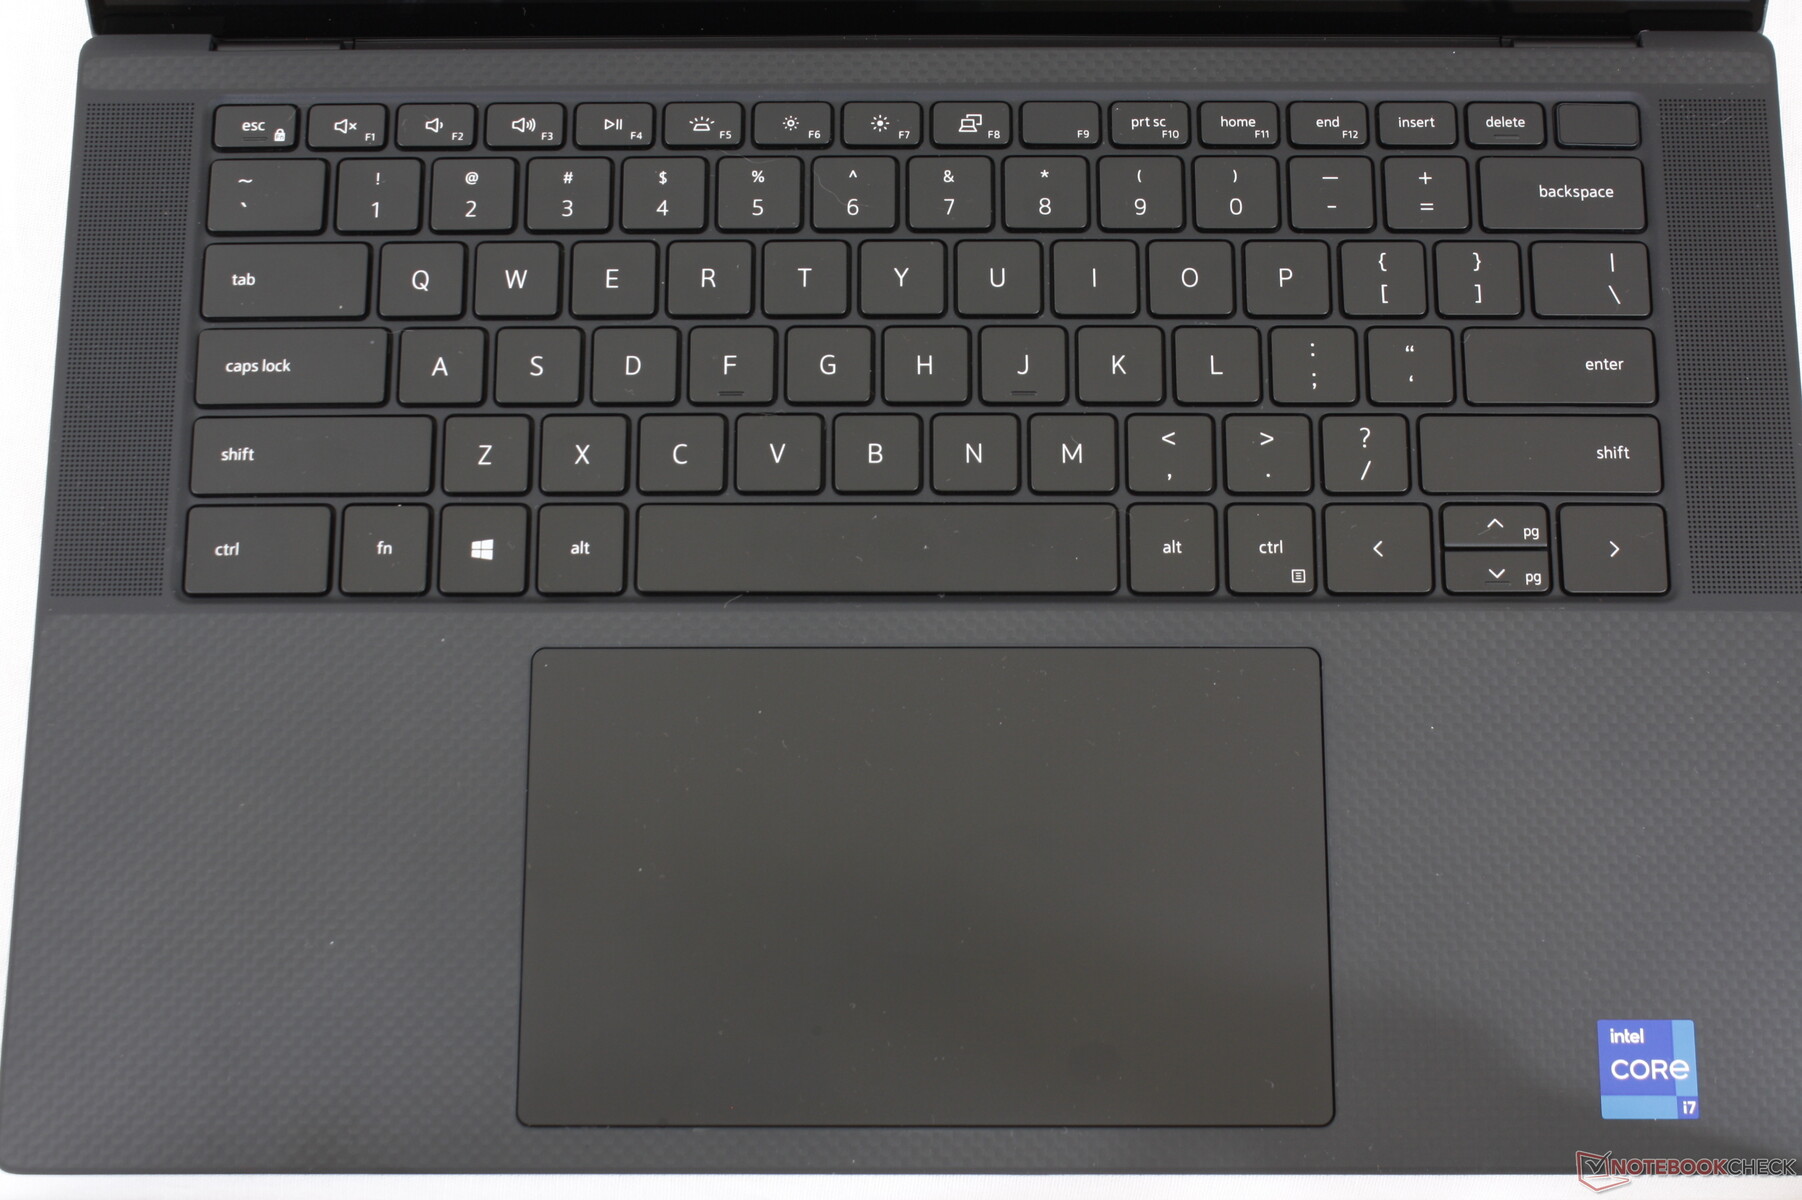
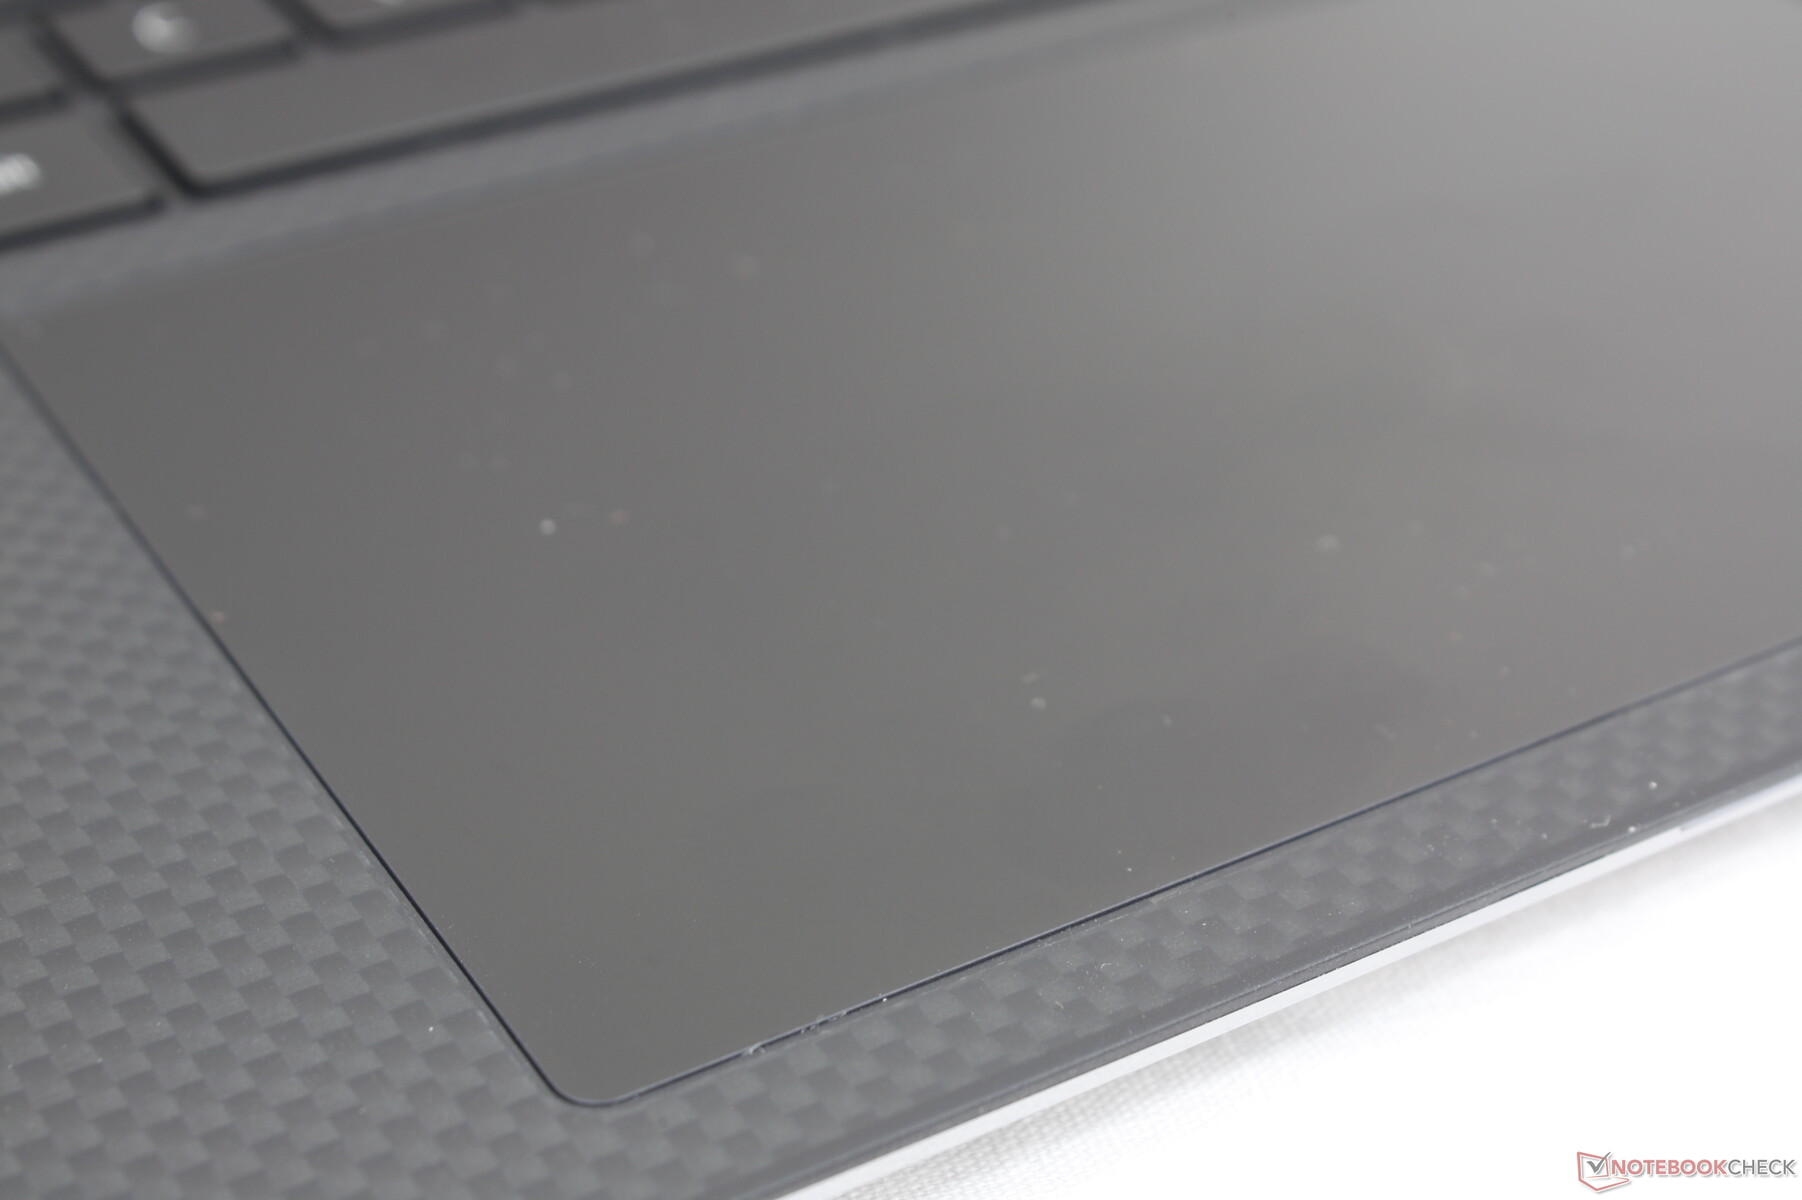
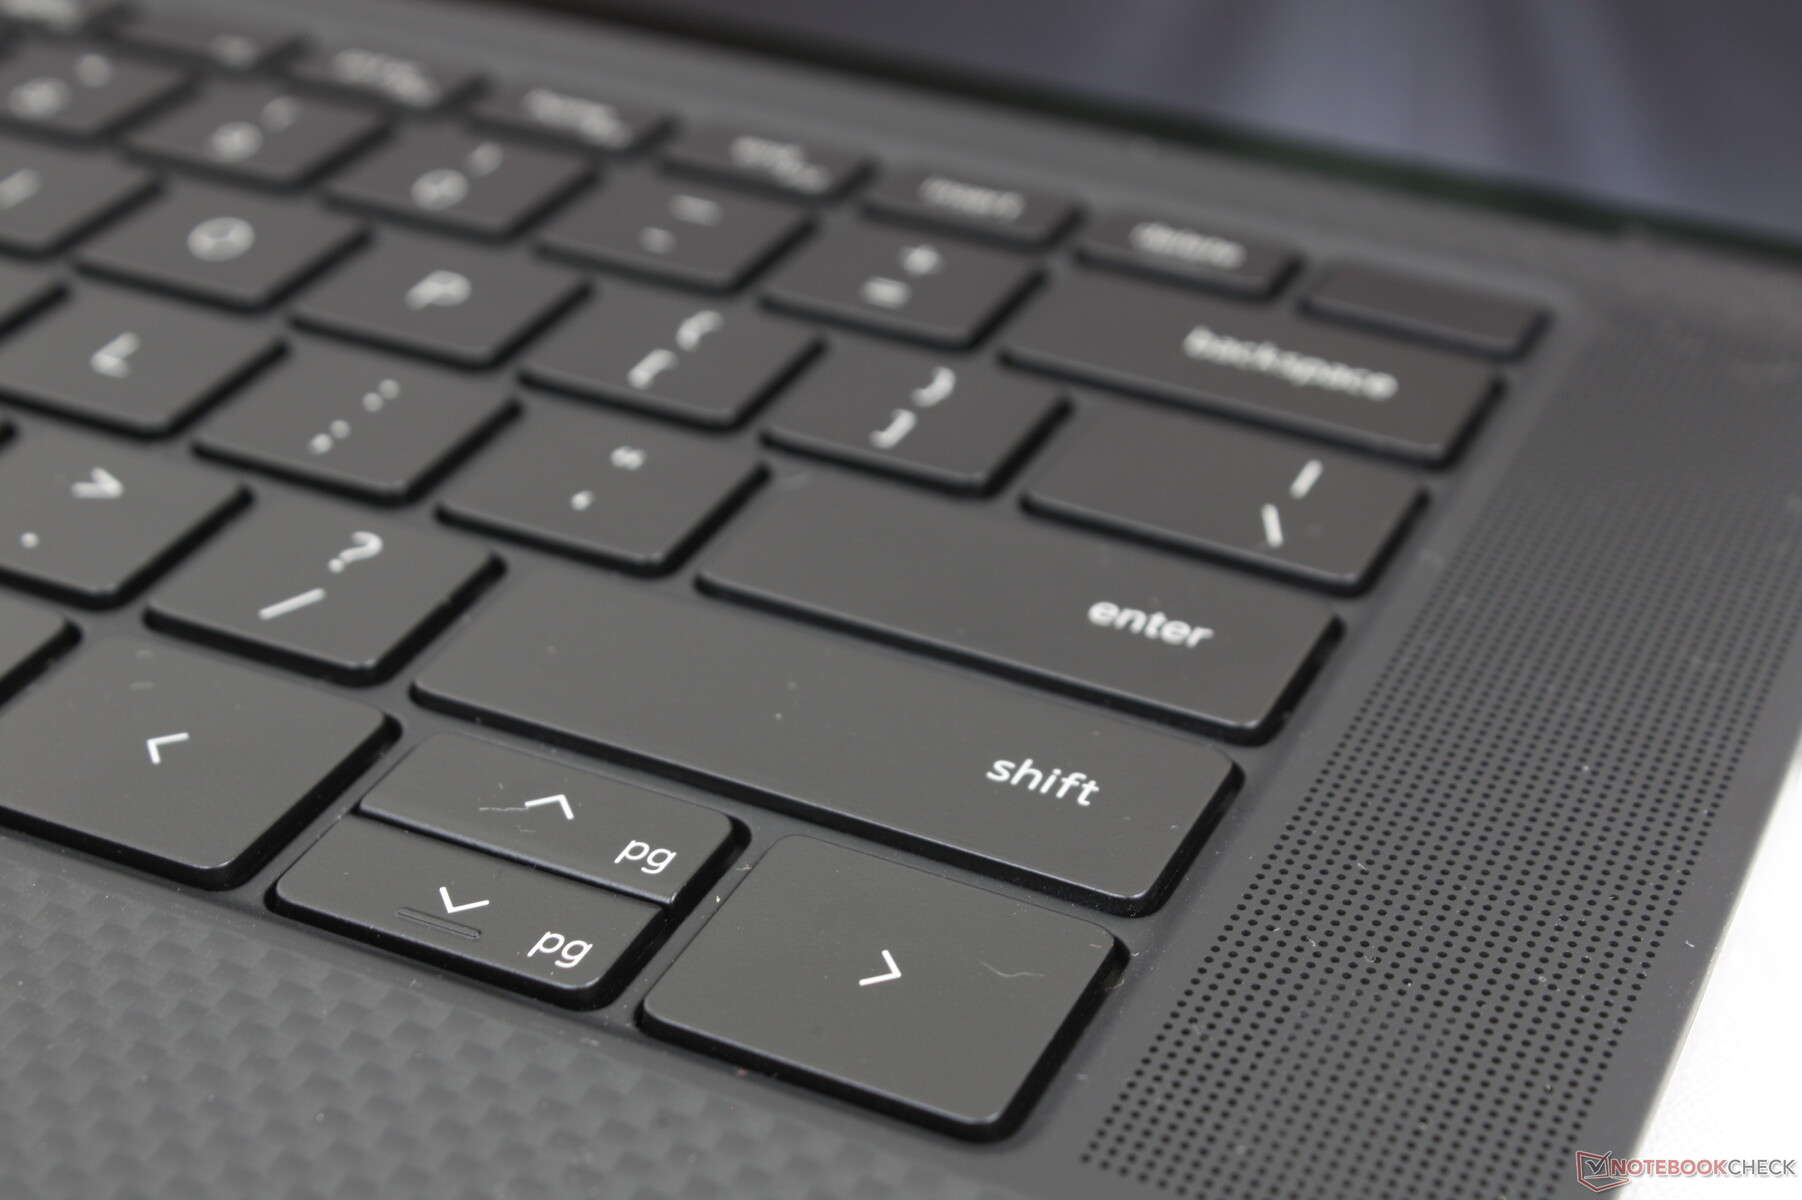
Input Devices

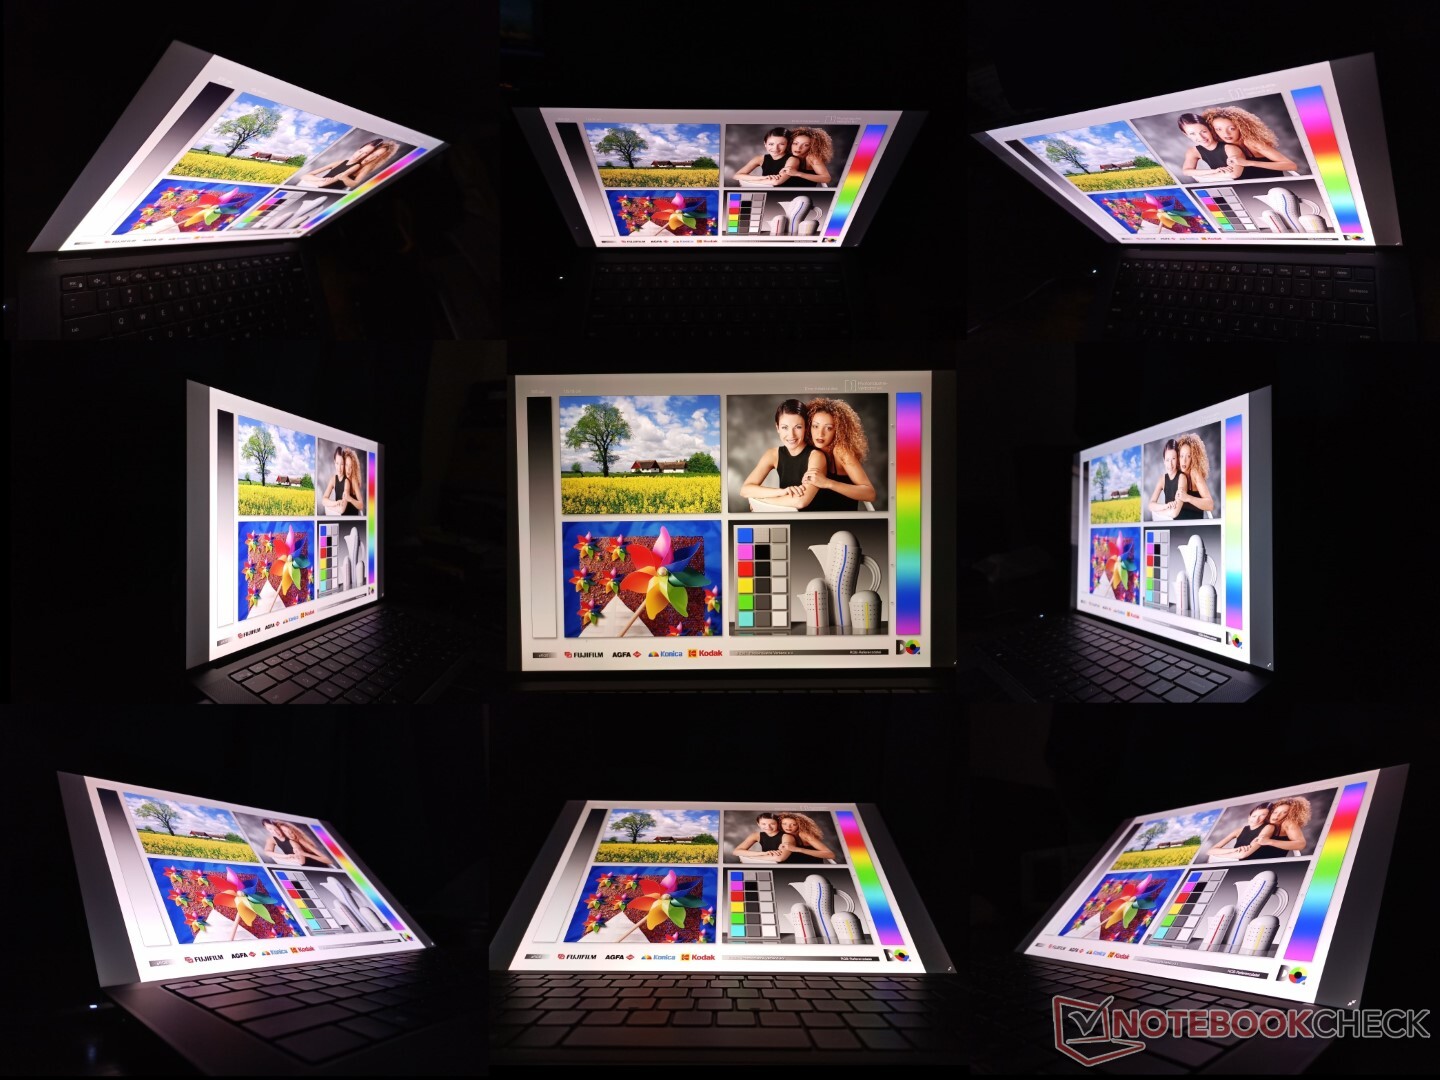
Display
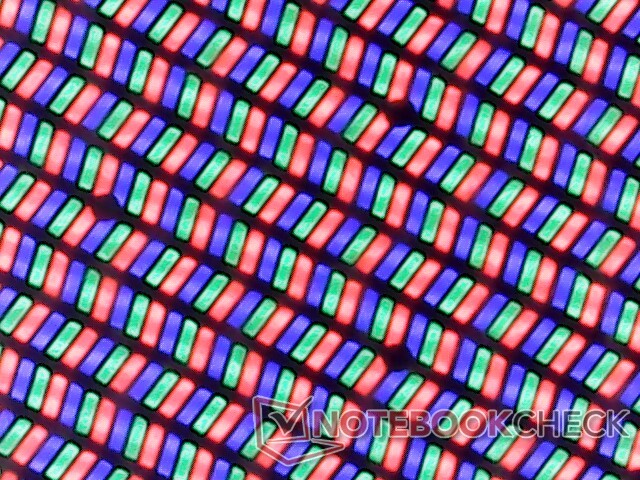
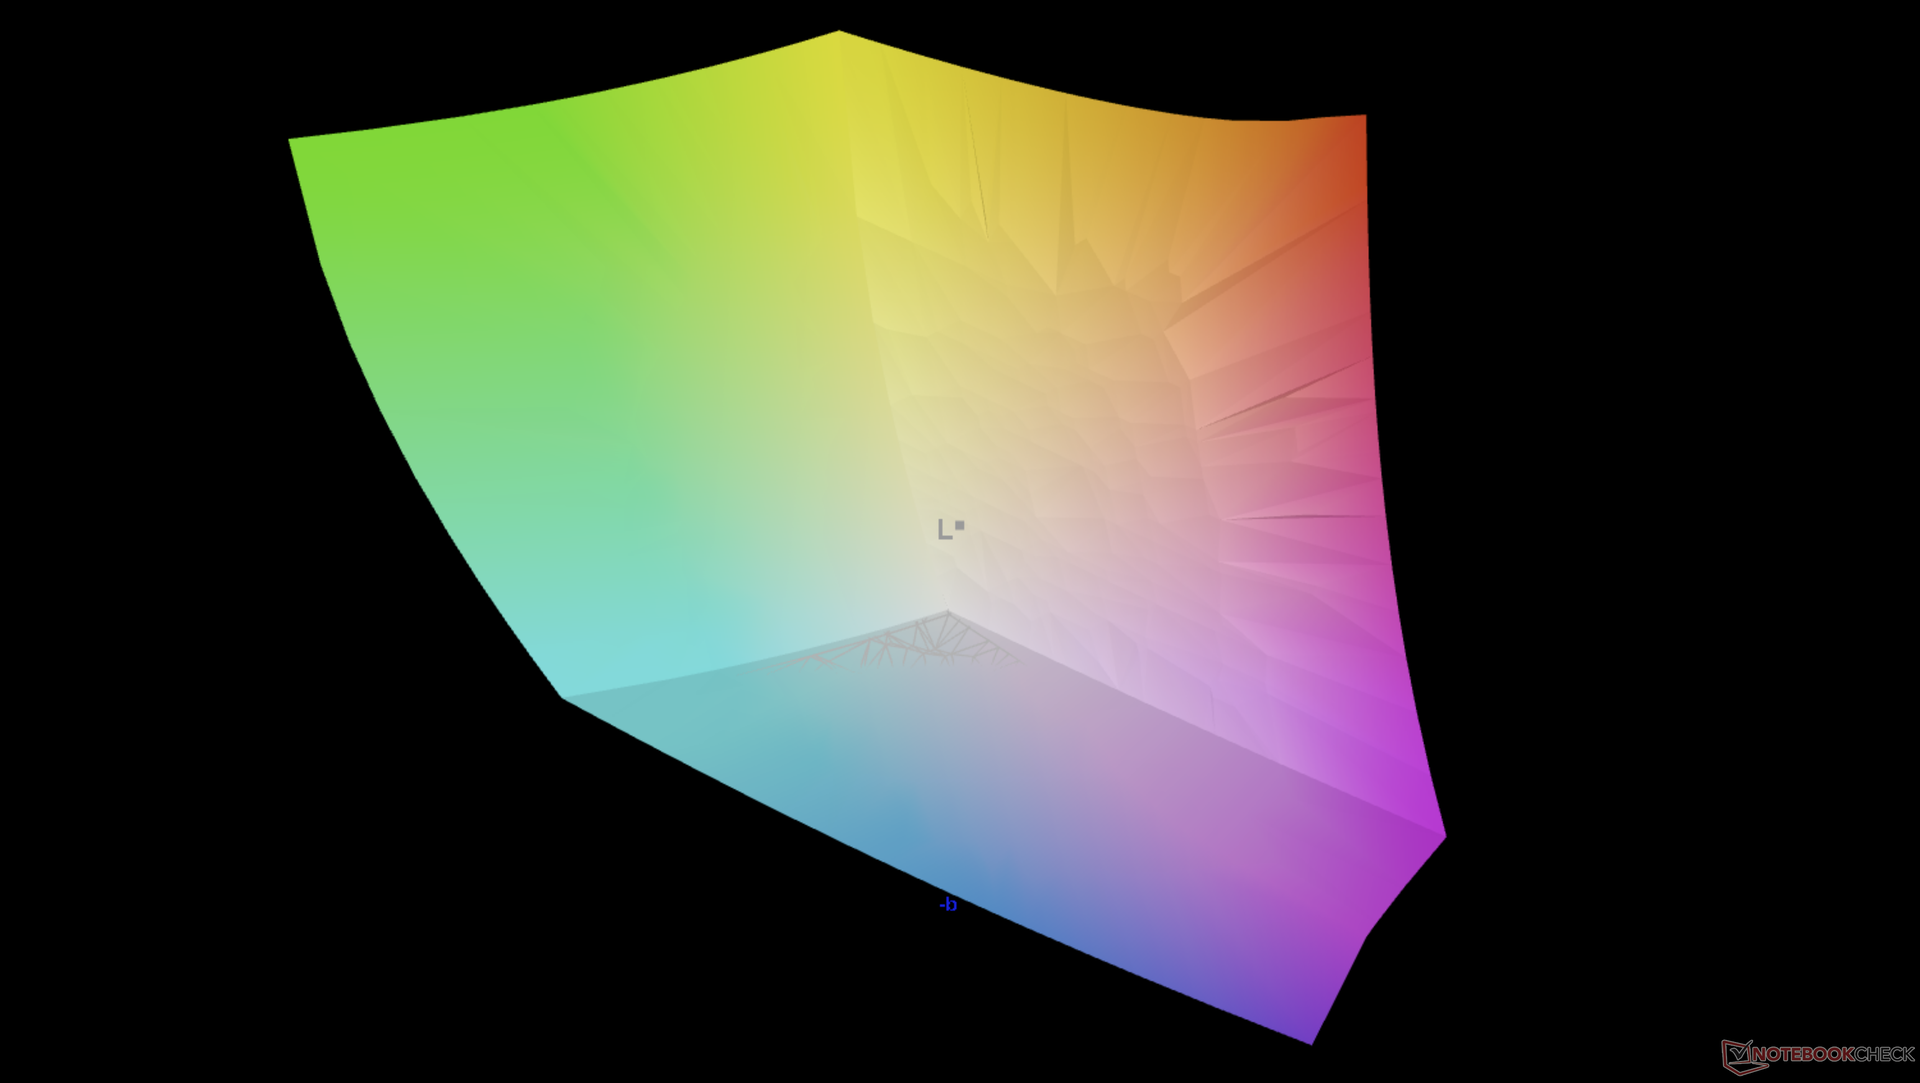
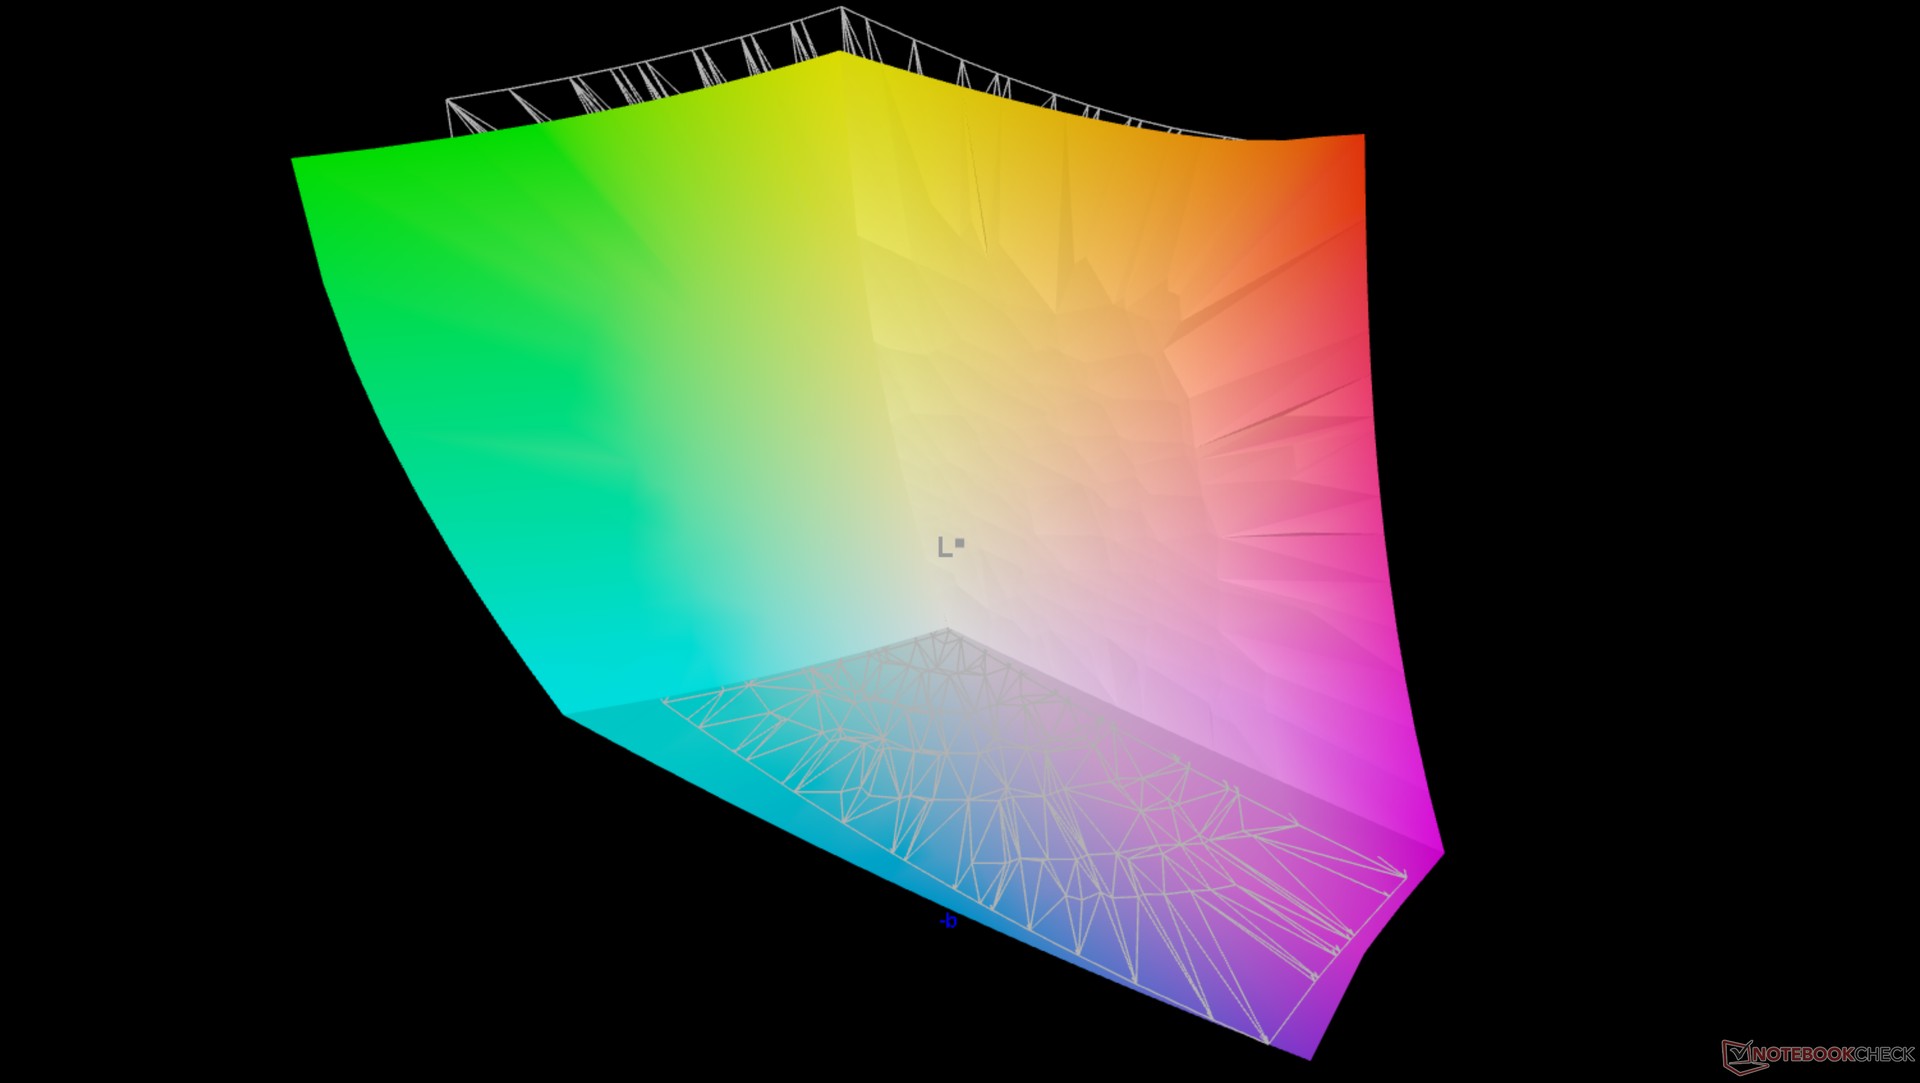
Dell continues to use the same Sharp LQ156R1 IPS touchscreen on all of its 16:10 XPS 15 and Precision 5550/5560 4K SKUs which is fine because this is still a high-end panel with full AdobeRGB coverage, high >1000:1 contrast ratio, and bright ~500 nit backlight. The viewing experience is therefore consistent between the latest XPS 15 and Precision 55x0 models. A lesser matte 1200p non-touch display is available on some SKUs just like on the XPS 15, but OLED is curiously omitted on the Precision 5560.
The slow black-white and gray-gray response times continue to be the main disadvantage meaning ghosting is very noticeable especially when compared to OLED. This won't be a huge issue for most CAD-type applications.
| |||||||||||||||||||||||||
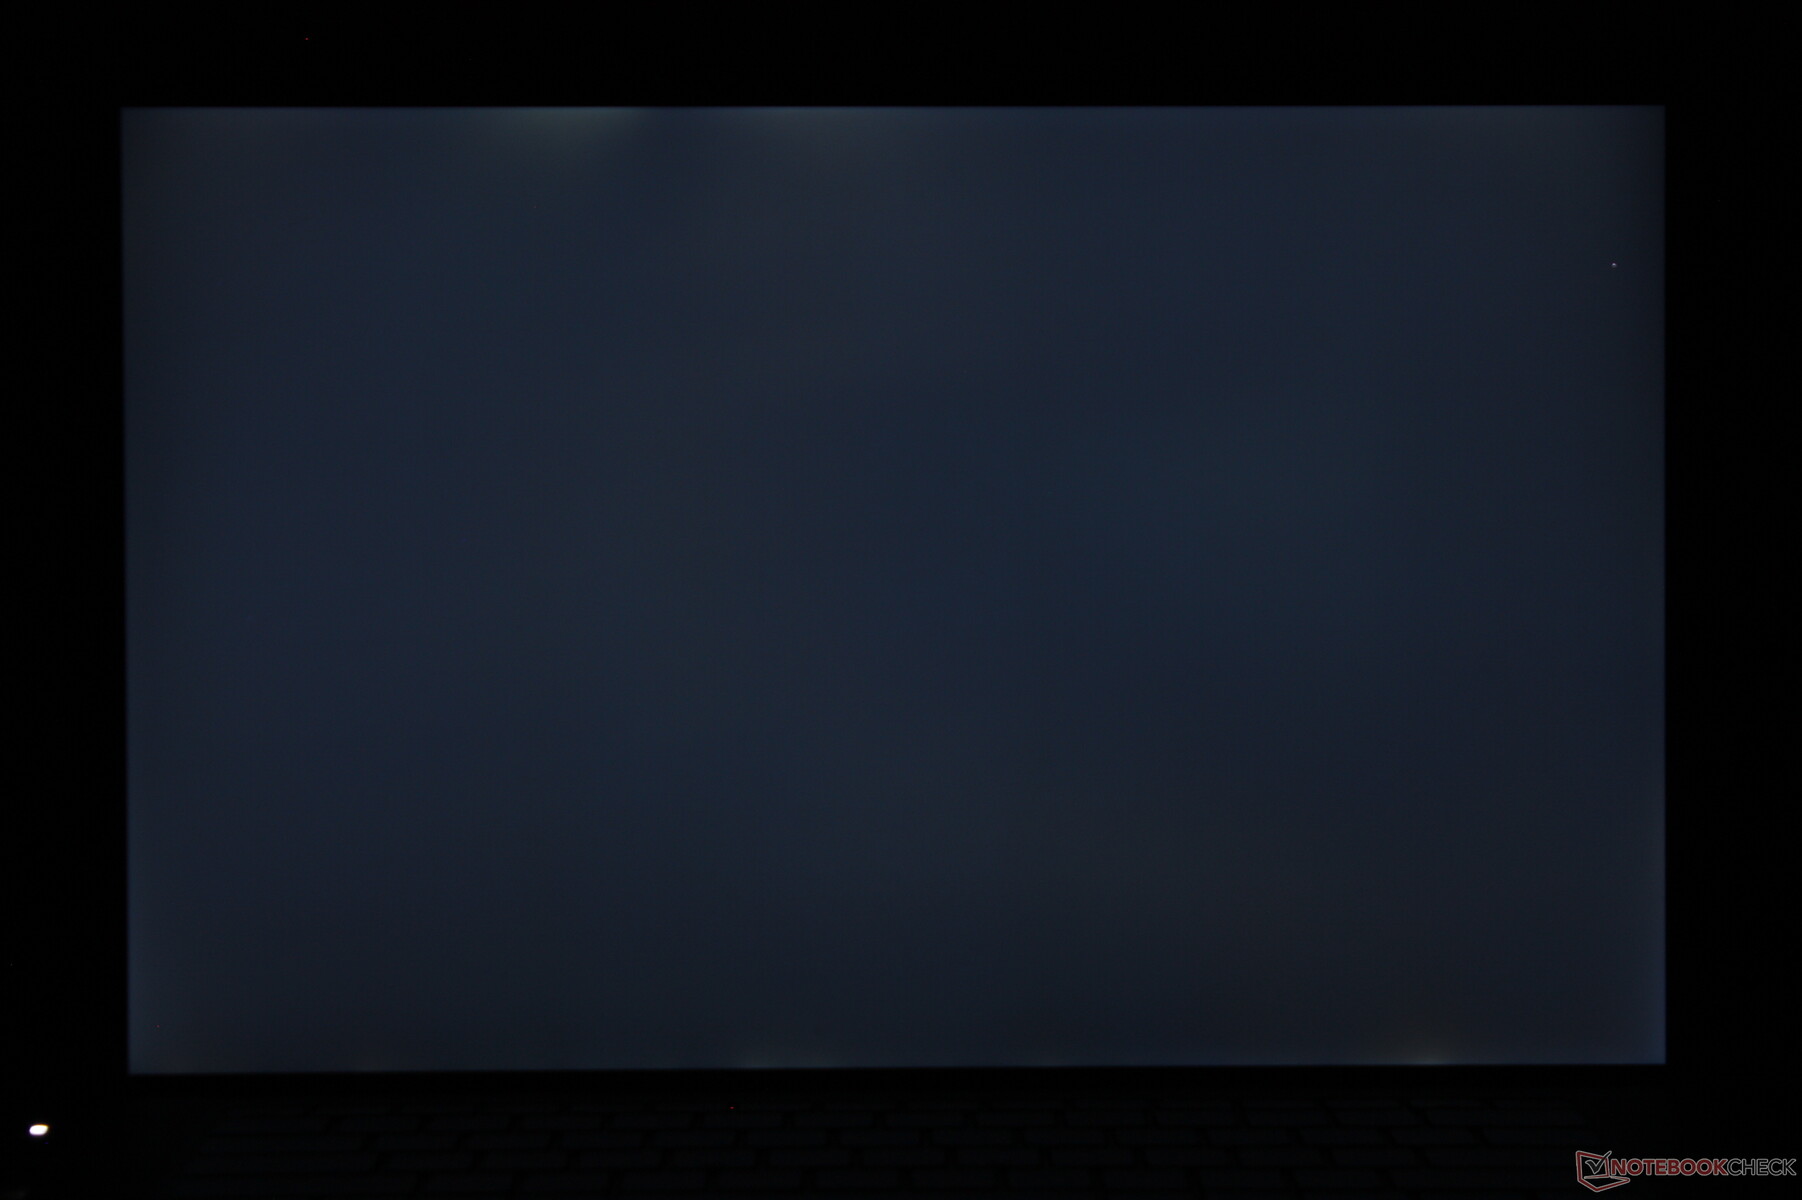
Brightness Distribution: 83 %
Center on Battery: 501.5 cd/m²
Contrast: 1140:1 (Black: 0.44 cd/m²)
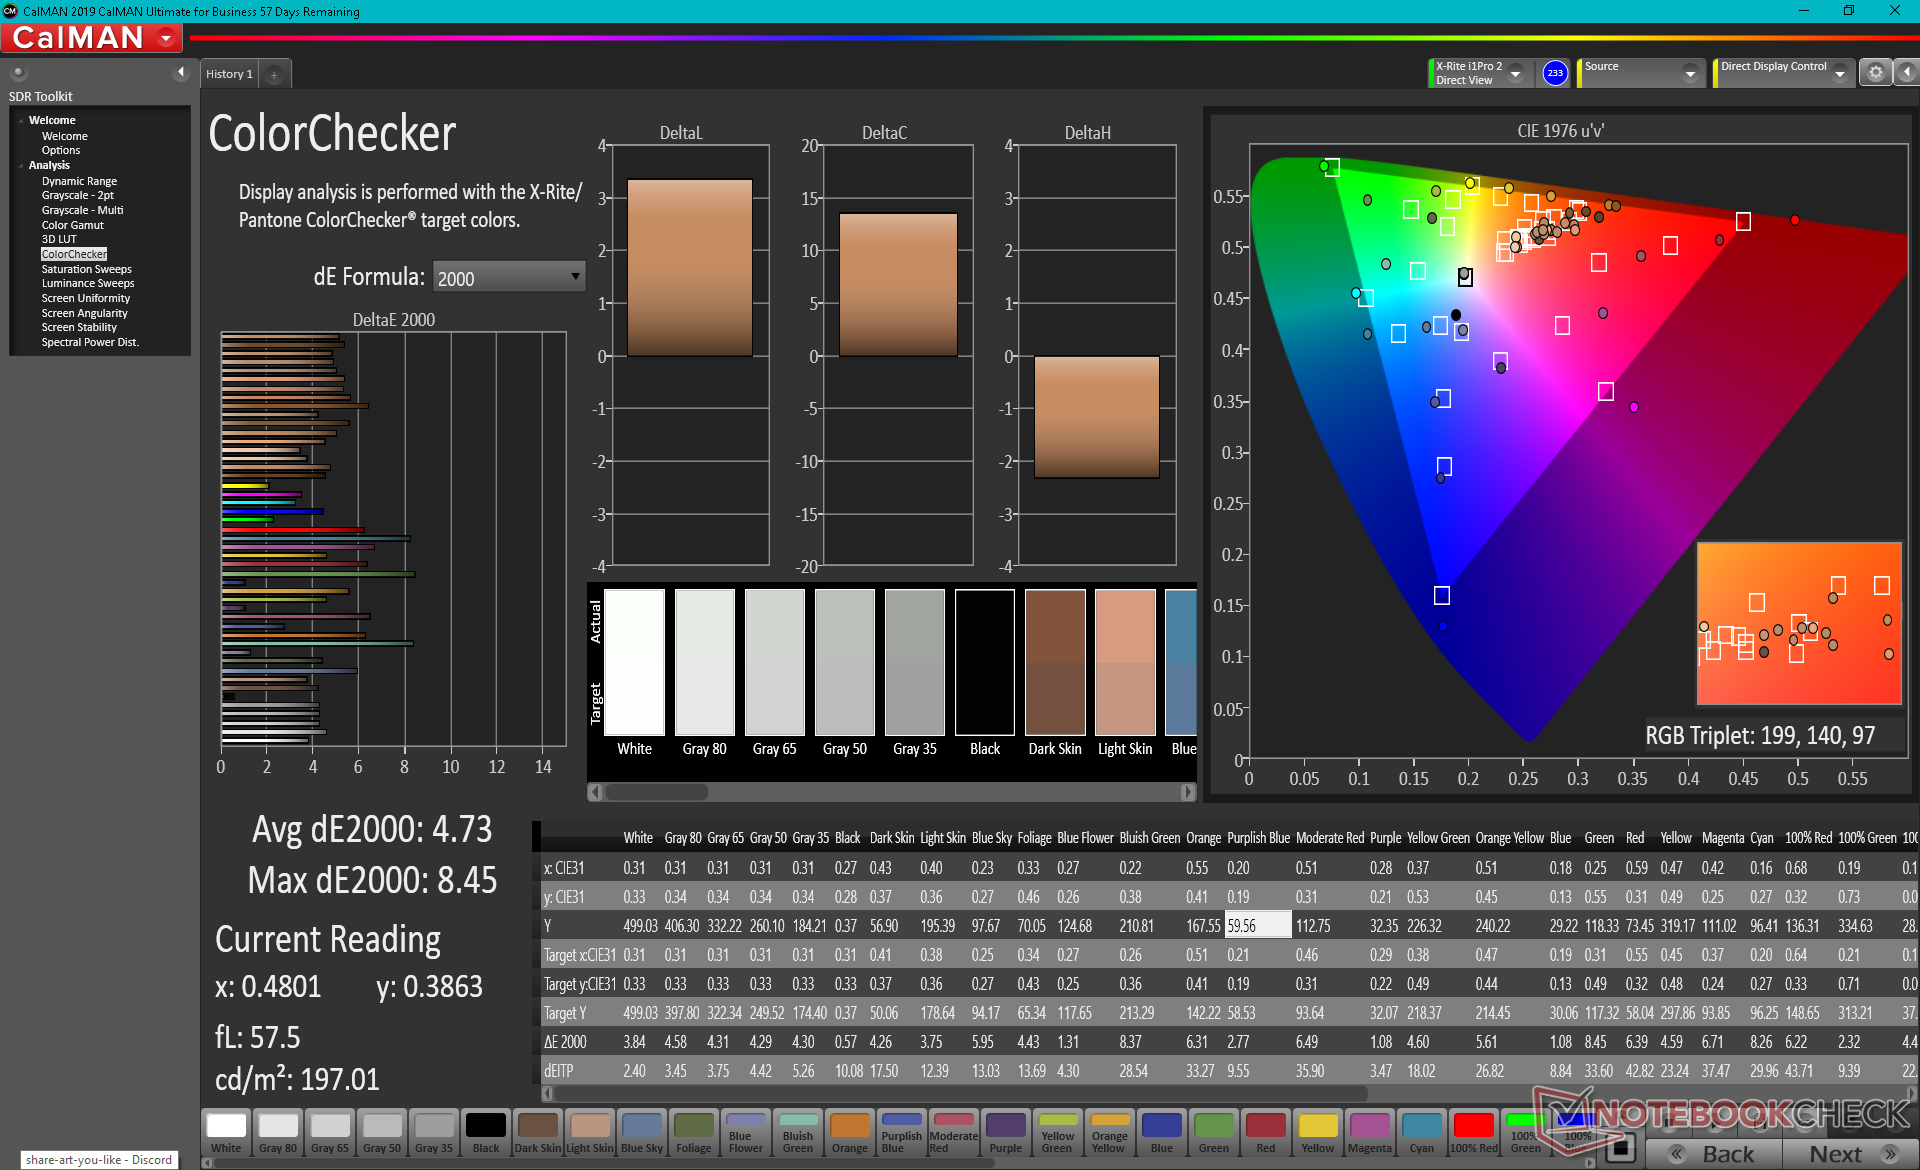
ΔE ColorChecker Calman: 4.73 | ∀{0.5-29.43 Ø4.72}
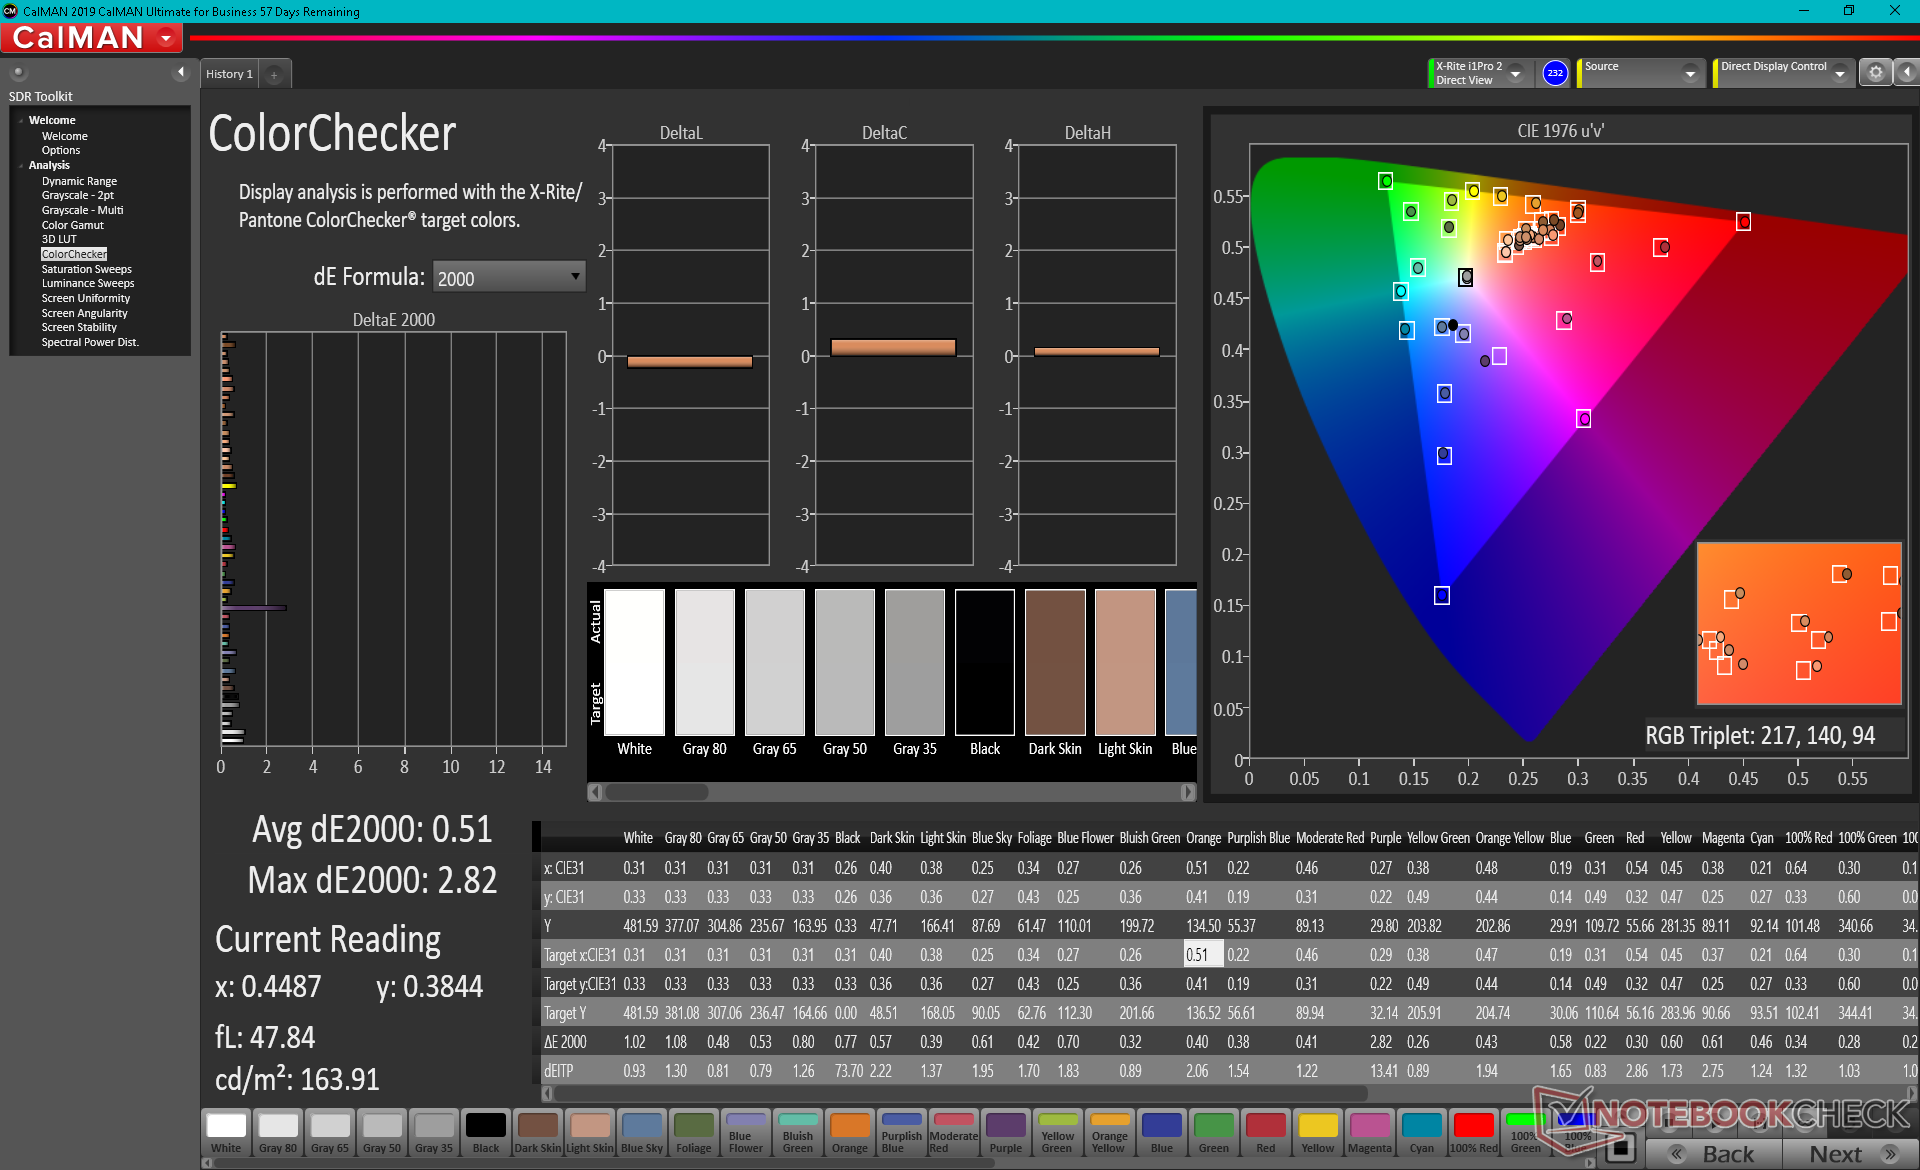
calibrated: 0.51
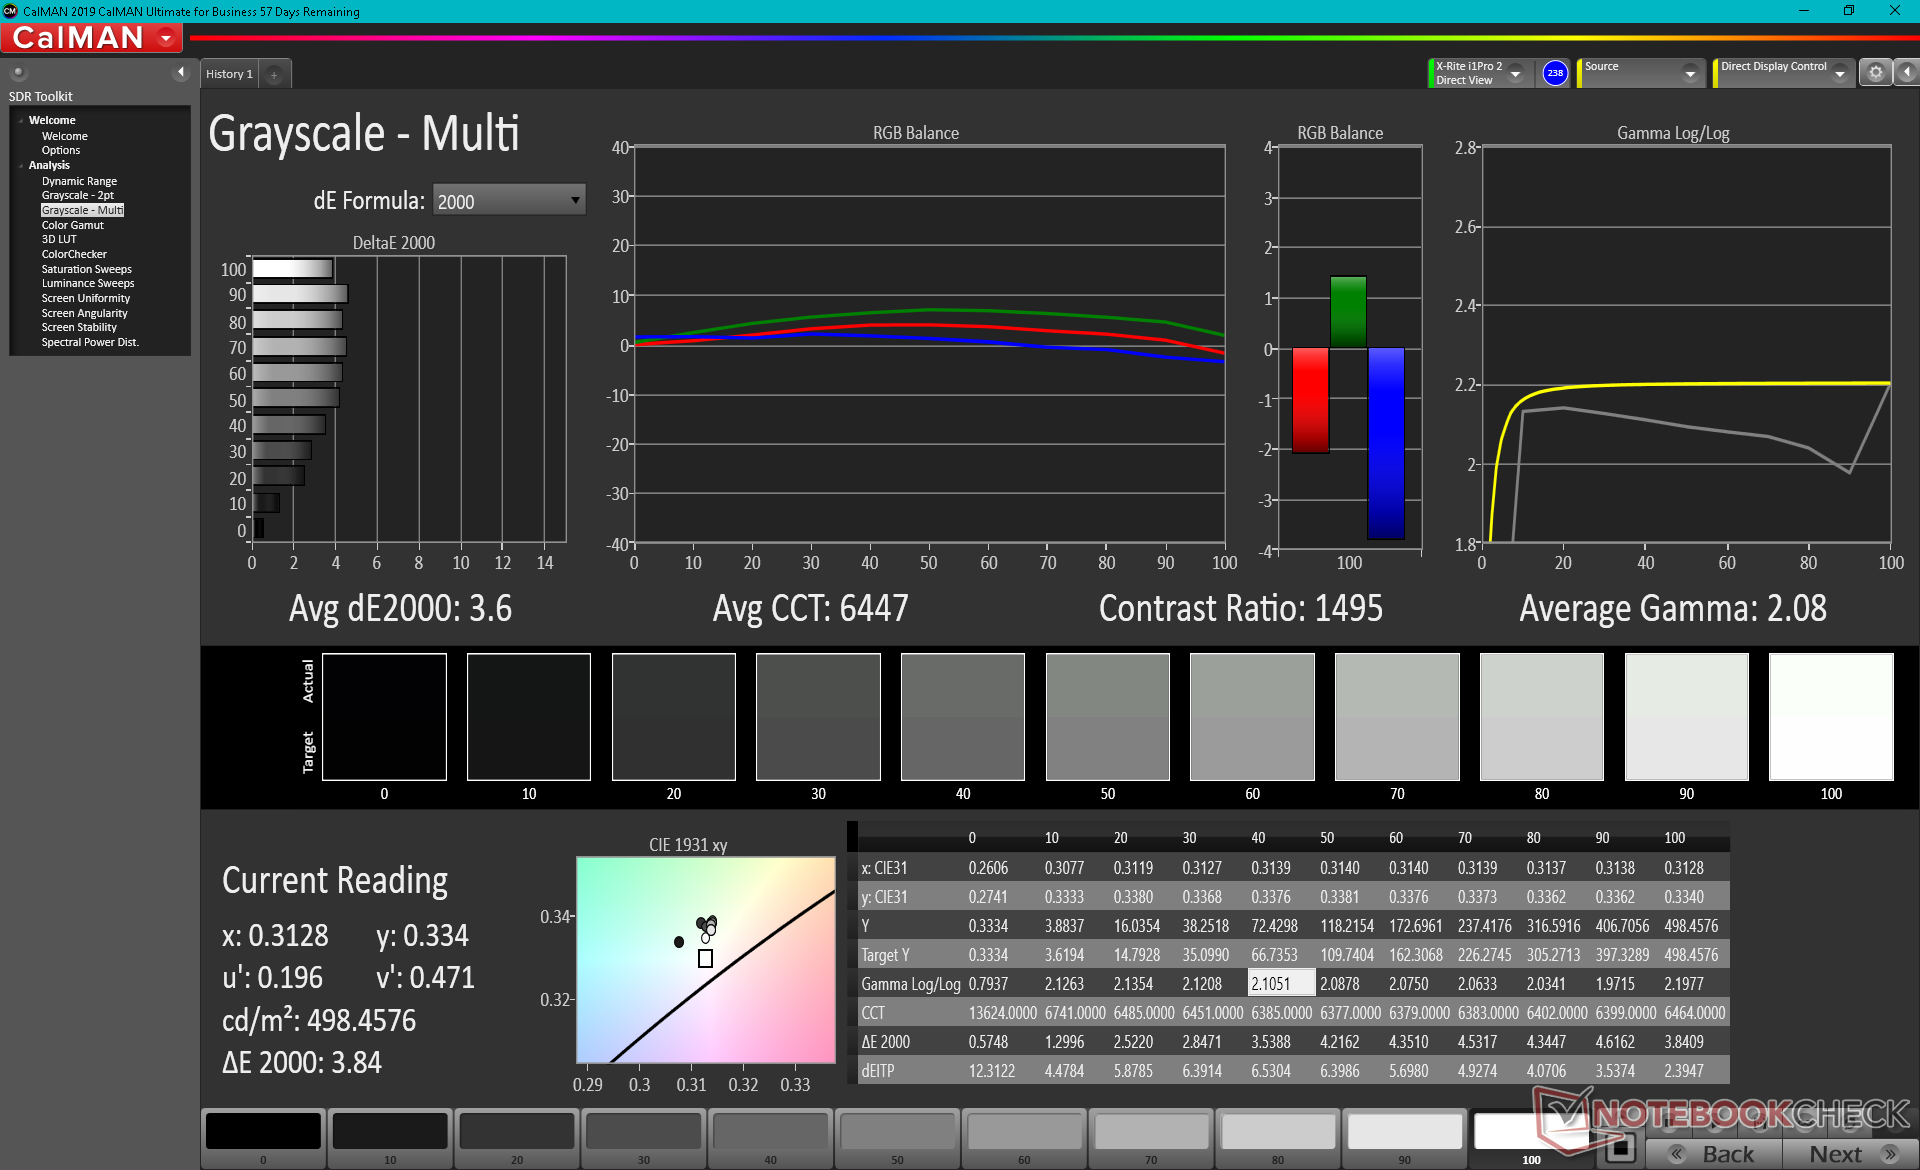
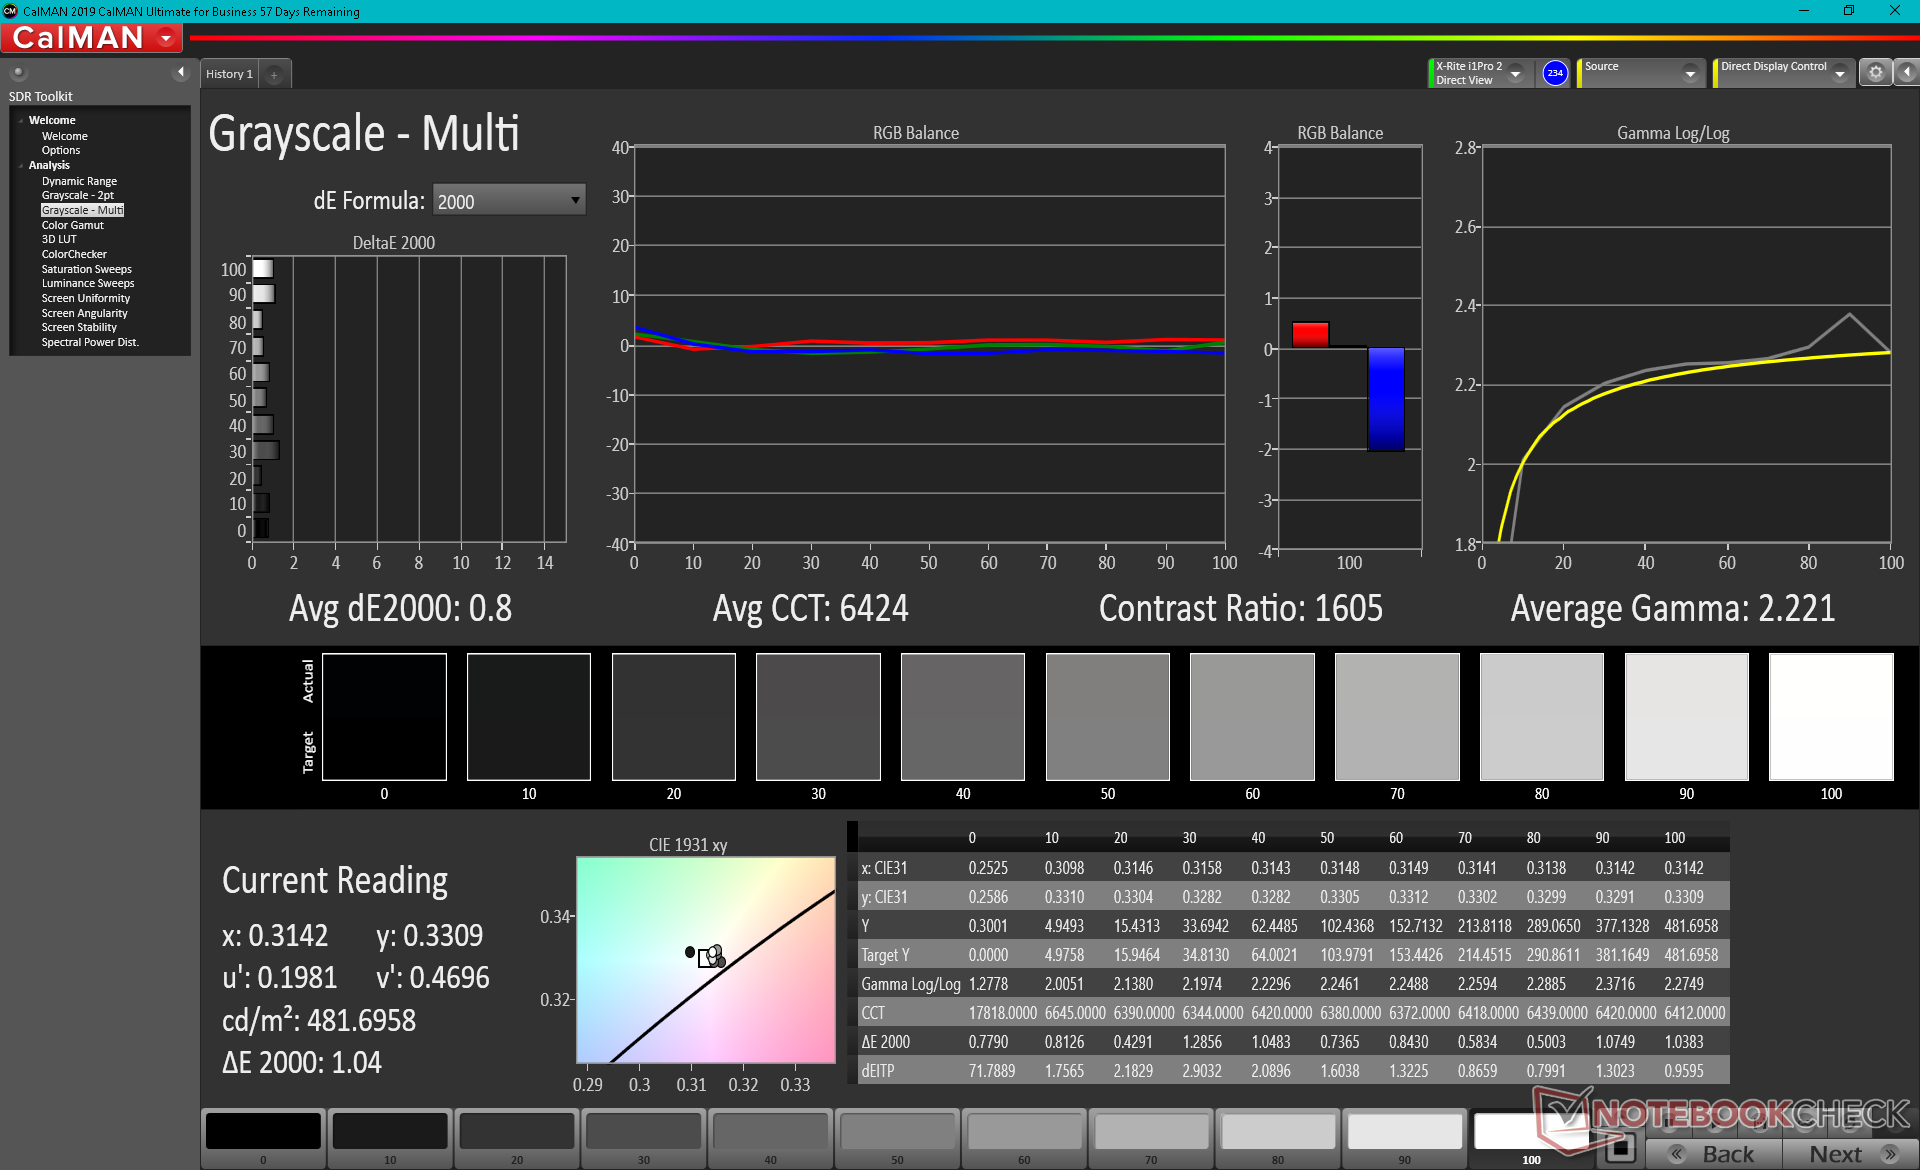
ΔE Greyscale Calman: 3.6 | ∀{0.09-98 Ø4.97}
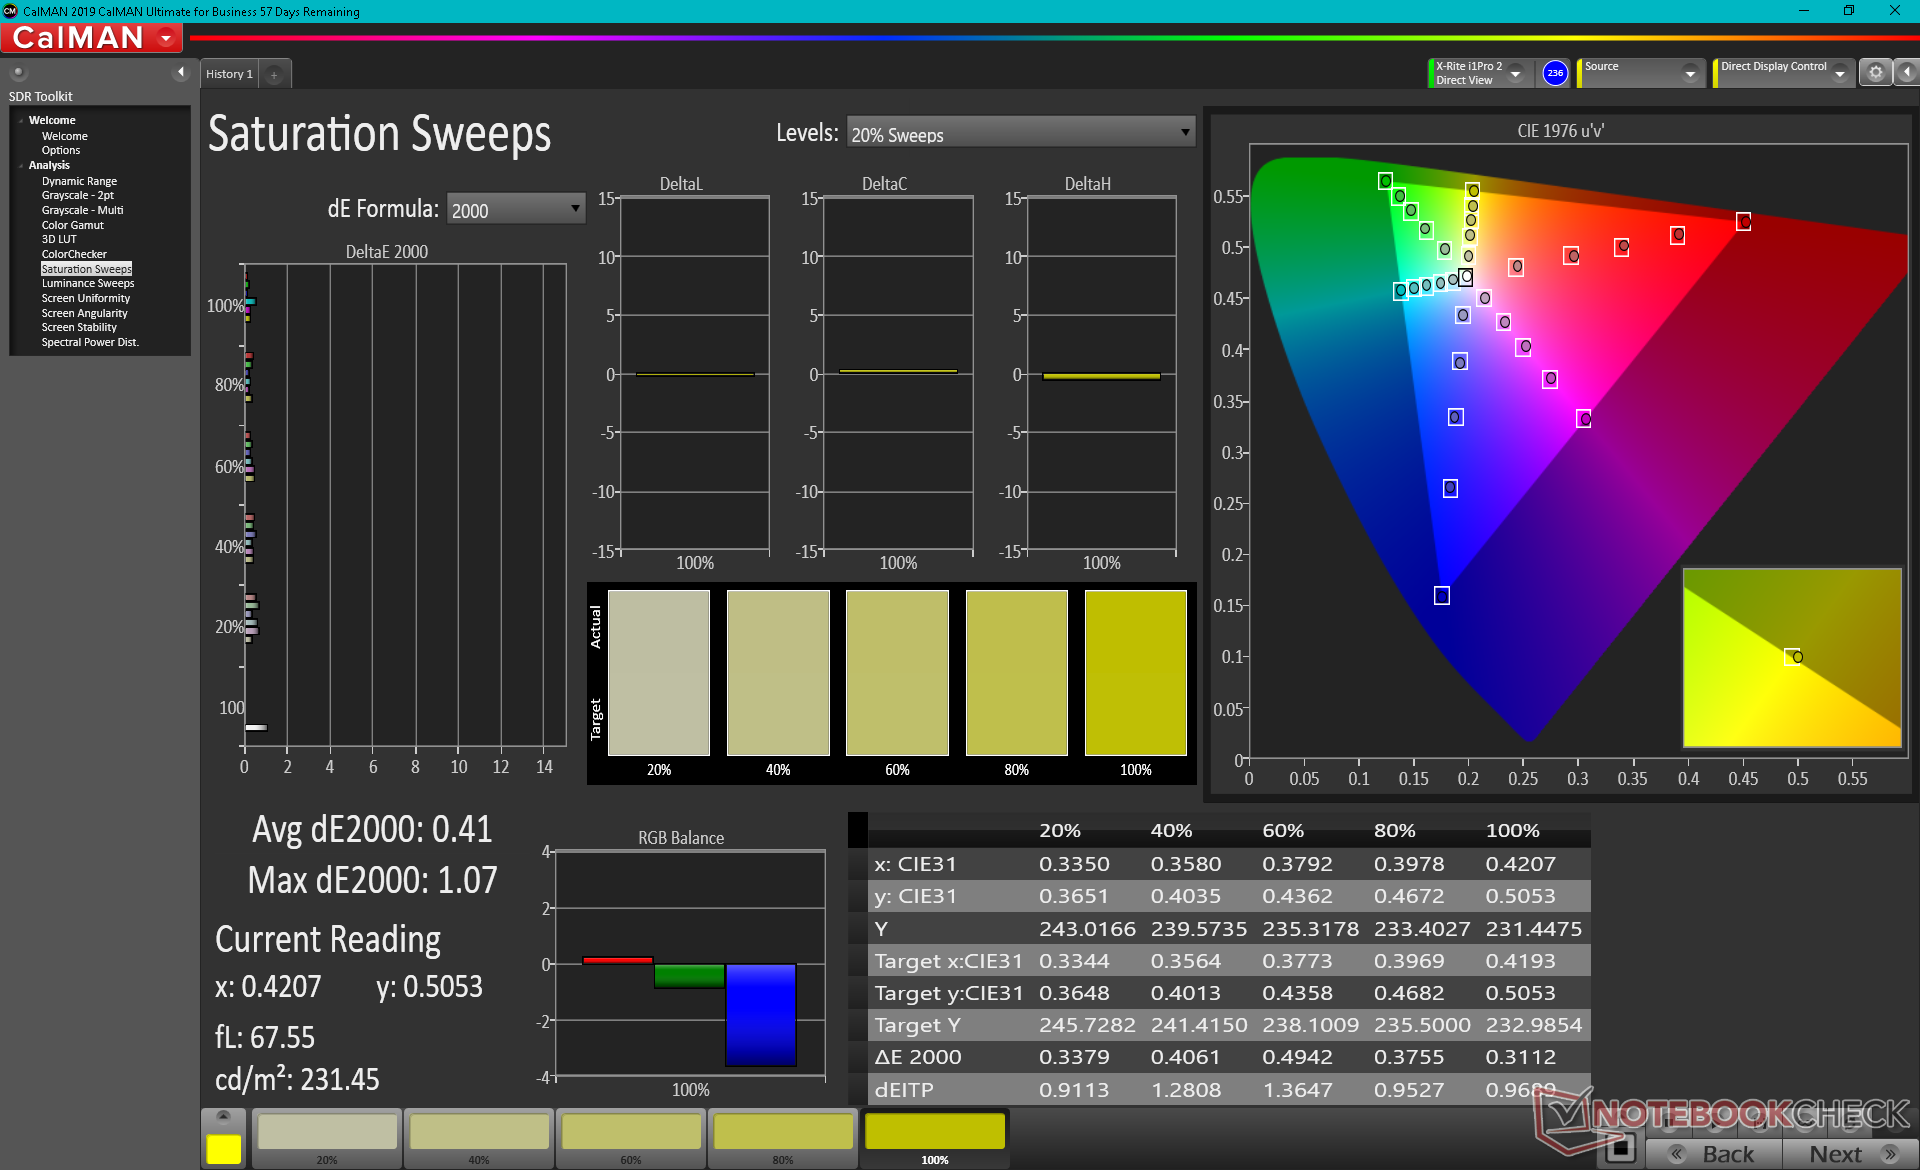
100% AdobeRGB 1998 (Argyll 3D)
100% sRGB (Argyll 3D)
94.9% Display P3 (Argyll 3D)
Gamma: 2.08
CCT: 6447 K
| Dell Precision 5000 5560 Sharp LQ156R1, IPS, 15.6", 3840x2400 | Lenovo ThinkPad P15 G2-20YQ001JGE N156HCE_GN1, IPS, 15.6", 1920x1080 | HP ZBook Studio 15 G8 SDC4145, OLED, 15.6", 3840x2160 | Asus ProArt StudioBook Pro 15 W500G5T AU Optronics B156ZAN03.1, IPS, 15.6", 3840x2160 | Dell Precision 7550 AU Optronics B156ZAN, IPS, 15.6", 3840x2160 | Dell Precision 5550 P91F Sharp LQ156R1, IPS, 15.6", 3840x2400 | Razer Blade 15 Studio Edition 2020 Samsung SDCA029, OLED, 15.6", 3840x2160 | |
|---|---|---|---|---|---|---|---|
| Display | -19% | 0% | -7% | -5% | -2% | 1% | |
| Display P3 Coverage (%) | 94.9 | 68.6 -28% | 99.9 5% | 82.1 -13% | 82.1 -13% | 89.9 -5% | 99.9 5% |
| sRGB Coverage (%) | 100 | 99.8 0% | 100 0% | 97.6 -2% | 99.6 0% | 100 0% | 100 0% |
| AdobeRGB 1998 Coverage (%) | 100 | 70.6 -29% | 95.3 -5% | 95 -5% | 96.8 -3% | 99.9 0% | 97.3 -3% |
| Response Times | 34% | 94% | -19% | -10% | -5% | 90% | |
| Response Time Grey 50% / Grey 80% * (ms) | 47.2 ? | 37.6 ? 20% | 2.4 ? 95% | 58 ? -23% | 51.2 ? -8% | 46 ? 3% | 4 ? 92% |
| Response Time Black / White * (ms) | 30.4 ? | 16 ? 47% | 2.4 ? 92% | 35 ? -15% | 34 ? -12% | 34 ? -12% | 4 ? 87% |
| PWM Frequency (Hz) | 26040 ? | 240.4 ? | |||||
| Screen | 9% | -73% | 10% | -68% | -79% | 140% | |
| Brightness middle (cd/m²) | 501.5 | 498 -1% | 379.6 -24% | 344 -31% | 473.5 -6% | 469.8 -6% | 380 -24% |
| Brightness (cd/m²) | 467 | 490 5% | 380 -19% | 335 -28% | 461 -1% | 464 -1% | 388 -17% |
| Brightness Distribution (%) | 83 | 95 14% | 95 14% | 93 12% | 90 8% | 85 2% | 93 12% |
| Black Level * (cd/m²) | 0.44 | 0.39 11% | 0.37 16% | 0.55 -25% | 0.42 5% | 0.018 96% | |
| Contrast (:1) | 1140 | 1277 12% | 930 -18% | 861 -24% | 1119 -2% | 21111 1752% | |
| Colorchecker dE 2000 * | 4.73 | 2.1 56% | 5.15 -9% | 1.76 63% | 4.8 -1% | 5.16 -9% | 5.47 -16% |
| Colorchecker dE 2000 max. * | 8.45 | 5.6 34% | 7.79 8% | 4.31 49% | 8.73 -3% | 9.33 -10% | 8.19 3% |
| Colorchecker dE 2000 calibrated * | 0.51 | 0.8 -57% | 3.1 -508% | 3.08 -504% | 3.75 -635% | 3.04 -496% | |
| Greyscale dE 2000 * | 3.6 | 3.4 6% | 2.6 28% | 3.12 13% | 5.6 -56% | 5.5 -53% | 5.3 -47% |
| Gamma | 2.08 106% | 2.32 95% | 1.99 111% | 2.2 100% | 2.34 94% | 2 110% | 2.15 102% |
| CCT | 6447 101% | 7162 91% | 6166 105% | 6563 99% | 7549 86% | 6198 105% | 6128 106% |
| Color Space (Percent of AdobeRGB 1998) (%) | 85 | 86.4 | 89.2 | 86 | |||
| Color Space (Percent of sRGB) (%) | 98 | 99.7 | 100 | 100 | |||
| Total Average (Program / Settings) | 8% /
6% | 7% /
-27% | -5% /
1% | -28% /
-46% | -29% /
-52% | 77% /
103% |
* ... smaller is better
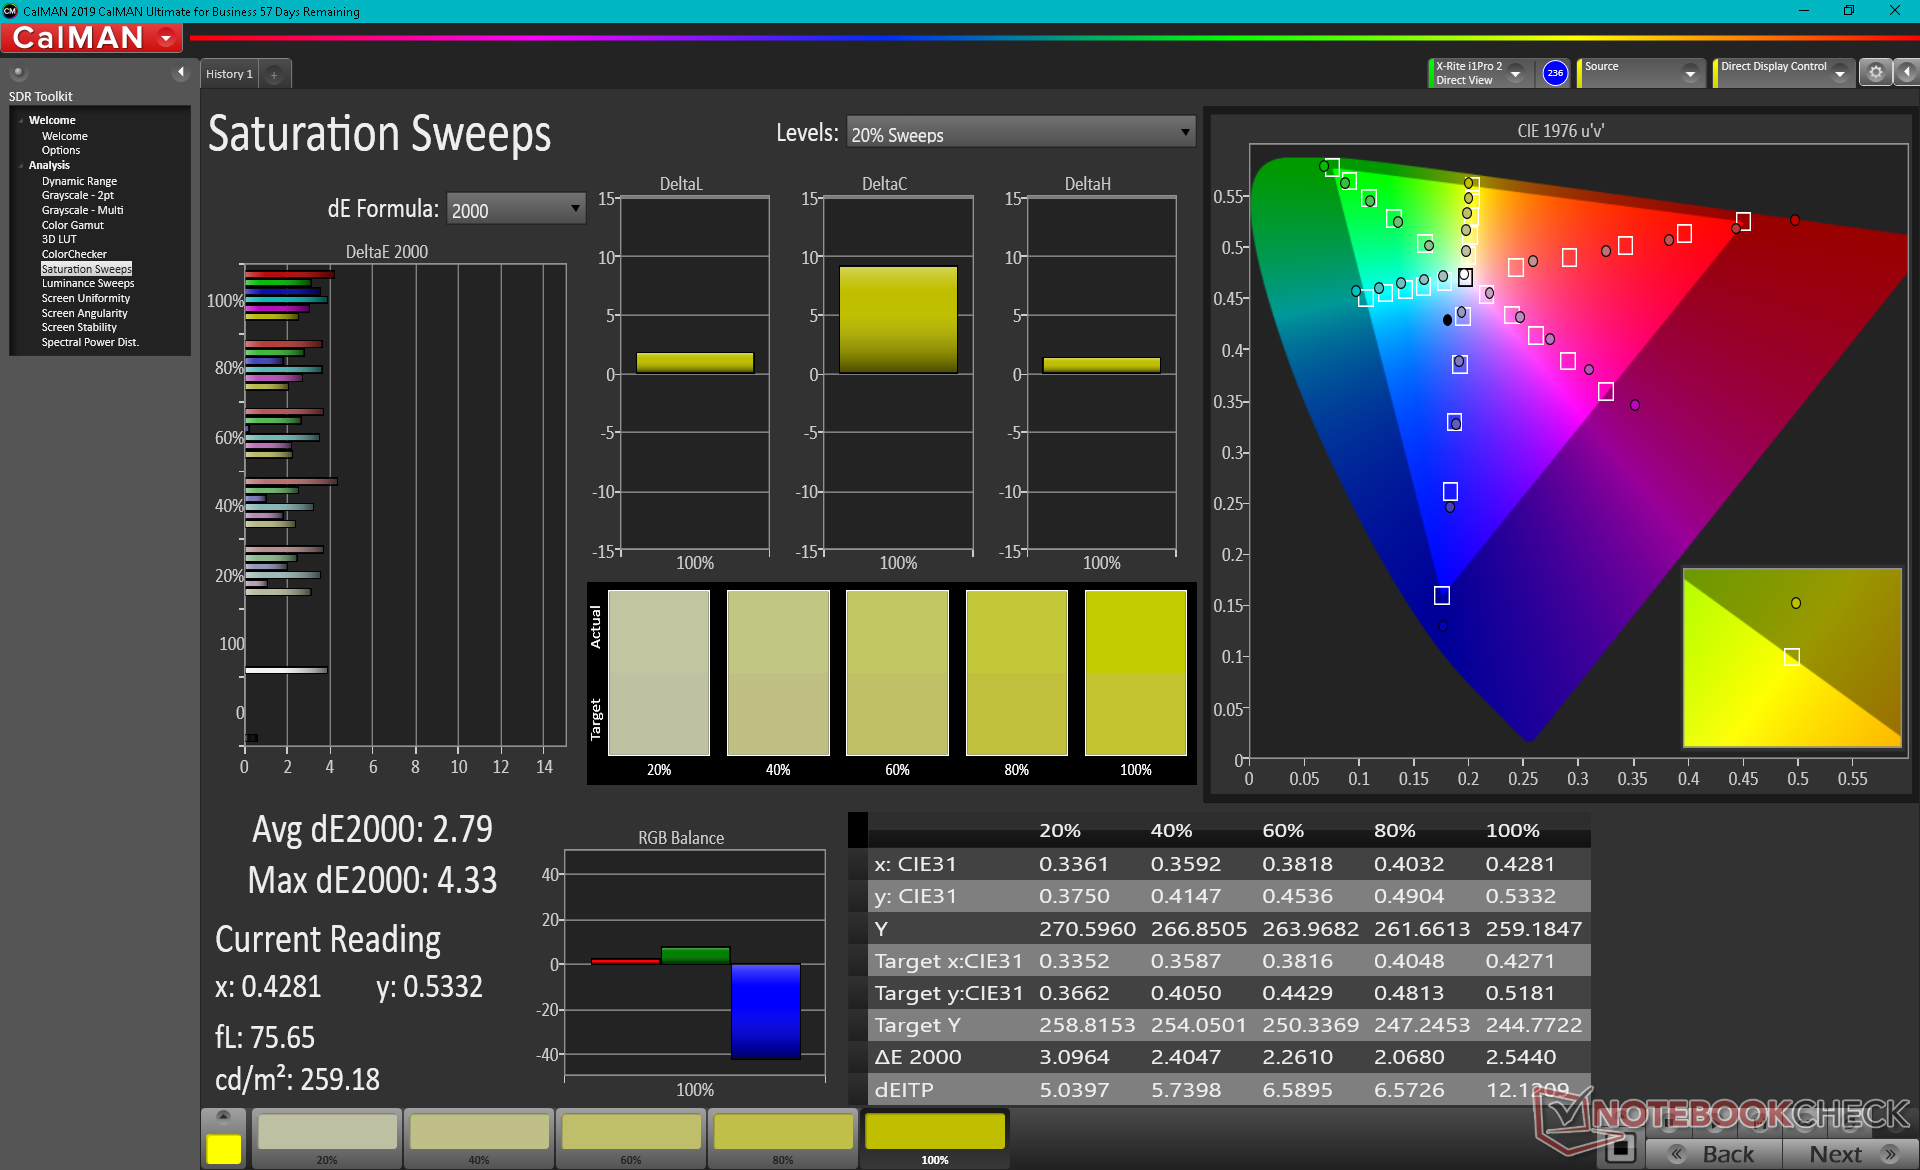
Colors could have been better calibrated out of the box as average grayscale and color deltaE values are only decent at 3.6 and 4.73, respectively. We're able to knock both values to less than one each after calibrating with our X-Rite colorimeter.
Display Response Times
| ↔ Response Time Black to White | ||
|---|---|---|
| 30.4 ms ... rise ↗ and fall ↘ combined | ↗ 16.4 ms rise | 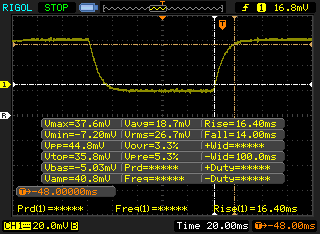 |
| ↘ 14 ms fall | ||
| The screen shows slow response rates in our tests and will be unsatisfactory for gamers. In comparison, all tested devices range from 0.1 (minimum) to 240 (maximum) ms. » 82 % of all devices are better. This means that the measured response time is worse than the average of all tested devices (19.8 ms). | ||
| ↔ Response Time 50% Grey to 80% Grey | ||
| 47.2 ms ... rise ↗ and fall ↘ combined | ↗ 25.2 ms rise | 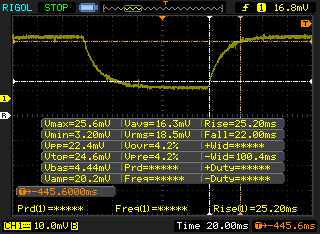 |
| ↘ 22 ms fall | ||
| The screen shows slow response rates in our tests and will be unsatisfactory for gamers. In comparison, all tested devices range from 0.165 (minimum) to 636 (maximum) ms. » 82 % of all devices are better. This means that the measured response time is worse than the average of all tested devices (31 ms). | ||
Screen Flickering / PWM (Pulse-Width Modulation)
| Screen flickering / PWM not detected | 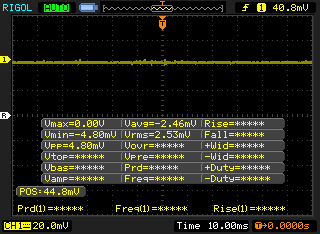 | ||
In comparison: 52 % of all tested devices do not use PWM to dim the display. If PWM was detected, an average of 7747 (minimum: 5 - maximum: 343500) Hz was measured. | |||
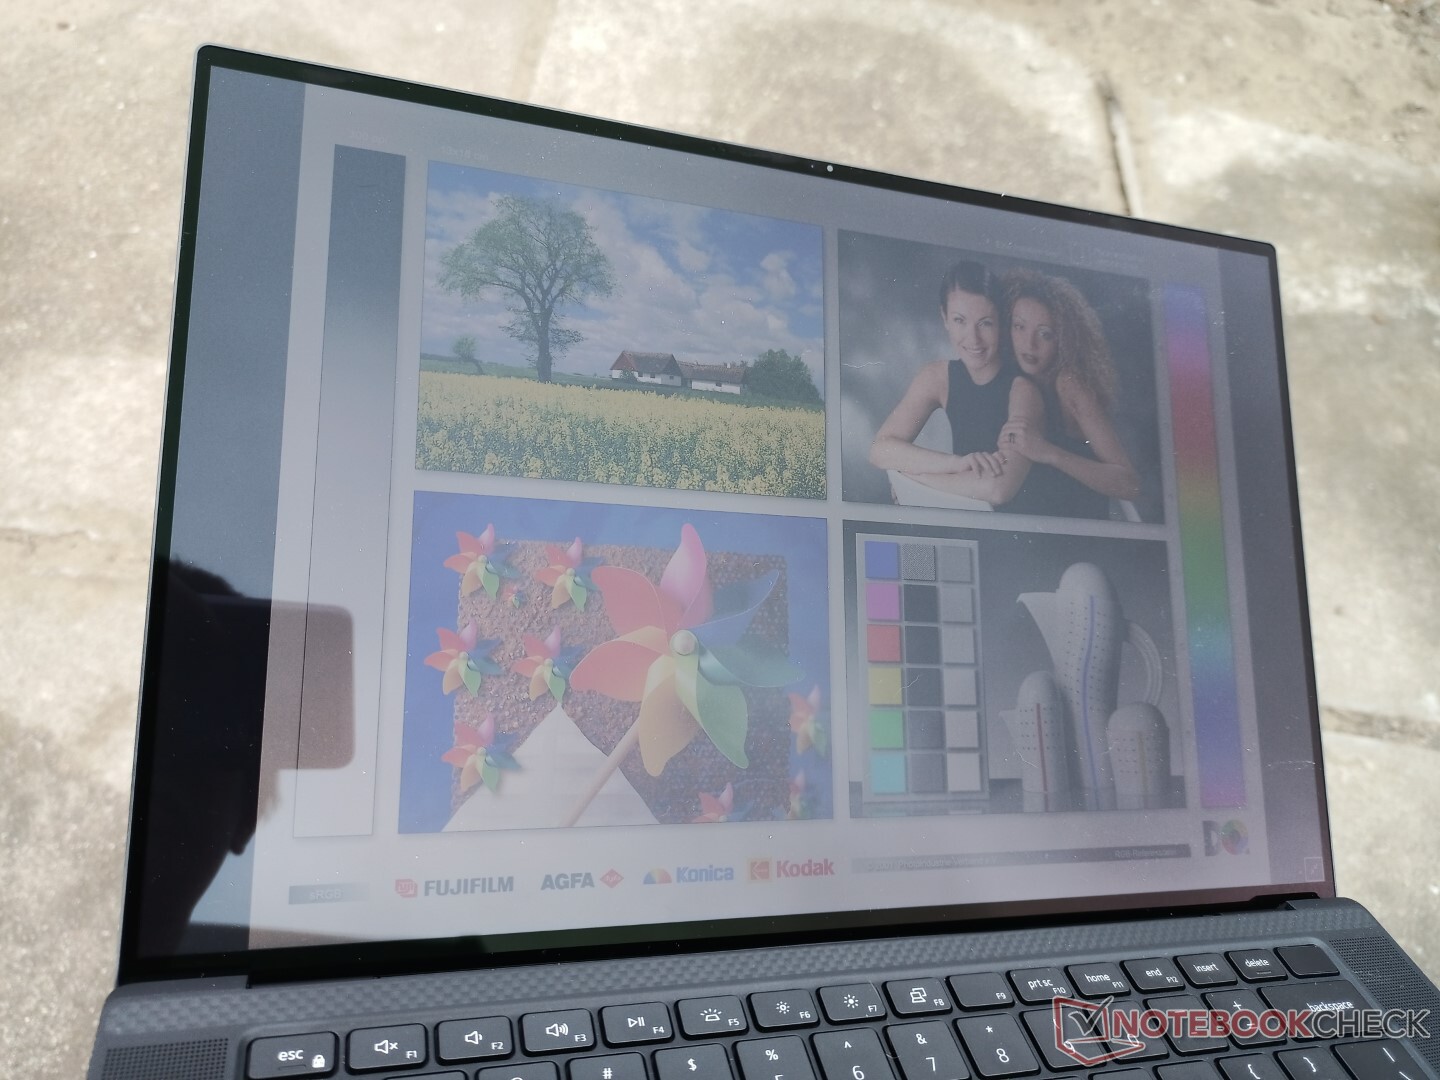
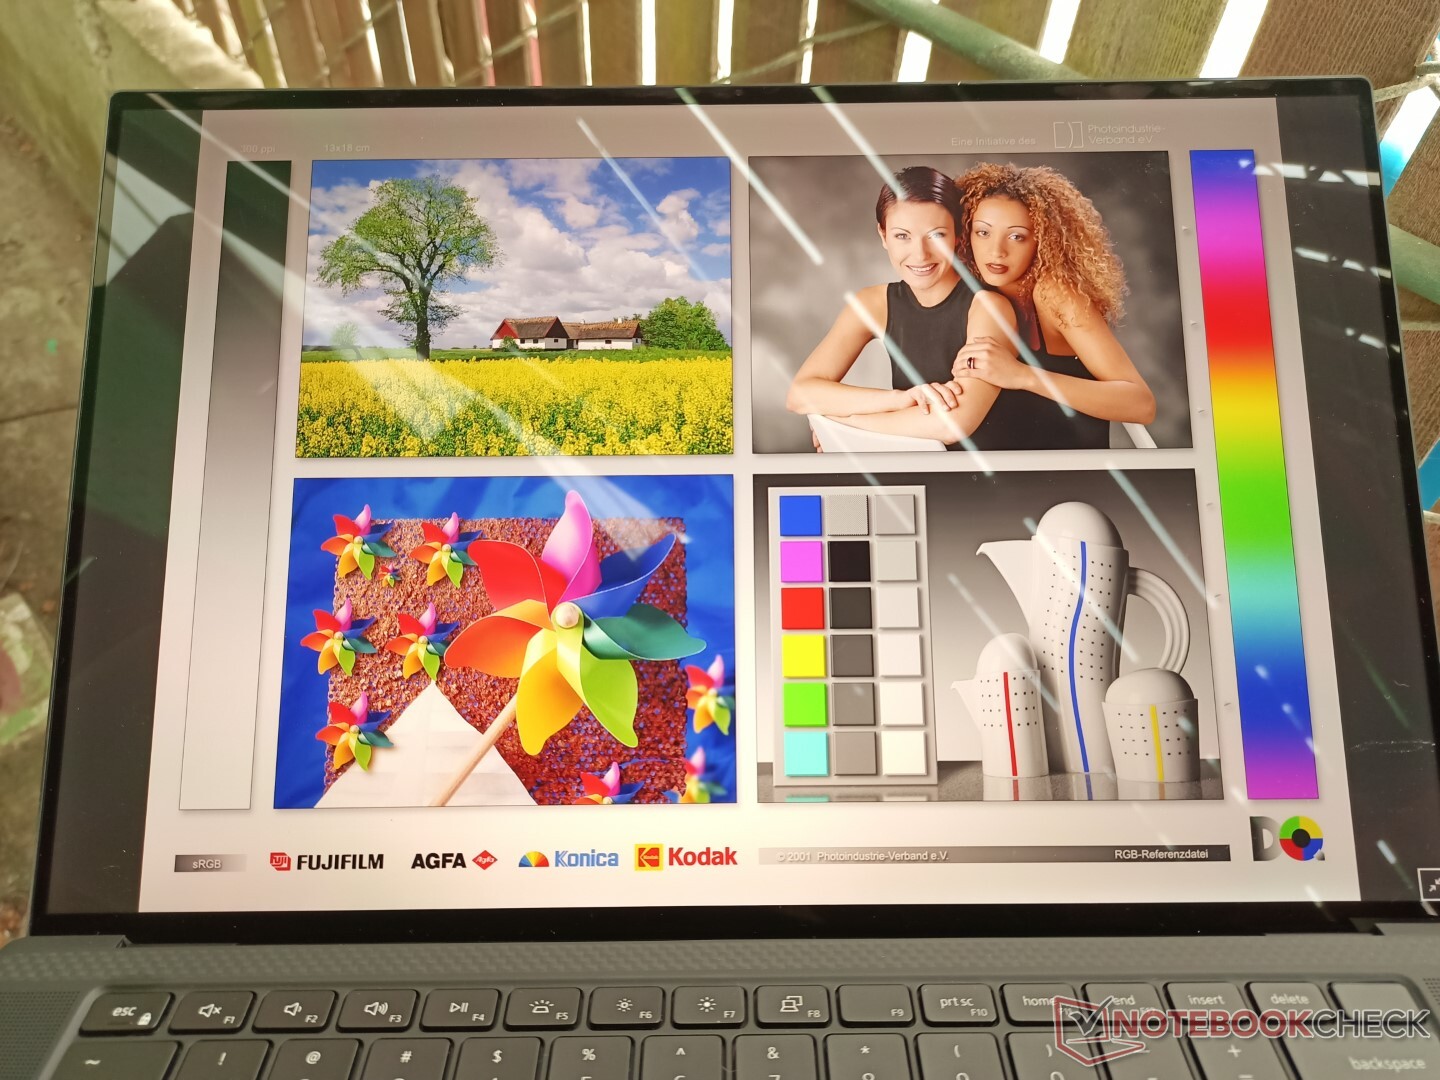
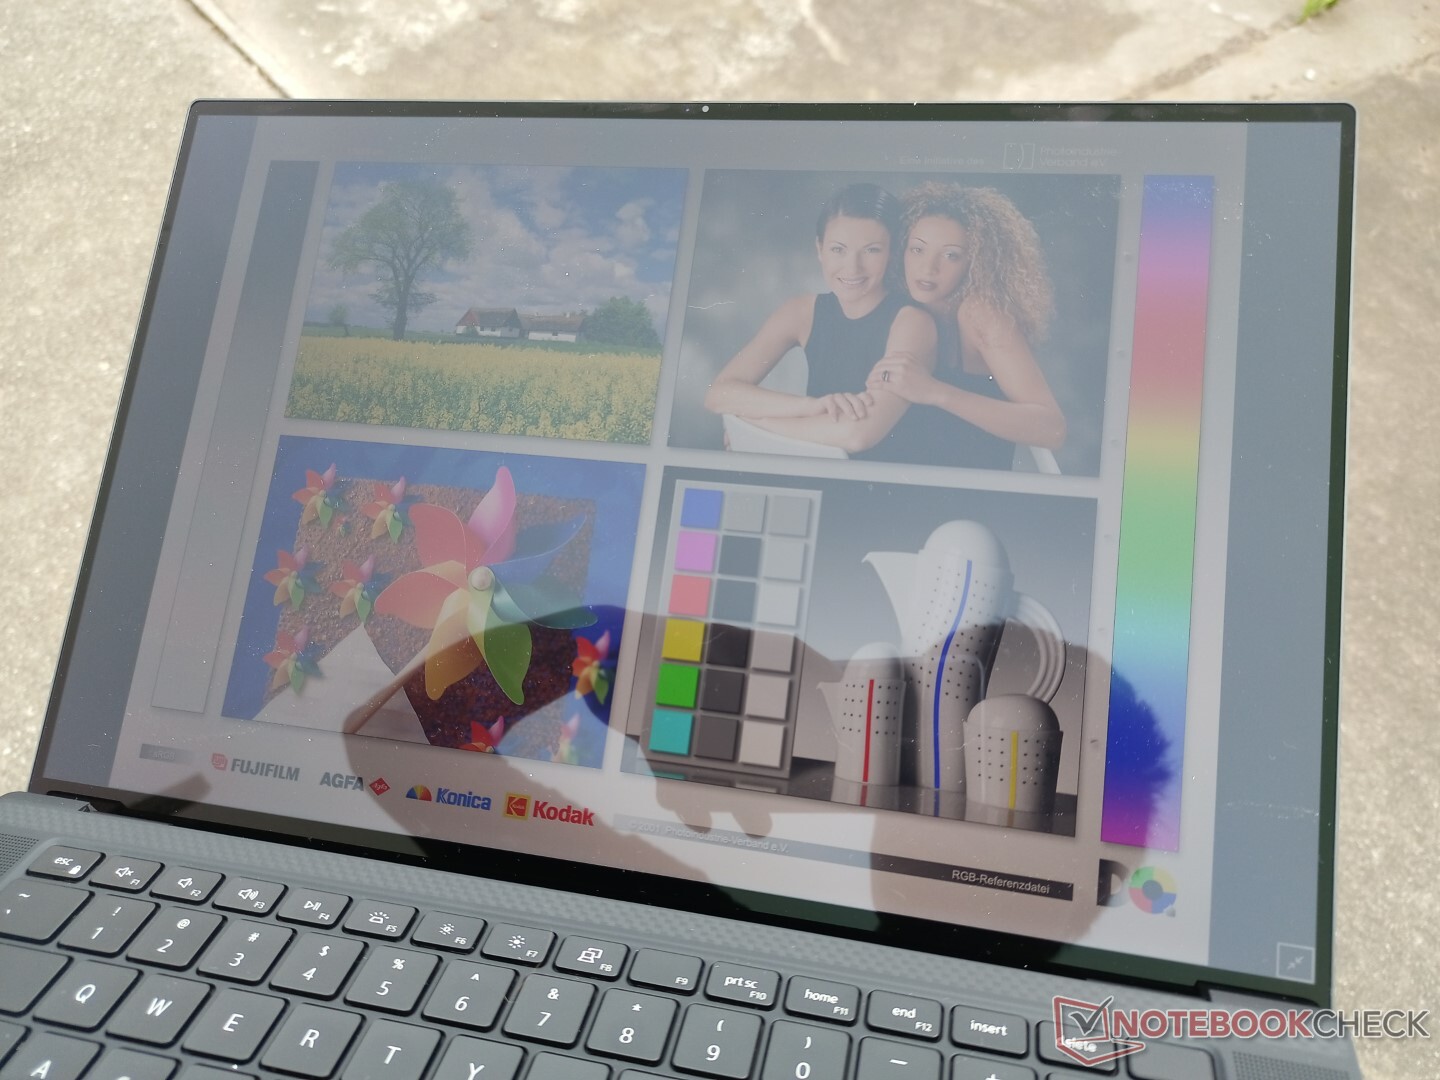
Outdoor visibility is better than on the Razer Blade 15 Studio or Asus ProArt due to the brighter backlight on our Precision 5560. However, some glare will always be present on the glossy overlay. Users may want to consider the matte 1200p display option instead to reduce glare.
Performance — 45 W TGP Quadro RTX Graphics
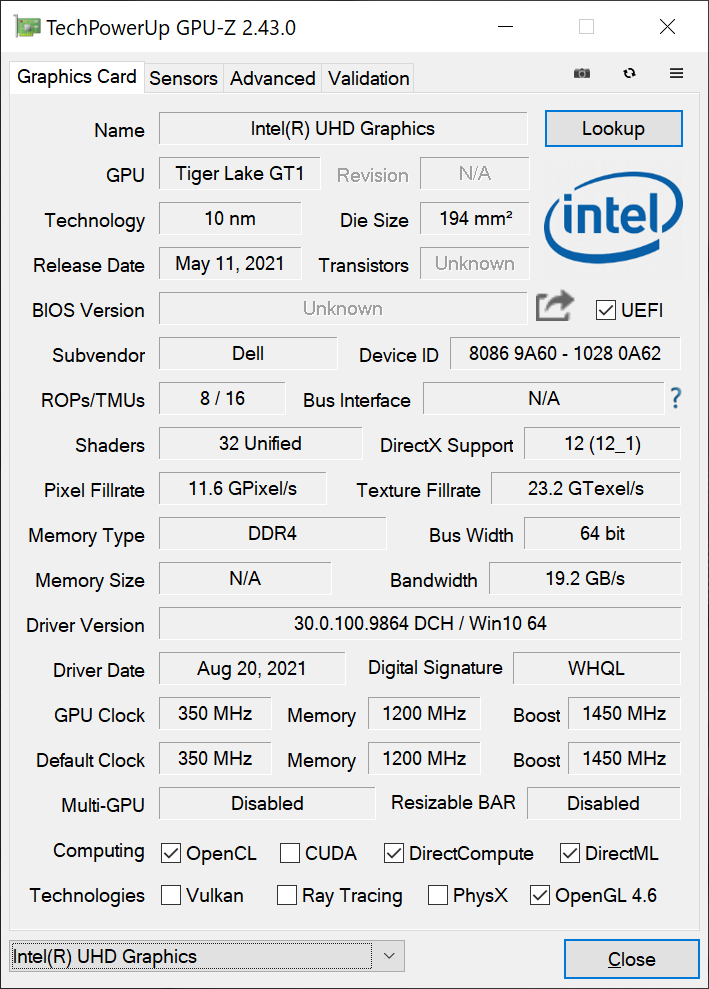
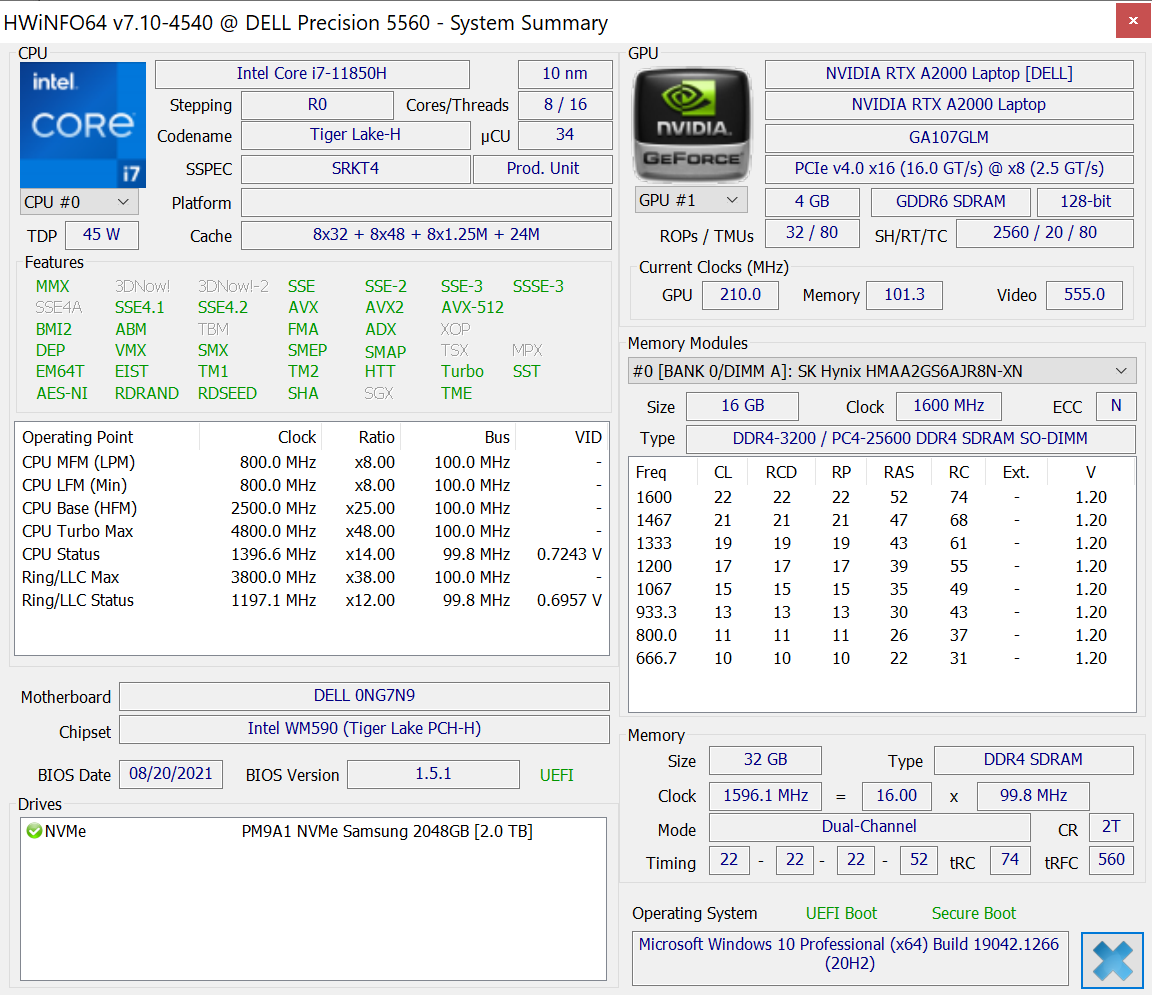
Dell offers both non-vPro (i5-11500H, i7-11800H) and vPro (i7-11850H, i9-11950H, Xeon W-11955M) Tiger Lake-H options alongside Nvidia Quadro GPUs (NVIDIA T1200, RTX A2000) for nearly all configurations. These GPUs, vPro CPUs, and associated optional ECC RAM are what separate the Precision 5560 from the consumer-level XPS 15 series.
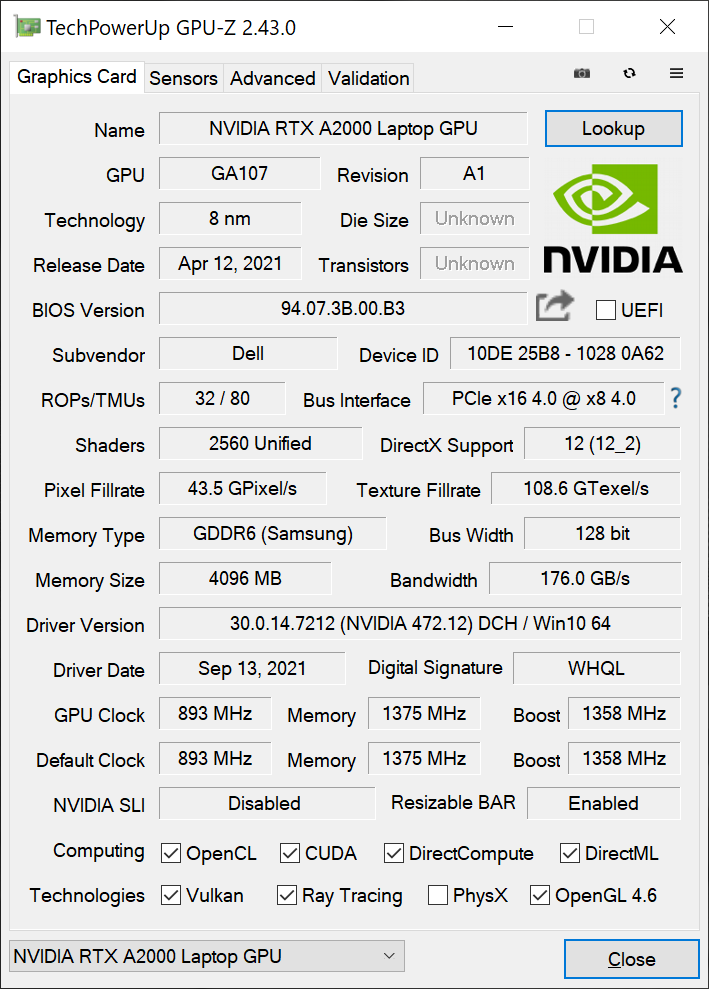
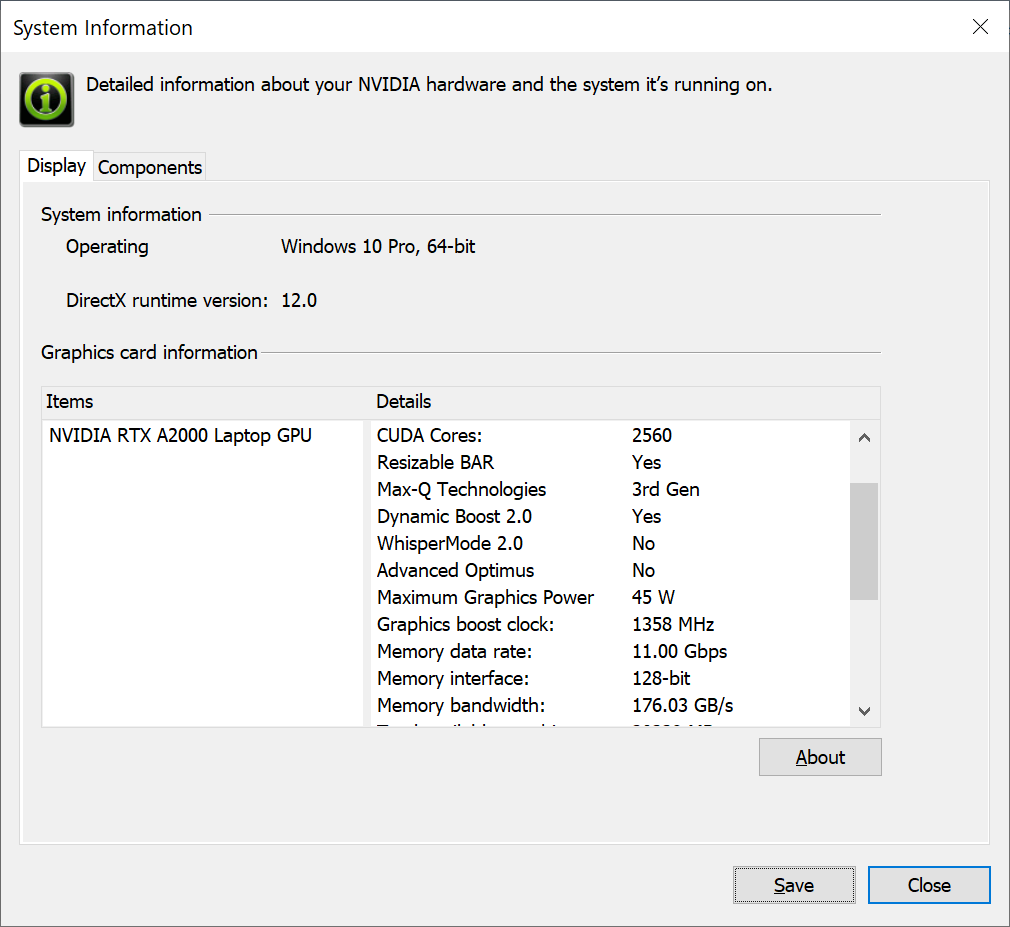
The Quadro RTX A2000 GPU on our test unit supports Resizable Bar and Dynamic Boost 2.0 but with no support for Advanced Optimus or WhisperMode 2.0. At just 45 W TGP, this is technically a Max-Q GPU even if Max-Q isn't in the name. The older Quadro T2000 Max-Q in the Precision 5550 was estimated to be in the 40 W TGP range in comparison.
Our unit was set to Ultra Performance mode via the Dell Power Manager software prior to running our benchmarks below for the highest possible scores.
Processor
Overall multi-thread performance is about 15 percent slower than the Core i7-11800H which is the price to pay for integrated vPro support. Upgrading to the Core i9-11950H is expected to boost multi-thread performance by up to 20 percent based on our experience with the HP ZBook Studio 15 G8. Single-thread performance remains almost identical, however.
Performance sustainability is excellent as shown by the consistent CineBench R15 xT results below.
Cinebench R15 Multi Loop
Cinebench R23: Multi Core | Single Core
Cinebench R15: CPU Multi 64Bit | CPU Single 64Bit
Blender: v2.79 BMW27 CPU
7-Zip 18.03: 7z b 4 -mmt1 | 7z b 4
Geekbench 5.5: Single-Core | Multi-Core
HWBOT x265 Benchmark v2.2: 4k Preset
LibreOffice : 20 Documents To PDF
R Benchmark 2.5: Overall mean
| Cinebench R23 / Multi Core | |
| Lenovo Legion 5 15ACH-82JU00C6GE-FL | |
| HP ZBook Studio 15 G8 | |
| Lenovo ThinkPad P15 G2-20YQ001JGE | |
| Average Intel Core i7-11850H (9779 - 11935, n=2) | |
| HP ZBook Studio G7 | |
| Dell Precision 5000 5560 | |
| Lenovo ThinkPad P15 Gen1-20ST000DGE | |
| Lenovo ThinkPad P15s Gen2-20W6000GGE | |
| Cinebench R23 / Single Core | |
| HP ZBook Studio 15 G8 | |
| Average Intel Core i7-11850H (1513 - 1552, n=2) | |
| Dell Precision 5000 5560 | |
| Lenovo ThinkPad P15 G2-20YQ001JGE | |
| Lenovo ThinkPad P15s Gen2-20W6000GGE | |
| Lenovo Legion 5 15ACH-82JU00C6GE-FL | |
| HP ZBook Studio G7 | |
| Lenovo ThinkPad P15 Gen1-20ST000DGE | |
Cinebench R23: Multi Core | Single Core
Cinebench R15: CPU Multi 64Bit | CPU Single 64Bit
Blender: v2.79 BMW27 CPU
7-Zip 18.03: 7z b 4 -mmt1 | 7z b 4
Geekbench 5.5: Single-Core | Multi-Core
HWBOT x265 Benchmark v2.2: 4k Preset
LibreOffice : 20 Documents To PDF
R Benchmark 2.5: Overall mean
* ... smaller is better
System Performance
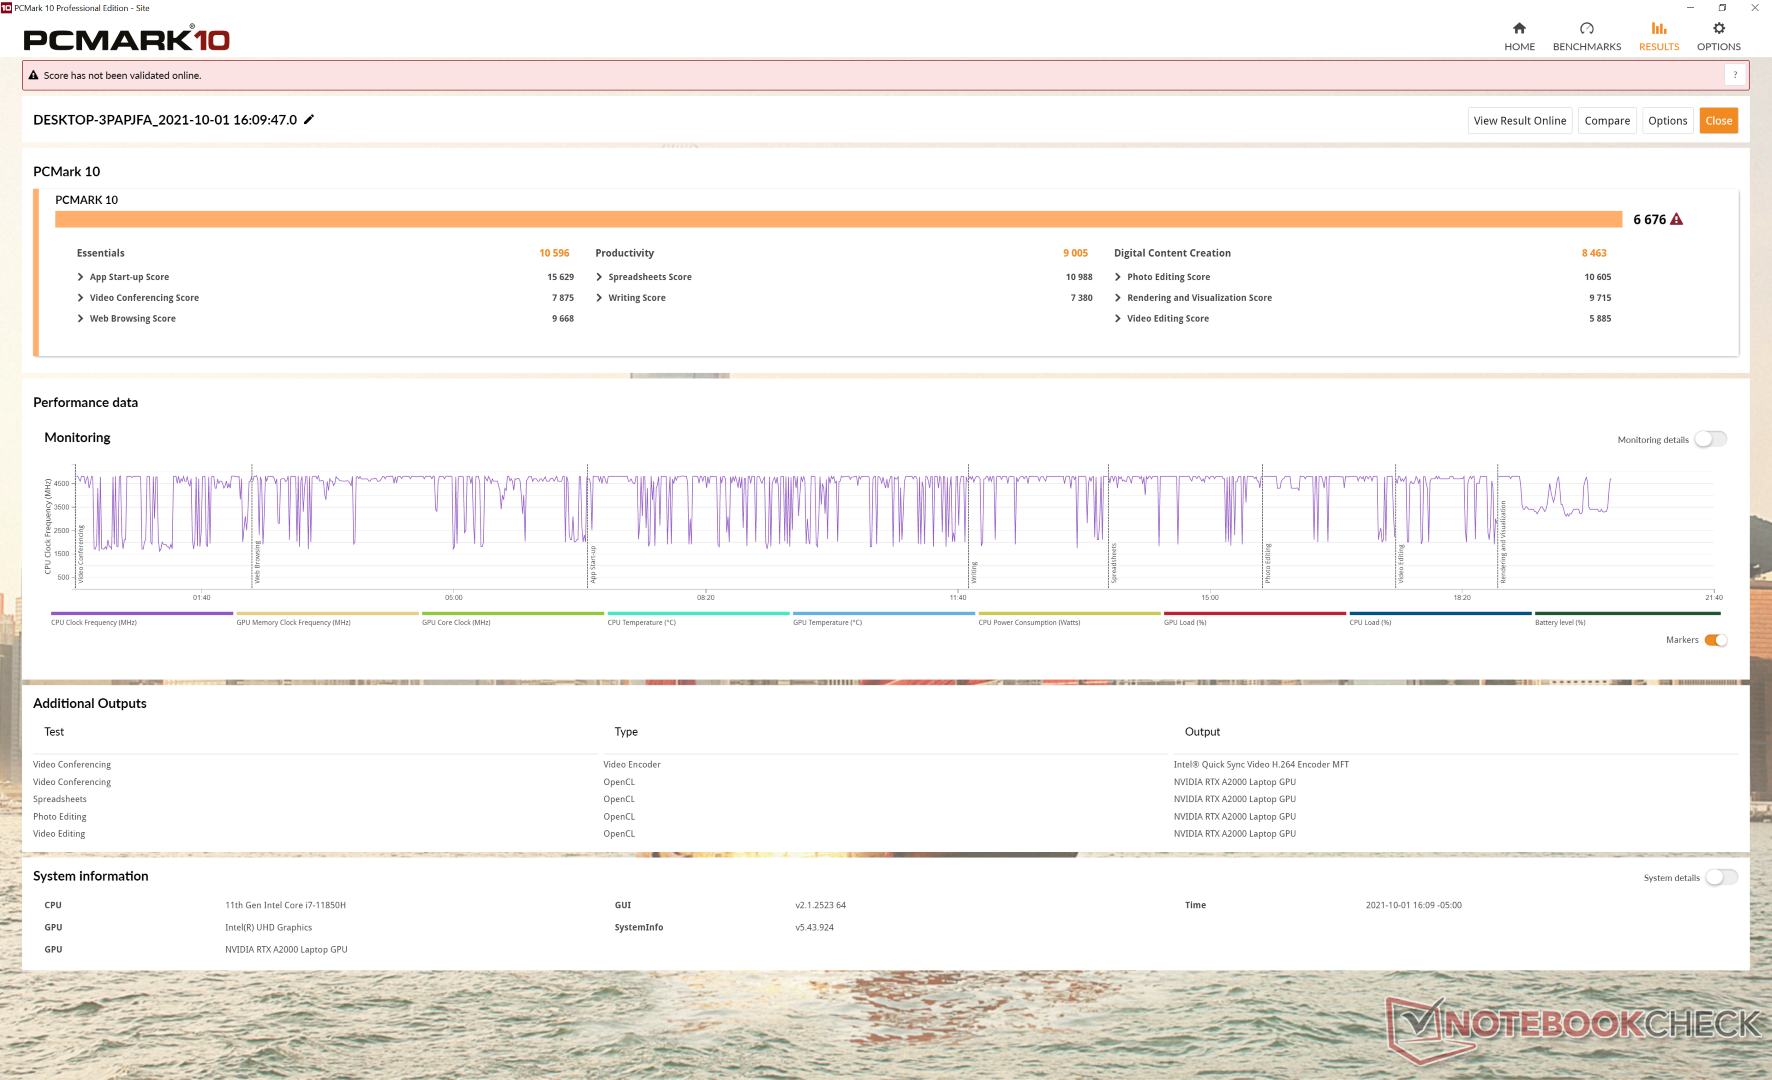
PCMark scores are consistently higher than on the Precision 5550 especially in the GPU-heavy Digital Content Creation benchmark where the RTX A2000 can flex over the Quadro T2000 Max-Q.
| PCMark 10 / Score | |
| HP ZBook Studio 15 G8 | |
| Dell Precision 5000 5560 | |
| Average Intel Core i7-11850H, NVIDIA RTX A2000 Laptop GPU (n=1) | |
| Lenovo ThinkPad P15 G2-20YQ001JGE | |
| Dell Precision 7550 | |
| Dell Precision 5550 P91F | |
| Razer Blade 15 Studio Edition 2020 | |
| Asus ProArt StudioBook Pro 15 W500G5T | |
| PCMark 10 / Essentials | |
| Dell Precision 5000 5560 | |
| Average Intel Core i7-11850H, NVIDIA RTX A2000 Laptop GPU (n=1) | |
| Lenovo ThinkPad P15 G2-20YQ001JGE | |
| HP ZBook Studio 15 G8 | |
| Dell Precision 5550 P91F | |
| Dell Precision 7550 | |
| Razer Blade 15 Studio Edition 2020 | |
| Asus ProArt StudioBook Pro 15 W500G5T | |
| PCMark 10 / Productivity | |
| Dell Precision 5000 5560 | |
| Average Intel Core i7-11850H, NVIDIA RTX A2000 Laptop GPU (n=1) | |
| HP ZBook Studio 15 G8 | |
| Lenovo ThinkPad P15 G2-20YQ001JGE | |
| Razer Blade 15 Studio Edition 2020 | |
| Dell Precision 7550 | |
| Dell Precision 5550 P91F | |
| Asus ProArt StudioBook Pro 15 W500G5T | |
| PCMark 10 / Digital Content Creation | |
| HP ZBook Studio 15 G8 | |
| Lenovo ThinkPad P15 G2-20YQ001JGE | |
| Dell Precision 5000 5560 | |
| Average Intel Core i7-11850H, NVIDIA RTX A2000 Laptop GPU (n=1) | |
| Dell Precision 7550 | |
| Dell Precision 5550 P91F | |
| Asus ProArt StudioBook Pro 15 W500G5T | |
| Razer Blade 15 Studio Edition 2020 | |
| PCMark 10 Score | 6676 points | |
Help | ||
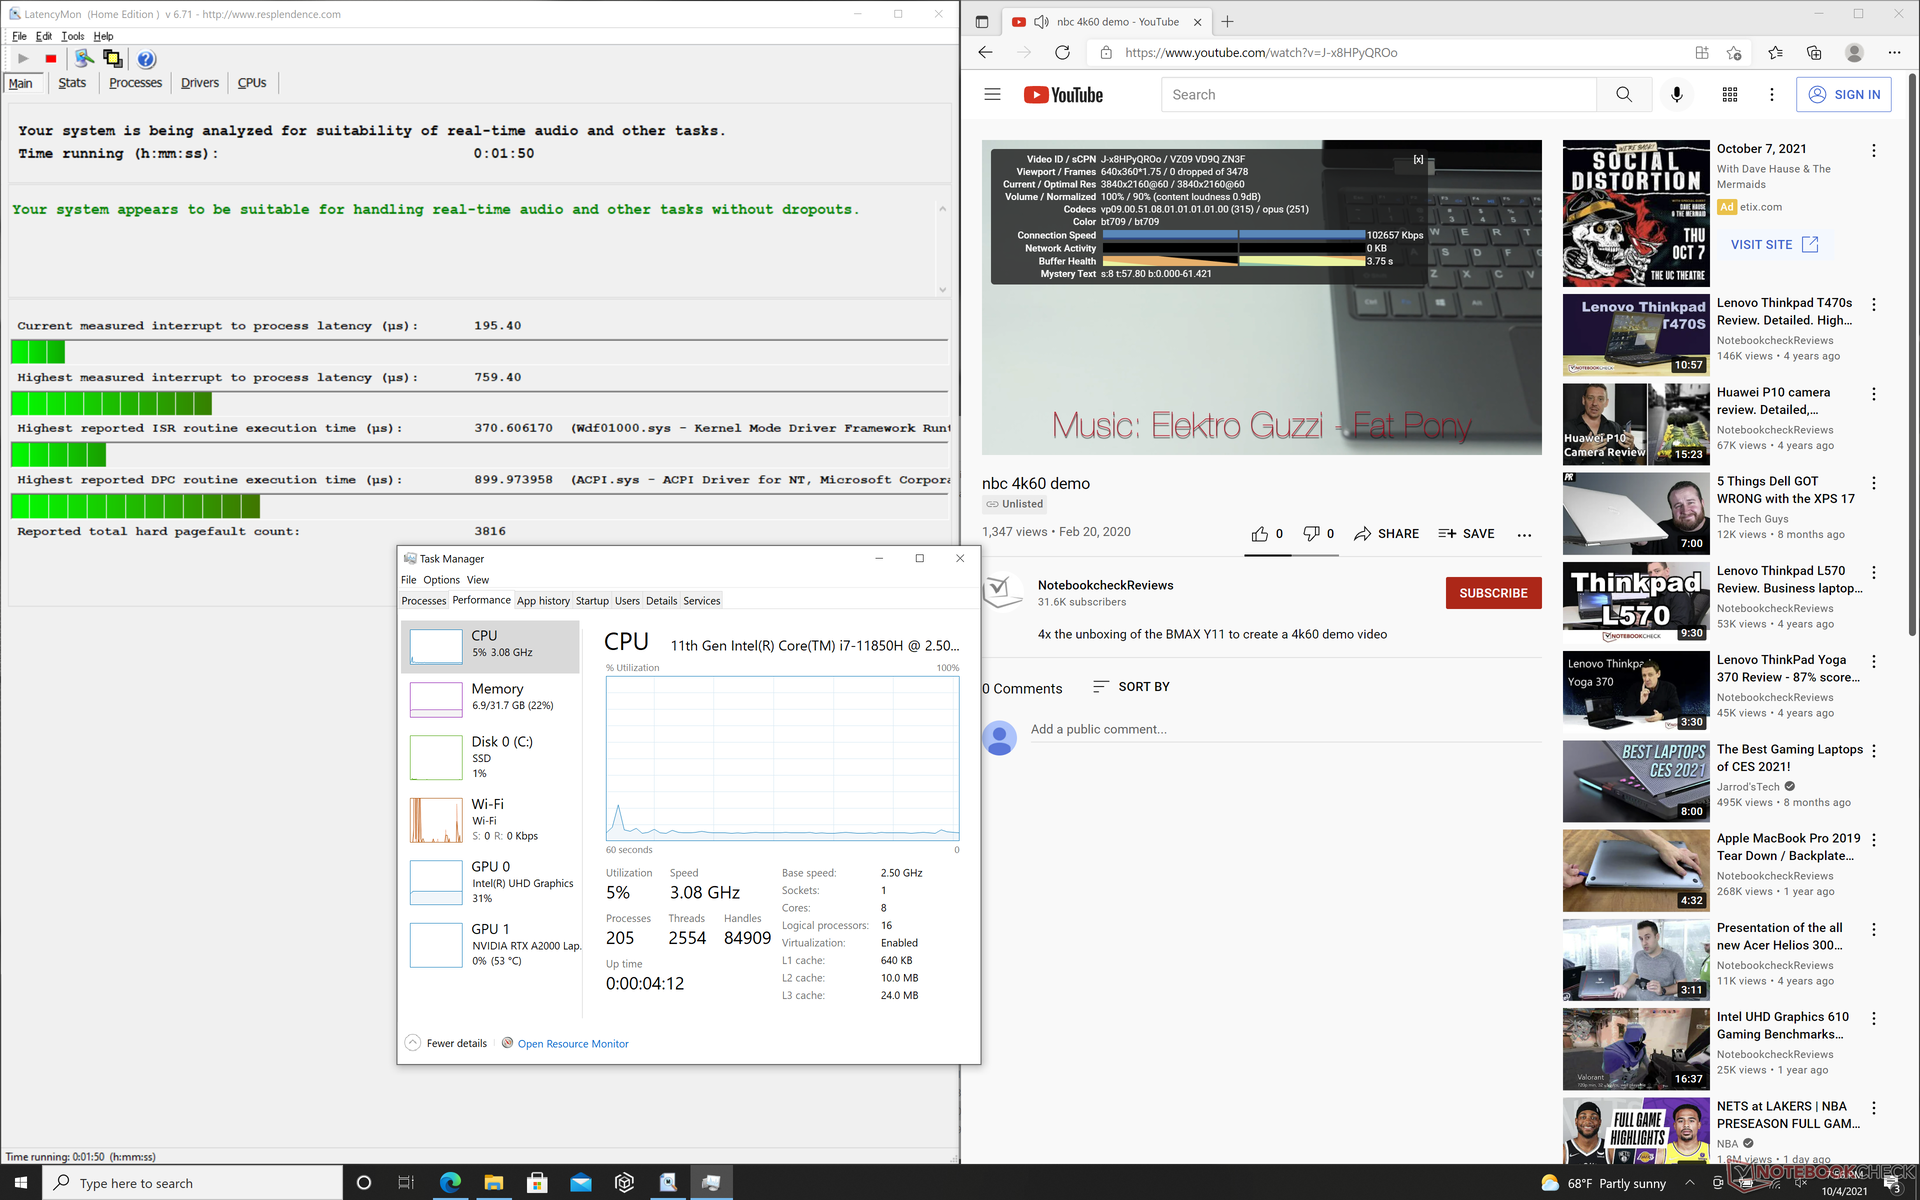
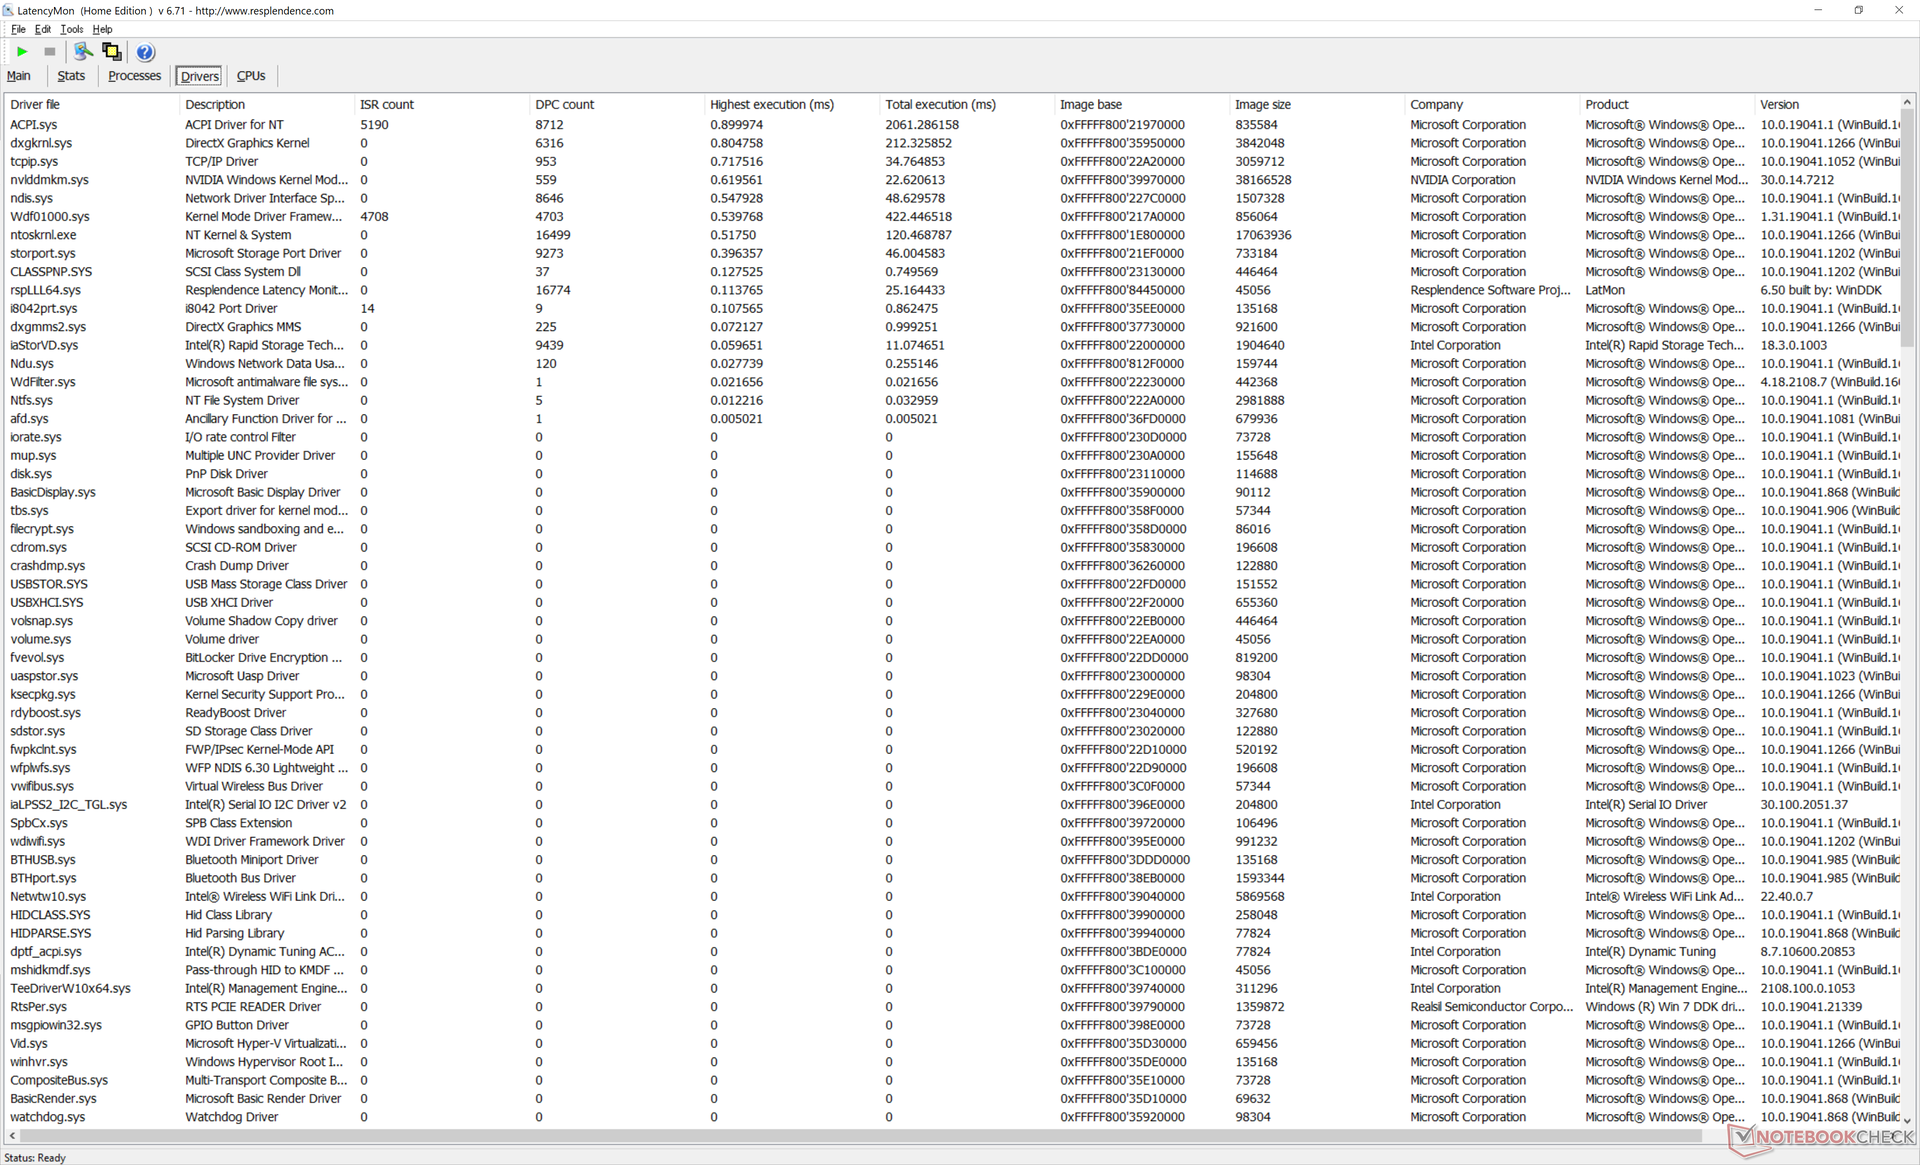
DPC Latency
LatencyMon shows no DPC latency issues when opening multiple browser tabs or when running Prime95. 4K video playback at 60 FPS is also completely smooth and with no dropped frames. We expect no less from any workstation.
| DPC Latencies / LatencyMon - interrupt to process latency (max), Web, Youtube, Prime95 | |
| Dell Precision 7550 | |
| Lenovo ThinkPad P15 G2-20YQ001JGE | |
| Asus ProArt StudioBook Pro 15 W500G5T | |
| HP ZBook Studio 15 G8 | |
| Dell Precision 5000 5560 | |
| Razer Blade 15 Studio Edition 2020 | |
| Dell Precision 5550 P91F | |
* ... smaller is better
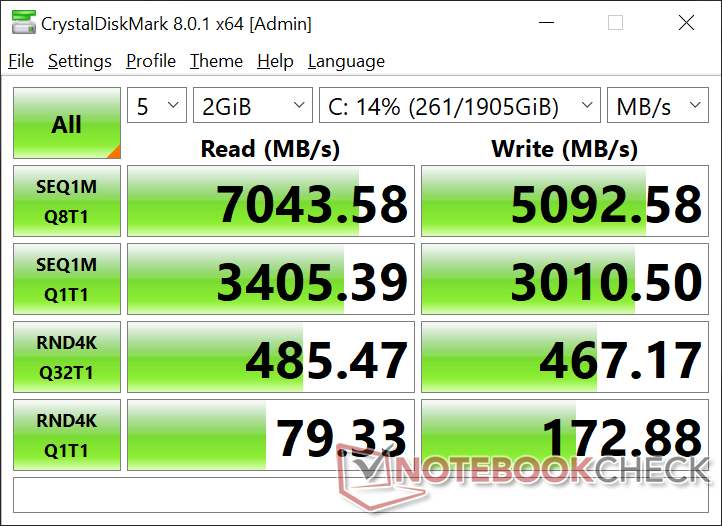
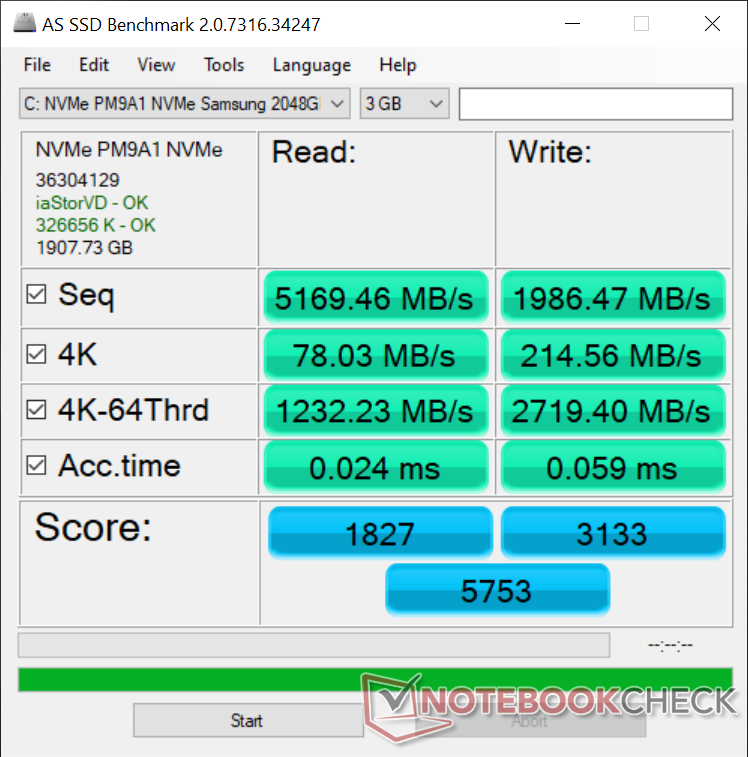
Storage Devices
Dell has confirmed with us that both M.2 storage bays each support PCIe4 x4 SSDs compared to only PCIe3 on the Precision 5550. Even the Alienware x17 R1 can only support just one PCIe4 x4 SSD despite having two M.2 SSD slots. Our test unit ships with a Samsung PM9A1 which is one of the fastest consumer-level PCIe4 SSDs currently available and it's consequently a huge performance upgrade from the SK Hynix PC601A on last year's model.
| Dell Precision 5000 5560 Samsung PM9A1 MZVL22T0HBLB | Lenovo ThinkPad P15 G2-20YQ001JGE Kioxia XG7 KXG7AZNV512G | HP ZBook Studio 15 G8 Samsung PM981a MZVLB2T0HALB | Asus ProArt StudioBook Pro 15 W500G5T Samsung SSD PM981 MZVLB1T0HALR | Dell Precision 7550 SK Hynix PC601A NVMe 1TB | Dell Precision 5550 P91F SK Hynix PC601A NVMe 1TB | Razer Blade 15 Studio Edition 2020 Samsung PM981a MZVLB1T0HBLR | |
|---|---|---|---|---|---|---|---|
| AS SSD | -8% | -16% | -16% | -42% | -142% | -33% | |
| Seq Read (MB/s) | 5169 | 5105 -1% | 2953 -43% | 2702 -48% | 2028 -61% | 2039 -61% | 1982 -62% |
| Seq Write (MB/s) | 1986 | 1815 -9% | 1691 -15% | 2348 18% | 1193 -40% | 1376 -31% | 2252 13% |
| 4K Read (MB/s) | 78 | 47.46 -39% | 43.98 -44% | 37.59 -52% | 42.31 -46% | 44.11 -43% | 47.13 -40% |
| 4K Write (MB/s) | 214.6 | 137.3 -36% | 105.4 -51% | 107.1 -50% | 105.5 -51% | 113.3 -47% | 88.2 -59% |
| 4K-64 Read (MB/s) | 1232 | 2112 71% | 1065 -14% | 1491 21% | 1128 -8% | 1094 -11% | 1481 20% |
| 4K-64 Write (MB/s) | 2719 | 1702 -37% | 1957 -28% | 1794 -34% | 1537 -43% | 1630 -40% | 1842 -32% |
| Access Time Read * (ms) | 0.024 | 0.065 -171% | 0.04 -67% | 0.046 -92% | 0.069 -188% | 0.059 -146% | 0.087 -262% |
| Access Time Write * (ms) | 0.059 | 0.03 49% | 0.105 -78% | 0.034 42% | 0.106 -80% | 0.99 -1578% | 0.04 32% |
| Score Read (Points) | 1827 | 2670 46% | 1404 -23% | 1798 -2% | 1373 -25% | 1342 -27% | 1726 -6% |
| Score Write (Points) | 3133 | 2021 -35% | 2232 -29% | 2136 -32% | 1762 -44% | 1881 -40% | 2155 -31% |
| Score Total (Points) | 5753 | 5885 2% | 4297 -25% | 4835 -16% | 3801 -34% | 3883 -33% | 4781 -17% |
| Copy ISO MB/s (MB/s) | 3201 | 2054 -36% | 2474 -23% | 2302 -28% | 1768 -45% | 2489 -22% | 1982 -38% |
| Copy Program MB/s (MB/s) | 415.8 | 714 72% | 1074 158% | 564 36% | 627 51% | 682 64% | 501 20% |
| Copy Game MB/s (MB/s) | 1212 | 1431 18% | 1929 59% | 1336 10% | 1477 22% | 1515 25% | 1140 -6% |
| CrystalDiskMark 5.2 / 6 | -9% | -29% | 38% | -35% | -36% | -26% | |
| Write 4K (MB/s) | 172.4 | 141.1 -18% | 110.5 -36% | 1107 542% | 121 -30% | 122.6 -29% | 132.9 -23% |
| Read 4K (MB/s) | 78.8 | 58.8 -25% | 51.8 -34% | 43.38 -45% | 42.16 -46% | 42.4 -46% | 46.73 -41% |
| Write Seq (MB/s) | 2991 | 3320 11% | 2071 -31% | 2387 -20% | 2150 -28% | 2167 -28% | 2214 -26% |
| Read Seq (MB/s) | 3351 | 2994 -11% | 2505 -25% | 2431 -27% | 1755 -48% | 1747 -48% | 2018 -40% |
| Write 4K Q32T1 (MB/s) | 459.2 | 626 36% | 429.8 -6% | 340.7 -26% | 395.3 -14% | 388.8 -15% | 478.9 4% |
| Read 4K Q32T1 (MB/s) | 484.3 | 401.8 -17% | 418.3 -14% | 397.8 -18% | 381.8 -21% | 367.3 -24% | 540 12% |
| Write Seq Q32T1 (MB/s) | 4761 | 3742 -21% | 3060 -36% | 2390 -50% | 2730 -43% | 2629 -45% | 2975 -38% |
| Read Seq Q32T1 (MB/s) | 7071 | 5097 -28% | 3539 -50% | 3502 -50% | 3468 -51% | 3460 -51% | 3195 -55% |
| Total Average (Program / Settings) | -9% /
-8% | -23% /
-21% | 11% /
4% | -39% /
-40% | -89% /
-103% | -30% /
-31% |
* ... smaller is better

Disk Throttling: DiskSpd Read Loop, Queue Depth 8
GPU Performance
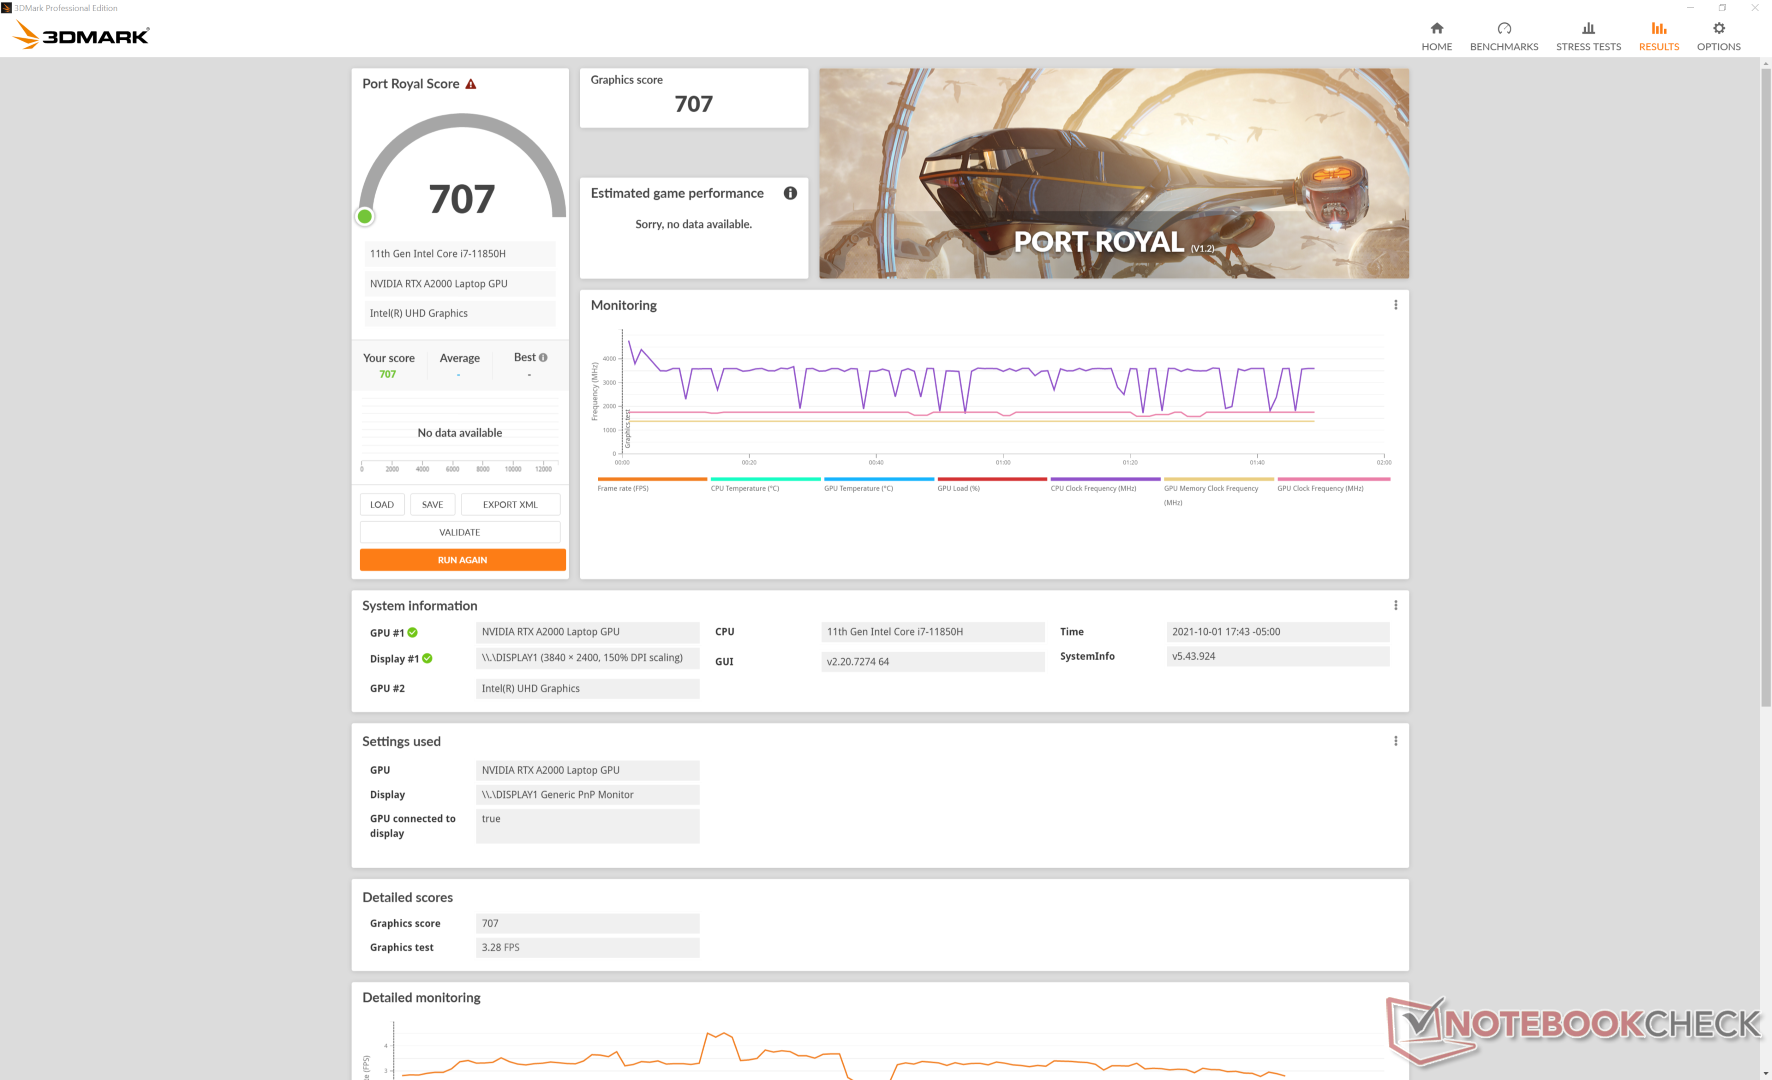
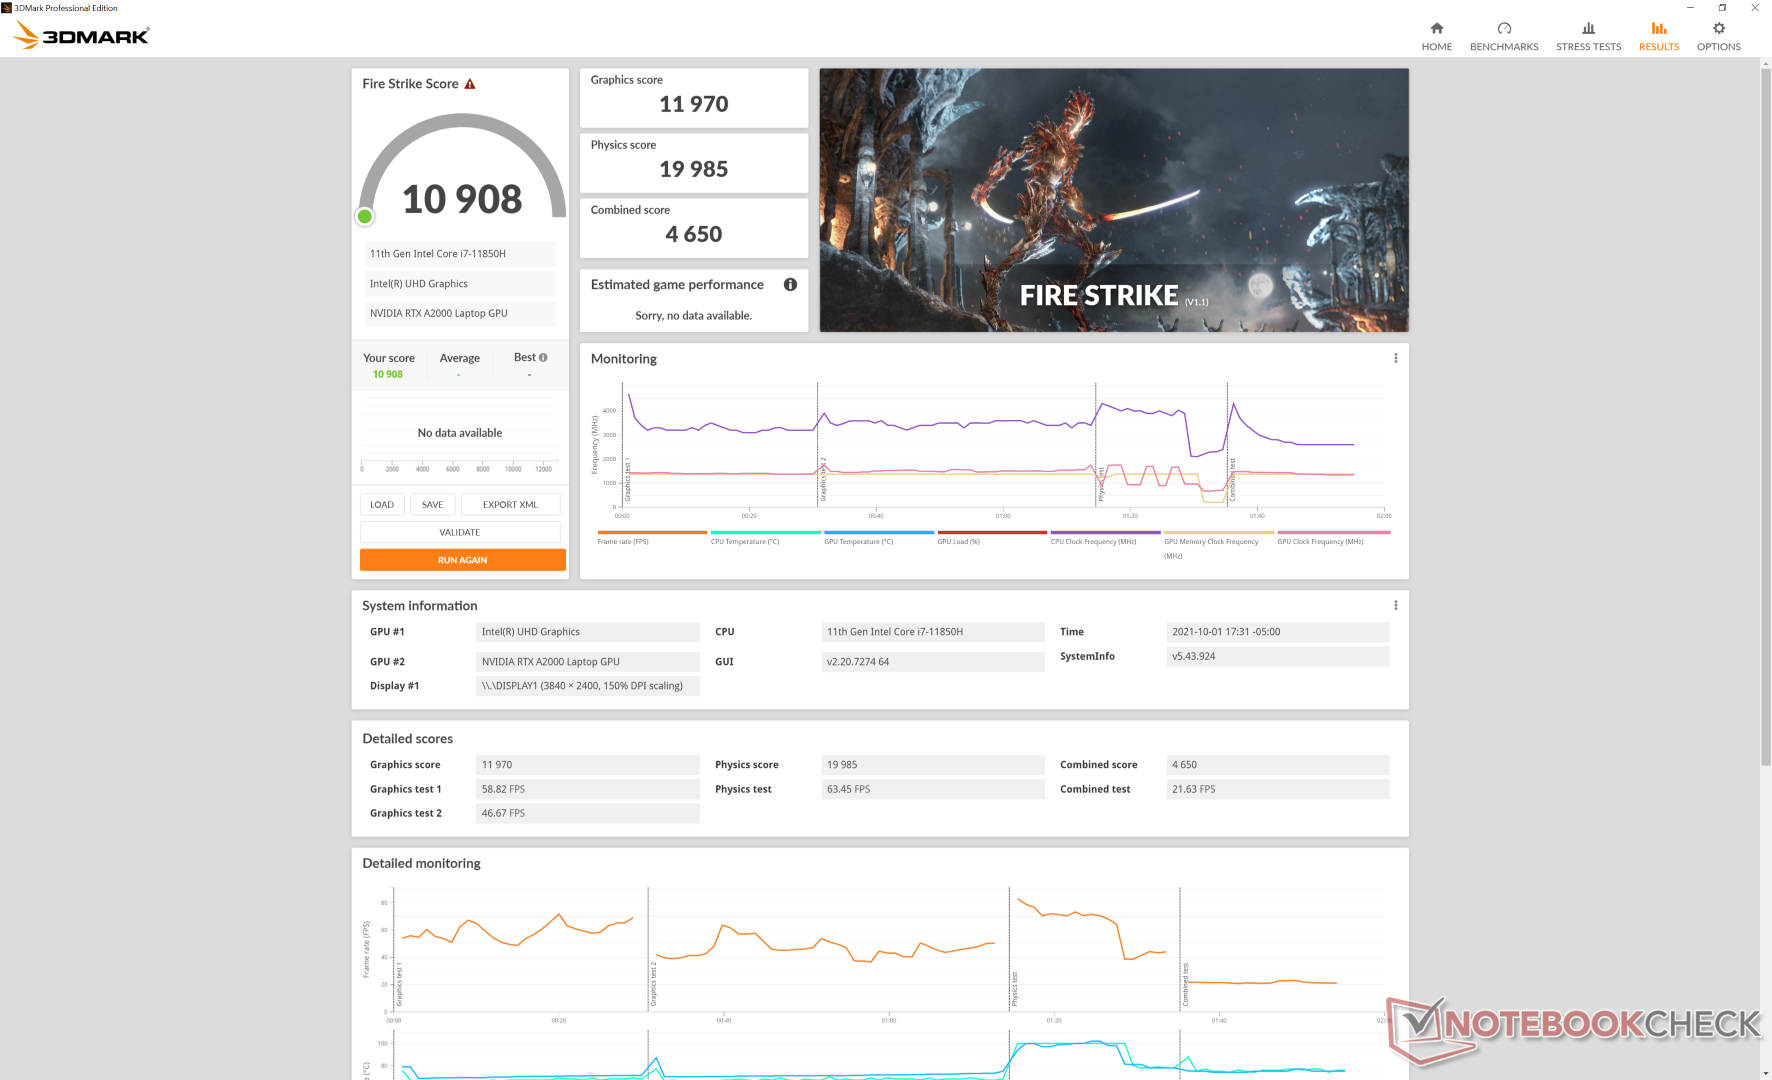
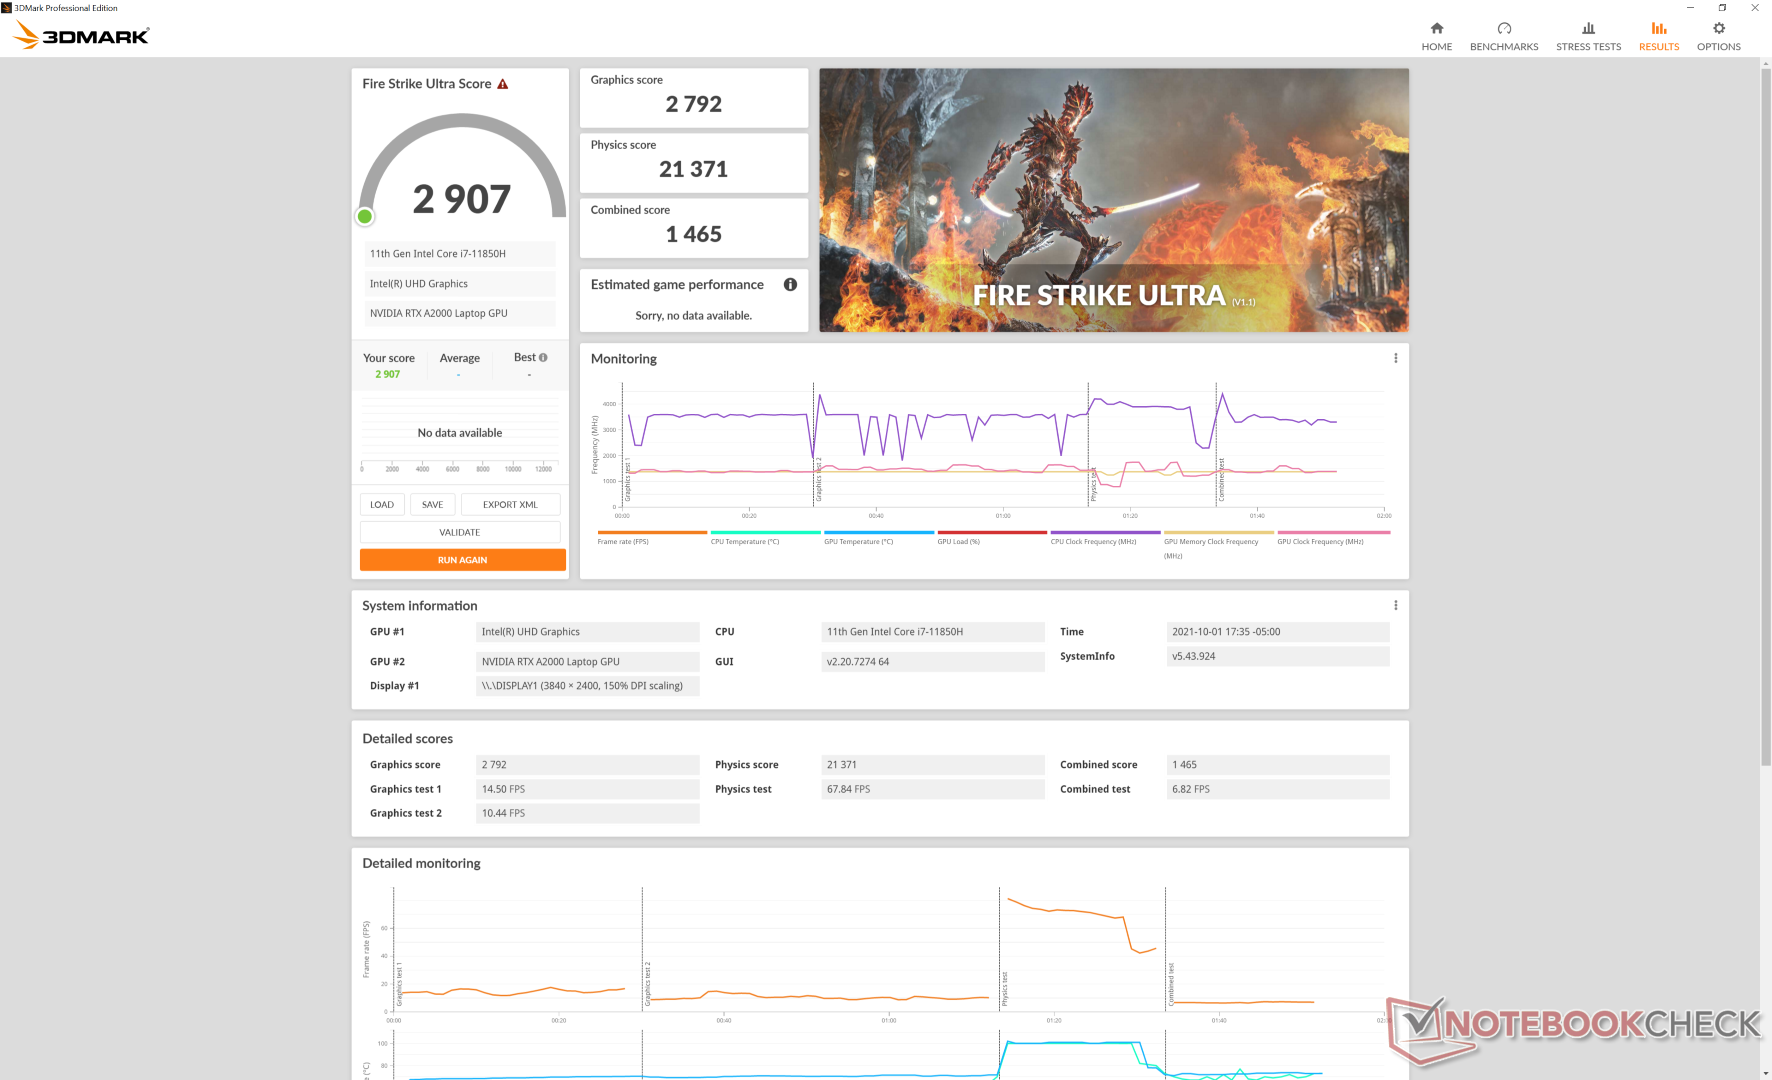
Raw graphics performance from the Quadro RTX A2000 sits comfortably in between the consumer GeForce GTX 1650 Ti and GTX 1660 Ti or about 10 percent slower than the older Quadro RTX 3000 Max-Q. The performance boost is more significant at 40 to 50 percent when compared to the Quadro T2000 Max-Q in the Precision 5550. Upgrading to a Quadro RTX A3000, which is not available on the Precision 5560 series, can bring a performance boost of 30 to 40 percent over our Quadro RTX A2000.
Interestingly, SpecViewPerf scores are closer than expected between our RTX A2000 and last generation Quadro RTX 3000 Max-Q despite the more power-hungry older Turing GPU to suggest improved optimization in workstation-type loads for our Ampere GPU.
If gaming, expect performance to be about 20 to 30 percent slower than the GTX 1660 Ti since Quadro GPUs are not optimized for games. Strange Brigade, for example, would sometimes crash one or two minutes into the benchmark.
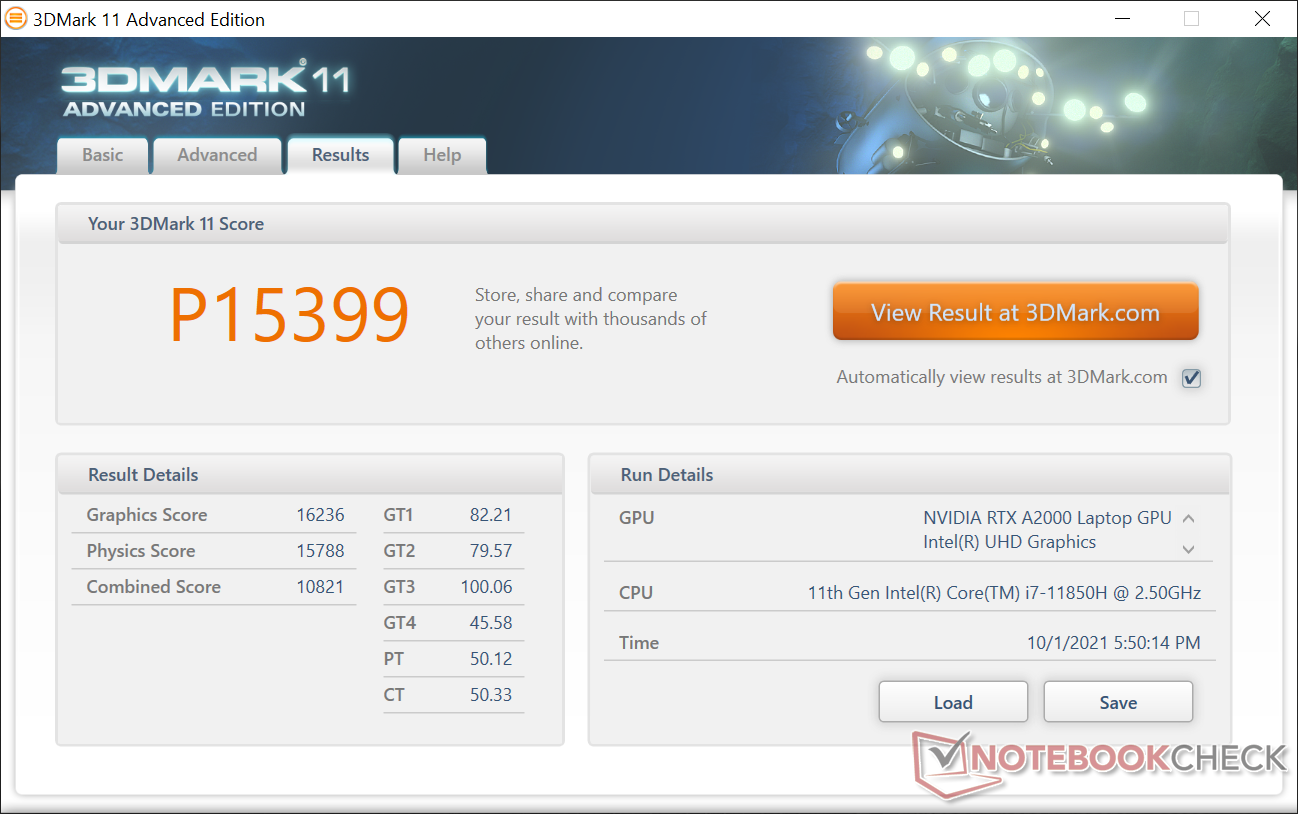
| 3DMark 11 Performance | 15399 points | |
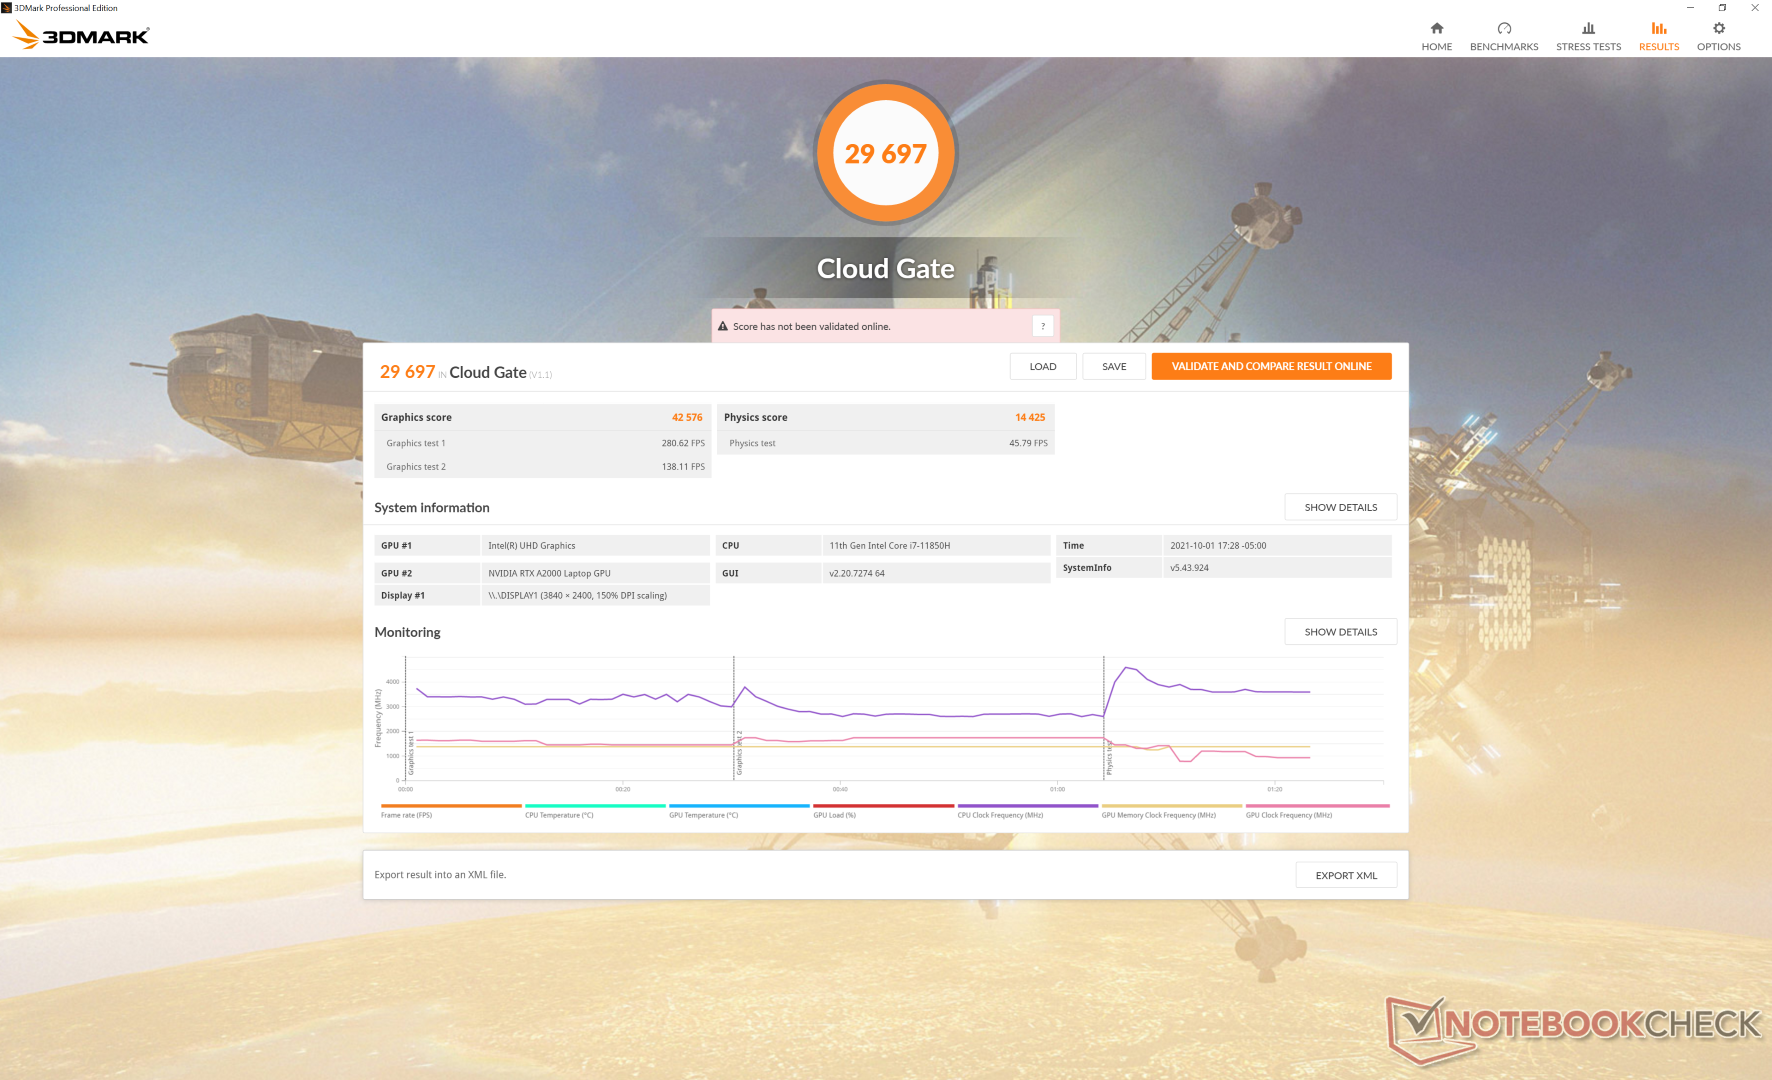
| 3DMark Cloud Gate Standard Score | 29697 points | |
| 3DMark Fire Strike Score | 10908 points | |
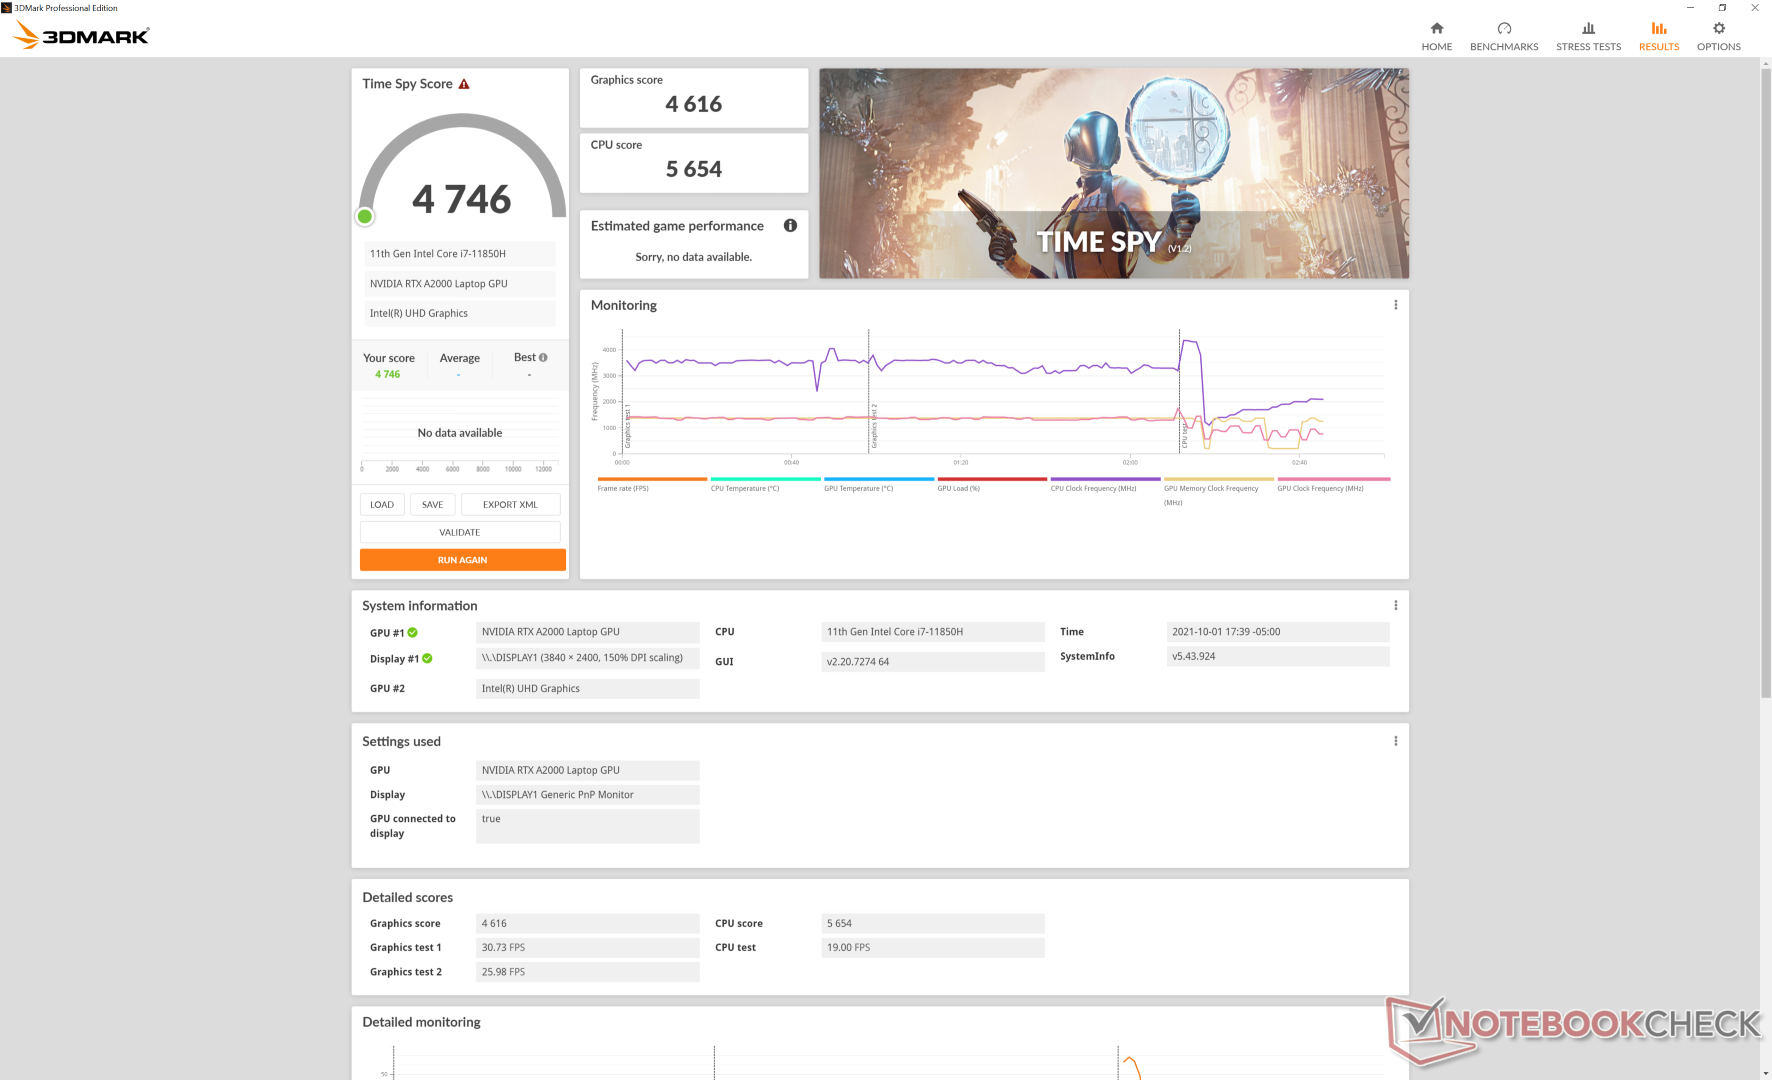
| 3DMark Time Spy Score | 4746 points | |
Help | ||
Witcher 3 FPS Chart
| low | med. | high | ultra | QHD | 4K | |
|---|---|---|---|---|---|---|
| GTA V (2015) | 179 | 170 | 112 | 57.8 | 42.9 | |
| The Witcher 3 (2015) | 259.8 | 151.9 | 92.4 | 50 | 33.1 | |
| Dota 2 Reborn (2015) | 173 | 155 | 130 | 119 | 62.9 | |
| Final Fantasy XV Benchmark (2018) | 86.9 | 63.2 | 46.6 | 34.4 | 19.3 | |
| X-Plane 11.11 (2018) | 112 | 89.2 | 75.1 | 45.3 | ||
| Far Cry 5 (2018) | 120 | 82 | 77 | 69 | 49 | |
| Strange Brigade (2018) | 251 | 60.4 | ||||
| Shadow of the Tomb Raider (2018) | 107 | 62 | 58 | 55 | 40 | 17 |
| Far Cry New Dawn (2019) | 106 | 72 | 71 | 59 | 49 | |
| Metro Exodus (2019) | 110.4 | 55.1 | 42.3 | 34.9 | 27 | |
| Borderlands 3 (2019) | 115.5 | 60.7 | 46.2 | 36 | ||
| Gears Tactics (2020) | 104.3 | 113.7 | 77.5 | 53.4 | 37.3 | |
| Horizon Zero Dawn (2020) | 81 | 60 | 55 | 49 | 41 | |
| Watch Dogs Legion (2020) | 86 | 62 | 51 | 29 | 20 | |
| Dirt 5 (2020) | 86.3 | 68 | 54.6 | 41.9 | 34 | |
| Assassin´s Creed Valhalla (2020) | 80 | 55 | 39 | 32 | 27 | |
| Immortals Fenyx Rising (2020) | 107 | 80 | 72 | 64 | 53 | |
| Hitman 3 (2021) | 166.6 | 83.4 | 78.6 | 73.9 | 48.4 | |
| F1 2021 (2021) | 114 | 120 | 104 | 37 | 24 |
Emissions
System Noise
Interestingly, fan noise is noticeably quieter than what we observed on the Precision 5550. While fan noise can reach over 50 dB(A) on the Precision 5550, we're only able to reach up to 41.4 dB(A) at maximum on our Precision 5560 even when subjected to the same stressful conditions. This lower fan ceiling on the newer model is appreciated and it actually helps the system to be one of the quieter ultrathin mobile workstations in the market, but this comes at the cost of higher core temperatures. Our Stress Test section below will show a CPU temperature difference of 16 C between the two laptops when running Prime95.
| Dell Precision 5000 5560 RTX A2000 Laptop GPU, i7-11850H, Samsung PM9A1 MZVL22T0HBLB | Lenovo ThinkPad P15 G2-20YQ001JGE RTX A3000 Laptop GPU, i7-11800H, Kioxia XG7 KXG7AZNV512G | HP ZBook Studio 15 G8 GeForce RTX 3070 Laptop GPU, i9-11950H, Samsung PM981a MZVLB2T0HALB | Asus ProArt StudioBook Pro 15 W500G5T Quadro RTX 5000 Max-Q, i7-9750H, Samsung SSD PM981 MZVLB1T0HALR | Dell Precision 7550 Quadro RTX 5000 Max-Q, W-10885M, SK Hynix PC601A NVMe 1TB | Dell Precision 5550 P91F Quadro T2000 Max-Q, i7-10875H, SK Hynix PC601A NVMe 1TB | Razer Blade 15 Studio Edition 2020 Quadro RTX 5000 Max-Q, i7-10875H, Samsung PM981a MZVLB1T0HBLR | |
|---|---|---|---|---|---|---|---|
| Noise | -25% | -18% | -26% | -27% | -17% | -28% | |
| off / environment * (dB) | 23.4 | 24.3 -4% | 23.5 -0% | 25.2 -8% | 25.8 -10% | 26.2 -12% | 30.1 -29% |
| Idle Minimum * (dB) | 23.6 | 24.3 -3% | 25.3 -7% | 27.9 -18% | 25.8 -9% | 26.2 -11% | 30.1 -28% |
| Idle Average * (dB) | 23.6 | 24.3 -3% | 25.3 -7% | 27.9 -18% | 25.8 -9% | 26.2 -11% | 30.1 -28% |
| Idle Maximum * (dB) | 23.6 | 28.6 -21% | 25.3 -7% | 27.9 -18% | 25.9 -10% | 26.2 -11% | 30.1 -28% |
| Load Average * (dB) | 25.8 | 47.5 -84% | 41.2 -60% | 47 -82% | 51.2 -98% | 39.2 -52% | 42.3 -64% |
| Witcher 3 ultra * (dB) | 40.1 | 49.4 -23% | 51.9 -29% | 39 3% | 48.2 -20% | ||
| Load Maximum * (dB) | 41.4 | 54.9 -33% | 49.4 -19% | 46.9 -13% | 51.9 -25% | 50.6 -22% | 42.1 -2% |
* ... smaller is better
Noise level
| Idle |
| 23.6 / 23.6 / 23.6 dB(A) |
| Load |
| 25.8 / 41.4 dB(A) |
 | ||
30 dB silent 40 dB(A) audible 50 dB(A) loud |
||
min: | ||
Temperature
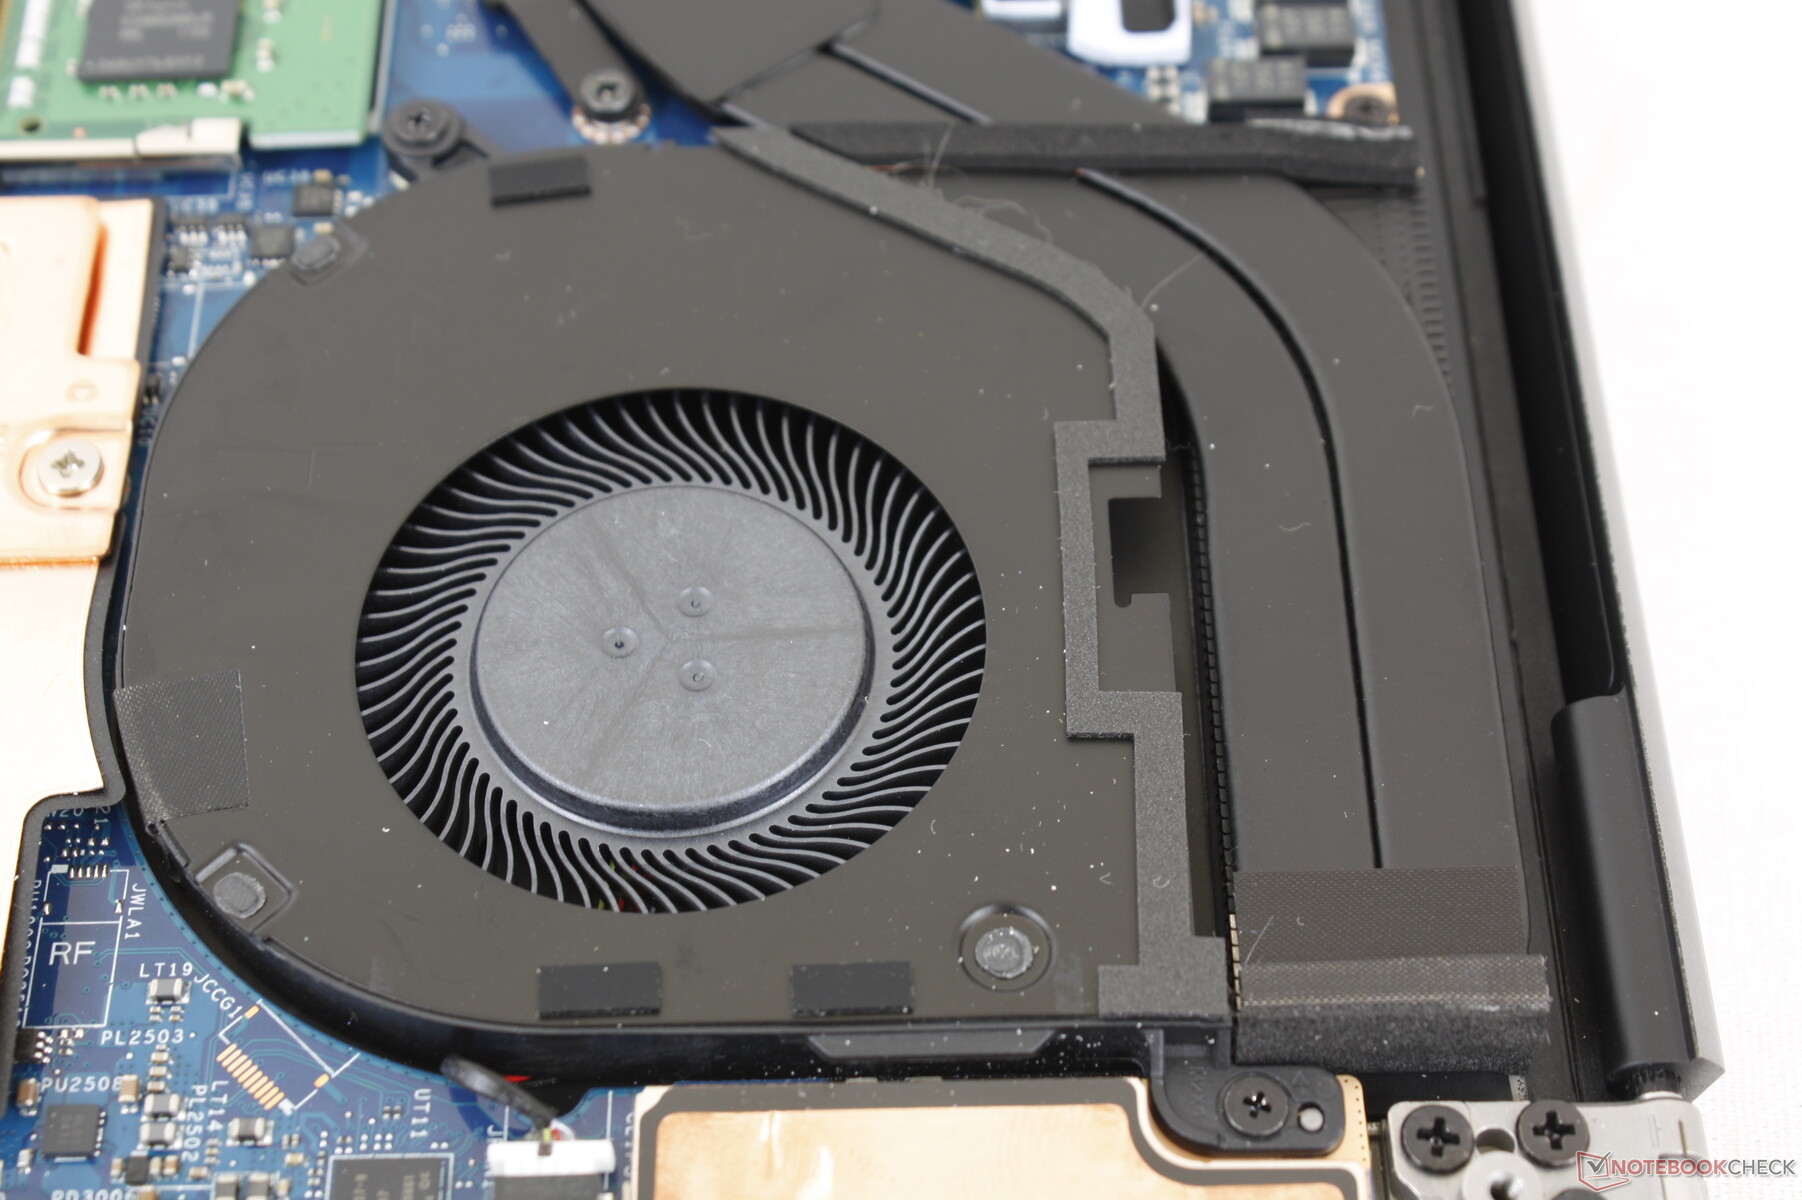
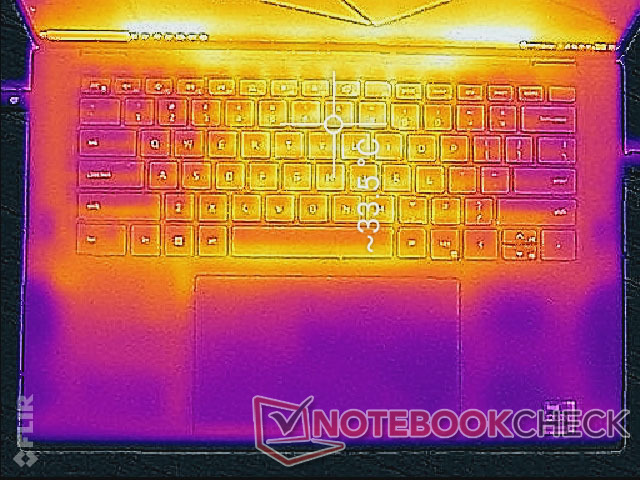
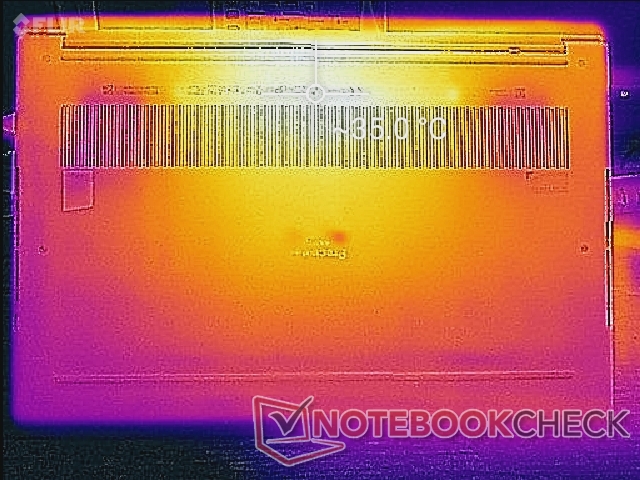
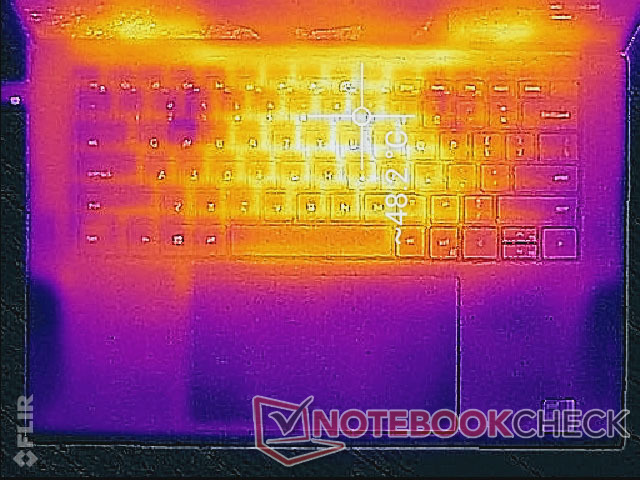
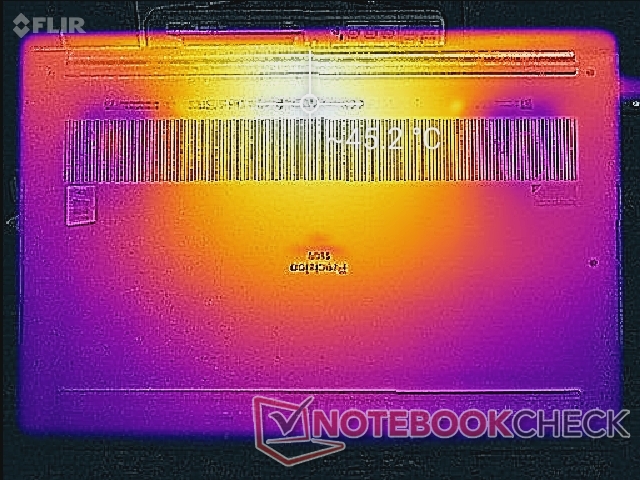
Surface temperatures when under load are similar to what we recorded on the Precision 5550 with hot spots approaching 49 C and 45 C on the top and bottom, respectively. Temperature development is largely symmetrical due to the symmetrical cooling solution within and so the keyboard center will be much warmer than the palm rests or edges. The ThinkPad P15 Gen 2 is a more powerful mobile workstation than our Precision 5560, but its hot spots can become much warmer at over 63 C as a result.
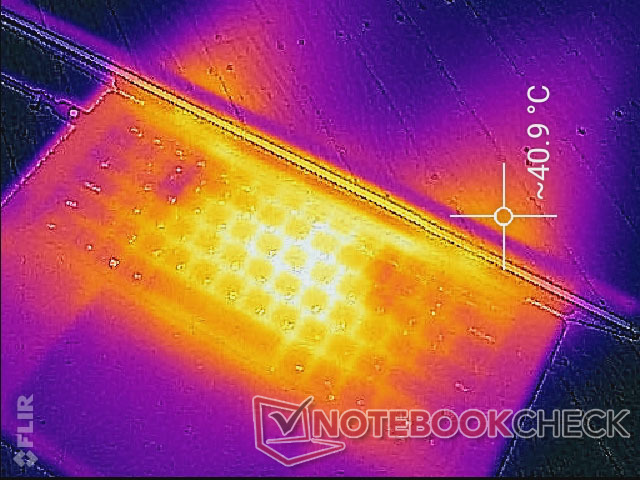
(-) The maximum temperature on the upper side is 48.2 °C / 119 F, compared to the average of 38.2 °C / 101 F, ranging from 22.2 to 69.8 °C for the class Workstation.
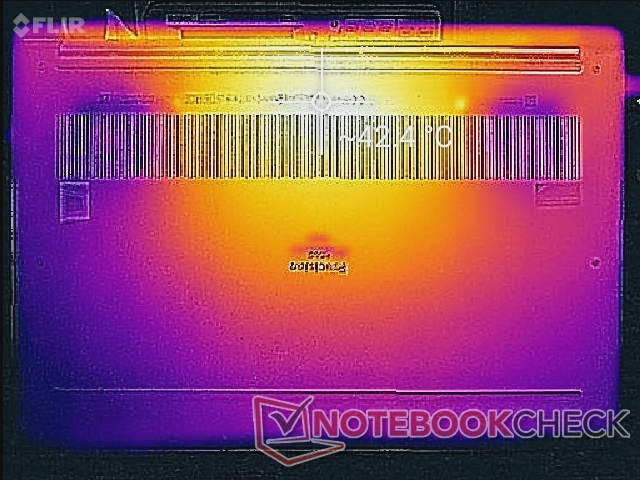
(±) The bottom heats up to a maximum of 42.6 °C / 109 F, compared to the average of 41.1 °C / 106 F
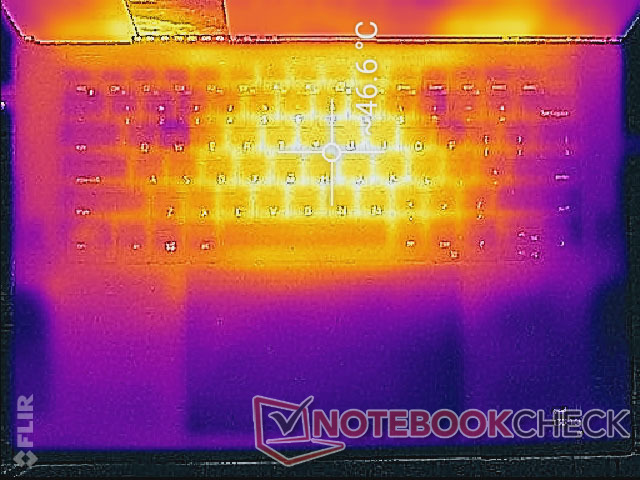
(+) In idle usage, the average temperature for the upper side is 30.6 °C / 87 F, compared to the device average of 32 °C / 90 F.
(±) Playing The Witcher 3, the average temperature for the upper side is 35.4 °C / 96 F, compared to the device average of 32 °C / 90 F.
(+) The palmrests and touchpad are cooler than skin temperature with a maximum of 30.8 °C / 87.4 F and are therefore cool to the touch.
(-) The average temperature of the palmrest area of similar devices was 27.8 °C / 82 F (-3 °C / -5.4 F).
Stress Test
When running Prime95, the CPU would boost to 3.8 GHz for the first couple of seconds before reaching a core temperature of 100 C. Clock rates would then fall to the 2.8 to 3.0 GHz range for the next minute or so before falling even further to the 2.5 to 2.8 GHz range. Core temperature would eventually stabilize at around 90 C compared to 98 C on the HP ZBook Studio 15 G8 or just 74 C on the Precision 5550.
When running Witcher 3 to represent stressful loads, the CPU and GPU would stabilize at 69 C and 75 C, respectively, compared to 66 C and 67 C on the Precision 5550. Real-time GPU board power draw would be stable at 45 W compared to 40 W on the Precision 5550 which may partly explain the slightly higher GPU temperature of our Precision 5560.
Running on battery power will impact performance. A 3DMark 11 test on batteries would return Physics and Graphics scores of 14330 and 12191 points, respectively, compared to 15788 and 16236 points when on mains.
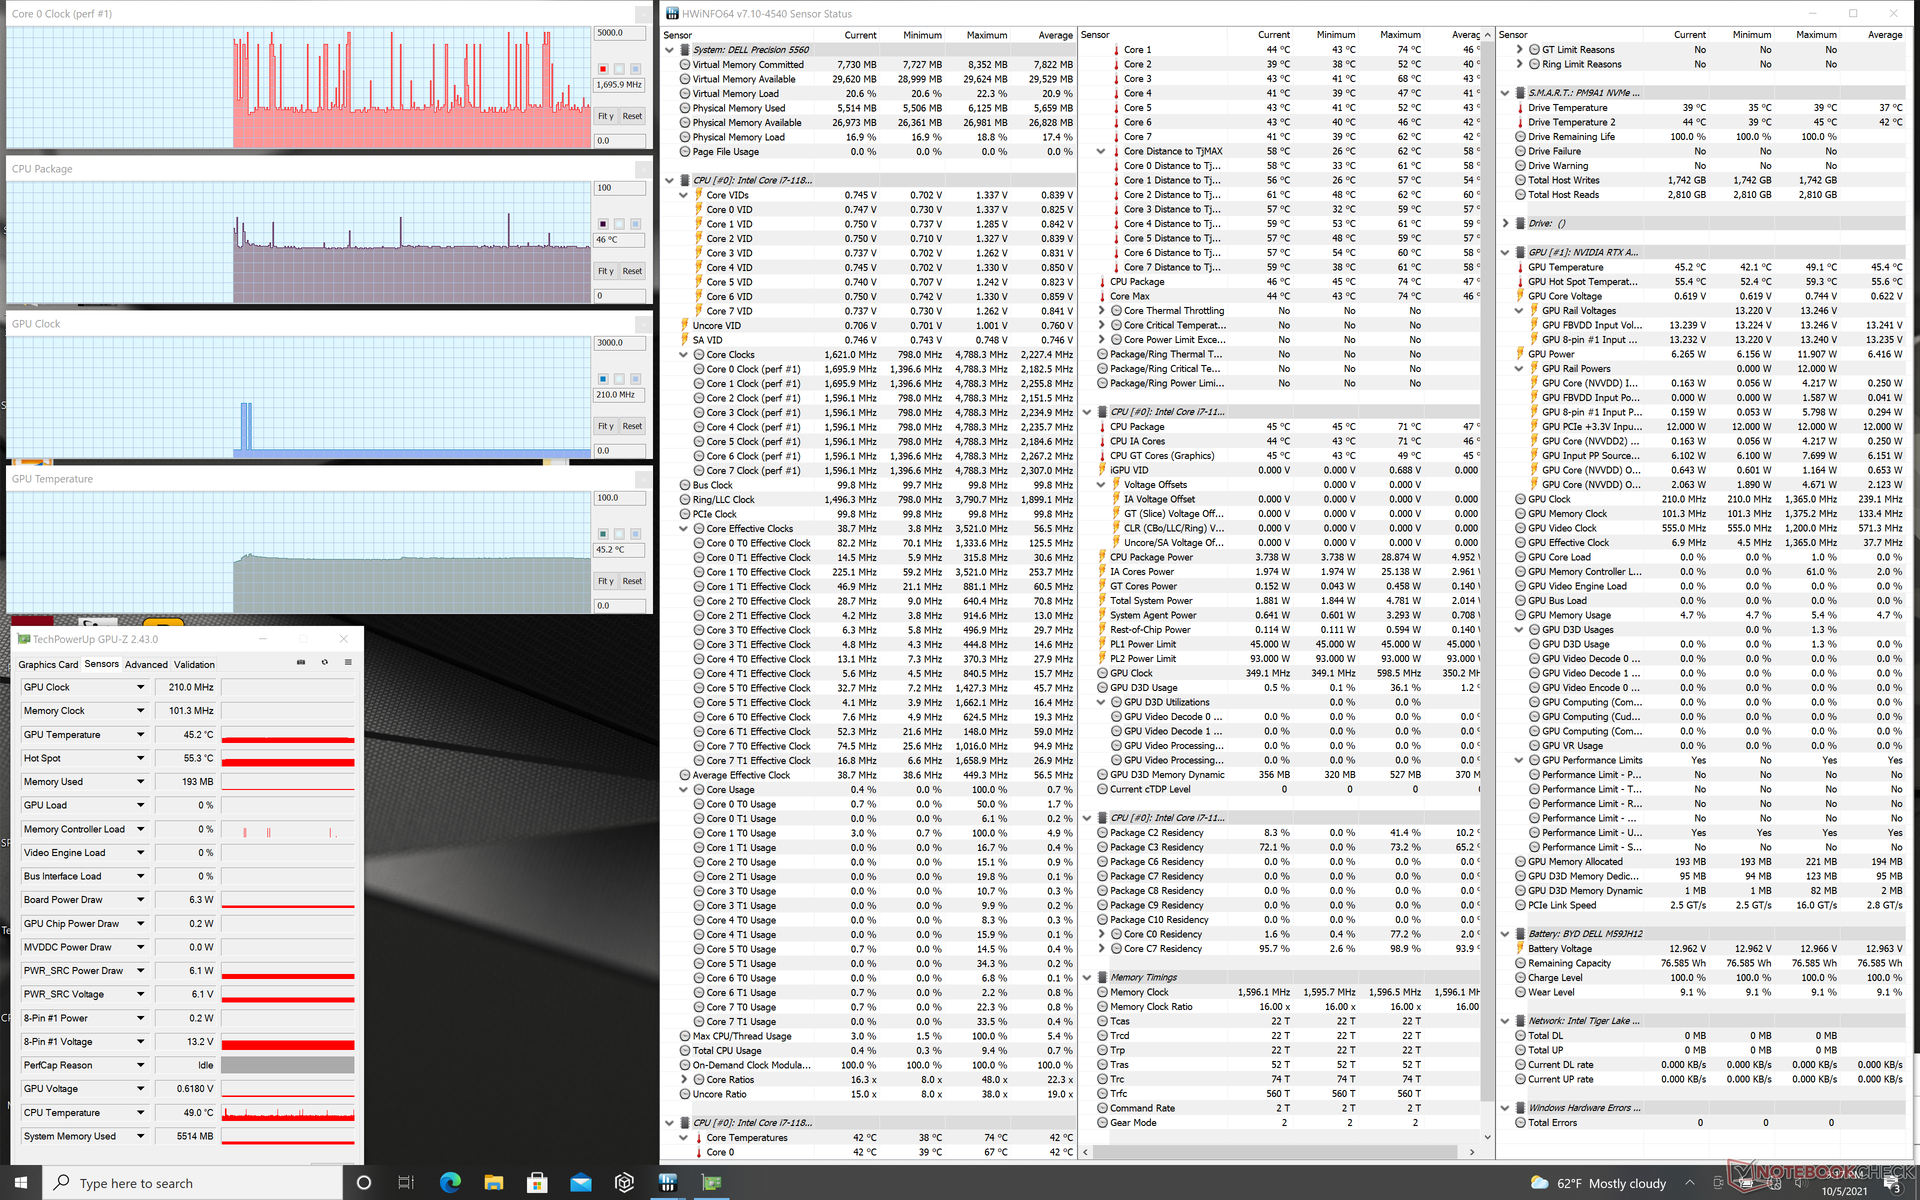
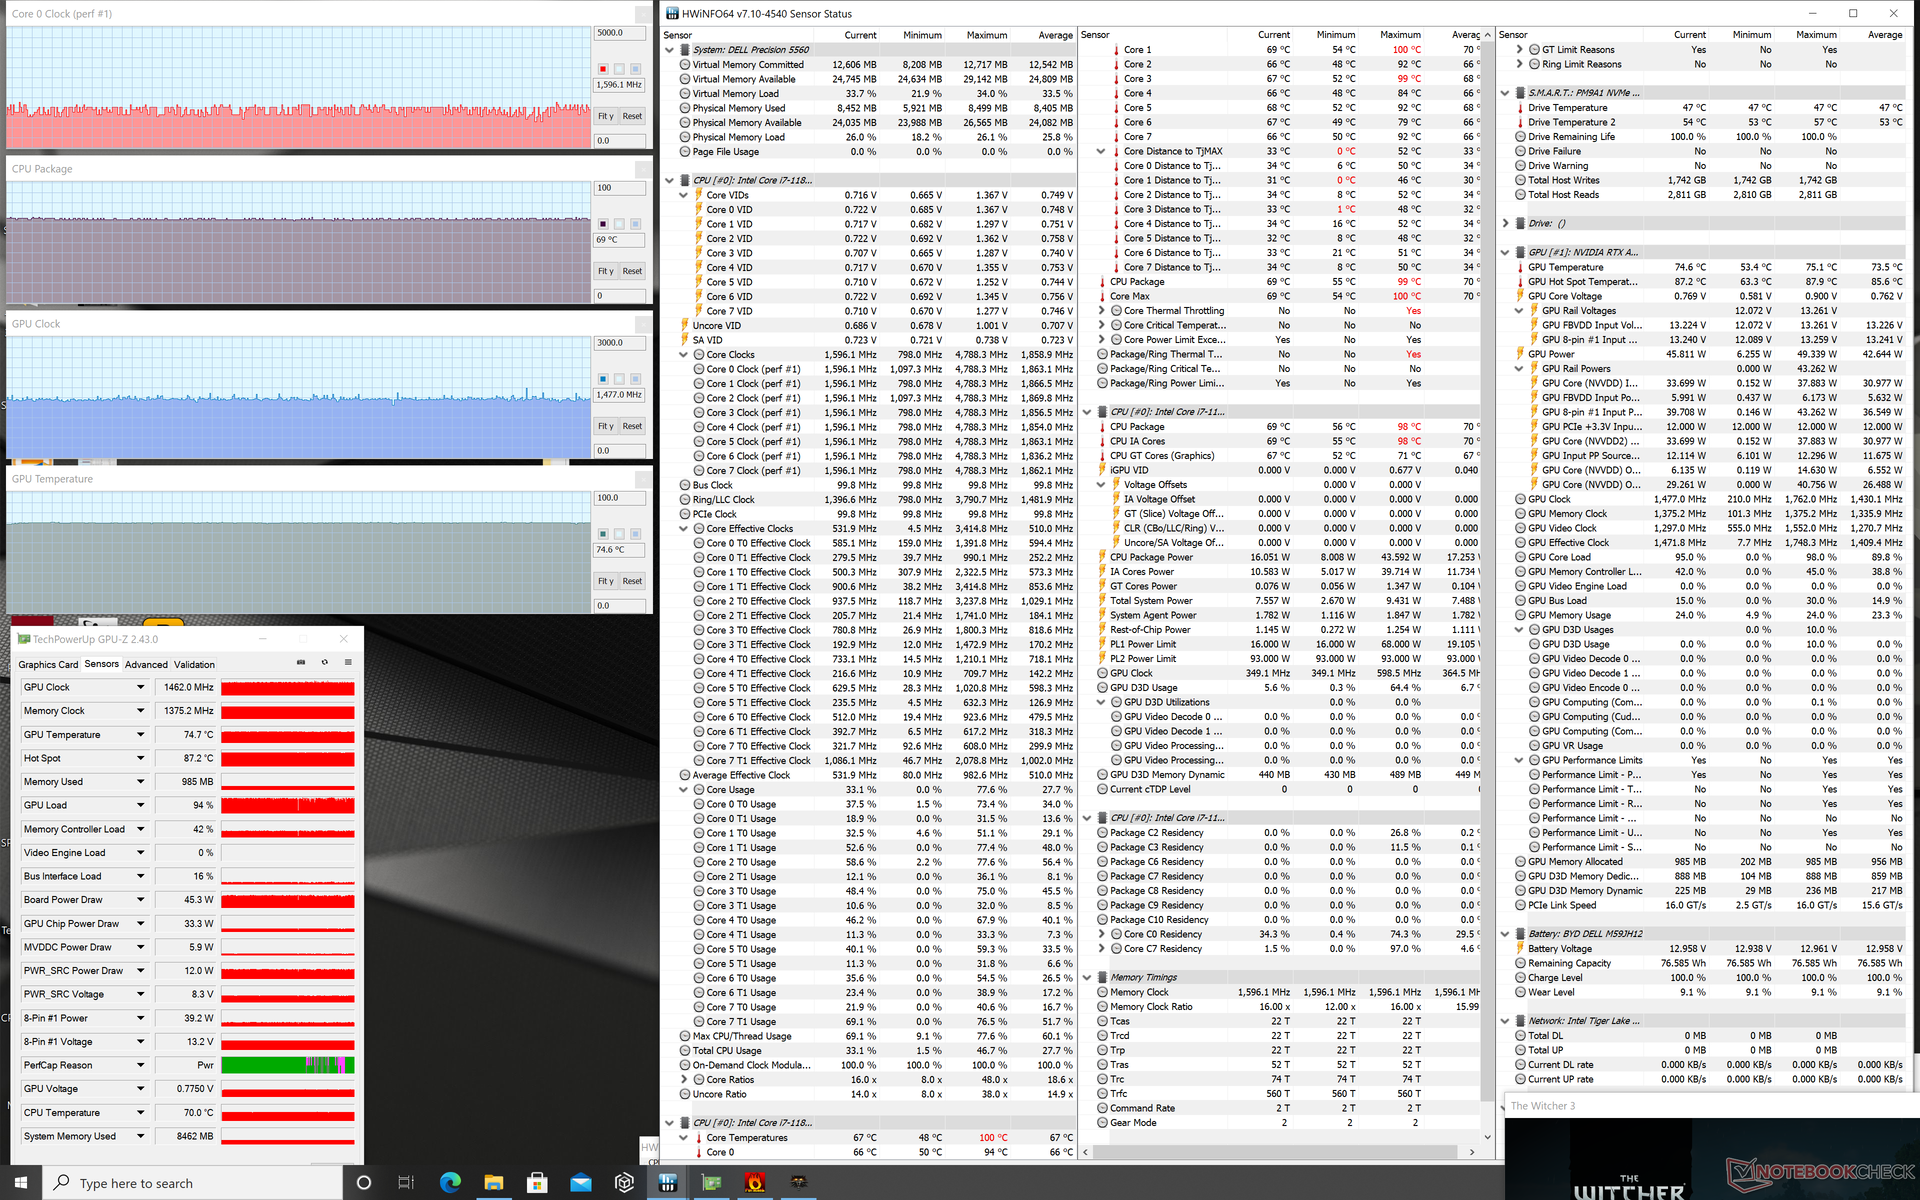
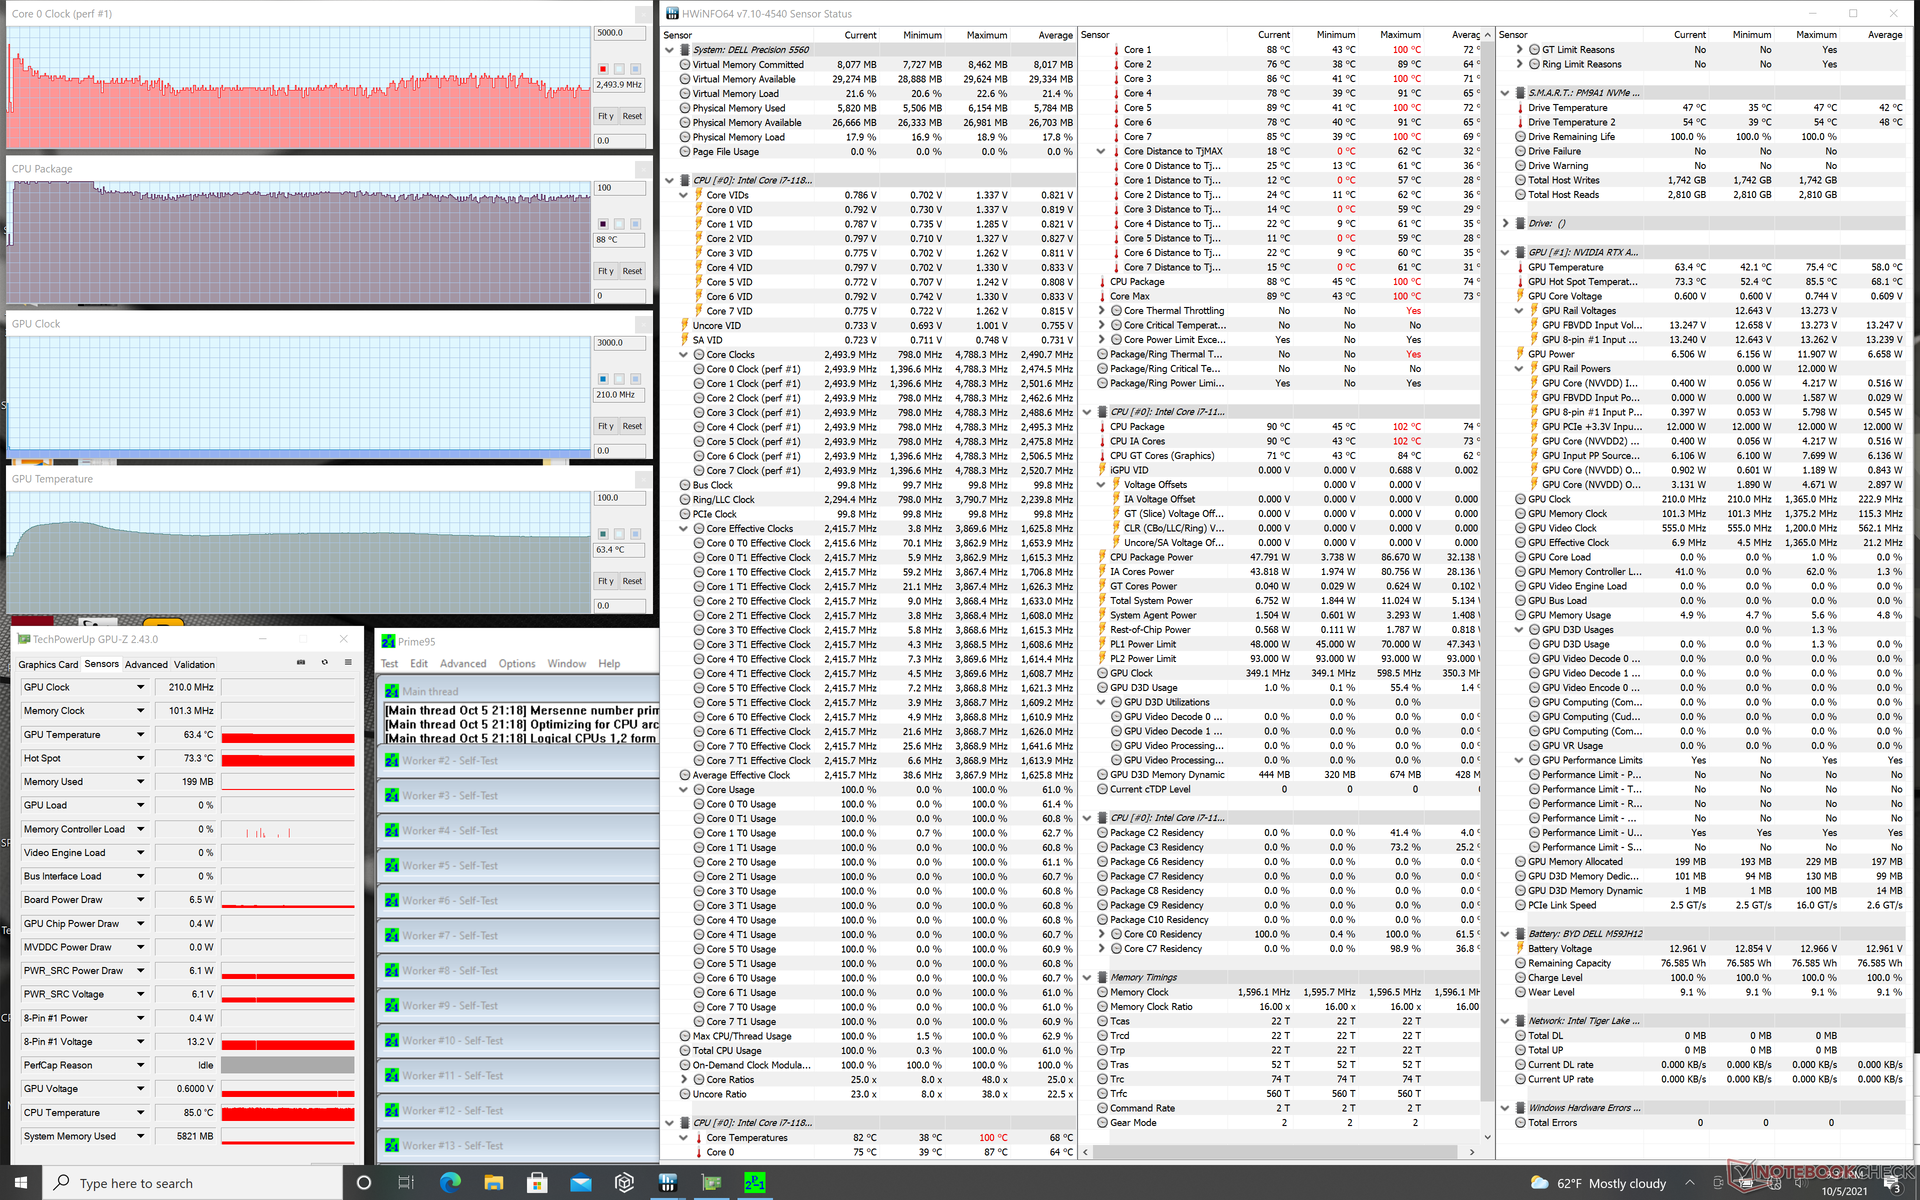
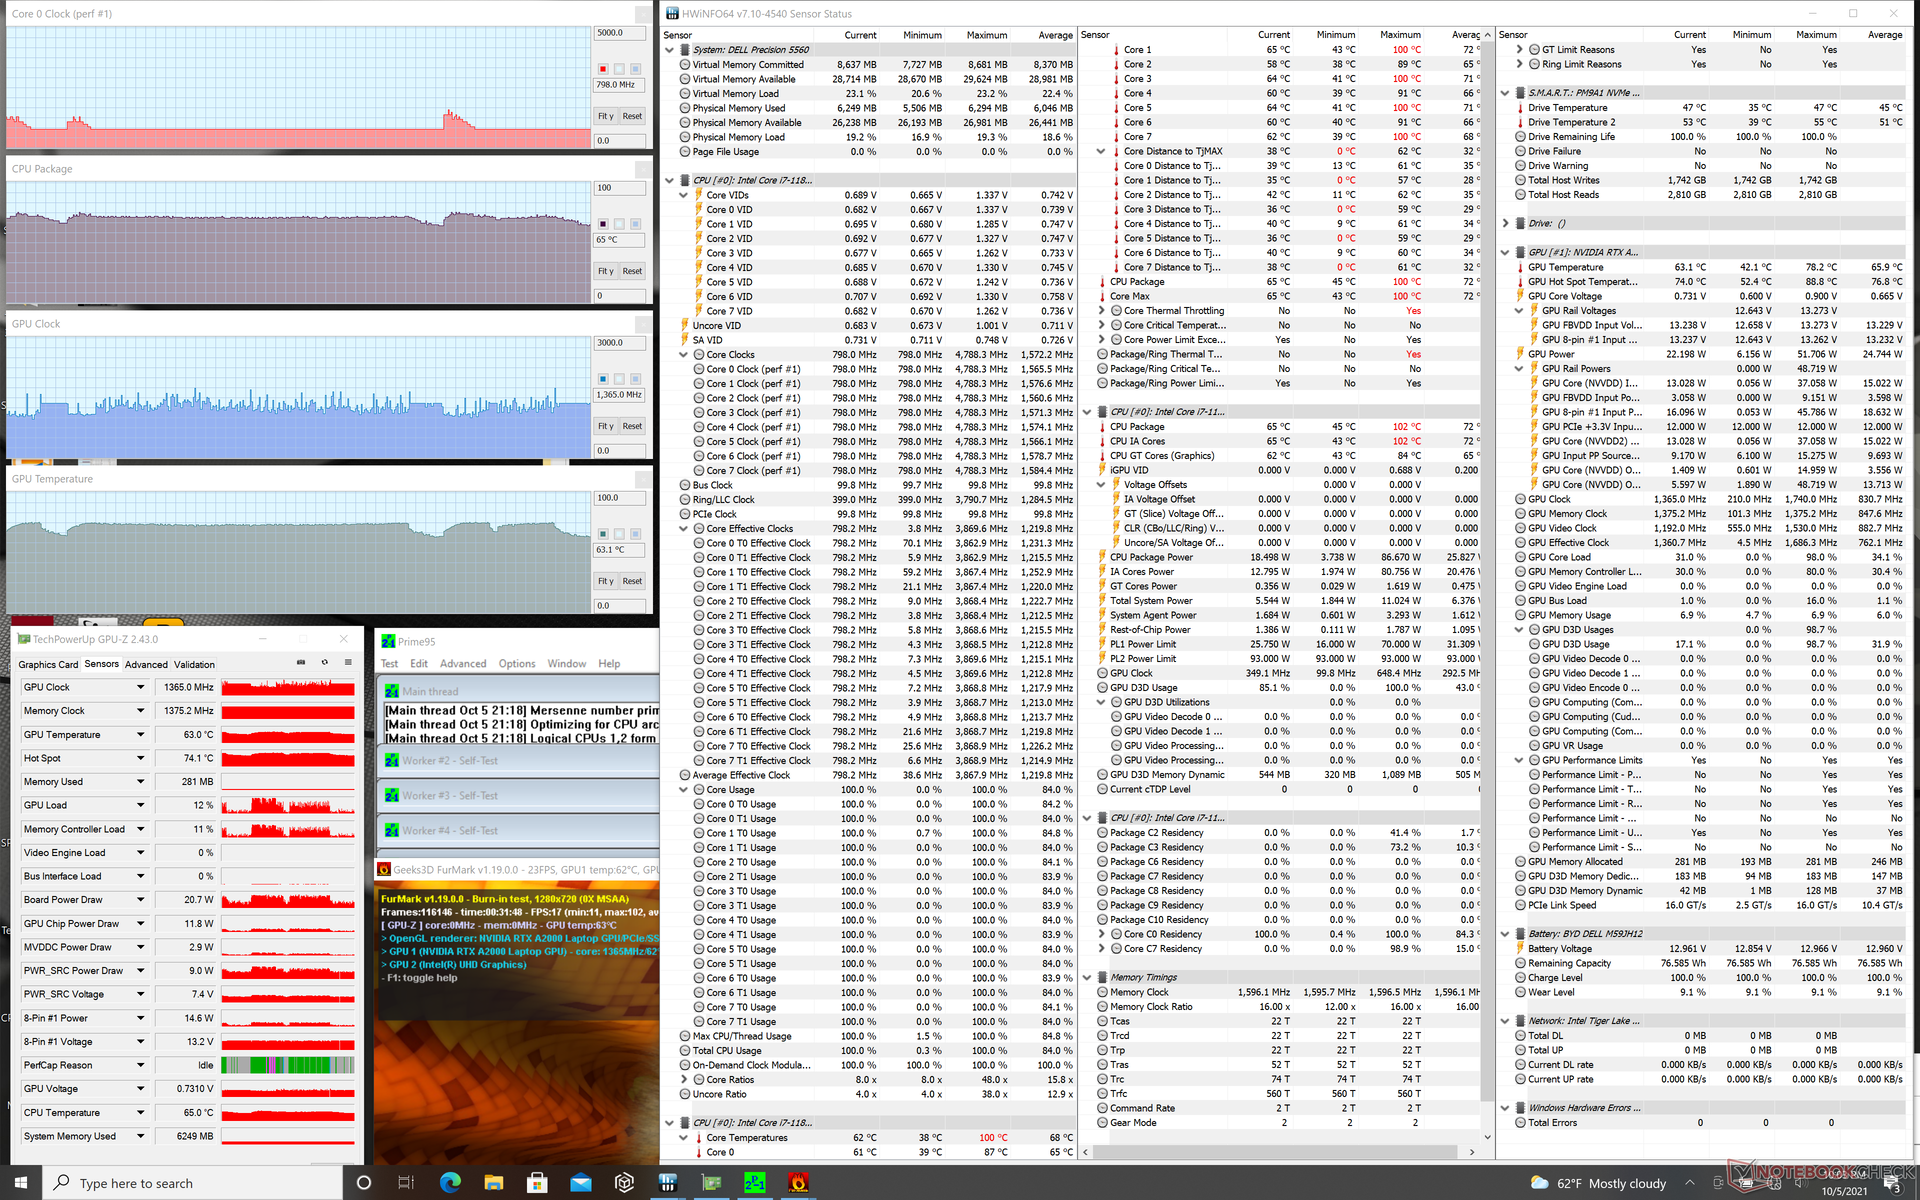
| CPU Clock (GHz) | GPU Clock (MHz) | Average CPU Temperature (°C) | Average GPU Temperature (°C) | |
| System Idle | -- | -- | 46 | 45 |
| Prime95 Stress | 2.5 - 2.8 | -- | ~90 | 63 |
| Prime95 + FurMark Stress | 0.8 - 1.4 | 1000 - 1400 | 64 - 75 | 63 - 75 |
| Witcher 3 Stress | ~1.6 | 1462 | 69 | 75 |
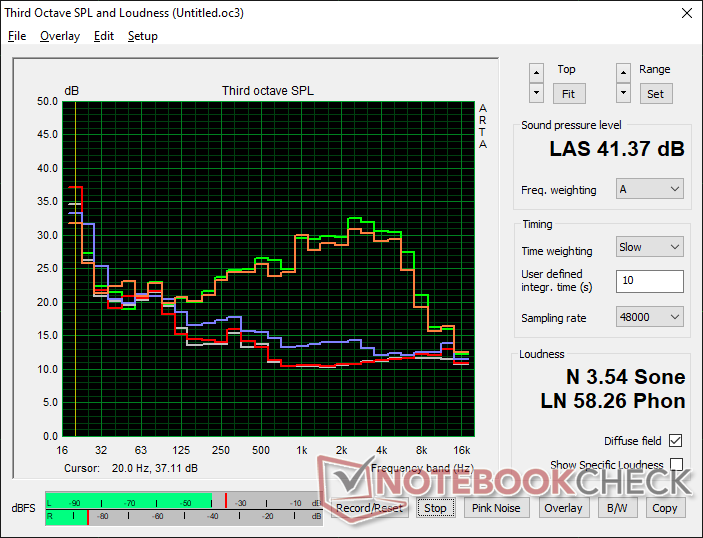
Speakers

Dell Precision 5000 5560 audio analysis
(±) | speaker loudness is average but good (75.2 dB)
Bass 100 - 315 Hz
(±) | reduced bass - on average 9.8% lower than median
(±) | linearity of bass is average (8.8% delta to prev. frequency)
Mids 400 - 2000 Hz
(±) | higher mids - on average 5.7% higher than median
(+) | mids are linear (3.7% delta to prev. frequency)
Highs 2 - 16 kHz
(+) | balanced highs - only 2.7% away from median
(+) | highs are linear (6.4% delta to prev. frequency)
Overall 100 - 16.000 Hz
(+) | overall sound is linear (14.8% difference to median)
Compared to same class
» 33% of all tested devices in this class were better, 6% similar, 61% worse
» The best had a delta of 7%, average was 17%, worst was 35%
Compared to all devices tested
» 20% of all tested devices were better, 4% similar, 76% worse
» The best had a delta of 4%, average was 23%, worst was 134%
Apple MacBook 12 (Early 2016) 1.1 GHz audio analysis
(+) | speakers can play relatively loud (83.6 dB)
Bass 100 - 315 Hz
(±) | reduced bass - on average 11.3% lower than median
(±) | linearity of bass is average (14.2% delta to prev. frequency)
Mids 400 - 2000 Hz
(+) | balanced mids - only 2.4% away from median
(+) | mids are linear (5.5% delta to prev. frequency)
Highs 2 - 16 kHz
(+) | balanced highs - only 2% away from median
(+) | highs are linear (4.5% delta to prev. frequency)
Overall 100 - 16.000 Hz
(+) | overall sound is linear (10.2% difference to median)
Compared to same class
» 7% of all tested devices in this class were better, 2% similar, 90% worse
» The best had a delta of 5%, average was 18%, worst was 53%
Compared to all devices tested
» 5% of all tested devices were better, 1% similar, 94% worse
» The best had a delta of 4%, average was 23%, worst was 134%
Energy Management
Power Consumption
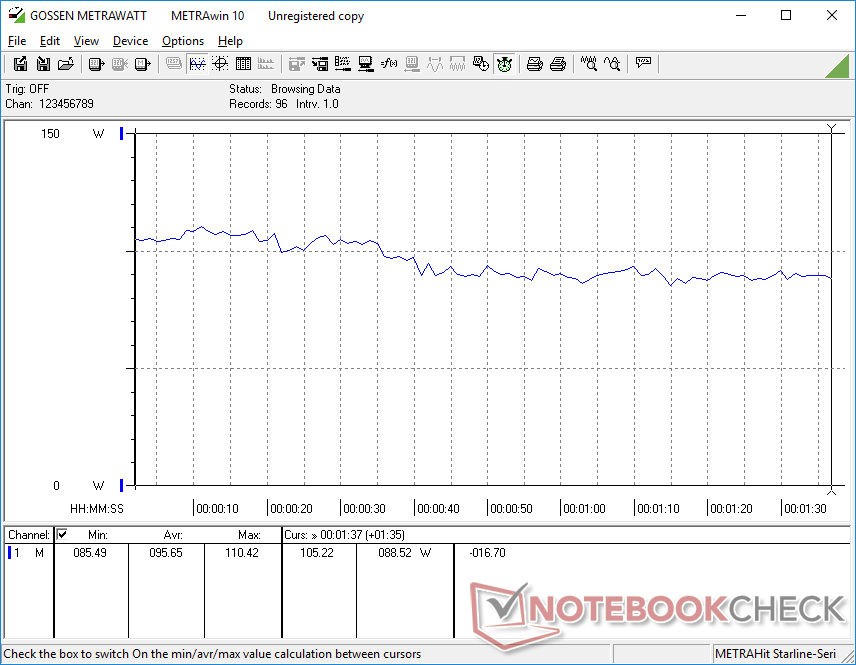
Power consumption is a mixed bag. When under lower loads, our unit would be more power-hungry than the Precision 5550 (6 W to 24 W vs. 5 W to 19 W) which likely contributed to the shorter battery life results in our next section. On the other hand, power consumption would remain nearly the same as the Precision 5550 when running higher loads like games even though our CPU and GPU can be up to 15 percent and 50 percent faster than the Core i7-10875H and Quadro T2000 Max-Q, respectively. Performance-per-watt is therefore higher year-over-year when running demanding applications.
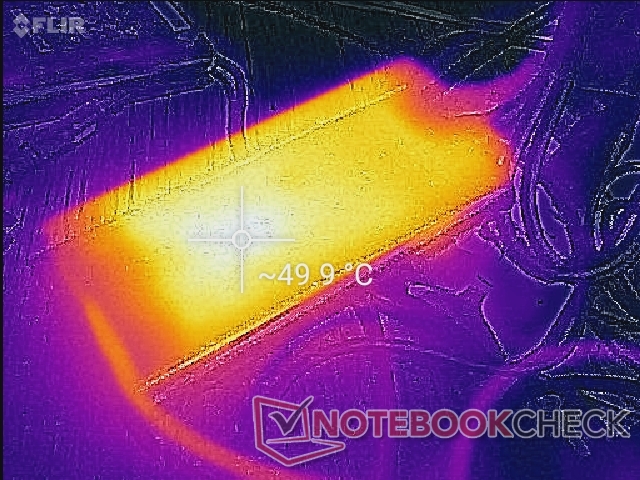
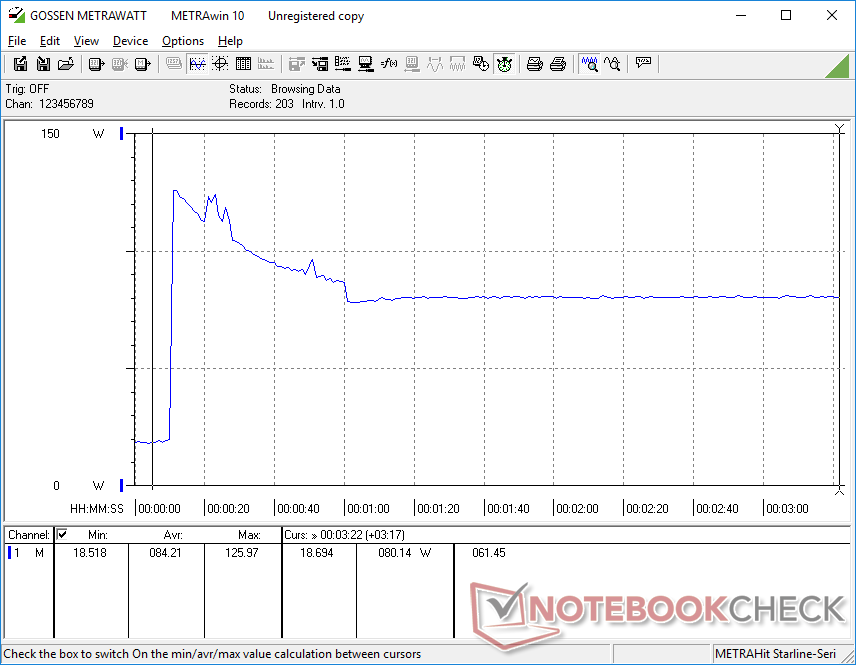
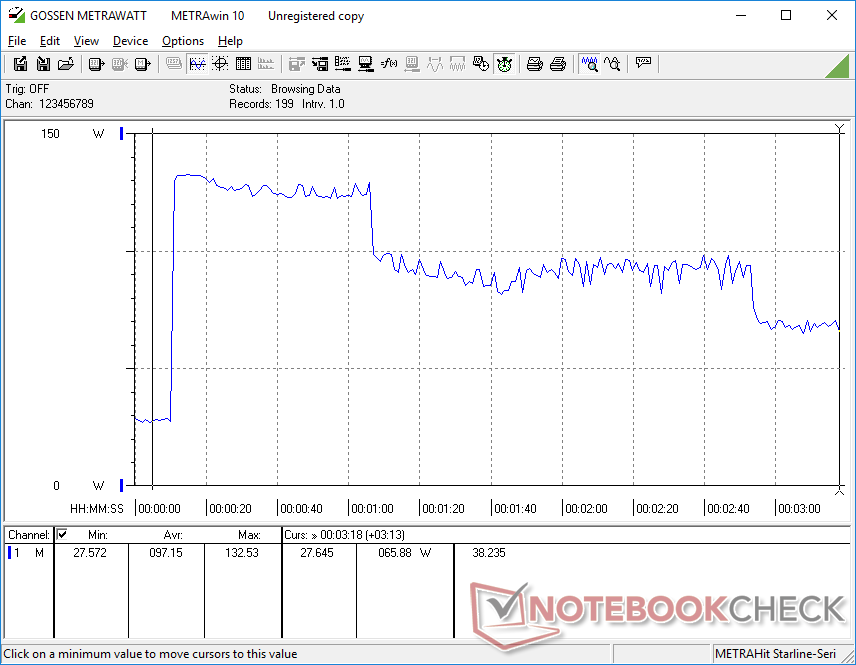
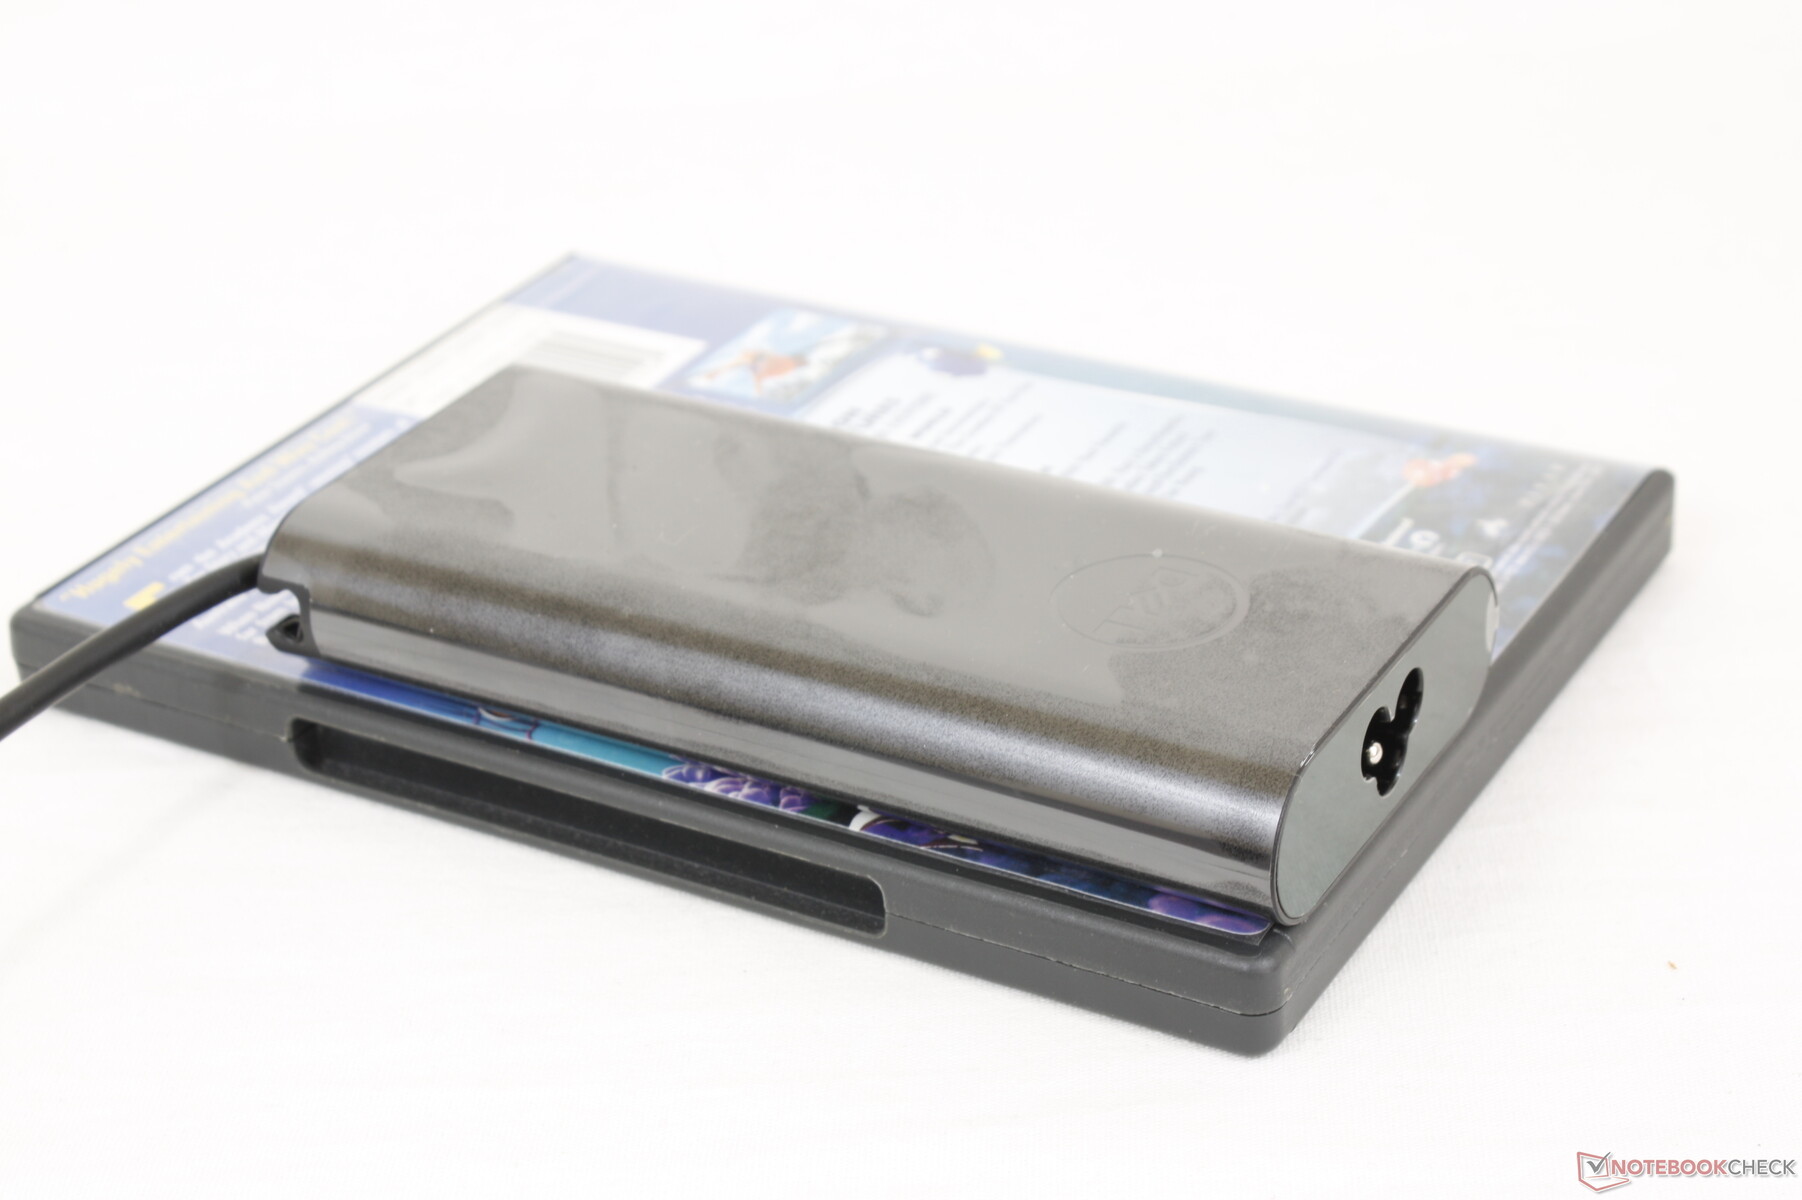
We're able to record a temporary maximum consumption of 133 W from the small (~14.3 x 6.5 x 2.2 cm) 130 W USB-C AC adapter. Consumption falls over time as shown by our graphs below due to thermal limitations. The battery will not drain when connected to mains which is not the case on some early Precision 5750 models.

| Off / Standby | |
| Idle | |
| Load |
|
Key:
min: | |
| Dell Precision 5000 5560 i7-11850H, RTX A2000 Laptop GPU, Samsung PM9A1 MZVL22T0HBLB, IPS, 3840x2400, 15.6" | Lenovo ThinkPad P15 G2-20YQ001JGE i7-11800H, RTX A3000 Laptop GPU, Kioxia XG7 KXG7AZNV512G, IPS, 1920x1080, 15.6" | HP ZBook Studio 15 G8 i9-11950H, GeForce RTX 3070 Laptop GPU, Samsung PM981a MZVLB2T0HALB, OLED, 3840x2160, 15.6" | Asus ProArt StudioBook Pro 15 W500G5T i7-9750H, Quadro RTX 5000 Max-Q, Samsung SSD PM981 MZVLB1T0HALR, IPS, 3840x2160, 15.6" | Dell Precision 7550 W-10885M, Quadro RTX 5000 Max-Q, SK Hynix PC601A NVMe 1TB, IPS, 3840x2160, 15.6" | Dell Precision 5550 P91F i7-10875H, Quadro T2000 Max-Q, SK Hynix PC601A NVMe 1TB, IPS, 3840x2400, 15.6" | Razer Blade 15 Studio Edition 2020 i7-10875H, Quadro RTX 5000 Max-Q, Samsung PM981a MZVLB1T0HBLR, OLED, 3840x2160, 15.6" | |
|---|---|---|---|---|---|---|---|
| Power Consumption | -11% | -43% | -30% | -38% | 7% | -44% | |
| Idle Minimum * (Watt) | 6.2 | 6.3 -2% | 11 -77% | 11.6 -87% | 8.2 -32% | 5.6 10% | 13.4 -116% |
| Idle Average * (Watt) | 13.9 | 10.7 23% | 18.8 -35% | 19 -37% | 16.8 -21% | 11.2 19% | 18 -29% |
| Idle Maximum * (Watt) | 23.8 | 11.6 51% | 31.7 -33% | 20.6 13% | 24.4 -3% | 18.4 23% | 26.1 -10% |
| Load Average * (Watt) | 95.7 | 99.3 -4% | 105.2 -10% | 102 -7% | 131 -37% | 114 -19% | 115 -20% |
| Witcher 3 ultra * (Watt) | 87 | 154 -77% | 148 -70% | 156.6 -80% | 76.7 12% | 145 -67% | |
| Load Maximum * (Watt) | 132.6 | 210 -58% | 171.8 -30% | 178 -34% | 201.8 -52% | 134.2 -1% | 165 -24% |
* ... smaller is better
Power Consumption Witcher 3 / Stresstest
Battery Life
Runtimes are generally shorter than what we recorded on last year's Precision 5550. Real-world WLAN use would only last for about 6.5 hours compared to 9 hours on the older model even when both are set to identical Balanced power profiles with Optimus active.
Charging from empty to full capacity takes about 2 hours. We appreciate that the system can be recharged via any of its three USB-C ports whereas some laptops would support charging on only one USB-C port. This same Dell charger can also be used to charge modern XPS laptops.
| Dell Precision 5000 5560 i7-11850H, RTX A2000 Laptop GPU, 86 Wh | Lenovo ThinkPad P15 G2-20YQ001JGE i7-11800H, RTX A3000 Laptop GPU, 94 Wh | HP ZBook Studio 15 G8 i9-11950H, GeForce RTX 3070 Laptop GPU, 83 Wh | Asus ProArt StudioBook Pro 15 W500G5T i7-9750H, Quadro RTX 5000 Max-Q, 76 Wh | Dell Precision 7550 W-10885M, Quadro RTX 5000 Max-Q, 95 Wh | Dell Precision 5550 P91F i7-10875H, Quadro T2000 Max-Q, 86 Wh | Razer Blade 15 Studio Edition 2020 i7-10875H, Quadro RTX 5000 Max-Q, 80 Wh | |
|---|---|---|---|---|---|---|---|
| Battery runtime | 15% | 2% | -25% | -3% | 36% | -9% | |
| Reader / Idle (h) | 12 | 12.9 8% | 11.1 -7% | 22.6 88% | 8.8 -27% | ||
| WiFi v1.3 (h) | 6.3 | 9.9 57% | 6.2 -2% | 4.7 -25% | 8.9 41% | 9 43% | 5.7 -10% |
| Load (h) | 1.8 | 1.3 -28% | 1.8 0% | 1 -44% | 1.4 -22% | 2 11% |
Pros
Cons
Verdict — Same Looks, Much Faster Graphics
Why purchase the Precision 5560 when it is visually identical to the Precision 5550? The jump in GPU power will be the main reason to consider the newer model over the older one. Nvidia's Quadro RTX A2000 is a generation ahead of the Quadro T2000 Max-Q to provide up to 50 percent faster GPU performance at minimal cost to power consumption, battery life, weight, surface temperature, and even fan noise. The gains in performance-per-watt alone help make the system perform faster than its ultrathin profile would otherwise suggest. Users will get a boost to CPU performance as well albeit by much smaller margins.
A huge boost in GPU power over the Precision 5550. If the Quadro RTX A2000 is of no interest to you, however, then you might want to consider last year's visually identical model instead.
For whatever reason, our Precision 5560 can't reach the same maximum fan noise ceiling that we experienced on the 5550. This could have potentially been on purpose by the manufacturer in an attempt to lower fan noise, but it does impact core temperatures somewhat.
Users who know they can benefit from the boost in graphics power will want to skip the Precision 5550 for the 5560. Otherwise, the 5550 can offer an identical user experience in terms of physical features and display. Competitors like the MSI WS66, Razer Blade 15 Studio, or Lenovo ThinkPad P15 G2 are slightly thicker but they carry even faster GPUs from the Quadro RTX A3000 and up that aren't available on the Precision 5000 series.
Price and availability
Dell Precision 5000 5560
- 10/06/2021 v7 (old)
Allen Ngo
Price comparison
