Dell Latitude 9420 2-in-1 Convertible Review: Totally Better Than The Latitude 9410
While last year's Latitude 9410 2-in-1 wasn't bad by any means, we blasted it for being a near carbon copy of the Latitude 7400 2-in-1 with no major changes. We also gave it flack for its Comet Lake-U CPU which was aging poorly in the face of newer and faster AMD Ryzen Zen 2 or Intel 10th gen Ice Lake options at the time.
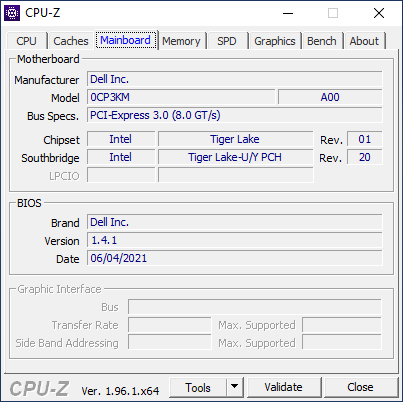
Now that it's 2021, Dell seems to have taken those above criticisms to heart as the new Latitude 9420 2-in-1 is a full-on refresh that seemingly addresses the clear drawbacks of its immediate Latitude 9410 2-in-1 predecessor. The convertible sports the latest 11th gen Intel Tiger Lake-U vPro CPUs in a brand new 16:10 form factor to be a notable departure from last year's 16:9 model.
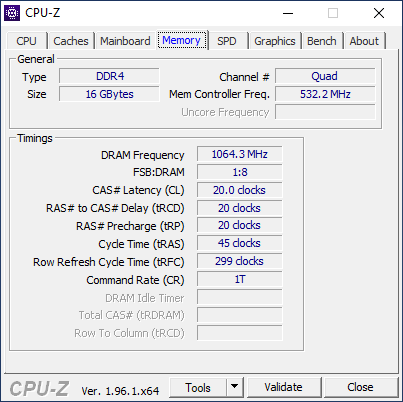
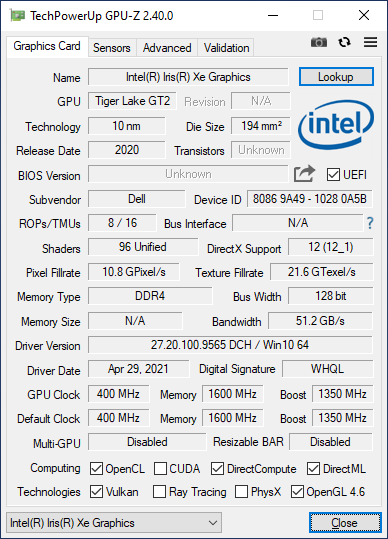
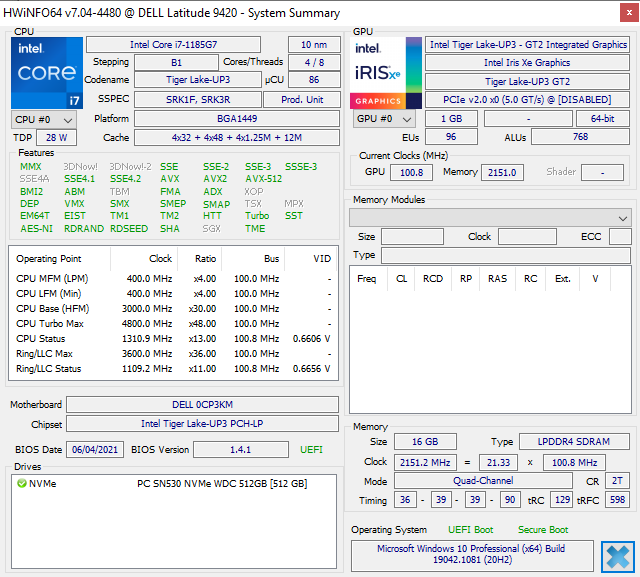
Our configuration in review is a higher-end SKU with the Core i7-1185G7 CPU, 16 GB of RAM, 2560 x 1600 QHD+ resolution touchscreen, and 512 GB NVMe SSD for about $2880 USD. Lesser SKUs with the Core i5-1135G7 and FHD+ panel are also available for less. All options come with integrated Iris Xe graphics.
Direct competitors to the Latitude 9420 2-in-1 include other subnotebook business convertibles like the Lenovo ThinkPad X1 Yoga G6, HP EliteBook x360 1040 G7, or MSI Summit E13 Flip Evo.
More Dell reviews:
potential competitors in comparison
Rating | Date | Model | Weight | Height | Size | Resolution | Price |
|---|---|---|---|---|---|---|---|
| 89 % v7 (old) | 07 / 2021 | Dell Latitude 9420 2-in-1 i7-1185G7, Iris Xe G7 96EUs | 1.5 kg | 13.94 mm | 14.00" | 2560x1600 | |
| 91.4 % v7 (old) | 04 / 2021 | Lenovo ThinkPad X1 Yoga G6-20Y0S00200 i7-1165G7, Iris Xe G7 96EUs | 1.4 kg | 15 mm | 14.00" | 1920x1200 | |
| 90.6 % v7 (old) | 03 / 2021 | HP EliteBook x360 1040 G7, i7-10810U i7-10810U, UHD Graphics 620 | 1.4 kg | 16.5 mm | 14.00" | 1920x1080 | |
| 88.7 % v7 (old) | 08 / 2020 | Dell Latitude 14 9410 2-in-1 P110G i7-10610U, UHD Graphics 620 | 1.5 kg | 14.89 mm | 14.00" | 1920x1080 | |
| 85 % v7 (old) | 05 / 2020 | Asus ZenBook Flip 14 UX463FA-AI039T i5-10210U, UHD Graphics 620 | 1.4 kg | 18 mm | 14.00" | 1920x1080 | |
| 86.9 % v7 (old) | 04 / 2021 | MSI Summit E13 Flip Evo A11MT i7-1185G7, Iris Xe G7 96EUs | 1.4 kg | 14.9 mm | 13.40" | 1920x1200 |
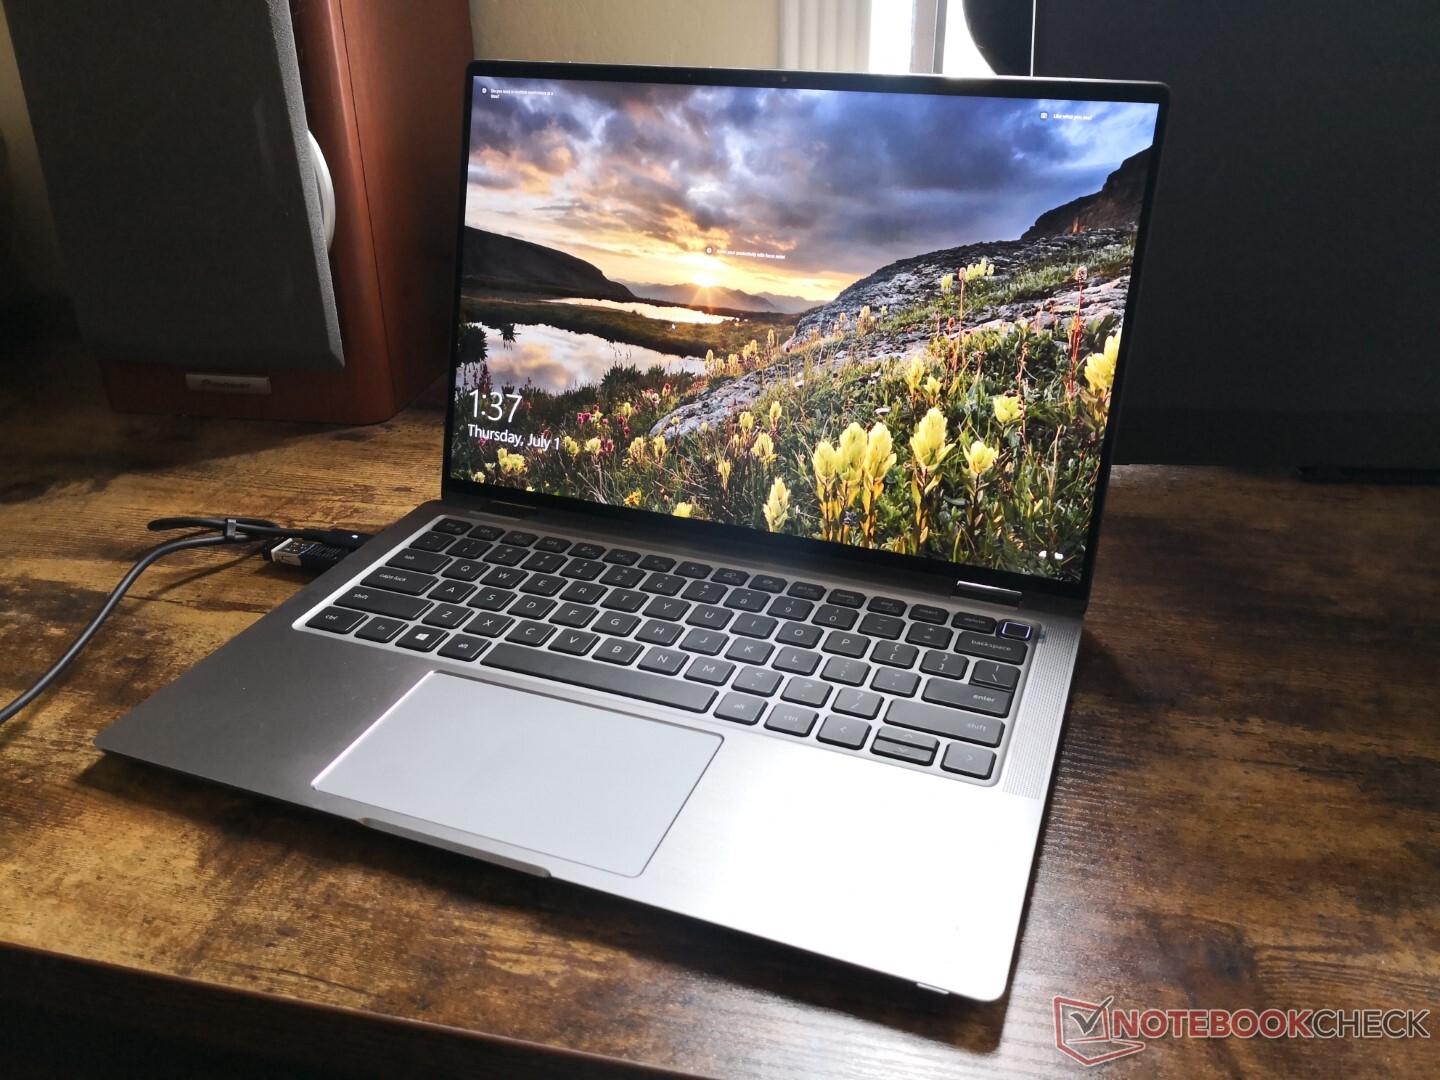
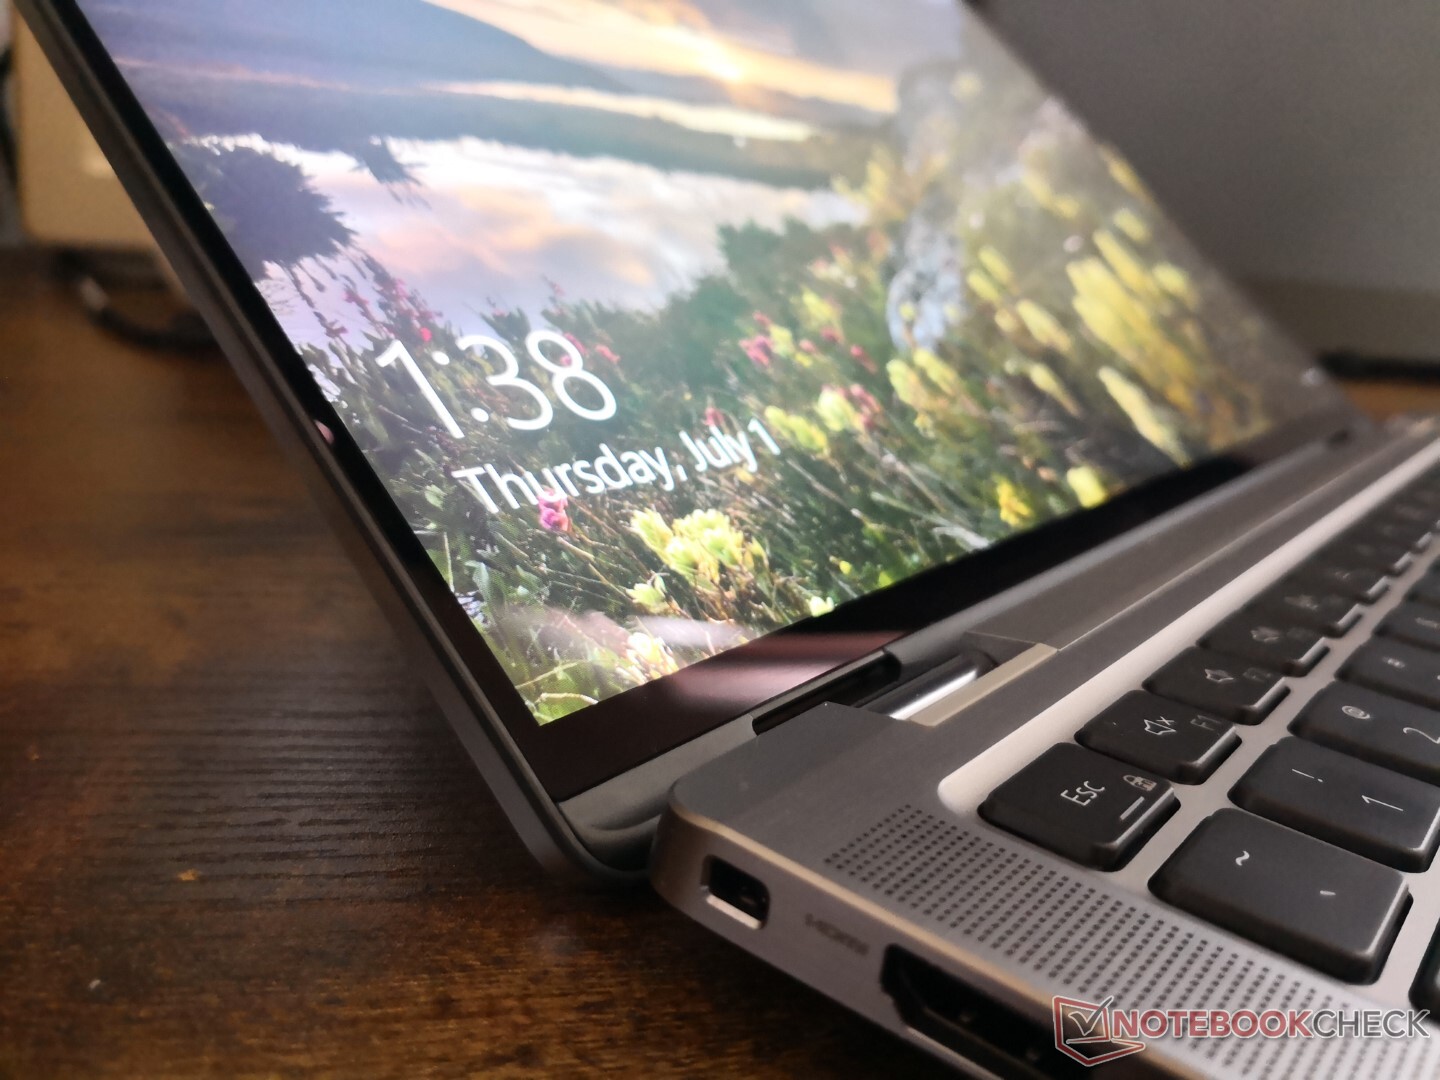
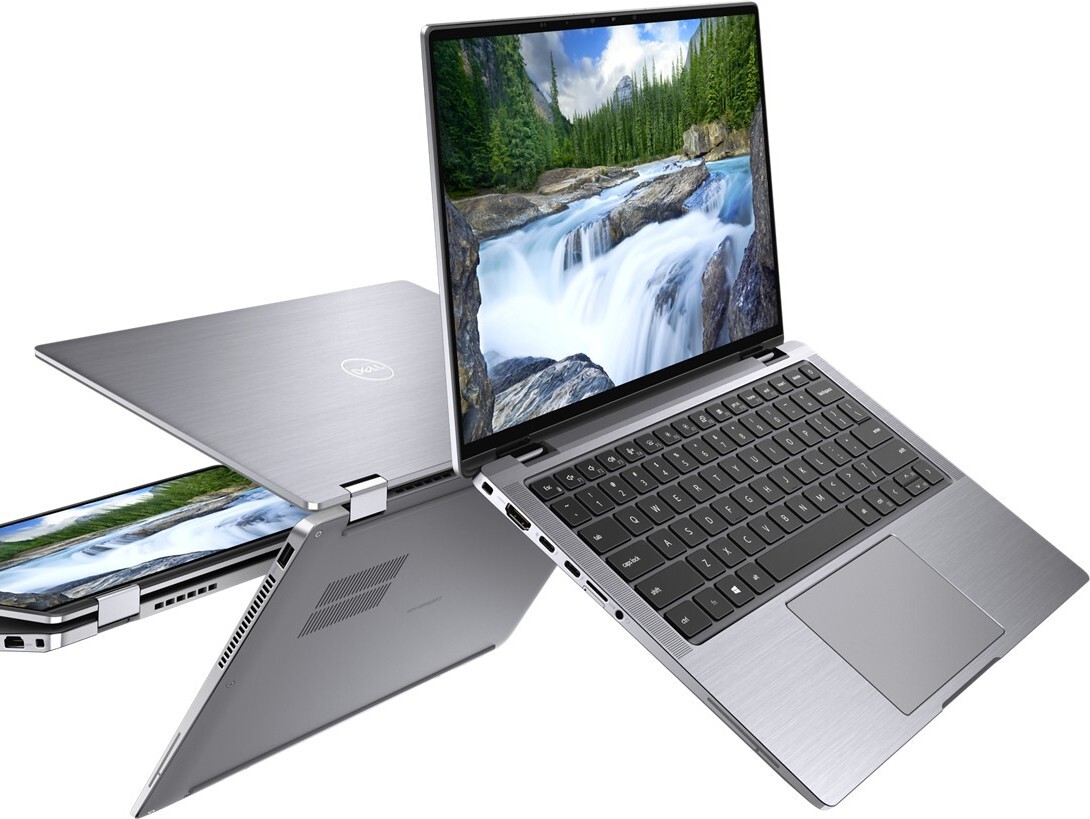
Case — Squarer, Simpler, and Shinier
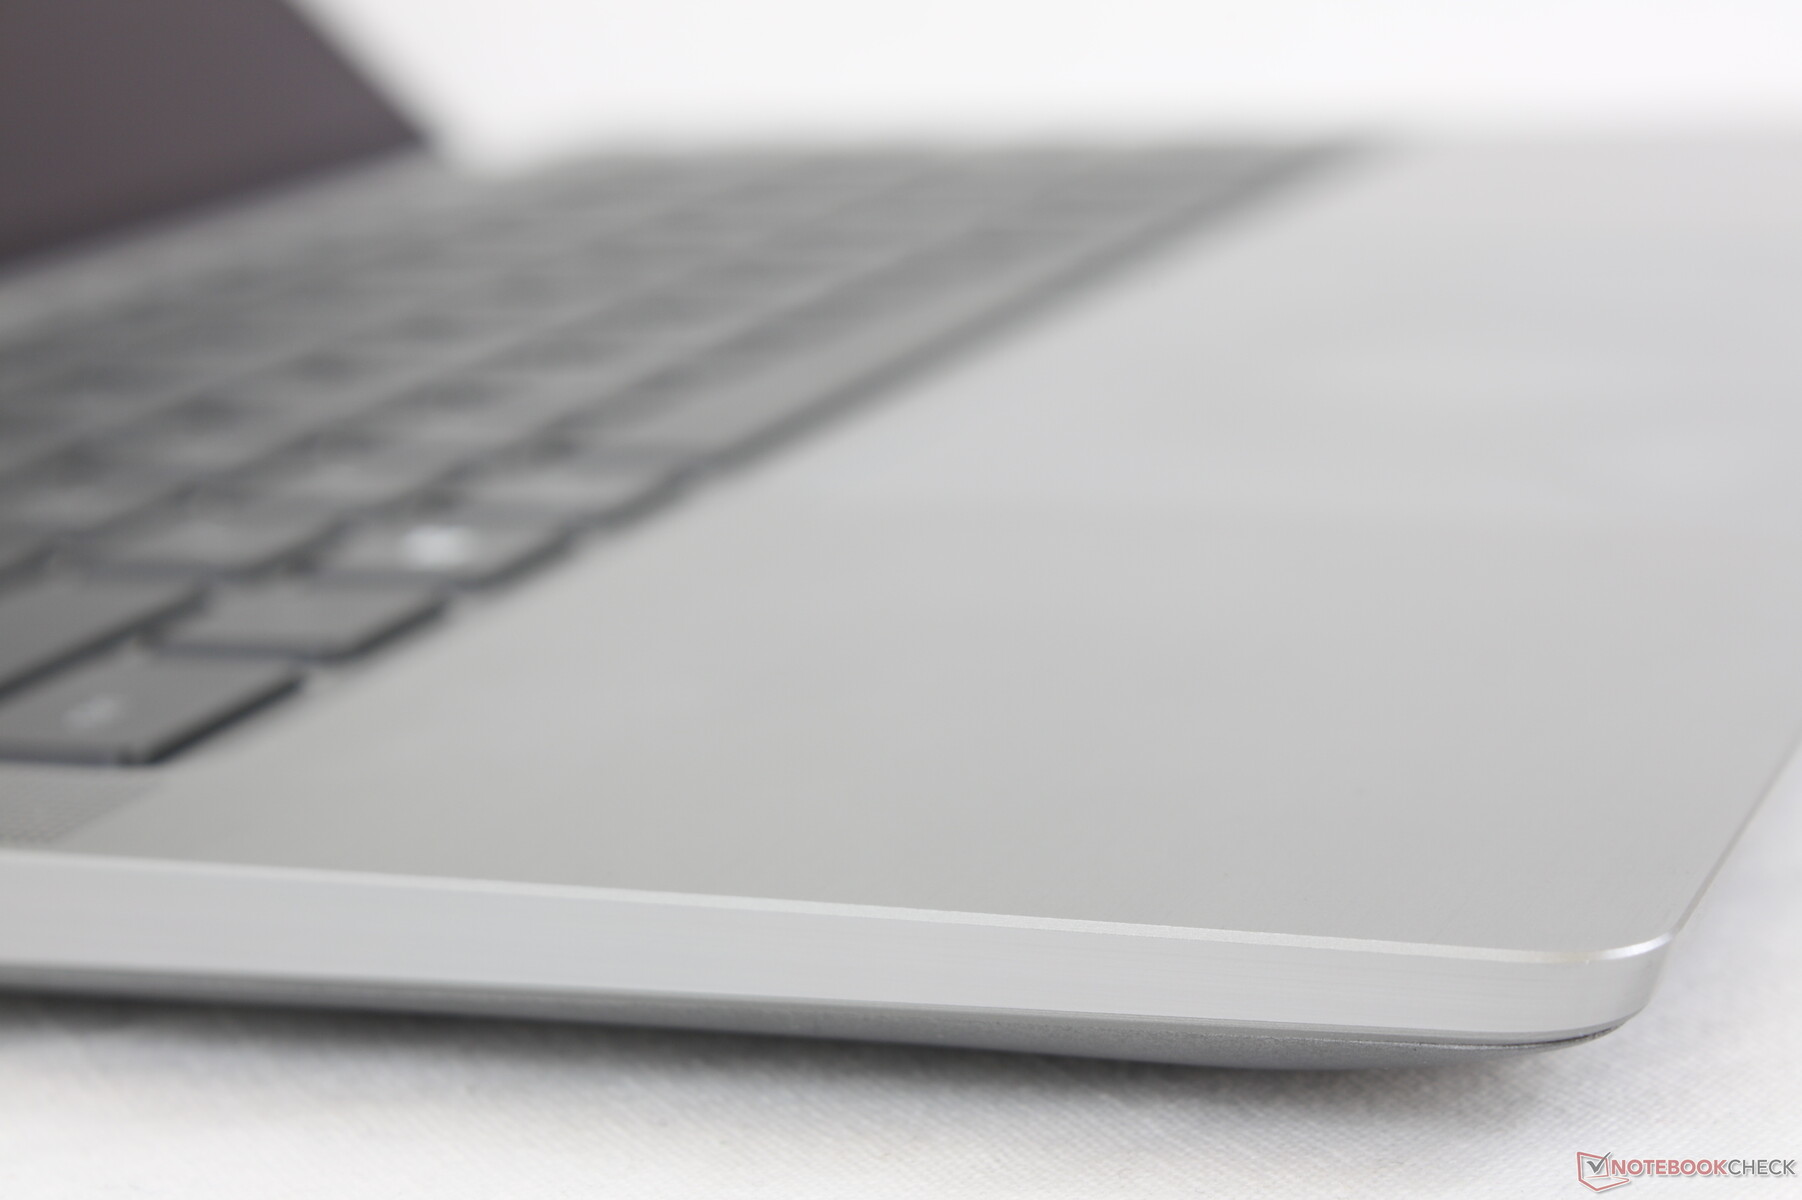
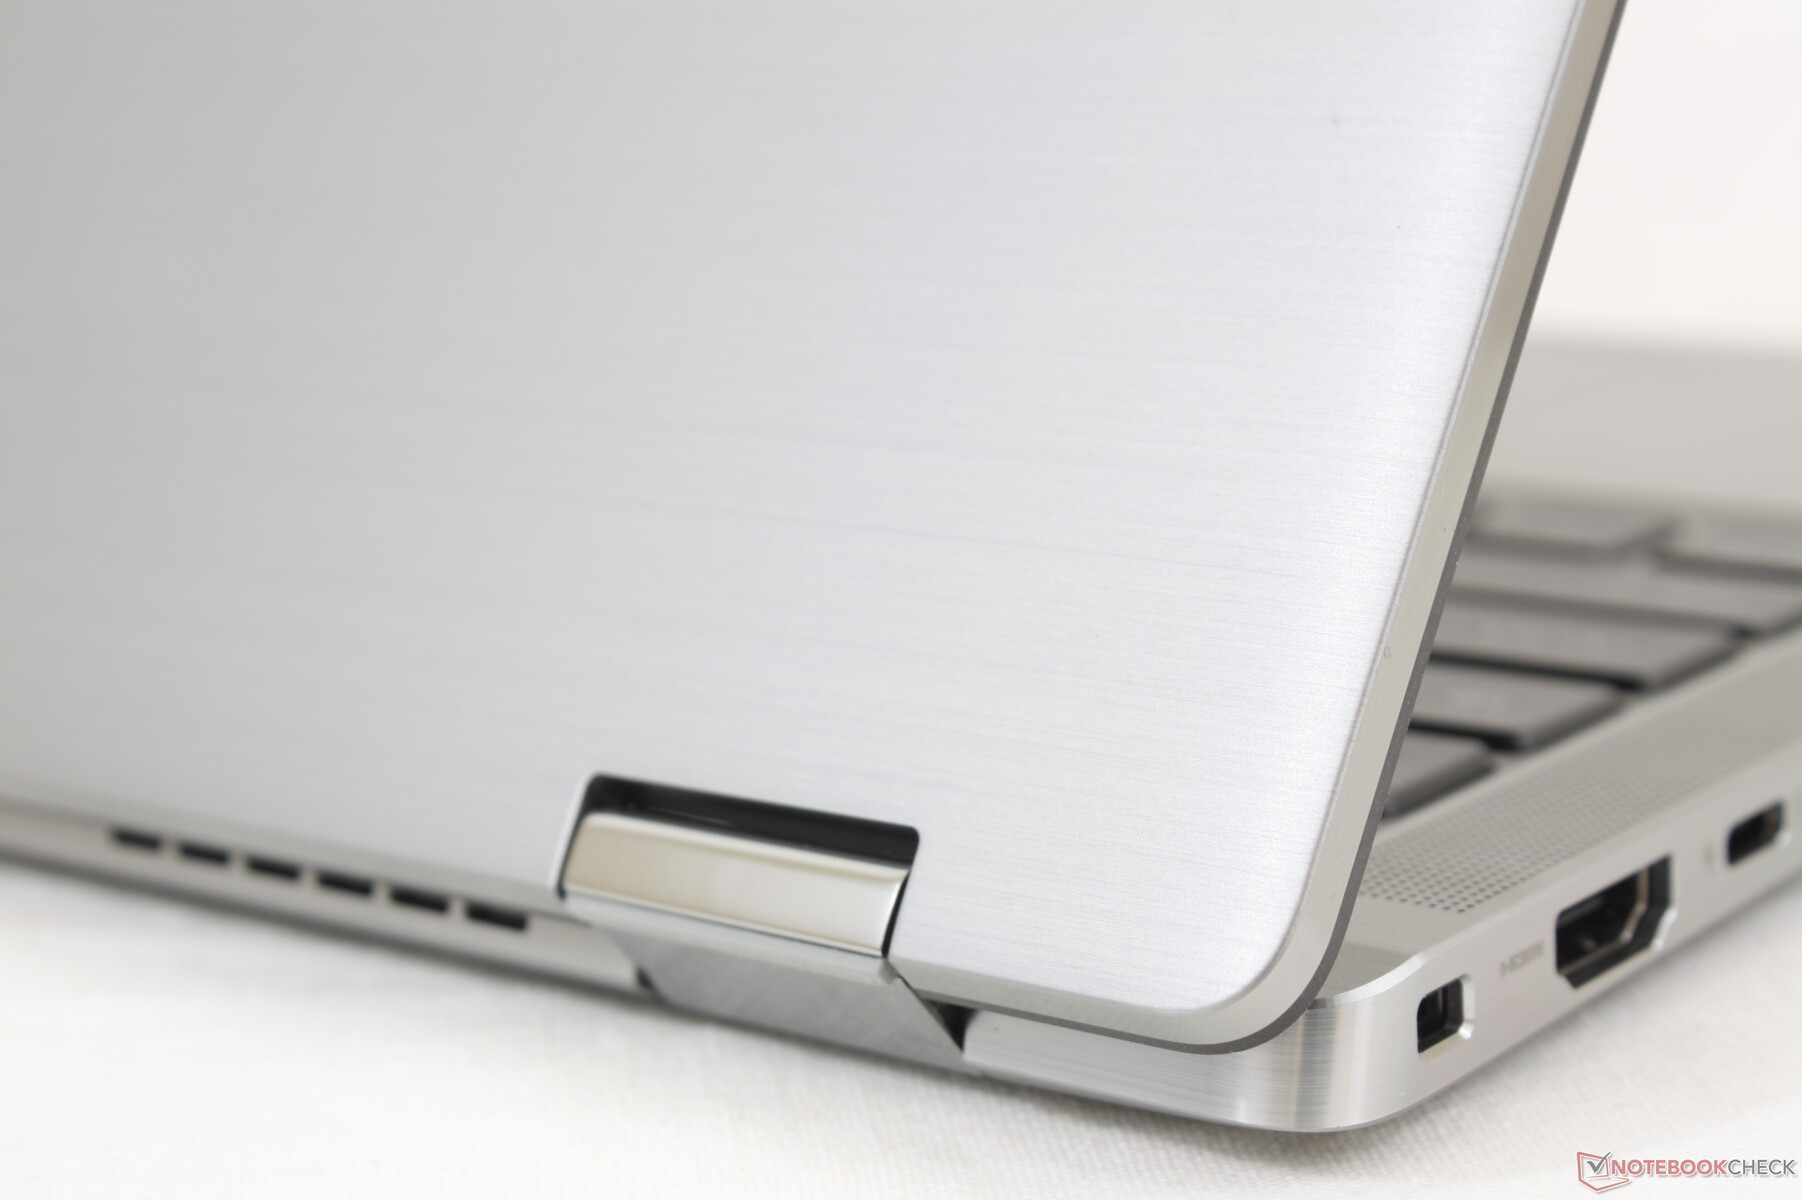
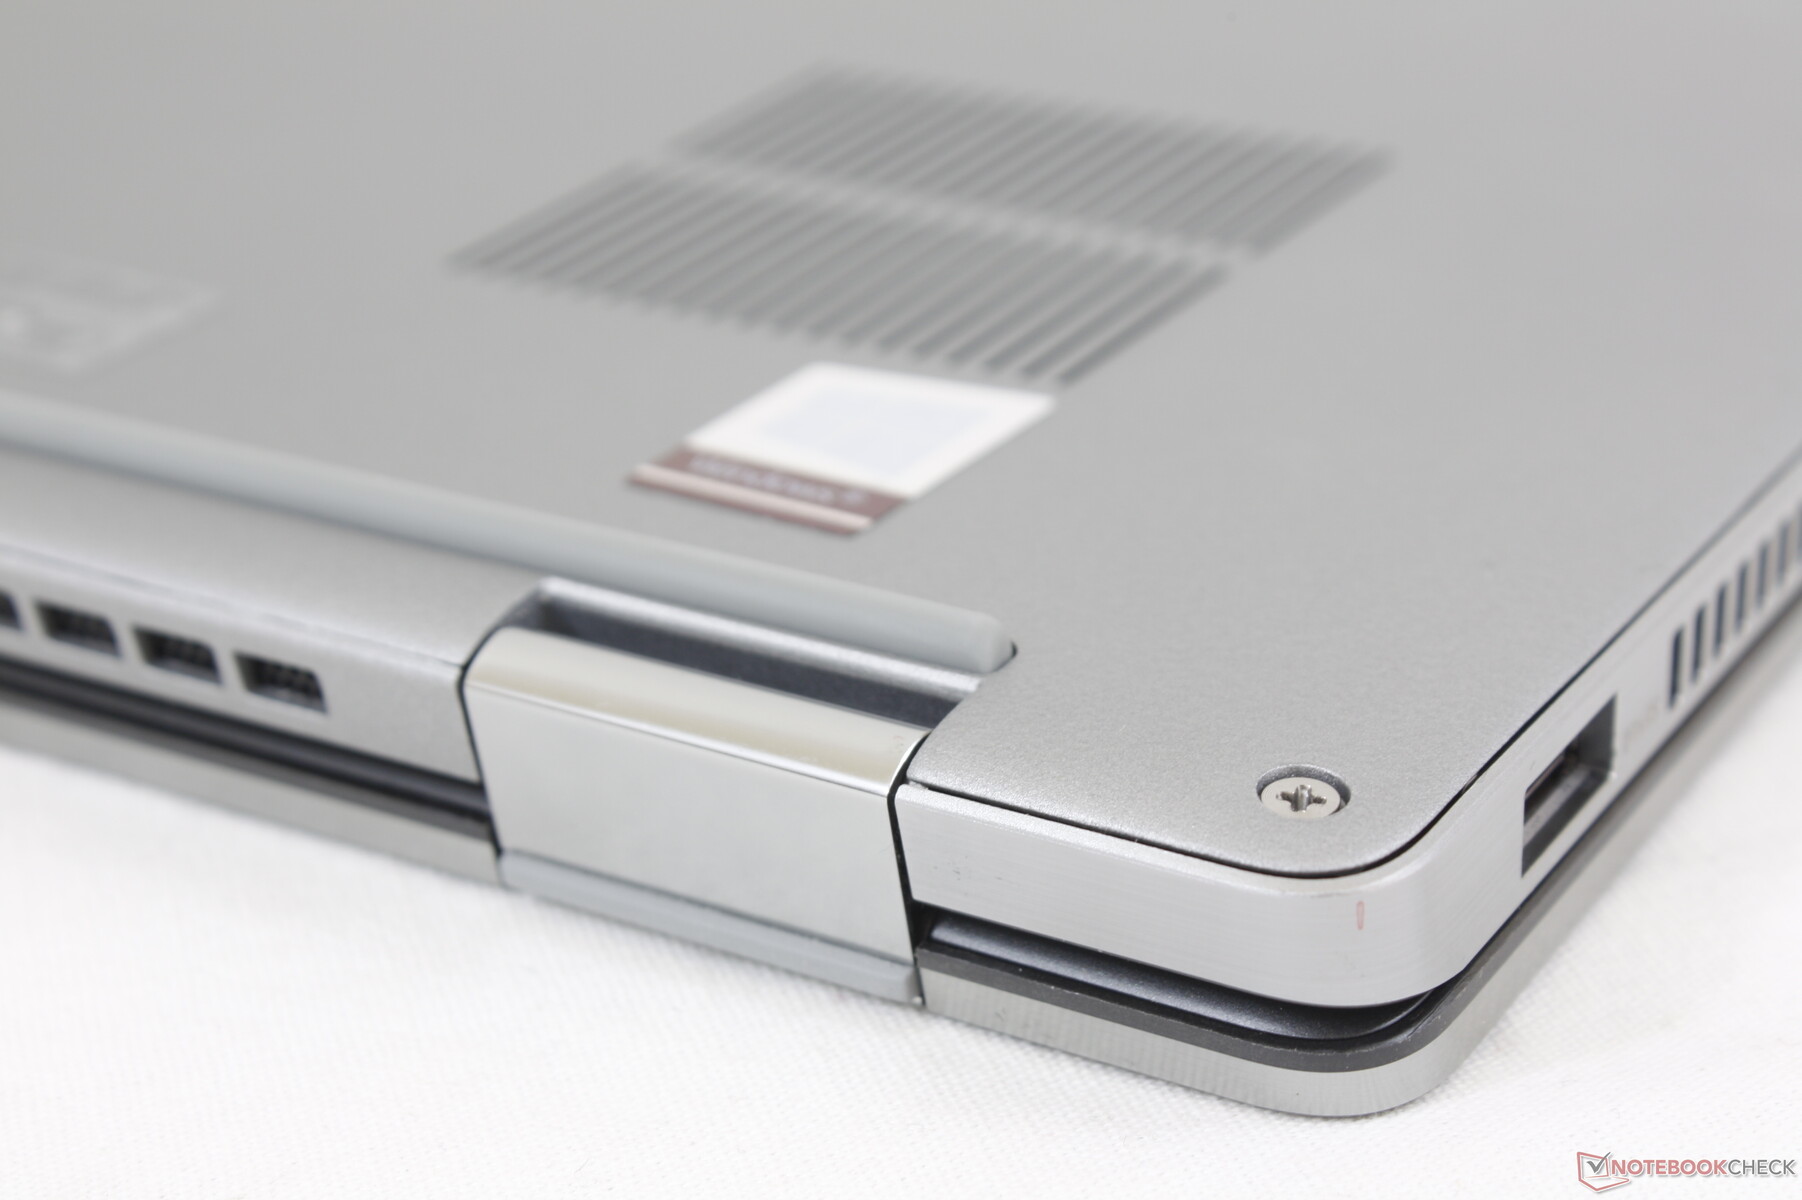
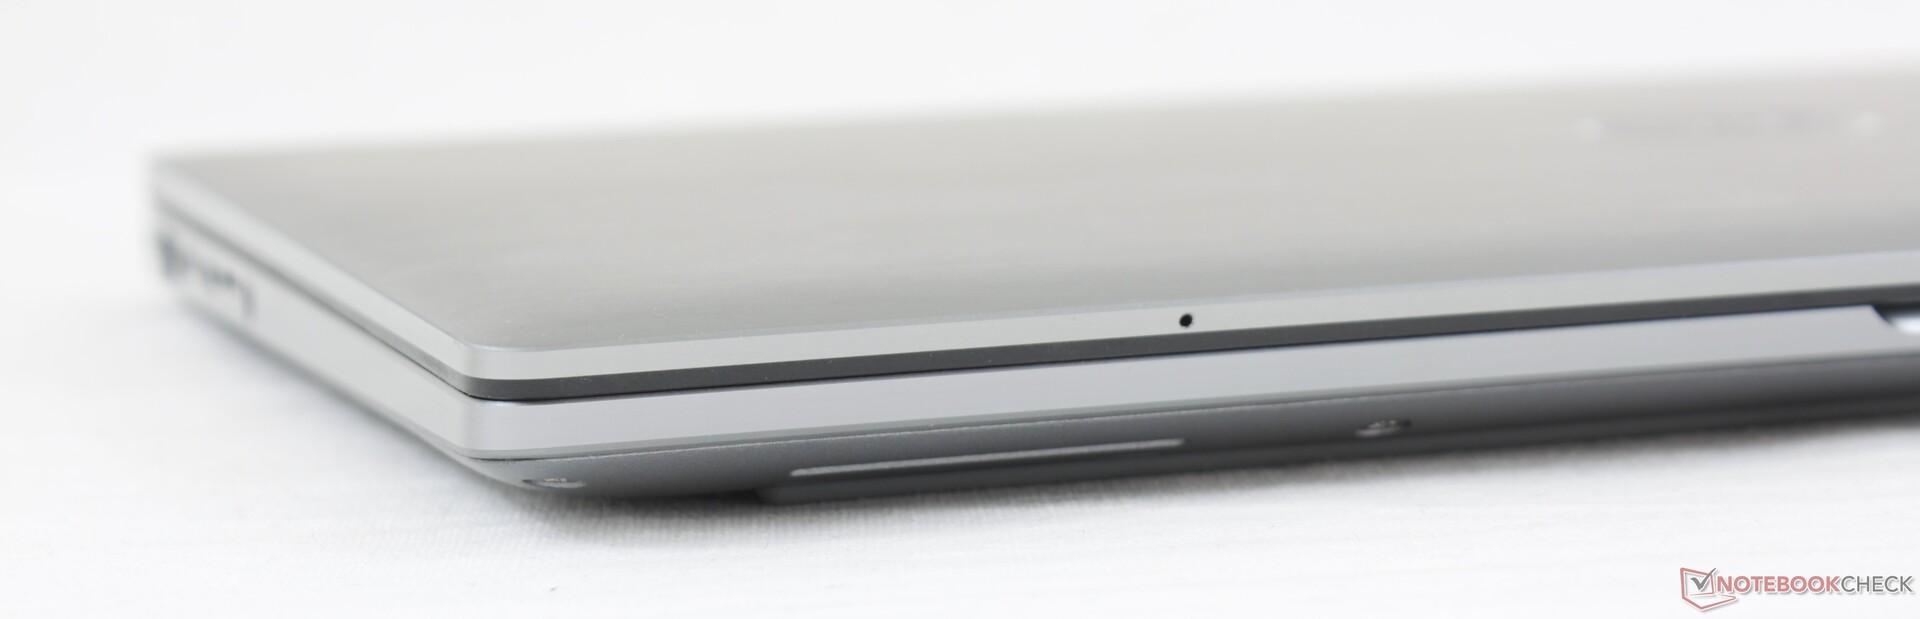
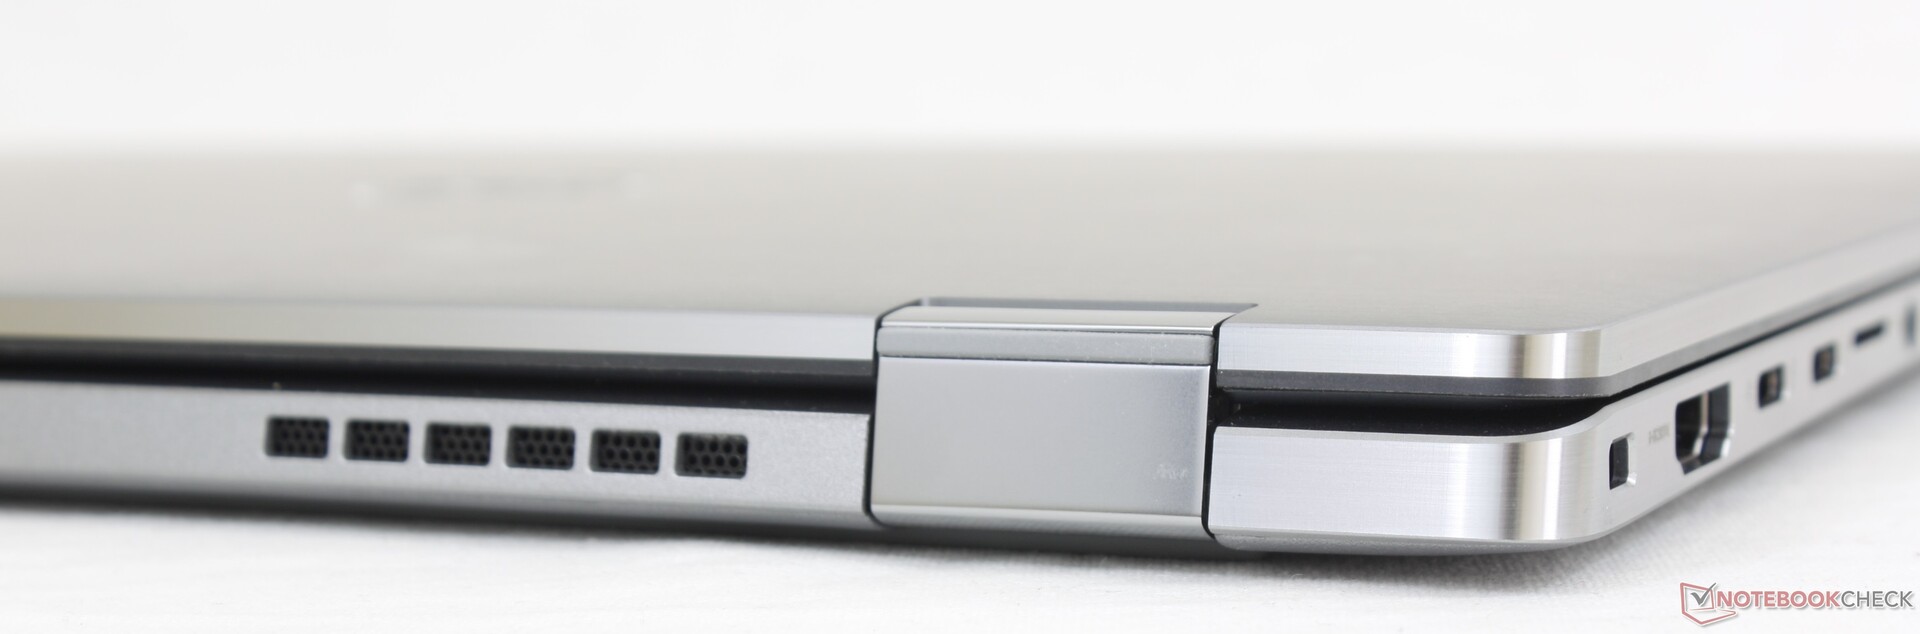
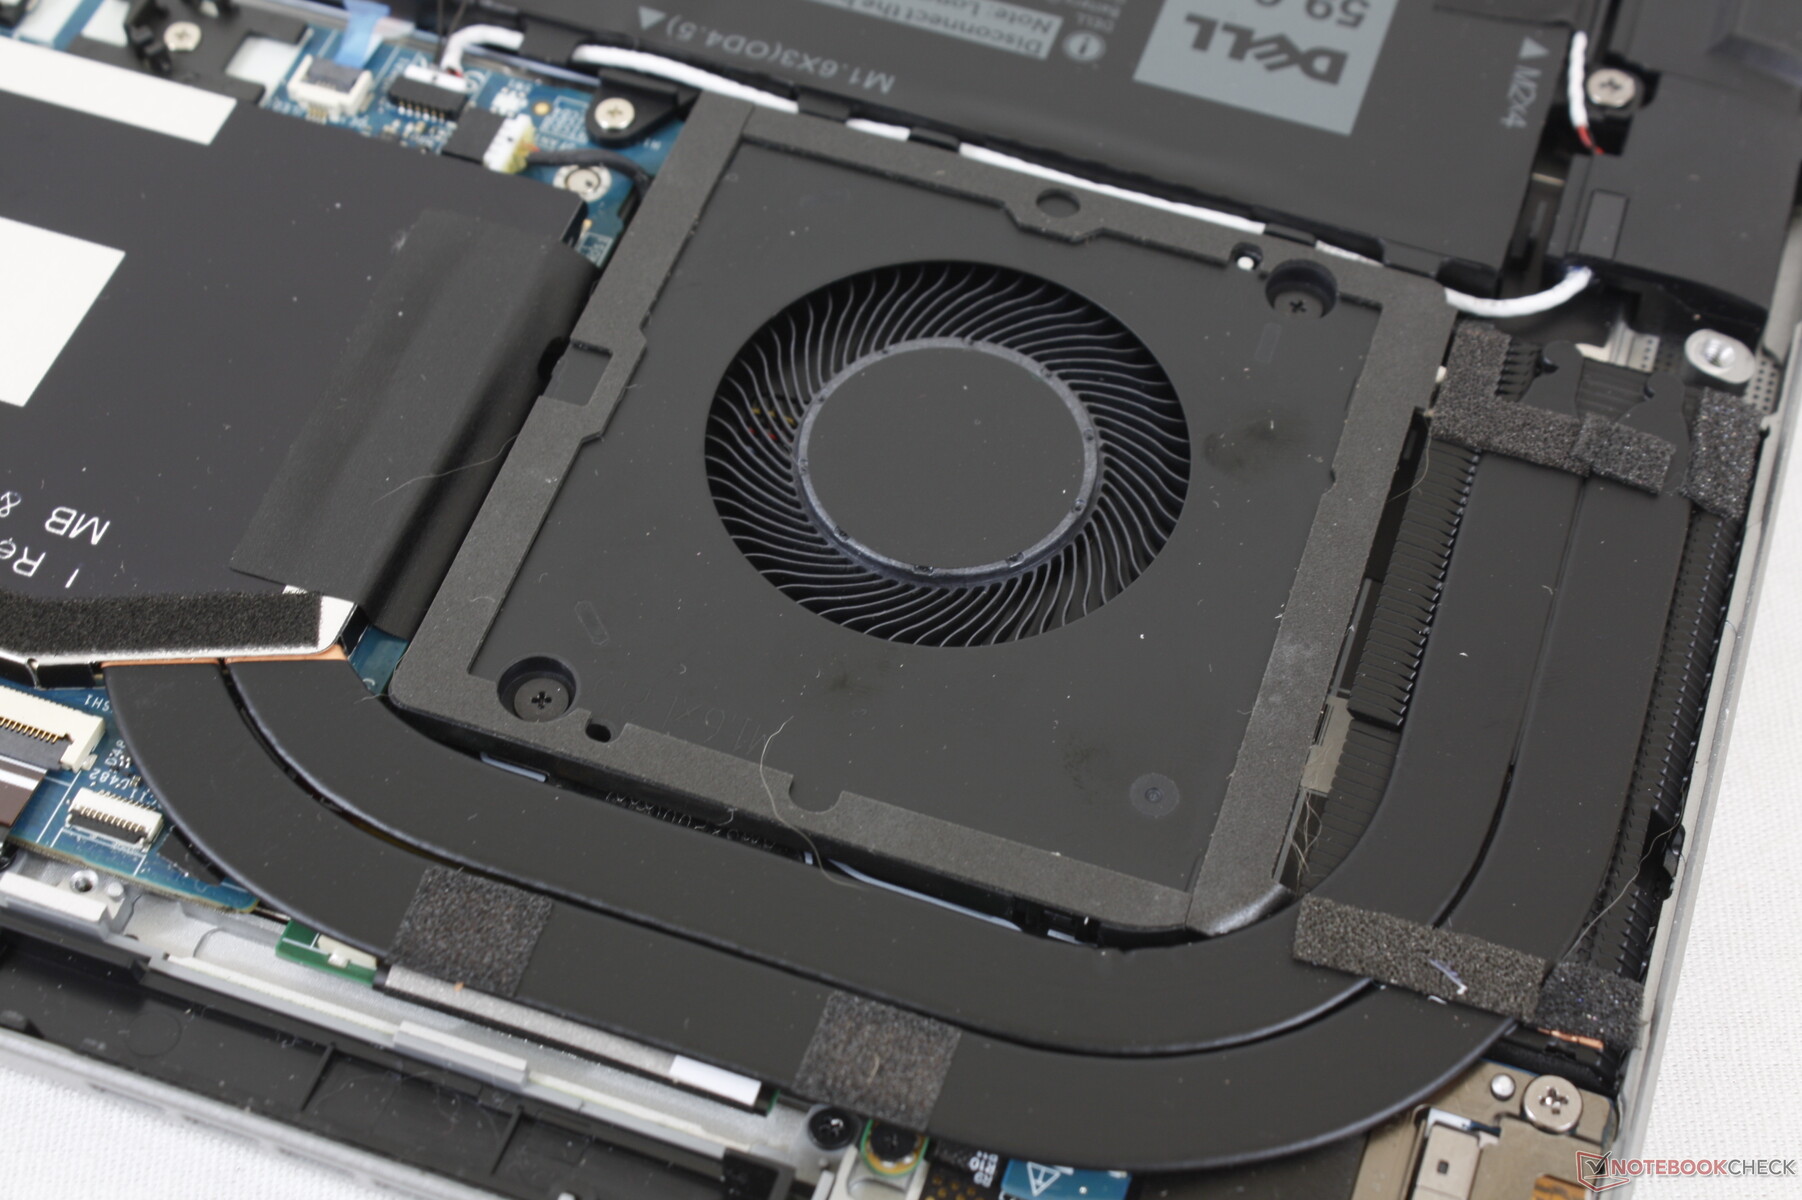
Though the silver color scheme remains unchanged, the chassis and motherboard have been revamped for the better. The system has gained additional speakers along the sides of the keyboard, a larger clickpad, a new automatic webcam shutter, and a larger cooling solution with more copper heat pipes. Its edges and corners are now chrome-cut for a shiny brushed metal look to contrast the matte outer lid and base. The keyboard perimeter is also now symmetrical because of the redesigned power button and arrow keys for an overall cleaner appearance.
Chassis rigidity remains excellent with no creaking and only a bit of warping down the keyboard center or ouer lid. It feels comparable to the HP Spectre x360 14 in this regard.
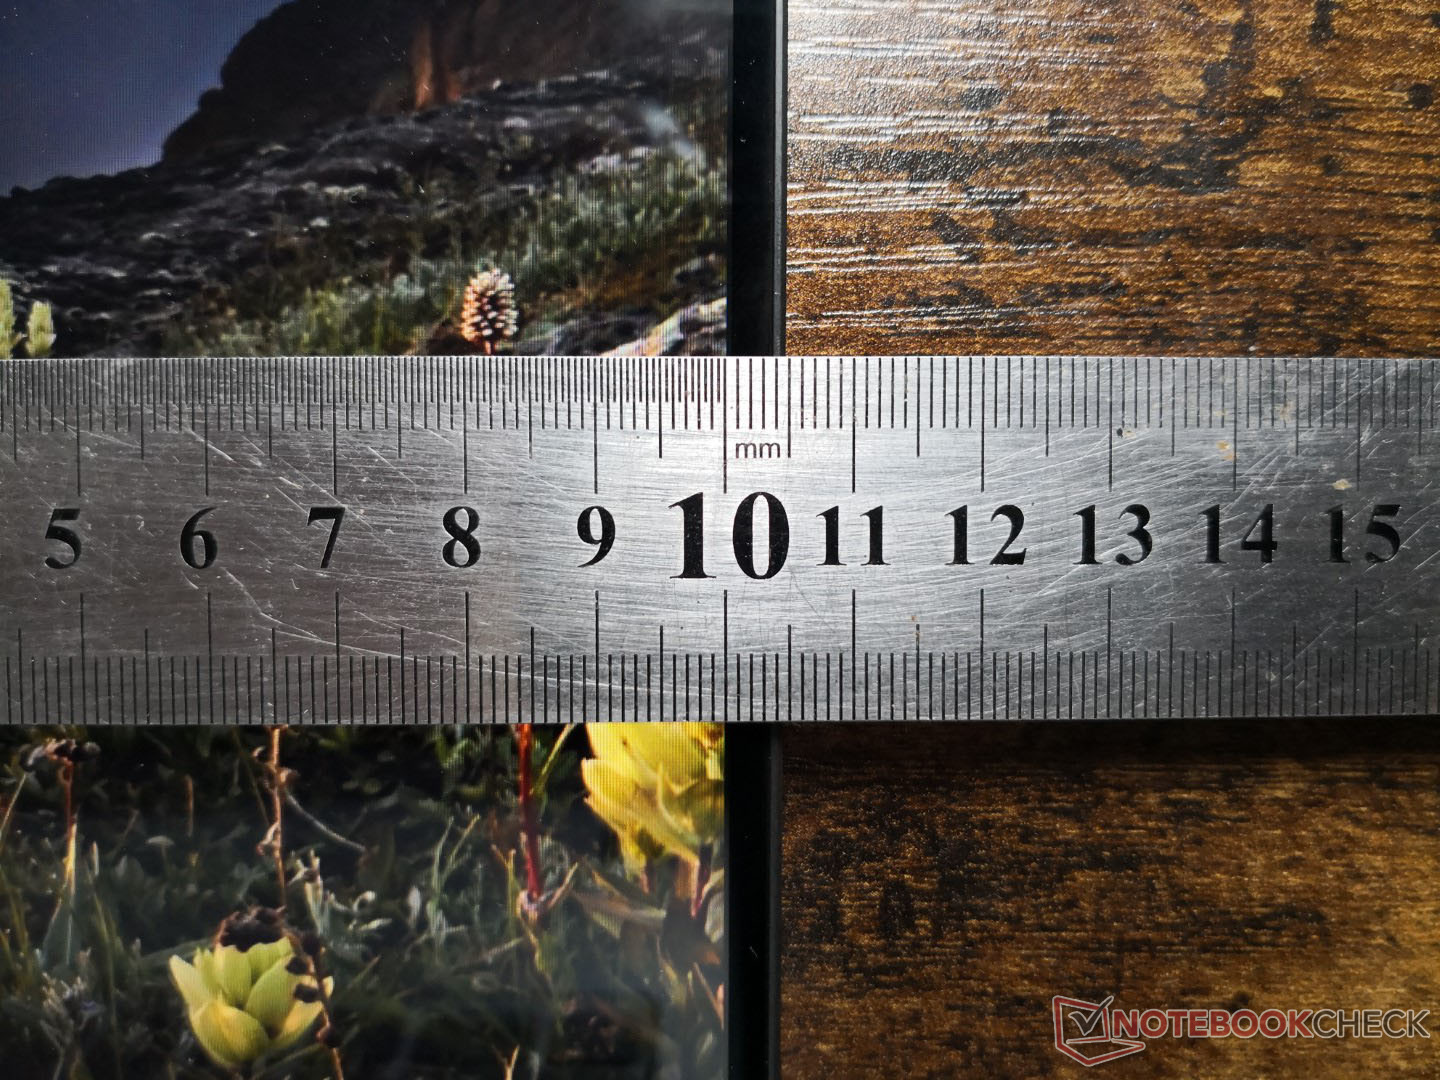
The Latitude 9320 2-in-1 is a bit squarer in length and width than on the Latitude 9310 2-in-1 due to the move from 16:9 to 16:10. It's about one millimeter thinner, but overall weight is essentially the same between both models at 1.5 kg. Portability is therefore not any better or worse than with last year's model.
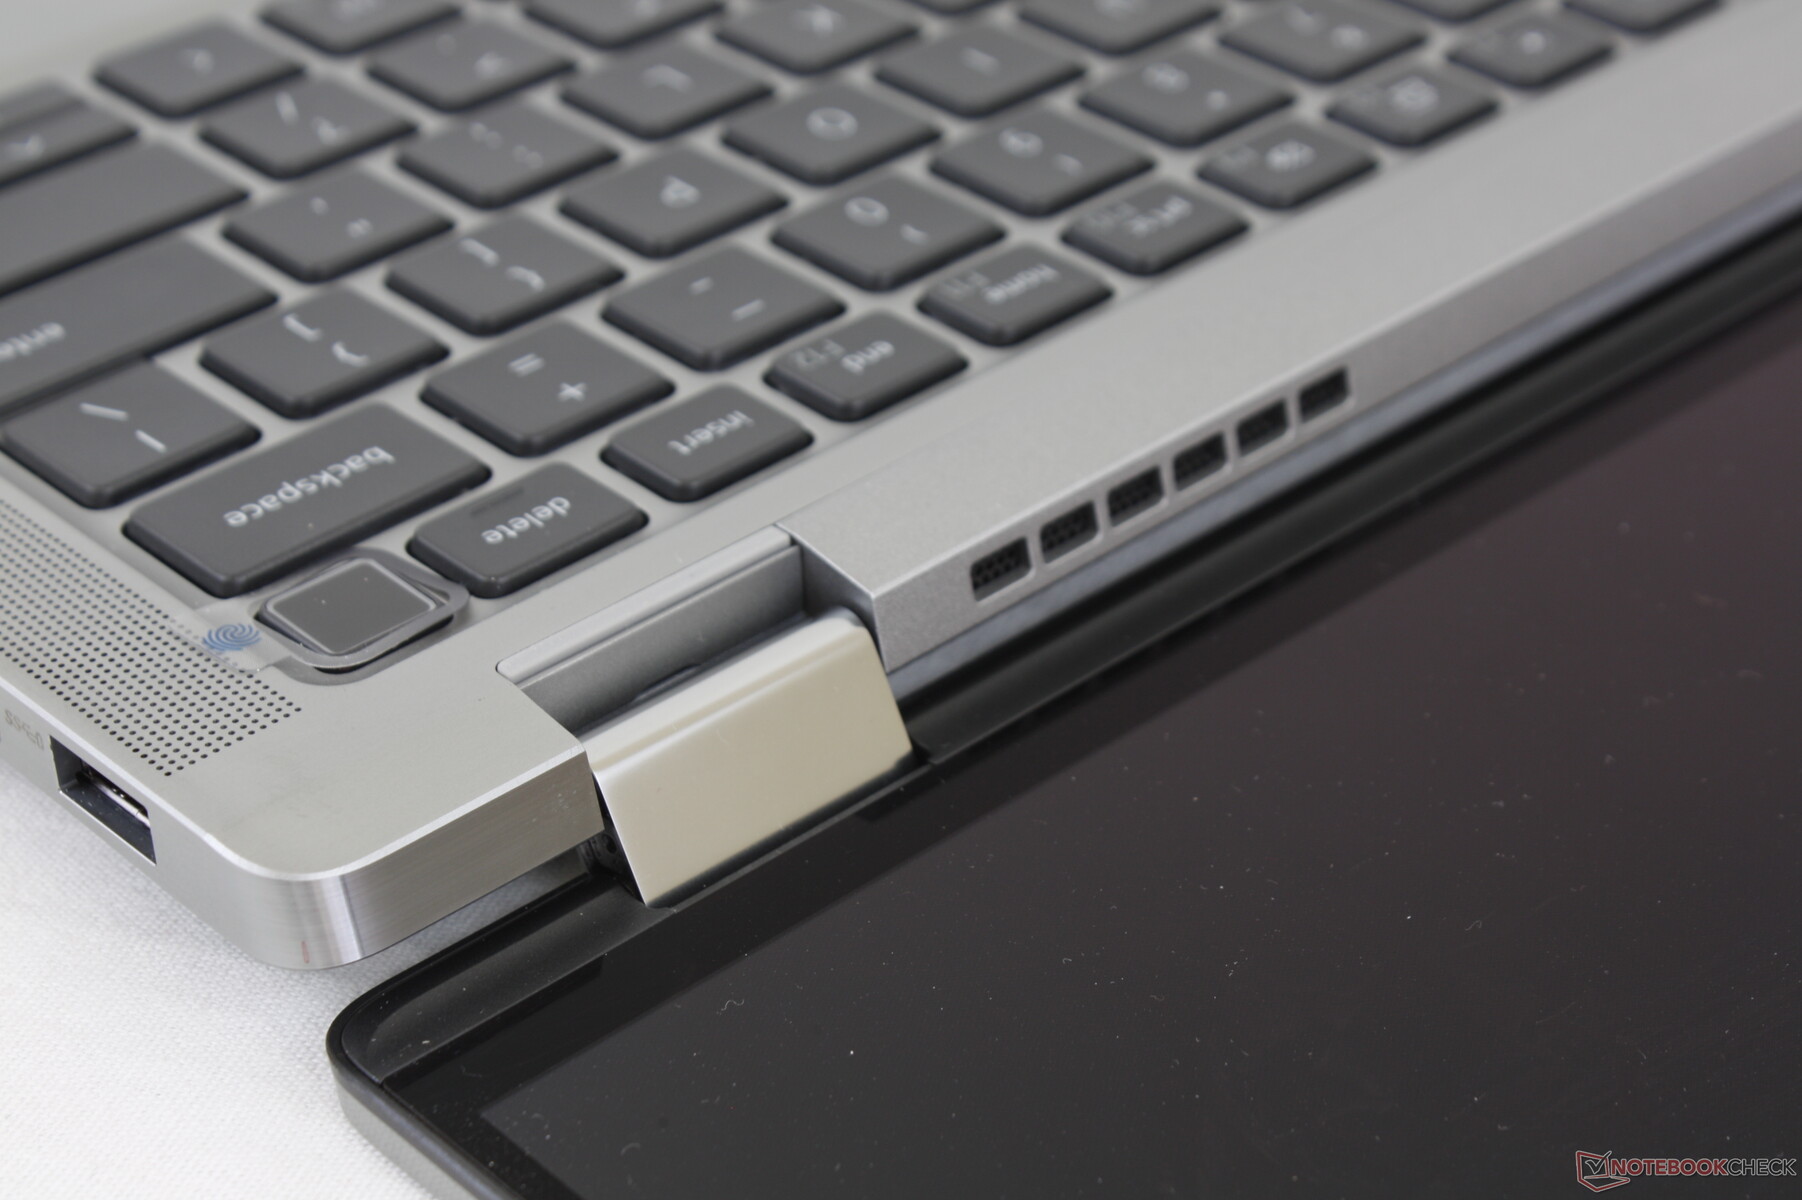
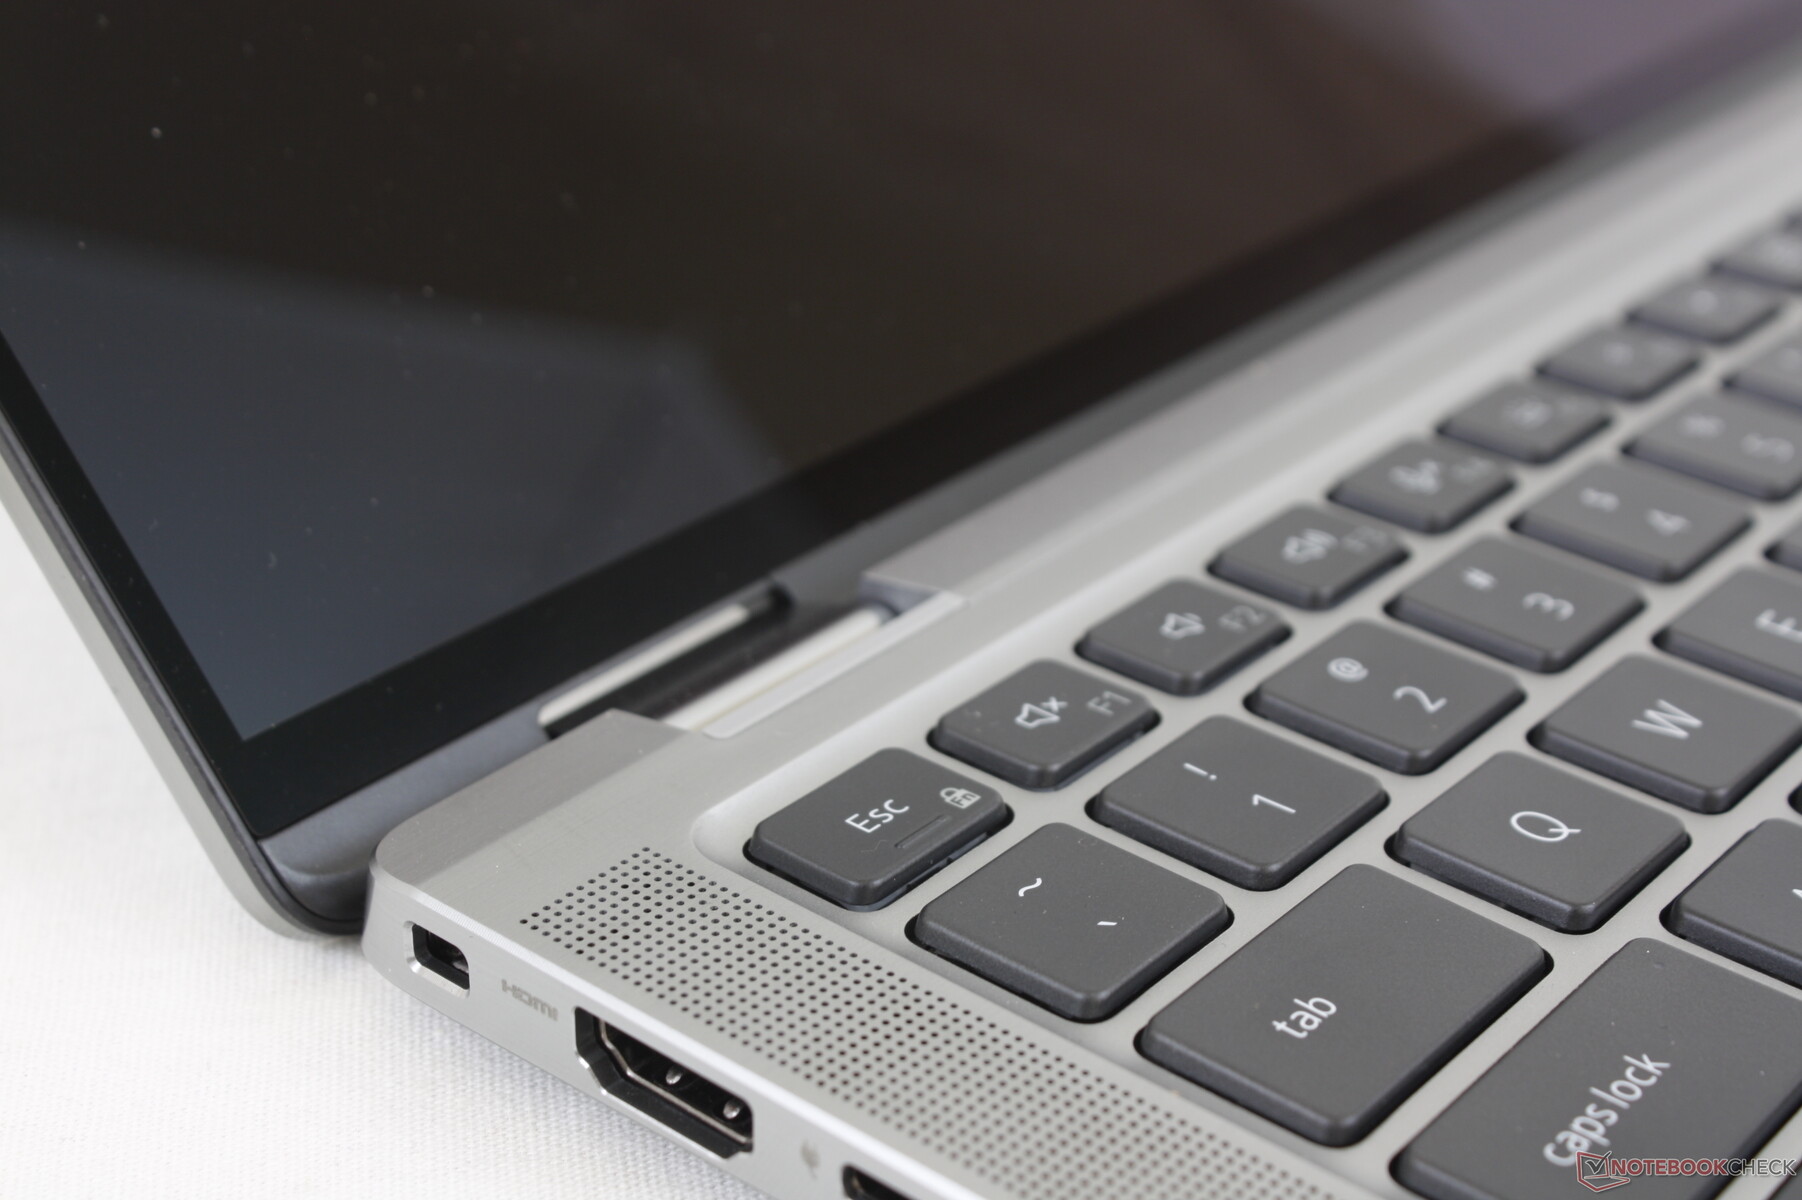
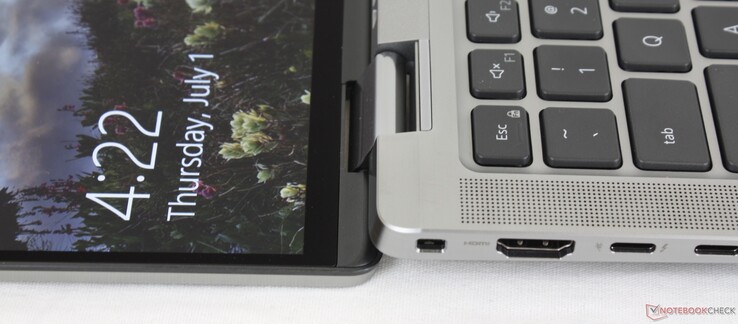
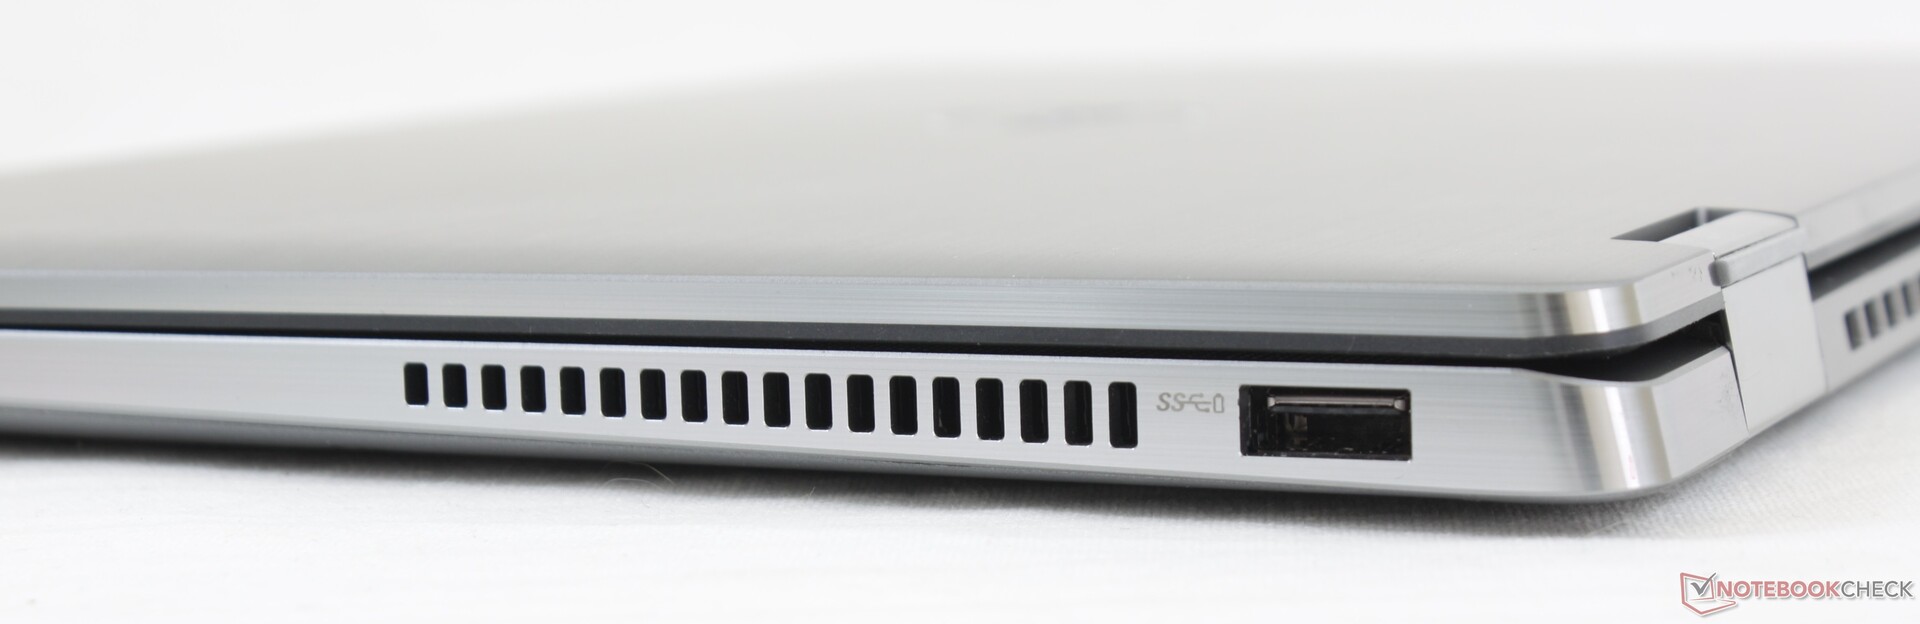
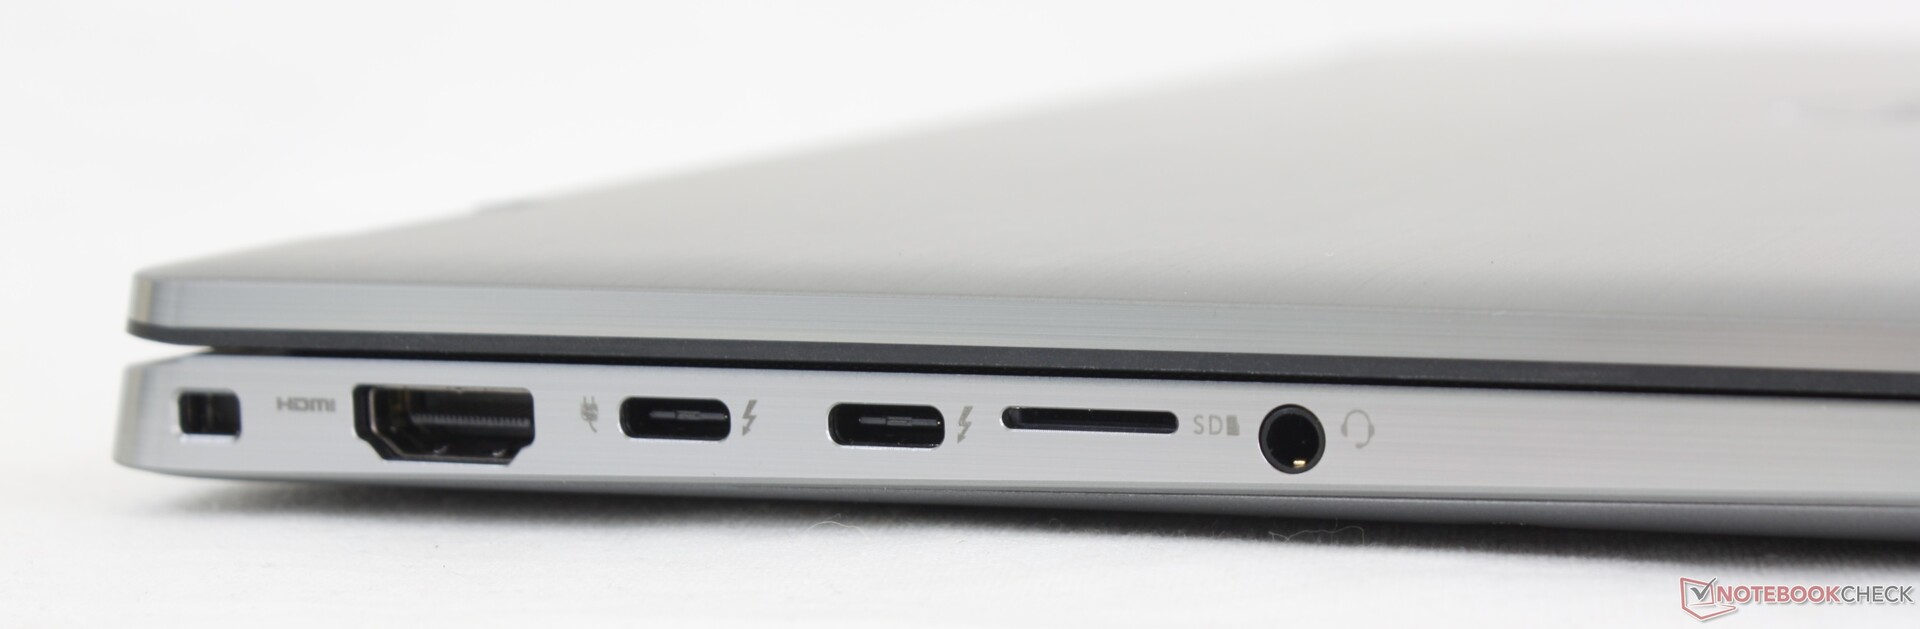
Connectivity — Now With Thunderbolt 4 Support
Port options are similar to the Latitude 9410 2-in-1 but with two important changes. Firstly, the ports have been rearranged so that nearly all of them are now along the left edge. Secondly, Dell has dropped the second USB-A port leaving just one on the 9420 2-in-1. In other words, this latest revision actually has fewer ports than its predecessor.
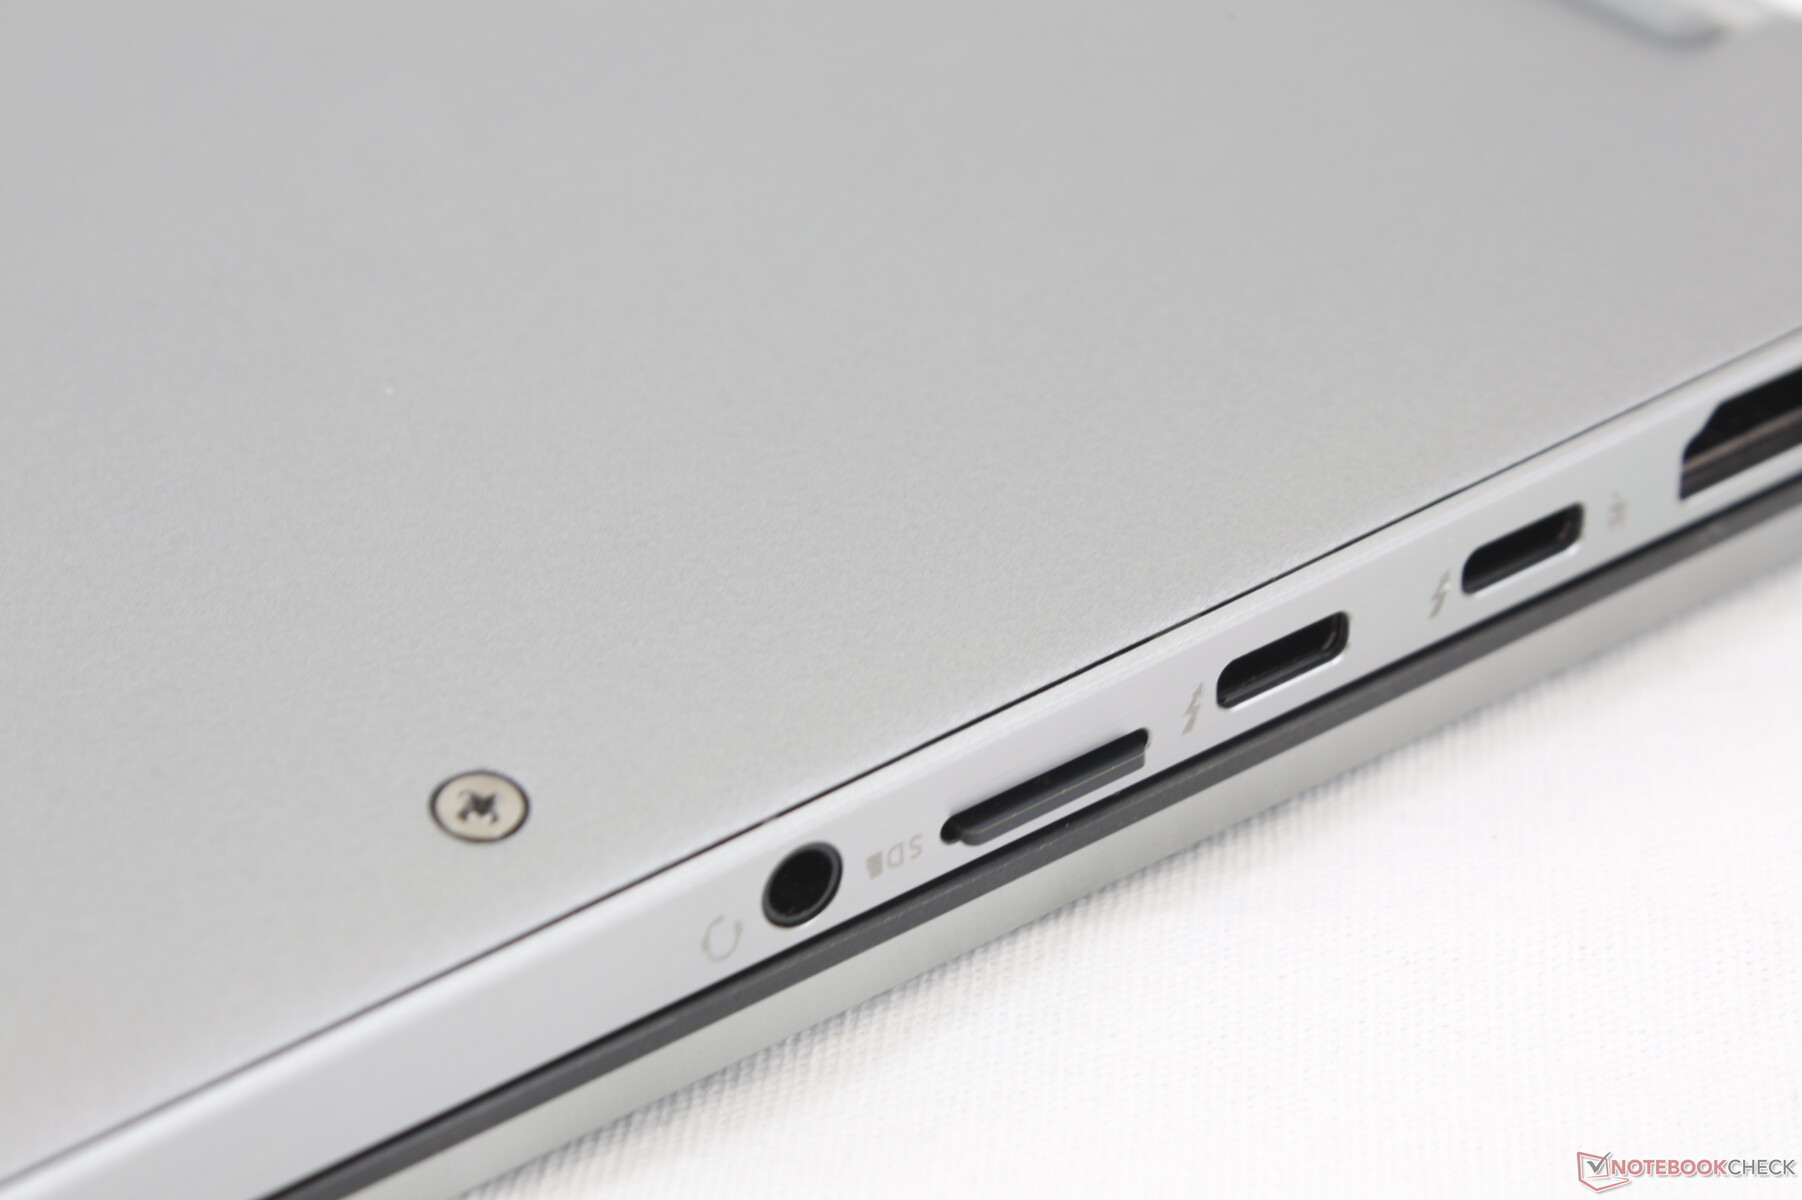
The optional Micro-SIM slot sits underneath the MicroSD slot if configured with 4G/5G and eSIM.
SD Card Reader
Transfer rates with the integrated MicroSD reader are still very fast. Moving 1 GB of pictures from our UHS-II test card takes only about 7 seconds compared to over two times longer on the MSI Simmit E13 Flip.
| SD Card Reader | |
| average JPG Copy Test (av. of 3 runs) | |
| Dell Latitude 14 9410 2-in-1 P110G (Toshiba Exceria Pro M501 64 GB UHS-II) | |
| Dell Latitude 9420 2-in-1 (AV PRO microSD 128 GB V60) | |
| MSI Summit E13 Flip Evo A11MT (AV PRO microSD 128 GB V60) | |
| Asus ZenBook Flip 14 UX463FA-AI039T (Toshiba Exceria Pro M501 microSDXC 64GB) | |
| maximum AS SSD Seq Read Test (1GB) | |
| Dell Latitude 14 9410 2-in-1 P110G (Toshiba Exceria Pro M501 64 GB UHS-II) | |
| Dell Latitude 9420 2-in-1 (AV PRO microSD 128 GB V60) | |
| MSI Summit E13 Flip Evo A11MT (AV PRO microSD 128 GB V60) | |
| Asus ZenBook Flip 14 UX463FA-AI039T (Toshiba Exceria Pro M501 microSDXC 64GB) | |
Communication
The Intel AX210 comes standard for Wi-Fi 6E compatibility. For most users, however, the benefits of Wi-Fi 6E won't be immediately realized since Wi-Fi 6E routers would be required. Raw transfer rates appear to be nearly identical to what we observed on the 9410 2-in-1 when paired to our Netgear RAX200 test router.
Webcam
Dell says they've upgraded the webcam with temporal noise reduction to improve image quality. With our test image below, we can indeed see a slight-to-moderate increase in clarity when compared to last year's model. Color temperature is noticeably warmer this time around, however.


Security
TPM 2.0, Windows Hello, fingerprint reader, Wedge lock, and proximity sensor for hands-free login are available. The latter is enabled by default and so users may want to open Dell Optimizer to toggle this feature or else the laptop will sleep after just a minute or two of inactivity.
A webcam shutter now comes standard unlike on the Latitude 9410 2-in-1. Users can configure the shutter to open and close automatically or manually lock it with the push of the F9 button.
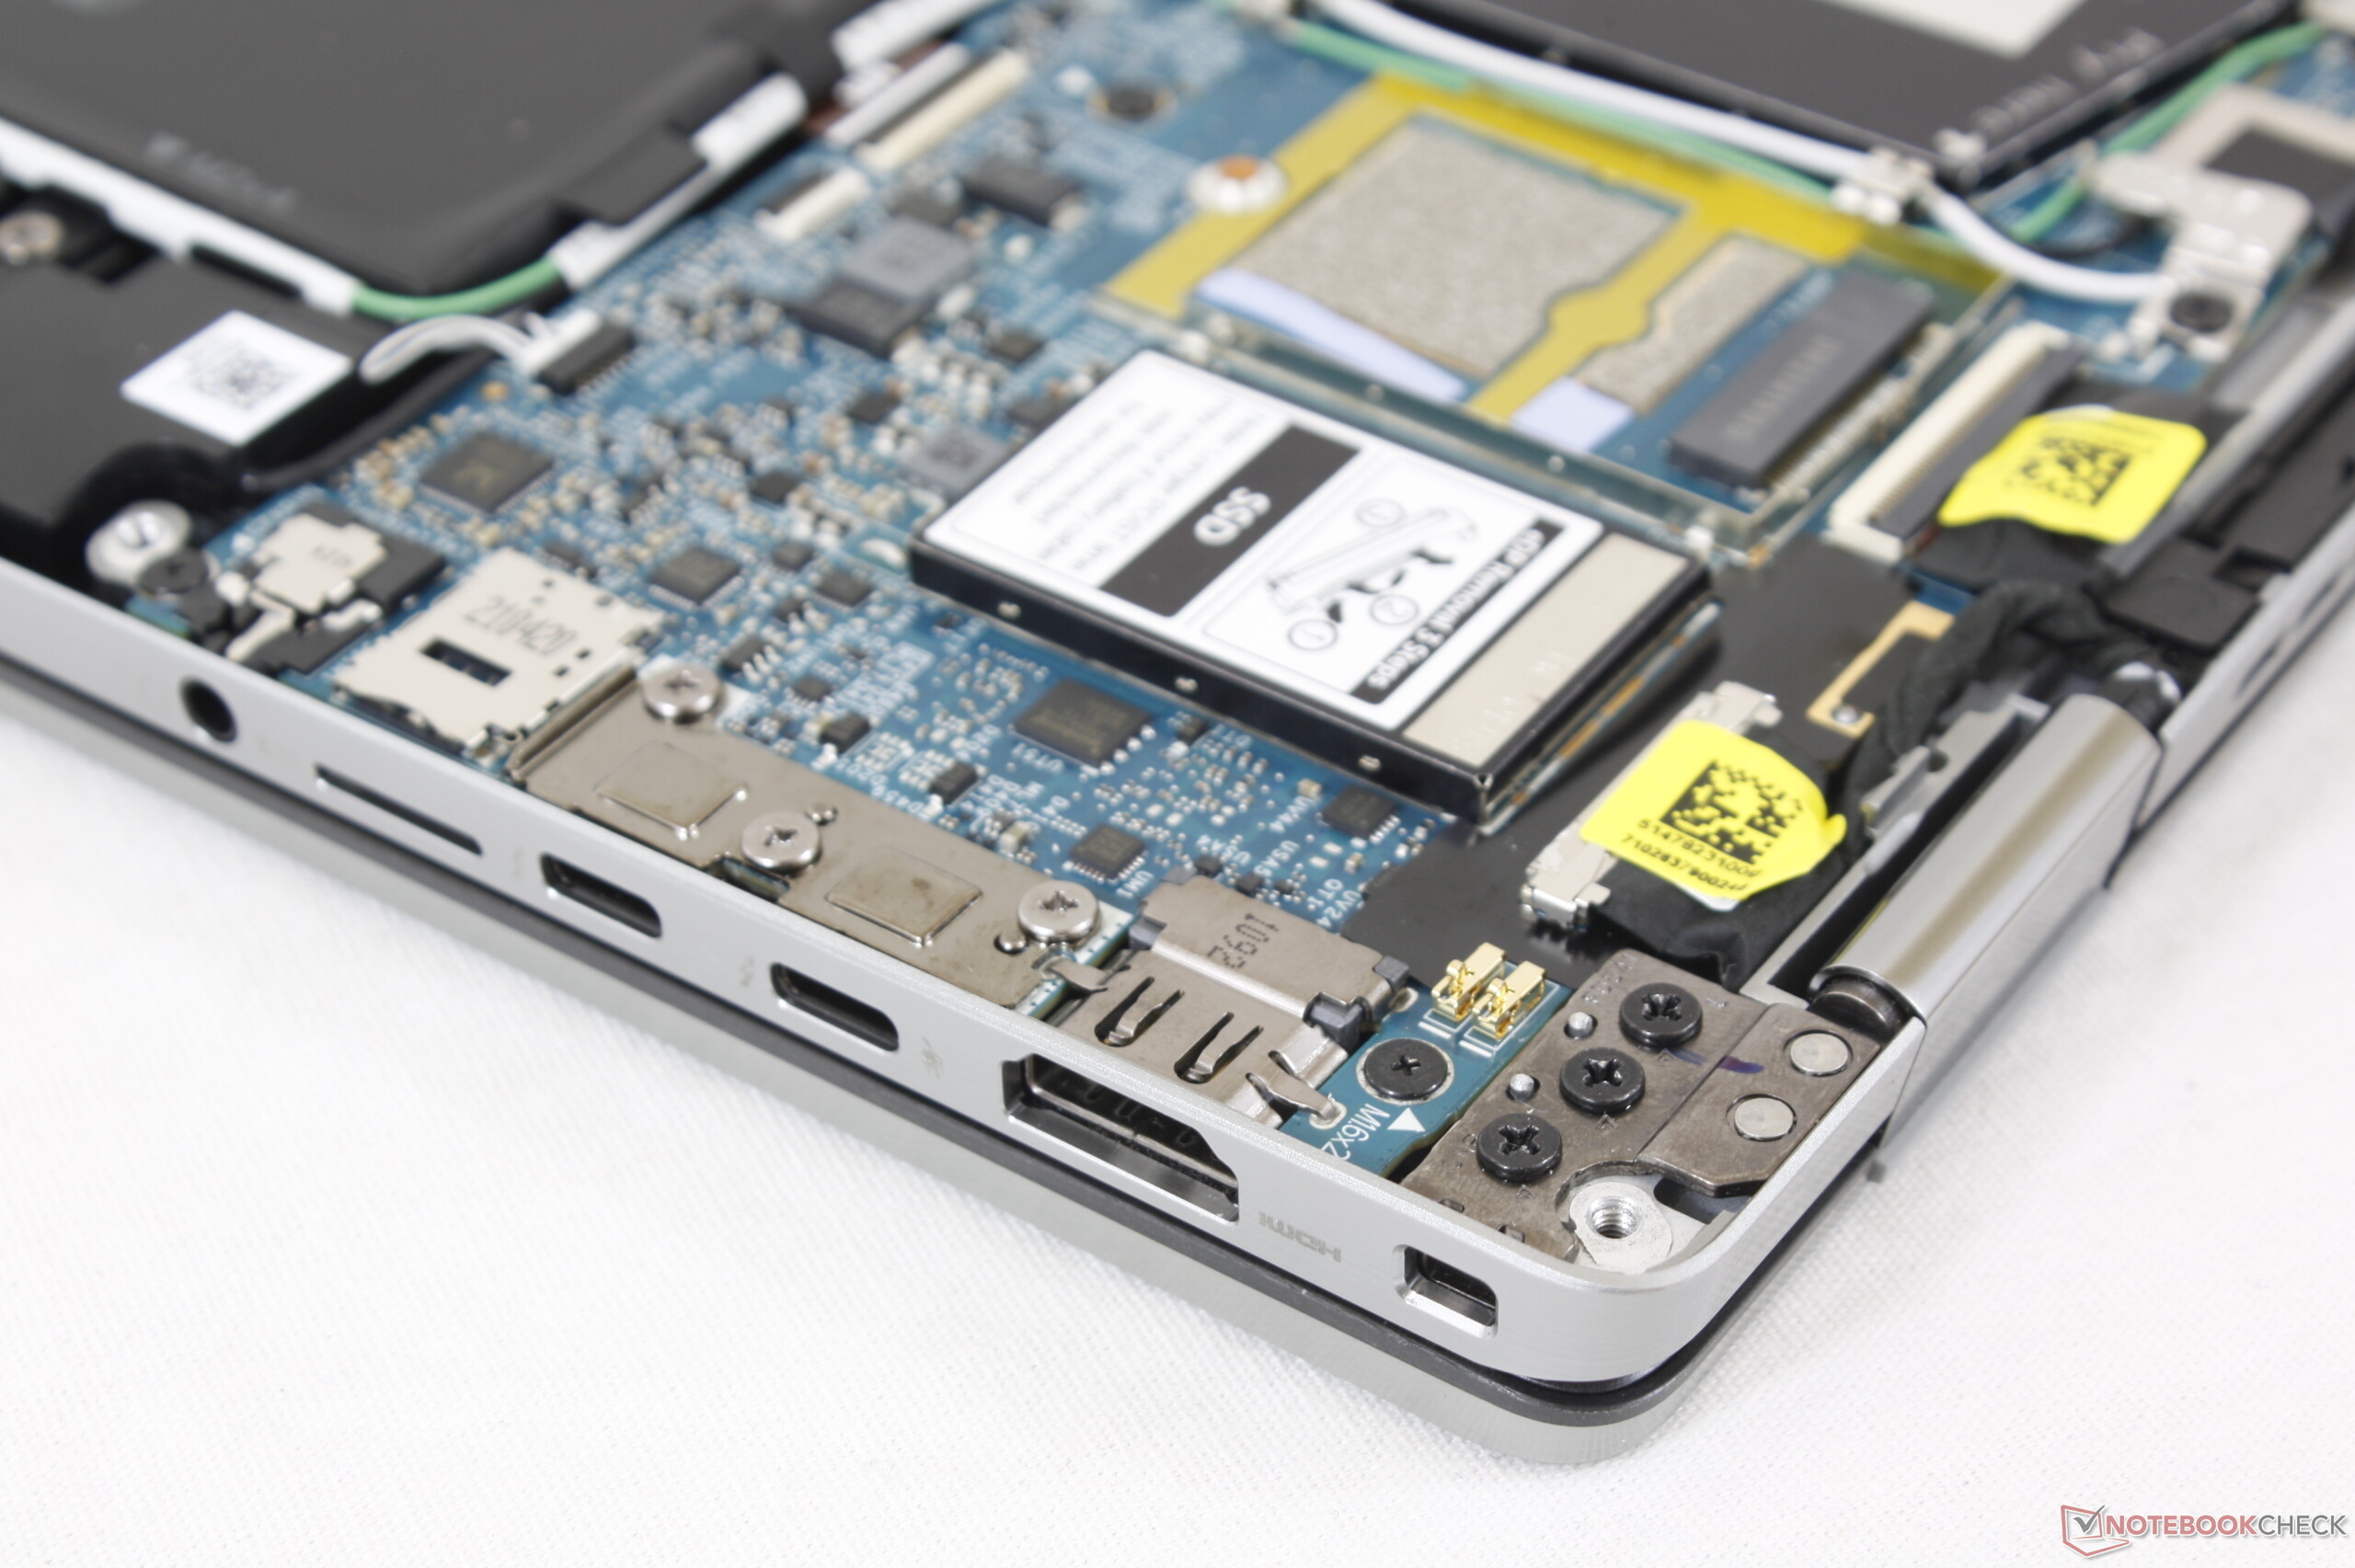
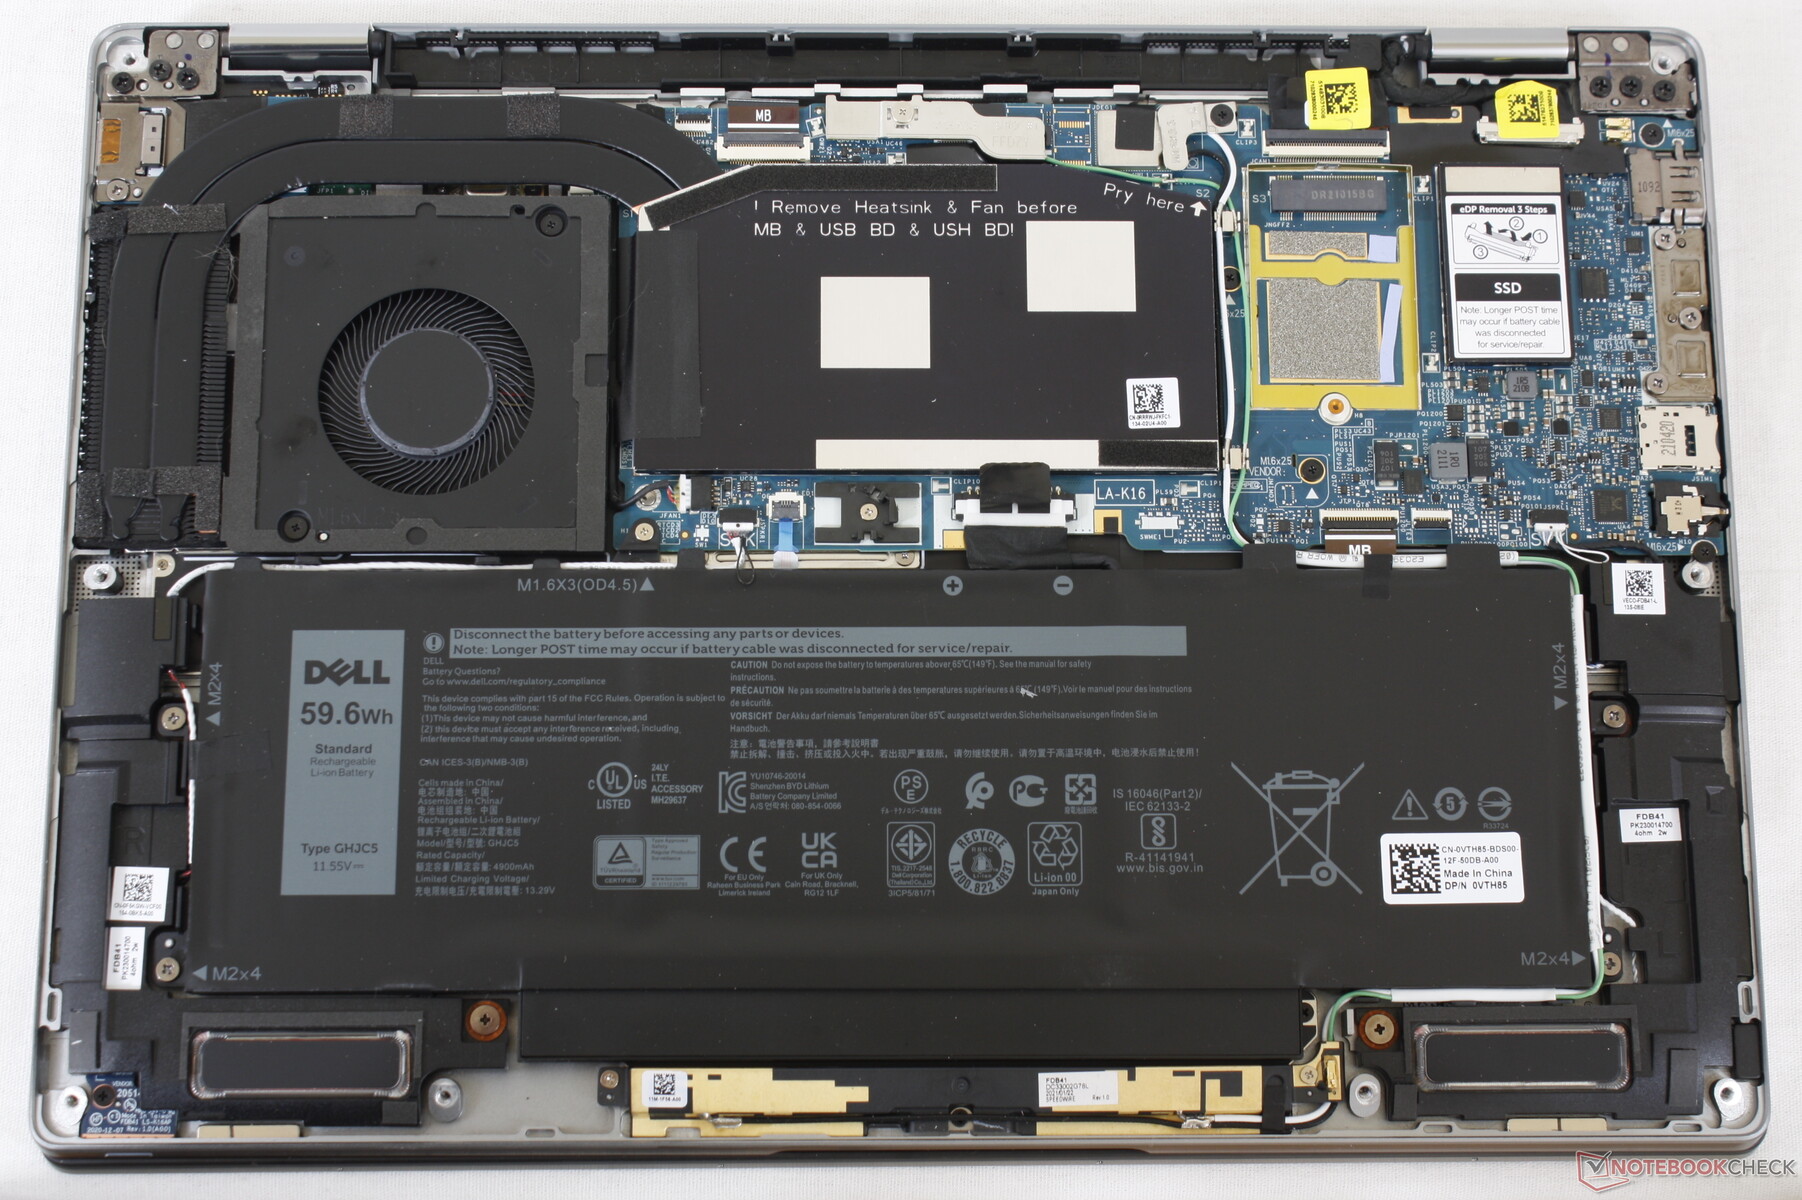
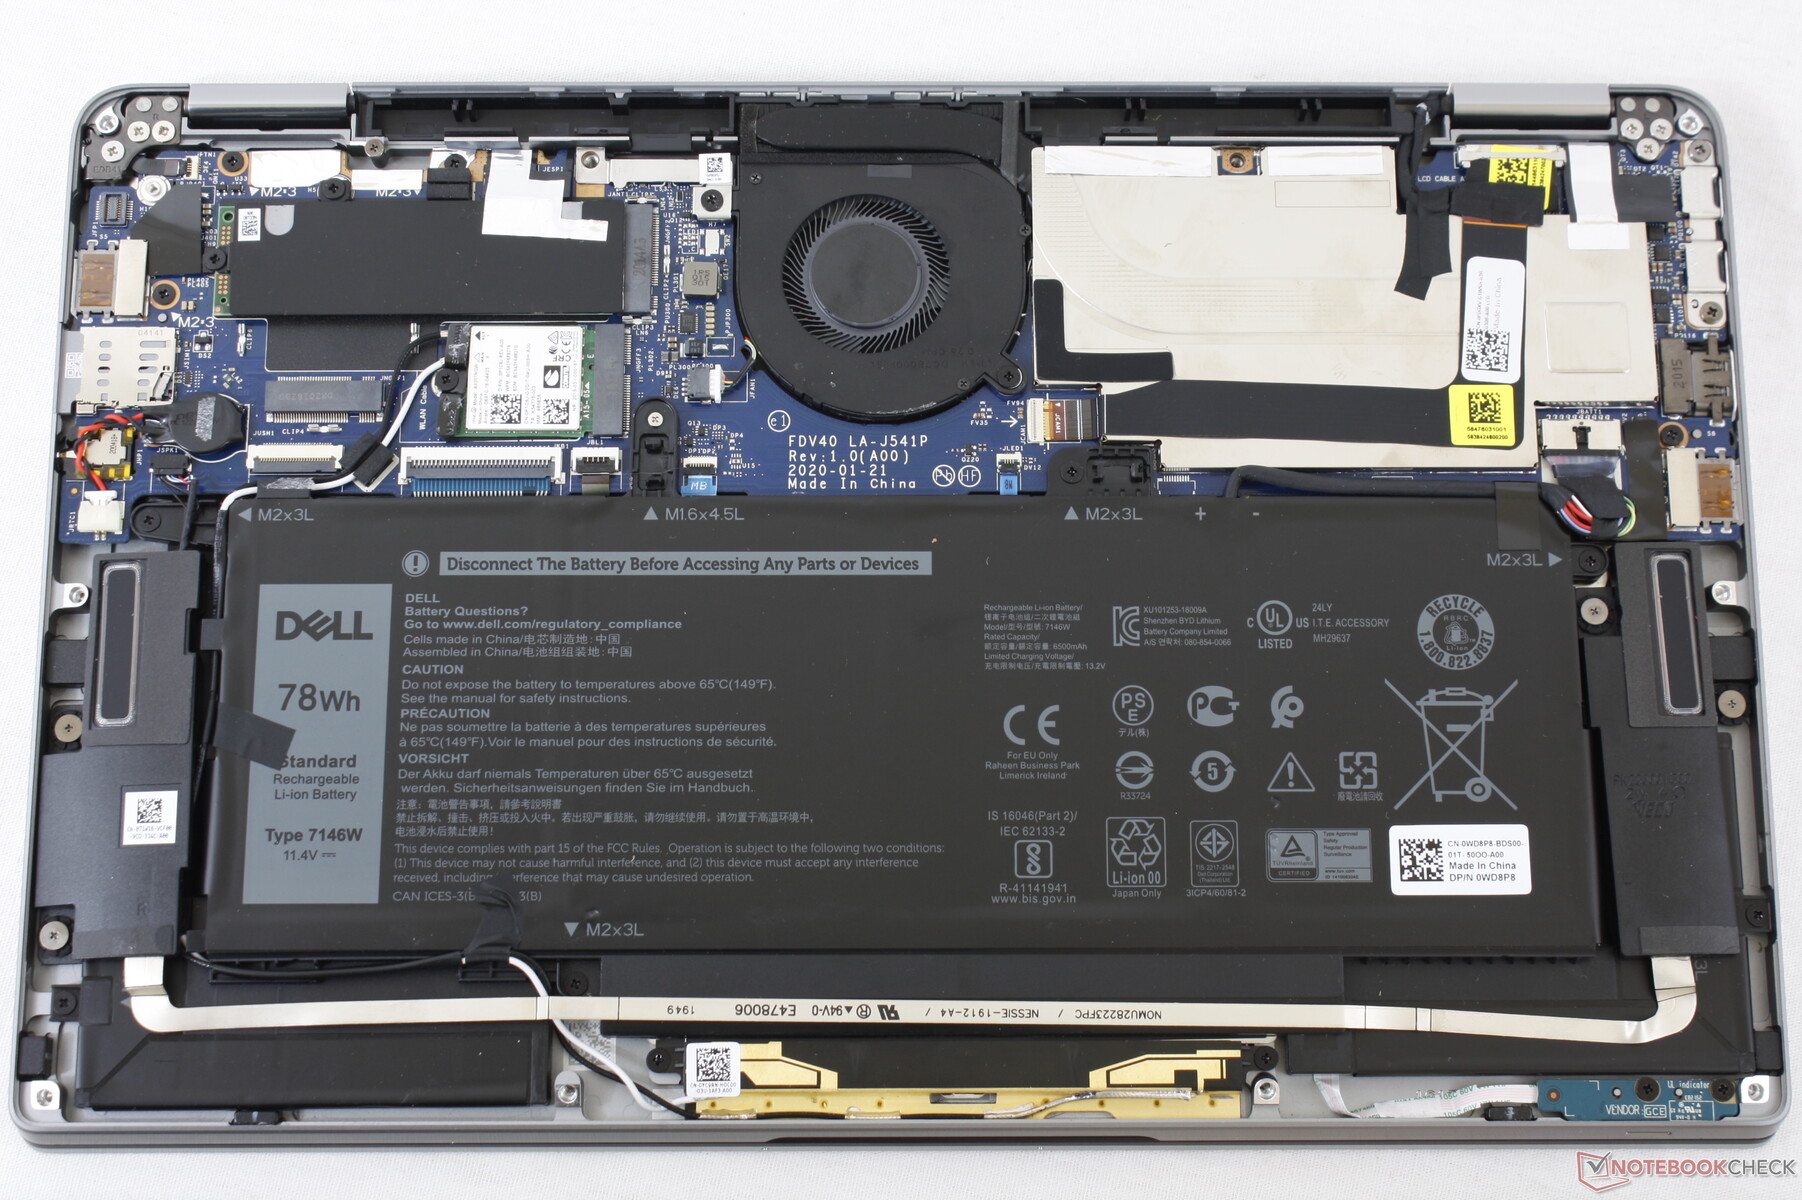
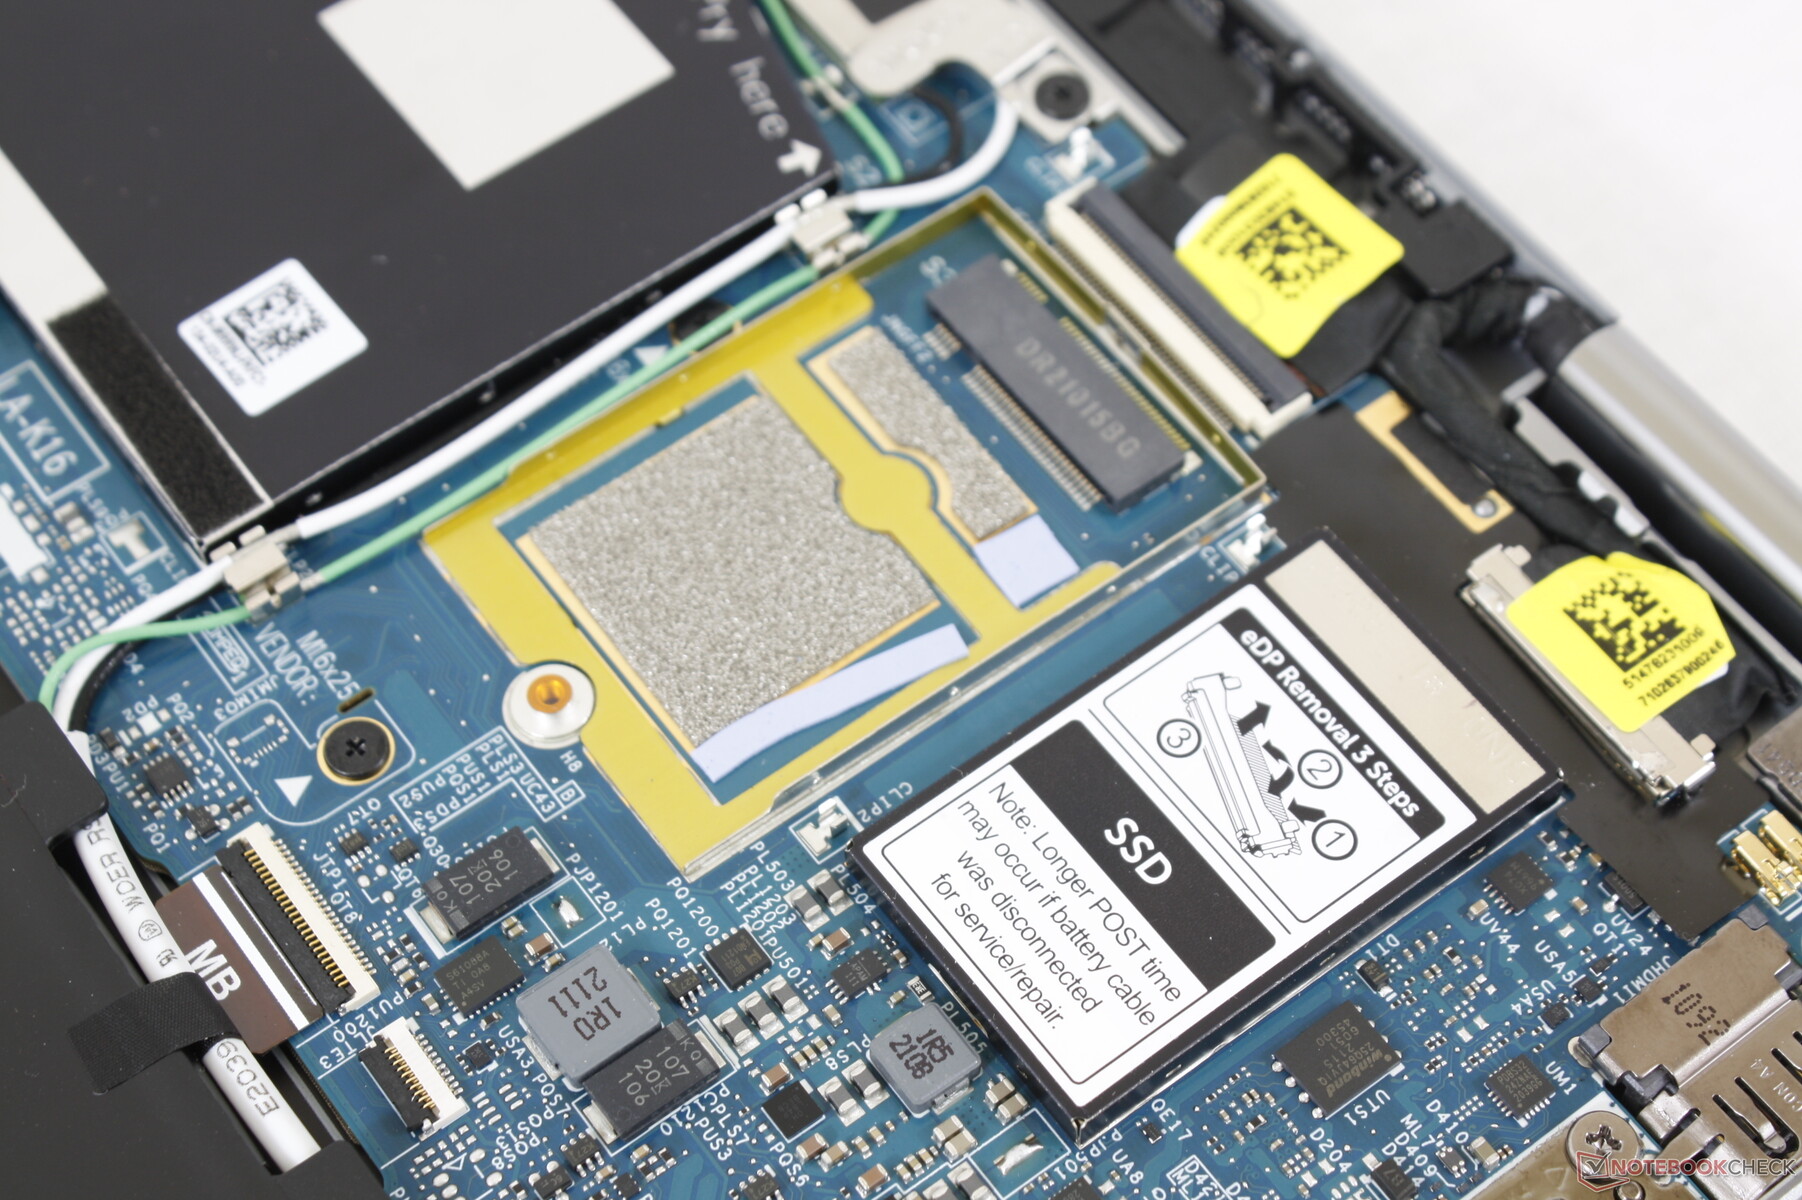
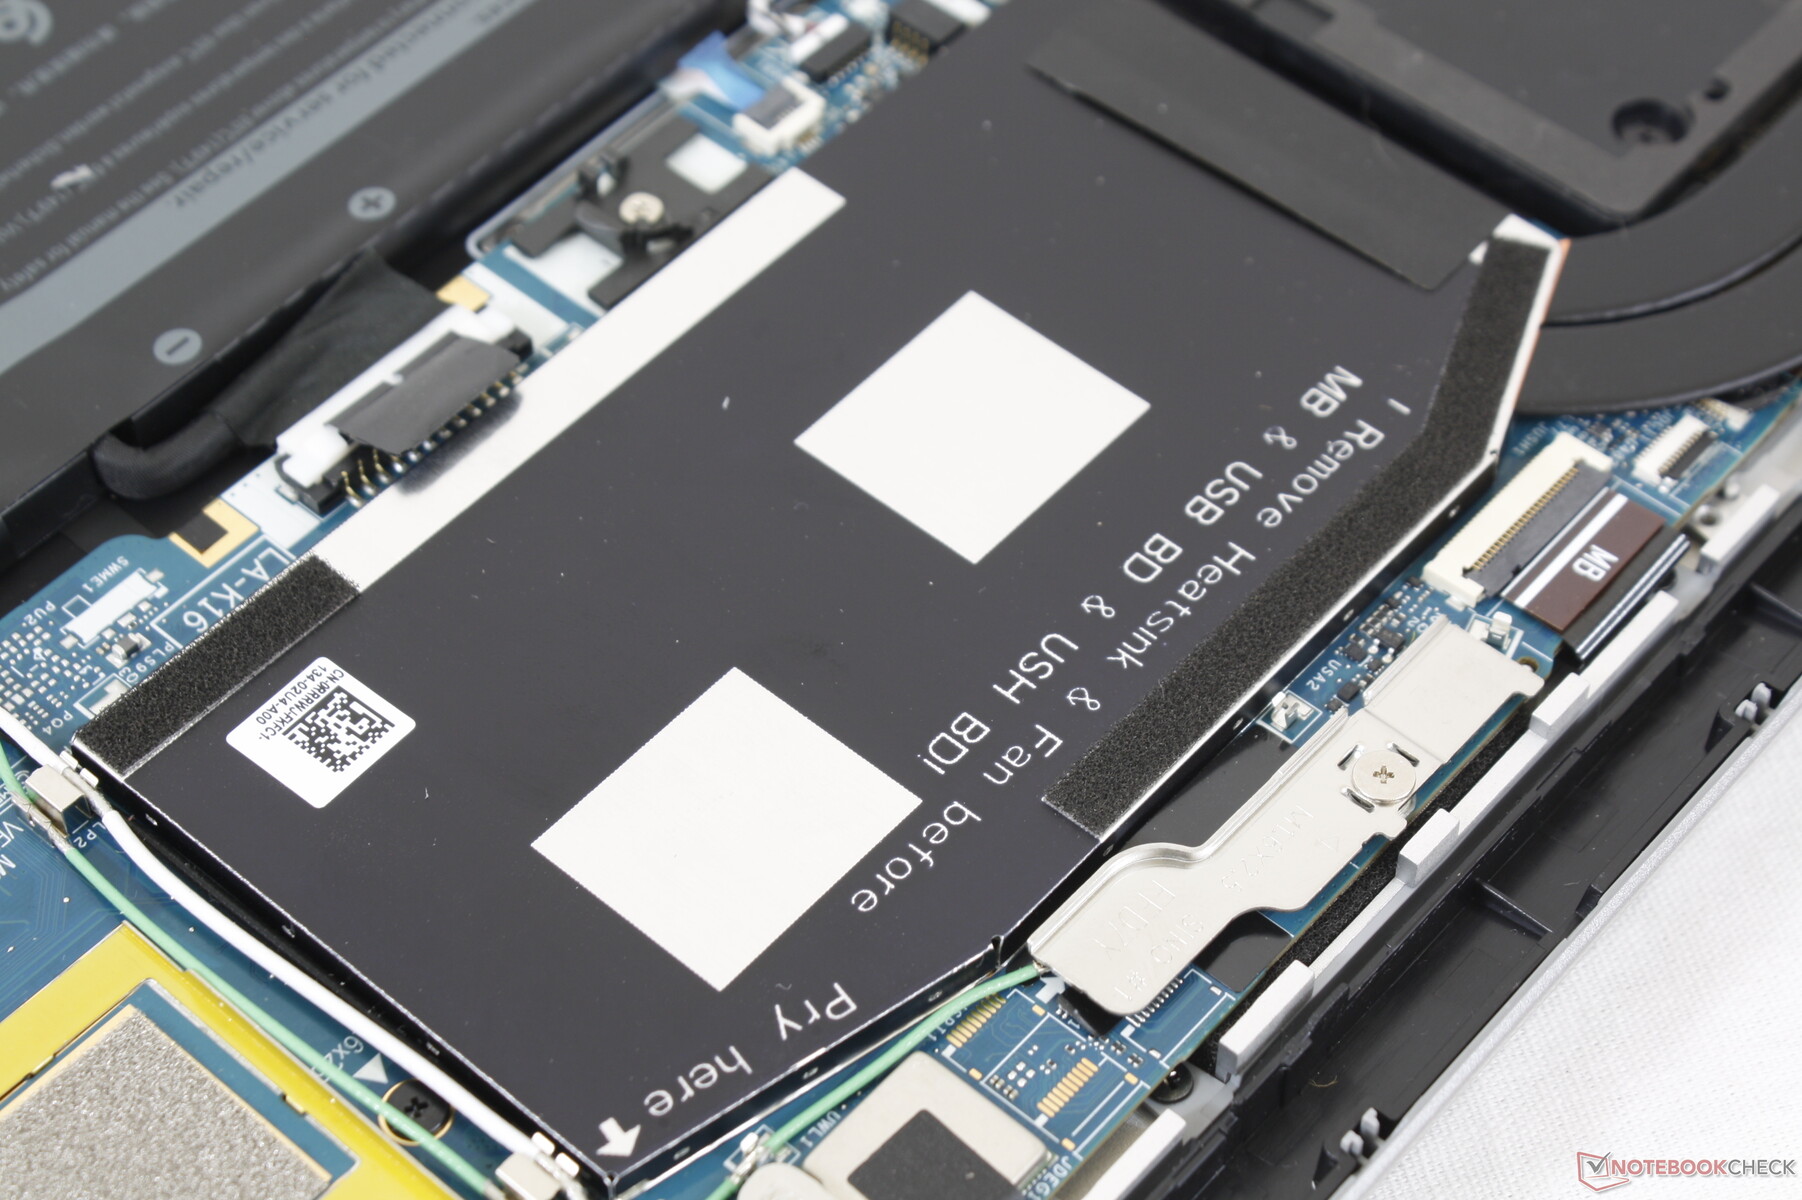
Maintenance
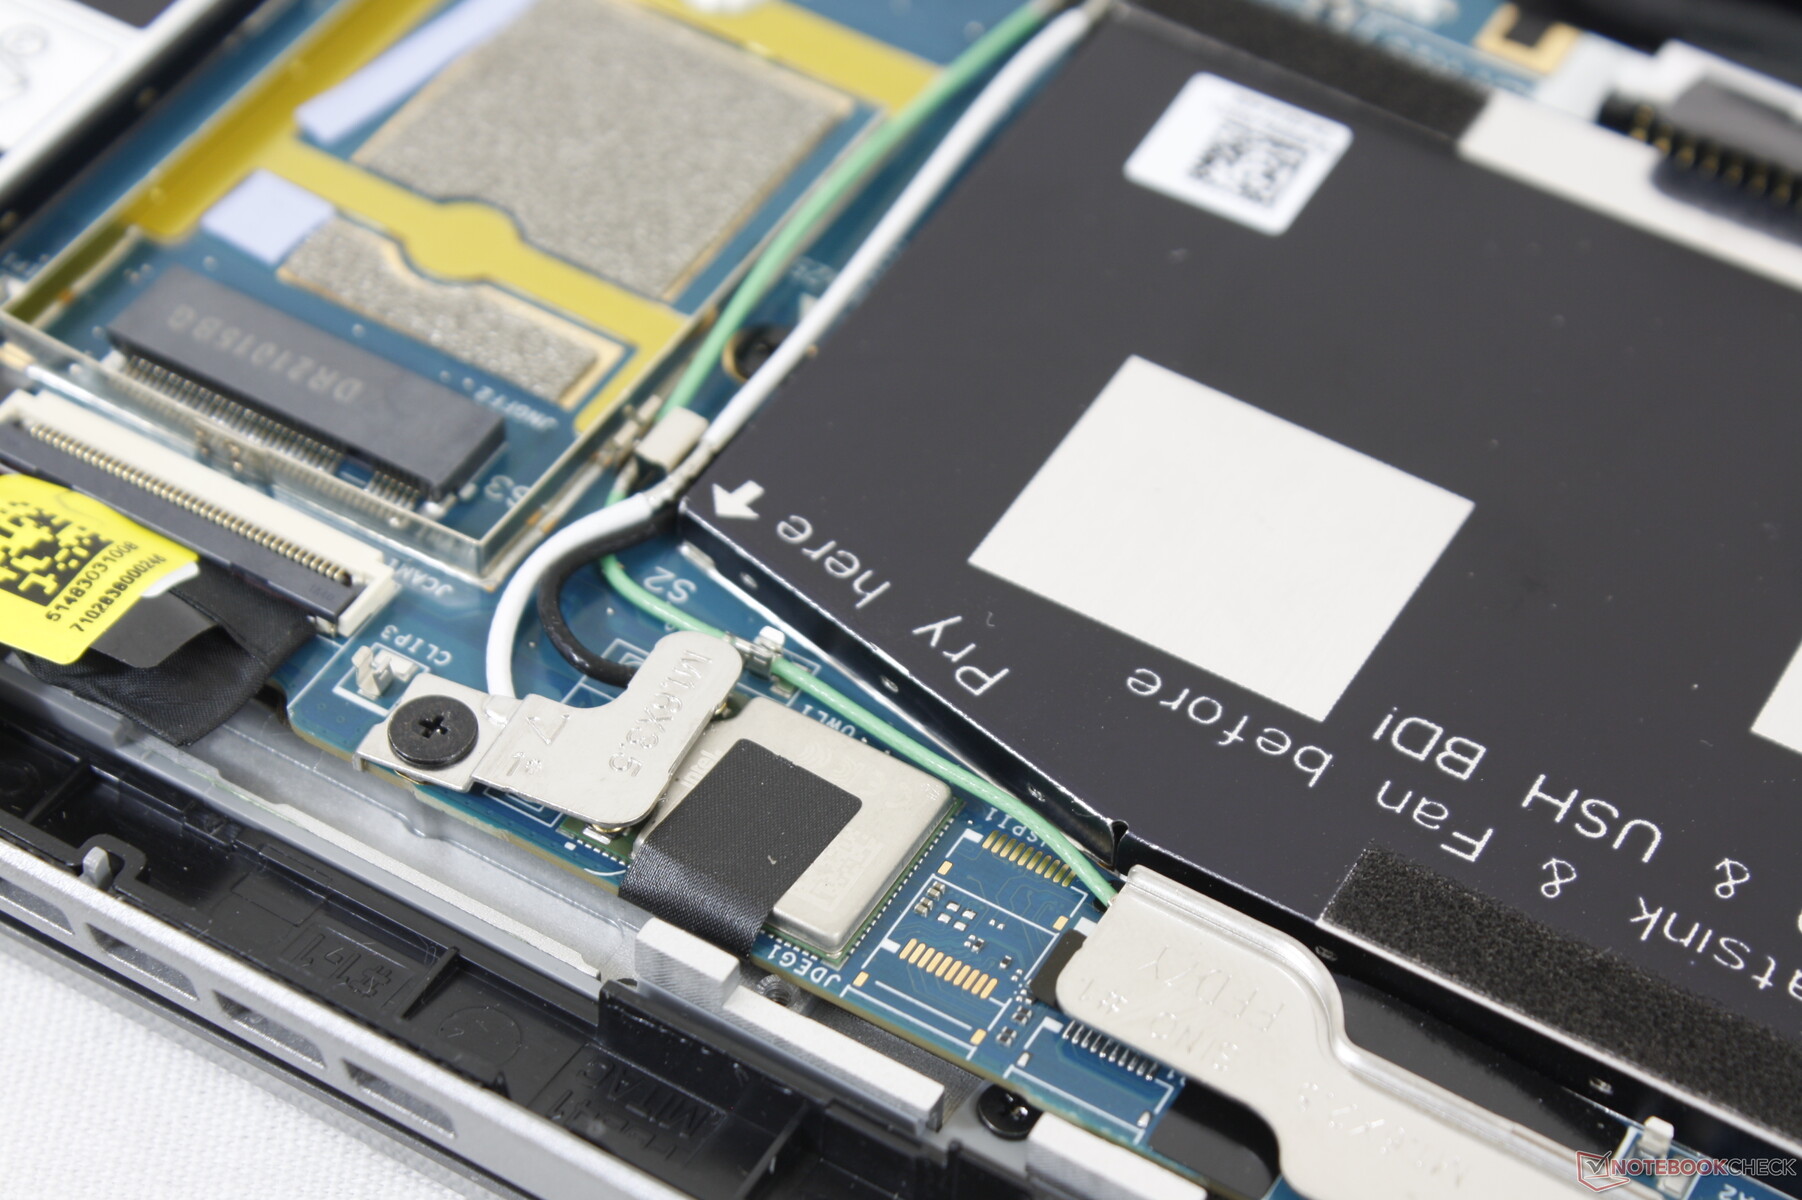
The bottom panel comes off fairly easily with just a Philips screwdriver and a sharp edge. Users get access to the WAN slot, M.2 2230 SSD slot, and main battery. Both RAM and WLAN are soldered and M.2 2280 drives are not supported likely to save on space and weight.
Dell says users cannot install a second SSD onto the WAN slot which is a shame because the slot essentially becomes dead space if not configured with WAN.
Accessories and Warranty
There are no extras in the box outside of the paperwork and AC adapter. Nonetheless, Dell offers a variety of accessories including an active pen and rechargeable wireless mouse. A three-year limited warranty comes standard.
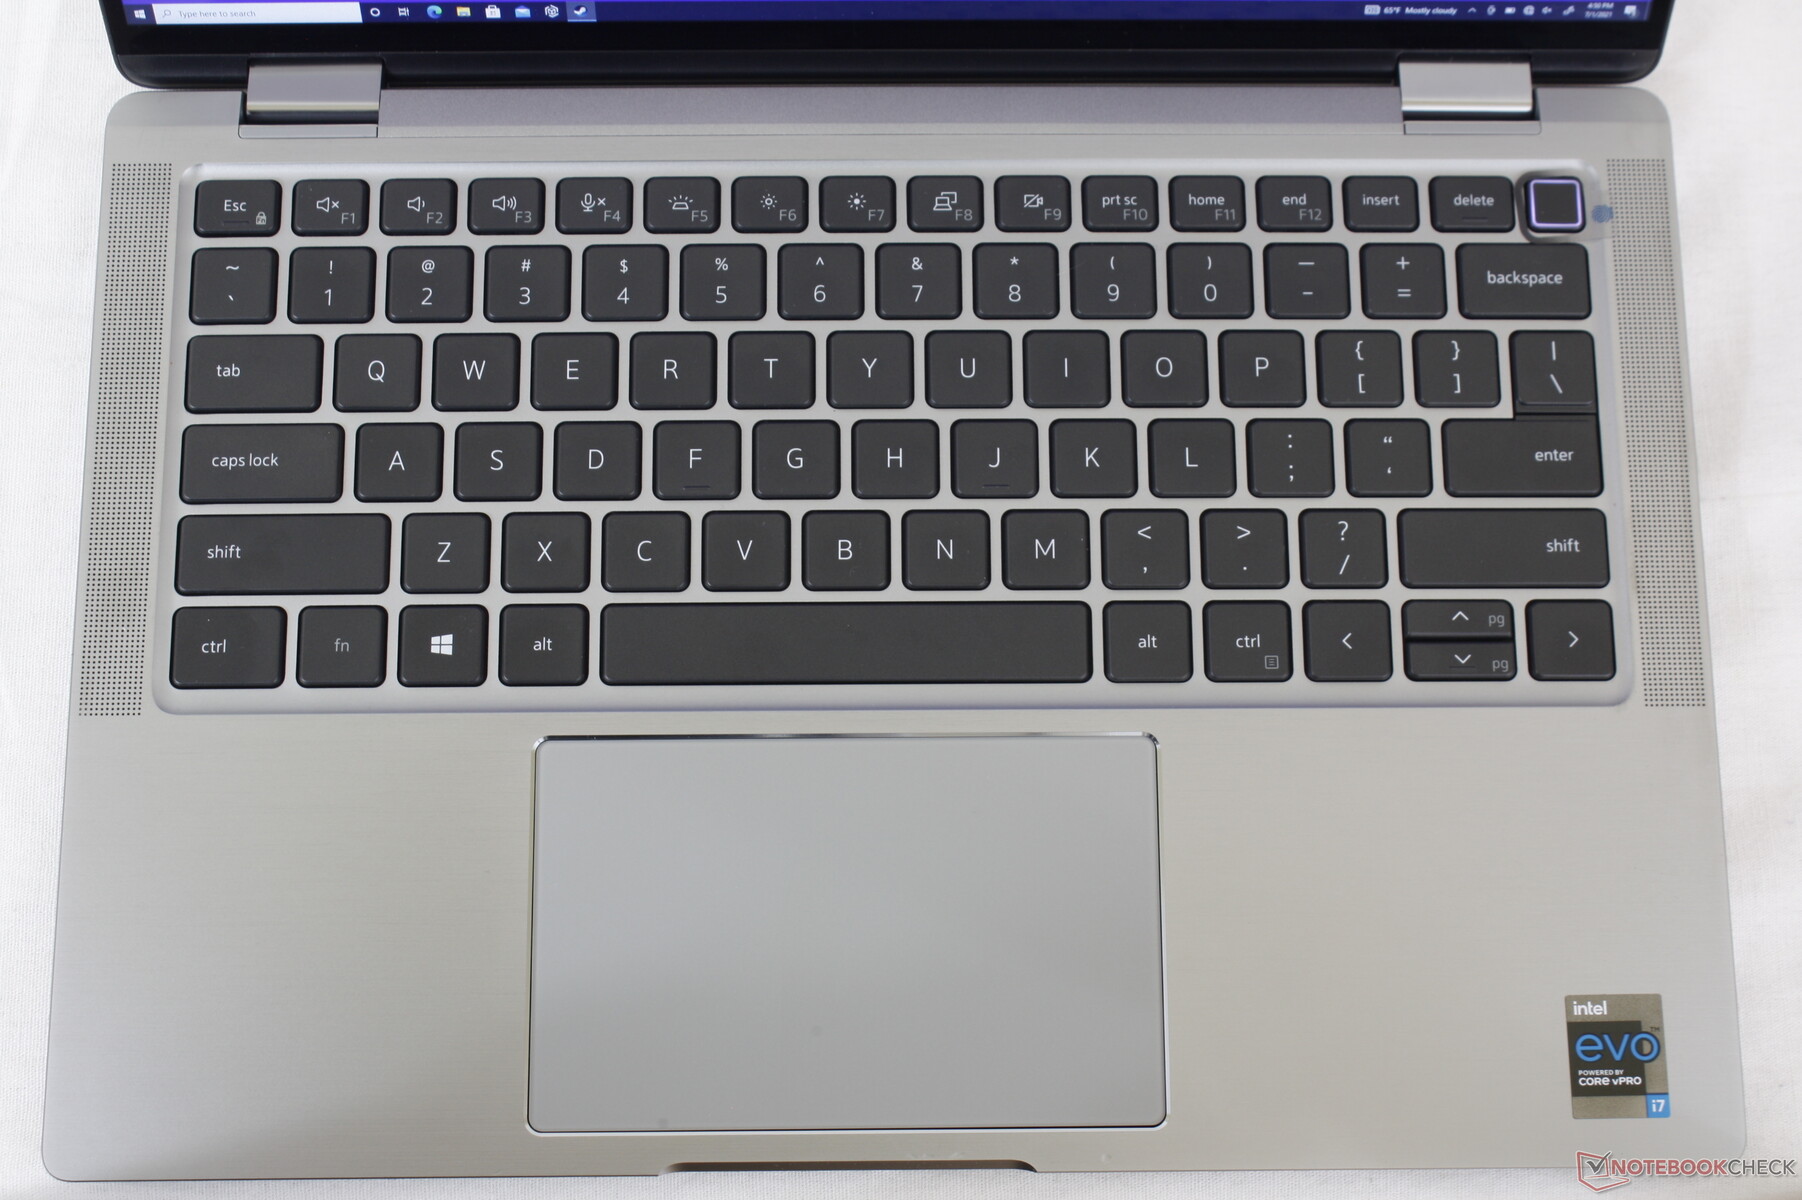
Input Devices — Bigger and Better
Keyboard
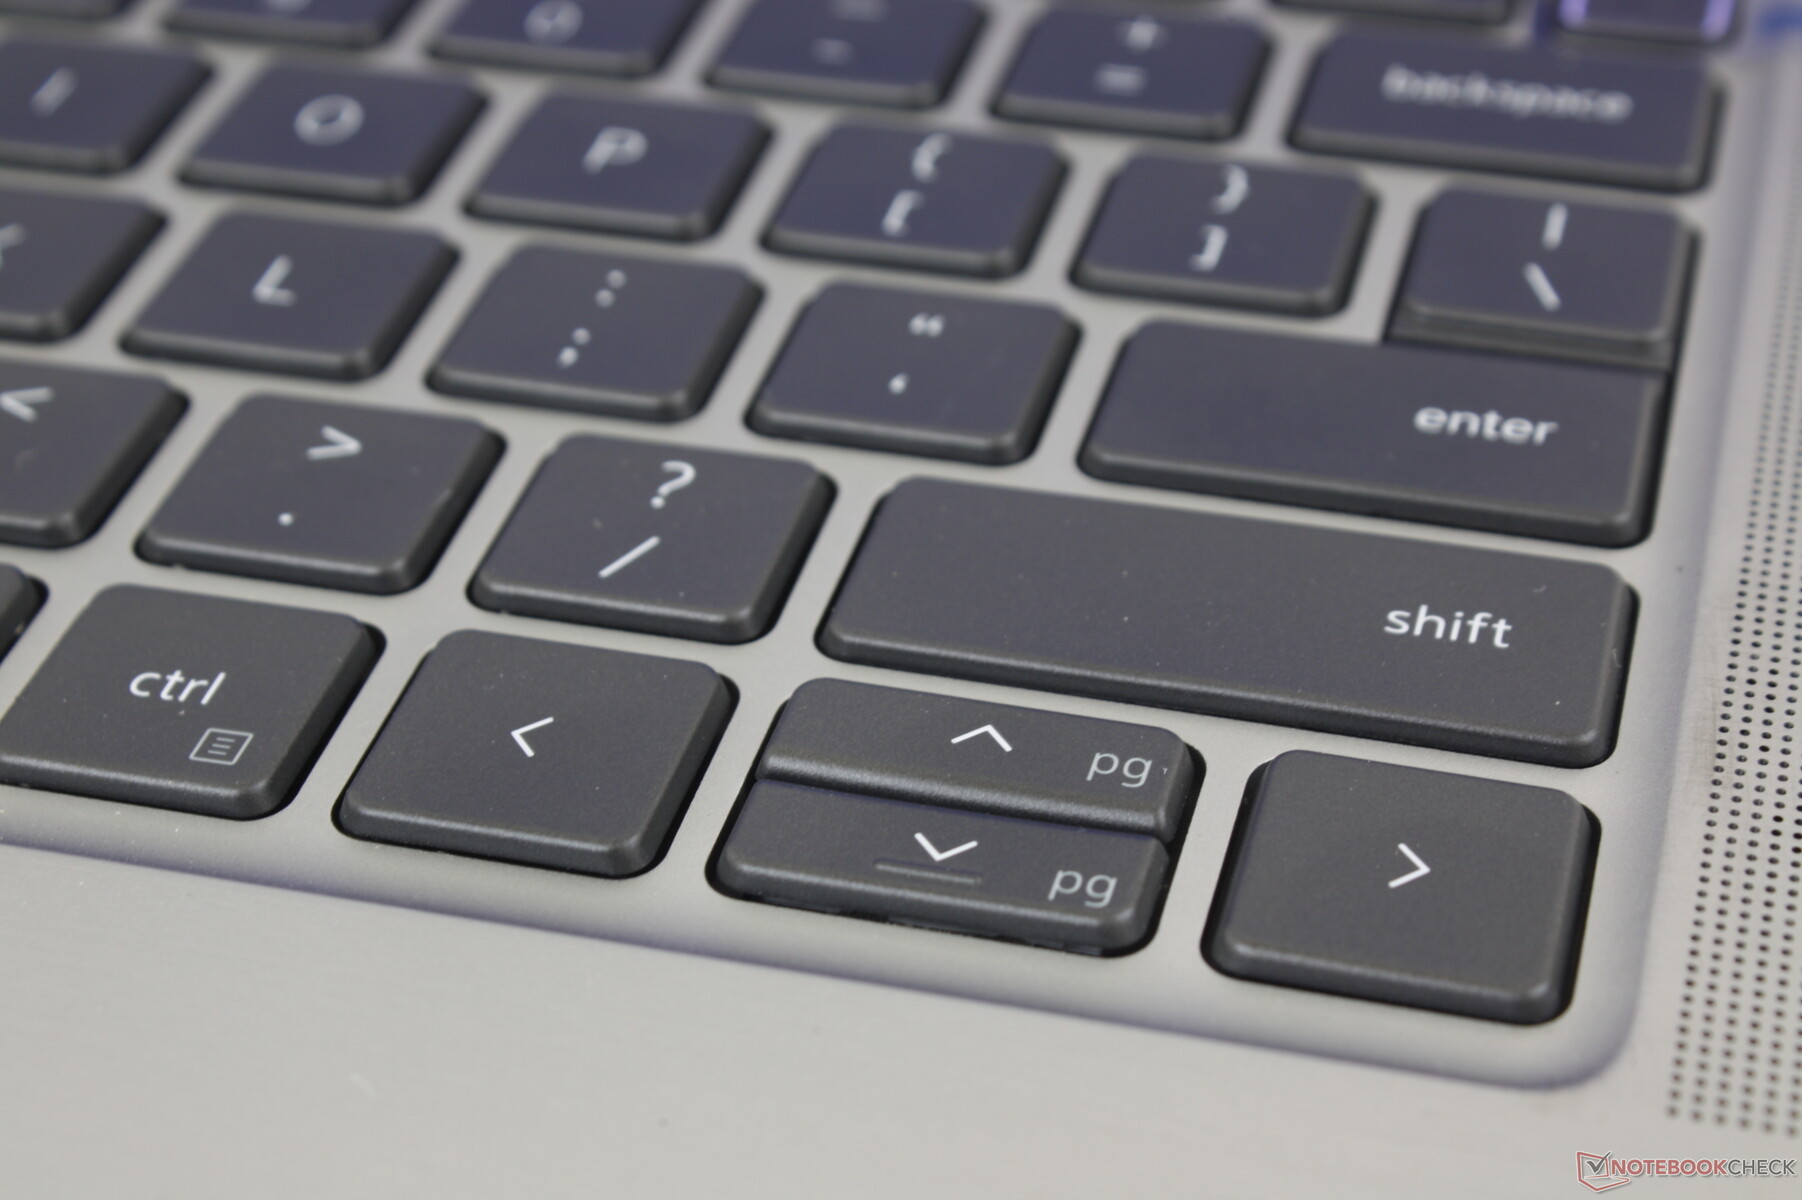
The backlit keyboard has changed mostly for the better on the 9420 2-in-1. The key caps themselves, for example, are now slightly larger than the ones on the 9410 while the fingerprint-enabled Power button has been relocated to the corner of the keyboard. The dedicated PgUp and PgDn keys, however, have been removed which may irk some users.
Key feedback remains excellent with firm, uniform feedback despite the quiet clatter. Even so, deeper travel would have made for a more satisfying typing experience. The Enter and Space keys, for example, are shallower than what we're used to on other business laptops like the Lenovo ThinkPad T series or the HP EliteBook 1040.
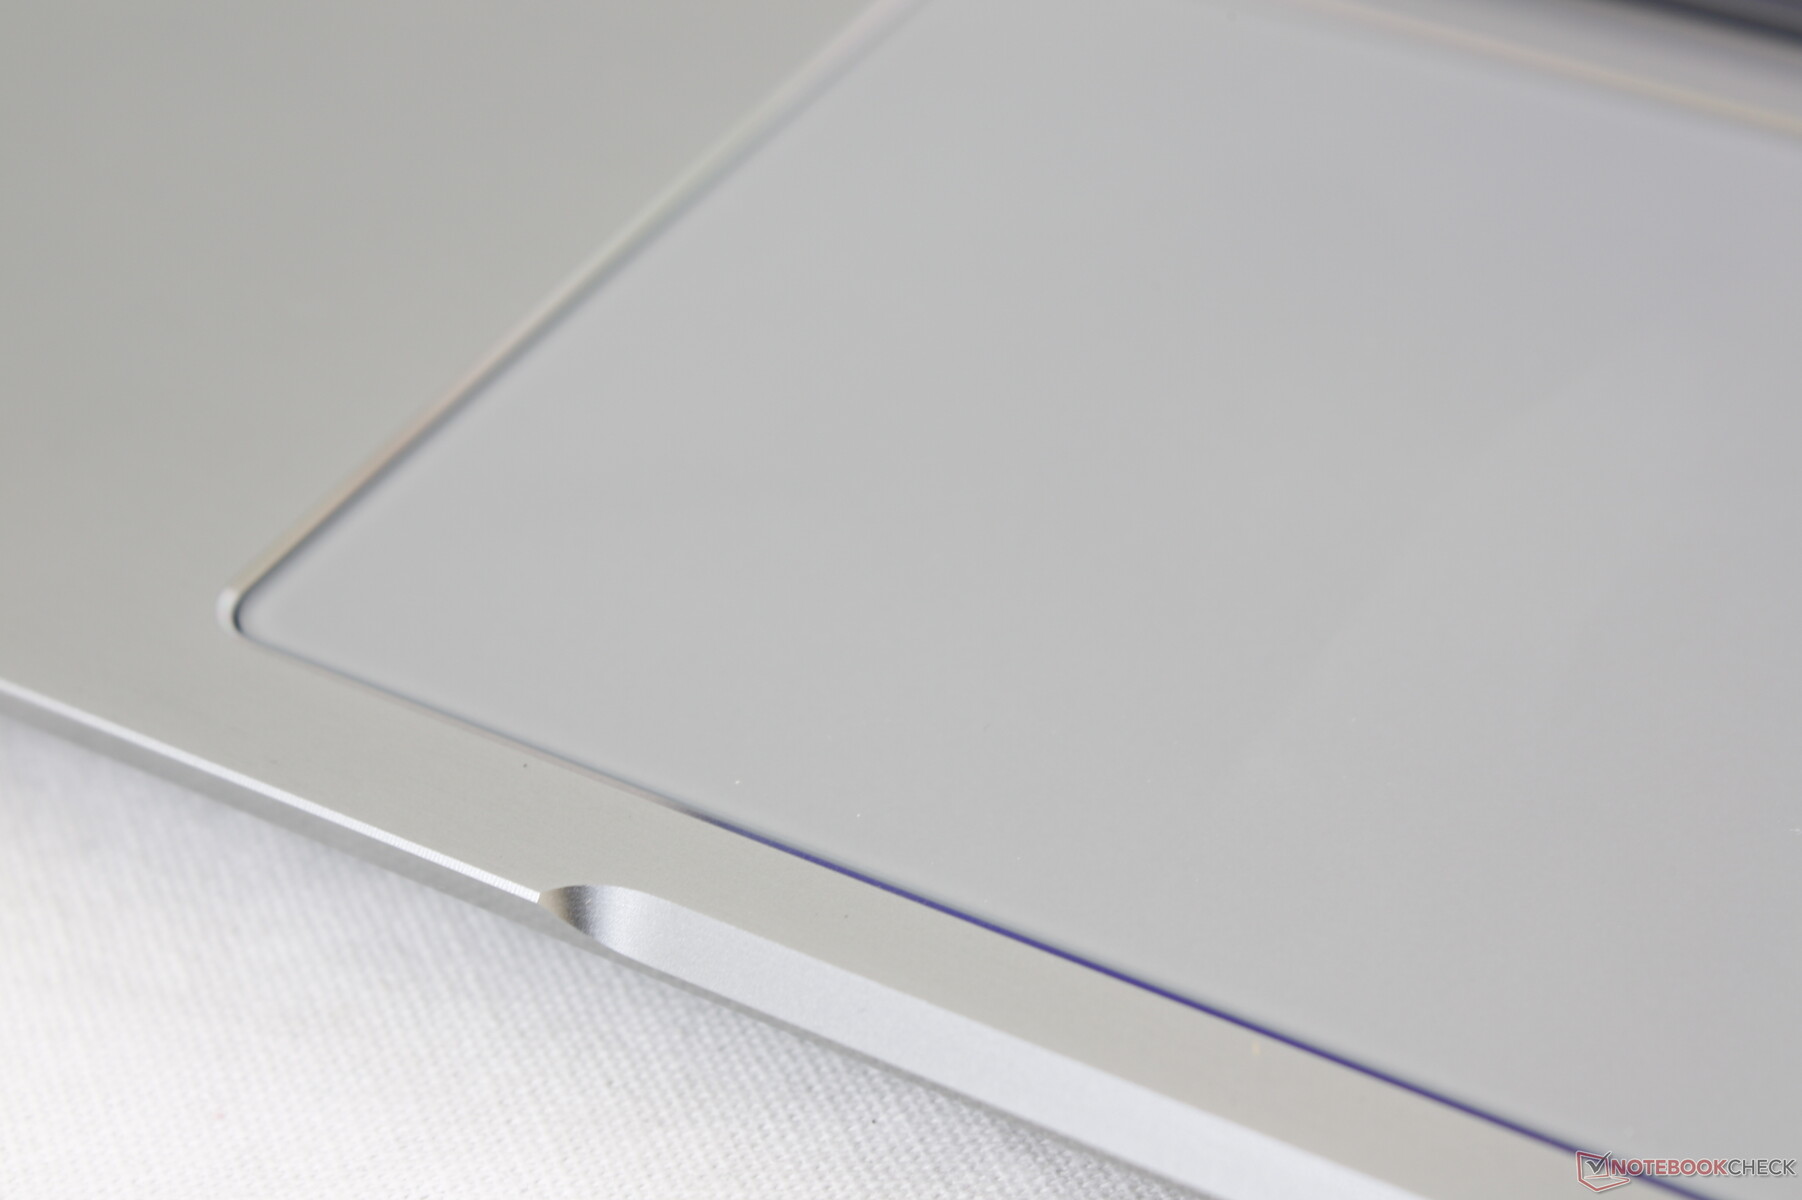
Touchpad
The clickpad is larger over last year's model (11.5 x 7.2 cm vs. 10.5 x 6 cm). Thus, it doesn't feel cramped at all despite the 14-inch form factor. Traction is smooth when gliding at medium to high speeds while there is slight sticking at slower speeds to aid in precision.
Feedback is on the spongy side when clicking on the clickpad. Clatter is soft and quiet as a result, but we would have preferred firmer feedback for a more satisfying click.

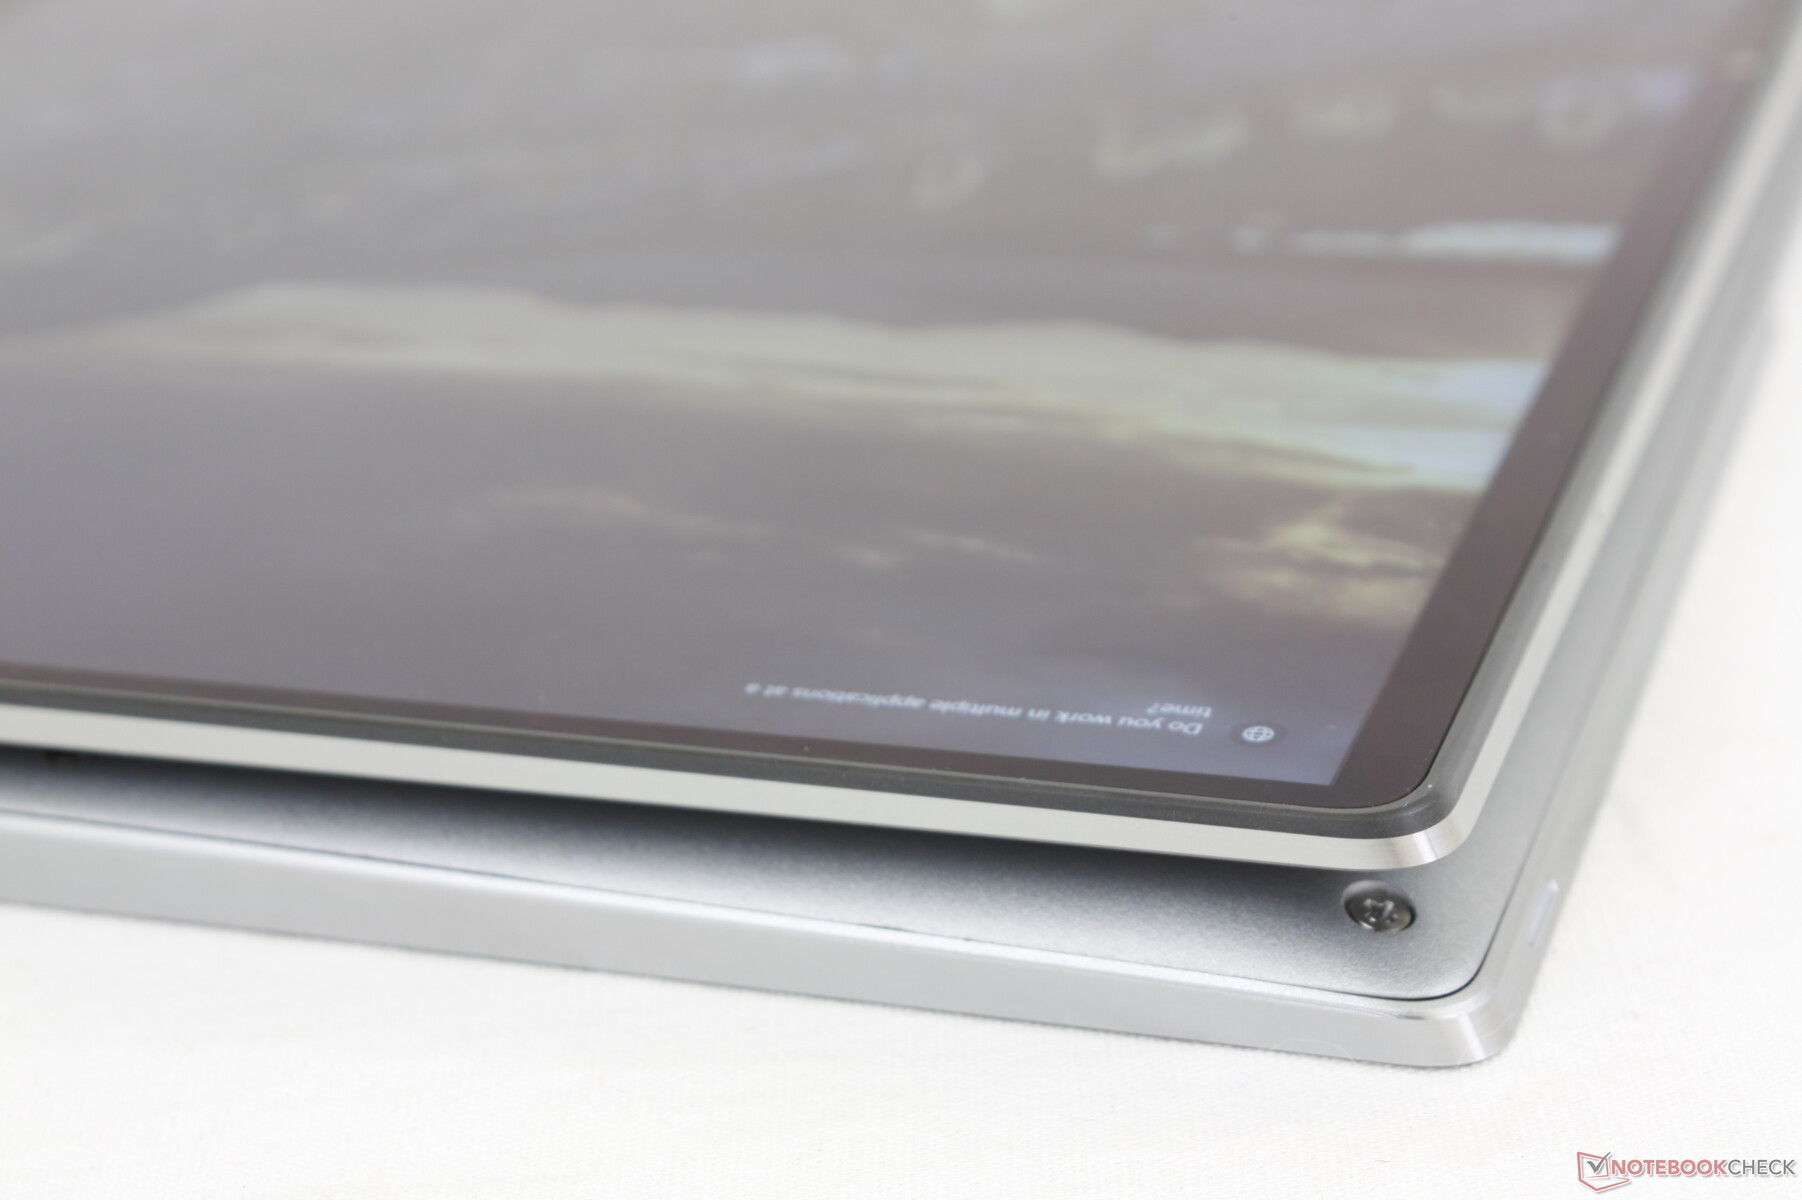
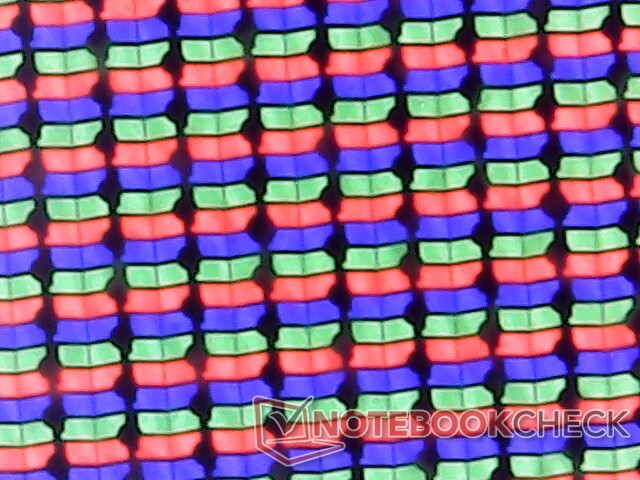
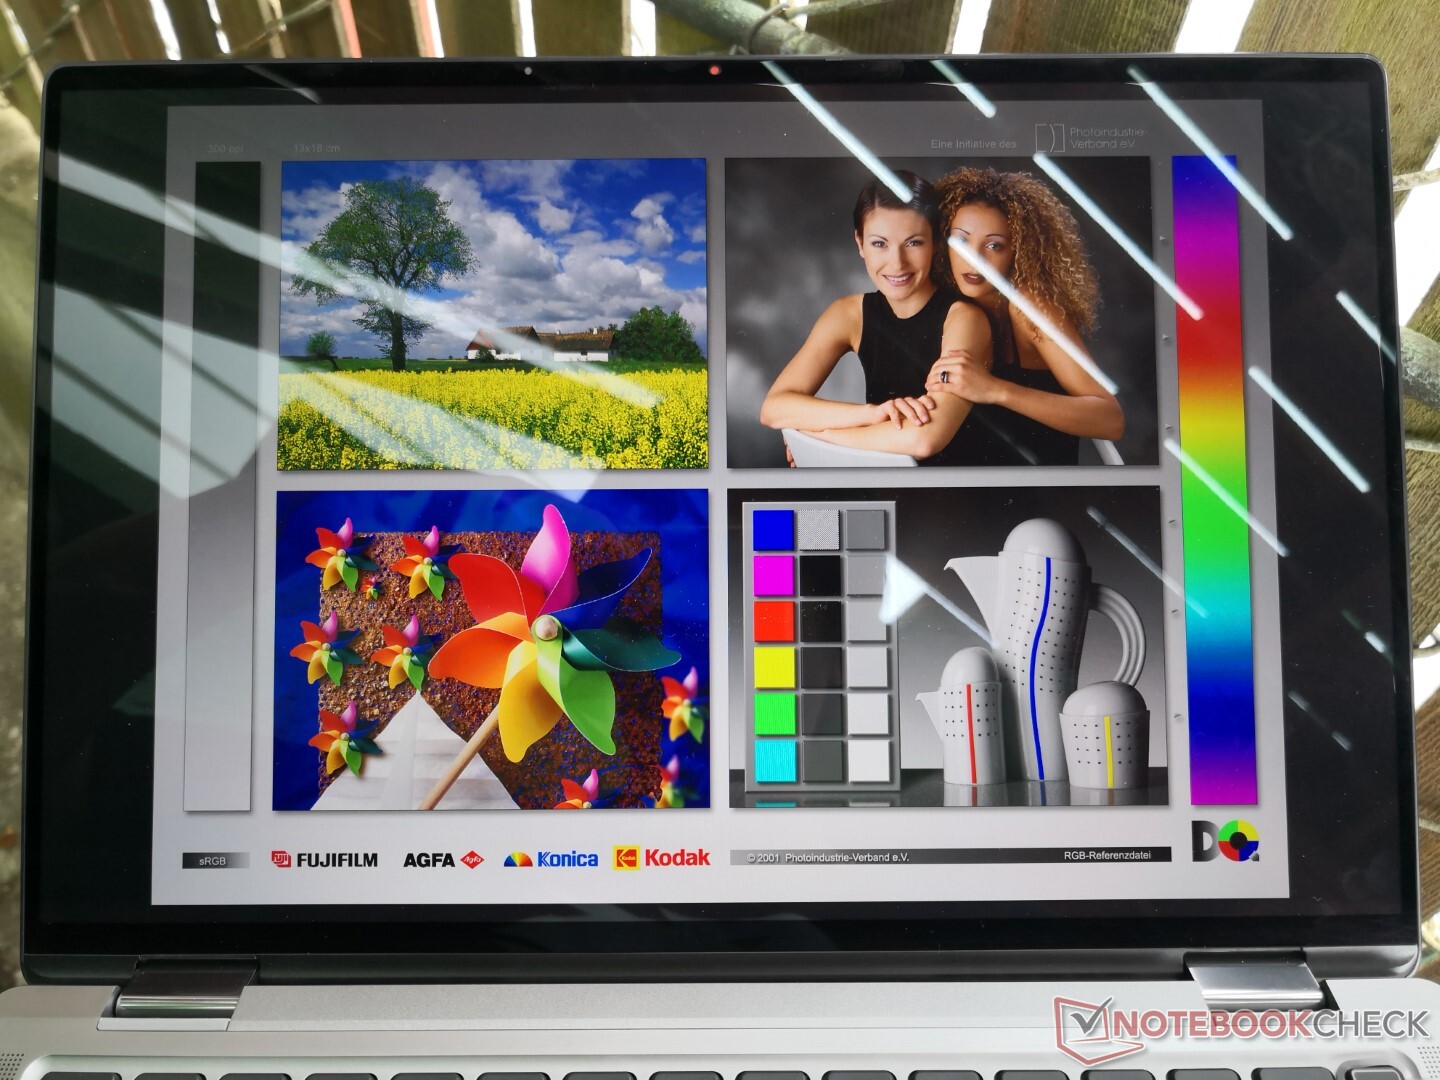
Display — 500 Nits with Full sRGB Coverage
The AU Optronics B140QAN panel has appeared on older 14-inch laptops like the Lenovo ThinkPad T470s or Dell Latitude 14 E7470, but this is the first time we're seeing it on a 16:10 form factor and at a higher native resolution of 2560 x 1600. Image quality is excellent with its sharp picture and high ~1500:1 contrast ratio. Some graininess can be observed when displaying all white and on the full brightness setting, but it's minor enough to easily overlook.
Speaking of brightness, we're able to measure a maximum brightness of 484 nits on the center of the screen to be close to Dell's advertisement claim of 500 nits.
| |||||||||||||||||||||||||
Brightness Distribution: 92 %
Center on Battery: 483.6 cd/m²
Contrast: 1511:1 (Black: 0.32 cd/m²)
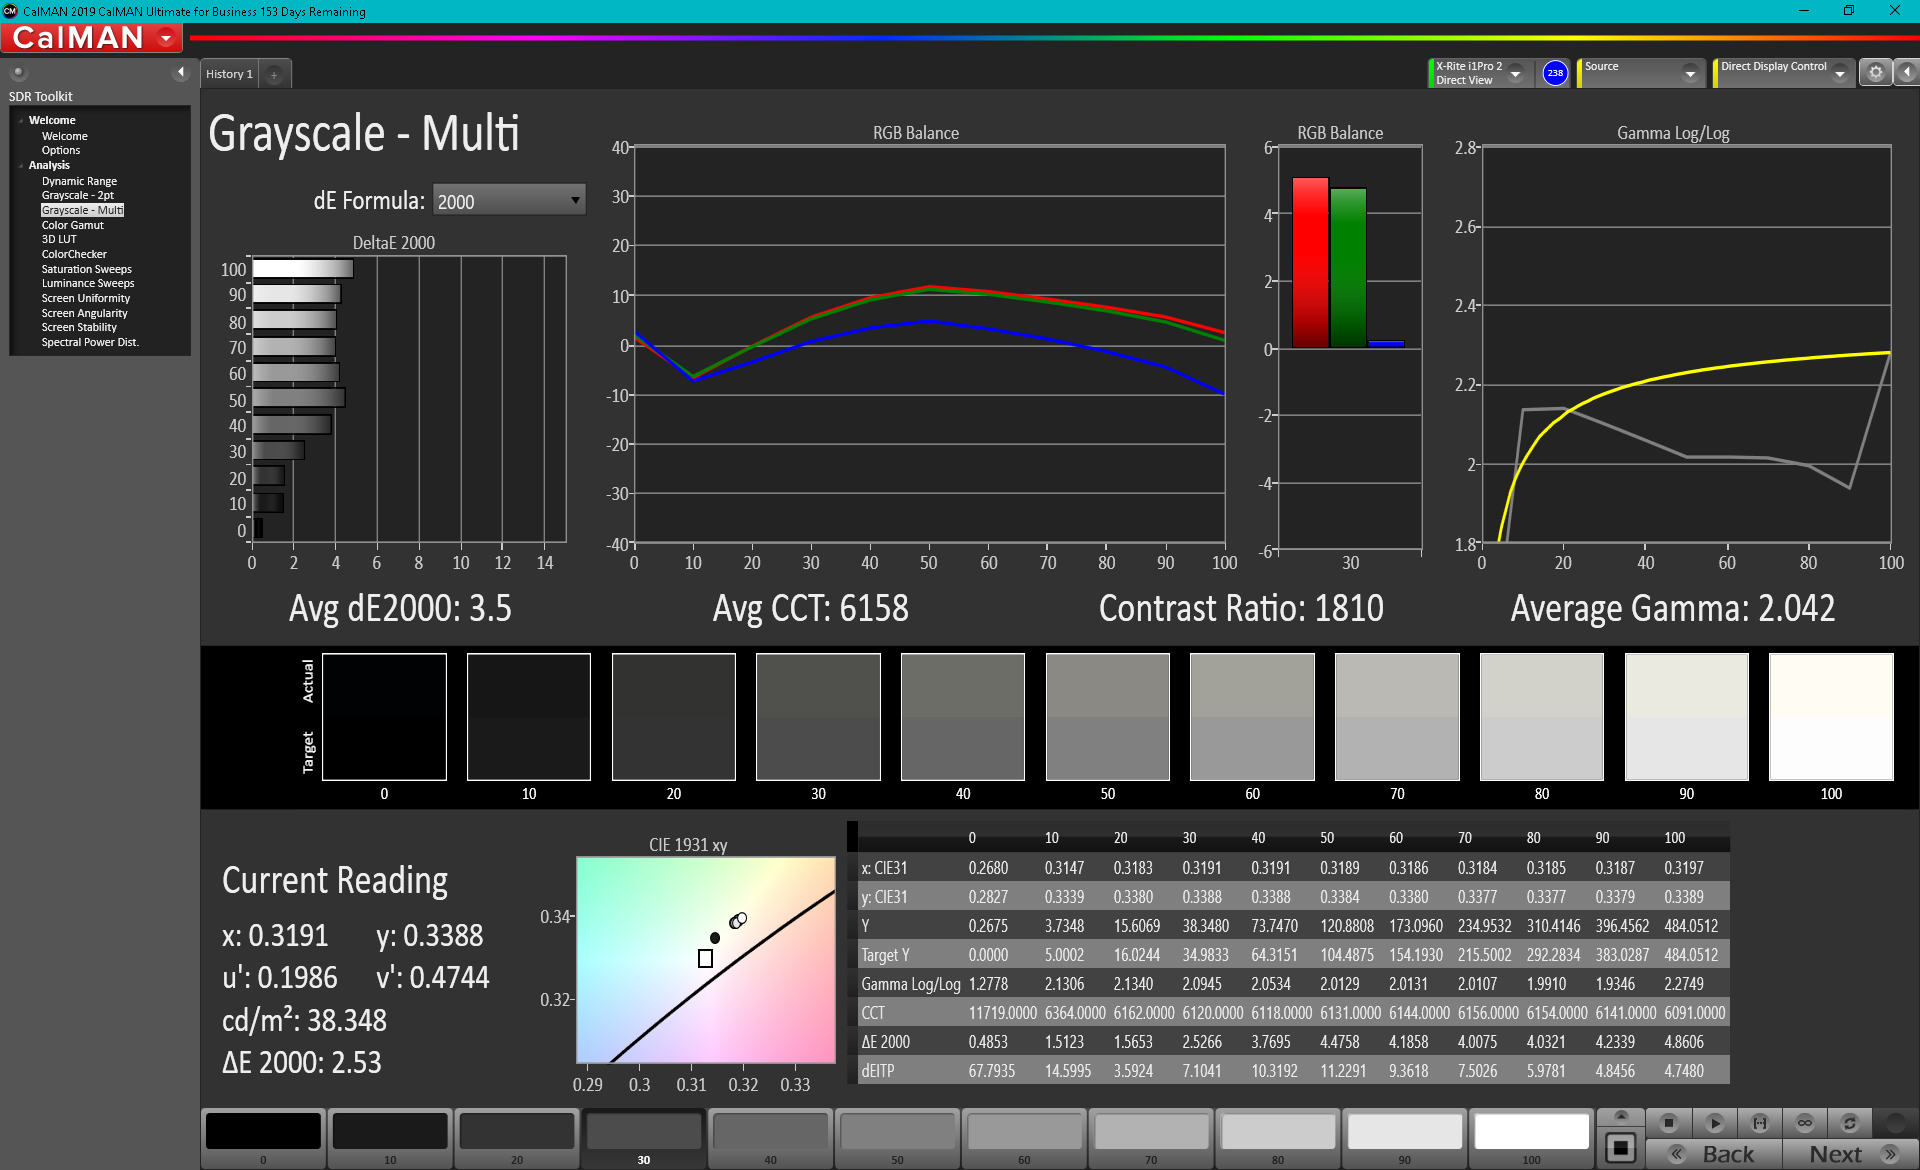
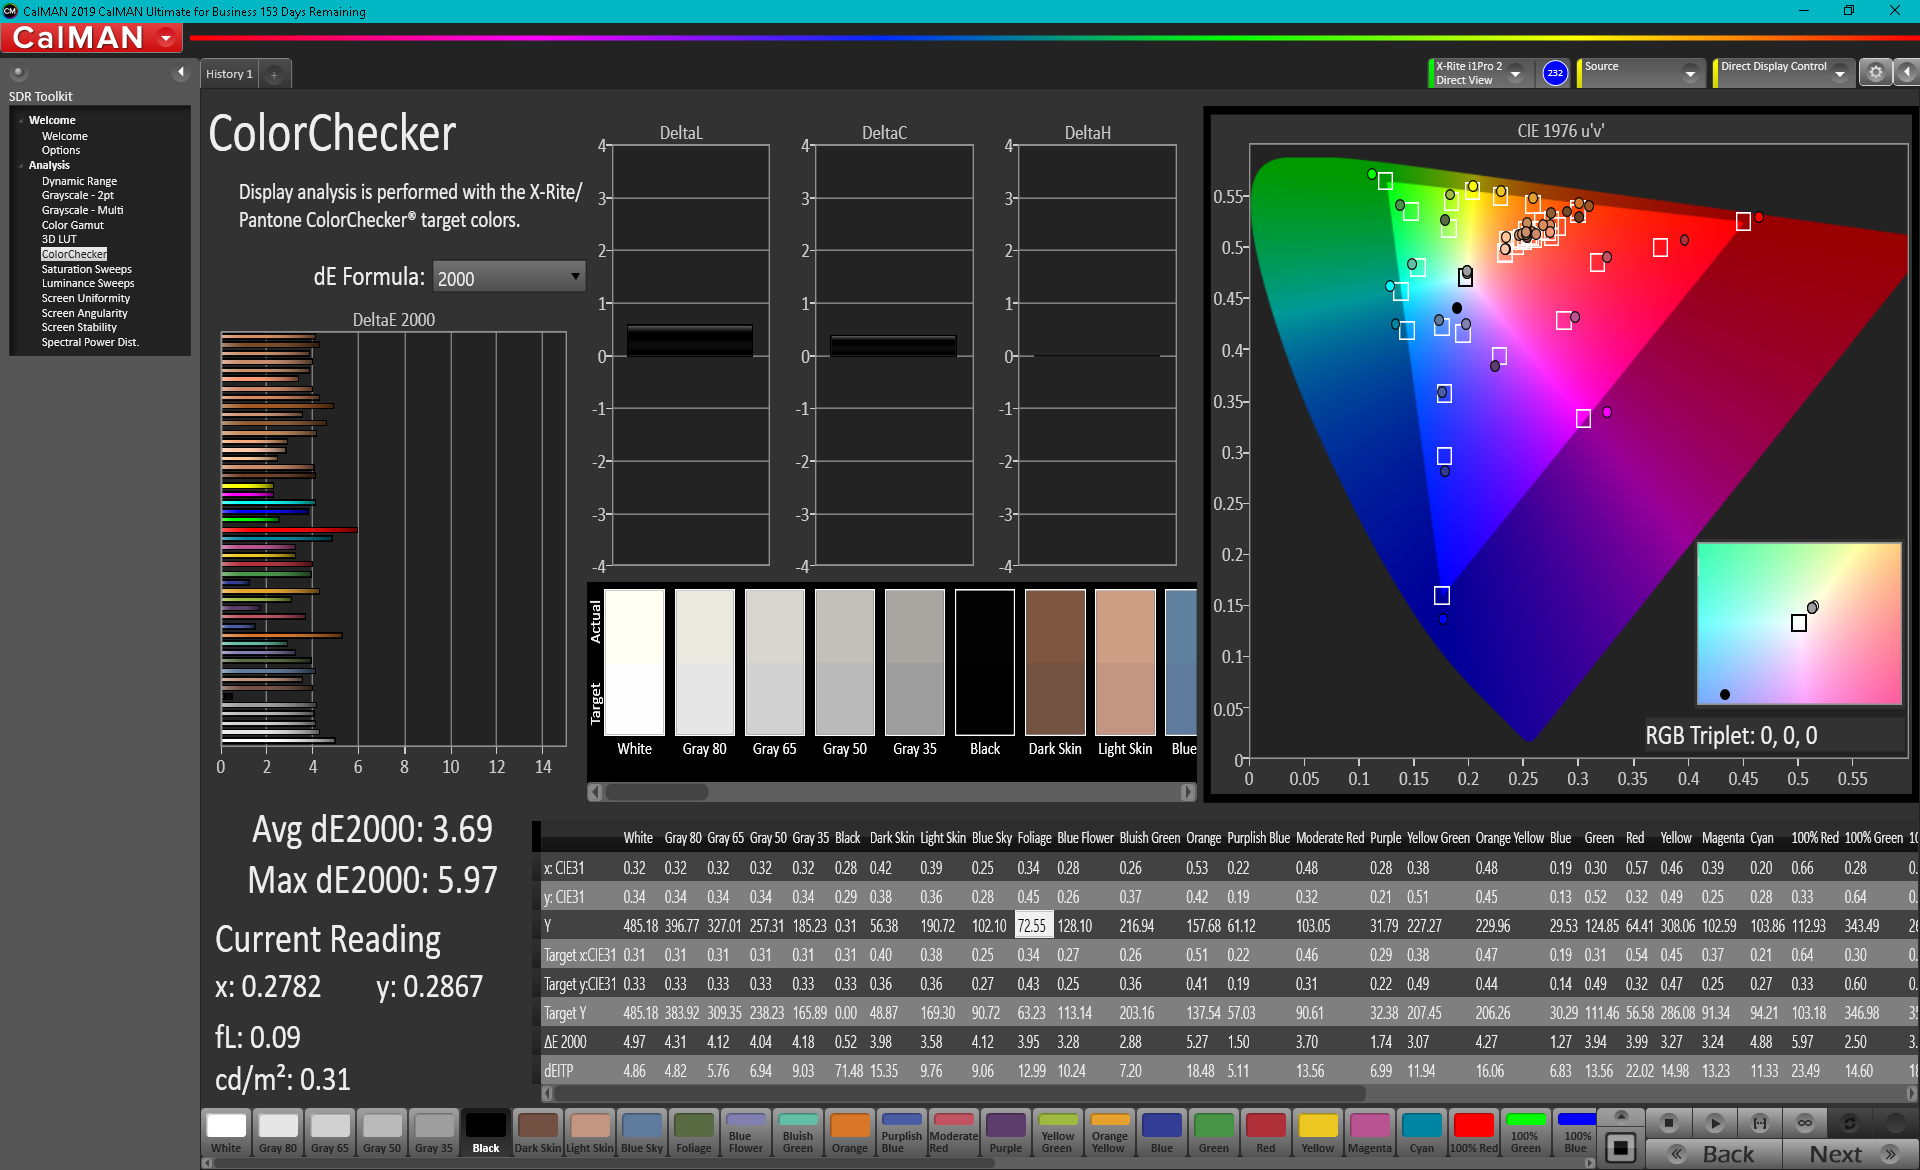
ΔE ColorChecker Calman: 3.69 | ∀{0.5-29.43 Ø4.73}
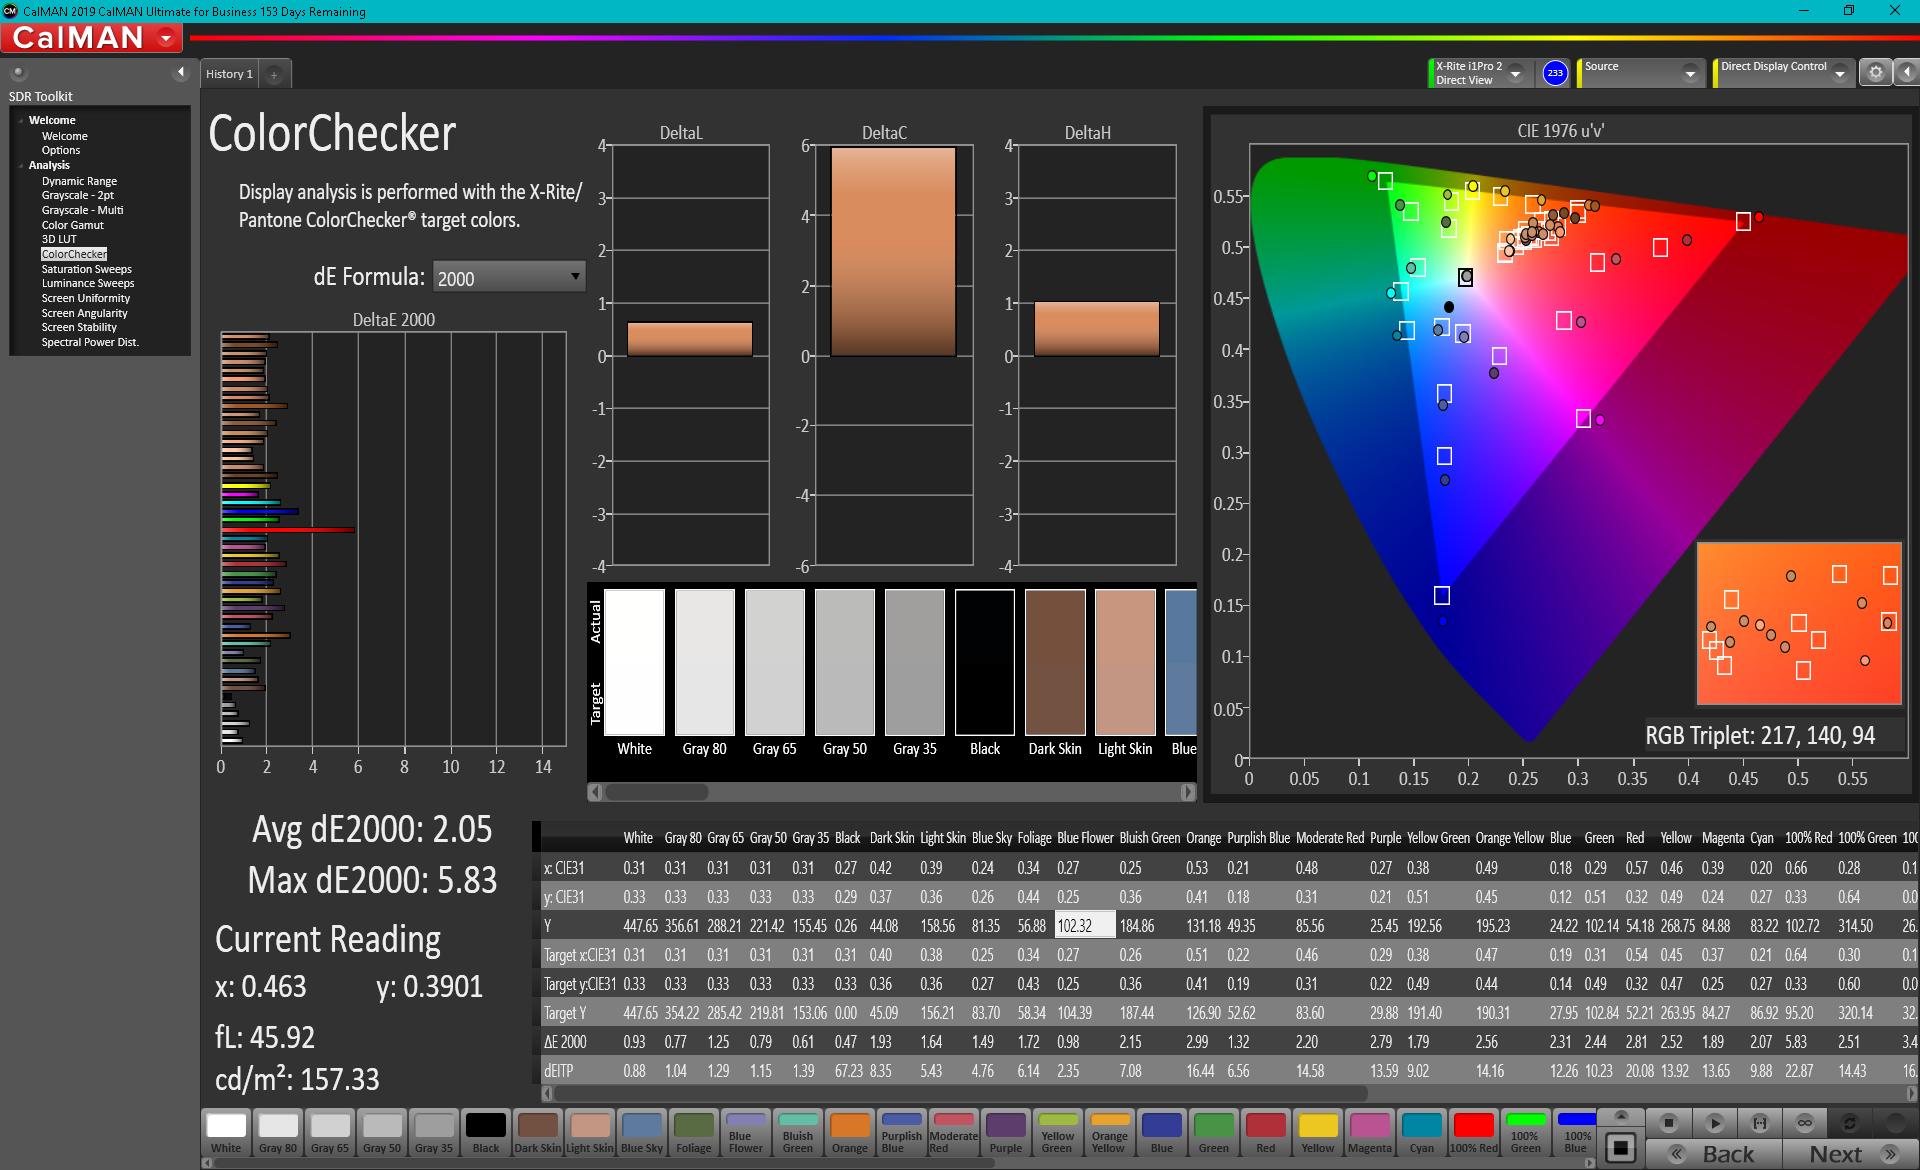
calibrated: 2.05
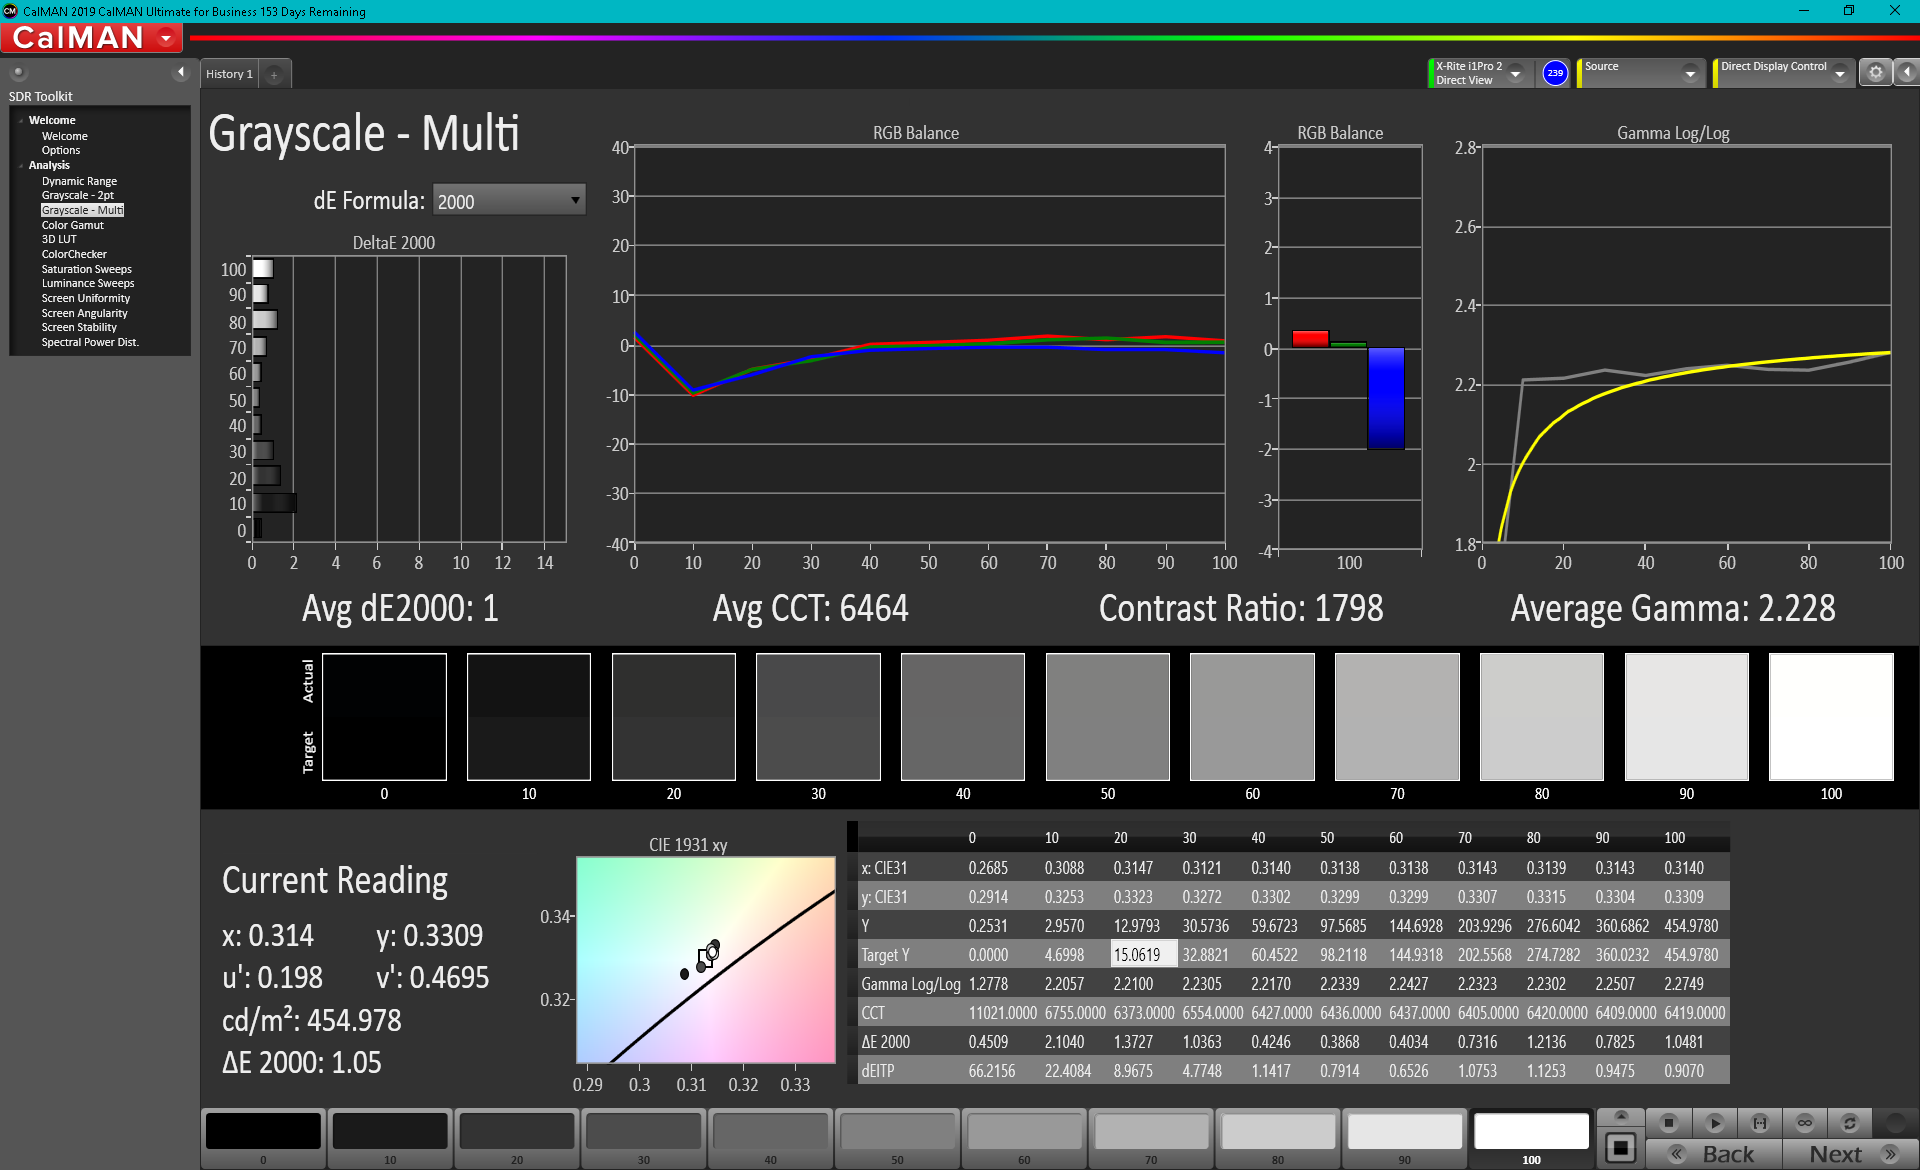
ΔE Greyscale Calman: 3.5 | ∀{0.09-98 Ø4.97}
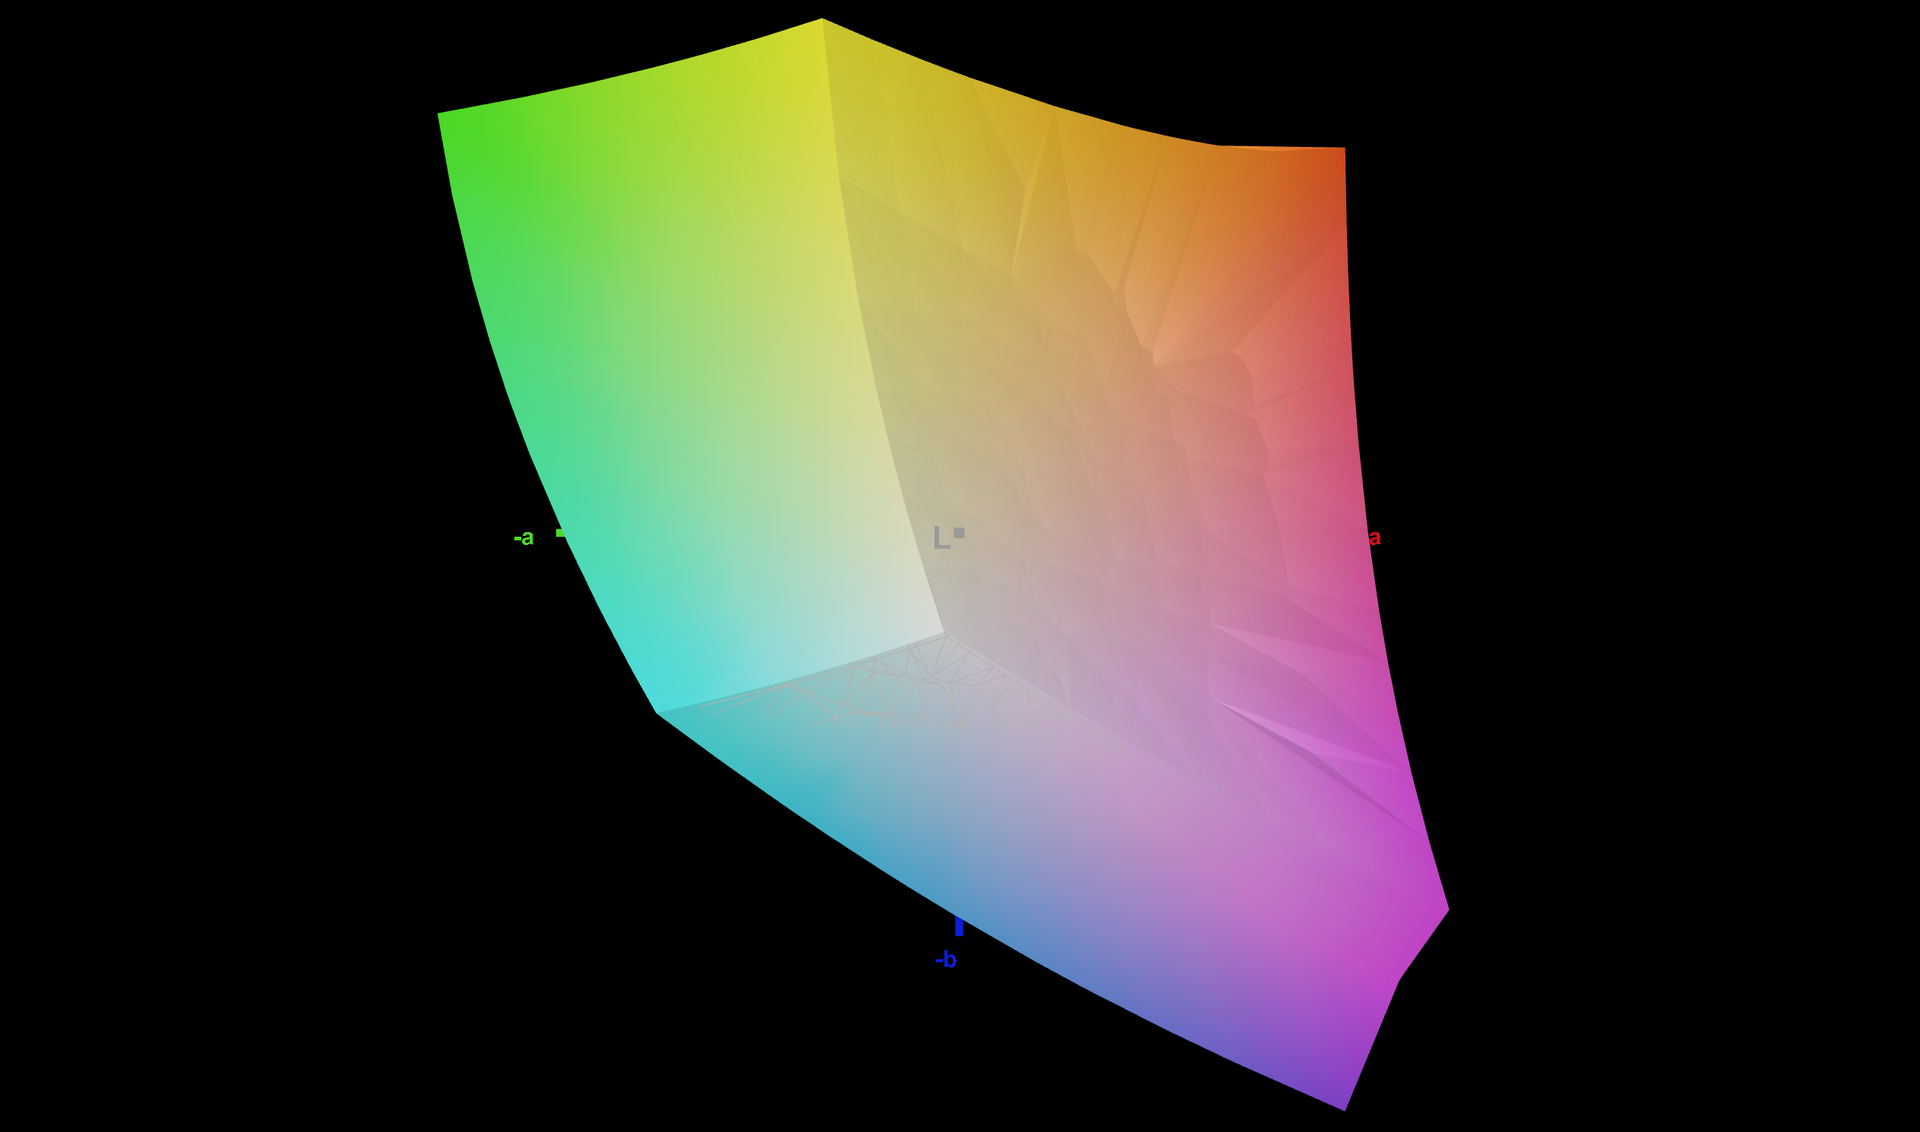
79.7% AdobeRGB 1998 (Argyll 3D)
100% sRGB (Argyll 3D)
80.7% Display P3 (Argyll 3D)
Gamma: 2.04
CCT: 6158 K
| Dell Latitude 9420 2-in-1 AU Optronics B140QAN, IPS, 14", 2560x1600 | Lenovo ThinkPad X1 Yoga G6-20Y0S00200 LP140WU1-SPB1, IPS, 14", 1920x1200 | HP EliteBook x360 1040 G7, i7-10810U BOE08A3, IPS, 14", 1920x1080 | Dell Latitude 14 9410 2-in-1 P110G Sharp LQ140M1, IPS, 14", 1920x1080 | Asus ZenBook Flip 14 UX463FA-AI039T AU AUO323D, IPS, 14", 1920x1080 | MSI Summit E13 Flip Evo A11MT Sharp LQ134N1JW53, IPS, 13.4", 1920x1200 | |
|---|---|---|---|---|---|---|
| Display | -9% | -12% | -10% | -21% | -9% | |
| Display P3 Coverage (%) | 80.7 | 69.8 -14% | 66.1 -18% | 68.1 -16% | 60.1 -26% | 69.8 -14% |
| sRGB Coverage (%) | 100 | 97.1 -3% | 95.5 -4% | 99.2 -1% | 85.5 -14% | 98.8 -1% |
| AdobeRGB 1998 Coverage (%) | 79.7 | 72.2 -9% | 68.1 -15% | 69.4 -13% | 61.1 -23% | 70.6 -11% |
| Response Times | 21% | 3% | -11% | 24% | -27% | |
| Response Time Grey 50% / Grey 80% * (ms) | 54 ? | 49.2 ? 9% | 52.4 ? 3% | 58.4 ? -8% | 36 ? 33% | 64 ? -19% |
| Response Time Black / White * (ms) | 32.8 ? | 22 ? 33% | 32 ? 2% | 37.2 ? -13% | 28 ? 15% | 44 ? -34% |
| PWM Frequency (Hz) | 1667 ? | |||||
| Screen | 10% | -7% | 20% | -18% | 22% | |
| Brightness middle (cd/m²) | 483.6 | 417 -14% | 406.7 -16% | 293.4 -39% | 280 -42% | 551.3 14% |
| Brightness (cd/m²) | 465 | 404 -13% | 382 -18% | 290 -38% | 286 -38% | 517 11% |
| Brightness Distribution (%) | 92 | 93 1% | 88 -4% | 92 0% | 78 -15% | 91 -1% |
| Black Level * (cd/m²) | 0.32 | 0.22 31% | 0.28 12% | 0.19 41% | 0.208 35% | 0.37 -16% |
| Contrast (:1) | 1511 | 1895 25% | 1452 -4% | 1544 2% | 1346 -11% | 1490 -1% |
| Colorchecker dE 2000 * | 3.69 | 2.8 24% | 3.74 -1% | 1.29 65% | 3.97 -8% | 1.45 61% |
| Colorchecker dE 2000 max. * | 5.97 | 4.7 21% | 5.92 1% | 3.61 40% | 8.29 -39% | 2.86 52% |
| Colorchecker dE 2000 calibrated * | 2.05 | 1.6 22% | 2.18 -6% | 0.88 57% | 3.42 -67% | 1.7 17% |
| Greyscale dE 2000 * | 3.5 | 3.7 -6% | 4.3 -23% | 1.7 51% | 2.83 19% | 1.3 63% |
| Gamma | 2.04 108% | 2.08 106% | 2.19 100% | 2.18 101% | 2.34 94% | 2.14 103% |
| CCT | 6158 106% | 6545 99% | 6781 96% | 6394 102% | 6556 99% | 6580 99% |
| Color Space (Percent of AdobeRGB 1998) (%) | 65.9 | 61.6 | 63.8 | 56 | 65 | |
| Color Space (Percent of sRGB) (%) | 96.6 | 95.1 | 99.1 | 85 | 99 | |
| Total Average (Program / Settings) | 7% /
8% | -5% /
-7% | -0% /
9% | -5% /
-13% | -5% /
9% |
* ... smaller is better
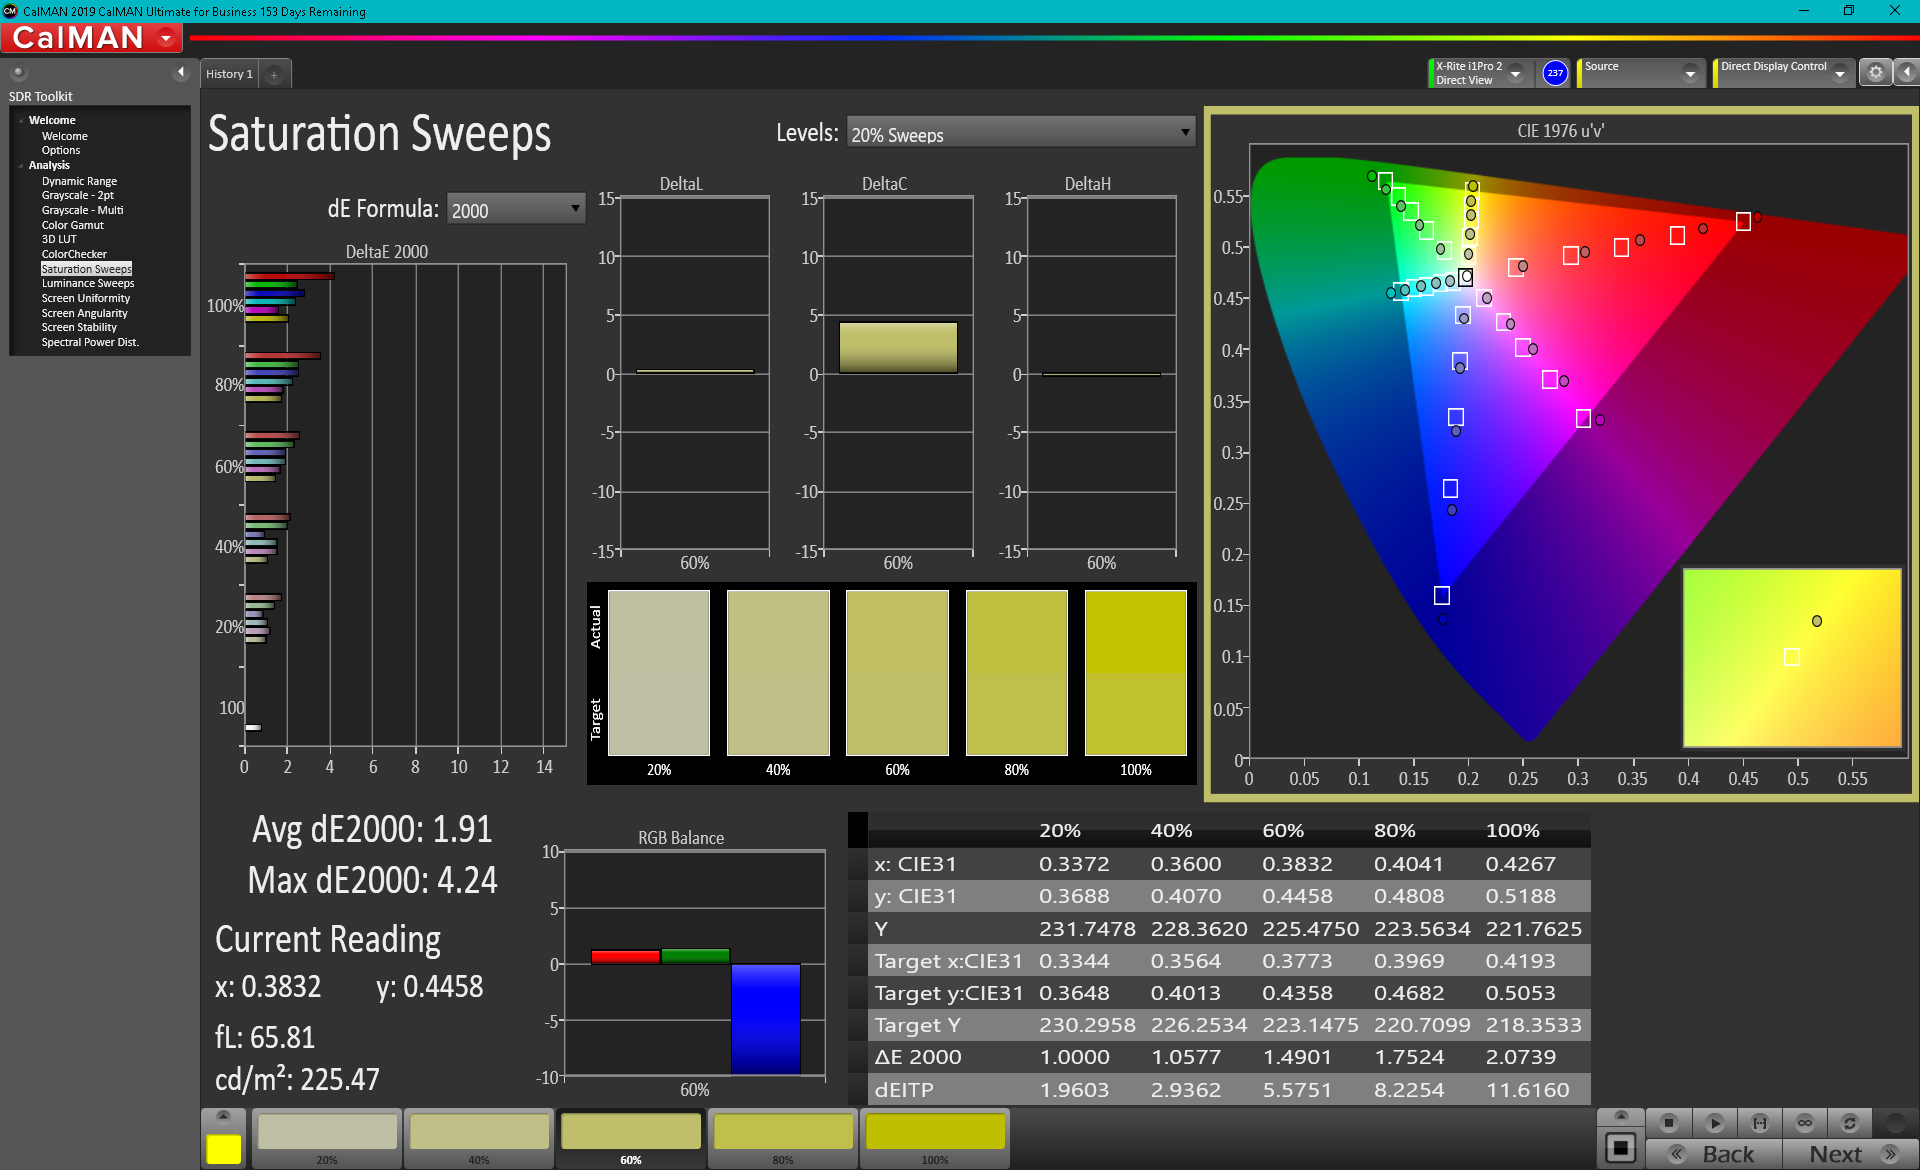
At 81 percent of DCI-P3, color coverage is slightly wider than on the older 9410 2-in-1 which covers just 68 percent. Full sRGB coverage comes standard just like on most high-end business laptops.

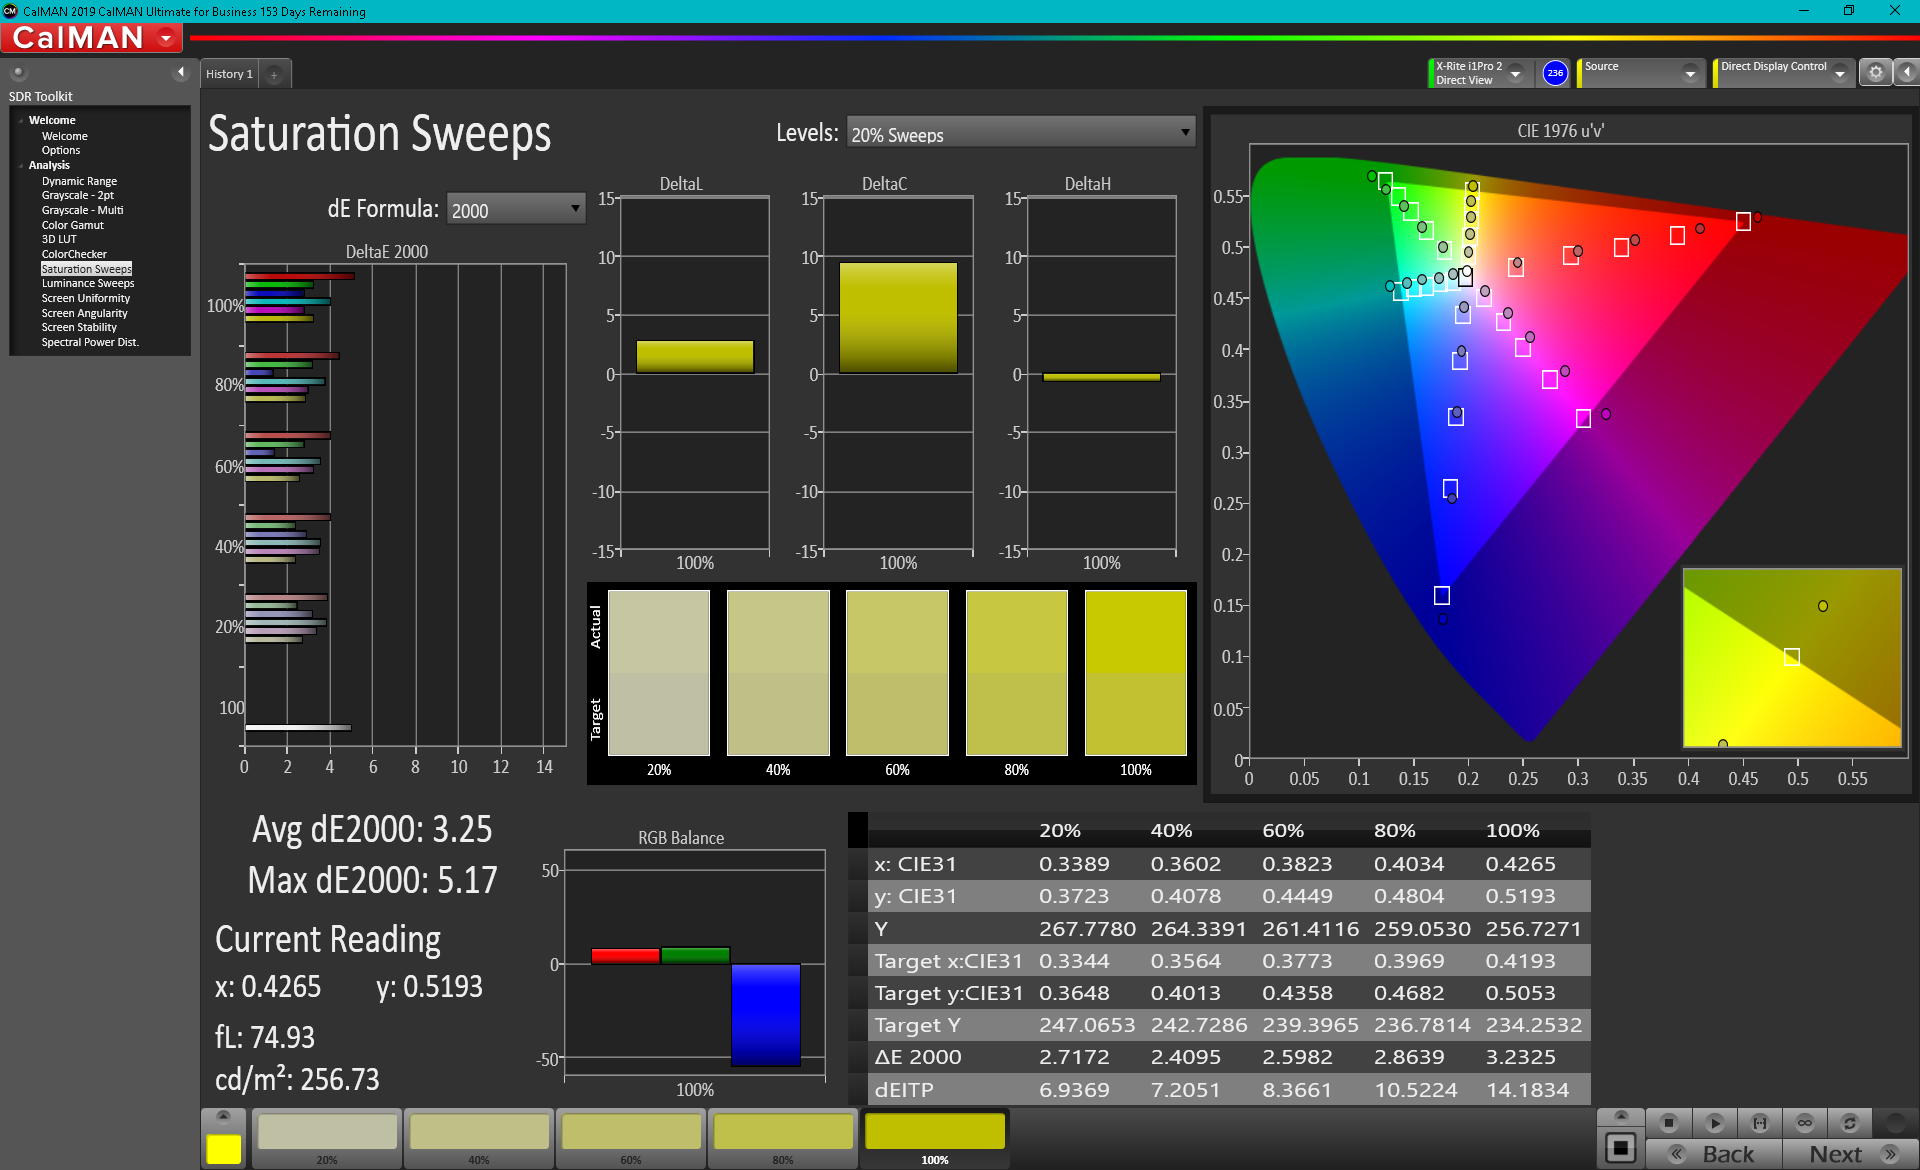
X-Rite colorimeter measurements show decently calibrated grayscale and colors out of the box with average DeltaE values of 3.5 and 3.69, respectively. Color temperature, however, is warmer than we would like at 6158. Calibrating the panel ourselves would improve all these small shortcomings for more accurate colors overall as shown by our CalMAN results below.
Display Response Times
| ↔ Response Time Black to White | ||
|---|---|---|
| 32.8 ms ... rise ↗ and fall ↘ combined | ↗ 16.4 ms rise | 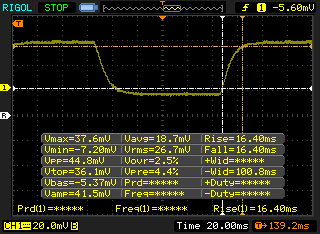 |
| ↘ 16.4 ms fall | ||
| The screen shows slow response rates in our tests and will be unsatisfactory for gamers. In comparison, all tested devices range from 0.1 (minimum) to 240 (maximum) ms. » 88 % of all devices are better. This means that the measured response time is worse than the average of all tested devices (19.9 ms). | ||
| ↔ Response Time 50% Grey to 80% Grey | ||
| 54 ms ... rise ↗ and fall ↘ combined | ↗ 24 ms rise | 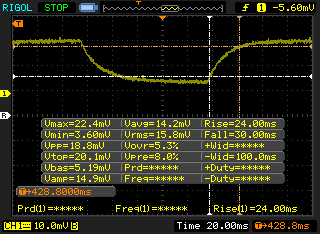 |
| ↘ 30 ms fall | ||
| The screen shows slow response rates in our tests and will be unsatisfactory for gamers. In comparison, all tested devices range from 0.165 (minimum) to 636 (maximum) ms. » 91 % of all devices are better. This means that the measured response time is worse than the average of all tested devices (31.1 ms). | ||
Screen Flickering / PWM (Pulse-Width Modulation)
| Screen flickering / PWM not detected | 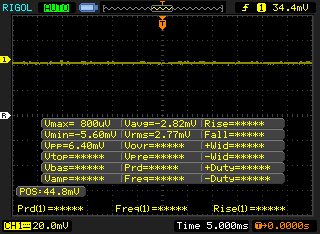 | ||
In comparison: 52 % of all tested devices do not use PWM to dim the display. If PWM was detected, an average of 7801 (minimum: 5 - maximum: 343500) Hz was measured. | |||
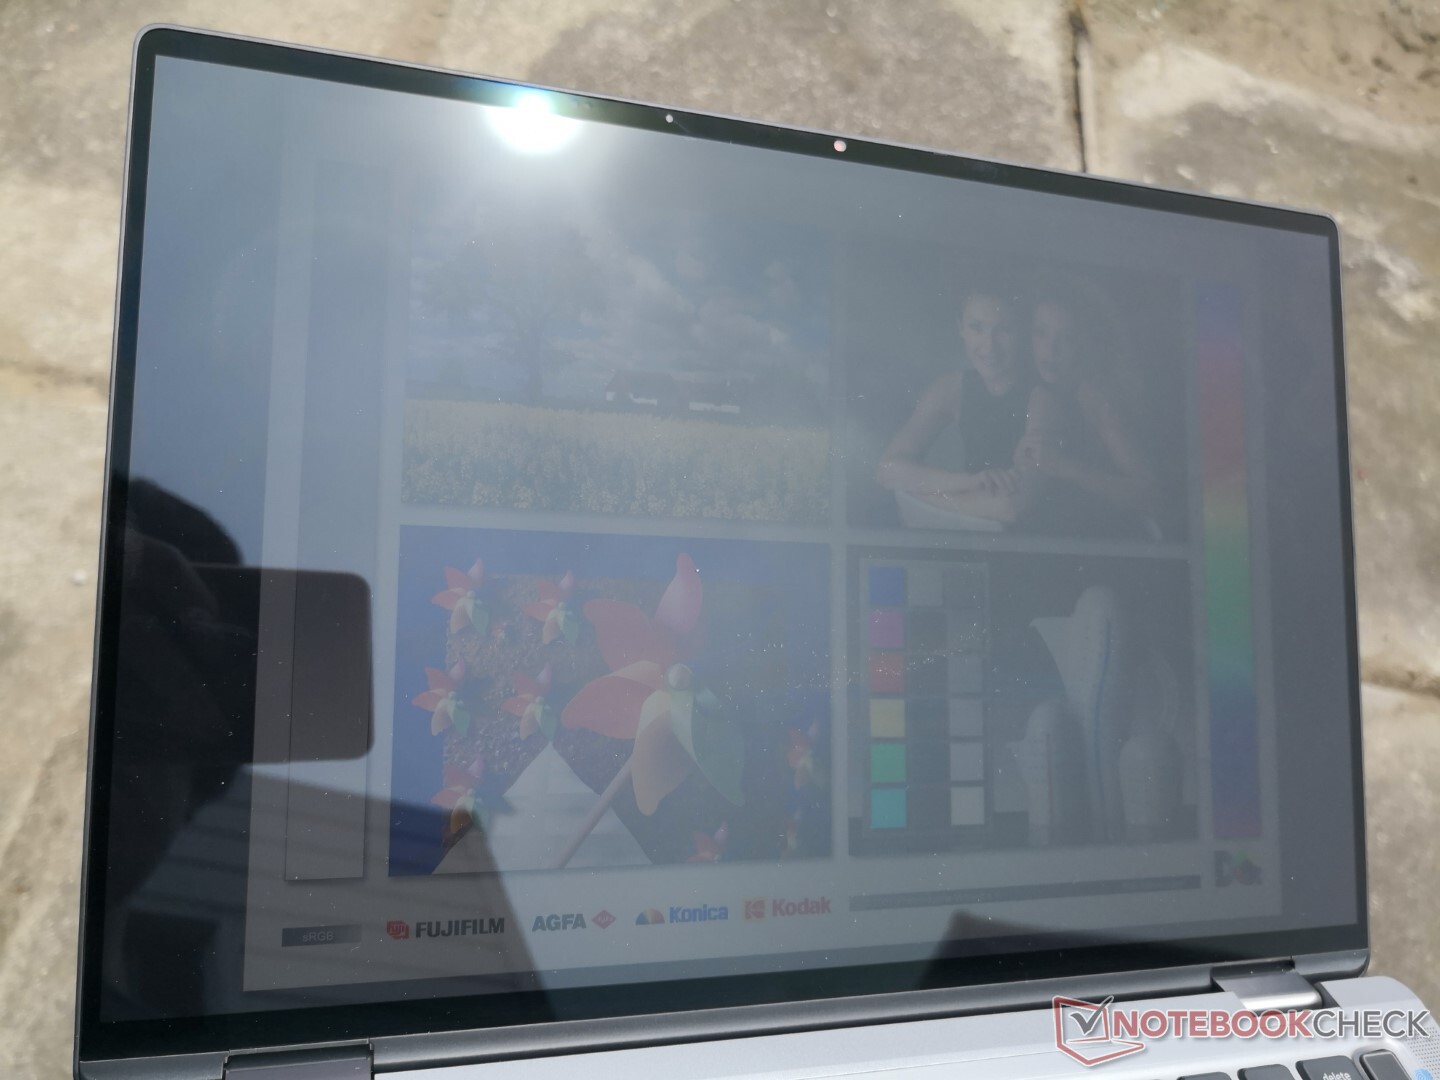
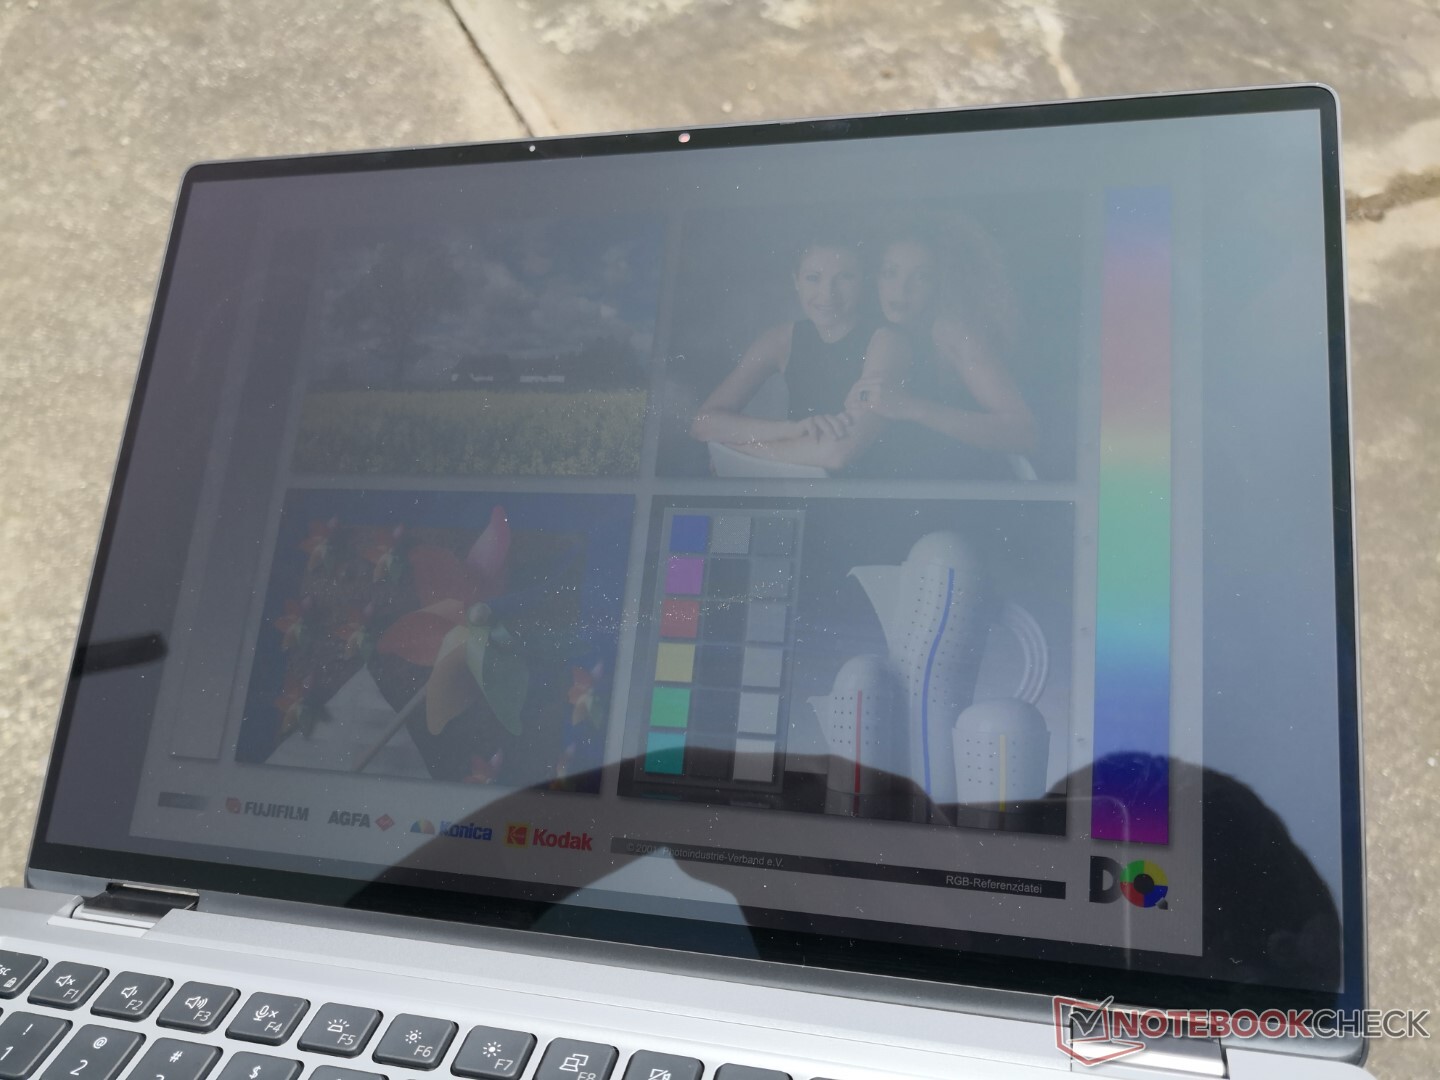
Outdoor visibility is good when under shade or when ambient lighting is under control. There will still be some glare from the glossy screen, but the viewing experience won't be significantly compromised. Users should avoid overcast or direct sunlight or else colors will appear washed out.
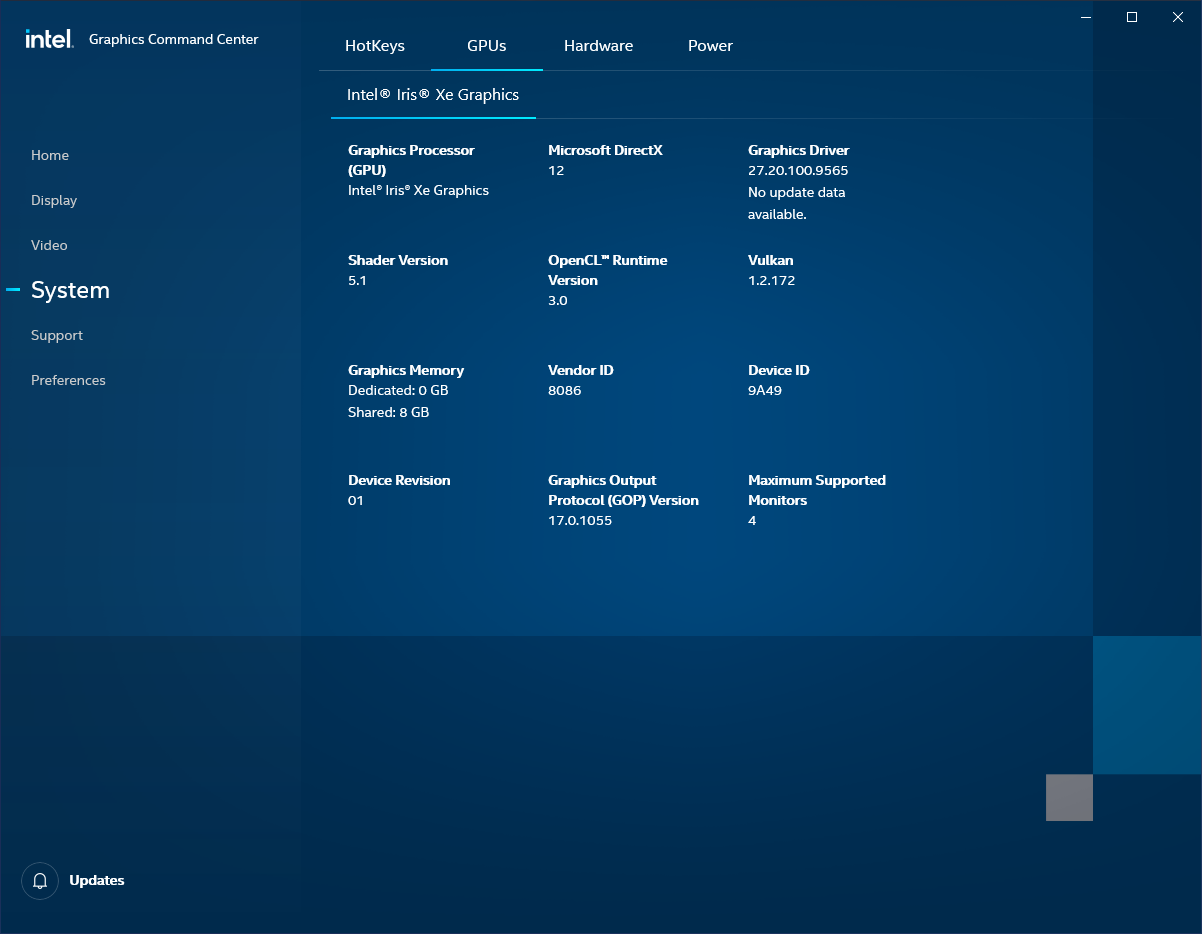
If you plan on using the laptop outdoors frequently, then we highly recommend disabling the Display Power Savings feature via Intel Graphics Command Center or else maximum brightness will automatically drop to 402 nits when on battery power.
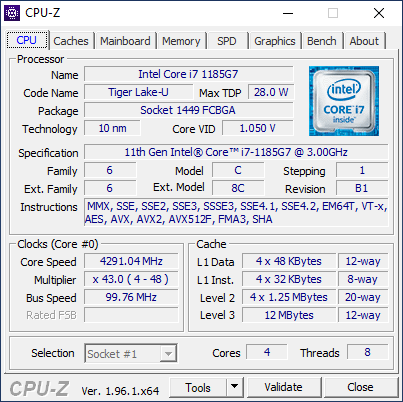
Performance — 11th Gen Intel with Iris Xe and vPro
Dell completely skipped over the 10th gen Ice Lake series last year on its Latitude 9410 2-in-1 since there were no SKUs with vPro support. Though that entailed sticking to the older and slower Comet Lake-U series, we think this may have been for the best since the latest 11th gen Tiger Lake vPro options are exceptionally faster than anything from the Ice Lake series especially in terms of graphics performance.
Users can configure with the vPro-enabled Core i5-1145G7 or i7-1185G7. The least expensive Core i5-1135G7 configuration includes no vPro support at all. There are no discrete graphics options.
Our unit was set to Ultra Performance mode via Dell Power Manager prior to running any performance benchmarks below for the highest possible scores. Users should become familiar with the pre-installed Dell software like Optimizer, Power Manager, Command, and Digital Delivery as many Dell-specific features are only accessible through these programs.
Processor
Raw multi-thread performance is excellent with CineBench results that are about 5 to 11 percent higher than the average laptop in our database equipped with the same Core i7-1185G7 CPU. Performance is essentially on par with the more common Core i7-1165G7. If multi-thread performance is more valuable than single-thread performance, then users may want to invest in an AMD Ryzen laptop instead.
Running CineBench R15 xT in a loop shows cycling scores ranging from 800 to 920 points due to the cycling clock rates as detailed in our Stress Test section below. Most other laptops tend to stabilize at fixed clock rates for more even performance.
Cinebench R23: Multi Core | Single Core
Cinebench R15: CPU Multi 64Bit | CPU Single 64Bit
Blender: v2.79 BMW27 CPU
7-Zip 18.03: 7z b 4 -mmt1 | 7z b 4
Geekbench 5.5: Single-Core | Multi-Core
HWBOT x265 Benchmark v2.2: 4k Preset
LibreOffice : 20 Documents To PDF
R Benchmark 2.5: Overall mean
* ... smaller is better
System Performance
PCMark scores are consistently above the preceding Latitude 9410 2-in-1 especially in the GPU-heavy Digital Content Creation benchmark where the integrated UHD Graphics 620 is horrendously outdated. Results are also a hair better than the competing MSI Summit E13 Flip which comes with the exact same CPU as our Dell.
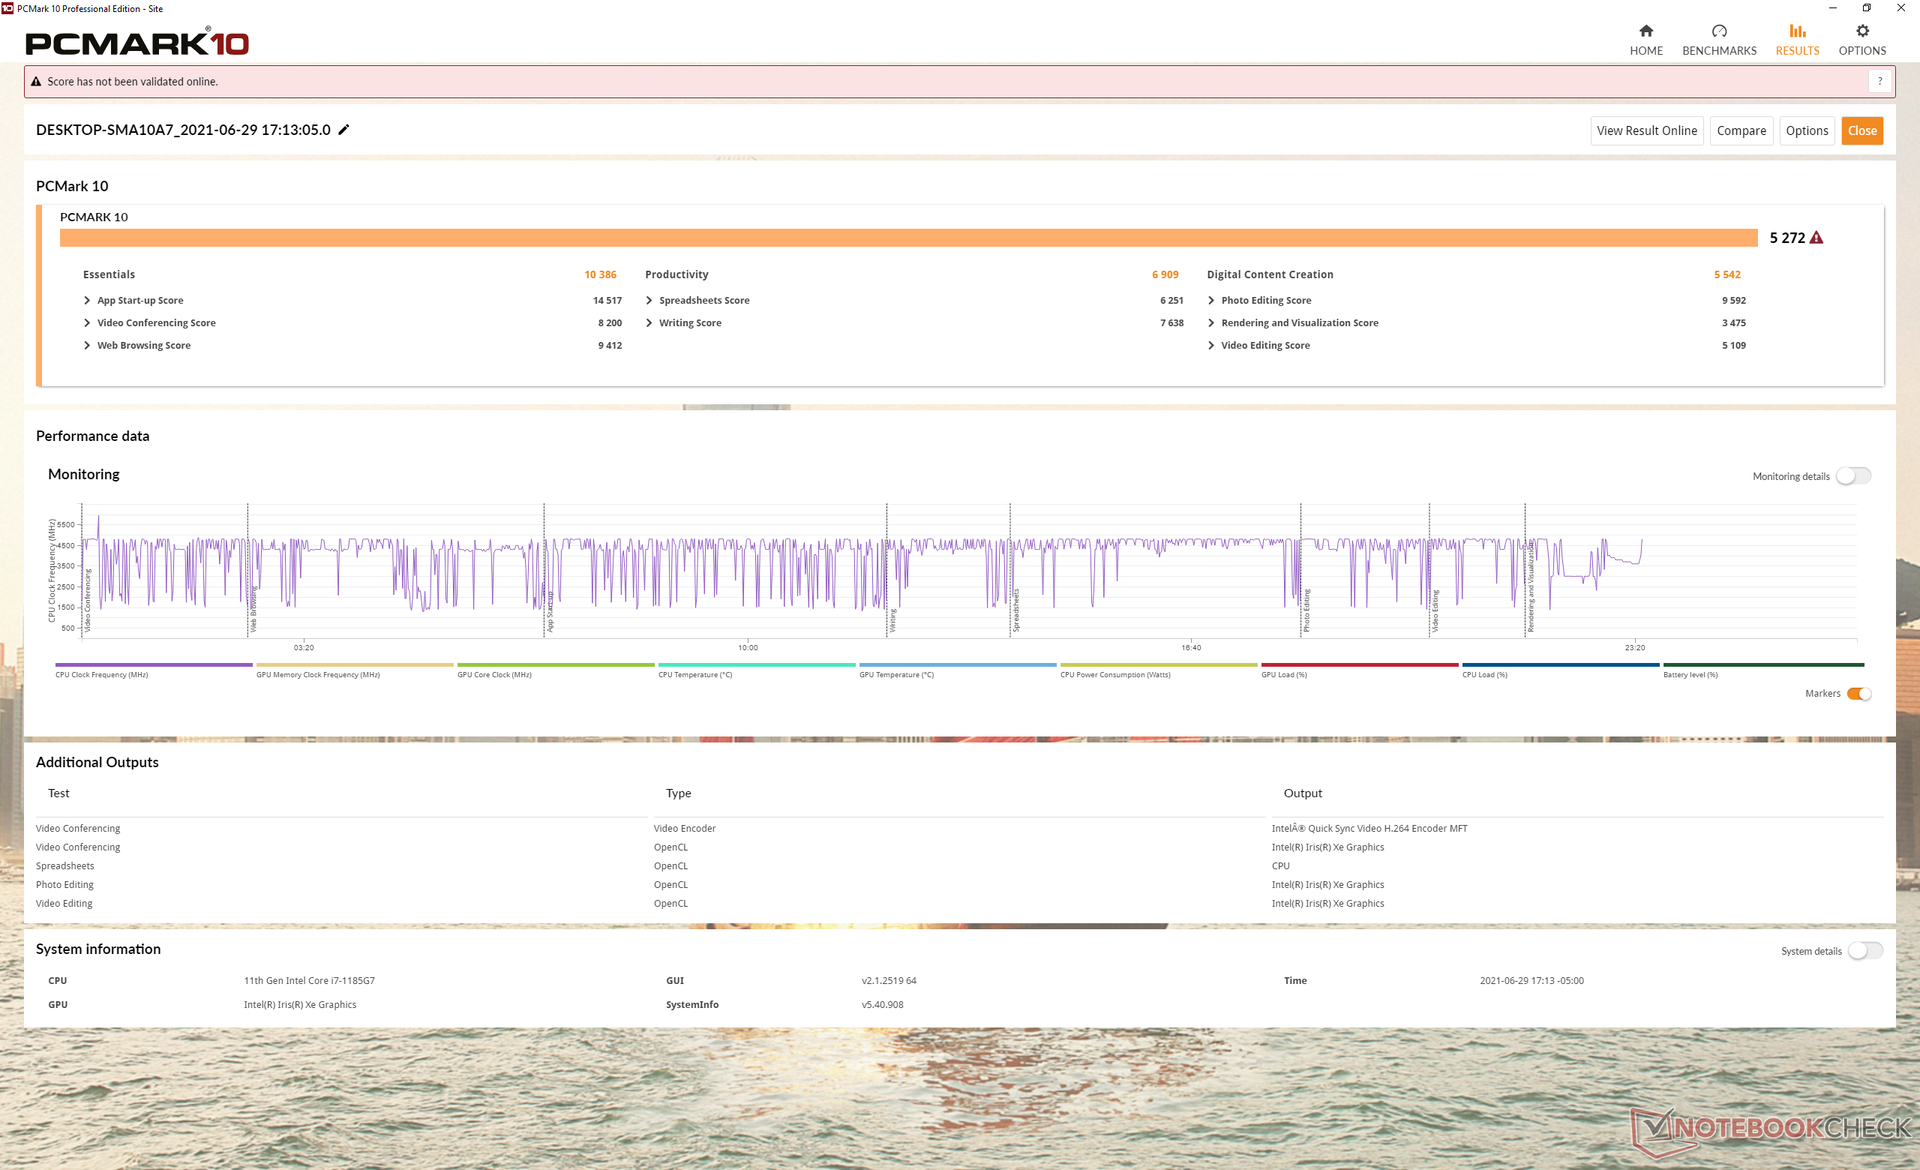
| PCMark 10 Score | 5272 points | |
Help | ||
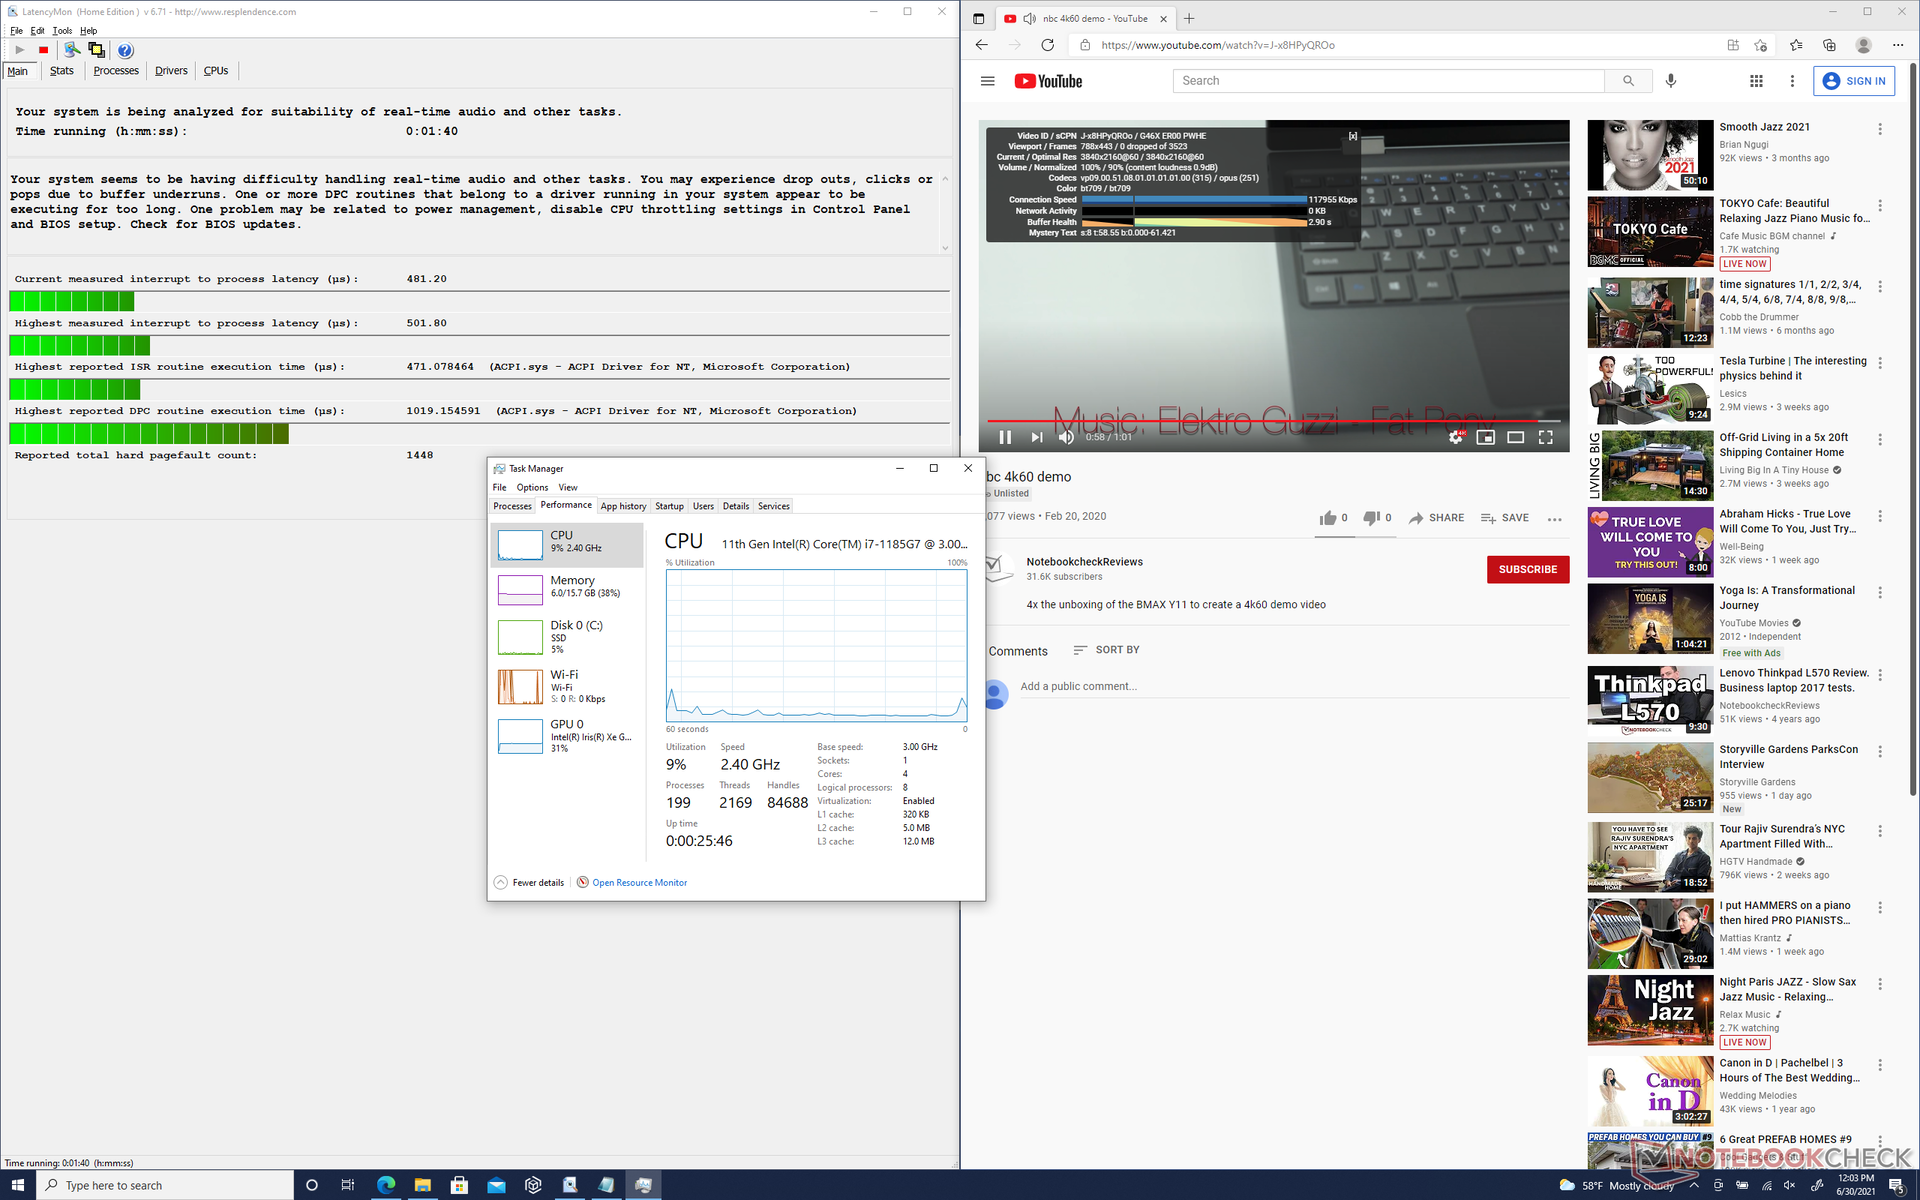
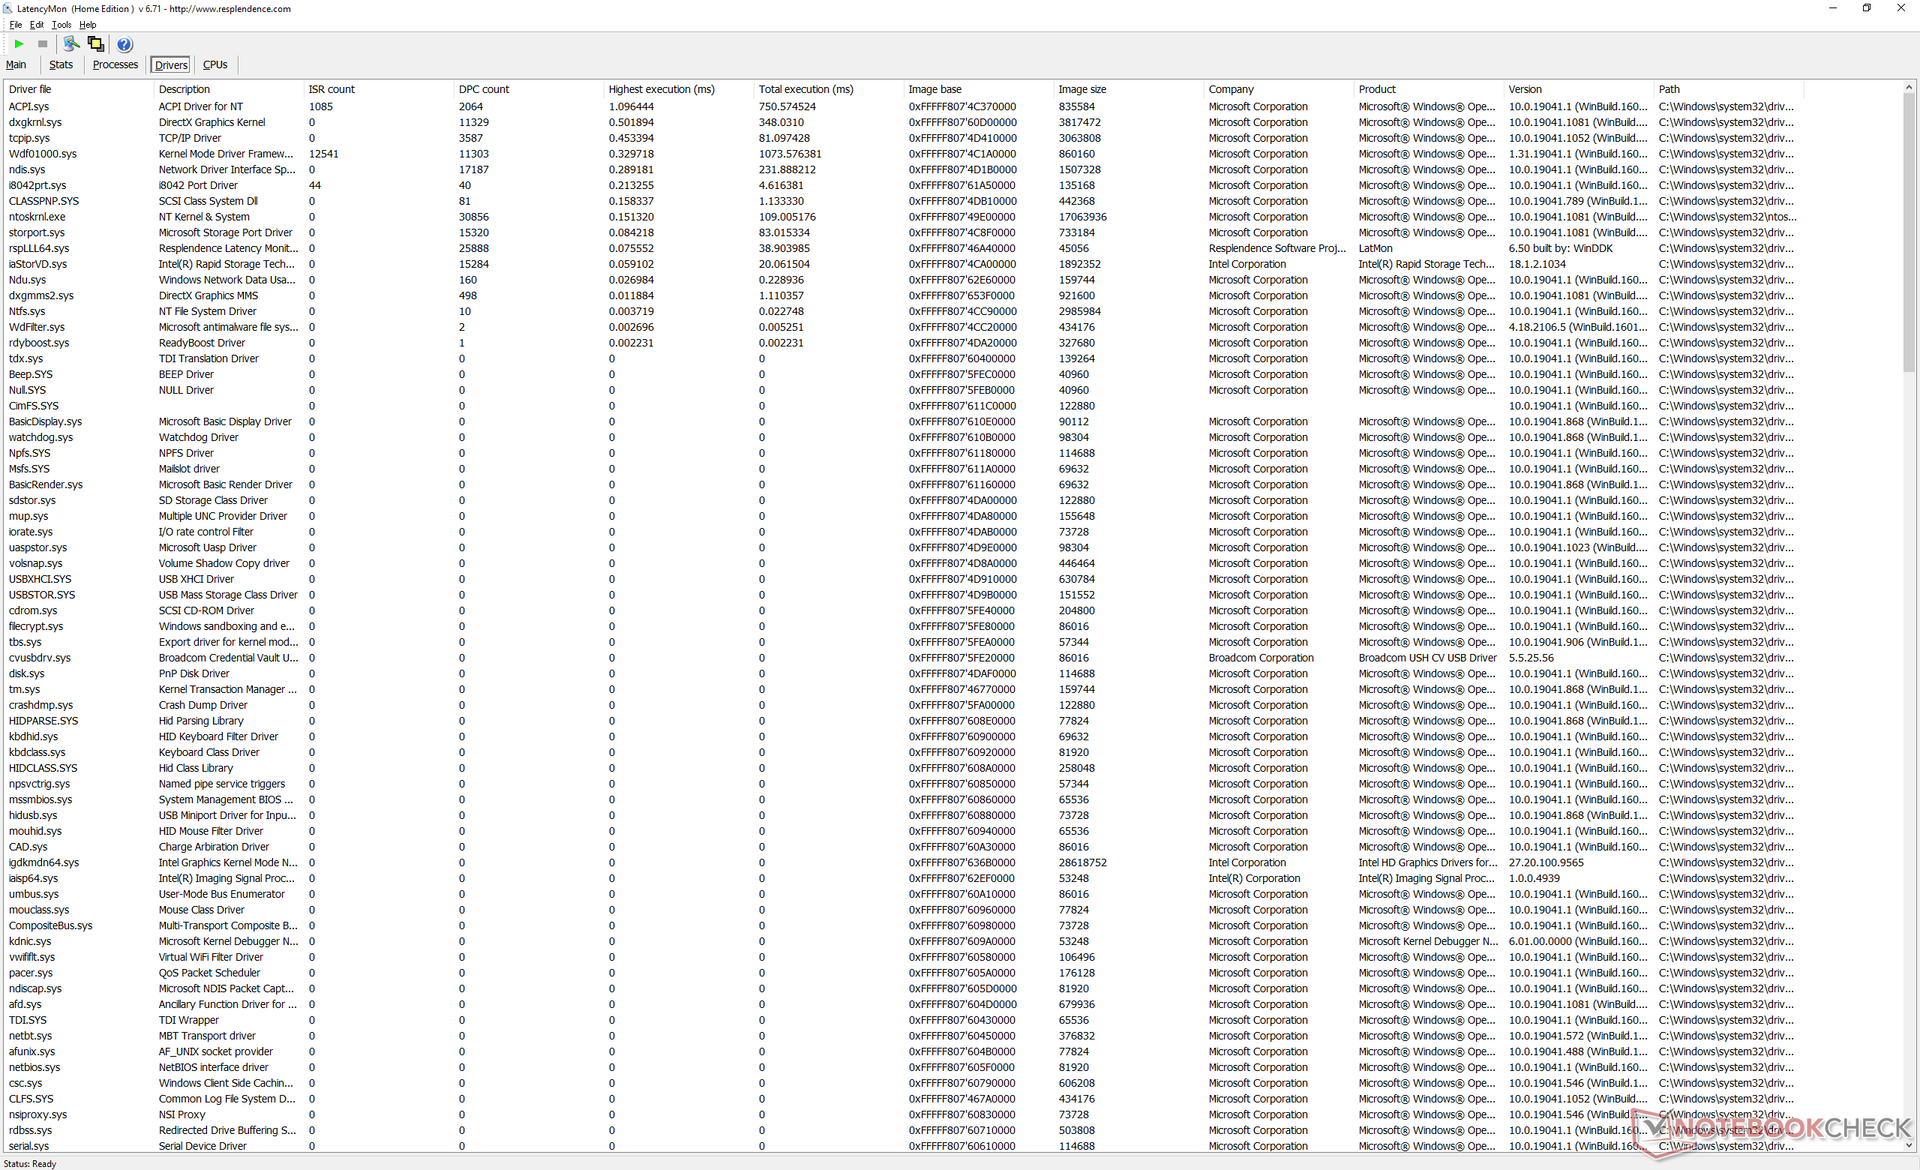
DPC Latency
LatencyMon reveals minor DPC latency issues when opening multiple browser tabs on our homepage. 4K video playback at 60 FPS is otherwise smooth and without any frame skips.
| DPC Latencies / LatencyMon - interrupt to process latency (max), Web, Youtube, Prime95 | |
| Lenovo ThinkPad X1 Yoga G6-20Y0S00200 | |
| MSI Summit E13 Flip Evo A11MT | |
| HP EliteBook x360 1040 G7, i7-10810U | |
| Dell Latitude 14 9410 2-in-1 P110G | |
| Dell Latitude 9420 2-in-1 | |
| Asus ZenBook Flip 14 UX463FA-AI039T | |
* ... smaller is better
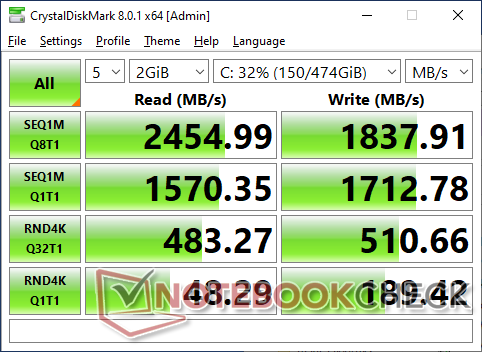
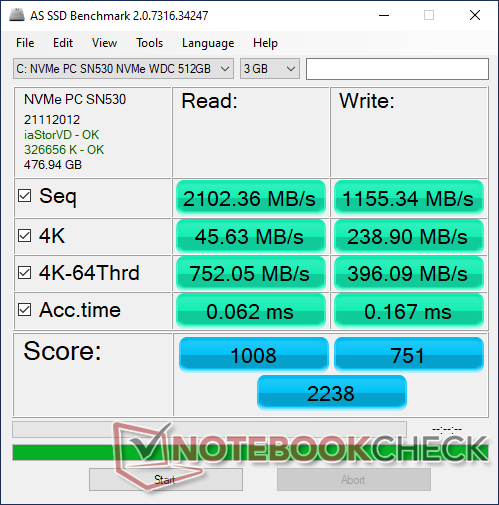
Storage Devices — M.2 2230 Only
Our test unit comes with the midrange 512 GB Western Digital SN530 NVMe SSD for sequential read rates approaching 2300 MB/s. Sequential write rates are slower at about half that of the Samsung PM981a. A few 14-inch Ultrabooks are starting to incorporate even faster PCIe 4.0 slots like the ThinkPad X1 Yoga G6 or Vaio Z.
| Dell Latitude 9420 2-in-1 WDC PC SN530 SDBPNPZ-512G | Lenovo ThinkPad X1 Yoga G6-20Y0S00200 Samsung PM9A1 MZVL21T0HCLR | HP EliteBook x360 1040 G7, i7-10810U Samsung SSD PM981a MZVLB512HBJQ | Dell Latitude 14 9410 2-in-1 P110G Micron 2200S 512GB | Asus ZenBook Flip 14 UX463FA-AI039T Kingston RBUSNS8154P3512GJ1 | MSI Summit E13 Flip Evo A11MT Phison 1TB SM2801T24GKBB4S-E162 | |
|---|---|---|---|---|---|---|
| AS SSD | 169% | 44% | -9% | -19% | 85% | |
| Seq Read (MB/s) | 2102 | 4878 132% | 2857 36% | 1117 -47% | 1336 -36% | 3789 80% |
| Seq Write (MB/s) | 1155 | 3660 217% | 1394 21% | 969 -16% | 653 -43% | 2257 95% |
| 4K Read (MB/s) | 45.63 | 85.1 87% | 51.5 13% | 41.93 -8% | 26.65 -42% | 54.2 19% |
| 4K Write (MB/s) | 238.9 | 222.7 -7% | 136.1 -43% | 76.4 -68% | 52.7 -78% | 78.7 -67% |
| 4K-64 Read (MB/s) | 752 | 2827 276% | 793 5% | 827 10% | 644 -14% | 1330 77% |
| 4K-64 Write (MB/s) | 396.1 | 2349 493% | 1536 288% | 792 100% | 482.9 22% | 2038 415% |
| Access Time Read * (ms) | 0.062 | 0.023 63% | 0.047 24% | 0.055 11% | 0.074 -19% | 0.042 32% |
| Access Time Write * (ms) | 0.167 | 0.02 88% | 0.08 52% | 0.366 -119% | 0.072 57% | 0.04 76% |
| Score Read (Points) | 1008 | 3400 237% | 1130 12% | 981 -3% | 804 -20% | 1763 75% |
| Score Write (Points) | 751 | 2938 291% | 1811 141% | 966 29% | 601 -20% | 2343 212% |
| Score Total (Points) | 2238 | 8020 258% | 3459 55% | 2450 9% | 1786 -20% | 4938 121% |
| Copy ISO MB/s (MB/s) | 1588 | 3088 94% | 2076 31% | 1290 -19% | 2270 43% | |
| Copy Program MB/s (MB/s) | 1038 | 1181 14% | 558 -46% | 661 -36% | 670 -35% | |
| Copy Game MB/s (MB/s) | 1006 | 2260 125% | 1332 32% | 1271 26% | 1525 52% | |
| CrystalDiskMark 5.2 / 6 | 102% | 17% | -14% | -43% | 54% | |
| Write 4K (MB/s) | 190 | 241.9 27% | 133.1 -30% | 81.2 -57% | 54.6 -71% | 311.1 64% |
| Read 4K (MB/s) | 48.1 | 93 93% | 57.7 20% | 45.41 -6% | 28.19 -41% | 56.6 18% |
| Write Seq (MB/s) | 1700 | 4195 147% | 2159 27% | 1190 -30% | 840 -51% | 2397 41% |
| Read Seq (MB/s) | 1594 | 3234 103% | 2495 57% | 1766 11% | 905 -43% | 2277 43% |
| Write 4K Q32T1 (MB/s) | 517 | 672 30% | 423.3 -18% | 436 -16% | 409.5 -21% | 803 55% |
| Read 4K Q32T1 (MB/s) | 477.8 | 750 57% | 369.3 -23% | 374.4 -22% | 292.4 -39% | 849 78% |
| Write Seq Q32T1 (MB/s) | 1841 | 4931 168% | 2984 62% | 1582 -14% | 1038 -44% | 2410 31% |
| Read Seq Q32T1 (MB/s) | 2472 | 7103 187% | 3556 44% | 3017 22% | 1607 -35% | 4954 100% |
| Total Average (Program / Settings) | 136% /
145% | 31% /
35% | -12% /
-11% | -31% /
-29% | 70% /
74% |
* ... smaller is better

Disk Throttling: DiskSpd Read Loop, Queue Depth 8
GPU Performance — One Of The Fastest For A Business Convertible
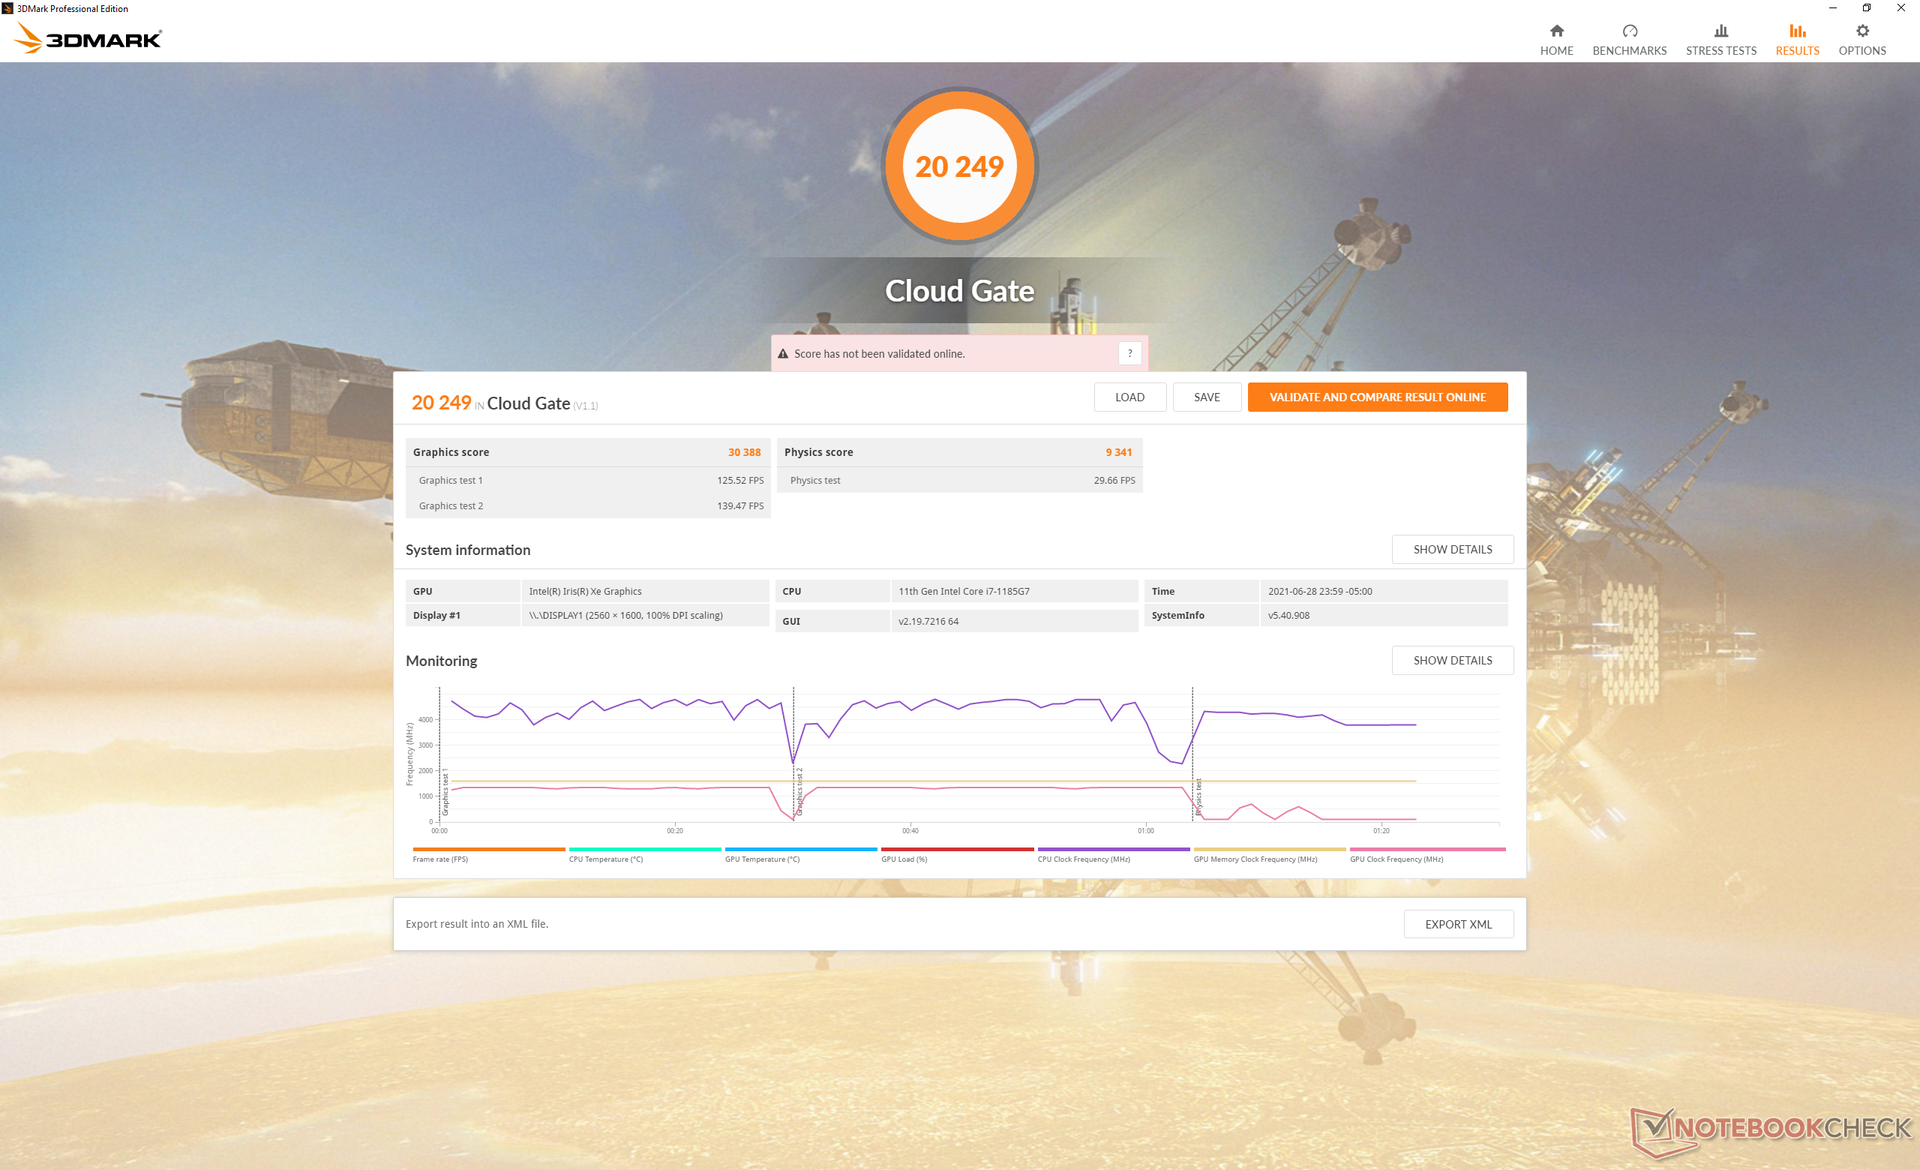
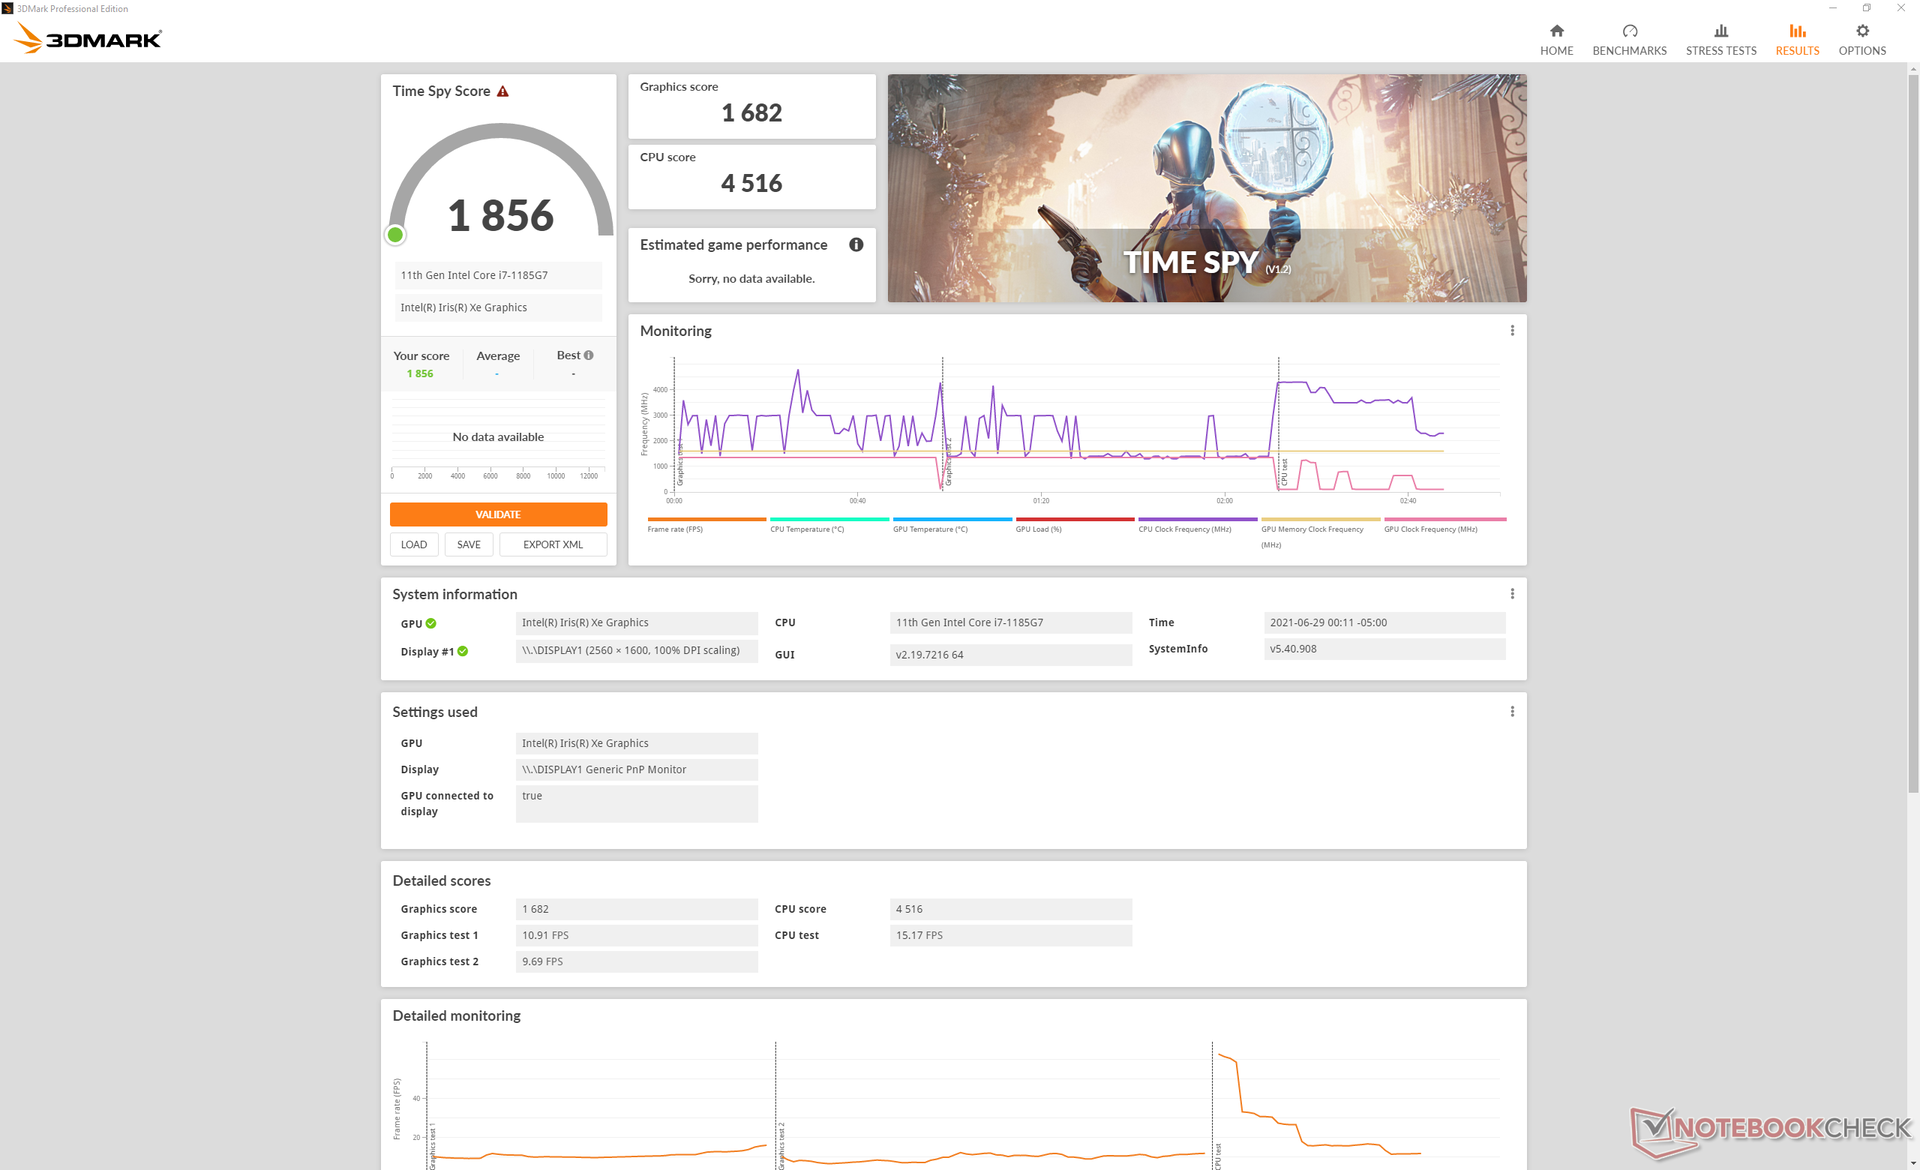
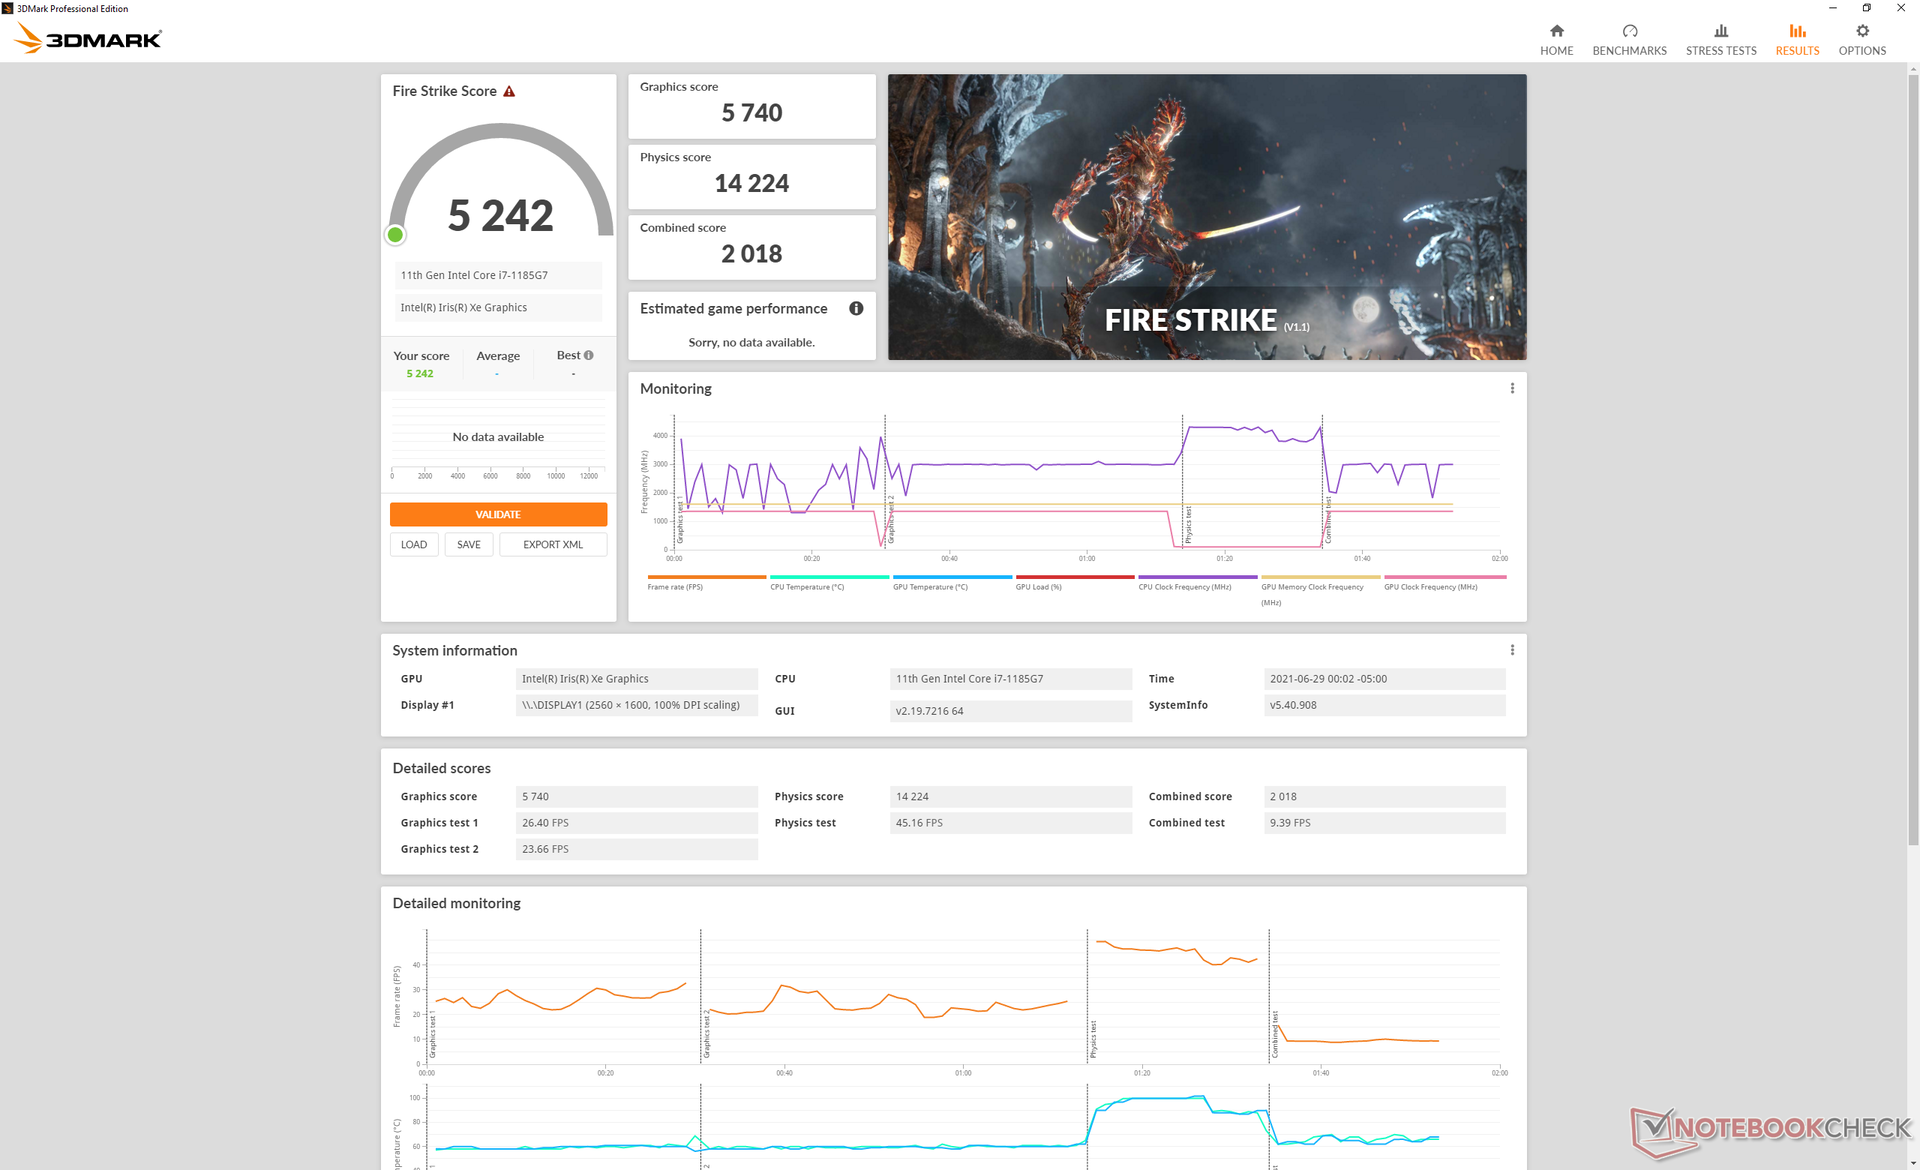
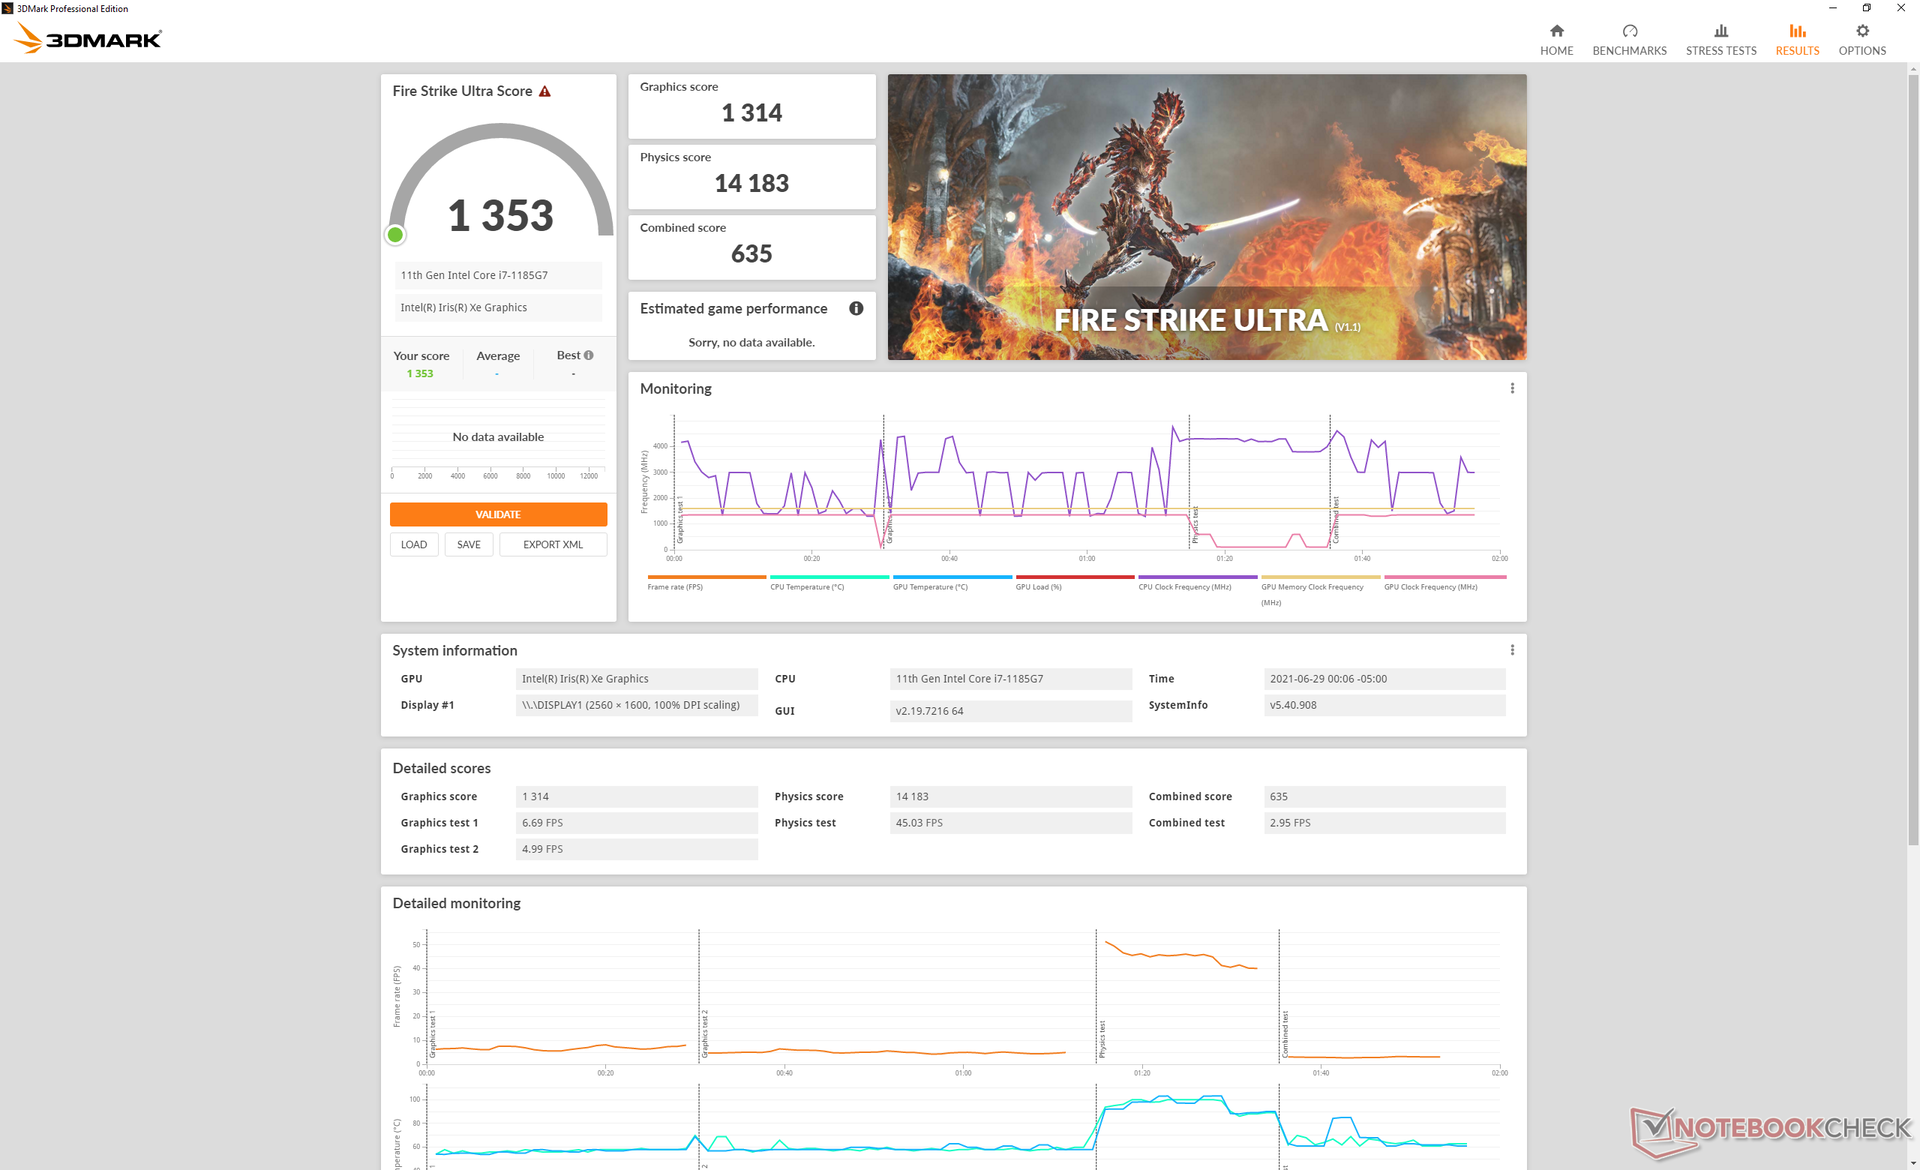
Graphics performance is one of the fastest we've seen on any Iris Xe 96 EUs laptop thus far with 3DMark scores that are 17 percent higher than the average. Intel's lead over the competing Radeon RX Vega series is definitely widening if these synthetic scores are of any indication.
In real-world games, however, results can look very different. Simply idling on Witcher 3 shows fluctuating frame rates between 80 FPS and 105 FPS as shown by the graph below due to the cycling GPU and CPU clock rates. Thus, while average performance can be high, the moment-to-moment performance can be unsteady. Average frame rates in most titles are much closer to the Radeon RX Vega 8 with Final Fantasy XV being a notable exception.
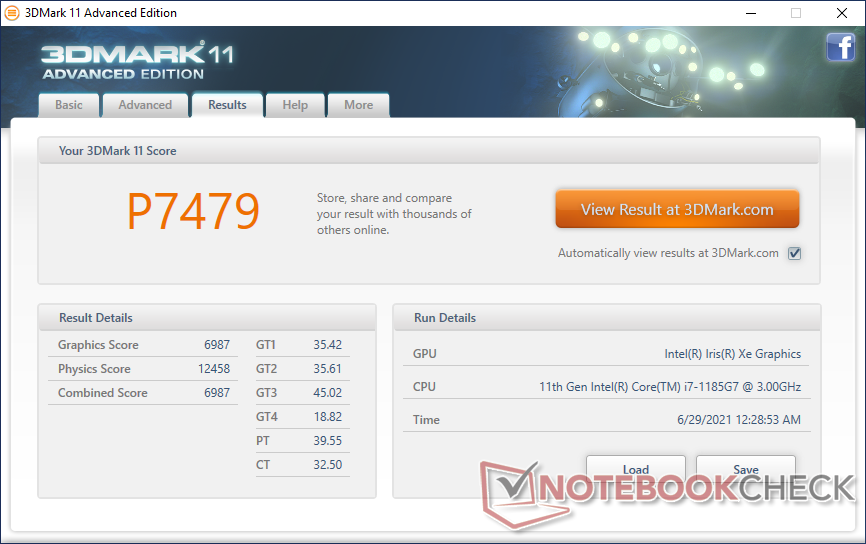
| 3DMark 11 Performance | 7479 points | |
| 3DMark Cloud Gate Standard Score | 20249 points | |
| 3DMark Fire Strike Score | 5242 points | |
| 3DMark Time Spy Score | 1856 points | |
Help | ||
Witcher 3 FPS Chart
| low | med. | high | ultra | |
|---|---|---|---|---|
| GTA V (2015) | 83.4 | 52.2 | 19 | 8.45 |
| The Witcher 3 (2015) | 79.8 | 56 | 31.1 | 15.3 |
| Dota 2 Reborn (2015) | 86.6 | 86.2 | 56.7 | 53.3 |
| Final Fantasy XV Benchmark (2018) | 47.4 | 26.2 | 26.2 | |
| X-Plane 11.11 (2018) | 29.7 | 39 | 34 | |
| Strange Brigade (2018) | 95.5 | 41.6 | 32.9 | 26.6 |
Emissions — Quiet In Most Cases
System Noise
The internal fan is almost always quiet during low to medium loads. It doesn't even budge after running the first 90-second benchmark scene of 3DMark 06 which is uncommon on laptops. In other words, it takes a lot more work to get the fan moving. A longer browsing or video streaming session may induce a fan noise of only 26.8 dB(A) against a background of 25.4 dB(A) which is essentially inaudible in a typical office or classroom environment.
The system can still be loud when it needs to be. Running higher loads like games, for example, may induce a fan noise of just over 41 dB(A) to be louder than what we recorded on the Lenovo ThinkPad X1 Yoga G6 or EliteBook x360 1040 G7.
| Dell Latitude 9420 2-in-1 Iris Xe G7 96EUs, i7-1185G7, WDC PC SN530 SDBPNPZ-512G | Lenovo ThinkPad X1 Yoga G6-20Y0S00200 Iris Xe G7 96EUs, i7-1165G7, Samsung PM9A1 MZVL21T0HCLR | HP EliteBook x360 1040 G7, i7-10810U UHD Graphics 620, i7-10810U, Samsung SSD PM981a MZVLB512HBJQ | Dell Latitude 14 9410 2-in-1 P110G UHD Graphics 620, i7-10610U, Micron 2200S 512GB | Asus ZenBook Flip 14 UX463FA-AI039T UHD Graphics 620, i5-10210U, Kingston RBUSNS8154P3512GJ1 | MSI Summit E13 Flip Evo A11MT Iris Xe G7 96EUs, i7-1185G7, Phison 1TB SM2801T24GKBB4S-E162 | |
|---|---|---|---|---|---|---|
| Noise | -1% | -1% | -13% | -12% | -9% | |
| off / environment * (dB) | 25.4 | 24.2 5% | 25.2 1% | 26.1 -3% | 30.1 -19% | 24.5 4% |
| Idle Minimum * (dB) | 25.4 | 24.2 5% | 25.2 1% | 26.1 -3% | 30.1 -19% | 24.7 3% |
| Idle Average * (dB) | 25.4 | 24.2 5% | 25.2 1% | 26.1 -3% | 30.1 -19% | 24.7 3% |
| Idle Maximum * (dB) | 25.4 | 29.9 -18% | 25.2 1% | 26.1 -3% | 30.1 -19% | 26.4 -4% |
| Load Average * (dB) | 25.4 | 33.7 -33% | 30 -18% | 39.9 -57% | 30.1 -19% | 37.8 -49% |
| Witcher 3 ultra * (dB) | 41.3 | 33.7 18% | 41.4 -0% | |||
| Load Maximum * (dB) | 41.3 | 36.7 11% | 38.1 8% | 44.7 -8% | 32.02 22% | 48.8 -18% |
* ... smaller is better
Noise level
| Idle |
| 25.4 / 25.4 / 25.4 dB(A) |
| Load |
| 25.4 / 41.3 dB(A) |
 | ||
30 dB silent 40 dB(A) audible 50 dB(A) loud |
||
min: | ||
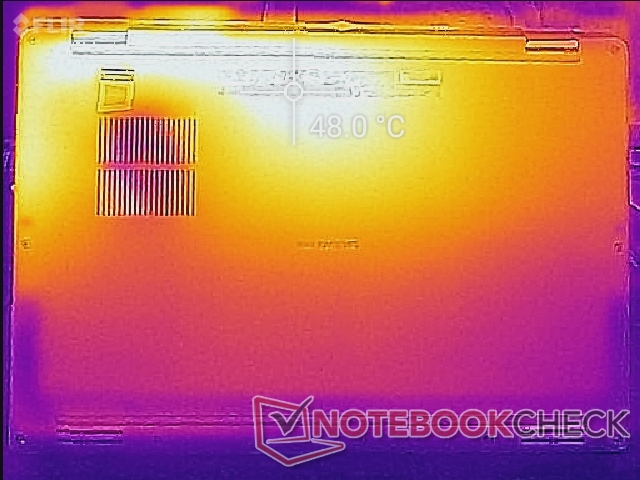
Temperature
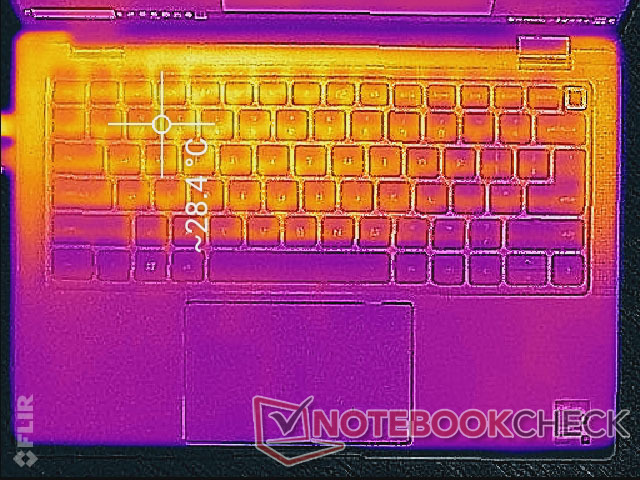
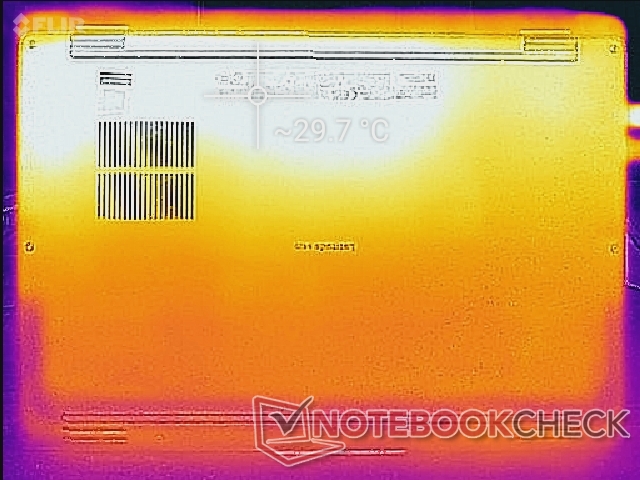
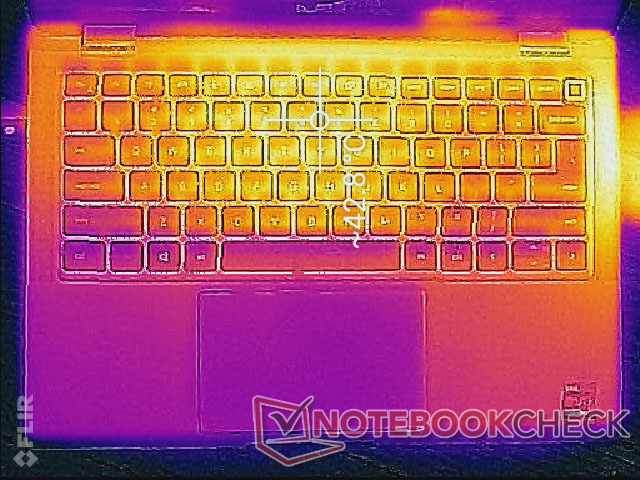
Surface temperatures are overall cooler than on the older Latitude 9410 2-in-1 design. When running high loads, hot spots would range between 42C and 48 C on the top and bottom sides, respectively, compared to 48 C and 56 C on last year's model. Dell managed to pull off lower temperatures with fewer ventilation grilles on the bottom panel as well.
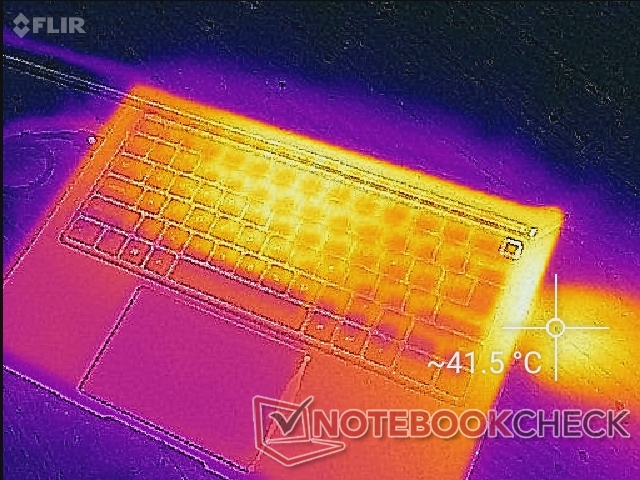
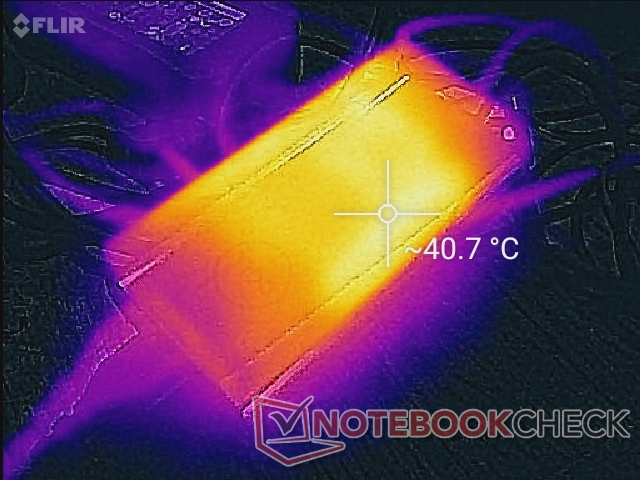
(±) The maximum temperature on the upper side is 43.4 °C / 110 F, compared to the average of 35.4 °C / 96 F, ranging from 19.6 to 60 °C for the class Convertible.
(-) The bottom heats up to a maximum of 48 °C / 118 F, compared to the average of 36.9 °C / 98 F
(+) In idle usage, the average temperature for the upper side is 28 °C / 82 F, compared to the device average of 30.3 °C / 87 F.
(+) The palmrests and touchpad are reaching skin temperature as a maximum (33.4 °C / 92.1 F) and are therefore not hot.
(-) The average temperature of the palmrest area of similar devices was 28 °C / 82.4 F (-5.4 °C / -9.7 F).
Stress Test — Fast But Unsteady
When stressed with Prime95, the CPU would boost to 4 GHz for just the first couple of seconds until hitting a core temperature of 100 C. Clock rates would then stabilize at about 3.1 GHz for the next couple of minutes until finally cycling between 1.8 GHz to 3.1 GHz and 73 C to 100 C indefinitely. This cycling behavior is similar to the XPS 13 series which also utilizes Dell's Dynamic Power Policy to squeeze out more performance from the CPU. Most other laptops with the same CPU, like the MSI Summit Flip, would stabilize at a flatter 2.8 to 3.0 GHz range and 94 C when subjected to similar conditions. The drawback to Dell's approach is that clock rates can be unsteady as a result.
Similar cycling behavior can be observed when gaming as well. Running Witcher 3, for example, causes GPU clock rates and temperatures to cycle as shown by the table below. Frame rates will consequently cycle along and so users may want to consider engaging v-sync when gaming.
Running on battery power will limit performance. A 3DMark 11 test on batteries would return Physics and Graphics scores of 8051 and 6606 points, respectively, compared to 12458 and 6987 points when on mains.
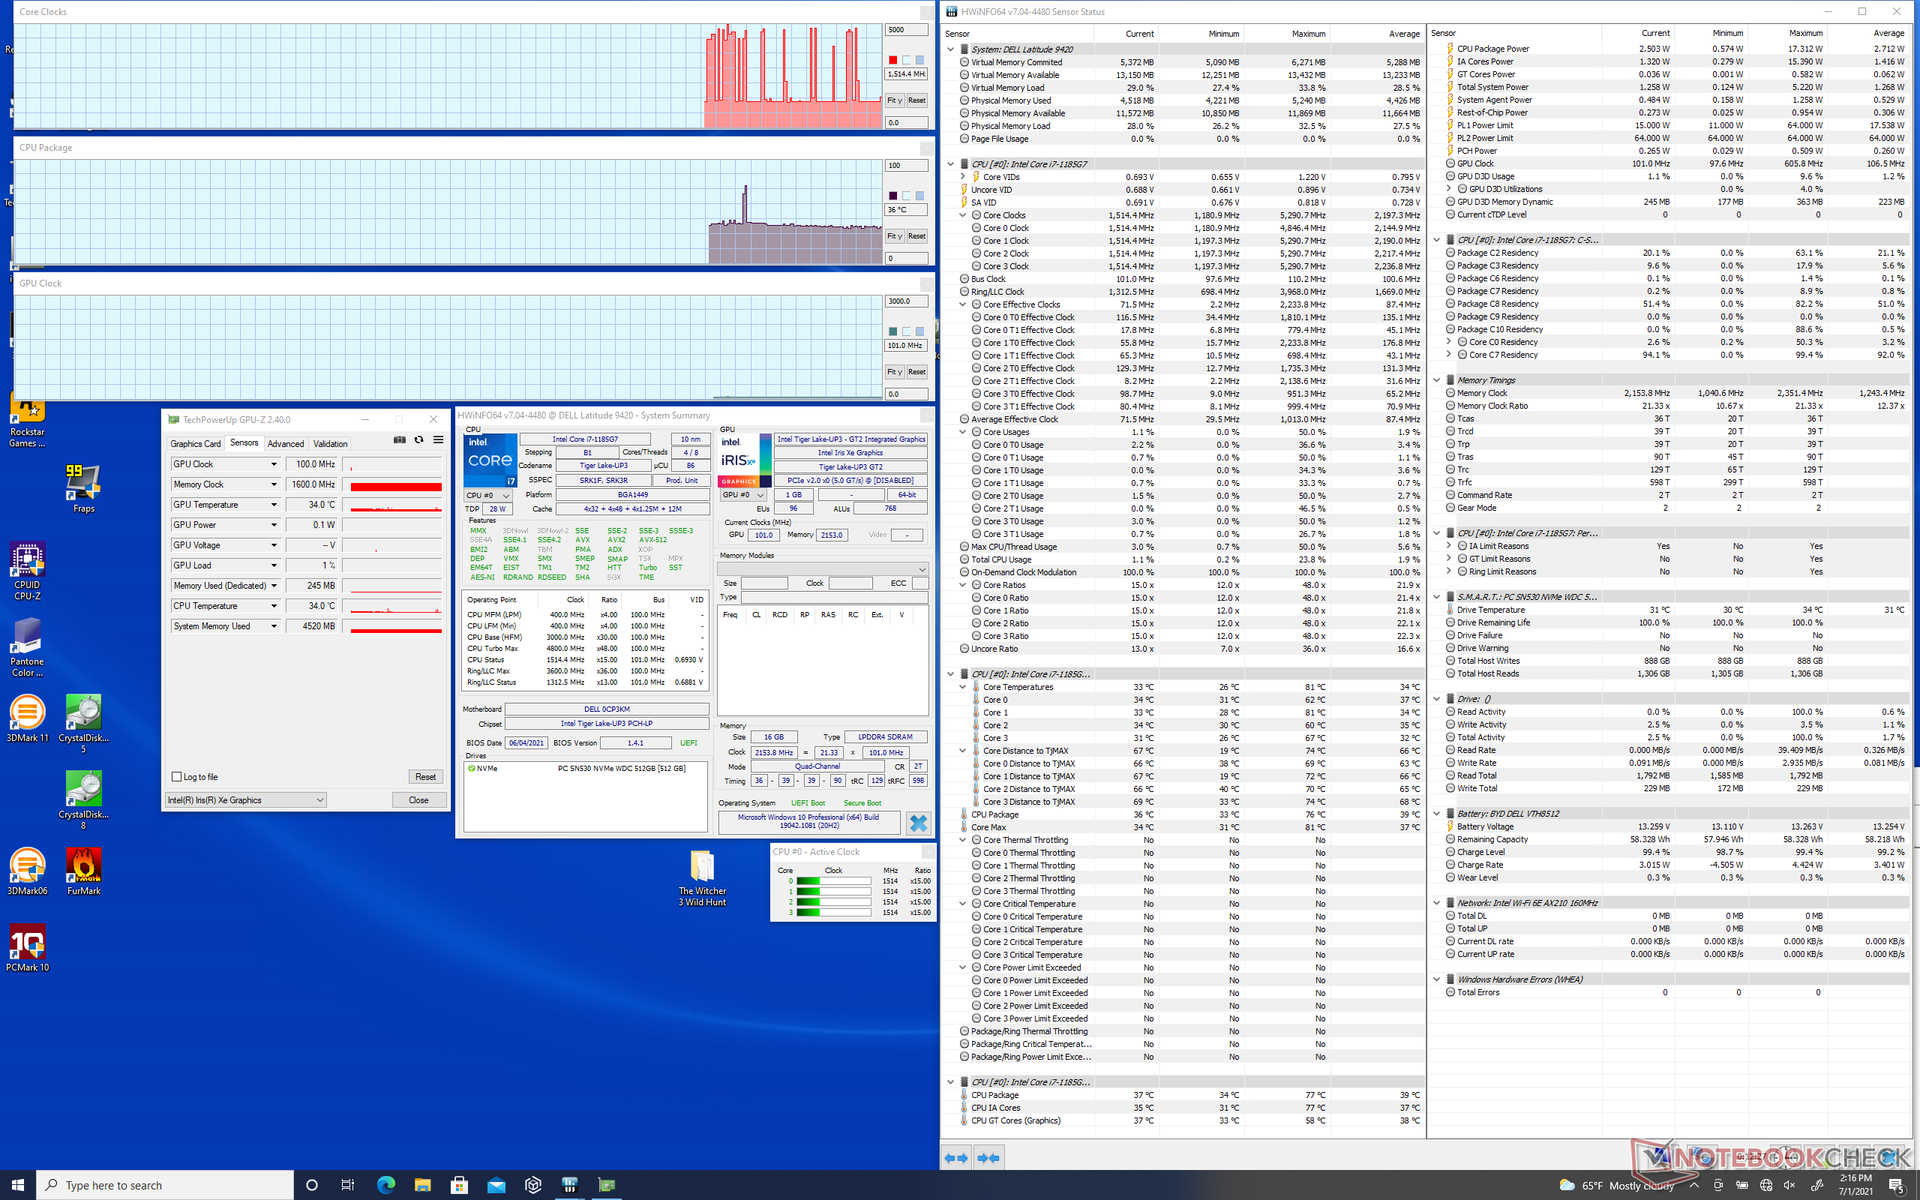
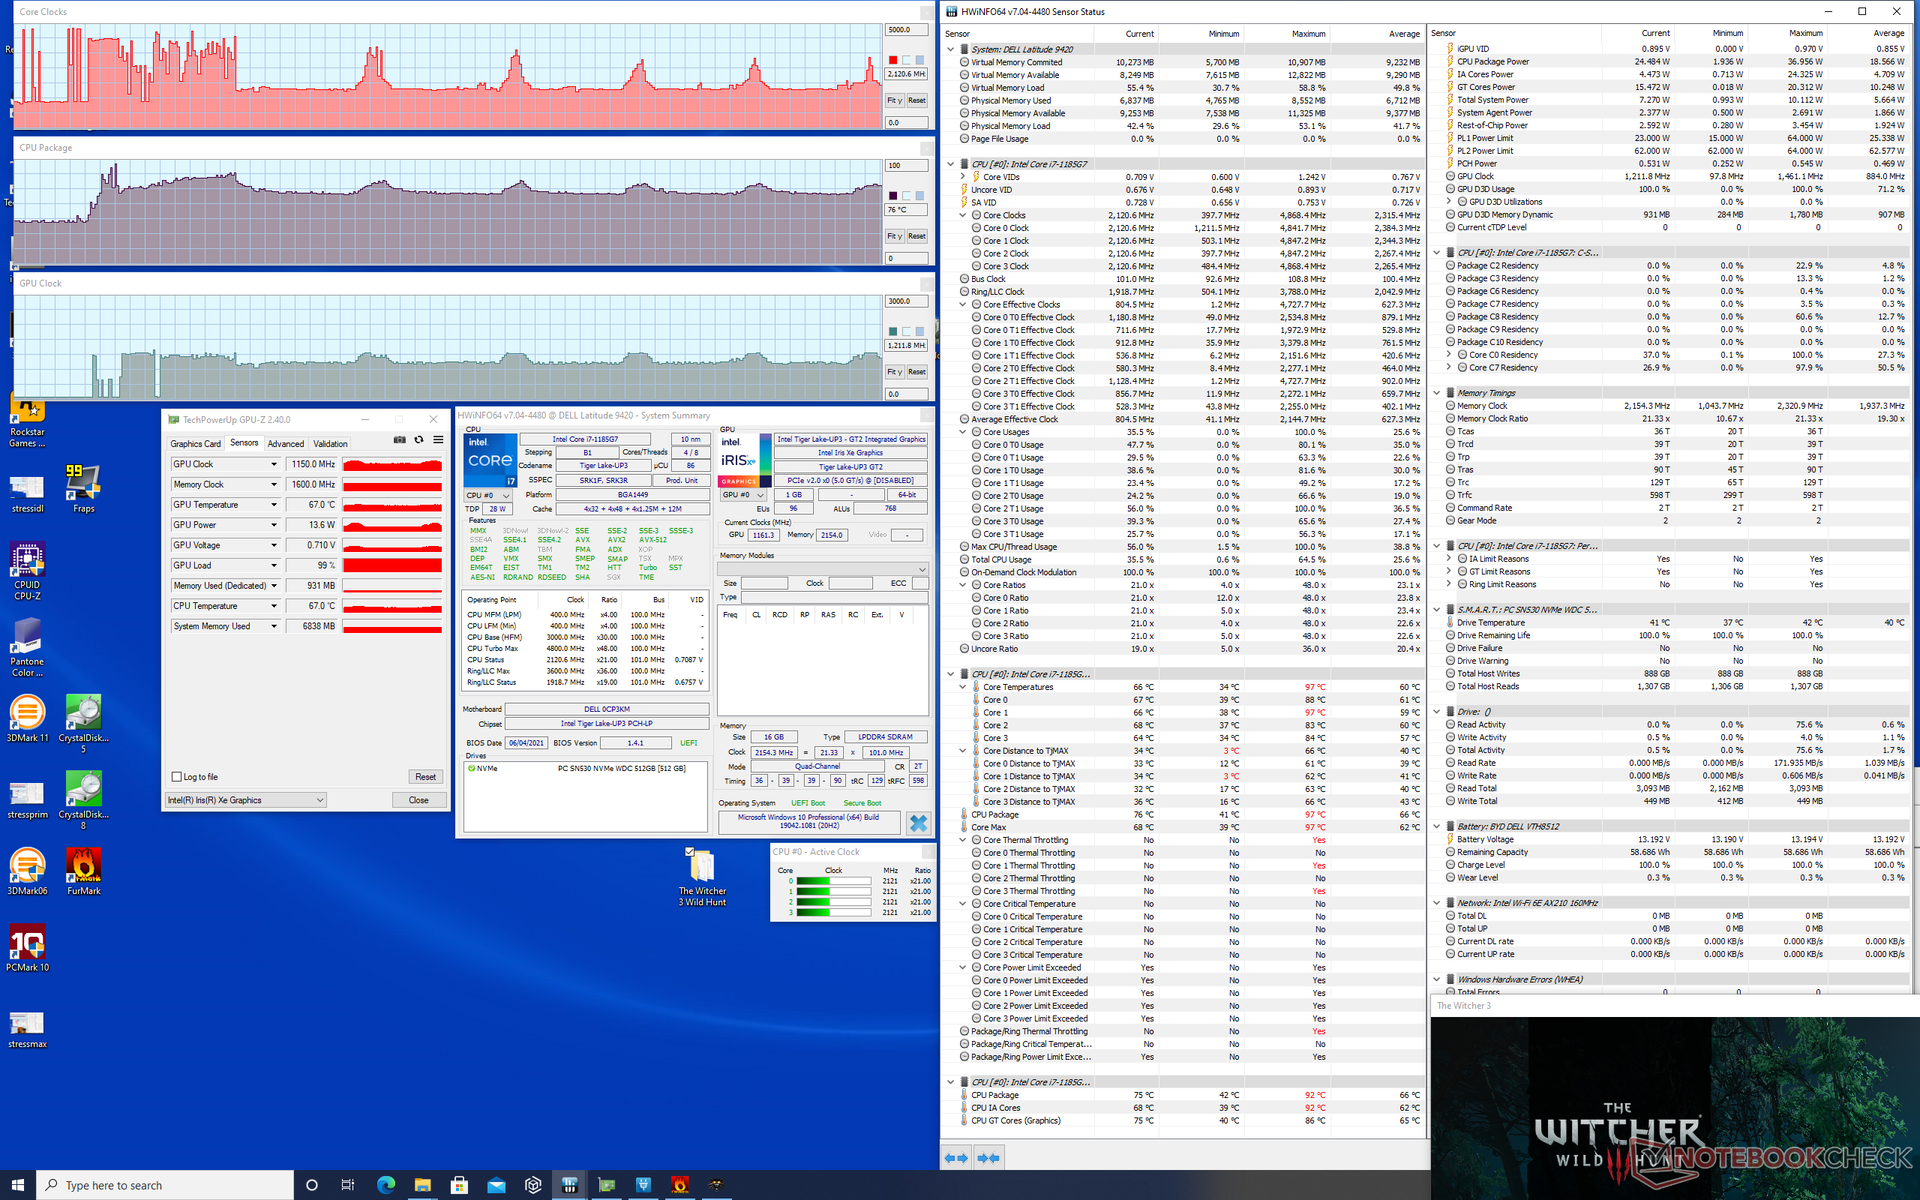
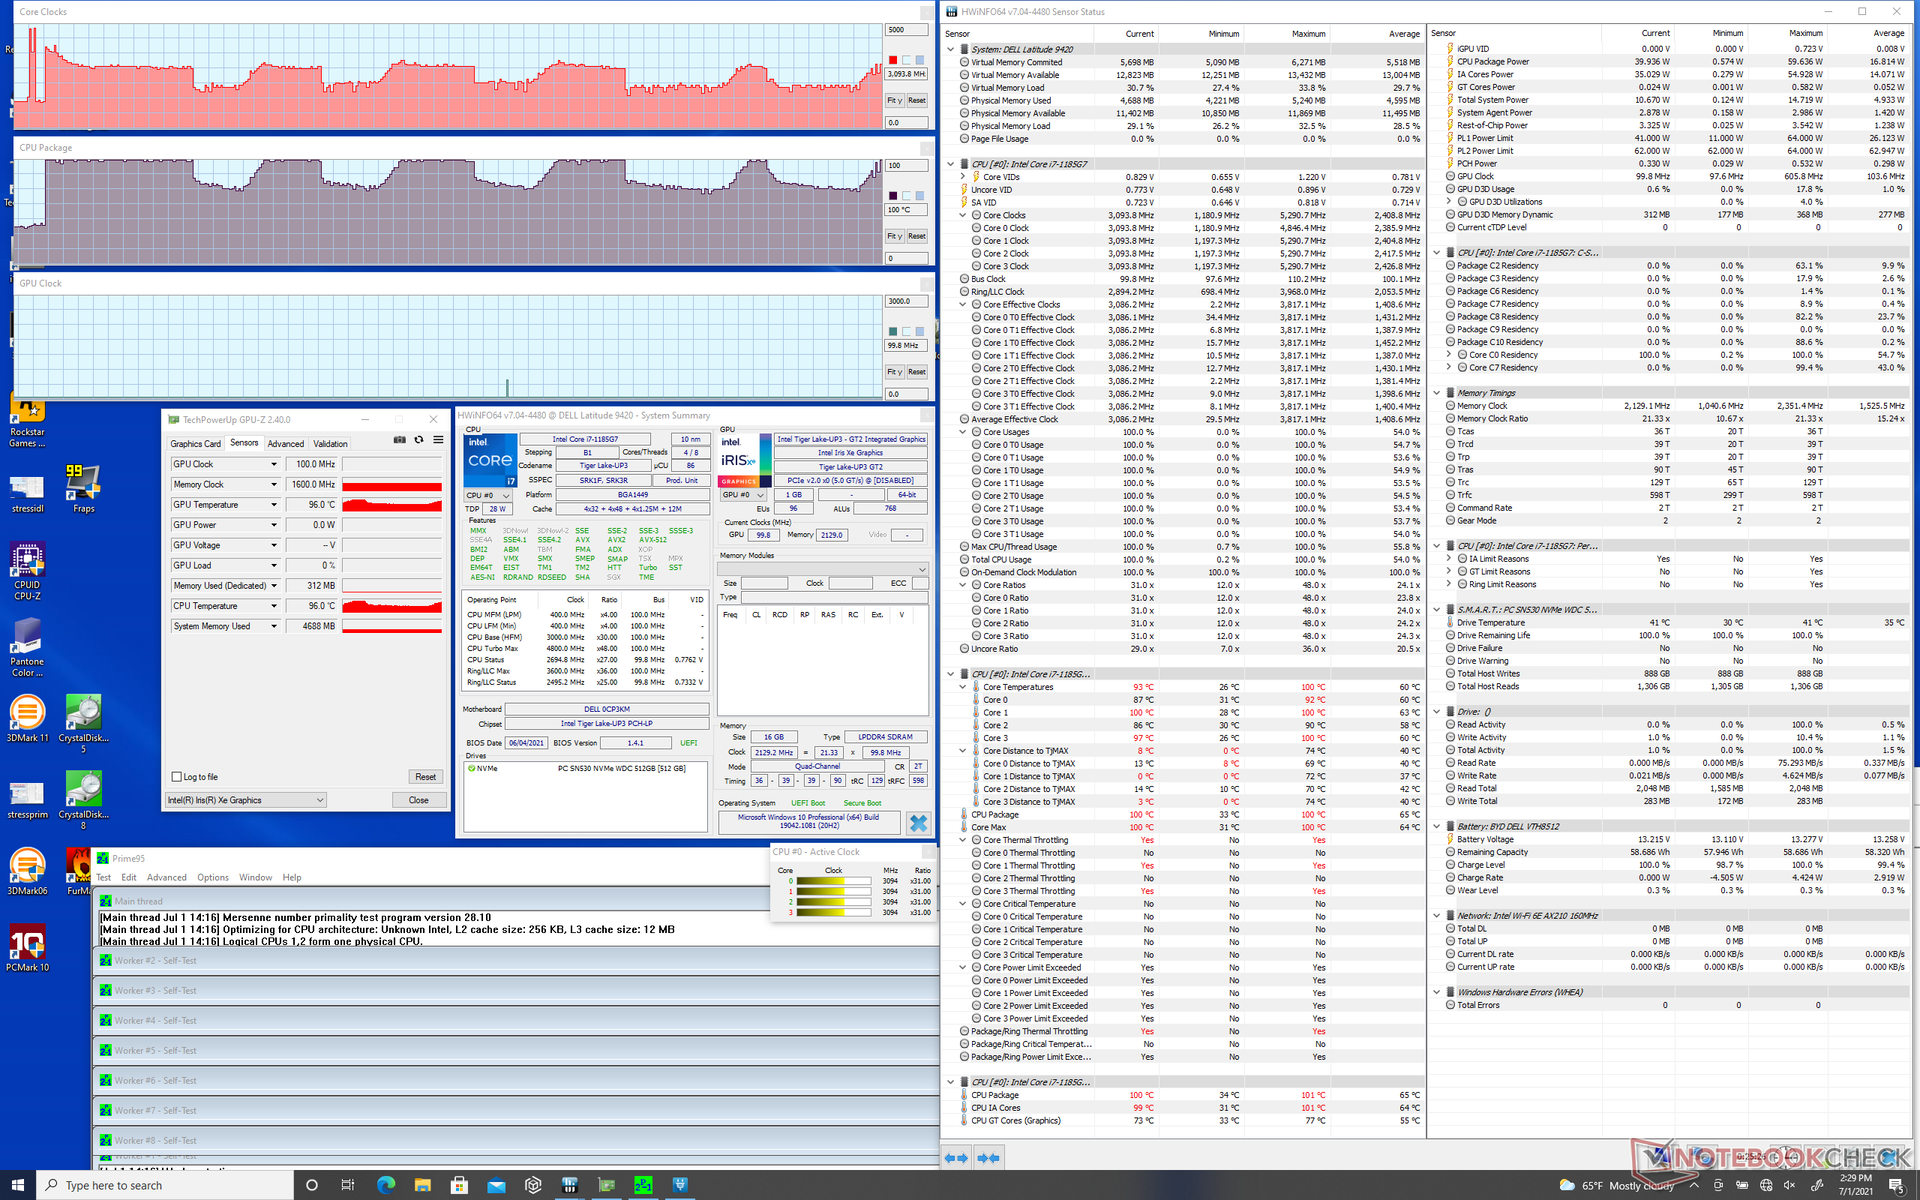
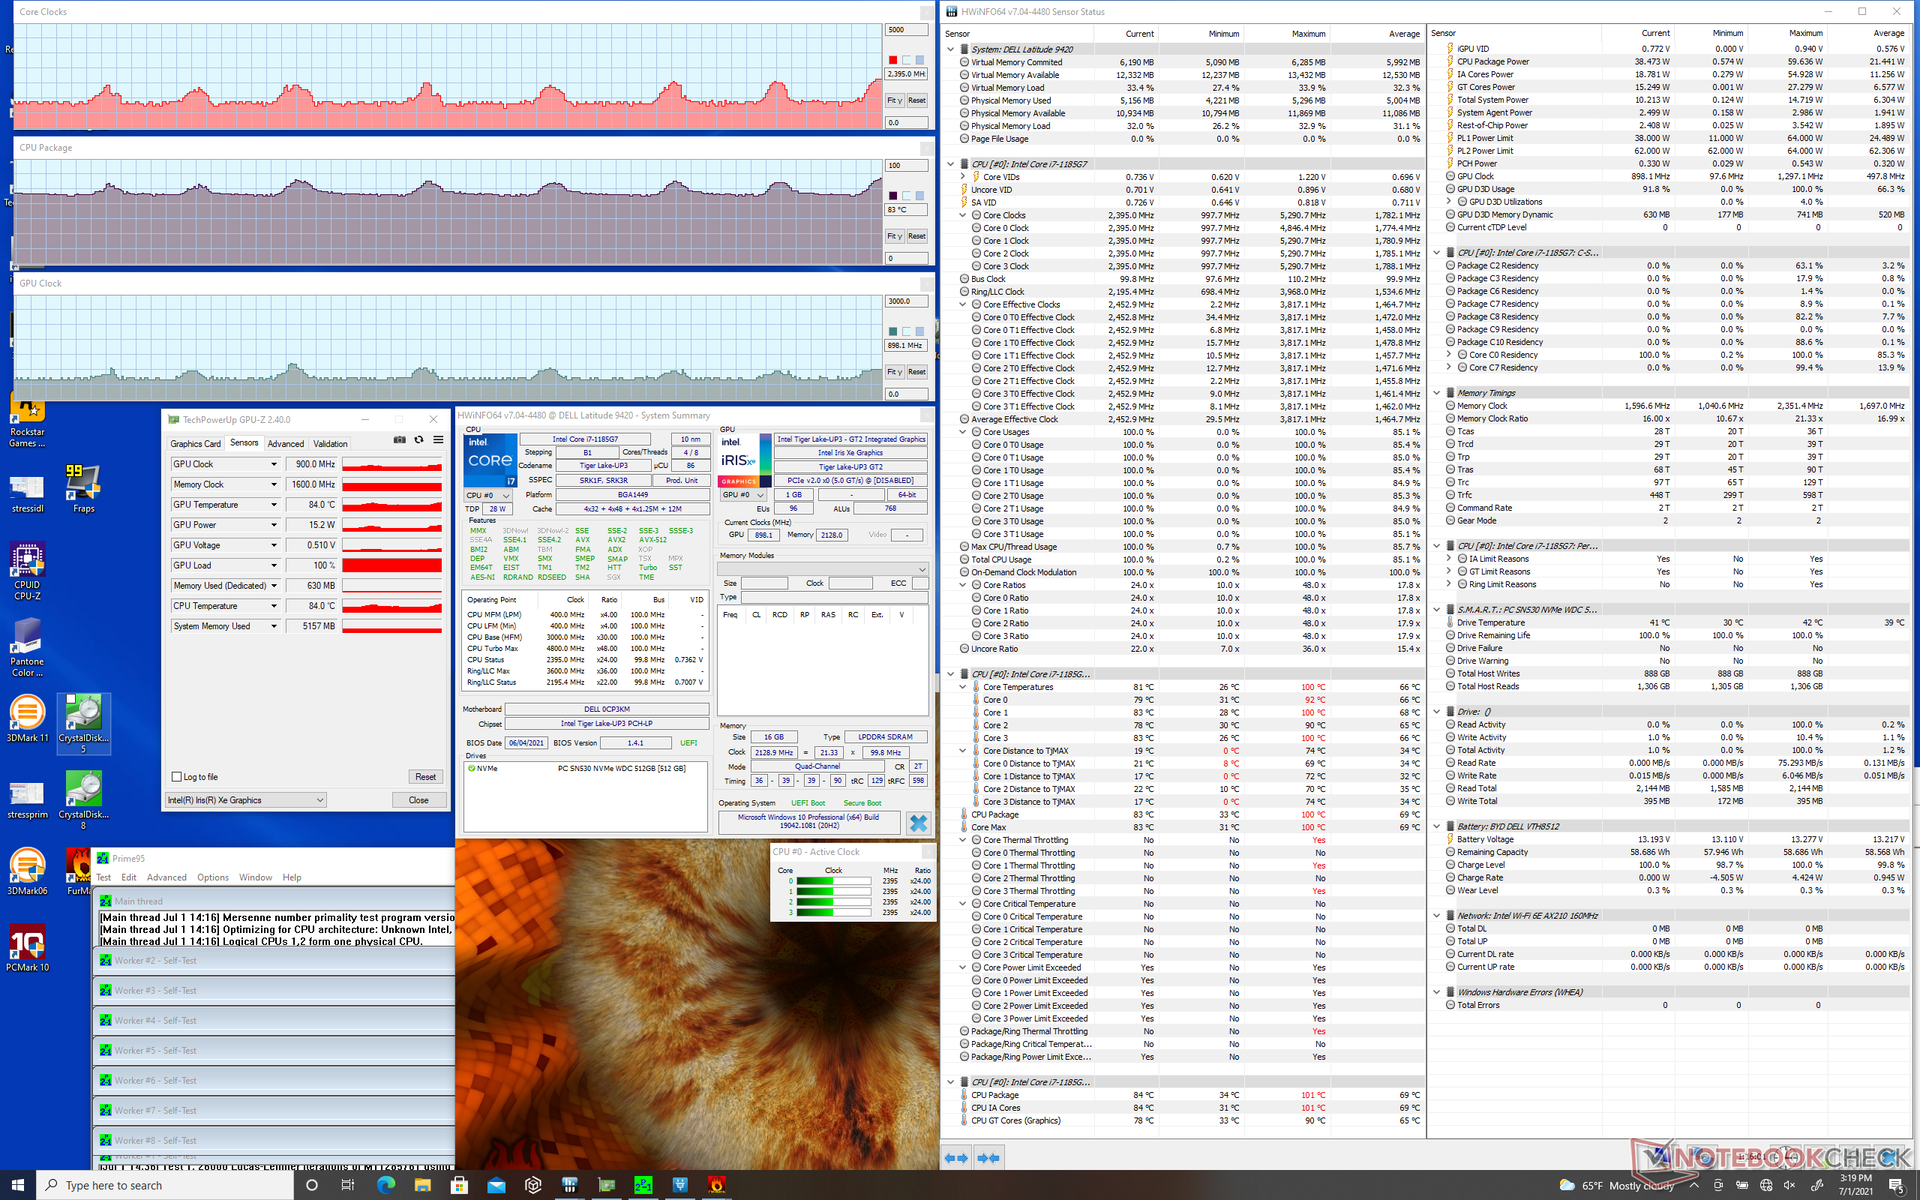
| CPU Clock (GHz) | GPU Clock (MHz) | Average CPU Temperature (°C) | |
| System Idle | -- | -- | 36 |
| Prime95 Stress | 1.8 - 3.1 | -- | 73 - 100 |
| Prime95 + FurMark Stress | 1.1 - 2.2 | 600 - 900 | 66 - 80 |
| Witcher 3 Stress | 1.8 - 3.8 | 1050 - 1350 | 68 - 78 |
Speakers
Dell has upgraded the speakers to include four in total. Not only is volume louder than on most other laptops at 87 dB(A), audio quality is better than expected at all ranges. These could easily pass on a multimedia laptop let alone a business convertible meant for offices and conferences.


Dell Latitude 9420 2-in-1 audio analysis
(+) | speakers can play relatively loud (87.3 dB)
Bass 100 - 315 Hz
(±) | reduced bass - on average 7.4% lower than median
(+) | bass is linear (6.2% delta to prev. frequency)
Mids 400 - 2000 Hz
(+) | balanced mids - only 1.3% away from median
(+) | mids are linear (2.9% delta to prev. frequency)
Highs 2 - 16 kHz
(+) | balanced highs - only 3.6% away from median
(+) | highs are linear (3.9% delta to prev. frequency)
Overall 100 - 16.000 Hz
(+) | overall sound is linear (6.7% difference to median)
Compared to same class
» 0% of all tested devices in this class were better, 1% similar, 99% worse
» The best had a delta of 6%, average was 20%, worst was 57%
Compared to all devices tested
» 1% of all tested devices were better, 0% similar, 99% worse
» The best had a delta of 4%, average was 24%, worst was 134%
Apple MacBook 12 (Early 2016) 1.1 GHz audio analysis
(+) | speakers can play relatively loud (83.6 dB)
Bass 100 - 315 Hz
(±) | reduced bass - on average 11.3% lower than median
(±) | linearity of bass is average (14.2% delta to prev. frequency)
Mids 400 - 2000 Hz
(+) | balanced mids - only 2.4% away from median
(+) | mids are linear (5.5% delta to prev. frequency)
Highs 2 - 16 kHz
(+) | balanced highs - only 2% away from median
(+) | highs are linear (4.5% delta to prev. frequency)
Overall 100 - 16.000 Hz
(+) | overall sound is linear (10.2% difference to median)
Compared to same class
» 7% of all tested devices in this class were better, 2% similar, 91% worse
» The best had a delta of 5%, average was 18%, worst was 53%
Compared to all devices tested
» 5% of all tested devices were better, 1% similar, 94% worse
» The best had a delta of 4%, average was 24%, worst was 134%
Energy Management — High Performance-Per-Watt But Smaller Battery
Power Consumption
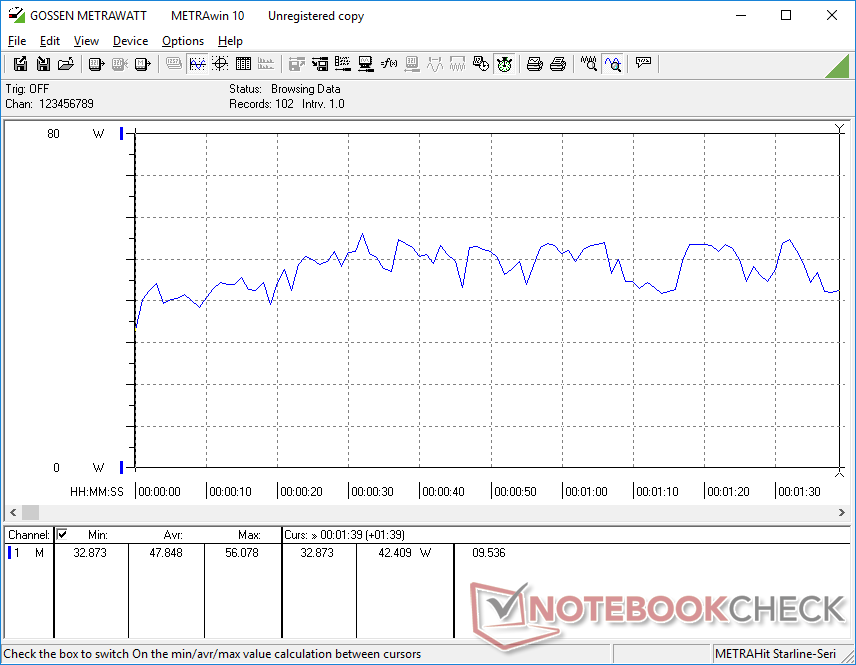
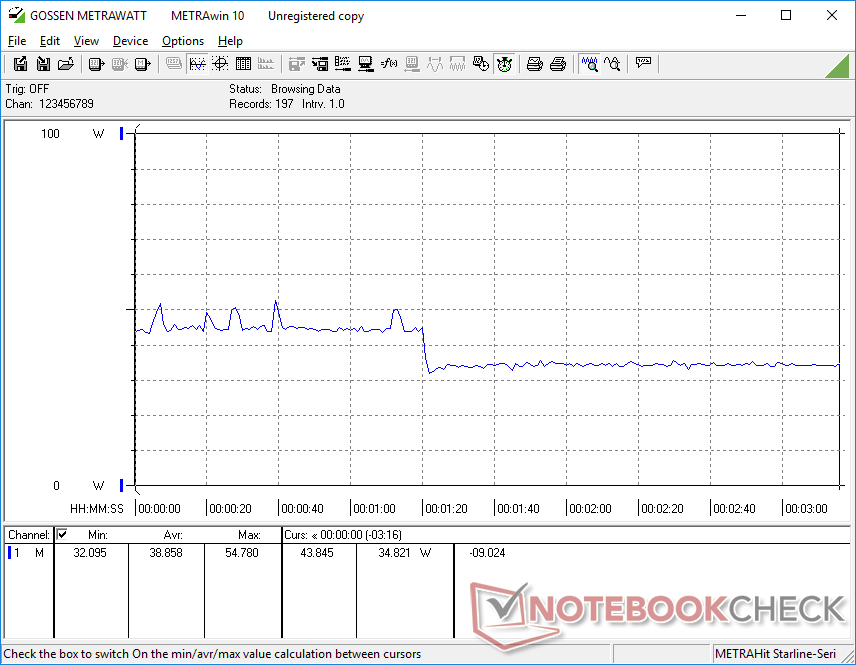
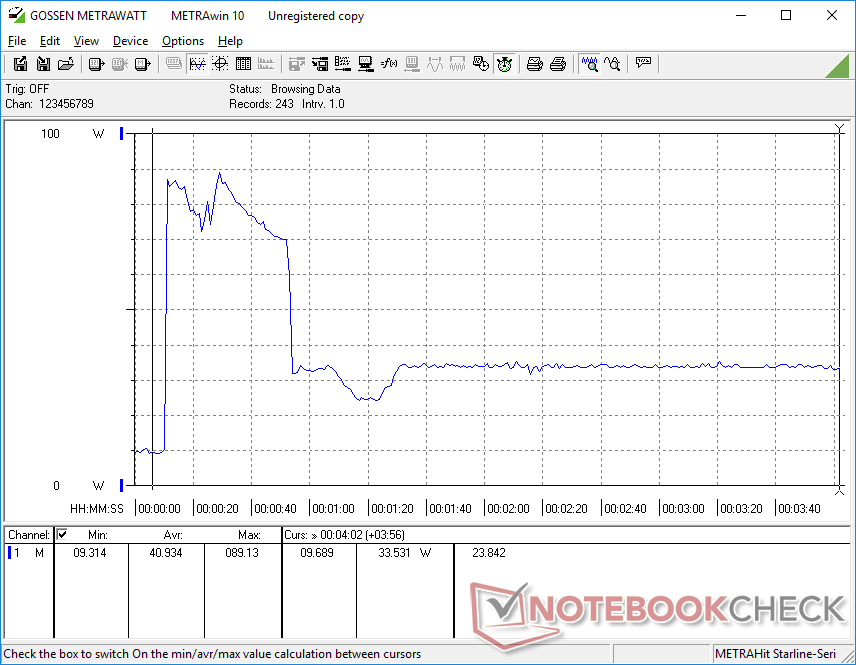
Idling on desktop at the lowest brightness setting would consume just 4.6 W while the maximum brightness setting would demand about 3 W more. Running higher loads like games consumes 23 percent more power than on last year's Latitude 9410 2-in-1, but the immense ~300 percent boost to graphics performance over the ancient UHD Graphics 620 more than makes up for it.
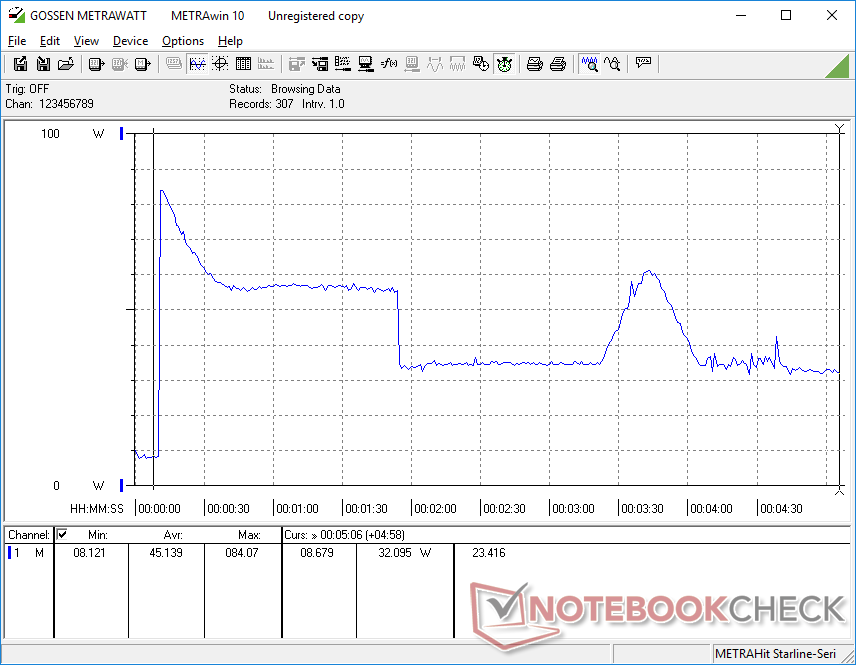
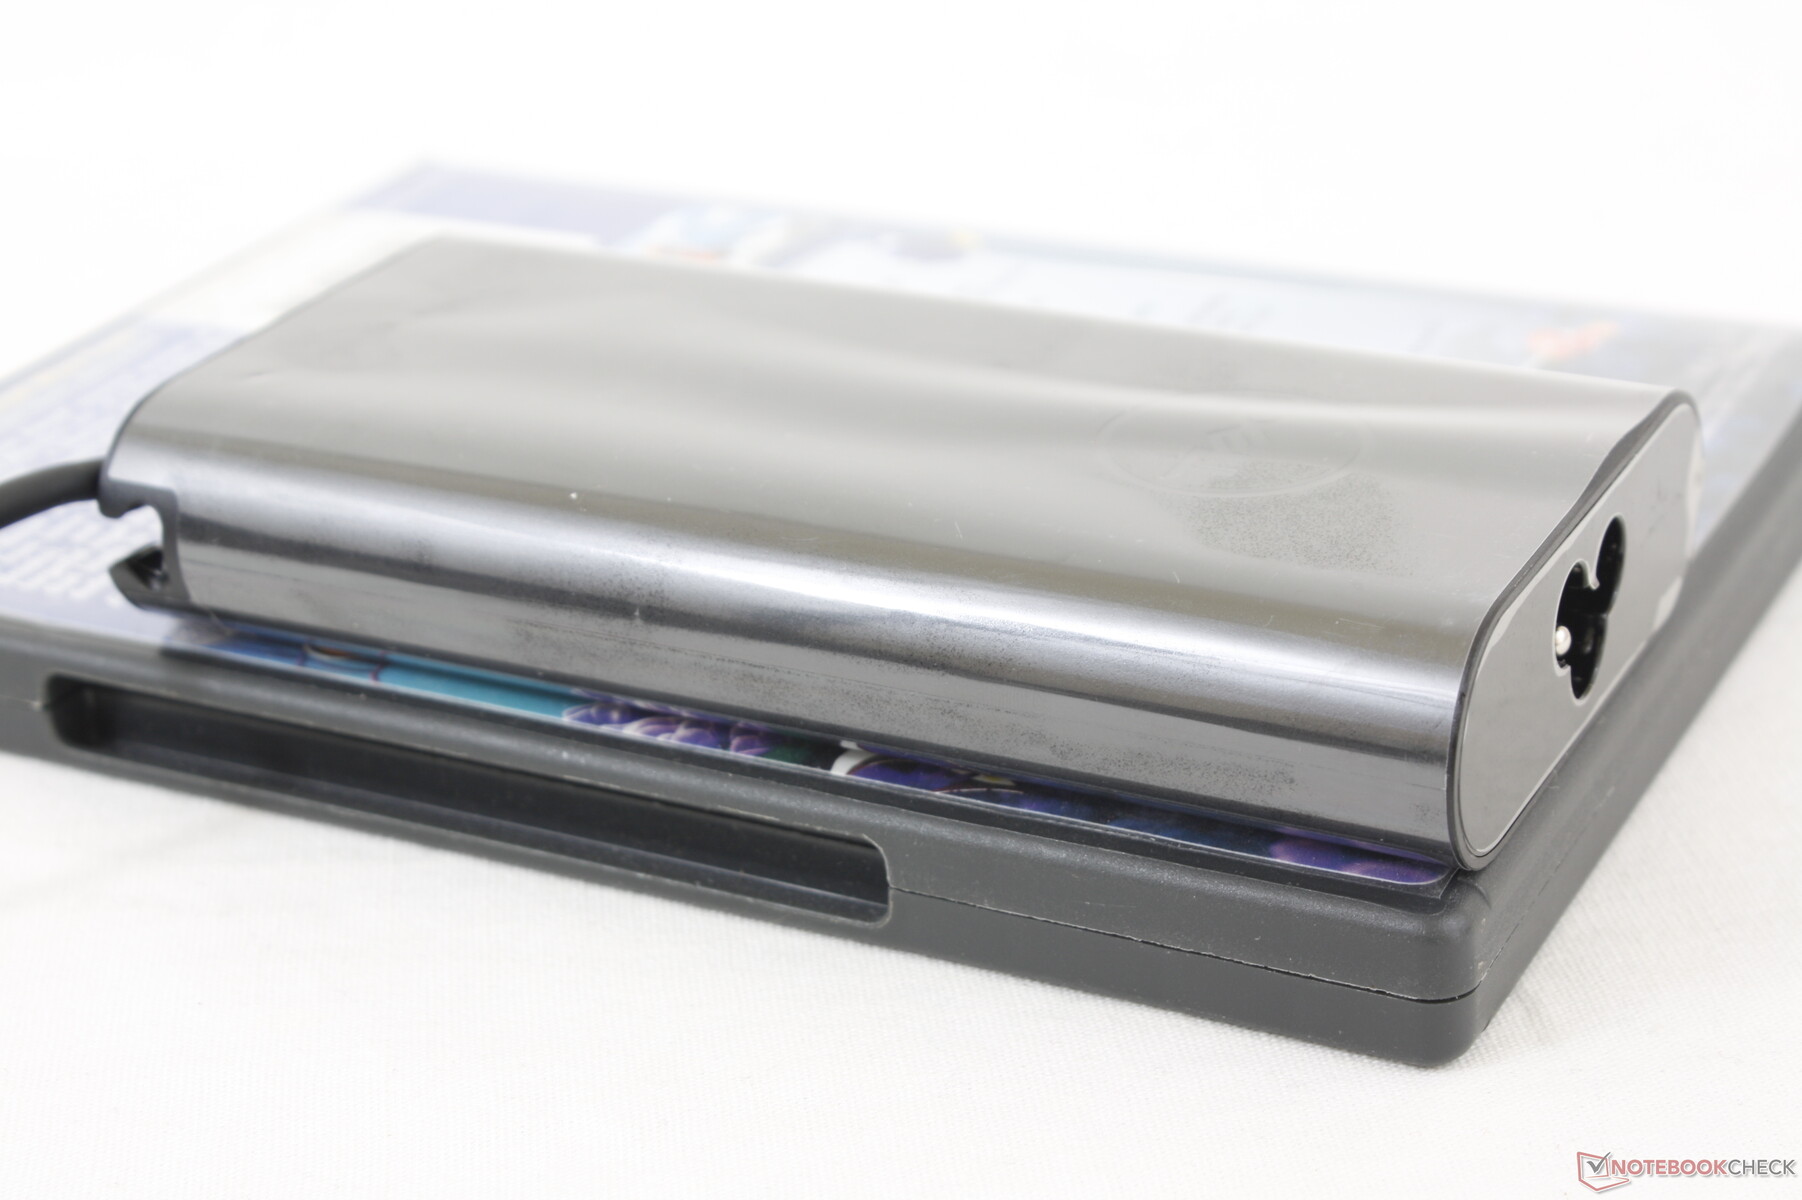
We're able to record a maximum draw of 87 W to be much more than most other ULV-powered laptops. This higher draw is due to the included 90 W AC adapter which is a very high rating for this type of processor and system. The HP Spectre x360 14, for example, ships with just a 65 W AC adapter. The higher AC power headroom allows the processor in the Dell to perform faster than average even if the Turbo Boost benefits are short lived.
| Off / Standby | |
| Idle | |
| Load |
|
Key:
min: | |
| Dell Latitude 9420 2-in-1 i7-1185G7, Iris Xe G7 96EUs, WDC PC SN530 SDBPNPZ-512G, IPS, 2560x1600, 14" | Lenovo ThinkPad X1 Yoga G6-20Y0S00200 i7-1165G7, Iris Xe G7 96EUs, Samsung PM9A1 MZVL21T0HCLR, IPS, 1920x1200, 14" | HP EliteBook x360 1040 G7, i7-10810U i7-10810U, UHD Graphics 620, Samsung SSD PM981a MZVLB512HBJQ, IPS, 1920x1080, 14" | Dell Latitude 14 9410 2-in-1 P110G i7-10610U, UHD Graphics 620, Micron 2200S 512GB, IPS, 1920x1080, 14" | Asus ZenBook Flip 14 UX463FA-AI039T i5-10210U, UHD Graphics 620, Kingston RBUSNS8154P3512GJ1, IPS, 1920x1080, 14" | MSI Summit E13 Flip Evo A11MT i7-1185G7, Iris Xe G7 96EUs, Phison 1TB SM2801T24GKBB4S-E162, IPS, 1920x1200, 13.4" | |
|---|---|---|---|---|---|---|
| Power Consumption | 12% | 35% | 34% | 13% | -4% | |
| Idle Minimum * (Watt) | 4.6 | 3.3 28% | 1.6 65% | 2.6 43% | 3.6 22% | 4.8 -4% |
| Idle Average * (Watt) | 7.8 | 5.8 26% | 4.5 42% | 3.9 50% | 7.5 4% | 8.4 -8% |
| Idle Maximum * (Watt) | 8.2 | 9.6 -17% | 5.2 37% | 4.6 44% | 9.4 -15% | 8.6 -5% |
| Load Average * (Watt) | 47.9 | 47.2 1% | 41.7 13% | 38.9 19% | 42 12% | 47.1 2% |
| Witcher 3 ultra * (Watt) | 38.8 | 35.6 8% | 51.6 -33% | |||
| Load Maximum * (Watt) | 87.1 | 65.3 25% | 70.8 19% | 76.2 13% | 51 41% | 65.9 24% |
* ... smaller is better
Power Consumption Witcher 3
Battery Life
Expect about 11.5 hours of real-world WLAN use from the internal 60 Wh battery or about 7.5 hours if configured with the smaller 40 Wh battery. Battery capacity and runtimes are smaller and shorter, respectively, than on last year's Latitude 9410 2-in-1.
Charging from empty to full capacity with the included USB-C adapter is fast at under 2 hours. This adapter can also be used to charge most other USB-C devices.
| Dell Latitude 9420 2-in-1 i7-1185G7, Iris Xe G7 96EUs, 60 Wh | Lenovo ThinkPad X1 Yoga G6-20Y0S00200 i7-1165G7, Iris Xe G7 96EUs, 57 Wh | HP EliteBook x360 1040 G7, i7-10810U i7-10810U, UHD Graphics 620, 78.6 Wh | Dell Latitude 14 9410 2-in-1 P110G i7-10610U, UHD Graphics 620, 78 Wh | Asus ZenBook Flip 14 UX463FA-AI039T i5-10210U, UHD Graphics 620, 50 Wh | MSI Summit E13 Flip Evo A11MT i7-1185G7, Iris Xe G7 96EUs, 70 Wh | |
|---|---|---|---|---|---|---|
| Battery runtime | -7% | 104% | 57% | -34% | -18% | |
| Reader / Idle (h) | 28.7 | 62.8 119% | 48.2 68% | 21.1 -26% | ||
| WiFi v1.3 (h) | 11.7 | 12 3% | 18.8 61% | 19 62% | 7.7 -34% | 11.2 -4% |
| Load (h) | 2.4 | 2 -17% | 5.6 133% | 3.4 42% | 1.8 -25% |
Pros
Cons
Verdict — Dell's Most Versatile Commercial Convertible Yet
The Latitude 9420 2-in-1 is a huge leap over the older 9410 2-in-1. The new 16:10 aspect ratio is more fitting for office-type workloads, the speakers are louder, processor performance has been improved tremendously, the clickpad is larger, and there is an actual webcam shutter now.
It's not a perfect successor, however. There are fewer ports here on the 9420 2-in-1 than on the 9410 2-in-1 while some users may prefer the layout of the arrow keys on last year's model. Support for full-size M.2 2280 SSDs is gone, the WLAN module is no longer removable, and battery capacity is smaller for shorter runtimes. These setbacks may be relatively minor depending on your usage scenario.
The Latitude 9420 2-in-1 gets almost everything right with just a few minor setbacks that should be easy to overlook for most users.
The advantages of the Latitude 9420 2-in-1 are also pretty clear over competitors like the ThinkPad X1 Yoga G6 or EliteBook x360 1040 G7. For example, the Dell system doesn't suffer from the performance issues we observed on the Lenovo and it comes with a brighter display as well. Meanwhile, the EliteBook x360 1040 design is still stuck on 16:9 panels. Users may still want to consider the Lenovo convertible for its PCIe 4.0 SSD compatibility and matte panel or the HP convertible for its integrated NFC and 1000-nit brightness option — all features that are still lacking on the Latitude 9420 2-in-1.
Price and availability
Name price and availability of the tested model, if necessary deviating relevant equipment variants. Affil link to a store from the list in the link-window.
Dell Latitude 9420 2-in-1
- 07/05/2021 v7 (old)
Allen Ngo
Price comparison
