MSI Summit E13 Flip Evo Convertible Review: A Timeless Design
Known for its wide range of gaming laptops, MSI has been branching out to other categories as of late with its mobile workstations and Core U-powered Ultrabooks like the Modern and Prestige series. The latest is the high-end Summit series targeting prosumers willing to pay a bit extra for a more luxurious design and user experience. MSI announced a handful of models late last year including the 13.4-inch Summit E13 Flip, 14-inch Summit B14 and E14, and 15.6-inch Summit B15 and E15.
The model we'll be looking at here is the Summit E13 Flip convertible retailing for about $1600 to $1900 USD depending on the storage and RAM configuration. All SKUs at the moment otherwise come with the same Core i7-1185G7 CPU and 16:10 1200p IPS touchscreen. Direct competitors include other high-end convertible subnotebooks like the Dell XPS 13 9310 2-in-1, Lenovo ThinkPad X1 Yoga, Asus ZenBook Flip S, or the HP Spectre x360 13 or Spectre x360 14.
More MSI reviews:
potential competitors in comparison
Rating | Date | Model | Weight | Height | Size | Resolution | Price |
|---|---|---|---|---|---|---|---|
| 86.9 % v7 (old) | 04 / 2021 | MSI Summit E13 Flip Evo A11MT i7-1185G7, Iris Xe G7 96EUs | 1.4 kg | 14.9 mm | 13.40" | 1920x1200 | |
| 86.3 % v7 (old) | 10 / 2019 | Dell XPS 13 7390 2-in-1 Core i7 i7-1065G7, Iris Plus Graphics G7 (Ice Lake 64 EU) | 1.3 kg | 13 mm | 13.40" | 1920x1200 | |
| 89.4 % v7 (old) | 12 / 2020 | HP Spectre x360 14t-ea000 i7-1165G7, Iris Xe G7 96EUs | 1.3 kg | 17.2 mm | 13.50" | 1920x1280 | |
| 87.8 % v7 (old) | 03 / 2021 | Huawei MateBook X Pro 2021 i7-1165G7, Iris Xe G7 96EUs | 1.3 kg | 14.6 mm | 13.90" | 3000x2000 | |
| 87.3 % v7 (old) | 04 / 2021 | Lenovo ThinkPad X1 Titanium Yoga G1 20QA001RGE i7-1160G7, Iris Xe G7 96EUs | 1.2 kg | 11.5 mm | 13.50" | 2256x1504 | |
| 84.1 % v7 (old) | 01 / 2021 | Asus Zenbook 14 UX435EG i7-1165G7, GeForce MX450 | 1.3 kg | 16.9 mm | 14.00" | 1920x1080 |
Case
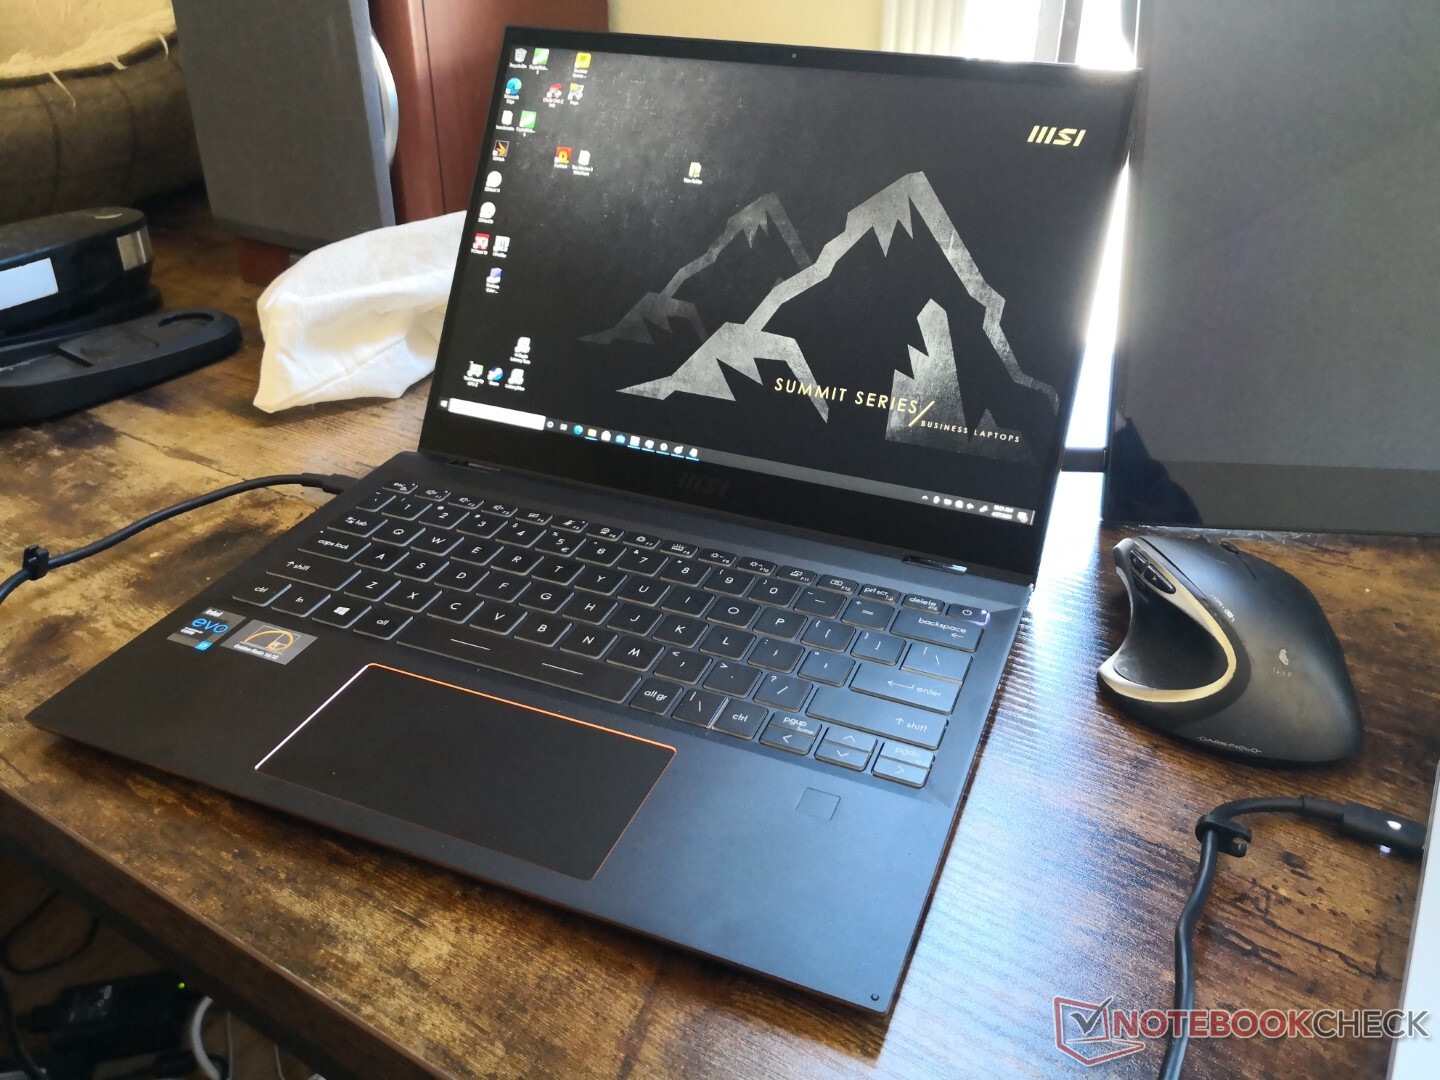
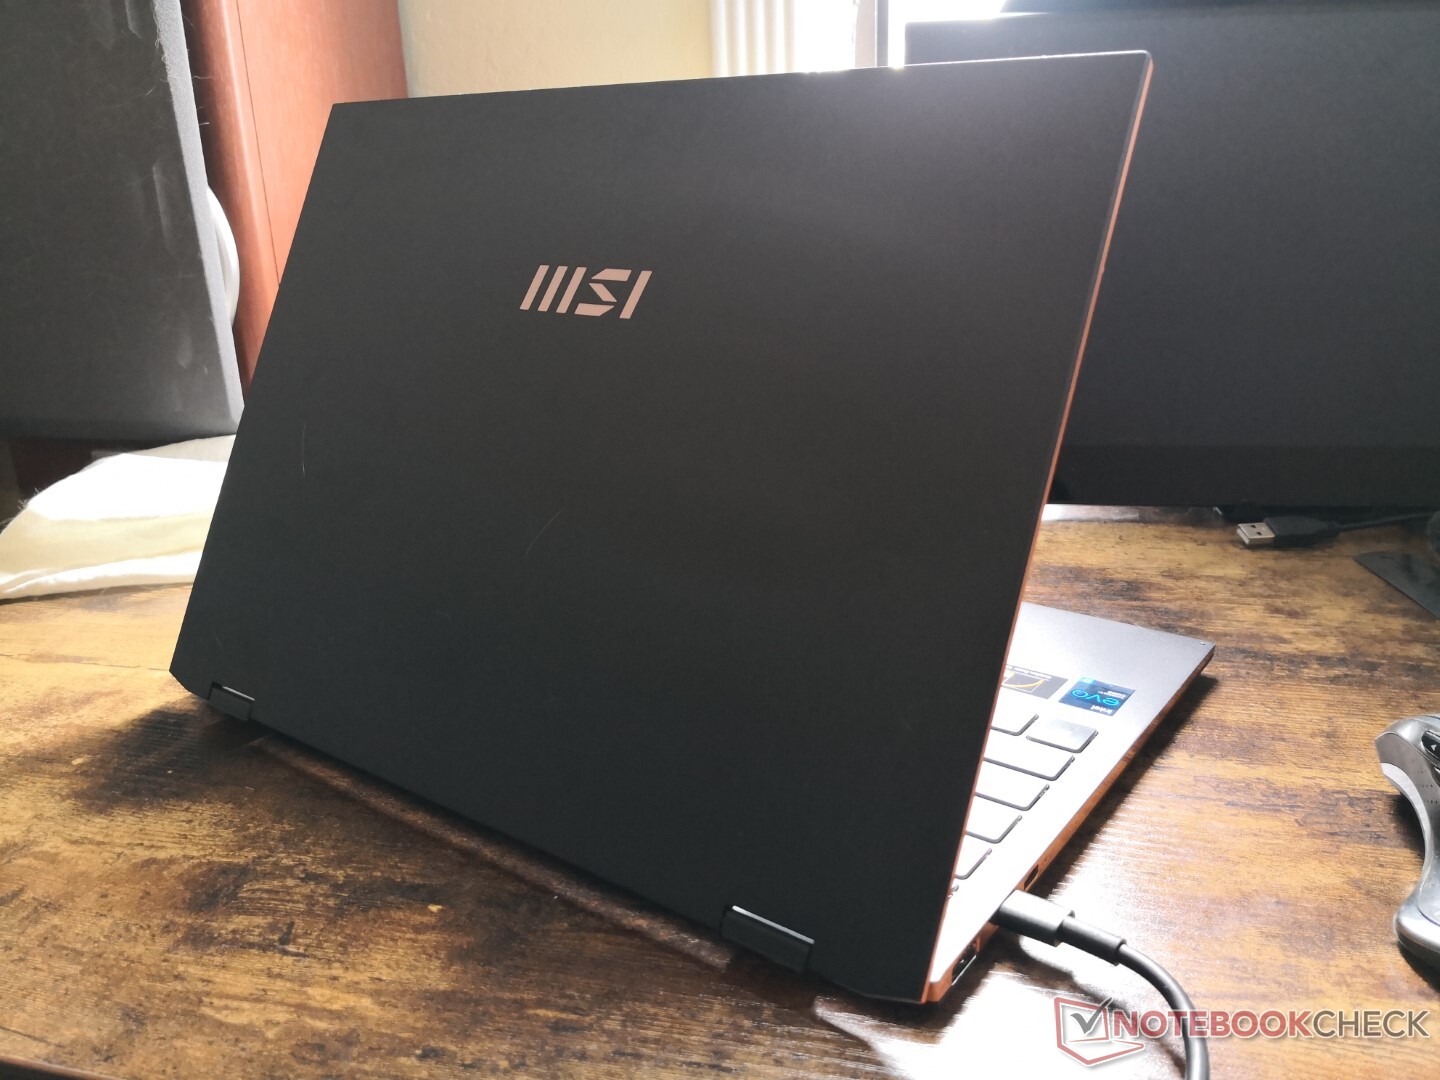
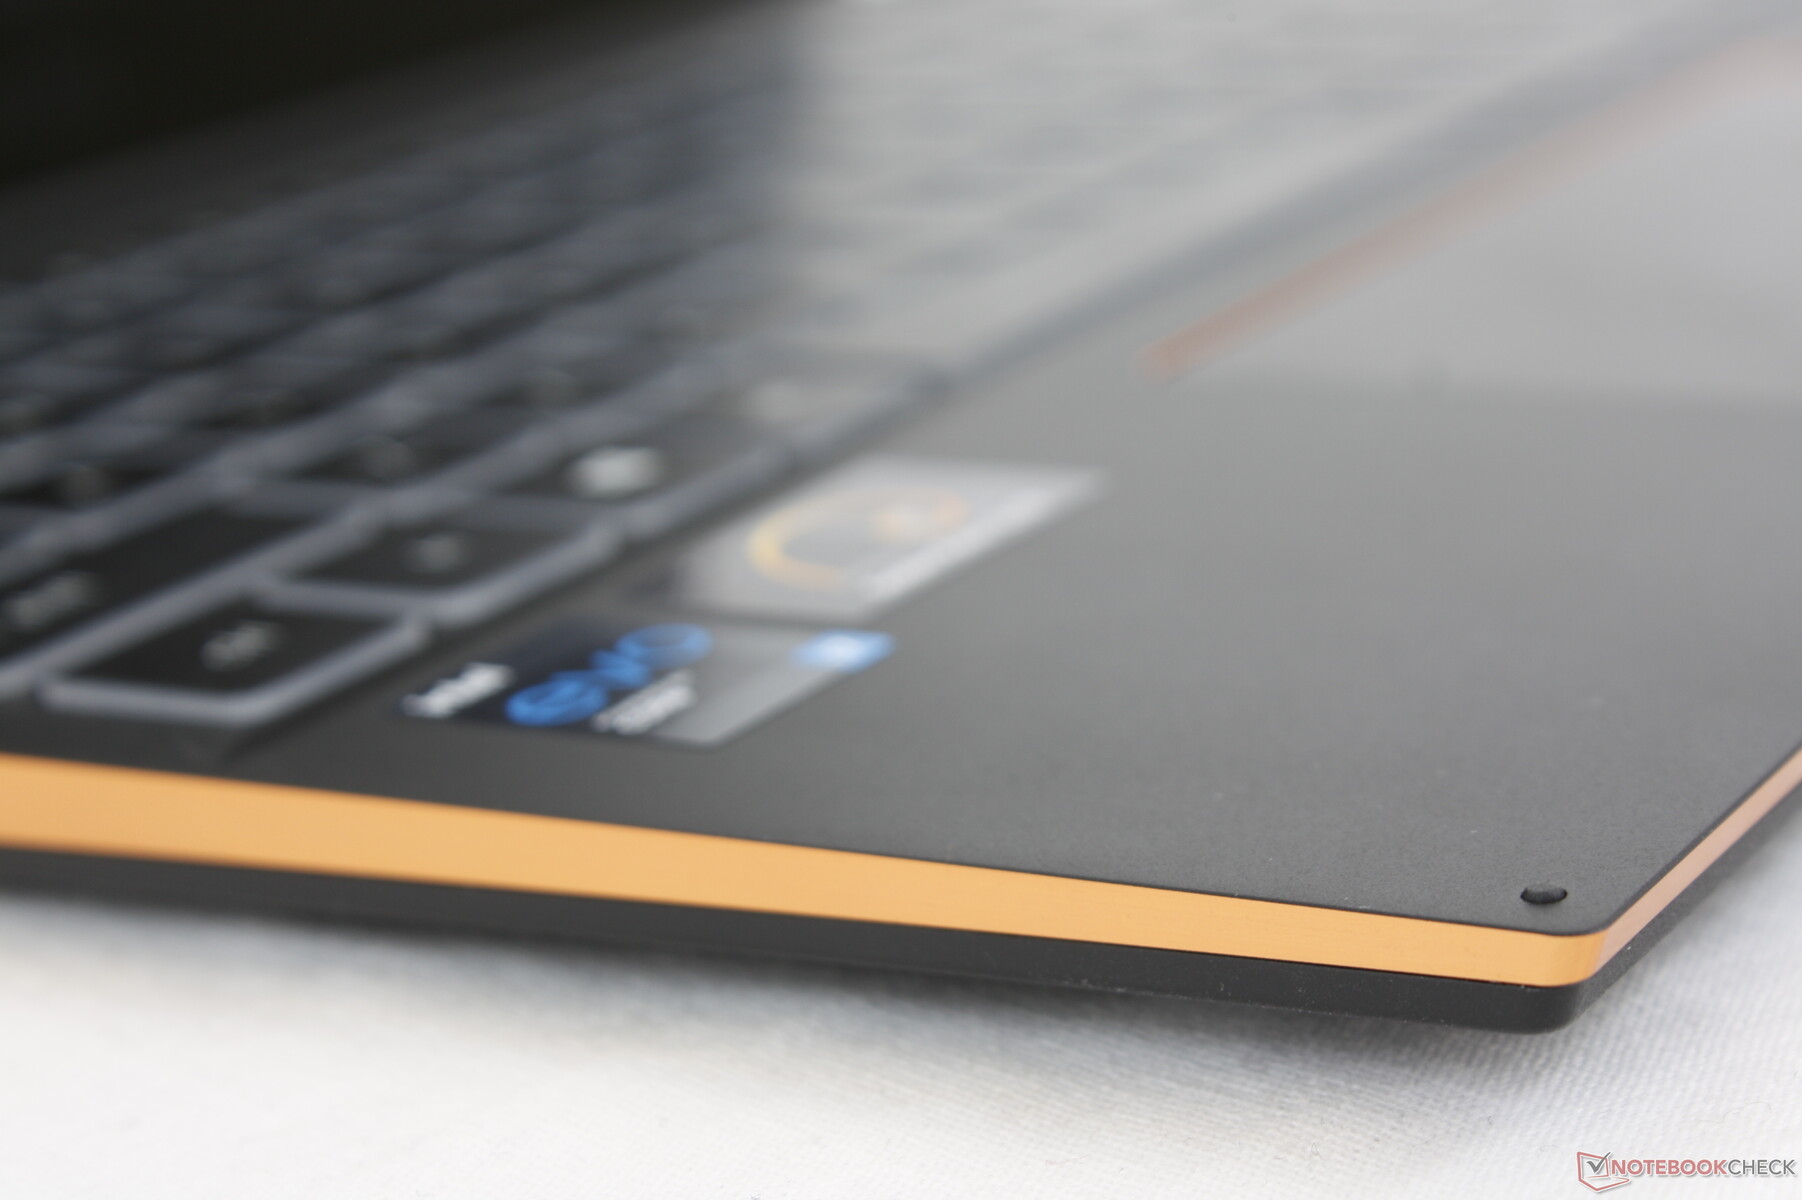
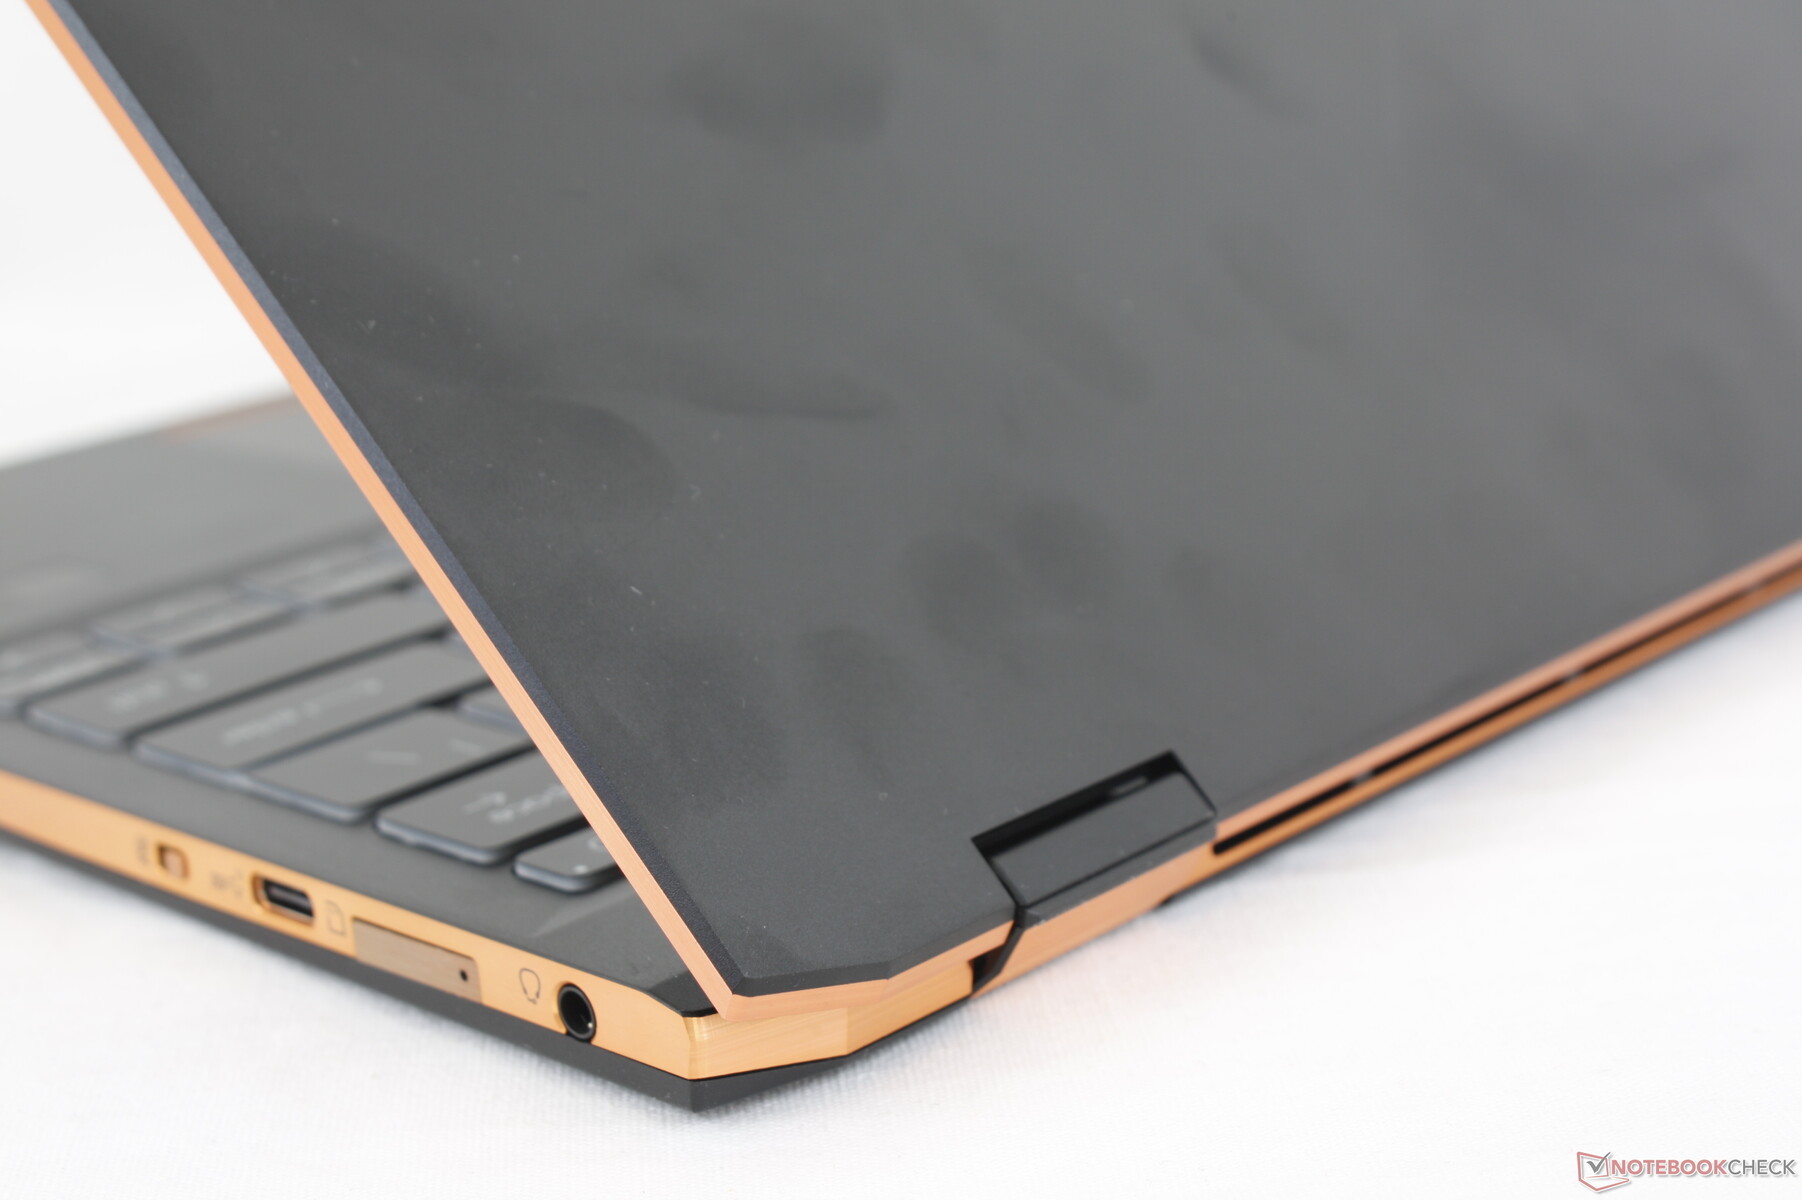
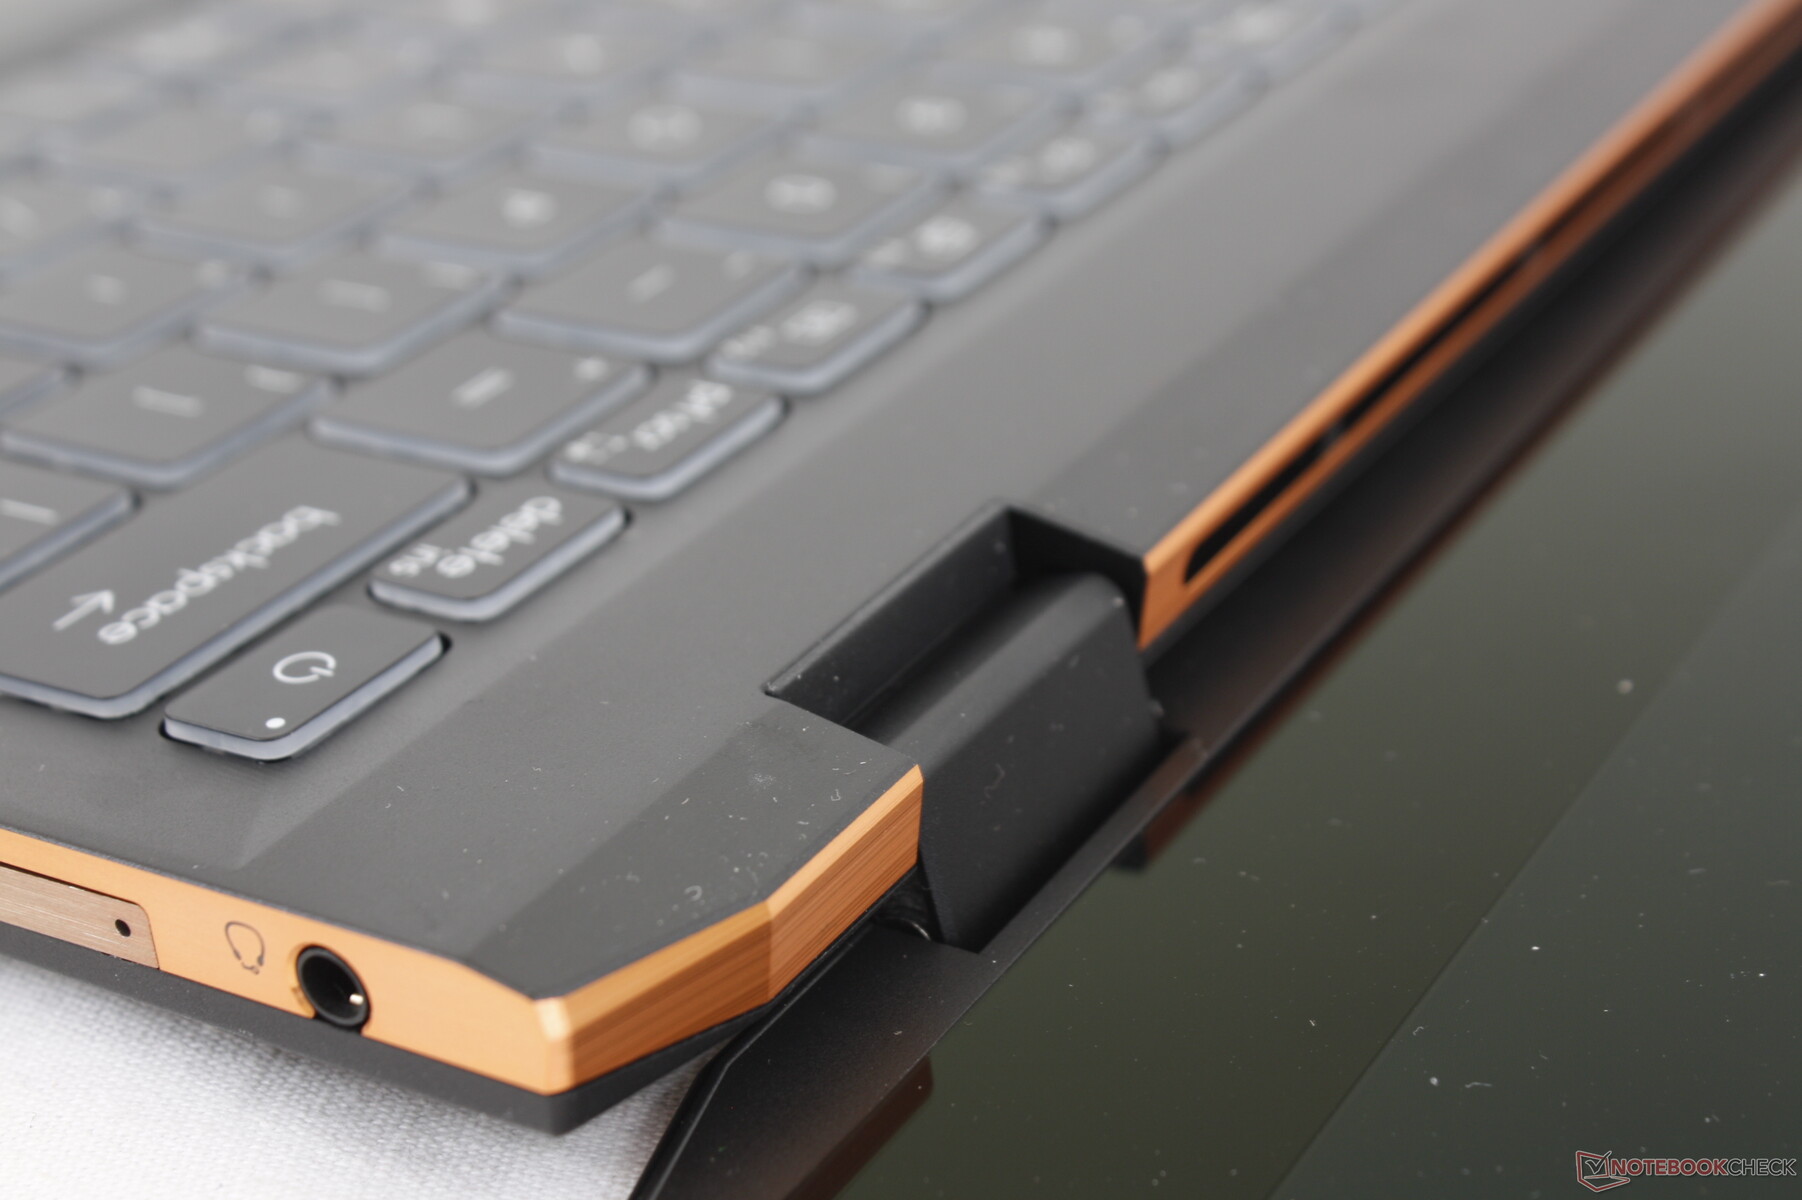
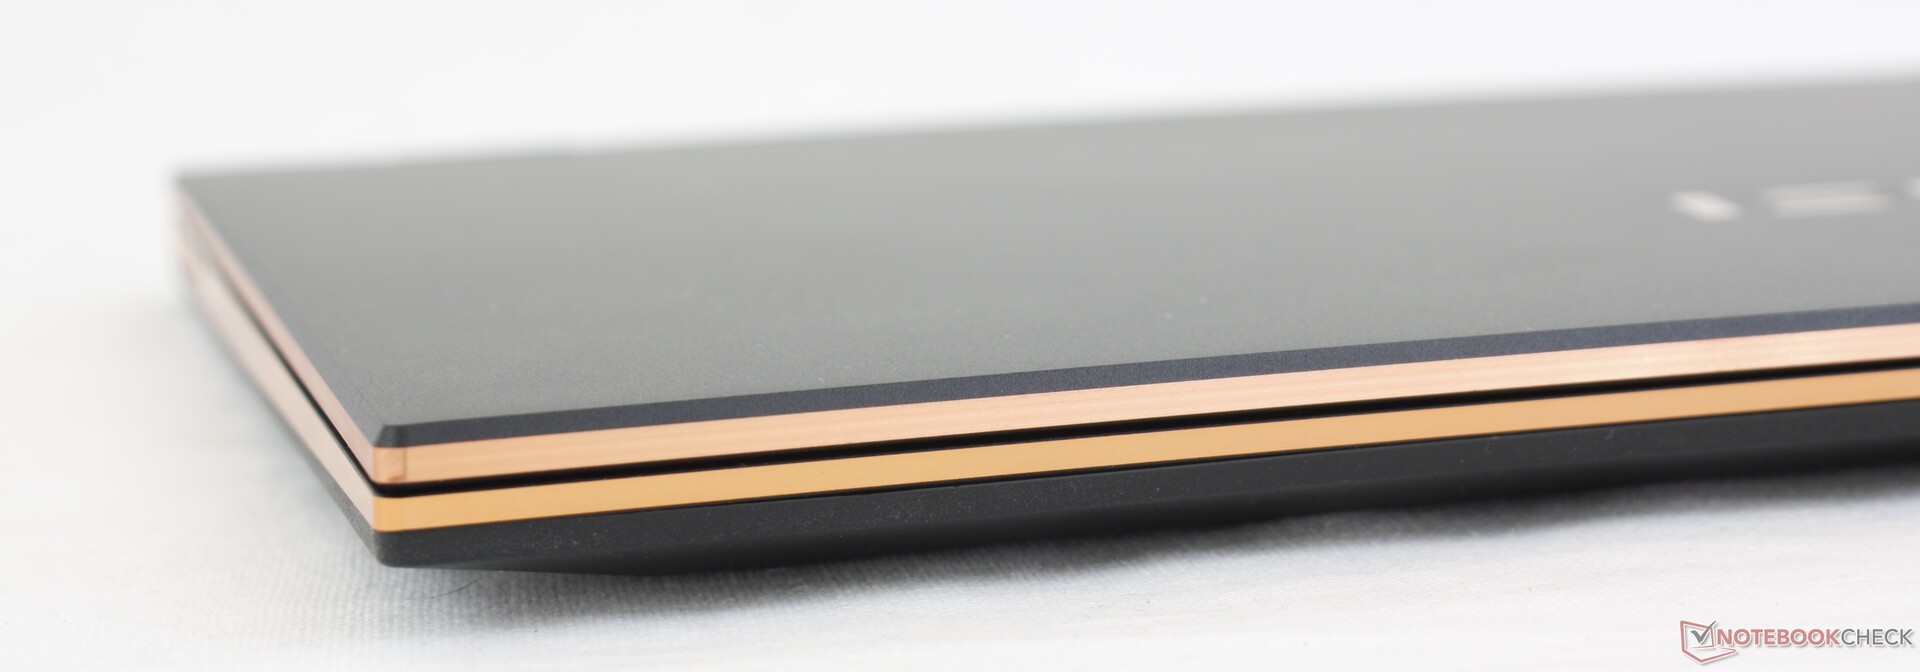
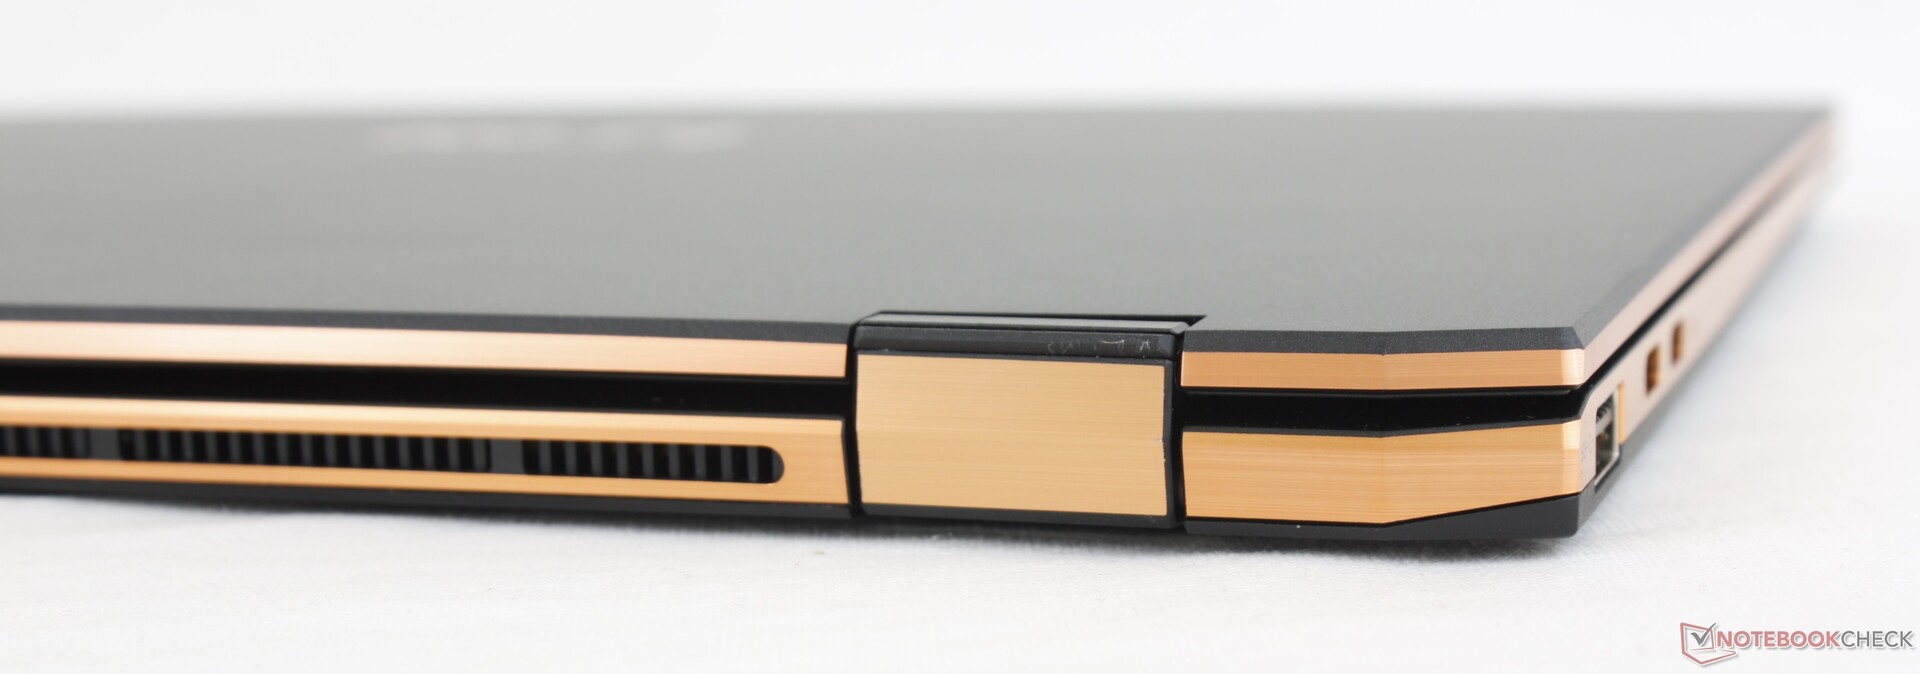
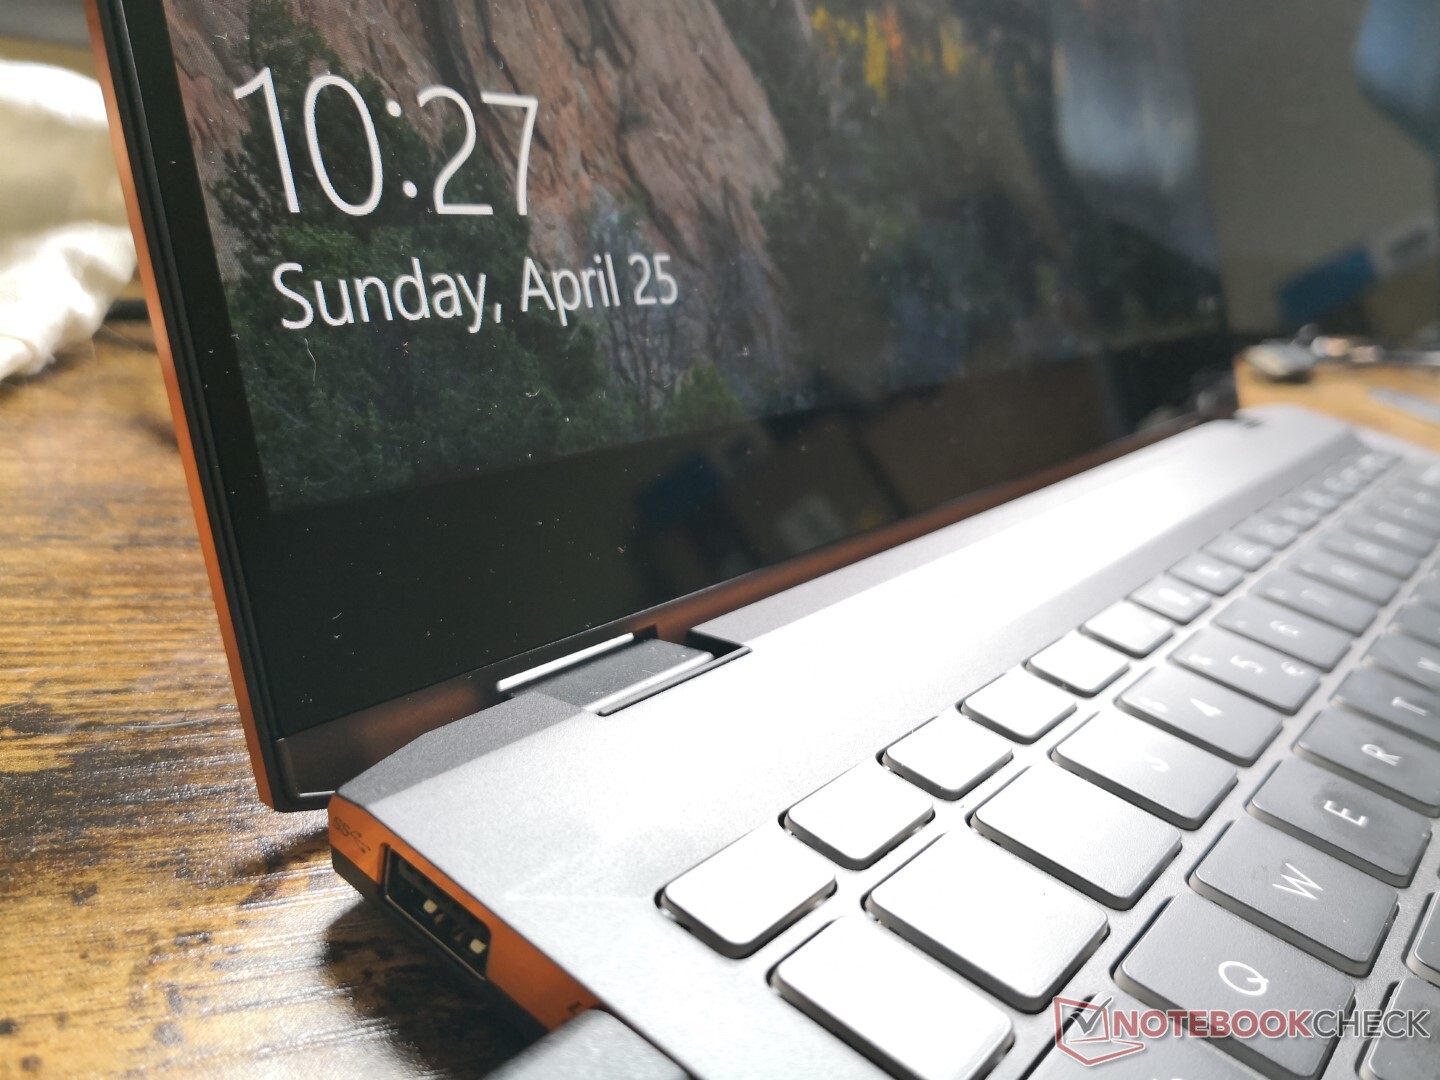
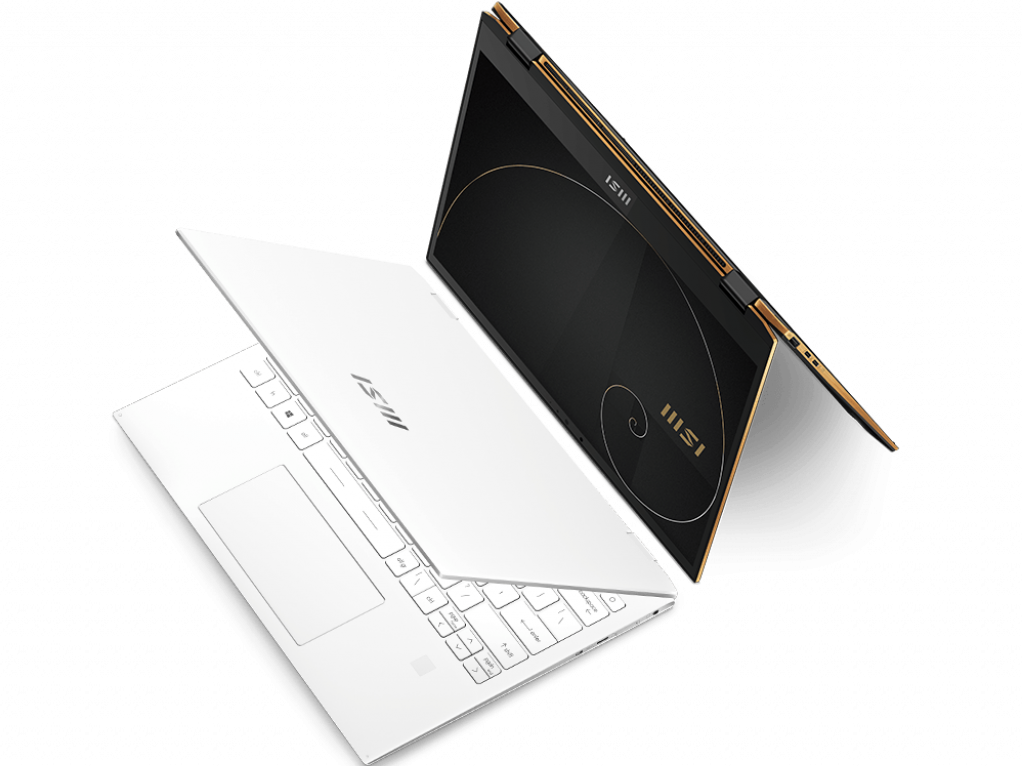
The matte ash-colored surfaces and bronze-colored trims contrast the light gray Modern and Prestige series from MSI. In fact, the overall aesthetic and colors are very close to what HP offers through its Spectre series. Even the sharp, italicized MSI logo on the outer lid and rear "diamond-cut" corners look a lot like the latest Spectre laptops. This isn't a snub at MSI or anything as we're simply sharing our initial observations of the Summit design.
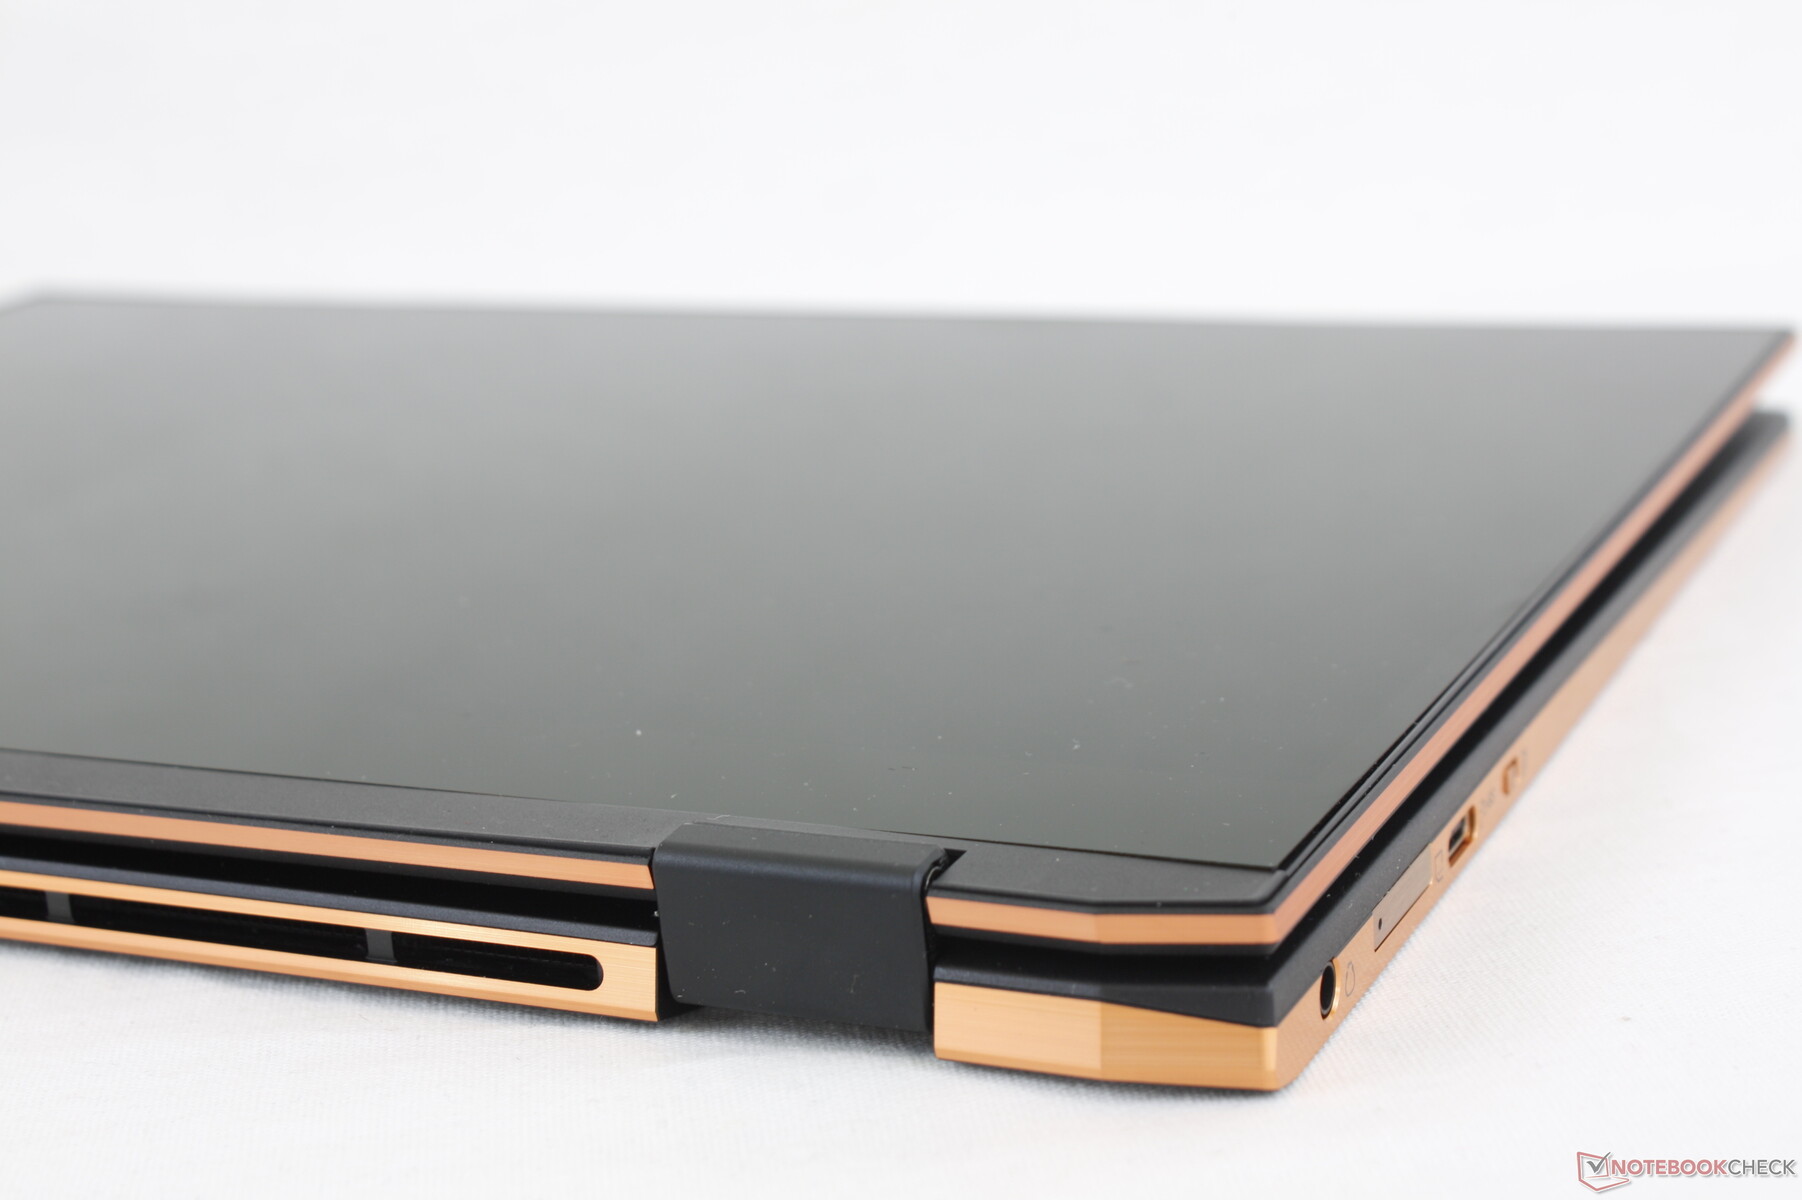
Base rigidity is excellent with only minimal warping and no creaking when twisting its corners or pressing down on the keyboard center. The lid, however, flexes a bit more than on the Dell XPS 13 or HP Spectre x360 13 for a slightly weaker impression. The hinges are our least favorite aspect of the Summit E13 Flip as they feel weak especially once you go past 140 degrees. The lid tends to teeter when adjusting angles as well.
As nice as it may look, the Summit E13 Flip isn't the smallest in its category. The system is still larger in length and width than both the XPS 13 2-in-1 and Spectre x360 14 even though the latter offers a slightly larger 13.5-inch display. It's also a bit heavier by about 100 g or even 200 g when compared to the Lenovo X1 Titanium Yoga. This isn't to say that the MSI isn't lightweight or portable, but there are certainly better options available in this regard.
Connectivity
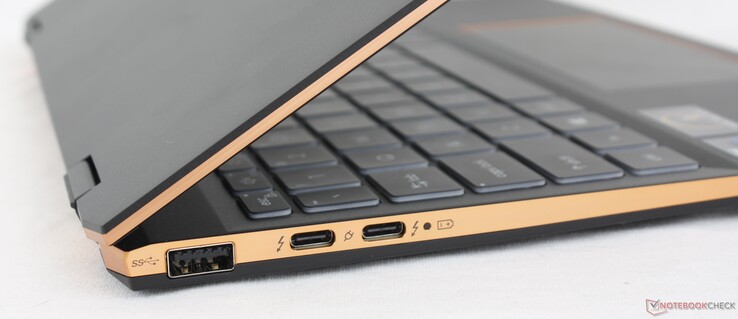
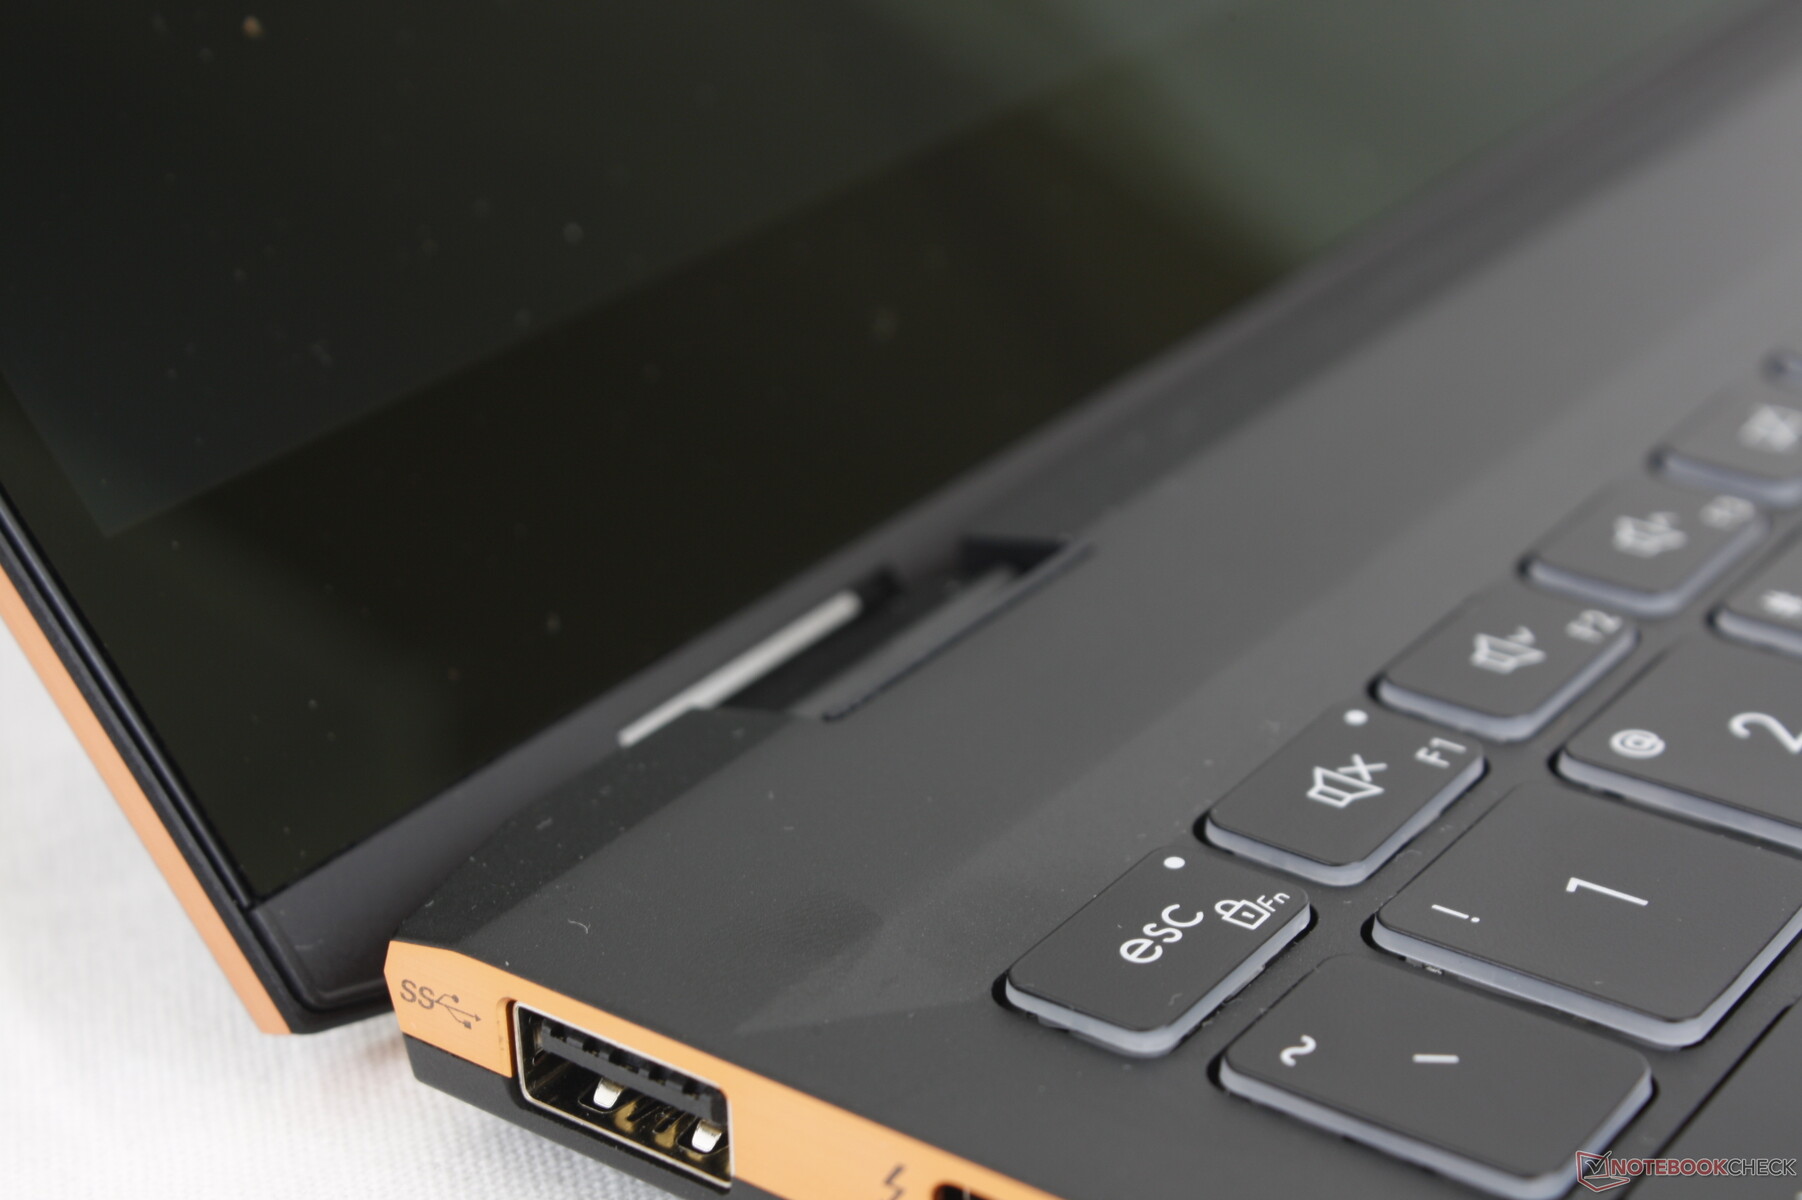
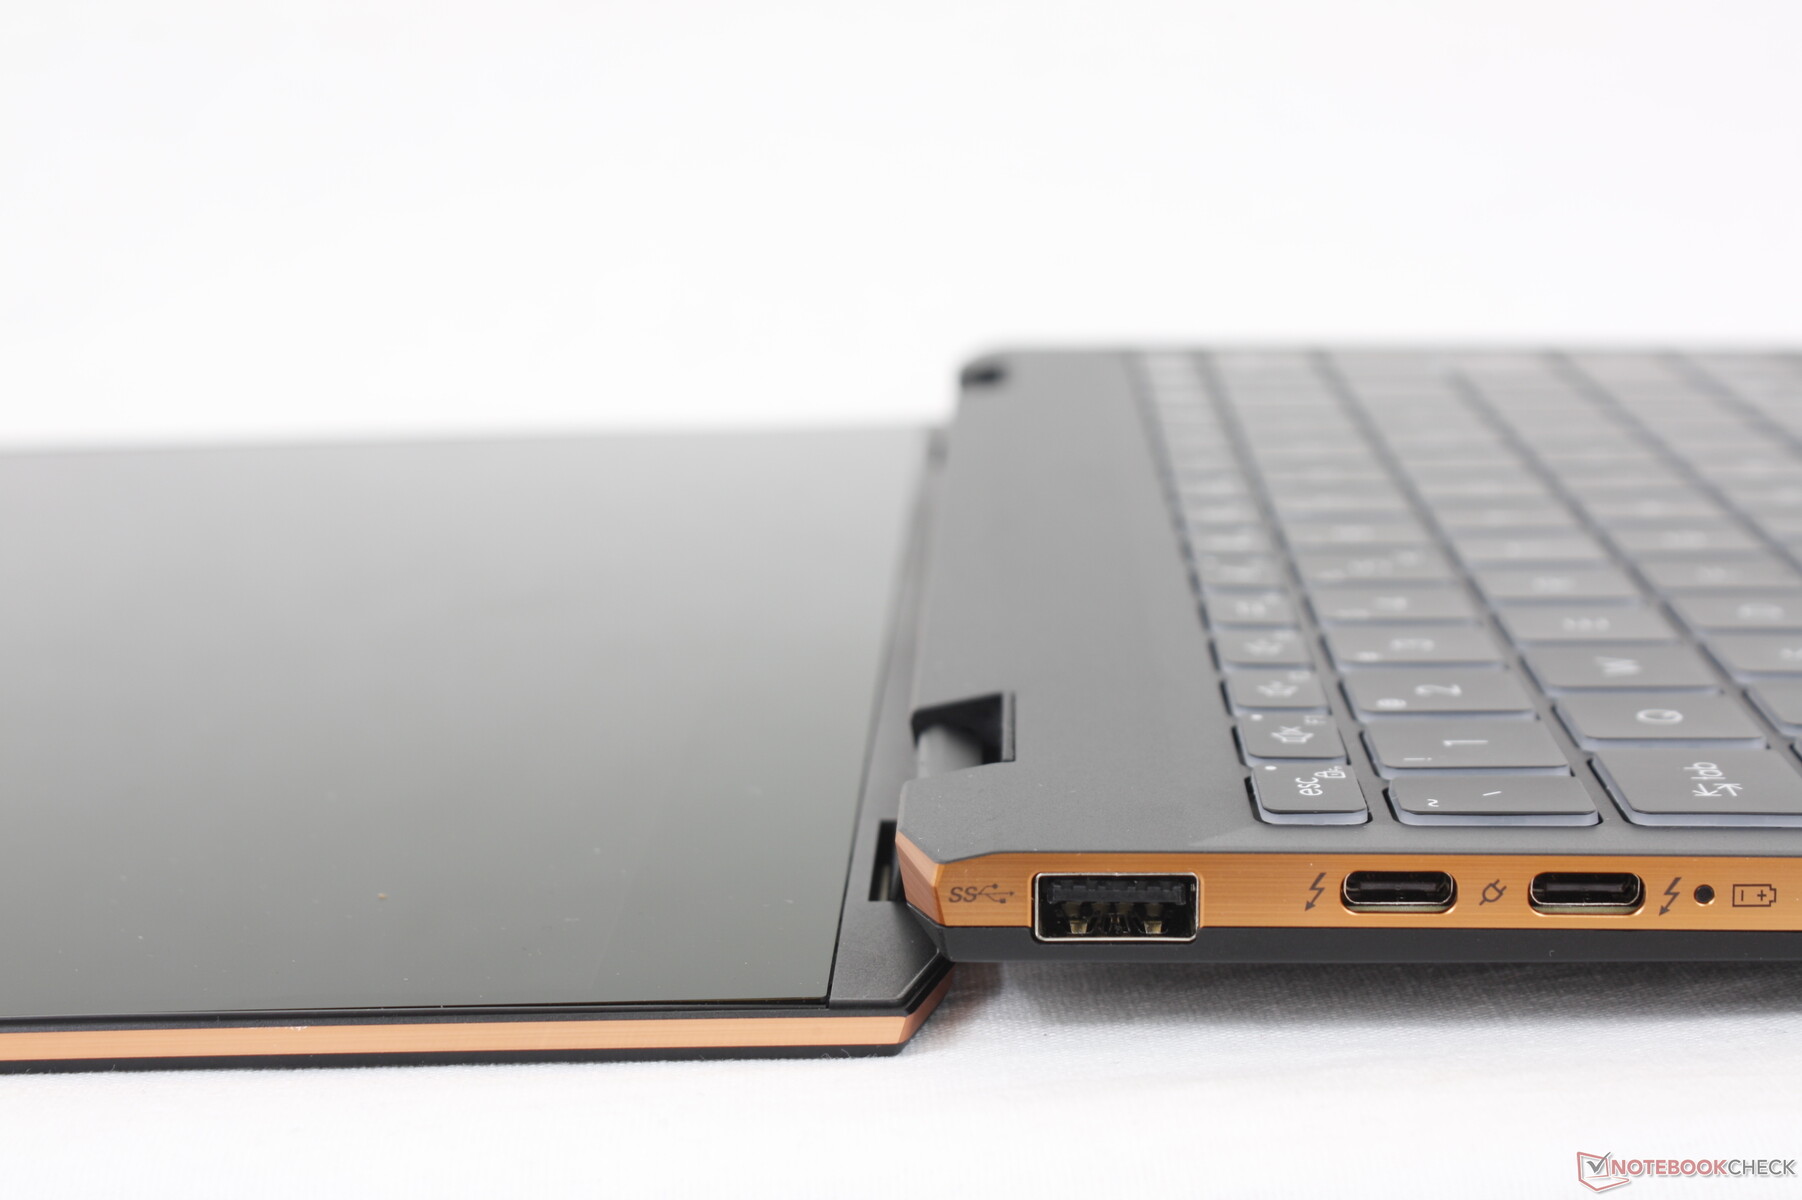
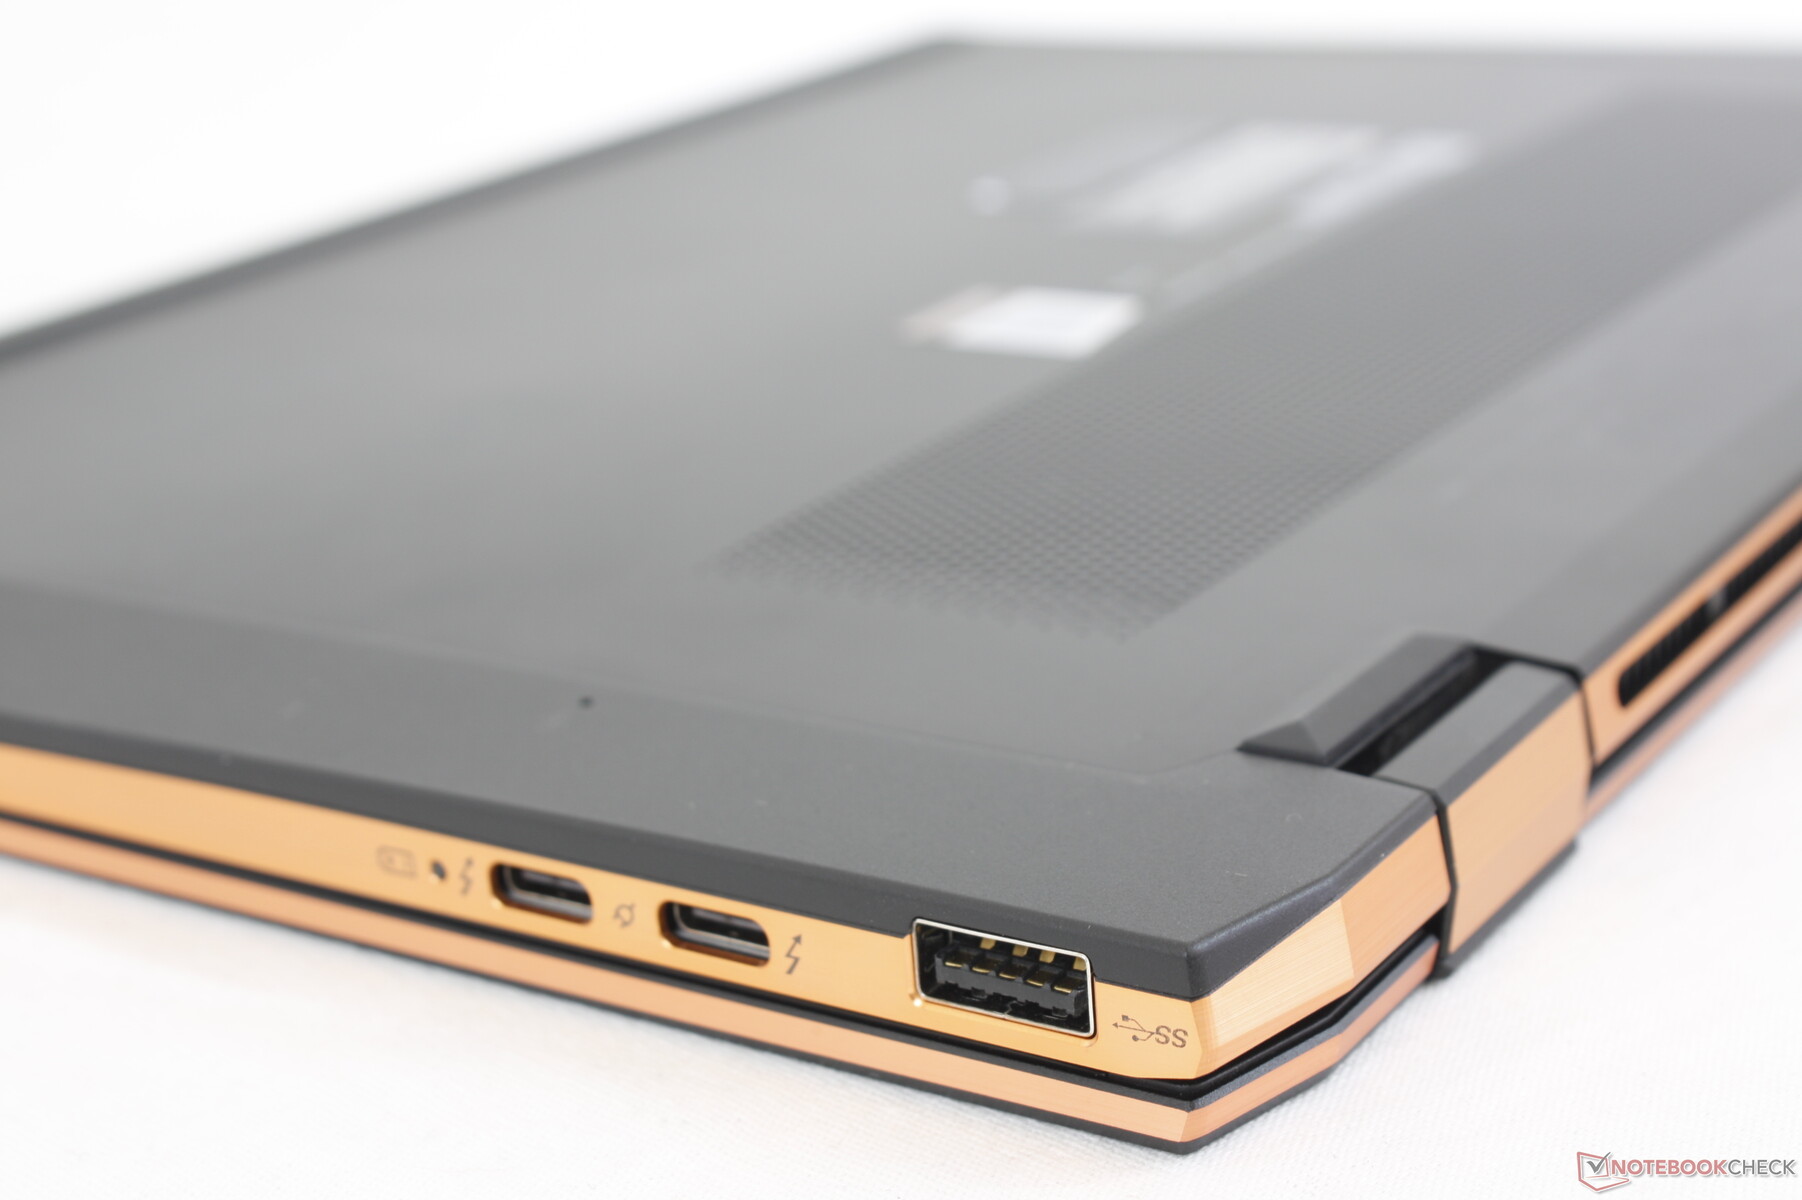
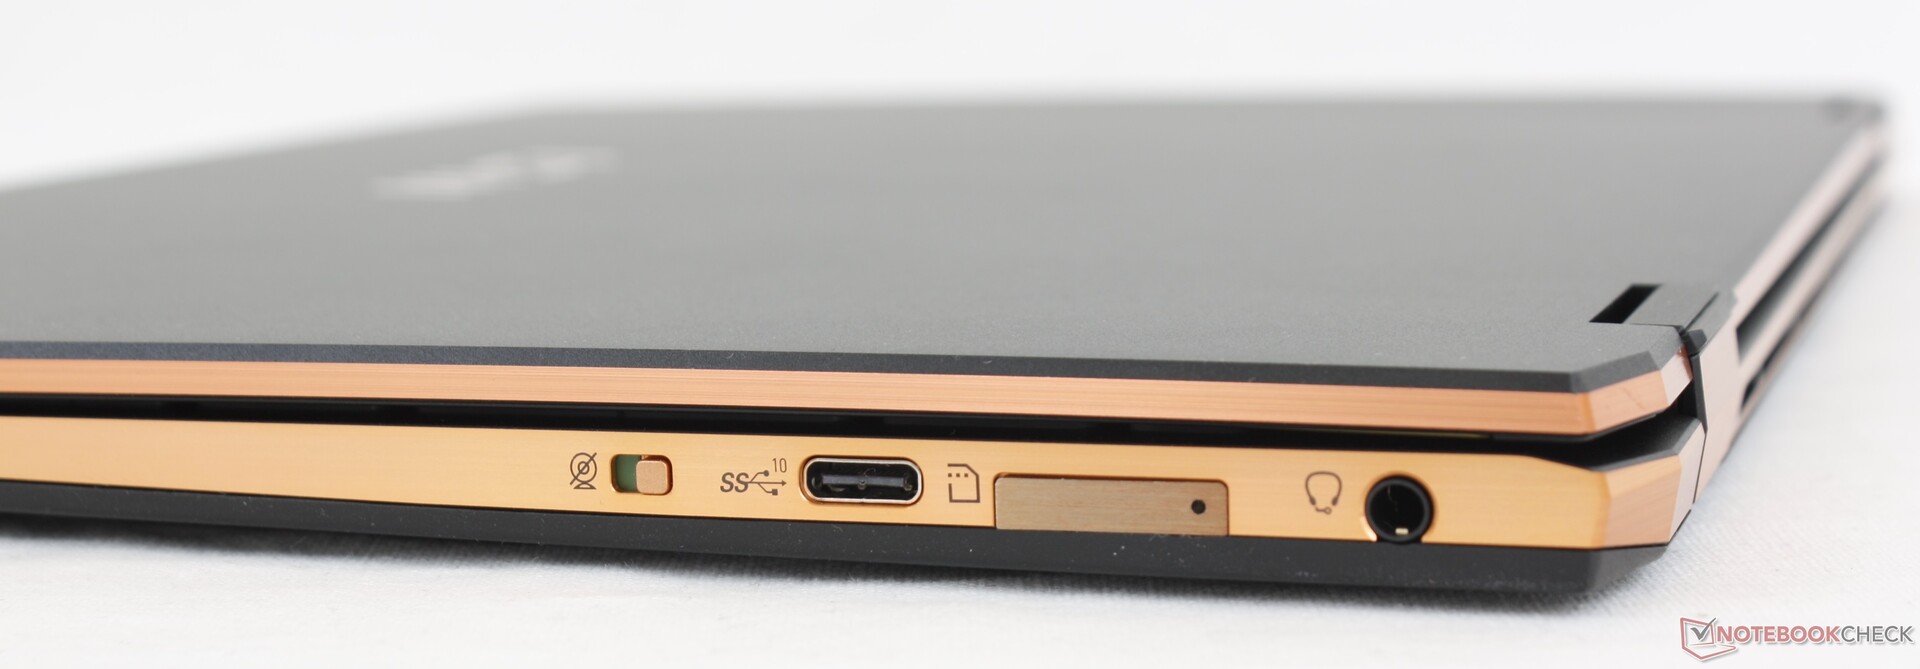
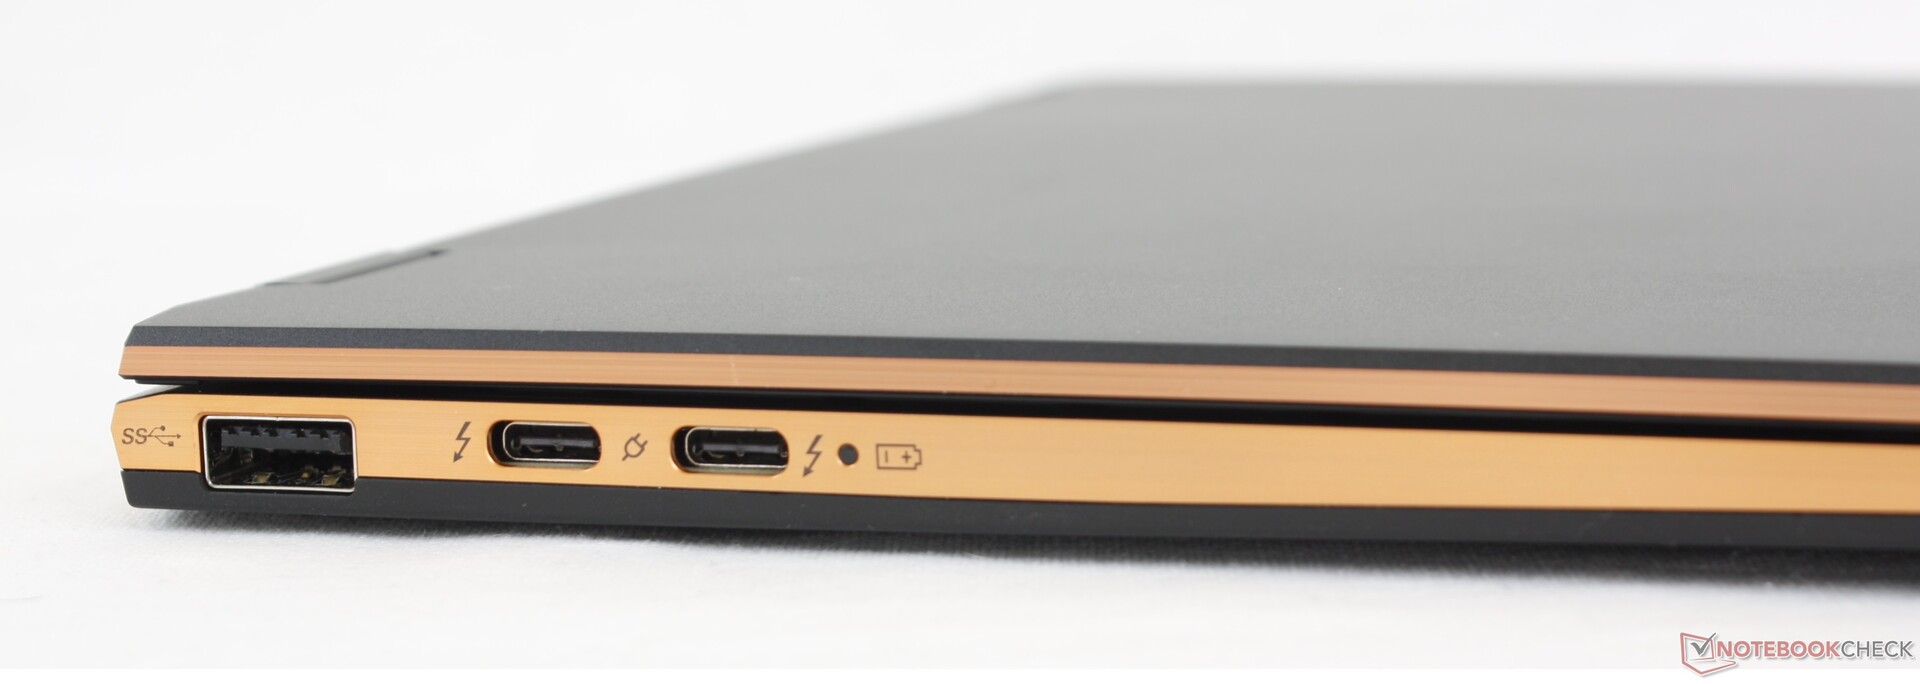
Port options are respectable for the category as there are more options here than on the HP Spectre x360 14 or Dell XPS 13 7390 2-in-1. Most notably, the system comes with three USB-C ports for compatibility with multiple adapters. Note that Power Delivery and DisplayPort are only compatible on the USB-C ports along the left edge while the USB-C port on the right edge supports neither.
A bizarre feature of the MSI laptop is that it has two camera kill switches: one on the keyboard and one along the right edge. It would have been simpler to just have one kill switch to avoid fumbling around with two different switches.
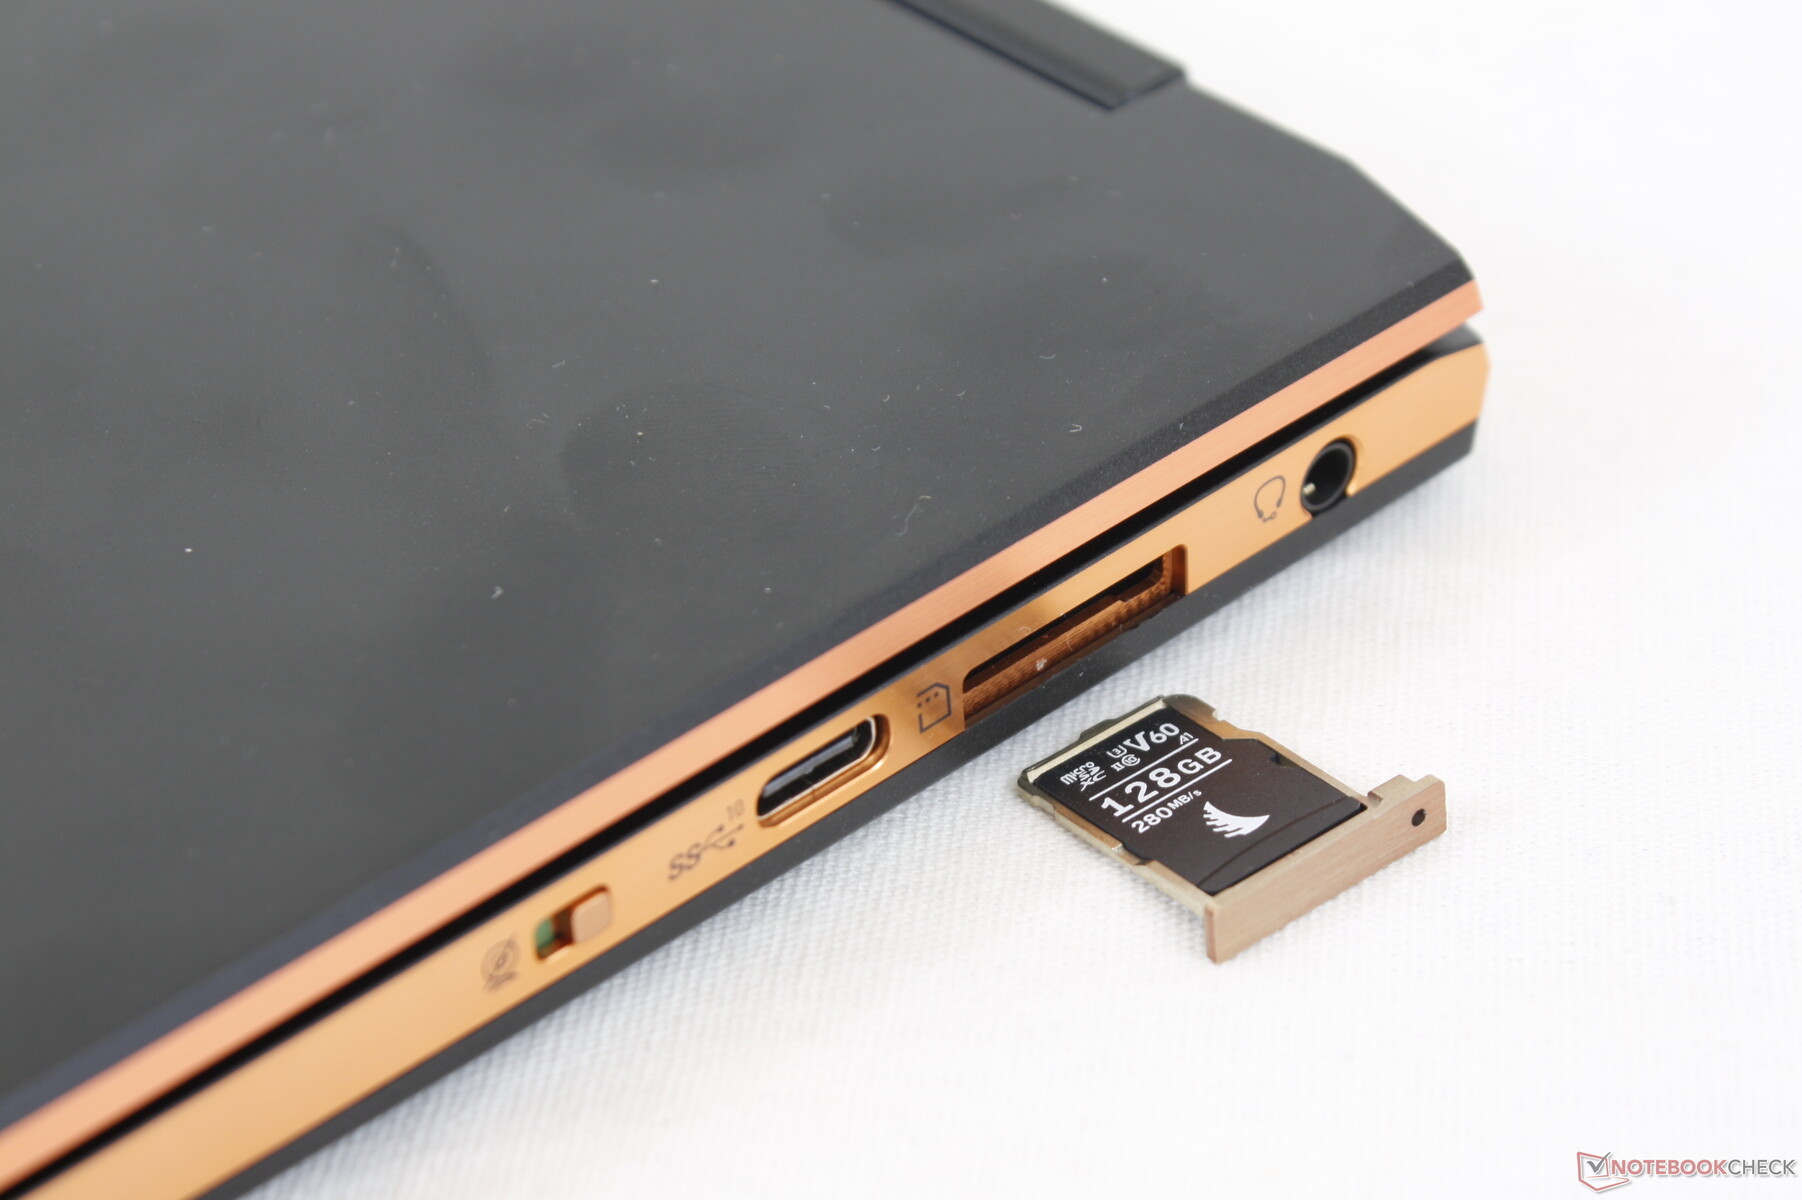
SD Card Reader
Unlike on most other laptops, accessing the MicroSD reader on the Summit E13 Flip requires a SIM pick to be somewhat of a hassle. Transfer rates are also slower than expected at less than half that of the Spectre x360 14 or XPS 13.
| SD Card Reader | |
| average JPG Copy Test (av. of 3 runs) | |
| HP Spectre x360 14t-ea000 (Toshiba Exceria Pro M501 microSDXC 32GB) | |
| Dell XPS 13 7390 2-in-1 Core i7 (Toshiba Exceria Pro M501 64 GB UHS-II) | |
| Asus Zenbook 14 UX435EG (Toshiba Exceria Pro M501 microSDXC 64GB) | |
| MSI Summit E13 Flip Evo A11MT (AV PRO microSD 128 GB V60) | |
| maximum AS SSD Seq Read Test (1GB) | |
| HP Spectre x360 14t-ea000 (Toshiba Exceria Pro M501 microSDXC 32GB) | |
| Dell XPS 13 7390 2-in-1 Core i7 (Toshiba Exceria Pro M501 64 GB UHS-II) | |
| Asus Zenbook 14 UX435EG (Toshiba Exceria Pro M501 microSDXC 64GB) | |
| MSI Summit E13 Flip Evo A11MT (AV PRO microSD 128 GB V60) | |
Communication
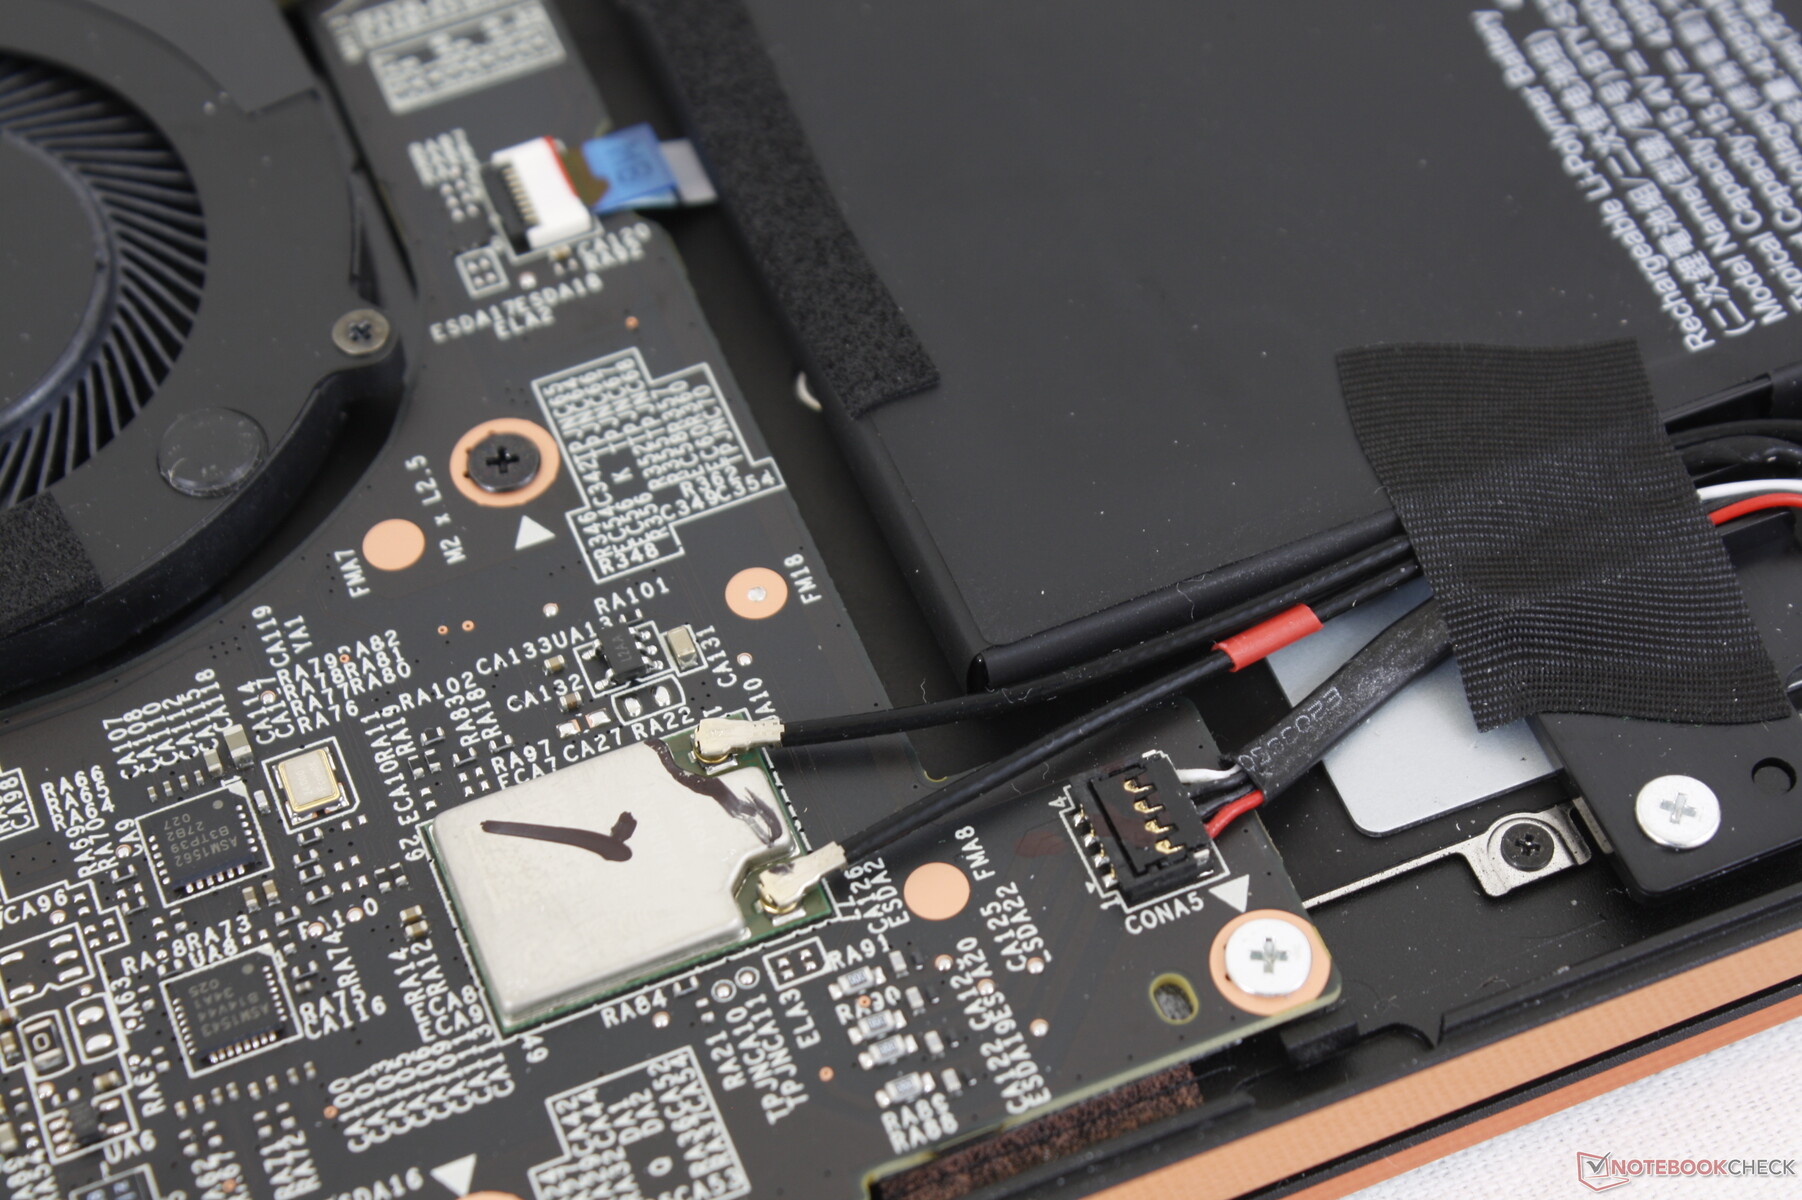
The system ships with the newer Intel AX210 instead of the AX200/201 for Wi-Fi 6E compatibility. Even so, transfer rates are slower than expected when connected to our Netgear RAX200 test router even after multiple retests.
Killer USB-C Ethernet Adapter - Upgrade to a stable connection
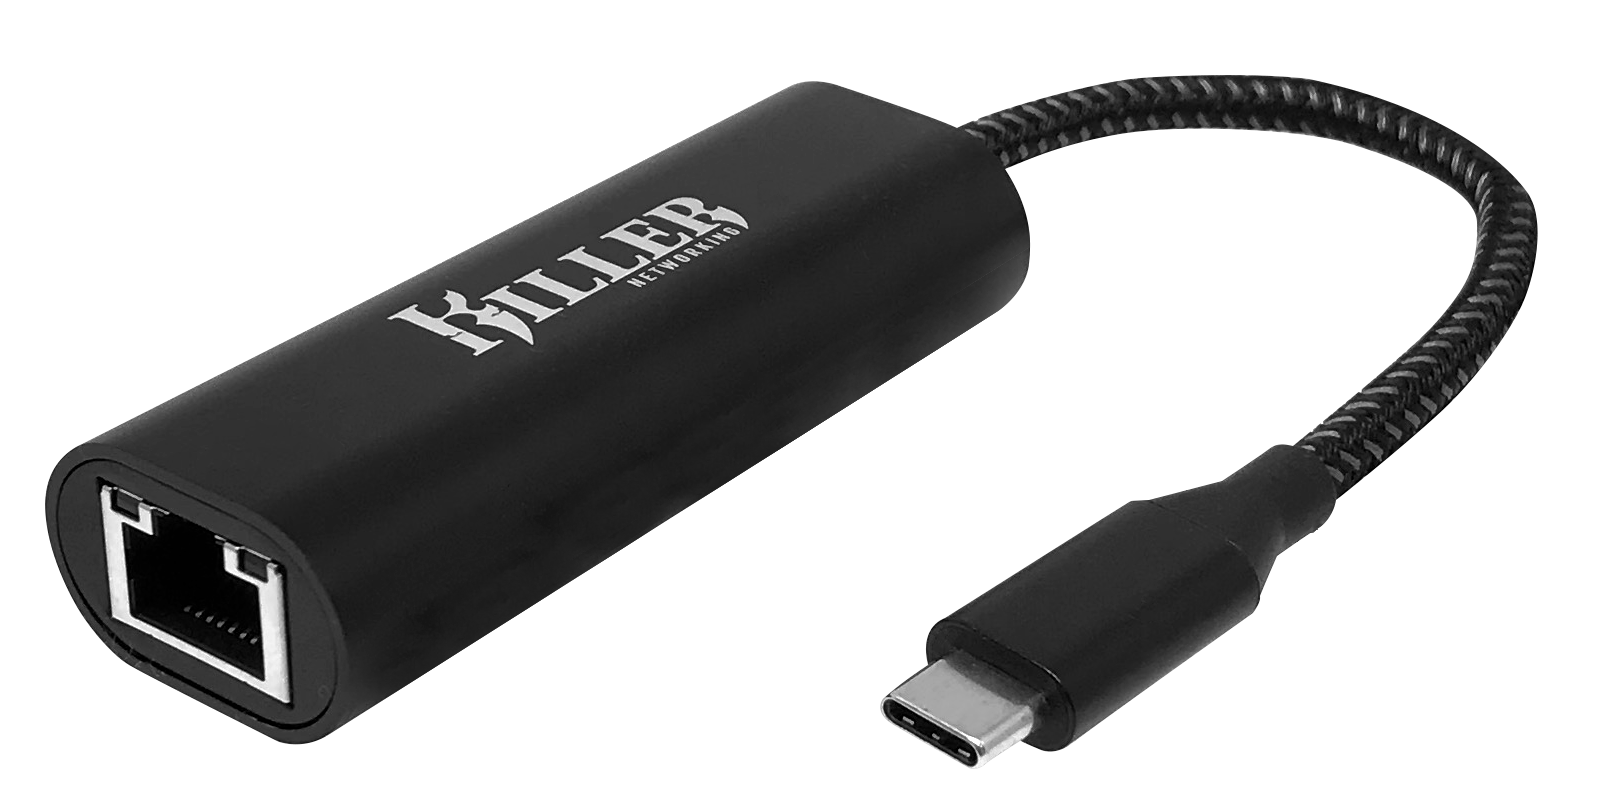
Despite advances in wireless networking, Ethernet is still the top choice for gamers and power users. The Killer 2.5G Ethernet to USB-C Adapter enables seamless Ethernet connectivity with full 2.5 Gbps throughput. It also brings the best of Killer technologies including the much acclaimed Killer Prioritization Engine, GameFast, Extreme Mode, and Intelligence Engine that ensure your favorite game or app gets the bandwidth and priority it deserves. For laptops already equipped with a Killer wireless card, Killer DoubleShot Pro offers bandwidth doubling and fine-grained control over network packets passing through each connection.
In our testing, the Killer 2.5G Ethernet Adapter lived up to the advertised speeds consistently throughout testing. You can read more about performance comparison with other USB Ethernet Adapters in our article.
The Killer 2.5G Ethernet to USB-C adapter can be purchased on Amazon for US$ 49.99
Webcam


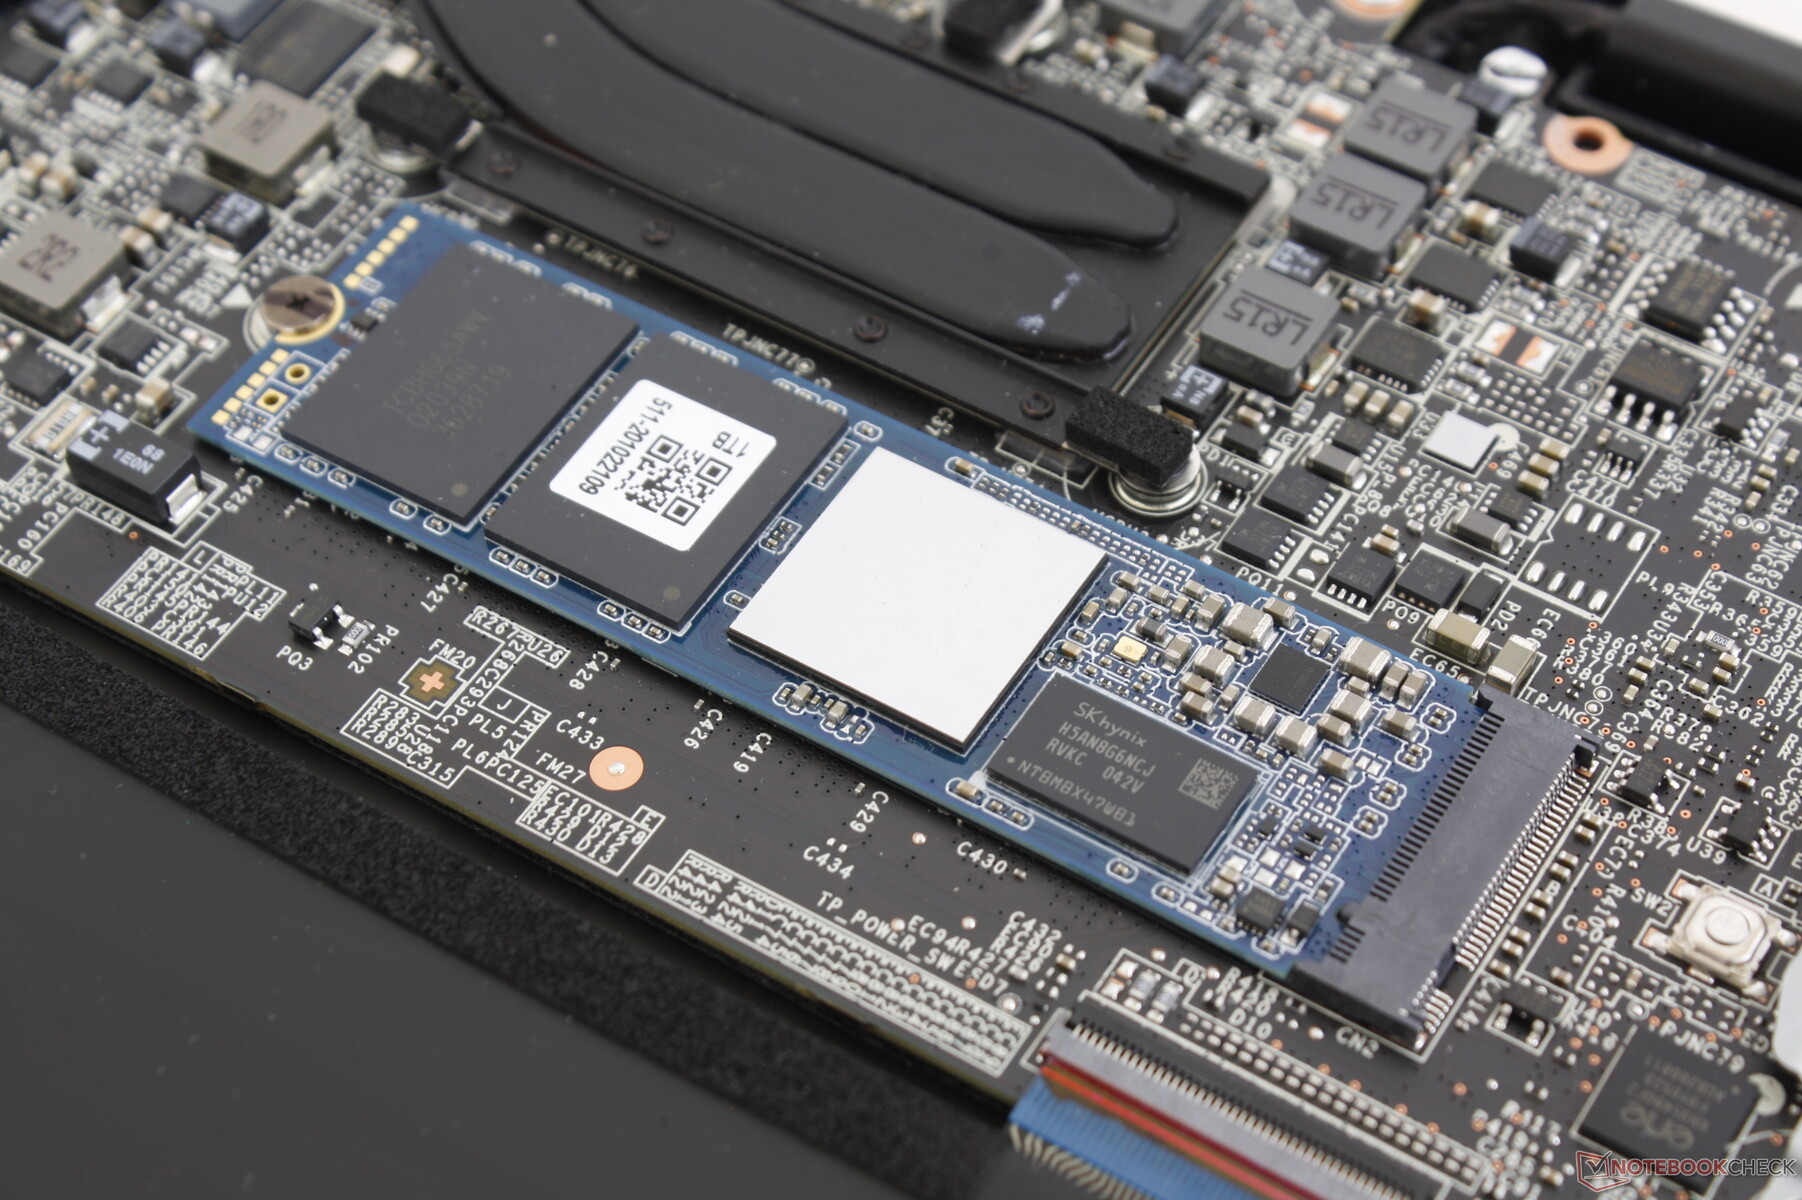
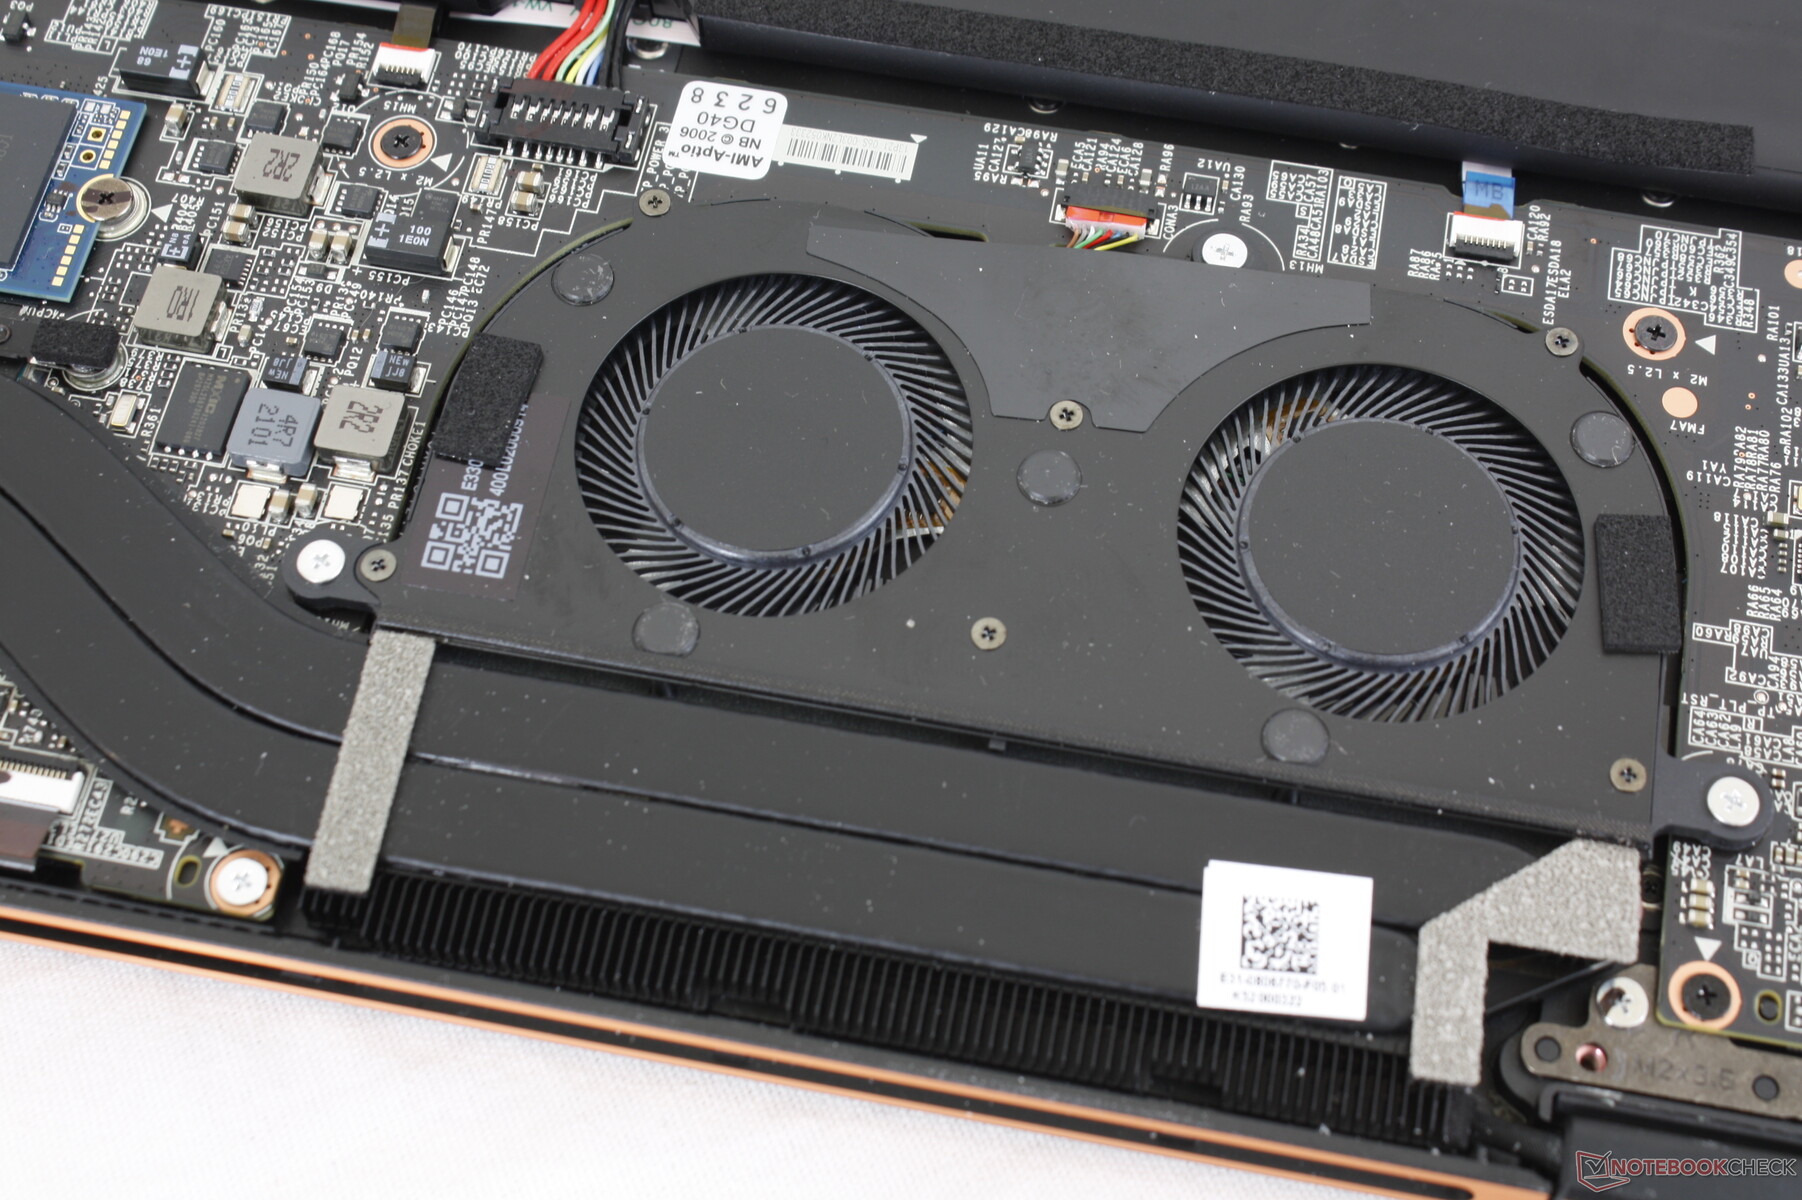
Maintenance
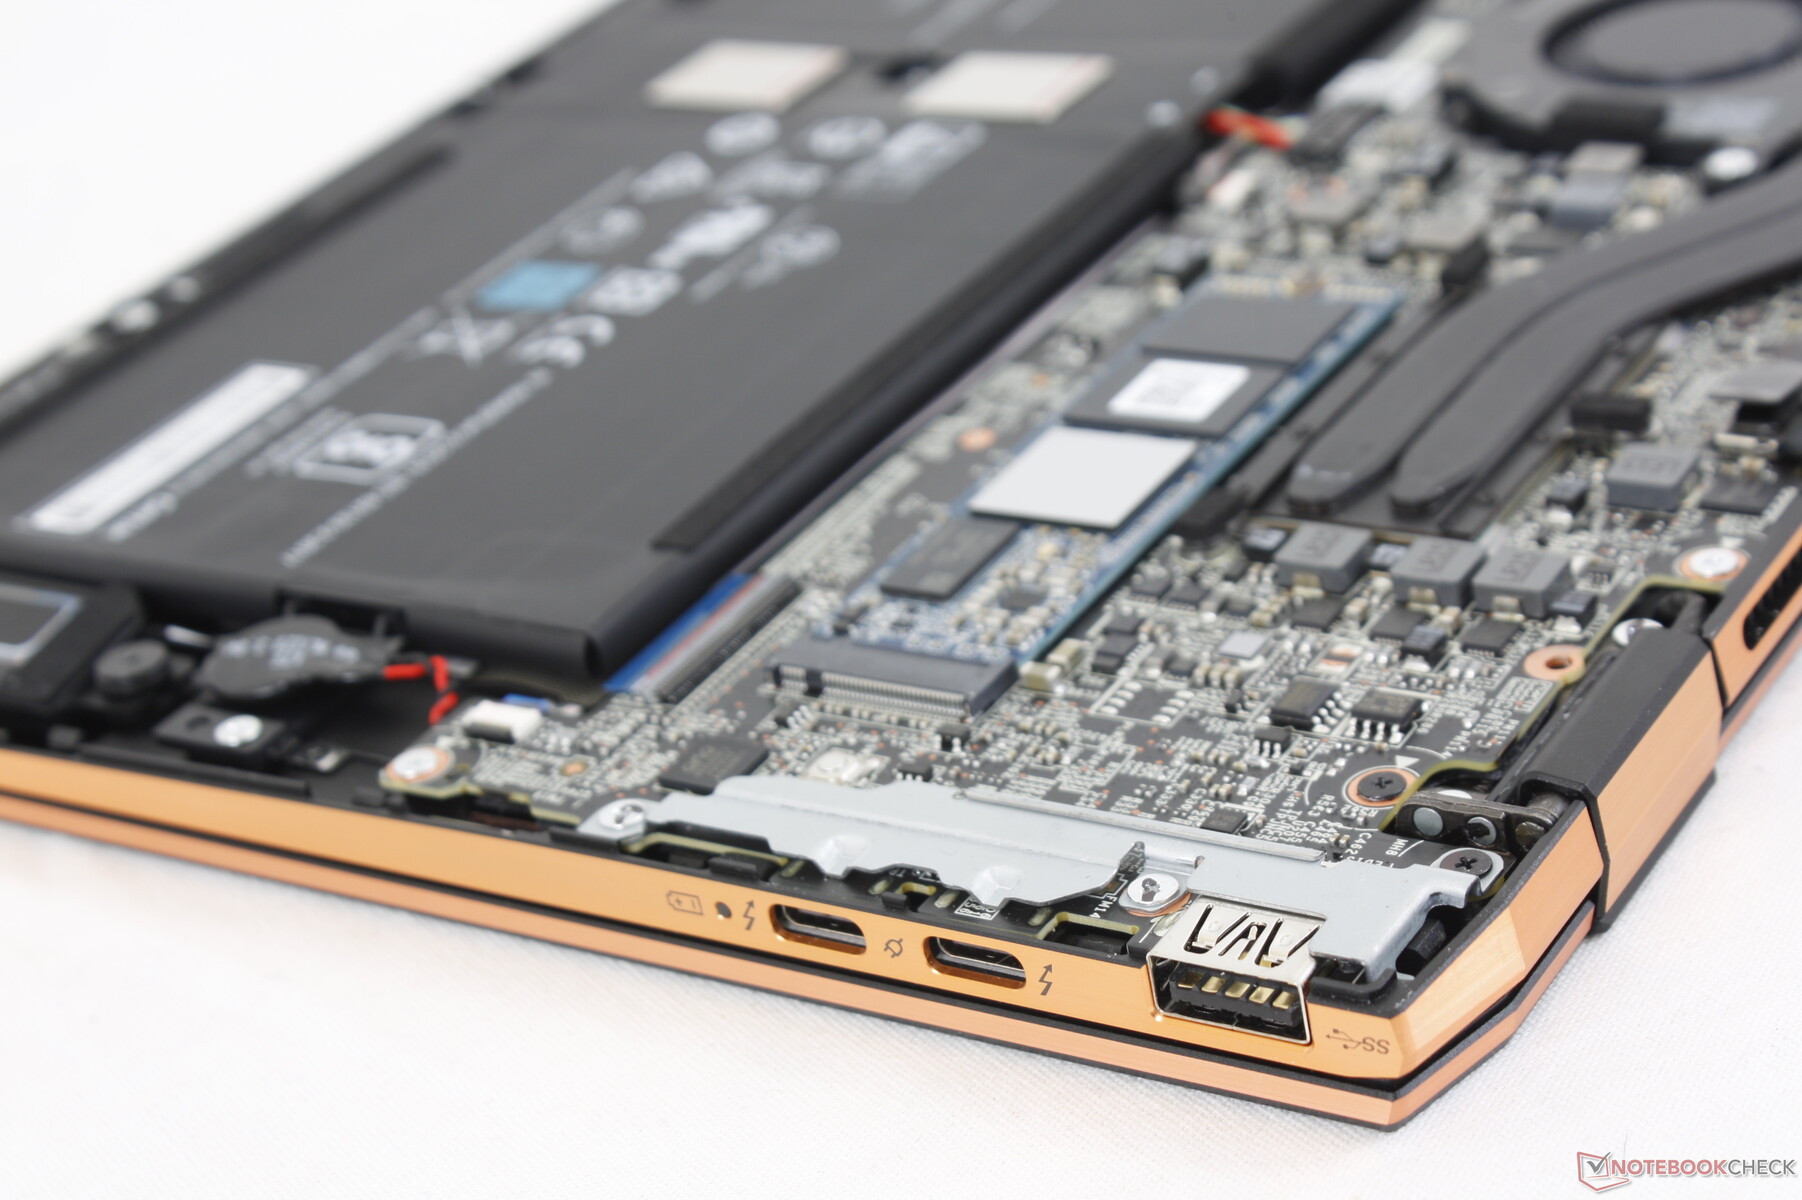
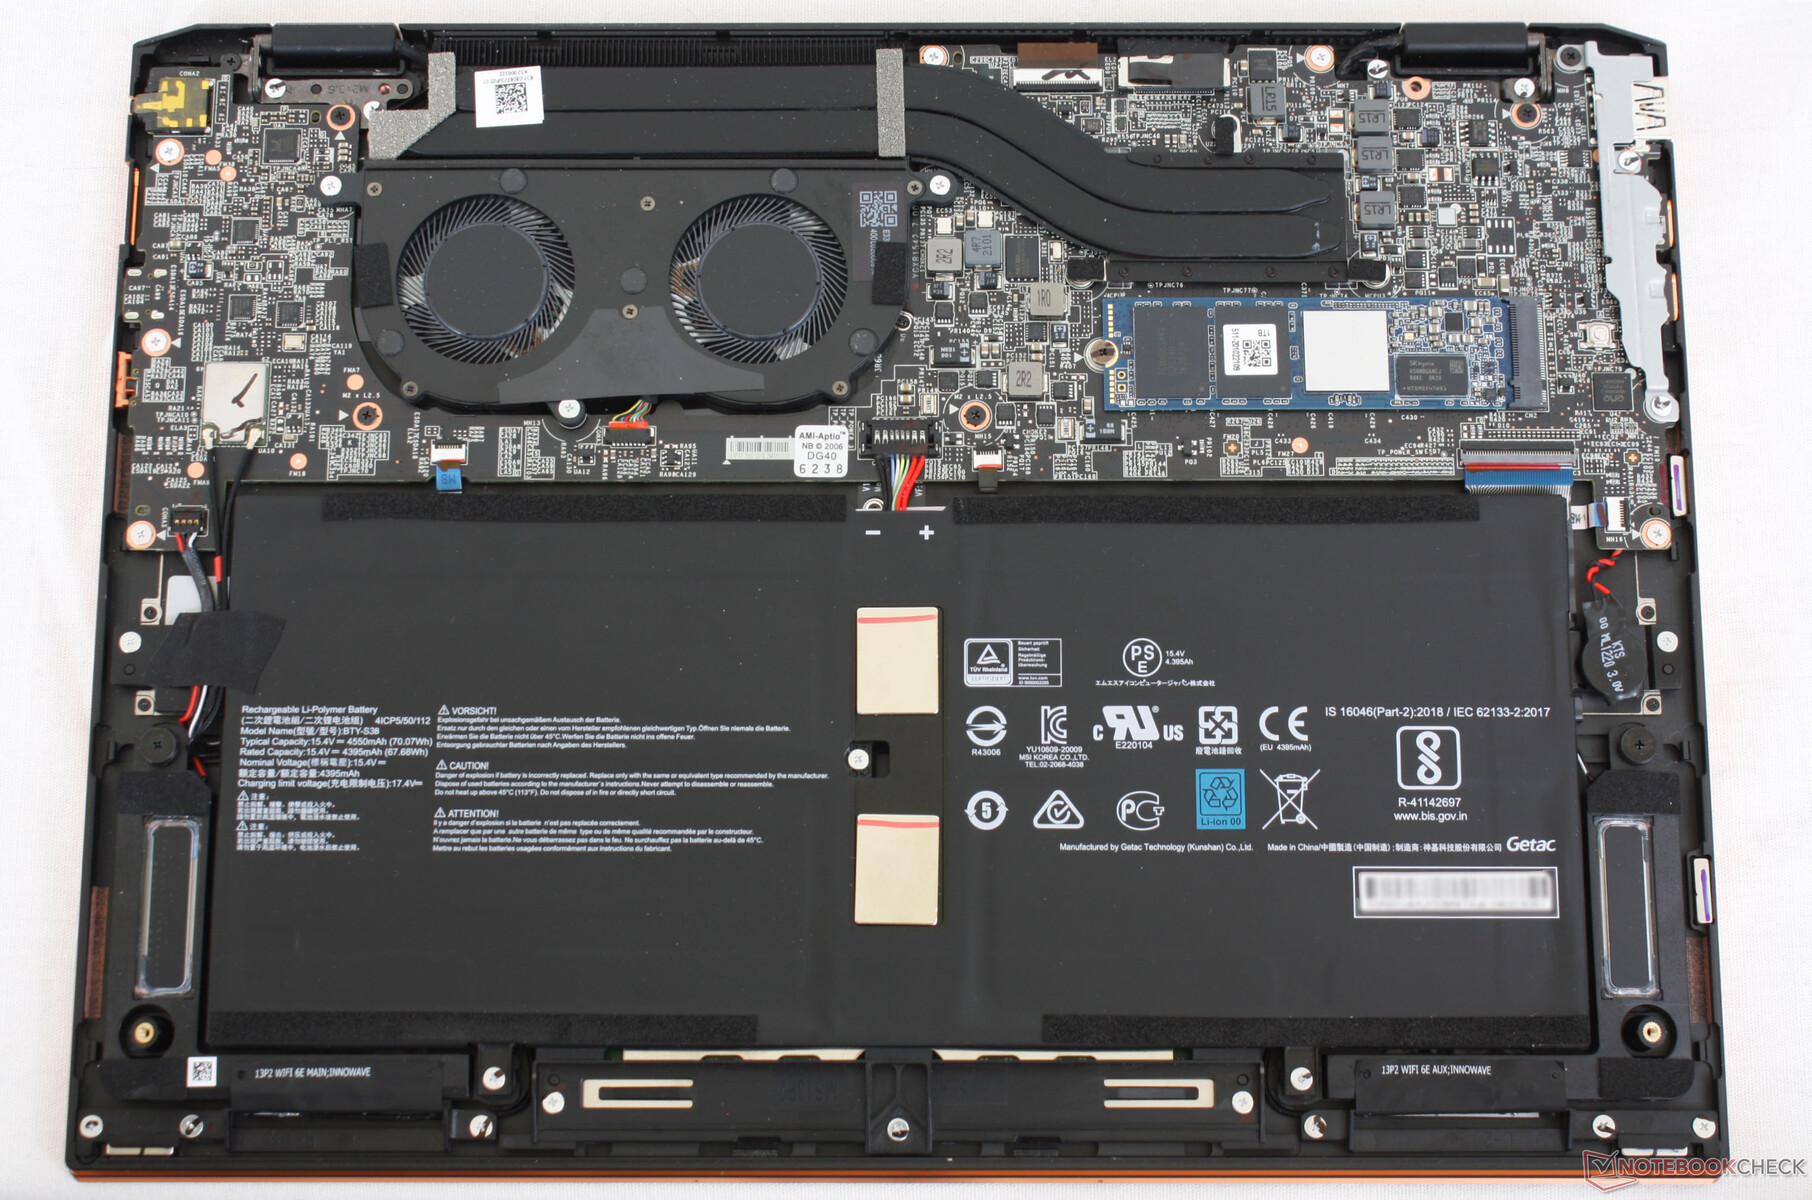
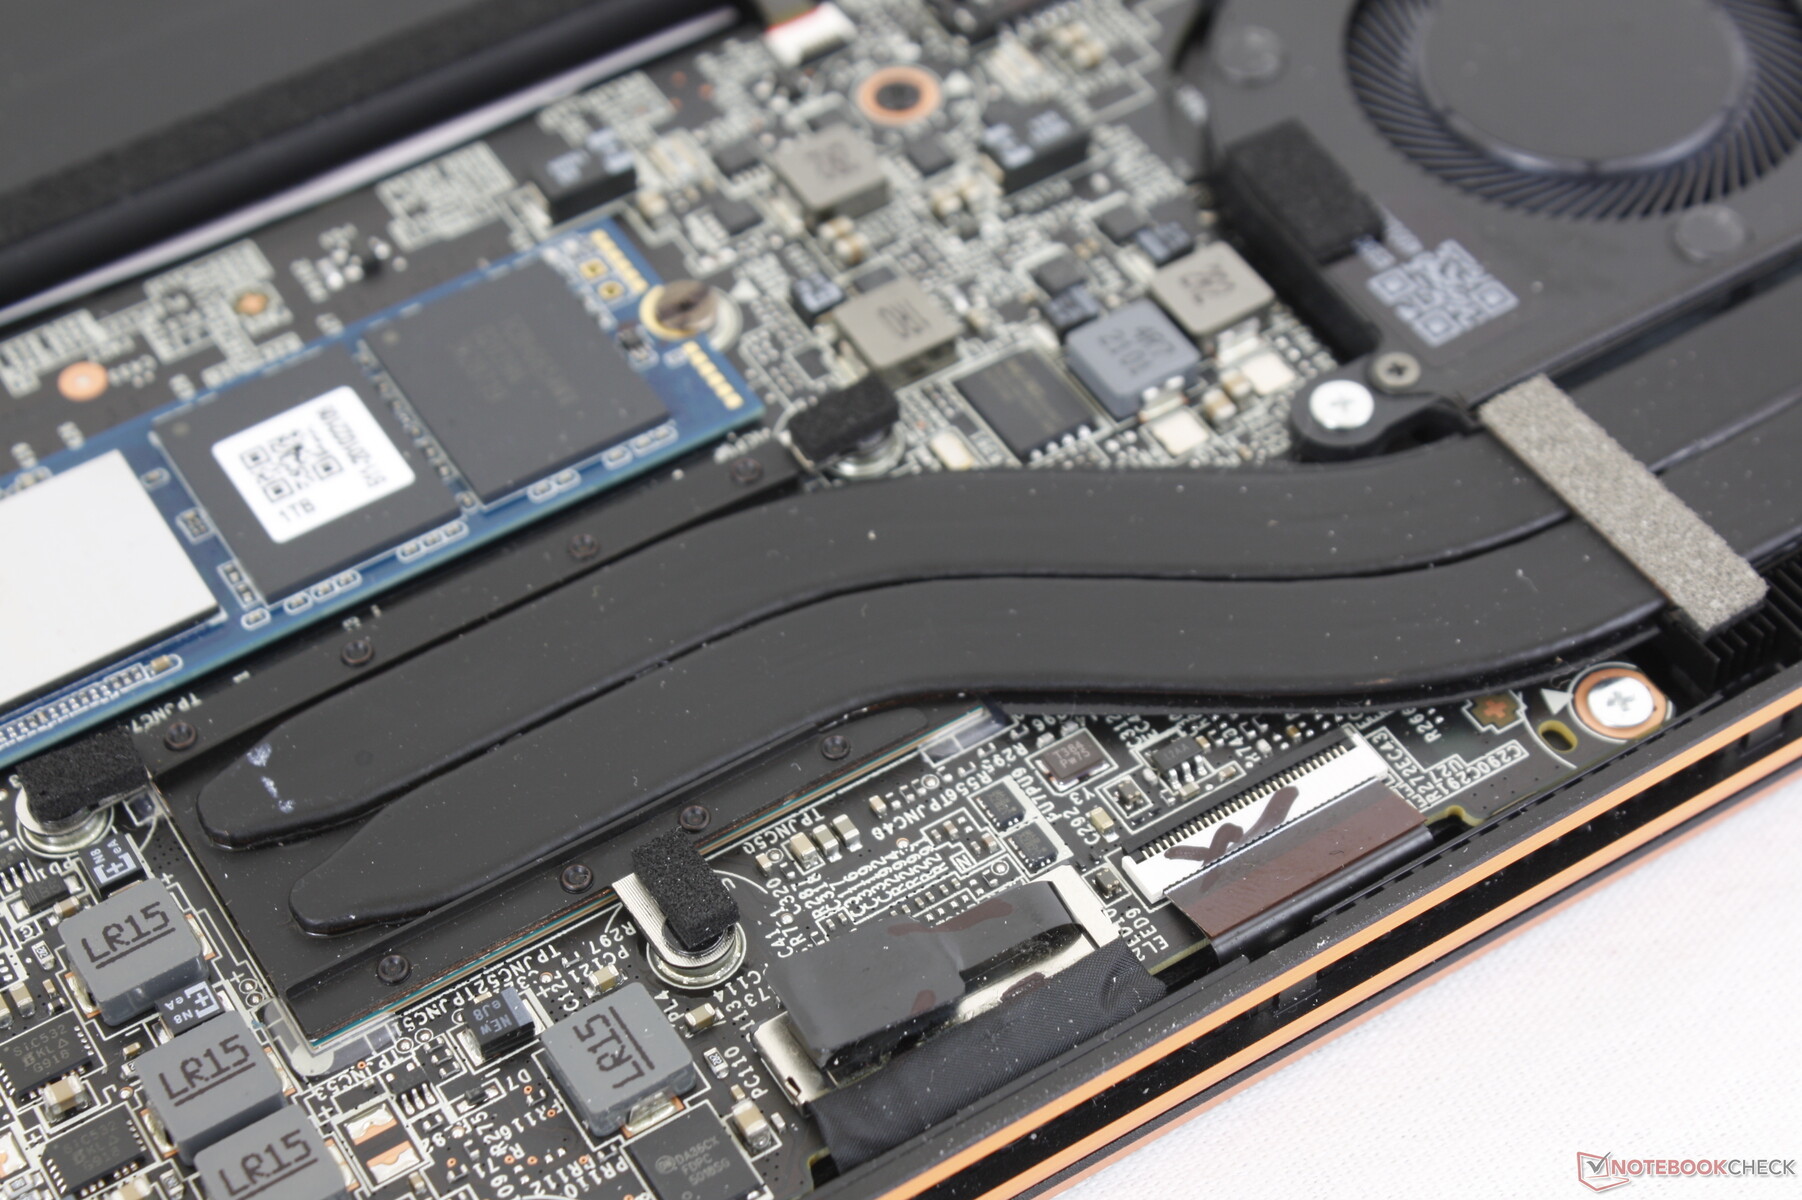
The bottom panel is secured by just four Philips screws. However, keep in mind that a 'factory seal' sticker must be broken and that the two rear screws are hidden underneath the rubber feet. Thus, it's more difficult to service the Summit E13 Flip when compared to most other laptops from MSI.
Only the single M.2 2280 slot is upgradeable since both RAM and WLAN are soldered.
Accessories and Warranty
The packaging includes an active MSI pen and protective carrying sleeve alongside the usual paperwork. A cleaning cloth is not included.
The standard one-year limited warranty applies with additional protection if ordered from Xotic PC.
Input Devices
Keyboard
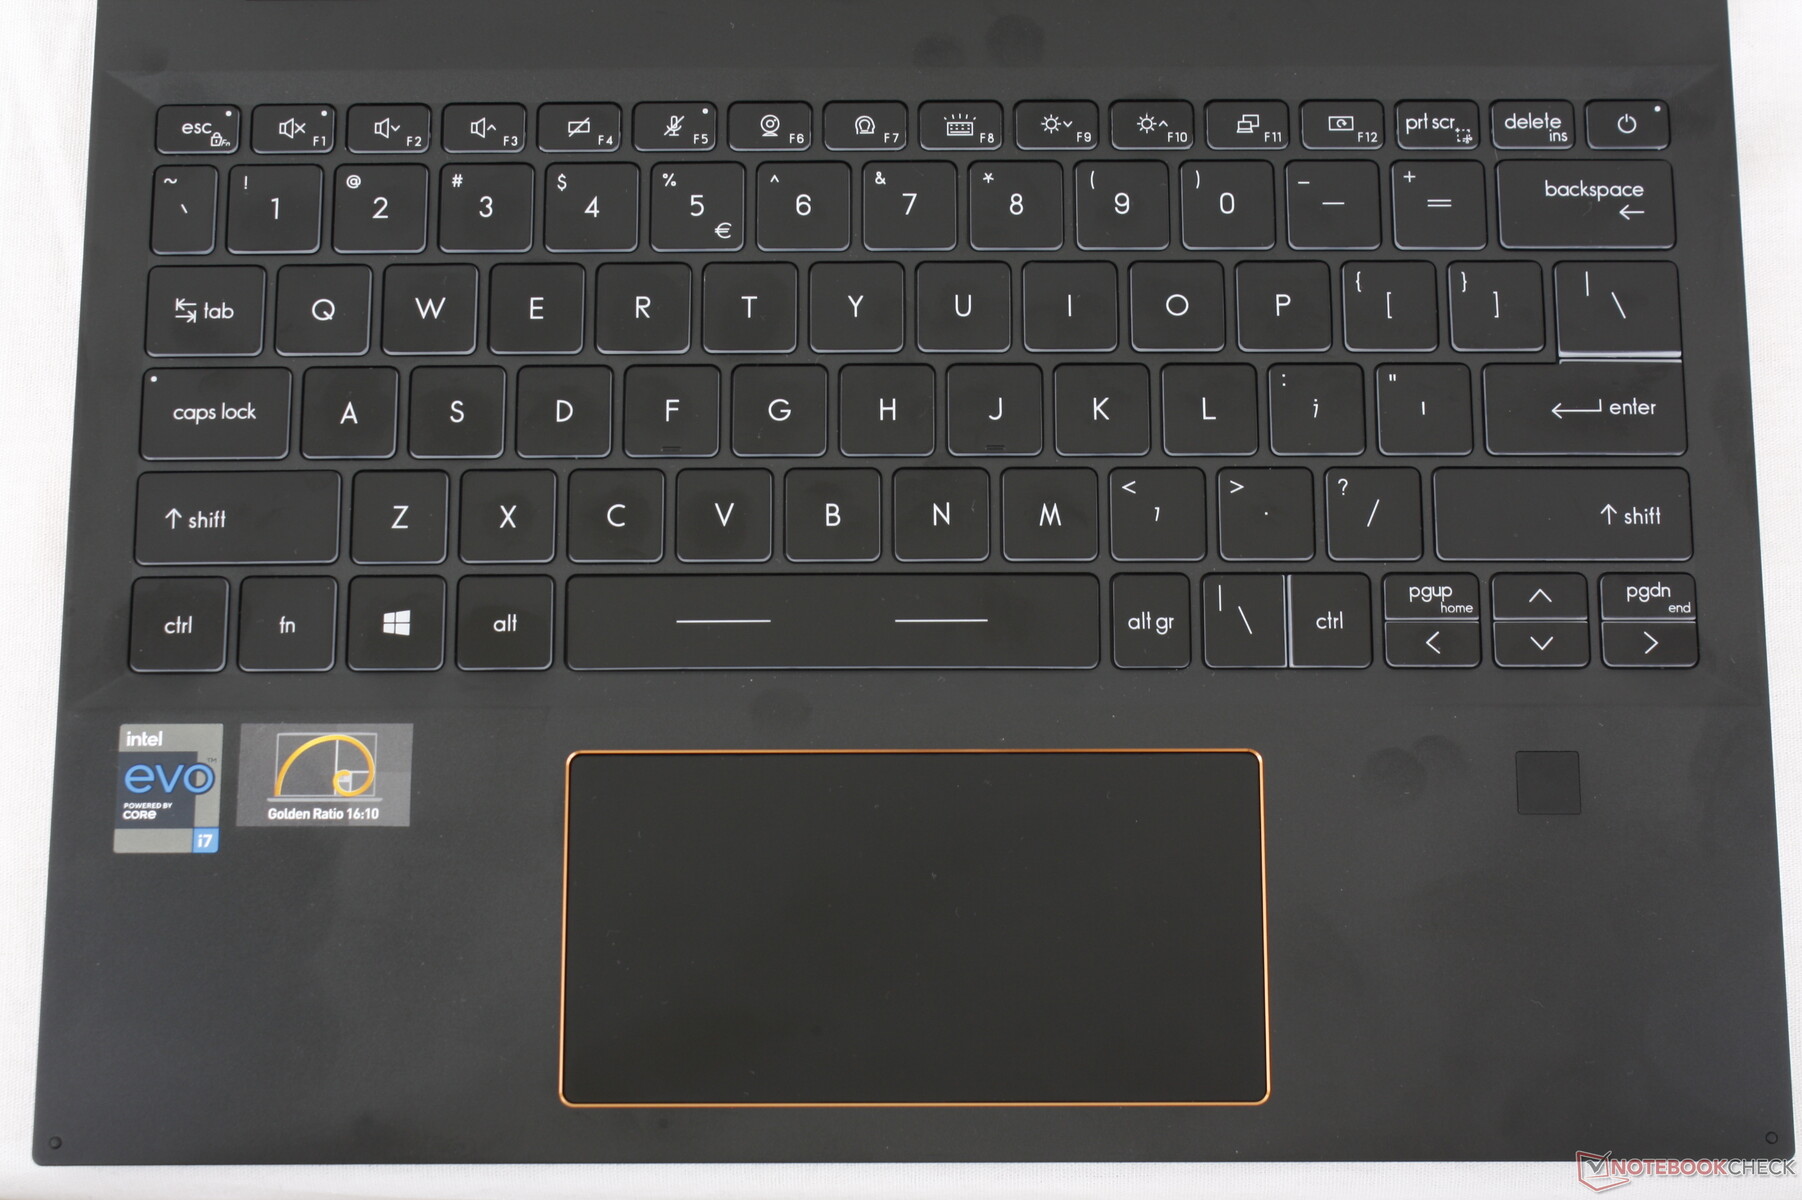
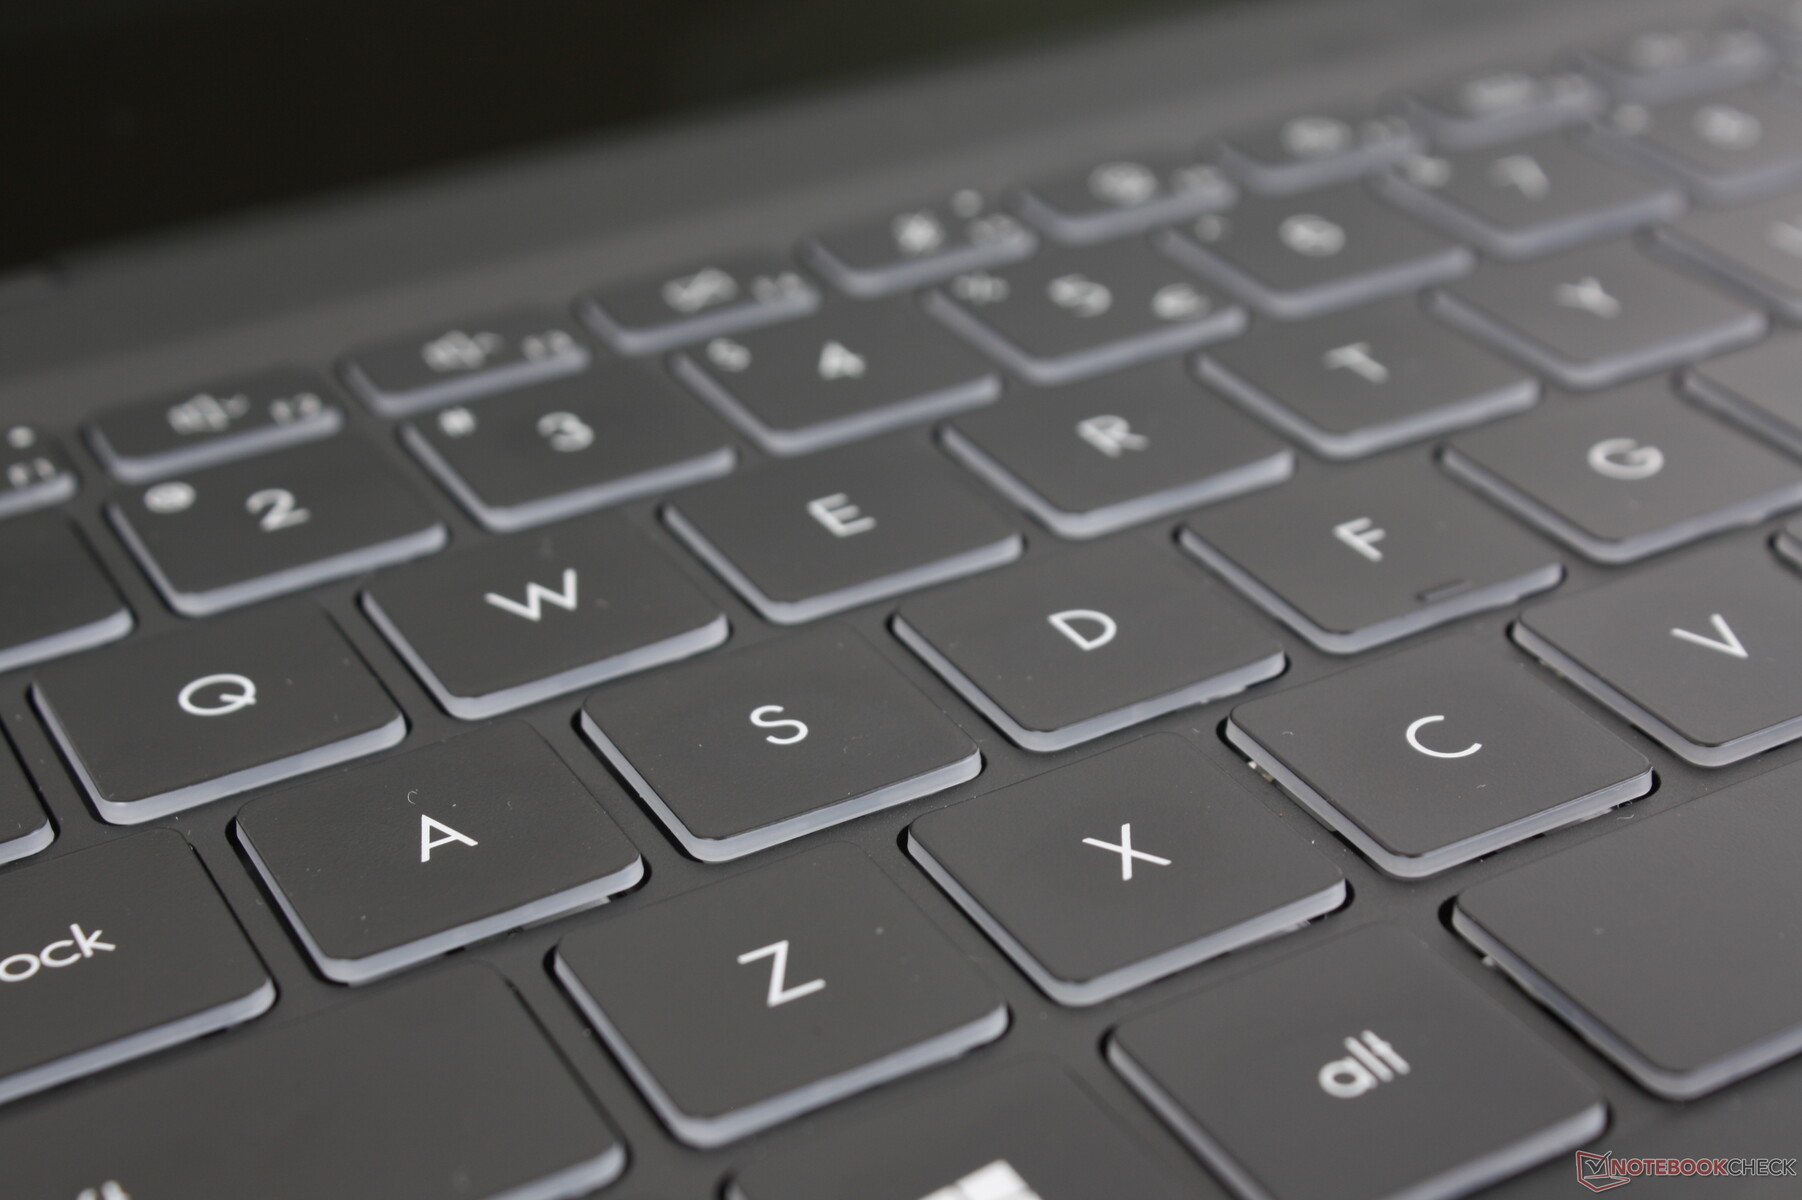
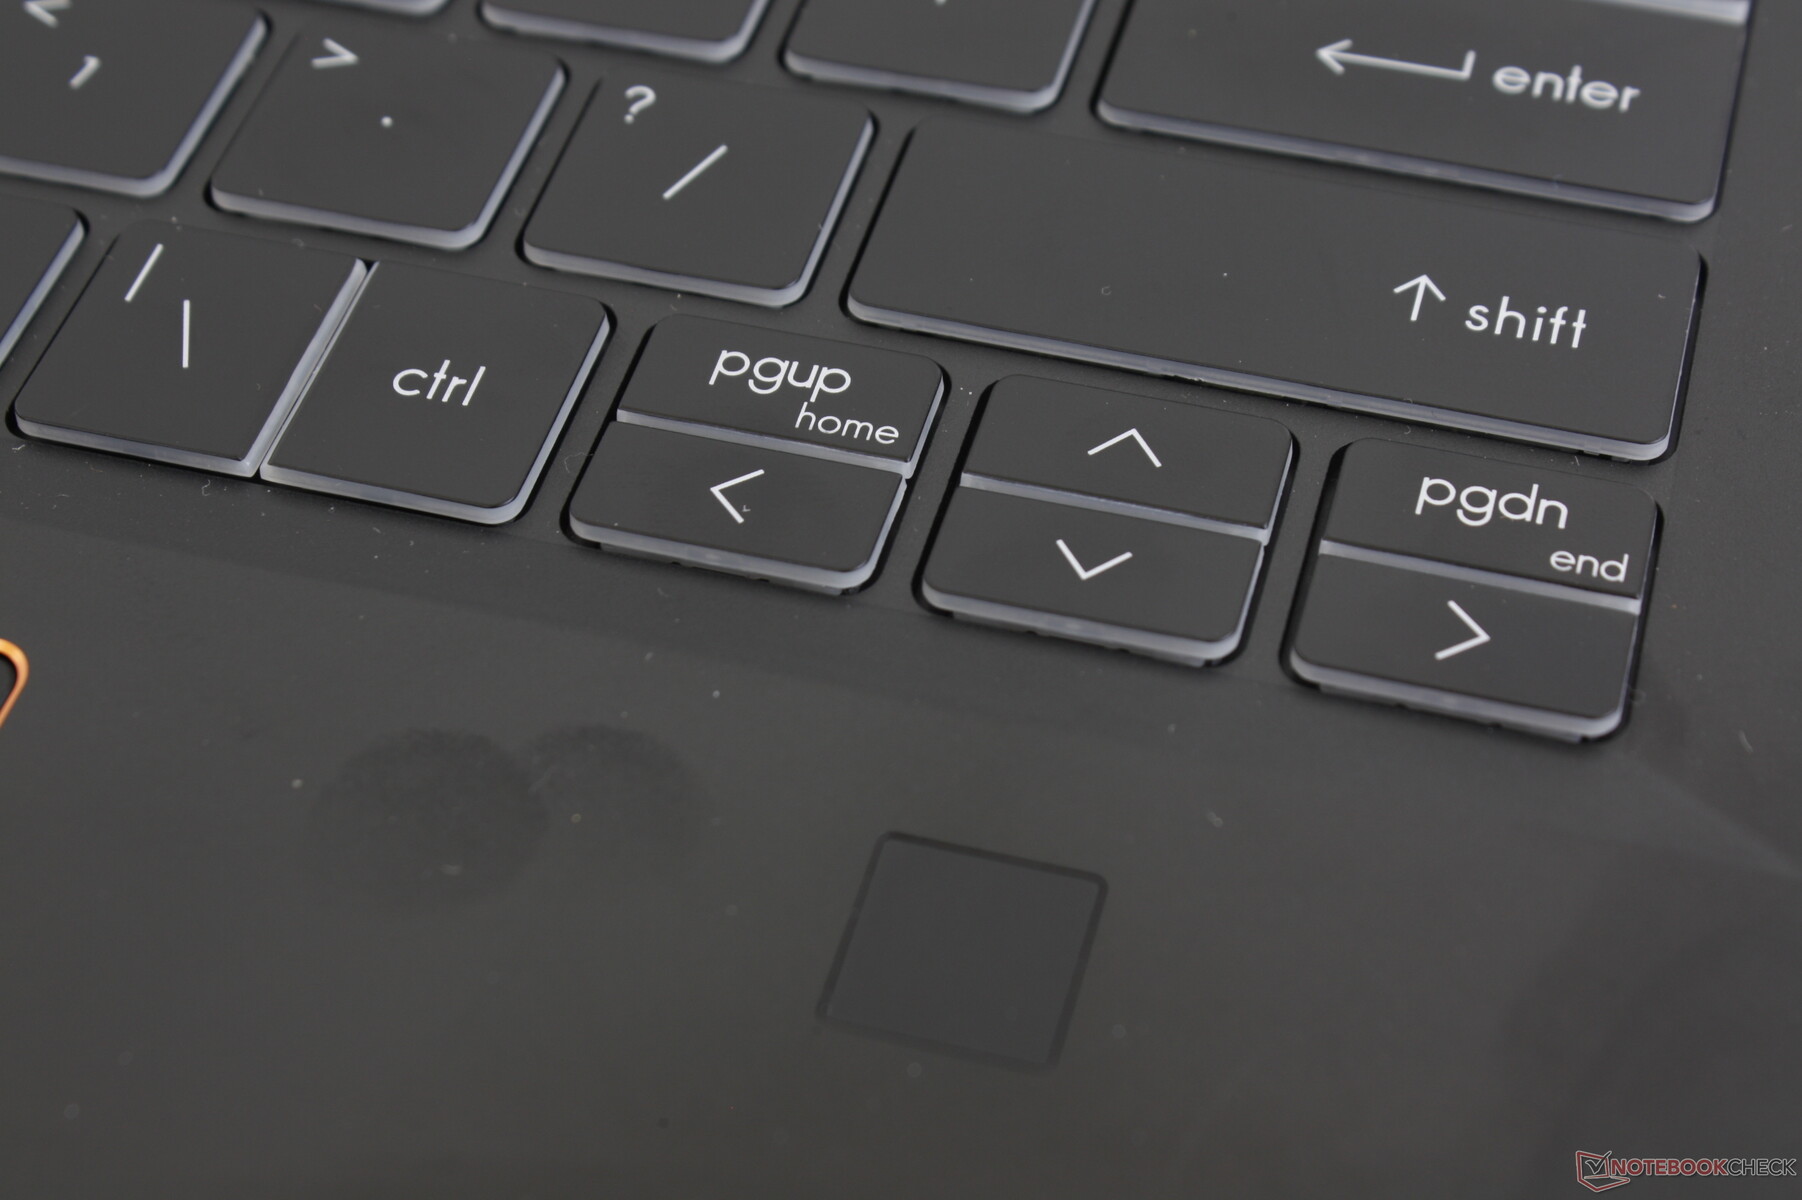
Key layout is brand new for the Summit series. The full-size directional keys, PgUp, PgDn, and Delete keys on the Prestige 14, for example, are now much smaller on the Summit E13 Flip. The Ctrl key is also squished with the "\" key which makes it annoying to use.
Travel is shallow and key feedback is on the light side when compared to the firmer and deeper keys of the HP Spectre. MSI isn't offering anything particularly innovative or special in this regard as the typing experience here is comparable to mid-range Ultrabooks like the Asus VivoBook.
Touchpad
The wide clickpad is slightly larger than the clickpad on the HP Spectre x360 13 (~12 x 6 cm vs. 11.1 x 5.6 cm). Its surface is completely smooth and textureless with just a bit of sticking when gliding at slower speeds. Cursor control feels more responsive than on most other subnotebooks due to the native 120 Hz refresh rate of the display.
The integrated mouse buttons have moderate feedback and relatively quiet clatter when pressed. Though there's nothing particularly wrong about the way the mouse buttons have been implemented, we personally would have preferred firmer and louder feedback for more satisfying clicks.

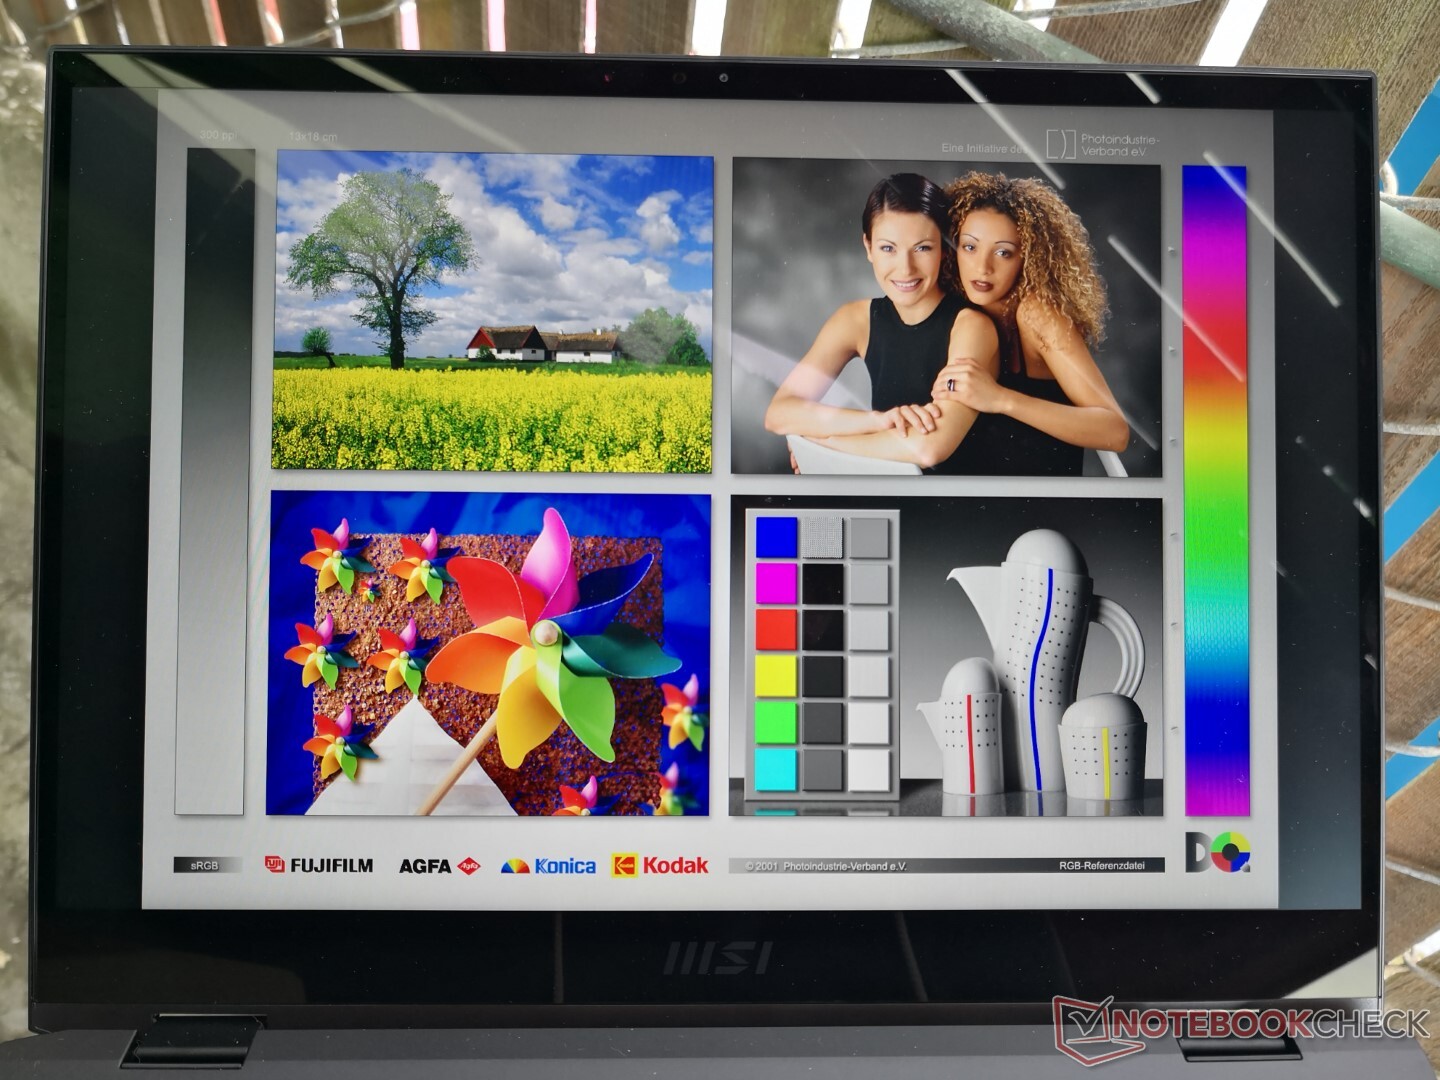
Display
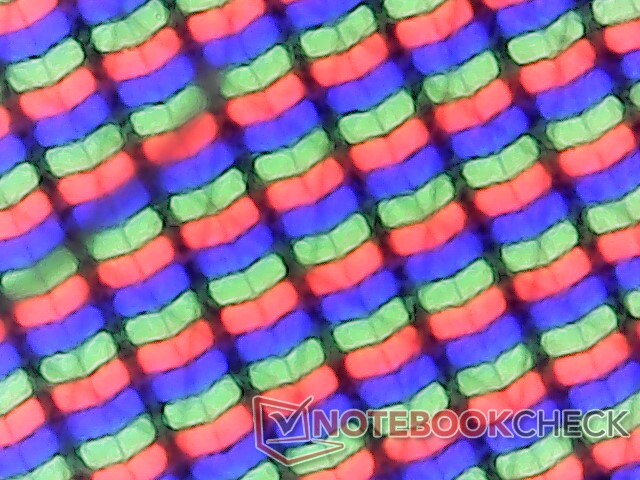
The screen is bright at over 500 nits with both excellent contrast and colors that rival the 13.4-inch touchscreen of the Dell XPS 13 2-in-1. In fact, both laptops are using very similar Sharp panels (LQ134N1JW53 vs. LQ134N1) which would explain their similar innate characteristics.
The big differentiating factor between the MSI and most other subnotebooks like the Dell XPS 13 is its 120 Hz native refresh rate for ultra-smooth movements. Black-white and gray-gray response times, however, are unfortunately much slower as a consequence for more noticeable ghosting.

| |||||||||||||||||||||||||
Brightness Distribution: 91 %
Center on Battery: 551.3 cd/m²
Contrast: 1490:1 (Black: 0.37 cd/m²)
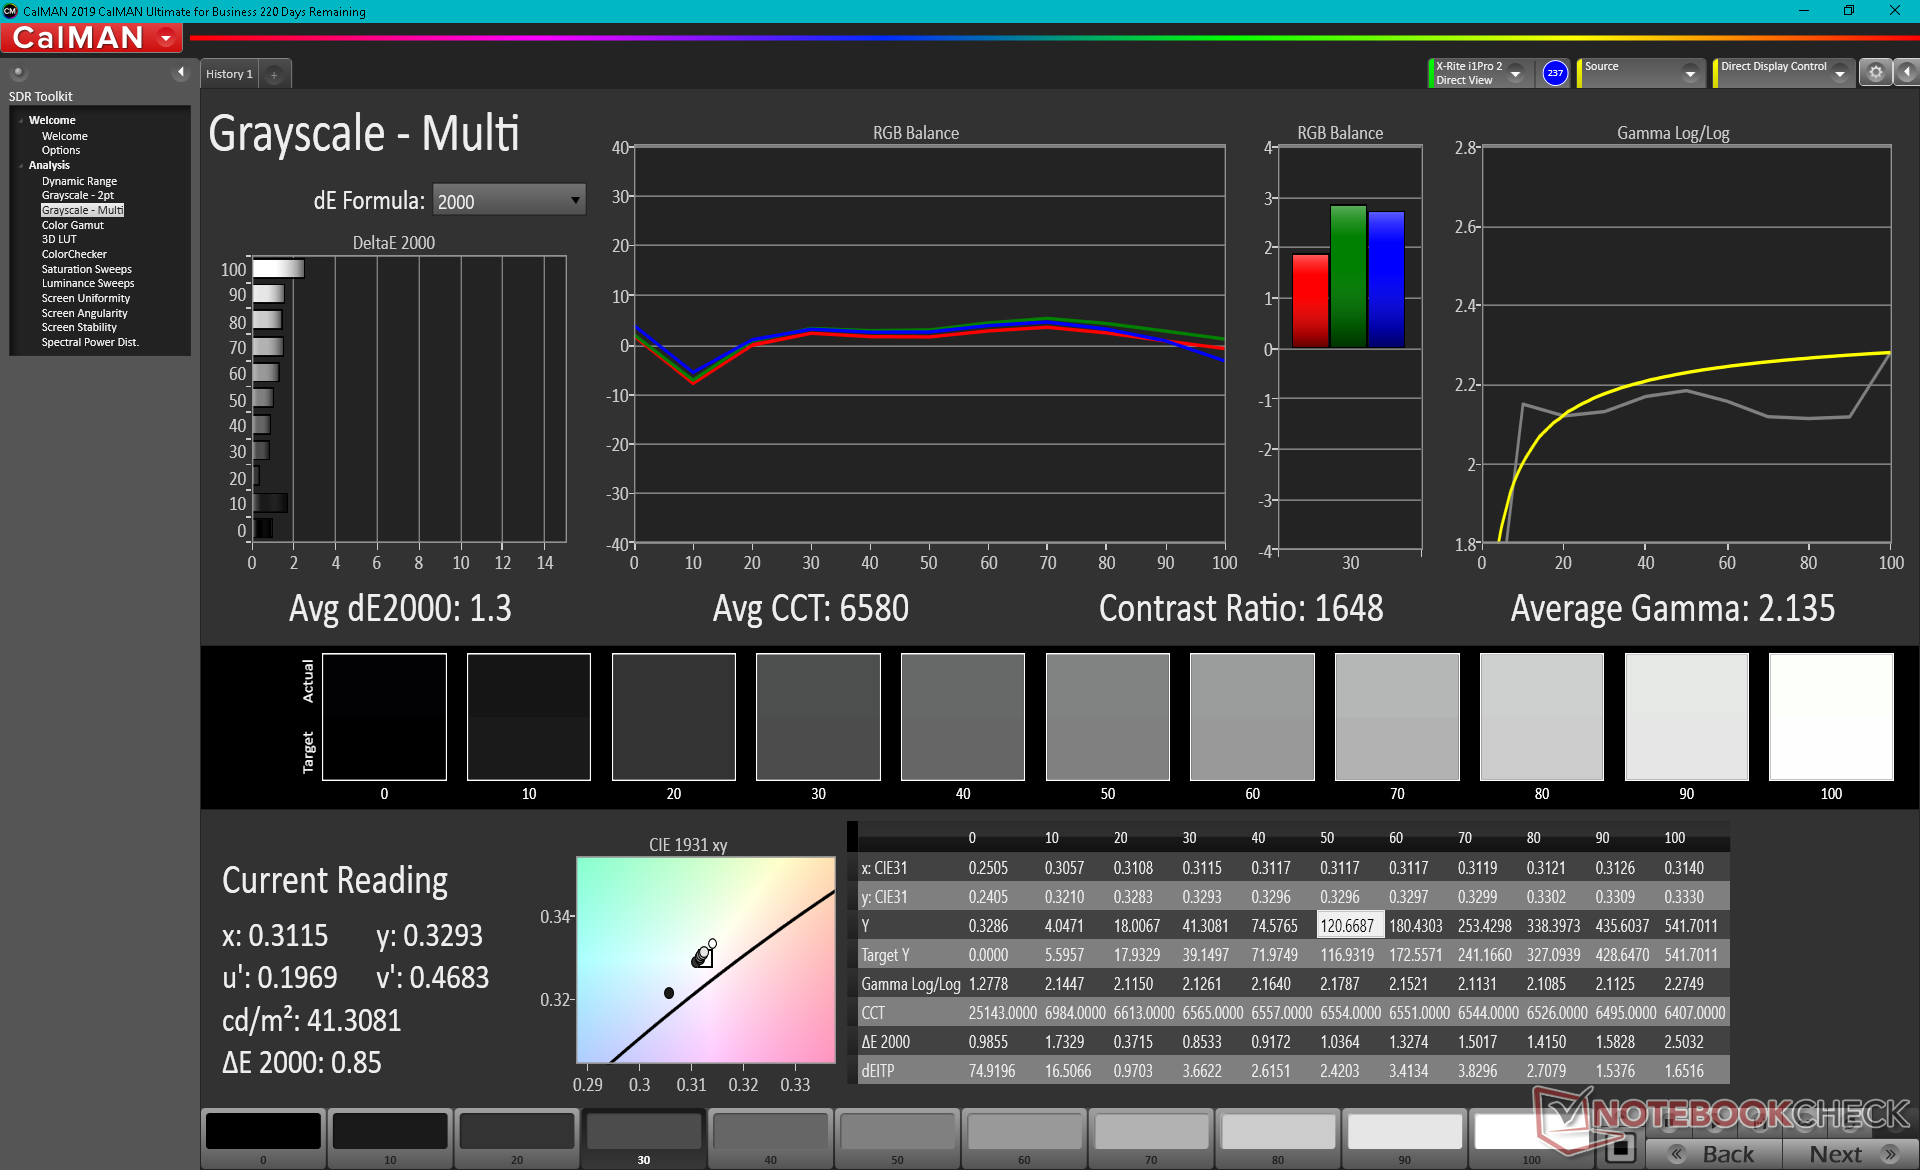
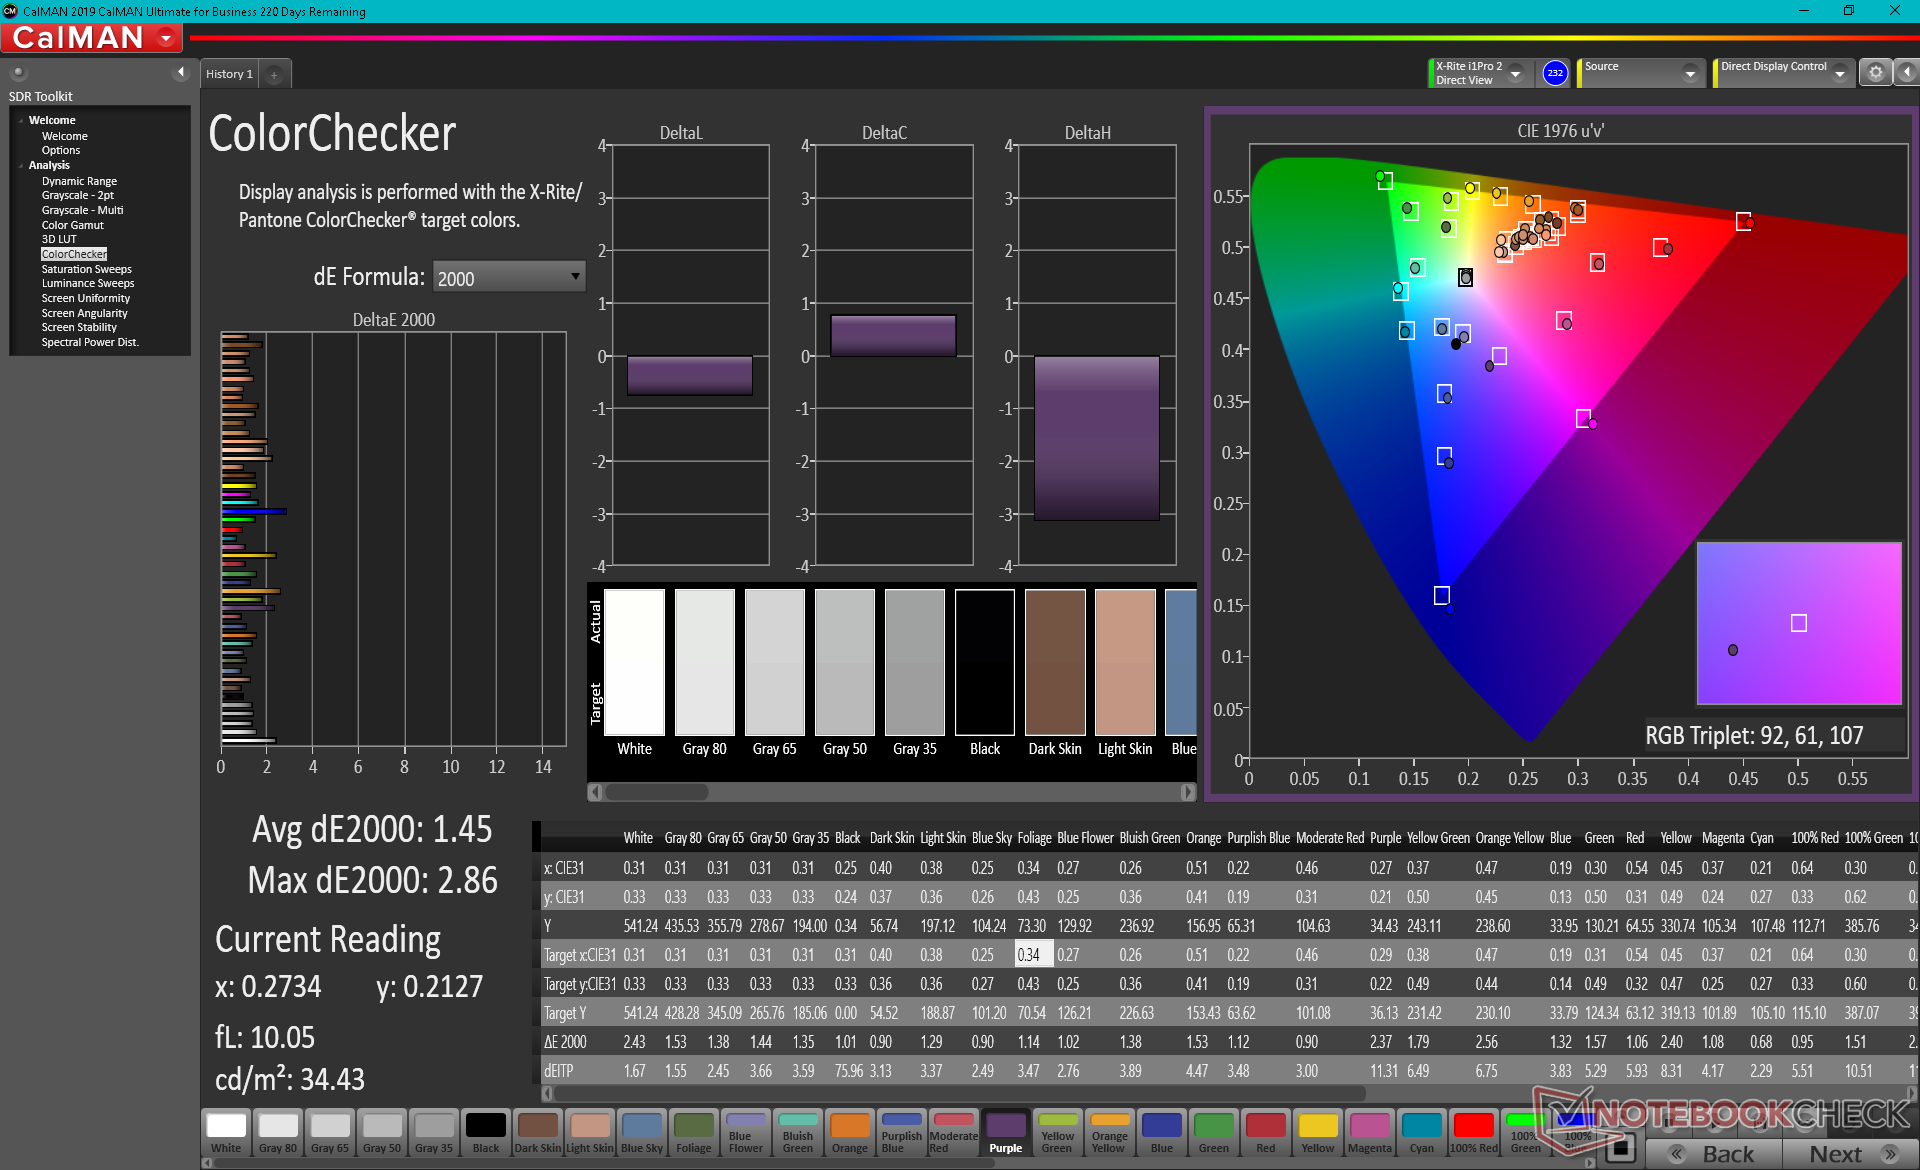
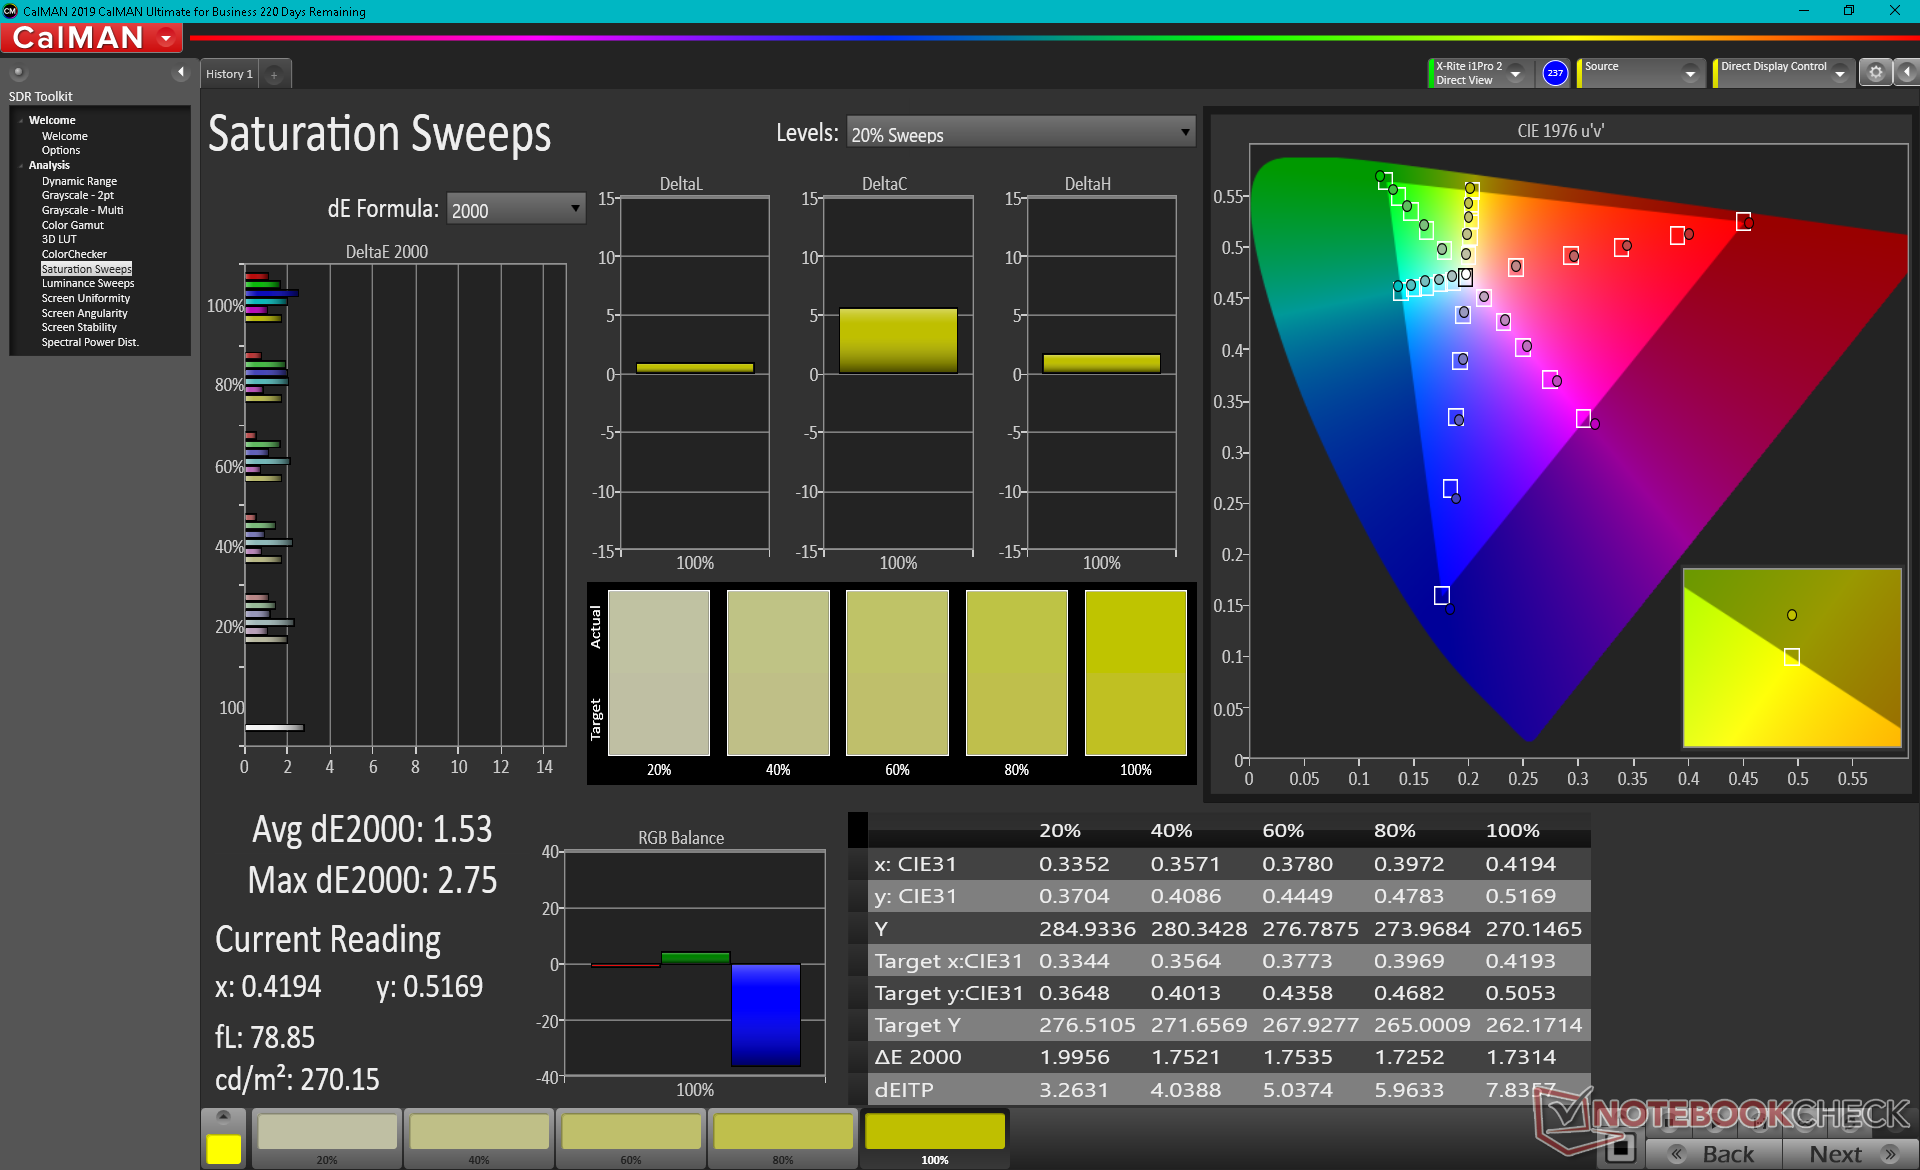
ΔE ColorChecker Calman: 1.45 | ∀{0.5-29.43 Ø4.71}
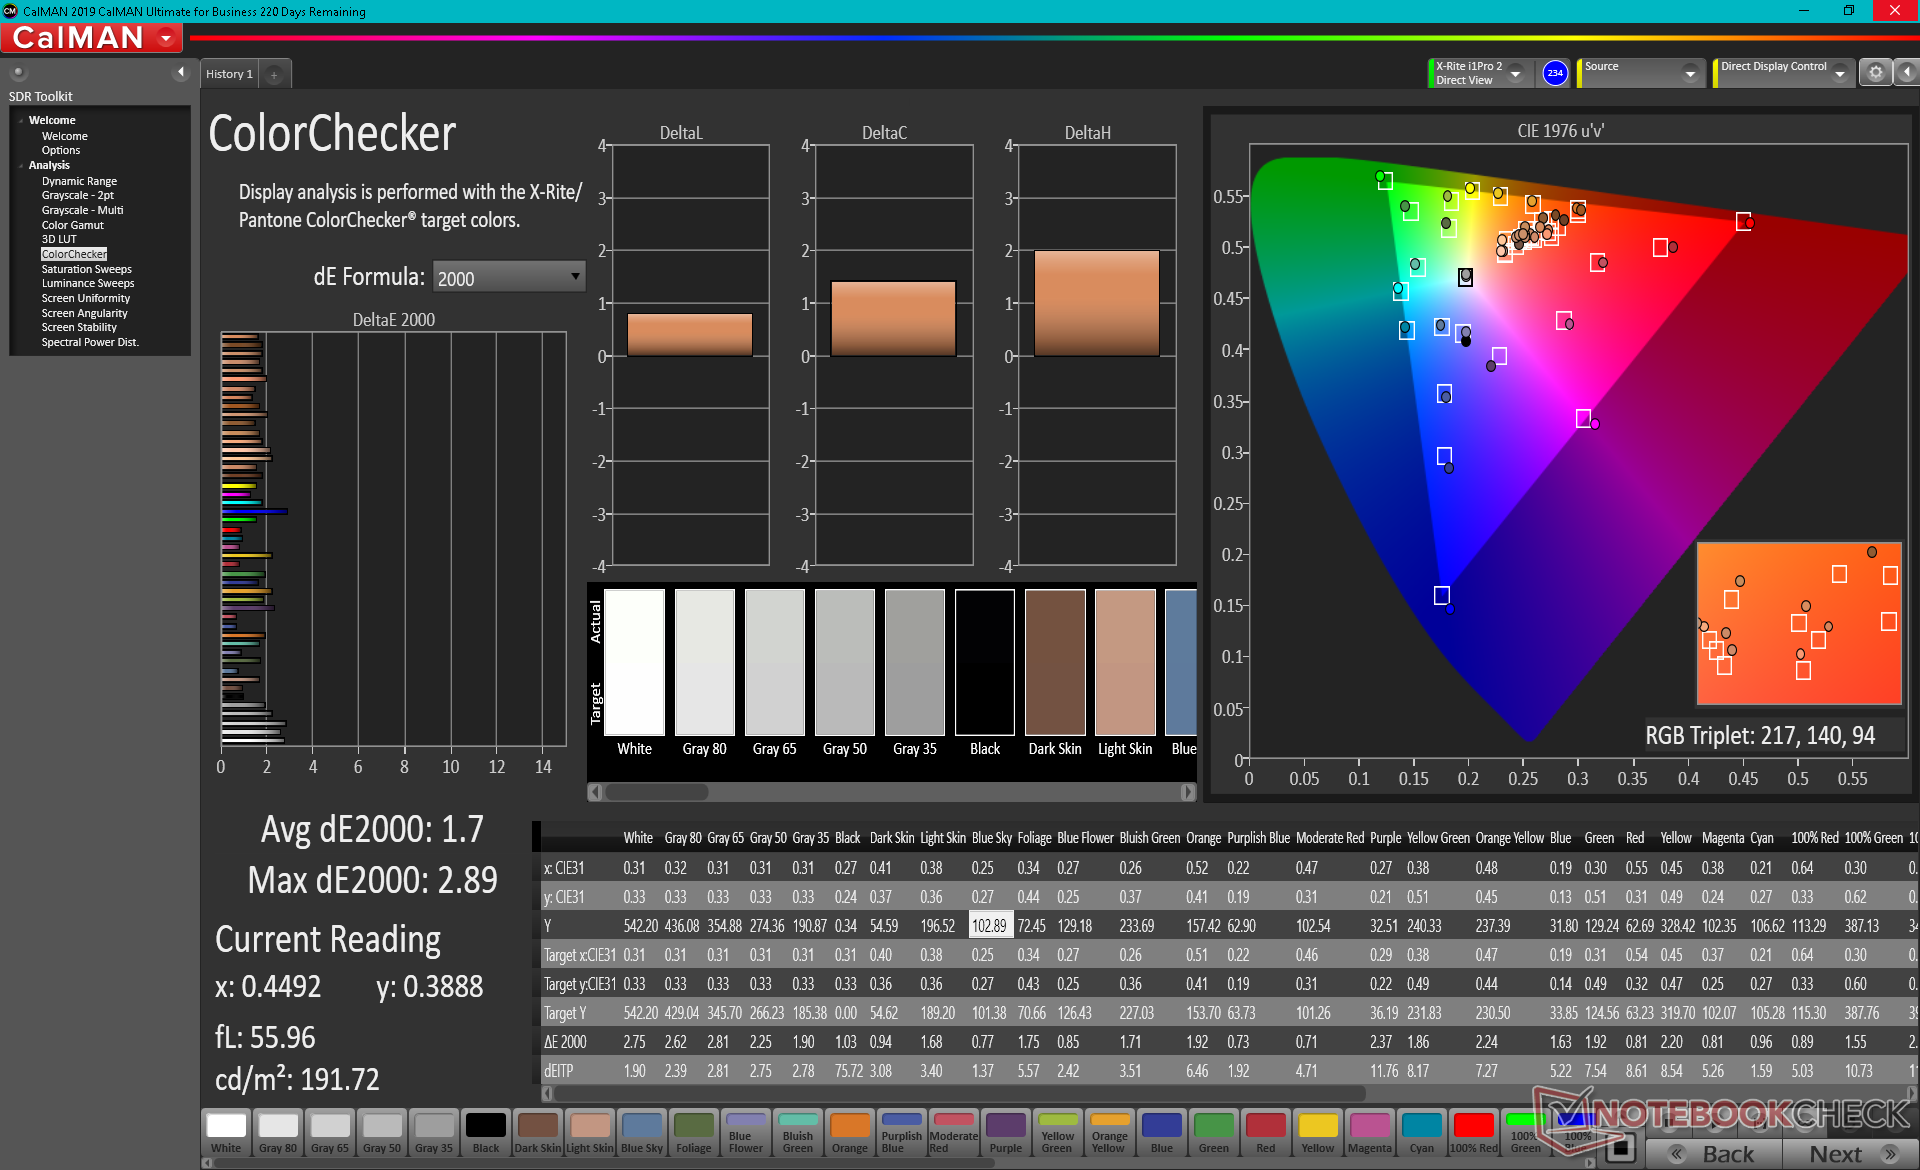
calibrated: 1.7
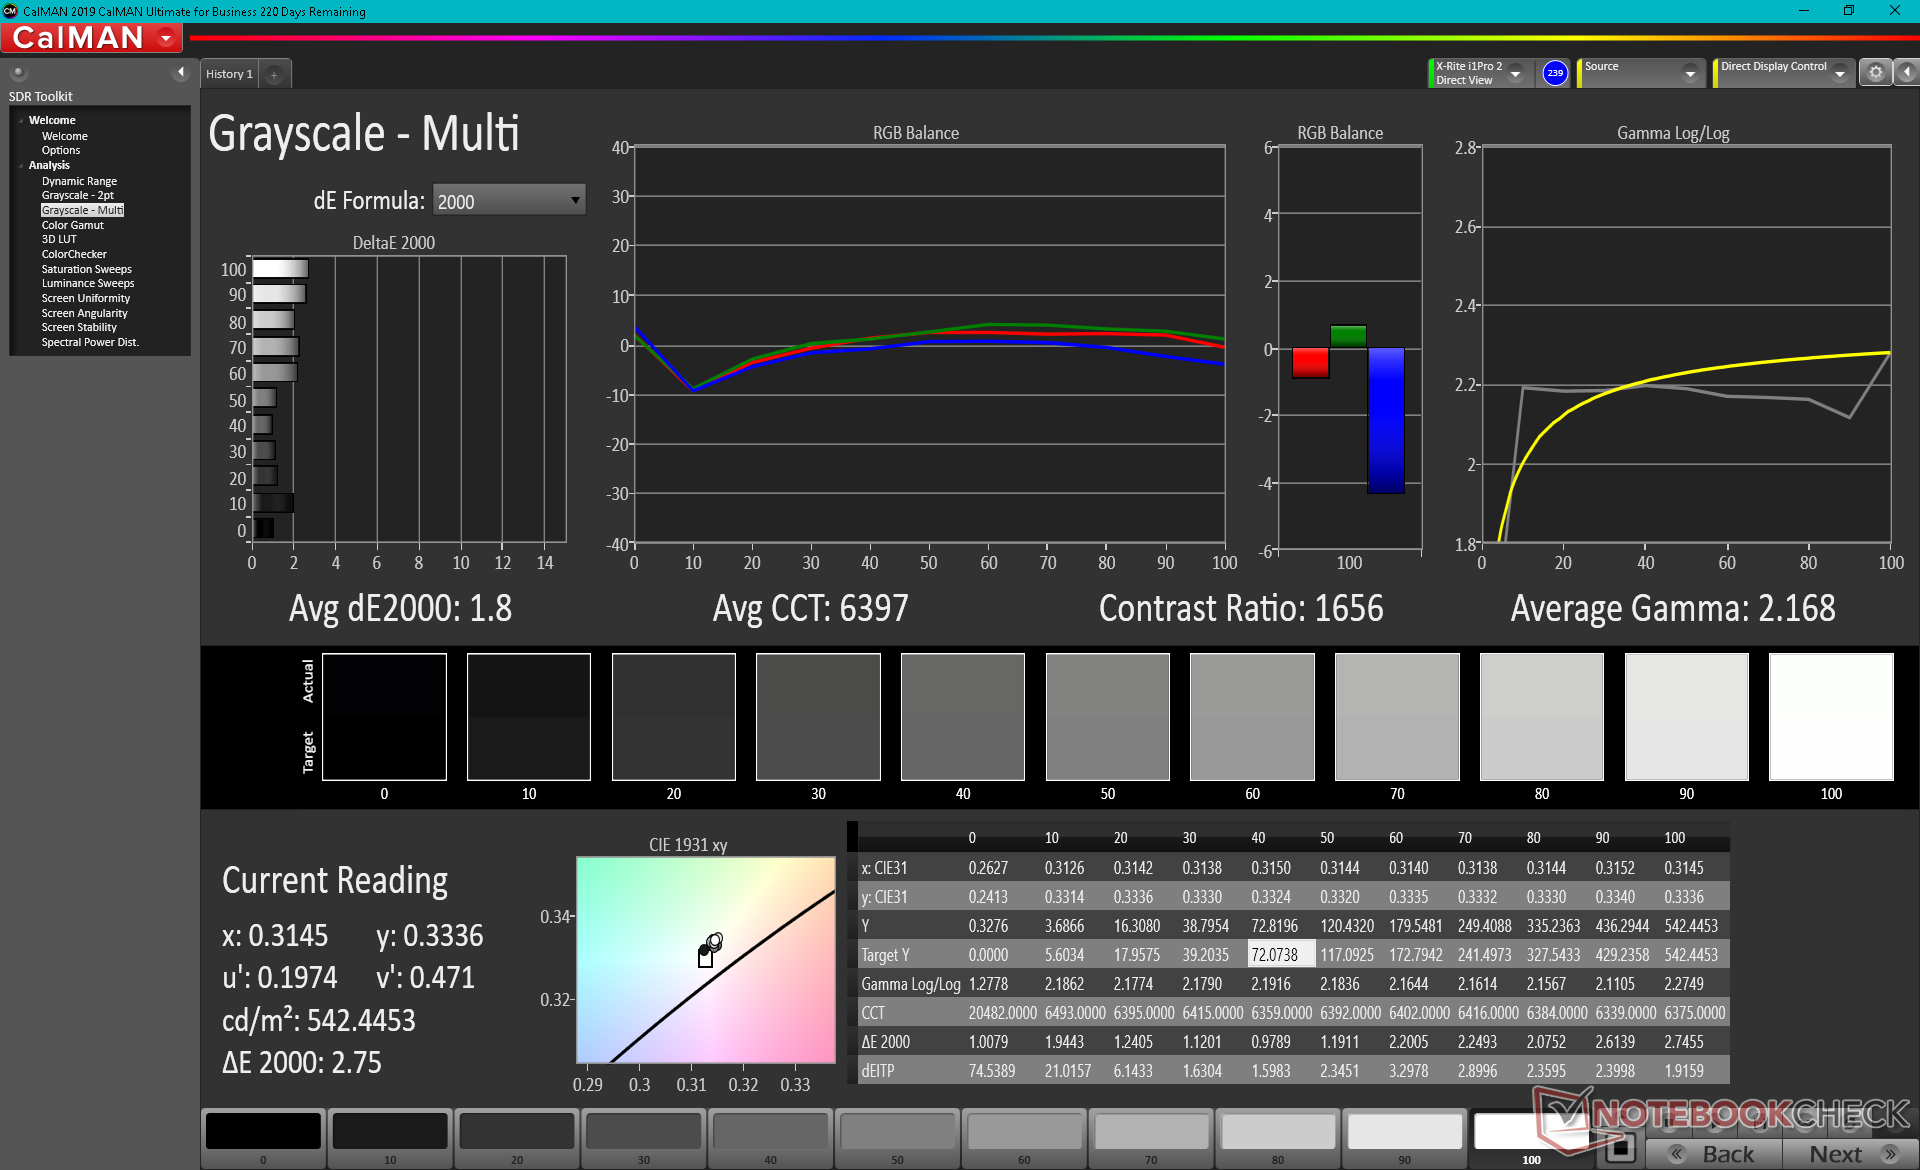
ΔE Greyscale Calman: 1.3 | ∀{0.09-98 Ø4.96}
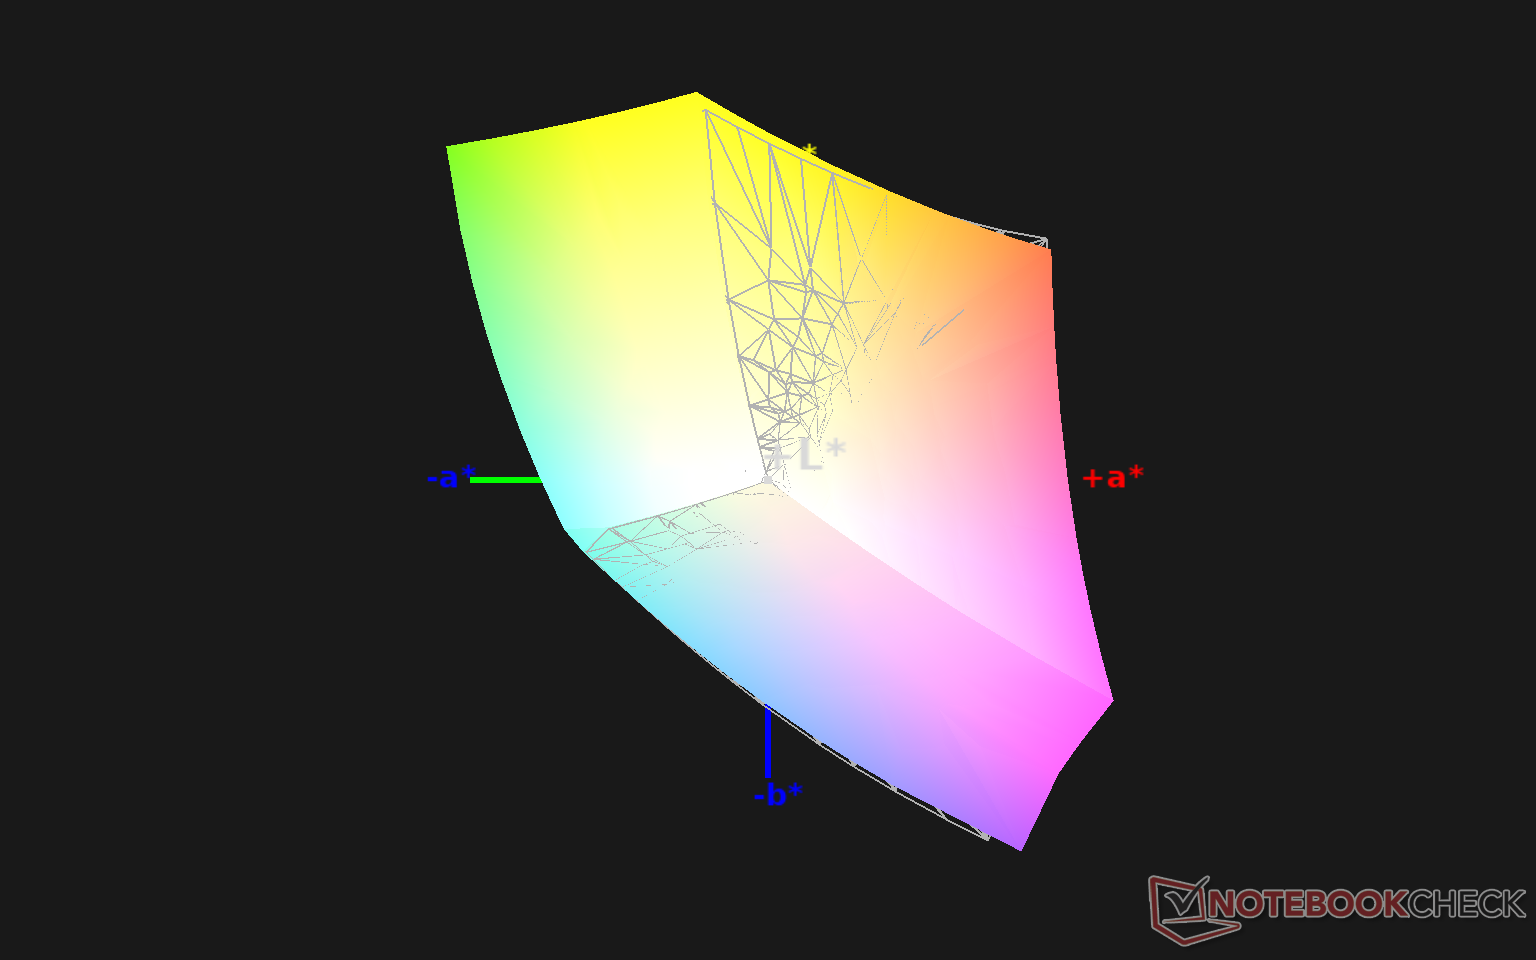
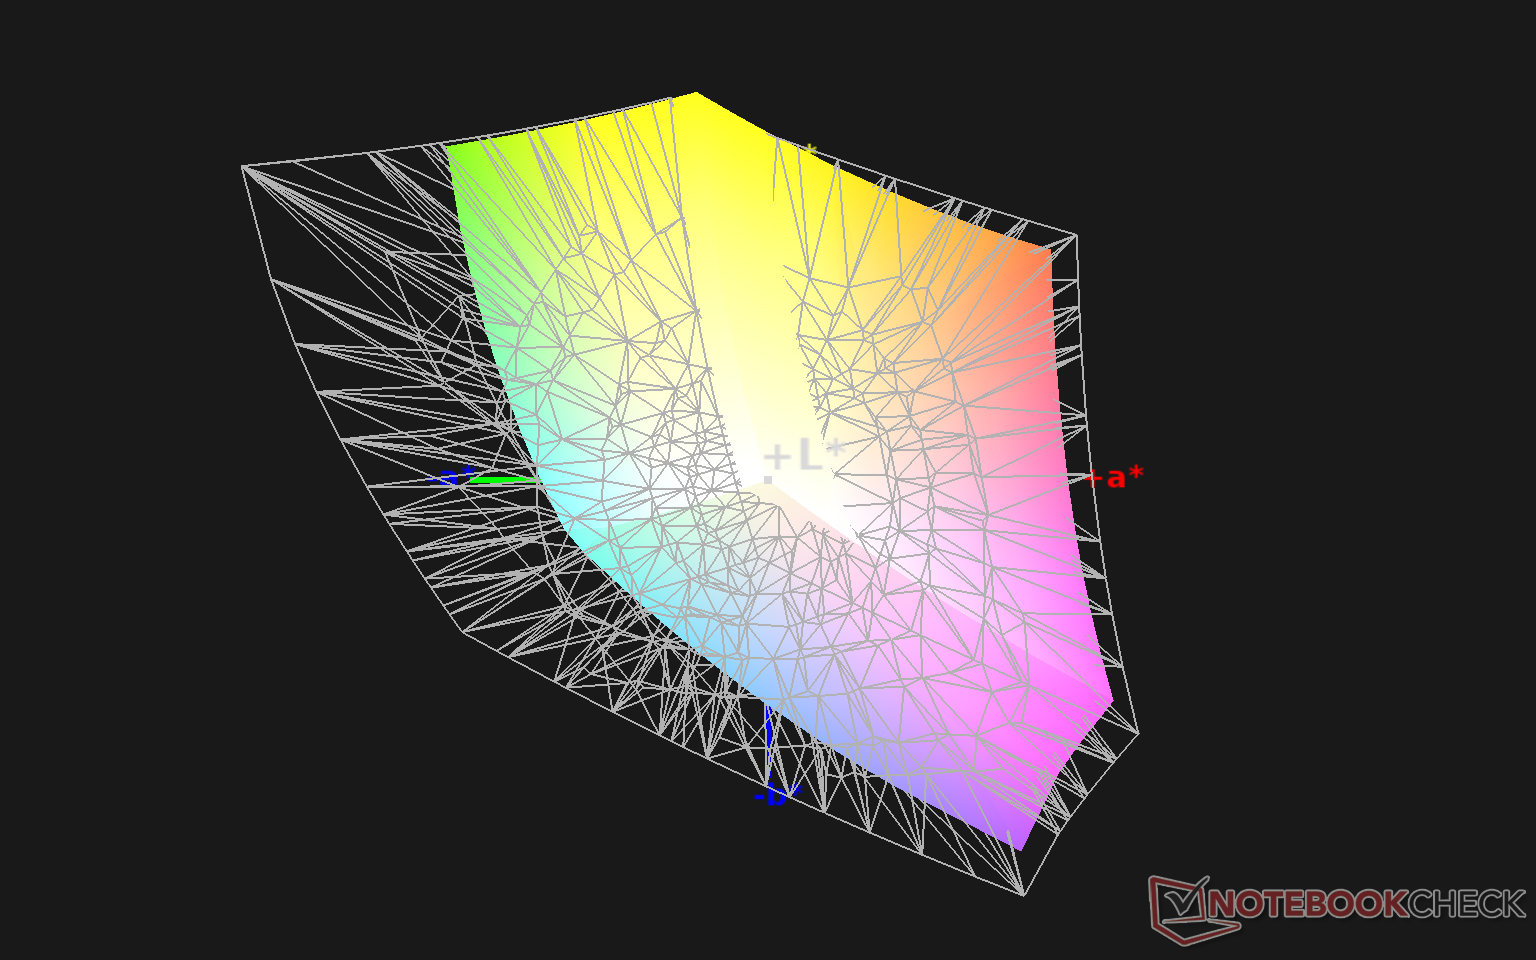
99% sRGB (Argyll 1.6.3 3D)
65% AdobeRGB 1998 (Argyll 1.6.3 3D)
70.6% AdobeRGB 1998 (Argyll 3D)
98.8% sRGB (Argyll 3D)
69.8% Display P3 (Argyll 3D)
Gamma: 2.14
CCT: 6580 K
| MSI Summit E13 Flip Evo A11MT Sharp LQ134N1JW53, IPS, 13.4", 1920x1200 | Dell XPS 13 7390 2-in-1 Core i7 Sharp LQ134N1, IPS, 13.4", 1920x1200 | HP Spectre x360 14t-ea000 LG Philips LGD0663, IPS, 13.5", 1920x1280 | Huawei MateBook X Pro 2021 TIANMA XM, IPS, 13.9", 3000x2000 | Lenovo ThinkPad X1 Titanium Yoga G1 20QA001RGE LPM135M467, IPS, 13.5", 2256x1504 | Asus Zenbook 14 UX435EG Au Optronics B140HAN03.2, IPS, 14", 1920x1080 | |
|---|---|---|---|---|---|---|
| Display | 0% | -4% | -6% | -11% | ||
| Display P3 Coverage (%) | 69.8 | 69.9 0% | 65.8 -6% | 64.9 -7% | 60.9 -13% | |
| sRGB Coverage (%) | 98.8 | 99.2 0% | 98.2 -1% | 94.4 -4% | 90.4 -9% | |
| AdobeRGB 1998 Coverage (%) | 70.6 | 71.5 1% | 67.9 -4% | 66.3 -6% | 62.3 -12% | |
| Response Times | 30% | 7% | 41% | 31% | 38% | |
| Response Time Grey 50% / Grey 80% * (ms) | 64 ? | 47.6 ? 26% | 62 ? 3% | 37.6 ? 41% | 53.6 ? 16% | 39 ? 39% |
| Response Time Black / White * (ms) | 44 ? | 29.2 ? 34% | 39.6 ? 10% | 26.4 ? 40% | 24 ? 45% | 28 ? 36% |
| PWM Frequency (Hz) | 2500 ? | |||||
| Screen | -15% | -26% | -4% | -17% | -85% | |
| Brightness middle (cd/m²) | 551.3 | 549.8 0% | 443.5 -20% | 502 -9% | 466 -15% | 323 -41% |
| Brightness (cd/m²) | 517 | 520 1% | 394 -24% | 474 -8% | 454 -12% | 313 -39% |
| Brightness Distribution (%) | 91 | 86 -5% | 78 -14% | 89 -2% | 94 3% | 80 -12% |
| Black Level * (cd/m²) | 0.37 | 0.39 -5% | 0.17 54% | 0.33 11% | 0.23 38% | 0.36 3% |
| Contrast (:1) | 1490 | 1410 -5% | 2609 75% | 1521 2% | 2026 36% | 897 -40% |
| Colorchecker dE 2000 * | 1.45 | 2.12 -46% | 2.7 -86% | 1.35 7% | 2.1 -45% | 4.86 -235% |
| Colorchecker dE 2000 max. * | 2.86 | 3.66 -28% | 4.36 -52% | 3.67 -28% | 4.5 -57% | 7.52 -163% |
| Colorchecker dE 2000 calibrated * | 1.7 | 1.37 19% | 2.61 -54% | 1.2 29% | 3.64 -114% | |
| Greyscale dE 2000 * | 1.3 | 2.6 -100% | 3.4 -162% | 1.7 -31% | 2.7 -108% | 4.83 -272% |
| Gamma | 2.14 103% | 2.3 96% | 2.09 105% | 2.24 98% | 2.08 106% | 2.64 83% |
| CCT | 6580 99% | 6884 94% | 6144 106% | 6440 101% | 6210 105% | 7405 88% |
| Color Space (Percent of AdobeRGB 1998) (%) | 65 | 65.4 1% | 62.1 -4% | 61.1 -6% | 61.1 -6% | 57.5 -12% |
| Color Space (Percent of sRGB) (%) | 99 | 99.7 1% | 98.5 -1% | 94.3 -5% | 94.9 -4% | 90.3 -9% |
| Total Average (Program / Settings) | 5% /
-7% | -8% /
-18% | 10% /
2% | 7% /
-9% | -19% /
-56% |
* ... smaller is better
Color space covers all of sRGB and not any larger much like on most other high-end Ultrabooks. OLED would have offered even deeper colors approaching DCI-P3, but such a panel option is not available on the MSI.
X-Rite colorimeter measurements show a well-calibrated display out of the box with average DeltaE grayscale and ColorChecker values of just 1.3 and 1.45, respectively. An end-user calibrated is not necessary.

Display Response Times
| ↔ Response Time Black to White | ||
|---|---|---|
| 44 ms ... rise ↗ and fall ↘ combined | ↗ 22 ms rise | 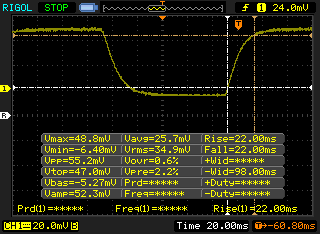 |
| ↘ 22 ms fall | ||
| The screen shows slow response rates in our tests and will be unsatisfactory for gamers. In comparison, all tested devices range from 0.1 (minimum) to 240 (maximum) ms. » 98 % of all devices are better. This means that the measured response time is worse than the average of all tested devices (19.8 ms). | ||
| ↔ Response Time 50% Grey to 80% Grey | ||
| 64 ms ... rise ↗ and fall ↘ combined | ↗ 30.8 ms rise | 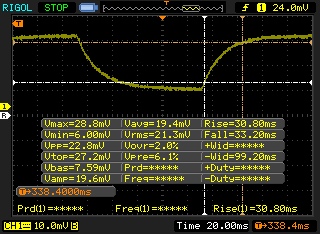 |
| ↘ 33.2 ms fall | ||
| The screen shows slow response rates in our tests and will be unsatisfactory for gamers. In comparison, all tested devices range from 0.165 (minimum) to 636 (maximum) ms. » 97 % of all devices are better. This means that the measured response time is worse than the average of all tested devices (30.9 ms). | ||
Screen Flickering / PWM (Pulse-Width Modulation)
| Screen flickering / PWM not detected | 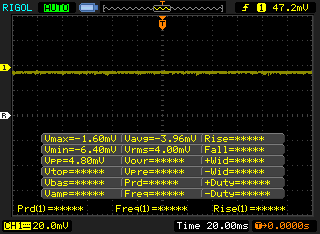 | ||
In comparison: 52 % of all tested devices do not use PWM to dim the display. If PWM was detected, an average of 7741 (minimum: 5 - maximum: 343500) Hz was measured. | |||
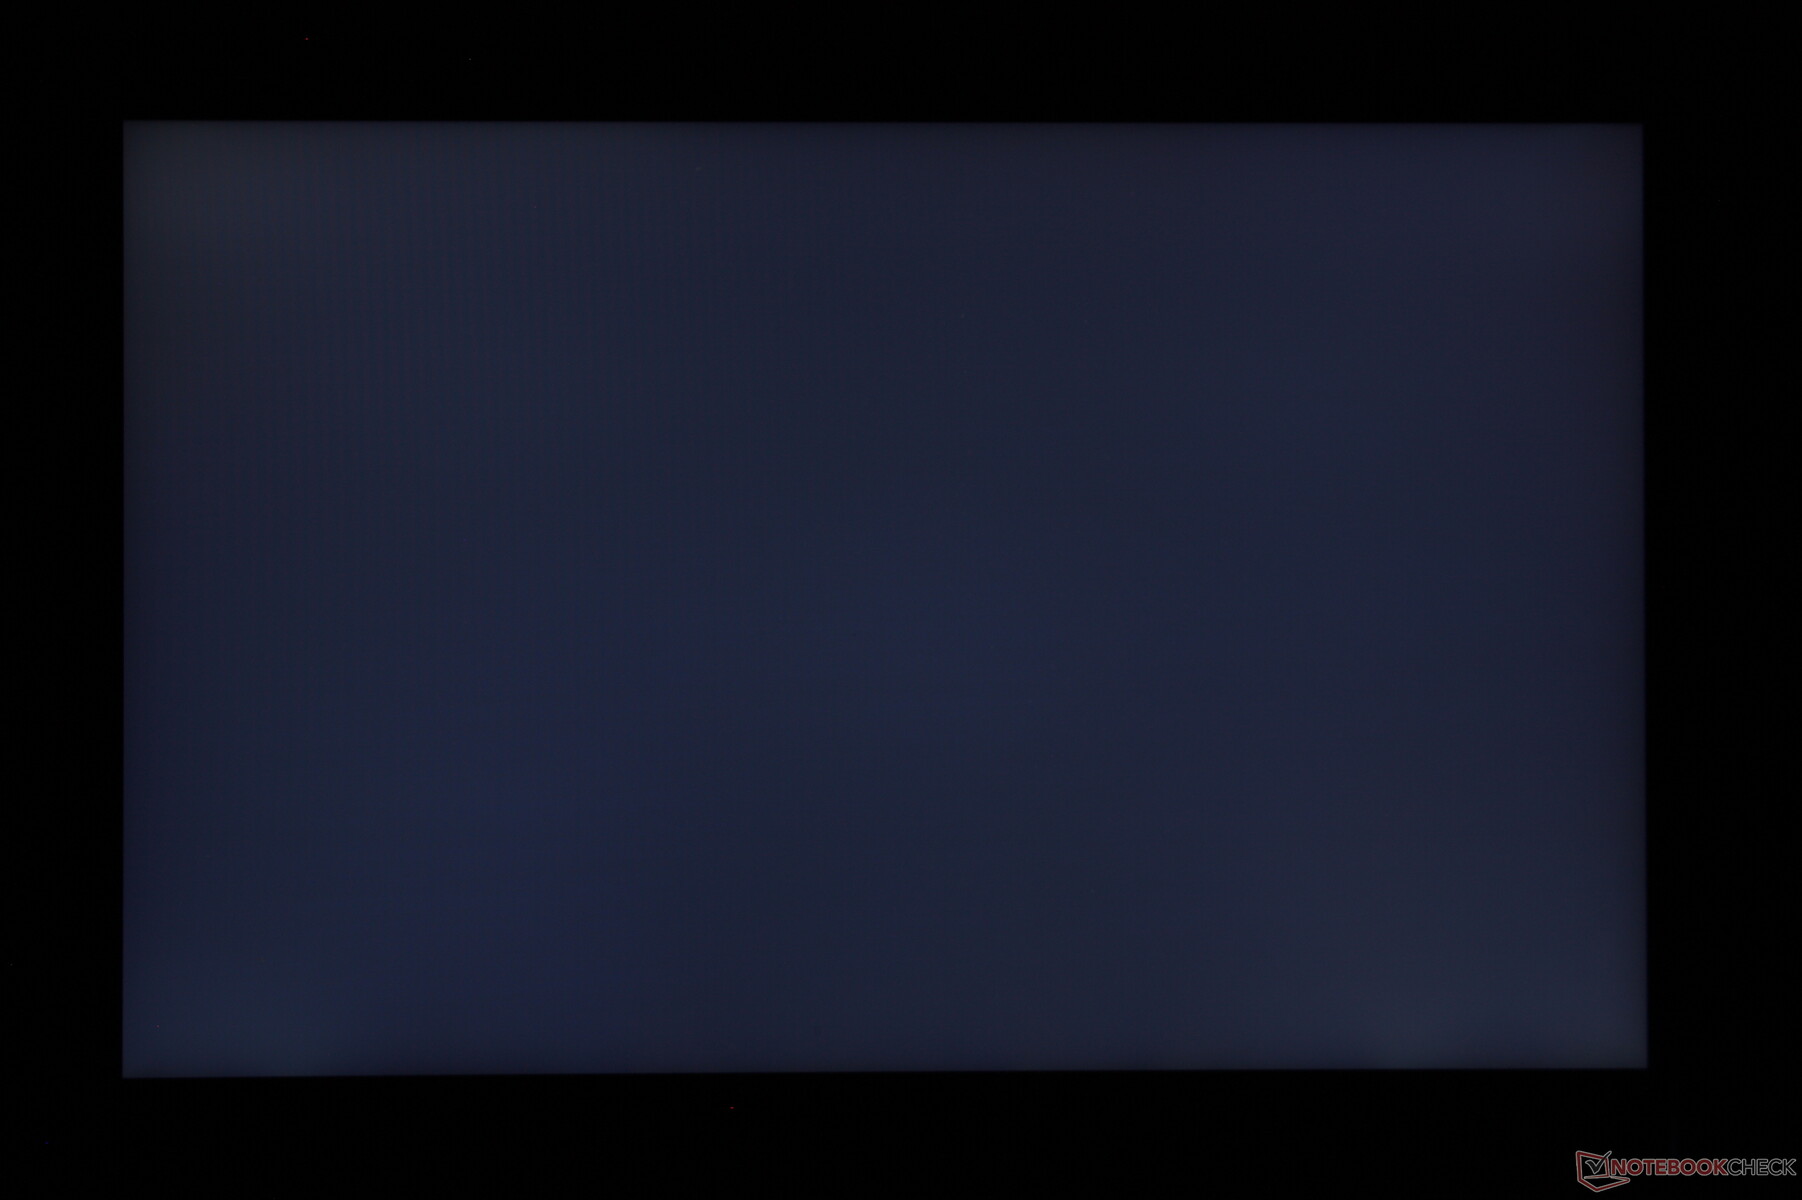
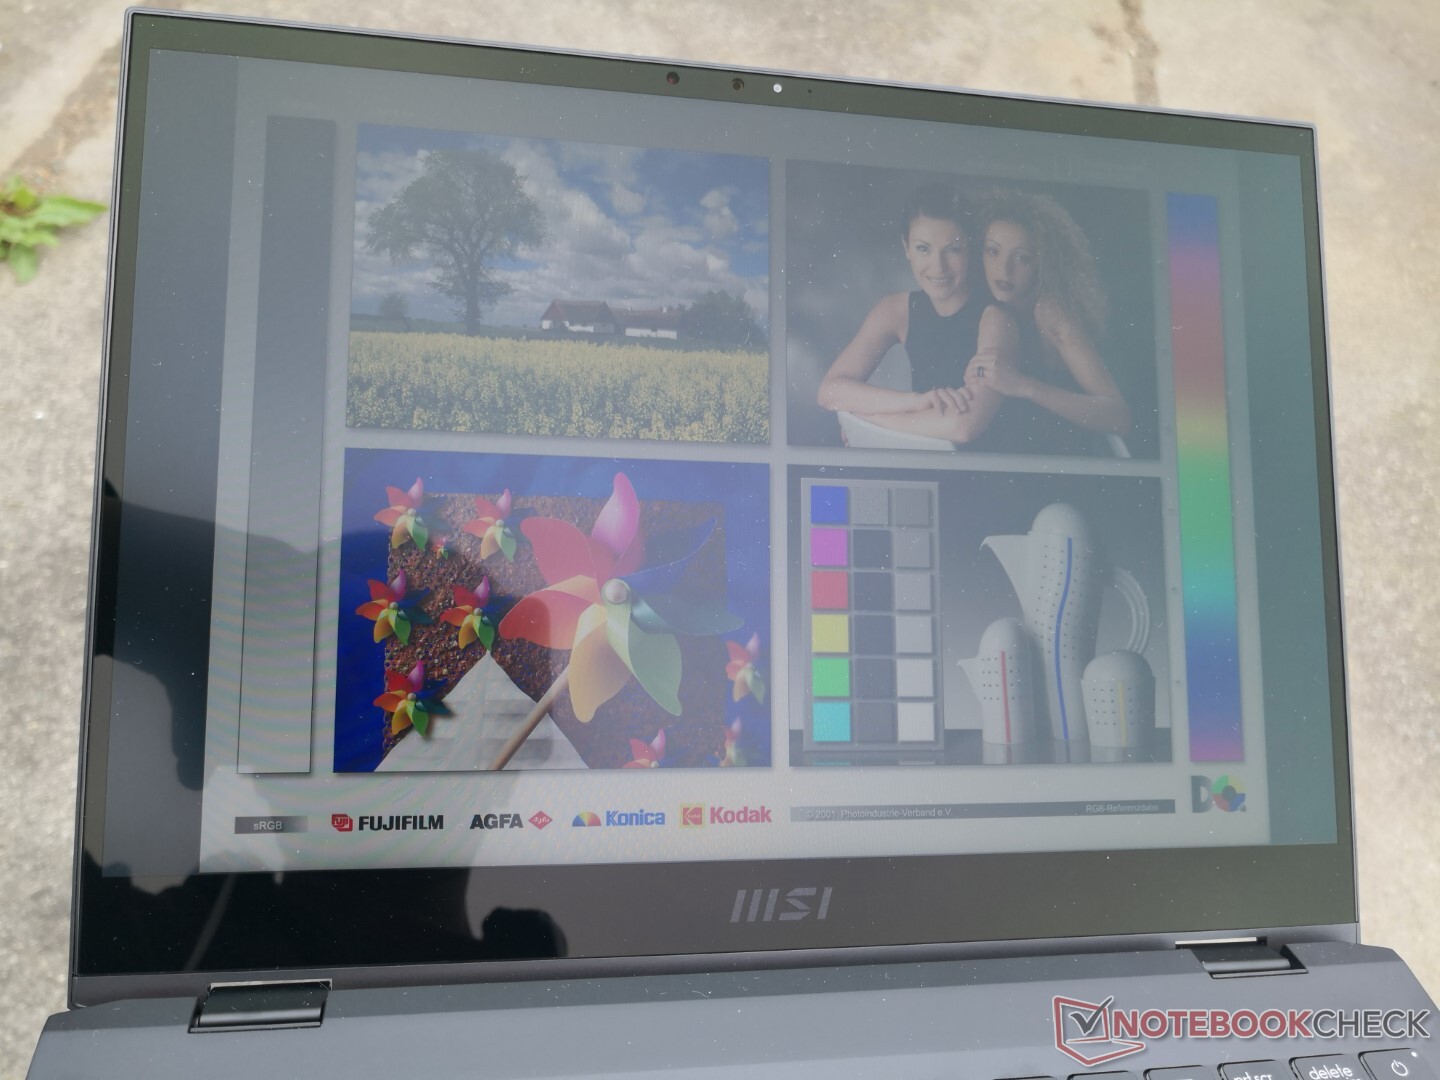
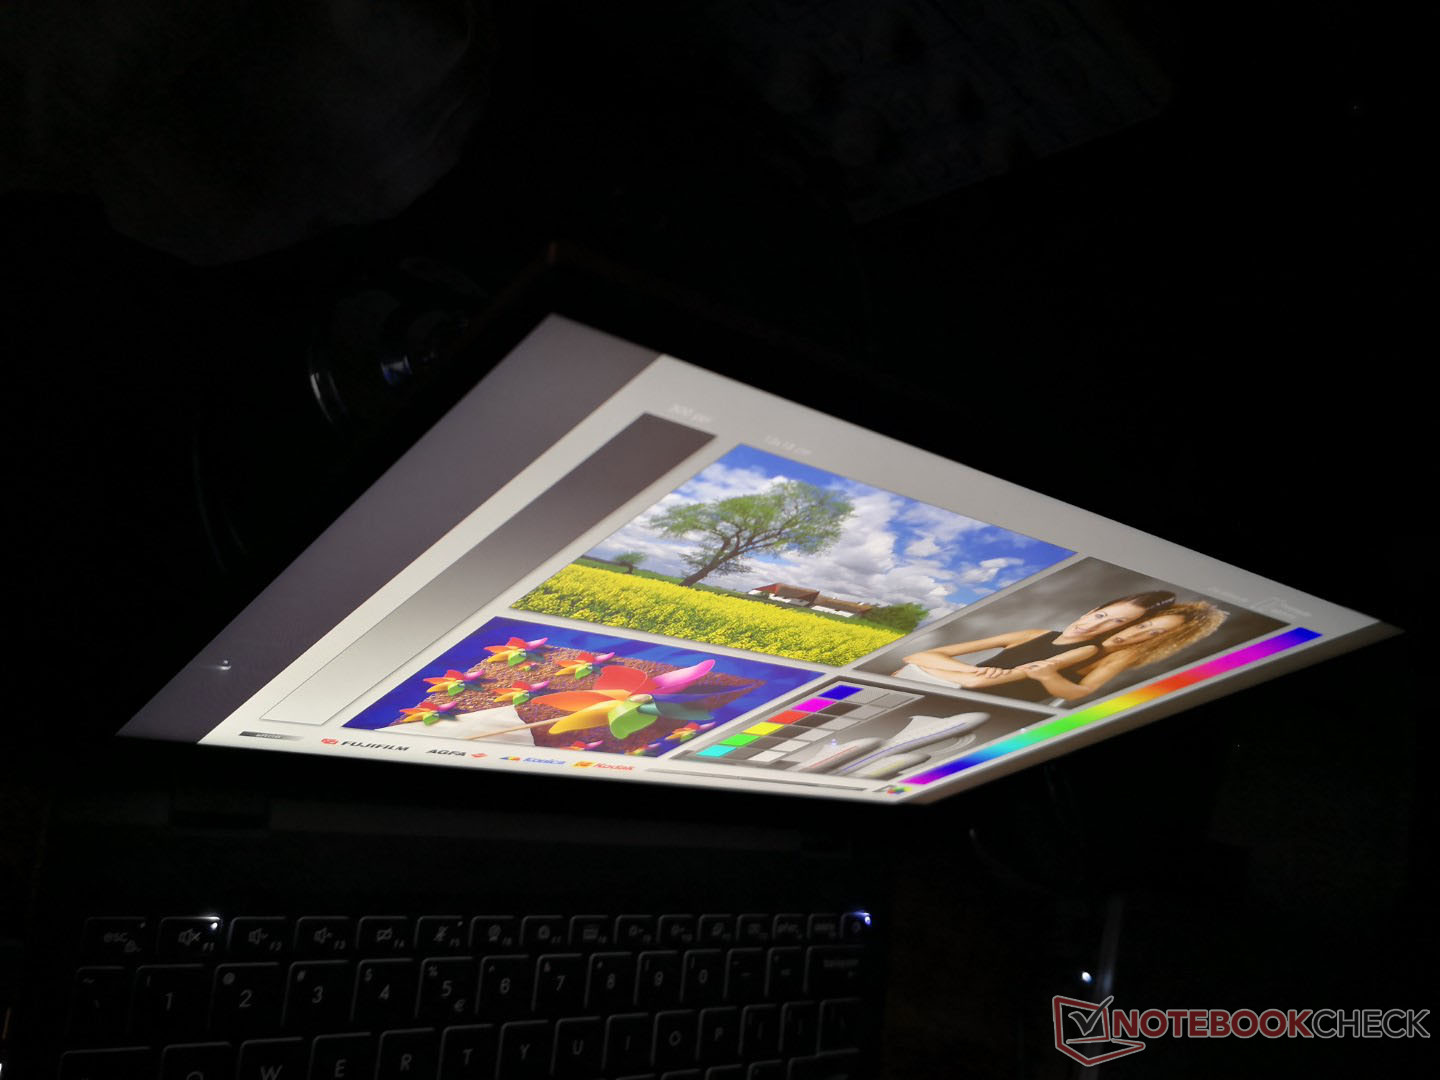
Glare is unavoidable if working outdoors because of the glossy overlay and bright or overcast days will still wash out the screen. Fortunately, the screen is bright enough to mitigate much of the glare when working under shade. Outdoor visibility is most similar to the XPS 13 2-in-1 as both have similar maximum brightness and contrast levels.

Performance
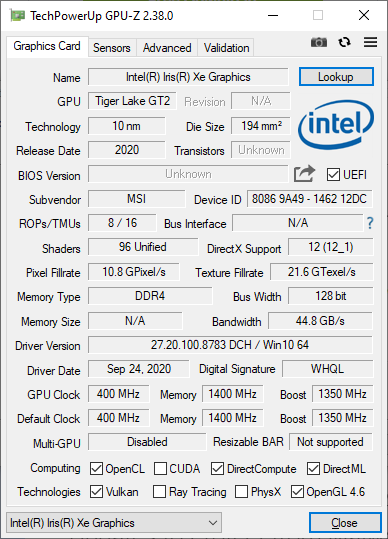
All SKUs at the moment come with the 11th gen Core i7-1185G7 CPU with no other options. It would have been great to see a Core i7-1165G7 configuration for users who might not be interested in vPro. The performance difference between a Core i7-1165G7 and i7-1185G7 is also minimal at best.
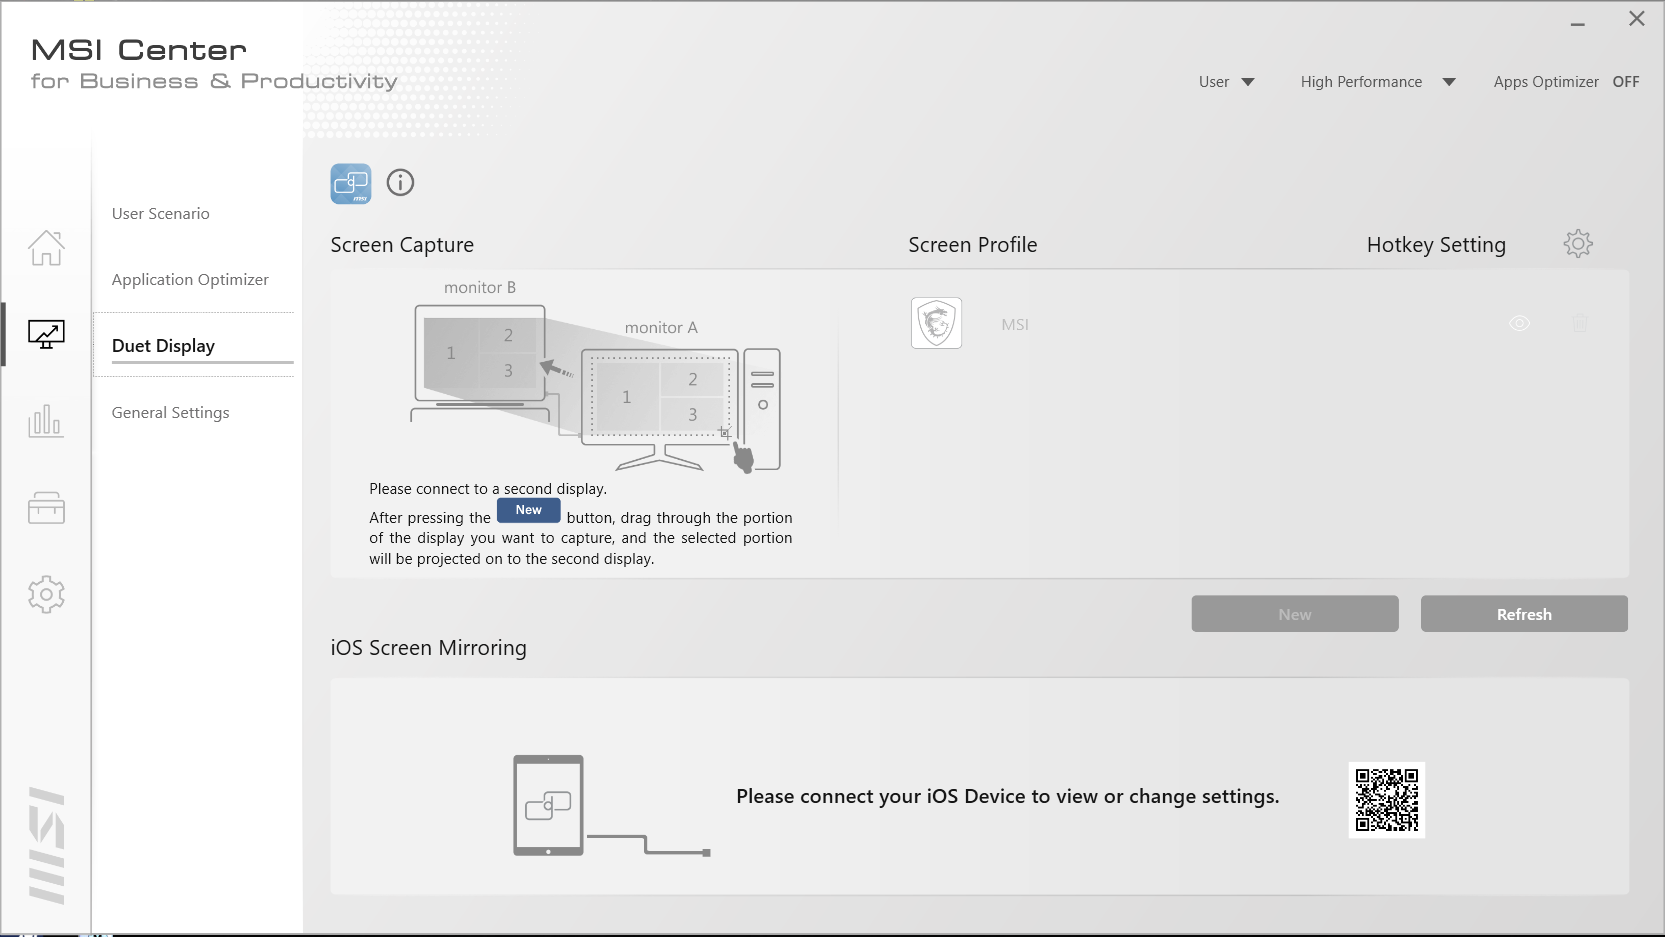
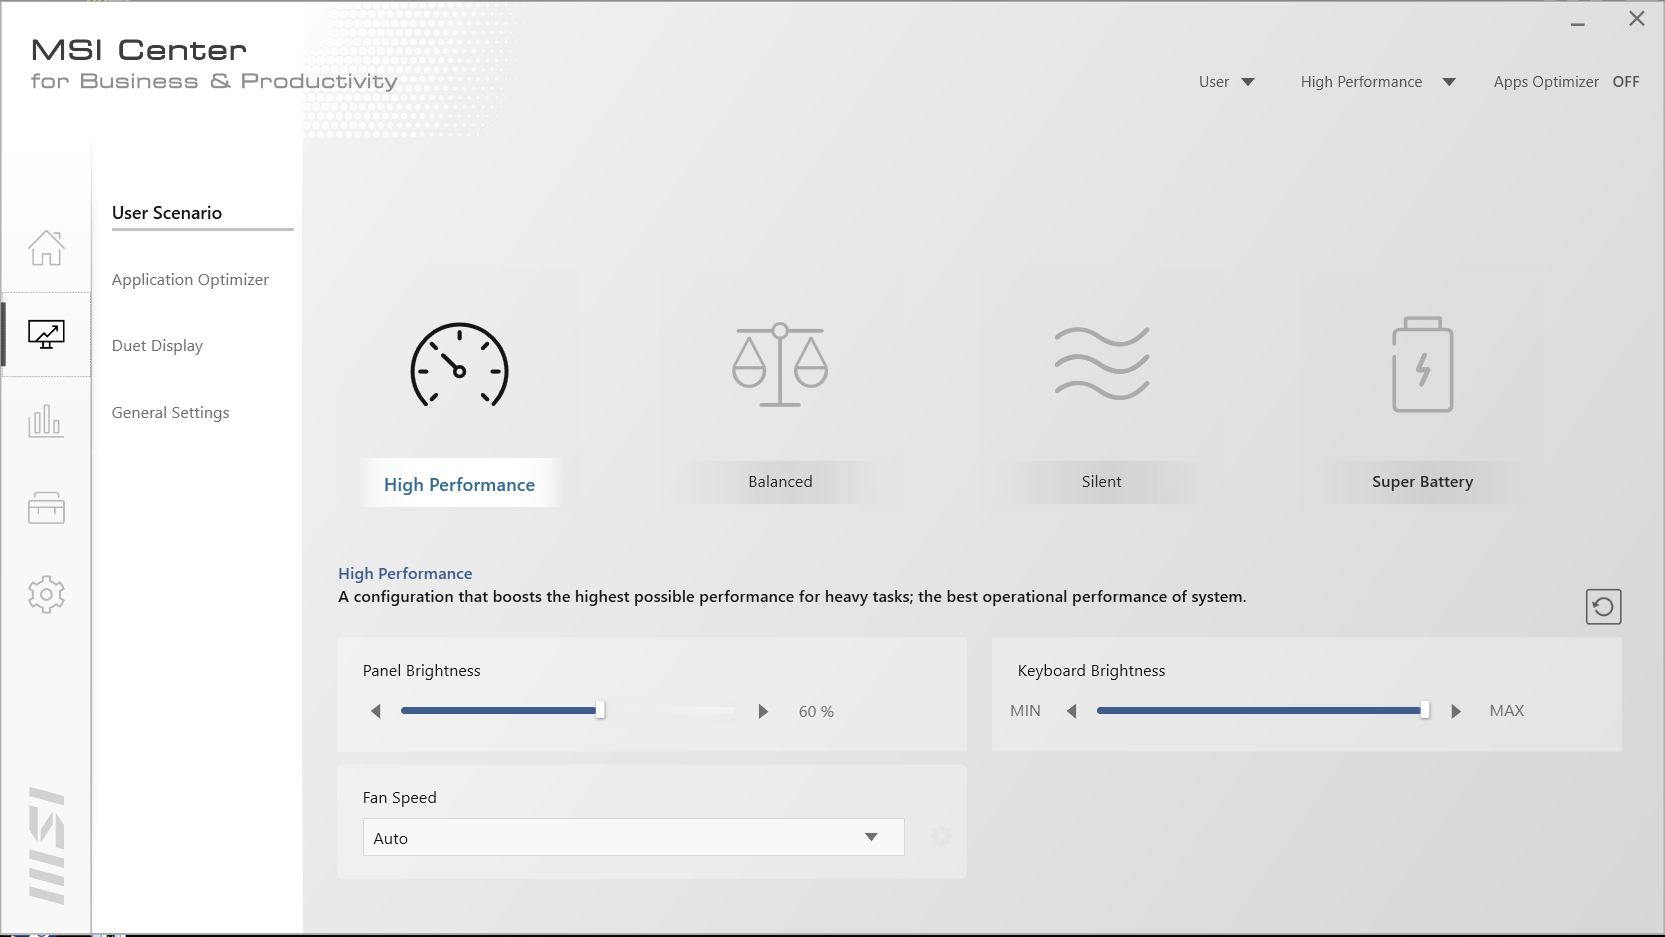
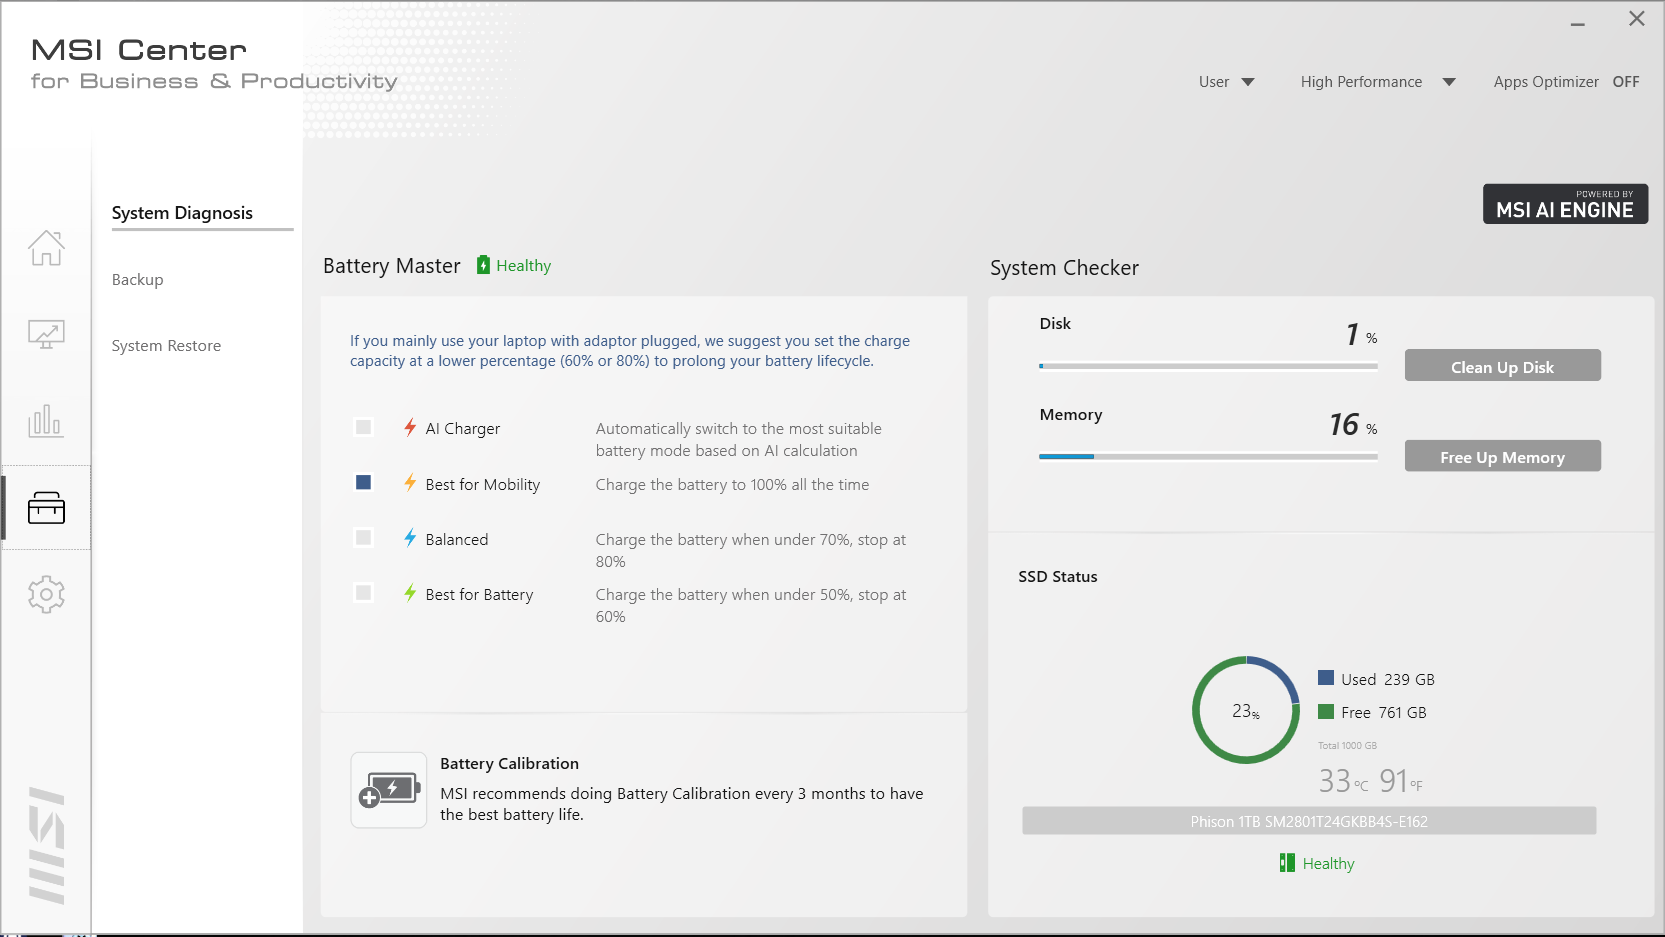
Iris Xe graphics comes standard on all SKUs with no discrete options. Our unit was set to High Performance mode via MSI Center prior to running all performance benchmarks below. We recommend owners become familiar with MSI Center as key system settings are toggled here.
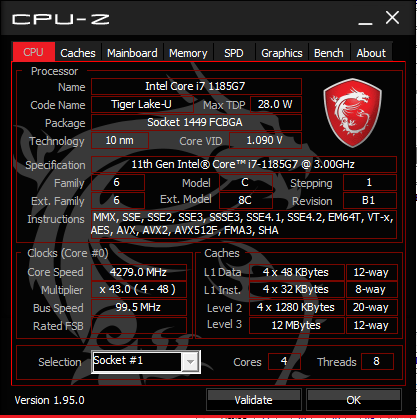

Processor
CPU performance is excellent with better Turbo Boost sustainability than many other subnotebooks with the same Tiger Lake-U CPU. For example, the latest Lenovo Yoga 9i 14 and Huawei MateBook X Pro are roughly 13 percent and 25 percent slower, respectively, after accounting for performance throttling on all systems. The competing Ryzen 7 4700U is still the faster processor in multi-threaded loads while being slower in single-threaded applications.
Cinebench R23: Multi Core | Single Core
Cinebench R15: CPU Single 64Bit | CPU Multi 64Bit
Blender: v2.79 BMW27 CPU
7-Zip 18.03: 7z b 4 -mmt1 | 7z b 4
Geekbench 5.5: Single-Core | Multi-Core
HWBOT x265 Benchmark v2.2: 4k Preset
LibreOffice : 20 Documents To PDF
R Benchmark 2.5: Overall mean
| Cinebench R23 / Multi Core | |
| MSI Summit E13 Flip Evo A11MT | |
| Lenovo ThinkBook 14 G2 ITL 20VD008WGE | |
| Average Intel Core i7-1185G7 (3610 - 6383, n=24) | |
| Huawei MateBook X Pro 2021 | |
| Lenovo Yoga Slim 7i Carbon 13 ITL | |
| Cinebench R23 / Single Core | |
| MSI Summit E13 Flip Evo A11MT | |
| Average Intel Core i7-1185G7 (1251 - 1532, n=24) | |
| Lenovo ThinkBook 14 G2 ITL 20VD008WGE | |
| Lenovo Yoga Slim 7i Carbon 13 ITL | |
| Huawei MateBook X Pro 2021 | |
| HWBOT x265 Benchmark v2.2 / 4k Preset | |
| Asus VivoBook Flip 14 TM420IA | |
| MSI Summit E13 Flip Evo A11MT | |
| HP Envy x360 13-ay0010nr | |
| Lenovo ThinkBook 14 G2 ITL 20VD008WGE | |
| Average Intel Core i7-1185G7 (5.02 - 8.13, n=27) | |
| Lenovo Yoga Slim 7i Carbon 13 ITL | |
| Huawei MateBook X Pro 2021 | |
| Asus Zenbook S UX393JA | |
| Samsung Galaxy Book Flex 13.3 | |
| R Benchmark 2.5 / Overall mean | |
| Samsung Galaxy Book Flex 13.3 | |
| Asus Zenbook S UX393JA | |
| Lenovo ThinkBook 14 G2 ITL 20VD008WGE | |
| HP Envy x360 13-ay0010nr | |
| Asus VivoBook Flip 14 TM420IA | |
| Huawei MateBook X Pro 2021 | |
| MSI Summit E13 Flip Evo A11MT | |
| Average Intel Core i7-1185G7 (0.55 - 0.615, n=27) | |
| Lenovo Yoga Slim 7i Carbon 13 ITL | |
* ... smaller is better
System Performance
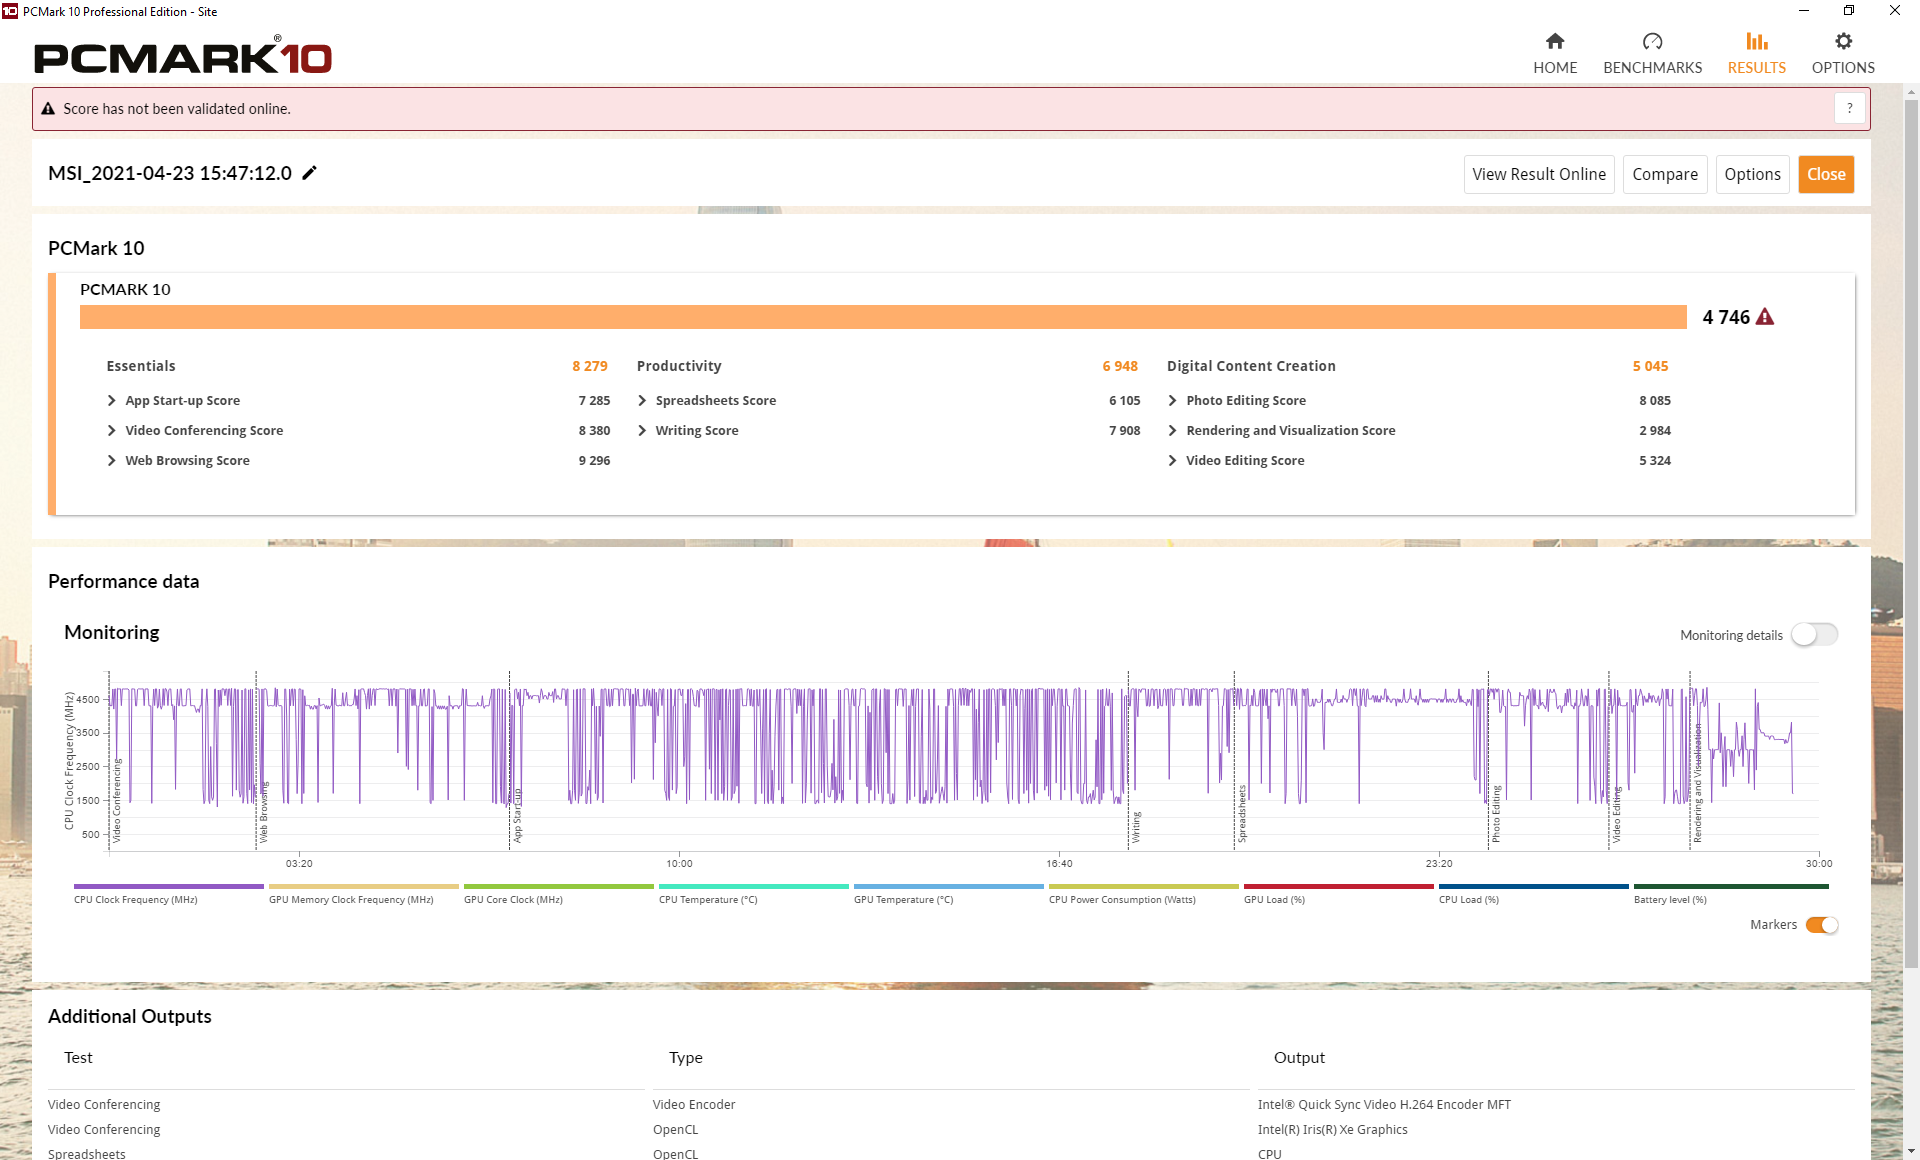
| PCMark 10 Score | 4746 points | |
Help | ||
DPC Latency
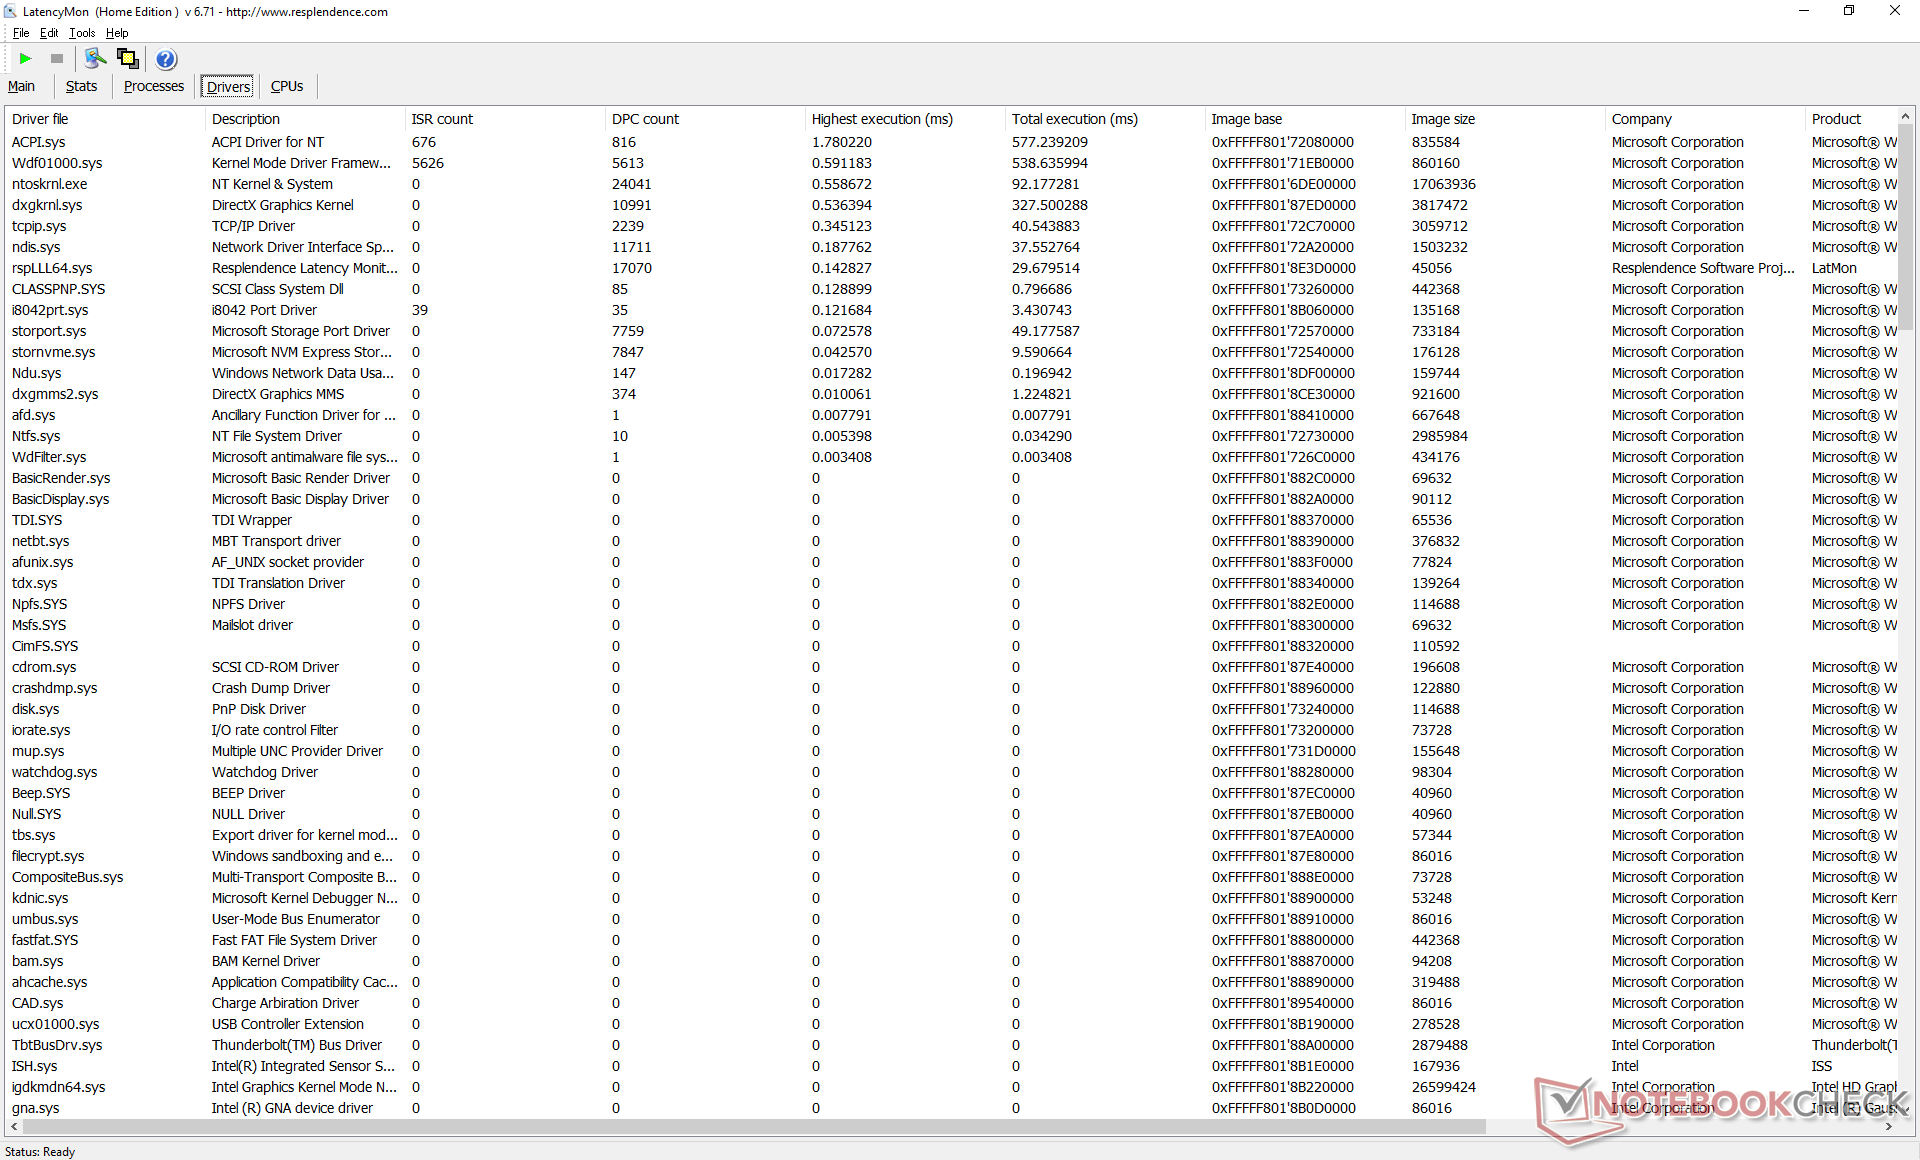
LatencyMon reveals DPC latency issues when opening multiple tabs on our homepage. 4K UHD video playback would also result in 4 dropped frames during our minute-long test video.

| DPC Latencies / LatencyMon - interrupt to process latency (max), Web, Youtube, Prime95 | |
| MSI Summit E13 Flip Evo A11MT | |
| HP Spectre x360 14t-ea000 | |
| Lenovo ThinkPad X1 Titanium Yoga G1 20QA001RGE | |
| Huawei MateBook X Pro 2021 | |
| Asus Zenbook 14 UX435EG | |
* ... smaller is better
Storage Devices
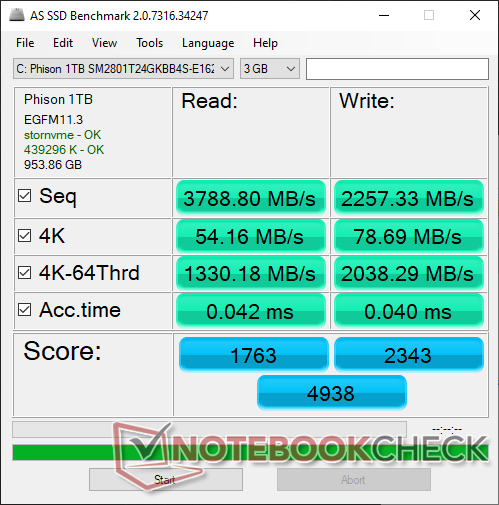
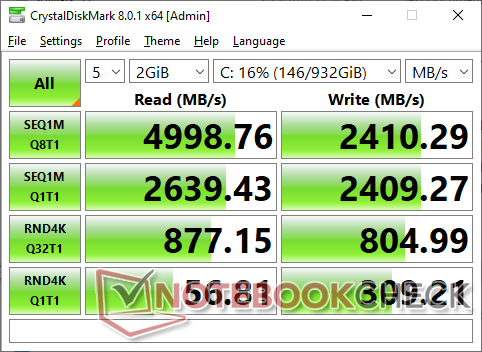
The Summit E13 Flip is one of the few in its size category at the moment to come with a PCIe 4.0 M.2 slot to support speeds of up to two times the typical PCIe 3.0 NVMe drive. Our test unit comes with the same 1 TB Phison PCIe 4.0 NVMe SSD as found on the larger Summit E15. This is a mid-range PCIe 4.0 SSD as transfer rates top out at around 5000 MB/s compared to almost 7000 MB/s with the Samsung PM9A1.
Strangely, there is a ramp up time before transfer rates can reach their full potential when running DiskSpd in a loop as shown by the graph below. Our results differ from the aforementioned Summit E15 even after multiple retests.
| MSI Summit E13 Flip Evo A11MT Phison 1TB SM2801T24GKBB4S-E162 | Dell XPS 13 7390 2-in-1 Core i7 Toshiba BG4 KBG40ZPZ512G | HP Spectre x360 14t-ea000 Samsung SSD PM981a MZVLB512HBJQ | Huawei MateBook X Pro 2021 Samsung PM981a MZVLB1T0HBLR | Lenovo ThinkPad X1 Titanium Yoga G1 20QA001RGE Toshiba BG4 KBG40ZNT512G | Asus Zenbook 14 UX435EG Samsung PM981a MZVLB1T0HBLR | |
|---|---|---|---|---|---|---|
| AS SSD | -144% | -16% | 7% | -45% | 10% | |
| Seq Read (MB/s) | 3789 | 1801 -52% | 2188 -42% | 2794 -26% | 1898 -50% | 2861 -24% |
| Seq Write (MB/s) | 2257 | 1125 -50% | 1320 -42% | 2385 6% | 1065 -53% | 2837 26% |
| 4K Read (MB/s) | 54.2 | 39.7 -27% | 53.5 -1% | 60.7 12% | 58 7% | 60.3 11% |
| 4K Write (MB/s) | 78.7 | 67 -15% | 123.7 57% | 180.8 130% | 200.7 155% | 164.2 109% |
| 4K-64 Read (MB/s) | 1330 | 1253 -6% | 1010 -24% | 1768 33% | 580 -56% | 1598 20% |
| 4K-64 Write (MB/s) | 2038 | 209 -90% | 1808 -11% | 1800 -12% | 779 -62% | 1572 -23% |
| Access Time Read * (ms) | 0.042 | 0.069 -64% | 0.055 -31% | 0.037 12% | 0.052 -24% | 0.046 -10% |
| Access Time Write * (ms) | 0.04 | 0.625 -1463% | 0.076 -90% | 0.073 -83% | 0.16 -300% | 0.021 47% |
| Score Read (Points) | 1763 | 1472 -17% | 1282 -27% | 2108 20% | 828 -53% | 1945 10% |
| Score Write (Points) | 2343 | 388 -83% | 2063 -12% | 2219 -5% | 1087 -54% | 2020 -14% |
| Score Total (Points) | 4938 | 2583 -48% | 3970 -20% | 5392 9% | 2316 -53% | 4966 1% |
| Copy ISO MB/s (MB/s) | 2270 | 1293 -43% | 1644 -28% | 2065 -9% | 1659 -27% | 2414 6% |
| Copy Program MB/s (MB/s) | 670 | 560 -16% | 920 37% | 734 10% | 519 -23% | 575 -14% |
| Copy Game MB/s (MB/s) | 1525 | 927 -39% | 1725 13% | 1629 7% | 872 -43% | 1408 -8% |
| CrystalDiskMark 5.2 / 6 | -43% | -28% | -13% | -30% | -5% | |
| Write 4K (MB/s) | 311.1 | 106.7 -66% | 82.2 -74% | 197.5 -37% | 226.6 -27% | 211.8 -32% |
| Read 4K (MB/s) | 56.6 | 49.94 -12% | 45.7 -19% | 52.9 -7% | 62.8 11% | 50.1 -11% |
| Write Seq (MB/s) | 2397 | 1223 -49% | 2000 -17% | 2174 -9% | 1296 -46% | 2938 23% |
| Read Seq (MB/s) | 2277 | 1801 -21% | 2206 -3% | 2156 -5% | 1445 -37% | 2639 16% |
| Write 4K Q32T1 (MB/s) | 803 | 325.3 -59% | 451.2 -44% | 632 -21% | 545 -32% | 656 -18% |
| Read 4K Q32T1 (MB/s) | 849 | 551 -35% | 351 -59% | 694 -18% | 687 -19% | 723 -15% |
| Write Seq Q32T1 (MB/s) | 2410 | 1224 -49% | 2982 24% | 3017 25% | 1483 -38% | 3022 25% |
| Read Seq Q32T1 (MB/s) | 4954 | 2350 -53% | 3529 -29% | 3561 -28% | 2334 -53% | 3561 -28% |
| Total Average (Program / Settings) | -94% /
-107% | -22% /
-20% | -3% /
0% | -38% /
-40% | 3% /
4% |
* ... smaller is better

Disk Throttling: DiskSpd Read Loop, Queue Depth 8
GPU Performance
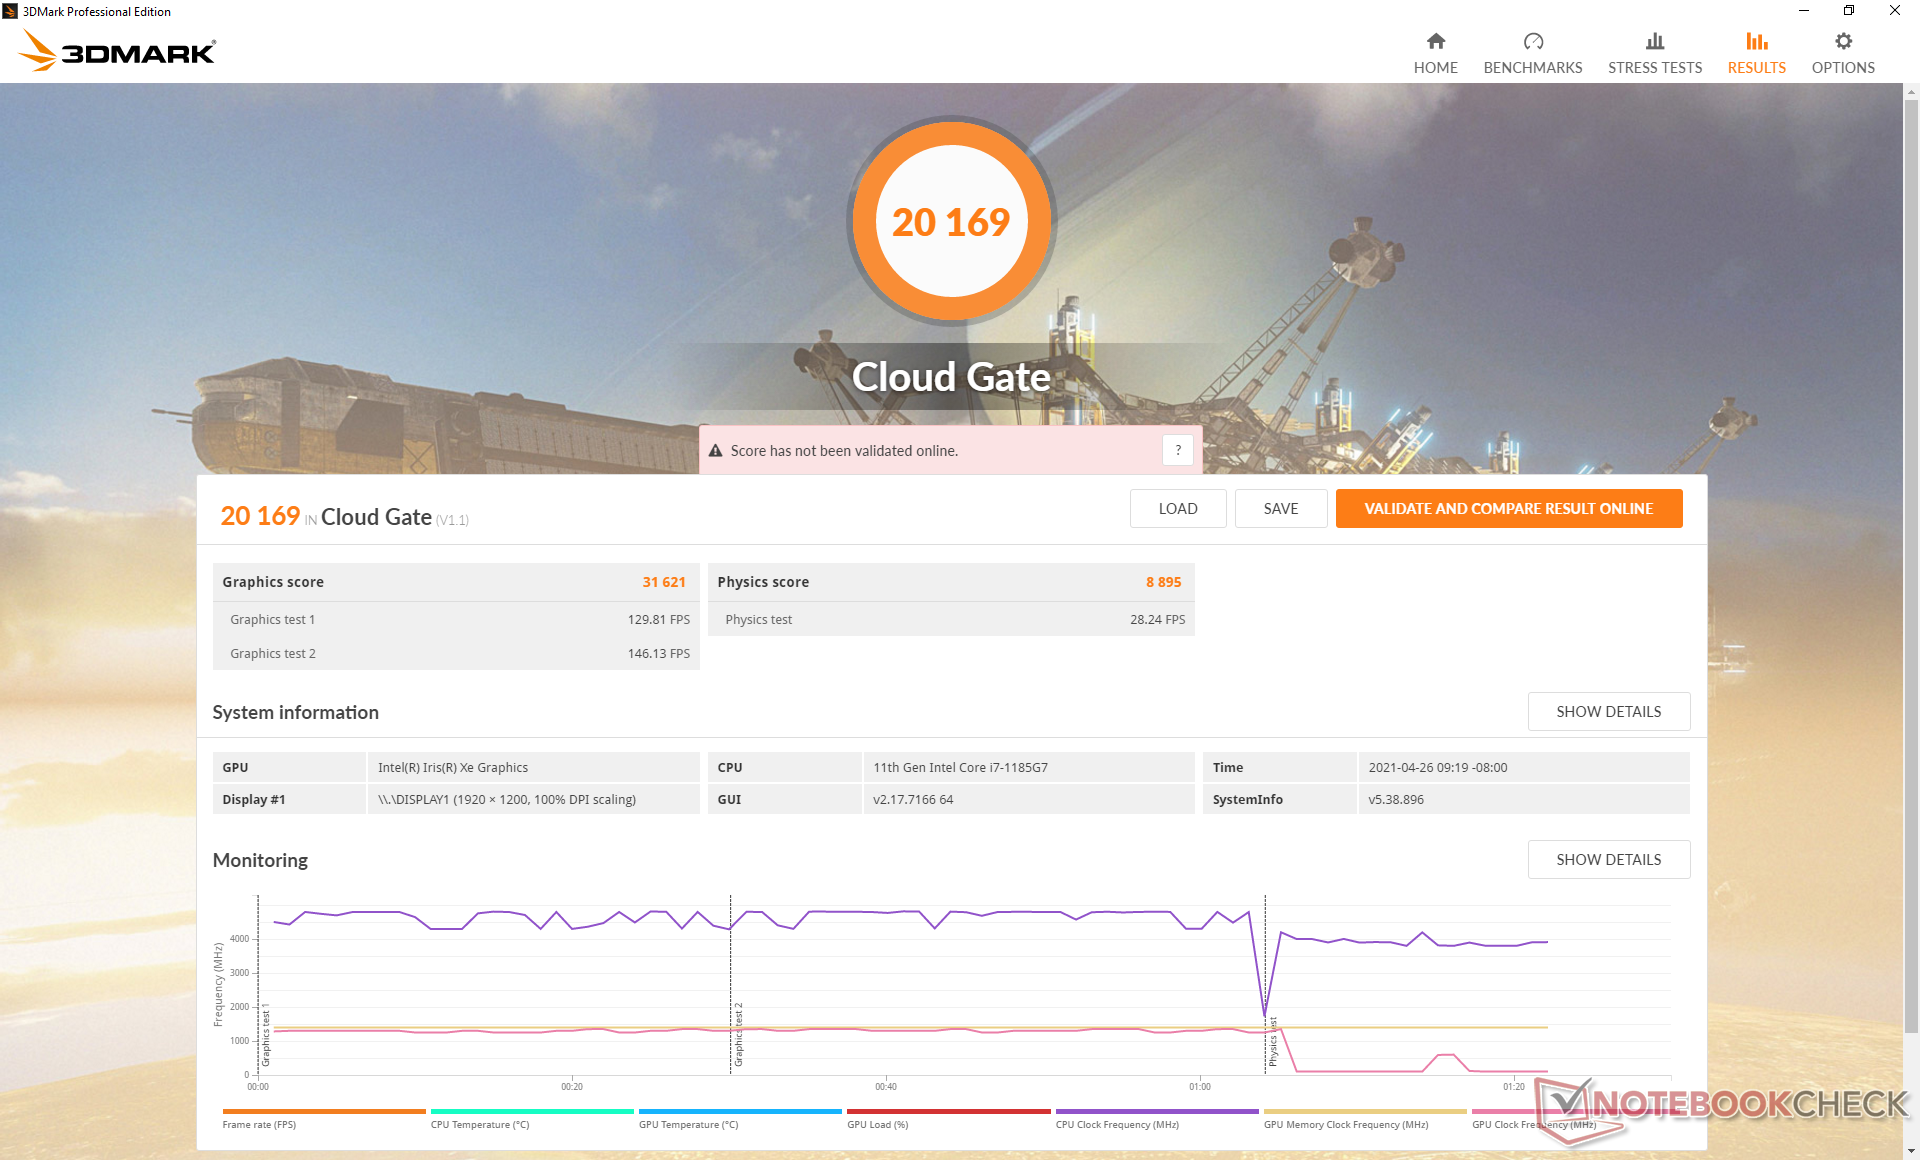
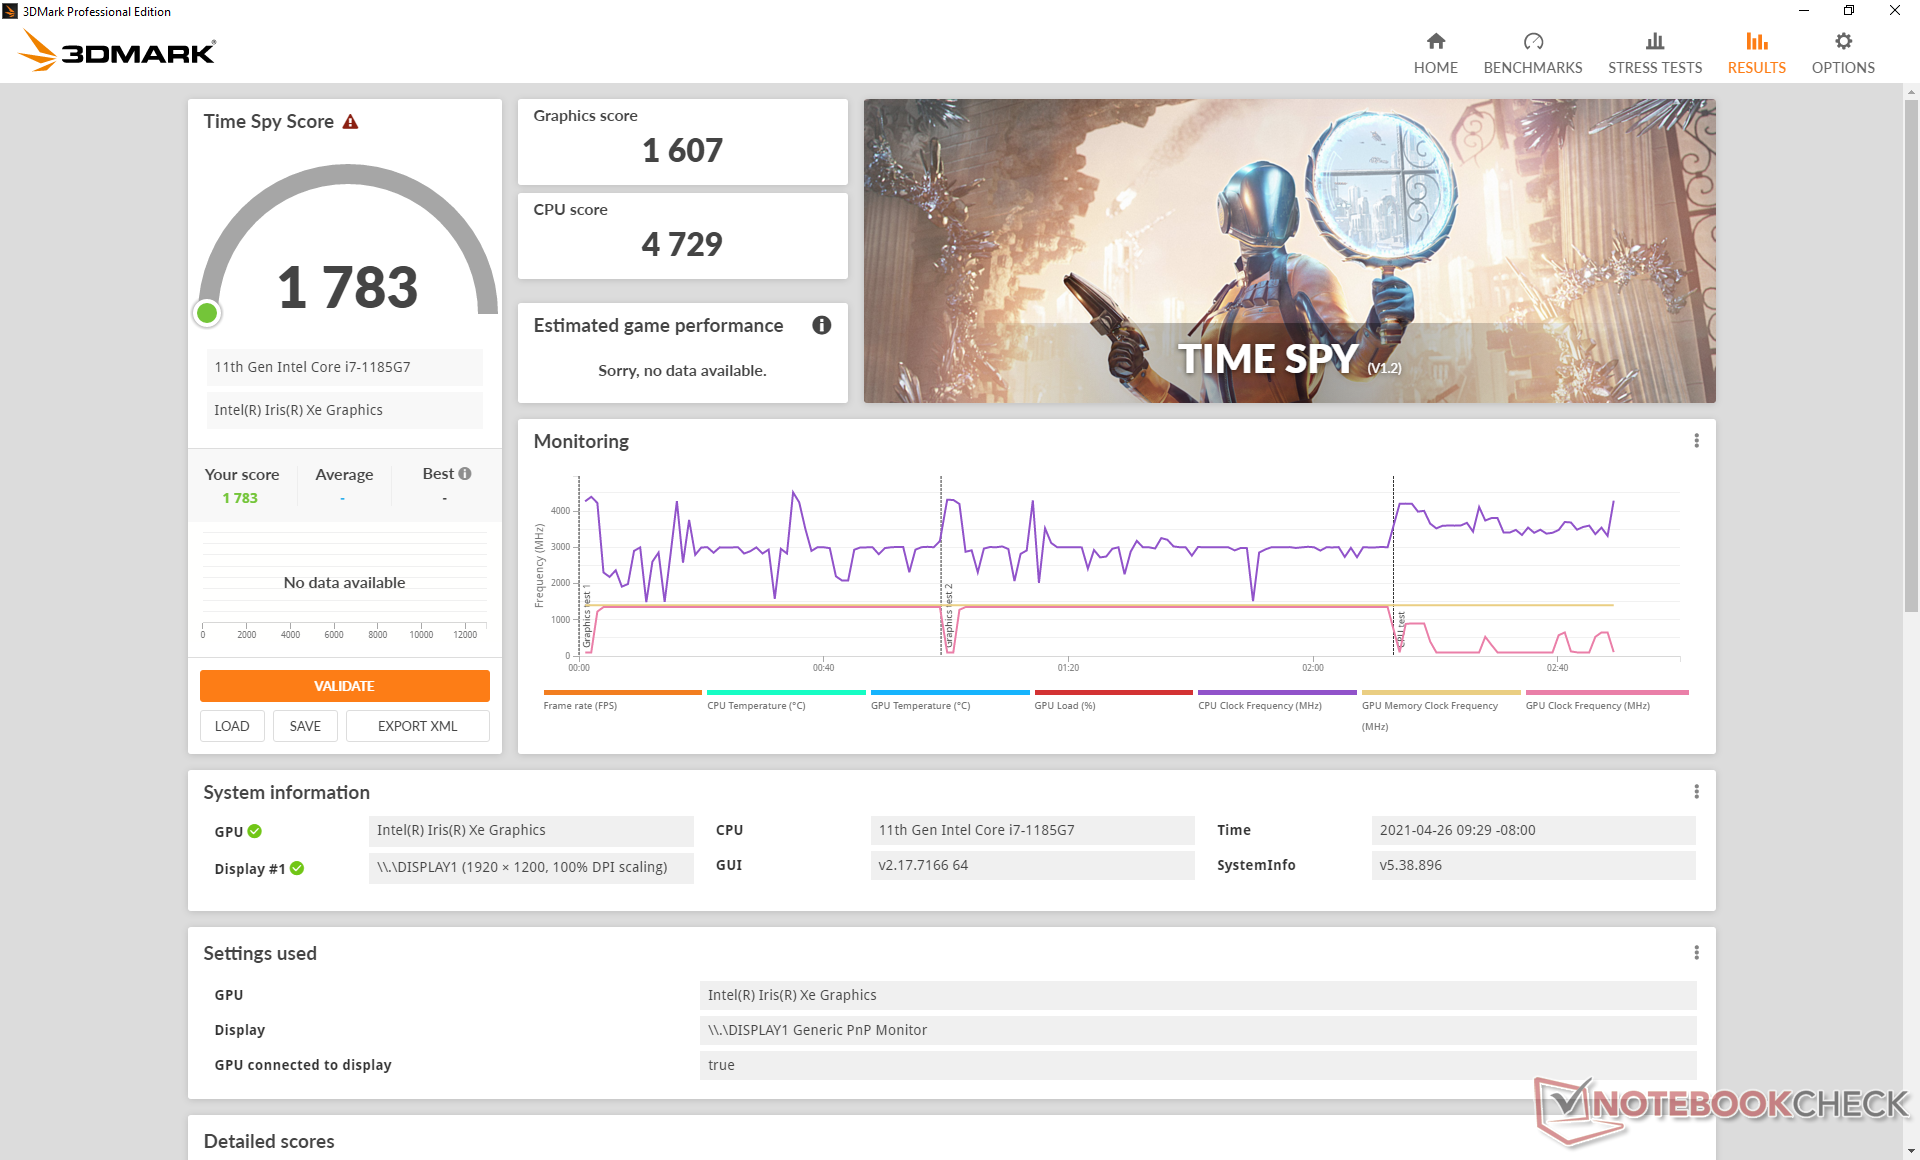
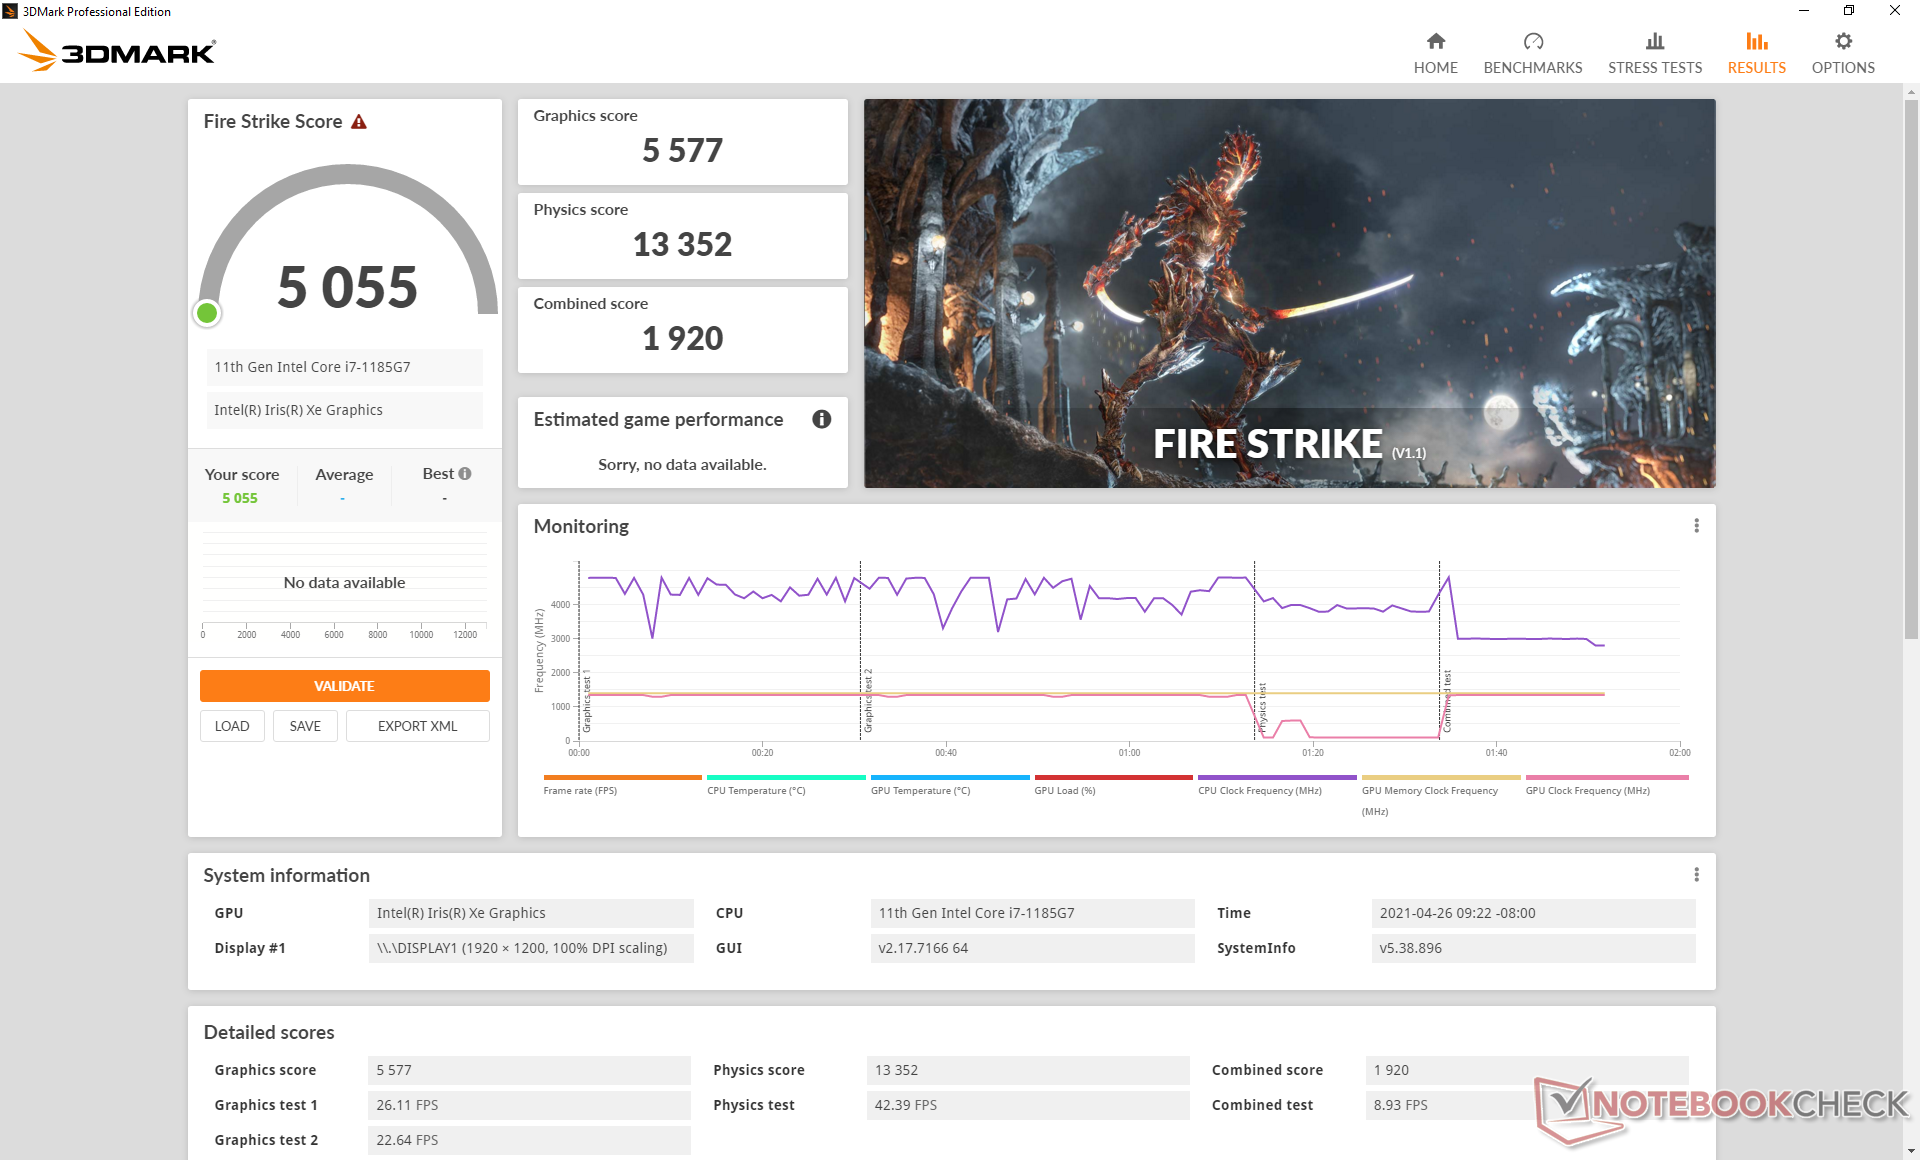
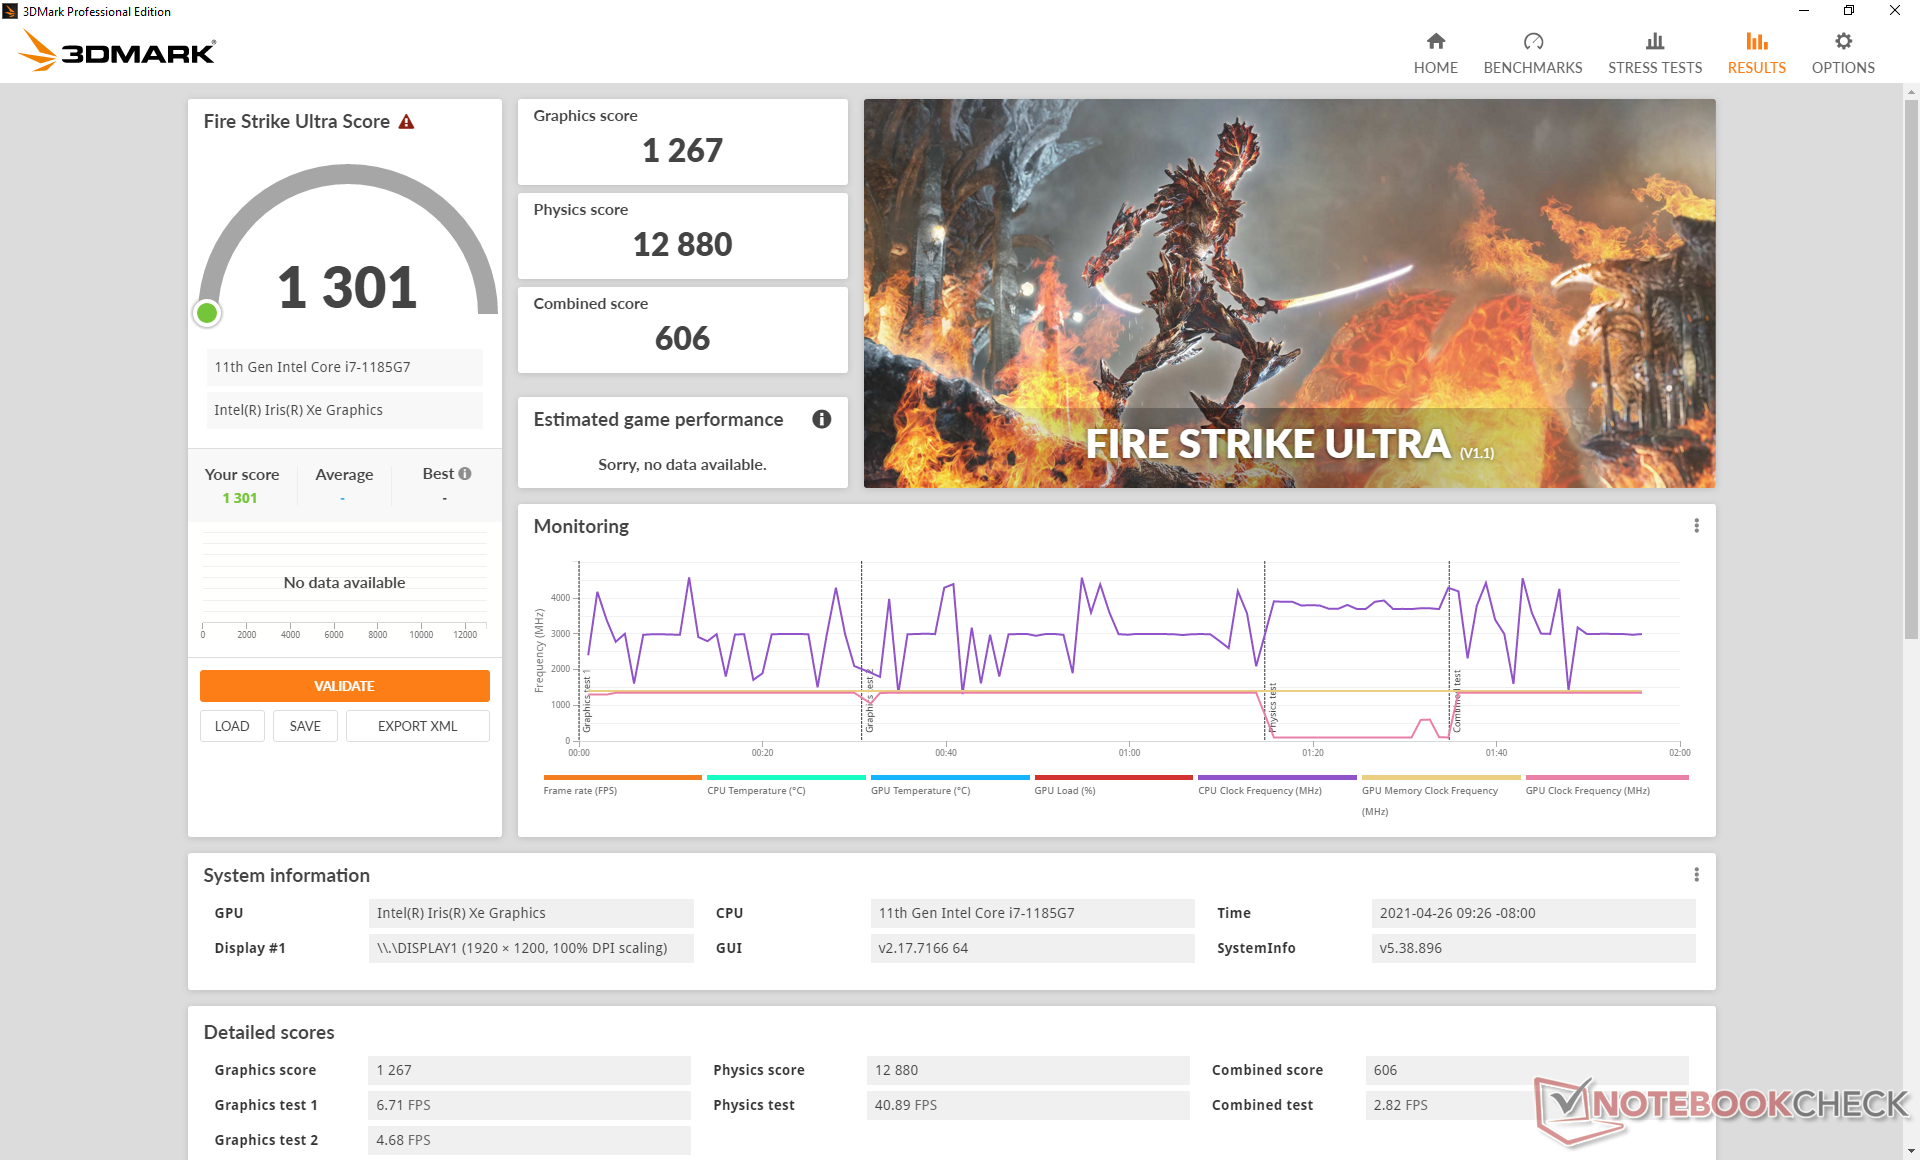
Raw graphics performance is excellent as 3DMark results are consistently at least 10 percent higher than the average Iris Xe 96 EUs in our database. This advantage translates well to real-world games where average frame rates are able to edge out most other Core i7 Tiger Lake-U laptops. We suspect that the 32 GB of RAM may be partly responsible here as that is two times more than what Ultrabooks typically come with. Users upgrading from the UHD Graphics 620 or even the Iris Plus G7 will see noticeable gains.
Gaming is possible, but fast-moving games like Overwatch or Rocket League should be avoided on the main screen due to heavy ghosting.

| 3DMark 11 Performance | 7330 points | |
| 3DMark Cloud Gate Standard Score | 20169 points | |
| 3DMark Fire Strike Score | 5055 points | |
| 3DMark Time Spy Score | 1783 points | |
Help | ||
| low | med. | high | ultra | |
|---|---|---|---|---|
| GTA V (2015) | 90.6 | 76.1 | 23.7 | 11.2 |
| The Witcher 3 (2015) | 99.9 | 61.8 | 31 | 14.7 |
| Dota 2 Reborn (2015) | 82.6 | 69.6 | 48.5 | 47.2 |
| Final Fantasy XV Benchmark (2018) | 44.7 | 24.1 | 18.2 | |
| X-Plane 11.11 (2018) | 26.7 | 37.7 | 33.1 | |
| Strange Brigade (2018) | 97.4 | 39.1 | 30.8 | 25.1 |
Emissions
System Noise
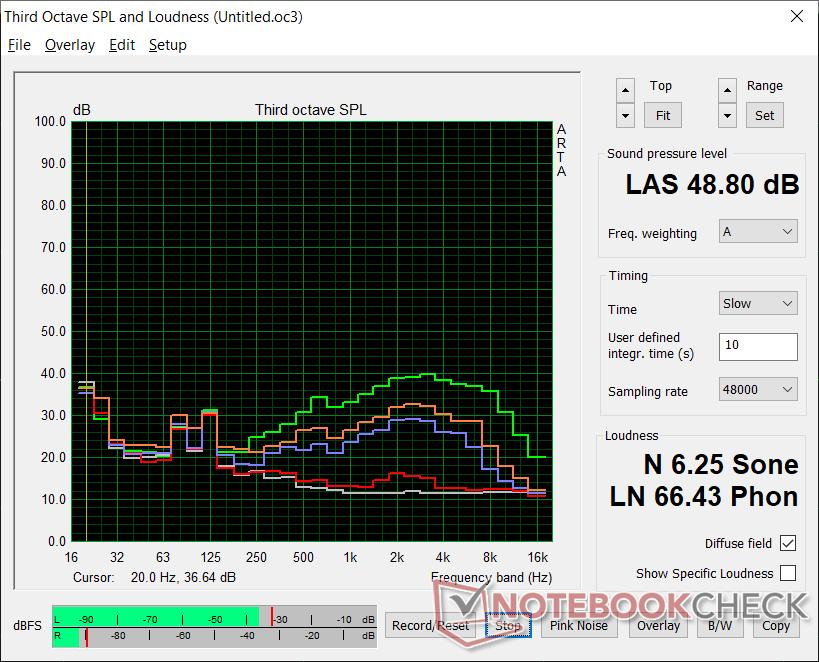
The fans are generally silent during low loads for a quiet browsing or video streaming experience. If on High Performance mode, however, they tend to pulse more frequently and jump to 26.4 dB(A) or higher against a silent background of 24.5 dB(A). Users should set the system to Silent or Balanced mode via MSI Center if minimizing fan noise is a priority.
Gaming will induce a fan noise between 37.8 dB(A) and 41.4 dB(A) to be as loud as the Asus ZenBook 14 with the discrete GeForce MX450 GPU. Enabling Cooler Boost will bump fan noise up even further to almost 49 dB(A) to be one of the loudest Core U-powered convertibles. Fortunately, the feature is not needed for most applications.
| MSI Summit E13 Flip Evo A11MT Iris Xe G7 96EUs, i7-1185G7, Phison 1TB SM2801T24GKBB4S-E162 | Dell XPS 13 7390 2-in-1 Core i7 Iris Plus Graphics G7 (Ice Lake 64 EU), i7-1065G7, Toshiba BG4 KBG40ZPZ512G | HP Spectre x360 14t-ea000 Iris Xe G7 96EUs, i7-1165G7, Samsung SSD PM981a MZVLB512HBJQ | Huawei MateBook X Pro 2021 Iris Xe G7 96EUs, i7-1165G7, Samsung PM981a MZVLB1T0HBLR | Lenovo ThinkPad X1 Titanium Yoga G1 20QA001RGE Iris Xe G7 96EUs, i7-1160G7, Toshiba BG4 KBG40ZNT512G | Asus Zenbook 14 UX435EG GeForce MX450, i7-1165G7, Samsung PM981a MZVLB1T0HBLR | |
|---|---|---|---|---|---|---|
| Noise | -4% | 6% | 9% | 7% | -1% | |
| off / environment * (dB) | 24.5 | 28.1 -15% | 25.8 -5% | 25.4 -4% | 25.1 -2% | 25.6 -4% |
| Idle Minimum * (dB) | 24.7 | 28.1 -14% | 25.9 -5% | 25.6 -4% | 25.1 -2% | 25.6 -4% |
| Idle Average * (dB) | 24.7 | 28.1 -14% | 25.9 -5% | 25.6 -4% | 25.1 -2% | 25.6 -4% |
| Idle Maximum * (dB) | 26.4 | 28.1 -6% | 25.9 2% | 25.6 3% | 27.1 -3% | 26.3 -0% |
| Load Average * (dB) | 37.8 | 31.7 16% | 26.4 30% | 28.7 24% | 32.7 13% | 41.6 -10% |
| Witcher 3 ultra * (dB) | 41.4 | 43.4 -5% | 36.9 11% | 32 23% | 32.7 21% | 41.6 -0% |
| Load Maximum * (dB) | 48.8 | 43.4 11% | 41.5 15% | 38.2 22% | 35.8 27% | 41.6 15% |
* ... smaller is better
Noise level
| Idle |
| 24.7 / 24.7 / 26.4 dB(A) |
| Load |
| 37.8 / 48.8 dB(A) |
 | ||
30 dB silent 40 dB(A) audible 50 dB(A) loud |
||
min: | ||
Temperature
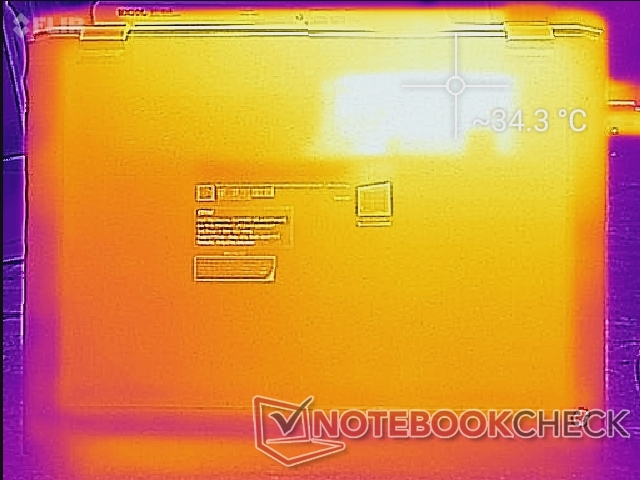
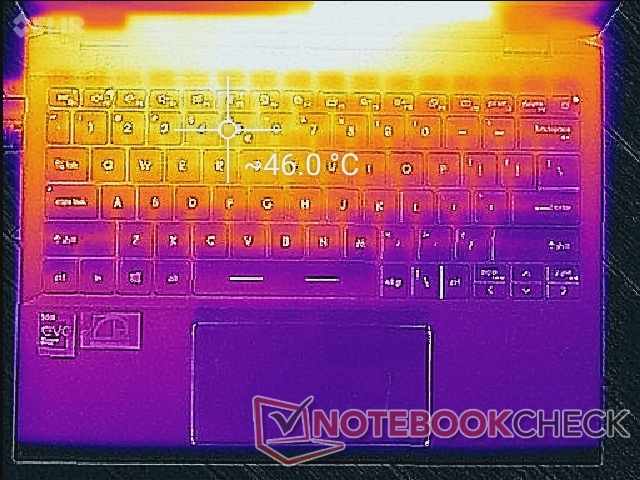
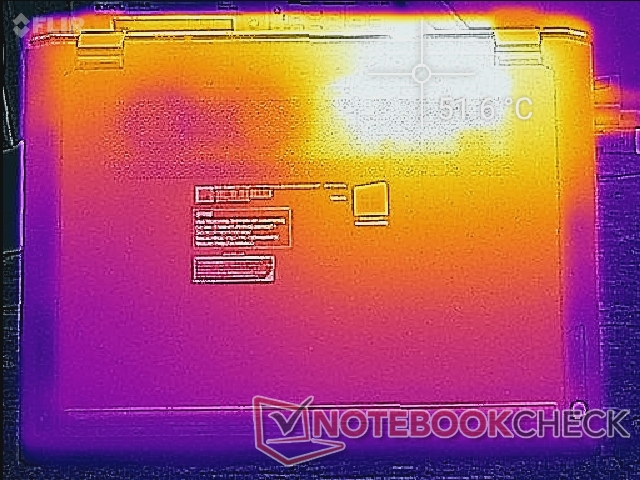
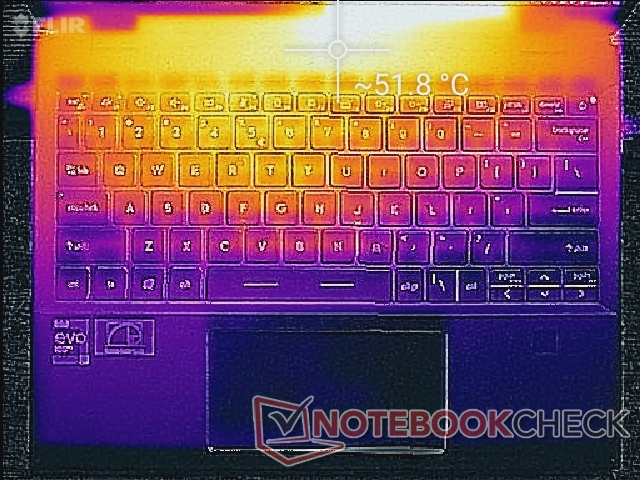
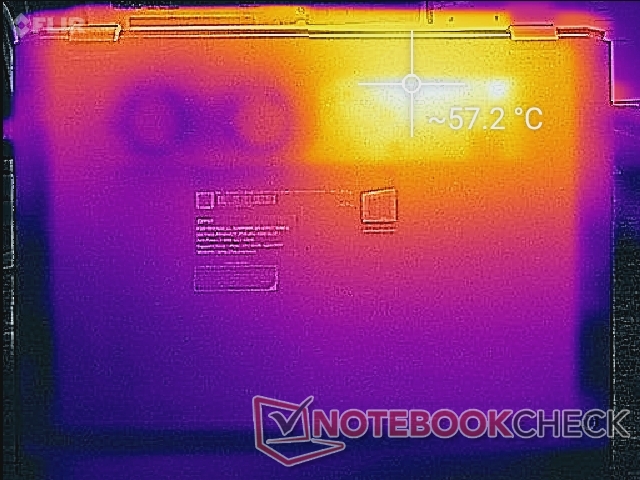
Surface temperatures are always warmest on the left half of the laptop than the right due to the positioning of the cooling solution inside. The hot spot on the keyboard can become as warm as 46 C while the underside can be up to 52 C when gaming. Though not bothersome, the warm areas are definitely noticeable and likely due to the high core temperatures as detailed in our Stress Test section. Be sure to not block the relatively small ventilation window on the bottom of the laptop when running demanding loads.
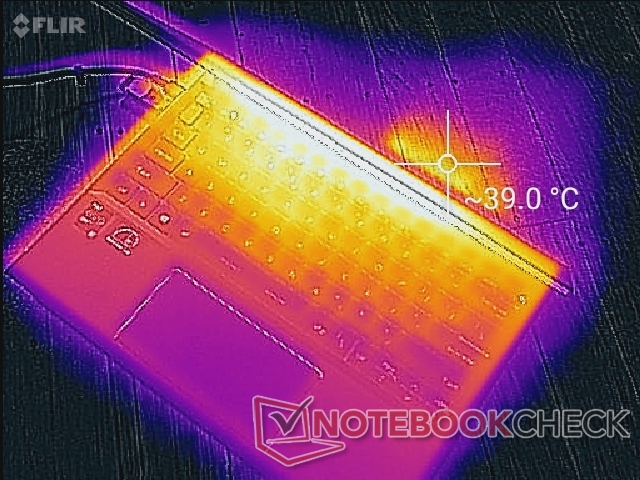

(-) The maximum temperature on the upper side is 52 °C / 126 F, compared to the average of 35.4 °C / 96 F, ranging from 19.6 to 60 °C for the class Convertible.
(-) The bottom heats up to a maximum of 57.4 °C / 135 F, compared to the average of 36.9 °C / 98 F
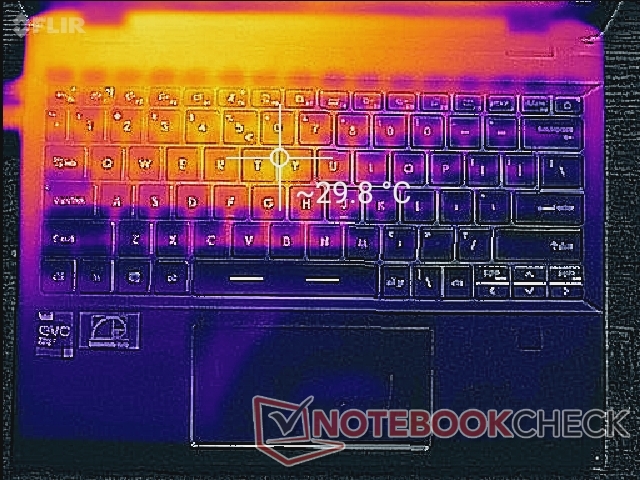
(+) In idle usage, the average temperature for the upper side is 27 °C / 81 F, compared to the device average of 30.3 °C / 87 F.
(±) Playing The Witcher 3, the average temperature for the upper side is 35.7 °C / 96 F, compared to the device average of 30.3 °C / 87 F.
(+) The palmrests and touchpad are cooler than skin temperature with a maximum of 27.6 °C / 81.7 F and are therefore cool to the touch.
(±) The average temperature of the palmrest area of similar devices was 28 °C / 82.4 F (+0.4 °C / 0.7 F).
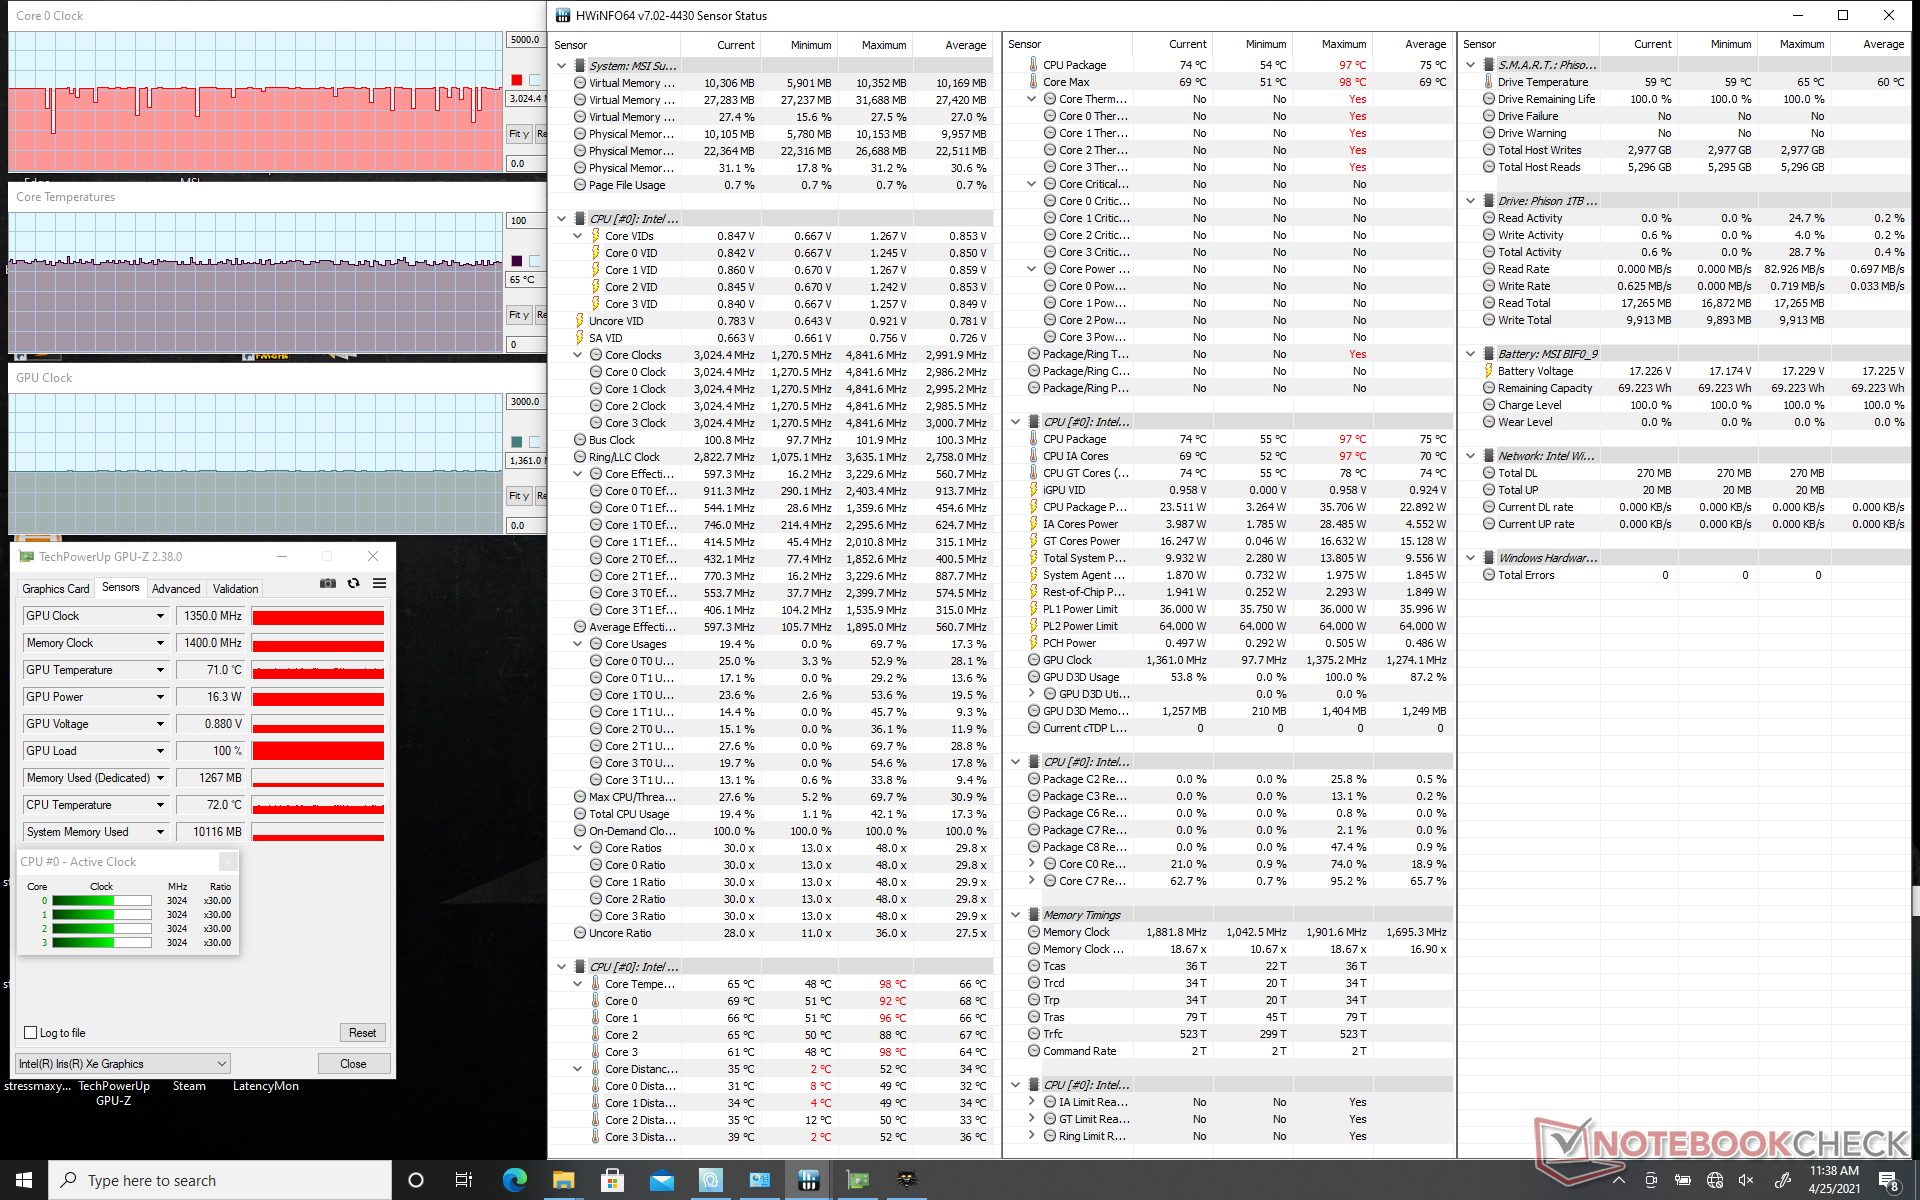
Stress Test
When stressed with Prime95, the CPU would boost to 3.7 GHz for the first few seconds before hitting a core temperature of 95 C. Clock rates would then stabilize at around 2.7 to 2.9 GHz in order to maintain a core temperature of 91 C. The MSI runs much warmer than most other Ultrabooks where core temperatures would typically stabilize in the 70 C to 80 C range instead like on the Huawei MateBook X Pro or Asus ZenBook 14.
Enabling Cooler Boost mode (i.e., maximum fan mode) will not significantly impact CPU or GPU performance. Core temperature when gaming, however, can be cooler by up to 10 C if the feature is enabled.
Running on battery power will limit graphics performance. A Fire Strike test on batteries would return Physics and Graphics scores of 12682 and 4701 points, respectively, compared to 13352 and 5577 points when on mains.
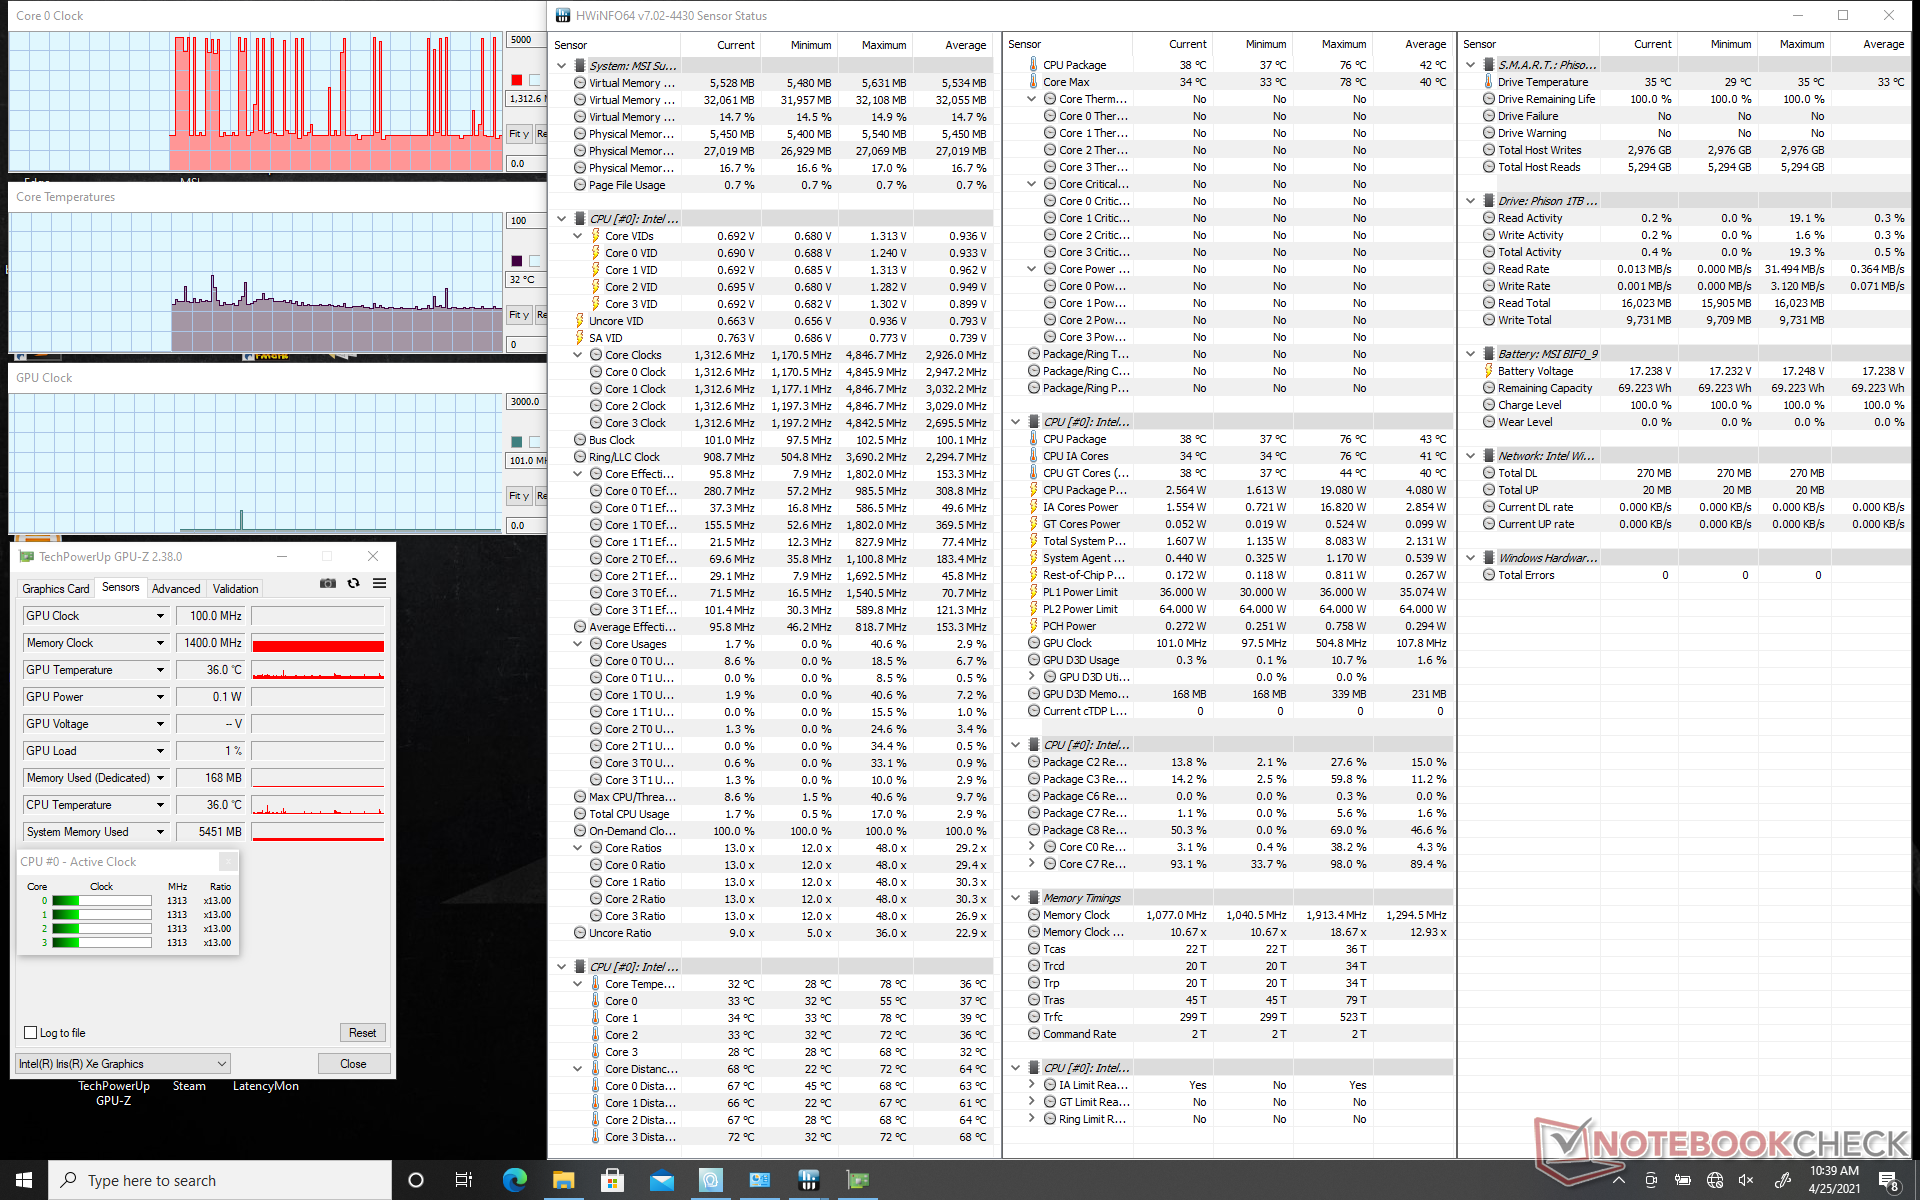
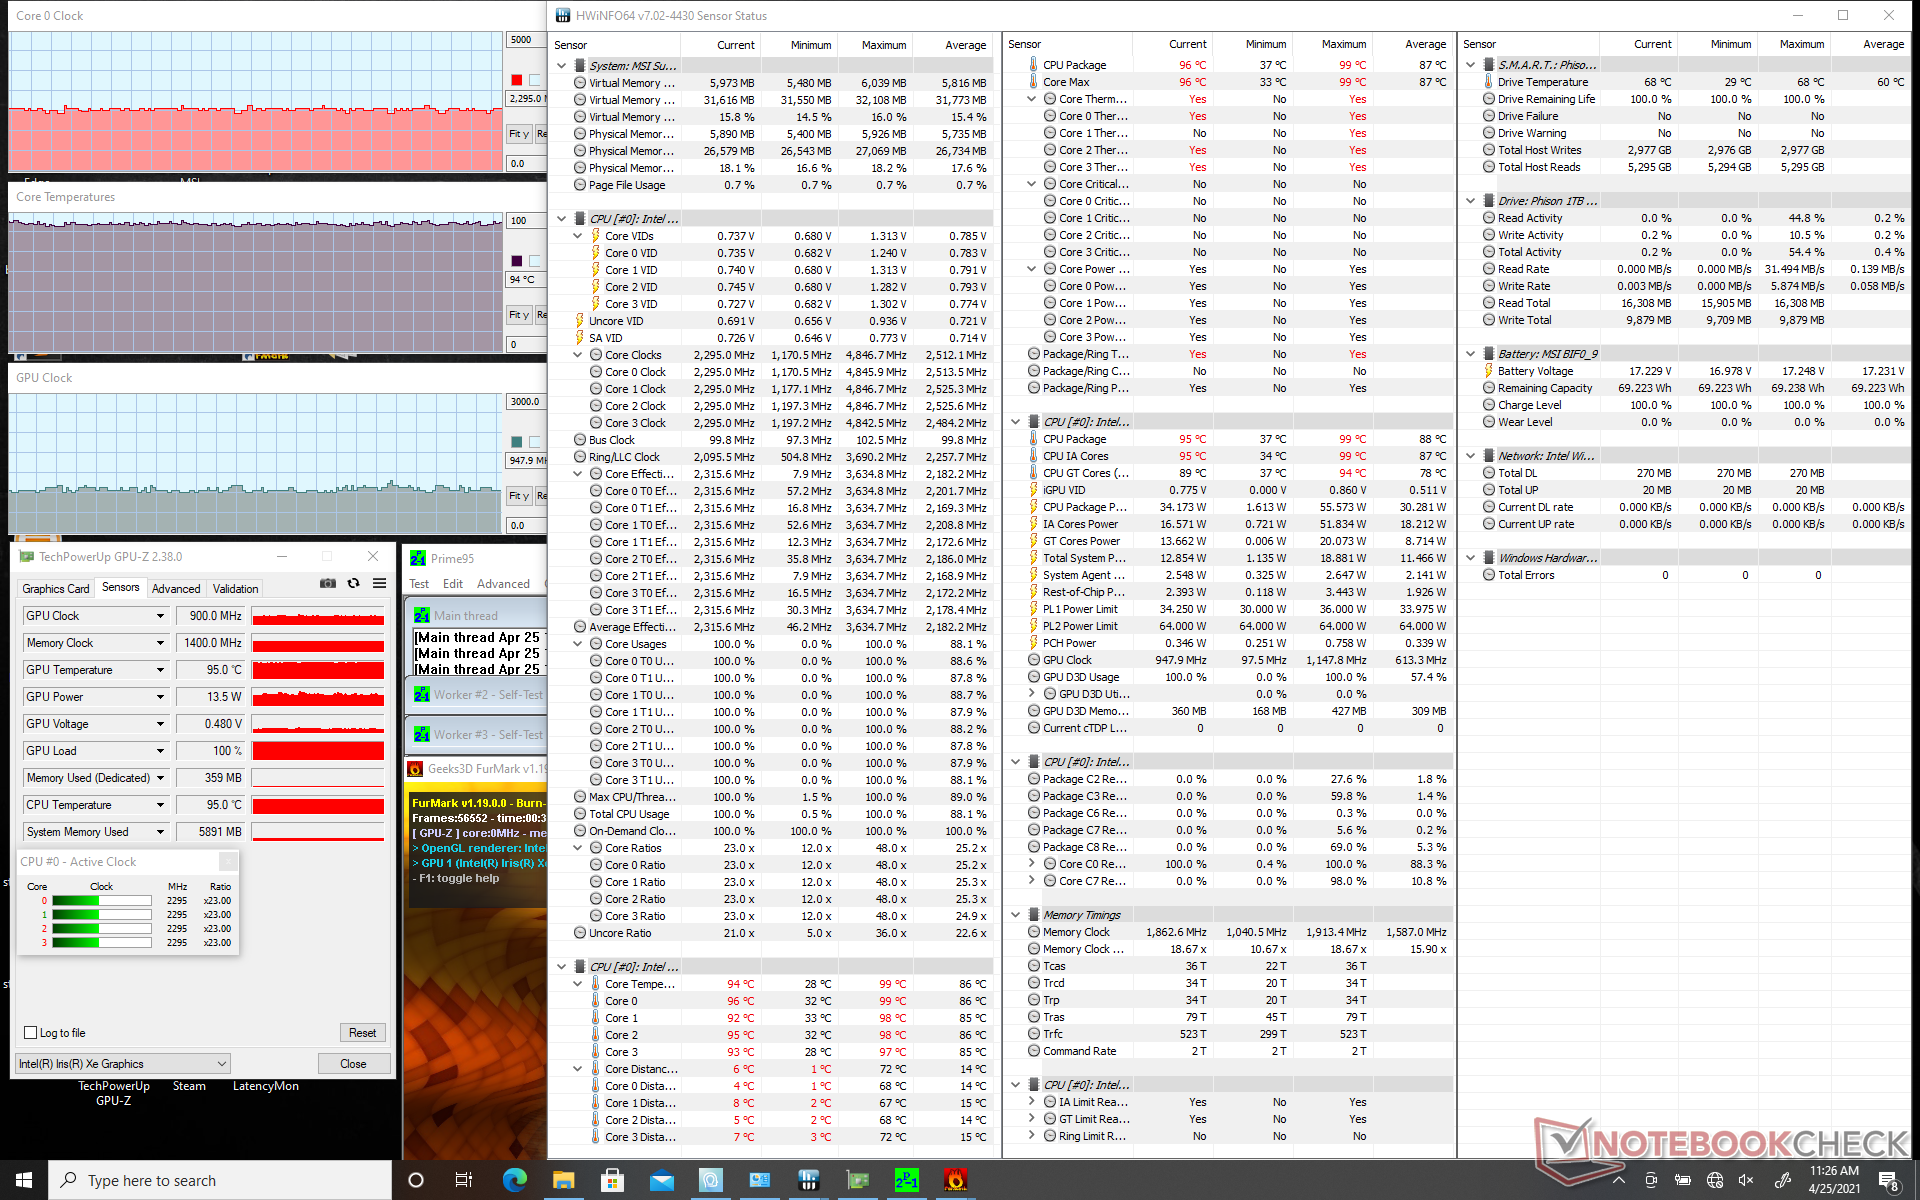


| CPU Clock (GHz) | GPU Clock (MHz) | Average CPU Temperature (°C) | |
| System Idle | -- | -- | 32 |
| Prime95 Stress (Cooler Boost off) | 2.7 - 2.9 | -- | 91 |
| Prime95 Stress (Cooler Boost on) | 2.8 - 3.0 | -- | 94 |
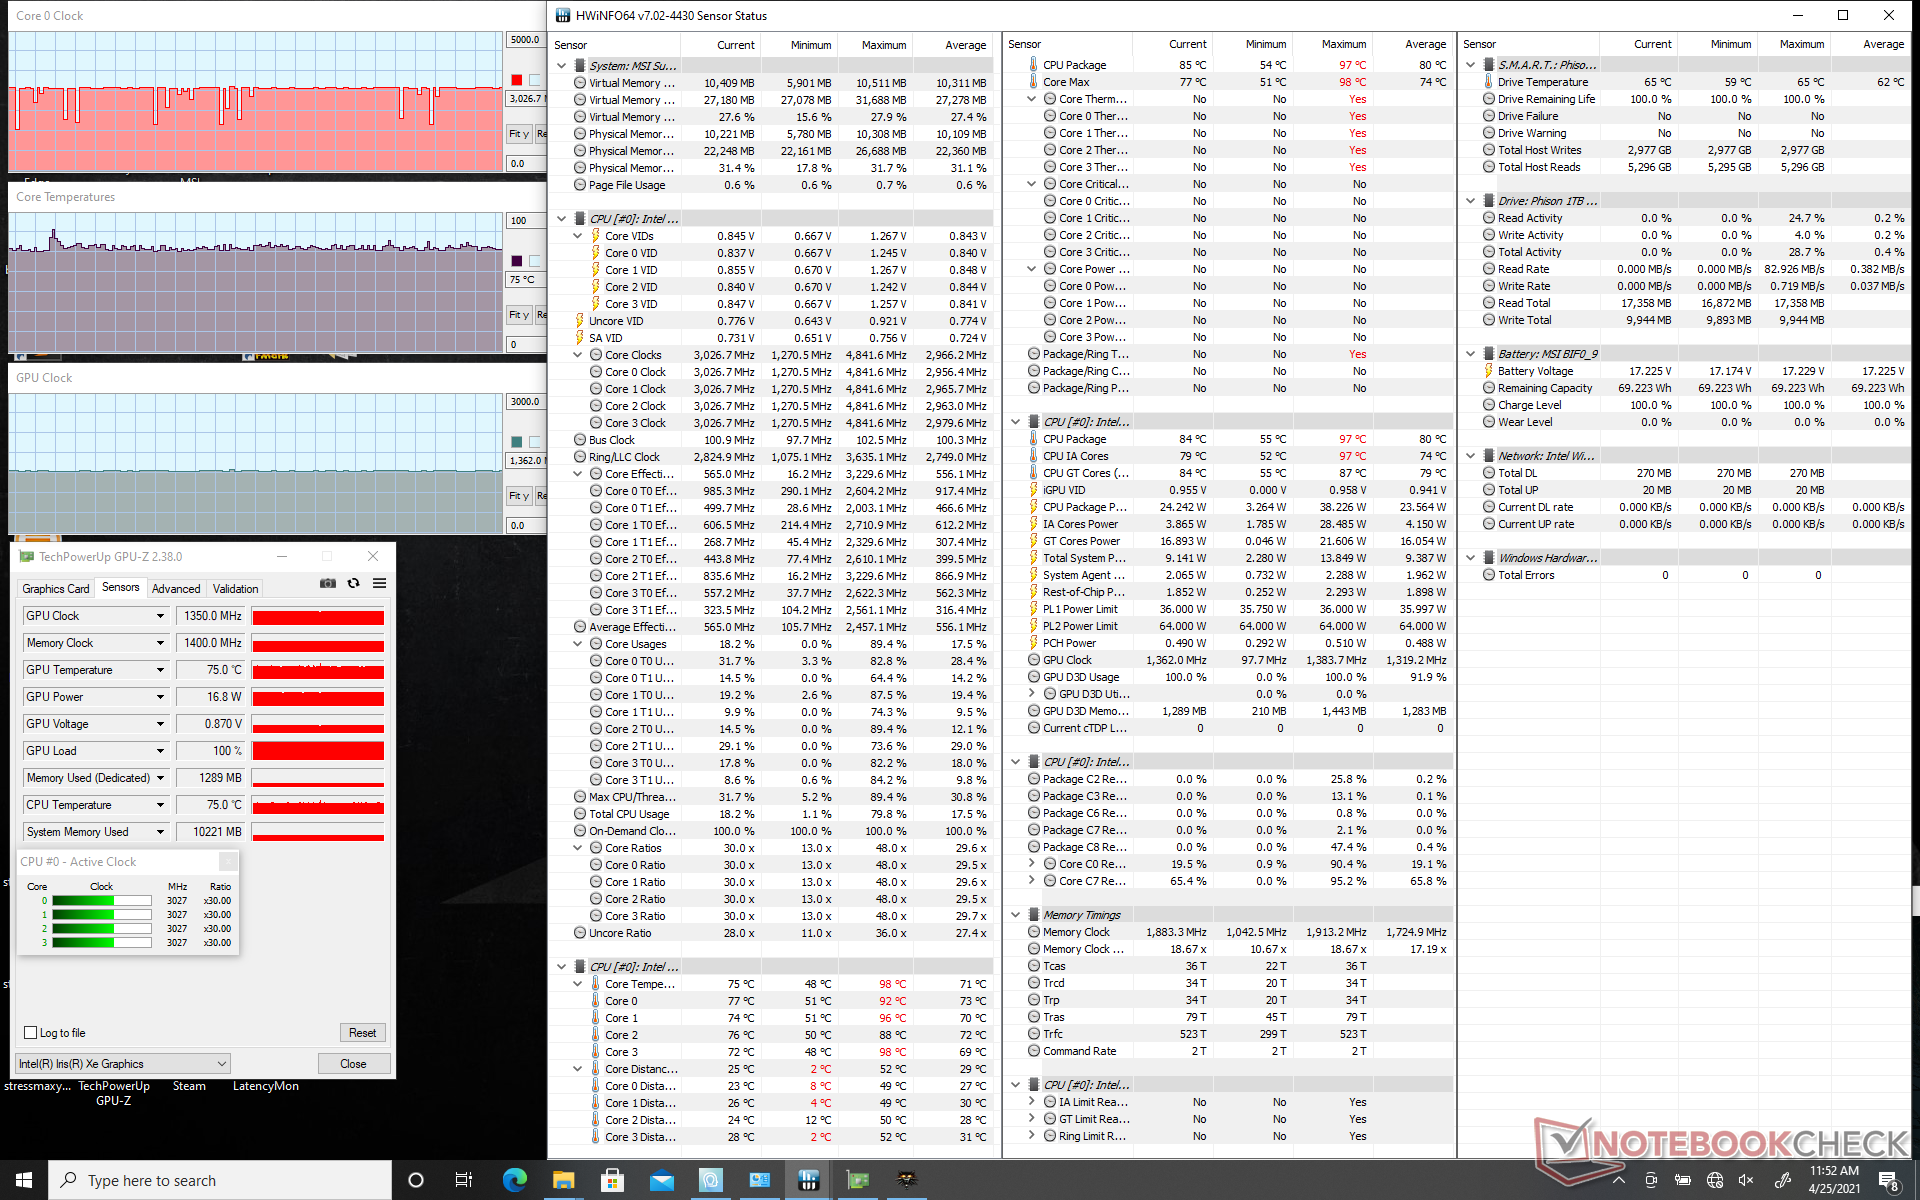
| Witcher 3 Stress (Cooler Boost off) | 3.0 | 1350 | 75 |
| Witcher 3 Stress (Cooler Boost on) | 3.0 | 1350 | 65 |
| Prime95 + FurMark Stress (Cooler Boost on) | 2.3 | 900 | 94 |
Speakers


MSI Summit E13 Flip Evo A11MT audio analysis
(±) | speaker loudness is average but good (79.6 dB)
Bass 100 - 315 Hz
(±) | reduced bass - on average 7.6% lower than median
(±) | linearity of bass is average (8.8% delta to prev. frequency)
Mids 400 - 2000 Hz
(+) | balanced mids - only 3% away from median
(+) | mids are linear (6.1% delta to prev. frequency)
Highs 2 - 16 kHz
(+) | balanced highs - only 3.7% away from median
(+) | highs are linear (5.3% delta to prev. frequency)
Overall 100 - 16.000 Hz
(+) | overall sound is linear (12.5% difference to median)
Compared to same class
» 14% of all tested devices in this class were better, 3% similar, 83% worse
» The best had a delta of 6%, average was 20%, worst was 57%
Compared to all devices tested
» 11% of all tested devices were better, 2% similar, 86% worse
» The best had a delta of 4%, average was 23%, worst was 134%
Apple MacBook 12 (Early 2016) 1.1 GHz audio analysis
(+) | speakers can play relatively loud (83.6 dB)
Bass 100 - 315 Hz
(±) | reduced bass - on average 11.3% lower than median
(±) | linearity of bass is average (14.2% delta to prev. frequency)
Mids 400 - 2000 Hz
(+) | balanced mids - only 2.4% away from median
(+) | mids are linear (5.5% delta to prev. frequency)
Highs 2 - 16 kHz
(+) | balanced highs - only 2% away from median
(+) | highs are linear (4.5% delta to prev. frequency)
Overall 100 - 16.000 Hz
(+) | overall sound is linear (10.2% difference to median)
Compared to same class
» 7% of all tested devices in this class were better, 2% similar, 90% worse
» The best had a delta of 5%, average was 18%, worst was 53%
Compared to all devices tested
» 5% of all tested devices were better, 1% similar, 94% worse
» The best had a delta of 4%, average was 23%, worst was 134%
Energy Management
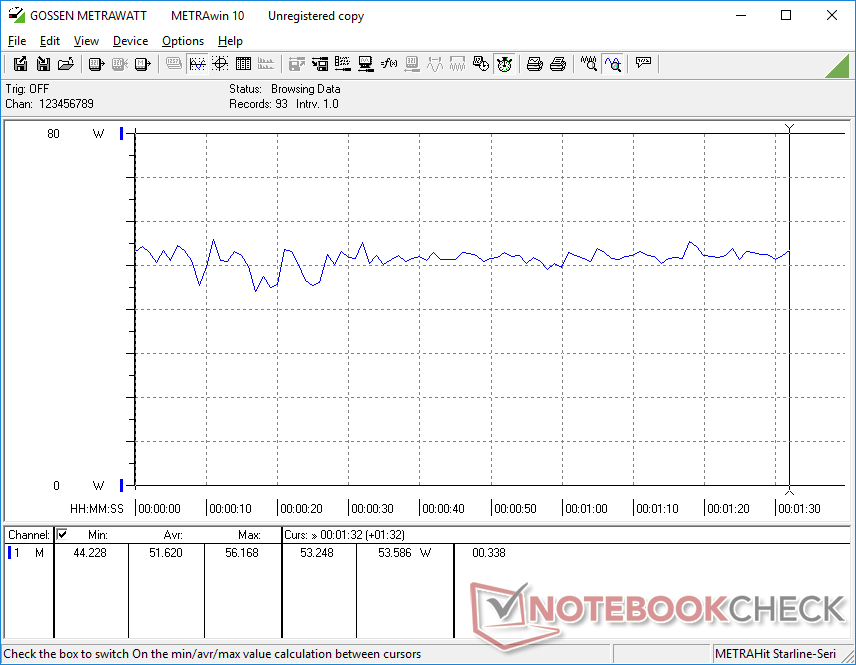
Power Consumption
Our MSI system consumes more power than the XPS 13, Spectre x360 14, and MateBook X Pro even though the latter two come with the same 11th gen CPU and Iris Xe GPU. Running Witcher 3, for example, would consume 52 W on the MSI compared to 32 W to 43 W on the aforementioned alternatives. The results are perhaps not unexpected since the MSI outperforms all of them in both CPU and GPU benchmarks to be the most powerful of the bunch.
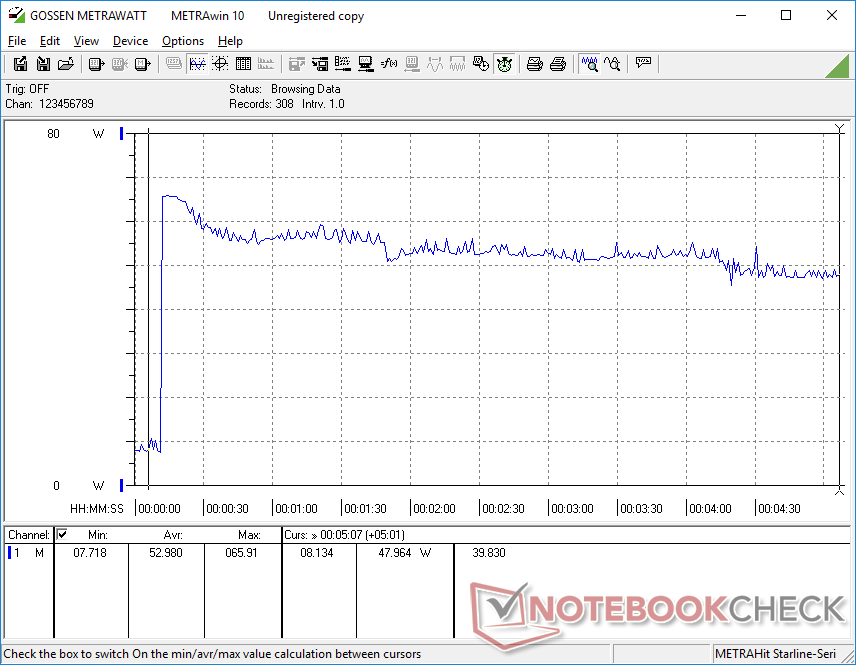
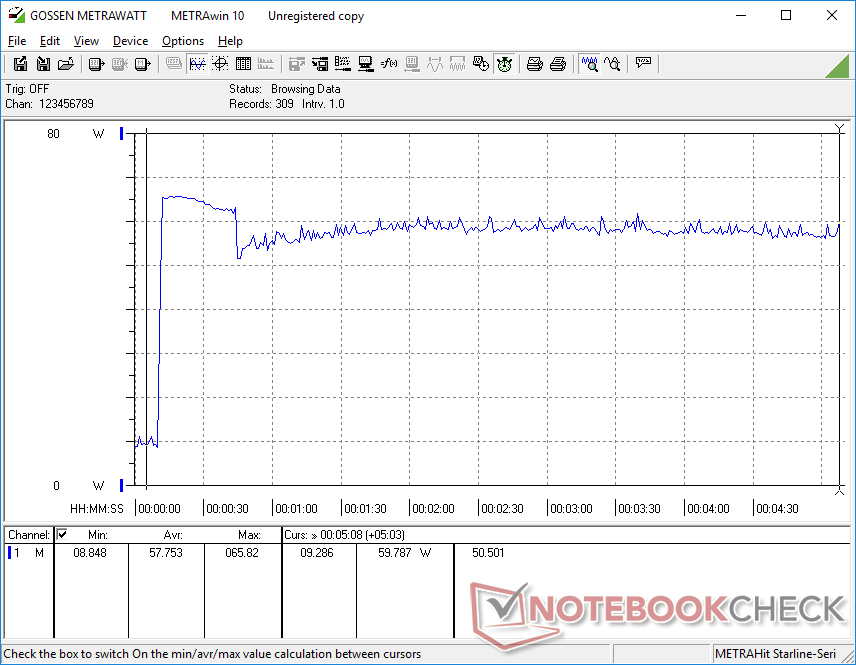
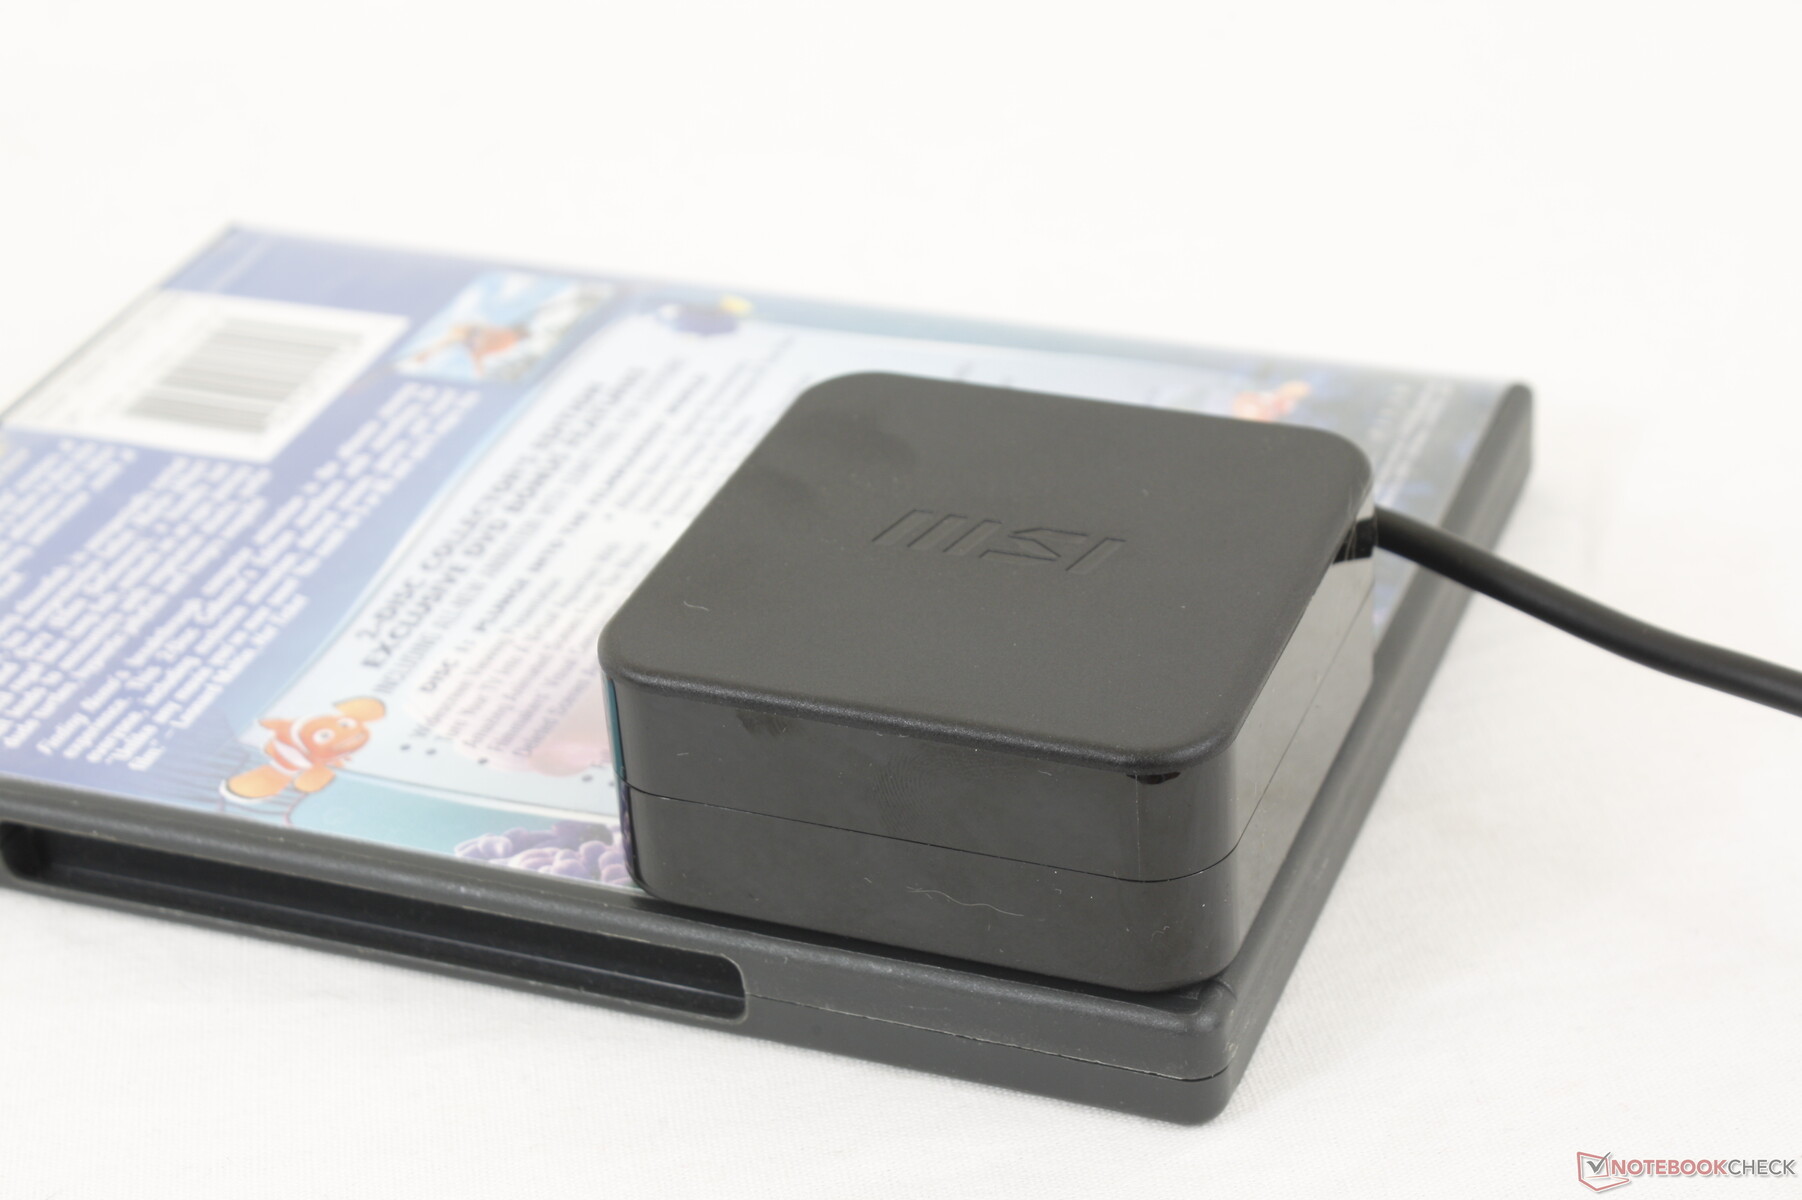
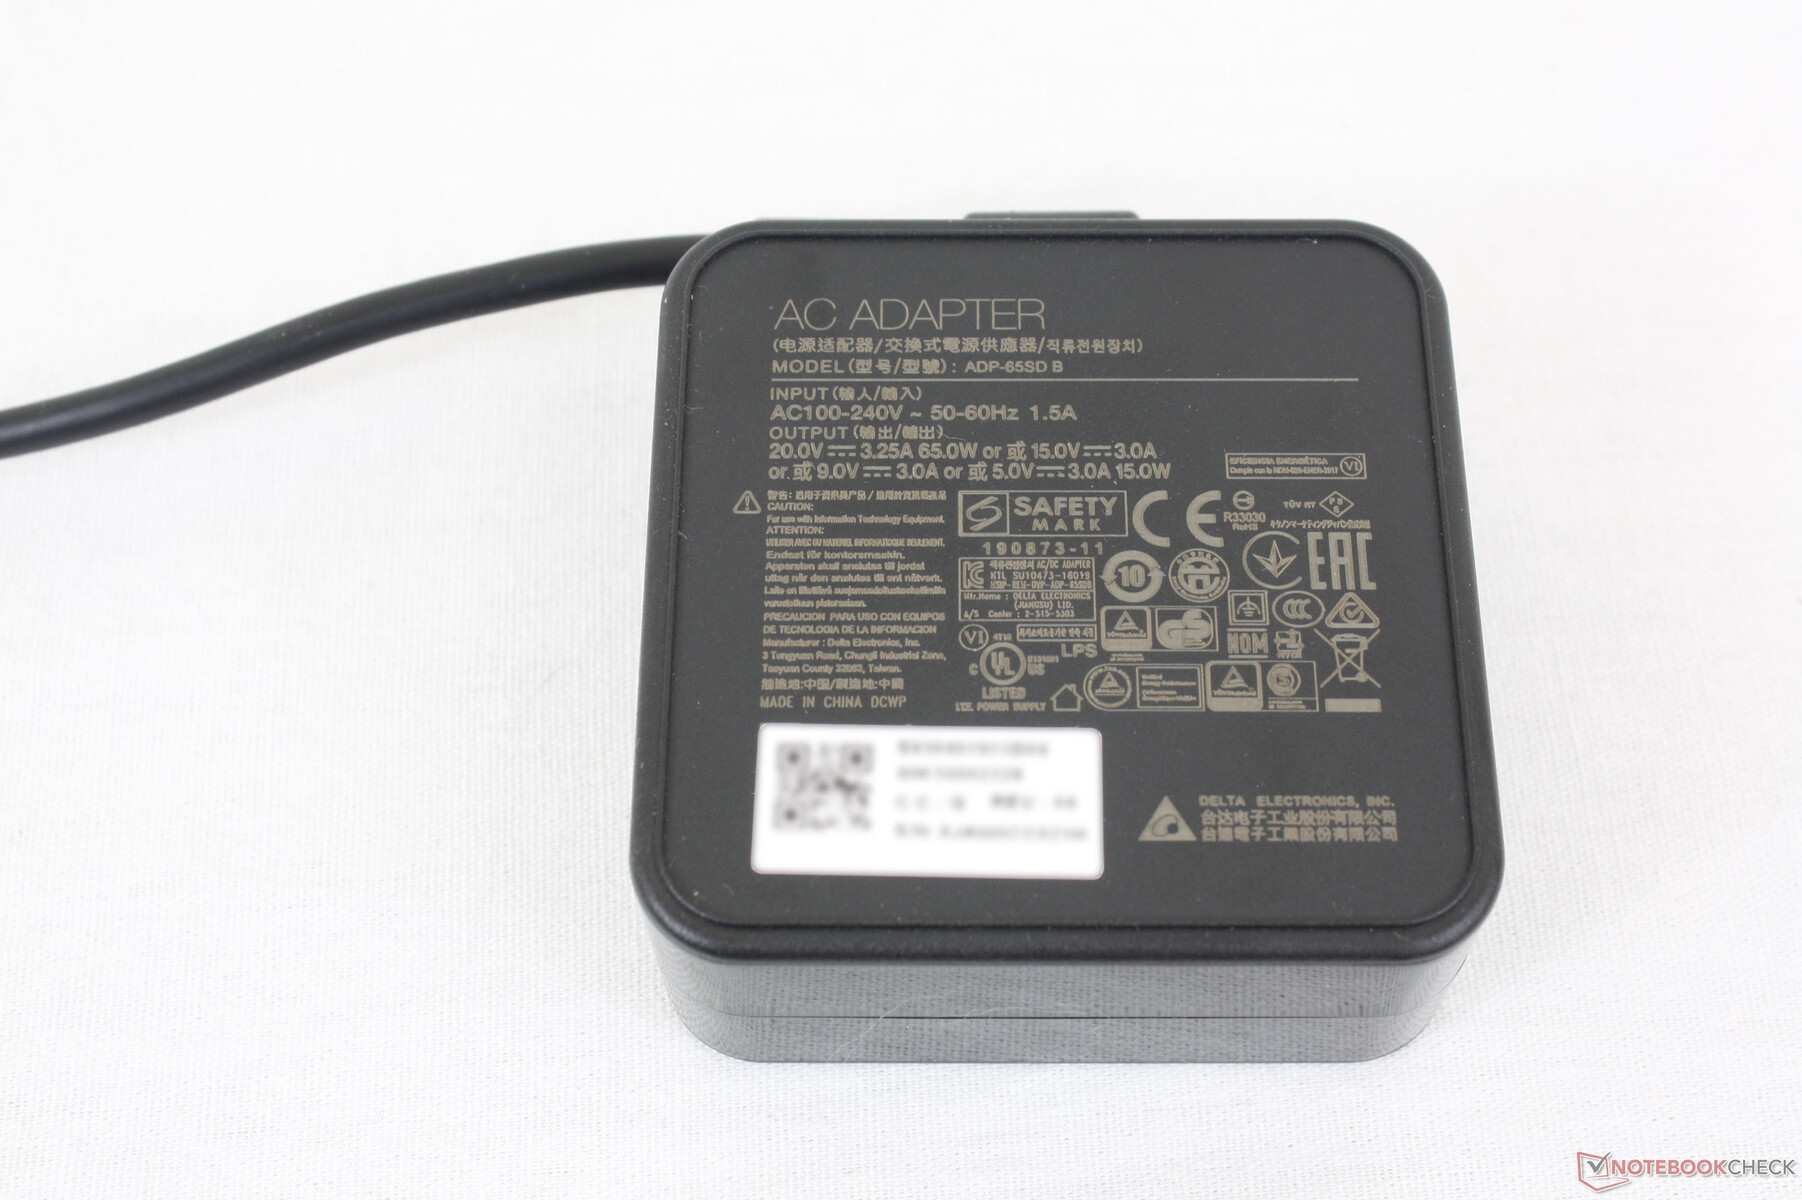
We're able to measure a maximum draw of 65.9 W from the small (~6.5 x 6.5 x 2.8 cm) AC adapter when running Prime95. This maximum rate lasts for just a few seconds as shown by the graphs below since maximum Turbo Boost is not sustainable over long periods.

| Off / Standby | |
| Idle | |
| Load |
|
Key:
min: | |
| MSI Summit E13 Flip Evo A11MT i7-1185G7, Iris Xe G7 96EUs, Phison 1TB SM2801T24GKBB4S-E162, IPS, 1920x1200, 13.4" | Dell XPS 13 7390 2-in-1 Core i7 i7-1065G7, Iris Plus Graphics G7 (Ice Lake 64 EU), Toshiba BG4 KBG40ZPZ512G, IPS, 1920x1200, 13.4" | HP Spectre x360 14t-ea000 i7-1165G7, Iris Xe G7 96EUs, Samsung SSD PM981a MZVLB512HBJQ, IPS, 1920x1280, 13.5" | Huawei MateBook X Pro 2021 i7-1165G7, Iris Xe G7 96EUs, Samsung PM981a MZVLB1T0HBLR, IPS, 3000x2000, 13.9" | Lenovo ThinkPad X1 Titanium Yoga G1 20QA001RGE i7-1160G7, Iris Xe G7 96EUs, Toshiba BG4 KBG40ZNT512G, IPS, 2256x1504, 13.5" | Asus Zenbook 14 UX435EG i7-1165G7, GeForce MX450, Samsung PM981a MZVLB1T0HBLR, IPS, 1920x1080, 14" | |
|---|---|---|---|---|---|---|
| Power Consumption | 25% | 26% | -4% | 19% | 0% | |
| Idle Minimum * (Watt) | 4.8 | 2.6 46% | 3 37% | 6.7 -40% | 3.9 19% | 3.4 29% |
| Idle Average * (Watt) | 8.4 | 5.3 37% | 5.1 39% | 10 -19% | 7.3 13% | 7.6 10% |
| Idle Maximum * (Watt) | 8.6 | 7 19% | 6.4 26% | 10.3 -20% | 10.3 -20% | 14.2 -65% |
| Load Average * (Watt) | 47.1 | 43.1 8% | 39.6 16% | 35.7 24% | 30.6 35% | 56 -19% |
| Witcher 3 ultra * (Watt) | 51.6 | 43.1 16% | 39.6 23% | 32.7 37% | 25.5 51% | 41 21% |
| Load Maximum * (Watt) | 65.9 | 49 26% | 56.2 15% | 67.6 -3% | 57.1 13% | 50.4 24% |
* ... smaller is better
Battery Life
The relatively large 70 Wh battery offers almost 11.5 hours of real-world WLAN use. Charging from empty to full takes about 1.5 to 2 hours with the included USB-C AC adapter. We experienced some charging abnormalities at first, but this mysteriously went away after fully discharging and charging the battery a couple of times.
| MSI Summit E13 Flip Evo A11MT i7-1185G7, Iris Xe G7 96EUs, 70 Wh | Dell XPS 13 7390 2-in-1 Core i7 i7-1065G7, Iris Plus Graphics G7 (Ice Lake 64 EU), 51 Wh | HP Spectre x360 14t-ea000 i7-1165G7, Iris Xe G7 96EUs, 66 Wh | Huawei MateBook X Pro 2021 i7-1165G7, Iris Xe G7 96EUs, 56 Wh | Lenovo ThinkPad X1 Titanium Yoga G1 20QA001RGE i7-1160G7, Iris Xe G7 96EUs, 44.5 Wh | Asus Zenbook 14 UX435EG i7-1165G7, GeForce MX450, 63 Wh | |
|---|---|---|---|---|---|---|
| Battery runtime | -20% | 37% | 18% | -10% | -23% | |
| Reader / Idle (h) | 21.1 | 36.4 73% | 19.5 -8% | 18.5 -12% | ||
| WiFi v1.3 (h) | 11.2 | 9 -20% | 11.8 5% | 10.5 -6% | 8.4 -25% | 8.5 -24% |
| Load (h) | 1.8 | 2.4 33% | 3 67% | 1.9 6% | 1.2 -33% |
Pros
Cons
Verdict

MSI wants to prove that it can do more than just gaming laptops and the Summit E13 Flip is a great example of what the manufacturer is capable of especially in terms of aesthetics and performance. Normally for subnotebooks or convertibles, TDP and performance are often below average as makers want to meet slimmer designs and lower weight targets. The Summit manages to outperform others in its size class and category while still looking sleek and portable in the process. If you want a convertible that won't throttle significantly when under load, then this MSI will be one of the better options you can find.
The Summit E13 Flip has the performance to back up its attractive design. However, there is still room for improvement in regard to the display ghosting and average rigidity of the 360-degree hinges.
The drawbacks are generally minor, but they do add up fairly quickly. The hinges, for example, could be stiffer and the HP Spectre x360 14 still feels like the stronger-built chassis. Ghosting is noticeable despite the buttery-smooth 120 Hz refresh rate while the small arrow keys, Ctrl key, and smartphone-style MicroSD tray are all awkward to use. Overall footprint and weight are also slightly larger and heavier, respectively, than the XPS 13 2-in-1 or aforementioned Spectre and both core temperatures and fan noise are greater as well. Thus, while the MSI system is definitely faster and longer-lasting, the gains don't come free.
Price and availability
Our exact configuration is now shipping at Xotic PC for $1900 USD. An alternative SKU with half the RAM and storage is also available for $1600 USD. The system is also widely available from other major retailers for around the same $1600 to $1900 USD price range from Walmart, Newegg, Best Buy, and Amazon.
MSI Summit E13 Flip Evo A11MT
- 04/28/2021 v7 (old)
Allen Ngo
Price comparison
