MSI Summit B15 A11M Laptop Review: Embracing Iris Xe Over GeForce MX
MSI unveiled its Summit series at CES 2021 which encompasses a range of laptops designed for workplaces, offices, content creation, and other semi-professional to professional environments. Top-end models include the 13.4-inch Summit E13 and 15.6-inch Summit E15 each retailing for around $2000 USD.
The model we'll be looking at here is an entry-level model in the series called the Summit B15. Unlike the aforementioned Summit E models, the B15 lacks the gold trims and discrete GPU options for a lighter weight and more affordable price point. It otherwise comes equipped with similar 11th gen Tiger Lake-U processor options. Direct competitors include other mid-range to upper mid-range prosumer laptops like the HP Envy 15, XPG Xenia Xe, Lenovo ThinkBook 15, Microsoft Surface Laptop 4, or the LG Gram series.
More MSI reviews:
potential competitors in comparison
Rating | Date | Model | Weight | Height | Size | Resolution | Price |
|---|---|---|---|---|---|---|---|
| 81.2 % v7 (old) | 05 / 2021 | MSI Summit B15 A11M i7-1165G7, Iris Xe G7 96EUs | 1.5 kg | 16.9 mm | 15.60" | 1920x1080 | |
| 83.7 % v7 (old) | 02 / 2021 | MSI Summit E15 A11SCST i7-1185G7, GeForce GTX 1650 Ti Max-Q | 1.8 kg | 16.9 mm | 15.60" | 1920x1080 | |
| 86.8 % v7 (old) | 05 / 2020 | Dell XPS 15 9500 Core i5 i5-10300H, UHD Graphics 630 | 1.8 kg | 18 mm | 15.60" | 1920x1200 | |
| 85 % v7 (old) | 01 / 2020 | HP Spectre X360 15-5ZV31AV i7-10510U, GeForce MX250 | 2.1 kg | 19.3 mm | 15.60" | 3840x2160 | |
| 87.5 % v7 (old) | 05 / 2021 | ADATA XPG Xenia Xe i7-1165G7, Iris Xe G7 96EUs | 1.7 kg | 14.9 mm | 15.60" | 1920x1080 | |
| 85.2 % v7 (old) | 03 / 2020 | Asus ZenBook 15 UX534FTC-A8190T i7-10510U, GeForce GTX 1650 Max-Q | 1.6 kg | 18.9 mm | 15.60" | 1920x1080 |
Case
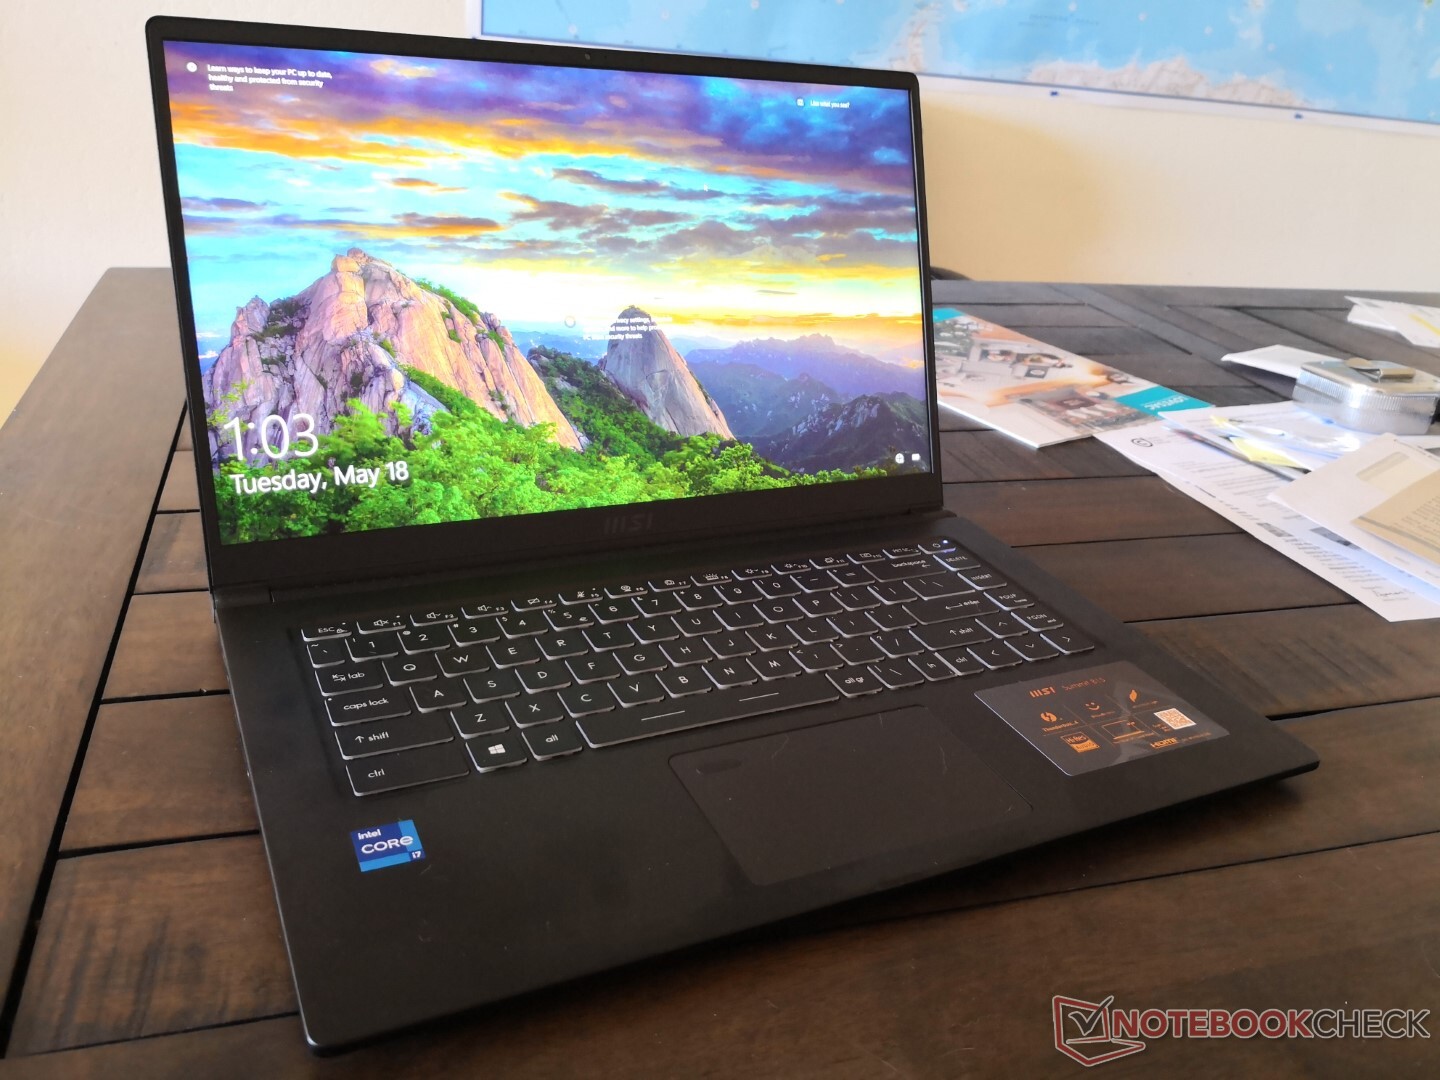
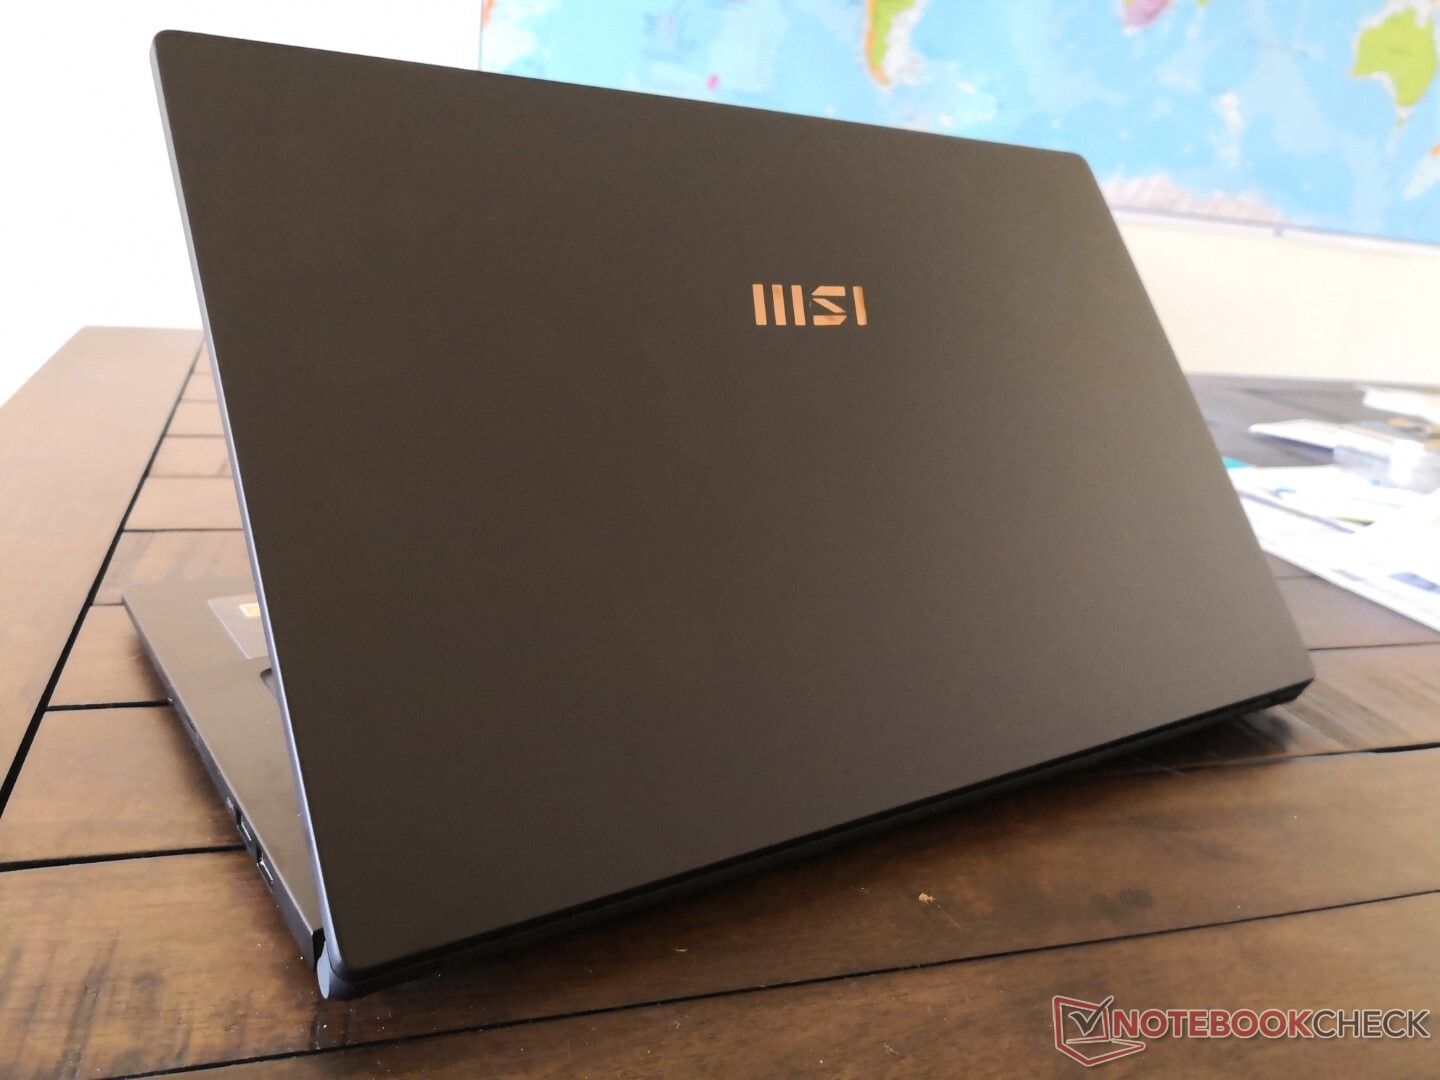
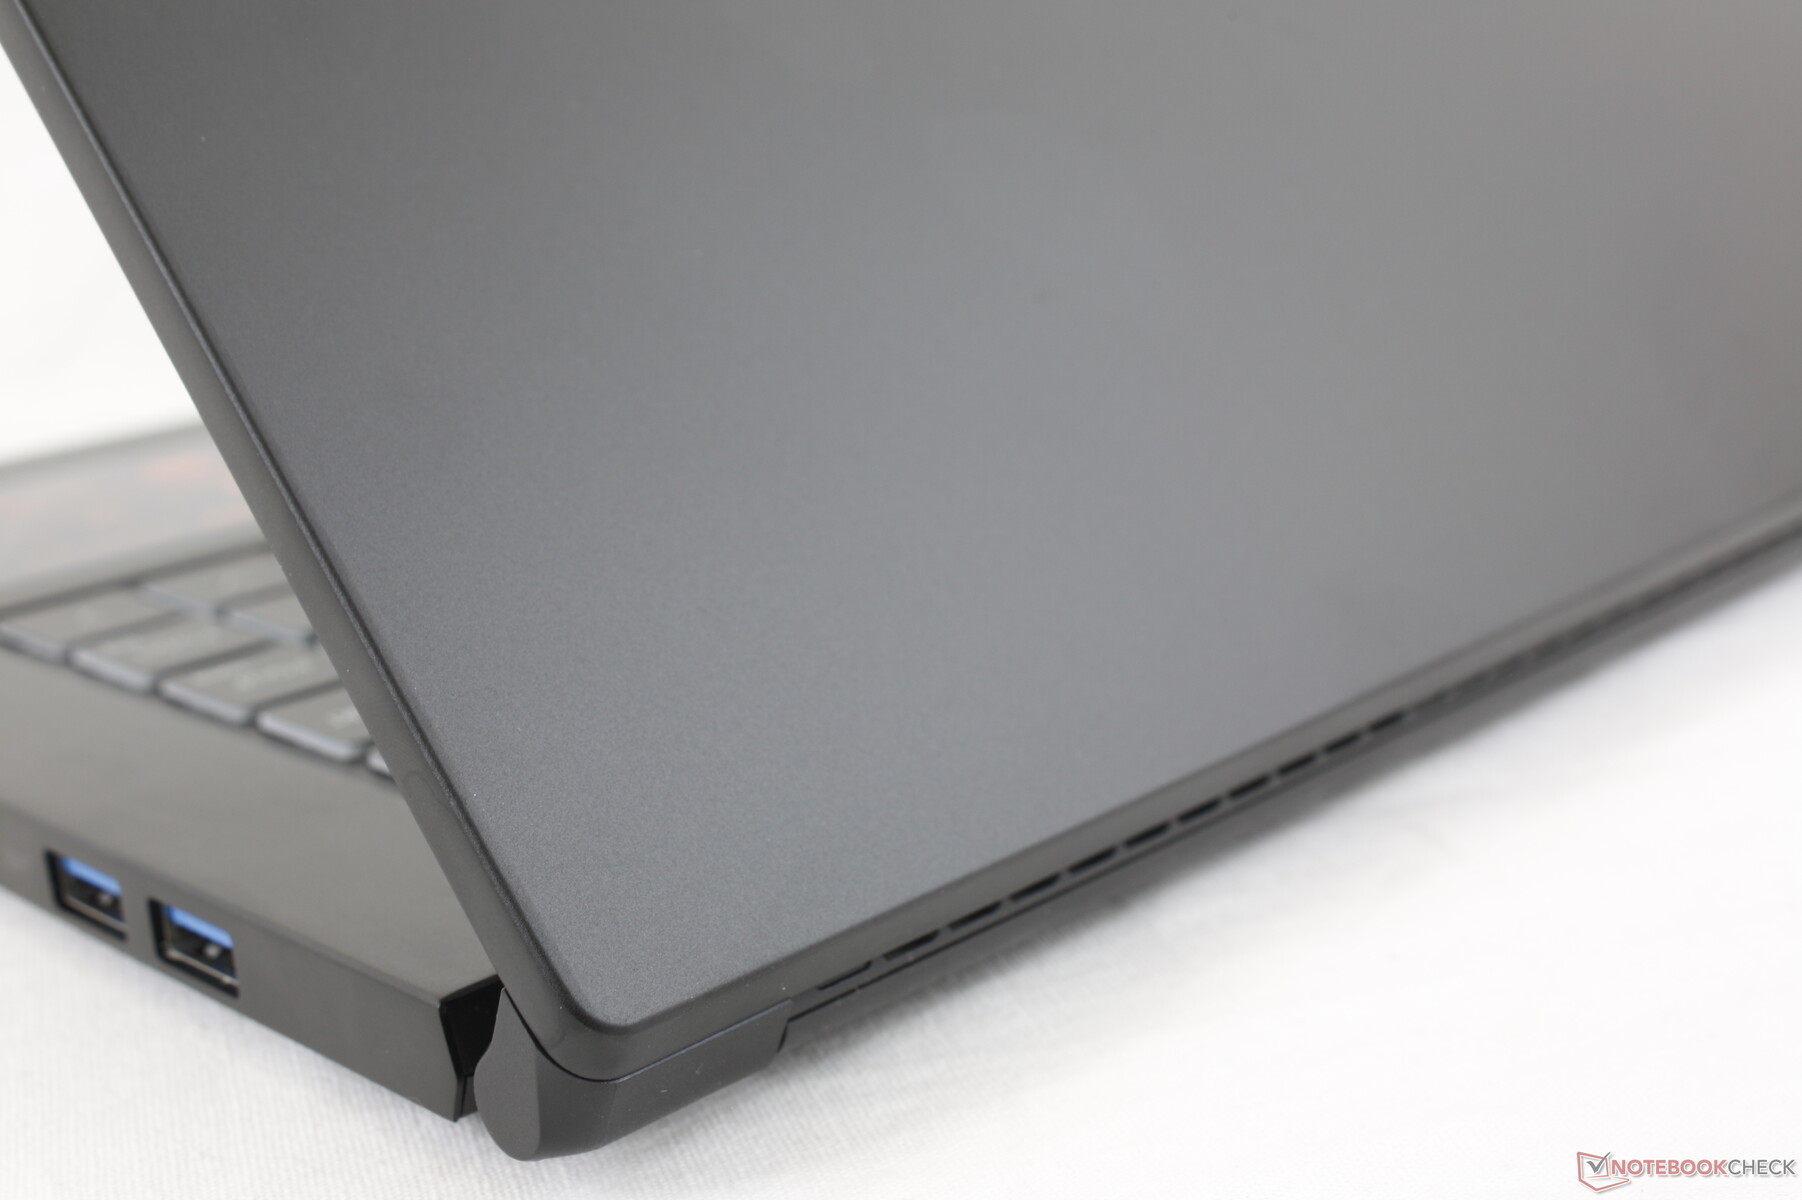
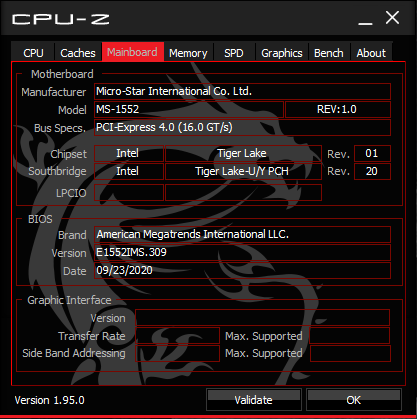
If the Summit B15 looks familiar, then that is because it is essentially a rebranded 2020 Modern 15 with a new golden 'MSI' logo on the outer lid. Its chassis and features are nearly identical to the Modern 15 including even the motherboard inside. MSI is currently in the midst of reshuffling its laptop portfolio and so both the aging Modern and Prestige series will eventually consolidate under the newer Summit series in the near future. The move should eventually make it easier for customers to distinguish between different MSI laptops as the company already has one too many model names to keep track of.
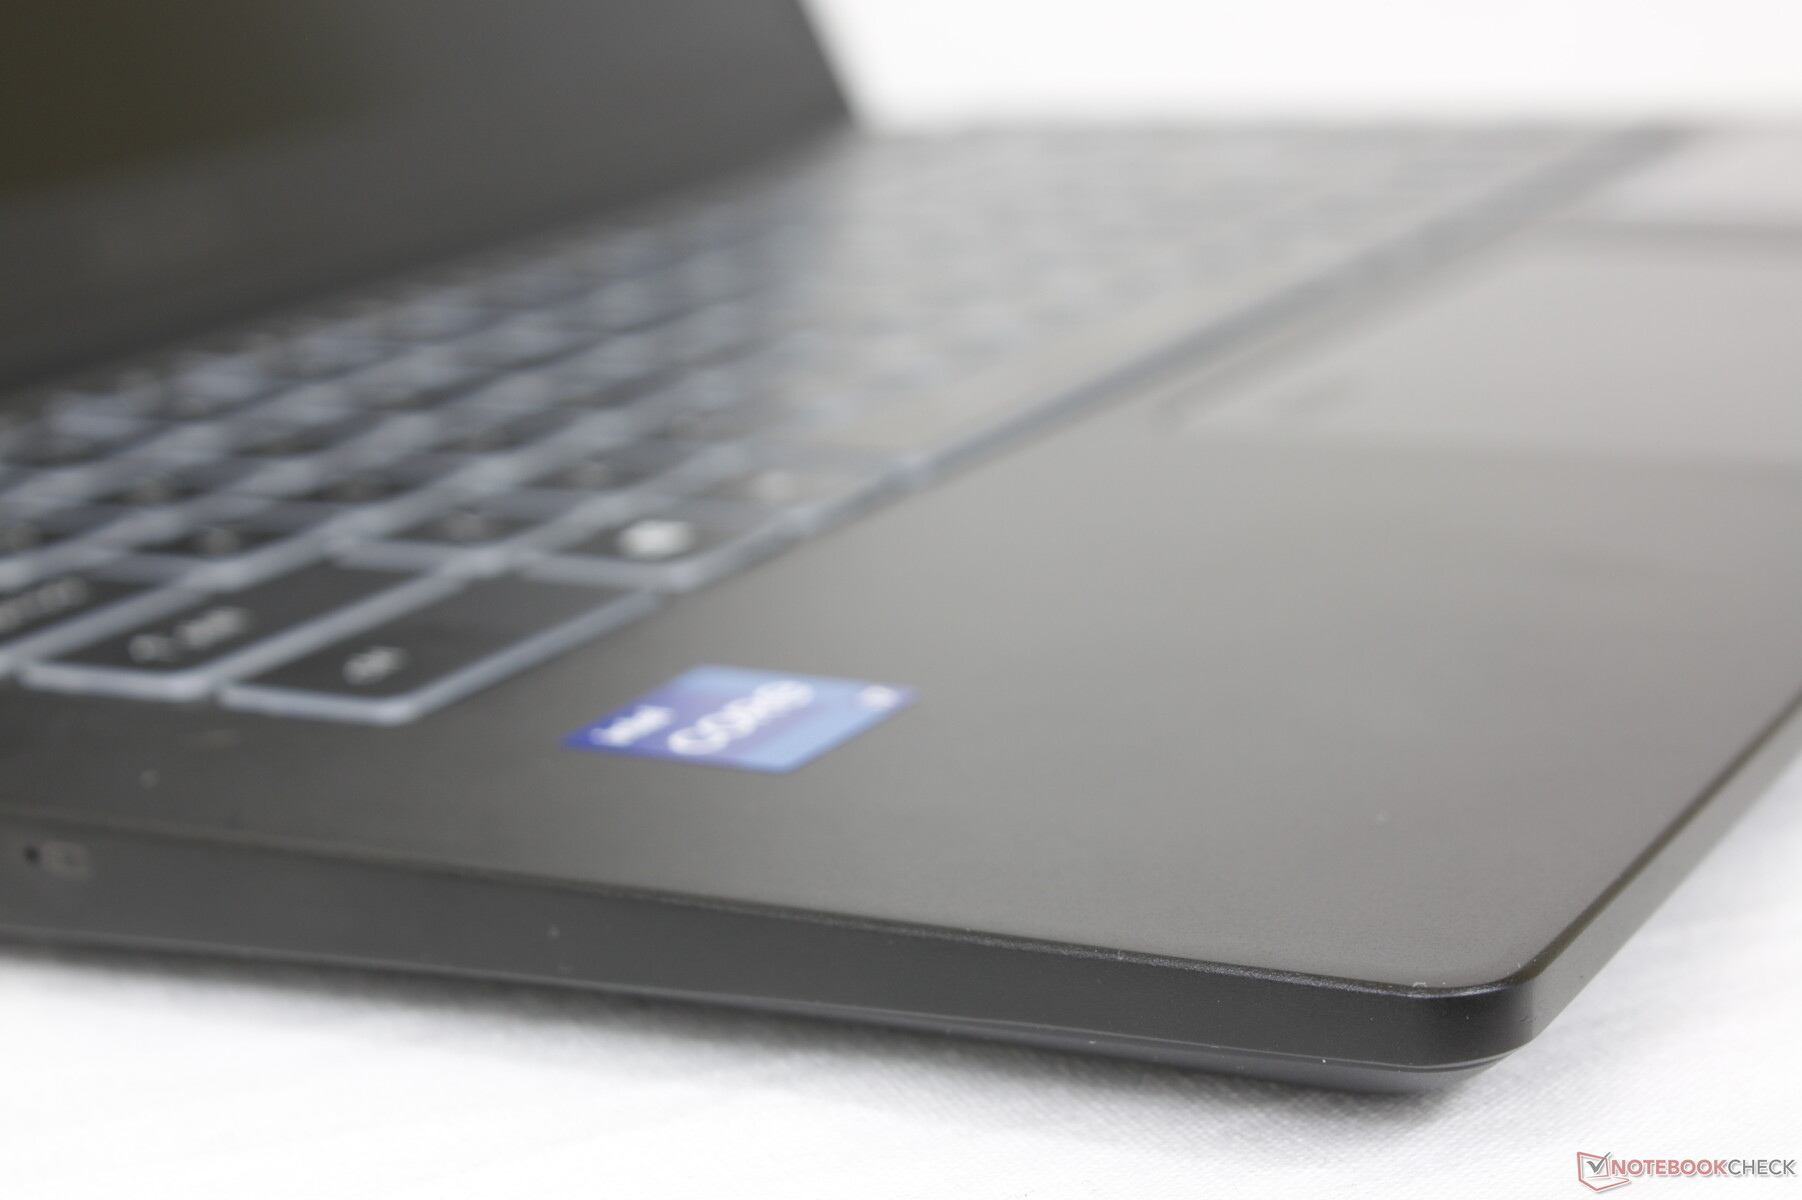
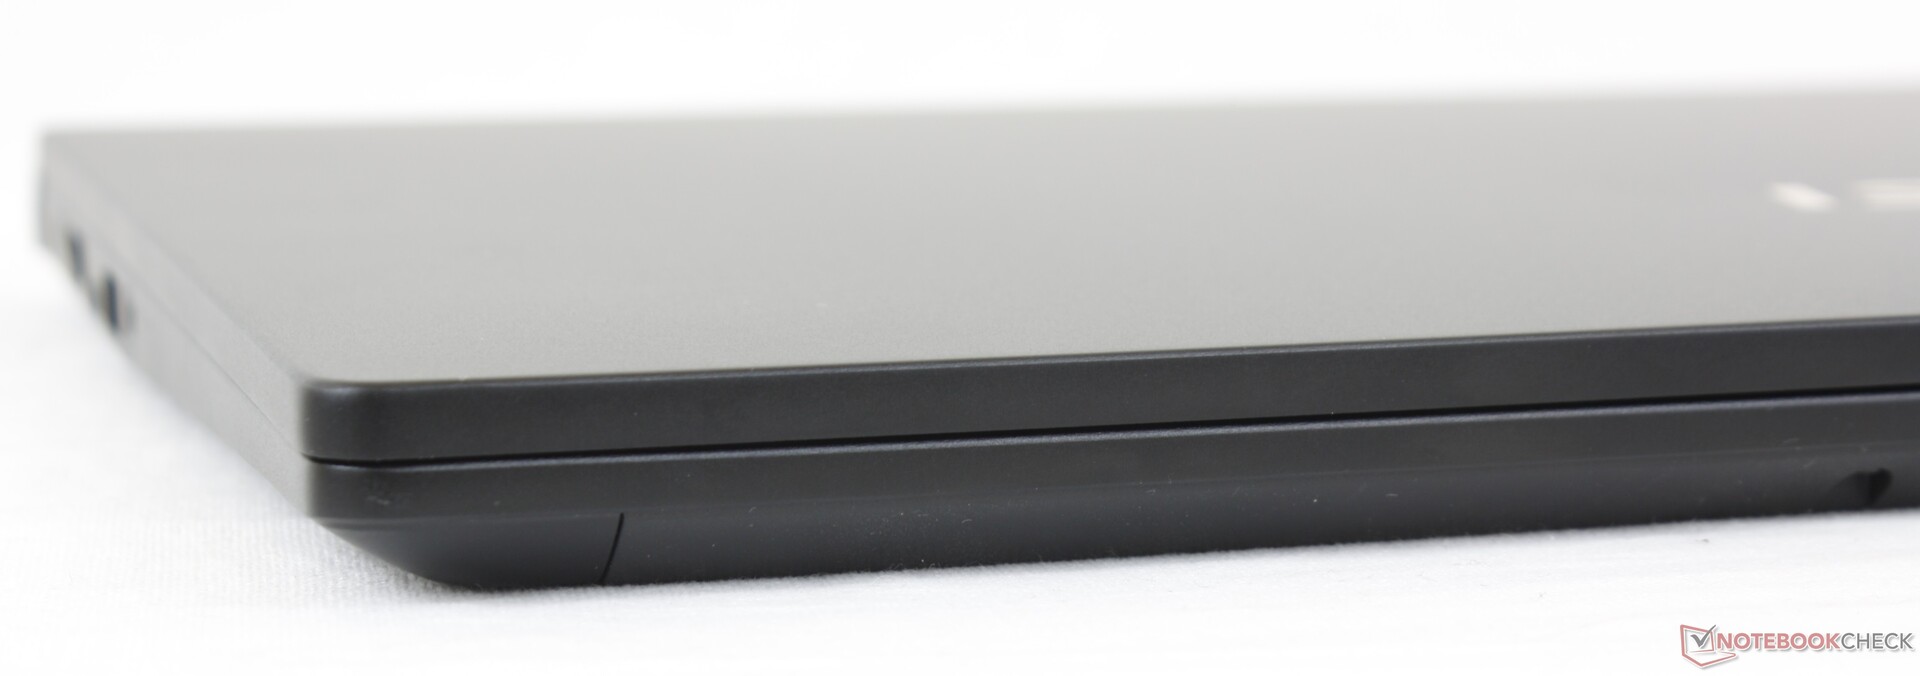
Our original impressions on last year's Modern 15 apply here on the Summit B15. Base rigidity is still pretty good while the lid still flexes a bit more than we would like. Full-on business laptops like the Dell Latitude, HP EliteBook, or Lenovo ThinkPad are definitely pricier but are of stronger quality.
A key reason for choosing the Summit B15 (or Modern 15) over alternatives from Dell, HP, or others is its very light weight of just 1.5 kg. The competing Lenovo ThinkBook 15 G2 or ADATA XPG Xenia Xe are each about 200 grams heavier in comparison while being nearly identical in dimensions.
Connectivity
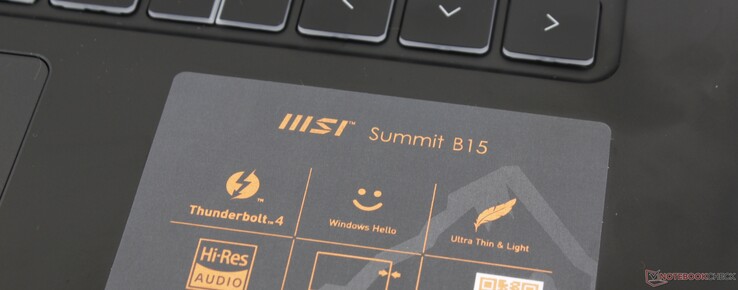
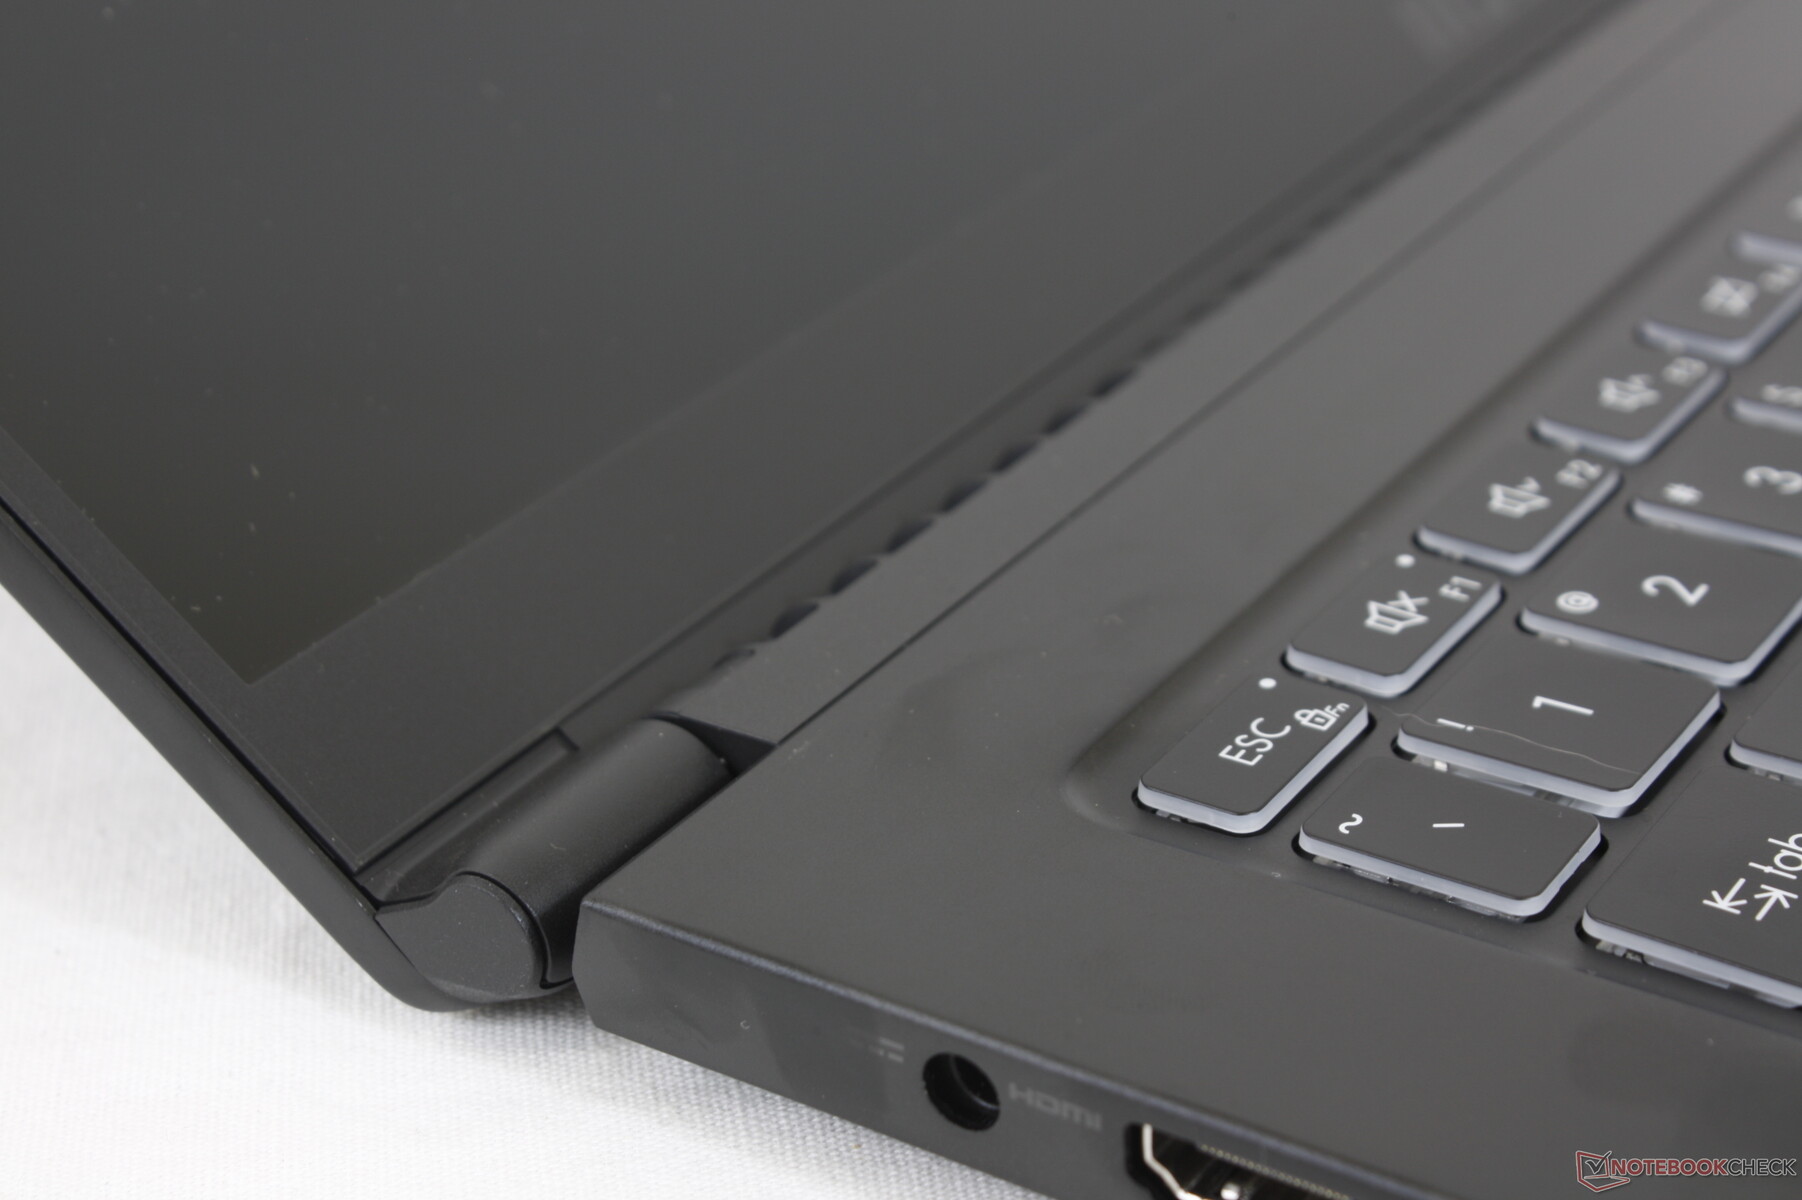
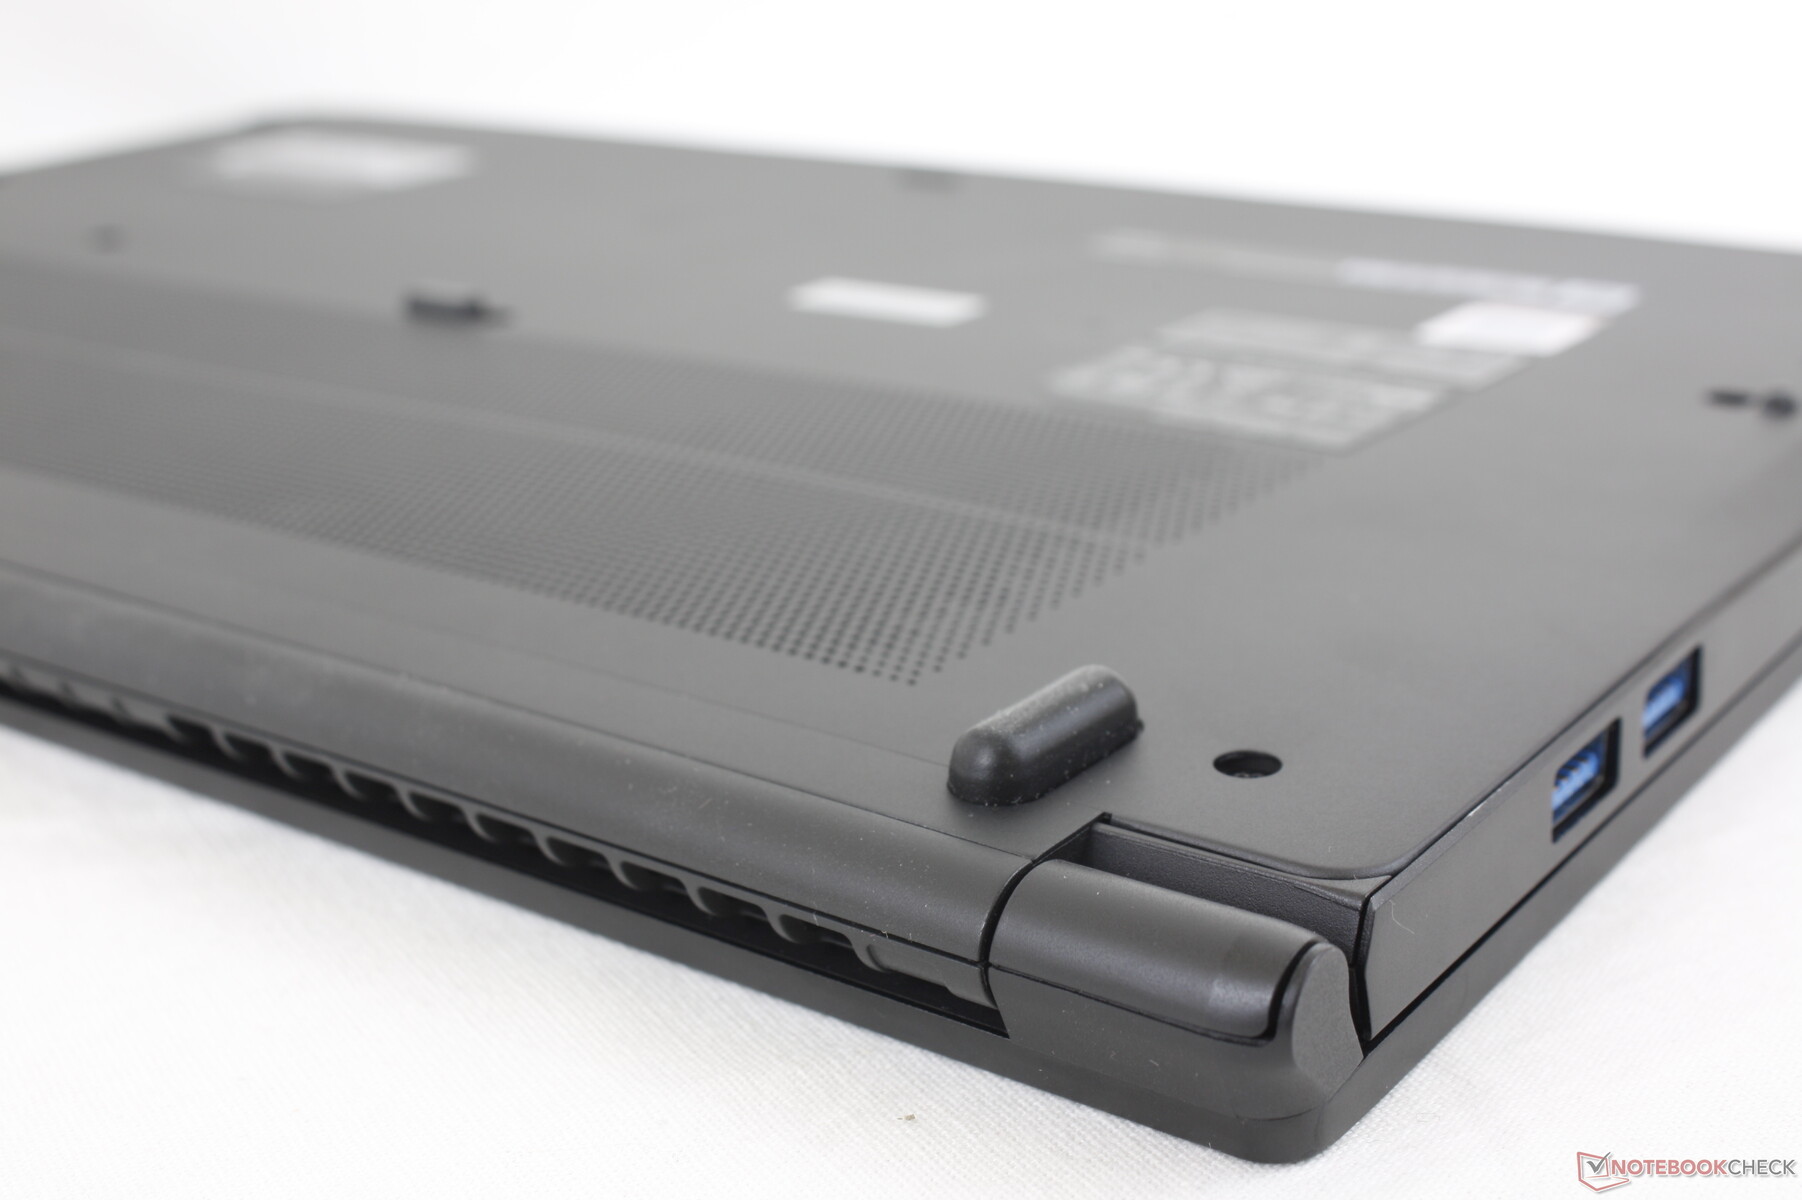
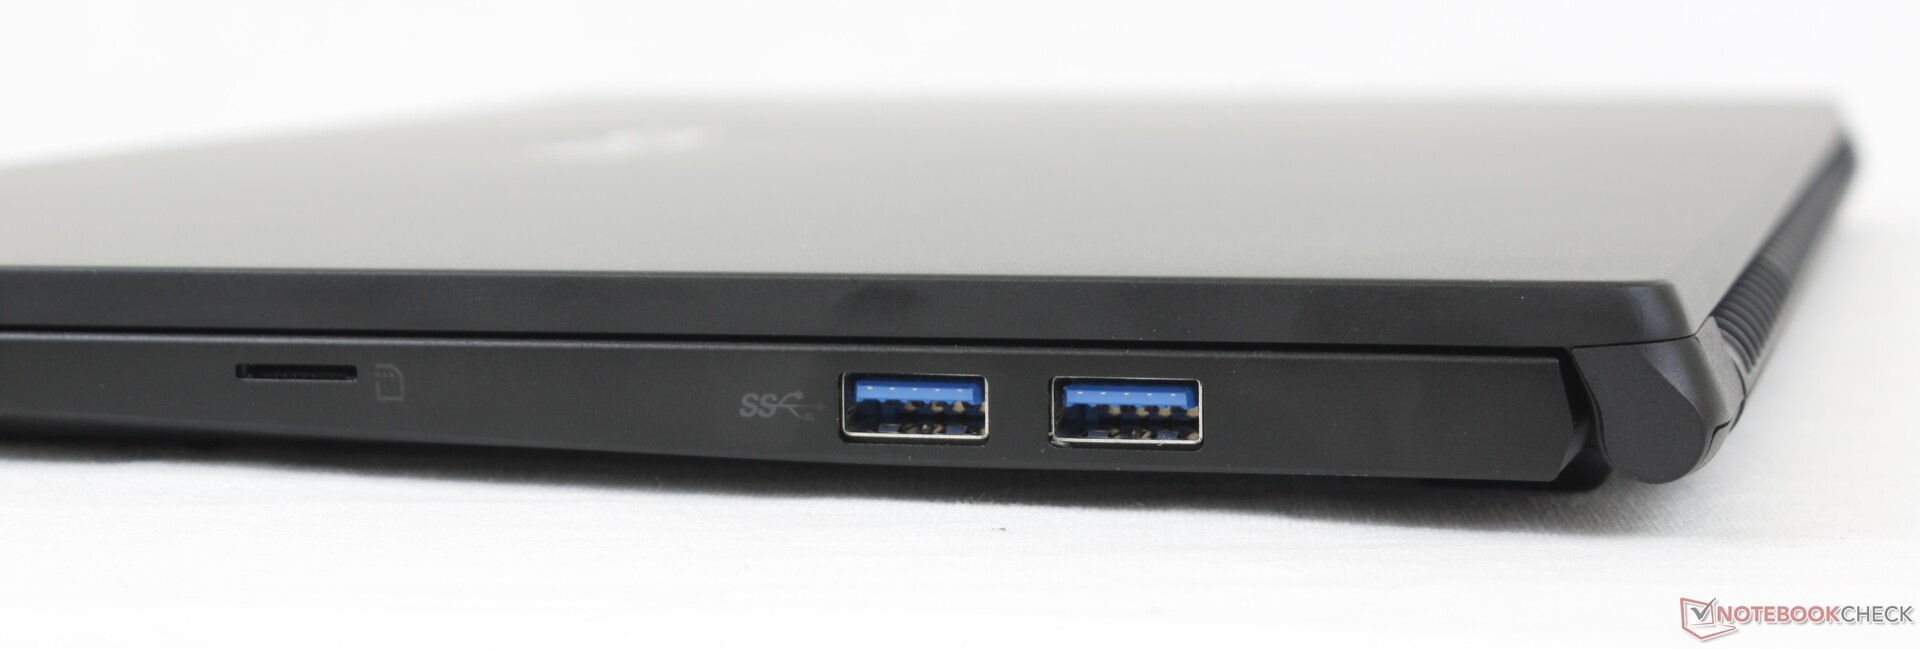
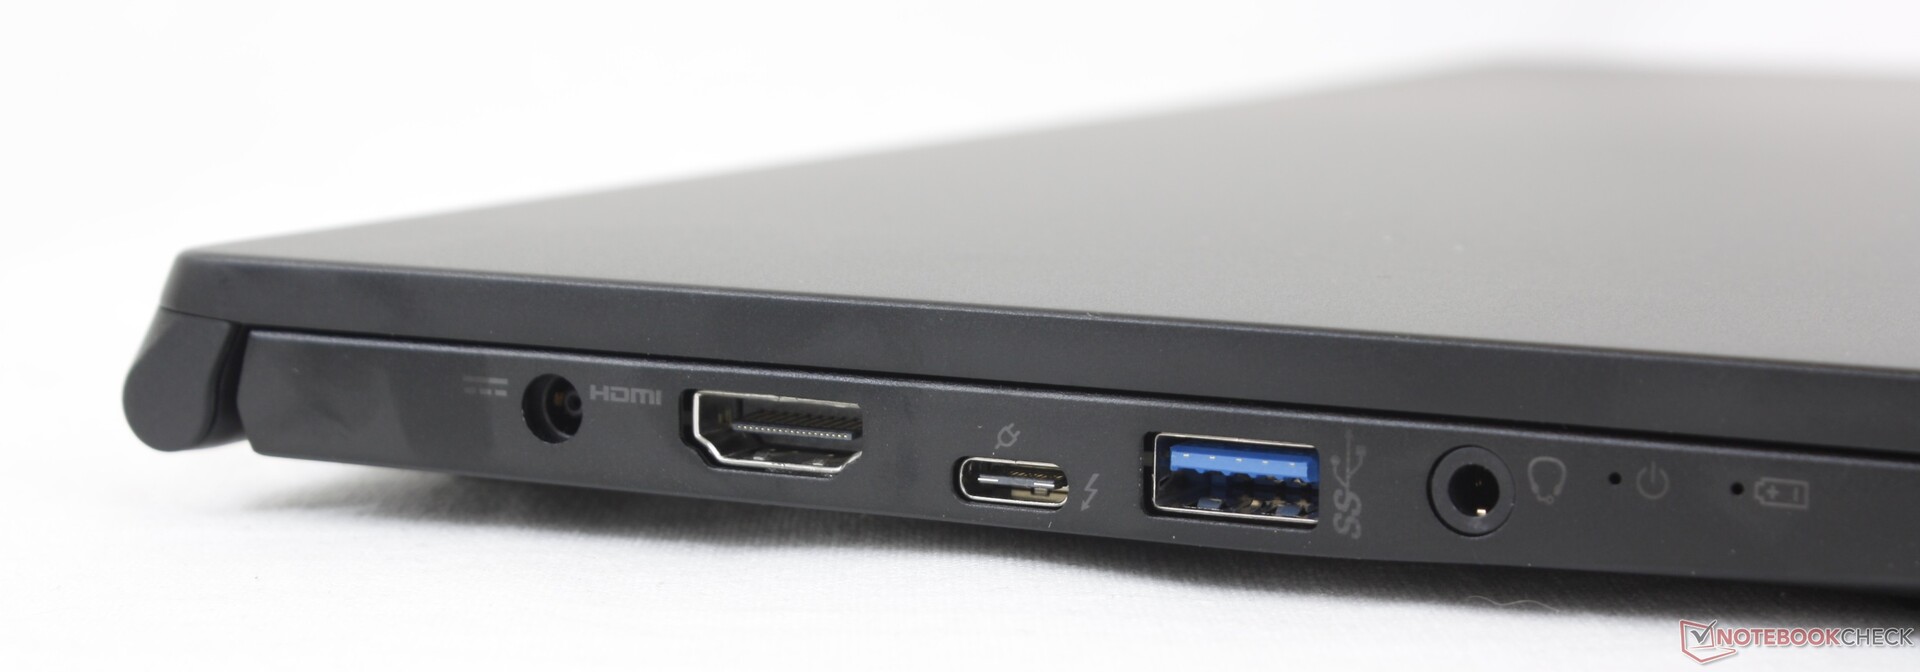
Port options remain unchanged from the Modern 15 save for two major upgrades: the HDMI port now supports 4K60 output while the USB-C port is now Thunderbolt 4 compatible. Users can connect external graphics docks to the Summit B15 whereas that was impossible on the Modern 15.
SD Card Reader
MSI has upgraded the MicroSD slot to be about 6x faster than the same MicroSD slot on the older Modern 15. Moving 1 GB of pictures from our UHS-II test card to desktop takes around 7 seconds compared to 40 seconds on last year's model.
| SD Card Reader | |
| average JPG Copy Test (av. of 3 runs) | |
| Dell XPS 15 9500 Core i5 (Toshiba Exceria Pro SDXC 64 GB UHS-II) | |
| HP Spectre X360 15-5ZV31AV (Toshiba Exceria Pro M501 UHS-II) | |
| MSI Summit B15 A11M (AV PRO microSD 128 GB V60) | |
| MSI Summit E13 Flip Evo A11MT (AV PRO microSD 128 GB V60) | |
| MSI Modern 15 A10RB (Toshiba Exceria Pro M501 UHS-II) | |
| maximum AS SSD Seq Read Test (1GB) | |
| Dell XPS 15 9500 Core i5 (Toshiba Exceria Pro SDXC 64 GB UHS-II) | |
| MSI Summit B15 A11M (AV PRO microSD 128 GB V60) | |
| HP Spectre X360 15-5ZV31AV (Toshiba Exceria Pro M501 UHS-II) | |
| MSI Summit E13 Flip Evo A11MT (AV PRO microSD 128 GB V60) | |
| MSI Modern 15 A10RB (Toshiba Exceria Pro M501 UHS-II) | |
Communication
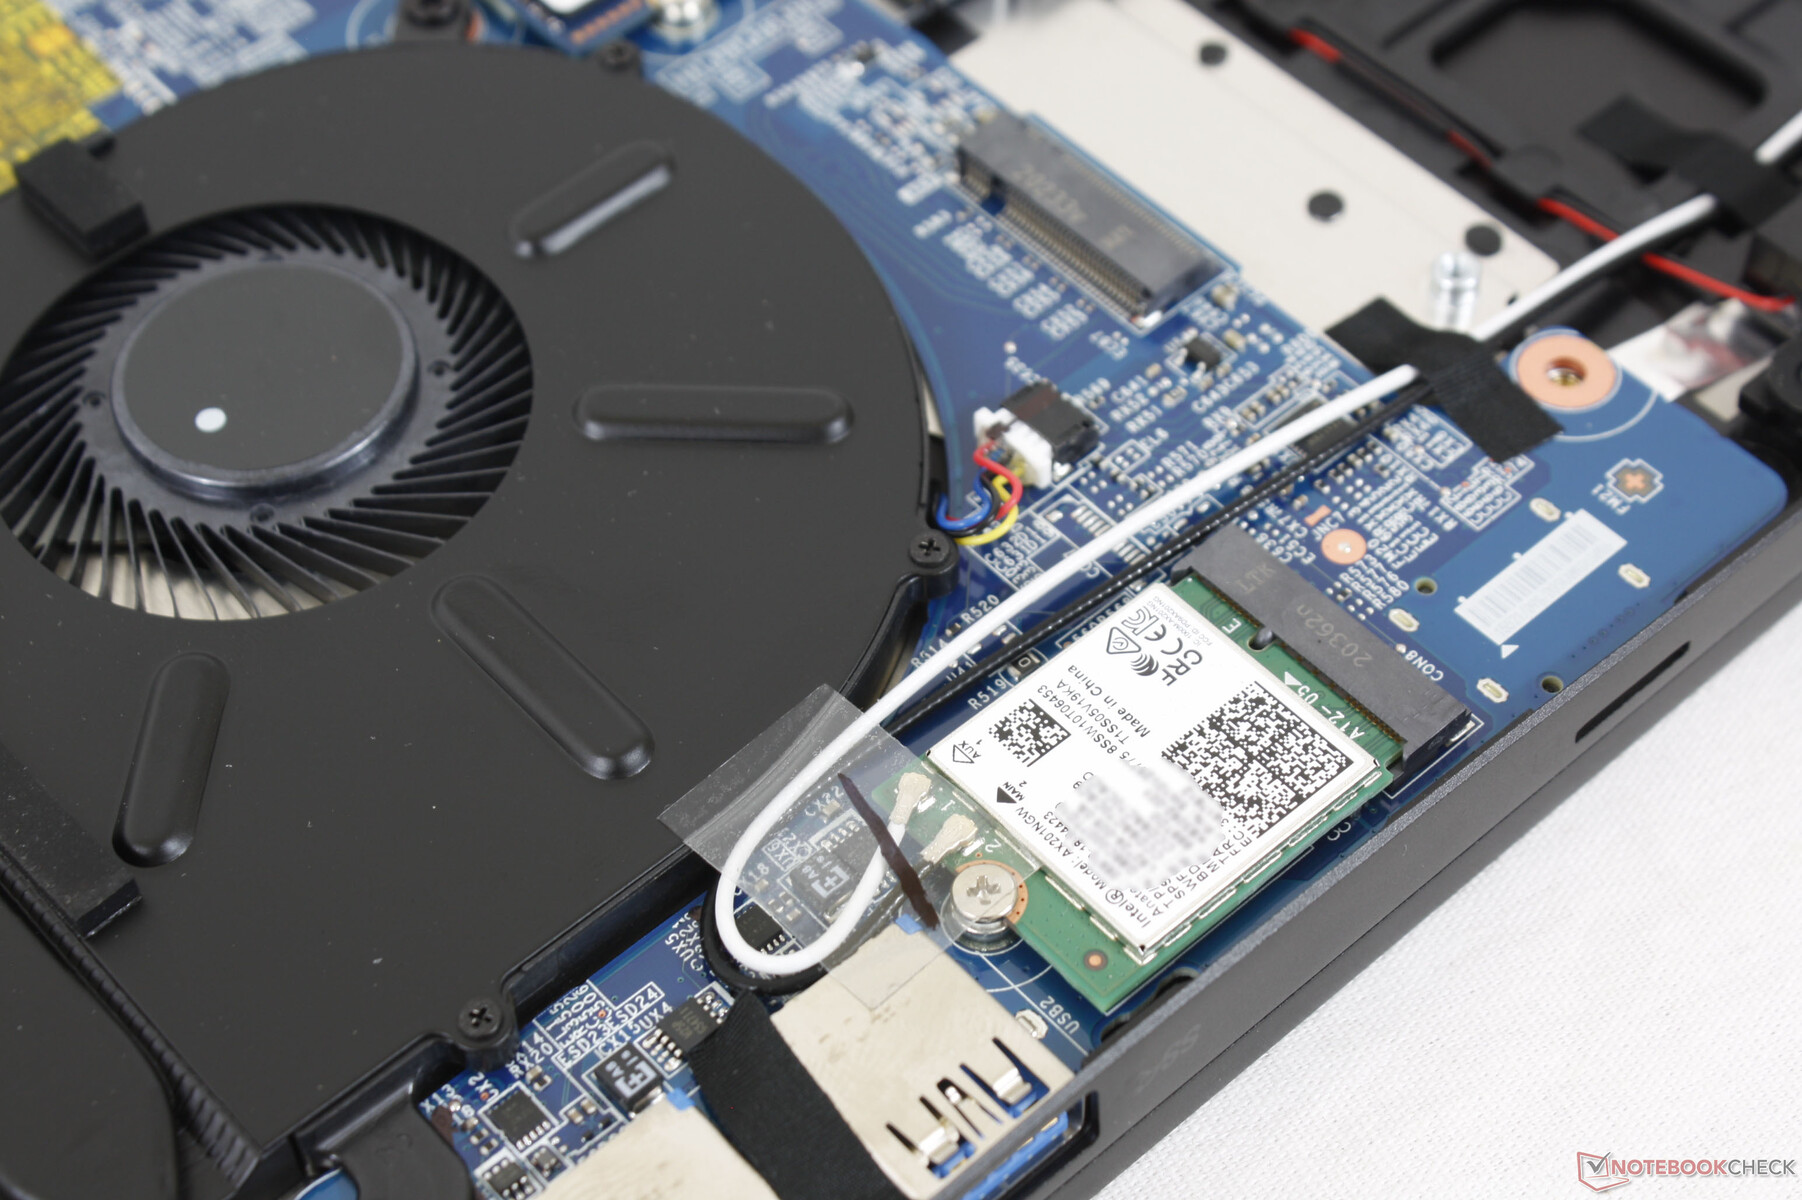
The Intel AX201 comes standard for Wi-Fi 6 and Bluetooth 5.1 connectivity. We experienced no issues when paired to our Netgear RAX200 router.
Webcam


Maintenance
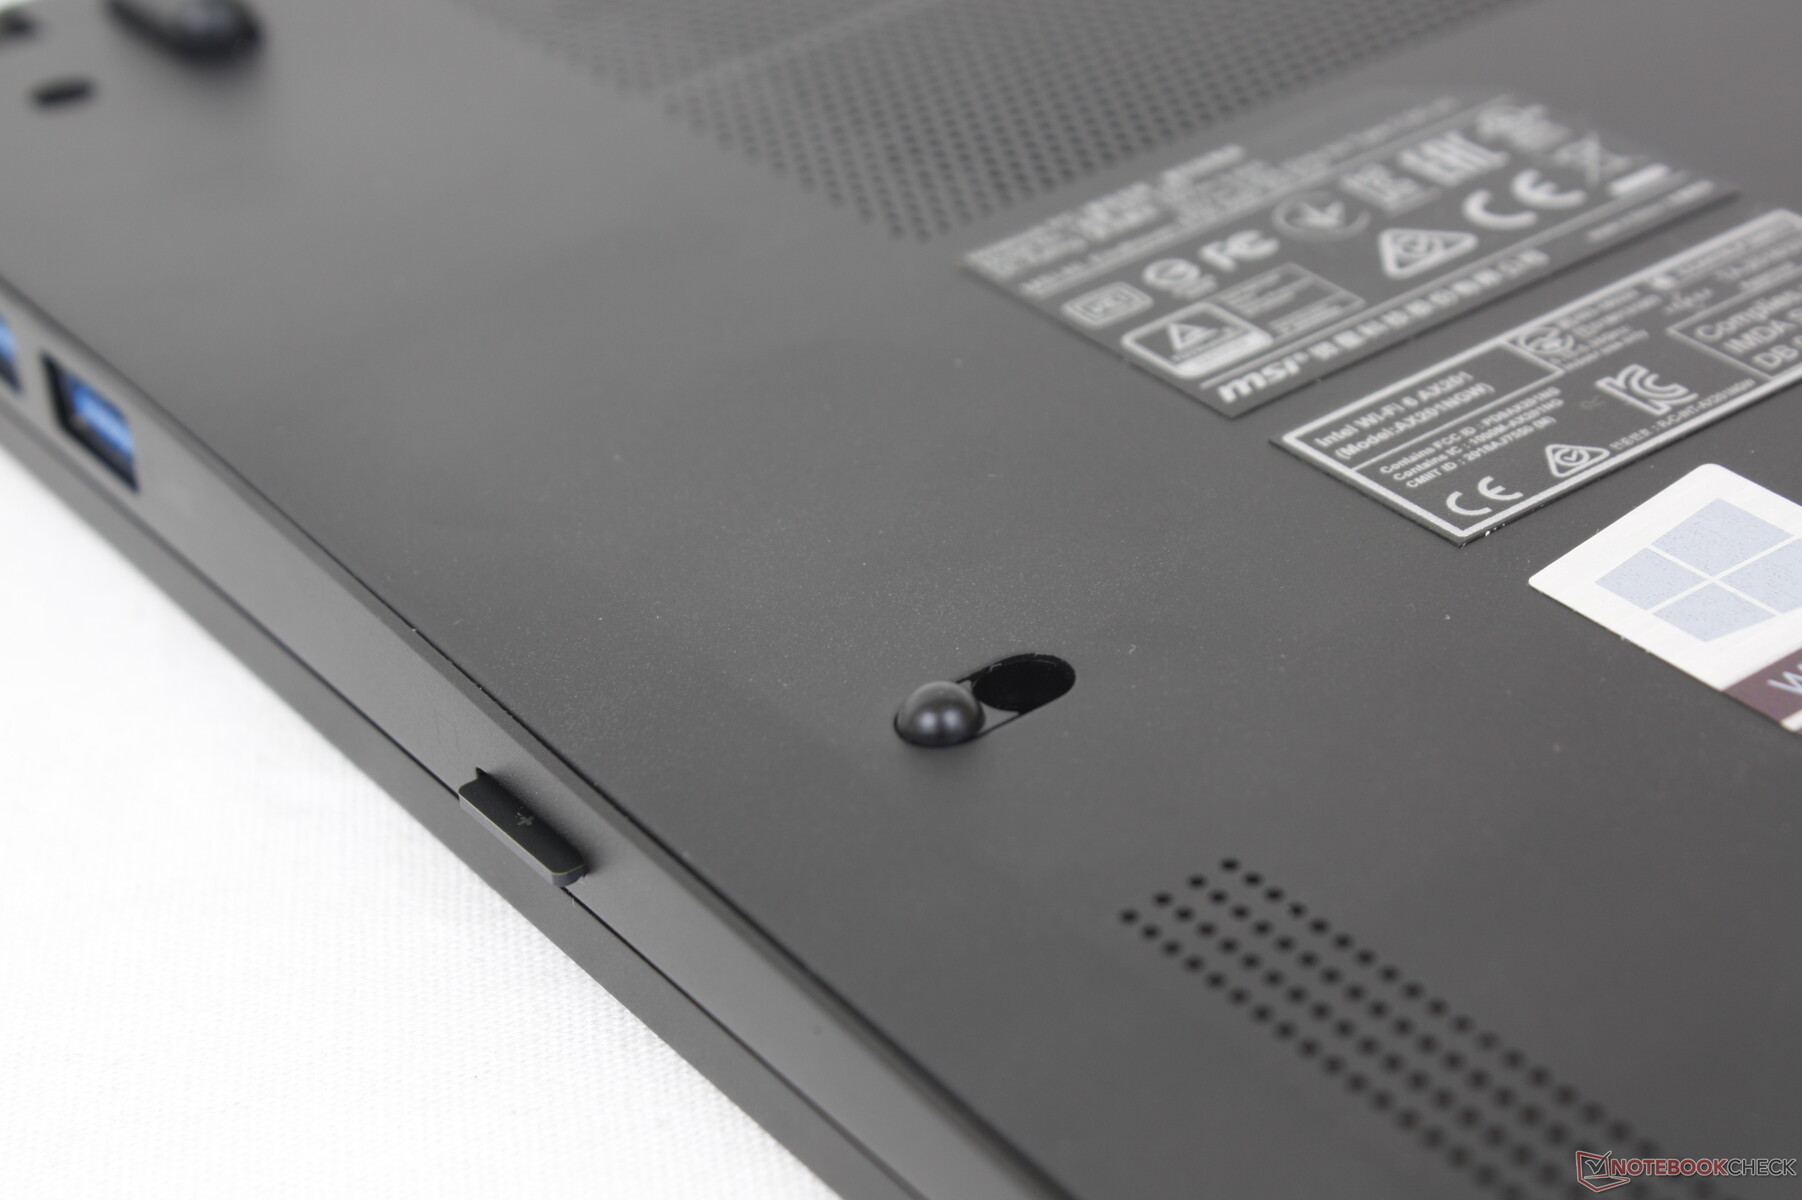
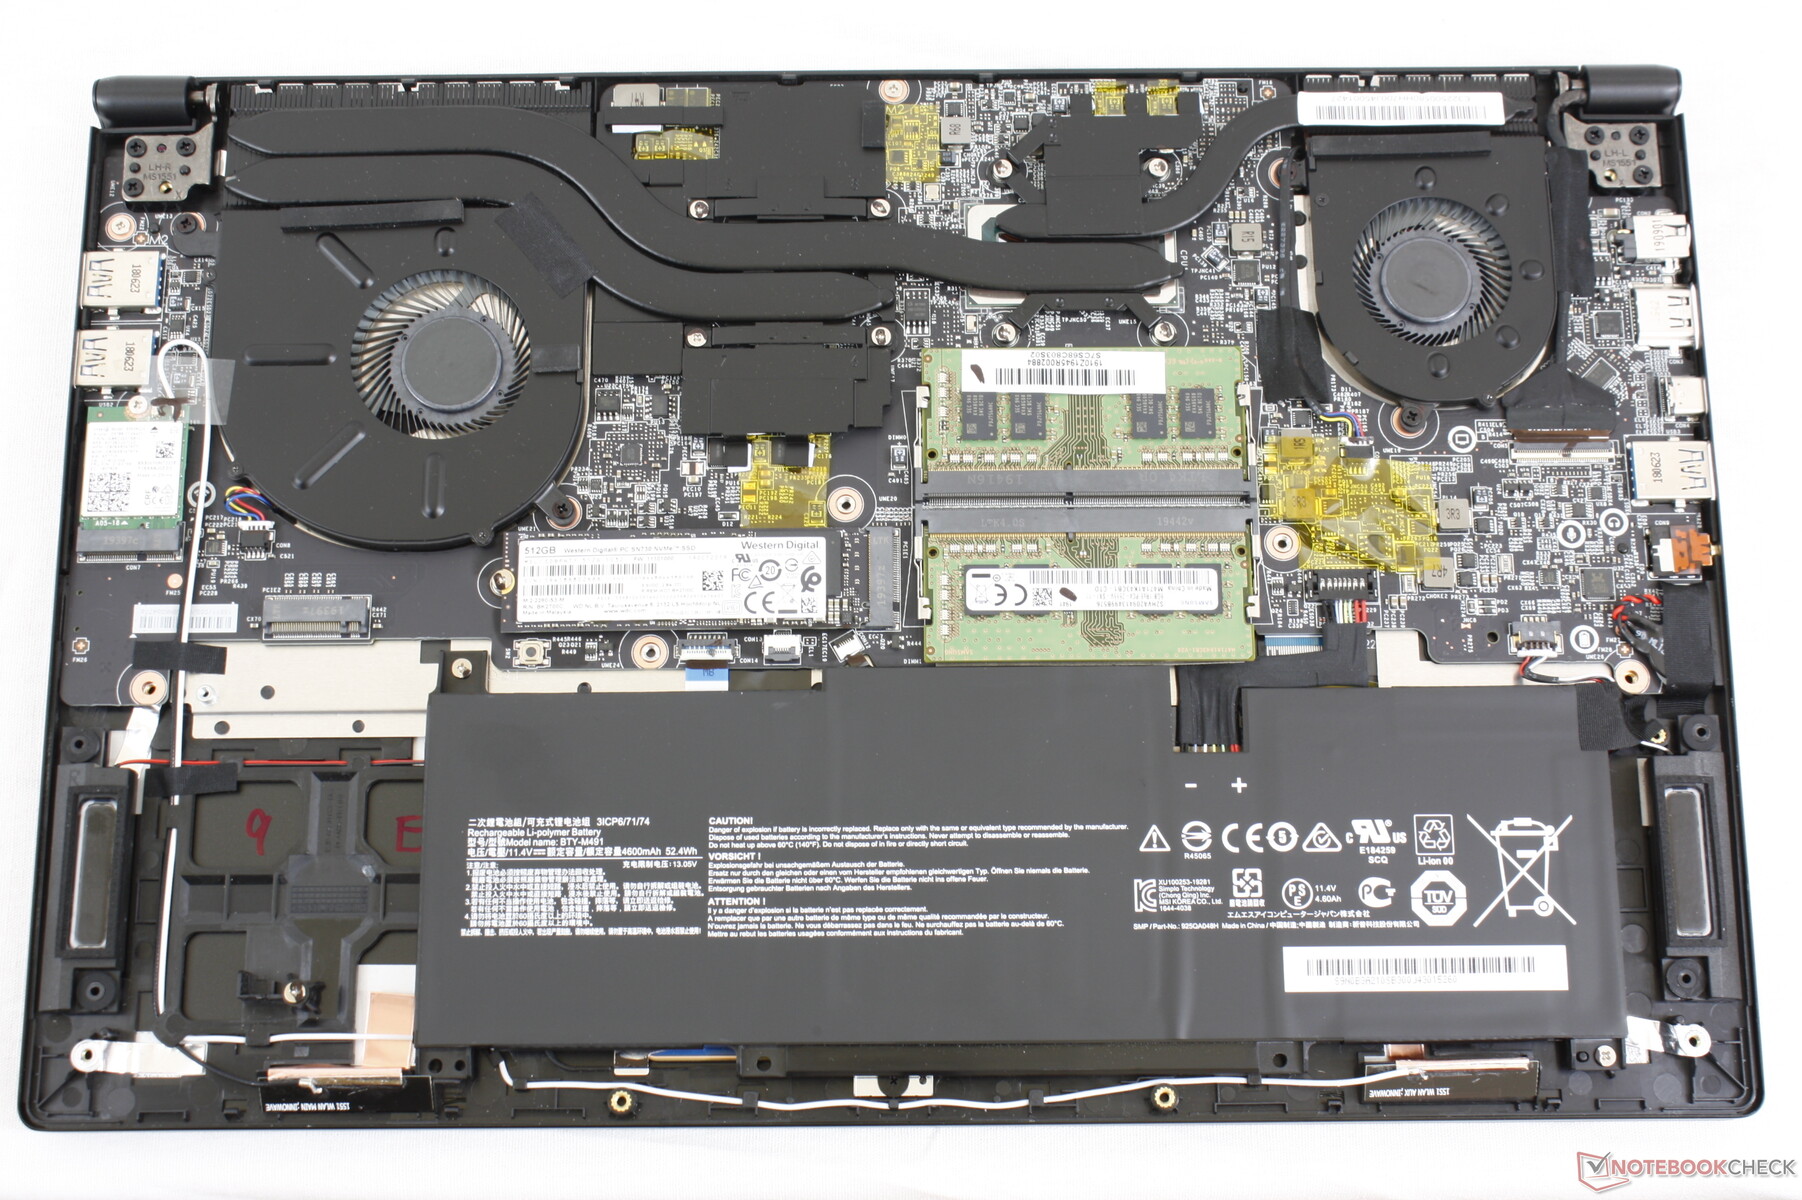
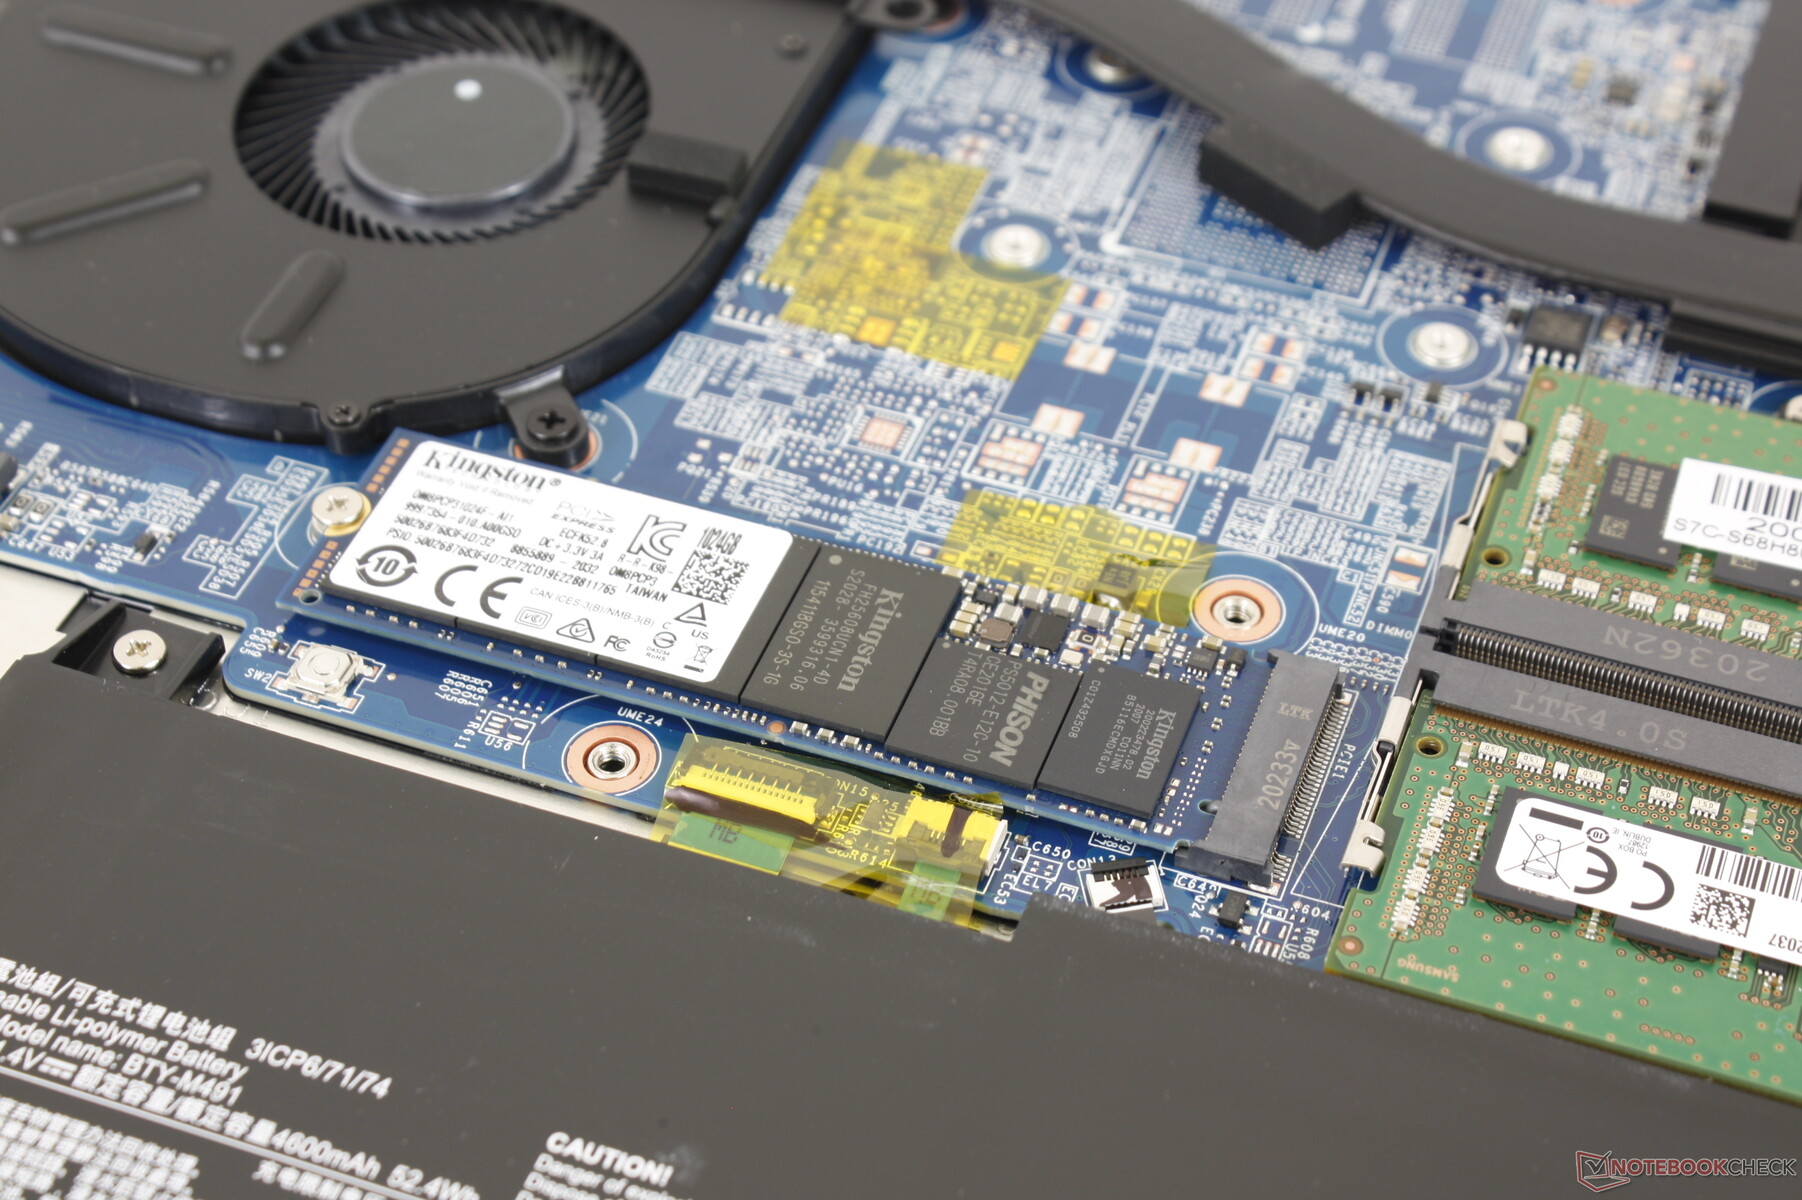
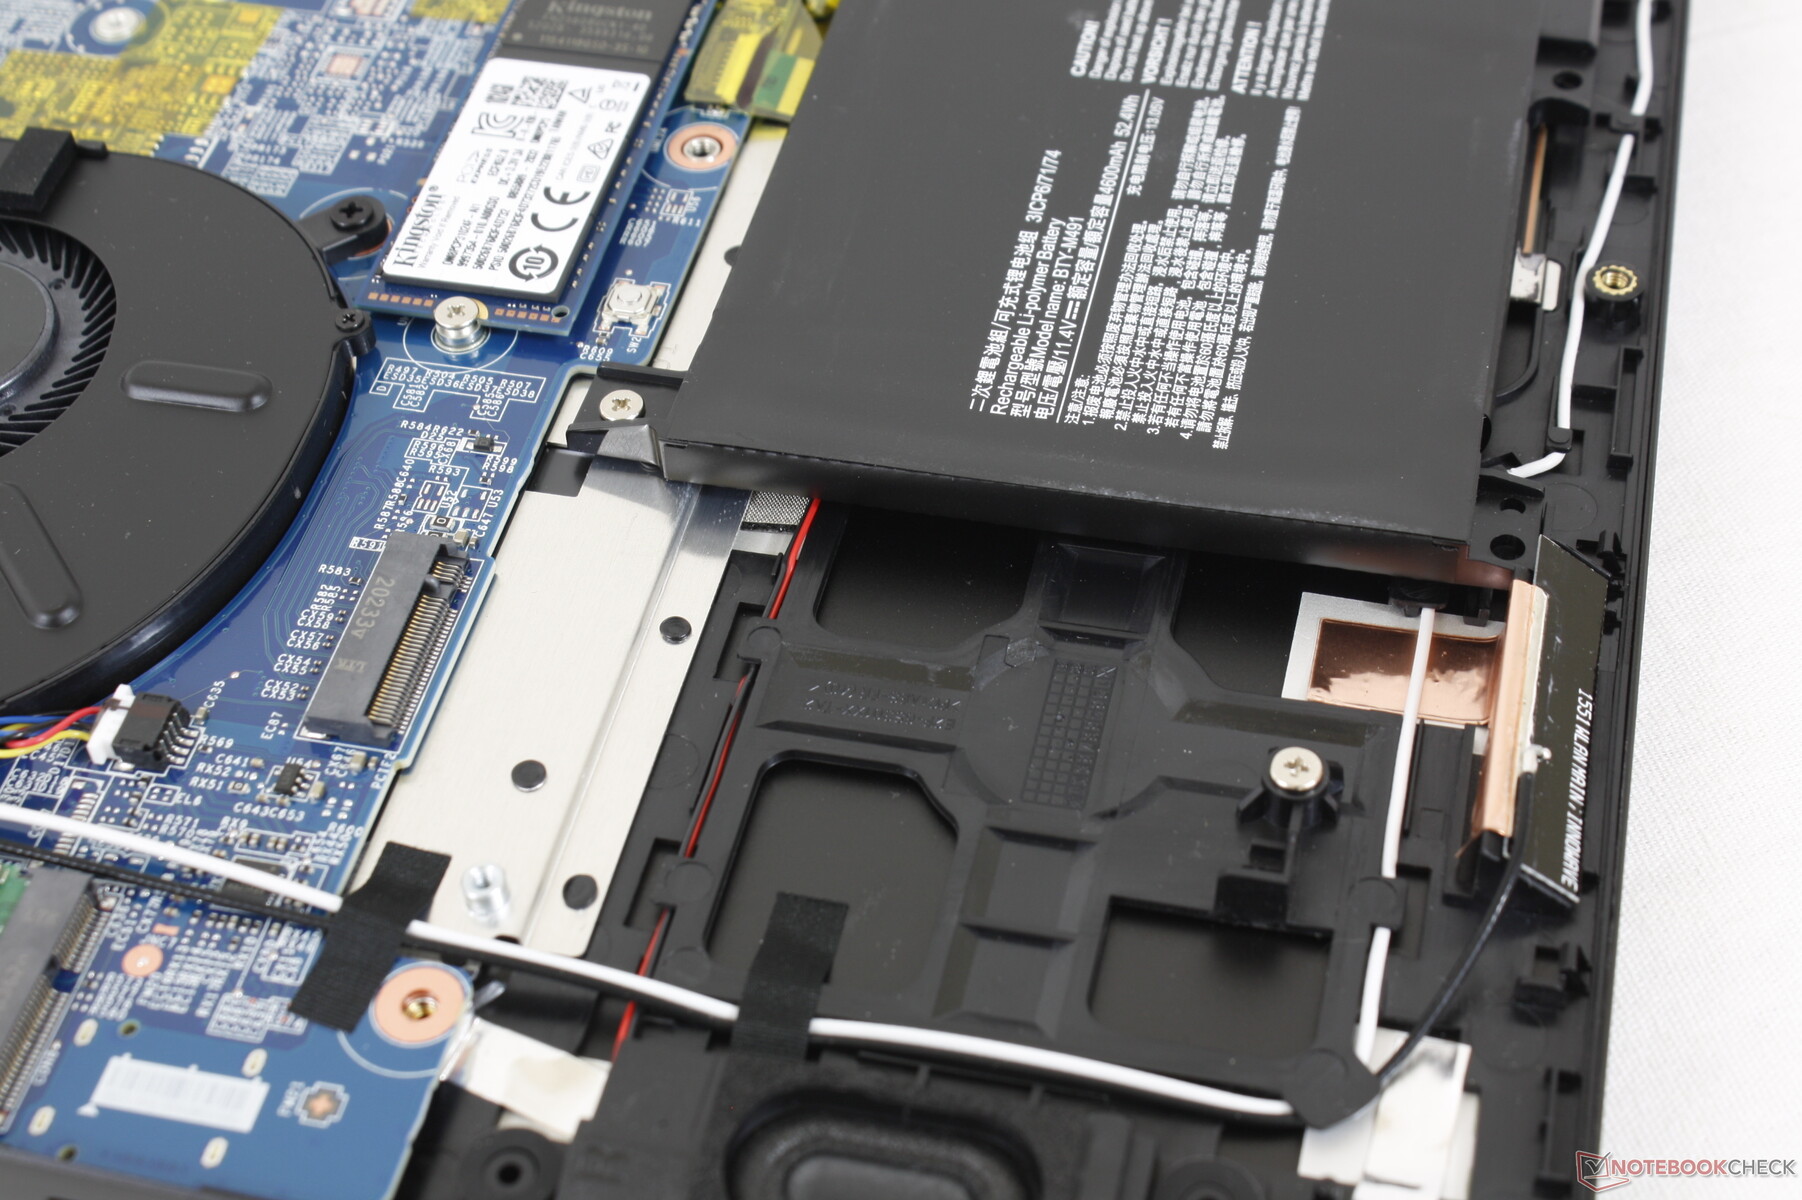
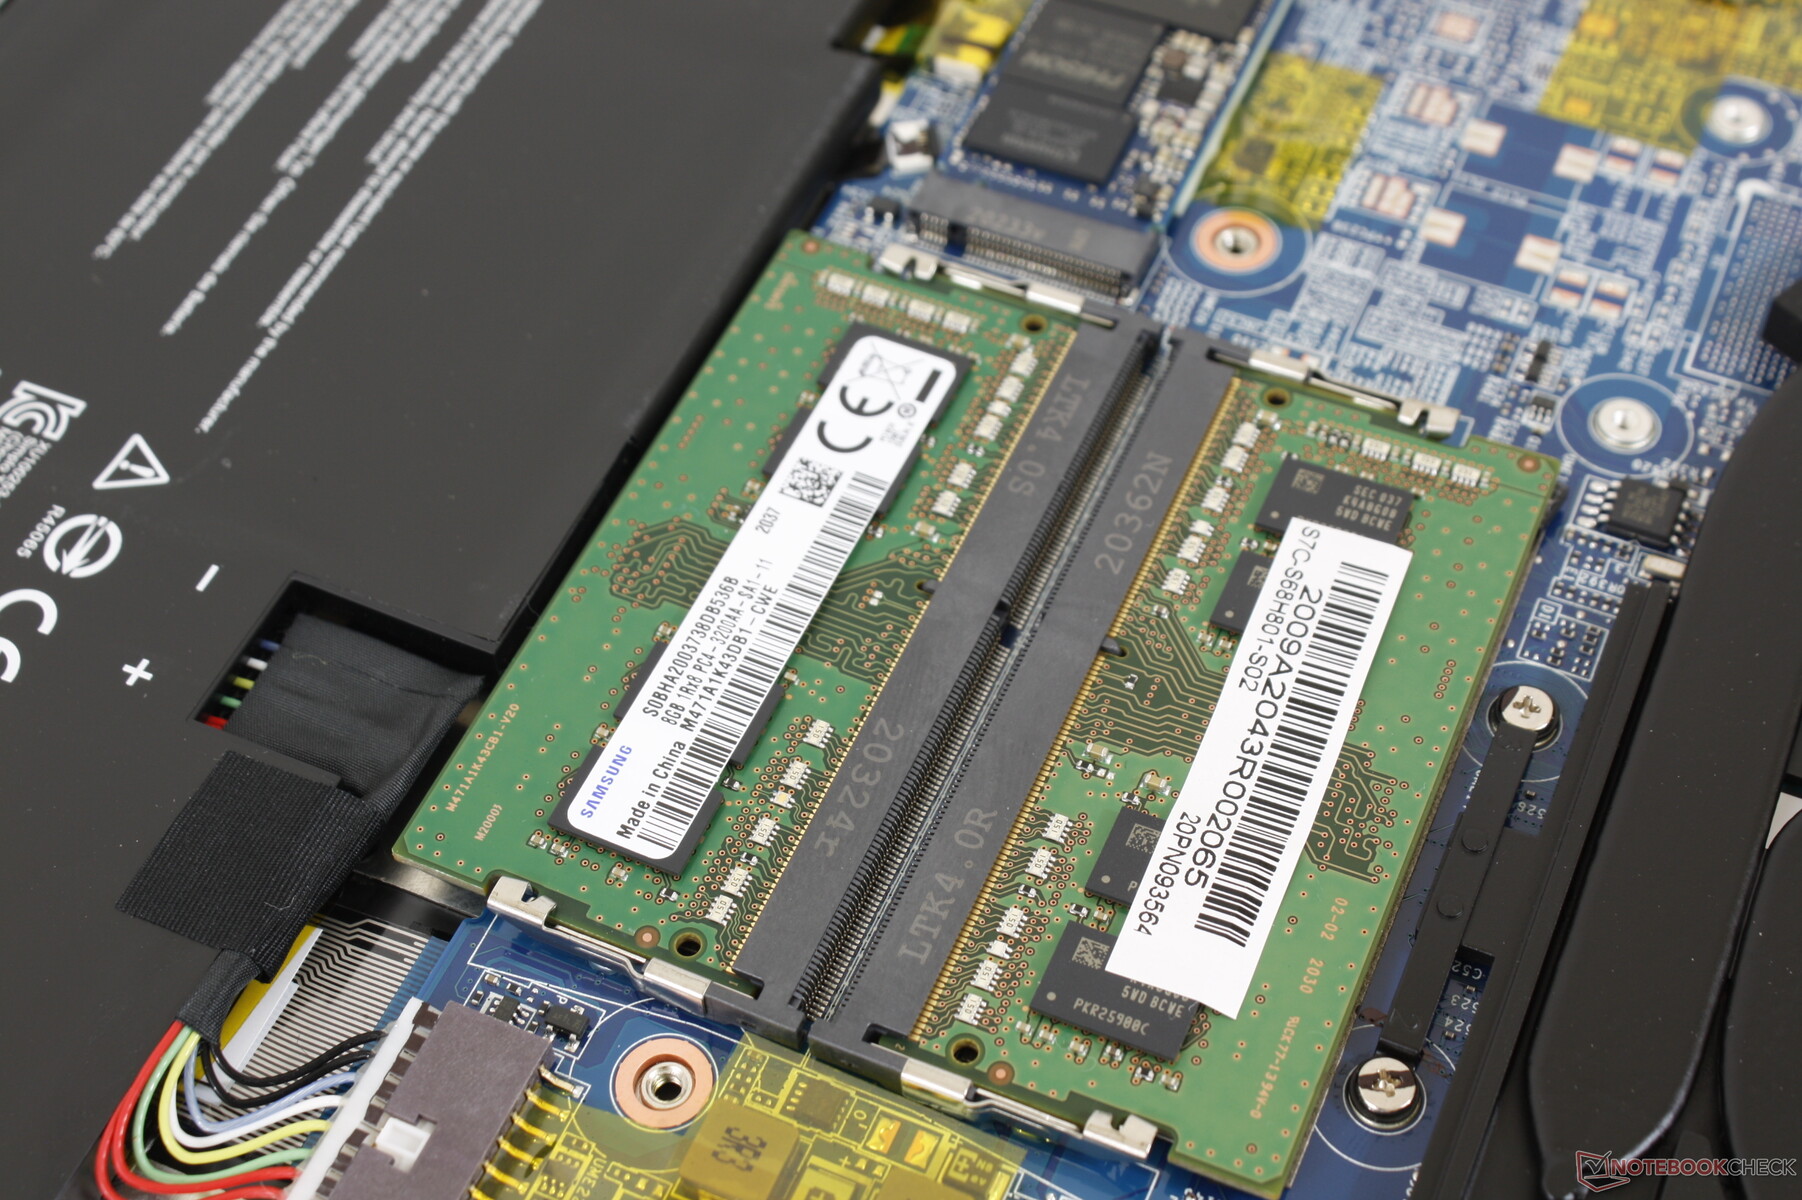
The bottom panel pops off fairly easily with just a Philips screwdriver. However, keep in mind that a factory seal sticker must first be broken. Once inside, the similarities between the Summit B15 and last year's Modern 15 become even more obvious as shown by the comparison images below.
Accessories and Warranty
The retail box includes a USB-A to RJ-45 adapter alongside the paperwork and AC adapter. The standard one-year limited warranty applies with extension options if purchased from Xotic PC.
Input Devices
Keyboard
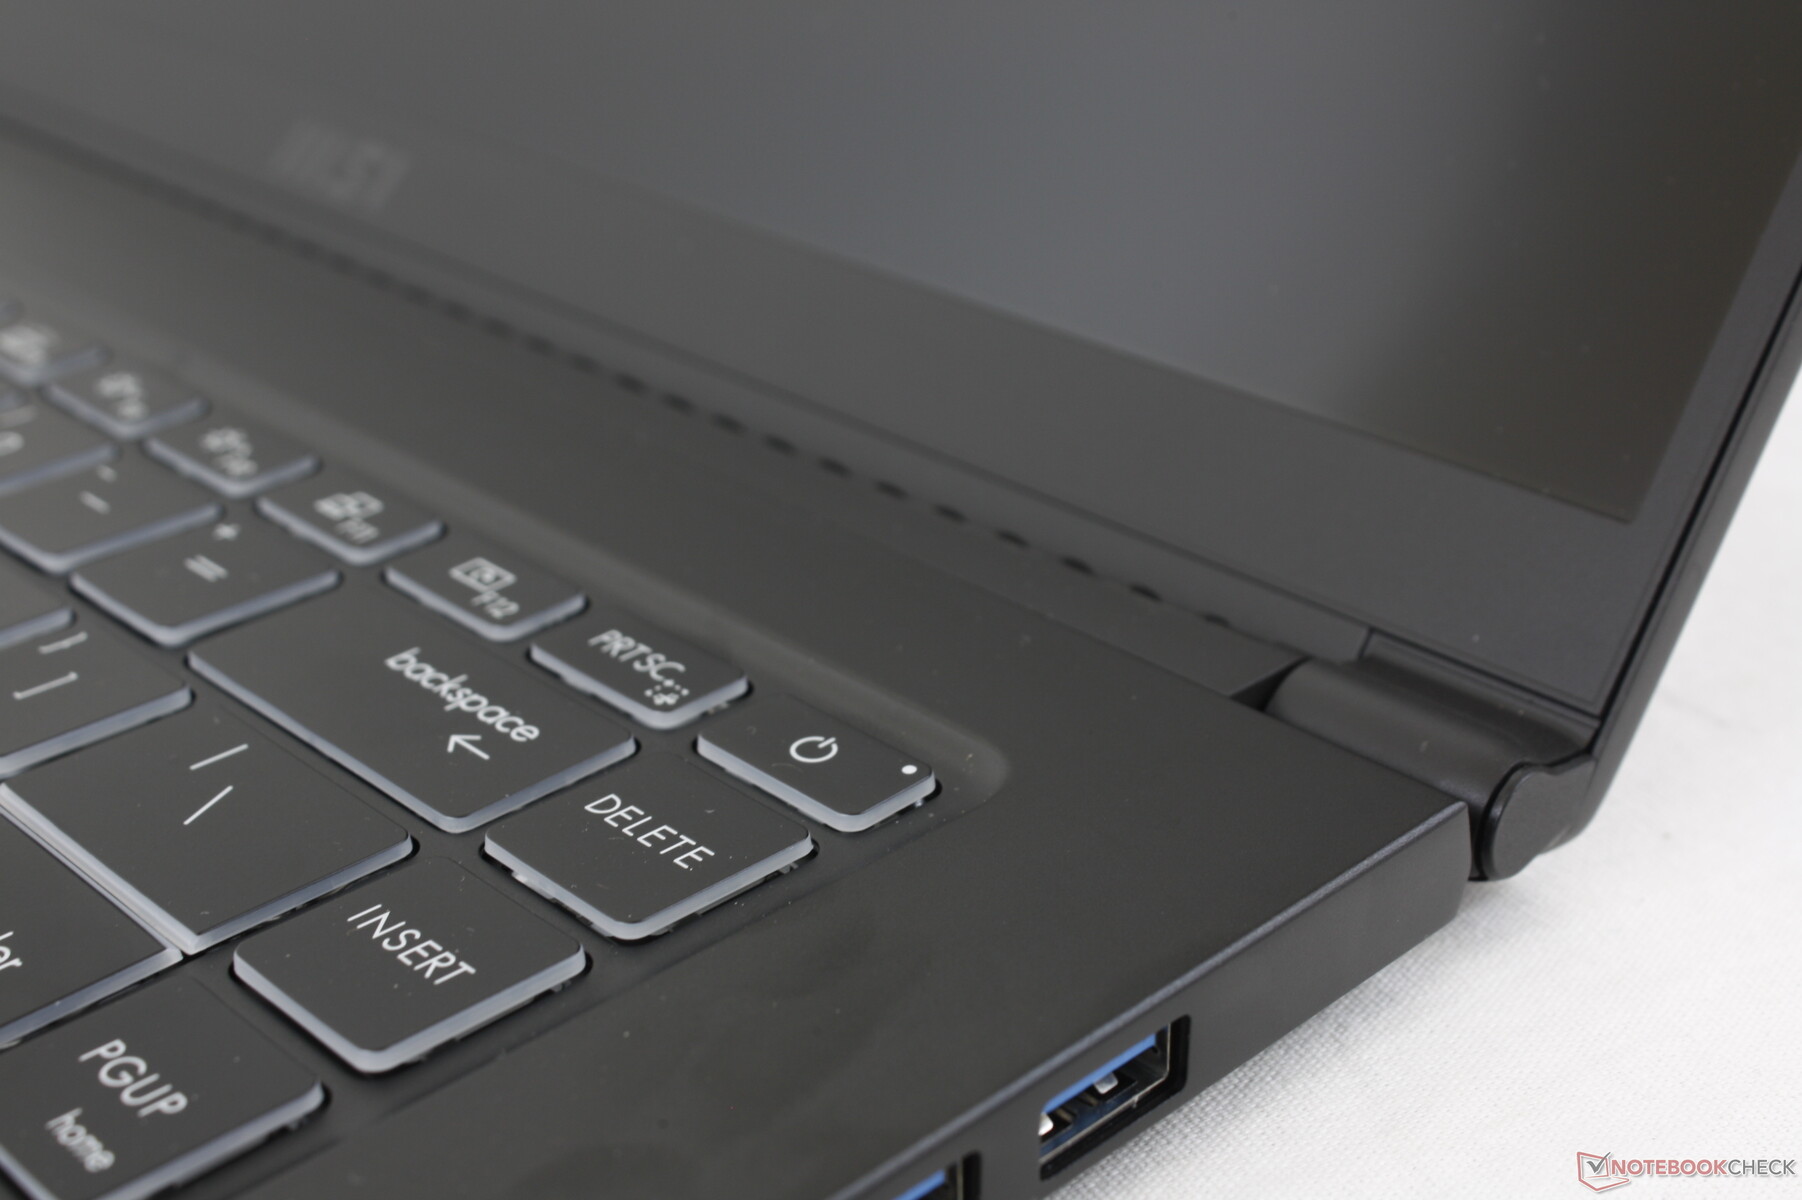
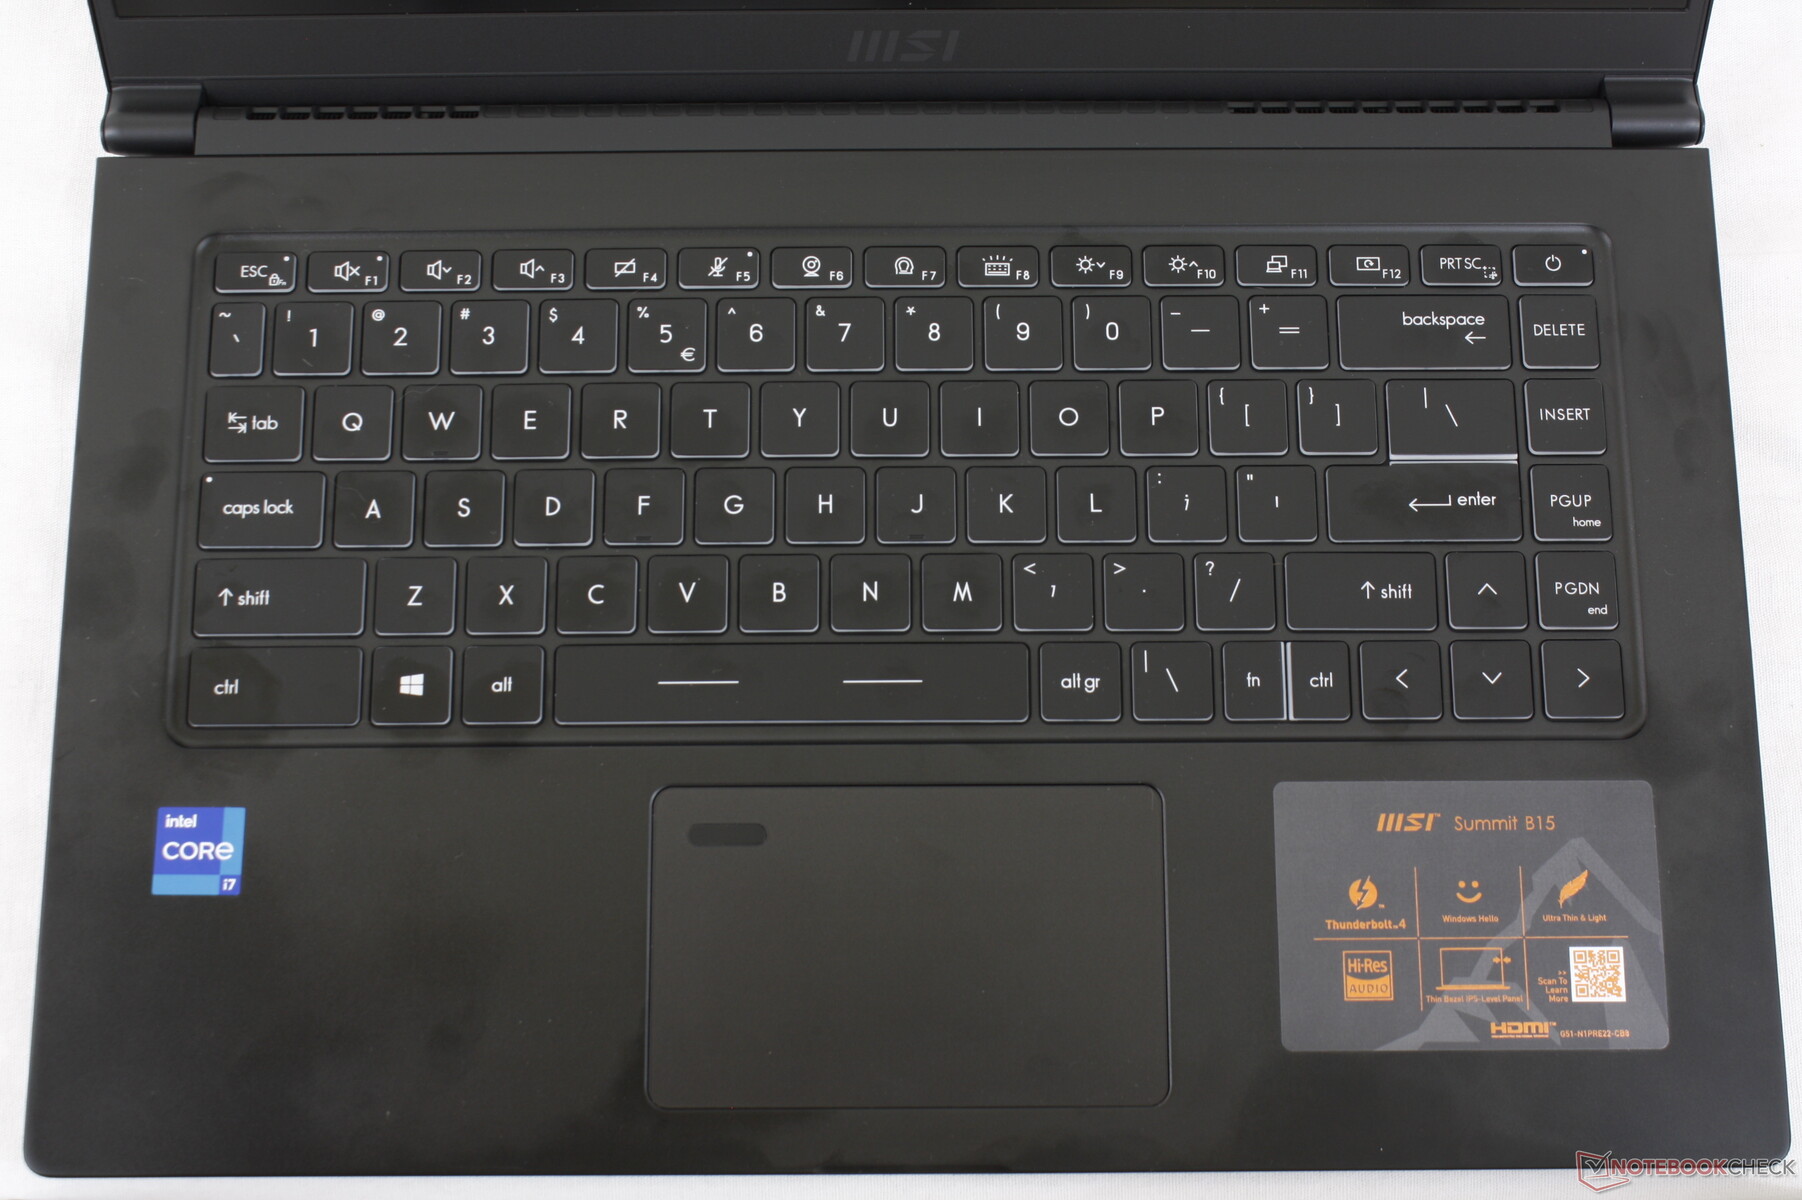
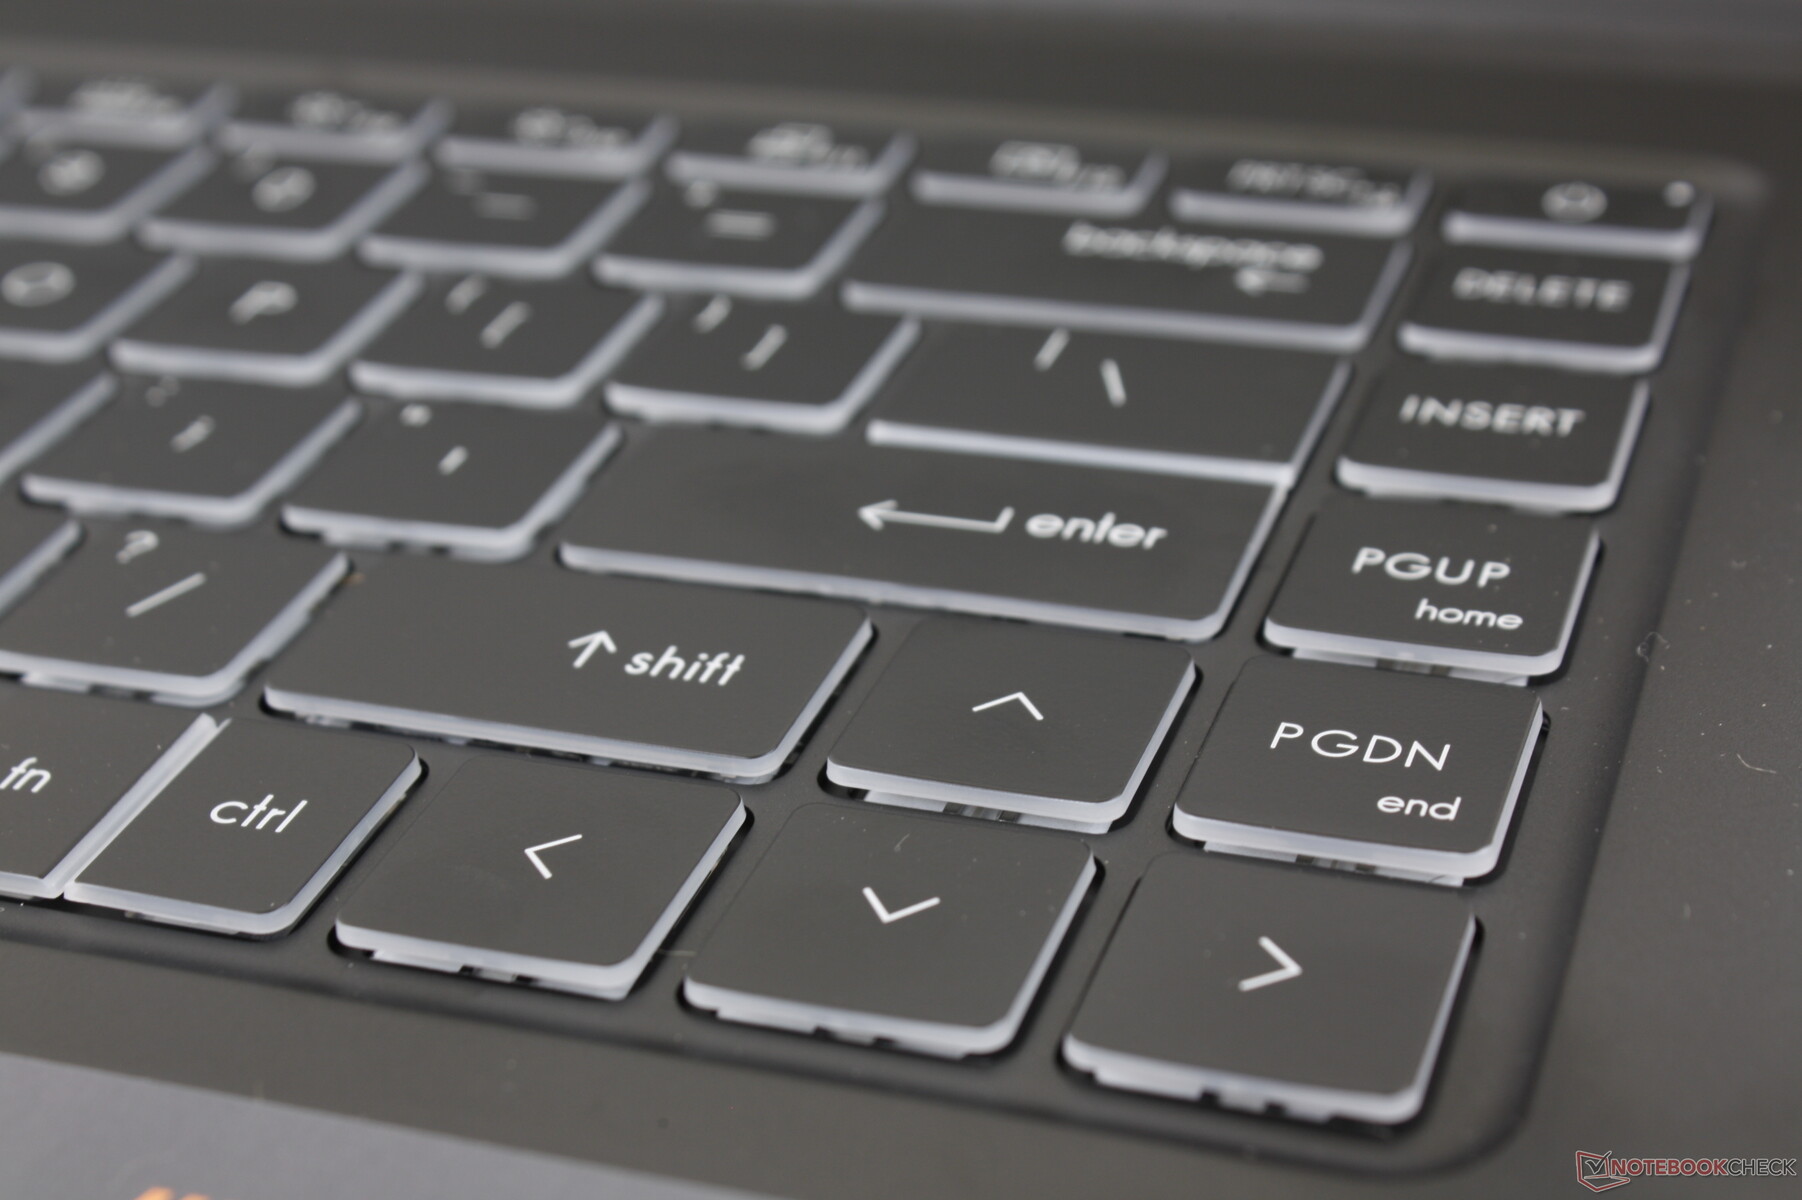
Key font has changed from the Modern 15 to be sharper and not as bold or italicized. Otherwise, key feedback and layout remain exactly the same. Keys feel firmer and deeper than on the XPG Xenia Xe and Dell XPS 15, respectively, but clatter is slightly louder as a result. We do appreciate the full-size PgUp, PgDn, Delete, and arrow keys as these are oftentimes shrunk on most other laptops.
Touchpad
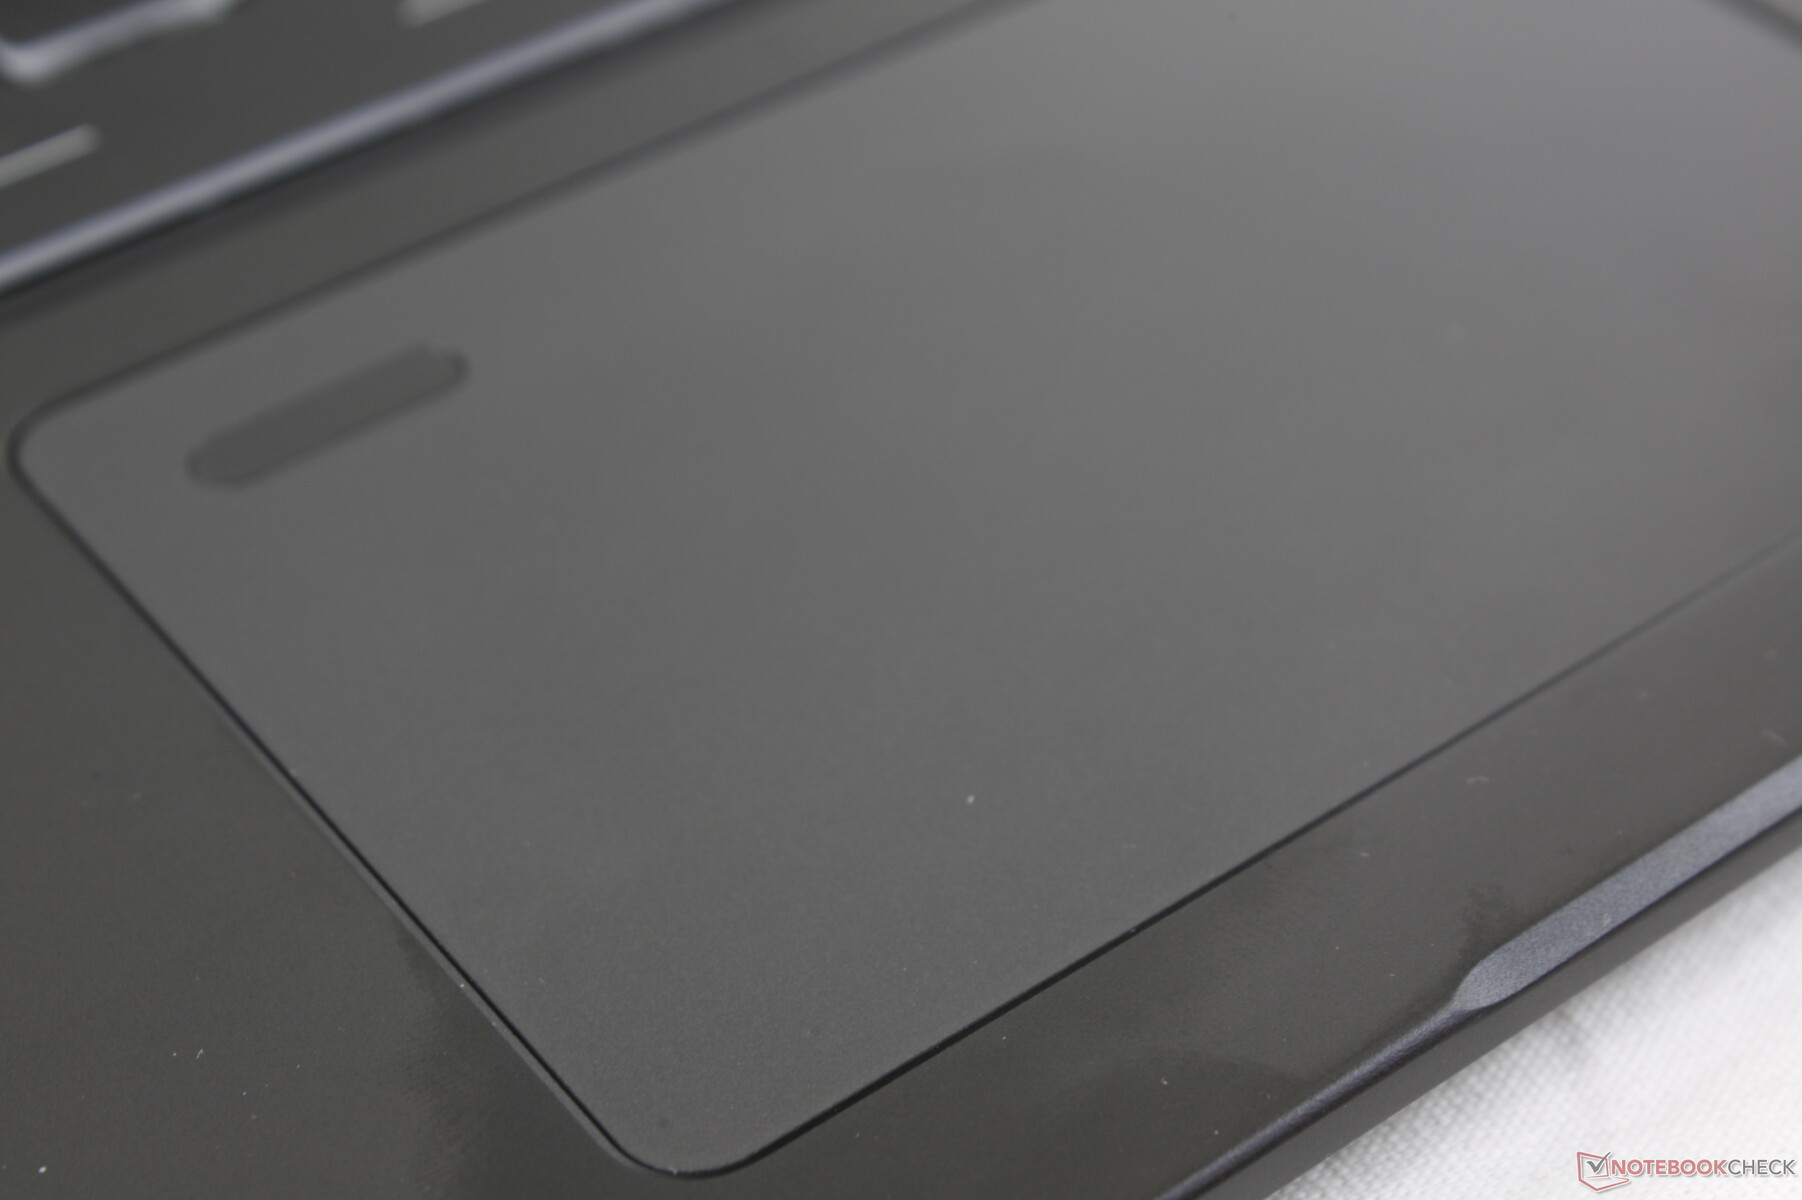
The clickpad is the same size as the one on the Modern 15 (10.5 x 6.5 cm) with the same smooth texture and spongy feedback. It's not as soft as the clickpad on the Xenia Xe, but it could have definitely been firmer for a more satisfying click.
We suspect that MSI will eventually move the fingerprint reader away from the clickpad much like what we're already seeing from Dell, HP, and others.

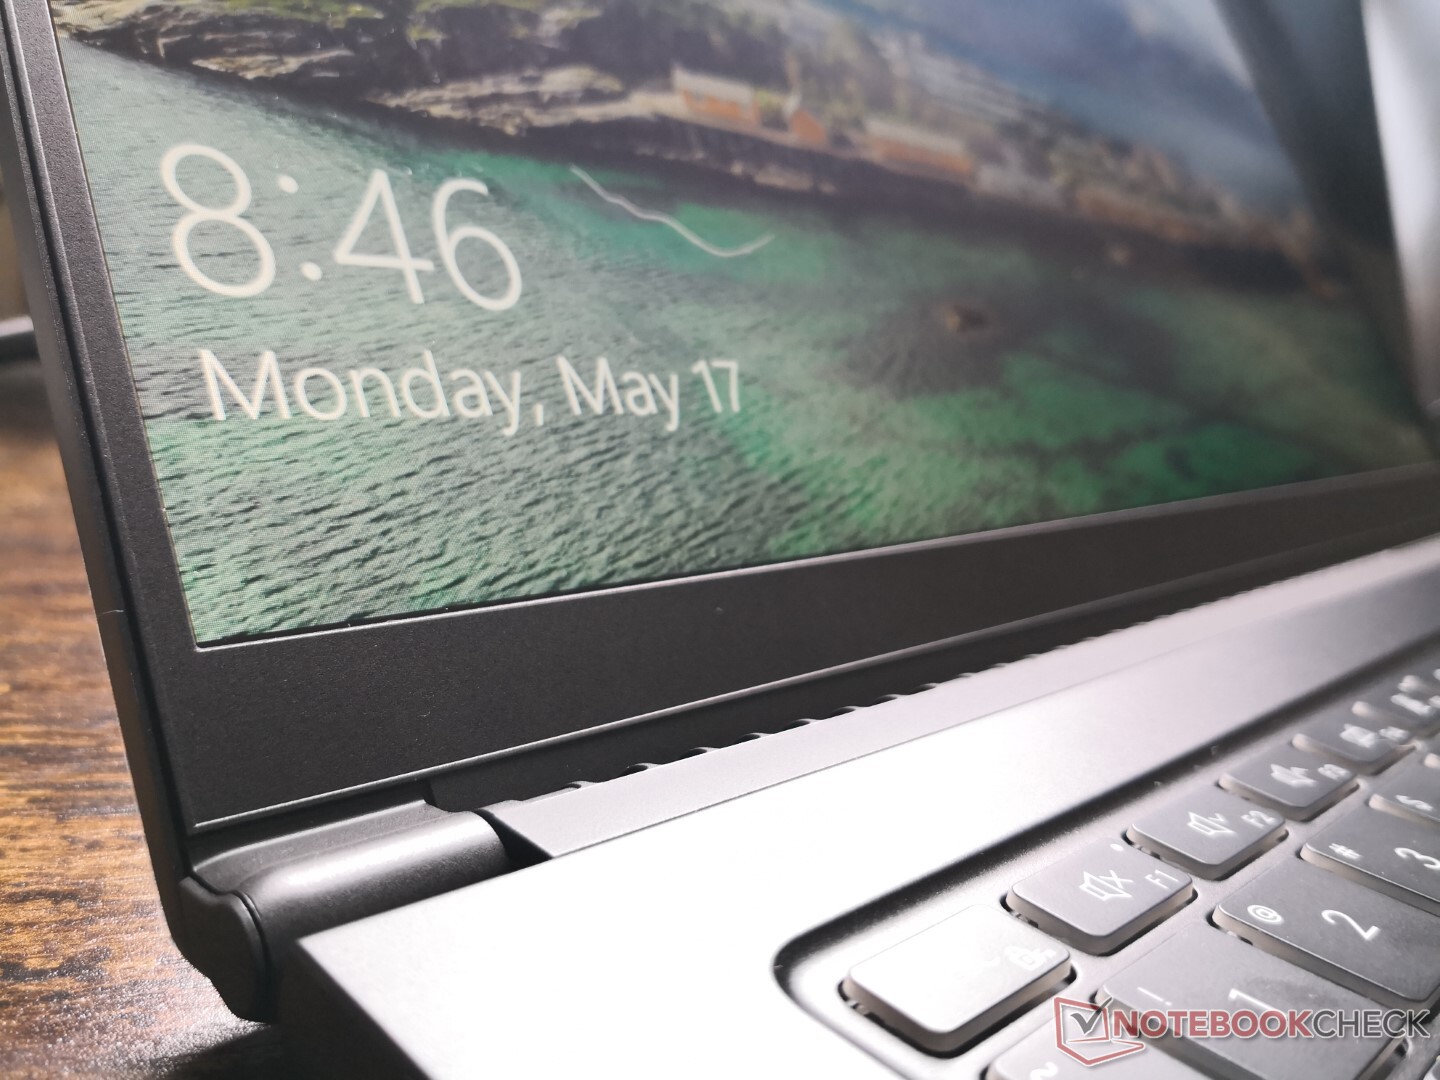
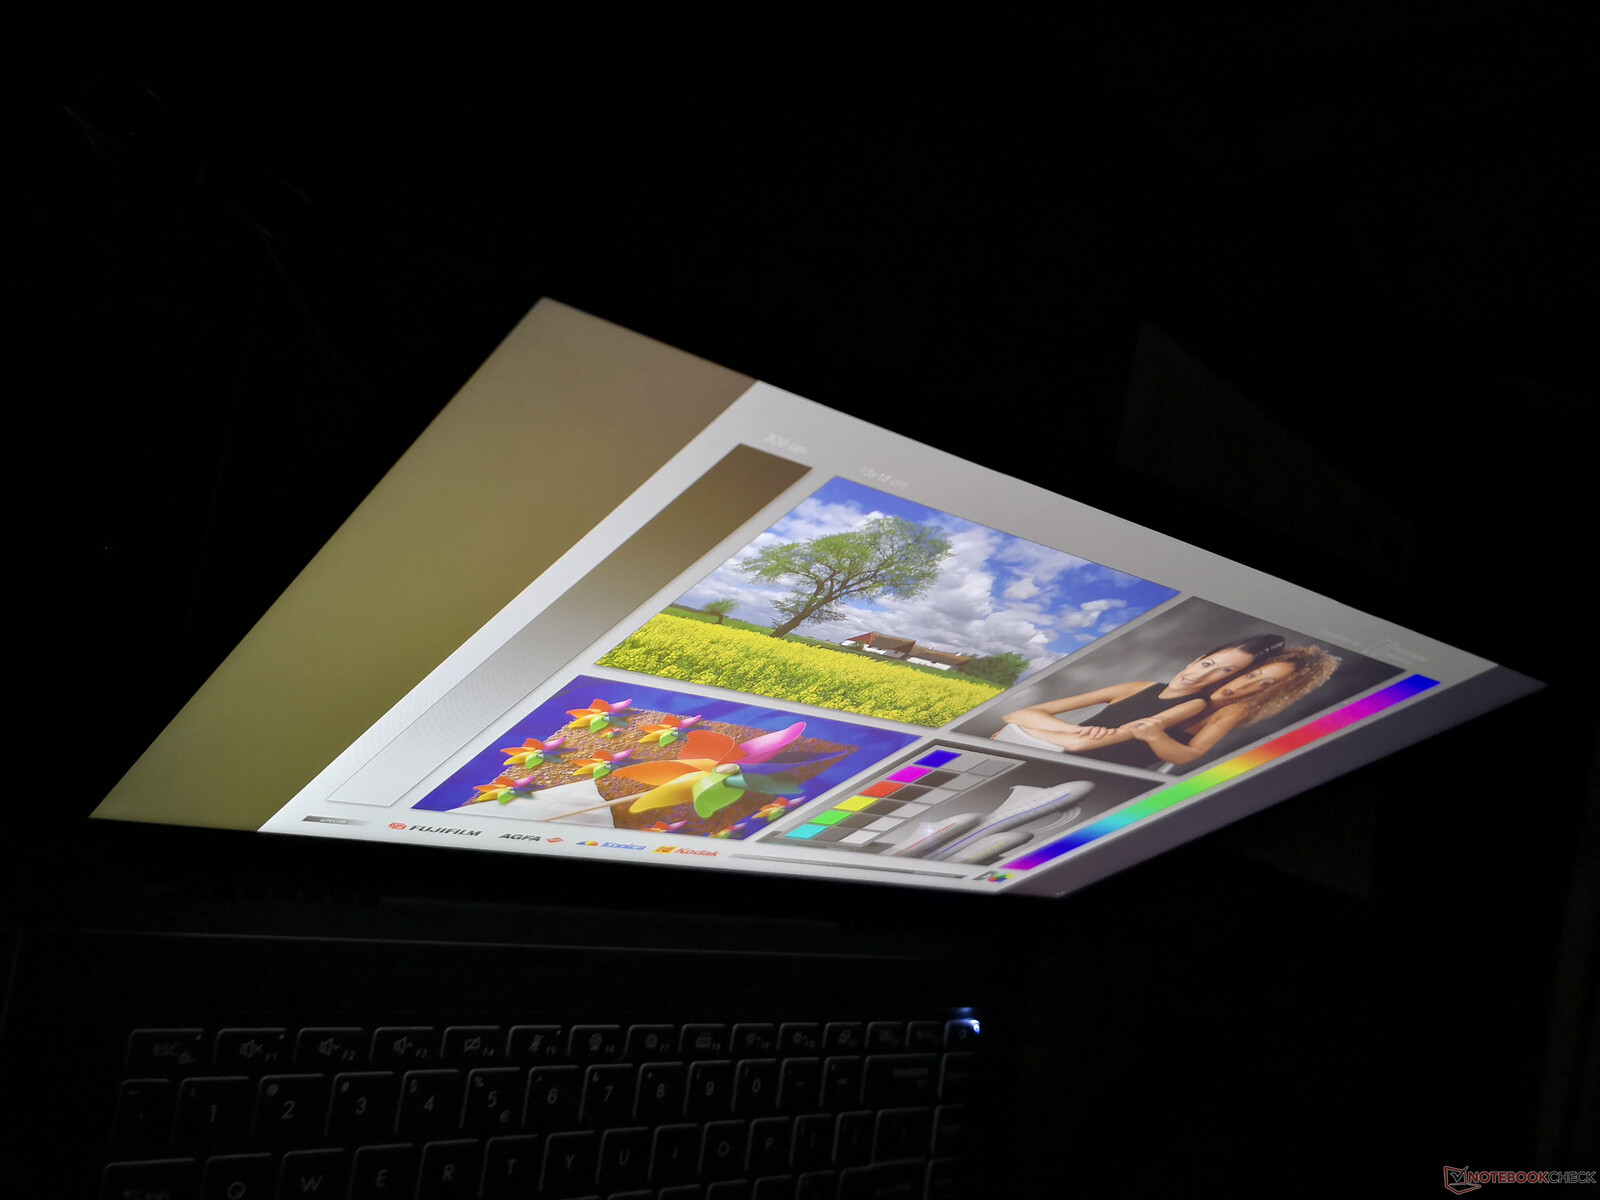
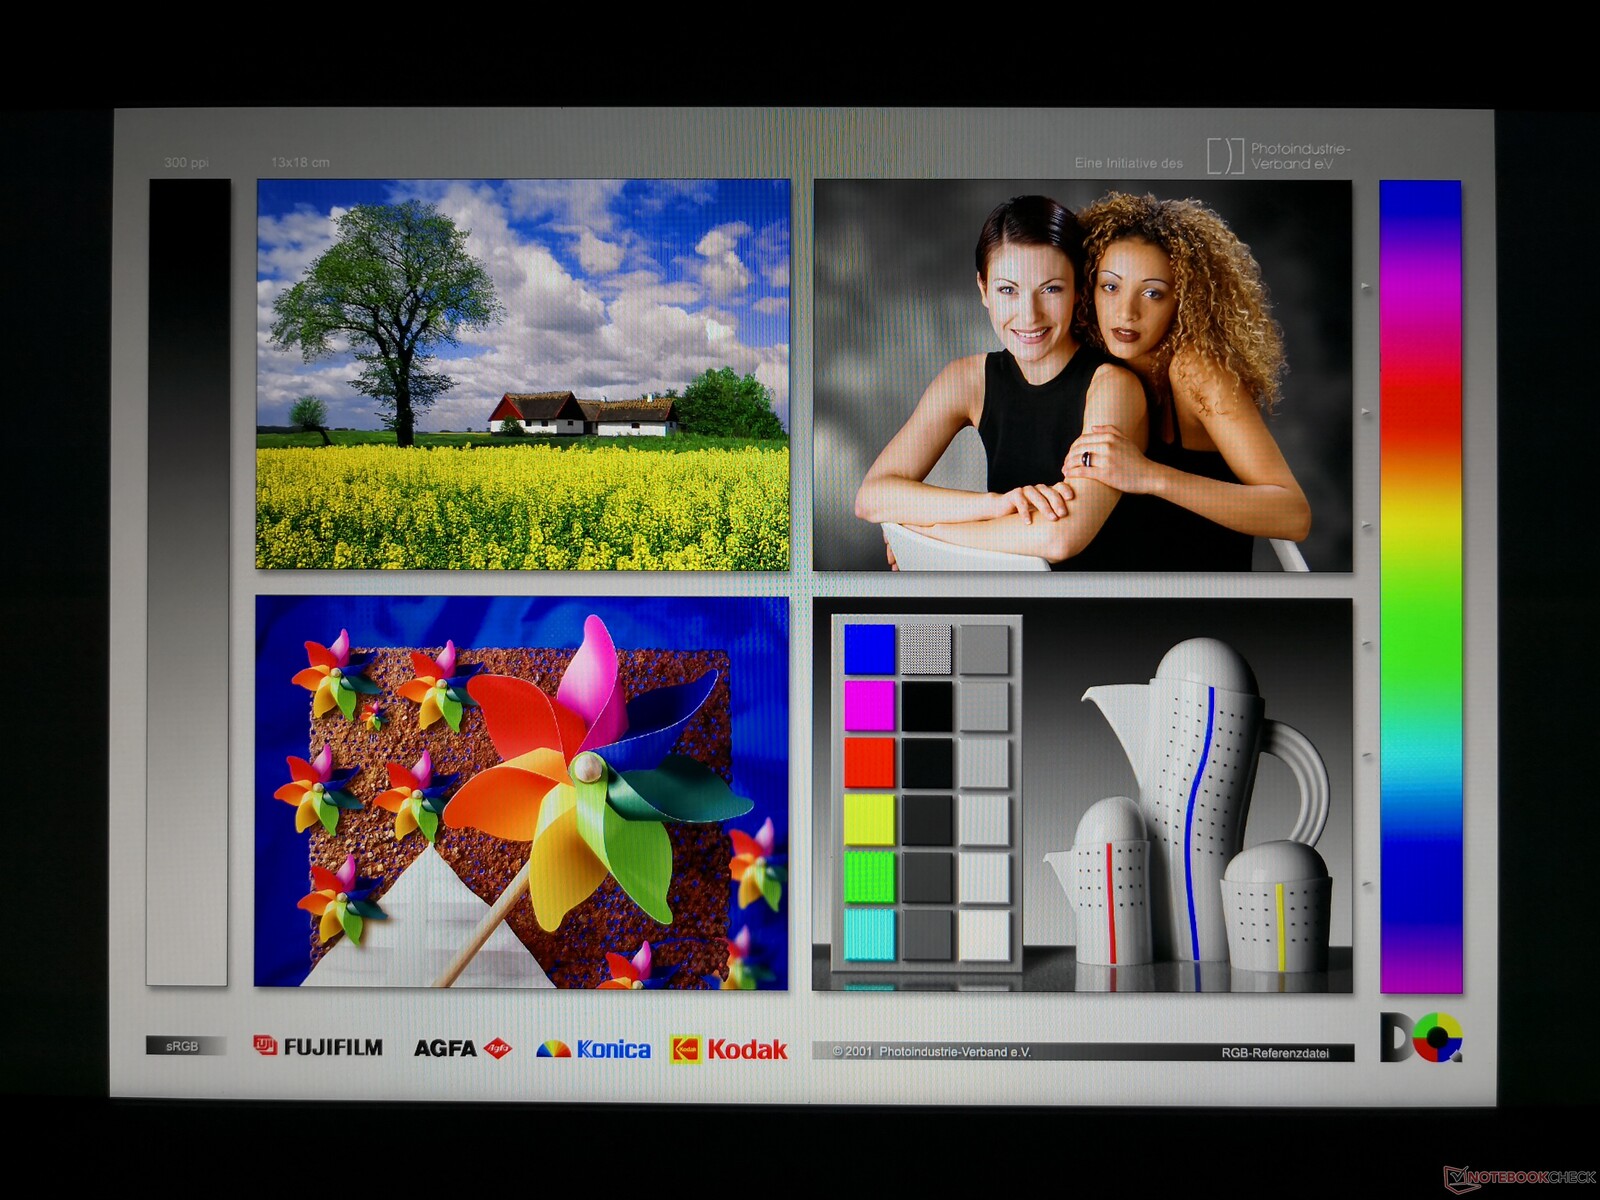
Display
The Summit B15 uses the same matte Chi Mei N156HCE-EN1 IPS panel as found on the 2019 MSI PS63 Modern. In fact, this exact panel is quite common on upper mid-range 15.6-inch laptops including the ThinkPad P52, ThinkPad X1 Extreme, Asus ZenBook Pro UX550, and even MSI's own Modern 15. Image quality is therefore similar between all of these laptops including the average black-white response times and decent contrast ratio. Pulse-width modulation at lower brightness levels is back as well.


| |||||||||||||||||||||||||
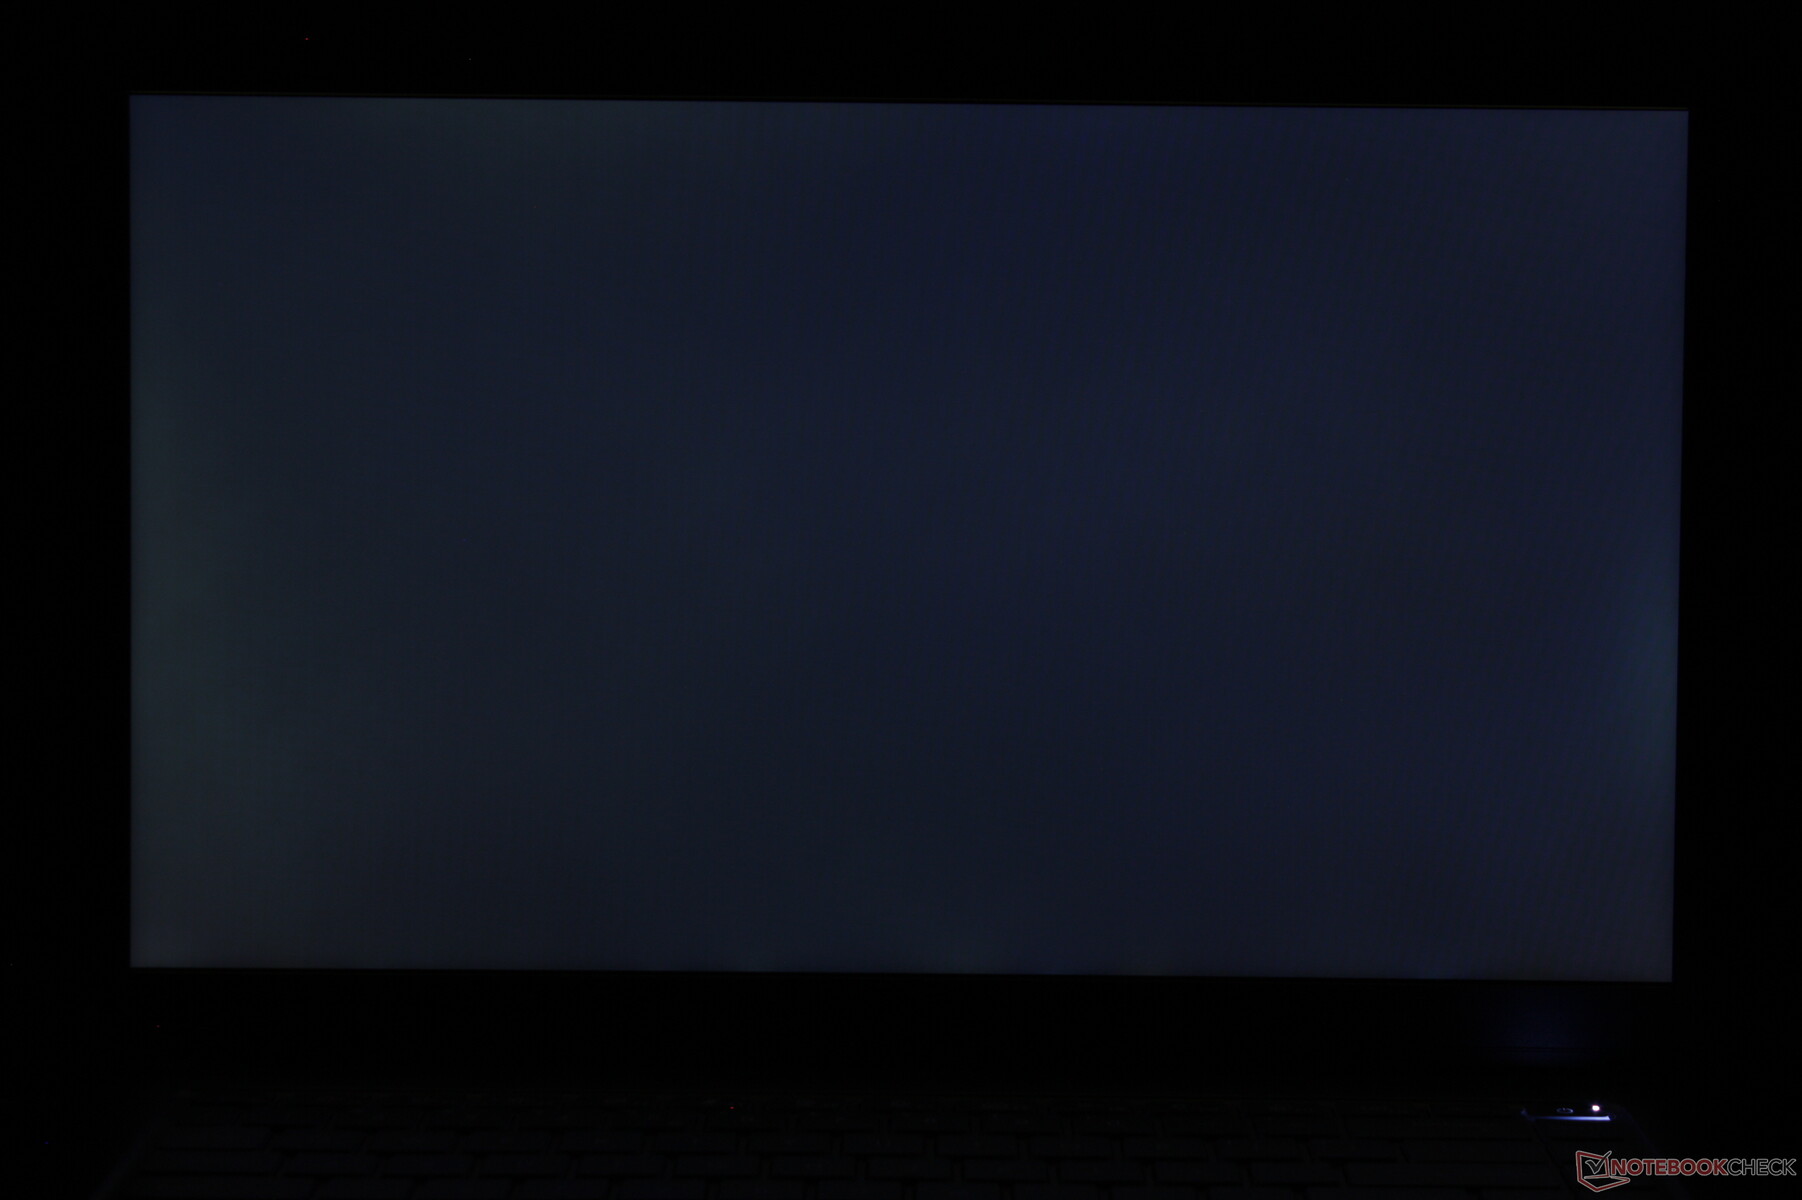
Brightness Distribution: 81 %
Center on Battery: 341.3 cd/m²
Contrast: 758:1 (Black: 0.45 cd/m²)
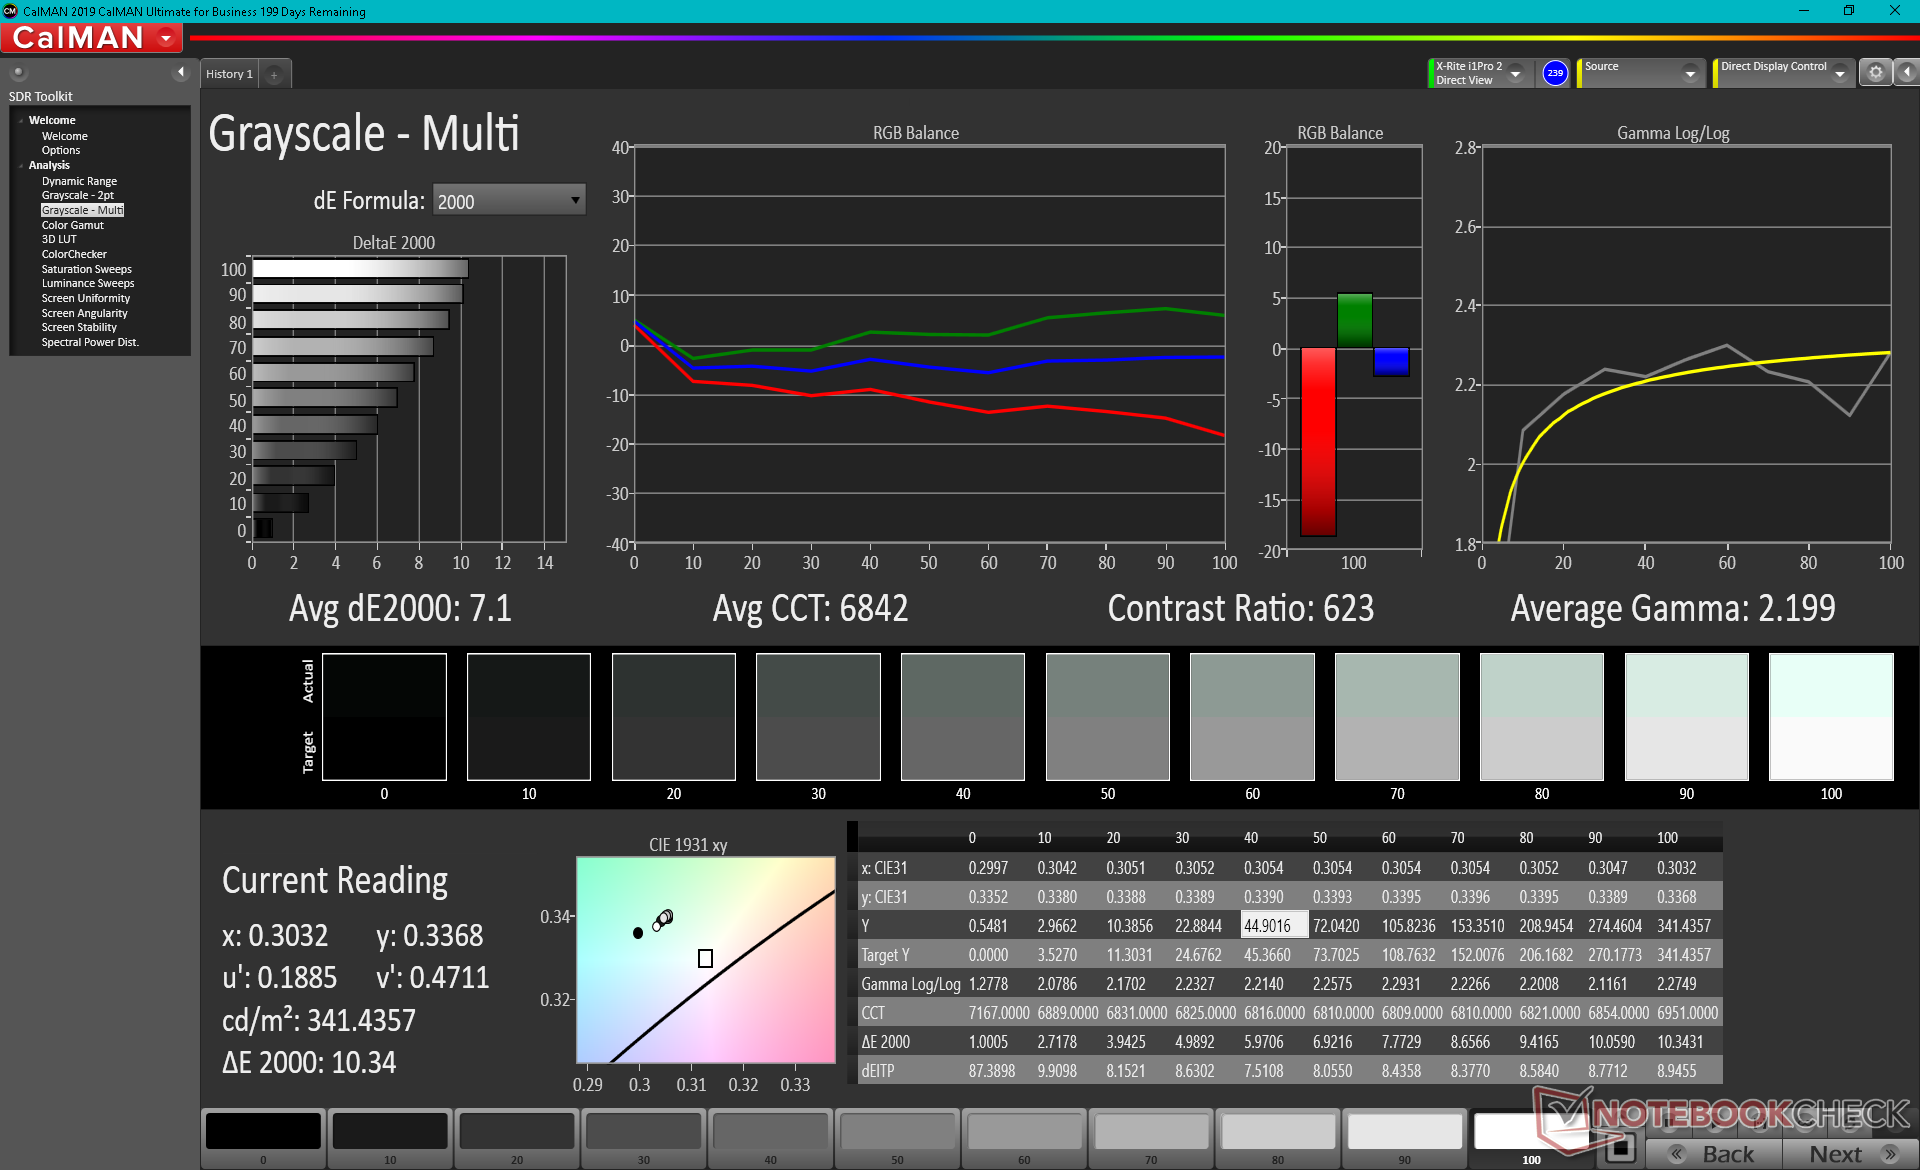
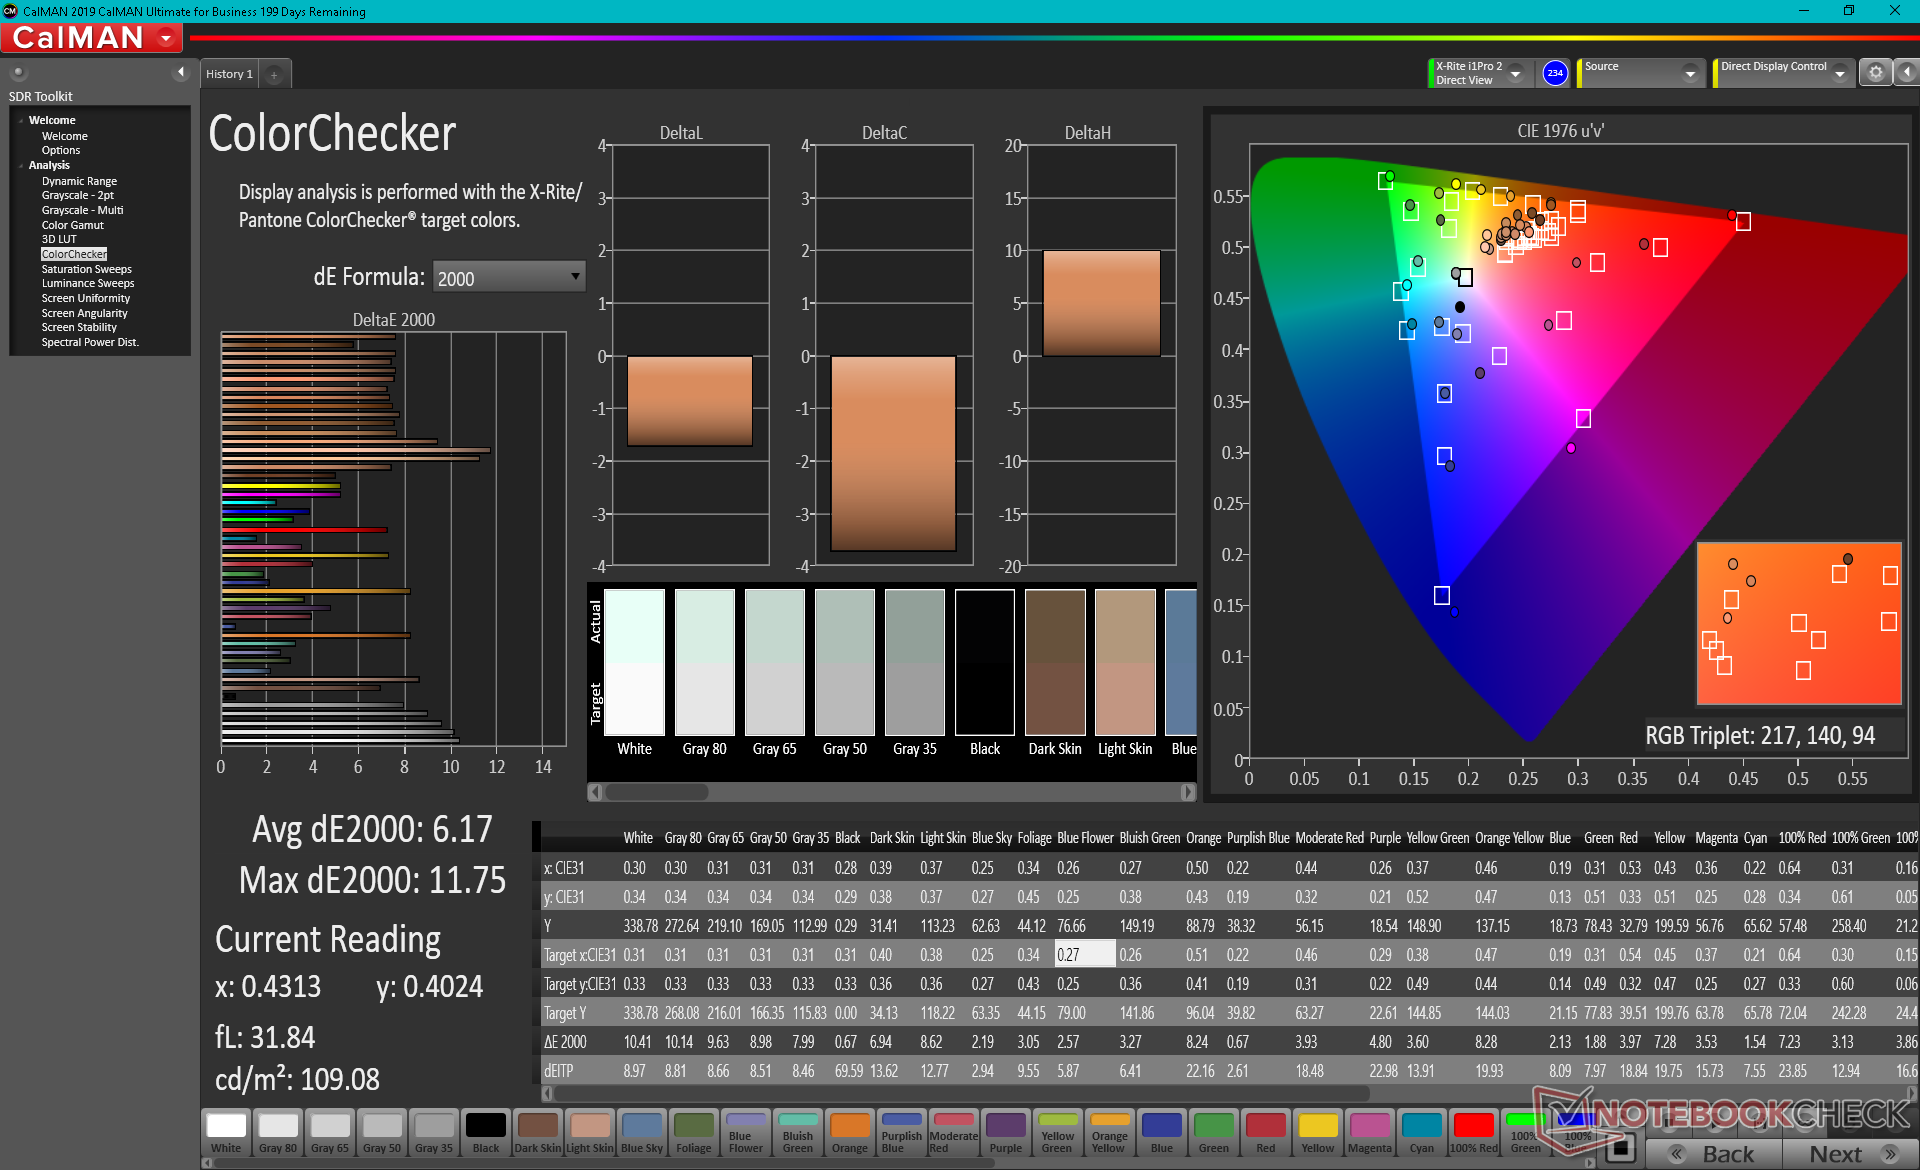
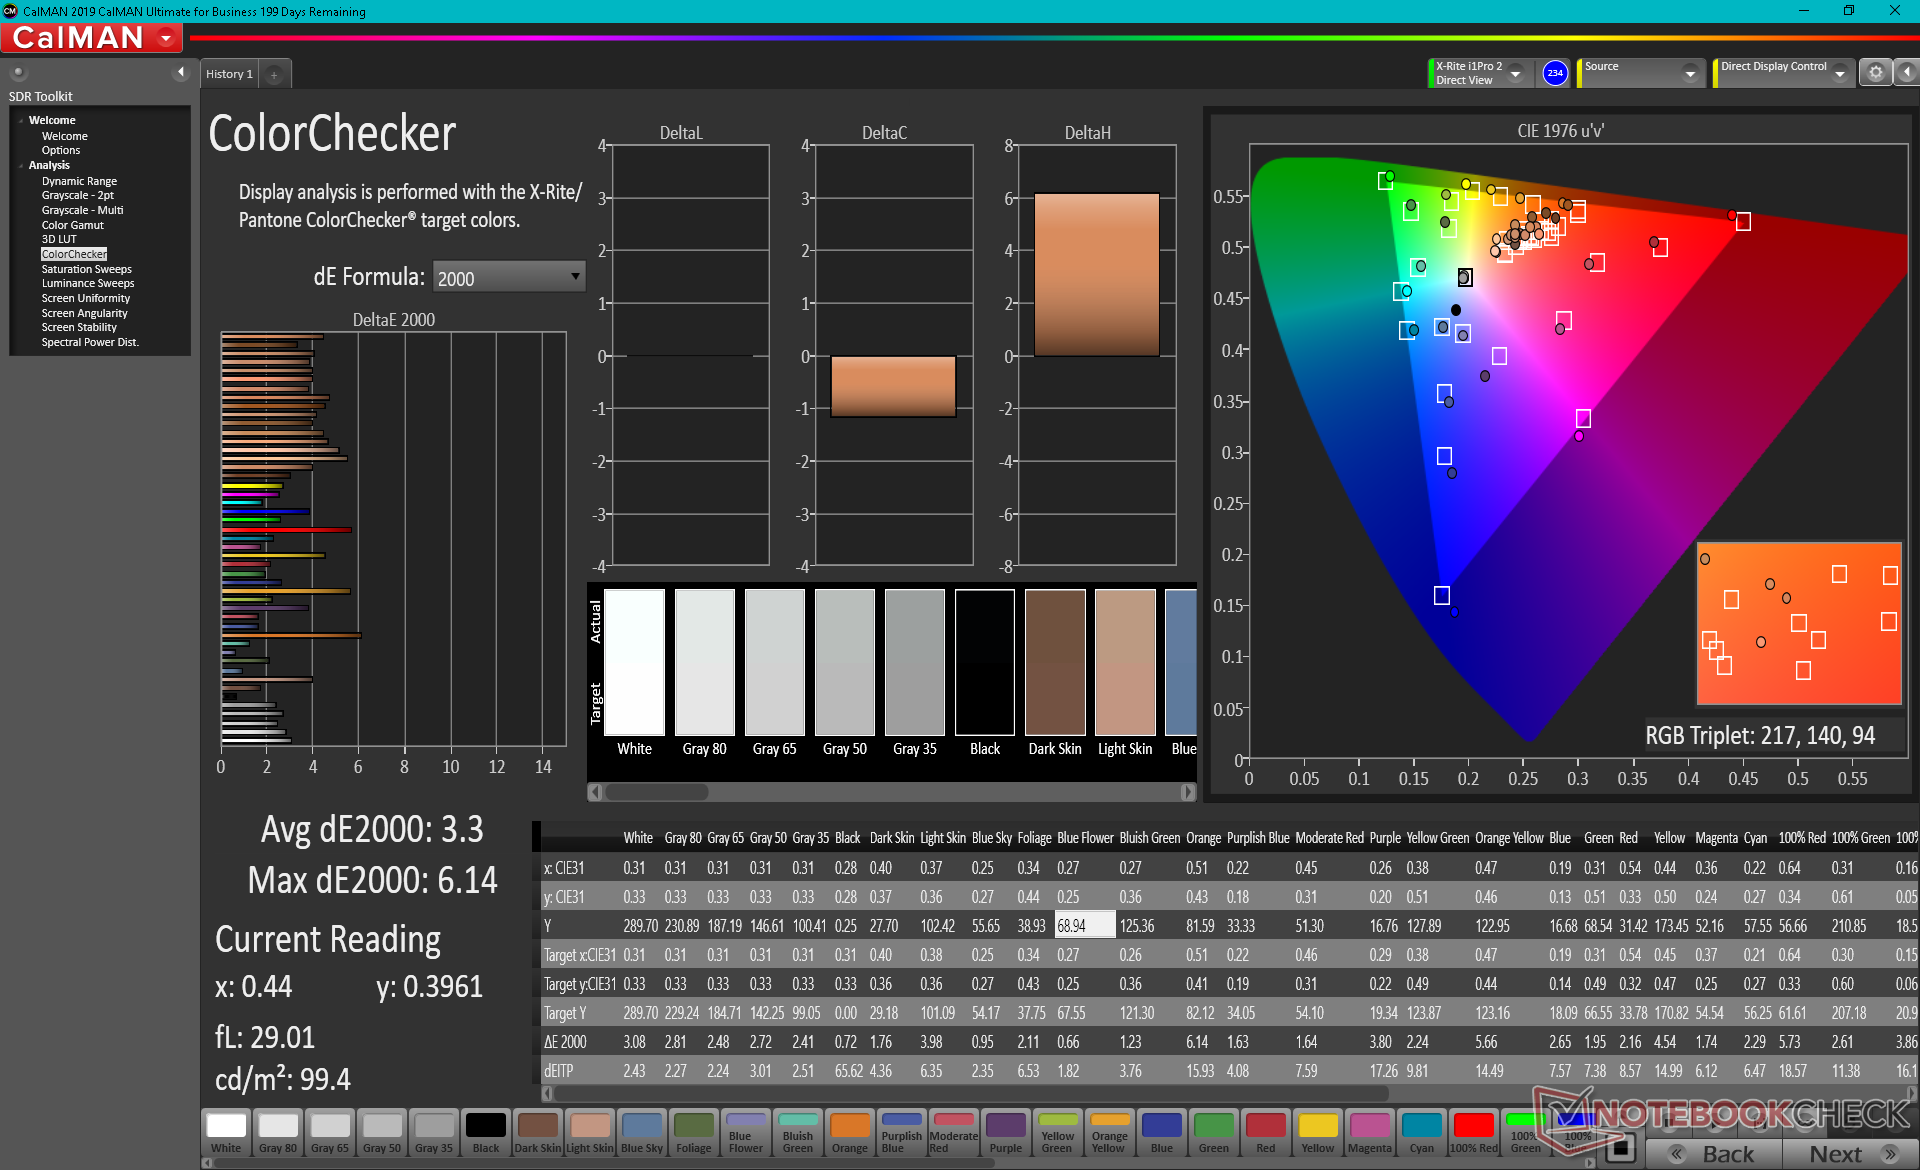
ΔE ColorChecker Calman: 6.17 | ∀{0.5-29.43 Ø4.73}
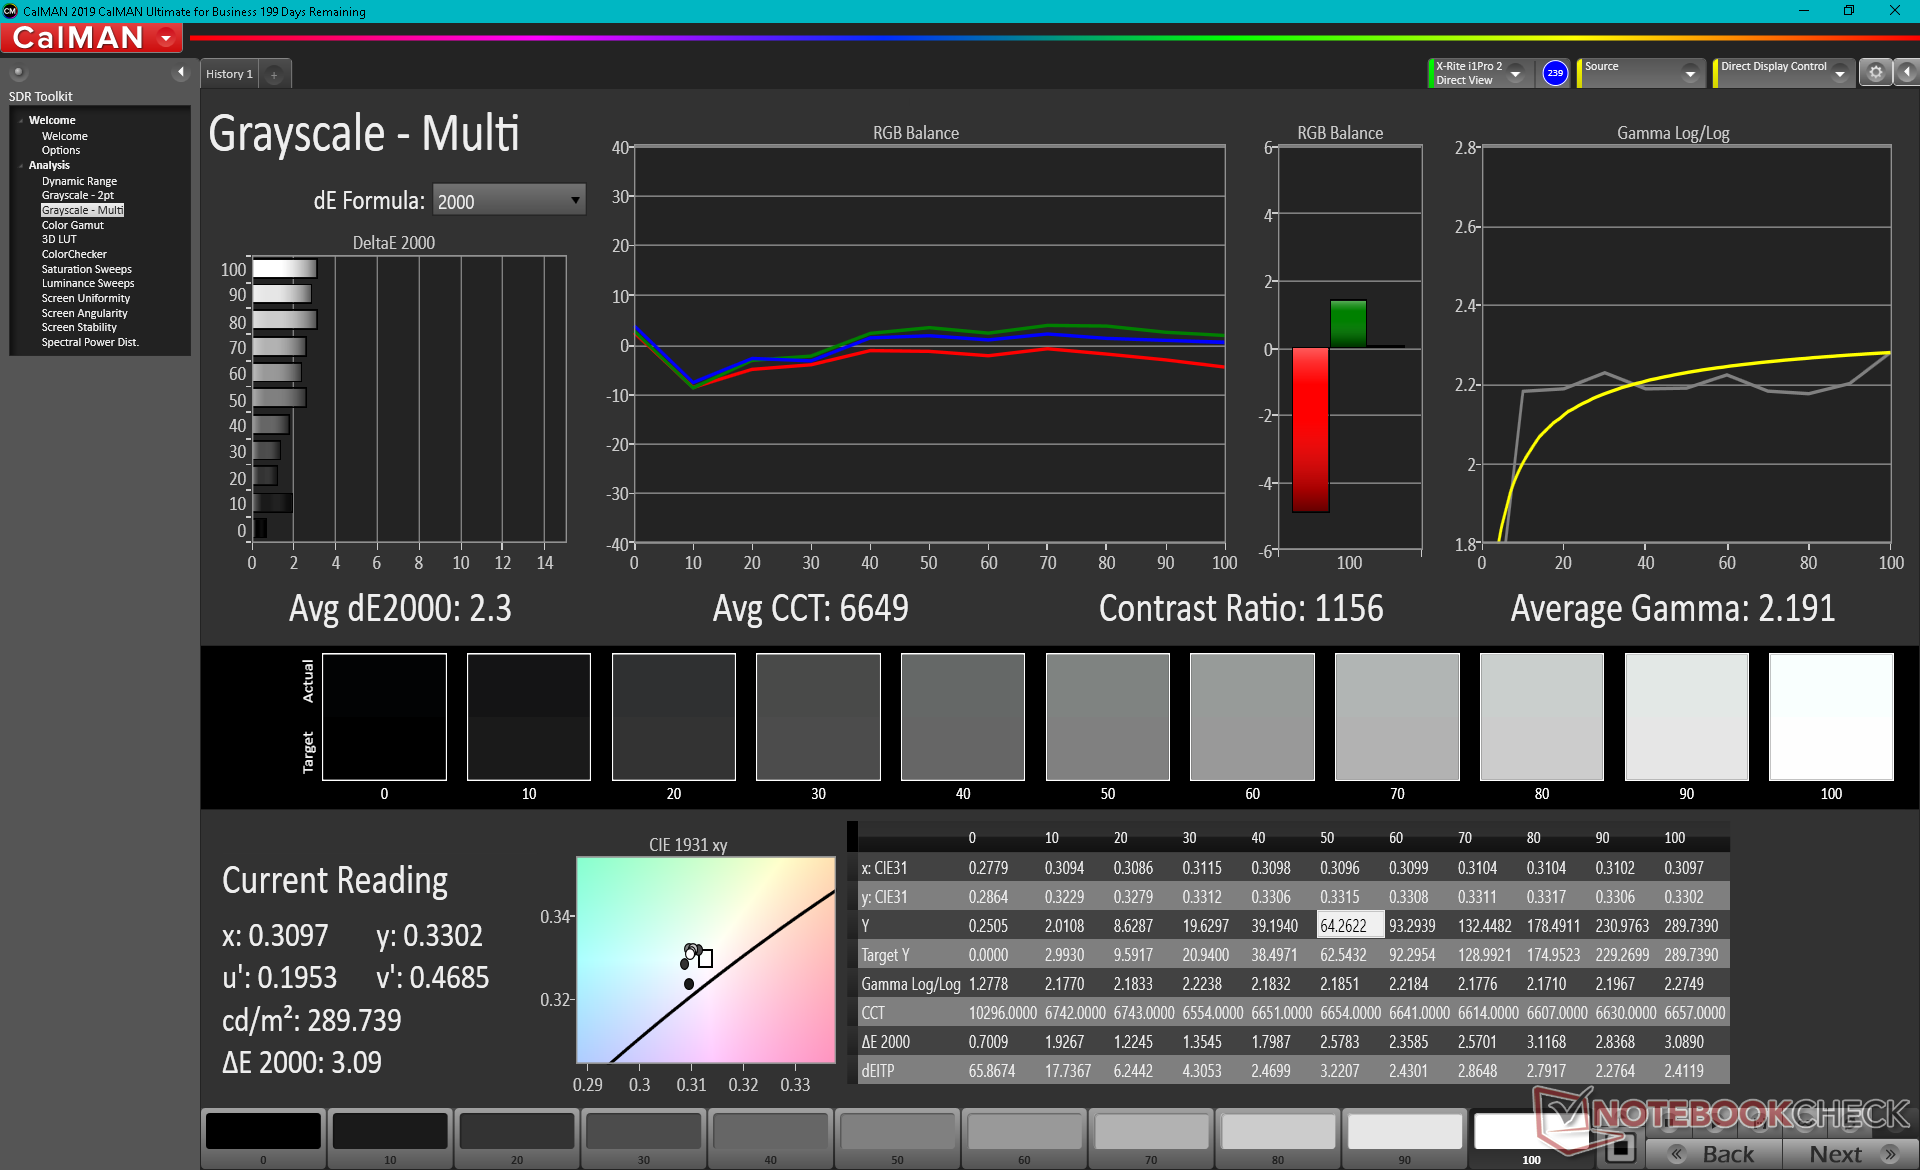
calibrated: 3.3
ΔE Greyscale Calman: 7.1 | ∀{0.09-98 Ø4.97}
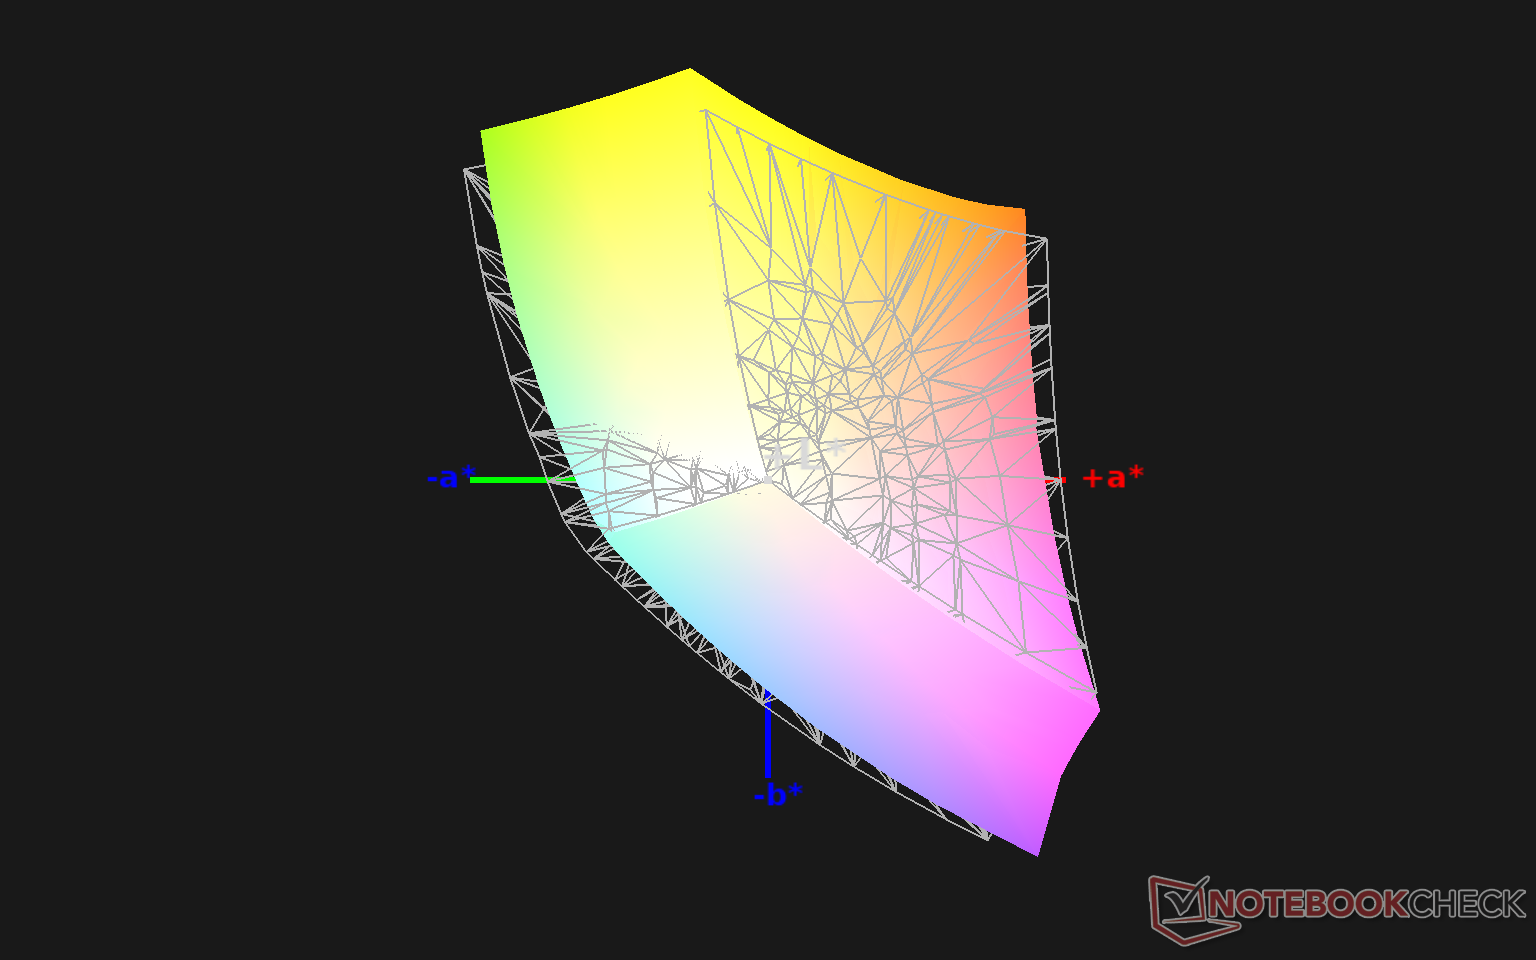
90.1% sRGB (Argyll 1.6.3 3D)
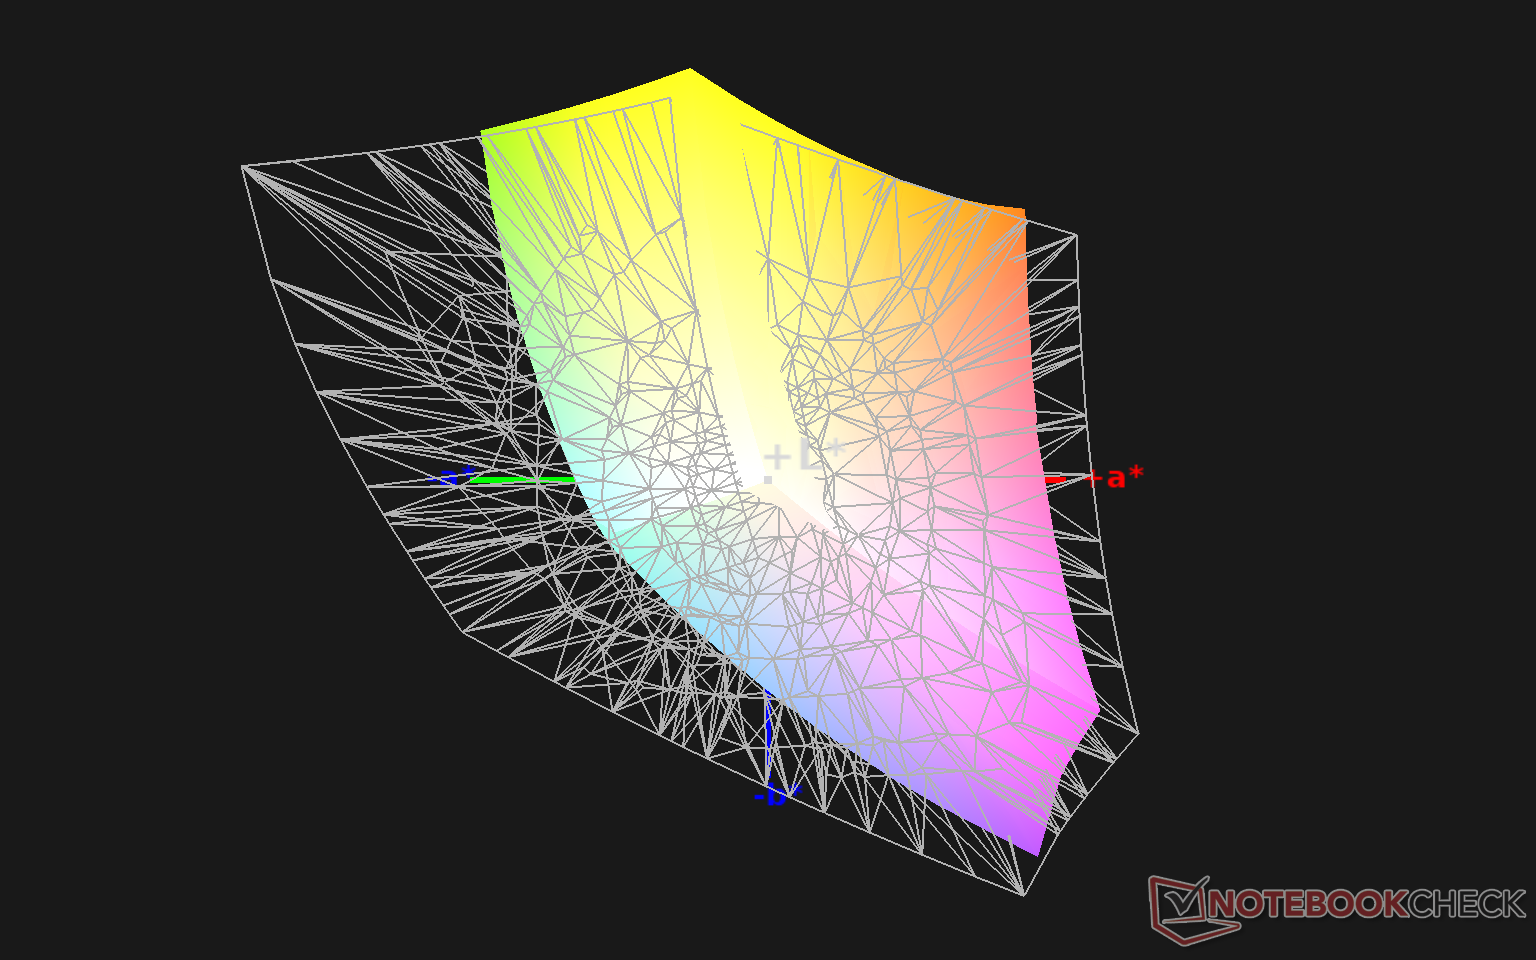
58.7% AdobeRGB 1998 (Argyll 1.6.3 3D)
66% AdobeRGB 1998 (Argyll 3D)
90.6% sRGB (Argyll 3D)
65.7% Display P3 (Argyll 3D)
Gamma: 2.2
CCT: 6842 K
| MSI Summit B15 A11M Chi Mei N156HCE-EN1, IPS, 15.6", 1920x1080 | MSI Summit E15 A11SCST AU Optronics B156HAB03.1, IPS, 15.6", 1920x1080 | Dell XPS 15 9500 Core i5 Sharp LQ156N1, IPS, 15.6", 1920x1200 | HP Spectre X360 15-5ZV31AV AU Optronics AUO30EB, IPS, 15.6", 3840x2160 | ADATA XPG Xenia Xe BOE08F5, IPS, 15.6", 1920x1080 | Asus ZenBook 15 UX534FTC-A8190T BOE CQ NV156FHM-N63, IPS, 15.6", 1920x1080 | |
|---|---|---|---|---|---|---|
| Display | -1% | 18% | 4% | 7% | -4% | |
| Display P3 Coverage (%) | 65.7 | 64.5 -2% | 81.5 24% | 68.3 4% | 70 7% | 65 -1% |
| sRGB Coverage (%) | 90.6 | 89.3 -1% | 100 10% | 94.3 4% | 95.2 5% | 86.2 -5% |
| AdobeRGB 1998 Coverage (%) | 66 | 65.3 -1% | 79.6 21% | 68.4 4% | 71.2 8% | 62.9 -5% |
| Response Times | -1% | 4% | -34% | -31% | -5% | |
| Response Time Grey 50% / Grey 80% * (ms) | 40.4 ? | 43.2 ? -7% | 42 ? -4% | 56.8 ? -41% | 56.8 ? -41% | 45 ? -11% |
| Response Time Black / White * (ms) | 32.4 ? | 30.8 ? 5% | 28.8 ? 11% | 40.8 ? -26% | 38.8 ? -20% | 32 ? 1% |
| PWM Frequency (Hz) | 25510 ? | |||||
| Screen | 20% | 41% | 22% | 39% | 22% | |
| Brightness middle (cd/m²) | 341.3 | 298 -13% | 592 73% | 284.6 -17% | 480.4 41% | 299 -12% |
| Brightness (cd/m²) | 310 | 280 -10% | 565 82% | 285 -8% | 451 45% | 280 -10% |
| Brightness Distribution (%) | 81 | 90 11% | 85 5% | 85 5% | 88 9% | 89 10% |
| Black Level * (cd/m²) | 0.45 | 0.22 51% | 0.46 -2% | 0.25 44% | 0.31 31% | 0.21 53% |
| Contrast (:1) | 758 | 1355 79% | 1287 70% | 1138 50% | 1550 104% | 1424 88% |
| Colorchecker dE 2000 * | 6.17 | 5.41 12% | 3.19 48% | 3.52 43% | 2.53 59% | 4.76 23% |
| Colorchecker dE 2000 max. * | 11.75 | 8.59 27% | 5.45 54% | 5.56 53% | 7.28 38% | 9 23% |
| Colorchecker dE 2000 calibrated * | 3.3 | 2.97 10% | 2.03 38% | 3 9% | 1.69 49% | |
| Greyscale dE 2000 * | 7.1 | 4.1 42% | 3.9 45% | 3.2 55% | 3.8 46% | 3.53 50% |
| Gamma | 2.2 100% | 2.334 94% | 2.25 98% | 2.28 96% | 2.15 102% | 2.3 96% |
| CCT | 6842 95% | 7025 93% | 6522 100% | 7070 92% | 6760 96% | 7228 90% |
| Color Space (Percent of AdobeRGB 1998) (%) | 58.7 | 65 11% | 71.6 22% | 61.1 4% | 63 7% | 56 -5% |
| Color Space (Percent of sRGB) (%) | 90.1 | 90 0% | 100 11% | 93.8 4% | 94.9 5% | 86 -5% |
| Total Average (Program / Settings) | 6% /
13% | 21% /
32% | -3% /
12% | 5% /
25% | 4% /
13% |
* ... smaller is better
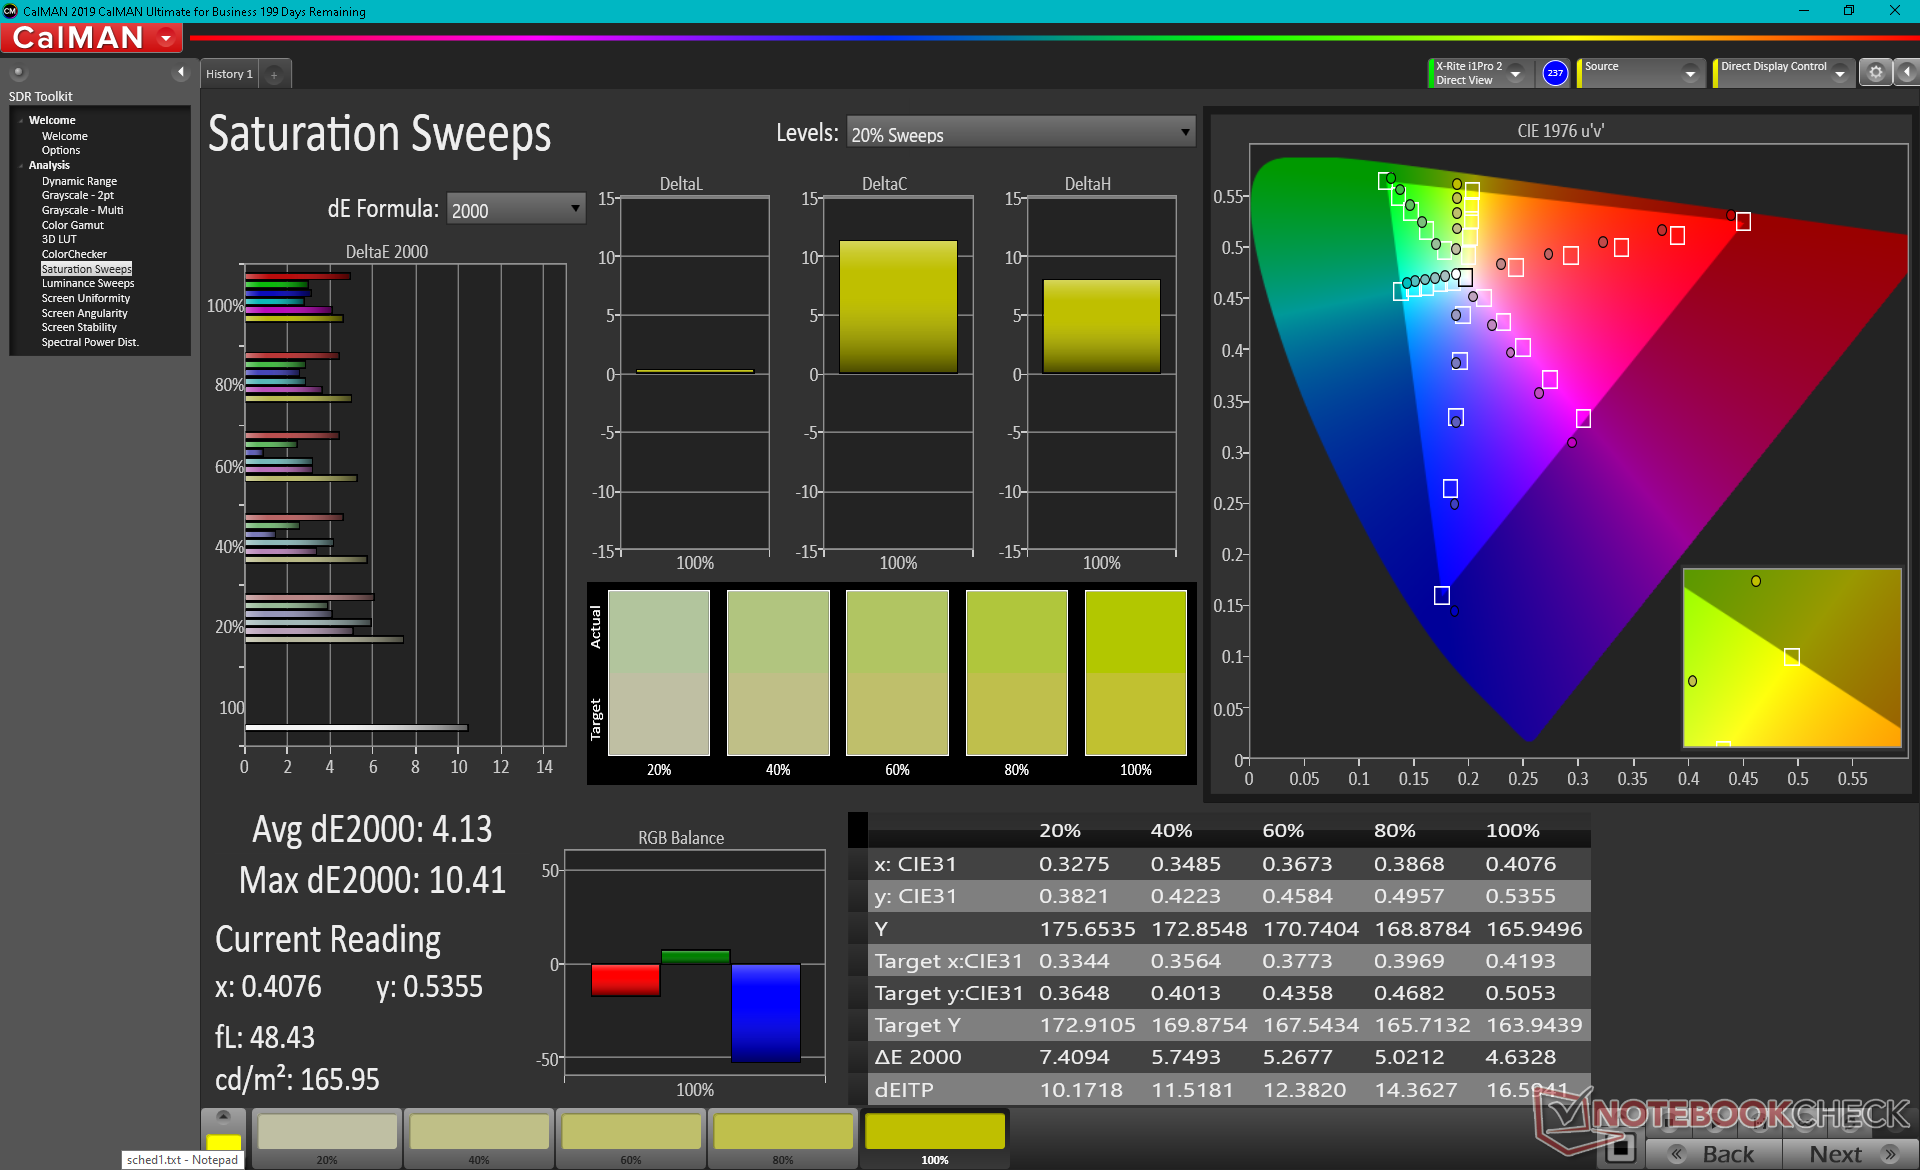
Color space covers approximately 90 percent of sRGB to be good enough for the target casual graphics editor. You'll have to spend more on alternative 4K or OLED models from Dell, HP, or others if AdobeRGB coverage is your target.
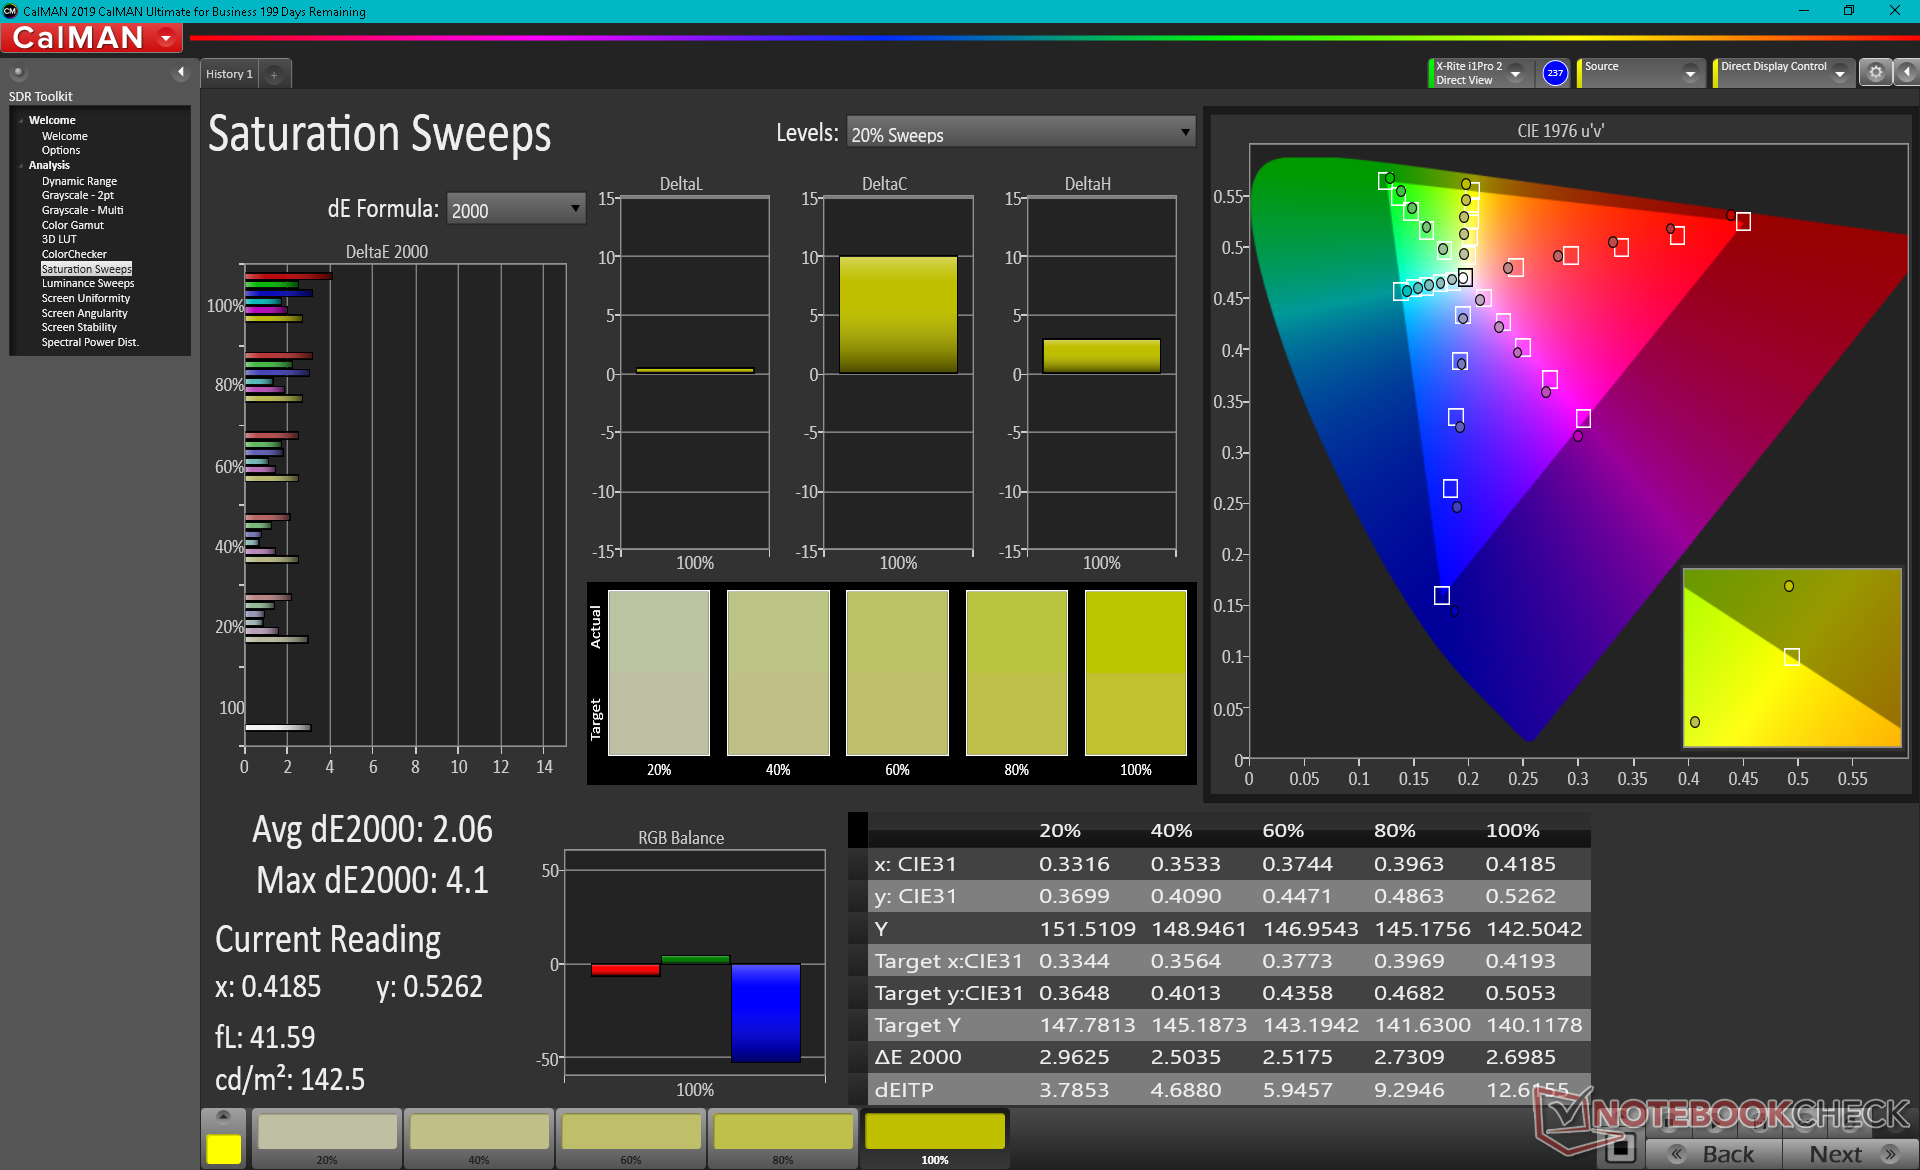
X-Rite colorimeter measurements reveal an overly cool color temperature out of the box for poor grayscale and color reproduction despite the relatively high 90 percent sRGB coverage. The data makes sense because MSI does not pre-calibrate the Summit B15 series at factory. Colors and grayscale improve significantly after calibration with much lower average DeltaE values. We recommend applying our calibrated ICM profile for a more color accurate display.
Display Response Times
| ↔ Response Time Black to White | ||
|---|---|---|
| 32.4 ms ... rise ↗ and fall ↘ combined | ↗ 18.4 ms rise | 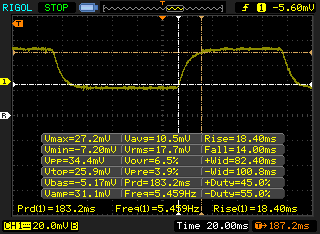 |
| ↘ 14 ms fall | ||
| The screen shows slow response rates in our tests and will be unsatisfactory for gamers. In comparison, all tested devices range from 0.1 (minimum) to 240 (maximum) ms. » 88 % of all devices are better. This means that the measured response time is worse than the average of all tested devices (19.9 ms). | ||
| ↔ Response Time 50% Grey to 80% Grey | ||
| 40.4 ms ... rise ↗ and fall ↘ combined | ↗ 20.4 ms rise | 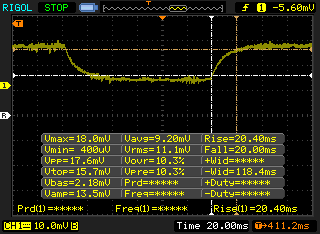 |
| ↘ 20 ms fall | ||
| The screen shows slow response rates in our tests and will be unsatisfactory for gamers. In comparison, all tested devices range from 0.165 (minimum) to 636 (maximum) ms. » 63 % of all devices are better. This means that the measured response time is worse than the average of all tested devices (31.1 ms). | ||
Screen Flickering / PWM (Pulse-Width Modulation)
| Screen flickering / PWM detected | 25510 Hz | ≤ 25 % brightness setting | 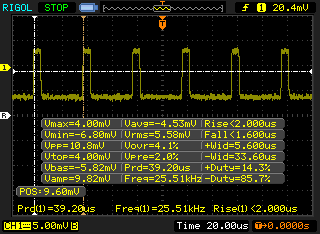 |
The display backlight flickers at 25510 Hz (worst case, e.g., utilizing PWM) Flickering detected at a brightness setting of 25 % and below. There should be no flickering or PWM above this brightness setting. The frequency of 25510 Hz is quite high, so most users sensitive to PWM should not notice any flickering. In comparison: 52 % of all tested devices do not use PWM to dim the display. If PWM was detected, an average of 7798 (minimum: 5 - maximum: 343500) Hz was measured. | |||
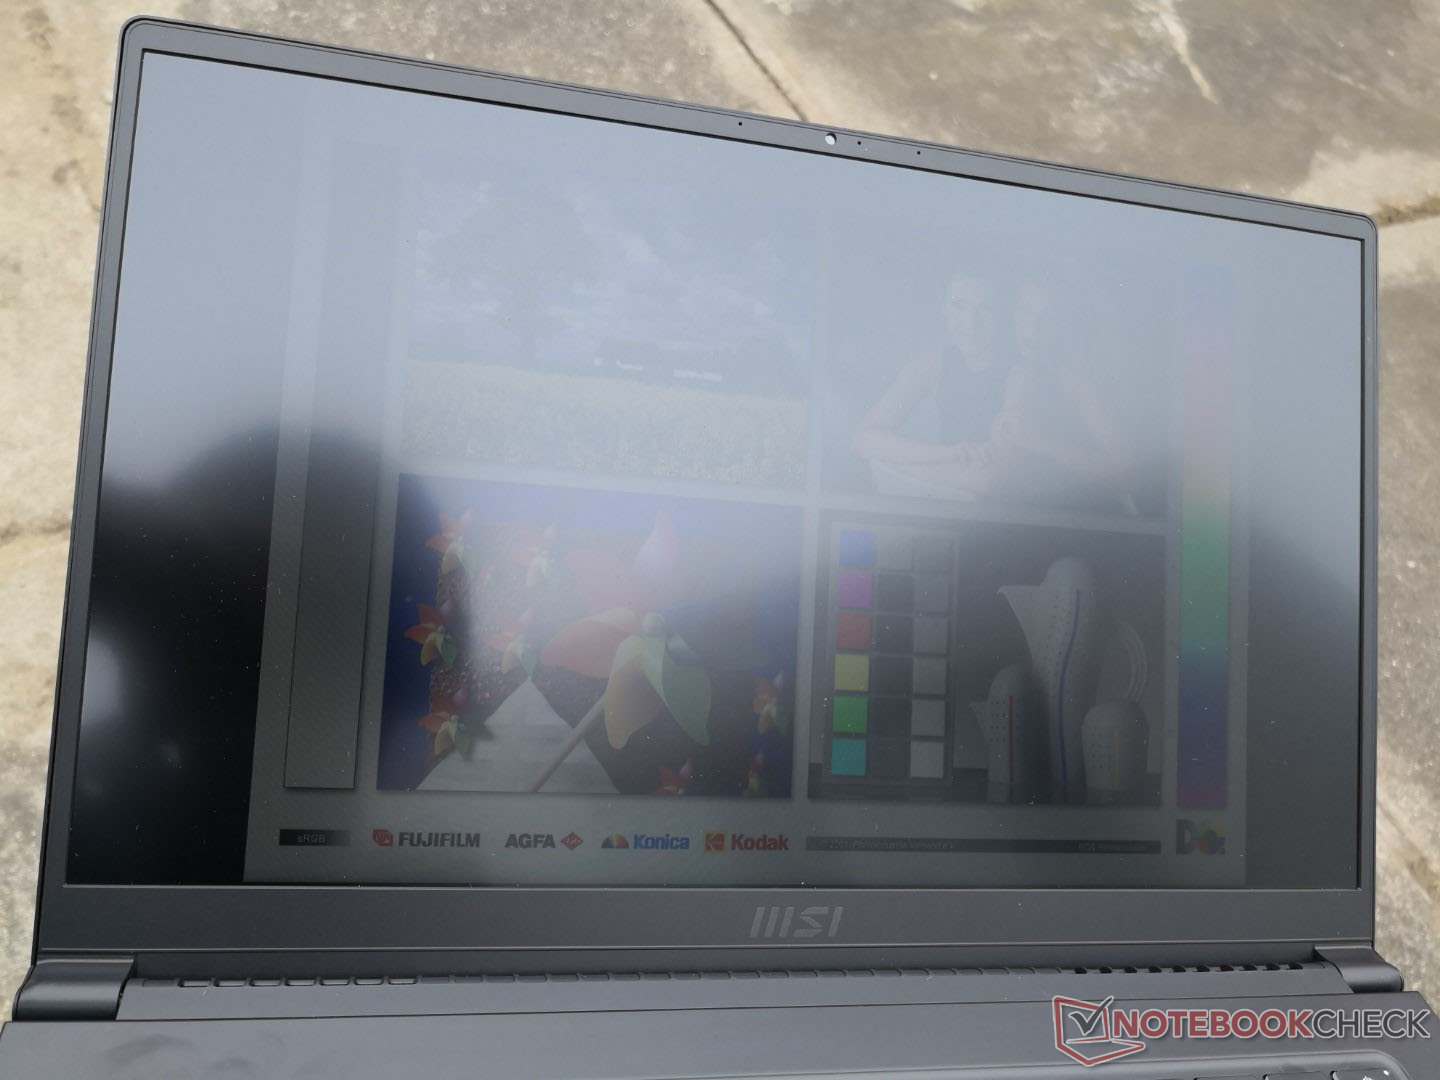
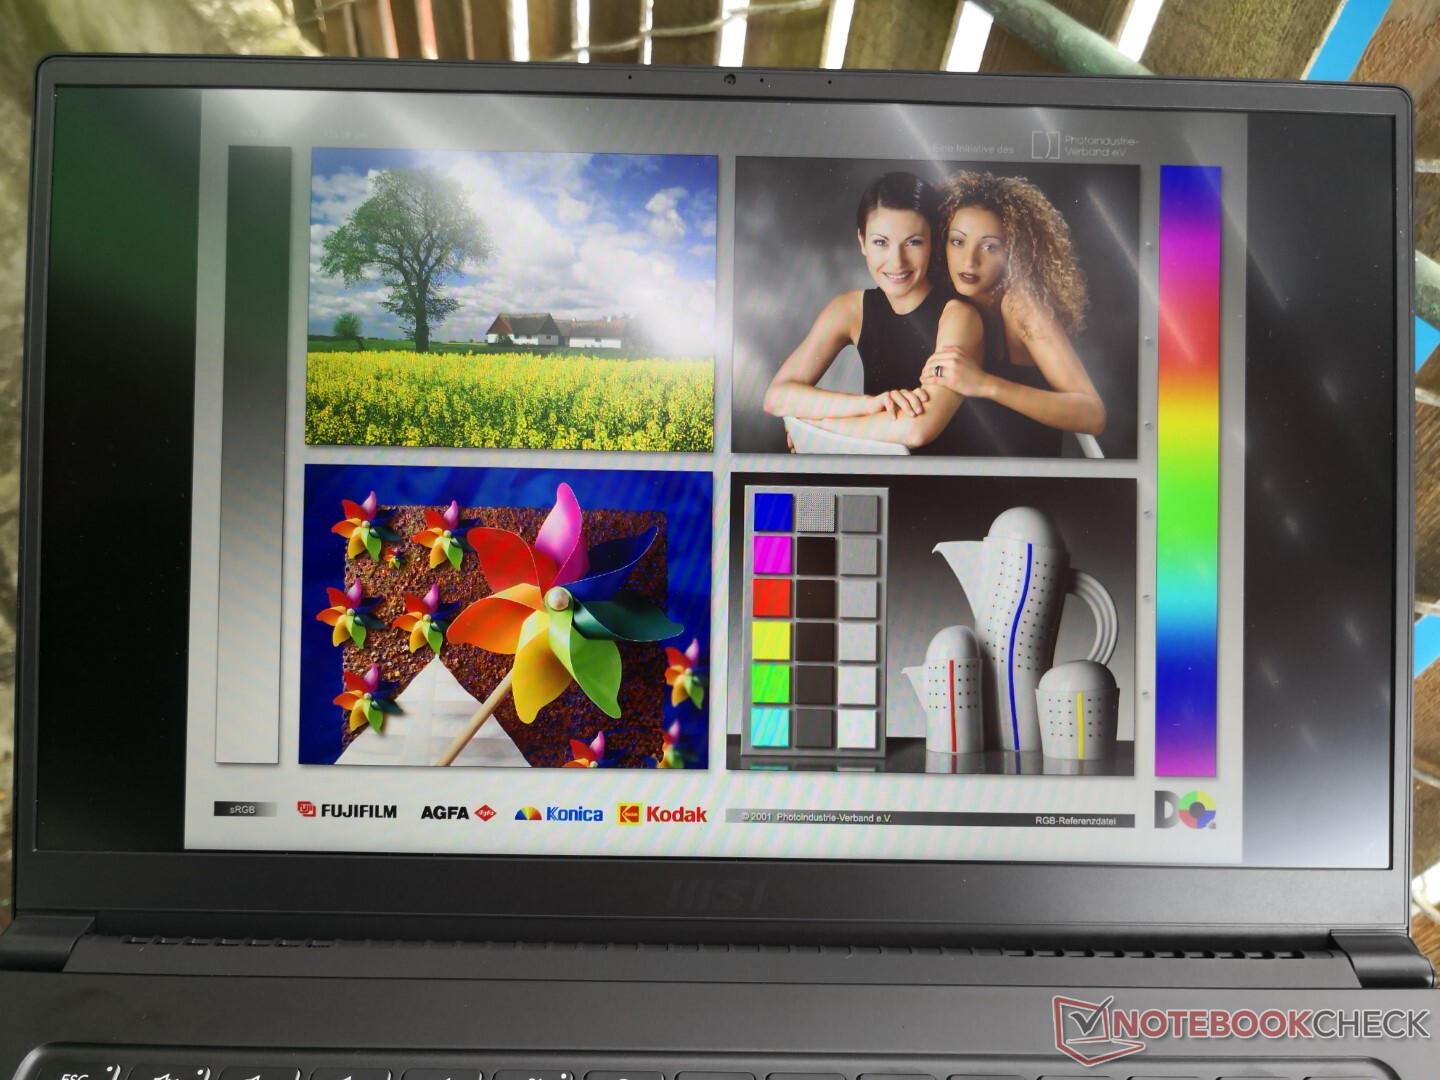
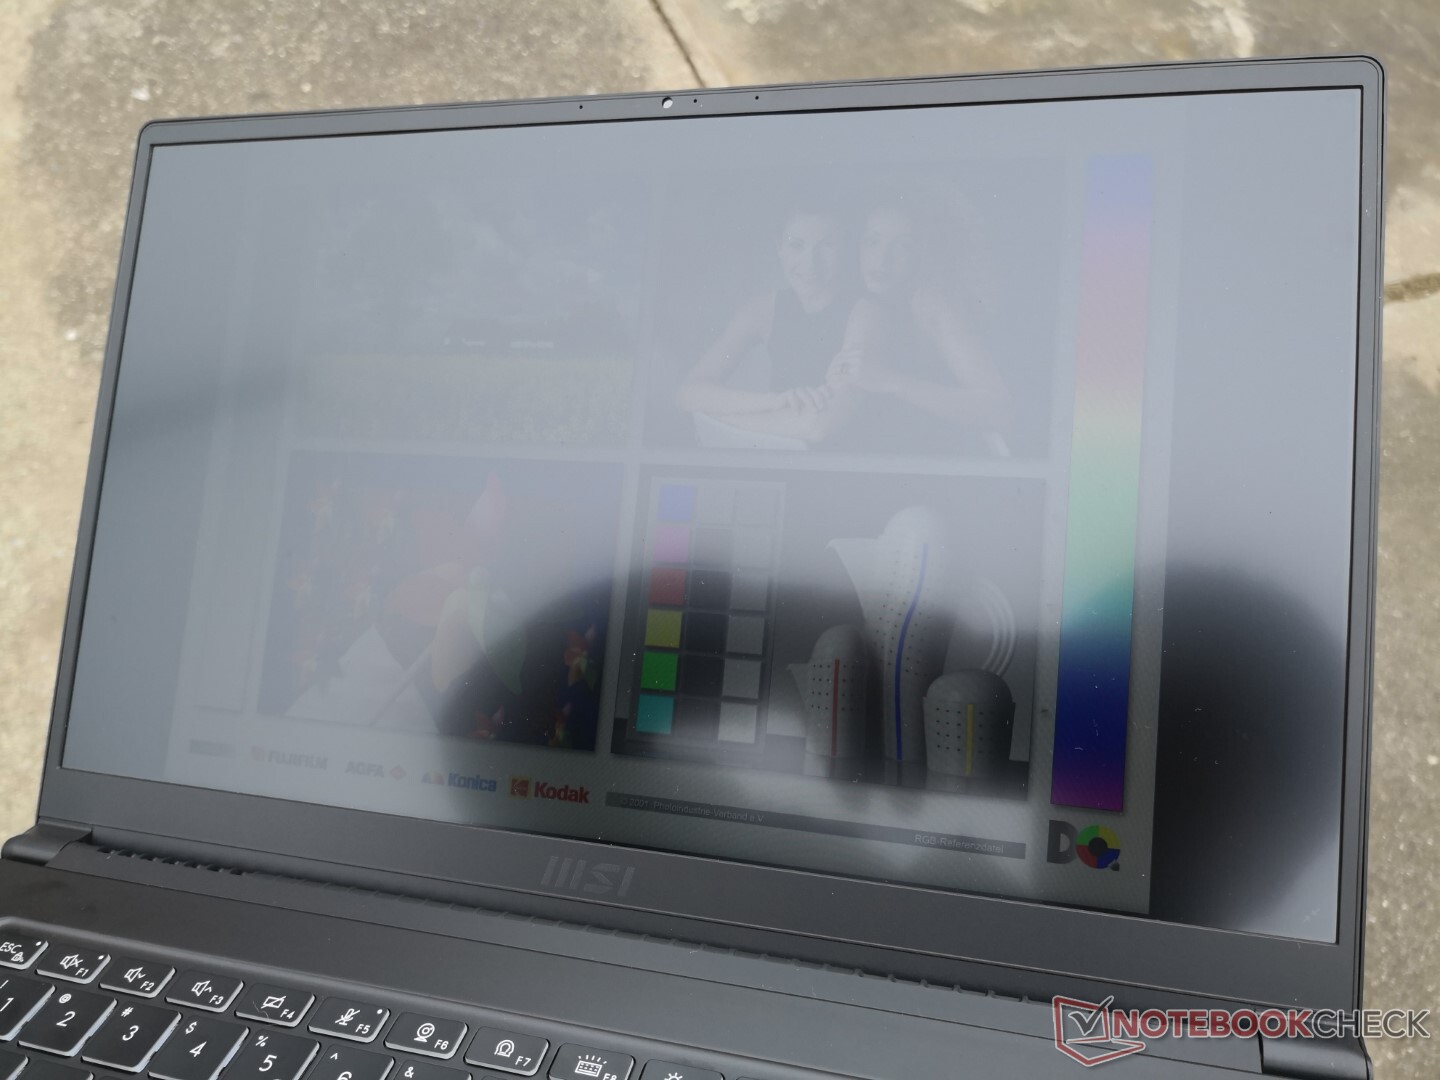
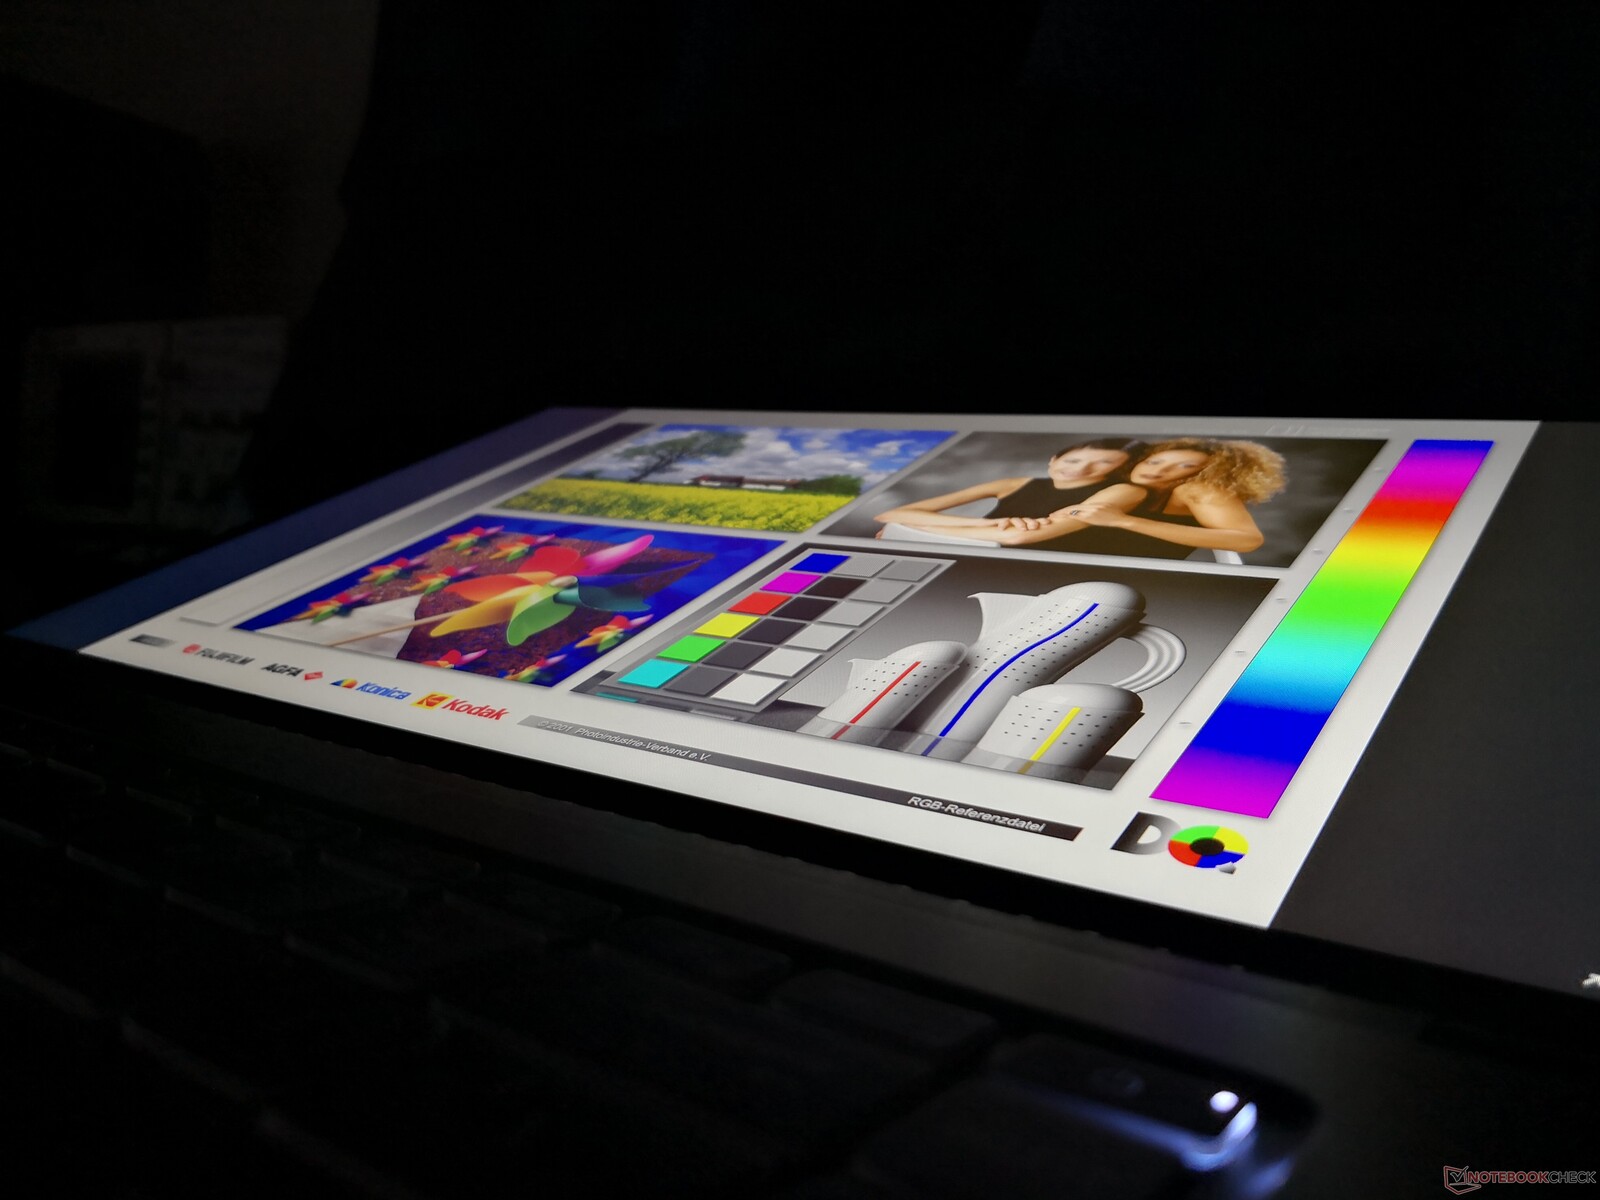
Outdoor visibility is not as good as the Dell XPS 15 or MacBook Pro 15 both of which have noticeably brighter displays. Glare isn't as heavy on the MSI due to its matte panel, but the display is still hard to comfortably see in most scenarios.
Performance
Only two SKUs are available as of this writing with either the ULV Core i5-1135G7 or Core i7-1165G7. For faster Core H options, MSI offers the Creator Z16 series instead.
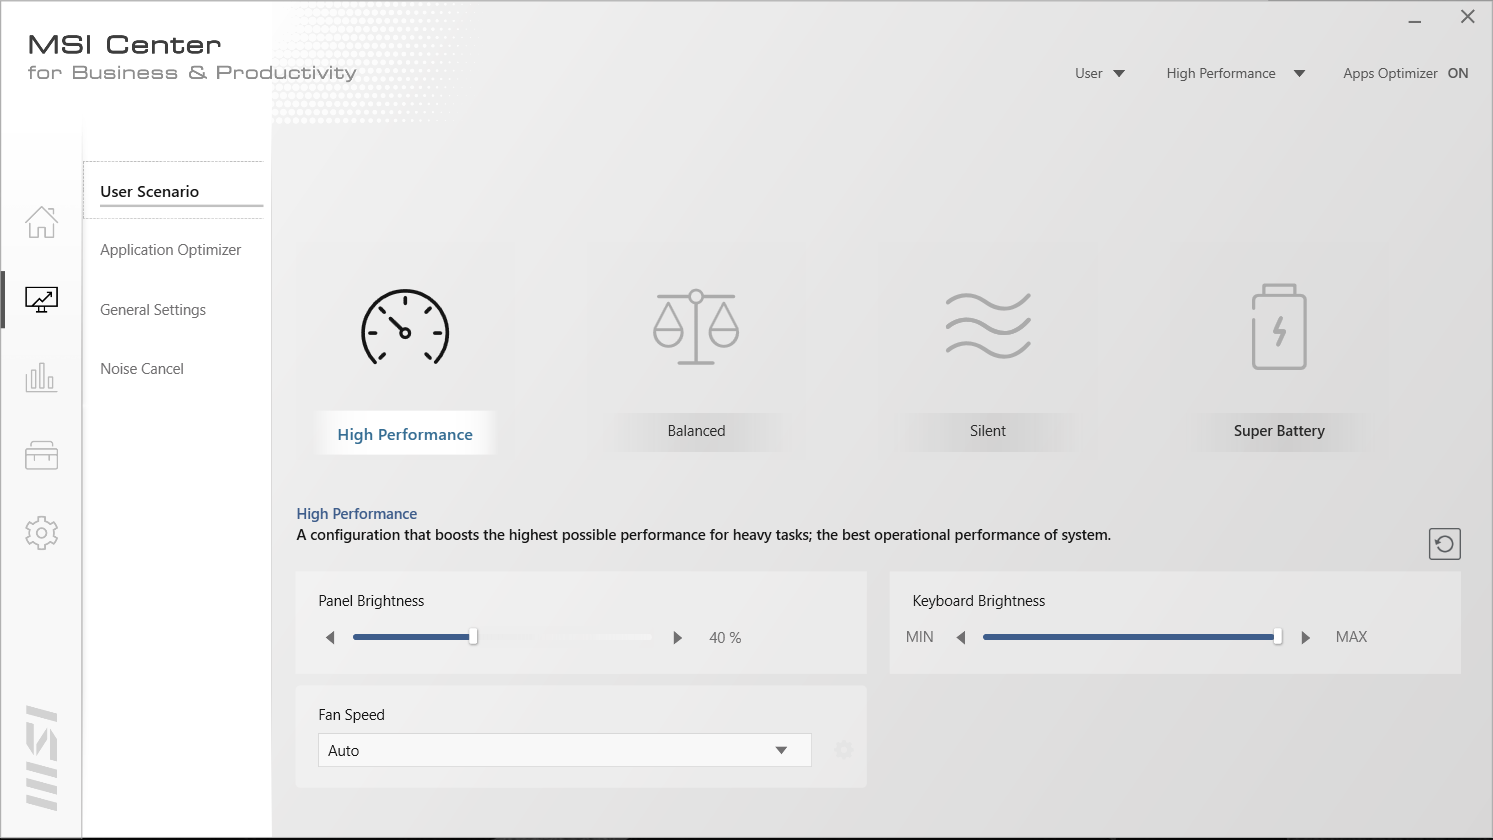
Our unit was set to High Performance mode via MSI Center prior to running any performance benchmarks below for the best possible scores. We recommend owners become familiar with this software as MSI-specific updates and features are found here.
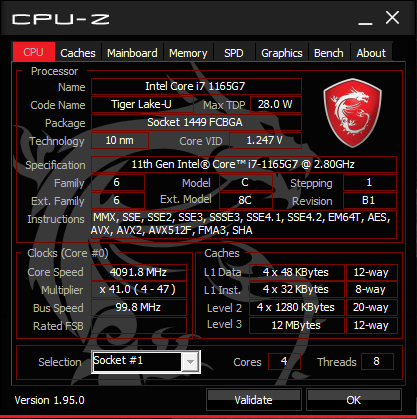
Processor
CPU performance is excellent with CineBench R15 xT scores that are 12 percent faster than the average laptop in our database equipped with the same CPU. CineBench R20 and R23 scores are even better at 23 percent over the average to imply superior Turbo Boost sustainability than most other laptops since the R20 and R23 benchmarks are significantly longer than R15. The processor is able to consistently outperform both the 10th gen Core i7-10510U and Core i5-10300H in the HP Spectre x360 15 and Dell XPS 15, respectively.
Going for the cheaper Core i5-1135G7 instead of our Core i7-1165G7 configuration will result in just a slight 7 to 10 percent decrease in processor performance based on our experience with other Core i5-1135G7 laptops.
Cinebench R23: Multi Core | Single Core
Cinebench R15: CPU Multi 64Bit | CPU Single 64Bit
Blender: v2.79 BMW27 CPU
7-Zip 18.03: 7z b 4 -mmt1 | 7z b 4
Geekbench 5.5: Single-Core | Multi-Core
HWBOT x265 Benchmark v2.2: 4k Preset
LibreOffice : 20 Documents To PDF
R Benchmark 2.5: Overall mean
| Cinebench R23 / Multi Core | |
| Lenovo IdeaPad Flex 5 14ALC05 82HU002YUS | |
| Lenovo Yoga Slim 7-14ARE | |
| MSI Summit B15 A11M | |
| MSI Summit E15 A11SCST | |
| Average Intel Core i7-1165G7 (2525 - 6862, n=64) | |
| Cinebench R23 / Single Core | |
| MSI Summit B15 A11M | |
| MSI Summit E15 A11SCST | |
| Average Intel Core i7-1165G7 (1110 - 1539, n=59) | |
| Lenovo IdeaPad Flex 5 14ALC05 82HU002YUS | |
| Lenovo Yoga Slim 7-14ARE | |
| HWBOT x265 Benchmark v2.2 / 4k Preset | |
| Lenovo Yoga Slim 7-14ARE | |
| Lenovo IdeaPad Flex 5 14ALC05 82HU002YUS | |
| Dell XPS 15 9500 Core i7 4K UHD | |
| Lenovo ThinkPad E15 Gen2-20T9S00K00 | |
| MSI Summit B15 A11M | |
| Dell XPS 15 9500 Core i5 | |
| Lenovo ThinkBook 15 Gen2 ITL | |
| MSI Summit E15 A11SCST | |
| Lenovo IdeaPad 5 15IIL05 | |
| Average Intel Core i7-1165G7 (1.39 - 8.47, n=80) | |
Cinebench R23: Multi Core | Single Core
Cinebench R15: CPU Multi 64Bit | CPU Single 64Bit
Blender: v2.79 BMW27 CPU
7-Zip 18.03: 7z b 4 -mmt1 | 7z b 4
Geekbench 5.5: Single-Core | Multi-Core
HWBOT x265 Benchmark v2.2: 4k Preset
LibreOffice : 20 Documents To PDF
R Benchmark 2.5: Overall mean
* ... smaller is better
System Performance
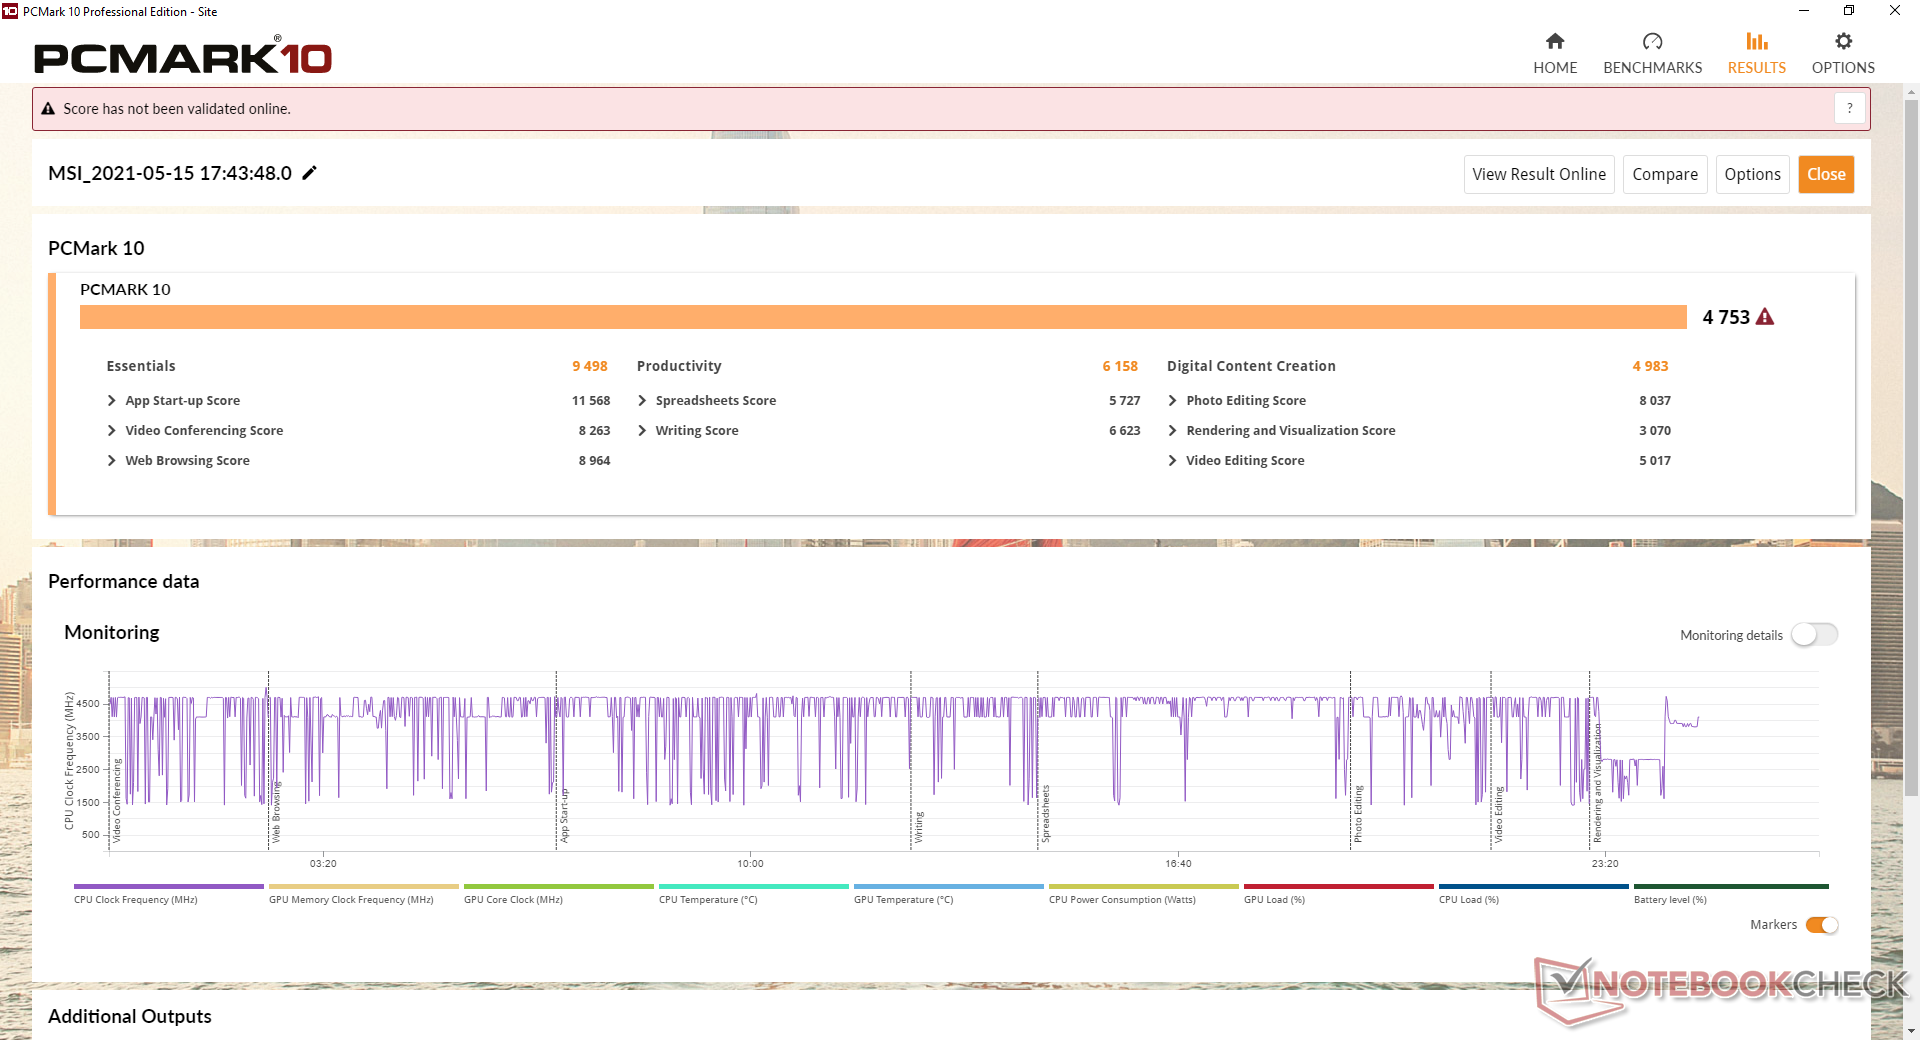
| PCMark 10 Score | 4753 points | |
Help | ||
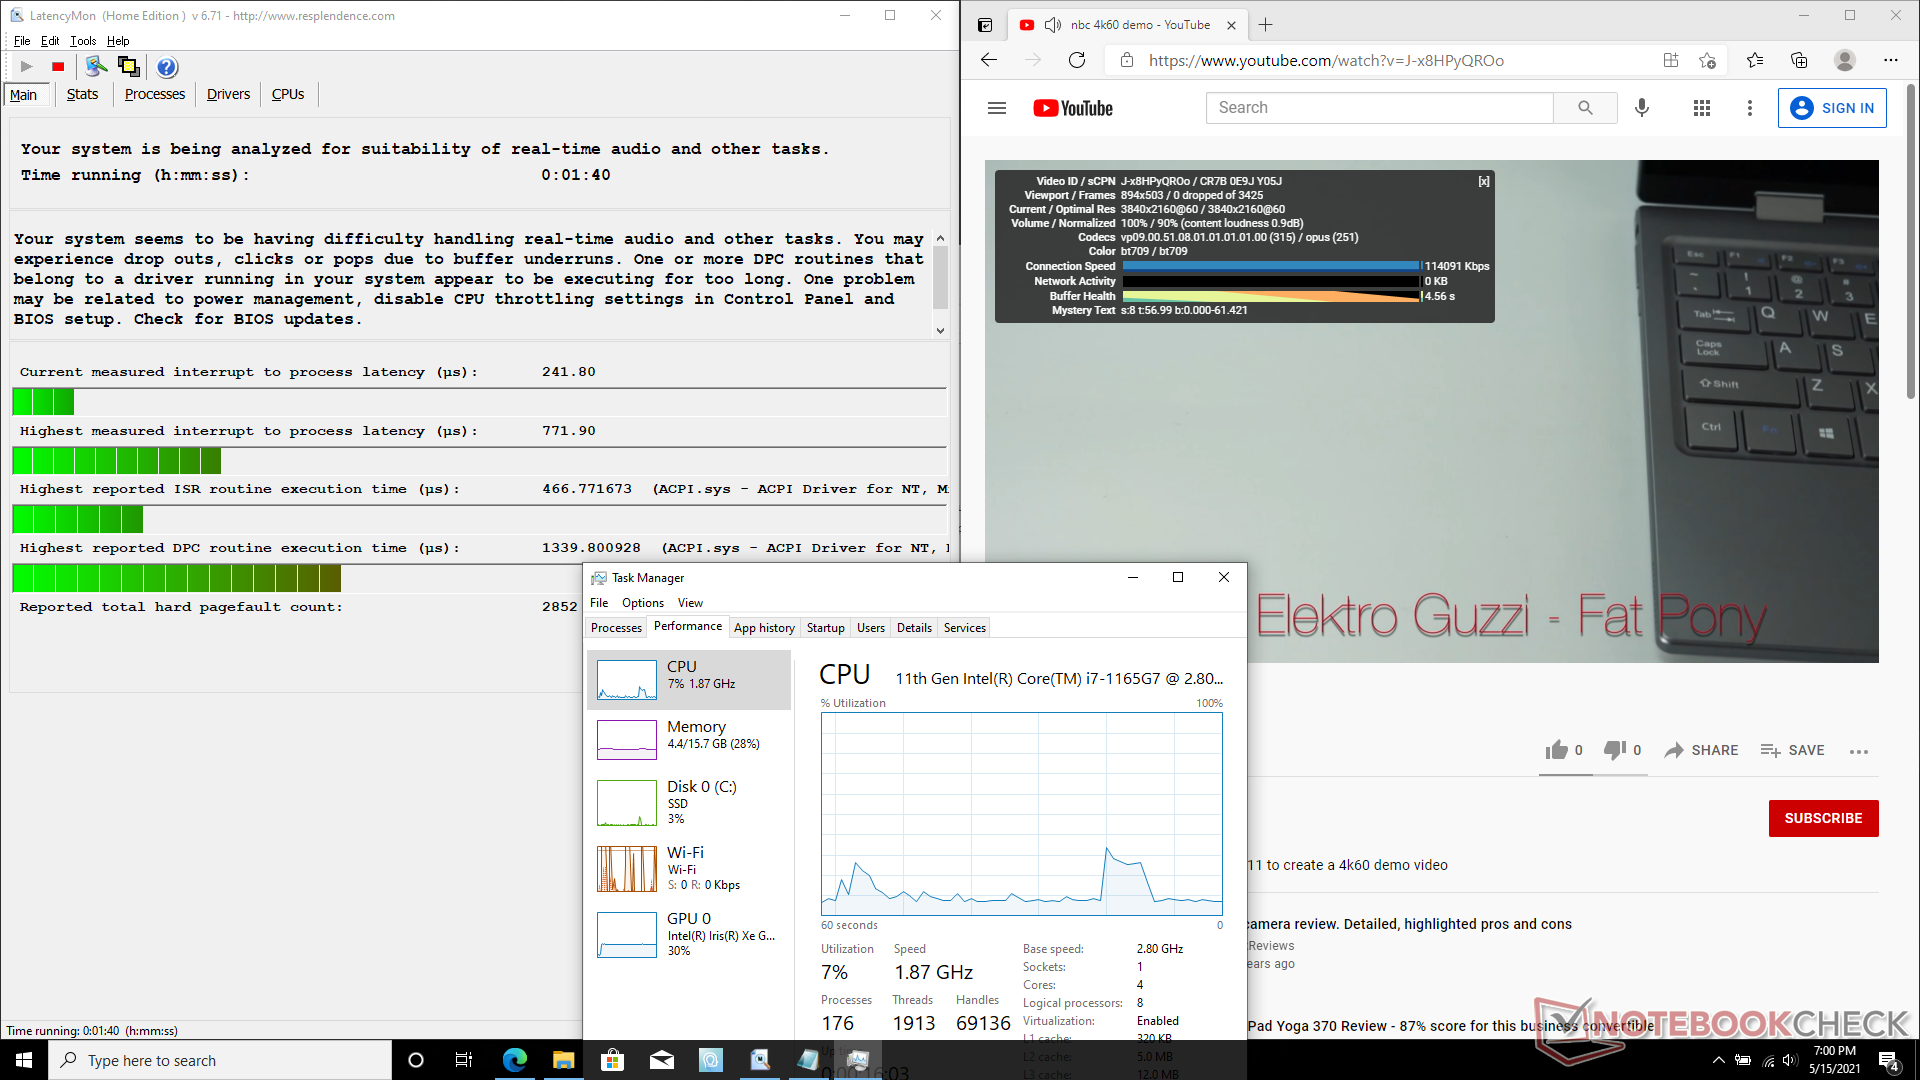
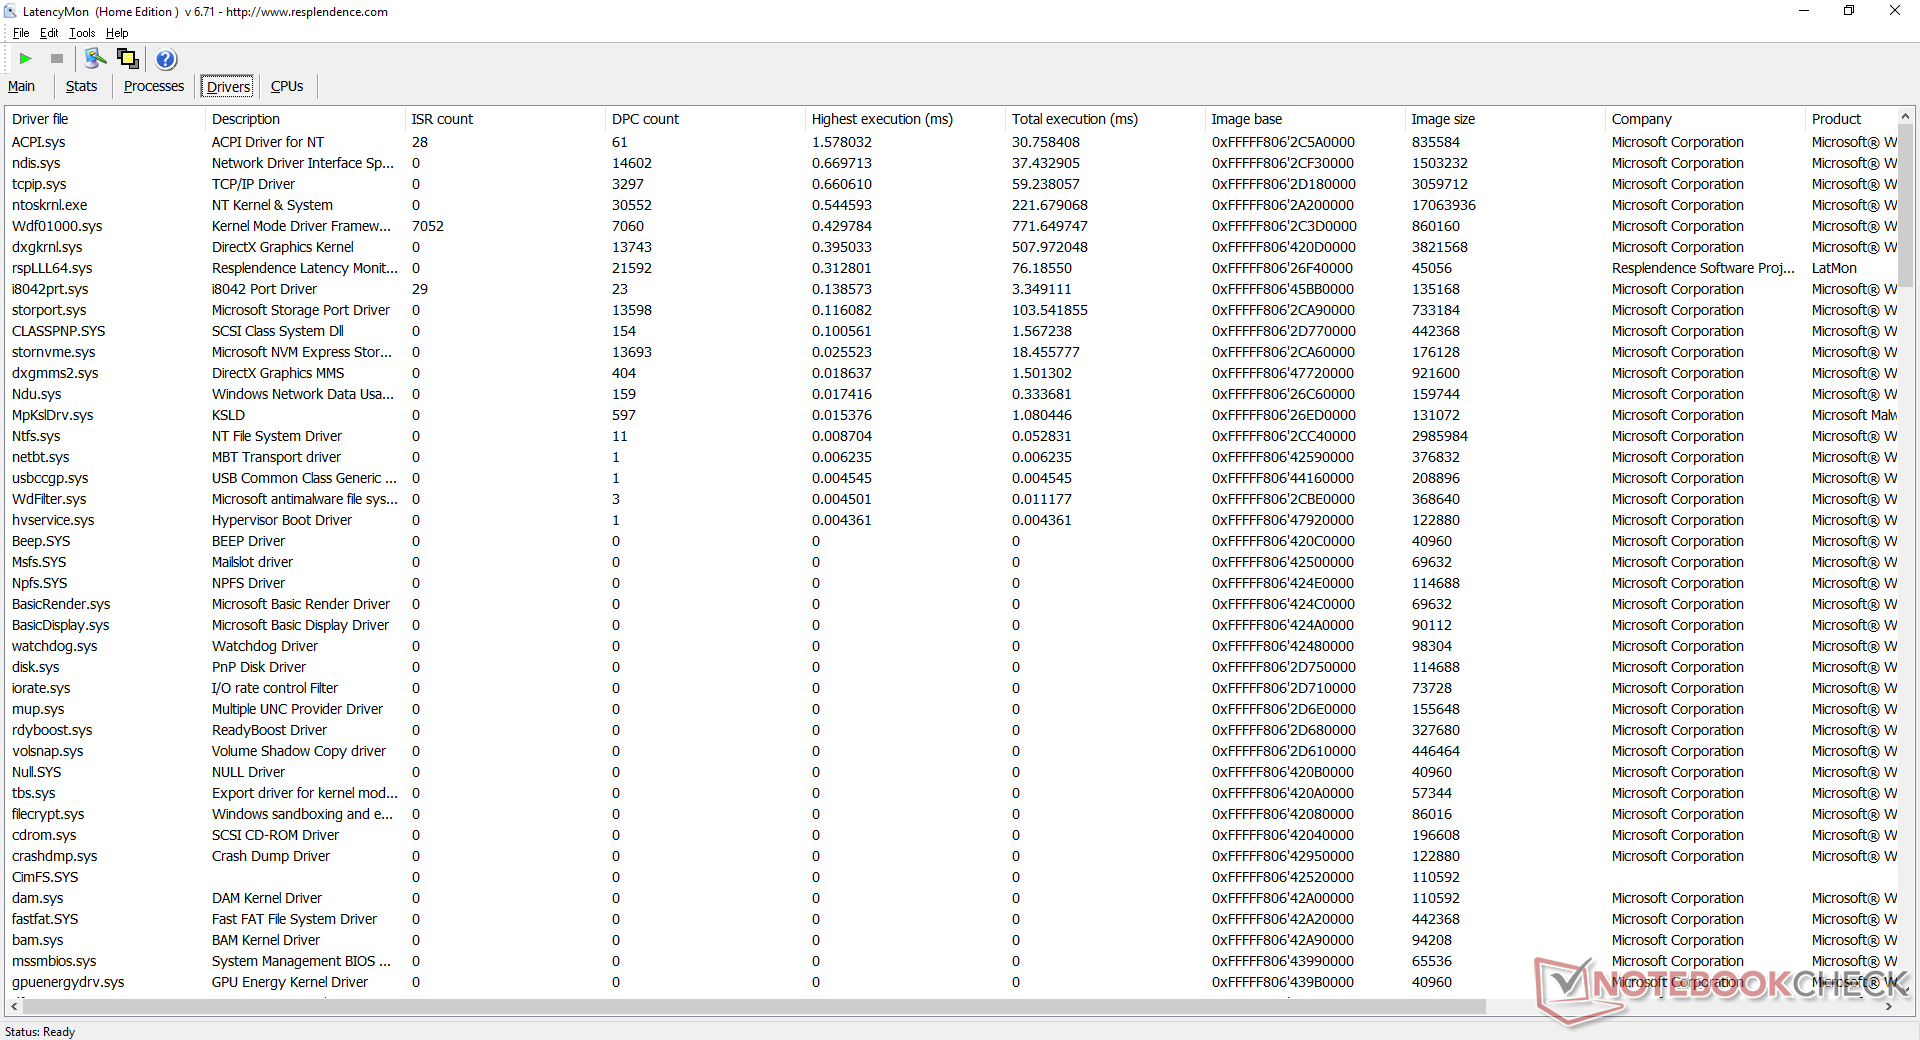
DPC Latency
LatencyMon shows minor DPC latency issues when opening multiple browser tabs on our homepage. 4K video playback at 60 FPS is otherwise smooth and with no dropped frames.
| DPC Latencies / LatencyMon - interrupt to process latency (max), Web, Youtube, Prime95 | |
| ADATA XPG Xenia Xe | |
| Dell XPS 15 9500 Core i5 | |
| MSI Summit E15 A11SCST | |
| MSI Summit B15 A11M | |
* ... smaller is better
Storage Devices
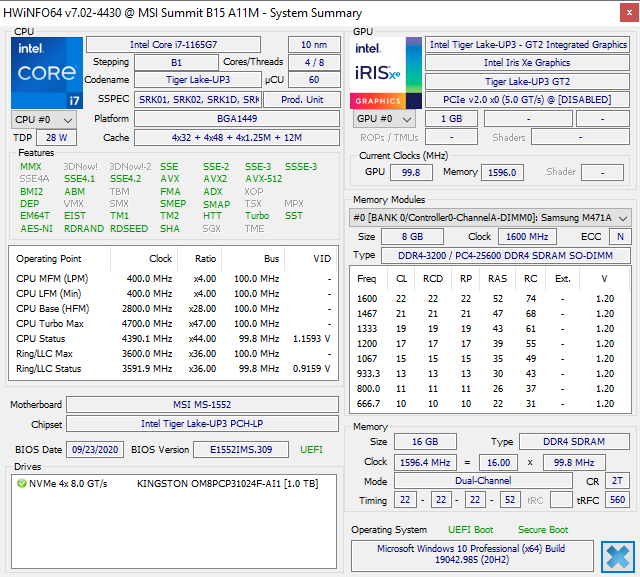
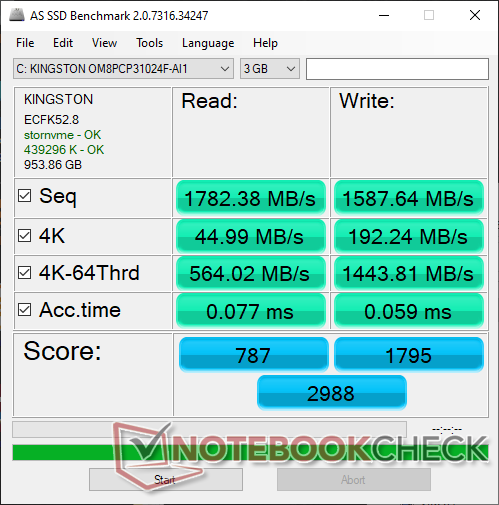
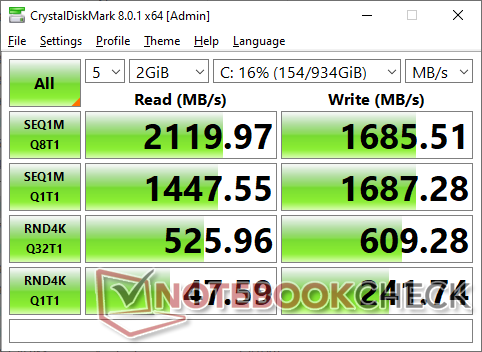
Up to two internal M.2 2280 SSDs are supported with one of those slots being compatible with PCIe 4.0 speeds. Our test unit ships with the 1 TB Kingston OM8PCP31024F which is a fairly inexpensive PCIe 3.0 NVMe SSD with average transfer rates topping out at around 2100 MB/s. Of course, users can configure faster SSDs before purchasing or install one themselves.
| MSI Summit B15 A11M Kingston OM8PCP31024F | MSI Summit E15 A11SCST Phison 1TB SM2801T24GKBB4S-E162 | HP Spectre X360 15-5ZV31AV Intel SSD 660p 2TB SSDPEKNW020T8 | ADATA XPG Xenia Xe ADATA XPG Gammix S50 1TB | |
|---|---|---|---|---|
| AS SSD | 42% | -12% | 25% | |
| Seq Read (MB/s) | 1782 | 3597 102% | 1220 -32% | 3842 116% |
| Seq Write (MB/s) | 1588 | 2101 32% | 1152 -27% | 1601 1% |
| 4K Read (MB/s) | 44.99 | 62.5 39% | 52.3 16% | 51.2 14% |
| 4K Write (MB/s) | 192.2 | 208.9 9% | 146.6 -24% | 260.8 36% |
| 4K-64 Read (MB/s) | 564 | 1145 103% | 652 16% | 1222 117% |
| 4K-64 Write (MB/s) | 1444 | 1482 3% | 847 -41% | 1508 4% |
| Access Time Read * (ms) | 0.077 | 0.05 35% | 0.077 -0% | 0.065 16% |
| Access Time Write * (ms) | 0.059 | 0.019 68% | 0.106 -80% | 0.249 -322% |
| Score Read (Points) | 787 | 1567 99% | 826 5% | 1657 111% |
| Score Write (Points) | 1795 | 1901 6% | 1109 -38% | 1929 7% |
| Score Total (Points) | 2988 | 4207 41% | 2371 -21% | 4329 45% |
| Copy ISO MB/s (MB/s) | 1541 | 2209 43% | 2070 34% | 2166 41% |
| Copy Program MB/s (MB/s) | 641 | 455.2 -29% | 571 -11% | 995 55% |
| Copy Game MB/s (MB/s) | 908 | 1225 35% | 1219 34% | 1844 103% |
| CrystalDiskMark 5.2 / 6 | 42% | -6% | 47% | |
| Write 4K (MB/s) | 235.9 | 242.9 3% | 151.5 -36% | 159.6 -32% |
| Read 4K (MB/s) | 47.06 | 54.6 16% | 59.3 26% | 45.45 -3% |
| Write Seq (MB/s) | 1684 | 2420 44% | 1424 -15% | 2498 48% |
| Read Seq (MB/s) | 1333 | 2300 73% | 1609 21% | 2340 76% |
| Write 4K Q32T1 (MB/s) | 606 | 392.7 -35% | 393.6 -35% | 645 6% |
| Read 4K Q32T1 (MB/s) | 422.8 | 667 58% | 369.4 -13% | 439.4 4% |
| Write Seq Q32T1 (MB/s) | 1688 | 2424 44% | 1946 15% | 4057 140% |
| Read Seq Q32T1 (MB/s) | 2116 | 4944 134% | 1934 -9% | 4960 134% |
| Total Average (Program / Settings) | 42% /
42% | -9% /
-10% | 36% /
33% |
* ... smaller is better

Disk Throttling: DiskSpd Read Loop, Queue Depth 8
GPU Performance
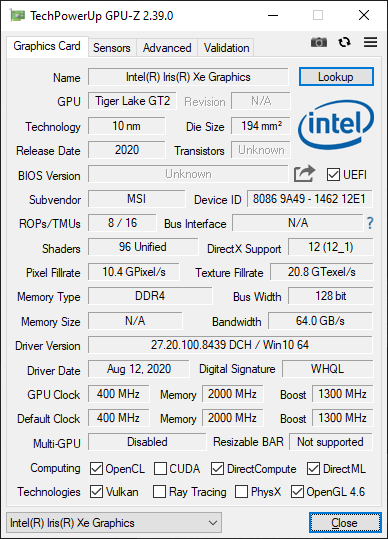
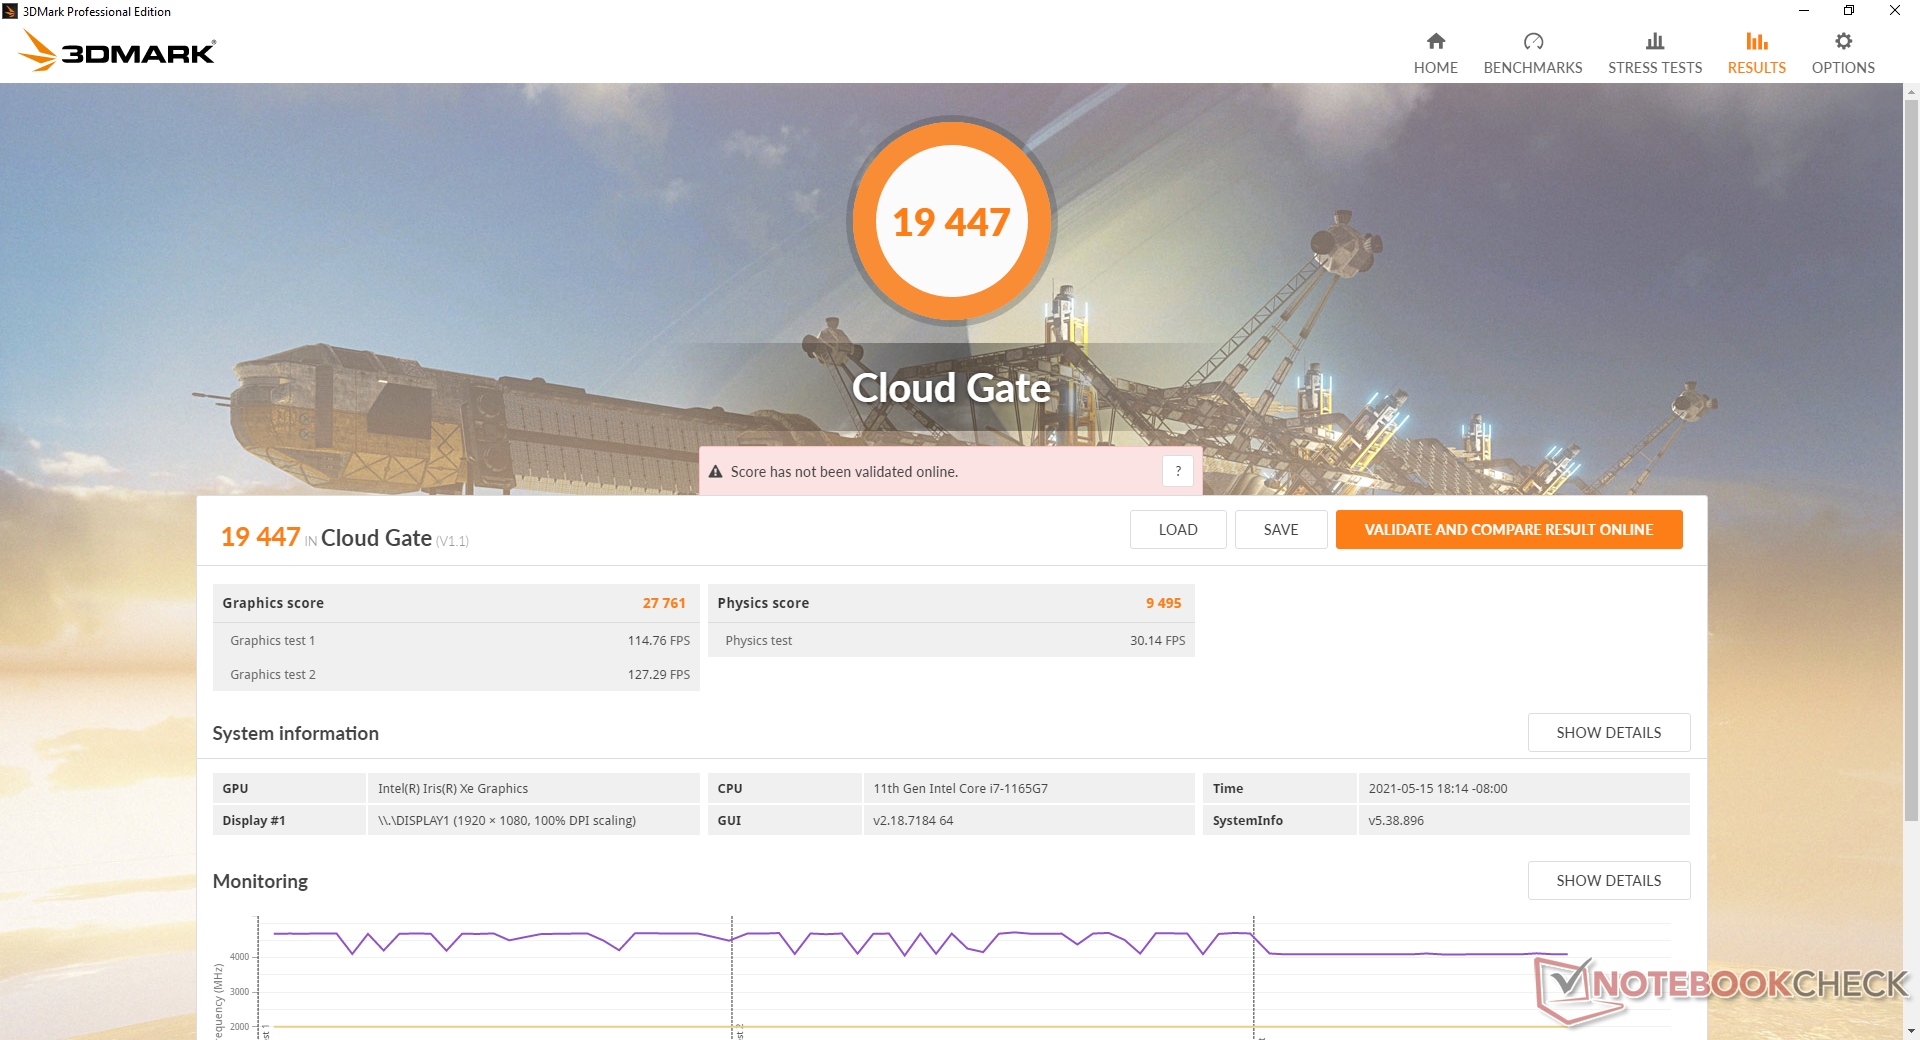
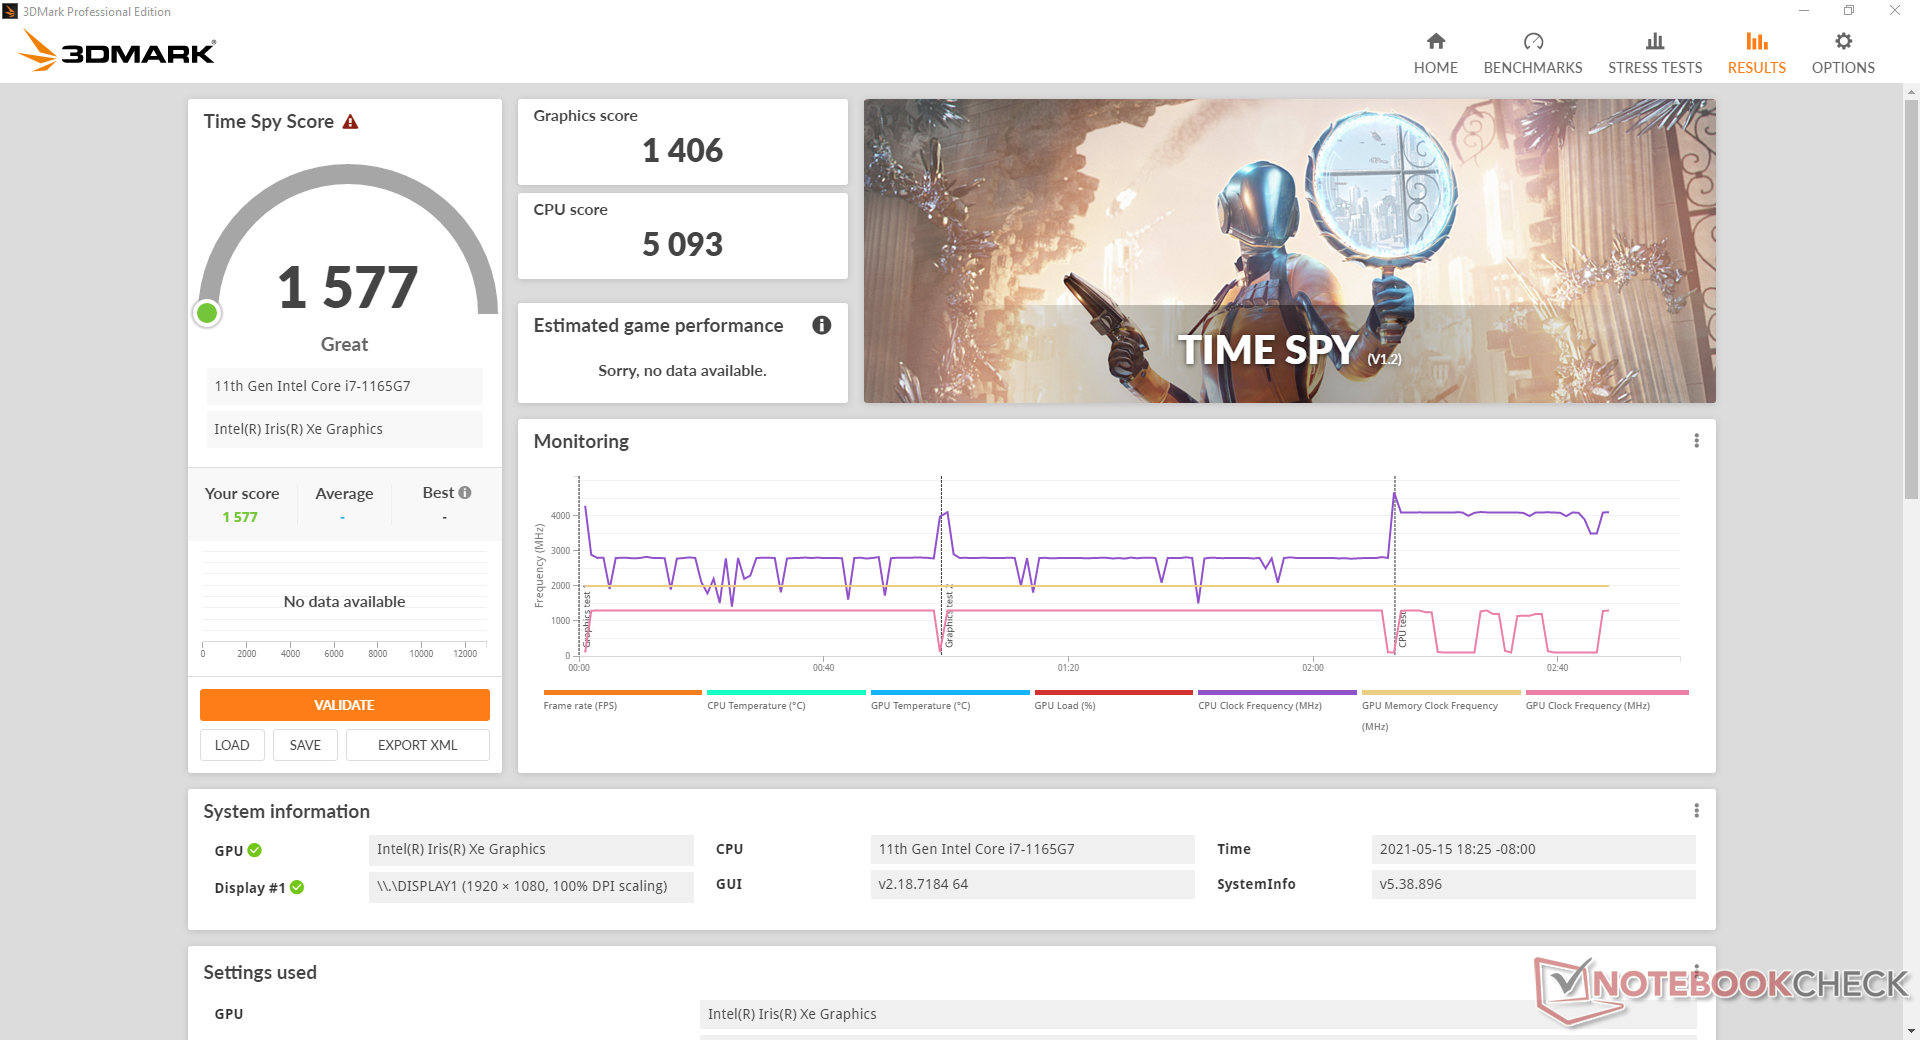
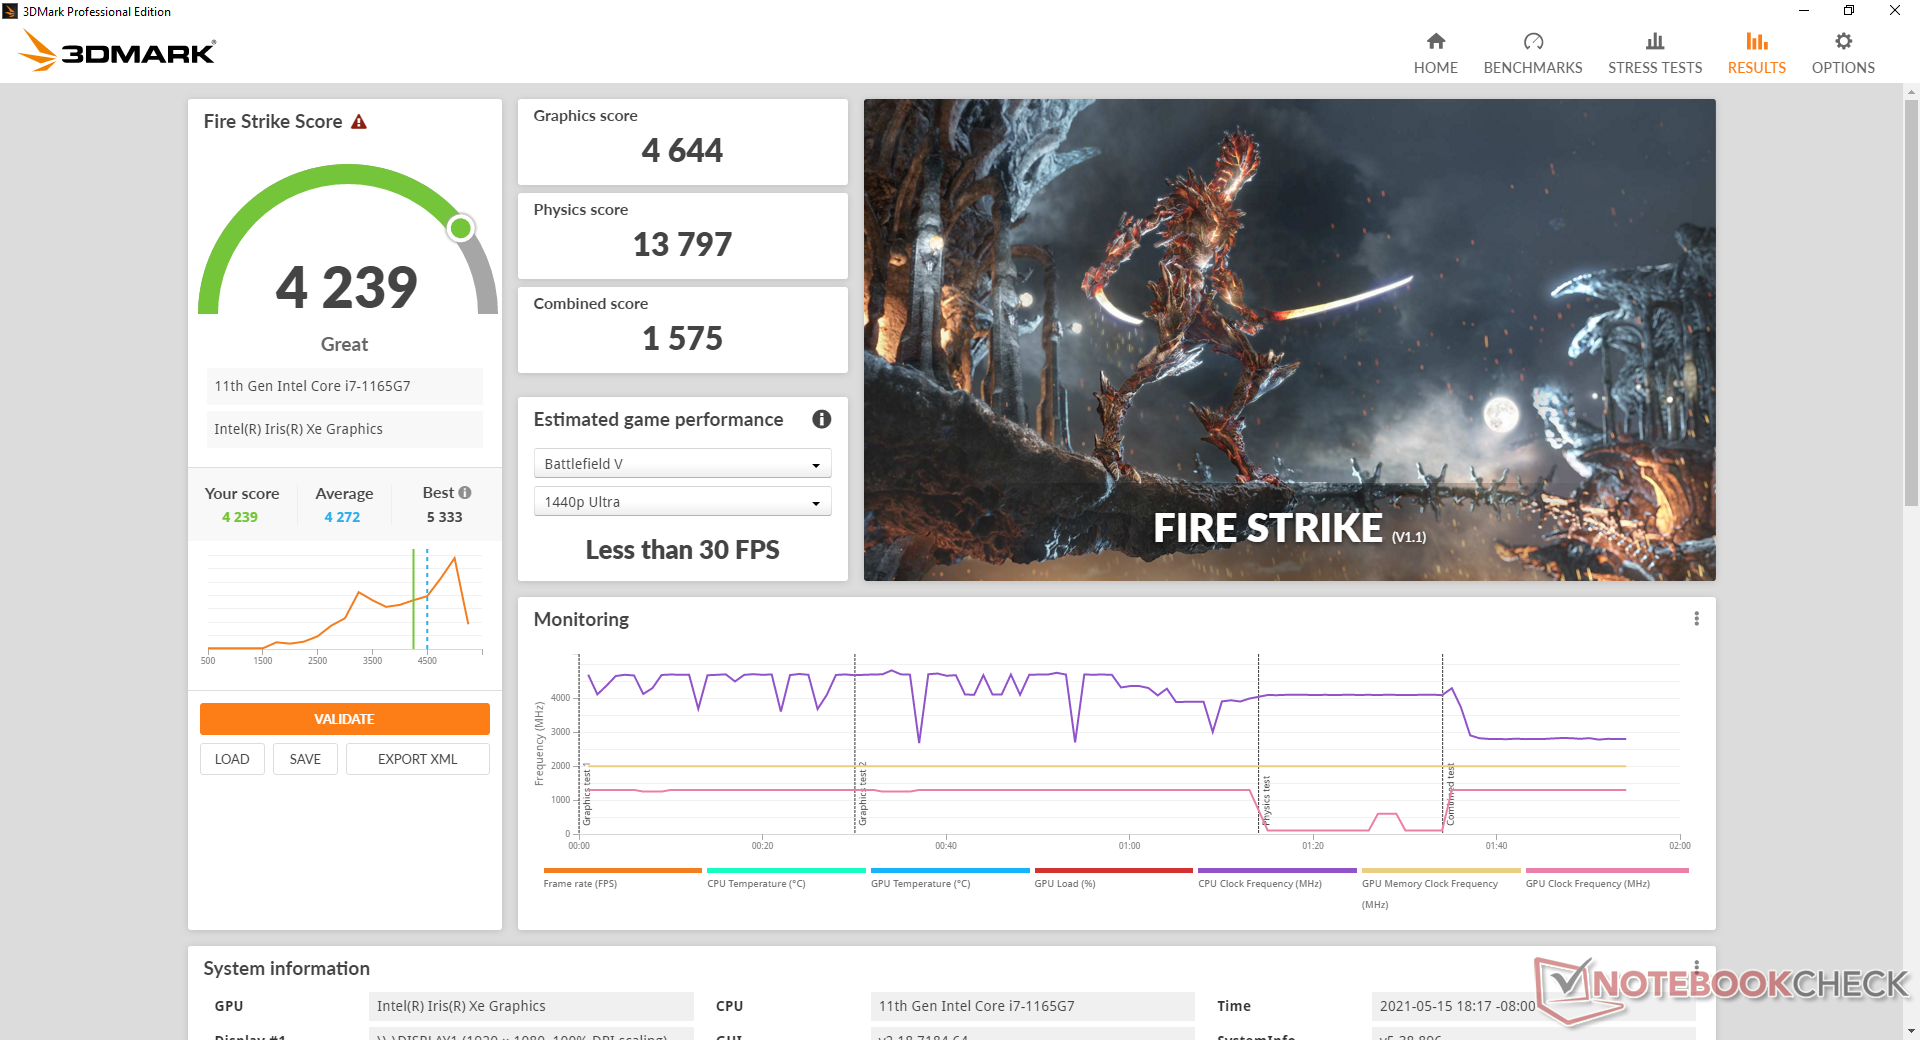
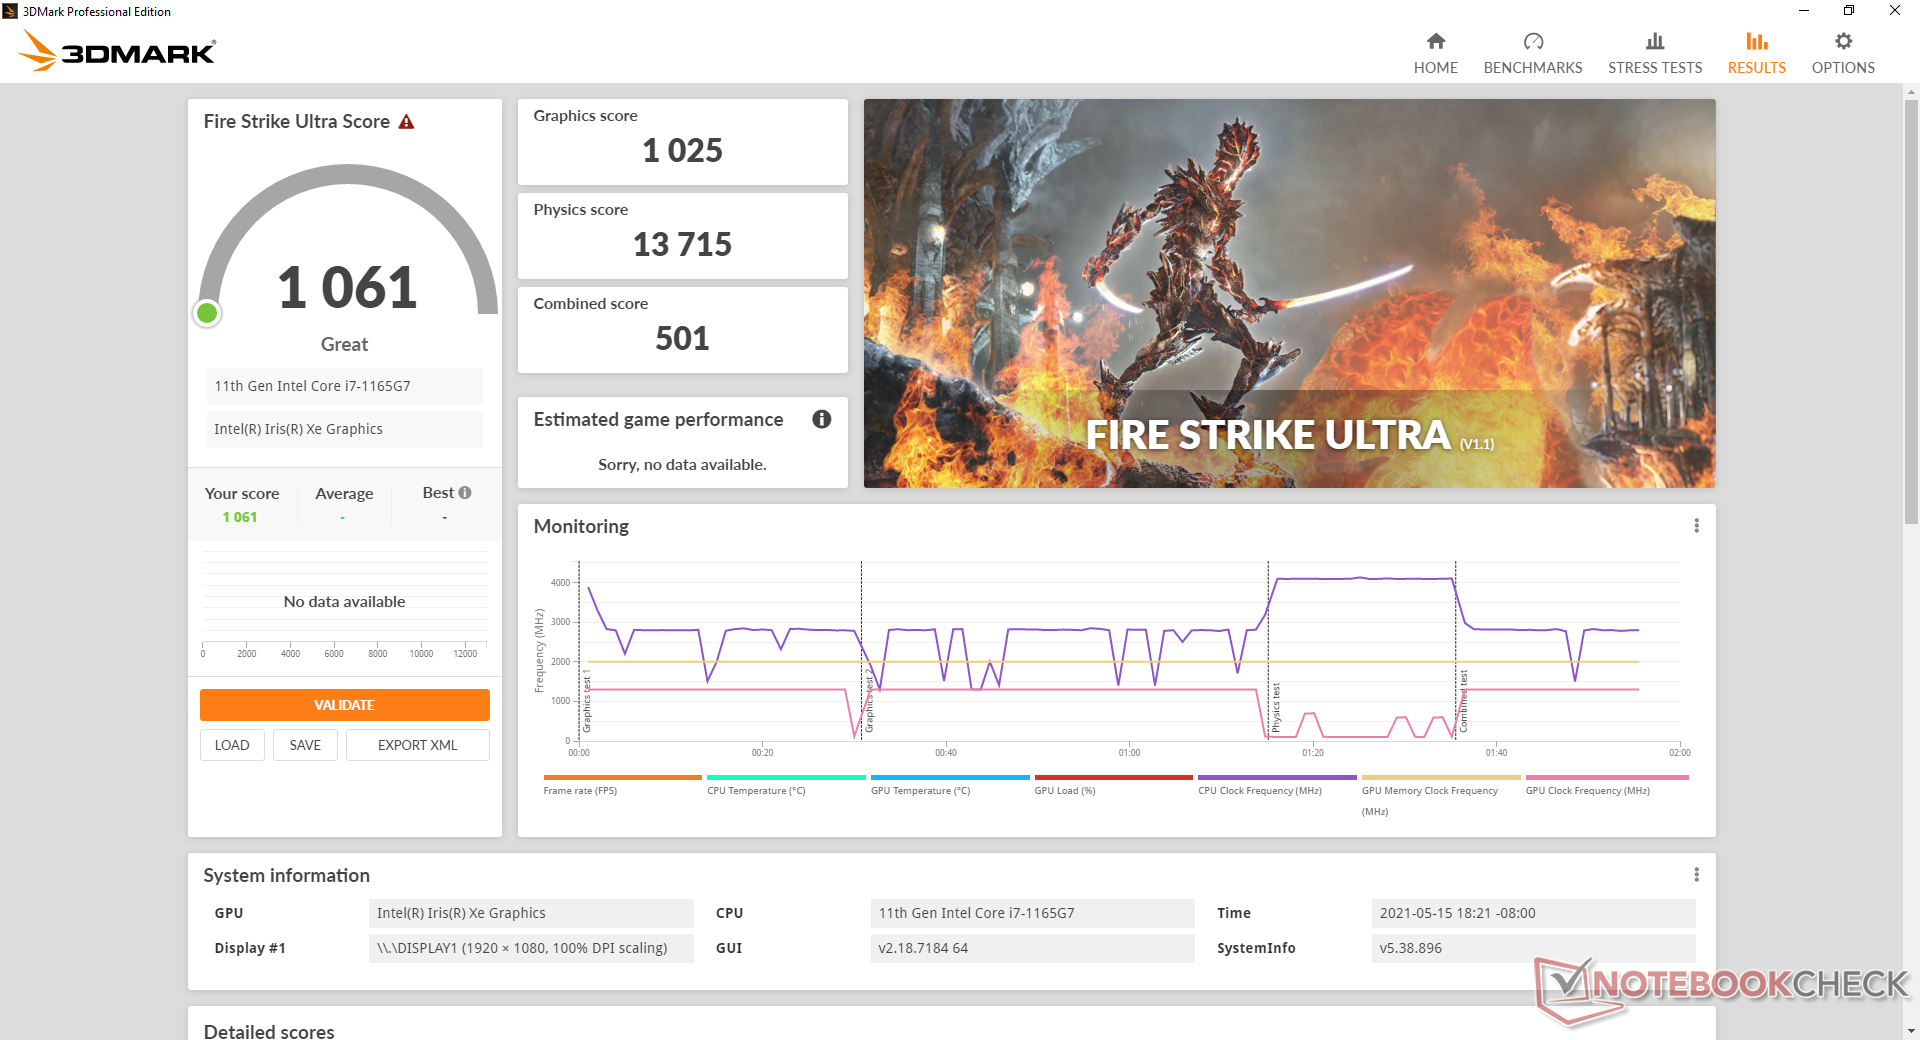
Graphics performance is within a few percentage points of the average laptop in our database equipped with the same Iris Xe 96 EUs GPU. Though 3DMark shows it outperforming the GeForce MX250/350/450 series, these Nvidia GPUs are still the better bet when under real-world gaming conditions largely due to the more mature drivers from Nvidia and the higher power envelope available for the CPU when a discrete GPU is present. As far as integrated GPUs go, however, Iris Xe is the one to beat.
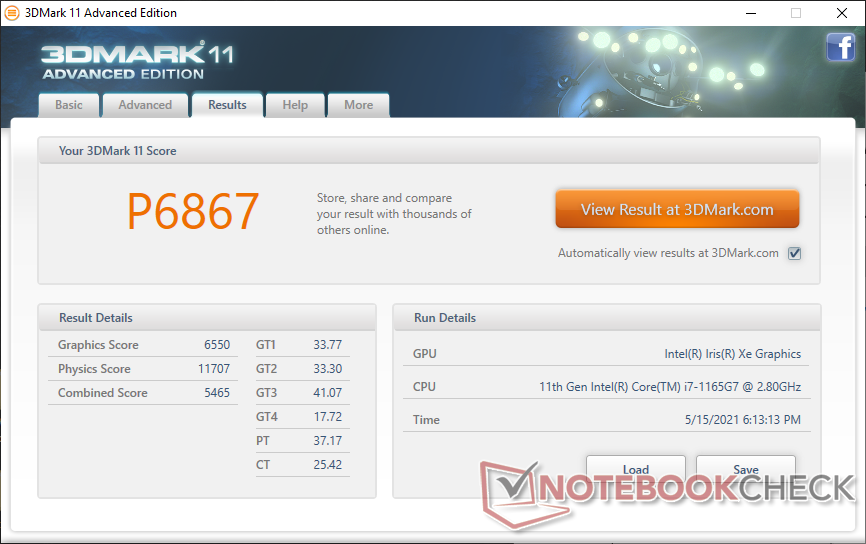
| 3DMark 11 Performance | 6867 points | |
| 3DMark Cloud Gate Standard Score | 19447 points | |
| 3DMark Fire Strike Score | 4239 points | |
| 3DMark Time Spy Score | 1577 points | |
Help | ||
| low | med. | high | ultra | |
|---|---|---|---|---|
| The Witcher 3 (2015) | 95.3 | 56.3 | 30.8 | 14.5 |
| Dota 2 Reborn (2015) | 81.5 | 67.3 | 45.4 | 42.3 |
| Final Fantasy XV Benchmark (2018) | 39.1 | 20.4 | 15.8 | |
| X-Plane 11.11 (2018) | 59.3 | 42.3 | 38.5 |
Emissions
System Noise
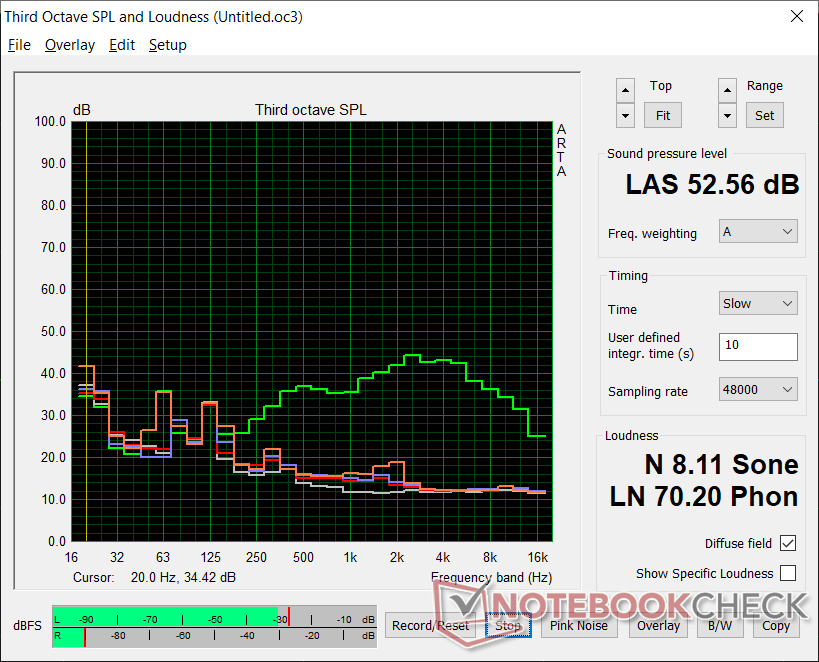
Fan noise is never truly silent even when set to "Silent" mode on MSI Center. We're able to record a very slight fan noise of 26.4 dB(A) against a background of 25.2 dB(A) no matter what setting the laptop would be on.
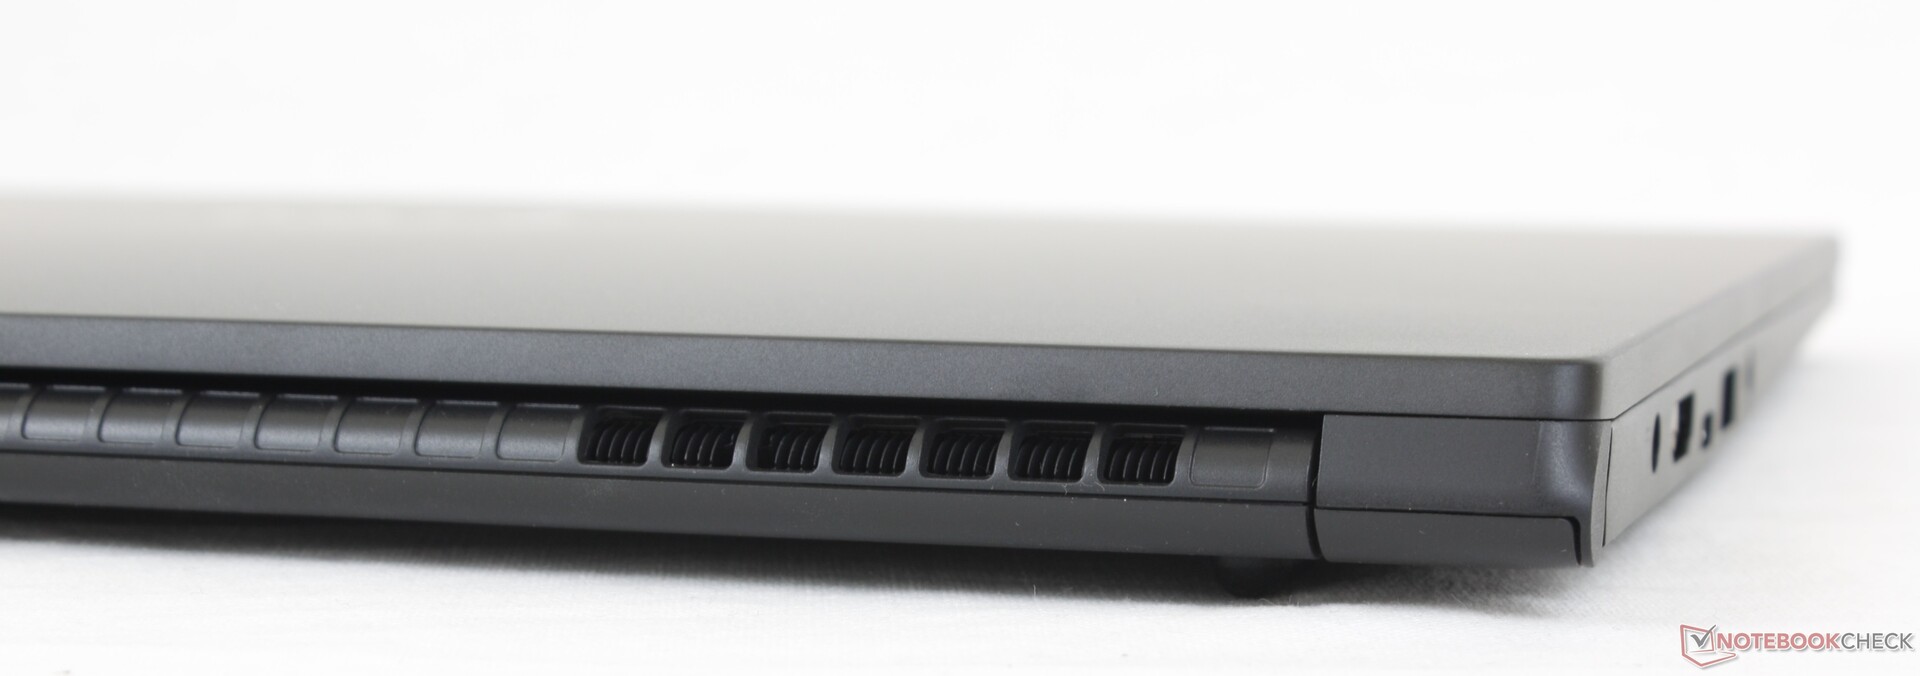
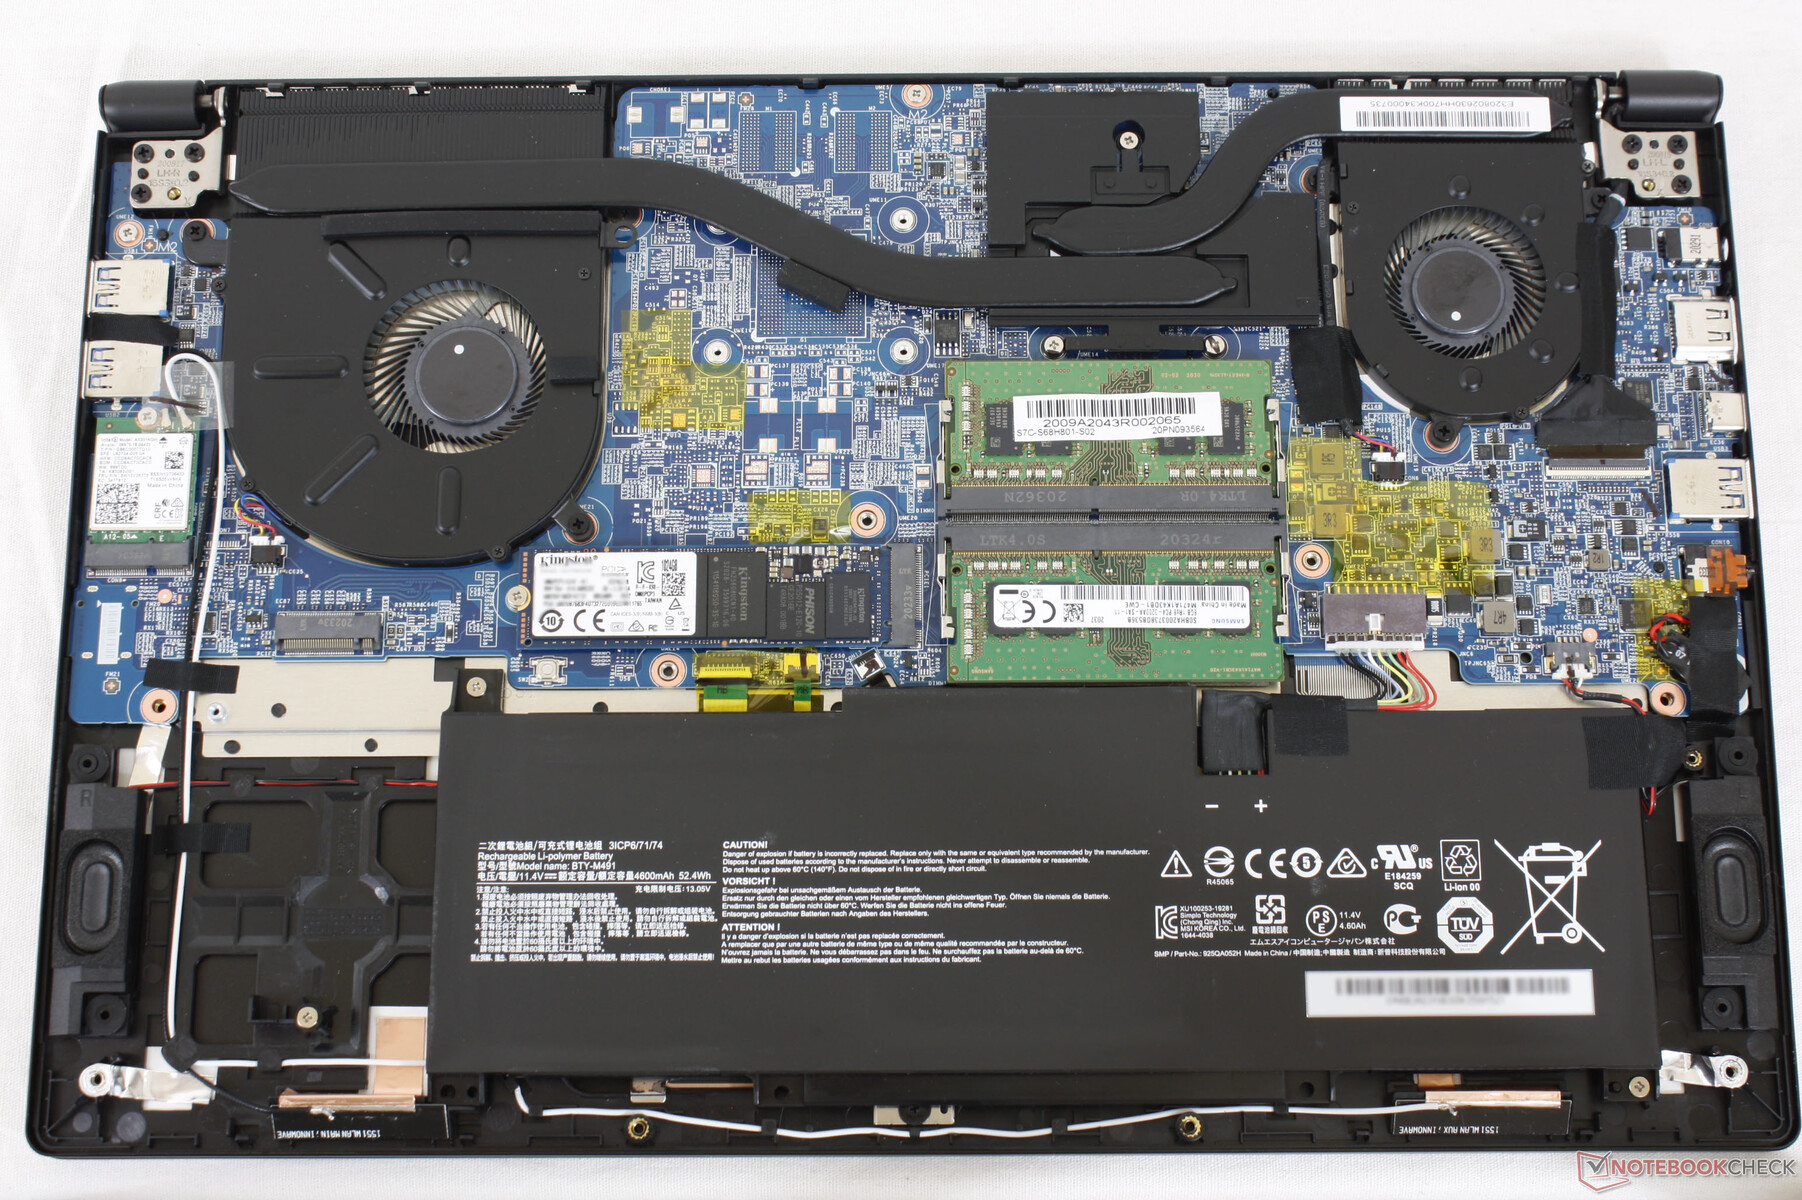
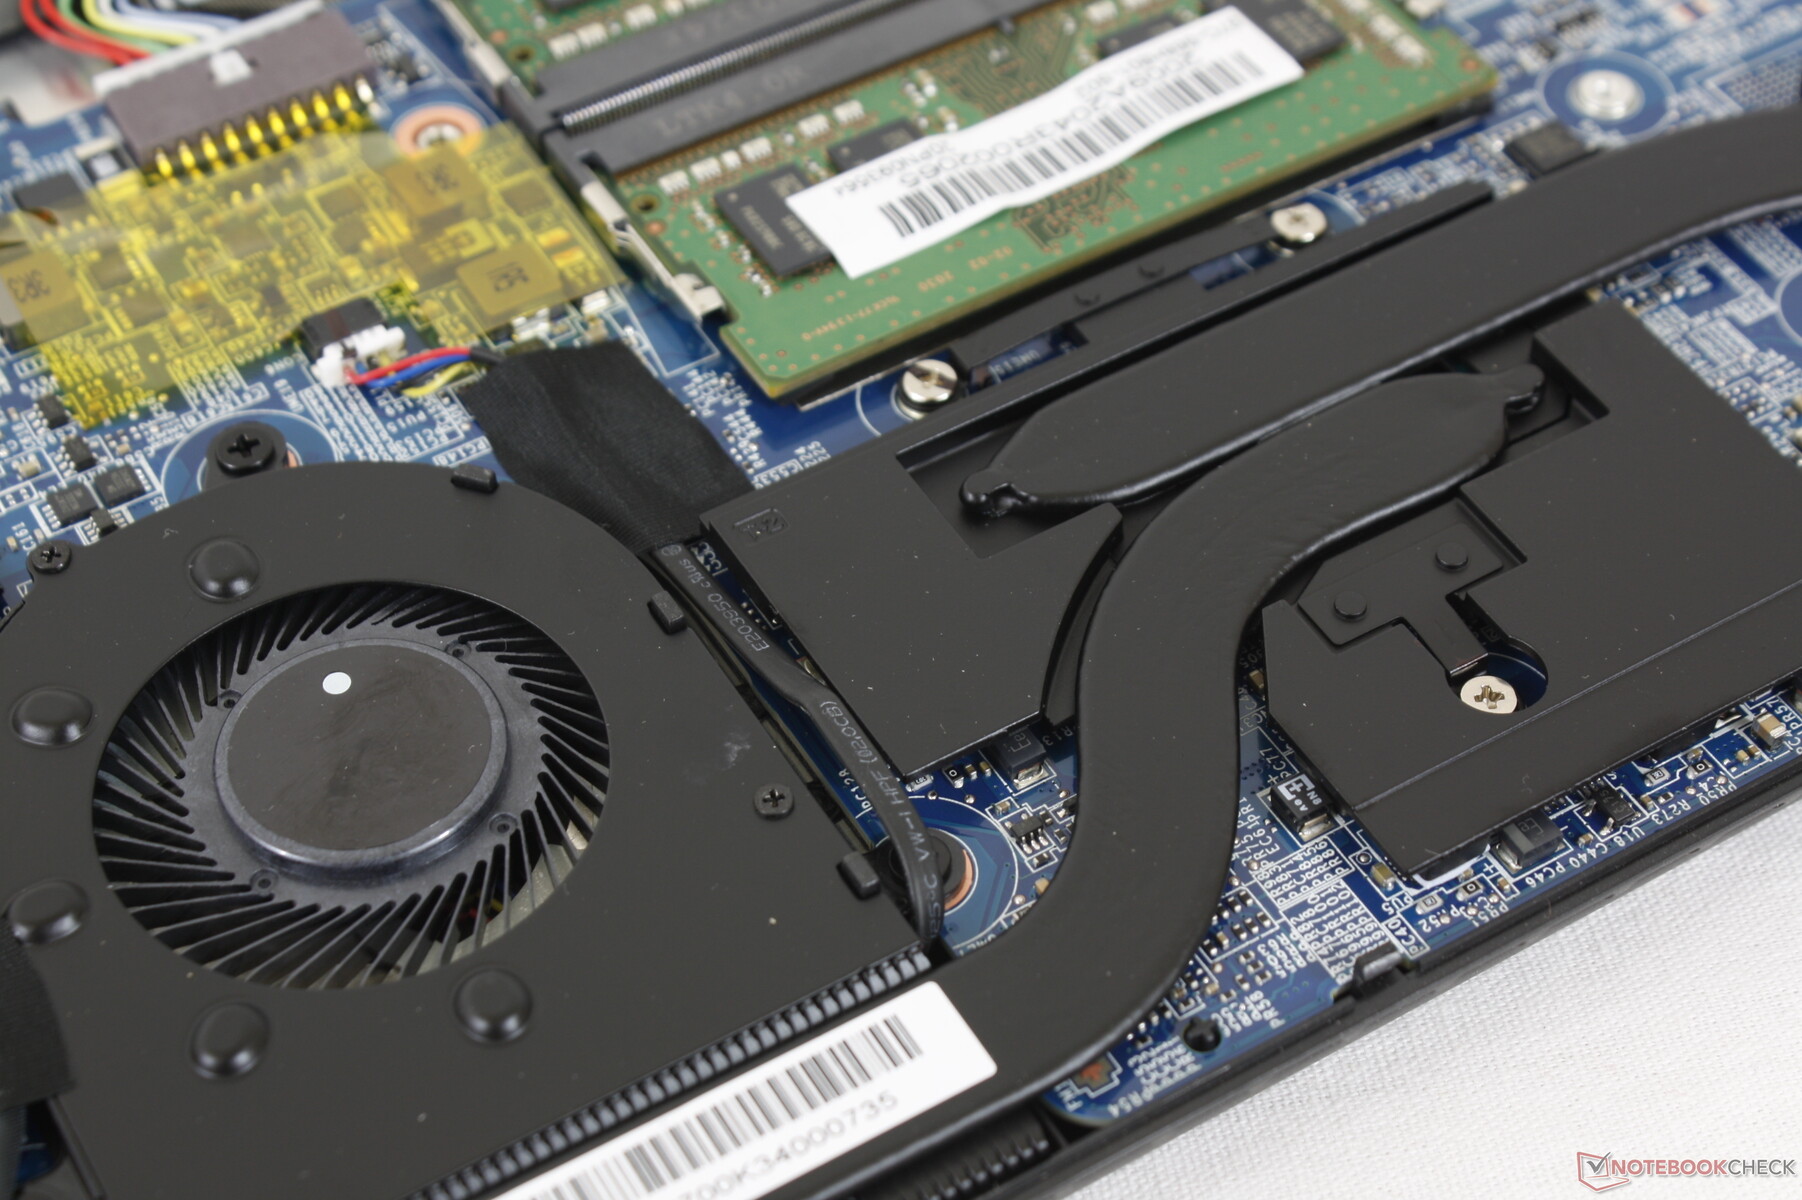
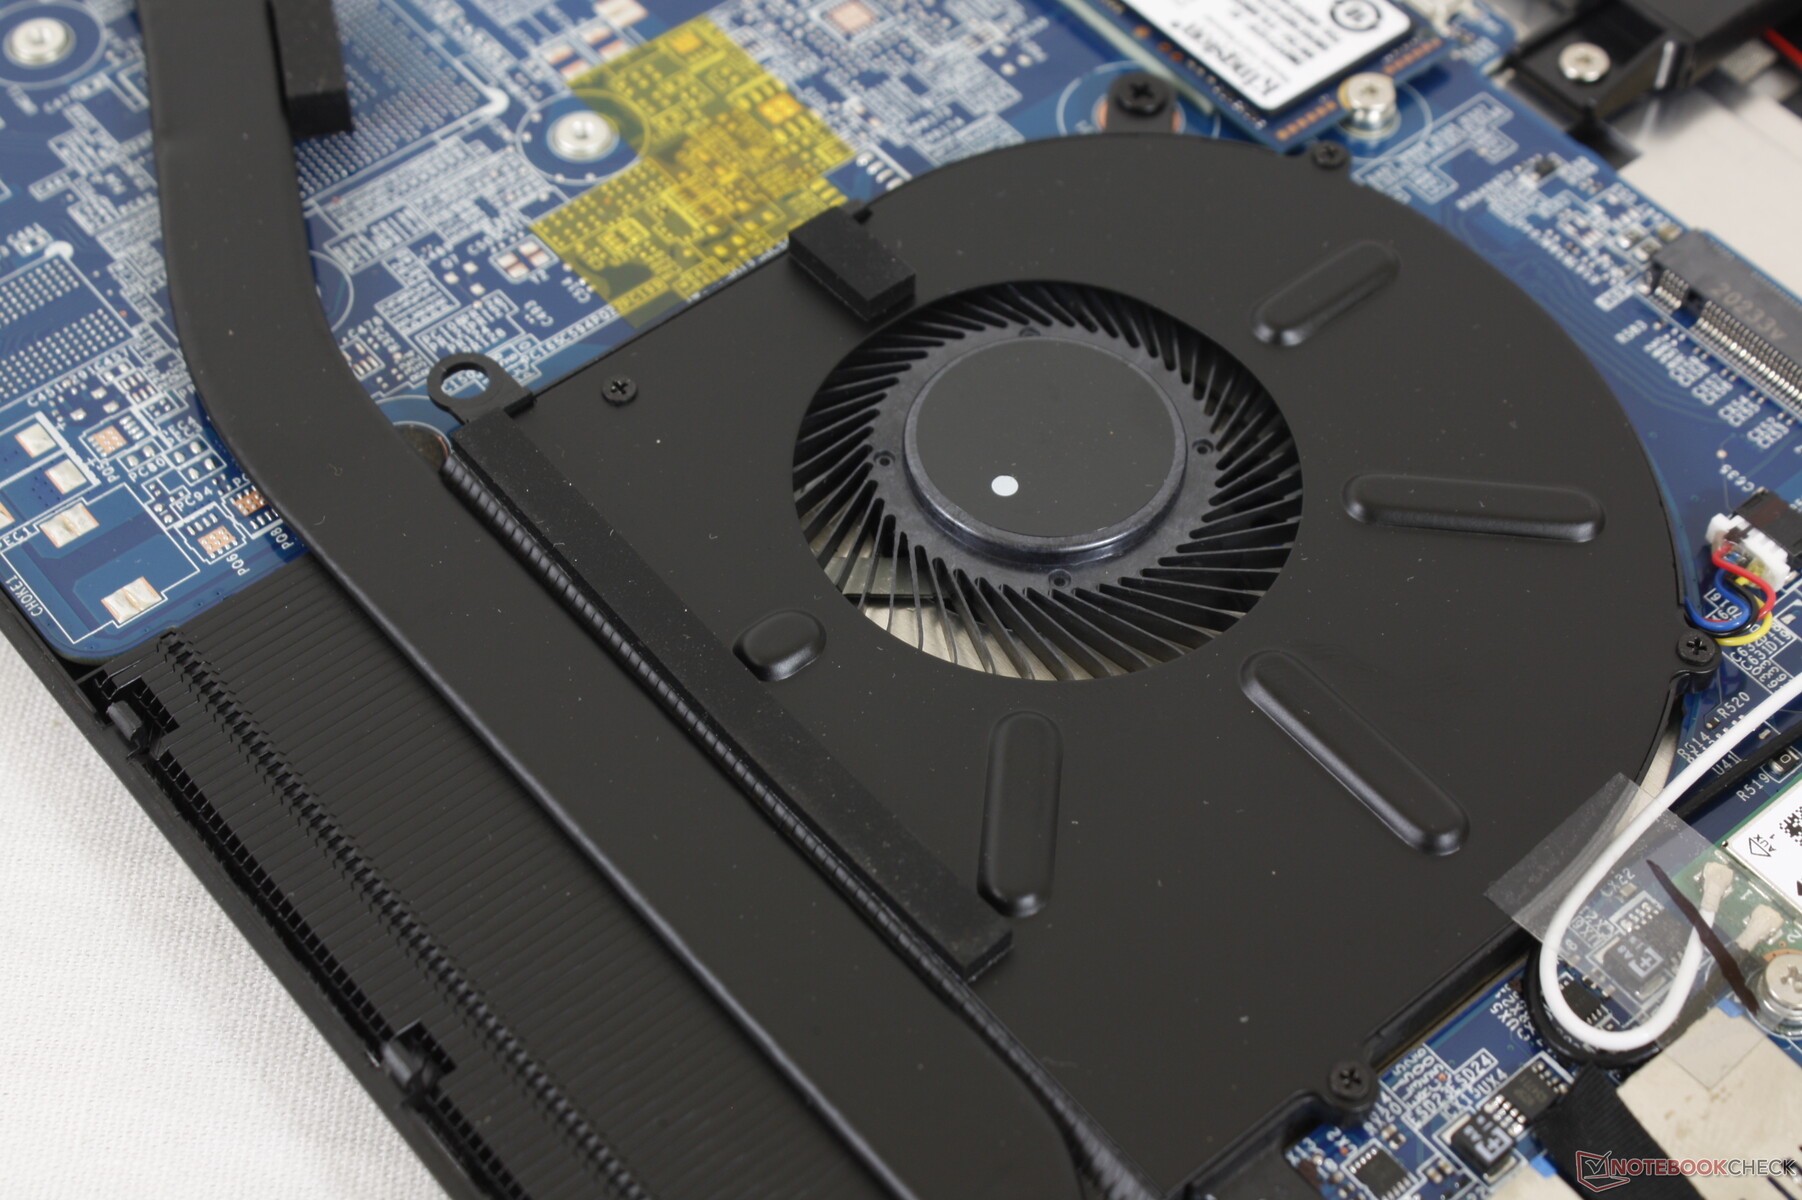
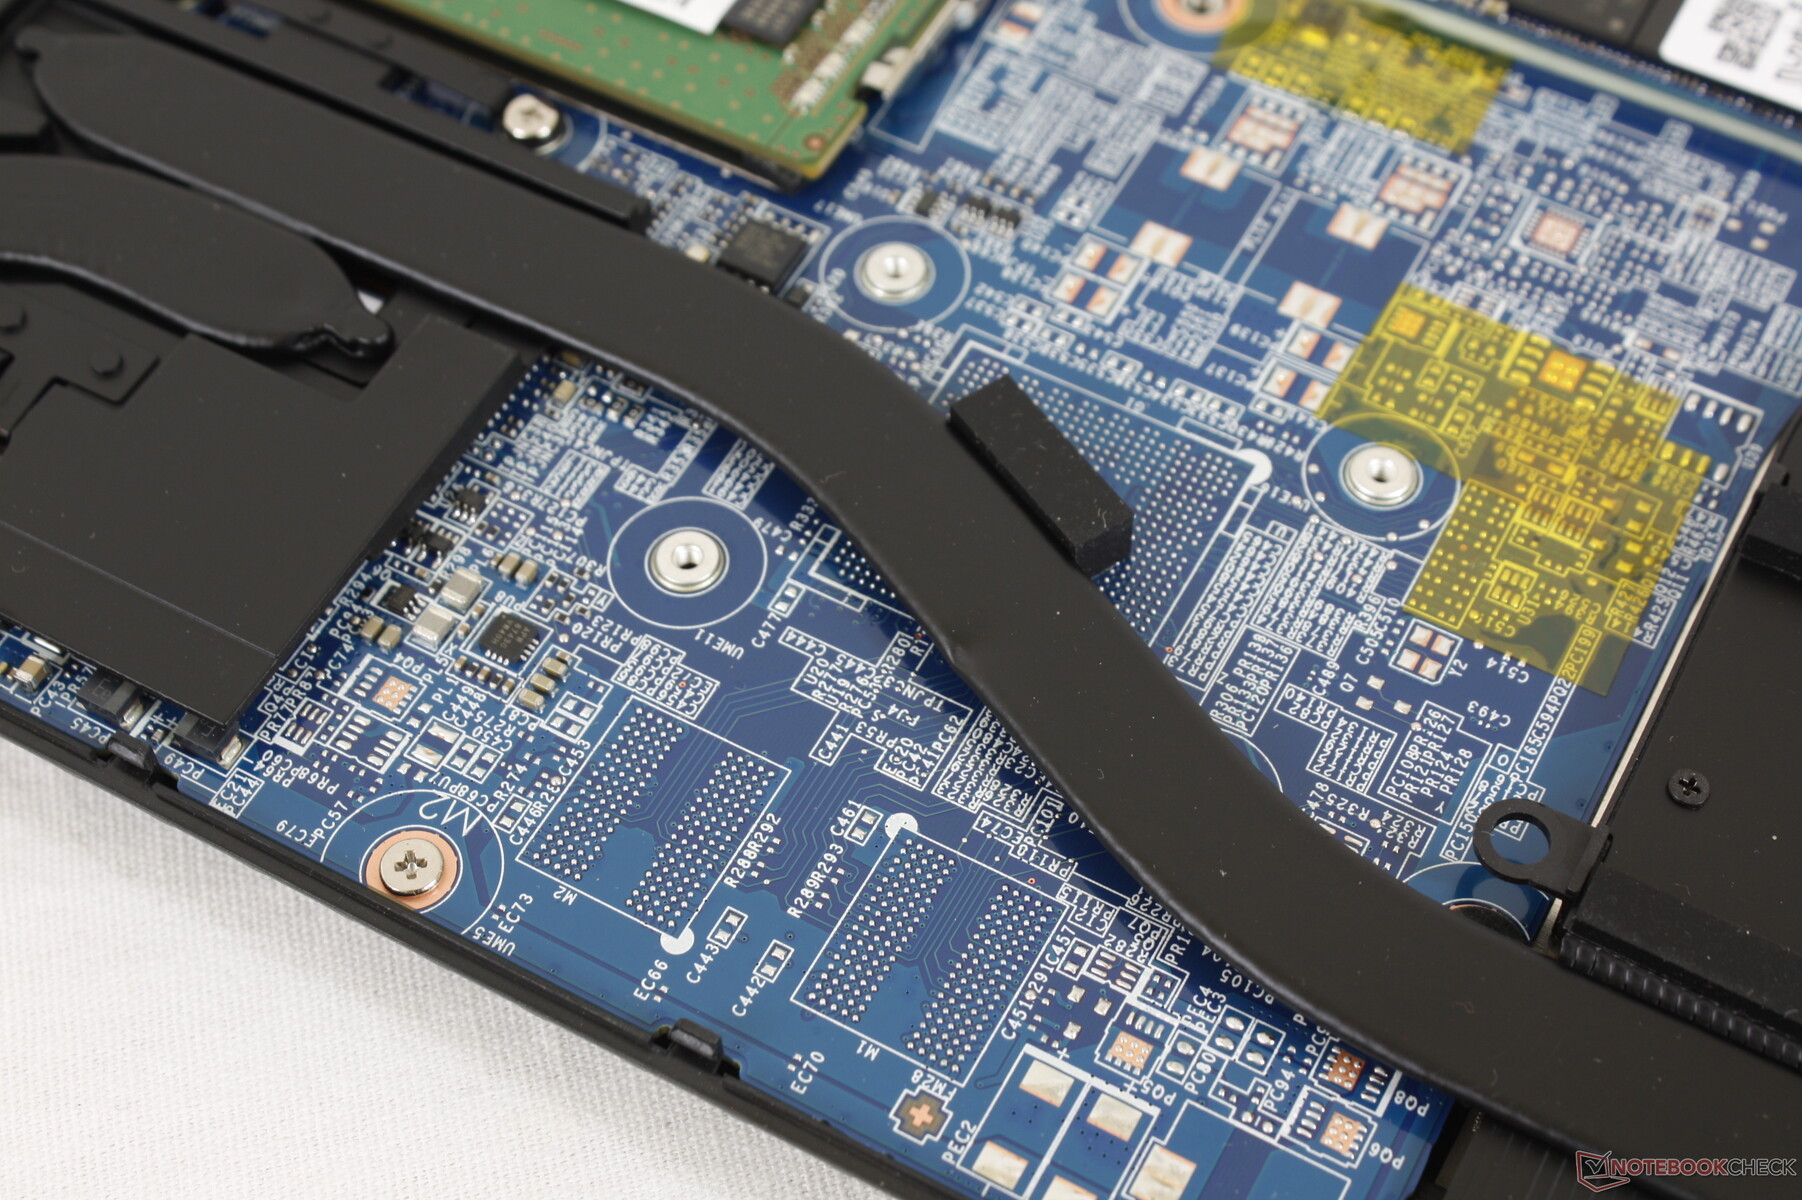
Thankfully, the fans remain quiet at 26.4 dB(A) even after running the first benchmark scene of 3DMark 06. This is because the cooling solution was designed to cool both a CPU and discrete GPU as shown by the images below despite the fact that our Summit B15 has no discrete GPU. Thus, the two internal fans need not always be active to keep the system as cool.
Of course, the system can still get very loud when running games at high frame rates where the CPU will be stressed. In this case, fan noise can be as high as 40 dB(A) or 52.6 dB(A) when Cooler Boost is toggled off or on, respectively. Note that Cooler Boost is mostly unnecessary for this ULV laptop as our Stress Test section below will show.
Fan noise is very low when running Witcher 3 on Ultra settings since frame rates are in the single digits. When set to low graphical settings, fan noise would jump almost immediately to the 40 dB(A) range due to the increase in CPU performance.
| MSI Summit B15 A11M Iris Xe G7 96EUs, i7-1165G7, Kingston OM8PCP31024F | MSI Summit E15 A11SCST GeForce GTX 1650 Ti Max-Q, i7-1185G7, Phison 1TB SM2801T24GKBB4S-E162 | Dell XPS 15 9500 Core i5 UHD Graphics 630, i5-10300H, Toshiba KBG40ZNS256G NVMe | HP Spectre X360 15-5ZV31AV GeForce MX250, i7-10510U, Intel SSD 660p 2TB SSDPEKNW020T8 | ADATA XPG Xenia Xe Iris Xe G7 96EUs, i7-1165G7, ADATA XPG Gammix S50 1TB | |
|---|---|---|---|---|---|
| Noise | -17% | -2% | -14% | -7% | |
| off / environment * (dB) | 25.2 | 24 5% | 28 -11% | 30.1 -19% | 25.2 -0% |
| Idle Minimum * (dB) | 26.4 | 28 -6% | 28 -6% | 30.1 -14% | 25.2 5% |
| Idle Average * (dB) | 26.4 | 29 -10% | 28 -6% | 30.1 -14% | 25.2 5% |
| Idle Maximum * (dB) | 26.4 | 32 -21% | 28 -6% | 30.1 -14% | 25.2 5% |
| Load Average * (dB) | 26.8 | 43 -60% | 28 -4% | 30.1 -12% | 35.7 -33% |
| Witcher 3 ultra * (dB) | 28 | 41 -46% | 39.7 -42% | 39.7 -42% | |
| Load Maximum * (dB) | 52.6 | 44 16% | 41.9 20% | 42 20% | 45.3 14% |
* ... smaller is better
Noise level
| Idle |
| 26.4 / 26.4 / 26.4 dB(A) |
| Load |
| 26.8 / 52.6 dB(A) |
 | ||
30 dB silent 40 dB(A) audible 50 dB(A) loud |
||
min: | ||
Temperature
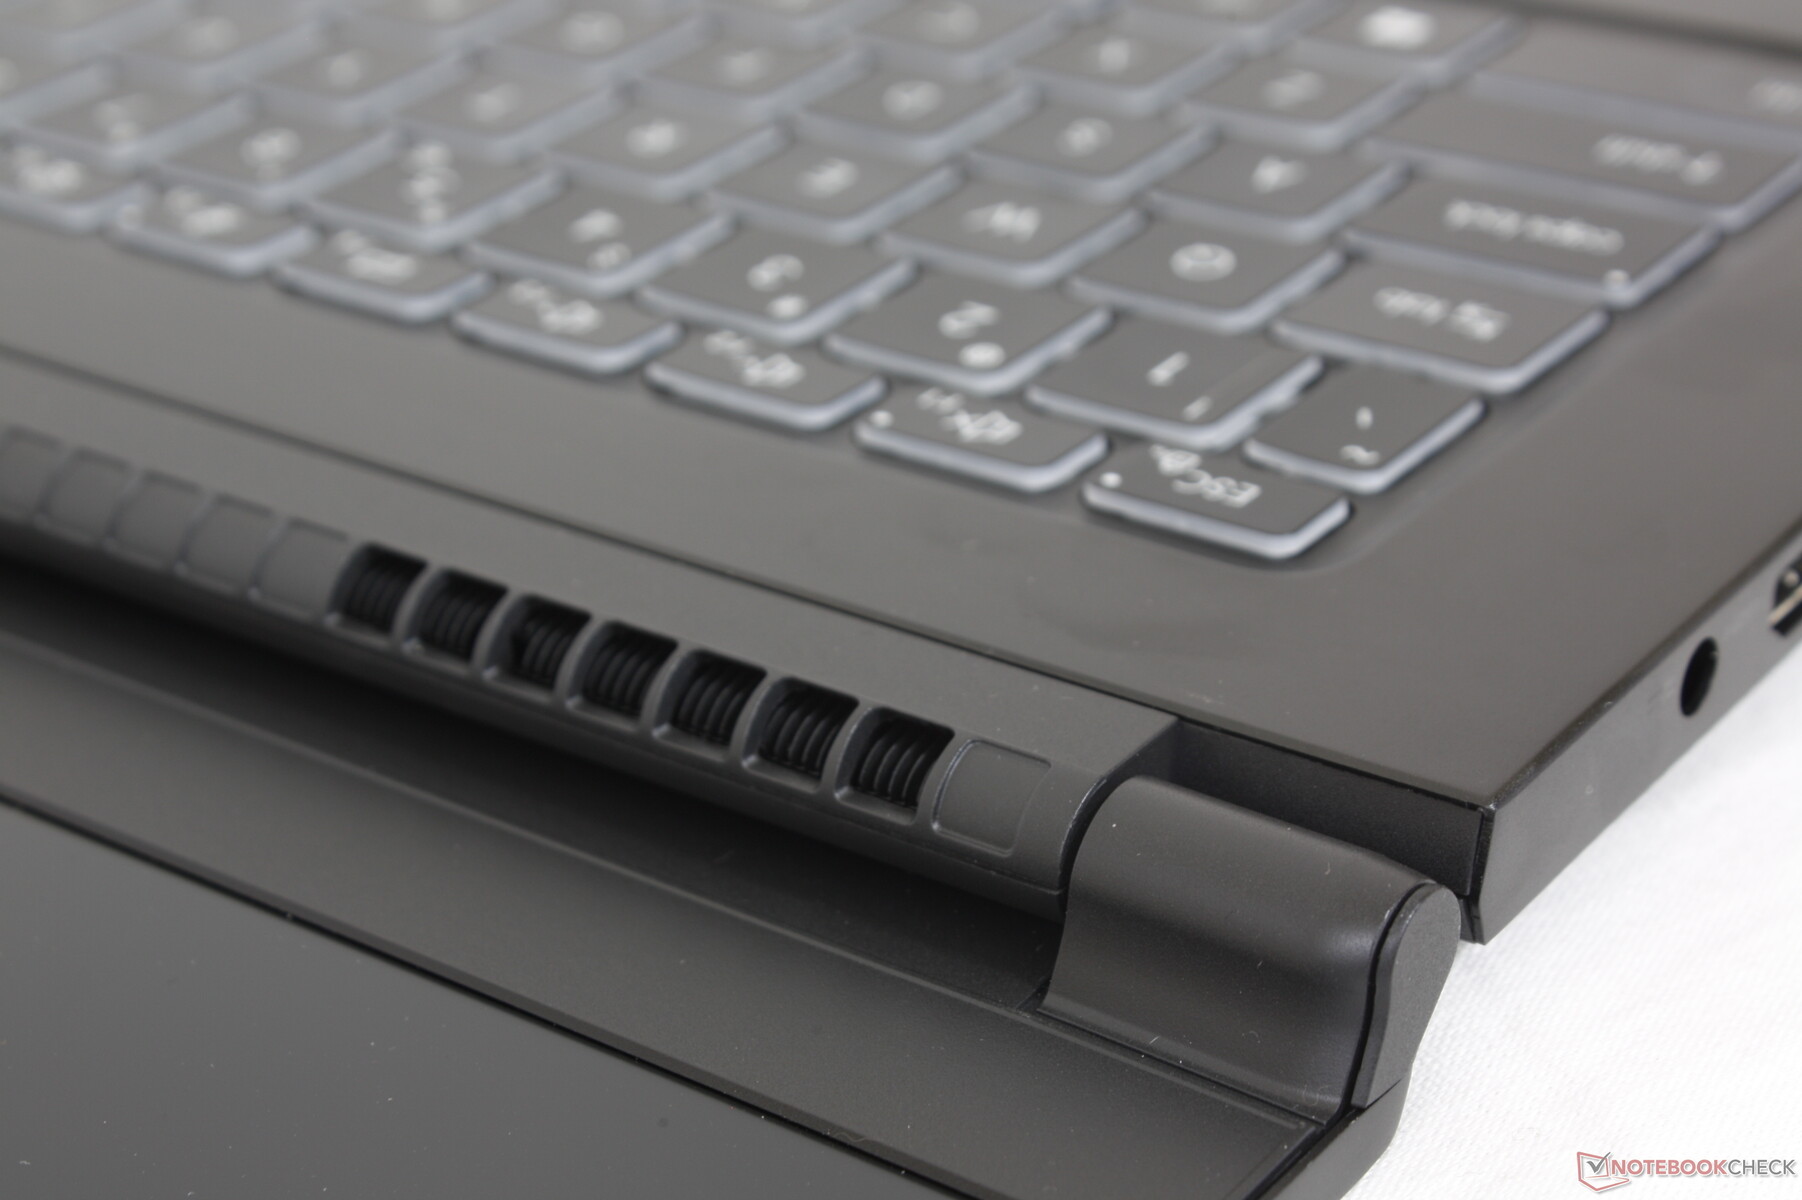
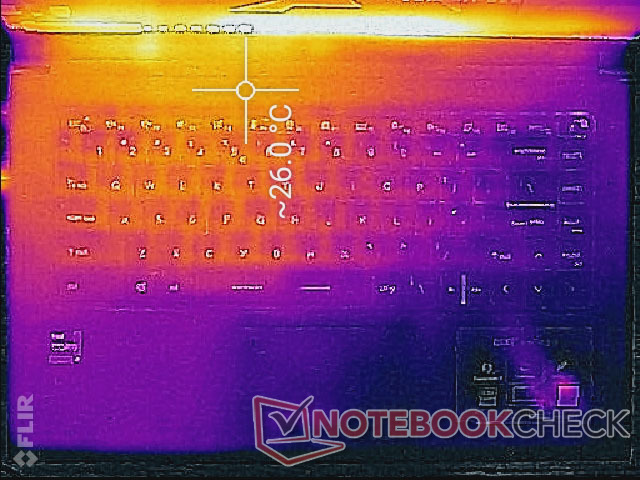
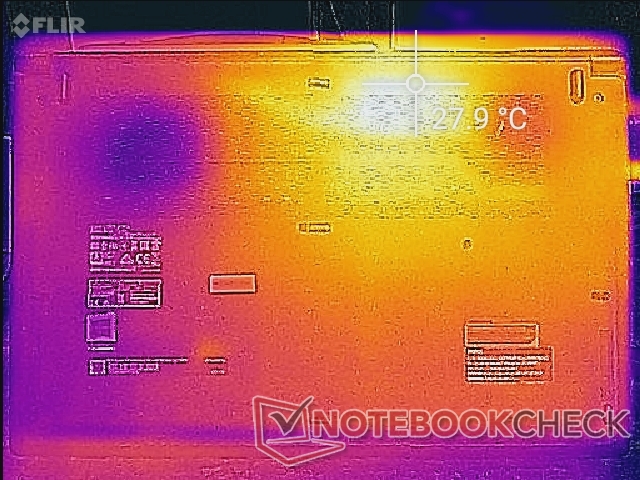
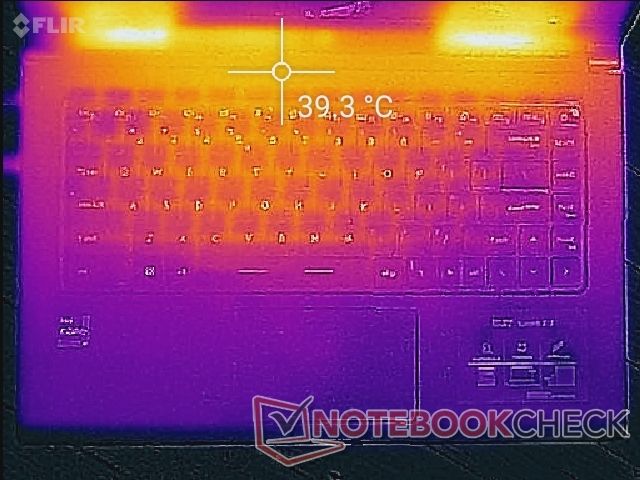
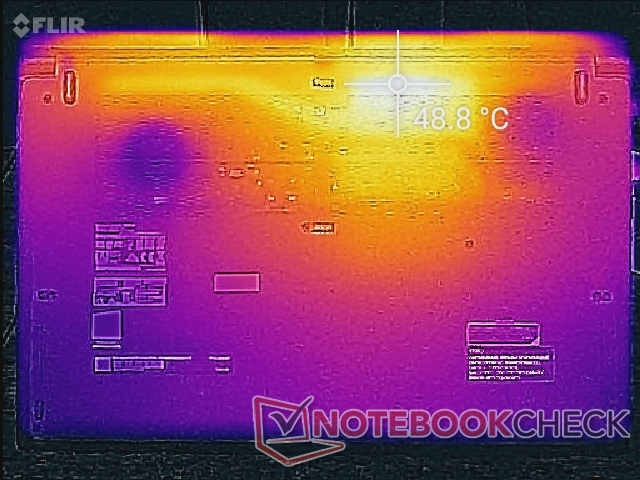
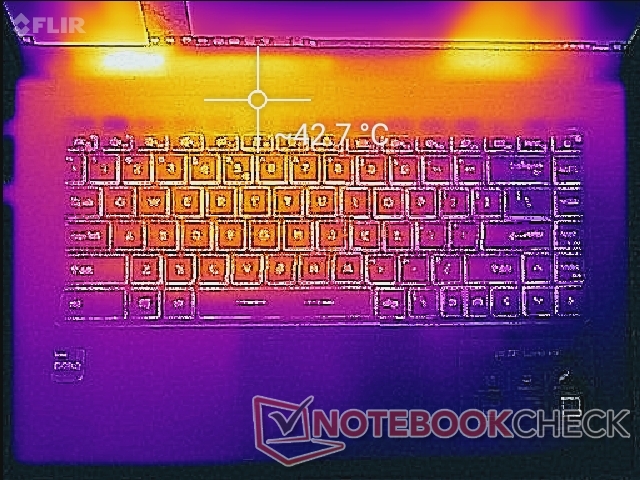
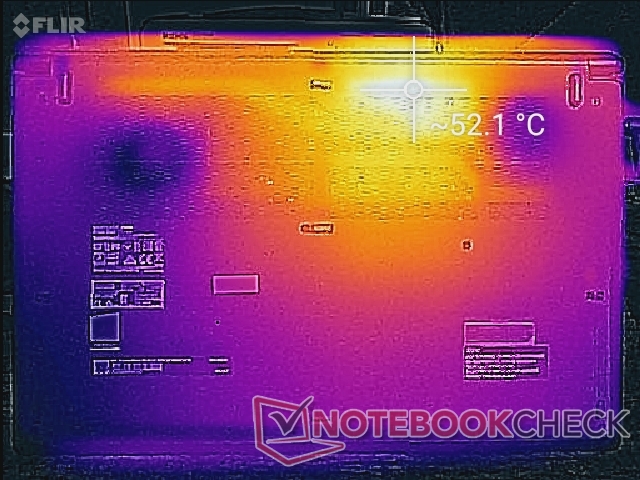
Surface temperatures are noticeably cooler than what we observed on the Modern 15 likely because our Summit B15 doesn't come with a discrete GPU. For example, the keyboard center stabilizes at around 38 C when running heavy processing loads compared to 45 C on the Modern 15. Hot spots on the bottom are also a few degrees cooler this time around. More of the bottom surface is dedicated to ventilation unlike the tiny grilles on the Razer Blade Stealth or Blade 15 series.
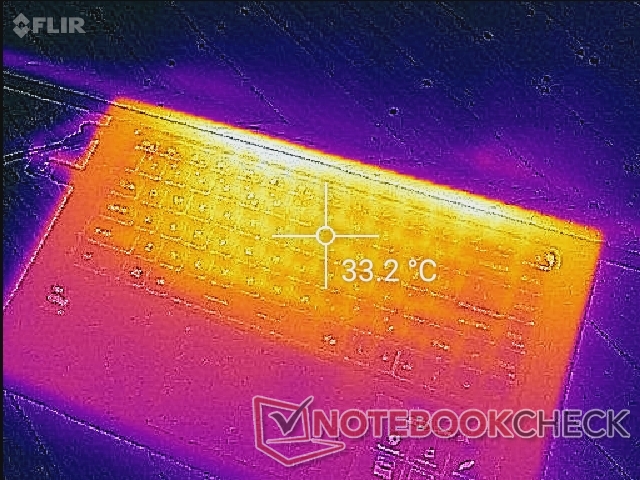
(±) The maximum temperature on the upper side is 42.8 °C / 109 F, compared to the average of 34.3 °C / 94 F, ranging from 21.2 to 62.5 °C for the class Office.
(-) The bottom heats up to a maximum of 52.2 °C / 126 F, compared to the average of 36.8 °C / 98 F
(+) In idle usage, the average temperature for the upper side is 24.2 °C / 76 F, compared to the device average of 29.5 °C / 85 F.
(+) Playing The Witcher 3, the average temperature for the upper side is 31.9 °C / 89 F, compared to the device average of 29.5 °C / 85 F.
(+) The palmrests and touchpad are cooler than skin temperature with a maximum of 29.2 °C / 84.6 F and are therefore cool to the touch.
(±) The average temperature of the palmrest area of similar devices was 27.5 °C / 81.5 F (-1.7 °C / -3.1 F).
Stress Test
When stressed with Prime95, the CPU would boost to 3.8 GHz for the first few seconds before steadily dropping and eventually stabilizing at the 3.0 to 3.1 GHz range. Enabling Cooler Boost mode (i.e., maximum fan mode) will cause the CPU to run slightly faster at 3.2 to 3.3 GHz while core temperature remains the same at 90 C. CPU temperature on the Modern 15 would be much cooler at 73 C when under similar loads.
When running Witcher 3 to represent real-world stressful loads, the CPU would stabilize at just 67 C or even 56 C if Cooler Boost is enabled. Performance remains the same no matter the Cooler Boost setting, however, meaning that the feature is mostly for temperature purposes.
Running on batteries may impact graphics performance. A 3DMark 11 test on battery power would return the same Physics score as AC adapter power but with a slightly lower graphics score (6550 vs. 6232 points).
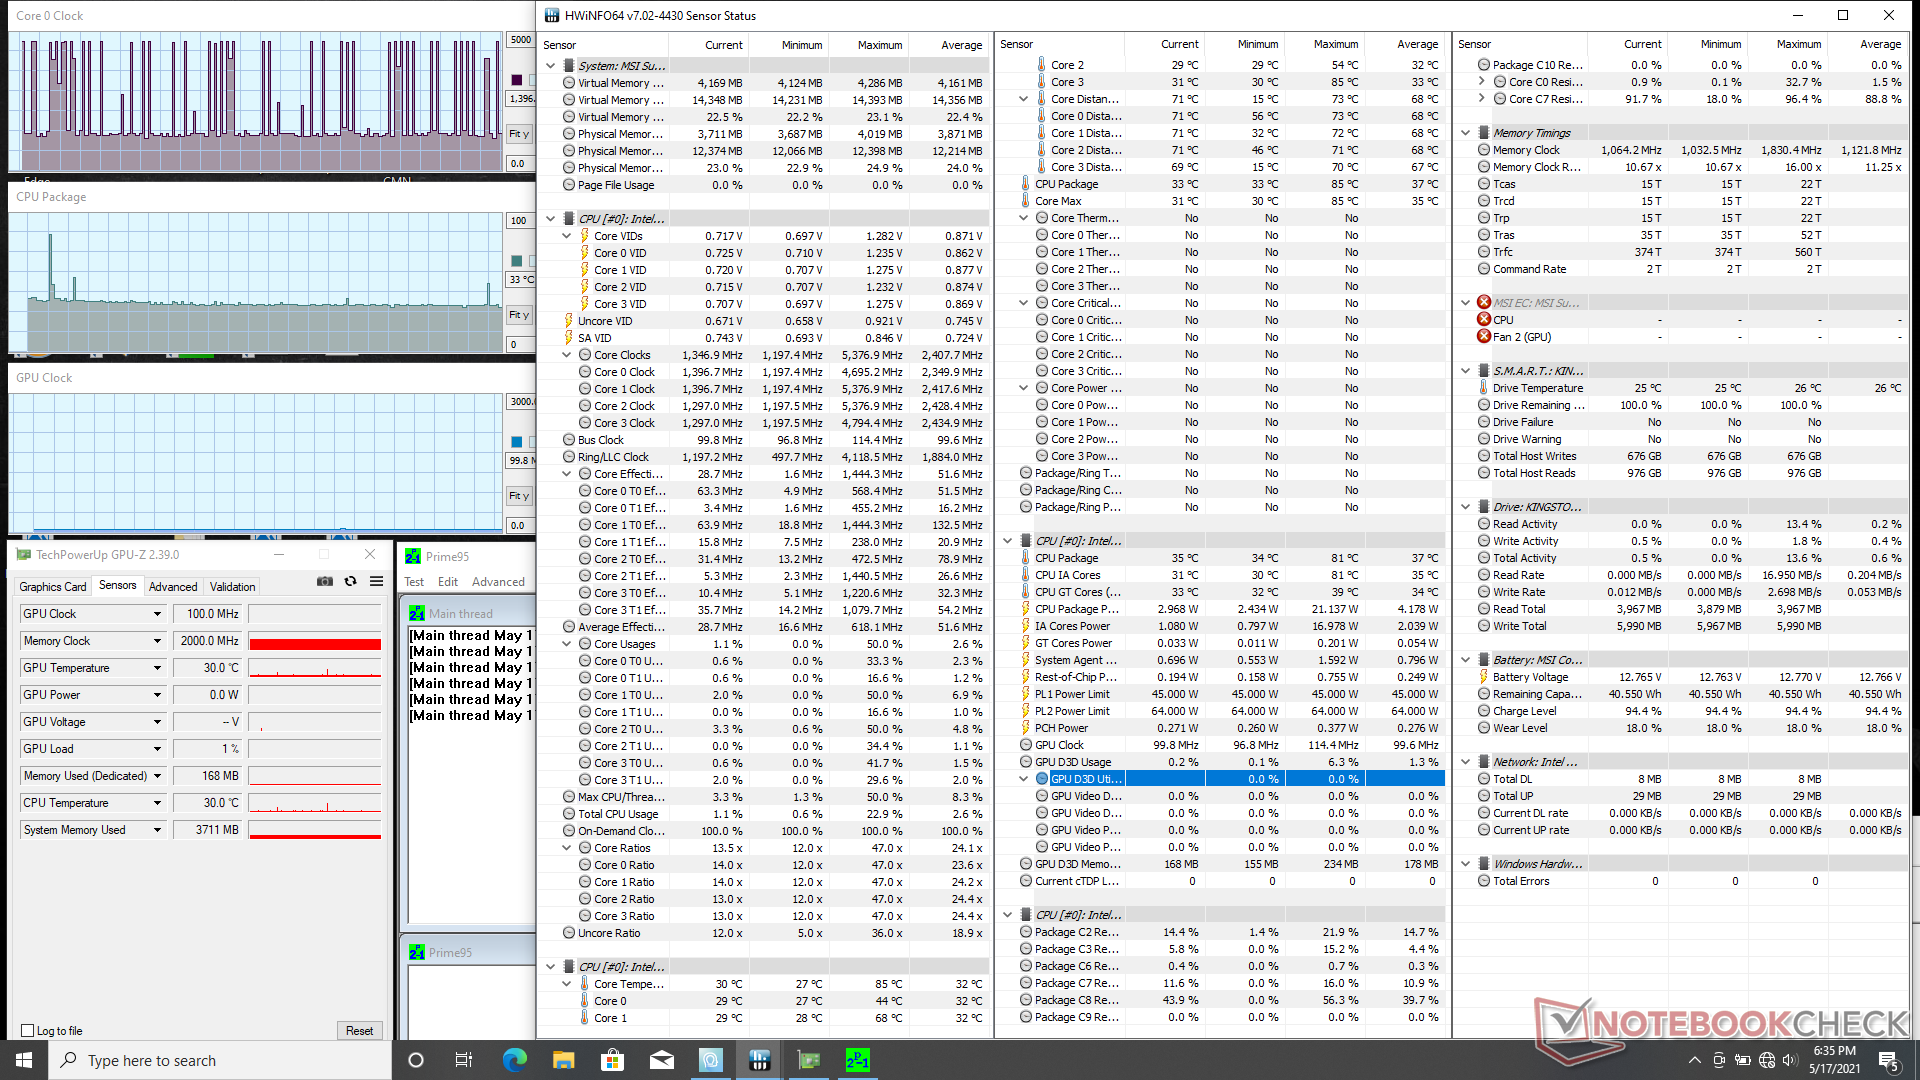
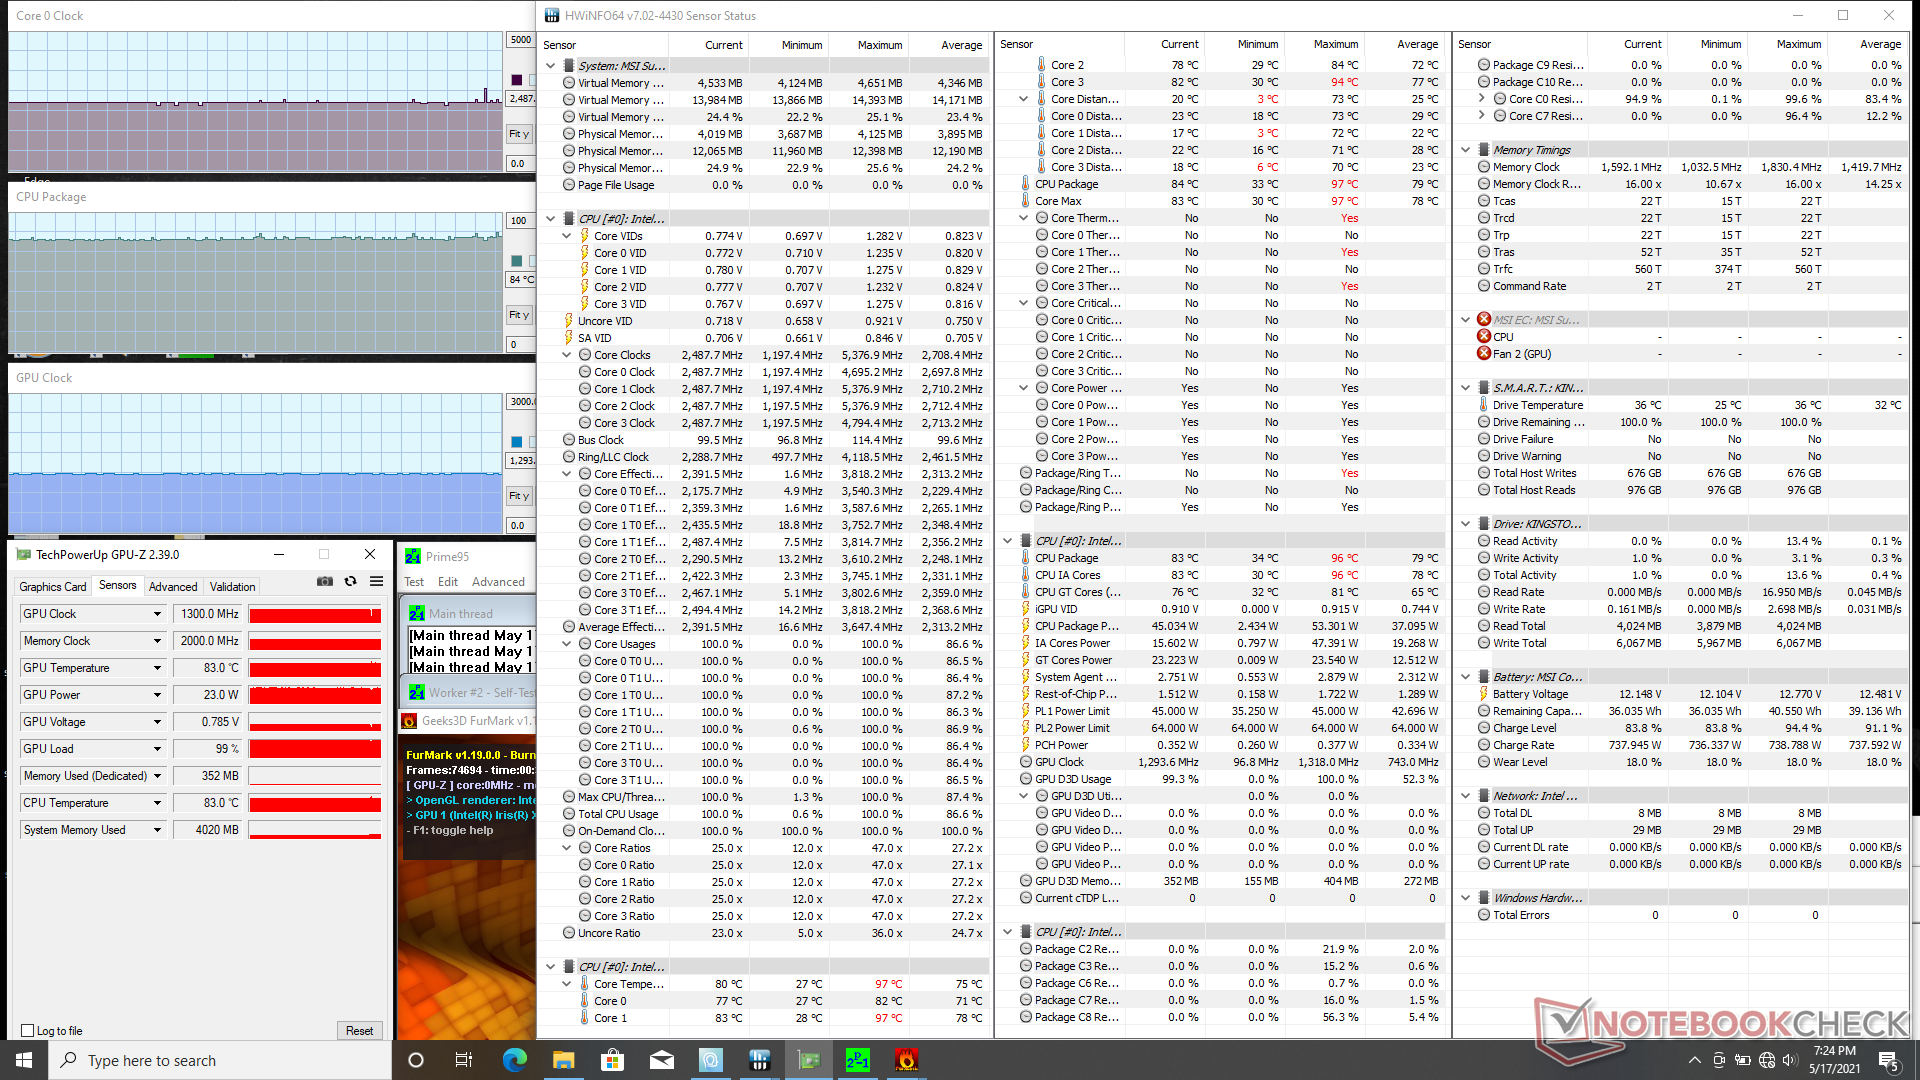
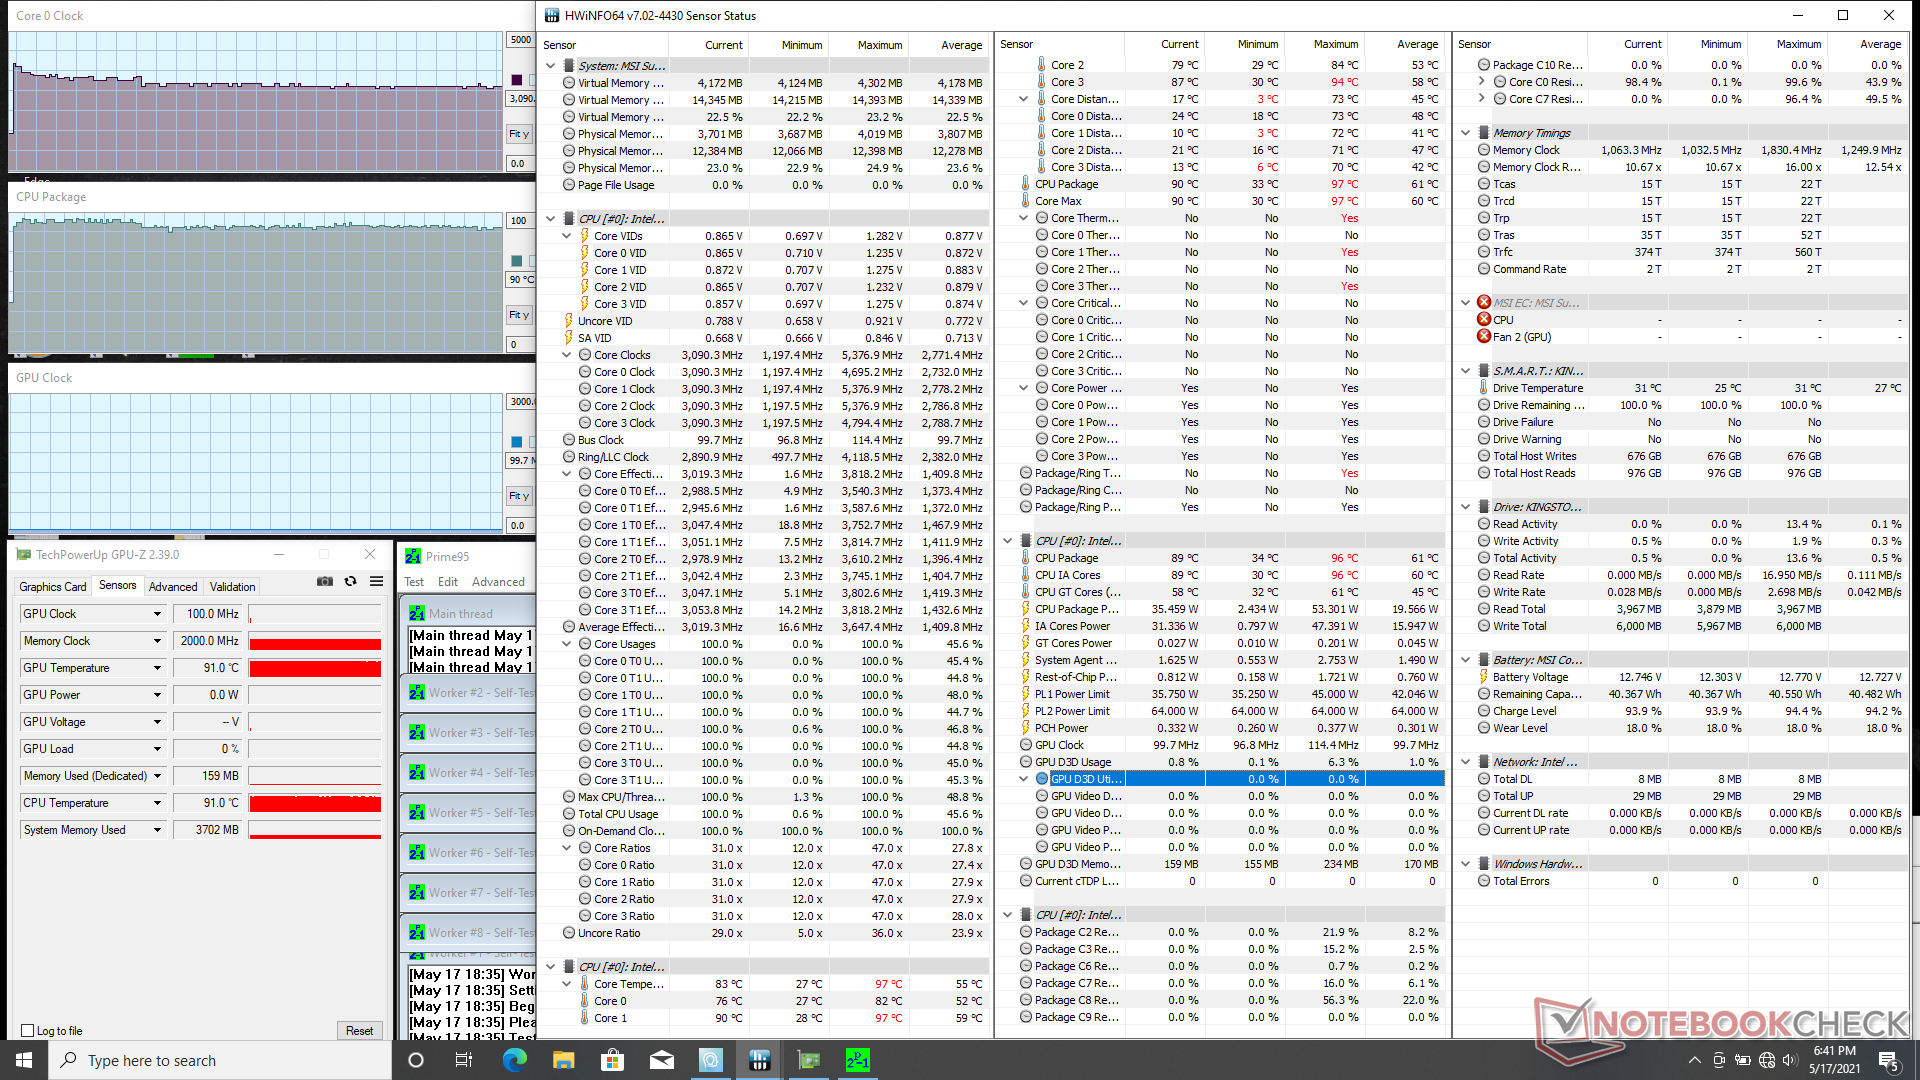
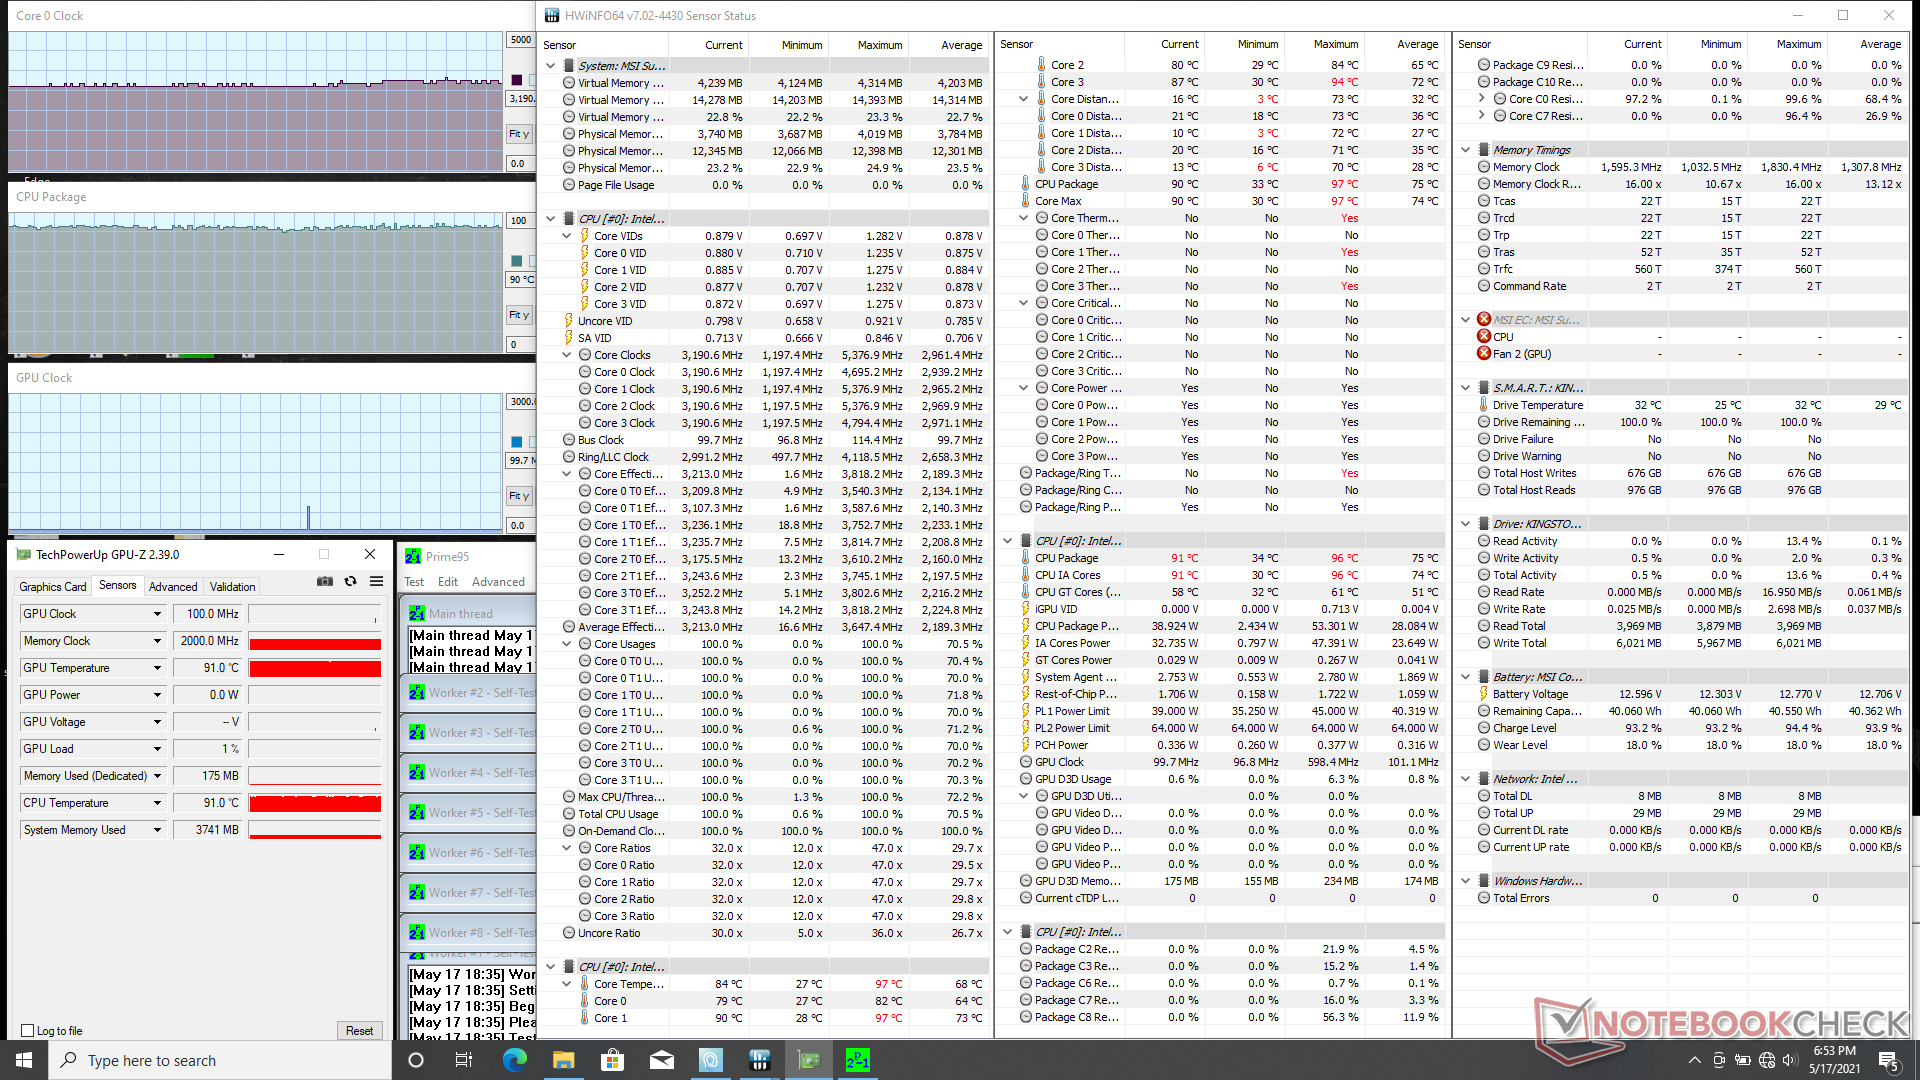
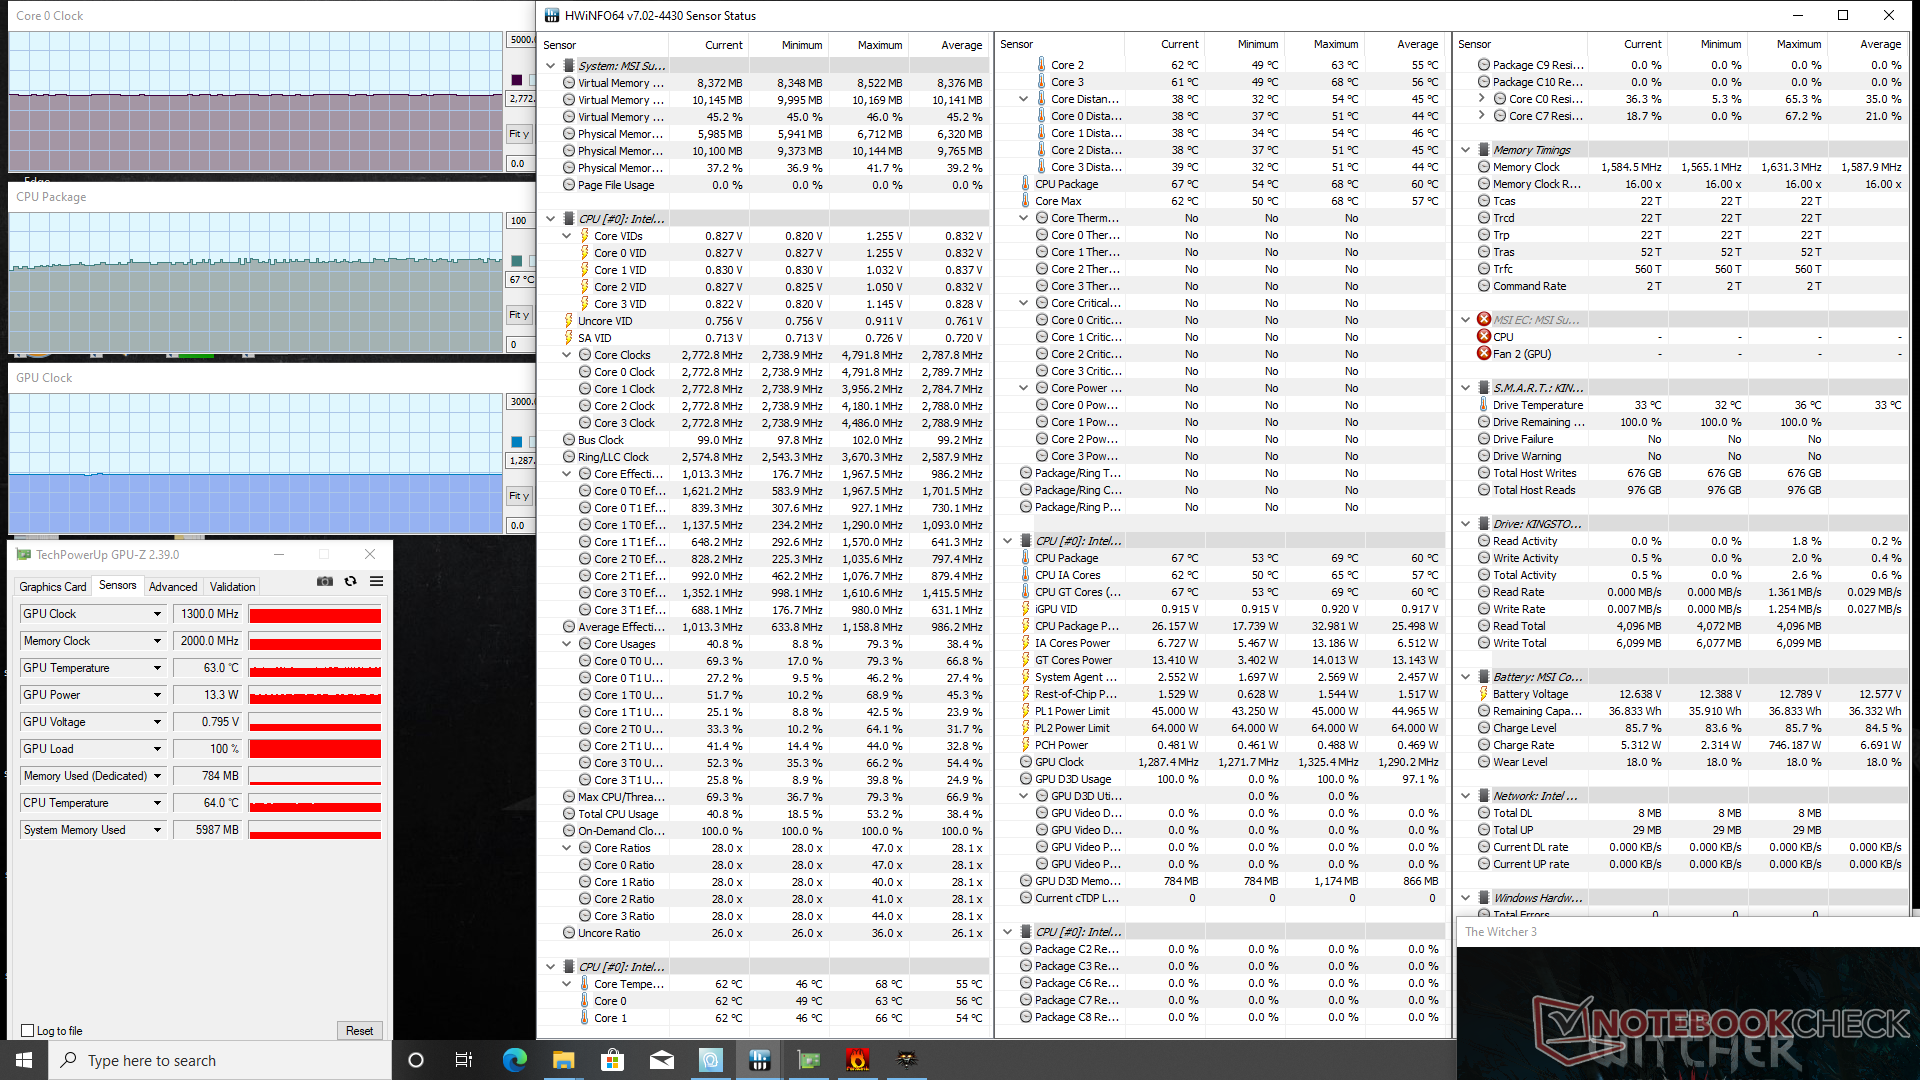

| CPU Clock (GHz) | GPU Clock (MHz) | Average CPU Temperature (°C) | |
| System Idle | -- | -- | 33 |
| Prime95 + FurMark Stress (Cooler Boost on) | 2.5 | 1300 | 84 |
| Prime95 Stress (Cooler Boost off) | 3.0 - 3.1 | -- | 90 |
| Prime95 Stress (Cooler Boost on) | 3.2 - 3.3 | -- | 90 |
| Witcher 3 Stress (Cooler Boost off) | 2.8 | 1300 | 67 |
| Witcher 3 Stress (Cooler Boost on) | 2.8 | 1300 | 56 |
Speakers


MSI Summit B15 A11M audio analysis
(+) | speakers can play relatively loud (83.9 dB)
Bass 100 - 315 Hz
(-) | nearly no bass - on average 18.2% lower than median
(±) | linearity of bass is average (12.2% delta to prev. frequency)
Mids 400 - 2000 Hz
(±) | higher mids - on average 9.5% higher than median
(±) | linearity of mids is average (9.3% delta to prev. frequency)
Highs 2 - 16 kHz
(±) | higher highs - on average 7.5% higher than median
(±) | linearity of highs is average (7.1% delta to prev. frequency)
Overall 100 - 16.000 Hz
(±) | linearity of overall sound is average (25.6% difference to median)
Compared to same class
» 78% of all tested devices in this class were better, 6% similar, 16% worse
» The best had a delta of 7%, average was 21%, worst was 53%
Compared to all devices tested
» 78% of all tested devices were better, 4% similar, 17% worse
» The best had a delta of 4%, average was 24%, worst was 134%
Apple MacBook 12 (Early 2016) 1.1 GHz audio analysis
(+) | speakers can play relatively loud (83.6 dB)
Bass 100 - 315 Hz
(±) | reduced bass - on average 11.3% lower than median
(±) | linearity of bass is average (14.2% delta to prev. frequency)
Mids 400 - 2000 Hz
(+) | balanced mids - only 2.4% away from median
(+) | mids are linear (5.5% delta to prev. frequency)
Highs 2 - 16 kHz
(+) | balanced highs - only 2% away from median
(+) | highs are linear (4.5% delta to prev. frequency)
Overall 100 - 16.000 Hz
(+) | overall sound is linear (10.2% difference to median)
Compared to same class
» 7% of all tested devices in this class were better, 2% similar, 91% worse
» The best had a delta of 5%, average was 18%, worst was 53%
Compared to all devices tested
» 5% of all tested devices were better, 1% similar, 94% worse
» The best had a delta of 4%, average was 24%, worst was 134%
Energy Management
Power Consumption
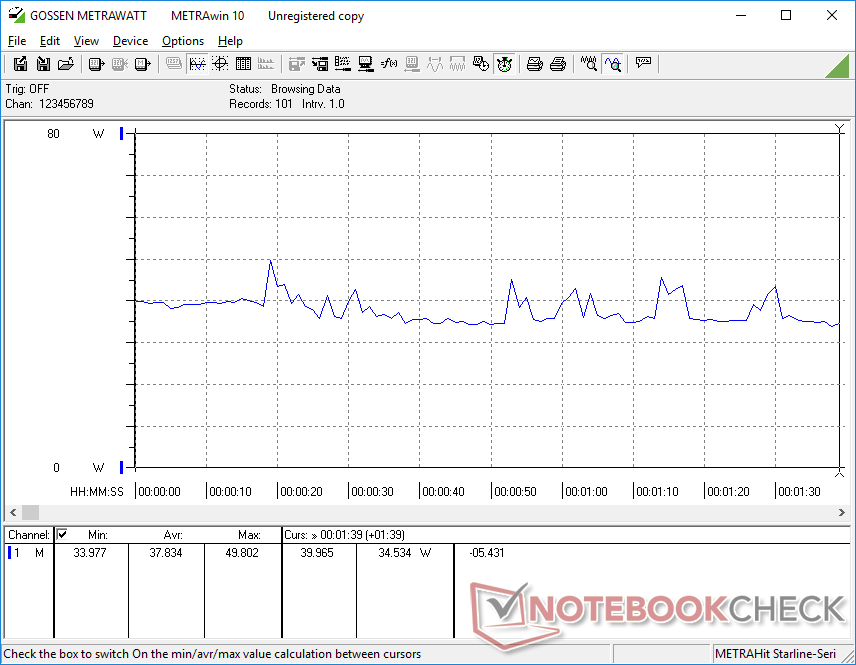
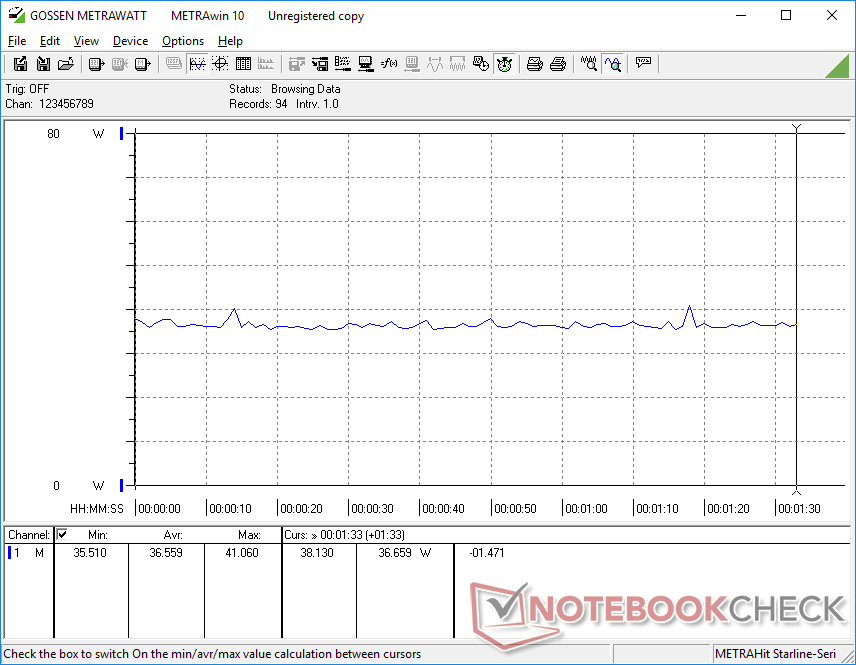
Power consumption is low especially when compared to last year's Modern 15. Idling on desktop consumes between 4 W and 9 W depending on the brightness level and power profile whereas the Modern 15 would consume between 6 W and 15 W. Running games would also consume just 38 W on our Summit B15 compared to 59 W to 83 W on the Modern 15 even though our Summit system can outperform the 10th gen CPU in the Modern 15 while being roughly on par with the GeForce MX250.
Interestingly, the XPG Xenia Xe with the same Core i7-1165G7 CPU and Iris Xe GPU would consume slightly more power than our Summit B15 when gaming (44 W vs. 38 W). The XPG system, however, would also consistently outperform our Summit in GPU benchmarks and games.
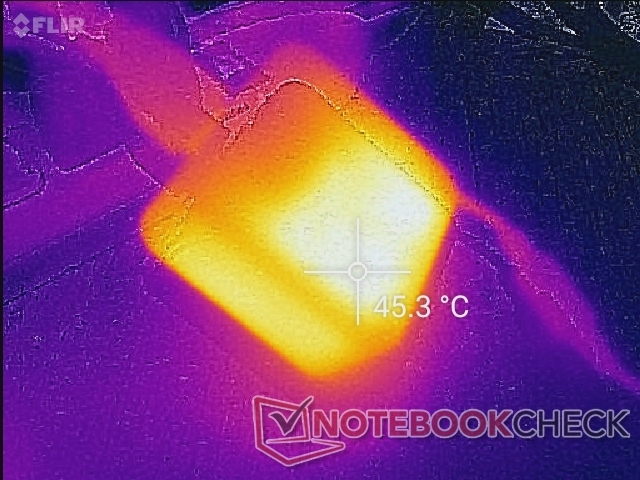
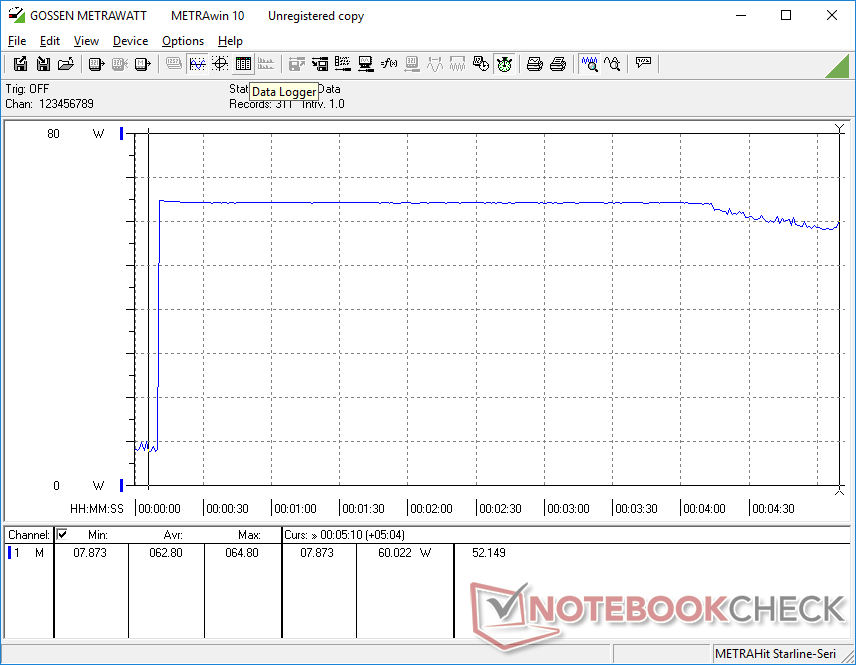
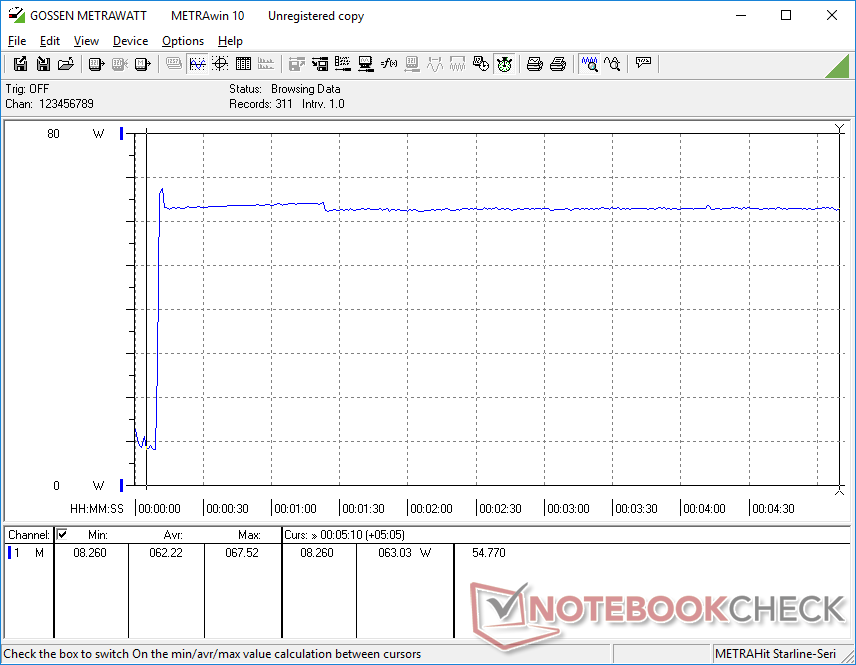
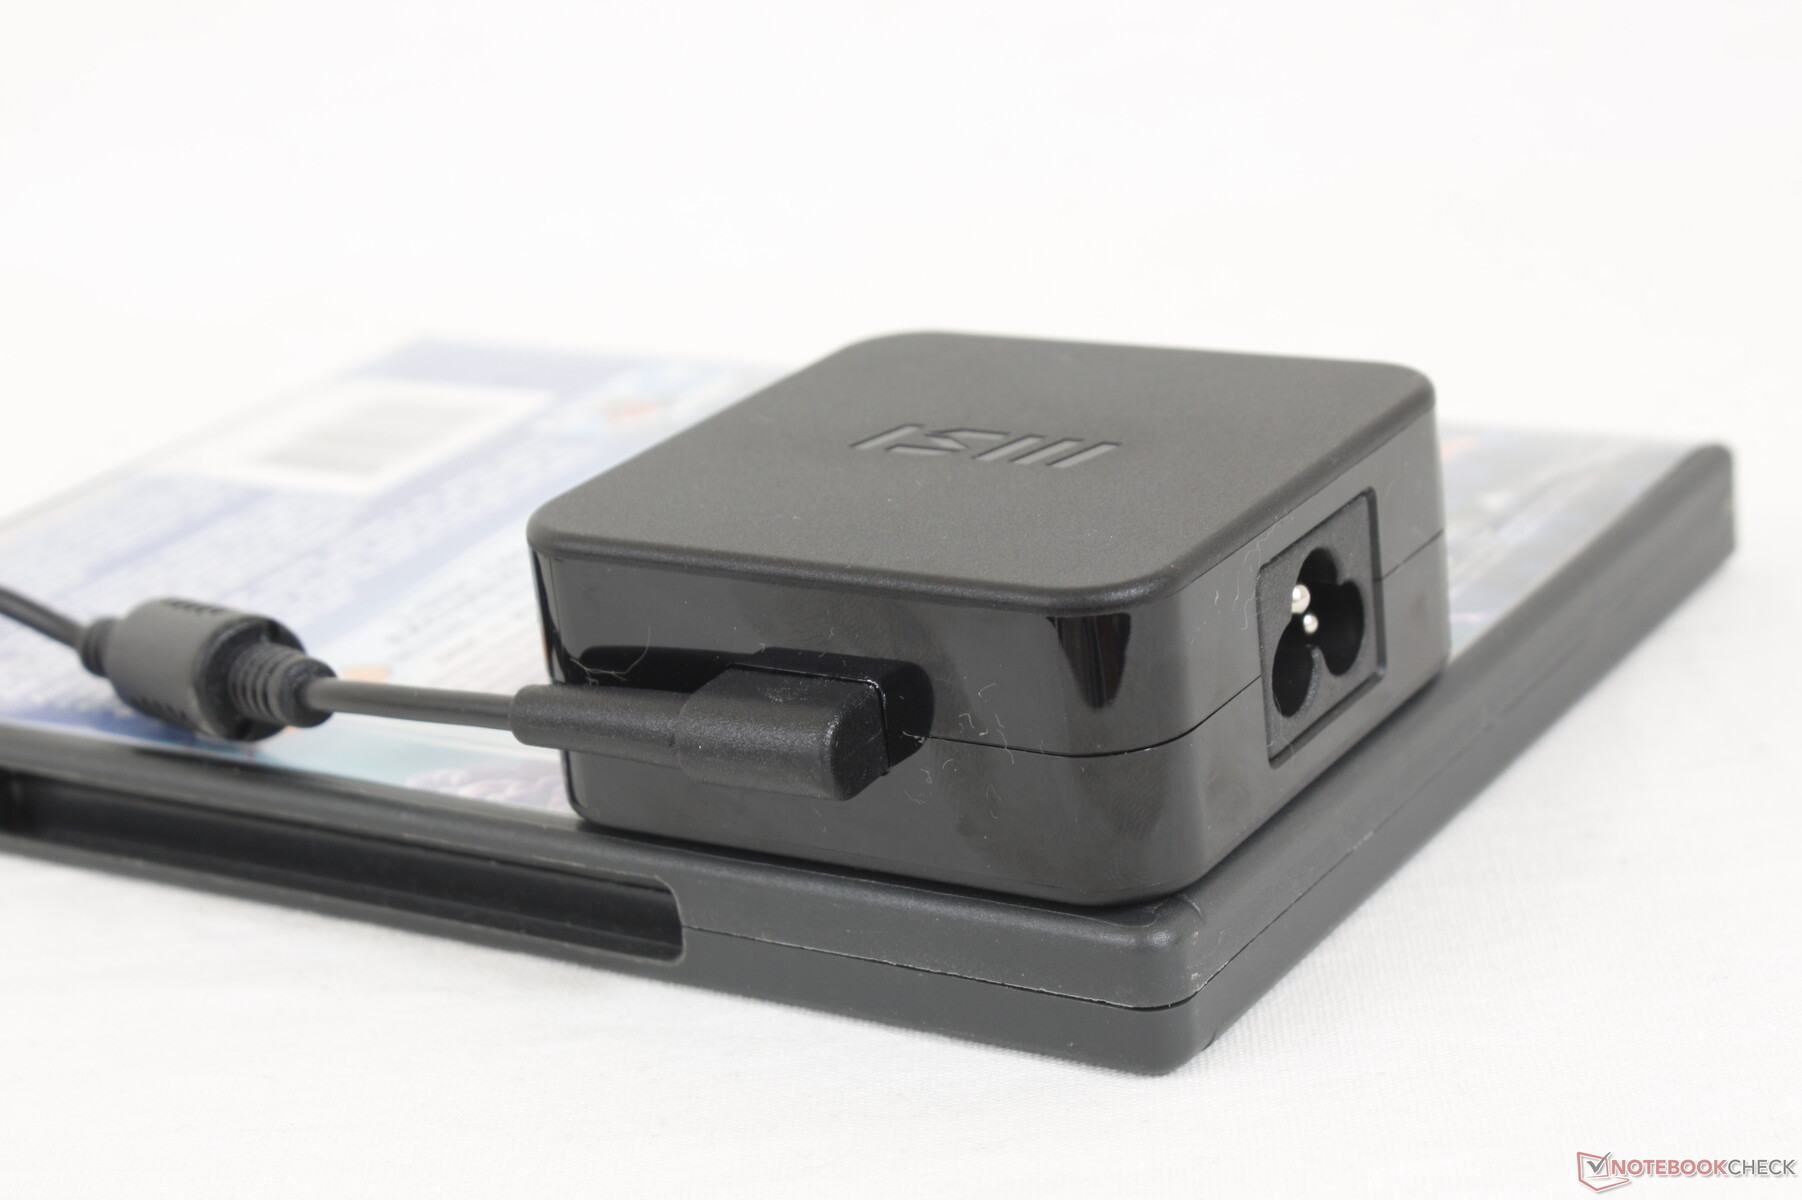
We're able to record a maximum temporary draw of 67.5 W from the small (~6.5 x 6.5 x 2.8 cm) 65 W AC adapter. The system can even maintain a rough 60 to 63 W draw for extended periods when under extreme processing stress to show that a more capable AC adapter might have been beneficial.
| Off / Standby | |
| Idle | |
| Load |
|
Key:
min: | |
| MSI Summit B15 A11M i7-1165G7, Iris Xe G7 96EUs, Kingston OM8PCP31024F, IPS, 1920x1080, 15.6" | MSI Summit E15 A11SCST i7-1185G7, GeForce GTX 1650 Ti Max-Q, Phison 1TB SM2801T24GKBB4S-E162, IPS, 1920x1080, 15.6" | Dell XPS 15 9500 Core i5 i5-10300H, UHD Graphics 630, Toshiba KBG40ZNS256G NVMe, IPS, 1920x1200, 15.6" | HP Spectre X360 15-5ZV31AV i7-10510U, GeForce MX250, Intel SSD 660p 2TB SSDPEKNW020T8, IPS, 3840x2160, 15.6" | ADATA XPG Xenia Xe i7-1165G7, Iris Xe G7 96EUs, ADATA XPG Gammix S50 1TB, IPS, 1920x1080, 15.6" | Asus ZenBook 15 UX534FTC-A8190T i7-10510U, GeForce GTX 1650 Max-Q, Samsung SSD PM981 MZVLB1T0HALR, IPS, 1920x1080, 15.6" | |
|---|---|---|---|---|---|---|
| Power Consumption | -68% | -3% | -34% | 8% | -29% | |
| Idle Minimum * (Watt) | 4.2 | 6 -43% | 2.9 31% | 5.2 -24% | 2.7 36% | 2.8 33% |
| Idle Average * (Watt) | 7.7 | 10 -30% | 7.6 1% | 8.5 -10% | 5.3 31% | 7.7 -0% |
| Idle Maximum * (Watt) | 8.4 | 16 -90% | 8 5% | 8.7 -4% | 7.3 13% | 9.4 -12% |
| Load Average * (Watt) | 37.8 | 84 -122% | 41.7 -10% | 65.6 -74% | 43.6 -15% | 57 -51% |
| Witcher 3 ultra * (Watt) | 36.6 | 69 -89% | 56.5 -54% | 43.5 -19% | 62 -69% | |
| Load Maximum * (Watt) | 67.5 | 90 -33% | 94.8 -40% | 92.4 -37% | 66.8 1% | 116 -72% |
* ... smaller is better
Battery Life
Runtimes are decent at around 6.5 hours of real-world WLAN use to be several hours shorter than the pricier Summit E15. The difference can be attributed to the smaller battery capacity of just 52 W compared to 80 W on the aforementioned model.
Charging the system from empty to full capacity with the AC barrel adapter takes about 2 hours. The system can also recharge via third party USB-C AC adapters. We suspect that future models will drop the proprietary AC barrel port altogether and switch to USB-C charging only.
| MSI Summit B15 A11M i7-1165G7, Iris Xe G7 96EUs, 52 Wh | MSI Summit E15 A11SCST i7-1185G7, GeForce GTX 1650 Ti Max-Q, 80.25 Wh | Dell XPS 15 9500 Core i5 i5-10300H, UHD Graphics 630, 56 Wh | HP Spectre X360 15-5ZV31AV i7-10510U, GeForce MX250, 84 Wh | ADATA XPG Xenia Xe i7-1165G7, Iris Xe G7 96EUs, 73.41 Wh | Asus ZenBook 15 UX534FTC-A8190T i7-10510U, GeForce GTX 1650 Max-Q, 71 Wh | |
|---|---|---|---|---|---|---|
| Battery runtime | 41% | 48% | 92% | 77% | 92% | |
| Reader / Idle (h) | 18.4 | 19.5 6% | 26.4 43% | 22.6 23% | 27.2 48% | |
| WiFi v1.3 (h) | 6.6 | 9.1 38% | 9.3 41% | 10.8 64% | 11.7 77% | 12.4 88% |
| Load (h) | 1 | 1.8 80% | 1.6 60% | 2.9 190% | 2.4 140% |
Pros
Cons
Verdict

Is the MSI Summit B15 worth purchasing over the older Modern 15 even though both are very similar laptops? If you value Thunderbolt 4, a faster processor, and generally quieter fan noise, then the newer Summit B15 may be worth considering. Its raw performance is impressive for such a lightweight 15.6-inch form factor and users can always connect external GPUs and monitors for faster graphics and better colors, respectively.
Travelers will love the superlight weight, quiet fans, and high performance relative to popular 15.6-inch Ultrabooks like the XPS 15, Spectre x360 15, or Lenovo IdeaPad 15. However, for a >$1000 USD laptop, chassis rigidity isn't as strong as we would like.
If your workloads consist mostly of basic web browsing, video streaming, light gaming or minimal editing, then the Modern 15 with GeForce MX graphics will be more than enough while costing hundreds of dollars less. Keep in mind that the two laptops will provide the same experience when it comes to the display, keyboard, clickpad, and chassis quality. You will, however, lose the lucrative docking capabilities of Thunderbolt.
Price and availability
MSI Summit B15 A11M
- 05/20/2021 v7 (old)
Allen Ngo
Price comparison
