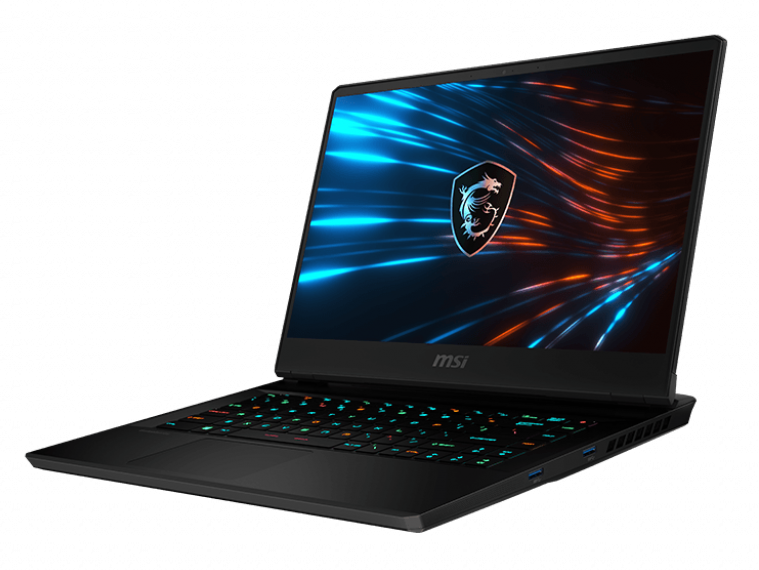
MSI GP66 Leopard 10UG Laptop Review: A Complete Series Overhaul
Unveiled earlier this year alongside the mobile Nvidia Ampere series, the GP66 introduces a brand new design over the older GP65. Almost everything has changed from the keyboard to the cooling solution to represent the start of a new generation for the GP family. For those unfamiliar, the GP series is home to MSI's mid-range gaming laptops above the cheaper GL and GF series and below the pricier GE and GT series.
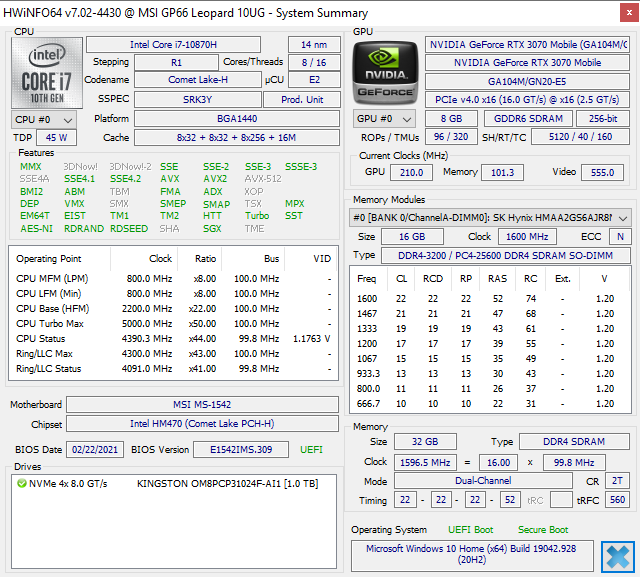
SKUs range from an Intel 10th gen Core-i7 10870H CPU with GeForce RTX 3060 graphics up to the Core i7-10875H with RTX 3080. Our review configuration is a middle configuration with the i7-10870H and RTX 3070 for around $2500 USD depending on the RAM and storage.
Competing models include other upper mid-range 15.6-inch gaming laptops like the Gigabyte Aorus 15P, Asus ROG Zephyrus G15, or Lenovo Legion 7.
More MSI reviews:
potential competitors in comparison
Rating | Date | Model | Weight | Height | Size | Resolution | Price |
|---|---|---|---|---|---|---|---|
| 84.2 % v7 (old) | 04 / 2021 | MSI GP66 Leopard 10UG i7-10870H, GeForce RTX 3070 Laptop GPU | 2.3 kg | 23.4 mm | 15.60" | 1920x1080 | |
| 83.2 % v7 (old) | 05 / 2020 | MSI GP65 10SFK-047US i7-10750H, GeForce RTX 2070 Mobile | 2.3 kg | 27.5 mm | 15.60" | 1920x1080 | |
| 85.4 % v7 (old) | 04 / 2021 | Alienware m15 R4 i9-10980HK, GeForce RTX 3070 Laptop GPU | 2.3 kg | 20 mm | 15.60" | 1920x1080 | |
| 86.1 % v7 (old) | 02 / 2021 | Aorus 15P XC i7-10870H, GeForce RTX 3070 Laptop GPU | 2.2 kg | 27 mm | 15.60" | 1920x1080 | |
| 83.8 % v7 (old) | 02 / 2021 | Asus ROG Zephyrus G15 GA503Q R9 5900HS, GeForce RTX 3080 Laptop GPU | 2 kg | 20 mm | 15.60" | 2560x1440 | |
| 80.4 % v7 (old) | 03 / 2021 | MSI GF65 Thin 10UE i7-10750H, GeForce RTX 3060 Laptop GPU | 1.9 kg | 21.7 mm | 15.60" | 1920x1080 |
Case
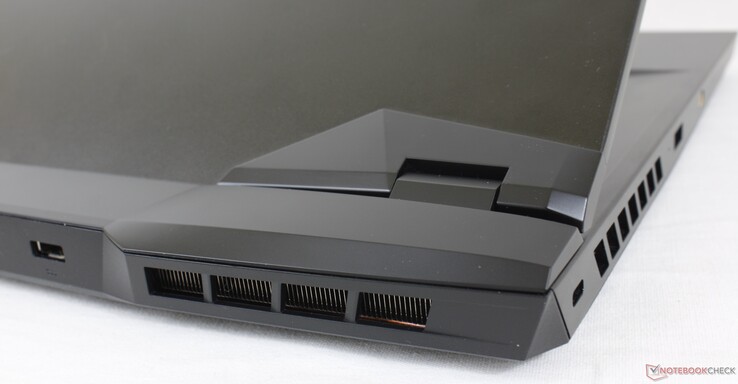
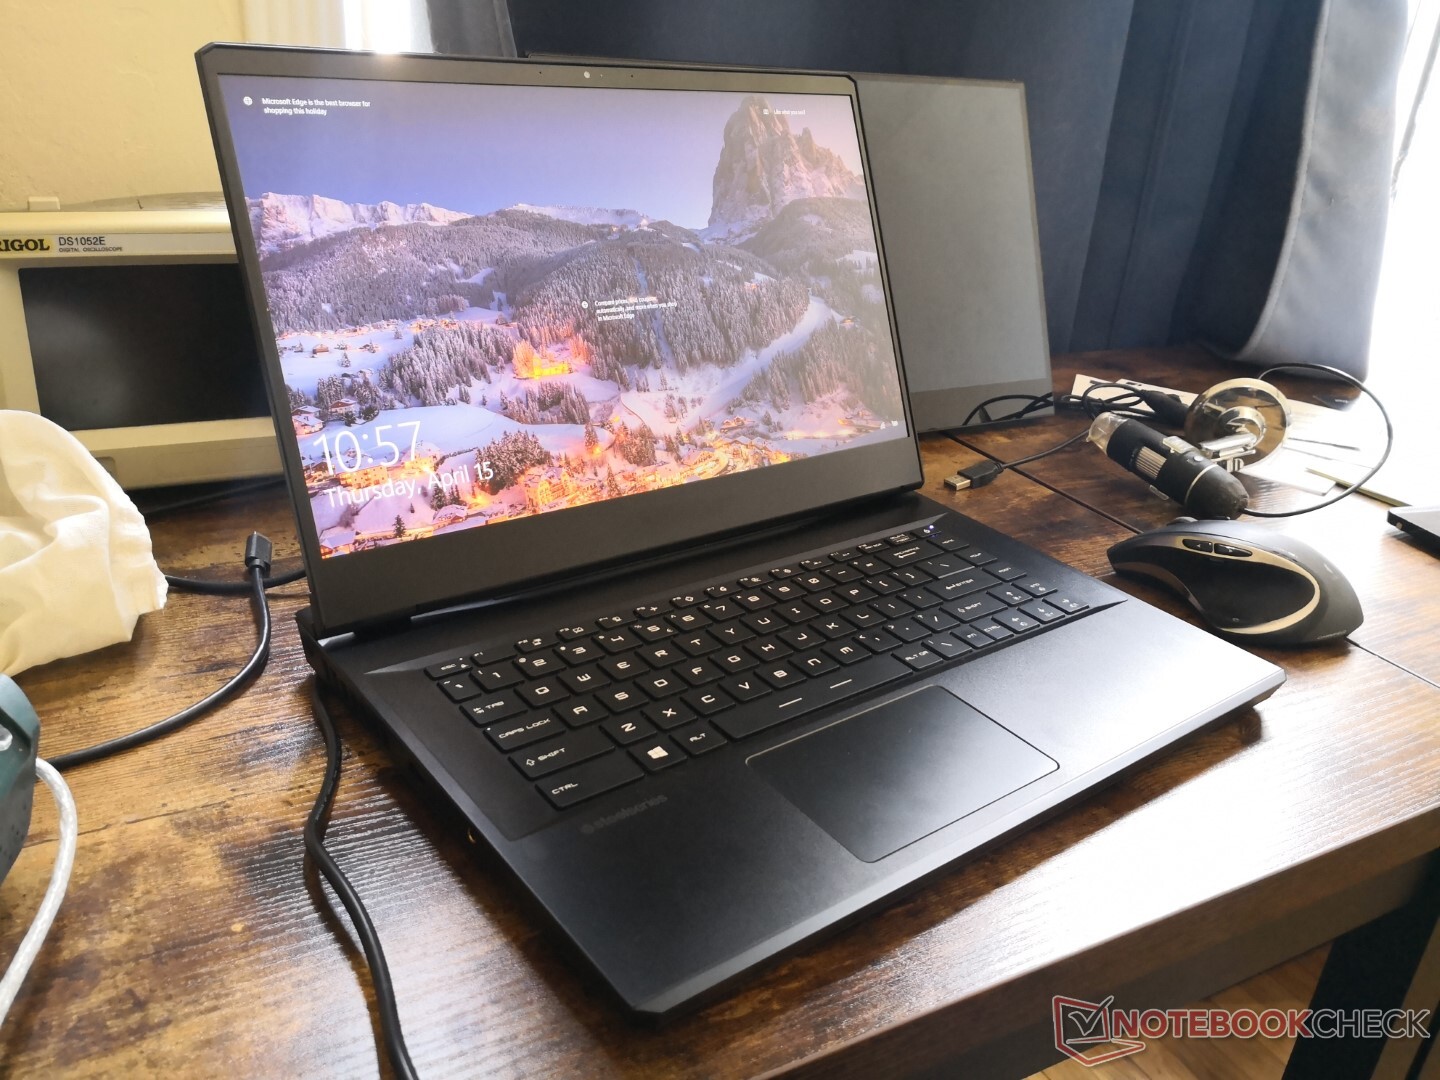
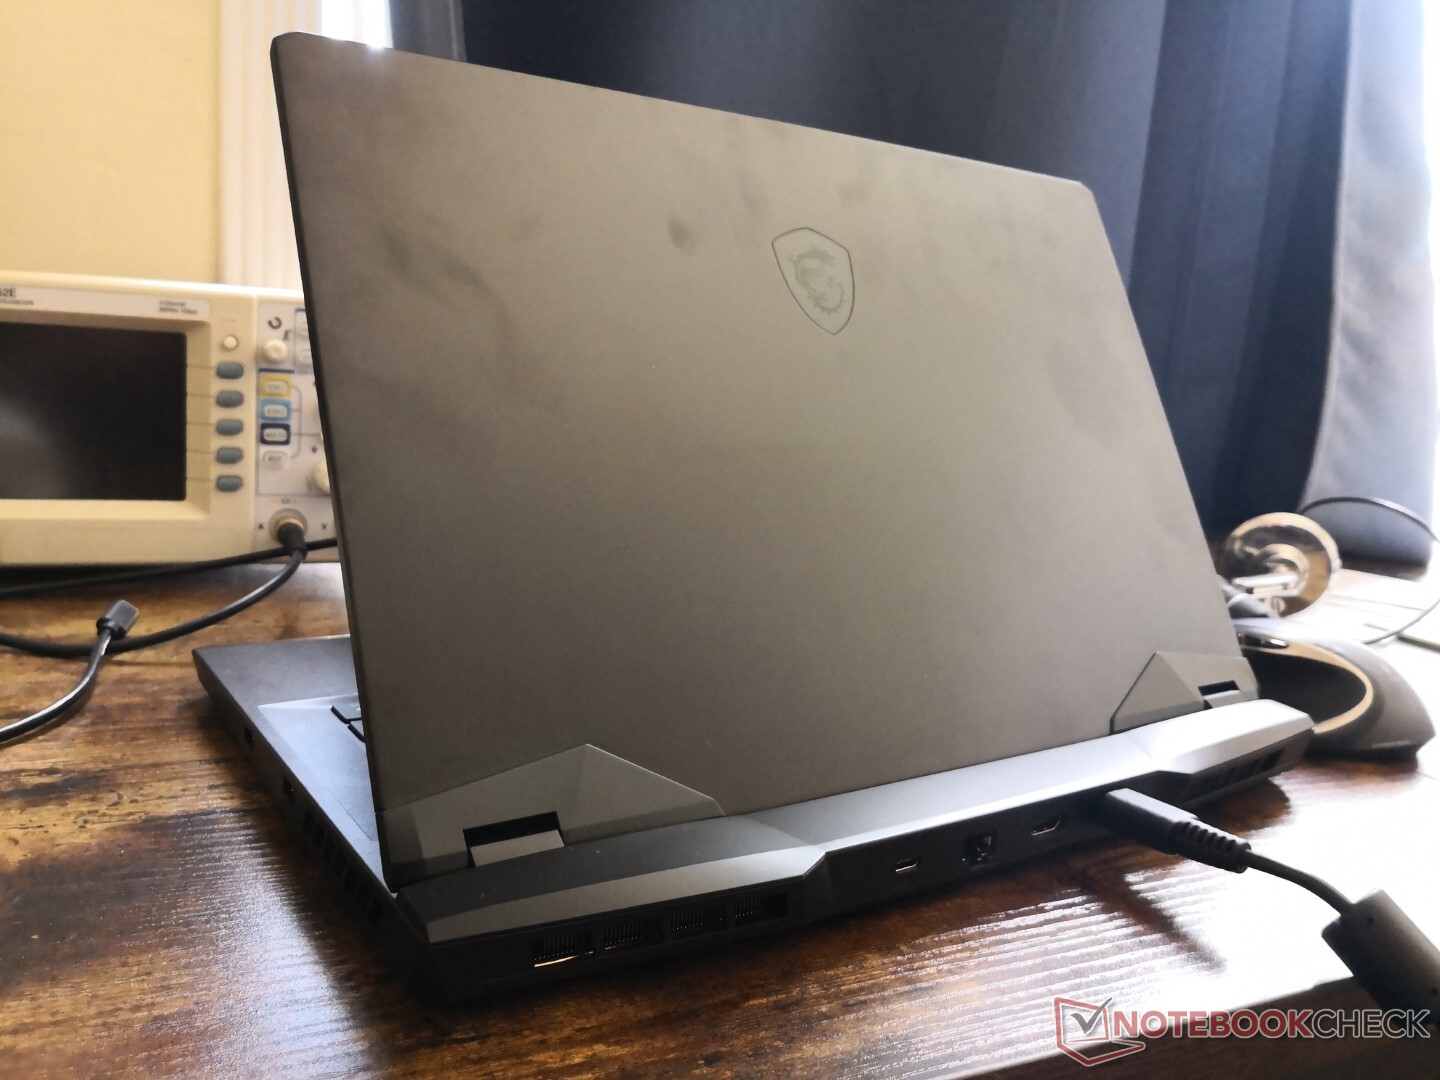
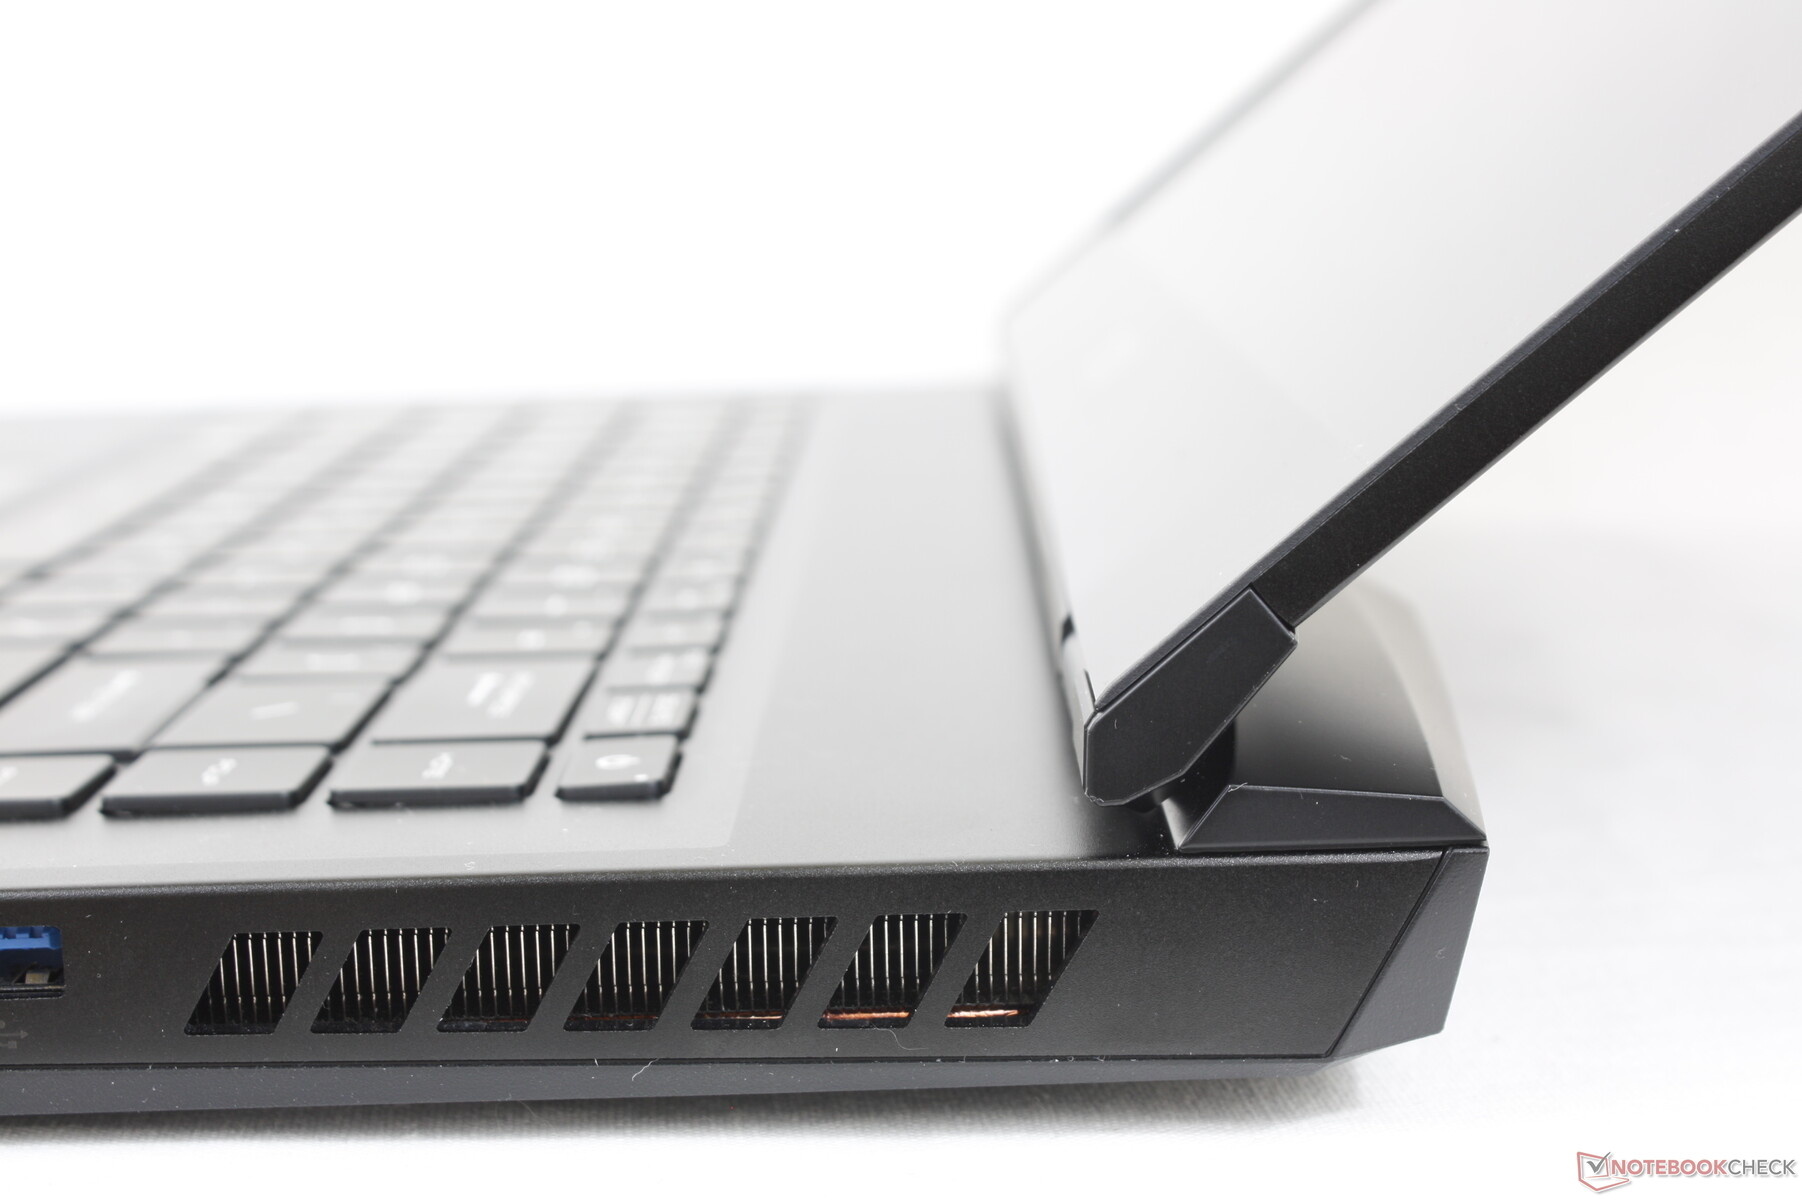
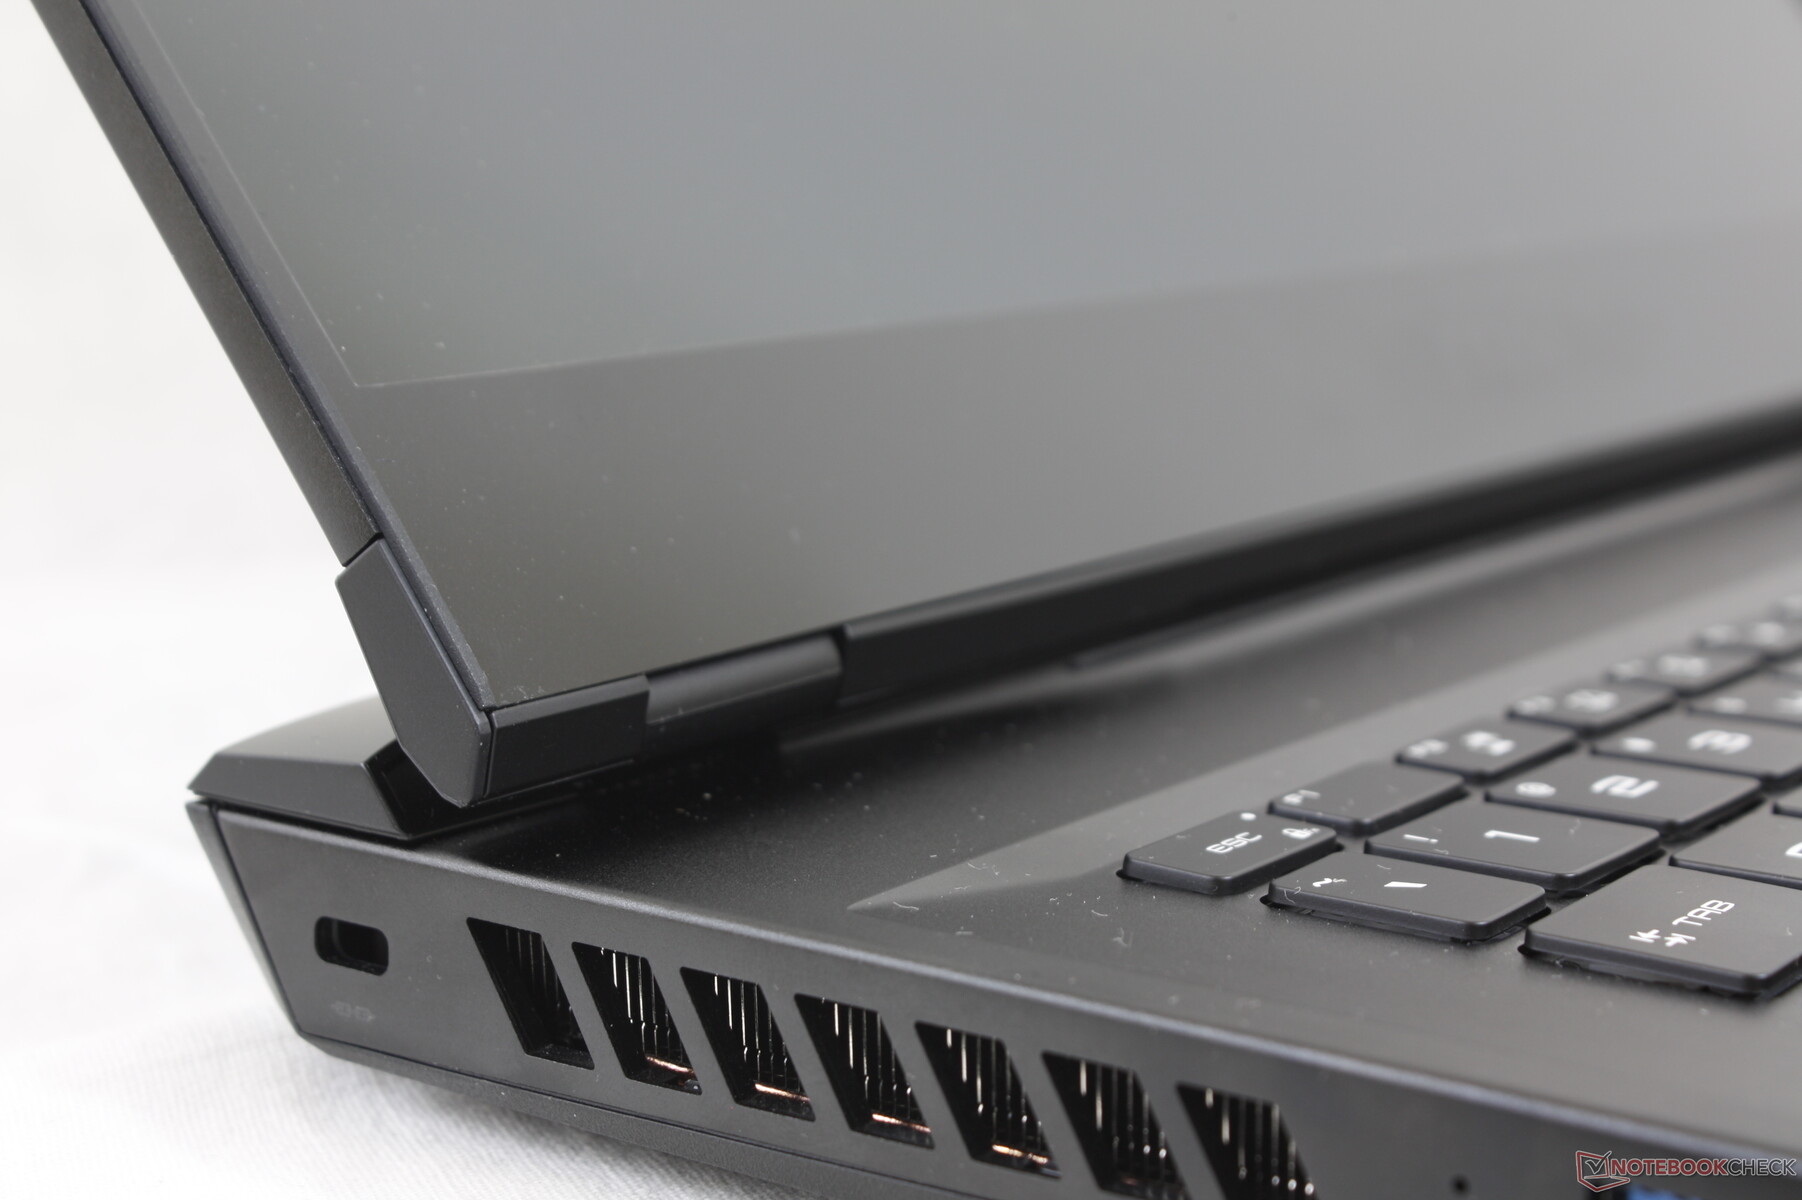
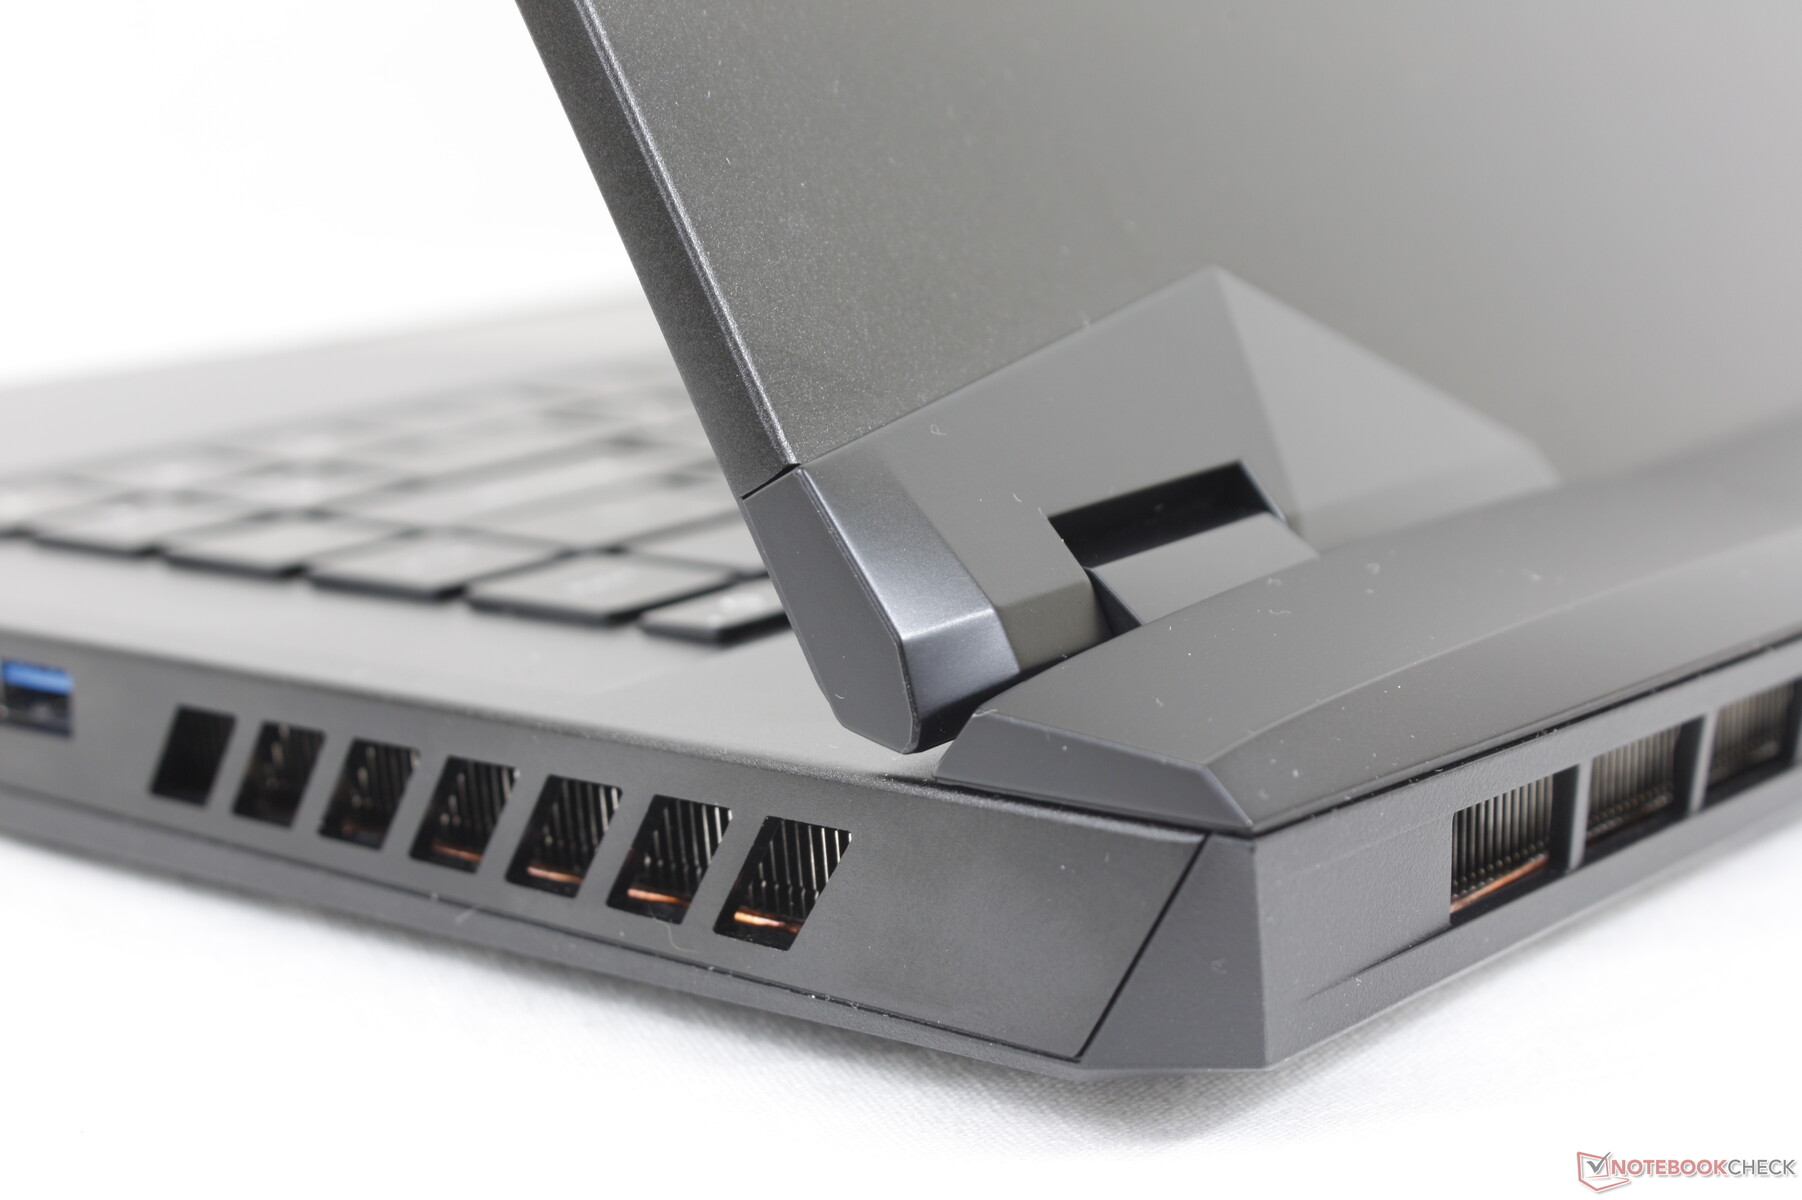
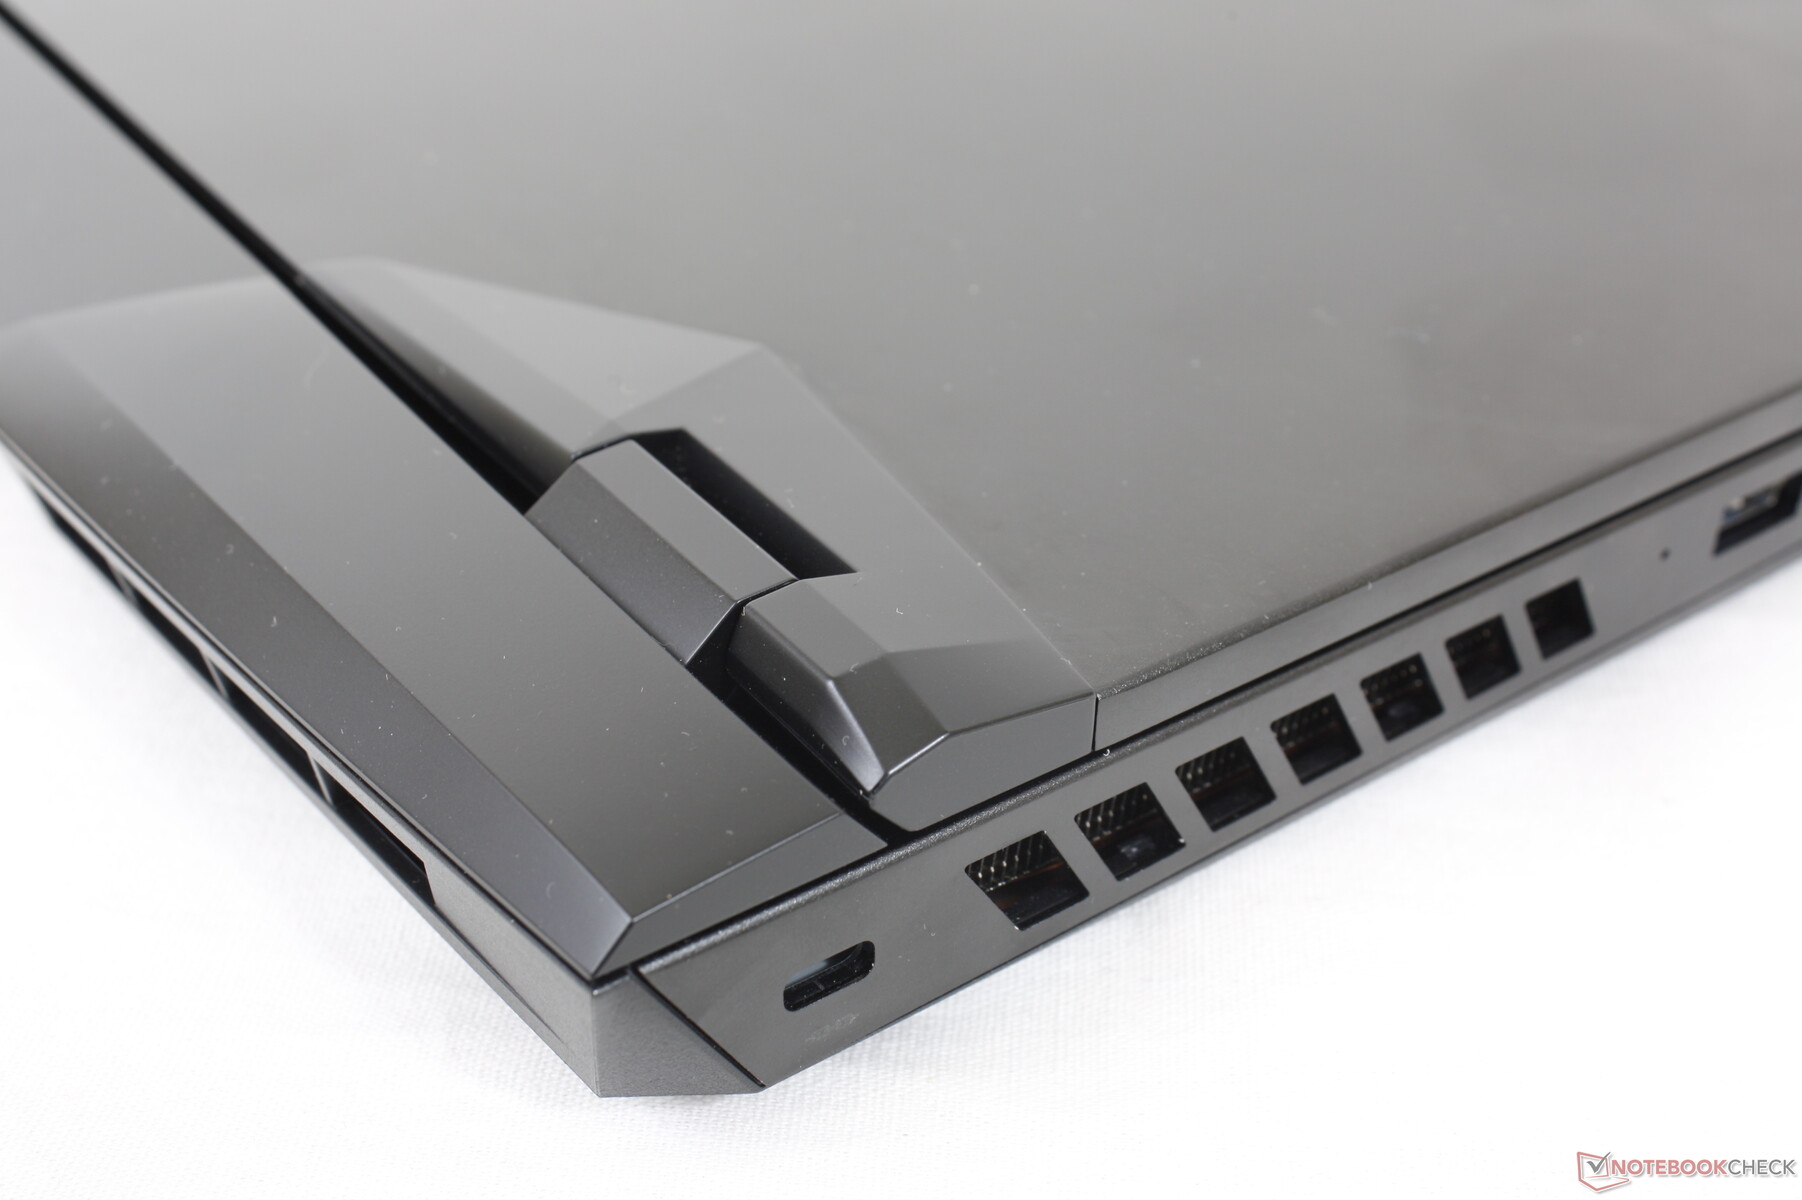
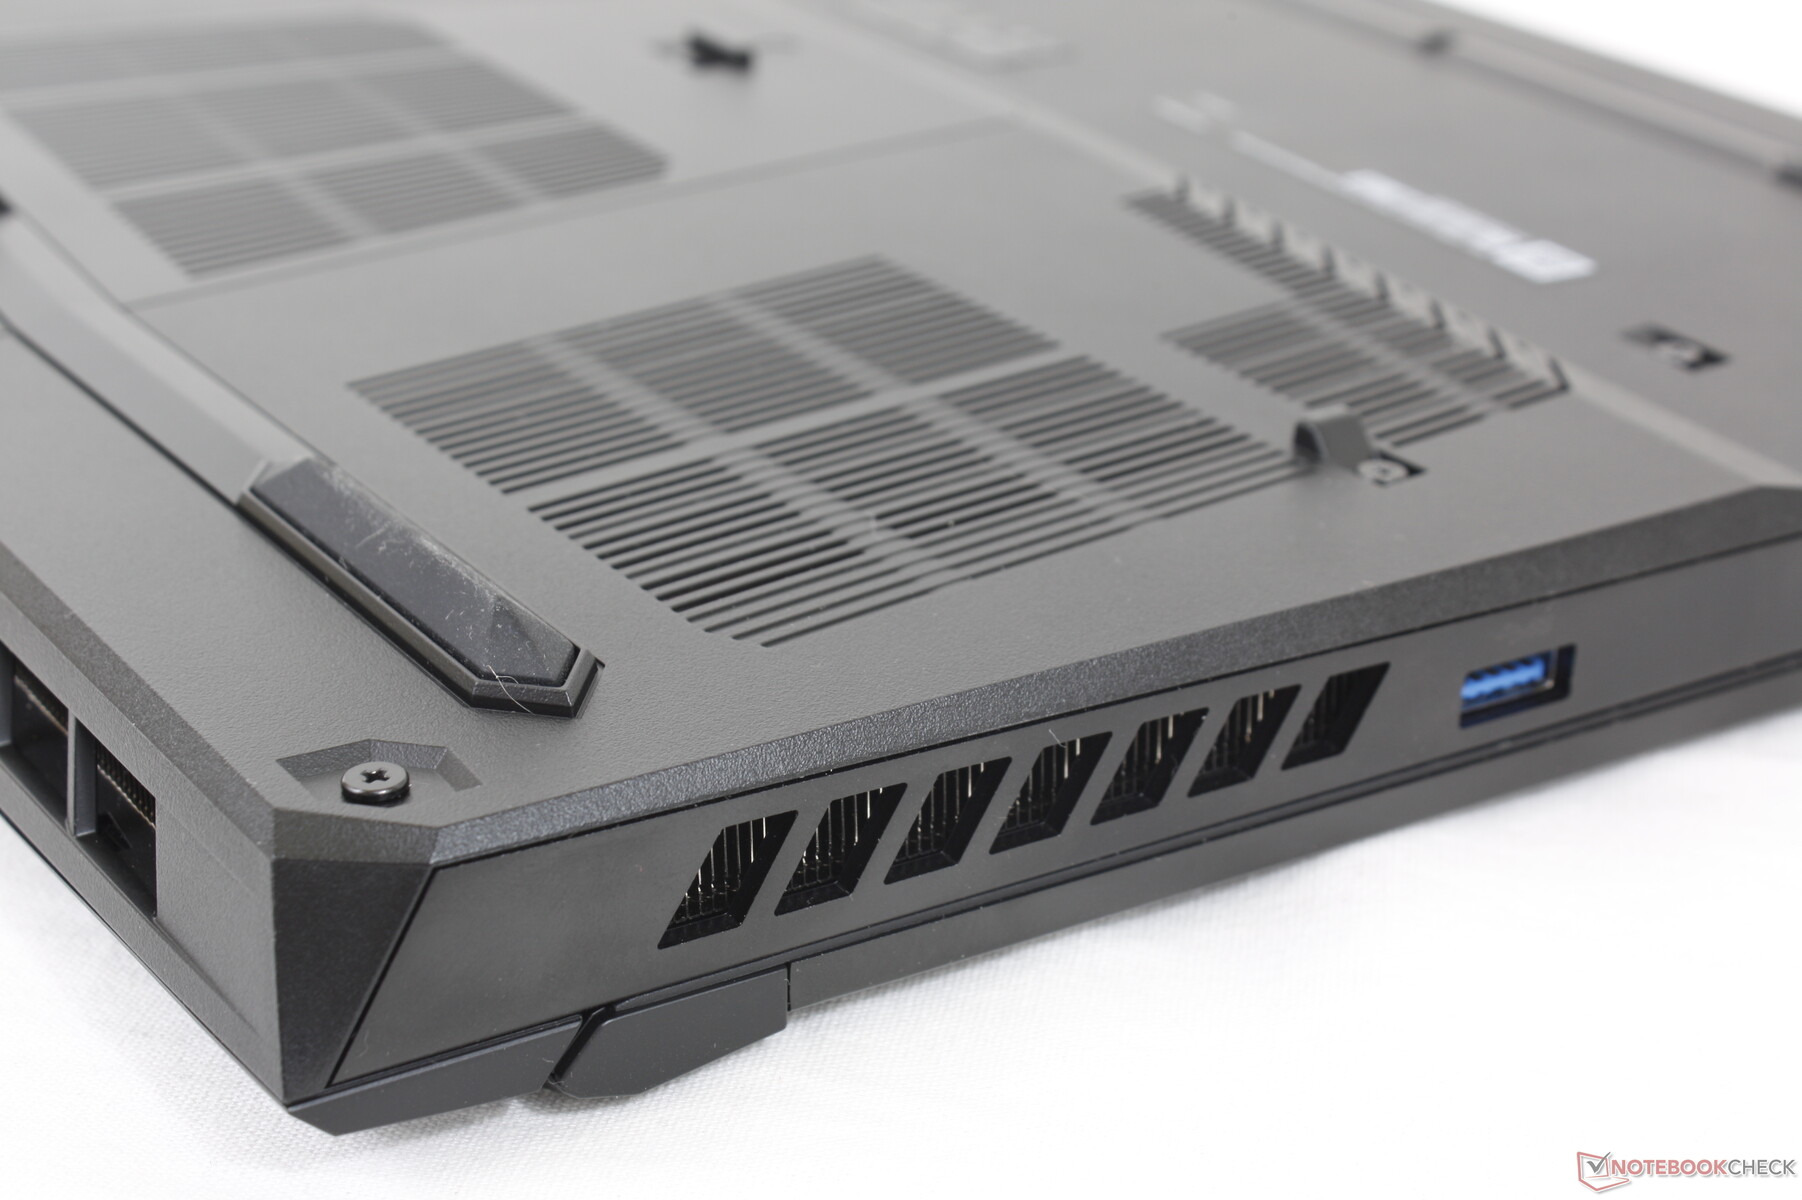
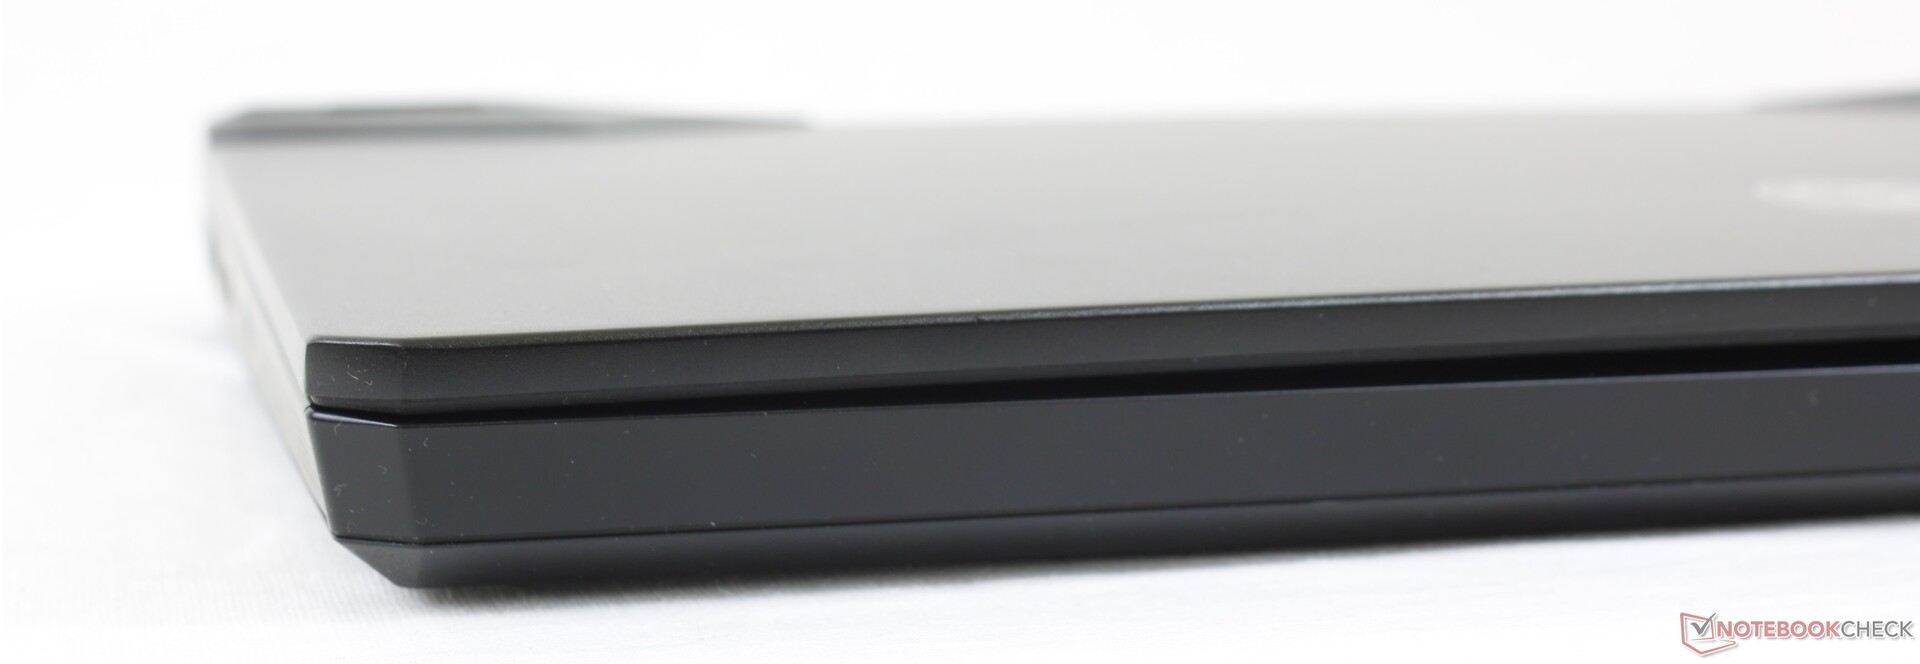
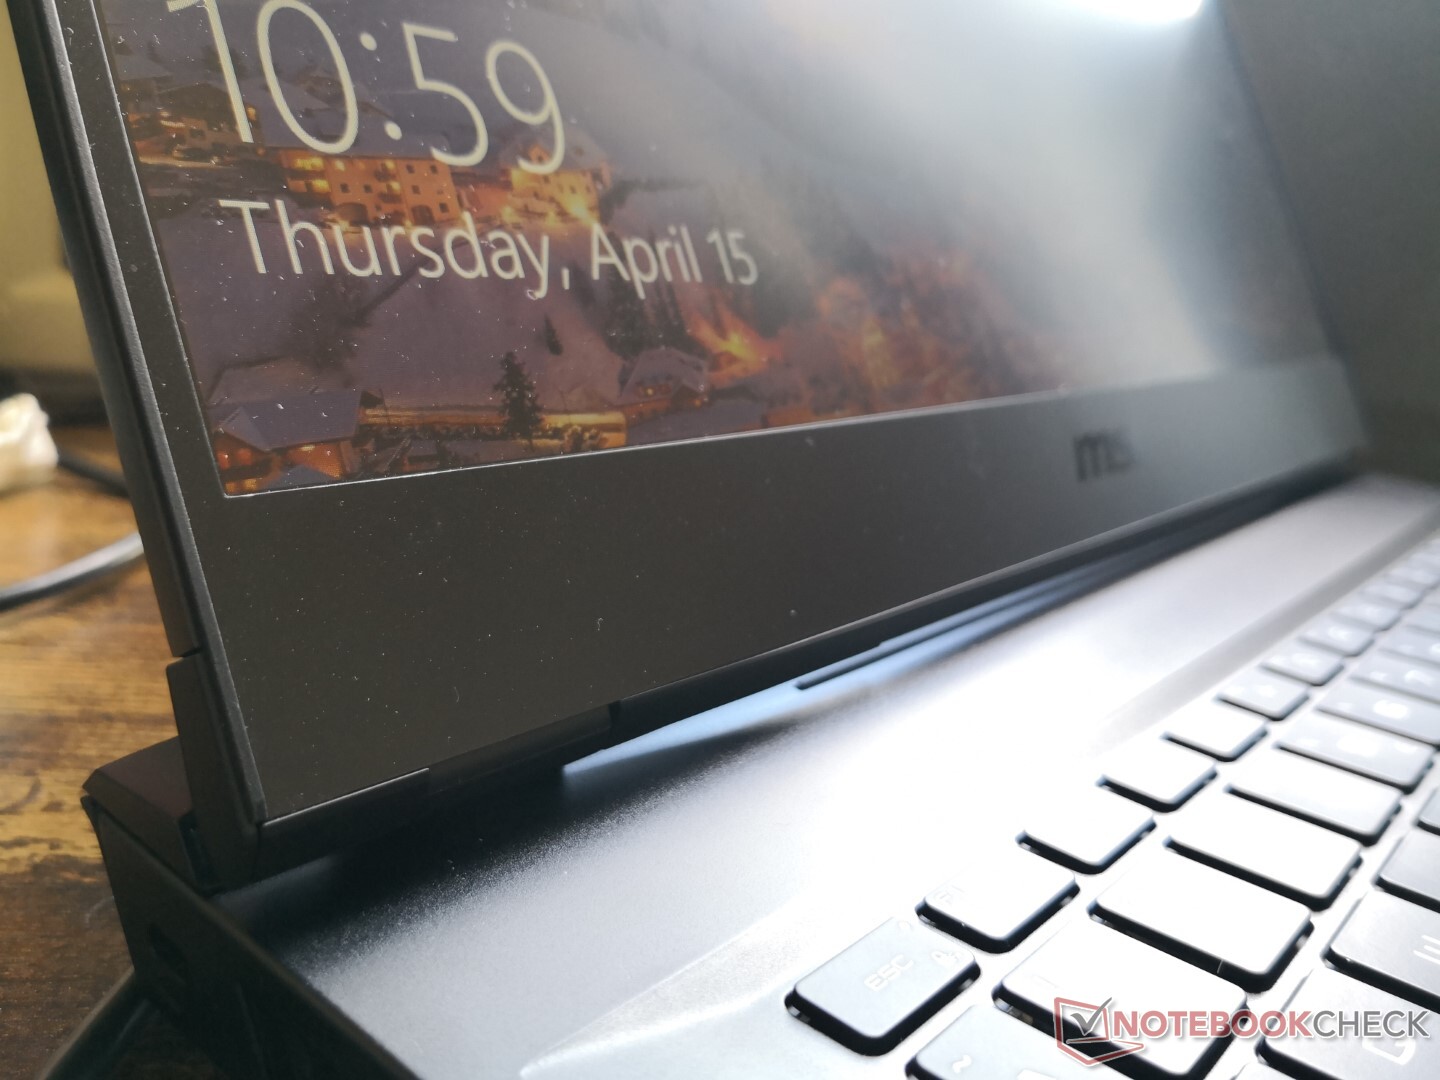
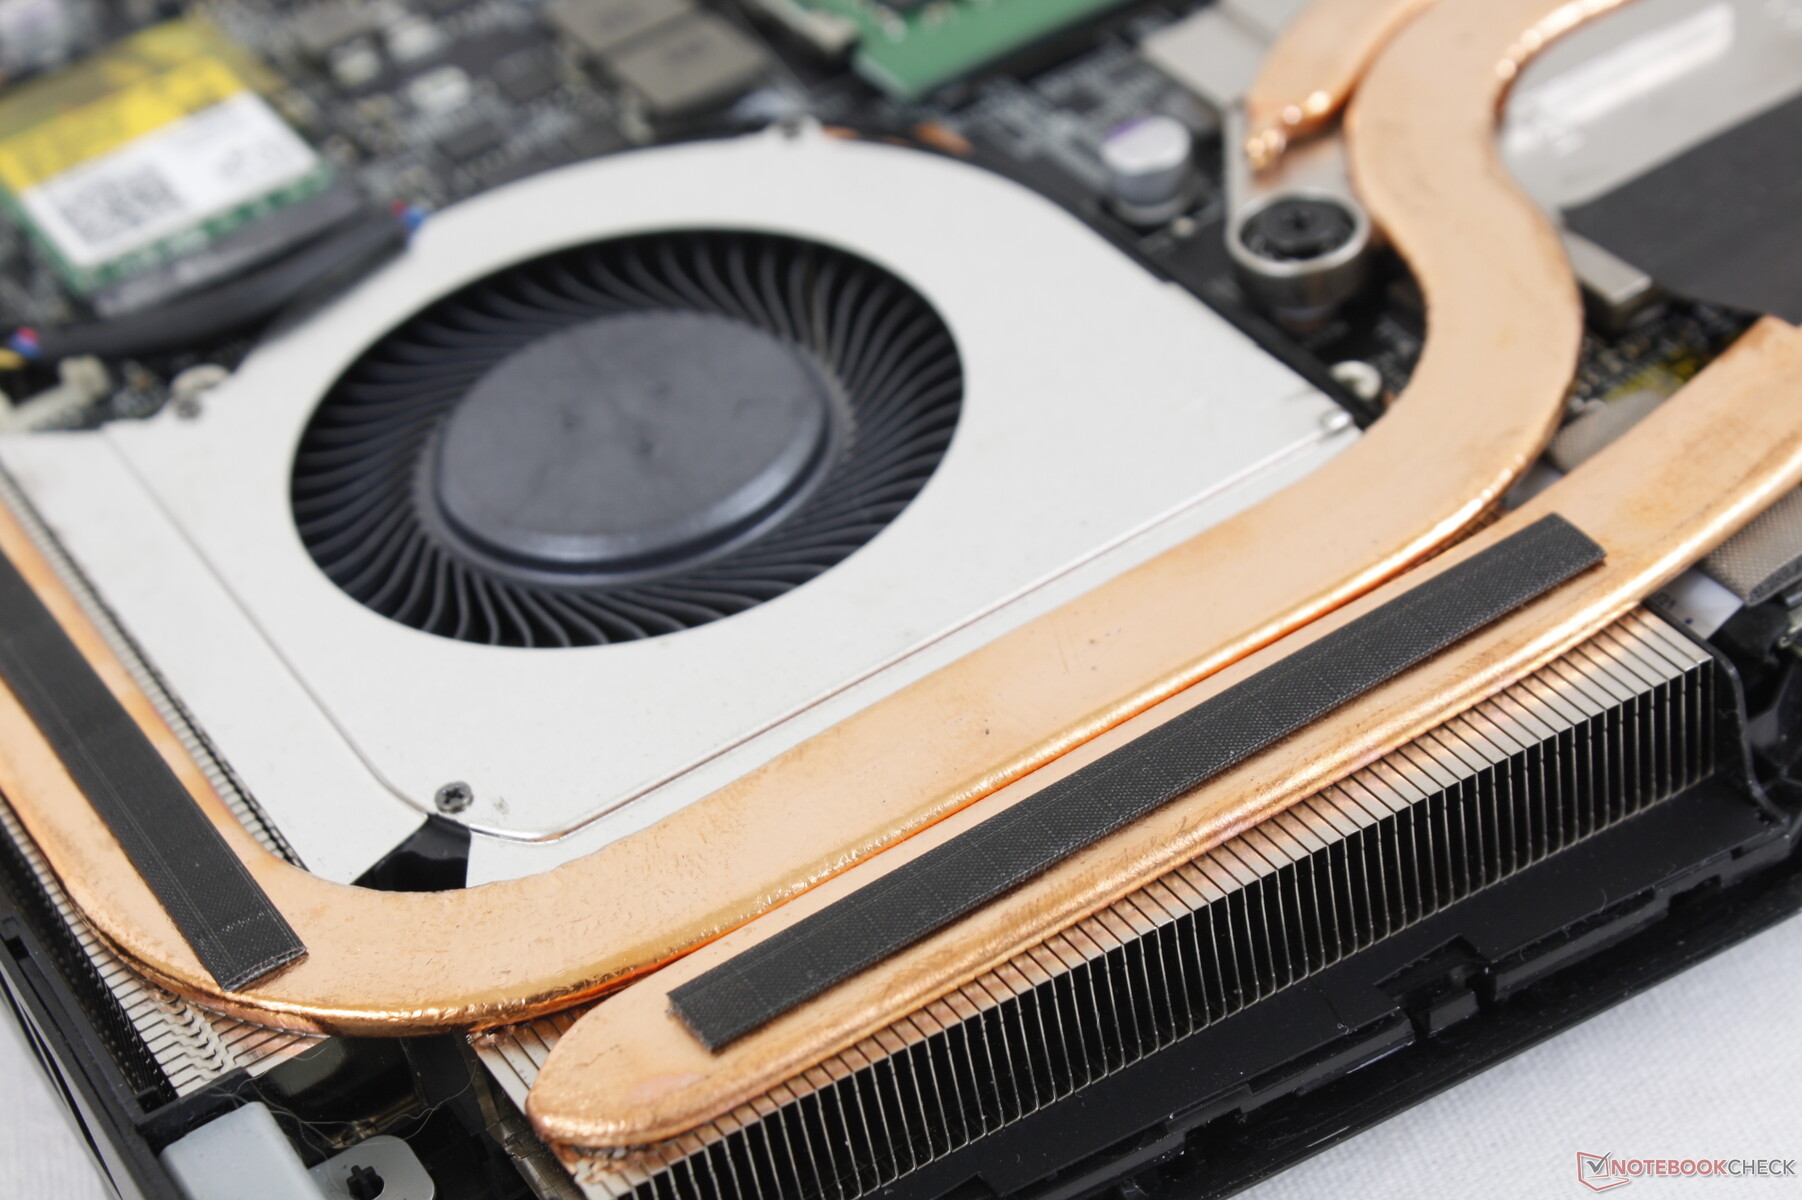
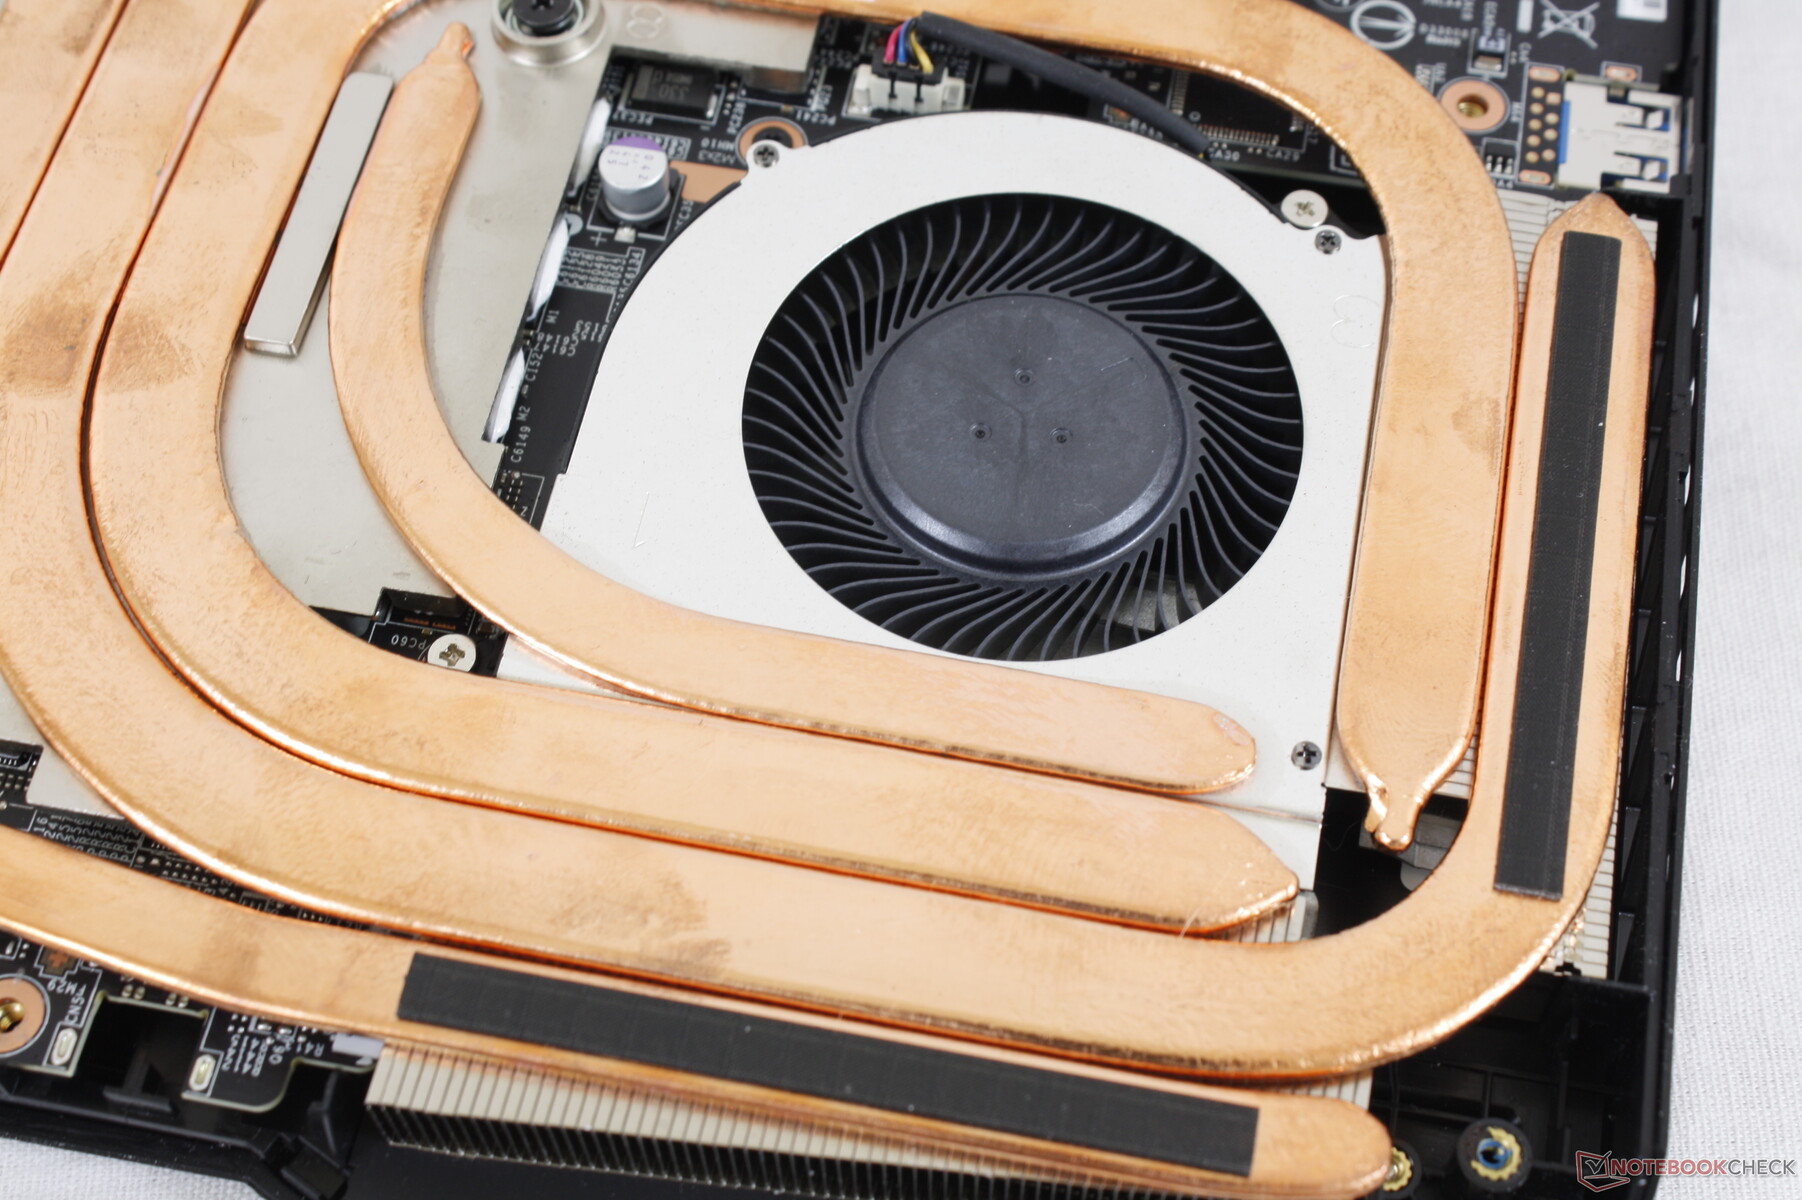
The biggest physical change from the GP65 to the GP66 is the larger rear in order to accommodate a more powerful cooling solution. The overall visual design can otherwise be best described as a toned down GE66 with their similar smooth metal outer lids but a darker black color scheme. The RGB light bar along the front edge of the GE66 is not present on the GP66 while the per-key RGB keyboard lighting remains.
Build quality is excellent especially for the base. The keyboard deck exhibits just minimal flexing and creaking when bending or twisting its front corners. The lid, however, could have been stiffer as the hinges tend to teeter when adjusting angles. The outer lid also flexes more readily than on the Asus ROG Strix G15 when applying pressure down its center.
The new design is noticeably longer than the older GP65 in length because of the new "jet engine" rear. Otherwise, weight remains nearly the same gen-to-gen at 2.3 kg and the system is actually thinner this time around by about 4 mm. The competing Alienware m15 R4 is even larger while the Asus Zephyrus G15 GA503Q is both lighter and smaller.
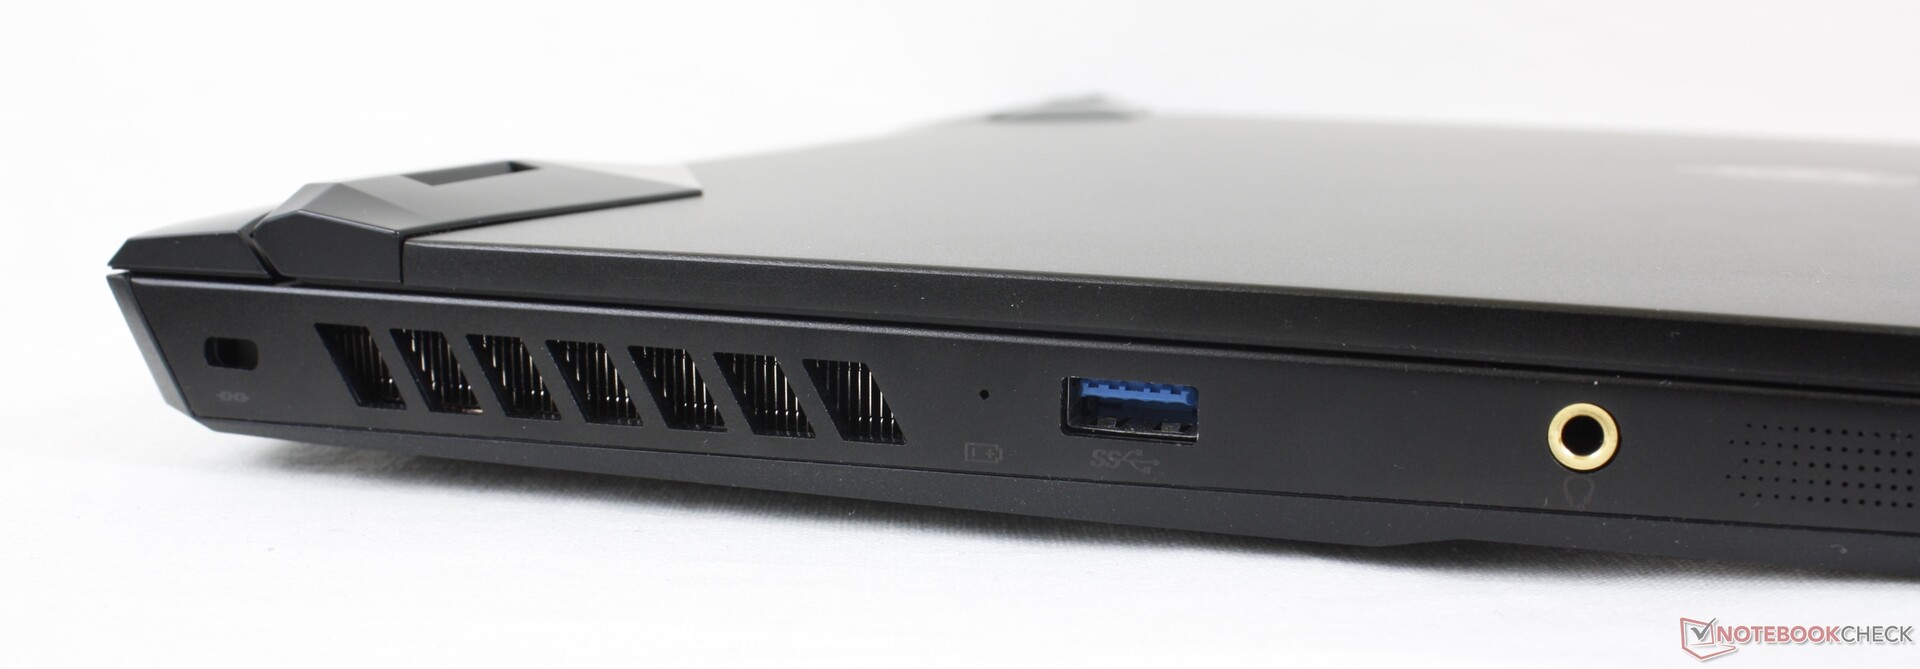
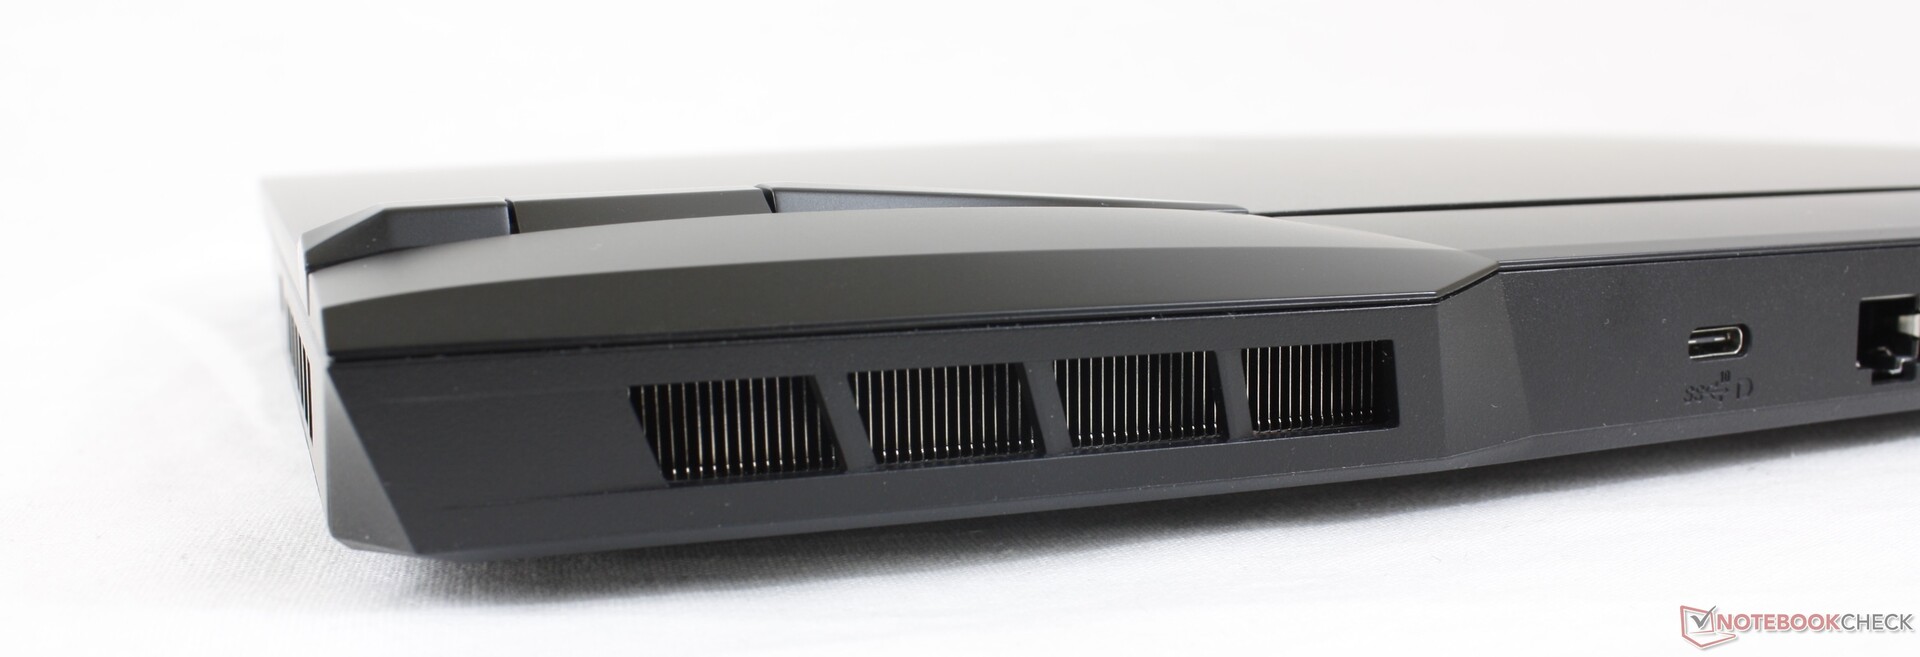
Connectivity
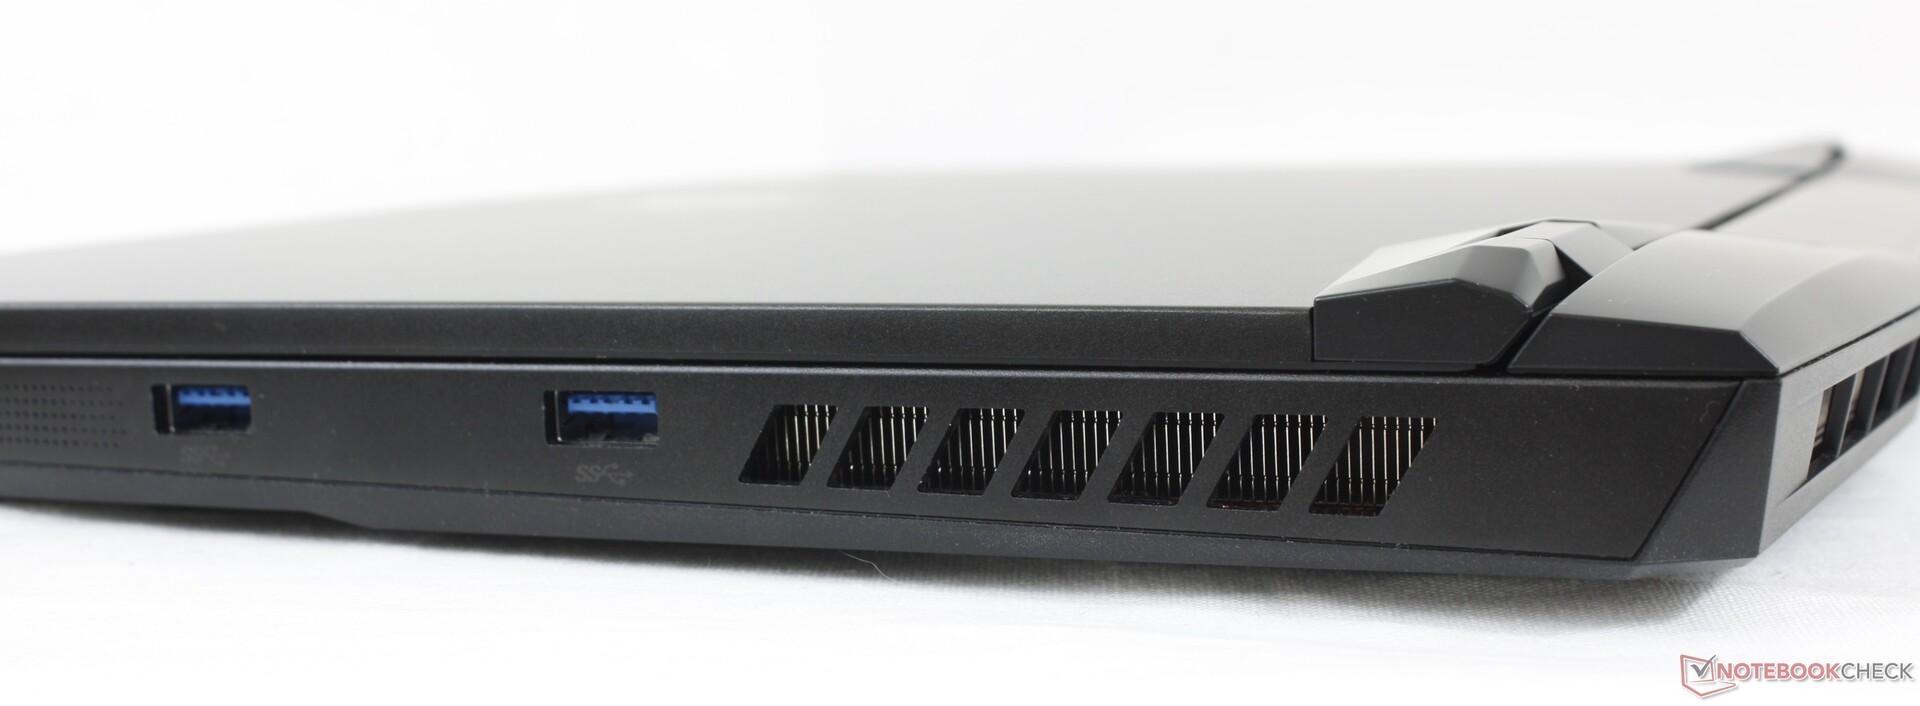
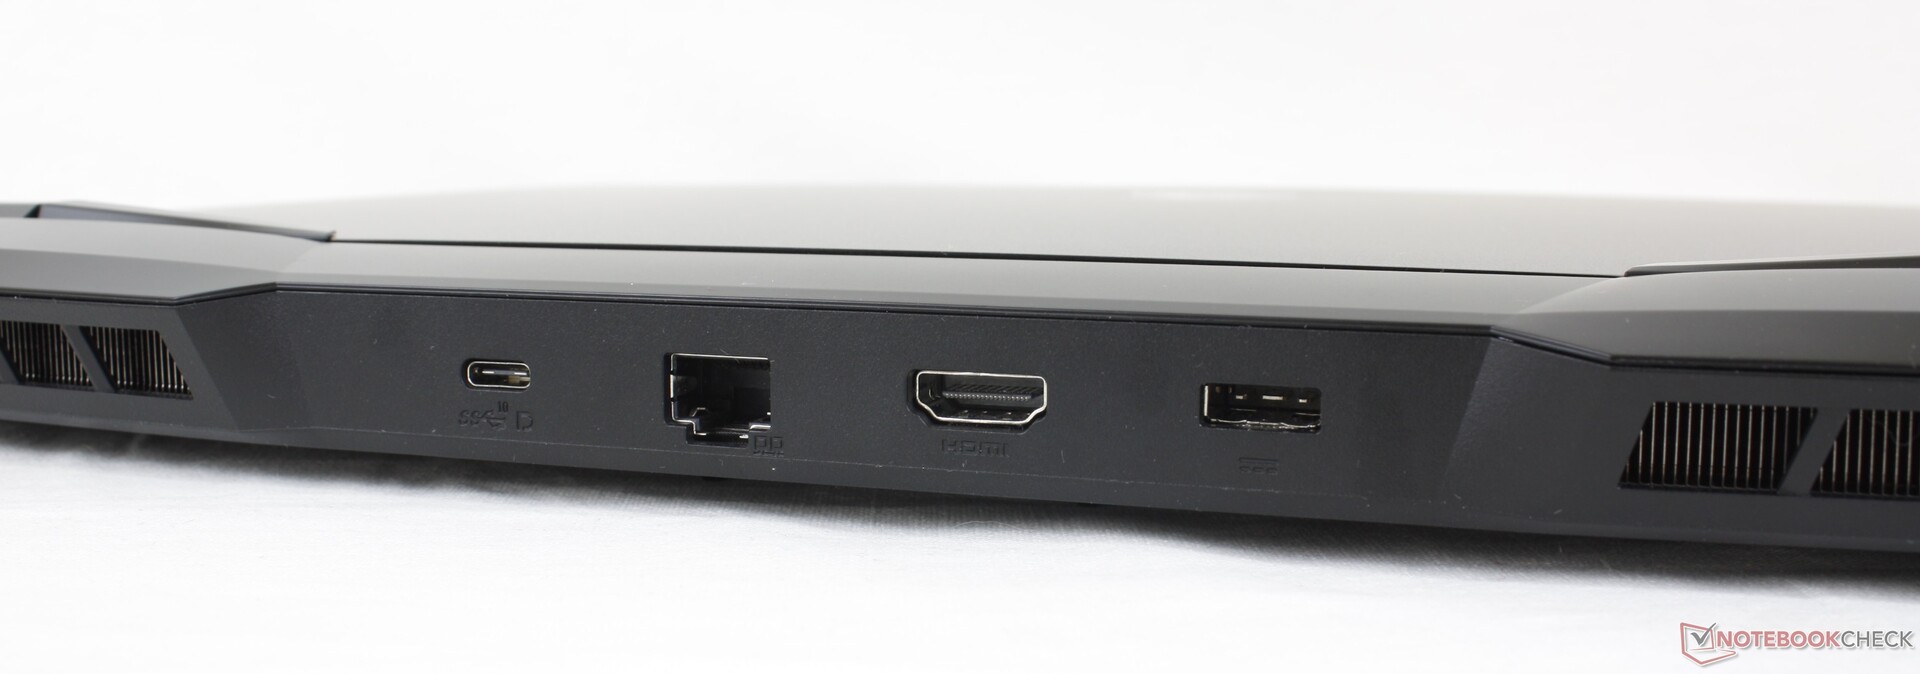
Port options and positioning have changed significantly from the GP65. For one, the ports are now more evenly distributed along the left, right, and rear edges whereas they were all clumped together on the GP65. Secondly, both the 3.5 mm microphone and mini-DisplayPort ports are now gone in favor of DisplayPort-over-USB-C. HDMI has been upgraded from 1.4 to 2.0 for 4K60 support and there is an extra USB-A port for three in total.
Keep in mind that Thunderbolt and USB-C Power Delivery are not supported. Thus, users cannot recharge the GP66 with USB-C adapters unlike on the Razer Blade 15 or Alienware m15.
Communication
Webcam


Maintenance
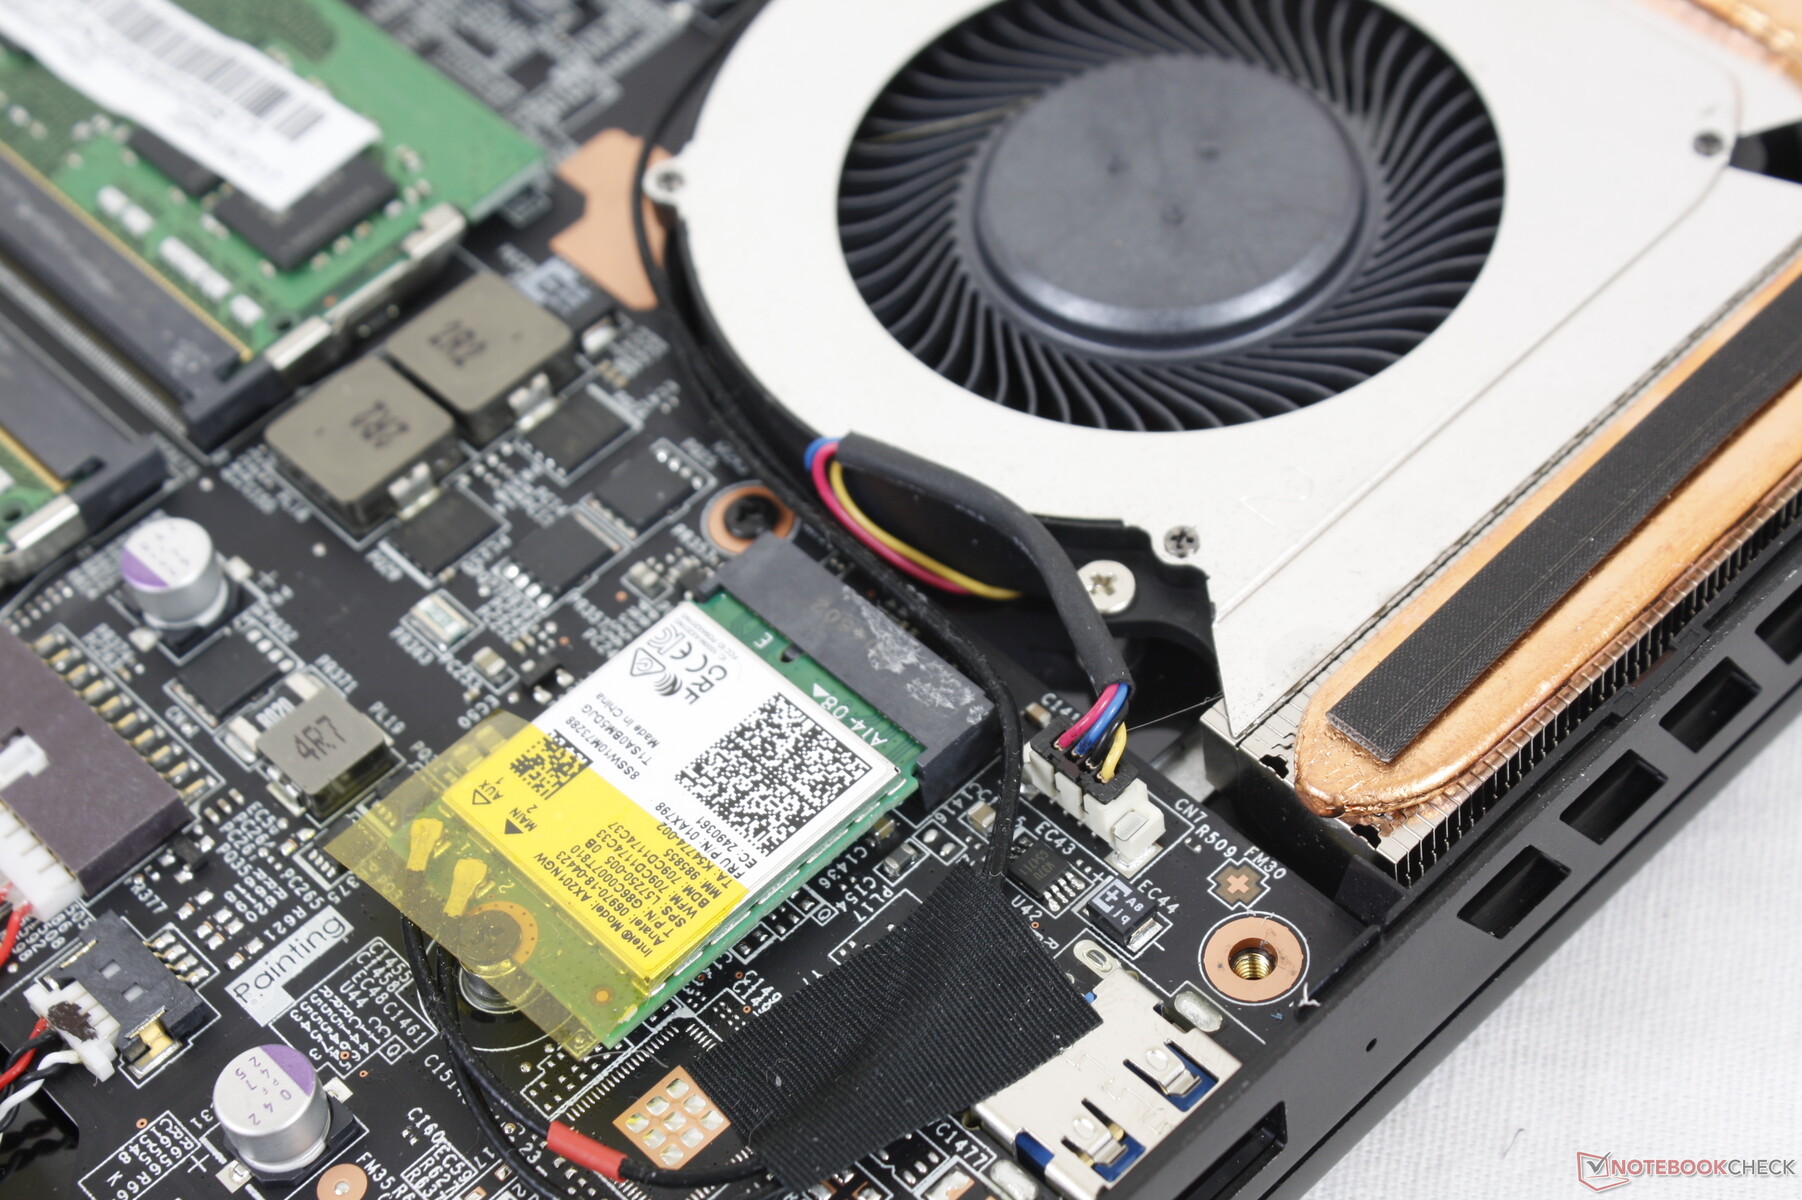
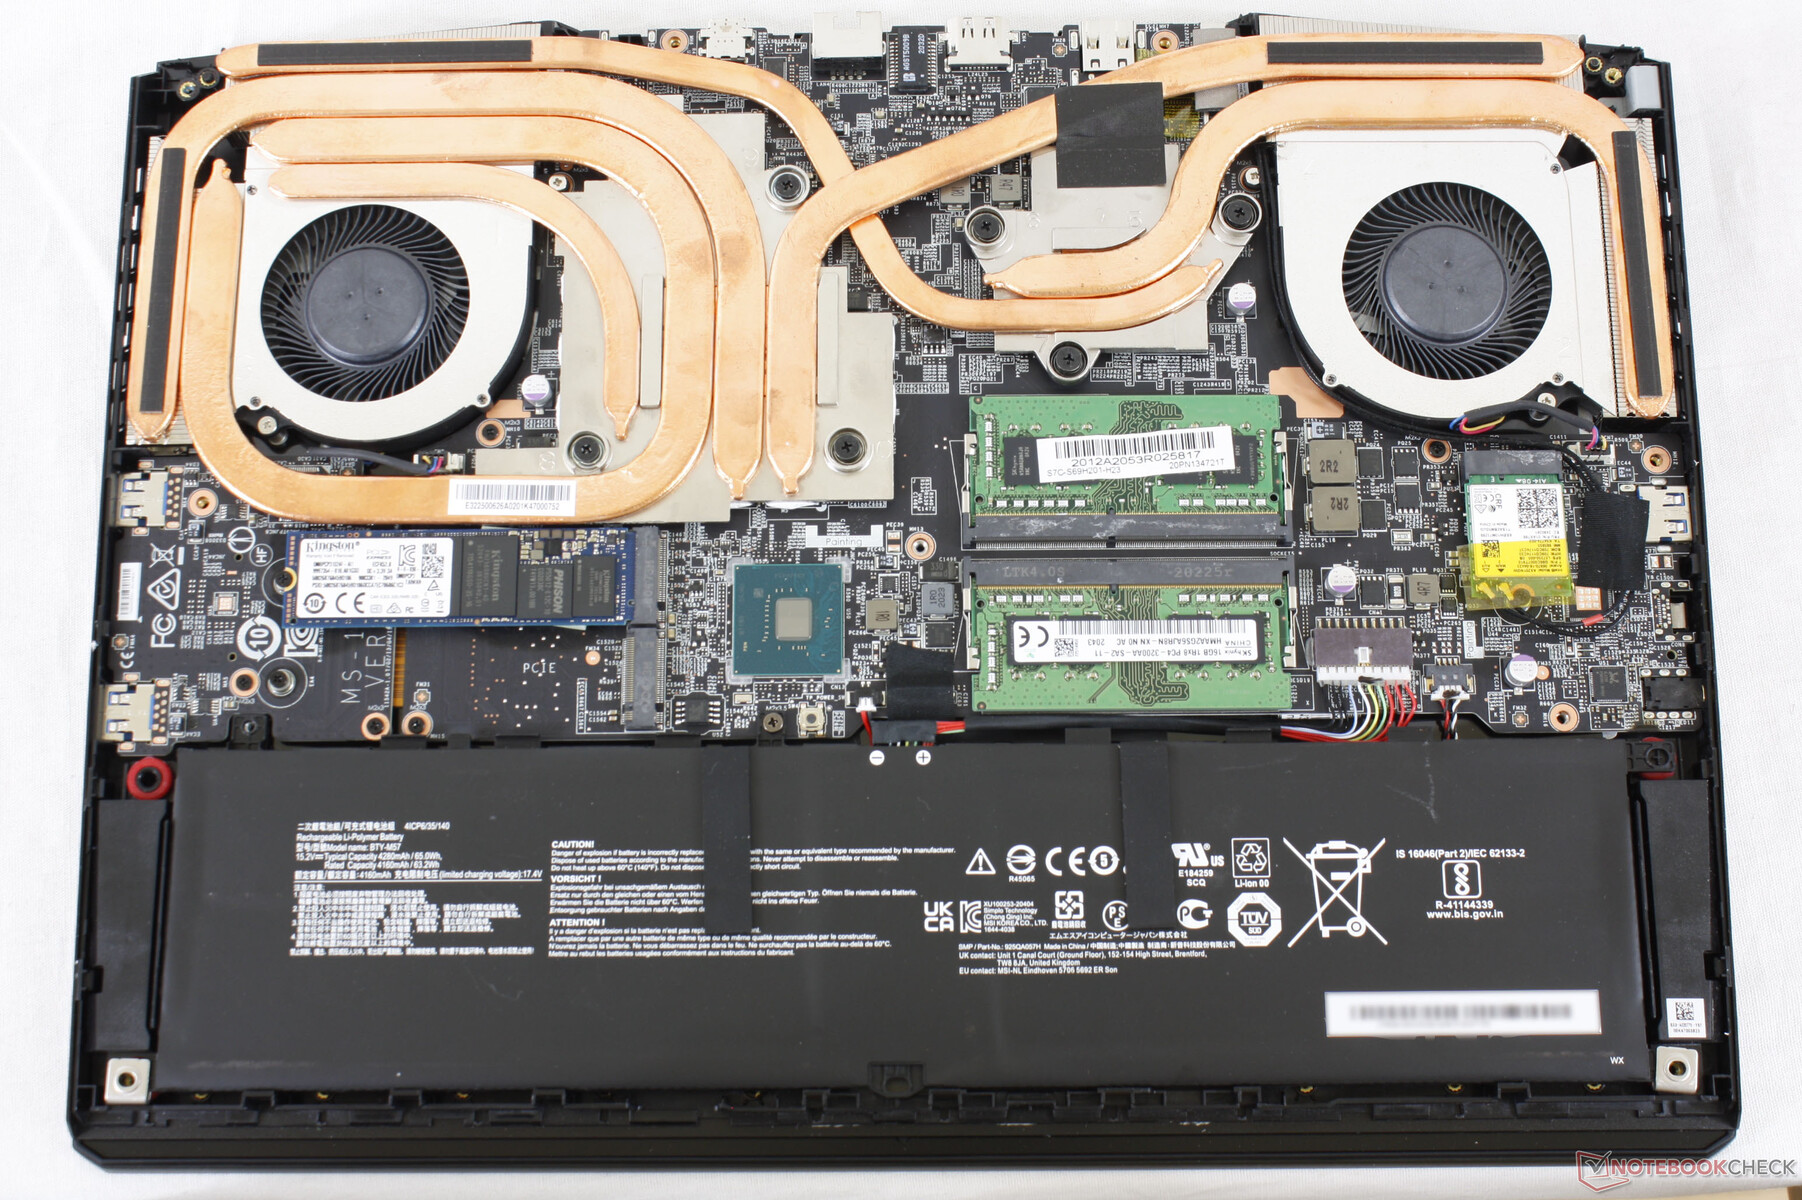
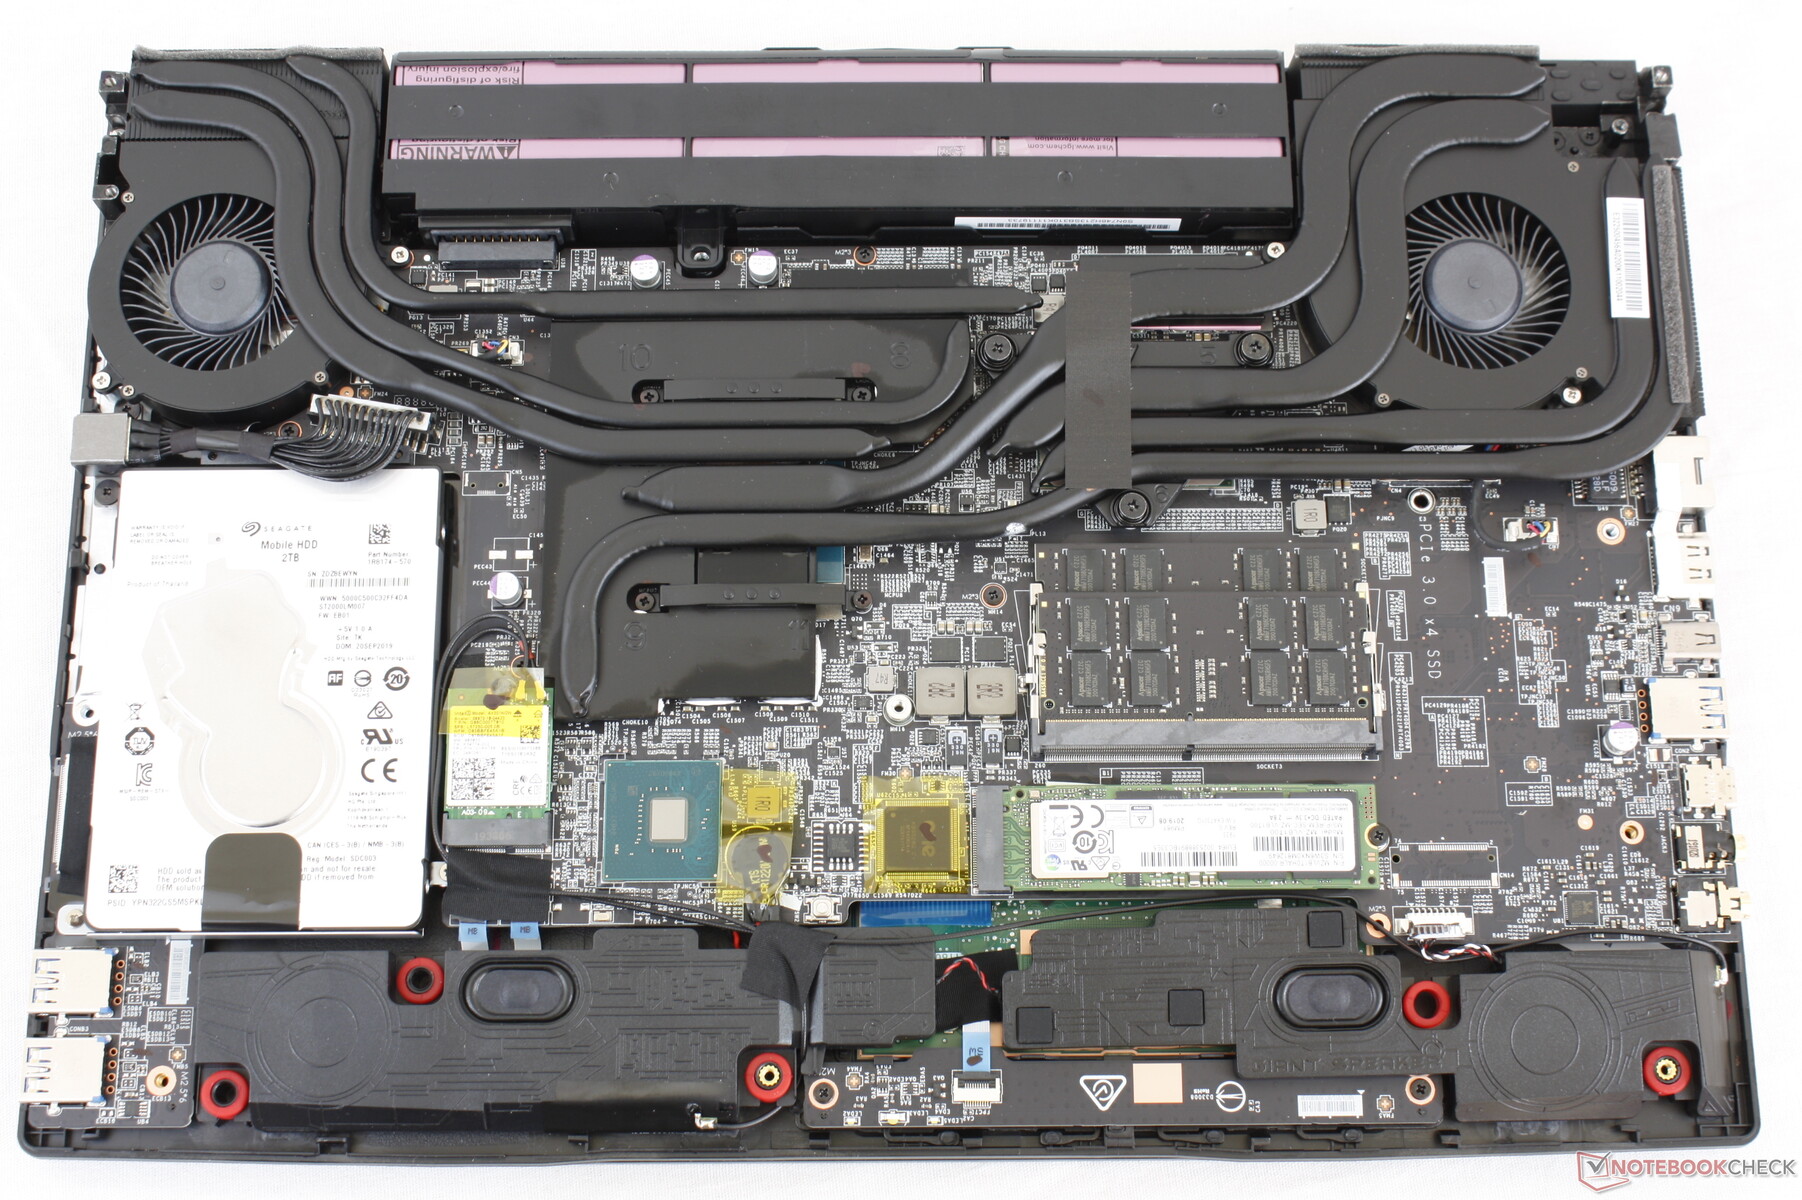
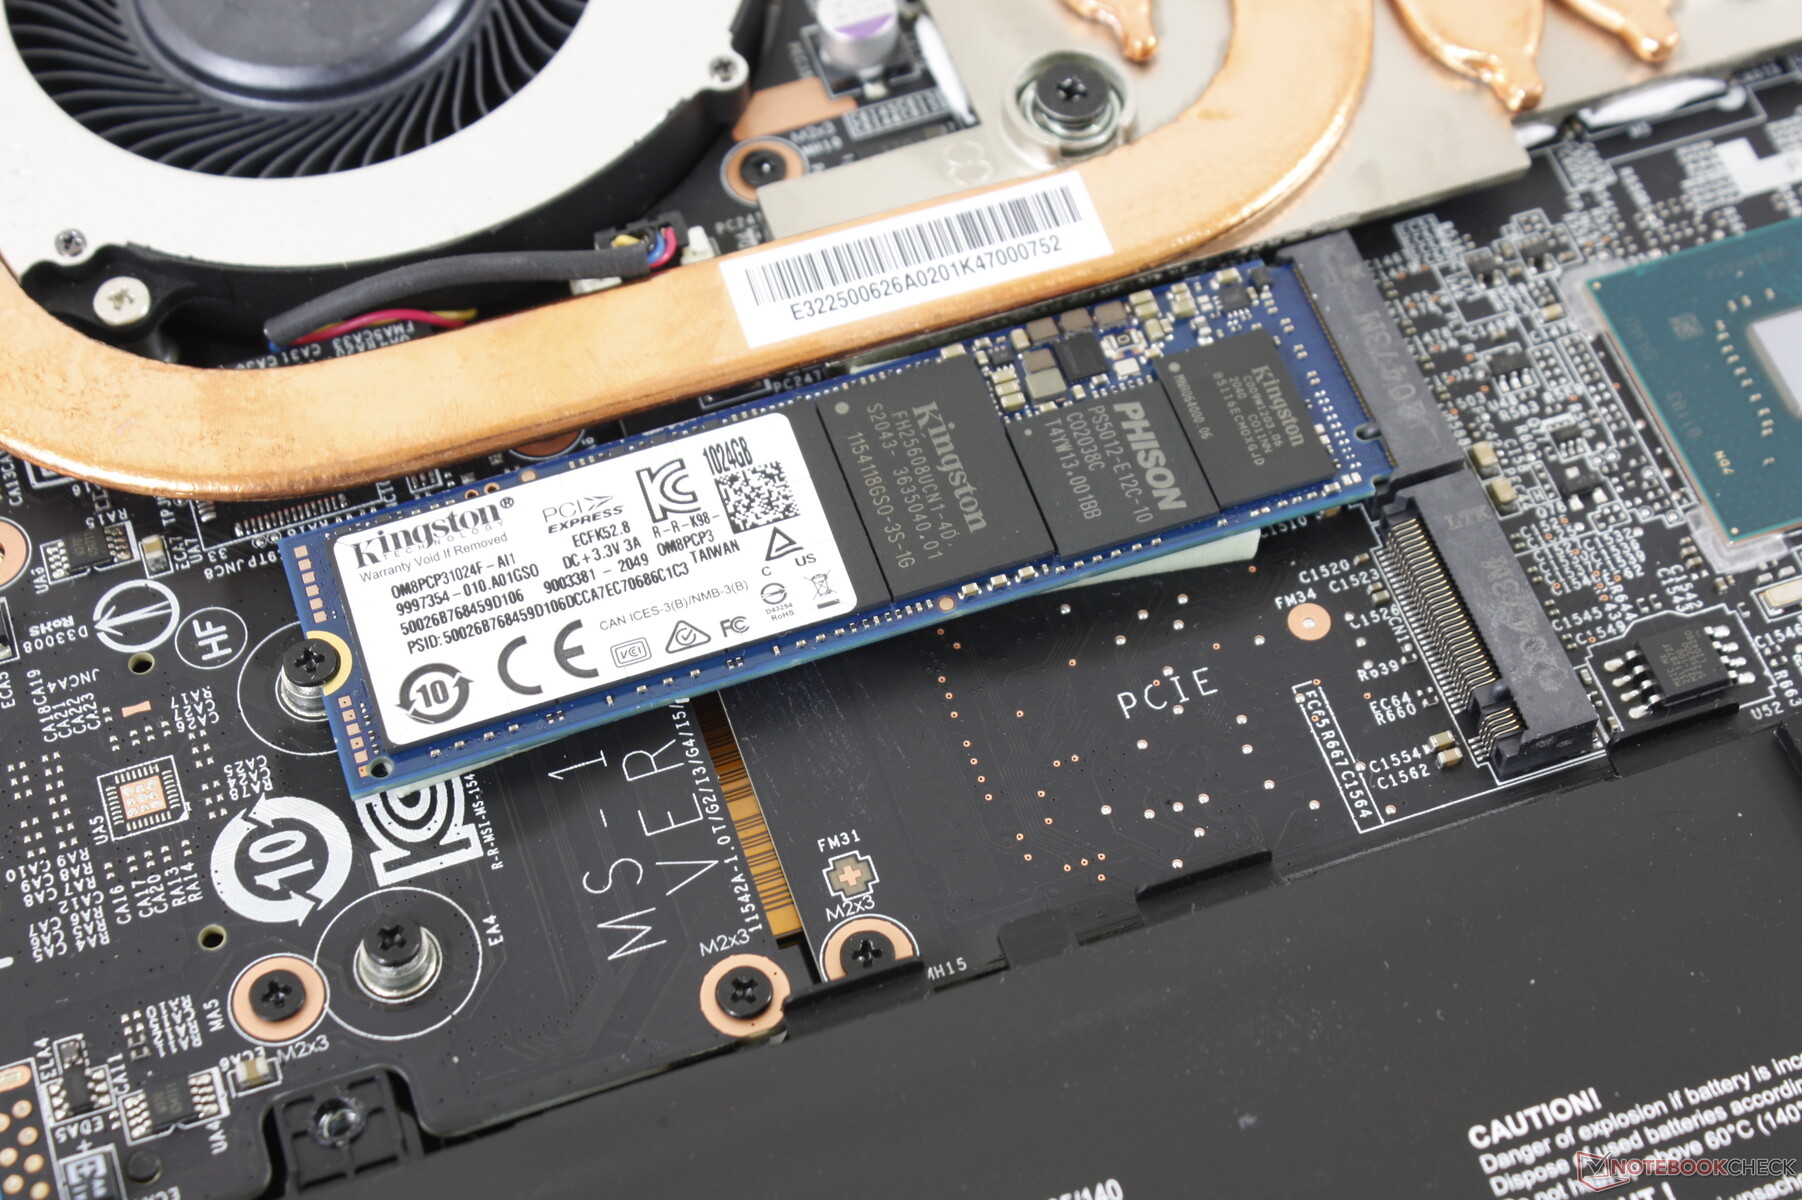
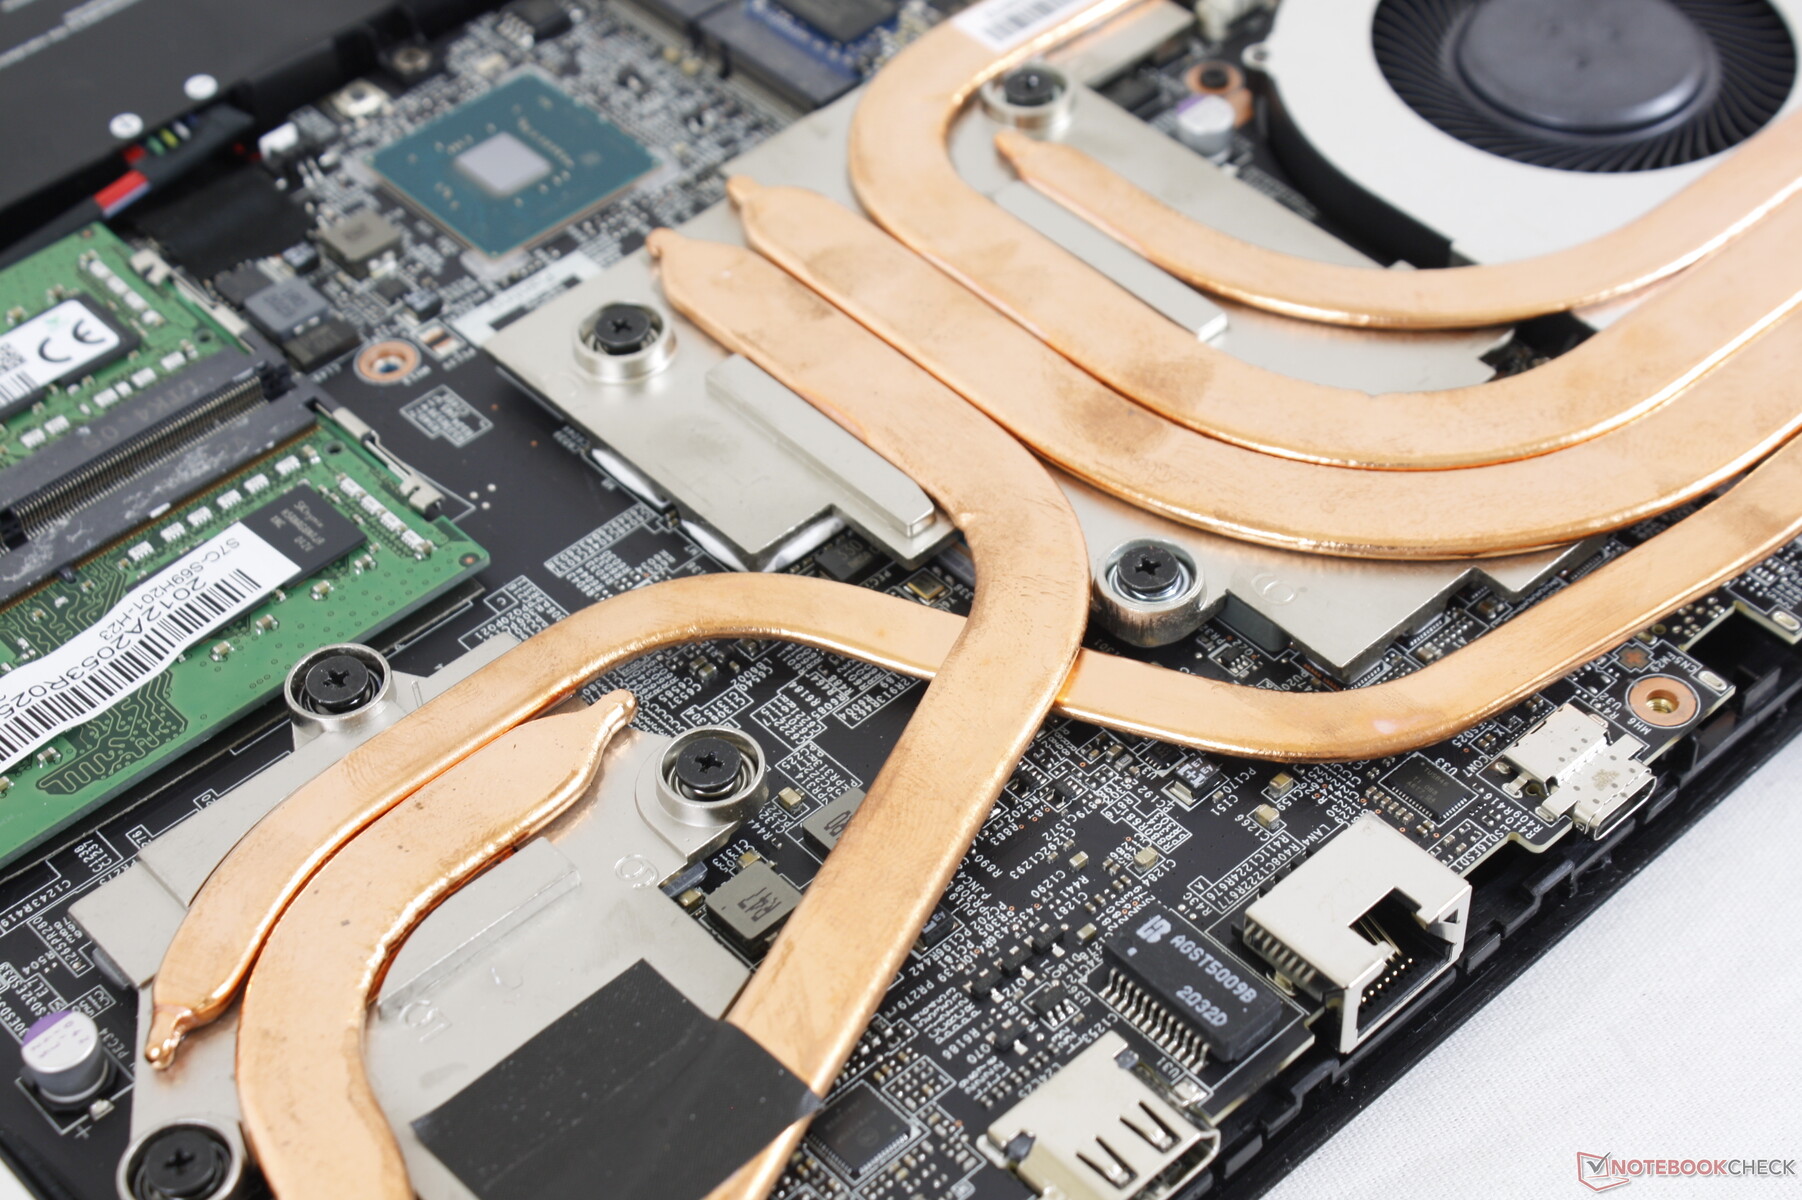
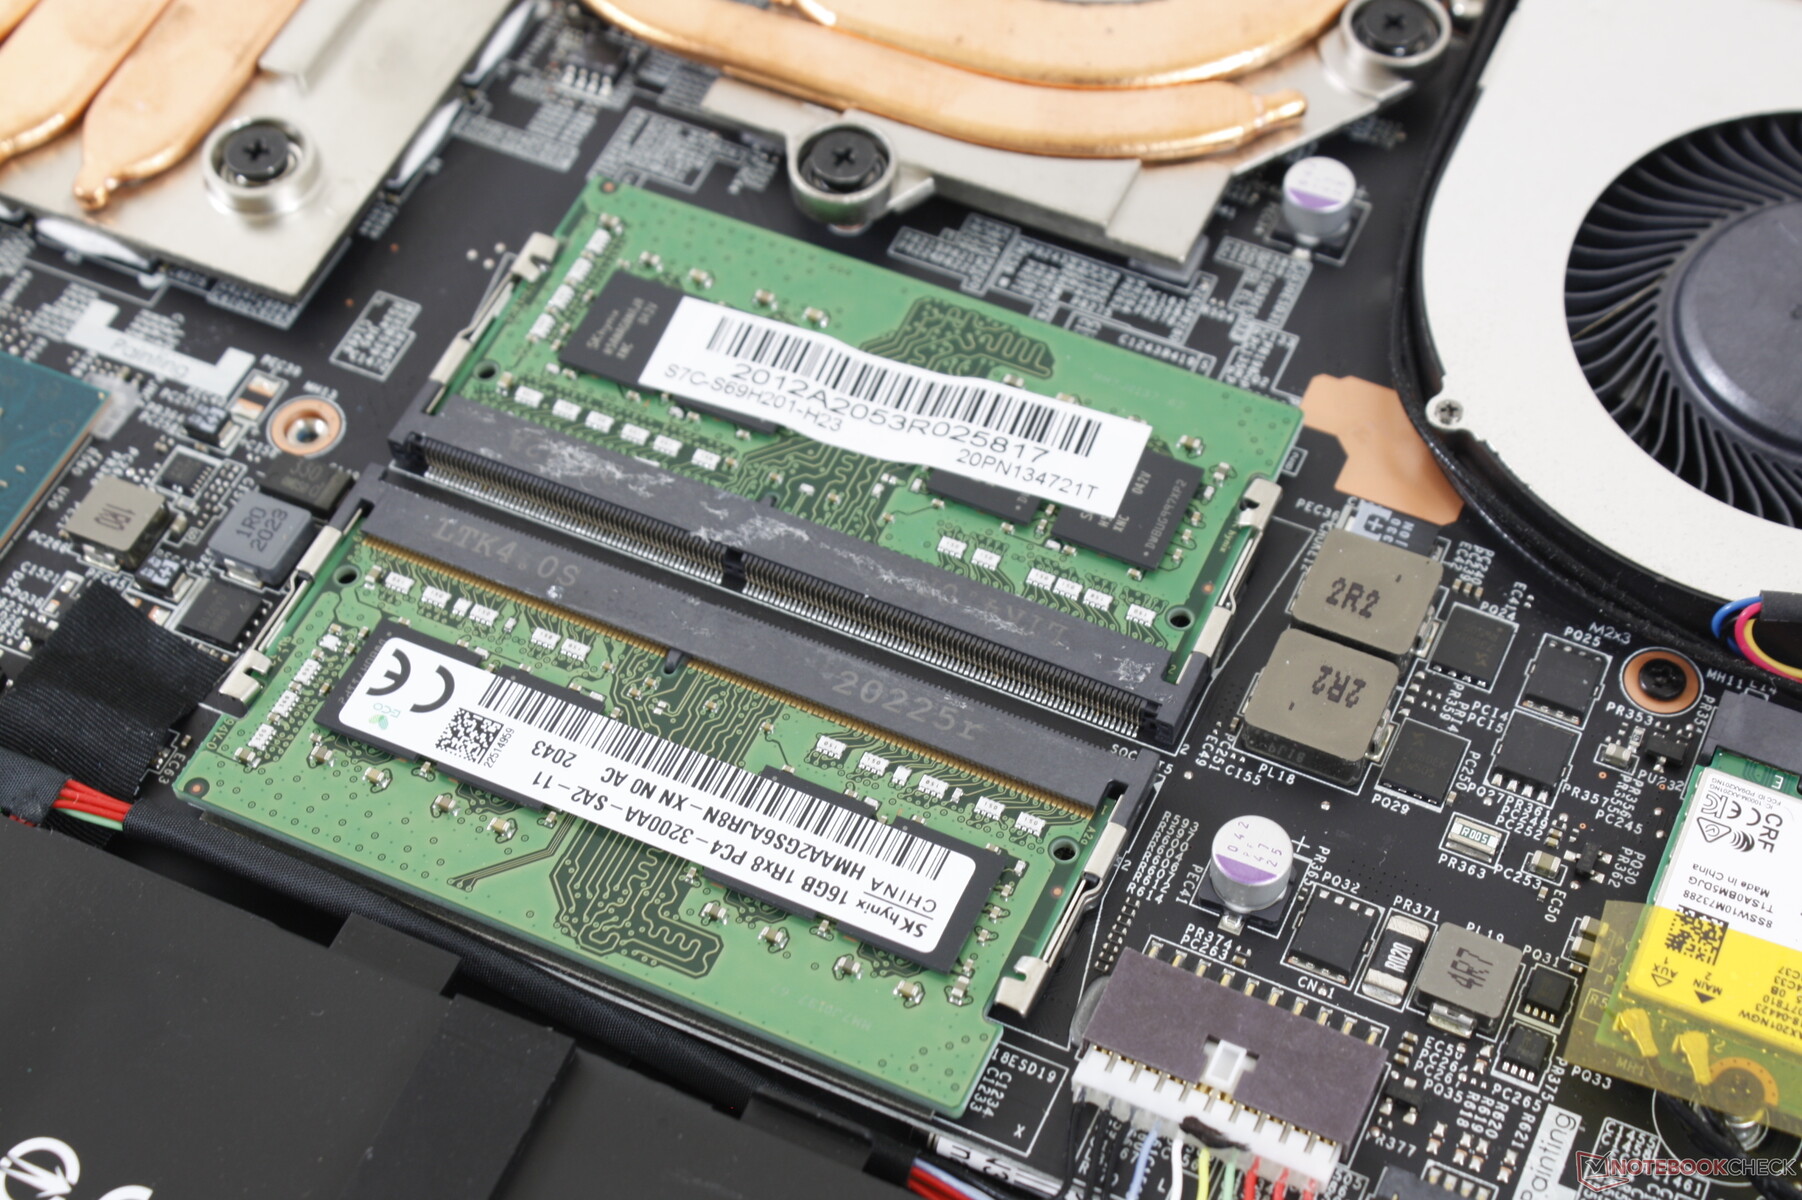
Servicing is more difficult than on the GP65 because the bottom panel on the GP66 is much tighter around the edges and corners. A sharp edge and a careful hand are necessary to safely remove the panel. Once inside, users will have direct access to 2x M.2 2280 slots, 2x SODIMM, battery, and the WLAN module.
Accessories and Warranty
There are no extras in the box other than the AC adapter and paperwork. The velvet cleaning cloth that is included with GS and GT series laptops is not included here.
The standard one-year limited manufacturer warranty applies.
Input Devices
Keyboard
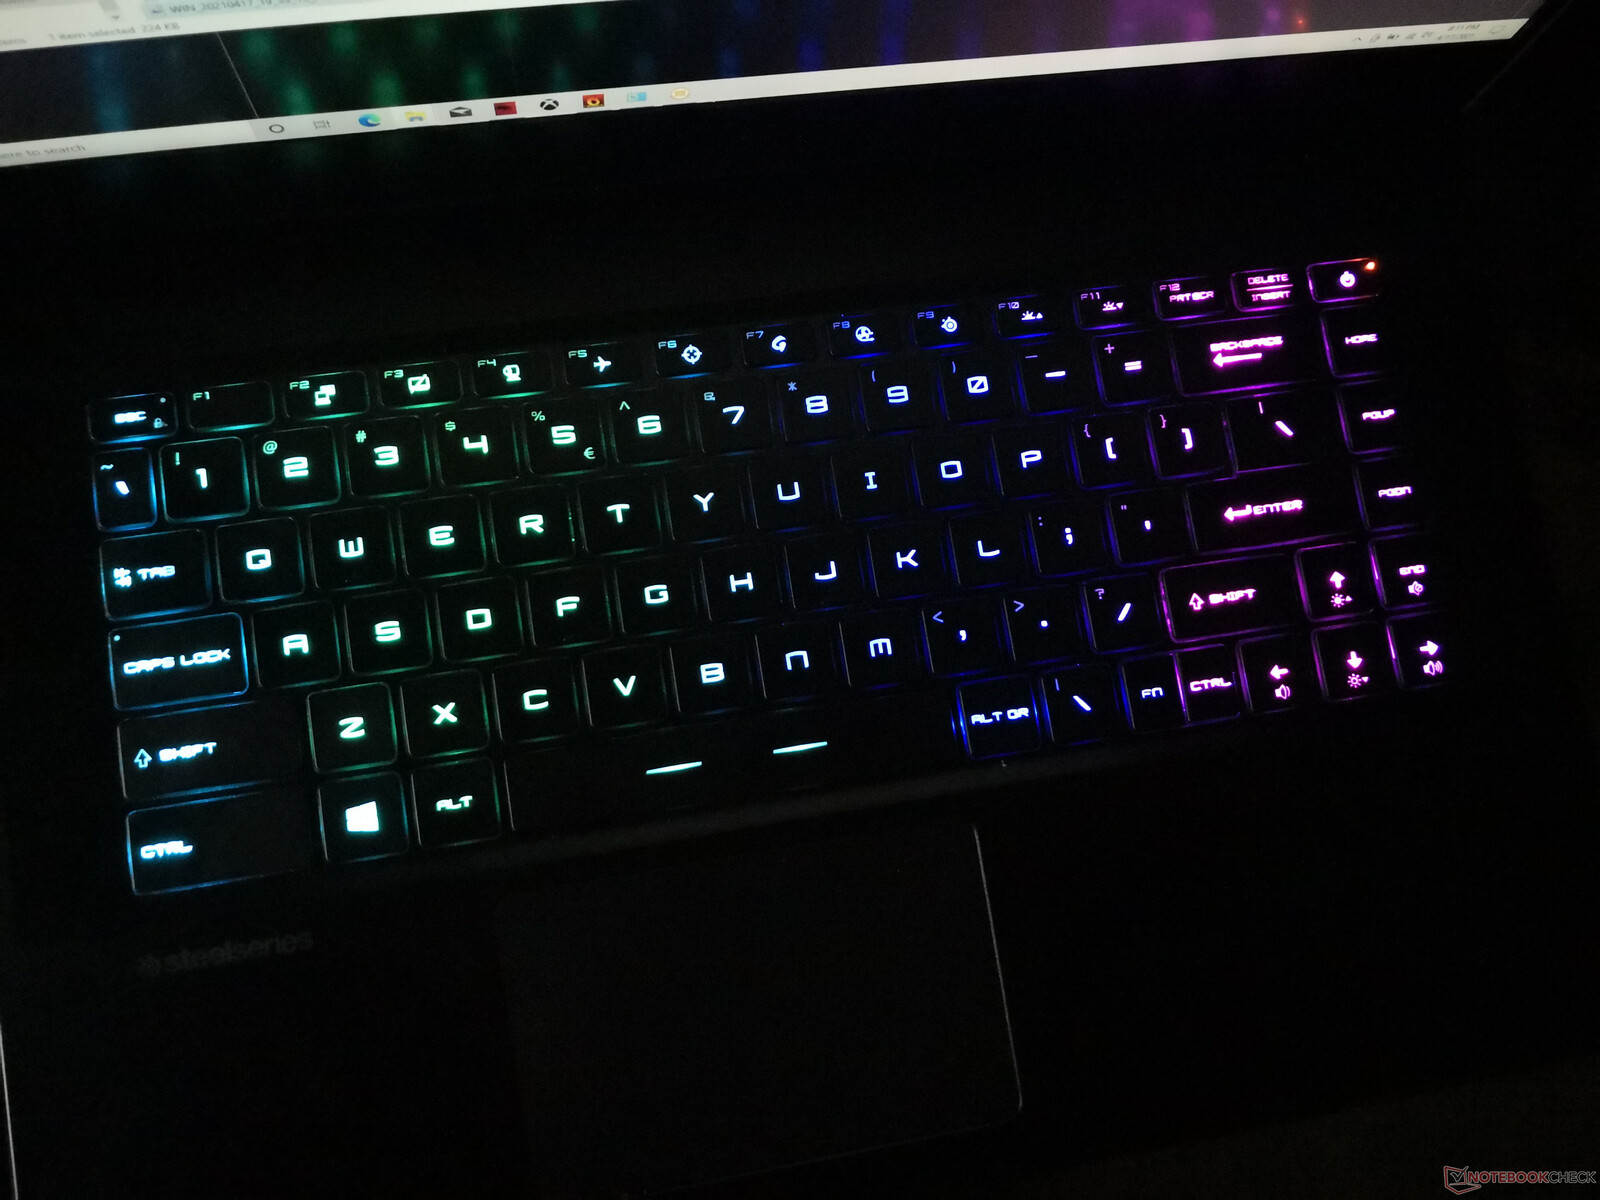
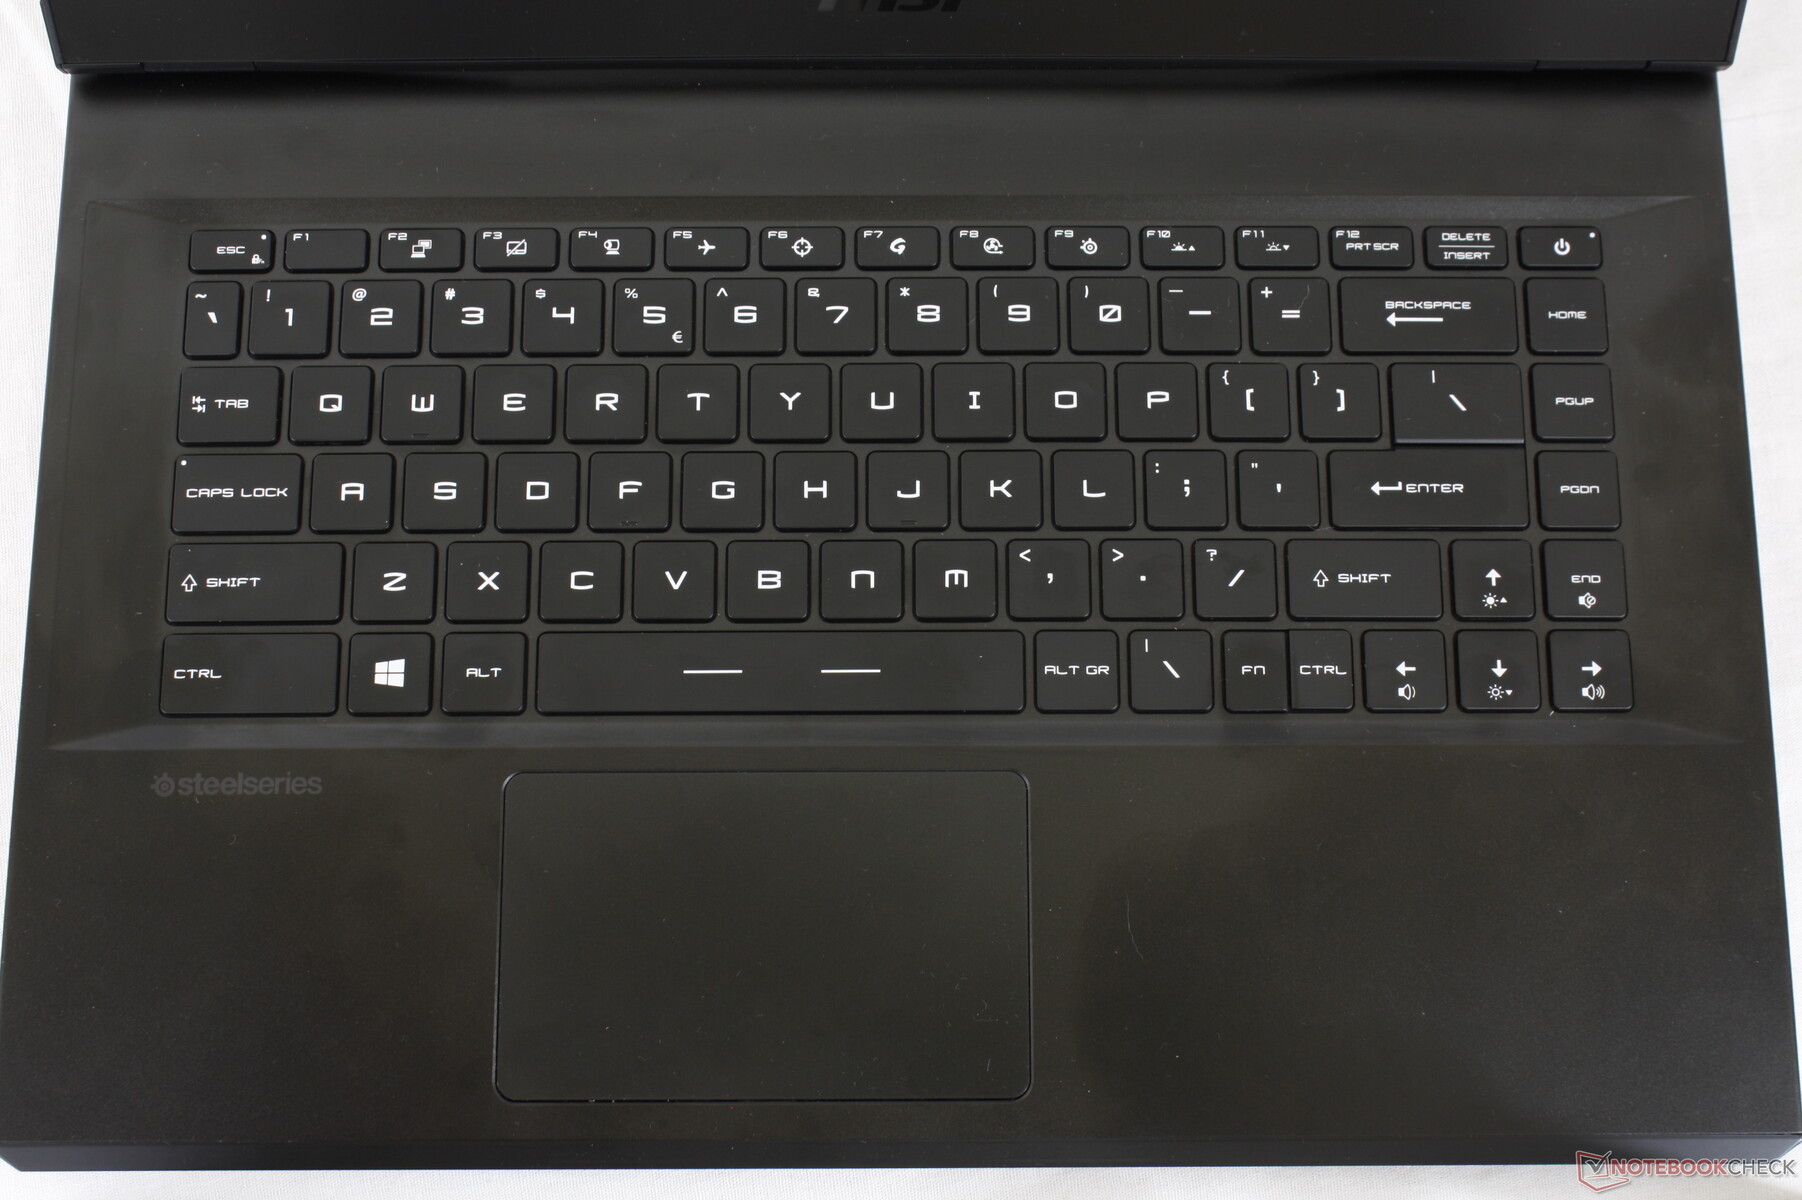
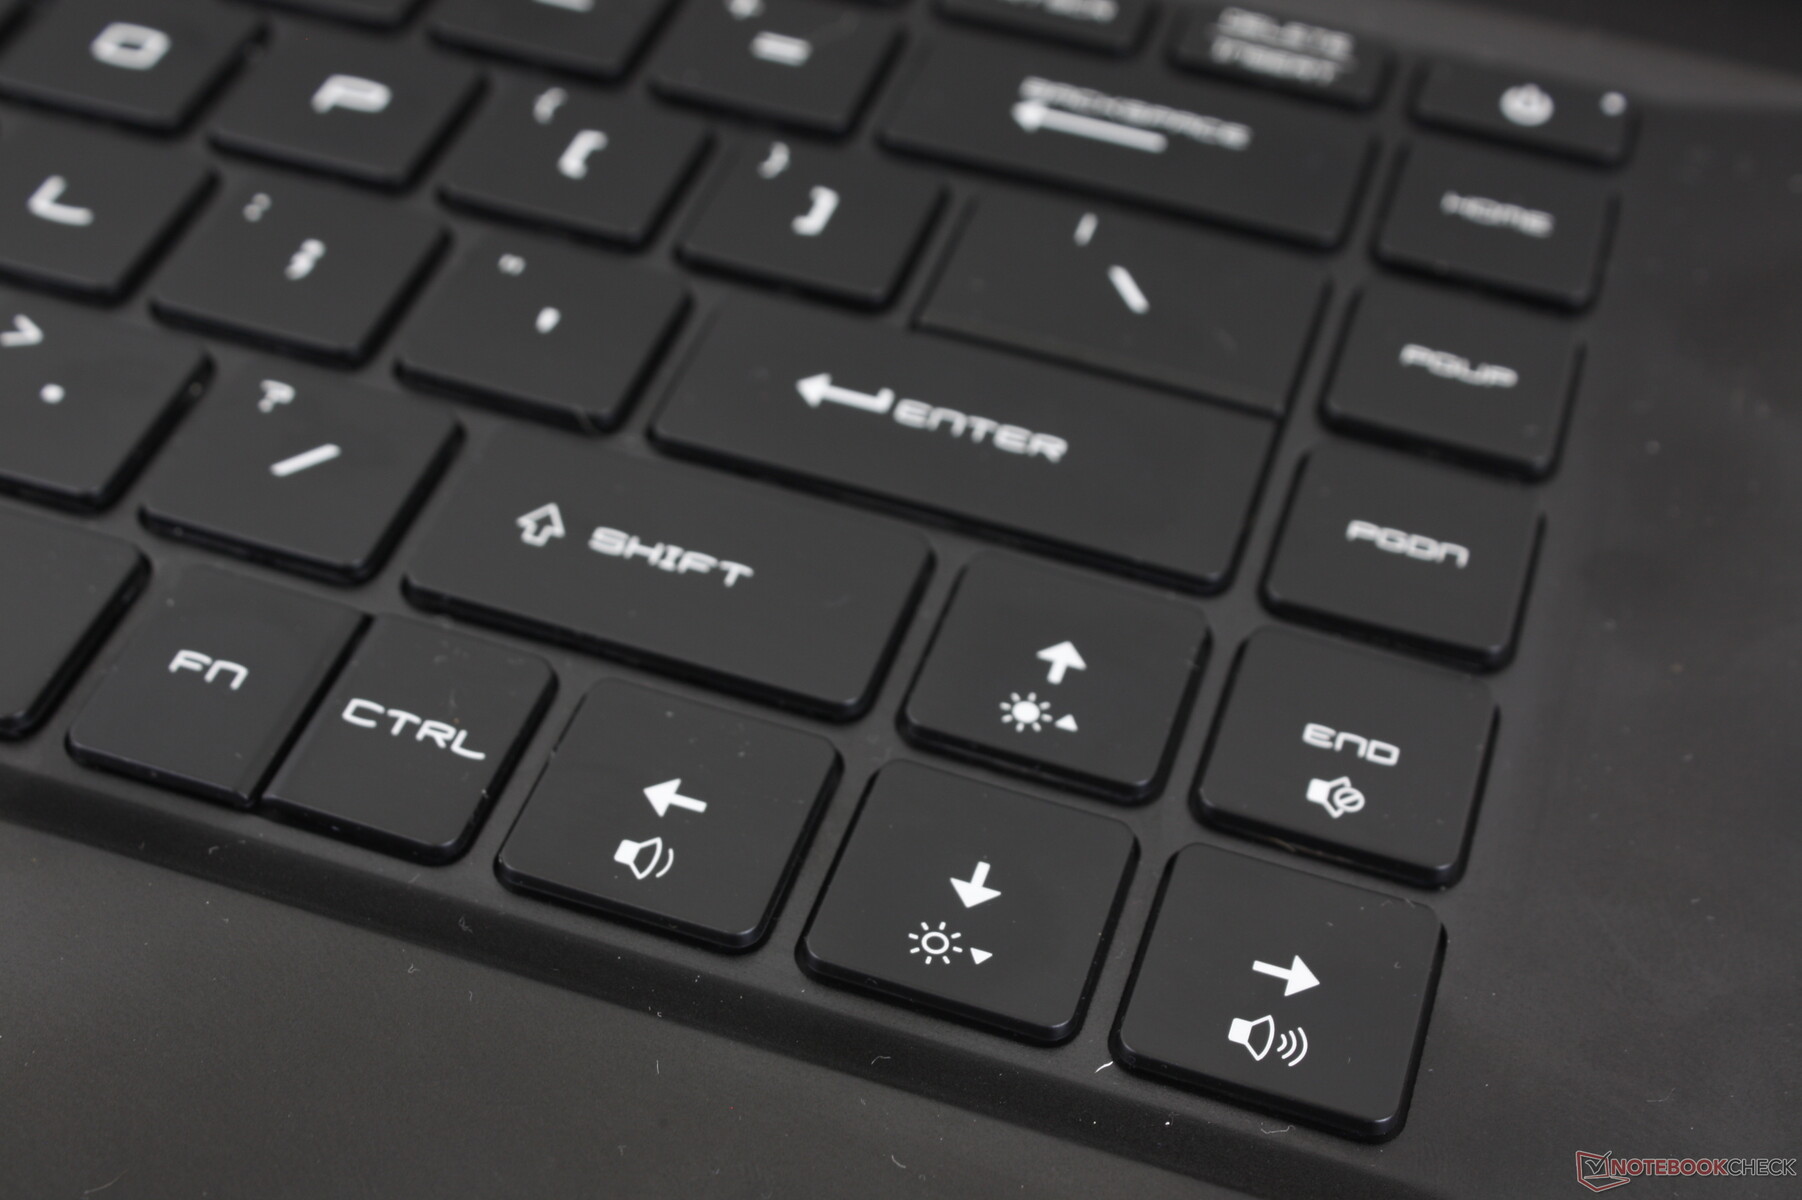
The keyboard is identical to the keyboard on the GE66 and a huge departure from the GP65. The NumPad, for example, is now gone and travel feels shorter with crisper feedback in return. Clatter is also slightly louder and higher-pitched than before especially in regard to the Space and Enter keys.
Per-key RGB lighting returns. The lighting could be more uniform, however, as the secondary key symbols (i.e., !, @, #, etc.) do not glow as brightly as the main symbols (1, 2, 3, etc.).
Touchpad
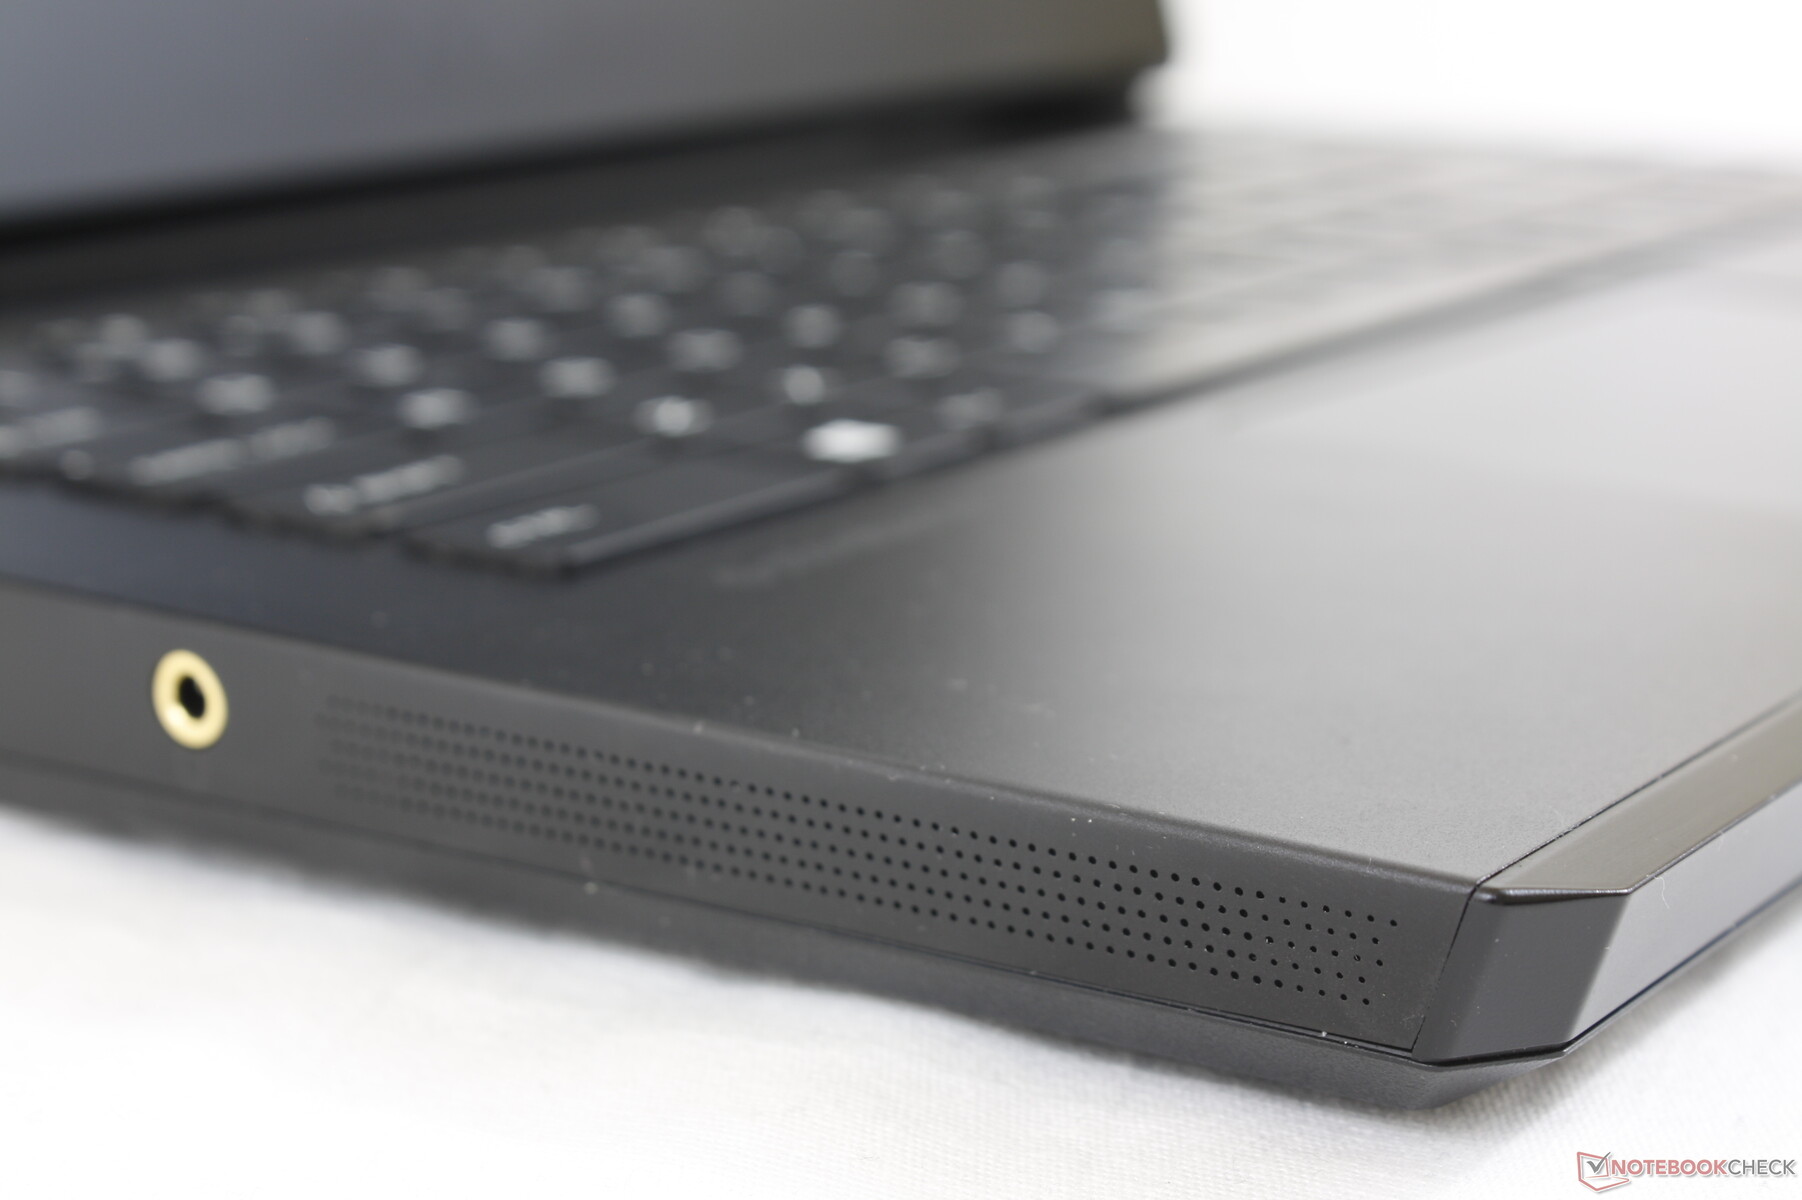
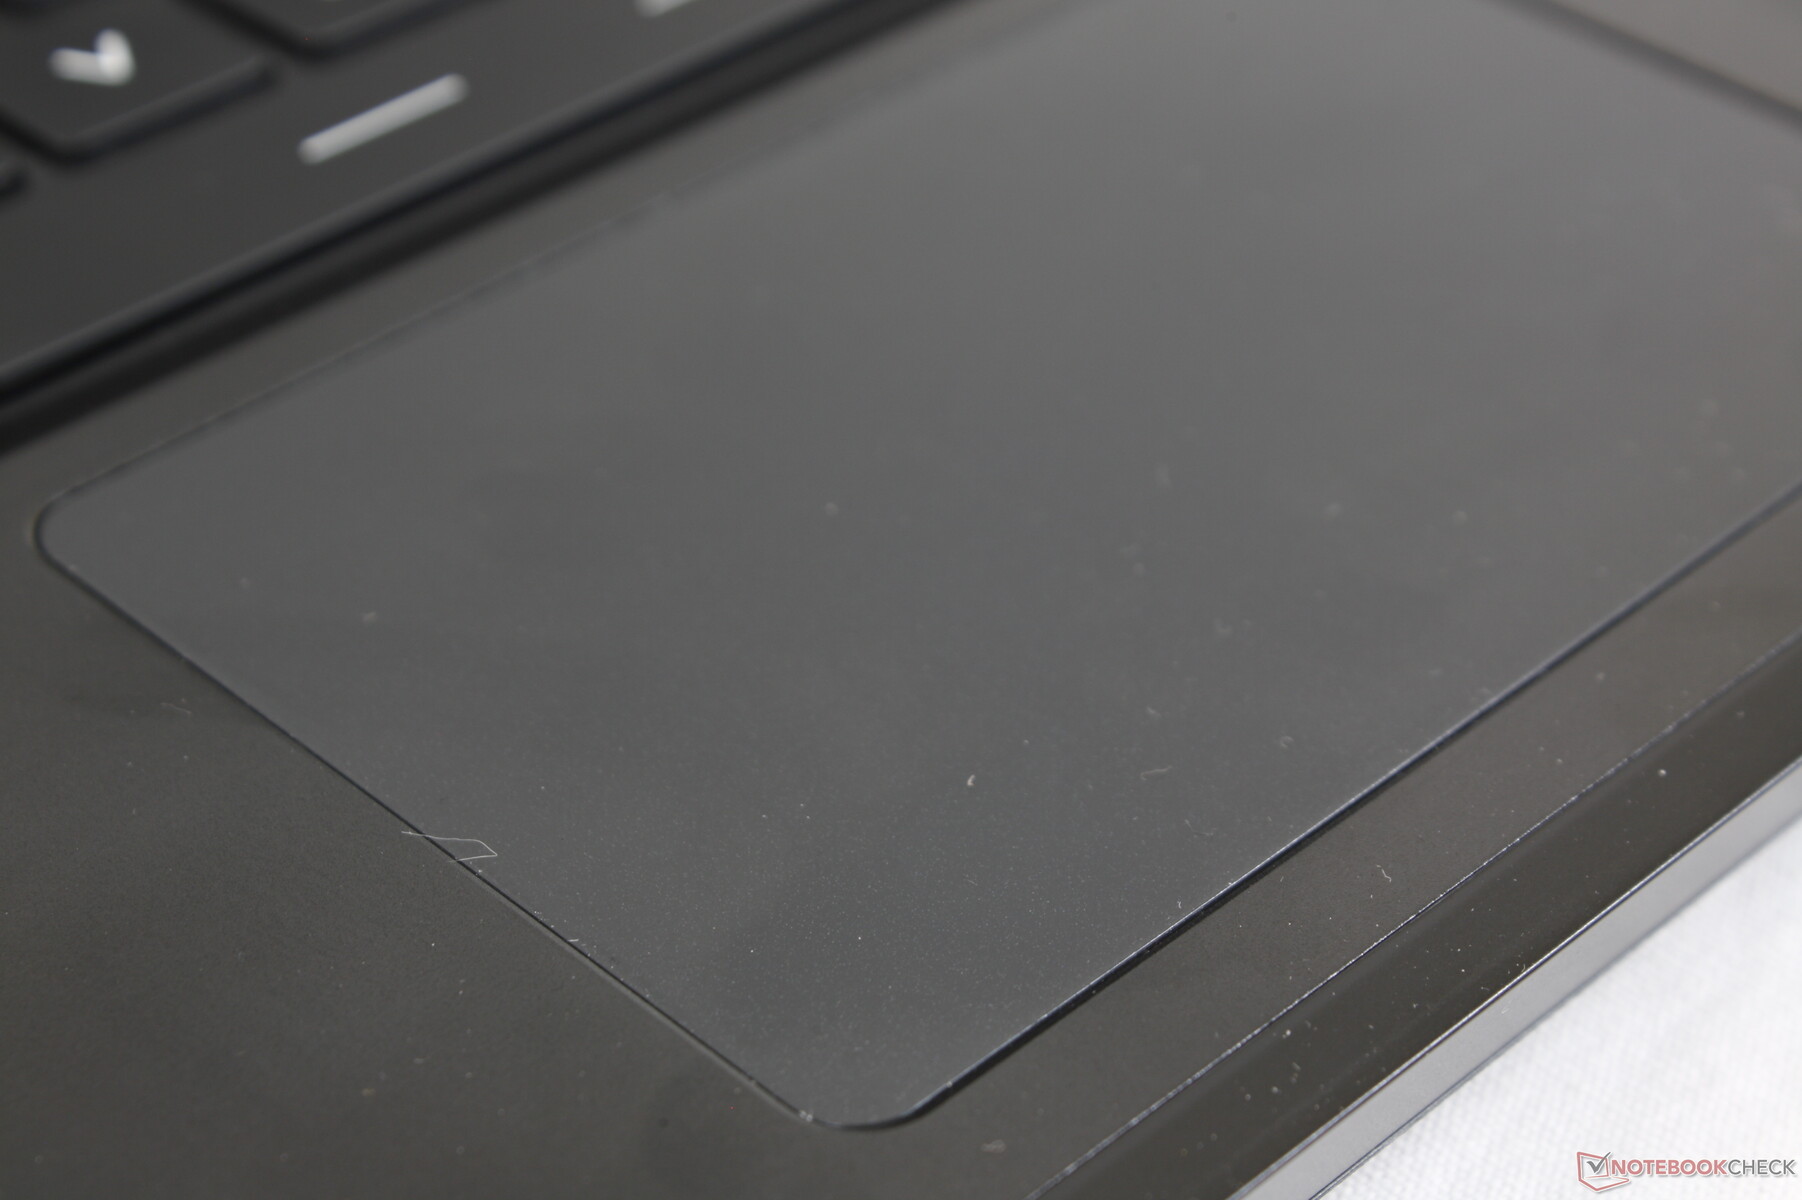
The plastic clickpad is relatively small (10.5 x 6.5 cm) with a smooth glide at medium-fast speeds and just a bit of sticking at slower speeds for more accurate clicks. Its integrated click keys are spongy and they require more force than usual to register which can become tiring if you don't have an external mouse. Though the new clickpad is serviceable, we do miss the dedicated mouse buttons and firmer clickpad on the older GP65.

Display
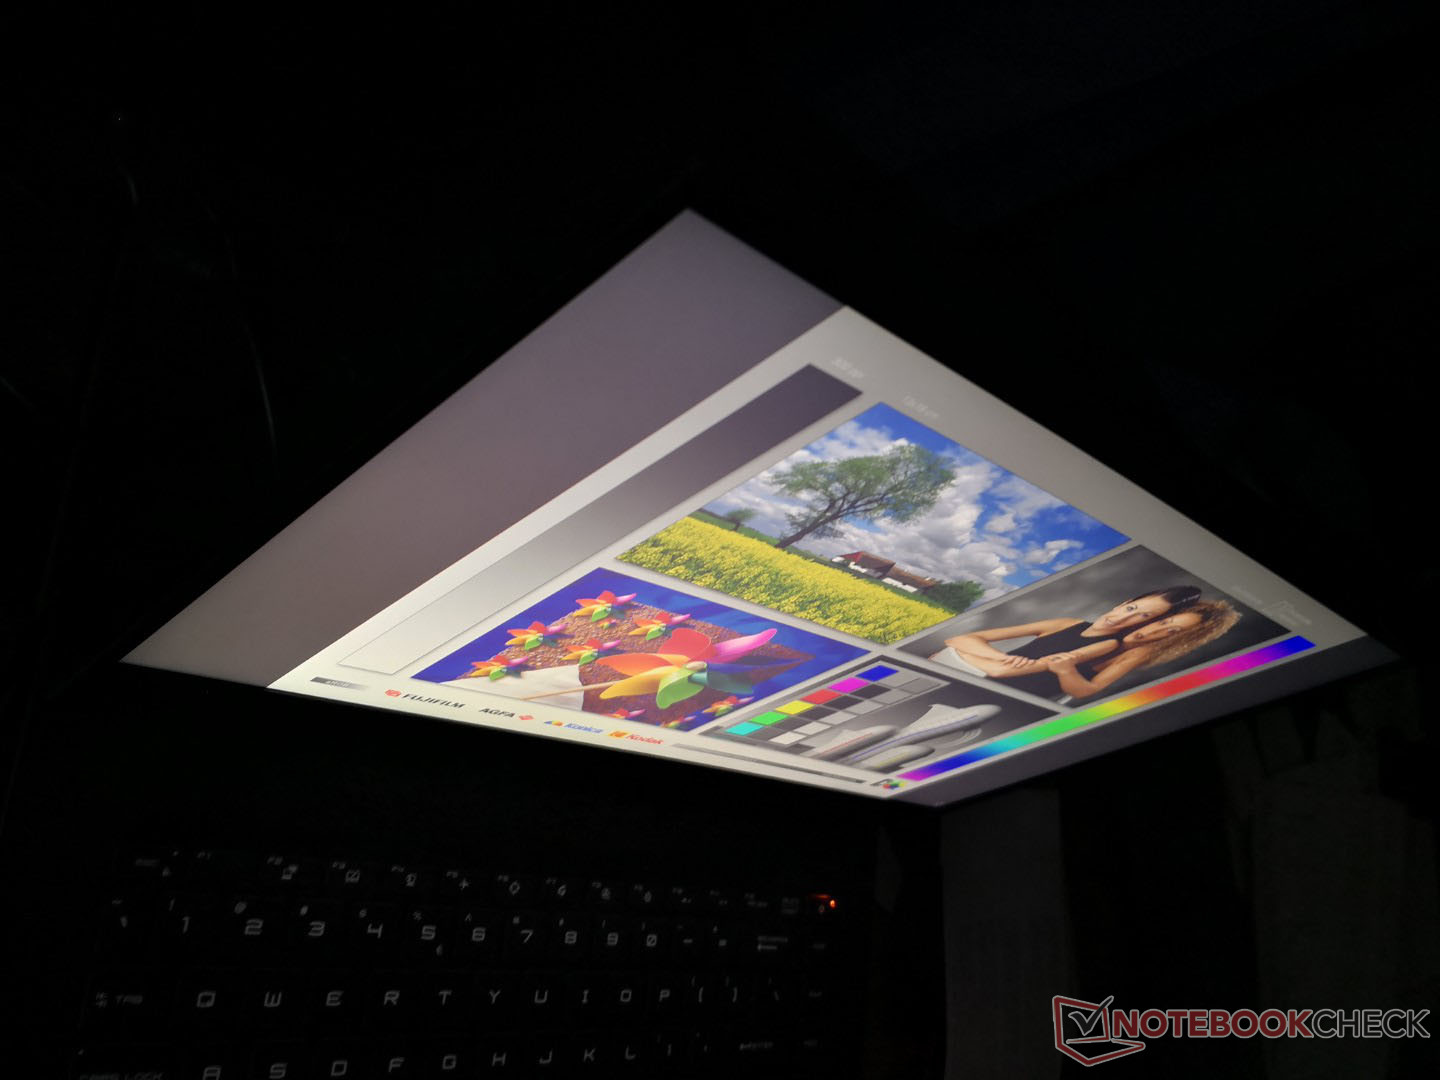
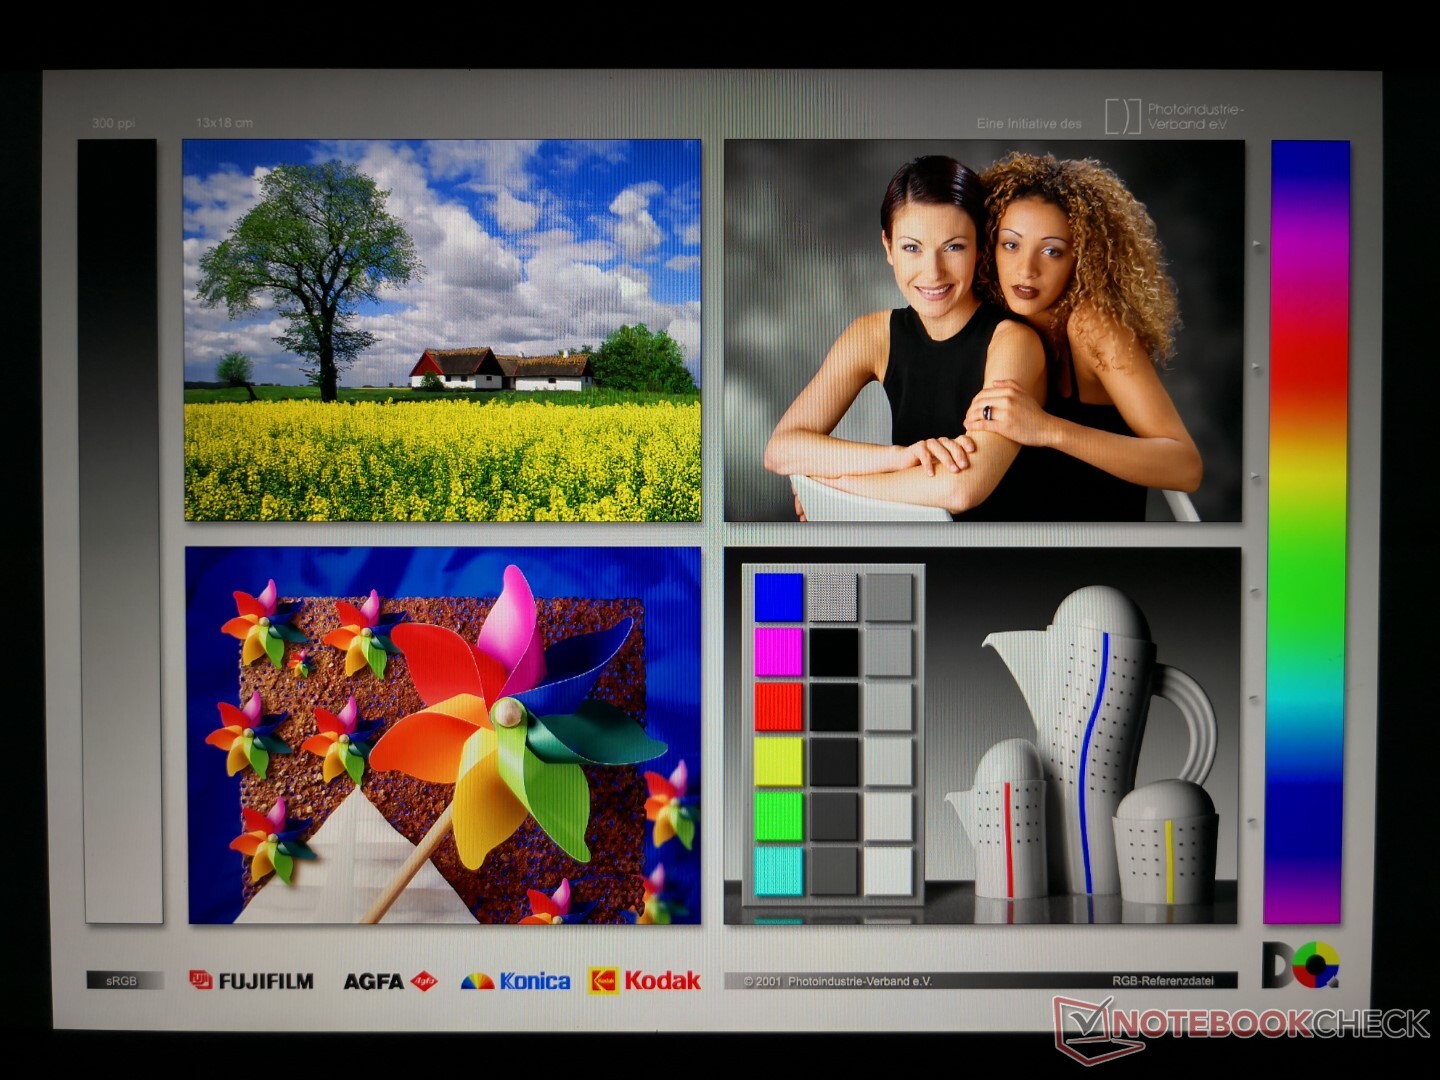
Our GP66 10UG configuration uses the same 240 Hz Sharp LQ156M1JW03 panel as found on the GE66 10SFS, GS65 Stealth 9SG, Razer Blade 15, and Aorus 15P XC. Colors, contrast, and response times are therefore similar between all these laptops which is a good thing since many of these models are high-end gaming systems.
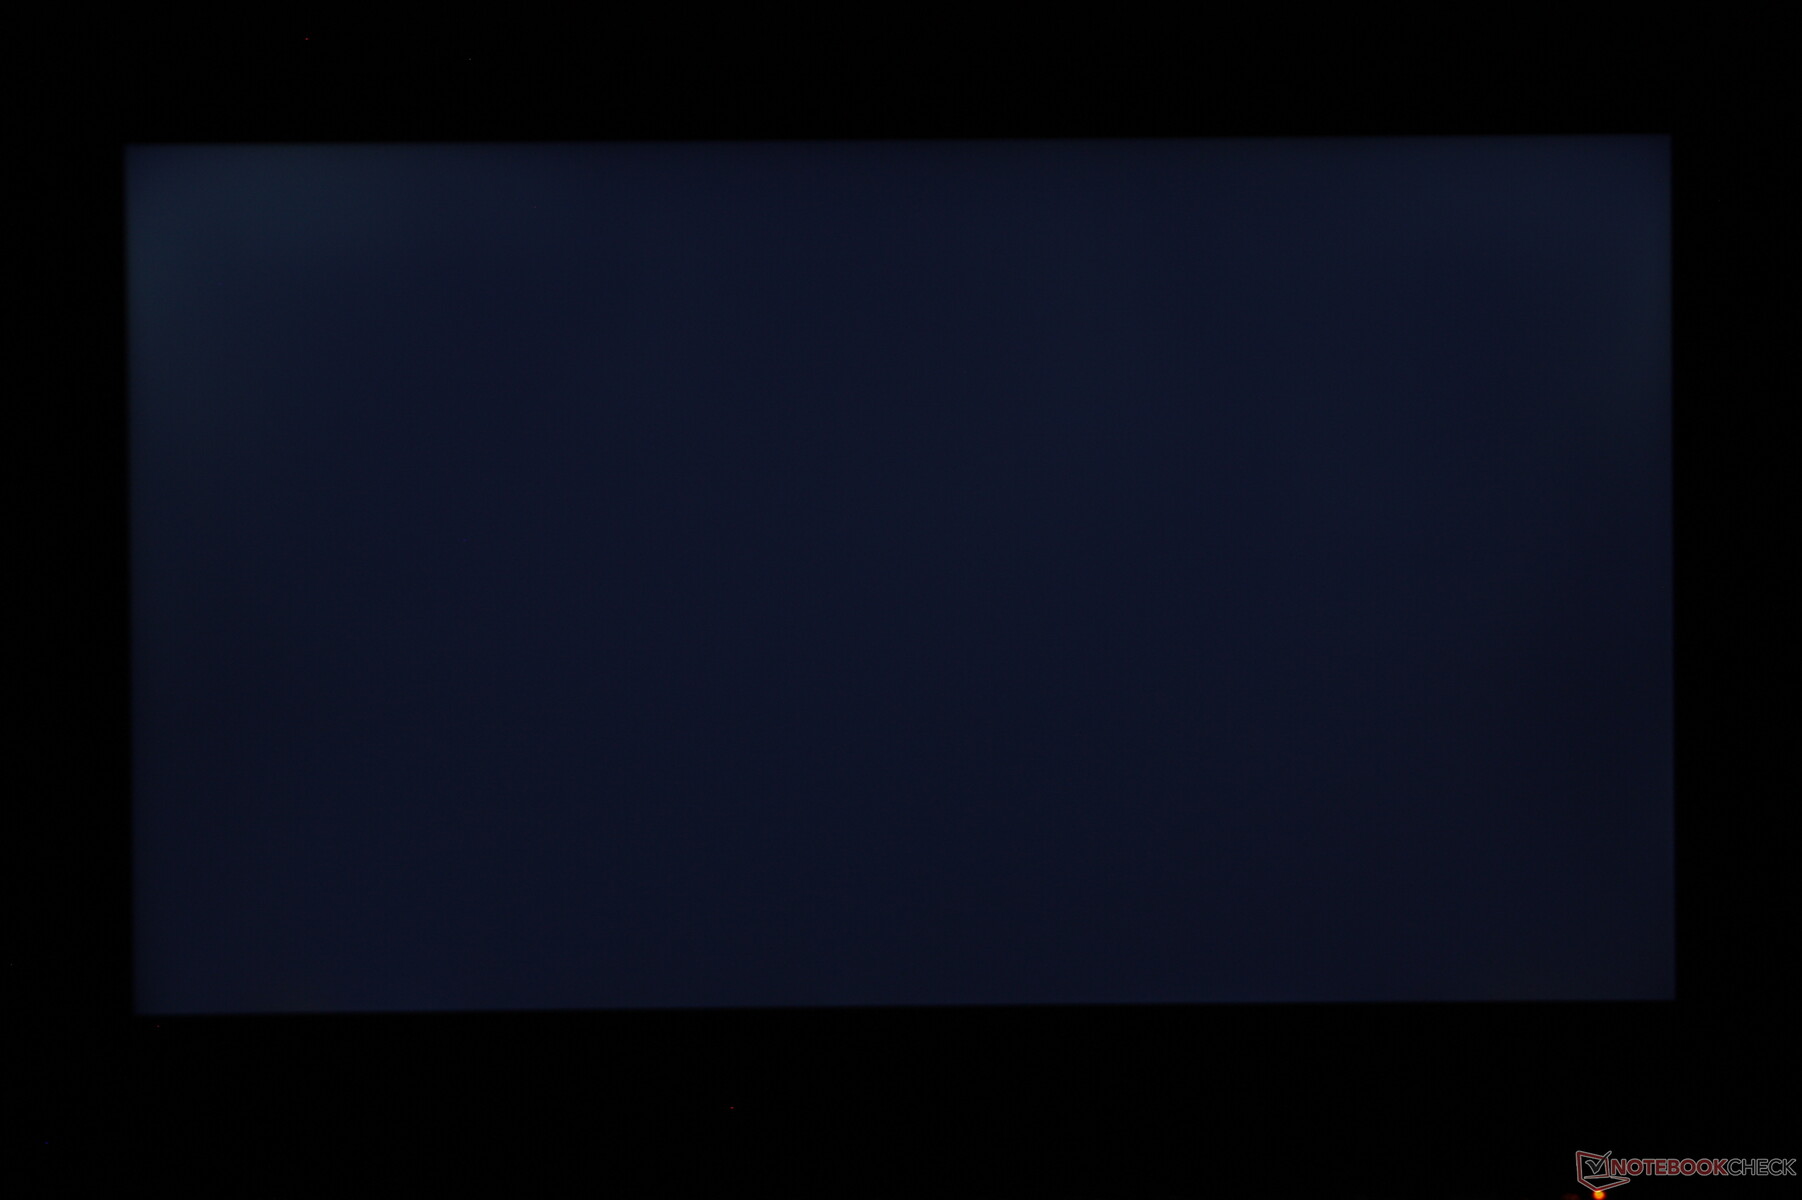
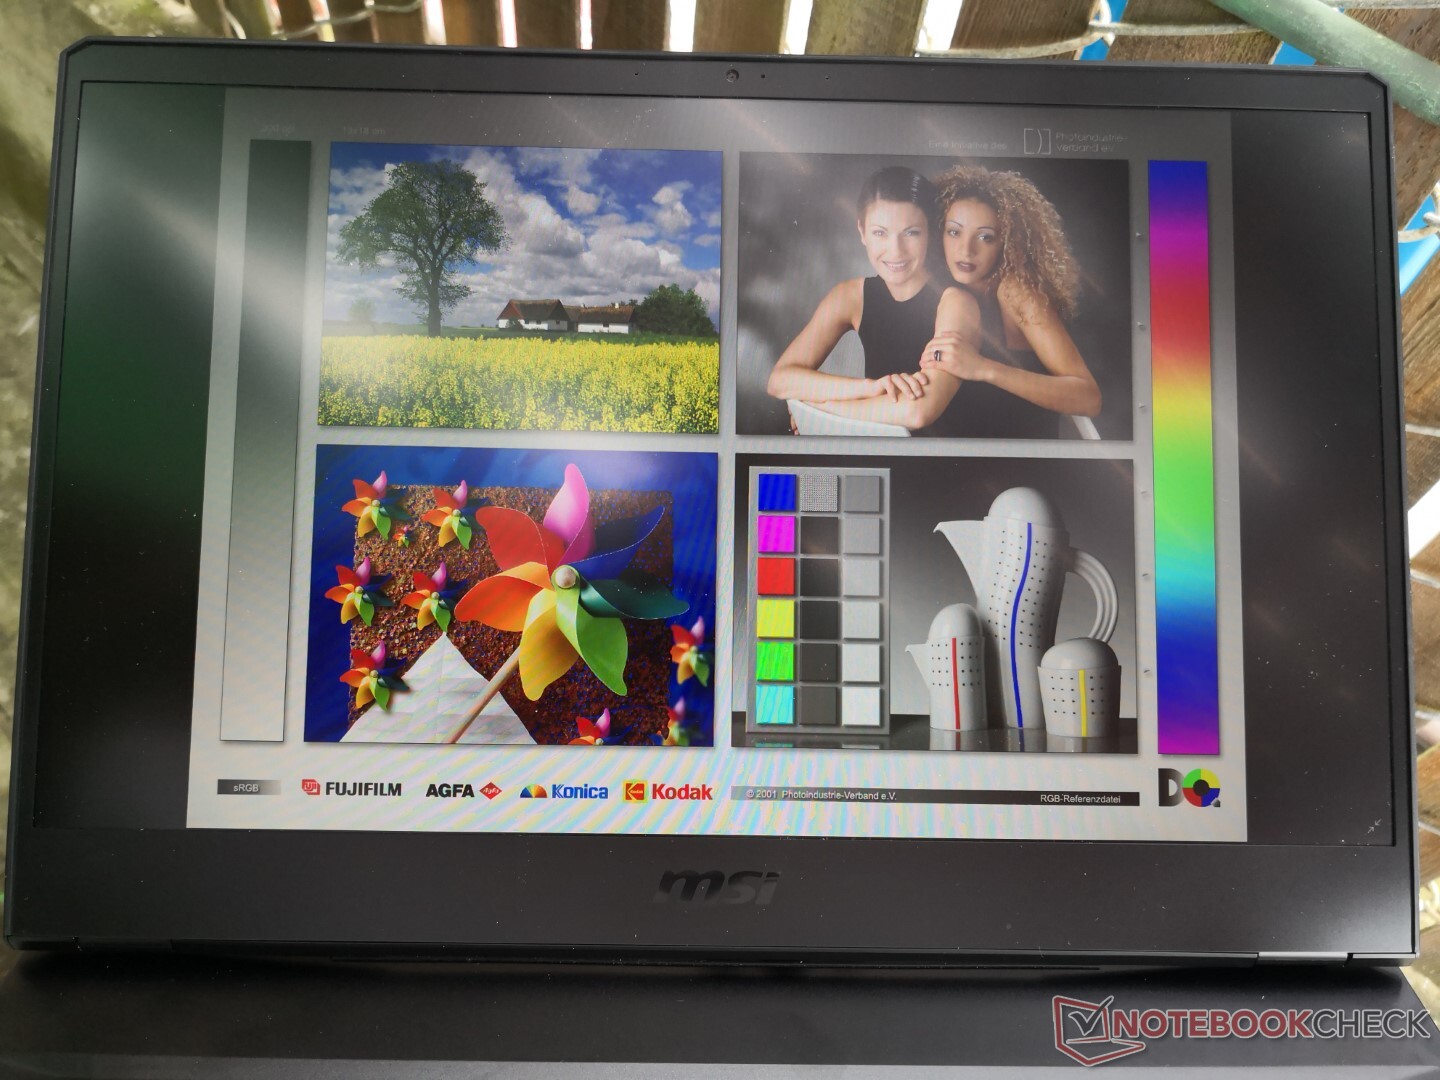
A key difference on the GP66 display when compared to the aforementioned laptops is that it is noticeably dimmer. Maximum brightness tops out at about 210 nits whereas most other gaming laptops are 300 nits or brighter.
| |||||||||||||||||||||||||
Brightness Distribution: 83 %
Center on Battery: 225.9 cd/m²
Contrast: 982:1 (Black: 0.23 cd/m²)
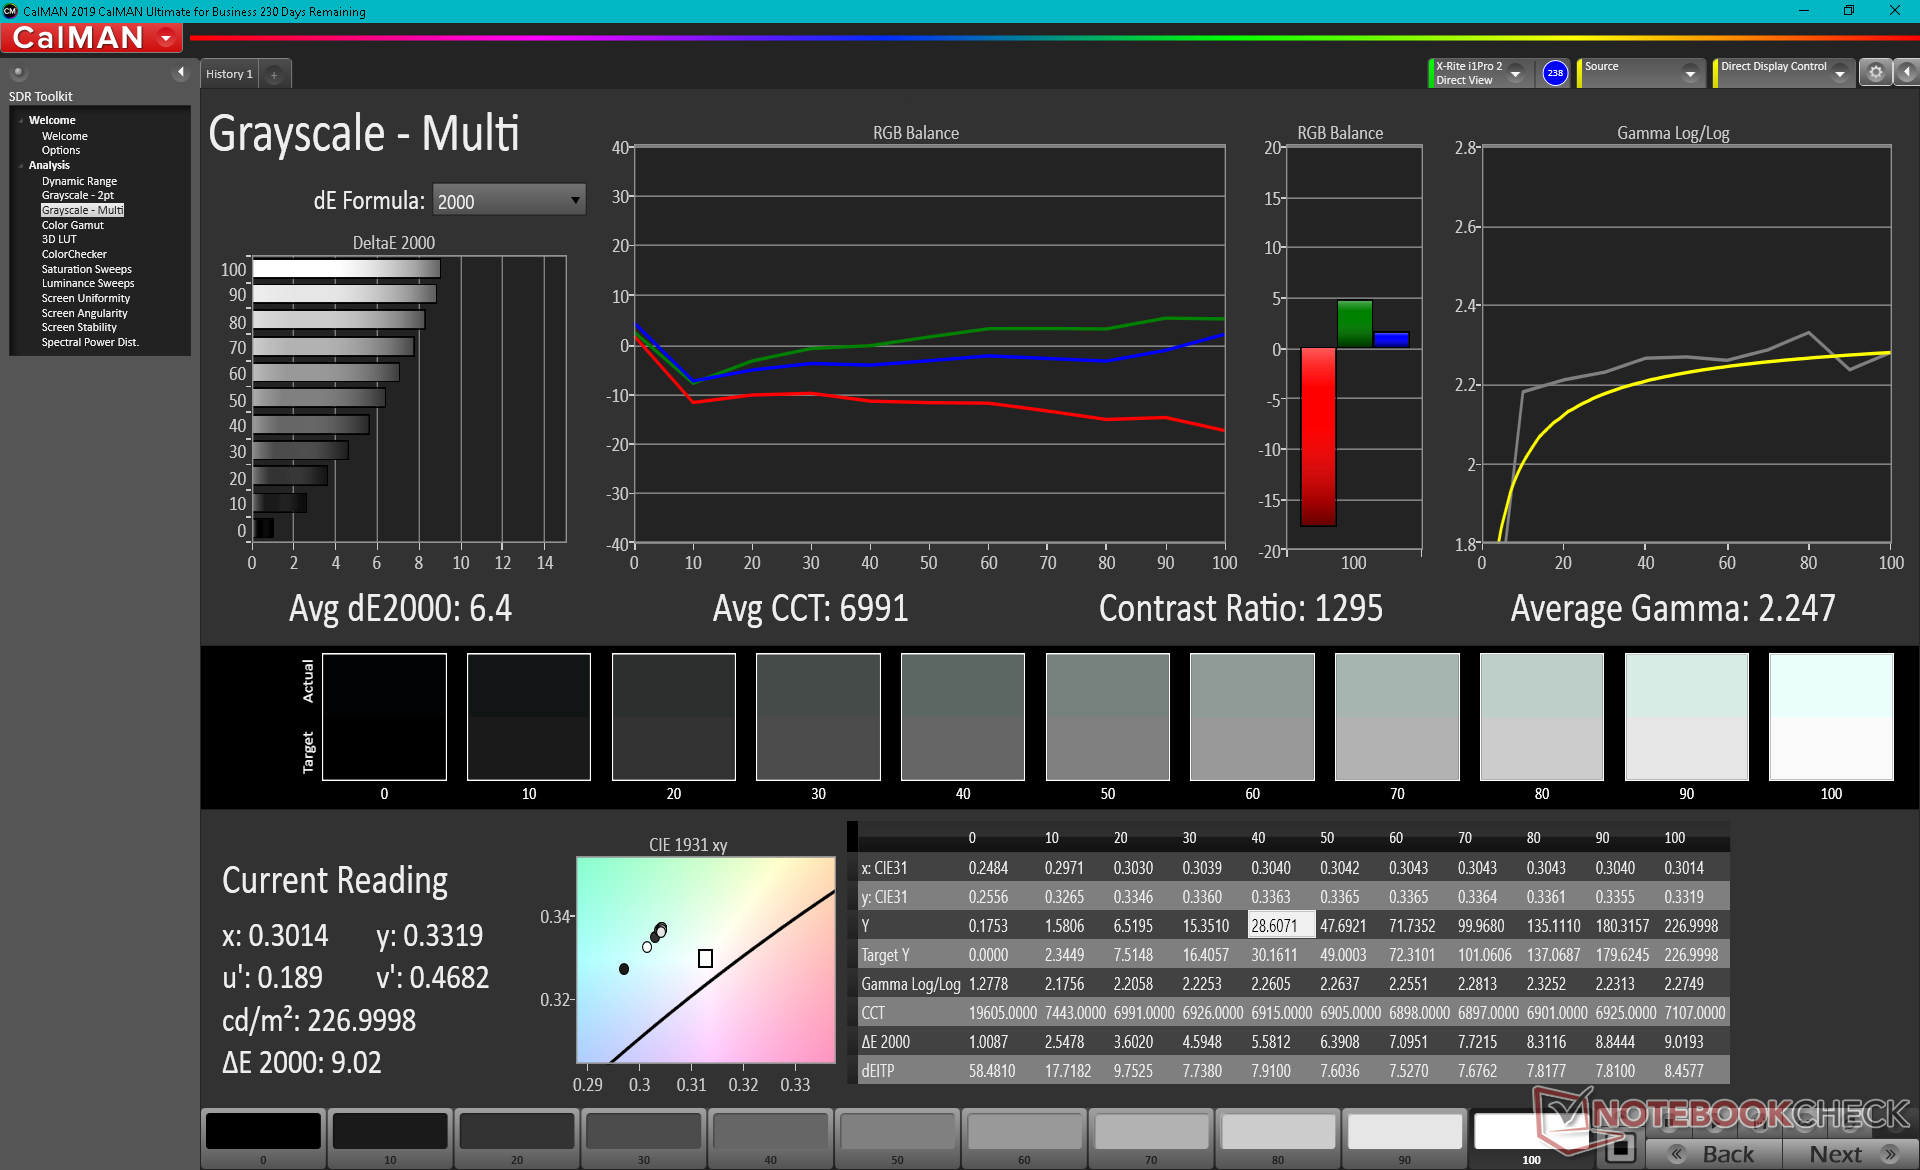
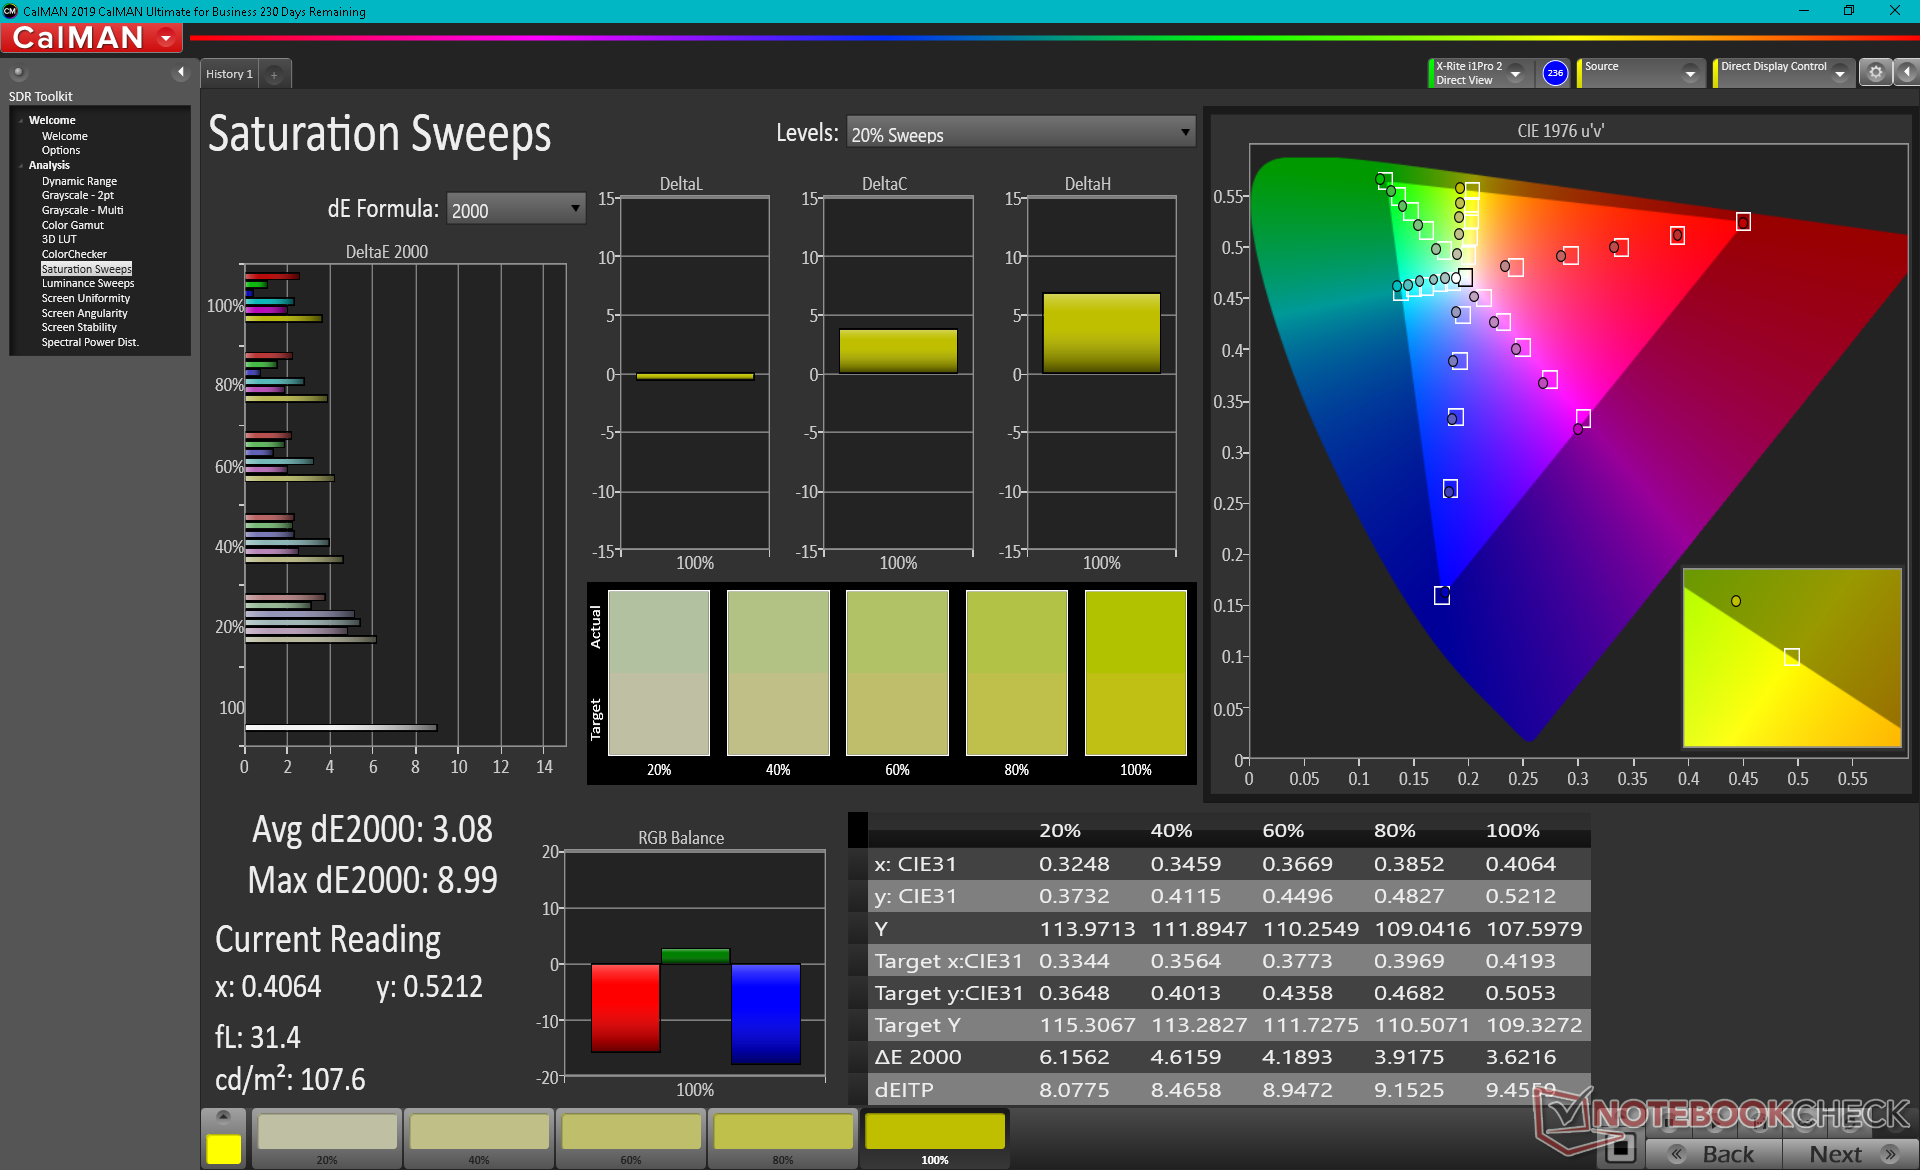
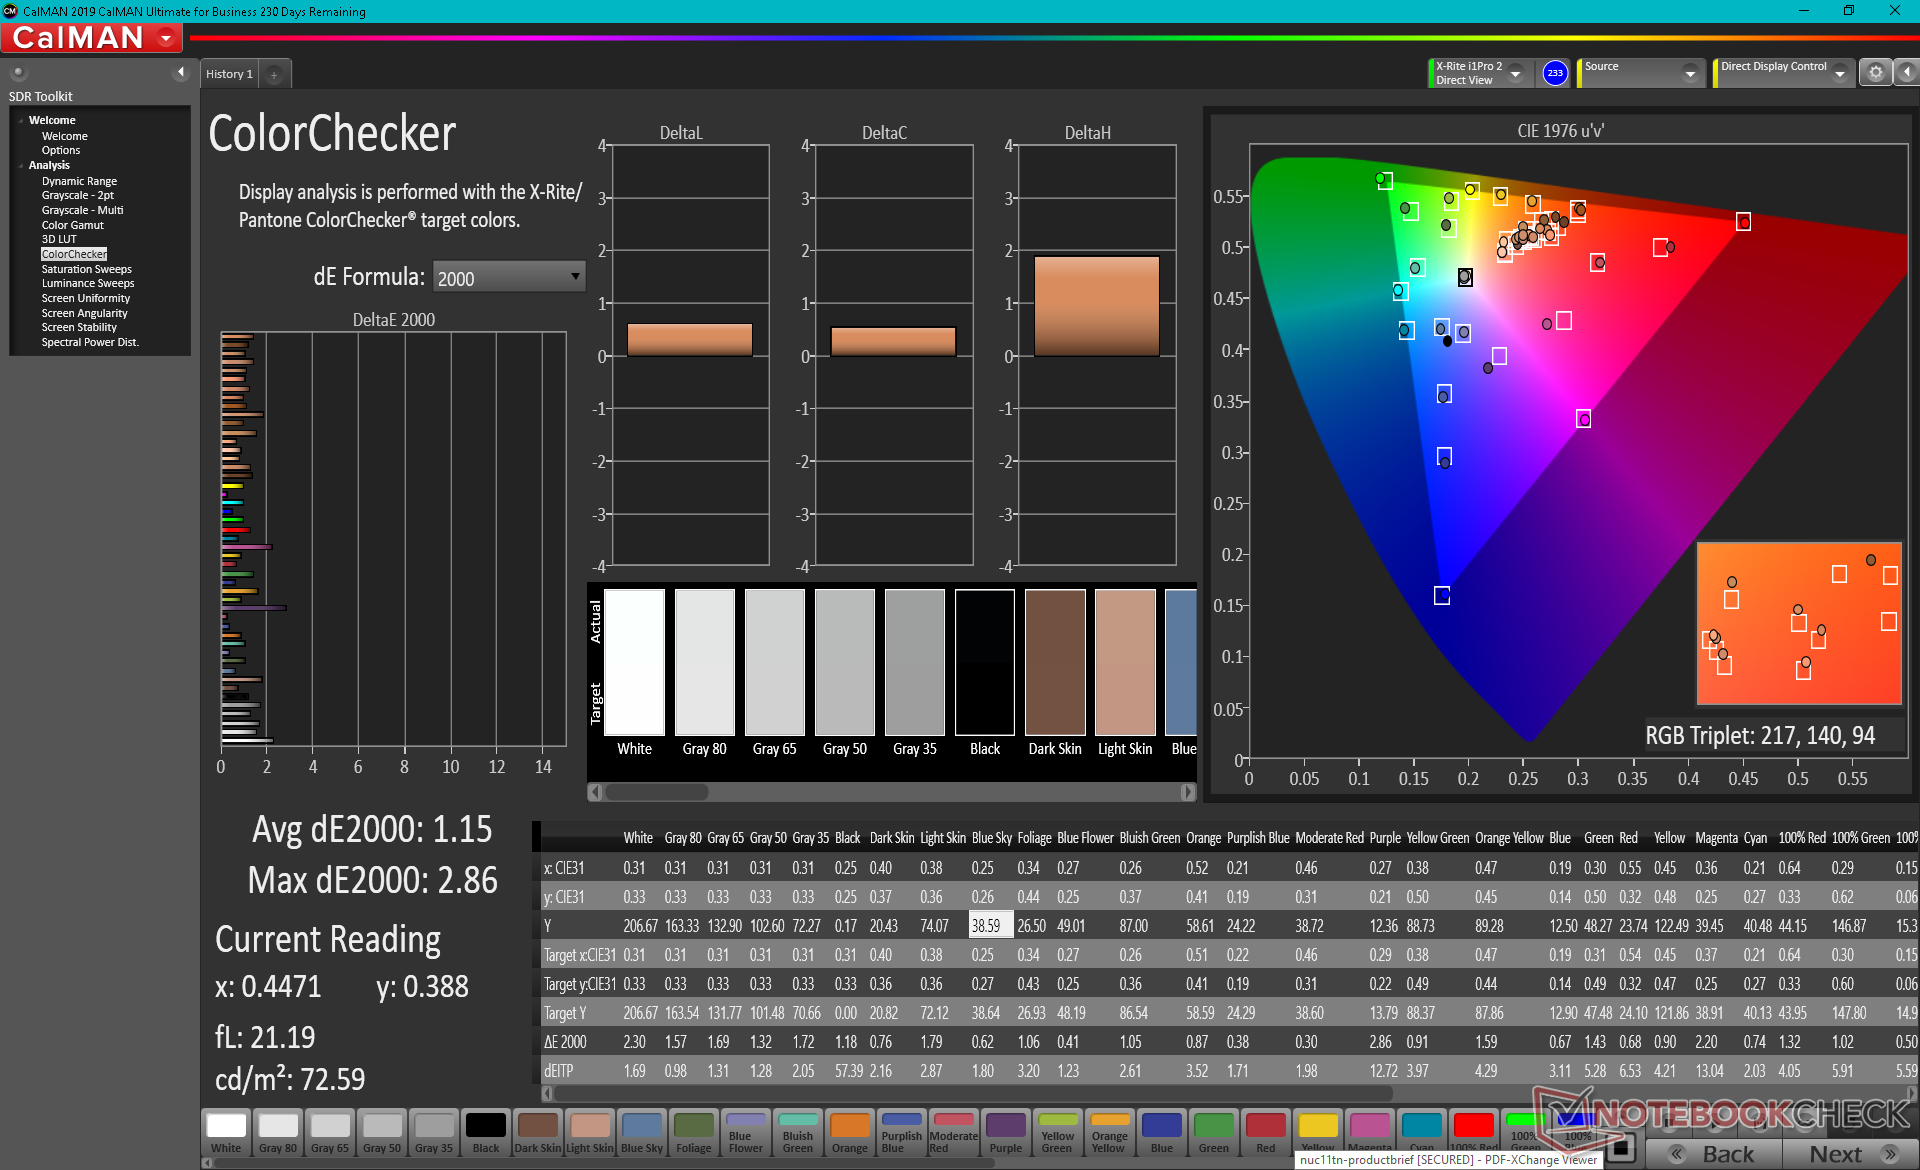
ΔE ColorChecker Calman: 3.98 | ∀{0.5-29.43 Ø4.71}
calibrated: 1.15
ΔE Greyscale Calman: 6.4 | ∀{0.09-98 Ø4.96}
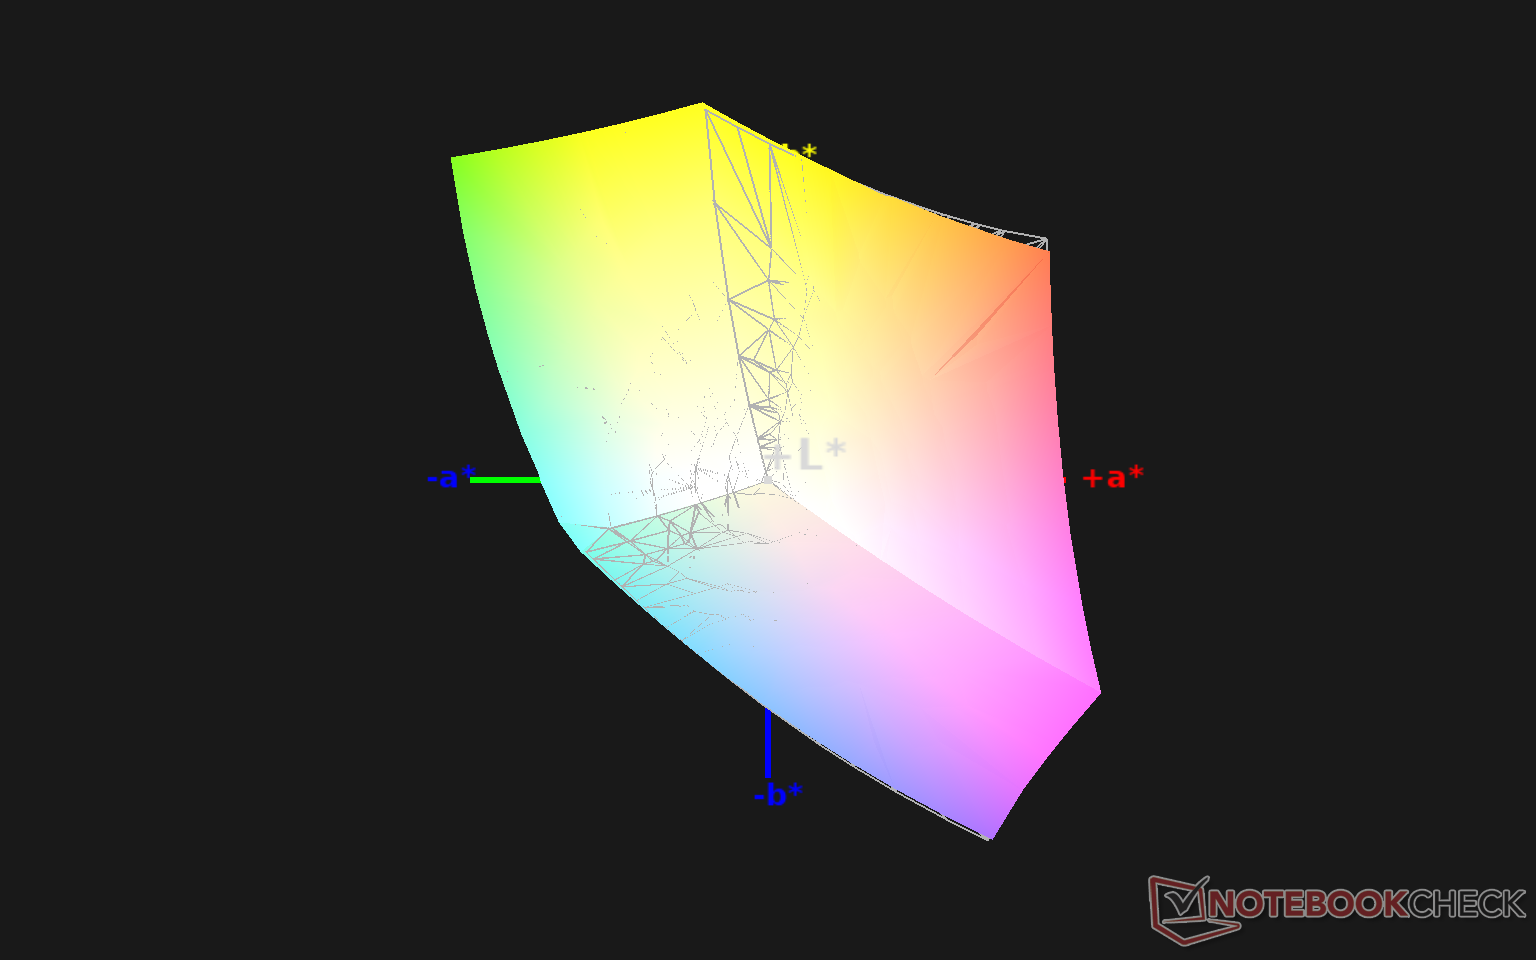
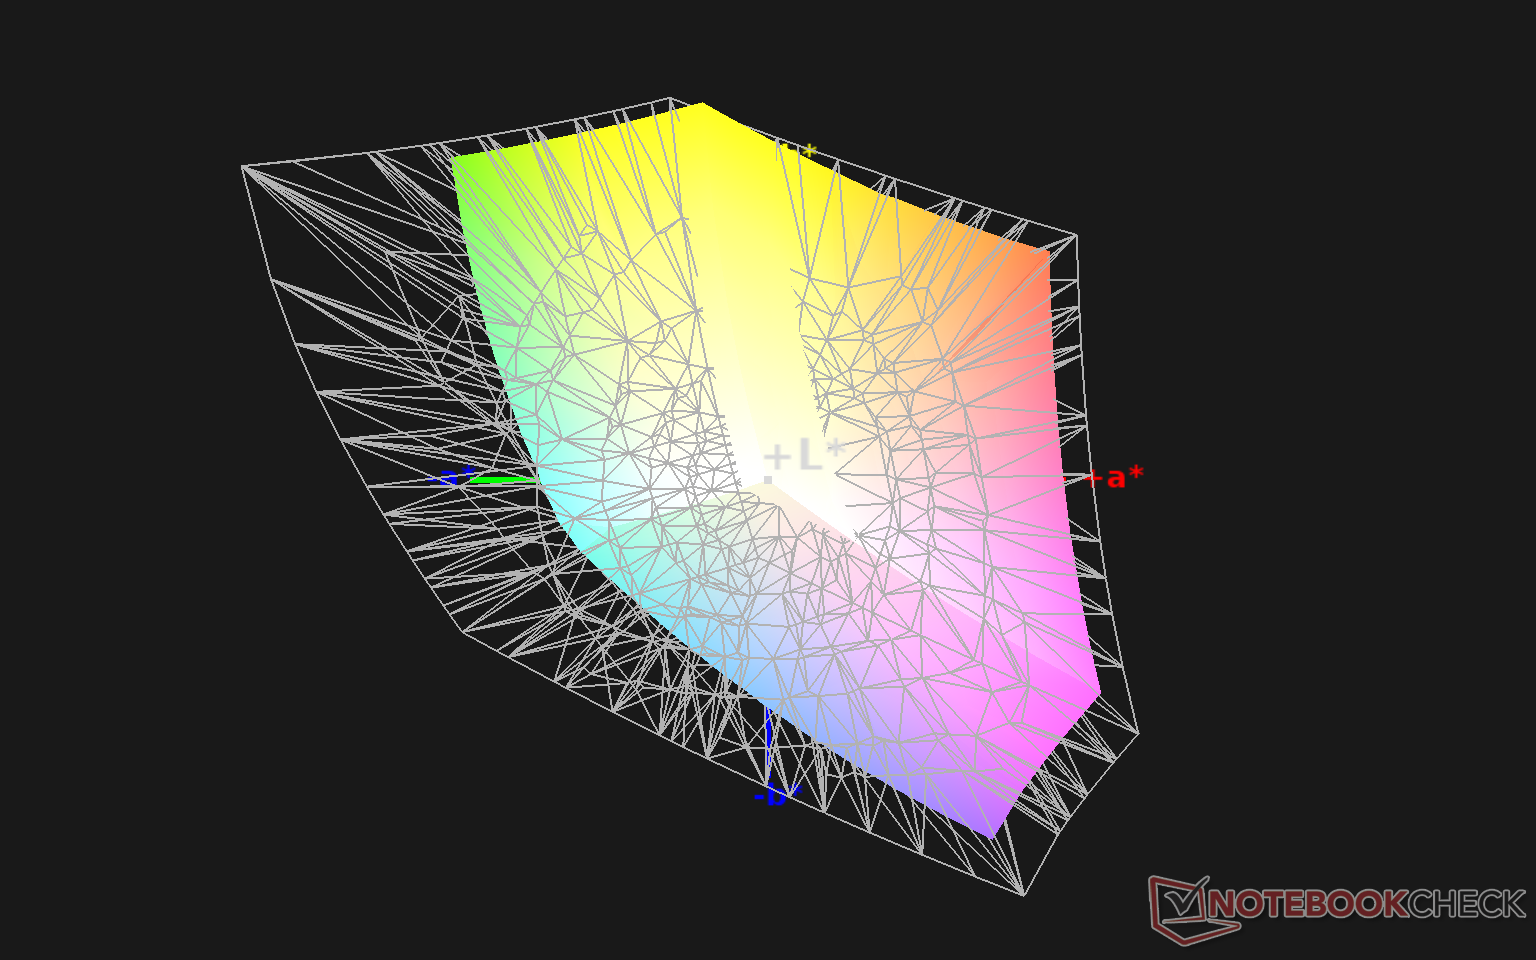
99.3% sRGB (Argyll 1.6.3 3D)
64.5% AdobeRGB 1998 (Argyll 1.6.3 3D)
70.4% AdobeRGB 1998 (Argyll 3D)
99.2% sRGB (Argyll 3D)
68.3% Display P3 (Argyll 3D)
Gamma: 2.25
CCT: 6991 K
| MSI GP66 Leopard 10UG Sharp LQ156M1JW03, IPS, 15.6", 1920x1080 | MSI GP65 10SFK-047US LG Philips LP156WFG-SPB3, IPS, 15.6", 1920x1080 | Alienware m15 R4 LG Philips LGD066E, IPS, 15.6", 1920x1080 | Aorus 15P XC Sharp LQ156M1JW03, IPS, 15.6", 1920x1080 | Asus ROG Zephyrus G15 GA503Q CMN N156KME-GNA (CMN152A), IPS-Level, 15.6", 2560x1440 | MSI GF65 Thin 10UE AU Optronics B156HAN08.4, IPS, 15.6", 1920x1080 | |
|---|---|---|---|---|---|---|
| Display | -7% | 1% | -2% | 22% | -44% | |
| Display P3 Coverage (%) | 68.3 | 63.5 -7% | 69.4 2% | 67.2 -2% | 97.3 42% | 37.65 -45% |
| sRGB Coverage (%) | 99.2 | 94.4 -5% | 99 0% | 98.7 -1% | 99.9 1% | 56.3 -43% |
| AdobeRGB 1998 Coverage (%) | 70.4 | 65.1 -8% | 70.5 0% | 68.6 -3% | 86.2 22% | 38.9 -45% |
| Response Times | -1% | 21% | 9% | 9% | -200% | |
| Response Time Grey 50% / Grey 80% * (ms) | 13.6 ? | 10.4 ? 24% | 7.4 ? 46% | 11.2 ? 18% | 8.8 ? 35% | 36.8 ? -171% |
| Response Time Black / White * (ms) | 9.6 ? | 12 ? -25% | 10 ? -4% | 9.6 ? -0% | 11.2 ? -17% | 31.6 ? -229% |
| PWM Frequency (Hz) | 23580 ? | 24040 ? | ||||
| Screen | -3% | 24% | 27% | 2% | -32% | |
| Brightness middle (cd/m²) | 225.9 | 384.9 70% | 333 47% | 298 32% | 327 45% | 266.5 18% |
| Brightness (cd/m²) | 211 | 358 70% | 303 44% | 278 32% | 309 46% | 262 24% |
| Brightness Distribution (%) | 83 | 87 5% | 86 4% | 88 6% | 89 7% | 91 10% |
| Black Level * (cd/m²) | 0.23 | 0.67 -191% | 0.29 -26% | 0.29 -26% | 0.33 -43% | 0.18 22% |
| Contrast (:1) | 982 | 574 -42% | 1148 17% | 1028 5% | 991 1% | 1481 51% |
| Colorchecker dE 2000 * | 3.98 | 2.43 39% | 1.8 55% | 0.96 76% | 4.49 -13% | 5.33 -34% |
| Colorchecker dE 2000 max. * | 8.95 | 4.58 49% | 4.49 50% | 3.22 64% | 8.42 6% | 18.28 -104% |
| Colorchecker dE 2000 calibrated * | 1.15 | 2.03 -77% | 1.13 2% | 0.83 28% | 2.27 -97% | 4.36 -279% |
| Greyscale dE 2000 * | 6.4 | 2.6 59% | 1.9 70% | 1.3 80% | 4.2 34% | 4.5 30% |
| Gamma | 2.25 98% | 2.2 100% | 2.265 97% | 2.242 98% | 2.173 101% | 2.35 94% |
| CCT | 6991 93% | 6981 93% | 6840 95% | 6519 100% | 7014 93% | 6289 103% |
| Color Space (Percent of AdobeRGB 1998) (%) | 64.5 | 59.7 -7% | 71 10% | 69 7% | 86 33% | 35.6 -45% |
| Color Space (Percent of sRGB) (%) | 99.3 | 93.9 -5% | 93 -6% | 91 -8% | 99 0% | 55.8 -44% |
| Total Average (Program / Settings) | -4% /
-3% | 15% /
19% | 11% /
19% | 11% /
6% | -92% /
-55% |
* ... smaller is better
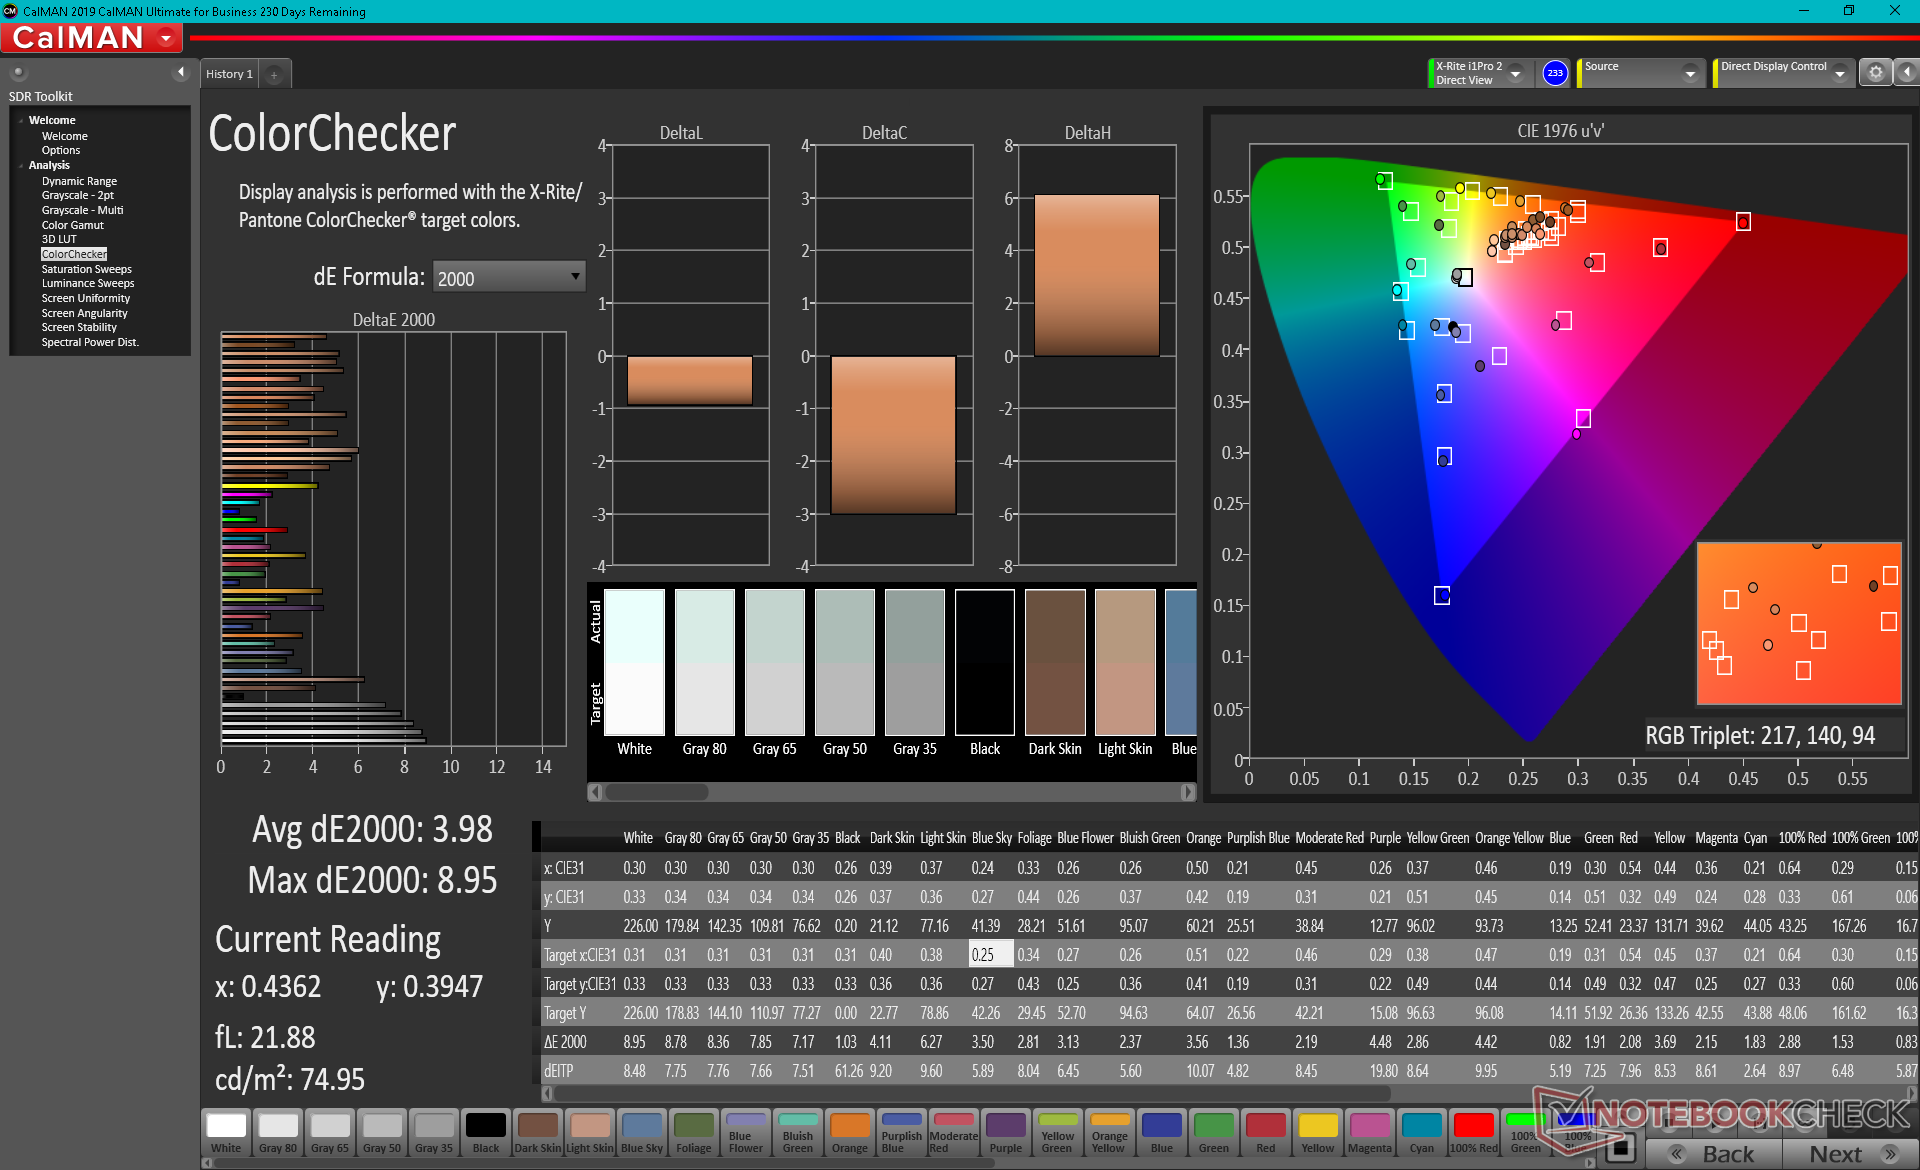
Color space covers all of sRGB to be comparable to most high-end gaming laptops. We're glad that MSI isn't using one of those cheap Panda panels which typically have much poorer colors.
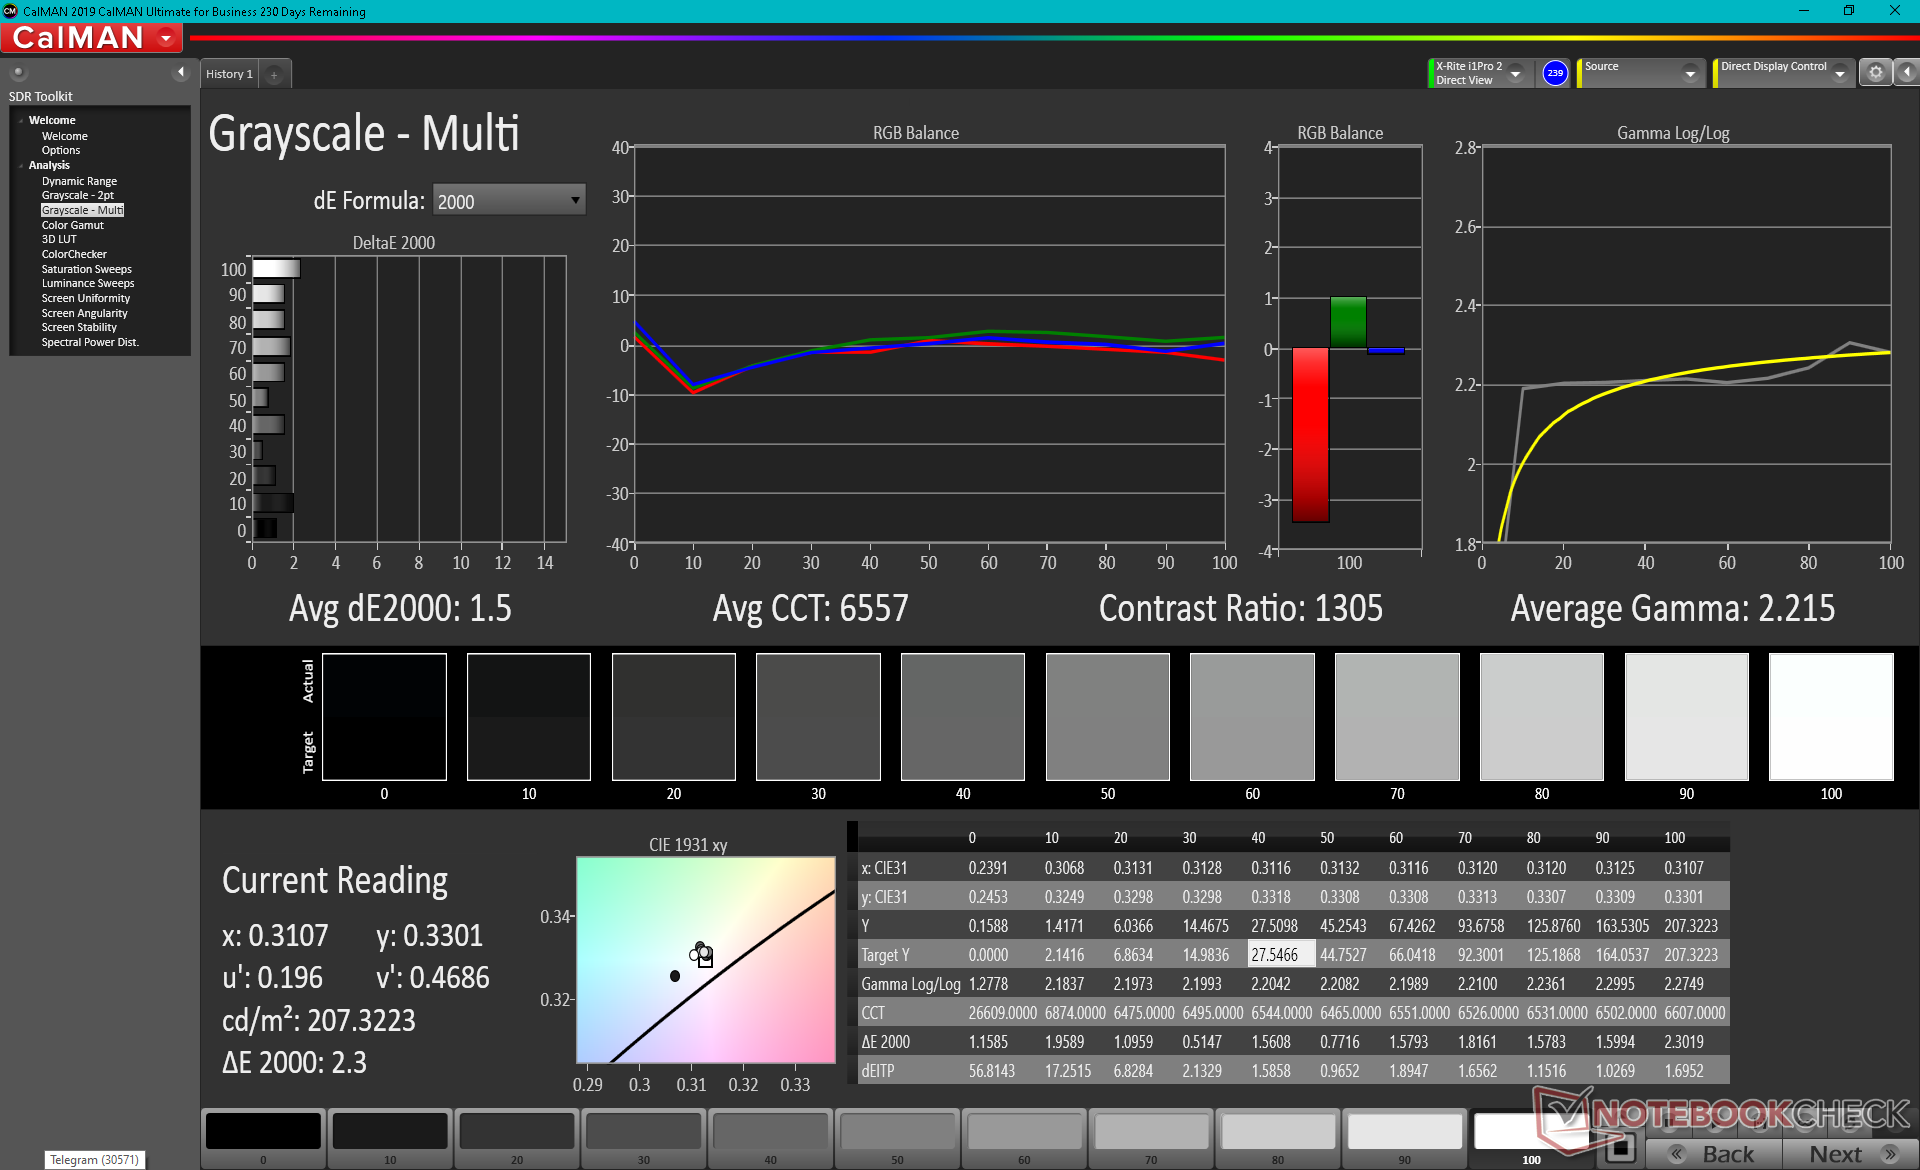
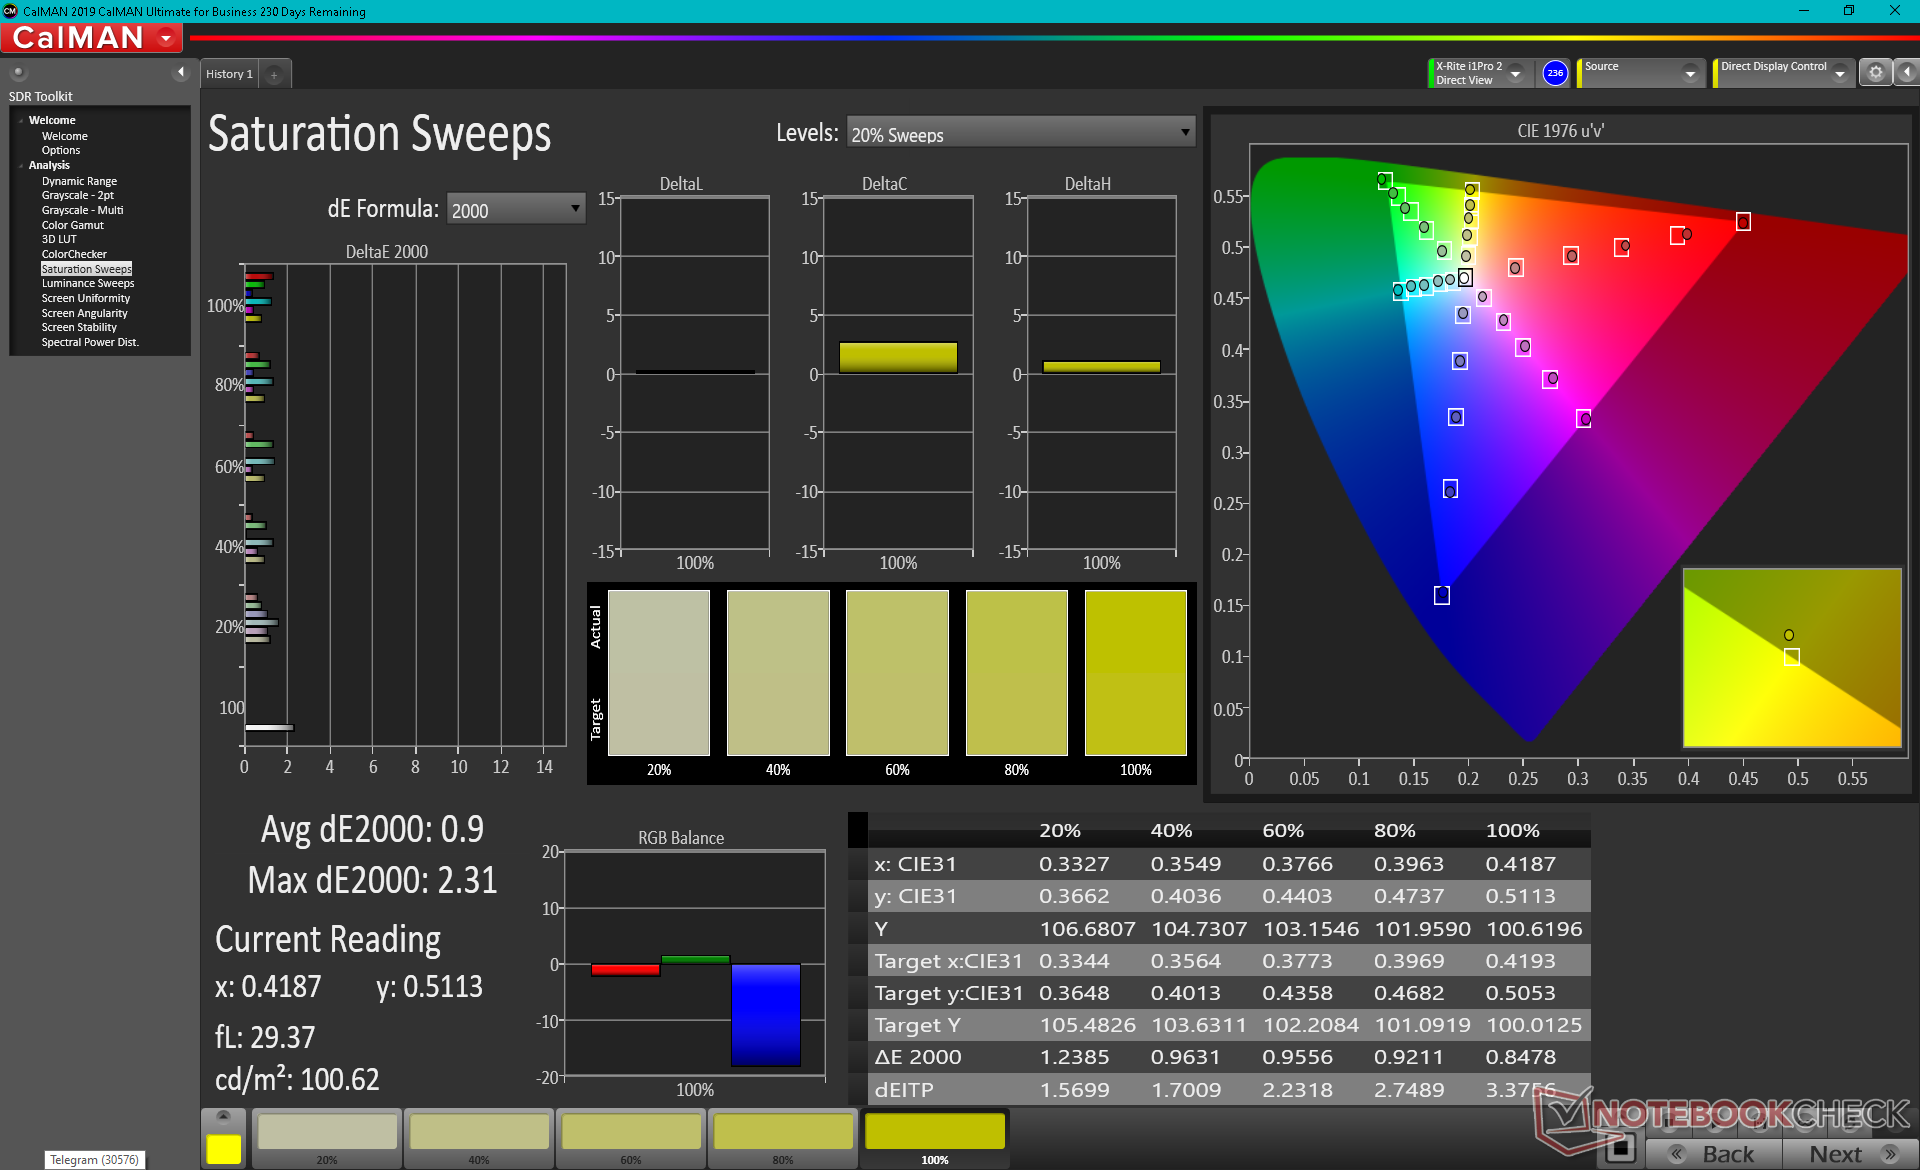
X-Rite colorimeter measurements show an uncalibrated display out of the box which is to be expected since the GP66 is not a flagship Pantone-calibrated gaming laptop. Color temperature is too cool and color accuracy suffers as a result. Colors improve significantly once properly calibrated with final grayscale and color deltaE values of just 1.5 and 1.15, respectively. We recommend applying our ICM profile above to get the most out of the display if you don't have access to a colorimeter.
Display Response Times
| ↔ Response Time Black to White | ||
|---|---|---|
| 9.6 ms ... rise ↗ and fall ↘ combined | ↗ 5.2 ms rise | 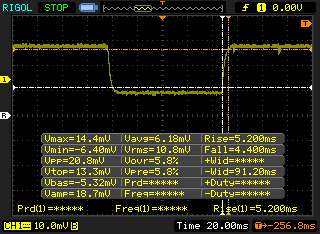 |
| ↘ 4.4 ms fall | ||
| The screen shows fast response rates in our tests and should be suited for gaming. In comparison, all tested devices range from 0.1 (minimum) to 240 (maximum) ms. » 26 % of all devices are better. This means that the measured response time is better than the average of all tested devices (19.8 ms). | ||
| ↔ Response Time 50% Grey to 80% Grey | ||
| 13.6 ms ... rise ↗ and fall ↘ combined | ↗ 7.6 ms rise | 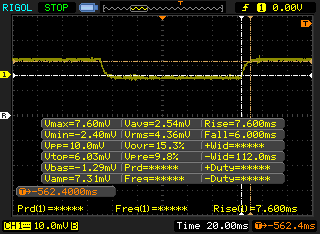 |
| ↘ 6 ms fall | ||
| The screen shows good response rates in our tests, but may be too slow for competitive gamers. In comparison, all tested devices range from 0.165 (minimum) to 636 (maximum) ms. » 27 % of all devices are better. This means that the measured response time is better than the average of all tested devices (31 ms). | ||
Screen Flickering / PWM (Pulse-Width Modulation)
| Screen flickering / PWM detected | 23580 Hz | ≤ 34 % brightness setting | 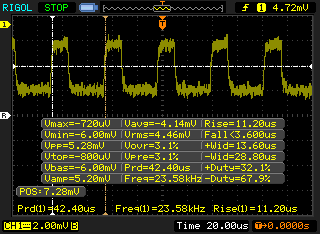 |
The display backlight flickers at 23580 Hz (worst case, e.g., utilizing PWM) Flickering detected at a brightness setting of 34 % and below. There should be no flickering or PWM above this brightness setting. The frequency of 23580 Hz is quite high, so most users sensitive to PWM should not notice any flickering. In comparison: 52 % of all tested devices do not use PWM to dim the display. If PWM was detected, an average of 7754 (minimum: 5 - maximum: 343500) Hz was measured. | |||
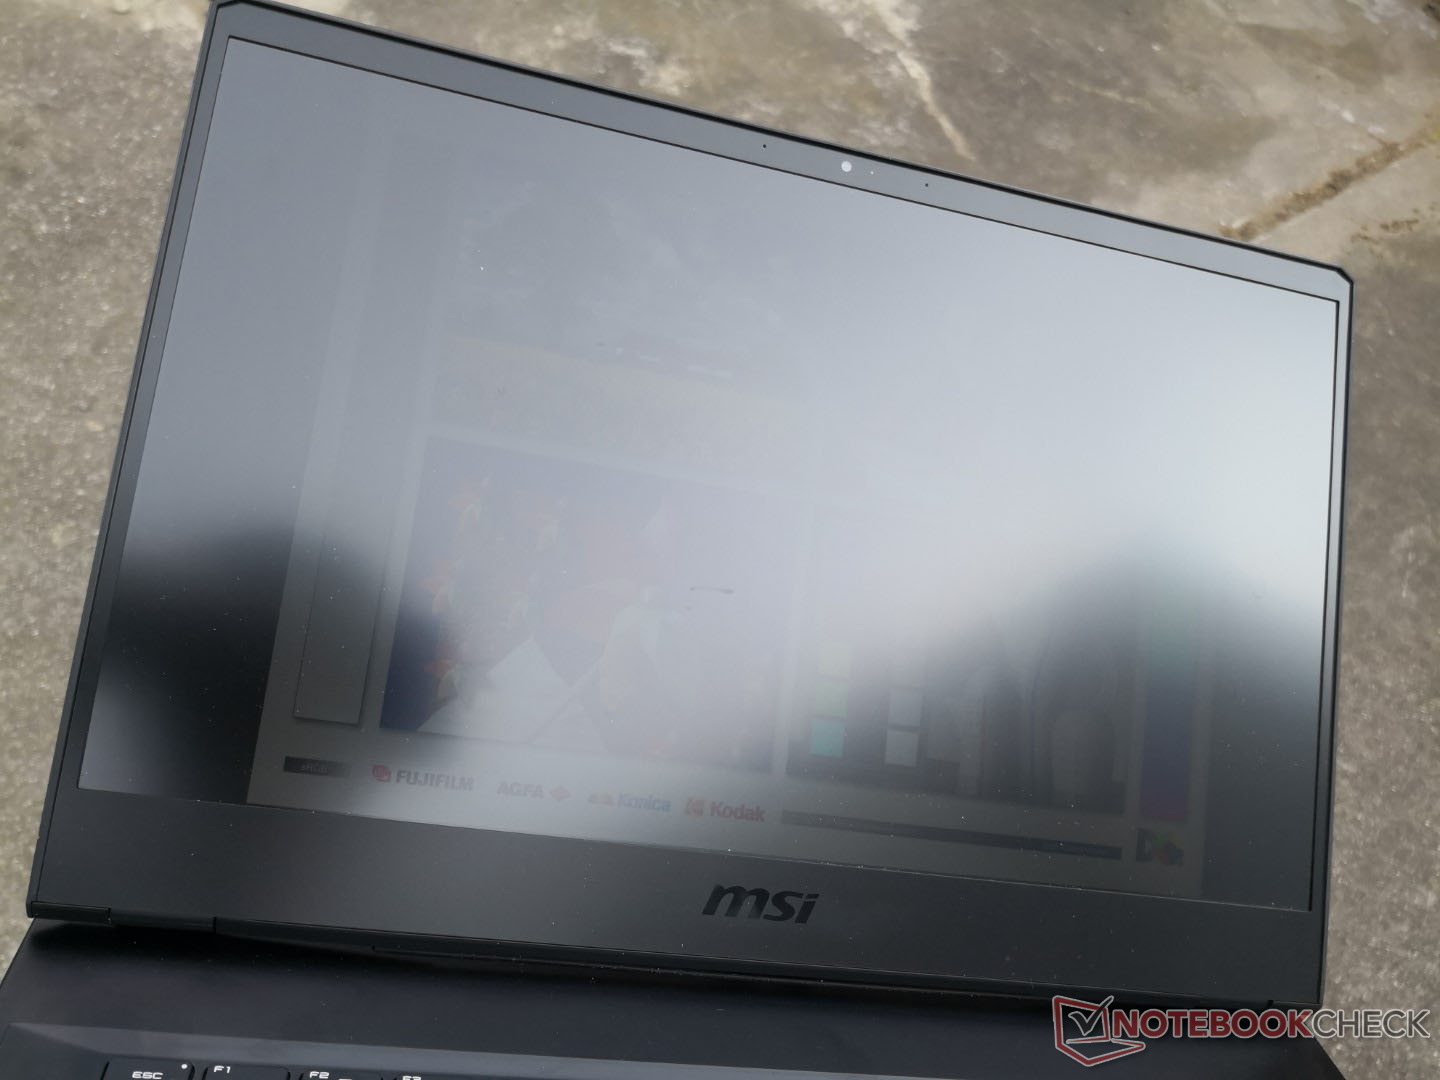
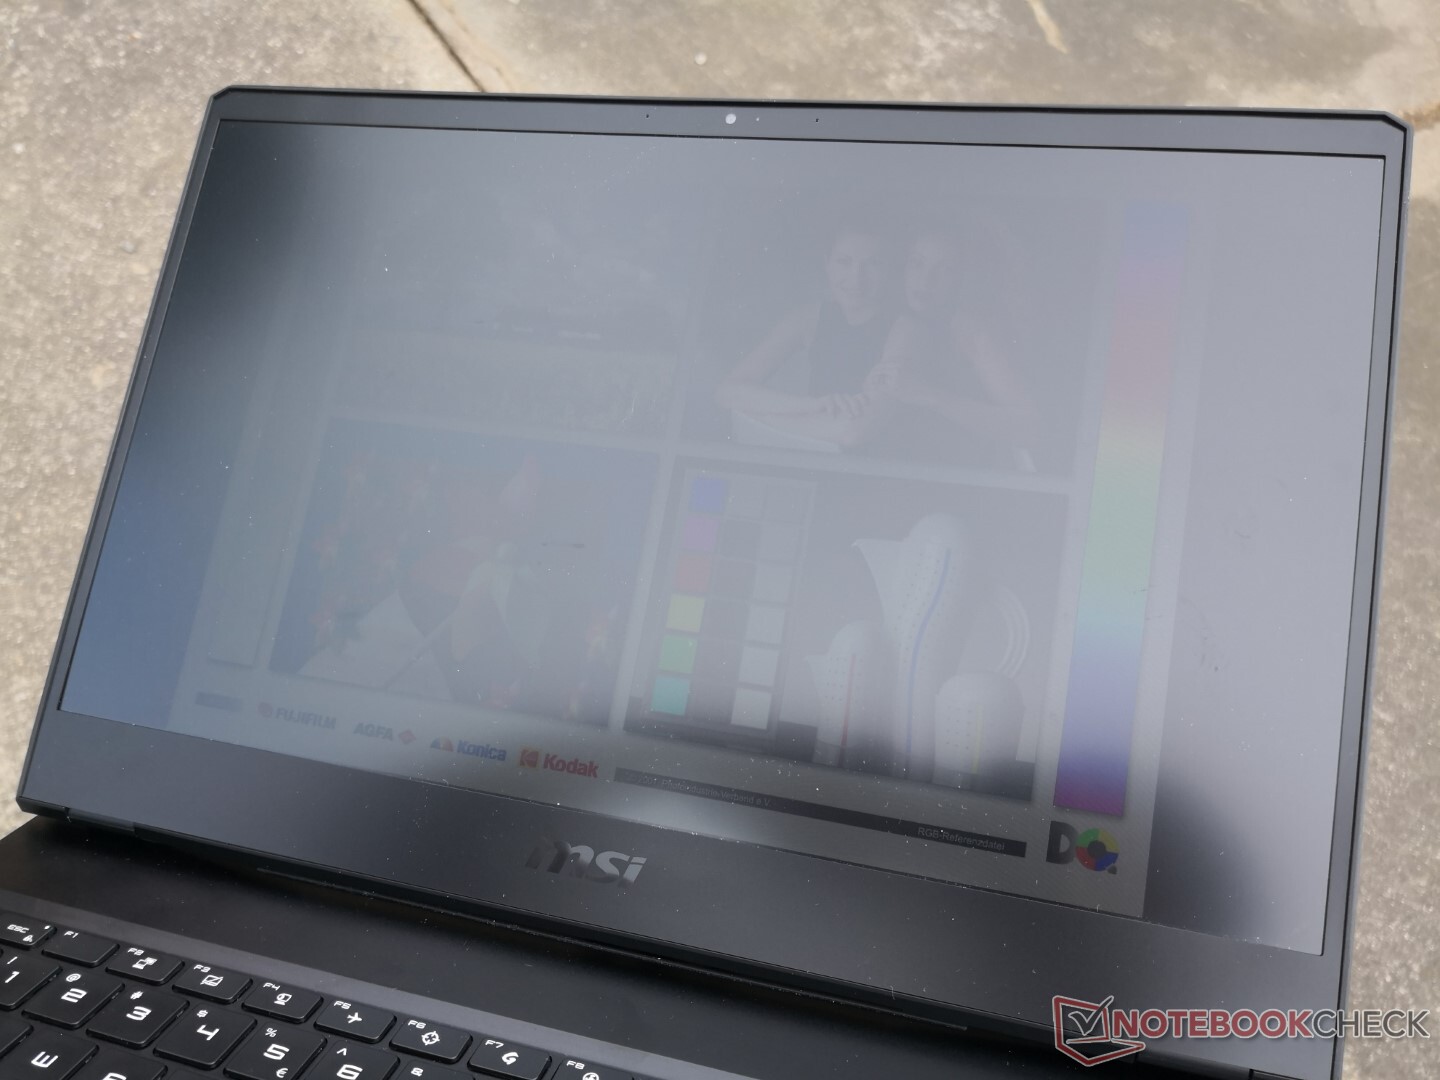
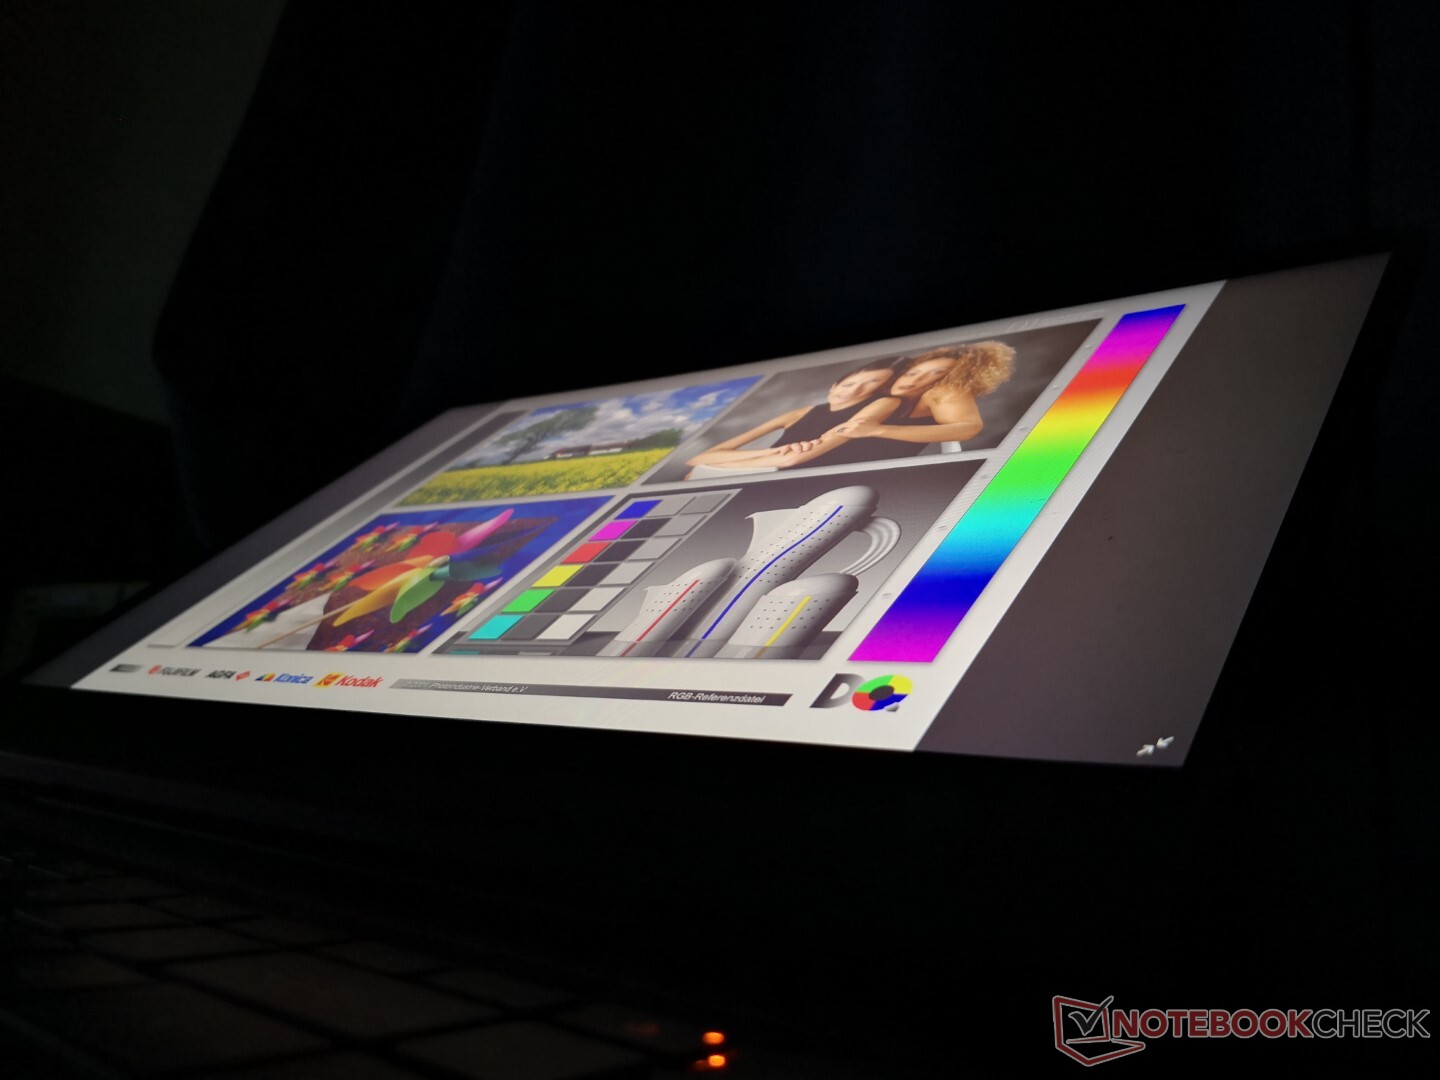
Outdoor visibility is poor as the display is not that bright. Glare is noticeable under most conditions and even if it could be reduced, onscreen content will appear washed out anyway.
Performance
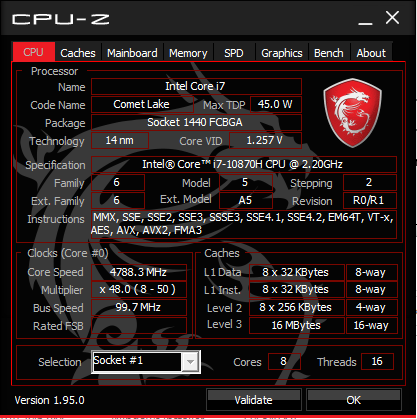
MSI is only offering 10th gen Comet Lake-H Core i7-10870H and Core i7-10875H options at the moment with nothing else. However, we would've been fine with just one of those options only as any differences between the i7-10870H and i7-10875H are incredibly minor. Users will have to look at the cheaper Bravo or Alpha series for AMD options.
Graphics range from the GeForce RTX 3060 to 3080 at 130 W TGP each. Both automatic and manual graphics switching are available via the Dragon Center software. We recommend owners become familiar with Dragon Center as key features are toggled here.
We had set our unit to Extreme Performance mode with the Nvidia GPU active prior to running any performance benchmarks below.
Processor
CPU performance is excellent with decent Turbo Boost sustainability as shown by our CineBench R15 xT loop results below. Performance is even as fast as the more expensive Core i9-10980HK in the Alienware m15 R4. Differences between the Core i7-10875H and Core i7-10870H are within just a couple of percentage points.
Cinebench R15: CPU Multi 64Bit | CPU Single 64Bit
Blender: v2.79 BMW27 CPU
7-Zip 18.03: 7z b 4 -mmt1 | 7z b 4
Geekbench 5.5: Single-Core | Multi-Core
HWBOT x265 Benchmark v2.2: 4k Preset
LibreOffice : 20 Documents To PDF
R Benchmark 2.5: Overall mean
| LibreOffice / 20 Documents To PDF | |
| HP Pavilion Gaming 15-ec1206ng | |
| Schenker XMG Core 15 Ampere | |
| Average Intel Core i7-10870H (46 - 64.4, n=12) | |
| Alienware m15 R4 | |
| MSI GP66 Leopard 10UG | |
| Razer Blade 15 Base Edition 2021, i7-10750H RTX 3060 | |
| Asus Zephyrus S15 GX502L | |
| MSI GT76 Titan DT 10SGS | |
| Asus ROG Zephyrus Duo 15 SE GX551QS | |
* ... smaller is better
System Performance
PCMark results are where we expect them to be relative to other laptops with the same CPU and GPU. Scores are consistently higher than the GP65 except in the Essentials benchmark likely due to the slower NVMe SSD in our GP66 test unit.
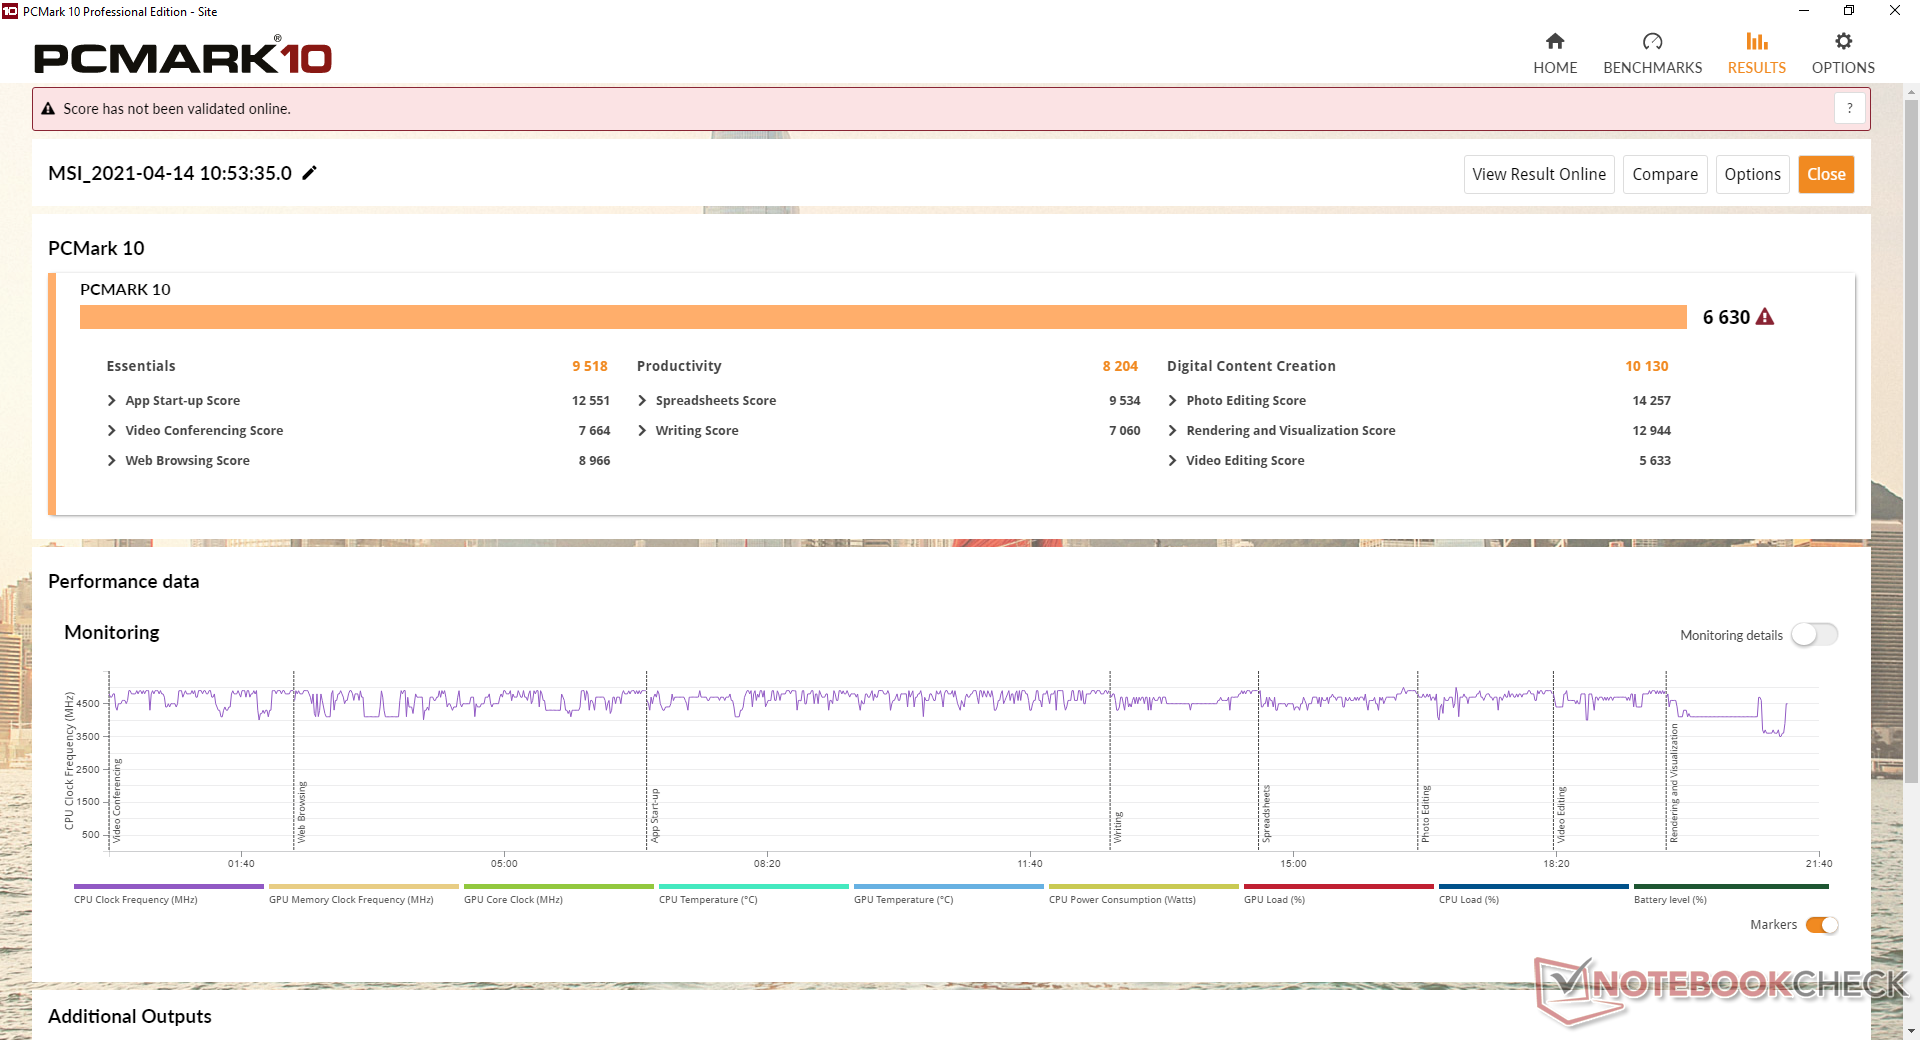
| PCMark 10 Score | 6630 points | |
Help | ||
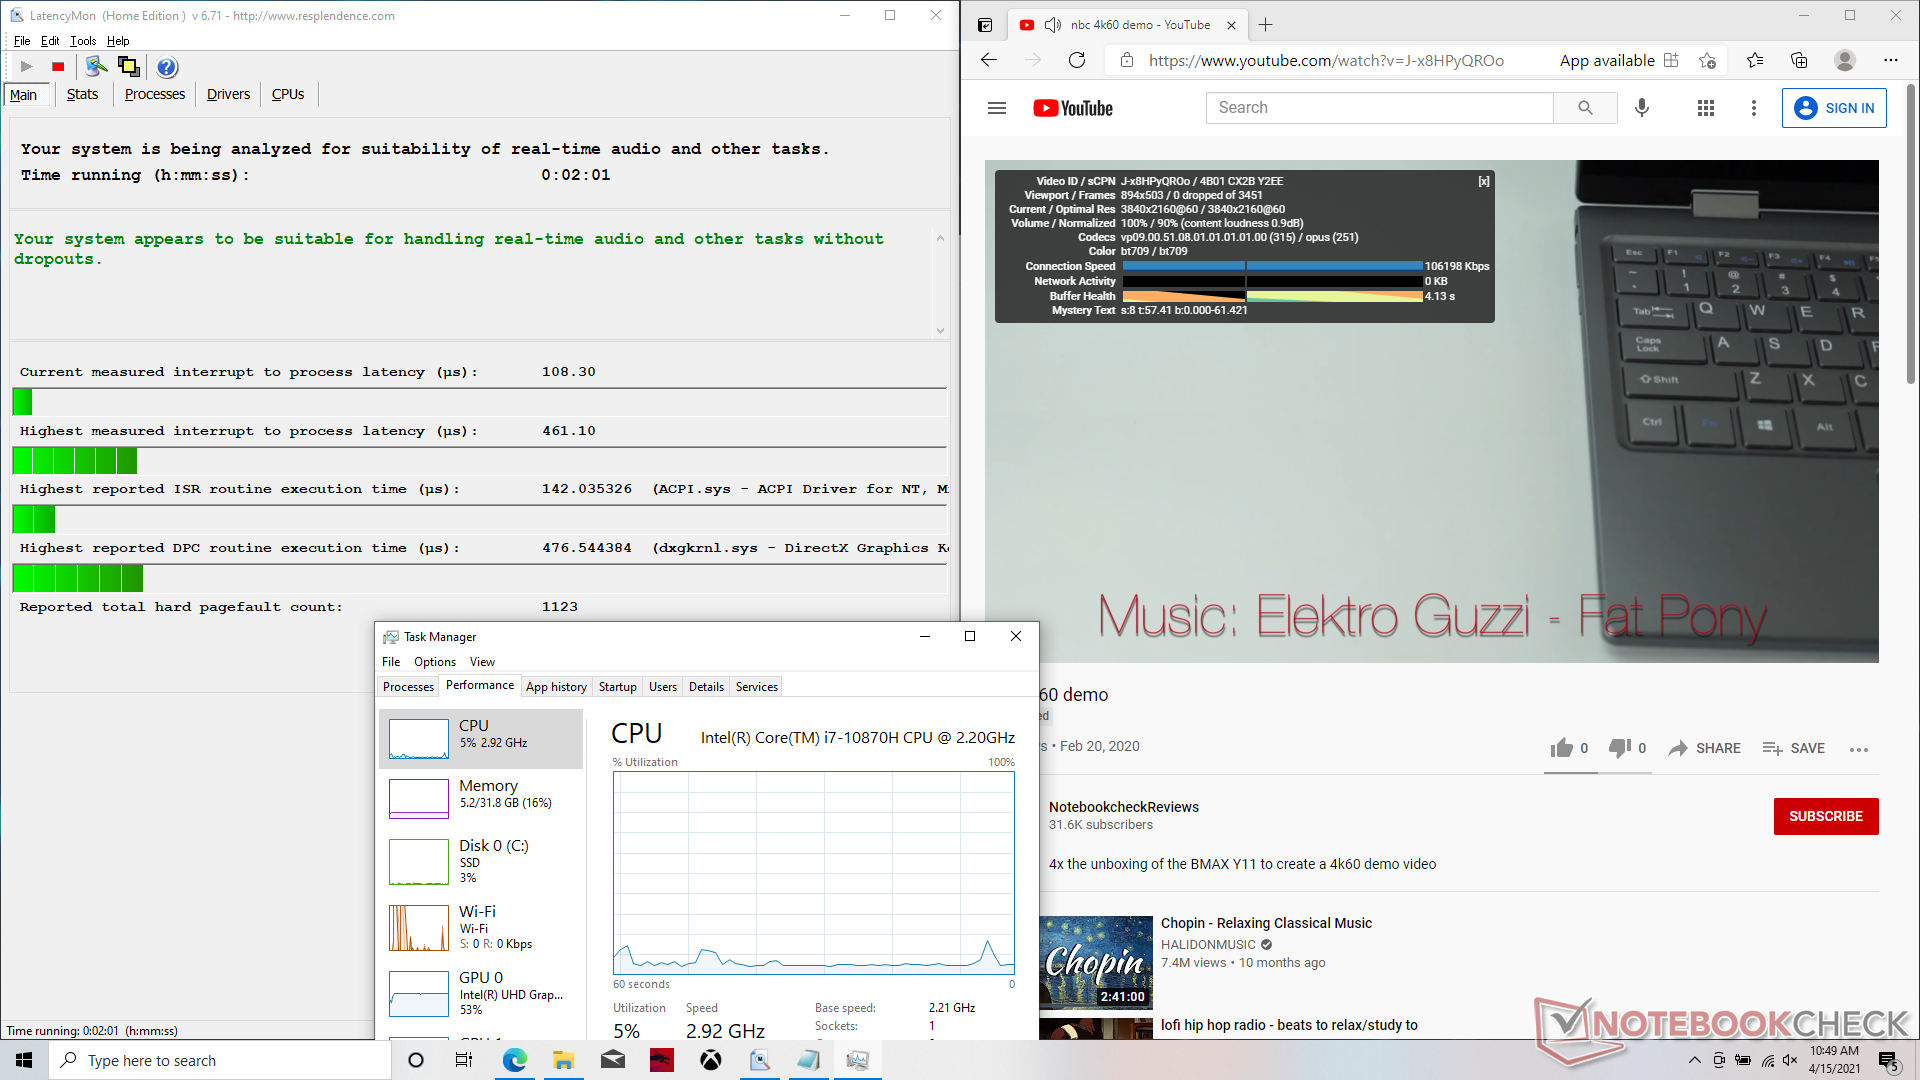
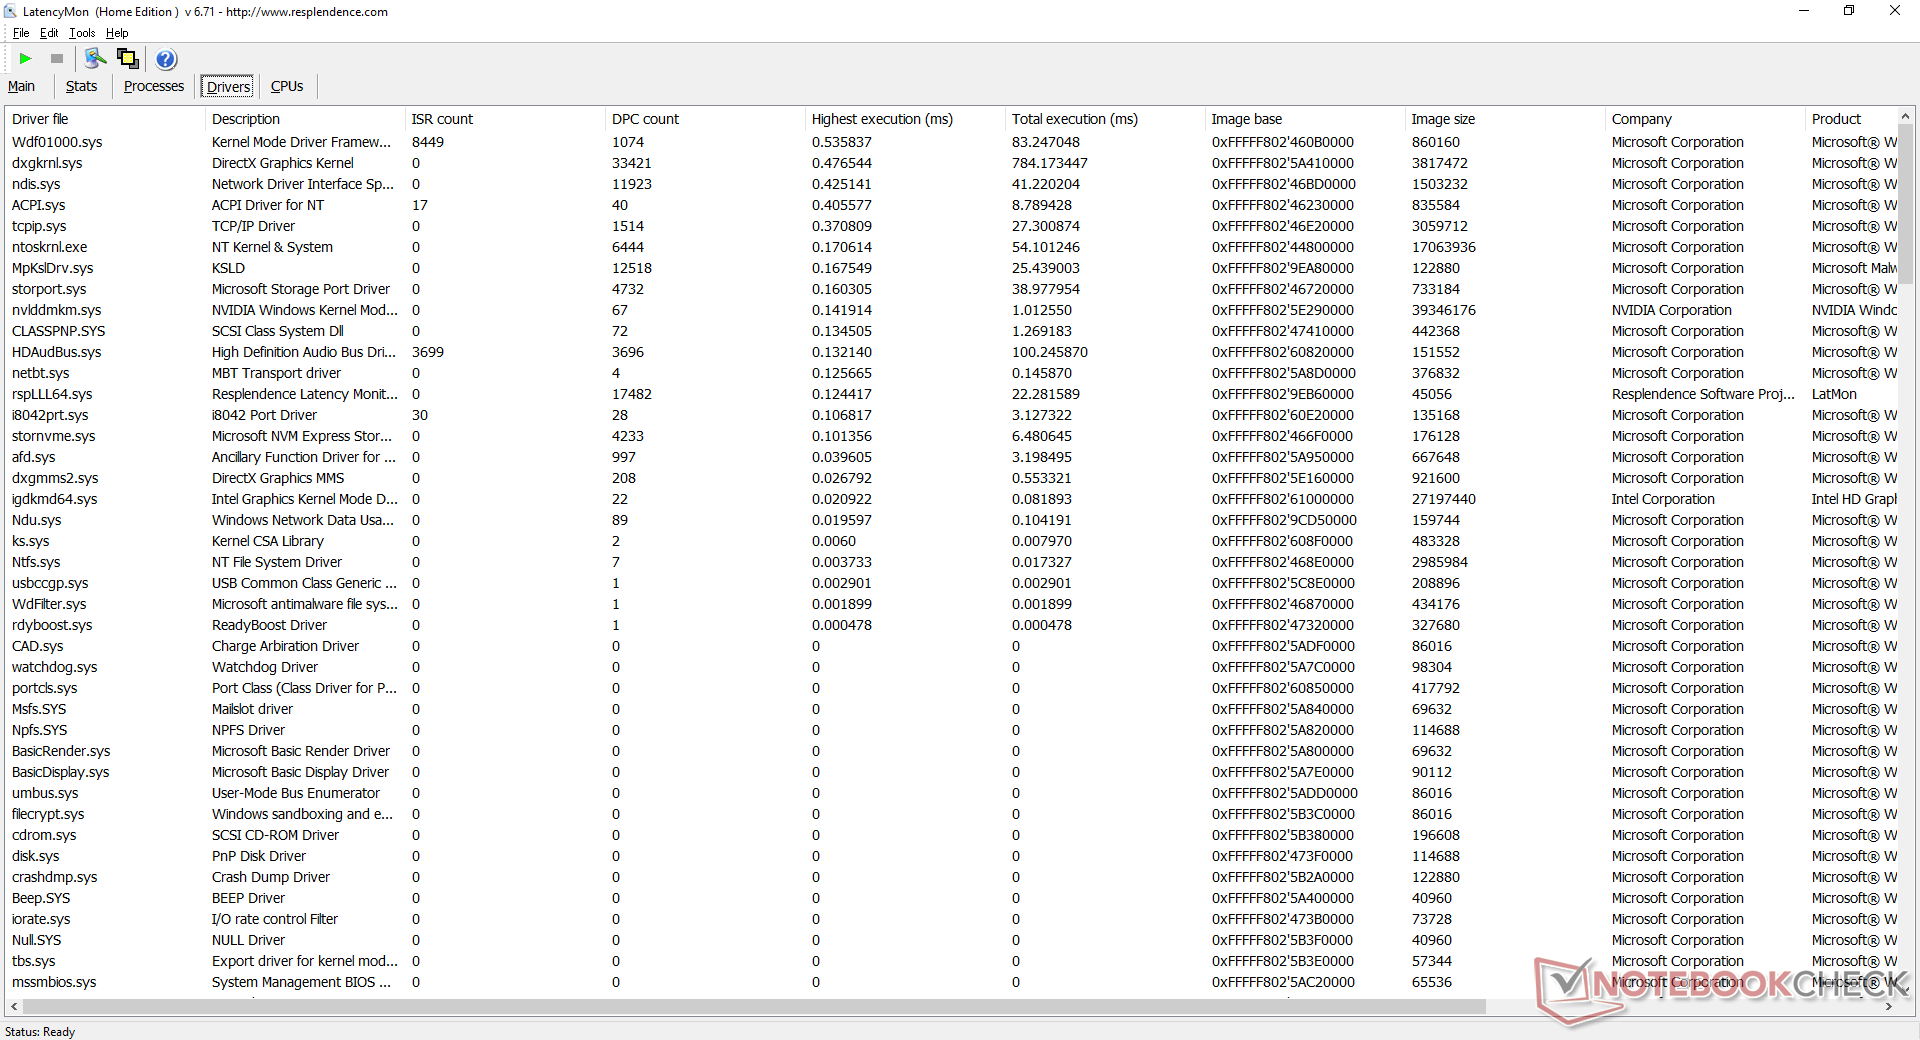
DPC Latency
LatencyMon shows no DPC latency issues when opening multiple browser tabs on our homepage. 4K video playback at 60 FPS is smooth and with no dropped frames as to be expected from any gaming laptop.
| DPC Latencies / LatencyMon - interrupt to process latency (max), Web, Youtube, Prime95 | |
| Alienware m15 R4 | |
| Aorus 15P XC | |
| MSI GP65 10SFK-047US | |
| MSI GF65 Thin 10UE | |
| MSI GP66 Leopard 10UG | |
| Asus ROG Zephyrus G15 GA503Q | |
* ... smaller is better
Storage Devices
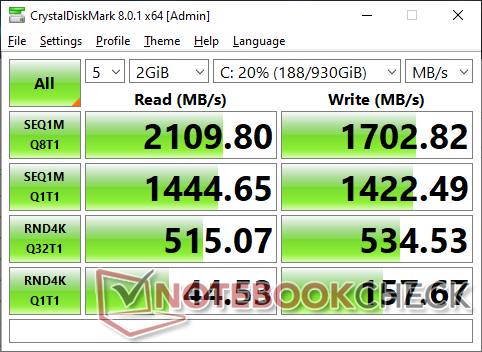
Whereas the GP65 could support up to three internal drives (2x M.2, 1x 2.5-inch SATA III), the GP66 can support up to 2x M.2 drives only. The 1 TB Kingston OM8PCP31024F in our unit is a mid-range NVMe drive that's slower than both the Samsung PM981 and Micron 2300.
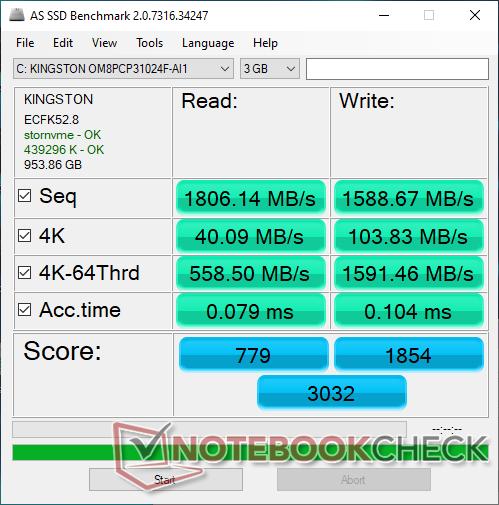
| MSI GP66 Leopard 10UG Kingston OM8PCP31024F | MSI GP65 10SFK-047US Samsung SSD PM981 MZVLB1T0HALR | Alienware m15 R4 Micron 2300 1TB MTFDHBA1T0TDV | Aorus 15P XC ESR512GTLCG-EAC-4 | Asus ROG Zephyrus G15 GA503Q SK Hynix HFM001TD3JX013N | MSI GF65 Thin 10UE Samsung SSD PM981 MZVLB1T0HALR | |
|---|---|---|---|---|---|---|
| AS SSD | 50% | 38% | 45% | 58% | 50% | |
| Seq Read (MB/s) | 1806 | 2066 14% | 2658 47% | 2694 49% | 2950 63% | 3002 66% |
| Seq Write (MB/s) | 1589 | 2418 52% | 2769 74% | 2327 46% | 1600 1% | 2420 52% |
| 4K Read (MB/s) | 40.09 | 54.2 35% | 46.07 15% | 47.77 19% | 53.6 34% | 48.46 21% |
| 4K Write (MB/s) | 103.8 | 129 24% | 87.2 -16% | 98.8 -5% | 126.8 22% | 114.3 10% |
| 4K-64 Read (MB/s) | 559 | 1865 234% | 1372 145% | 1746 212% | 1429 156% | 1873 235% |
| 4K-64 Write (MB/s) | 1591 | 1878 18% | 1247 -22% | 2267 42% | 2177 37% | 1882 18% |
| Access Time Read * (ms) | 0.079 | 0.042 47% | 0.052 34% | 0.079 -0% | 0.064 19% | 0.045 43% |
| Access Time Write * (ms) | 0.104 | 0.091 12% | 0.098 6% | 0.039 62% | 0.029 72% | 0.101 3% |
| Score Read (Points) | 779 | 2126 173% | 1684 116% | 2063 165% | 1778 128% | 2221 185% |
| Score Write (Points) | 1854 | 2249 21% | 1611 -13% | 2598 40% | 2464 33% | 2238 21% |
| Score Total (Points) | 3032 | 5482 81% | 4166 37% | 5698 88% | 5090 68% | 5565 84% |
| Copy ISO MB/s (MB/s) | 2674 | 2927 9% | 1877 -30% | 2421 -9% | ||
| Copy Program MB/s (MB/s) | 895 | 728 -19% | 555 -38% | 705 -21% | ||
| Copy Game MB/s (MB/s) | 1596 | 1614 1% | 1201 -25% | 1490 -7% | ||
| CrystalDiskMark 5.2 / 6 | 31% | 41% | 28% | 42% | 30% | |
| Write 4K (MB/s) | 153.2 | 145 -5% | 93.7 -39% | 130.2 -15% | 156.4 2% | 157.3 3% |
| Read 4K (MB/s) | 43.98 | 46.84 7% | 48.1 9% | 45.47 3% | 66.7 52% | 46.69 6% |
| Write Seq (MB/s) | 1527 | 2377 56% | 2785 82% | 2269 49% | 2318 52% | 2389 56% |
| Read Seq (MB/s) | 1112 | 2185 96% | 2598 134% | 1643 48% | 2151 93% | 2196 97% |
| Write 4K Q32T1 (MB/s) | 520 | 463.5 -11% | 481.9 -7% | 547 5% | 525 1% | 407.6 -22% |
| Read 4K Q32T1 (MB/s) | 516 | 527 2% | 521 1% | 654 27% | 452.1 -12% | 519 1% |
| Write Seq Q32T1 (MB/s) | 1697 | 2395 41% | 3362 98% | 2512 48% | 3055 80% | 2401 41% |
| Read Seq Q32T1 (MB/s) | 2110 | 3470 64% | 3200 52% | 3382 60% | 3607 71% | 3344 58% |
| Total Average (Program / Settings) | 41% /
43% | 40% /
40% | 37% /
39% | 50% /
51% | 40% /
43% |
* ... smaller is better

Disk Throttling: DiskSpd Read Loop, Queue Depth 8
GPU Performance
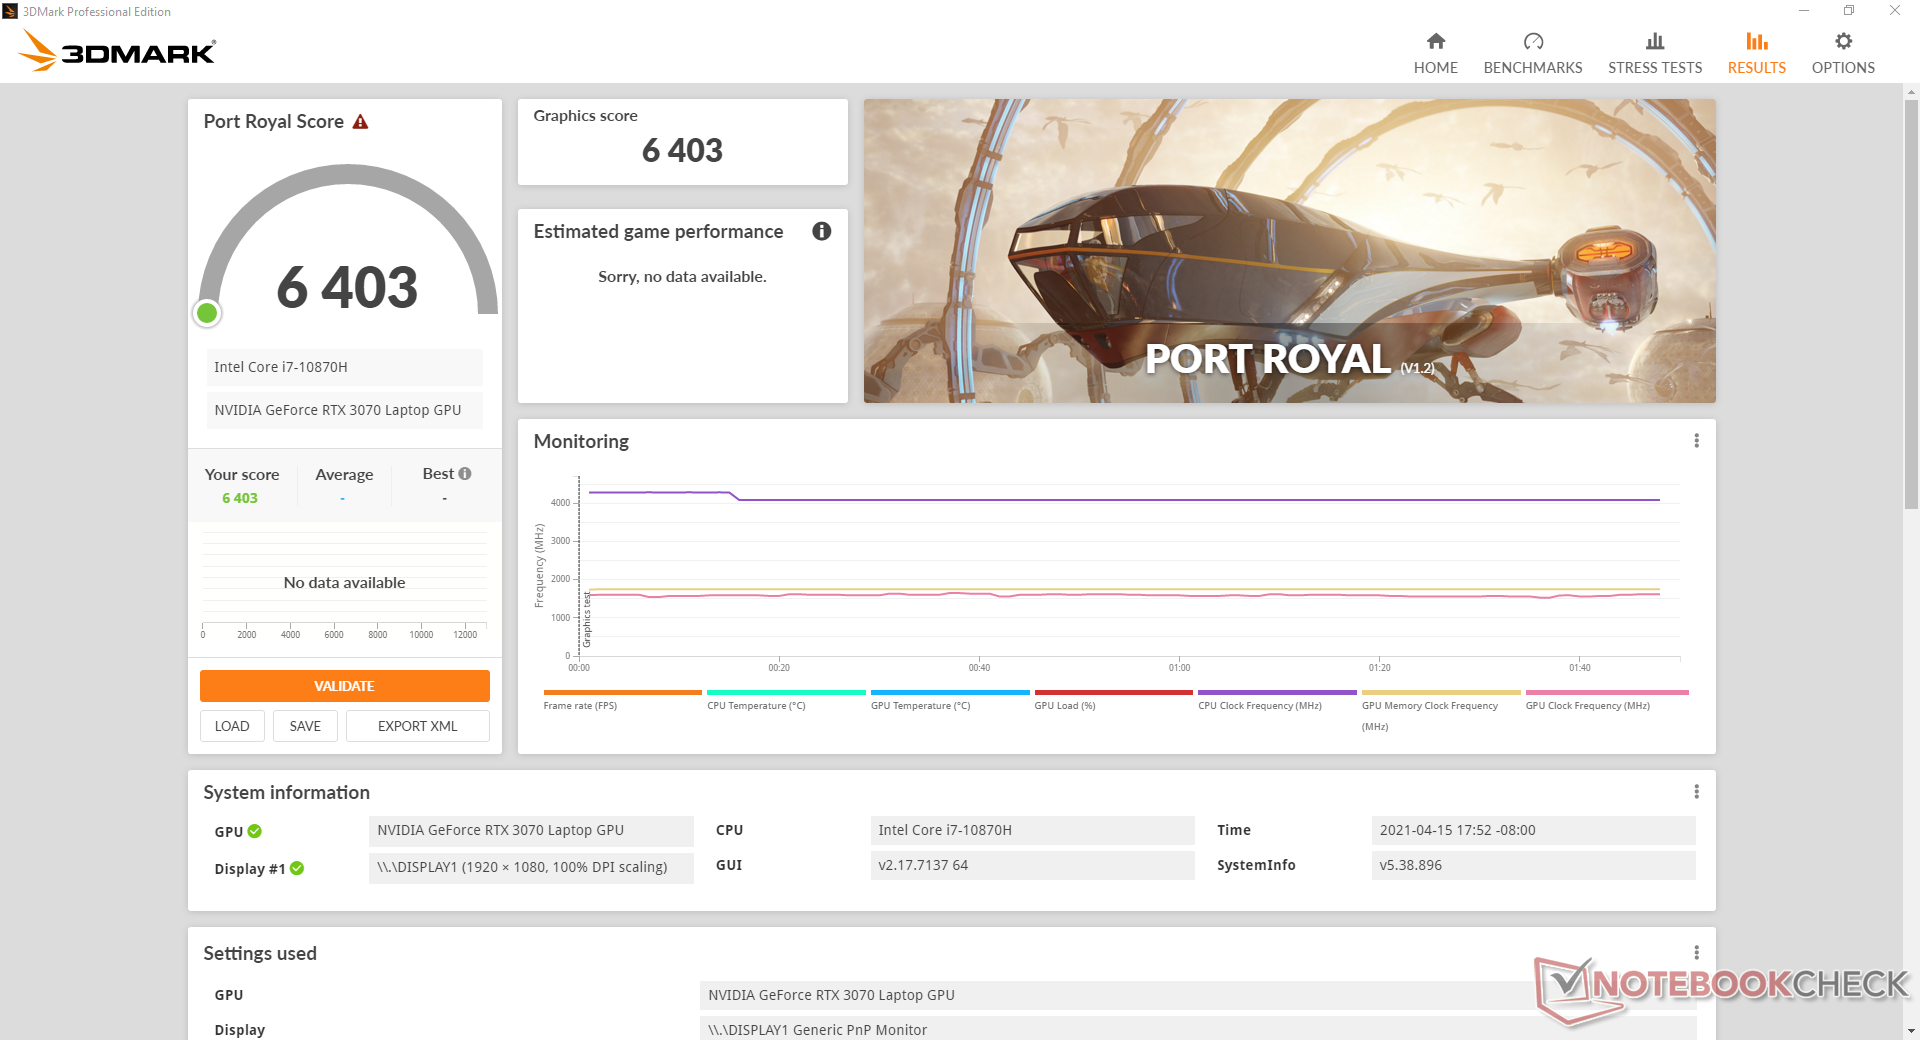
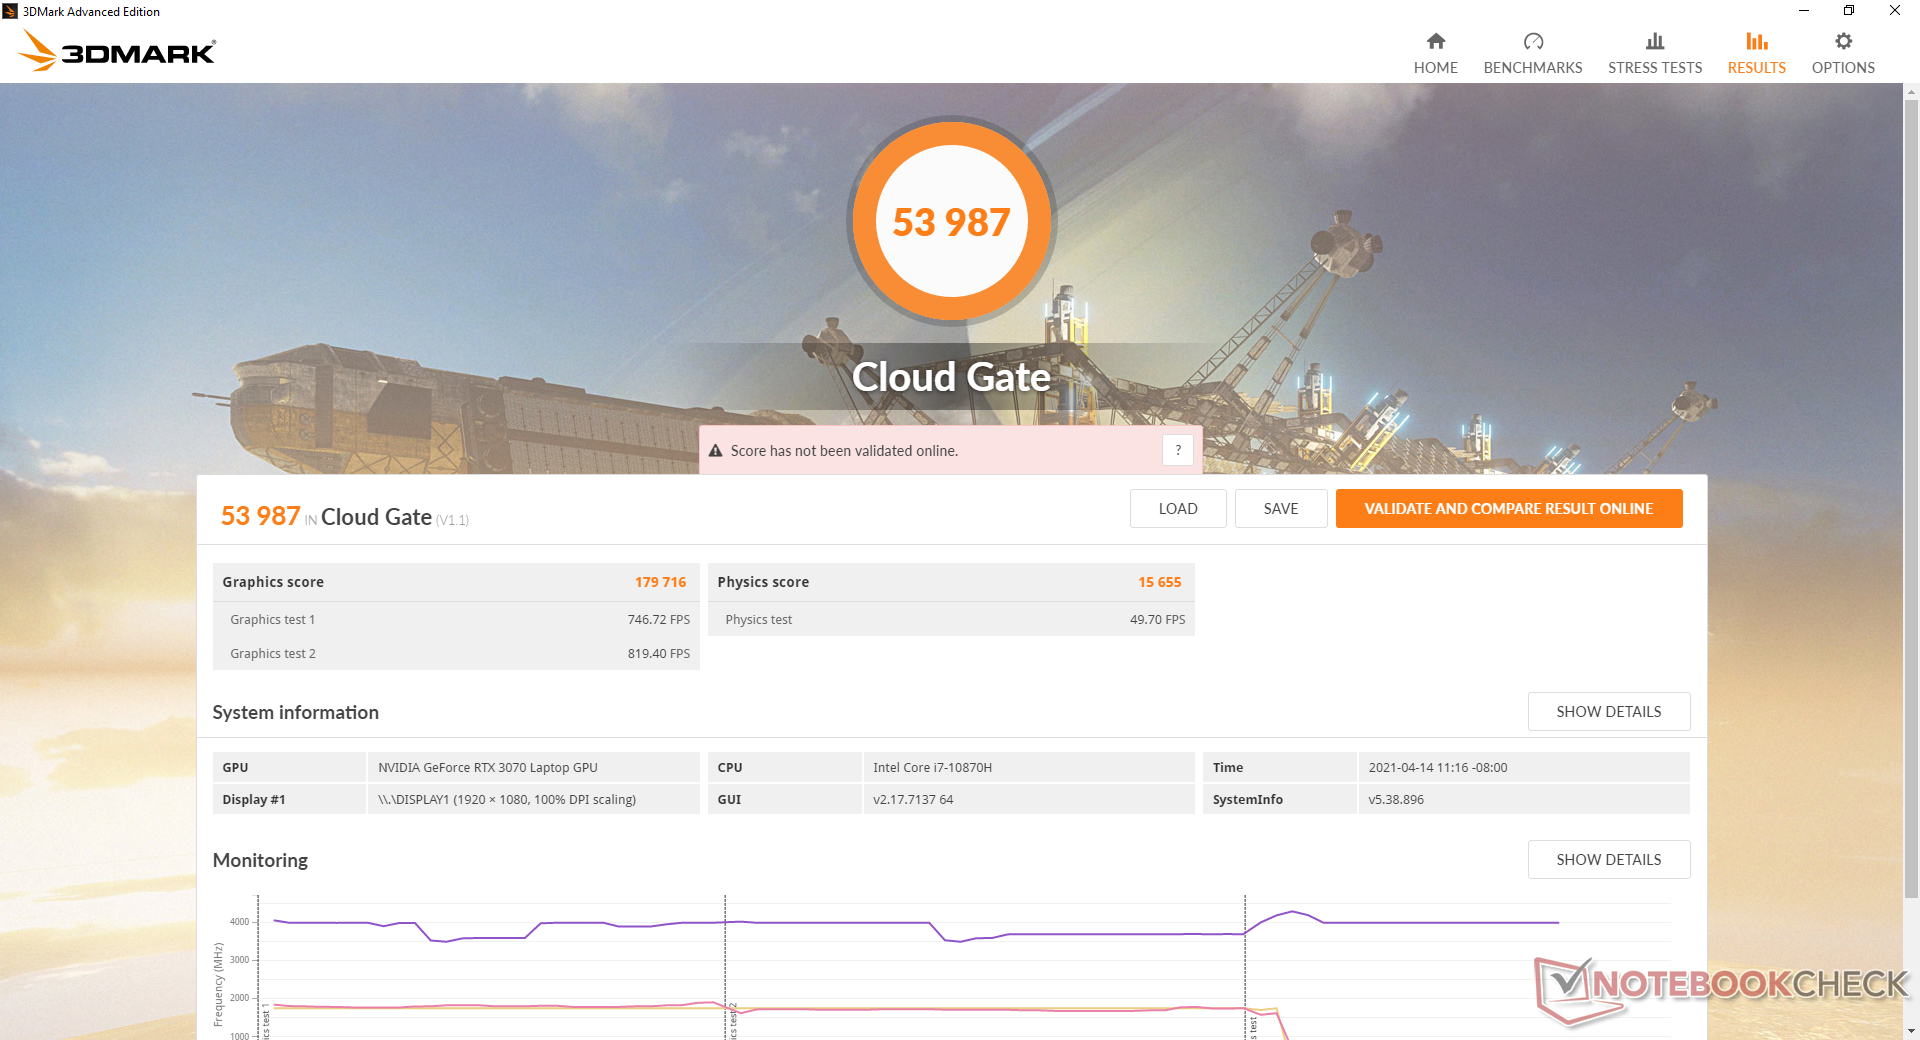
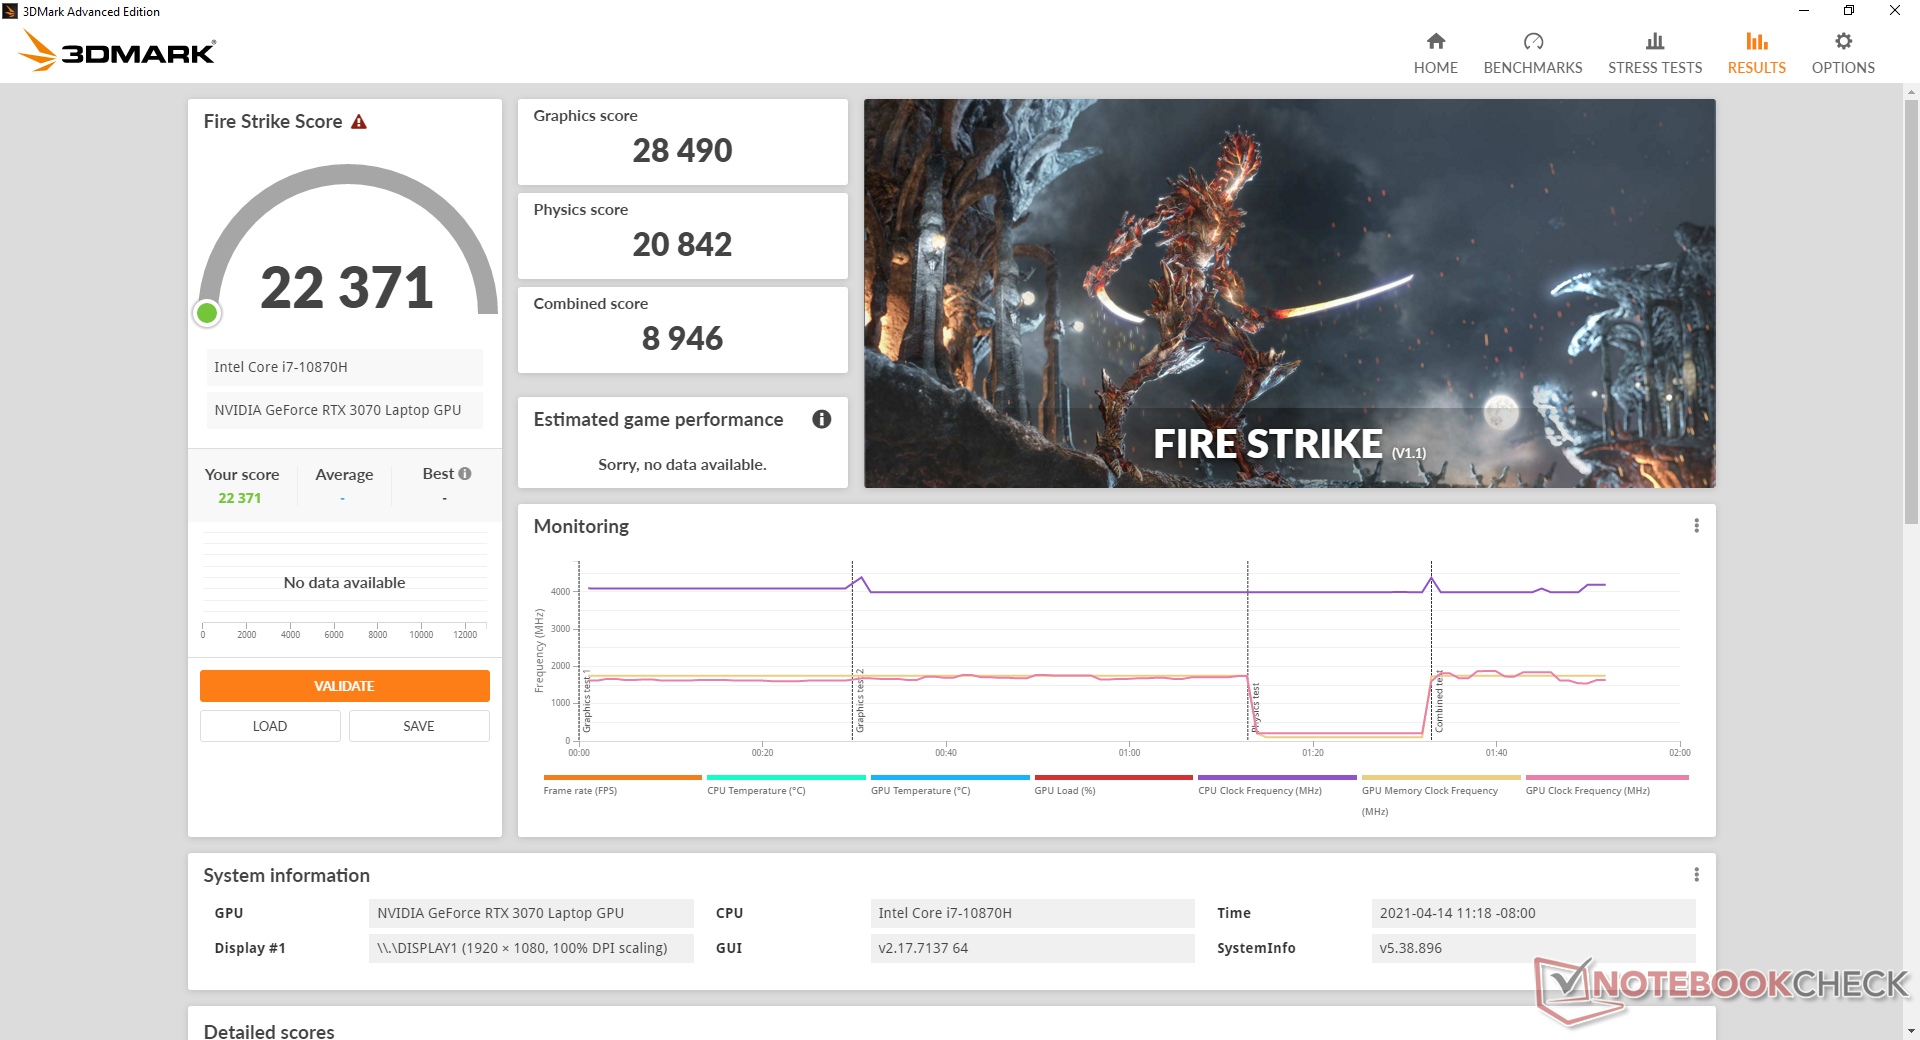
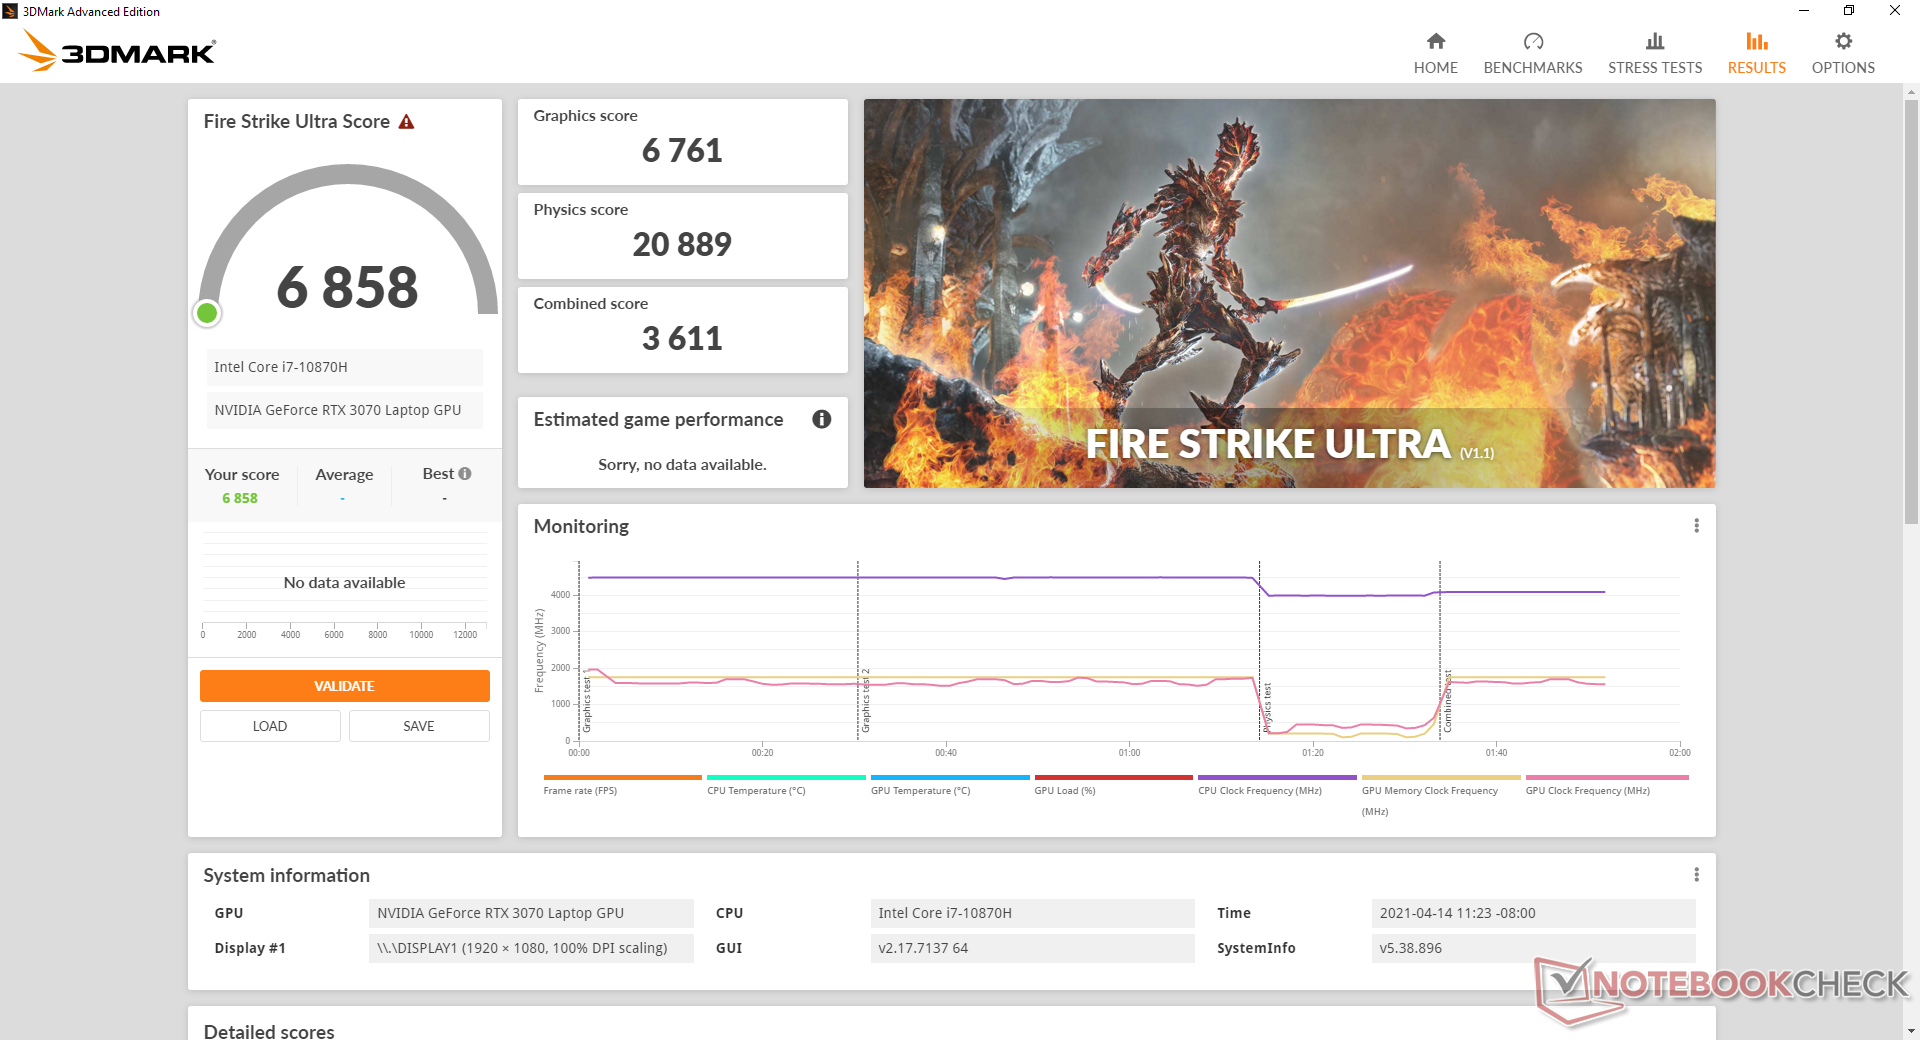
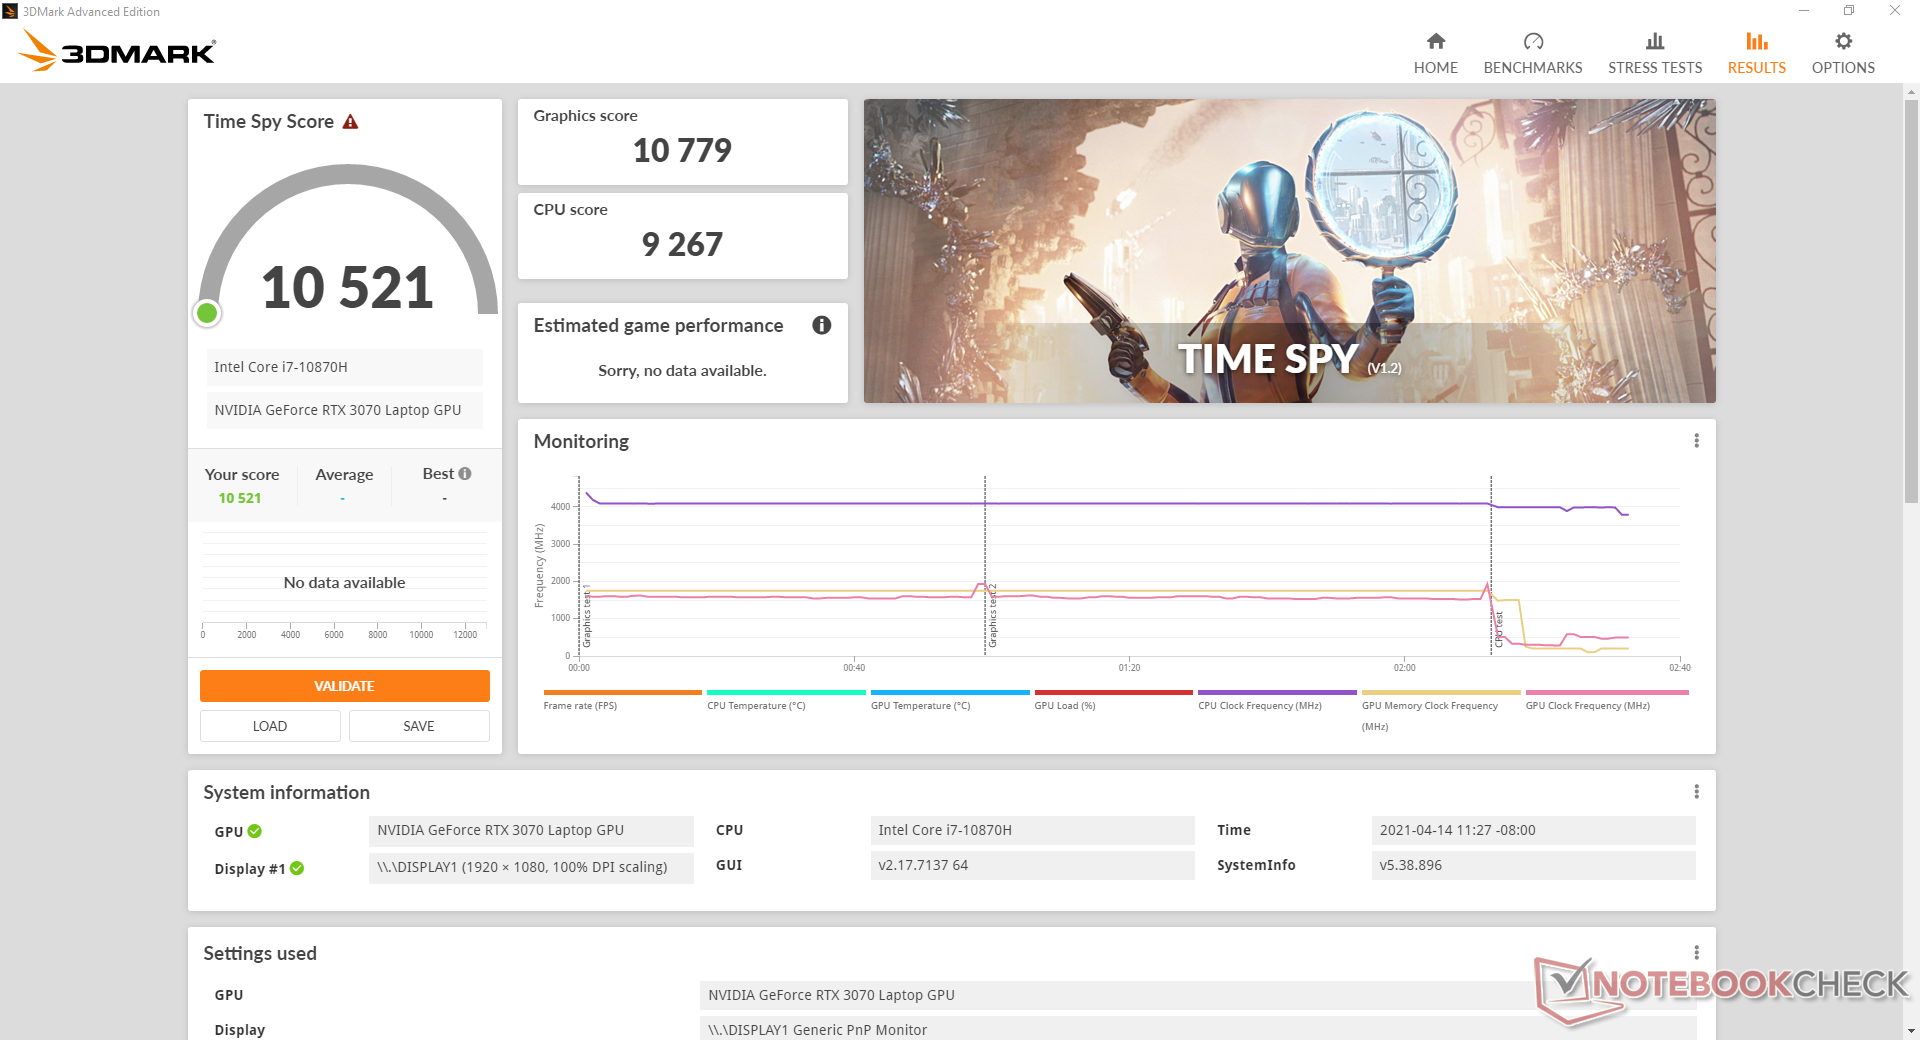
Raw graphics performance is only 6 to 9 percent slower than the 130 W GeForce RTX 3080 in the Asus Zephyrus Duo 15 SE according to 3DMark benchmarks. Users upgrading from an older RTX 2070 laptop will see noteworthy gains of up to 35 to 40 percent. Nonetheless, a desktop PC with a "proper" GeForce RTX 3070 graphics card is still about 20 percent faster than our RTX 3070 mobile version.
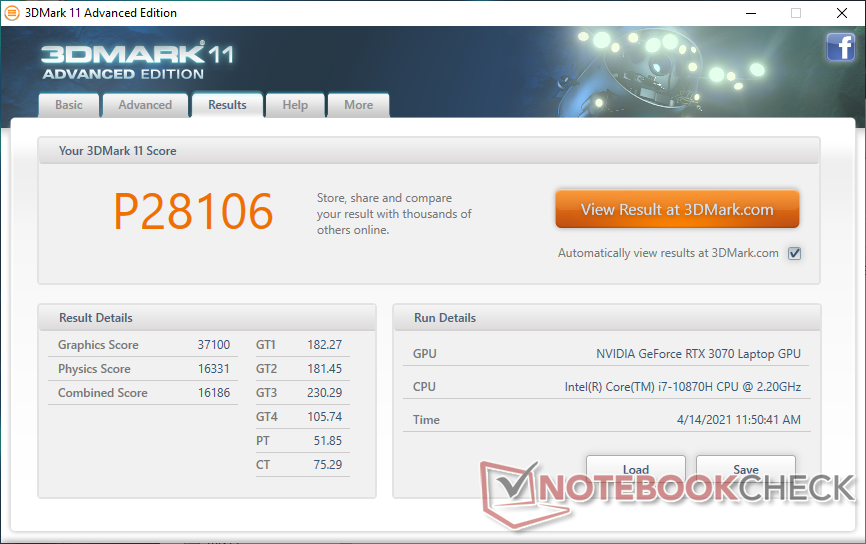
| 3DMark 11 Performance | 28106 points | |
| 3DMark Cloud Gate Standard Score | 53987 points | |
| 3DMark Fire Strike Score | 22371 points | |
| 3DMark Time Spy Score | 10521 points | |
Help | ||
| low | med. | high | ultra | |
|---|---|---|---|---|
| GTA V (2015) | 181 | 166 | 96.6 | |
| The Witcher 3 (2015) | 362.7 | 298.1 | 206.9 | 107.9 |
| Dota 2 Reborn (2015) | 156 | 141 | 141 | 135 |
| Final Fantasy XV Benchmark (2018) | 175 | 142 | 103 | |
| X-Plane 11.11 (2018) | 116 | 104 | 85.7 | |
| Strange Brigade (2018) | 399 | 279 | 225 | 194 |
Emissions
System Noise
The fans will idle when the laptop is idling on desktop with no other active programs. However, even a slight increase in CPU utilization will kickstart the CPU fan and so the laptop will not be truly silent under most real-world scenarios. We're able to record a noise of 32.8 dB(A) when web browsing or video streaming against a silent background of 24.7 dB(A). It's enough to be noticeable but not particularly bothersome.
Fan noise when gaming will hover around 48.8 dB(A) with no pulsing or erratic RPM behavior. This is quieter than what we recorded on the older GP65 while being on par with the latest Alienware m15 R4, Aorus 15P, and Asus ROG Zephyrus G15 each with RTX 30 graphics.
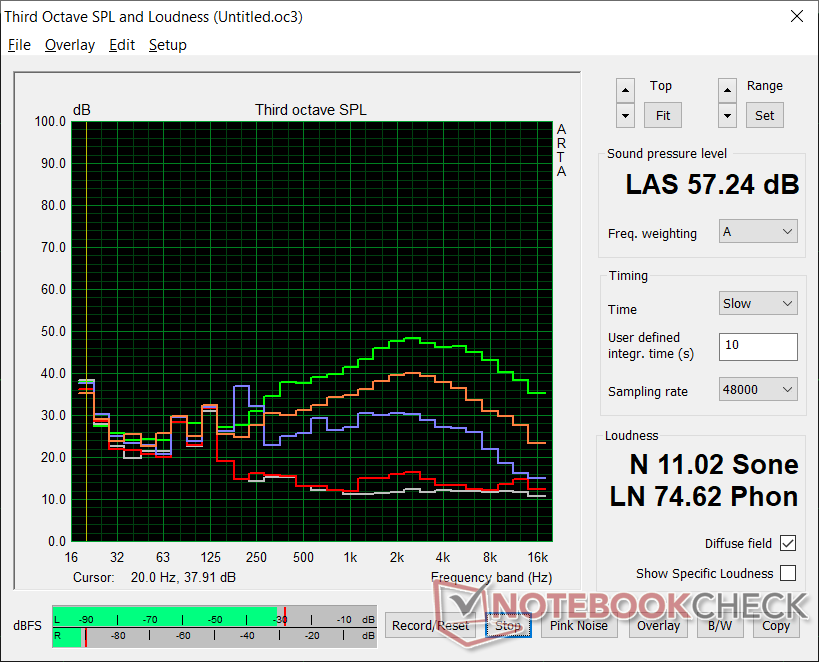
If Cooler Boost (i.e., maximum fan mode) is enabled, fan noise will jump immediately to 57.2 dB(A) regardless of onscreen load. It's a massive increase in fan noise for not all that much performance gain as our Stress Test section below will detail.
Our test unit exhibits a slight coil whine of 26.8 dB(A) against a background of 24.7 dB(A).
| MSI GP66 Leopard 10UG GeForce RTX 3070 Laptop GPU, i7-10870H, Kingston OM8PCP31024F | MSI GP65 10SFK-047US GeForce RTX 2070 Mobile, i7-10750H, Samsung SSD PM981 MZVLB1T0HALR | Alienware m15 R4 GeForce RTX 3070 Laptop GPU, i9-10980HK, Micron 2300 1TB MTFDHBA1T0TDV | Aorus 15P XC GeForce RTX 3070 Laptop GPU, i7-10870H, ESR512GTLCG-EAC-4 | Asus ROG Zephyrus G15 GA503Q GeForce RTX 3080 Laptop GPU, R9 5900HS, SK Hynix HFM001TD3JX013N | MSI GF65 Thin 10UE GeForce RTX 3060 Laptop GPU, i7-10750H, Samsung SSD PM981 MZVLB1T0HALR | |
|---|---|---|---|---|---|---|
| Noise | -15% | -4% | -4% | -4% | -9% | |
| off / environment * (dB) | 24.7 | 29.3 -19% | 24 3% | 24 3% | 25 -1% | 24.7 -0% |
| Idle Minimum * (dB) | 26.8 | 31.9 -19% | 25 7% | 25 7% | 26 3% | 33.1 -24% |
| Idle Average * (dB) | 26.8 | 31.9 -19% | 26 3% | 29 -8% | 27 -1% | 33.1 -24% |
| Idle Maximum * (dB) | 26.8 | 33.5 -25% | 37 -38% | 34 -27% | 31 -16% | 33.1 -24% |
| Load Average * (dB) | 40.4 | 47 -16% | 48 -19% | 44 -9% | 49 -21% | 42.7 -6% |
| Witcher 3 ultra * (dB) | 48.8 | 53.8 -10% | 47 4% | 49 -0% | 49 -0% | 40.6 17% |
| Load Maximum * (dB) | 57.2 | 56.7 1% | 49 14% | 53 7% | 51 11% | 59.4 -4% |
* ... smaller is better
Noise level
| Idle |
| 26.8 / 26.8 / 26.8 dB(A) |
| Load |
| 40.4 / 57.2 dB(A) |
 | ||
30 dB silent 40 dB(A) audible 50 dB(A) loud |
||
min: | ||
Temperature
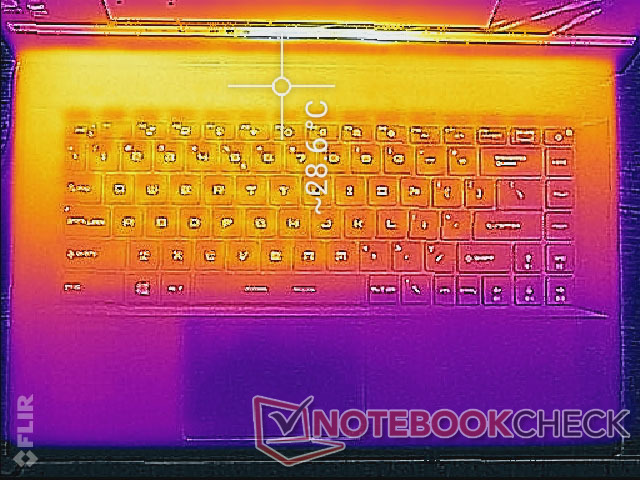
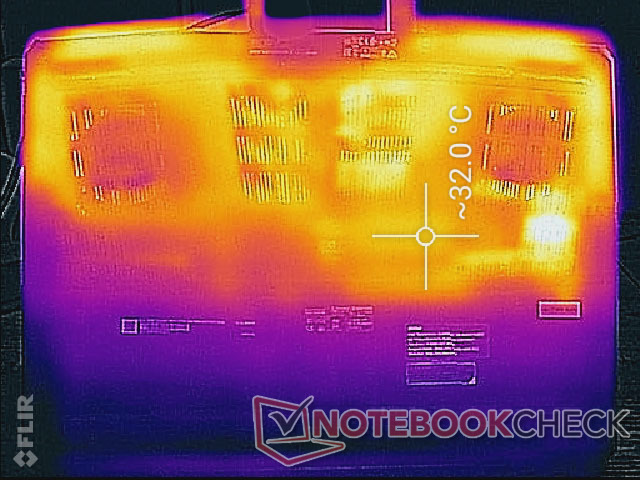
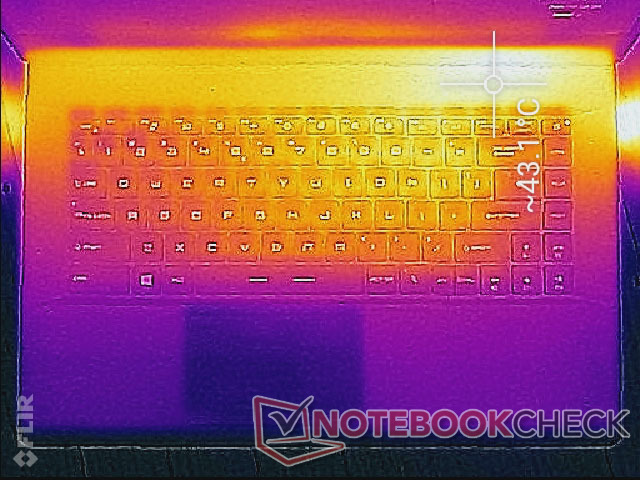
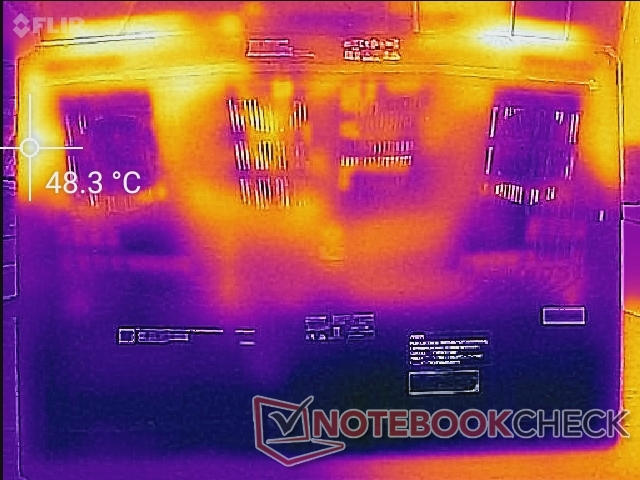
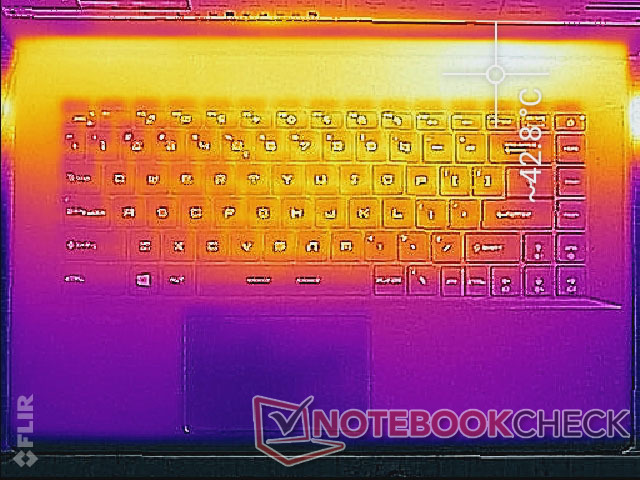
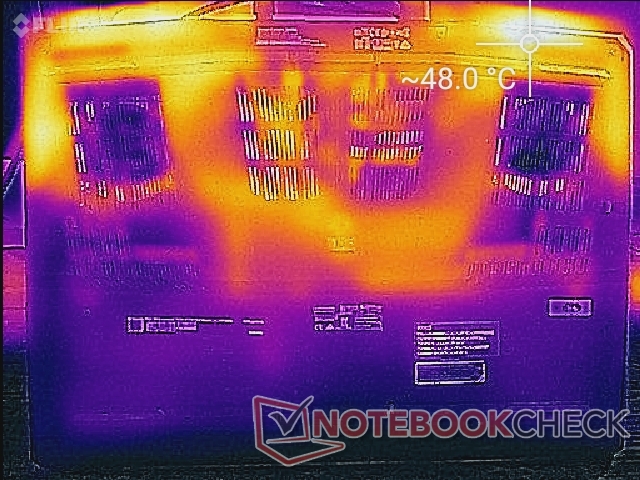
Surface temperatures are slightly cooler than on the GP65. When gaming, hot spots on the GP66 would reach 43 C and 48 C on the top and bottom of the base, respectively, compared to 46 C to 50 C on the GP65. Additionally, the hot spots are now located above the first row of keyboard keys for a cooler typing experience whereas the hot spots on the GP65 and even GS66 are closer to their keyboard centers.
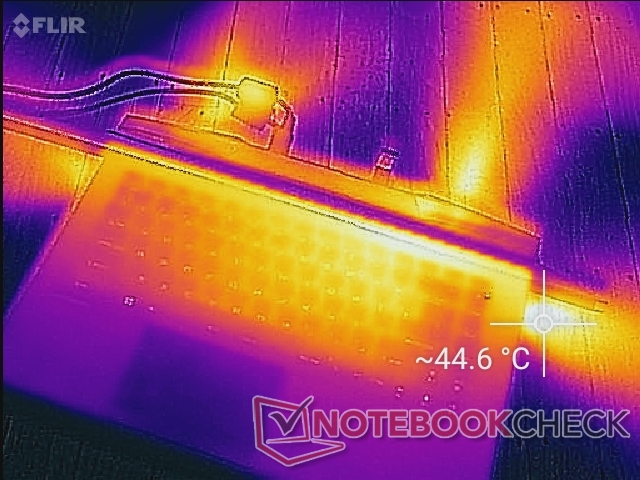
(±) The maximum temperature on the upper side is 42.8 °C / 109 F, compared to the average of 40.4 °C / 105 F, ranging from 21.2 to 68.8 °C for the class Gaming.
(-) The bottom heats up to a maximum of 50 °C / 122 F, compared to the average of 43.2 °C / 110 F
(+) In idle usage, the average temperature for the upper side is 29.4 °C / 85 F, compared to the device average of 33.9 °C / 93 F.
(±) Playing The Witcher 3, the average temperature for the upper side is 33.4 °C / 92 F, compared to the device average of 33.9 °C / 93 F.
(+) The palmrests and touchpad are cooler than skin temperature with a maximum of 25.8 °C / 78.4 F and are therefore cool to the touch.
(+) The average temperature of the palmrest area of similar devices was 28.8 °C / 83.8 F (+3 °C / 5.4 F).
Stress Test
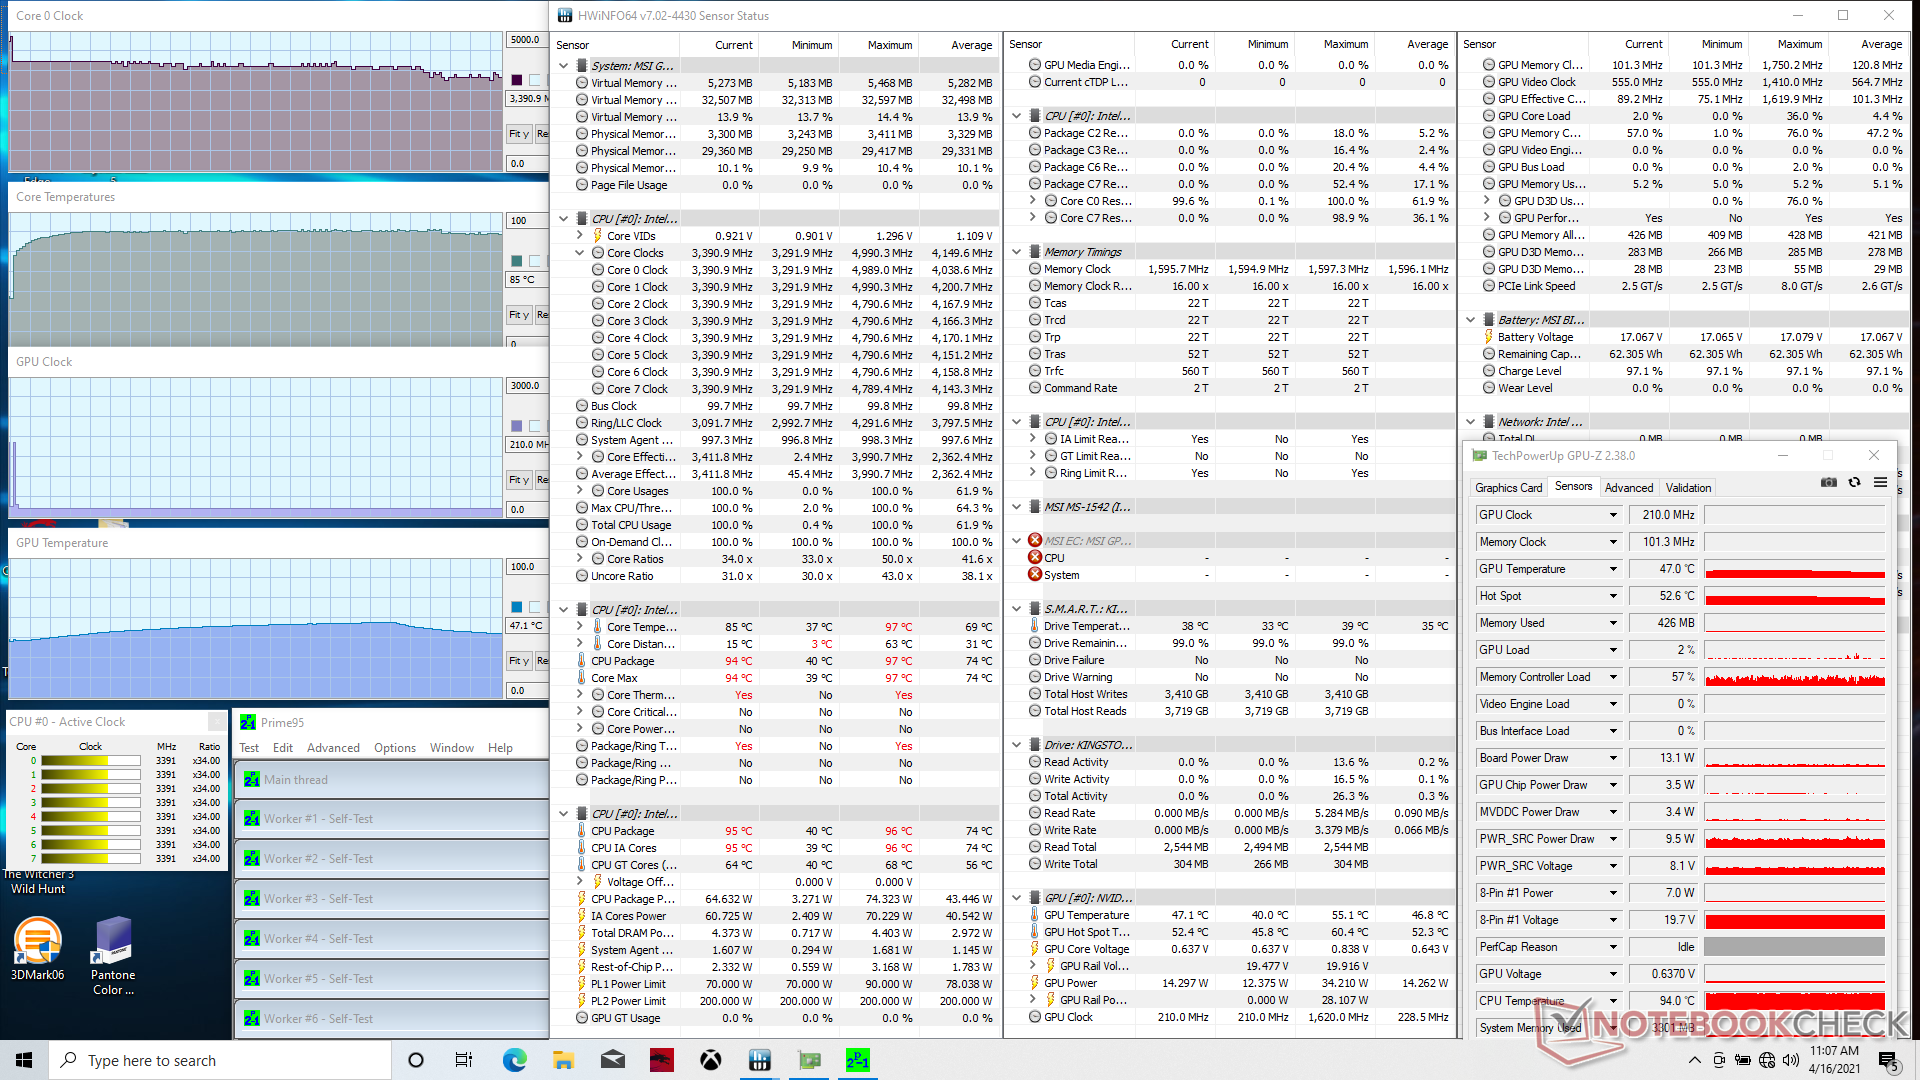
When running Prime95 to stress the processor, CPU clock rates would boost to 4 GHz until hitting a core temperature of 88 C about 20 seconds later. Thereafter, clock rates would steadily fall and stabilize at the 3.2 to 3.4 GHz range in order to maintain a slightly cooler core temperature of 85 C. Enabling Cooler Boost mode would result in just very minor changes to CPU clock rates and temperature.
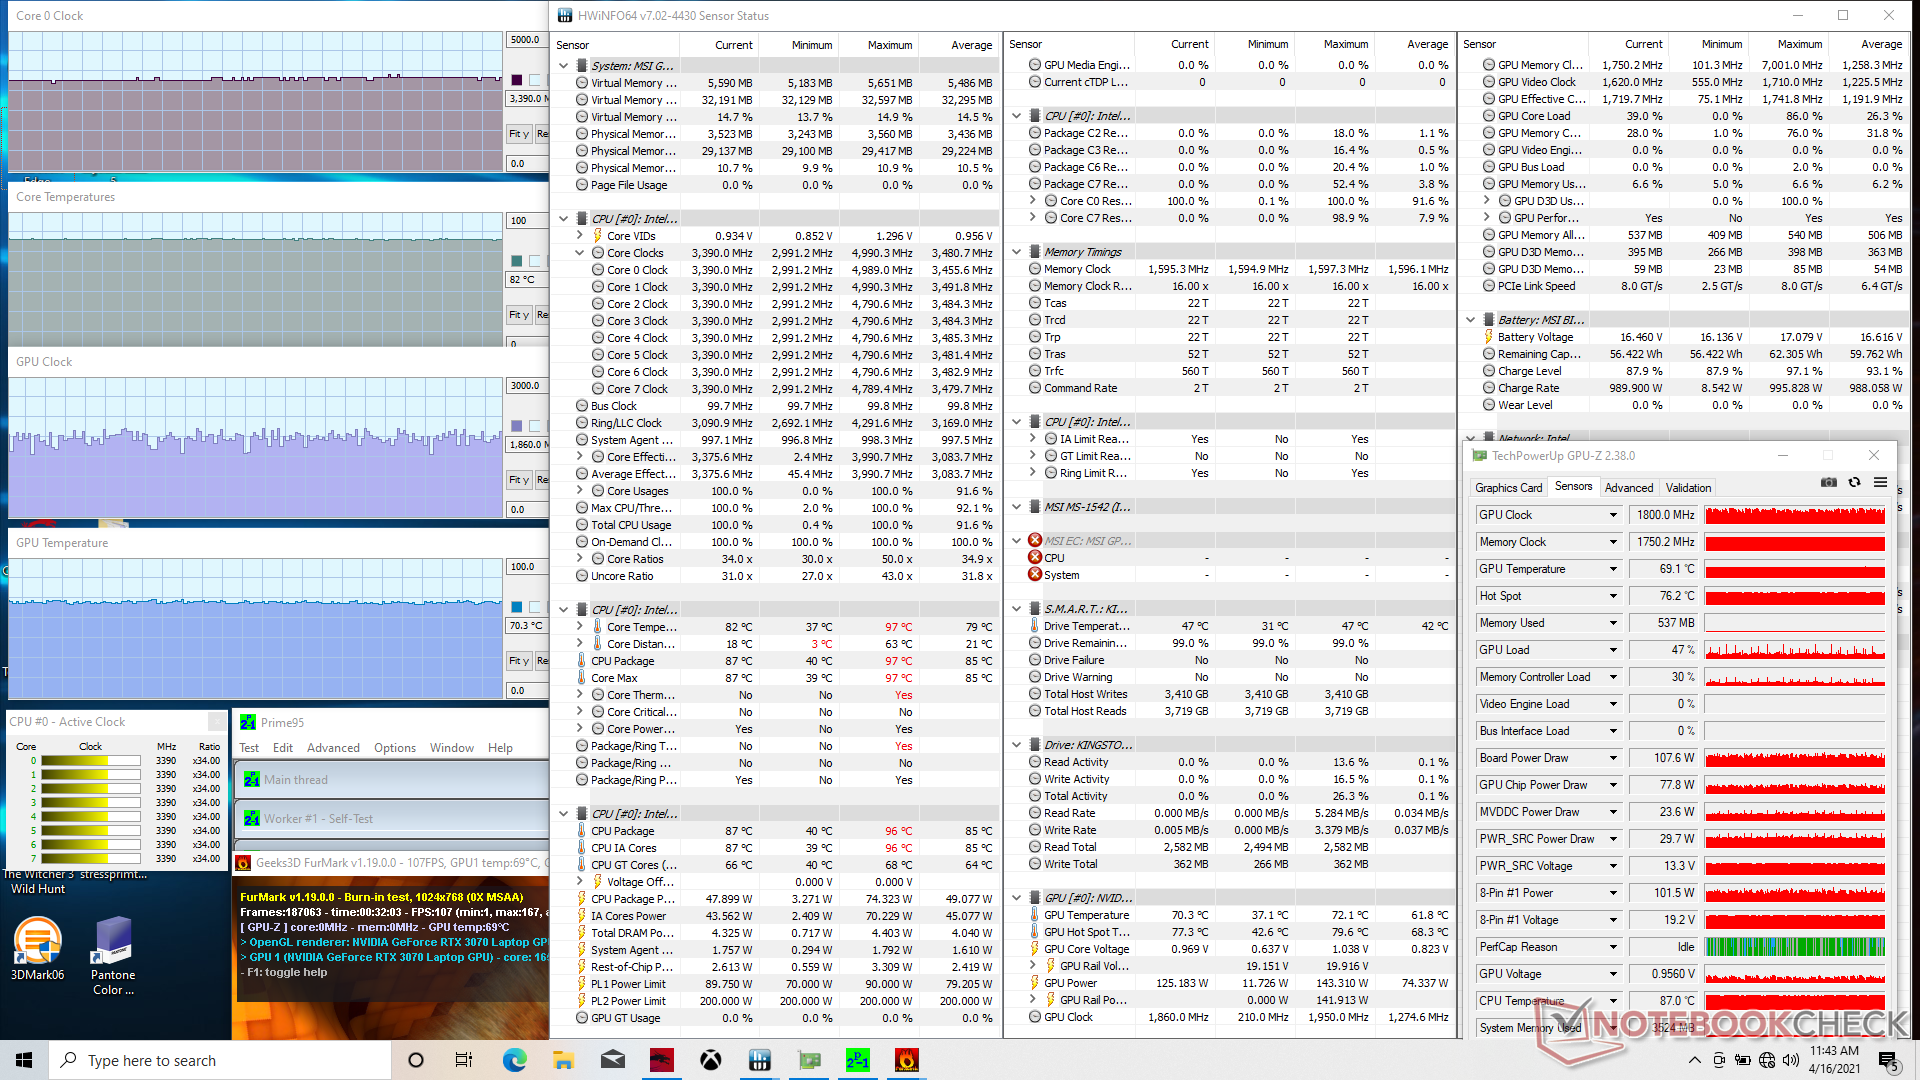
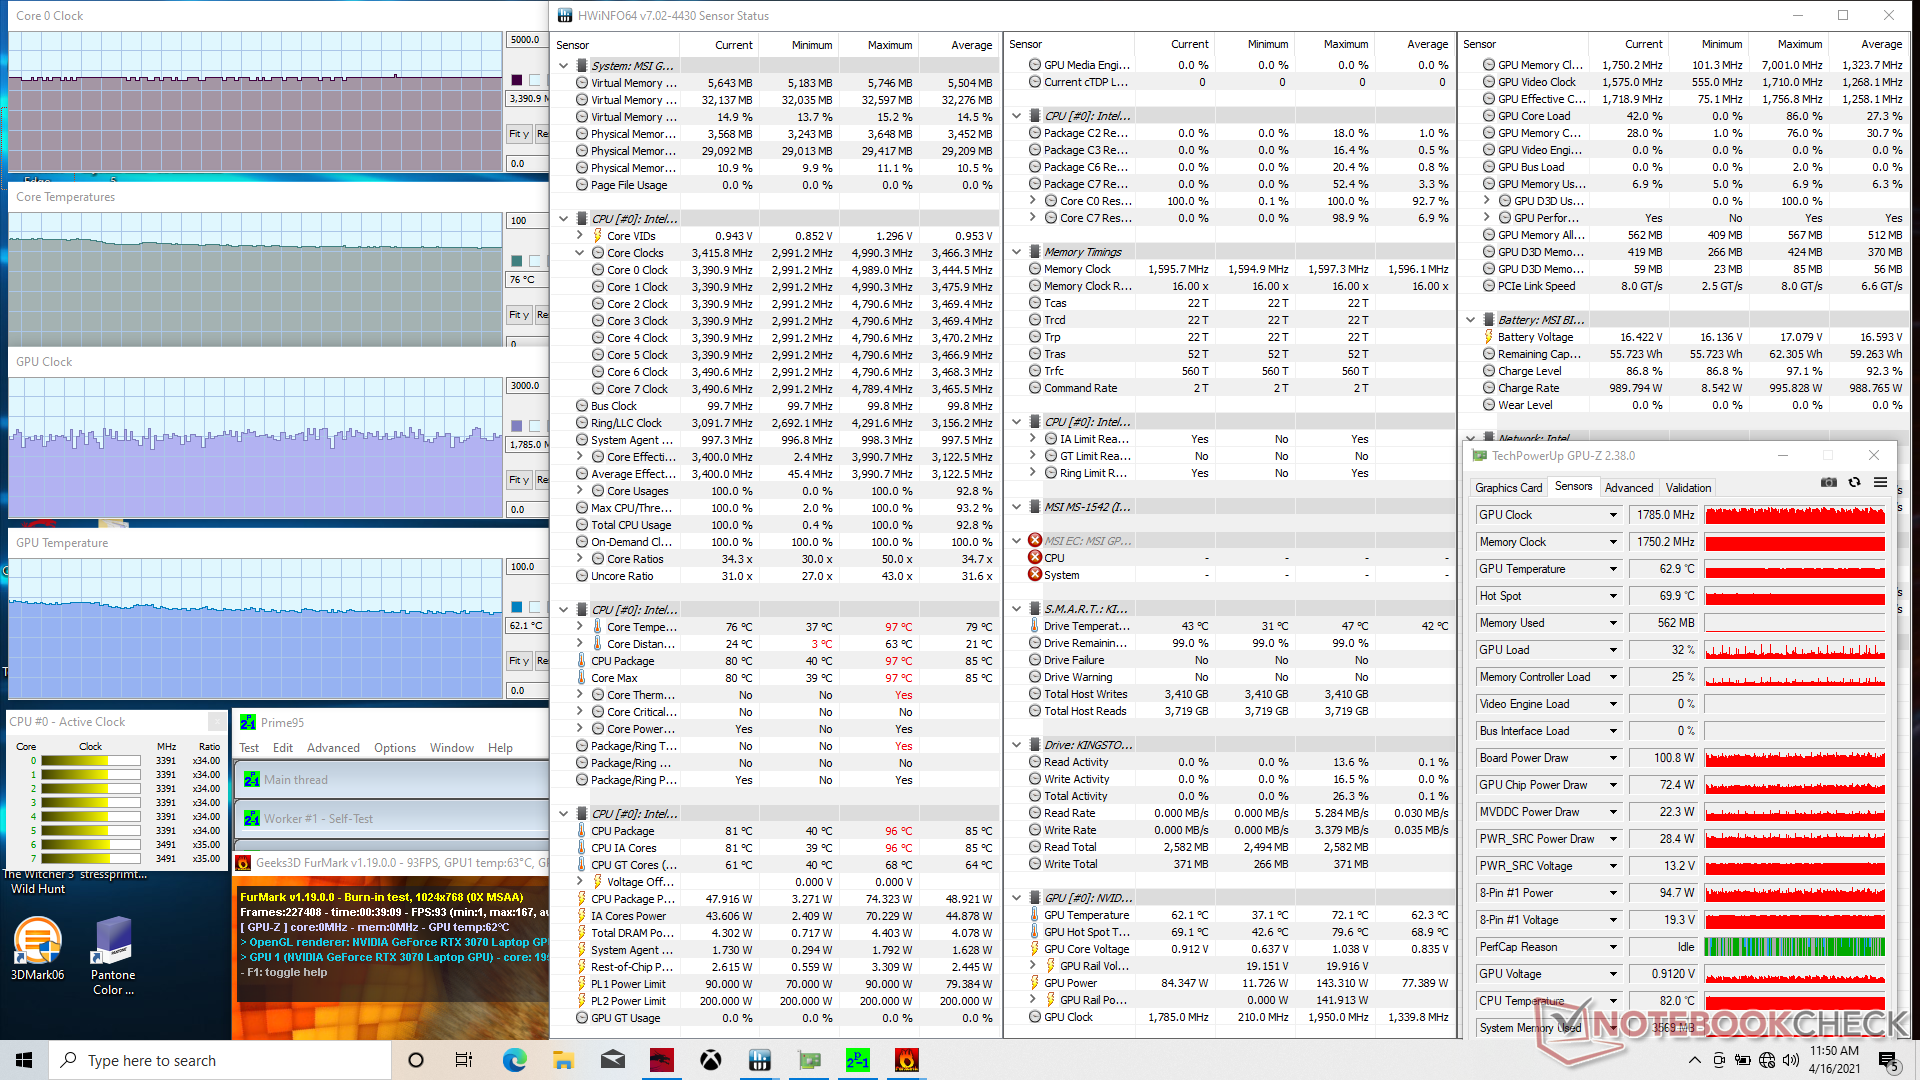
Running Prime95 and FurMark simultaneously would result in stable CPU and GPU temperatures of 82 C and 70 C, respectively. If Cooler Boost is on, core temperatures would drop by about 8 C each.
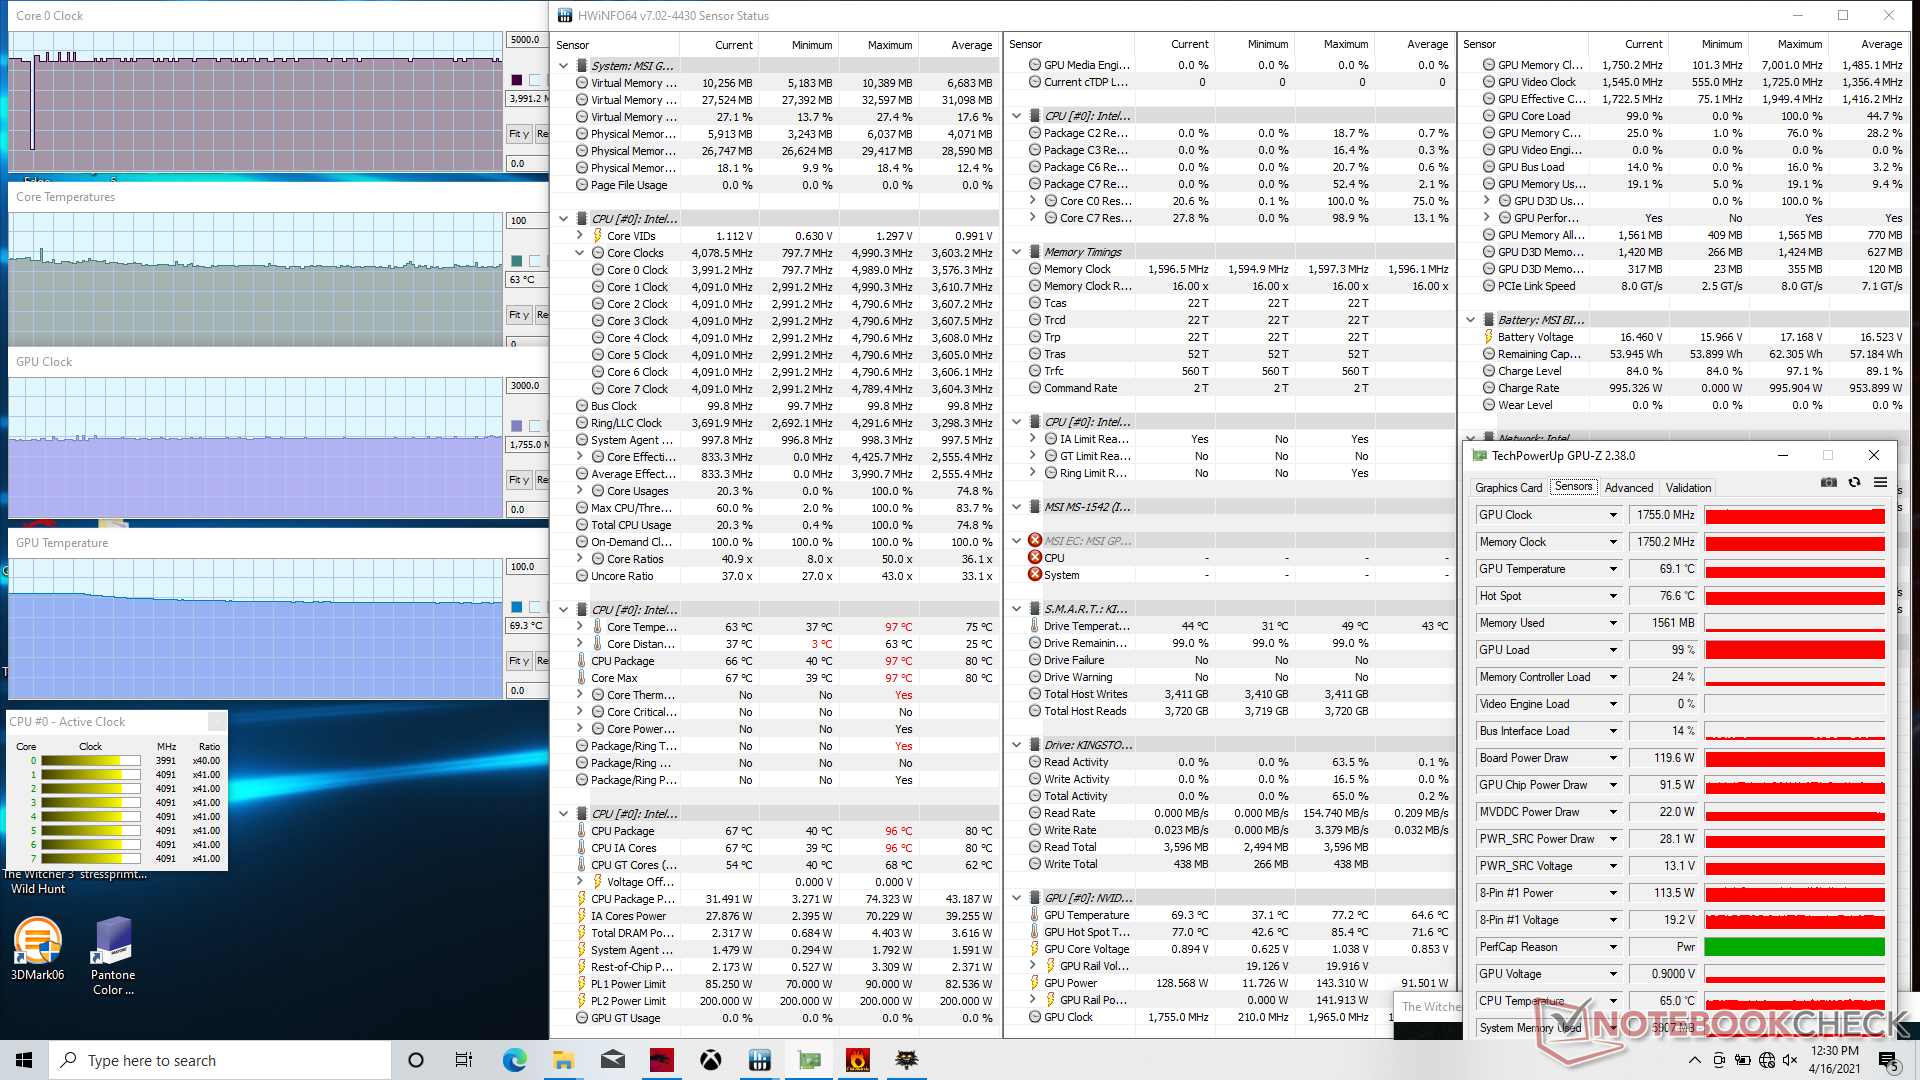
When running Witcher 3 to represent real-world gaming stress, core temperatures would stabilize in the 67 C to 76 C range if Cooler Boost is off and 63 to 69 C range if Cooler Boost is on. GPU clock rates would also increase slightly from 1680 MHz to 1755 MHz with a board power draw of 120 W to 130 W as advertised by the manufacturer. Running this same test on the GP65 would result in warmer CPU and GPU temperatures of 96 C and 79 C.
Running on batteries will limit performance. A Fire Strike test on battery power returned Physics and Graphics scores of 12004 and 6385 points, respectively, compared to 20842 and 28490 points when on mains.
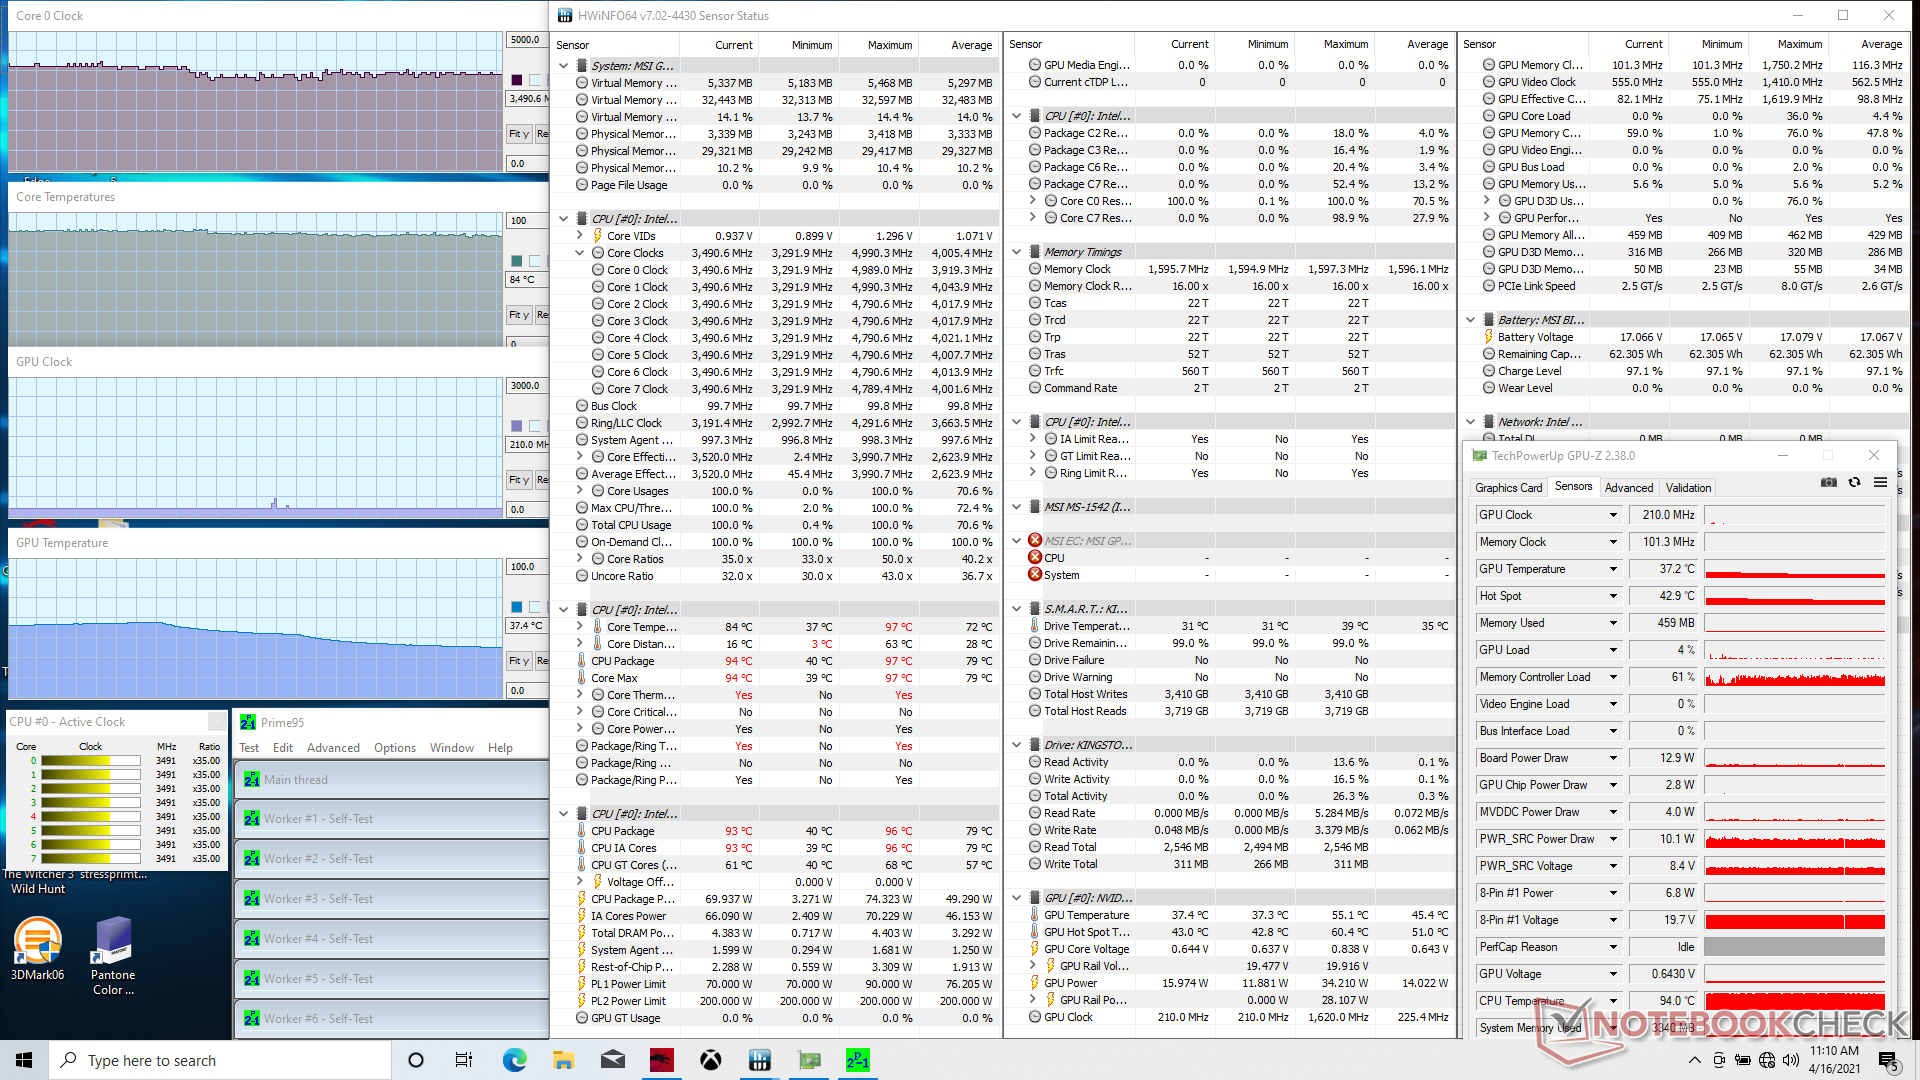

| CPU Clock (GHz) | GPU Clock (MHz) | Average CPU Temperature (°C) | Average GPU Temperature (°C) | |
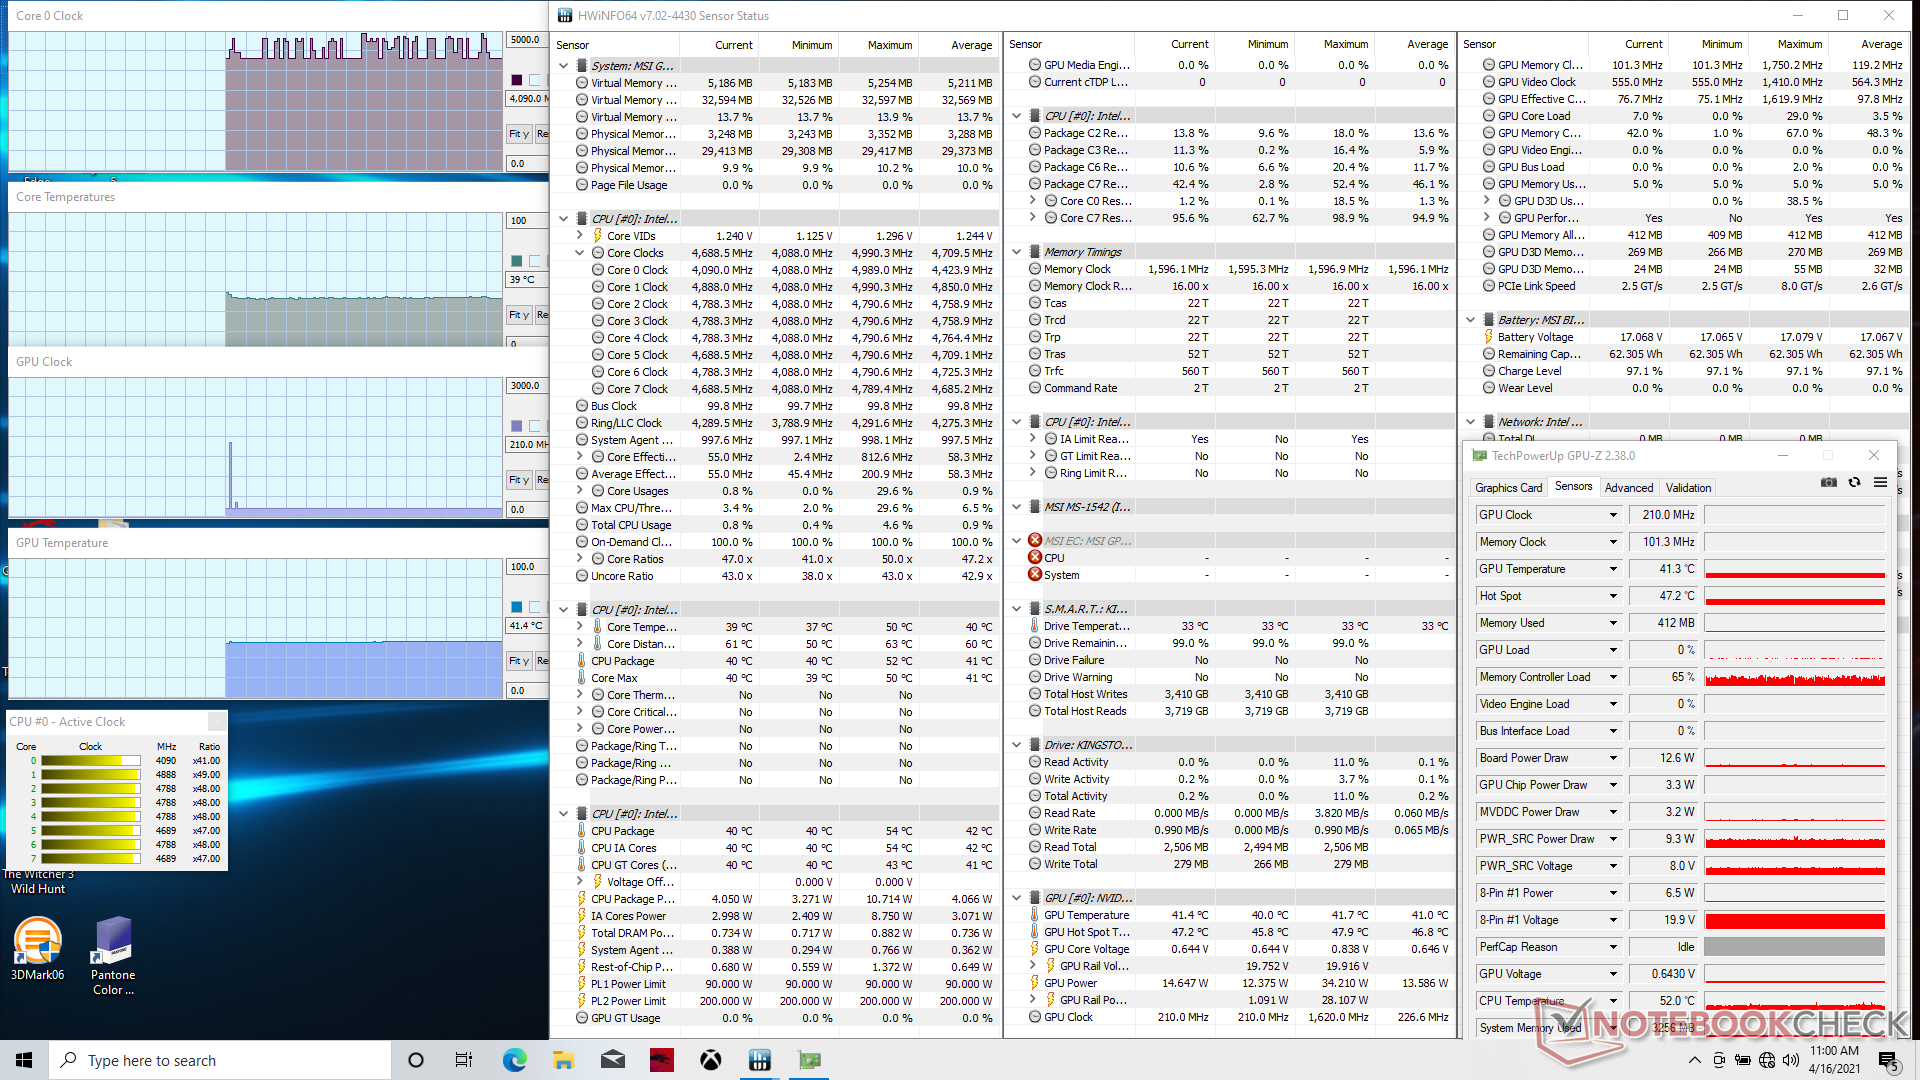
| System Idle | -- | -- | 39 | 41 |
| Prime95 Stress (Cooler Boost off) | 3.2 - 3.4 | -- | 85 | 47 |
| Prime95 Stress (Cooler Boost on) | 3.3 - 3.5 | -- | 84 | 37 |
| Prime95 + FurMark Stress (Cooler Boost off) | 3.3 - 3.4 | ~1800 | 82 | 70 |
| Prime95 + FurMark Stress (Cooler Boost on) | 3.4 | ~1800 | 76 | 62 |
| Witcher 3 Stress (Cooler Boost off) | 4.0 | 1680 | 67 | 76 |
| Witcher 3 Stress (Cooler Boost on) | 4.0 | 1755 | 63 | 69 |
Speakers


MSI GP66 Leopard 10UG audio analysis
(±) | speaker loudness is average but good (81.3 dB)
Bass 100 - 315 Hz
(-) | nearly no bass - on average 18.4% lower than median
(±) | linearity of bass is average (11% delta to prev. frequency)
Mids 400 - 2000 Hz
(±) | higher mids - on average 5.1% higher than median
(+) | mids are linear (4.6% delta to prev. frequency)
Highs 2 - 16 kHz
(±) | higher highs - on average 5.9% higher than median
(±) | linearity of highs is average (9.2% delta to prev. frequency)
Overall 100 - 16.000 Hz
(±) | linearity of overall sound is average (19.3% difference to median)
Compared to same class
» 65% of all tested devices in this class were better, 8% similar, 27% worse
» The best had a delta of 6%, average was 18%, worst was 132%
Compared to all devices tested
» 47% of all tested devices were better, 8% similar, 46% worse
» The best had a delta of 4%, average was 23%, worst was 134%
Apple MacBook 12 (Early 2016) 1.1 GHz audio analysis
(+) | speakers can play relatively loud (83.6 dB)
Bass 100 - 315 Hz
(±) | reduced bass - on average 11.3% lower than median
(±) | linearity of bass is average (14.2% delta to prev. frequency)
Mids 400 - 2000 Hz
(+) | balanced mids - only 2.4% away from median
(+) | mids are linear (5.5% delta to prev. frequency)
Highs 2 - 16 kHz
(+) | balanced highs - only 2% away from median
(+) | highs are linear (4.5% delta to prev. frequency)
Overall 100 - 16.000 Hz
(+) | overall sound is linear (10.2% difference to median)
Compared to same class
» 7% of all tested devices in this class were better, 2% similar, 90% worse
» The best had a delta of 5%, average was 18%, worst was 53%
Compared to all devices tested
» 5% of all tested devices were better, 1% similar, 94% worse
» The best had a delta of 4%, average was 23%, worst was 134%
Energy Management
Power Consumption
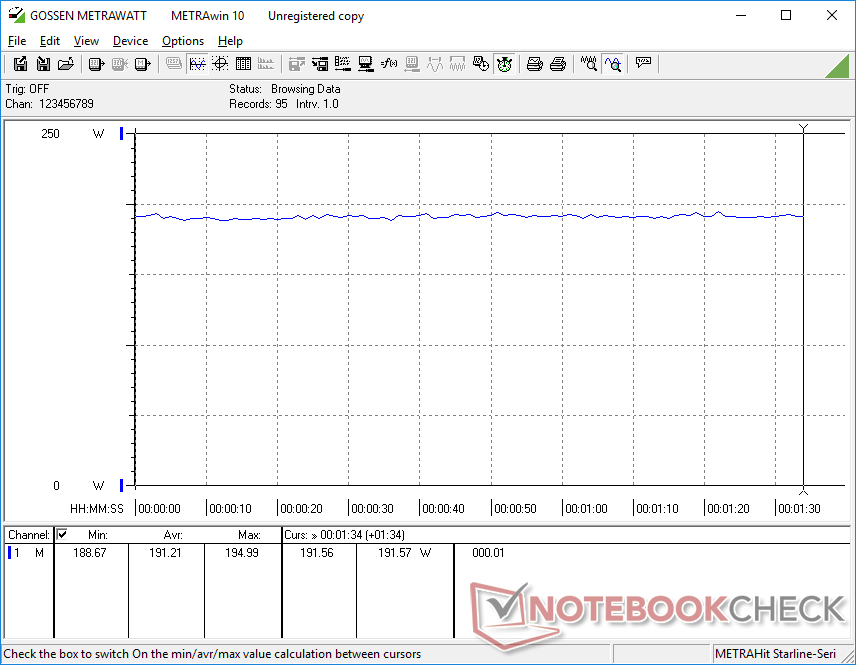
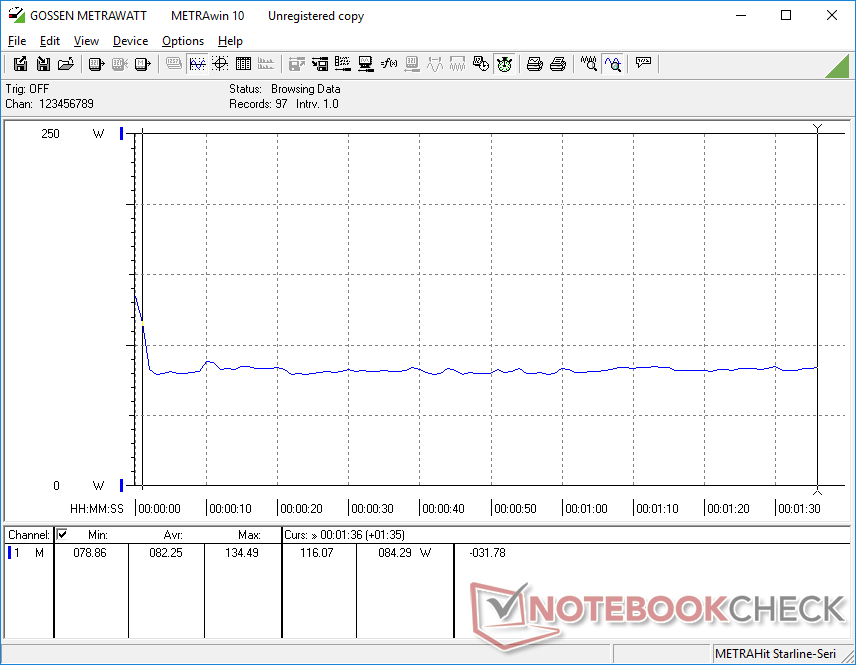
Overall power consumption is a lot closer to the GP65 than we had expected. For example, idling on desktop would consume between 13 W and 23 W which almost matches the GP65. Running Witcher 3 would average 191 W to be just 3 percent more than on the GP65 while offering a 40 to 45 percent boost in graphics performance. The gen-to-gen increase in performance-per-watt is impressive in this regard.
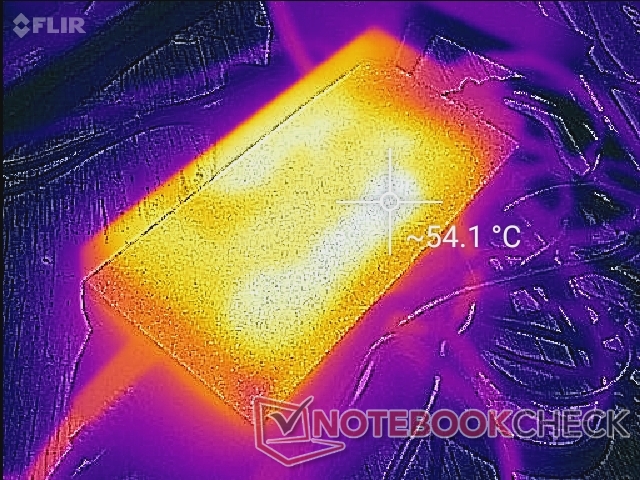
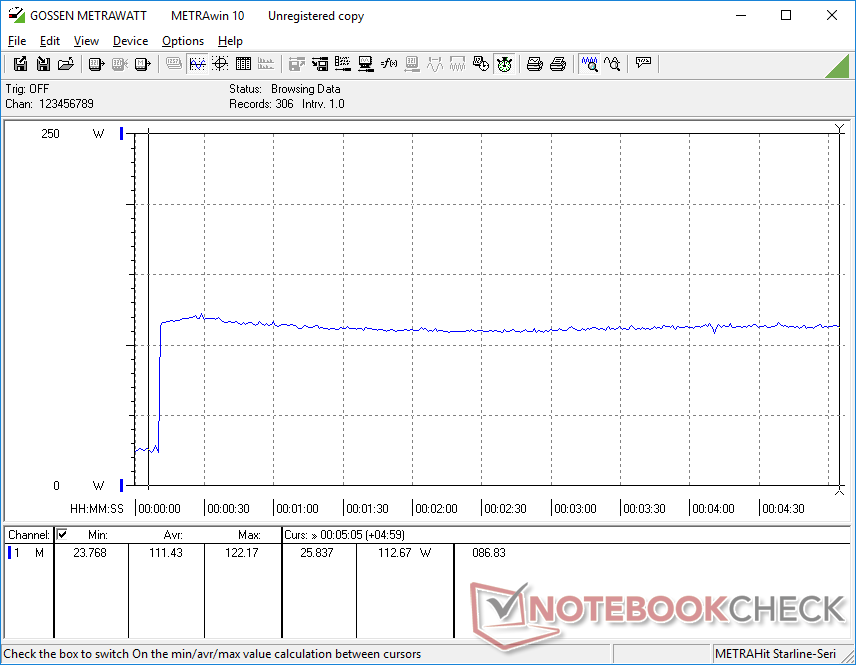
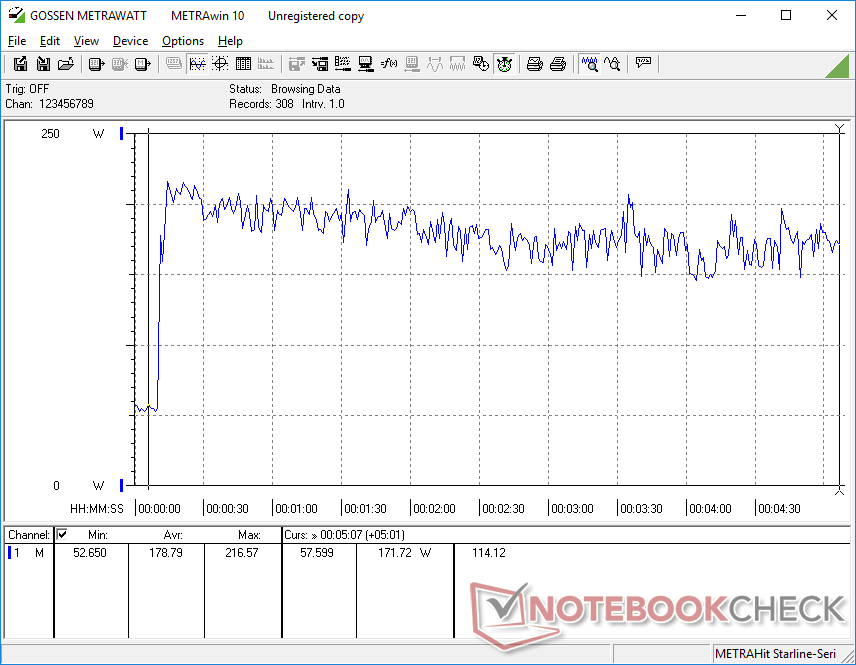
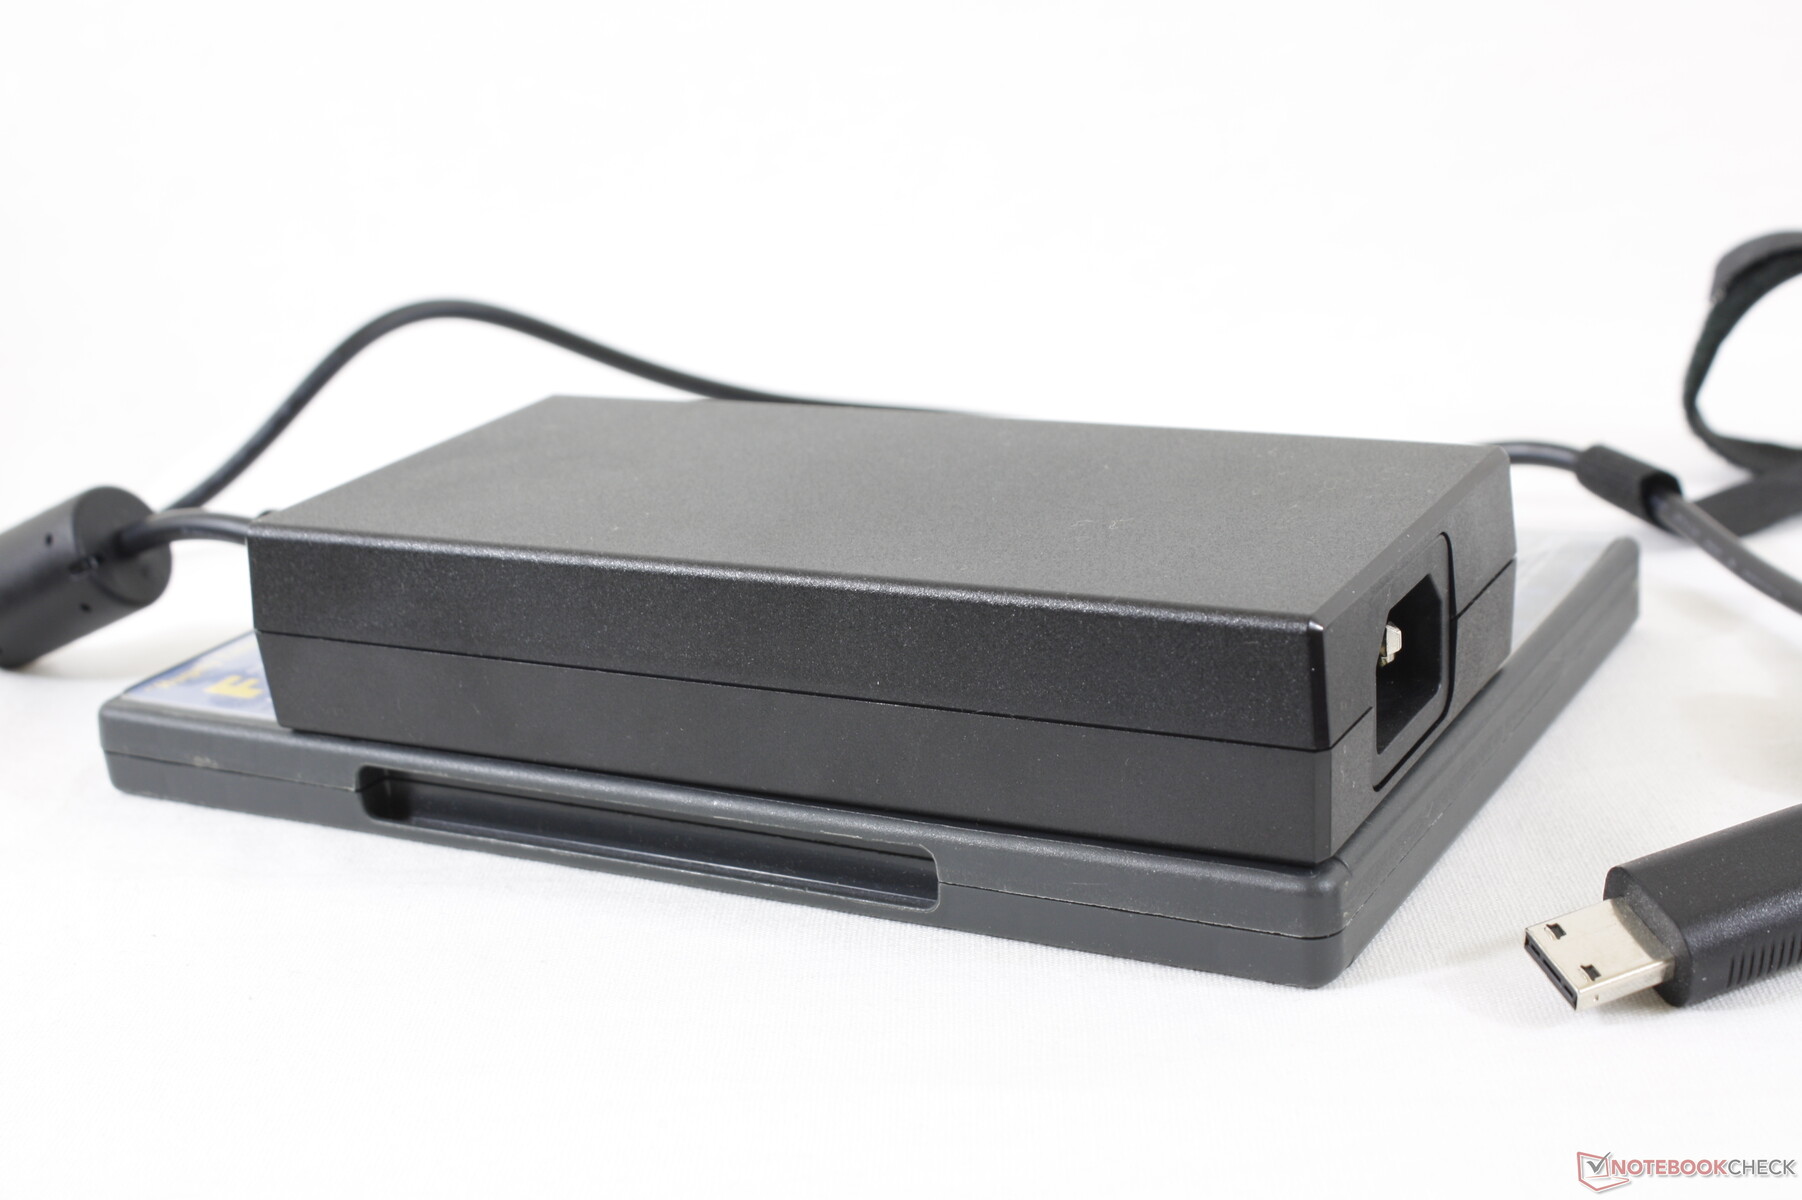
We're able to record a maximum draw of 216 W from the medium-sized (~15.3 x 7.3 x 3.0 cm) 230 W AC adapter.
| Off / Standby | |
| Idle | |
| Load |
|
Key:
min: | |
| MSI GP66 Leopard 10UG i7-10870H, GeForce RTX 3070 Laptop GPU, Kingston OM8PCP31024F, IPS, 1920x1080, 15.6" | MSI GP65 10SFK-047US i7-10750H, GeForce RTX 2070 Mobile, Samsung SSD PM981 MZVLB1T0HALR, IPS, 1920x1080, 15.6" | Alienware m15 R4 i9-10980HK, GeForce RTX 3070 Laptop GPU, Micron 2300 1TB MTFDHBA1T0TDV, IPS, 1920x1080, 15.6" | Aorus 15P XC i7-10870H, GeForce RTX 3070 Laptop GPU, ESR512GTLCG-EAC-4, IPS, 1920x1080, 15.6" | Asus ROG Zephyrus G15 GA503Q R9 5900HS, GeForce RTX 3080 Laptop GPU, SK Hynix HFM001TD3JX013N, IPS-Level, 2560x1440, 15.6" | MSI GF65 Thin 10UE i7-10750H, GeForce RTX 3060 Laptop GPU, Samsung SSD PM981 MZVLB1T0HALR, IPS, 1920x1080, 15.6" | |
|---|---|---|---|---|---|---|
| Power Consumption | -2% | -68% | -8% | 21% | 29% | |
| Idle Minimum * (Watt) | 15.3 | 14.2 7% | 35 -129% | 14 8% | 10 35% | 5.4 65% |
| Idle Average * (Watt) | 21.2 | 18.8 11% | 39 -84% | 17 20% | 12 43% | 12.8 40% |
| Idle Maximum * (Watt) | 22.3 | 23.9 -7% | 48 -115% | 33 -48% | 17 24% | 19.5 13% |
| Load Average * (Watt) | 82.3 | 96.9 -18% | 135 -64% | 96 -17% | 108 -31% | 86.6 -5% |
| Witcher 3 ultra * (Watt) | 191.2 | 185 3% | 194 -1% | 179 6% | 123 36% | 115.7 39% |
| Load Maximum * (Watt) | 216.6 | 233.4 -8% | 252 -16% | 256 -18% | 182 16% | 175.2 19% |
* ... smaller is better
Battery Life
Battery capacity has increased from 51 Wh on the GP65 to 65 Wh on the GP66. WLAN runtimes are now also much longer at just over 5 hours to be almost 1.5 hours longer than what we recorded on the GP65.
Maximum battery life, however, could have been better. Setting the system on Super Battery mode with brightness on minimum and the iGPU active would result in a total runtime of just 6.5 hours which isn't all that much longer than our WLAN settings.
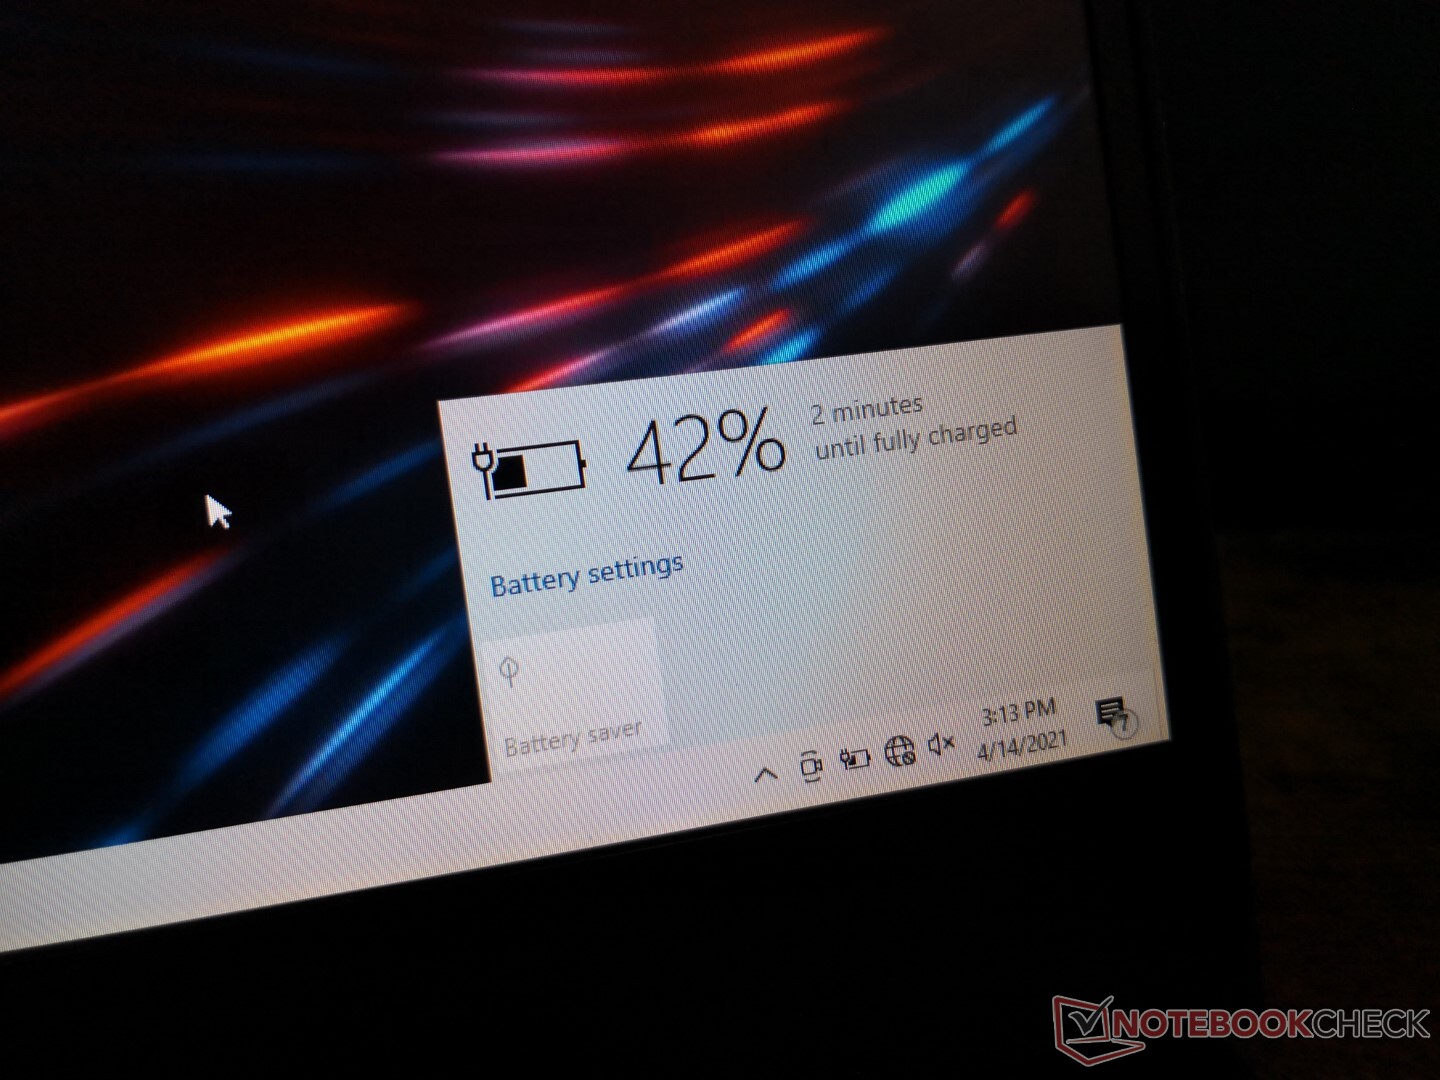
The recharge rate from empty to full capacity is very slow at over 4 hours with the included AC adapter. We suspect that there is a charging bug because the estimated recharge time can also sometimes be inaccurate. Most other laptops will fully recharge in just 1.5 to 2 hours in comparison.
The battery will recharge even slower or not at all when running games. For example, playing Witcher 3 on AC adapter power at 20 percent battery charge for one hour would charge the battery to just 23 percent only (or +3 percent over the course of an hour).
| MSI GP66 Leopard 10UG i7-10870H, GeForce RTX 3070 Laptop GPU, 65 Wh | MSI GP65 10SFK-047US i7-10750H, GeForce RTX 2070 Mobile, 51 Wh | Alienware m15 R4 i9-10980HK, GeForce RTX 3070 Laptop GPU, 86 Wh | Aorus 15P XC i7-10870H, GeForce RTX 3070 Laptop GPU, 99 Wh | Asus ROG Zephyrus G15 GA503Q R9 5900HS, GeForce RTX 3080 Laptop GPU, 90 Wh | MSI GF65 Thin 10UE i7-10750H, GeForce RTX 3060 Laptop GPU, 51 Wh | |
|---|---|---|---|---|---|---|
| Battery runtime | -27% | -34% | 42% | 72% | 23% | |
| Reader / Idle (h) | 6.6 | 3.7 -44% | 9.5 44% | 12.1 83% | 11.1 68% | |
| WiFi v1.3 (h) | 5.1 | 3.7 -27% | 2.7 -47% | 6.7 31% | 9.4 84% | 4.6 -10% |
| Load (h) | 1 | 0.9 -10% | 1.5 50% | 1.5 50% | 1.1 10% |
Pros
Cons
Verdict
After two years with the GP65 design, the GP66 is a full revamp and a huge improvement overall. It may have gotten a bit larger gen-to-gen, but the size increase feels justified considering the jump in graphics performance, improvements to fan noise, cooler core temperatures, sleeker design, and longer battery life. Overall impressions are very close to the GE66 which is supposed to be the higher-end model.
The GP66 punches above its mid-range weight to be as good as many higher-end models.
There's a huge asterisk above "mid-range", however, as the GP66 is not cheap at the moment despite its classification. Prices range wildly from $2500 to $3000 USD to be in the high-end or enthusiast category. We're hoping that this is only a supply issue that can be resolved in short time as we can definitely see the GP66 becoming a popular model because of its above-average attributes all around.
Regardless of its high-end price, this is still a mid-range gaming laptop and so users should be aware of its shortcomings. There is no Thunderbolt, IR camera, or SD card reader, for example, and the display is dim relative to most other gaming laptops. The slow and inconsistent battery recharge rate certainly deserves a closer look. Until then, don't expect the battery to charge at a decent rate when gaming.
Price and availability
MSI GP66 Leopard 10UG
- 04/18/2021 v7 (old)
Allen Ngo
Price comparison
