MSI GP76 Leopard 10UG laptop review: RTX 3070 runs at 140 watts

With the GS66 Stealth 10UG, we already had a notebook from MSI equipped with the RTX 3070 Laptop GPU in for review. However, the latter ran at a limited TGP of 95 watts, which resulted in significant limitations in terms of graphics performance. In the MSI GP76 Leopard 10UG that we now have before us, the Nvidia GeForce RTX 3070 has a TGP of 140 watts and should, therefore, be able to fully utilize its performance.
Our test configuration also includes an Intel Core i7-10750H, 16 GB of RAM, and a 512 GB SSD. With this equipment, the GP76 Leopard has to face the comparison with the competitors listed below. You can also add more laptops from our database under each section.
Possible contenders in comparison
Rating | Date | Model | Weight | Height | Size | Resolution | Price |
|---|---|---|---|---|---|---|---|
| 85.1 % v7 (old) | 03 / 2021 | MSI GP76 Leopard 10UG i7-10750H, GeForce RTX 3070 Laptop GPU | 2.9 kg | 26 mm | 17.30" | 1920x1080 | |
| 86.1 % v7 (old) | 02 / 2021 | Aorus 15P XC i7-10870H, GeForce RTX 3070 Laptop GPU | 2.2 kg | 27 mm | 15.60" | 1920x1080 | |
| 85 % v7 (old) | 02 / 2021 | Asus ROG Strix G15 G513QR R9 5900HX, GeForce RTX 3070 Laptop GPU | 2.3 kg | 27.2 mm | 15.60" | 1920x1080 | |
| 85.1 % v7 (old) | 01 / 2021 | Schenker XMG Neo 17 (Early 2021, RTX 3070, 5800H) R7 5800H, GeForce RTX 3070 Laptop GPU | 2.5 kg | 27 mm | 17.30" | 2560x1440 |
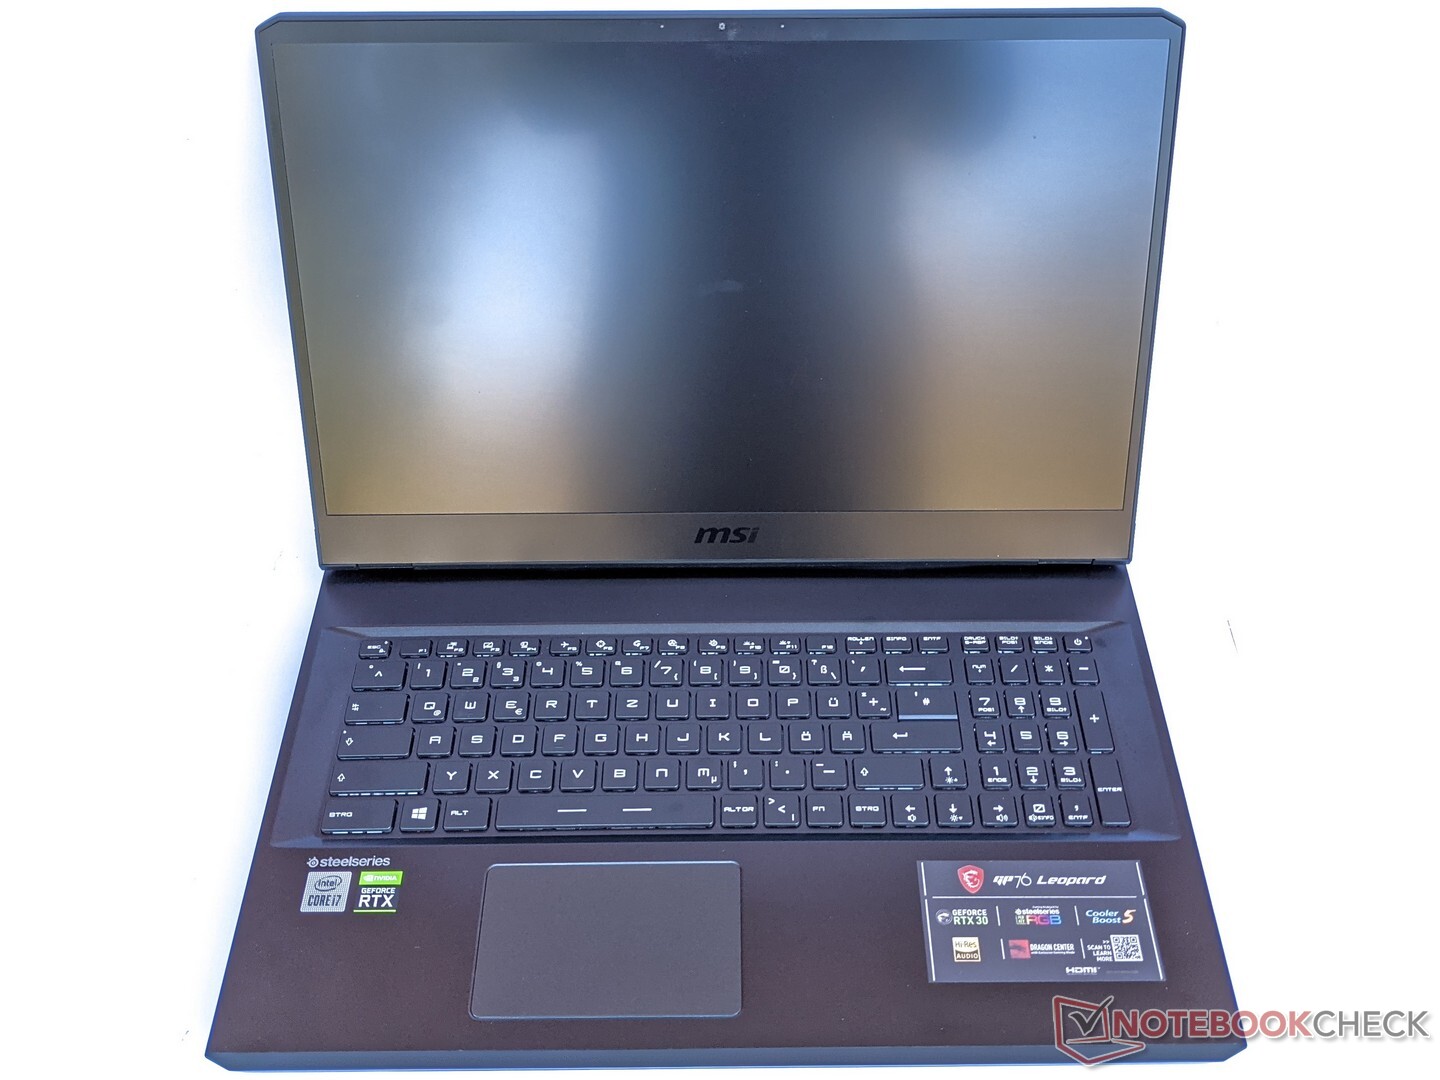
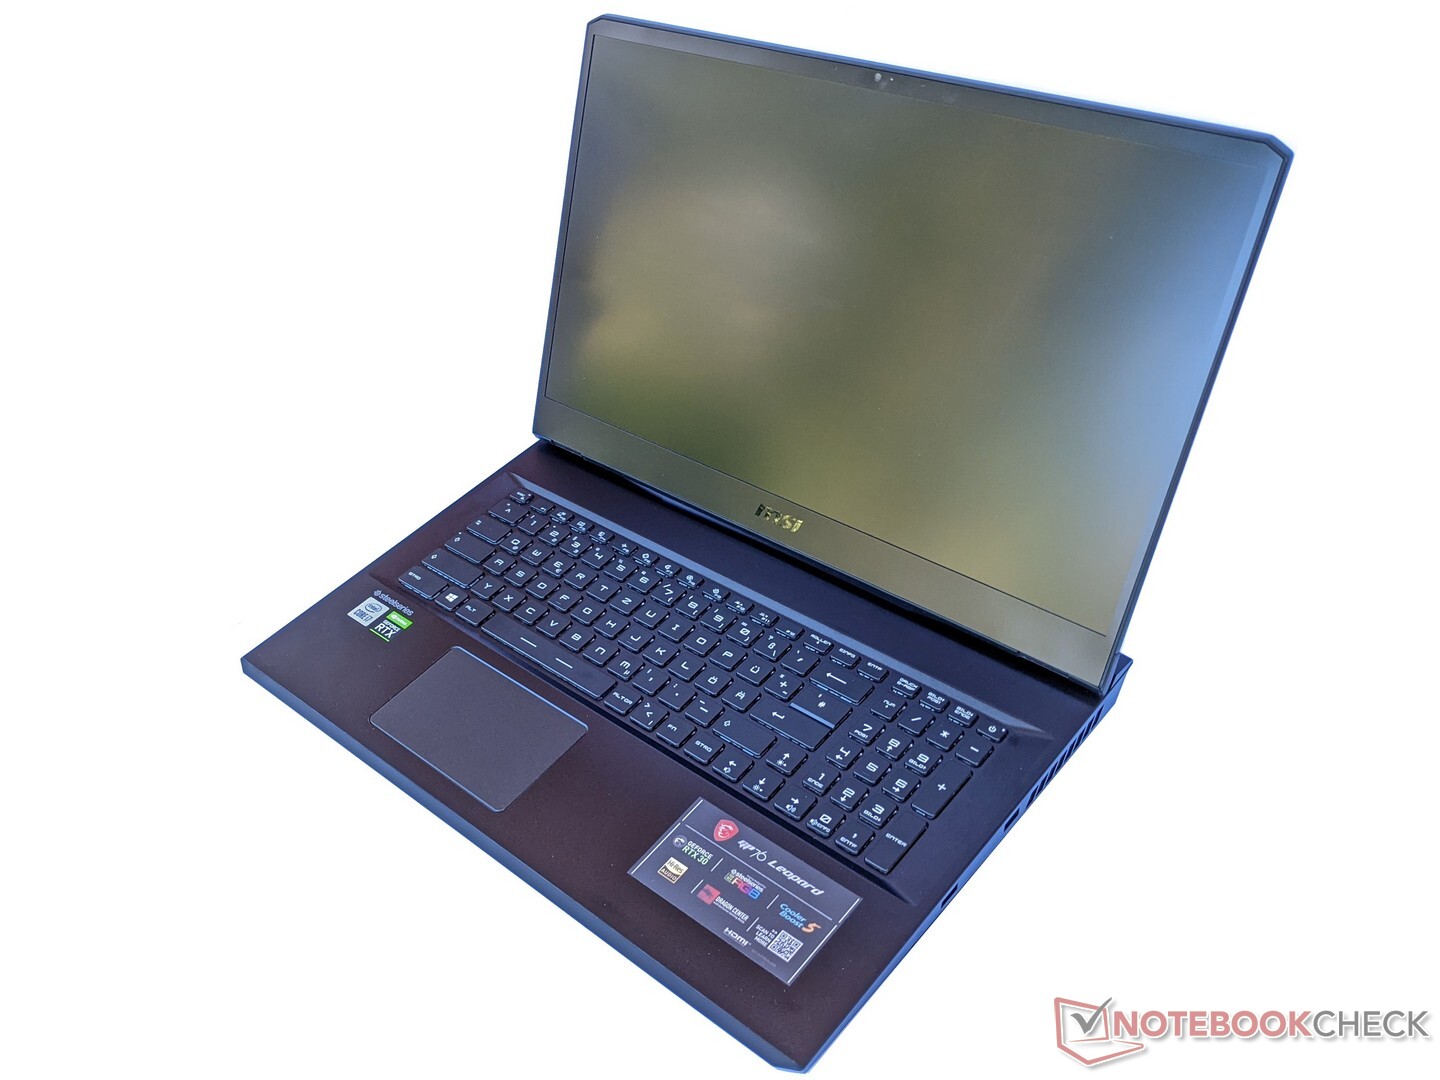
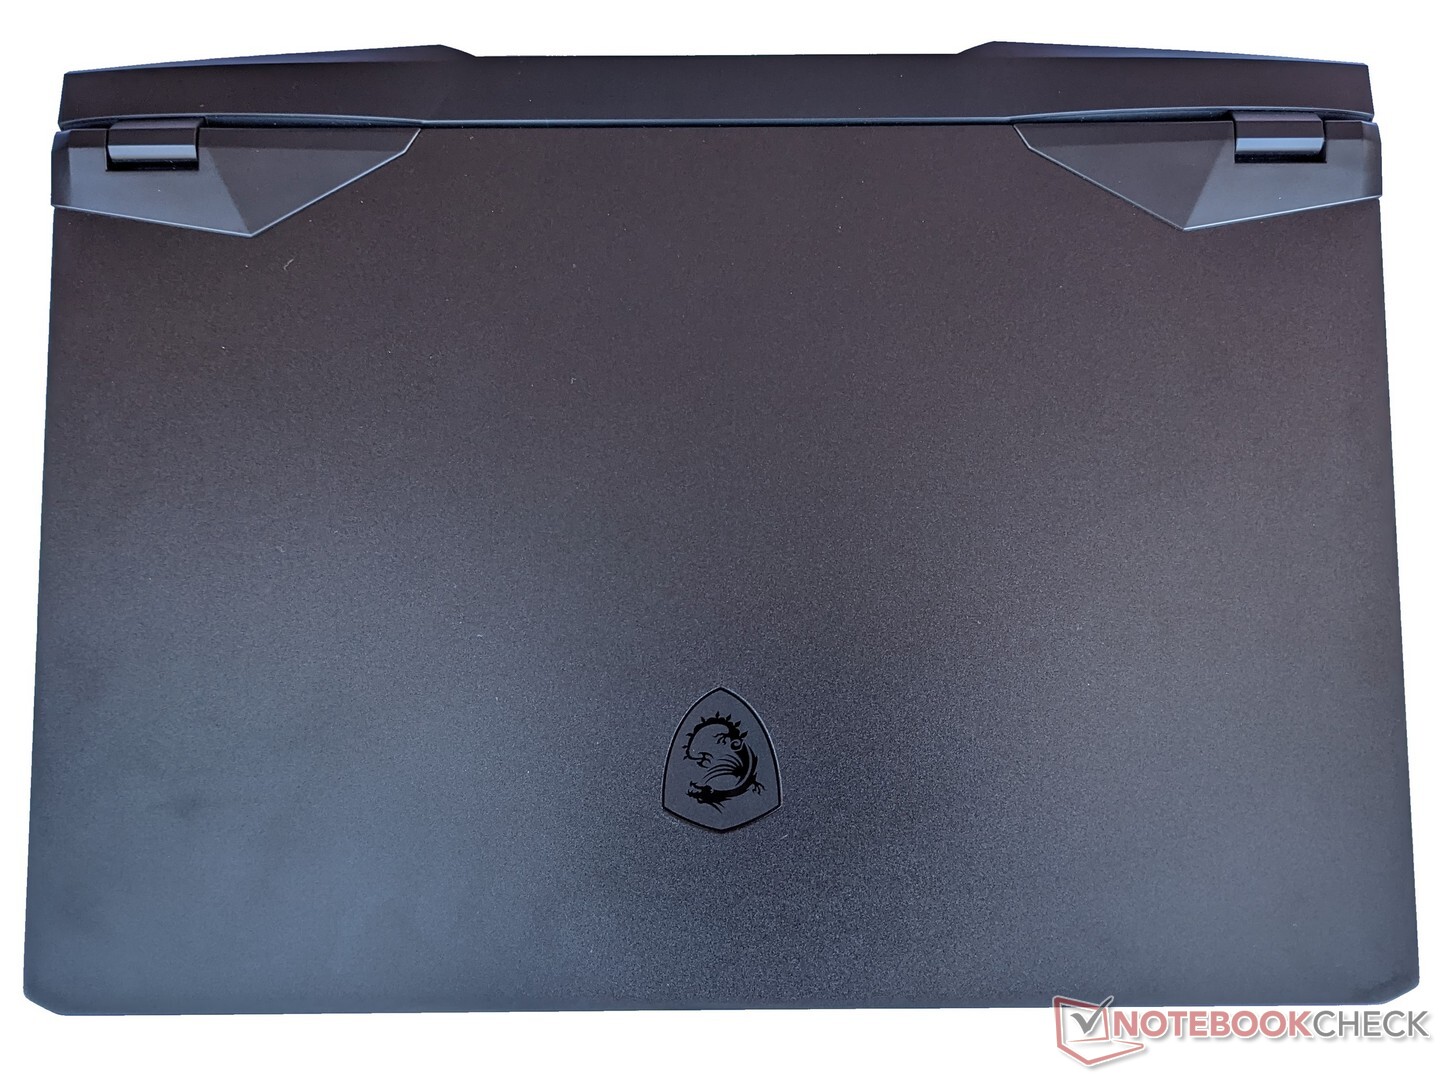
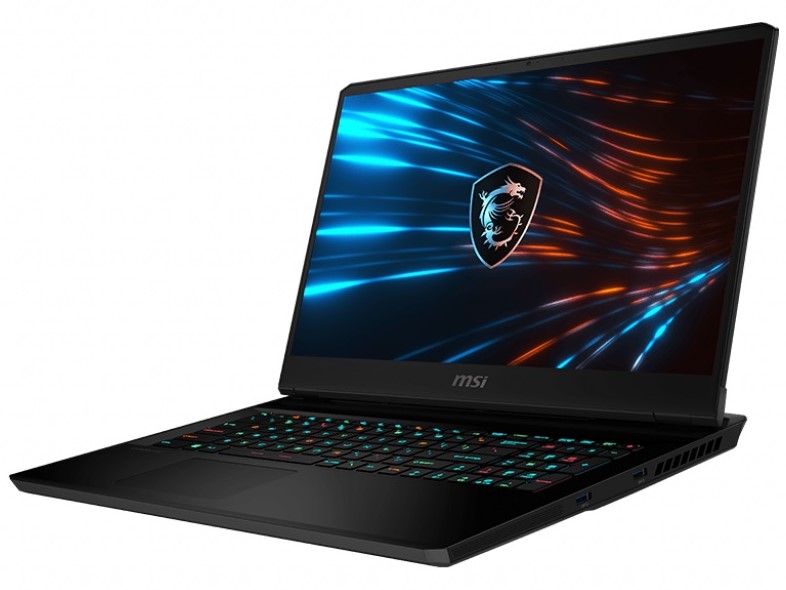
Case - Robust 17-inch laptop from MSI
MSI equips the GP76 Leopard with a sturdy metal case. Since this also applies to the lid, it's quite resistant to torsion despite its corresponding size for a 17-inch display. All parts of the laptop are of high quality and cleanly manufactured, so that there's no room for criticism here. The screen can also be opened with one hand, but the maximum angle is limited to about 140 degrees.
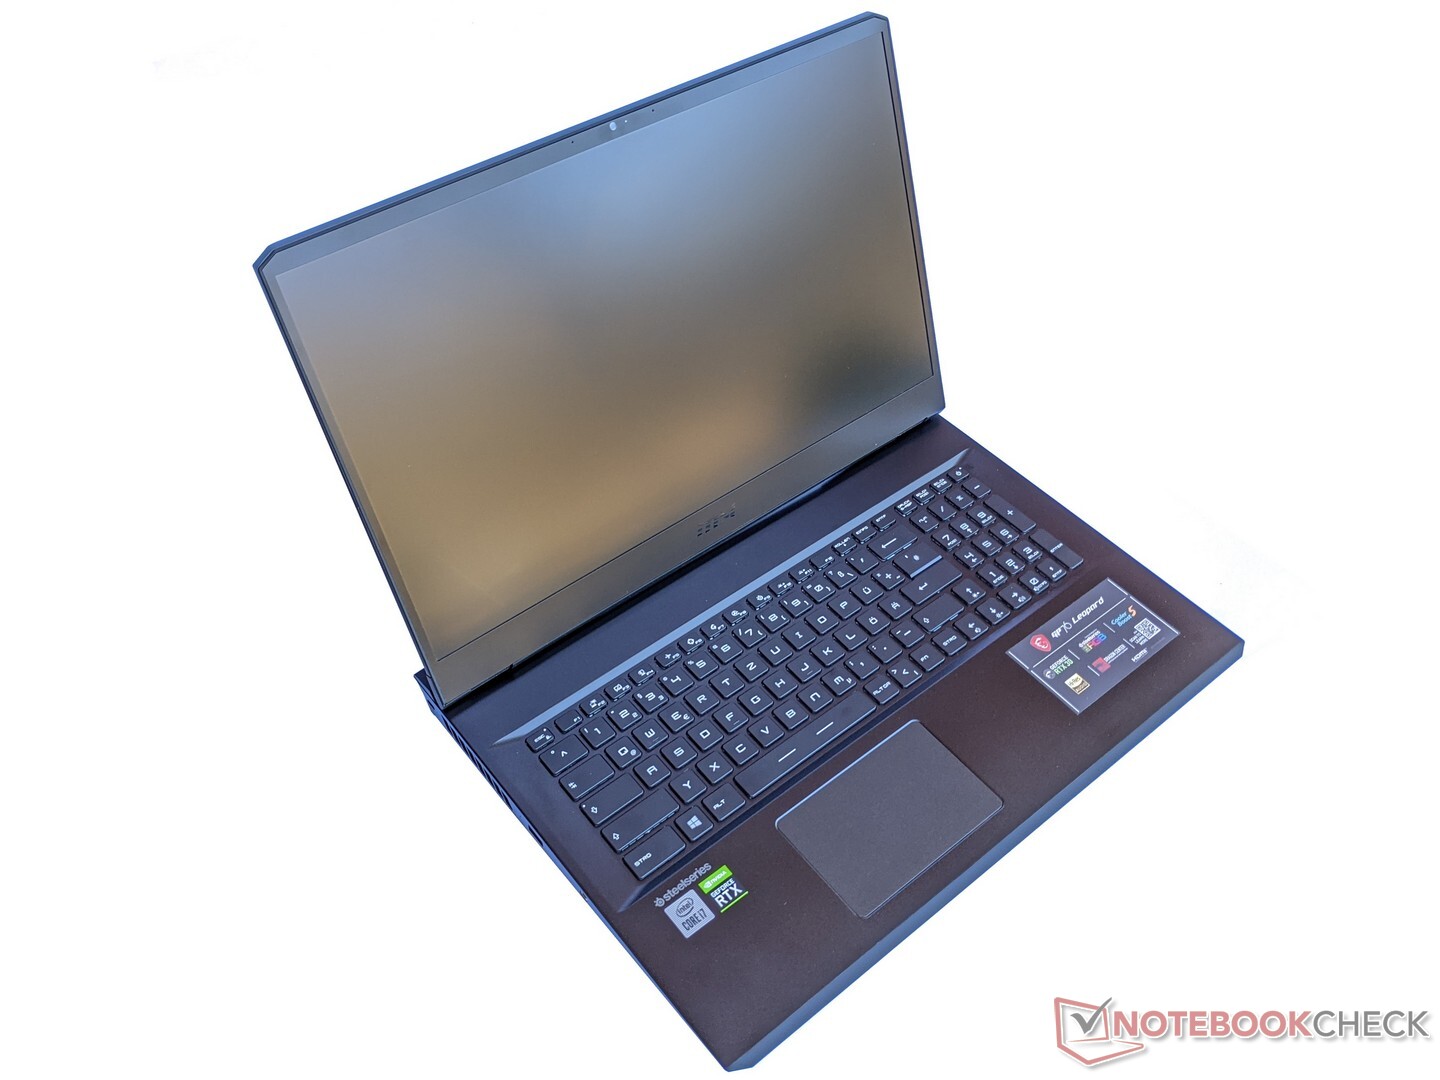
Despite the narrow display bezel, the dimensions are a bit larger than in other 17-inch laptops, especially in terms of depth. The weight is also a bit higher at 2.8 kg. However, with a thickness of about 2.6 centimeters, the GP76 Leopard can keep up with comparable 15-inch laptops. However, MSI's gaming laptop is still a long way off from ultra-slim gaming competitors.
Connectivity - Fast WLAN but no memory card reader
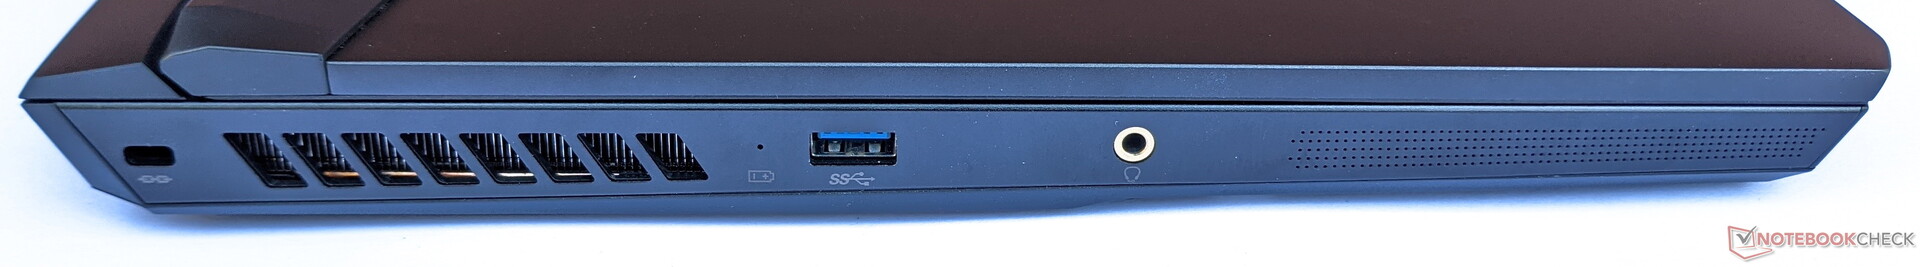
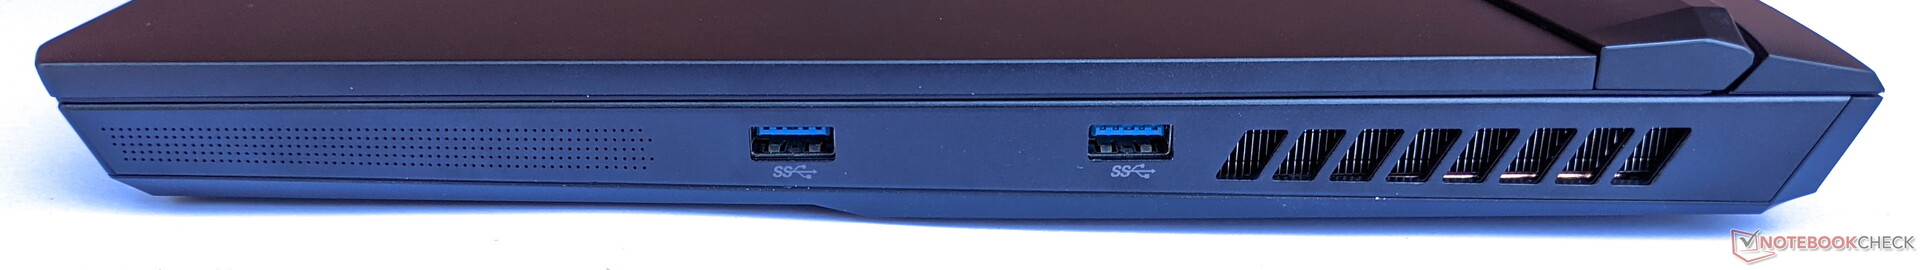
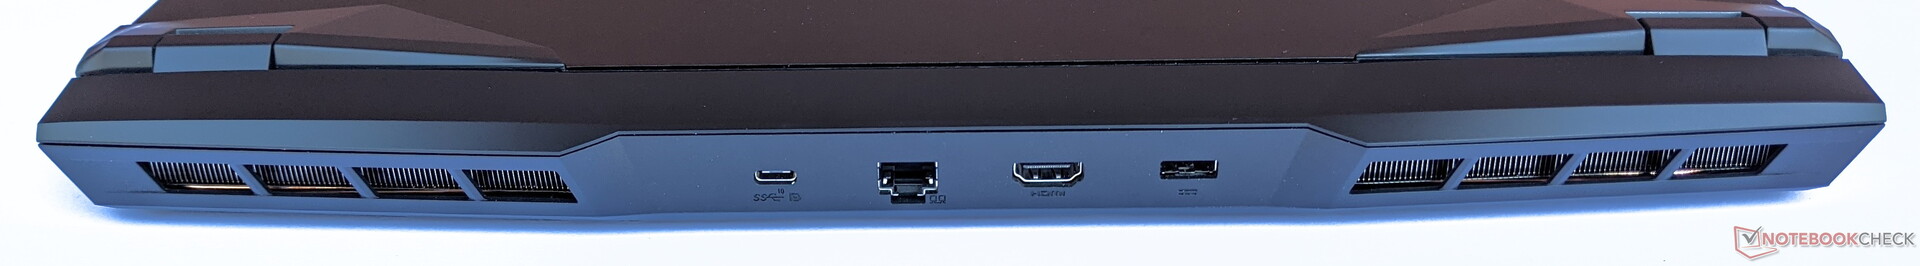
The majority of the ports in the GP76 Leopard 10UG are located on the back. The power connector and the DisplayPort-capable USB Type-C 3.2 Gen. 2 port are also found there. The remaining USB Type-A ports are located on the sides and are relatively far to the front. A memory card reader isn't available.
Communication
With our Netgear Nighthawk AX12 reference router, the MSI laptop achieves speeds of 1,270 Mb/s for receiving data and 1,310 Mb/s for sending data. Consequently, it achieves a good result and can place itself in the middle of our test field.
Webcam
Like many other manufacturers, MSI only installs a low-resolution webcam with 0.9 MP in this laptop. As a result, image quality is mediocre and shows significant blurriness and pale colors even in good lighting conditions.


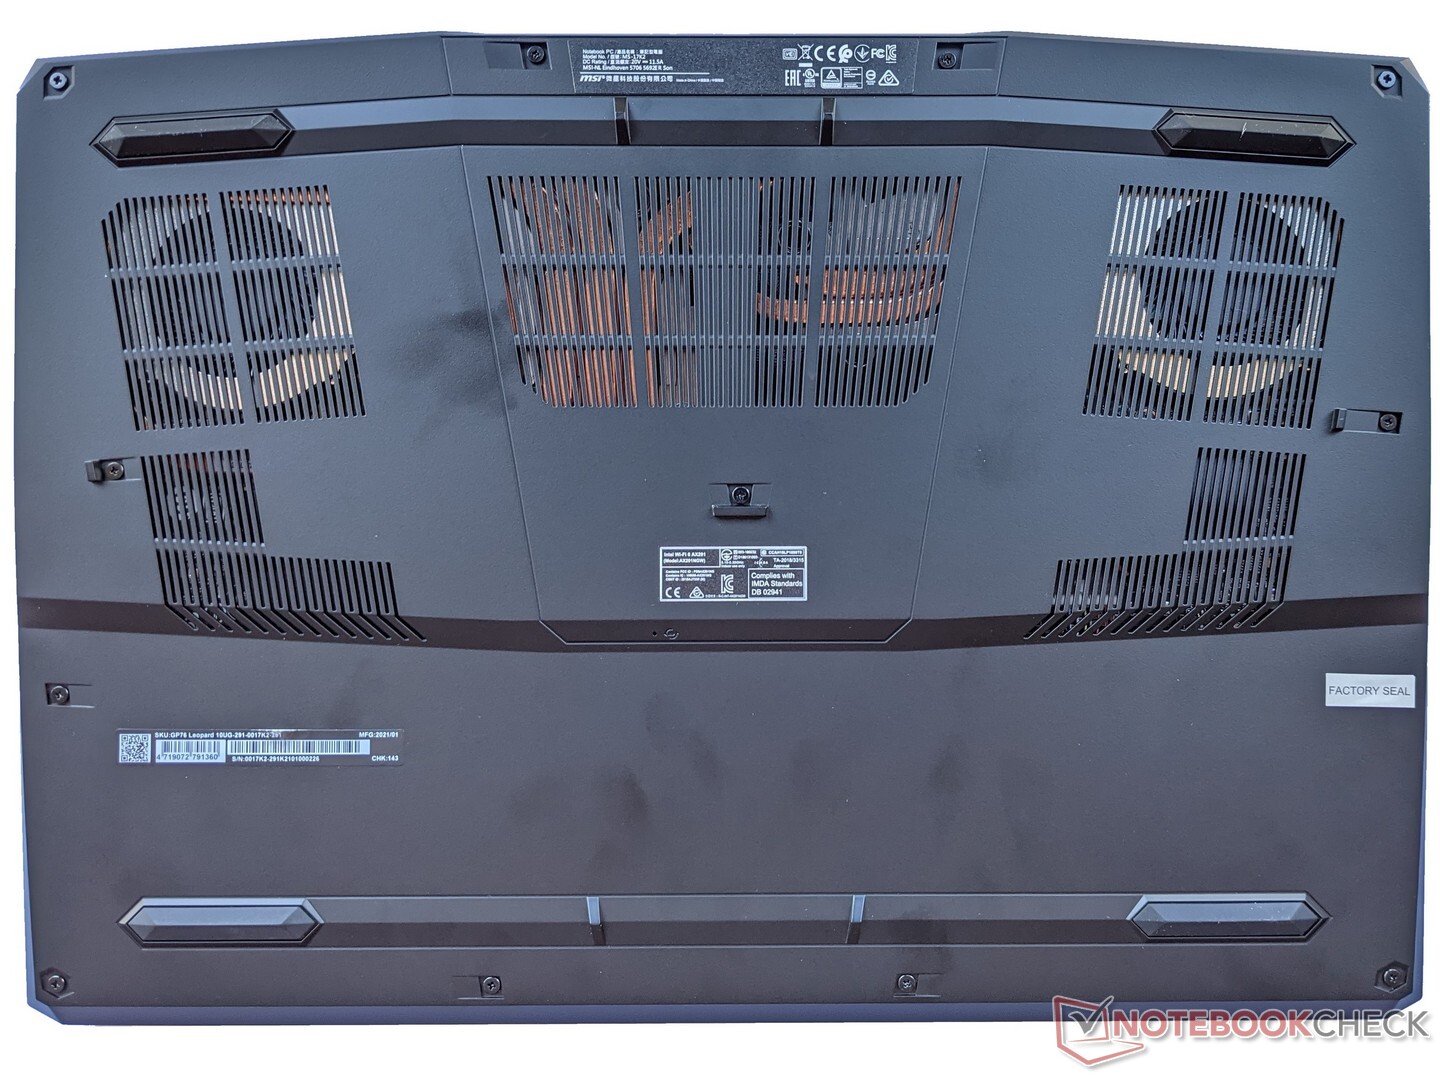
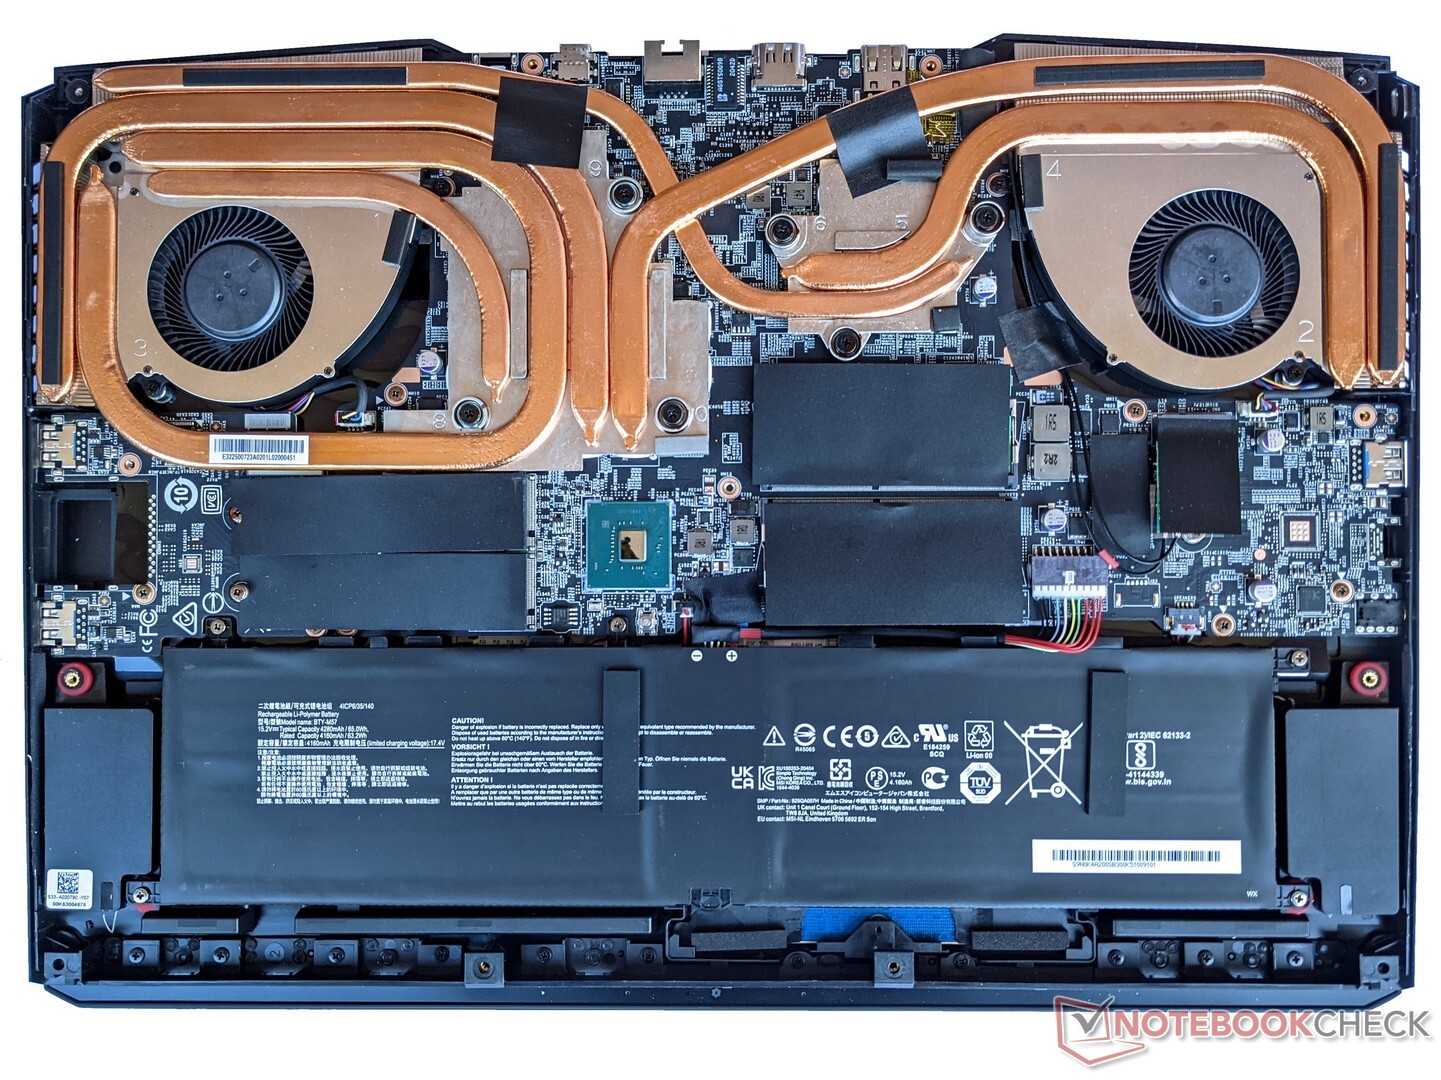
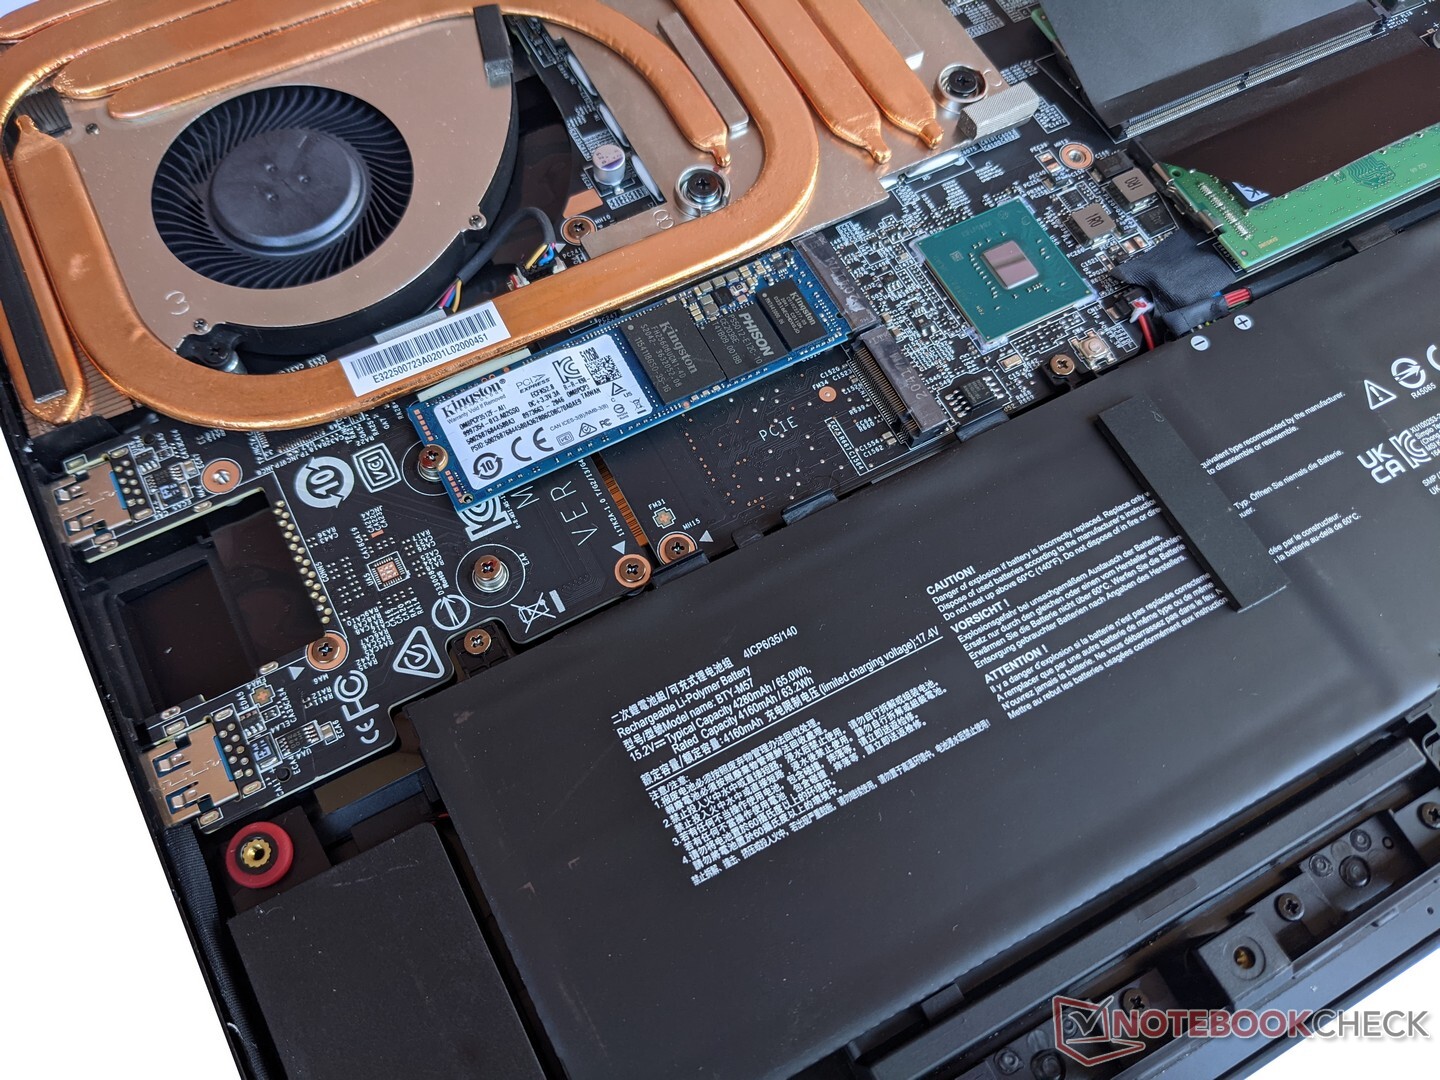
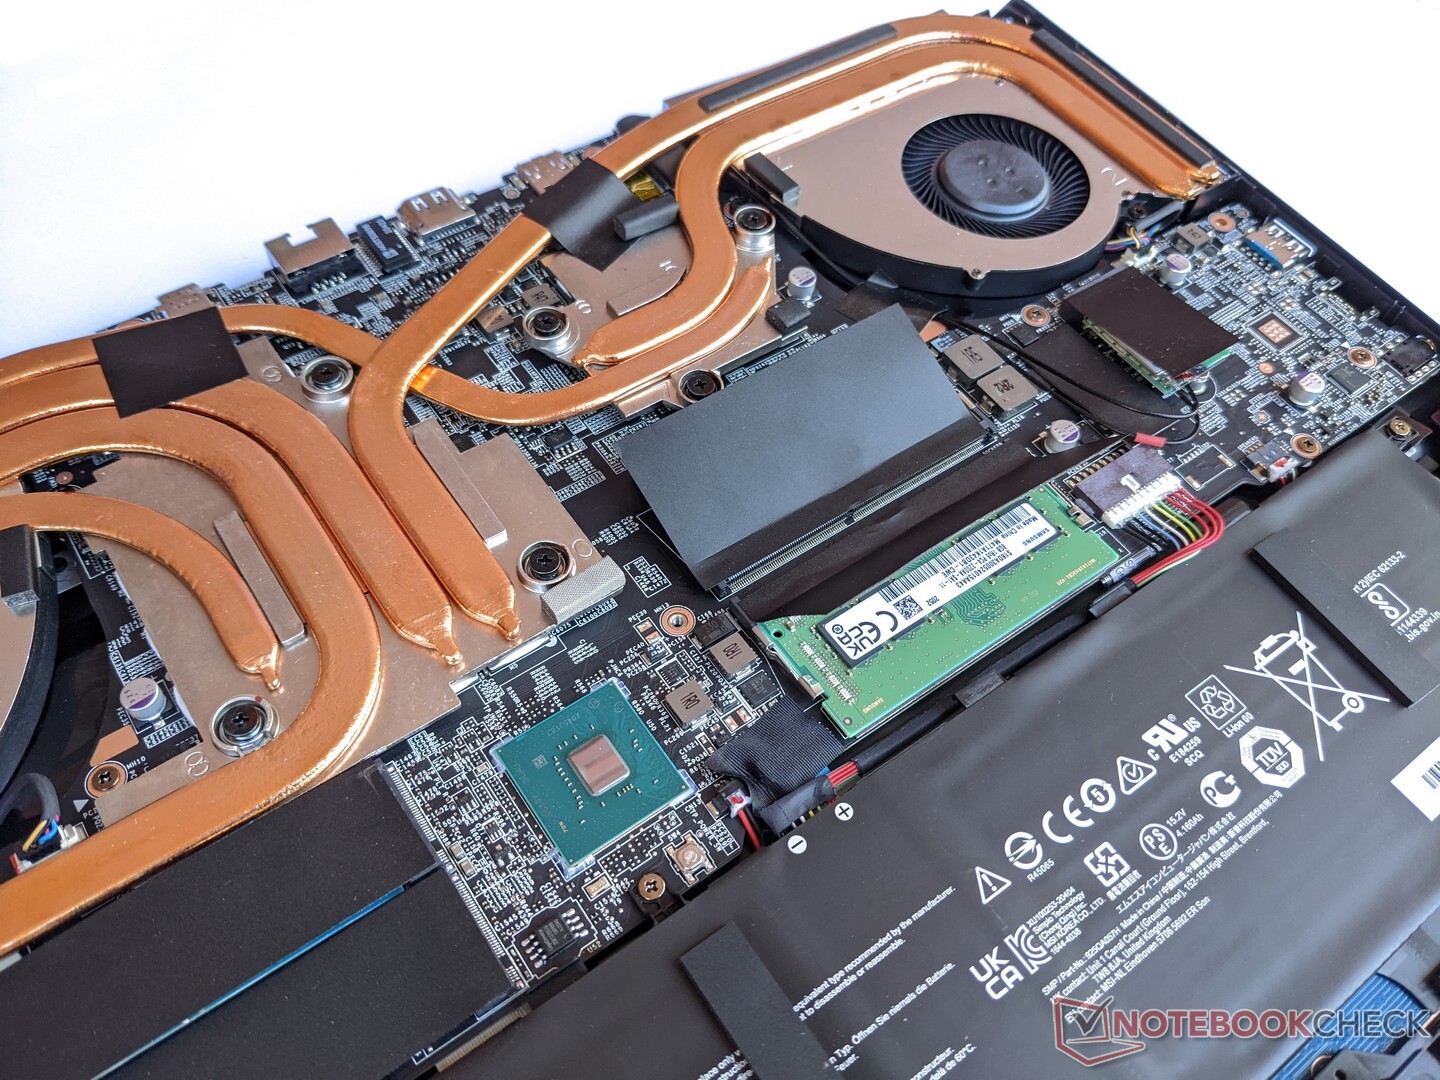
Maintenance
Getting inside the MSI GP76 Leopard 10UG is a bit of a hassle. It's important to note that the front edge of the bottom cover is connected to the front, which in turn is attached to the top of the base unit. Together with the relatively tight hooks, a lot of patience and calculated force is required. Once the bottom is open, two M.2 slots for the mass storage devices, two RAM slots, and the WLAN module are easily accessible.
Warranty
MSI grants buyers a 24-month warranty period. It can also be extended for a fee.
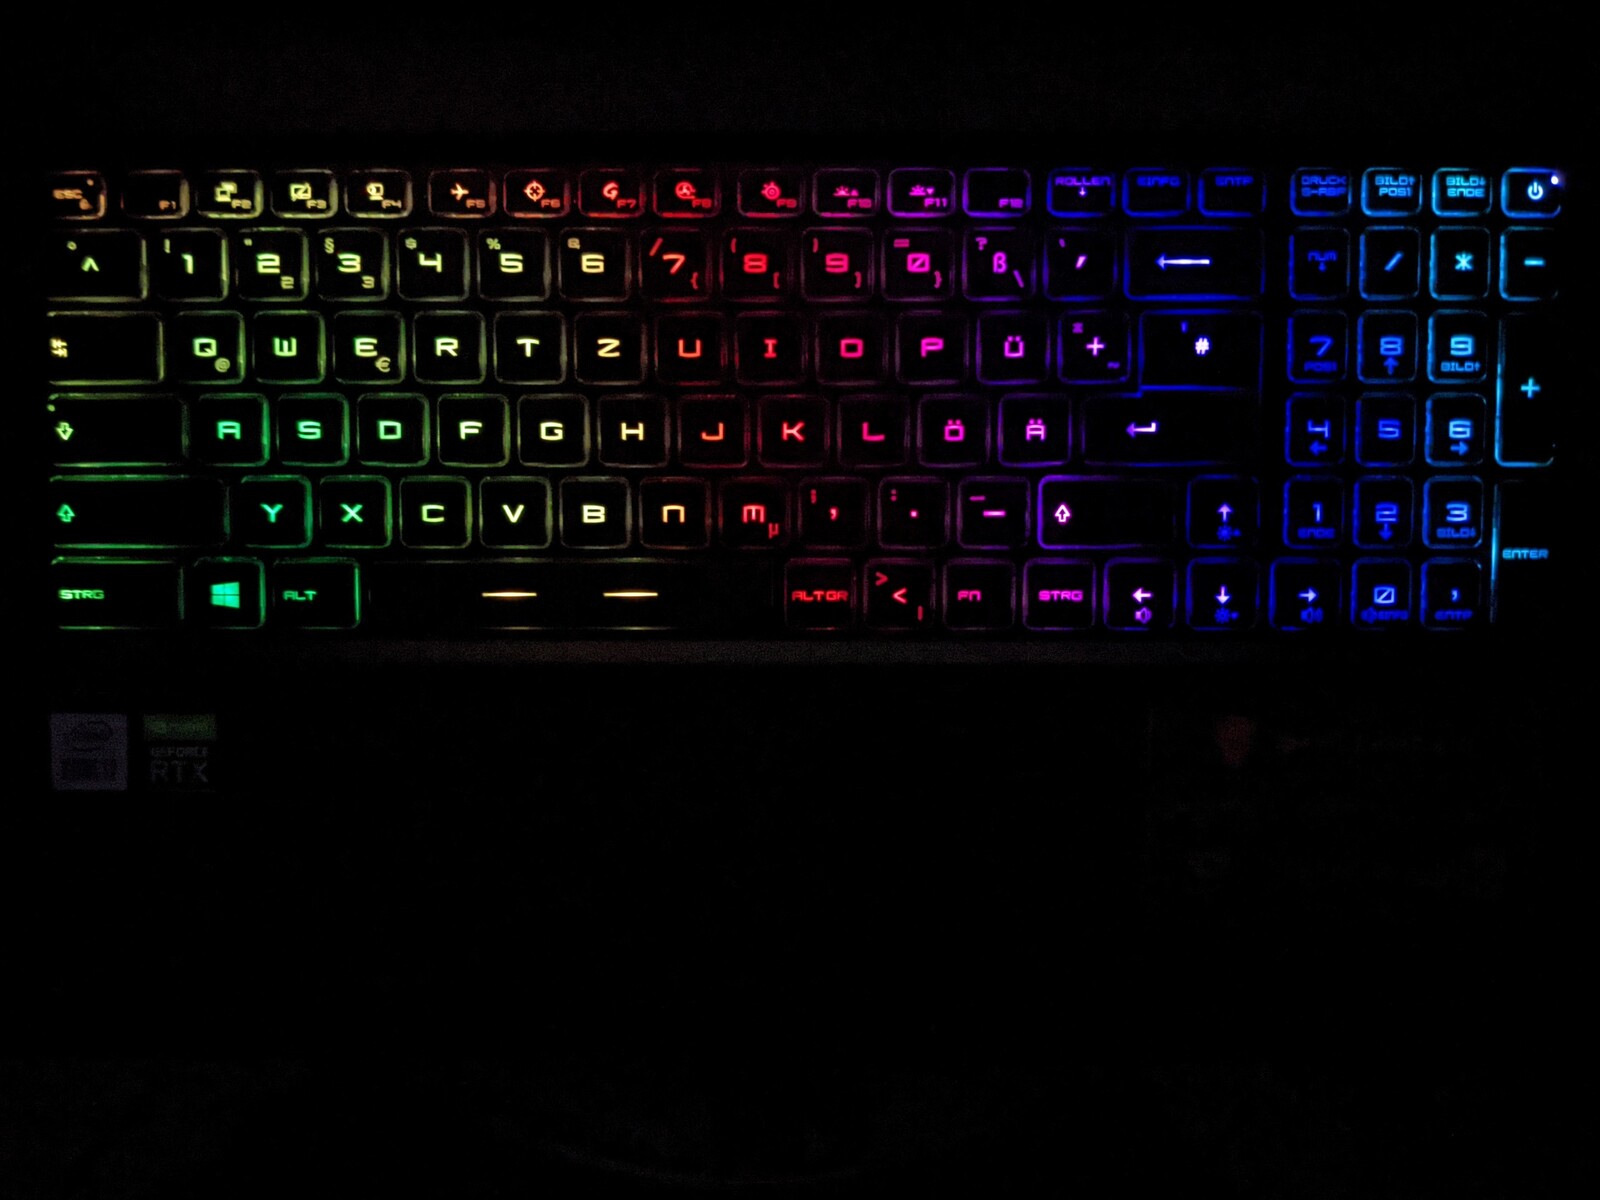
Input devices - Solid keyboard with RGB lighting
Keyboard
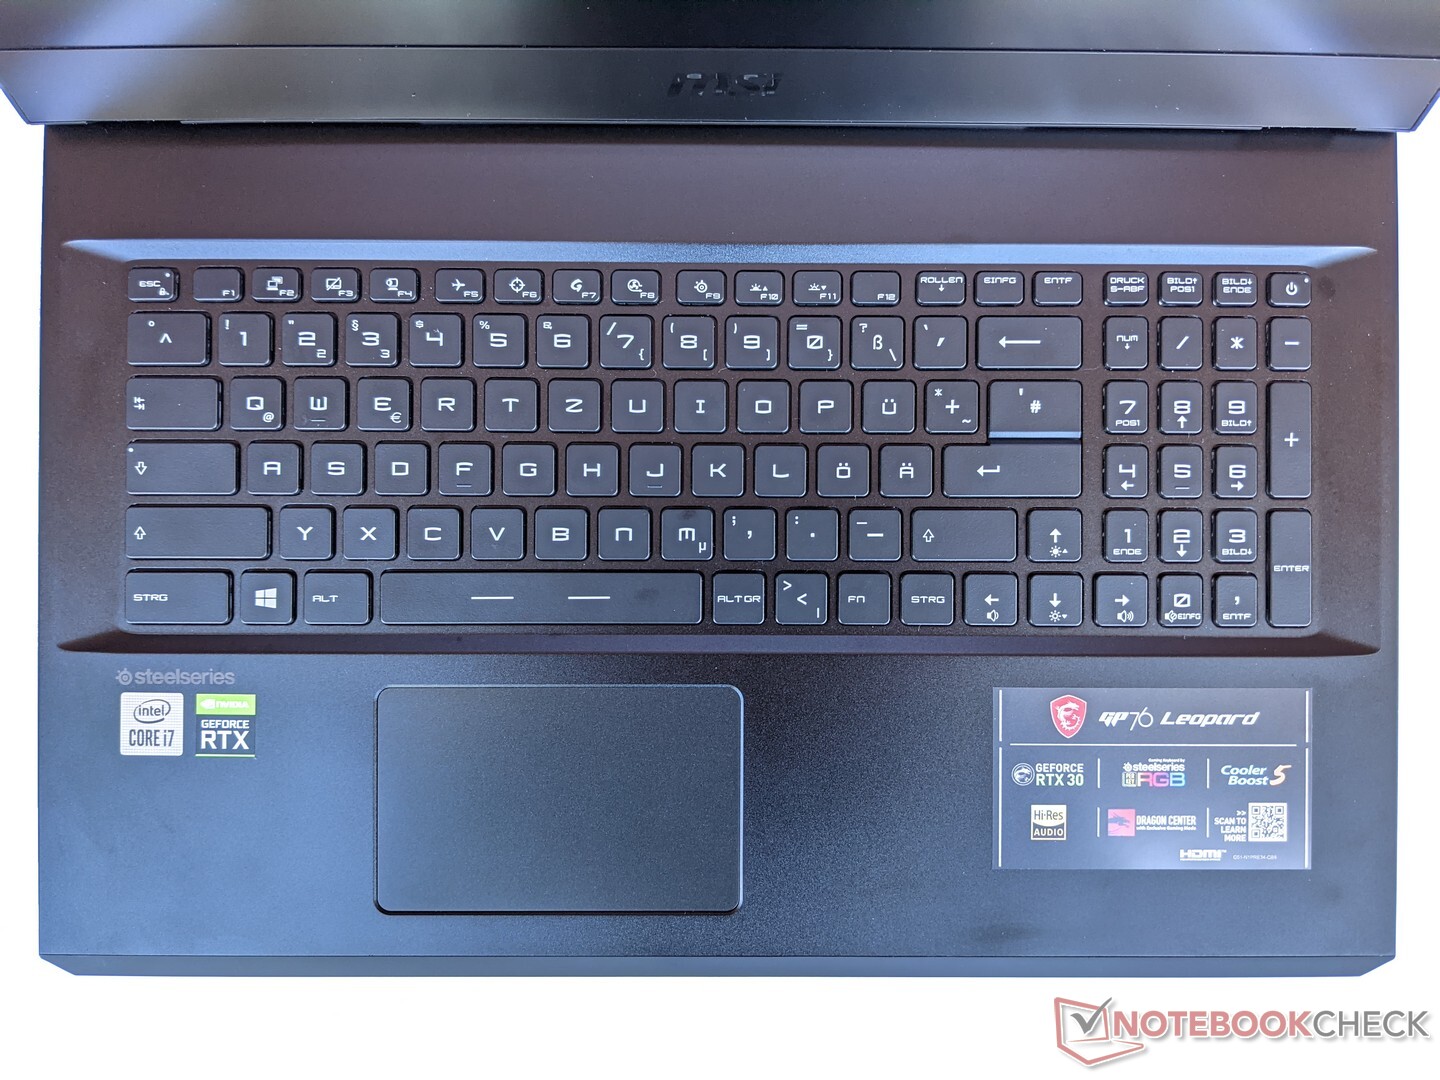
The keyboard of the GP76 Leopard 10UG offers a noticeable pressure point and a firm grip for the fingers, which also makes it suitable for users who type a lot. While the arrow keys are the same size as the letter keys, the F keys are much smaller. The MSI laptop also has RGB lighting that can be configured extensively.
Touchpad
Users of the MSI GP76 can use a ClickPad as a mouse replacement. It triggers mouse clicks reliably via touch functionality as well as through mechanical pressure. The smooth surface is also well suited for precise cursor navigation.
Display - Gaming laptop with 144 Hz panel
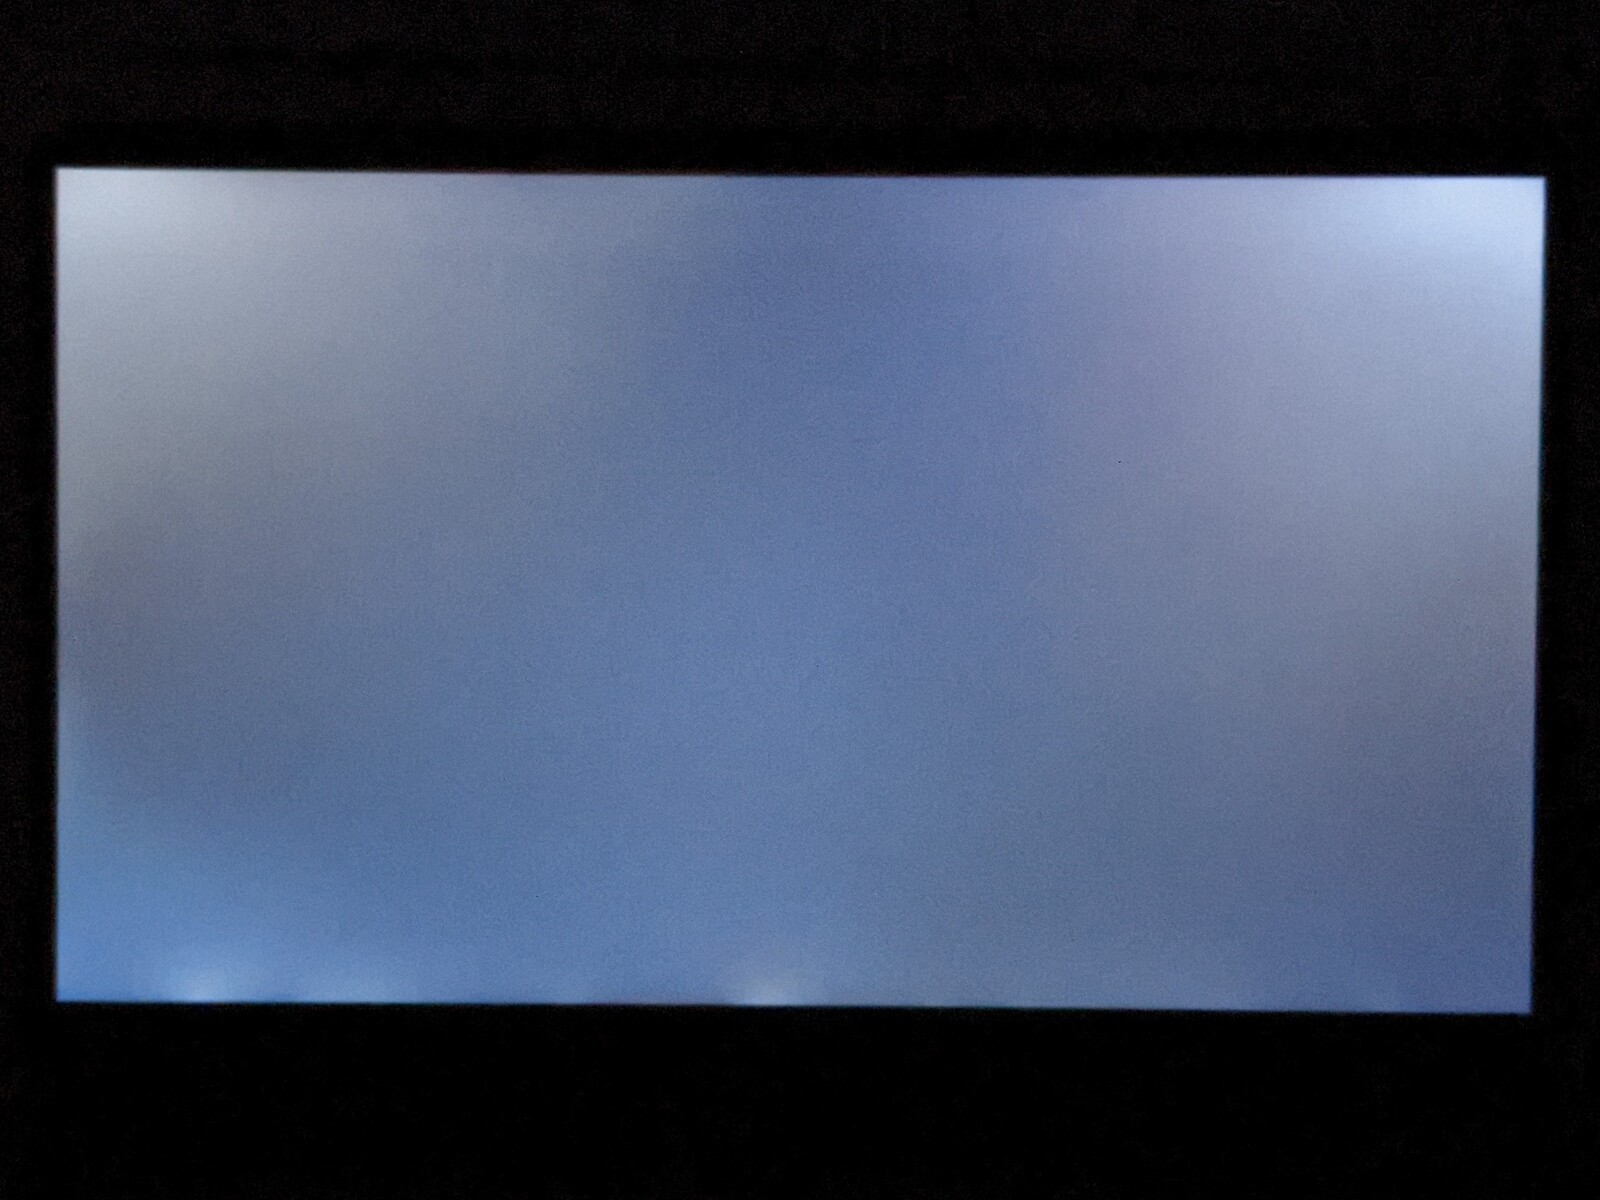
The screen of the MSI GP76 Leopard 10UG consists of a 17.3-inch IPS panel with a refresh rate of 144 Hz, and it offers a resolution of 1920x1080 pixels. The maximum brightness of 314 cd/m² on average is well suited for bright interiors and is one of the best rates in our test field. The brightness distribution of 87% is also on par with the competition.
We observe PWM at a frequency of 24,510 Hz starting at brightness levels below 39%. Since this value is quite high, users with sensitive eyes shouldn't necessarily have to deal with problems.
| |||||||||||||||||||||||||
Brightness Distribution: 87 %
Center on Battery: 328 cd/m²
Contrast: 1131:1 (Black: 0.29 cd/m²)
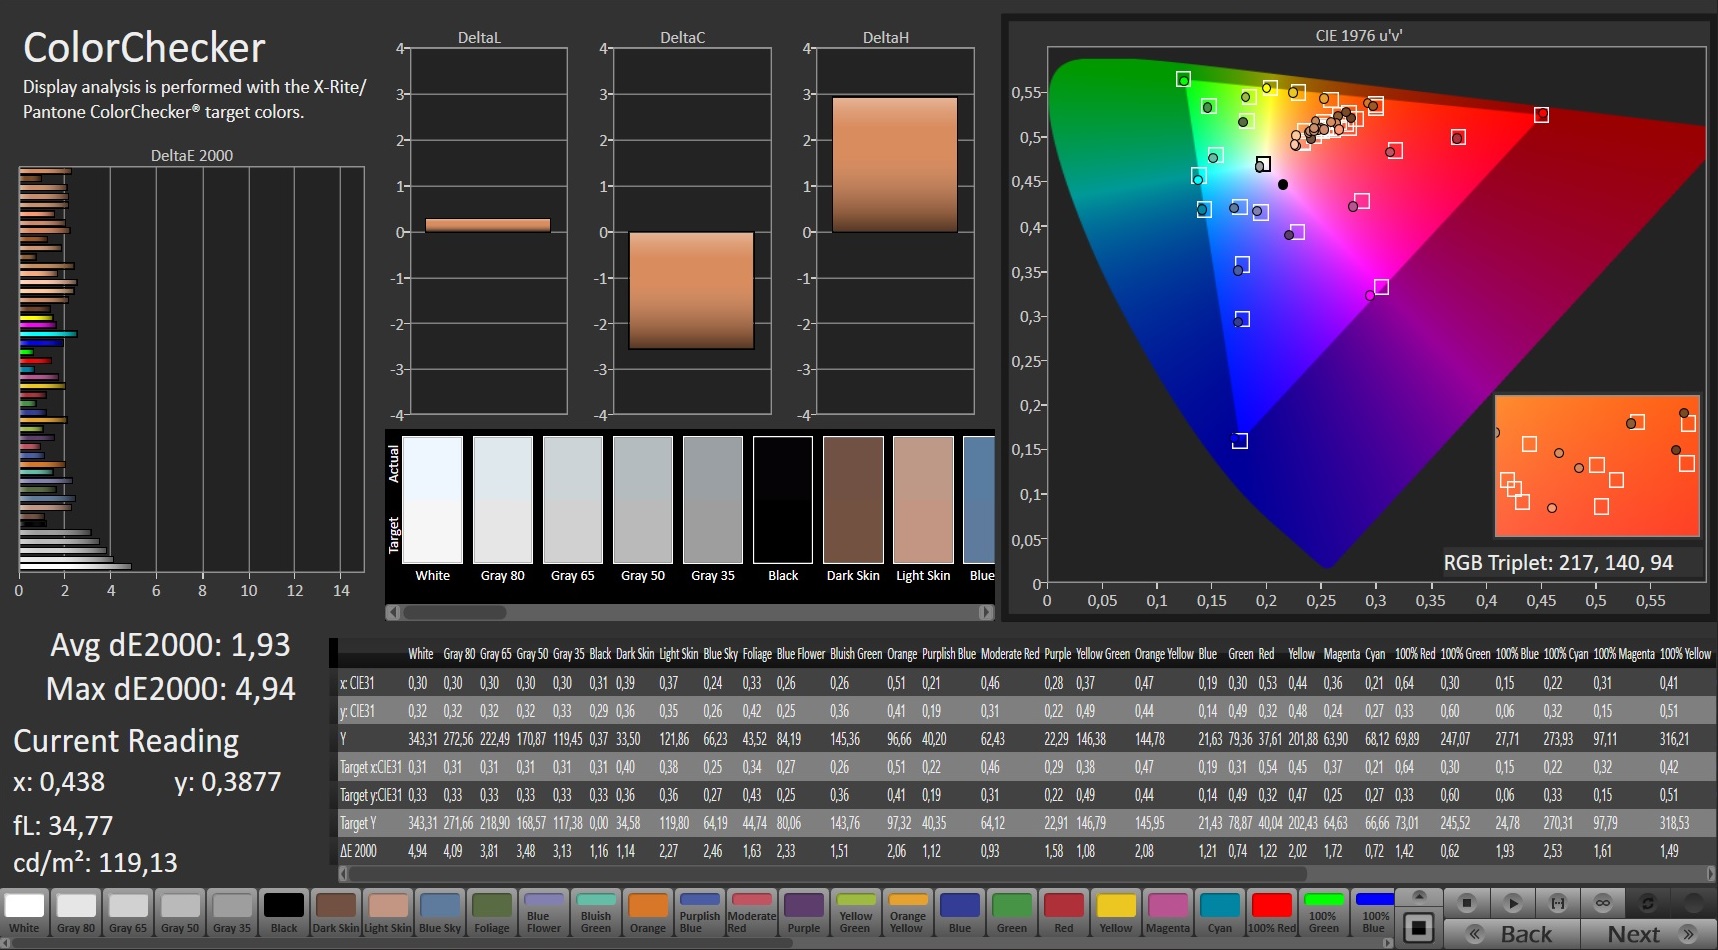
ΔE ColorChecker Calman: 1.93 | ∀{0.5-29.43 Ø4.71}
calibrated: 0.68
ΔE Greyscale Calman: 2.8 | ∀{0.09-98 Ø4.96}
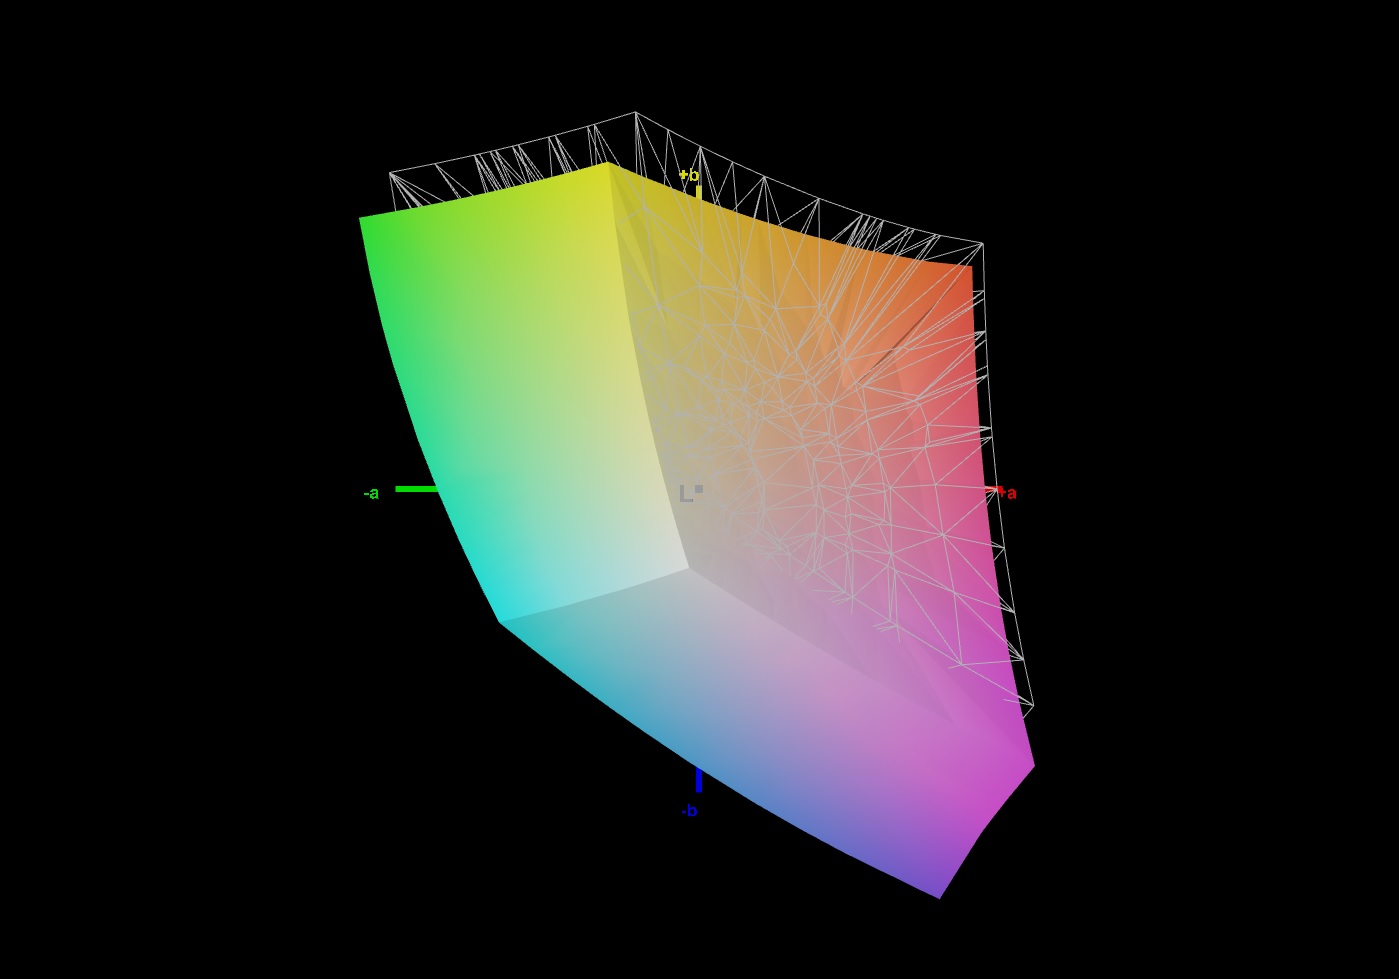
89% sRGB (Argyll 1.6.3 3D)
67% AdobeRGB 1998 (Argyll 1.6.3 3D)
66.9% AdobeRGB 1998 (Argyll 3D)
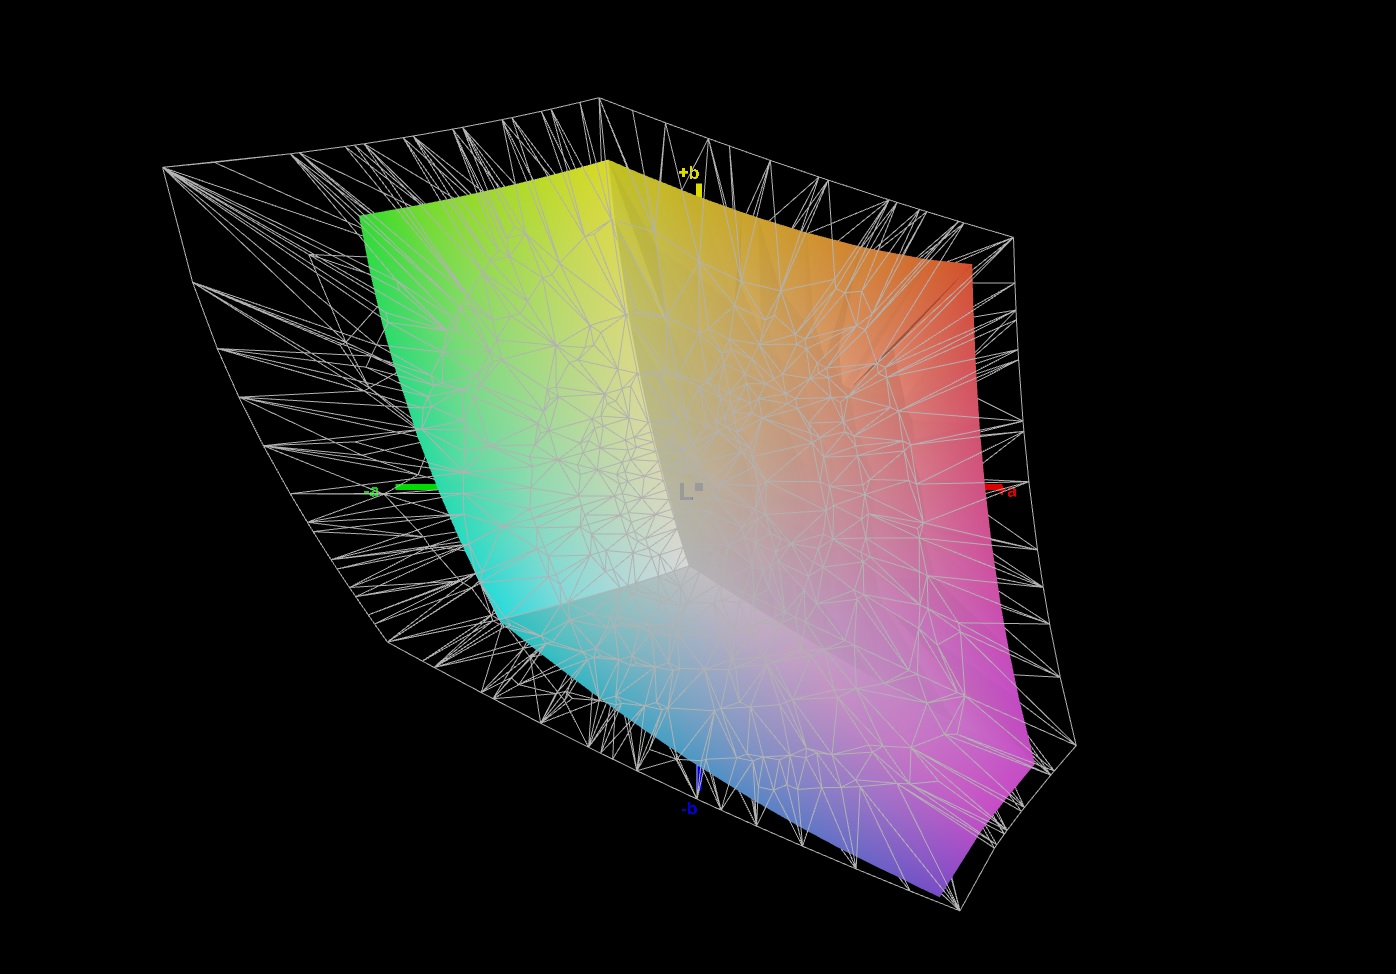
96.4% sRGB (Argyll 3D)
64.7% Display P3 (Argyll 3D)
Gamma: 2.18
CCT: 7023 K
| MSI GP76 Leopard 10UG Chi Mei CMN176E, IPS, 1920x1080, 17.3" | Aorus 15P XC Sharp LQ156M1JW03, IPS, 1920x1080, 15.6" | Asus ROG Strix G15 G513QR LQ156M1JW25, IPS, 1920x1080, 15.6" | Schenker XMG Neo 17 (Early 2021, RTX 3070, 5800H) BOE NE173QHM-NY2 (BOE0977), IPS, 2560x1440, 17.3" | |
|---|---|---|---|---|
| Display | 3% | 2% | 6% | |
| Display P3 Coverage (%) | 64.7 | 67.2 4% | 67.7 5% | 70.5 9% |
| sRGB Coverage (%) | 96.4 | 98.7 2% | 94.3 -2% | 99.5 3% |
| AdobeRGB 1998 Coverage (%) | 66.9 | 68.6 3% | 68.2 2% | 71.8 7% |
| Response Times | -20% | 2% | -60% | |
| Response Time Grey 50% / Grey 80% * (ms) | 7.4 ? | 11.2 ? -51% | 8.2 ? -11% | 16.8 ? -127% |
| Response Time Black / White * (ms) | 10.8 ? | 9.6 ? 11% | 9.2 ? 15% | 10 ? 7% |
| PWM Frequency (Hz) | 24510 ? | 24040 ? | ||
| Screen | 9% | -20% | -9% | |
| Brightness middle (cd/m²) | 328 | 298 -9% | 308 -6% | 410 25% |
| Brightness (cd/m²) | 314 | 278 -11% | 288 -8% | 381 21% |
| Brightness Distribution (%) | 87 | 88 1% | 86 -1% | 88 1% |
| Black Level * (cd/m²) | 0.29 | 0.29 -0% | 0.23 21% | 0.37 -28% |
| Contrast (:1) | 1131 | 1028 -9% | 1339 18% | 1108 -2% |
| Colorchecker dE 2000 * | 1.93 | 0.96 50% | 3.28 -70% | 2.55 -32% |
| Colorchecker dE 2000 max. * | 4.94 | 3.22 35% | 8.51 -72% | 4.33 12% |
| Colorchecker dE 2000 calibrated * | 0.68 | 0.83 -22% | 0.83 -22% | 1.28 -88% |
| Greyscale dE 2000 * | 2.8 | 1.3 54% | 5 -79% | 3.4 -21% |
| Gamma | 2.18 101% | 2.242 98% | 2.057 107% | 2.275 97% |
| CCT | 7023 93% | 6519 100% | 7393 88% | 6637 98% |
| Color Space (Percent of AdobeRGB 1998) (%) | 67 | 69 3% | 68 1% | 72 7% |
| Color Space (Percent of sRGB) (%) | 89 | 91 2% | 90 1% | 95 7% |
| Total Average (Program / Settings) | -3% /
4% | -5% /
-13% | -21% /
-12% |
* ... smaller is better
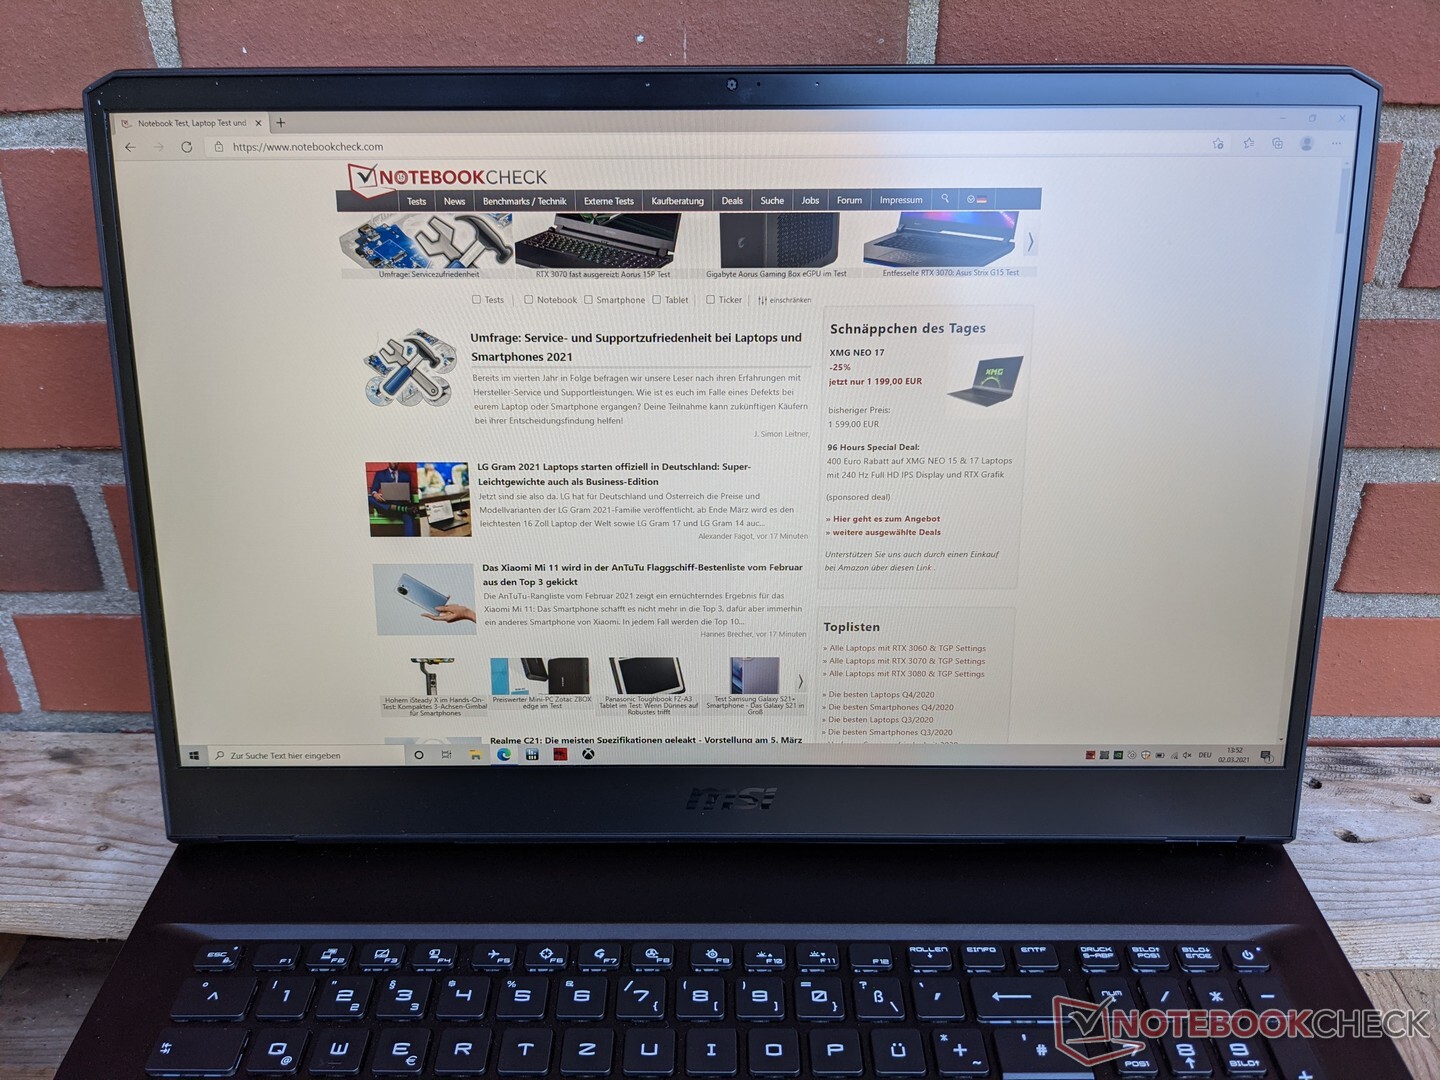
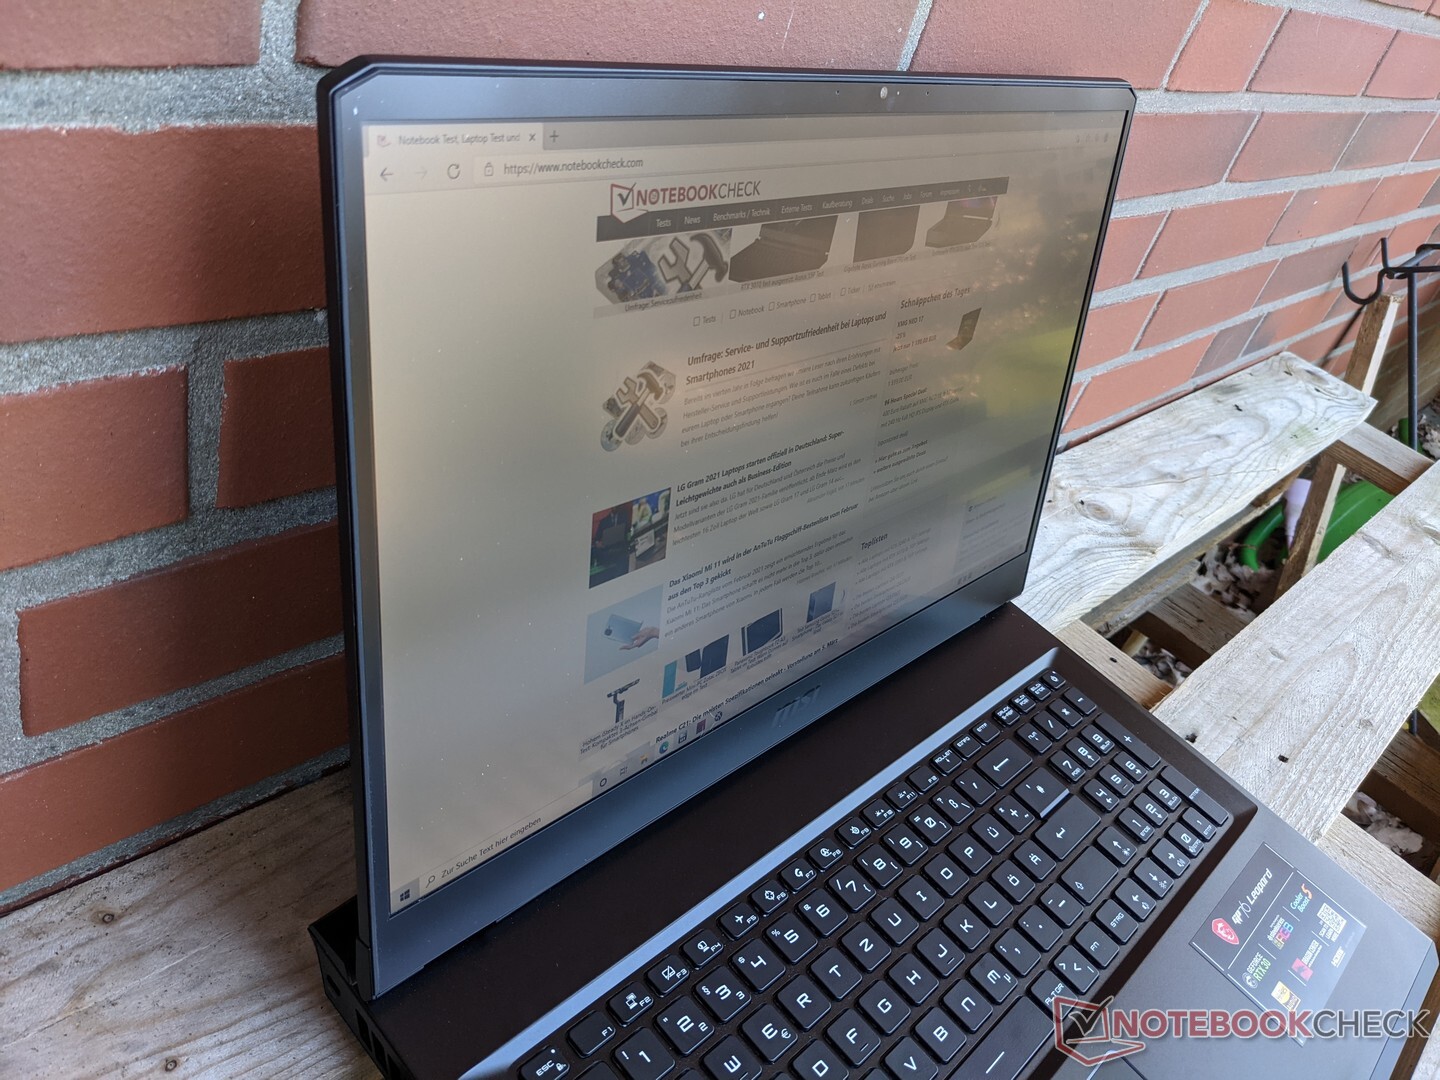
The GP76 Leopard can be used well outdoors as long as places in the shade are preferred. Despite the matte surface, slight reflections of objects in the surroundings can also appear when looking at the screen from the side.
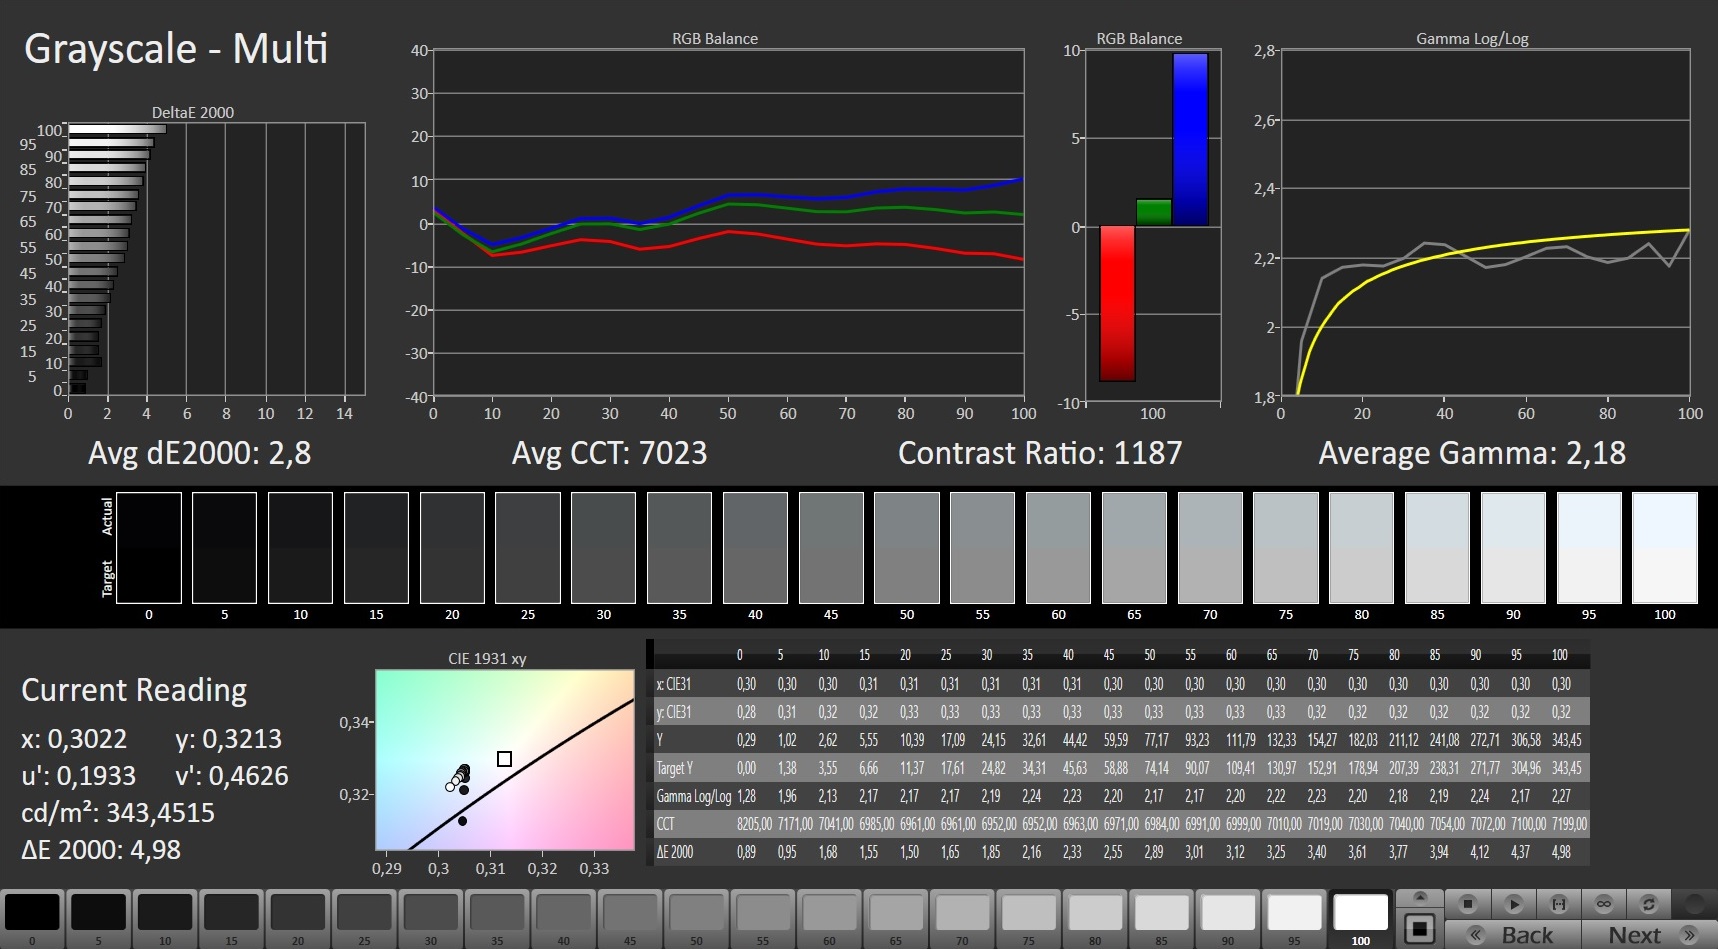

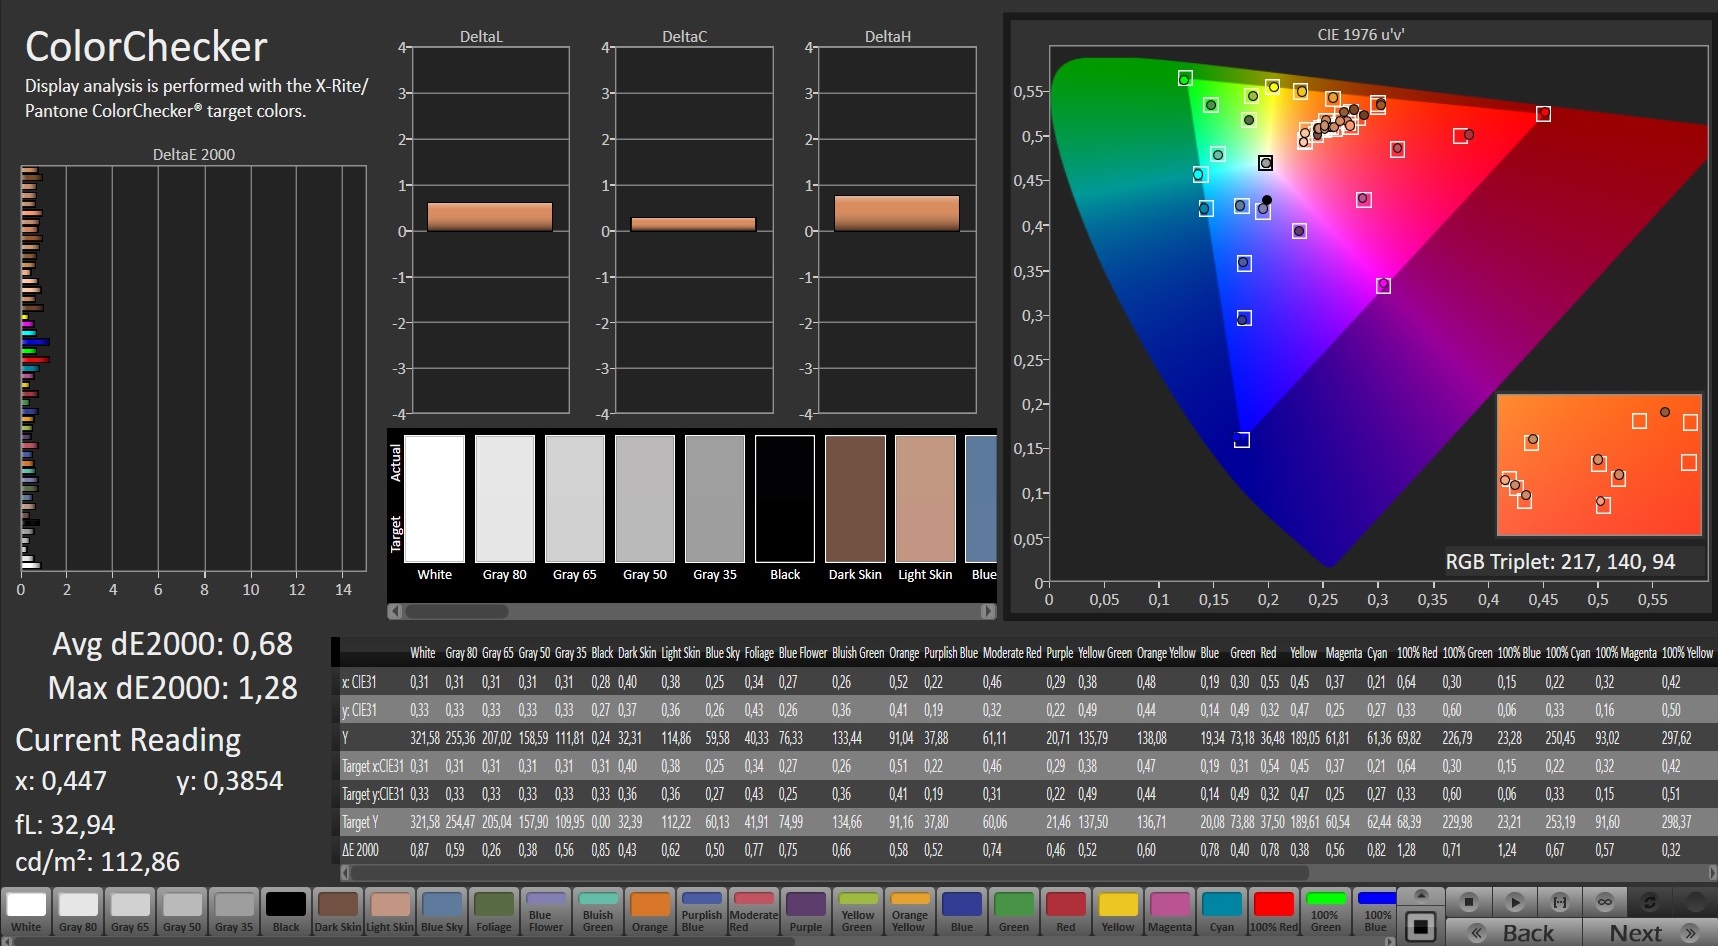
Our measurements show that the MSI Leopard 10UG has a color-space coverage of 89% (sRGB) and 67% (AdobeRGB), respectively. Furthermore, the contrast ratio is 1,131:1, while the black level is 0.29 cd/m². This makes colors look vivid and well separated from each other. In addition, black image content is displayed relatively richly.
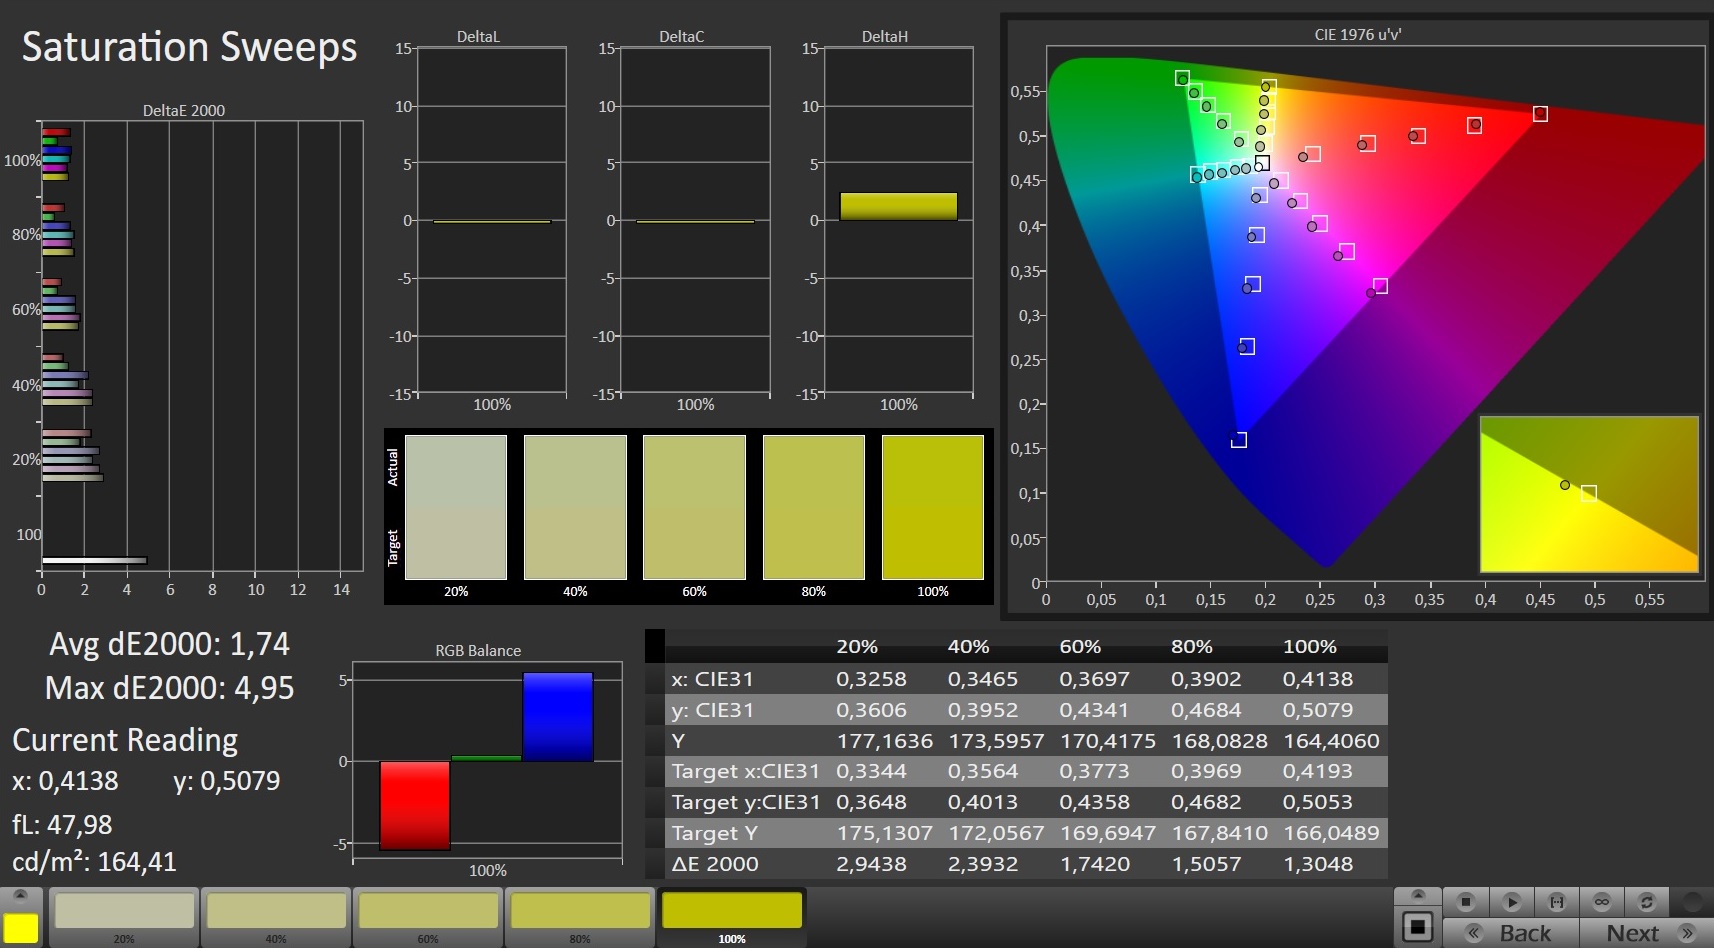
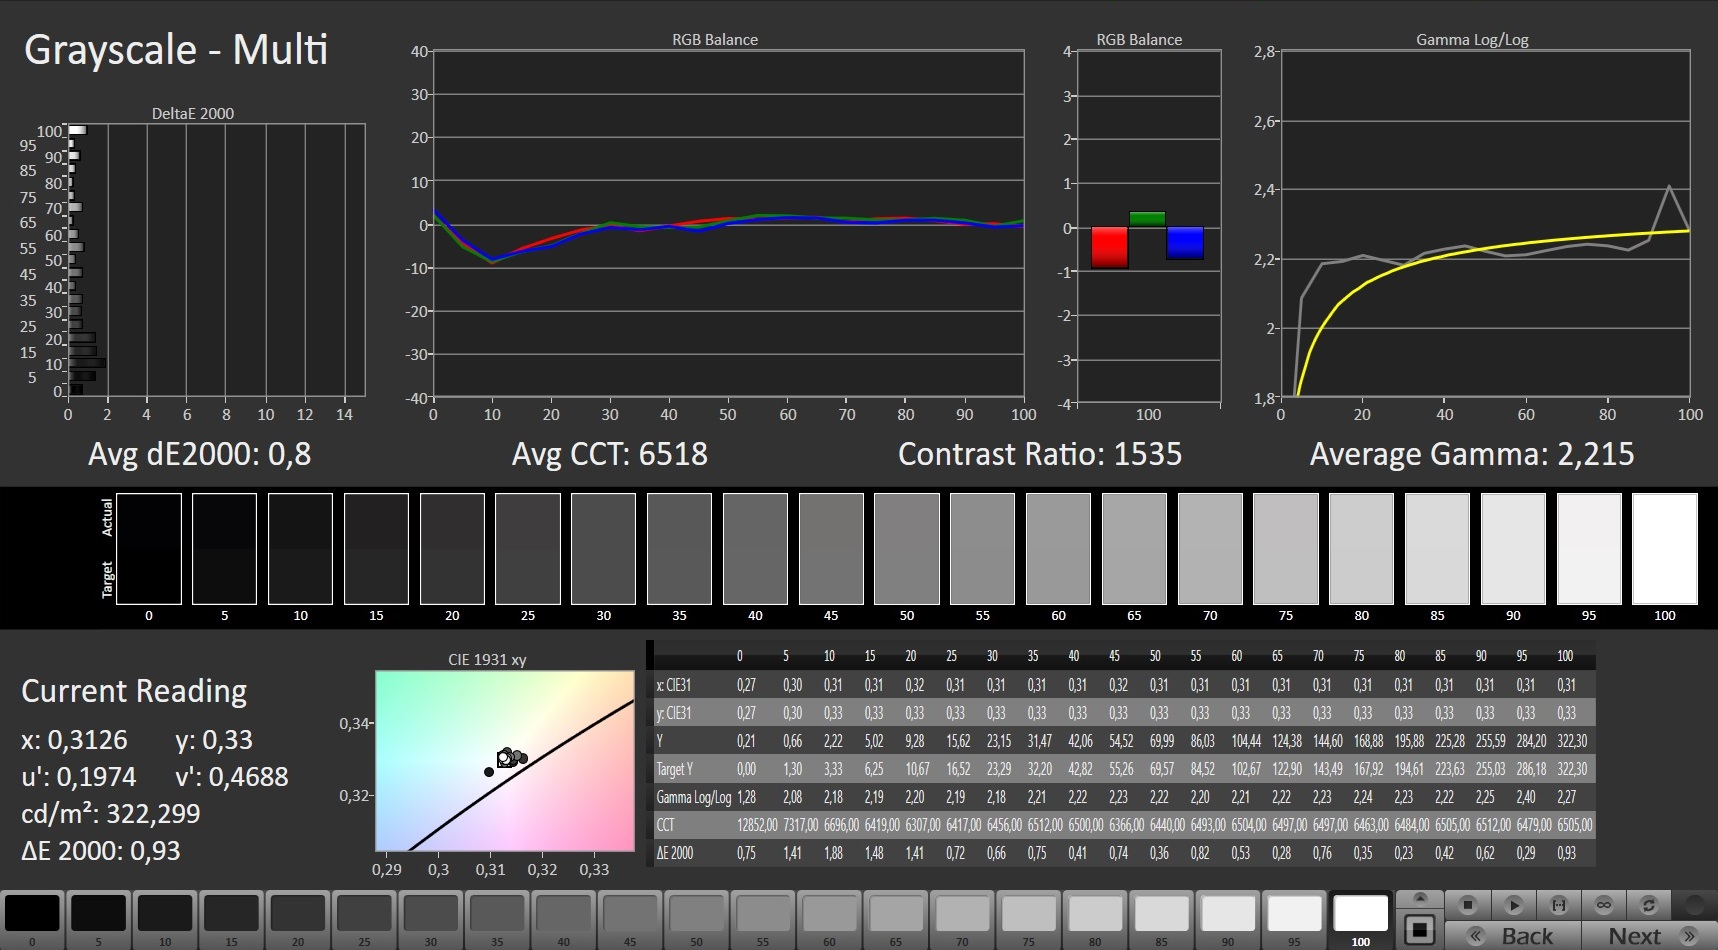
The CalMAN analysis also shows that the display reproduces colors only with a slight deviation out of the box. However, this can be almost completely corrected by means of a calibration. The corresponding ICC file can be downloaded in the top right window next to the display brightness distribution graph.
Display Response Times
| ↔ Response Time Black to White | ||
|---|---|---|
| 10.8 ms ... rise ↗ and fall ↘ combined | ↗ 5.6 ms rise | 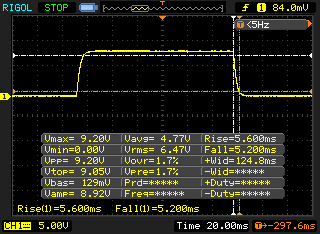 |
| ↘ 5.2 ms fall | ||
| The screen shows good response rates in our tests, but may be too slow for competitive gamers. In comparison, all tested devices range from 0.1 (minimum) to 240 (maximum) ms. » 29 % of all devices are better. This means that the measured response time is better than the average of all tested devices (19.8 ms). | ||
| ↔ Response Time 50% Grey to 80% Grey | ||
| 7.4 ms ... rise ↗ and fall ↘ combined | ↗ 3.8 ms rise | 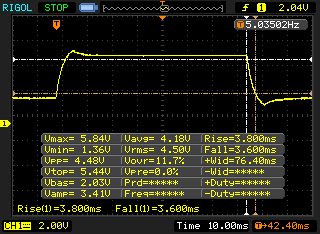 |
| ↘ 3.6 ms fall | ||
| The screen shows very fast response rates in our tests and should be very well suited for fast-paced gaming. In comparison, all tested devices range from 0.165 (minimum) to 636 (maximum) ms. » 20 % of all devices are better. This means that the measured response time is better than the average of all tested devices (30.9 ms). | ||
Screen Flickering / PWM (Pulse-Width Modulation)
| Screen flickering / PWM detected | 24510 Hz | ≤ 39 % brightness setting | 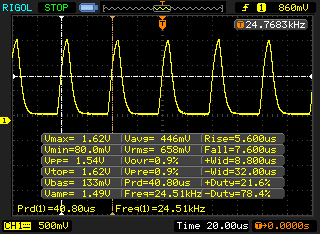 |
The display backlight flickers at 24510 Hz (worst case, e.g., utilizing PWM) Flickering detected at a brightness setting of 39 % and below. There should be no flickering or PWM above this brightness setting. The frequency of 24510 Hz is quite high, so most users sensitive to PWM should not notice any flickering. In comparison: 52 % of all tested devices do not use PWM to dim the display. If PWM was detected, an average of 7741 (minimum: 5 - maximum: 343500) Hz was measured. | |||
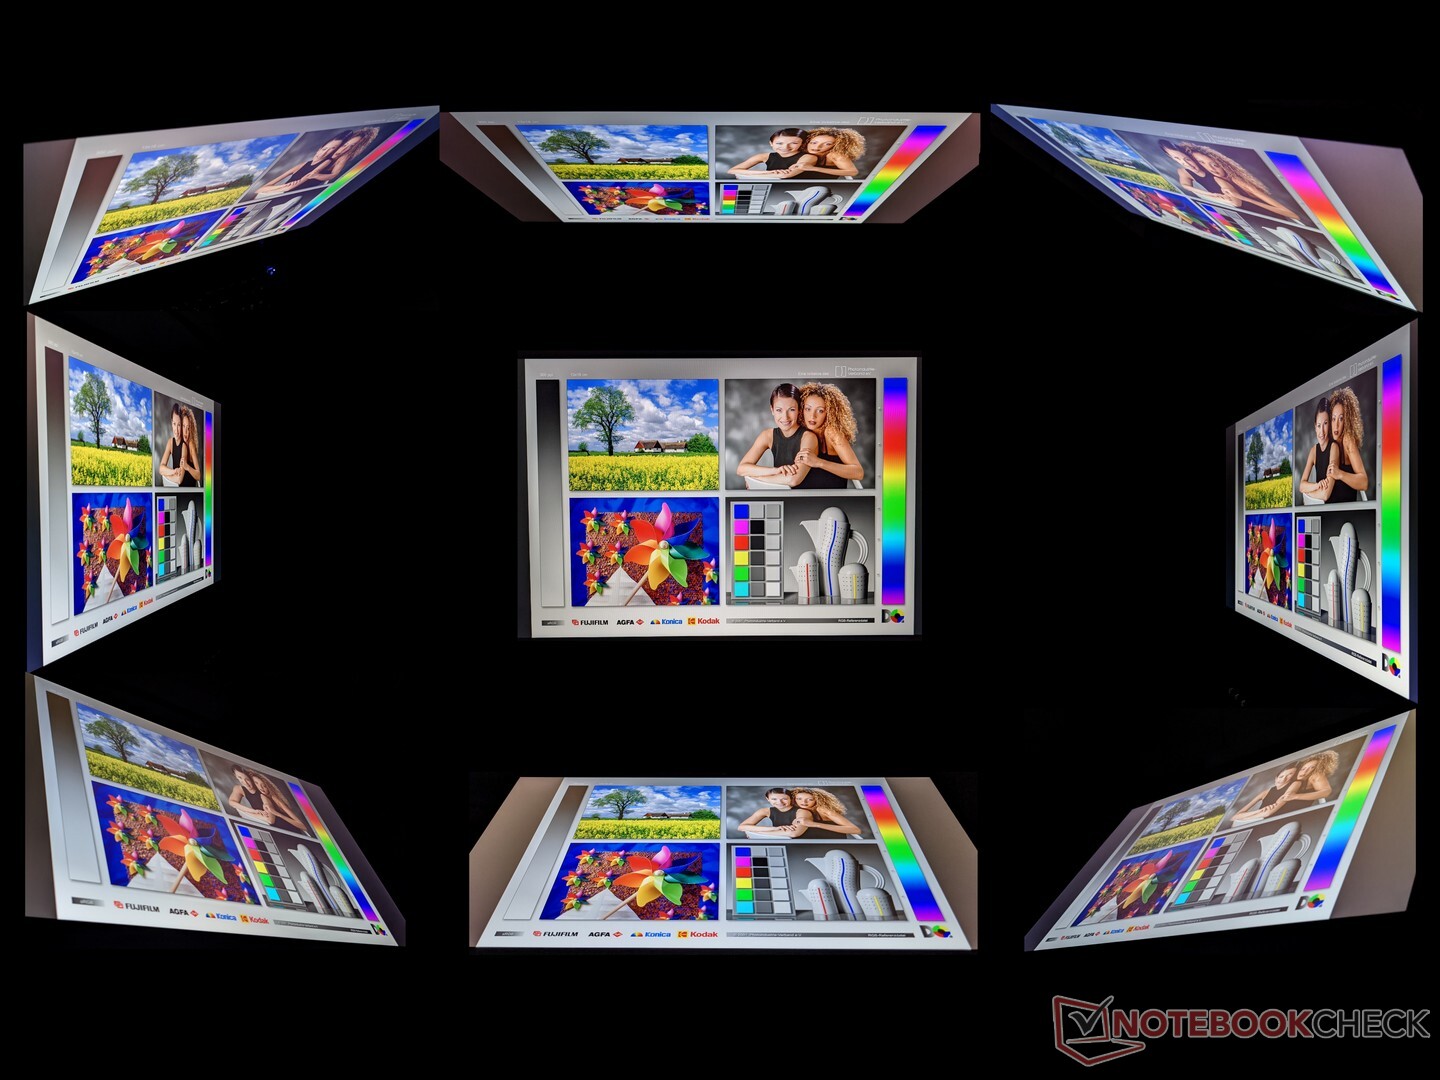
The IPS panel of the GP76 Leopard 10UG is very viewing-angle stable. Image content can be viewed from almost any angle without this leading to distortions or color shifts.
Performance - High graphics performance thanks to maximum TGP
With the GP76 Leopard, MSI targets gamers and users who are looking for a laptop for demanding graphics applications. In addition to the variant with the Nvidia GeForce RTX 3070 and the Intel Core i7-10750H that we are reviewing here, MSI's gaming laptop is also available with the Intel Core i7-10870H and the Nvidia GeForce RTX 3060. There are also different memory configurations.
All of the following benchmarks were executed using the "Extreme Performance" mode.
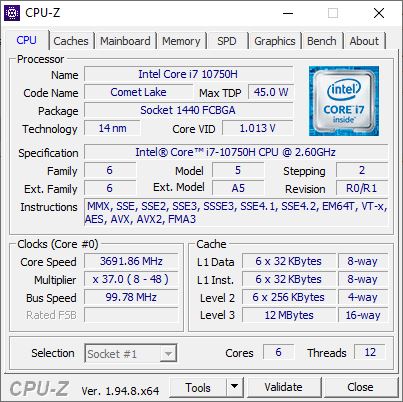

Processor
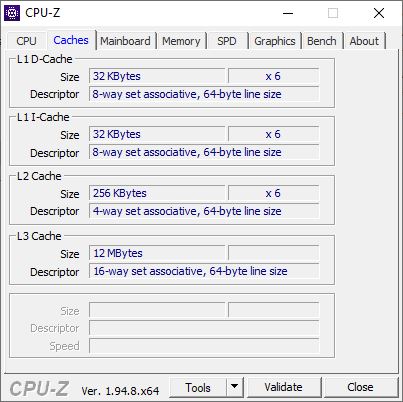
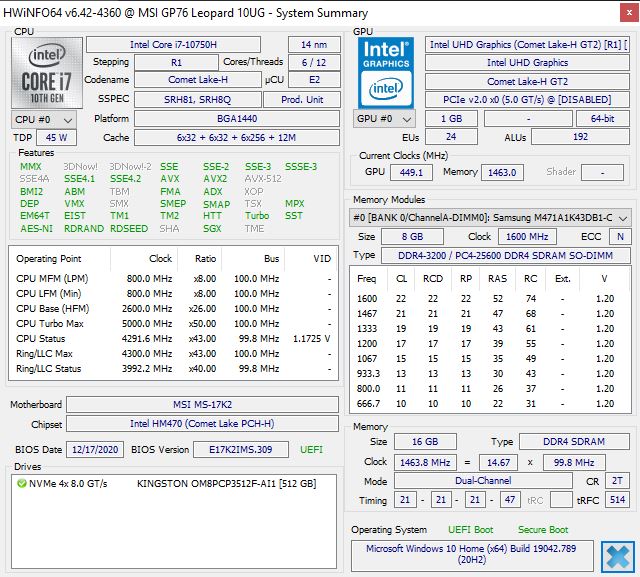
The Intel Core i7-10750H used here is a hexa-core CPU that can process up to 12 tasks at the same time. The clock rates are between 2.6 and 5 GHz, whereby the duration over which high frequencies can be maintained largely depends on the cooling system. In our Cinebench R15 endurance test, the MSI laptop shows that it can maintain its performance consistently even over prolonged periods of time.
In the individual benchmarks, the GP76 achieves results that are slightly below the average of all the laptops that we've tested with this CPU. Users who opt for the Intel Core i7-10870H will benefit particularly in multi-core applications. The same is true for comparable AMD CPUs, but these are not offered in the MSI Leopard.
* ... smaller is better
System performance
The MSI GP76 Leopard 10UG achieves a good result in the PCMark 10 test for system performance, where the productivity score in particular is quite high. Overall, the rivals in our test field score better, but this is explained by their higher processor performance. The gaming laptop runs very smoothly in everyday use, and there are no microstutters or the like. Programs are launched quickly, and files are also accessed without any delays.
Our CPU Benchmarks article shows how other laptops performed in our tests.
| PCMark 10 Score | 6017 points | |
Help | ||
DPC latencies
The test with LatencyMon shows that the MSI GP76 Leopard 10UG doesn't exhibit elevated latency times. Therefore, it's suitable for real-time applications.
| DPC Latencies / LatencyMon - interrupt to process latency (max), Web, Youtube, Prime95 | |
| Schenker XMG Neo 17 (Early 2021, RTX 3070, 5800H) | |
| Aorus 15P XC | |
| MSI GP76 Leopard 10UG | |
| Asus ROG Strix G15 G513QR | |
* ... smaller is better
Storage
MSI has installed a 512 GB SSD from Kingston in our test configuration of the GP76 Leopard 10UG. Although it delivers good results on average in the storage benchmarks, it can't keep up with the much faster models found in the rest of our test field.
The performance of other storage devices in comparison can be found in our HDD/SSD Benchmarks article.
| MSI GP76 Leopard 10UG Kingston OM8PCP3512F-AB | Aorus 15P XC ESR512GTLCG-EAC-4 | Asus ROG Strix G15 G513QR SK Hynix HFM001TD3JX013N | Schenker XMG Neo 17 (Early 2021, RTX 3070, 5800H) Samsung SSD 970 EVO Plus 500GB | Average Kingston OM8PCP3512F-AB | |
|---|---|---|---|---|---|
| CrystalDiskMark 5.2 / 6 | 64% | 101% | 6% | ||
| Write 4K (MB/s) | 143.7 | 130.2 -9% | 206.1 43% | 194.5 ? 35% | |
| Read 4K (MB/s) | 45.1 | 45.47 1% | 53 18% | 47.3 ? 5% | |
| Write Seq (MB/s) | 978 | 2269 132% | 3018 209% | 978 ? 0% | |
| Read Seq (MB/s) | 1163 | 1643 41% | 2575 121% | 1299 ? 12% | |
| Write 4K Q32T1 (MB/s) | 519 | 547 5% | 535 3% | 505 ? -3% | |
| Read 4K Q32T1 (MB/s) | 302.7 | 654 116% | 608 101% | 301 ? -1% | |
| Write Seq Q32T1 (MB/s) | 981 | 2512 156% | 3242 230% | 978 ? 0% | |
| Read Seq Q32T1 (MB/s) | 1983 | 3382 71% | 3617 82% | 1930 ? -3% | |
| AS SSD | 105% | 87% | 114% | -4% | |
| Seq Read (MB/s) | 1659 | 2694 62% | 2881 74% | 3020 82% | 1570 ? -5% |
| Seq Write (MB/s) | 921 | 2327 153% | 1570 70% | 2631 186% | 904 ? -2% |
| 4K Read (MB/s) | 51 | 47.77 -6% | 52.4 3% | 60.3 18% | 48.2 ? -5% |
| 4K Write (MB/s) | 120.1 | 98.8 -18% | 124 3% | 171.6 43% | 118.9 ? -1% |
| 4K-64 Read (MB/s) | 463.5 | 1746 277% | 1334 188% | 1410 204% | 415 ? -10% |
| 4K-64 Write (MB/s) | 909 | 2267 149% | 2189 141% | 2324 156% | 829 ? -9% |
| Access Time Read * (ms) | 0.179 | 0.079 56% | 0.055 69% | 0.045 75% | 0.1294 ? 28% |
| Access Time Write * (ms) | 0.032 | 0.039 -22% | 0.03 6% | 0.024 25% | 0.0371 ? -16% |
| Score Read (Points) | 680 | 2063 203% | 1675 146% | 1773 161% | 619 ? -9% |
| Score Write (Points) | 1121 | 2598 132% | 2470 120% | 2759 146% | 1036 ? -8% |
| Score Total (Points) | 2130 | 5698 168% | 4943 132% | 5429 155% | 1955 ? -8% |
| Total Average (Program / Settings) | 85% /
88% | 87% /
87% | 108% /
108% | 1% /
0% |
* ... smaller is better

Continuous load read: DiskSpd Read Loop, Queue Depth 8
Graphics card
MSI has installed an Nvidia GeForce RTX 3070 with a TGP of 140 watts in the GP76 Leopard 10UG. This corresponds to the maximum configurable power consumption and is reflected in the benchmark results with significantly better rates.
Compared with the MSI GS66 Stealth and its GeForce RTX 3070 with a TGP of 95 watts, the GP76 delivers an approximately 20% higher performance. The MSI Leopard also holds its own against the rest of our test field, with the XMG Neo 17 offering a similarly good performance.
How other graphics cards perform in comparison can be found in our GPU Benchmarks article.
| 3DMark 11 Performance | 25847 points | |
| 3DMark Fire Strike Score | 22121 points | |
| 3DMark Time Spy Score | 9933 points | |
Help | ||
Gaming performance
Nvidia's mobile GeForce RTX 3070 can bring modern and demanding games smoothly onto the screen. Frame rates are usually well above 60 fps when the highest graphics setting is selected at Full HD resolution. Smooth gaming is also possible in UHD and 4K resolutions, although details might have to be reduced depending on the title. Overall, users will also benefit from the higher TGP here that allows for an increase of up to 20 fps in high detail settings depending on the title.
The performance that can be expected in other titles is listed in our GPU Games article.
| The Witcher 3 - 1920x1080 Ultra Graphics & Postprocessing (HBAO+) | |
| Average of class Gaming (104.7 - 240, n=7, last 2 years) | |
| MSI GP76 Leopard 10UG | |
| Schenker XMG Neo 17 (Early 2021, RTX 3070, 5800H) | |
| Aorus 15P XC | |
| Asus ROG Strix G15 G513QR | |
| Average NVIDIA GeForce RTX 3070 Laptop GPU (34.9 - 109, n=52) | |
| MSI GS66 Stealth 10UG | |
| Final Fantasy XV Benchmark - 1920x1080 High Quality | |
| Average of class Gaming (64.2 - 215, n=91, last 2 years) | |
| MSI GP76 Leopard 10UG | |
| Asus ROG Strix G15 G513QR | |
| MSI GS66 Stealth 10UG | |
| Average NVIDIA GeForce RTX 3070 Laptop GPU (27.9 - 107, n=49) | |
| Far Cry 5 - 1920x1080 Ultra Preset AA:T | |
| Average of class Gaming (70 - 151, n=6, last 2 years) | |
| MSI GP76 Leopard 10UG | |
| Average NVIDIA GeForce RTX 3070 Laptop GPU (89 - 140, n=36) | |
| Aorus 15P XC | |
| Asus ROG Strix G15 G513QR | |
In our The Witcher 3 endurance test with the "Ultra" graphics settings, the MSI GP76 Leopard 10UG only shows minor frame rate drops that are quickly stabilized. As a result, users don't have to expect performance drops even during long gaming sessions.
| low | med. | high | ultra | |
|---|---|---|---|---|
| The Witcher 3 (2015) | 109 | |||
| Dota 2 Reborn (2015) | 140 | 139 | 123 | 117 |
| Final Fantasy XV Benchmark (2018) | 90.2 | |||
| X-Plane 11.11 (2018) | 105 | 93.9 | 80.2 | |
| Far Cry 5 (2018) | 114 | |||
| Anno 1800 (2019) | 38.9 | 38.3 | 34.5 | 24.4 |
| Doom Eternal (2020) | 216 |
Emissions - MSI laptop with good speakers
Noise emissions
The fans of the MSI GP76 Leopard can get very loud at up to 54 dB(A). The resulting noise is uniform and not high-frequency, which makes it tolerable. However, depending on the selected performance mode and the 3D application's load, the gaming laptop can also be operated almost silently.
Noise level
| Idle |
| 25 / 32 / 34 dB(A) |
| Load |
| 54 / 54 dB(A) |
 | ||
30 dB silent 40 dB(A) audible 50 dB(A) loud |
||
min: | ||
Temperature
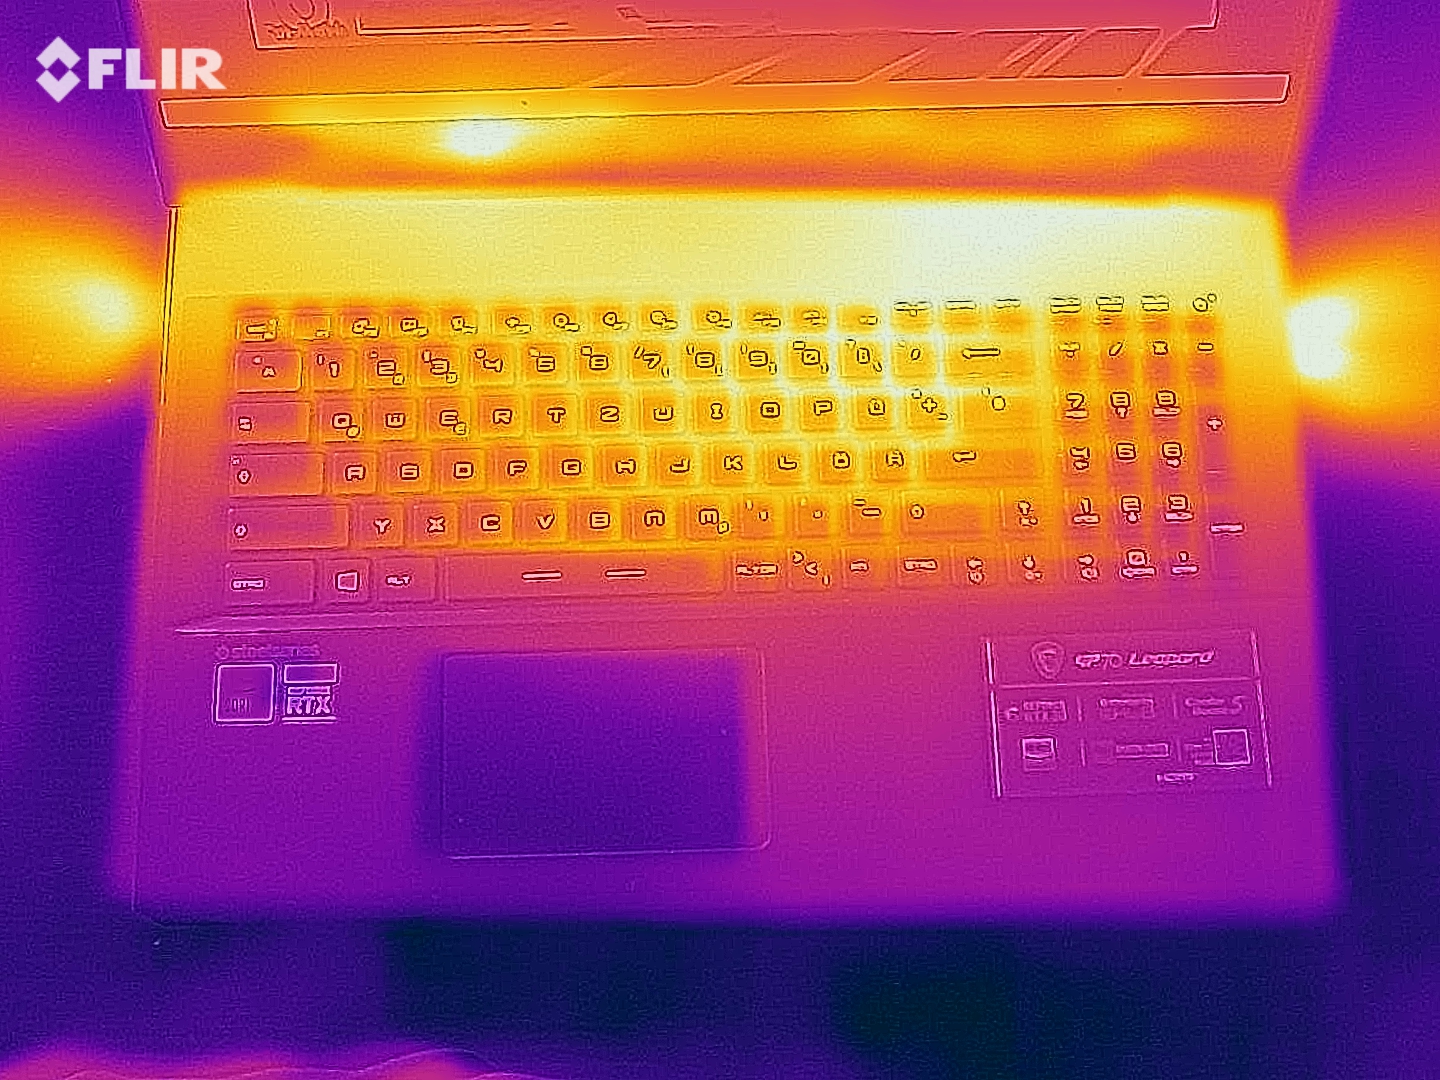
In our test, the surfaces of the MSI laptop heat up to 48 °C (~118 °F) under load. The warmest spot is on the right rear corner of the underside. The palm rests only heat up moderately, allowing the GP76 Leopard 10UG to remain usable even under heavy load.
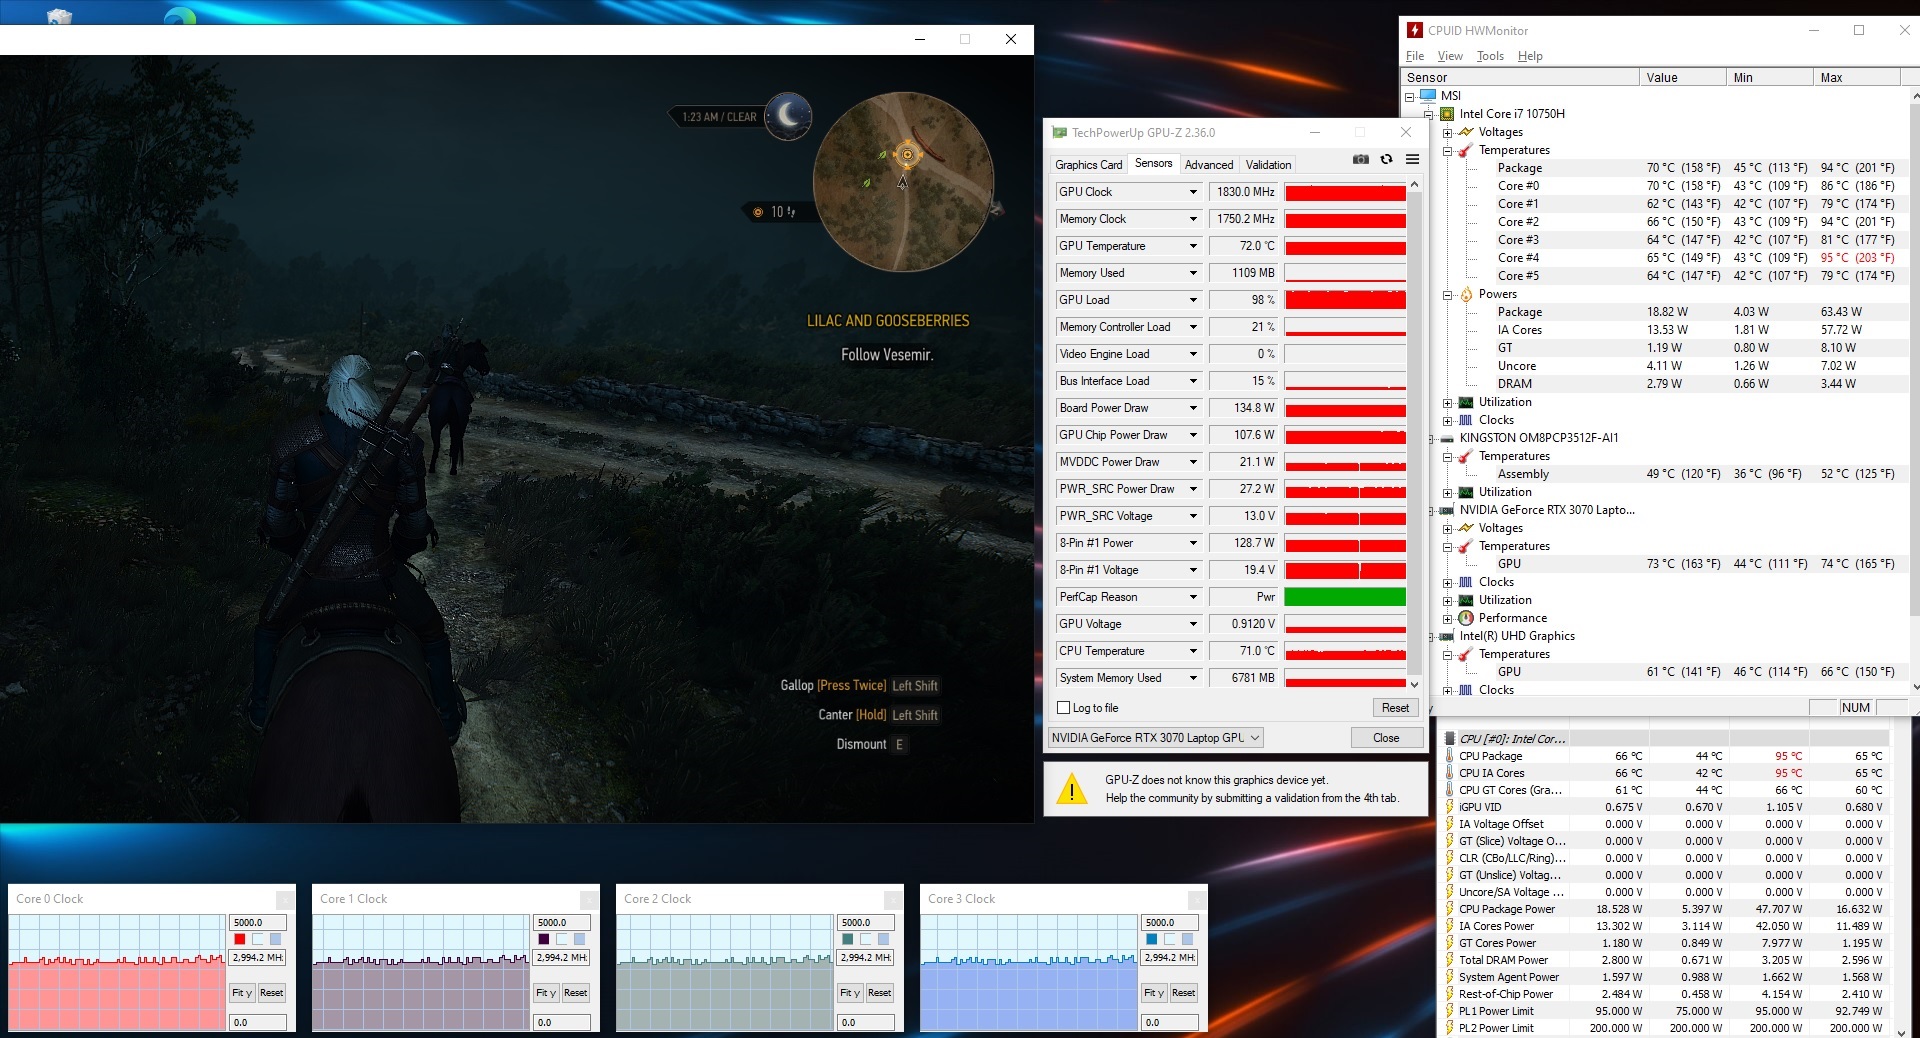
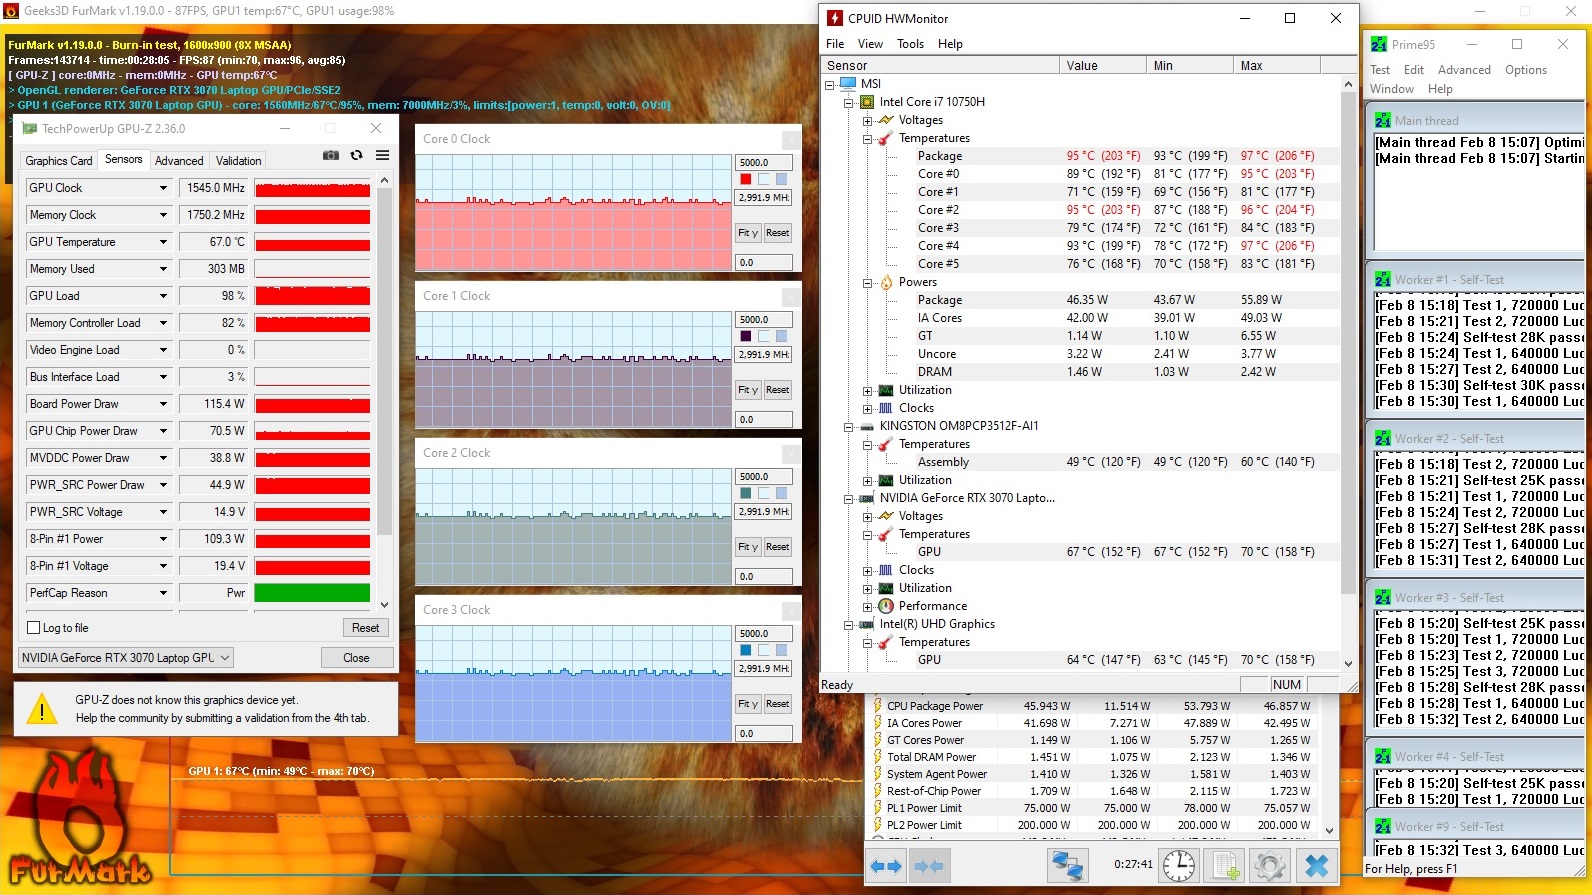
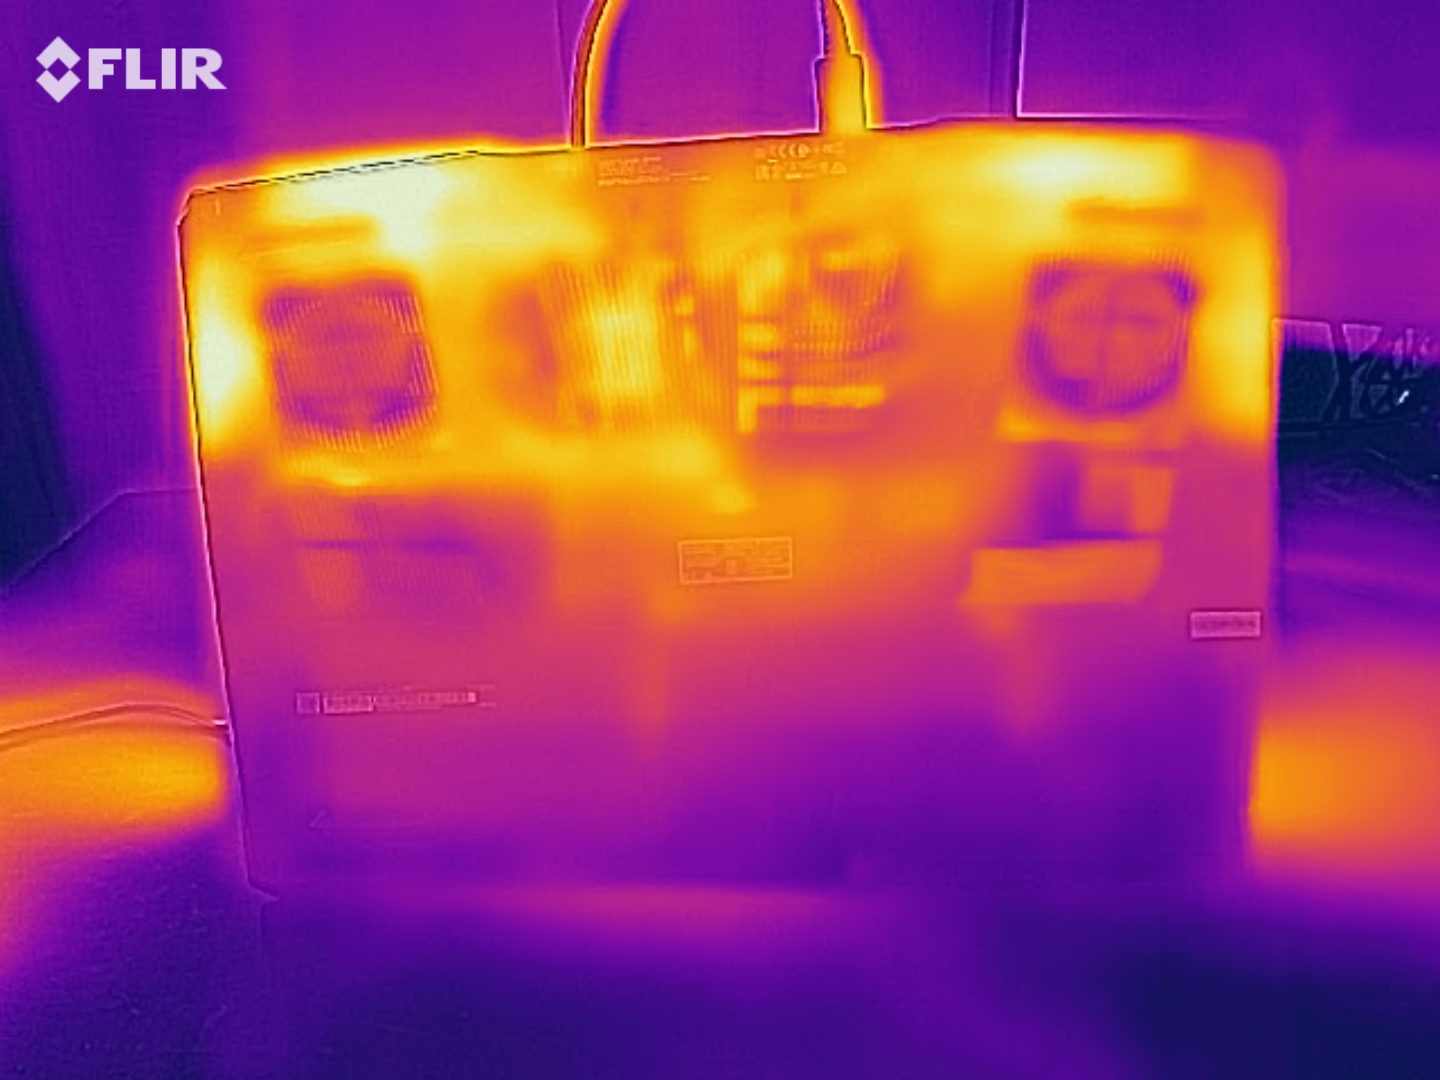
The temperatures inside the GP76 rise up to 97 °C (~207 °F) during our approximately one-hour continuous stress test. The CPU clock rates are kept relatively stable at around 3 GHz, which is above the base clock speed. This means that the cooling system of the MSI Leopard 10UG works well, so that users don't have to expect restrictions due to excessively high temperatures.
(±) The maximum temperature on the upper side is 43 °C / 109 F, compared to the average of 40.4 °C / 105 F, ranging from 21.2 to 68.8 °C for the class Gaming.
(-) The bottom heats up to a maximum of 47 °C / 117 F, compared to the average of 43.2 °C / 110 F
(+) In idle usage, the average temperature for the upper side is 27.7 °C / 82 F, compared to the device average of 33.9 °C / 93 F.
(±) Playing The Witcher 3, the average temperature for the upper side is 37.3 °C / 99 F, compared to the device average of 33.9 °C / 93 F.
(+) The palmrests and touchpad are cooler than skin temperature with a maximum of 29 °C / 84.2 F and are therefore cool to the touch.
(±) The average temperature of the palmrest area of similar devices was 28.8 °C / 83.8 F (-0.2 °C / -0.4 F).
Speakers
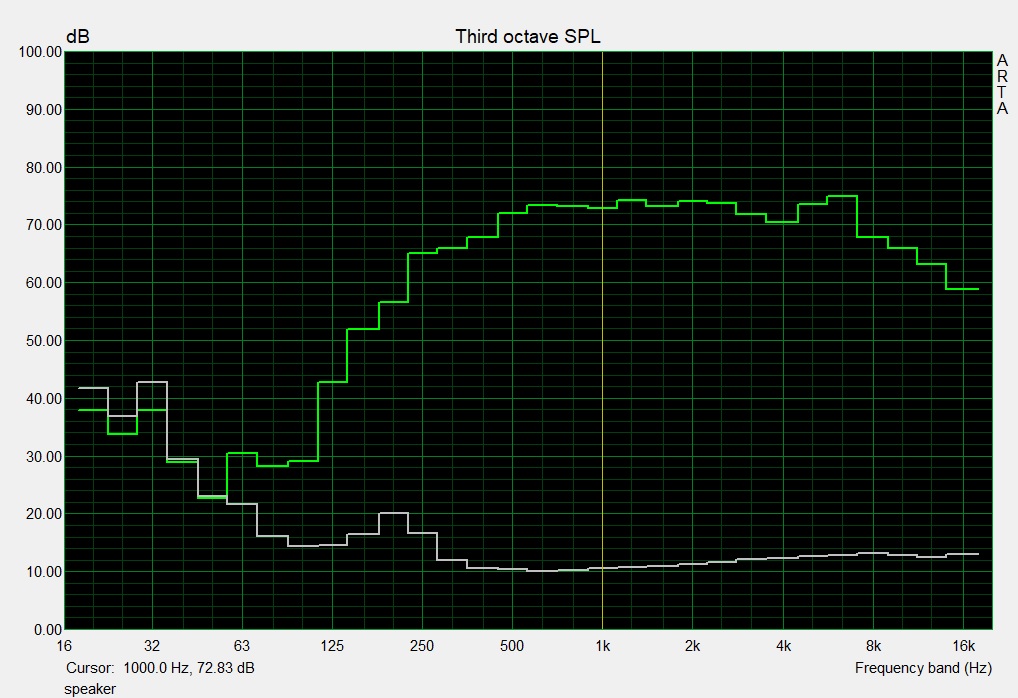
The speakers of the MSI GP76 offer high volume and a wide sound spectrum. This makes them well suited for media playback. However, depending on the settings, the fan noise can be annoying in games. Therefore, the use of headphones is recommended depending on the scenario.
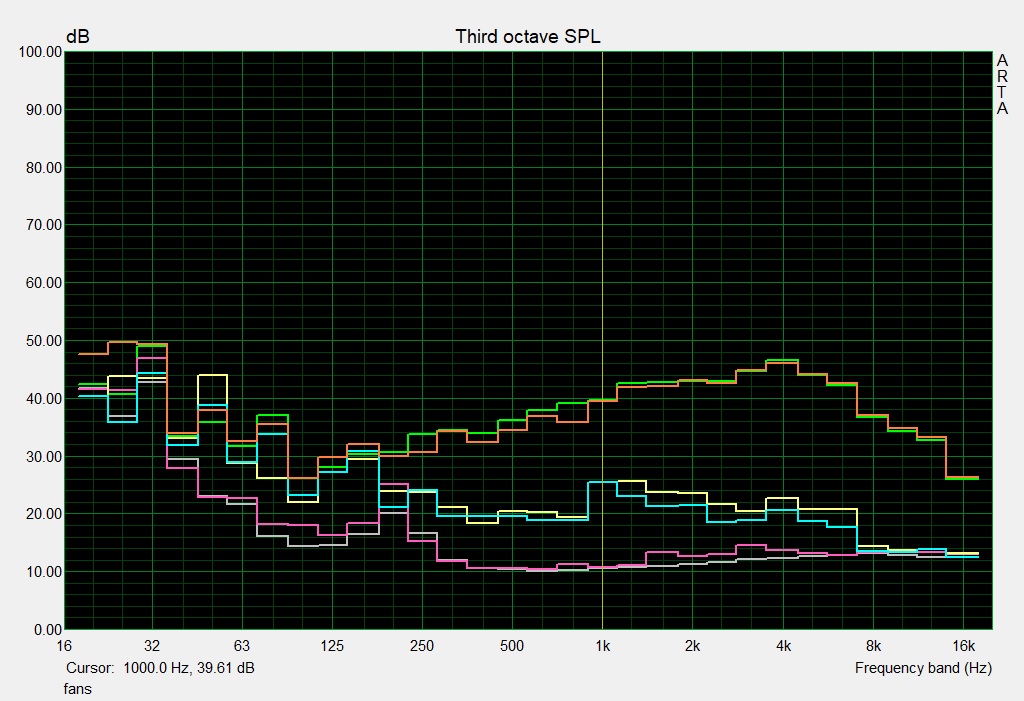
MSI GP76 Leopard 10UG audio analysis
(+) | speakers can play relatively loud (85 dB)
Bass 100 - 315 Hz
(-) | nearly no bass - on average 18.5% lower than median
(±) | linearity of bass is average (10.8% delta to prev. frequency)
Mids 400 - 2000 Hz
(+) | balanced mids - only 2.9% away from median
(+) | mids are linear (2.4% delta to prev. frequency)
Highs 2 - 16 kHz
(+) | balanced highs - only 2.8% away from median
(+) | highs are linear (4.2% delta to prev. frequency)
Overall 100 - 16.000 Hz
(+) | overall sound is linear (13.2% difference to median)
Compared to same class
» 19% of all tested devices in this class were better, 4% similar, 77% worse
» The best had a delta of 6%, average was 18%, worst was 132%
Compared to all devices tested
» 14% of all tested devices were better, 3% similar, 84% worse
» The best had a delta of 4%, average was 23%, worst was 134%
Apple MacBook 12 (Early 2016) 1.1 GHz audio analysis
(+) | speakers can play relatively loud (83.6 dB)
Bass 100 - 315 Hz
(±) | reduced bass - on average 11.3% lower than median
(±) | linearity of bass is average (14.2% delta to prev. frequency)
Mids 400 - 2000 Hz
(+) | balanced mids - only 2.4% away from median
(+) | mids are linear (5.5% delta to prev. frequency)
Highs 2 - 16 kHz
(+) | balanced highs - only 2% away from median
(+) | highs are linear (4.5% delta to prev. frequency)
Overall 100 - 16.000 Hz
(+) | overall sound is linear (10.2% difference to median)
Compared to same class
» 7% of all tested devices in this class were better, 2% similar, 90% worse
» The best had a delta of 5%, average was 18%, worst was 53%
Compared to all devices tested
» 5% of all tested devices were better, 1% similar, 94% worse
» The best had a delta of 4%, average was 23%, worst was 134%
Energy management - Average battery life
Energy consumption
Our measurements show a maximum power consumption of 210 watts for the MSI GP76 Leopard 10UG, whereby the average value under load is 92 watts. Both rates are lower than those of the remaining devices in our test field. In idle usage, the MSI laptop is on par with the competition.
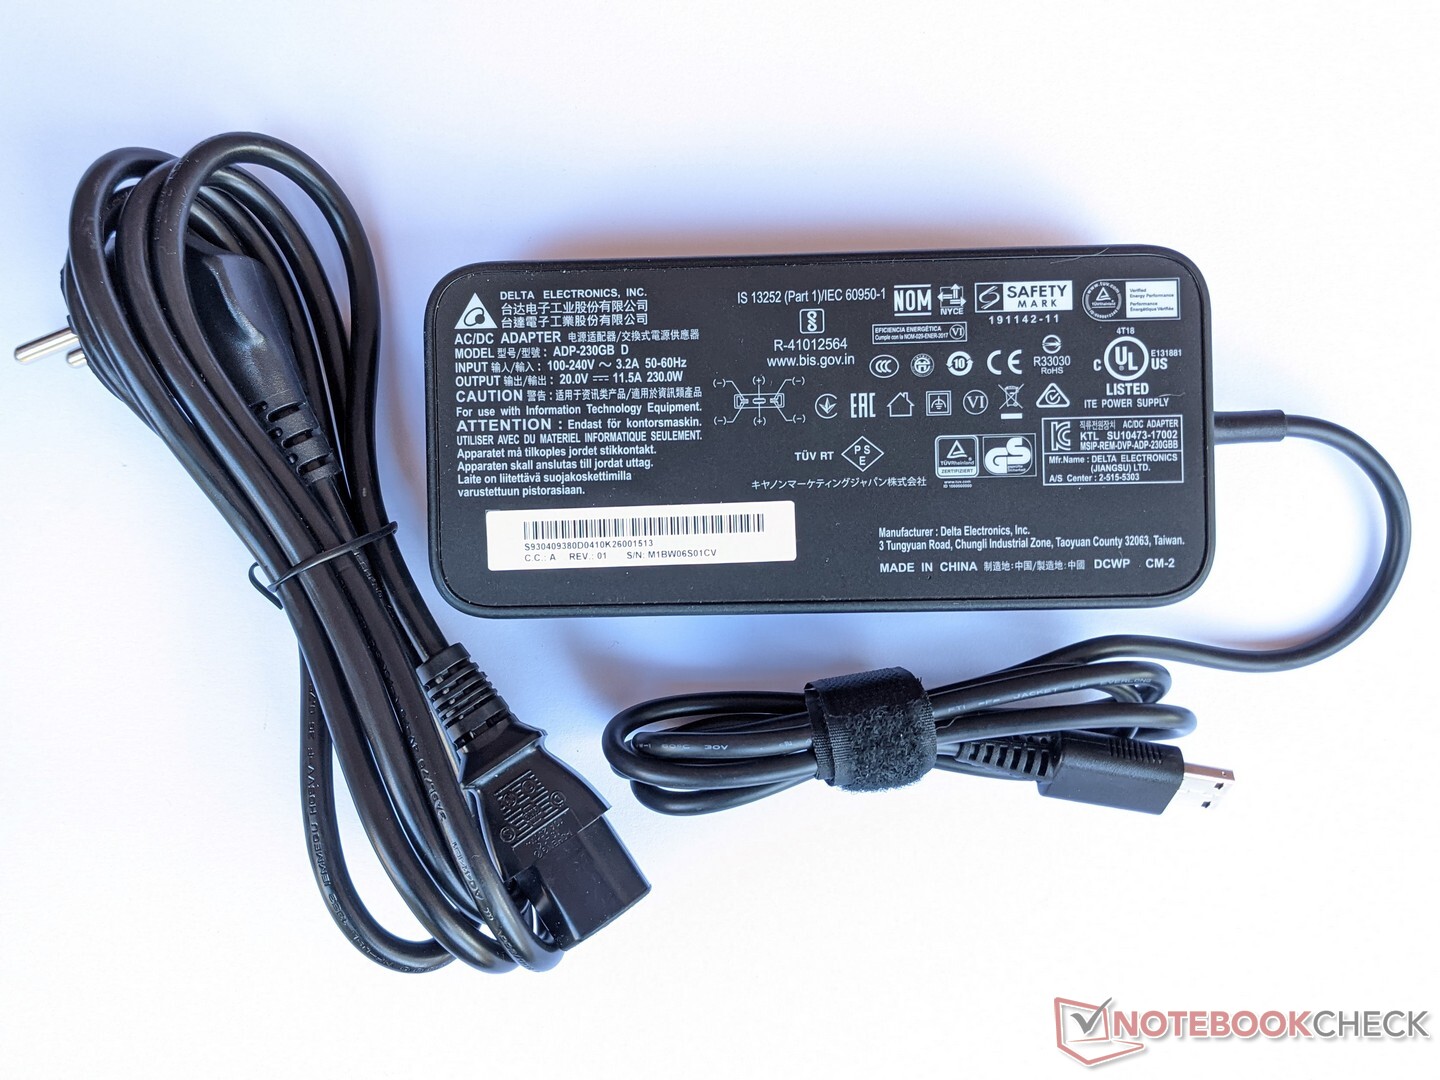
The included power adapter has an output of 230 watts and offers, therefore, a sufficiently high capacity to ensure a reliable power supply.
| Off / Standby | |
| Idle | |
| Load |
|
Key:
min: | |
| MSI GP76 Leopard 10UG i7-10750H, GeForce RTX 3070 Laptop GPU | Aorus 15P XC i7-10870H, GeForce RTX 3070 Laptop GPU | Asus ROG Strix G15 G513QR R9 5900HX, GeForce RTX 3070 Laptop GPU | Schenker XMG Neo 17 (Early 2021, RTX 3070, 5800H) R7 5800H, GeForce RTX 3070 Laptop GPU | MSI GS66 Stealth 10UG i7-10870H, GeForce RTX 3070 Laptop GPU | Average of class Gaming | |
|---|---|---|---|---|---|---|
| Power Consumption | -10% | 8% | -9% | -0% | -12% | |
| Idle Minimum * (Watt) | 12 | 14 -17% | 4 67% | 13 -8% | 12.9 -8% | 13.1 ? -9% |
| Idle Average * (Watt) | 16 | 17 -6% | 9 44% | 16 -0% | 15.4 4% | 19 ? -19% |
| Idle Maximum * (Watt) | 28 | 33 -18% | 36 -29% | 26 7% | 27.1 3% | 24.6 ? 12% |
| Load Average * (Watt) | 92 | 96 -4% | 130 -41% | 125 -36% | 98.2 -7% | 111.3 ? -21% |
| Witcher 3 ultra * (Watt) | 198 | 179 10% | 174 12% | 187 6% | 164.9 17% | |
| Load Maximum * (Watt) | 210 | 256 -22% | 227 -8% | 259 -23% | 232.9 -11% | 260 ? -24% |
* ... smaller is better
Battery life
In our practical WLAN test, the MSI GP76 Leopard 10UG reaches a runtime of 4:12 hours. This means that it makes good use of its 65 Wh battery. Except for the Schenker XMG Neo 17, the batteries of the remaining contenders in our test field are partly equipped with significantly higher capacities.
The battery tests were performed in the "Balanced" performance mode.
| MSI GP76 Leopard 10UG i7-10750H, GeForce RTX 3070 Laptop GPU, 65 Wh | Aorus 15P XC i7-10870H, GeForce RTX 3070 Laptop GPU, 99 Wh | Asus ROG Strix G15 G513QR R9 5900HX, GeForce RTX 3070 Laptop GPU, 90 Wh | Schenker XMG Neo 17 (Early 2021, RTX 3070, 5800H) R7 5800H, GeForce RTX 3070 Laptop GPU, 62 Wh | MSI GS66 Stealth 10UG i7-10870H, GeForce RTX 3070 Laptop GPU, 99.9 Wh | Average of class Gaming | |
|---|---|---|---|---|---|---|
| Battery runtime | 73% | 95% | -15% | 112% | 65% | |
| Reader / Idle (h) | 5.6 | 9.5 70% | 4.7 -16% | 10.8 93% | 7.84 ? 40% | |
| WiFi v1.3 (h) | 4.2 | 6.7 60% | 7.4 76% | 3.5 -17% | 7.1 69% | 7.08 ? 69% |
| Load (h) | 0.8 | 1.5 88% | 1.7 113% | 0.7 -13% | 2.2 175% | 1.496 ? 87% |
Pros
Cons
Verdict - Powerful gaming laptop
The MSI GP76 Leopard 10UG is a classic gaming laptop. Although it's not small due to the 17-inch 144 Hz display, there are no major differences in thickness compared to 15-inch devices, for example. The highlight and centerpiece is the mobile Nvidia GeForce RTX 3070 that runs at 140 watts in maximum mode. Compared to throttled variants, it provides quite a bit more graphics performance and consequently enables a few more FPS in games.
The MSI GP76 Leopard 10UG can effortlessly bring modern games onto the screen. However, maintenance is unnecessarily complicated.
No corners have been cut on the rest of the equipment either, making the GP76 Leopard an all-around high-quality gaming laptop. We would have liked easier access to the interior, though. The bottom cover isn't simply screwed and hooked in, but it goes around the front of the laptop almost up to the corners. As a result, the front edge has to be pulled off as well, so that all hooks are released at the back and sides. This is very cumbersome and difficult to do for inexperienced users, making it unnecessarily difficult to add a second SSD or more RAM.
Price and availability
You can easily check for availability on MSI's website. At the time of writing, the only retailer listed in the United States is Micro Center. It should be noted that this version comes with an Intel Core i7-10875H instead, as well as with a Full HD display at 300 Hz, 32 GB of RAM, and a 1 TB SSD. This model will currently set you back $2,299.99.
MSI GP76 Leopard 10UG
- 03/05/2021 v7 (old)
Mike Wobker
Price comparison

