Schenker XMG Pro 15 (Clevo PB51RF-G) Laptop Review: Fun and games

Notebooks from Schenker Technologies are available from various online shops or from the company's own homepage bestware.com where buyers can configure their personal device, choosing from a wide range of options. The Pro 15, for example, can be equipped with dozens of RAM and storage device options. Apart from two DDR4 RAM slots, the 15-inch device also has two M.2 slots and a classic 2.5-inch slot (which we would have eliminated in favor of battery capacity). Users can also choose the network module, keyboard language and operating system.
However, there are currently no additional options for the display, GPU and processor: Schenker has chosen the GeForce RTX 2070, Core i7-9750H and a speedy 144-Hz panel with G-Sync technology. The high-end device is available from 1900 Euros (~$2050) and our test configuration (see details below) cost around 2100 Euros (~$2265).
Some of the XMG Pro 15's competitors are other 15-inch gamers equipped with a GeForce RTX 2070, such as the Asus Strix G531GW, the Asus Zephyrus S GX502GW, the MSI GE65 Raider 9SF and the Schenker XMG Ultra 15. These notebooks will feature in our comparison tables in each section.
Rating | Date | Model | Weight | Height | Size | Resolution | Price |
|---|---|---|---|---|---|---|---|
| 83.3 % v7 (old) | 02 / 2020 | Schenker XMG Pro 15 i7-9750H, GeForce RTX 2070 Mobile | 2.5 kg | 30 mm | 15.60" | 1920x1080 | |
| 82.1 % v7 (old) | 10 / 2019 | Asus Strix Scar III G531GW-AZ062T i7-9750H, GeForce RTX 2070 Mobile | 2.4 kg | 25 mm | 15.60" | 1920x1080 | |
| 81.3 % v7 (old) | 05 / 2019 | Asus Zephyrus S GX502GW i7-9750H, GeForce RTX 2070 Mobile | 2.1 kg | 19 mm | 15.60" | 1920x1080 | |
| 84.7 % v7 (old) | 12 / 2019 | MSI GE65 Raider 9SF-049US i9-9880H, GeForce RTX 2070 Mobile | 2.3 kg | 26.9 mm | 15.60" | 1920x1080 | |
| 87 % v6 (old) | 03 / 2019 | Schenker XMG Ultra 15 Turing i7-9700K, GeForce RTX 2070 Mobile | 3.5 kg | 38 mm | 15.60" | 1920x1080 |
Case
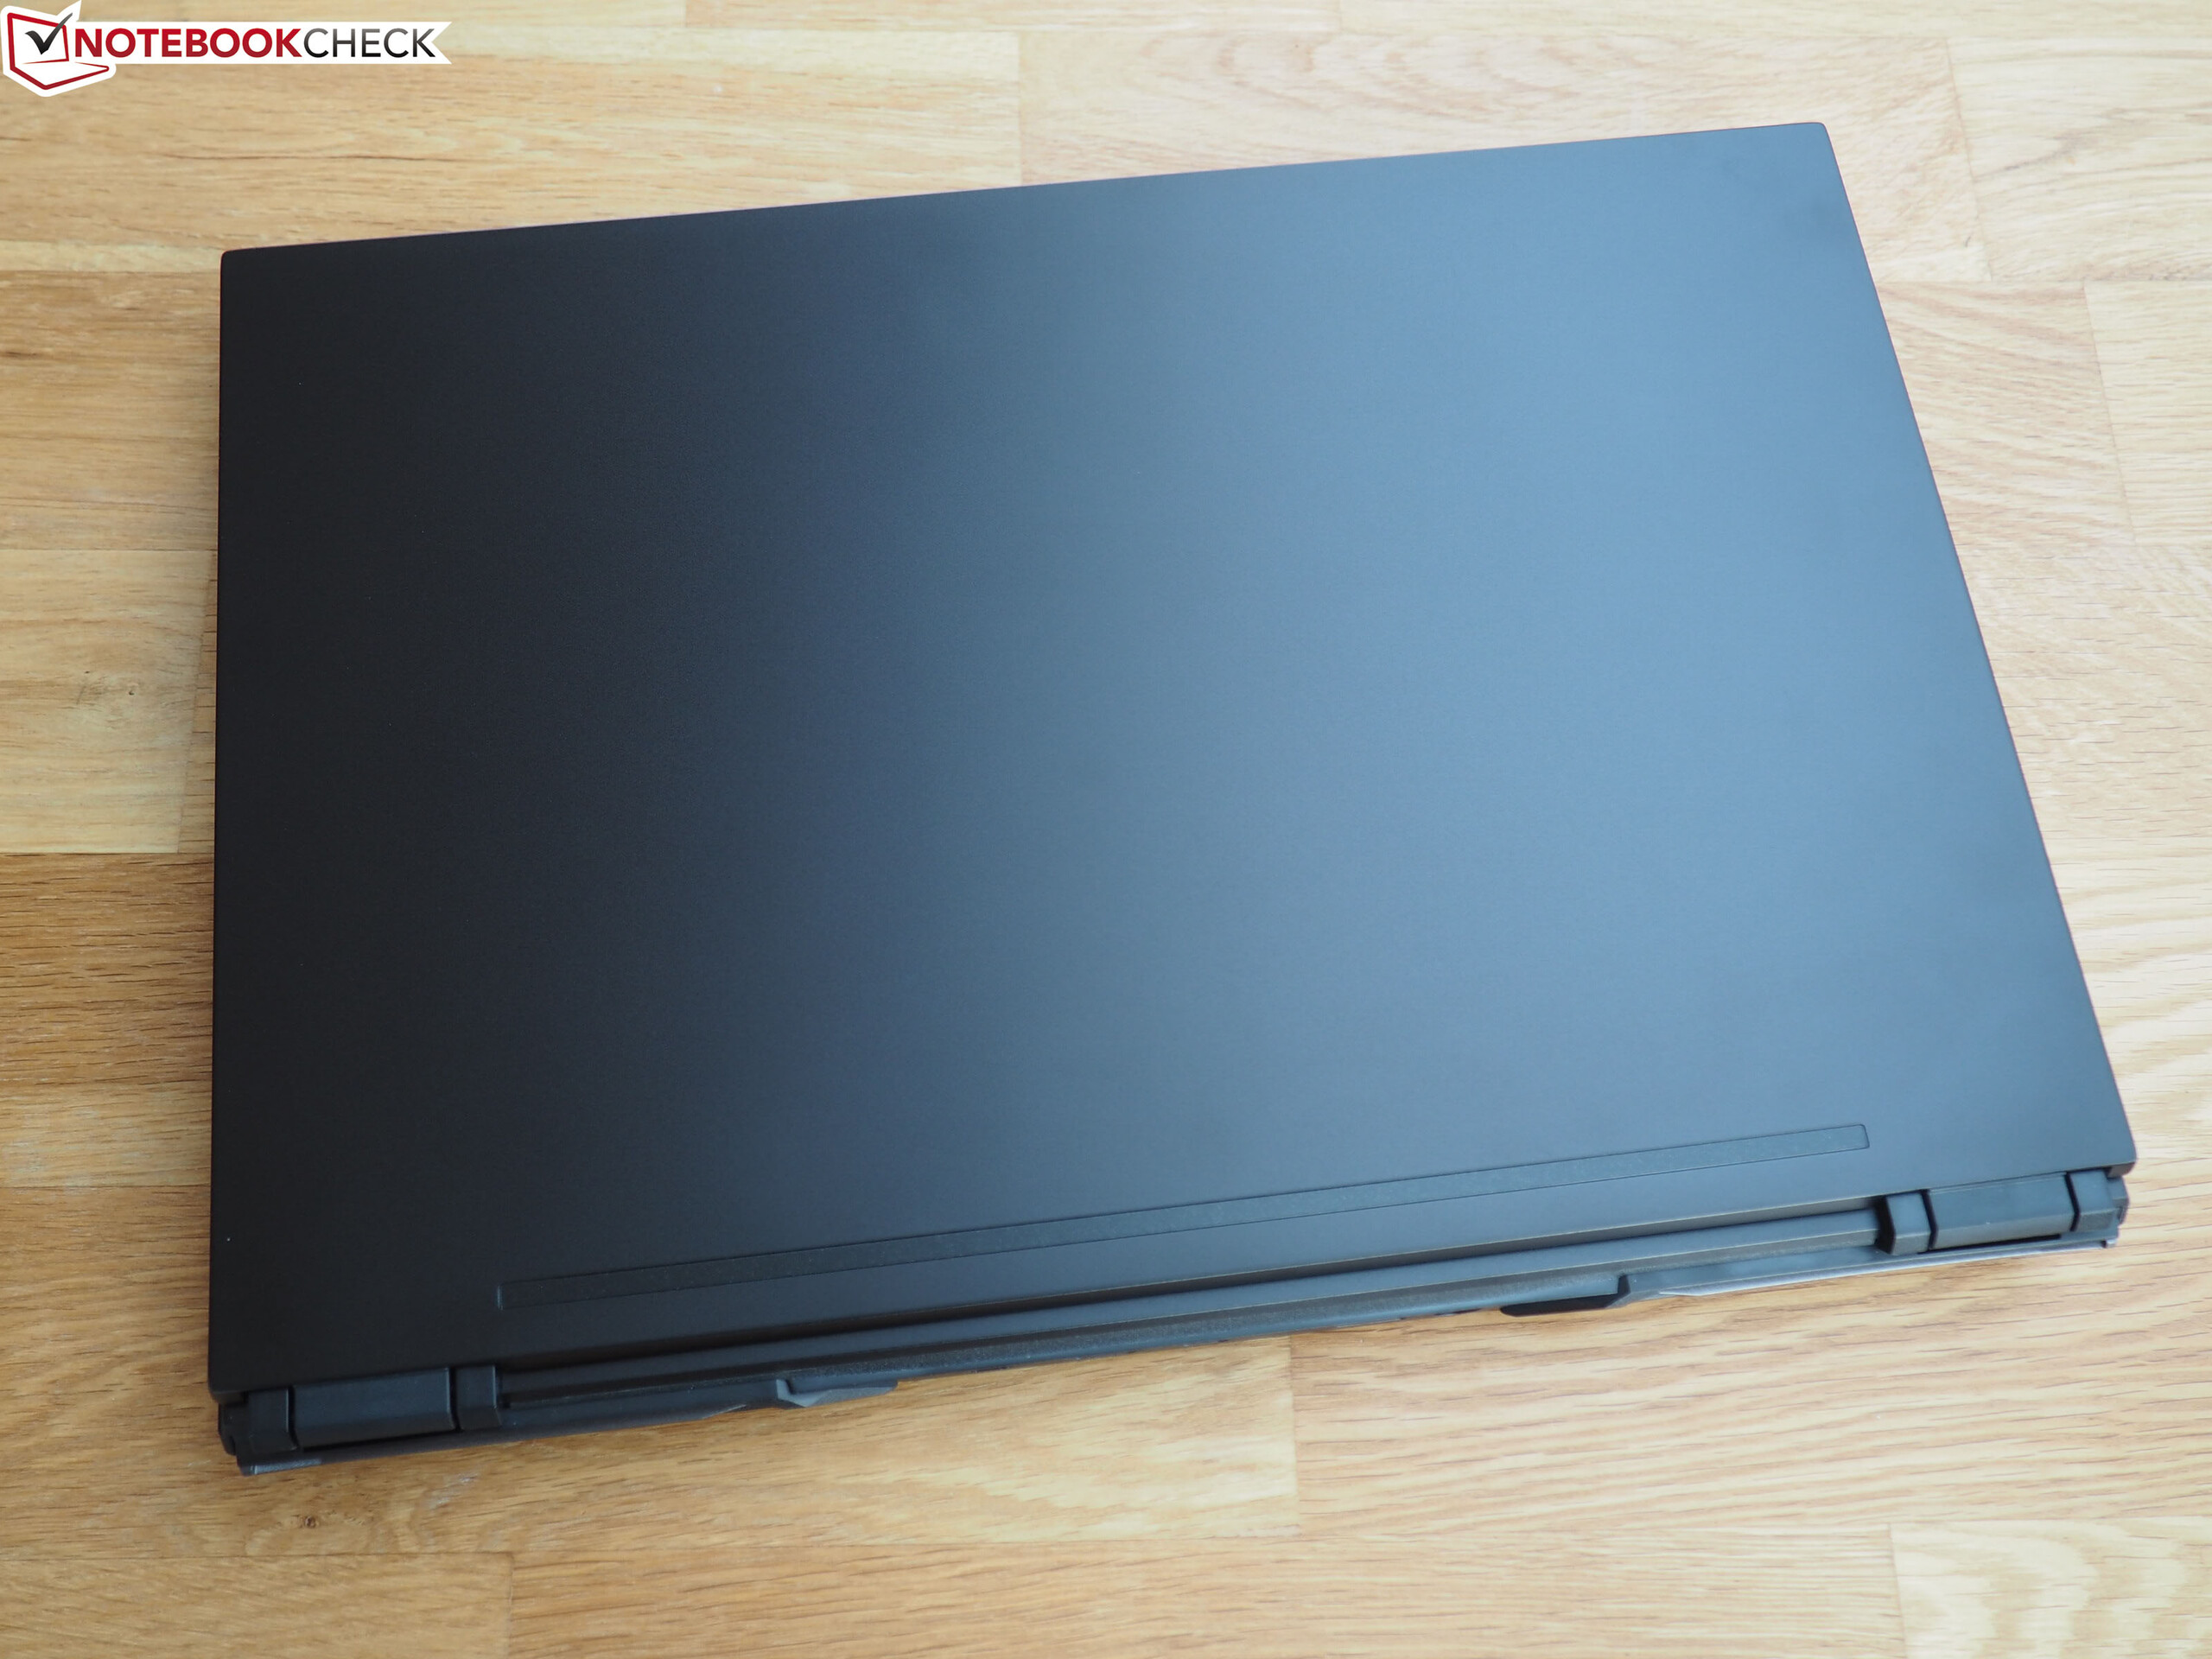
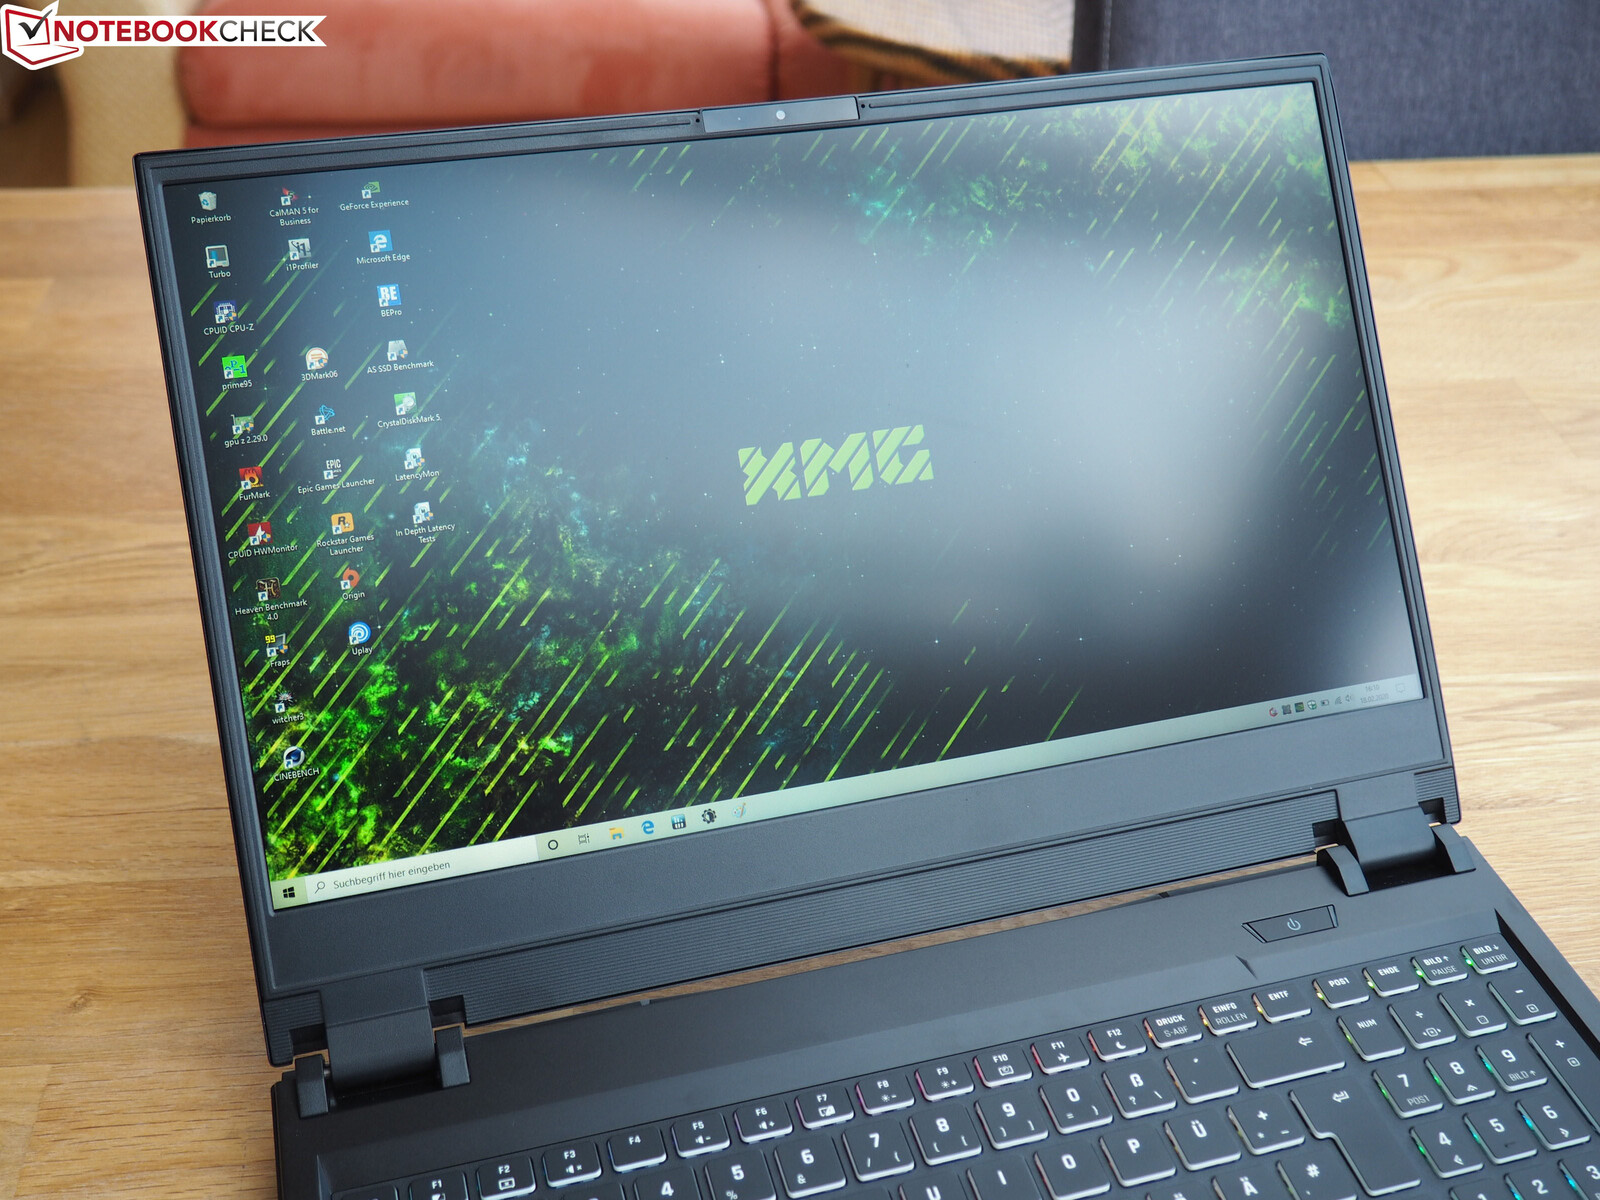
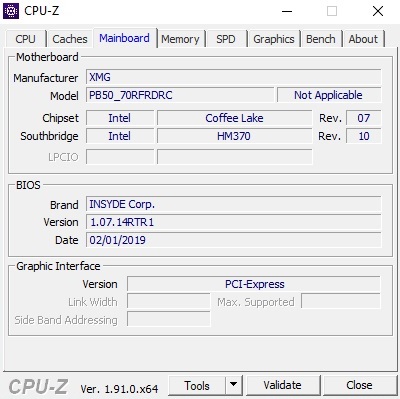
The PB51RF-G-Barebone that this device is based on comes from Clevo. As is typical for Clevo devices, the case design is fairly simple - except for its RGB keyboard backlighting, of course. But the black surface does not feature any intricate patterns. While the display frame and base unit are made of plastic, the cover and top of the base unit are made of aluminum, which makes the Pro 15 look good.
The wobbly display cover aside, the device is fairly stable and has good workmanship. Most of the elements on our test sample combine nicely.
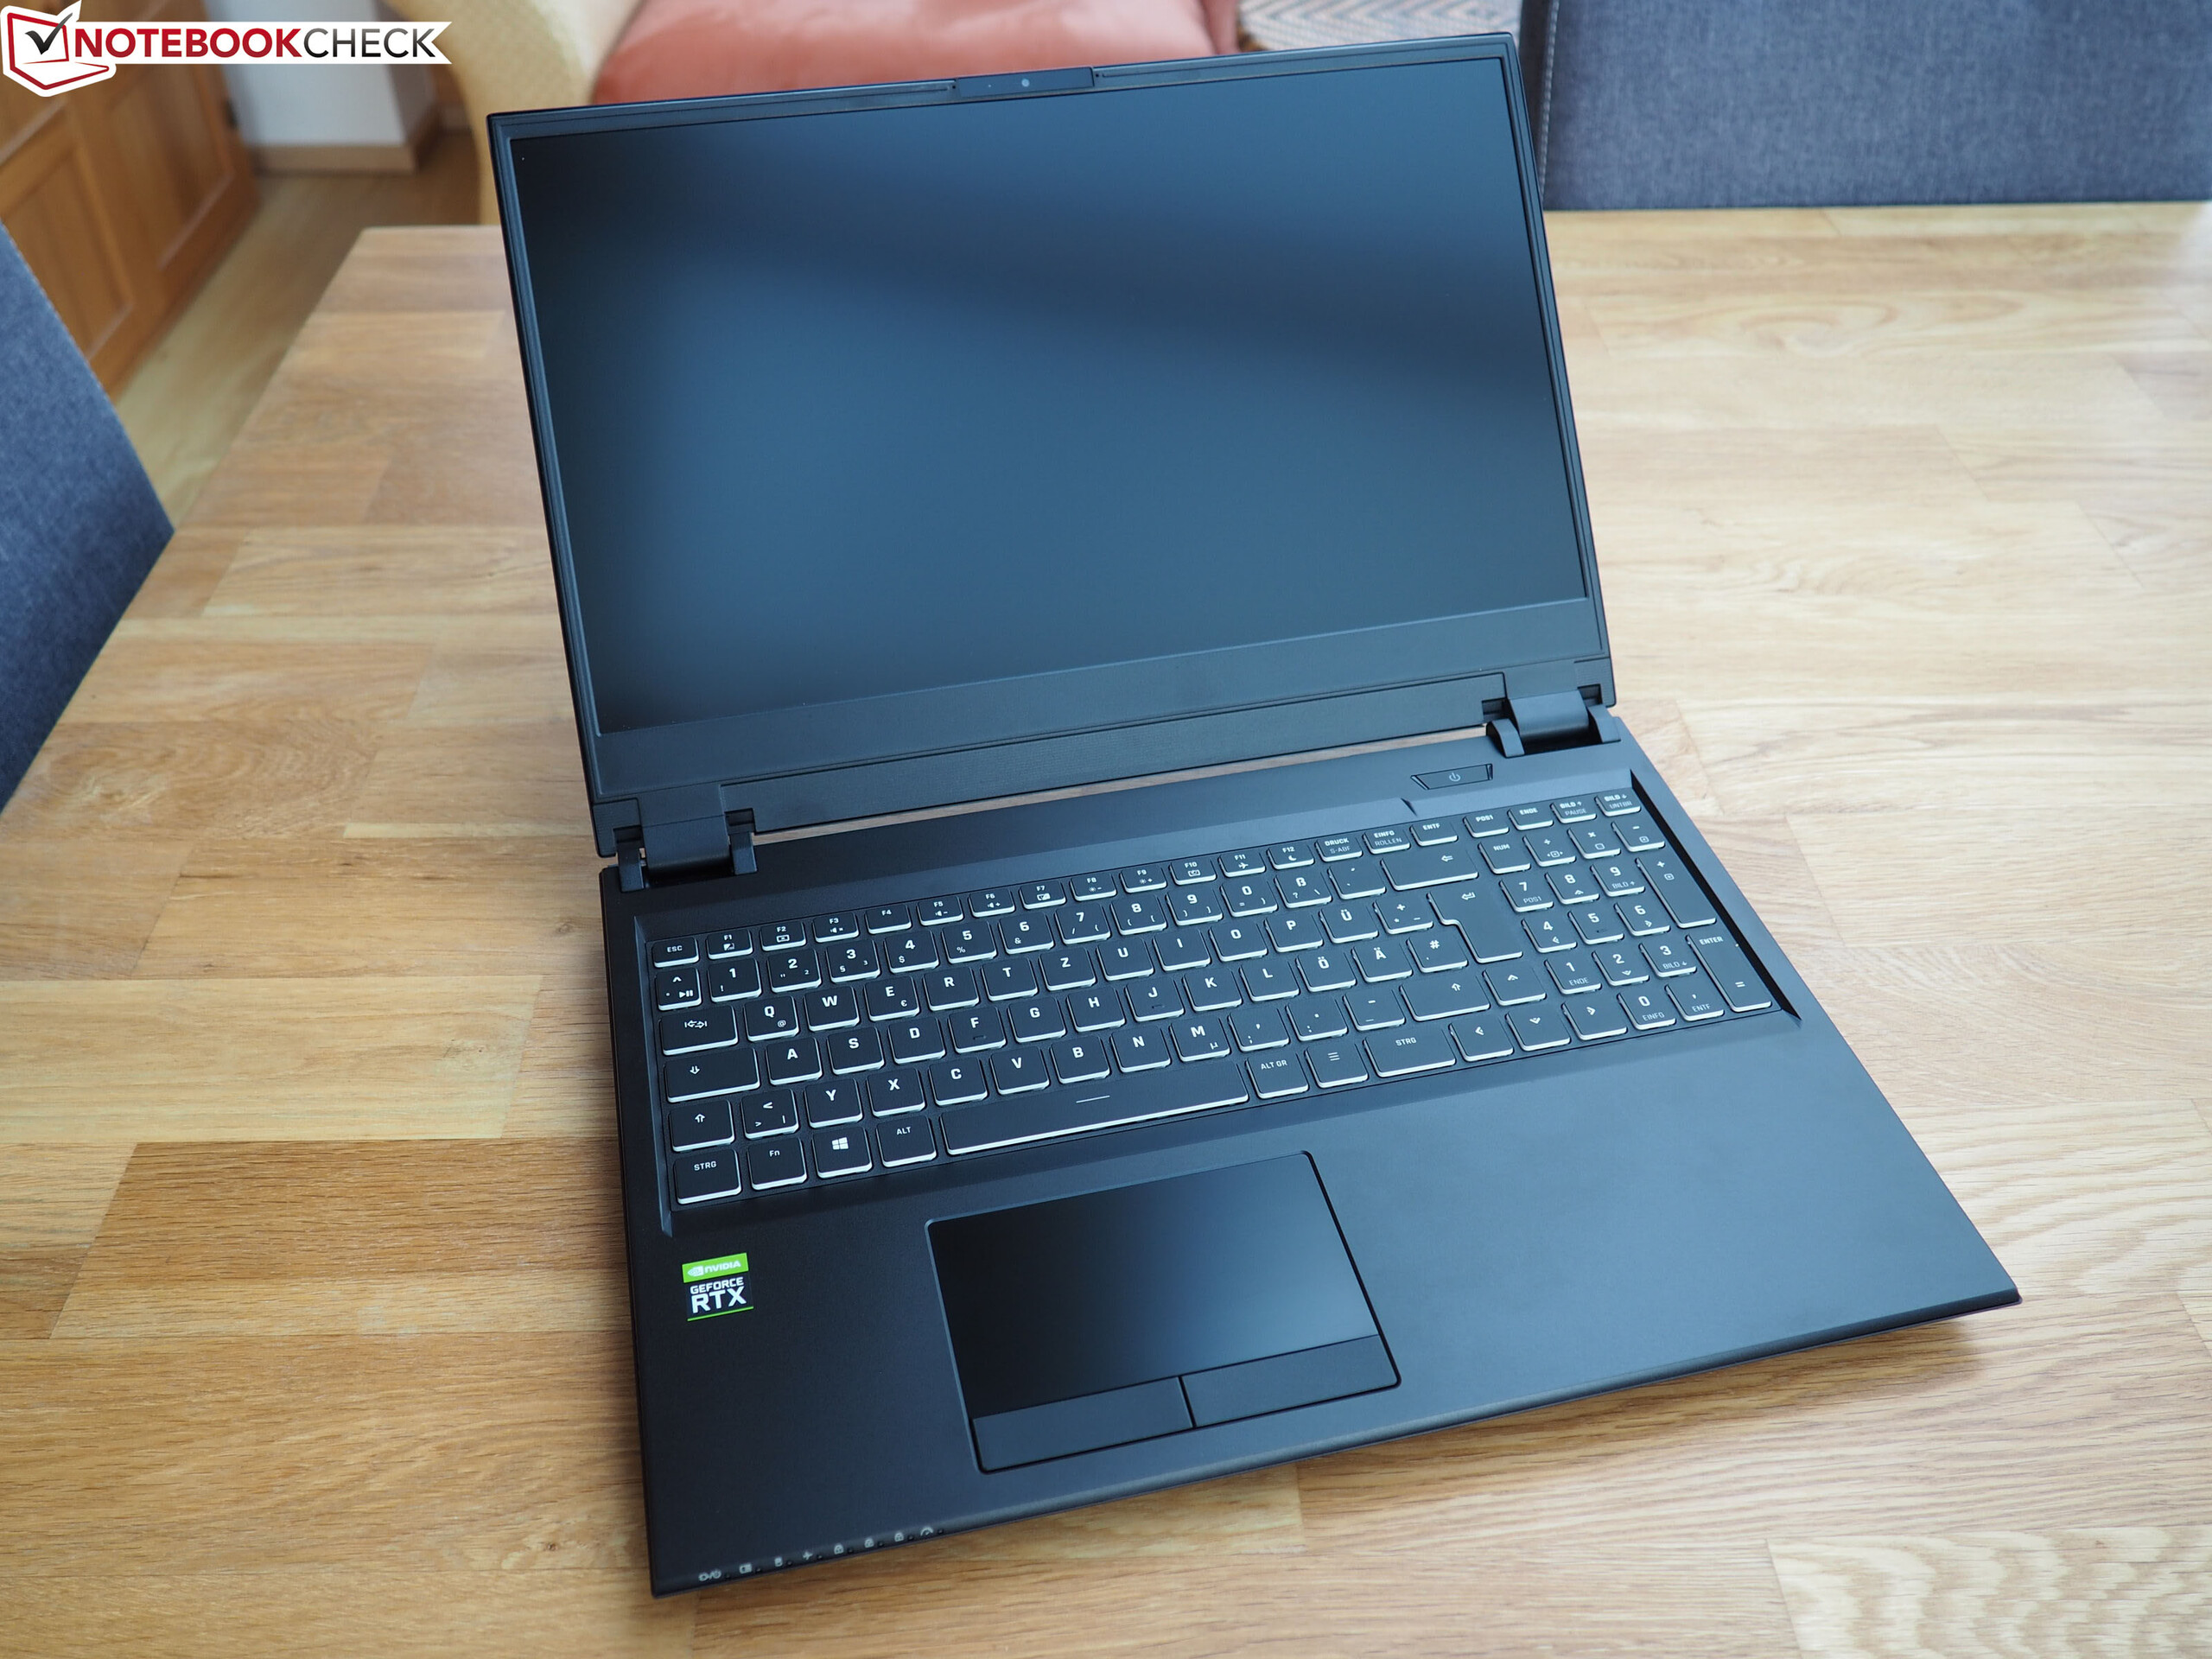

The Pro 15 weighs 2.5 kg, which makes it a little heavier than most of its competition. Apart from the XMG Ultra 15, most of the other devices weigh between 2.1 and 2.4 kg. The same goes for height. At 3.0 cm, our test unit is the second-thickest device in the comparison. The MSI GE65 and the Asus devices Strix G531GW and Zephyrus S GX502GW are only between 1.9 and 2.7 cm high. At least the XMG Pro 15 doesn't have too big a footprint thanks to its slim-bezel design. Its 35.9 x 25.8 cm still makes it easily portable.
Connectivity
Ports
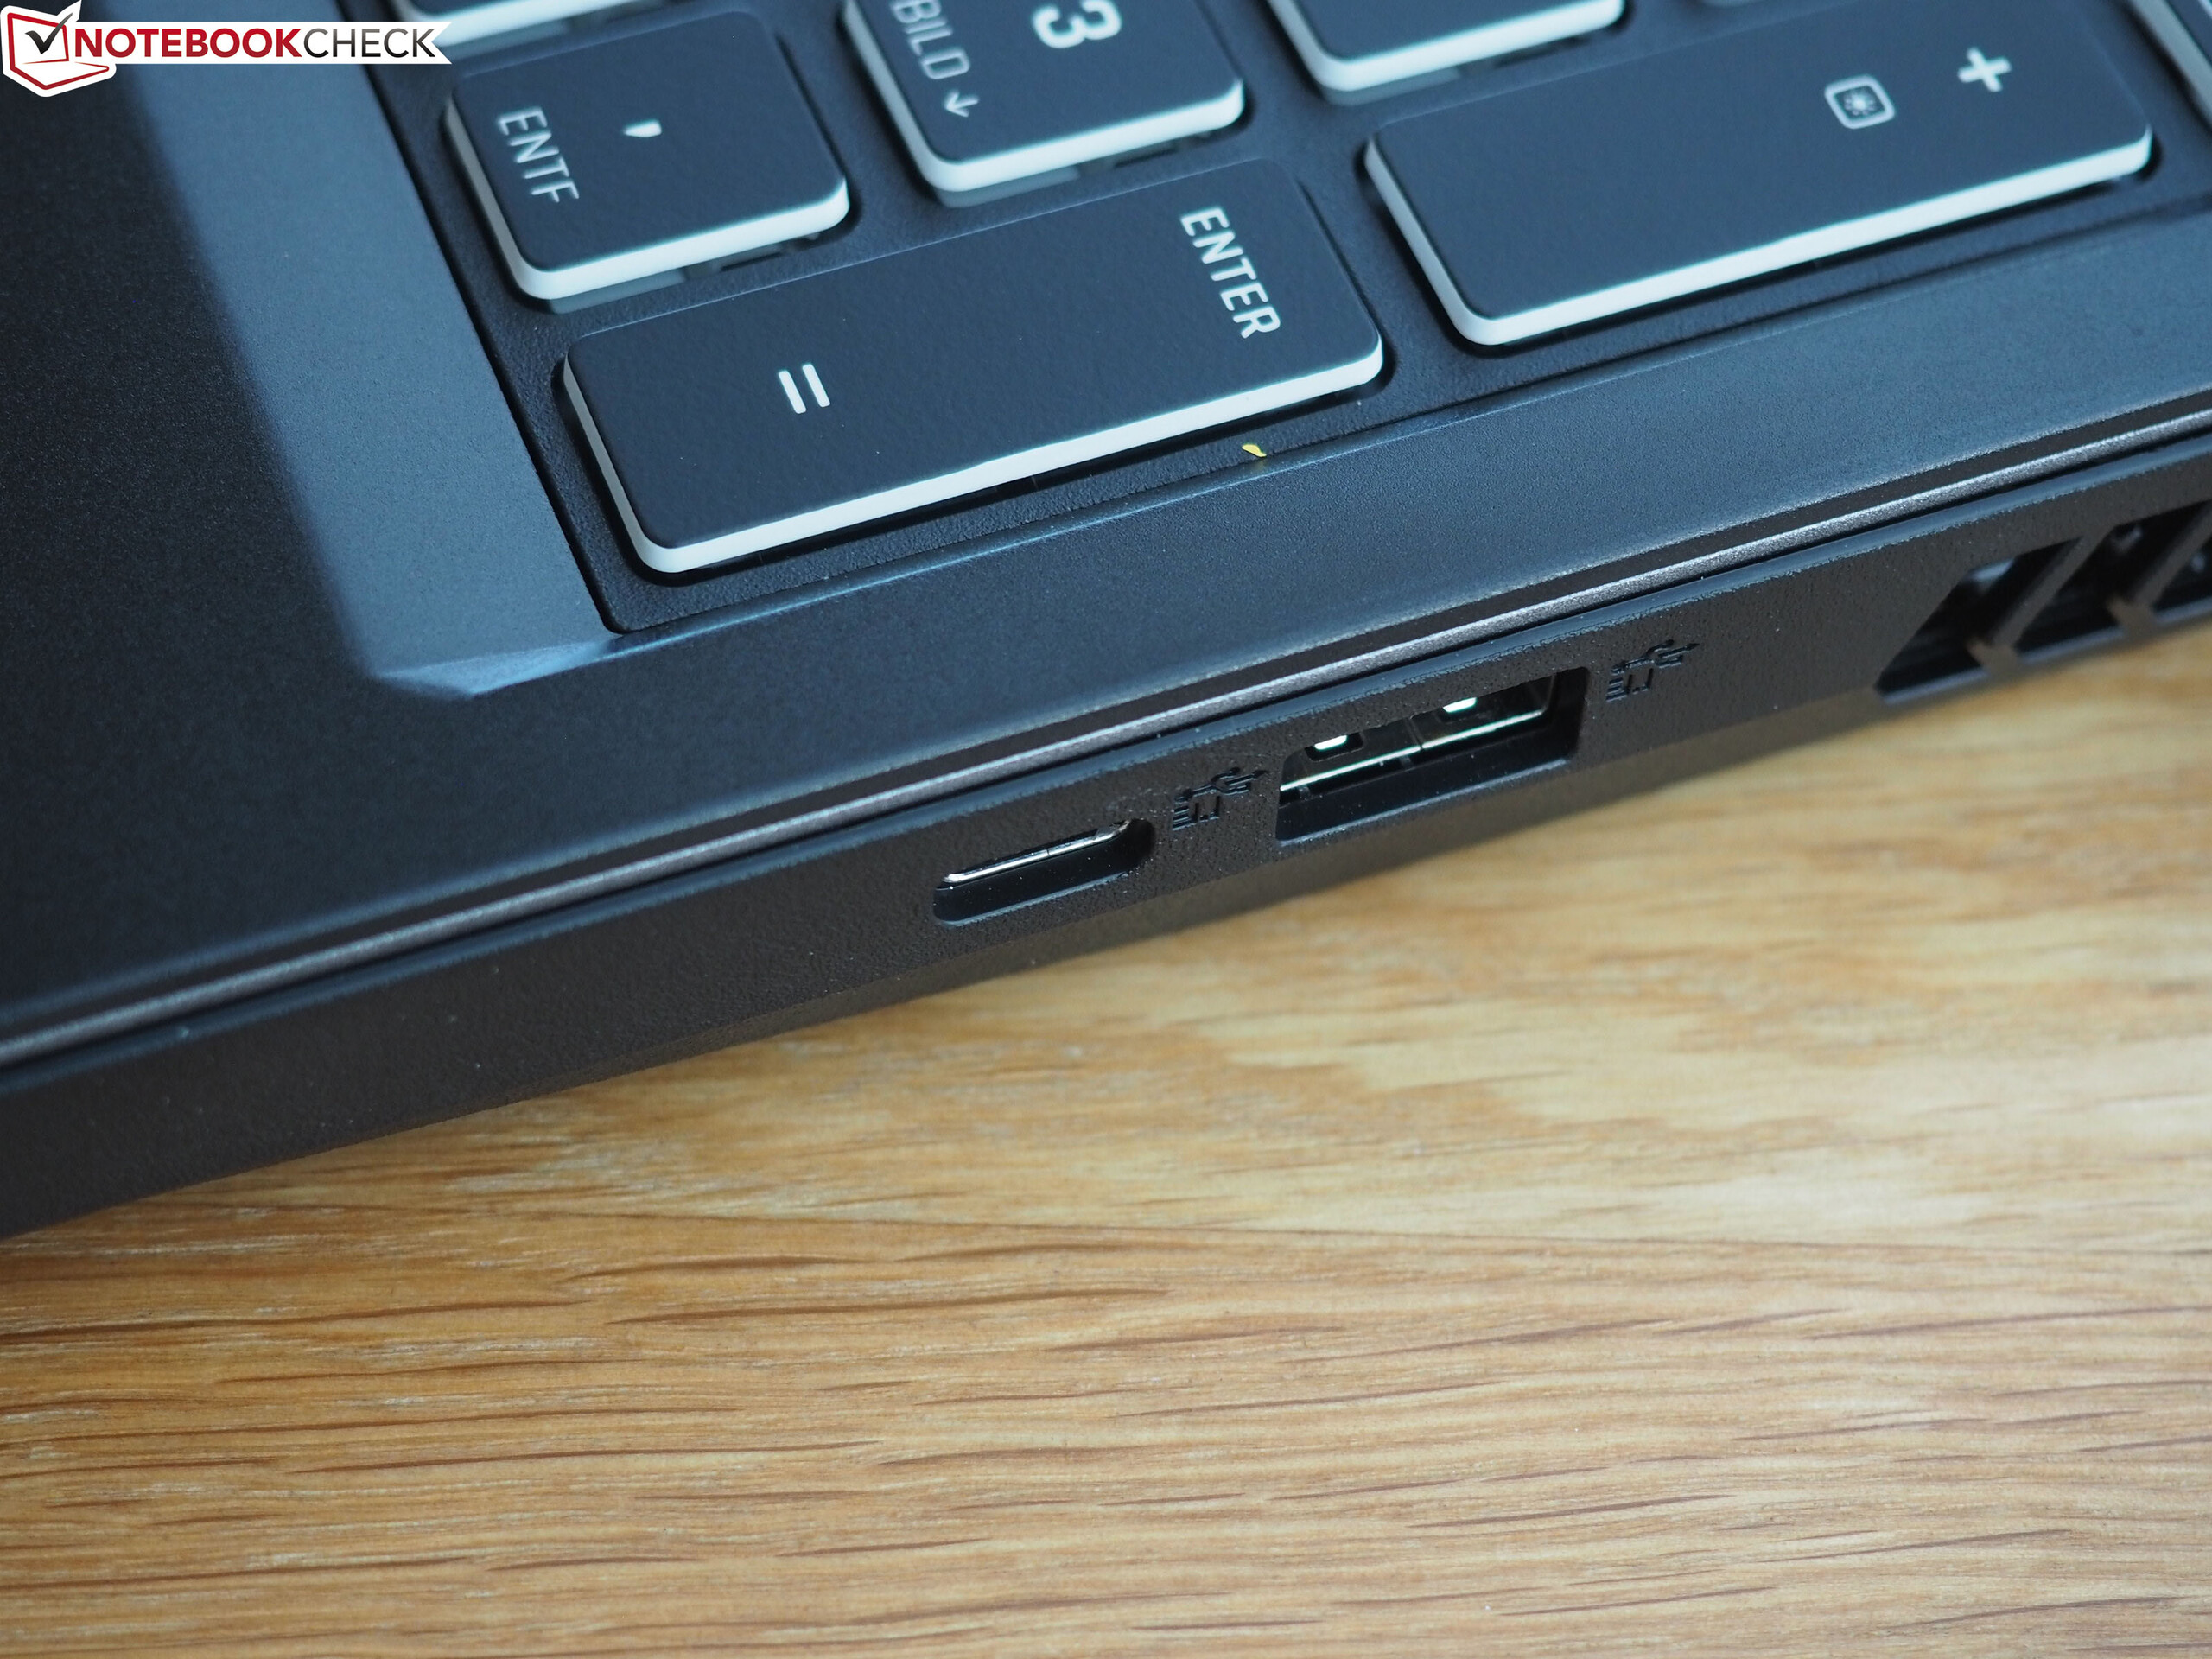
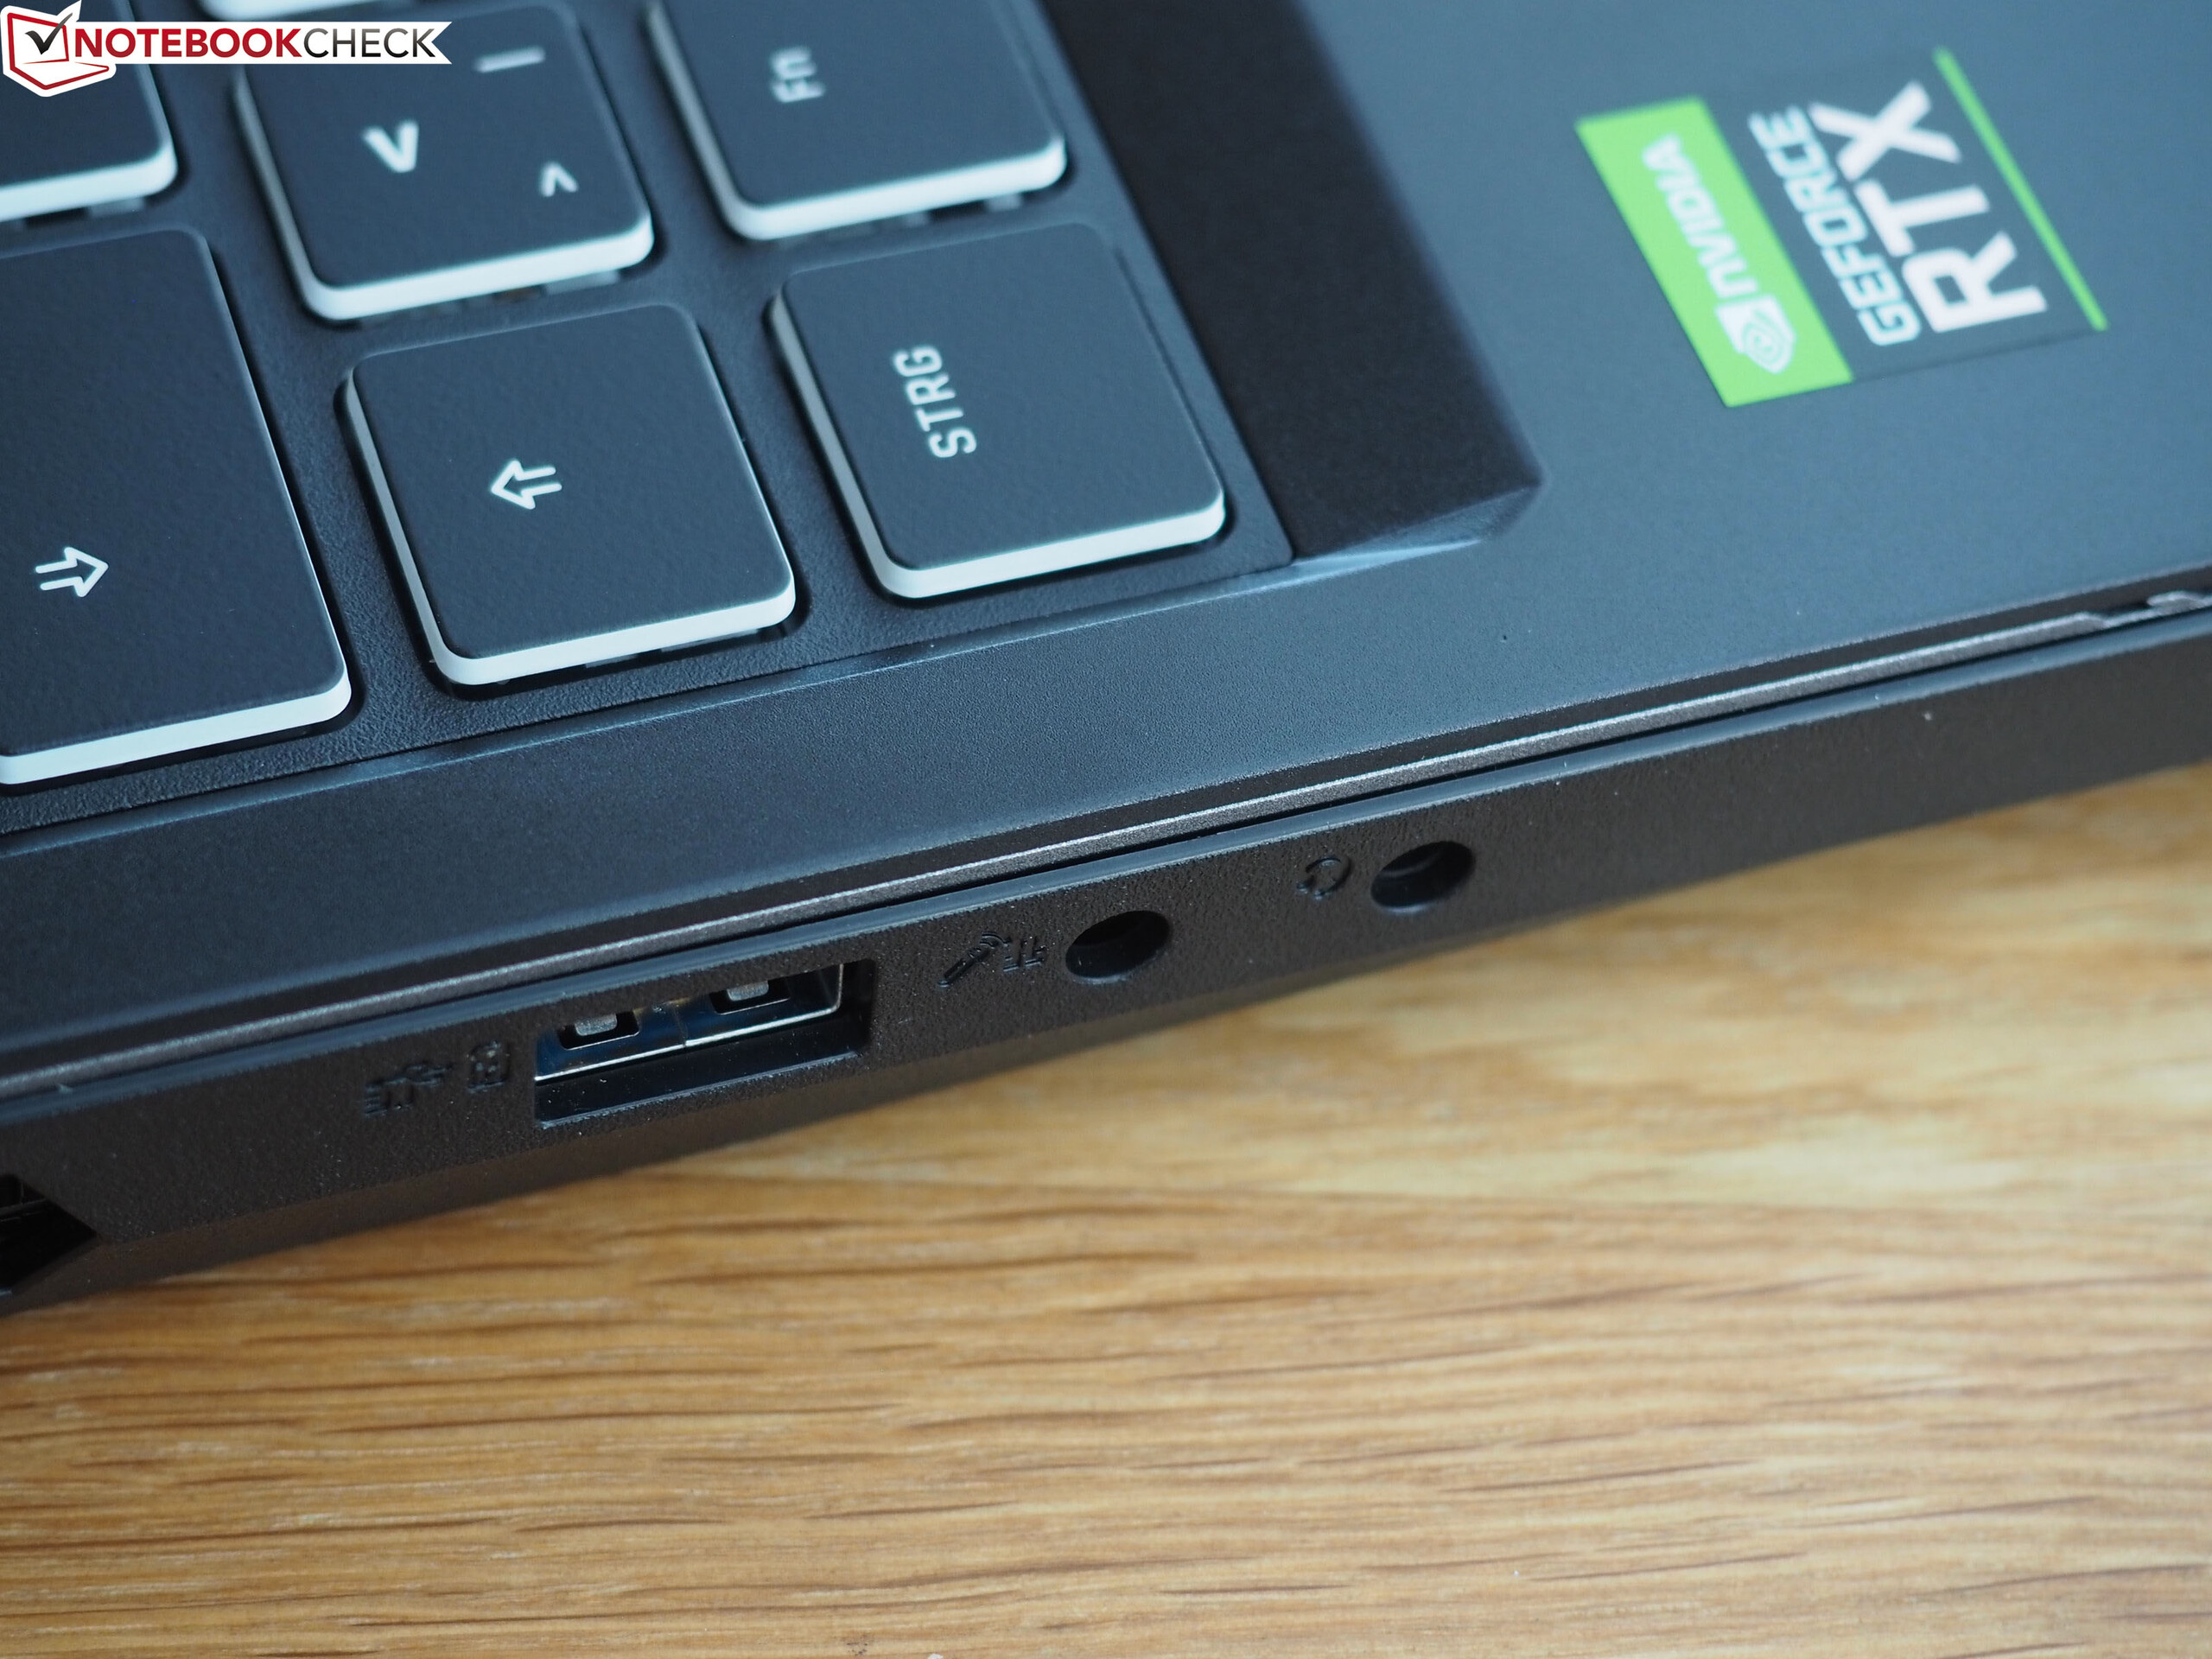
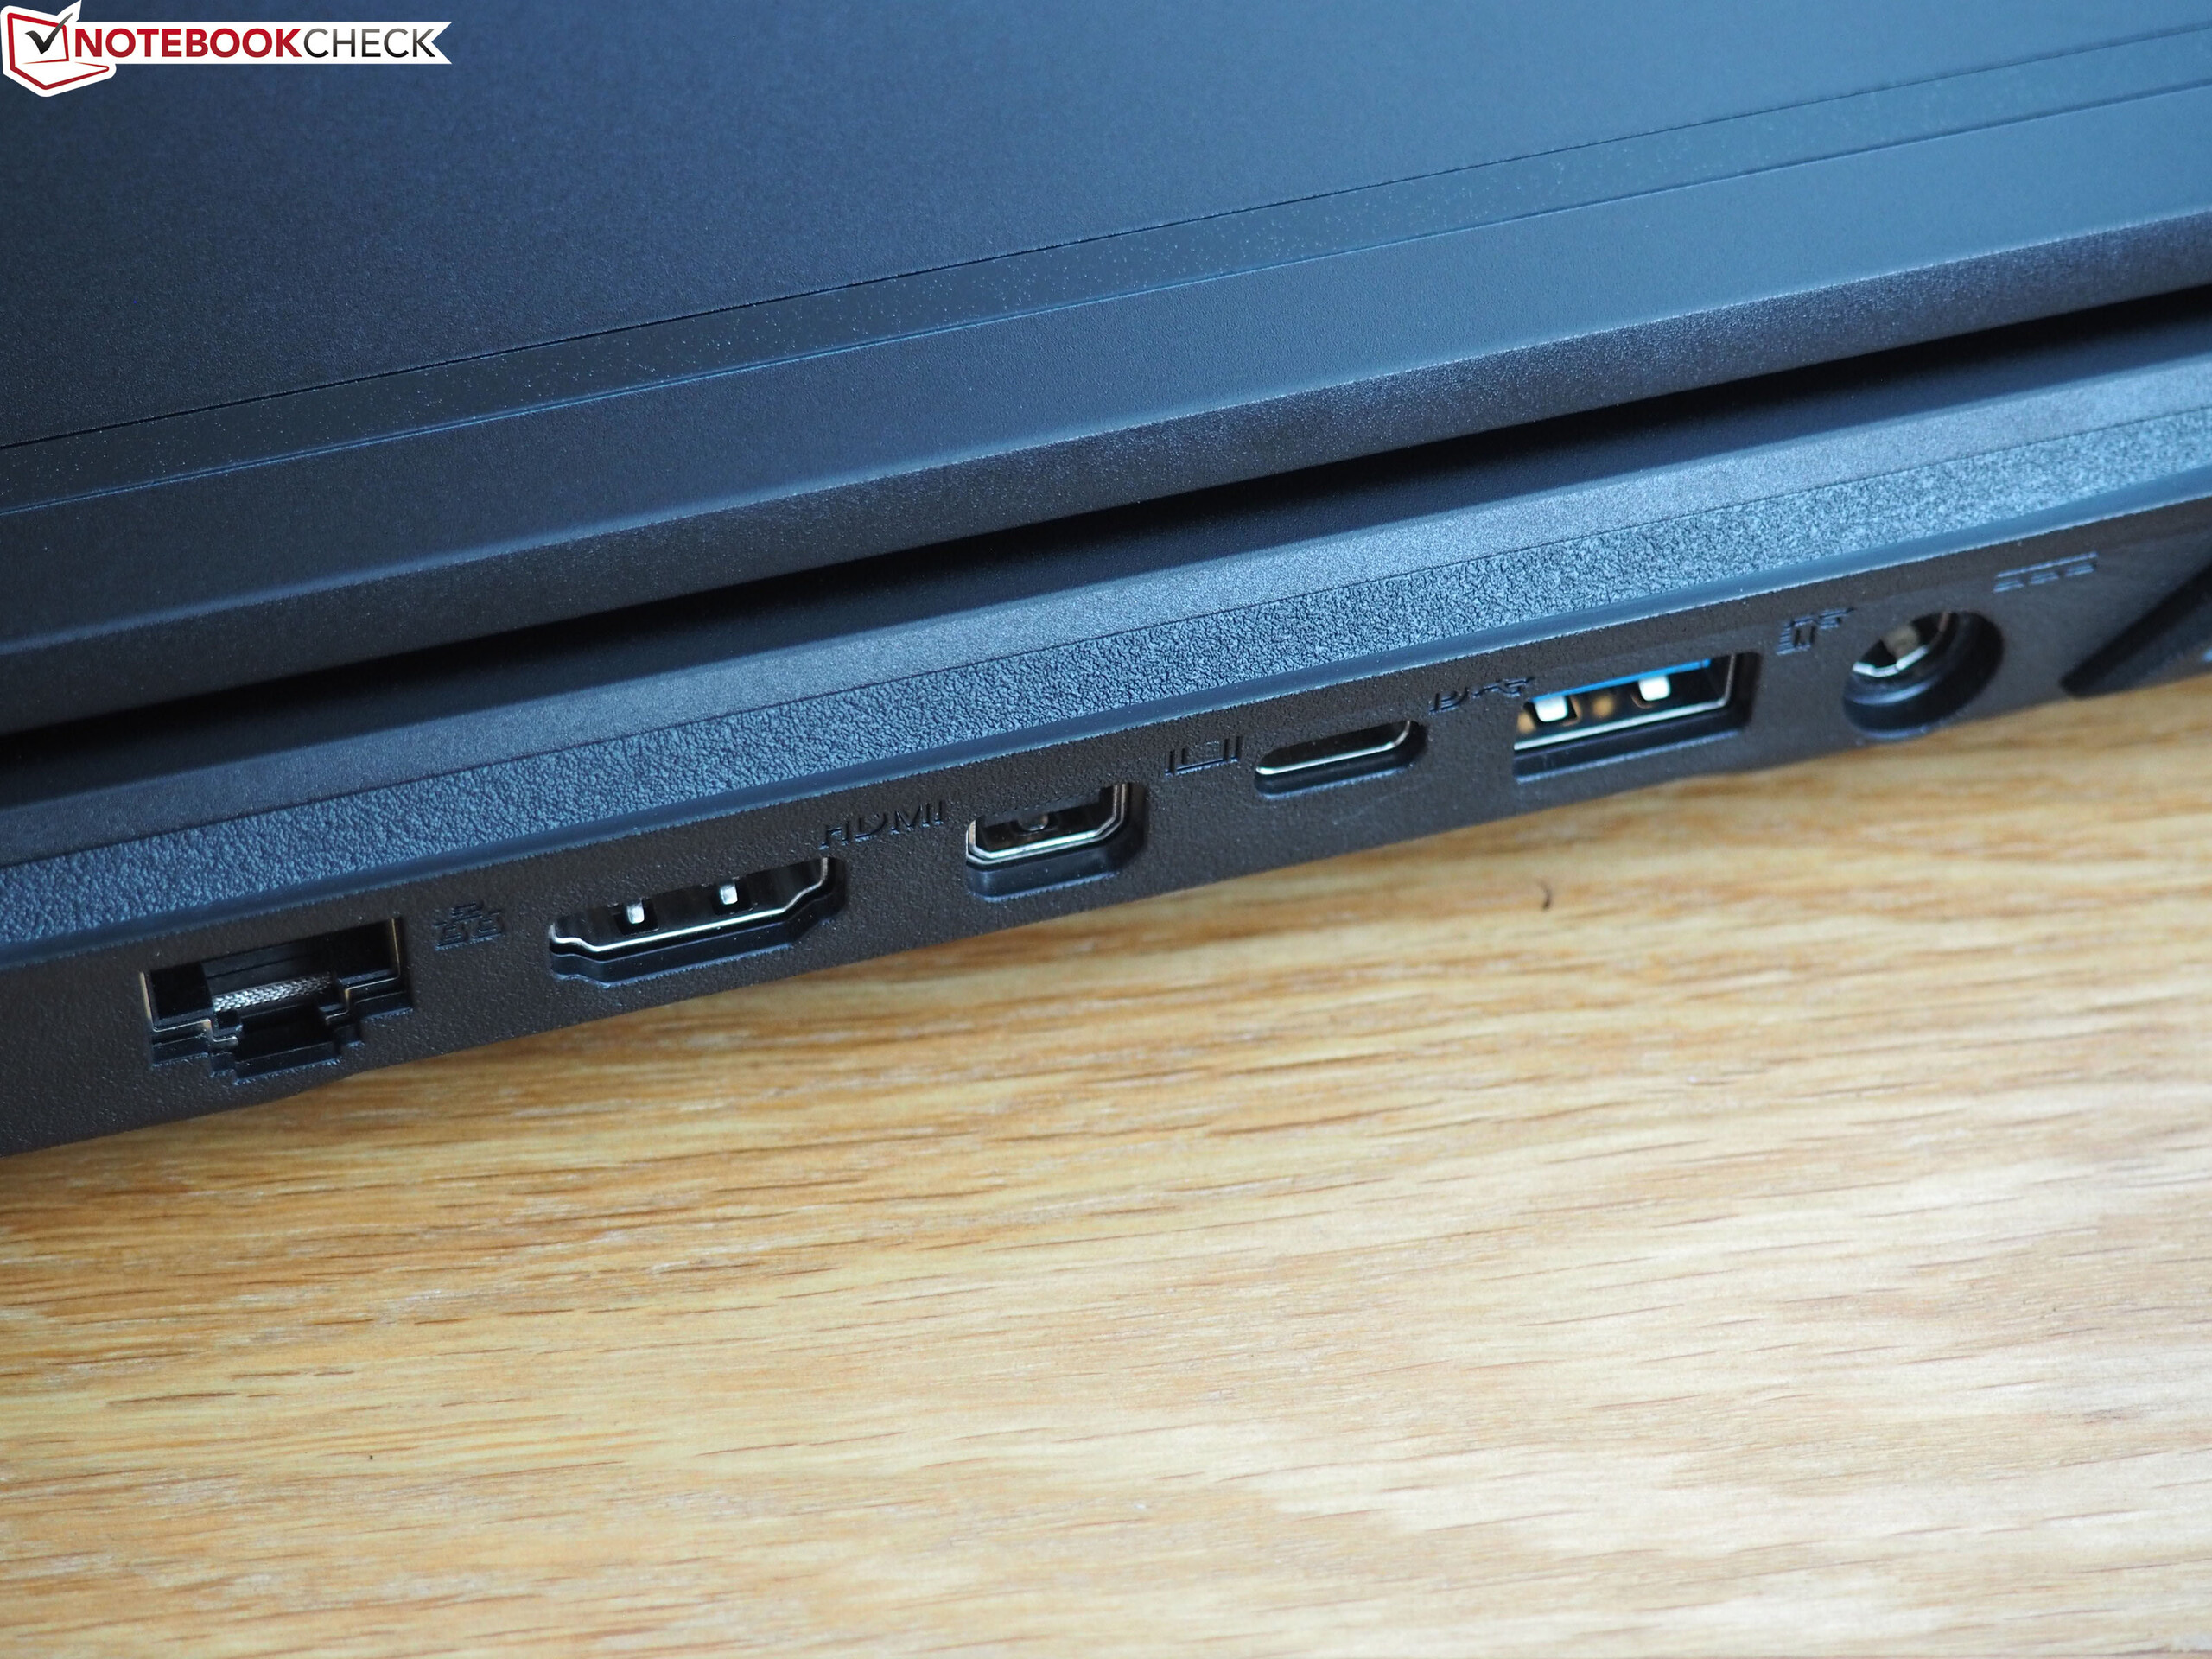
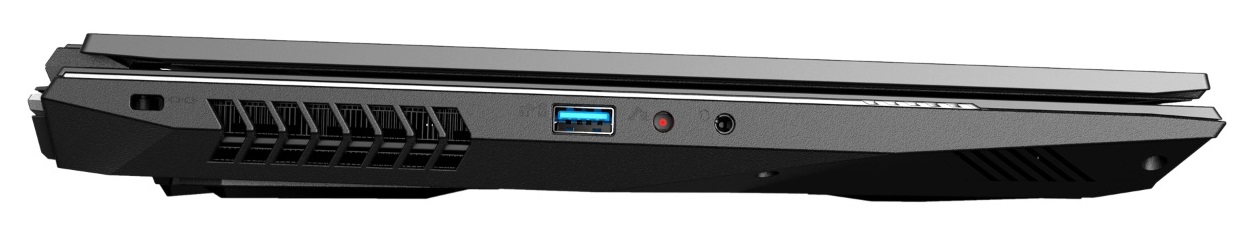
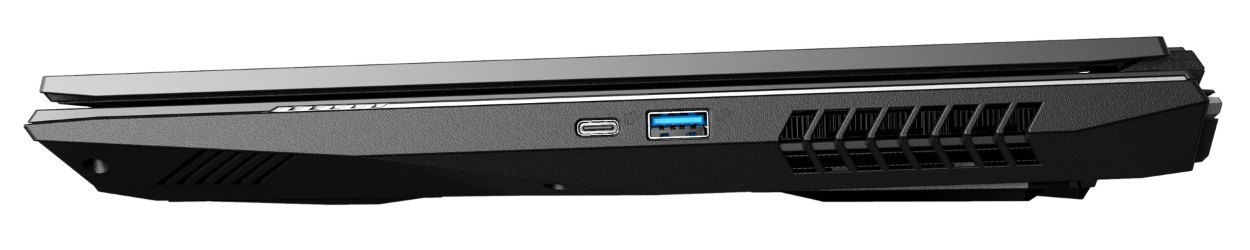
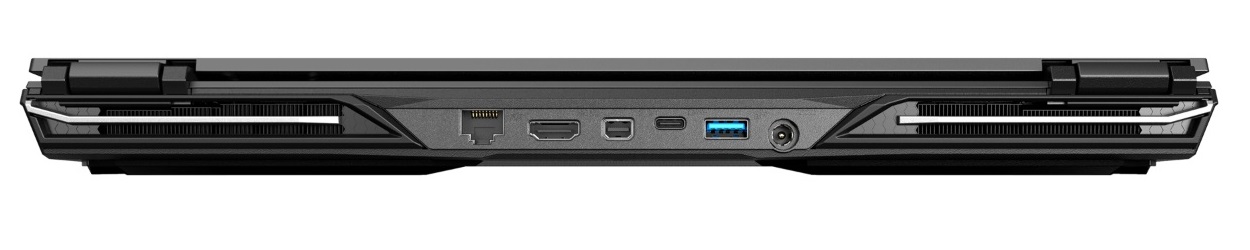
Contrary to the recently tested (and significantly cheaper) XMG Core 15, the Pro 15 features a wide range of ports. It has three Type-A USB 3.0 ports and two Type-C USB 3.1 Gen 2 ports (one supporting DisplayPort, the other Thunderbolt 3). The port selection is up to date and ensures a wide range of possible applications. The device also has two audio jacks for a microphone and headphone as well as a card reader, an RJ45 port and a Kensington lock. Finally, we have a mini DisplayPort and an HDMI 2.0 output (each 4K@60 Hz).
The port distribution is very good. As there are hardly any ports on the left and right sides, users can easily use a mouse without worrying about other cables being in the way.
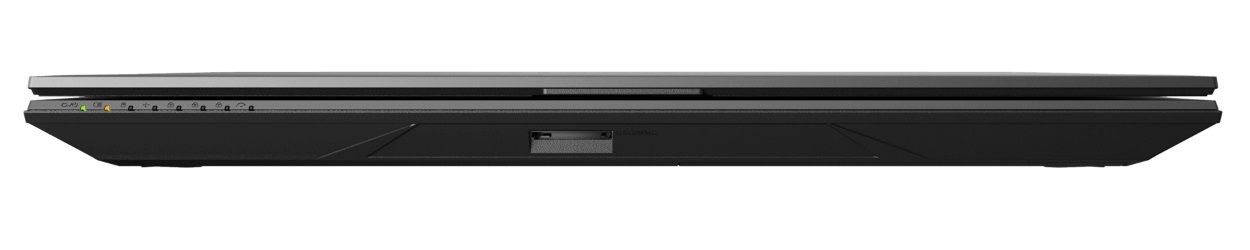
SD card reader
The manufacturer should also be praised for the particularly fast card reader, which reaches over 200 MB/s during sequential reading and when transferring photos - our reference card almost reached its limits. Other gaming laptops such as the MSI GE65 9SF struggle along at USB 2.0 speeds (around 30 MB/s).
| SD Card Reader | |
| average JPG Copy Test (av. of 3 runs) | |
| Schenker XMG Pro 15 (Toshiba Exceria Pro SDXC 64 GB UHS-II) | |
| Schenker XMG Ultra 15 Turing (Toshiba Exceria Pro SDXC 64 GB UHS-II) | |
| Average of class Gaming (20.9 - 210, n=54, last 2 years) | |
| MSI GE65 Raider 9SF-049US (Toshiba Exceria Pro SDXC 64 GB UHS-II) | |
| maximum AS SSD Seq Read Test (1GB) | |
| Schenker XMG Pro 15 (Toshiba Exceria Pro SDXC 64 GB UHS-II) | |
| Schenker XMG Ultra 15 Turing (Toshiba Exceria Pro SDXC 64 GB UHS-II) | |
| Average of class Gaming (25.5 - 261, n=51, last 2 years) | |
| MSI GE65 Raider 9SF-049US (Toshiba Exceria Pro SDXC 64 GB UHS-II) | |
Communication
Wireless communication is very fast on the XMG Pro 15. Due to the changed test setup (ax router instead of ac router), we cannot really compare the results with the competition, but more than 1300 Mb/s when sending and receiving at a distance of one meter is definitely a first-class result. We're not surprised - after all, the Intel Wi-Fi 6 AX200 (available at an extra charge) is a cutting-edge wireless module.
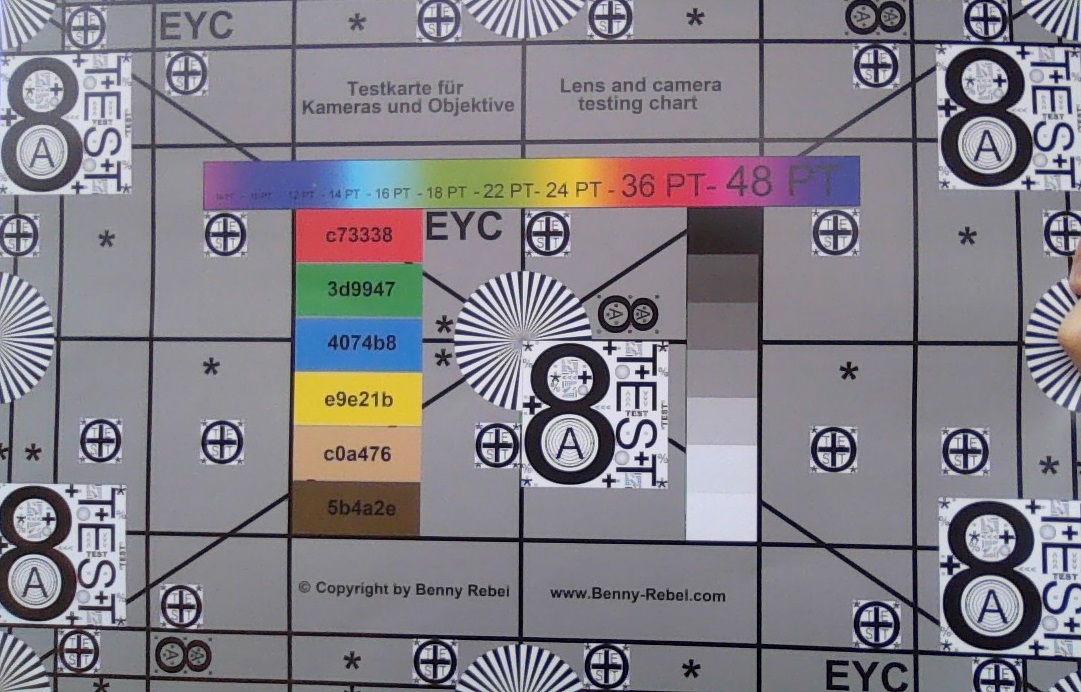
Webcam

Accessories
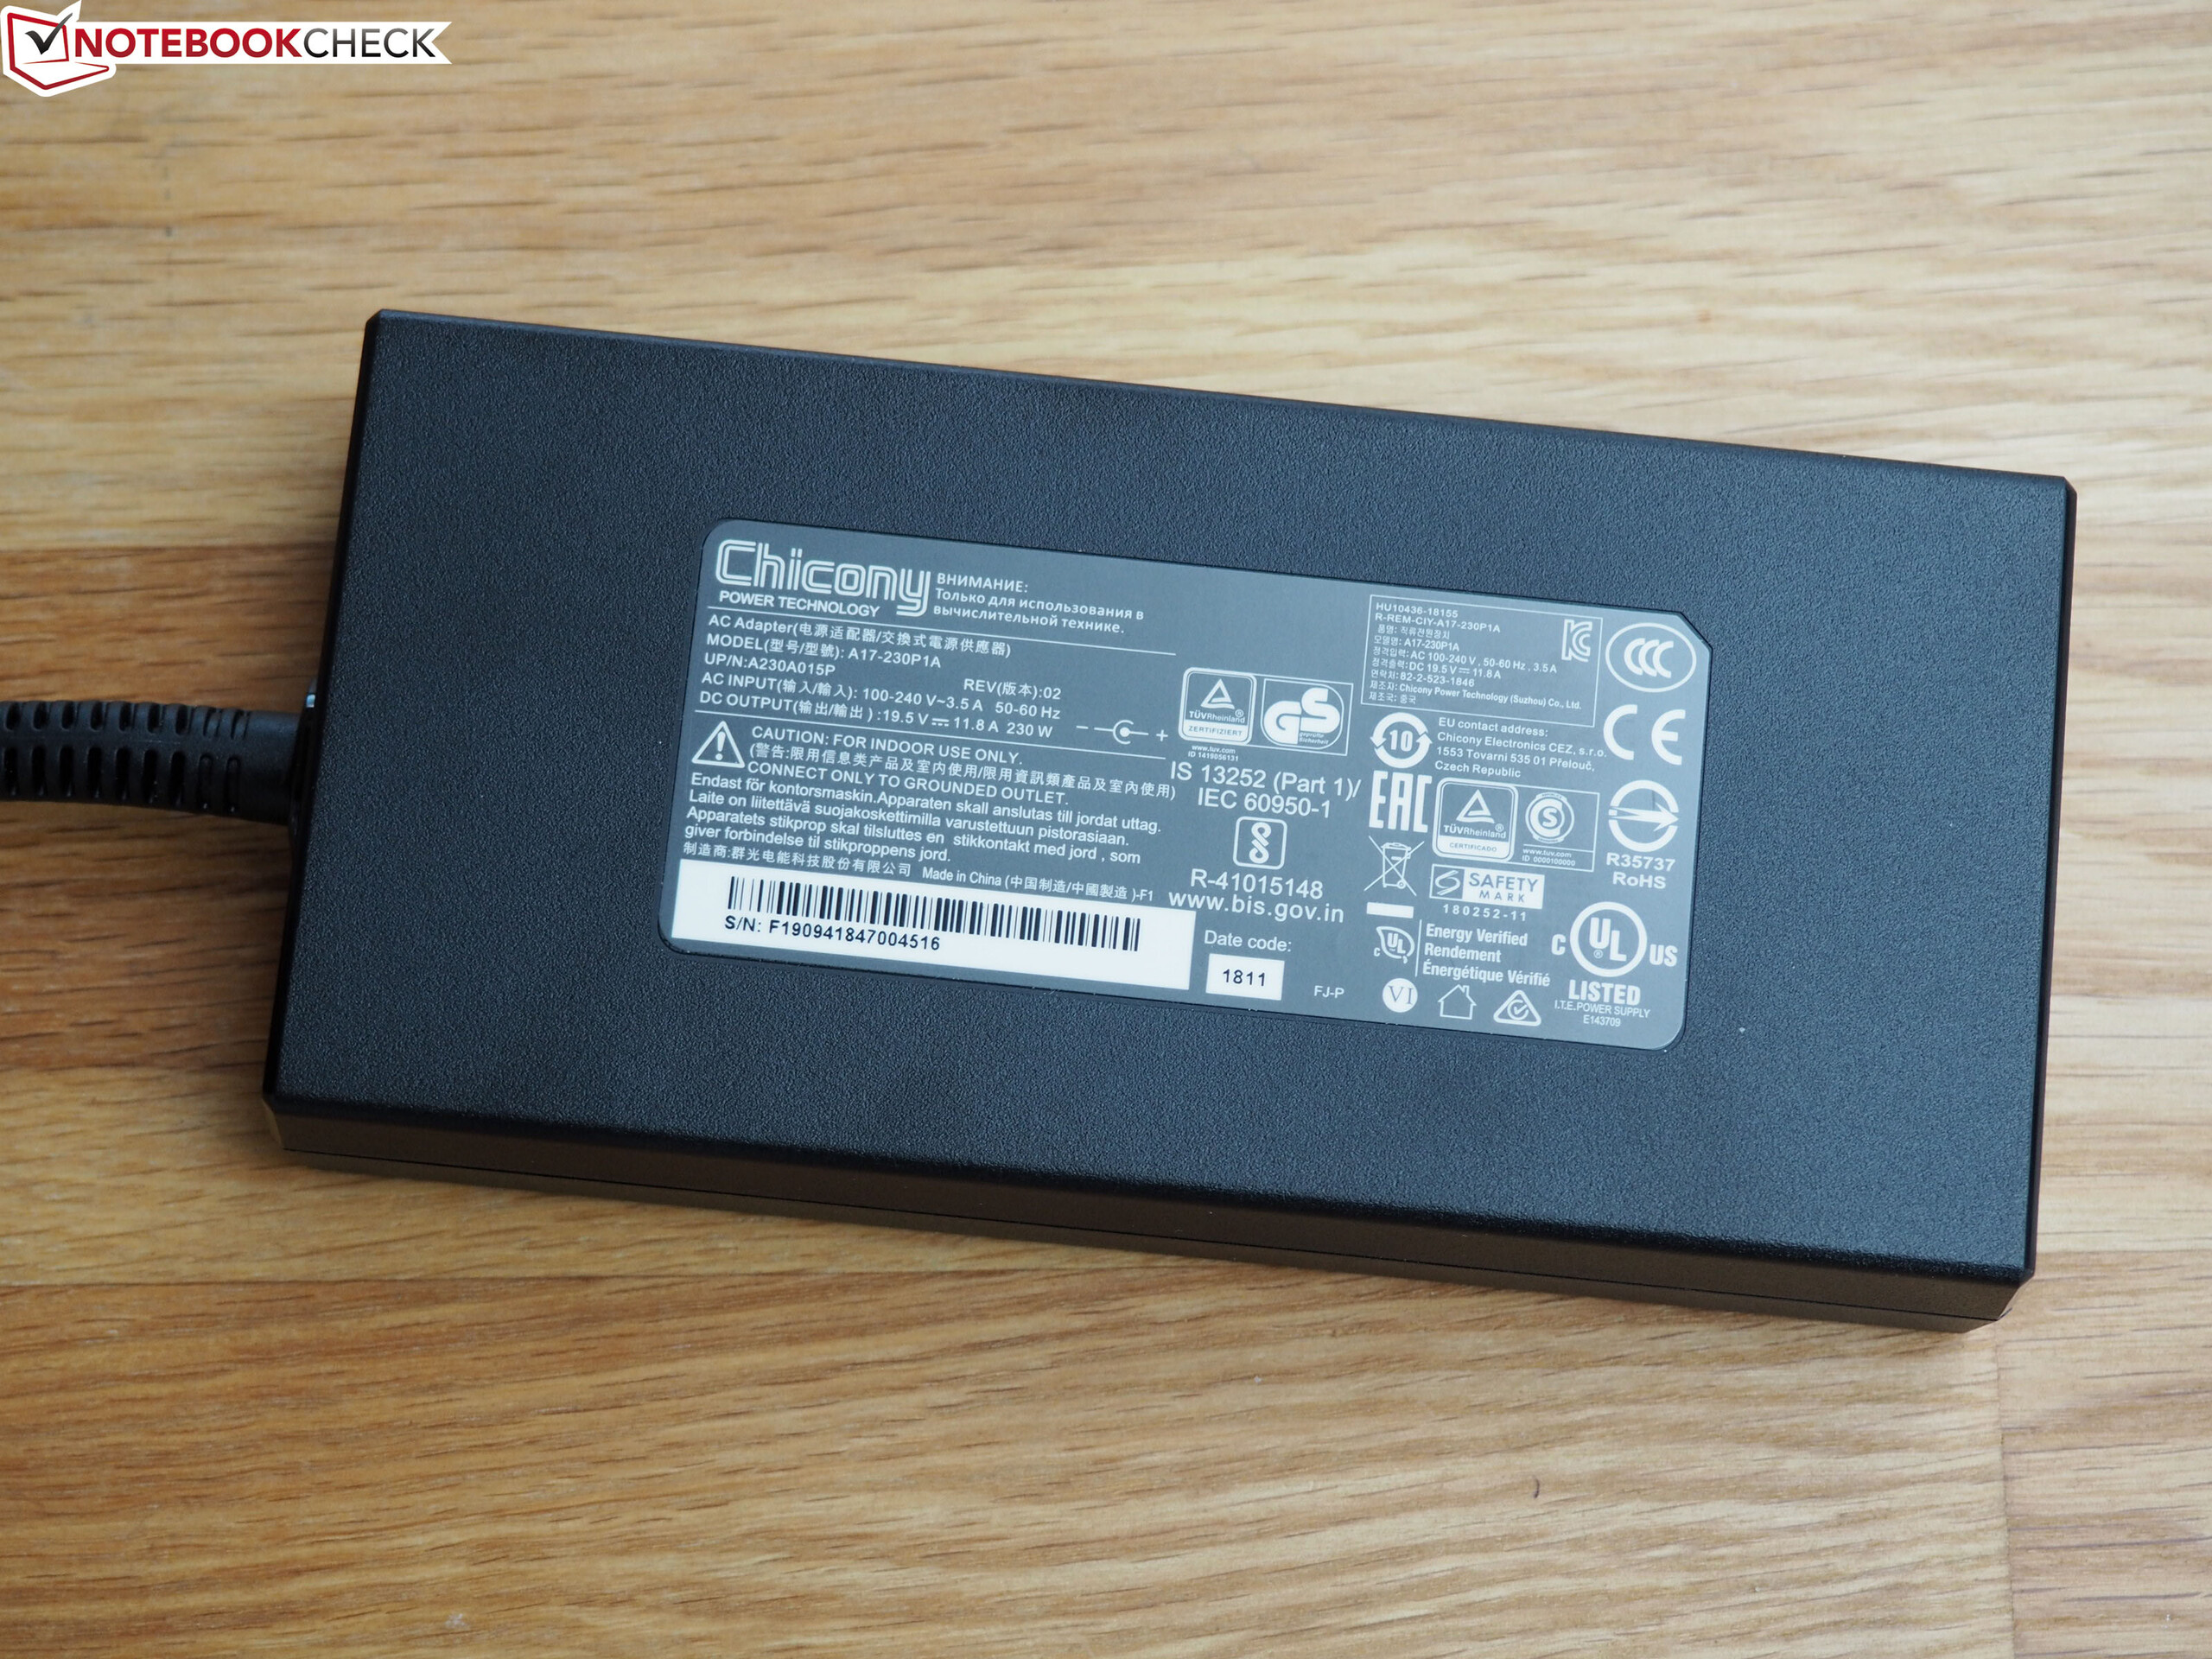
The scope of delivery is very generous and includes a thick user's manual, a cleaning cloth, a USB stick, a DVD with drivers as well as screws for the 2.5-inch bay. The AC adapter is fairly slim and has a rated output of 230 Watt.
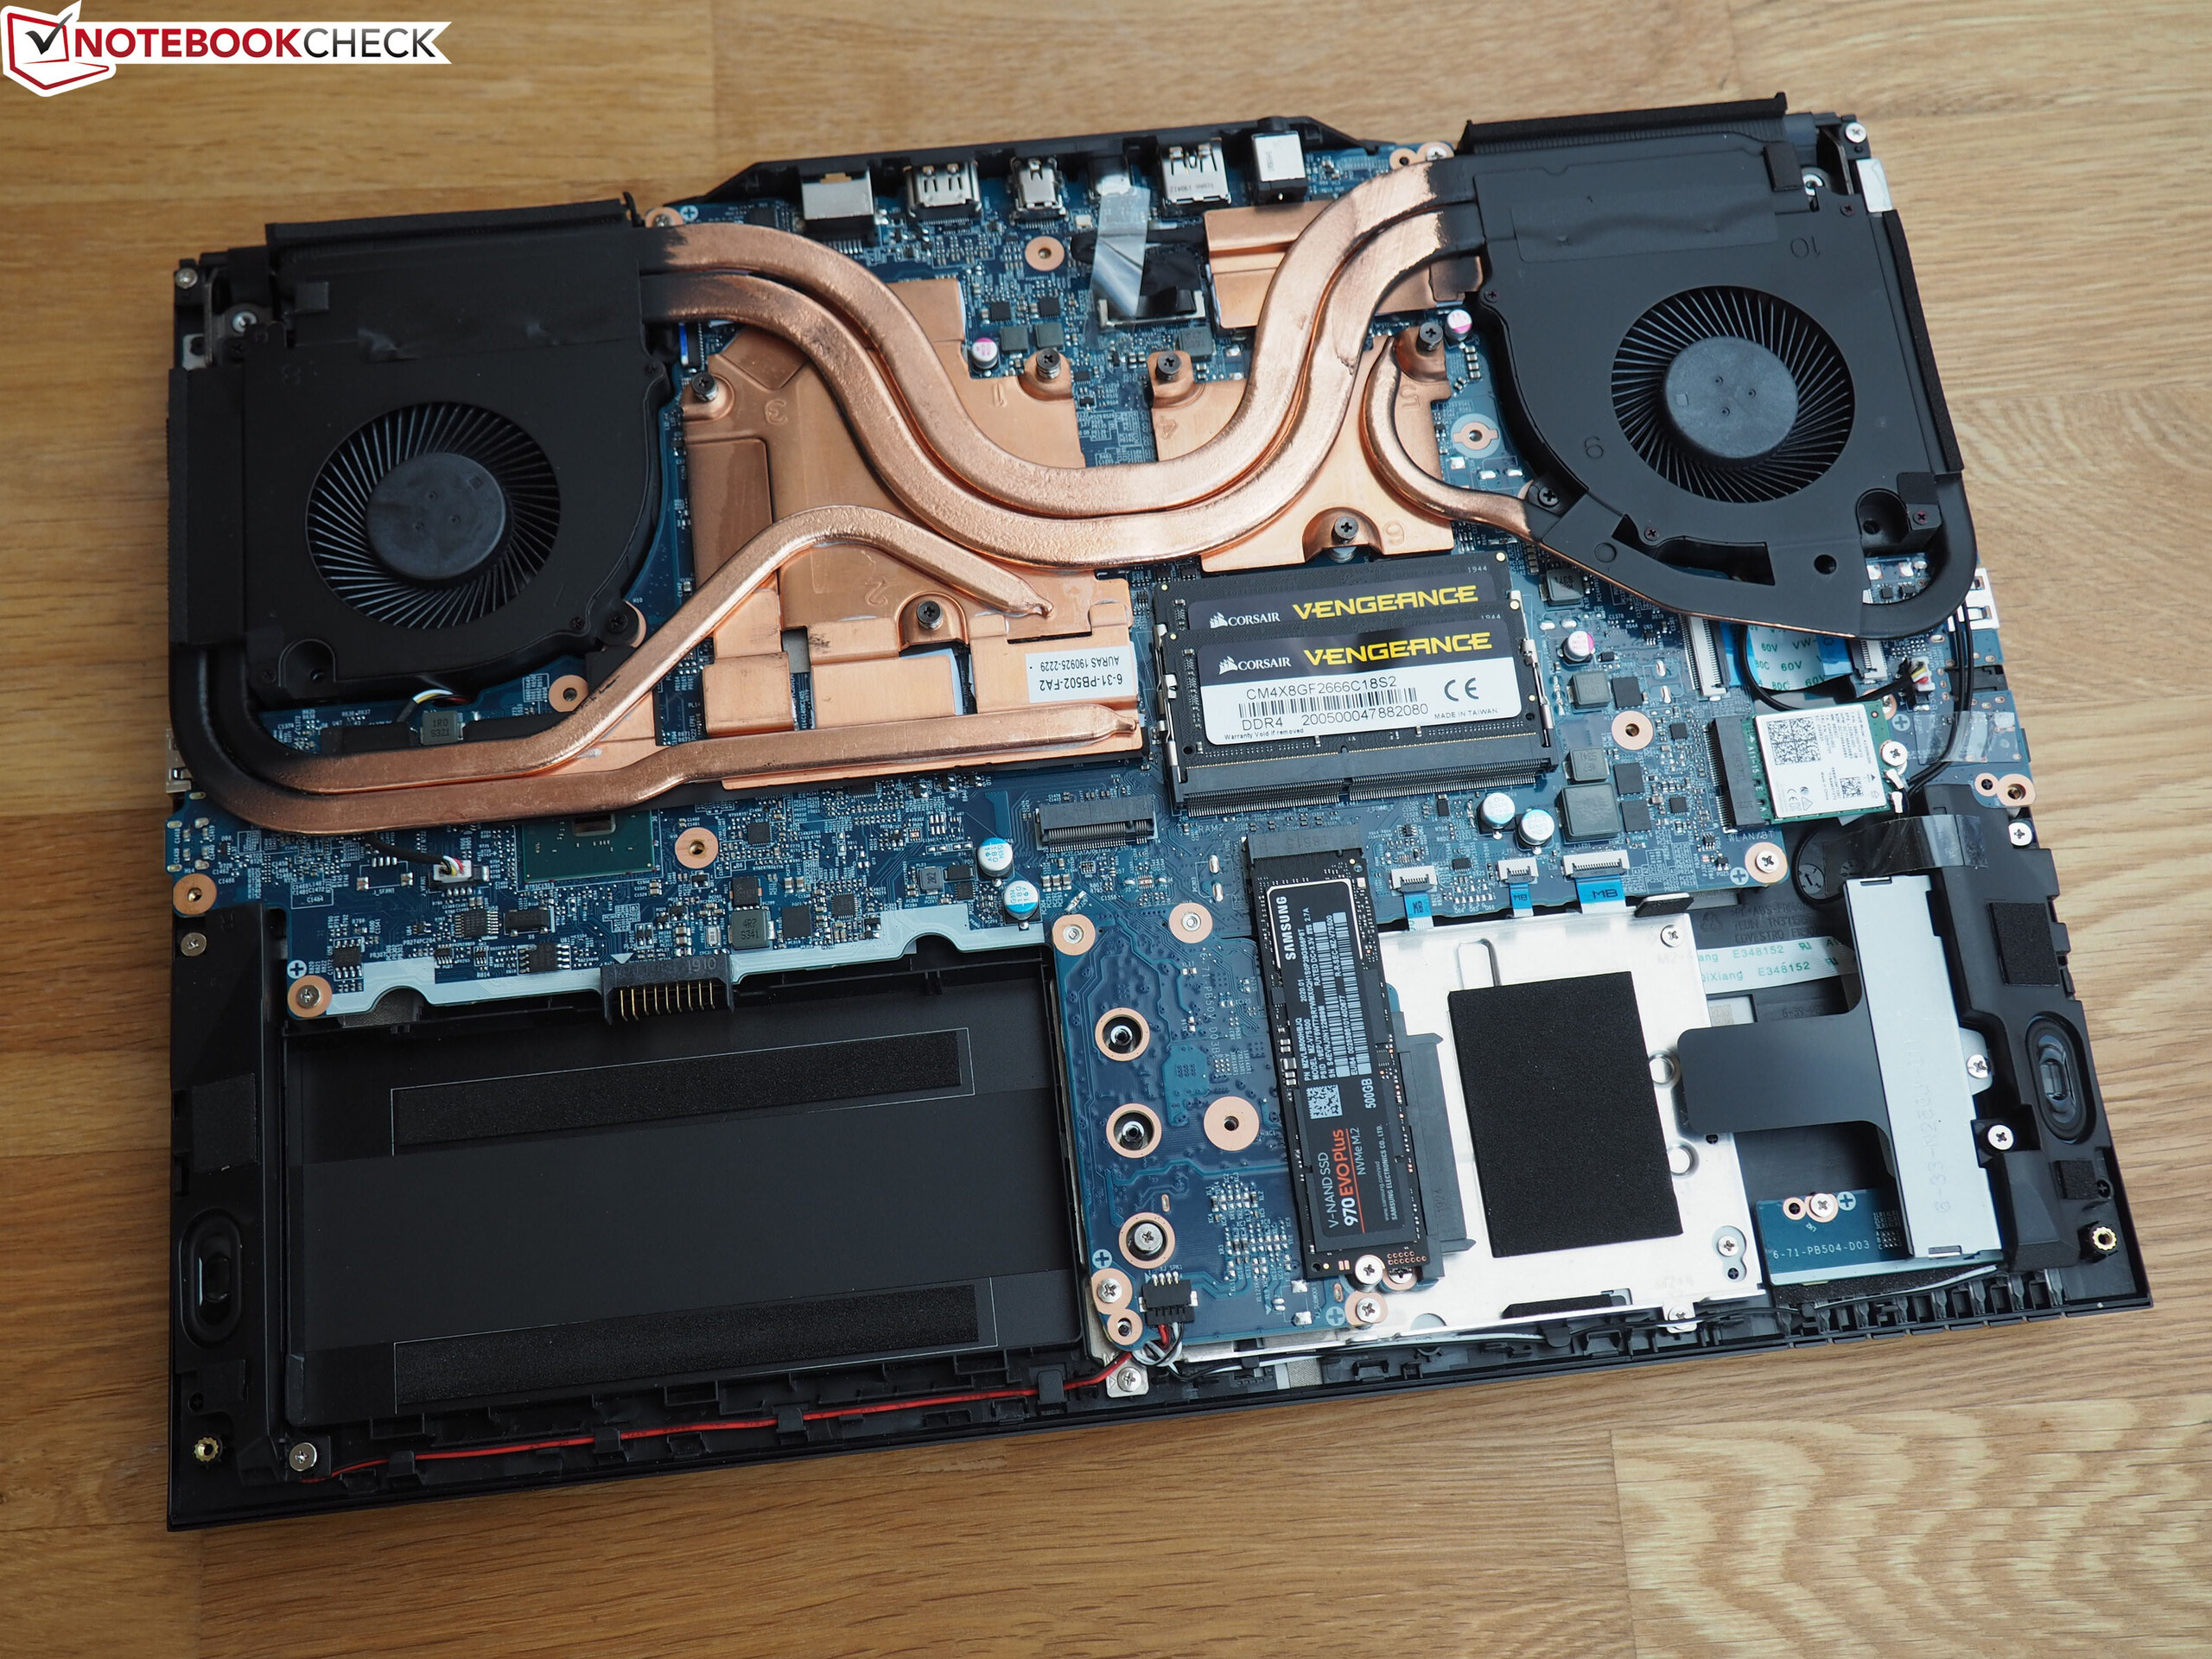
Maintenance
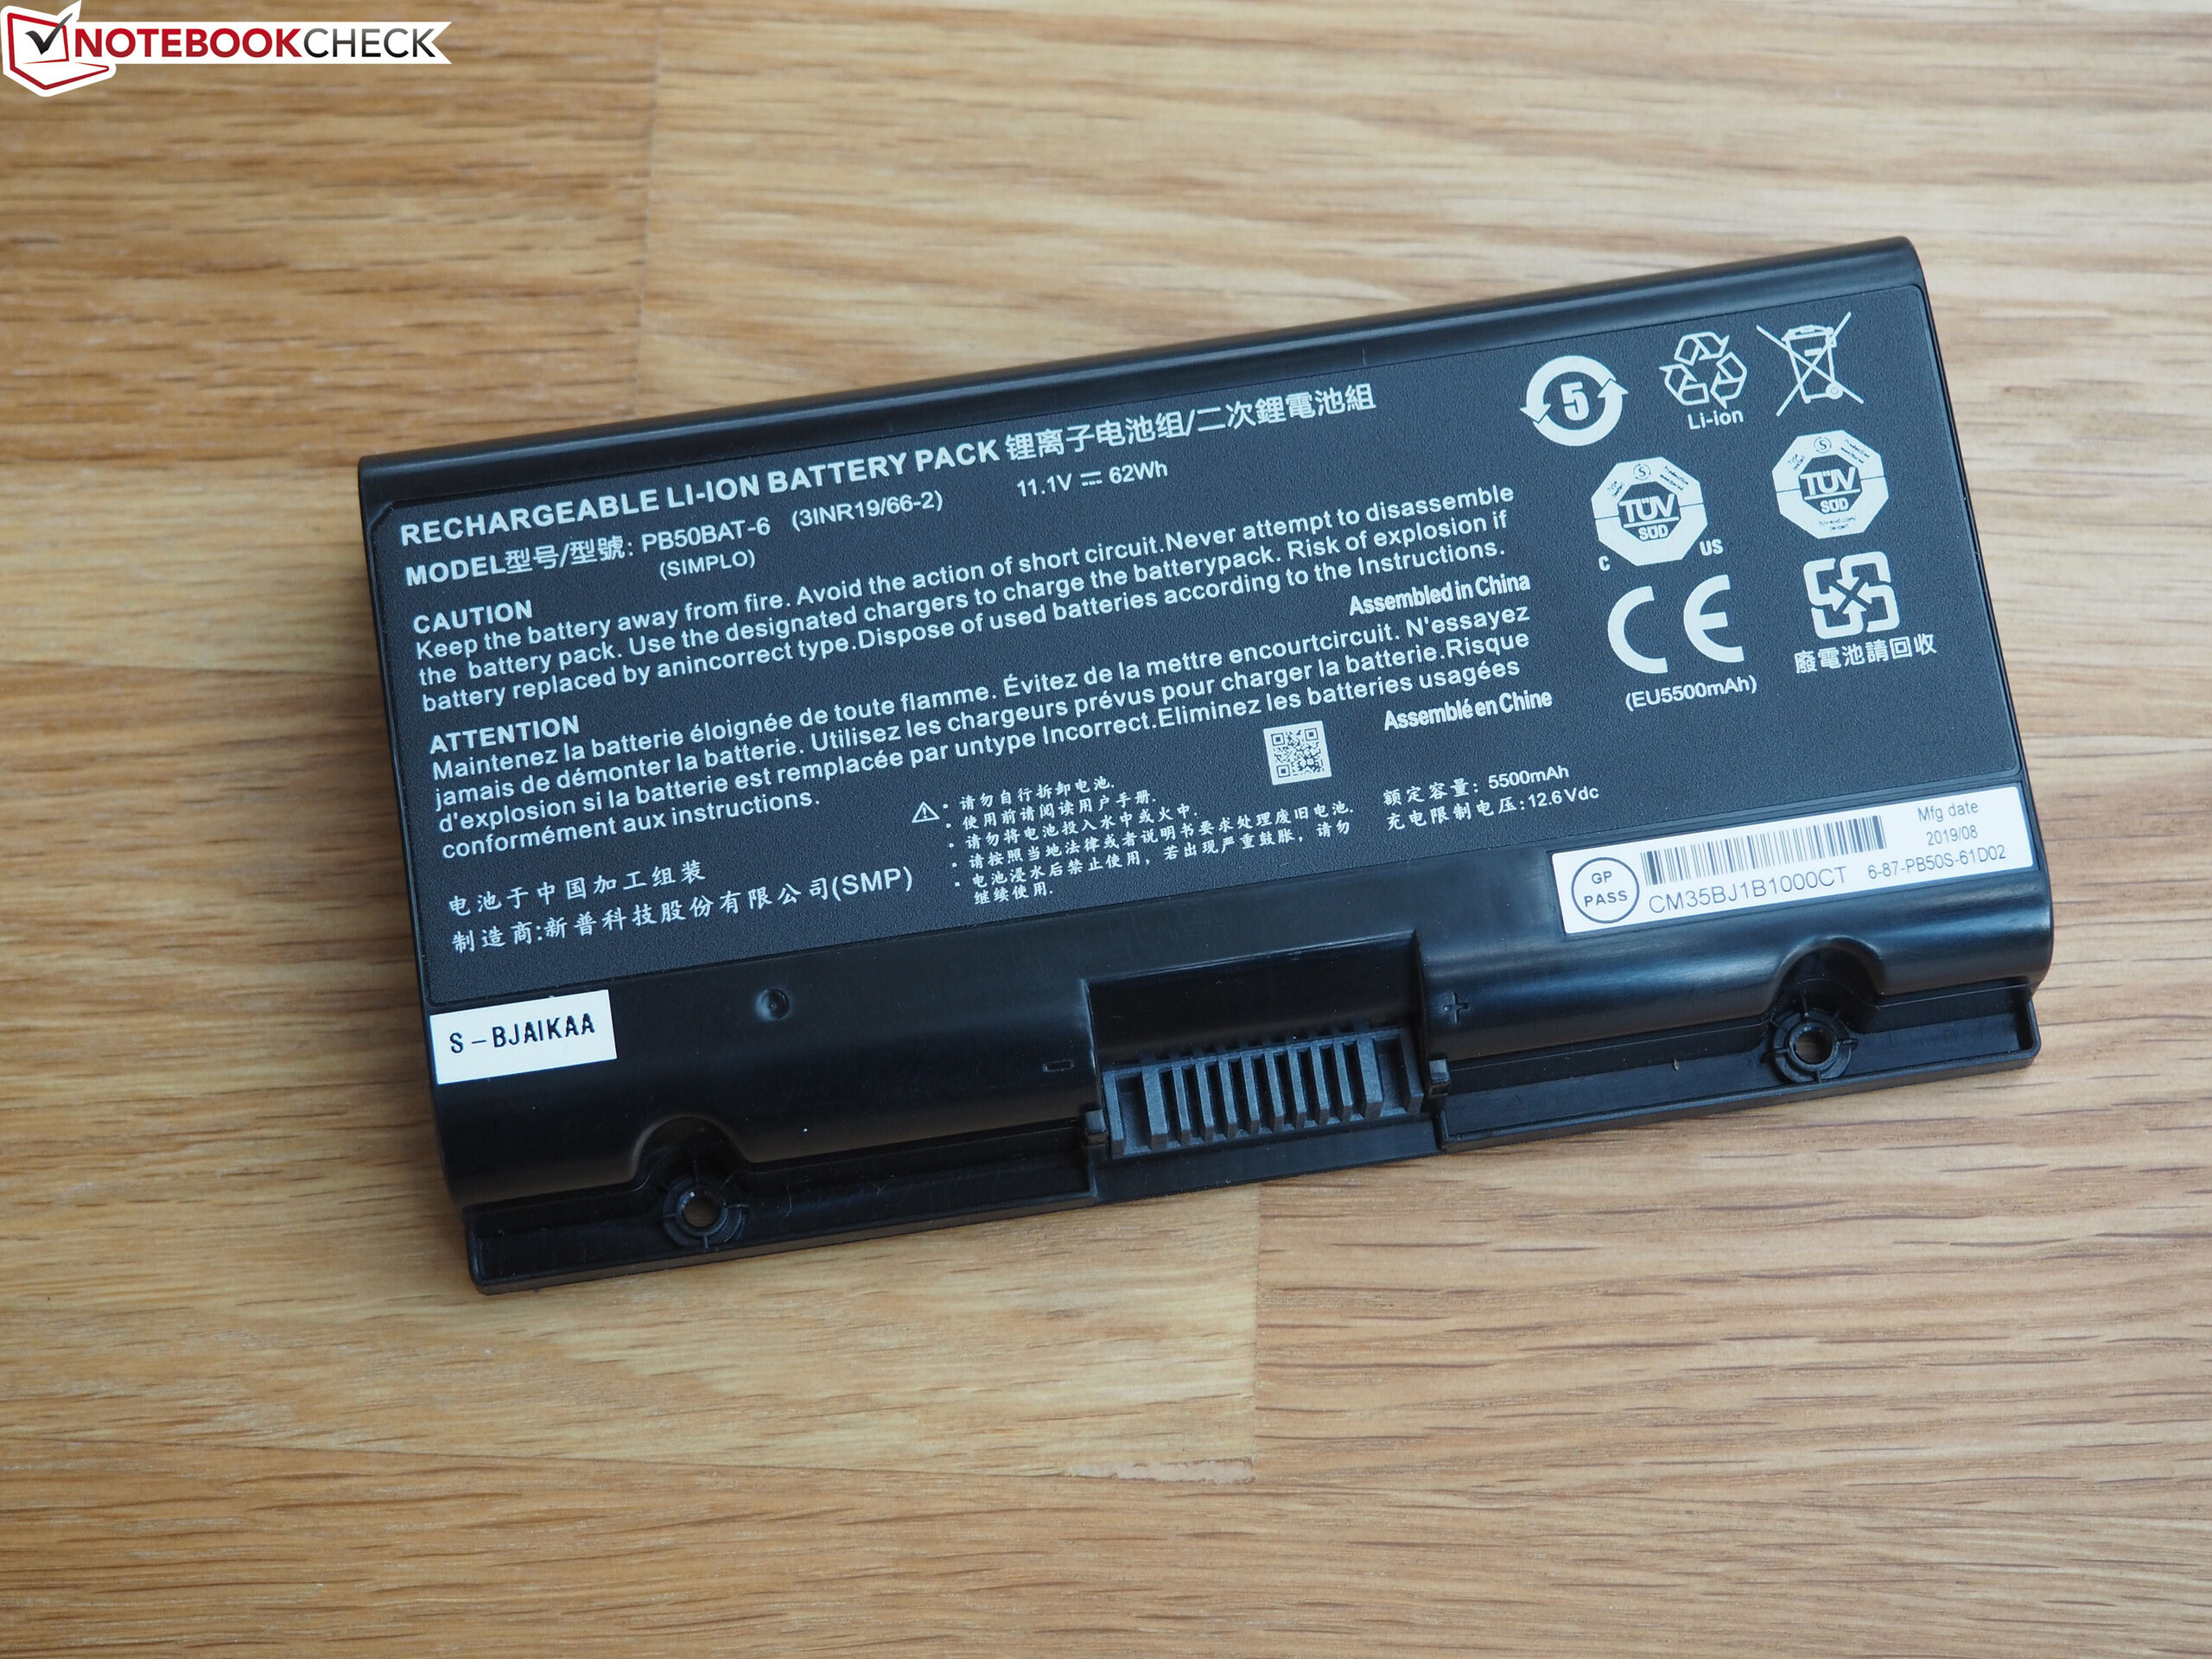
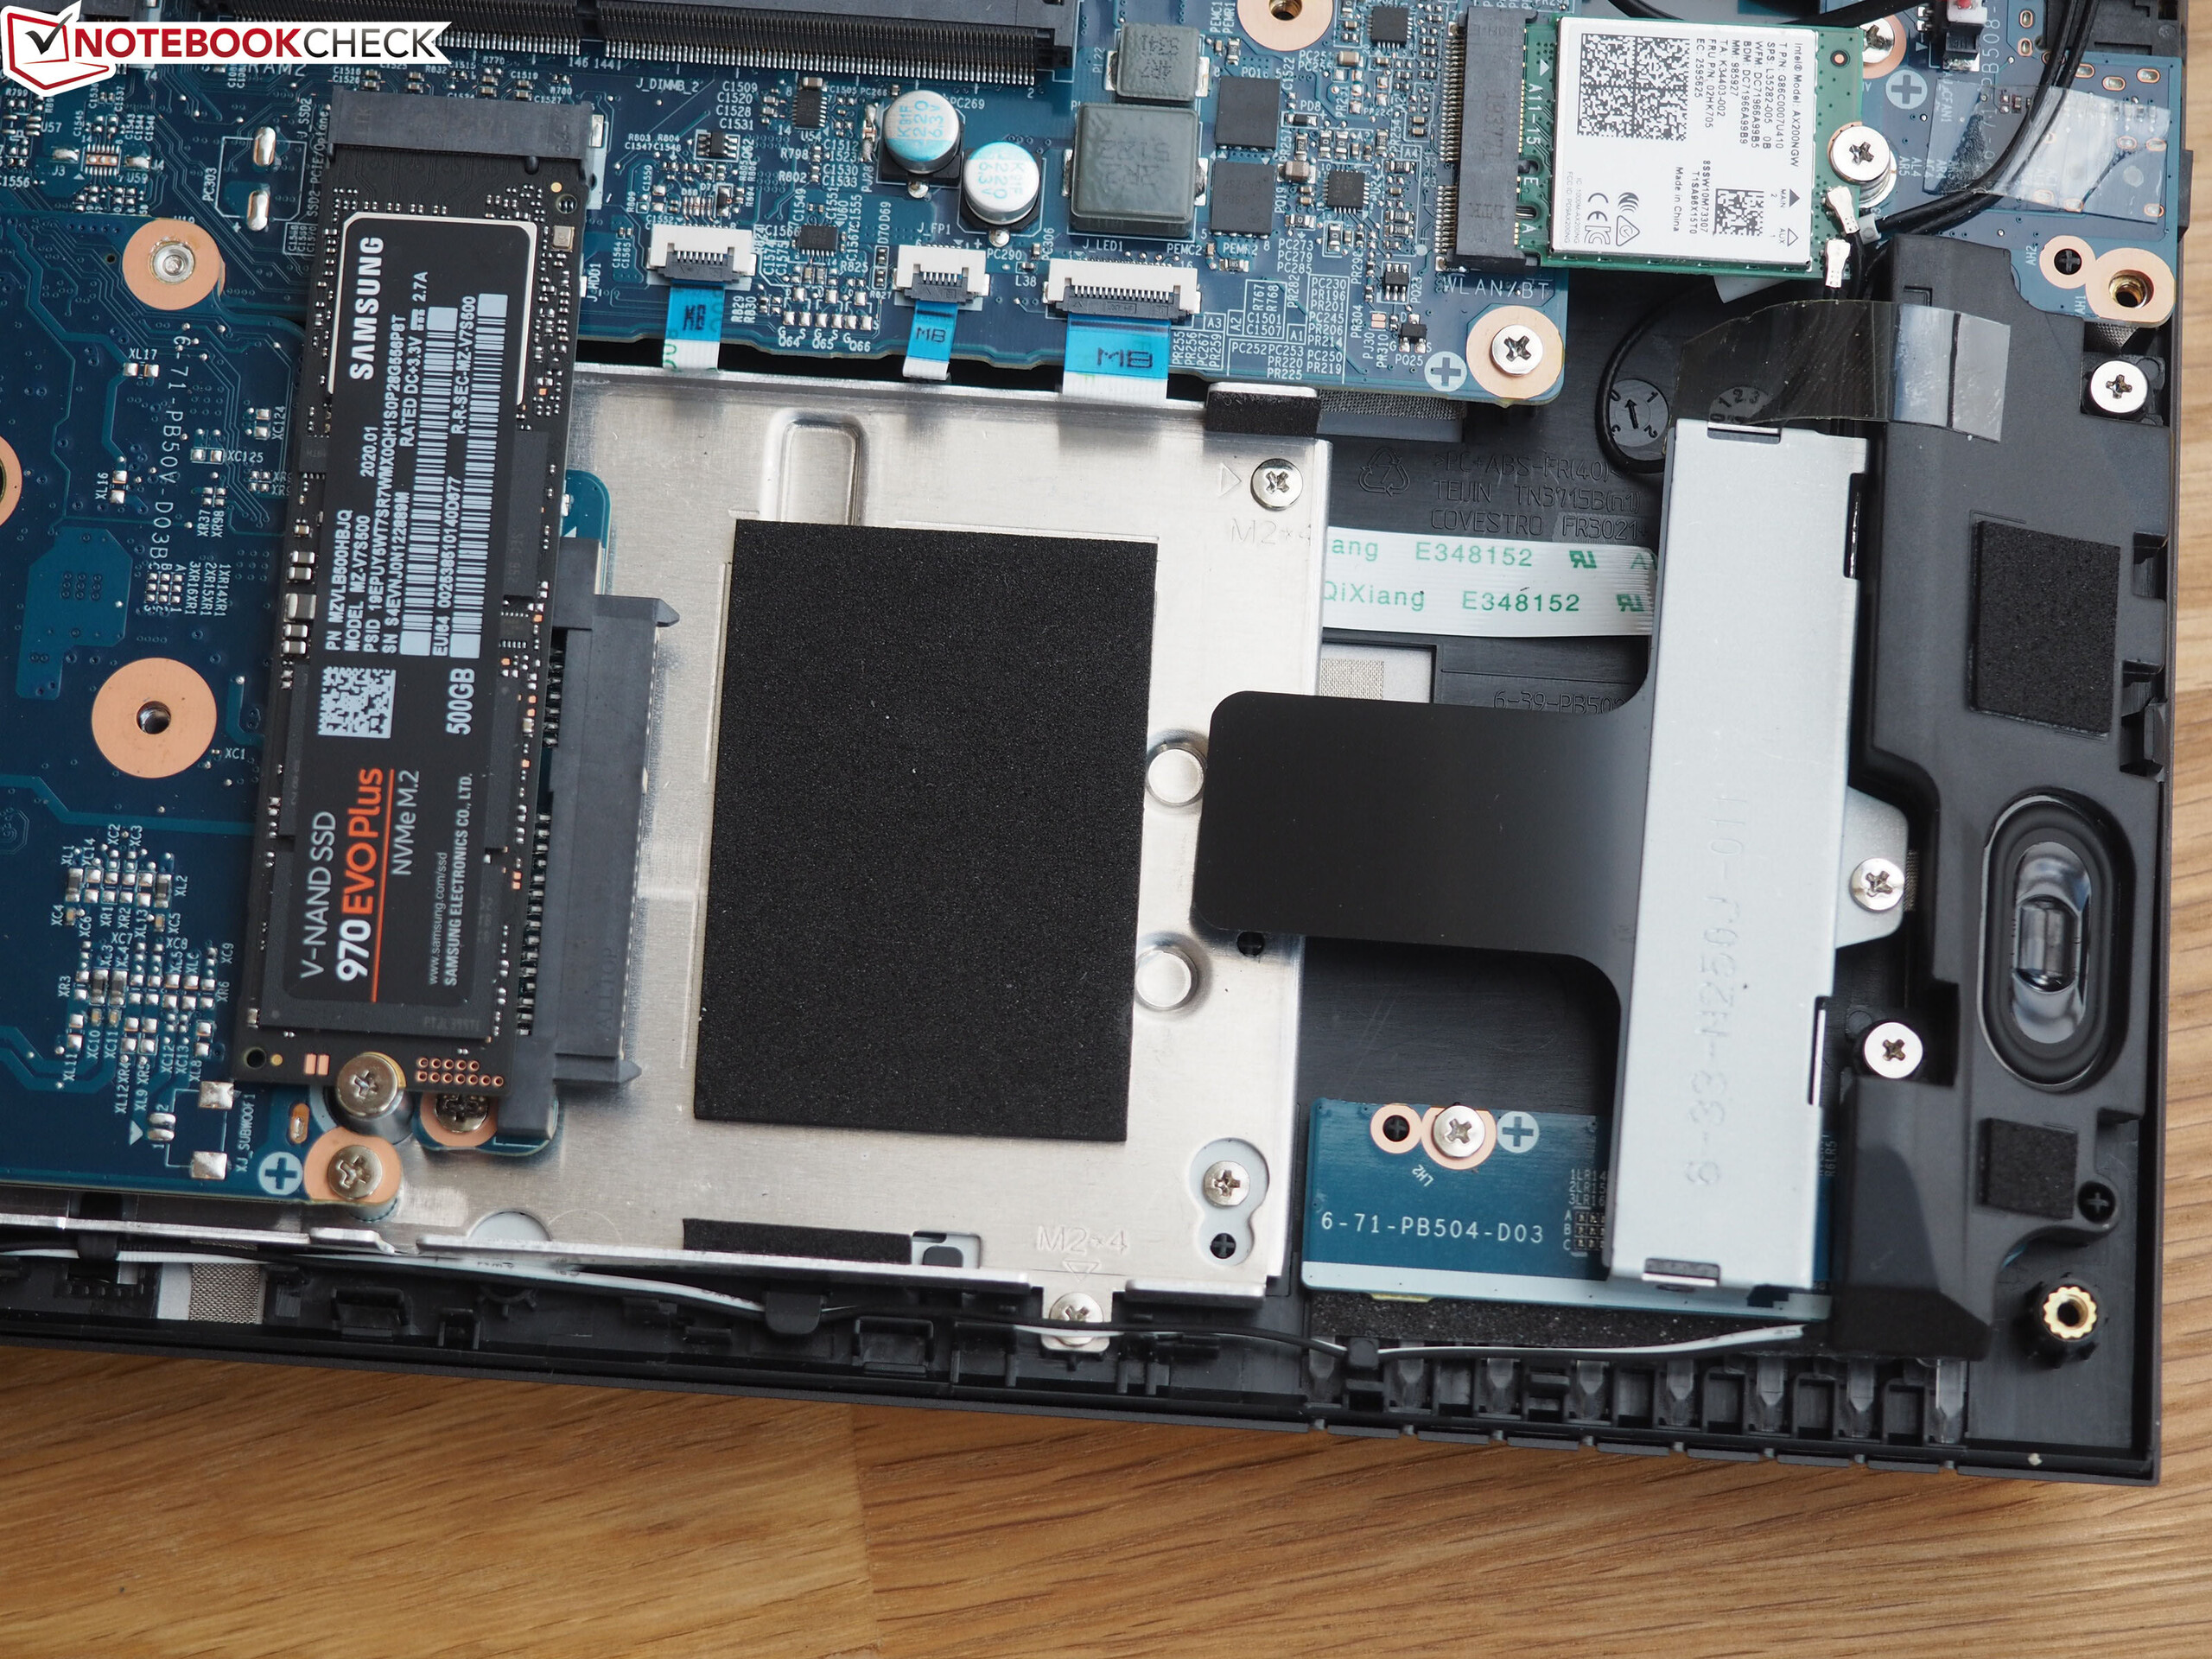
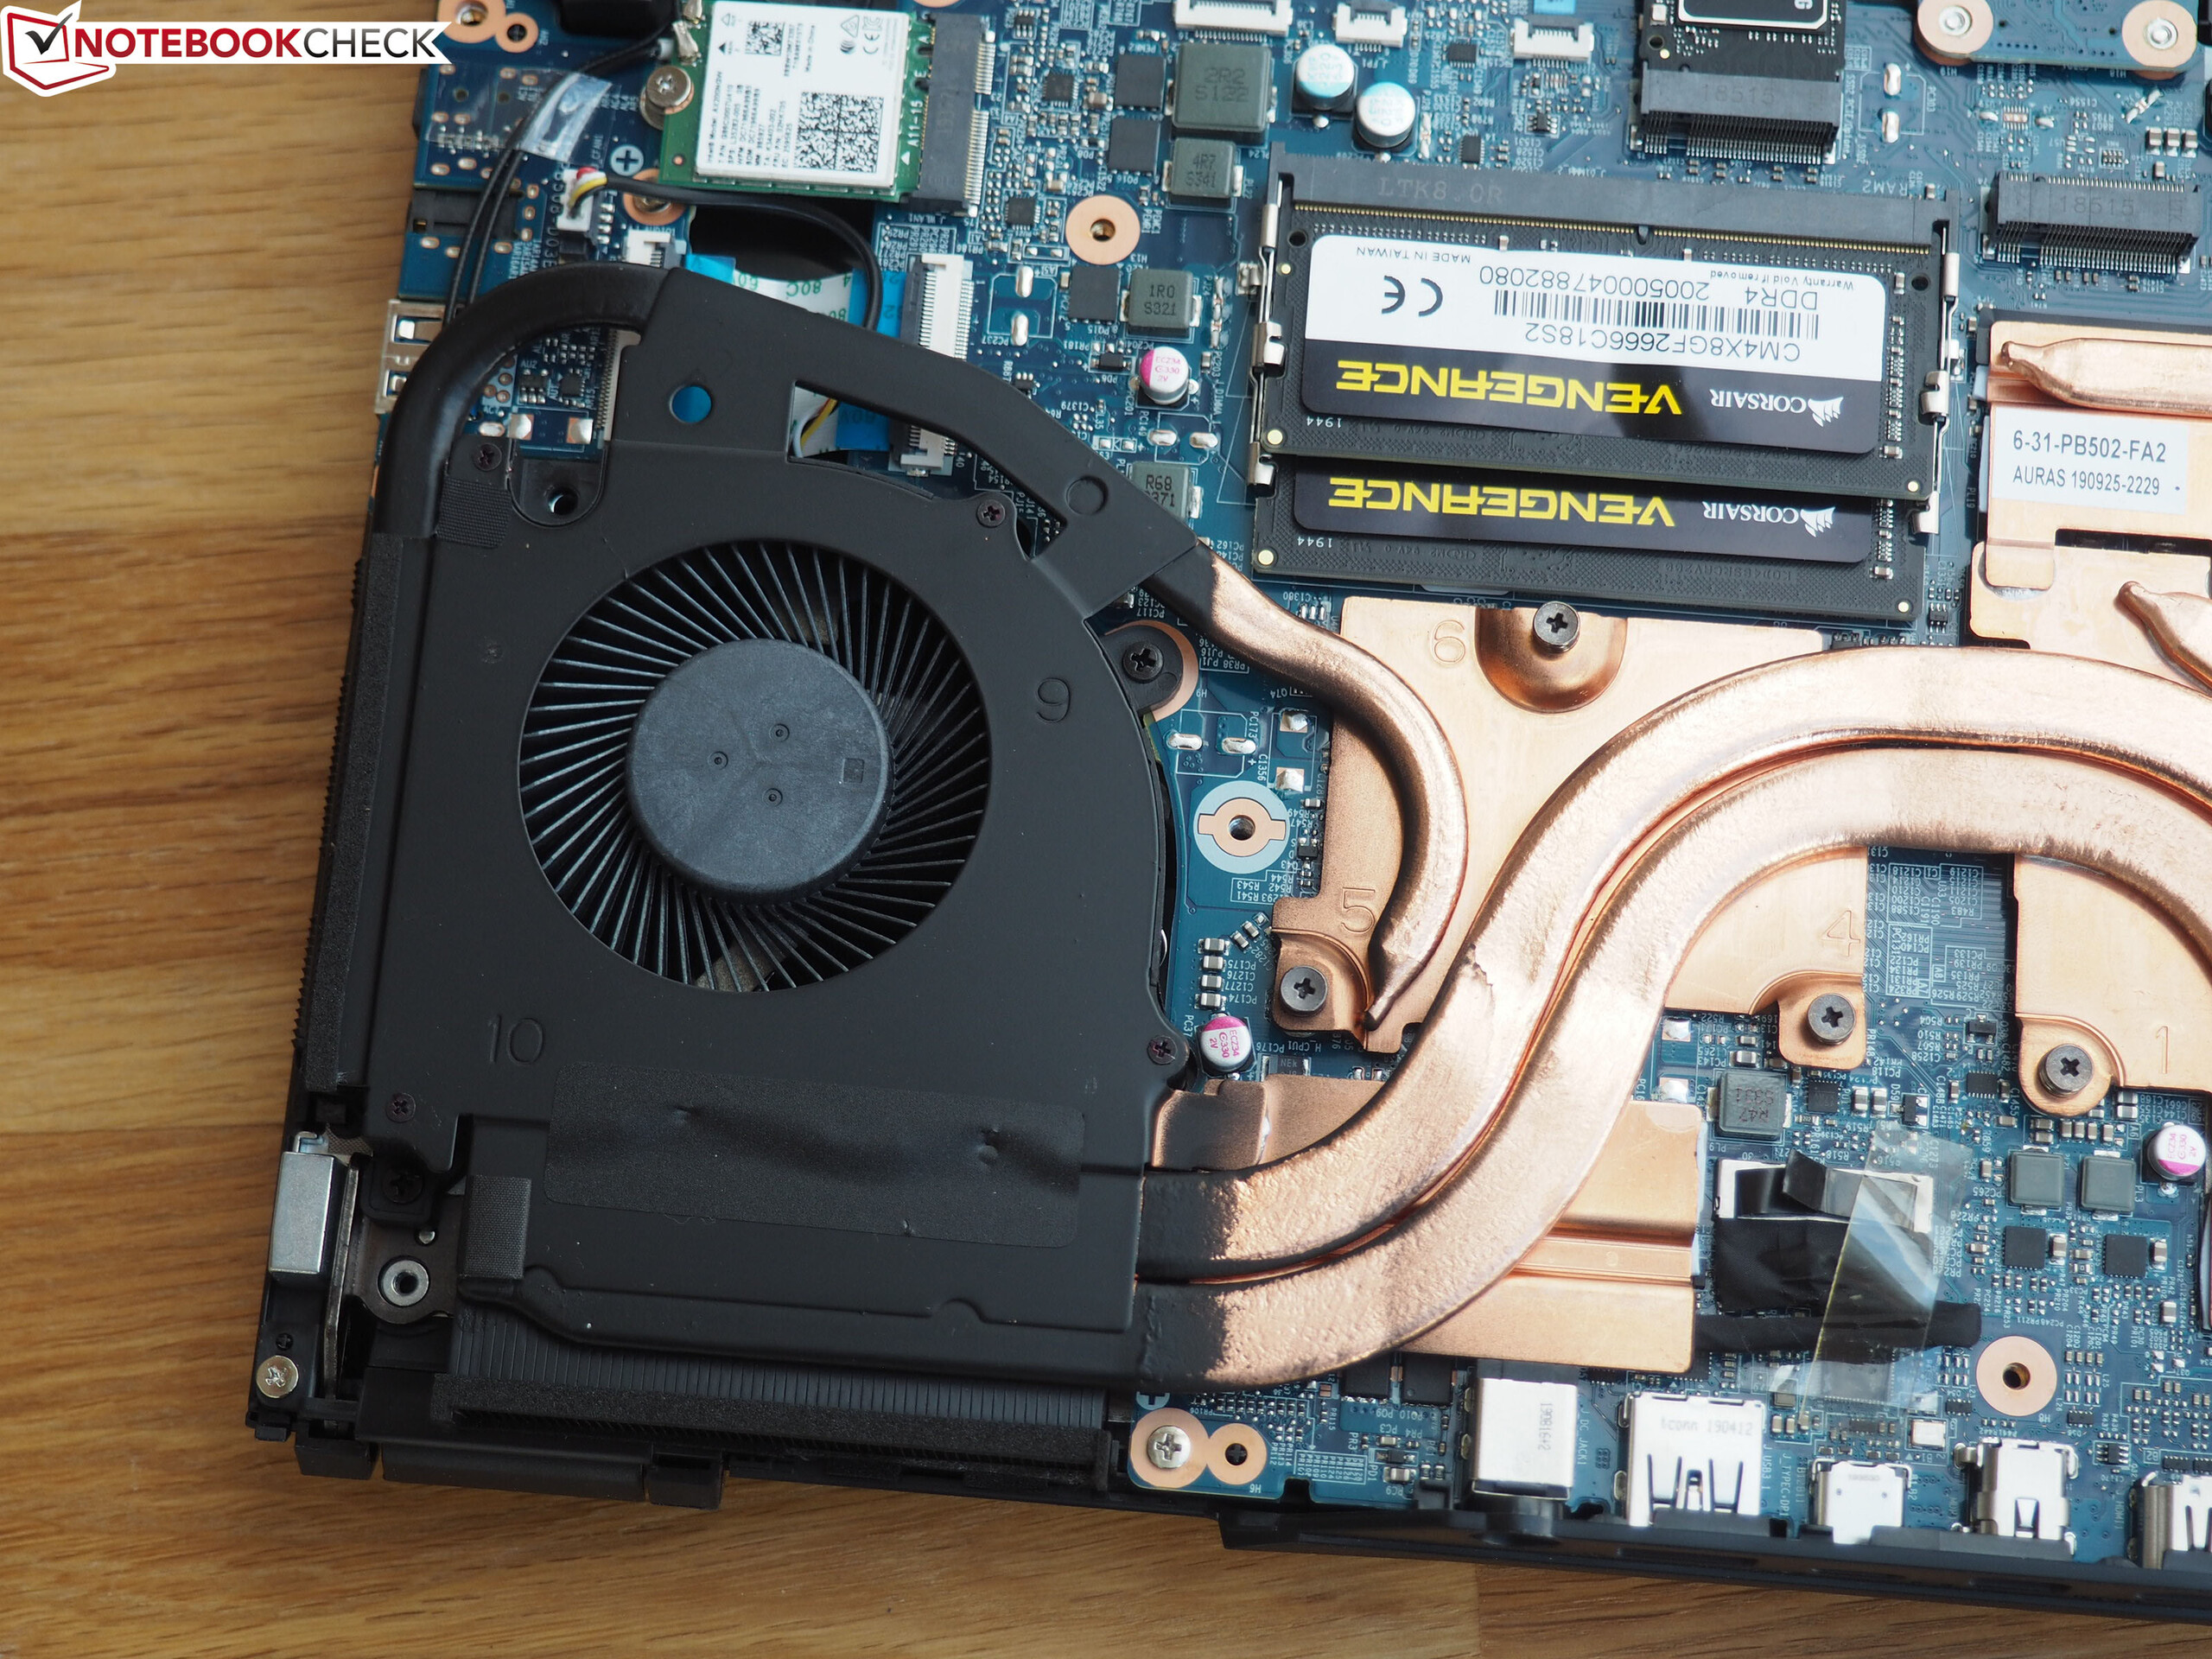
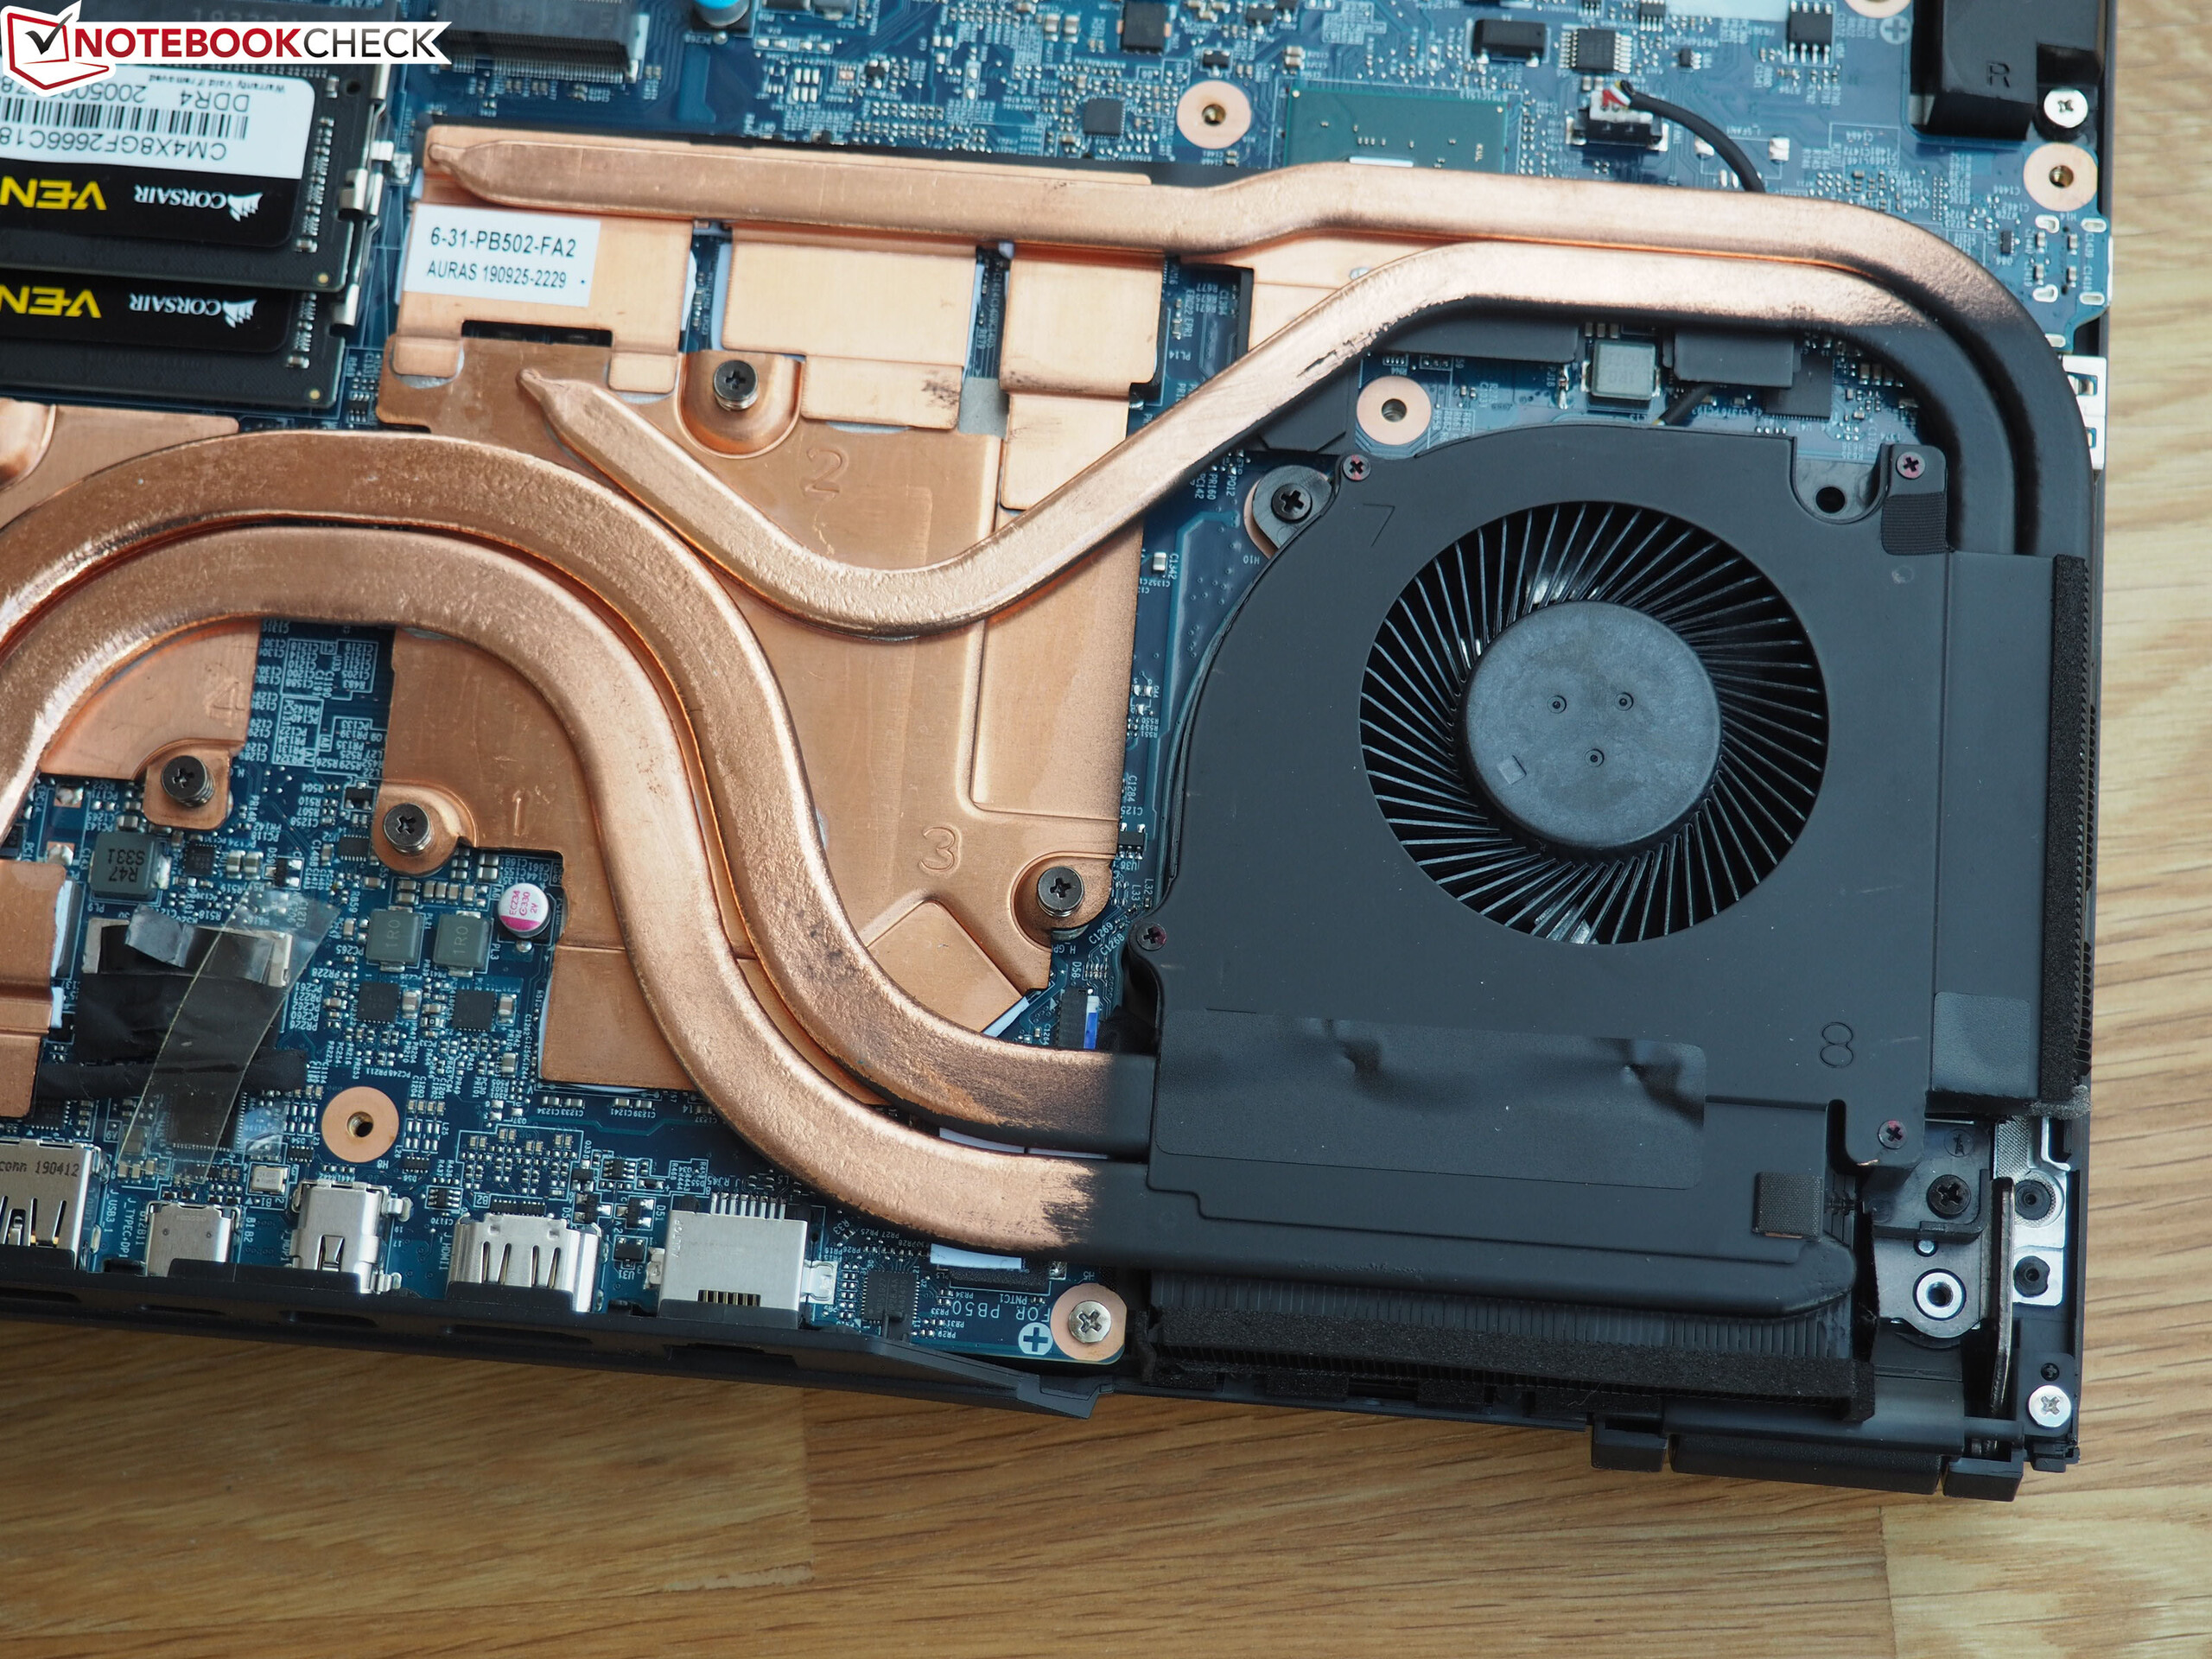
To get to the insides, users will have to remove the entire bottom cover of the base unit. Once this is done, you gain access to the RAM and storage slots, the Wi-Fi adapter, the processor and graphics card. The two latter elements are soldered on and are covered by a clever cooling system that consists of two cooling fans, several heat pipes and metal plates. A great advantage: Unlike with most other laptops nowadays, the battery is directly accessible from the outside.
Warranty
The standard warranty runs for 24 months. Buyers can also purchase a warranty extension that prolongs it to three years and/or includes a fast repair service.
Input Devices
Keyboard
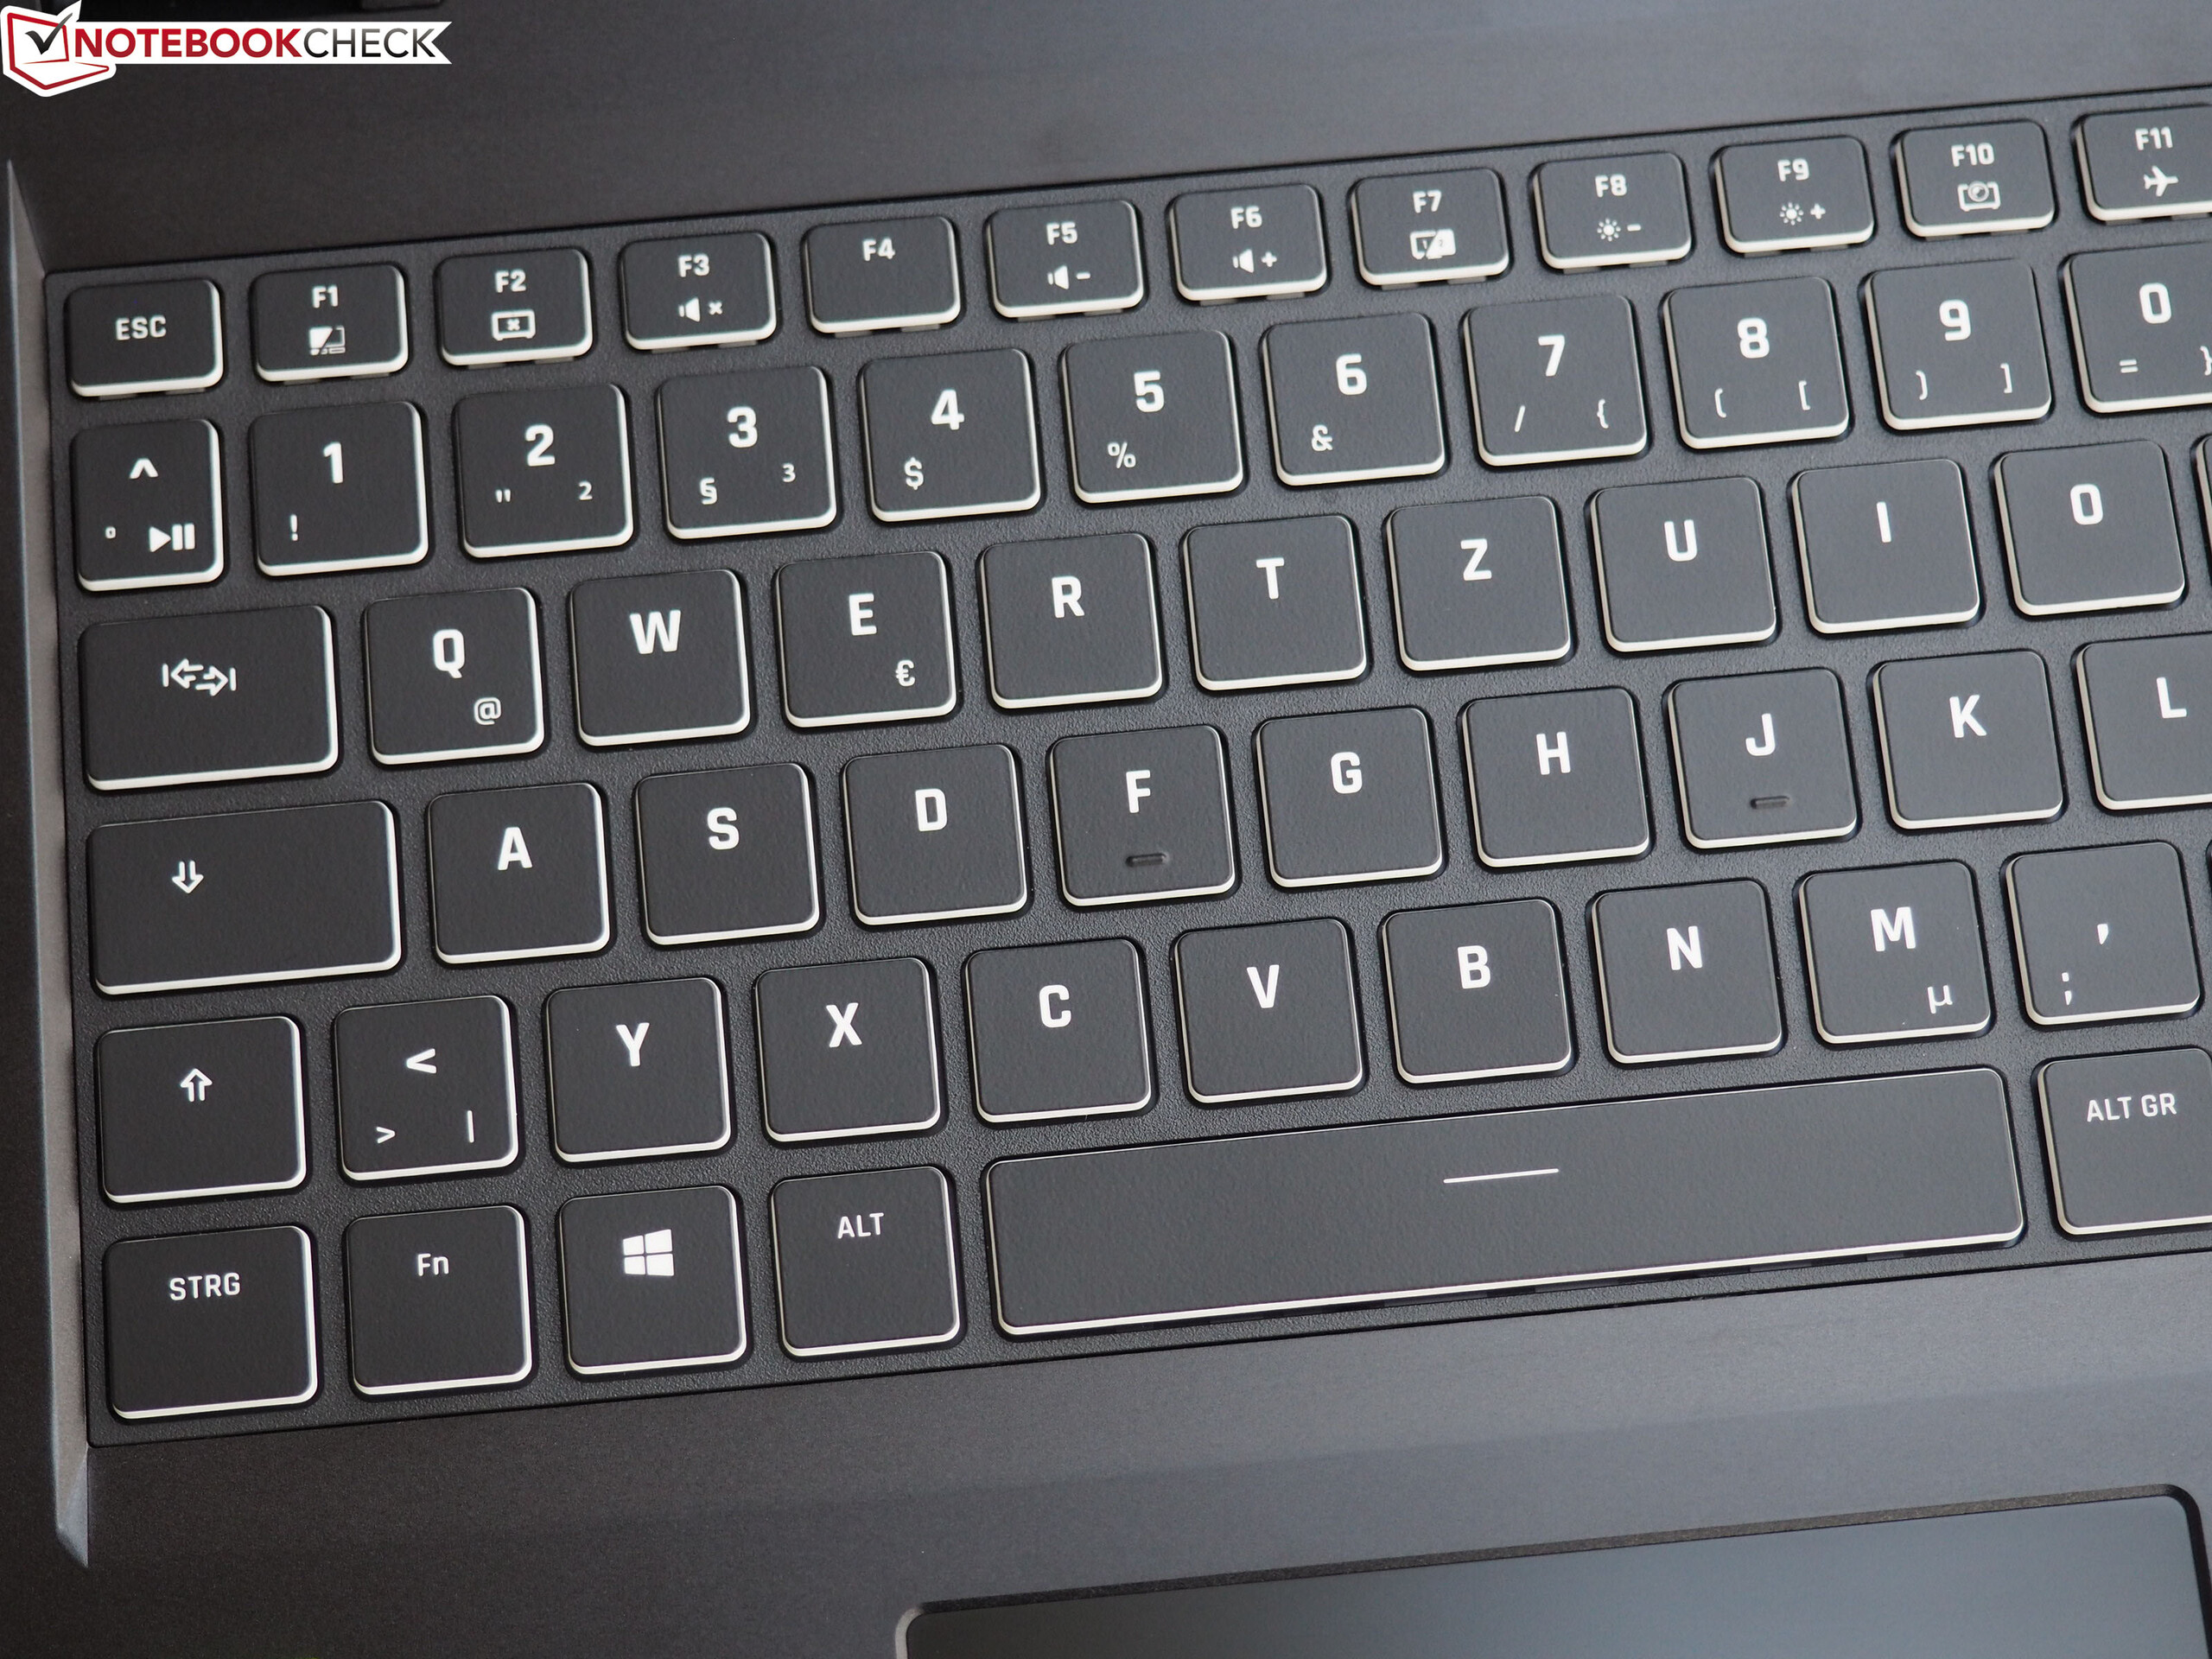
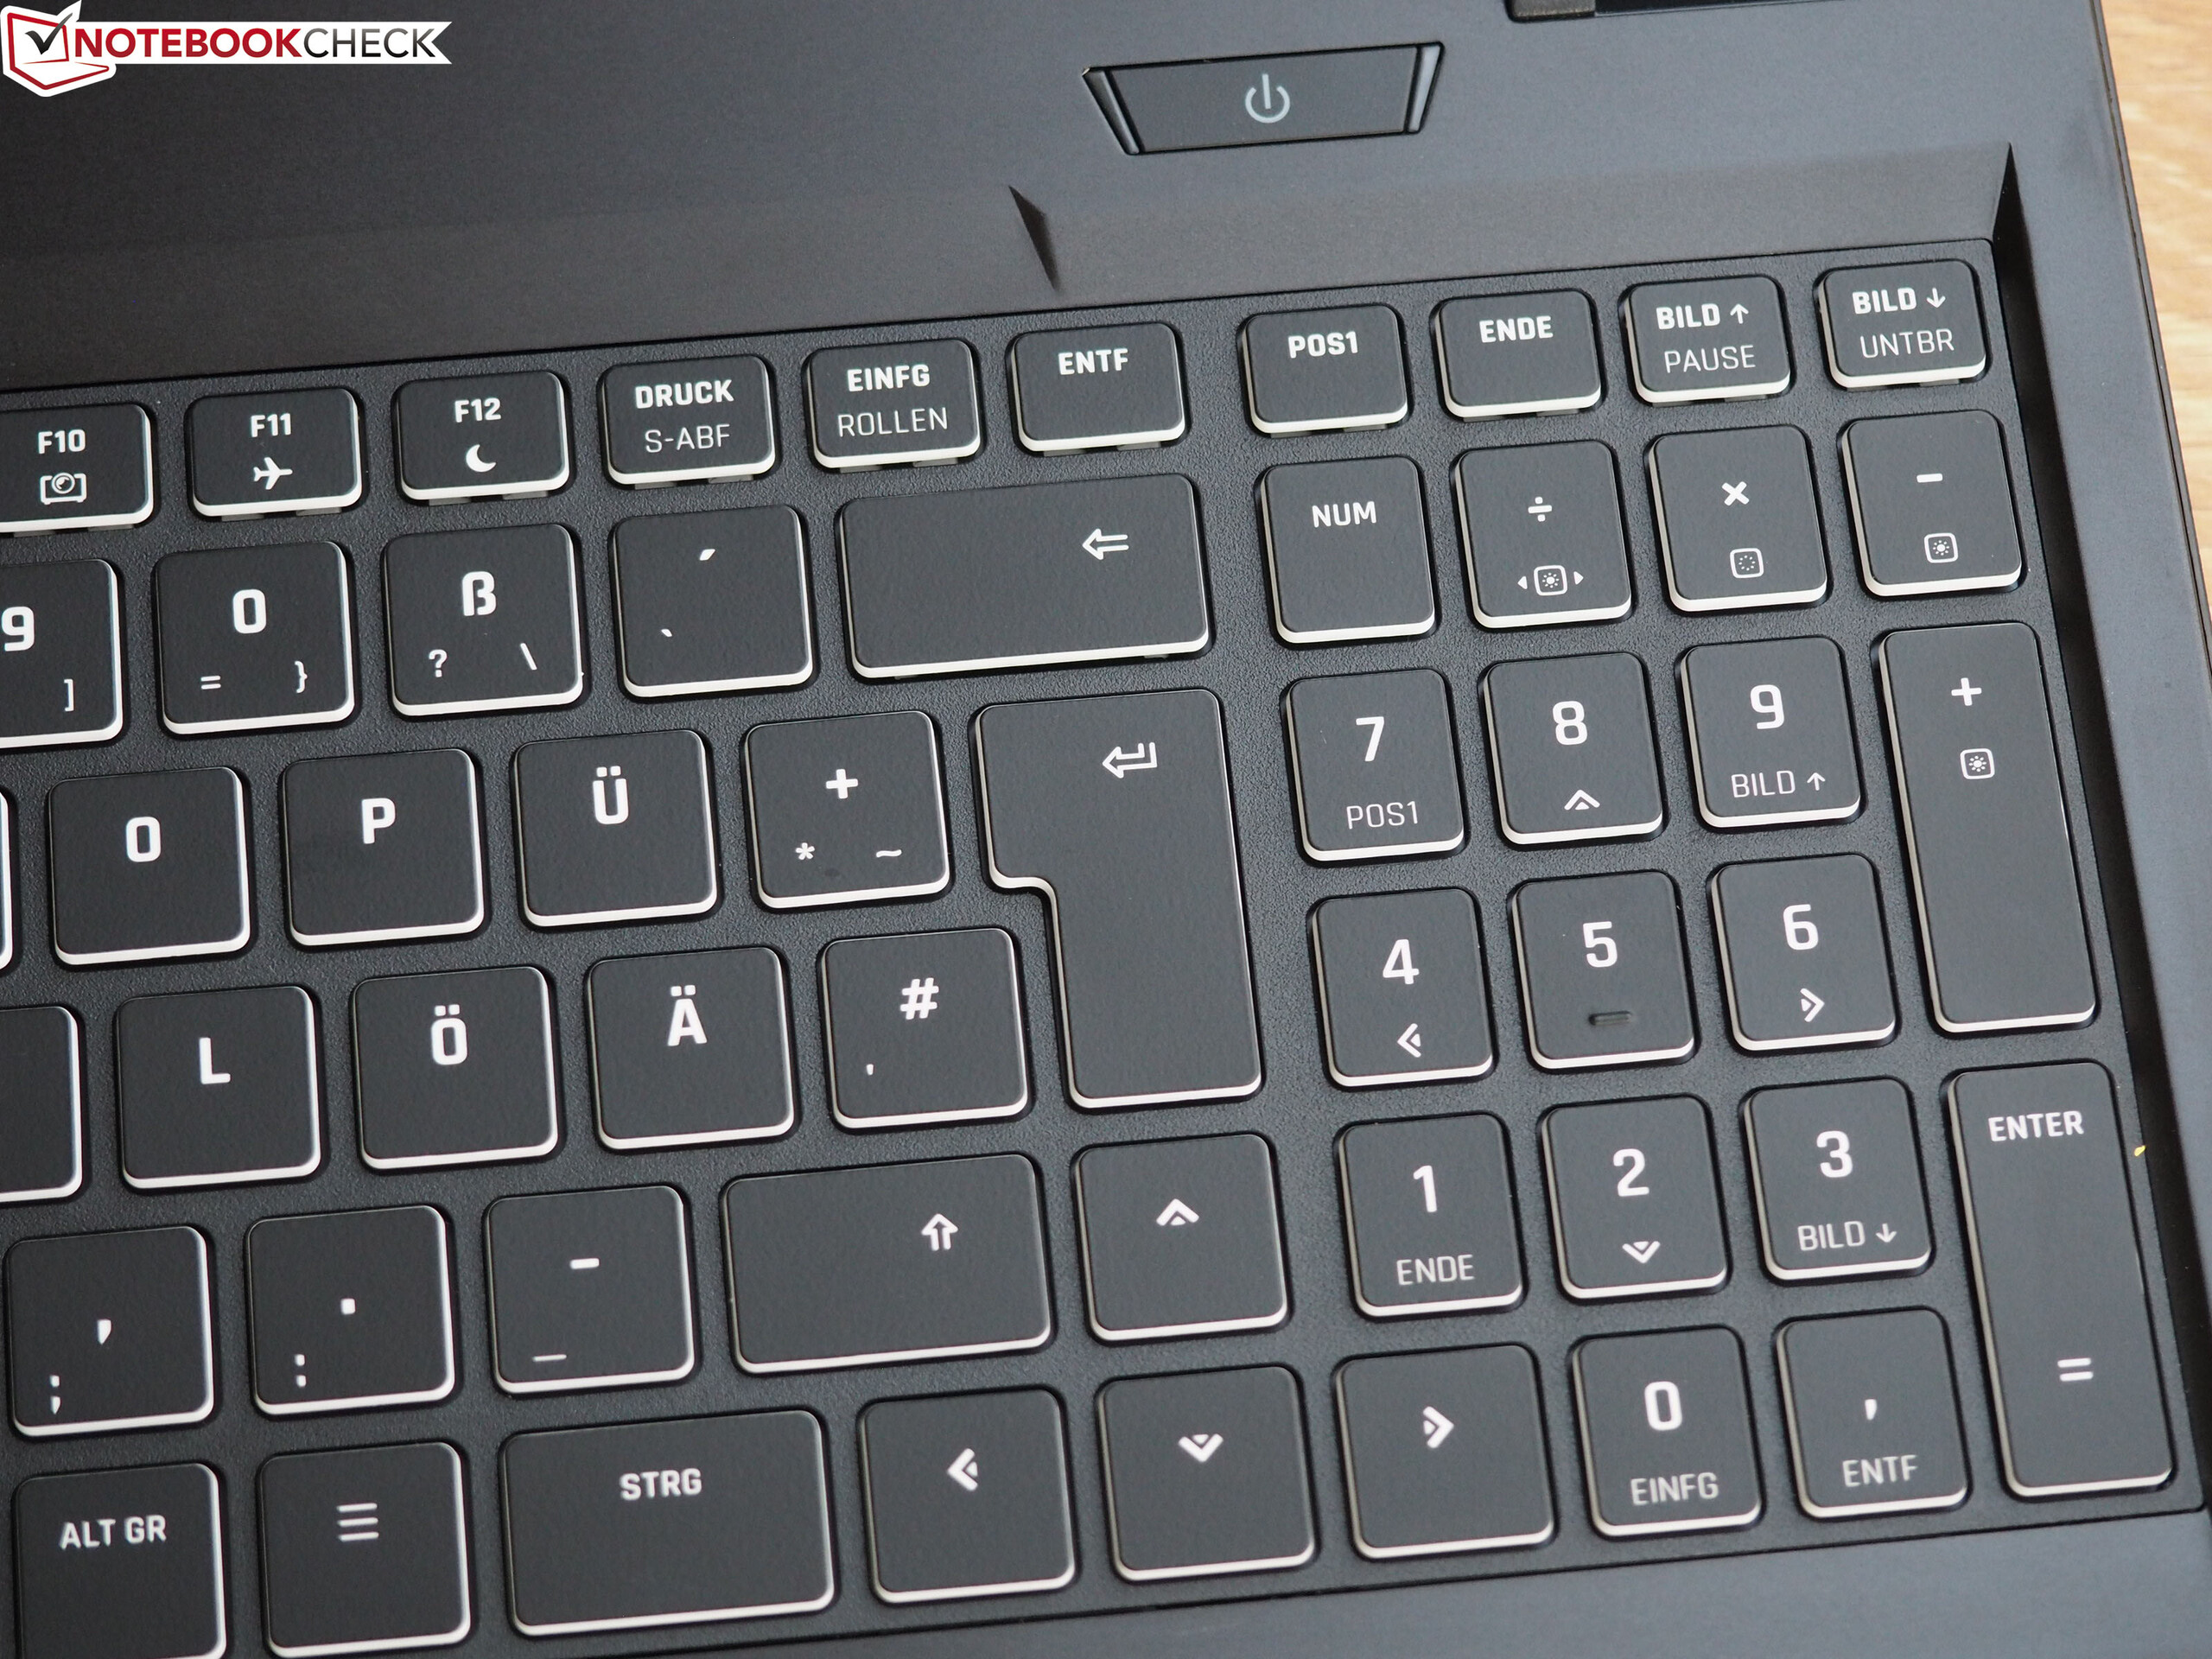
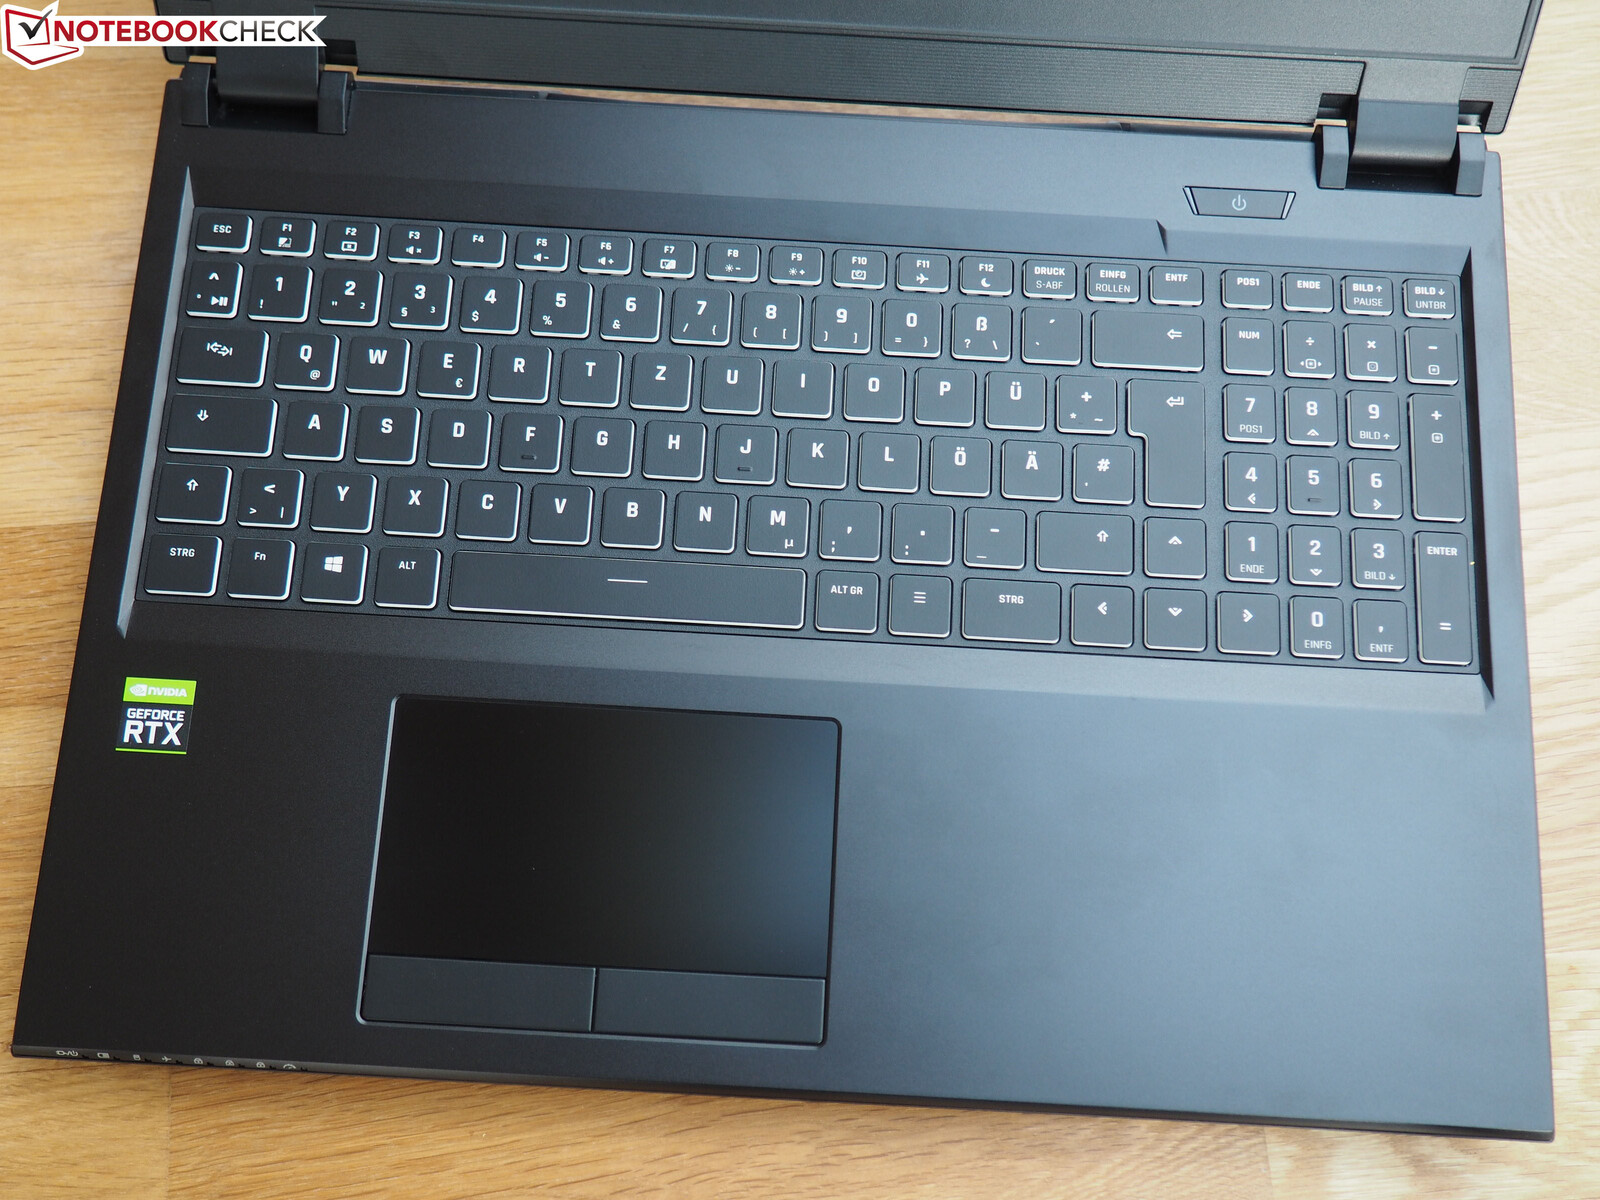
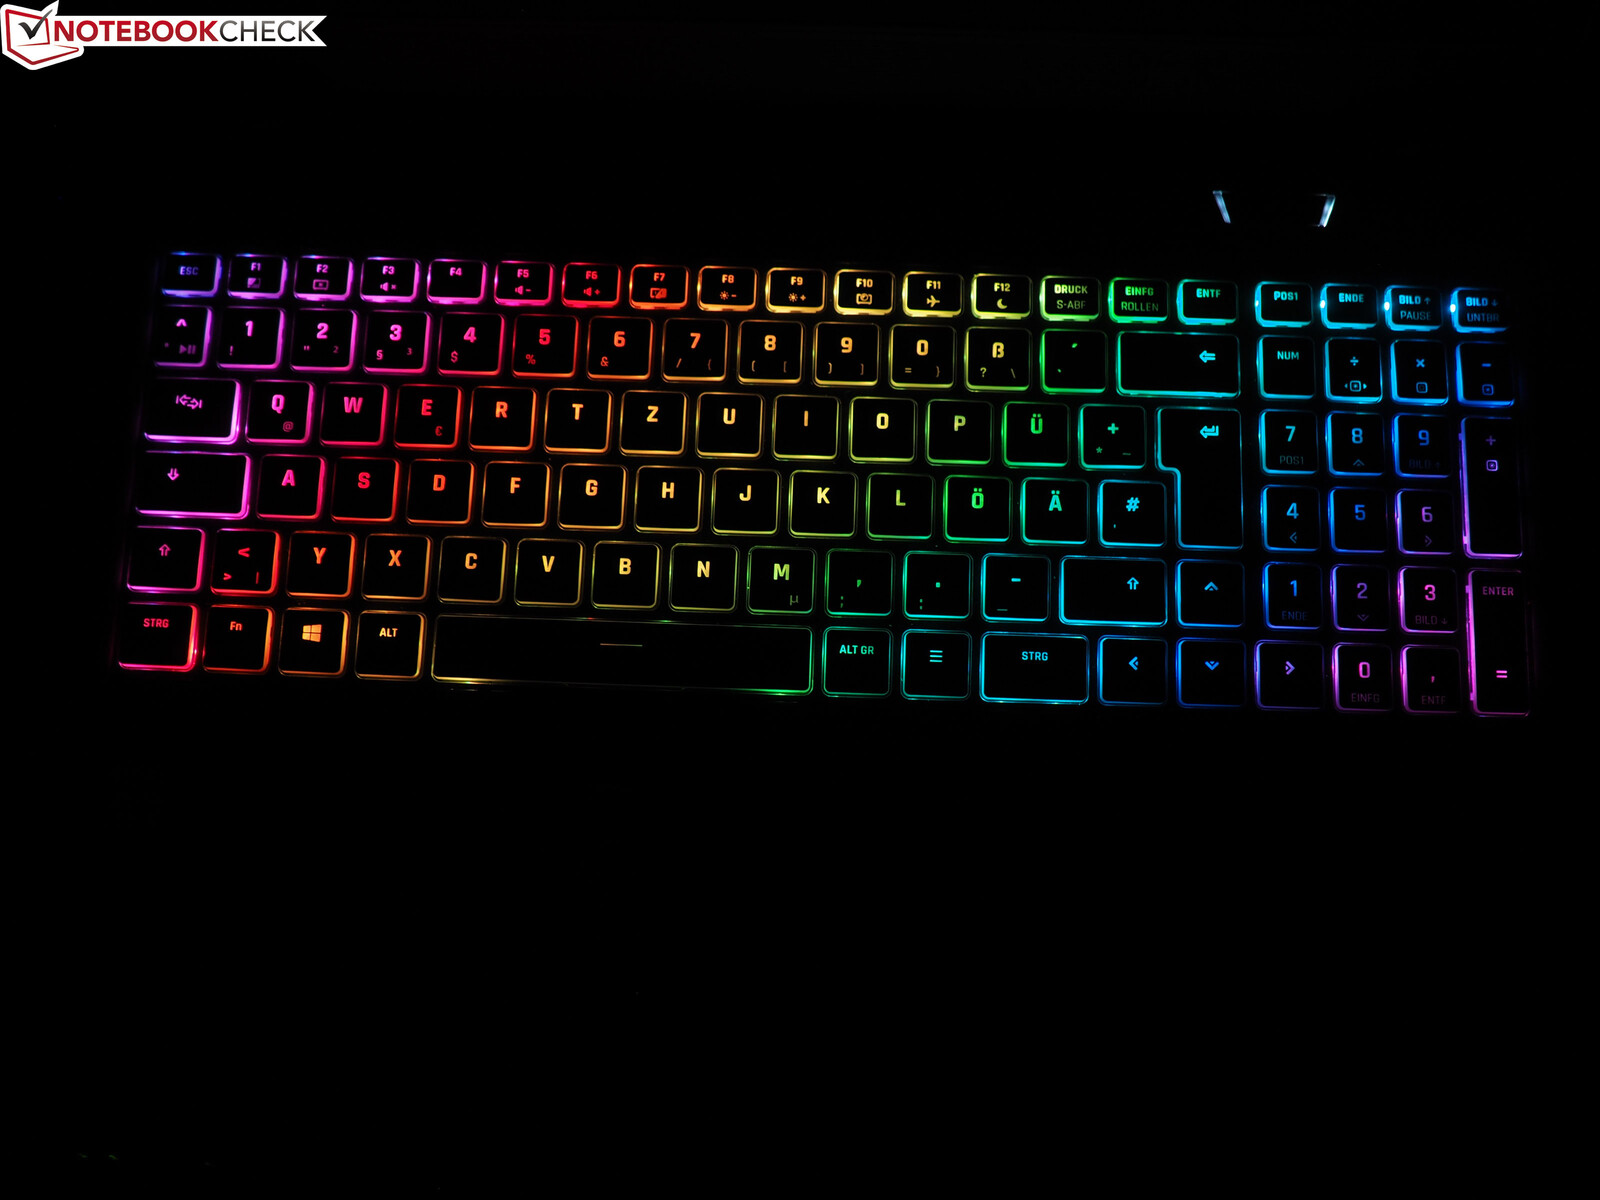
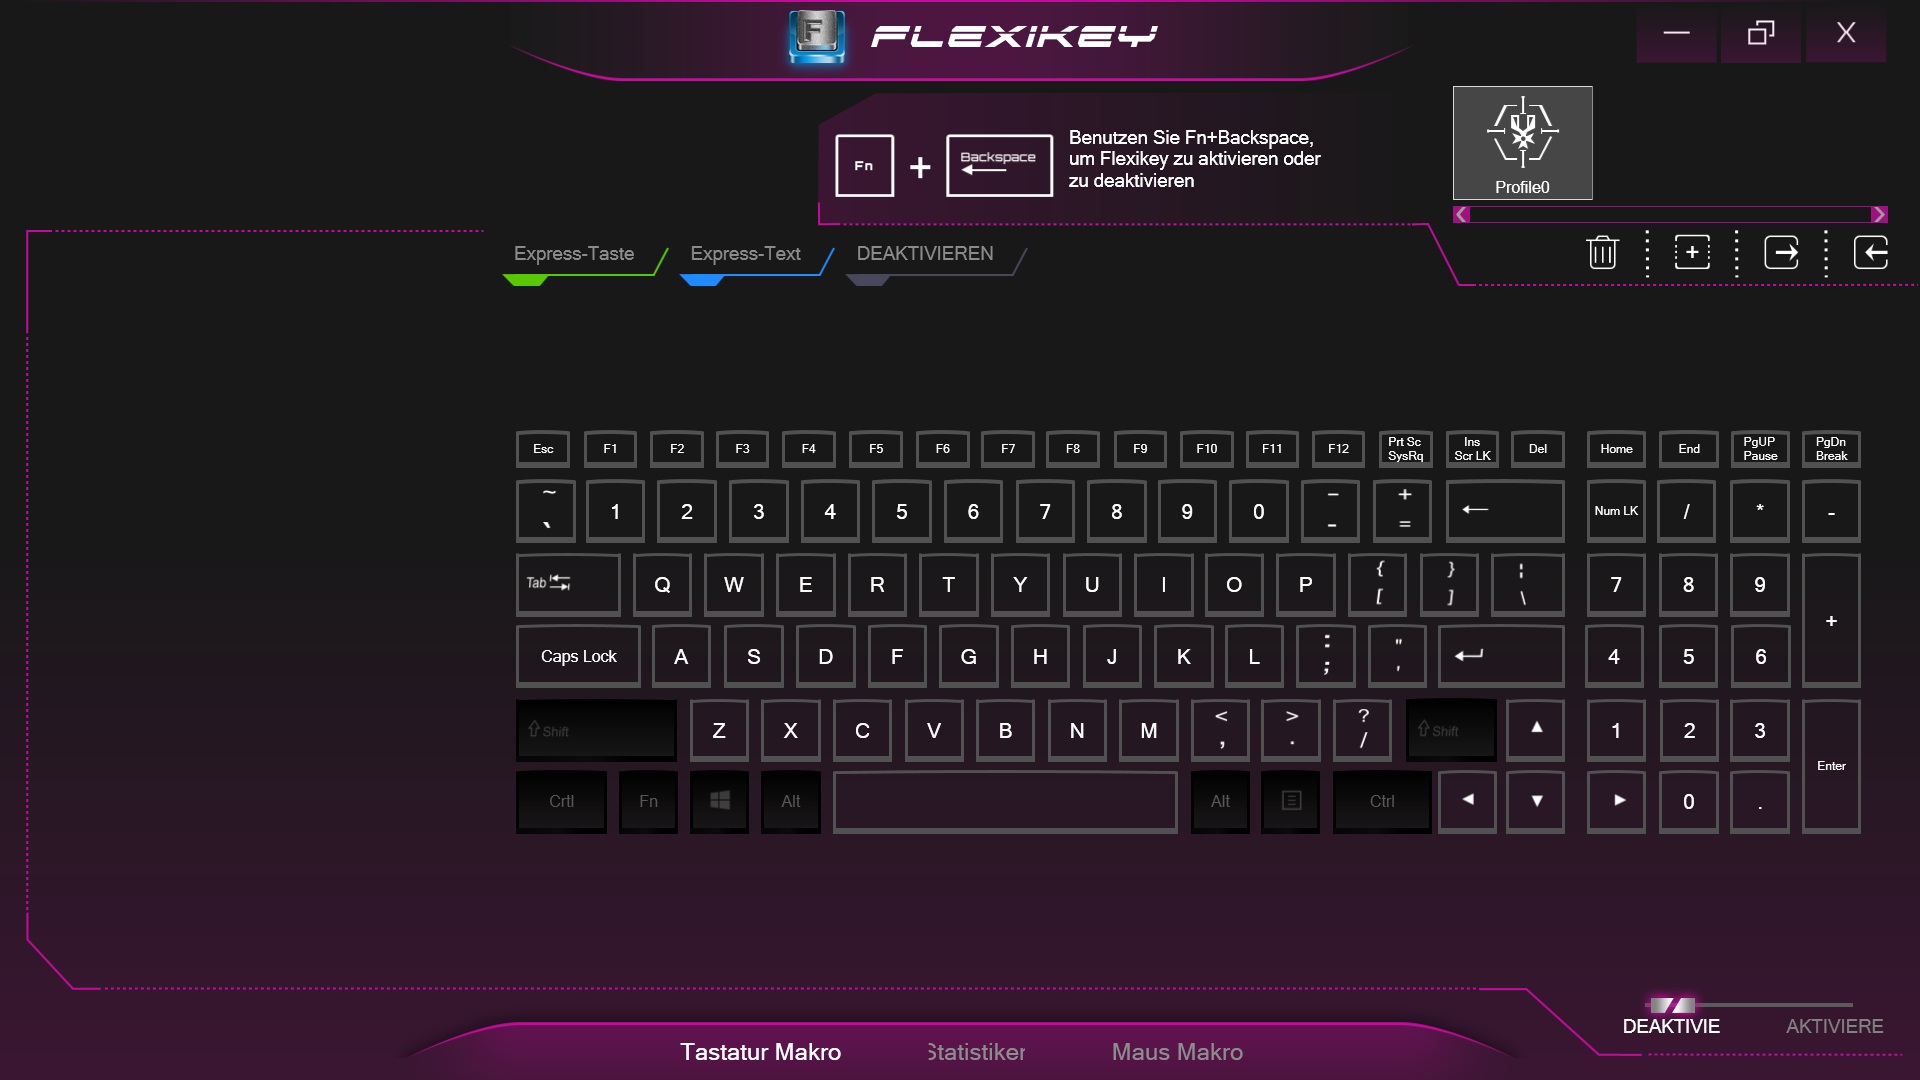
Although the chiclet keyboard tends to rattle a little in the center and gives way noticeably under pressure, the keyboard itself gives a good impression. Despite the limited available space, the manufacturer has included a fully functional (albeit narrow) number pad, which is considered a must-have by some users. Typing turns out to be very comfortable and neither too hard nor too soft. The layout of the German version is depicted below.
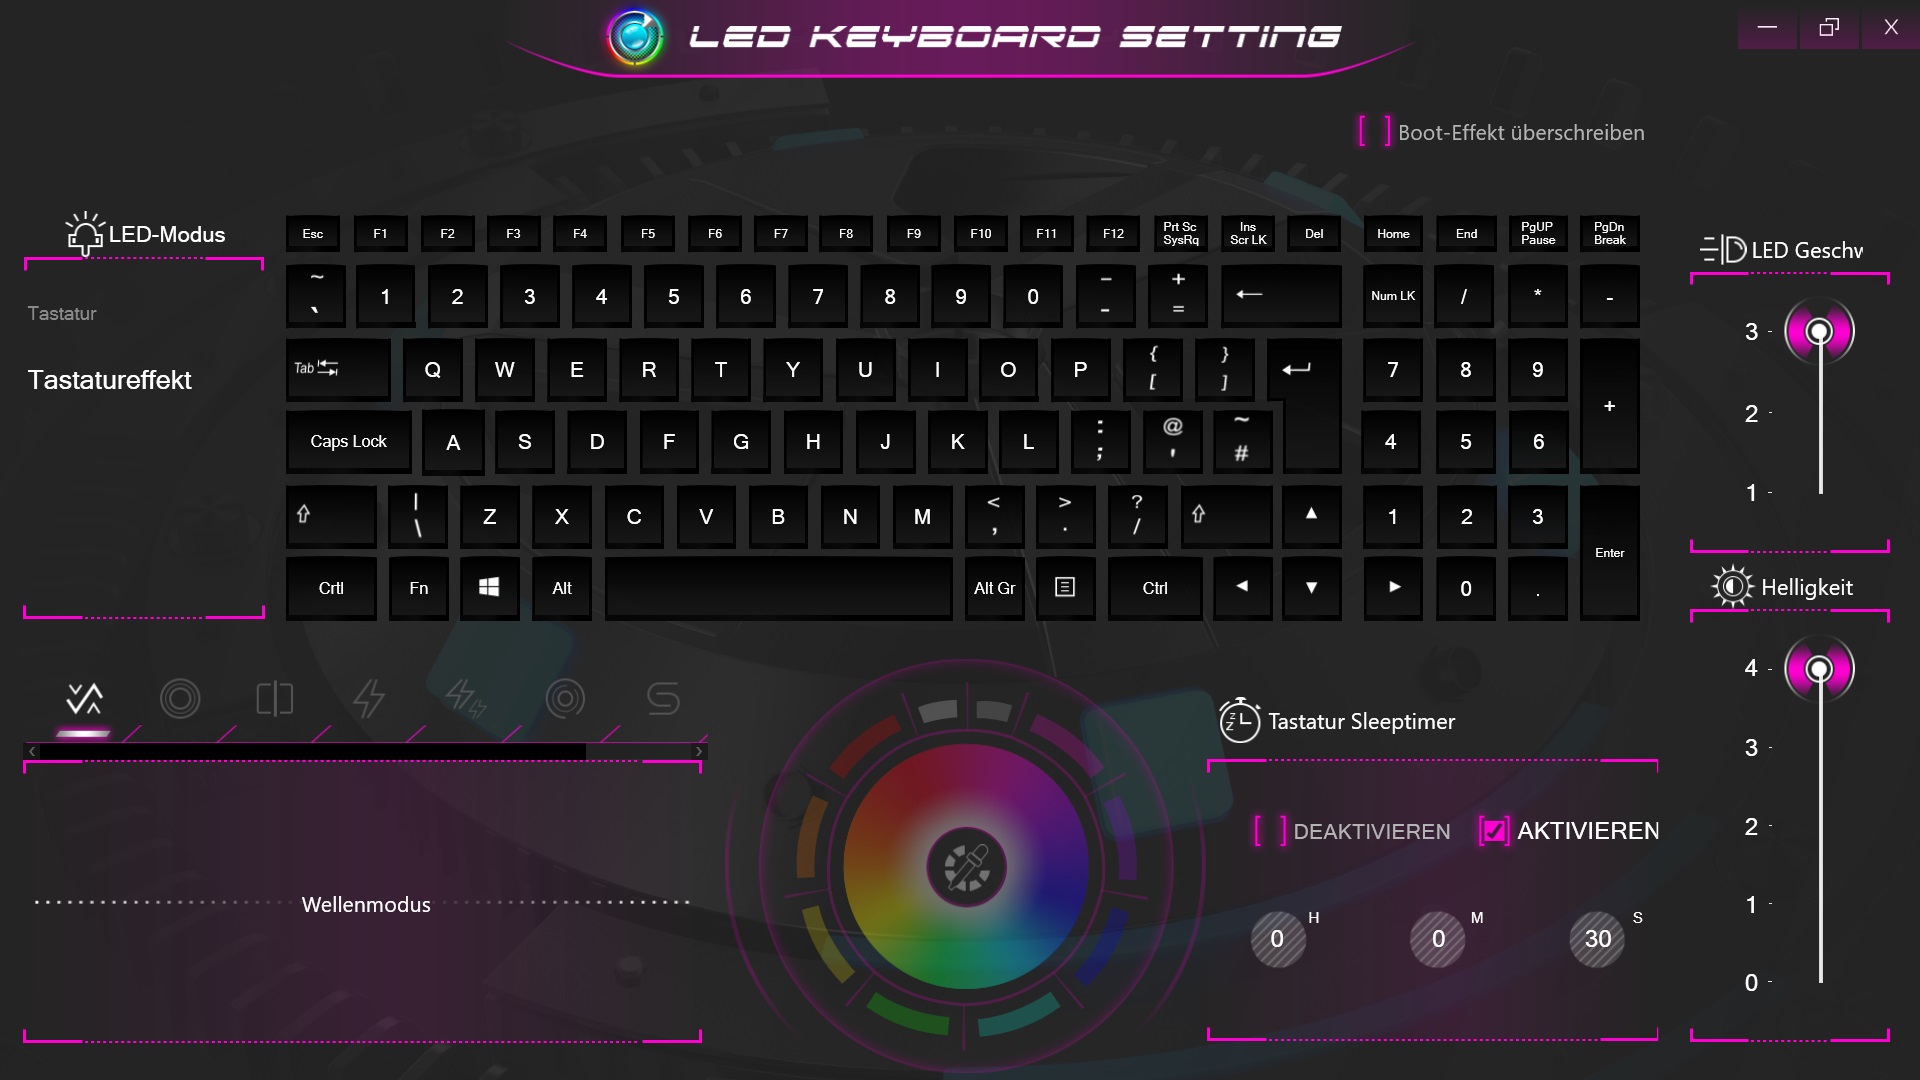
The biggest highlight of this keyboard is the RGB backlighting, which can be adapted to personal preferences in a variety of ways using software (mode, color, intensity, speed, etc.). The white rim and lettering make the keyboard easy to read without backlighting during the day.
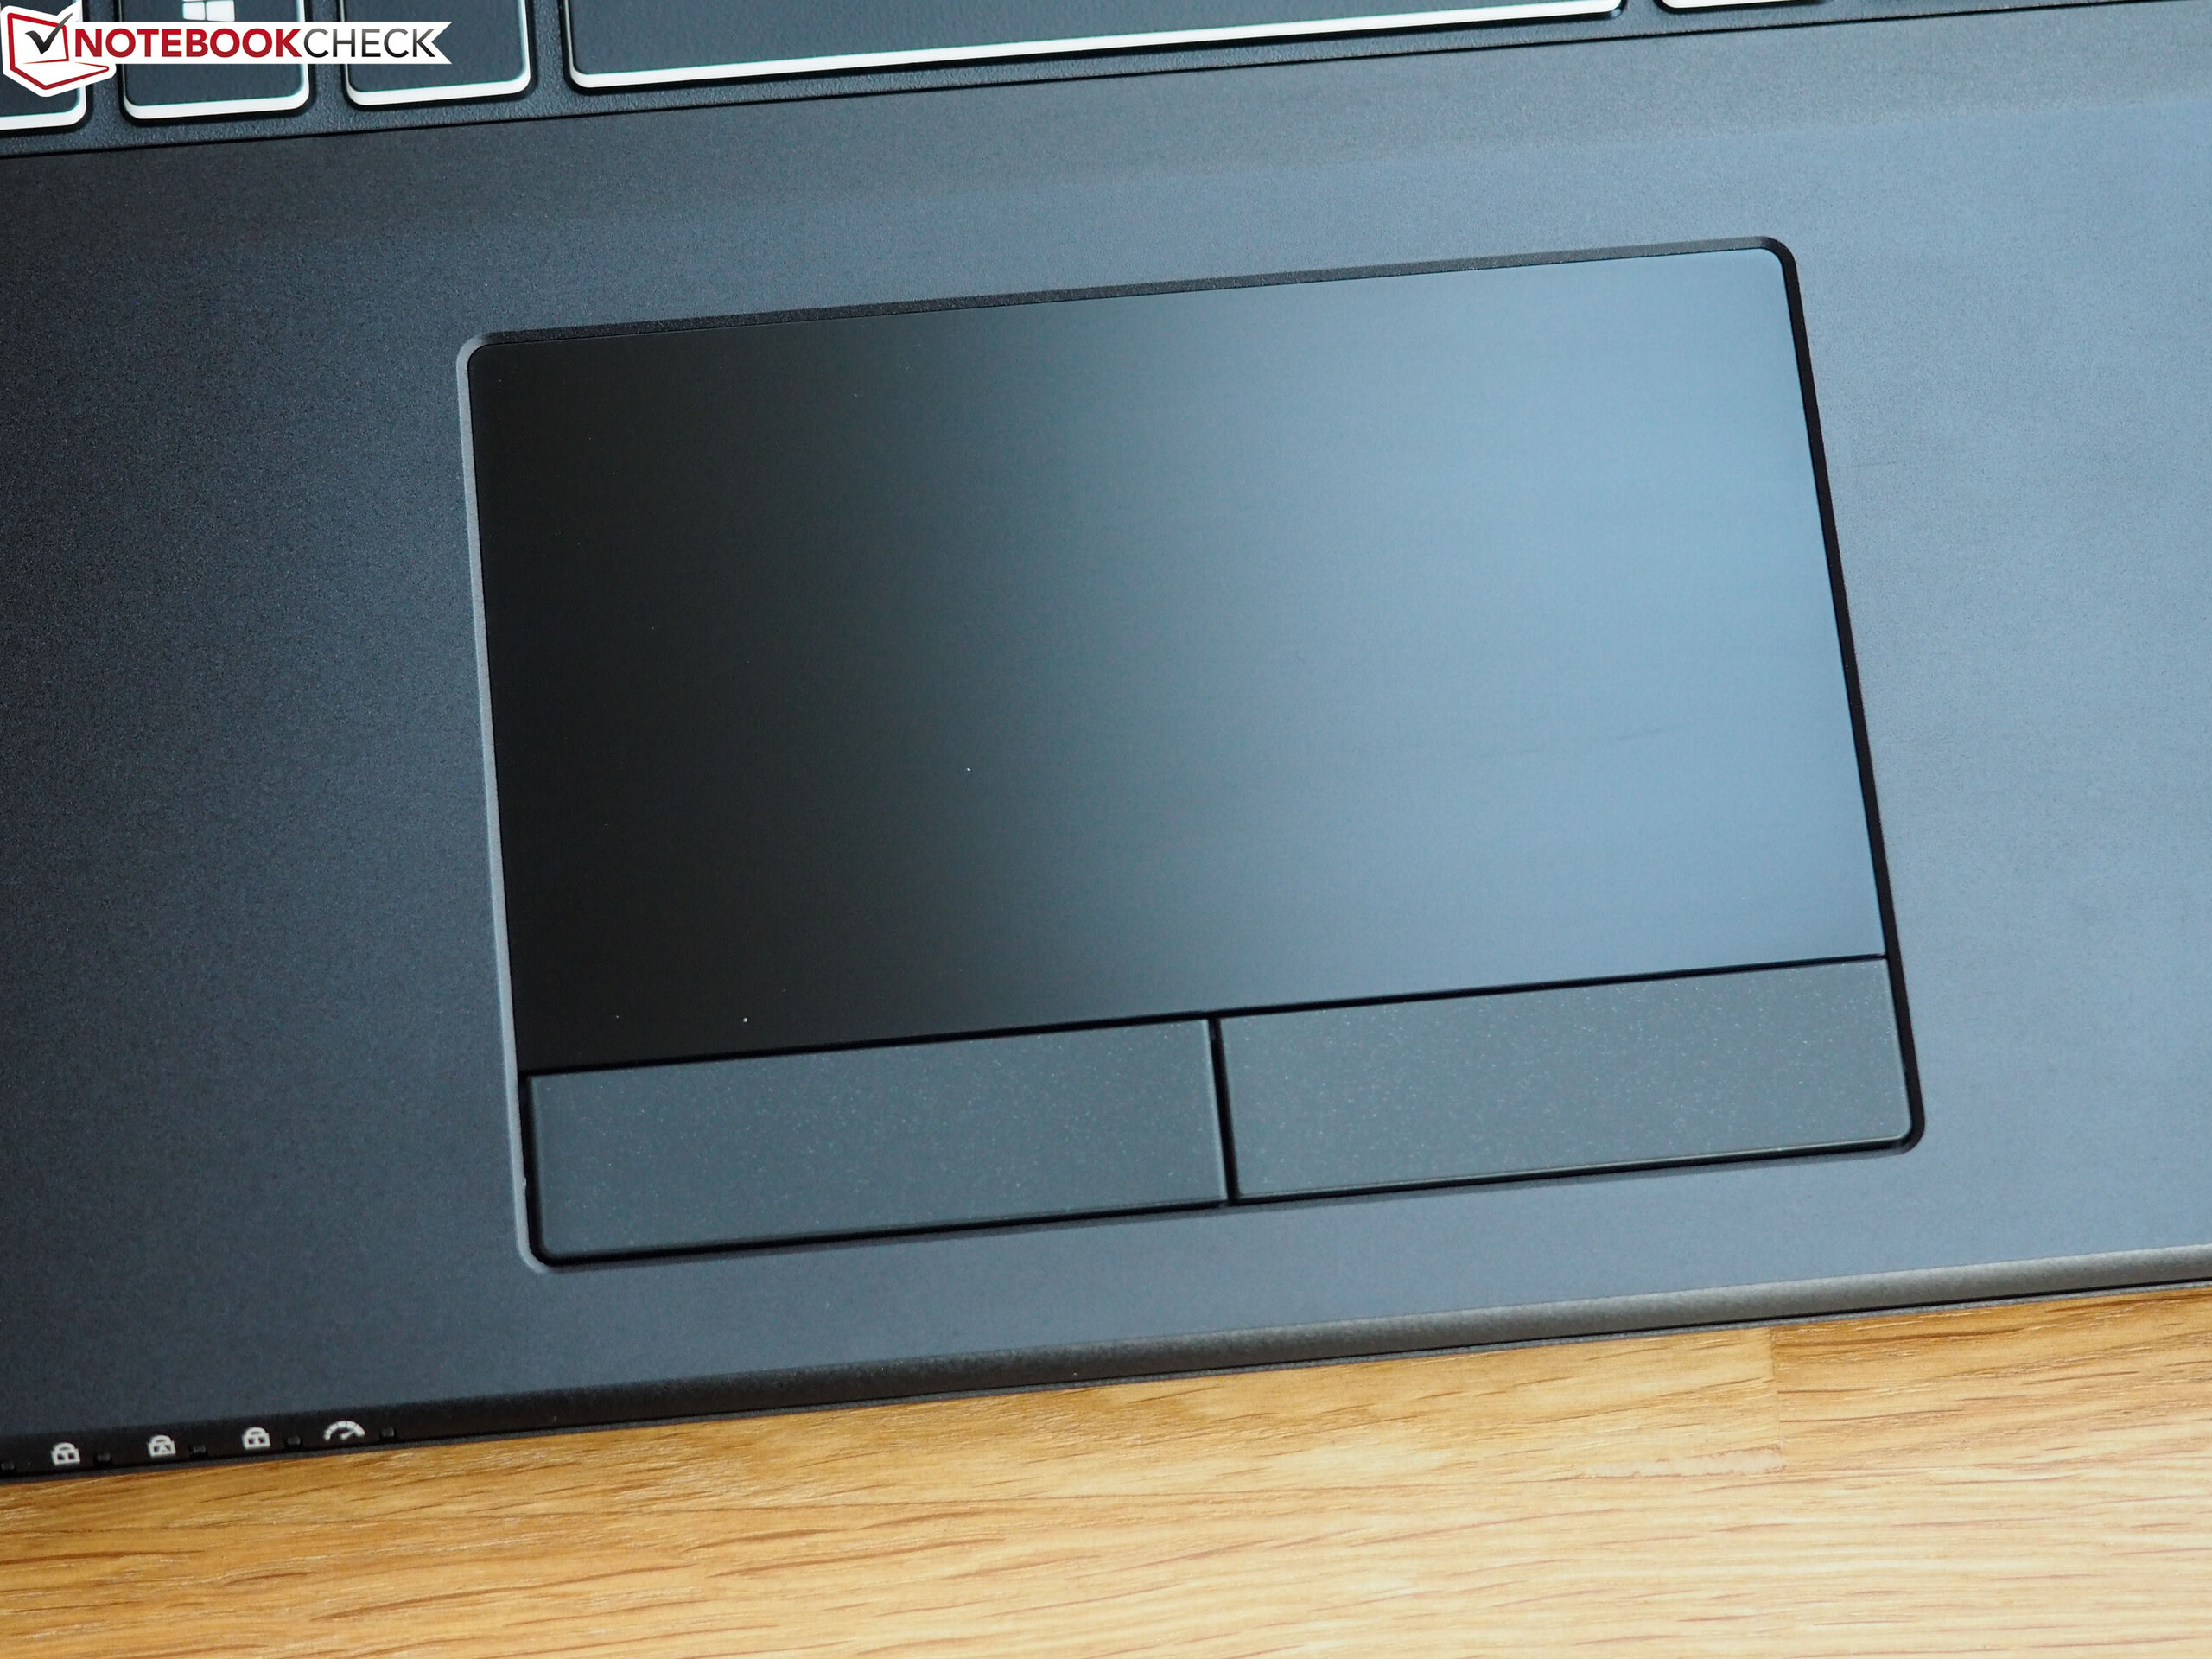
Touchpad
The touchpad, which has an integrated fingerprint reader, is a mixed bag. While its smooth surface ensures good gliding, it could be more precise. Inputs occasionally feel spongy. We did not encounter any issues while testing multi-touch gestures. The pad responded quickly and reliably to two-finger gestures such as scrolling or zooming. The dedicated mouse buttons have a relatively soft feedback.
At 10.8 x 6.2 cm, the touchpad has a good size. As it is placed quite far to the left, you might want to deactivate the touchpad while gaming with an external mouse, to avoid any false inputs.
Display
The display is a matte Full HD screen with a 144 Hz refresh rate. This promises low response rates, which our measurements confirmed: 11 to 17 ms are good for an IPS panel.
| |||||||||||||||||||||||||
Brightness Distribution: 89 %
Center on Battery: 346 cd/m²
Contrast: 1236:1 (Black: 0.28 cd/m²)
ΔE ColorChecker Calman: 4.62 | ∀{0.5-29.43 Ø4.71}
calibrated: 1.58
ΔE Greyscale Calman: 4.95 | ∀{0.09-98 Ø4.96}
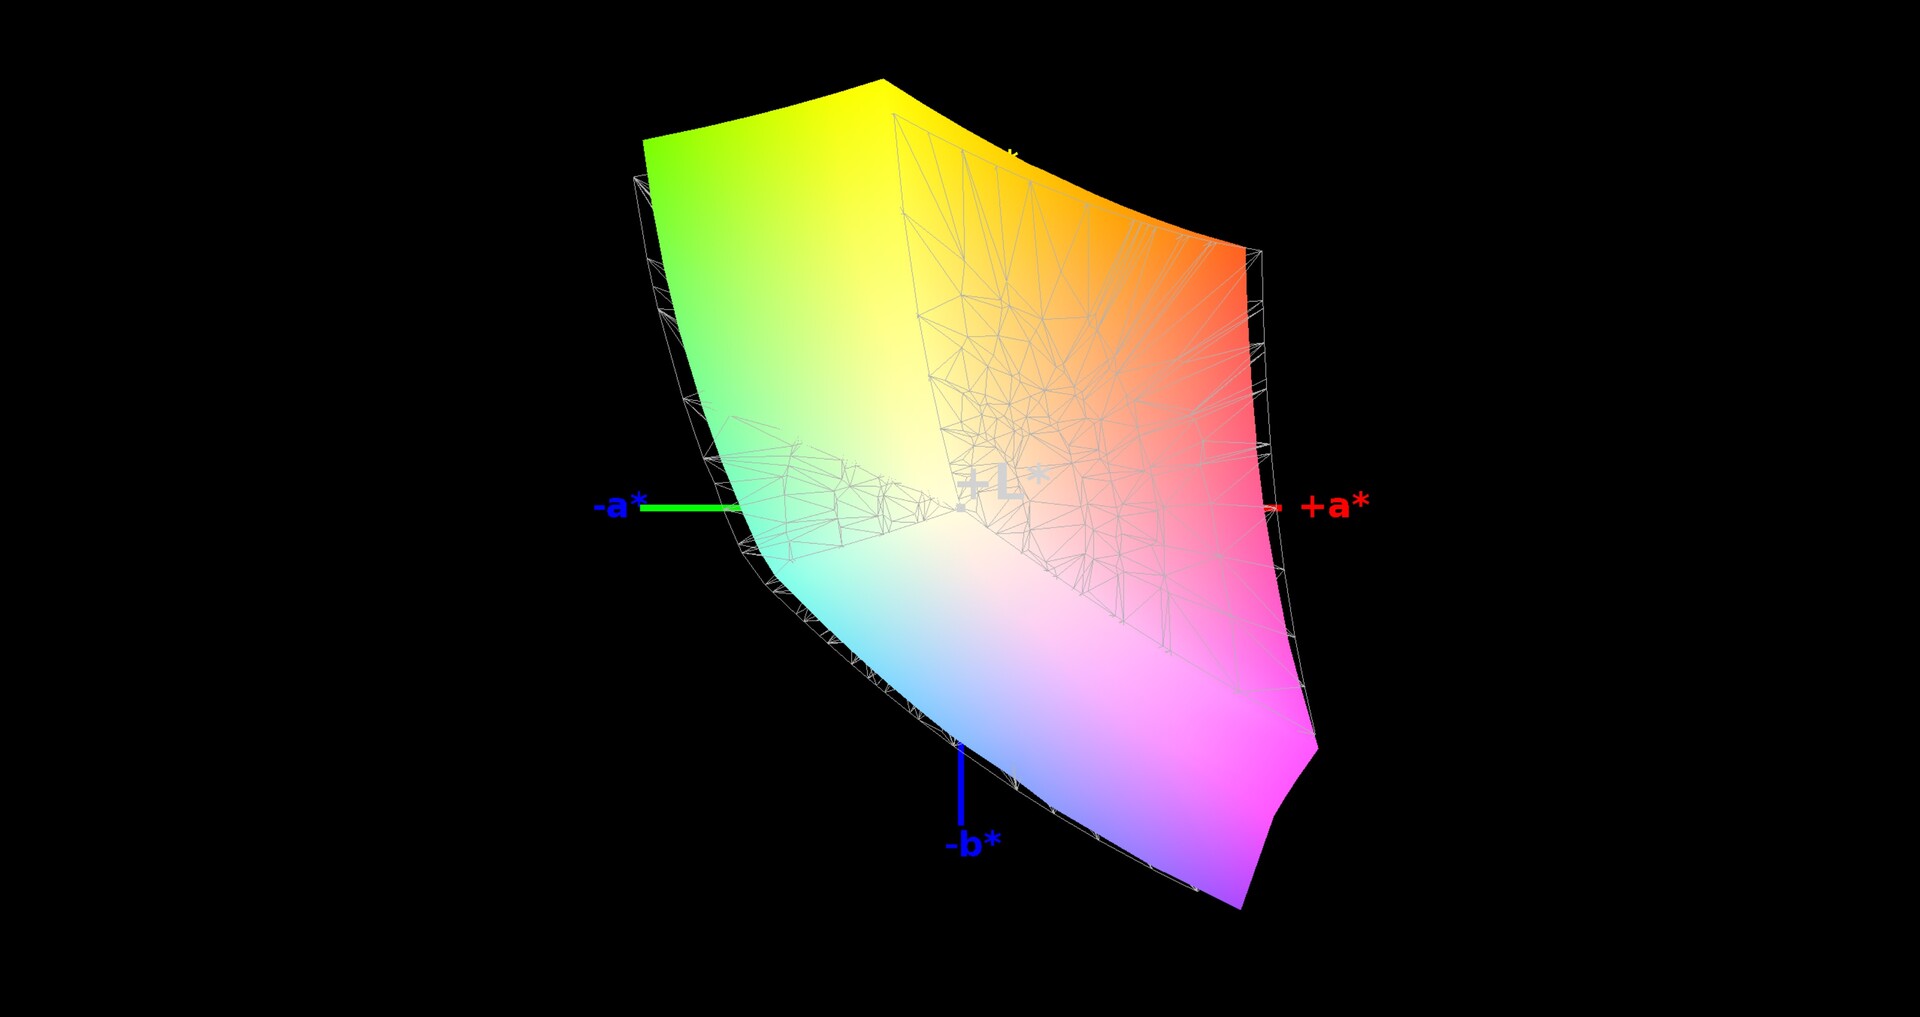
94% sRGB (Argyll 1.6.3 3D)
61% AdobeRGB 1998 (Argyll 1.6.3 3D)
68.1% AdobeRGB 1998 (Argyll 3D)
94.4% sRGB (Argyll 3D)
66.7% Display P3 (Argyll 3D)
Gamma: 2.36
CCT: 7733 K
| Schenker XMG Pro 15 AU Optronics B156HAN (AUO80ED), IPS, 1920x1080, 15.6" | Asus Strix Scar III G531GW-AZ062T Sharp LQ156M1JW09 (SHP14D3), IPS, 1920x1080, 15.6" | Asus Zephyrus S GX502GW AU Optronics B156HAN08.2 (AUO82ED), IPS, 1920x1080, 15.6" | MSI GE65 Raider 9SF-049US Sharp LQ156M1JW03, IPS, 1920x1080, 15.6" | Schenker XMG Ultra 15 Turing AU Optronics B156HAN07.0 (AUO70ED), IPS, 1920x1080, 15.6" | |
|---|---|---|---|---|---|
| Display | 0% | -3% | 4% | -1% | |
| Display P3 Coverage (%) | 66.7 | 66.2 -1% | 64.9 -3% | 69.3 4% | 66.1 -1% |
| sRGB Coverage (%) | 94.4 | 97.1 3% | 91 -4% | 98.9 5% | 92.6 -2% |
| AdobeRGB 1998 Coverage (%) | 68.1 | 67.6 -1% | 65.9 -3% | 70.7 4% | 67.1 -1% |
| Response Times | 17% | 40% | 12% | -8% | |
| Response Time Grey 50% / Grey 80% * (ms) | 17.2 ? | 15 ? 13% | 7.2 ? 58% | 13.2 ? 23% | 17.6 ? -2% |
| Response Time Black / White * (ms) | 11.2 ? | 9 ? 20% | 8.8 ? 21% | 11.2 ? -0% | 12.8 ? -14% |
| PWM Frequency (Hz) | 250 ? | 23150 ? | |||
| Screen | -7% | 0% | 9% | 1% | |
| Brightness middle (cd/m²) | 346 | 309 -11% | 286 -17% | 277.4 -20% | 263 -24% |
| Brightness (cd/m²) | 346 | 284 -18% | 275 -21% | 264 -24% | 264 -24% |
| Brightness Distribution (%) | 89 | 88 -1% | 90 1% | 90 1% | 89 0% |
| Black Level * (cd/m²) | 0.28 | 0.42 -50% | 0.37 -32% | 0.24 14% | 0.17 39% |
| Contrast (:1) | 1236 | 736 -40% | 773 -37% | 1156 -6% | 1547 25% |
| Colorchecker dE 2000 * | 4.62 | 3.99 14% | 2.19 53% | 1.51 67% | 4.45 4% |
| Colorchecker dE 2000 max. * | 8.93 | 8.3 7% | 4.4 51% | 4.93 45% | 8.33 7% |
| Colorchecker dE 2000 calibrated * | 1.58 | 1.12 29% | 2.27 -44% | 1.77 -12% | 1.93 -22% |
| Greyscale dE 2000 * | 4.95 | 5.43 -10% | 2.2 56% | 3.7 25% | 4.77 4% |
| Gamma | 2.36 93% | 2.57 86% | 2.41 91% | 2.23 99% | 2.52 87% |
| CCT | 7733 84% | 7767 84% | 6405 101% | 7061 92% | 7767 84% |
| Color Space (Percent of AdobeRGB 1998) (%) | 61 | 63 3% | 59 -3% | 65.1 7% | 60 -2% |
| Color Space (Percent of sRGB) (%) | 94 | 97 3% | 91 -3% | 99.1 5% | 93 -1% |
| Total Average (Program / Settings) | 3% /
-3% | 12% /
5% | 8% /
9% | -3% /
-1% |
* ... smaller is better
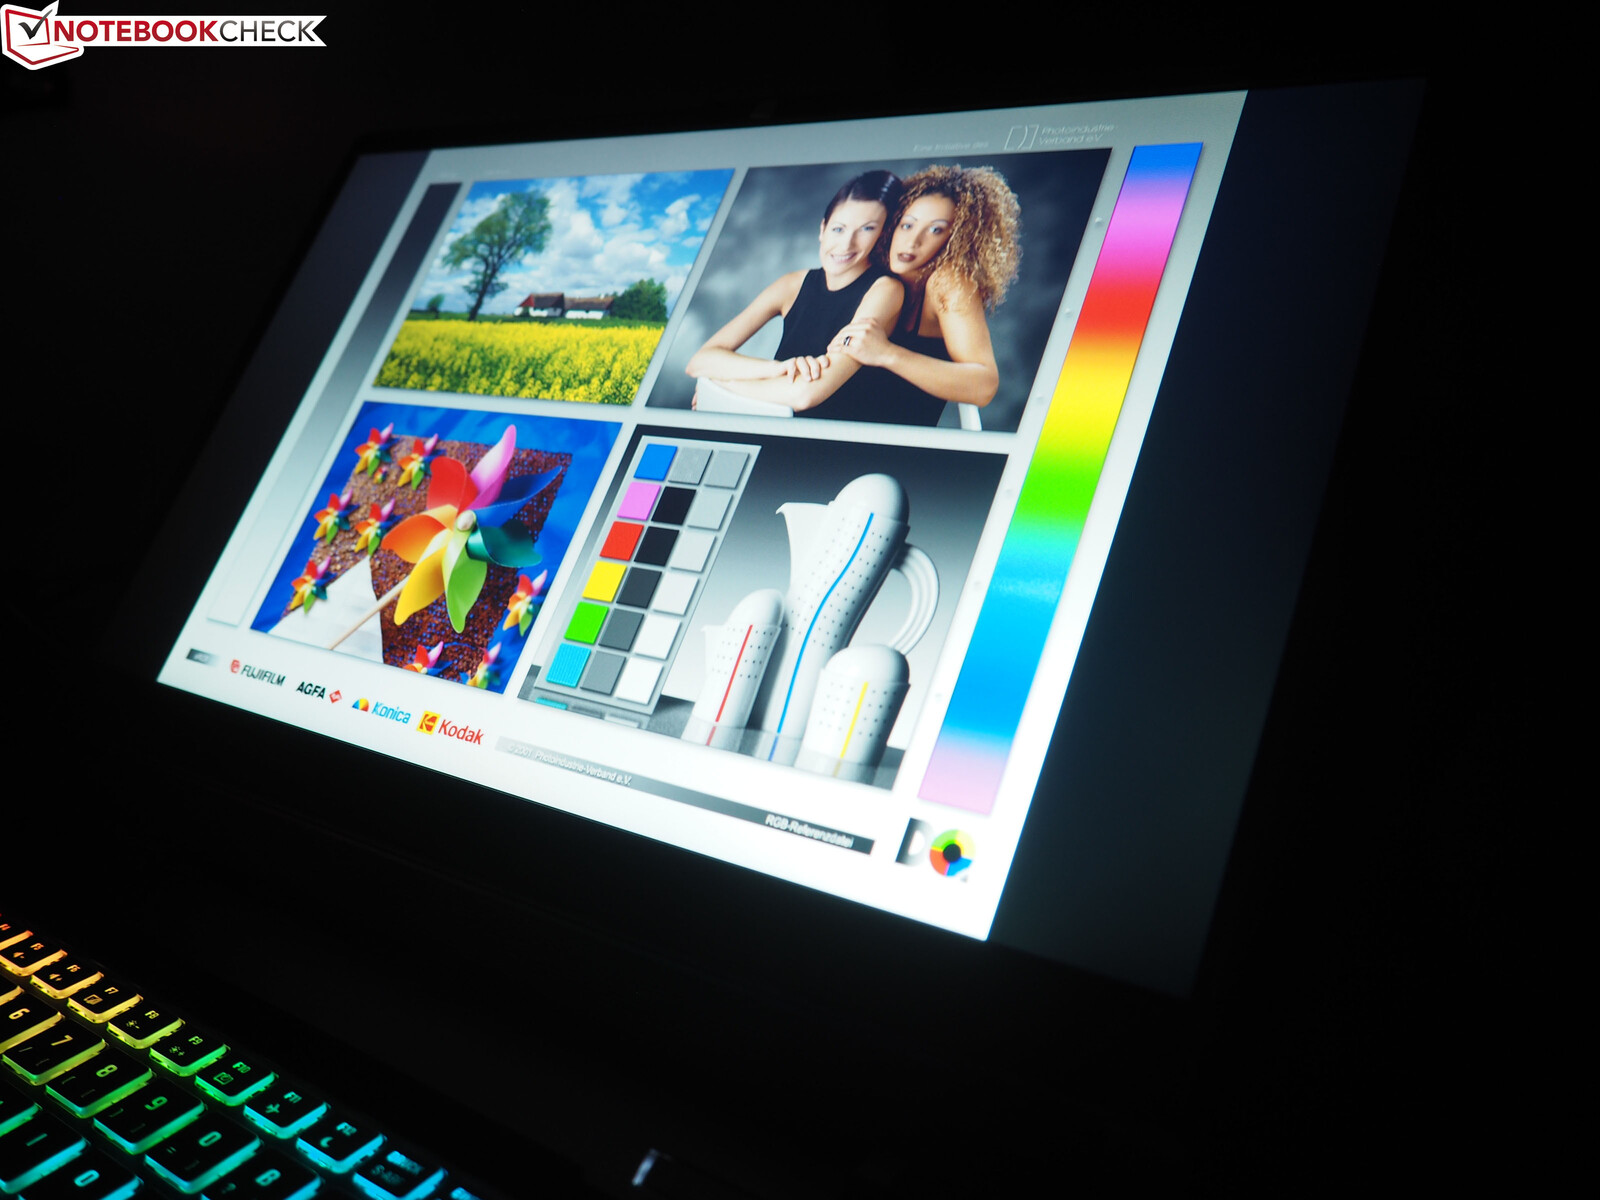
"Good" is also an appropriate description of most of the other aspects of this display. Thanks to its average luminosity of 345 cd/m², the XMG Pro 15 can be used outdoors.
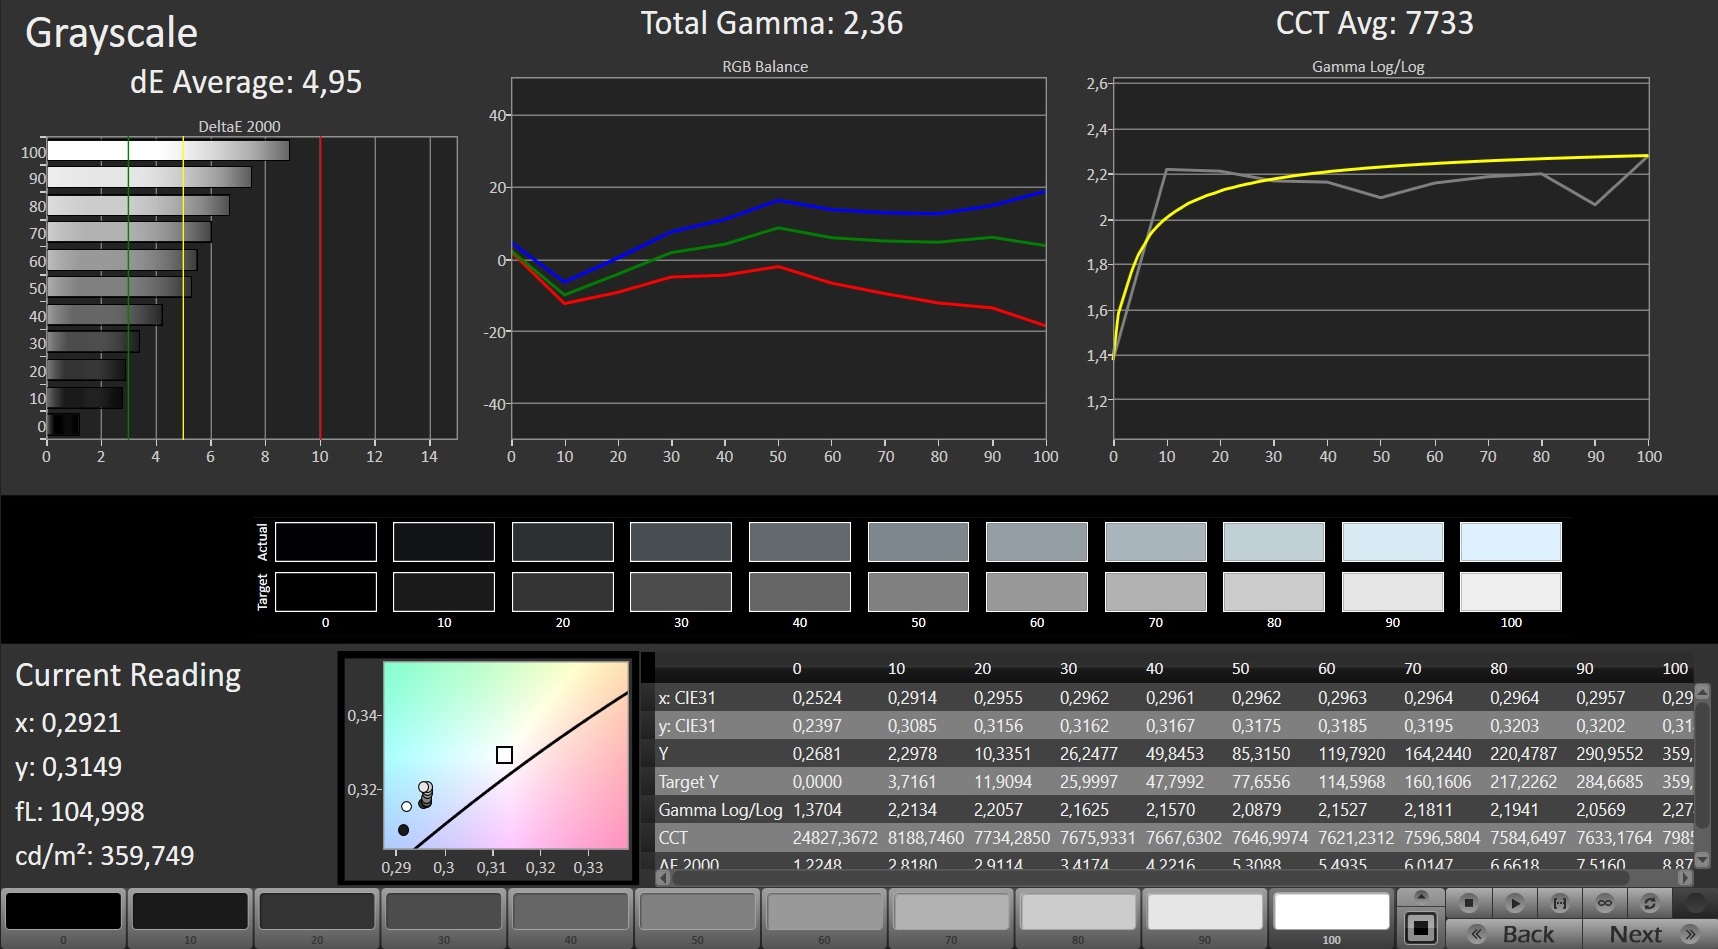
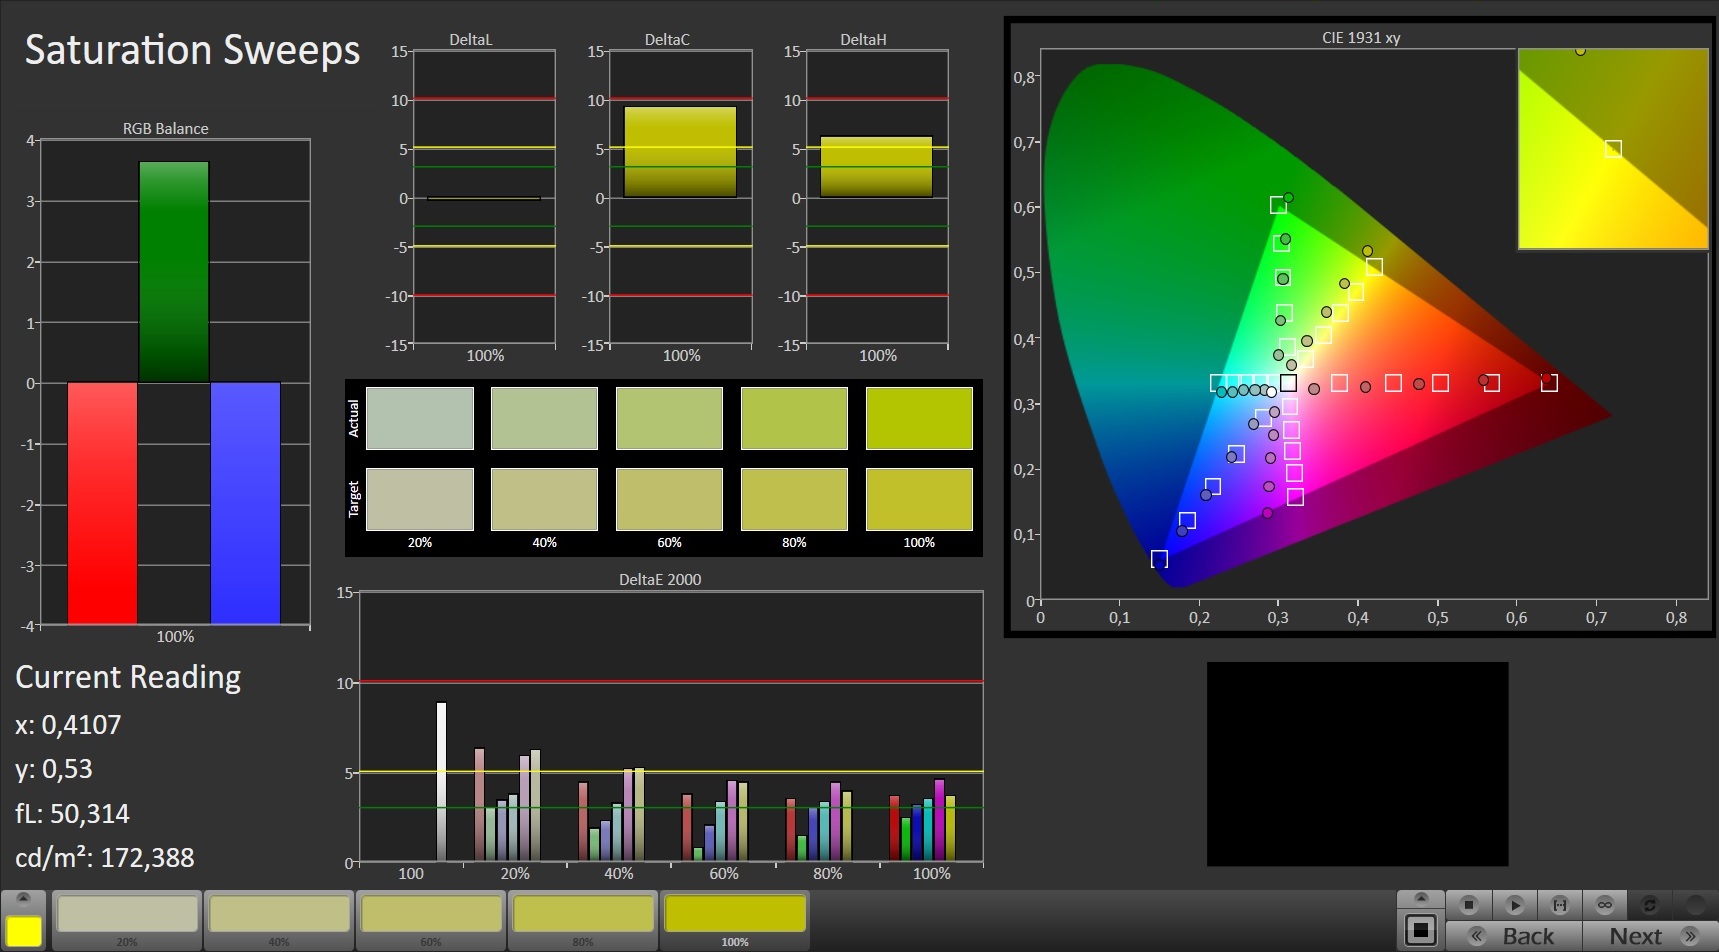
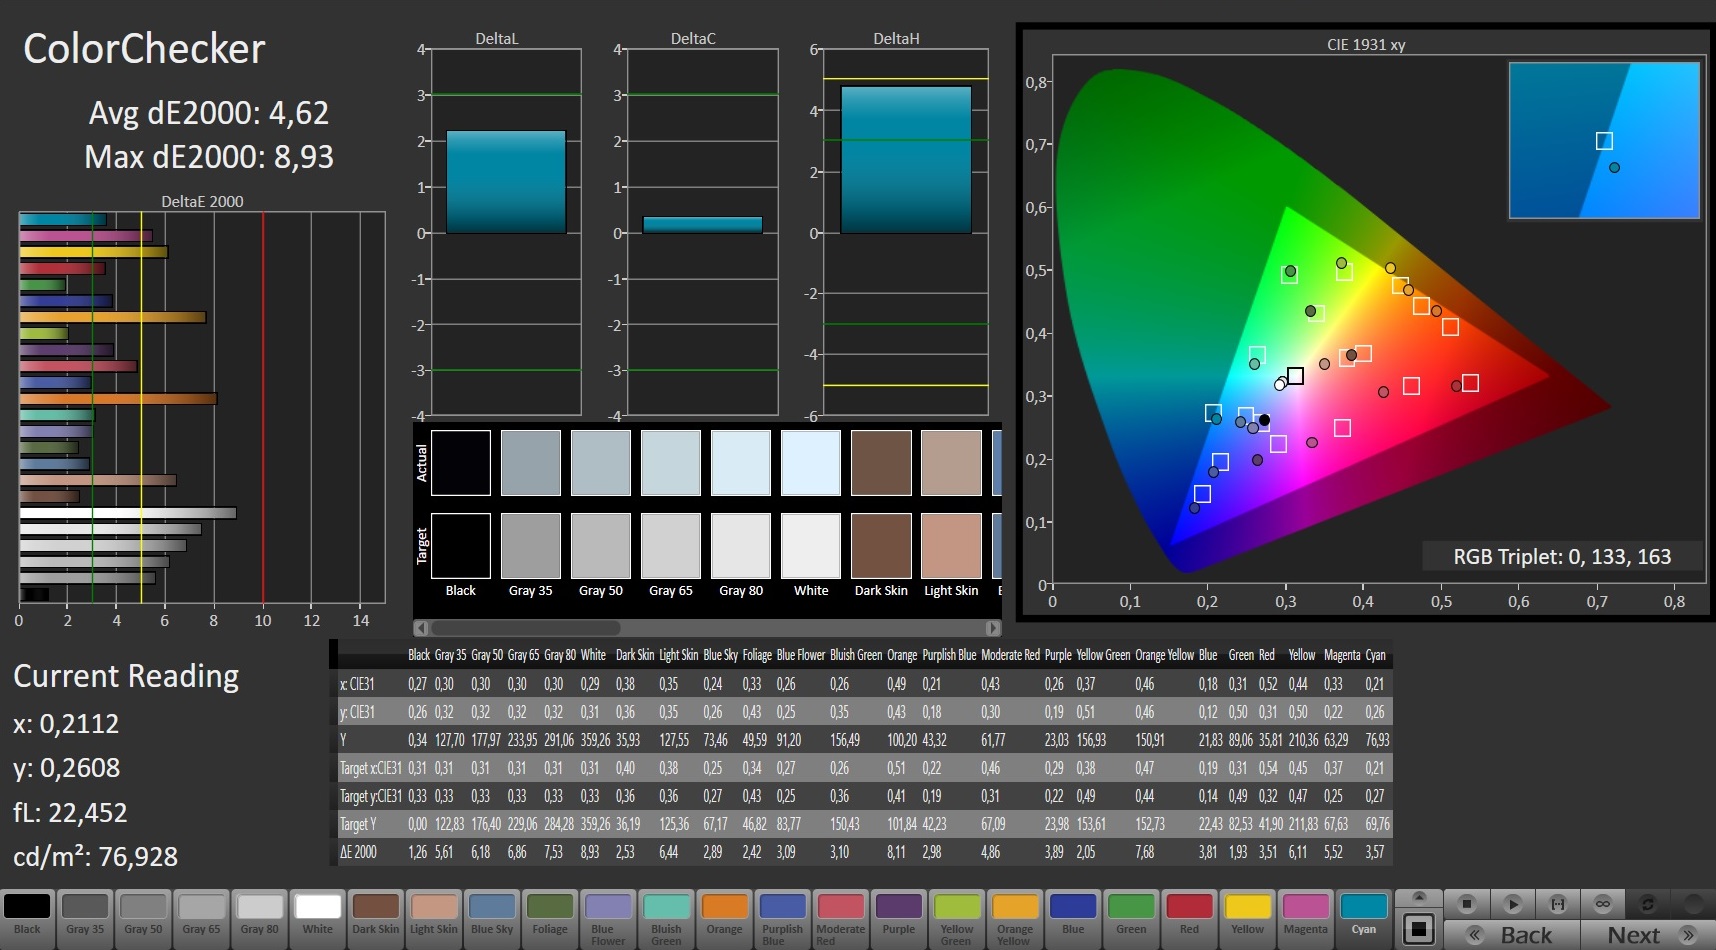
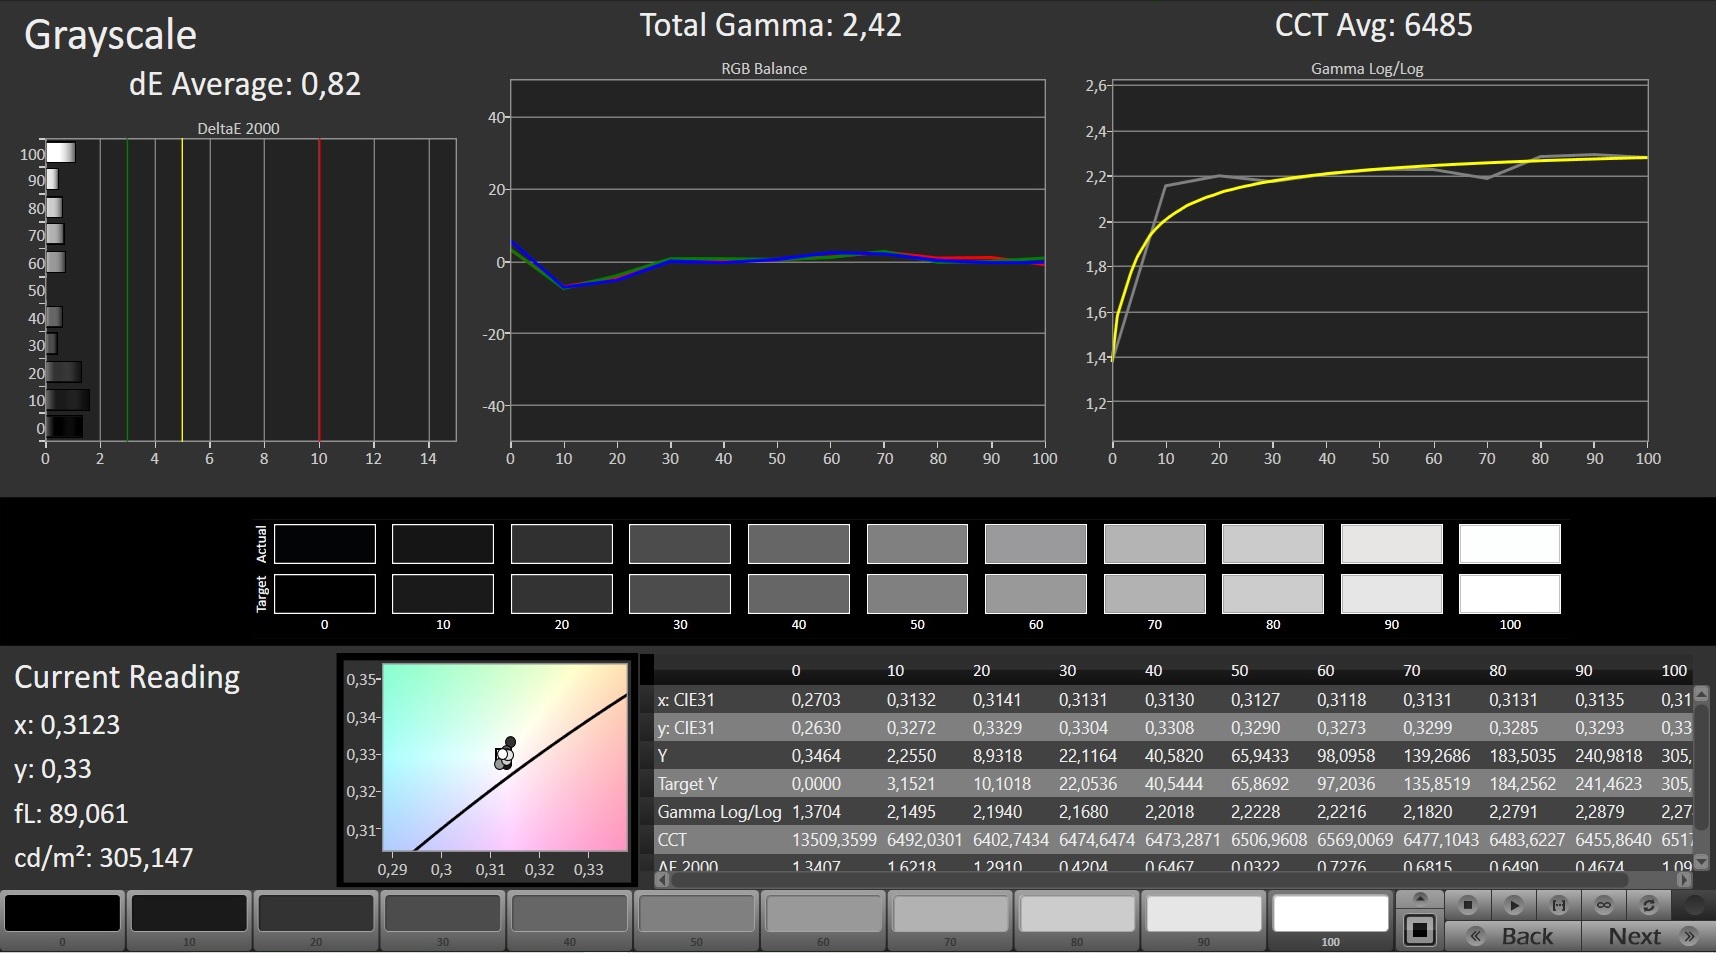
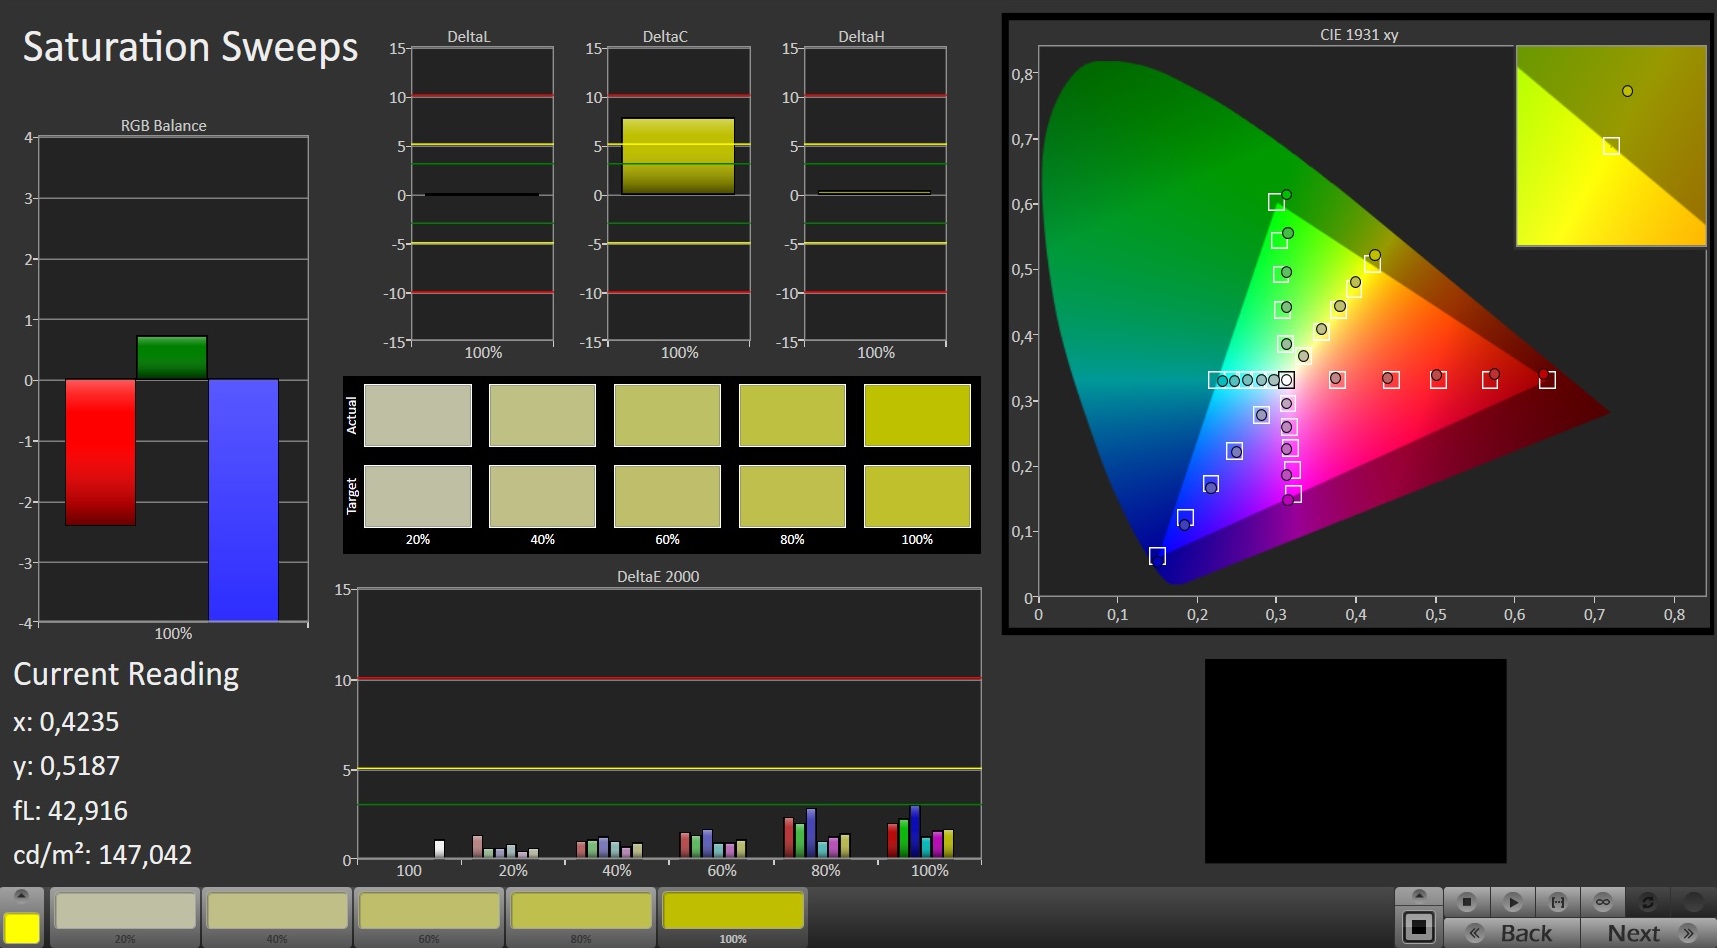
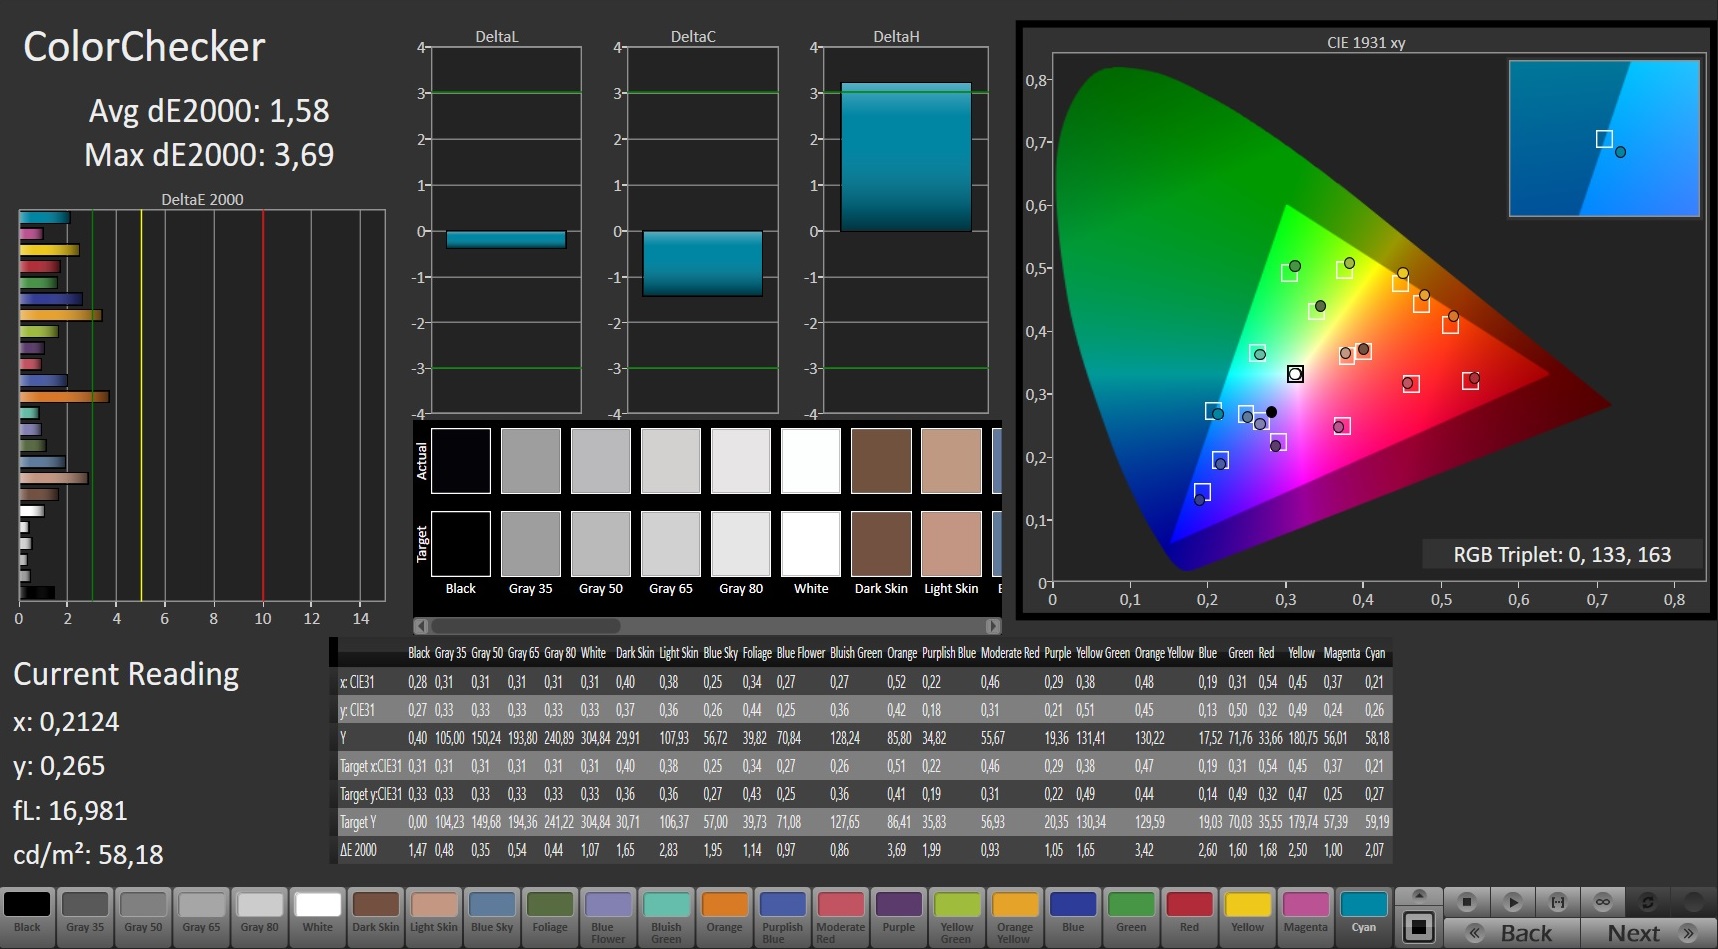
Thanks to its decent black value (0.28 cd/m²) the display has a contrast ratio of 1200:1. The color space (94% coverage of sRGB) is also very satisfactory, although the display did show a slight blue cast on whites ex-works. This can easily be dealt with by calibrating the screen or using our ICC profile (available for download above).

As so often happens with laptops, the XMG Pro 15 has issues with strong backlight bleeding. We noticed several light areas around the edges on our test unit. Depending on what we were doing, they were more or less bothersome.
Display Response Times
| ↔ Response Time Black to White | ||
|---|---|---|
| 11.2 ms ... rise ↗ and fall ↘ combined | ↗ 6 ms rise | 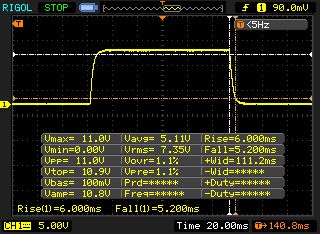 |
| ↘ 5.2 ms fall | ||
| The screen shows good response rates in our tests, but may be too slow for competitive gamers. In comparison, all tested devices range from 0.1 (minimum) to 240 (maximum) ms. » 30 % of all devices are better. This means that the measured response time is better than the average of all tested devices (19.8 ms). | ||
| ↔ Response Time 50% Grey to 80% Grey | ||
| 17.2 ms ... rise ↗ and fall ↘ combined | ↗ 8 ms rise | 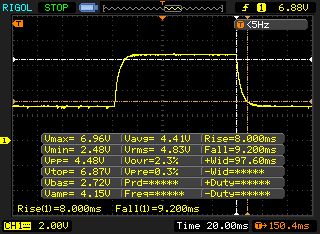 |
| ↘ 9.2 ms fall | ||
| The screen shows good response rates in our tests, but may be too slow for competitive gamers. In comparison, all tested devices range from 0.165 (minimum) to 636 (maximum) ms. » 31 % of all devices are better. This means that the measured response time is better than the average of all tested devices (31 ms). | ||
Screen Flickering / PWM (Pulse-Width Modulation)
| Screen flickering / PWM not detected |  | ||
In comparison: 52 % of all tested devices do not use PWM to dim the display. If PWM was detected, an average of 7754 (minimum: 5 - maximum: 343500) Hz was measured. | |||
Testing Conditions
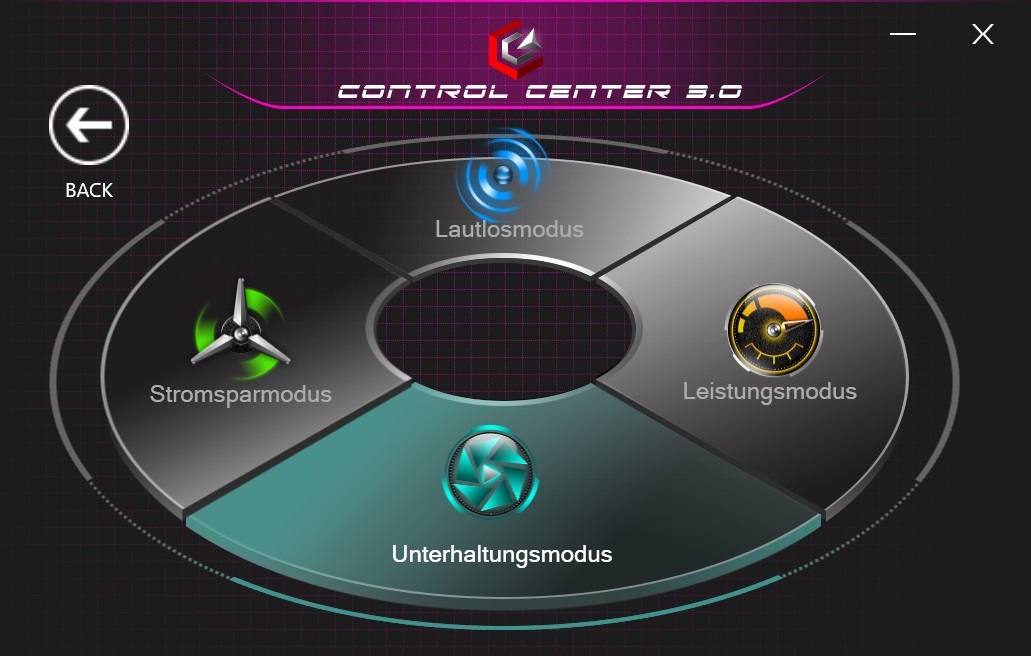
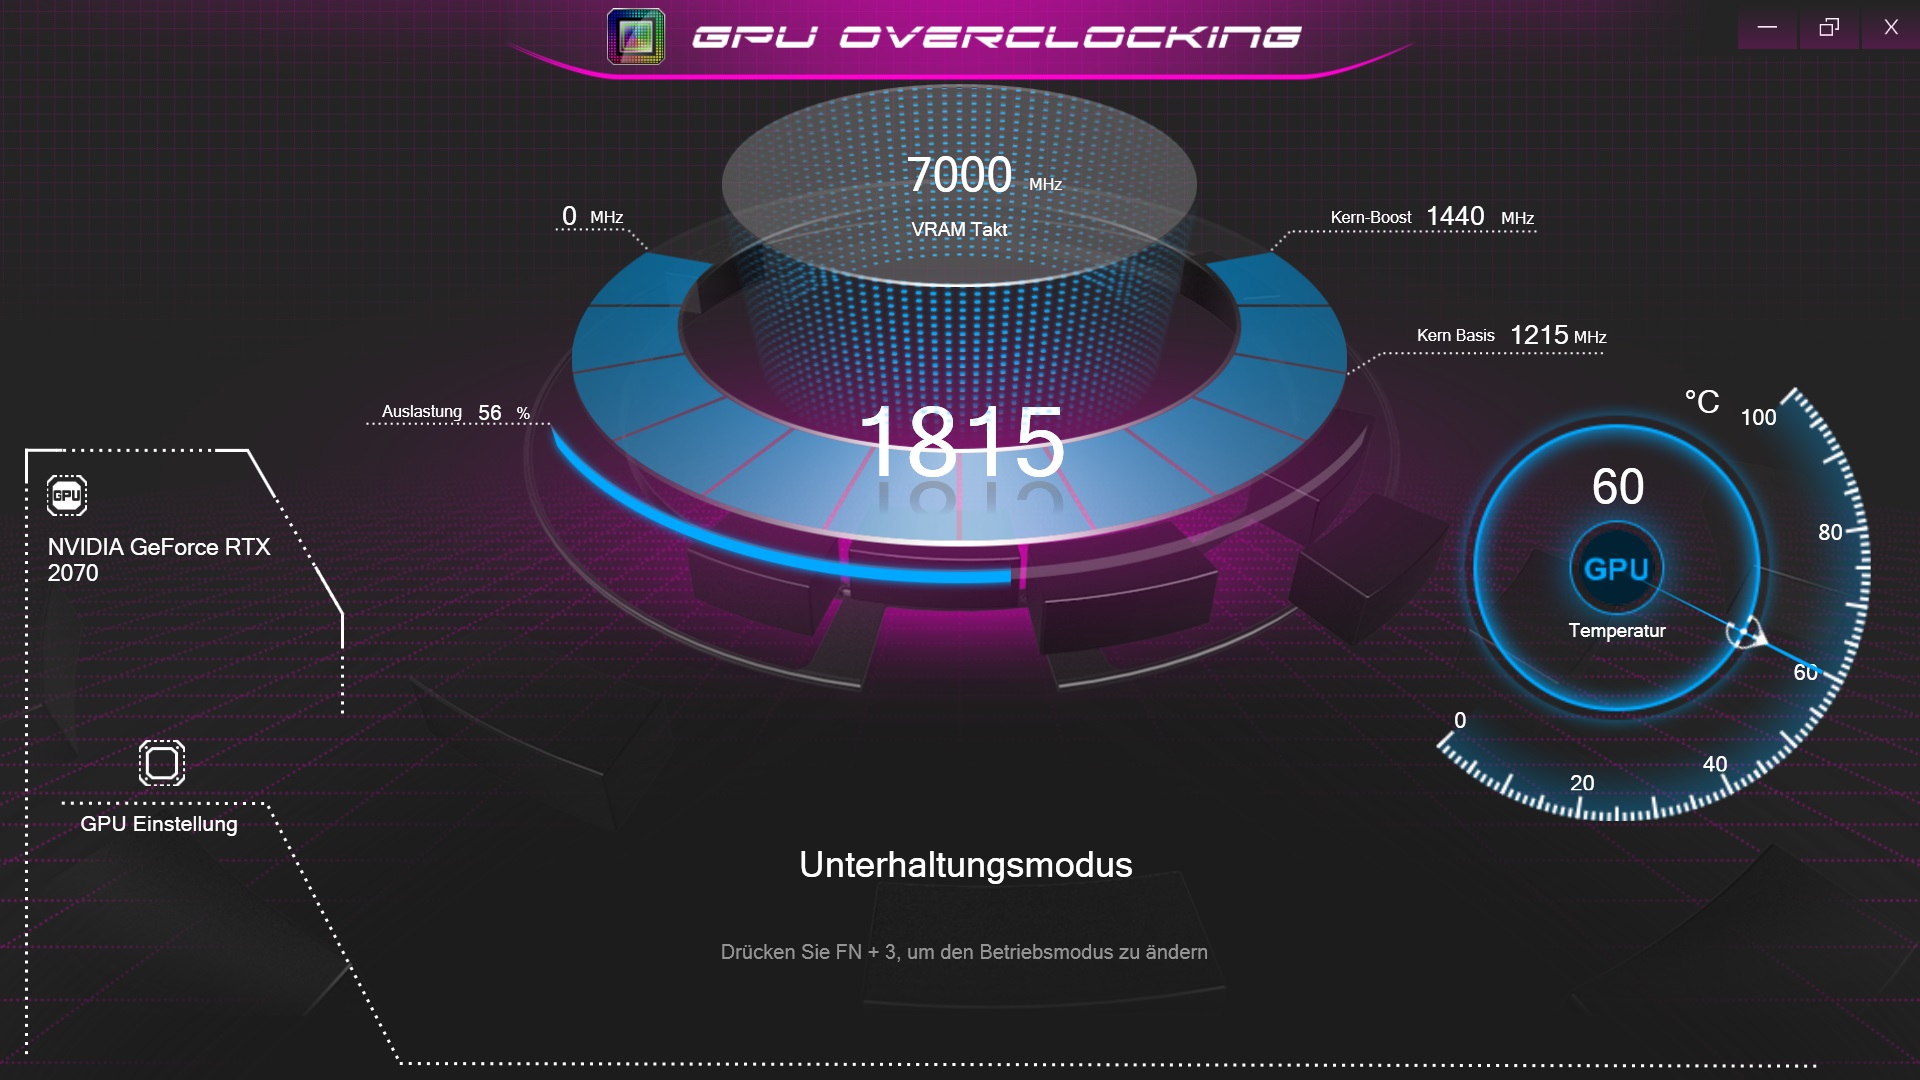
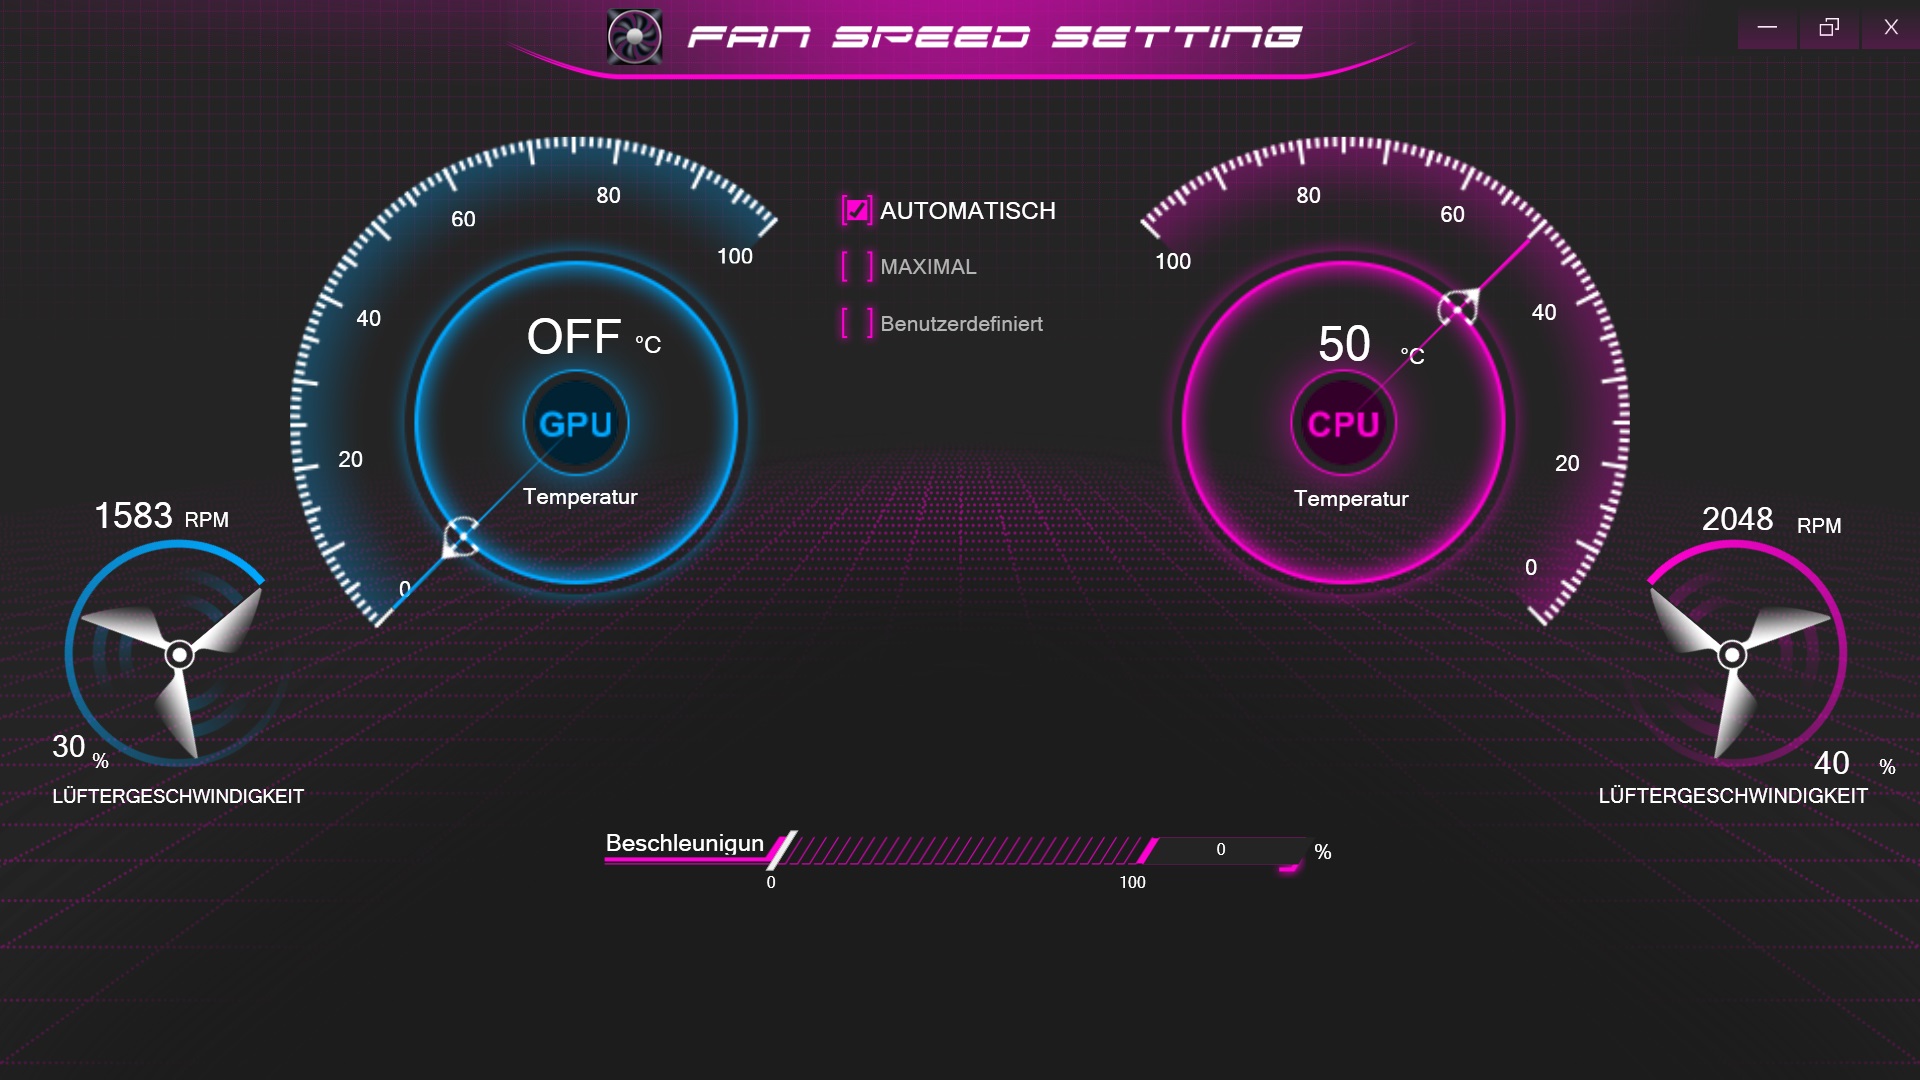
The preinstalled Control Center can be used to make changes to the system. Our measurements were all made with the power mode set to "entertainment" and the fan speed set to "automatic". G-Sync was deactivated to increase the battery life. The 15-inch laptop can also run using Nvidia's Optimus technology to save power.
Performance
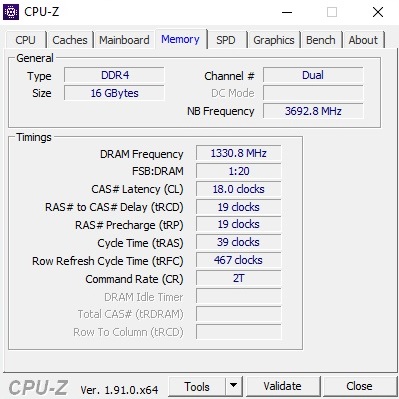
The XMG Pro 15 clearly belongs to the high-end segment. The six-core processor and ray-tracing GPU should provide sufficient processing power for the coming years, as long as you choose a configuration with a minimum of 16 GB of RAM and an SSD for the operating system.
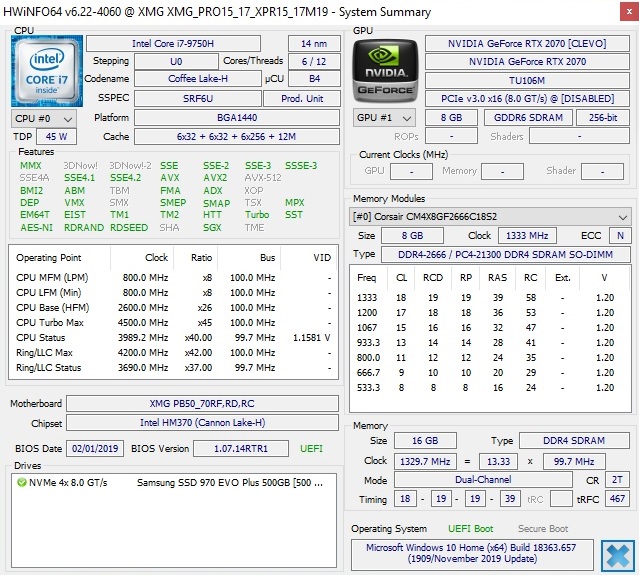
Processor
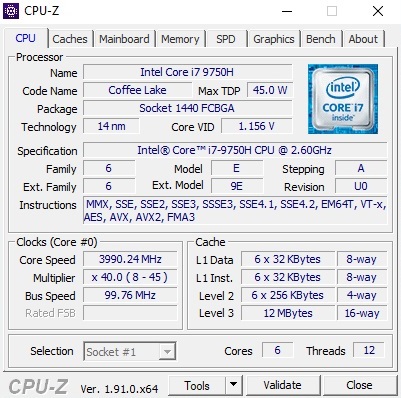
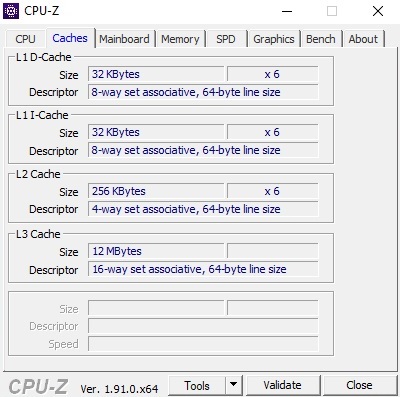
The Core i7-9750H is based on Intel's Coffee Lake generation (45-Watt TDP) and can work up to 12 threads simultaneously thanks to Hyper-Threading. The 12-MB L3 cache also ensures that the device is very future-proof.
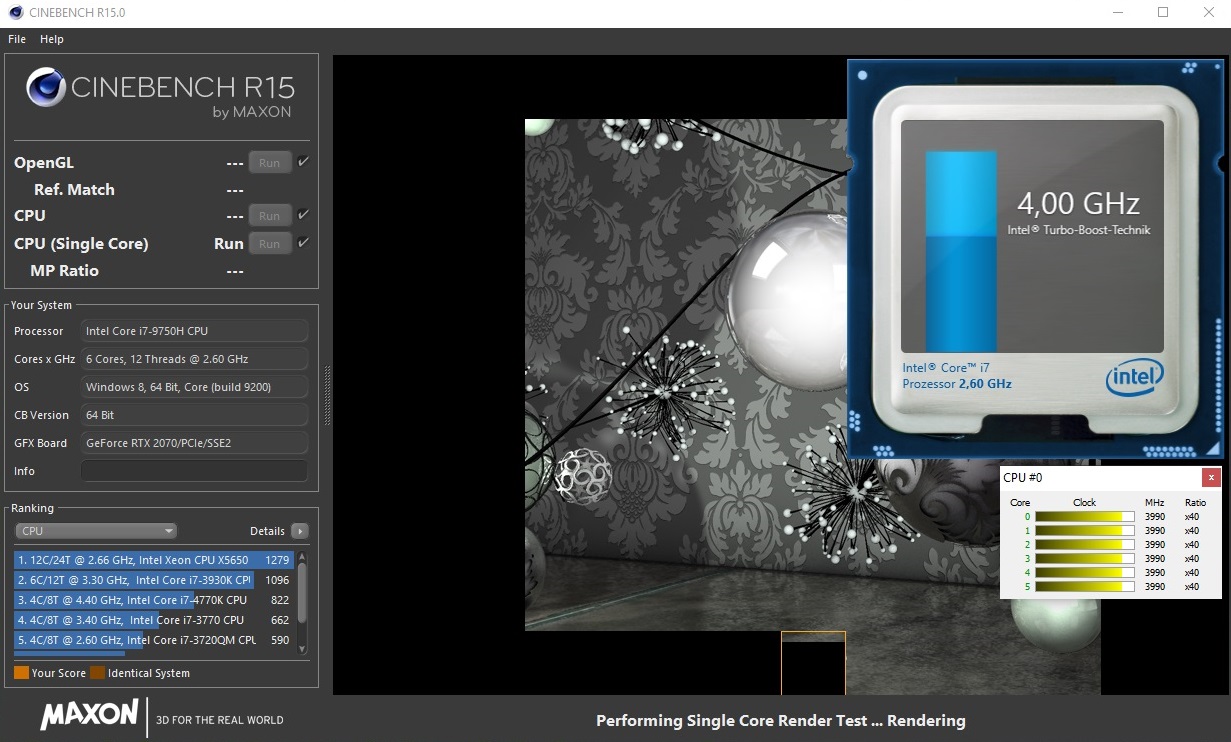
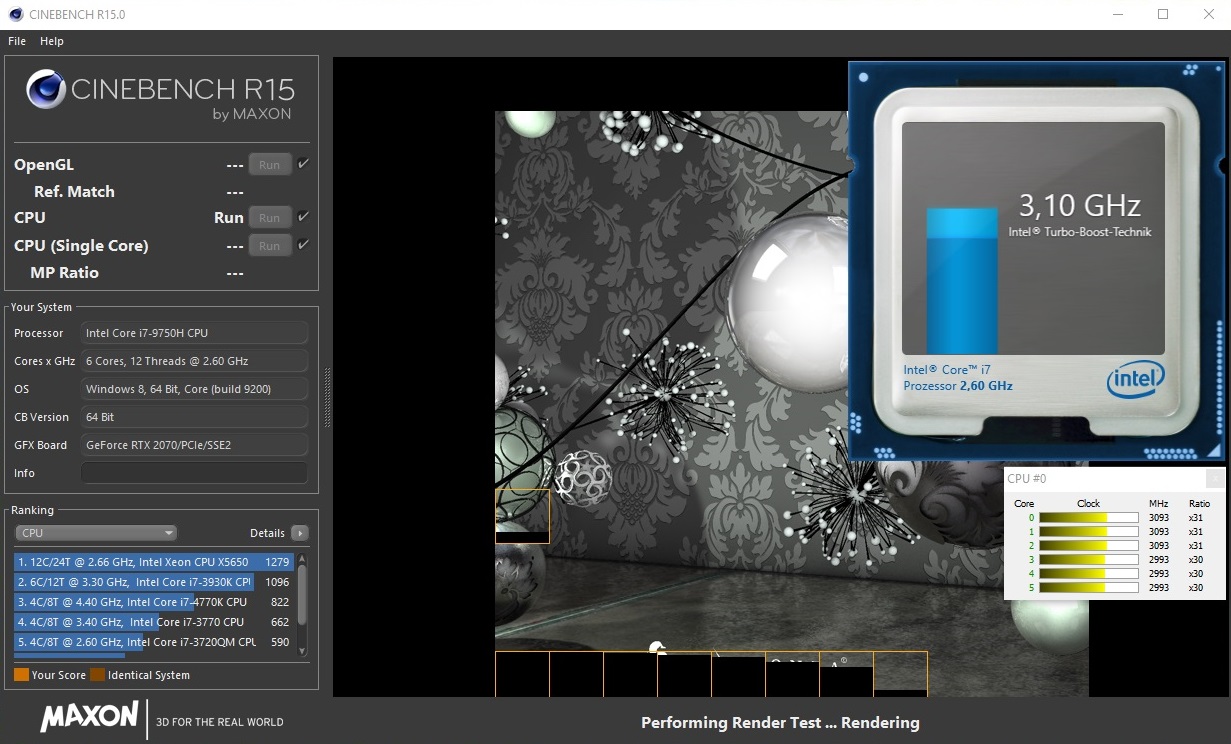
The base clock rate of the 14-nm chip is 2.6 GHz, which the turbo boost can increase to up to 4.5 GHz. However, these levels are hardly ever reached in practice. While the Core i7-9750H settled at 4.0 GHz during the single-core test, it only reached 3.0 - 3.1 GHz in the long run during the multi-core test after initially clocking at 3.5 - 4.0 GHz. The depiction of our Cinebench loop illustrates this beautifully.
This clock rate positions the XMG Pro 15 behind its 9750H competition from Asus. The power mode "performance" would probably offer better results (but this would have an effect on the emission results, which already aren't ideal).
System Performance
Although the PCMark 10 results of our XMG Pro 15 are the lowest in our comparison field and booting is not particularly fast, the 15-inch notebook still offers high system performance, which is mainly due to the SSD. Modern SSDs not only guarantee a fast installation process but also short loading times and program launches.
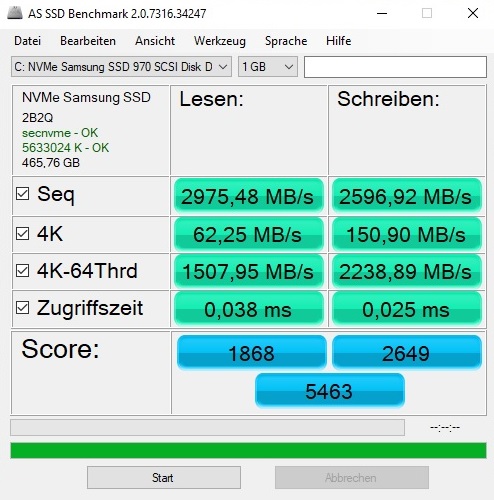
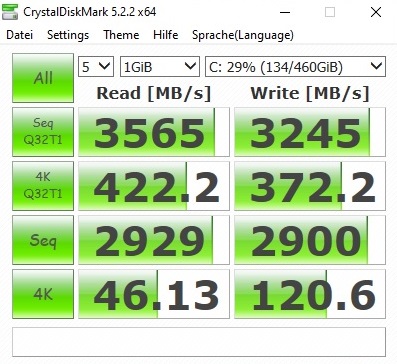
Storage Device
And now for the storage device. Our test unit is equipped with an NVMe SSD from Samsung. The 500-GB version of the 970 Evo Plus has an M.2 format and offers an attractive price-to-performance ratio. It reaches around 3000 MB/s during sequential reading and writing, which makes it one of the fastest products available. Buyers can also choose an additional M.2 SSD and a 2.5-inch hard drive during configuration.
| Schenker XMG Pro 15 Samsung SSD 970 EVO Plus 500GB | Asus Strix Scar III G531GW-AZ062T Intel SSD 660p SSDPEKNW512G8 | Asus Zephyrus S GX502GW 2x Intel SSD 660p SSDPEKNW512G8 (RAID 0) | MSI GE65 Raider 9SF-049US Samsung SSD PM981 MZVLB1T0HALR | Schenker XMG Ultra 15 Turing Samsung SSD 970 EVO Plus 1TB | |
|---|---|---|---|---|---|
| CrystalDiskMark 5.2 / 6 | -32% | -19% | -6% | -12% | |
| Write 4K (MB/s) | 120.6 | 133.3 11% | 97 -20% | 125.7 4% | 129.9 8% |
| Read 4K (MB/s) | 46.13 | 55.3 20% | 49.58 7% | 45.04 -2% | 47.15 2% |
| Write Seq (MB/s) | 2900 | 980 -66% | 1838 -37% | 2361 -19% | 1840 -37% |
| Read Seq (MB/s) | 2929 | 1406 -52% | 2421 -17% | 1987 -32% | 1775 -39% |
| Write 4K Q32T1 (MB/s) | 372.2 | 286.3 -23% | 326.9 -12% | 407.1 9% | 294.5 -21% |
| Read 4K Q32T1 (MB/s) | 422.2 | 331.5 -21% | 372.9 -12% | 537 27% | 373.6 -12% |
| Write Seq Q32T1 (MB/s) | 3245 | 976 -70% | 1894 -42% | 2398 -26% | 3295 2% |
| Read Seq Q32T1 (MB/s) | 3565 | 1520 -57% | 2828 -21% | 3309 -7% | 3535 -1% |

Graphics Performance
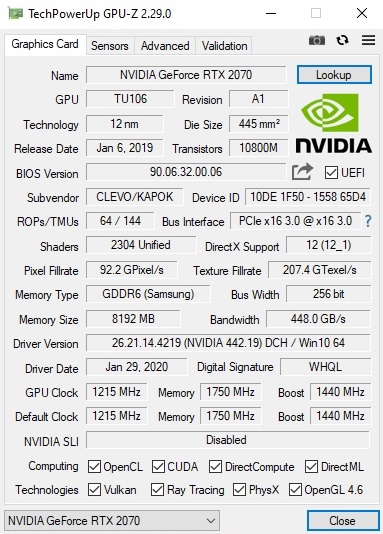
The GeForce RTX 2070 (based on Nvidia's Turing architecture) takes care of 3D applications. The DirectX 12 chip is produced in the 12-nm process; it has 2304 shader units and is equipped with an 8-GB GDDR6 VRAM (256-bit interface) module.
| 3DMark 11 Performance | 20935 points | |
| 3DMark Cloud Gate Standard Score | 37846 points | |
| 3DMark Fire Strike Score | 17762 points | |
| 3DMark Time Spy Score | 7508 points | |
Help | ||
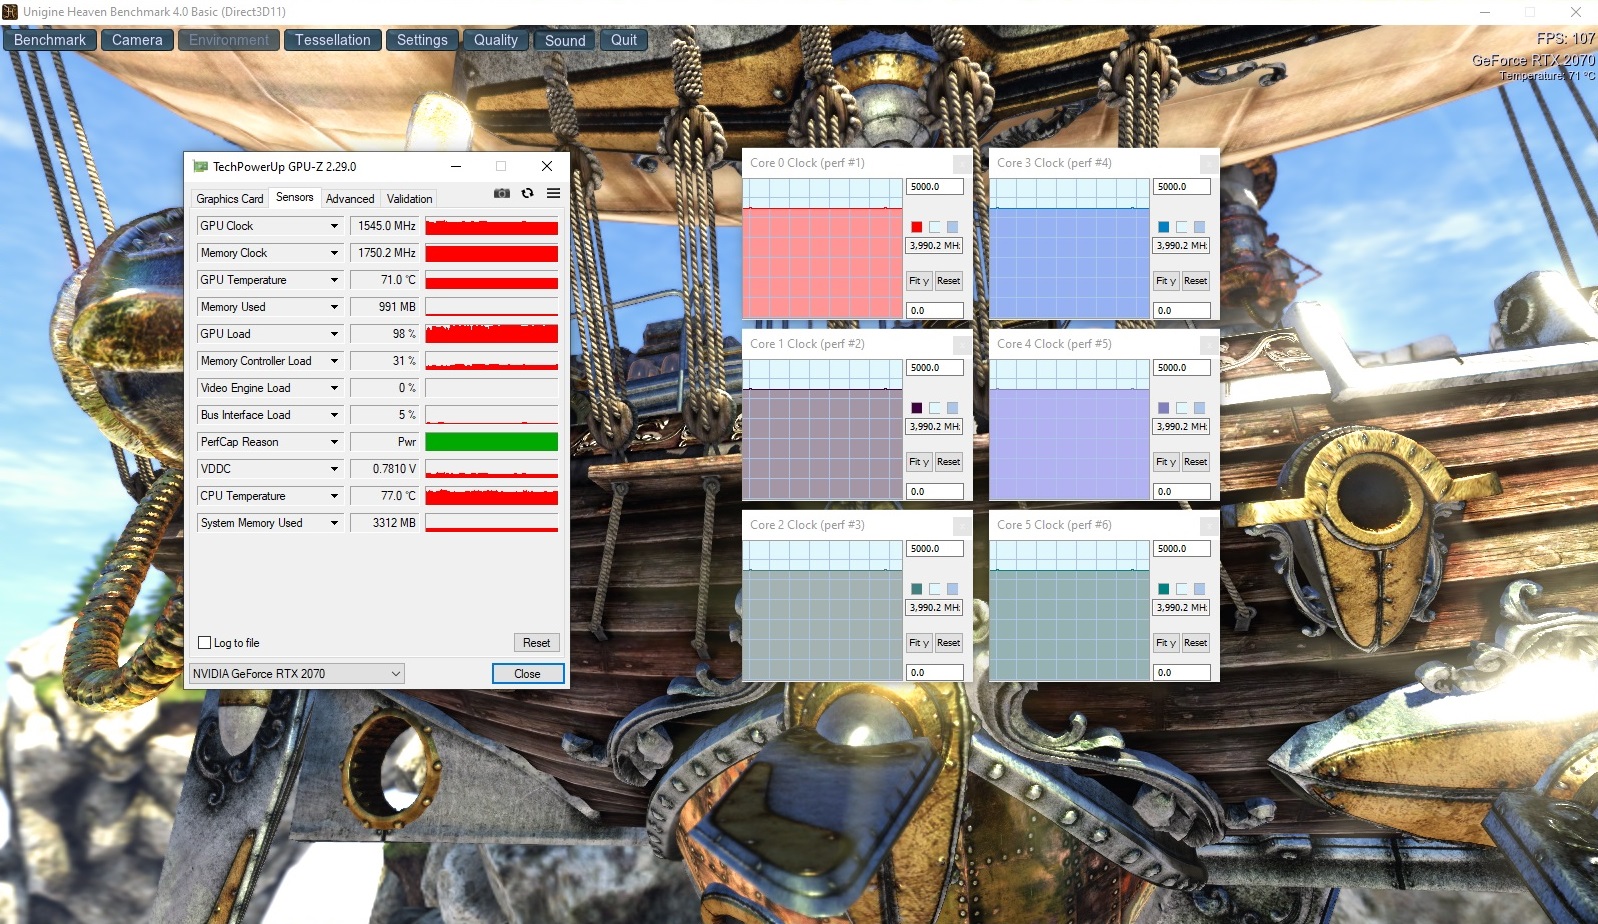
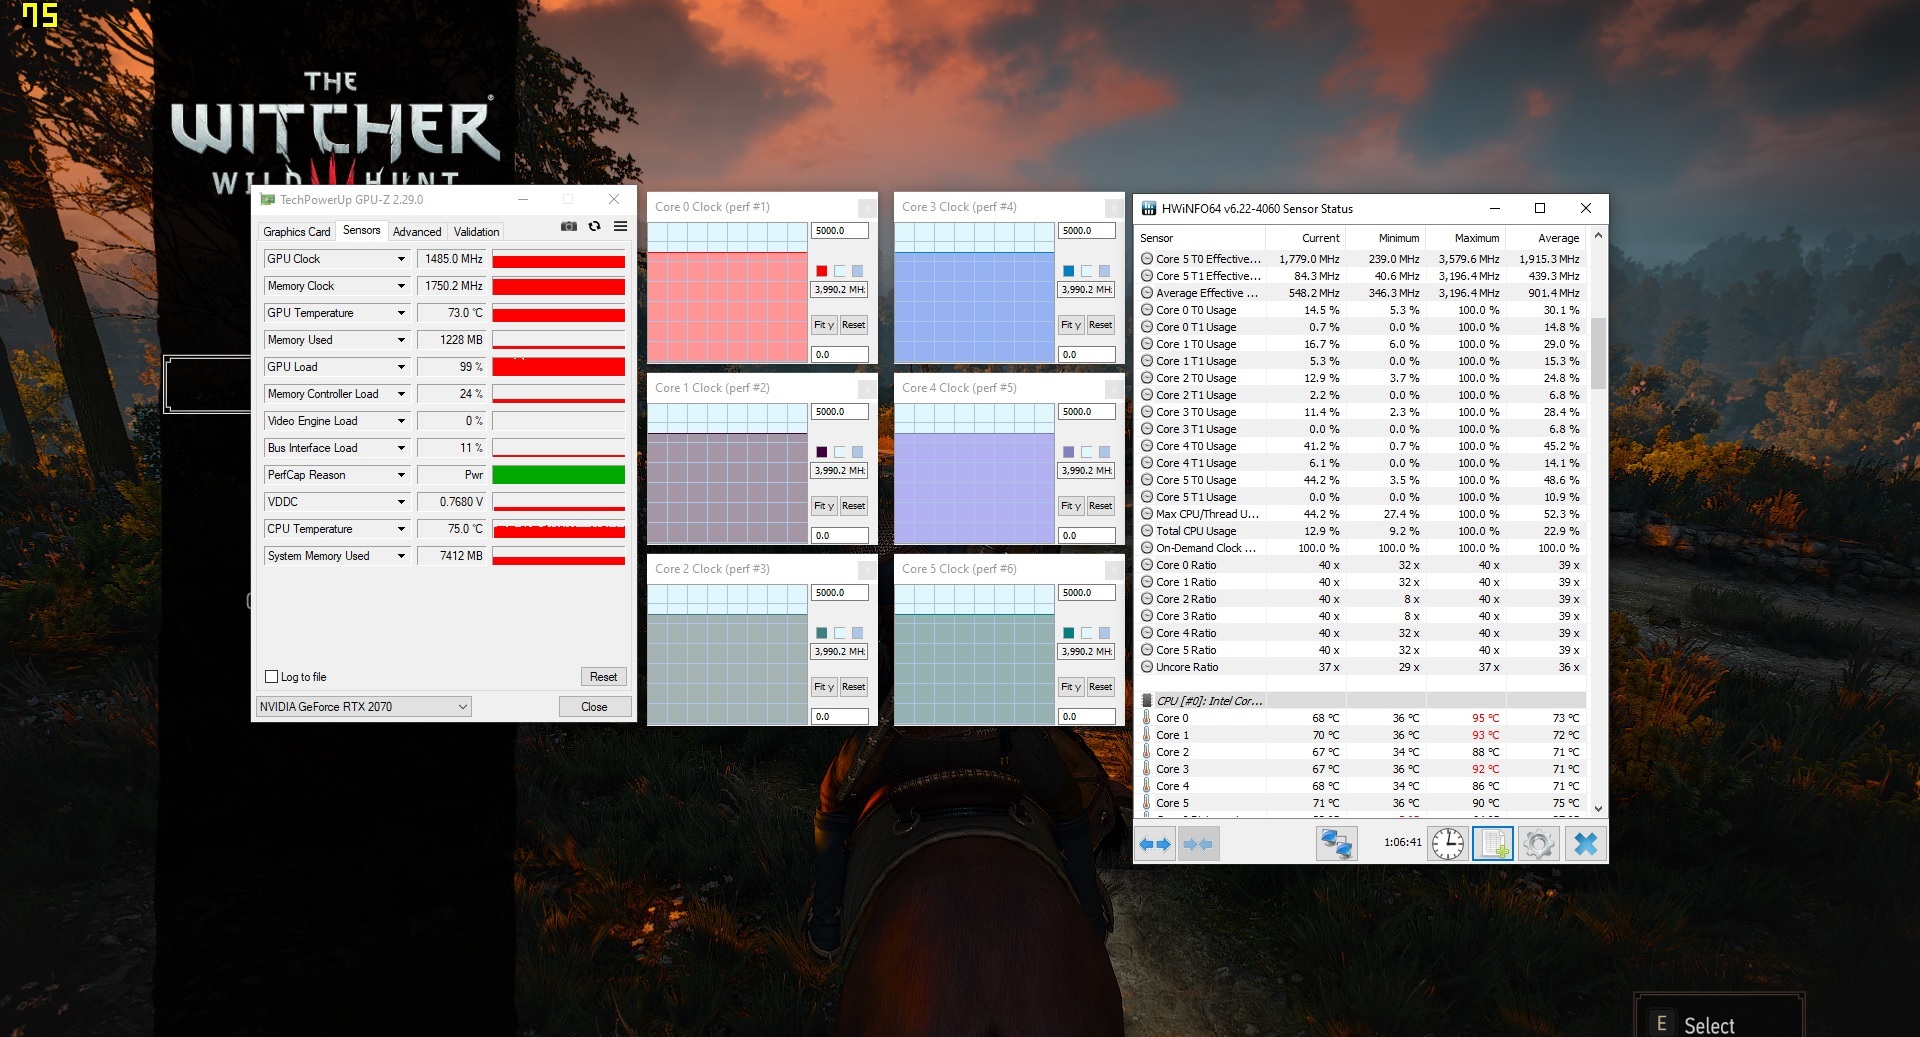
Like with the CPU, we also tested the clock rate of the GPU. The GeForce RTX 2070 speeds up from a standard 1215 MHz to 1500 MHz under load. During the GPU-Z render test, the Pro 15 even managed to get 1935 MHz out of the chip. The Pro 15 is among the top of its class in terms of graphics performance based on our range of benchmarks (3DMark Port Royal, 3DMark Fire Strike, 3DMark 11, etc.).
The 60-minute test using the role-playing game The Witcher 3 (1920x1080, Ultra) didn't uncover any anomalies. The frame rate remained relatively constant throughout the test and there were no drops in performance (see graph below).
Gaming Performance
The GeForce RTX 2070 can make good use of the 144-Hz panel in our test unit. Nvidia's high-end chip can display every current game smoothly at 1920x1080 pixels and maximum details. Only very demanding games such as Anno 1800 and Red Dead Redemption 2 have an average frame rate below 60 fps.
| The Witcher 3 - 1920x1080 Ultra Graphics & Postprocessing (HBAO+) | |
| Average of class Gaming (104.7 - 240, n=7, last 2 years) | |
| MSI GE65 Raider 9SF-049US | |
| Schenker XMG Pro 15 | |
| Schenker XMG Ultra 15 Turing | |
| Asus Strix Scar III G531GW-AZ062T | |
| Asus Zephyrus S GX502GW | |
If you connect a QHD display (2560x1440 pixels), you will still get good performance. While Nvidia's Turing flagship, the GeForce RTX 2080, really gets to flex its muscles when it comes to 4K gaming, the GeForce RTX 2070 does reach its limits in this area.
| low | med. | high | ultra | |
|---|---|---|---|---|
| The Witcher 3 (2015) | 142 | 74.4 | ||
| Dota 2 Reborn (2015) | 153 | 140 | 130 | 122 |
| X-Plane 11.11 (2018) | 110 | 95.5 | 81.1 | |
| Anno 1800 (2019) | 68.5 | 41.1 | ||
| Rage 2 (2019) | 103 | 100 | ||
| FIFA 20 (2019) | 190 | 189 | ||
| Ghost Recon Breakpoint (2019) | 89 | 67 | ||
| GRID 2019 (2019) | 104 | 75.4 | ||
| Call of Duty Modern Warfare 2019 (2019) | 113 | 92.9 | ||
| Need for Speed Heat (2019) | 83.5 | 78.1 | ||
| Star Wars Jedi Fallen Order (2019) | 92.2 | 90.7 | ||
| Red Dead Redemption 2 (2019) | 66.8 | 42.4 |
Emissions
System Noise
Clevo barebones often have issues with cooling. The same goes for the new PB51RF-G case. Firstly, the cooling fans can occasionally turn up really high while idling or during simple office, video or web activities, and secondly, they are very loud during 3D applications.
Despite its thicker case, the XMG Pro 15 is louder than its competition at 55 dB during The Witcher 3. Considering the CPU and GPU temperature of around 70 °C, it should be possible to reduce the fan noise. Our conclusion: The cooling fans aren't very well balanced in entertainment mode. Users who are sensitive to noise or don't want to use a headset while gaming will have to look for an alternative.
Noise level
| Idle |
| 30 / 32 / 40 dB(A) |
| Load |
| 56 / 56 dB(A) |
 | ||
30 dB silent 40 dB(A) audible 50 dB(A) loud |
||
min: | ||
| Schenker XMG Pro 15 i7-9750H, GeForce RTX 2070 Mobile | Asus Strix Scar III G531GW-AZ062T i7-9750H, GeForce RTX 2070 Mobile | Asus Zephyrus S GX502GW i7-9750H, GeForce RTX 2070 Mobile | MSI GE65 Raider 9SF-049US i9-9880H, GeForce RTX 2070 Mobile | Schenker XMG Ultra 15 Turing i7-9700K, GeForce RTX 2070 Mobile | Average of class Gaming | |
|---|---|---|---|---|---|---|
| Noise | 9% | 2% | 6% | -1% | 16% | |
| off / environment * (dB) | 30 | 30 -0% | 30 -0% | 28.8 4% | 30 -0% | 24.1 ? 20% |
| Idle Minimum * (dB) | 30 | 30.6 -2% | 31 -3% | 33 -10% | 32 -7% | 26 ? 13% |
| Idle Average * (dB) | 32 | 30.6 4% | 33 -3% | 33 -3% | 33 -3% | 27.4 ? 14% |
| Idle Maximum * (dB) | 40 | 37.7 6% | 38 5% | 33.1 17% | 36 10% | 30.1 ? 25% |
| Load Average * (dB) | 56 | 36.5 35% | 50 11% | 38 32% | 55 2% | 43.6 ? 22% |
| Witcher 3 ultra * (dB) | 55 | 52.1 5% | 53 4% | 52.9 4% | 57 -4% | |
| Load Maximum * (dB) | 56 | 48.1 14% | 56 -0% | 57.8 -3% | 59 -5% | 54.2 ? 3% |
* ... smaller is better
Temperature
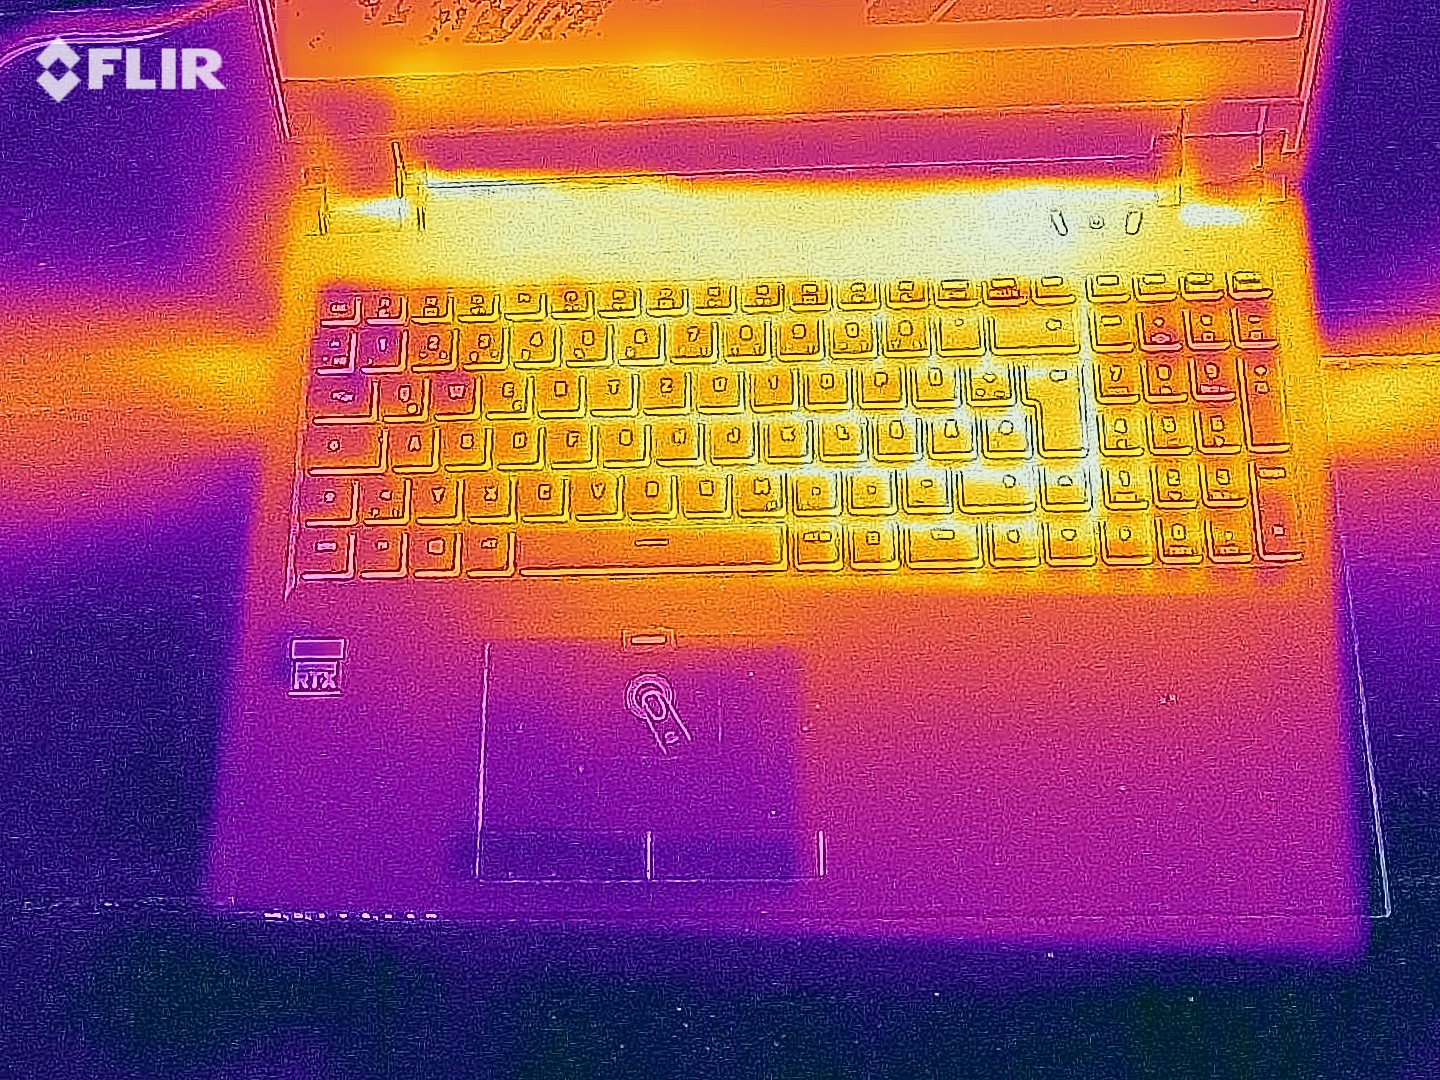
One advantage of the overly active fans is that the case does not heat up too much. We measured a maximum surface temperature of 43 °C, which is the best result in our comparison field. This also means that the 15-inch Schenker can be used on your lap - that's fairly unusual for a gaming laptop.
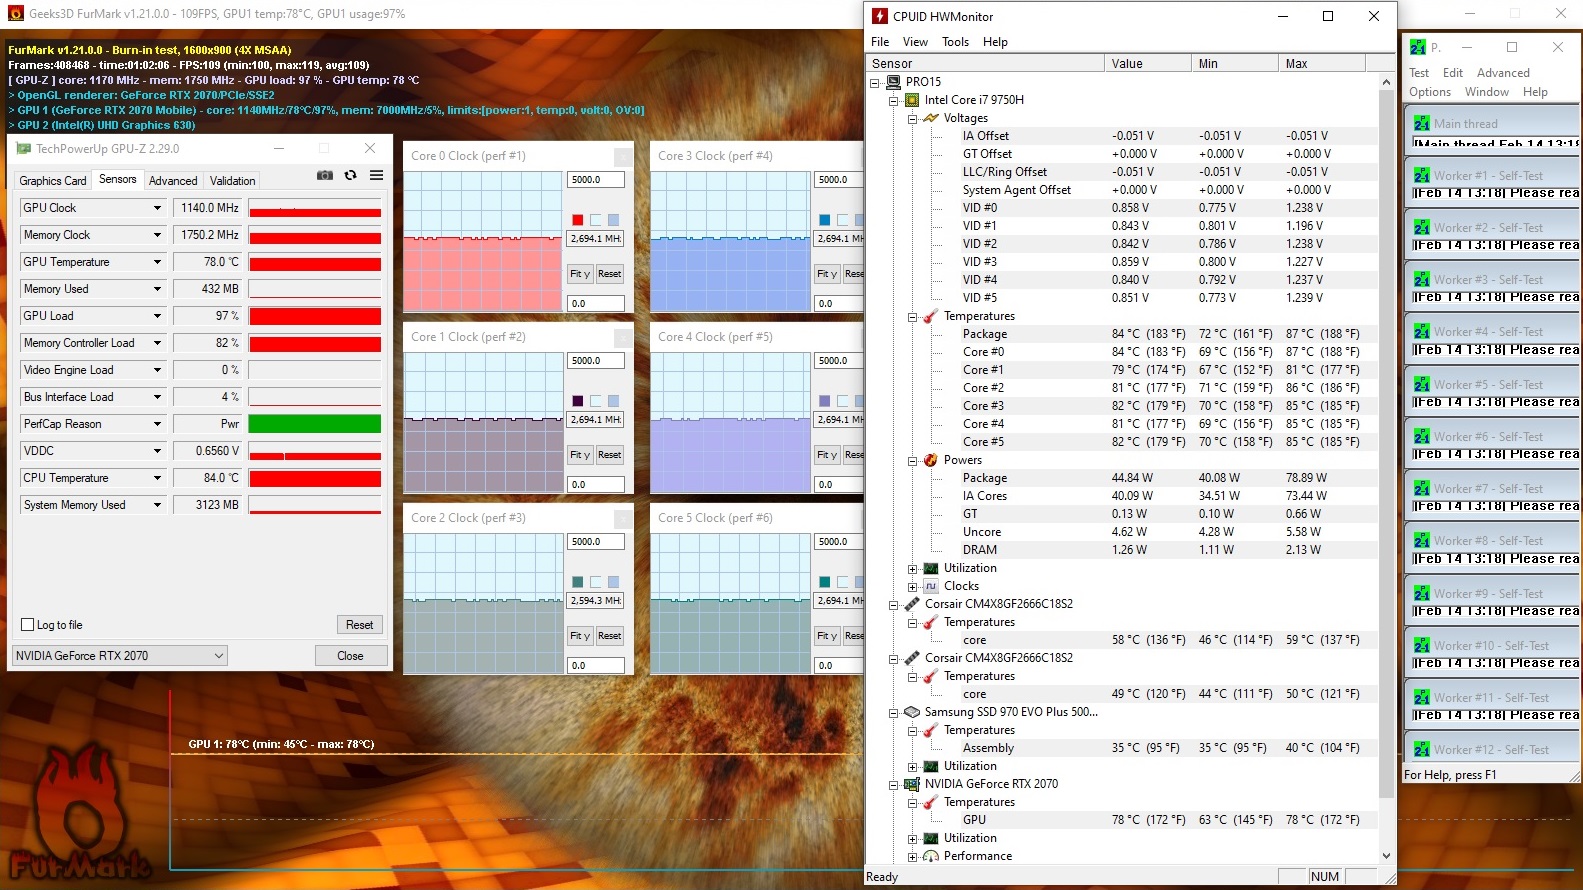
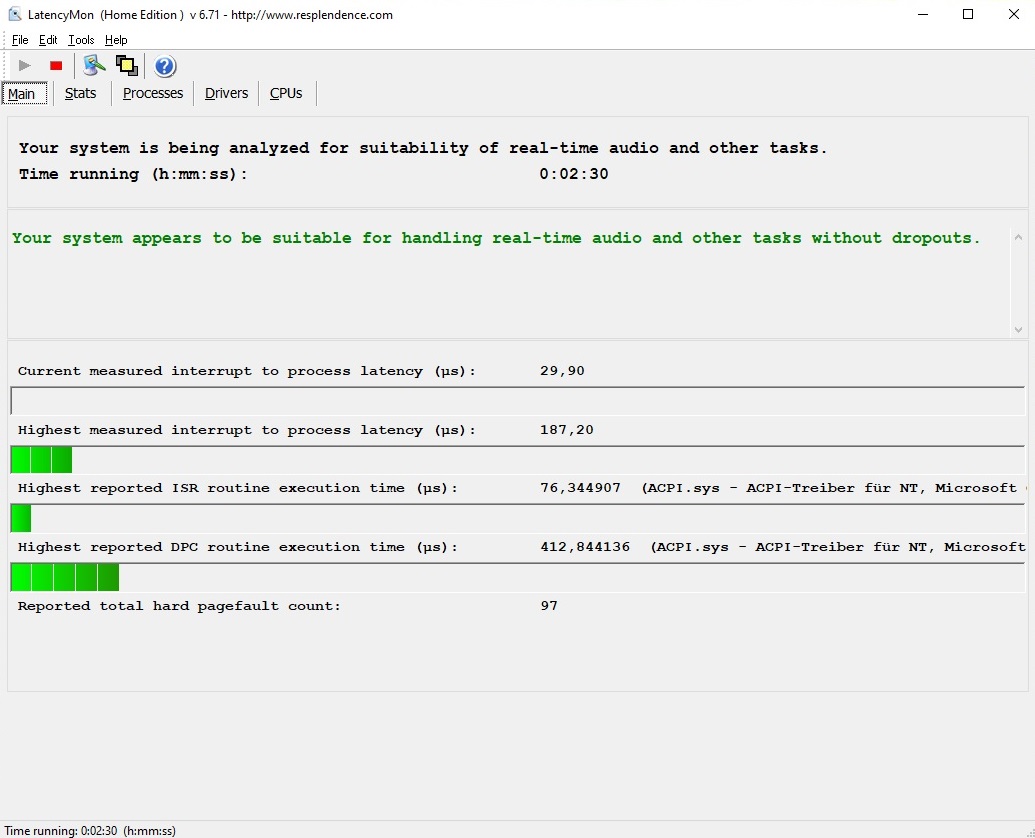
The components do not heat up particularly either. Even during our stress test with FurMark and Prime95, the Core i7-9750H remained below 90 °C while the GeForce RTX 2070 never went over 80 °C.
(±) The maximum temperature on the upper side is 43 °C / 109 F, compared to the average of 40.4 °C / 105 F, ranging from 21.2 to 68.8 °C for the class Gaming.
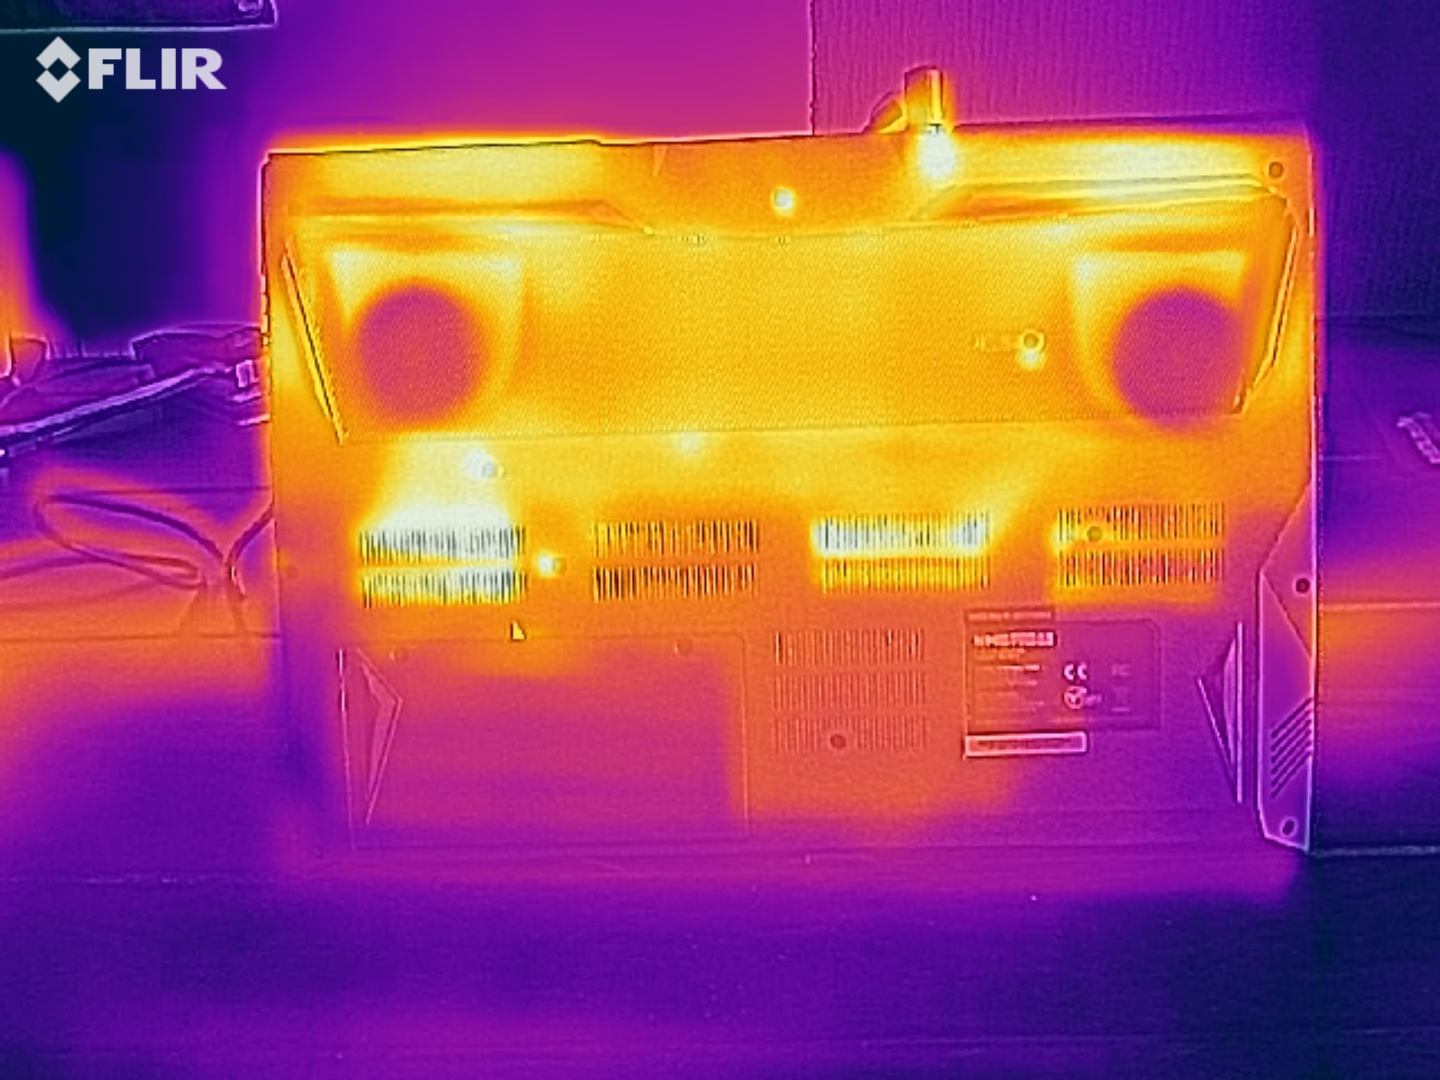
(±) The bottom heats up to a maximum of 43 °C / 109 F, compared to the average of 43.2 °C / 110 F
(+) In idle usage, the average temperature for the upper side is 26.4 °C / 80 F, compared to the device average of 33.9 °C / 93 F.
(±) Playing The Witcher 3, the average temperature for the upper side is 36.3 °C / 97 F, compared to the device average of 33.9 °C / 93 F.
(+) The palmrests and touchpad are cooler than skin temperature with a maximum of 31 °C / 87.8 F and are therefore cool to the touch.
(-) The average temperature of the palmrest area of similar devices was 28.8 °C / 83.8 F (-2.2 °C / -4 F).
| Schenker XMG Pro 15 i7-9750H, GeForce RTX 2070 Mobile | Asus Strix Scar III G531GW-AZ062T i7-9750H, GeForce RTX 2070 Mobile | Asus Zephyrus S GX502GW i7-9750H, GeForce RTX 2070 Mobile | MSI GE65 Raider 9SF-049US i9-9880H, GeForce RTX 2070 Mobile | Schenker XMG Ultra 15 Turing i7-9700K, GeForce RTX 2070 Mobile | Average of class Gaming | |
|---|---|---|---|---|---|---|
| Heat | -14% | -16% | -17% | -5% | -10% | |
| Maximum Upper Side * (°C) | 43 | 45.6 -6% | 54 -26% | 45 -5% | 45 -5% | 45.2 ? -5% |
| Maximum Bottom * (°C) | 43 | 55.5 -29% | 47 -9% | 53 -23% | 48 -12% | 48.1 ? -12% |
| Idle Upper Side * (°C) | 29 | 31.8 -10% | 33 -14% | 31.2 -8% | 30 -3% | 31 ? -7% |
| Idle Bottom * (°C) | 30 | 33.3 -11% | 34 -13% | 39 -30% | 30 -0% | 34.2 ? -14% |
* ... smaller is better
Speakers
The sound quality of the XMG Pro 15 is acceptable. While mids and highs actually come out fairly well in our audio analysis, the bass - as usual - is basically nonexistent. Not even the high maximum volume of 86 dB can really make up for that. Overall, the 2.0 system is suitable for mobile use for when you don't have a headset or external speaker at hand.
Schenker XMG Pro 15 audio analysis
(+) | speakers can play relatively loud (86 dB)
Bass 100 - 315 Hz
(-) | nearly no bass - on average 30.4% lower than median
(±) | linearity of bass is average (11.3% delta to prev. frequency)
Mids 400 - 2000 Hz
(+) | balanced mids - only 3.7% away from median
(+) | mids are linear (6.3% delta to prev. frequency)
Highs 2 - 16 kHz
(+) | balanced highs - only 2.1% away from median
(+) | highs are linear (4.3% delta to prev. frequency)
Overall 100 - 16.000 Hz
(±) | linearity of overall sound is average (20.2% difference to median)
Compared to same class
» 72% of all tested devices in this class were better, 6% similar, 23% worse
» The best had a delta of 6%, average was 18%, worst was 132%
Compared to all devices tested
» 53% of all tested devices were better, 8% similar, 39% worse
» The best had a delta of 4%, average was 23%, worst was 134%
Schenker XMG Ultra 15 Turing audio analysis
(±) | speaker loudness is average but good (77 dB)
Bass 100 - 315 Hz
(±) | reduced bass - on average 11.1% lower than median
(±) | linearity of bass is average (12.7% delta to prev. frequency)
Mids 400 - 2000 Hz
(+) | balanced mids - only 1.9% away from median
(+) | mids are linear (4.3% delta to prev. frequency)
Highs 2 - 16 kHz
(+) | balanced highs - only 3.6% away from median
(+) | highs are linear (3.3% delta to prev. frequency)
Overall 100 - 16.000 Hz
(+) | overall sound is linear (14.5% difference to median)
Compared to same class
» 27% of all tested devices in this class were better, 7% similar, 66% worse
» The best had a delta of 6%, average was 18%, worst was 132%
Compared to all devices tested
» 18% of all tested devices were better, 4% similar, 77% worse
» The best had a delta of 4%, average was 23%, worst was 134%
Energy Management
Power Consumption
The power consumption of our test unit is average for a gaming notebook. While our measurements reported a consumption of 15 - 16 Watt while idling, the device reached between 101 and 145 Watt under load. These are typical values for a combination of a Core i7-9750H with a GeForce RTX 2070.
| Off / Standby | |
| Idle | |
| Load |
|
Key:
min: | |
| Schenker XMG Pro 15 i7-9750H, GeForce RTX 2070 Mobile | Asus Strix Scar III G531GW-AZ062T i7-9750H, GeForce RTX 2070 Mobile | Asus Zephyrus S GX502GW i7-9750H, GeForce RTX 2070 Mobile | MSI GE65 Raider 9SF-049US i9-9880H, GeForce RTX 2070 Mobile | Schenker XMG Ultra 15 Turing i7-9700K, GeForce RTX 2070 Mobile | Average of class Gaming | |
|---|---|---|---|---|---|---|
| Power Consumption | 13% | -24% | 1% | -61% | 0% | |
| Idle Minimum * (Watt) | 15 | 11.4 24% | 24 -60% | 15 -0% | 35 -133% | 13 ? 13% |
| Idle Average * (Watt) | 19 | 13.5 29% | 27 -42% | 18.5 3% | 39 -105% | 19 ? -0% |
| Idle Maximum * (Watt) | 26 | 21.6 17% | 33 -27% | 20.2 22% | 47 -81% | 24.6 ? 5% |
| Load Average * (Watt) | 101 | 106 -5% | 129 -28% | 110.9 -10% | 117 -16% | 110.7 ? -10% |
| Witcher 3 ultra * (Watt) | 177 | 186 -5% | 176 1% | 187.3 -6% | 196 -11% | |
| Load Maximum * (Watt) | 245 | 196 20% | 216 12% | 260 -6% | 299 -22% | 259 ? -6% |
* ... smaller is better
Battery Life
The battery life needs improving. Despite graphics switching, the XMG Pro 15 cannot keep going for very long without being connected to a power supply. It lasts just about 1 hour under load (maximum brightness), which is not particularly impressive in 2020. The 3.5 hours of browsing on Wi-Fi (medium brightness) is disappointing as well. In perfect conditions - at low load and with the display set to minimum brightness, we managed to eke out 5 hours of battery life. The battery is not particularly strong with a capacity of 62 Wh. We would have expected at least 70 or maybe even 80 Wh (like in the XMG Ultra 15) considering the price range.
| Schenker XMG Pro 15 i7-9750H, GeForce RTX 2070 Mobile, 62 Wh | Asus Strix Scar III G531GW-AZ062T i7-9750H, GeForce RTX 2070 Mobile, 66 Wh | Asus Zephyrus S GX502GW i7-9750H, GeForce RTX 2070 Mobile, 76 Wh | MSI GE65 Raider 9SF-049US i9-9880H, GeForce RTX 2070 Mobile, 51 Wh | Schenker XMG Ultra 15 Turing i7-9700K, GeForce RTX 2070 Mobile, 82 Wh | Average of class Gaming | |
|---|---|---|---|---|---|---|
| Battery runtime | 60% | 1% | -9% | -16% | 62% | |
| Reader / Idle (h) | 5.2 | 5.9 13% | 6.2 19% | 3.2 -38% | 8.27 ? 59% | |
| WiFi v1.3 (h) | 3.5 | 5.6 60% | 3.7 6% | 3.6 3% | 2.6 -26% | 7.11 ? 103% |
| Load (h) | 1.2 | 1 -17% | 0.6 -50% | 1.4 17% | 1.502 ? 25% | |
| H.264 (h) | 2.6 | 8.32 ? |
Pros
Cons
Verdict
The XMG Pro 15 perfectly fits into the gap between the thin & light range and the classic desktop replacements. Users who prefer a compact case but don't want to forego high performance have come to the right place.
The Core i7-9750H and GeForce RTX 2070 can display all current titles at full details and are the ideal companion for hardcore gamers. Our test unit also offers complementary RGB keyboard backlighting, a lot of upgrade and configuration options and a wide range of available ports, including Thunderbolt 3. The responsive and high-contrast 144-Hz screen is another great feature.
Unfortunately, the cooling fans undermine the otherwise excellent concept. The fact that the fans sometimes turn up seemingly for no reason and that 3D operation is generally too loud is something we have often remarked on with Clevo barebones. The weak battery life has also had an impact on our overall rating.
Schenker XMG Pro 15
- 02/19/2020 v7 (old)
Florian Glaser
Price comparison

