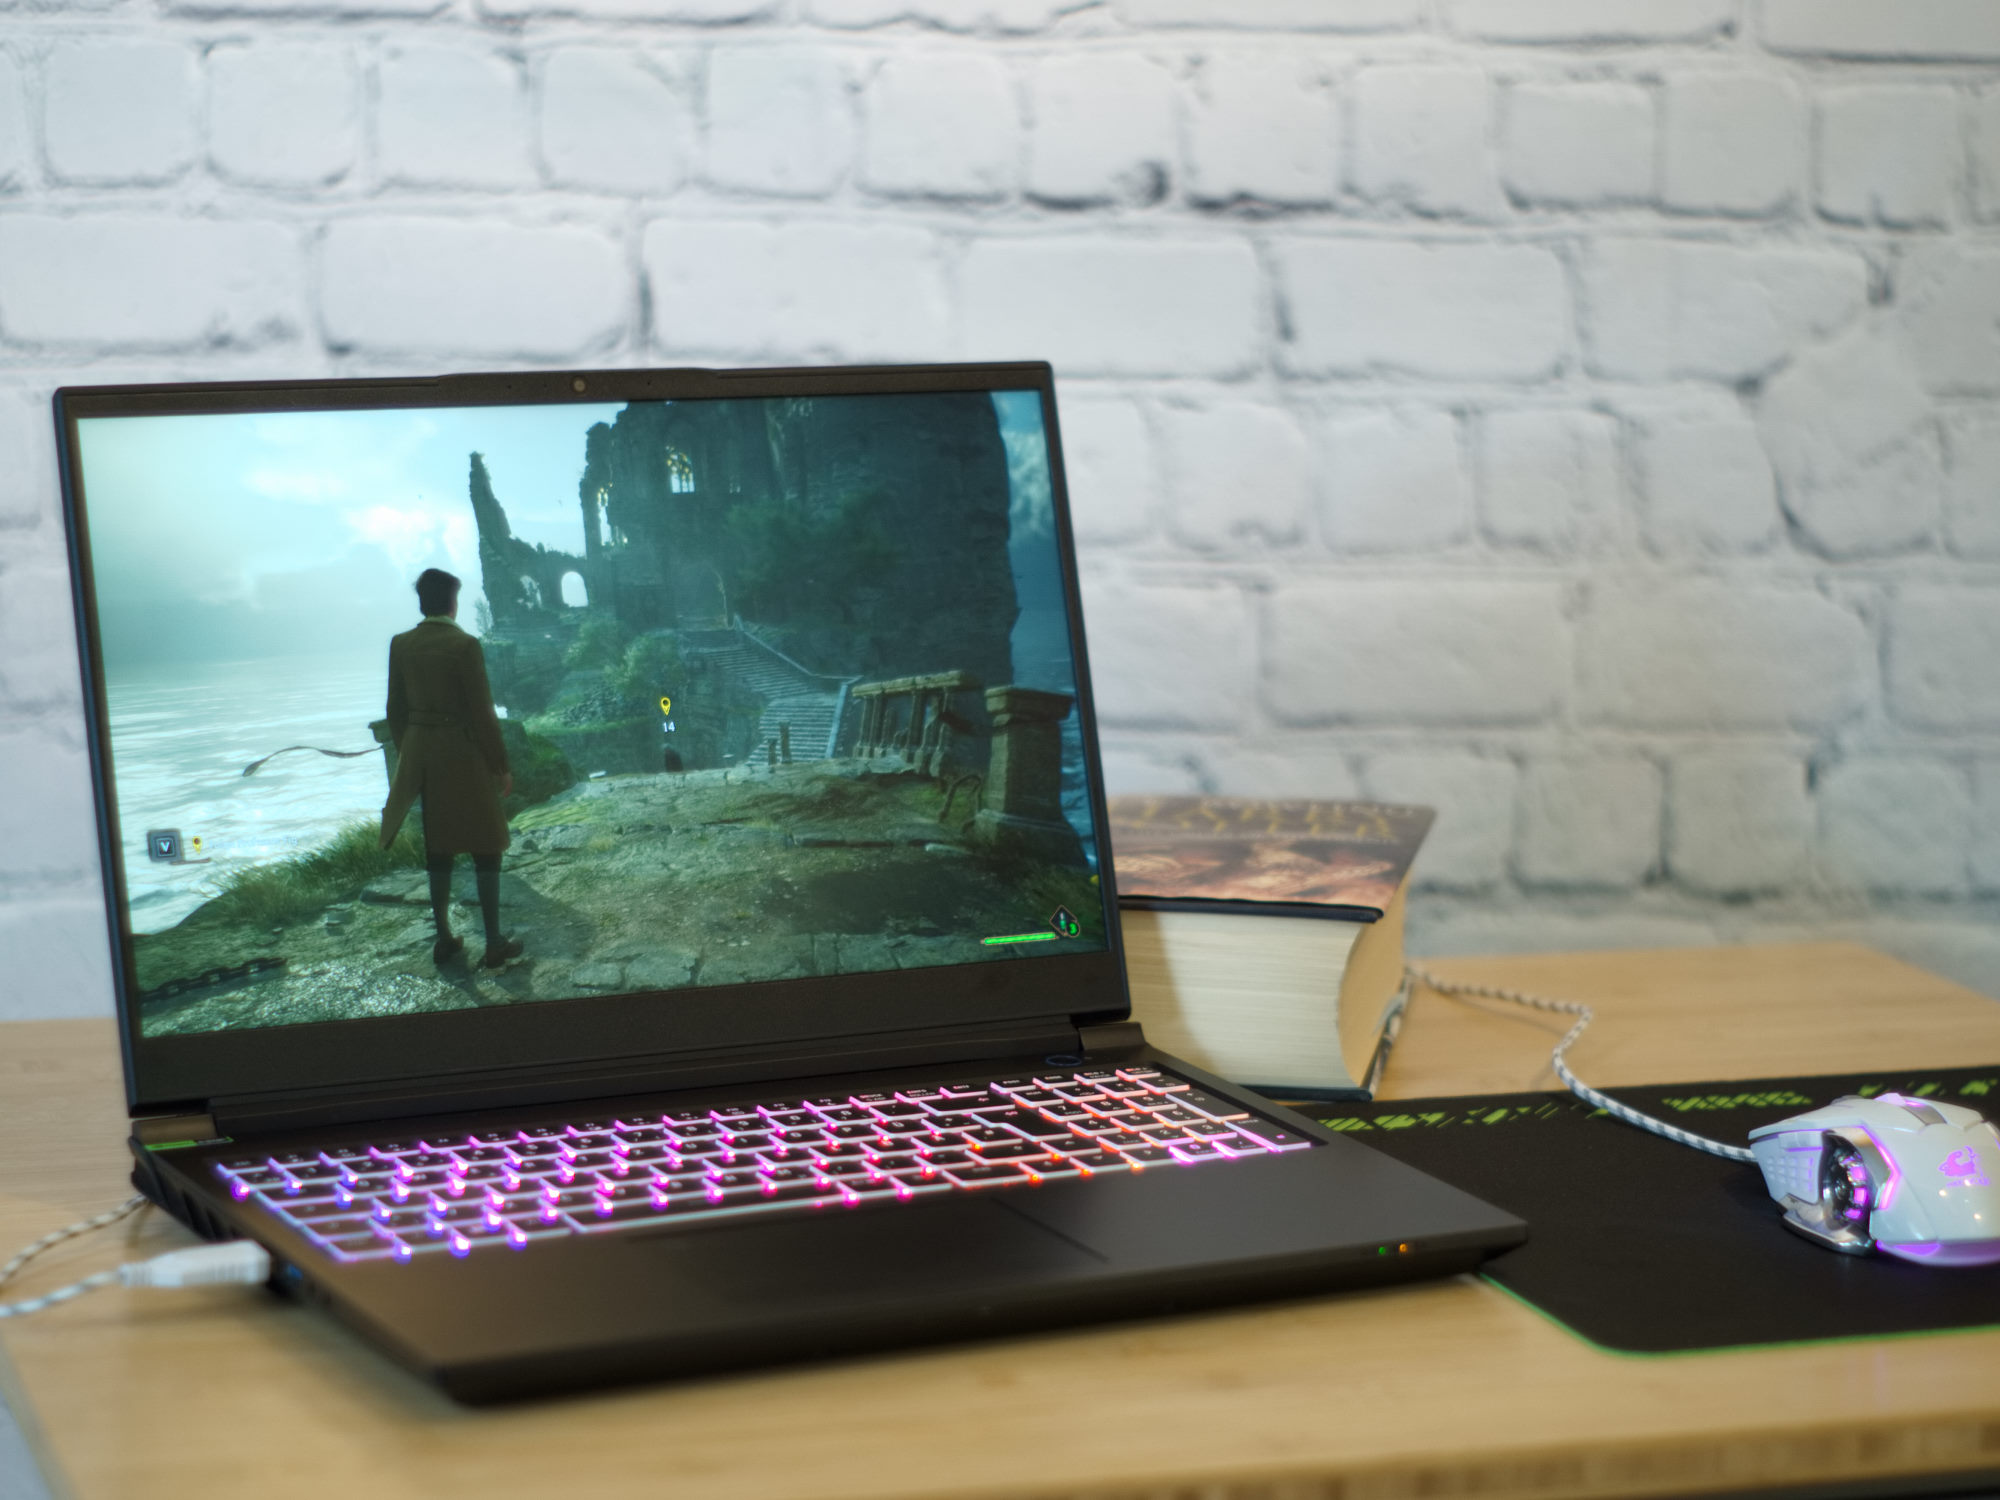
Schenker XMG Pro 15 E23 (PD50SND-G) gaming laptop reviewed: Here's to work-play balance!

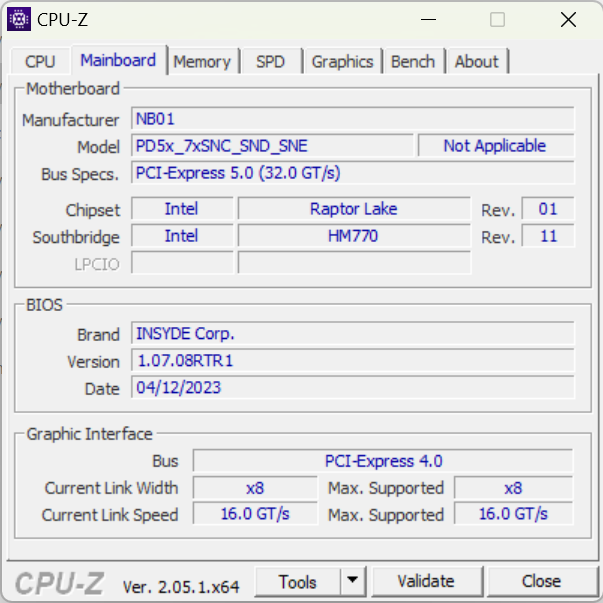
Schenker laptops are regularly updated and last year we reviewed two of the XMG Pro 15's predecessors. One with a Tiger Lake CPU, one with Alder Lake and both coming with an RTX 3080. In terms of the processor, our review device is equipped with the latest Raptor Lake generation and has opted for an Nvidia GeForce RTX 4060. But, the laptop has not only received internal adjustments since the design has also been given a slight makeover. The device is now based on the Clevo PD50SND-G barebone.
A comparison with the predecessor is interesting because although the graphics card now originates from Nvidia's newest Ada Lovelace generation, its class has been lowered from 80 to 60. Another configuration option is provided in the form of the RTX 4070. Both graphics cards run at 140 to 150 watts. The Pro 15 E23 has managed to put in an impressive performance and it stands up well in comparison to gaming laptops such as the Dell G15 5530 or the Aorus 15X ASF. A little beyond this level is the Asus ZenBook Pro 14 Duo. However, the multimedia laptop also boasts high fps counts in many current titles.
Possible competitors compared
Rating | Date | Model | Weight | Height | Size | Resolution | Price |
|---|---|---|---|---|---|---|---|
| 86.2 % v7 (old) | 07 / 2023 | Schenker XMG Pro 15 (E23) i9-13900HX, GeForce RTX 4060 Laptop GPU | 2.4 kg | 24.9 mm | 15.60" | 2560x1440 | |
| 86.9 % v7 (old) | 07 / 2022 | Schenker XMG Pro 15 (i7-12700H, RTX 3080 Ti) i7-12700H, GeForce RTX 3080 Ti Laptop GPU | 2.4 kg | 25 mm | 15.60" | 2560x1440 | |
| 84.2 % v7 (old) | 06 / 2023 | Dell G15 5530 i7-13650HX, GeForce RTX 4060 Laptop GPU | 3 kg | 26.95 mm | 15.60" | 1920x1080 | |
| 86.3 % v7 (old) | 06 / 2023 | Asus TUF A15 FA507 R7 7735HS, GeForce RTX 4050 Laptop GPU | 2.2 kg | 24.9 mm | 15.60" | 1920x1080 | |
| 86.2 % v7 (old) | 04 / 2023 | Aorus 15X ASF i7-13700HX, GeForce RTX 4070 Laptop GPU | 2.3 kg | 19.7 mm | 15.60" | 2560x1440 | |
| 87 % v7 (old) | 06 / 2023 | Asus ZenBook Pro 14 Duo UX8402VV-P1021W i9-13900H, GeForce RTX 4060 Laptop GPU | 1.8 kg | 21 mm | 14.50" | 2880x1800 | |
| 82.4 % v7 (old) | 04 / 2023 | MSI Cyborg 15 A12VF i7-12650H, GeForce RTX 4060 Laptop GPU | 2 kg | 22.9 mm | 15.60" | 1920x1080 | |
| 88.4 % v7 (old) | 06 / 2023 | Alienware x16 R1 i9-13900HK, GeForce RTX 4080 Laptop GPU | 2.6 kg | 18.57 mm | 16.00" | 2560x1600 |
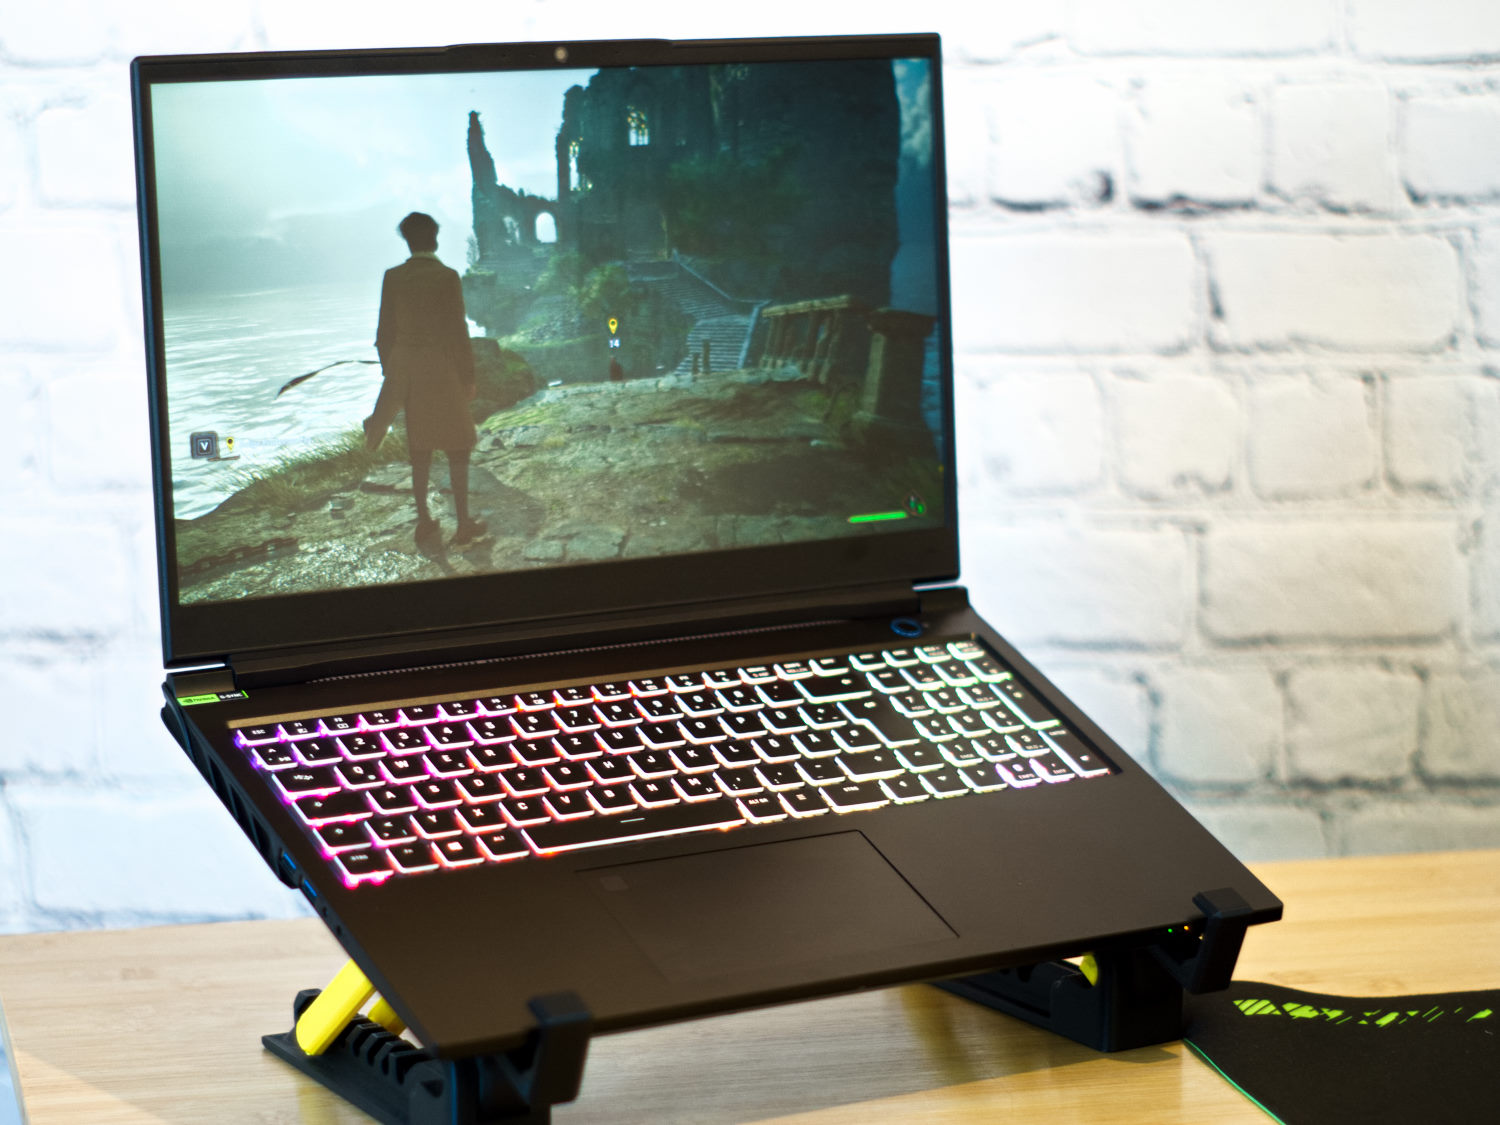
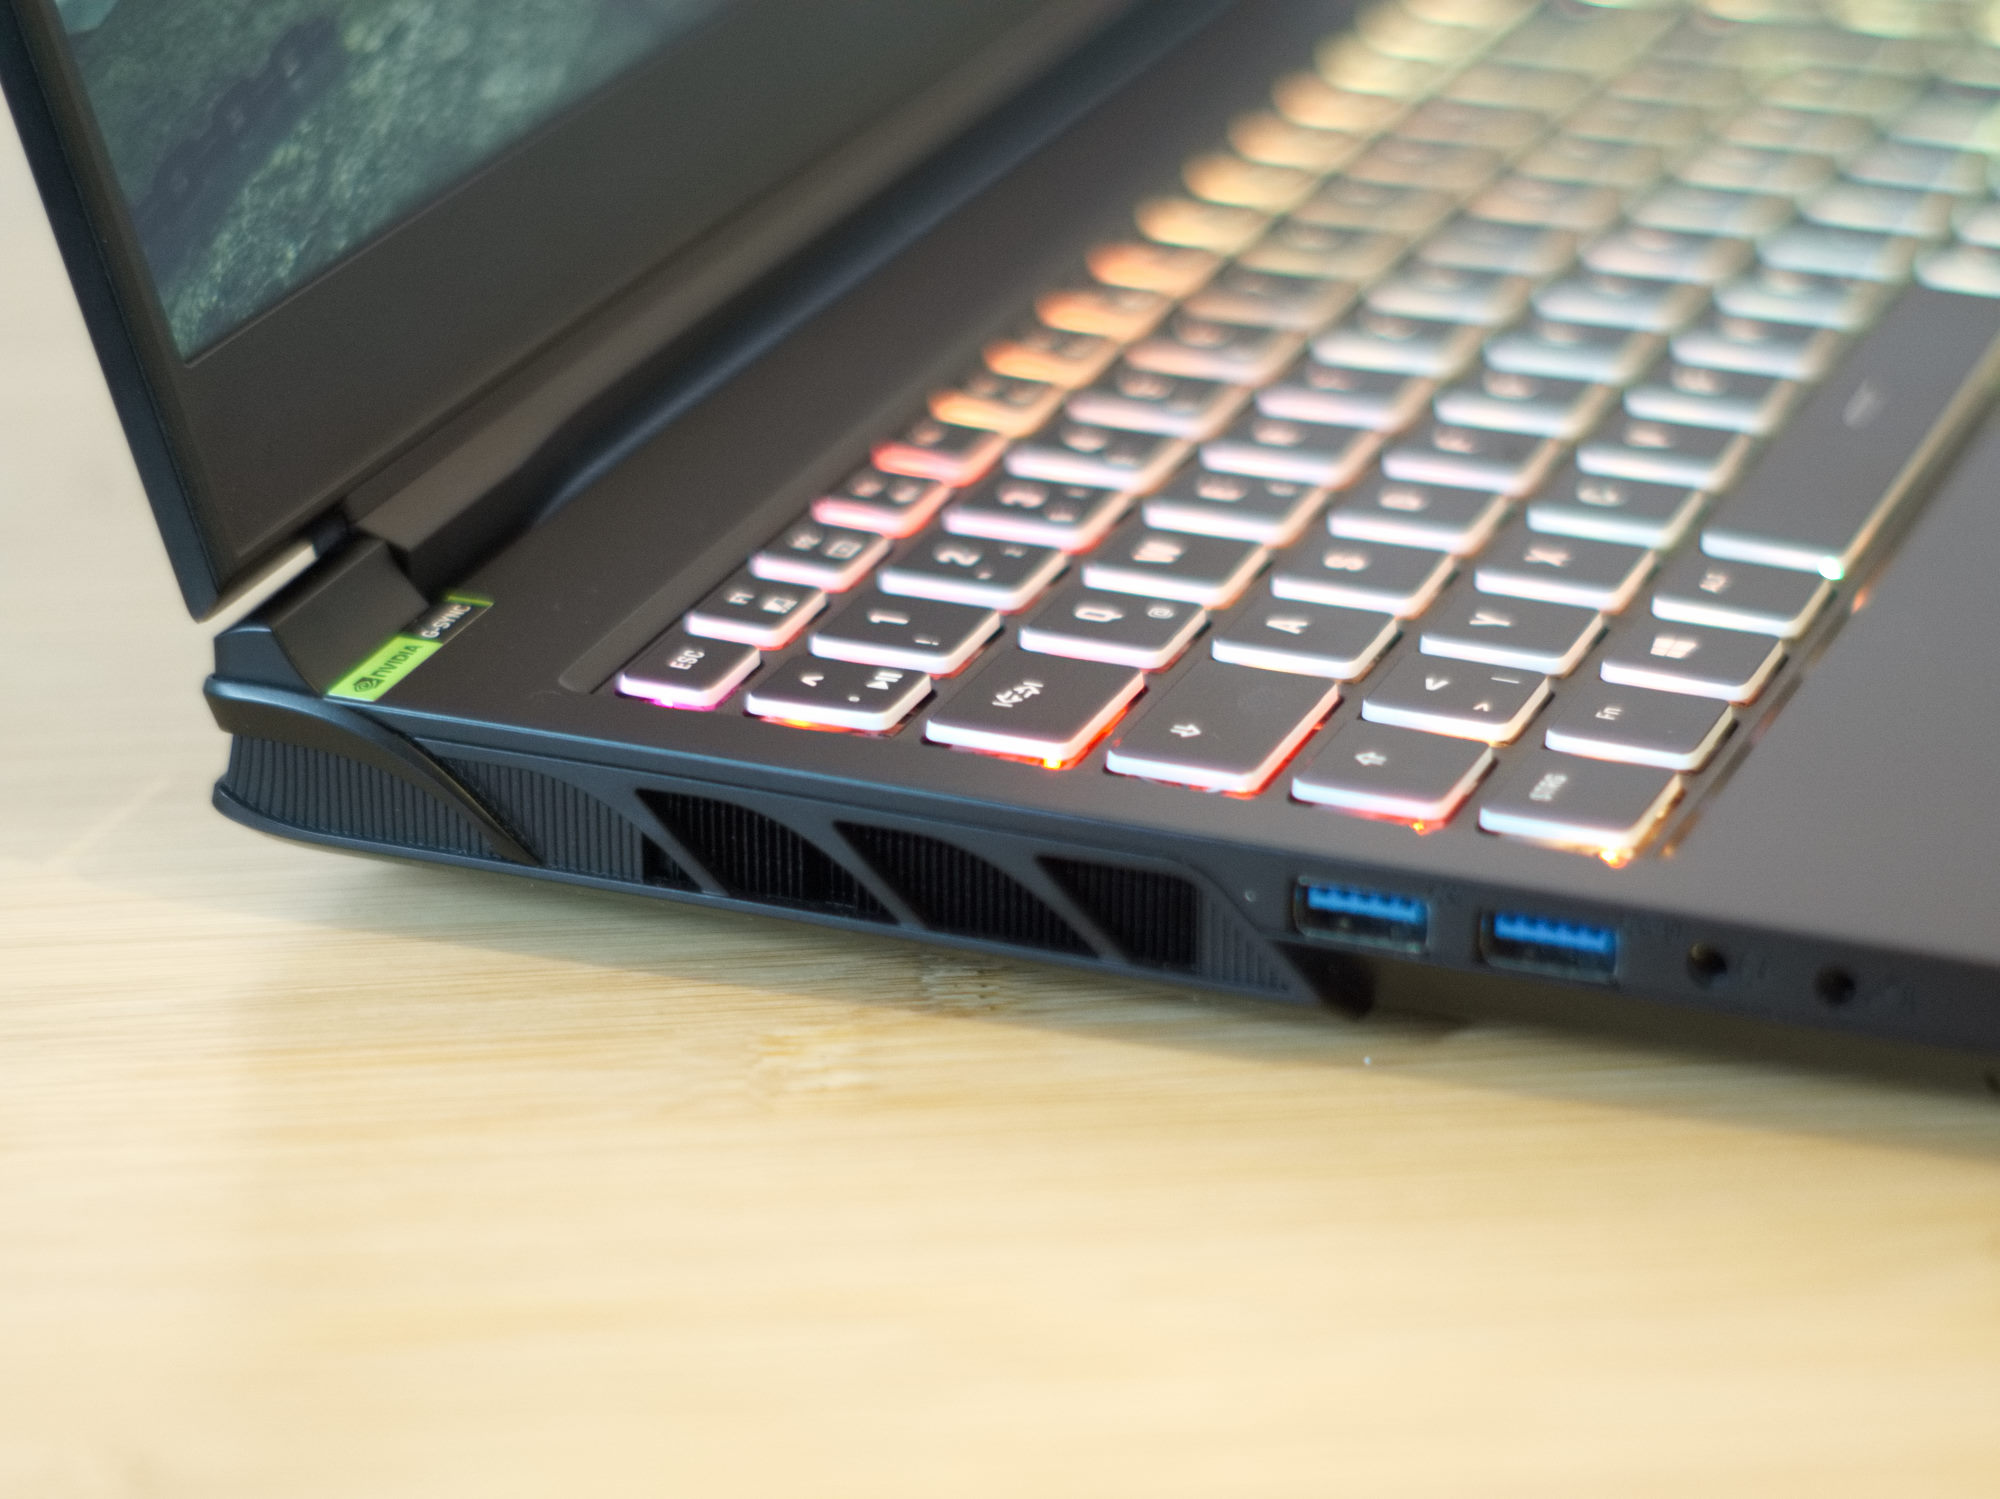
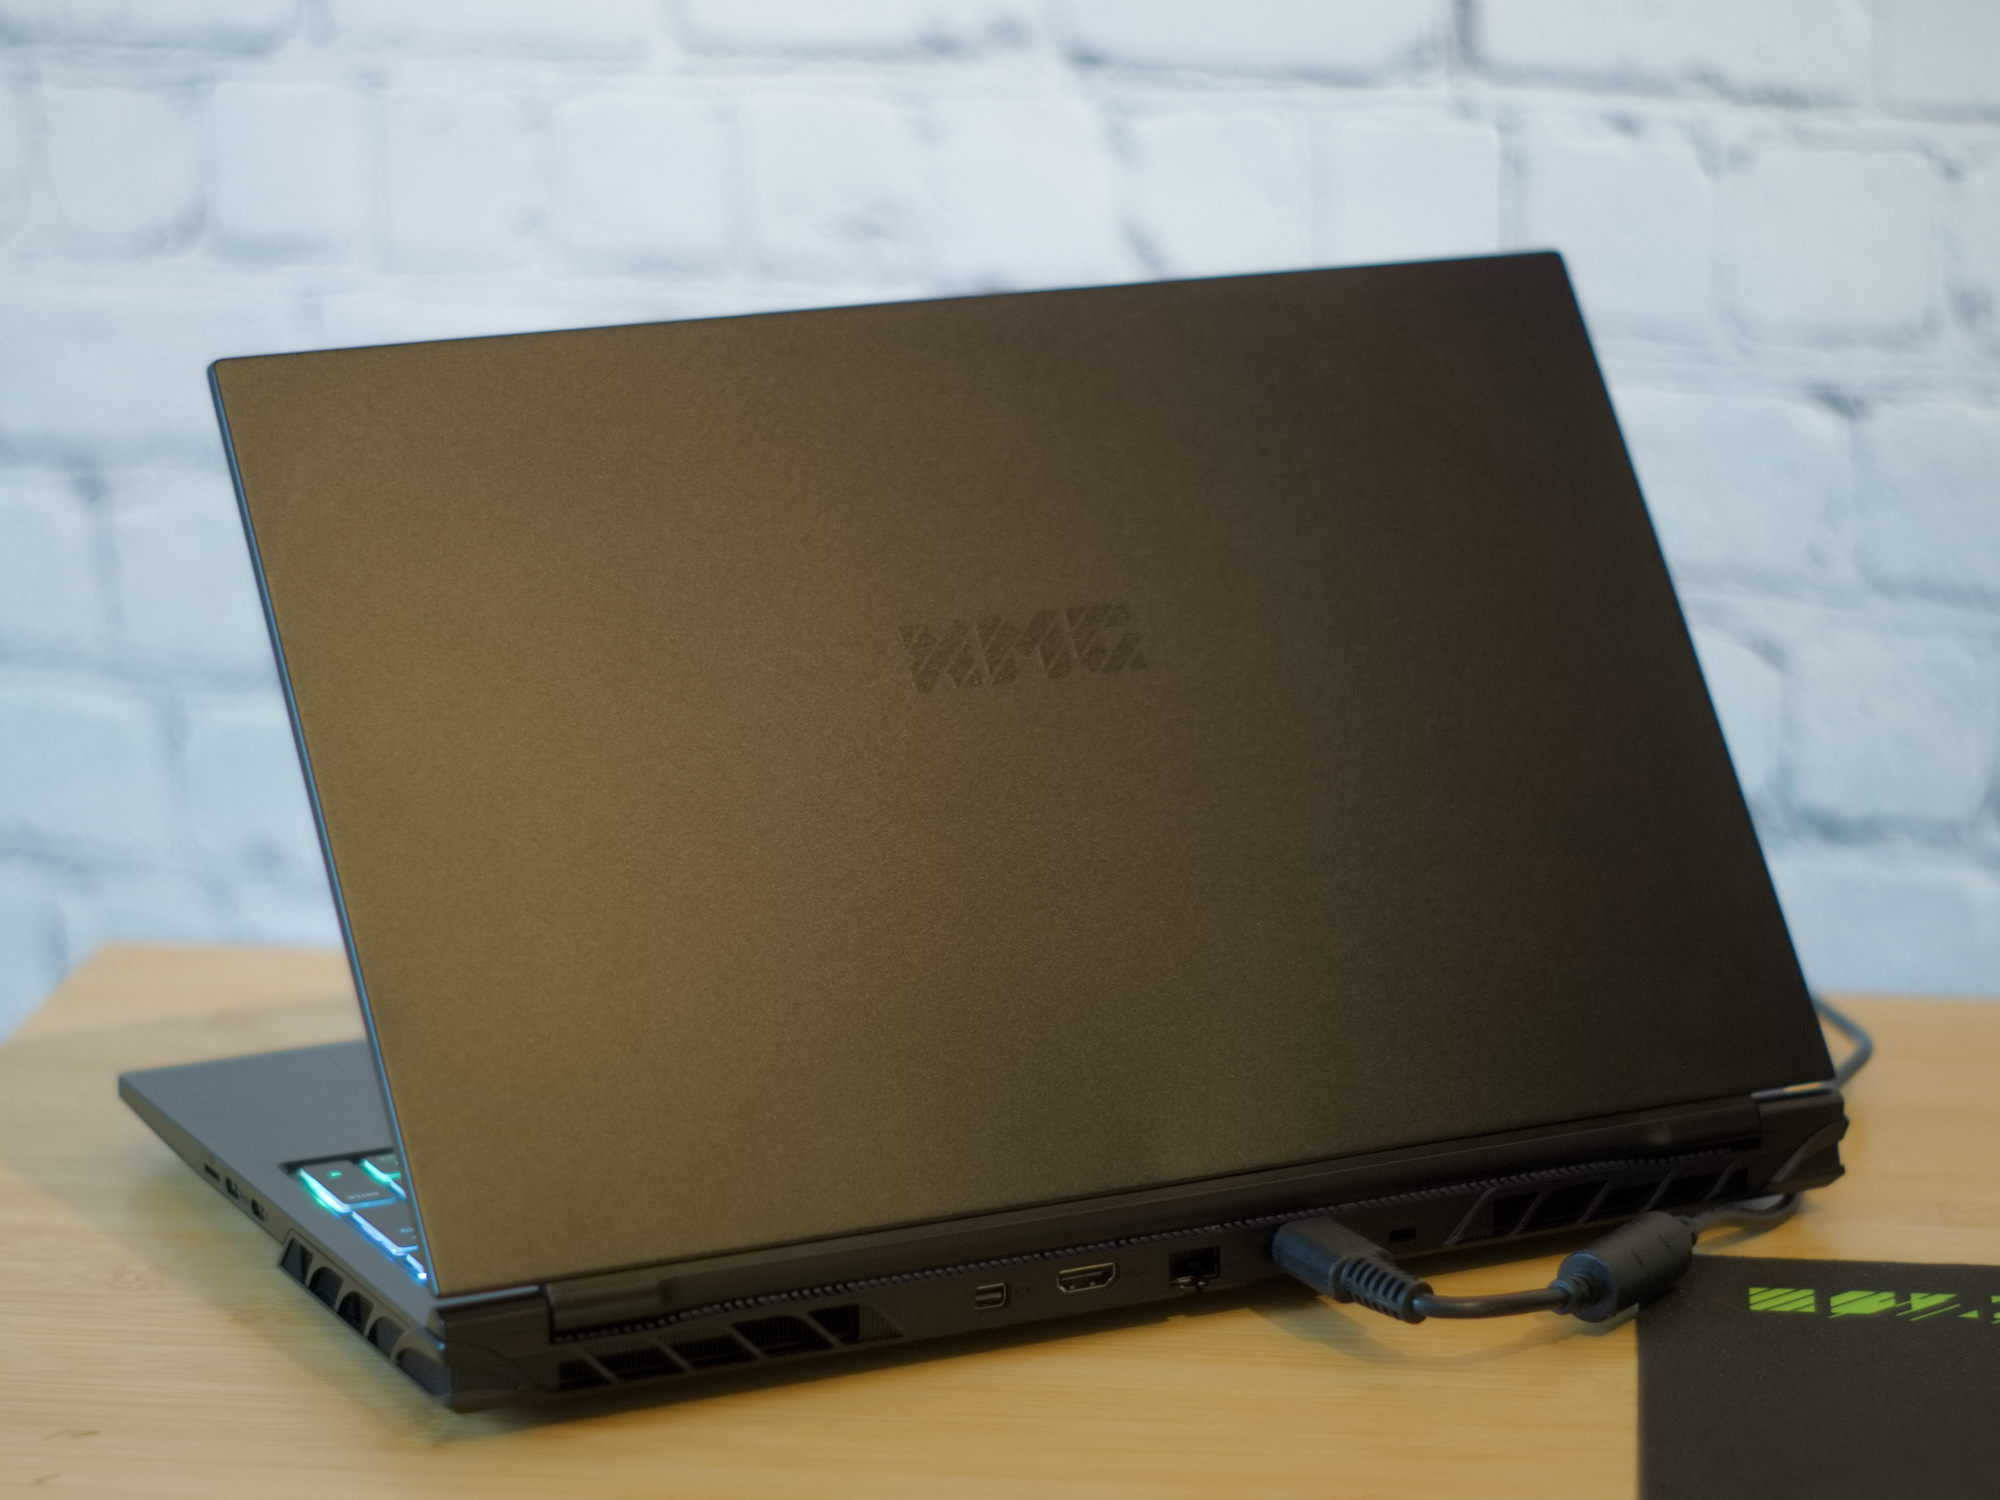
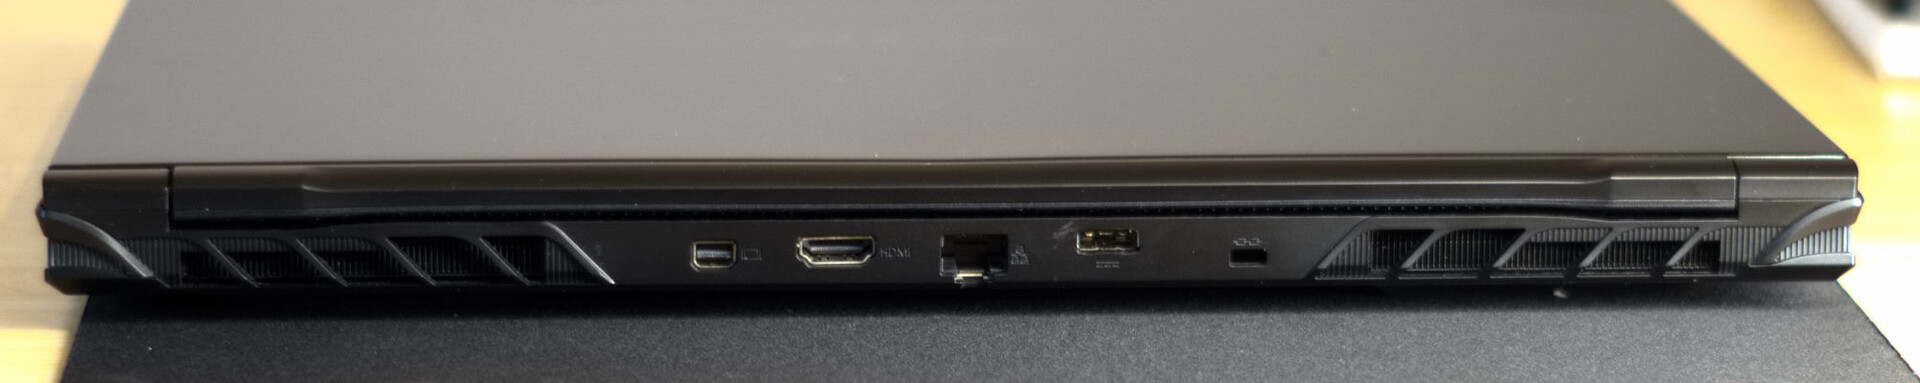
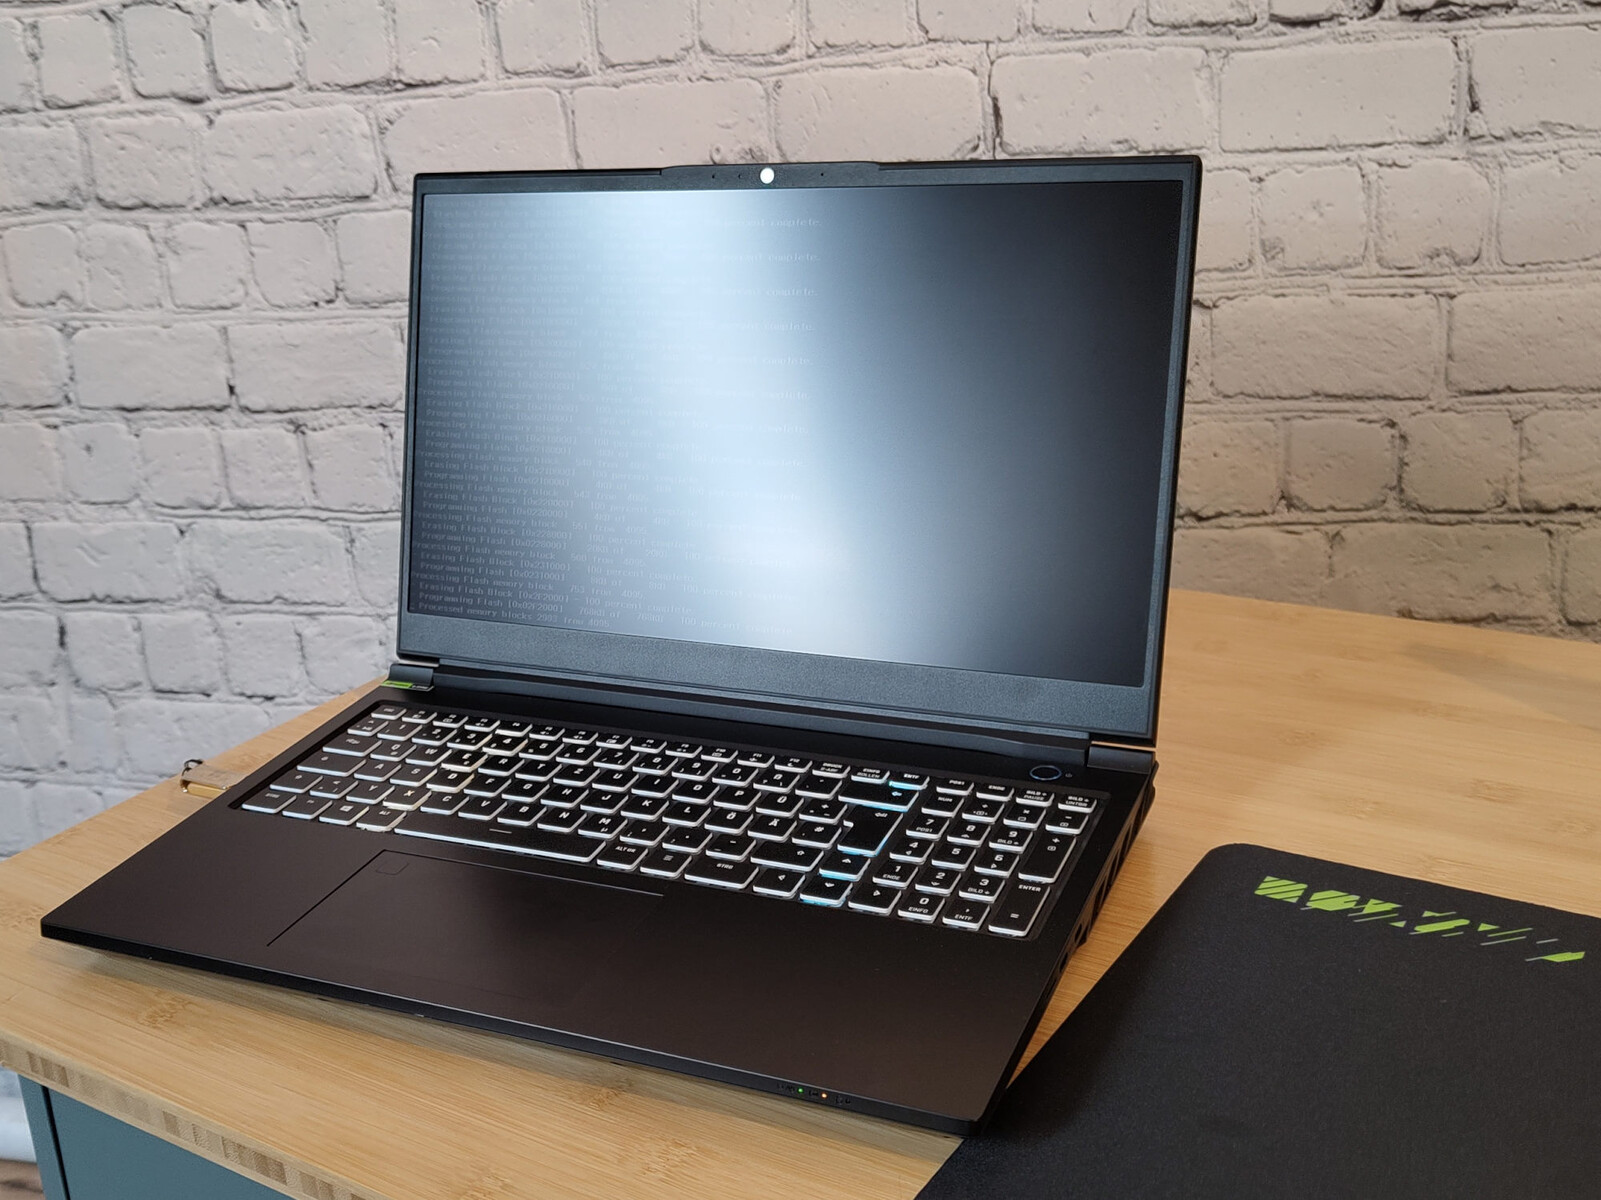
Case & features - High metal content
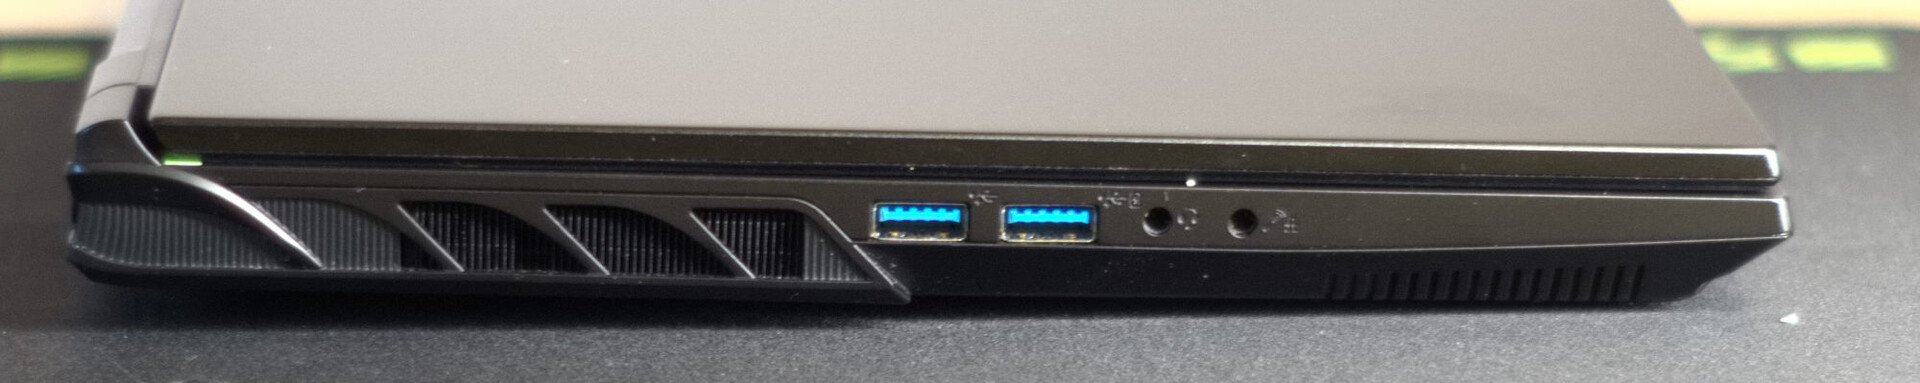
Compared to its predecessor, the Pro 15 E23 has received some minor detail adjustments. Those affected are essentially the vents on the laptop's sides and a positional swapping of the RJ45 slot and a USB-C slot. Now all the USB ports can be found on the sides of the device.
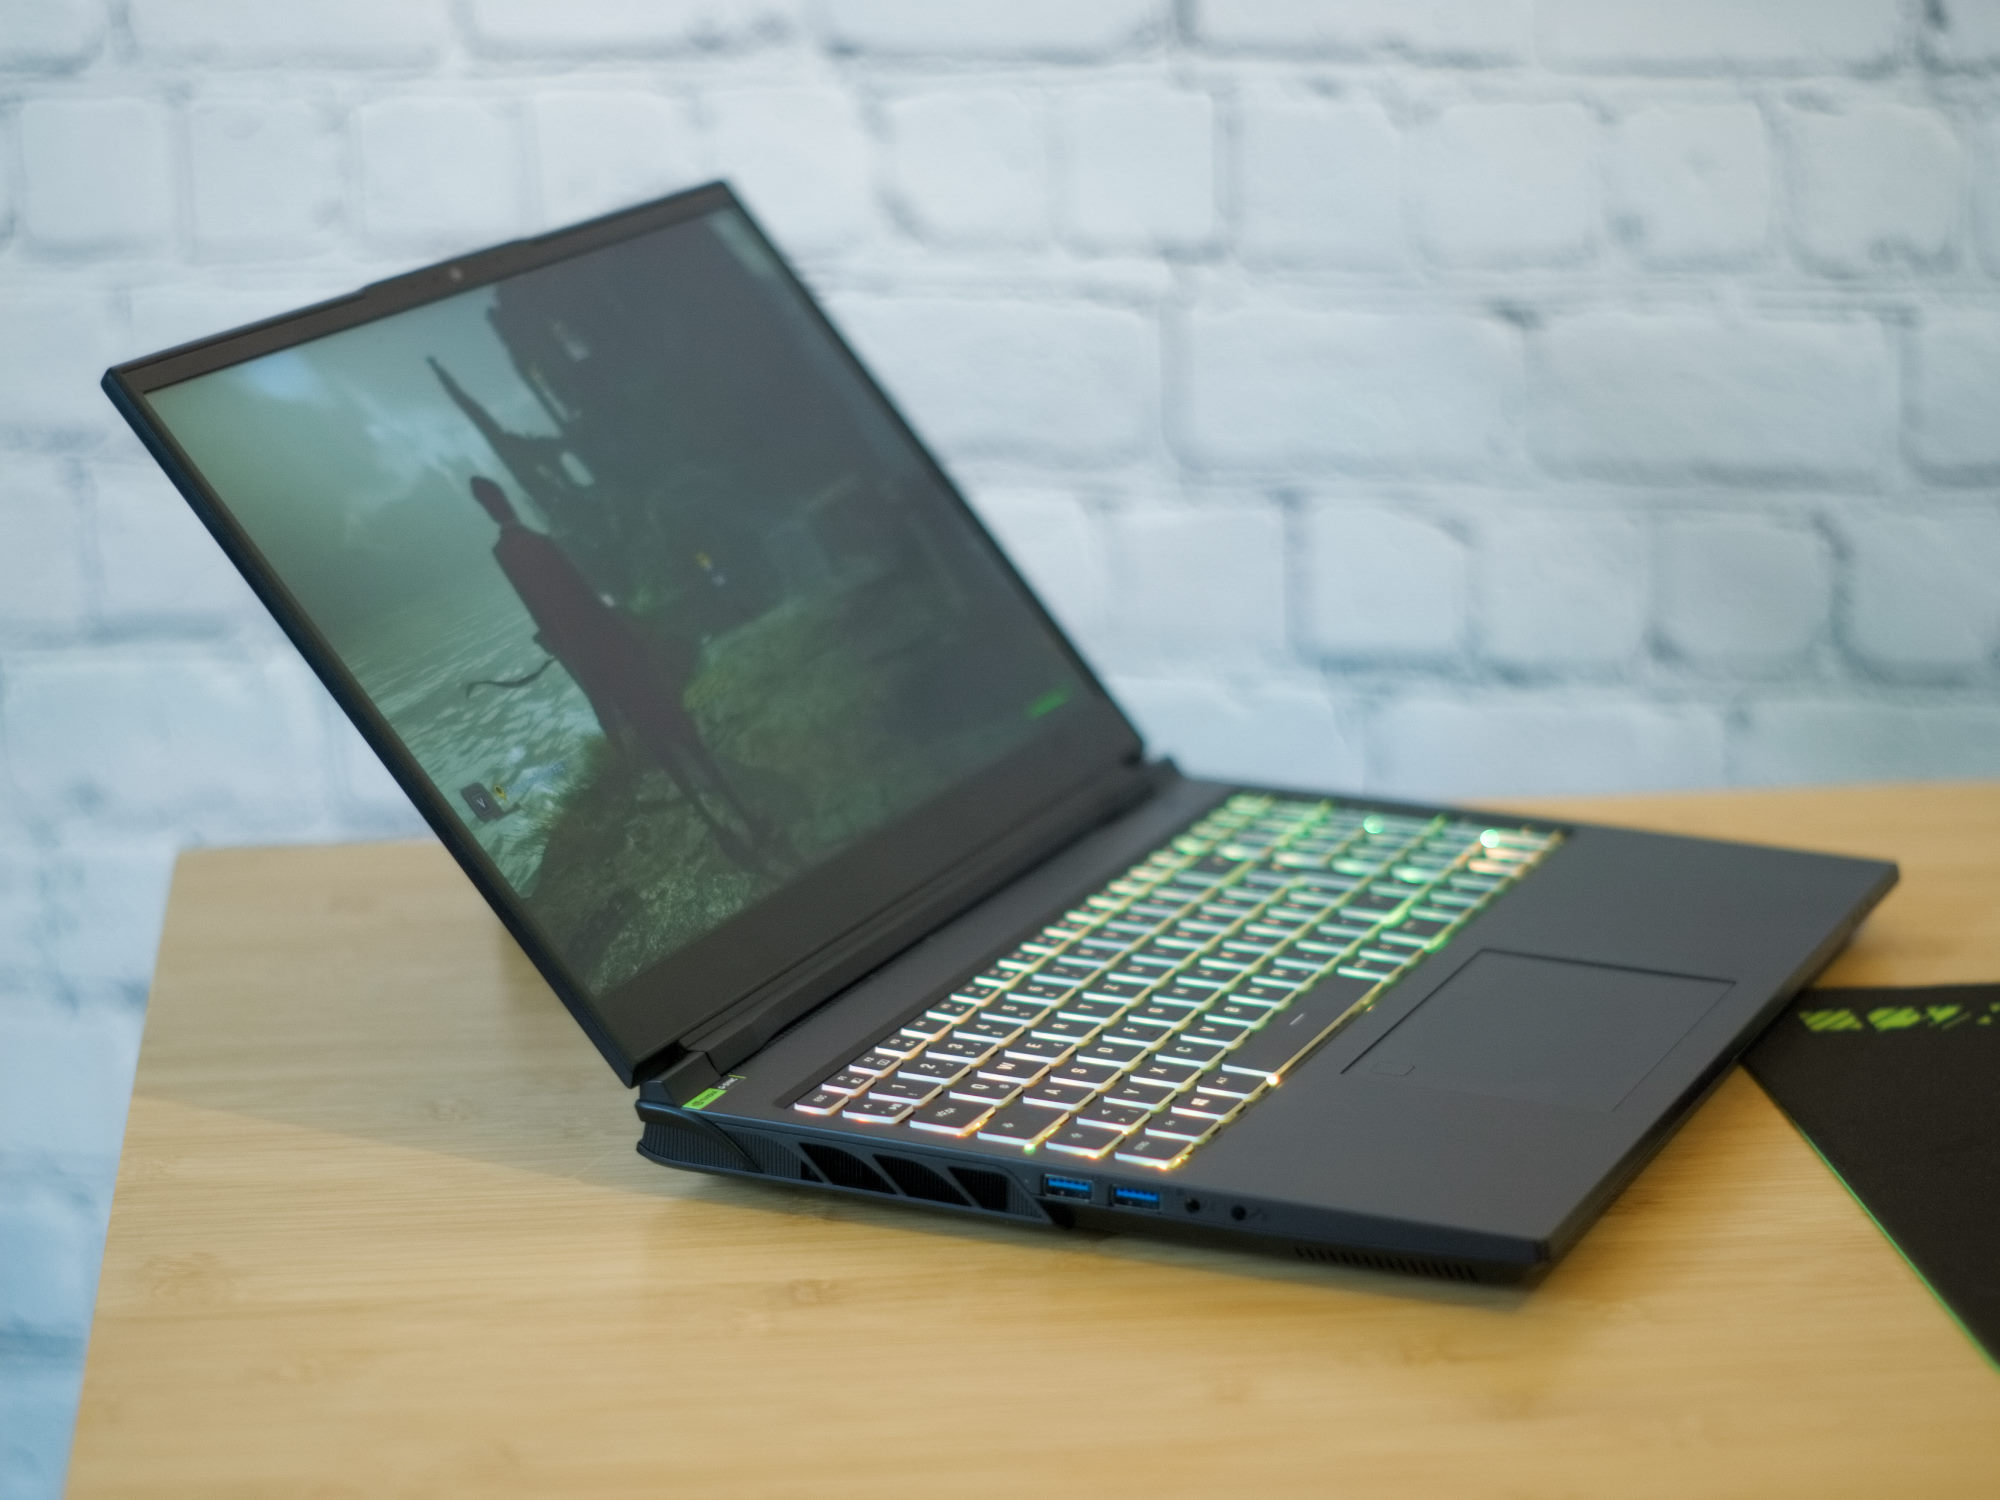
The design remains understated, black and largely free of branding. Both the size and weight of the laptop are almost identical to its predecessor. The laptop's display lid and the bottom of the shell continue to be made of aluminum whereas the top of the shell is made of plastic. The display is framed by a wide-looking plastic rim which is only 5 mm thick a the sides, one centimteter at the top and two centimeters at the bottom. It is possible to coax a little creaking noise from the screen and the base by twisting them. But, in order to achieve this some considerable effort has to be applied since all the laptop's parts are very well built and solid. The keyboard and display lid only flex somewhat when a lot of pressure is applied and the hinges securely keep the monitor in every conceivable position between 0° and 135°.

SD card reader, Wi-Fi and webcam

Das Pro 15 possesses, at least in comparison to many other gaming laptops, a microSD card reader. Combined with our AV Pro microSD (V60), we recorded good transfer speeds in the range of 80 to 90 MB/s.
In the 6 GHz network, the laptop's Intel Wi-Fi 6E AX211 demonstrated mostly excellent data speeds but in the 5 GHz network, it returned rather below-average figures when it came to transfer speeds.
For streamers, the quality of the built-in Full HD webcam is likely to be insufficient, especially under poor lighting conditions. However, it can be used for occasional video calls.
| SD Card Reader | |
| average JPG Copy Test (av. of 3 runs) | |
| Average of class Gaming (20.9 - 210, n=55, last 2 years) | |
| Schenker XMG Pro 15 (E23) | |
| Schenker XMG Pro 15 (i7-12700H, RTX 3080 Ti) | |
| Asus ZenBook Pro 14 Duo UX8402VV-P1021W (AV Pro SD microSD 128 GB V60) | |
| Alienware x16 R1 (AV PRO microSD 128 GB V60) | |
| maximum AS SSD Seq Read Test (1GB) | |
| Alienware x16 R1 (AV PRO microSD 128 GB V60) | |
| Average of class Gaming (25.5 - 261, n=52, last 2 years) | |
| Schenker XMG Pro 15 (i7-12700H, RTX 3080 Ti) | |
| Schenker XMG Pro 15 (E23) | |
| Asus ZenBook Pro 14 Duo UX8402VV-P1021W (AV Pro SD microSD 128 GB V60) | |

 GeForce RTX 4060 Laptop GPU, i9-13900HX, Crucial P5 Plus 1TB CT1000P5PSSD8")
 GeForce RTX 4060 Laptop GPU, i9-13900HX, Crucial P5 Plus 1TB CT1000P5PSSD8")
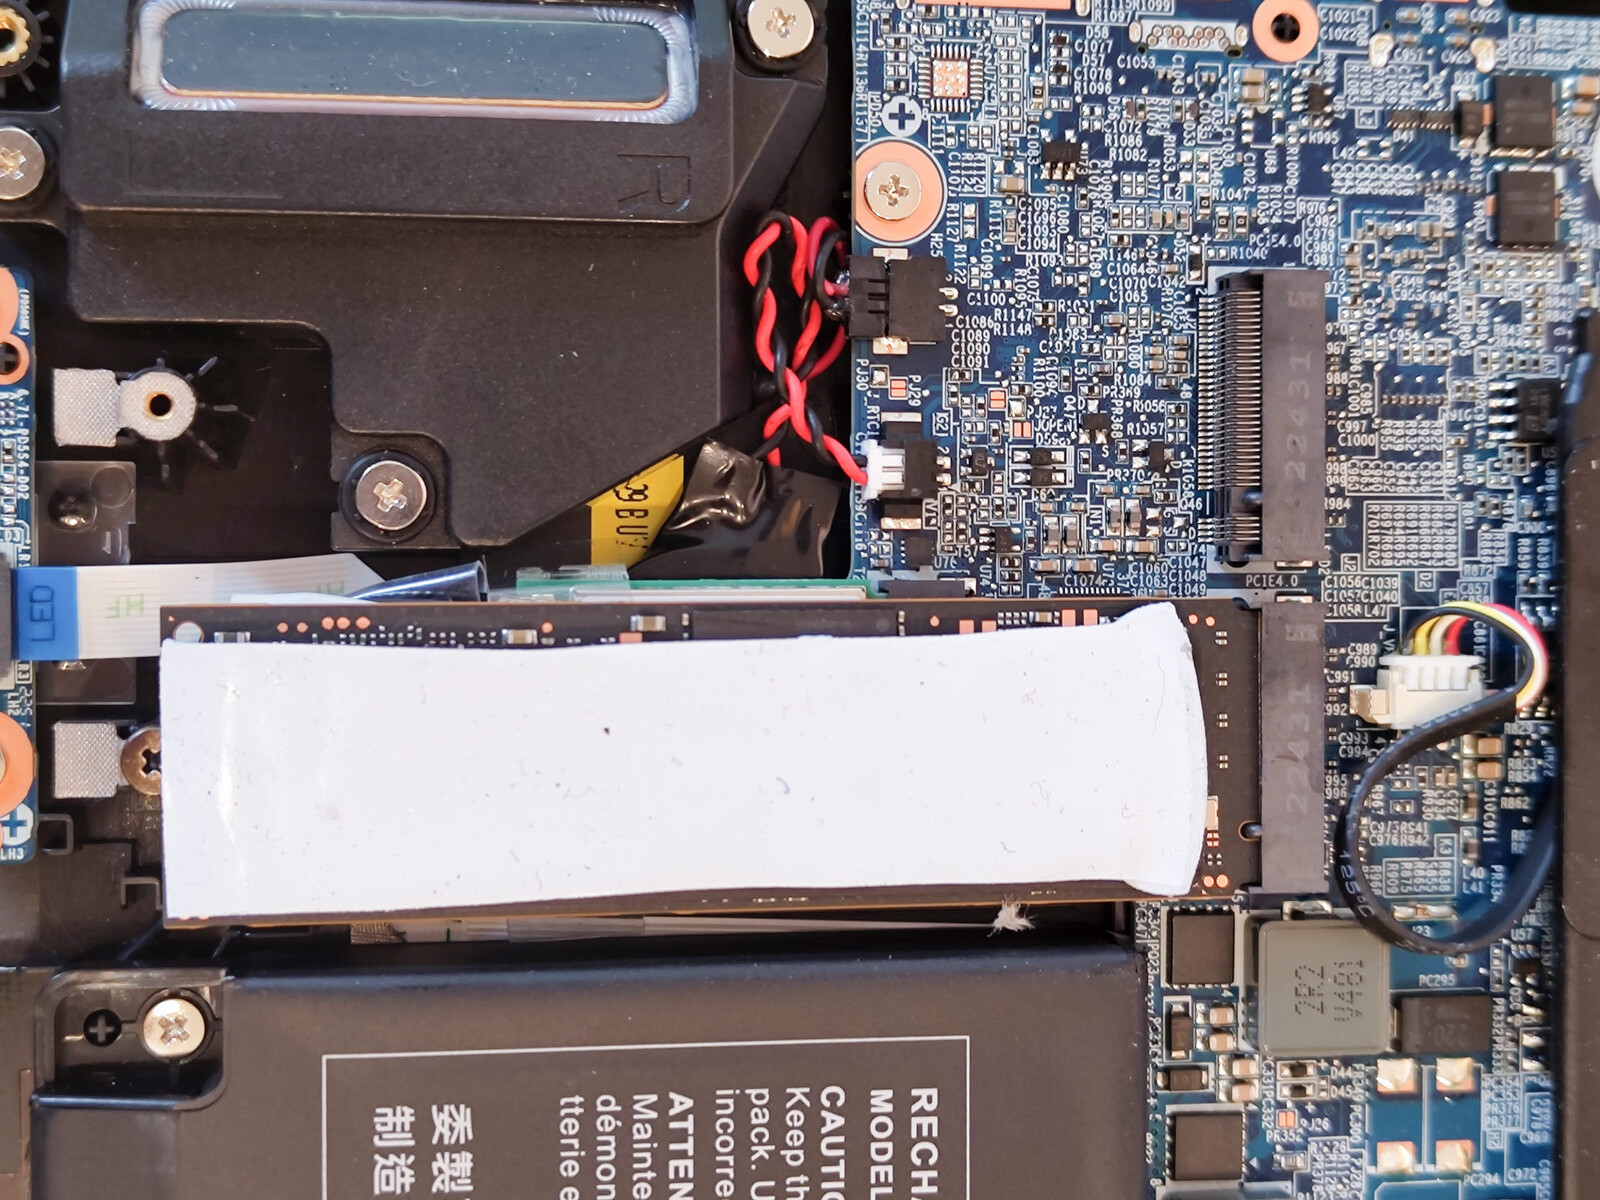
Accessories and maintenance
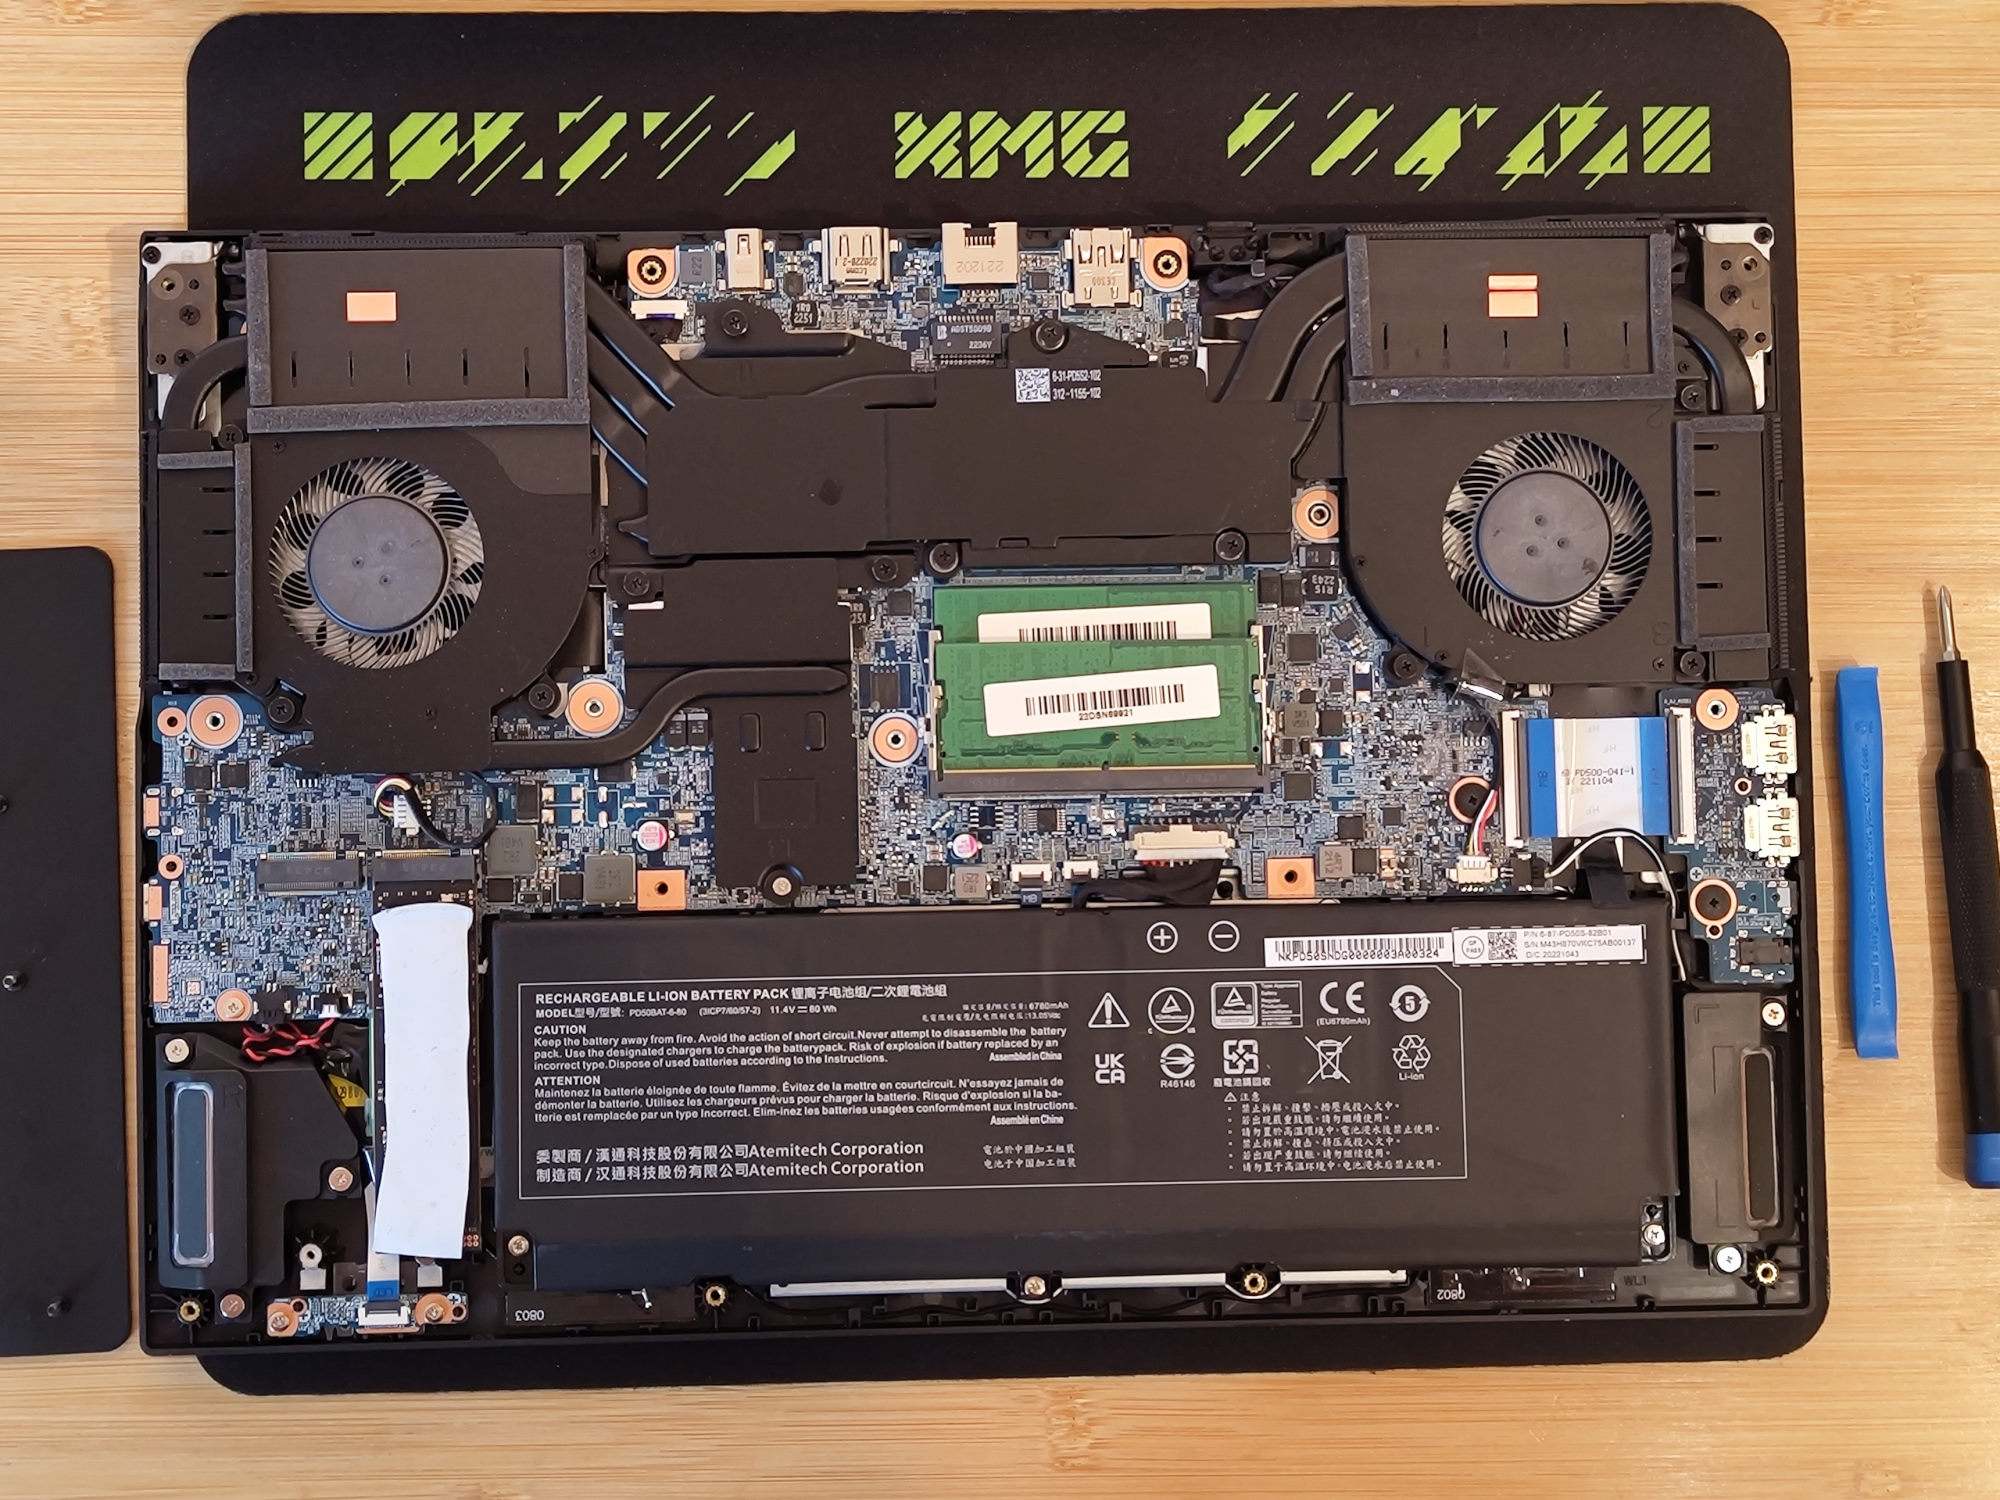
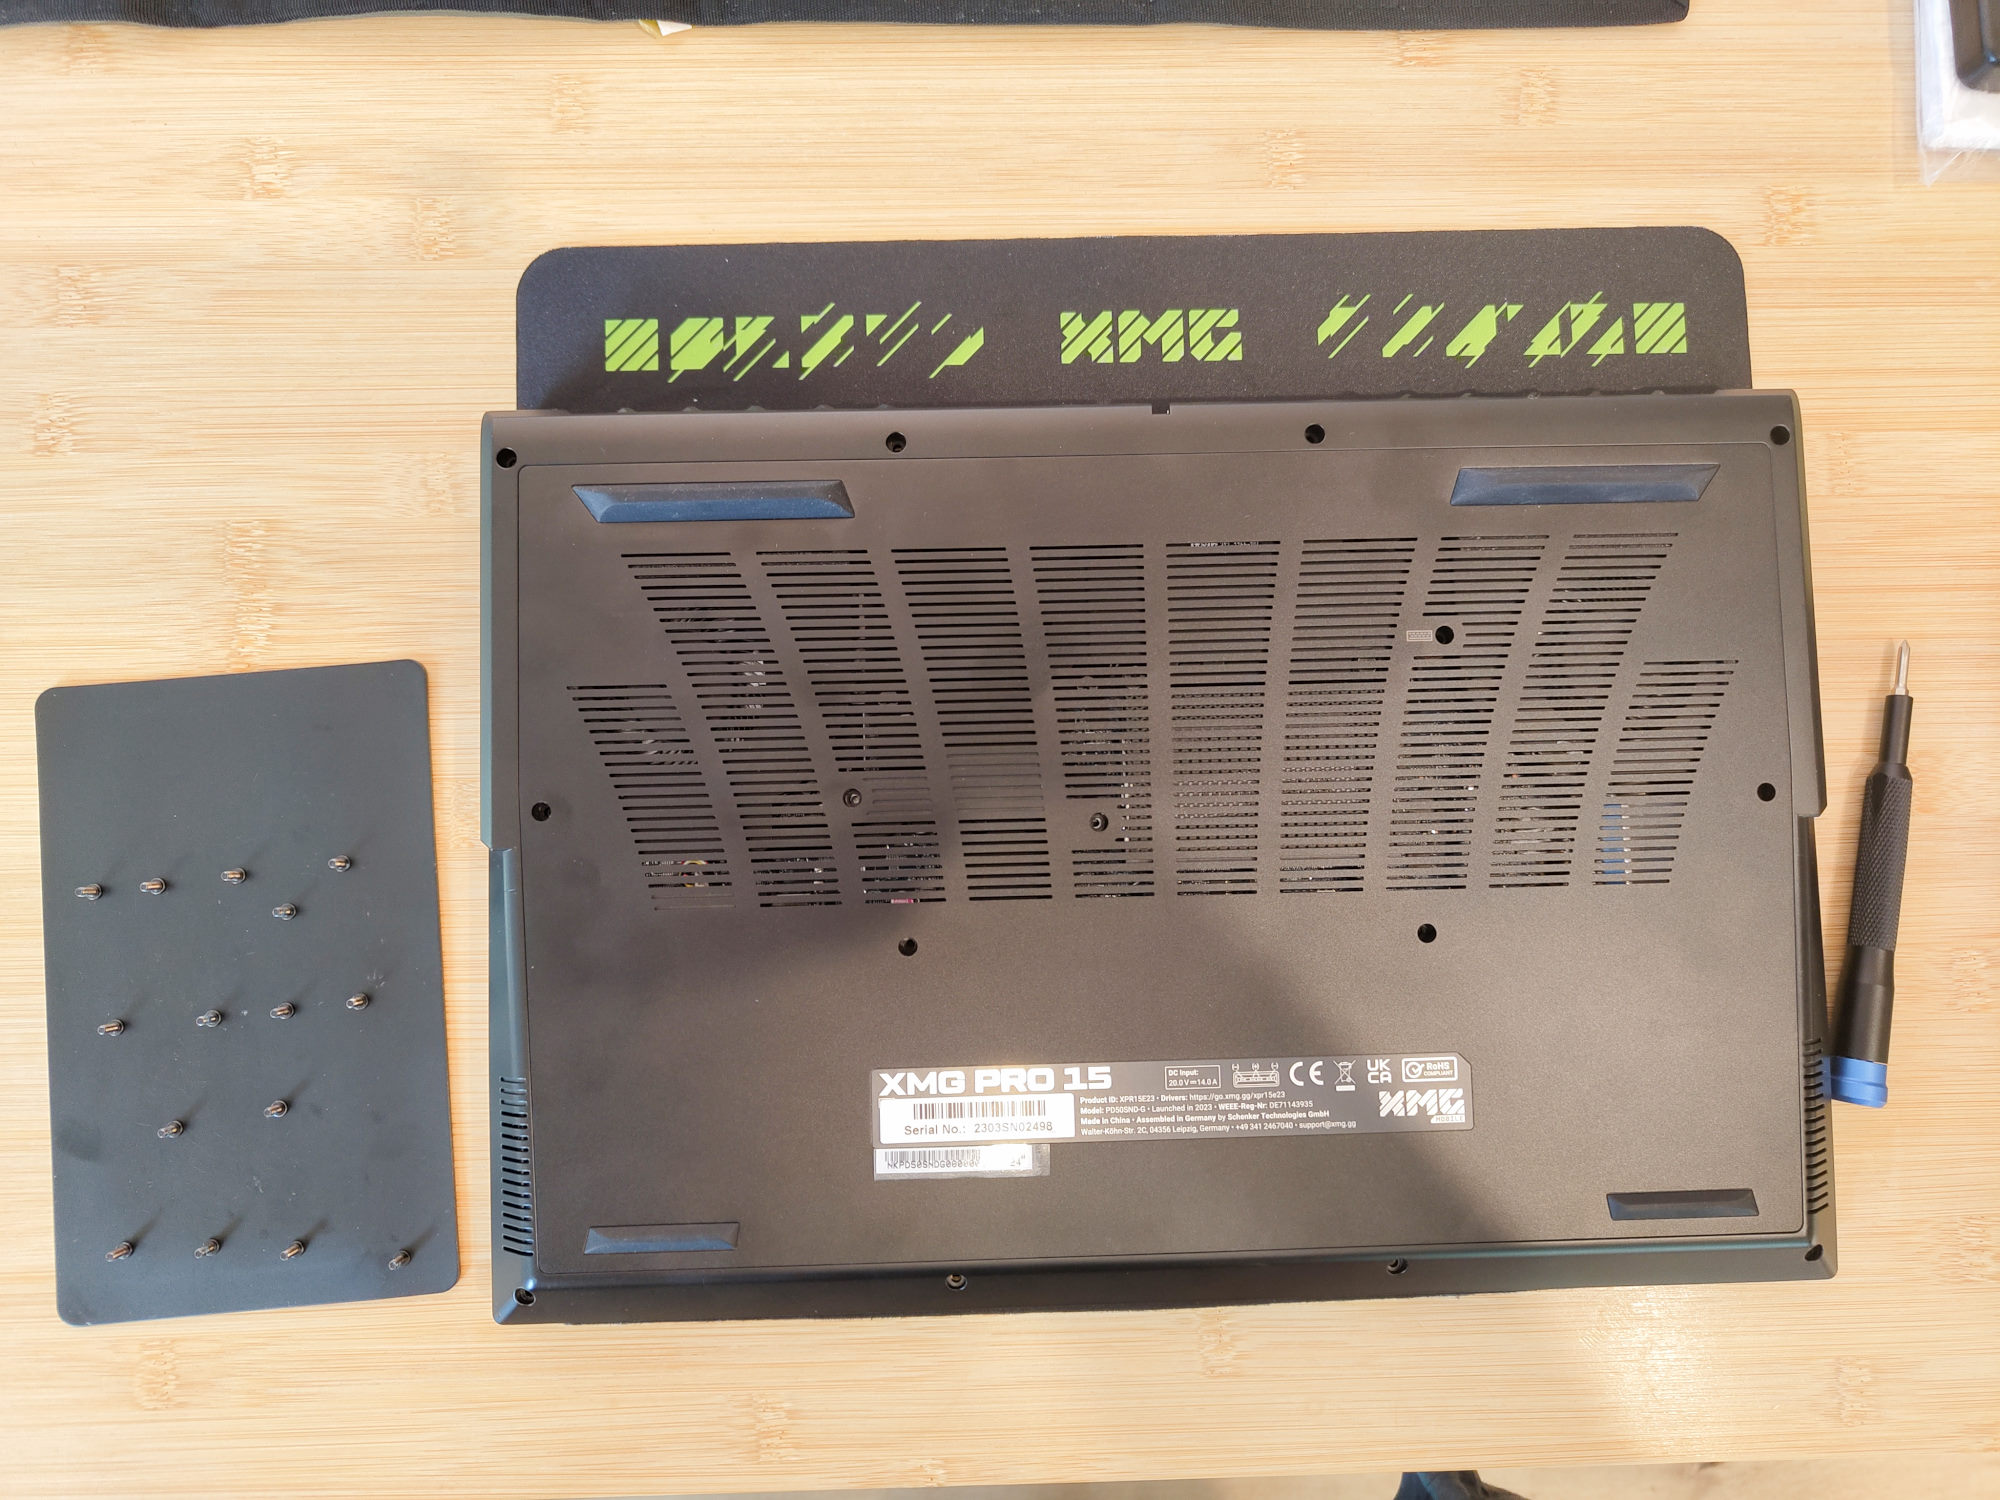
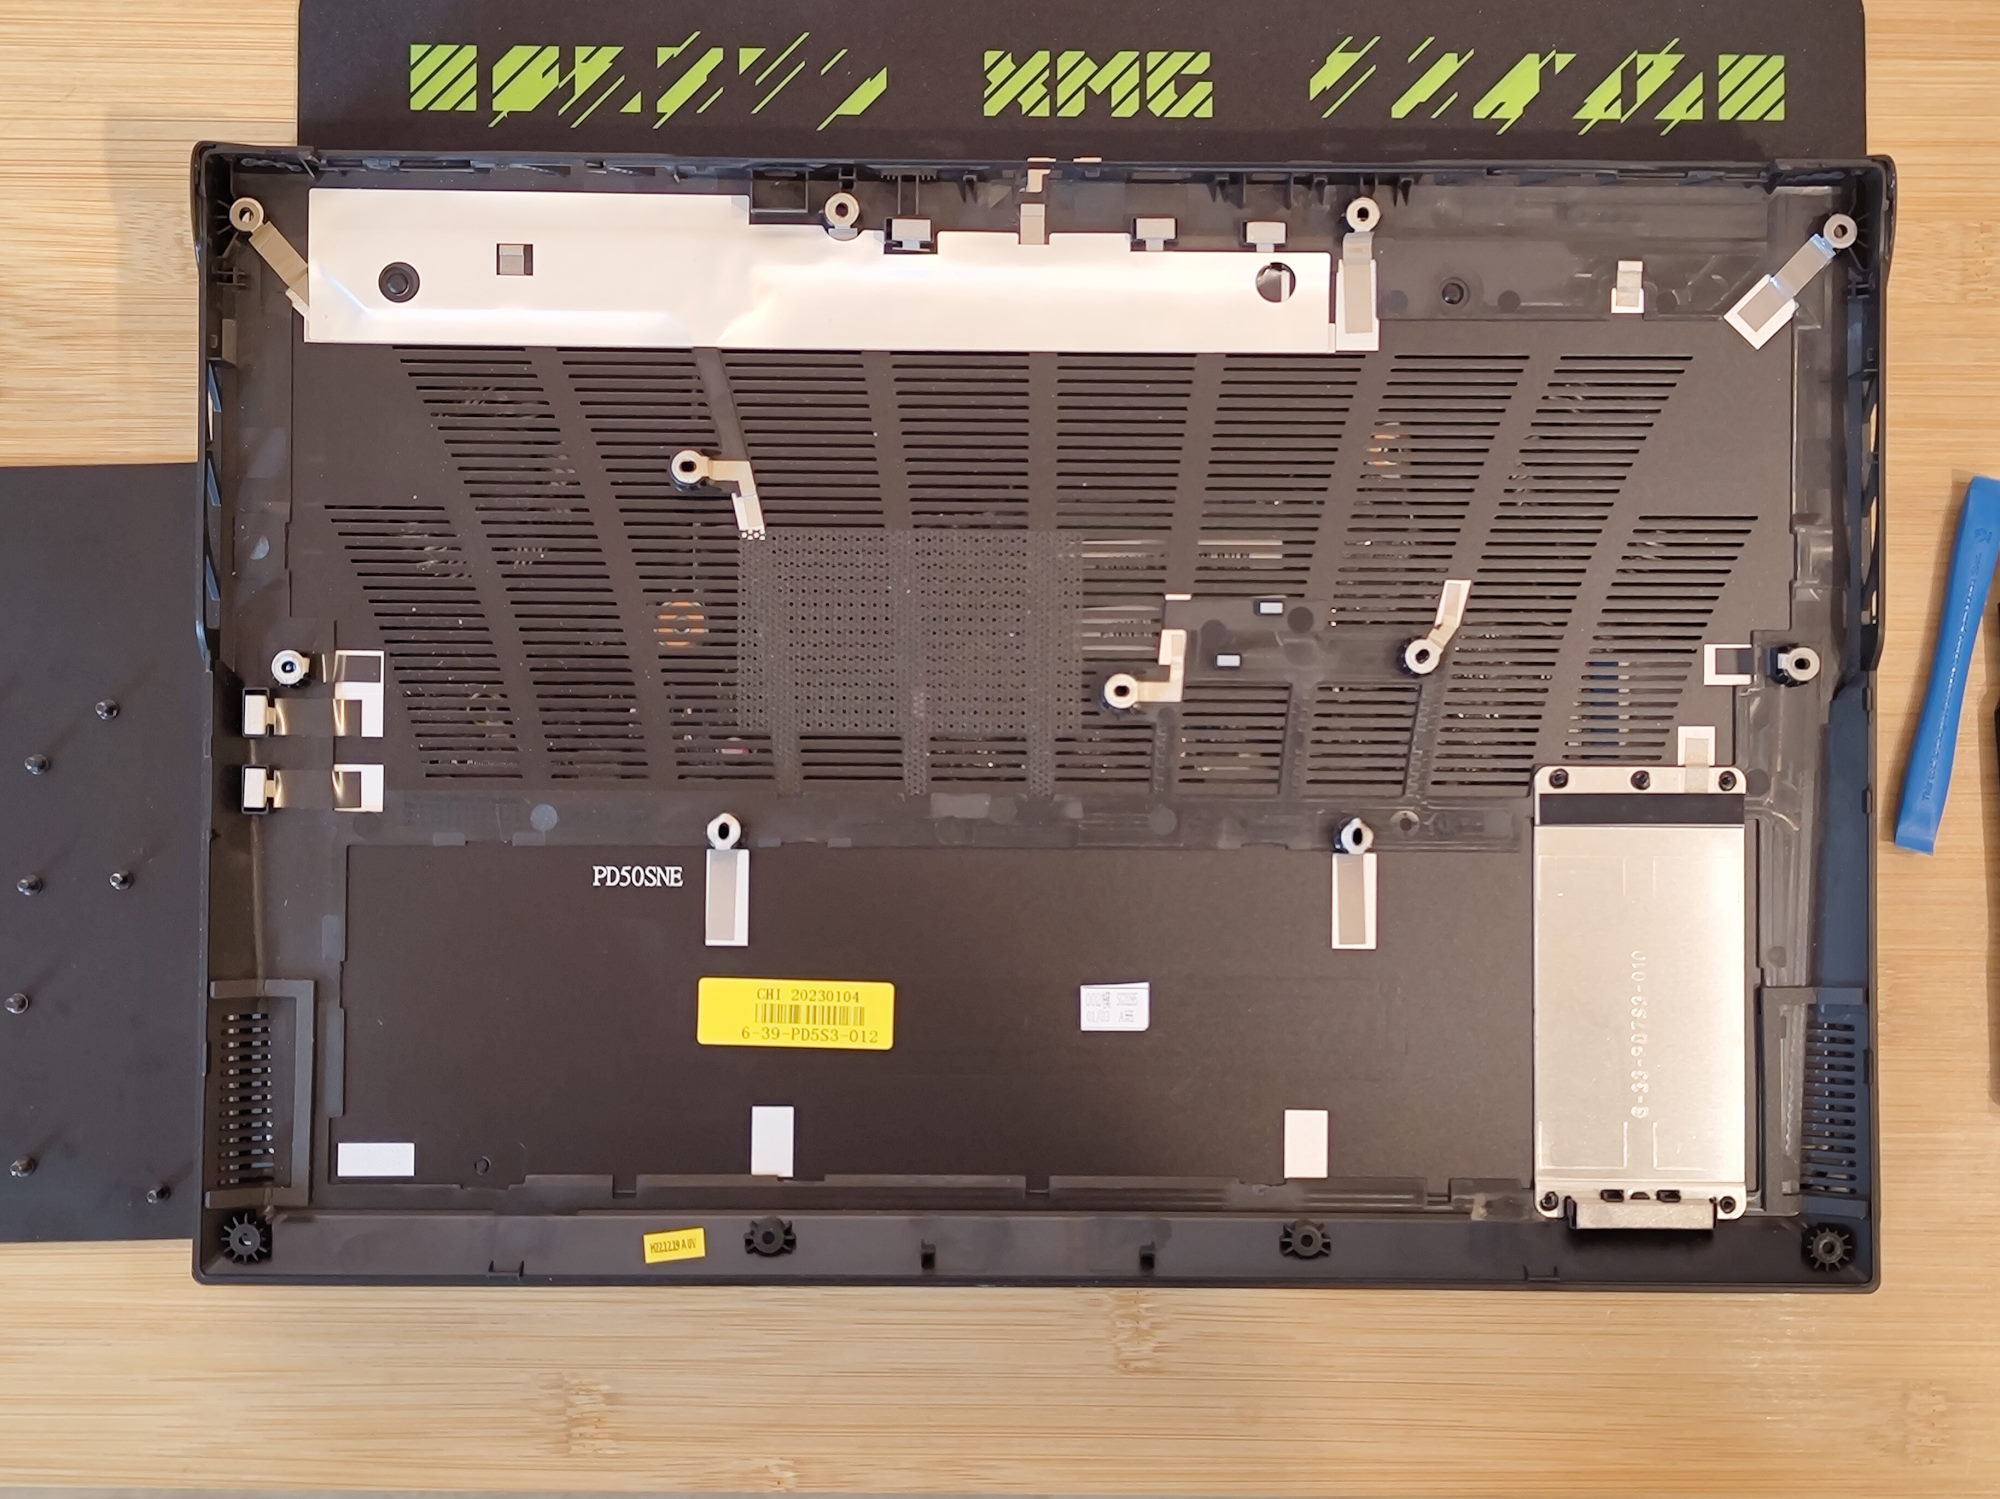
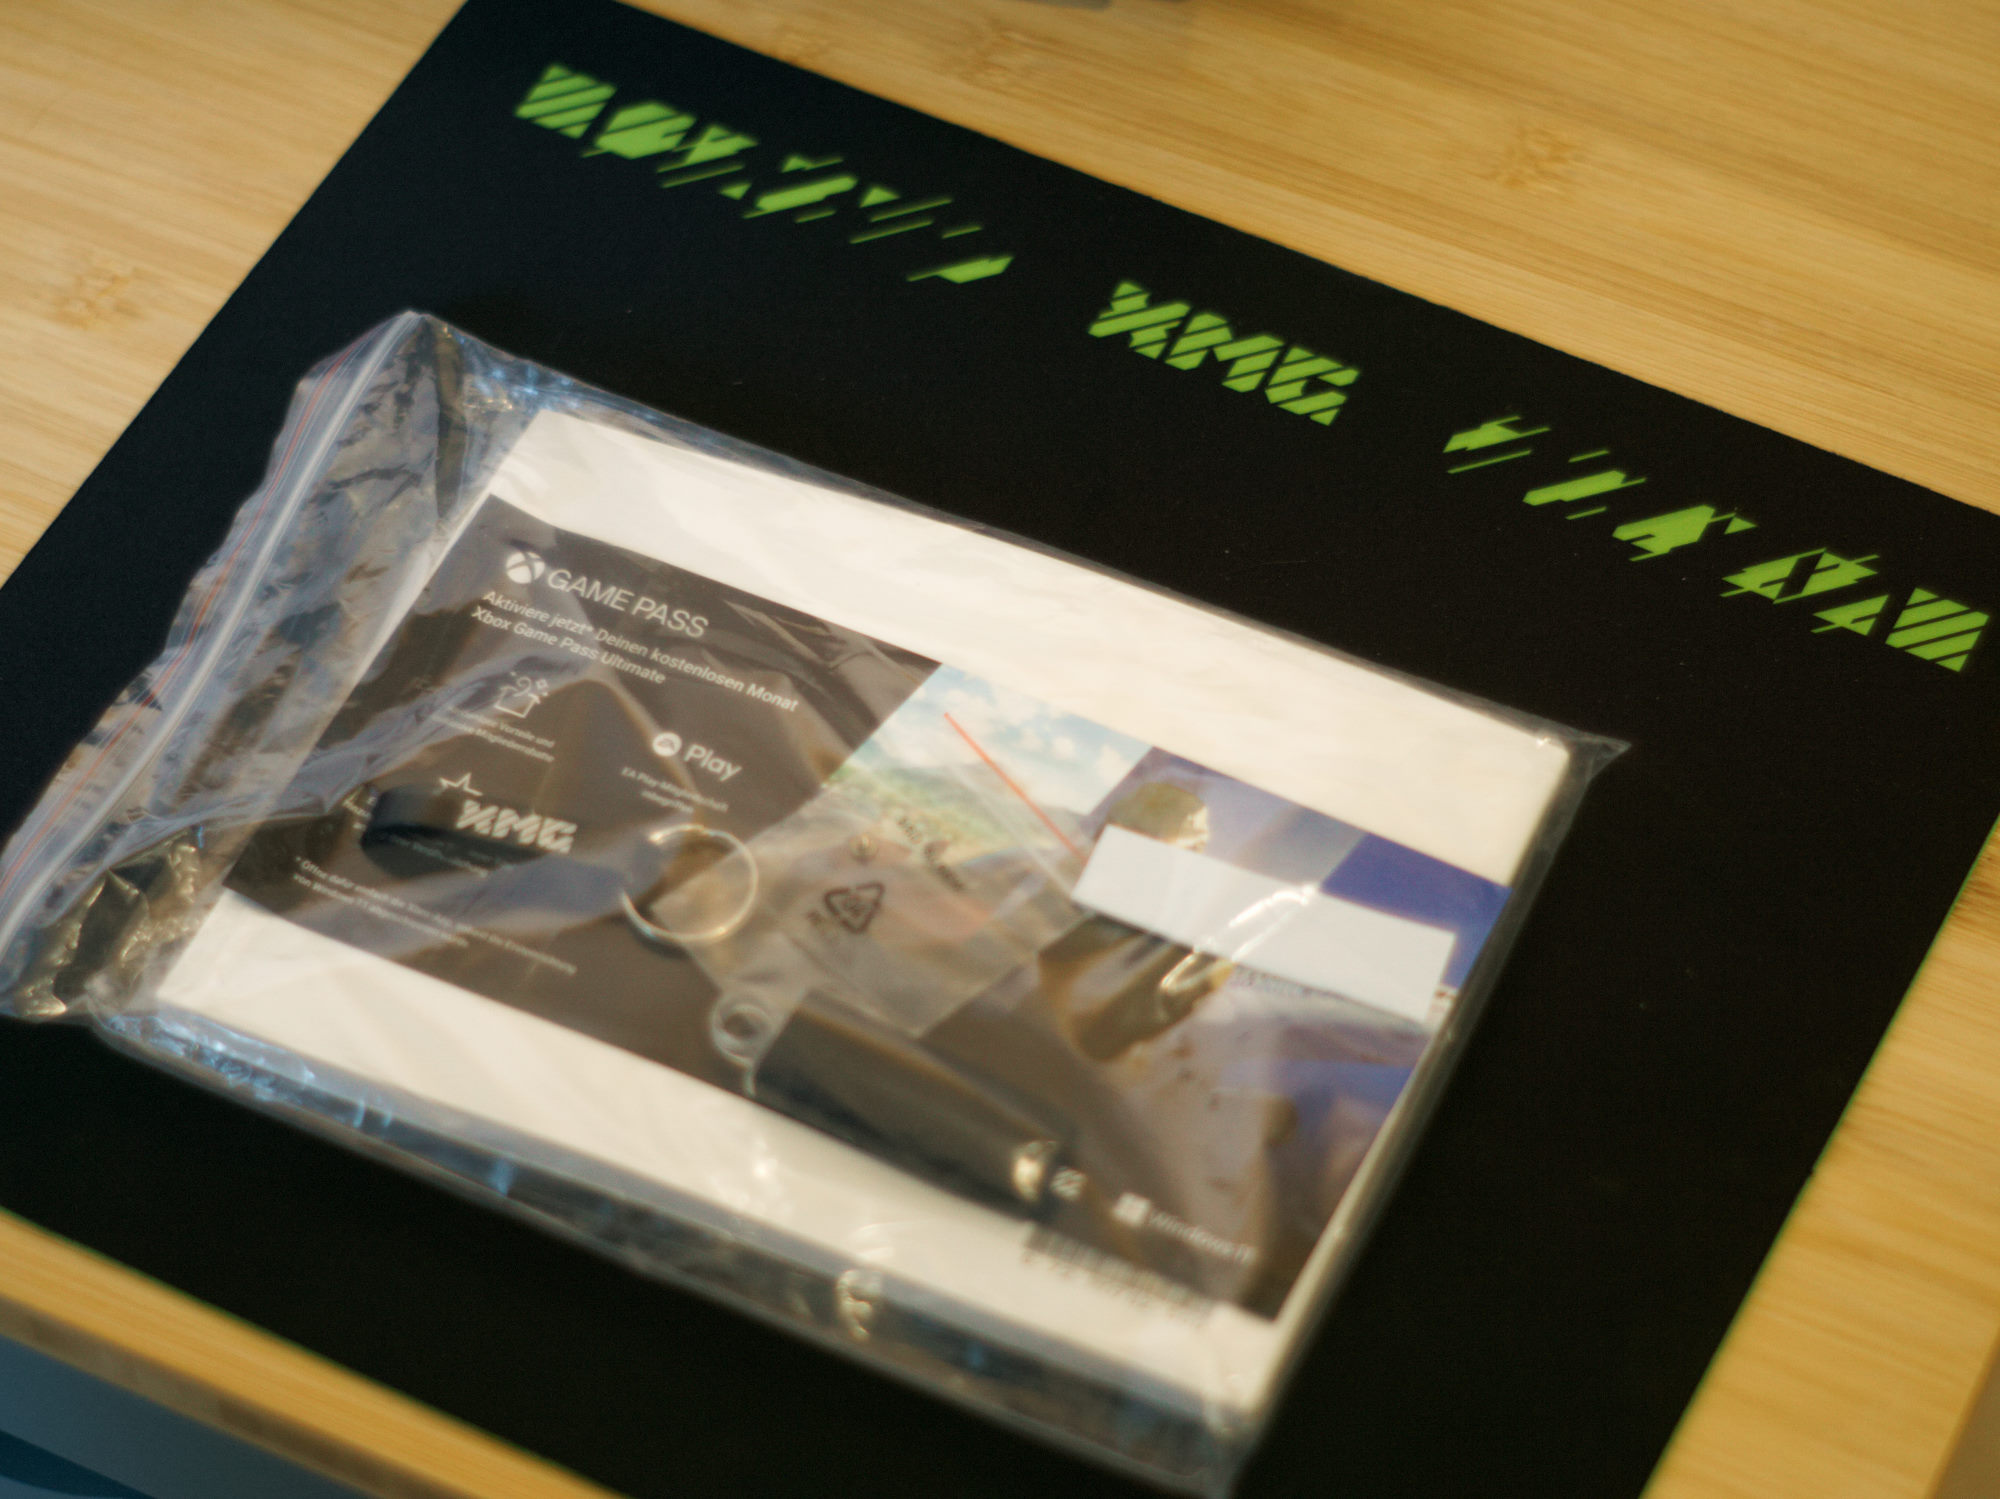
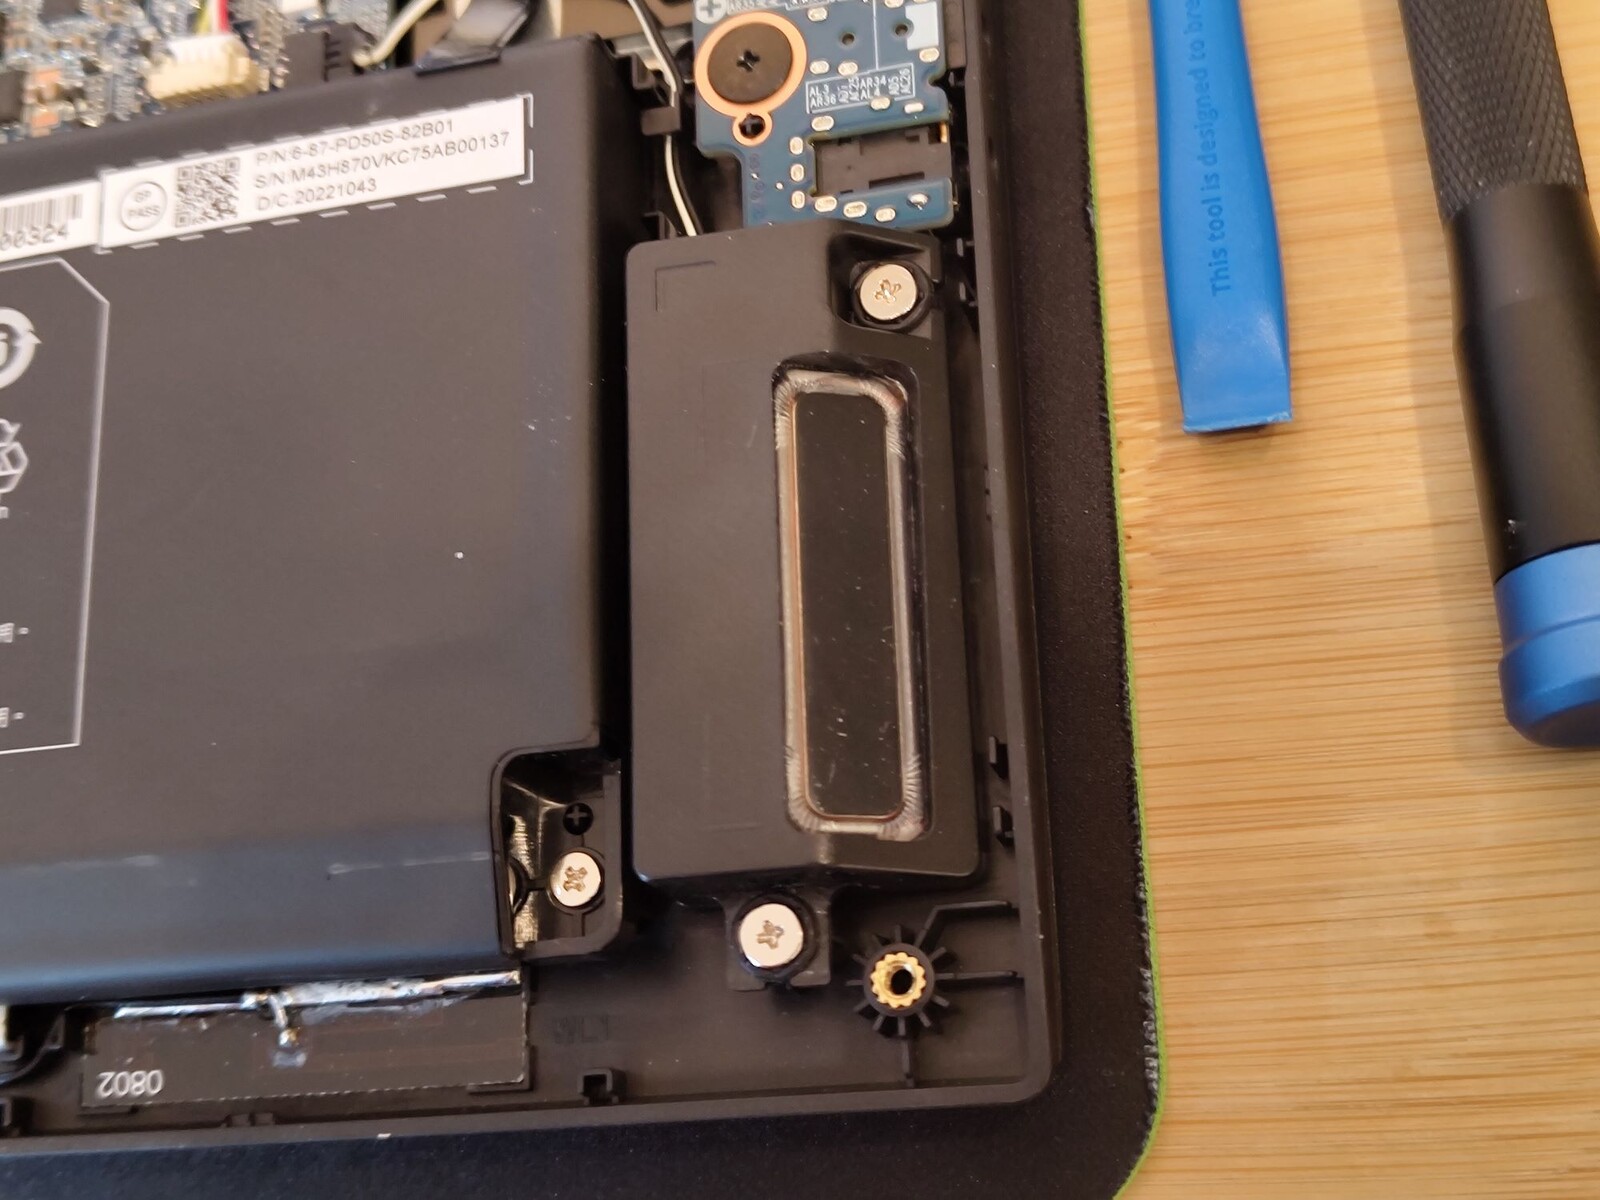
A whole 15 screws secure the base cover. Upon unscrewing them, the cover can be easily prised open from the front with the help of a plastic opening tool. Beneath it, you will find swappable RAM and a free M.2 slot for an additional SSD. The appropriate thermal pad is included with the laptop, as is a CD with drivers, a USB stick with the same content, a large mouse pad and a bottle opener.
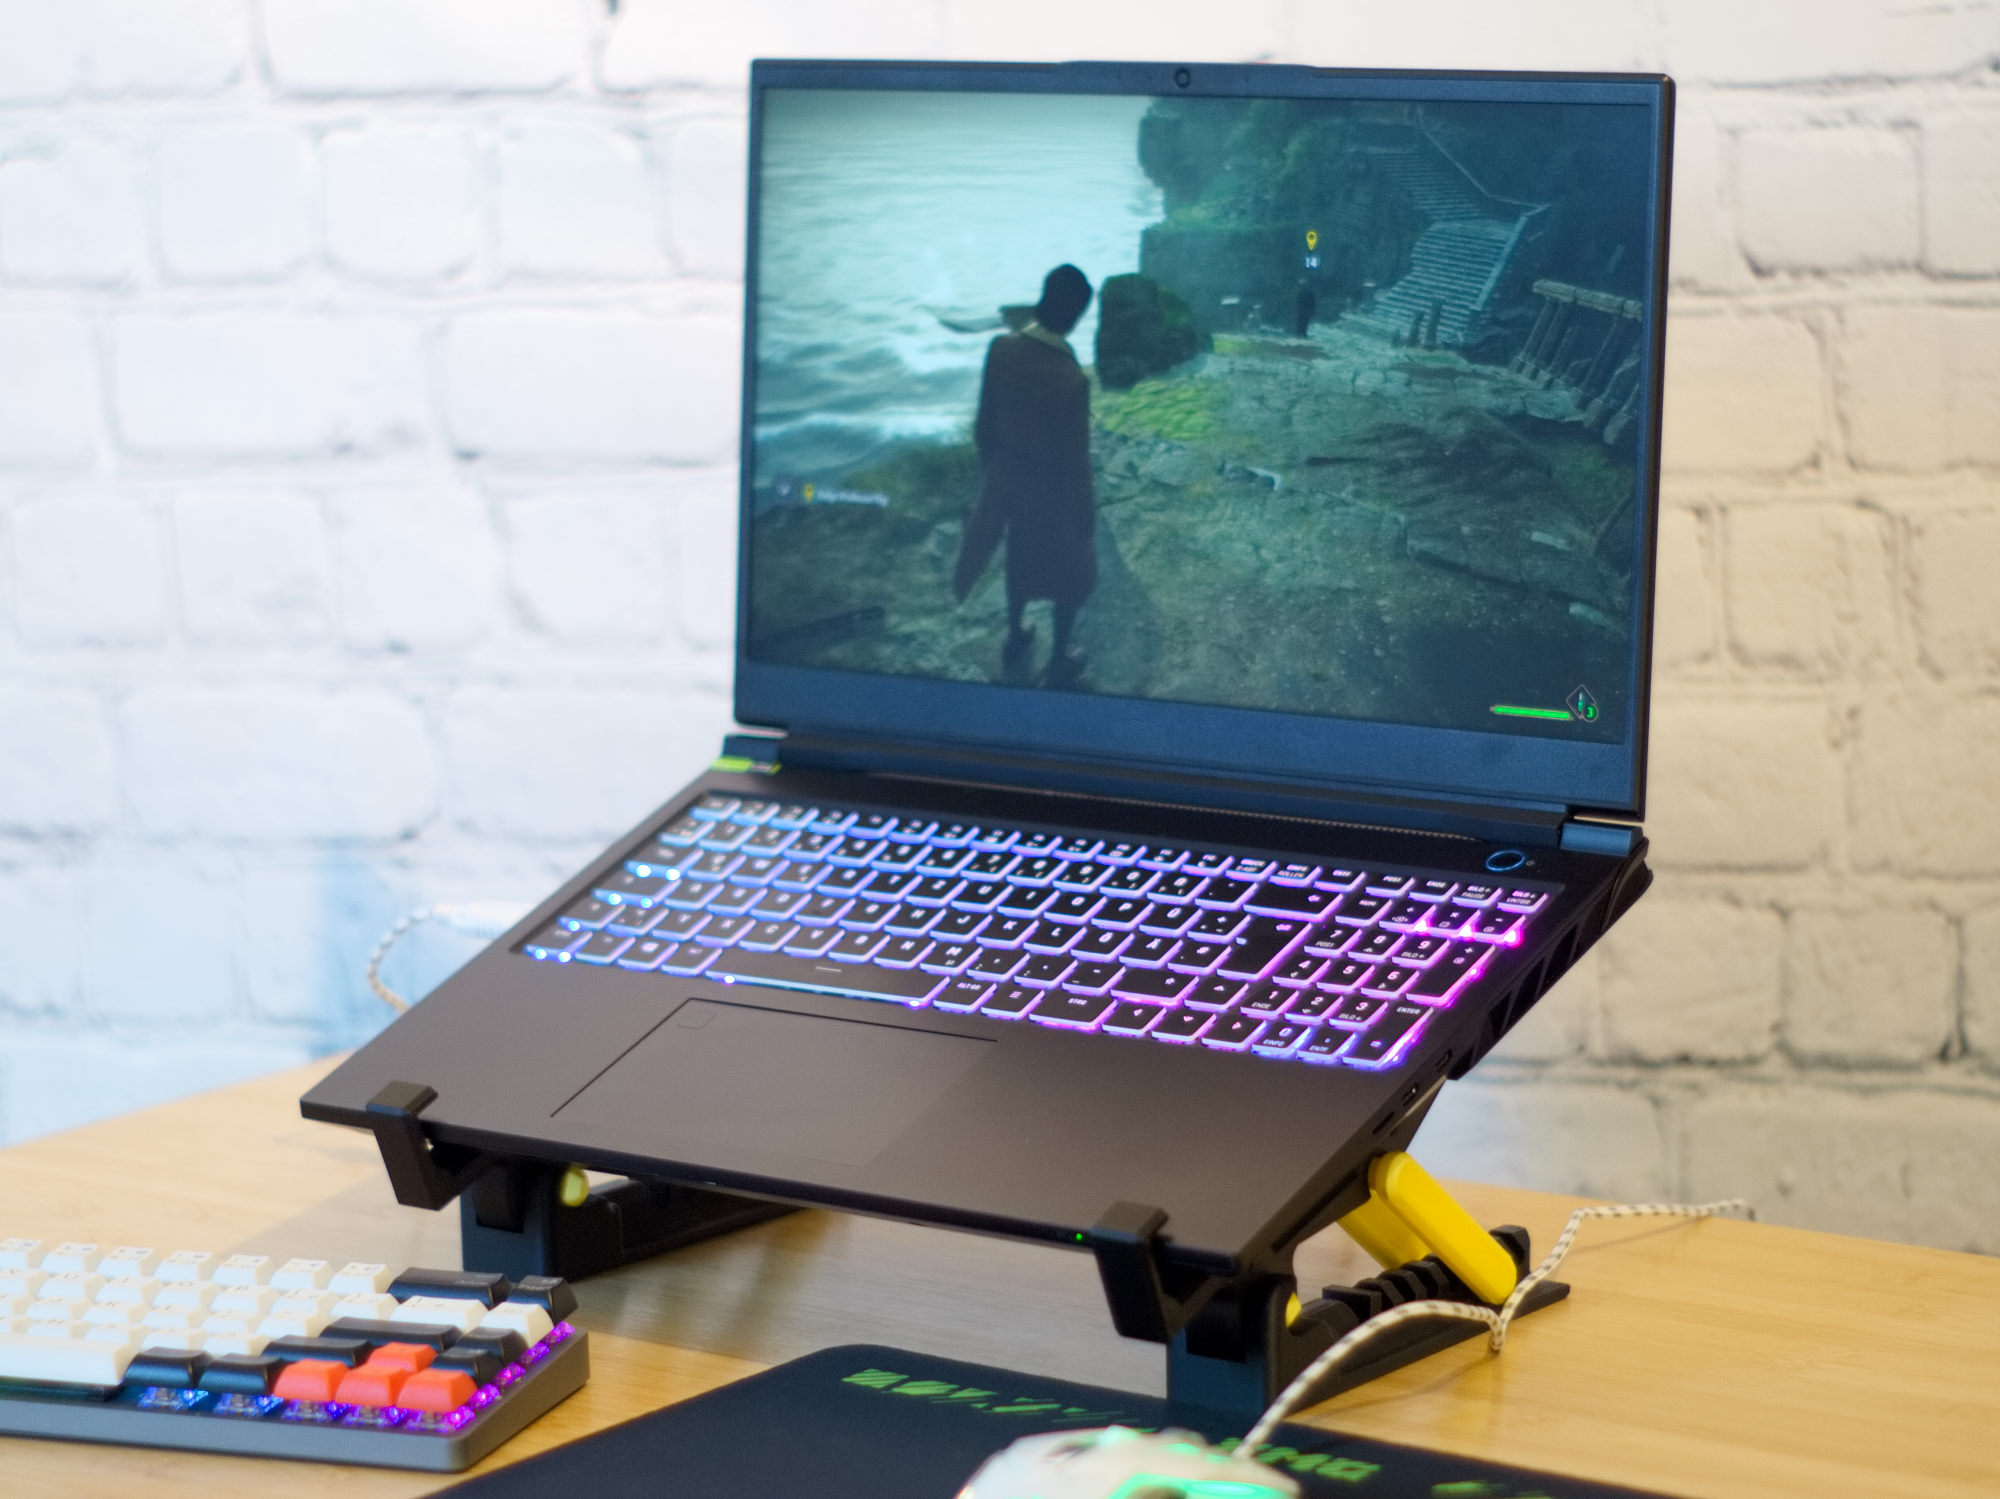
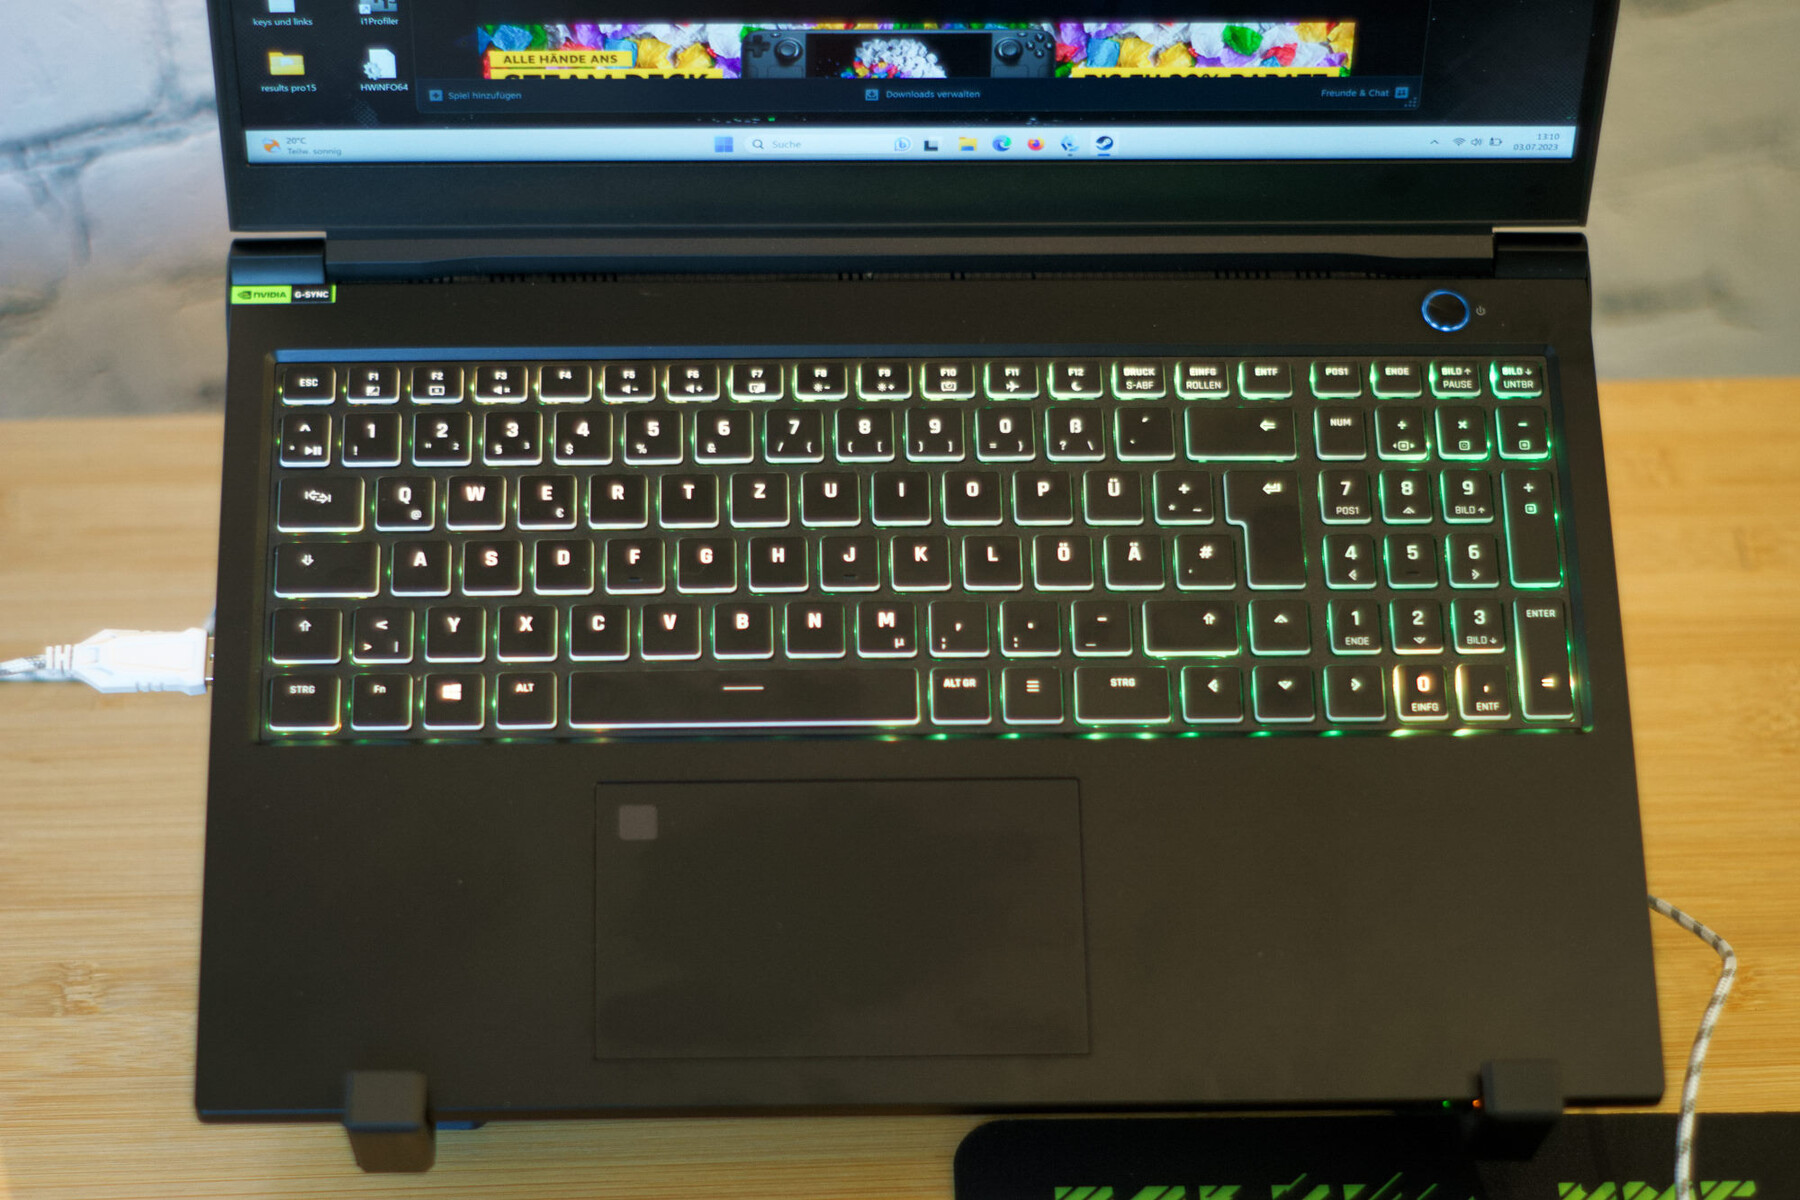
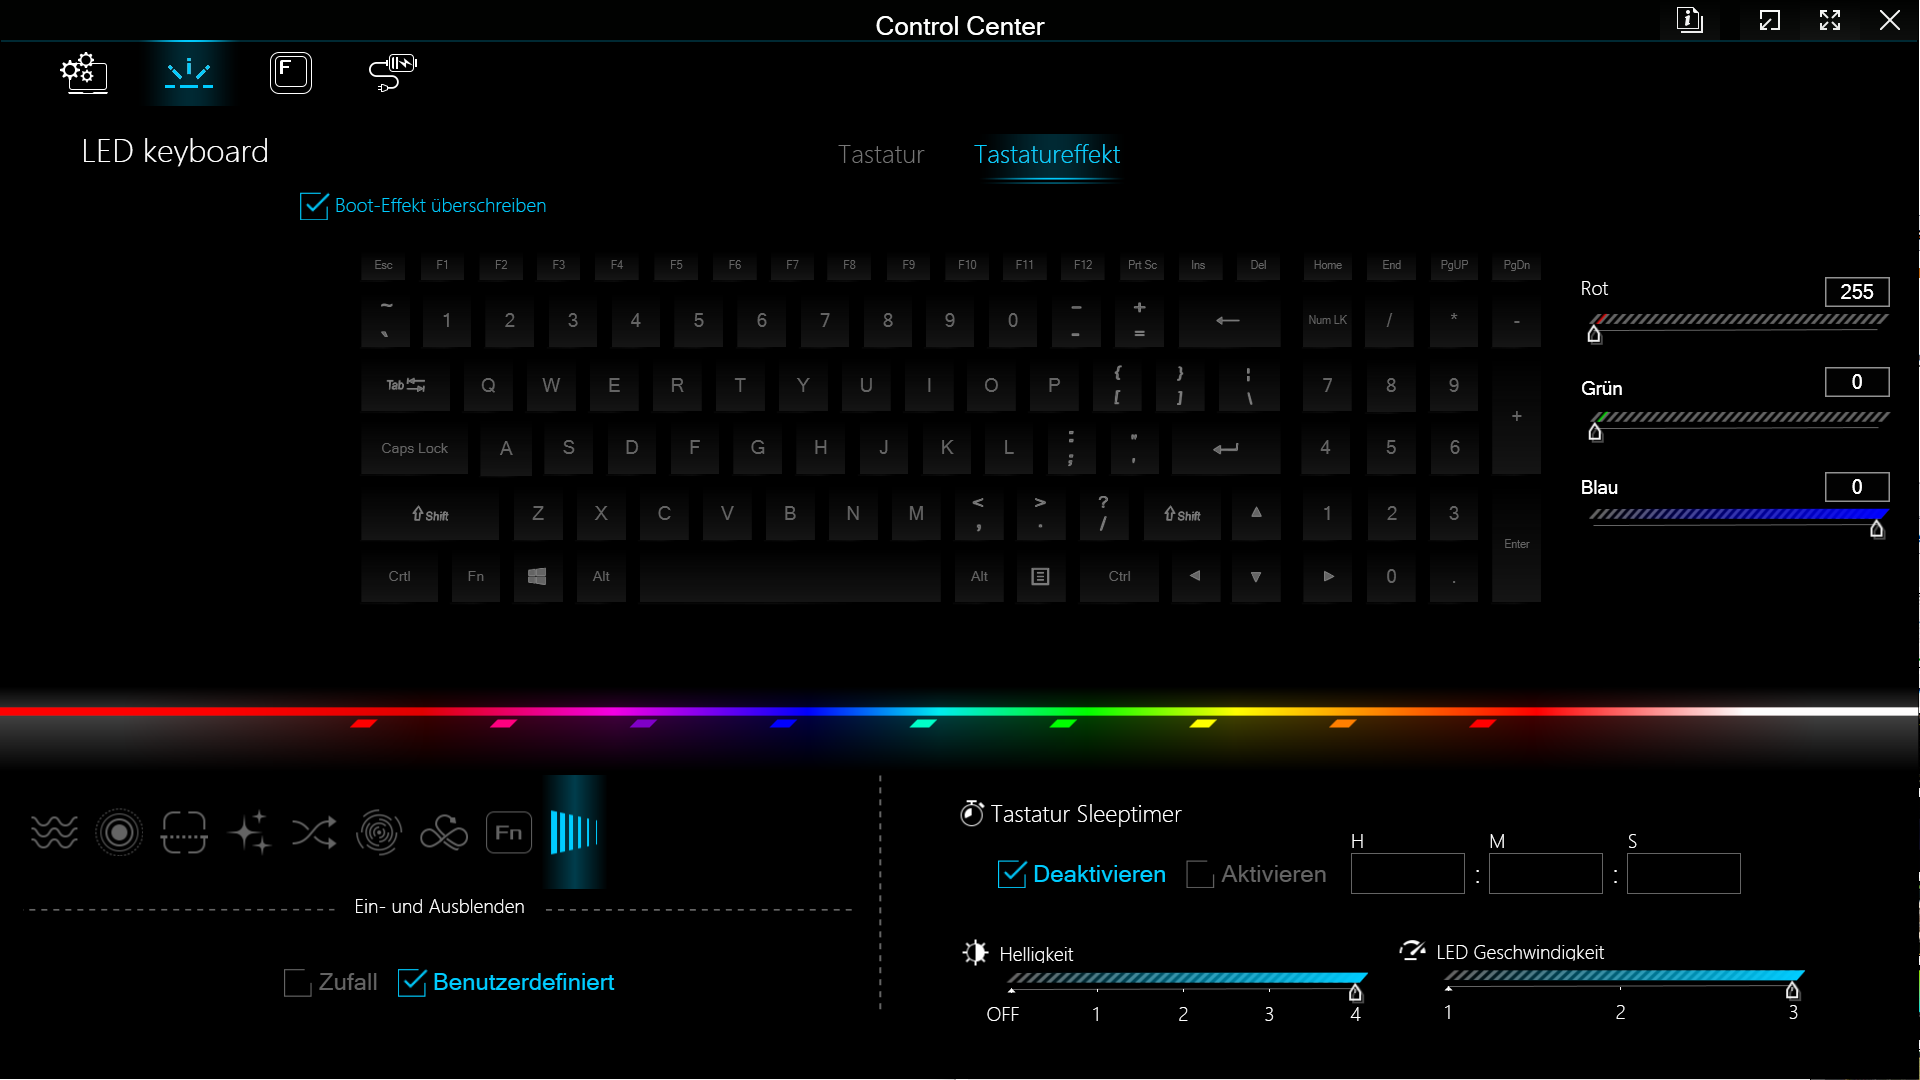
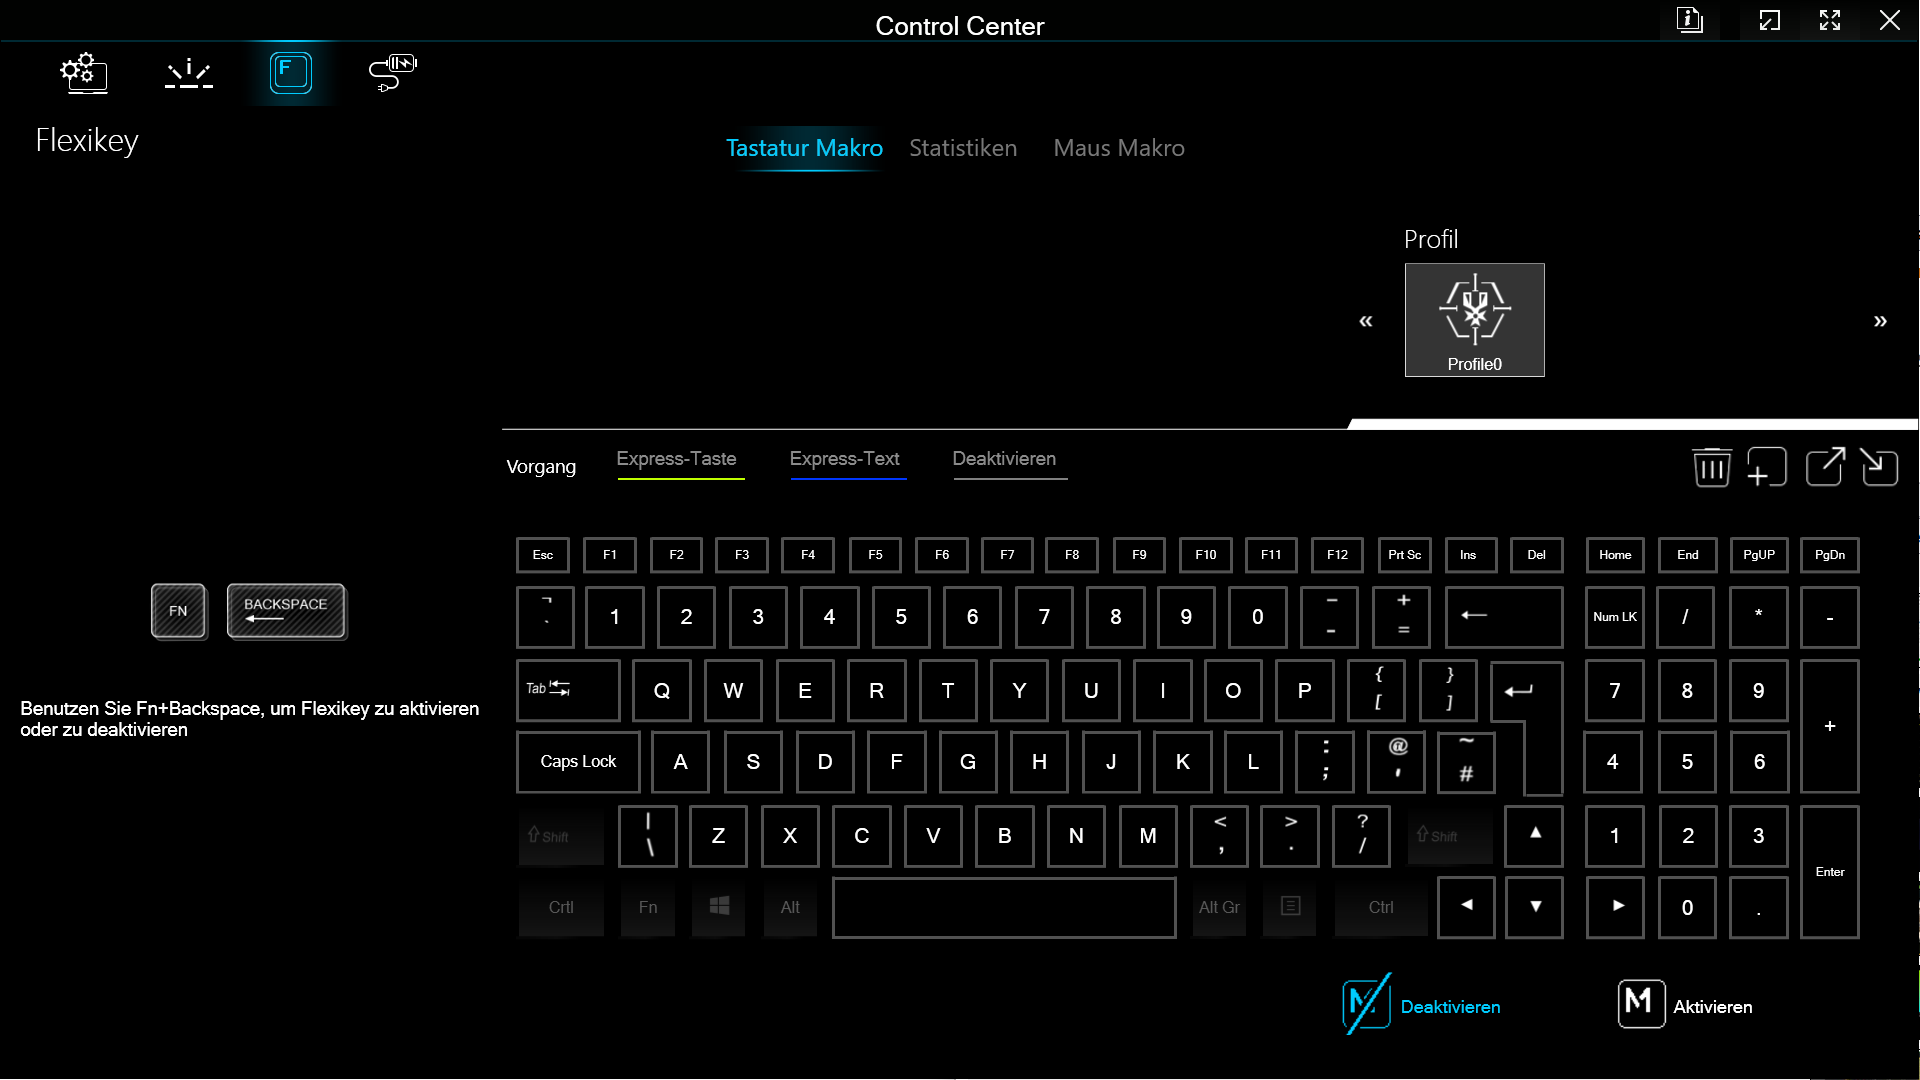
Input devices - A full-sized RGB keyboard
A 12 × 7 cm Clickpad with a fingerprint scanner and a full-sized keyboard with a numerical keypad comprise the XMG Pro 15's input devices. Both have pleasant haptics and a tangible pressure point. In terms of the keyboard, the key travel is around 1.5 mm. All of the keys can be individually lit with RGB lighting.
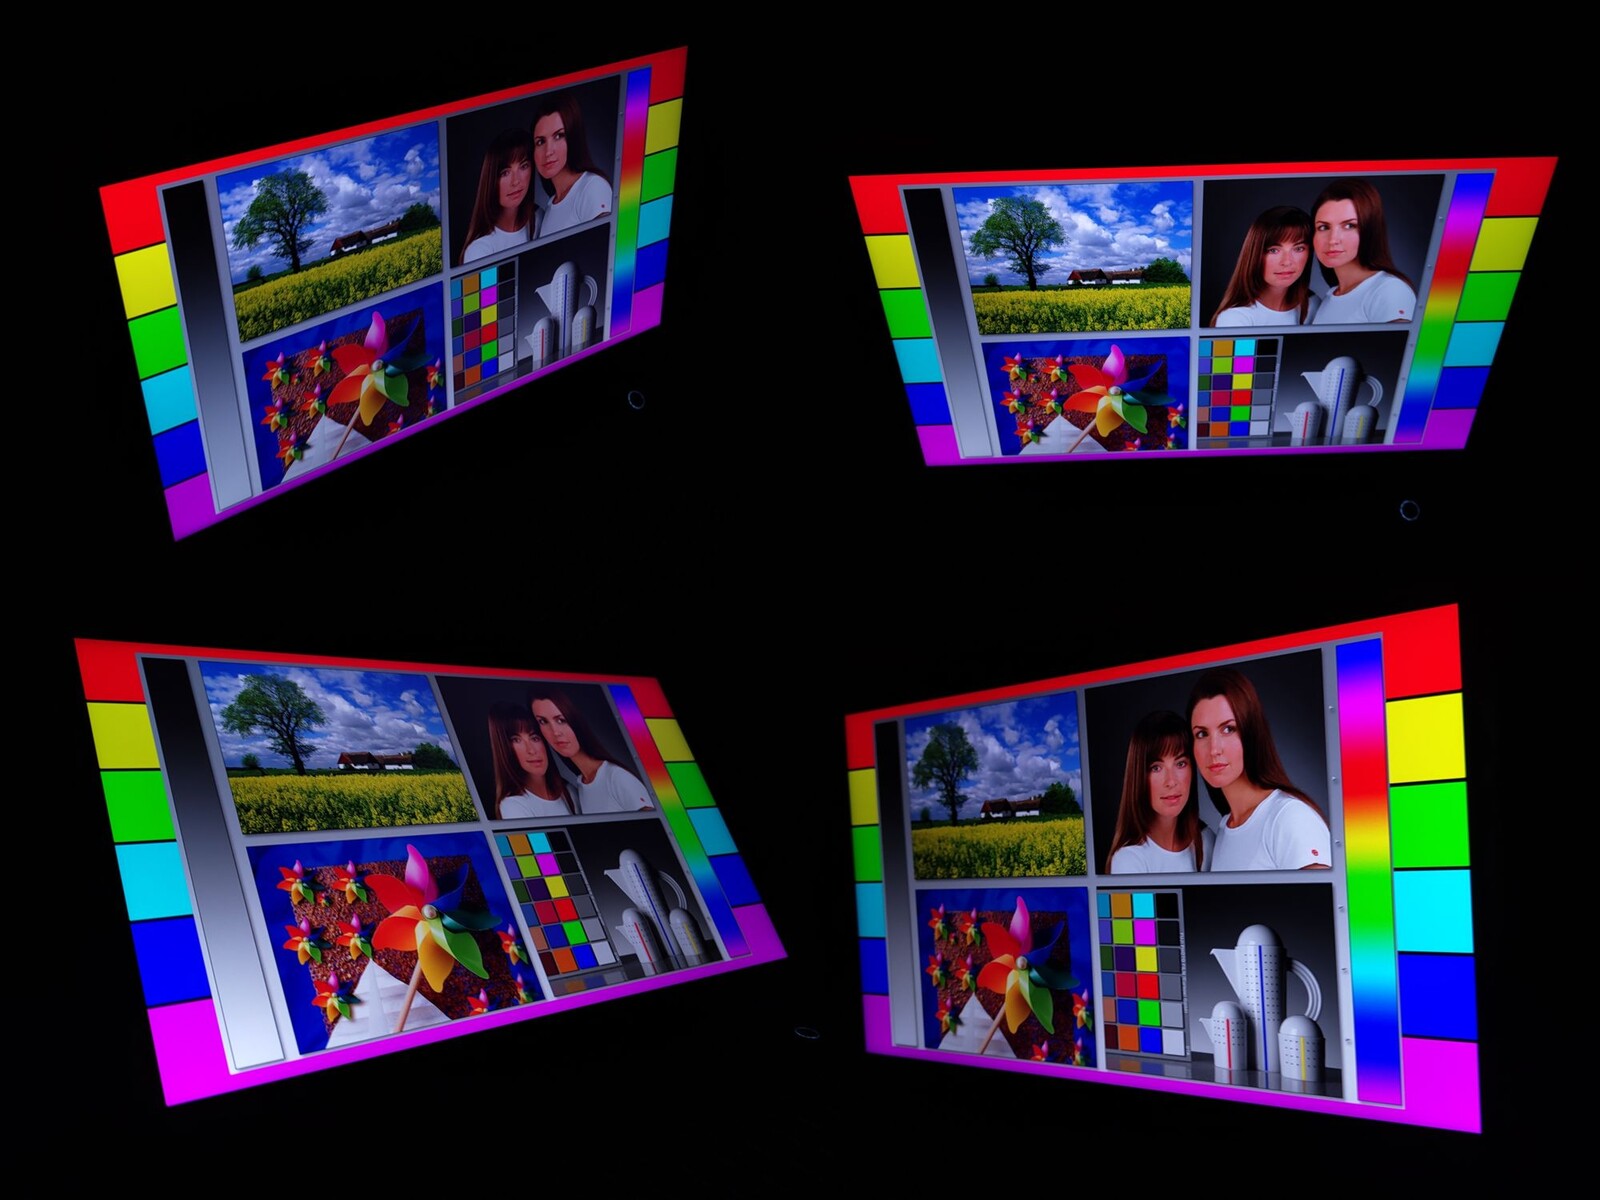
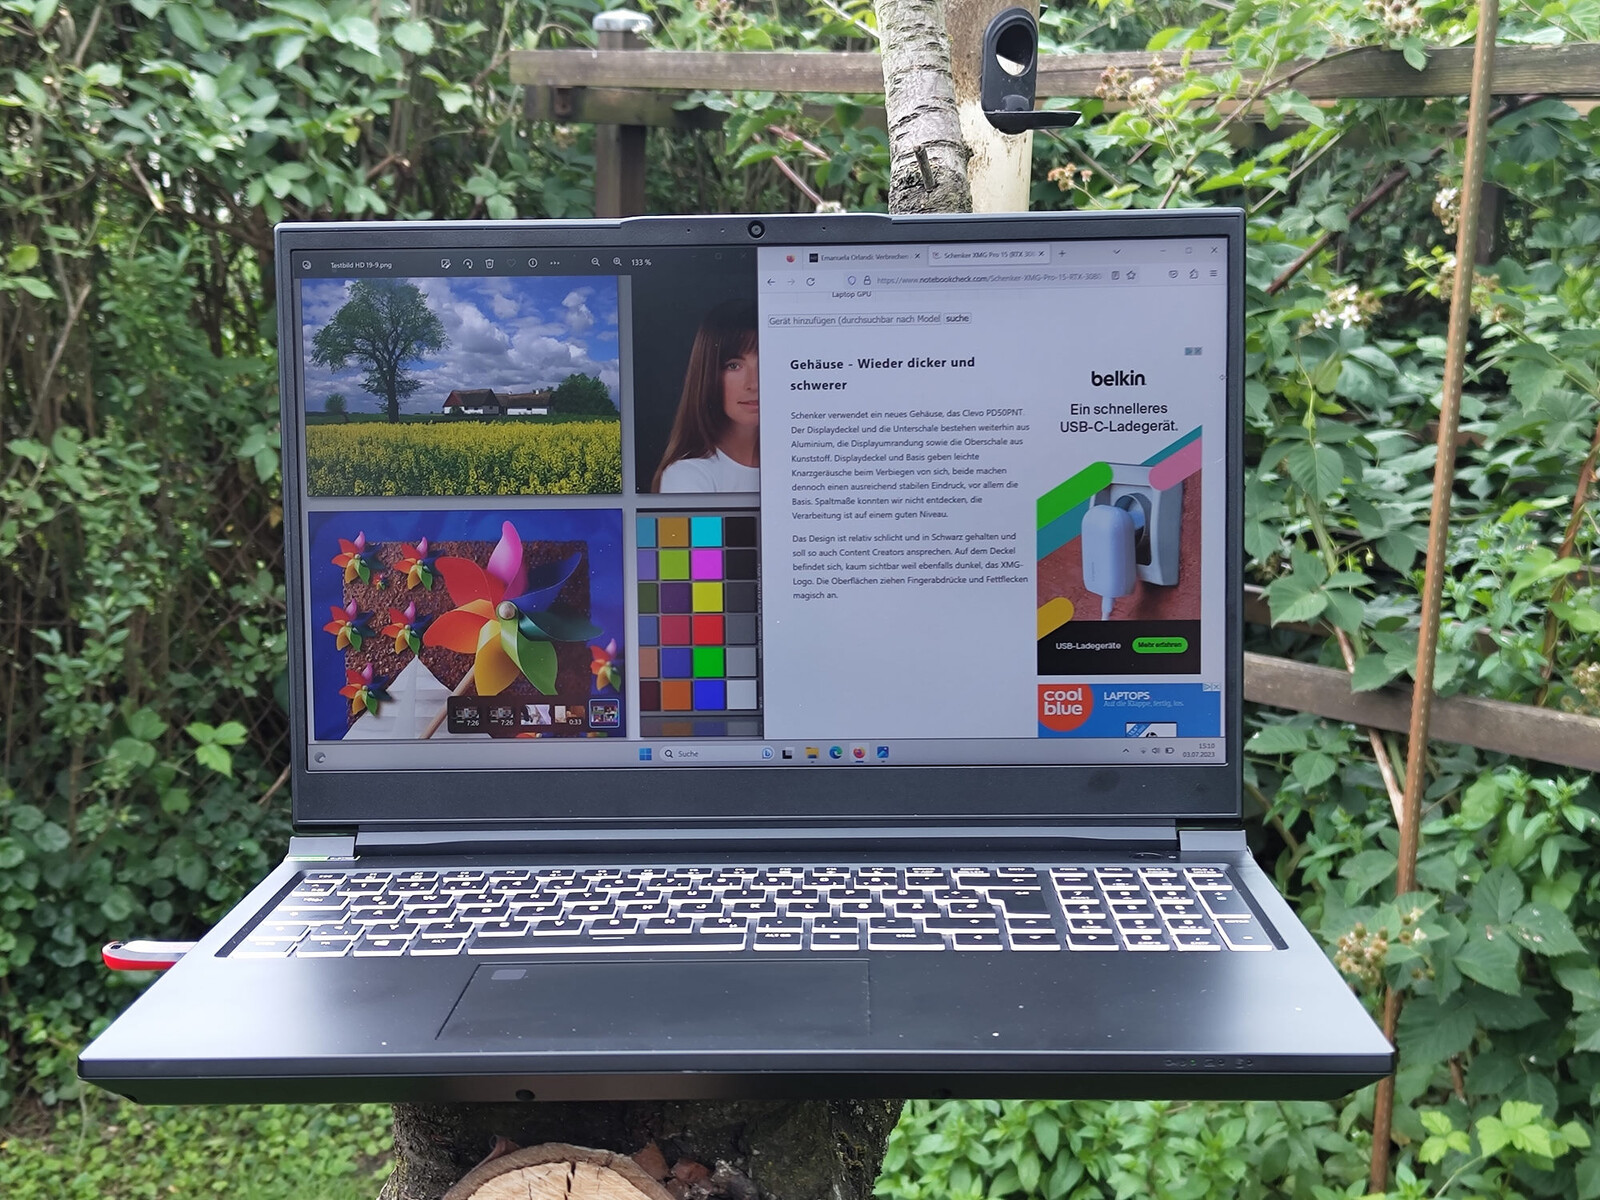
Display - A 240 Hz QHD and DisplayP3
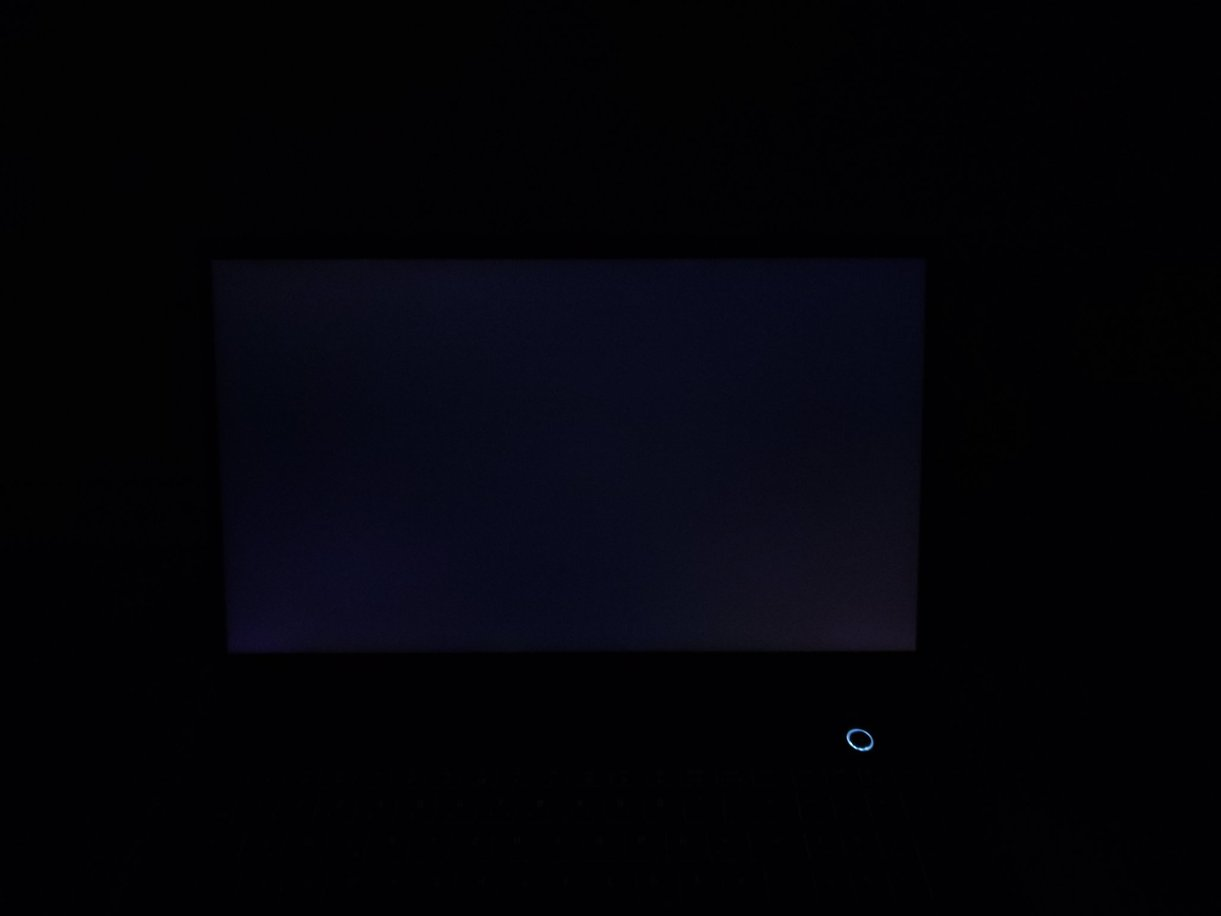
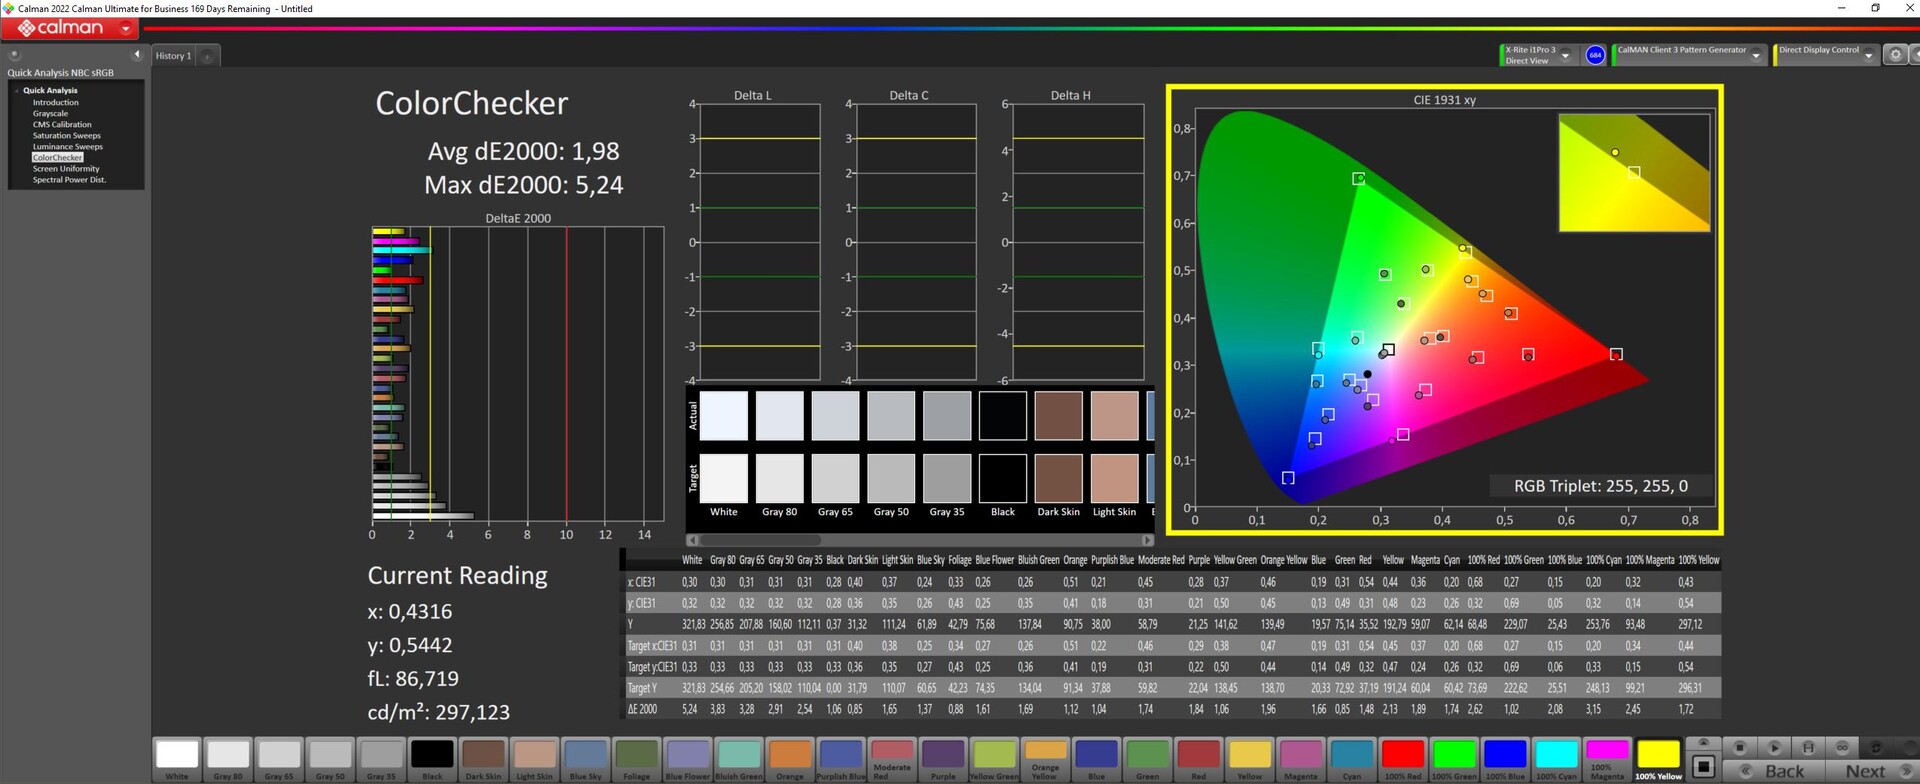
Although it's not an OLED, the XMG Pro 15 possesses a good G-Sync, IPS display. At 240 Hz and 2,560 × 1,440 pixels, the sRGB and DisplayP3 color spaces are almost completely covered. At full brightness, it is, however, slightly noticeable that the 300 cd/m² display is illuminated noticeably more in the middle of the screen than at the edges. However, unlike the predecessor, this doesn't manifest itself in clearly visible screen bleeding.
In comparison to the last-gen model, the display's response times are largely unchanged. The frame rate has been upgraded from 165 Hz to 240 Hz. We did not detect any screen flickering.
| |||||||||||||||||||||||||
Brightness Distribution: 85 %
Contrast: 894:1 (Black: 0.36 cd/m²)
ΔE ColorChecker Calman: 1.98 | ∀{0.5-29.43 Ø4.73}
calibrated: 1.98
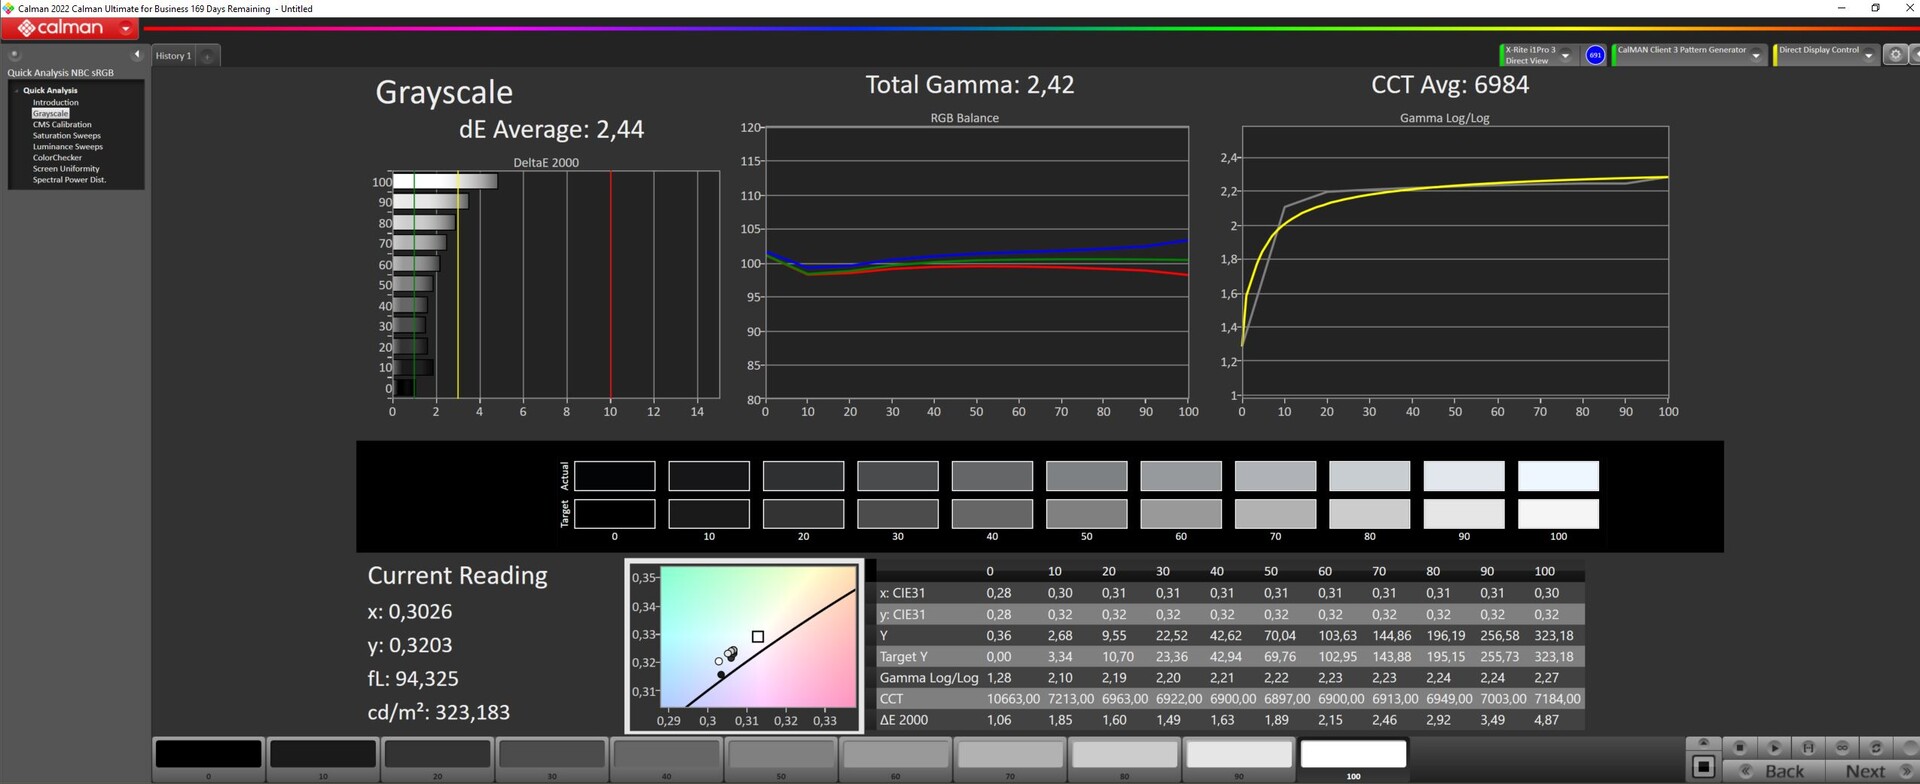
ΔE Greyscale Calman: 2.44 | ∀{0.09-98 Ø4.97}
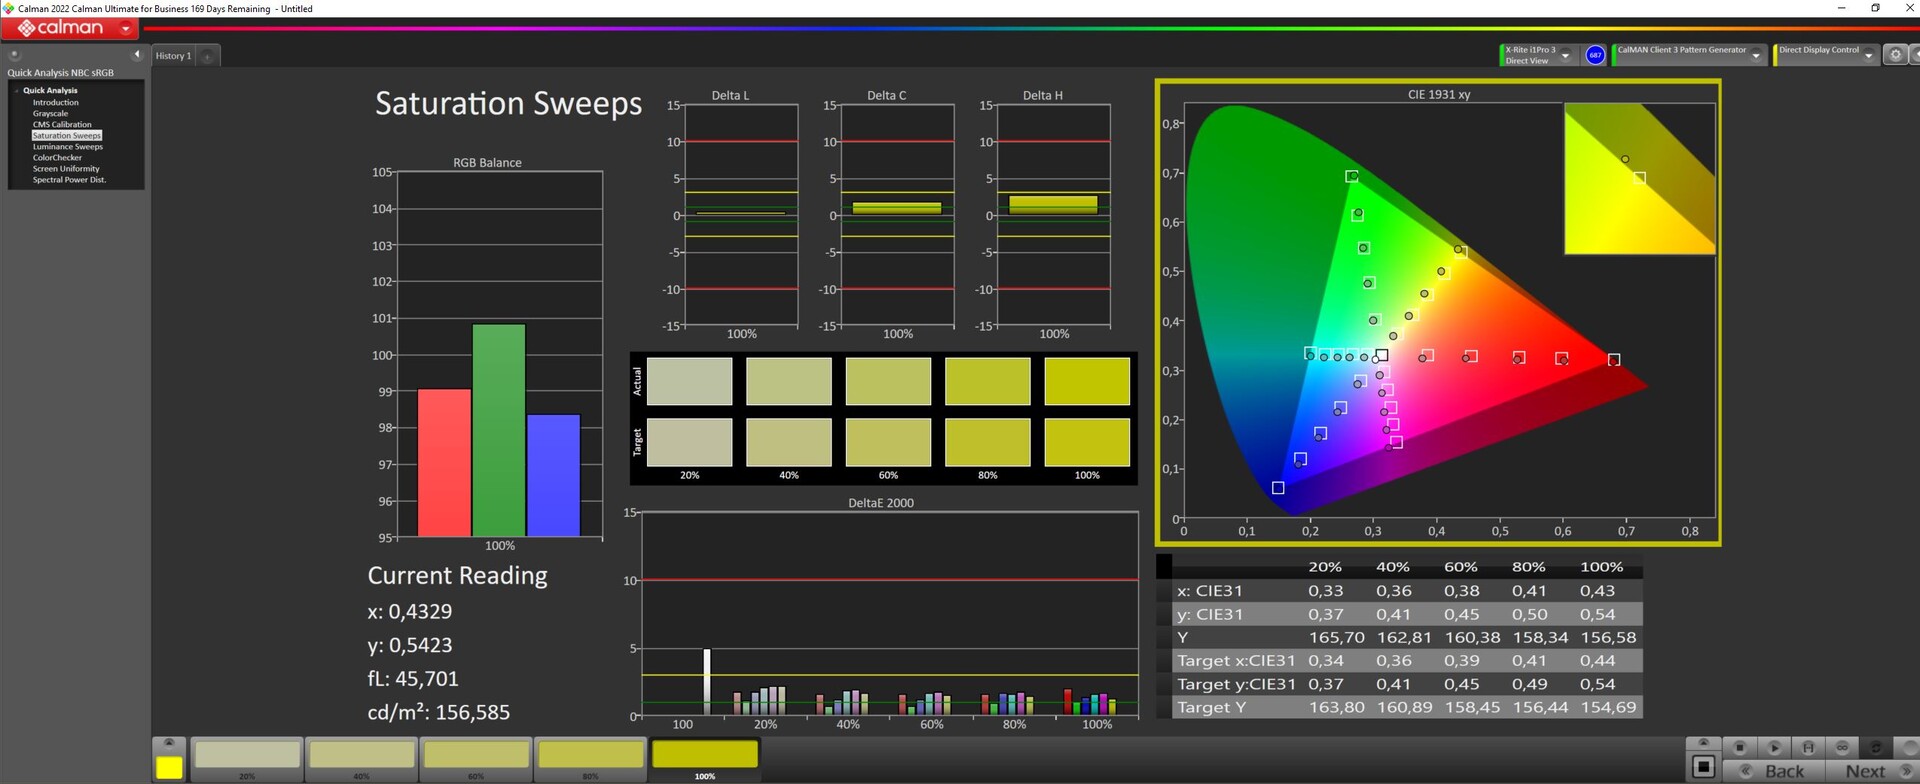
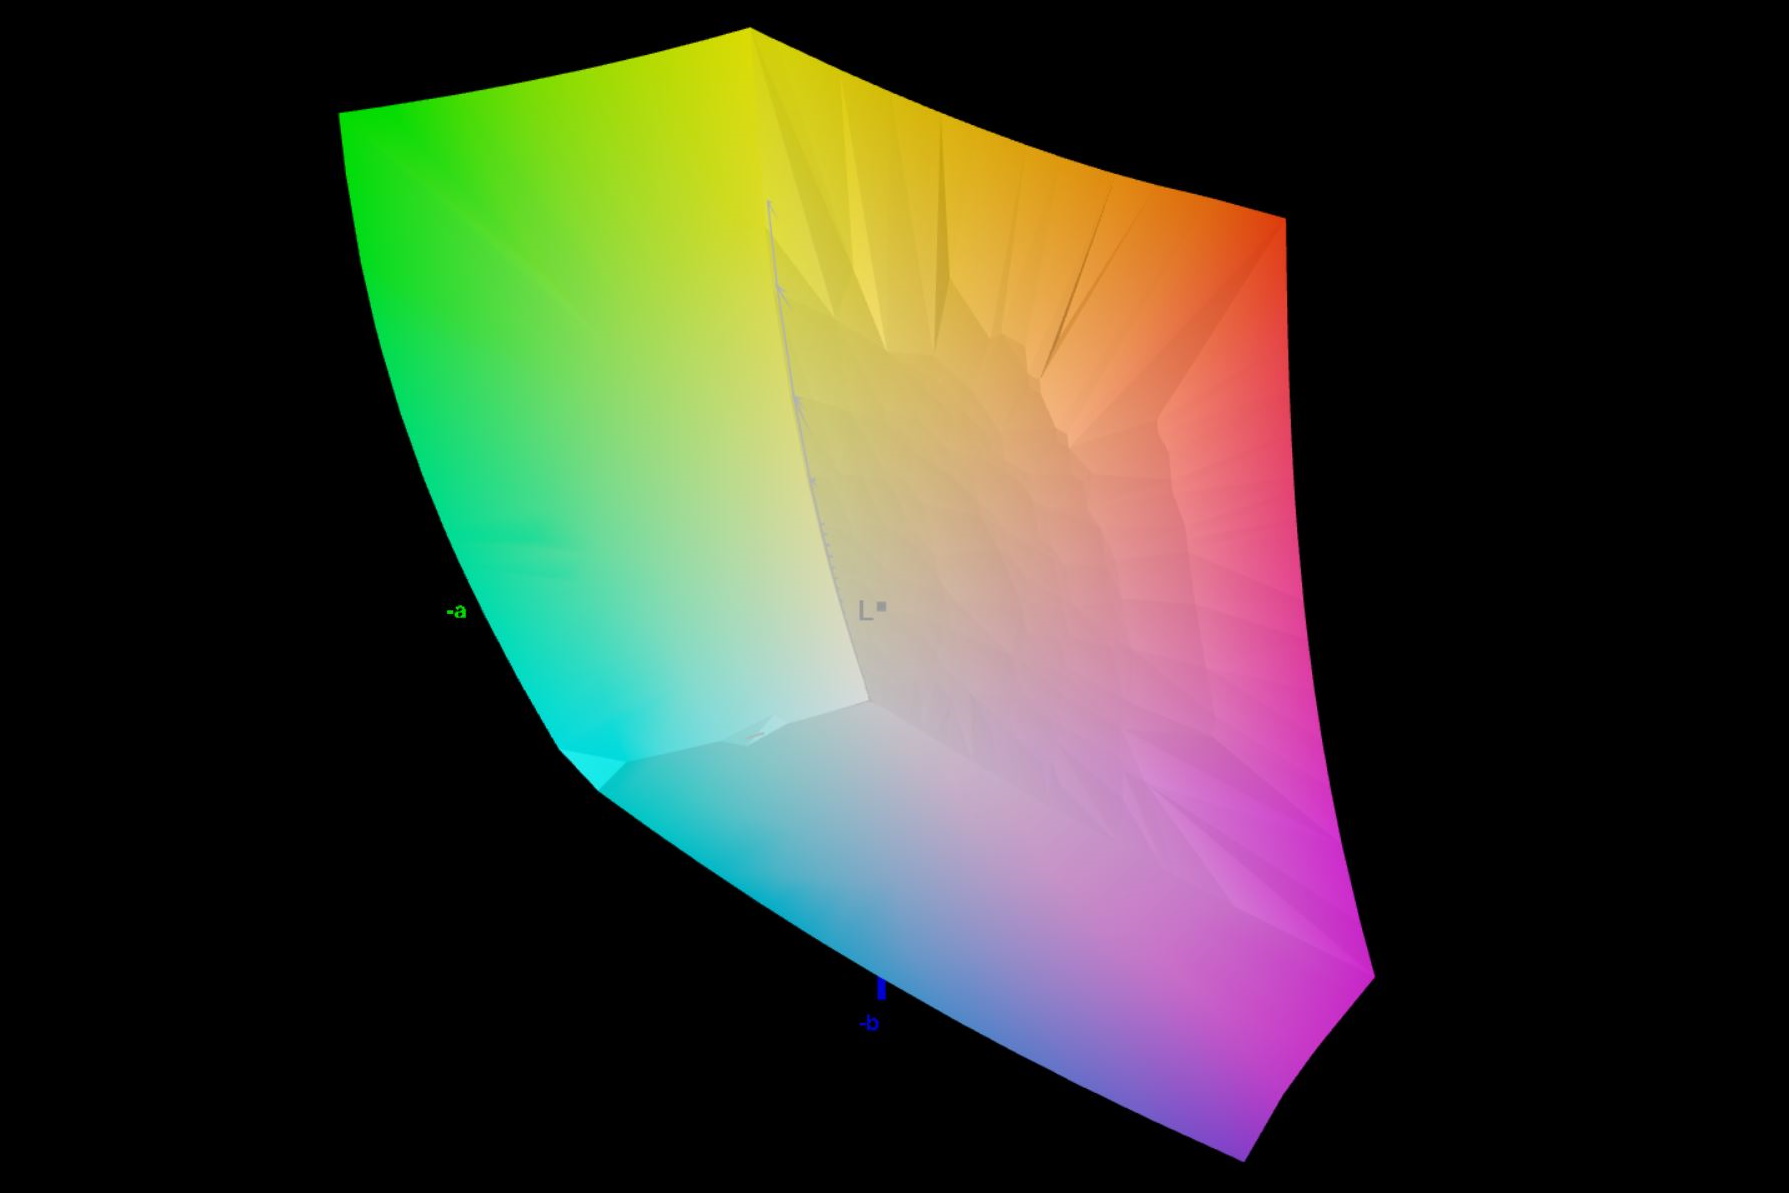
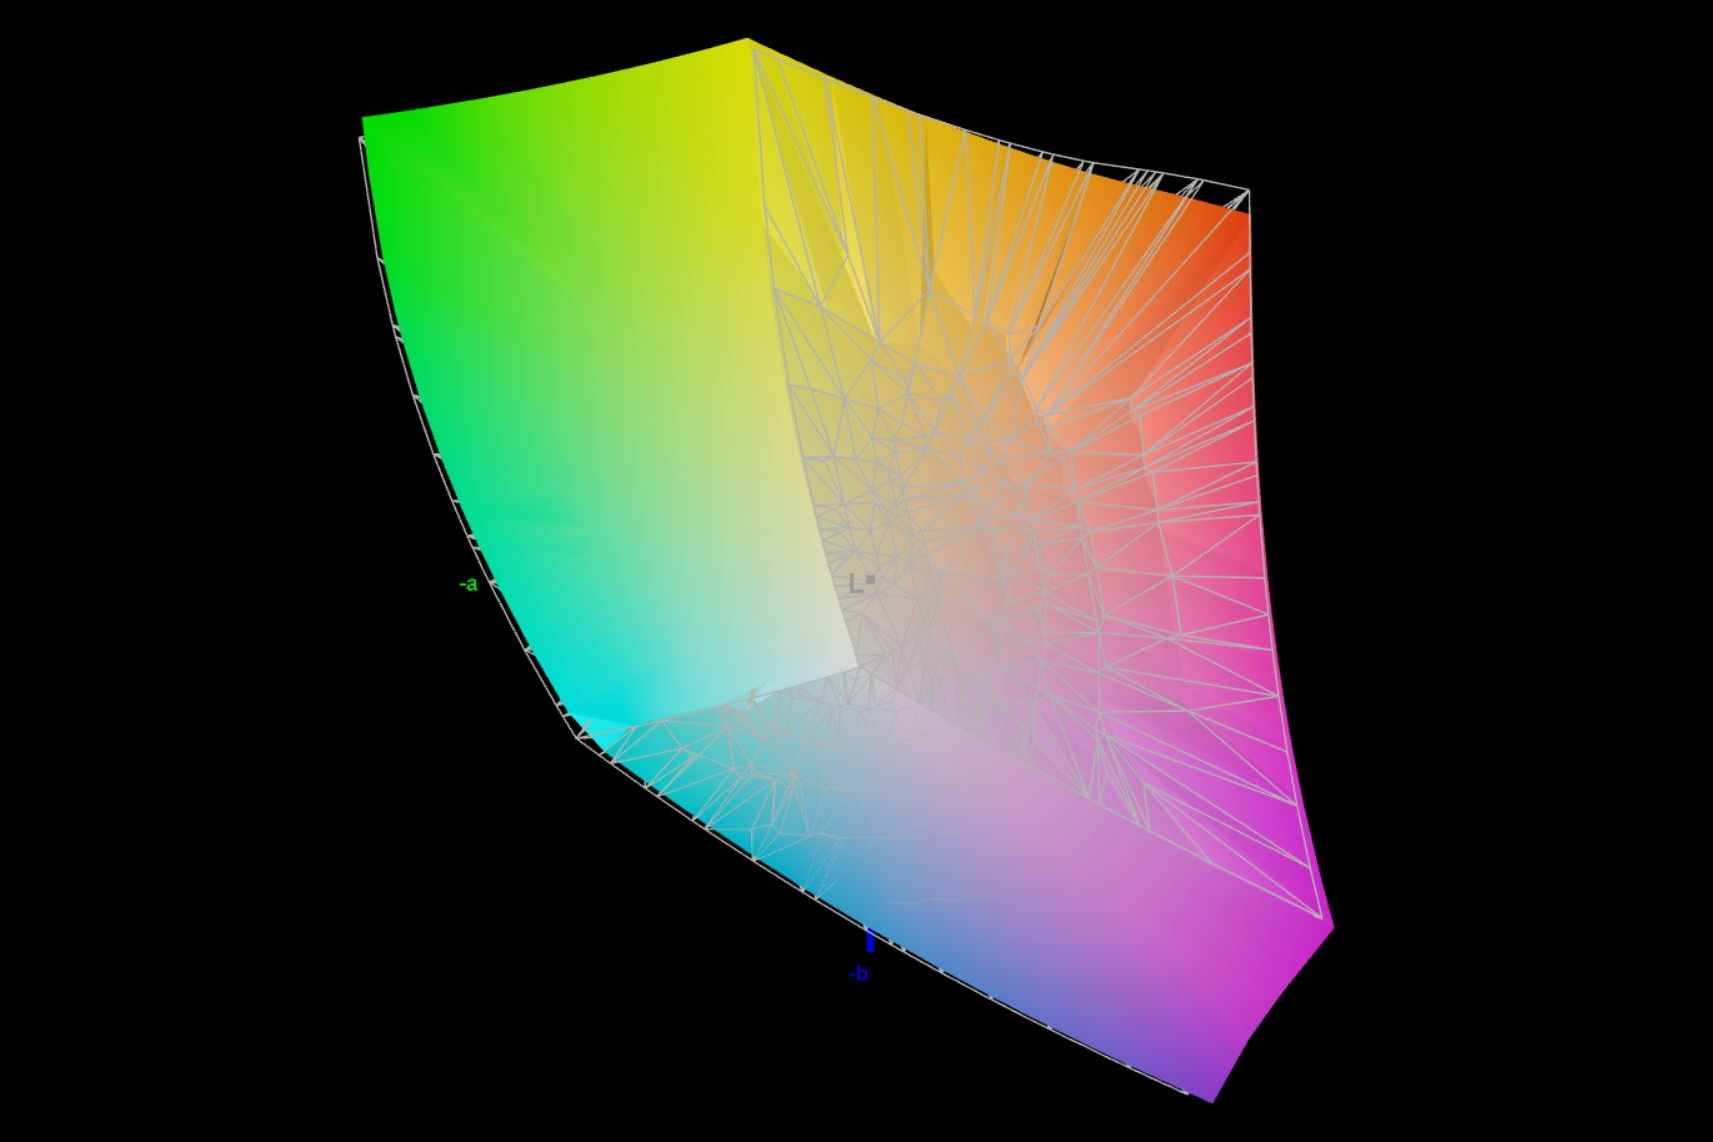
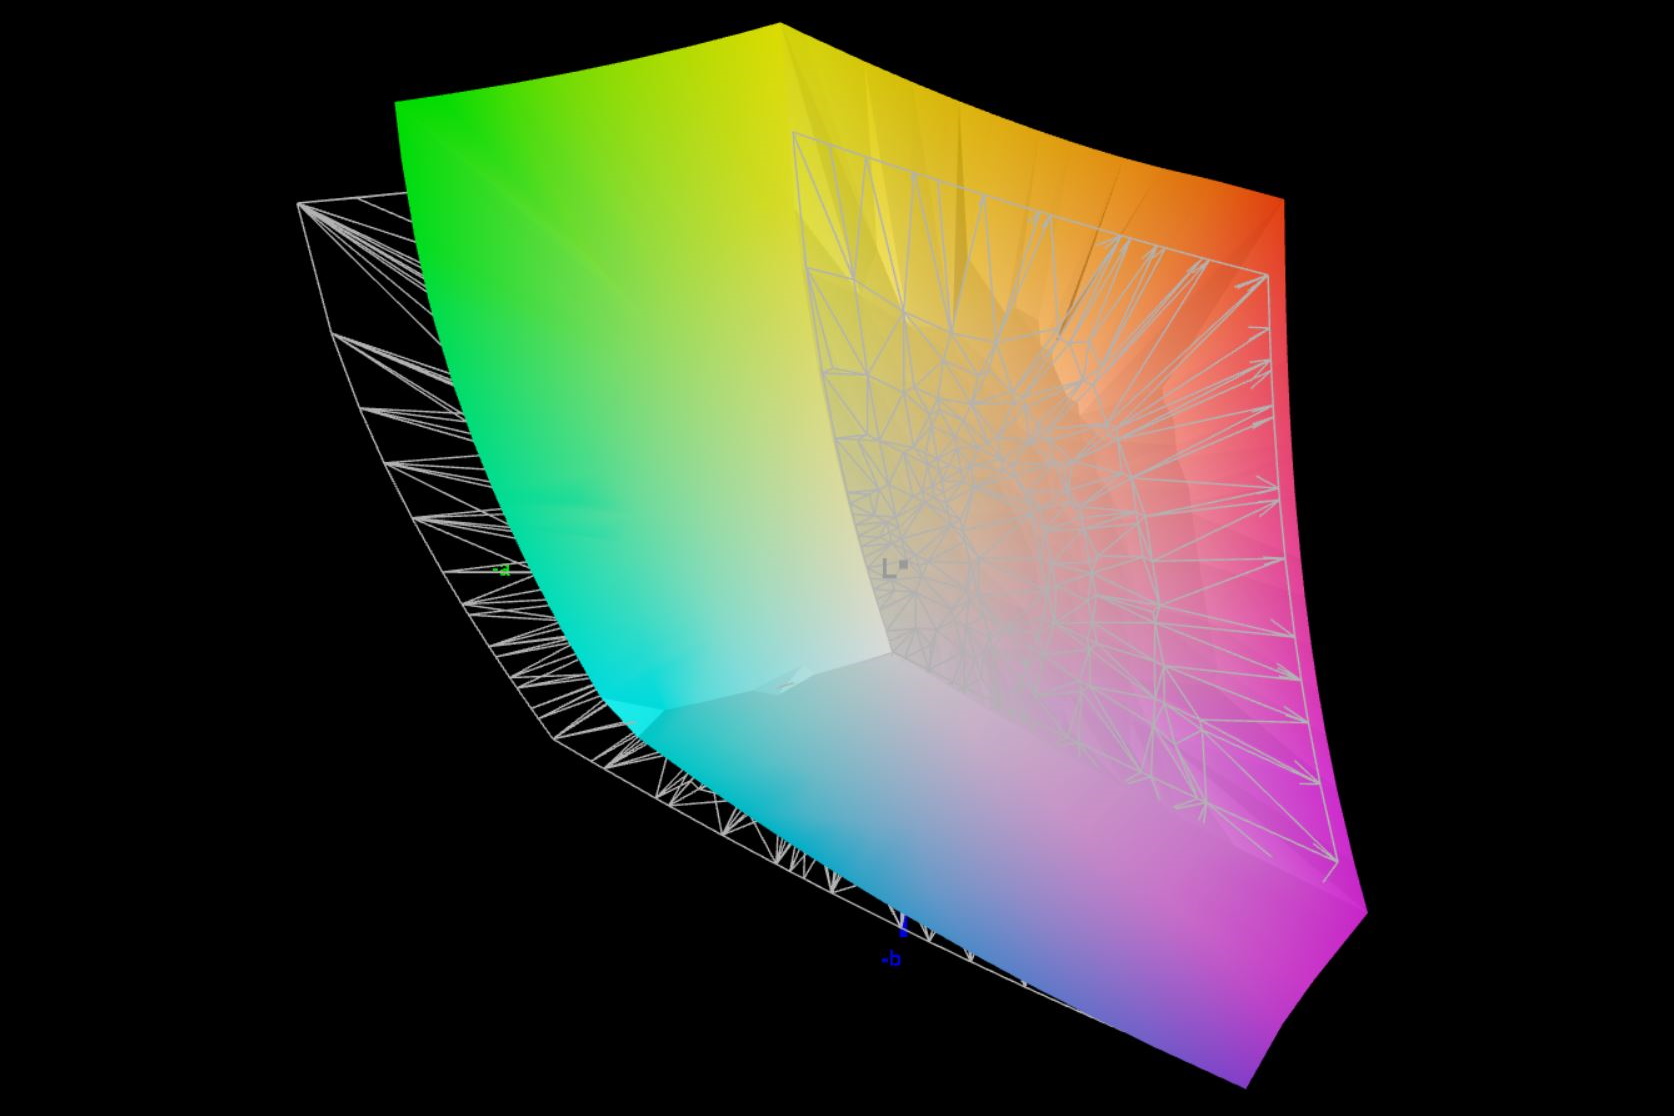
85.4% AdobeRGB 1998 (Argyll 3D)
99.9% sRGB (Argyll 3D)
97.8% Display P3 (Argyll 3D)
Gamma: 2.42
CCT: 6984 K
| Schenker XMG Pro 15 (E23) BOE0AD1, IPS, 2560x1440, 15.6" | Schenker XMG Pro 15 (i7-12700H, RTX 3080 Ti) BOE09C2 (BOE CQ NE156QHM-NY1), IPS, 2560x1440, 15.6" | Dell G15 5530 AUO B156HAN, IPS, 1920x1080, 15.6" | Aorus 15X ASF BOE CQ NE156QHM-NZ1, IPS, 2560x1440, 15.6" | MSI Cyborg 15 A12VF AU Optronics B156HAN15.1, IPS, 1920x1080, 15.6" | Alienware x16 R1 BOE NE16NZ4, IPS, 2560x1600, 16" | |
|---|---|---|---|---|---|---|
| Display | 0% | -13% | -16% | -48% | 2% | |
| Display P3 Coverage (%) | 97.8 | 97.5 0% | 73.1 -25% | 69.3 -29% | 42.3 -57% | 99.2 1% |
| sRGB Coverage (%) | 99.9 | 99.9 0% | 98.4 -2% | 98.2 -2% | 62.6 -37% | 100 0% |
| AdobeRGB 1998 Coverage (%) | 85.4 | 85.2 0% | 74.4 -13% | 70.5 -17% | 43.7 -49% | 88.6 4% |
| Response Times | 7% | 60% | 7% | -52% | 29% | |
| Response Time Grey 50% / Grey 80% * (ms) | 14 ? | 13.2 ? 6% | 3.39 ? 76% | 12.4 ? 11% | 22 ? -57% | 5.1 ? 64% |
| Response Time Black / White * (ms) | 9.6 ? | 8.8 ? 8% | 5.35 ? 44% | 9.4 ? 2% | 14 ? -46% | 10.3 ? -7% |
| PWM Frequency (Hz) | 21620 ? | |||||
| Screen | -33% | -25% | 24% | -22% | 14% | |
| Brightness middle (cd/m²) | 322 | 317 -2% | 320 -1% | 316 -2% | 247 -23% | 302.2 -6% |
| Brightness (cd/m²) | 301 | 294 -2% | 316 5% | 301 0% | 234 -22% | 285 -5% |
| Brightness Distribution (%) | 85 | 83 -2% | 94 11% | 90 6% | 89 5% | 89 5% |
| Black Level * (cd/m²) | 0.36 | 0.32 11% | 0.21 42% | 0.28 22% | 0.25 31% | 0.26 28% |
| Contrast (:1) | 894 | 991 11% | 1524 70% | 1129 26% | 988 11% | 1162 30% |
| Colorchecker dE 2000 * | 1.98 | 4.22 -113% | 4.55 -130% | 1.54 22% | 3.78 -91% | 1.63 18% |
| Colorchecker dE 2000 max. * | 5.24 | 5.97 -14% | 9.83 -88% | 2.46 53% | 6.42 -23% | 4.13 21% |
| Colorchecker dE 2000 calibrated * | 1.98 | 4.09 -107% | 1.51 24% | 1.21 39% | 3.94 -99% | 1.17 41% |
| Greyscale dE 2000 * | 2.44 | 4.41 -81% | 6.2 -154% | 1.3 47% | 2.16 11% | 2.5 -2% |
| Gamma | 2.42 91% | 2.29 96% | 2.07 106% | 2.307 95% | 2.33 94% | 2.23 99% |
| CCT | 6984 93% | 6733 97% | 6479 100% | 6456 101% | 6906 94% | 6590 99% |
| Total Average (Program / Settings) | -9% /
-20% | 7% /
-10% | 5% /
13% | -41% /
-32% | 15% /
14% |
* ... smaller is better
Out-of-the-box, the color deviations are more than appropriately small for a gaming laptop With the colors and gray scales in Calman ColorChecker, at ΔΕ 1,98 and ΔΕ 2,44, respectively, the XMG Pro 15 sits clearly within the target range of ΔΕ < 3. Our own ICC profile (download in the info box) ought to be able to slightly reduce the overemphasized blue somewhat and significantly improve both the gray scales and color reproduction. Together with the almost completely covered DisplayP3 color space, we are dealing with a display which seems to be suitable for professional video editing.
Display Response Times
| ↔ Response Time Black to White | ||
|---|---|---|
| 9.6 ms ... rise ↗ and fall ↘ combined | ↗ 4.2 ms rise | 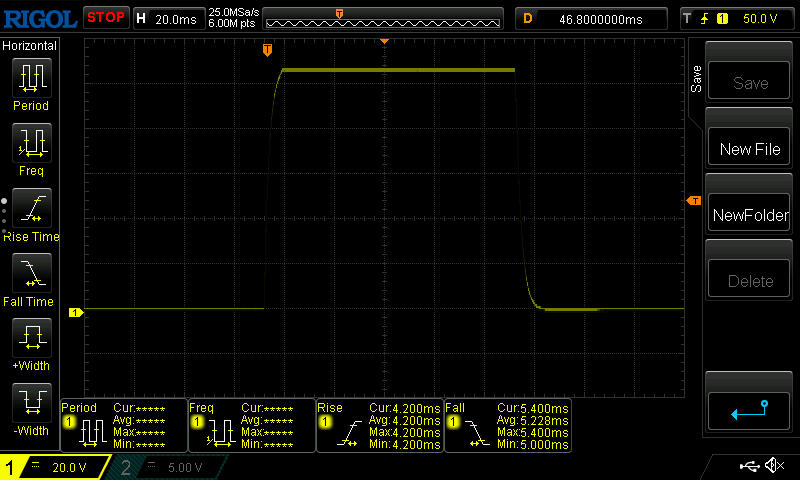 |
| ↘ 5.4 ms fall | ||
| The screen shows fast response rates in our tests and should be suited for gaming. In comparison, all tested devices range from 0.1 (minimum) to 240 (maximum) ms. » 26 % of all devices are better. This means that the measured response time is better than the average of all tested devices (19.9 ms). | ||
| ↔ Response Time 50% Grey to 80% Grey | ||
| 14 ms ... rise ↗ and fall ↘ combined | ↗ 6.6 ms rise | 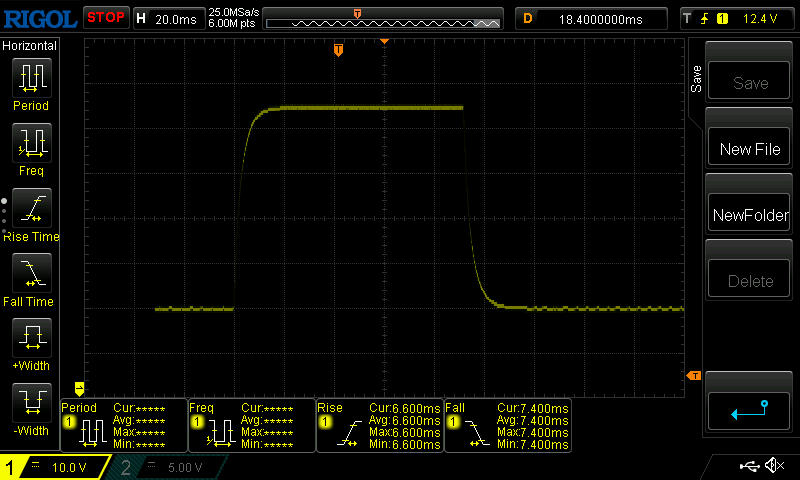 |
| ↘ 7.4 ms fall | ||
| The screen shows good response rates in our tests, but may be too slow for competitive gamers. In comparison, all tested devices range from 0.165 (minimum) to 636 (maximum) ms. » 28 % of all devices are better. This means that the measured response time is better than the average of all tested devices (31.1 ms). | ||
Screen Flickering / PWM (Pulse-Width Modulation)
| Screen flickering / PWM not detected | 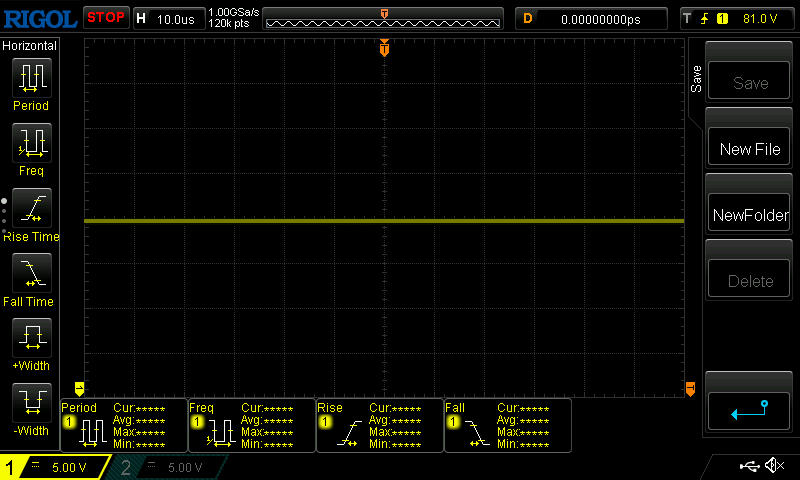 | ||
In comparison: 52 % of all tested devices do not use PWM to dim the display. If PWM was detected, an average of 7798 (minimum: 5 - maximum: 343500) Hz was measured. | |||
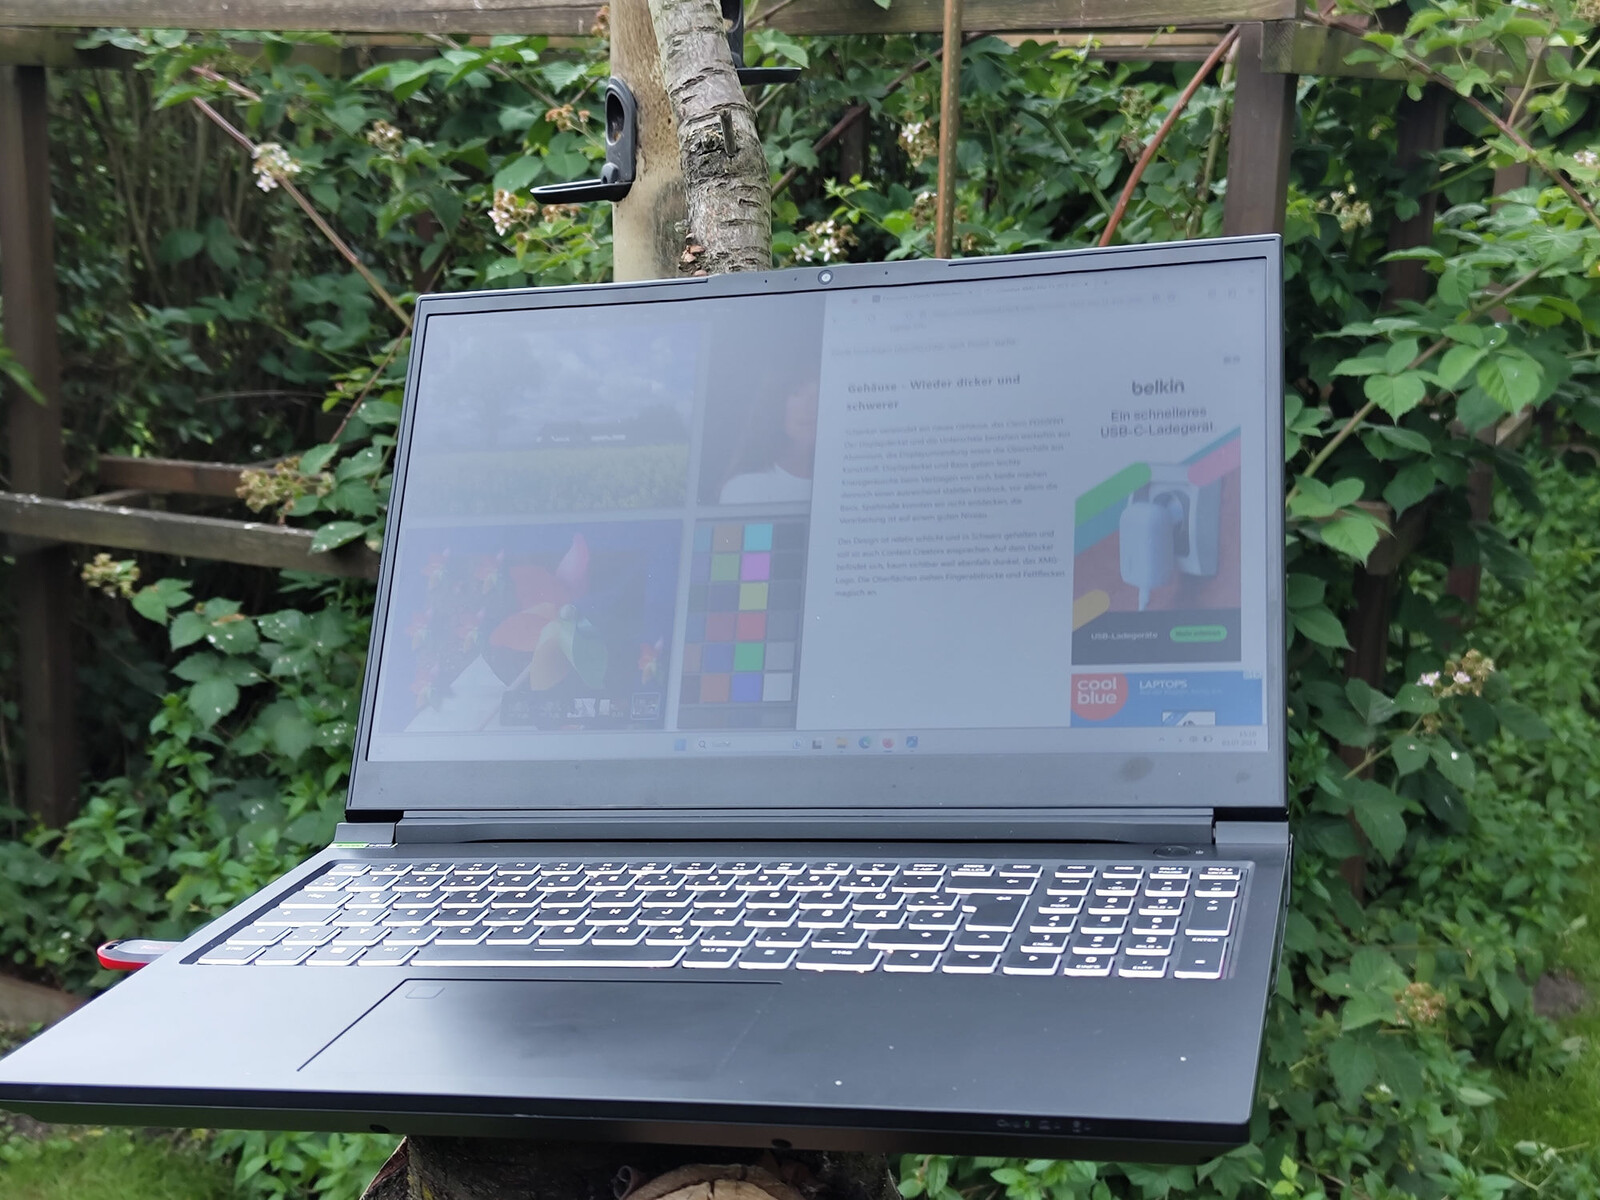
It's also possible to use the 15-inch laptop outdoors, thanks to the matte and relatively bright display. Depending on the location, you have to choose the appropriate viewing angle in order to experience the lowest possible amount of reflections. Luckily, the IPS panel possesses very stable viewing angles.
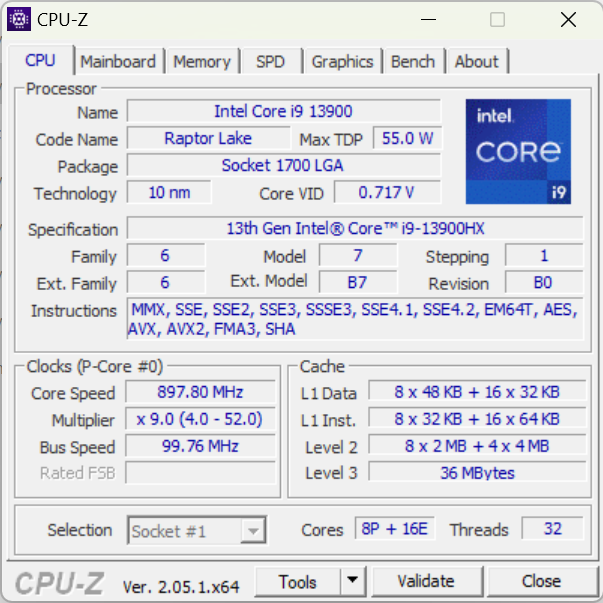
Performance - The Intel Core i9 and Nvidia GeForce RTX 4060 have staying power
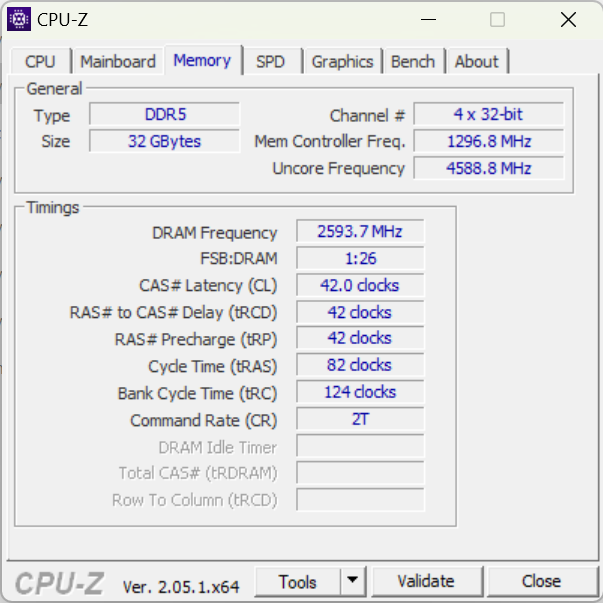
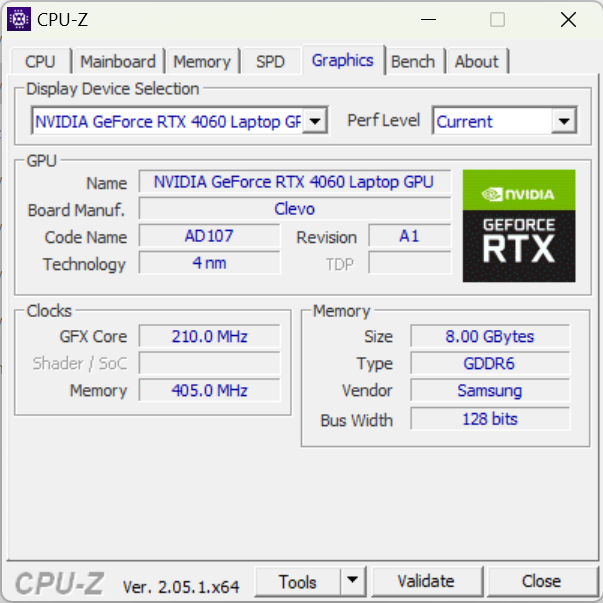
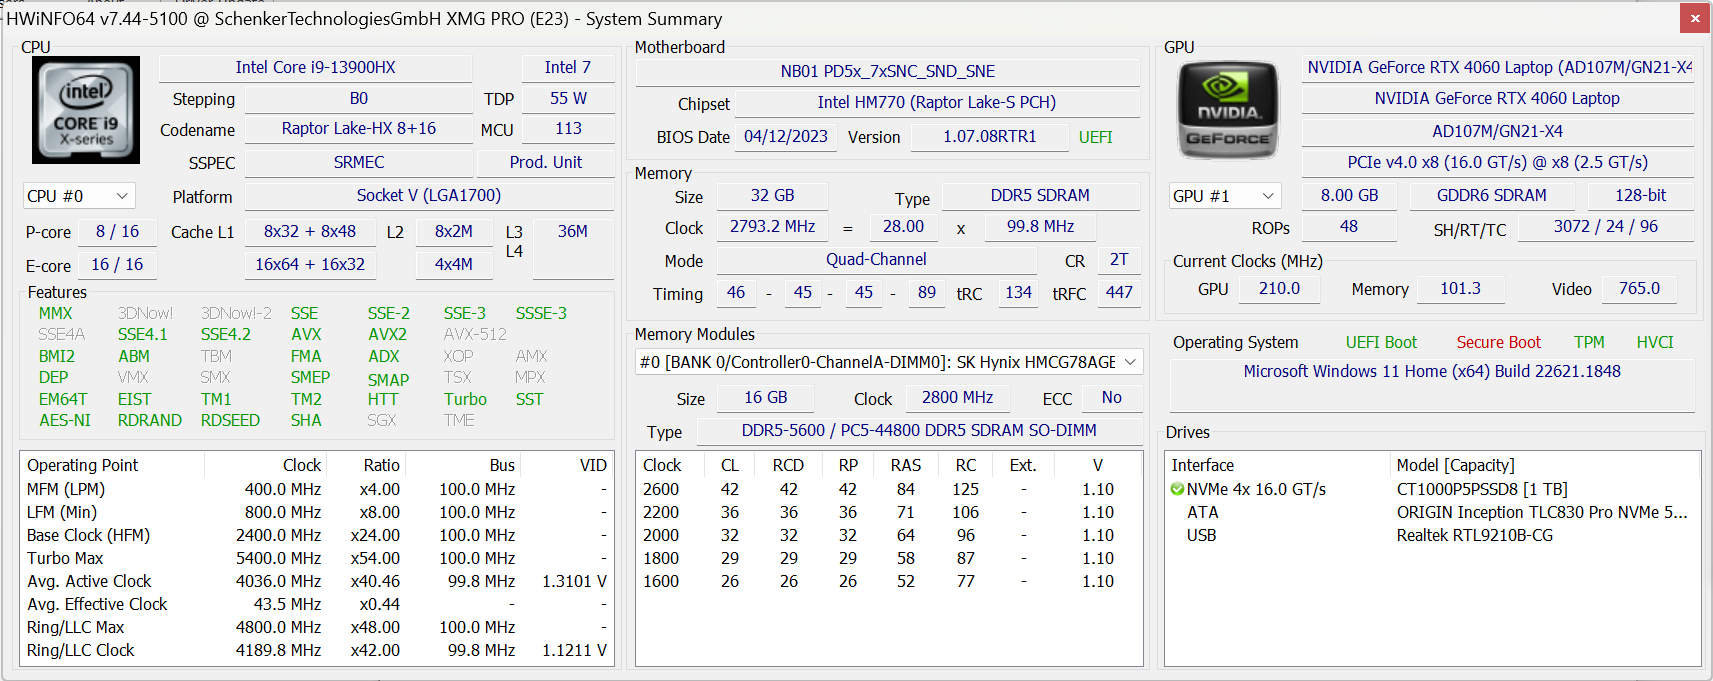
In our review device, a powerful Intel Core i9-13900HX and the Nvidia GeForce RTX 4060 are responsible for sufficient power to be able to handle games and most creative tasks. The laptop can be configured with 8 to 64 GB of DDR5 RAM. Our review sample is equipped with 32 GB. Typical for Schenker, many different options can be chosen from as part of Bestware's ordering process. In addition to the RTX 4060, an RTX 4070 is also configurable. When it comes to SSDs and WiFi options, a wide selection is also available.

Test conditions
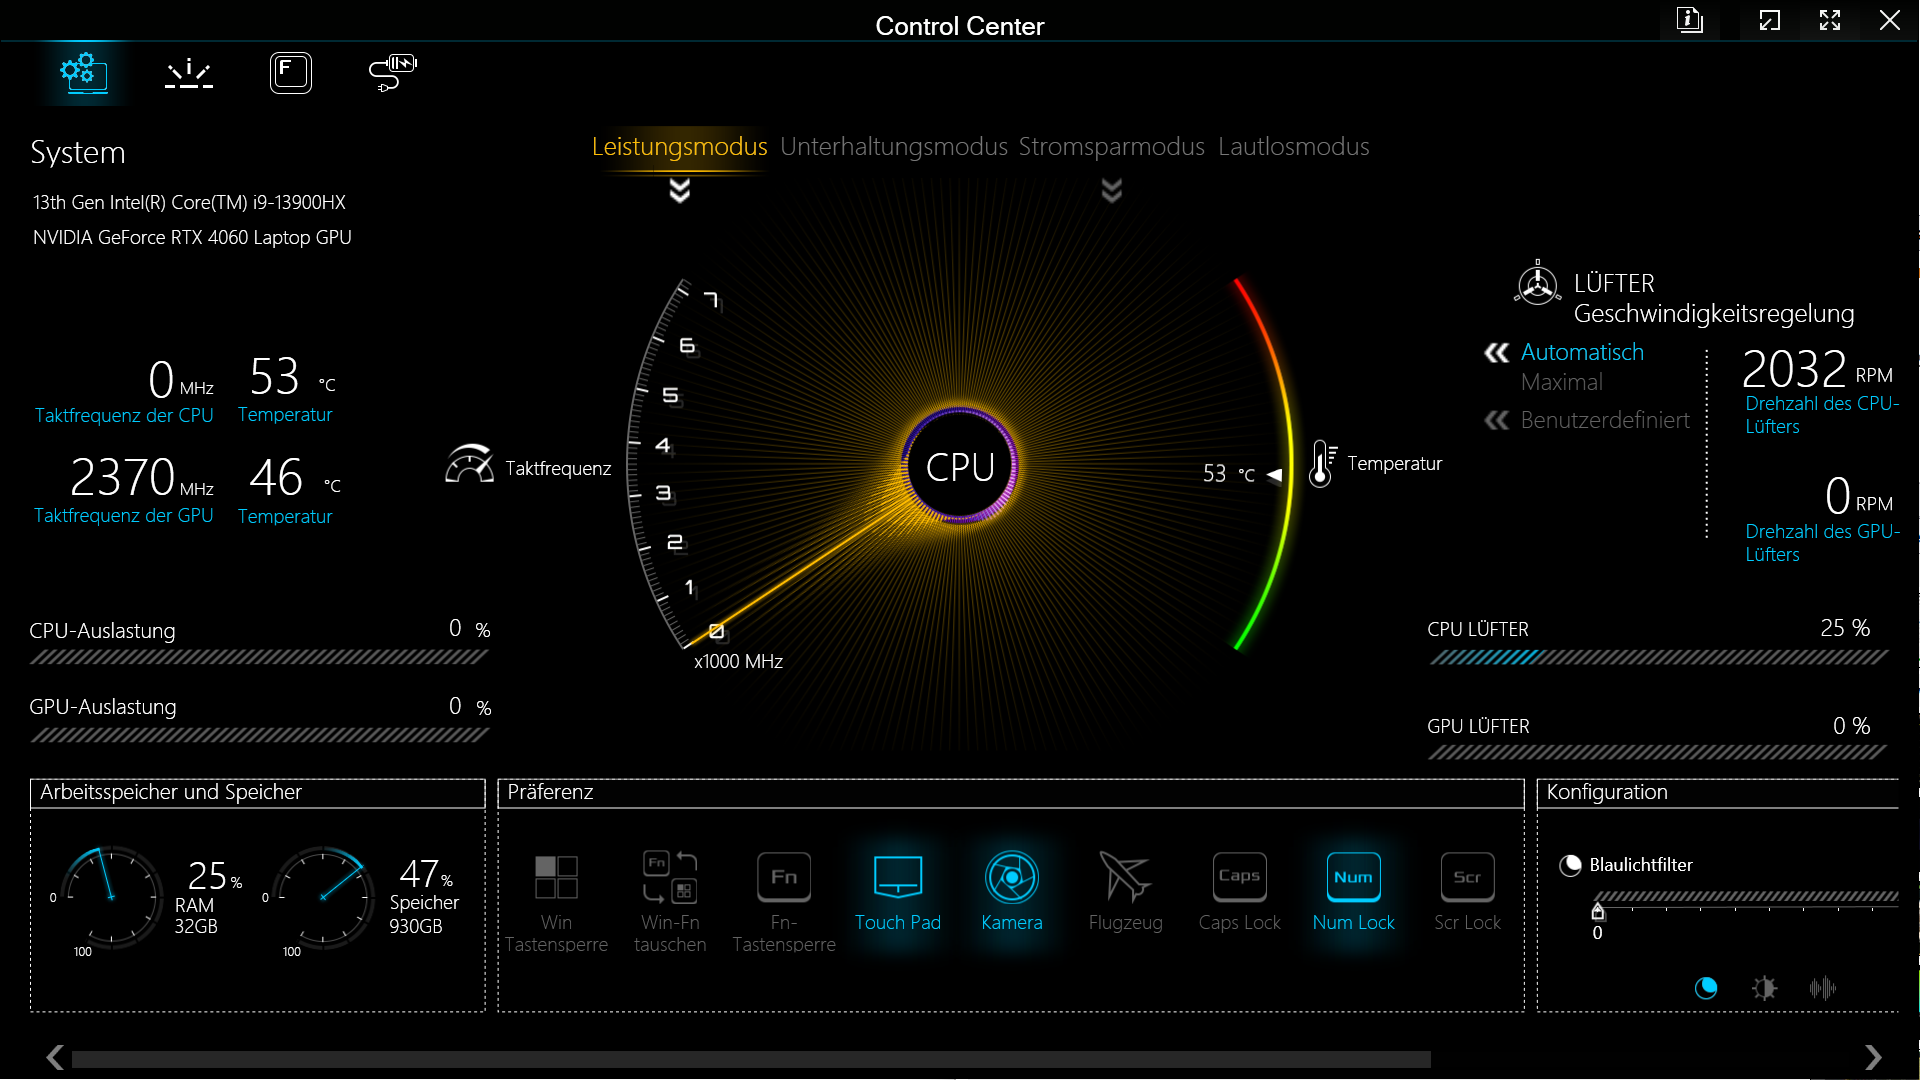
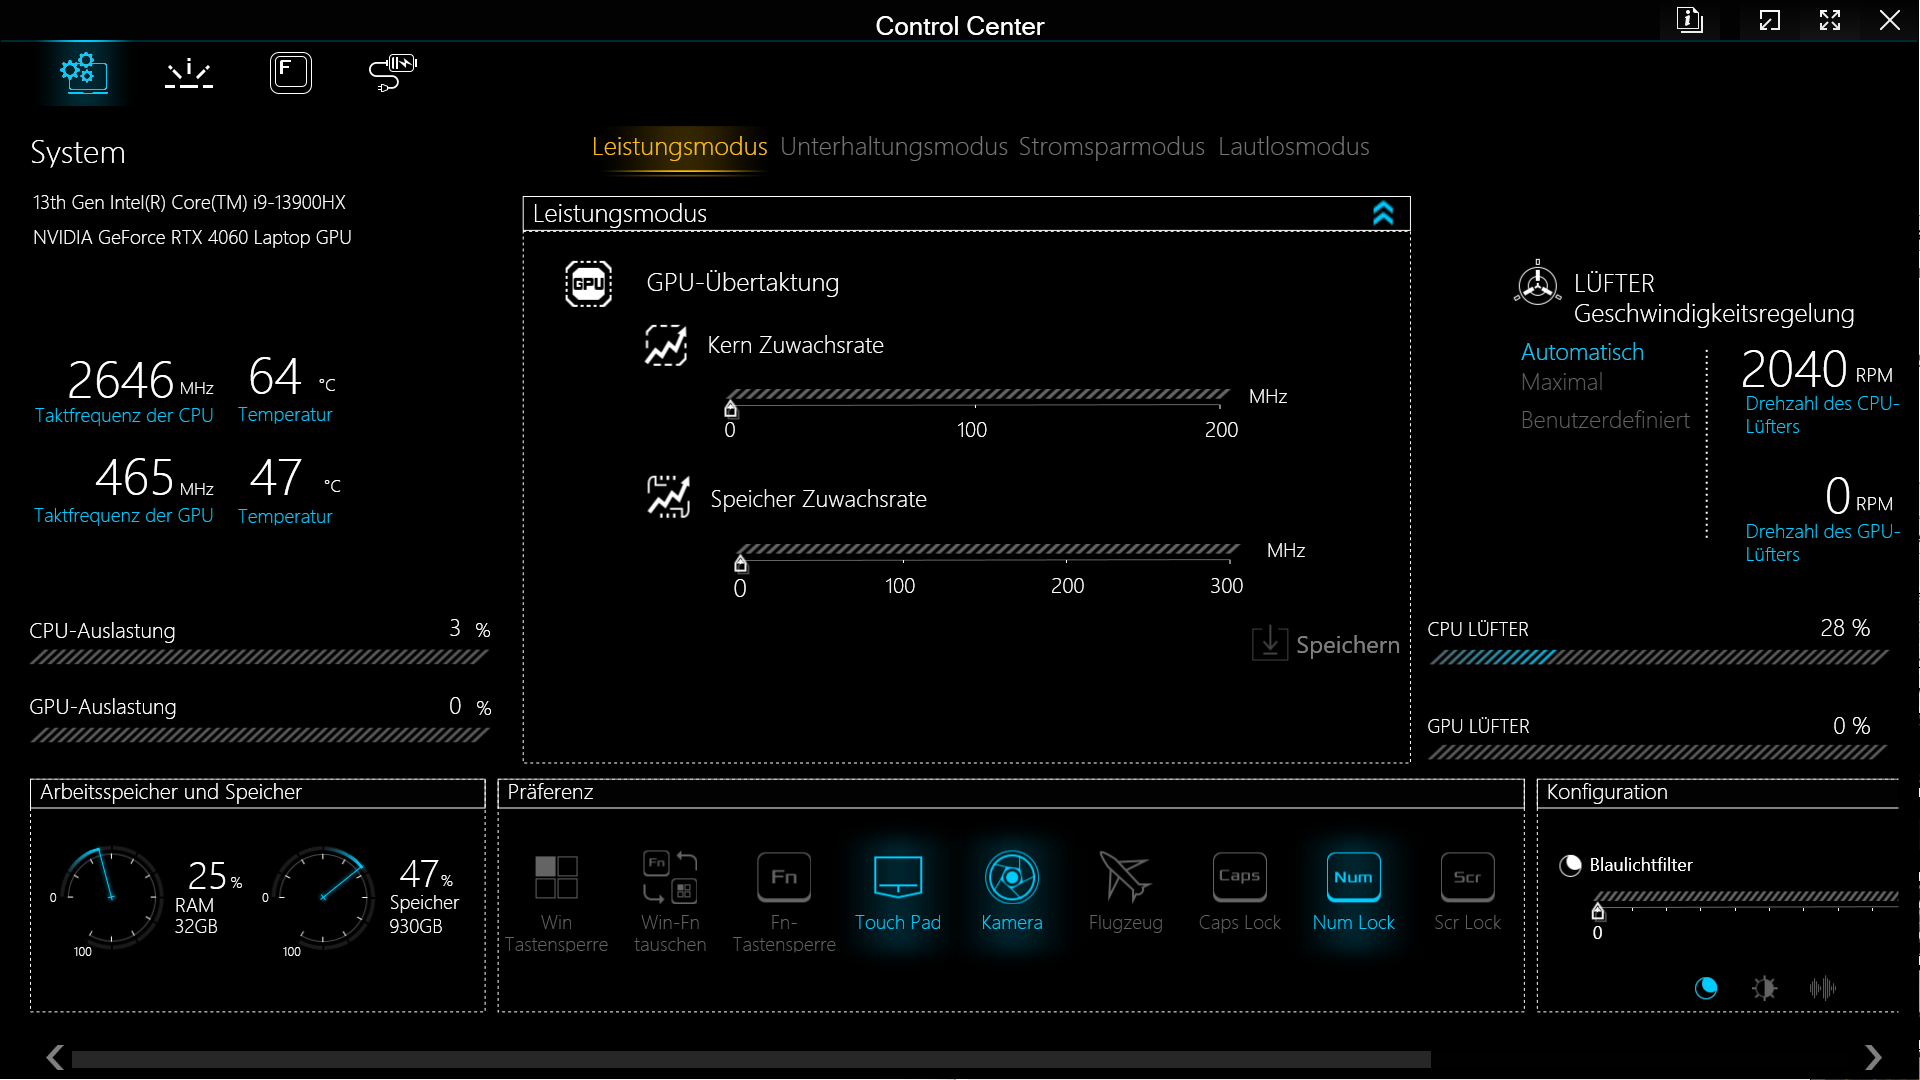
The various performance levels - performance mode, entertainment mode, energy saving mode and silent mode, can be selected via Control Center. Additionally, in performance mode, there are options available to slightly overclock the GPU and the graphics memory. The Intel Core i9 is supplied with a maximum of 135 watts and the GeForce RTX 4060 with 140 watts, if 25 watts are switched from the processor to the graphics card. The following target values apply in the individual energy savings modes:
| Modus: | Performance mode | Entertainment mode | Energy saving mode | Quiet mode |
|---|---|---|---|---|
| CPU PL1 | 135 W | 65 W | 55 W | 45 W |
| CPU PL2 | 162 W | 115 W | 115 W | 115 W |
| Target temperature CPU | 93 °C | 87 °C | 85 °C | 85 °C |
| GPU TGP + Dynamic Boost | 115 W + 25 W | 115 W + 0 W | 115 W + 0 W | 115 W + 0 W |
| Target temperature GPU | 87 °C | 87 °C | 87 °C | 87 °C |
The logs we compiled show that the gaming laptop can withstand a very high performance-boost for up to 90 seconds in both entertainment and performance modes. Schenker suggests carrying out everyday tasks in entertainment mode. However, we decided to perform all the benchmarks in performance mode.

Processor
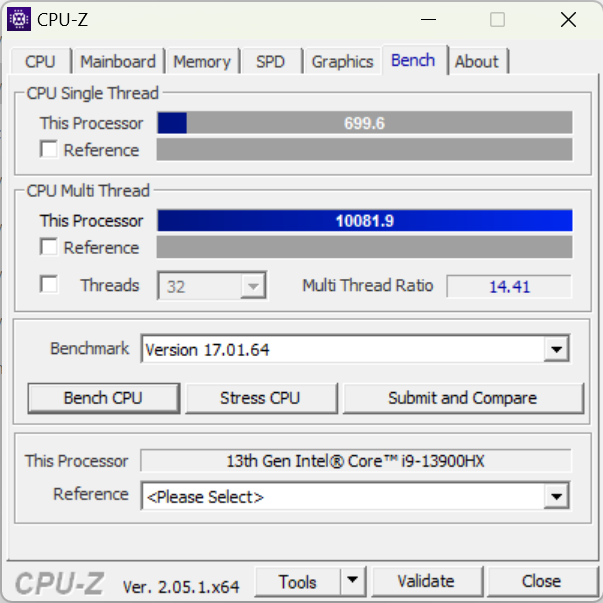
The Intel Core i9-13900HX is the most powerful laptop processor in the current Raptor Lake generation. This CPU is able to simultaneously process 32 threads distributed over 8 P cores and 16 E cores. Thanks to its high PL1 and PL2 values, the i9 really shows the potential it possesses with the XMG Pro 15 topping all other devices in the processor benchmarks.
Cinebench R15 Multi Continuous Test
Cinebench R23: Multi Core | Single Core
Cinebench R20: CPU (Multi Core) | CPU (Single Core)
Cinebench R15: CPU Multi 64Bit | CPU Single 64Bit
Blender: v2.79 BMW27 CPU
7-Zip 18.03: 7z b 4 | 7z b 4 -mmt1
Geekbench 5.5: Multi-Core | Single-Core
HWBOT x265 Benchmark v2.2: 4k Preset
LibreOffice : 20 Documents To PDF
R Benchmark 2.5: Overall mean
| CPU Performance rating | |
| Average Intel Core i9-13900HX | |
| Average of class Gaming | |
| Schenker XMG Pro 15 (E23) | |
| Alienware x16 R1 -1! | |
| Aorus 15X ASF | |
| Dell G15 5530 | |
| Asus ZenBook Pro 14 Duo UX8402VV-P1021W | |
| Schenker XMG Pro 15 (i7-12700H, RTX 3080 Ti) | |
| MSI Cyborg 15 A12VF | |
| Asus TUF A15 FA507 | |
| Cinebench R23 / Multi Core | |
| Average Intel Core i9-13900HX (24270 - 32623, n=23) | |
| Average of class Gaming (10488 - 40970, n=113, last 2 years) | |
| Schenker XMG Pro 15 (E23) | |
| Dell G15 5530 | |
| Aorus 15X ASF | |
| Alienware x16 R1 | |
| Asus ZenBook Pro 14 Duo UX8402VV-P1021W | |
| Schenker XMG Pro 15 (i7-12700H, RTX 3080 Ti) | |
| MSI Cyborg 15 A12VF | |
| Asus TUF A15 FA507 | |
| Cinebench R23 / Single Core | |
| Average Intel Core i9-13900HX (1867 - 2105, n=20) | |
| Average of class Gaming (1166 - 2356, n=113, last 2 years) | |
| Asus ZenBook Pro 14 Duo UX8402VV-P1021W | |
| Alienware x16 R1 | |
| Aorus 15X ASF | |
| Schenker XMG Pro 15 (E23) | |
| Dell G15 5530 | |
| Schenker XMG Pro 15 (i7-12700H, RTX 3080 Ti) | |
| MSI Cyborg 15 A12VF | |
| Asus TUF A15 FA507 | |
| Cinebench R20 / CPU (Multi Core) | |
| Average Intel Core i9-13900HX (9152 - 12541, n=21) | |
| Average of class Gaming (4029 - 16108, n=112, last 2 years) | |
| Schenker XMG Pro 15 (E23) | |
| Dell G15 5530 | |
| Aorus 15X ASF | |
| Alienware x16 R1 | |
| Asus ZenBook Pro 14 Duo UX8402VV-P1021W | |
| Schenker XMG Pro 15 (i7-12700H, RTX 3080 Ti) | |
| MSI Cyborg 15 A12VF | |
| Asus TUF A15 FA507 | |
| Cinebench R20 / CPU (Single Core) | |
| Average Intel Core i9-13900HX (722 - 810, n=21) | |
| Asus ZenBook Pro 14 Duo UX8402VV-P1021W | |
| Average of class Gaming (442 - 895, n=112, last 2 years) | |
| Alienware x16 R1 | |
| Aorus 15X ASF | |
| Schenker XMG Pro 15 (E23) | |
| Dell G15 5530 | |
| Schenker XMG Pro 15 (i7-12700H, RTX 3080 Ti) | |
| MSI Cyborg 15 A12VF | |
| Asus TUF A15 FA507 | |
| Cinebench R15 / CPU Multi 64Bit | |
| Average Intel Core i9-13900HX (3913 - 4970, n=22) | |
| Average of class Gaming (1578 - 6271, n=113, last 2 years) | |
| Schenker XMG Pro 15 (E23) | |
| Aorus 15X ASF | |
| Dell G15 5530 | |
| Alienware x16 R1 | |
| Asus ZenBook Pro 14 Duo UX8402VV-P1021W | |
| Schenker XMG Pro 15 (i7-12700H, RTX 3080 Ti) | |
| Asus TUF A15 FA507 | |
| MSI Cyborg 15 A12VF | |
| Cinebench R15 / CPU Single 64Bit | |
| Average of class Gaming (188.8 - 343, n=112, last 2 years) | |
| Average Intel Core i9-13900HX (247 - 304, n=22) | |
| Asus ZenBook Pro 14 Duo UX8402VV-P1021W | |
| Alienware x16 R1 | |
| Aorus 15X ASF | |
| Dell G15 5530 | |
| Schenker XMG Pro 15 (i7-12700H, RTX 3080 Ti) | |
| Asus TUF A15 FA507 | |
| Schenker XMG Pro 15 (E23) | |
| MSI Cyborg 15 A12VF | |
| Blender / v2.79 BMW27 CPU | |
| MSI Cyborg 15 A12VF | |
| Asus TUF A15 FA507 | |
| Schenker XMG Pro 15 (i7-12700H, RTX 3080 Ti) | |
| Asus ZenBook Pro 14 Duo UX8402VV-P1021W | |
| Aorus 15X ASF | |
| Dell G15 5530 | |
| Average of class Gaming (80 - 330, n=110, last 2 years) | |
| Schenker XMG Pro 15 (E23) | |
| Average Intel Core i9-13900HX (101 - 153, n=22) | |
| 7-Zip 18.03 / 7z b 4 | |
| Average Intel Core i9-13900HX (90675 - 127283, n=21) | |
| Schenker XMG Pro 15 (E23) | |
| Average of class Gaming (33491 - 148086, n=111, last 2 years) | |
| Dell G15 5530 | |
| Alienware x16 R1 | |
| Aorus 15X ASF | |
| Asus ZenBook Pro 14 Duo UX8402VV-P1021W | |
| Schenker XMG Pro 15 (i7-12700H, RTX 3080 Ti) | |
| Asus TUF A15 FA507 | |
| MSI Cyborg 15 A12VF | |
| 7-Zip 18.03 / 7z b 4 -mmt1 | |
| Average Intel Core i9-13900HX (6340 - 7177, n=21) | |
| Aorus 15X ASF | |
| Average of class Gaming (4199 - 7436, n=111, last 2 years) | |
| Schenker XMG Pro 15 (E23) | |
| Asus ZenBook Pro 14 Duo UX8402VV-P1021W | |
| Alienware x16 R1 | |
| Dell G15 5530 | |
| Asus TUF A15 FA507 | |
| Schenker XMG Pro 15 (i7-12700H, RTX 3080 Ti) | |
| MSI Cyborg 15 A12VF | |
| Geekbench 5.5 / Multi-Core | |
| Average Intel Core i9-13900HX (17614 - 21075, n=22) | |
| Schenker XMG Pro 15 (E23) | |
| Average of class Gaming (6460 - 27010, n=111, last 2 years) | |
| Aorus 15X ASF | |
| Alienware x16 R1 | |
| Dell G15 5530 | |
| Asus ZenBook Pro 14 Duo UX8402VV-P1021W | |
| Schenker XMG Pro 15 (i7-12700H, RTX 3080 Ti) | |
| MSI Cyborg 15 A12VF | |
| Asus TUF A15 FA507 | |
| Geekbench 5.5 / Single-Core | |
| Average of class Gaming (986 - 2474, n=111, last 2 years) | |
| Average Intel Core i9-13900HX (1345 - 2093, n=22) | |
| Alienware x16 R1 | |
| Asus ZenBook Pro 14 Duo UX8402VV-P1021W | |
| Aorus 15X ASF | |
| Dell G15 5530 | |
| Schenker XMG Pro 15 (E23) | |
| MSI Cyborg 15 A12VF | |
| Schenker XMG Pro 15 (i7-12700H, RTX 3080 Ti) | |
| Asus TUF A15 FA507 | |
| HWBOT x265 Benchmark v2.2 / 4k Preset | |
| Average Intel Core i9-13900HX (23.5 - 34.4, n=22) | |
| Average of class Gaming (11.5 - 44.3, n=111, last 2 years) | |
| Schenker XMG Pro 15 (E23) | |
| Dell G15 5530 | |
| Alienware x16 R1 | |
| Aorus 15X ASF | |
| Schenker XMG Pro 15 (i7-12700H, RTX 3080 Ti) | |
| Asus ZenBook Pro 14 Duo UX8402VV-P1021W | |
| Asus TUF A15 FA507 | |
| MSI Cyborg 15 A12VF | |
| MSI Cyborg 15 A12VF | |
| LibreOffice / 20 Documents To PDF | |
| Schenker XMG Pro 15 (E23) | |
| Asus TUF A15 FA507 | |
| Average of class Gaming (19 - 88.8, n=111, last 2 years) | |
| Schenker XMG Pro 15 (i7-12700H, RTX 3080 Ti) | |
| Dell G15 5530 | |
| Alienware x16 R1 | |
| Aorus 15X ASF | |
| Average Intel Core i9-13900HX (32.8 - 51.1, n=21) | |
| Asus ZenBook Pro 14 Duo UX8402VV-P1021W | |
| MSI Cyborg 15 A12VF | |
| R Benchmark 2.5 / Overall mean | |
| Asus TUF A15 FA507 | |
| MSI Cyborg 15 A12VF | |
| Schenker XMG Pro 15 (E23) | |
| Schenker XMG Pro 15 (i7-12700H, RTX 3080 Ti) | |
| Aorus 15X ASF | |
| Asus ZenBook Pro 14 Duo UX8402VV-P1021W | |
| Average of class Gaming (0.3439 - 0.759, n=112, last 2 years) | |
| Alienware x16 R1 | |
| Dell G15 5530 | |
| Average Intel Core i9-13900HX (0.375 - 0.4564, n=22) | |
* ... smaller is better
AIDA64: FP32 Ray-Trace | FPU Julia | CPU SHA3 | CPU Queen | FPU SinJulia | FPU Mandel | CPU AES | CPU ZLib | FP64 Ray-Trace | CPU PhotoWorxx
| Performance rating | |
| Average of class Gaming | |
| Average Intel Core i9-13900HX | |
| Schenker XMG Pro 15 (E23) | |
| Alienware x16 R1 | |
| Aorus 15X ASF | |
| Dell G15 5530 | |
| Asus TUF A15 FA507 | |
| Asus ZenBook Pro 14 Duo UX8402VV-P1021W | |
| MSI Cyborg 15 A12VF | |
| Schenker XMG Pro 15 (i7-12700H, RTX 3080 Ti) | |
| AIDA64 / FP32 Ray-Trace | |
| Average of class Gaming (10227 - 85542, n=110, last 2 years) | |
| Average Intel Core i9-13900HX (17589 - 27615, n=22) | |
| Alienware x16 R1 | |
| Dell G15 5530 | |
| Schenker XMG Pro 15 (E23) | |
| Aorus 15X ASF | |
| Asus TUF A15 FA507 | |
| Asus ZenBook Pro 14 Duo UX8402VV-P1021W | |
| MSI Cyborg 15 A12VF | |
| Schenker XMG Pro 15 (i7-12700H, RTX 3080 Ti) | |
| AIDA64 / FPU Julia | |
| Average of class Gaming (51376 - 238426, n=110, last 2 years) | |
| Average Intel Core i9-13900HX (88686 - 137015, n=22) | |
| Asus TUF A15 FA507 | |
| Schenker XMG Pro 15 (E23) | |
| Alienware x16 R1 | |
| Dell G15 5530 | |
| Aorus 15X ASF | |
| Asus ZenBook Pro 14 Duo UX8402VV-P1021W | |
| MSI Cyborg 15 A12VF | |
| Schenker XMG Pro 15 (i7-12700H, RTX 3080 Ti) | |
| AIDA64 / CPU SHA3 | |
| Average of class Gaming (2180 - 9817, n=110, last 2 years) | |
| Average Intel Core i9-13900HX (4362 - 7029, n=22) | |
| Schenker XMG Pro 15 (E23) | |
| Dell G15 5530 | |
| Alienware x16 R1 | |
| Aorus 15X ASF | |
| Asus TUF A15 FA507 | |
| Asus ZenBook Pro 14 Duo UX8402VV-P1021W | |
| MSI Cyborg 15 A12VF | |
| Schenker XMG Pro 15 (i7-12700H, RTX 3080 Ti) | |
| AIDA64 / CPU Queen | |
| Average Intel Core i9-13900HX (125644 - 141385, n=22) | |
| Schenker XMG Pro 15 (E23) | |
| Alienware x16 R1 | |
| Average of class Gaming (49785 - 173351, n=101, last 2 years) | |
| Aorus 15X ASF | |
| Asus ZenBook Pro 14 Duo UX8402VV-P1021W | |
| Dell G15 5530 | |
| Asus TUF A15 FA507 | |
| Schenker XMG Pro 15 (i7-12700H, RTX 3080 Ti) | |
| MSI Cyborg 15 A12VF | |
| AIDA64 / FPU SinJulia | |
| Average Intel Core i9-13900HX (12334 - 17179, n=22) | |
| Average of class Gaming (4424 - 33636, n=110, last 2 years) | |
| Asus TUF A15 FA507 | |
| Schenker XMG Pro 15 (E23) | |
| Aorus 15X ASF | |
| Alienware x16 R1 | |
| Dell G15 5530 | |
| Schenker XMG Pro 15 (i7-12700H, RTX 3080 Ti) | |
| Asus ZenBook Pro 14 Duo UX8402VV-P1021W | |
| MSI Cyborg 15 A12VF | |
| AIDA64 / FPU Mandel | |
| Average of class Gaming (25115 - 128721, n=110, last 2 years) | |
| Average Intel Core i9-13900HX (43850 - 69202, n=22) | |
| Asus TUF A15 FA507 | |
| Alienware x16 R1 | |
| Schenker XMG Pro 15 (E23) | |
| Dell G15 5530 | |
| Aorus 15X ASF | |
| Asus ZenBook Pro 14 Duo UX8402VV-P1021W | |
| MSI Cyborg 15 A12VF | |
| Schenker XMG Pro 15 (i7-12700H, RTX 3080 Ti) | |
| AIDA64 / CPU AES | |
| Aorus 15X ASF | |
| Average Intel Core i9-13900HX (89413 - 237881, n=22) | |
| Average of class Gaming (39258 - 247074, n=110, last 2 years) | |
| Schenker XMG Pro 15 (E23) | |
| Dell G15 5530 | |
| Alienware x16 R1 | |
| Asus TUF A15 FA507 | |
| MSI Cyborg 15 A12VF | |
| Asus ZenBook Pro 14 Duo UX8402VV-P1021W | |
| Schenker XMG Pro 15 (i7-12700H, RTX 3080 Ti) | |
| AIDA64 / CPU ZLib | |
| Average Intel Core i9-13900HX (1284 - 1958, n=22) | |
| Average of class Gaming (574 - 2531, n=110, last 2 years) | |
| Schenker XMG Pro 15 (E23) | |
| Dell G15 5530 | |
| Alienware x16 R1 | |
| Aorus 15X ASF | |
| Schenker XMG Pro 15 (i7-12700H, RTX 3080 Ti) | |
| MSI Cyborg 15 A12VF | |
| Asus ZenBook Pro 14 Duo UX8402VV-P1021W | |
| Asus TUF A15 FA507 | |
| AIDA64 / FP64 Ray-Trace | |
| Average of class Gaming (5509 - 45446, n=110, last 2 years) | |
| Average Intel Core i9-13900HX (9481 - 15279, n=22) | |
| Alienware x16 R1 | |
| Dell G15 5530 | |
| Schenker XMG Pro 15 (E23) | |
| Aorus 15X ASF | |
| Asus TUF A15 FA507 | |
| Asus ZenBook Pro 14 Duo UX8402VV-P1021W | |
| MSI Cyborg 15 A12VF | |
| Schenker XMG Pro 15 (i7-12700H, RTX 3080 Ti) | |
| AIDA64 / CPU PhotoWorxx | |
| Schenker XMG Pro 15 (E23) | |
| Alienware x16 R1 | |
| Average Intel Core i9-13900HX (42994 - 51994, n=22) | |
| Average of class Gaming (12271 - 89891, n=110, last 2 years) | |
| Asus ZenBook Pro 14 Duo UX8402VV-P1021W | |
| Dell G15 5530 | |
| MSI Cyborg 15 A12VF | |
| Aorus 15X ASF | |
| Schenker XMG Pro 15 (i7-12700H, RTX 3080 Ti) | |
| Asus TUF A15 FA507 | |
System performance
In the area of system performance, the review device also turned in strong numbers and even outperformed the Aorus 15X ASF despite sharing similar TDP and TGP values. In PCMark 10, the XMG Pro 15 is only a few points behind the slim Asus ZenBook Pro 14 Duo which shows that a powerful gaming laptop doesn't always have to be a heavy gaming laptop.
CrossMark: Overall | Productivity | Creativity | Responsiveness
| PCMark 10 / Score | |
| Alienware x16 R1 | |
| Average of class Gaming (5828 - 11574, n=96, last 2 years) | |
| Asus ZenBook Pro 14 Duo UX8402VV-P1021W | |
| Schenker XMG Pro 15 (E23) | |
| Average Intel Core i9-13900HX, NVIDIA GeForce RTX 4060 Laptop GPU (n=1) | |
| Asus TUF A15 FA507 | |
| Aorus 15X ASF | |
| MSI Cyborg 15 A12VF | |
| Dell G15 5530 | |
| Schenker XMG Pro 15 (i7-12700H, RTX 3080 Ti) | |
| PCMark 10 / Essentials | |
| Schenker XMG Pro 15 (E23) | |
| Average Intel Core i9-13900HX, NVIDIA GeForce RTX 4060 Laptop GPU (n=1) | |
| Asus ZenBook Pro 14 Duo UX8402VV-P1021W | |
| Alienware x16 R1 | |
| Dell G15 5530 | |
| Schenker XMG Pro 15 (i7-12700H, RTX 3080 Ti) | |
| Aorus 15X ASF | |
| MSI Cyborg 15 A12VF | |
| Average of class Gaming (8810 - 12600, n=100, last 2 years) | |
| Asus TUF A15 FA507 | |
| PCMark 10 / Productivity | |
| Average of class Gaming (6845 - 18766, n=98, last 2 years) | |
| Schenker XMG Pro 15 (E23) | |
| Average Intel Core i9-13900HX, NVIDIA GeForce RTX 4060 Laptop GPU (n=1) | |
| Dell G15 5530 | |
| MSI Cyborg 15 A12VF | |
| Alienware x16 R1 | |
| Asus ZenBook Pro 14 Duo UX8402VV-P1021W | |
| Aorus 15X ASF | |
| Asus TUF A15 FA507 | |
| Schenker XMG Pro 15 (i7-12700H, RTX 3080 Ti) | |
| PCMark 10 / Digital Content Creation | |
| Alienware x16 R1 | |
| Average of class Gaming (7602 - 19657, n=98, last 2 years) | |
| Asus ZenBook Pro 14 Duo UX8402VV-P1021W | |
| Asus TUF A15 FA507 | |
| Aorus 15X ASF | |
| Schenker XMG Pro 15 (E23) | |
| Average Intel Core i9-13900HX, NVIDIA GeForce RTX 4060 Laptop GPU (n=1) | |
| MSI Cyborg 15 A12VF | |
| Schenker XMG Pro 15 (i7-12700H, RTX 3080 Ti) | |
| Dell G15 5530 | |
| CrossMark / Overall | |
| Aorus 15X ASF | |
| Average of class Gaming (1366 - 2409, n=98, last 2 years) | |
| Schenker XMG Pro 15 (E23) | |
| Average Intel Core i9-13900HX, NVIDIA GeForce RTX 4060 Laptop GPU (n=1) | |
| Alienware x16 R1 | |
| Asus ZenBook Pro 14 Duo UX8402VV-P1021W | |
| Dell G15 5530 | |
| MSI Cyborg 15 A12VF | |
| Asus TUF A15 FA507 | |
| CrossMark / Productivity | |
| Aorus 15X ASF | |
| Average of class Gaming (1386 - 2254, n=98, last 2 years) | |
| Alienware x16 R1 | |
| Schenker XMG Pro 15 (E23) | |
| Average Intel Core i9-13900HX, NVIDIA GeForce RTX 4060 Laptop GPU (n=1) | |
| Asus ZenBook Pro 14 Duo UX8402VV-P1021W | |
| Dell G15 5530 | |
| MSI Cyborg 15 A12VF | |
| Asus TUF A15 FA507 | |
| CrossMark / Creativity | |
| Average of class Gaming (1343 - 2729, n=98, last 2 years) | |
| Schenker XMG Pro 15 (E23) | |
| Average Intel Core i9-13900HX, NVIDIA GeForce RTX 4060 Laptop GPU (n=1) | |
| Aorus 15X ASF | |
| Asus ZenBook Pro 14 Duo UX8402VV-P1021W | |
| Dell G15 5530 | |
| Alienware x16 R1 | |
| MSI Cyborg 15 A12VF | |
| Asus TUF A15 FA507 | |
| CrossMark / Responsiveness | |
| Aorus 15X ASF | |
| Alienware x16 R1 | |
| Schenker XMG Pro 15 (E23) | |
| Average Intel Core i9-13900HX, NVIDIA GeForce RTX 4060 Laptop GPU (n=1) | |
| Average of class Gaming (1226 - 2334, n=98, last 2 years) | |
| MSI Cyborg 15 A12VF | |
| Asus ZenBook Pro 14 Duo UX8402VV-P1021W | |
| Dell G15 5530 | |
| Asus TUF A15 FA507 | |
| PCMark 10 Score | 7521 points | |
Help | ||
| AIDA64 / Memory Copy | |
| Schenker XMG Pro 15 (E23) | |
| Average Intel Core i9-13900HX (67716 - 79193, n=22) | |
| Alienware x16 R1 | |
| Average of class Gaming (21750 - 129946, n=110, last 2 years) | |
| Asus ZenBook Pro 14 Duo UX8402VV-P1021W | |
| Dell G15 5530 | |
| Aorus 15X ASF | |
| MSI Cyborg 15 A12VF | |
| Asus TUF A15 FA507 | |
| Schenker XMG Pro 15 (i7-12700H, RTX 3080 Ti) | |
| AIDA64 / Memory Read | |
| Schenker XMG Pro 15 (E23) | |
| Average Intel Core i9-13900HX (73998 - 88462, n=22) | |
| Average of class Gaming (22956 - 118858, n=110, last 2 years) | |
| Dell G15 5530 | |
| Alienware x16 R1 | |
| Aorus 15X ASF | |
| MSI Cyborg 15 A12VF | |
| Asus ZenBook Pro 14 Duo UX8402VV-P1021W | |
| Asus TUF A15 FA507 | |
| Schenker XMG Pro 15 (i7-12700H, RTX 3080 Ti) | |
| AIDA64 / Memory Write | |
| Alienware x16 R1 | |
| Average of class Gaming (22297 - 135096, n=110, last 2 years) | |
| Schenker XMG Pro 15 (E23) | |
| Average Intel Core i9-13900HX (65472 - 77045, n=22) | |
| Asus ZenBook Pro 14 Duo UX8402VV-P1021W | |
| Dell G15 5530 | |
| MSI Cyborg 15 A12VF | |
| Aorus 15X ASF | |
| Asus TUF A15 FA507 | |
| Schenker XMG Pro 15 (i7-12700H, RTX 3080 Ti) | |
| AIDA64 / Memory Latency | |
| Average of class Gaming (75.3 - 259, n=110, last 2 years) | |
| Alienware x16 R1 | |
| Asus ZenBook Pro 14 Duo UX8402VV-P1021W | |
| MSI Cyborg 15 A12VF | |
| Dell G15 5530 | |
| Aorus 15X ASF | |
| Average Intel Core i9-13900HX (75.3 - 91.1, n=22) | |
| Schenker XMG Pro 15 (E23) | |
| Asus TUF A15 FA507 | |
* ... smaller is better
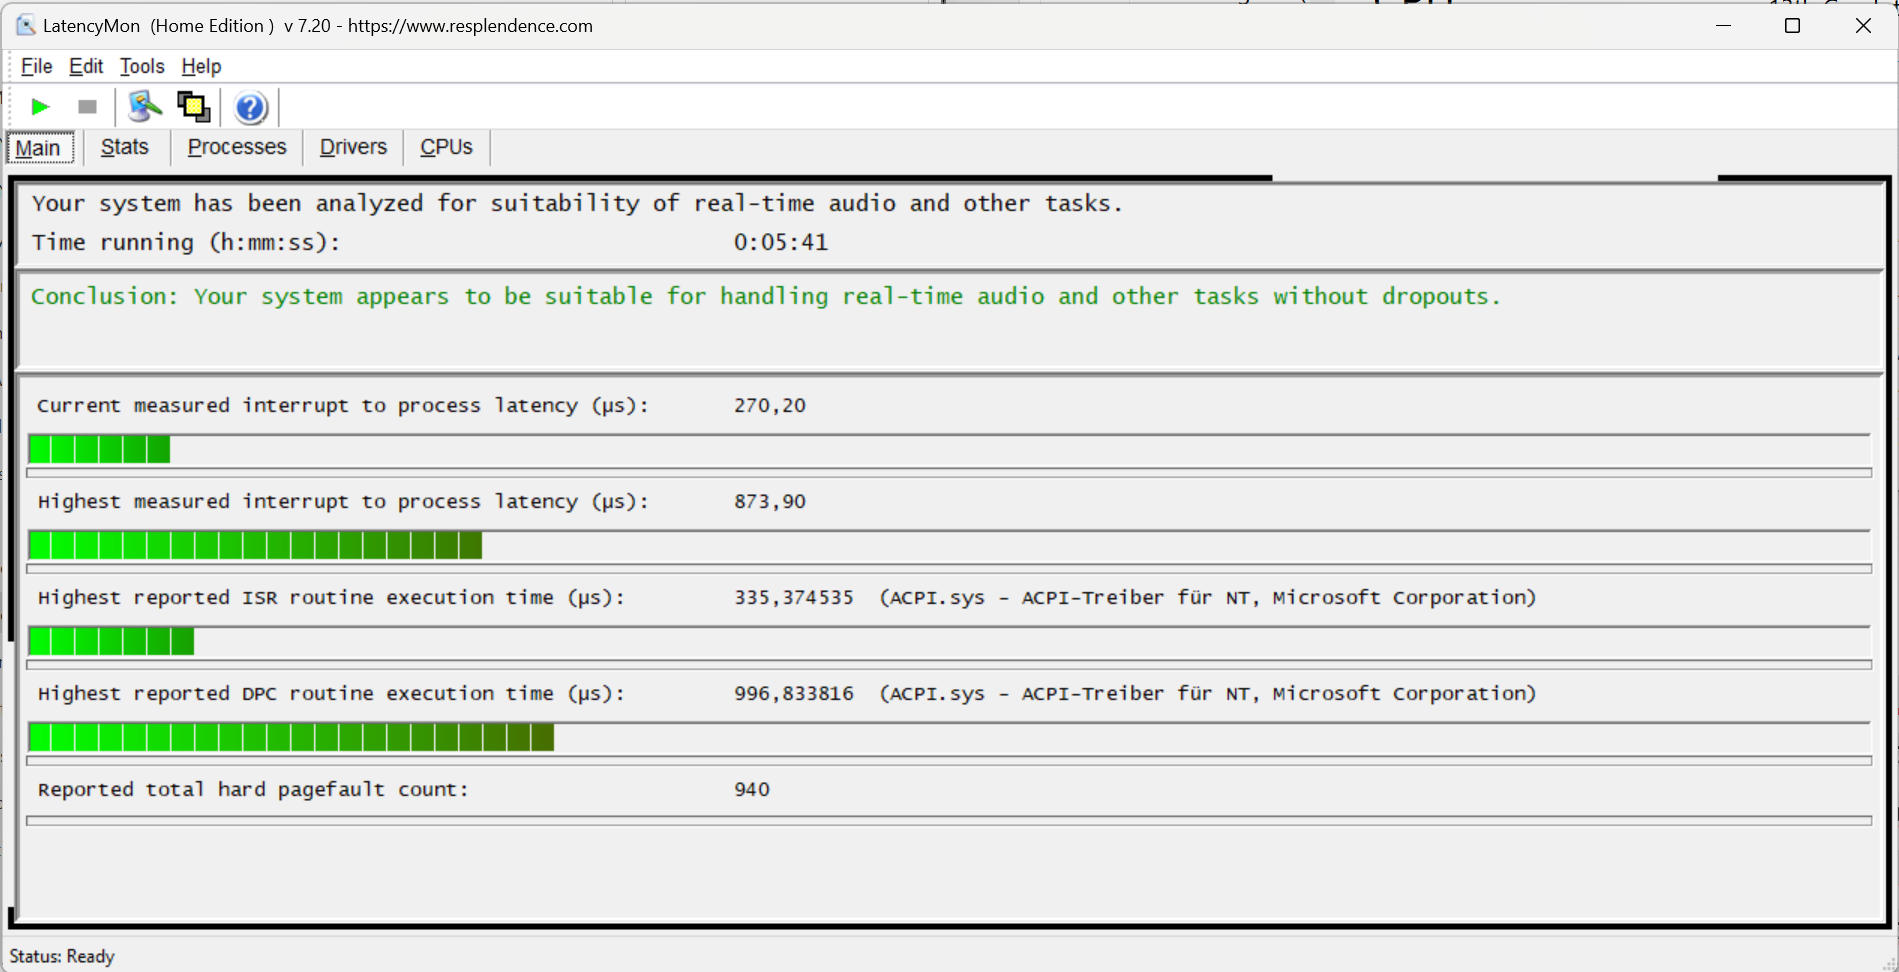
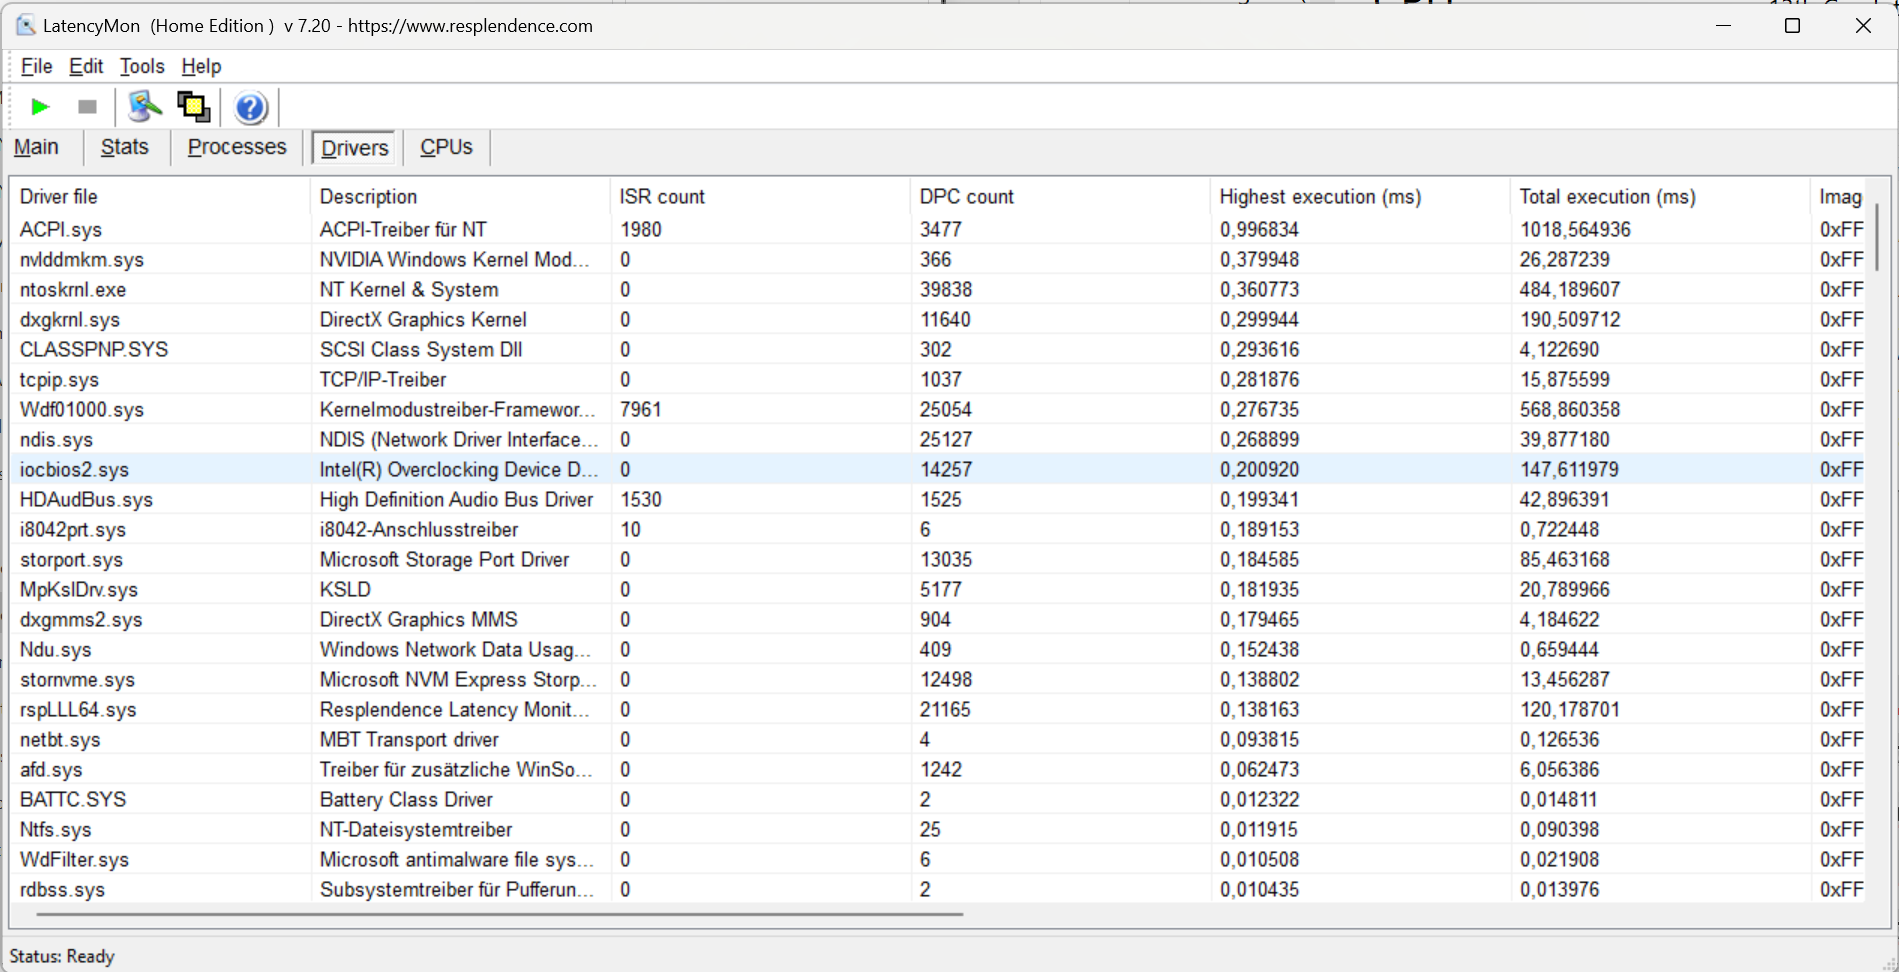
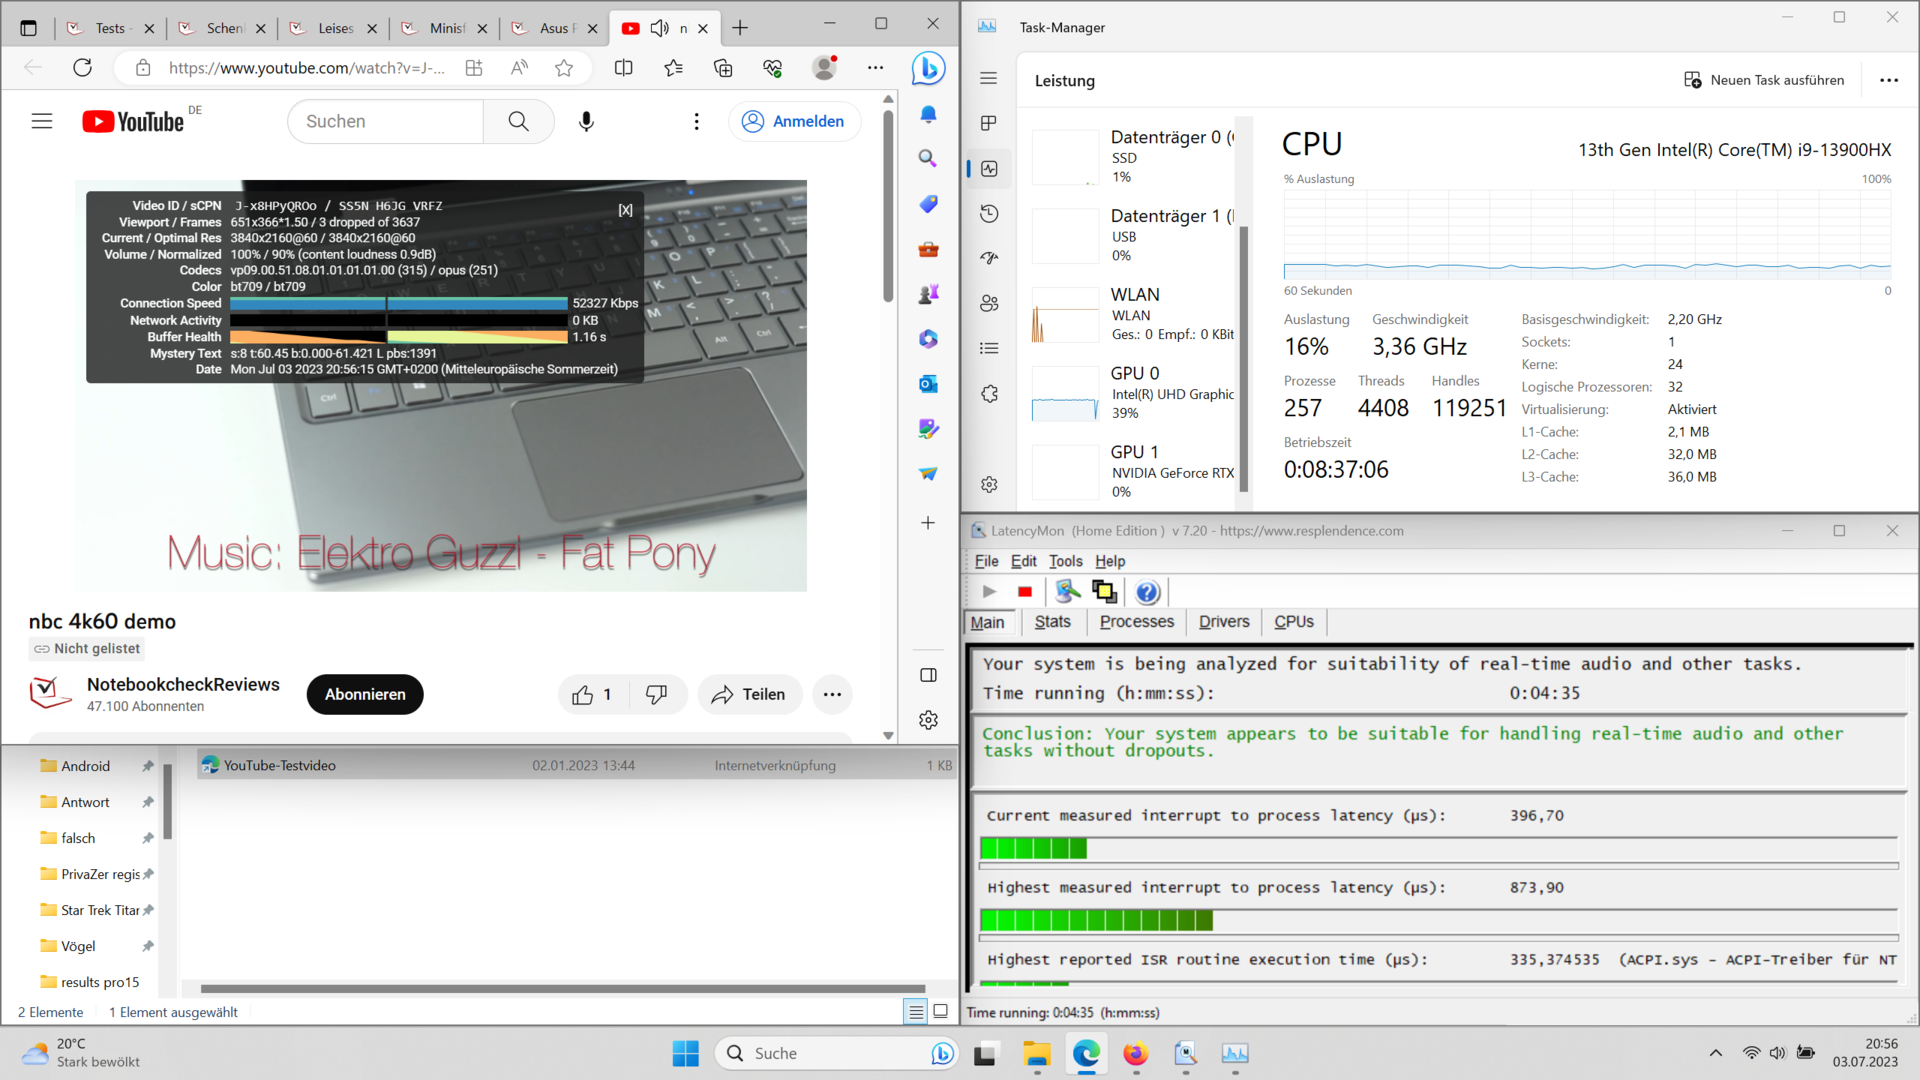
DPC latencies
In this area, it's noticeable that the interaction problems between the Nvidia drivers and other drivers have, in the meantime, been overcome. In this laptop, at the time of testing, the DPC latencies sit at a low level with current drivers and firmware.
| DPC Latencies / LatencyMon - interrupt to process latency (max), Web, Youtube, Prime95 | |
| Dell G15 5530 | |
| Aorus 15X ASF | |
| Schenker XMG Pro 15 (i7-12700H, RTX 3080 Ti) | |
| Alienware x16 R1 | |
| MSI Cyborg 15 A12VF | |
| Asus ZenBook Pro 14 Duo UX8402VV-P1021W | |
| Schenker XMG Pro 15 (E23) | |
* ... smaller is better
Mass storage
Of all the NVMe SSDs Schenker offers for the XMG Pro 15, the Crucial P5 Plus is probably not the fastest option. However, in tests, it delivered returned good values which it maintained over longer periods of time. In the DiskSpd loop, we only observed minimal throttling after quite a few runs.

* ... smaller is better
Continuous Performance Read: DiskSpd Read Loop, Queue Depth 8
Graphics card
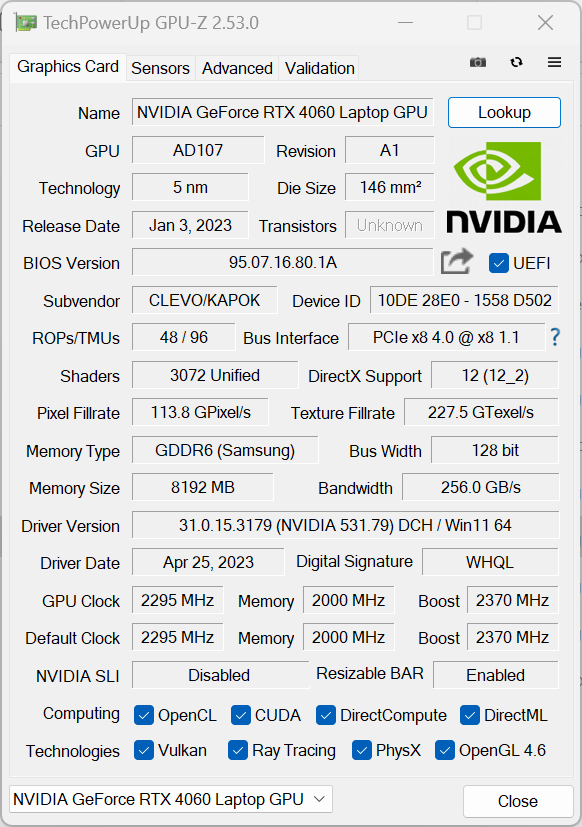
Now we come to our review's core question. Can the Nvidia GeForce RTX 4060 in our review device keep up with the predecessor's RTX 3080 Ti? The honest answer to this question is a clear yes and no. Depending on the benchmark, you will have to reckon with 10 % to 20 % less performance. When gaming, the difference in performance between the current XMG Pro 15 and the predecessor rather depends on the game. While something like The Witcher 3 profits from the 4060's higher clock speed and achieves higher frame rates, in GTA V, the Pro 15 E23 lags somewhat behind its predecessor. However, the XMG Pro 15 can also be configured with an RTX 4070. The Aorus 15X ASF shows that the difference in performance between an RTX 3080 Ti and an RTX 4070 is very low - in every situation. Since the Aorus and XMG Pro 15 operate with almost identical TDP and TGP values, this indicates the possible performance to be expected in the XMG Pro 15 with an RTX 4070.
| 3DMark 11 Performance | 29518 points | |
| 3DMark Ice Storm Standard Score | 146918 points | |
| 3DMark Cloud Gate Standard Score | 54429 points | |
| 3DMark Fire Strike Score | 23131 points | |
| 3DMark Time Spy Score | 10776 points | |
Help | ||
* ... smaller is better
| The Witcher 3 - 1920x1080 Ultra Graphics & Postprocessing (HBAO+) | |
| Average of class Gaming (95 - 240, n=8, last 2 years) | |
| Alienware x16 R1 | |
| Schenker XMG Pro 15 (E23) | |
| Asus ZenBook Pro 14 Duo UX8402VV-P1021W | |
| Schenker XMG Pro 15 (i7-12700H, RTX 3080 Ti) | |
| Aorus 15X ASF | |
| Dell G15 5530 | |
| Asus TUF A15 FA507 | |
| MSI Cyborg 15 A12VF | |
| Final Fantasy XV Benchmark - 1920x1080 High Quality | |
| Alienware x16 R1 | |
| Average of class Gaming (41 - 215, n=104, last 2 years) | |
| Aorus 15X ASF | |
| Schenker XMG Pro 15 (i7-12700H, RTX 3080 Ti) | |
| Dell G15 5530 | |
| Asus ZenBook Pro 14 Duo UX8402VV-P1021W | |
| Asus TUF A15 FA507 | |
| MSI Cyborg 15 A12VF | |
| Hogwarts Legacy | |
| 2560x1440 Ultra Preset AA:High T | |
| Average of class Gaming (52 - 96.8, n=2, last 2 years) | |
| Schenker XMG Pro 15 (E23) | |
| Average NVIDIA GeForce RTX 4060 Laptop GPU (42.8 - 45, n=4) | |
| 1920x1080 Ultra Preset AA:High T | |
| Average of class Gaming (76 - 108.3, n=2, last 2 years) | |
| Average NVIDIA GeForce RTX 4060 Laptop GPU (61.9 - 91.9, n=6) | |
| Schenker XMG Pro 15 (E23) | |
| MSI Cyborg 15 A12VF | |
| Asus TUF A15 FA507 | |
| 1920x1080 High Preset AA:High T | |
| Asus TUF A15 FA507 | |
| Average of class Gaming (n=1last 2 years) | |
| Average NVIDIA GeForce RTX 4060 Laptop GPU (70.8 - 107.7, n=6) | |
| MSI Cyborg 15 A12VF | |
| Schenker XMG Pro 15 (E23) | |
| low | med. | high | ultra | QHD | 4K | |
|---|---|---|---|---|---|---|
| GTA V (2015) | 184.5 | 178.9 | 170.6 | 107.2 | 87 | |
| The Witcher 3 (2015) | 112 | 159.7 | ||||
| Dota 2 Reborn (2015) | 210 | 182.9 | 176.1 | 154.3 | 126.4 | |
| X-Plane 11.11 (2018) | 154.9 | 135.9 | 111 | 102 | ||
| Strange Brigade (2018) | 377 | 267 | 213 | 183.3 | 127.5 | |
| Shadow of the Tomb Raider (2018) | 142 | 94 | ||||
| Cyberpunk 2077 1.6 (2022) | 80.6 | 48.56 | ||||
| Tiny Tina's Wonderlands (2022) | 89.29 | 60.01 | ||||
| F1 22 (2022) | 245 | 235 | 179.8 | 66.4 | 43 | |
| Call of Duty Modern Warfare 2 2022 (2022) | 91 | 66 | ||||
| Hogwarts Legacy (2023) | 90.4 | 70.8 | 64 | 44.4 |
Emissions & energy - quiet speakers and loud fans
Noise emissions

Unfortunately, in tests, the XMG Pro 15 proved itself to be very loud. Using activated performance mode under full load and at a distance of 15 centimeters, we measured a whole 53 dB(A) in Prime95 and Furmark. The fans have other tricks up their sleeves though. Our experience shows that the entertainment mode also offers enough performance for many games. This significantly reduces the noise level emitted from the laptop. In normal use without 3D applications, you can even expect very quiet to silent operation. This, at least, helps it have its nose a little in front compared to the predecessor.
Noise level
| Idle |
| 24 / 24 / 24 dB(A) |
| Load |
| 53.65 / 53.65 dB(A) |
 | ||
30 dB silent 40 dB(A) audible 50 dB(A) loud |
||
min: | ||
| Schenker XMG Pro 15 (E23) GeForce RTX 4060 Laptop GPU, i9-13900HX, Crucial P5 Plus 1TB CT1000P5PSSD8 | Schenker XMG Pro 15 (i7-12700H, RTX 3080 Ti) GeForce RTX 3080 Ti Laptop GPU, i7-12700H, Samsung SSD 980 Pro 1TB MZ-V8P1T0BW | Dell G15 5530 GeForce RTX 4060 Laptop GPU, i7-13650HX, SSTC CL4-3D512-Q11 | Asus TUF A15 FA507 GeForce RTX 4050 Laptop GPU, R7 7735HS, Micron 2400 MTFDKBA512QFM | Aorus 15X ASF GeForce RTX 4070 Laptop GPU, i7-13700HX, Gigabyte AG470S1TB-SI B10 | Asus ZenBook Pro 14 Duo UX8402VV-P1021W GeForce RTX 4060 Laptop GPU, i9-13900H, Samsung PM9A1 MZVL22T0HBLB | MSI Cyborg 15 A12VF GeForce RTX 4060 Laptop GPU, i7-12650H, Samsung PM9B1 1024GB MZVL41T0HBLB | Alienware x16 R1 GeForce RTX 4080 Laptop GPU, i9-13900HK, SK hynix PC801 HFS001TEJ9X101N | |
|---|---|---|---|---|---|---|---|---|
| Noise | -11% | 7% | 14% | -13% | -13% | -25% | 4% | |
| off / environment * (dB) | 24 | 23 4% | 20.41 15% | 23.3 3% | 25 -4% | 25.2 -5% | 27 -13% | 22.7 5% |
| Idle Minimum * (dB) | 24 | 23 4% | 26.85 -12% | 23.3 3% | 28 -17% | 25.2 -5% | 27 -13% | 23.1 4% |
| Idle Average * (dB) | 24 | 31.22 -30% | 26.85 -12% | 23.3 3% | 29 -21% | 25.2 -5% | 37.5 -56% | 25.8 -8% |
| Idle Maximum * (dB) | 24 | 33.09 -38% | 26.85 -12% | 23.3 3% | 36 -50% | 32.5 -35% | 38 -58% | 25.8 -8% |
| Load Average * (dB) | 53.65 | 56.35 -5% | 27.65 48% | 29.6 45% | 50 7% | 59.7 -11% | 56.3 -5% | 39.3 27% |
| Witcher 3 ultra * (dB) | 53.53 | 56.89 -6% | 47.9 11% | 43 20% | 54 -1% | 49.9 7% | ||
| Load Maximum * (dB) | 53.65 | 56.89 -6% | 47.86 11% | 43 20% | 58 -8% | 60.9 -14% | 56.3 -5% | 54.8 -2% |
* ... smaller is better
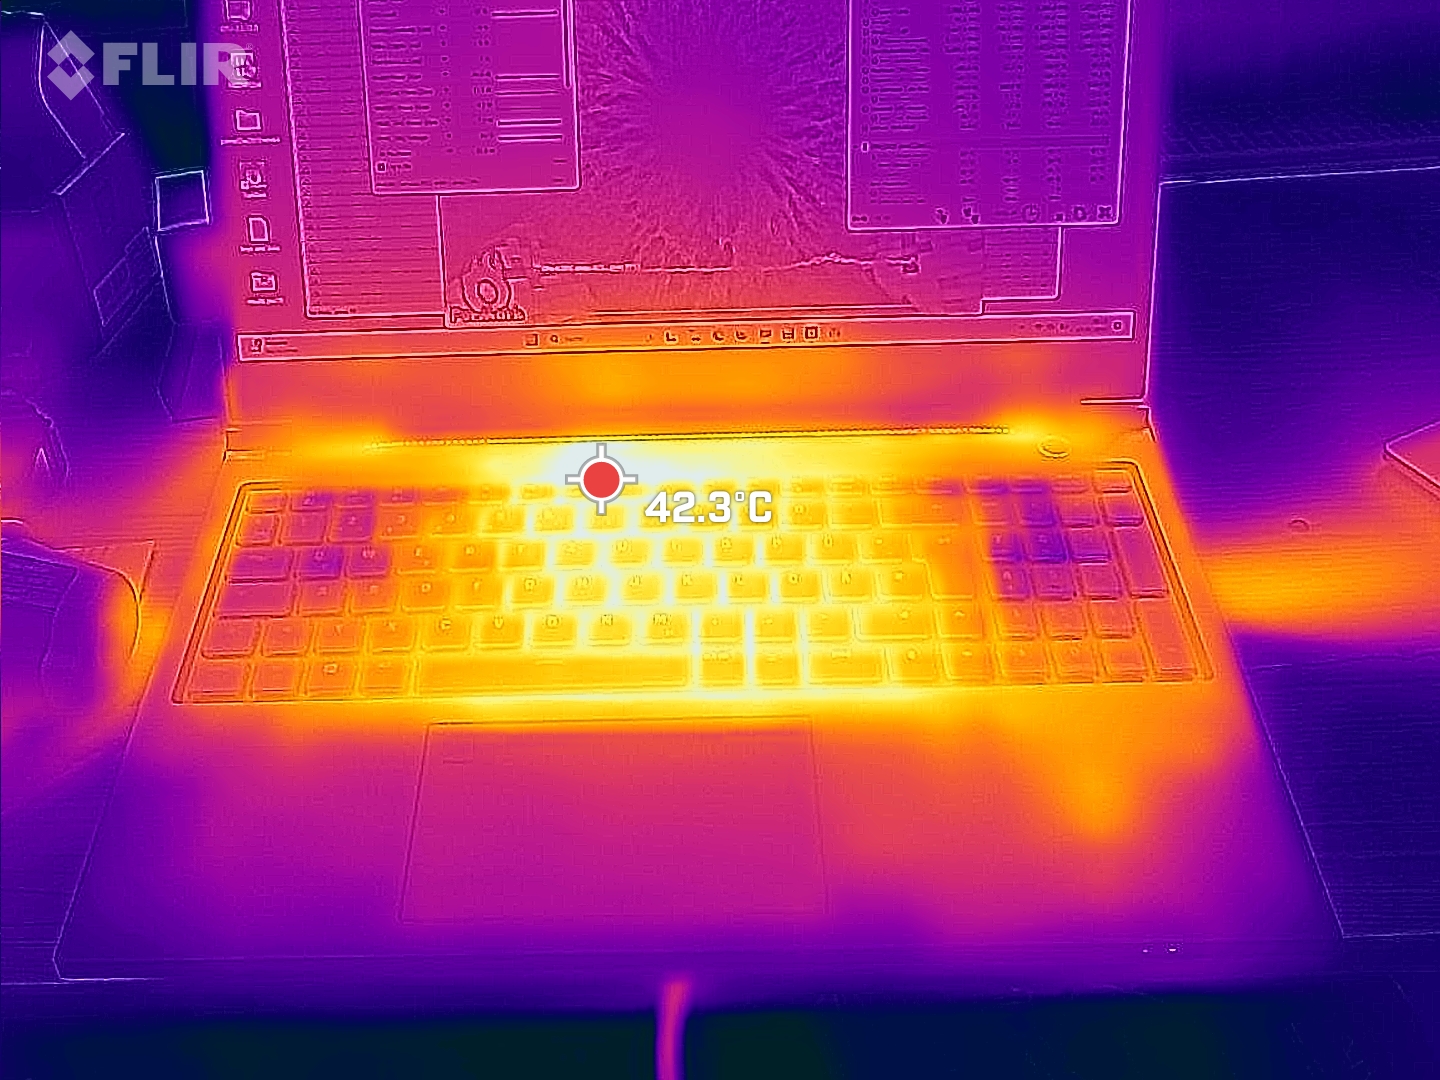
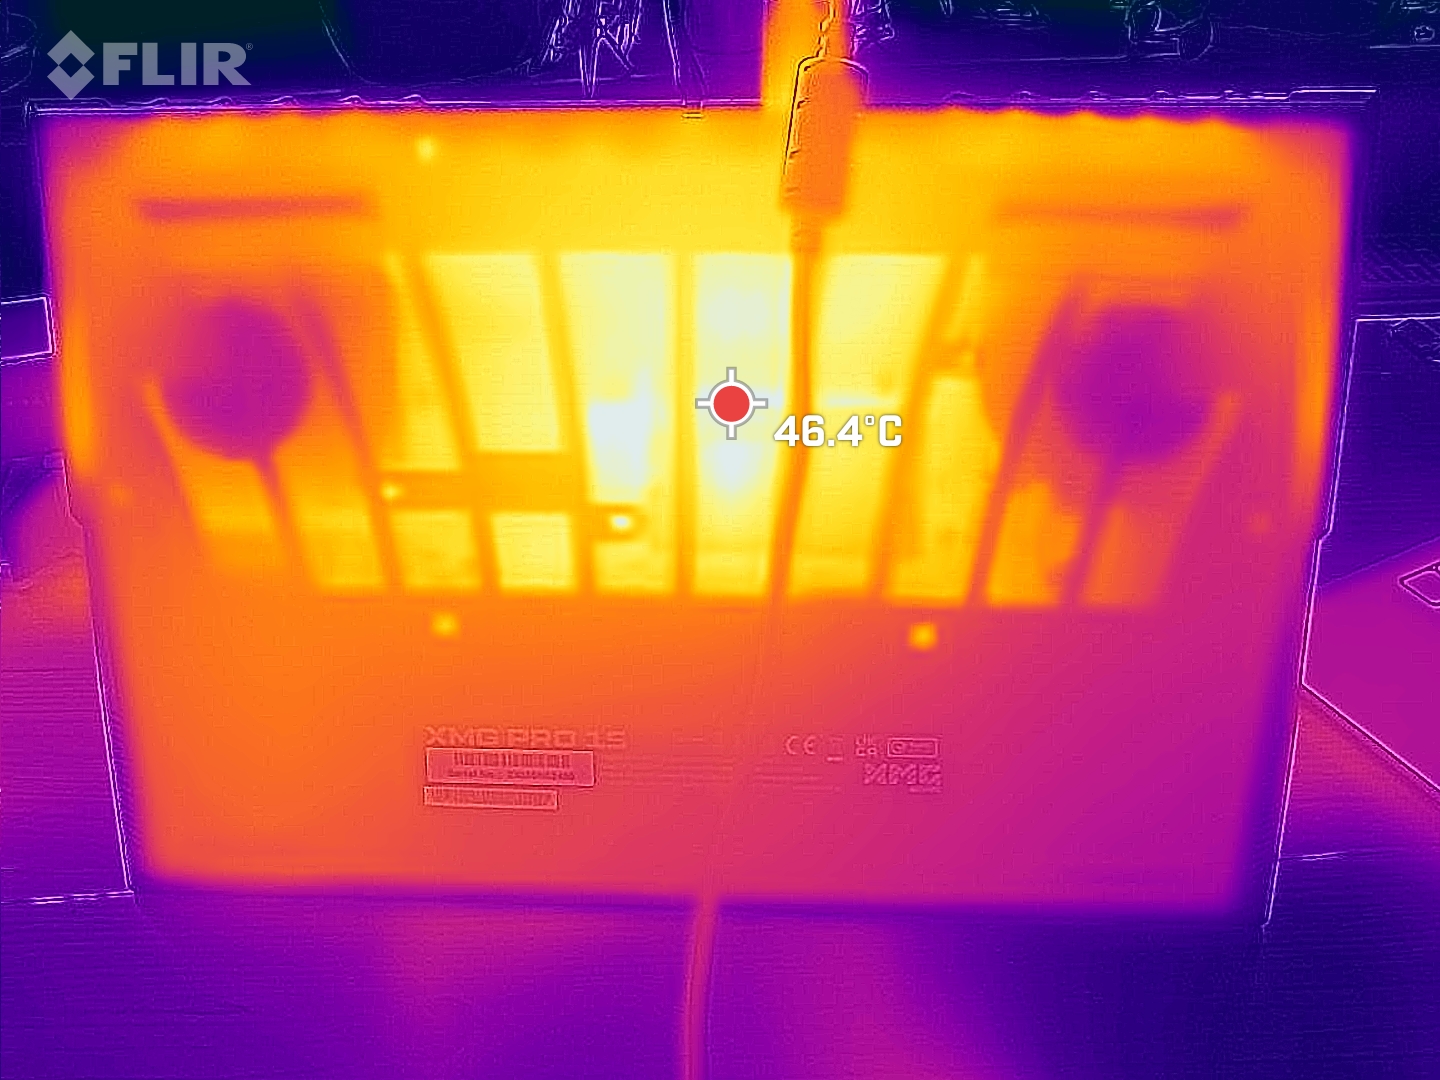
Temperature
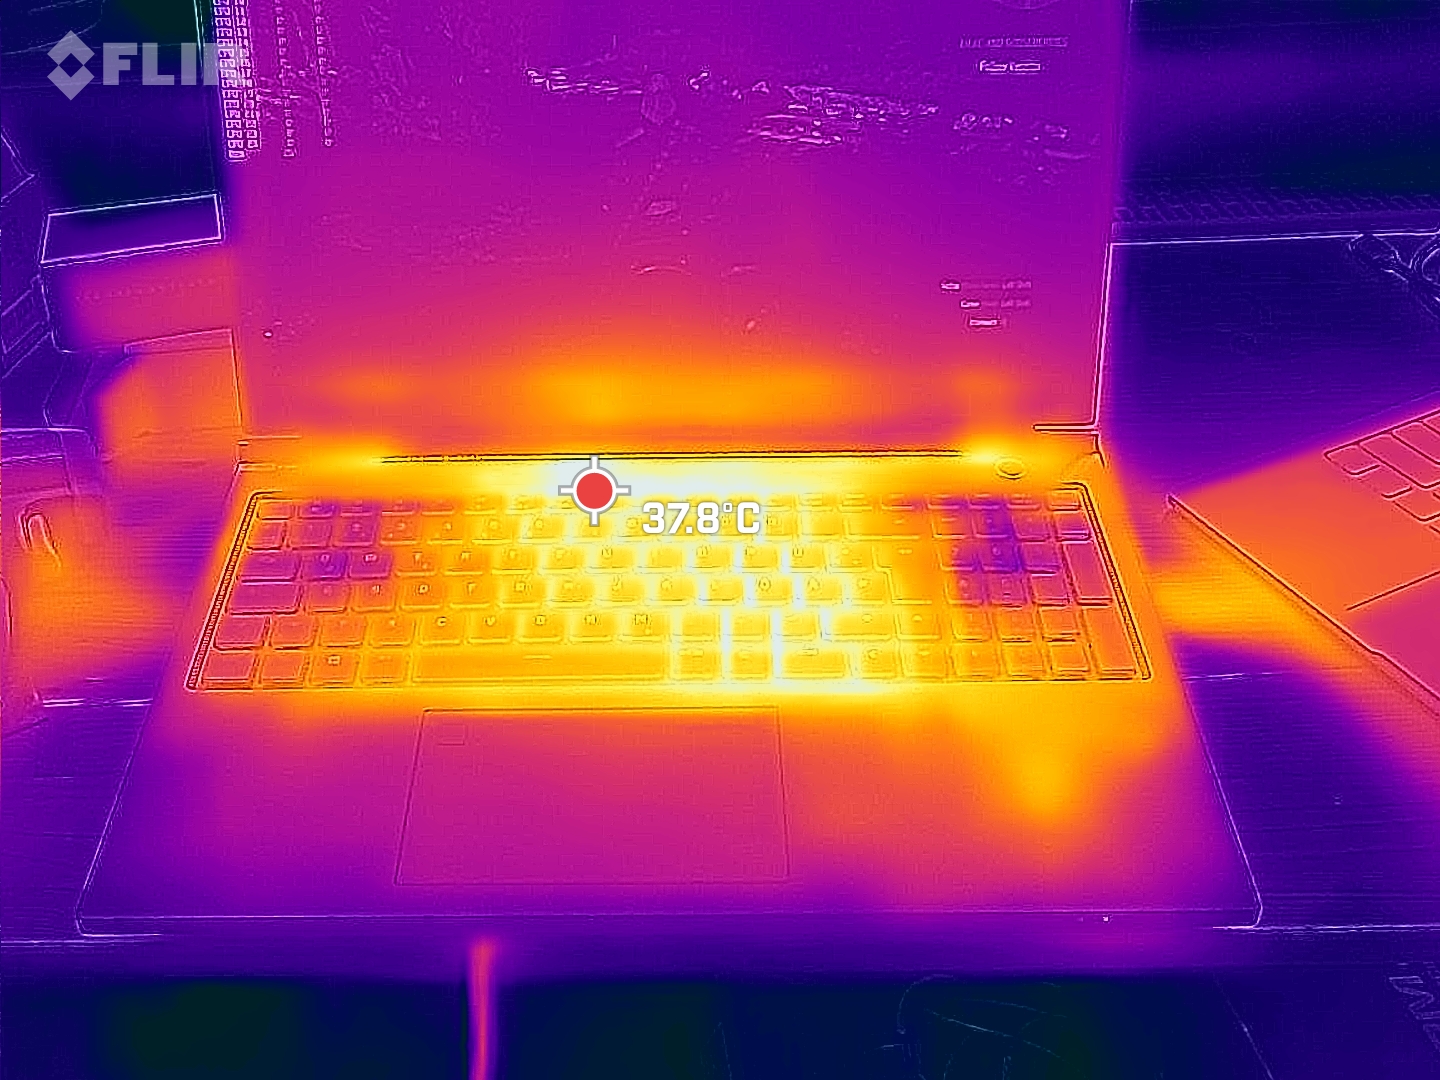
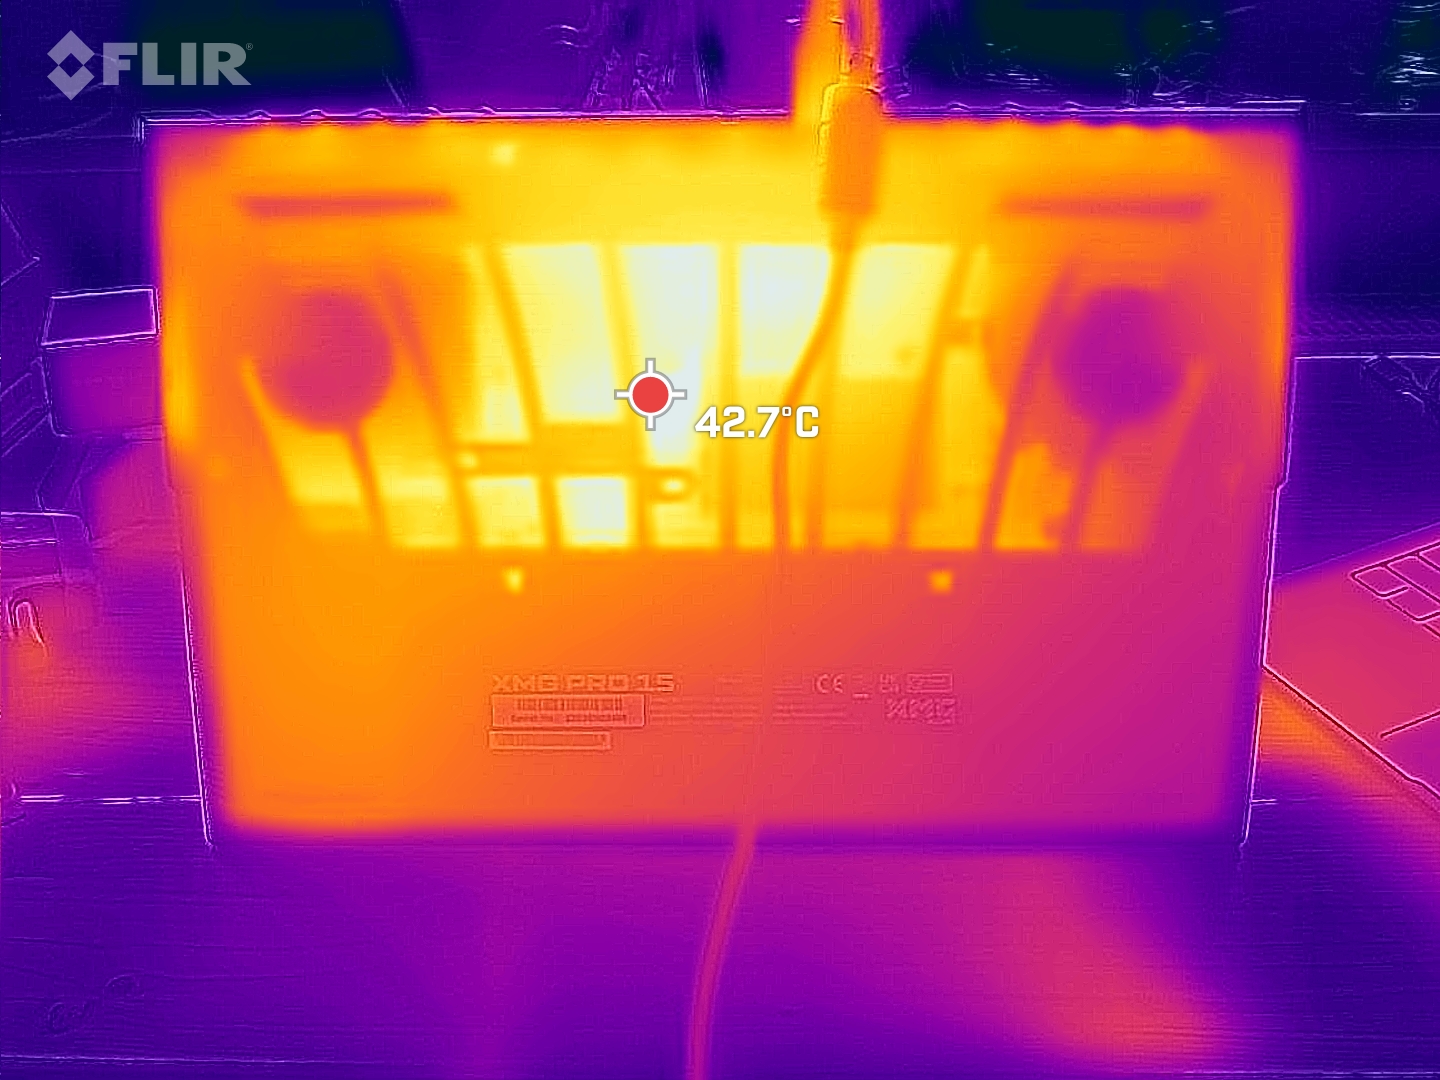
With surface temperatures of up to 50 °C in the stress test, the XMG Pro 15 is considerably warmer than many of its competitors. However, for one thing, we're only talking about relatively small hotspots, and secondly, the base unit's surface is made of plastic. On contact, this makes the high temperatures appear significantly lower. When gaming it would be wrong to describe the keyboard as cool but it doesn't, however, feel unpleasantly warm. The laptop's performance is also not throttled over time.
(-) The maximum temperature on the upper side is 50 °C / 122 F, compared to the average of 40.4 °C / 105 F, ranging from 21.2 to 68.8 °C for the class Gaming.
(-) The bottom heats up to a maximum of 50 °C / 122 F, compared to the average of 43.2 °C / 110 F
(+) In idle usage, the average temperature for the upper side is 28.7 °C / 84 F, compared to the device average of 33.9 °C / 93 F.
(±) Playing The Witcher 3, the average temperature for the upper side is 35.6 °C / 96 F, compared to the device average of 33.9 °C / 93 F.
(+) The palmrests and touchpad are reaching skin temperature as a maximum (34 °C / 93.2 F) and are therefore not hot.
(-) The average temperature of the palmrest area of similar devices was 28.8 °C / 83.8 F (-5.2 °C / -9.4 F).
| Schenker XMG Pro 15 (E23) Intel Core i9-13900HX, NVIDIA GeForce RTX 4060 Laptop GPU | Schenker XMG Pro 15 (i7-12700H, RTX 3080 Ti) Intel Core i7-12700H, NVIDIA GeForce RTX 3080 Ti Laptop GPU | Dell G15 5530 Intel Core i7-13650HX, NVIDIA GeForce RTX 4060 Laptop GPU | Asus TUF A15 FA507 AMD Ryzen 7 7735HS, NVIDIA GeForce RTX 4050 Laptop GPU | Aorus 15X ASF Intel Core i7-13700HX, NVIDIA GeForce RTX 4070 Laptop GPU | Asus ZenBook Pro 14 Duo UX8402VV-P1021W Intel Core i9-13900H, NVIDIA GeForce RTX 4060 Laptop GPU | MSI Cyborg 15 A12VF Intel Core i7-12650H, NVIDIA GeForce RTX 4060 Laptop GPU | Alienware x16 R1 Intel Core i9-13900HK, NVIDIA GeForce RTX 4080 Laptop GPU | |
|---|---|---|---|---|---|---|---|---|
| Heat | -5% | -9% | 11% | 13% | 9% | 15% | -4% | |
| Maximum Upper Side * (°C) | 50 | 57 -14% | 54 -8% | 48.9 2% | 42 16% | 37.1 26% | 47.5 5% | 47.2 6% |
| Maximum Bottom * (°C) | 50 | 52 -4% | 62.2 -24% | 44.6 11% | 51 -2% | 49.4 1% | 35.5 29% | 47.8 4% |
| Idle Upper Side * (°C) | 33 | 32 3% | 33.4 -1% | 27.1 18% | 27 18% | 30 9% | 27.7 16% | 36.8 -12% |
| Idle Bottom * (°C) | 32 | 34 -6% | 33.4 -4% | 27.5 14% | 26 19% | 32.4 -1% | 29.5 8% | 35.8 -12% |
* ... smaller is better
Speakers
The average perceived volume of the XMG Pro 15's two speakers sits at only 72.5 dB(A). Many frequency ranges are significantly below the fan's volume under load. As a result, when gaming, a headset or external speakers are a must. These can be connected via the 3.5 mm headphone jack, Bluetooth or optical S/PDIF via the 3.5 mm connector. Using this method, it's also possible to connect a Surround Sound system directly to the computer.
Schenker XMG Pro 15 (E23) audio analysis
(±) | speaker loudness is average but good (72.52 dB)
Bass 100 - 315 Hz
(±) | reduced bass - on average 12.9% lower than median
(±) | linearity of bass is average (7.2% delta to prev. frequency)
Mids 400 - 2000 Hz
(±) | higher mids - on average 6.2% higher than median
(±) | linearity of mids is average (7.8% delta to prev. frequency)
Highs 2 - 16 kHz
(+) | balanced highs - only 2.5% away from median
(+) | highs are linear (4.6% delta to prev. frequency)
Overall 100 - 16.000 Hz
(±) | linearity of overall sound is average (18% difference to median)
Compared to same class
» 55% of all tested devices in this class were better, 9% similar, 36% worse
» The best had a delta of 6%, average was 18%, worst was 132%
Compared to all devices tested
» 38% of all tested devices were better, 8% similar, 54% worse
» The best had a delta of 4%, average was 24%, worst was 134%
Asus ZenBook Pro 14 Duo UX8402VV-P1021W audio analysis
(+) | speakers can play relatively loud (83.7 dB)
Bass 100 - 315 Hz
(-) | nearly no bass - on average 19.9% lower than median
(±) | linearity of bass is average (11.9% delta to prev. frequency)
Mids 400 - 2000 Hz
(+) | balanced mids - only 1.2% away from median
(+) | mids are linear (4.7% delta to prev. frequency)
Highs 2 - 16 kHz
(±) | higher highs - on average 5.5% higher than median
(+) | highs are linear (5.9% delta to prev. frequency)
Overall 100 - 16.000 Hz
(±) | linearity of overall sound is average (16.1% difference to median)
Compared to same class
» 41% of all tested devices in this class were better, 6% similar, 53% worse
» The best had a delta of 5%, average was 17%, worst was 45%
Compared to all devices tested
» 26% of all tested devices were better, 5% similar, 69% worse
» The best had a delta of 4%, average was 24%, worst was 134%
Power consumption
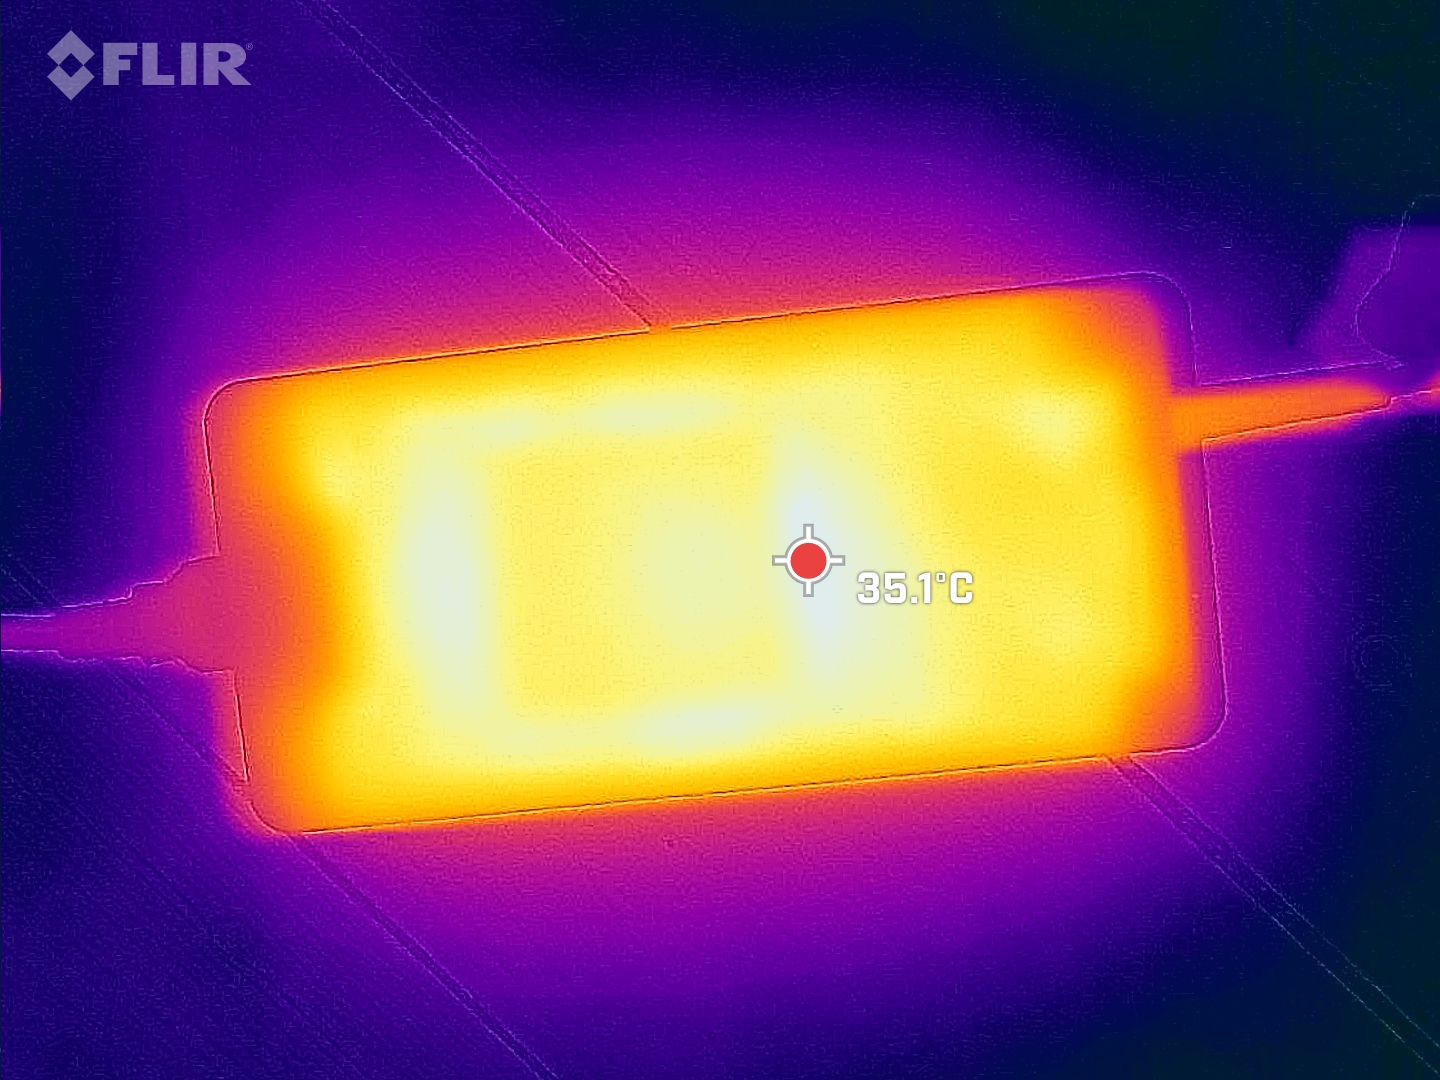
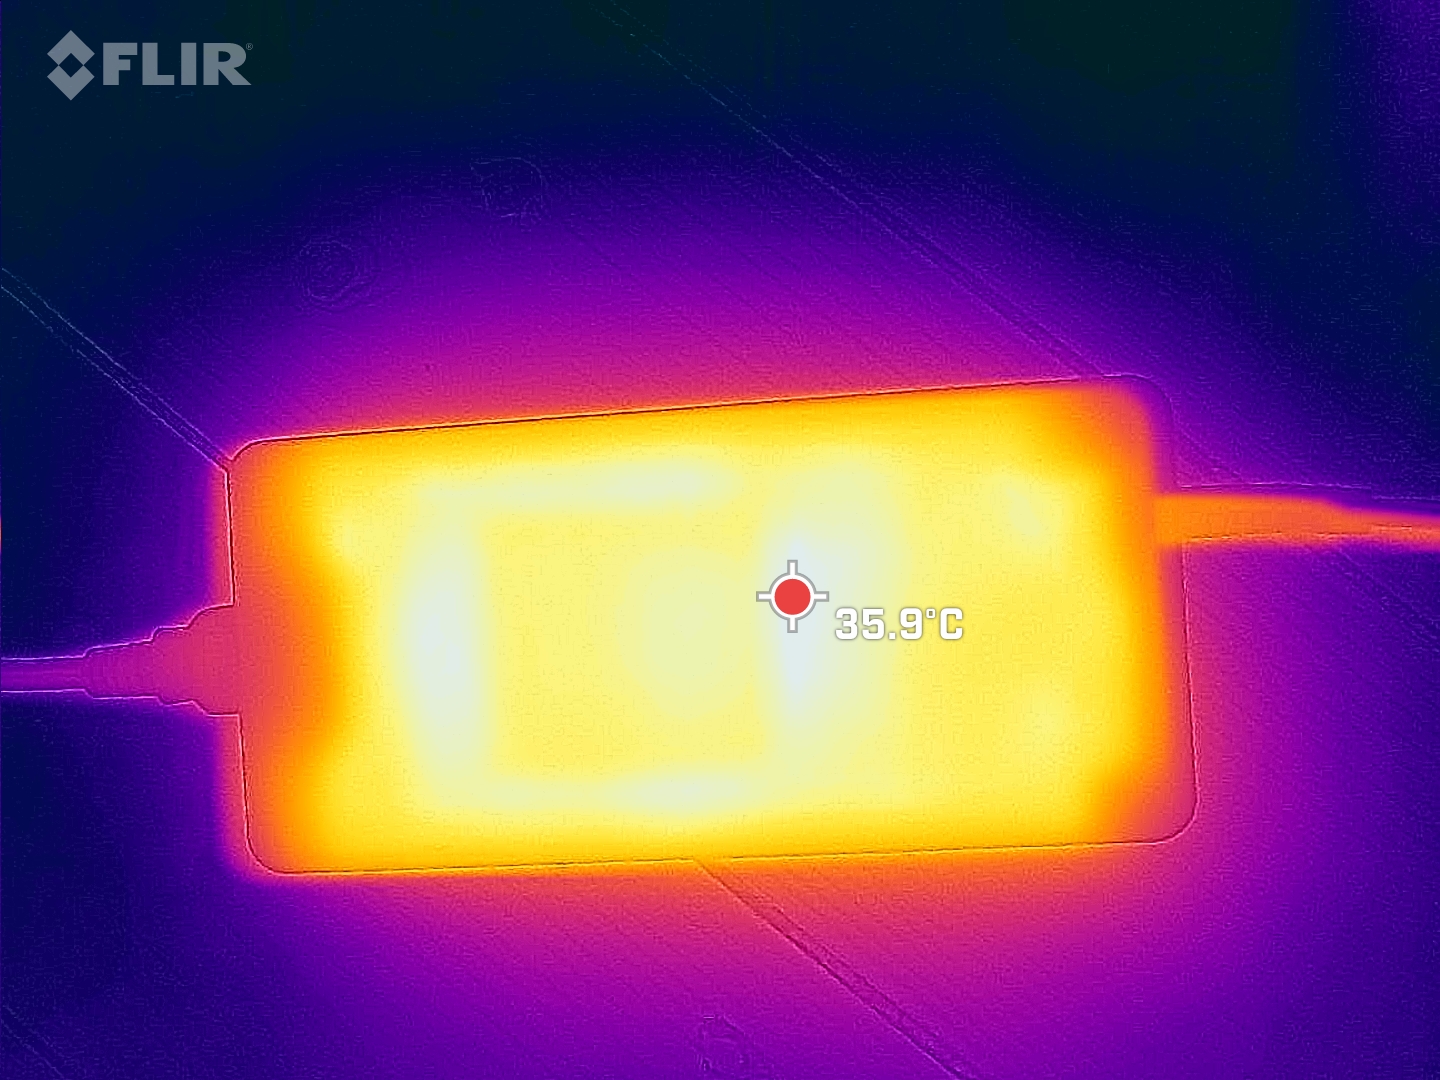
In accordance with its category, the Schenker XMG Pro 15 is not an energy-saving miracle. A large PSU is included which can supply up to 280 watts. When used with the gaming laptop that means it still has a little left in reserve. In the Prime95 stress test and Furmark it drew a maximum of 269 watts, but was more like 215 watts on average.
| Off / Standby | |
| Idle | |
| Load |
|
Key:
min: | |
Power consumption Witcher 3 / stress test
Power consumption with an external monitor
Battery life
In our Wi-Fi internet surfing test, the XMG Pro 15 E23 couldn't manage more than six hours. However, not a lot else can be expected of an 80 Wh battery. Having said that, the review device has a small problem when it comes to the dGPU's sleep mode. It is not always switched on reliably but Schenker is aware of the problem and is working on a solution.
| Schenker XMG Pro 15 (E23) i9-13900HX, GeForce RTX 4060 Laptop GPU, 80 Wh | Schenker XMG Pro 15 (i7-12700H, RTX 3080 Ti) i7-12700H, GeForce RTX 3080 Ti Laptop GPU, 80 Wh | Dell G15 5530 i7-13650HX, GeForce RTX 4060 Laptop GPU, 86 Wh | Asus TUF A15 FA507 R7 7735HS, GeForce RTX 4050 Laptop GPU, 90 Wh | Aorus 15X ASF i7-13700HX, GeForce RTX 4070 Laptop GPU, 99 Wh | Asus ZenBook Pro 14 Duo UX8402VV-P1021W i9-13900H, GeForce RTX 4060 Laptop GPU, 76 Wh | MSI Cyborg 15 A12VF i7-12650H, GeForce RTX 4060 Laptop GPU, 53.5 Wh | Alienware x16 R1 i9-13900HK, GeForce RTX 4080 Laptop GPU, 90 Wh | Average of class Gaming | |
|---|---|---|---|---|---|---|---|---|---|
| Battery runtime | -2% | -22% | 29% | 25% | 71% | 27% | -60% | 0% | |
| WiFi v1.3 (h) | 5.7 | 5.8 2% | 6.5 14% | 11.7 105% | 8.2 44% | 9 58% | 7.5 32% | 2.5 -56% | 7.01 ? 23% |
| Load (h) | 1.9 | 1.8 -5% | 0.8 -58% | 1 -47% | 2 5% | 3.5 84% | 2.3 21% | 0.7 -63% | 1.47 ? -23% |
| H.264 (h) | 5.3 | 6.8 | 12.5 | 7.9 | 8 | 8.26 ? | |||
| Witcher 3 ultra (h) | 0.8 | ||||||||
| Reader / Idle (h) | 11.3 | 13.6 | 7.3 | 8.71 ? |
Pros
Cons
Verdict - perfect for work-play balance

The XMG Pro 15 E23 is advertized as a gaming workstation. In our review, it meets all the requirements for a good, mid-range gaming laptop but also many aspects that make it a decent laptop for video and film work. The unassuming design in no way reflects the 15.6-inch device's thunderous performance. Out-of-the-box, Schenker has refined a solid barebone that comes with good input devices and a strong selection of ports as well as premium components.
Some of the predecessor's disadvantages have either been significantly reduced or completely eliminated. Now the SSD runs stably at high speeds, the display is brighter and the volume has been adjusted slightly. The gaming laptop might still not be quiet but it now knows the right moments when to behave properly.
A few of the XMG Pro 15 E23's jagged edges have been smoothed meaning the gaming laptop now only comes with some minor annoyances.
There are no clear negative points that stick out. A missing rear USB port is rather unfortunate meaning only a wireless mouse and keyboard setup will result in a cable-free desktop. Anyone not wishing to permanently push the laptop to its performance limits will enjoy using the quiet entertainment mode. Most games also run well. Only the 240 Hz QHD display's slow response times bother us. In the meantime, the difference to competitors such as Aorus 15X ASF or MSI Cyborg 15 can only be found in the details. Anyone with an eye on a more exciting gaming laptop would be better taking a look at the Alienware x16 R1 or the Asus ROG Strix G16 - but you will not be rewarded with that much more power.
Price and availability
The XMG Pro 15 can be configured at Bestware. Without Windows, an SSD and the minimum amount of RAM, the laptop starts at 1,893 euros. Our review device without Windows 11 comes in at 2,150 euros. For an activated Windows 11 Home, Bestware is asking for an additional 100 euros. Schenker is clearly not following the upward price spiral. Last year, the Pro 15 E22 with an RTX 3070 Ti, 32 GB of RAM and a 1 TB SSD cost 2,510 euros. For the E23 with an RTX 4070, 32 GB of RAM and a 1 TB SSD Bestware has an asking price of 2,400 euros.
Schenker XMG Pro 15 (E23)
- 07/04/2023 v7 (old)
Marc Herter
Transparency
The selection of devices to be reviewed is made by our editorial team. The test sample was provided to the author as a loan by the manufacturer or retailer for the purpose of this review. The lender had no influence on this review, nor did the manufacturer receive a copy of this review before publication. There was no obligation to publish this review. As an independent media company, Notebookcheck is not subjected to the authority of manufacturers, retailers or publishers.
This is how Notebookcheck is testing
Every year, Notebookcheck independently reviews hundreds of laptops and smartphones using standardized procedures to ensure that all results are comparable. We have continuously developed our test methods for around 20 years and set industry standards in the process. In our test labs, high-quality measuring equipment is utilized by experienced technicians and editors. These tests involve a multi-stage validation process. Our complex rating system is based on hundreds of well-founded measurements and benchmarks, which maintains objectivity. Further information on our test methods can be found here.
Price comparison

