
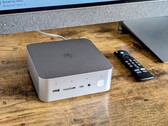
Beelink GTI13 Ultra mini PC review: A Mac Mini alternative with Intel Core i9
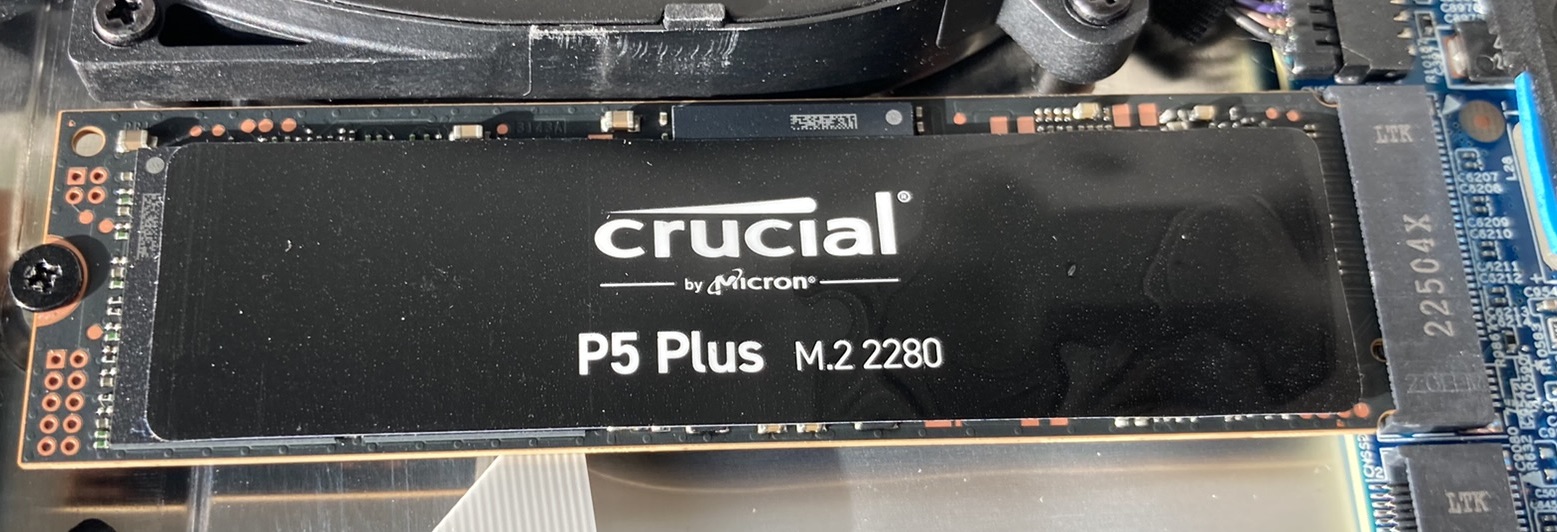
For $600, the GTI13 Ultra is incredible bang for the buck as it comes standard with 32 GB RAM, 1 TB SSD, Intel 13th gen CPU, integrated microphone, speakers, and more that most mini PCs lack in this price range.
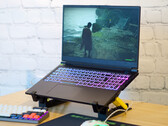
Intel Core i9-13900HK, Iris Xe G7 96EUs, 1.3 kg