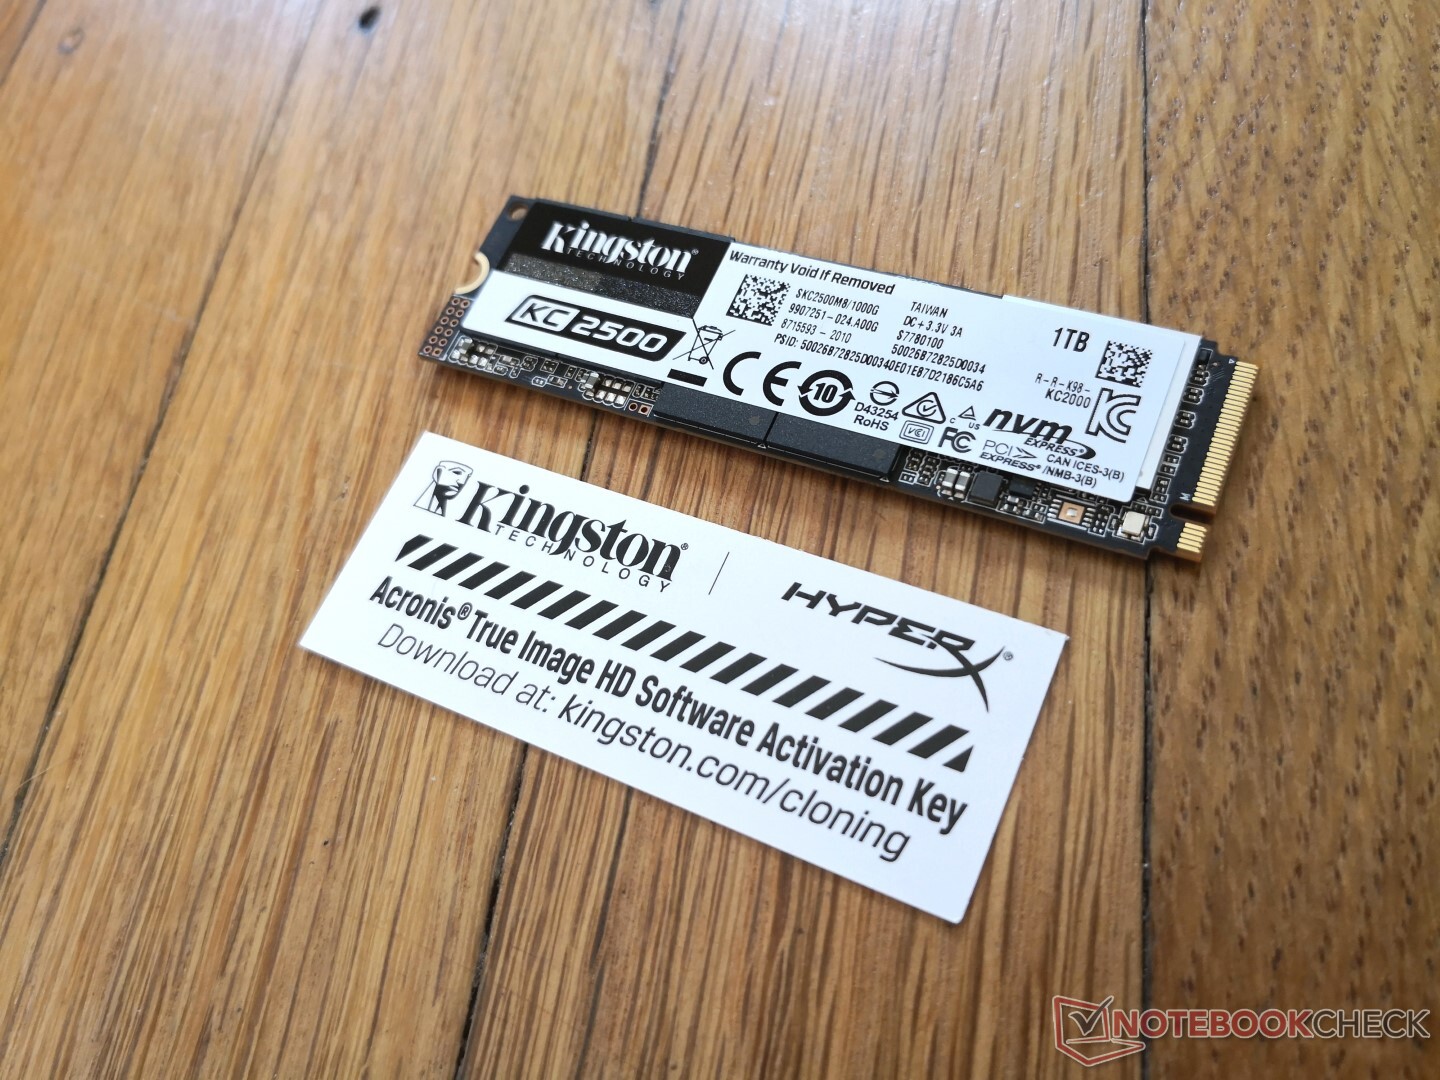
Kingston KC2500 1 TB NVMe PCIe x4 SSD Benchmarked
After having checked out the budget-oriented Kingston A2000 series, we're now ready to see what the manufacturer has in store for enthusiast users. The KC2500 series replaces the outgoing KC2000 series by offering higher read and write rates to better exploit the M.2 PCIe x4 interface.
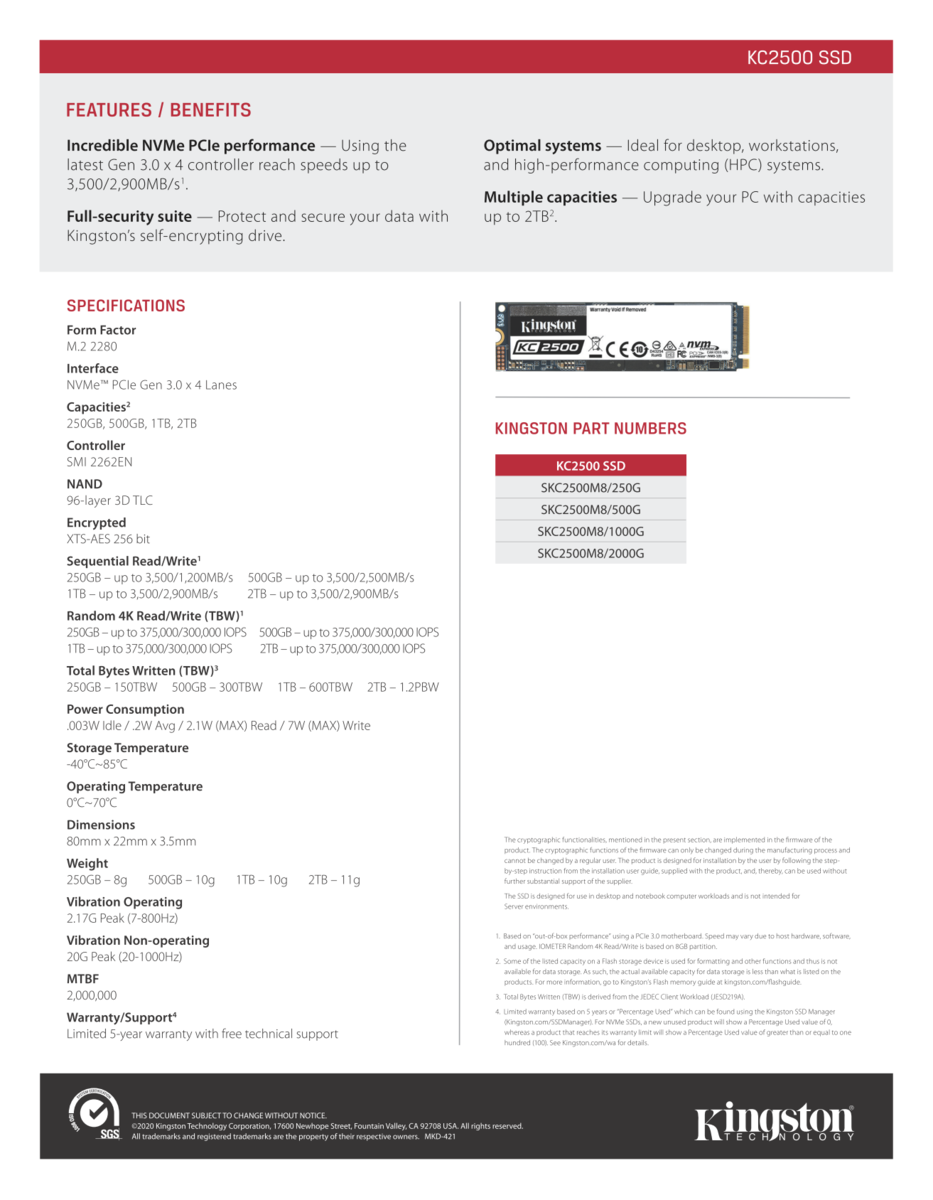
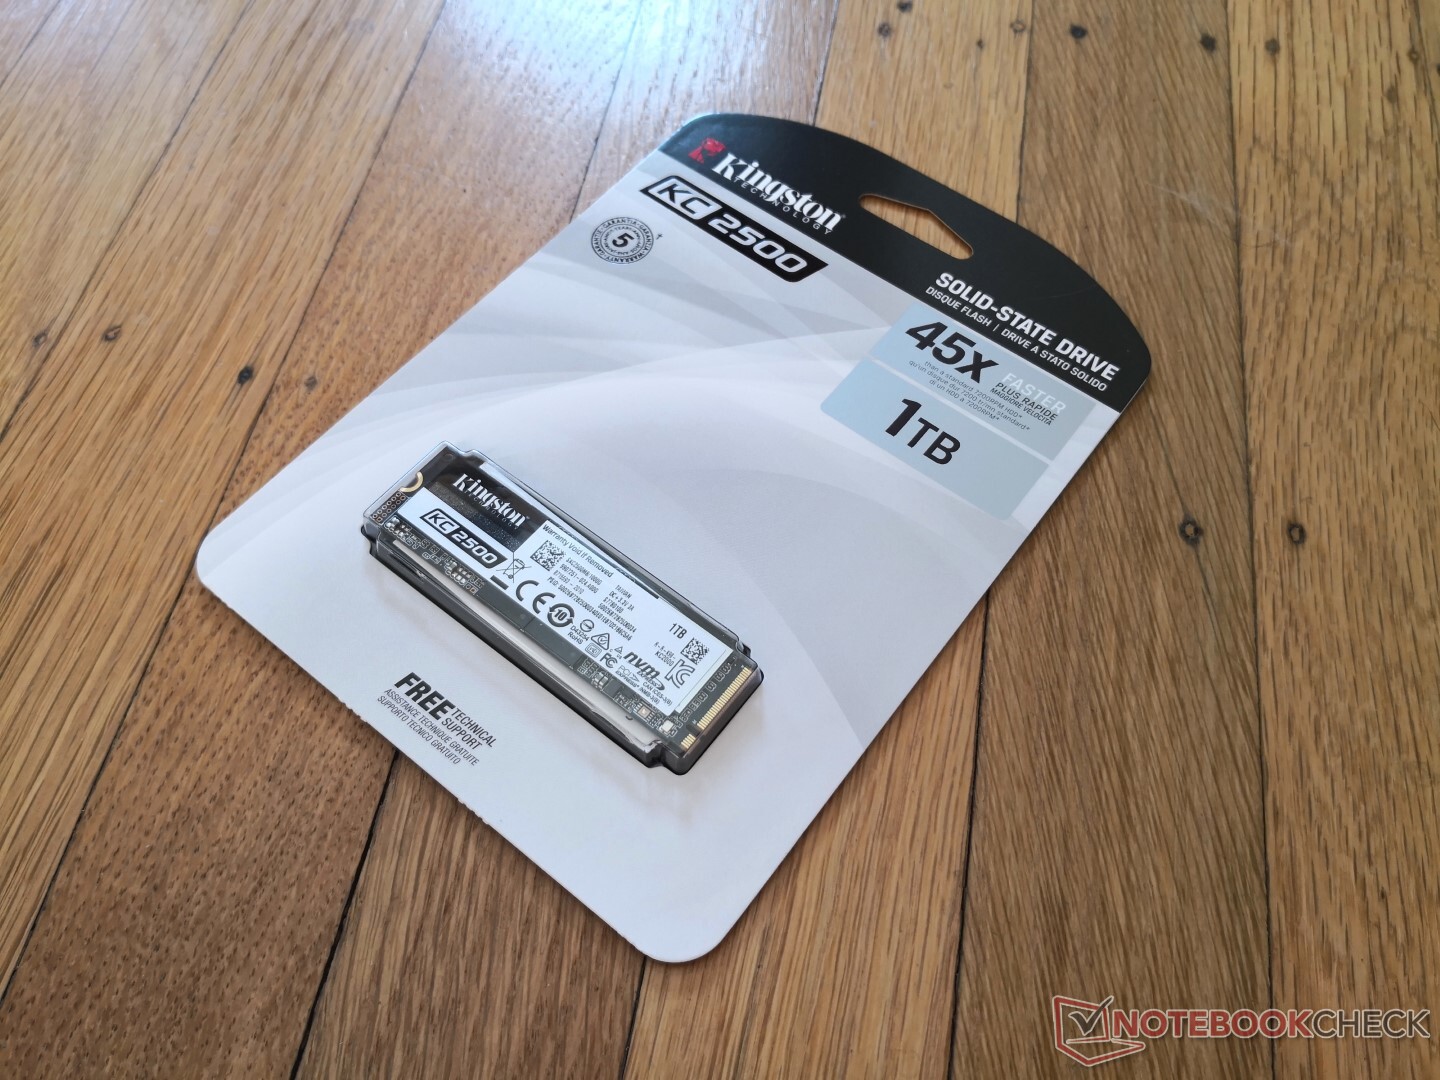
Newegg and Amazon are each carrying the 250 GB, 500 GB, and 1 TB capacities for $77, $128 USD, and $221 USD, respectively, with a 2 TB version planned. All capacities come with 5-year warranty as standard.
| Kingston KC2500 | Sequential Read/Write | IOPS Random Read/Write | MTBF (hours) | TBW | Weight (g) |
| 250 GB | 3500/1200 MB/s | 375000/300000 | 2,000,000 | 150 | 8 |
| 500 GB | 3500/2500 MB/s | 375000/300000 | 2,000,000 | 300 | 10 |
| 1 TB | 3500/2900 MB/s | 375000/300000 | 2,000,000 | 600 | 10 |
| 2 TB | 3500/2900 MB/s | 375000/300000 | 2,000,000 | 1200 | 11 |

Test System

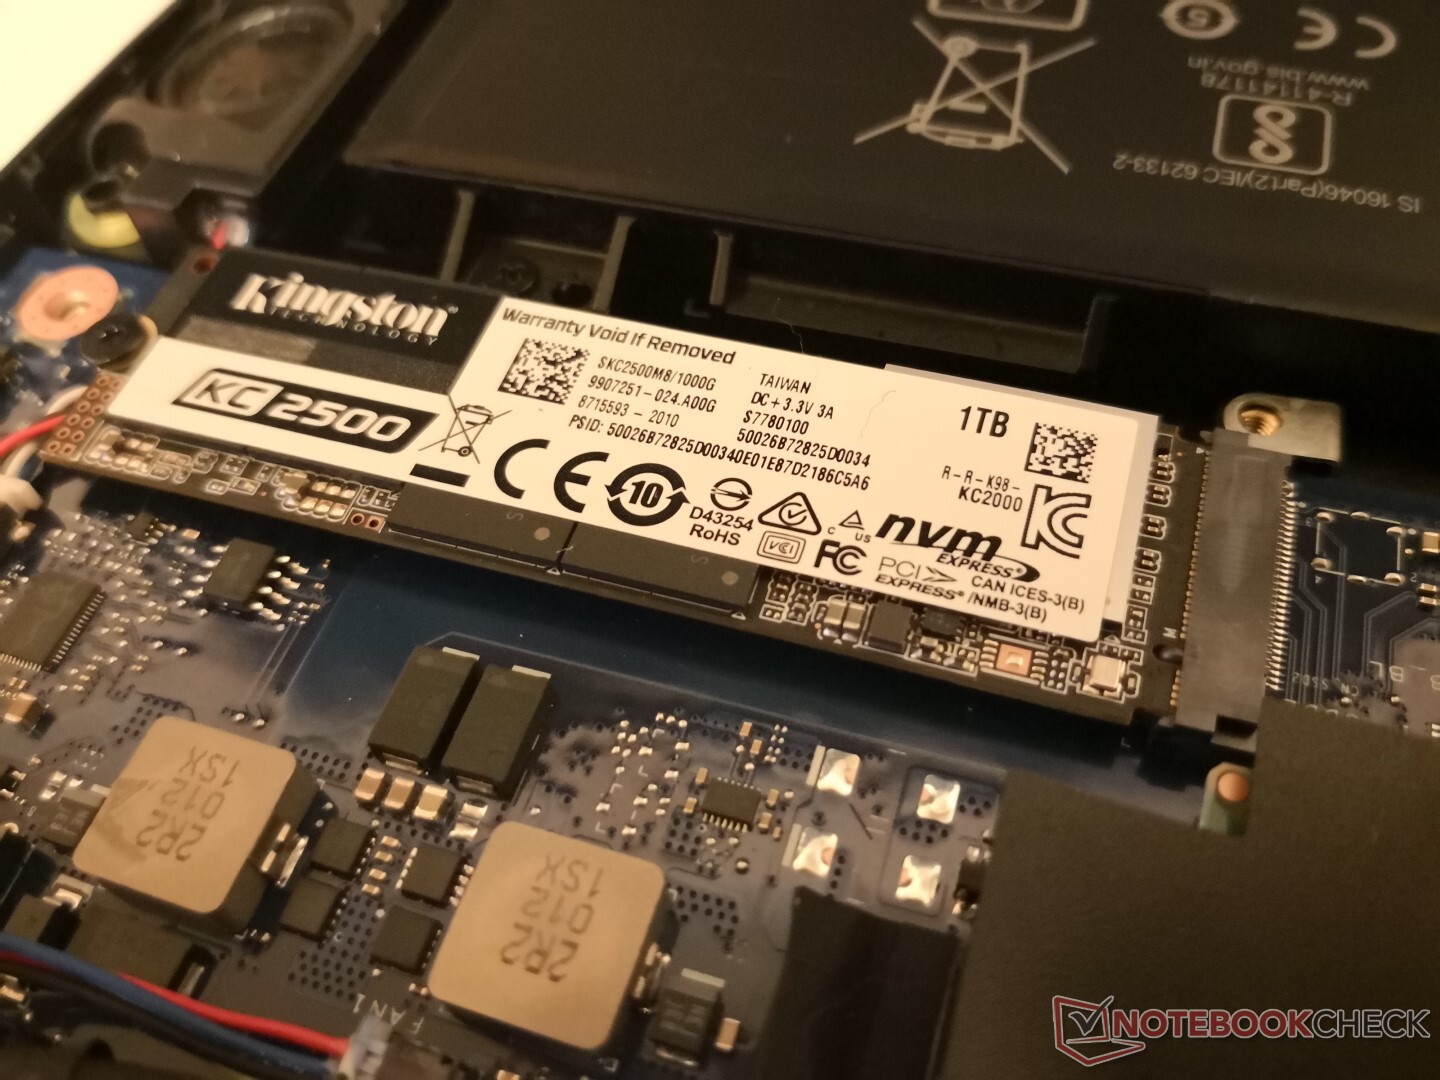
Our host system is the Asus TUF A17 FA706IU running on an AMD Ryzen 7 4800H CPU and GeForce GTX 1660 Ti GPU. The 17.3-inch laptop houses two accessible PCIe x4 M.2 2280 slots for easy upgrading.
Kingston doesn't include any screws inside the packaging unlike on the HP EX950. However, there is a product key for Acronis imaging to aid in mirroring and drive migration.
AS SSD & CrystalDiskMark
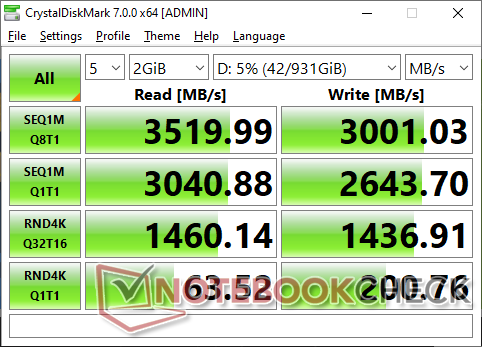
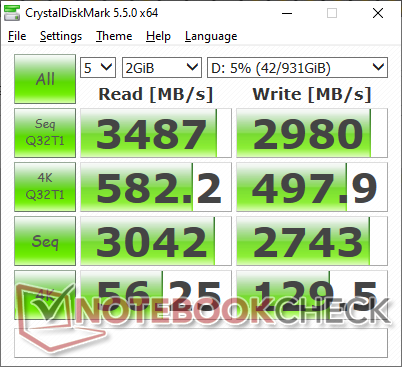
CrystalDiskMark shows that our KC2500 is able to reach the advertised speeds of 3500 MB/s and 2900 MB/s when reading and writing, respectively, at a queue depth of 8.
| Walmart EVOO Gaming 17 Kingston KC2500 Kingston KC2500 1 TB SKC2500M81000G | Western Digital Blue SN550 NVMe Western Digital Blue SN550 NVMe SSD 1 TB WDS100T2B0C | Walmart EVOO Gaming 17 Lexar NM610 Lexar NM610 1TB | Kingston A2000 Kingston SA2000M81000G | Asus ZenBook Duo UX481FL Intel SSD 660p 1TB SSDPEKNW010T8 | |
|---|---|---|---|---|---|
| AS SSD | -26% | -44% | -12% | -43% | |
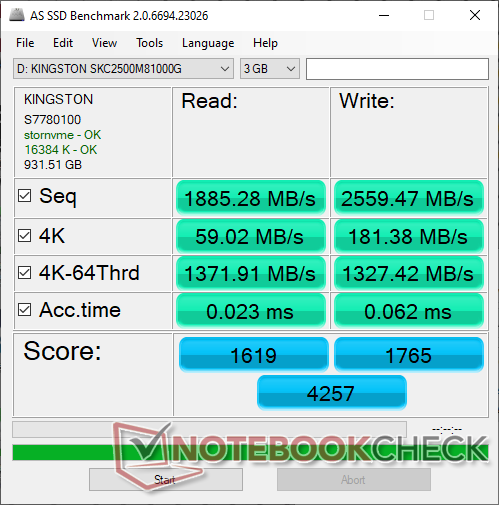
| Seq Read (MB/s) | 1885 | 1852 -2% | 1411 -25% | 1622 -14% | 1237 -34% |
| Seq Write (MB/s) | 2559 | 1322 -48% | 1440 -44% | 1936 -24% | 1069 -58% |
| 4K Read (MB/s) | 59 | 26.84 -55% | 31.57 -46% | 61 3% | 52.1 -12% |
| 4K Write (MB/s) | 181.4 | 165.7 -9% | 153.3 -15% | 150.6 -17% | 134.7 -26% |
| 4K-64 Read (MB/s) | 1372 | 386.4 -72% | 839 -39% | 1098 -20% | 585 -57% |
| 4K-64 Write (MB/s) | 1327 | 1098 -17% | 685 -48% | 1041 -22% | 854 -36% |
| Access Time Read * (ms) | 0.023 | 0.024 -4% | 0.021 9% | 0.024 -4% | 0.05 -117% |
| Access Time Write * (ms) | 0.062 | 0.096 -55% | 0.252 -306% | 0.075 -21% | 0.117 -89% |
| Score Read (Points) | 1619 | 598 -63% | 1011 -38% | 1321 -18% | 761 -53% |
| Score Write (Points) | 1765 | 1396 -21% | 982 -44% | 1385 -22% | 1095 -38% |
| Score Total (Points) | 4257 | 2280 -46% | 2516 -41% | 3413 -20% | 2255 -47% |
| Copy ISO MB/s (MB/s) | 1975 | 1496 -24% | 1633 -17% | 1612 -18% | 1714 -13% |
| Copy Program MB/s (MB/s) | 630 | 799 27% | 737 17% | 703 12% | 511 -19% |
| Copy Game MB/s (MB/s) | 1174 | 1488 27% | 1458 24% | 1425 21% | 1187 1% |
| CrystalDiskMark 5.2 / 6 | -5% | -34% | 0% | -26% | |
| Write 4K (MB/s) | 129.5 | 234.3 81% | 114.9 -11% | 193.7 50% | 140.7 9% |
| Read 4K (MB/s) | 56.3 | 53.1 -6% | 35.11 -38% | 71 26% | 55.6 -1% |
| Write Seq (MB/s) | 2743 | 1978 -28% | 1451 -47% | 2044 -25% | 1415 -48% |
| Read Seq (MB/s) | 3042 | 1102 -64% | 1528 -50% | 1992 -35% | 1516 -50% |
| Write 4K Q32T1 (MB/s) | 497.9 | 573 15% | 392.4 -21% | 623 25% | 474.5 -5% |
| Read 4K Q32T1 (MB/s) | 582 | 763 31% | 477.8 -18% | 704 21% | 403.4 -31% |
| Write Seq Q32T1 (MB/s) | 2980 | 2011 -33% | 1695 -43% | 2173 -27% | 1796 -40% |
| Read Seq Q32T1 (MB/s) | 3487 | 2355 -32% | 2107 -40% | 2279 -35% | 1913 -45% |
| Write 4K Q8T8 (MB/s) | 1469 | 1072 | |||
| Read 4K Q8T8 (MB/s) | 1434 | 1167 | |||
| Total Average (Program / Settings) | -16% /
-18% | -39% /
-40% | -6% /
-7% | -35% /
-37% |
* ... smaller is better

Running DiskSpd Read in a loop 50 times results in increasingly faster performance over time due to caching. Transfer rates hit their peak of about 3500 MB/s towards the end of the loop test.
Disk Throttling: DiskSpd Read Loop, Queue Depth 8
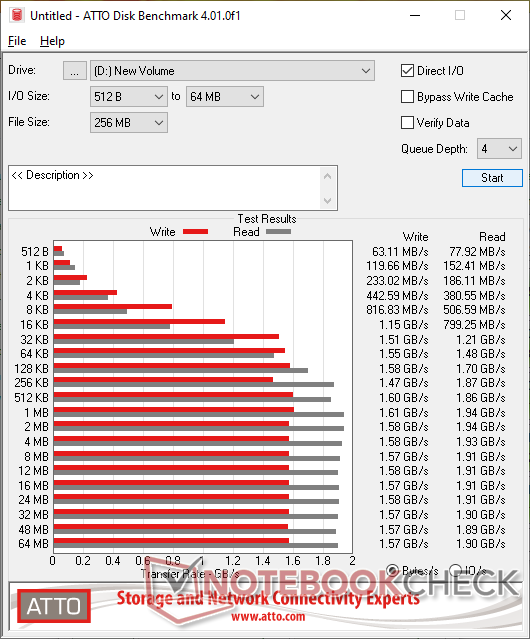
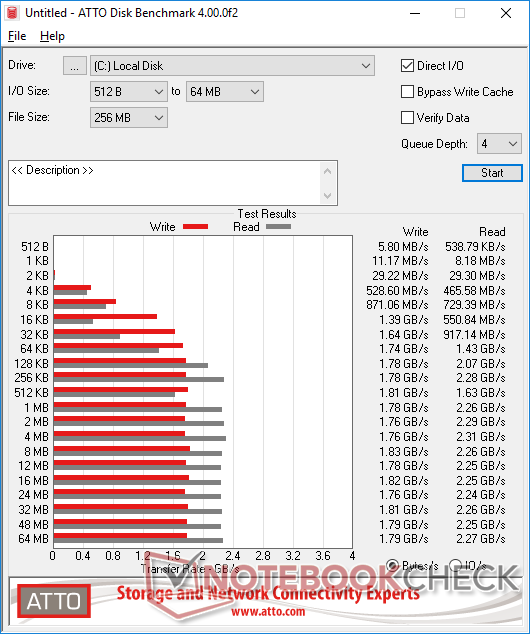
ATTO
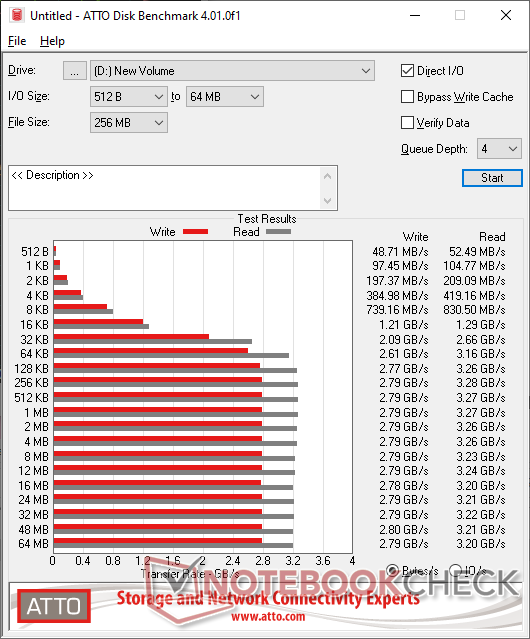
Write rates become stable at about 2700 to 2800 MB/s when reaching 64 KB block sizes or greater. Read rates, however, are slower and with more variation. Write rates are shown to be faster than read rates yet again despite the advertisement stating the opposite. Performance at very small block sizes is much faster than on the popular Western Digital SN550.
| Walmart EVOO Gaming 17 Kingston KC2500 , , Kingston KC2500 1 TB SKC2500M81000G | Western Digital Blue SN550 NVMe , , Western Digital Blue SN550 NVMe SSD 1 TB WDS100T2B0C | Samsung 960 Pro 1TB Titan X Pascal, E5-2680 v4, Samsung SSD 960 Pro 1TB m.2 NVMe | Kingston A2000 , , Kingston SA2000M81000G | Intel NUC8i7BEH Asura NVMe SSD Iris Plus Graphics 655, i7-8559U, Asura Genesis Xtreme NVMe M.2 SSD 1 TB | Walmart EVOO Gaming 17 Lexar NM610 , , Lexar NM610 1TB | |
|---|---|---|---|---|---|---|
| ATTO Disk Benchmark | -35% | -14% | -28% | -18% | -41% | |
| 8192KB write (KB/s) | 2790000 | 1830000 -34% | 2079890 -25% | 2000000 -28% | 1960000 -30% | 1570000 -44% |
| 4096KB write (KB/s) | 2790000 | 1760000 -37% | 2090010 -25% | 2000000 -28% | 1960000 -30% | 1580000 -43% |
| 2048KB write (KB/s) | 2790000 | 1760000 -37% | 2090010 -25% | 1860000 -33% | 1970000 -29% | 1580000 -43% |
| 1024KB write (KB/s) | 2790000 | 1780000 -36% | 2100230 -25% | 1760000 -37% | 1960000 -30% | 1610000 -42% |
| 512KB write (KB/s) | 2790000 | 1810000 -35% | 2090010 -25% | 1940000 -30% | 1960000 -30% | 1600000 -43% |
| 256KB write (KB/s) | 2790000 | 1780000 -36% | 2098690 -25% | 2000000 -28% | 1920000 -31% | 1470000 -47% |
| 128KB write (KB/s) | 2770000 | 1780000 -36% | 2078800 -25% | 2000000 -28% | 1940000 -30% | 1580000 -43% |
| 64KB write (KB/s) | 2610000 | 1740000 -33% | 2073620 -21% | 1920000 -26% | 1870000 -28% | 1550000 -41% |
| 32KB write (KB/s) | 2090000 | 1640000 -22% | 2054220 -2% | 1760000 -16% | 1620000 -22% | 1510000 -28% |
| 16KB write (KB/s) | 1210000 | 1390000 15% | 1102410 -9% | 1410000 17% | 1160000 -4% | 1150000 -5% |
| 8192KB read (KB/s) | 3230000 | 2260000 -30% | 2960680 -8% | 2030000 -37% | 2970000 -8% | 1910000 -41% |
| 4096KB read (KB/s) | 3260000 | 2310000 -29% | 3019900 -7% | 2060000 -37% | 2960000 -9% | 1930000 -41% |
| 2048KB read (KB/s) | 3260000 | 2290000 -30% | 3026480 -7% | 1990000 -39% | 2920000 -10% | 1940000 -40% |
| 1024KB read (KB/s) | 3270000 | 2260000 -31% | 3263860 0% | 1870000 -43% | 2860000 -13% | 1940000 -41% |
| 512KB read (KB/s) | 3270000 | 1630000 -50% | 3197250 -2% | 2060000 -37% | 2820000 -14% | 1860000 -43% |
| 256KB read (KB/s) | 3280000 | 2280000 -30% | 3230230 -2% | 2080000 -37% | 3080000 -6% | 1870000 -43% |
| 128KB read (KB/s) | 3260000 | 2070000 -37% | 3003310 -8% | 2070000 -37% | 2670000 -18% | 1700000 -48% |
| 64KB read (KB/s) | 3160000 | 1430000 -55% | 2458920 -22% | 2030000 -36% | 2550000 -19% | 1480000 -53% |
| 32KB read (KB/s) | 2660000 | 917140 -66% | 2432300 -9% | 1730000 -35% | 2190000 -18% | 1210000 -55% |
| 16KB read (KB/s) | 1290000 | 550840 -57% | 1257110 -3% | 1450000 12% | 1440000 12% | 799250 -38% |
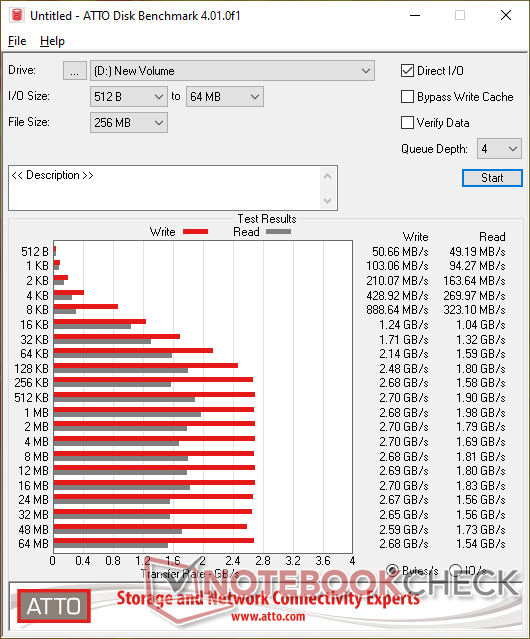
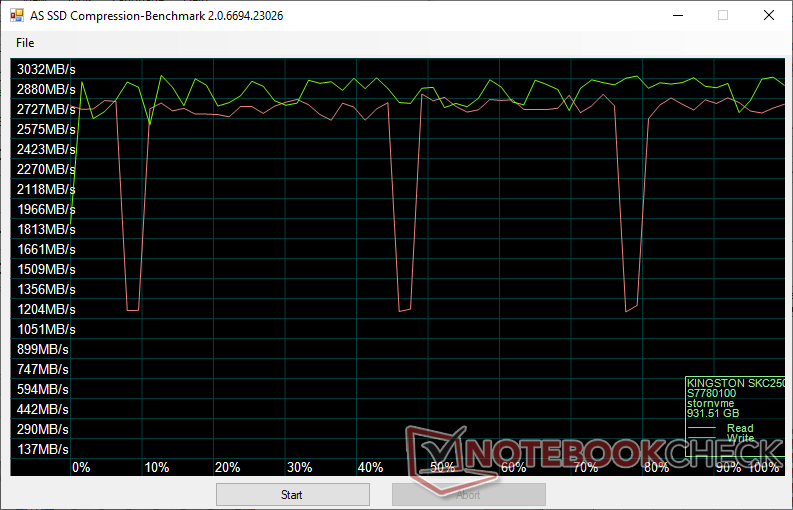
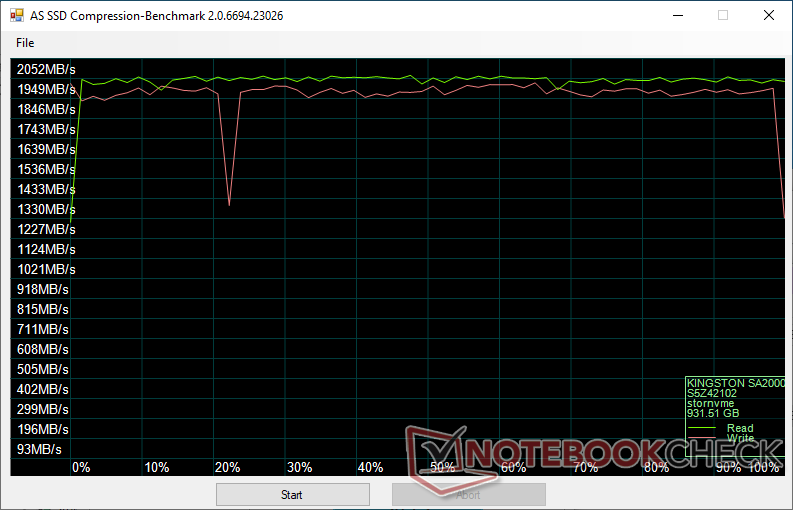
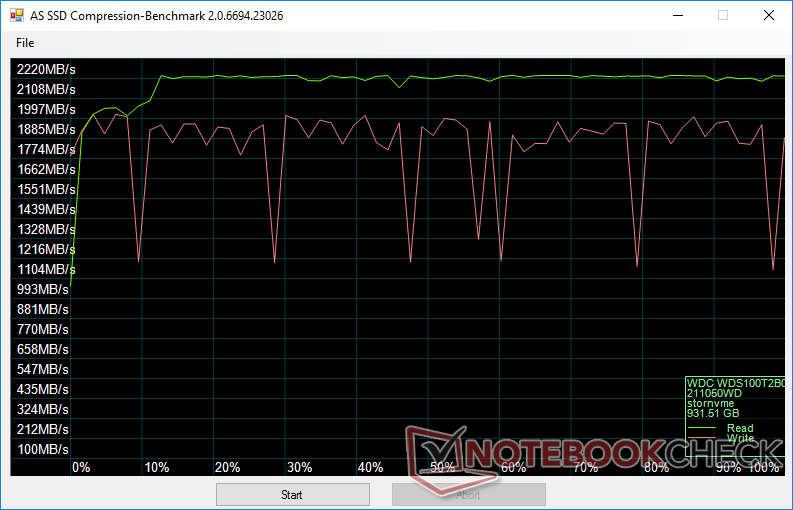
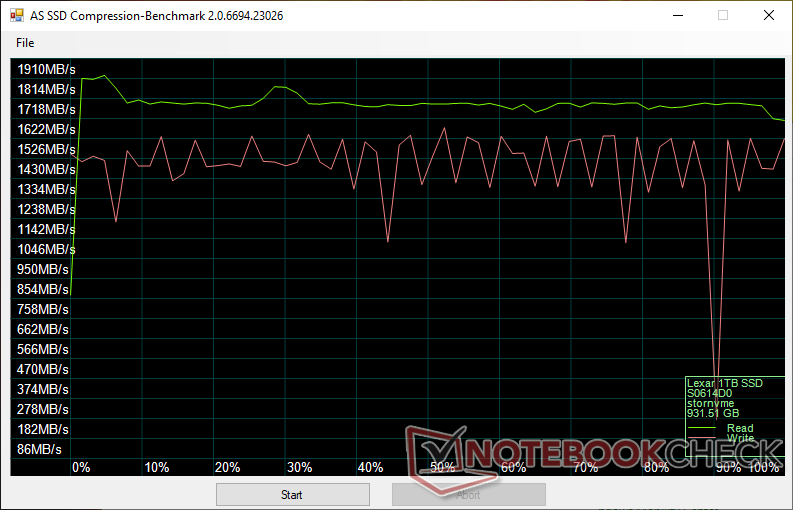
Data Compression
Data compression is not as stable as we would like. Write rates would drop steeply from ~2700 MB/s down to ~1200 MB/s whereas the Lexar NM610 or Western Digital SN550 have shallower dips.
Temperature
HWiNFO shows an idling temperature of 37 C and a maximum of 66 W when running CrystalDiskMark. Results are much warmer than what we recorded on the slower Western Digital SN550 by over 15 C.


Verdict
The Kingston KC2500 series is home to some of the fastest PCIe x4 NVme SSDs for consumers at the moment with transfer rates higher than that of the Samsung PM981 commonly found on high-end Ultrabooks and gaming laptops. Temperatures can approach 70 C when under load, however, so sustained loads on a laptop form factor may not be ideal. Though we didn't run into any throttling issues without one, a heat sink wouldn't be a bad idea to get the drive running at more comfortable temperatures.
