SK Hynix Gold S31 SSD Benchmarked
SK Hynix recently launched a lineup of inexpensive 2.5-inch SATA III SSDs called the Gold S31. The series is notable because the core components of these drives have all been designed in-house by SK Hynix including the NAND modules, controller, and DRAM instead of being outsourced.
Three initial options are available at launch: 250 GB, 500 GB, and 1000 GB each with similar sequential read rates, write rates, and estimated operation lifetimes. Prices range from $49 up to $119 on Amazon. The model we will be testing is the 1 TB model.
Storage Capacity |
Max Sequential Read (MB/s) | Max Sequential Write (MB/s) | MTBF (in millions of hours) | TBW (Terabytes Written) |
250 GB |
560 | 525 | 1.5 | 600 |
500 GB |
560 | 525 | 1.5 | 600 |
1 TB |
560 | 525 | 1.5 | 600 |
Test System
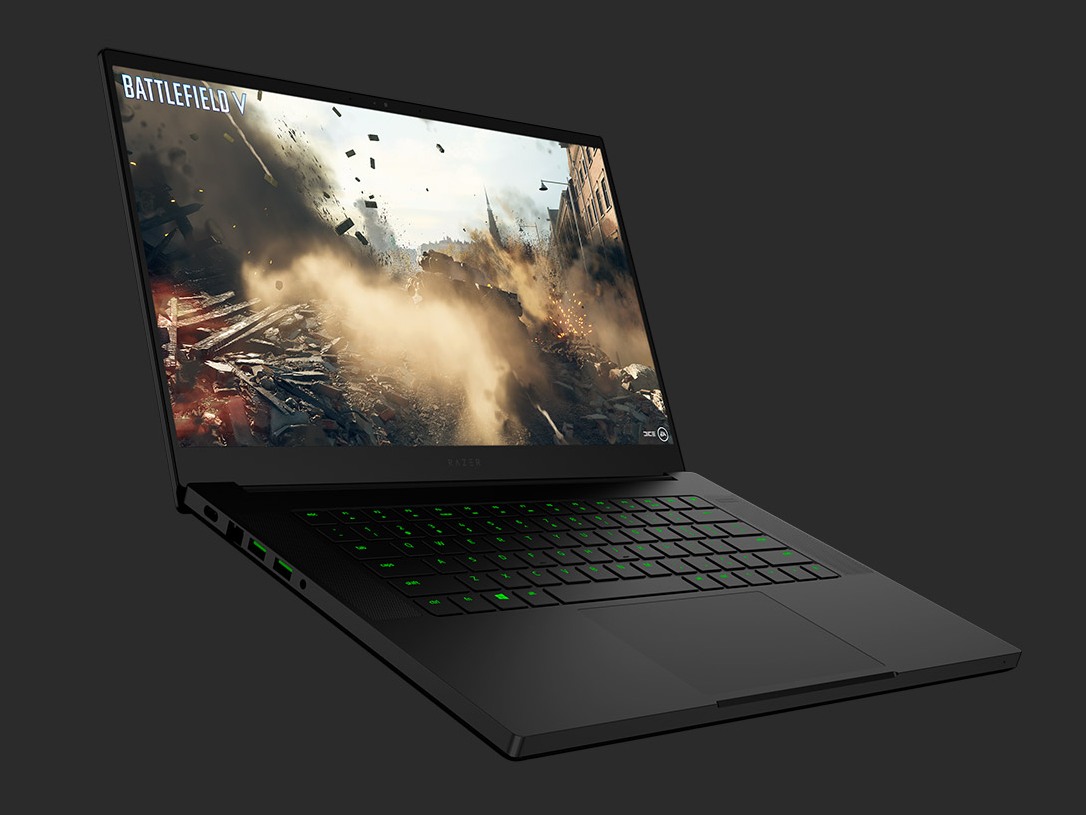
Our test unit is the Razer Blade 15 GTX 1660 Ti. This particular system includes a 2.5-inch SATA III bay for easy storage expansion unlike on the pricier Blade 15 RTX 2070 Max-Q or RTX 2080 Max-Q SKUs.
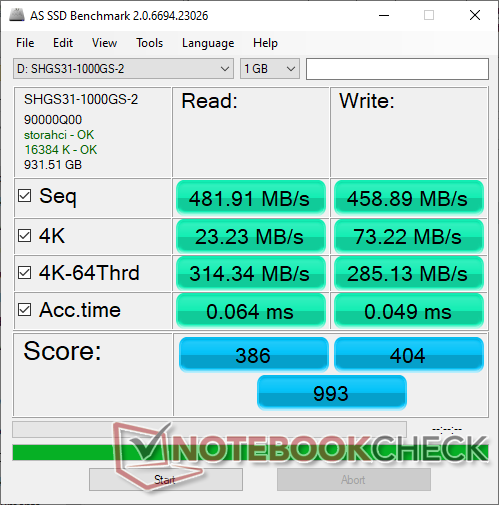
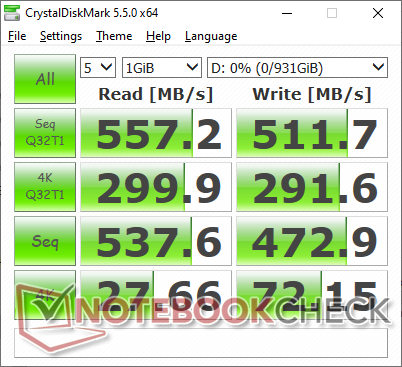
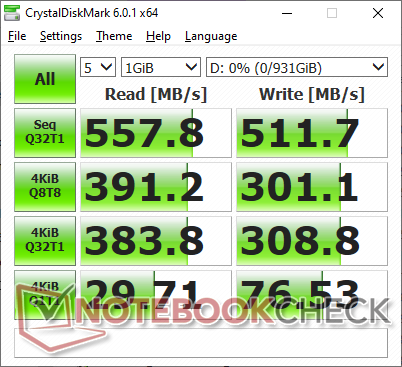
AS SSD & CrystalDiskMark
Of course, transfer rates will be slower than most NVMe drives including SK Hynix's own PC401/PC501 series. Results are more comparable to the SATA III-based SC311 series instead.
| SK Hynix Gold S31 SSD SK hynix Gold S31 1TB | Dell Latitude 5300 SK Hynix PC401 512GB M.2 (HFS512GD9TNG) | Dell Latitude 13 3390 SK hynix SC311 SATA | MSI GP65 Leopard 9SE-225US Toshiba KBG30ZMT512G | Microsoft Surface Laptop 2-LQN-00004 SK Hynix BC501 NVMe 256 GB | |
|---|---|---|---|---|---|
| AS SSD | 131% | -29% | 6% | 25% | |
| Seq Read (MB/s) | 481.9 | 2123 341% | 479.5 0% | 1307 171% | 826 71% |
| Seq Write (MB/s) | 458.9 | 744 62% | 354.9 -23% | 730 59% | 555 21% |
| 4K Read (MB/s) | 23.23 | 43.02 85% | 23.88 3% | 27.58 19% | 33.39 44% |
| 4K Write (MB/s) | 73.2 | 117.4 60% | 51.3 -30% | 80.3 10% | 95.3 30% |
| 4K-64 Read (MB/s) | 314.3 | 680 116% | 294.8 -6% | 878 179% | 447 42% |
| 4K-64 Write (MB/s) | 285.1 | 1039 264% | 217.5 -24% | 246.8 -13% | 370.4 30% |
| Access Time Read * (ms) | 0.064 | 0.057 11% | 0.093 -45% | 0.231 -261% | 0.048 25% |
| Access Time Write * (ms) | 0.049 | 0.051 -4% | 0.071 -45% | 0.223 -355% | 0.048 2% |
| Score Read (Points) | 386 | 935 142% | 367 -5% | 1036 168% | 563 46% |
| Score Write (Points) | 404 | 1230 204% | 304 -25% | 400 -1% | 521 29% |
| Score Total (Points) | 993 | 2586 160% | 860 -13% | 1940 95% | 1369 38% |
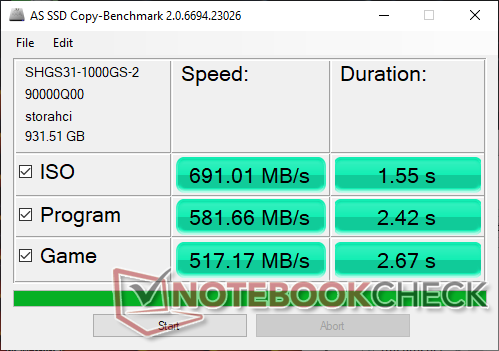
| Copy ISO MB/s (MB/s) | 691 | 294 -57% | 993 44% | 755 9% | |
| Copy Program MB/s (MB/s) | 582 | 137.4 -76% | 309.5 -47% | 325.1 -44% | |
| Copy Game MB/s (MB/s) | 517 | 202.2 -61% | 582 13% | 577 12% | |
| CrystalDiskMark 5.2 / 6 | 136% | -5% | 67% | 55% | |
| Write 4K (MB/s) | 72.2 | 119.2 65% | 52.4 -27% | 99.3 38% | 87.3 21% |
| Read 4K (MB/s) | 27.66 | 41.43 50% | 24.71 -11% | 46.96 70% | 36.52 32% |
| Write Seq (MB/s) | 472.9 | 1240 162% | 484.1 2% | 716 51% | |
| Read Seq (MB/s) | 538 | 1668 210% | 548 2% | 1009 88% | |
| Write 4K Q32T1 (MB/s) | 291.6 | 381.7 31% | 329.9 13% | 240.1 -18% | 324.1 11% |
| Read 4K Q32T1 (MB/s) | 299.9 | 371.5 24% | 250.7 -16% | 581 94% | 249 -17% |
| Write Seq Q32T1 (MB/s) | 512 | 1369 167% | 508 -1% | 686 34% | 811 58% |
| Read Seq Q32T1 (MB/s) | 557 | 2652 376% | 550 -1% | 1581 184% | 1631 193% |
| Write 4K Q8T8 (MB/s) | 350.5 | 268.1 | |||
| Read 4K Q8T8 (MB/s) | 359.7 | 977 | |||
| Total Average (Program / Settings) | 134% /
133% | -17% /
-20% | 37% /
24% | 40% /
36% |
* ... smaller is better

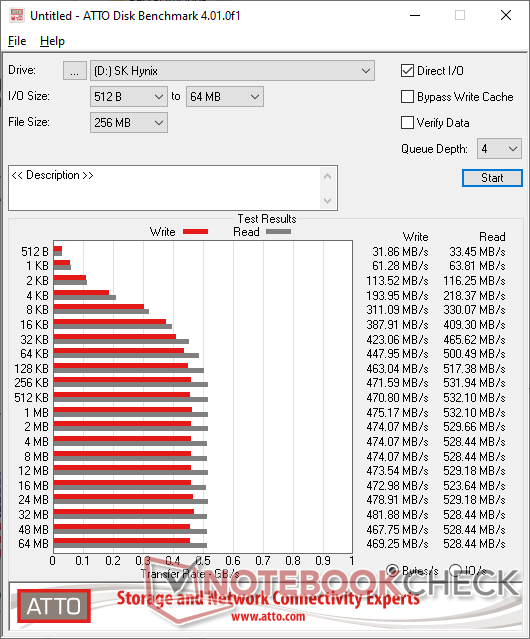
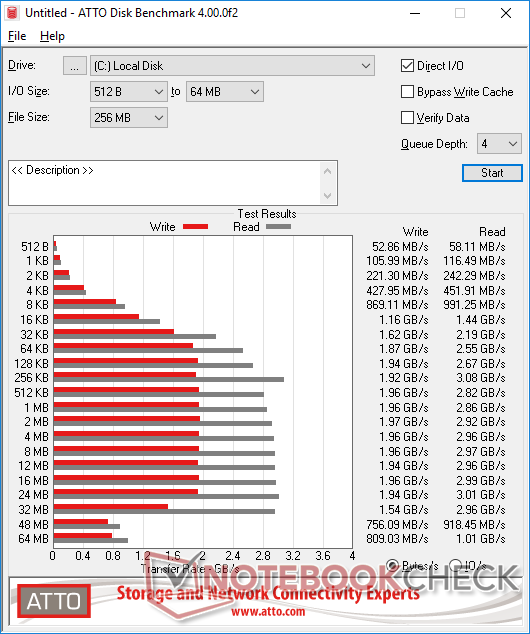
ATTO
ATTO tests transfer rates across larger block sizes ranging from 512 Bytes to 64 MB for a bigger picture of overall performance. The SK Hynix drive is able to maintain its advertised promise of ~500 MB/s read and write at block sizes of 128 KB and greater.
| Samsung SSD 970 Evo Plus 500 GB | Samsung SSD 960 Pro 1TB m.2 NVMe | Samsung SSD 960 Evo 250GB m.2 NVMe | Samsung SSD 970 EVO Plus 500GB | Toshiba KBG20ZMS256G | |
|---|---|---|---|---|---|
| ATTO Disk Benchmark | 367% | 308% | 457% | 61% | |
| 1024KB read (KB/s) | 532100 | 3263860 513% | 3173620 496% | 2811540 428% | 1231950 132% |
| 2048KB read (KB/s) | 529660 | 3026480 471% | 3154120 495% | 2960680 459% | 1351830 155% |
| 4096KB read (KB/s) | 528440 | 3019900 471% | 3099870 487% | 2975270 463% | 1187170 125% |
| 8192KB read (KB/s) | 528440 | 2960680 460% | 2990000 466% | 2975270 463% | 1099620 108% |
| 1024KB write (KB/s) | 475170 | 2100230 342% | 1429920 201% | 3205200 575% | 586388 23% |
| 2048KB write (KB/s) | 474070 | 2090010 341% | 1423030 200% | 3297730 596% | 557948 18% |
| 4096KB write (KB/s) | 474070 | 2090010 341% | 1423030 200% | 3322220 601% | 564467 19% |
| 8192KB write (KB/s) | 474070 | 2079890 339% | 1423030 200% | 3322220 601% | 554109 17% |
| 16KB write (KB/s) | 387910 | 1102410 184% | 1118800 188% | 1153140 197% | 524483 35% |
| 16KB read (KB/s) | 409030 | 1257110 207% | 1000960 145% | 1173620 187% | 306332 -25% |
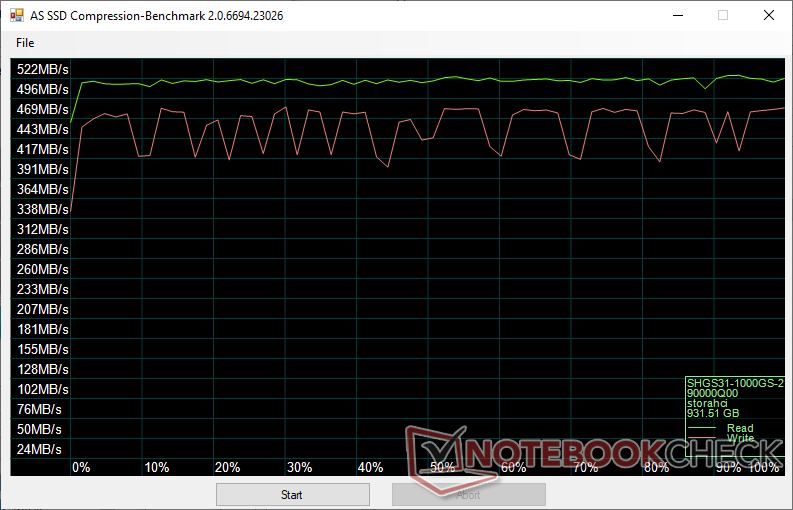
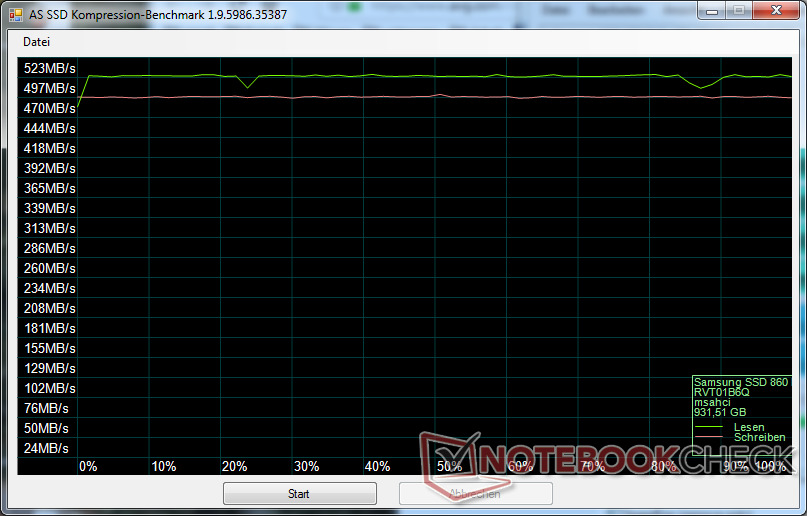
Data Compression
Data compression is not as steady as it could be. Write rates will alternate between approximately 417 MB/s and 469 MB/s instead of remaining steady like on the older Samsung 860 EVO.
Emissions
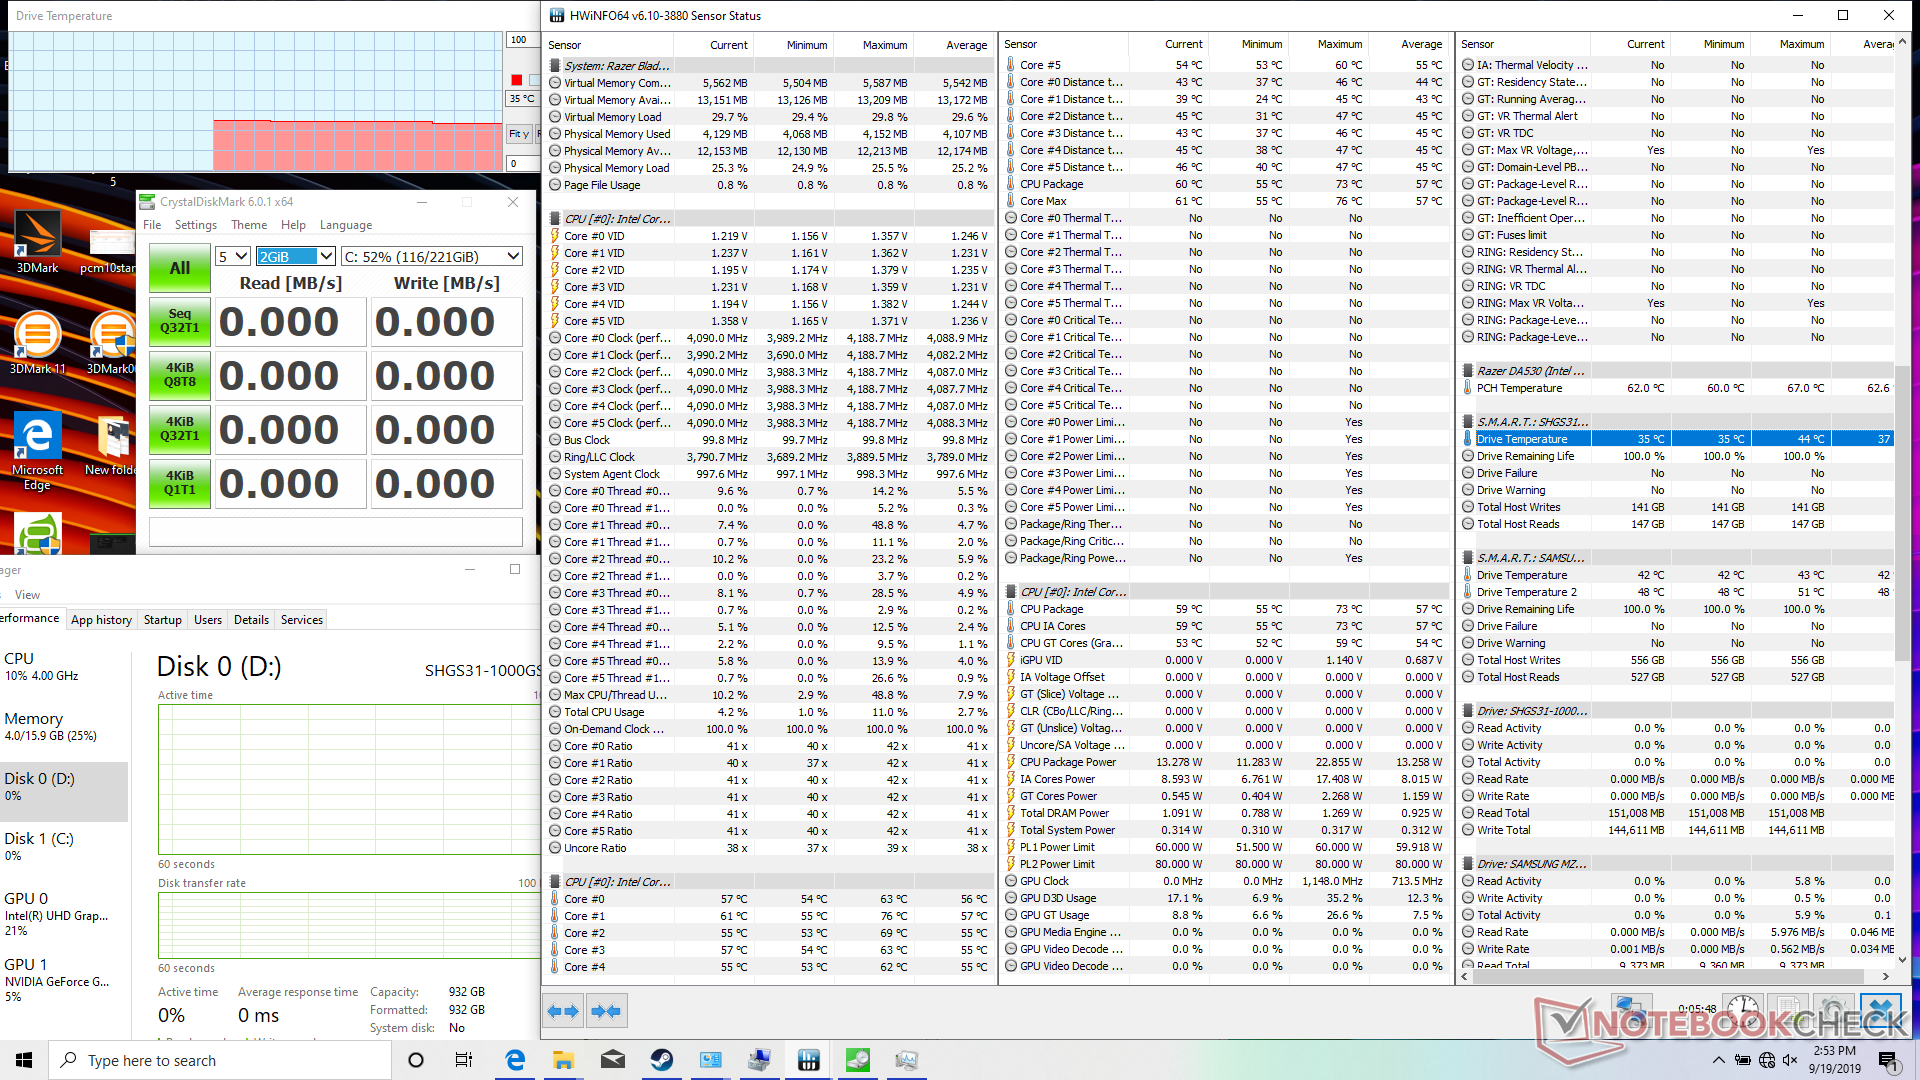
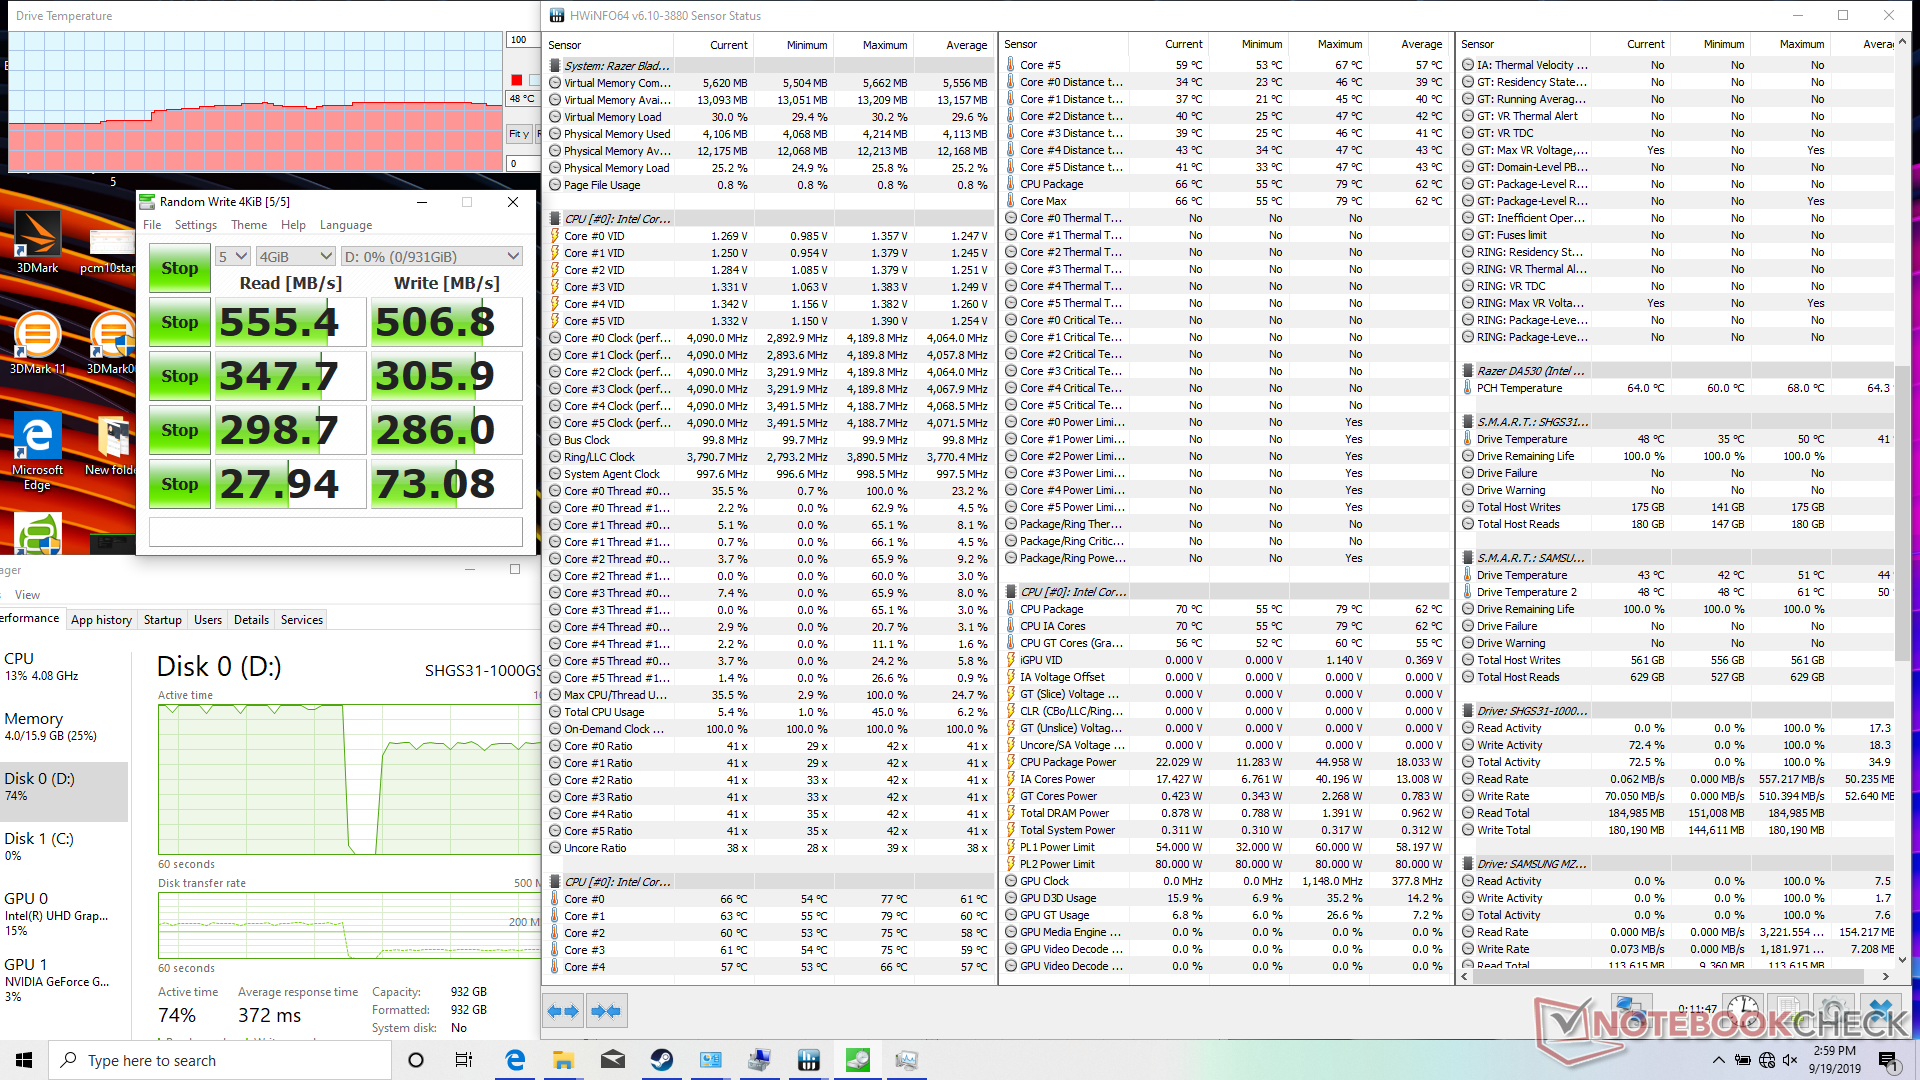
Temperature
Drive temperature rises from 35 C when idling to a high of 51 C after two CrystalDiskMark runs. The Asura M.2 NVMe drive requires heat sinks in order sustain temperatures in the same range.
Verdict
There are no surprises from a performance perspective as the Gold S31 is based on SATA III after all. This aging bus tops out at the 500 MB/s range when under real-world conditions which is close to what we've recorded from the SK Hynix drive. If you're looking for a no-frills 2.5-inch SSD with a 5-year standard warranty, then the Gold S31 series will get the job done — no more, no less.
Price comparison
