Samsung 970 Evo Plus SSD (NVMe, M.2) Review
Last year we reviewed the then new Samsung 970 Evo SSD, which was one of the fastest drives that we had ever tested. Samsung has now supplied us with its 970 Evo Plus in advance of its official release. The South Korean manufacturer reports that the new drive should achieve 53% faster random write speeds than the 970 Evo.
The Evo series is synonymous for being good value for money. There are currently three versions of the 970 Evo Plus, but Samsung is expected to release a 2-TB model in mid-April or May.
We have included the current RRPs below and have compared them to the current prices for the 970 Evo and the 970 Pro. The 970 Evo is currently around €20 (~$23) cheaper than Samsung's new drive, although the Pro remains noticeably pricier. However, entry-level prices are likely to decline in line with the trend of flash memory price cuts, so watch this space.
| Model | Storage capacity (Price in €) |
| Samsung 970 Evo Plus | 250 GB (99.90), 500 GB (139.90), 1 TB (259.90), 2 TB (519.90) |
| Samsung 970 Evo | 250 GB (77.90), 500 GB (120.90), 1 TB (242.90), 2 TB (469.90) |
| Samsung 970 Pro | 512 GB (169.90), 1 TB (349.90) |
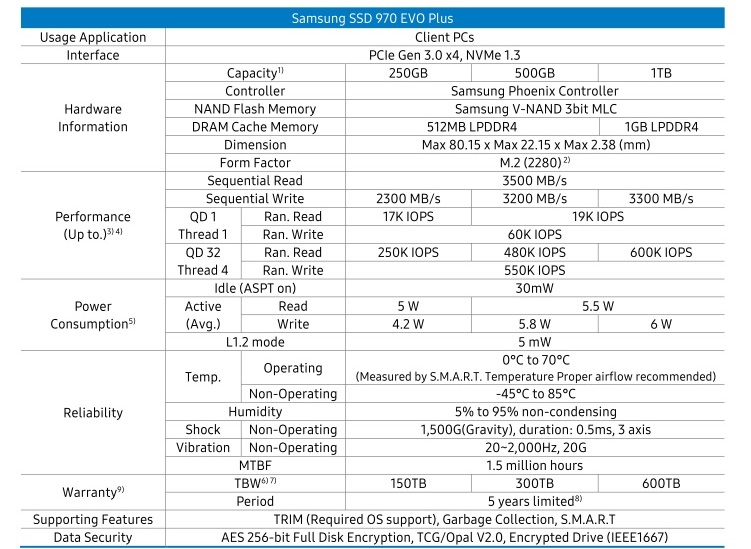
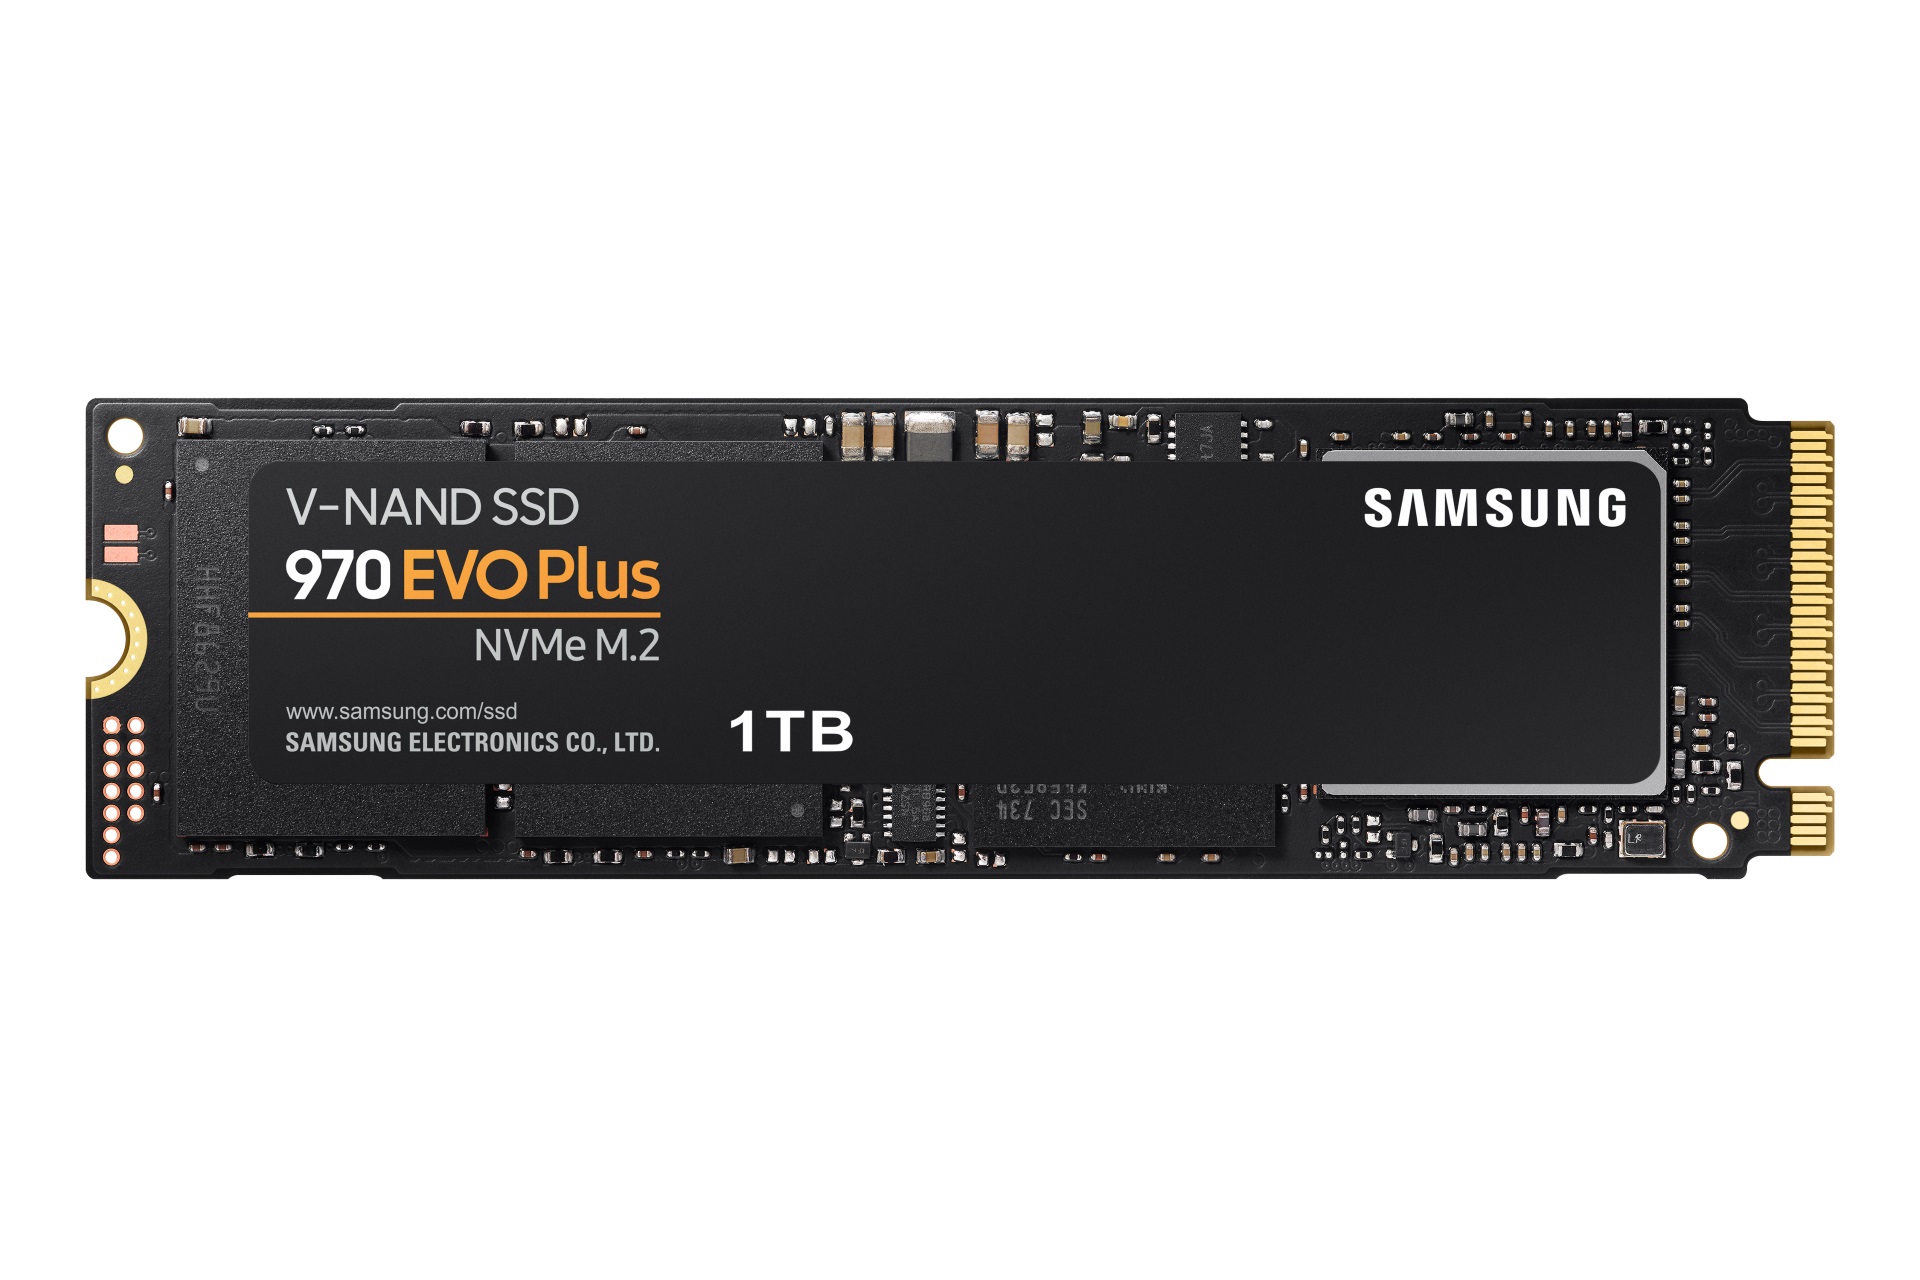
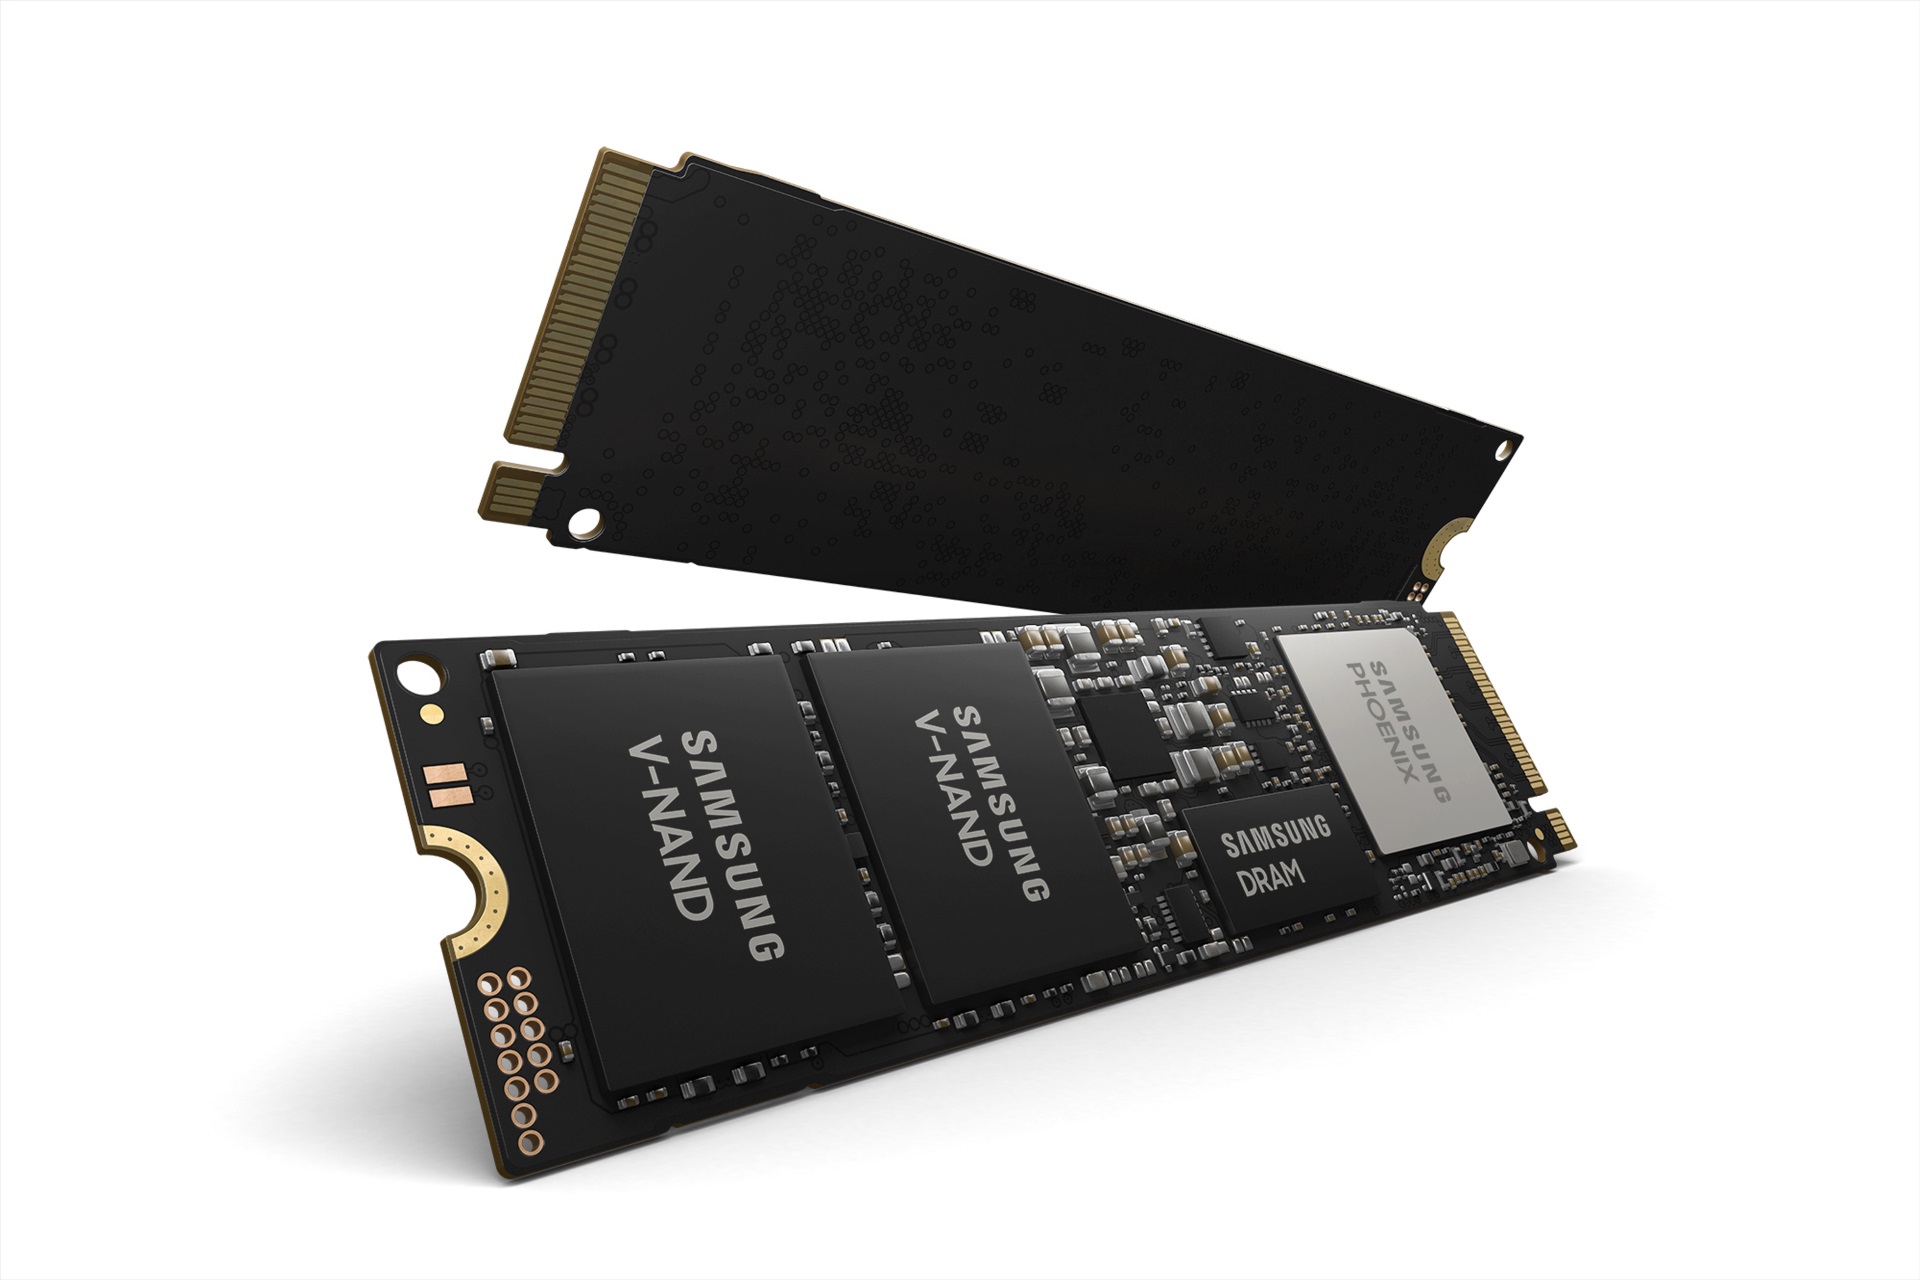
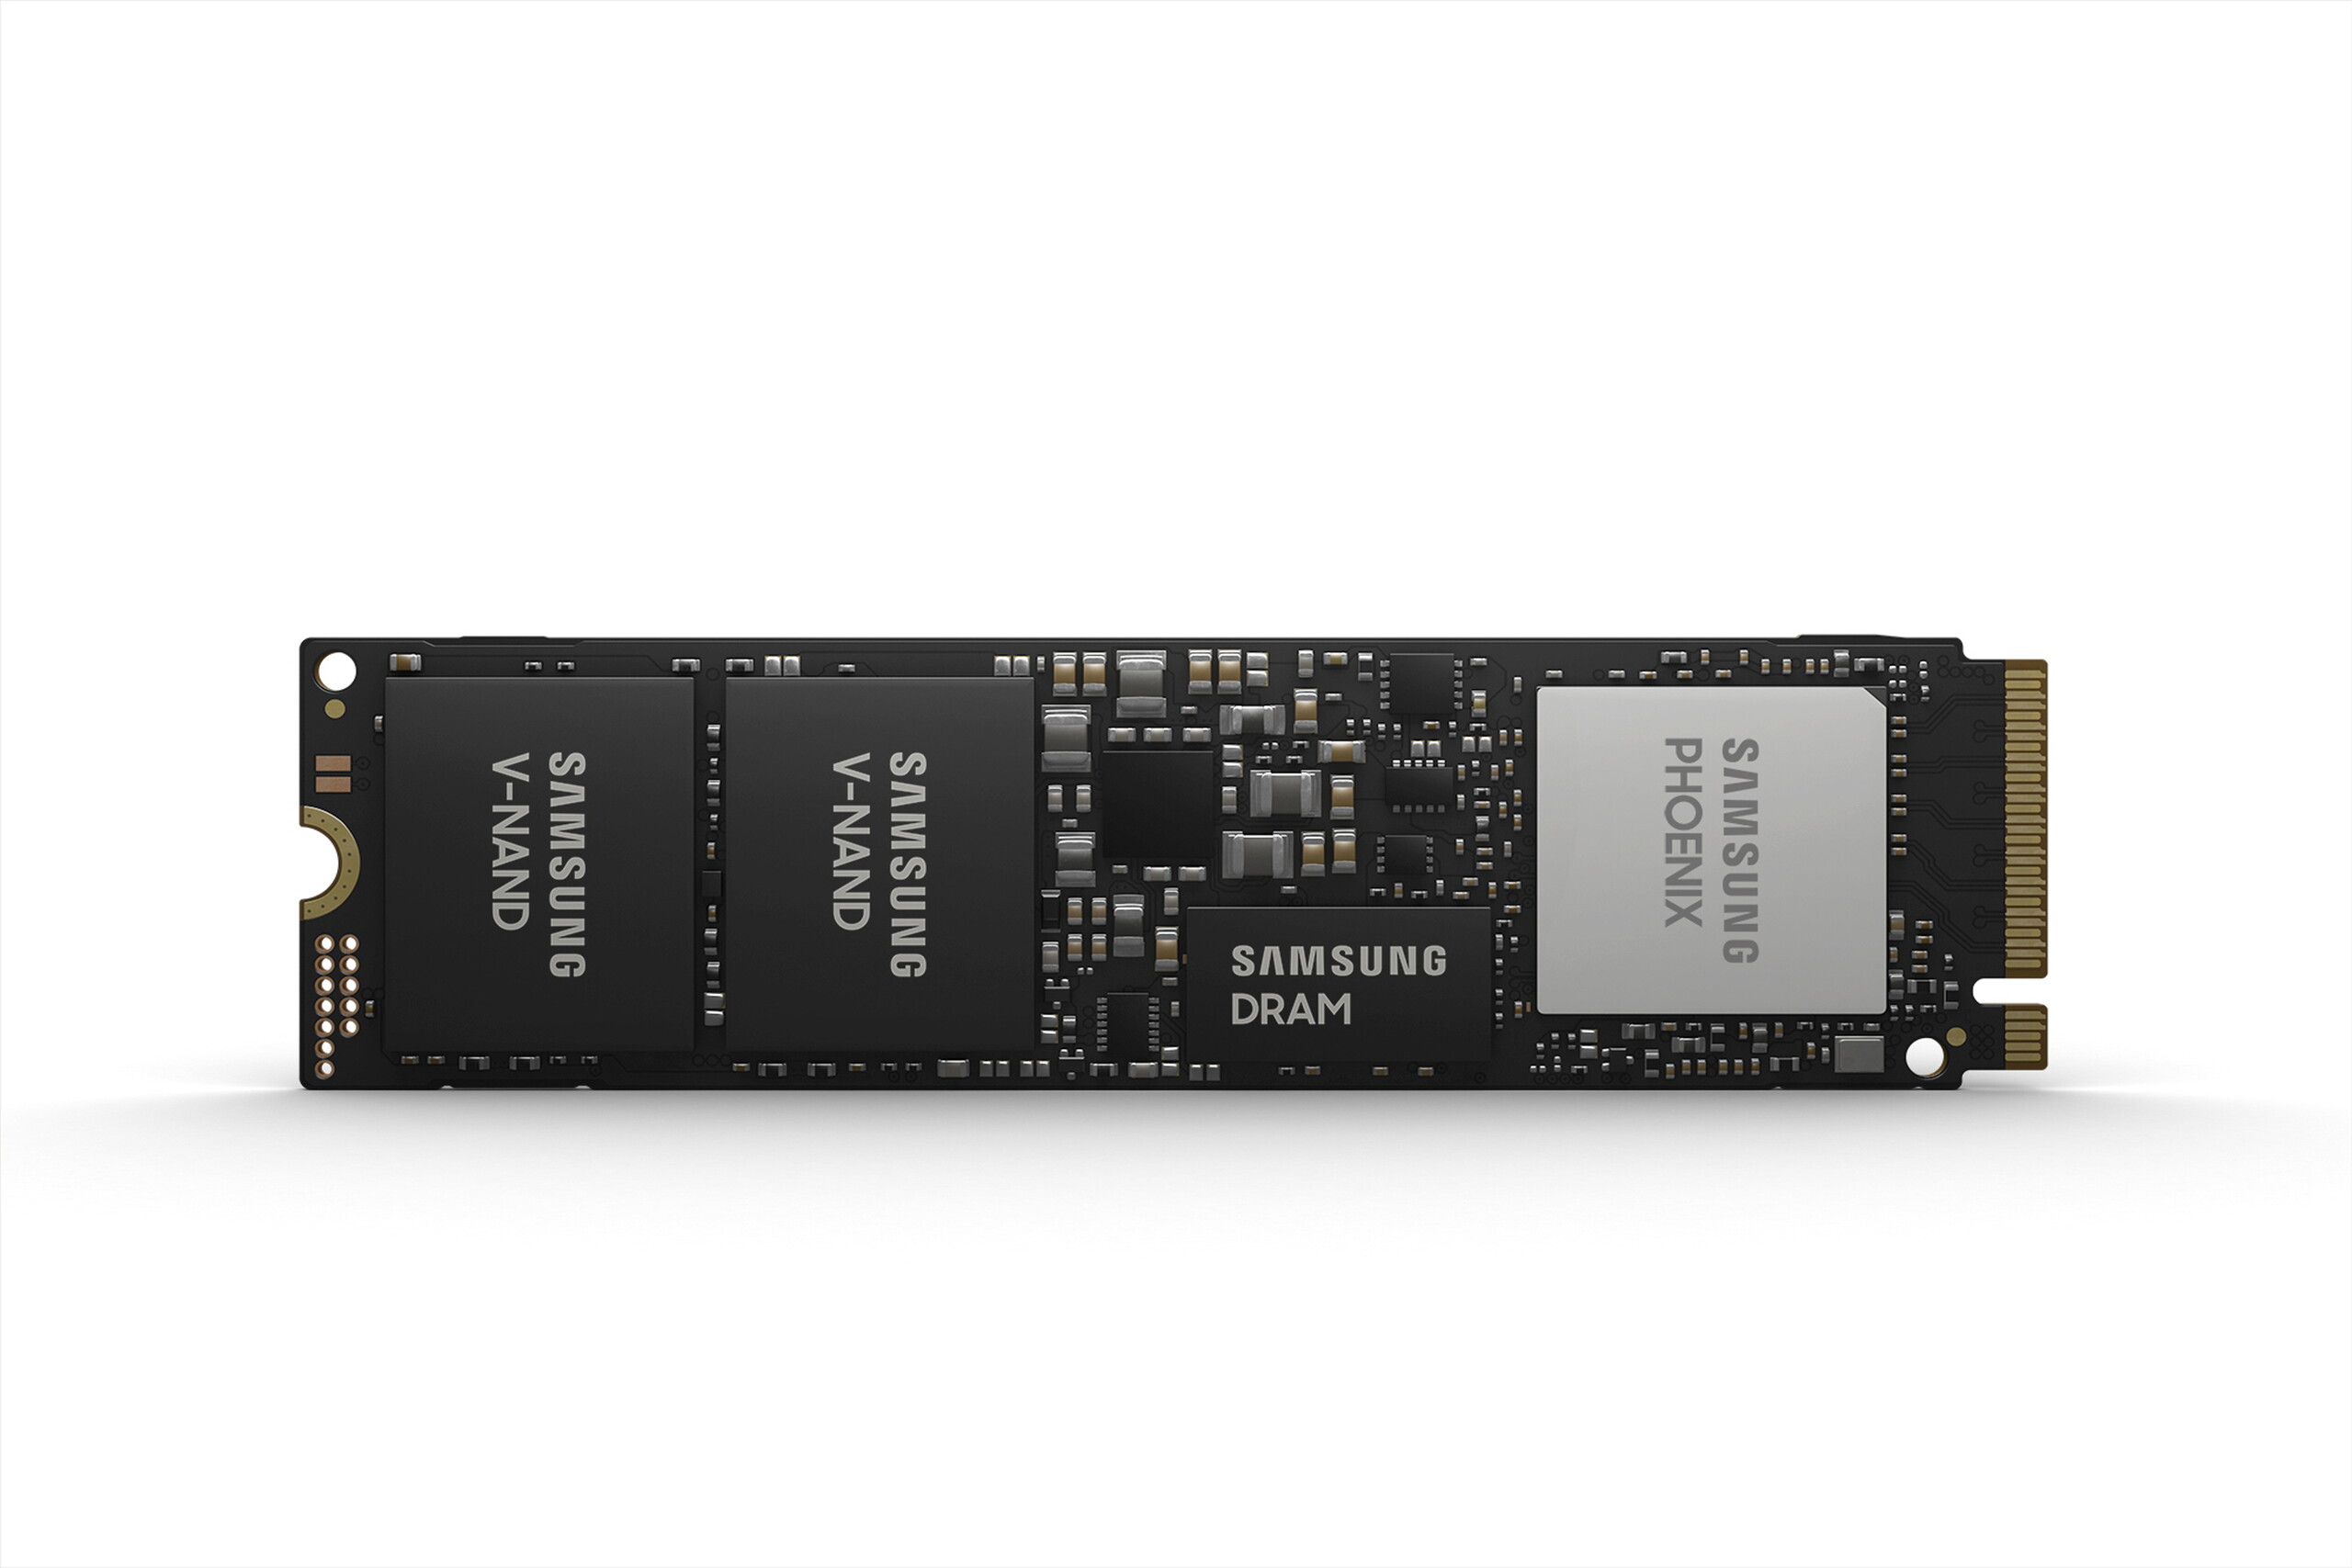
All Plus models use the NVMe v1.3 protocol and can access up to 4 PCIe lanes (Gen. 3). Samsung has used the advanced V5 NAND 3-bit MLC (TLC) memory, with the company reserving its 2-bit cells for its more expensive Pro series. More bits per cell allow for higher storage capacities at lower costs, although this may impact on durability and performance.
Additionally, Samsung has further optimised the Phoenix controller firmware and has applied a nickel coating around the controller, which should provide optimal heat dissipation. Moreover, the company continues to implement its TurboWrite technology, which reserves a faster SLC buffer and intelligently expands it when needed. This feature remains untouched compared to the standard version of the Evo.
Unlike SATA SSDs, M.2 2280 drives produce less waste heat, so maintaining low operating temperatures is even more important to avoid performance degradation or shortening the life of your drive. Samsung has improved the firmware of its Dynamic Thermal Guard too, which should give the Plus SSD an advantage over the standard Evo. The company claims that this should help deliver more consistent performance under heavy load scenarios too.
Power Consumption
According to Samsung, the 970 Evo Plus should consume only 30 mW in idle, which rises to 5 W under load for the 250-GB model and 6 W for the 1-TB version when writing data. The SSD should also consume between 5 and 5.5. W when reading data.
Warranty & Durability
The 970 Evo Plus comes with a 5-year limited warranty. The limit refers to the total GBs that the drive has written. Samsung affords a 150-TB write limit for the 250-GB model, a 300- TB limit for the 500-GB model and a 600-TB limit for the 1-TB model. The warranty will expire prematurely if you write more than the specified limits before the 5-year warranty period, but the warranty will not last until you exceed the write limits.
Test System
We used the Alienware 13 R3 as our test system. The centrepiece is its Intel Core i5 6300HQ Skylake processor. The Alienware 13 R3 has 16 GB of RAM and an NVIDIA GeForce GTX 1060 GPU. Dell also pre-installs Windows 10 64-bit as the default OS.
We installed our test 970 Evo Plus in the second M.2 slot, which can access up to 4 PCIe lanes.
Synthetic Benchmarks
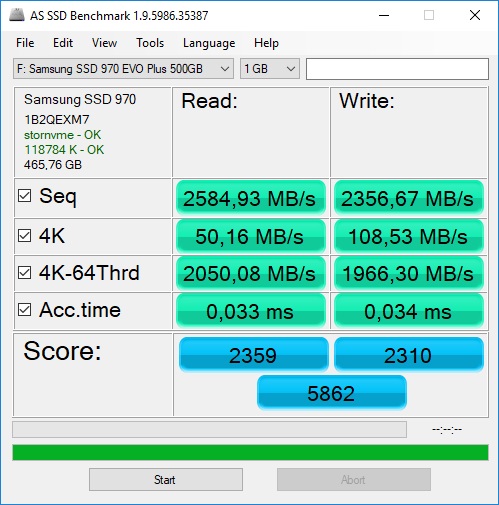
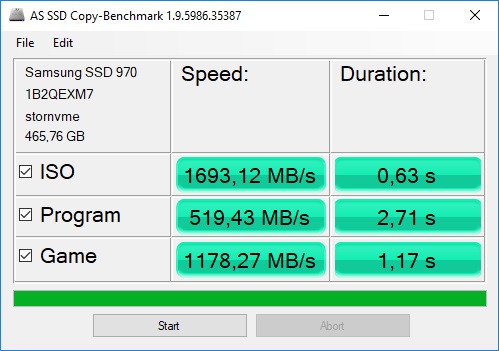
AS SSD & CrystalDiskMark
AS SSD and CrystalDiskMark certify that the 970 Evo Plus has excellent transfer speeds. Our test drive averaged 16% faster transfer speeds than the 970 Evo in AS SSD and is 9% faster than the 970 Pro.
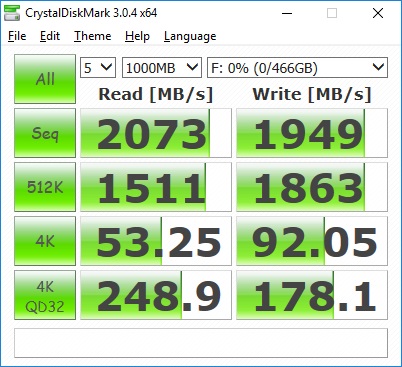
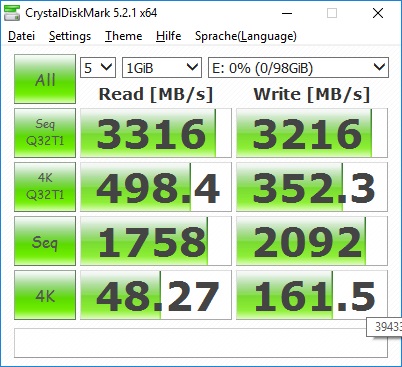
The performance difference in CrystalDiskMark is narrower though. The 970 Pro averaged 7% faster transfer speeds than the 970 Evo Plus in CrystalDiskMark v3, although we lack the data for the standard 970 Evo, so we cannot compare the performance for this benchmark. However, the 970 Evo Plus finished 22% ahead of the 970 Evo in CrystalDiskMark 5, and 17% beyond the 970 Pro.
Samsung clearly has done a good job at optimising the 970 Evo Plus, at least according to these two synthetic tests.
| Samsung SSD 970 Evo Plus 500 GB | Samsung SSD 970 EVO 500GB | Samsung SSD 970 Pro 512GB | Samsung SSD 860 QVO 1TB | Samsung SSD 960 Evo 250GB m.2 NVMe | |
|---|---|---|---|---|---|
| AS SSD | -16% | -9% | -57% | -42% | |
| Copy Game MB/s (MB/s) | 1178 | 1128 -4% | 316.7 -73% | 833 -29% | |
| Copy Program MB/s (MB/s) | 519 | 400.8 -23% | 234.4 -55% | 355.8 -31% | |
| Copy ISO MB/s (MB/s) | 1693 | 1957 16% | 401.6 -76% | 1198 -29% | |
| Score Total (Points) | 5862 | 4666 -20% | 4269 -27% | 1106 -81% | 3614 -38% |
| Score Write (Points) | 2310 | 2237 -3% | 1925 -17% | 444 -81% | 1195 -48% |
| Score Read (Points) | 2359 | 1612 -32% | 1551 -34% | 430 -82% | 1637 -31% |
| Access Time Write * (ms) | 0.034 | 0.033 3% | 0.03 12% | 0.03 12% | 0.052 -53% |
| Access Time Read * (ms) | 0.033 | 0.064 -94% | 0.03 9% | 0.036 -9% | 0.076 -130% |
| 4K-64 Write (MB/s) | 1966 | 1893 -4% | 1593 -19% | 285 -86% | 971 -51% |
| 4K-64 Read (MB/s) | 2050 | 1294 -37% | 1276 -38% | 342.8 -83% | 1352 -34% |
| 4K Write (MB/s) | 108.5 | 113.4 5% | 126.7 17% | 110.2 2% | 71.4 -34% |
| 4K Read (MB/s) | 50.2 | 55.5 11% | 52.8 5% | 35.32 -30% | 30.59 -39% |
| Seq Write (MB/s) | 2357 | 2300 -2% | 2051 -13% | 491.6 -79% | 1522 -35% |
| Seq Read (MB/s) | 2585 | 2630 2% | 2216 -14% | 520 -80% | 2549 -1% |
| CrystalDiskMark 3.0 | 7% | -27% | 10% | ||
| Write 4k QD32 (MB/s) | 178.1 | 208.4 17% | 270.3 52% | 410.2 130% | |
| Read 4k QD32 (MB/s) | 248.9 | 296.5 19% | 308.8 24% | 480.8 93% | |
| Write 4k (MB/s) | 92.1 | 112.6 22% | 121.5 32% | 77.4 -16% | |
| Read 4k (MB/s) | 53.3 | 52.2 -2% | 36.86 -31% | 34.36 -36% | |
| Write 512 (MB/s) | 1863 | 1979 6% | 504 -73% | 1246 -33% | |
| Read 512 (MB/s) | 1511 | 1639 8% | 429.1 -72% | 1088 -28% | |
| Write Seq (MB/s) | 1949 | 1840 -6% | 513 -74% | 1563 -20% | |
| Read Seq (MB/s) | 2073 | 1859 -10% | 541 -74% | 1920 -7% | |
| CrystalDiskMark 5.2 / 6 | -22% | -17% | -54% | ||
| Write 4K (MB/s) | 161.5 | 100.4 -38% | 110 -32% | 126.1 -22% | |
| Read 4K (MB/s) | 48.27 | 41.6 -14% | 51.5 7% | 36.74 -24% | |
| Write Seq (MB/s) | 2092 | 1407 -33% | 1829 -13% | 517 -75% | |
| Read Seq (MB/s) | 1758 | 1376 -22% | 1837 4% | 545 -69% | |
| Write 4K Q32T1 (MB/s) | 352.3 | 279.3 -21% | 209.9 -40% | 245.6 -30% | |
| Read 4K Q32T1 (MB/s) | 498.4 | 343.9 -31% | 299.4 -40% | 277.5 -44% | |
| Write Seq Q32T1 (MB/s) | 3216 | 2442 -24% | 2303 -28% | 527 -84% | |
| Read Seq Q32T1 (MB/s) | 3316 | 3524 6% | 3559 7% | 556 -83% | |
| Total Average (Program / Settings) | -19% /
-18% | -6% /
-7% | -46% /
-48% | -16% /
-23% |
* ... smaller is better
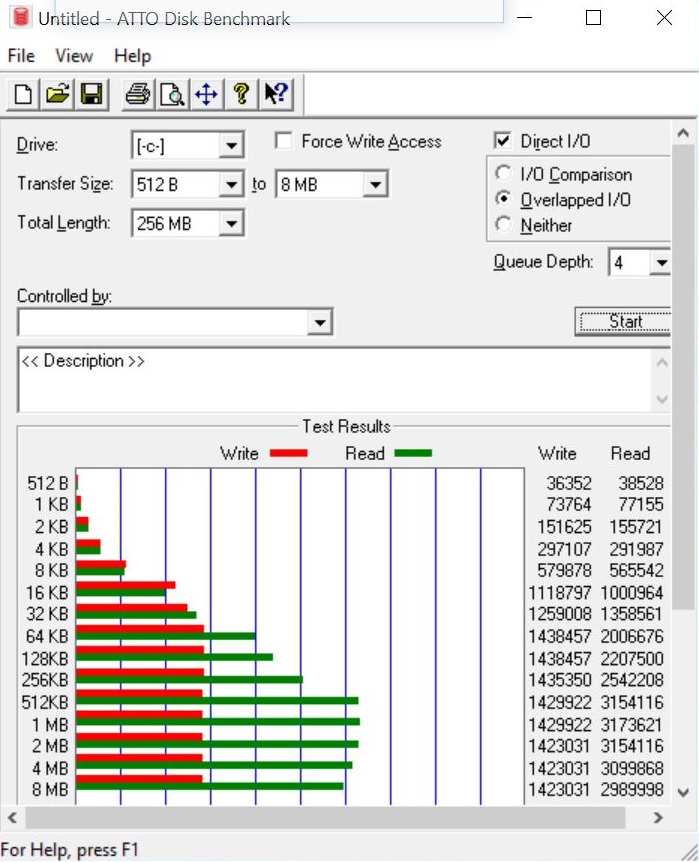
ATTO
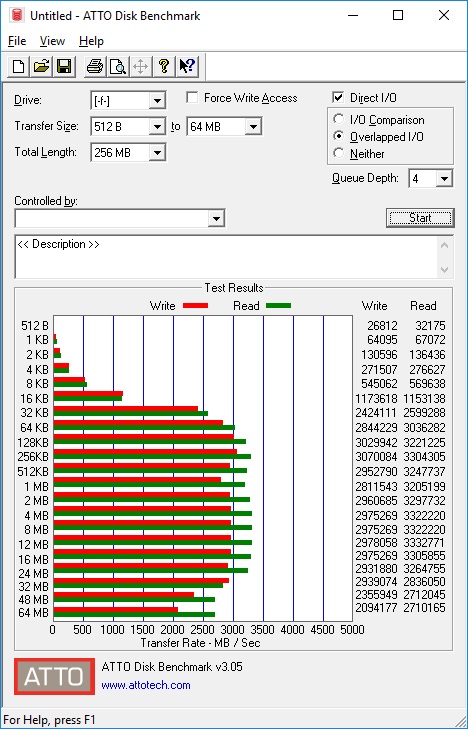
The 970 Evo Plus also scored highly in the ATTO benchmark. Unfortunately, we lack comparable values for the 970 Evo and the 970 Pro, which is why we can only compare the 970 Evo Plus against last generation’s 960 Pro.
ATTO also demonstrates the extent to which Samsung has improved write speeds between generations. The 960 Pro can keep up with the 970 Evo Plus on read speeds, it cannot compete with the newer drive’s write speeds though. The differences between the 960 Evo and the 970 Evo Plus are even greater. However, the speed improvements are mainly write-based, with the increases in read speeds being somewhat limited.
| Samsung SSD 970 Evo Plus 500 GB | Samsung SSD 960 Pro 1TB m.2 NVMe | Samsung SSD 960 Evo 250GB m.2 NVMe | |
|---|---|---|---|
| ATTO Disk Benchmark | -12% | -22% | |
| 1024KB read (KB/s) | 2811540 | 3263860 16% | 3173620 13% |
| 2048KB read (KB/s) | 2960680 | 3026480 2% | 3154120 7% |
| 4096KB read (KB/s) | 2975270 | 3019900 2% | 3099870 4% |
| 8192KB read (KB/s) | 2975270 | 2960680 0% | 2990000 0% |
| 1024KB write (KB/s) | 3205200 | 2100230 -34% | 1429920 -55% |
| 2048KB write (KB/s) | 3297730 | 2090010 -37% | 1423030 -57% |
| 4096KB write (KB/s) | 3322220 | 2090010 -37% | 1423030 -57% |
| 8192KB write (KB/s) | 3322220 | 2079890 -37% | 1423030 -57% |
| 16KB write (KB/s) | 1153140 | 1102410 -4% | 1118800 -3% |
| 16KB read (KB/s) | 1173620 | 1257110 7% | 1000960 -15% |
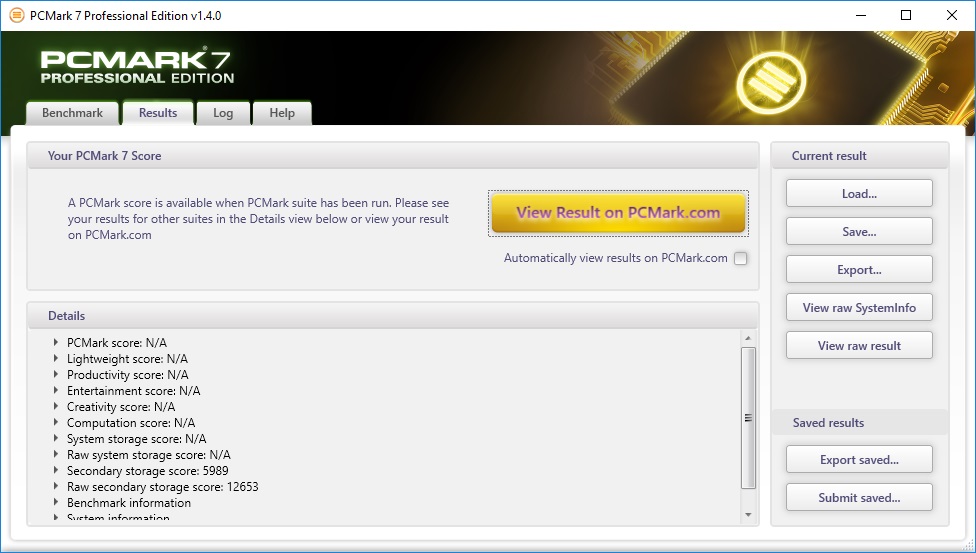
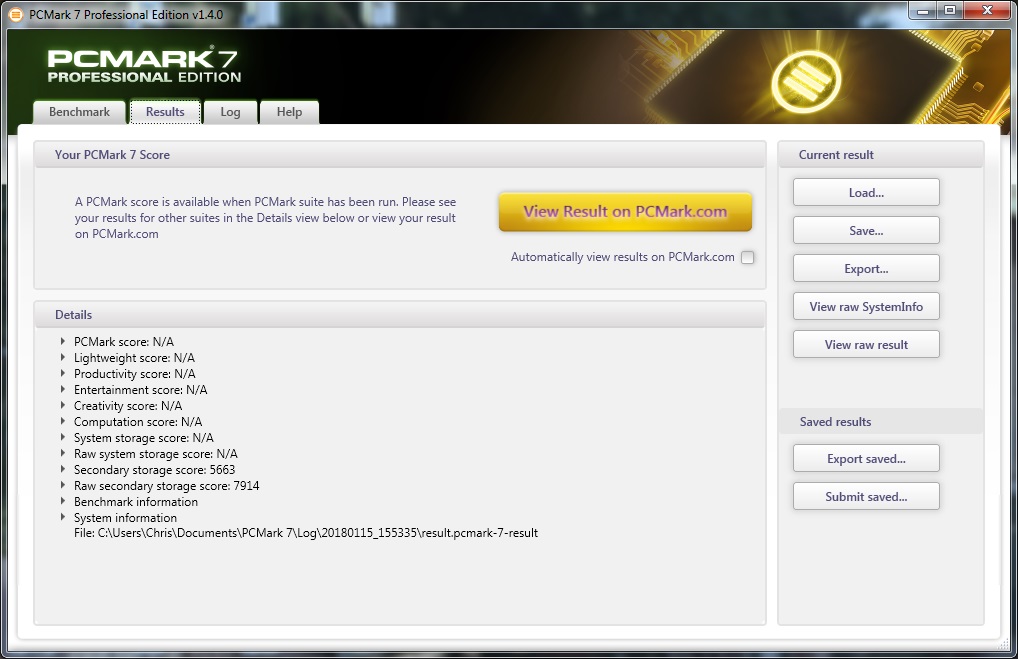
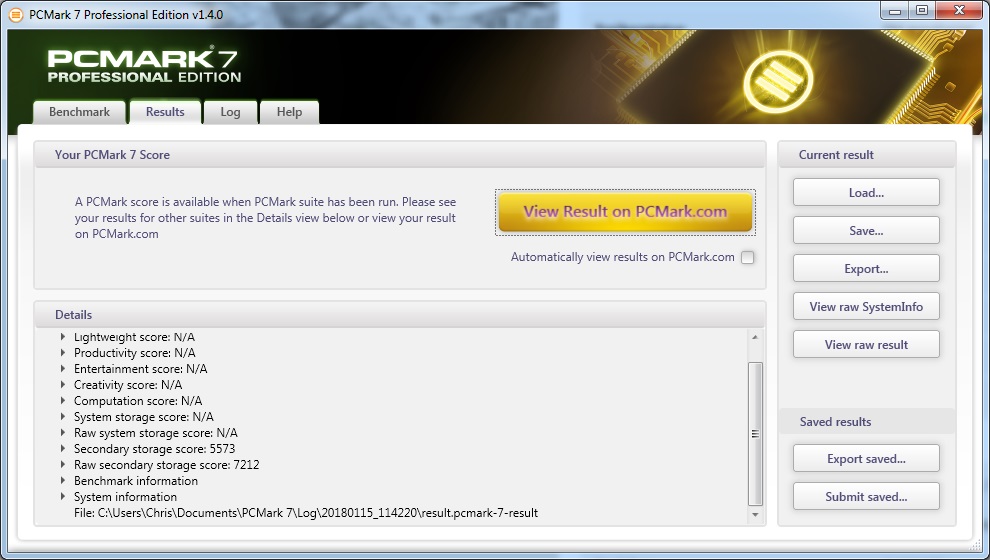
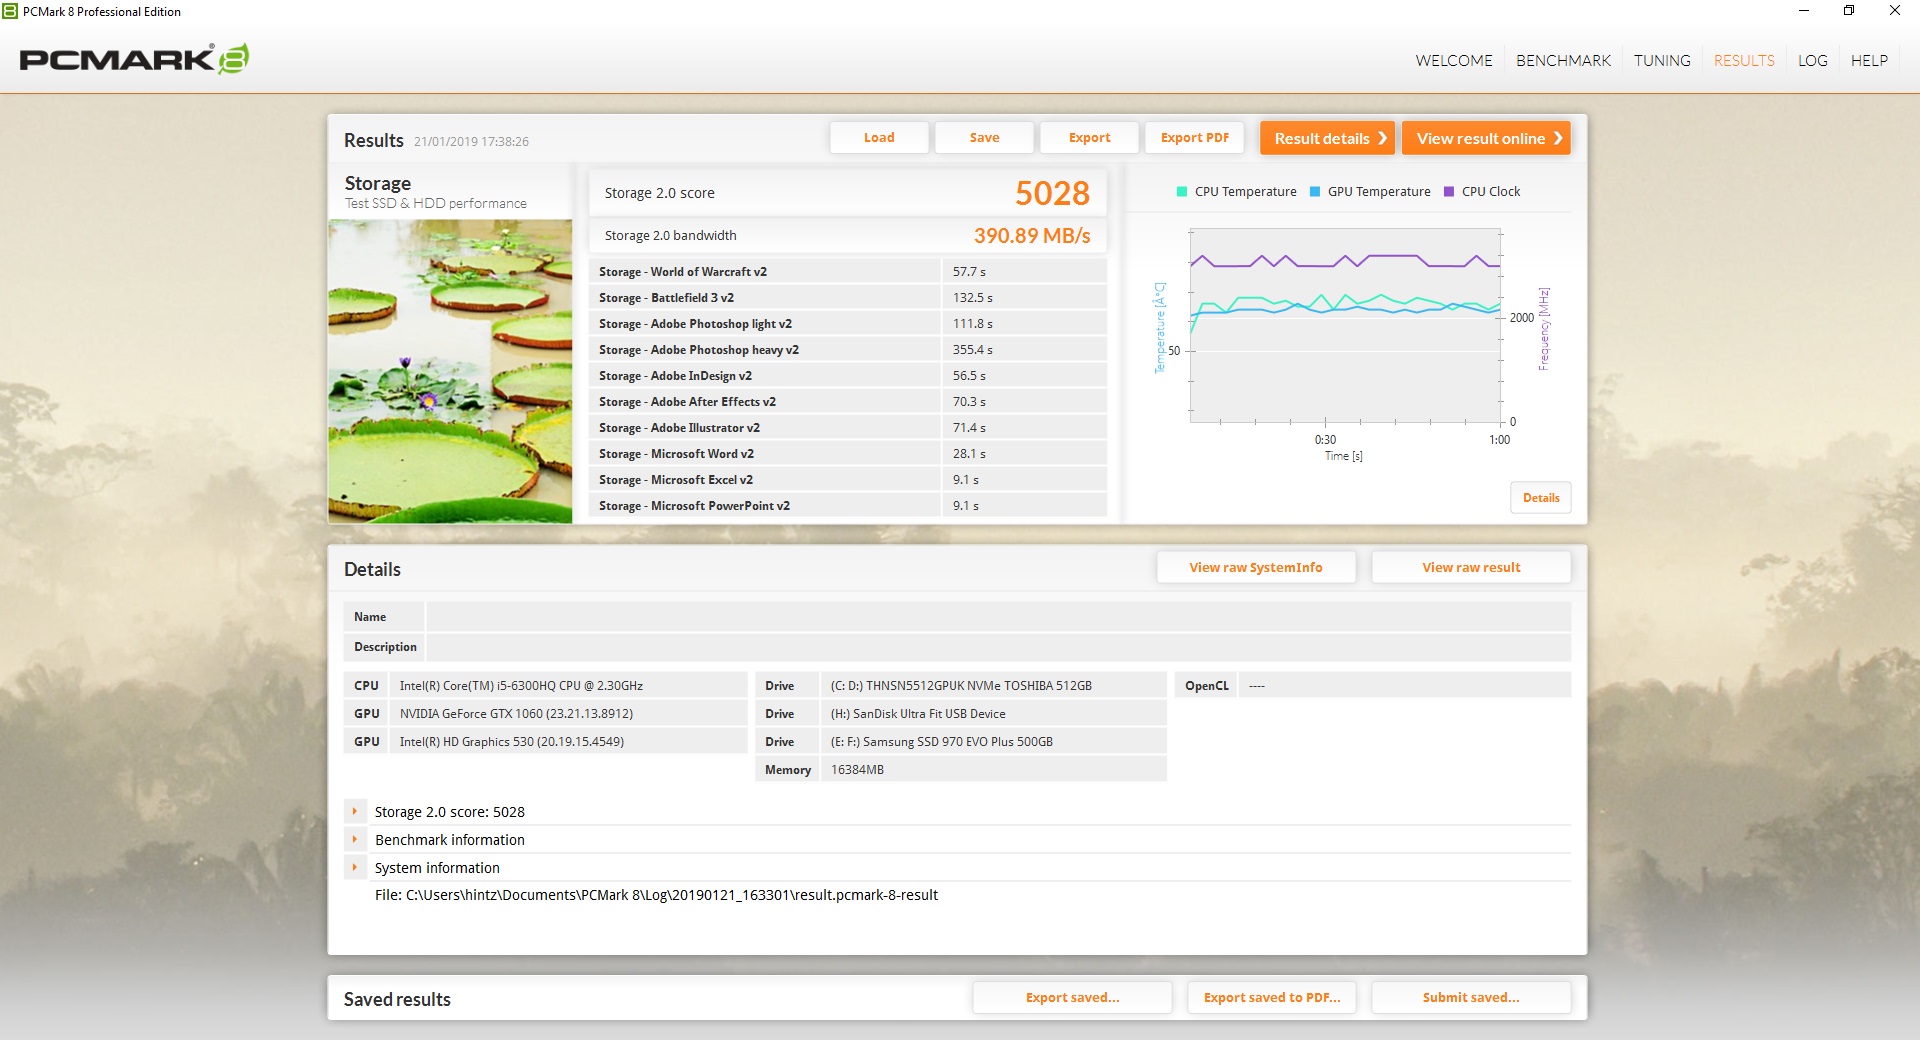
PCMark
PCMark 7 and 8 scores are roughly comparable to last generation’s SSDs though. On first glance, the secondary storage scores have changed only marginally between generations, which explains the PCMark scores that has increased slightly. By contrast, raw secondary storage scores have more than doubled compared to the 860 generation.
| Test \ Modell | 970 Evo Plus | 860 Evo | 860 Pro | Test \ Modell | 970 Evo Plus | 860 Evo | 860 Pro | |
| PCMark 7 | -13% |
-21% |
PCMark 8 | |||||
| Secondary Storage | 5989 |
5573 -7% |
5663 -5% |
Storage Score V2 | 5028 |
4999 -1% |
5007 |
|
| Raw Sec. Storage | 12653 |
7212 -43% |
7914 -37% |
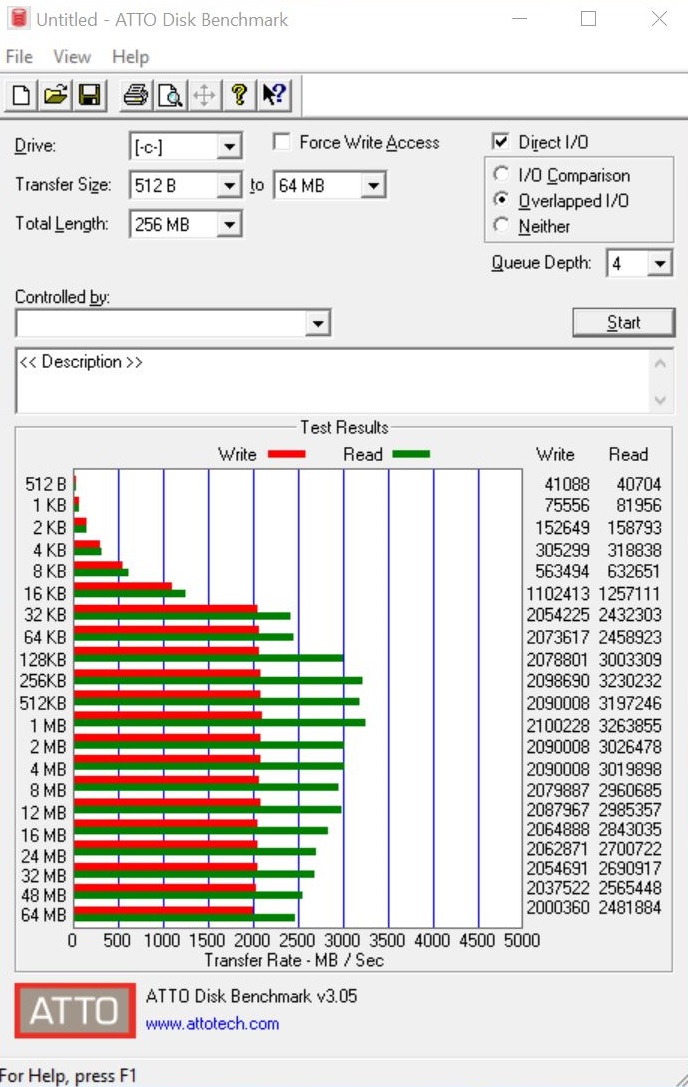
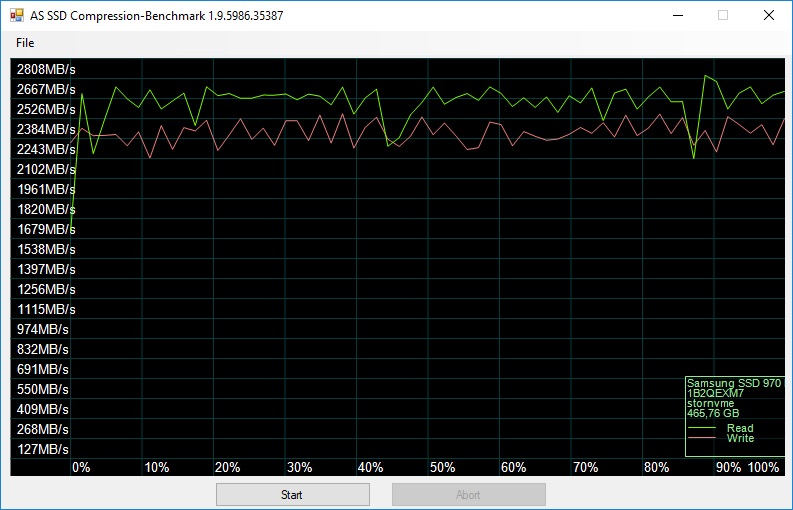
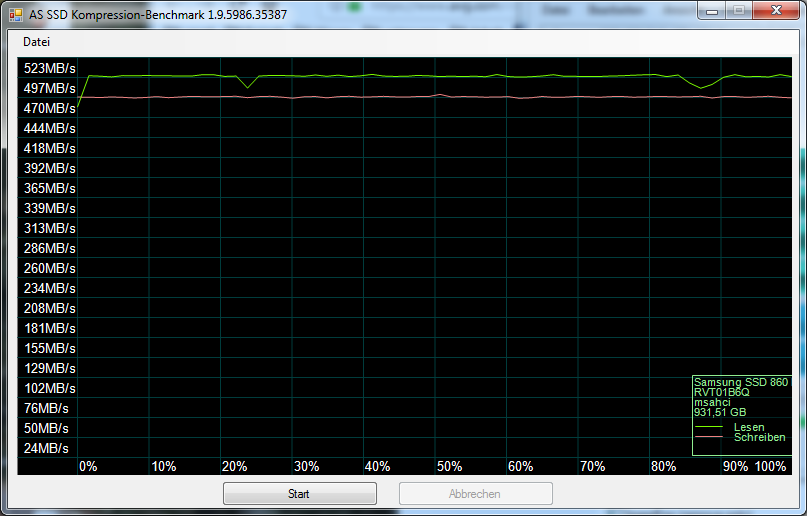
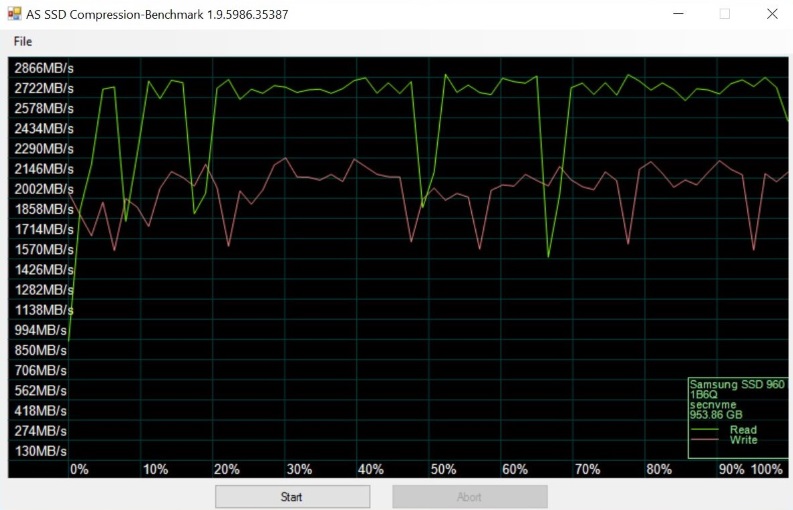
Data Compression
There are two notable changes regarding data compression. Firstly, Samsung has made it easier to maintain peak performance constant, at least compared to the 860 Pro. Fluctuations have continued to reduce, and performance drops have declined too.
Moreover, write speeds have increased again. The 960 Pro still achieves faster read speeds, but the new Evo Plus has significantly higher write speeds. Additionally, our screenshots below demonstrate the difference in compression behaviour between the SATA-based 860 Evo and the PCIe-based 970 Evo Plus.
Verdict
The Samsung 970 Evo Plus is an even better, cheaper alternative to the 970 Pro than last year’s 970 Evo. The new SSD stands out in almost every aspect compared to its predecessor. Samsung has noticeably improved write speeds, although the improvements in read speeds are less pronounced.
Samsung has improved upon its already market-leading 970 Evo. The 970 Evo Plus leads the way of consumer-grade SSDs and has improved upon its predecessor in all the right places.
The 970 Evo Plus currently costs around €20 (~$23) more than the 970 Evo for all but the 1-TB version. The 970 Evo Plus is a worthy upgrade in our eyes, but the 970 Evo was already a class-leading SSD, so it is still a valid option for most people. It will be interesting to see how prices for the two drives fluctuate with the impending reduction in flash storage costs though.

