Samsung 860 Evo and Samsung 860 Pro SSD (SATA) Review

Just last December we tested the new and fast Samsung 960 Evo and 960 Pro NVMe SSDs for the M.2 interface. Now the manufacturer has supplied us with test samples for the new SATA 3 860 Evo and 860 Pro models. At least on paper M.2 SSDs with NVMe protocol offer significantly higher data transfers than SATA 3 SSDs with AHCI protocol. However, the M.2 interface is not yet integrated in every PC and although in many notebooks there is already M.2, it is only with the slower SATA instead of NVMe connection.
Unlike the 960 Series, Samsung's new 860 Series feature the old interface, giving all mainstream users without NVMe-M.2 connectivity a fast upgrade option by using the new storage devices to take advantage of the interface. Compared to conventional hard disks, they also offer a huge speed advantage. The difference to the faster NVMe models is usually more measurable than noticeable, unless you transfer large amounts of data every day.
The two test models offer a capacity of 1 TB, but the series also includes sizes from 250 GB to 4 TB. We have the two new models compete against each other. We are also throwing the two predecessor models into the test ring. For the sake of illustration, the Samsung 960 Pro is included in the comparison group to illustrate the differences between the two interfaces.
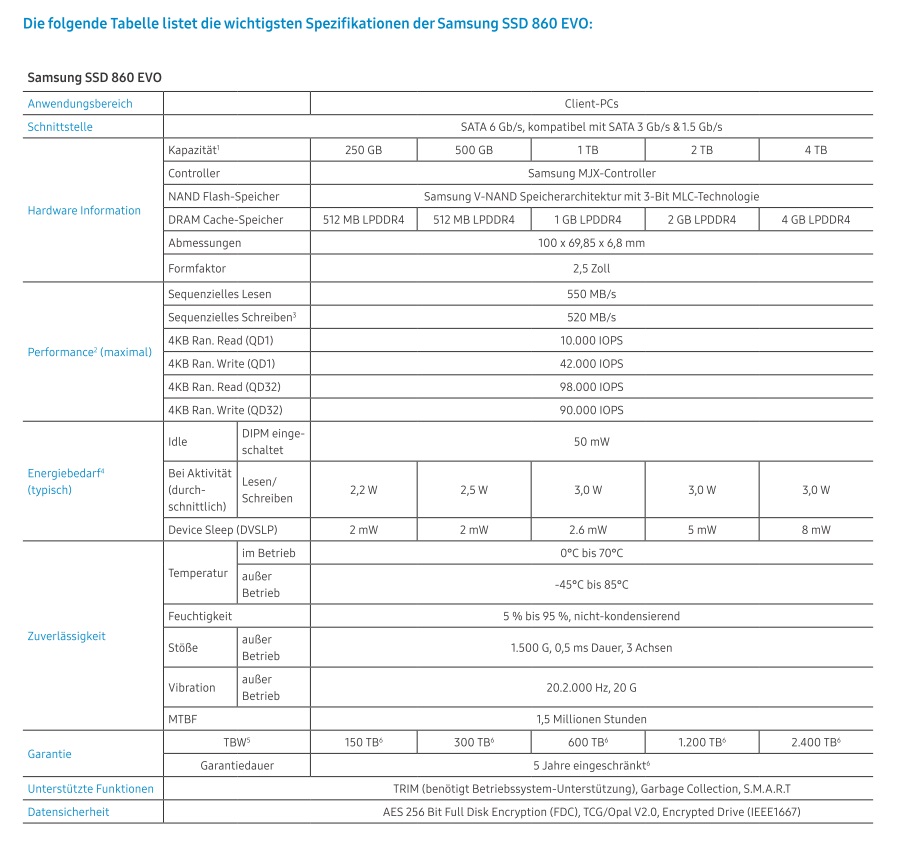
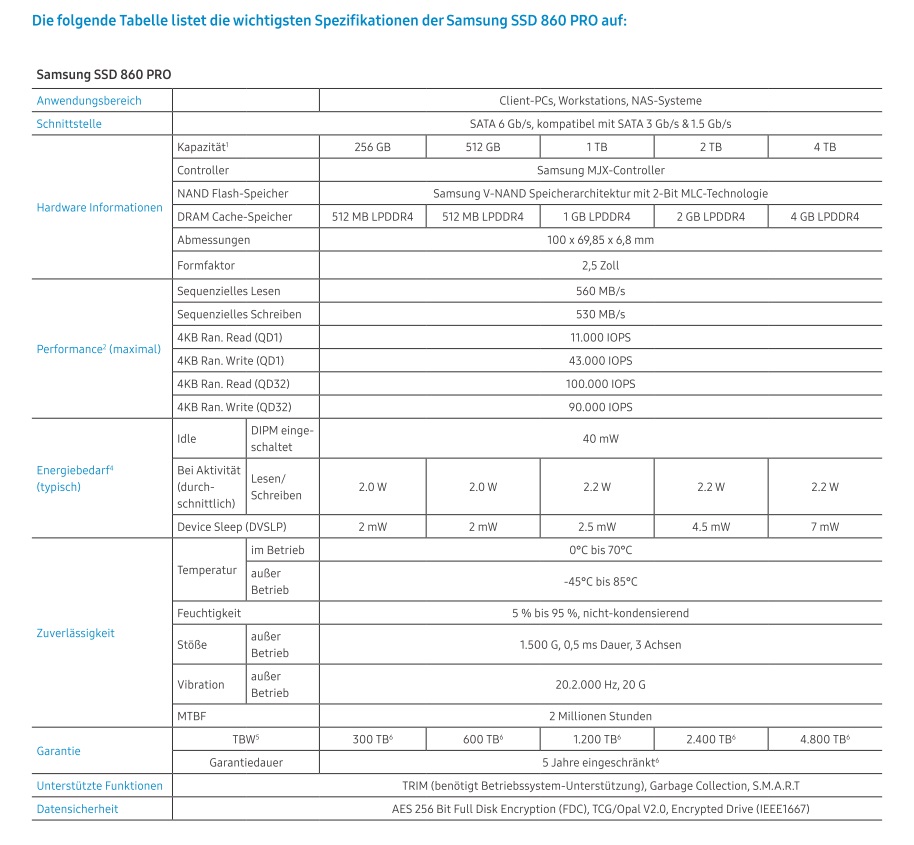
| Model | Samsung 860 Evo | Samsung 860 Pro |
| Storage capacity in GB | 250 / 500 / 1.000 / 2.000 / 4.000 | 256 / 512 / 1024 / 2048 |
| Prices in Euro | 109,99 / 189,99 / 369,99 / 729,99 / 1.559,99 | 145,90 / 259,90 / 499,90 / 989,90 |
In terms of storage technology, both 860 models are equipped with 3D-V-NAND. The 860 Evo offers a 3-bit TLC memory, while the Pro version is set to 2-bit MLC. The 2-bit MLC memory potentially increases speed and longevity even further. However, the Evo version is cheaper. Samsung grants a 5-year limited manufacturer's warranty for both models.
In contrast to the predecessor, the continuous power capability is said to have increased by 25% (Pro) and 50% (Evo), respectively. The total write data volumes increase by a factor of up to eight times of the 850 series, up to 2,400 TB TBW (Total Bytes Written) for the Evo and up to 4,800 TB TBW for the Pro. The figures for the maximum gain refer to the models with 4 TB. In the case of the 1 TB variant, the total amount of write data still increases fourfold and the increase for the smaller models declines correspondingly.
Test System
Our test system is led by an Intel Core i5-4570 with four cores and 3.2 GHz clock rate. It has 8 GB of memory and an ASRock H87 mainboard. A GeForce GTX 770 ensures the graphics performance and the operating system is Windows 10 Home 64-bit. The desktop PC Storage drives are connected via SATA 3, but there are also variants for M.2 2280 SATA and mSATA, which of course are also suitable for notebooks equipped with the respective interfaces.
Synthetic Benchmarks
ATTO vs. AS SSD and CrystalDiskMark
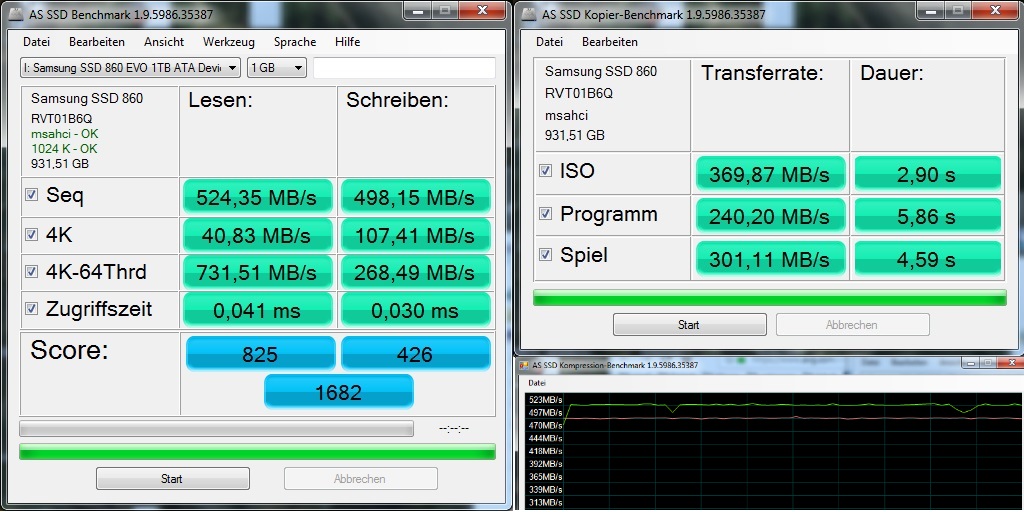
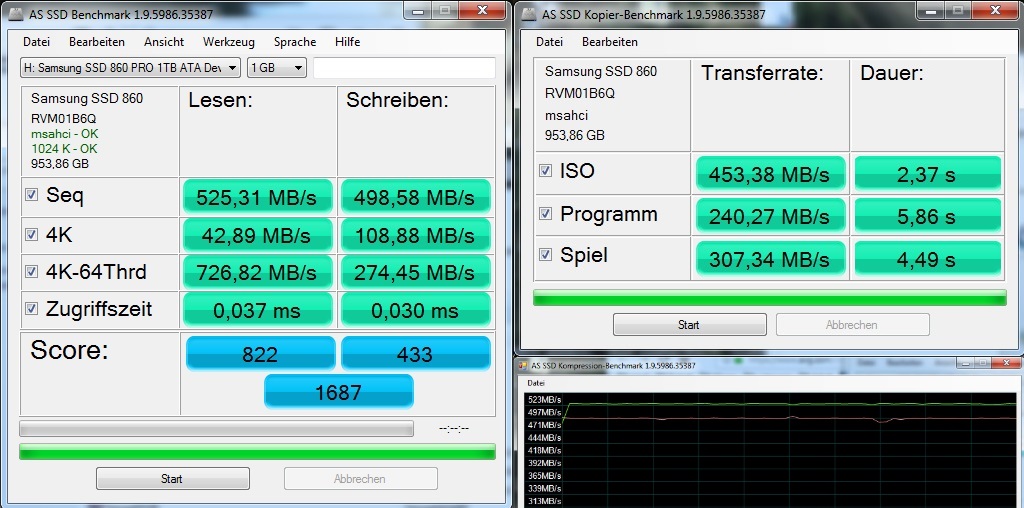
As expected, the new Samsung models deliver good performances, at least for the SATA interface. They can again easily beat the two successful and popular predecessor models. However, the sequential read and write values have not improved significantly. Nevertheless, the general reading score of the respective test software is increasing. This is particularly due to the improved 4K (-64) values.
In addition, access times have also been optimized so that the new Evo can easily pass the old Pro. In this case, the new Pro is even better while the normally better M. 2-SSD 960 Pro comes out worst in terms of access times.
Otherwise, the differences between the two new 860 models are extremely small. Here, too, it becomes clear that the room for improvement is extremely limited. In the 850 series, Evo is still separated by approx. 30% from the Pro. In the 860 series, they are almost equal in terms of overall ranking, with a difference of around 3%.
| Samsung SSD 860 Pro 1TB | Samsung SSD 860 Evo 1TB | Samsung SSD 850 EVO 1TB | Samsung SSD 850 PRO 1TB | Samsung SSD 960 Pro 1TB m.2 NVMe | |
|---|---|---|---|---|---|
| AS SSD | -3% | -32% | -3% | 135% | |
| Copy Game MB/s (MB/s) | 307.3 | 301.1 -2% | 462 50% | 833 171% | |
| Copy Program MB/s (MB/s) | 240.3 | 240.2 0% | 366 52% | 401.8 67% | |
| Copy ISO MB/s (MB/s) | 453.4 | 369.9 -18% | 474 5% | 1292 185% | |
| Score Total (Points) | 1687 | 1682 0% | 1030 -39% | 1186 -30% | 4187 148% |
| Score Write (Points) | 433 | 426 -2% | 398 -8% | 472 9% | 1337 209% |
| Score Read (Points) | 822 | 825 0% | 413 -50% | 465 -43% | 1911 132% |
| Access Time Write * (ms) | 0.03 | 0.03 -0% | 0.049 -63% | 0.032 -7% | 0.052 -73% |
| Access Time Read * (ms) | 0.037 | 0.041 -11% | 0.06 -62% | 0.045 -22% | 0.051 -38% |
| 4K-64 Write (MB/s) | 274.5 | 268.5 -2% | 277.5 1% | 321 17% | 1057 285% |
| 4K-64 Read (MB/s) | 727 | 732 1% | 331.9 -54% | 378 -48% | 1605 121% |
| 4K Write (MB/s) | 108.9 | 107.4 -1% | 73.9 -32% | 101 -7% | 70.4 -35% |
| 4K Read (MB/s) | 42.89 | 40.83 -5% | 29.7 -31% | 35 -18% | 31.74 -26% |
| Seq Write (MB/s) | 498.6 | 498.1 0% | 465.7 -7% | 496 -1% | 2092 320% |
| Seq Read (MB/s) | 525 | 524 0% | 511 -3% | 526 0% | 2738 422% |
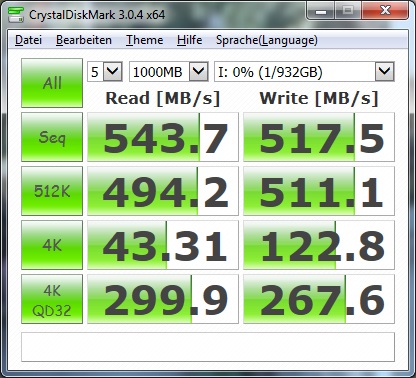
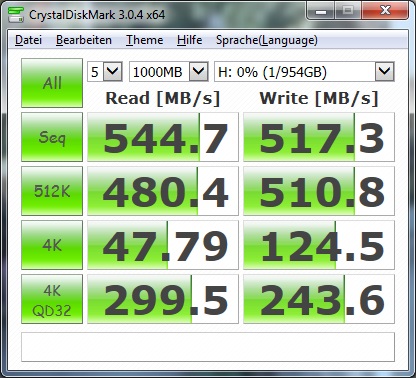
| CrystalDiskMark 3.0 | 0% | -8% | 2% | 138% | |
| Write 4k QD32 (MB/s) | 243.6 | 267.6 10% | 346 42% | 351 44% | 401.8 65% |
| Read 4k QD32 (MB/s) | 299.5 | 299.9 0% | 339.9 13% | 391 31% | 479.9 60% |
| Write 4k (MB/s) | 124.5 | 122.8 -1% | 92 -26% | 116 -7% | 77.5 -38% |
| Read 4k (MB/s) | 47.79 | 43.31 -9% | 35.37 -26% | 38 -20% | 31.61 -34% |
| Write 512 (MB/s) | 511 | 511 0% | 393.2 -23% | 481 -6% | 1728 238% |
| Read 512 (MB/s) | 480.4 | 494.2 3% | 413.1 -14% | 396 -18% | 1261 162% |
| Write Seq (MB/s) | 517 | 518 0% | 439 -15% | 494 -4% | 2087 304% |
| Read Seq (MB/s) | 545 | 544 0% | 485.4 -11% | 528 -3% | 2452 350% |
| Total Average (Program / Settings) | -2% /
-2% | -20% /
-21% | -1% /
-1% | 137% /
136% |
* ... smaller is better
With Atto you can see the big differences to the 960 Pro with NVMe. The two 860 models differ only marginally from each other. A difference of about 9% (due to an outlier!) of both 860 models is compared to a lead of more than 274% of the 960 Pro with NVMe protocol.
| Samsung SSD 860 Pro 1TB | Samsung SSD 860 Evo 1TB | Samsung SSD 960 Pro 1TB m.2 NVMe | |
|---|---|---|---|
| ATTO Disk Benchmark | 0% | 326% | |
| 1024KB read (KB/s) | 563152 | 563151 0% | 3263860 480% |
| 2048KB read (KB/s) | 561841 | 563151 0% | 3026480 439% |
| 4096KB read (KB/s) | 561841 | 563151 0% | 3019900 438% |
| 8192KB read (KB/s) | 561841 | 563151 0% | 2960680 427% |
| 1024KB write (KB/s) | 531555 | 530242 0% | 2100230 295% |
| 2048KB write (KB/s) | 531555 | 532874 0% | 2090010 293% |
| 4096KB write (KB/s) | 532874 | 530242 0% | 2090010 292% |
| 8192KB write (KB/s) | 532140 | 533315 0% | 2079890 291% |
| 16KB write (KB/s) | 458850 | 469762 2% | 1102410 140% |
| 16KB read (KB/s) | 479651 | 480847 0% | 1257110 162% |
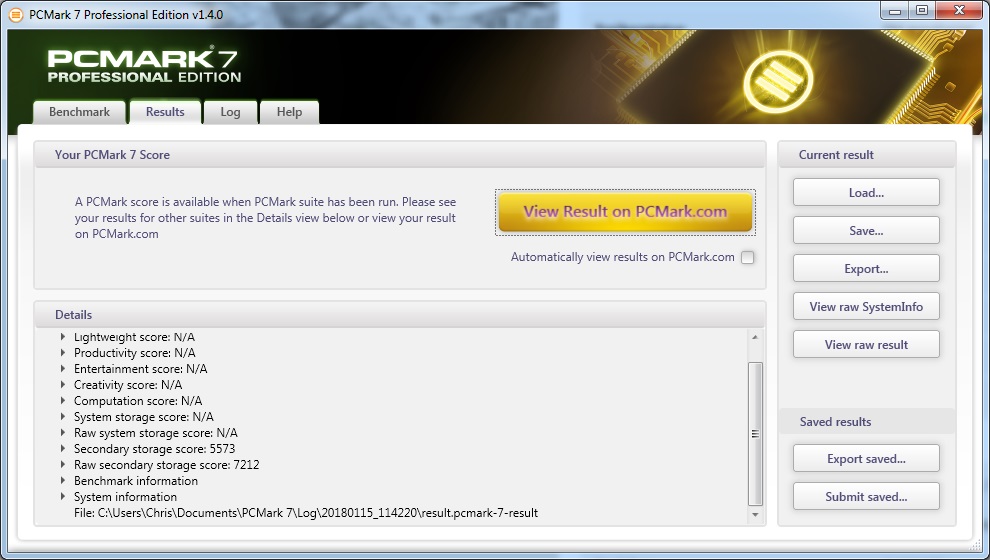
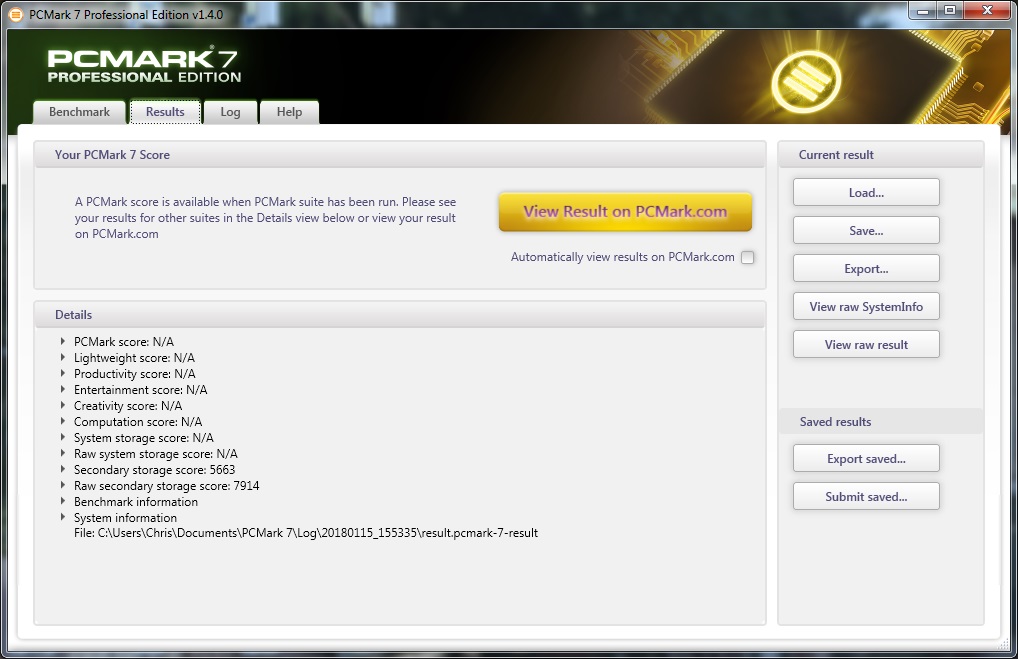
The chart shows that even in PCMark 7 storage, there are only minor differences between the new Evo and the Pro. At 6%, the 860 Pro is slightly ahead of the Evo overall, but it cannot really stand out.
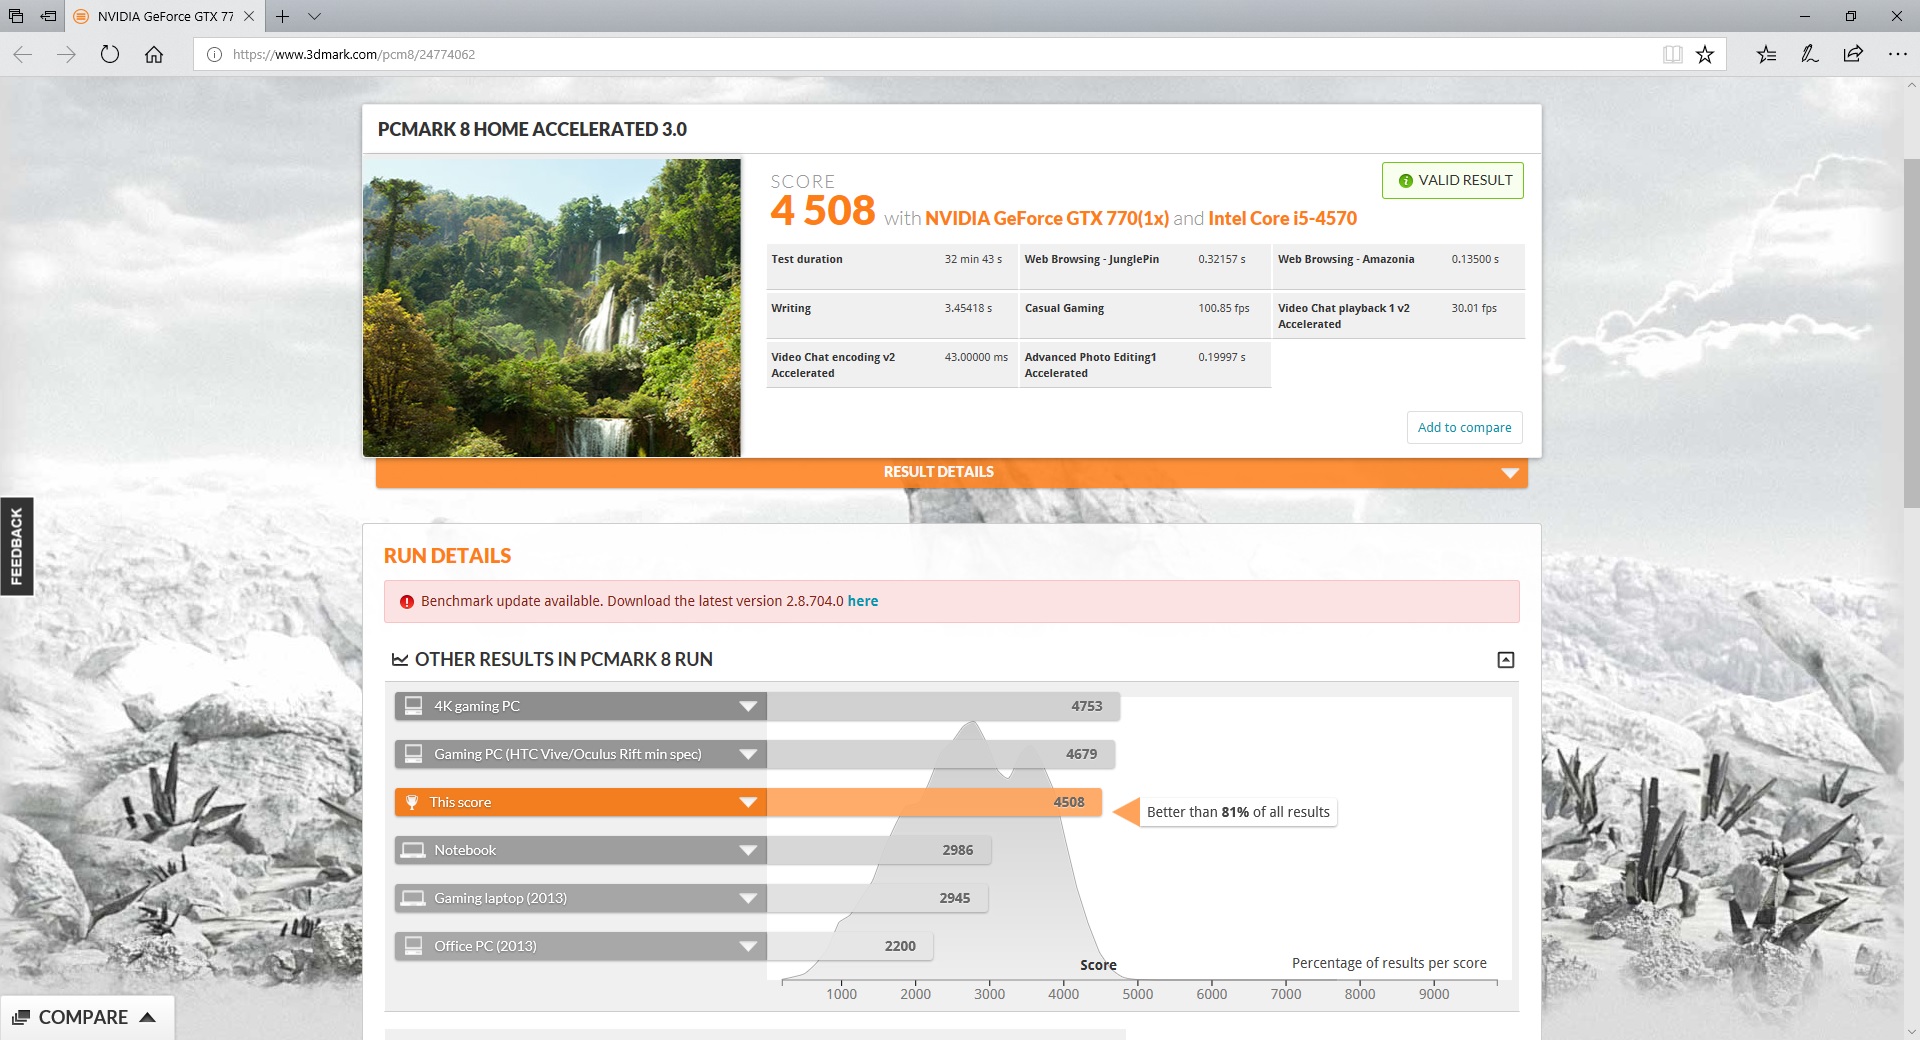
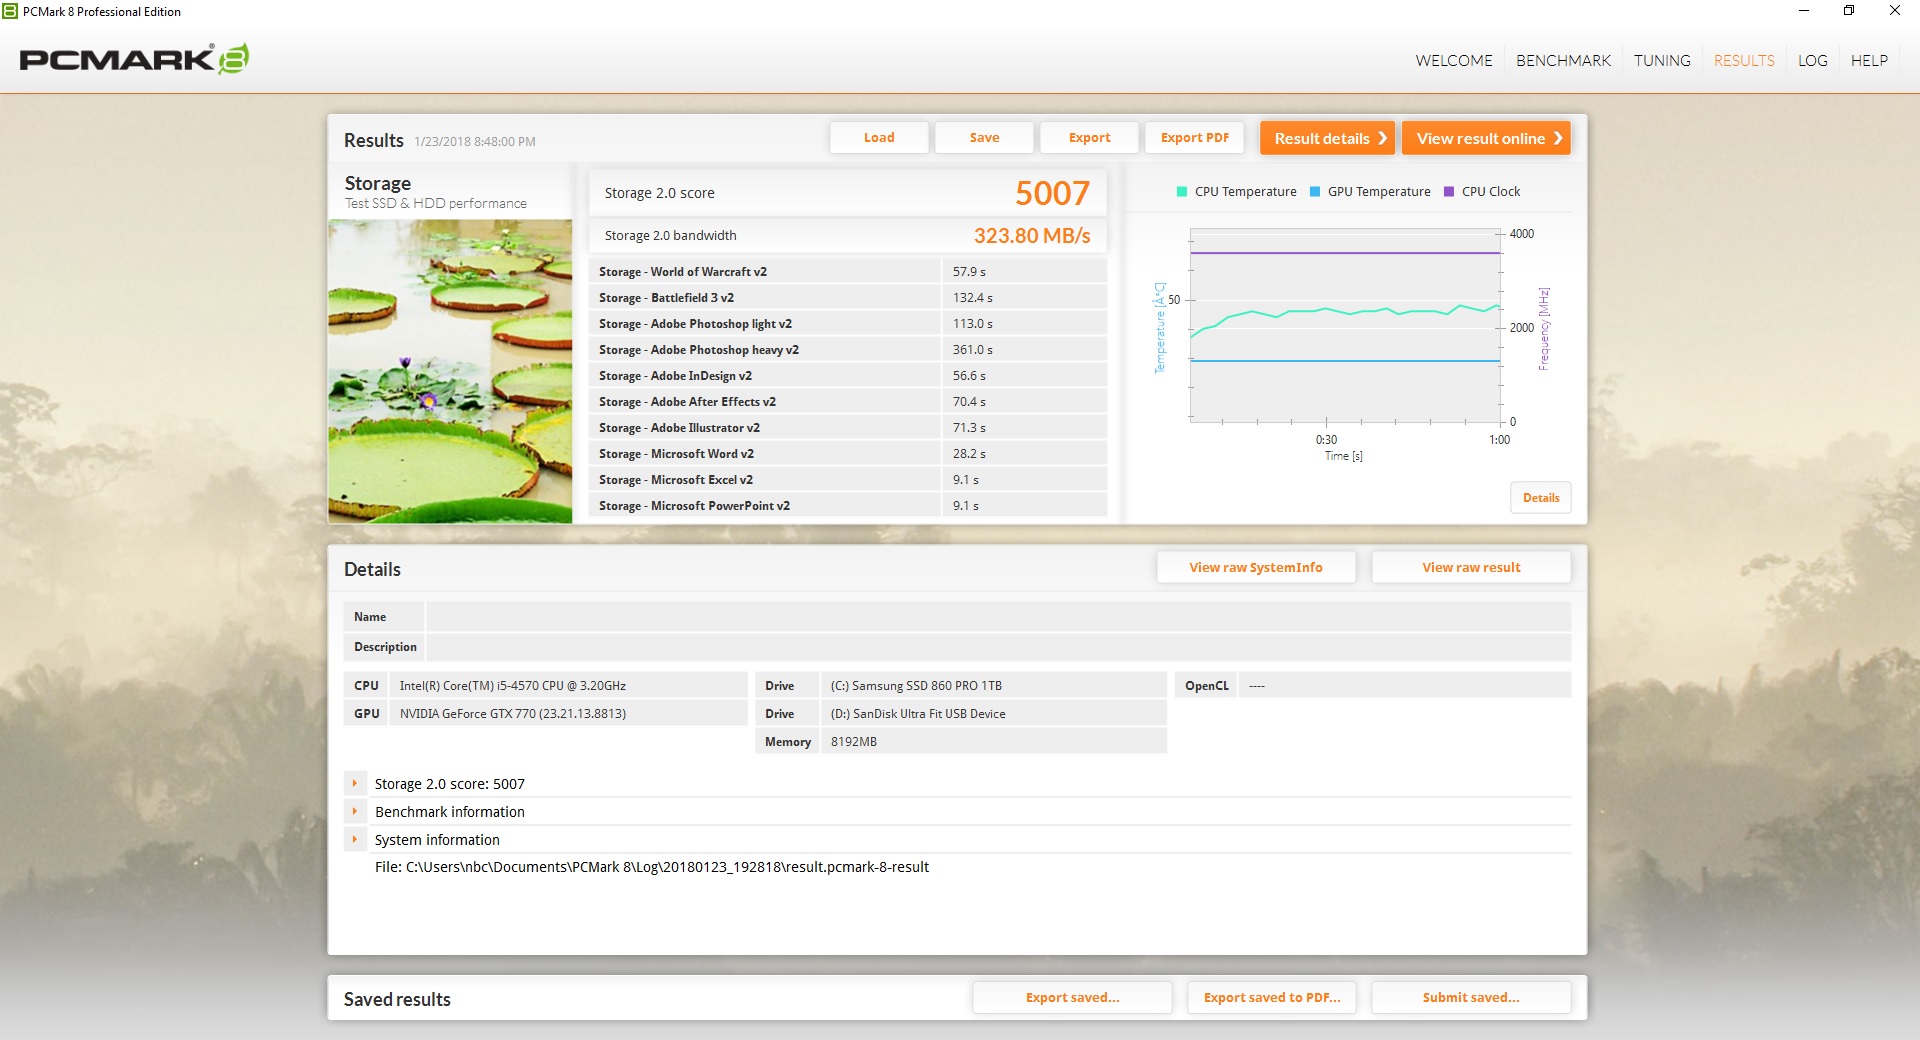
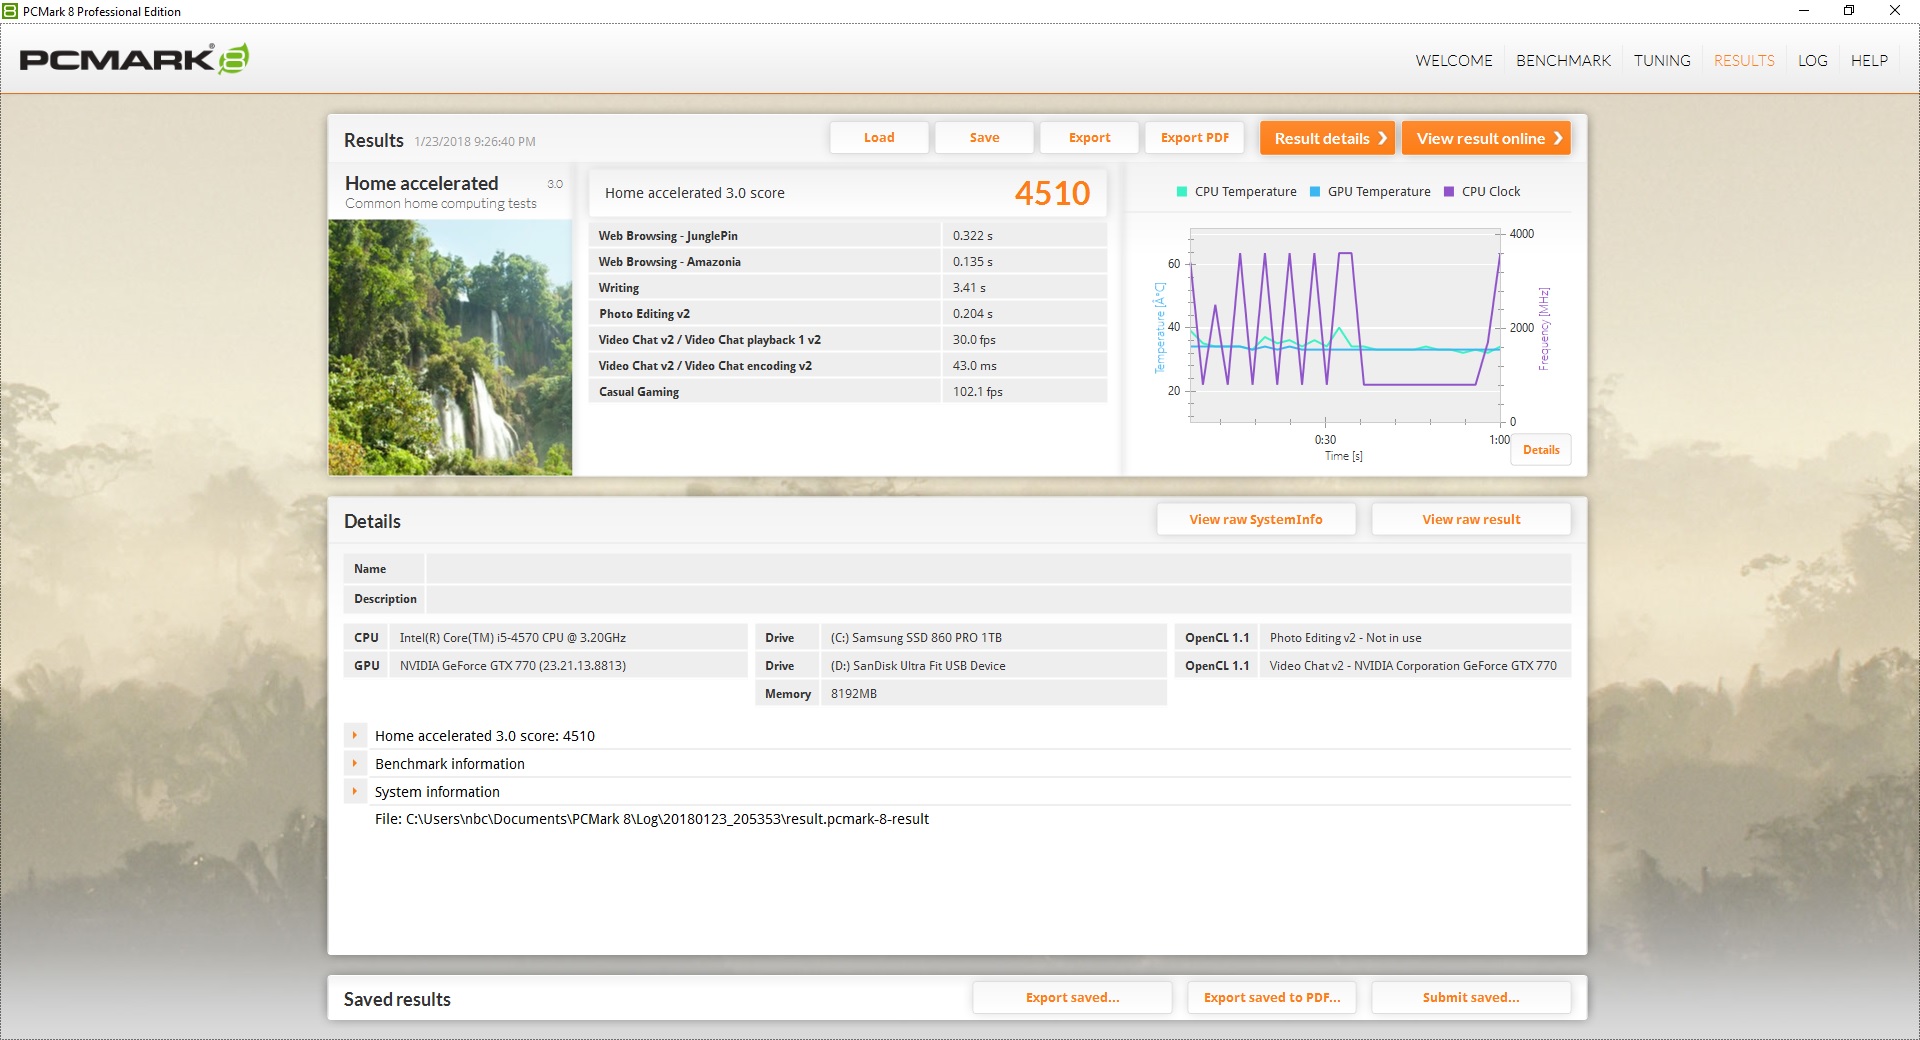
The PCMark 8 benchmark reveals even fewer differences. In the test of the system memory, the 860 Pro has to settle for a single-digit point lead compared to the 860 Evo. The differences in the home score are even smaller with just 2 points. In both cases, the difference is less than 1%.
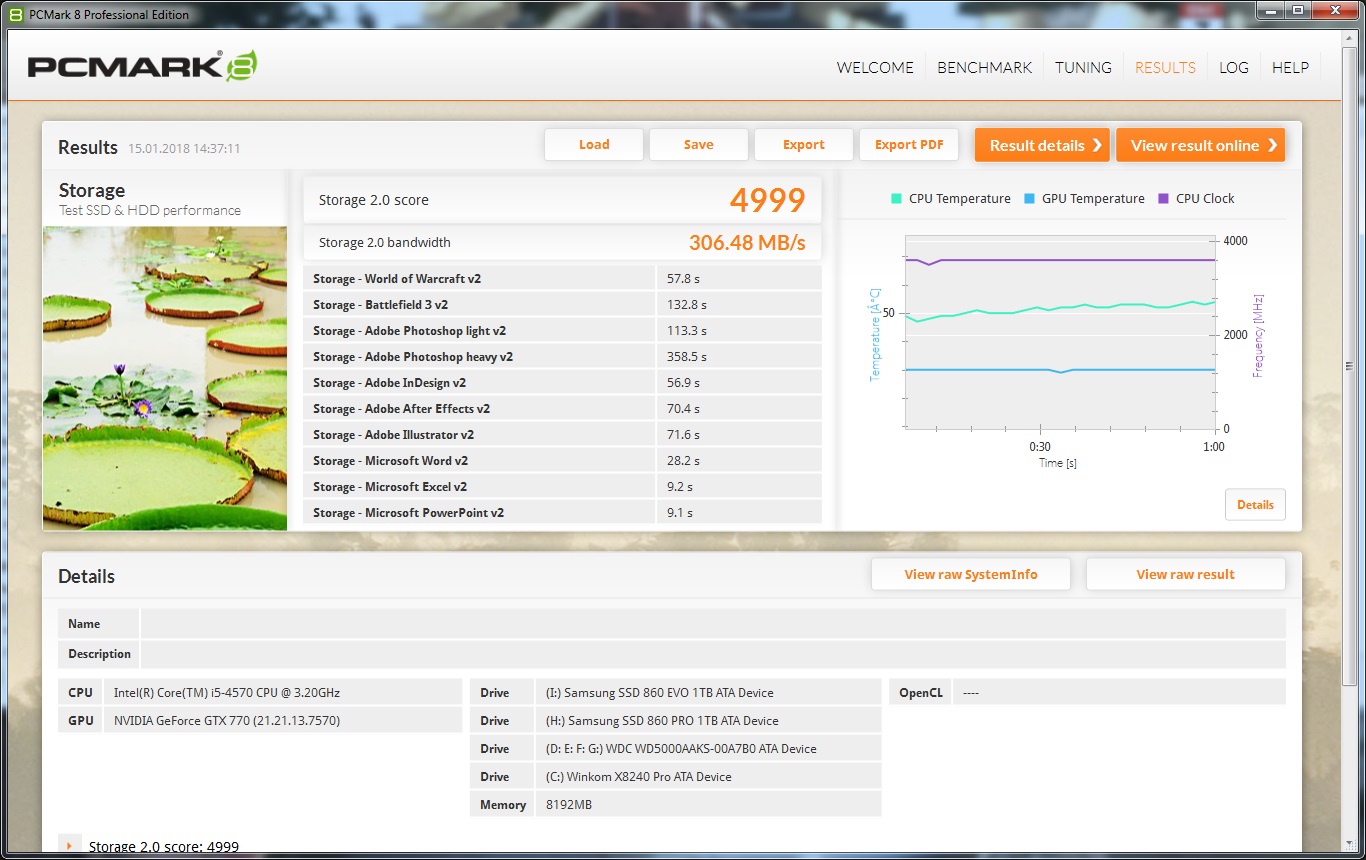
| Test \ Modell | Samsung 860 Evo | Samsung 860 Pro | Samsung 860 Evo | Samsung 860 Pro | ||
| PCMark 7 | 6% |
PCMark 8 | ||||
| Secondary Storage | 5573 |
5663 +2% |
Storage Score V2 | 4999 |
5007 +0% |
|
| Raw Sec. Storage | 7212 |
7914 +10% |
Home Acc. V2 | 4508 |
4510 +0% |
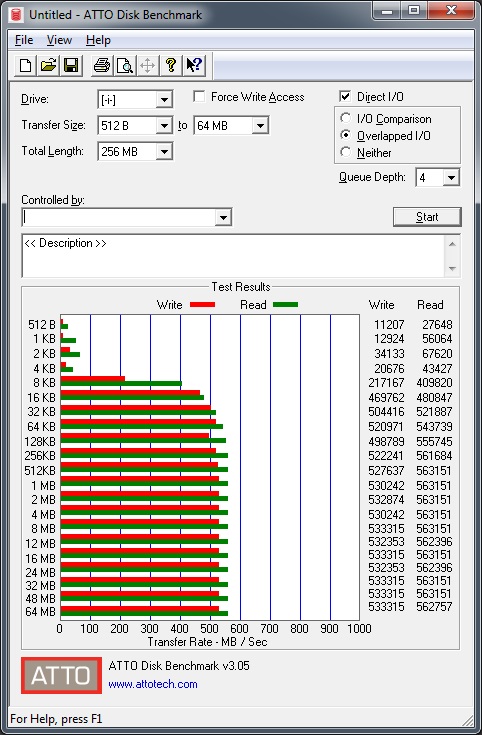
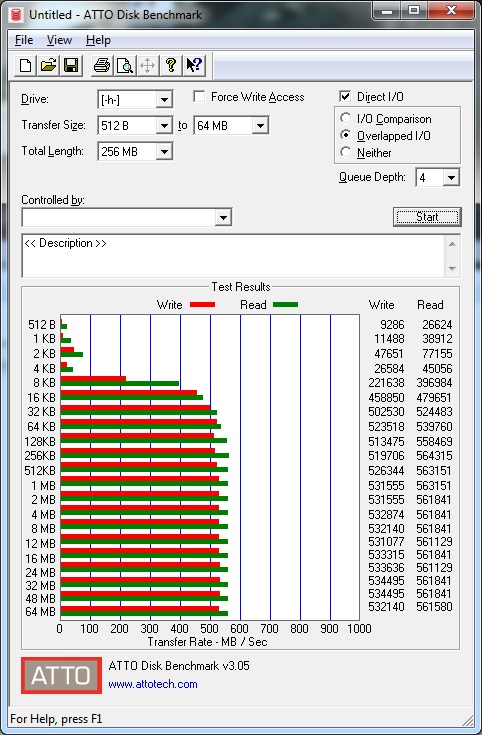
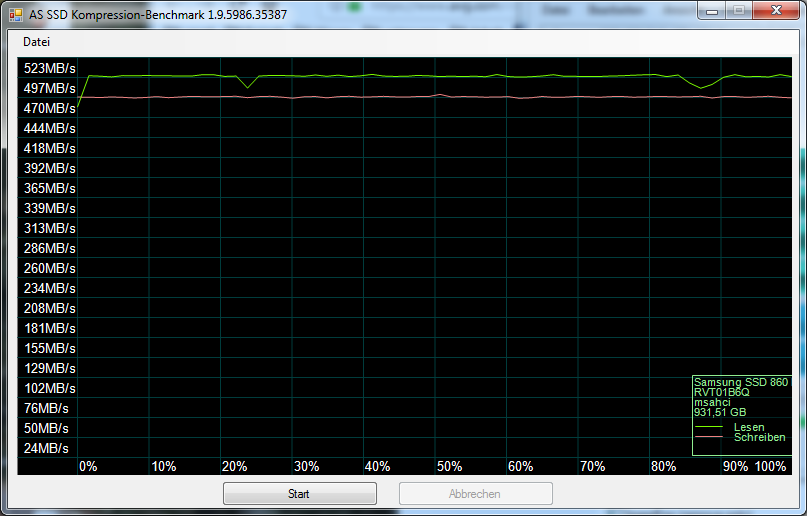
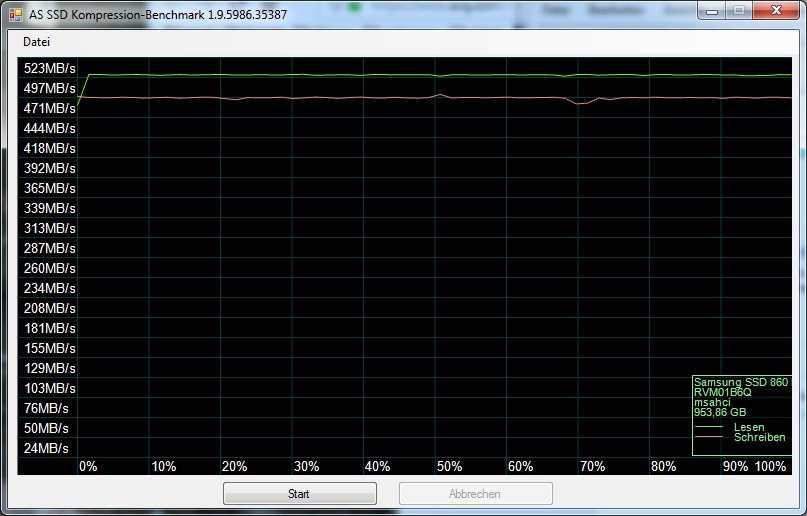
Data Compression
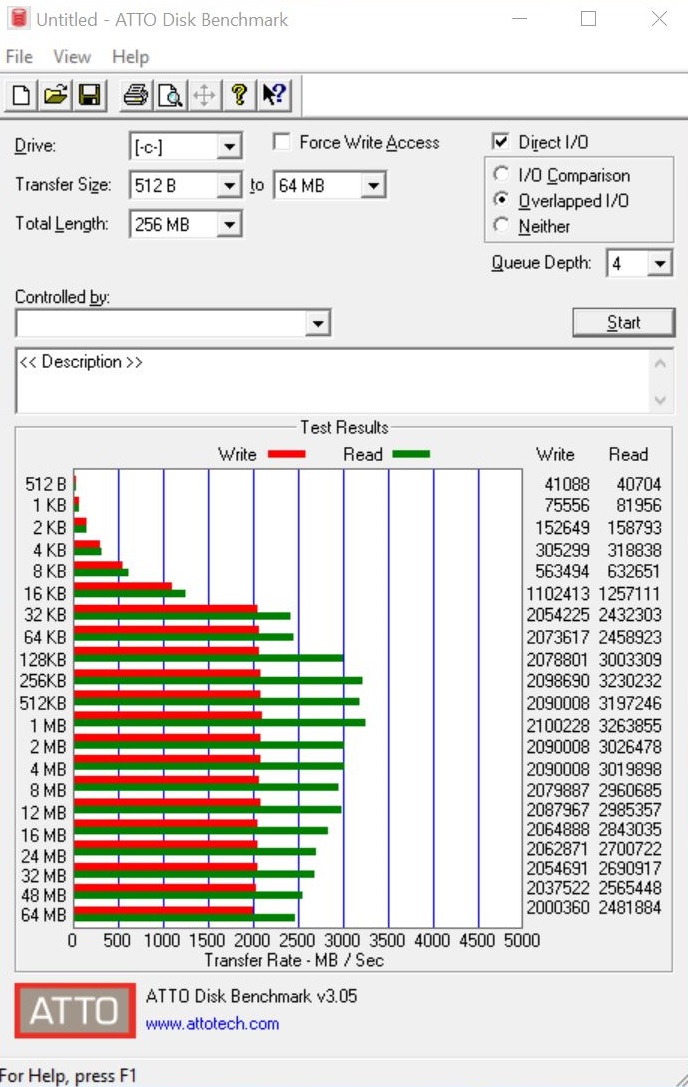
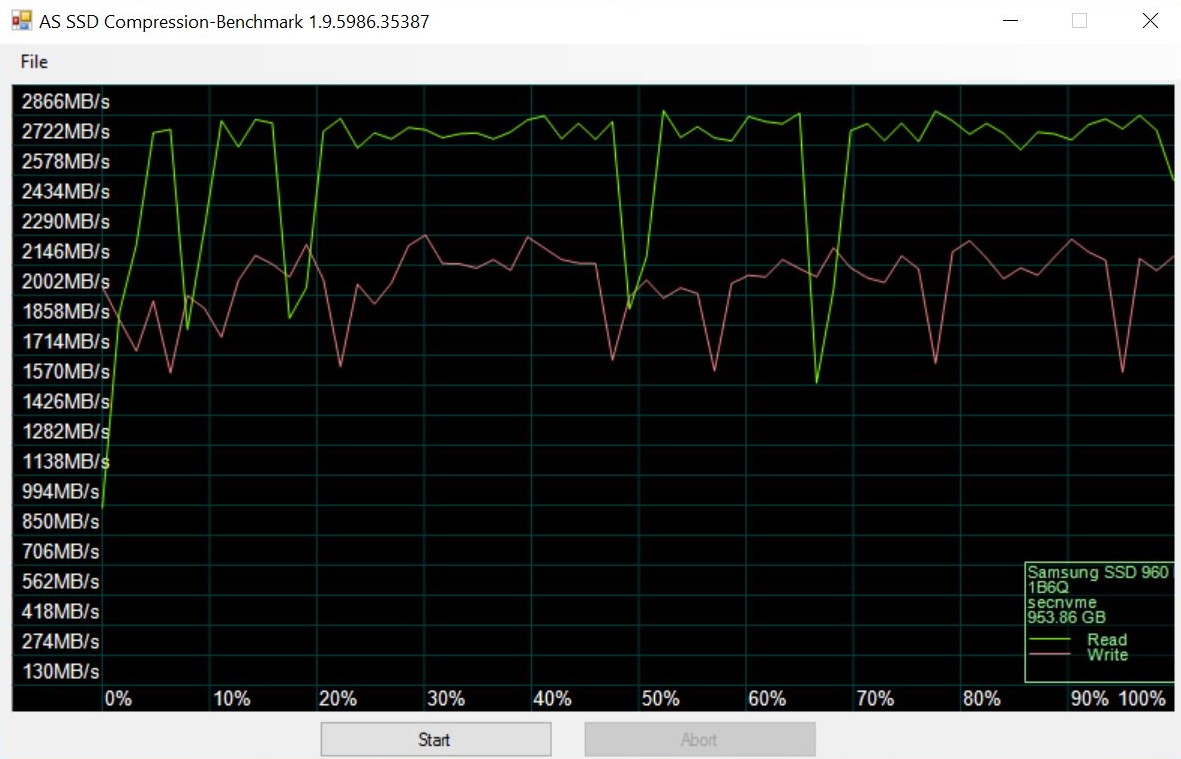
The dilemma of the SATA interface becomes evident graphically in data compression. Samsung's new 860 series is pushing the boundaries of the outdated protocol even further. There are almost no differences between the two models or fluctuations within them. This looks like a nice consistency, but in the end, there is no room to move upwards. The Pro's graph actually looks slightly smoother than the Evo's graph, but the minimal measurement differences are practically non-existent. For comparison, below is a picture of the 960 Pro, in which the base value is already significantly higher. The graph also shows more variations and swings.
Verdict

During the test, the new 860 series achieves very good results within its class and can once again outdo its popular predecessor. In particular, the 4K values and access times were further optimized. This makes Samsung's 860 Evo and 860 Pro models ideal for any notebook or desktop PC with the SATA interface only. With the new storage drives, the long overdue switch from a conventional hard disk or HDD is very smooth. Here, the gain in speed is particularly noticeable and definitely worthwhile.
However, the test results also show that the manufacturers are approaching the performance limits of the SATA interface leading to a decrease in speed gains. Efforts to push the limits even further to the limit are admirable, but major performance leaps as in M.2 SSDs with NVMe connectivity are not expected to happen.
Despite the improvement to its predecessor, the change is hardly worthwhile. The difference to the 850 Evo is still relevant, but the mainstream user will rarely notice it in practice. The SATA models are already obsolete for users who have an M.2 slot with a fast PCIe connection and NVMe protocol. Everyone else, on the other hand, can buy without hesitation. The purchase of the Pro model only makes sense for enthusiasts though, because the differences to the new Evo are insufficient to cover the price difference.
