Kingston KC600 SSD Benchmarked: More Reason to Ditch that Old HDD
Introduced earlier this month, the Kingston KC600 series of 2.5-inch SATA III SSDs succeeds the older KC400 series aimed at users on tighter budgets. It brings both an updated SM2259 controller and XTS-AES 256-bit encryption at capacities ranging from 256 GB up to 2 TB. The unit we'll be benchmarking here is the 1 TB SKU.
The 256 GB and 512 GB capacities are now available for $44 and $73 USD, respectively, with the higher capacities coming at a later date. A five-year warranty comes standard no matter the option.
See the official product page for the KC600 series here for more information.
| Storage Capacity | Max Sequential Read (MB/s) | Max Sequential Write (MB/s) | Read IOPS | Write IOPS | Life Expectancy (MTBF) | TBW |
| 256 GB | 550 | 500 | 90K | 80K | 1 million hours | 150 TB |
| 512 GB | 550 | 520 | 90K | 80K | 1 million hours | 300 TB |
| 1024 GB | 550 | 520 | 90K | 80K | 1 million hours | 600 TB |
| 2048 GB | 550 | 520 | 90K | 80K | 1 million hours | 1200 TB |
Test System
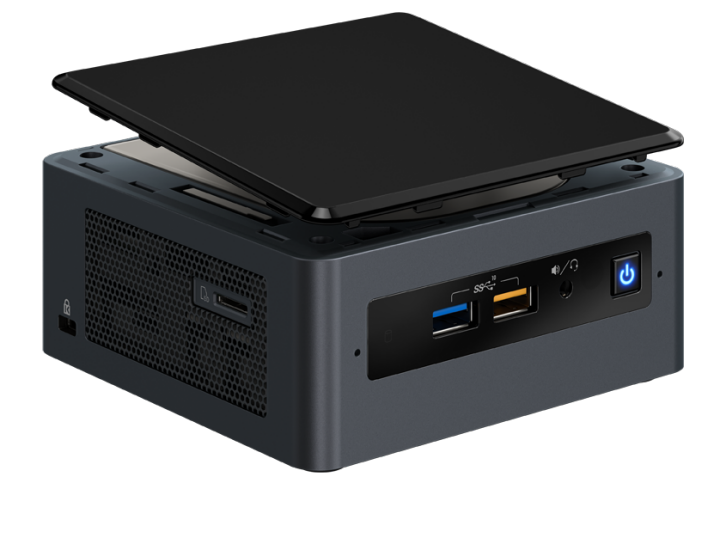
We use the same Intel NUC8i7BEH mini PC that we used for the Kingston A2000 since it supports both M.2 and 2.5-inch SATA III drives simultaneously. Installation is as straightforward as one would expect, but keep in mind that the packaging includes no screws or cloning software unless if purchased as an upgrade kit.
See our review on the Intel NUC8i7BEH to learn more about the mini PC.
AS SSD & CrystalDiskMark
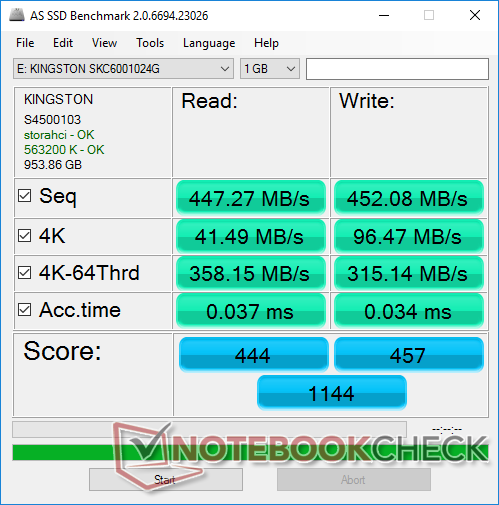
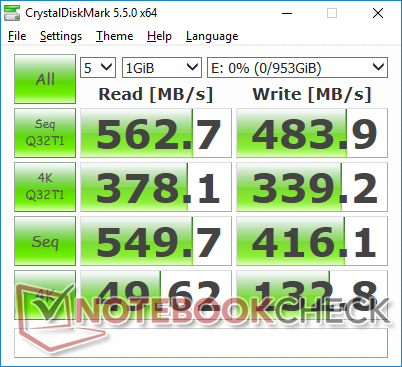
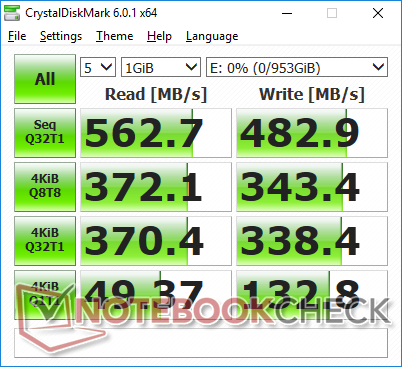
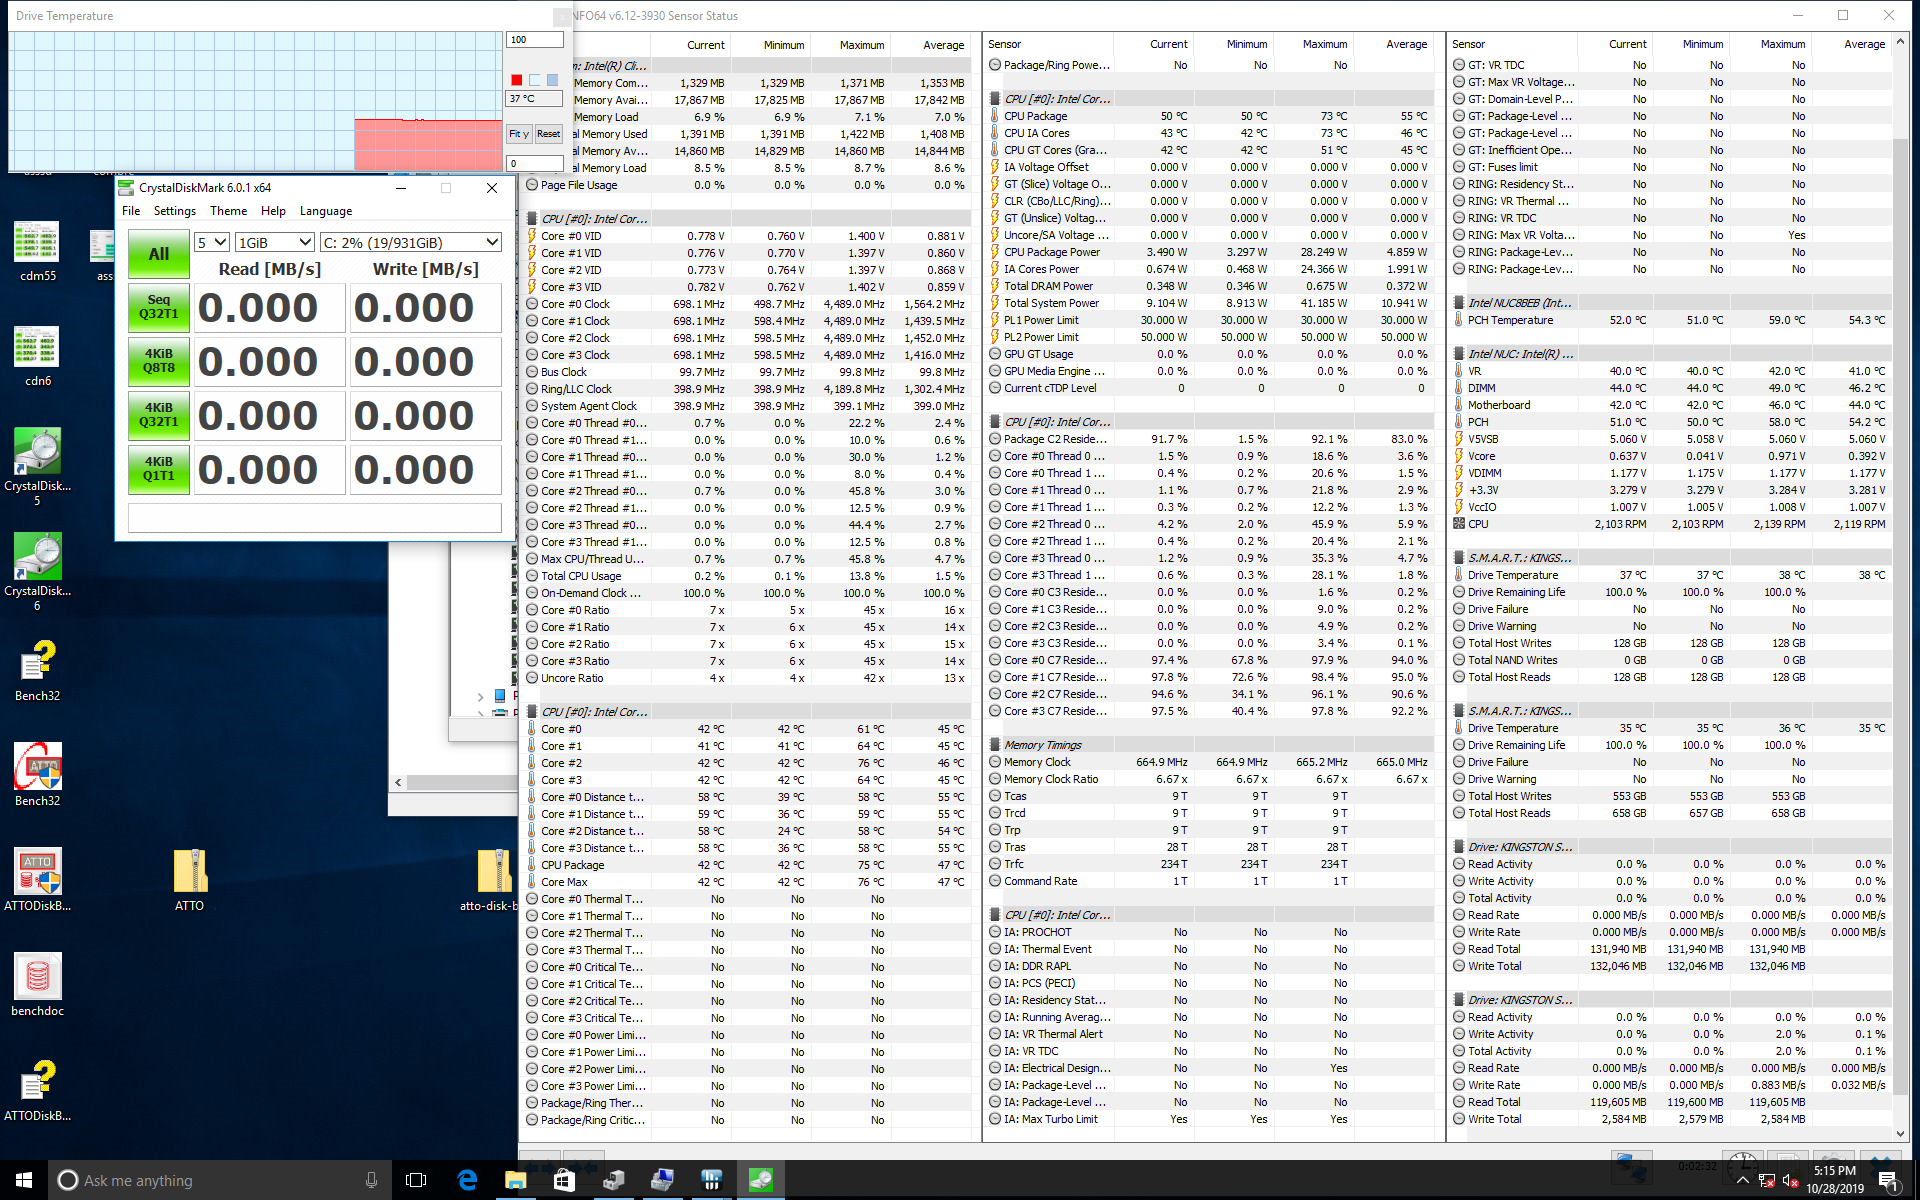
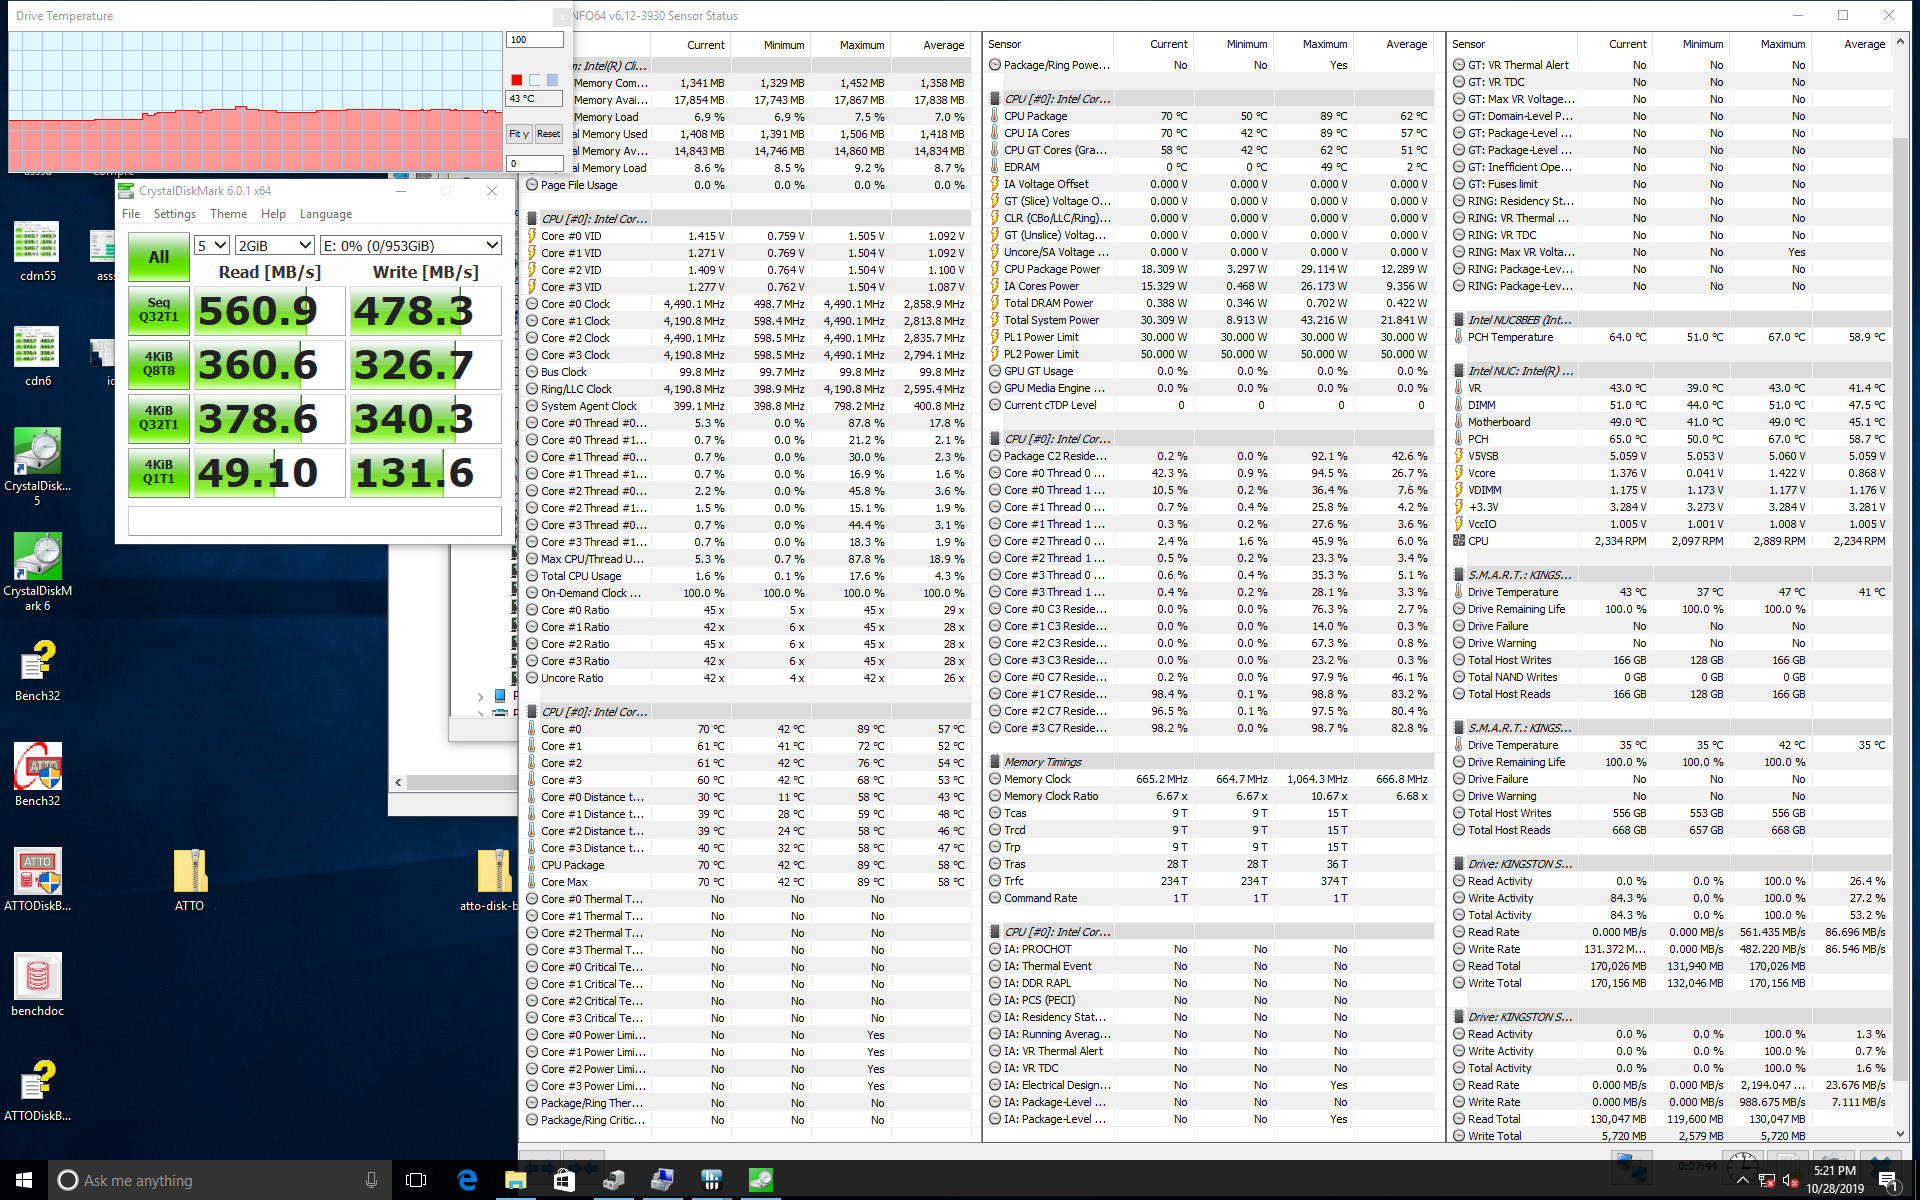
The official specifications sheet advertises sequential read and write rates of up to 550 MB/s and 520 MB/s, respectively. CrystalDiskMark 5.5 and AS SSD show we can expect sequential write rates to be closer to the 420 to 460 MB/s range instead. Write and read rates of smaller 4K blocks are faster than what we recorded on the competing SK Hynix Gold S31.
| Kingston KC600 | SK Hynix Gold S31 SSD SK hynix Gold S31 1TB | Lenovo Ideapad C340-15IWL-81N5004QGE SK hynix BC501 HFM128GDJTNG-831 | Microsoft Surface Laptop 3 15 Ryzen 5 3580U SK hynix BC501 HFM256GDGTNG | Dell G7 7590 Toshiba BG3 KBG30ZMS256G | Corsair One i160 Samsung PM961 NVMe MZVLW512HMJP | |
|---|---|---|---|---|---|---|
| AS SSD | -22% | -17% | -10% | -96% | 128% | |
| Seq Read (MB/s) | 447.3 | 481.9 8% | 1399 213% | 1122 151% | 1013 126% | 2117 373% |
| Seq Write (MB/s) | 452.1 | 458.9 2% | 369.8 -18% | 514 14% | 203.8 -55% | 1469 225% |
| 4K Read (MB/s) | 41.69 | 23.23 -44% | 40 -4% | 34.98 -16% | 29.57 -29% | 40.04 -4% |
| 4K Write (MB/s) | 96.5 | 73.2 -24% | 109.2 13% | 96.8 0% | 71.4 -26% | 145.7 51% |
| 4K-64 Read (MB/s) | 358.1 | 314.3 -12% | 264.3 -26% | 492 37% | 332.1 -7% | 1248 249% |
| 4K-64 Write (MB/s) | 315.1 | 285.1 -10% | 181.9 -42% | 339.9 8% | 152.9 -51% | 1104 250% |
| Access Time Read * (ms) | 0.037 | 0.064 -73% | 0.07 -89% | 0.056 -51% | 0.183 -395% | 0.1 -170% |
| Access Time Write * (ms) | 0.034 | 0.049 -44% | 0.041 -21% | 0.11 -224% | 0.248 -629% | 0.025 26% |
| Score Read (Points) | 444 | 386 -13% | 444 0% | 639 44% | 463 4% | 1499 238% |
| Score Write (Points) | 457 | 404 -12% | 328 -28% | 488 7% | 245 -46% | 1397 206% |
| Score Total (Points) | 1144 | 993 -13% | 963 -16% | 1434 25% | 913 -20% | 3633 218% |
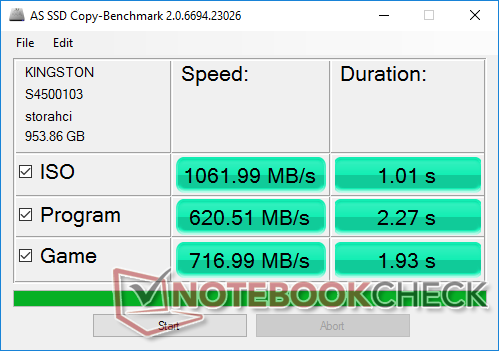
| Copy ISO MB/s (MB/s) | 1062 | 691 -35% | 265.8 -75% | 828 -22% | 263.6 -75% | 1984 87% |
| Copy Program MB/s (MB/s) | 621 | 582 -6% | 158.7 -74% | 200.5 -68% | 213.8 -66% | 488.5 -21% |
| Copy Game MB/s (MB/s) | 717 | 517 -28% | 216.8 -70% | 387.4 -46% | 188 -74% | 1168 63% |
| CrystalDiskMark 5.2 / 6 | -14% | 16% | 50% | -6% | 101% | |
| Write 4K (MB/s) | 132.8 | 72.2 -46% | 105 -21% | 99 -25% | 77 -42% | 174.7 32% |
| Read 4K (MB/s) | 49.62 | 27.66 -44% | 39.72 -20% | 35.63 -28% | 31.39 -37% | 47.08 -5% |
| Write Seq (MB/s) | 416.1 | 472.9 14% | 326.9 -21% | 706 70% | 230.1 -45% | 701 68% |
| Read Seq (MB/s) | 550 | 538 -2% | 1033 88% | 1044 90% | 848 54% | 599 9% |
| Write 4K Q32T1 (MB/s) | 339.2 | 291.6 -14% | 269.1 -21% | 326.6 -4% | 152.1 -55% | 399.8 18% |
| Read 4K Q32T1 (MB/s) | 378.1 | 299.9 -21% | 284.8 -25% | 270 -29% | 316.6 -16% | 474.3 25% |
| Write Seq Q32T1 (MB/s) | 483.9 | 512 6% | 321 -34% | 820 69% | 226.8 -53% | 1520 214% |
| Read Seq Q32T1 (MB/s) | 563 | 557 -1% | 1606 185% | 2028 260% | 1395 148% | 2680 376% |
| Write 4K Q8T8 (MB/s) | 343.4 | 1115 225% | ||||
| Read 4K Q8T8 (MB/s) | 372.1 | 560 50% | ||||
| Total Average (Program / Settings) | -18% /
-19% | -1% /
-5% | 20% /
12% | -51% /
-63% | 115% /
117% |
* ... smaller is better
ATTO
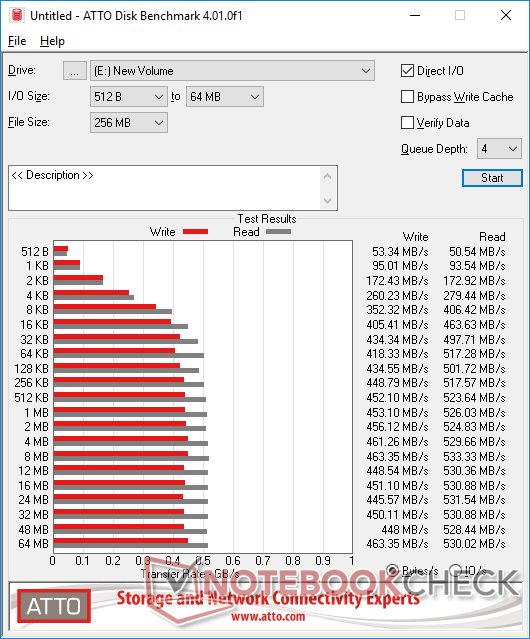
ATTO is useful as it tests a wide range of block sizes to paint a bigger picture of the performance of the SSD. Read and write rates top out at about 530 MB/s and 450 MB/s, respectively, with transfer rates remaining relatively steady until I/O sizes become 8 KB or smaller.
| Kingston KC600 | Samsung 970 Evo Plus SSD (500 GB) | Intel NUC8i7BEH Asura NVMe SSD | Dell Latitude 7285 | SK Hynix Gold S31 SSD | |
|---|---|---|---|---|---|
| ATTO Disk Benchmark | 462% | 353% | 61% | -0% | |
| 8192KB write (KB/s) | 463350 | 3322220 617% | 1960000 323% | 554109 20% | 474070 2% |
| 4096KB write (KB/s) | 461260 | 3322220 620% | 1960000 325% | 564467 22% | 474070 3% |
| 2048KB write (KB/s) | 456120 | 3297730 623% | 1970000 332% | 557948 22% | 474070 4% |
| 1024KB write (KB/s) | 453100 | 3205200 607% | 1960000 333% | 586388 29% | 475170 5% |
| 16KB write (KB/s) | 405410 | 1153140 184% | 1160000 186% | 524483 29% | 387910 -4% |
| 8192KB read (KB/s) | 533330 | 2975270 458% | 2970000 457% | 1099620 106% | 528440 -1% |
| 4096KB read (KB/s) | 529660 | 2975270 462% | 2960000 459% | 1187170 124% | 528440 0% |
| 2048KB read (KB/s) | 524830 | 2960680 464% | 2920000 456% | 1351830 158% | 529660 1% |
| 1024KB read (KB/s) | 526030 | 2811540 434% | 2860000 444% | 1231950 134% | 532100 1% |
| 16KB read (KB/s) | 463630 | 1173620 153% | 1440000 211% | 306332 -34% | 409030 -12% |
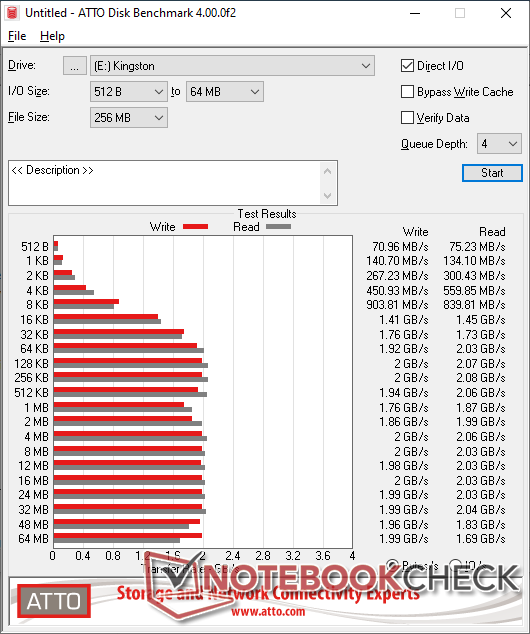
Data Compression
While read rates are steady, write rates are slightly more variable with momentary dips to as low as 314 MB/s. These same dips would occur again after repeat runs.
")
")
Temperature
Drive temperature peaks at about 47 C after two runs of CrystalDiskMark 6. Results are not unlike what we discovered on the Kingston A2000 NVMe SSD.
Verdict
At over a decade old, the SATA III interface holds no more surprises. SATA III SSDs nowadays are targeting users still stuck on mechanical HDDs where the performance boost can be over an order of magnitude faster.
If we are to nitpick, however, the sequential write rates of the Kingston KC600 are slightly slower than expected at around 460 MB/s at best. Sequential read and rate rates would ideally be nearly the same at over 500 MB/s each to fully exploit the SATA III interface, but the target audience for these inexpensive SSDs will likely not notice or even care. If you're still sporting a primary mechanical drive, then there's almost no excuse to not upgrade at this point.
Price comparison
