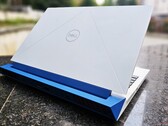
SSTC CL4-3D512-Q11

The SSTC CL4-3D512-Q11 is a mid-range NVMe PCIe SSD in the small 2242 form factor. The CL4-3D512 is rated at up to 3,500 / 2,100 MB/s sequential read / write and 4000K/350K IOPS. The MTBF is higher than 2 million hours and the drive is rated at 1W idle power, 8.25 W active power and 5 mW in sleep mode.
| Type | SSD |
| Size | M.2 2242 |
| Capacity | 512 GB |
| Interface | NVMe |
| Announced | 20.06.2023 |
| Link | SSTC CL4-3D512-Q11 |
Benchmarks
Performance Rating - DiskSpd
19.9 pt (23%)
Seagate ST1000LM014 Solid State Hybrid Drive
...
256 GB UFS 4.0 Flash
ESO512GYLCT
SSTC CL4-3D512-Q11
Foresee XP1000F512G
SK Hynix HFM512GD3JX013N
Samsung SSD PM981 MZVLB256HAHQ
Kingston OM8PCP31024F
...
Kingston Fury Renegade G5 8TB
0%
100%
AS SSD - Copy Game
min: 337.19 avg: 394.7 median: 394.7 (7%) max: 452.22 MB/s
AS SSD - Copy Program
min: 296.26 avg: 297.9 median: 297.9 (11%) max: 299.56 MB/s
AS SSD - Copy ISO
min: 461.99 avg: 475.5 median: 475.5 (2%) max: 488.98 MB/s
AS SSD - Score Total
min: 2033 avg: 2152 median: 2152 (13%) max: 2271 Points
AS SSD - Score Write
min: 515 avg: 586 median: 585.5 (8%) max: 656 Points
AS SSD - Score Read
min: 979 avg: 1104 median: 1104 (18%) max: 1229 Points
AS SSD - Access Time Write *
min: 0.182 avg: 0.2 median: 0.2 (0%) max: 0.184 ms
AS SSD - Access Time Read *
min: 0.086 avg: 0.1 median: 0.1 (0%) max: 0.103 ms
AS SSD - 4K-64 Write
min: 276.64 avg: 343.8 median: 343.8 (6%) max: 410.96 MB/s
AS SSD - 4K-64 Read
min: 678.47 avg: 805 median: 805.4 (16%) max: 932.26 MB/s
AS SSD - 4K Write
min: 188.64 avg: 196 median: 196 (38%) max: 203.45 MB/s
AS SSD - 4K Read
min: 36.37 avg: 37.1 median: 37.1 (12%) max: 37.78 MB/s
AS SSD - Sequential Write
min: 413.88 avg: 454.3 median: 454.3 (4%) max: 494.63 MB/s
AS SSD - Sequential Read
min: 2603.73 avg: 2617 median: 2616.9 (21%) max: 2630.04 MB/s
CrystalDiskMark 5.2 / 6 - CDM 5/6 Write 4K
min: 140.7 avg: 159.9 median: 159.9 (14%) max: 179.1 MB/s
CrystalDiskMark 5.2 / 6 - CDM 5/6 Read 4K
min: 43.29 avg: 48.2 median: 48.2 (1%) max: 53.1 MB/s
CrystalDiskMark 5.2 / 6 - CDM 5 Write Seq
min: 472.6 avg: 487.2 median: 487.2 (3%) max: 501.8 MB/s
CrystalDiskMark 5.2 / 6 - CDM 5 Read Seq
min: 2047 avg: 2344 median: 2344 (27%) max: 2641 MB/s
CrystalDiskMark 5.2 / 6 - CDM 5/6 Write 4K Q32T1
min: 331.8 avg: 335.7 median: 335.7 (7%) max: 339.6 MB/s
CrystalDiskMark 5.2 / 6 - CDM 5/6 Read 4K Q32T1
min: 470 avg: 565 median: 565.3 (8%) max: 660.5 MB/s
CrystalDiskMark 5.2 / 6 - CDM 5/6 Write Seq Q32T1
min: 490.2 avg: 514 median: 513.5 (3%) max: 536.8 MB/s
CrystalDiskMark 5.2 / 6 - CDM 5/6 Read Seq Q32T1
min: 2758.4 avg: 2921 median: 2920.6 (16%) max: 3082.8 MB/s
CrystalDiskMark 5.2 / 6 - CDM 6 Write 4K Q8T8
min: 306.3 avg: 364.8 median: 364.8 (7%) max: 423.3 MB/s
CrystalDiskMark 5.2 / 6 - CDM 6 Read 4K Q8T8
min: 669.2 avg: 835 median: 834.9 (13%) max: 1000.6 MB/s
DiskSpd - DiskSpd 4k_q1t1_write
min: 144.6 avg: 184.3 median: 184.3 (42%) max: 224 MB/s
DiskSpd - DiskSpd 4k_q1t1_read
min: 34 avg: 39.2 median: 39.2 (11%) max: 44.4 MB/s
DiskSpd - DiskSpd 4k_q32t16_write
min: 373 avg: 440 median: 440 (7%) max: 507 MB/s
DiskSpd - DiskSpd 4k_q32t16_read
min: 500 avg: 777 median: 777 (10%) max: 1054 MB/s
DiskSpd - DiskSpd seq_write
min: 535 avg: 1198 median: 1198 (12%) max: 1861 MB/s
DiskSpd - DiskSpd seq_read
min: 2726 avg: 2784 median: 2783.5 (33%) max: 2841 MB/s
DiskSpd - DiskSpd seq_q8t1_write
min: 539 avg: 1346 median: 1345.5 (9%) max: 2152 MB/s
DiskSpd - DiskSpd seq_q8t1_read
min: 2985 avg: 3250 median: 3250 (20%) max: 3515 MB/s
DiskSpd - DiskSpd Loop seq_q8t1_read
min: 1692 avg: 1781 median: 1781 (11%) max: 1870 MB/s
- Range of benchmark values
- Average benchmark values
* Smaller numbers mean a higher performance
v1.35
Notebook reviews with SSTC CL4-3D512-Q11

The Dell G15 5530 now offers Intel Raptor Lake-HX options and positions itself as a capable upper mid-range gaming laptop. While the Core i7-13650HX and RTX 4060 combo augurs well for 1080p Ultra gaming, the G15 5530 has to contend with several compromises in order to keep the price competitive and distinguish itself from its premium Alienware brethren.
Intel Core i7-13650HX, NVIDIA GeForce RTX 4060 Laptop GPU, 15.6", 3 kgDell Inspiron 14 5430: Intel Core i7-1355U Intel Iris Xe Graphics G7 96EUs, 14.00", 1.5 kg
External Review » Dell Inspiron 14 5430
Dell G15 5530: Intel Core i7-13650HX NVIDIA GeForce RTX 4060 Laptop GPU, 15.60", 3 kg
External Review » Dell G15 5530
» Dell G15 gaming laptop with RTX 4060 and AMD Ryzen 7 7840HS now 22% off
» Dell G15 5530 gaming laptop with RTX 4060 and Core i7-13650HX now 25% off
