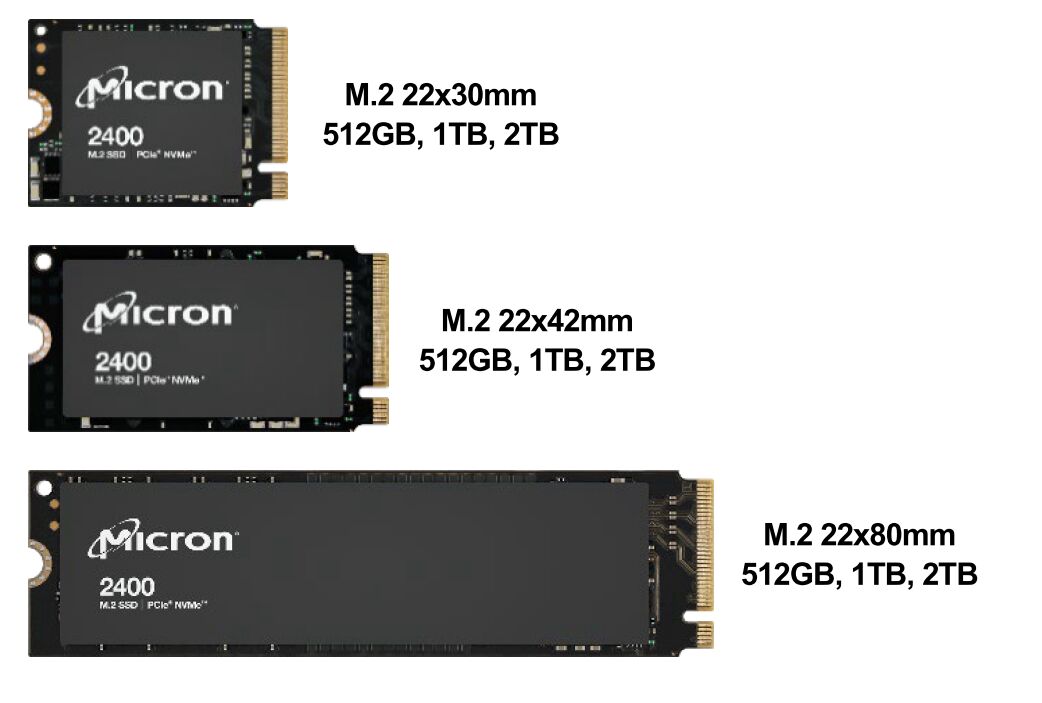
Notebook reviews with Micron 2400 MTFDKBA1T0QFM
Asus ExpertBook B5 B5404CMA Laptop Review: A compelling business laptop with all-day battery life that overlooks one important aspect
The Asus ExpertBook B5 is packed with essential hardware, software, and security features that businesses tend to prioritize. With an Intel Core Ultra 7 155U under the hood, the ExpertBook B5 can sail through most productivity tasks without much trouble. The mediocre IPS display, however, is a notable drawback in an otherwise solid offering.
Intel Core Ultra 7 155U, Graphics 4-Core iGPU (Arrow Lake), 14", 1.3 kgAsus TUF Gaming A16 Review: Cool, quiet, and affordable gaming laptop with a prominent but workable weakness
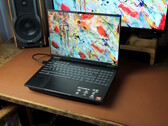
A Ryzen AI 9 HX 370 plus an RTX 4060, and a 144 Hz display with 1,200p resolution are the primary draws for the Asus TUF Gaming A16. We test this relatively affordable 16-inch gaming laptop and take a look at its performance against the competition.
AMD Ryzen AI 9 HX 370, NVIDIA GeForce RTX 4060 Laptop GPU, 16", 2.2 kgMSI Summit E13 AI Evo convertible review: Serious throttling issues with Core Ultra 7
The latest Summit E13 A1MTG shows what happens when you put a Core Ultra-H CPU in a laptop originally designed for a Core-U series processor. It may sound very fast on paper, but the subsequent throttling and temperature levels need attention.
Intel Core Ultra 7 155H, Arc 8-Core, 13.3", 1.3 kgAsus ZenBook S 16 OLED laptop review: Premiere for Ryzen AI 9 365 and Radeon 880M
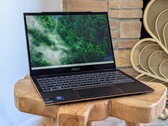
The ZenBook S 16 OLED is one of the first devices on the market to be equipped with AMD's brand new AI 9 processors. Having already tested a model based on the HX 370 (Radeon 890M), it was now the turn of the 365 model (Radeon 880M). How does the 16-incher fare against the competition and the last generation?
AMD Ryzen AI 9 365, Radeon 880M, 16", 1.5 kgAsus VivoBook S 14 OLED laptop review: Successful performance of the Ryzen AI 9 HX 370
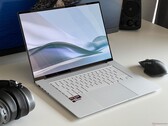
After the Ryzen AI 9 HX 370 inside the Zenbook S16 only fulfilled its performance potential to a limited extent, we are daring to try again by taking a look at the VivoBook S 14. In doing so, this also raises the question of whether the Radeon 890M iGPU can come close to the Intel Arc 8.
AMD Ryzen AI 9 HX 370, Radeon 890M, 14", 1.3 kgAsus ROG Zephyrus G16 GA605WV: AMD Ryzen AI 9 HX 370 NVIDIA GeForce RTX 4060 Laptop GPU, 16.00", 1.8 kg
Review » Asus ROG Zephyrus G16 2024 review - The slim gaming laptop now with AMD Zen 5
Asus ProArt P16 H7606WI: AMD Ryzen AI 9 HX 370 NVIDIA GeForce RTX 4070 Laptop GPU, 16.00", 1.8 kg
Review » Asus ProArt P16 laptop review - AMD Zen 5 meets RTX 4070 laptop and 4K OLED
Asus Zenbook S 16 UM5606-RK333W: AMD Ryzen AI 9 HX 370 AMD Radeon 890M, 16.00", 1.5 kg
Review » AMD Zen 5 Strix Point CPU analysis - Ryzen AI 9 HX 370 versus Intel Core Ultra, Apple M3 and Qualcomm Snapdragon X Elite
Review » AMD Zen 5 Strix Point iGPU analysis - Radeon 890M versus Intel Arc Graphics, Apple M3 and Qualcomm Adreno X1-85
Review » Asus Zenbook S 16 laptop review - The first Copilot+ laptop with AMD Zen 5 inside a 1.3-cm-thick case
Asus Vivobook S 15 OLED Snapdragon: Qualcomm Snapdragon X Elite X1E-78-100 Qualcomm SD X Adreno X1-85 3.8 TFLOPS, 15.60", 1.4 kg
Review » Asus Vivobook S 15 OLED review - A new age of laptops with the new Snapdragon X Elite?
Review » Qualcomm Snapdragon X Elite Analysis - More efficient than AMD & Intel, but Apple stays ahead
Asus Zenbook 14 OLED UM3406HA: AMD Ryzen 7 8840HS AMD Radeon 780M, 14.00", 1.2 kg
Review » Asus Zenbook 14 OLED review - The AMD variant of the Zenbook has received the weaker 1080p OLED screen
Asus ExpertBook B3 B3404CVF: Intel Core i7-1355U NVIDIA GeForce RTX 2050 Mobile, 14.00", 1.7 kg
Review » Asus ExpertBook B3 review: The powerful office laptop with 11-hour runtimes
Asus Expertbook B5 Flip B5402F, i7-1360P: Intel Core i7-1360P Intel Iris Xe Graphics G7 96EUs, 14.00", 1.4 kg
Review » Asus Expertbook B5 Flip B5402F review - A great convertible with a catch
Asus ZenBook 14 UX3405MA: Intel Core Ultra 7 155H Intel Arc 8-Core iGPU, 14.00", 1.2 kg
Review » Asus Zenbook 14 OLED review - The 1.2-kg subnotebook with 120-Hz OLED and Core Ultra 7
Asus VivoBook Pro 16 K6602VU: Intel Core i9-13900H NVIDIA GeForce RTX 4050 Laptop GPU, 16.00", 1.9 kg
Review » Asus VivoBook Pro 16 (2023) Laptop Review: Core i9-13900H, RTX 4050, and 3.2K OLED augur well for hobbyist creators
MSI Pulse 17 B13VGK: Intel Core i7-13700H NVIDIA GeForce RTX 4070 Laptop GPU, 17.30", 2.7 kg
Review » MSI Pulse 17 B13V gaming laptop review: With quiet wings
Acer Swift Go SFG16-71: Intel Core i7-13700H Intel Iris Xe Graphics G7 96EUs, 16.00", 1.6 kg
Review » Acer Swift Go 16 review: Multimedia laptop with dazzling OLED display
MSI Katana 15 B12VEK: Intel Core i7-12650H NVIDIA GeForce RTX 4050 Laptop GPU, 15.60", 2.3 kg
Review » MSI Katana 15 laptop review: Budget gamer with RTX 4050 and Alder Lake CPU
Asus ROG Strix G18 G814JI: Intel Core i7-13650HX NVIDIA GeForce RTX 4070 Laptop GPU, 18.00", 3 kg
Review » Asus ROG Strix G18 G814JI laptop review: Light and shade with the 18-inch gaming machine
MSI Katana 17 B13VFK: Intel Core i7-13620H NVIDIA GeForce RTX 4060 Laptop GPU, 17.30", 2.8 kg
Review » MSI Katana 17 B13V laptop review: Nvidia GeForce RTX 4060 makes its debut
Asus TUF Gaming A16 FA617: AMD Ryzen 7 7735HS AMD Radeon RX 7600S, 16.00", 2.2 kg
Review » Asus TUF Gaming A16 Advantage Edition in review: AMD notebook under the auspices of the 7
Asus TUF Gaming A16 FA608WV: AMD Ryzen AI 9 HX 370 NVIDIA GeForce RTX 4060 Laptop GPU, 16.00", 2.2 kg
External Review » Asus TUF Gaming A16 FA608WV
Asus VivoBook S 14 OLED M5406WA: AMD Ryzen AI 9 HX 370 AMD Radeon 890M, 14.00", 1.3 kg
External Review » Asus VivoBook S 14 OLED M5406WA
Asus Zenbook S 16 UM5606WA-RK052W: AMD Ryzen AI 9 365 AMD Radeon 880M, 16.00", 1.5 kg
External Review » Asus Zenbook S 16 UM5606WA-RK052W
Asus ProArt P16 H7606WI: AMD Ryzen AI 9 HX 370 NVIDIA GeForce RTX 4070 Laptop GPU, 16.00", 1.8 kg
External Review » Asus ProArt P16 H7606WI
Asus Vivobook S 15 OLED Snapdragon: Qualcomm Snapdragon X Elite X1E-78-100 Qualcomm SD X Adreno X1-85 3.8 TFLOPS, 15.60", 1.4 kg
External Review » Asus Vivobook S 15 OLED Snapdragon
Asus ROG Zephyrus G16 GA605WV: AMD Ryzen AI 9 HX 370 NVIDIA GeForce RTX 4060 Laptop GPU, 16.00", 1.8 kg
External Review » Asus ROG Zephyrus G16 GA605WV
Asus Zenbook S 16 UM5606-RK333W: AMD Ryzen AI 9 HX 370 AMD Radeon 890M, 16.00", 1.5 kg
External Review » Asus Zenbook S16 UM5606
Asus Zenbook 14 OLED UM3406HA: AMD Ryzen 7 8840HS AMD Radeon 780M, 14.00", 1.2 kg
External Review » Asus Zenbook 14 OLED UM3406HA
Asus ZenBook 14 UX3405MA: Intel Core Ultra 7 155H Intel Arc 8-Core iGPU, 14.00", 1.2 kg
External Review » Asus ZenBook 14 UX3405MA
Acer Swift Go SFG16-71: Intel Core i7-13700H Intel Iris Xe Graphics G7 96EUs, 16.00", 1.6 kg
External Review » Acer Swift Go SFG16-71
MSI Katana 17 B13VFK: Intel Core i7-13620H NVIDIA GeForce RTX 4060 Laptop GPU, 17.30", 2.8 kg
External Review » MSI Katana 17 B13VFK
MSI Katana 15 B12VEK: Intel Core i7-12650H NVIDIA GeForce RTX 4050 Laptop GPU, 15.60", 2.3 kg
External Review » MSI Katana 15 B12VEK
Asus TUF Gaming A16 FA617: AMD Ryzen 7 7735HS AMD Radeon RX 7600S, 16.00", 2.2 kg
External Review » Asus TUF Gaming A16 FA617
MSI Pulse 17 B13VGK: Intel Core i7-13700H NVIDIA GeForce RTX 4070 Laptop GPU, 17.30", 2.7 kg
External Review » MSI Pulse 17 B13VGK
Asus ROG Strix G18 G814JI: Intel Core i7-13650HX NVIDIA GeForce RTX 4070 Laptop GPU, 18.00", 3 kg
External Review » Asus ROG Strix G18 G814JI
Asus Zenbook S 16 UM5606WA-RK052W: AMD Ryzen AI 9 365 AMD Radeon 880M, 16.00", 1.5 kg
» This OLED laptop with 24 GB RAM might be best sub-$1000 Windows laptop currently on market
Asus VivoBook S 14 OLED M5406WA: AMD Ryzen AI 9 HX 370 AMD Radeon 890M, 14.00", 1.3 kg
» Big $350 price cut: Asus Vivobook S 14 OLED laptop with long battery life is now less than $1,000
Asus Vivobook S 15 OLED Snapdragon: Qualcomm Snapdragon X Elite X1E-78-100 Qualcomm SD X Adreno X1-85 3.8 TFLOPS, 15.60", 1.4 kg
» Asus Vivobook S15 with 120 Hz 3K OLED display drops below $850 on Amazon
Asus Zenbook S 16 UM5606WA-RK052W: AMD Ryzen AI 9 365 AMD Radeon 880M, 16.00", 1.5 kg
» Slim Asus Zenbook S 16 laptop with 120 Hz OLED panel enjoys $300 discount vs list price
Asus VivoBook S 14 OLED M5406WA: AMD Ryzen AI 9 HX 370 AMD Radeon 890M, 14.00", 1.3 kg
» Asus Vivobook S 14 (S5406) OLED laptop with 17-hour battery life drops back to record low price after 33% cut
Asus Zenbook S 16 UM5606-RK333W: AMD Ryzen AI 9 HX 370 AMD Radeon 890M, 16.00", 1.5 kg
» "Open-Box Excellent" Asus Zenbook S 16 with Ryzen AI 9 365 APU and 120 Hz OLED panel is now enjoying 41% price cut
Asus Zenbook S 16 UM5606WA-RK052W: AMD Ryzen AI 9 365 AMD Radeon 880M, 16.00", 1.5 kg
» "Open-Box Excellent" Asus Zenbook S 16 with Ryzen AI 9 365 APU and 120 Hz OLED panel is now enjoying 41% price cut
Asus ProArt P16 H7606WI: AMD Ryzen AI 9 HX 370 NVIDIA GeForce RTX 4070 Laptop GPU, 16.00", 1.8 kg
» Highly rated Asus ProArt P16 OLED laptop in "Open-Box Excellent" condition scores big $520 discount
Asus VivoBook S 14 OLED M5406WA: AMD Ryzen AI 9 HX 370 AMD Radeon 890M, 14.00", 1.3 kg
» Asus Vivobook S 14 OLED laptop with 32 GB of RAM and super long battery life enjoys 33.3% price cut
» Long-lasting Asus Vivobook S 14 OLED laptop with efficient Lunar Lake APU is back on sale
Asus Zenbook 14 OLED UM3406HA: AMD Ryzen 7 8840HS AMD Radeon 780M, 14.00", 1.2 kg
» Asus Zenbook 14 OLED laptop with Core Ultra 7 155H CPU, 16 GB of RAM and long battery life scores massive discount
Asus VivoBook S 14 OLED M5406WA: AMD Ryzen AI 9 HX 370 AMD Radeon 890M, 14.00", 1.3 kg
» Asus Vivobook S 16 (M506KA) and Vivobook S 14 (M5406WA) debut with new AMD Krackan Point APUs and OLED displays
» Asus Vivobook S 16 (S5606CA) launched with latest Intel Core Ultra 200H Arrow Lake mobile CPUs and Lumina OLED display
Asus Zenbook 14 OLED UM3406HA: AMD Ryzen 7 8840HS AMD Radeon 780M, 14.00", 1.2 kg
» 2025 Asus Zenbook 14 OLED notebooks now come with Intel Core Ultra 200H and Ryzen AI 300 APUs
Asus VivoBook S 14 OLED M5406WA: AMD Ryzen AI 9 HX 370 AMD Radeon 890M, 14.00", 1.3 kg
» Asus Vivobook S 14 OLED laptop with newest Lunar Lake CPU and long battery life is back on sale at lowest price to date
Asus ROG Zephyrus G16 GA605WV: AMD Ryzen AI 9 HX 370 NVIDIA GeForce RTX 4060 Laptop GPU, 16.00", 1.8 kg
» Asus Rog Zephyrus G16 RTX 4070 gaming laptop price reaches new record-low after 28% discount on list MSRP
Asus ProArt P16 H7606WI: AMD Ryzen AI 9 HX 370 NVIDIA GeForce RTX 4070 Laptop GPU, 16.00", 1.8 kg
» Asus ProArt P16 4K OLED laptop with Ryzen AI 9 HX 370 and RTX 4060 now on sale at lowest ever price
Asus VivoBook S 14 OLED M5406WA: AMD Ryzen AI 9 HX 370 AMD Radeon 890M, 14.00", 1.3 kg
» Portable Asus Vivobook S 14 OLED laptop with latest Intel Lunar Lake SoC and 16 GB RAM is on sale at 32% discount
Asus ZenBook 14 UX3405MA: Intel Core Ultra 7 155H Intel Arc 8-Core iGPU, 14.00", 1.2 kg
» Asus Zenbook 14 OLED laptop with long battery life and Core Ultra 7 155H is selling at affordable price
Asus ProArt P16 H7606WI: AMD Ryzen AI 9 HX 370 NVIDIA GeForce RTX 4070 Laptop GPU, 16.00", 1.8 kg
» Latest Asus ProArt PX13 OLED creator laptop with Ryzen AI 9 HX 370 drops to lowest price ever
Acer Swift Go SFG16-71: Intel Core i7-13700H Intel Iris Xe Graphics G7 96EUs, 16.00", 1.6 kg
» Acer Swift Go 14 OLED price dips to historic low again as Meteor Lake laptop records 20% discount
Asus Zenbook S 16 UM5606-RK333W: AMD Ryzen AI 9 HX 370 AMD Radeon 890M, 16.00", 1.5 kg
» Strix Point APU handheld performance simulation: Ryzen AI 9 HX 370 shines in gaming even when tested at just 17 W
Asus Vivobook S 15 OLED Snapdragon: Qualcomm Snapdragon X Elite X1E-78-100 Qualcomm SD X Adreno X1-85 3.8 TFLOPS, 15.60", 1.4 kg
» Snapdragon X Elite lags behind iPhone 15 Pro in GravityMark GPU test in a shocking anomaly
Asus TUF Gaming A16 FA617: AMD Ryzen 7 7735HS AMD Radeon RX 7600S, 16.00", 2.2 kg
» All-AMD Asus TUF Gaming A16 gaming laptop discounted by over 31% at Best Buy
Asus ZenBook 14 UX3405MA: Intel Core Ultra 7 155H Intel Arc 8-Core iGPU, 14.00", 1.2 kg
» The new Asus Zenbook 14 OLED 2024 has one major flaw
Acer Swift Go SFG16-71: Intel Core i7-13700H Intel Iris Xe Graphics G7 96EUs, 16.00", 1.6 kg
» Acer Swift Go 16: Budget laptop with Intel 13th-gen chip and QHD webcam drops to lowest price yet on Amazon
MSI Pulse 17 B13VGK: Intel Core i7-13700H NVIDIA GeForce RTX 4070 Laptop GPU, 17.30", 2.7 kg
» MSI Pulse 17 reviewed: Gaming laptop with a questionable price-performance ratio
MSI Katana 15 B12VEK: Intel Core i7-12650H NVIDIA GeForce RTX 4050 Laptop GPU, 15.60", 2.3 kg
» MSI Katana 15 with RTX 4050 reviewed: US$1499.99 for a budget gamer at the RTX 3060 level is too much
MSI Katana 17 B13VFK: Intel Core i7-13620H NVIDIA GeForce RTX 4060 Laptop GPU, 17.30", 2.8 kg
» Nvidia GeForce RTX 4060: Mid-range Ada Lovelace reviewed
Acer Swift Go SFG16-71: Intel Core i7-13700H Intel Iris Xe Graphics G7 96EUs, 16.00", 1.6 kg
» Marketing overshoots the mark: A laptop on the verge of overheating