Notebookcheck Logo

2x Samsung SM951 MZVPV512HDGL (RAID 0)

 2x MZVPV512HDGL (RAID 0)

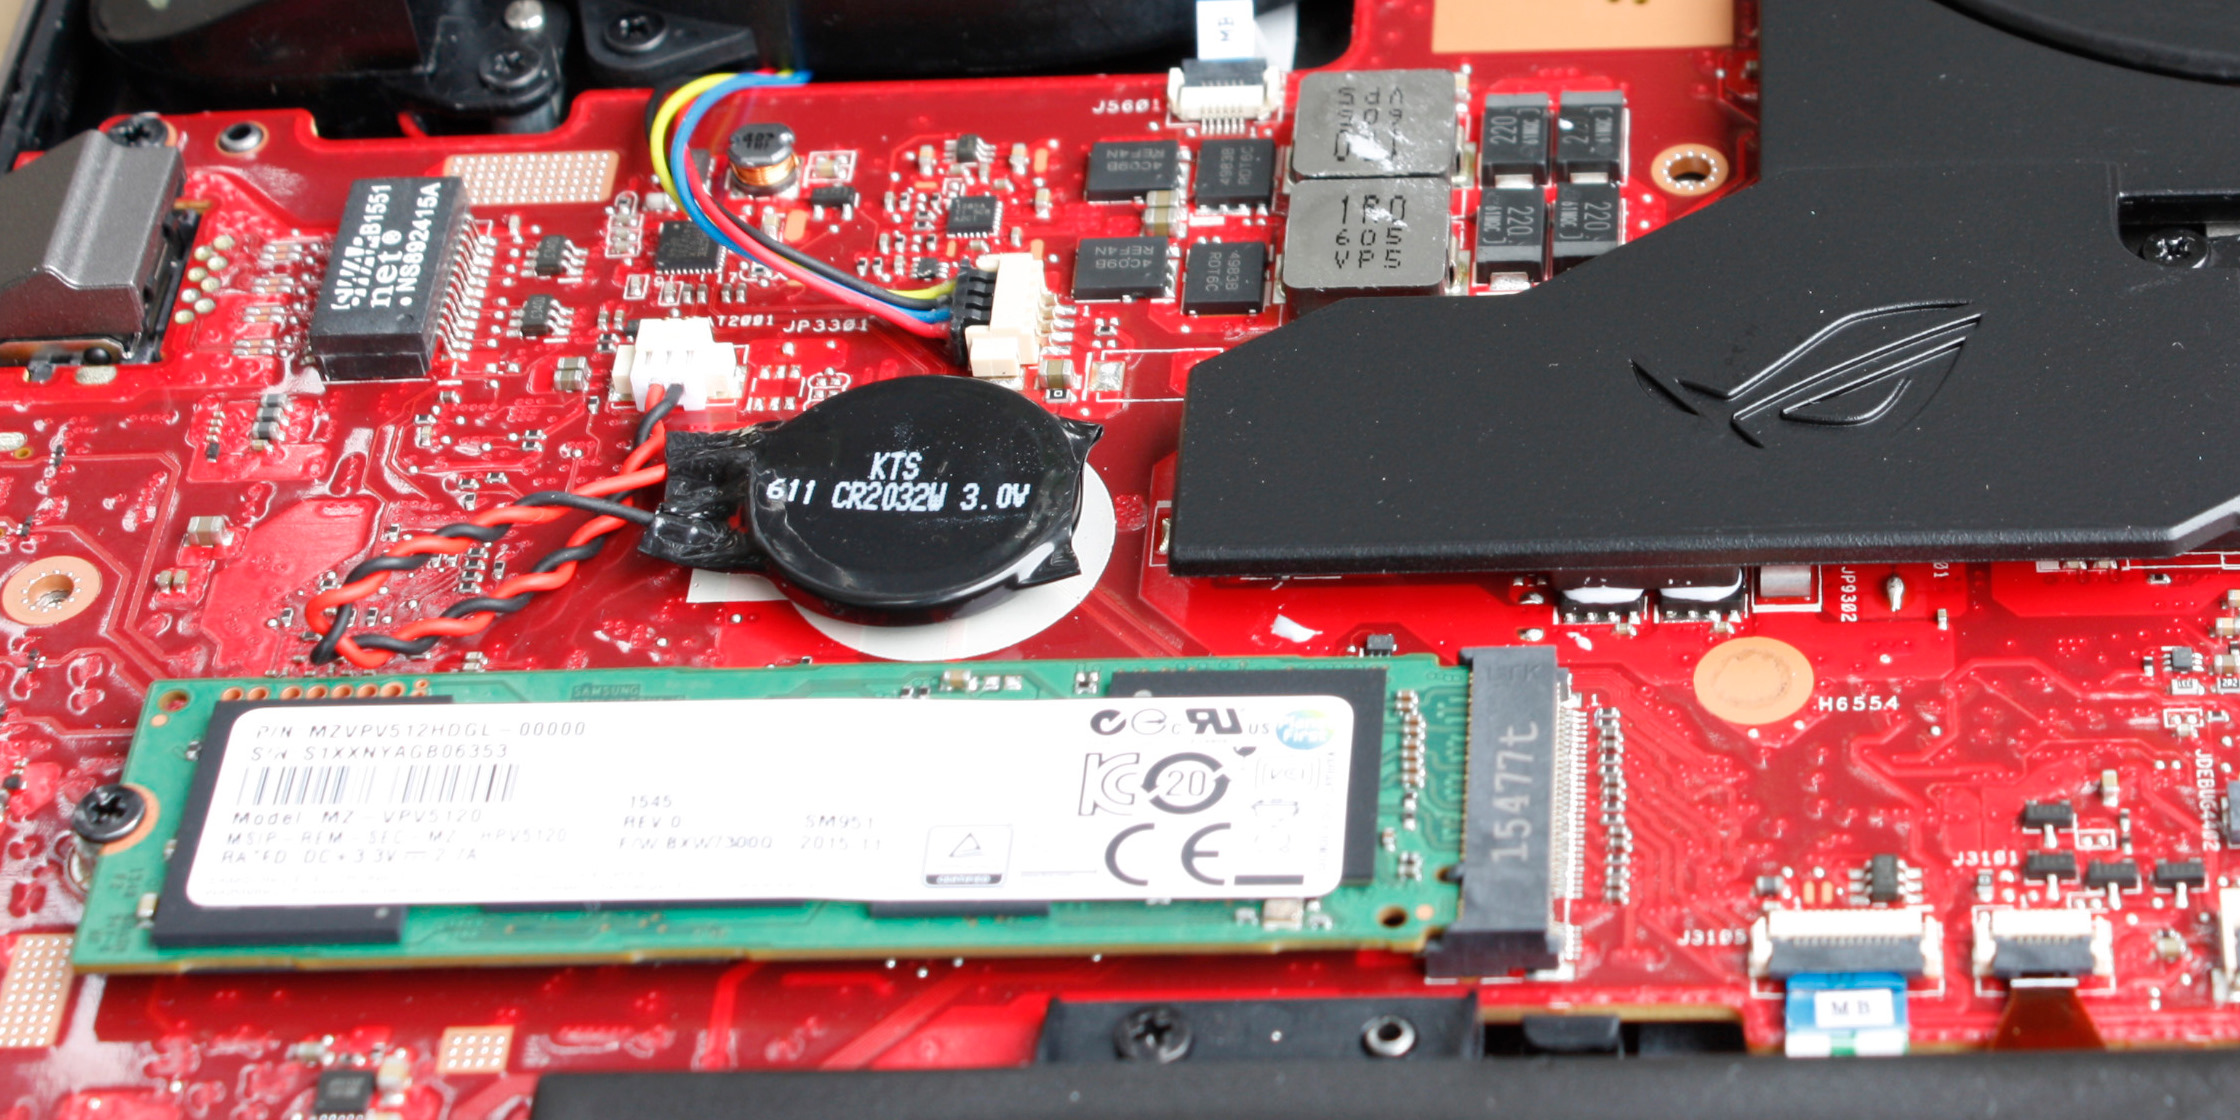
Two Samsung SM951 MZVPV512HDGL drives used together as a RAID 0 array are a high-performance storage solution with a total capacity of 1 TB that Notebookcheck first tested in 2015.

A single 512-GB SM951 is rated for sequential read rates up to 2.15 GB/s, with writes up to 1.55 GB/s. Our tests of the RAID carried out with AS SSD 1.6 showed rates of 2.4 GB/s and 2.83 GB/s, respectively, which is about what a generic budget NVMe PCIe 4 x4 SSD delivers in 2026.

RAID 0 is an array of two or more drives. It is designed to increase performance by processing data in a multi-threaded fashion. This is achieved by distributing the contents of files roughly equally among all disks in the set, the more, the merrier.

TypeSSD
SizeM.2 2280
Capacity1024 GB
InterfaceM.2
Announced01.01.2015

Benchmarks

AS SSD - Copy Game
min: 1308     avg: 1453     median: 1452.5 (24%)     max: 1597 MB/s
AS SSD - Copy Program
min: 503     avg: 645     median: 645 (24%)     max: 787 MB/s
AS SSD - Copy ISO
min: 1885     avg: 2180     median: 2179.5 (8%)     max: 2474 MB/s
AS SSD - Score Total
min: 3086     avg: 3371     median: 3370.5 (21%)     max: 3655 Points
AS SSD - Score Write
min: 1097     avg: 1109     median: 1108.5 (15%)     max: 1120 Points
AS SSD - Score Read
min: 1326     avg: 1508     median: 1507.5 (24%)     max: 1689 Points
AS SSD - Access Time Write *
min: 0.031     avg: 0     median: 0 (0%)     max: 0.039 ms
AS SSD - Access Time Read *
min: 0.035     avg: 0     median: 0 (0%)     max: 0.04 ms
AS SSD - 4K-64 Write
min: 748     avg: 763     median: 762.5 (13%)     max: 777 MB/s
AS SSD - 4K-64 Read
min: 1015     avg: 1181     median: 1180.5 (23%)     max: 1346 MB/s
AS SSD - 4K Write
min: 92.6     avg: 106.1     median: 106.1 (21%)     max: 119.6 MB/s
AS SSD - 4K Read
min: 42.28     avg: 44.4     median: 44.4 (14%)     max: 46.43 MB/s
AS SSD - Sequential Write
min: 2270     avg: 2398     median: 2397.5 (21%)     max: 2525 MB/s
AS SSD - Sequential Read
min: 2693     avg: 2829     median: 2828.5 (22%)     max: 2964 MB/s
CrystalDiskMark 3.0 - 4K QD32 Write
min: 463.3     avg: 588     median: 587.7 (55%)     max: 712 MB/s
CrystalDiskMark 3.0 - 4K QD32 Read
min: 584     avg: 701     median: 700.5 (54%)     max: 817 MB/s
CrystalDiskMark 3.0 - 4K Write
min: 110.7     avg: 125.9     median: 125.9 (4%)     max: 141 MB/s
CrystalDiskMark 3.0 - 4K Read
min: 47.25     avg: 48.9     median: 48.9 (1%)     max: 50.6 MB/s
CrystalDiskMark 3.0 - 512K Write
min: 2255     avg: 2351     median: 2350.5 (26%)     max: 2446 MB/s
CrystalDiskMark 3.0 - 512K Read
min: 1582     avg: 1608     median: 1608 (34%)     max: 1634 MB/s
CrystalDiskMark 3.0 - Sequential Write
min: 2434     avg: 2533     median: 2533 (24%)     max: 2632 MB/s
CrystalDiskMark 3.0 - Sequential Read
min: 3067     avg: 3103     median: 3103 (35%)     max: 3139 MB/s
PCMark 8 - PCMark 8 Storage v2
5027 Points (98%)
- Range of benchmark values
red legend - Average benchmark values
* Smaller numbers mean a higher performance

Add one or more devices and compare

In the following list you can select (and also search for) devices that should be added to the comparison. You can select more than one device.

search for model:
v1.35
log 16. 12:32:28

#0 ran 0s before starting gpusingle class +0s ... 0s

#1 no ids found in url (should be separated by "_") +0s ... 0s

#2 not redirecting to Ajax server +0s ... 0s

#3 did not recreate cache, as it is less than 5 days old! Created at Sun, 12 Jul 2026 08:48:07 +0200 +0.005s ... 0.005s

#4 composed specs +0.005s ... 0.01s

#5 did output specs +0s ... 0.01s

#6 getting avg benchmarks for device 763 +0.008s ... 0.018s

#7 got single benchmarks 763 +0.005s ... 0.023s

#8 got avg benchmarks for devices +0s ... 0.023s

#9 min, max, avg, median took s +3.547s ... 3.57s

#10 return log +0.316s ... 3.886s

Google LogoAdd as a preferred source on Google
Mail Logo
Klaus Hinum (Update: 2026-04-19)