Notebookcheck Logo

Corsair MP600

Corsair MP600 MP600

The Corsair Force Series Gen.4 PCIe MP600 2TB (CSSD-F2000GBMP600) is a high end PCIe 4.0 x4 SSD in M.2 2280 form factor. It is specified with 4950 MB/s read and 4250 MB/s maximum write and used 3D-NAND TLC flash memory chips. The TBW is specified at 3.6 PB and 1.7 mio hours MTBF. It uses a Phison PS5016-E16 8 channel controller and supports 256 Bit AES. 

TypeSSD
SizeM.2
Capacity2048 GB
InterfaceNVMe
Announced02.08.2019

Benchmarks

Performance Rating - DiskSpd
33.6 pt (51%)
AS SSD - Copy Game
min: 1157     avg: 1691     median: 1473.1 (25%)     max: 2933.79 MB/s
AS SSD - Copy Program
min: 509.99     avg: 634     median: 553 (21%)     max: 1071.55 MB/s
AS SSD - Copy ISO
min: 1672     avg: 3091     median: 2927 (27%)     max: 5035.78 MB/s
AS SSD - Score Total
min: 509.99     avg: 5801     median: 6961.5 (65%)     max: 8017 Points
AS SSD - Score Write
min: 2515     avg: 3277     median: 3365 (59%)     max: 4109 Points
AS SSD - Score Read
min: 980     avg: 2378     median: 2565.5 (10%)     max: 2877 Points
AS SSD - Access Time Write *
min: 0.013     avg: 0     median: 0 (0%)     max: 0.044 ms
AS SSD - Access Time Read *
min: 0.011     avg: 0.2     median: 0.1 (0%)     max: 0.869 ms
AS SSD - 4K-64 Write
min: 2045.48     avg: 2734     median: 2807.7 (55%)     max: 3474.92 MB/s
AS SSD - 4K-64 Read
min: 585.92     avg: 1884     median: 2074.8 (61%)     max: 2308.94 MB/s
AS SSD - 4K Write
min: 149.9     avg: 209.7     median: 207.2 (40%)     max: 277.34 MB/s
AS SSD - 4K Read
min: 57.25     avg: 145.5     median: 68.9 (22%)     max: 314.36 MB/s
AS SSD - Sequential Write
min: 2070     avg: 3326     median: 3882 (34%)     max: 4005.1 MB/s
AS SSD - Sequential Read
min: 2402     avg: 3485     median: 3771.7 (30%)     max: 4220.6 MB/s
CrystalDiskMark 3.0 - 4K QD32 Write
min: 382     avg: 569     median: 533.8 (52%)     max: 826.1 MB/s
CrystalDiskMark 3.0 - 4K QD32 Read
min: 490.5     avg: 749     median: 744.6 (58%)     max: 1076 MB/s
CrystalDiskMark 3.0 - 4K Write
min: 224.9     avg: 287.4     median: 300.9 (34%)     max: 355 MB/s
CrystalDiskMark 3.0 - 4K Read
min: 42.35     avg: 151.3     median: 60.4 (1%)     max: 343.2 MB/s
CrystalDiskMark 3.0 - 512K Write
min: 990.9     avg: 2994     median: 3214 (74%)     max: 4271 MB/s
CrystalDiskMark 3.0 - 512K Read
min: 987.4     avg: 2182     median: 2370 (68%)     max: 2509 MB/s
CrystalDiskMark 3.0 - Sequential Write
min: 986.4     avg: 3034     median: 3284 (58%)     max: 4270 MB/s
CrystalDiskMark 3.0 - Sequential Read
min: 2440     avg: 2925     median: 3092.5 (61%)     max: 3221 MB/s
CrystalDiskMark 5.2 / 6 - CDM 5/6 Write 4K
min: 239.3     avg: 279.7     median: 289.3 (26%)     max: 323.9 MB/s
CrystalDiskMark 5.2 / 6 - CDM 5/6 Read 4K
min: 53.17     avg: 148.1     median: 60.8 (2%)     max: 328.8 MB/s
CrystalDiskMark 5.2 / 6 - CDM 5 Write Seq
min: 762.1     avg: 2998     median: 3287 (18%)     max: 4263 MB/s
CrystalDiskMark 5.2 / 6 - CDM 5 Read Seq
min: 2464     avg: 2839     median: 2811 (34%)     max: 3201 MB/s
CrystalDiskMark 5.2 / 6 - CDM 5/6 Write 4K Q32T1
min: 549     avg: 712     median: 751.4 (25%)     max: 829.5 MB/s
CrystalDiskMark 5.2 / 6 - CDM 5/6 Read 4K Q32T1
min: 647     avg: 870     median: 918.7 (15%)     max: 1053.4 MB/s
CrystalDiskMark 5.2 / 6 - CDM 5/6 Write Seq Q32T1
min: 991.9     avg: 3077     median: 3350.2 (22%)     max: 4272 MB/s
CrystalDiskMark 5.2 / 6 - CDM 5/6 Read Seq Q32T1
min: 2619.7     avg: 4220     median: 4965.2 (27%)     max: 5003 MB/s
CrystalDiskMark 5.2 / 6 - CDM 6 Write 4K Q8T8
min: 929.8     avg: 2263     median: 2354.4 (47%)     max: 3406 MB/s
CrystalDiskMark 5.2 / 6 - CDM 6 Read 4K Q8T8
min: 1530.5     avg: 1970     median: 1896.1 (28%)     max: 2425.1 MB/s
PCMark 8 - PCMark 8 Storage v2
min: 4950     avg: 5051     median: 5082 (99%)     max: 5088 Points
DiskSpd - DiskSpd 4k_q1t1_write
min: 127     avg: 218.7     median: 162 (38%)     max: 351 MB/s
DiskSpd - DiskSpd 4k_q1t1_read
min: 37.3     avg: 102.2     median: 49.2 (14%)     max: 345 MB/s
DiskSpd - DiskSpd 4k_q32t16_write
min: 1254     avg: 1964     median: 1773 (36%)     max: 3746 MB/s
DiskSpd - DiskSpd 4k_q32t16_read
min: 1719     avg: 2172     median: 2111 (36%)     max: 3104 MB/s
DiskSpd - DiskSpd seq_write
min: 976     avg: 2774     median: 2312 (25%)     max: 4263 MB/s
DiskSpd - DiskSpd seq_read
min: 1482     avg: 2362     median: 2559 (36%)     max: 2975 MB/s
DiskSpd - DiskSpd seq_q8t1_write
min: 1552     avg: 3167     median: 3991 (27%)     max: 4270 MB/s
DiskSpd - DiskSpd seq_q8t1_read
min: 2599     avg: 4535     median: 4976 (31%)     max: 5006 MB/s
DiskSpd - DiskSpd Loop seq_q8t1_read
min: 2592     avg: 4466     median: 4953 (30%)     max: 4998 MB/s
010020030040050060070080090010001100120013001400150016001700180019002000210022002300240025002600270028002900300031003200330034003500360037003800390040004100420043004400450046004700480049005000Tooltip
- Range of benchmark values for this graphics card
- Average benchmark values for this graphics card
* Smaller numbers mean a higher performance

Add one or more devices and compare

In the following list you can select (and also search for) devices that should be added to the comparison. You can select more than one device.

restrict list:

show all (including archived), 2024, 2023
v1.26
log 16. 08:54:17

#0 no ids found in url (should be separated by "_") +0s ... 0s

#1 not redirecting to Ajax server +0s ... 0s

#2 did not recreate cache, as it is less than 5 days old! Created at Tue, 12 Mar 2024 16:12:25 +0100 +0.001s ... 0.001s

#3 composed specs +0.006s ... 0.007s

#4 did output specs +0s ... 0.007s

#5 getting avg benchmarks for device 3385 +0.018s ... 0.025s

#6 got single benchmarks 3385 +0.131s ... 0.156s

#7 got avg benchmarks for devices +0s ... 0.156s

#8 min, max, avg, median took s +0.959s ... 1.115s

#9 return log +0.012s ... 1.128s

Notebook reviews with Corsair MP600

GPD G1

GPD G1 eGPU review: External AMD Radeon RX 7600M XT with 8 GB of VRAM uses USB4 or OCuLink

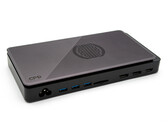
Many popular handhelds and mini-PCs have very limited 3D capabilities due to the fact they are only equipped with an iGPU. This is where GPD comes in with their...
AMD Ryzen 9 7950X | AMD Radeon RX 7600M XT | 32.00" | 1.1 kg
Acer Predator BiFrost Arc A750 OC

Acer Predator BiFrost Arc A750 OC desktop GPU review - Intel's second-strongest gaming graphics card has only been given 8 GB VRAM

Intel's second-fastest Arc series graphics card can currently be found for under US$300. In this review, we will be taking a look at whether its AMD and Nvidia ...
AMD Ryzen 9 7950X | Intel Arc A750 | 32.00" | 999 g
Acer Predator BiFrost Arc A770 OC

Acer Predator BiFrost Arc A770 OC desktop graphics card review - How does Intel's most powerful gaming card with 16 GB VRAM perform?

The two big players, Nvidia and AMD, often represent the first choice in the gaming industry. But for about a year now, Intel also has been playing a role in th...
AMD Ryzen 9 7950X | Intel Arc A770 | 32.00" | 999 g
AMD Radeon RX 7700 XT desktop graphics card review with 12 GB VRAM for less than 500 Euros

AMD Radeon RX 7700 XT desktop graphics card review with 12 GB VRAM for less than 500 Euros

The AMD Radeon RX 7700 XT follows in the footsteps of the AMD Radeon RX 6700 XT, which was able to score with a good price-performance ratio in the past. We eva...
AMD Ryzen 9 7950X | AMD Radeon RX 7700 XT | 32.00" | 1.1 kg
KFA2 GeForce RTX 4060 Ti EX

KFA2 GeForce RTX 4060 Ti EX 16 GB desktop graphics card review: A powerful mid-range GPU now with more VRAM

With the GeForce RTX 4060 Ti, Nvidia has brought out a good and very efficient graphics card for the price-conscious buyer. The 8-GB model already did well but ...
AMD Ryzen 9 7950X | NVIDIA GeForce RTX 4060 Ti 16G | 32.00" | 685 g

AMD Radeon RX 7800 XT: AMD Ryzen 9 7950X AMD Radeon RX 7800 XT, 32.00", 1.1 kg
  Review » AMD Radeon RX 7800 XT Desktop graphics card review: More affordable GeForce RTX 4070 performance

  Review » AMD Radeon RX 7600 desktop GPU review: RDNA3 vs. Ada Lovelace in the entry-level segment

  Review » AMD Radeon RX 7900 GRE review: The OEM desktop graphics card controlled by an RX 6950 XT at lower consumption

  Review » Asus Dual GeForce RTX 4060 Ti OC desktop graphics card review: A compact and frugal GPU for Full HD gaming

  Review » KFA2 GeForce RTX 4060 1-Click OC 2X graphics card review: Current entry-level GPU uses more power than expected

  Review » AMD Ryzen 7 7800X3D desktop CPU review: Faster than a Core i9-13900K thanks to 3D V-Cache and only 8 cores

  Review » KFA2 GeForce RTX 4060 Ti EX graphics card review: A compact mid-range GPU with great features and sleek lighting

  Review » MSI GeForce RTX 4060 Ti desktop graphics card review: The mid-range GPU that is larger than an RTX 4090

  Review » KFA2 GeForce RTX 4070 Ti EX Gamer desktop graphics card review: Affordable GPU for WQHD gaming without a lot of RGB

  Review » KFA2 GeForce RTX 4070 EX Gamer desktop graphics card review: A quiet, cool and frugal GPU for WQHD gaming

  Review » KFA2 GeForce RTX 4070 Ti SG desktop graphics card review: Nvidia's first Ada Lovelace GPU for under €1,000.

  Review » KFA2 GeForce RTX 3070 Ti SG desktop graphics card in review: Ampere is still good mid-range

  Review » KFA2 GeForce RTX 4080 SG desktop GPU review: Great performance meets questionable pricing

  Review » Asus TUF GeForce RTX 3080 Ti OC gaming graphics card review: How well does Ampere perform in 2022?

  Review » Intel Core i9-13900K and Intel Core i5-13600K review: More cores and a higher clock speed with Raptor Lake

  Review » Intel Core i9-13900K and Intel Core i5-13600K review: More cores and a higher clock speed with Raptor Lake

  Review » Intel Core i9-13900K and Intel Core i5-13600K review: More cores and a higher clock speed with Raptor Lake

  Review » Intel Core i9-13900K and Intel Core i5-13600K review: More cores and a higher clock speed with Raptor Lake

  Review » Sapphire Nitro+ Radeon RX 6650 XT Desktop-GPU Review: a powerful 1080p graphics card with a good cooler

  Review » Sapphire Nitro+ Radeon RX 6750 XT desktop GPU in review: Fast 1440p graphics card with a massive cooler

  Review » AMD Radeon RX 6950 XT desktop GPU in review: AMD's top model challenges the GeForce RTX 3090 Ti

  Review » KFA2 GeForce RTX 3080 SG 12GB Desktop Graphics Card Review: A Better RTX 3080 thanks to more VRAM and more Shaders?

  Review » AMD Radeon RX 6500 XT in review: AMD's new Navi-based entry-level graphics card

  Review » Testing the Nvidia GeForce RTX 3050 with 8GB: What are the capabilities of the new RTX-3000 series' entry-level model?

  Review » Good introduction to the high end? - AMD Radeon RX 6800 desktop GPU with 16 GB of VRAM in review

  Review » Review of the AMD Radeon RX 6600 Mid-Range Desktop GPU

  Review » Nvidia GeForce RTX 3060 12GB in review: Affordable entry into the RTX 3000 series?

  Review » Review of the AMD Radeon RX 6600 XT Desktop GPU (8 GB)

  Review » The new mid-range: The AMD Radeon RX 6700 XT Desktop GPU is equipped with 12 GB of VRAM

  Review » Nvidia GeForce RTX 3090 FE - High-end graphics power at a premium price!

  Review » NVIDIA GeForce GTX 1650 Super (Desktop) graphics card review

  Review » KFA2 GeForce RTX 2080 Ti EX Review - High-end Nvidia GPU with a custom cooling solution

  Review » KFA2 GeForce RTX 2060 Super (1-Click OC) - Custom RTX 2060 Super Series Model in Review

  Review » AMD Ryzen 9 3900X Desktop CPU Review: 12 cores meet Socket AM4

  Review » AMD Ryzen 7 3700X Desktop CPU Review: A frugal 8 core and 16 thread processor

   » Acer Predator BiFrost Arc A770 OC desktop GPU with 16 GB VRAM tested with current games

   » AMD Radeon RX 7800 XT Desktop graphics card in our test: Nvidia's midrange competitor costs $499

   » How Intel can get back on top

Please share our article, every link counts!