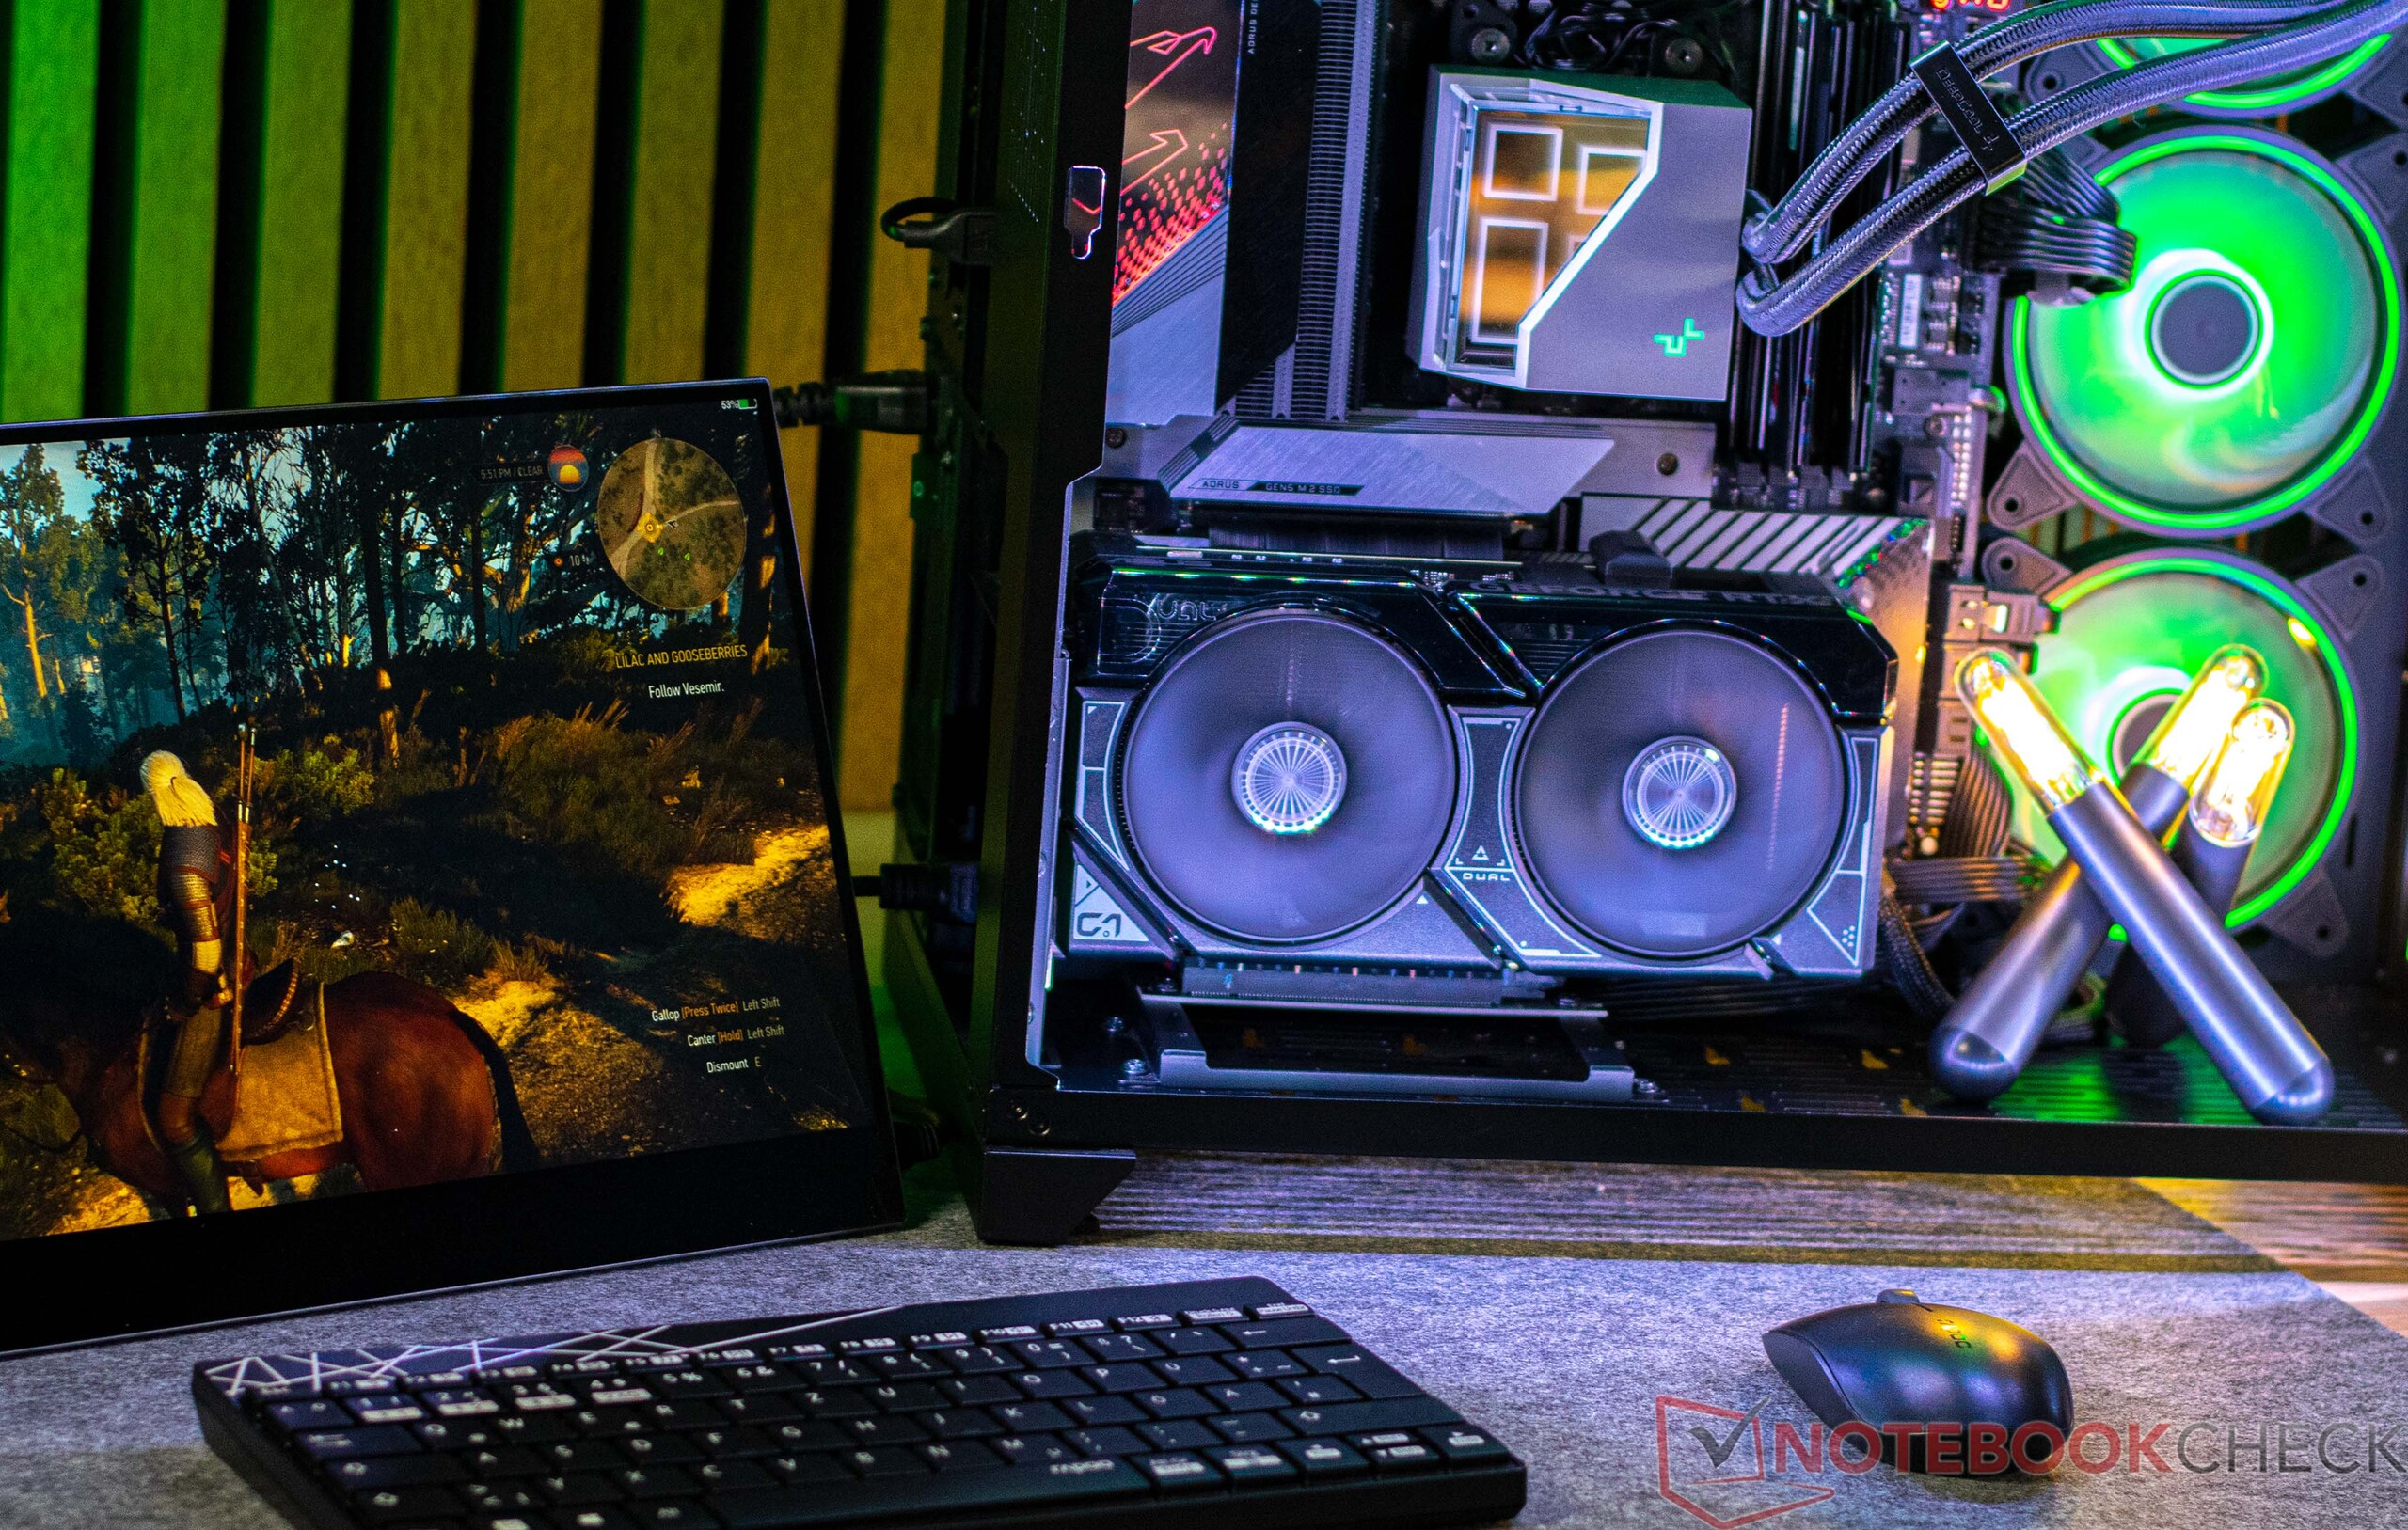
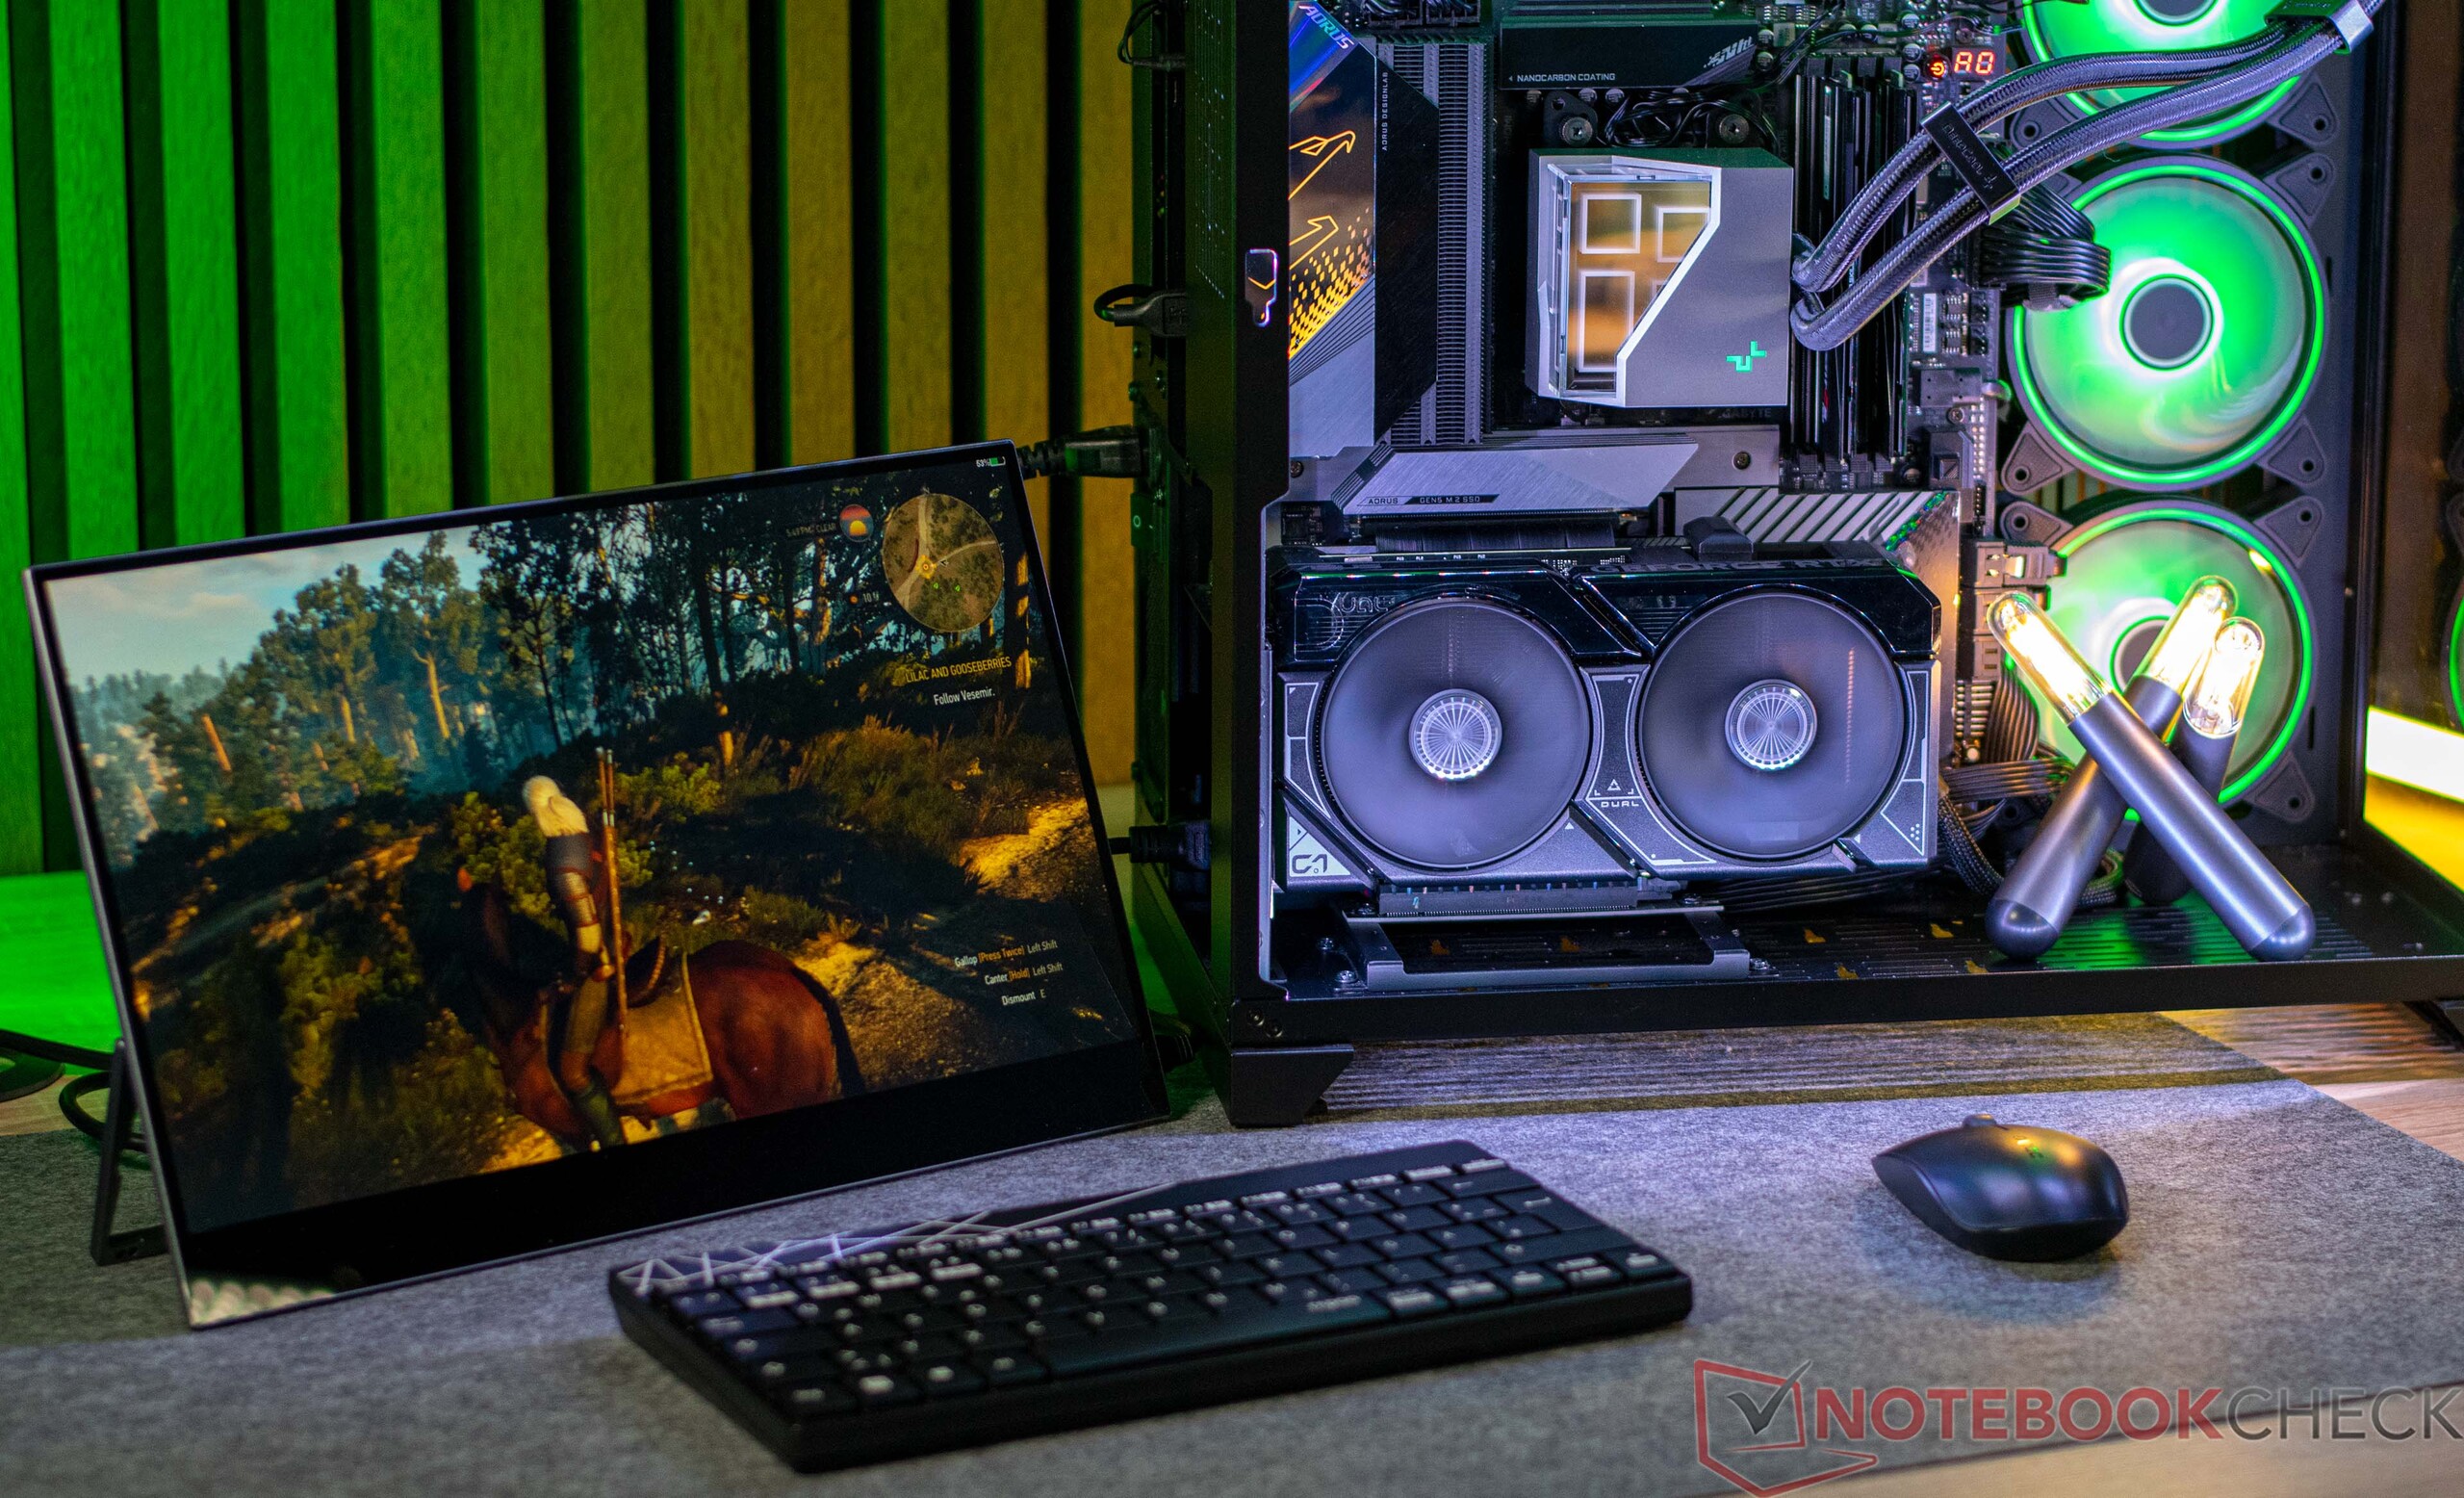
Asus Dual GeForce RTX 4060 Ti OC desktop graphics card review: A compact and frugal GPU for Full HD gaming
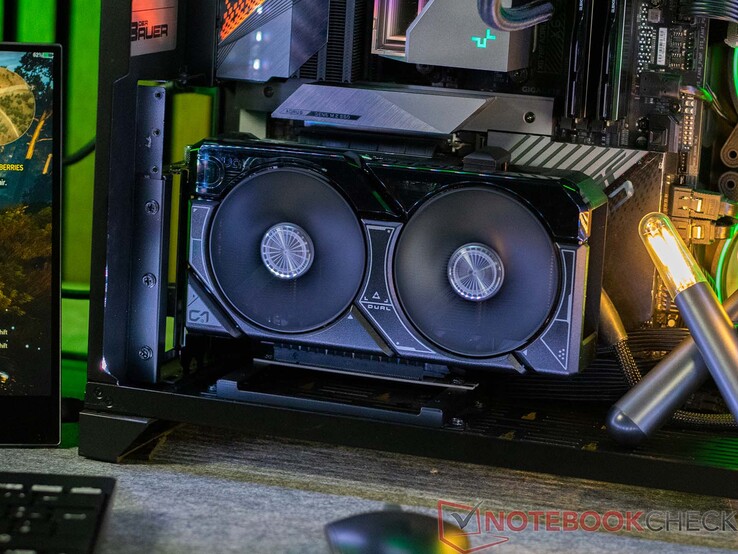
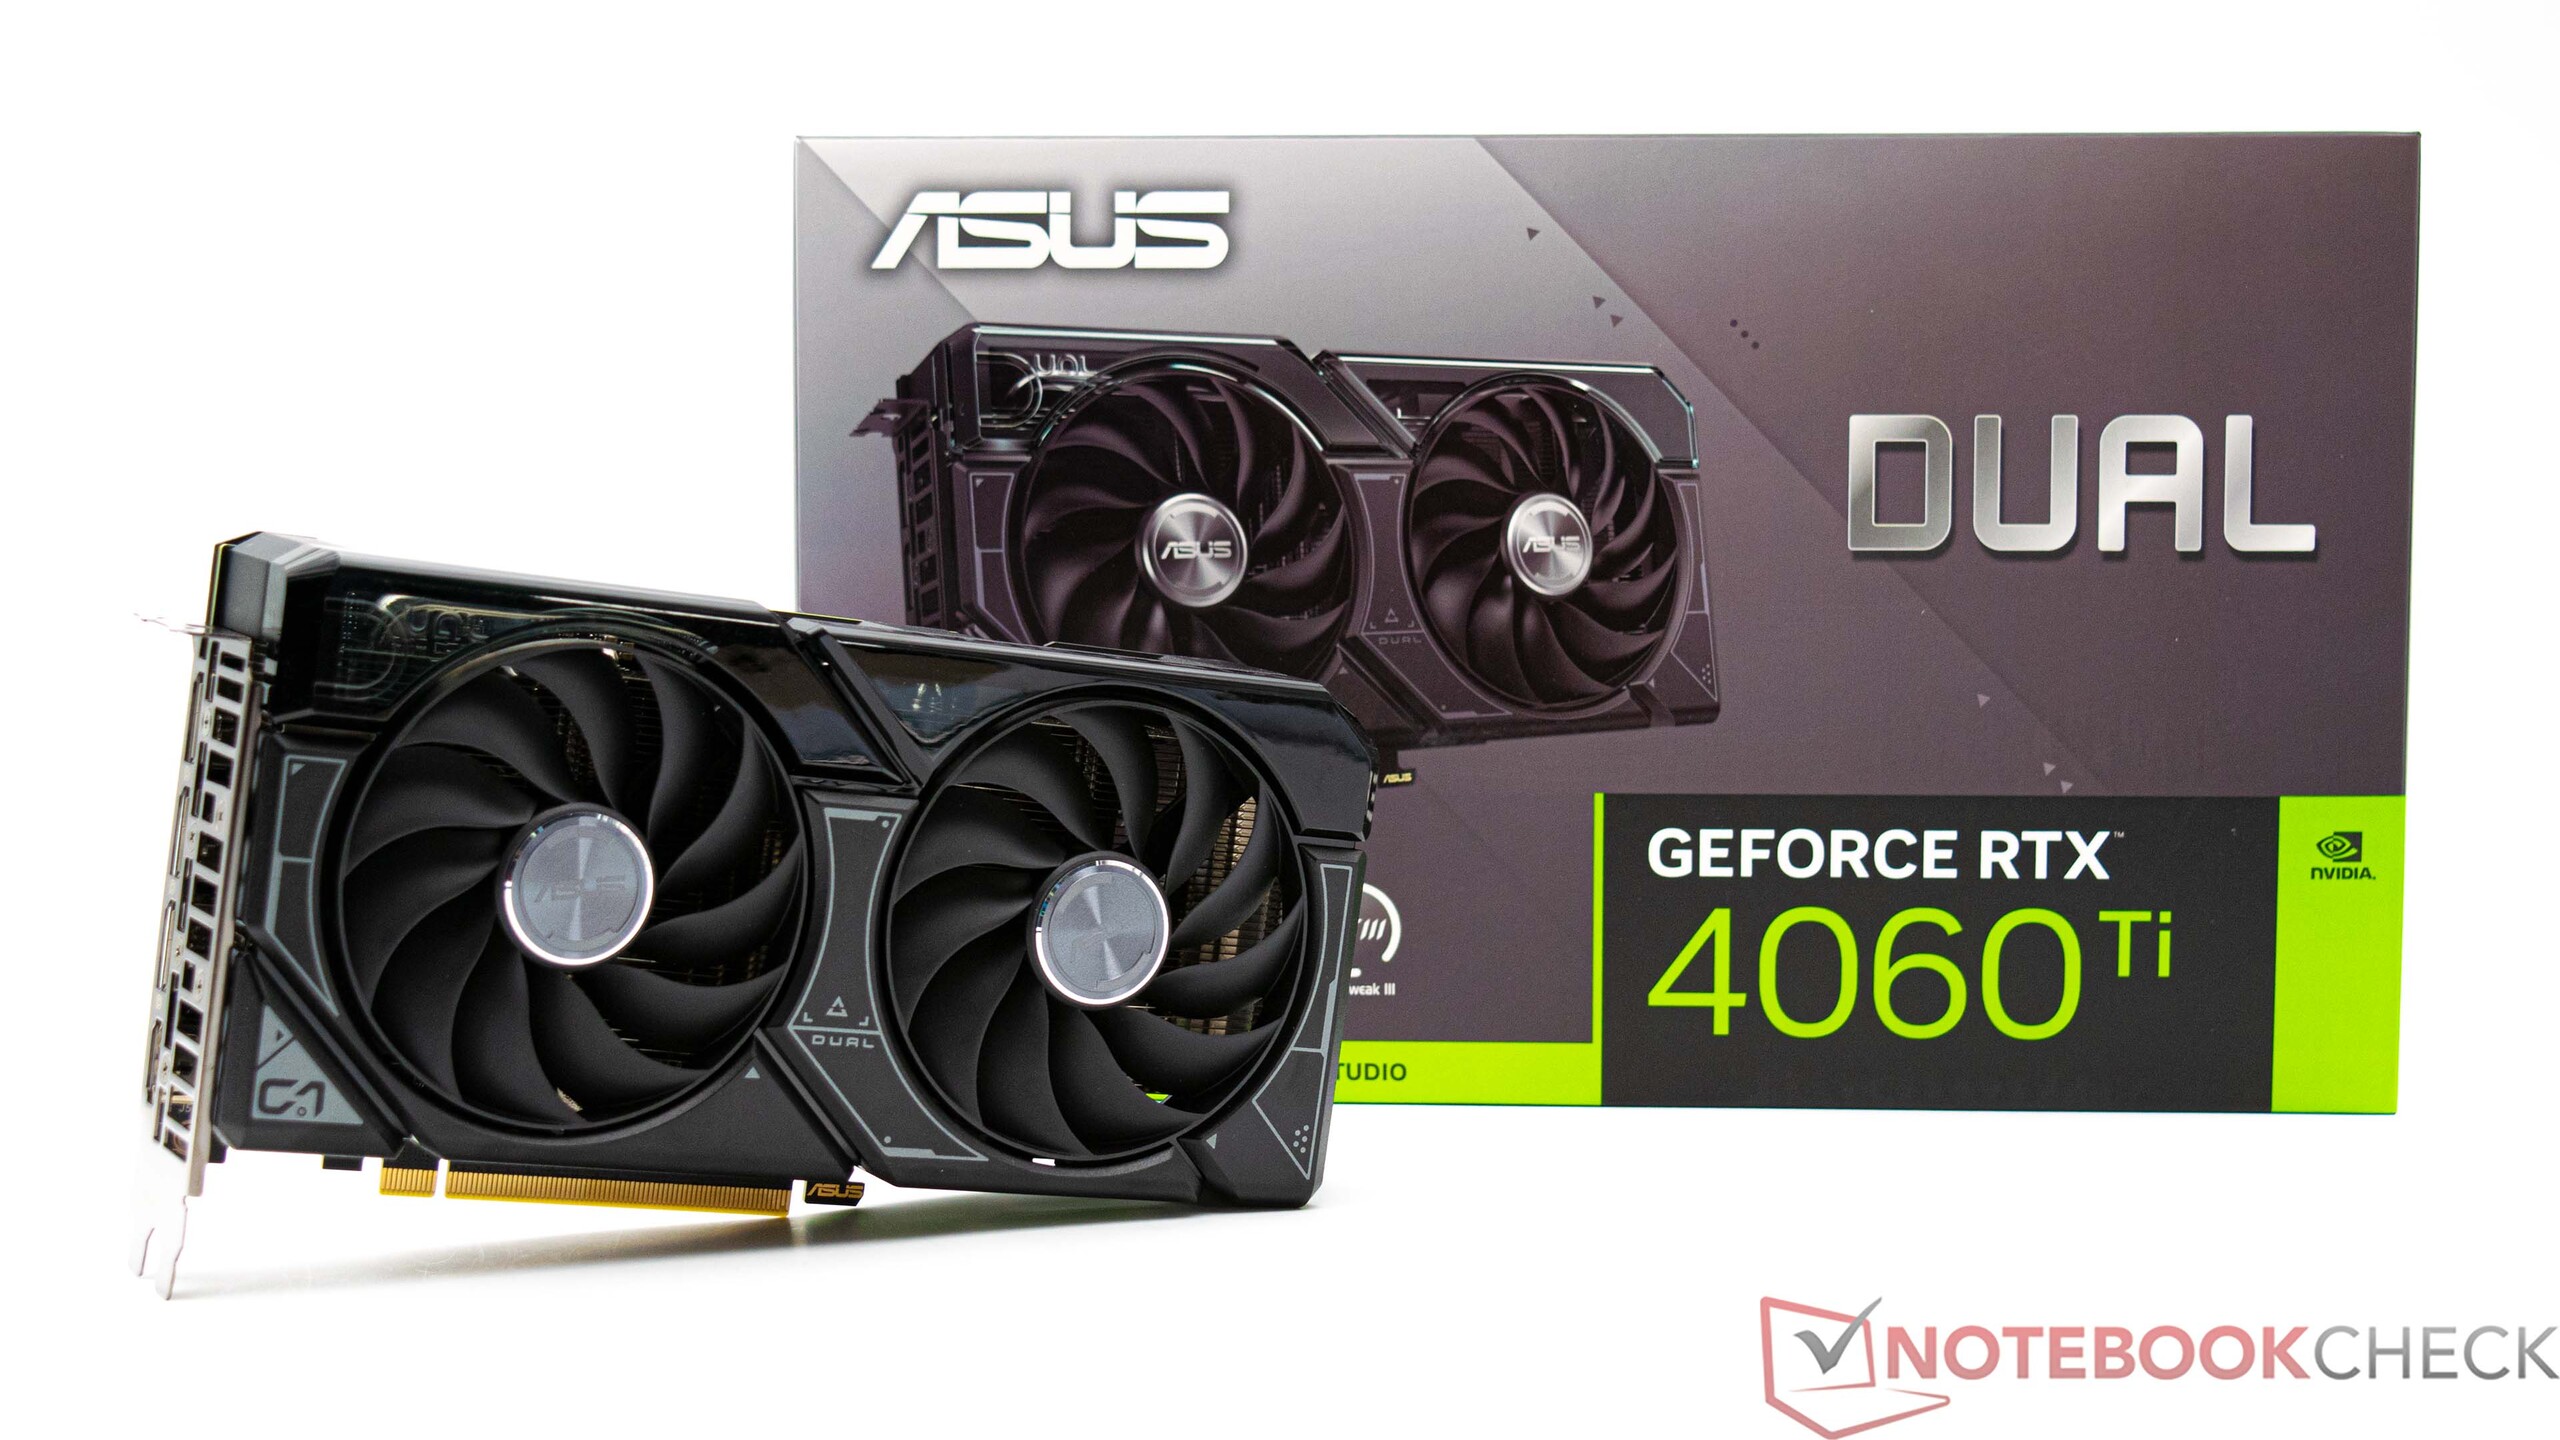
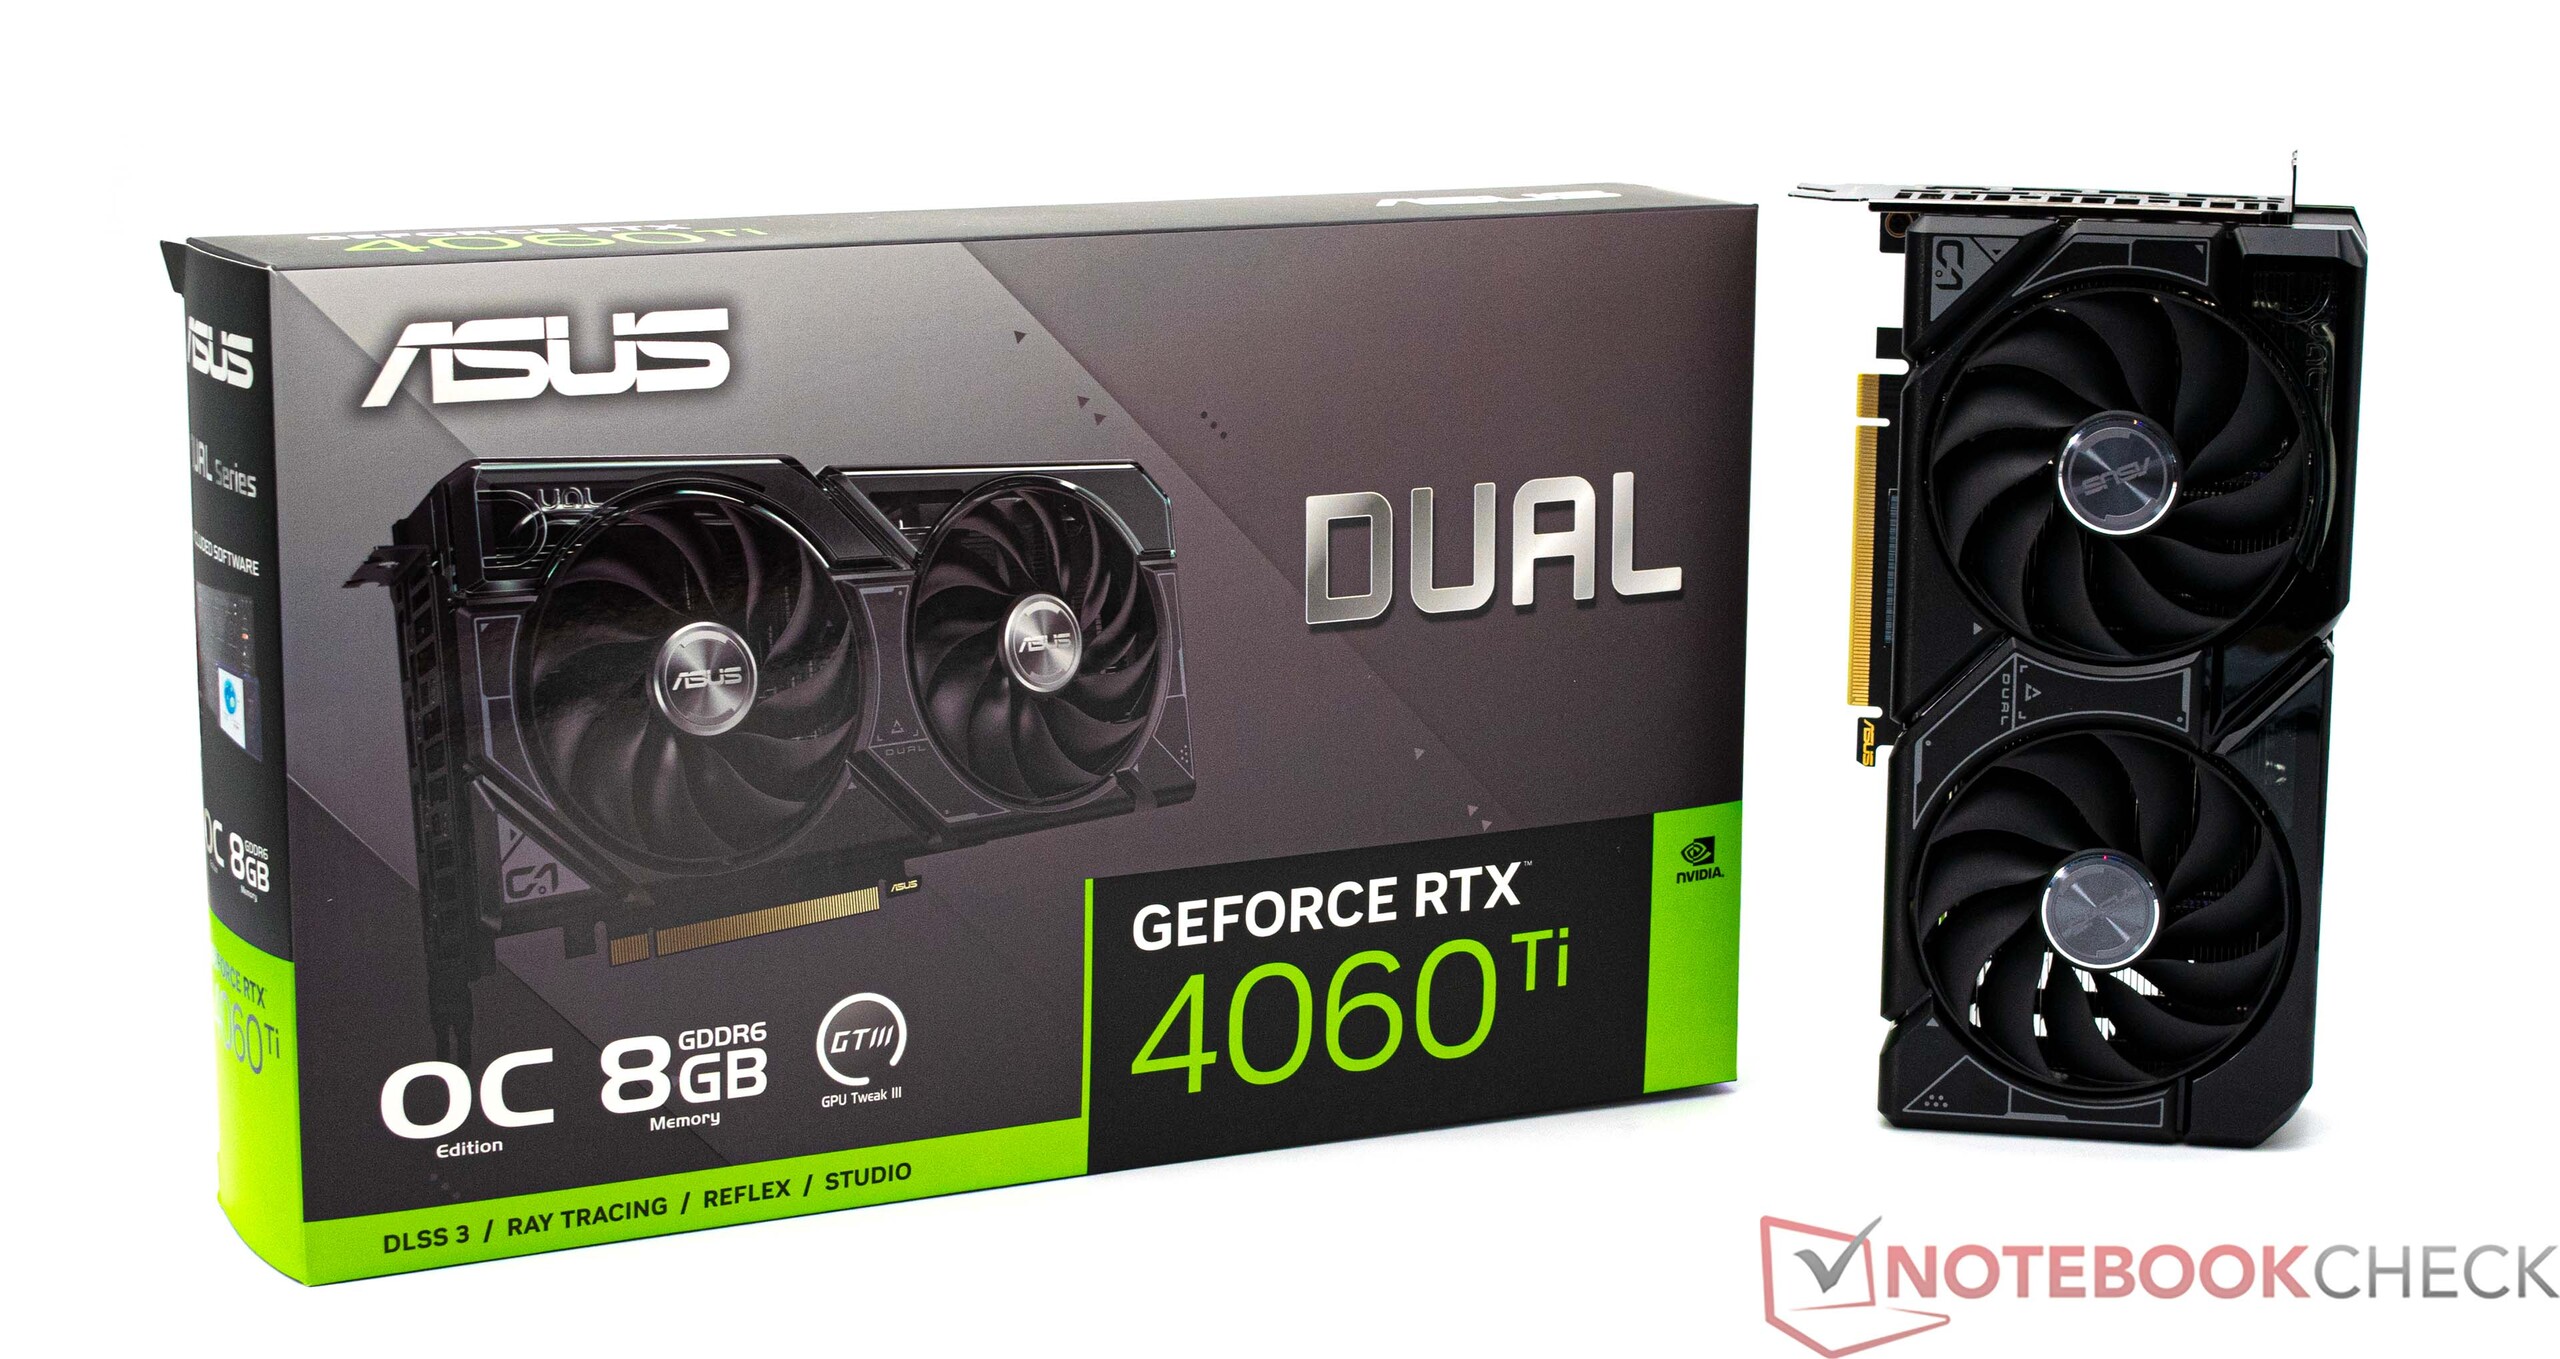
Asus has provided us with its Asus Dual GeForce RTX 4060 Ti OC to try out. This model, fitted with only 8 GB VRAM, is one of Asus' more affordable graphics cards. At the time of testing, you can find the component for around US$400 if you are looking for the one from Asus. The considerably larger TUF model made by the same manufacturer can be had for around US$50 more.
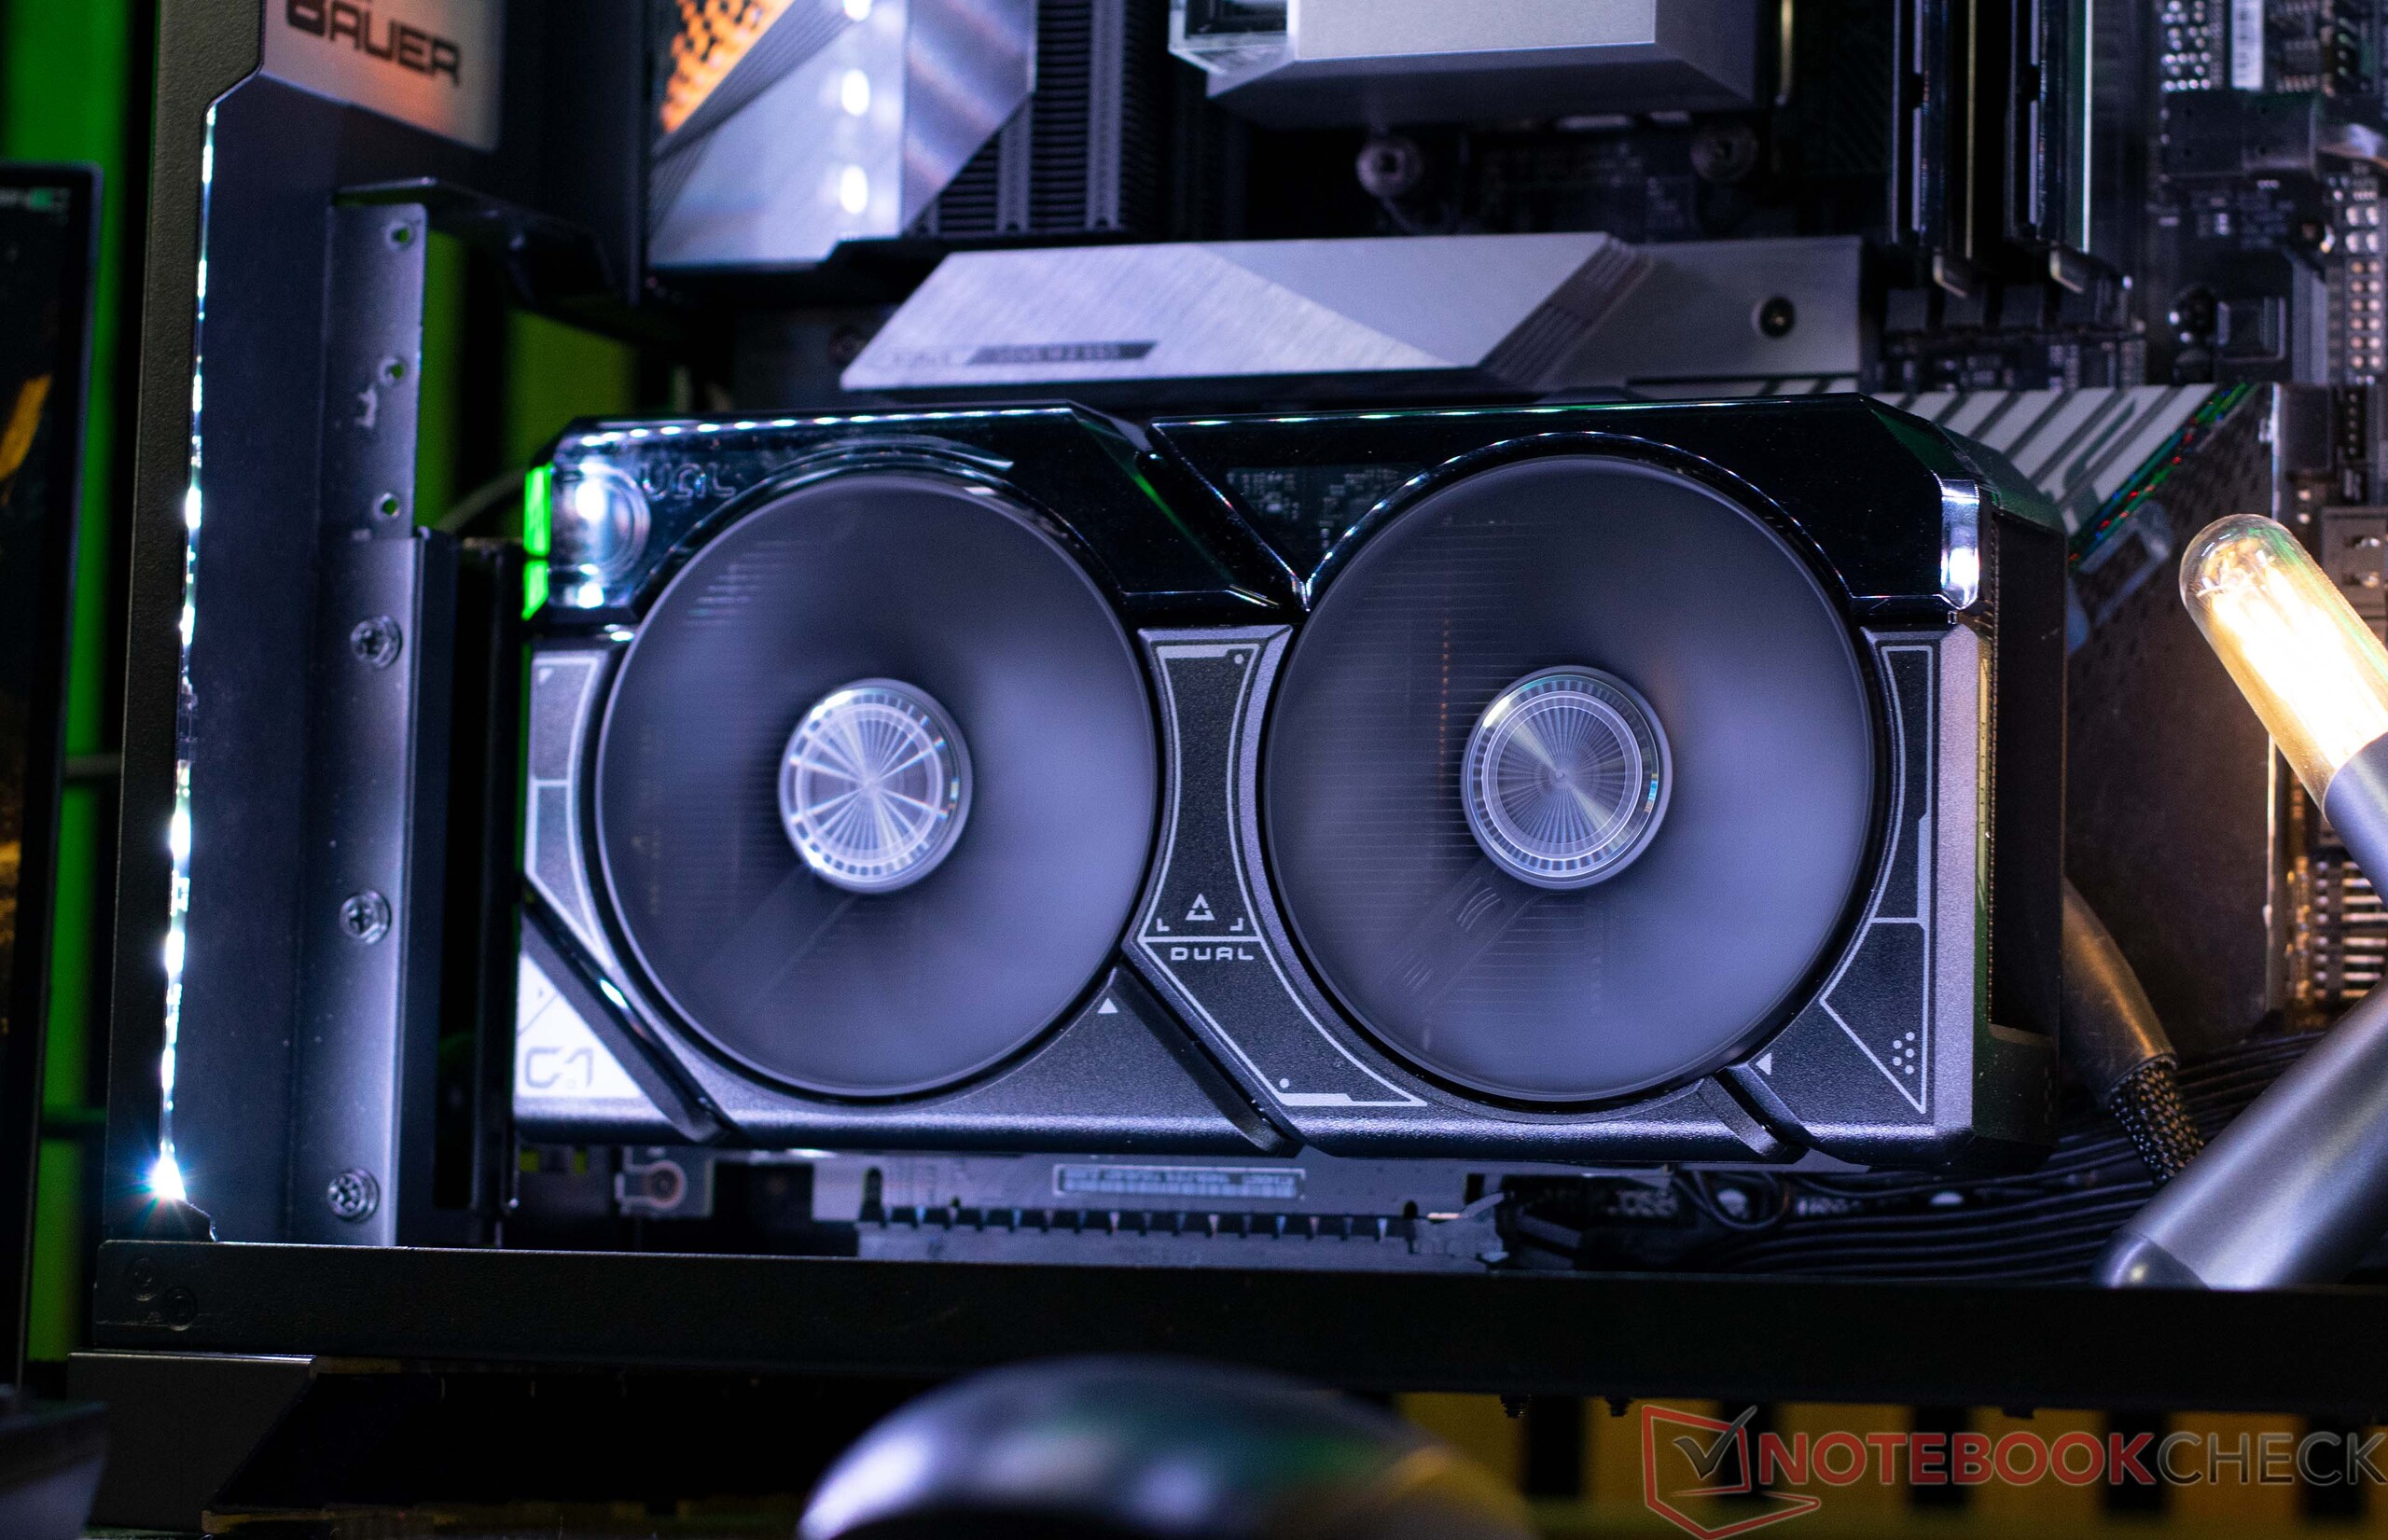
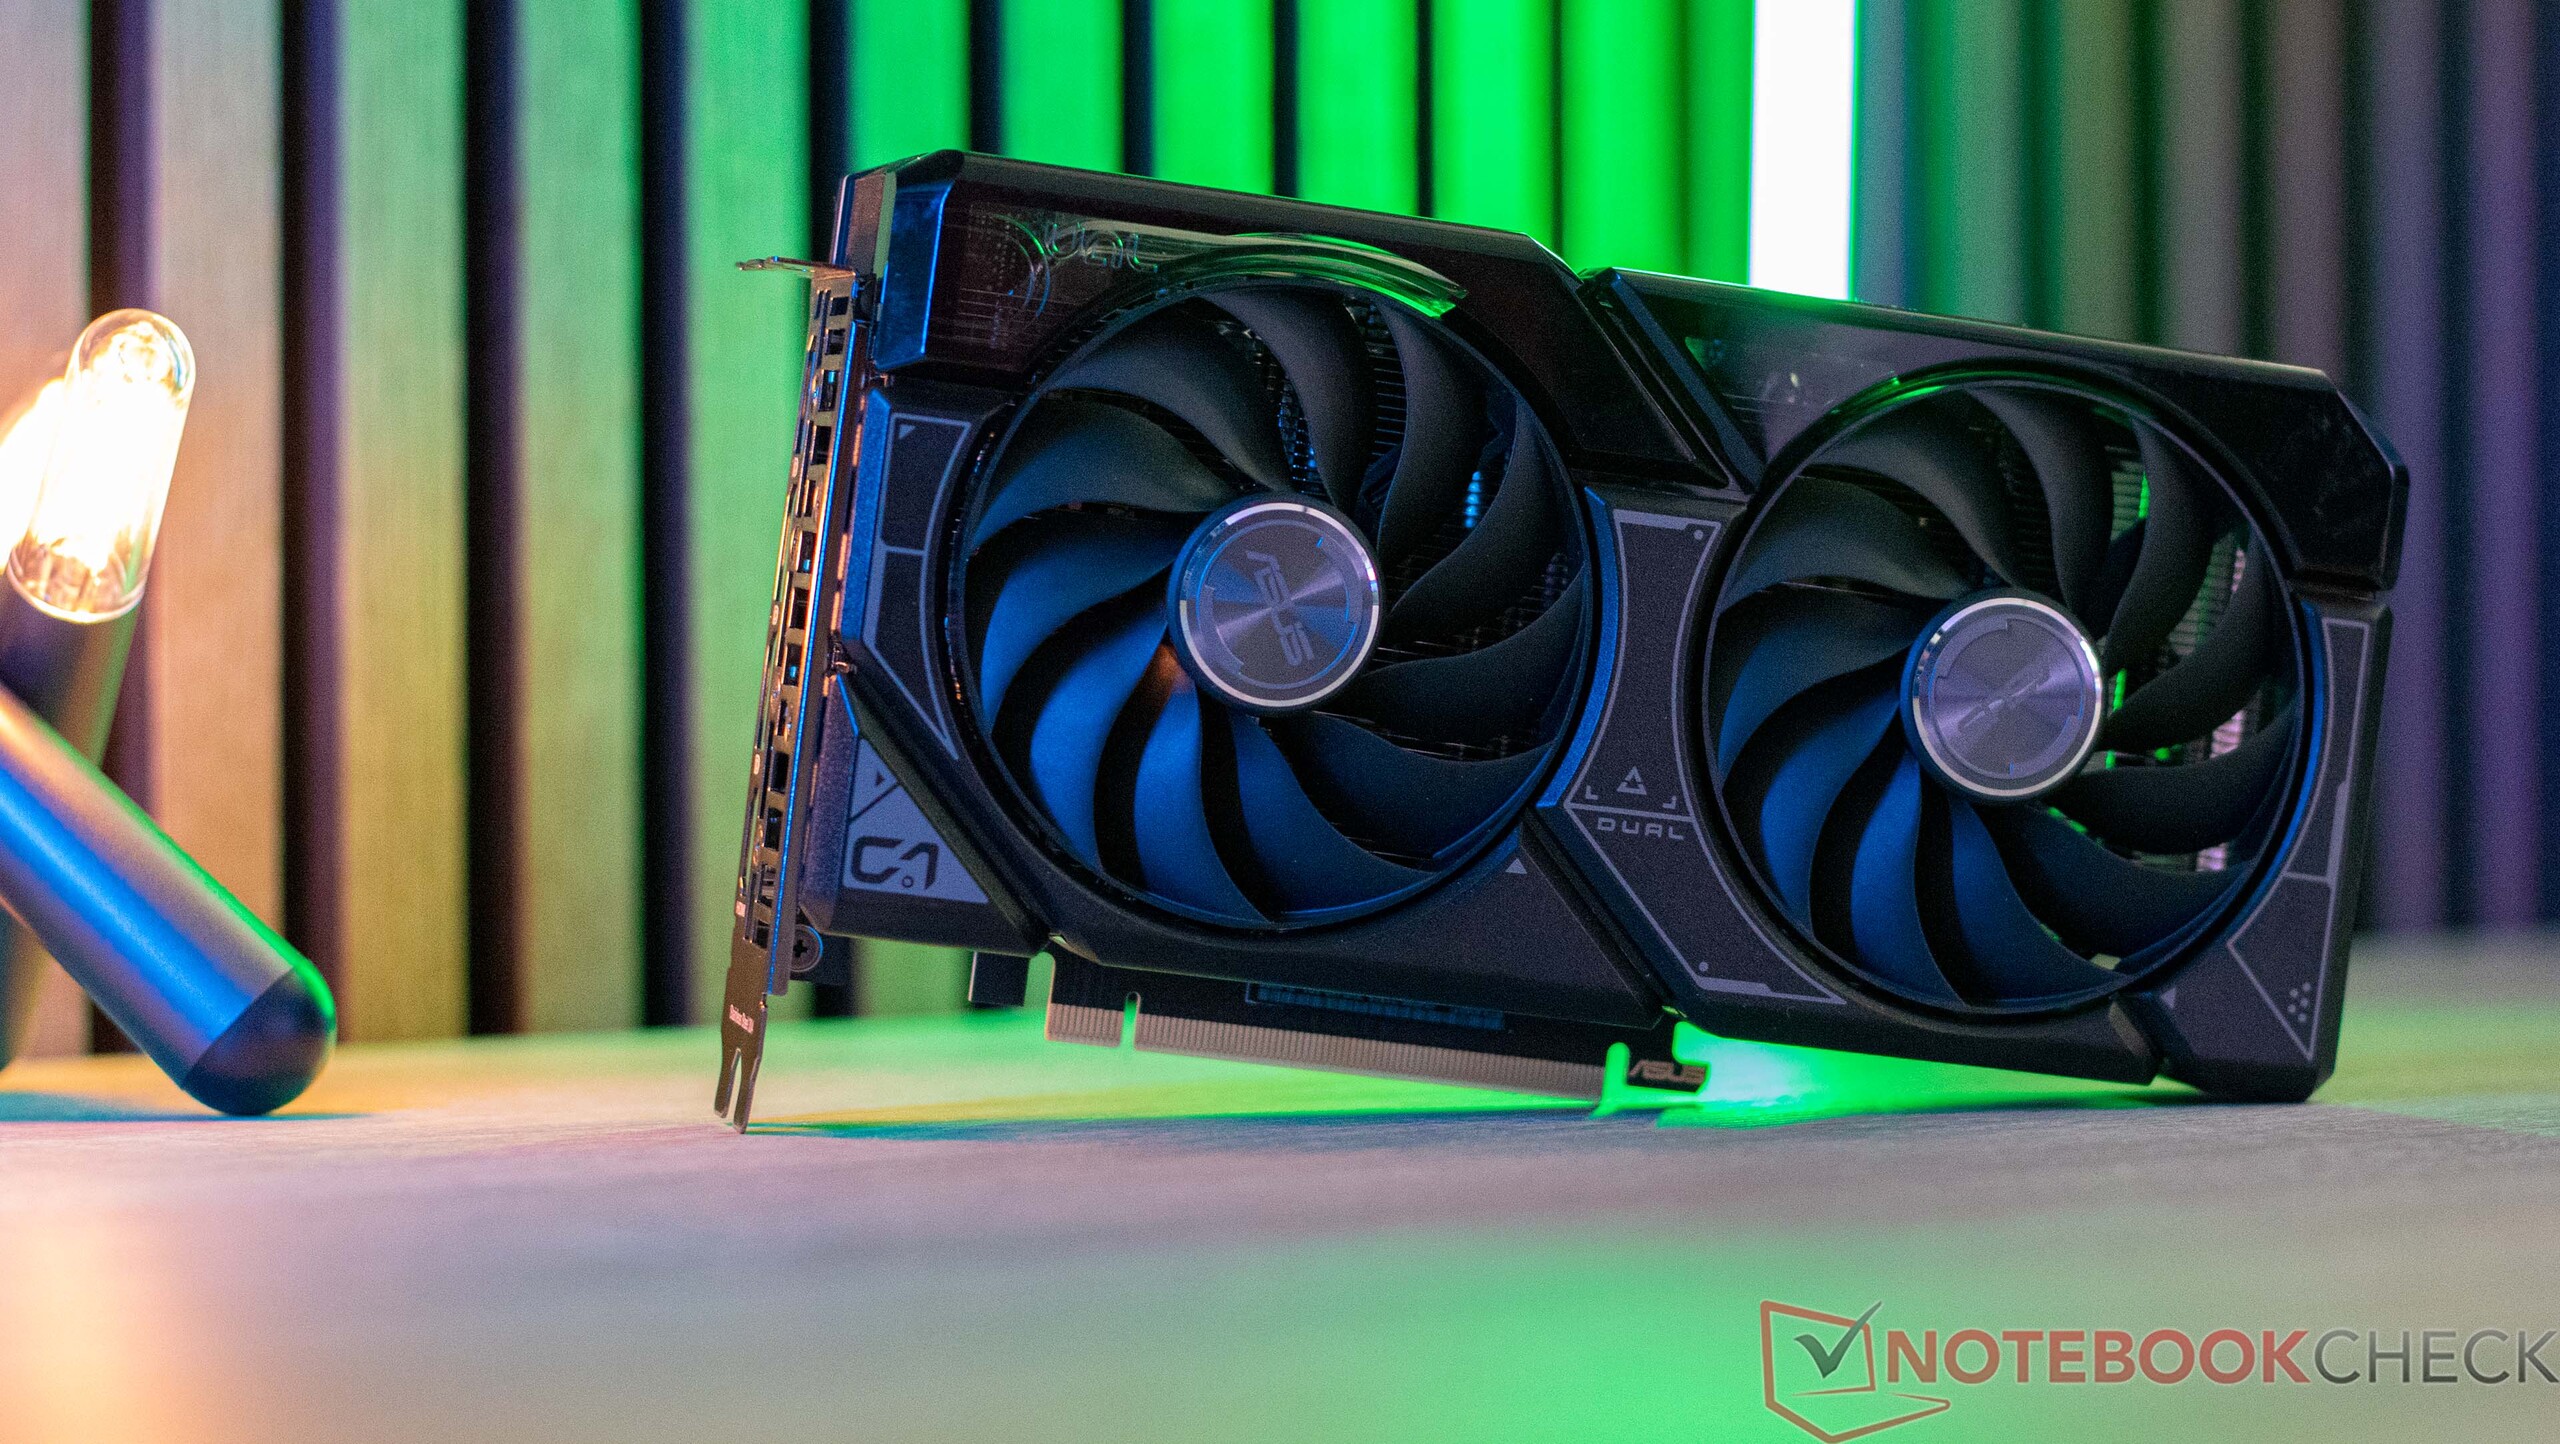
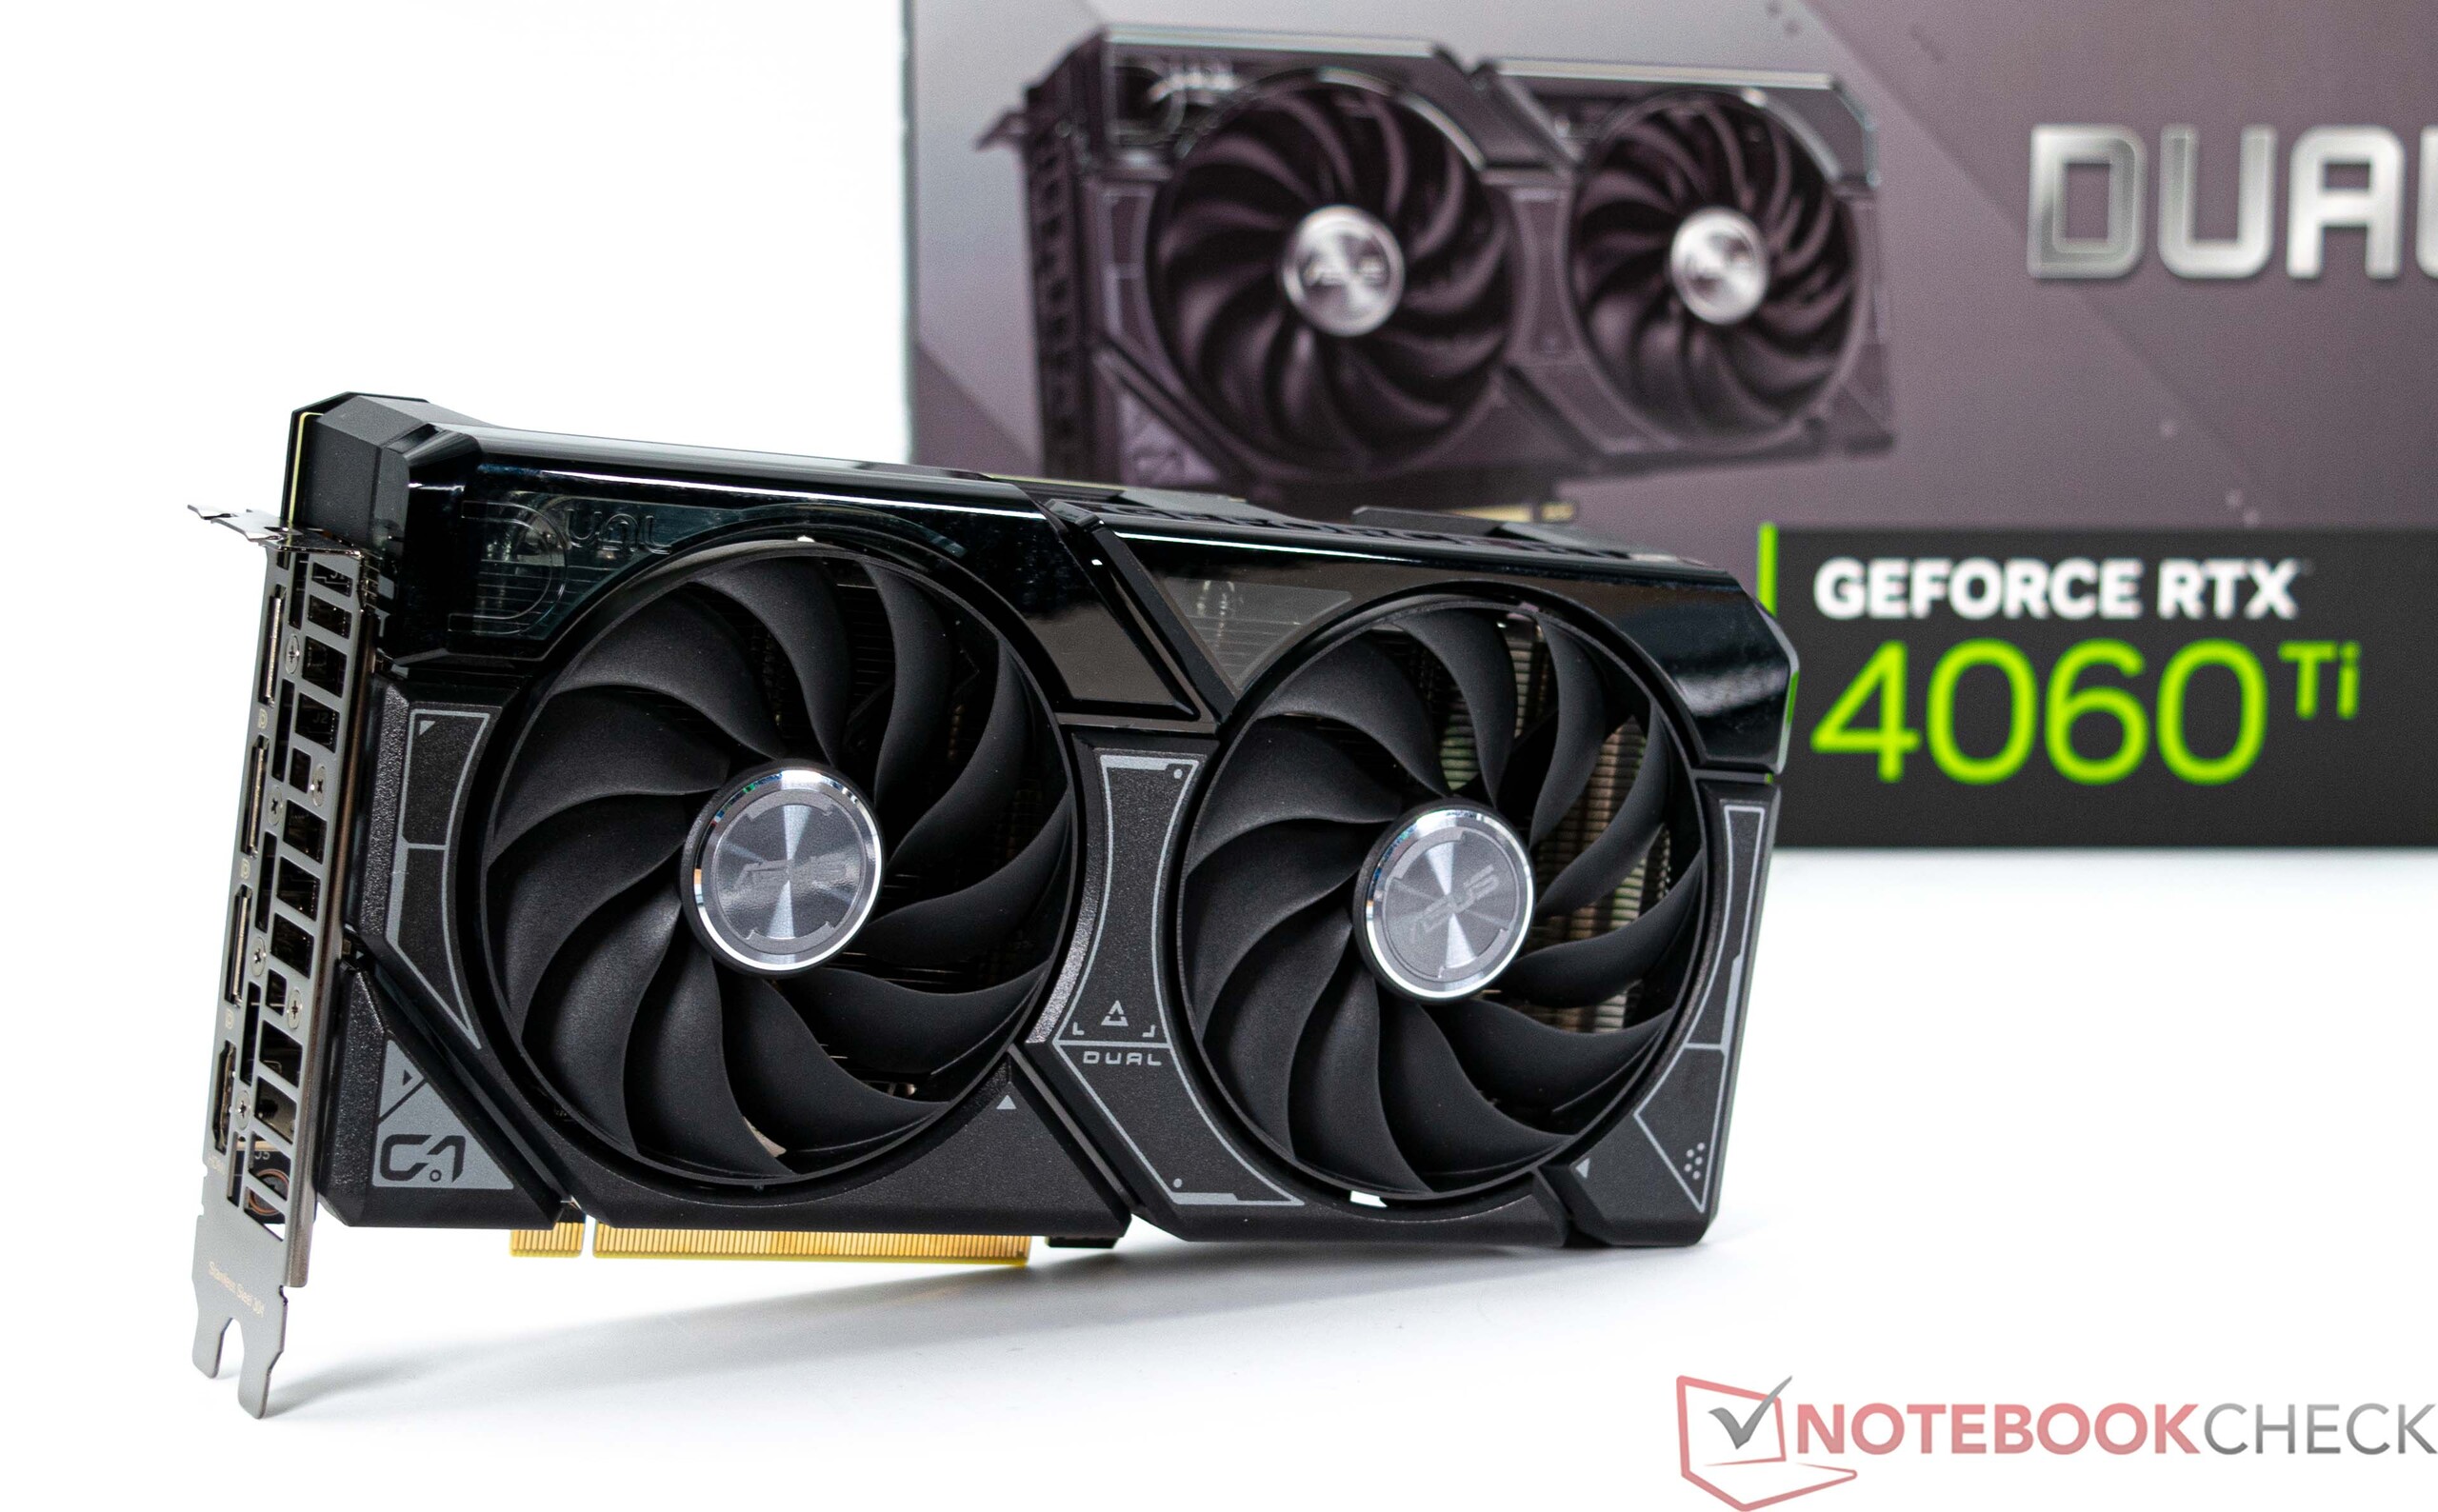
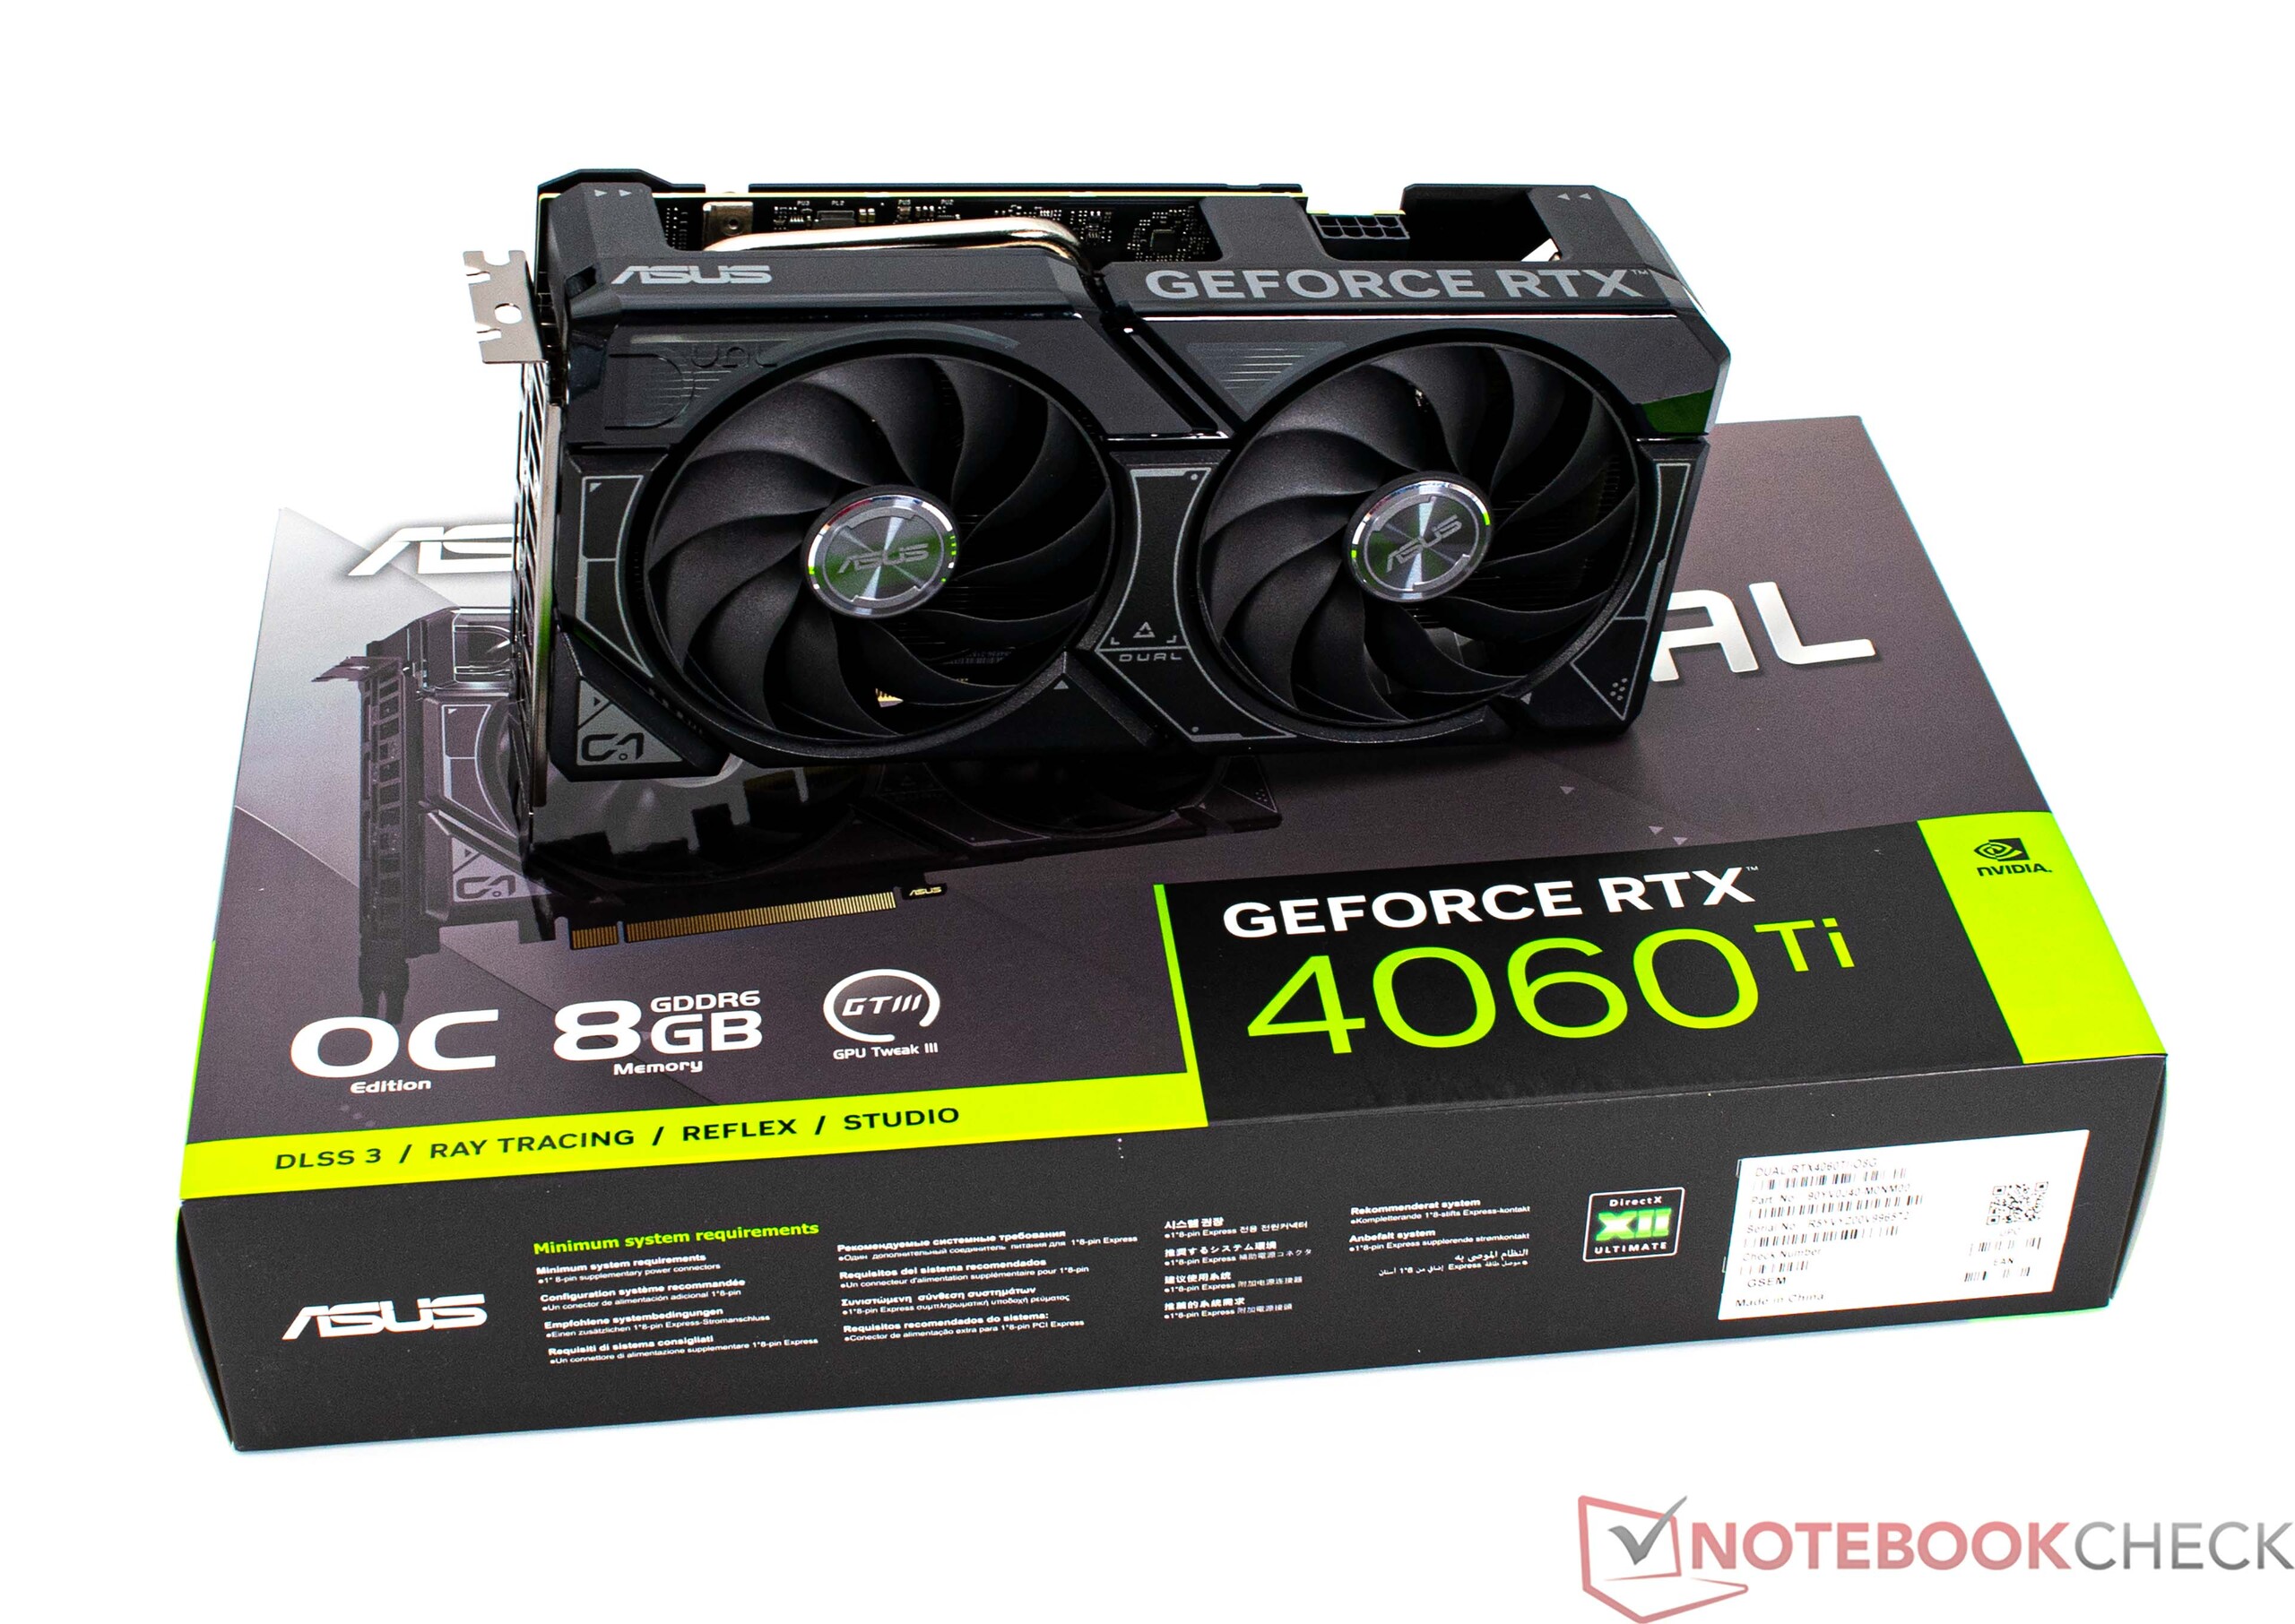
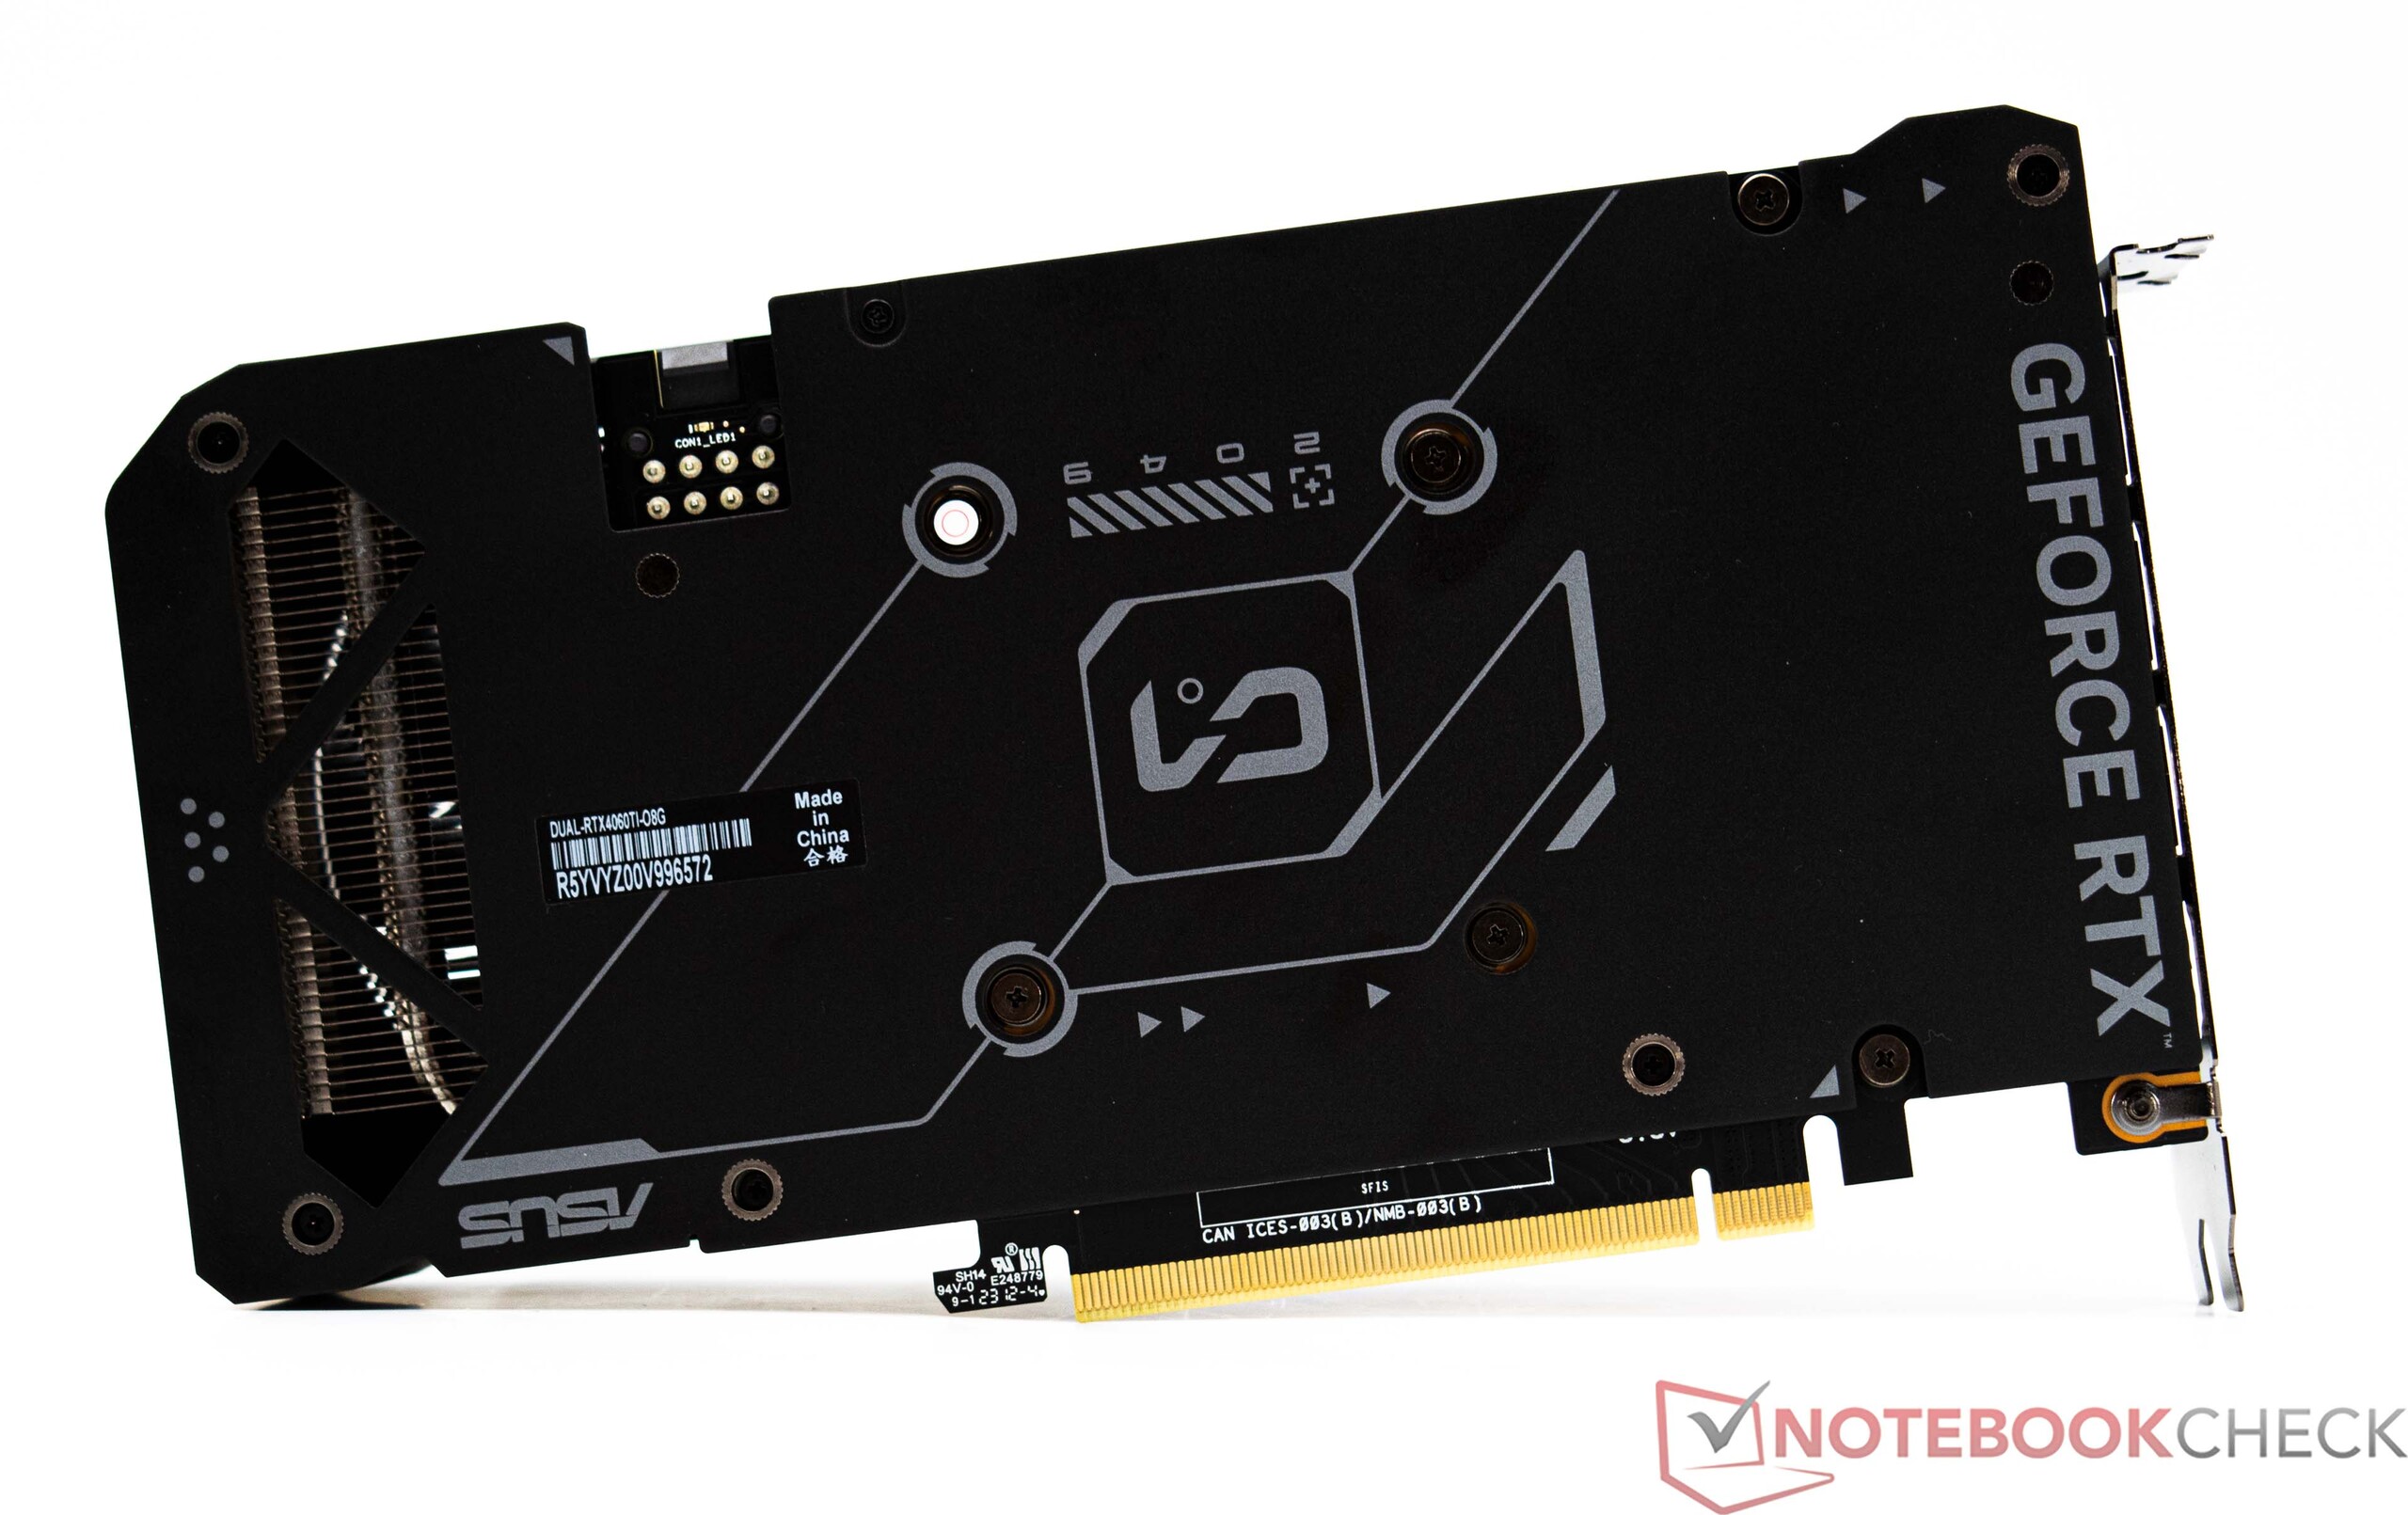
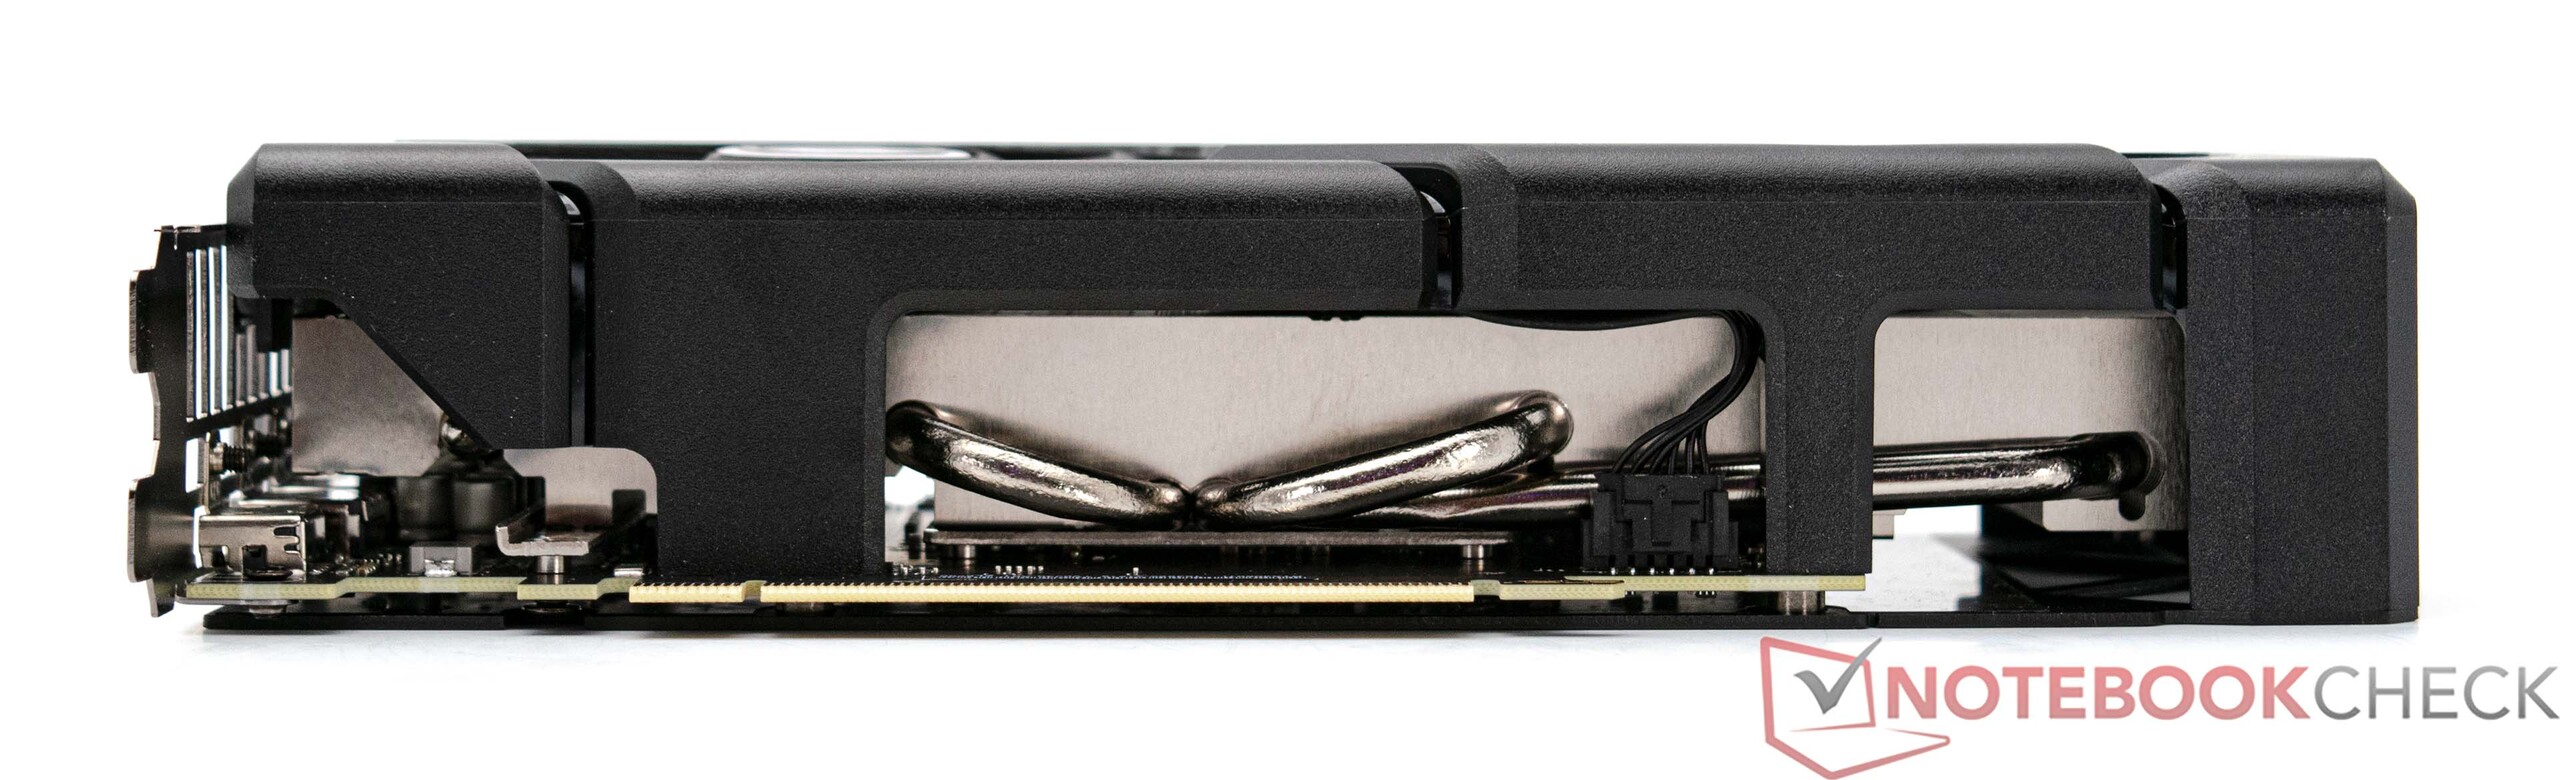
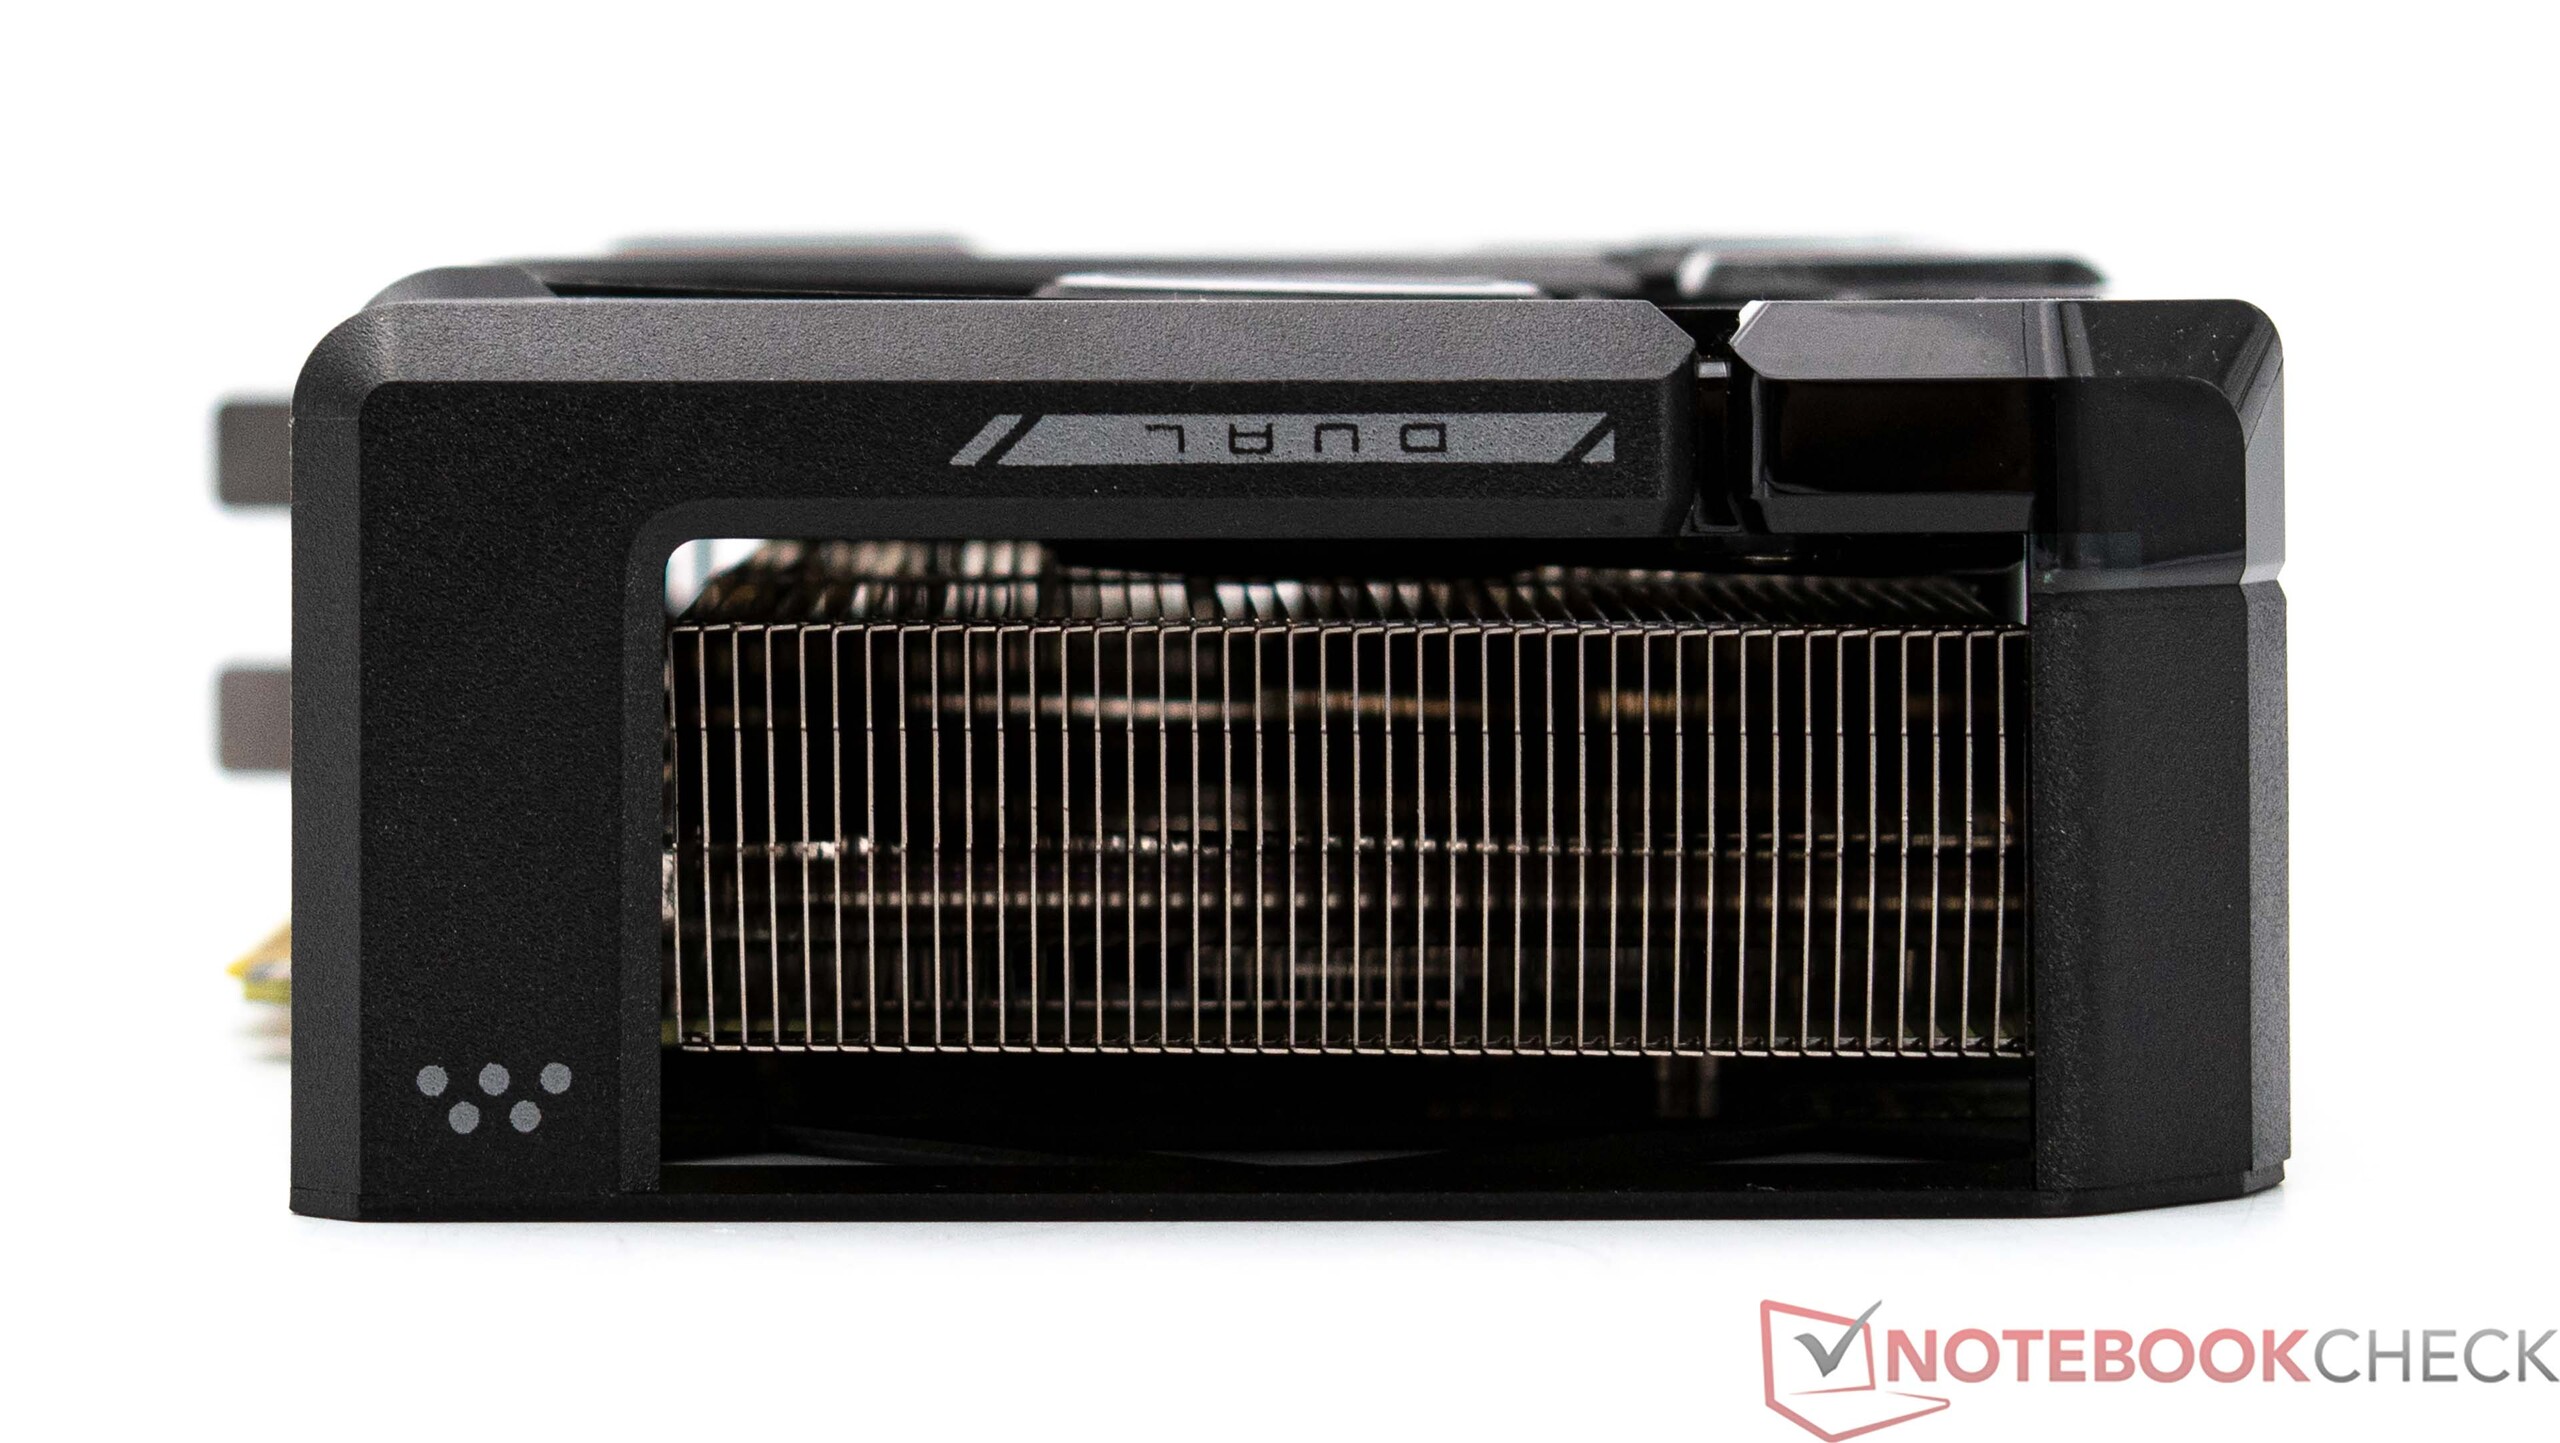
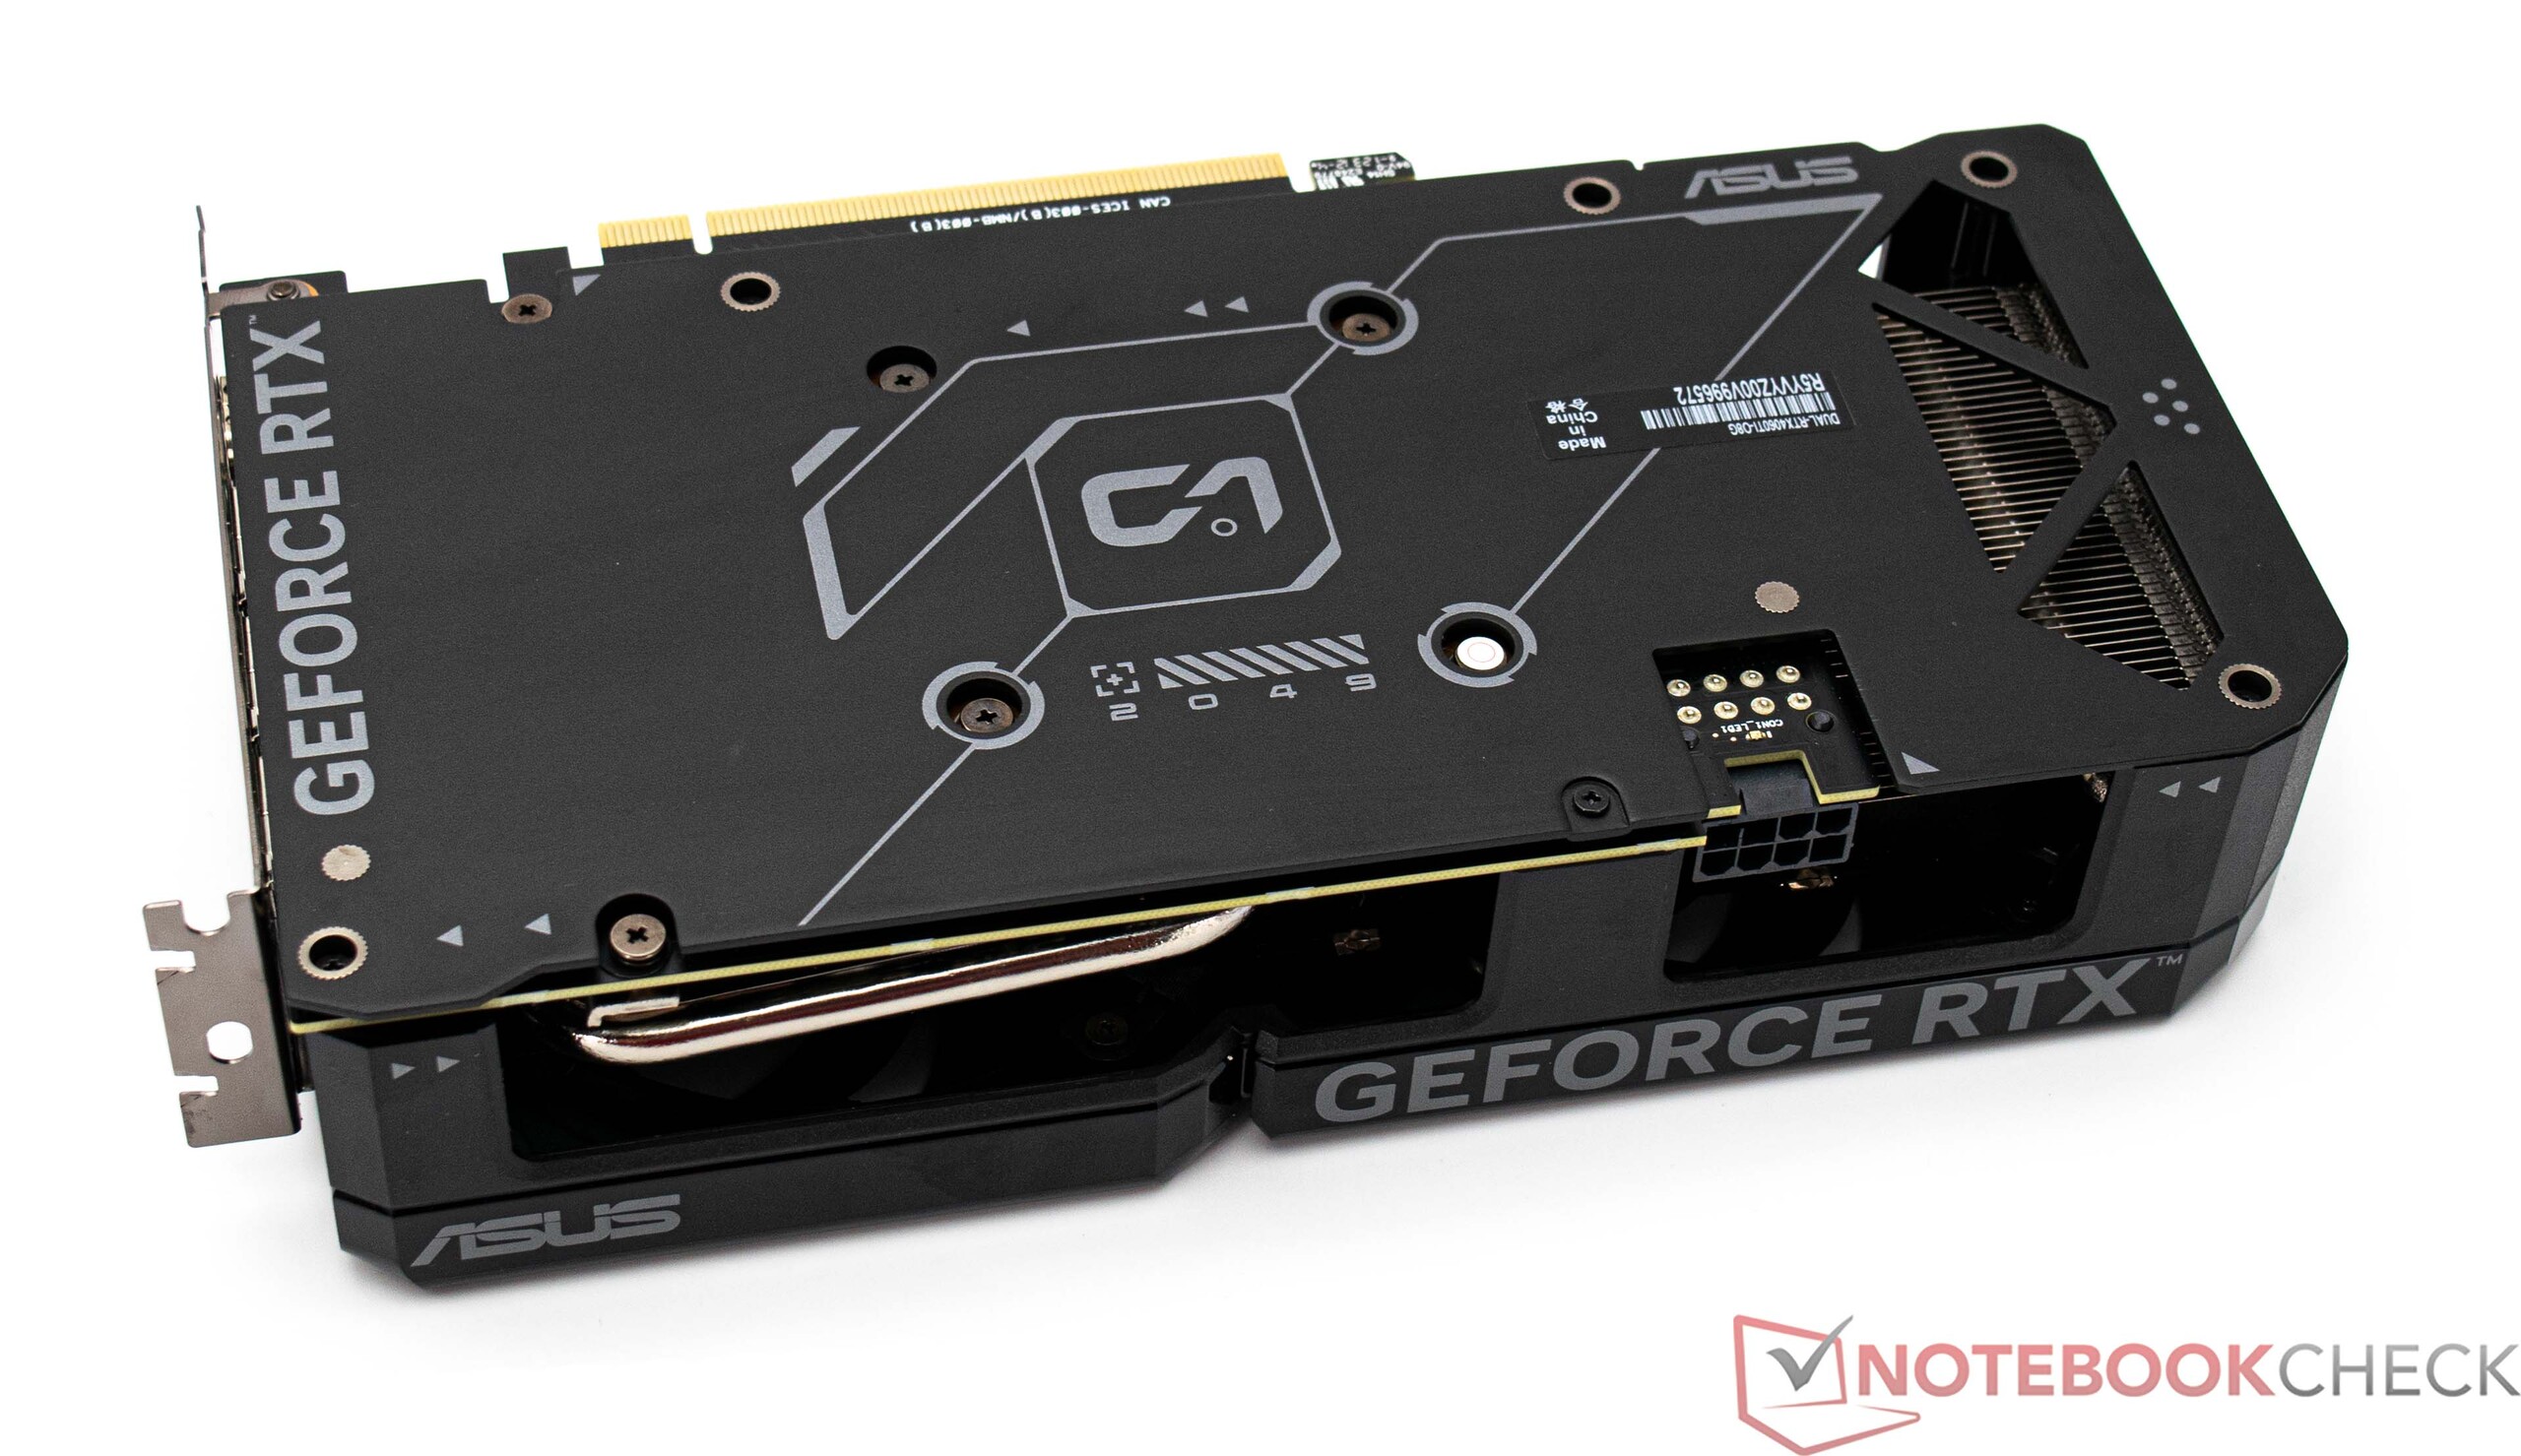
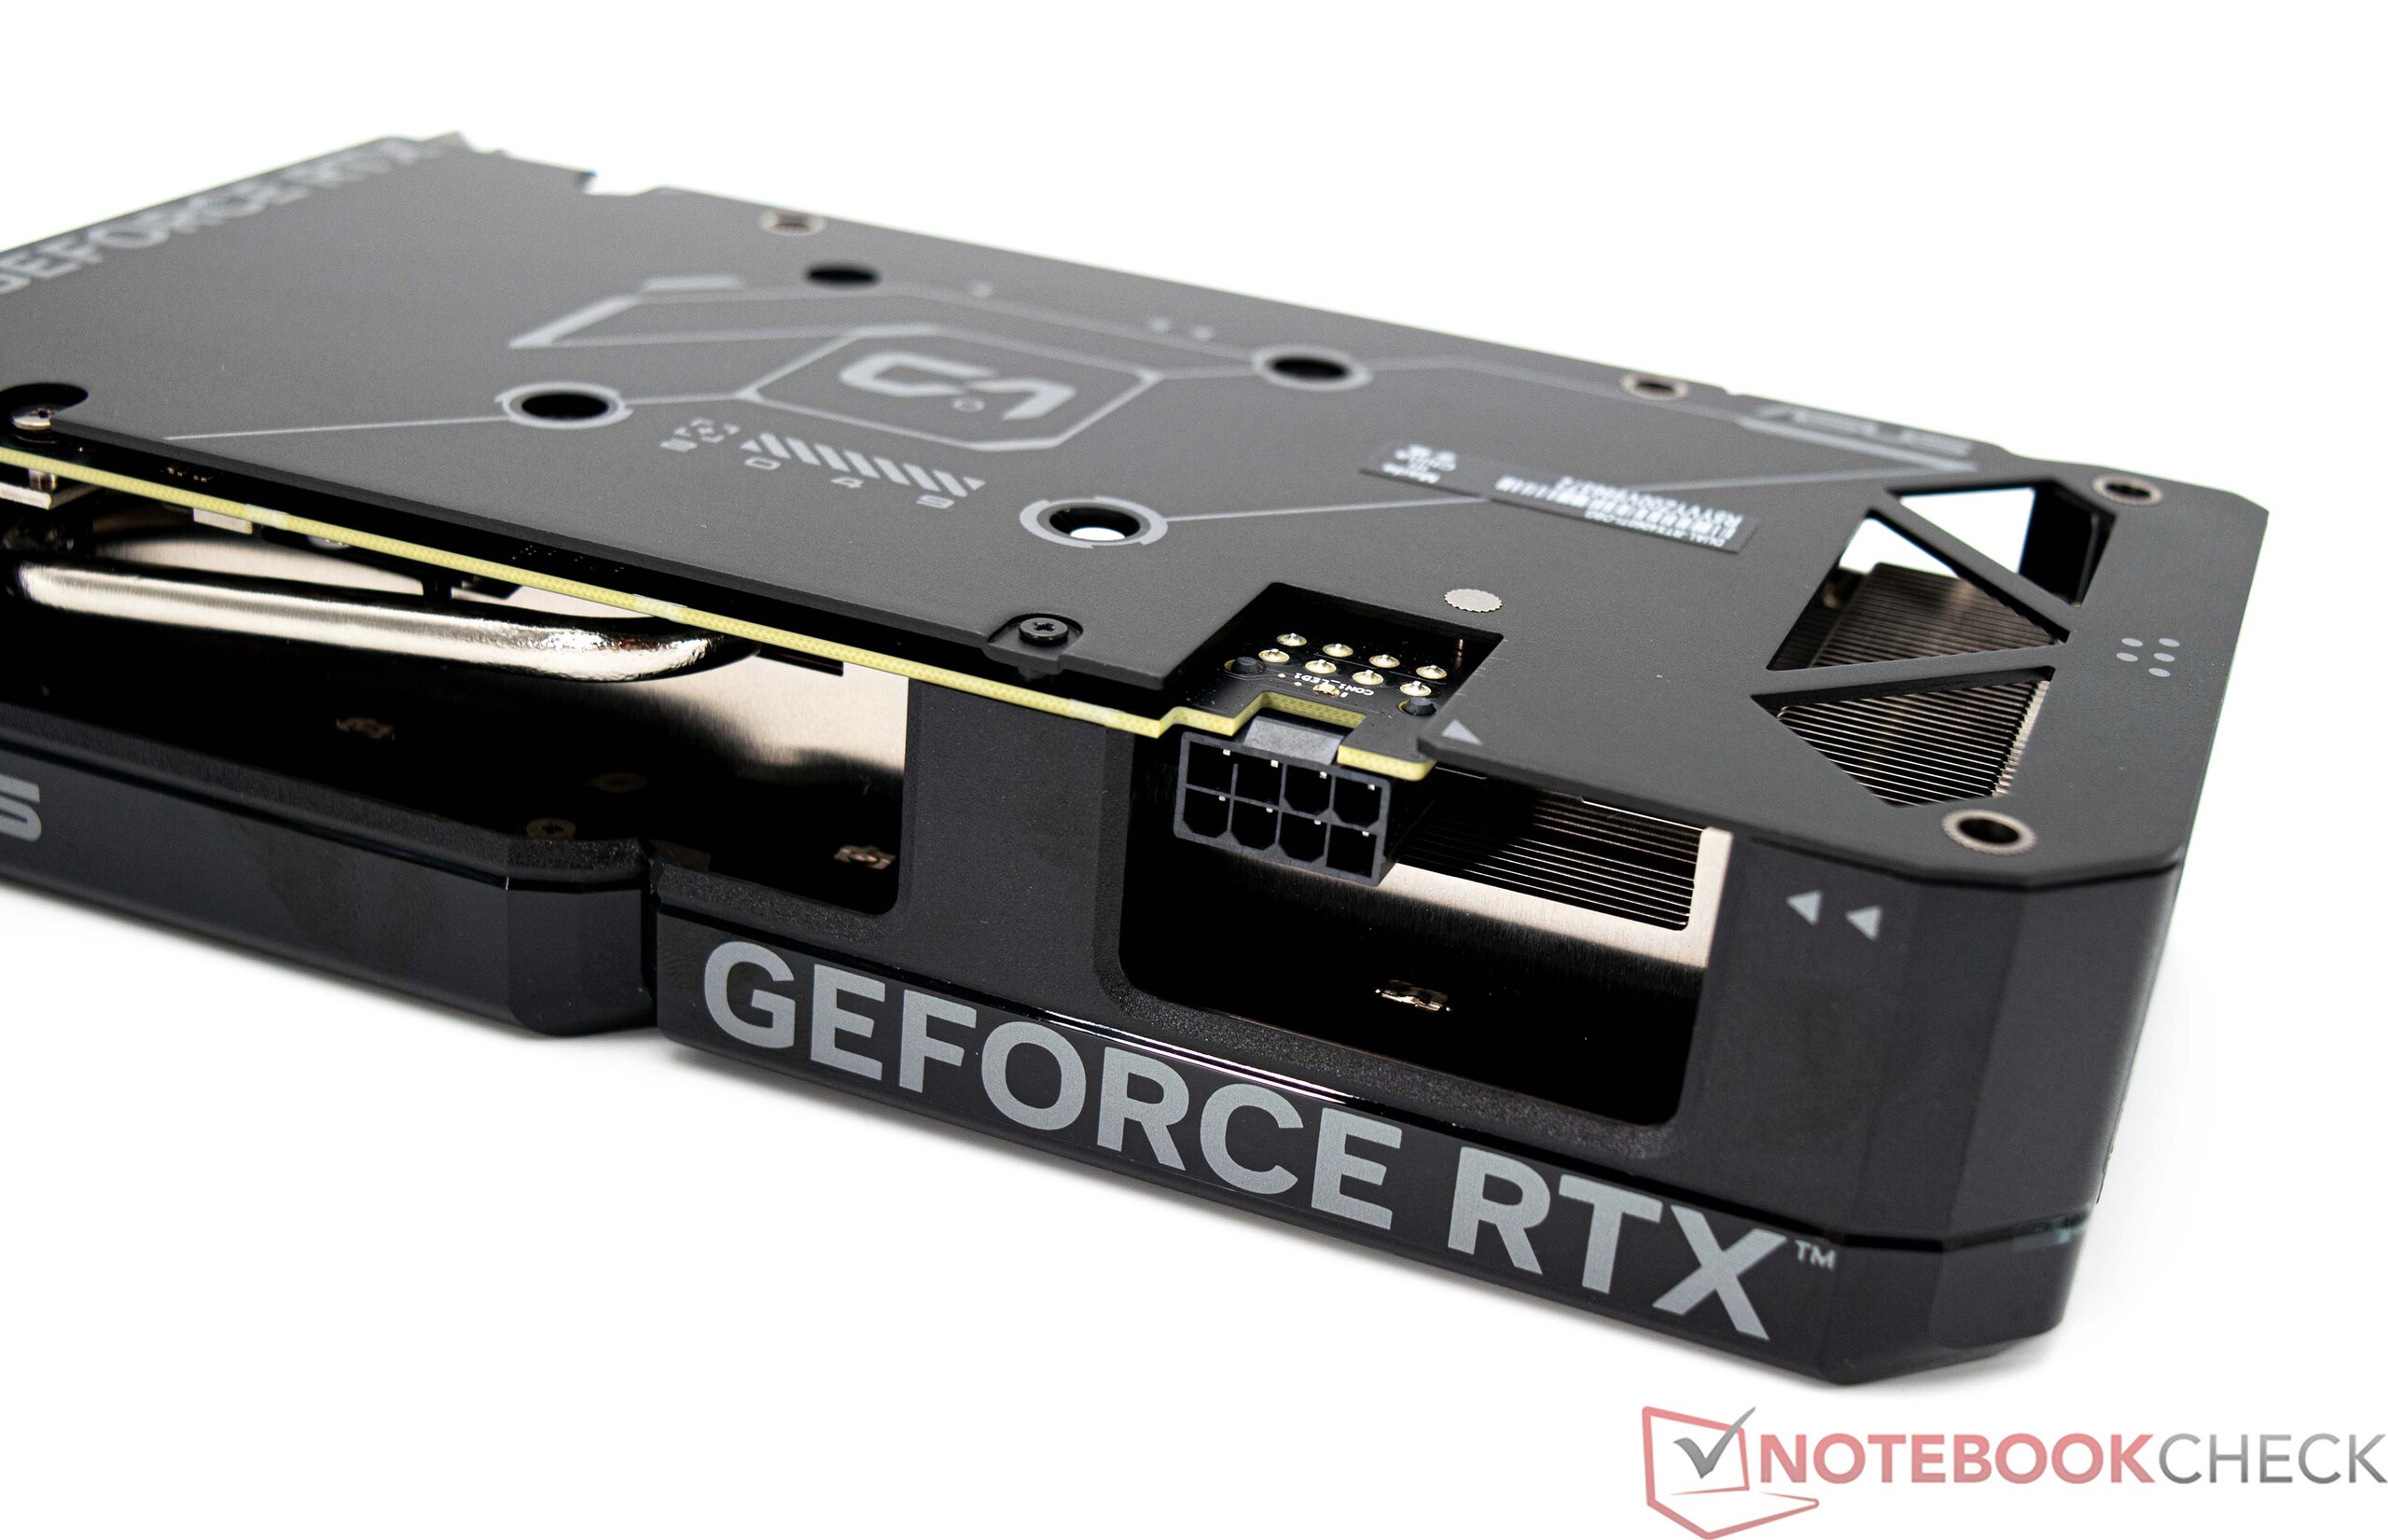
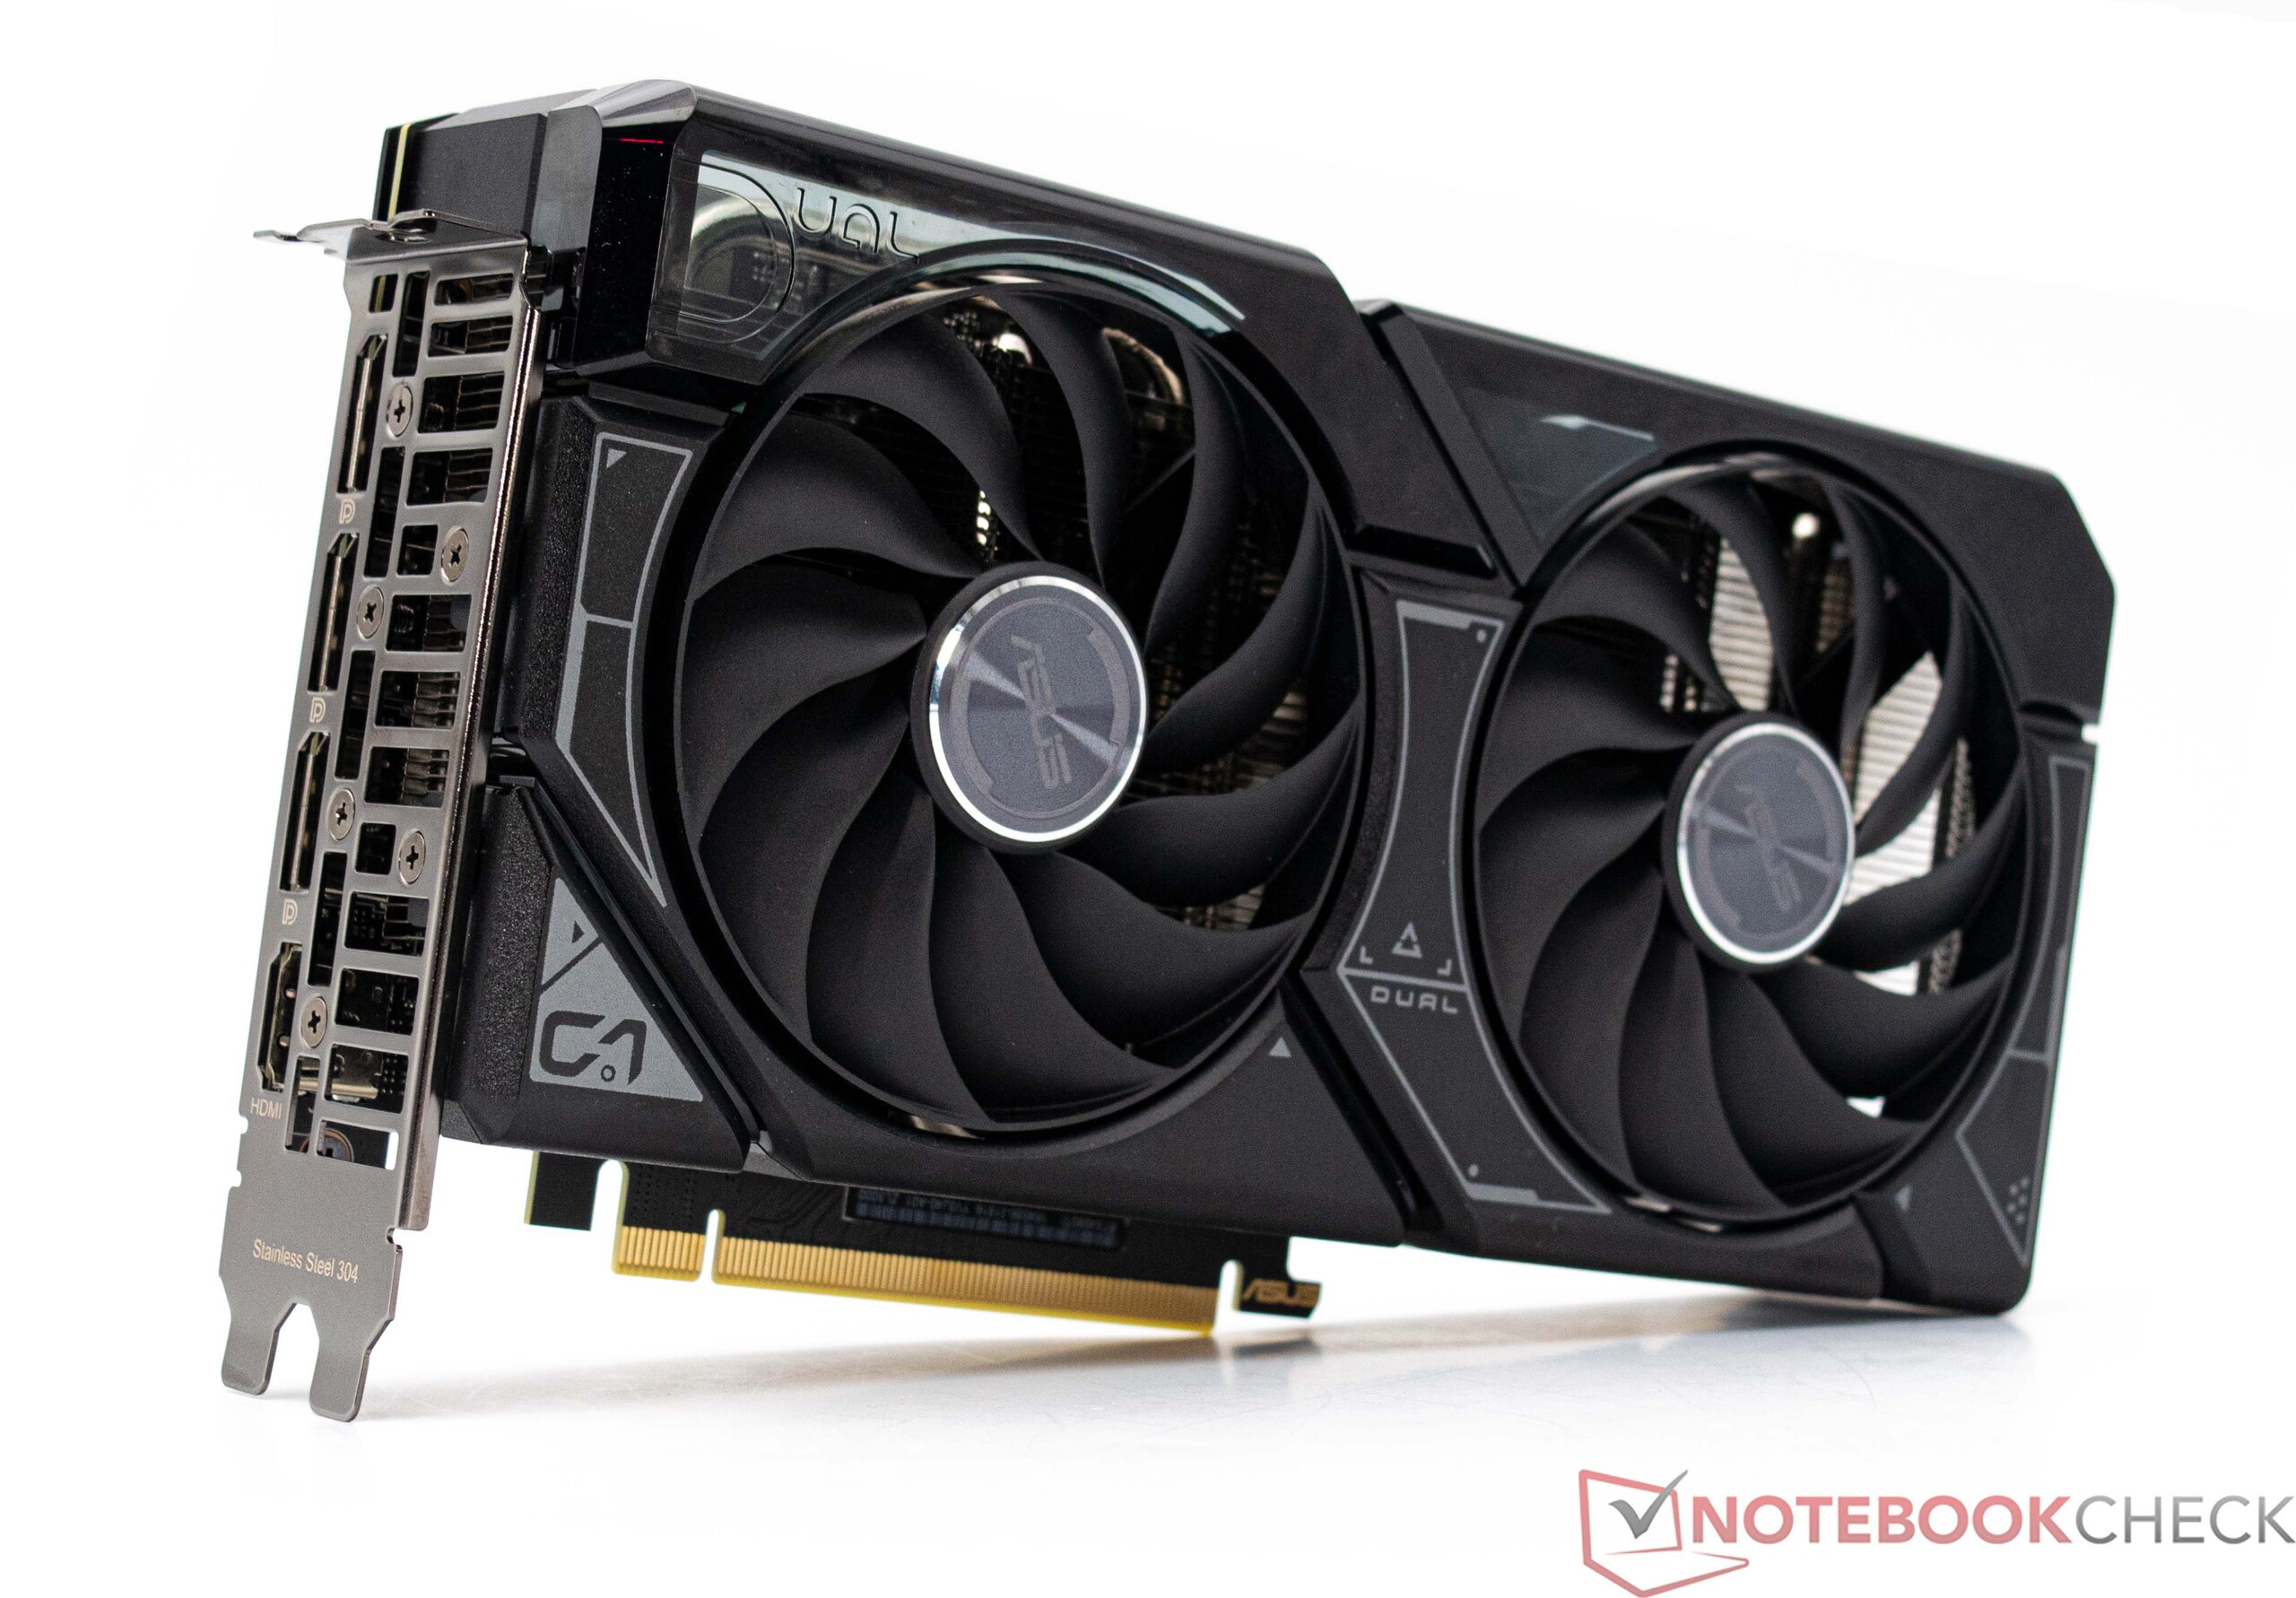
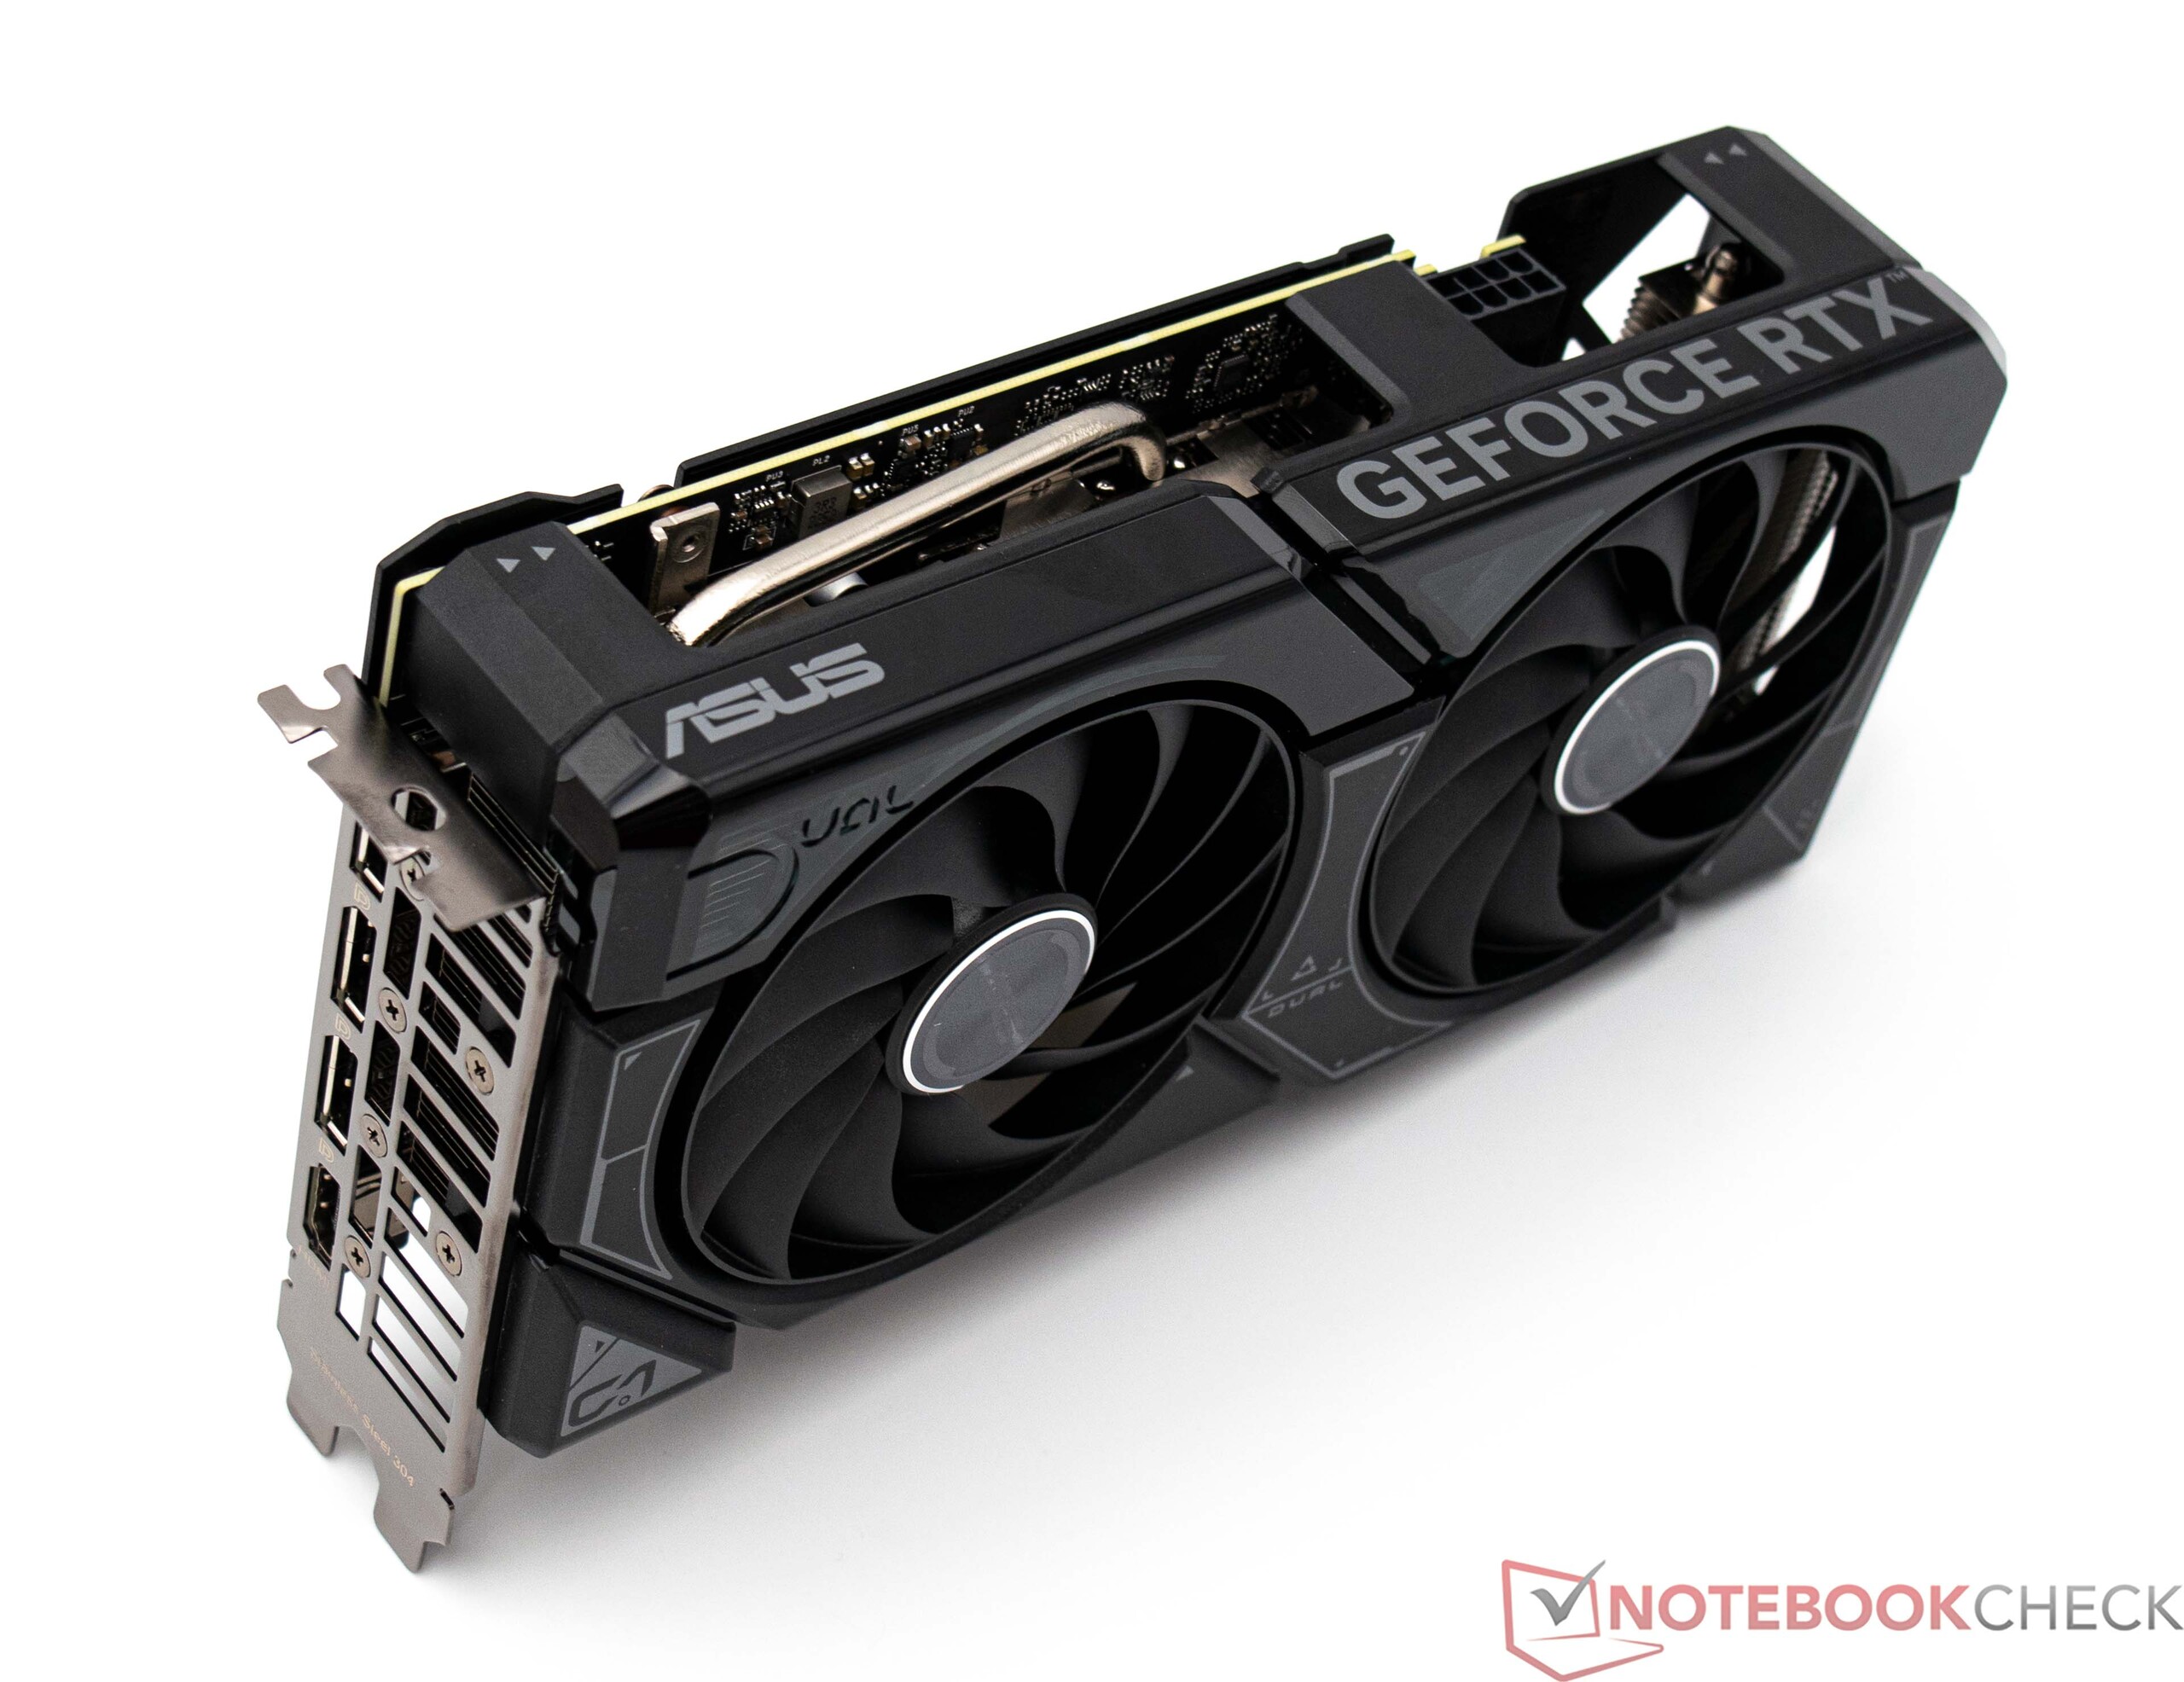
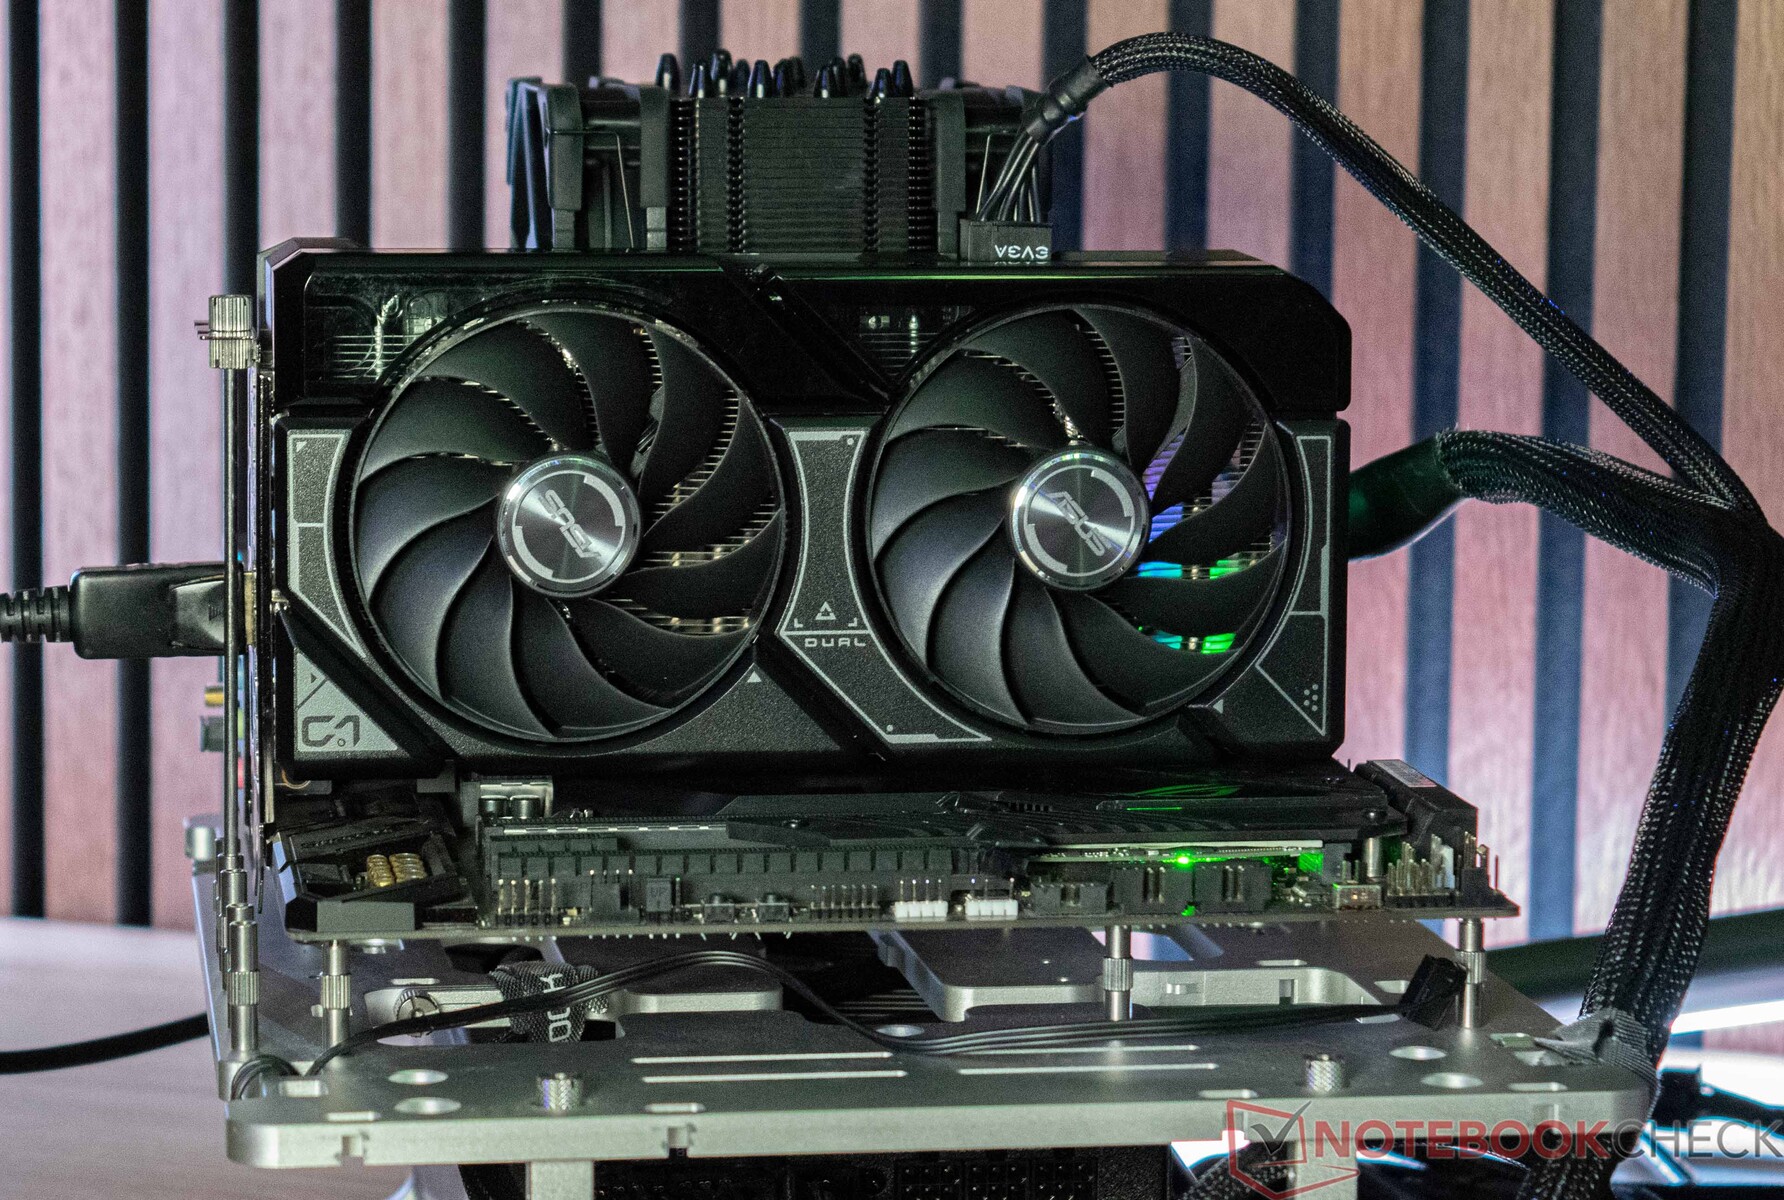
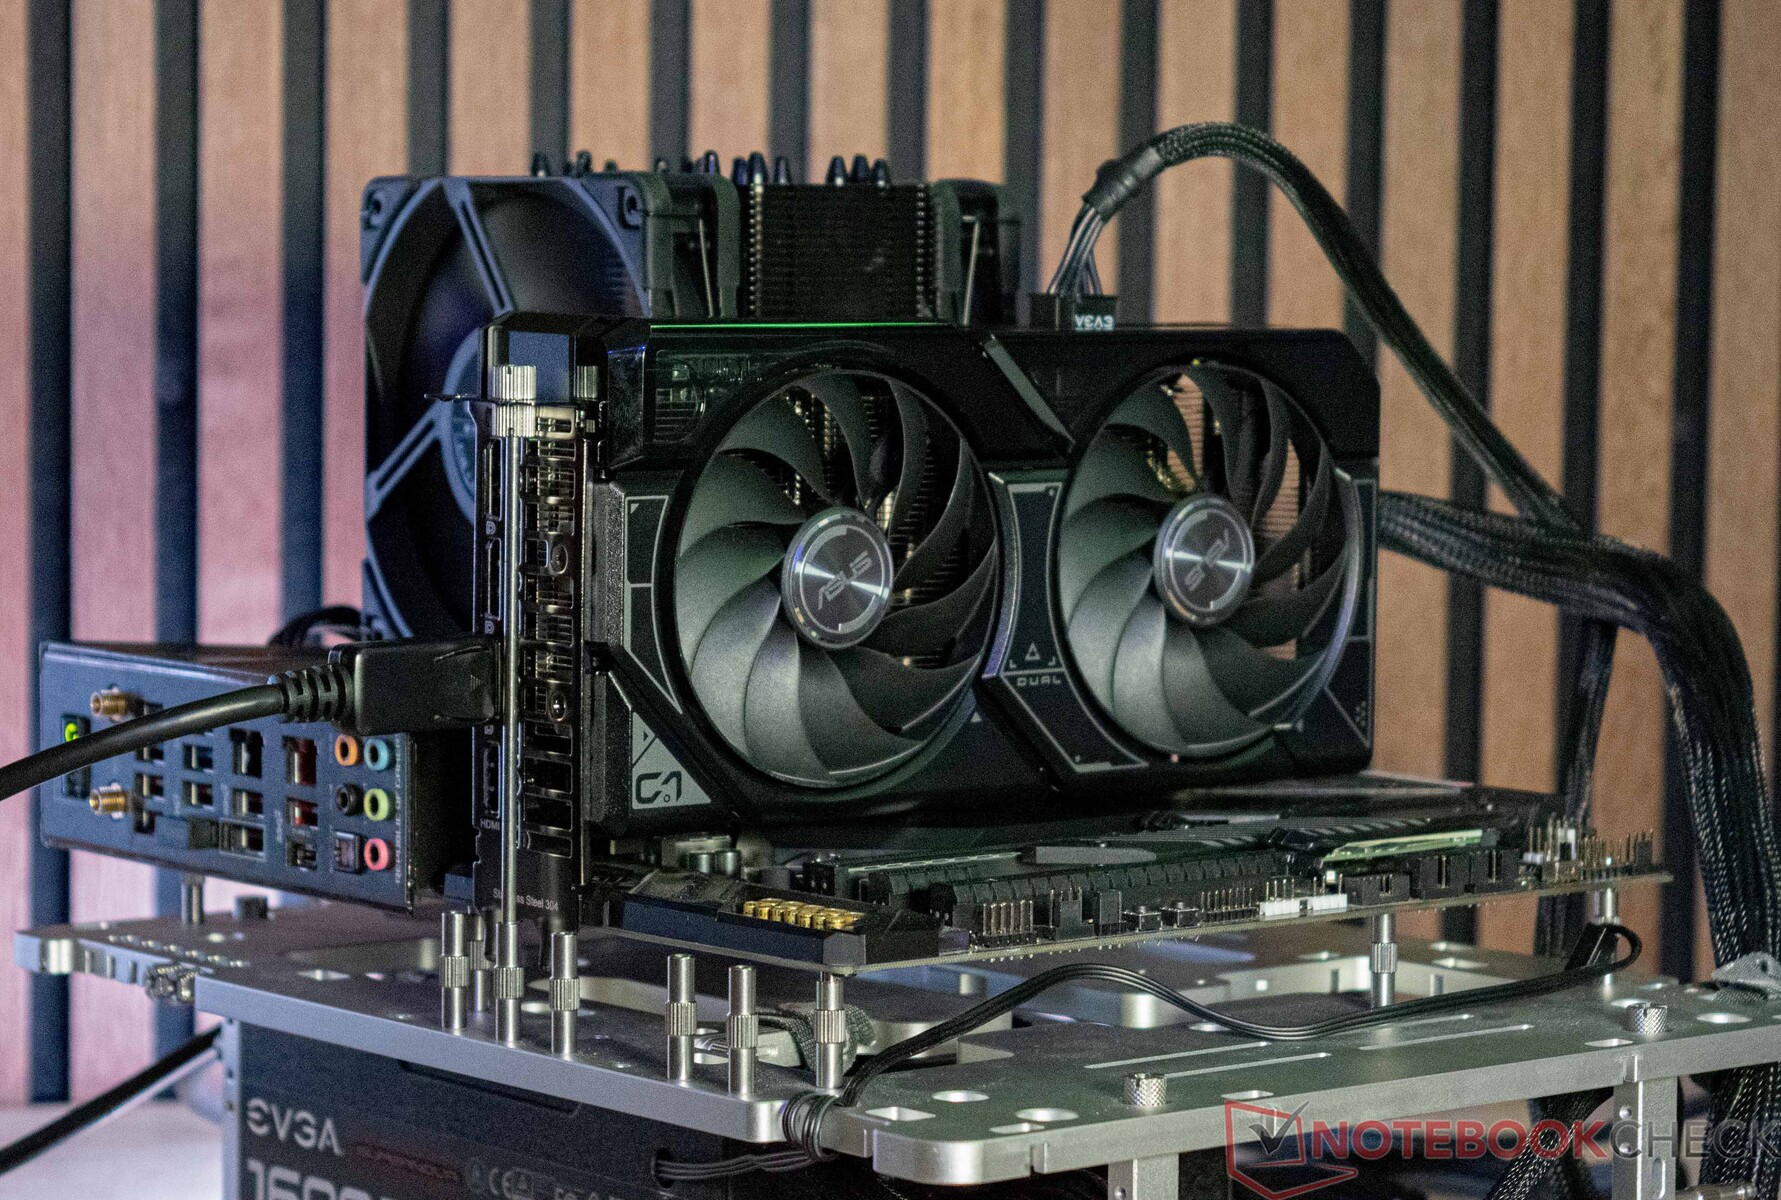
Due to the GeForce RTX 4060 Ti's low power consumption, which is limited to 160 watts, it shouldn't be hard to keep the graphics card in check. Even so, its built-in cooler can't completely avoid criticism. But more on that later. The Asus Dual GeForce RTX 4060 Ti OC's compact build is great as it only measures around 23 centimetres in length. This is quite a bit smaller than the KFA2 GeForce RTX 4060 Ti EX.
Nvidia's VRAM politics should be taken with a grain of salt. During the tests of the onboard partners MSI and KFA2, we already saw that the graphics card can deliver what it is made for. Furthermore, Nvidia has expanded the GPU's L2 cache considerably, meaning less data has to be transferred via the PCIe slot. This compensates for the lower memory bandwidth compared to an Nvidia Geforce RTX 3060 Ti
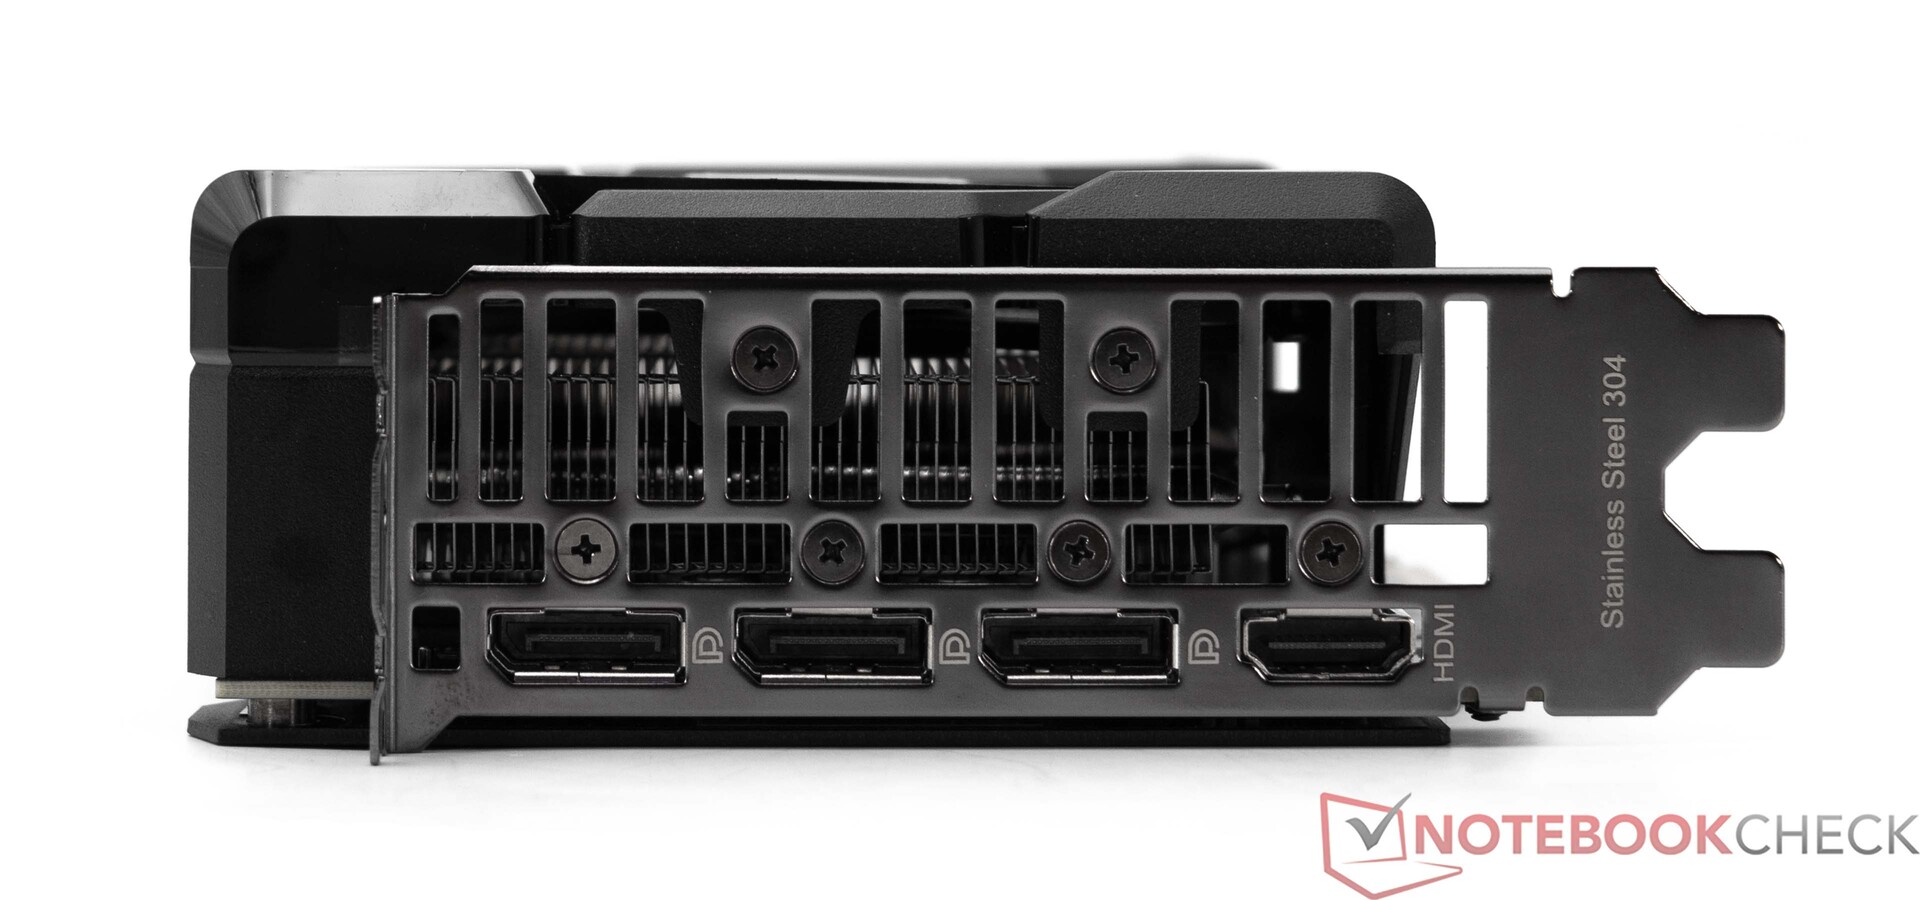
When it comes to external ports, you will have to continue to make do with the usual standards. In other words, the component features 1x HDMI 2.1a and 3x DisplayPort 1.4a. Currently, only AMD RDNA3 GPUs have DisplayPort 2.1.
Infos about our test system
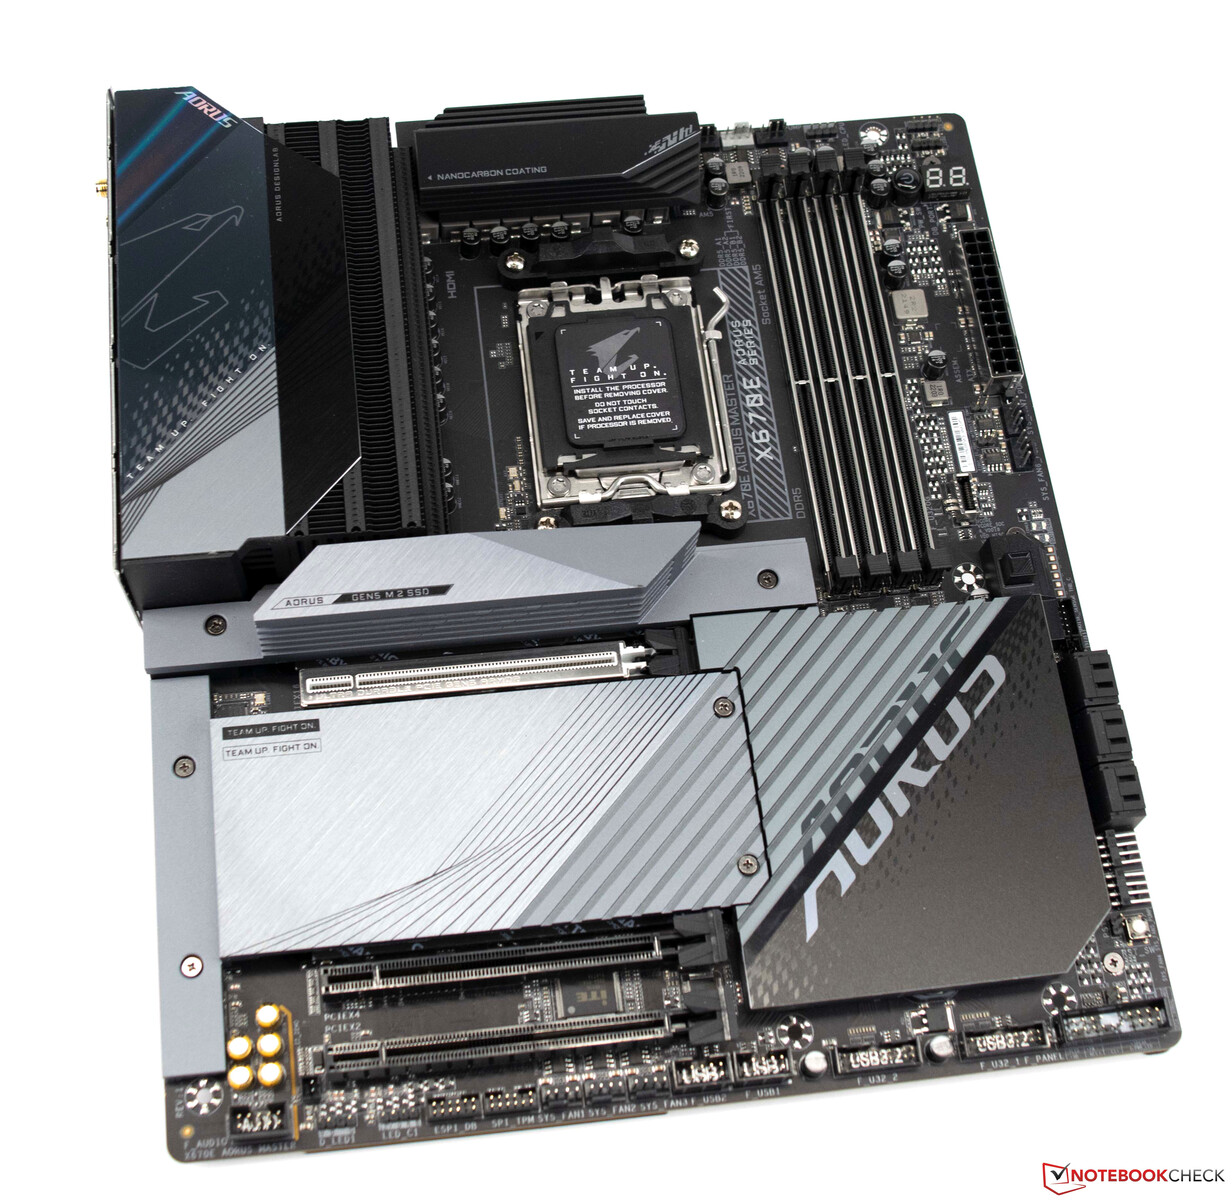
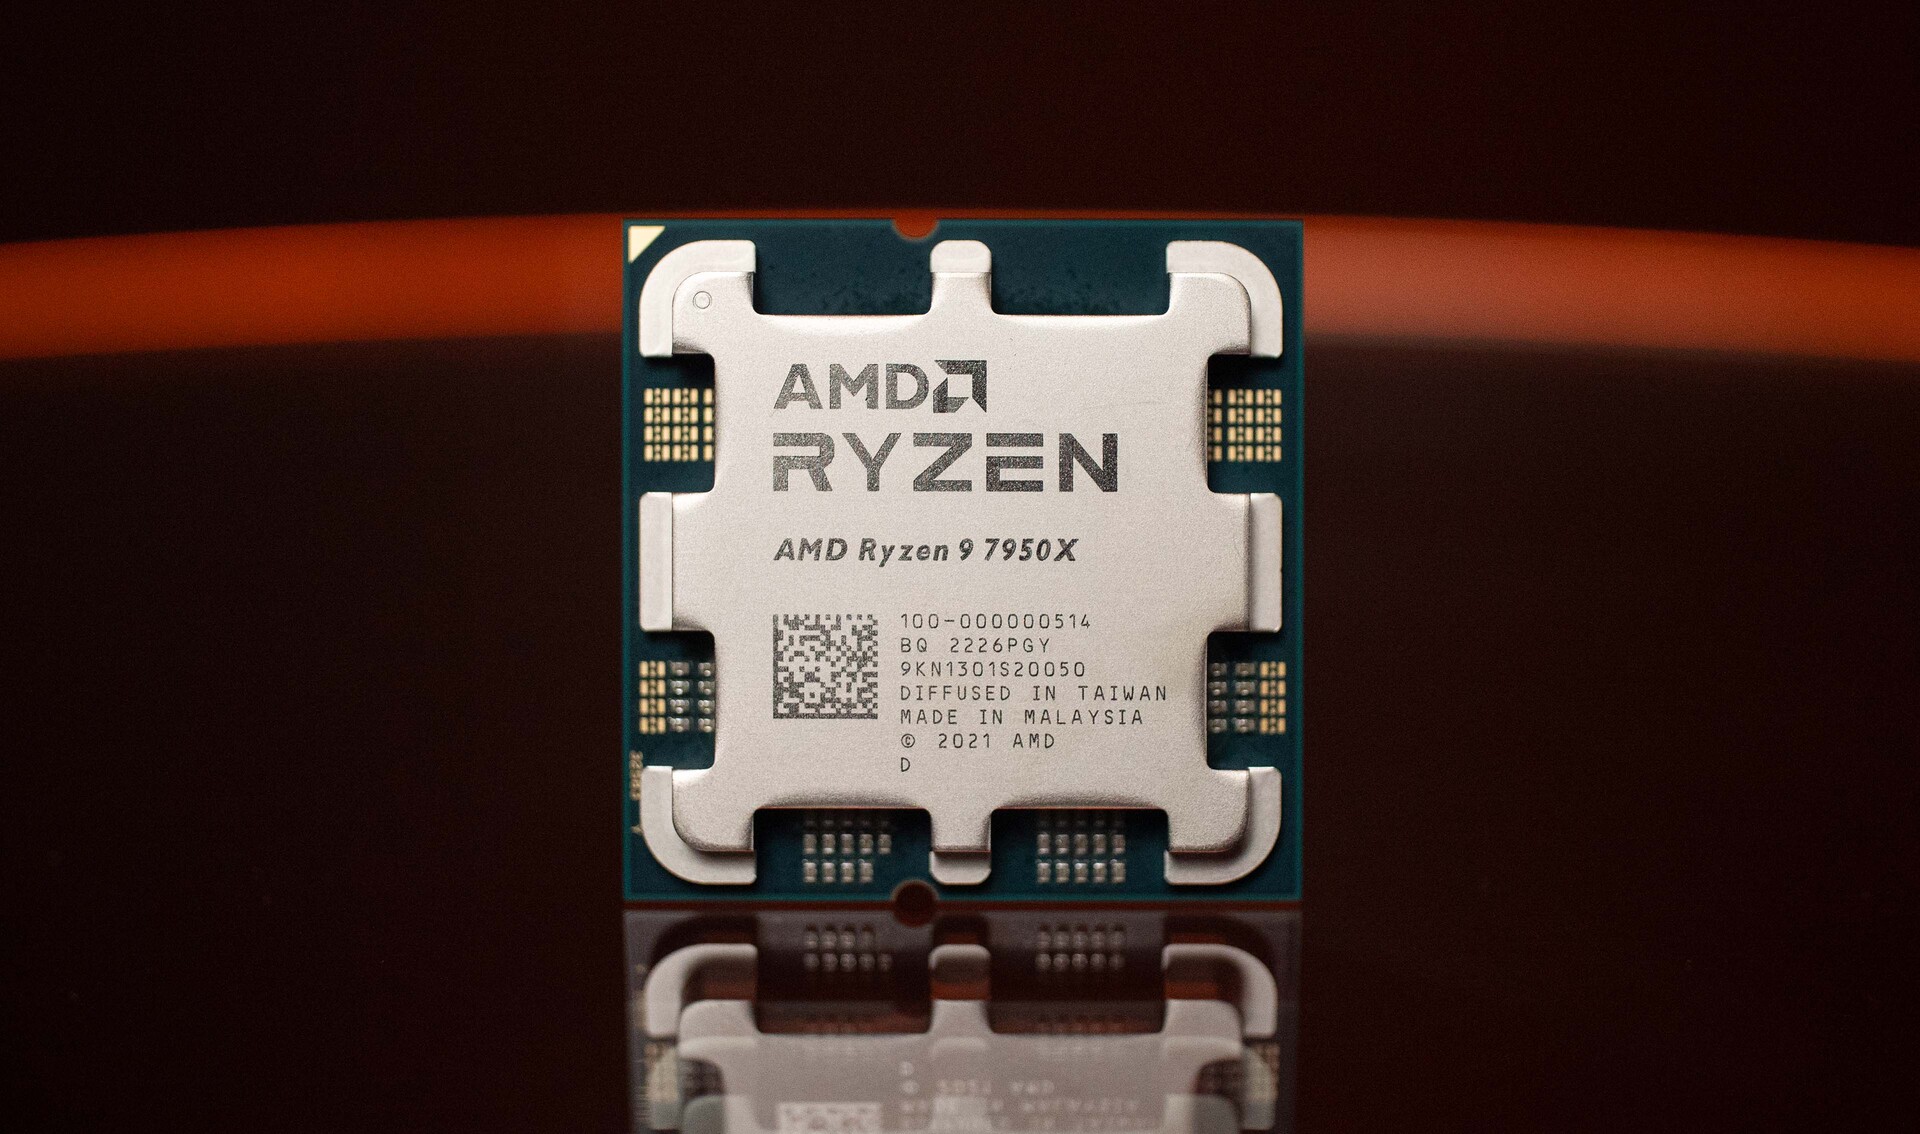
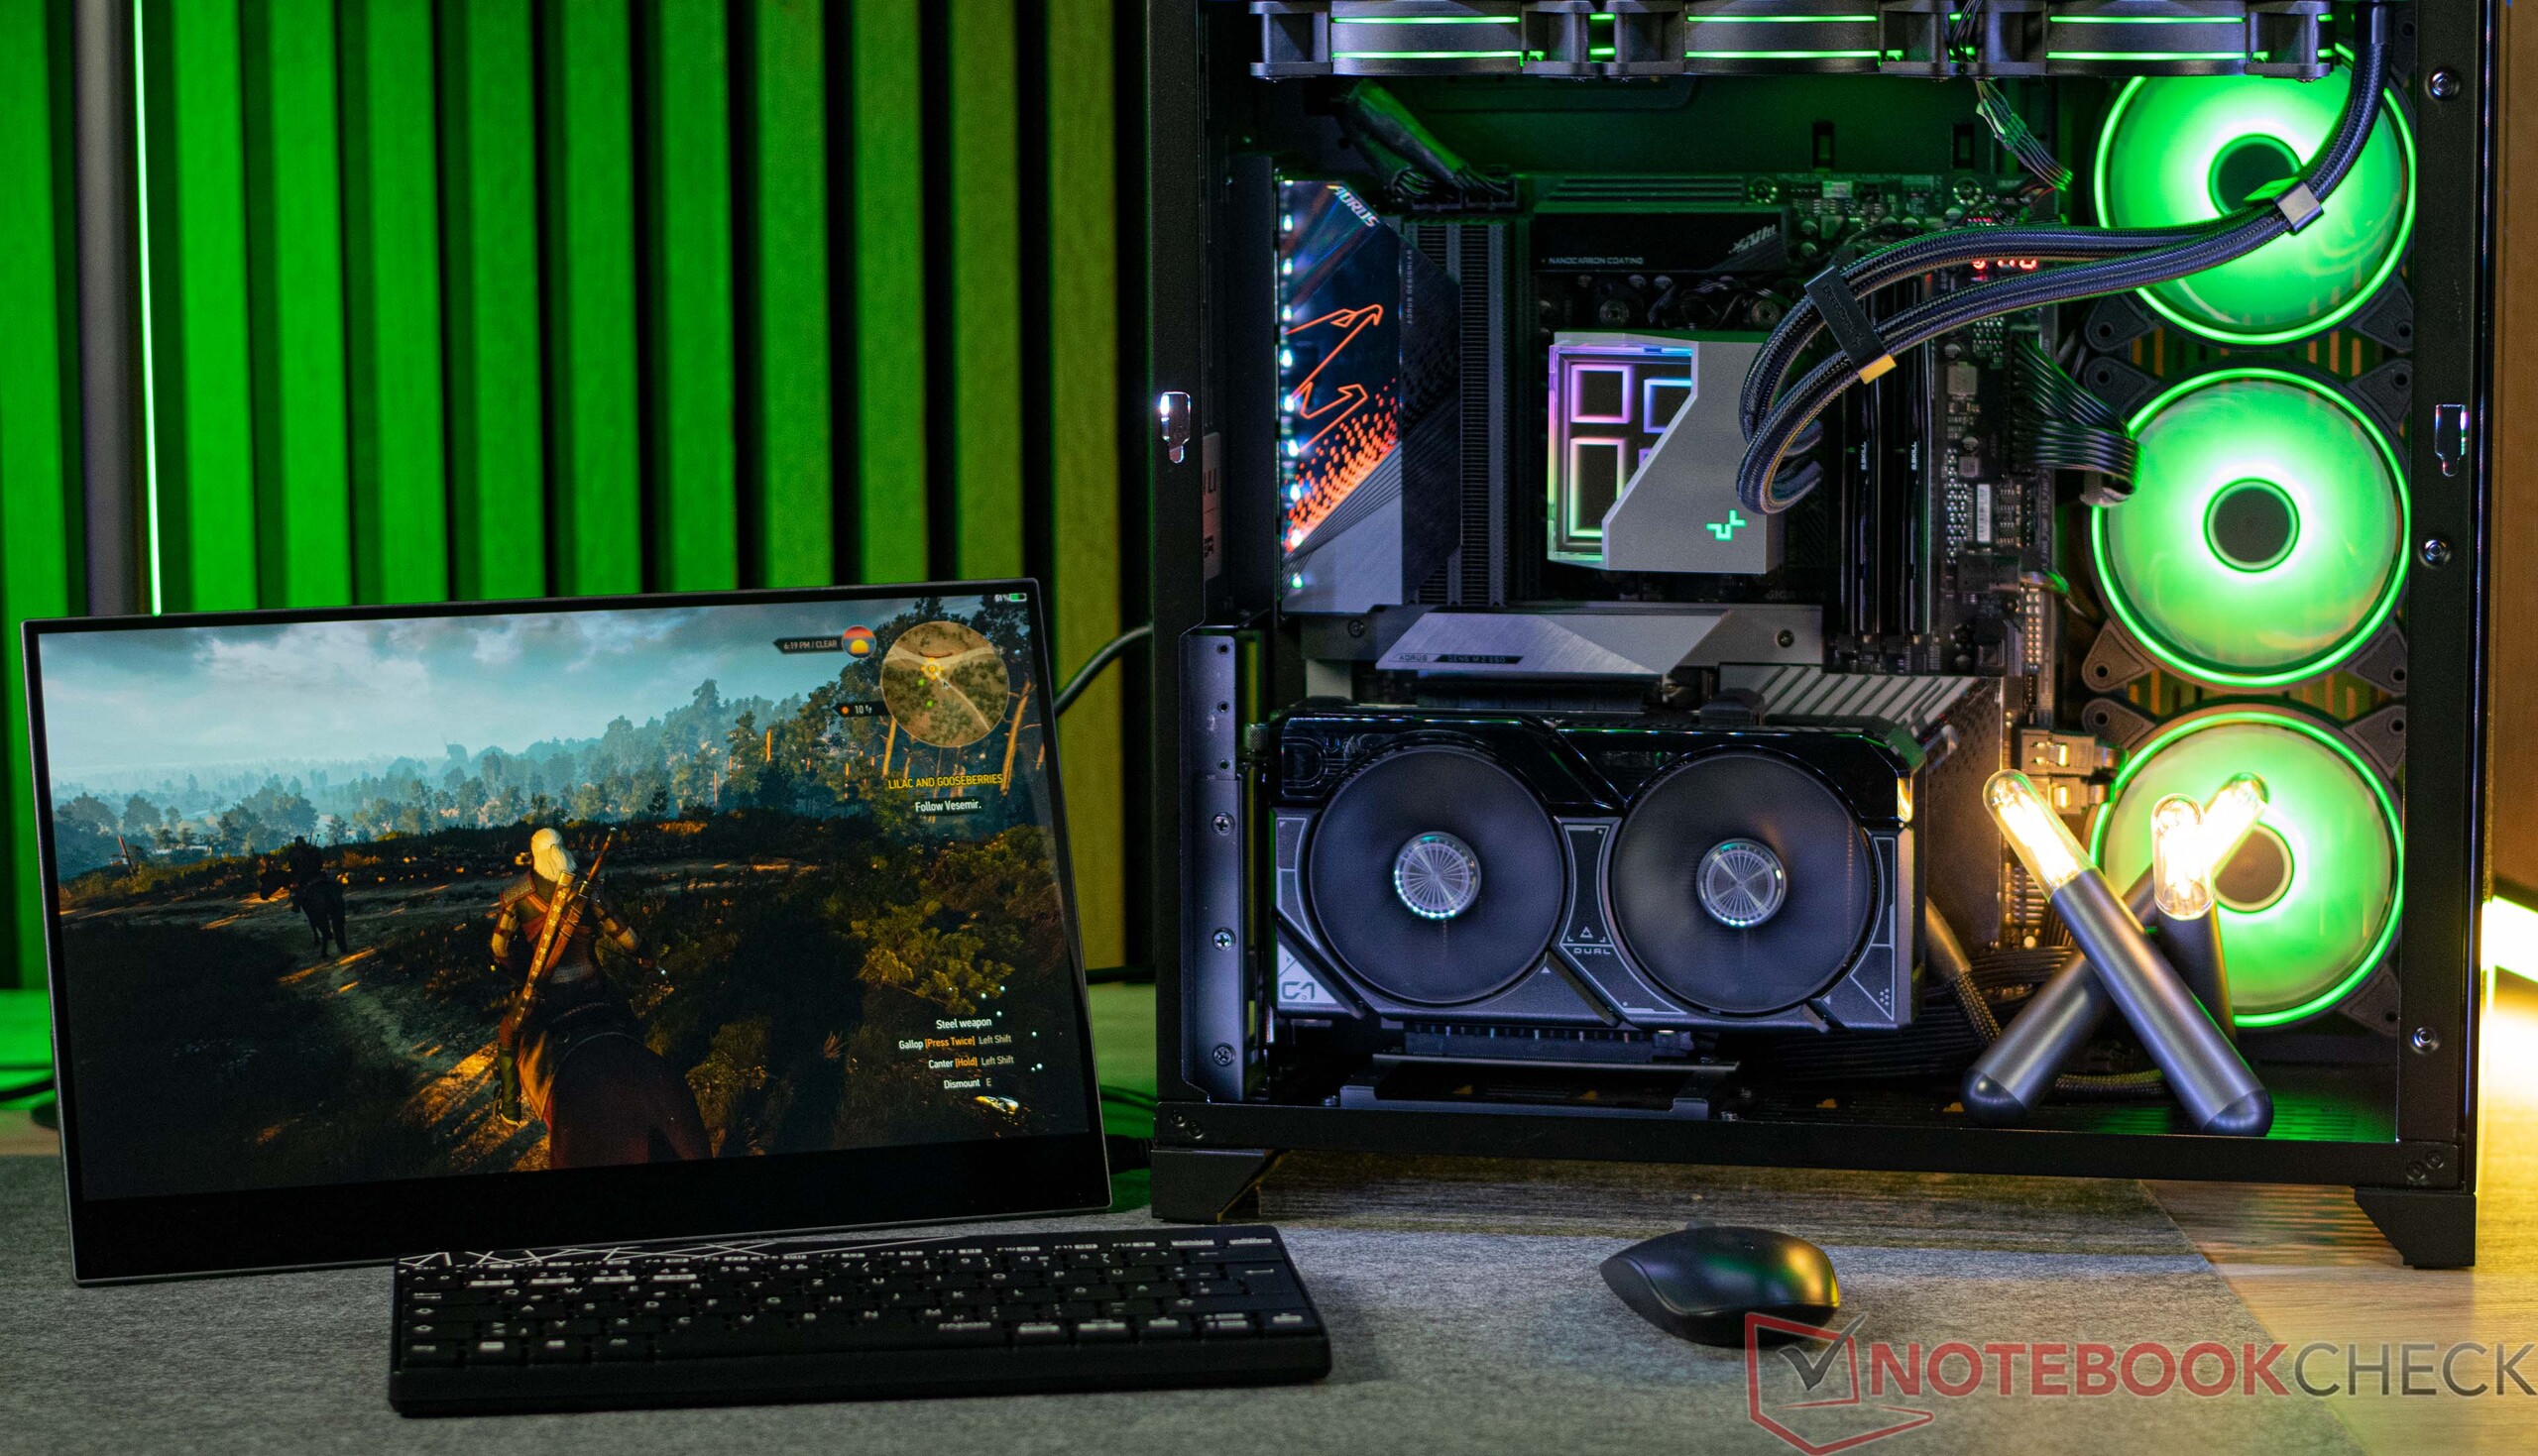
A current AMD platform based on the Gigabyte X670E Aorus Master serves as the test system. The CPU (AMD Ryzen 9 7950X) offers excellent performance, and we are using the AiO solution Deepcool LT720 for cooling. The 32 GB RAM is made by G.Skill and is operated using the matching EXPO profile. As a monitor, we used the Gigabyte M32U.
The test system in detail
We used this system for the following benchmarks and tests:
- Lian-Li O11 Dynamic
- AMD Ryzen 9 7950X
- Gigabyte X670E Aorus Master, BIOS: F12a
- Deepcool LT720
- Corsair HX1200i power supply
- G.Skill Trident Z5 Neo DDR5-6000 2x 16 GB, EXPO (DDR5-6000 CL30-38-38-96)
- Corsair MP600, 2 TB
- Crucial MX500, 2 TB
- Microsoft Windows 11 Professional 64 bit (Version 22H2)
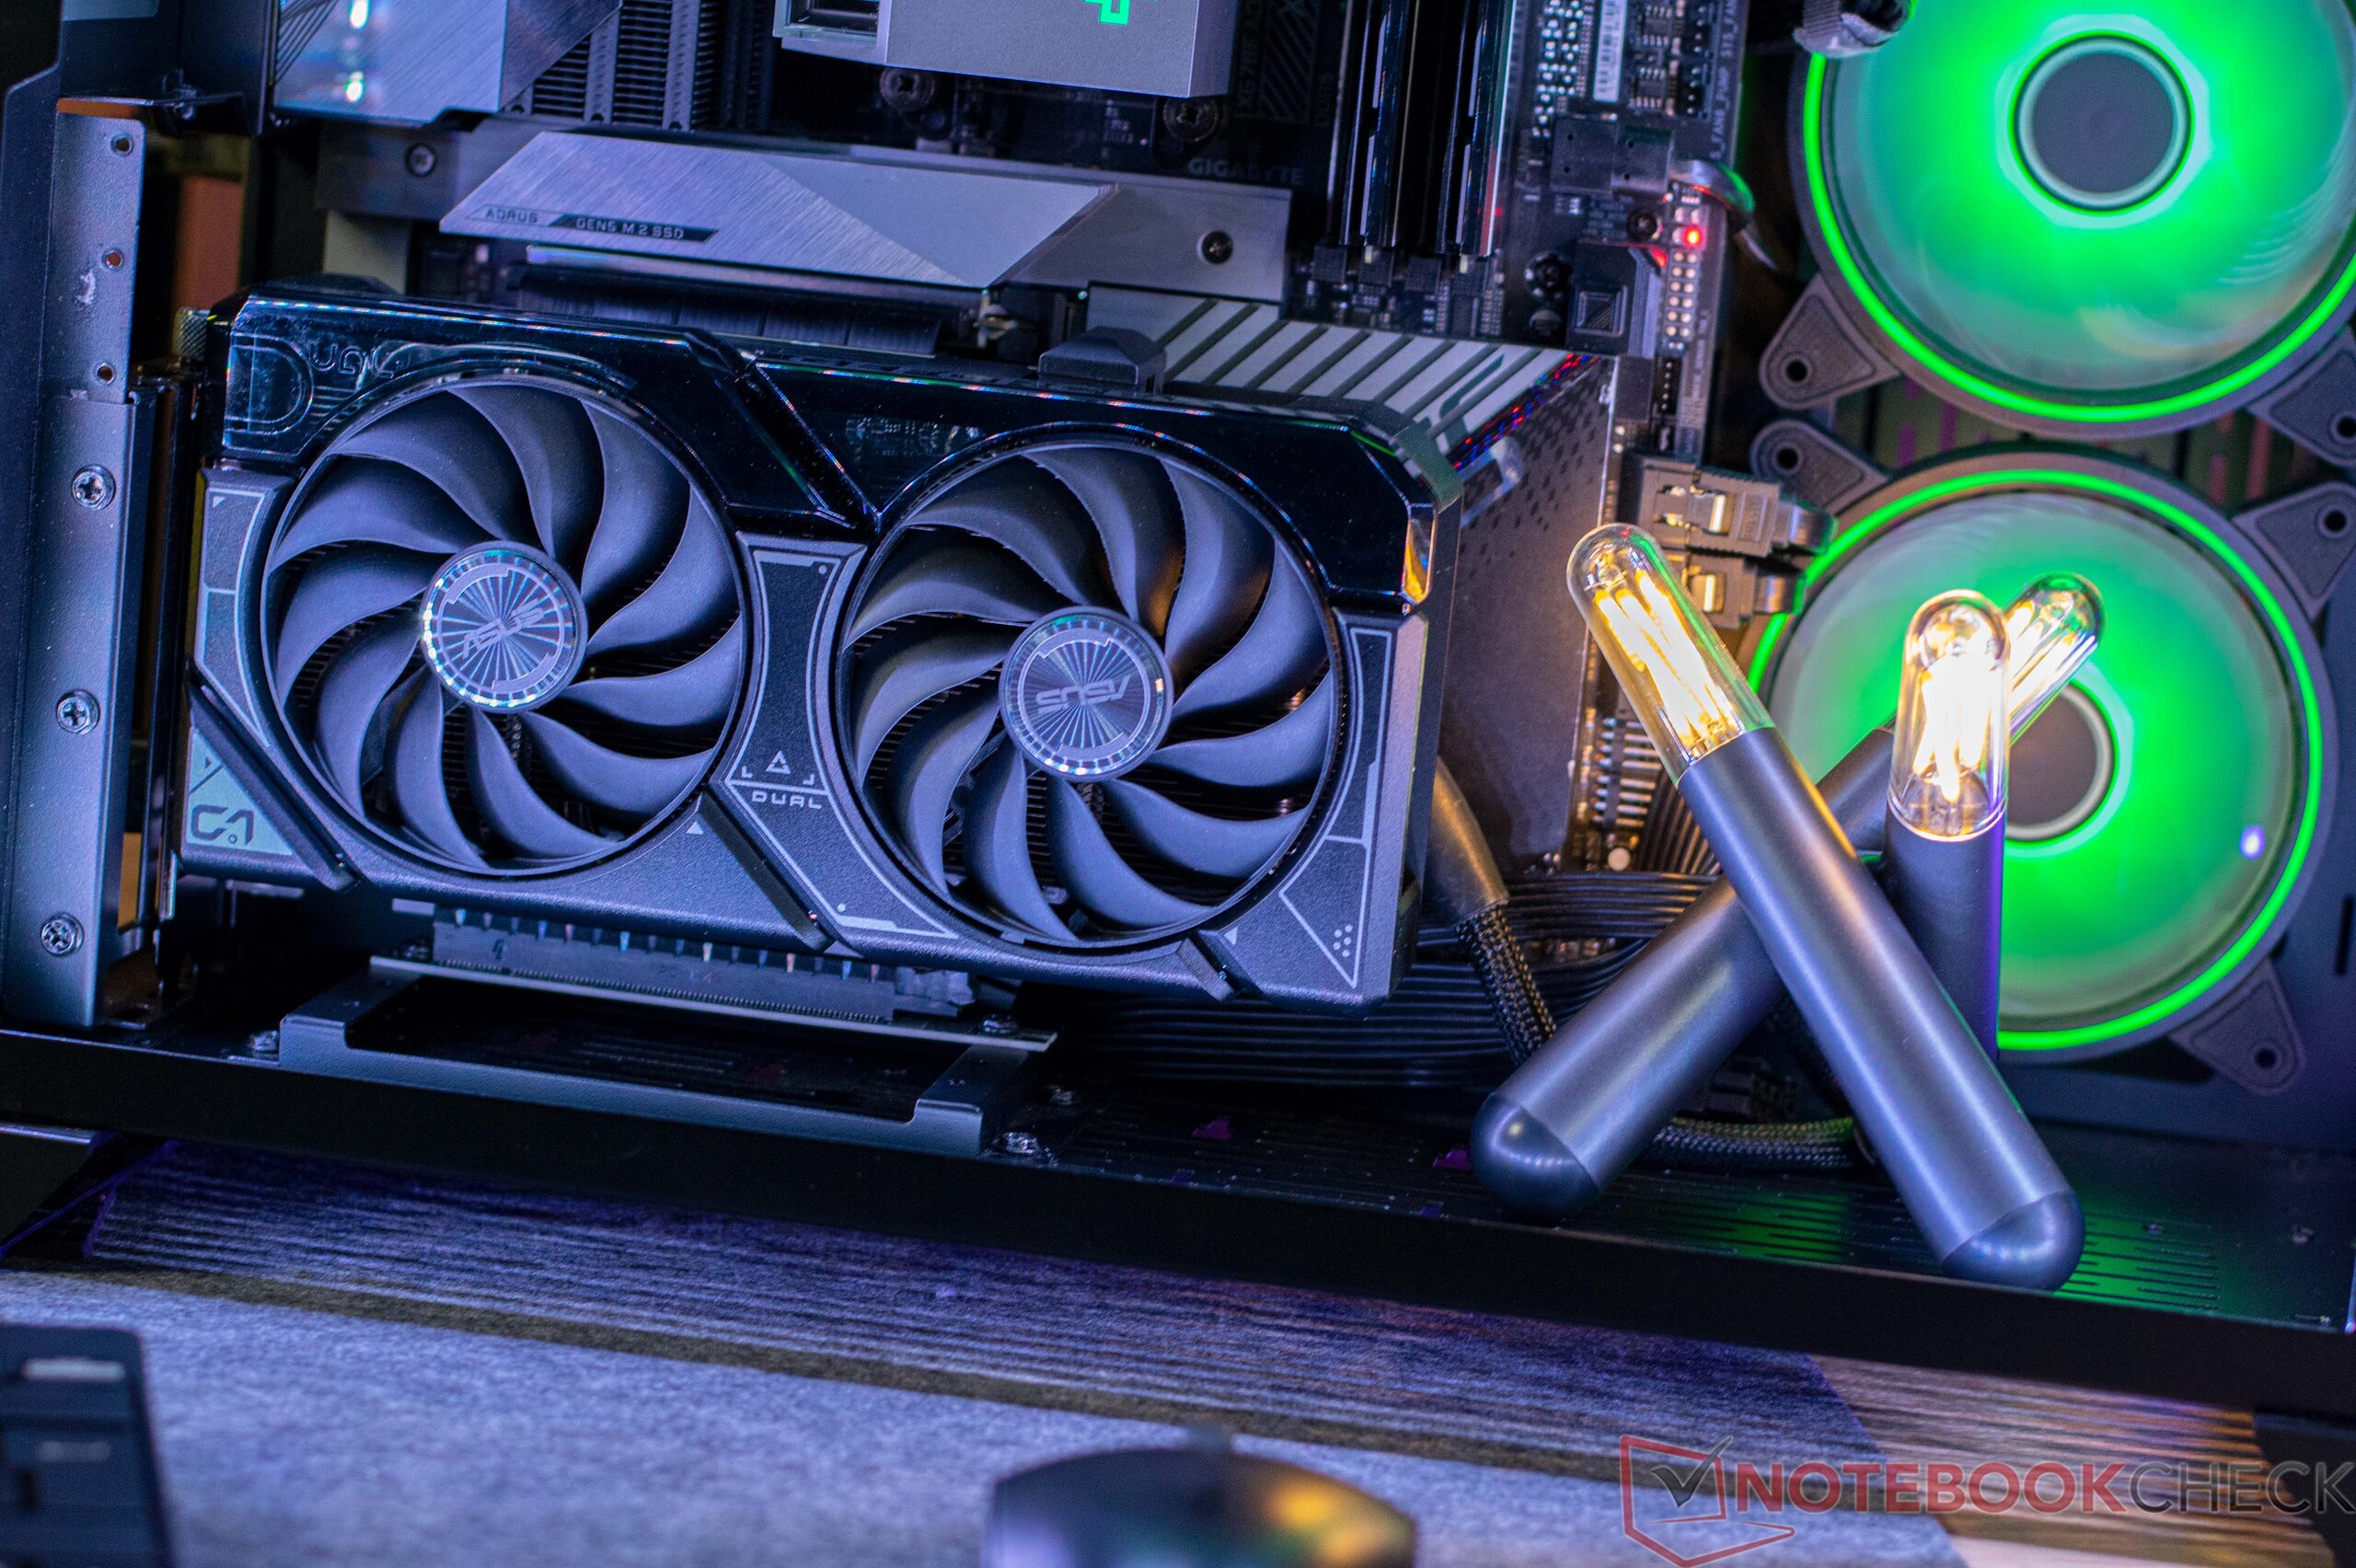
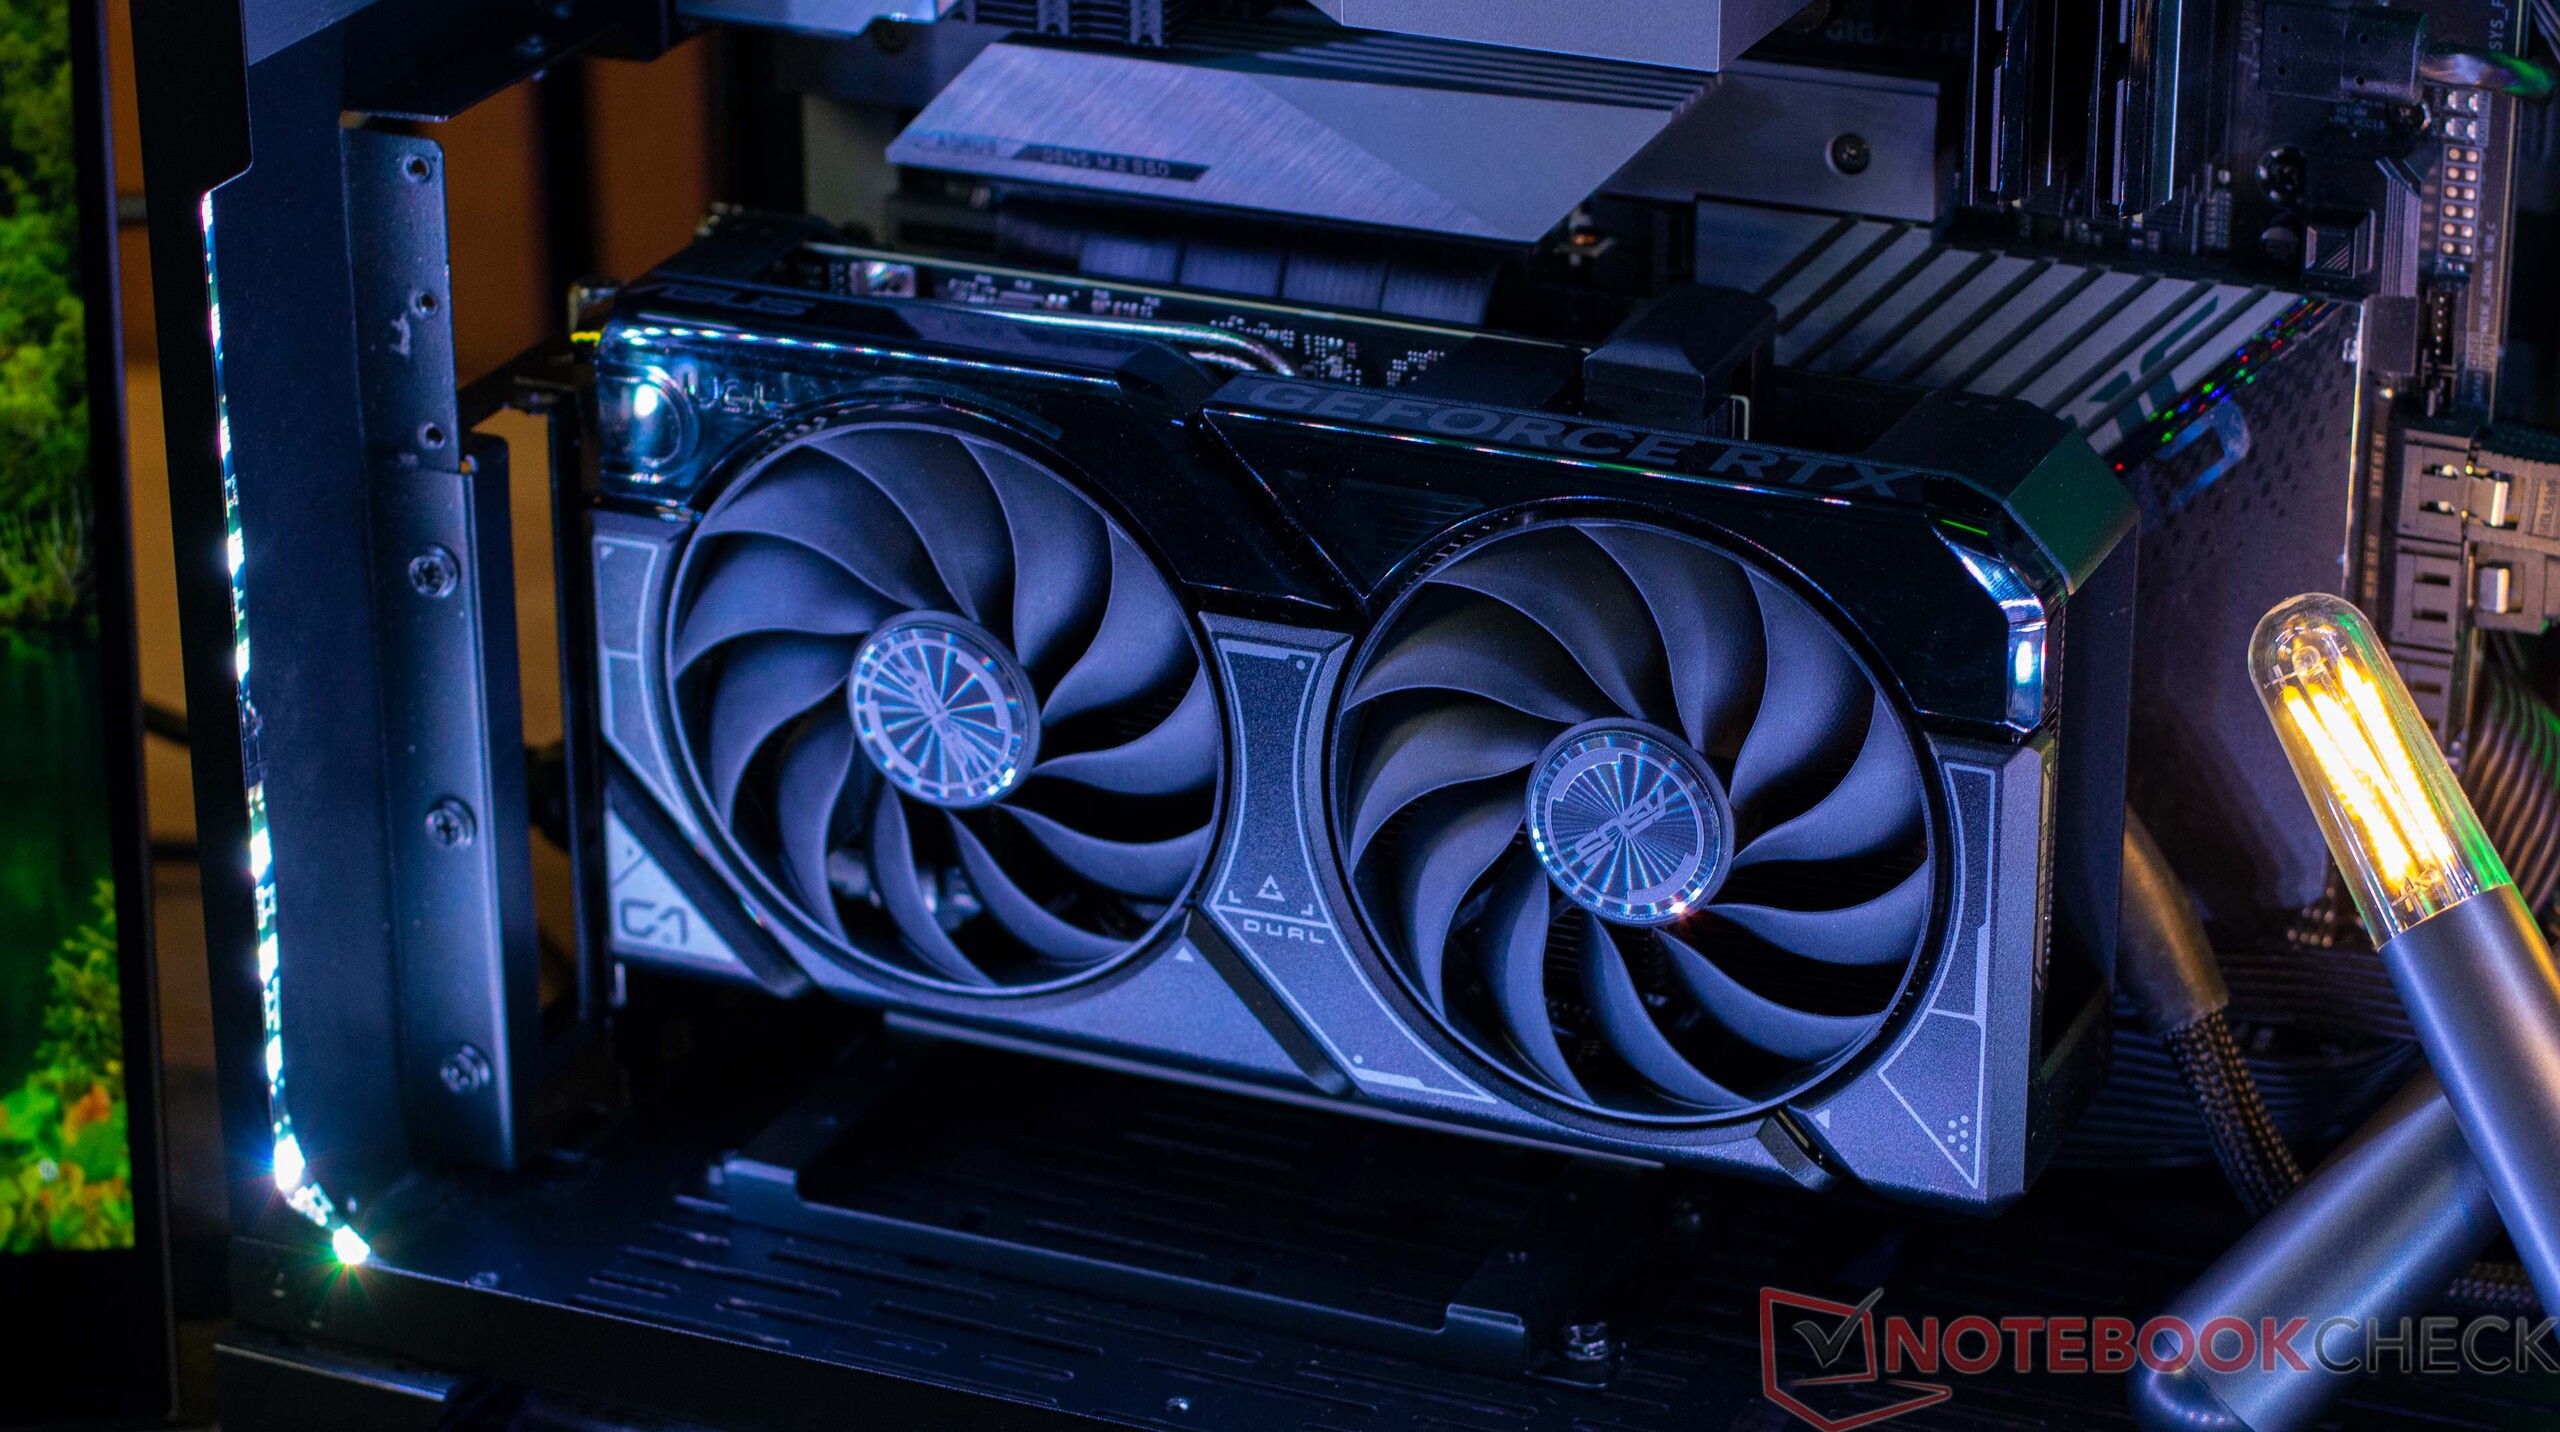
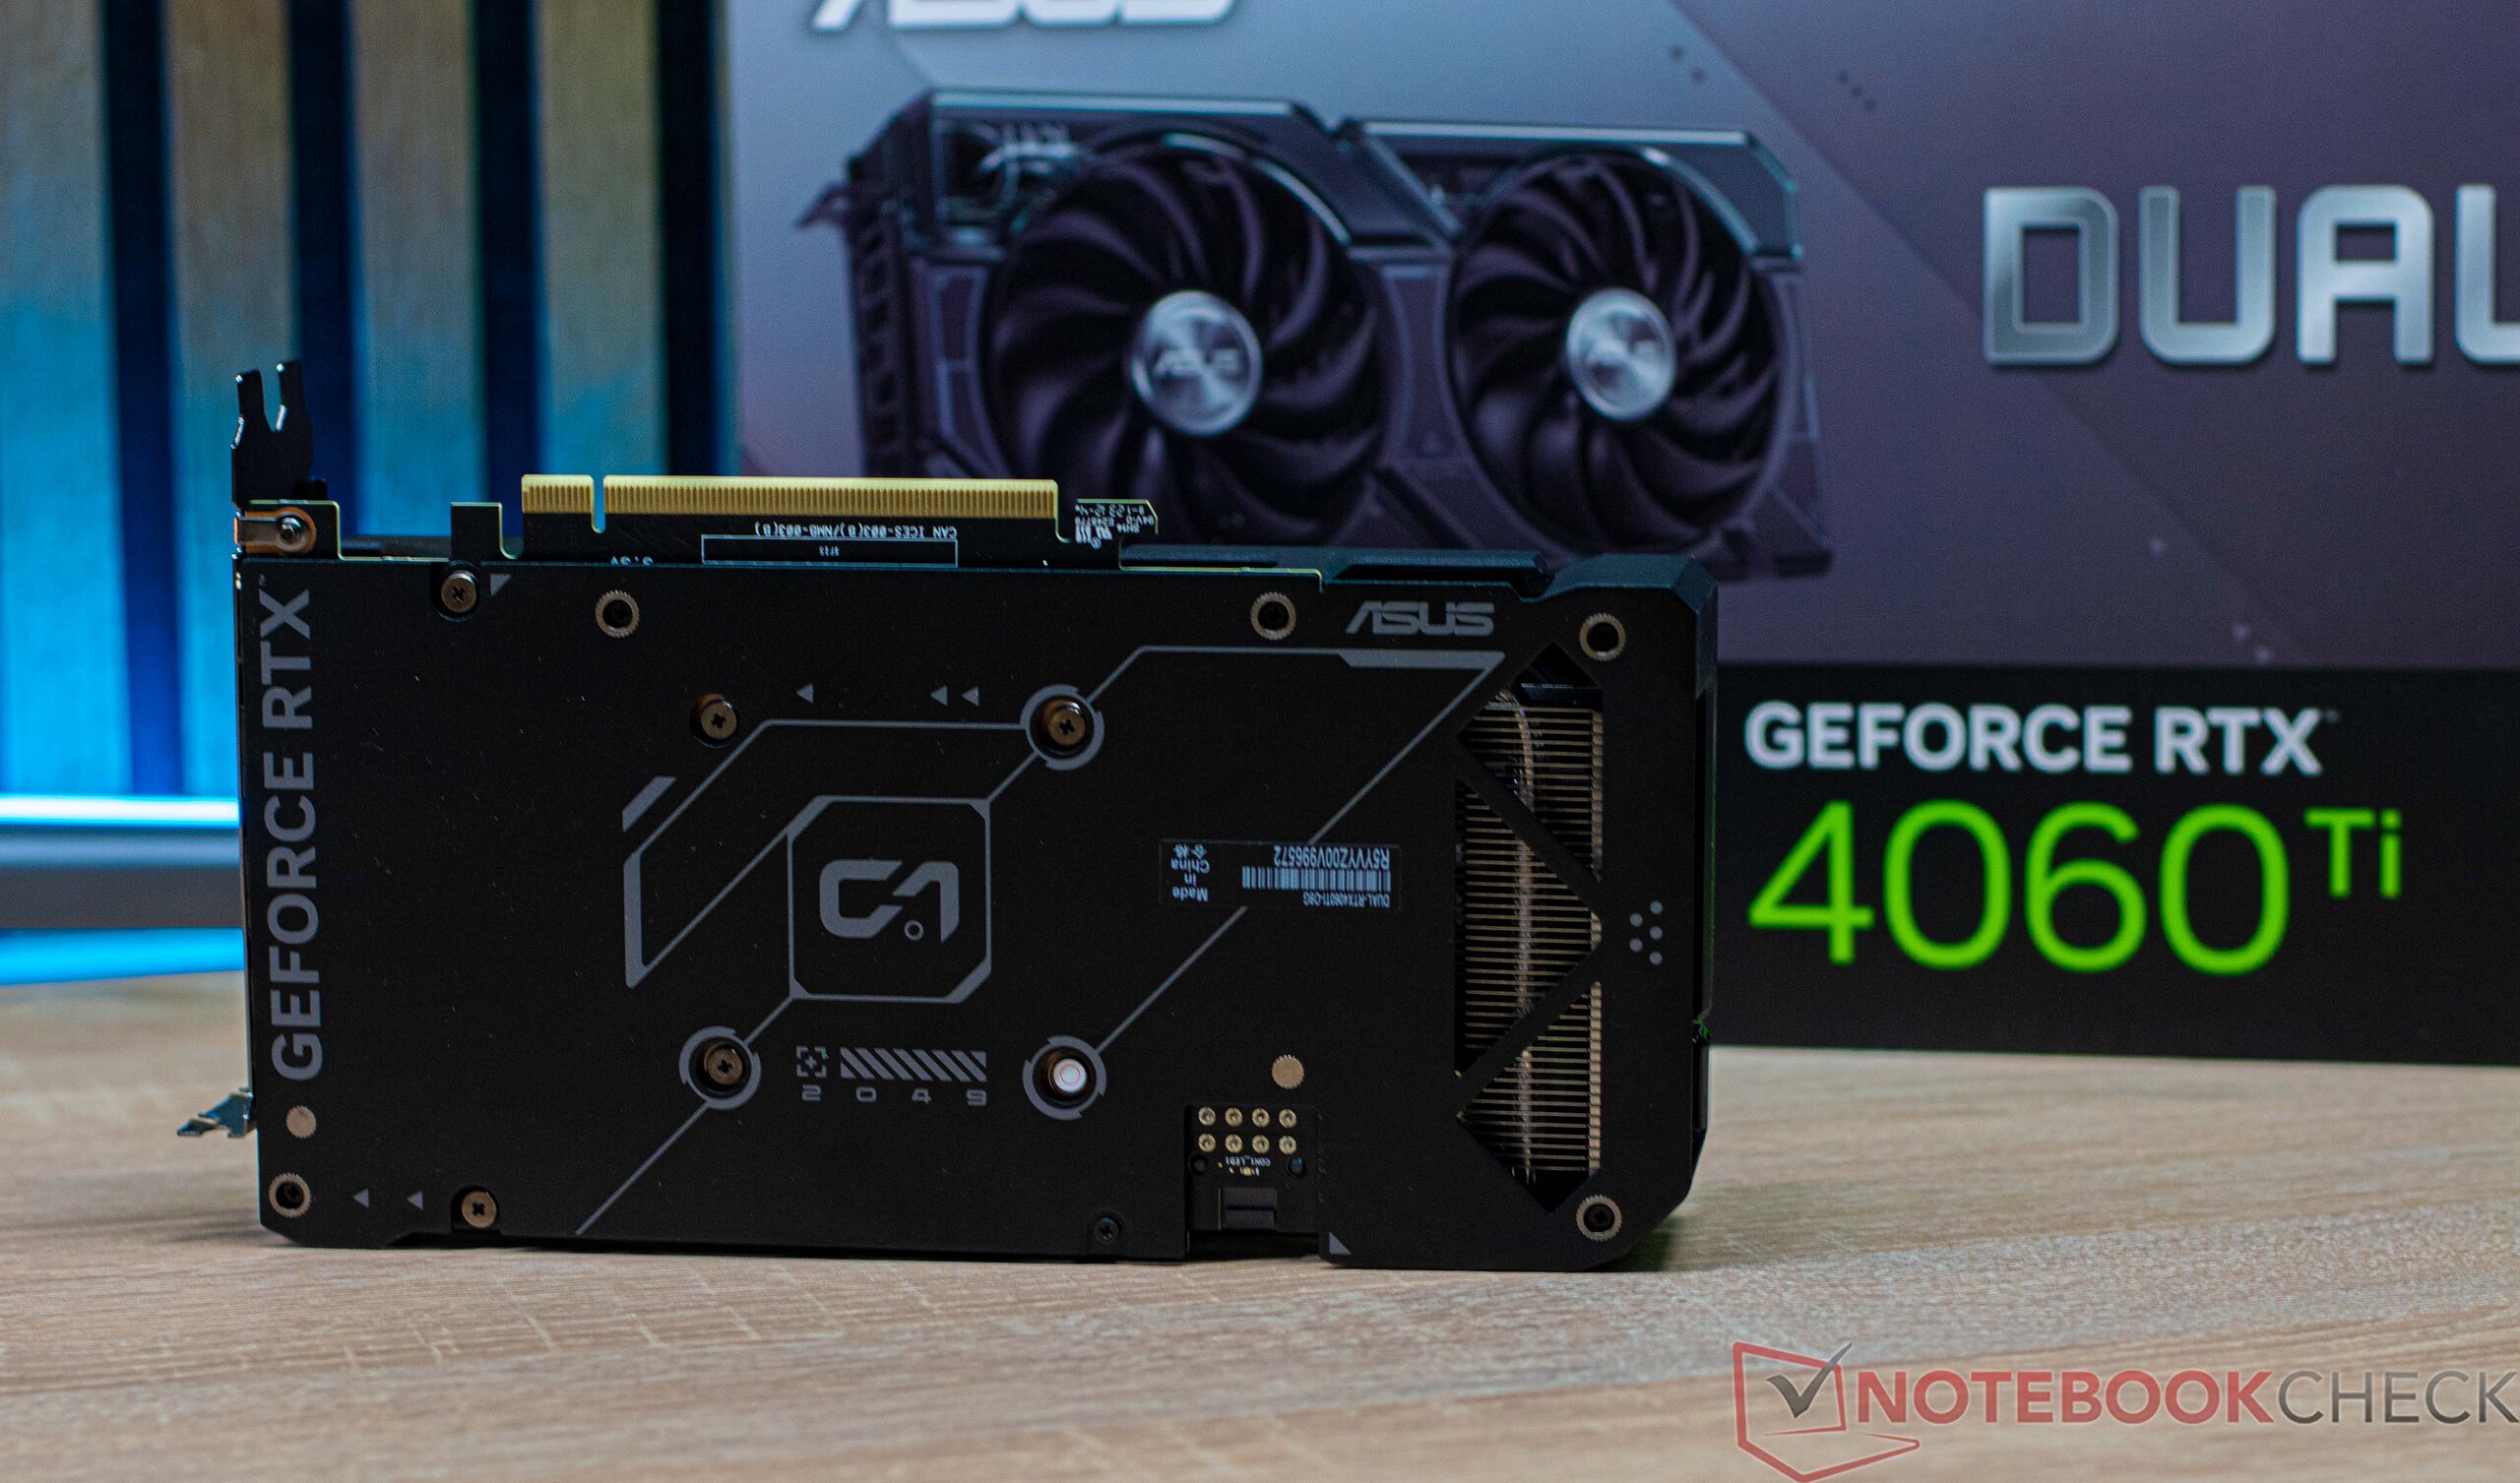
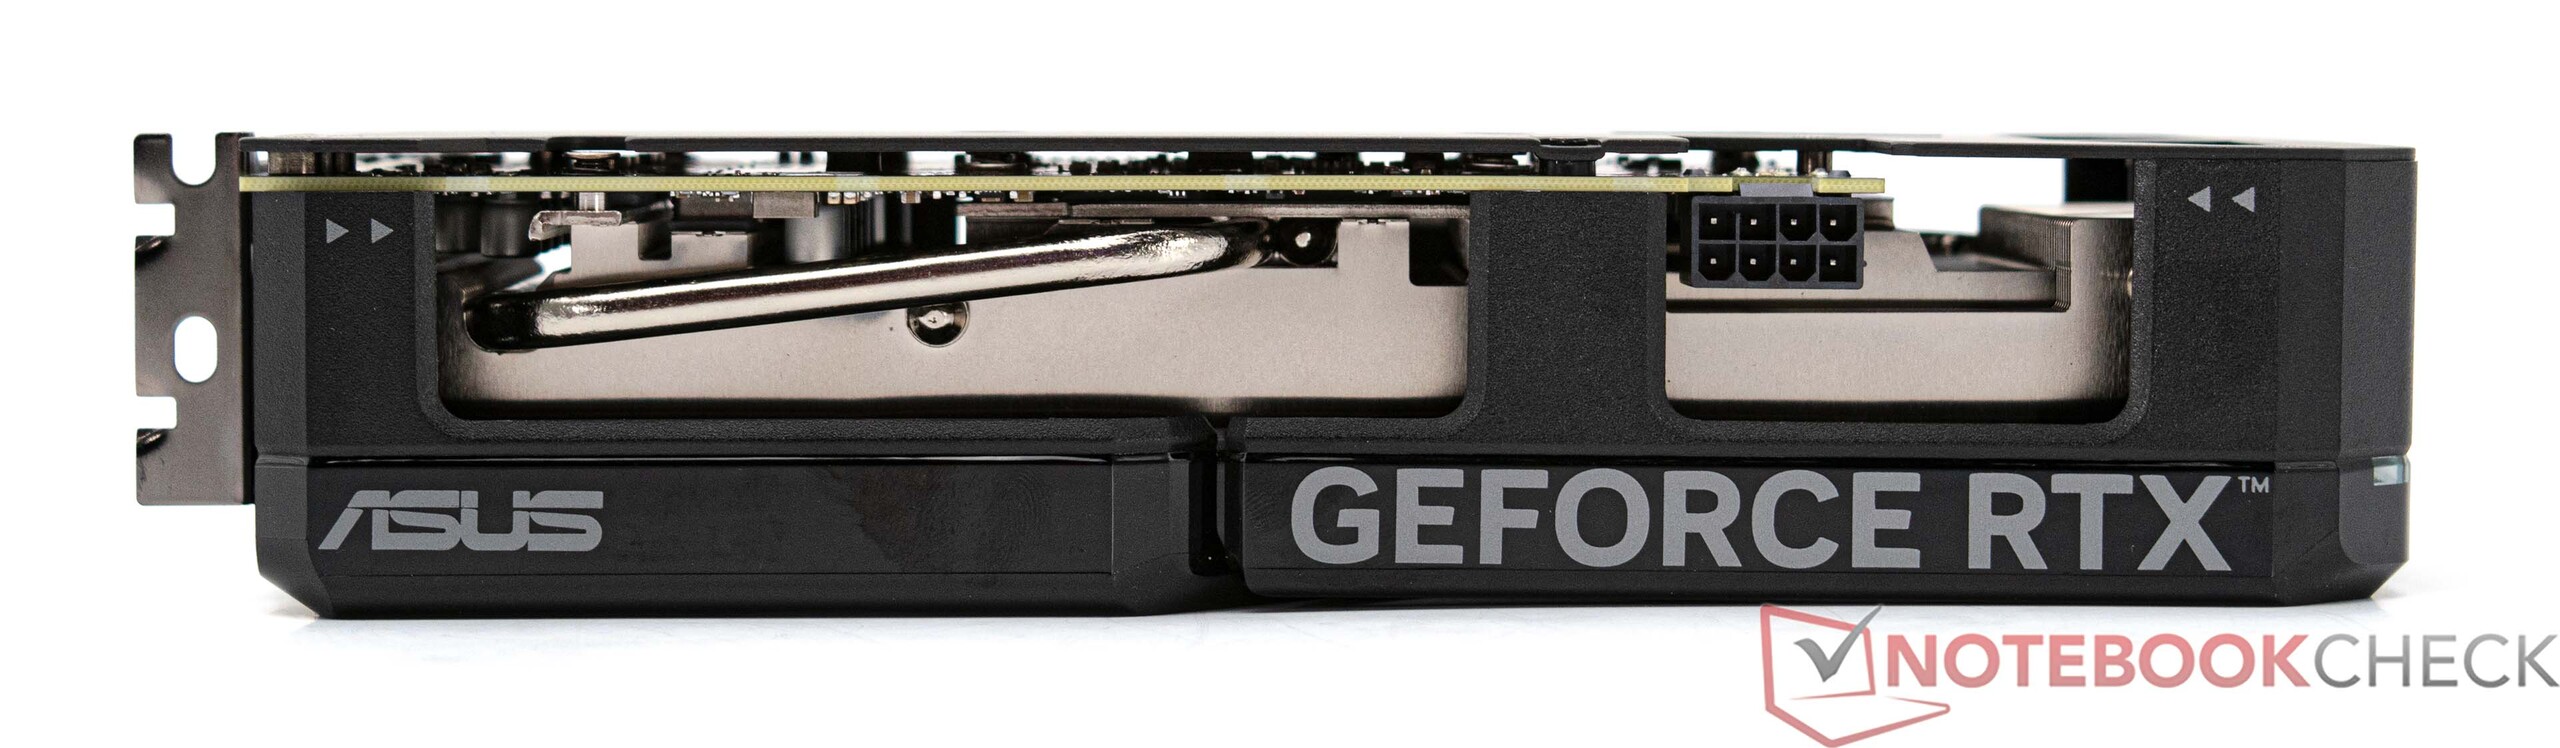
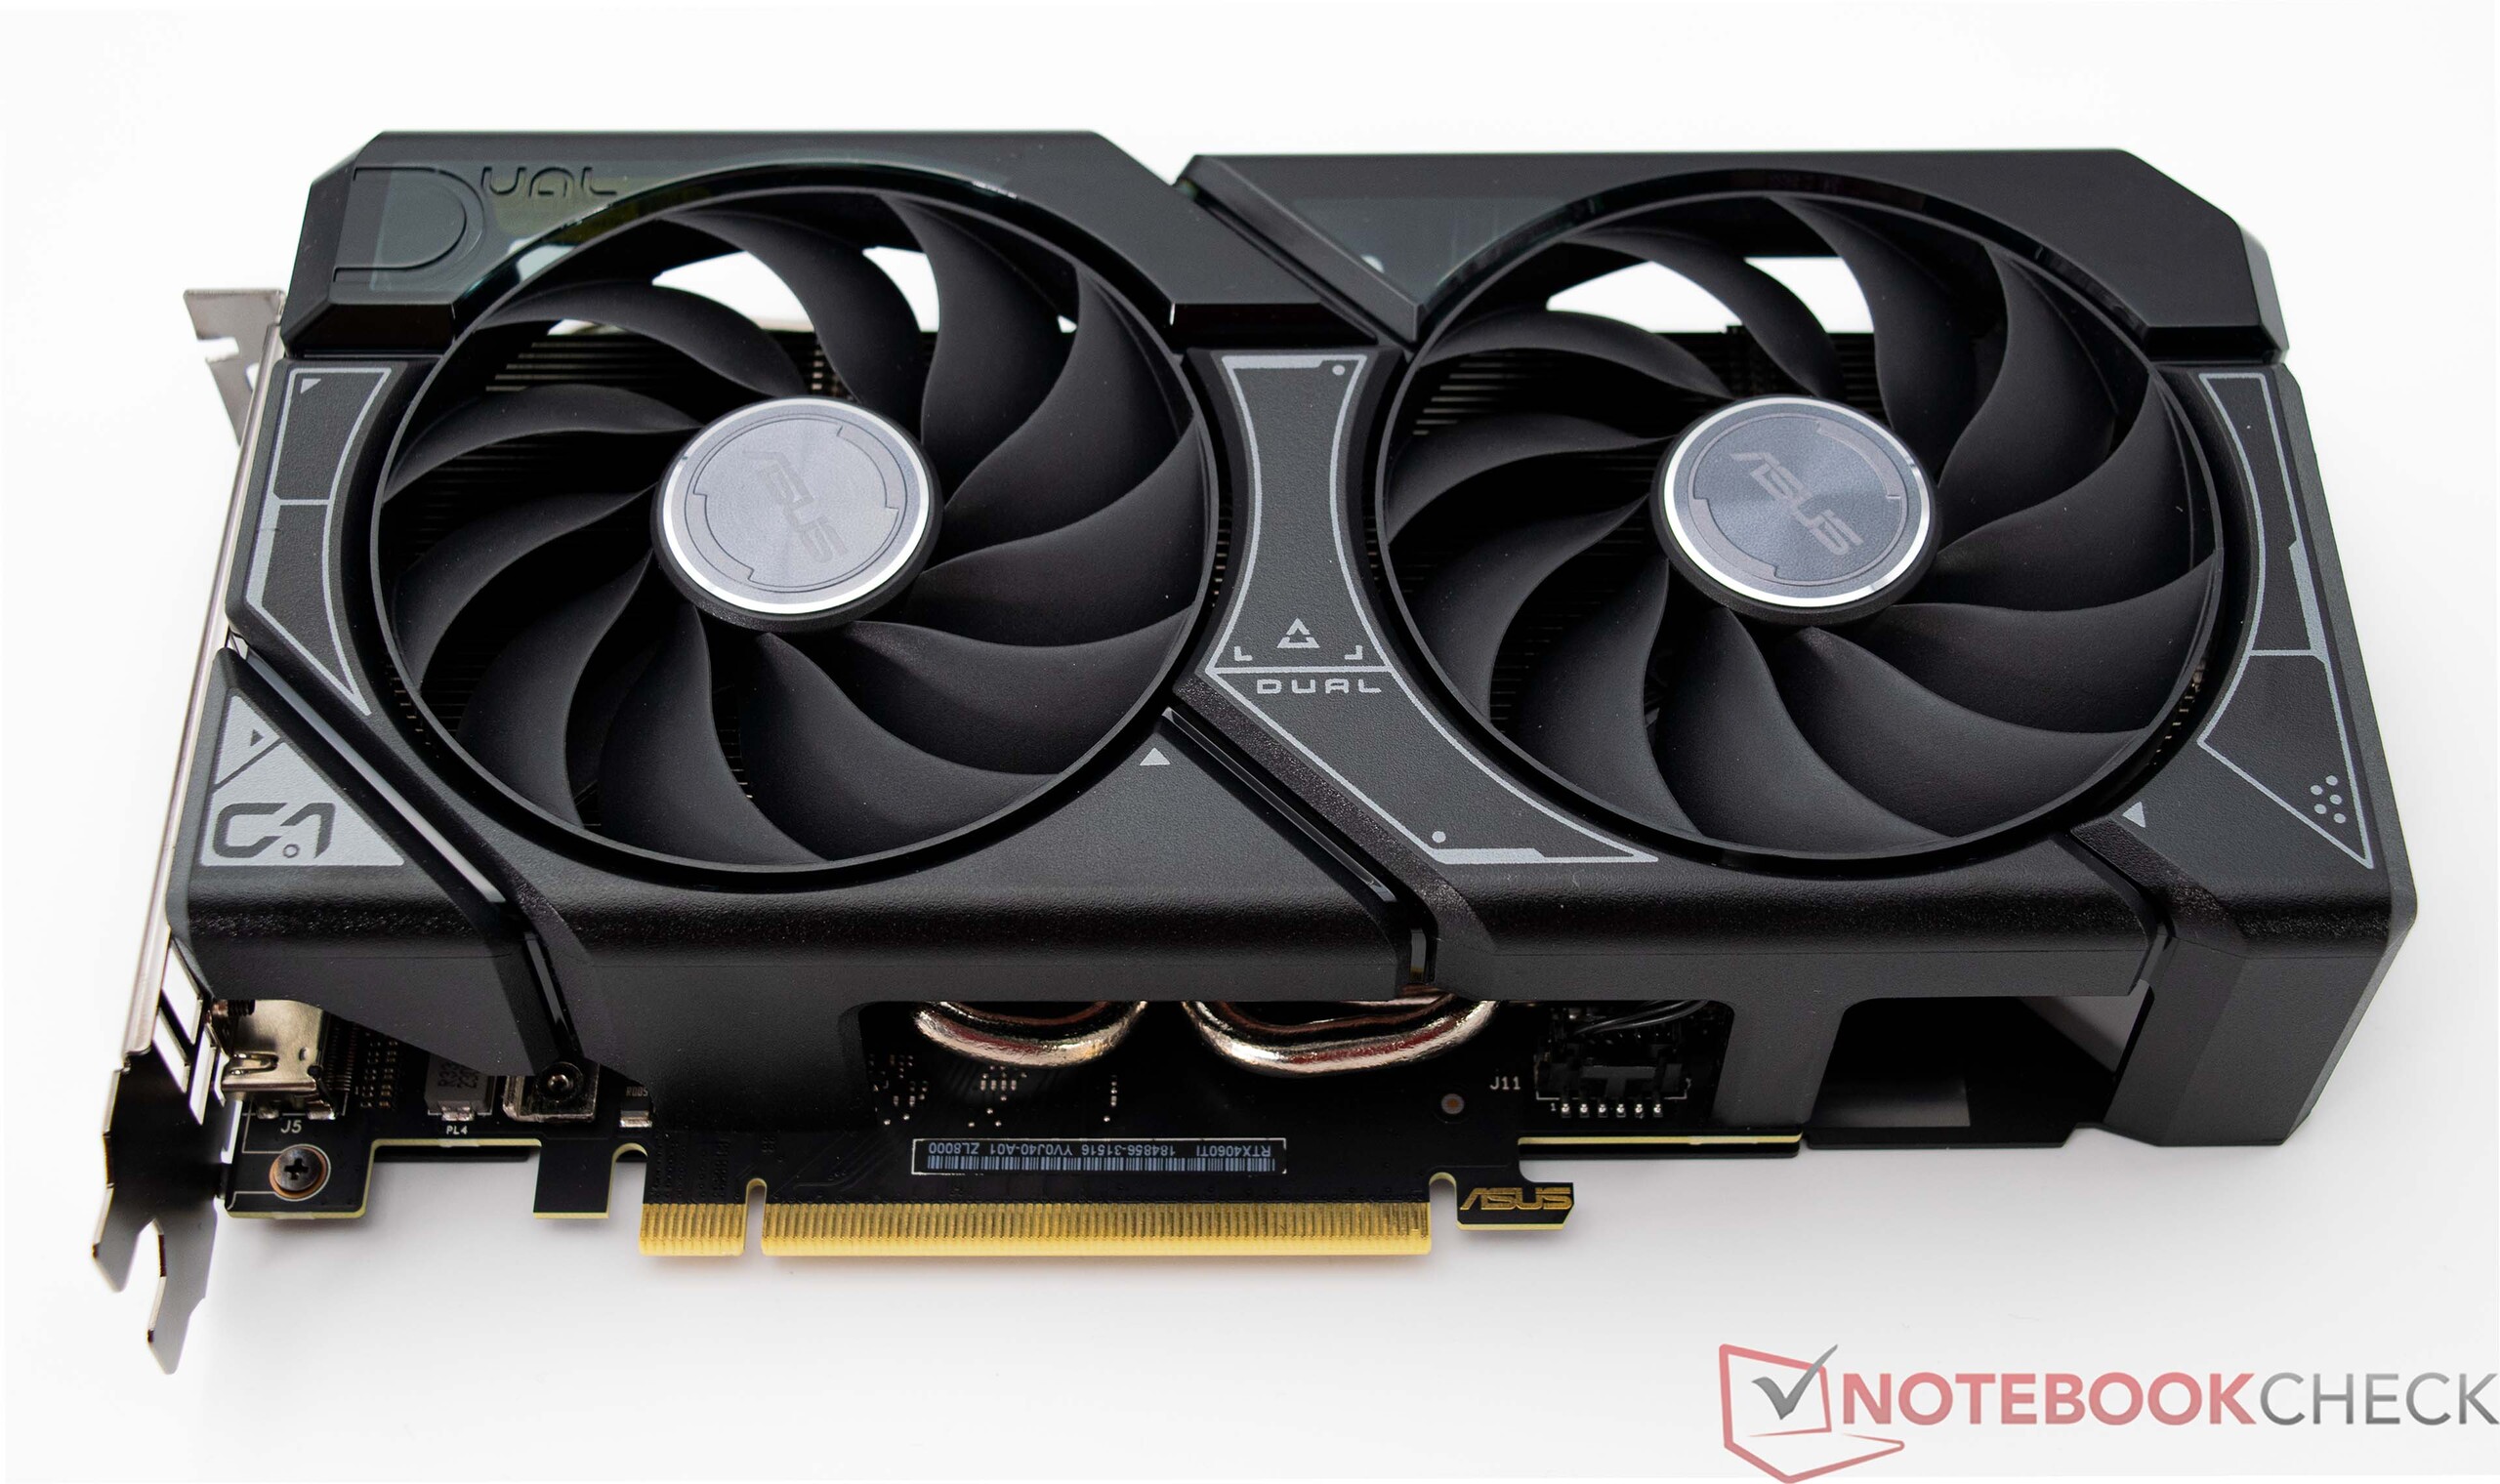
Asus Dual GeForce RTX 4060 Ti OC in detail
GeForce graphics cards' specs compared
| Features | RTX 4090 | RTX 4080 | RTX 4070 Ti | RTX 4070 | RTX 4060 Ti | RTX 3070 | RTX 3060 Ti |
| Chip | AD102 | AD103 | AD104 | AD104 | AD106 | GA104 | GA104 |
| FinFET process | TSMC 4N | TSMC 4N | TSMC 4N | TSMC 4N | TSMC 4N | 8 nm | 8 nm |
| CUDA cores | 16.384 | 9.728 | 7.680 | 5.888 | 4.352 | 5.888 | 4.864 |
| Texture units | 512 | 304 | 240 | 184 | 136 | 184 | 152 |
| Tensor cores | 512 4th gen | 304 4th gen | 240 4th gen | 184 4th gen | 136 4th gen | 184 3rd gen | 152 3rd gen |
| RT cores | 128 | 76 | 60 | 46 | 34 | 46 | 38 |
| GPU base clock | 2,235 MHz | 2,205 MHz | 2,310 MHz | 1,920 MHz | 2,310 MHz | 1,500 MHz | 1,410 MHz |
| GPU boost clock | 2,520 MHz | 2,505 MHz | 2,610 MHz | 2,475 MHz | 2,535 MHz | 1,725 MHz | 1,665 MHz |
| Memory bus | 384 Bit | 256 Bit | 192 Bit | 192 Bit | 128 Bit | 256 Bit | 256 Bit |
| Memory bandwidth | 1,008 GB/s | 716.8 GB/s | 504.2 GB/s | 504.2 GB/s | 288 GB/s | 448 GB/s | 448 GB/s |
| Video memory | 24 GB GDDR6X | 16 GB GDDR6X | 12 GB GDDR6 | 12 GB GDDR6X | 8 GB GDDR6 | 8 GB GDDR6 | 8 GB GDDR6 |
| Power consumption | 450 W | 320 W | 285 W | 215 W | 160 W | 220 W | 200 W |
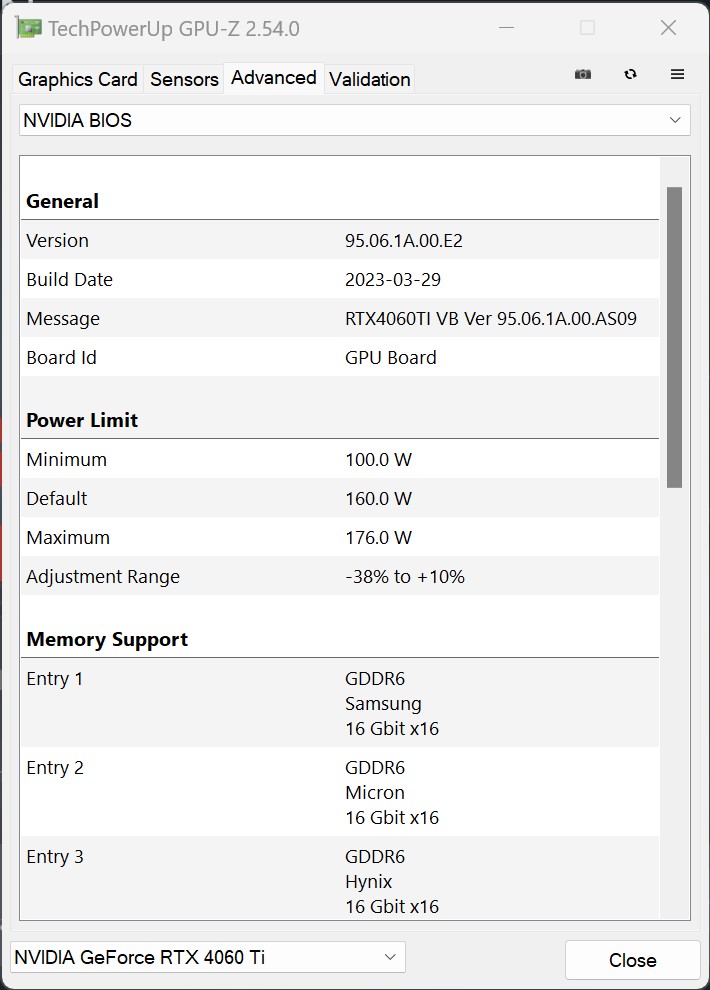
The ASUS Dual GeForce RTX 4060 Ti OC's clock rates
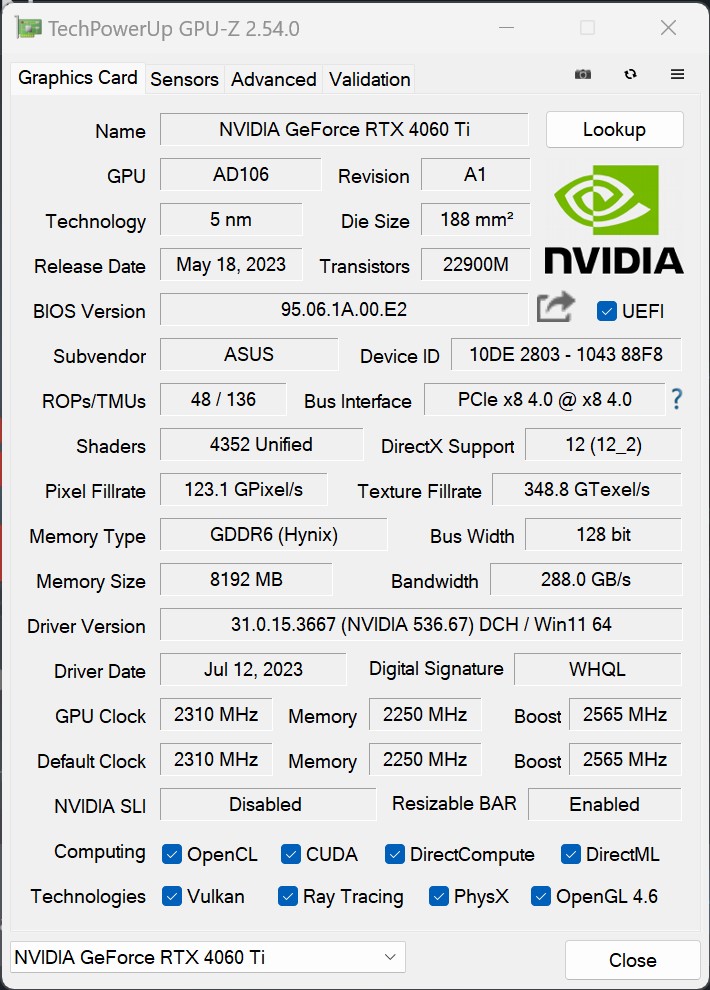
Compared to the Founders Edition of the GeForce RTX 4060 Ti, we only noted a slightly higher boost clock on the ASUS Dual GeForce RTX 4060 Ti OC. This gives the graphics card no advantage in practical use, as its specified boost clock of 2,565 MHz is almost always exceeded under load anyway. Its memory bandwidth is only half the size compared to the Nvidia GeForce RTX 3060 Ti, namely 128 bits. Since Nvidia has massively increased the GPU's internal L2 cache, the relevance of the high memory bandwidth decreases. Furthermore, the Nvidia GeForce RTX 4060 Ti is a graphics card that is designed for gaming in Full HD.
Synthetic benchmarks
The Asus Dual GeForce RTX 4060 Ti OC completed the synthetic benchmarks well and placed itself just ahead of the Nvidia GeForce RTX 3060 Ti. Our model came only 8 per cent ahead of its Ampere-based predecessor. Compared to the AMD Radeon RX 6650 XT, the Asus Dual GeForce RTX 4060 Ti OC had it easy. Although, our test sample couldn't come anywhere near the faster AMD Radeon RX 6750 XT.
Nvidia's next fastest model based on the GeForce RTX 4070 delivered about 30 per cent better performance. This gives it a little leeway for the possibility of releasing a further graphics card within this area at some point in the future.
| Performance rating - Percent | |
| Palit GeForce RTX 4090 GameRock OC | |
| AMD Radeon RX 7900 XTX | |
| KFA2 GeForce RTX 4080 SG | |
| AMD Radeon RX 7900 XT | |
| KFA2 GeForce RTX 4070 Ti EX Gamer | |
| NVIDIA GeForce RTX 3090 Founders Edition | |
| KFA2 GeForce RTX 3080 SG | |
| KFA2 GeForce RTX 4070 EX Gamer | |
| Nvidia Titan RTX | |
| KFA2 GeForce RTX 3070 Ti SG | |
| Sapphire Pulse Radeon RX 6750 XT | |
| MSI GeForce RTX 4060 Ti Gaming X Trio 8G | |
| NVIDIA GeForce RTX 3060 Ti FE | |
| Nvidia GeForce RTX 2070 Super | |
| KFA2 GeForce RTX 4060 1-Click-OC 2X | |
| Sapphire Nitro+ Radeon RX 6650 XT | |
| Nvidia GeForce RTX 2060 Super | |
| KFA2 GeForce GTX 1660 Super | |
| PNY GeForce GTX 1660 | |
| LuxMark v2.0 64Bit | |
| Room GPUs-only | |
| NVIDIA GeForce RTX 4090 | |
| NVIDIA GeForce RTX 4080 | |
| NVIDIA GeForce RTX 4070 Ti | |
| NVIDIA GeForce RTX 4070 | |
| NVIDIA GeForce RTX 3090 | |
| NVIDIA GeForce RTX 3080 12 GB | |
| AMD Radeon RX 7900 XTX | |
| AMD Radeon RX 6950 XT | |
| NVIDIA GeForce RTX 4060 Ti 8G | |
| NVIDIA Titan RTX | |
| NVIDIA GeForce RTX 3070 Ti | |
| AMD Radeon RX 7900 XT | |
| NVIDIA GeForce RTX 4060 | |
| NVIDIA GeForce RTX 3060 Ti | |
| AMD Radeon RX 6750 XT | |
| AMD Radeon RX 6650 XT | |
| Sala GPUs-only | |
| AMD Radeon RX 6950 XT | |
| NVIDIA GeForce RTX 4090 | |
| NVIDIA GeForce RTX 4080 | |
| NVIDIA GeForce RTX 4070 Ti | |
| AMD Radeon RX 7900 XTX | |
| NVIDIA GeForce RTX 3090 | |
| NVIDIA GeForce RTX 4070 | |
| NVIDIA GeForce RTX 3080 12 GB | |
| AMD Radeon RX 7900 XT | |
| NVIDIA GeForce RTX 4060 Ti 8G | |
| NVIDIA GeForce RTX 3070 Ti | |
| NVIDIA Titan RTX | |
| NVIDIA GeForce RTX 3060 Ti | |
| NVIDIA GeForce RTX 4060 | |
| AMD Radeon RX 6750 XT | |
| AMD Radeon RX 6650 XT | |
| Photoshop PugetBench | |
| GPU Score | |
| AMD Radeon RX 6750 XT | |
| AMD Radeon RX 7900 XT | |
| AMD Radeon RX 7900 XTX | |
| NVIDIA GeForce RTX 4080 | |
| NVIDIA GeForce RTX 3070 Ti | |
| NVIDIA GeForce RTX 4090 | |
| NVIDIA GeForce RTX 2060 Super (Desktop) | |
| NVIDIA GeForce RTX 2070 Super (Desktop) | |
| NVIDIA GeForce GTX 1660 (Desktop) | |
| NVIDIA Titan RTX | |
| AMD Radeon RX 6950 XT | |
| AMD Radeon RX 6650 XT | |
| NVIDIA GeForce RTX 4070 | |
| NVIDIA GeForce RTX 4060 Ti 8G | |
| NVIDIA GeForce RTX 4060 | |
| NVIDIA GeForce RTX 4070 Ti | |
| NVIDIA GeForce RTX 3080 12 GB | |
| Overall Score | |
| AMD Radeon RX 7900 XT | |
| AMD Radeon RX 6750 XT | |
| AMD Radeon RX 7900 XTX | |
| NVIDIA GeForce RTX 3070 Ti | |
| NVIDIA GeForce RTX 4080 | |
| NVIDIA GeForce RTX 4090 | |
| NVIDIA GeForce RTX 2060 Super (Desktop) | |
| NVIDIA GeForce RTX 2070 Super (Desktop) | |
| NVIDIA GeForce GTX 1660 (Desktop) | |
| NVIDIA GeForce RTX 4060 | |
| NVIDIA GeForce RTX 4060 Ti 8G | |
| NVIDIA GeForce RTX 4070 | |
| NVIDIA Titan RTX | |
| NVIDIA GeForce RTX 4070 Ti | |
| AMD Radeon RX 6950 XT | |
| AMD Radeon RX 6650 XT | |
| NVIDIA GeForce RTX 3080 12 GB | |
| Premiere Pro PugetBench | |
| GPU 0.9 | |
| NVIDIA GeForce RTX 4090 | |
| NVIDIA GeForce RTX 4080 | |
| NVIDIA GeForce RTX 3080 12 GB | |
| NVIDIA GeForce RTX 4070 Ti | |
| NVIDIA GeForce RTX 4070 | |
| AMD Radeon RX 7900 XTX | |
| NVIDIA GeForce RTX 3070 Ti | |
| NVIDIA Titan RTX | |
| AMD Radeon RX 7900 XT | |
| AMD Radeon RX 6950 XT | |
| NVIDIA GeForce RTX 2070 Super (Desktop) | |
| NVIDIA GeForce RTX 2060 Super (Desktop) | |
| NVIDIA GeForce RTX 4060 Ti 8G | |
| AMD Radeon RX 6750 XT | |
| AMD Radeon RX 6650 XT | |
| NVIDIA GeForce RTX 4060 | |
| NVIDIA GeForce GTX 1660 (Desktop) | |
| Overall Score 0.9 | |
| NVIDIA GeForce RTX 4090 | |
| NVIDIA GeForce RTX 4070 | |
| NVIDIA GeForce RTX 4080 | |
| NVIDIA Titan RTX | |
| NVIDIA GeForce RTX 4070 Ti | |
| NVIDIA GeForce RTX 2060 Super (Desktop) | |
| AMD Radeon RX 7900 XTX | |
| NVIDIA GeForce RTX 4060 | |
| NVIDIA GeForce RTX 2070 Super (Desktop) | |
| NVIDIA GeForce RTX 3070 Ti | |
| AMD Radeon RX 7900 XT | |
| NVIDIA GeForce RTX 4060 Ti 8G | |
| AMD Radeon RX 6750 XT | |
| NVIDIA GeForce GTX 1660 (Desktop) | |
| NVIDIA GeForce RTX 3080 12 GB | |
| AMD Radeon RX 6950 XT | |
| AMD Radeon RX 6650 XT | |
| Affinity Photo 2 - Combined (Single / Multi GPU) | |
| NVIDIA GeForce RTX 4070 | |
| NVIDIA GeForce RTX 4070 Ti | |
| NVIDIA GeForce RTX 4090 | |
| NVIDIA GeForce RTX 4080 | |
| NVIDIA GeForce RTX 2070 Super (Desktop) | |
| NVIDIA GeForce RTX 3070 Ti | |
| NVIDIA GeForce RTX 2060 Super (Desktop) | |
| AMD Radeon RX 6750 XT | |
| NVIDIA GeForce RTX 4060 | |
| NVIDIA GeForce RTX 4060 Ti 8G | |
| NVIDIA Titan RTX | |
| NVIDIA GeForce GTX 1660 (Desktop) | |
| NVIDIA GeForce GTX 1660 Super (Desktop) | |
| AMD Radeon RX 7900 XTX | |
| AMD Radeon RX 7900 XT | |
The ASUS Dual GeForce RTX 4060 Ti OC's internal competition
The direct competition between the RTX 4060 Ti models yields no clear winner. Our test sample delivered identical performance rates to the models from KFA2 and MSI, which we have also previously tested. Even so, the MSI GeForce RTX 4060 Ti Gaming X Trio managed to come in ever so slightly ahead - presumably due to its extremely large cooling unit. Both the Asus Dual GeForce RTX 4060 Ti OC and the KFA2 GeForce RTX 4060 Ti EX are fitted with considerably smaller coolers, to a small extent resulting in lower performance levels.
| Unigine Valley 1.0 | |
| 1920x1080 Extreme HD DirectX AA:x8 | |
| KFA2 GeForce RTX 4070 EX Gamer | |
| MSI GeForce RTX 4060 Ti Gaming X Trio 8G | |
| MSI GeForce RTX 4060 Ti Gaming X Trio 8G | |
| KFA2 GeForce RTX 4060 Ti EX | |
| KFA2 GeForce RTX 4060 1-Click-OC 2X | |
| 1920x1080 Extreme HD Preset OpenGL AA:x8 | |
| KFA2 GeForce RTX 4070 EX Gamer | |
| MSI GeForce RTX 4060 Ti Gaming X Trio 8G | |
| MSI GeForce RTX 4060 Ti Gaming X Trio 8G | |
| KFA2 GeForce RTX 4060 Ti EX | |
| KFA2 GeForce RTX 4060 1-Click-OC 2X | |
| Affinity Photo 2 - Combined (Single / Multi GPU) | |
| KFA2 GeForce RTX 4070 EX Gamer | |
| MSI GeForce RTX 4060 Ti Gaming X Trio 8G | |
| KFA2 GeForce RTX 4060 1-Click-OC 2X | |
| MSI GeForce RTX 4060 Ti Gaming X Trio 8G | |
| KFA2 GeForce RTX 4060 Ti EX | |
| Basemark GPU 1.2 | |
| 3840x2160 DX12 High Offscreen | |
| KFA2 GeForce RTX 4070 EX Gamer | |
| KFA2 GeForce RTX 4060 Ti EX | |
| MSI GeForce RTX 4060 Ti Gaming X Trio 8G | |
| 1920x1080 DX12 Medium Offscreen | |
| KFA2 GeForce RTX 4070 EX Gamer | |
| KFA2 GeForce RTX 4060 Ti EX | |
| MSI GeForce RTX 4060 Ti Gaming X Trio 8G | |
| 1280x720 DX12 Simple Offscreen | |
| KFA2 GeForce RTX 4070 EX Gamer | |
| MSI GeForce RTX 4060 Ti Gaming X Trio 8G | |
| KFA2 GeForce RTX 4060 Ti EX | |
| MSI GeForce RTX 4060 Ti Gaming X Trio 8G | |
| 3840x2160 Vulkan High Offscreen | |
| KFA2 GeForce RTX 4070 EX Gamer | |
| MSI GeForce RTX 4060 Ti Gaming X Trio 8G | |
| KFA2 GeForce RTX 4060 Ti EX | |
| MSI GeForce RTX 4060 Ti Gaming X Trio 8G | |
| 1920x1080 Vulkan Medium Offscreen | |
| KFA2 GeForce RTX 4070 EX Gamer | |
| MSI GeForce RTX 4060 Ti Gaming X Trio 8G | |
| KFA2 GeForce RTX 4060 Ti EX | |
| MSI GeForce RTX 4060 Ti Gaming X Trio 8G | |
| 1280x720 Vulkan Simple Offscreen | |
| KFA2 GeForce RTX 4070 EX Gamer | |
| MSI GeForce RTX 4060 Ti Gaming X Trio 8G | |
| KFA2 GeForce RTX 4060 Ti EX | |
| MSI GeForce RTX 4060 Ti Gaming X Trio 8G | |
Professional uses
We can only recommend the Asus Dual GeForce RTX 4060 Ti OC for professional use to a limited extent. In general, its performance could be increased by about 20 per cent compared to an Nvidia GeForce RTX 3060 Ti. Even so, it is missing quite a few features which can be found on professional graphics cards. You can quite clearly see this with the help of the Nvidia Titan RTX. During the synthetic tests, the Asus Dual GeForce RTX 4060 Ti OC only outperformed the Nvidia Titan RTX by 20 per cent, whereas the render tests showed a much bigger gap of over 200 per cent between the two contenders.
| NVIDIA GeForce RTX 4060 Ti 8G R9 7950X | NVIDIA GeForce RTX 4060 R9 7950X | NVIDIA GeForce RTX 4070 R9 7950X | NVIDIA GeForce RTX 4070 Ti R9 7950X | NVIDIA GeForce RTX 4080 R9 7950X | NVIDIA GeForce RTX 4090 R9 7950X | AMD Radeon RX 7900 XT R9 7950X | AMD Radeon RX 7900 XTX R9 7950X | NVIDIA Titan RTX R9 7950X | NVIDIA GeForce RTX 3060 Ti R9 5950X | NVIDIA GeForce RTX 3070 Ti R9 7950X | NVIDIA GeForce RTX 3080 12 GB R9 5900X | Average of class | |
|---|---|---|---|---|---|---|---|---|---|---|---|---|---|
| SPECviewperf 12 | -13% | 27% | 51% | 75% | 92% | 419% | 468% | 265% | -20% | 9% | -12% | 12% | |
| 1900x1060 3ds Max (3dsmax-05) (fps) | 286 | 251 -12% | 382 34% | 436 52% | 502 76% | 571 100% | 502 76% | 553 93% | 315 10% | 252 -12% | 330 15% | 334 17% | 202 ? -29% |
| 1900x1060 Catia (catia-04) (fps) | 128 | 113 -12% | 161 26% | 192 50% | 221 73% | 257 101% | 481 276% | 536 319% | 332 159% | 109 -15% | 136 6% | 79.1 -38% | 111.2 ? -13% |
| 1900x1060 Creo (creo-01) (fps) | 74.3 | 60.6 -18% | 89.1 20% | 99.4 34% | 110 48% | 115 55% | 176 137% | 187 152% | 197 165% | 57.8 -22% | 72.6 -2% | 74.4 0% | 66 ? -11% |
| 1900x1060 Energy (energy-01) (fps) | 22.8 | 15.9 -30% | 31.7 39% | 48 111% | 58.8 158% | 54.7 140% | 72.4 218% | 85.2 274% | 28.8 26% | 13.9 -39% | 18 -21% | 17.2 -25% | 16.4 ? -28% |
| 1900x1060 Maya (maya-04) (fps) | 252 | 233 -8% | 284 13% | 287 14% | 309 23% | 317 26% | 347 38% | 367 46% | 260 3% | 197 -22% | 279 11% | 139 -45% | 114.9 ? -54% |
| 1900x1060 Medical (medical-01) (fps) | 107 | 82.4 -23% | 132 23% | 157 47% | 171 60% | 119 11% | 288 169% | 347 224% | 101 -6% | 59.4 -44% | 106 -1% | 40.3 -62% | 57.4 ? -46% |
| 1900x1060 Showcase (showcase-01) (fps) | 122 | 109 -11% | 190 56% | 244 100% | 333 173% | 457 275% | 278 128% | 322 164% | 197 61% | 144 18% | 199 63% | 226 85% | 101 ? -17% |
| 1900x1060 Siemens NX (snx-02) (fps) | 14.5 | 14.2 -2% | 16.4 13% | 19 31% | 21.6 49% | 27.1 87% | 373 2472% | 400 2659% | 283 1852% | 12.3 -15% | 14.7 1% | 12 -17% | 60.5 ? 317% |
| 1900x1060 Solidworks (sw-03) (fps) | 94.8 | 91.2 -4% | 109 15% | 118 24% | 113 19% | 126 33% | 342 261% | 360 280% | 207 118% | 71.1 -25% | 101 7% | 73.8 -22% | 88.5 ? -7% |
| SPECviewperf 13 | -14% | 27% | 52% | 81% | 118% | 404% | 455% | 249% | -17% | 6% | 13% | 35% | |
| 3ds Max (3dsmax-06) (fps) | 286 | 252 -12% | 381 33% | 433 51% | 497 74% | 563 97% | 506 77% | 564 97% | 321 12% | 252 -12% | 330 15% | 334 17% | 193.8 ? -32% |
| Catia (catia-05) (fps) | 187 | 163 -13% | 241 29% | 290 55% | 340 82% | 402 115% | 728 289% | 825 341% | 534 186% | 161 -14% | 201 7% | 206 10% | 208 ? 11% |
| Creo (creo-02) (fps) | 298 | 230 -23% | 375 26% | 455 53% | 529 78% | 552 85% | 567 90% | 613 106% | 386 30% | 225 -24% | 286 -4% | 324 9% | 213 ? -29% |
| Energy (energy-02) (fps) | 45.3 | 34.6 -24% | 54.2 20% | 72.8 61% | 92.6 104% | 126 178% | 147 225% | 187 313% | 51.8 14% | 25.6 -43% | 30 -34% | 37.6 -17% | 38.8 ? -14% |
| Maya (maya-05) (fps) | 395 | 343 -13% | 510 29% | 591 50% | 678 72% | 715 81% | 670 70% | 735 86% | 499 26% | 344 -13% | 437 11% | 460 16% | 273 ? -31% |
| Medical (medical-02) (fps) | 92 | 76.5 -17% | 112 22% | 132 43% | 150 63% | 186 102% | 237 158% | 263 186% | 92 0% | 72.2 -22% | 83.6 -9% | 102 11% | 86.7 ? -6% |
| Showcase (showcase-02) (fps) | 121 | 108 -11% | 191 58% | 244 102% | 334 176% | 455 276% | 279 131% | 323 167% | 198 64% | 145 20% | 198 64% | 228 88% | 123.6 ? 2% |
| Siemens NX (snx-03) (fps) | 26.3 | 25.6 -3% | 29.5 12% | 34.1 30% | 39 48% | 49.1 87% | 675 2467% | 725 2657% | 512 1847% | 22.3 -15% | 26.4 0% | 26.3 0% | 136.6 ? 419% |
| Solidworks (sw-04) (fps) | 135 | 127 -6% | 157 16% | 168 24% | 179 33% | 186 38% | 307 127% | 323 139% | 218 61% | 99.6 -26% | 146 8% | 108 -20% | 123.3 ? -9% |
| SPECviewperf 2020 | -14% | 32% | 58% | 87% | 142% | 434% | 494% | 303% | -19% | 11% | 20% | 59% | |
| 3840x2160 Siemens NX (snx-04) (fps) | 20.1 | 19.5 -3% | 23.9 19% | 27.5 37% | 31.9 59% | 41.3 105% | 476 2268% | 514 2457% | 375 1766% | 18.2 -9% | 22.2 10% | 21.8 8% | 90.2 ? 349% |
| 3840x2160 Medical (medical-03) (fps) | 17.5 | 13.7 -22% | 22.2 27% | 26.9 54% | 32.2 84% | 45.9 162% | 53.9 208% | 62.3 256% | 16.5 -6% | 11.4 -35% | 16.3 -7% | 18.8 7% | 24 ? 37% |
| 3840x2160 Maya (maya-06) (fps) | 226 | 196 -13% | 305 35% | 372 65% | 447 98% | 498 120% | 401 77% | 481 113% | 274 21% | 215 -5% | 290 28% | 314 39% | 219 ? -3% |
| 3840x2160 Energy (energy-03) (fps) | 44.8 | 33.2 -26% | 57.6 29% | 75.7 69% | 90.4 102% | 141 215% | 99.6 122% | 129 188% | 93.9 110% | 14.5 -68% | 39.1 -13% | 37.2 -17% | 50.3 ? 12% |
| 3840x2160 Creo (creo-03) (fps) | 95.8 | 85.9 -10% | 112 17% | 121 26% | 128 34% | 133 39% | 173 81% | 187 95% | 135 41% | 76.6 -20% | 99.3 4% | 90 -6% | 78.3 ? -18% |
| 3840x2160 CATIA (catia-06) (fps) | 39.1 | 34 -13% | 51.6 32% | 61.2 57% | 75.5 93% | 95.3 144% | 113 189% | 127 225% | 90.9 132% | 37.9 -3% | 48 23% | 53.7 37% | 48.8 ? 25% |
| 3840x2160 3ds Max (3dsmax-07) (fps) | 74.5 | 67.4 -10% | 122 64% | 147 97% | 179 140% | 228 206% | 143 92% | 167 124% | 118 58% | 80.1 8% | 99 33% | 128 72% | 84 ? 13% |
| Total Average (Program / Settings) | -14% /
-14% | 29% /
28% | 54% /
53% | 81% /
81% | 117% /
115% | 419% /
418% | 472% /
470% | 272% /
270% | -19% /
-18% | 9% /
9% | 7% /
6% | 35% /
34% |
Gaming benchmarks
As already mentioned, the Nvidia GeForce RTX 4060 Ti is marketed toward gamers who primarily play games with a resolution of 1,920 x 1,080 pixels. This is also reflected in the current hardware survey undertaken by the gaming platform Steam, where the number was just over 61 per cent in July 2023. In our tests, we were able to smoothly run every game we tested at maximum detail settings. There were one or two games where we would recommend lowering the graphic details by a level. Some examples of this would be Hogwarts Legacy, A Plague Tale Requiem or The Last of Us. In the documented frame rates, we often noted drops in the low FPS. This takes its toll on how the games run, although we did still measure relatively good frame rates of 50 - 60 FPS.
Purely from a performance standpoint, we noted that the Asus Dual GeForce RTX 4060 Ti OC oftentimes competed with the AMD Radeon RX 6750 XT. Compared to the predecessor model (Nvidia GeForce RTX 3060 Ti), our test sample did 20 per cent better. The AMD competitor's 12-GB VRAM led to no noticeable advantage over our test sample.
| F1 2021 | |
| 2560x1440 Ultra High Preset + Raytracing AA:T AF:16x | |
| Palit GeForce RTX 4090 GameRock OC (874931) | |
| KFA2 GeForce RTX 4080 SG (874931) | |
| AMD Radeon RX 7900 XTX (874931) | |
| KFA2 GeForce RTX 4070 Ti EX Gamer (874931) | |
| AMD Radeon RX 7900 XT (874931) | |
| NVIDIA GeForce RTX 3090 Founders Edition (874931) | |
| KFA2 GeForce RTX 4070 EX Gamer (874931) | |
| KFA2 GeForce RTX 3080 SG (874931) | |
| KFA2 GeForce RTX 3070 Ti SG (874931) | |
| Nvidia Titan RTX (874931) | |
| ASUS Dual GeForce RTX 4060 Ti OC (874931) | |
| Sapphire Pulse Radeon RX 6750 XT (874931) | |
| Nvidia GeForce RTX 2070 Super (874931) | |
| KFA2 GeForce GTX 1660 Super (874931) | |
| Sapphire Nitro+ Radeon RX 6650 XT (874931) | |
| PNY GeForce GTX 1660 (874931) | |
| Nvidia GeForce RTX 2060 Super (874931) | |
| 1920x1080 Ultra High Preset + Raytracing AA:T AF:16x | |
| Palit GeForce RTX 4090 GameRock OC (874931) | |
| AMD Radeon RX 7900 XTX (874931) | |
| KFA2 GeForce RTX 4080 SG (874931) | |
| KFA2 GeForce RTX 4070 Ti EX Gamer (874931) | |
| AMD Radeon RX 7900 XT (874931) | |
| NVIDIA GeForce RTX 3090 Founders Edition (874931) | |
| KFA2 GeForce RTX 4070 EX Gamer (874931) | |
| KFA2 GeForce RTX 3080 SG (874931) | |
| KFA2 GeForce RTX 3070 Ti SG (874931) | |
| ASUS Dual GeForce RTX 4060 Ti OC (874931) | |
| Nvidia Titan RTX (874931) | |
| Sapphire Pulse Radeon RX 6750 XT (874931) | |
| Nvidia GeForce RTX 2070 Super (874931) | |
| Sapphire Nitro+ Radeon RX 6650 XT (874931) | |
| KFA2 GeForce GTX 1660 Super (874931) | |
| Nvidia GeForce RTX 2060 Super (874931) | |
| PNY GeForce GTX 1660 (874931) | |
| F1 22 | |
| 2560x1440 Ultra High Preset AA:T AF:16x | |
| Palit GeForce RTX 4090 GameRock OC (923662) | |
| KFA2 GeForce RTX 4080 SG (939134) | |
| AMD Radeon RX 7900 XTX (939134) | |
| KFA2 GeForce RTX 4070 Ti EX Gamer (959964) | |
| AMD Radeon RX 7900 XT (939134) | |
| NVIDIA GeForce RTX 3090 Founders Edition (923650) | |
| KFA2 GeForce RTX 4070 EX Gamer (959964) | |
| KFA2 GeForce GTX 1660 Super (928484) | |
| PNY GeForce GTX 1660 (928484) | |
| KFA2 GeForce RTX 3070 Ti SG (939134) | |
| Nvidia Titan RTX (923650) | |
| ASUS Dual GeForce RTX 4060 Ti OC (959964) | |
| Sapphire Pulse Radeon RX 6750 XT (959964) | |
| KFA2 GeForce RTX 4060 1-Click-OC 2X (959964) | |
| Nvidia GeForce RTX 2070 Super (923662) | |
| Nvidia GeForce RTX 2060 Super (923662) | |
| Sapphire Nitro+ Radeon RX 6650 XT | |
| 1920x1080 Ultra High Preset AA:T AF:16x | |
| Palit GeForce RTX 4090 GameRock OC | |
| KFA2 GeForce RTX 4080 SG (939134) | |
| AMD Radeon RX 7900 XTX (939134) | |
| KFA2 GeForce RTX 4070 Ti EX Gamer (959964) | |
| NVIDIA GeForce RTX 3090 Founders Edition (923650) | |
| AMD Radeon RX 7900 XT (939134) | |
| KFA2 GeForce RTX 4070 EX Gamer (959964) | |
| KFA2 GeForce GTX 1660 Super (928484) | |
| KFA2 GeForce RTX 3070 Ti SG (939134) | |
| PNY GeForce GTX 1660 (928484) | |
| Nvidia Titan RTX (923650) | |
| ASUS Dual GeForce RTX 4060 Ti OC (959964) | |
| Sapphire Pulse Radeon RX 6750 XT (959964) | |
| KFA2 GeForce RTX 4060 1-Click-OC 2X (959964) | |
| Nvidia GeForce RTX 2070 Super (923662) | |
| Nvidia GeForce RTX 2060 Super (923662) | |
| Sapphire Nitro+ Radeon RX 6650 XT | |
| A Plague Tale Requiem | |
| 2560x1440 Ultra Preset | |
| Palit GeForce RTX 4090 GameRock OC | |
| AMD Radeon RX 7900 XTX | |
| KFA2 GeForce RTX 4080 SG | |
| AMD Radeon RX 7900 XT | |
| KFA2 GeForce RTX 4070 Ti EX Gamer | |
| KFA2 GeForce RTX 4070 EX Gamer | |
| KFA2 GeForce RTX 3070 Ti SG | |
| Nvidia Titan RTX | |
| ASUS Dual GeForce RTX 4060 Ti OC | |
| Sapphire Pulse Radeon RX 6750 XT | |
| Nvidia GeForce RTX 2070 Super | |
| KFA2 GeForce RTX 4060 1-Click-OC 2X | |
| Nvidia GeForce RTX 2060 Super | |
| KFA2 GeForce GTX 1660 Super | |
| PNY GeForce GTX 1660 | |
| 1920x1080 Ultra Preset | |
| Palit GeForce RTX 4090 GameRock OC | |
| KFA2 GeForce RTX 4080 SG | |
| AMD Radeon RX 7900 XTX | |
| AMD Radeon RX 7900 XT | |
| KFA2 GeForce RTX 4070 Ti EX Gamer | |
| KFA2 GeForce RTX 4070 EX Gamer | |
| KFA2 GeForce RTX 3070 Ti SG | |
| Nvidia Titan RTX | |
| ASUS Dual GeForce RTX 4060 Ti OC | |
| Sapphire Pulse Radeon RX 6750 XT | |
| KFA2 GeForce RTX 4060 1-Click-OC 2X | |
| Nvidia GeForce RTX 2070 Super | |
| Nvidia GeForce RTX 2060 Super | |
| KFA2 GeForce GTX 1660 Super | |
| PNY GeForce GTX 1660 | |
| Spider-Man Miles Morales | |
| 2560x1440 Very High Preset AA:T | |
| KFA2 GeForce RTX 4080 SG | |
| Palit GeForce RTX 4090 GameRock OC | |
| AMD Radeon RX 7900 XTX | |
| KFA2 GeForce RTX 4070 Ti EX Gamer | |
| AMD Radeon RX 7900 XT | |
| KFA2 GeForce RTX 4070 EX Gamer | |
| KFA2 GeForce RTX 3070 Ti SG | |
| Nvidia Titan RTX | |
| ASUS Dual GeForce RTX 4060 Ti OC | |
| Sapphire Pulse Radeon RX 6750 XT | |
| KFA2 GeForce RTX 4060 1-Click-OC 2X | |
| Nvidia GeForce RTX 2070 Super | |
| Nvidia GeForce RTX 2060 Super | |
| PNY GeForce GTX 1660 | |
| KFA2 GeForce GTX 1660 Super | |
| 1920x1080 Very High Preset AA:T | |
| Palit GeForce RTX 4090 GameRock OC | |
| KFA2 GeForce RTX 4070 Ti EX Gamer | |
| AMD Radeon RX 7900 XTX | |
| KFA2 GeForce RTX 4070 EX Gamer | |
| KFA2 GeForce RTX 4080 SG | |
| AMD Radeon RX 7900 XT | |
| KFA2 GeForce RTX 3070 Ti SG | |
| Nvidia Titan RTX | |
| ASUS Dual GeForce RTX 4060 Ti OC | |
| Sapphire Pulse Radeon RX 6750 XT | |
| KFA2 GeForce RTX 4060 1-Click-OC 2X | |
| Nvidia GeForce RTX 2070 Super | |
| Nvidia GeForce RTX 2060 Super | |
| KFA2 GeForce GTX 1660 Super | |
| PNY GeForce GTX 1660 | |
| GRID Legends | |
| 2560x1440 Ultra Preset | |
| AMD Radeon RX 7900 XTX (643827) | |
| Palit GeForce RTX 4090 GameRock OC (591708) | |
| AMD Radeon RX 7900 XT (643827) | |
| KFA2 GeForce RTX 4080 SG (643827) | |
| KFA2 GeForce RTX 4070 Ti EX Gamer (712825) | |
| NVIDIA GeForce RTX 3090 Founders Edition (591708) | |
| KFA2 GeForce RTX 3070 Ti SG (643827) | |
| KFA2 GeForce RTX 4070 EX Gamer (712825) | |
| Sapphire Pulse Radeon RX 6750 XT (712825) | |
| Nvidia Titan RTX (591708) | |
| ASUS Dual GeForce RTX 4060 Ti OC (800660) | |
| Sapphire Nitro+ Radeon RX 6650 XT | |
| KFA2 GeForce RTX 4060 1-Click-OC 2X (800660) | |
| Nvidia GeForce RTX 2070 Super (591708) | |
| Nvidia GeForce RTX 2060 Super (623651) | |
| KFA2 GeForce GTX 1660 Super (623651) | |
| PNY GeForce GTX 1660 (623651) | |
| 1920x1080 Ultra Preset | |
| AMD Radeon RX 7900 XTX (643827) | |
| AMD Radeon RX 7900 XT (643827) | |
| Palit GeForce RTX 4090 GameRock OC (591708) | |
| KFA2 GeForce RTX 4080 SG (643827) | |
| KFA2 GeForce RTX 4070 Ti EX Gamer (712825) | |
| NVIDIA GeForce RTX 3090 Founders Edition (591708) | |
| KFA2 GeForce RTX 4070 EX Gamer (712825) | |
| Sapphire Pulse Radeon RX 6750 XT (712825) | |
| KFA2 GeForce RTX 3070 Ti SG (643827) | |
| Nvidia Titan RTX (591708) | |
| ASUS Dual GeForce RTX 4060 Ti OC (800660) | |
| Sapphire Nitro+ Radeon RX 6650 XT | |
| KFA2 GeForce RTX 4060 1-Click-OC 2X (800660) | |
| Nvidia GeForce RTX 2070 Super (591708) | |
| Nvidia GeForce RTX 2060 Super (623651) | |
| KFA2 GeForce GTX 1660 Super (623651) | |
| PNY GeForce GTX 1660 (623651) | |
| Final Fantasy XV Benchmark | |
| 1920x1080 High Quality | |
| Palit GeForce RTX 4090 GameRock OC (1.3) | |
| KFA2 GeForce RTX 4080 SG (1.3) | |
| AMD Radeon RX 7900 XTX (1.3) | |
| KFA2 GeForce RTX 4070 Ti EX Gamer (1.3) | |
| AMD Radeon RX 7900 XT (1.3) | |
| NVIDIA GeForce RTX 3090 Founders Edition (1.3) | |
| KFA2 GeForce RTX 4070 EX Gamer (1.3) | |
| KFA2 GeForce RTX 3080 SG (1.3) | |
| Nvidia Titan RTX (1.3) | |
| KFA2 GeForce RTX 3070 Ti SG (1.3) | |
| ASUS Dual GeForce RTX 4060 Ti OC (1.3) | |
| Sapphire Pulse Radeon RX 6750 XT (1.3) | |
| KFA2 GeForce RTX 4060 1-Click-OC 2X (1.3) | |
| Nvidia GeForce RTX 2070 Super (1.3) | |
| Sapphire Nitro+ Radeon RX 6650 XT (1.3) | |
| Nvidia GeForce RTX 2060 Super (1.3) | |
| KFA2 GeForce GTX 1660 Super (1.3) | |
| PNY GeForce GTX 1660 (1.3) | |
| 2560x1440 High Quality | |
| Palit GeForce RTX 4090 GameRock OC (1.3) | |
| KFA2 GeForce RTX 4080 SG (1.3) | |
| AMD Radeon RX 7900 XTX (1.3) | |
| KFA2 GeForce RTX 4070 Ti EX Gamer (1.3) | |
| AMD Radeon RX 7900 XT (1.3) | |
| NVIDIA GeForce RTX 3090 Founders Edition (1.3) | |
| KFA2 GeForce RTX 4070 EX Gamer (1.3) | |
| KFA2 GeForce RTX 3080 SG (1.3) | |
| KFA2 GeForce RTX 3070 Ti SG (1.3) | |
| Nvidia Titan RTX (1.3) | |
| ASUS Dual GeForce RTX 4060 Ti OC (1.3) | |
| Sapphire Pulse Radeon RX 6750 XT (1.3) | |
| KFA2 GeForce RTX 4060 1-Click-OC 2X (1.3) | |
| Nvidia GeForce RTX 2070 Super (1.3) | |
| Sapphire Nitro+ Radeon RX 6650 XT (1.3) | |
| Nvidia GeForce RTX 2060 Super (1.3) | |
| KFA2 GeForce GTX 1660 Super (1.3) | |
| PNY GeForce GTX 1660 (1.3) | |
| The Last of Us | |
| 1920x1080 Ultra Preset | |
| Palit GeForce RTX 4090 GameRock OC | |
| KFA2 GeForce RTX 4070 Ti EX Gamer | |
| KFA2 GeForce RTX 4070 EX Gamer | |
| ASUS Dual GeForce RTX 4060 Ti OC | |
| Sapphire Pulse Radeon RX 6750 XT | |
| Nvidia Titan RTX | |
| KFA2 GeForce RTX 4060 1-Click-OC 2X | |
| Nvidia GeForce RTX 2070 Super | |
| Nvidia GeForce RTX 2060 Super | |
| KFA2 GeForce GTX 1660 Super | |
| PNY GeForce GTX 1660 | |
| 2560x1440 Ultra Preset | |
| Palit GeForce RTX 4090 GameRock OC | |
| KFA2 GeForce RTX 4070 Ti EX Gamer | |
| KFA2 GeForce RTX 4070 EX Gamer | |
| Nvidia Titan RTX | |
| Sapphire Pulse Radeon RX 6750 XT | |
| ASUS Dual GeForce RTX 4060 Ti OC | |
| KFA2 GeForce RTX 4060 1-Click-OC 2X | |
| Nvidia GeForce RTX 2070 Super | |
| Nvidia GeForce RTX 2060 Super | |
| KFA2 GeForce GTX 1660 Super | |
| PNY GeForce GTX 1660 | |
| F1 23 | |
| 1920x1080 Ultra High Preset AA:T AF:16x | |
| Palit GeForce RTX 4090 GameRock OC (1022189) | |
| KFA2 GeForce RTX 4070 EX Gamer | |
| KFA2 GeForce GTX 1660 Super (1016022) | |
| ASUS Dual GeForce RTX 4060 Ti OC (1012607) | |
| Nvidia Titan RTX (1021115) | |
| PNY GeForce GTX 1660 (1016022) | |
| KFA2 GeForce RTX 4060 1-Click-OC 2X (1008687) | |
| Sapphire Pulse Radeon RX 6750 XT (1016022) | |
| Nvidia GeForce RTX 2070 Super (1021115) | |
| Nvidia GeForce RTX 2060 Super (1021115) | |
| 2560x1440 Ultra High Preset AA:T AF:16x | |
| Palit GeForce RTX 4090 GameRock OC (1022189) | |
| KFA2 GeForce RTX 4070 EX Gamer | |
| KFA2 GeForce GTX 1660 Super (1016022) | |
| PNY GeForce GTX 1660 (1016022) | |
| Nvidia Titan RTX (1021115) | |
| ASUS Dual GeForce RTX 4060 Ti OC (1012607) | |
| KFA2 GeForce RTX 4060 1-Click-OC 2X (1008687) | |
| Sapphire Pulse Radeon RX 6750 XT (1016022) | |
| Nvidia GeForce RTX 2070 Super (1021115) | |
| Nvidia GeForce RTX 2060 Super (1021115) | |
| Hogwarts Legacy | |
| 1920x1080 Ultra Preset AA:High T | |
| Palit GeForce RTX 4090 GameRock OC | |
| KFA2 GeForce RTX 4070 Ti EX Gamer | |
| KFA2 GeForce RTX 4070 EX Gamer | |
| Nvidia Titan RTX | |
| ASUS Dual GeForce RTX 4060 Ti OC | |
| Sapphire Pulse Radeon RX 6750 XT | |
| Nvidia GeForce RTX 2070 Super | |
| KFA2 GeForce RTX 4060 1-Click-OC 2X | |
| Nvidia GeForce RTX 2060 Super | |
| PNY GeForce GTX 1660 | |
| KFA2 GeForce GTX 1660 Super | |
| 2560x1440 Ultra Preset AA:High T | |
| Palit GeForce RTX 4090 GameRock OC | |
| KFA2 GeForce RTX 4070 Ti EX Gamer | |
| KFA2 GeForce RTX 4070 EX Gamer | |
| Nvidia Titan RTX | |
| Sapphire Pulse Radeon RX 6750 XT | |
| ASUS Dual GeForce RTX 4060 Ti OC | |
| Nvidia GeForce RTX 2070 Super | |
| KFA2 GeForce RTX 4060 1-Click-OC 2X | |
| Nvidia GeForce RTX 2060 Super | |
| KFA2 GeForce GTX 1660 Super | |
| PNY GeForce GTX 1660 | |
Asus vs. MSI and KFA2
| Performance rating - Percent | |
| KFA2 GeForce RTX 4070 EX Gamer | |
| MSI GeForce RTX 4060 Ti Gaming X Trio 8G | |
| ASUS Dual GeForce RTX 4060 Ti OC | |
| KFA2 GeForce RTX 4060 Ti EX | |
| KFA2 GeForce RTX 4060 1-Click-OC 2X | |
| The Witcher 3 | |
| 1920x1080 Ultra Graphics & Postprocessing (HBAO+) | |
| KFA2 GeForce RTX 4070 EX Gamer | |
| KFA2 GeForce RTX 4060 Ti EX | |
| MSI GeForce RTX 4060 Ti Gaming X Trio 8G | |
| ASUS Dual GeForce RTX 4060 Ti OC | |
| KFA2 GeForce RTX 4060 1-Click-OC 2X | |
| 1920x1080 High Graphics & Postprocessing (Nvidia HairWorks Off) | |
| KFA2 GeForce RTX 4070 EX Gamer | |
| KFA2 GeForce RTX 4060 Ti EX | |
| MSI GeForce RTX 4060 Ti Gaming X Trio 8G | |
| ASUS Dual GeForce RTX 4060 Ti OC | |
| KFA2 GeForce RTX 4060 1-Click-OC 2X | |
| F1 22 | |
| 2560x1440 Ultra High Preset AA:T AF:16x | |
| KFA2 GeForce RTX 4070 EX Gamer (959964) | |
| MSI GeForce RTX 4060 Ti Gaming X Trio 8G (959964) | |
| KFA2 GeForce RTX 4060 Ti EX (959964) | |
| ASUS Dual GeForce RTX 4060 Ti OC (959964) | |
| KFA2 GeForce RTX 4060 1-Click-OC 2X (959964) | |
| 1920x1080 Ultra High Preset AA:T AF:16x | |
| KFA2 GeForce RTX 4070 EX Gamer (959964) | |
| MSI GeForce RTX 4060 Ti Gaming X Trio 8G (959964) | |
| KFA2 GeForce RTX 4060 Ti EX (959964) | |
| ASUS Dual GeForce RTX 4060 Ti OC (959964) | |
| KFA2 GeForce RTX 4060 1-Click-OC 2X (959964) | |
| Cyberpunk 2077 1.6 | |
| 2560x1440 Ultra Preset | |
| KFA2 GeForce RTX 4070 EX Gamer | |
| MSI GeForce RTX 4060 Ti Gaming X Trio 8G | |
| ASUS Dual GeForce RTX 4060 Ti OC (1.6) | |
| KFA2 GeForce RTX 4060 Ti EX | |
| KFA2 GeForce RTX 4060 1-Click-OC 2X (1.6) | |
| 1920x1080 Ultra Preset | |
| KFA2 GeForce RTX 4070 EX Gamer | |
| ASUS Dual GeForce RTX 4060 Ti OC (1.6) | |
| MSI GeForce RTX 4060 Ti Gaming X Trio 8G | |
| KFA2 GeForce RTX 4060 Ti EX | |
| KFA2 GeForce RTX 4060 1-Click-OC 2X (1.6) | |
| Spider-Man Miles Morales | |
| 2560x1440 Very High Preset AA:T | |
| KFA2 GeForce RTX 4070 EX Gamer | |
| ASUS Dual GeForce RTX 4060 Ti OC | |
| KFA2 GeForce RTX 4060 Ti EX | |
| MSI GeForce RTX 4060 Ti Gaming X Trio 8G | |
| KFA2 GeForce RTX 4060 1-Click-OC 2X | |
| 1920x1080 Very High Preset AA:T | |
| KFA2 GeForce RTX 4070 EX Gamer | |
| MSI GeForce RTX 4060 Ti Gaming X Trio 8G | |
| ASUS Dual GeForce RTX 4060 Ti OC | |
| KFA2 GeForce RTX 4060 Ti EX | |
| KFA2 GeForce RTX 4060 1-Click-OC 2X | |
| Borderlands 3 | |
| 2560x1440 Badass Overall Quality (DX11) | |
| KFA2 GeForce RTX 4070 EX Gamer | |
| MSI GeForce RTX 4060 Ti Gaming X Trio 8G | |
| ASUS Dual GeForce RTX 4060 Ti OC | |
| KFA2 GeForce RTX 4060 Ti EX | |
| KFA2 GeForce RTX 4060 1-Click-OC 2X | |
| 1920x1080 Badass Overall Quality (DX11) | |
| KFA2 GeForce RTX 4070 EX Gamer | |
| MSI GeForce RTX 4060 Ti Gaming X Trio 8G | |
| ASUS Dual GeForce RTX 4060 Ti OC | |
| KFA2 GeForce RTX 4060 Ti EX | |
| KFA2 GeForce RTX 4060 1-Click-OC 2X | |
| GTA V | |
| 1920x1080 Highest AA:4xMSAA + FX AF:16x | |
| KFA2 GeForce RTX 4070 EX Gamer | |
| MSI GeForce RTX 4060 Ti Gaming X Trio 8G | |
| ASUS Dual GeForce RTX 4060 Ti OC | |
| KFA2 GeForce RTX 4060 Ti EX | |
| KFA2 GeForce RTX 4060 1-Click-OC 2X | |
| 2560x1440 Highest AA:4xMSAA + FX AF:16x | |
| KFA2 GeForce RTX 4070 EX Gamer | |
| MSI GeForce RTX 4060 Ti Gaming X Trio 8G | |
| ASUS Dual GeForce RTX 4060 Ti OC | |
| KFA2 GeForce RTX 4060 Ti EX | |
| KFA2 GeForce RTX 4060 1-Click-OC 2X | |
| Tiny Tina's Wonderlands | |
| 2560x1440 Badass Preset (DX12) | |
| KFA2 GeForce RTX 4070 EX Gamer | |
| MSI GeForce RTX 4060 Ti Gaming X Trio 8G | |
| ASUS Dual GeForce RTX 4060 Ti OC | |
| KFA2 GeForce RTX 4060 Ti EX | |
| KFA2 GeForce RTX 4060 1-Click-OC 2X | |
| 1920x1080 Badass Preset (DX12) | |
| KFA2 GeForce RTX 4070 EX Gamer | |
| MSI GeForce RTX 4060 Ti Gaming X Trio 8G | |
| ASUS Dual GeForce RTX 4060 Ti OC | |
| KFA2 GeForce RTX 4060 Ti EX | |
| KFA2 GeForce RTX 4060 1-Click-OC 2X | |
| GRID Legends | |
| 2560x1440 Ultra Preset | |
| KFA2 GeForce RTX 4070 EX Gamer (712825) | |
| MSI GeForce RTX 4060 Ti Gaming X Trio 8G (800660) | |
| ASUS Dual GeForce RTX 4060 Ti OC (800660) | |
| KFA2 GeForce RTX 4060 Ti EX (800660) | |
| KFA2 GeForce RTX 4060 1-Click-OC 2X (800660) | |
| 1920x1080 Ultra Preset | |
| KFA2 GeForce RTX 4070 EX Gamer (712825) | |
| MSI GeForce RTX 4060 Ti Gaming X Trio 8G (800660) | |
| ASUS Dual GeForce RTX 4060 Ti OC (800660) | |
| KFA2 GeForce RTX 4060 Ti EX (800660) | |
| KFA2 GeForce RTX 4060 1-Click-OC 2X (800660) | |
| Final Fantasy XV Benchmark | |
| 1920x1080 High Quality | |
| KFA2 GeForce RTX 4070 EX Gamer (1.3) | |
| MSI GeForce RTX 4060 Ti Gaming X Trio 8G (1.3) | |
| ASUS Dual GeForce RTX 4060 Ti OC (1.3) | |
| KFA2 GeForce RTX 4060 Ti EX (1.3) | |
| KFA2 GeForce RTX 4060 1-Click-OC 2X (1.3) | |
| 2560x1440 High Quality | |
| KFA2 GeForce RTX 4070 EX Gamer (1.3) | |
| ASUS Dual GeForce RTX 4060 Ti OC (1.3) | |
| KFA2 GeForce RTX 4060 Ti EX (1.3) | |
| MSI GeForce RTX 4060 Ti Gaming X Trio 8G (1.3) | |
| KFA2 GeForce RTX 4060 1-Click-OC 2X (1.3) | |
Ray tracing, DLSS and FG (Frame Generation)
Ray tracing and DLSS might possibly be the features that tip the scales when it comes to achieving playable frame rates. However, we are referring to the WQHD and even UHD range here. DLSS 3, which can exclusively be used with RTX 4000 graphics cards, allows you to play many games in higher resolutions. In our opinion, those who want to use ray tracing should always do so in conjunction with DLSS. The performance of the Asus Dual GeForce RTX 4060 Ti OC is simply not enough to achieve adequate frame rates.
| Spider-Man Miles Morales - 1920x0180 Very High Preset + Ray-Tracing AA:T | |
| Palit GeForce RTX 4090 GameRock OC | |
| KFA2 GeForce RTX 4080 SG | |
| KFA2 GeForce RTX 4070 Ti EX Gamer | |
| AMD Radeon RX 7900 XTX | |
| AMD Radeon RX 7900 XT | |
| KFA2 GeForce RTX 4070 EX Gamer | |
| KFA2 GeForce RTX 3070 Ti SG | |
| ASUS Dual GeForce RTX 4060 Ti OC | |
| Nvidia Titan RTX | |
| KFA2 GeForce RTX 4060 1-Click-OC 2X | |
| Sapphire Pulse Radeon RX 6750 XT | |
| Nvidia GeForce RTX 2070 Super | |
| Nvidia GeForce RTX 2060 Super | |
| Metro Exodus - 1920x1080 Ultra Quality DXR AF:16x | |
| Palit GeForce RTX 4090 GameRock OC | |
| KFA2 GeForce RTX 4080 SG | |
| AMD Radeon RX 7900 XTX | |
| KFA2 GeForce RTX 4070 Ti EX Gamer | |
| AMD Radeon RX 7900 XT | |
| NVIDIA GeForce RTX 3090 Founders Edition | |
| KFA2 GeForce RTX 4070 EX Gamer | |
| KFA2 GeForce RTX 3080 SG | |
| KFA2 GeForce RTX 3070 Ti SG | |
| Nvidia Titan RTX | |
| ASUS Dual GeForce RTX 4060 Ti OC | |
| NVIDIA GeForce RTX 3060 Ti FE | |
| Sapphire Pulse Radeon RX 6750 XT | |
| KFA2 GeForce RTX 4060 1-Click-OC 2X | |
| Nvidia GeForce RTX 2070 Super | |
| Nvidia GeForce RTX 2060 Super | |
| Far Cry 6 - 1920x1080 Ultra Graphics Quality + HD Textures + DXR AA:T | |
| AMD Radeon RX 7900 XTX | |
| AMD Radeon RX 7900 XT | |
| KFA2 GeForce RTX 4070 Ti EX Gamer | |
| Palit GeForce RTX 4090 GameRock OC | |
| KFA2 GeForce RTX 4070 EX Gamer | |
| NVIDIA GeForce RTX 3090 Founders Edition | |
| KFA2 GeForce RTX 4080 SG | |
| Nvidia Titan RTX | |
| Sapphire Pulse Radeon RX 6750 XT | |
| KFA2 GeForce RTX 3070 Ti SG | |
| Nvidia GeForce RTX 2070 Super | |
| Nvidia GeForce RTX 2060 Super | |
| KFA2 GeForce RTX 4060 1-Click-OC 2X | |
| Cyberpunk 2077 1.6 | |
| 3840x2160 Ray Tracing Ultra Preset (DLSS off) | |
| Palit GeForce RTX 4090 GameRock OC (1.6) | |
| KFA2 GeForce RTX 4080 SG (1.61) | |
| KFA2 GeForce RTX 4070 Ti EX Gamer | |
| AMD Radeon RX 7900 XTX (1.61) | |
| KFA2 GeForce RTX 4070 EX Gamer | |
| AMD Radeon RX 7900 XT (1.61) | |
| Sapphire Pulse Radeon RX 6750 XT | |
| KFA2 GeForce RTX 3070 Ti SG (1.61) | |
| Nvidia GeForce RTX 2070 Super (1.6) | |
| ASUS Dual GeForce RTX 4060 Ti OC (1.6) | |
| KFA2 GeForce RTX 4060 1-Click-OC 2X (1.6) | |
| 1920x1080 Ray Tracing Ultra Preset (DLSS off) | |
| Palit GeForce RTX 4090 GameRock OC (1.6) | |
| KFA2 GeForce RTX 4080 SG (1.61) | |
| KFA2 GeForce RTX 4070 Ti EX Gamer | |
| AMD Radeon RX 7900 XTX (1.61) | |
| KFA2 GeForce RTX 4070 EX Gamer | |
| AMD Radeon RX 7900 XT (1.61) | |
| ASUS Dual GeForce RTX 4060 Ti OC (1.6) | |
| KFA2 GeForce RTX 3070 Ti SG (1.61) | |
| KFA2 GeForce RTX 4060 1-Click-OC 2X (1.6) | |
| Nvidia GeForce RTX 2070 Super (1.6) | |
| Sapphire Pulse Radeon RX 6750 XT | |
| Nvidia GeForce RTX 2060 Super (1.6) | |
| The Callisto Protocol - 1920x1080 Ultra Preset (without FSR Upscaling) + Full Ray-Tracing | |
| AMD Radeon RX 7900 XTX | |
| KFA2 GeForce RTX 4070 Ti EX Gamer | |
| Palit GeForce RTX 4090 GameRock OC | |
| ASUS Dual GeForce RTX 4060 Ti OC | |
| AMD Radeon RX 7900 XT | |
| KFA2 GeForce RTX 4080 SG | |
| KFA2 GeForce RTX 4070 EX Gamer | |
| KFA2 GeForce RTX 3070 Ti SG | |
| Nvidia Titan RTX | |
| Nvidia GeForce RTX 2070 Super | |
| Nvidia GeForce RTX 2060 Super | |
| Sapphire Pulse Radeon RX 6750 XT | |
| PNY GeForce GTX 1660 | |
| KFA2 GeForce GTX 1660 Super | |
| Guardians of the Galaxy - 1920x1080 Ultra Preset + Ultra Ray-Tracing | |
| KFA2 GeForce RTX 4070 Ti EX Gamer | |
| AMD Radeon RX 7900 XTX | |
| KFA2 GeForce RTX 4070 EX Gamer | |
| AMD Radeon RX 7900 XT | |
| ASUS Dual GeForce RTX 4060 Ti OC | |
| Nvidia Titan RTX | |
| KFA2 GeForce RTX 4060 1-Click-OC 2X | |
| Nvidia GeForce RTX 2070 Super | |
| Sapphire Pulse Radeon RX 6750 XT | |
| Nvidia GeForce RTX 2060 Super | |
| A Plague Tale Requiem | |
| 3840x2160 Ultra DLSS Quality + Frame Generation | |
| KFA2 GeForce RTX 4070 Ti EX Gamer | |
| KFA2 GeForce RTX 4070 EX Gamer | |
| ASUS Dual GeForce RTX 4060 Ti OC | |
| KFA2 GeForce RTX 4060 1-Click-OC 2X | |
| 3840x2160 Ultra DLSS Quality | |
| KFA2 GeForce RTX 4070 Ti EX Gamer | |
| KFA2 GeForce RTX 4070 EX Gamer | |
| ASUS Dual GeForce RTX 4060 Ti OC | |
| KFA2 GeForce RTX 4060 1-Click-OC 2X | |
| Control | |
| 1920x1080 High Quality Preset & High Ray Tracing Preset (DX12) | |
| Palit GeForce RTX 4090 GameRock OC | |
| KFA2 GeForce RTX 4080 SG | |
| AMD Radeon RX 7900 XTX | |
| KFA2 GeForce RTX 4070 Ti EX Gamer | |
| AMD Radeon RX 7900 XT | |
| KFA2 GeForce RTX 3080 SG | |
| KFA2 GeForce RTX 4070 EX Gamer | |
| Nvidia Titan RTX | |
| ASUS Dual GeForce RTX 4060 Ti OC | |
| NVIDIA GeForce RTX 3060 Ti FE | |
| Sapphire Pulse Radeon RX 6750 XT | |
| KFA2 GeForce RTX 4060 1-Click-OC 2X | |
| Nvidia GeForce RTX 2070 Super | |
| Nvidia GeForce RTX 2060 Super | |
| Sapphire Nitro+ Radeon RX 6650 XT | |
| 3840x2160 High Quality Preset & High Ray Tracing Preset (DX12) | |
| KFA2 GeForce RTX 4070 Ti EX Gamer | |
| KFA2 GeForce RTX 4070 EX Gamer | |
| Sapphire Pulse Radeon RX 6750 XT | |
| KFA2 GeForce RTX 4060 1-Click-OC 2X | |
| ASUS Dual GeForce RTX 4060 Ti OC | |
| 3840x2160 High Quality, High Ray Tracing, DLSS | |
| KFA2 GeForce RTX 4070 Ti EX Gamer | |
| KFA2 GeForce RTX 4070 EX Gamer | |
| ASUS Dual GeForce RTX 4060 Ti OC | |
| KFA2 GeForce RTX 4060 1-Click-OC 2X | |
| The Last of Us - 3840x2160 Ultra Preset + Quality DLSS | |
| Palit GeForce RTX 4090 GameRock OC | |
| KFA2 GeForce RTX 4070 Ti EX Gamer | |
| KFA2 GeForce RTX 4070 EX Gamer | |
| Nvidia Titan RTX | |
| ASUS Dual GeForce RTX 4060 Ti OC | |
| KFA2 GeForce RTX 4060 1-Click-OC 2X | |
| Nvidia GeForce RTX 2070 Super | |
| low | med. | high | ultra | QHD | 4K DLSS | 4K | |
|---|---|---|---|---|---|---|---|
| GTA V (2015) | 187.8 | 187.5 | 187.5 | 143.1 | 103.4 | 103.6 | |
| The Witcher 3 (2015) | 691 | 474.4 | 275.9 | 136.2 | 100.7 | 80.4 | |
| Dota 2 Reborn (2015) | 307 | 267 | 252 | 236 | 167.8 | ||
| Final Fantasy XV Benchmark (2018) | 235 | 193.6 | 131.9 | 96.7 | 52.4 | ||
| X-Plane 11.11 (2018) | 219 | 195.6 | 148.8 | 125 | |||
| Far Cry 5 (2018) | 236 | 201 | 191 | 180 | 134 | 67 | |
| Strange Brigade (2018) | 733 | 350 | 275 | 237 | 154.3 | 80.5 | |
| Shadow of the Tomb Raider (2018) | 339 | 222 | 203 | 182.5 | 120.5 | 58.6 | |
| Far Cry New Dawn (2019) | 199 | 173 | 166 | 148 | 127 | 70 | |
| Metro Exodus (2019) | 308 | 170.6 | 127.9 | 100.8 | 79.3 | 48.6 | |
| Control (2019) | 239 | 160.8 | 118.3 | 69.2 | 44.5 | 34.3 | |
| Borderlands 3 (2019) | 243 | 204 | 156.8 | 121.8 | 84.2 | 43.7 | |
| F1 2020 (2020) | 609 | 426 | 337 | 230 | 174.3 | 95.7 | |
| F1 2021 (2021) | 726 | 463 | 355 | 175.8 | 127.2 | 66.5 | |
| Far Cry 6 (2021) | 213 | 180.1 | 157 | 140.8 | 102 | 2.7 | |
| Guardians of the Galaxy (2021) | 225 | 197 | 196 | 188 | 128 | 67 | |
| God of War (2022) | 178.6 | 145.7 | 116.6 | 85.2 | 69.7 | 46.1 | |
| GRID Legends (2022) | 255 | 223 | 197.4 | 163.8 | 136.5 | 84.5 | |
| Cyberpunk 2077 1.6 (2022) | 172 | 135.7 | 113 | 102 | 59.9 | 25.2 | |
| Ghostwire Tokyo (2022) | 234 | 222 | 219 | 217 | 126.3 | 58.1 | |
| Tiny Tina's Wonderlands (2022) | 300 | 234 | 154 | 118.7 | 80.8 | 37.2 | |
| F1 22 (2022) | 355 | 341 | 257 | 87.8 | 55.4 | 27.8 | |
| The Quarry (2022) | 224 | 164.6 | 134 | 104.8 | 71.7 | 22.4 | |
| A Plague Tale Requiem (2022) | 153.7 | 120.1 | 88.8 | 67.4 | 46.7 | 50.8 | 25 |
| Uncharted Legacy of Thieves Collection (2022) | 113.1 | 110.3 | 102.7 | 98.5 | 71.5 | 29.9 | |
| Spider-Man Miles Morales (2022) | 160.1 | 148.4 | 142.9 | 130.8 | 99.2 | 49.9 | |
| The Callisto Protocol (2022) | 180.6 | 175.4 | 165.4 | 102.6 | 79.5 | 48.1 | |
| High On Life (2023) | 335 | 220 | 160.9 | 132.1 | 77.4 | 32.2 | |
| The Witcher 3 v4 (2023) | 272.9 | 227.2 | 188.1 | 150.9 | 99.8 | 52.6 | |
| Dead Space Remake (2023) | 121.7 | 115.6 | 99.7 | 98 | 60.9 | ||
| Hogwarts Legacy (2023) | 168.2 | 136.4 | 105.7 | 79.6 | 57.1 | 30.5 | |
| Returnal (2023) | 133 | 128 | 116 | 98 | 72 | 41 | |
| Atomic Heart (2023) | 264 | 202 | 117.4 | 92.5 | 68.8 | 38.1 | |
| Company of Heroes 3 (2023) | 290.1 | 253 | 183.4 | 181.3 | 131.5 | 56.7 | |
| Sons of the Forest (2023) | 139.2 | 120.5 | 115.4 | 114.5 | 86.3 | 51.1 | |
| Resident Evil 4 Remake (2023) | 207 | 147.8 | 135.6 | 97.5 | 69.4 | 37.1 | |
| The Last of Us (2023) | 145.4 | 118.6 | 102.7 | 87 | 49.5 | 38.4 | 23.7 |
| Dead Island 2 (2023) | 343 | 316 | 225 | 165.9 | 104.1 | 54.5 | |
| Star Wars Jedi Survivor (2023) | 117.5 | 101.1 | 94.2 | 87 | 54.2 | 25.4 | |
| Diablo 4 (2023) | 269 | 253 | 242 | 252 | 158.5 | 91.7 | 66.2 |
| F1 23 (2023) | 386 | 353 | 250 | 82.1 | 51.5 | 43.4 | 24.8 |
| Ratchet & Clank Rift Apart (2023) | 101.5 | 91.1 | 73.3 | 68.3 | 63.7 | 56.6 | |
| Atlas Fallen (2023) | 193.5 | 188.4 | 177.3 | 152 | 105.9 | 56.1 | |
| Immortals of Aveum (2023) | 82 | 71.6 | 58.7 | 40.4 | 43.8 | 22.1 | |
| Armored Core 6 (2023) | 119.7 | 119.4 | 119.5 | 119.4 | 97.5 | 51.2 | |
| Baldur's Gate 3 (2023) | 153.6 | 124.2 | 103.8 | 100.6 | 67.4 | 64.7 | 35.2 |
The ASUS Dual GeForce RTX 4060 Ti OC's emissions
Noise emissions
For our noise emission measurements, we put the Asus Dual GeForce RTX 4060 Ti OC on our volume measurement system in an open setup. We also made sure that no other fans (CPU cooler and power supply fan) were in operation during the measurements, in order to only determine the emissions of the graphics card. Unfortunately, the Asus Dual GeForce RTX 4060 Ti OC is not a quiet graphics card. Nevertheless, the model offers a fan-stop mode, which allows the graphics card to operate silently under low load or in 2D mode. Under load, however, the graphics card is clearly audible - we measured up to 42.5 dB(A). During the stress test, the two fans revved up a bit more and our measurement device showed peaks of 46 dB(A). Thus, this marks the Asus Dual GeForce RTX 4060 Ti OC's biggest disadvantage, because we could even hear the graphics card within our closed test system under load. No other model in the comparison field came close to the MSI GeForce RTX 4060 Ti Gaming X Trio, which also operated almost silently under load.
Noise level
| Idle |
| 26.7 / 26.7 / 26.7 dB(A) |
| Load |
| 29.3 / 46 dB(A) |
 | ||
30 dB silent 40 dB(A) audible 50 dB(A) loud |
||
min: | ||
| ASUS Dual GeForce RTX 4060 Ti OC R9 7950X, GeForce RTX 4060 Ti 8G | MSI GeForce RTX 4060 Ti Gaming X Trio 8G R9 7950X, GeForce RTX 4060 Ti 8G | KFA2 GeForce RTX 4060 Ti EX R9 7950X, GeForce RTX 4060 Ti 8G | KFA2 GeForce RTX 4060 1-Click-OC 2X R9 7950X, GeForce RTX 4060 | KFA2 GeForce RTX 4070 EX Gamer R9 7950X, GeForce RTX 4070 | |
|---|---|---|---|---|---|
| Noise | -4% | -4% | 0% | -9% | |
| off / environment * (dB) | 25.4 | 29.7 -17% | 29.7 -17% | 25.8 -2% | 30 -18% |
| Idle Minimum * (dB) | 26.7 | 30.1 -13% | 30.1 -13% | 25.9 3% | 30.2 -13% |
| Idle Average * (dB) | 26.7 | 30.1 -13% | 30.1 -13% | 25.9 3% | 30.2 -13% |
| Idle Maximum * (dB) | 26.7 | 30.1 -13% | 30.1 -13% | 25.9 3% | 30.2 -13% |
| Load Average * (dB) | 29.3 | 30.15 -3% | 30.3 -3% | 30.3 -3% | 31.8 -9% |
| Witcher 3 ultra * (dB) | 42.5 | 35.8 16% | 45.2 -6% | ||
| Load Maximum * (dB) | 46 | 31 33% | 40 13% | 43.5 5% | 41.1 11% |
* ... smaller is better
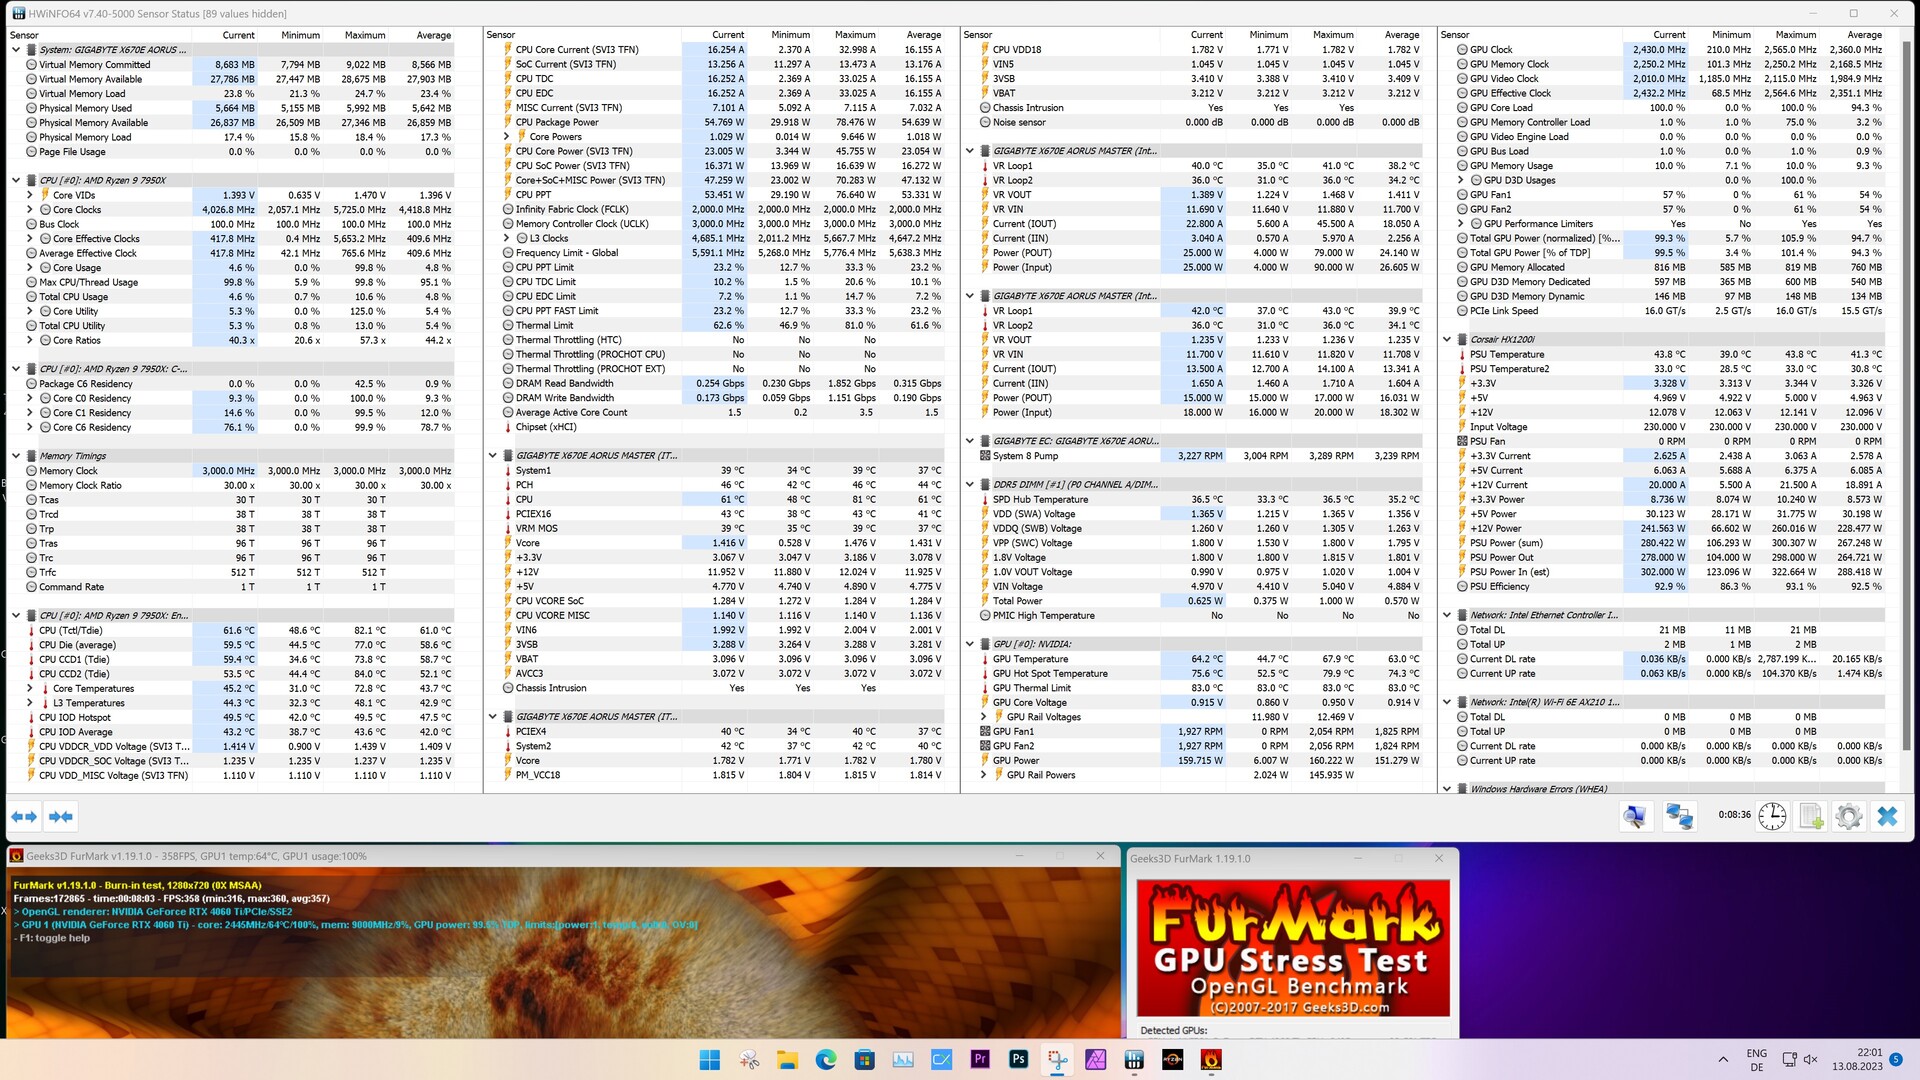
Temperatures and power consumption
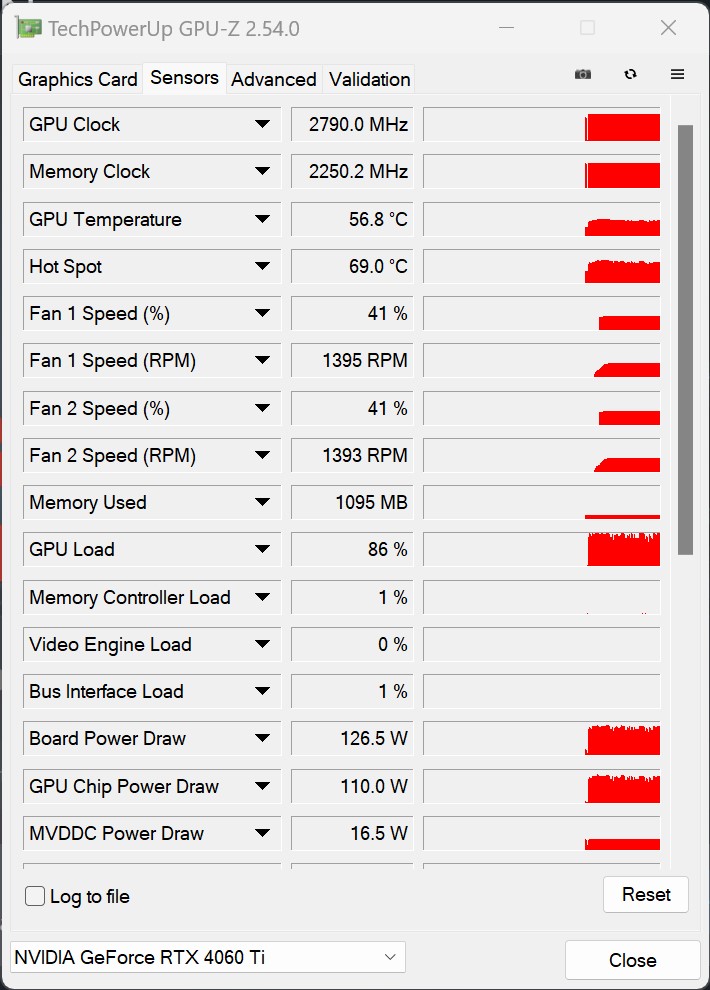
The relatively small cooler on the Asus Dual GeForce RTX 4060 Ti OC generally has no problem cooling the graphics card reliably. Its almost identical performance compared to the MSI GeForce RTX 4060 Ti Gaming X Trio confirms this. With an average of 63 °C, we noted relatively low temperatures during the stress test. Meanwhile, the hot spot value was just under 80 °C, which isn't too big an issue either. To counteract the noise issue under load a bit, the fan curve can be optimized to a certain extent. Due to the measured GPU temperatures, we believe there is still some leeway for users here.
In terms of power consumption, the Asus Dual GeForce RTX 4060 Ti OC scores thanks to its low TBP of only 160 watts. Compared to its competitors, Nvidia is clearly a step ahead here. Even the oftentimes beaten Sapphire Nitro+ Radeon RX 6650 XT requires more power. Compared to the Sapphire Pulse Radeon RX 6750 XT, we noted our test sample as requiring 20 - 30 per cent less power. This model could also be beaten by the Asus Dual GeForce RTX 4060 Ti OC in some gaming tests.


| Power Consumption / The Witcher 3 ultra (external Monitor) | |
| AMD Radeon RX 7900 XTX (Idle: 86.5 W) | |
| NVIDIA GeForce RTX 3090 Founders Edition | |
| Palit GeForce RTX 4090 GameRock OC | |
| KFA2 GeForce RTX 3080 SG | |
| KFA2 GeForce RTX 4080 SG (Idle: 86.4 W) | |
| AMD Radeon RX 7900 XT (Idle: 84.6 W) | |
| KFA2 GeForce RTX 3070 Ti SG (Idle: 88.9 W) | |
| KFA2 GeForce RTX 4070 Ti EX Gamer | |
| Sapphire Pulse Radeon RX 6750 XT | |
| NVIDIA GeForce RTX 3060 Ti Founders Edition (Idle: 111.39 W) | |
| KFA2 GeForce RTX 4070 EX Gamer | |
| Sapphire Nitro+ Radeon RX 6650 XT | |
| ASUS Dual GeForce RTX 4060 Ti OC | |
| KFA2 GeForce RTX 4060 1-Click-OC 2X | |
| Power Consumption / FurMark 1.19 GPU Stress Test (external Monitor) | |
| Palit GeForce RTX 4090 GameRock OC | |
| AMD Radeon RX 7900 XTX (Idle: 86.5 W) | |
| NVIDIA GeForce RTX 3090 Founders Edition | |
| AMD Radeon RX 7900 XT (Idle: 84.6 W) | |
| KFA2 GeForce RTX 3080 SG | |
| KFA2 GeForce RTX 3070 Ti SG (Idle: 88.9 W) | |
| KFA2 GeForce RTX 4080 SG (Idle: 86.4 W) | |
| KFA2 GeForce RTX 4070 Ti EX Gamer | |
| Sapphire Pulse Radeon RX 6750 XT | |
| NVIDIA GeForce RTX 3060 Ti Founders Edition (Idle: 111.39 W) | |
| Sapphire Nitro+ Radeon RX 6650 XT | |
| KFA2 GeForce RTX 4070 EX Gamer | |
| ASUS Dual GeForce RTX 4060 Ti OC | |
| KFA2 GeForce RTX 4060 1-Click-OC 2X | |
| Power Consumption / Witcher 3 ultra Efficiency (external Monitor) | |
| Palit GeForce RTX 4090 GameRock OC | |
| KFA2 GeForce RTX 4080 SG | |
| AMD Radeon RX 7900 XT | |
| AMD Radeon RX 7900 XTX | |
| KFA2 GeForce RTX 4070 Ti EX Gamer | |
| KFA2 GeForce RTX 4070 EX Gamer | |
| ASUS Dual GeForce RTX 4060 Ti OC | |
| KFA2 GeForce RTX 4060 1-Click-OC 2X | |
| Sapphire Pulse Radeon RX 6750 XT | |
| NVIDIA GeForce RTX 3090 Founders Edition | |
| KFA2 GeForce RTX 3070 Ti SG | |
| KFA2 GeForce RTX 3080 SG | |
| Sapphire Nitro+ Radeon RX 6650 XT | |
| NVIDIA GeForce RTX 3060 Ti Founders Edition | |
* ... smaller is better
Power consumption with external monitor
Pros
Cons
Verdict - Solid performance and very frugal

The Asus Dual GeForce RTX 4060 Ti OC is a sleek graphics card. Its shown performance proves that this is a solid and up-to-date graphics card from the current generation which is perfectly suited for Full HD gaming. This includes being able to run games in higher resolutions. Although, this isn't guaranteed. You'll have to take a look yourself at what performance your personal favorite games will require. This model only showed a small performance increase over an Nvidia GeForce RTX 3060 Ti. As a result, we would say a direct upgrade is unnecessary. If you still have graphics cards from the GTX era, then you'll get to benefit from quite a boost in performance if you go for the Nvidia GeForce RTX 4060 Ti. Furthermore, the graphics card benefits from low power consumption, which means you might not even need to buy a new power supply.
The Asus Dual GeForce RTX 4060 Ti OC is great if you are building a compact PC. In most cases, its 8 GB RAM should prove to be more than sufficient.
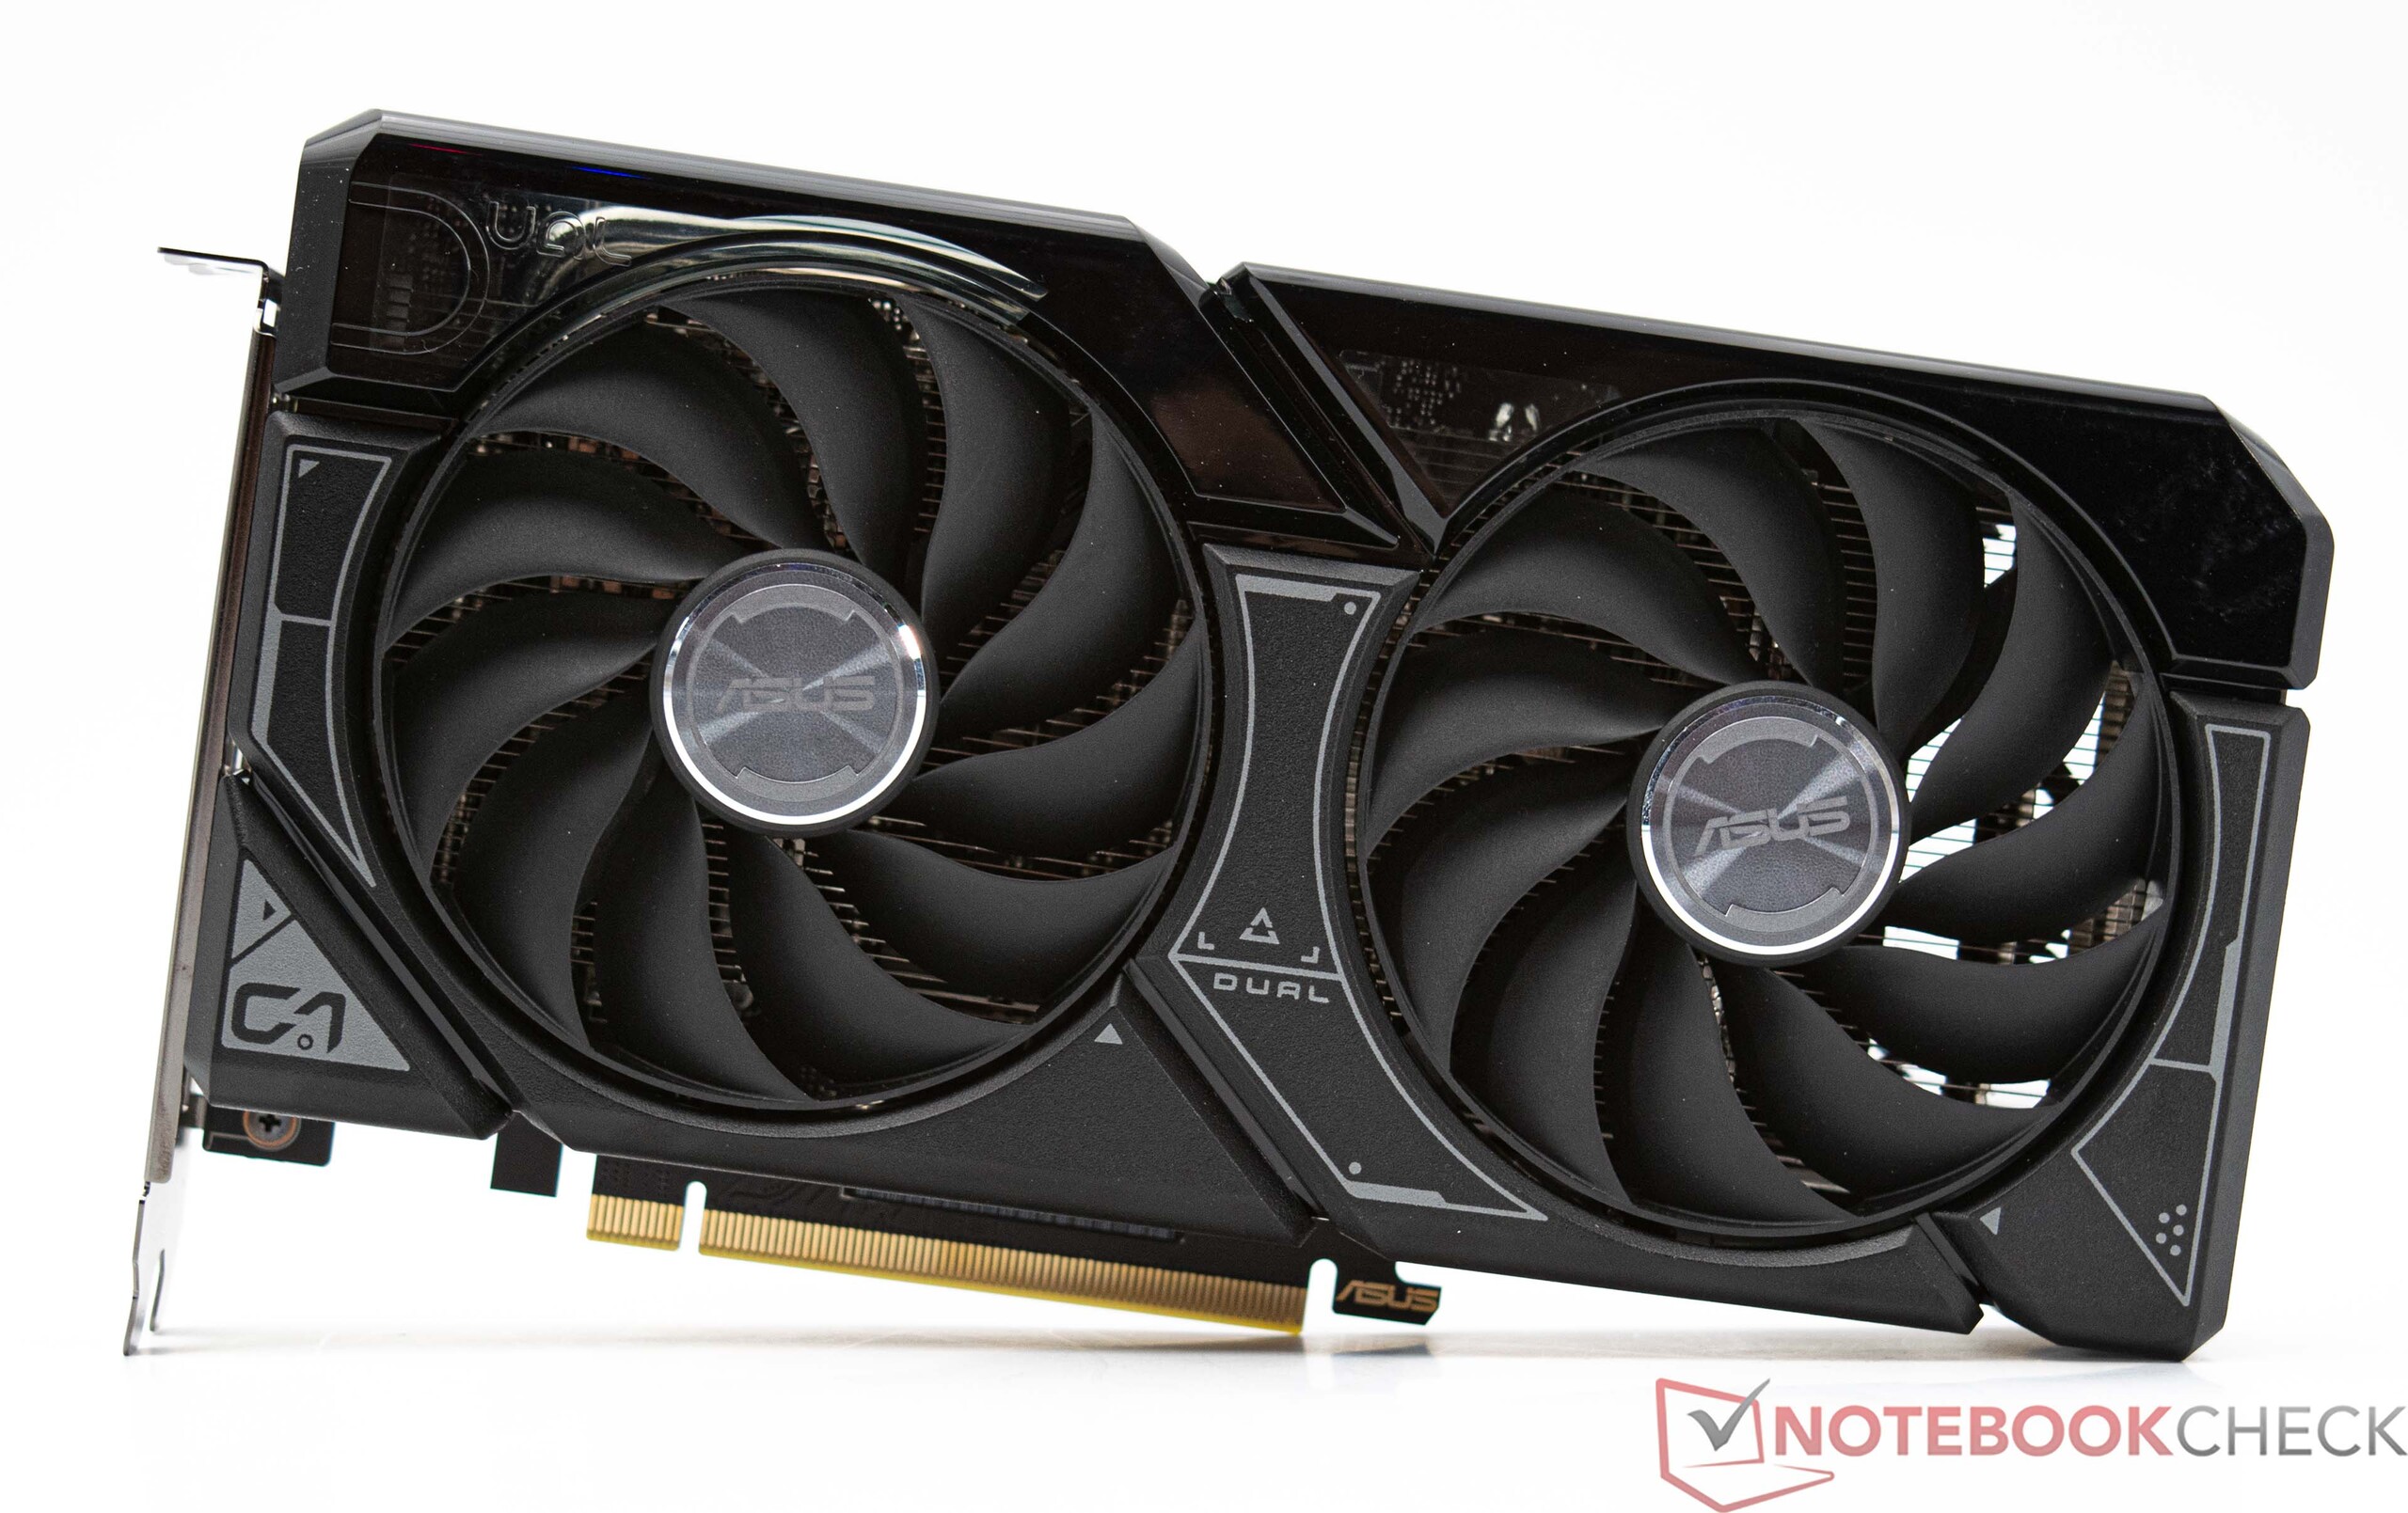
The model we tested is one of Asus' smaller ones if you just take a look at the graphics card's length. This means the Asus Dual GeForce RTX 4060 Ti OC will fit into almost every PC case. The MSI GeForce RTX 4060 Ti Gaming X Trio, on the other hand, will be more limited due to its enormous length. At the same time, Asus also loses out on a lot of cooling surface, which was noticeable in our test in the shape of clearly audible fans.
Price and availability
Currently, you can find the Asus Dual GeForce RTX 4060 Ti OC on Amazon for US$399.99.

