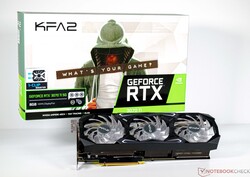
KFA2 GeForce RTX 3070 Ti SG desktop graphics card in review: Ampere is still good mid-range
If you are looking for a new graphics card, you will have to realize that Nvidia and AMD have only presented the top models of the new generations so far. These are currently priced far above 1,000 Euros and are thus simply too expensive for many. As a mid-range model, if you want to call it that, the Nvidia GeForce RTX 4070 Ti is expected to follow early next year. But this model will probably also exceed the 1,000 euro mark... (Note: original review was published at the end of 2022 before RTX 4070 Ti was released).
The new graphics cards are fast and offer a decent portion more performance compared to the previous generation. Nevertheless, the Ampere and RDNA2 models are not outdated and can still be interesting, especially in terms of price, since the GeForce RTX 3070 Ti models are already available for 670 Euros to buy. The KFA2 model used in this review is representative of all GeForce RTX 3070 Ti models, which do not differ much in terms of performance. A big thanks go to Igor'sLAB, who provided us with this model for review.
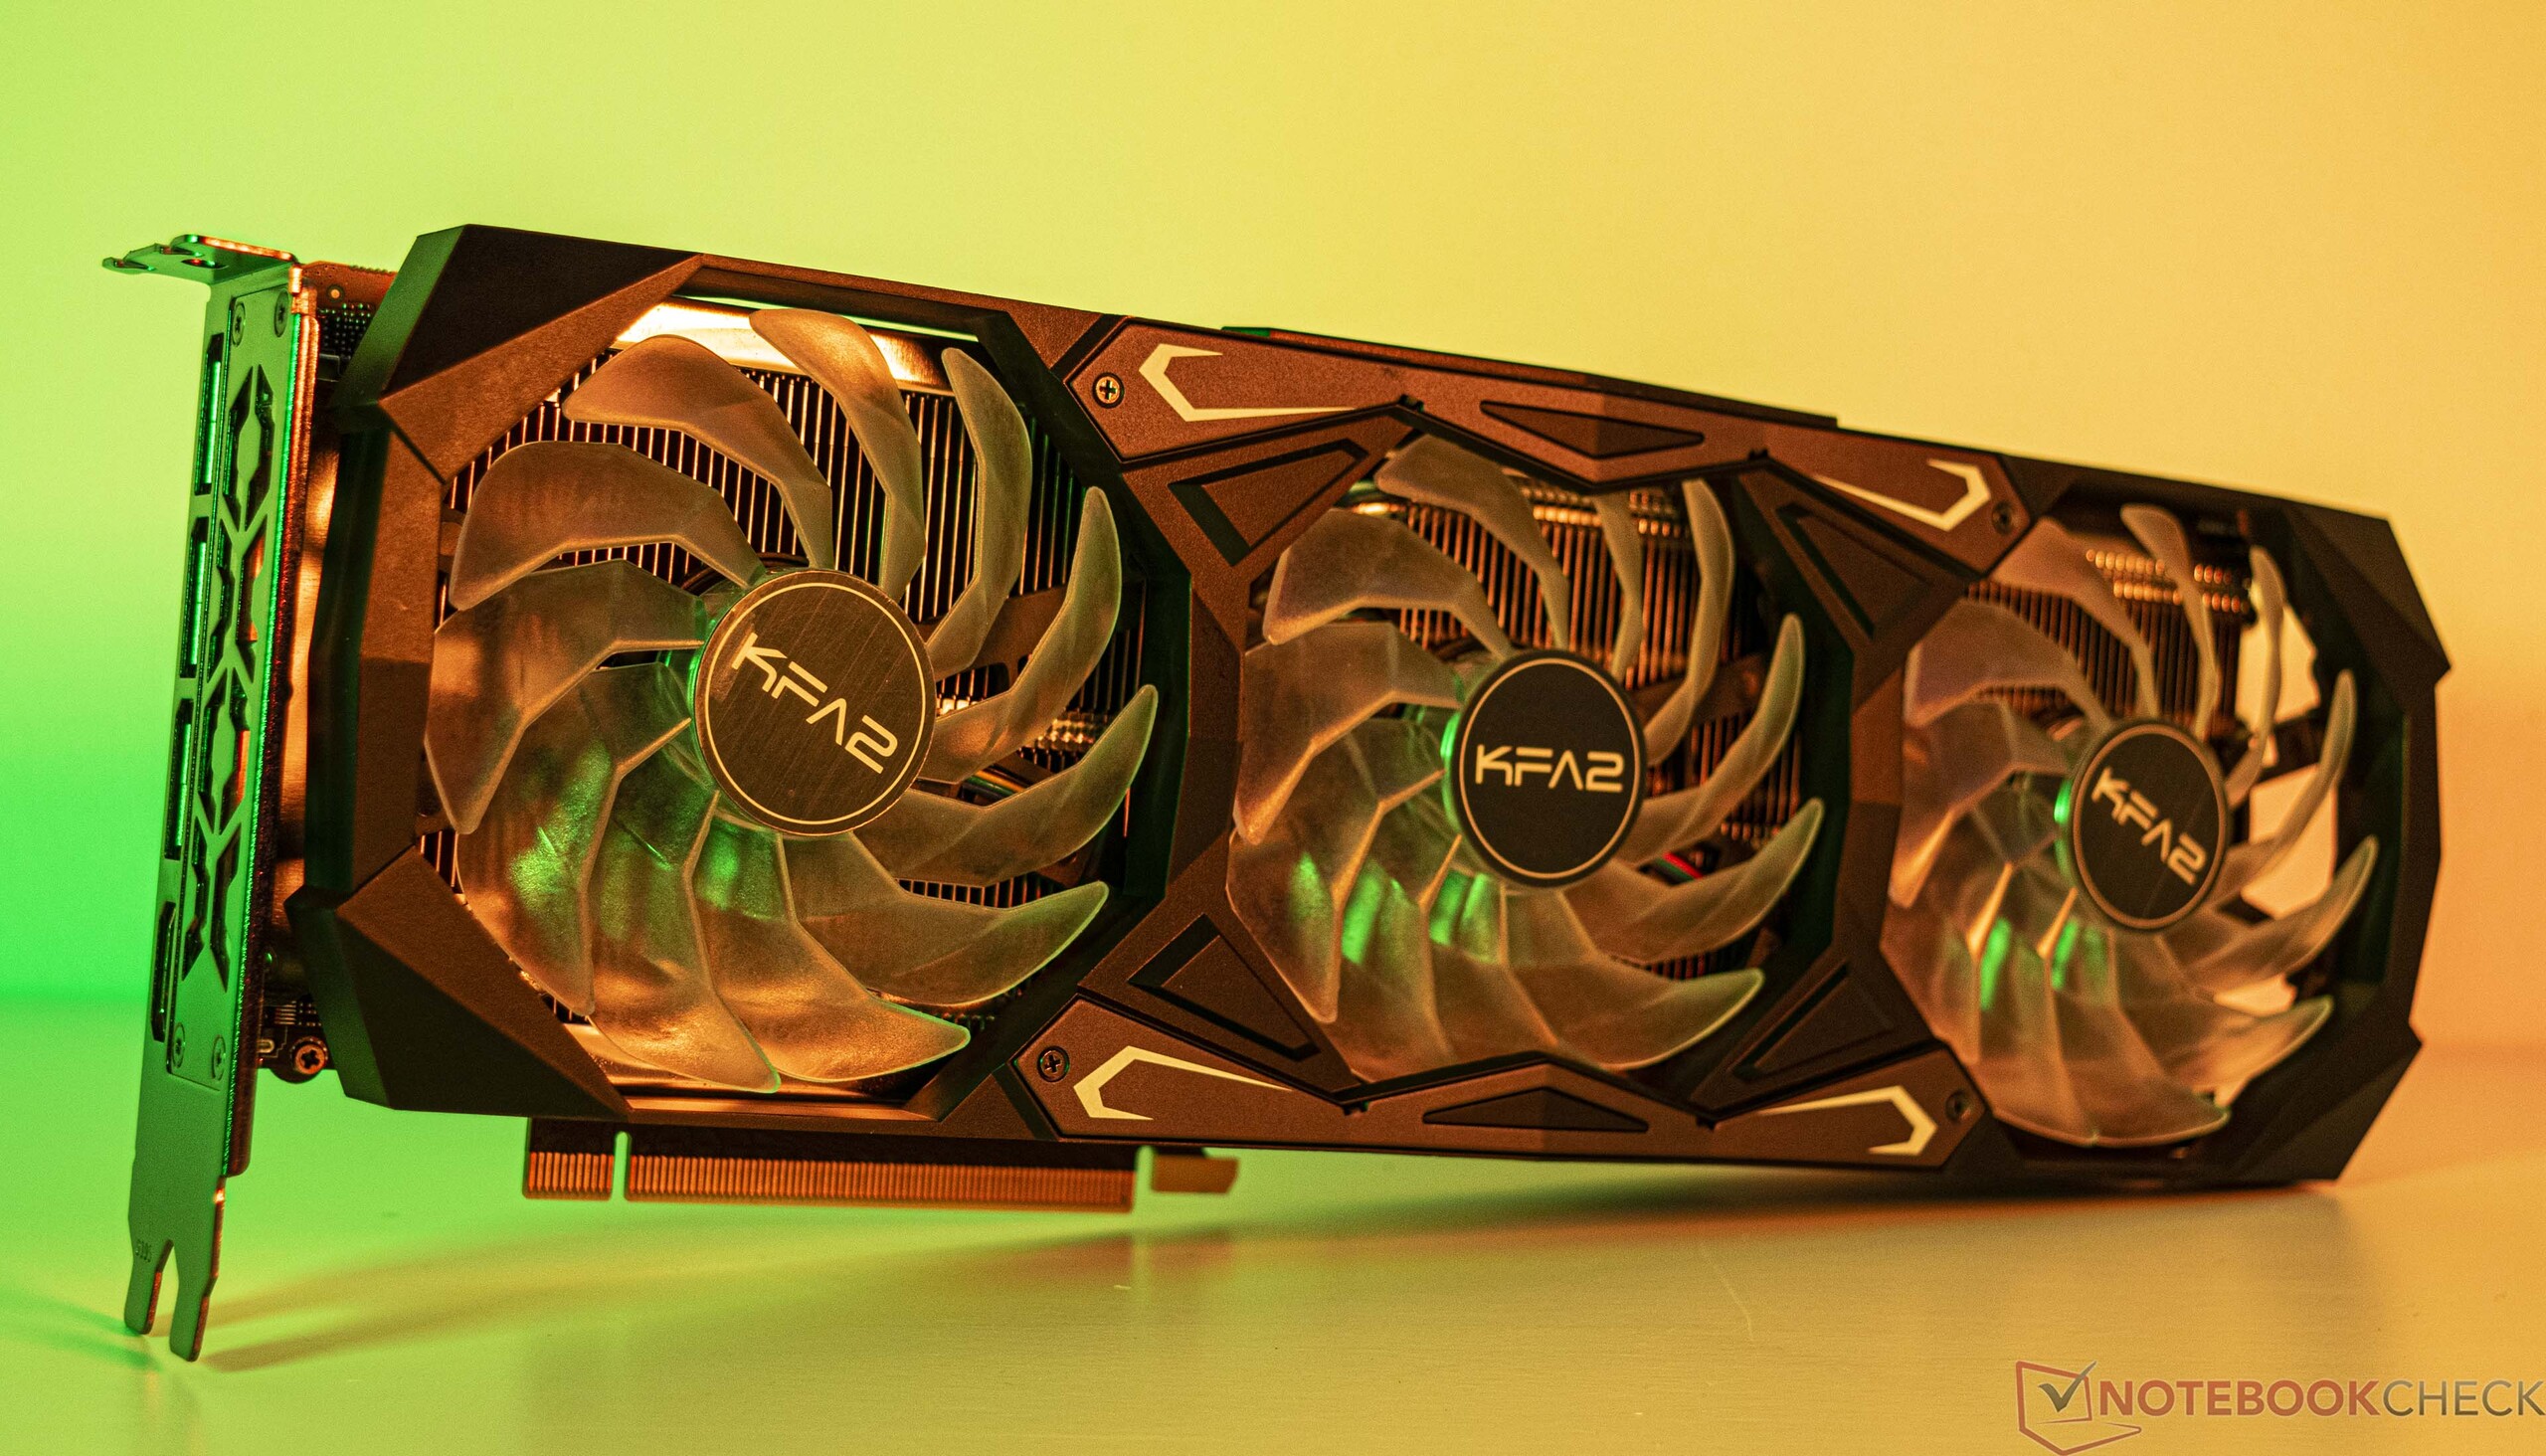
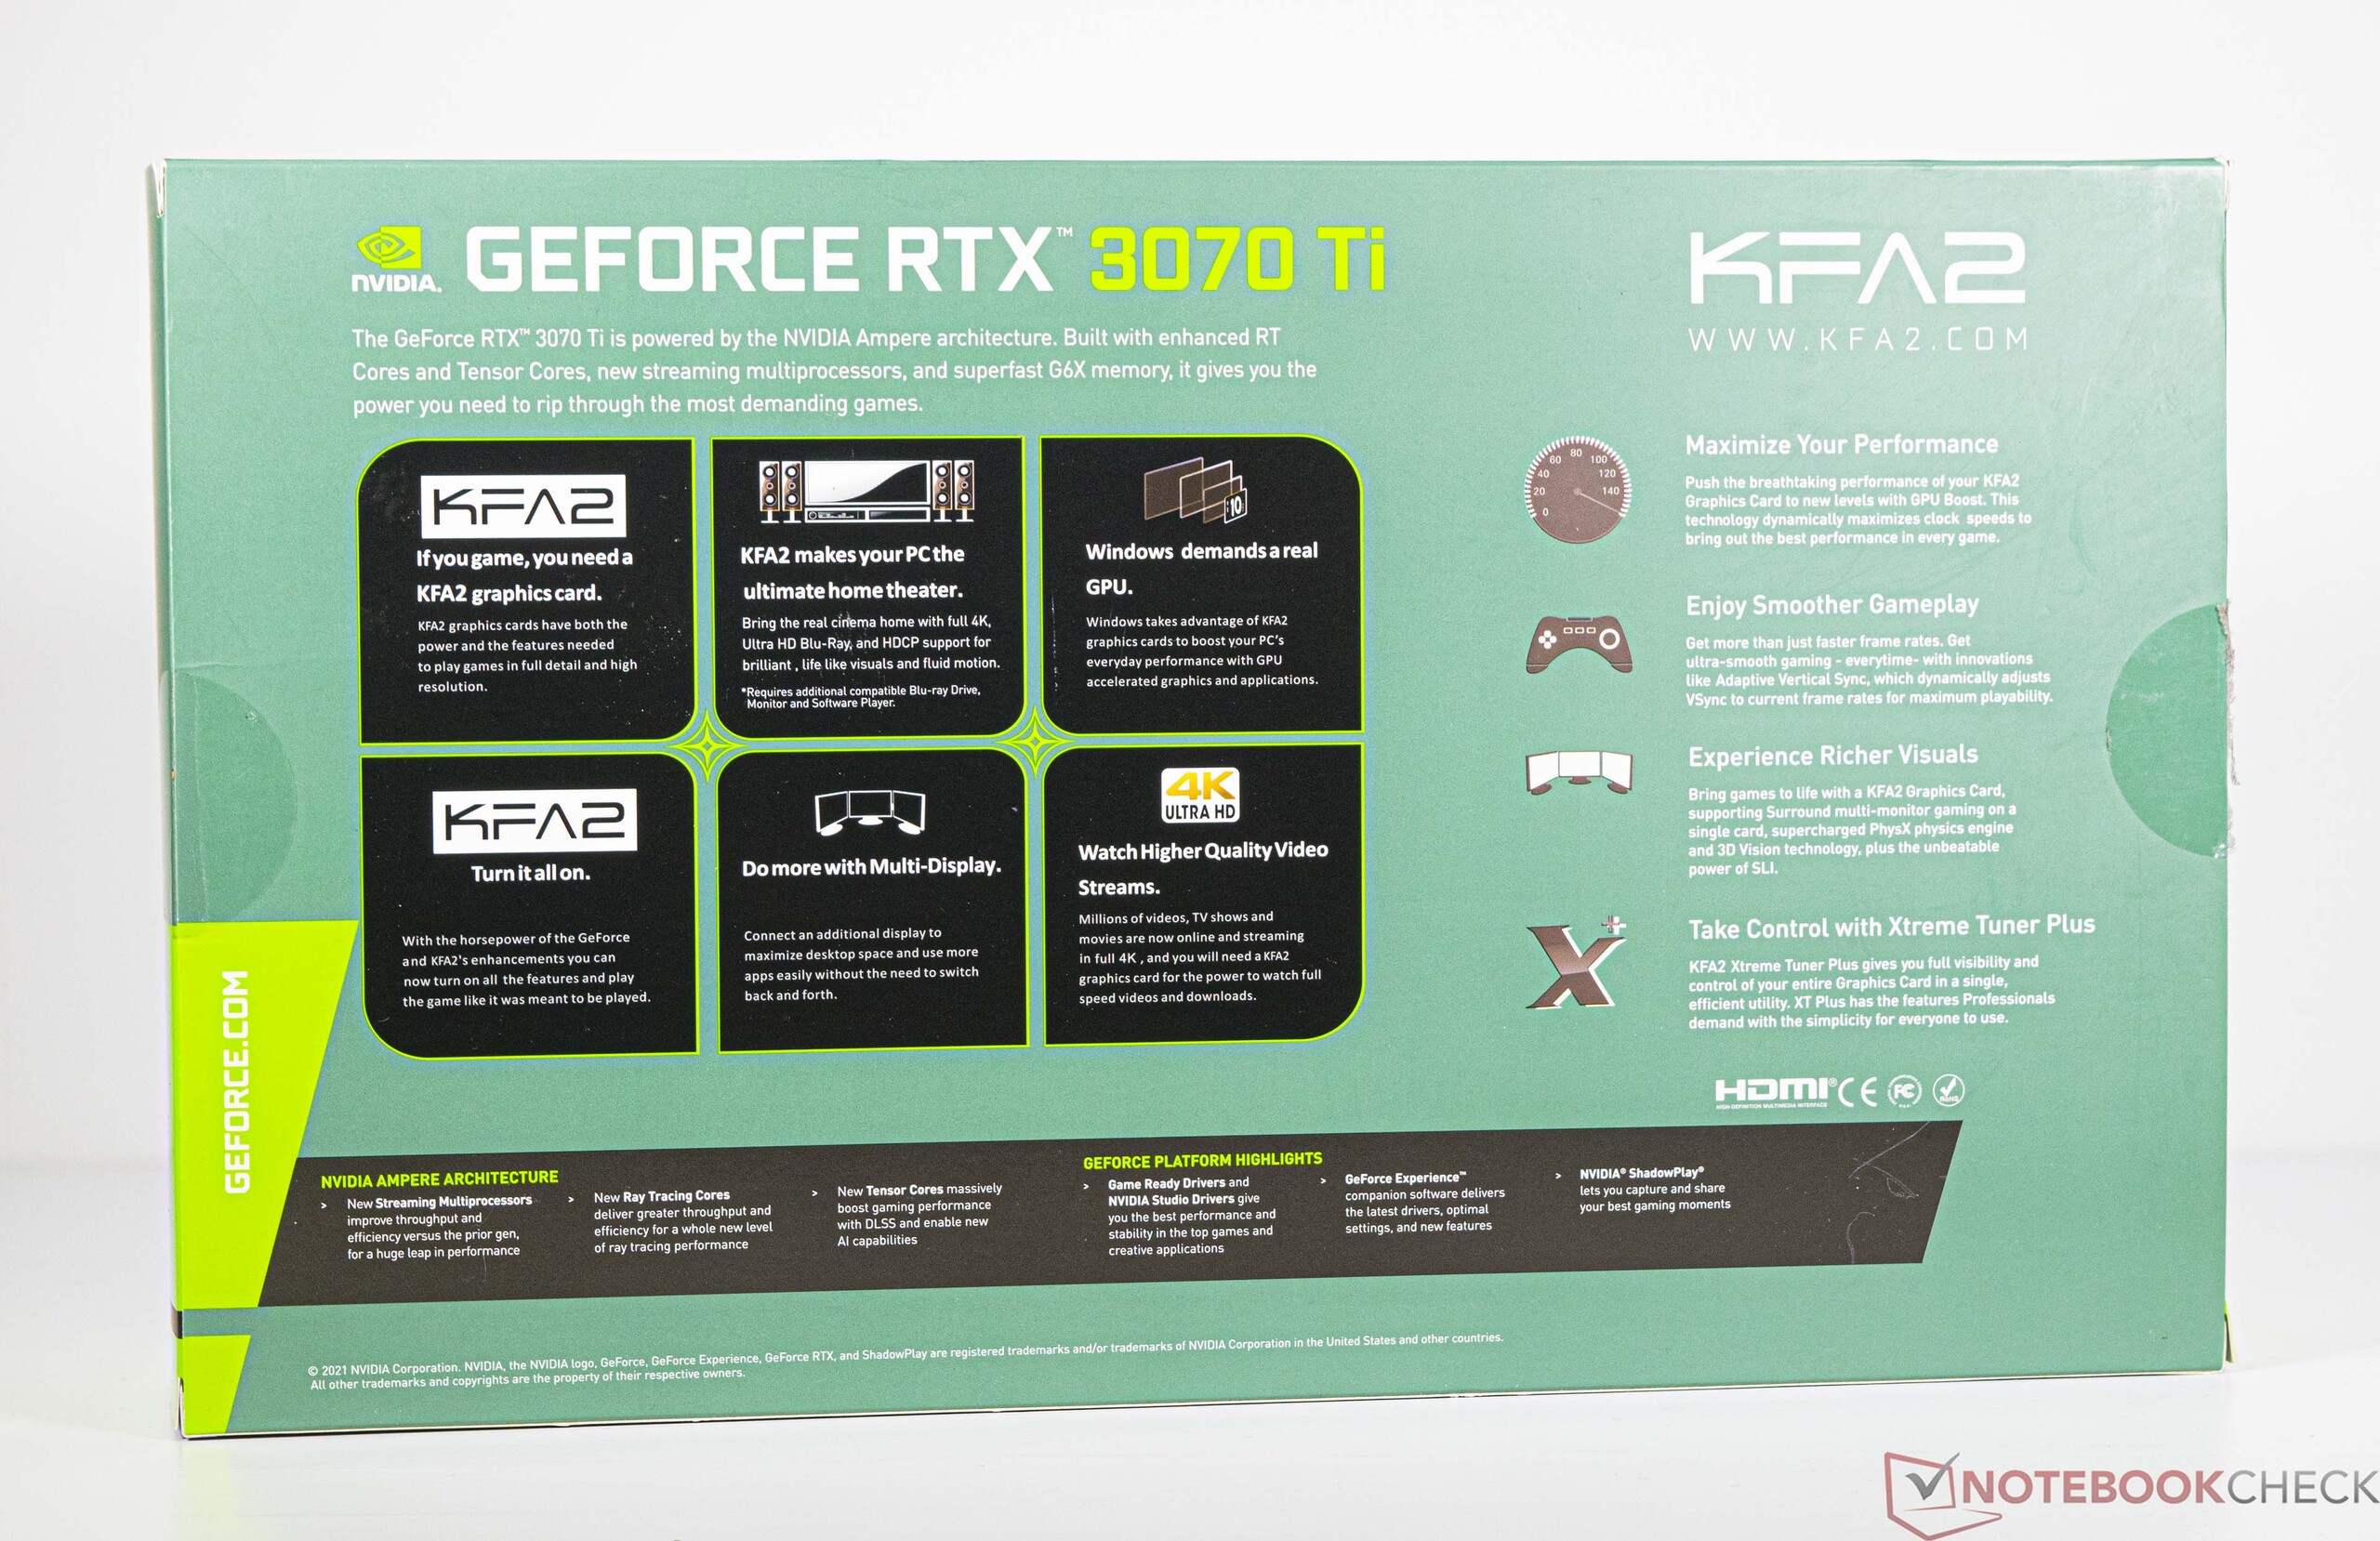
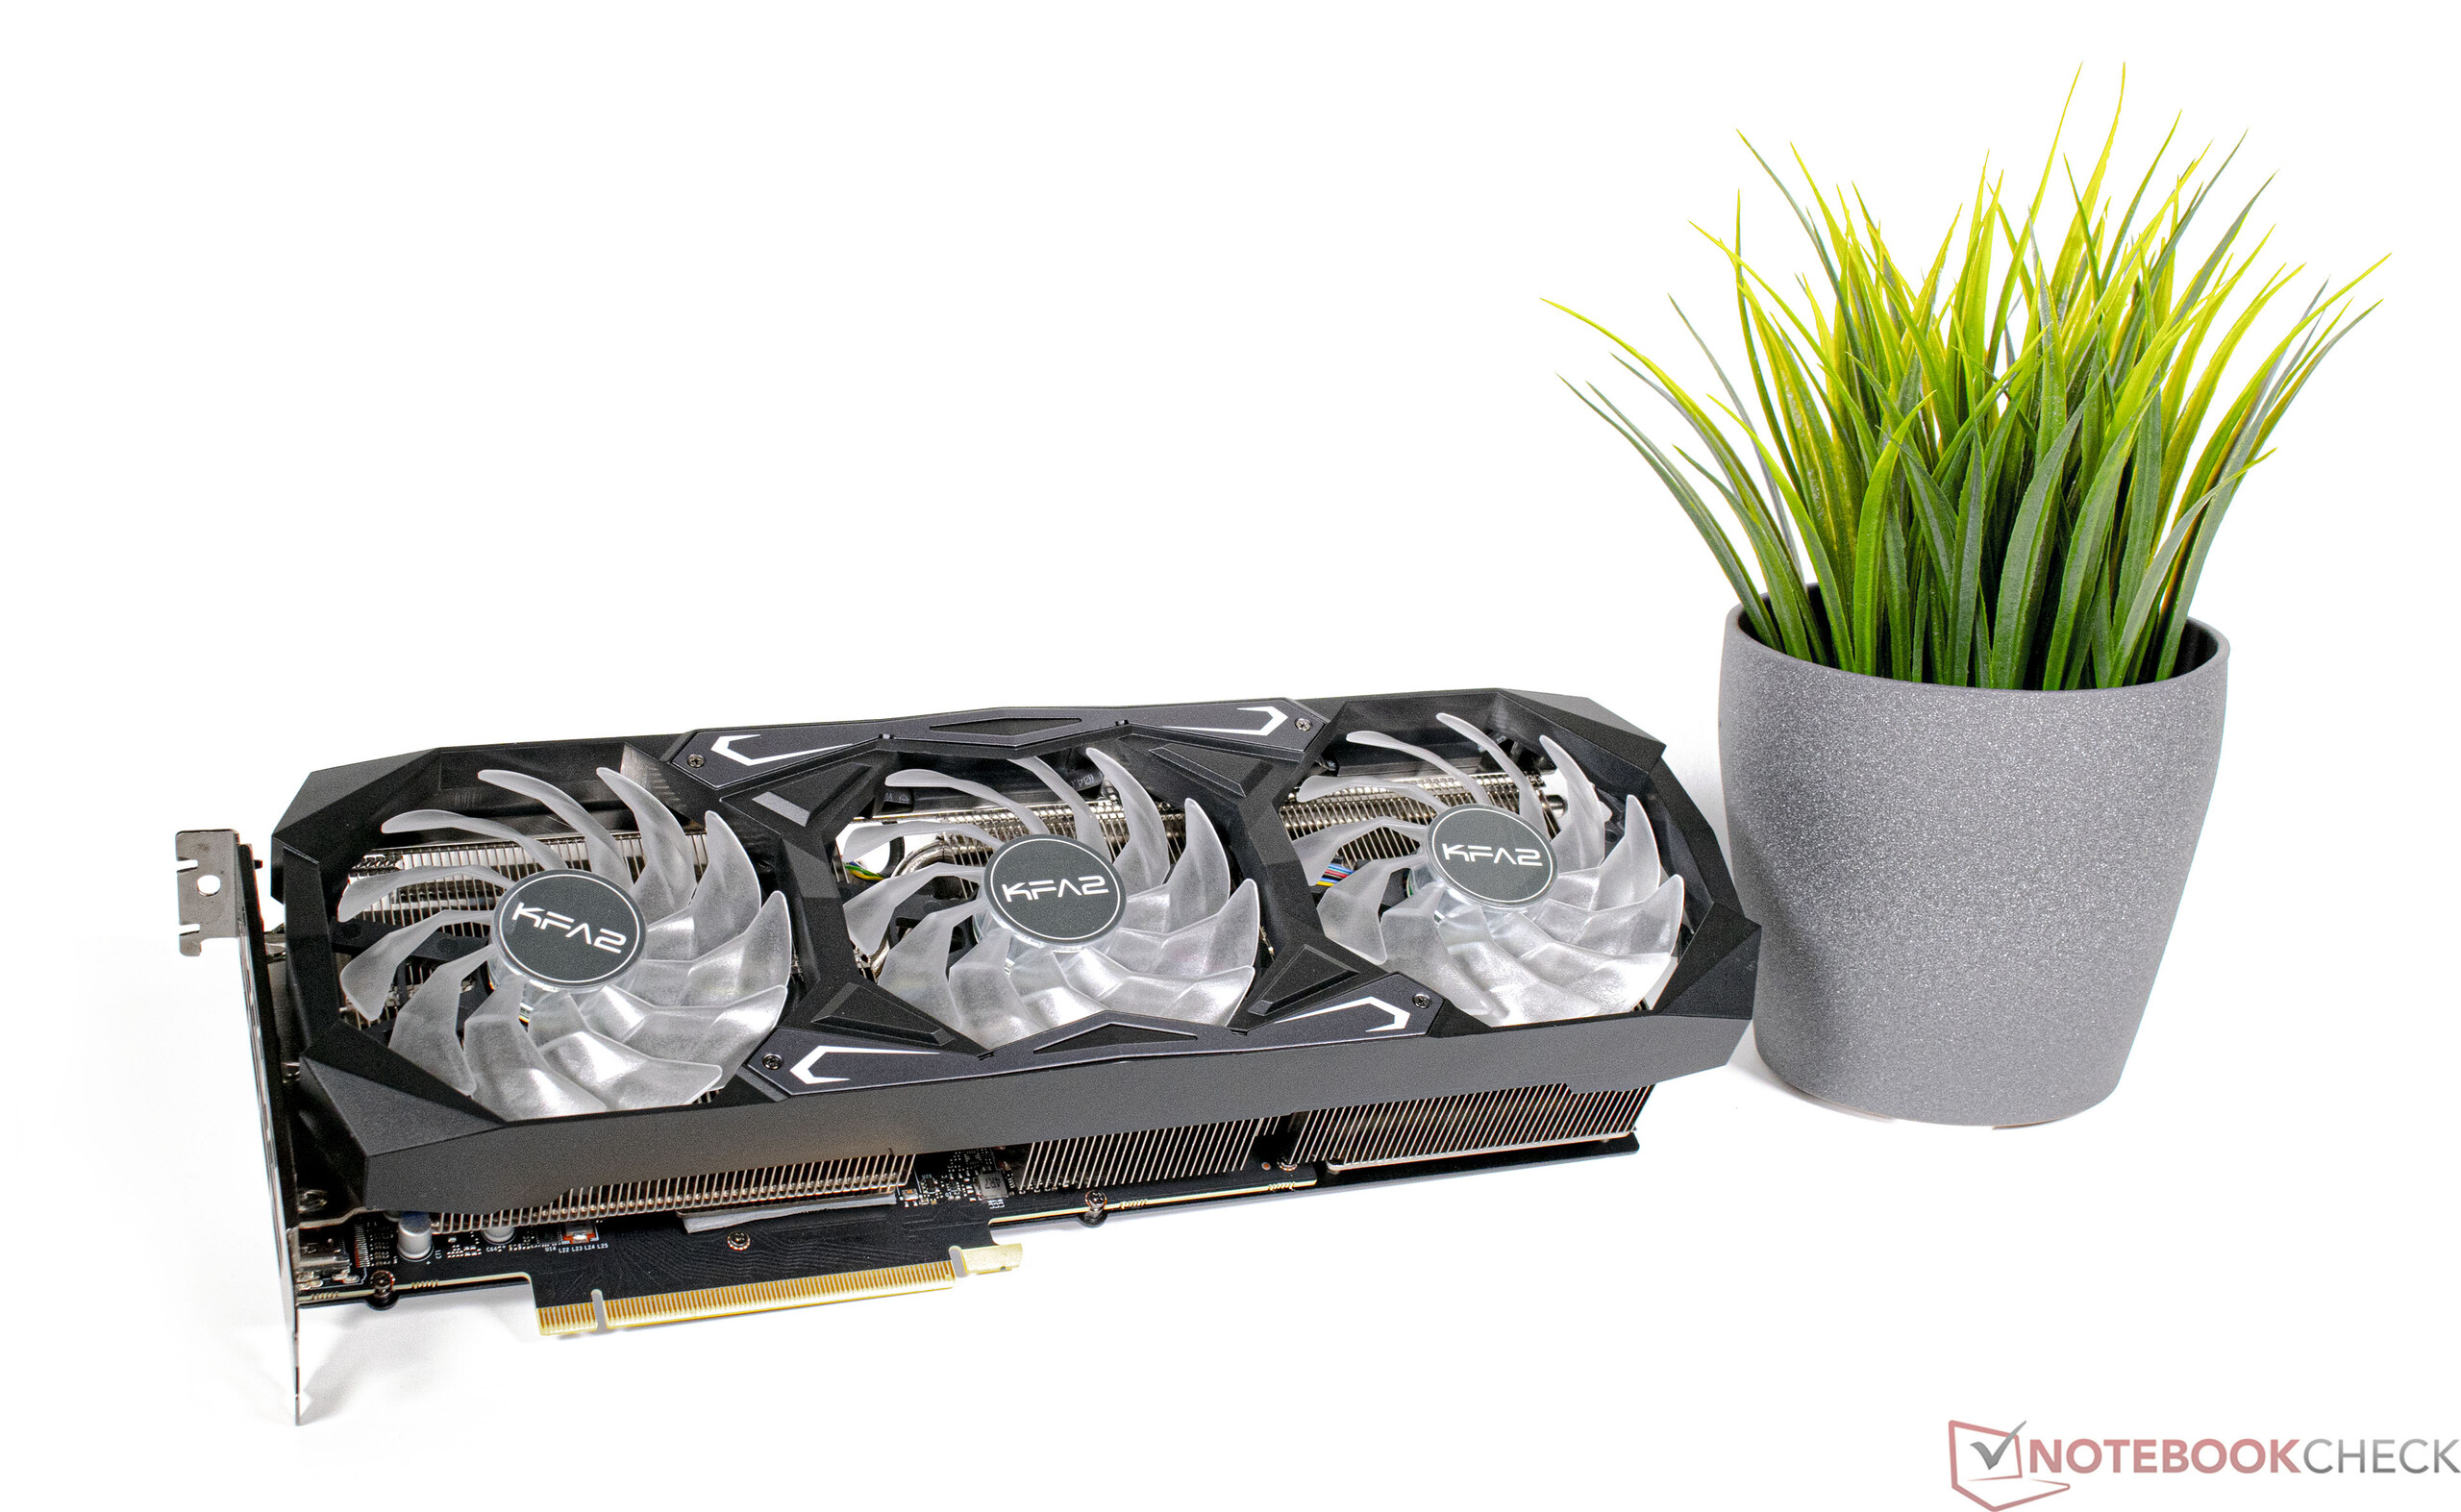
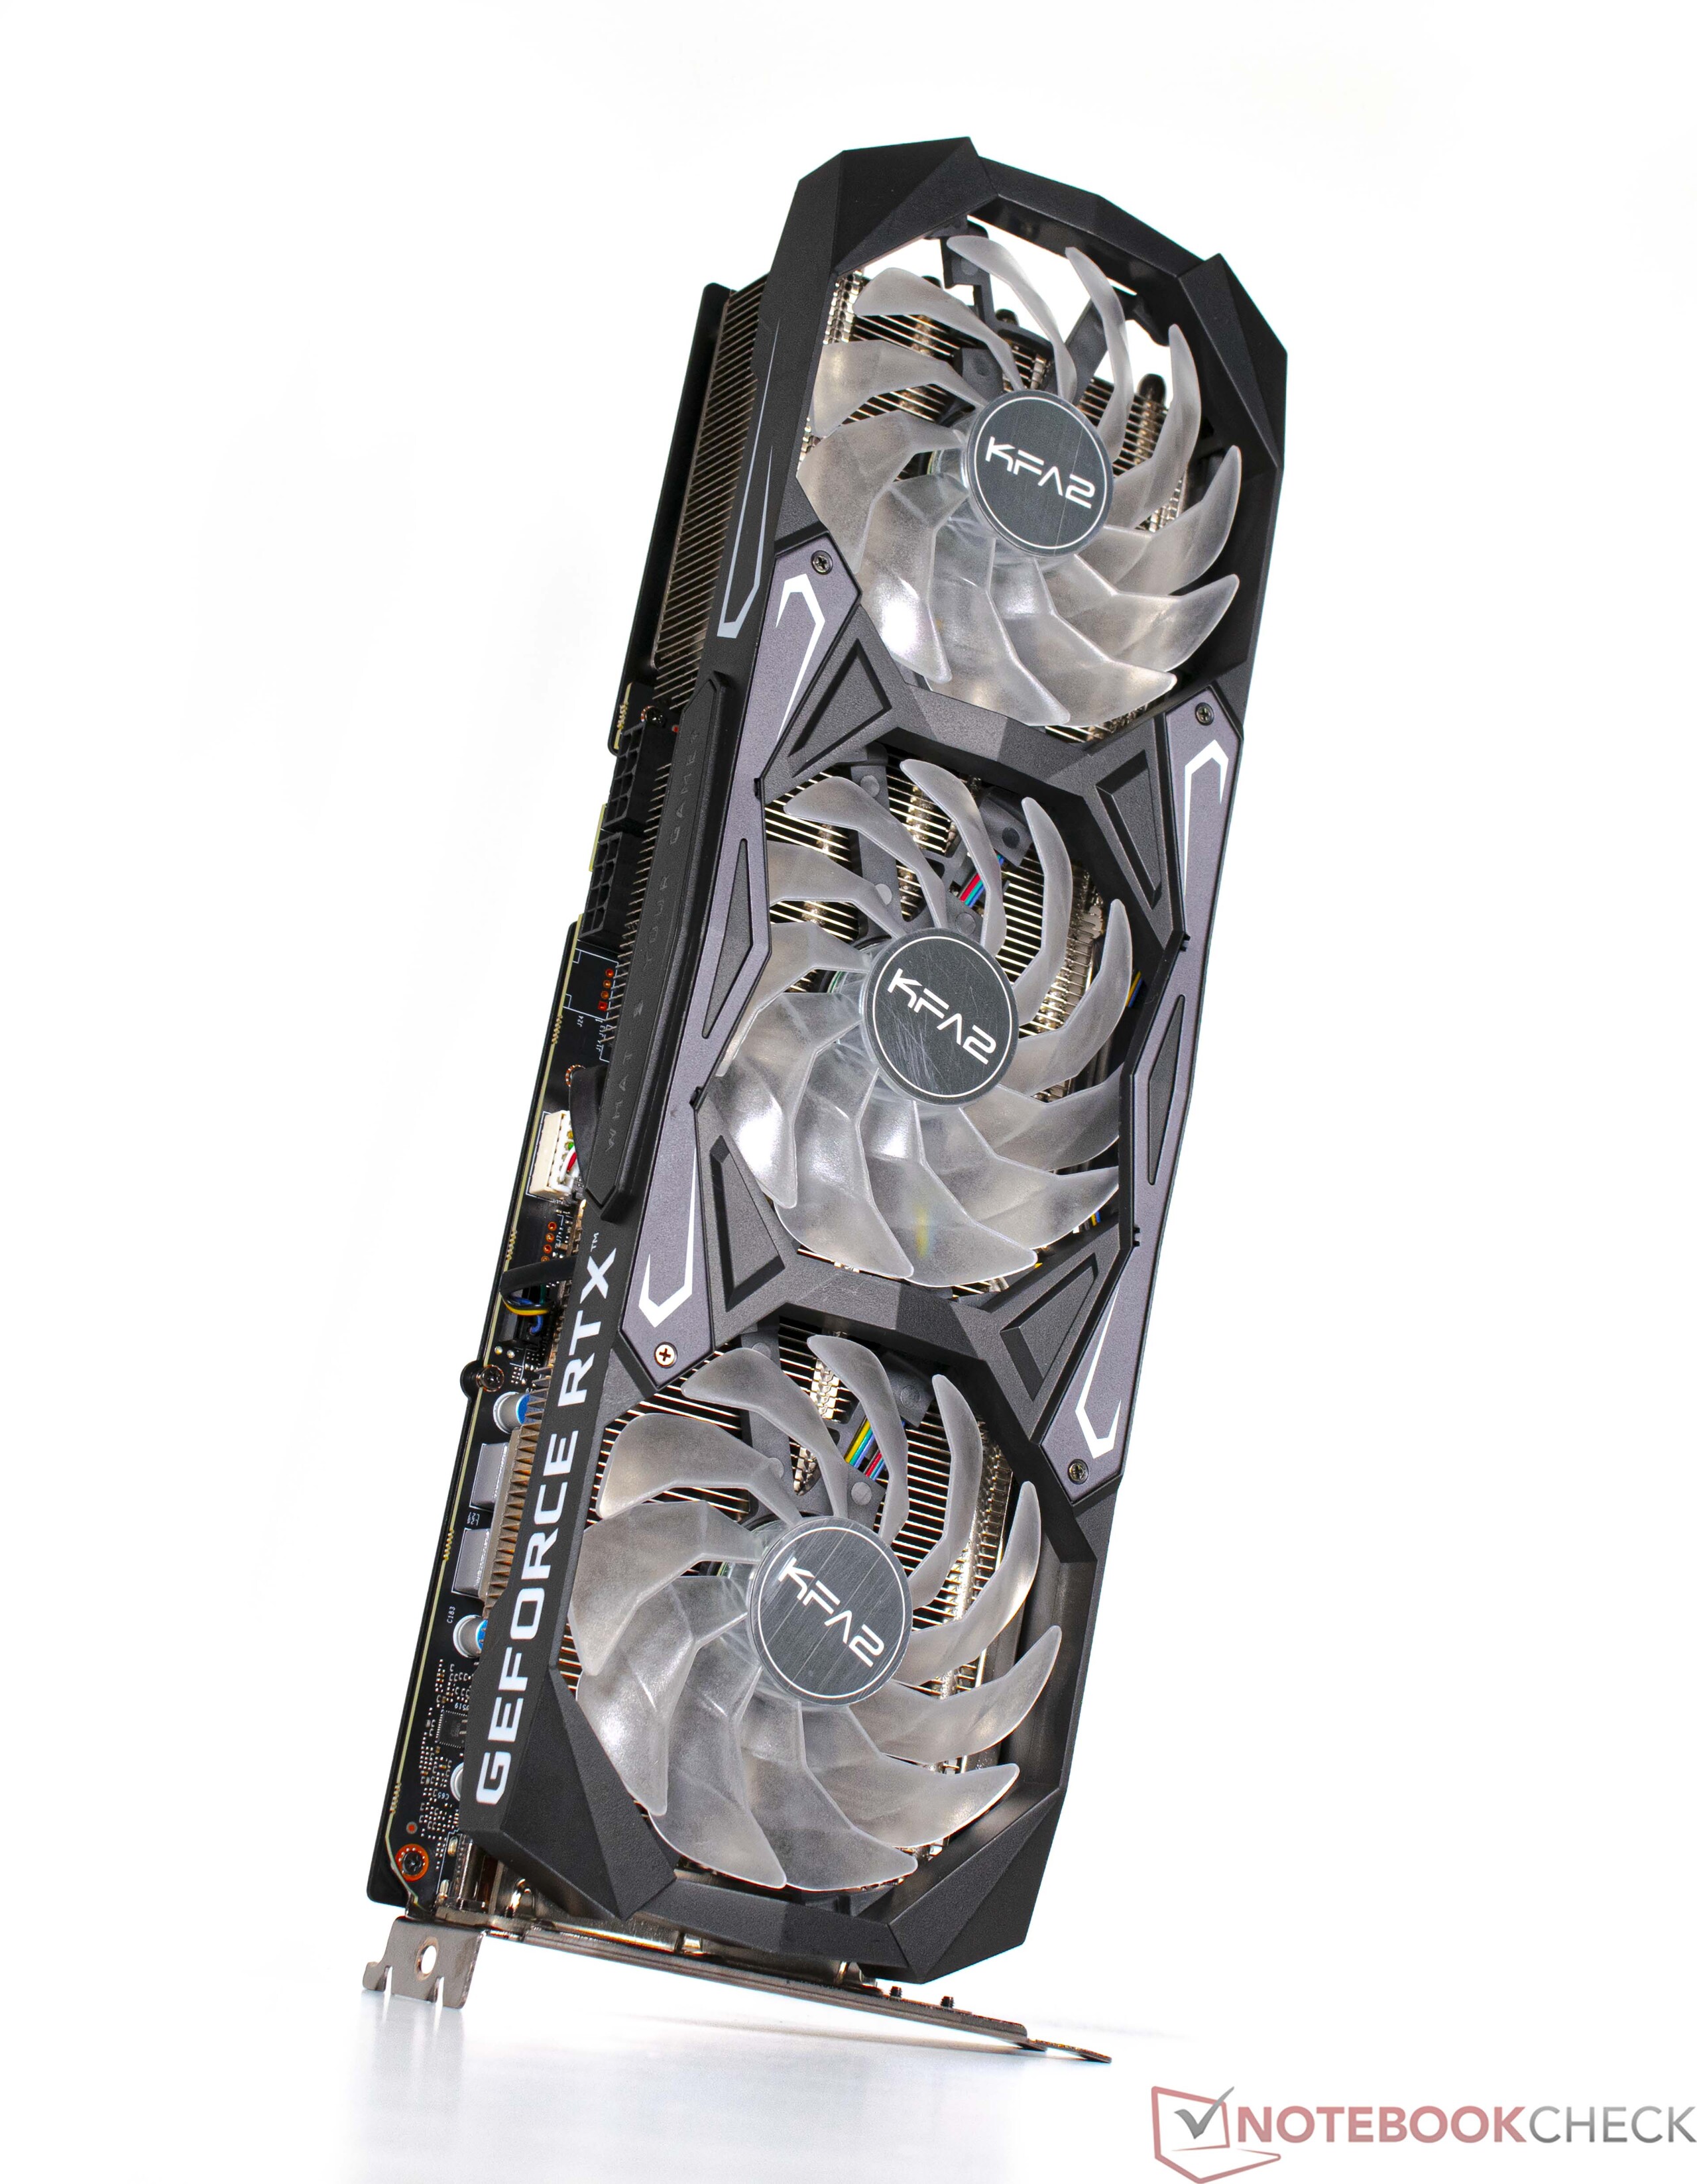
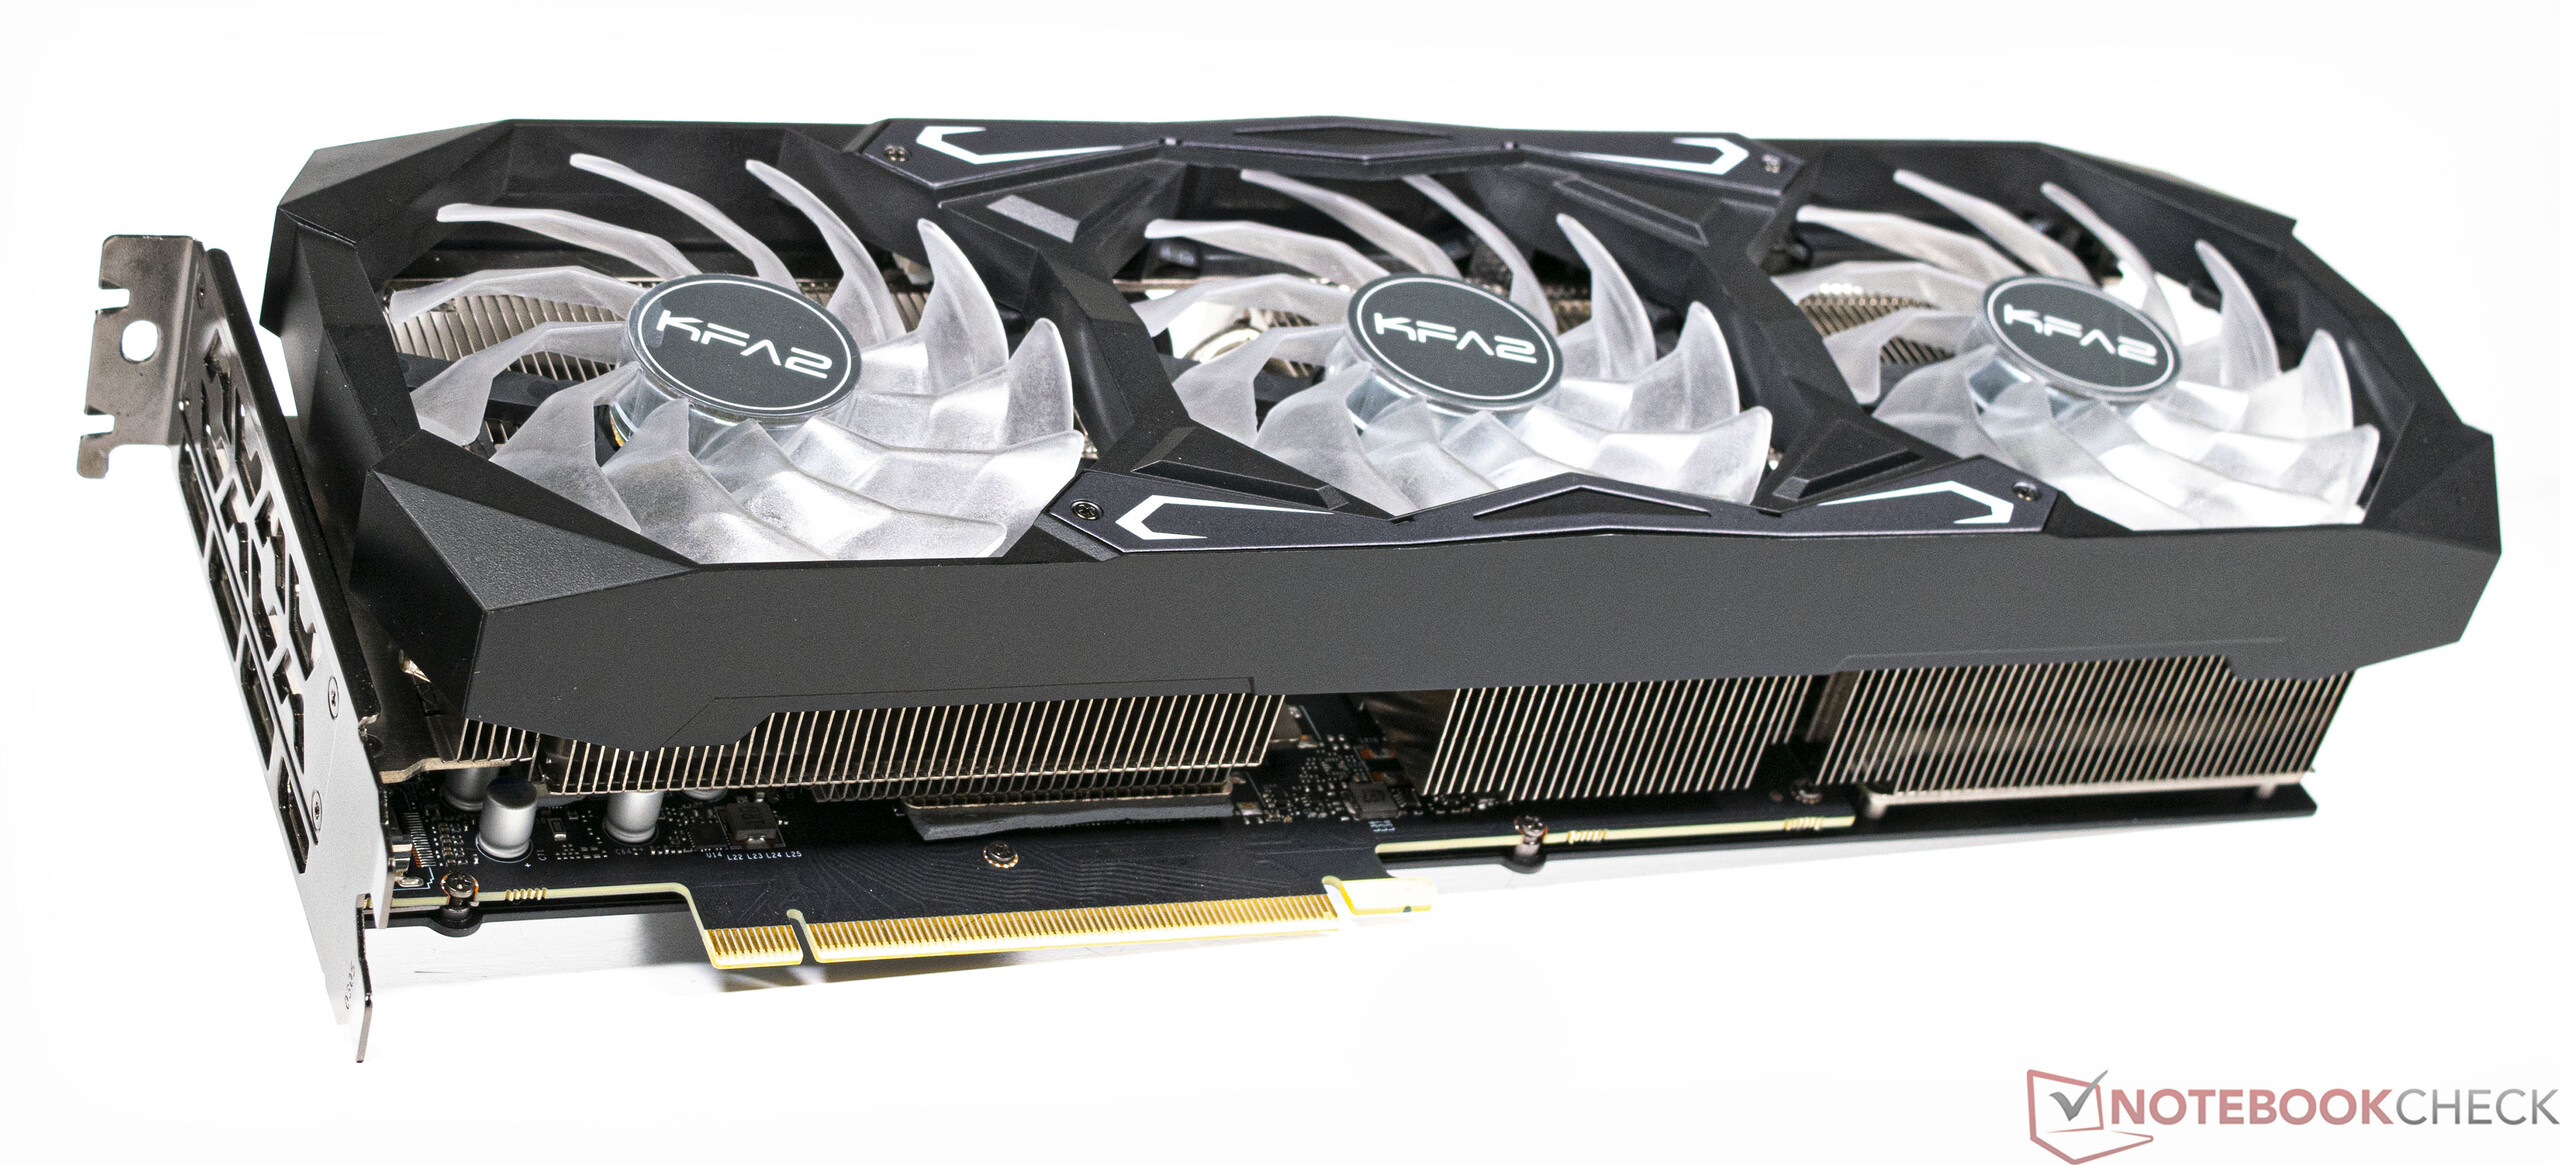
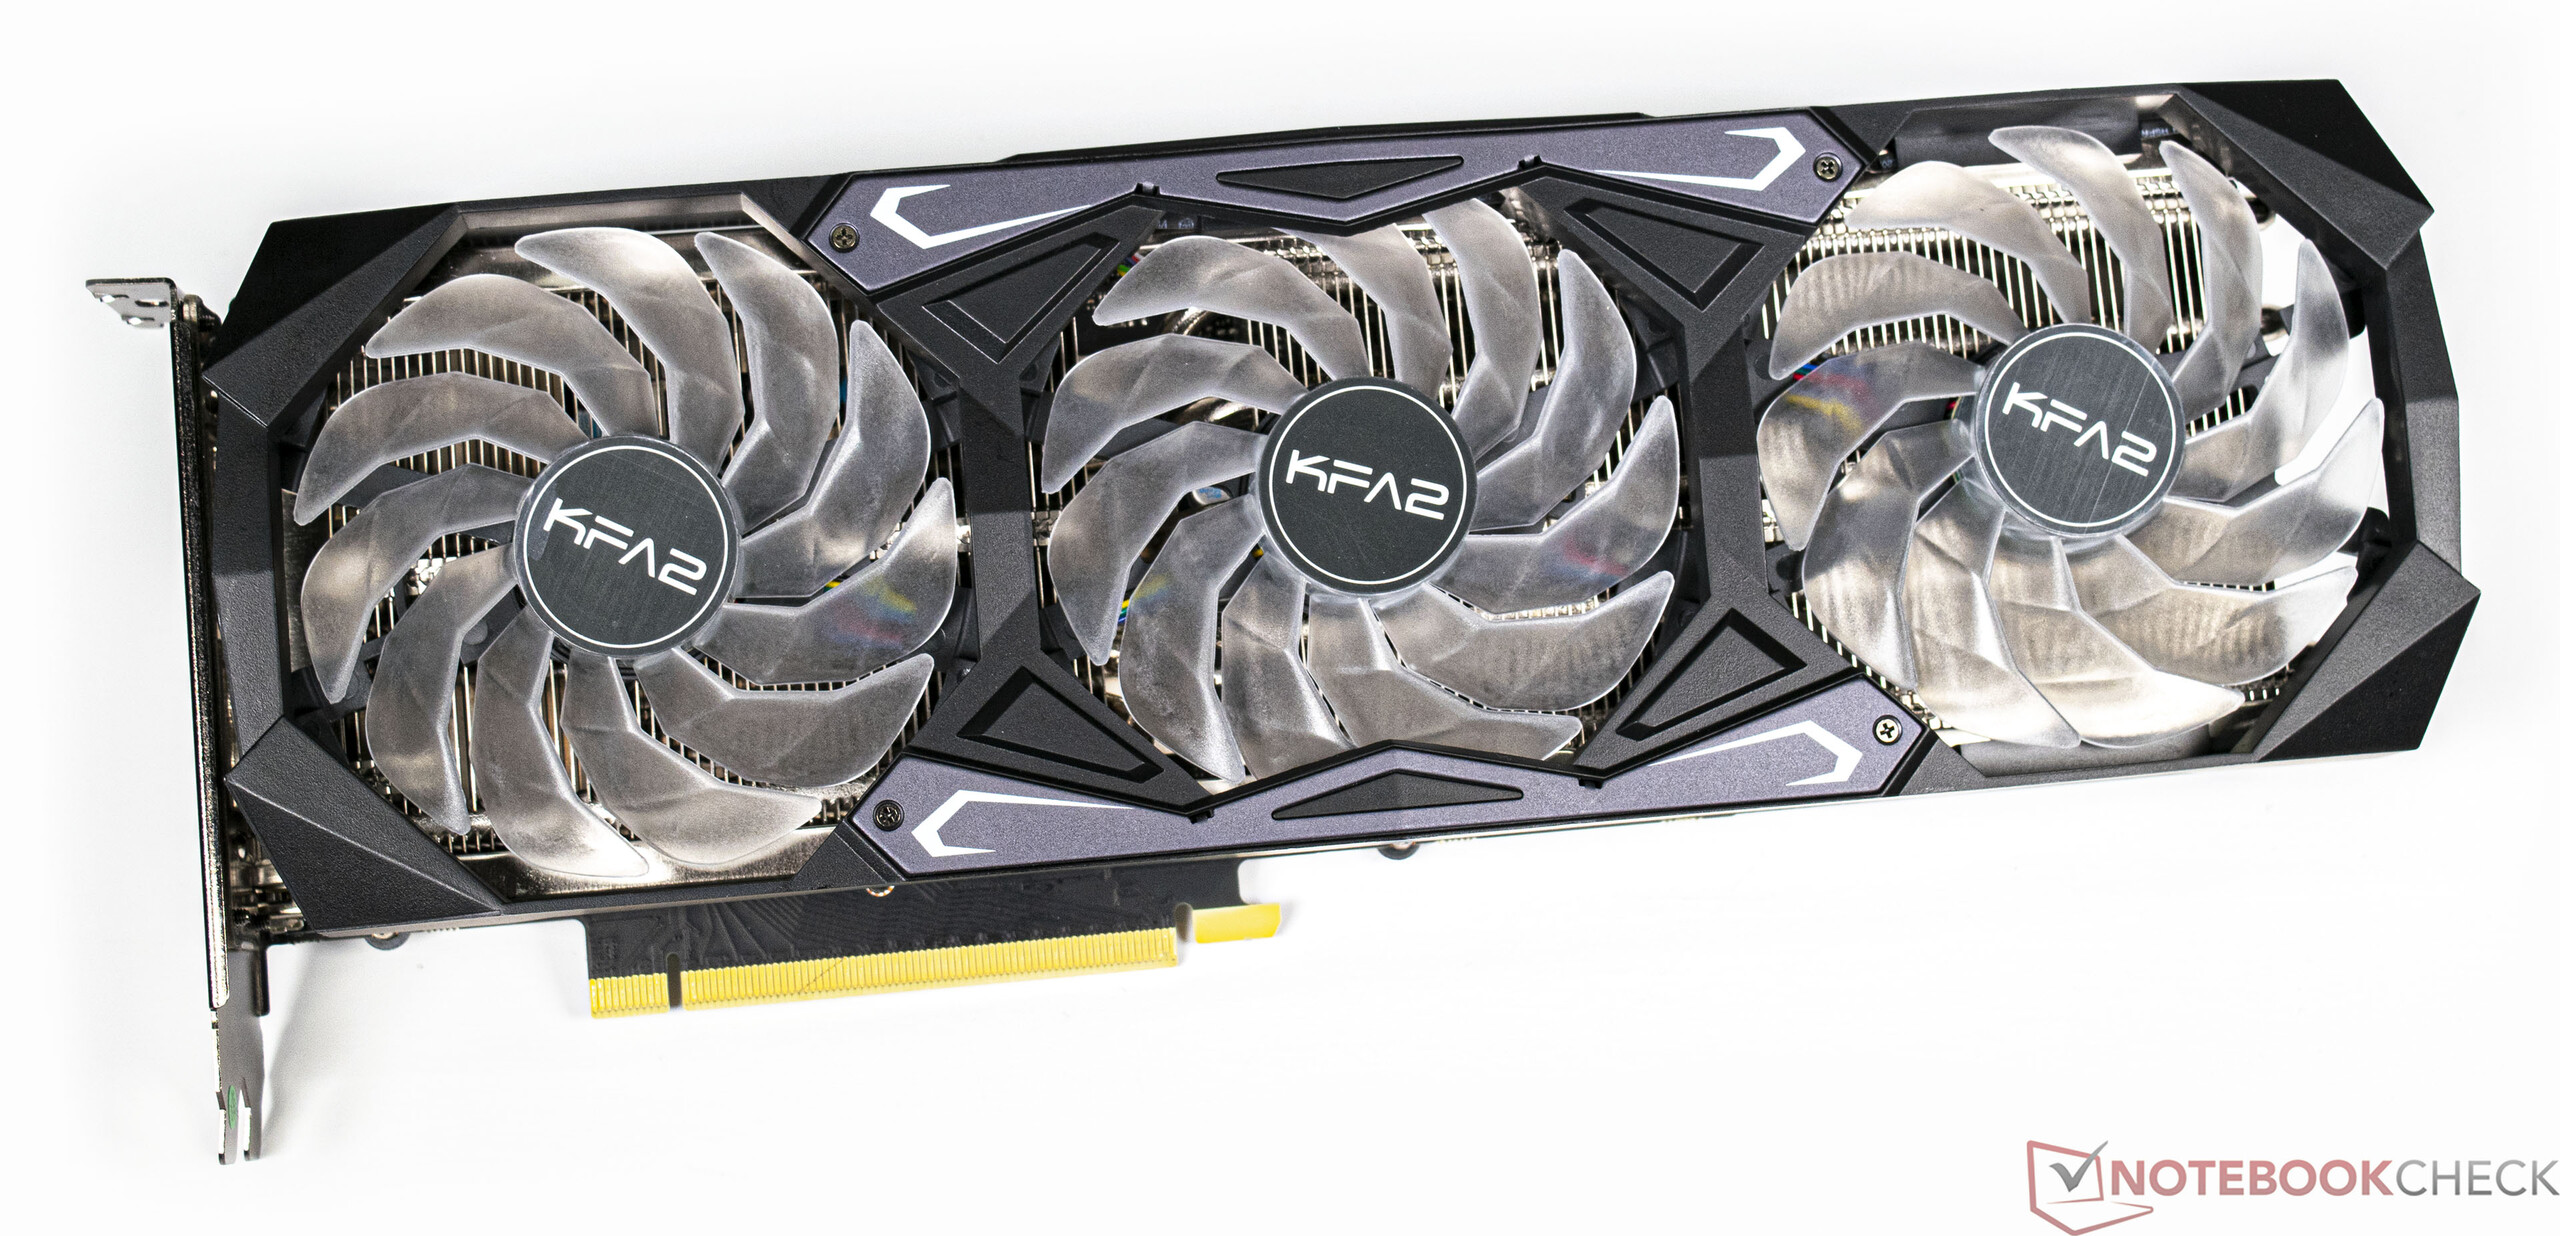
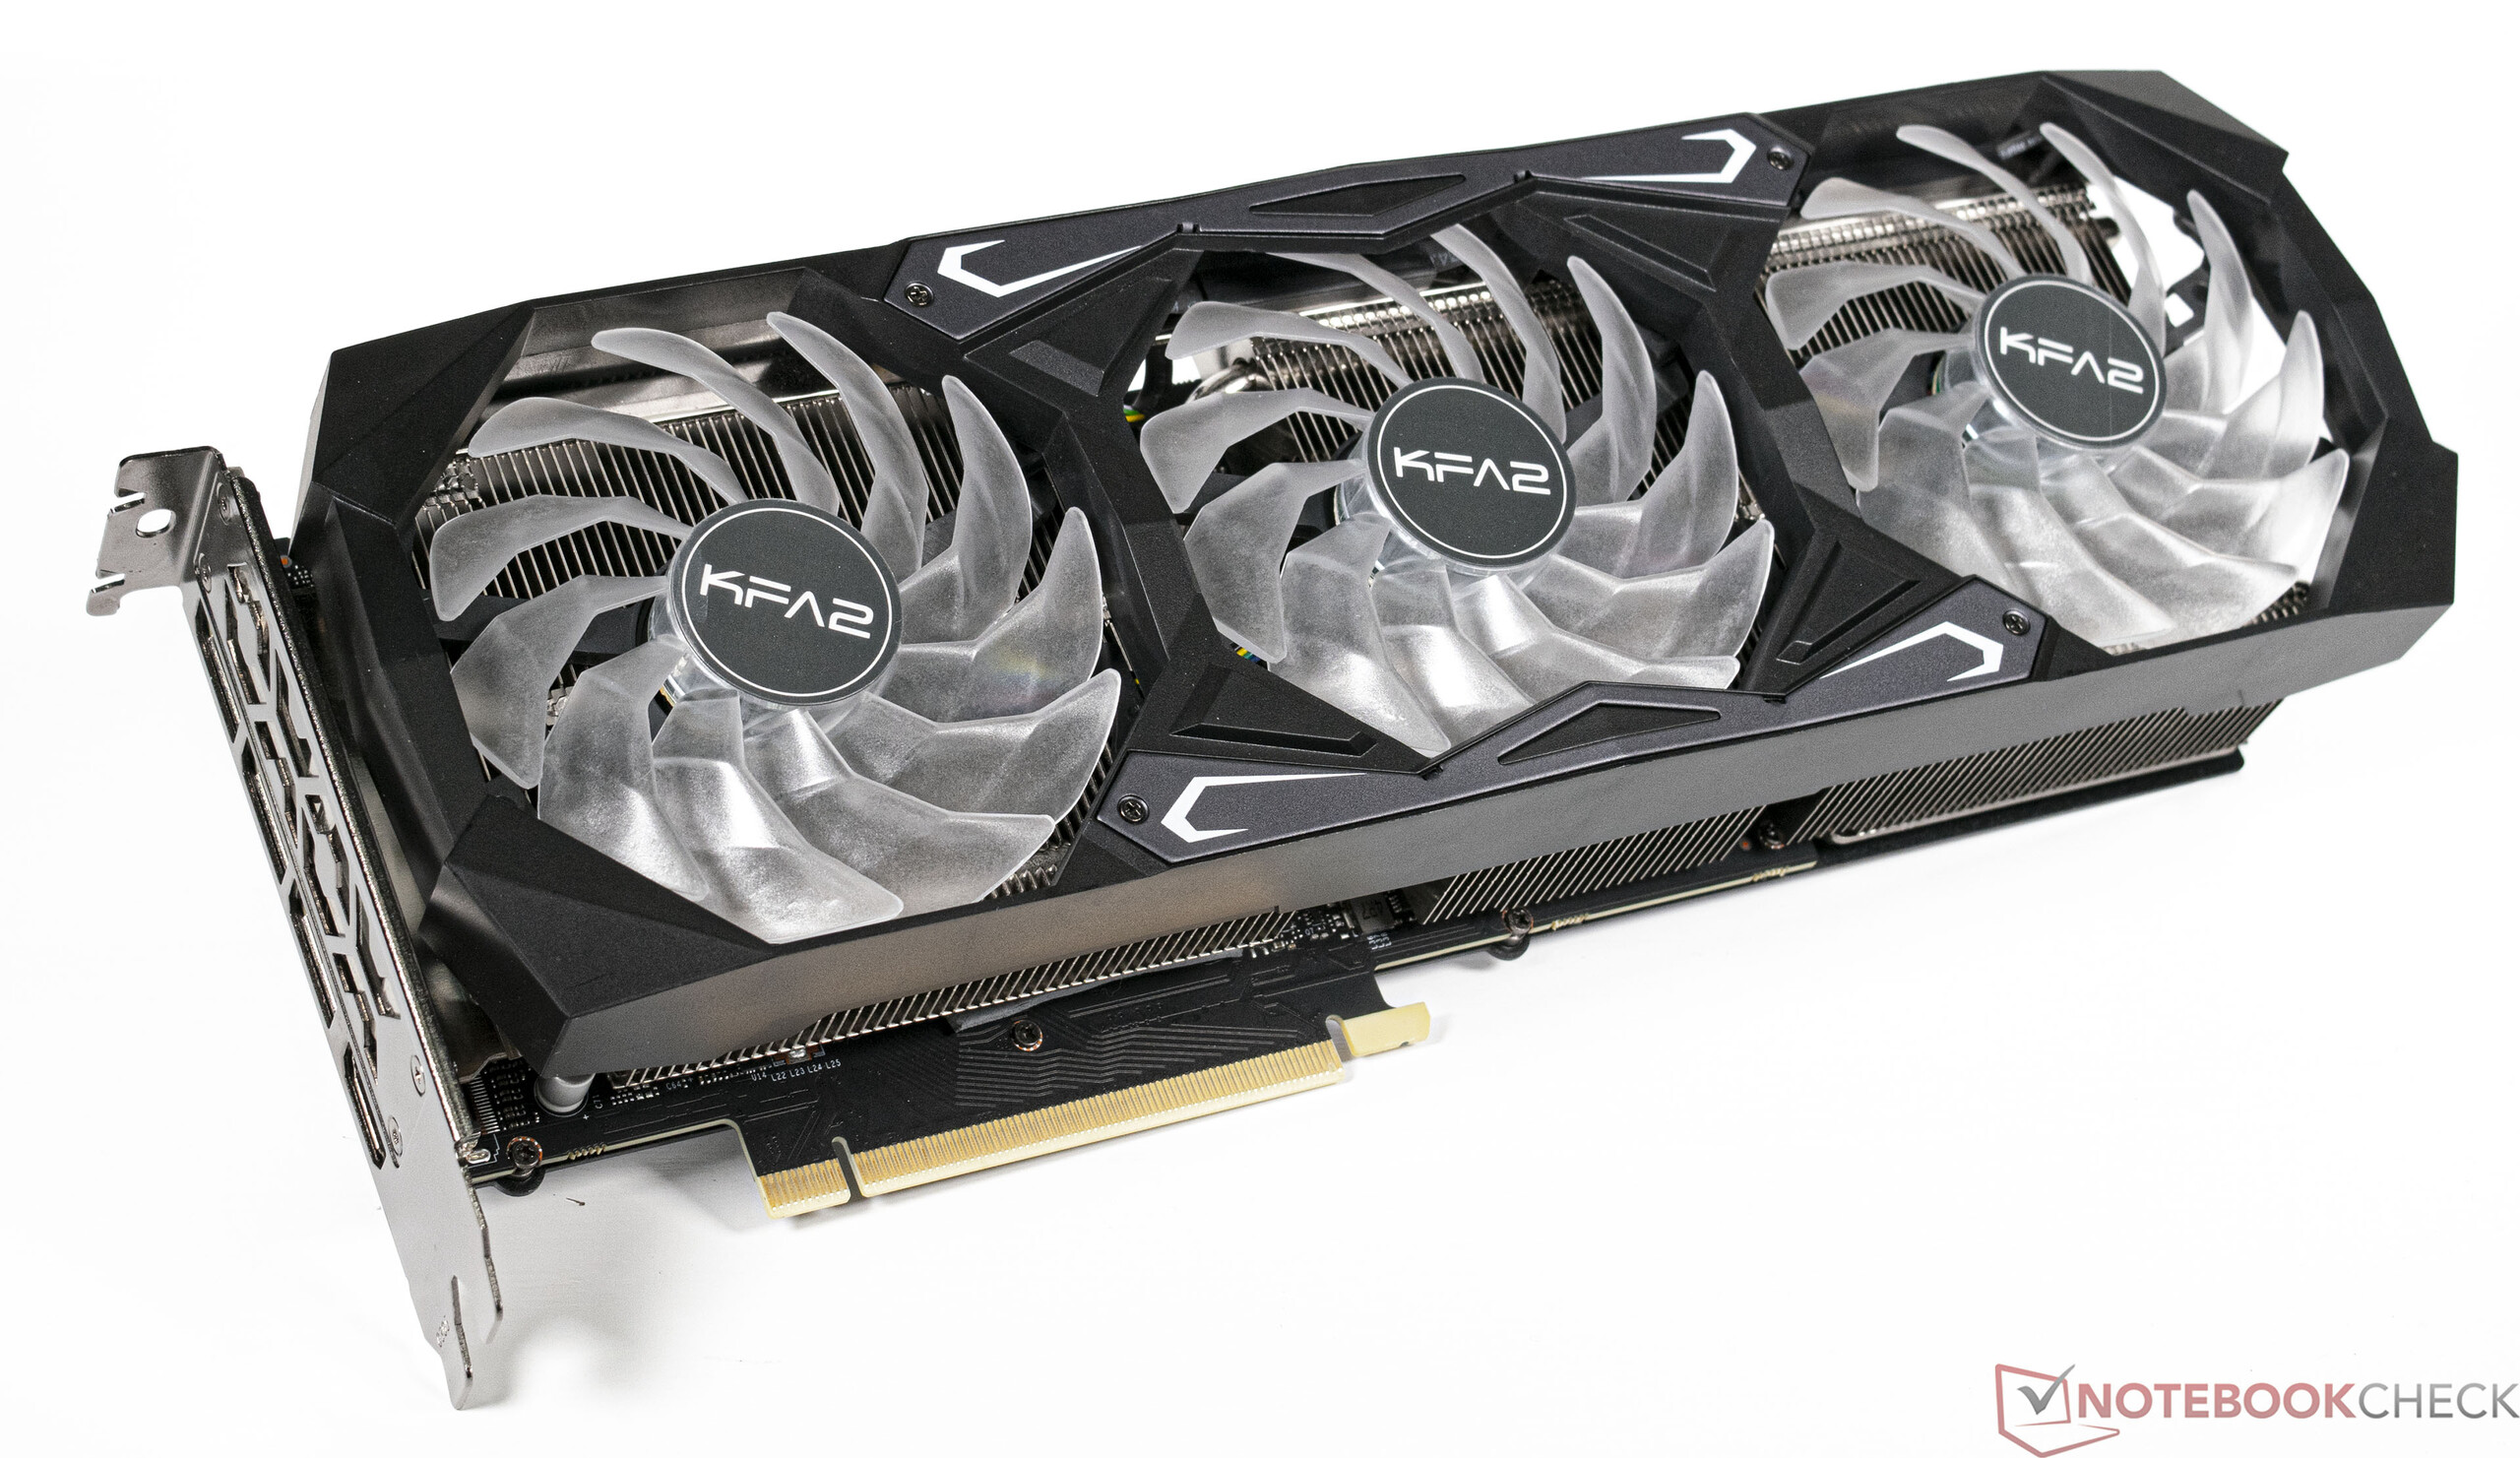
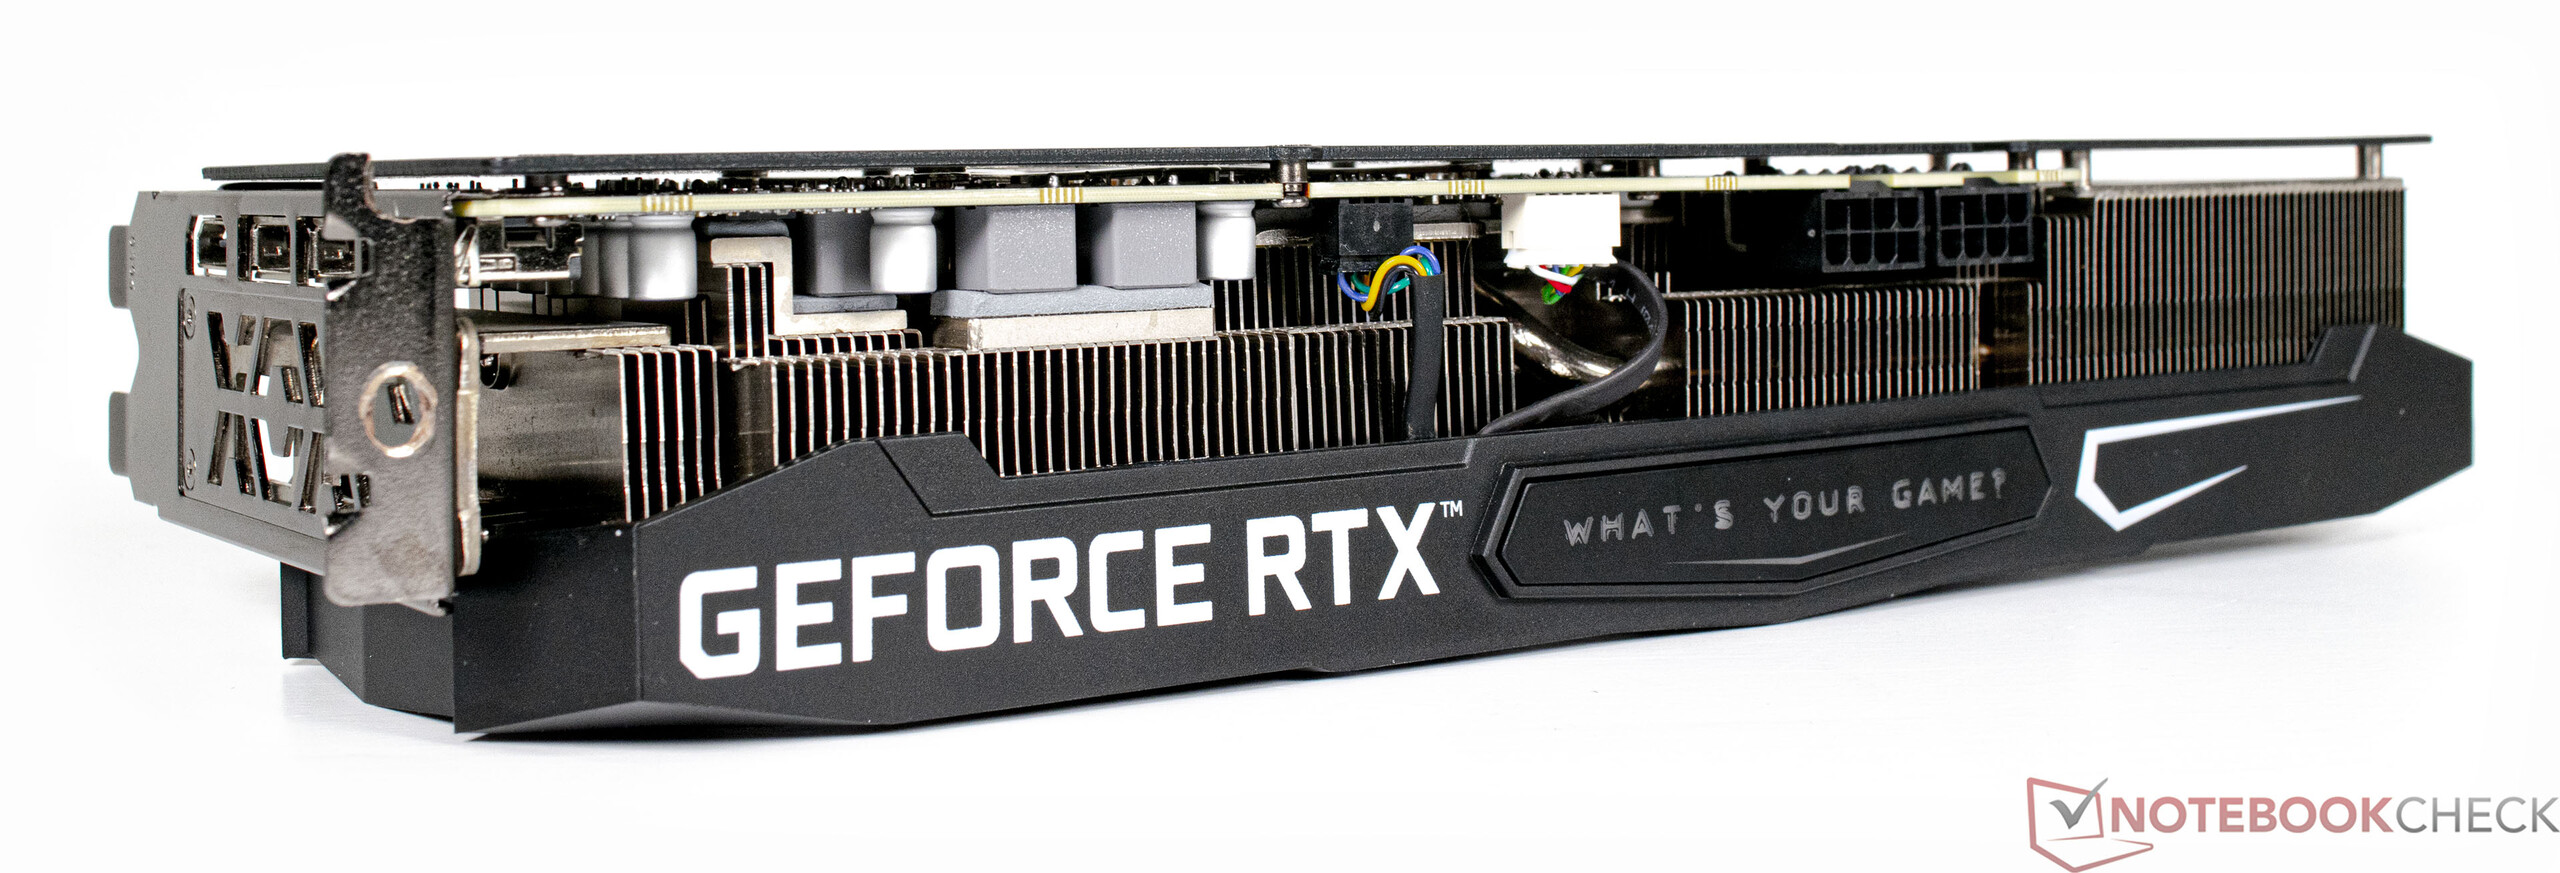
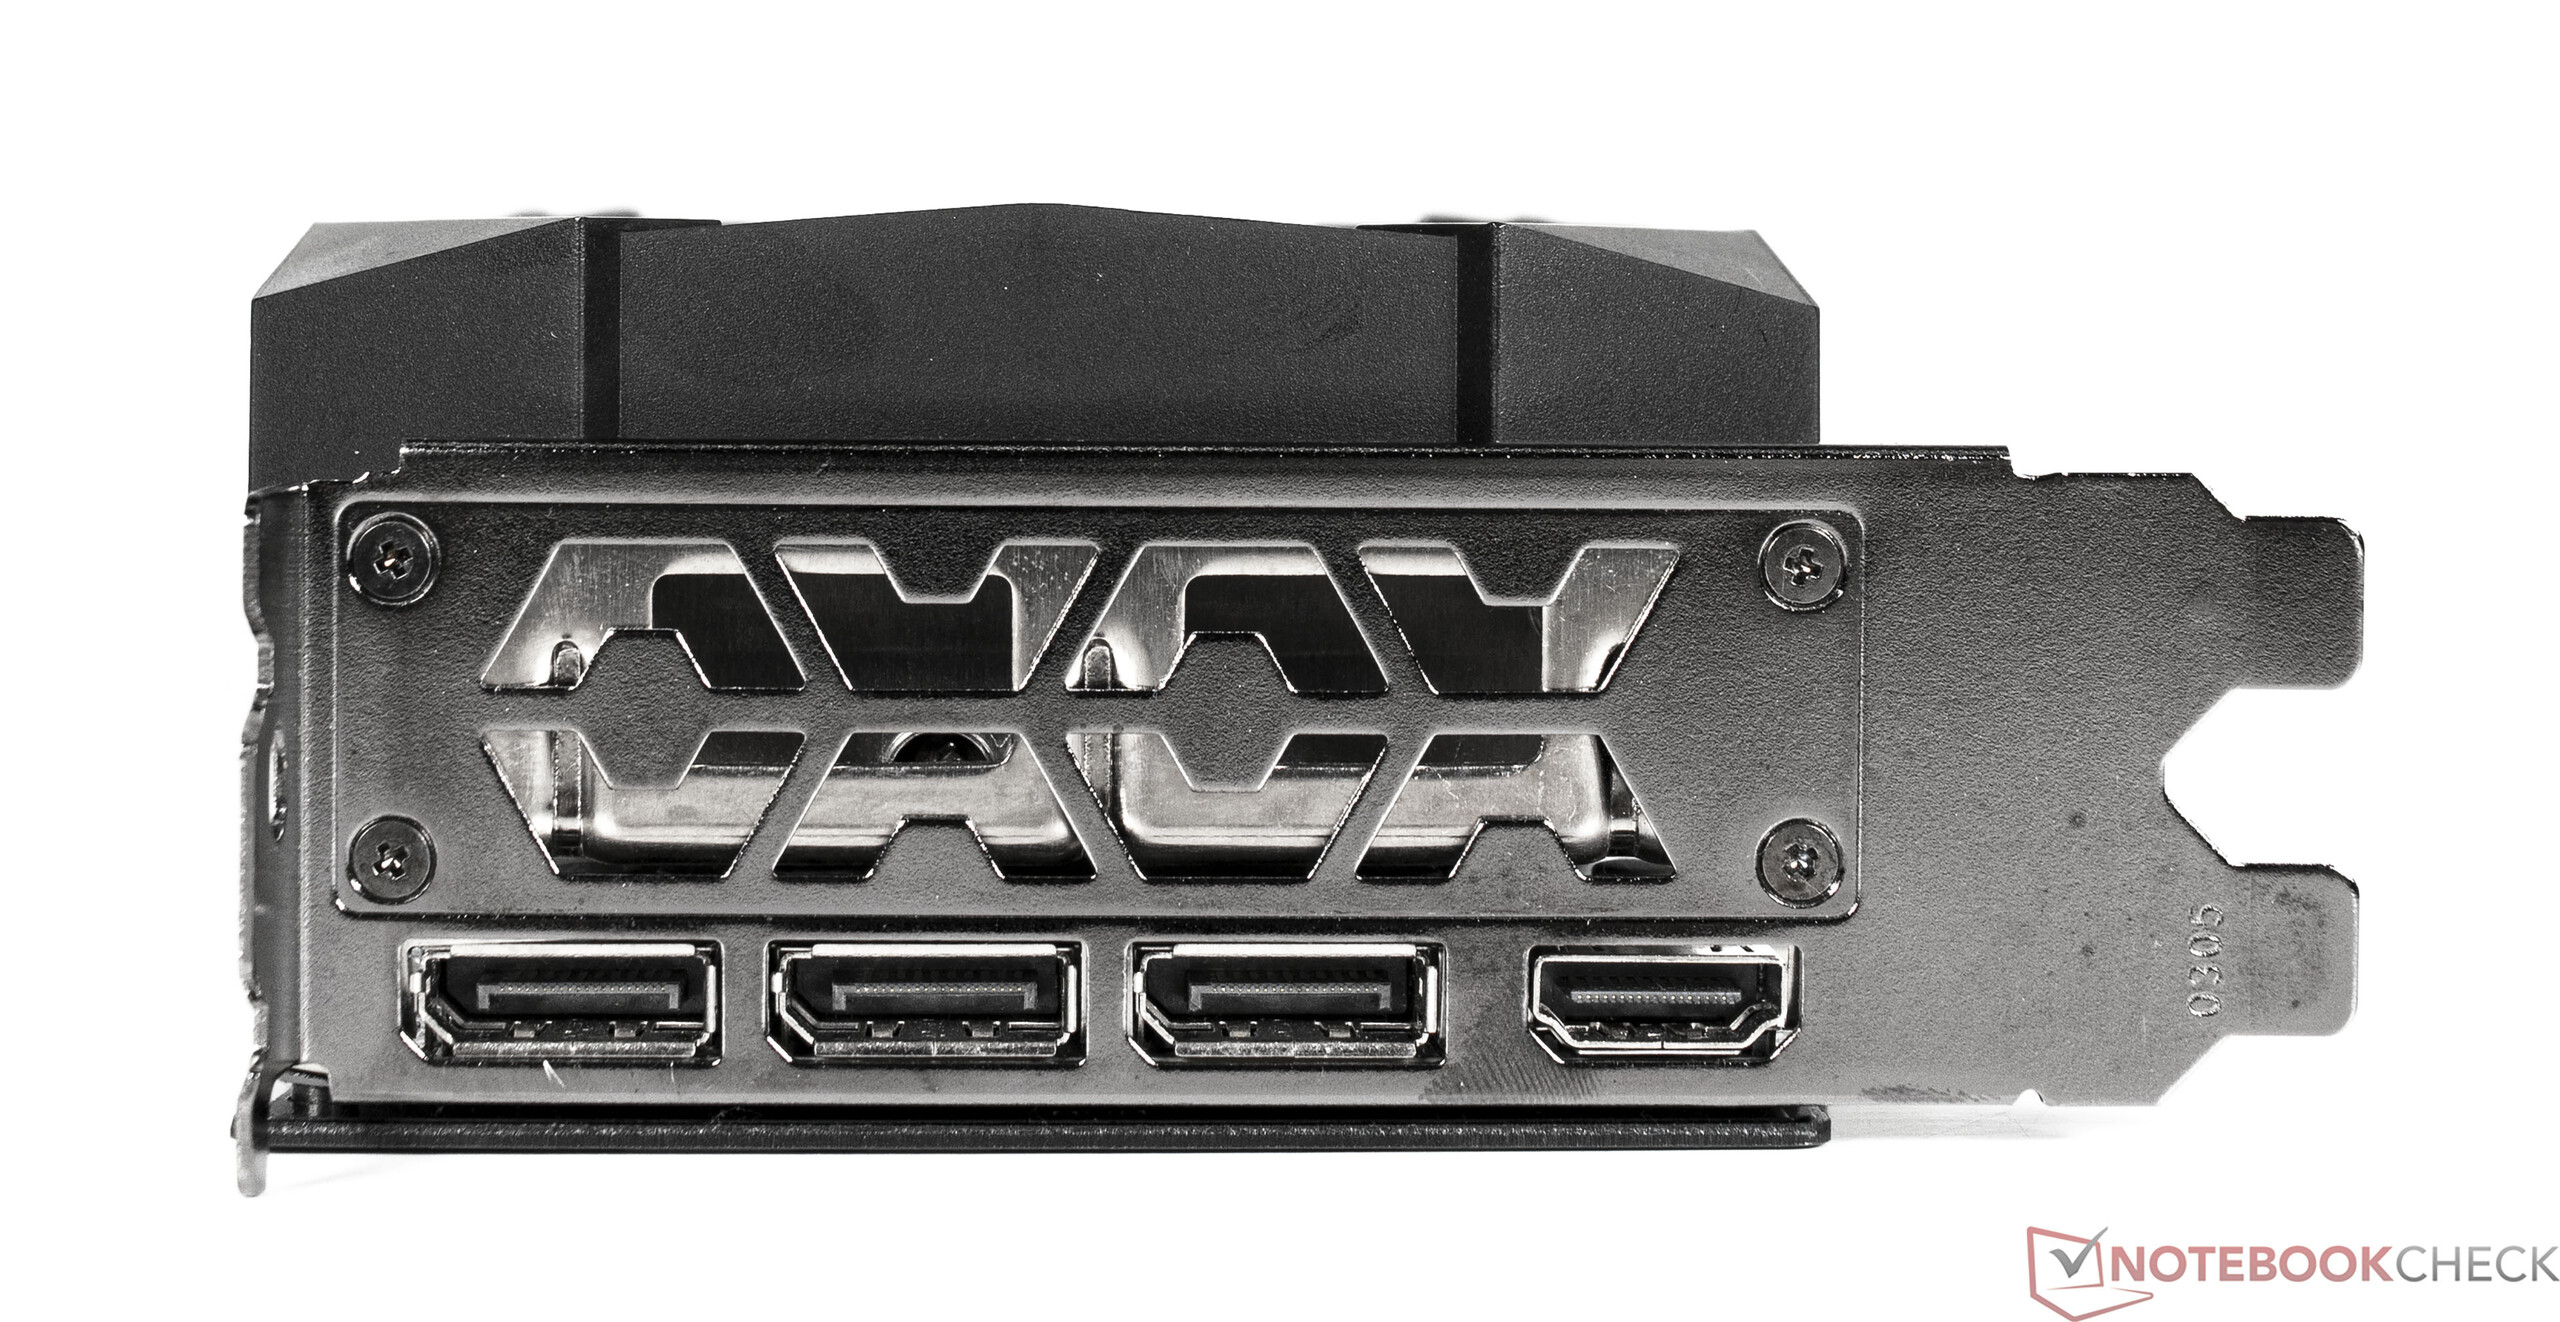
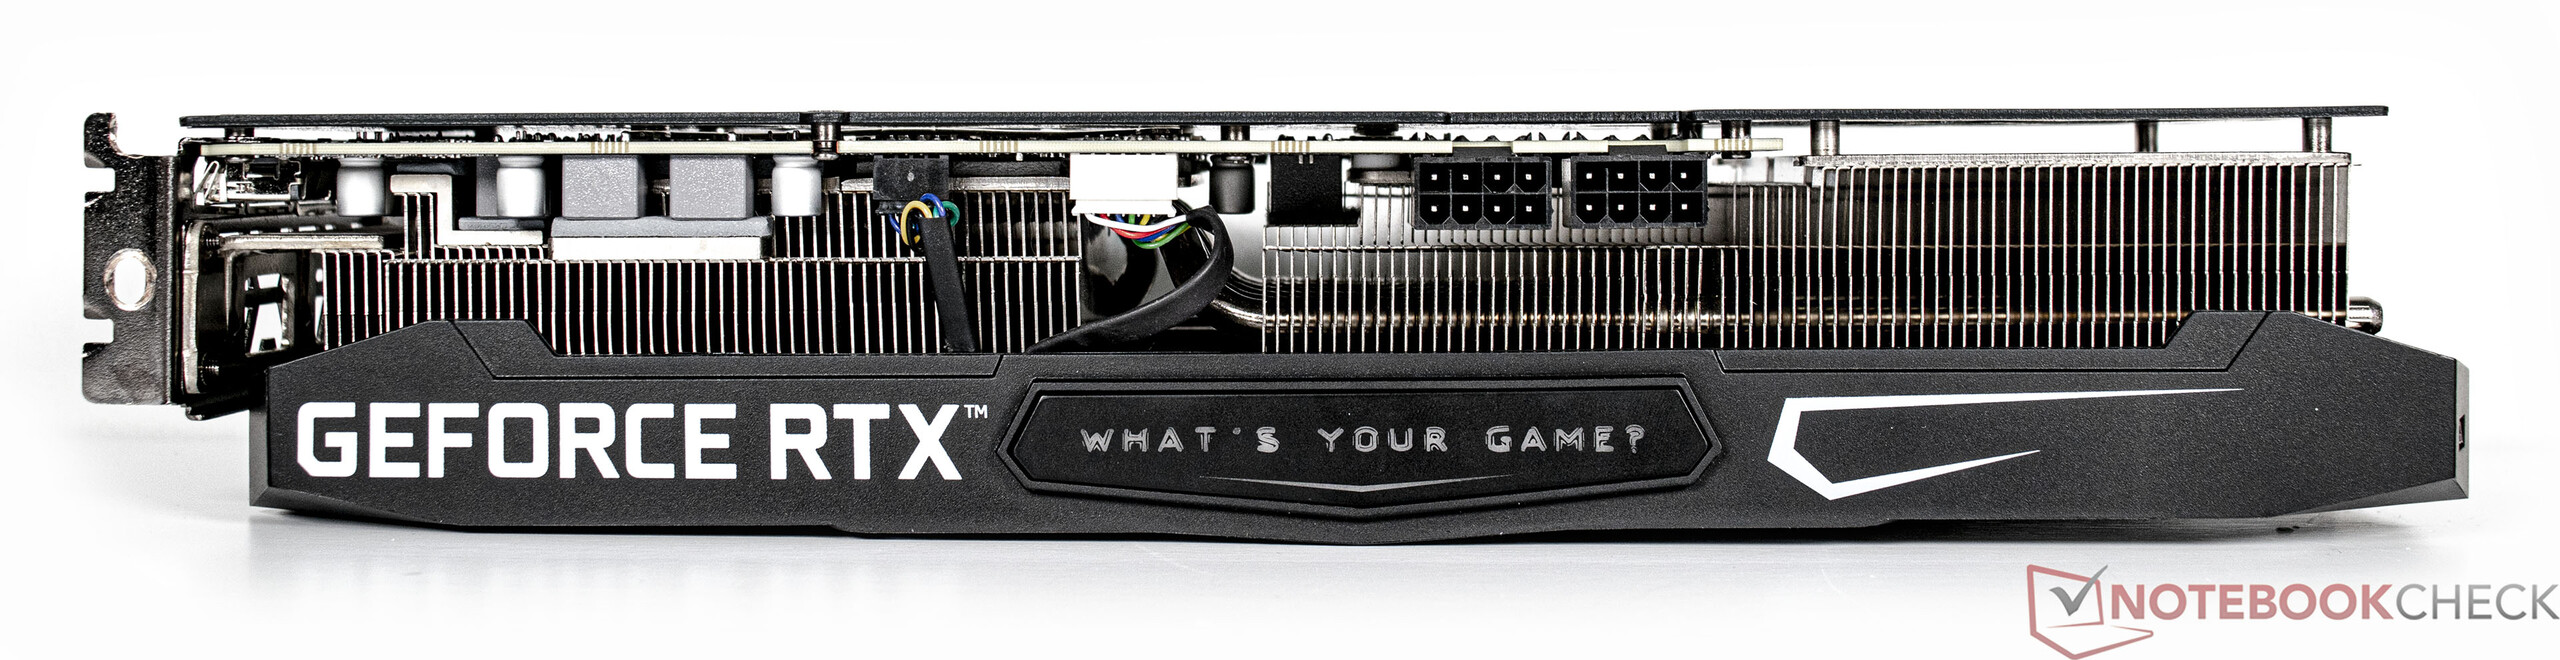
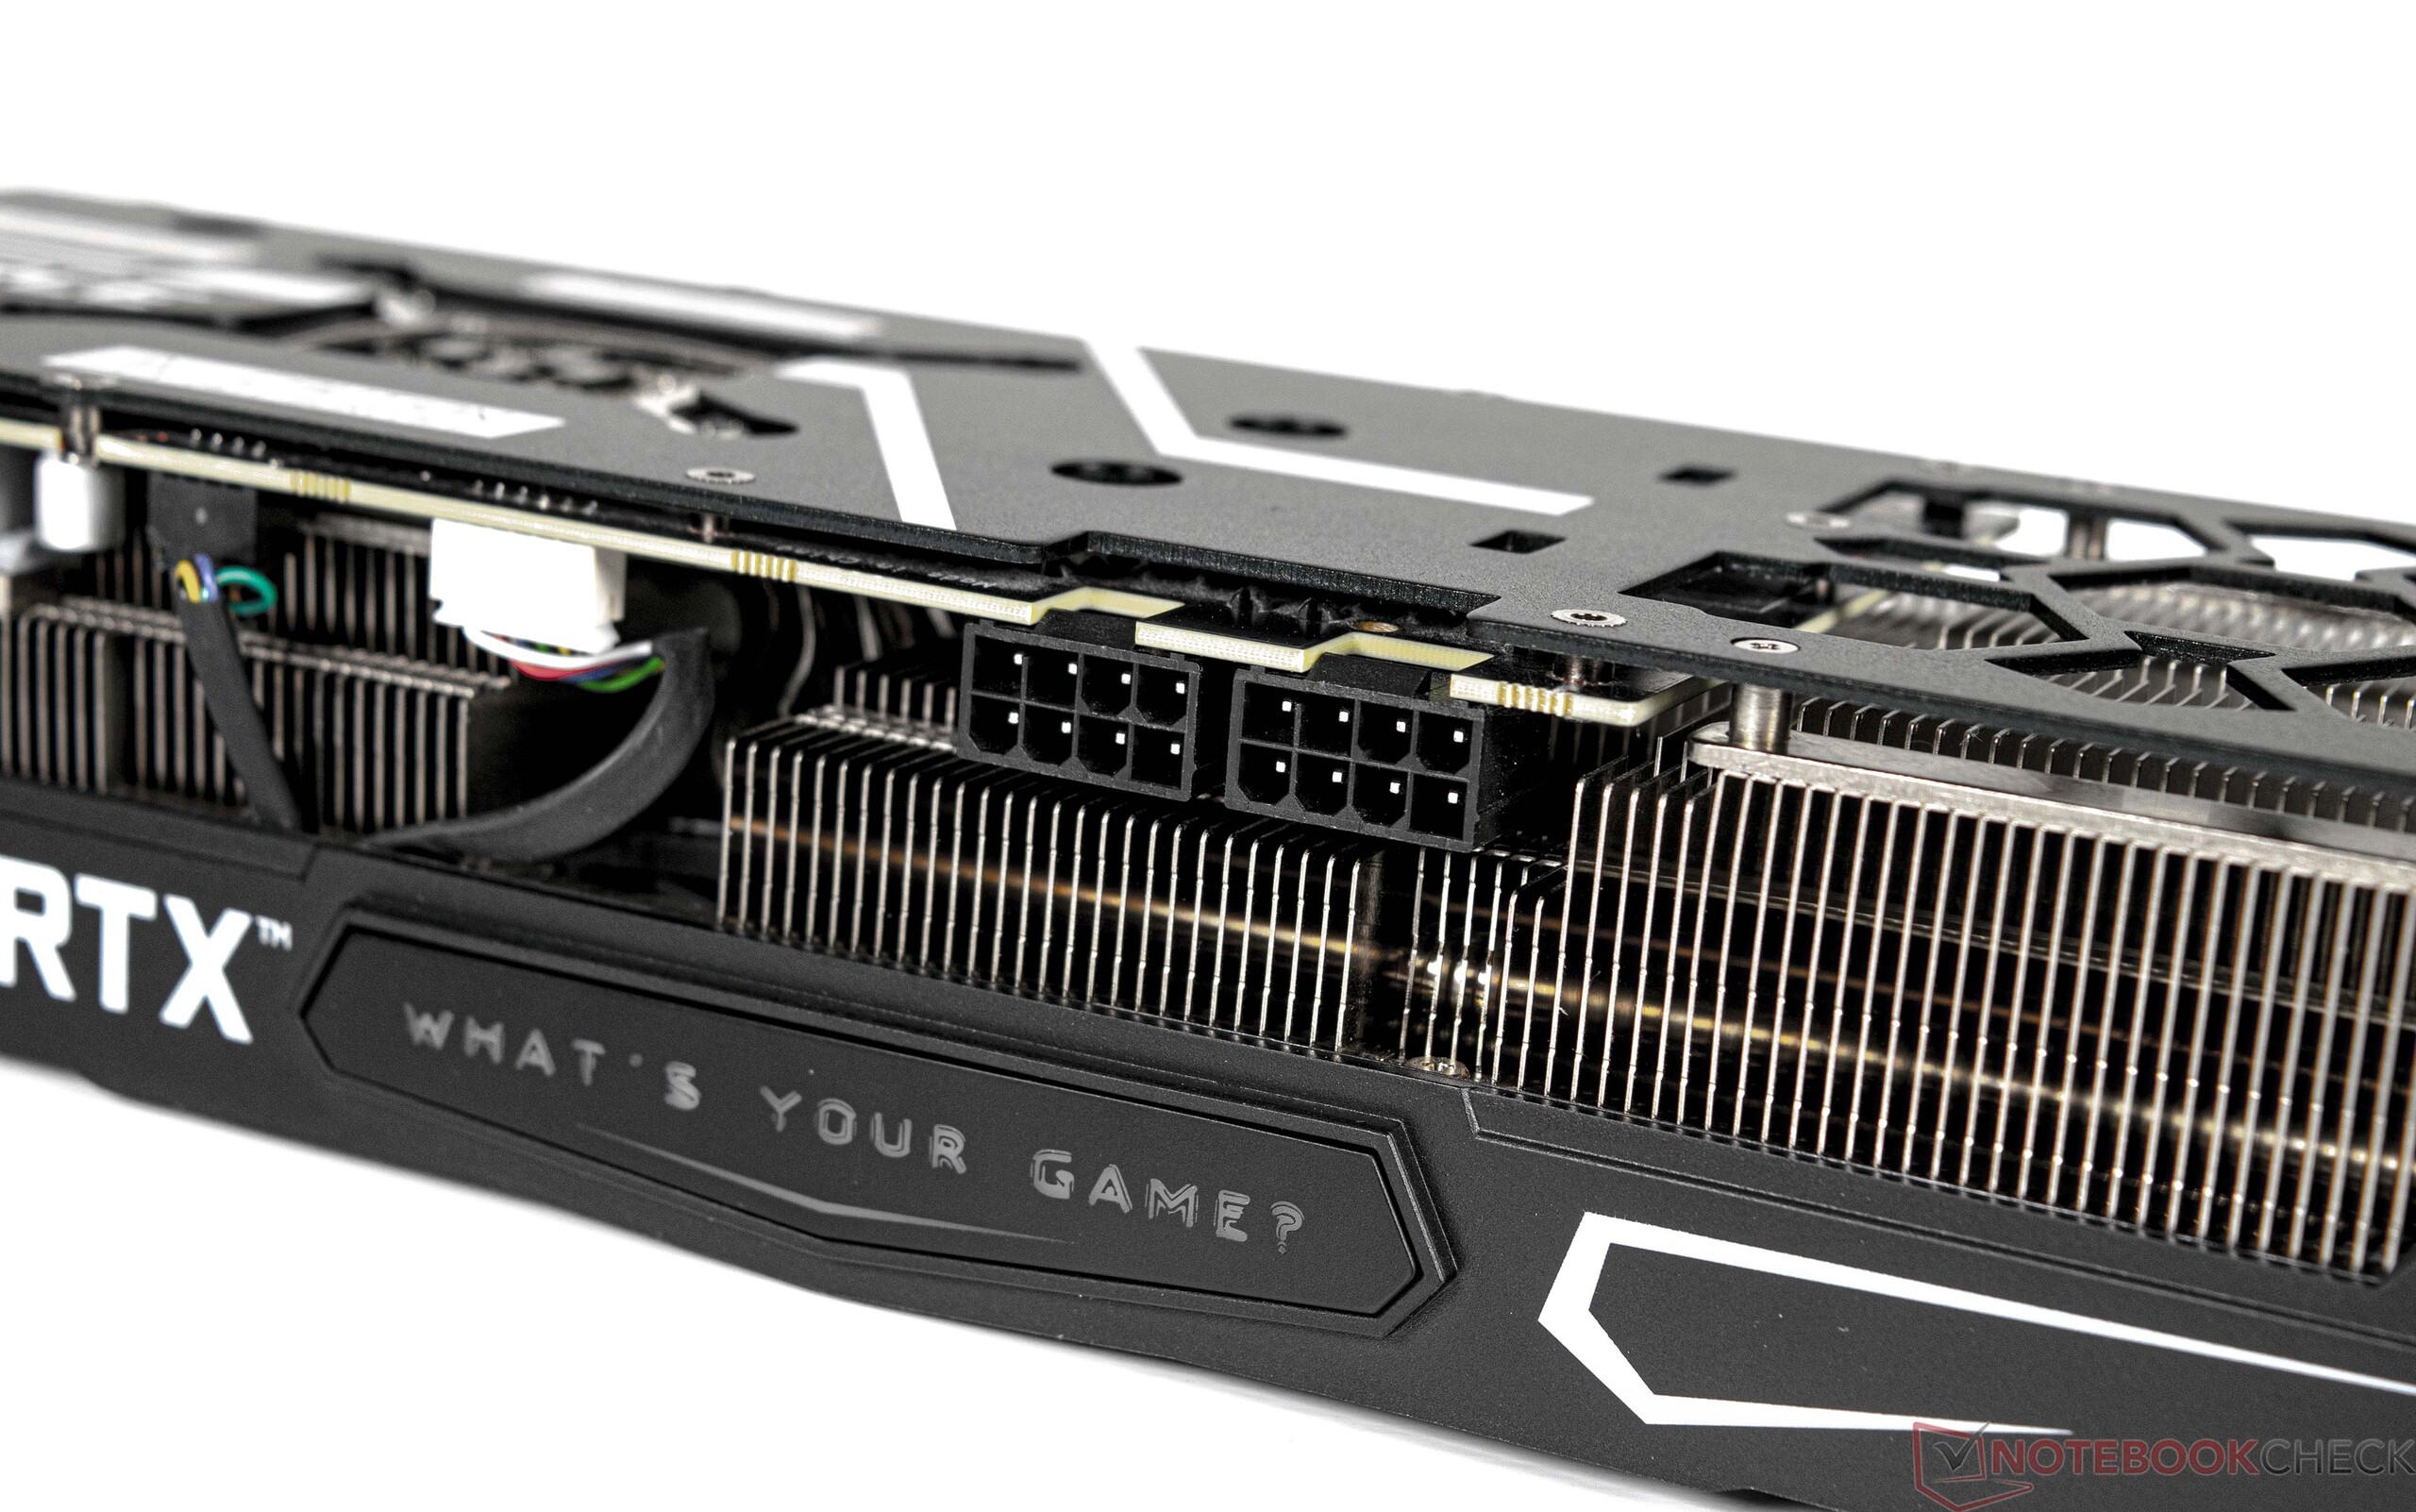
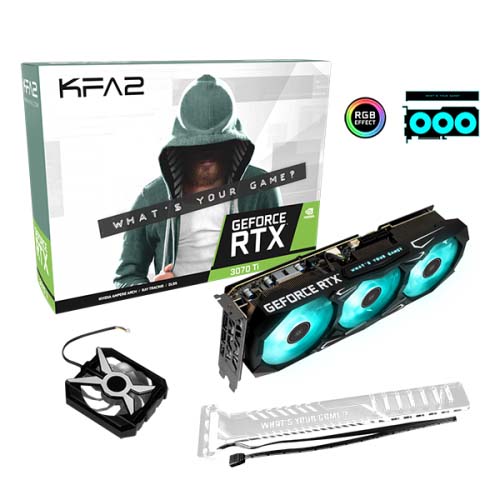
The KFA2 GeForce RTX 3070 Ti SG deviates visually from Nvidia's reference design and also the power supply relies on the well-tried 6+2-pin connectors and does without the 12-pin connector. With just under 33 centimeters, the model from KFA2 is very long and doesn't fit into every case. The graphics card's power consumption is 290 watts and there is 1x HDMI (2.1) and 3x DisplayPort (1.4a) externally.
The specifications of the graphics cards in comparison
| Equipment | RTX 3090 | RTX 3080 FE | KFA2 RTX 3070 Ti | RTX 3070 FE | RTX 3060 Ti | RTX 3060 | Titan RTX |
| Chip | GA102 | GA102 | GA104 | GA104 | GA104 | GA 106 | TU102 |
| FinFET Process | 8 nm | 8 nm | 8 nm | 8 nm | 8 nm | 8 nm | 12 nm |
| CUDA Cores | 10,496 | 8.704 | 6.144 | 5.888 | 4.864 | 3.584 | 4.608 |
| Texture Units | 328 | 272 | 192 | 184 | 152 | 112 | 288 |
| Tensor Cores | 328 3rd Gen. | 272 3rd Gen. | 192 3rd Gen. | 184 3rd Gen. | 152 3rd Gen. | 112 3rd Gen | 576 2nd Gen. |
| RT Cores | 82 | 68 | 48 | 46 | 38 | 28 | 72 |
| GPU Base Clock | 1.395 MHz | 1.440 MHz | 1.575 MHz | 1.500 MHz | 1.410 MHz | 1.320 MHz | 1.350 MHz |
| GPU Boost Clock | 1.695 MHz | 1.710 MHz | 1.800 MHz | 1.750 MHz | 1.665 MHz | 1.777 MHz | 1.770 MHz |
| Memory Bus | 384-bit | 320-bit | 256-bit | 256-bit | 192-bit | 192-bit | 384-bit |
| Memory Bandwidth | 936 GB/s | 760 GB/s | 608.3 GB/s | 448 GB/s | 360 GB/s | 360 GB/s | 672 GB/s |
| Video Memory | 24 GB GDDR6X | 10 GB GDDR6X | 8 GB GDDR6X | 8 GB GDDR6 | 8 GB GDDR6 | 12 GB GDDR6 | 24 GB GDDR6 |
| Power consumption | 350 W | 320 W | 290 W | 220 W | 200 W | 170 W | 280 W |
The test bench in detail
We use this system for the following benchmarks and tests:
- Lian-Li O11 Dynamic
- AMD Ryzen 9 7950X
- Gigabyte X670E Aorus Master, BIOS: F8a
- Alphacool Eisbear 360 AiO
- Corsair RM 1000x power supply
- G.Skill Trident Z5 Neo DDR5-6000 2x 16 GB, EXPO (DDR5-6000 CL30-38-38-96)
- Corsair MP600 2 TB
- Crucial MX500 2 TB
- Microsoft Windows 11 Professional 64-bit (version 22H2)
Synthetic benchmarks and compute performance
The synthetic benchmarks clearly show that the GeForce RTX 3070 Ti has an increasingly hard time competing against current models. However, our test sample is not completely alone in this, since AMD cannot keep up with the latest graphics cards with its RX 6800 and RX 6700 models. The bottom line is that the KFA2 GeForce RTX 3070 Ti SG duels with the AMD Radeon RX 6800 and the AMD Radeon RX 6700 XT. An Nvidia GeForce RTX 3080 Ti which we tested a few days ago in the Asus TUF version, is about 26 percent faster. The GeForce RTX 3070 Ti is very well suited for image editing, as the benchmark test with Affinity Photo 2 shows. Here the new RX 7900 graphics card is clearly beaten. A similar picture emerges in the Adobe benchmarks. AMD can only keep up with Nvidia's mid-range with its current high-end models here as well.
| Performance rating - Percent | |
| NVIDIA GeForce RTX 4090 | |
| AMD Radeon RX 7900 XTX | |
| NVIDIA GeForce RTX 4080 | |
| AMD Radeon RX 7900 XT | |
| NVIDIA GeForce RTX 3090 Ti | |
| NVIDIA GeForce RTX 3090 | |
| NVIDIA GeForce RTX 3080 Ti | |
| AMD Radeon RX 6950 XT | |
| AMD Radeon RX 6900 XT | |
| AMD Radeon RX 6800 | |
| AMD Radeon RX 6800 XT | |
| NVIDIA GeForce RTX 3070 Ti | |
| AMD Radeon RX 6700 XT | |
| 3DMark 11 - 1280x720 Performance GPU | |
| NVIDIA GeForce RTX 4090 | |
| NVIDIA GeForce RTX 4080 | |
| AMD Radeon RX 7900 XTX | |
| AMD Radeon RX 7900 XT | |
| AMD Radeon RX 6950 XT | |
| NVIDIA GeForce RTX 3090 Ti | |
| NVIDIA GeForce RTX 3080 Ti | |
| NVIDIA GeForce RTX 3090 | |
| AMD Radeon RX 6900 XT | |
| AMD Radeon RX 6800 | |
| AMD Radeon RX 6800 XT | |
| NVIDIA GeForce RTX 3070 Ti | |
| AMD Radeon RX 6700 XT | |
| Unigine Heaven 4.0 | |
| Extreme Preset DX11 | |
| NVIDIA GeForce RTX 4090 | |
| NVIDIA GeForce RTX 4080 | |
| AMD Radeon RX 7900 XTX | |
| AMD Radeon RX 7900 XT | |
| NVIDIA GeForce RTX 3080 Ti | |
| NVIDIA GeForce RTX 3090 | |
| NVIDIA GeForce RTX 3090 Ti | |
| AMD Radeon RX 6950 XT | |
| AMD Radeon RX 6900 XT | |
| AMD Radeon RX 6800 XT | |
| NVIDIA GeForce RTX 3070 Ti | |
| AMD Radeon RX 6800 | |
| AMD Radeon RX 6700 XT | |
| Extreme Preset OpenGL | |
| NVIDIA GeForce RTX 4090 | |
| AMD Radeon RX 7900 XTX | |
| NVIDIA GeForce RTX 4080 | |
| AMD Radeon RX 7900 XT | |
| NVIDIA GeForce RTX 3090 Ti | |
| NVIDIA GeForce RTX 3080 Ti | |
| NVIDIA GeForce RTX 3090 | |
| AMD Radeon RX 6800 | |
| AMD Radeon RX 6950 XT | |
| NVIDIA GeForce RTX 3070 Ti | |
| AMD Radeon RX 6900 XT | |
| AMD Radeon RX 6700 XT | |
| AMD Radeon RX 6800 XT | |
| Unigine Valley 1.0 | |
| 1920x1080 Extreme HD DirectX AA:x8 | |
| NVIDIA GeForce RTX 4090 | |
| NVIDIA GeForce RTX 4080 | |
| AMD Radeon RX 7900 XTX | |
| NVIDIA GeForce RTX 3090 | |
| AMD Radeon RX 7900 XT | |
| NVIDIA GeForce RTX 3080 Ti | |
| AMD Radeon RX 6950 XT | |
| AMD Radeon RX 6800 | |
| NVIDIA GeForce RTX 3090 Ti | |
| AMD Radeon RX 6900 XT | |
| NVIDIA GeForce RTX 3070 Ti | |
| AMD Radeon RX 6800 XT | |
| AMD Radeon RX 6700 XT | |
| 1920x1080 Extreme HD Preset OpenGL AA:x8 | |
| NVIDIA GeForce RTX 4090 | |
| NVIDIA GeForce RTX 4080 | |
| AMD Radeon RX 7900 XTX | |
| AMD Radeon RX 7900 XT | |
| NVIDIA GeForce RTX 3090 | |
| NVIDIA GeForce RTX 3080 Ti | |
| NVIDIA GeForce RTX 3090 Ti | |
| AMD Radeon RX 6800 | |
| AMD Radeon RX 6950 XT | |
| AMD Radeon RX 6900 XT | |
| NVIDIA GeForce RTX 3070 Ti | |
| AMD Radeon RX 6800 XT | |
| AMD Radeon RX 6700 XT | |
| LuxMark v2.0 64Bit | |
| Room GPUs-only | |
| NVIDIA GeForce RTX 4090 | |
| NVIDIA GeForce RTX 4080 | |
| NVIDIA GeForce RTX 3090 Ti | |
| NVIDIA GeForce RTX 3090 | |
| NVIDIA GeForce RTX 3080 Ti | |
| AMD Radeon RX 7900 XTX | |
| AMD Radeon RX 6950 XT | |
| AMD Radeon RX 6900 XT | |
| AMD Radeon RX 6800 XT | |
| NVIDIA GeForce RTX 3070 Ti | |
| AMD Radeon RX 7900 XT | |
| AMD Radeon RX 6800 | |
| AMD Radeon RX 6700 XT | |
| Sala GPUs-only | |
| AMD Radeon RX 6950 XT | |
| AMD Radeon RX 6900 XT | |
| AMD Radeon RX 6800 XT | |
| NVIDIA GeForce RTX 4090 | |
| NVIDIA GeForce RTX 4080 | |
| NVIDIA GeForce RTX 3090 Ti | |
| NVIDIA GeForce RTX 3080 Ti | |
| NVIDIA GeForce RTX 3090 | |
| AMD Radeon RX 7900 XTX | |
| AMD Radeon RX 7900 XT | |
| NVIDIA GeForce RTX 3070 Ti | |
| AMD Radeon RX 6800 | |
| AMD Radeon RX 6700 XT | |
| Photoshop PugetBench | |
| GPU Score | |
| AMD Radeon RX 6800 | |
| AMD Radeon RX 7900 XT | |
| AMD Radeon RX 7900 XTX | |
| AMD Radeon RX 6700 XT | |
| NVIDIA GeForce RTX 3070 Ti | |
| NVIDIA GeForce RTX 3080 Ti | |
| NVIDIA GeForce RTX 3090 | |
| AMD Radeon RX 6950 XT | |
| AMD Radeon RX 6800 XT | |
| Overall Score | |
| AMD Radeon RX 7900 XT | |
| AMD Radeon RX 7900 XTX | |
| AMD Radeon RX 6800 | |
| NVIDIA GeForce RTX 3070 Ti | |
| NVIDIA GeForce RTX 3080 Ti | |
| AMD Radeon RX 6700 XT | |
| NVIDIA GeForce RTX 3090 | |
| AMD Radeon RX 6800 XT | |
| AMD Radeon RX 6950 XT | |
| Premiere Pro PugetBench | |
| GPU 0.9 | |
| NVIDIA GeForce RTX 3090 | |
| NVIDIA GeForce RTX 3080 Ti | |
| AMD Radeon RX 7900 XTX | |
| NVIDIA GeForce RTX 3070 Ti | |
| AMD Radeon RX 7900 XT | |
| AMD Radeon RX 6950 XT | |
| AMD Radeon RX 6800 | |
| AMD Radeon RX 6700 XT | |
| Overall Score 0.9 | |
| NVIDIA GeForce RTX 3090 | |
| AMD Radeon RX 7900 XTX | |
| NVIDIA GeForce RTX 3080 Ti | |
| NVIDIA GeForce RTX 3070 Ti | |
| AMD Radeon RX 7900 XT | |
| AMD Radeon RX 6800 | |
| AMD Radeon RX 6700 XT | |
| AMD Radeon RX 6950 XT | |
| Affinity Photo 2 - Combined (Single / Multi GPU) | |
| NVIDIA GeForce RTX 3080 Ti | |
| NVIDIA GeForce RTX 3070 Ti | |
| AMD Radeon RX 6800 | |
| AMD Radeon RX 6700 XT | |
| AMD Radeon RX 7900 XTX | |
| AMD Radeon RX 7900 XT | |
| Blender | |
| v3.3 Classroom HIP/AMD | |
| AMD Radeon RX 6700 XT | |
| AMD Radeon RX 6800 | |
| AMD Radeon RX 7900 XT | |
| AMD Radeon RX 7900 XTX | |
| v3.3 Classroom CUDA | |
| NVIDIA GeForce RTX 3070 Ti | |
| NVIDIA GeForce RTX 3090 | |
| NVIDIA GeForce RTX 3080 Ti | |
* ... smaller is better
Professional Applications
| NVIDIA GeForce RTX 3070 Ti R9 7950X | NVIDIA GeForce RTX 4090 i9-13900K | NVIDIA GeForce RTX 3090 Ti R7 5800X3D | AMD Radeon RX 6950 XT R9 5900X | AMD Radeon RX 6800 XT R9 5950X | NVIDIA GeForce RTX 3090 i9-13900K | NVIDIA RTX A6000 TR Pro 3975WX | NVIDIA Titan RTX R9 7950X | AMD Radeon RX 7900 XT R9 7950X | AMD Radeon RX 7900 XTX R9 7950X | NVIDIA GeForce RTX 4080 i9-13900K | Average of class | |
|---|---|---|---|---|---|---|---|---|---|---|---|---|
| SPECviewperf 12 | 109% | 6% | 46% | 37% | 19% | 302% | 254% | 407% | 455% | 73% | 9% | |
| 1900x1060 Solidworks (sw-03) (fps) | 101 | 119 18% | 85.7 -15% | 157 55% | 150 49% | 106 5% | 225 123% | 207 105% | 342 239% | 360 256% | 127 26% | 89.4 ? -11% |
| 1900x1060 Siemens NX (snx-02) (fps) | 14.7 | 28.8 96% | 15.6 6% | 49.4 236% | 45.07 207% | 17.1 16% | 351 2288% | 283 1825% | 373 2437% | 400 2621% | 23.4 59% | 60.9 ? 314% |
| 1900x1060 Showcase (showcase-01) (fps) | 199 | 410 106% | 265 33% | 308 55% | 223 12% | 263 32% | 255 28% | 197 -1% | 278 40% | 322 62% | 304 53% | 103.8 ? -48% |
| 1900x1060 Medical (medical-01) (fps) | 106 | 288 172% | 87.1 -18% | 58.3 -45% | 77.3 -27% | 90 -15% | 159 50% | 101 -5% | 288 172% | 347 227% | 227 114% | 59.3 ? -44% |
| 1900x1060 Maya (maya-04) (fps) | 279 | 324 16% | 197 -29% | 90.7 -67% | 118 -58% | 306 10% | 144 -48% | 260 -7% | 347 24% | 367 32% | 310 11% | 117.8 ? -58% |
| 1900x1060 Energy (energy-01) (fps) | 18 | 82.6 359% | 27.6 53% | 23 28% | 28.39 58% | 26 44% | 39.8 121% | 28.8 60% | 72.4 302% | 85.2 373% | 57.5 219% | 16.9 ? -6% |
| 1900x1060 Creo (creo-01) (fps) | 72.6 | 122 68% | 76.4 5% | 115 58% | 119 64% | 101 39% | 136 87% | 197 171% | 176 142% | 187 158% | 118 63% | 66.7 ? -8% |
| 1900x1060 Catia (catia-04) (fps) | 136 | 274 101% | 150 10% | 199 46% | 238 75% | 177 30% | 229 68% | 332 144% | 481 254% | 536 294% | 229 68% | 113.7 ? -16% |
| 1900x1060 3ds Max (3dsmax-05) (fps) | 330 | 473 43% | 371 12% | 484 47% | 167 -49% | 369 12% | 336 2% | 315 -5% | 502 52% | 553 68% | 477 45% | 206 ? -38% |
| SPECviewperf 13 | 110% | 20% | 78% | 53% | 27% | 328% | 243% | 405% | 459% | 76% | 35% | |
| Solidworks (sw-04) (fps) | 146 | 190 30% | 118 -19% | 210 44% | 193 32% | 154 5% | 192 32% | 218 49% | 307 110% | 323 121% | 183 25% | 124.2 ? -15% |
| Siemens NX (snx-03) (fps) | 26.4 | 51.4 95% | 28 6% | 89.7 240% | 81.4 208% | 30.7 16% | 638 2317% | 512 1839% | 675 2457% | 725 2646% | 42.1 59% | 136.9 ? 419% |
| Showcase (showcase-02) (fps) | 198 | 412 108% | 265 34% | 312 58% | 232 17% | 262 32% | 255 29% | 198 0% | 279 41% | 323 63% | 305 54% | 126.3 ? -36% |
| Medical (medical-02) (fps) | 83.6 | 182 118% | 113 35% | 157 88% | 130 56% | 107 28% | 184 120% | 92 10% | 237 183% | 263 215% | 148 77% | 88.5 ? 6% |
| Maya (maya-05) (fps) | 437 | 838 92% | 493 13% | 372 -15% | 348 -20% | 580 33% | 415 -5% | 499 14% | 670 53% | 735 68% | 726 66% | 279 ? -36% |
| Energy (energy-02) (fps) | 30 | 119 297% | 48.4 61% | 60.3 101% | 58.4 95% | 45.1 50% | 132 340% | 51.8 73% | 147 390% | 187 523% | 91.7 206% | 39.7 ? 32% |
| Creo (creo-02) (fps) | 286 | 580 103% | 353 23% | 323 13% | 276 -3% | 397 39% | 366 28% | 386 35% | 567 98% | 613 114% | 544 90% | 216 ? -24% |
| Catia (catia-05) (fps) | 201 | 406 102% | 230 14% | 450 124% | 412 105% | 252 25% | 371 85% | 534 166% | 728 262% | 825 310% | 333 66% | 211 ? 5% |
| 3ds Max (3dsmax-06) (fps) | 330 | 474 44% | 373 13% | 483 46% | 284 -14% | 369 12% | 338 2% | 321 -3% | 506 53% | 564 71% | 478 45% | 197.2 ? -40% |
| SPECviewperf 2020 | 91% | 14% | 66% | 48% | 44% | 342% | 267% | 389% | 445% | 52% | 45% | |
| 3840x2160 Solidworks (solidworks-05) (fps) | 305 | 197 | 125 | 108 | 192 | 169 | 158 | 226 | 117.6 ? | |||
| 3840x2160 Siemens NX (snx-04) (fps) | 22.2 | 44 98% | 23.7 7% | 88.6 299% | 81.7 268% | 25.6 15% | 481 2067% | 375 1589% | 476 2044% | 514 2215% | 34.1 54% | 88.8 ? 300% |
| 3840x2160 Medical (medical-03) (fps) | 16.3 | 39.3 141% | 22.2 36% | 34.4 111% | 27.84 71% | 20.3 25% | 37.9 133% | 16.5 1% | 53.9 231% | 62.3 282% | 28.3 74% | 24 ? 47% |
| 3840x2160 Maya (maya-06) (fps) | 290 | 508 75% | 353 22% | 296 2% | 224 -23% | 356 23% | 329 13% | 274 -6% | 401 38% | 481 66% | 426 47% | 221 ? -24% |
| 3840x2160 Energy (energy-03) (fps) | 39.1 | 65.3 67% | 31.6 -19% | 47.6 22% | 60.8 55% | 101 158% | 63 61% | 93.9 140% | 99.6 155% | 129 230% | 45.6 17% | 50.2 ? 28% |
| 3840x2160 Creo (creo-03) (fps) | 99.3 | 142 43% | 84.5 -15% | 73.1 -26% | 65 -35% | 118 19% | 111 12% | 135 36% | 173 74% | 187 88% | 136 37% | 78.5 ? -21% |
| 3840x2160 CATIA (catia-06) (fps) | 48 | 95.6 99% | 58.6 22% | 53 10% | 42.4 -12% | 60.4 26% | 82.4 72% | 90.9 89% | 113 135% | 127 165% | 76.5 59% | 49.1 ? 2% |
| 3840x2160 3ds Max (3dsmax-07) (fps) | 99 | 213 115% | 145 46% | 144 45% | 114 15% | 143 44% | 137 38% | 118 19% | 143 44% | 167 69% | 172 74% | 85 ? -14% |
| Total Average (Program / Settings) | 103% /
104% | 13% /
13% | 63% /
63% | 46% /
46% | 30% /
29% | 324% /
323% | 255% /
254% | 400% /
401% | 453% /
453% | 67% /
68% | 30% /
29% |
Game benchmarks
In the practical test with numerous tested games, the KFA2 GeForce RTX 3070 Ti SG performs quite well and turns out to be a solid choice for 1440p gaming. The graphics card also masters older games in 2160p. Nevertheless, the VRAM capacity of only 8 GB is a sticking point in newer games. The AMD Radeon RX 6700 XT has our test sample very well under control and even the performance of an AMD Radeon RX 6800 can be surpassed in some games. With ray tracing features enabled, the gap between the two direct contenders becomes even slightly larger. Here, AMD is a generation behind, which is also true in view of the current battle between AMD Radeon RX 7900 and Nvidia GeForce RTX 4000.
For a further overview of the performance of the graphics cards we provided, we refer to our GPU comparison table.
| The Witcher 3 | |
| 3840x2160 High Graphics & Postprocessing (Nvidia HairWorks Off) | |
| NVIDIA GeForce RTX 4090 | |
| NVIDIA GeForce RTX 4080 | |
| NVIDIA GeForce RTX 3090 Ti | |
| AMD Radeon RX 7900 XTX | |
| AMD Radeon RX 7900 XT | |
| NVIDIA GeForce RTX 3090 | |
| AMD Radeon RX 6950 XT | |
| AMD Radeon RX 6900 XT | |
| AMD Radeon RX 6800 XT | |
| NVIDIA GeForce RTX 3070 Ti | |
| AMD Radeon RX 6800 | |
| AMD Radeon RX 6700 XT | |
| 1920x1080 Ultra Graphics & Postprocessing (HBAO+) | |
| NVIDIA GeForce RTX 4090 | |
| AMD Radeon RX 7900 XTX | |
| AMD Radeon RX 7900 XT | |
| NVIDIA GeForce RTX 4080 | |
| AMD Radeon RX 6950 XT | |
| NVIDIA GeForce RTX 3090 Ti (110% PT) | |
| NVIDIA GeForce RTX 3090 Ti (100% PT) | |
| NVIDIA GeForce RTX 3090 | |
| AMD Radeon RX 6900 XT | |
| AMD Radeon RX 6800 XT | |
| AMD Radeon RX 6800 | |
| NVIDIA GeForce RTX 3070 Ti | |
| AMD Radeon RX 6700 XT | |
| Metro Exodus | |
| 3840x2160 Ultra Quality AF:16x | |
| NVIDIA GeForce RTX 4090 | |
| NVIDIA GeForce RTX 4080 | |
| AMD Radeon RX 7900 XTX | |
| AMD Radeon RX 7900 XT | |
| NVIDIA GeForce RTX 3090 Ti | |
| NVIDIA GeForce RTX 3090 | |
| AMD Radeon RX 6950 XT | |
| AMD Radeon RX 6900 XT | |
| AMD Radeon RX 6800 | |
| AMD Radeon RX 6800 XT | |
| NVIDIA GeForce RTX 3070 Ti | |
| AMD Radeon RX 6700 XT | |
| 2560x1440 Ultra Quality AF:16x | |
| NVIDIA GeForce RTX 4090 | |
| NVIDIA GeForce RTX 4080 | |
| AMD Radeon RX 7900 XTX | |
| AMD Radeon RX 7900 XT | |
| NVIDIA GeForce RTX 3090 Ti | |
| NVIDIA GeForce RTX 3090 | |
| AMD Radeon RX 6950 XT | |
| AMD Radeon RX 6900 XT | |
| AMD Radeon RX 6800 XT | |
| AMD Radeon RX 6800 | |
| NVIDIA GeForce RTX 3070 Ti | |
| AMD Radeon RX 6700 XT | |
| 1920x1080 Ultra Quality AF:16x | |
| NVIDIA GeForce RTX 4090 | |
| AMD Radeon RX 7900 XTX | |
| NVIDIA GeForce RTX 4080 | |
| AMD Radeon RX 7900 XT | |
| NVIDIA GeForce RTX 3090 Ti | |
| NVIDIA GeForce RTX 3090 | |
| AMD Radeon RX 6950 XT | |
| AMD Radeon RX 6900 XT | |
| AMD Radeon RX 6800 XT | |
| AMD Radeon RX 6800 | |
| NVIDIA GeForce RTX 3070 Ti | |
| AMD Radeon RX 6700 XT | |
| Far Cry 5 | |
| 3840x2160 Ultra Preset AA:T | |
| NVIDIA GeForce RTX 4090 | |
| AMD Radeon RX 7900 XTX | |
| NVIDIA GeForce RTX 4080 | |
| AMD Radeon RX 7900 XT | |
| AMD Radeon RX 6950 XT | |
| NVIDIA GeForce RTX 3090 | |
| AMD Radeon RX 6800 XT | |
| AMD Radeon RX 6800 | |
| NVIDIA GeForce RTX 3070 Ti | |
| AMD Radeon RX 6700 XT | |
| 2560x1440 Ultra Preset AA:T | |
| NVIDIA GeForce RTX 4080 | |
| NVIDIA GeForce RTX 4090 | |
| NVIDIA GeForce RTX 3090 | |
| AMD Radeon RX 7900 XTX | |
| AMD Radeon RX 7900 XT | |
| AMD Radeon RX 6800 | |
| AMD Radeon RX 6950 XT | |
| NVIDIA GeForce RTX 3070 Ti | |
| AMD Radeon RX 6700 XT | |
| AMD Radeon RX 6800 XT | |
| 1920x1080 Ultra Preset AA:T | |
| NVIDIA GeForce RTX 4080 | |
| NVIDIA GeForce RTX 3090 | |
| NVIDIA GeForce RTX 4090 | |
| NVIDIA GeForce RTX 3070 Ti | |
| AMD Radeon RX 6800 | |
| AMD Radeon RX 7900 XTX | |
| AMD Radeon RX 7900 XT | |
| AMD Radeon RX 6700 XT | |
| AMD Radeon RX 6950 XT | |
| AMD Radeon RX 6800 XT | |
| Far Cry 6 | |
| 3840x2160 Ultra Graphics Quality + HD Textures AA:T | |
| NVIDIA GeForce RTX 4090 | |
| AMD Radeon RX 7900 XTX | |
| NVIDIA GeForce RTX 4080 | |
| AMD Radeon RX 7900 XT | |
| NVIDIA GeForce RTX 3090 Ti | |
| AMD Radeon RX 6950 XT | |
| NVIDIA GeForce RTX 3090 | |
| AMD Radeon RX 6800 | |
| AMD Radeon RX 6700 XT | |
| NVIDIA GeForce RTX 3070 Ti | |
| 2560x1440 Ultra Graphics Quality + HD Textures AA:T | |
| NVIDIA GeForce RTX 4080 | |
| AMD Radeon RX 7900 XTX | |
| NVIDIA GeForce RTX 4090 | |
| AMD Radeon RX 7900 XT | |
| NVIDIA GeForce RTX 3090 | |
| NVIDIA GeForce RTX 3090 Ti | |
| AMD Radeon RX 6800 | |
| AMD Radeon RX 6950 XT | |
| NVIDIA GeForce RTX 3070 Ti | |
| AMD Radeon RX 6700 XT | |
| 1920x1080 Ultra Graphics Quality + HD Textures AA:T | |
| AMD Radeon RX 7900 XTX | |
| NVIDIA GeForce RTX 4090 | |
| AMD Radeon RX 7900 XT | |
| NVIDIA GeForce RTX 4080 | |
| NVIDIA GeForce RTX 3090 | |
| AMD Radeon RX 6800 | |
| NVIDIA GeForce RTX 3070 Ti | |
| NVIDIA GeForce RTX 3090 Ti | |
| AMD Radeon RX 6700 XT | |
| AMD Radeon RX 6950 XT | |
| F1 22 | |
| 3840x2160 Ultra High Preset AA:T AF:16x | |
| NVIDIA GeForce RTX 4090 (928484) | |
| NVIDIA GeForce RTX 4080 (928484) | |
| AMD Radeon RX 7900 XTX (939134) | |
| AMD Radeon RX 7900 XT (939134) | |
| NVIDIA GeForce RTX 3090 (918016) | |
| AMD Radeon RX 6950 XT (905427) | |
| NVIDIA GeForce RTX 3070 Ti (939134) | |
| AMD Radeon RX 6800 (928484) | |
| AMD Radeon RX 6700 XT (939134) | |
| 2560x1440 Ultra High Preset AA:T AF:16x | |
| NVIDIA GeForce RTX 4090 (928484) | |
| NVIDIA GeForce RTX 4080 (928484) | |
| AMD Radeon RX 7900 XTX (939134) | |
| AMD Radeon RX 7900 XT (939134) | |
| NVIDIA GeForce RTX 3090 (918016) | |
| AMD Radeon RX 6950 XT (905427) | |
| NVIDIA GeForce RTX 3070 Ti (939134) | |
| AMD Radeon RX 6800 (928484) | |
| AMD Radeon RX 6700 XT (939134) | |
| 1920x1080 Ultra High Preset AA:T AF:16x | |
| NVIDIA GeForce RTX 4090 (928484) | |
| NVIDIA GeForce RTX 4080 (928484) | |
| AMD Radeon RX 7900 XTX (939134) | |
| AMD Radeon RX 7900 XT (939134) | |
| NVIDIA GeForce RTX 3090 (918016) | |
| AMD Radeon RX 6950 XT (905427) | |
| NVIDIA GeForce RTX 3070 Ti (939134) | |
| AMD Radeon RX 6800 | |
| AMD Radeon RX 6700 XT (939134) | |
| Forza Horizon 5 | |
| 3840x2160 Extreme Preset | |
| NVIDIA GeForce RTX 4090 | |
| NVIDIA GeForce RTX 4080 | |
| AMD Radeon RX 7900 XTX | |
| AMD Radeon RX 7900 XT | |
| AMD Radeon RX 6950 XT | |
| NVIDIA GeForce RTX 3090 Ti | |
| NVIDIA GeForce RTX 3090 | |
| AMD Radeon RX 6800 | |
| NVIDIA GeForce RTX 3070 Ti | |
| AMD Radeon RX 6700 XT | |
| 2560x1440 Extreme Preset | |
| NVIDIA GeForce RTX 4090 | |
| NVIDIA GeForce RTX 4080 | |
| AMD Radeon RX 7900 XTX | |
| AMD Radeon RX 7900 XT | |
| AMD Radeon RX 6950 XT | |
| NVIDIA GeForce RTX 3090 Ti | |
| NVIDIA GeForce RTX 3090 | |
| AMD Radeon RX 6800 | |
| NVIDIA GeForce RTX 3070 Ti | |
| AMD Radeon RX 6700 XT | |
| 1920x1080 Extreme Preset | |
| NVIDIA GeForce RTX 4090 | |
| NVIDIA GeForce RTX 4080 | |
| AMD Radeon RX 7900 XTX | |
| AMD Radeon RX 7900 XT | |
| AMD Radeon RX 6950 XT | |
| NVIDIA GeForce RTX 3090 Ti | |
| NVIDIA GeForce RTX 3090 | |
| AMD Radeon RX 6800 | |
| NVIDIA GeForce RTX 3070 Ti | |
| AMD Radeon RX 6700 XT | |
| Cyberpunk 2077 1.6 | |
| 3840x2160 Ultra Preset | |
| NVIDIA GeForce RTX 4090 (1.6) | |
| AMD Radeon RX 7900 XTX (1.61) | |
| NVIDIA GeForce RTX 4080 (1.6) | |
| AMD Radeon RX 7900 XT (1.61) | |
| NVIDIA GeForce RTX 3090 Ti (1.52) | |
| AMD Radeon RX 6950 XT | |
| AMD Radeon RX 6800 (1.61) | |
| NVIDIA GeForce RTX 3070 Ti (1.61) | |
| AMD Radeon RX 6700 XT (1.61) | |
| 2560x1440 Ultra Preset | |
| NVIDIA GeForce RTX 4090 (1.6) | |
| AMD Radeon RX 7900 XTX (1.61) | |
| NVIDIA GeForce RTX 4080 (1.6) | |
| AMD Radeon RX 7900 XT (1.61) | |
| NVIDIA GeForce RTX 3090 Ti (1.52) | |
| AMD Radeon RX 6950 XT | |
| AMD Radeon RX 6800 (1.61) | |
| NVIDIA GeForce RTX 3070 Ti (1.61) | |
| AMD Radeon RX 6700 XT (1.61) | |
| 1920x1080 Ultra Preset | |
| NVIDIA GeForce RTX 4090 (1.6) | |
| AMD Radeon RX 7900 XTX (1.61) | |
| NVIDIA GeForce RTX 4080 (1.6) | |
| AMD Radeon RX 7900 XT (1.61) | |
| NVIDIA GeForce RTX 3090 Ti (1.52) | |
| AMD Radeon RX 6800 (1.61) | |
| NVIDIA GeForce RTX 3070 Ti (1.61) | |
| AMD Radeon RX 6700 XT (1.61) | |
| AMD Radeon RX 6950 XT | |
| A Plague Tale Requiem | |
| 1920x1080 Ultra Preset | |
| AMD Radeon RX 7900 XTX | |
| AMD Radeon RX 7900 XT | |
| NVIDIA GeForce RTX 3070 Ti | |
| AMD Radeon RX 6800 | |
| AMD Radeon RX 6700 XT | |
| 3840x2160 Ultra Preset | |
| AMD Radeon RX 7900 XTX | |
| AMD Radeon RX 7900 XT | |
| NVIDIA GeForce RTX 3070 Ti | |
| AMD Radeon RX 6800 | |
| AMD Radeon RX 6700 XT | |
| 2560x1440 Ultra Preset | |
| AMD Radeon RX 7900 XTX | |
| AMD Radeon RX 7900 XT | |
| NVIDIA GeForce RTX 3070 Ti | |
| AMD Radeon RX 6800 | |
| AMD Radeon RX 6700 XT | |
| Spider-Man Miles Morales - 1920x0180 Very High Preset + Ray-Tracing AA:T | |
| NVIDIA GeForce RTX 4090 | |
| AMD Radeon RX 7900 XTX | |
| NVIDIA GeForce RTX 3080 Ti | |
| AMD Radeon RX 7900 XT | |
| NVIDIA GeForce RTX 3070 Ti | |
| AMD Radeon RX 6800 | |
| AMD Radeon RX 6700 XT | |
| Metro Exodus - 1920x1080 Ultra Quality DXR AF:16x | |
| NVIDIA GeForce RTX 4090 | |
| AMD Radeon RX 7900 XTX | |
| NVIDIA GeForce RTX 4080 | |
| AMD Radeon RX 7900 XT | |
| NVIDIA GeForce RTX 3080 Ti | |
| NVIDIA GeForce RTX 3090 | |
| NVIDIA GeForce RTX 3070 Ti | |
| Far Cry 6 - 1920x1080 Ultra Graphics Quality + HD Textures + DXR AA:T | |
| NVIDIA GeForce RTX 4080 | |
| AMD Radeon RX 7900 XTX | |
| AMD Radeon RX 7900 XT | |
| NVIDIA GeForce RTX 4090 | |
| NVIDIA GeForce RTX 3080 Ti | |
| NVIDIA GeForce RTX 3090 | |
| AMD Radeon RX 6800 | |
| AMD Radeon RX 6950 XT | |
| AMD Radeon RX 6700 XT | |
| NVIDIA GeForce RTX 3070 Ti | |
| Cyberpunk 2077 1.6 | |
| 3840x2160 Ray Tracing Ultra Preset (DLSS off) | |
| NVIDIA GeForce RTX 4090 (1.6) | |
| NVIDIA GeForce RTX 4080 (1.6) | |
| NVIDIA GeForce RTX 3090 (1.6) | |
| AMD Radeon RX 7900 XTX (1.61) | |
| NVIDIA GeForce RTX 3080 Ti (1.61) | |
| AMD Radeon RX 7900 XT (1.61) | |
| AMD Radeon RX 6800 (1.61) | |
| AMD Radeon RX 6700 XT (1.61) | |
| NVIDIA GeForce RTX 3070 Ti (1.61) | |
| 1920x1080 Ray Tracing Ultra Preset (DLSS off) | |
| NVIDIA GeForce RTX 4090 (1.6) | |
| NVIDIA GeForce RTX 4080 (1.6) | |
| NVIDIA GeForce RTX 3080 Ti (1.61) | |
| NVIDIA GeForce RTX 3090 (1.6) | |
| AMD Radeon RX 7900 XTX (1.61) | |
| AMD Radeon RX 7900 XT (1.61) | |
| NVIDIA GeForce RTX 3070 Ti (1.61) | |
| AMD Radeon RX 6800 (1.61) | |
| AMD Radeon RX 6700 XT (1.61) | |
| The Callisto Protocol - 1920x1080 Ultra Preset (without FSR Upscaling) + Full Ray-Tracing | |
| AMD Radeon RX 7900 XTX | |
| NVIDIA GeForce RTX 4090 | |
| AMD Radeon RX 7900 XT | |
| NVIDIA GeForce RTX 3080 Ti | |
| AMD Radeon RX 6800 | |
| NVIDIA GeForce RTX 3070 Ti | |
| AMD Radeon RX 6700 XT | |
| low | med. | high | ultra | QHD | 4K DLSS | 4K | |
|---|---|---|---|---|---|---|---|
| GTA V (2015) | 188 | 187.9 | 186.9 | 159.1 | 137.3 | 147.3 | |
| The Witcher 3 (2015) | 697 | 475 | 292 | 146.8 | 109.1 | ||
| Dota 2 Reborn (2015) | 298.5 | 264.5 | 249 | 230.1 | 193.5 | ||
| Final Fantasy XV Benchmark (2018) | 235 | 204 | 148.9 | 112.7 | 64.9 | ||
| X-Plane 11.11 (2018) | 219 | 192 | 149.6 | 126.9 | |||
| Far Cry 5 (2018) | 243 | 206 | 196 | 183 | 150 | 82 | |
| Strange Brigade (2018) | 703 | 398 | 316 | 274 | 205 | 119 | |
| Shadow of the Tomb Raider (2018) | 325 | 228 | 207 | 190.1 | 132.5 | 72.8 | |
| Far Cry New Dawn (2019) | 197 | 172 | 166 | 148 | 134 | 84 | |
| Metro Exodus (2019) | 285 | 183.8 | 139.9 | 109.8 | 87.9 | 55.9 | |
| Borderlands 3 (2019) | 240 | 209 | 165.2 | 131.8 | 95.9 | 53 | |
| F1 2020 (2020) | 556 | 427 | 352 | 243 | 183.8 | 104.8 | |
| F1 2021 (2021) | 649 | 486 | 379 | 183.9 | 135 | 76.7 | |
| Far Cry 6 (2021) | 215 | 181.9 | 160.3 | 144.1 | 112.8 | 16 | |
| Forza Horizon 5 (2021) | 303 | 210 | 196 | 121 | 102 | 70 | |
| God of War (2022) | 194.9 | 163.8 | 132.9 | 94.2 | 81 | 56.4 | |
| GRID Legends (2022) | 317 | 285 | 248 | 185.6 | 175.6 | 99.6 | |
| Cyberpunk 2077 1.6 (2022) | 174.2 | 138.2 | 121 | 111.1 | 72.7 | 35.5 | |
| Tiny Tina's Wonderlands (2022) | 313 | 247 | 168.5 | 129.9 | 92.1 | 50.8 | |
| F1 22 (2022) | 409 | 397 | 299 | 96.1 | 61 | 29.8 | |
| The Quarry (2022) | 234 | 174.3 | 143.5 | 115.6 | 81.1 | 44.4 | |
| FIFA 23 (2022) | 318 | 272 | 226 | 224 | 193.5 | 116.1 | |
| A Plague Tale Requiem (2022) | 167.1 | 129.1 | 95.8 | 75.5 | 52.8 | 30.5 | |
| Uncharted Legacy of Thieves Collection (2022) | 106.2 | 104.4 | 100.4 | 96.4 | 77.4 | 38.5 | |
| Call of Duty Modern Warfare 2 2022 (2022) | 151 | 143 | 115 | 113 | 81 | 78 | 50 |
| Spider-Man Miles Morales (2022) | 175.9 | 162.5 | 151.3 | 143.3 | 110.7 | 58.3 | |
| The Callisto Protocol (2022) | 195 | 159 | 104 | 103 | 78 | 46.7 | |
| Need for Speed Unbound (2022) | 187.9 | 176.6 | 153.8 | 129.8 | 98.7 | 55.8 |
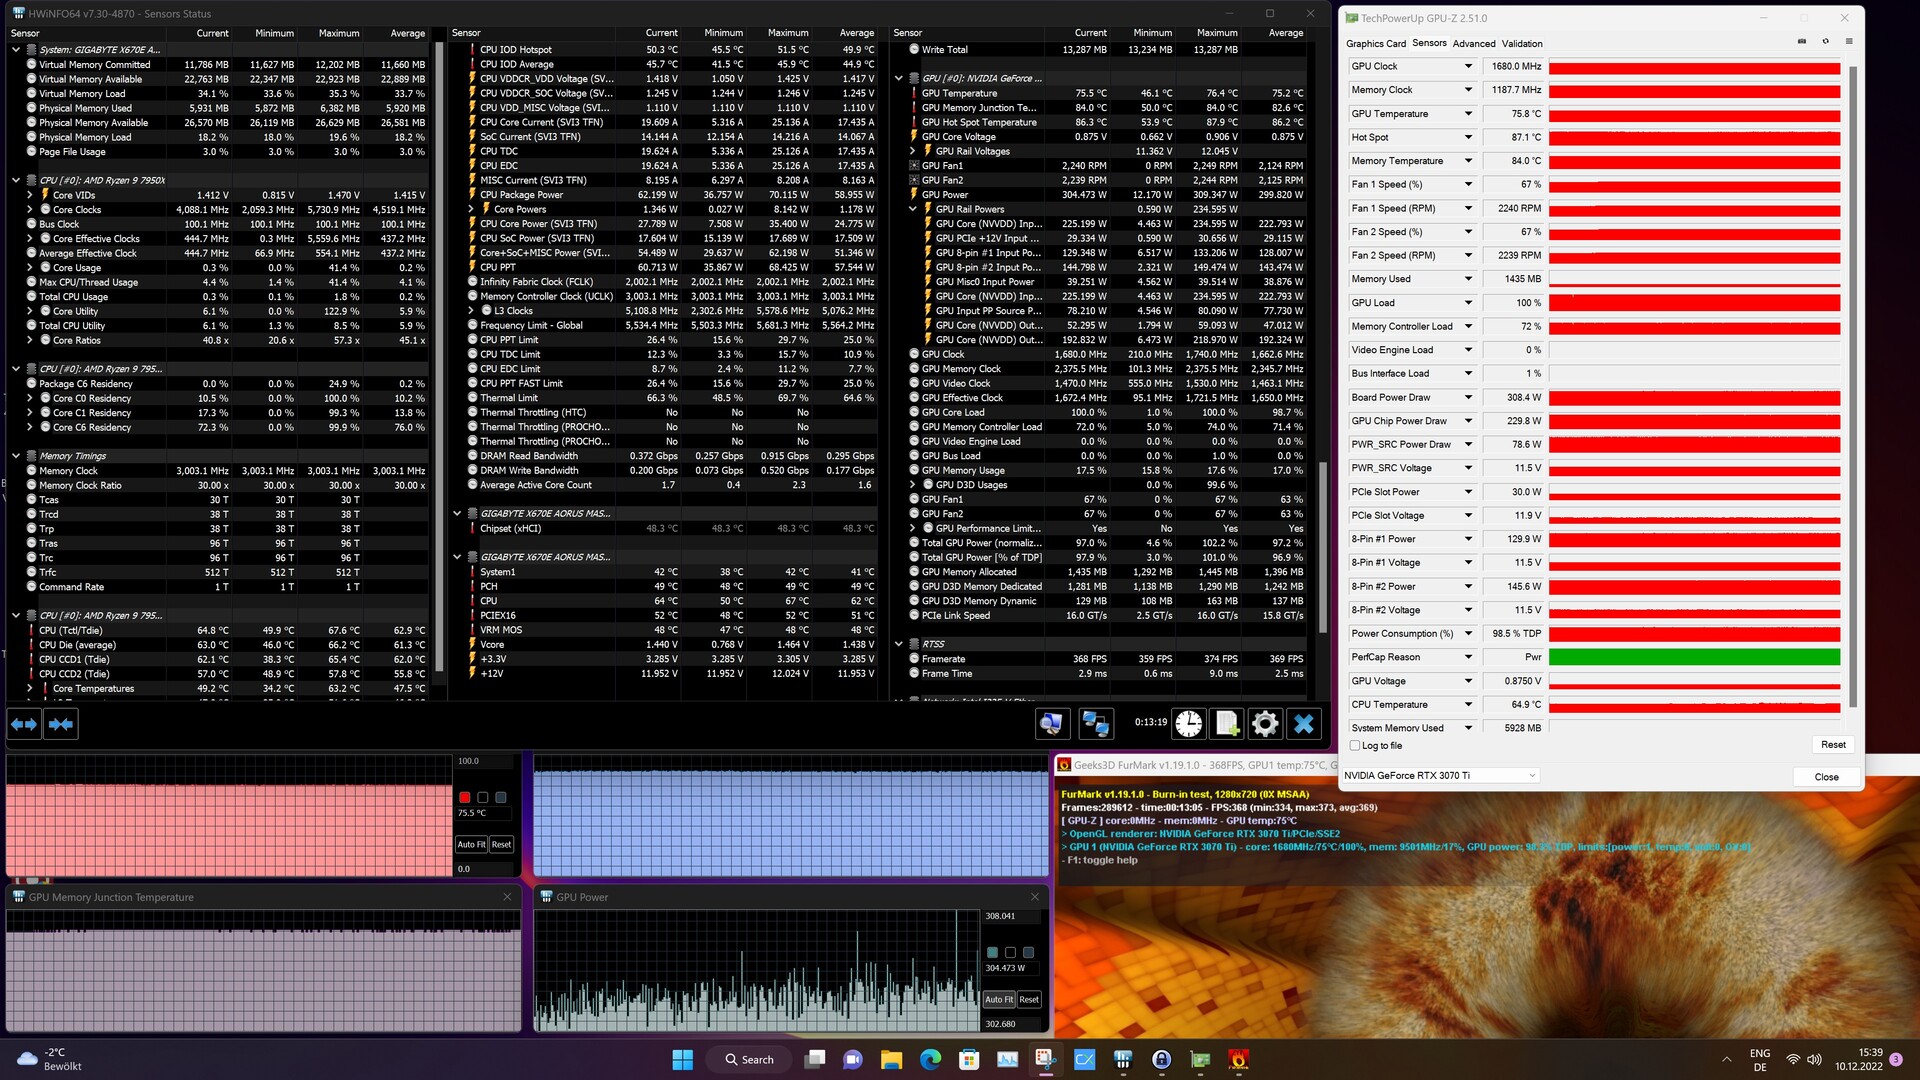
Emissions of the KFA2 GeForce RTX 3070 Ti SG
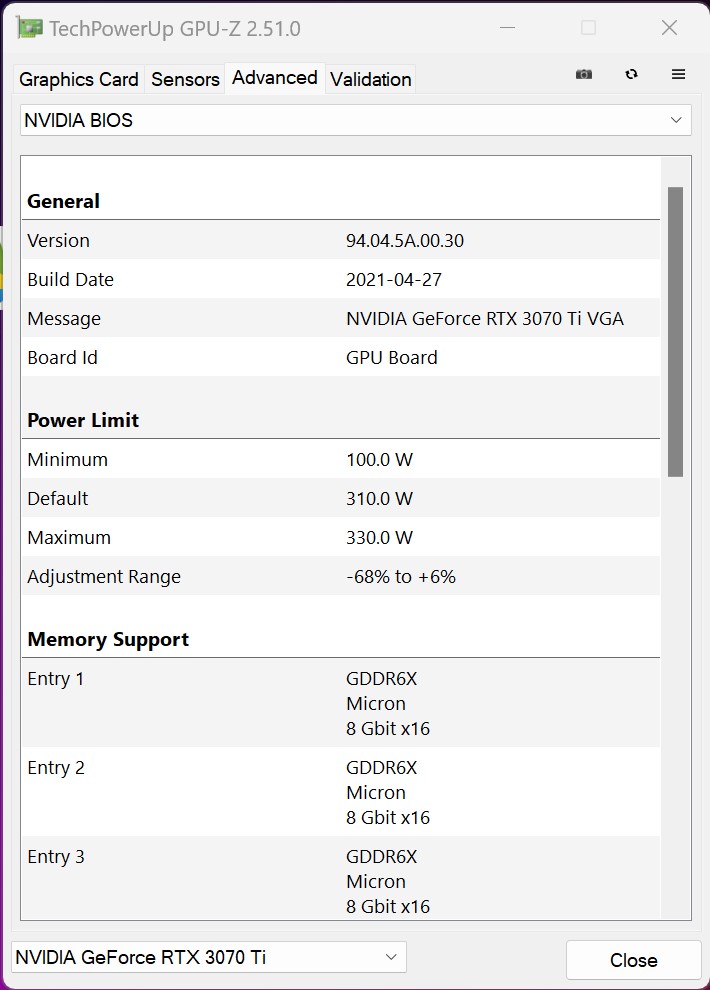
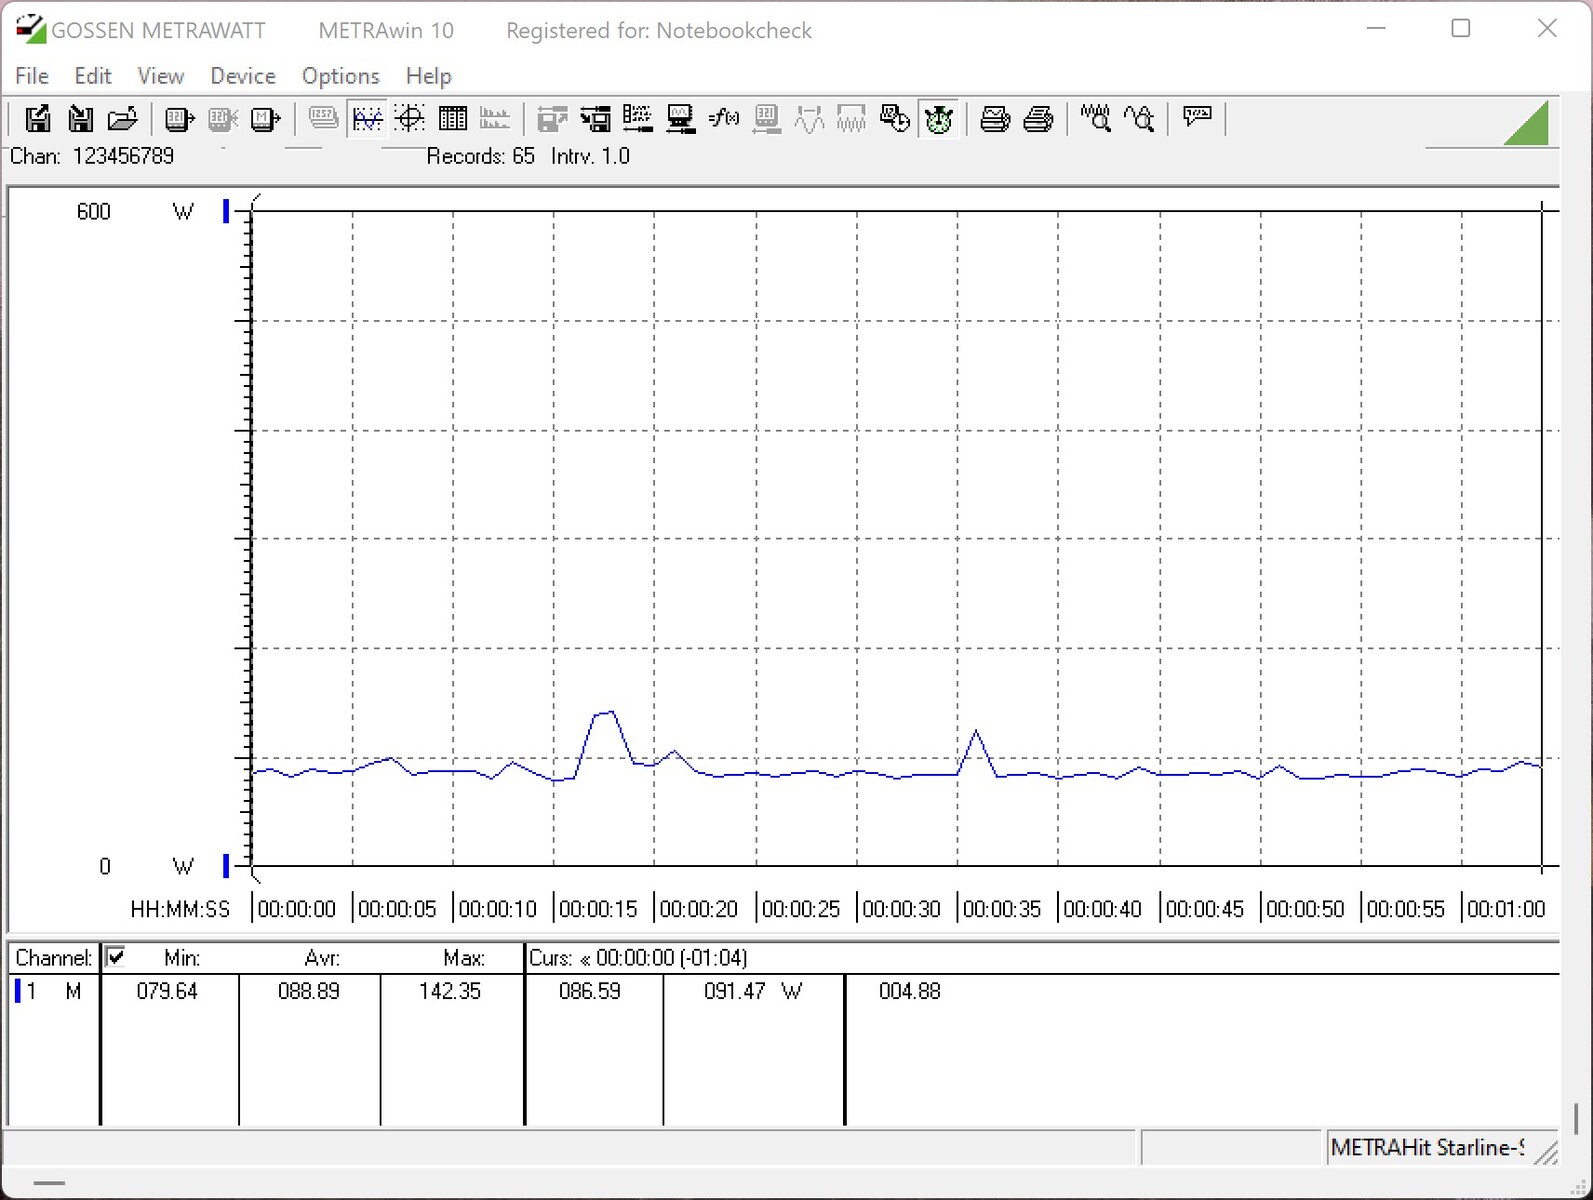
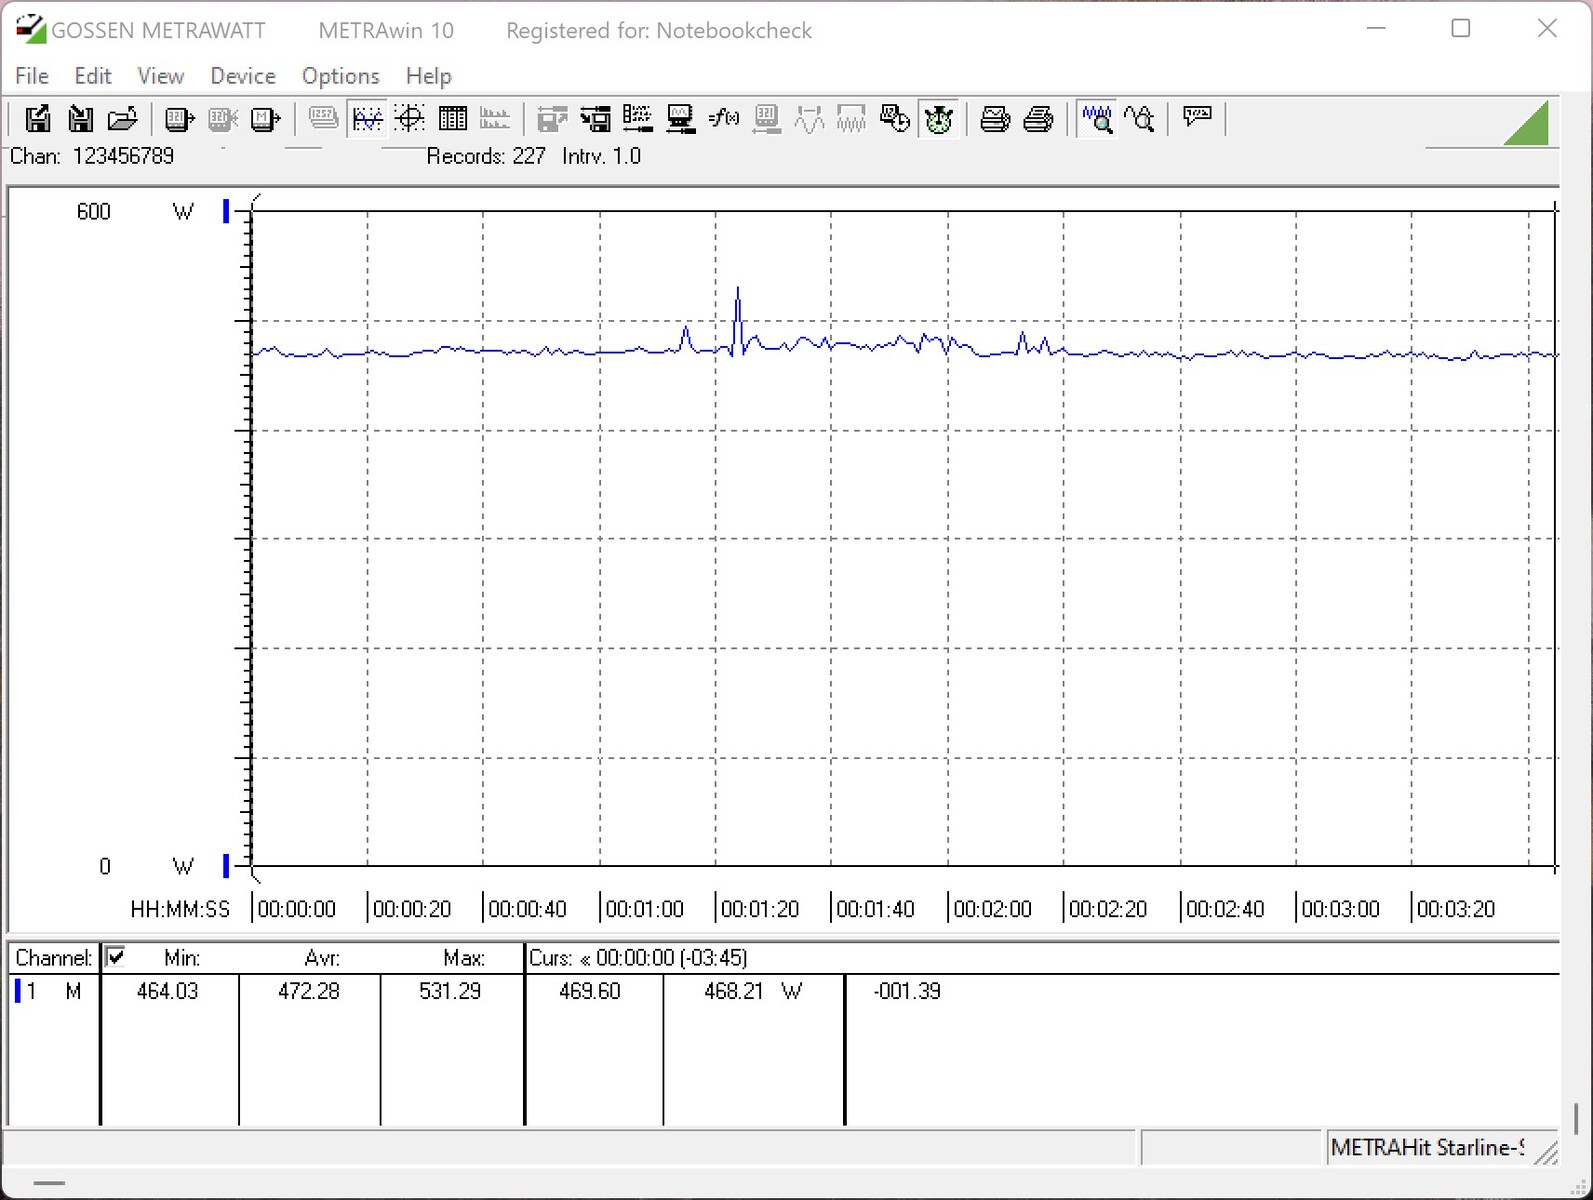
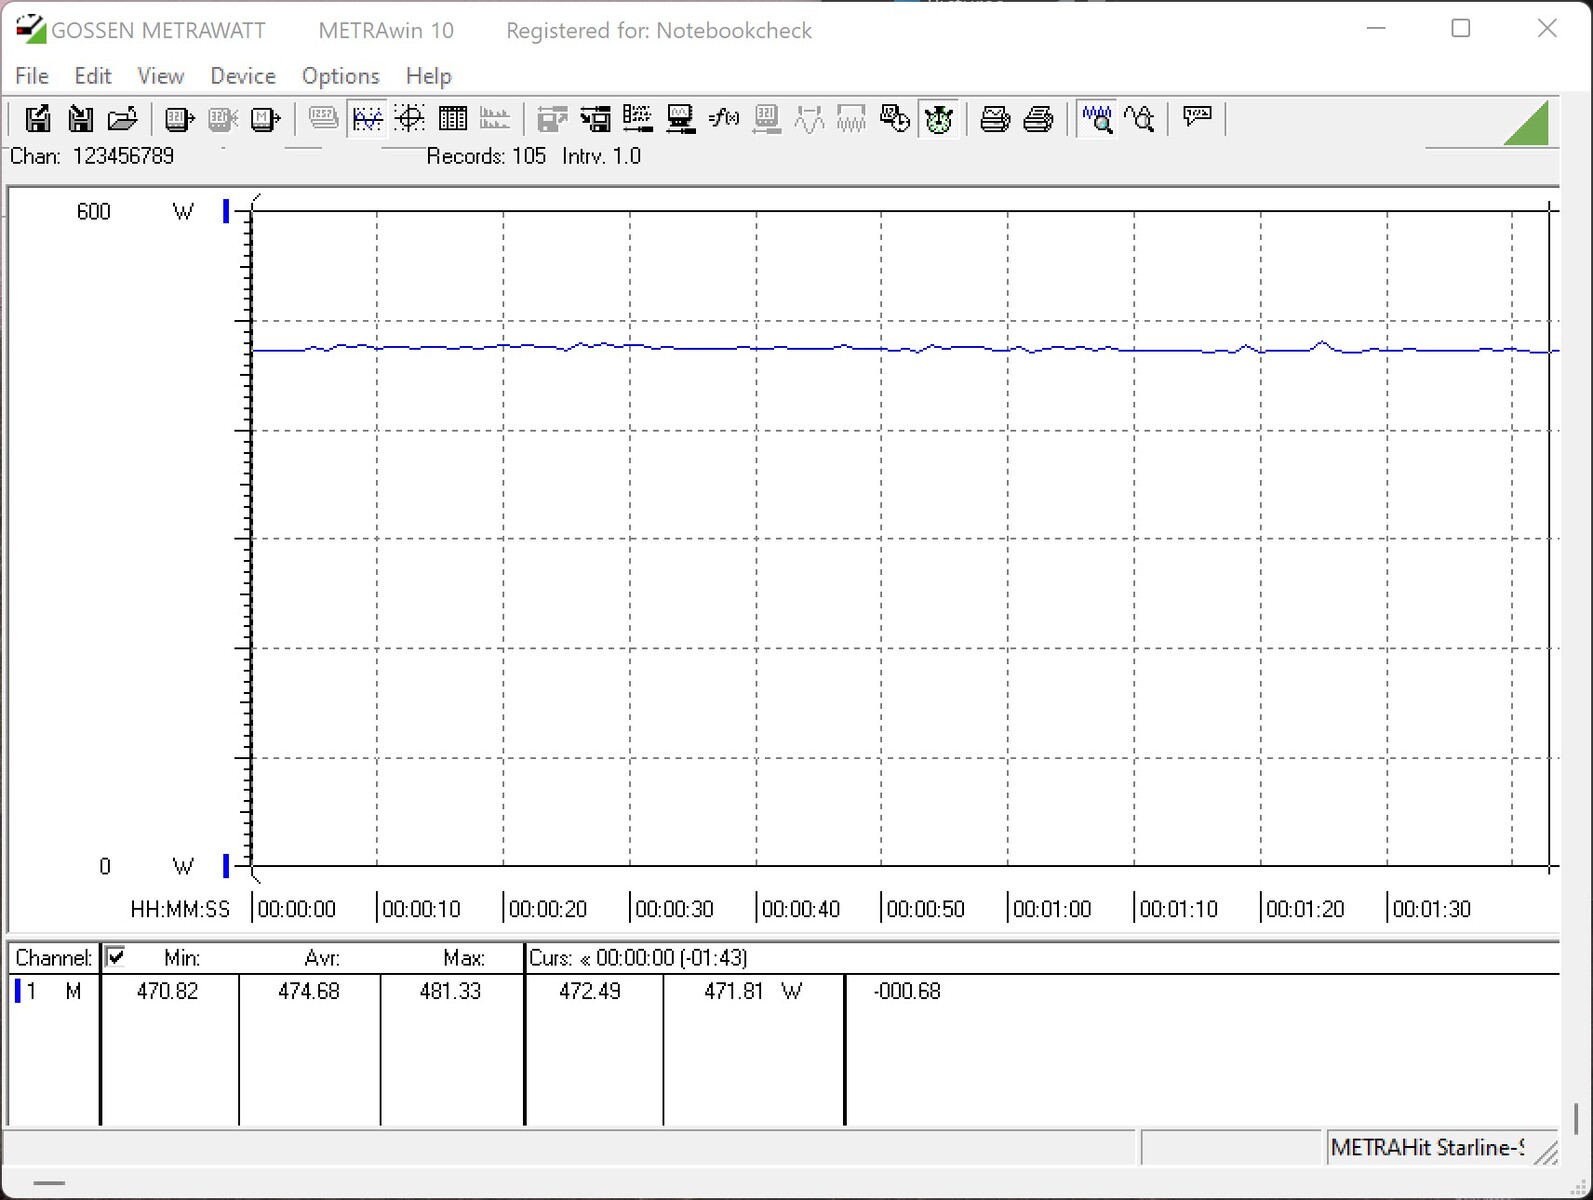
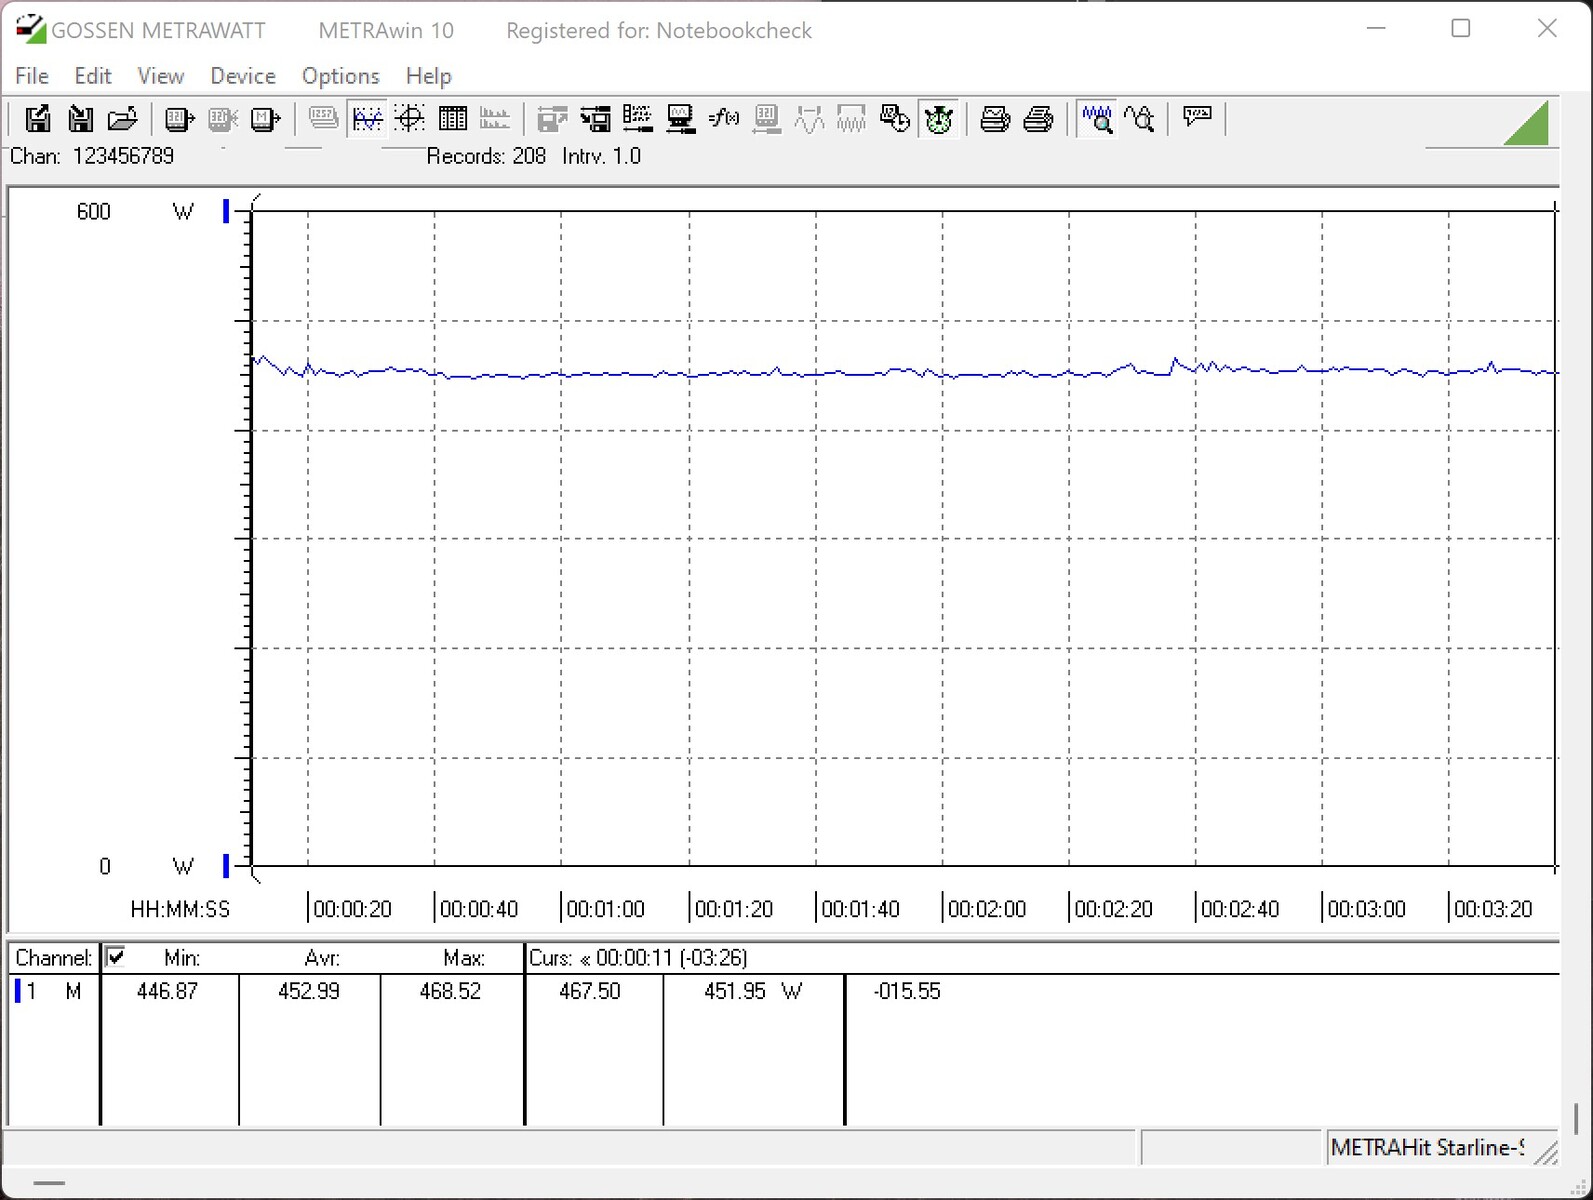
Nvidia specifies a maximum power consumption of 290 watts for the GeForce RTX 3070 Ti. KFA2 is no exception and adheres to this specification with the model we tested. In the test, this results in a total system power consumption of 472 watts in the stress test. The same system based on the new RDNA 3 graphics cards requires slightly more with 513 watts. We measured a similar consumption of 453 watts in gaming mode.
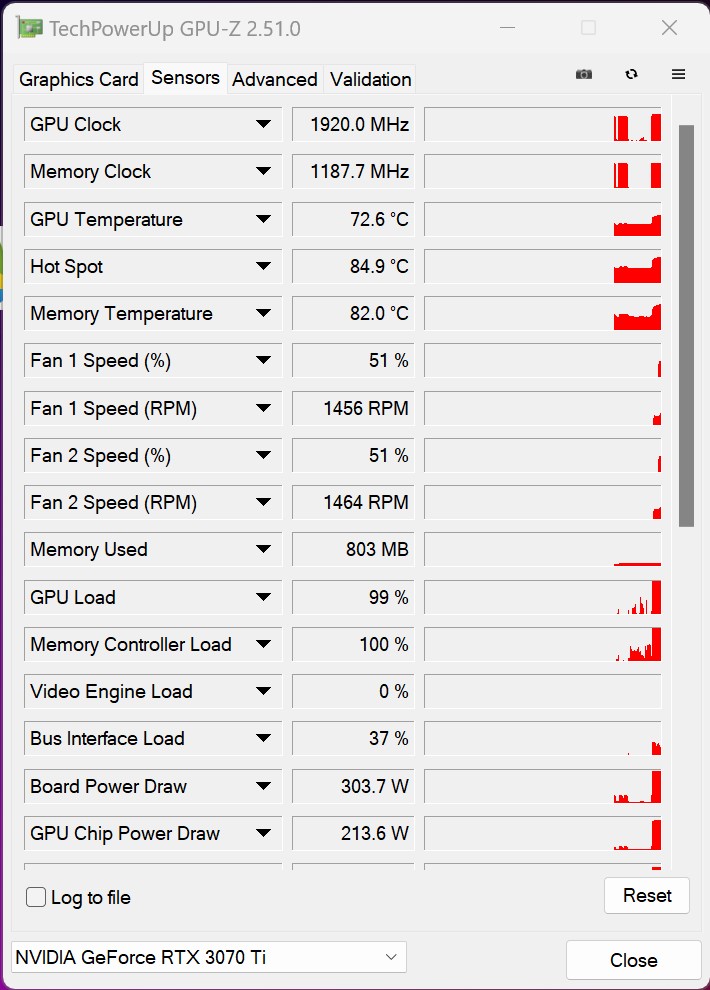
The temperatures do not reach critical ranges at any time, which would have surprised us due to the large cooler. The cooler, which is equipped with three axial fans, manages to keep the graphics chip at just under 76 °C. The VRAM only gets marginally warmer at 84 °C. With just over 2200 rpm, the fans still provide an audible noise under load. During the stress test, the sound pressure level is 44.8 dB(A) when the case is open, although the display shows about more than 43 dB(A) when gaming. Thanks to the fan-stop mode, the fans stand still without load.
| Power Consumption / FurMark 1.19 GPU Stress Test (external Monitor) | |
| NVIDIA GeForce RTX 4090 | |
| AMD Radeon RX 6950 XT | |
| AMD Radeon RX 7900 XTX (Idle: 86.5 W) | |
| NVIDIA GeForce RTX 3080 Ti (Idle: 78.2 W) | |
| AMD Radeon RX 7900 XT (Idle: 84.6 W) | |
| NVIDIA GeForce RTX 3070 Ti (Idle: 88.9 W) | |
| NVIDIA GeForce RTX 4080 (Idle: 78.45 W) | |
| NVIDIA GeForce RTX 4080 (Idle: 78.45 W) | |
| AMD Radeon RX 6800 (Idle: 81.4 W) | |
| AMD Radeon RX 6700 XT (Idle: 77.1 W) | |
| Power Consumption / The Witcher 3 ultra (external Monitor) | |
| AMD Radeon RX 6950 XT | |
| AMD Radeon RX 7900 XTX (Idle: 86.5 W) | |
| NVIDIA GeForce RTX 3090 (Idle: 95.2 W) | |
| NVIDIA GeForce RTX 4090 | |
| NVIDIA GeForce RTX 3080 Ti (Idle: 78.2 W) | |
| NVIDIA GeForce RTX 4080 (Idle: 78.45 W) | |
| NVIDIA GeForce RTX 4080 (Idle: 78.45 W) | |
| AMD Radeon RX 7900 XT (Idle: 84.6 W) | |
| NVIDIA GeForce RTX 3070 Ti (Idle: 88.9 W) | |
| AMD Radeon RX 6800 (Idle: 81.4 W) | |
| AMD Radeon RX 6700 XT (Idle: 77.1 W) | |
* ... smaller is better
Noise level
| Idle |
| 31.1 / 31.1 / 31.1 dB(A) |
| Load |
| 31.2 / 44.8 dB(A) |
 | ||
30 dB silent 40 dB(A) audible 50 dB(A) loud |
||
min: | ||
Pros
Cons
Verdict - Good mid-range, but also not cheap

With the KFA2 GeForce RTX 3070 Ti SG, we have taken a closer look at a still current graphics card of the last generation from Nvidia. Of course, the performance cannot keep up with today's high-end models, which is not the goal at all. Nevertheless, the performance of the GeForce RTX 3070 Ti is still on a good level, even though the graphics card saw the light of day more than a year ago. Thus, users who do not want to spend a lot of money on expensive top models will have to buy the previous generation. In view of the VRAM configuration, however, future-proofing is not a given. Only 8 GB VRAM is often the problem and in case of insufficient memory capacity, the frame rates drop significantly. However, DLSS or FSR can be used to counteract this and playable frame rates can be expected here as well. If you do not want to use upscaling functions, you should use the Nvidia GeForce RTX 3070 Ti primarily for 1,080p or 1,440p gaming. The graphics card consistently achieves good frame rates and is often faster than an AMD Radeon RX 6800, which is equipped with 16 GB of VRAM.
The ray tracing features can be used if you are satisfied with Full HD here. Nvidia has the biggest advantage over AMD here and the performance advantage compared to the AMD Radeon RX 6800 grows a bit.
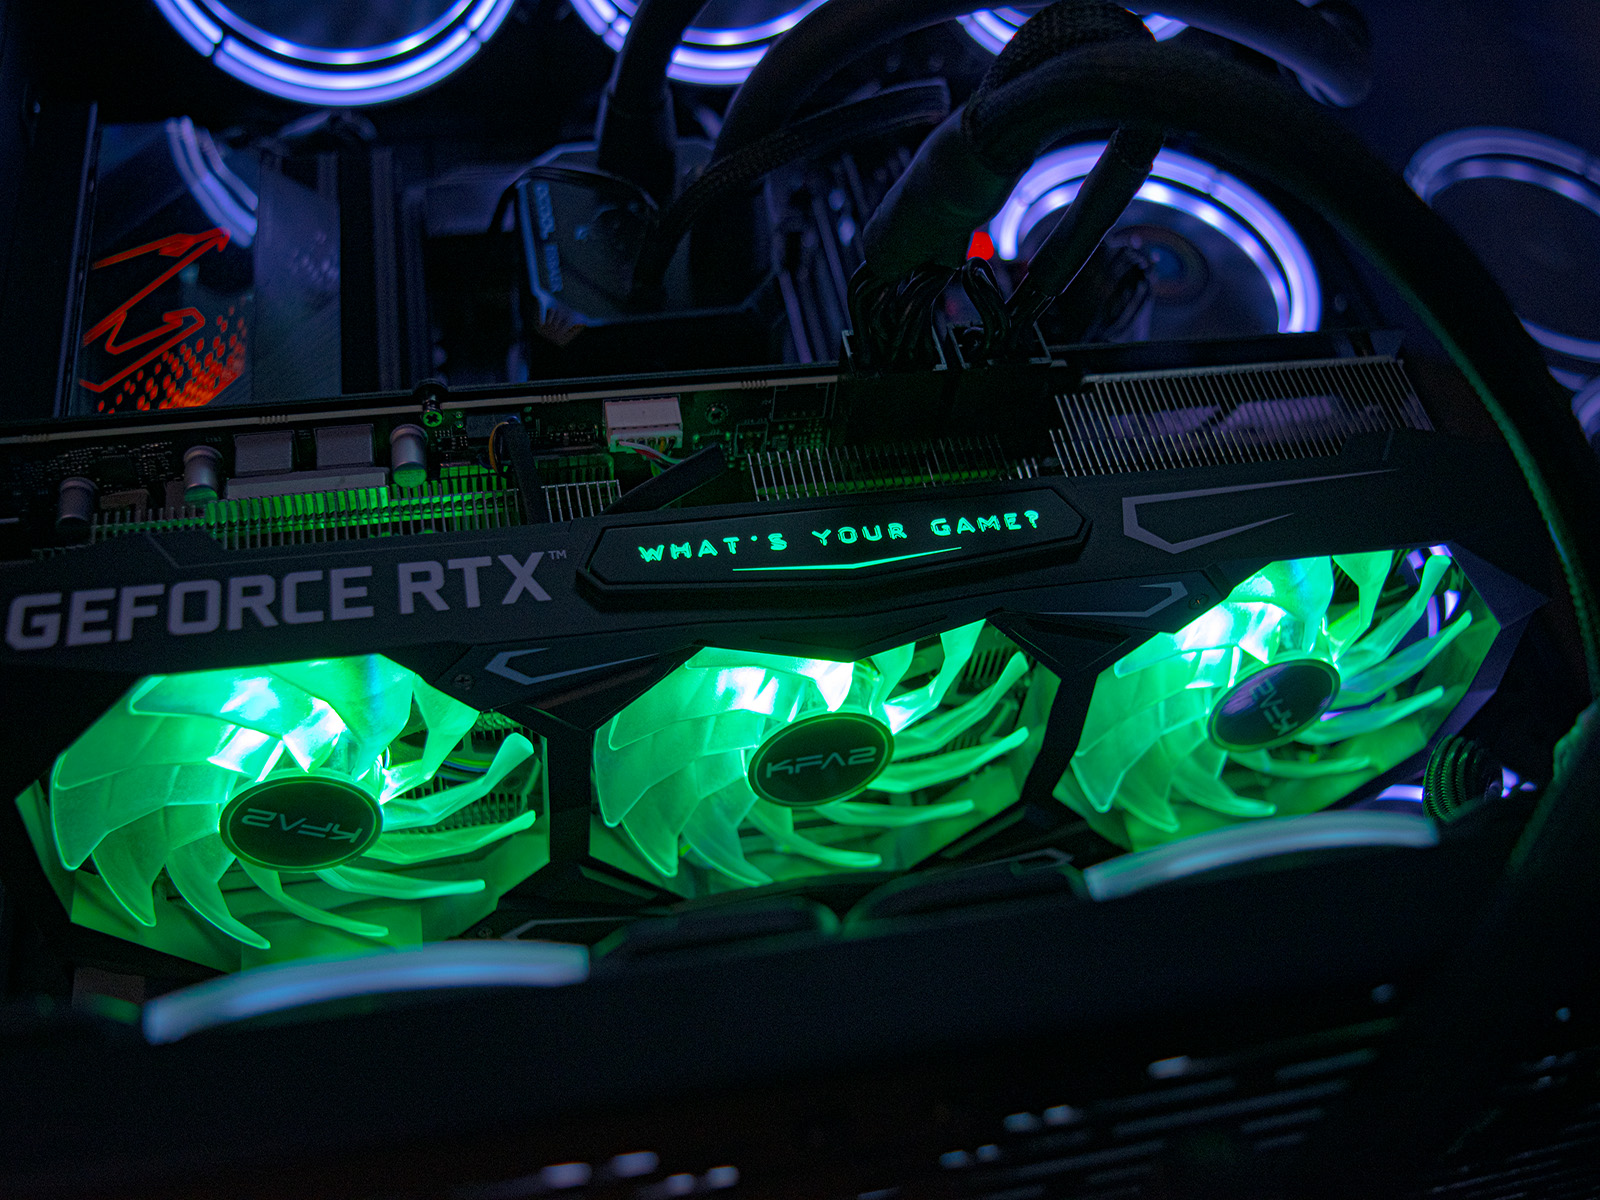
The KFA2 GeForce RTX 3070 Ti SG still offers plenty of performance to play demanding games.
The model from KFA2 used here in the test does not only differ optically from the Founders Edition. The boost clock is higher with up to 1,800 MHz and can also be increased to 1,815 MHz via the 1-Click function. However, the changes were not measurable in the test, which means that we consider this function to be pure marketing. Moreover, the maximum boost is usually exceeded anyway. The installed cooler is good and cools the graphics card reliably. Visually, there is a lot of RGB lighting, which makes the graphics card particularly suitable for use in a case with a viewing window. The graphics card is quietly audible under load. The KFA2 GeForce RTX 3070 Ti SG masters 2D operation completely silently thanks to fan-stop mode.
Prices and availability
The Nvidia GeForce RTX 3070 Ti is currently available for 670 Euros at Notebooksbilliger.de but in form of the model from Inno3D. The model from KFA2 used here currently costs 770 Euros, and other models can be purchased for 810 Euros at Amazon.

