Notebookcheck Logo

MSI GeForce RTX 4060 Ti desktop graphics card review: The mid-range GPU that is larger than an RTX 4090

Extremely efficient! The release of the Nvidia GeForce RTX 4060 Ti marks Nvidia's next model based on top-of-the-range Ada Lovelace architecture. In this review, you can read about how well the model performed with the MSI GeForce RTX 4060 Ti Gaming X Trio, with the help of a range of benchmarks.
MSI GeForce RTX 4060 Ti Gaming X Trio 8G
The MSI GeForce RTX 4060 Ti Gaming X Trio 8G's external ports

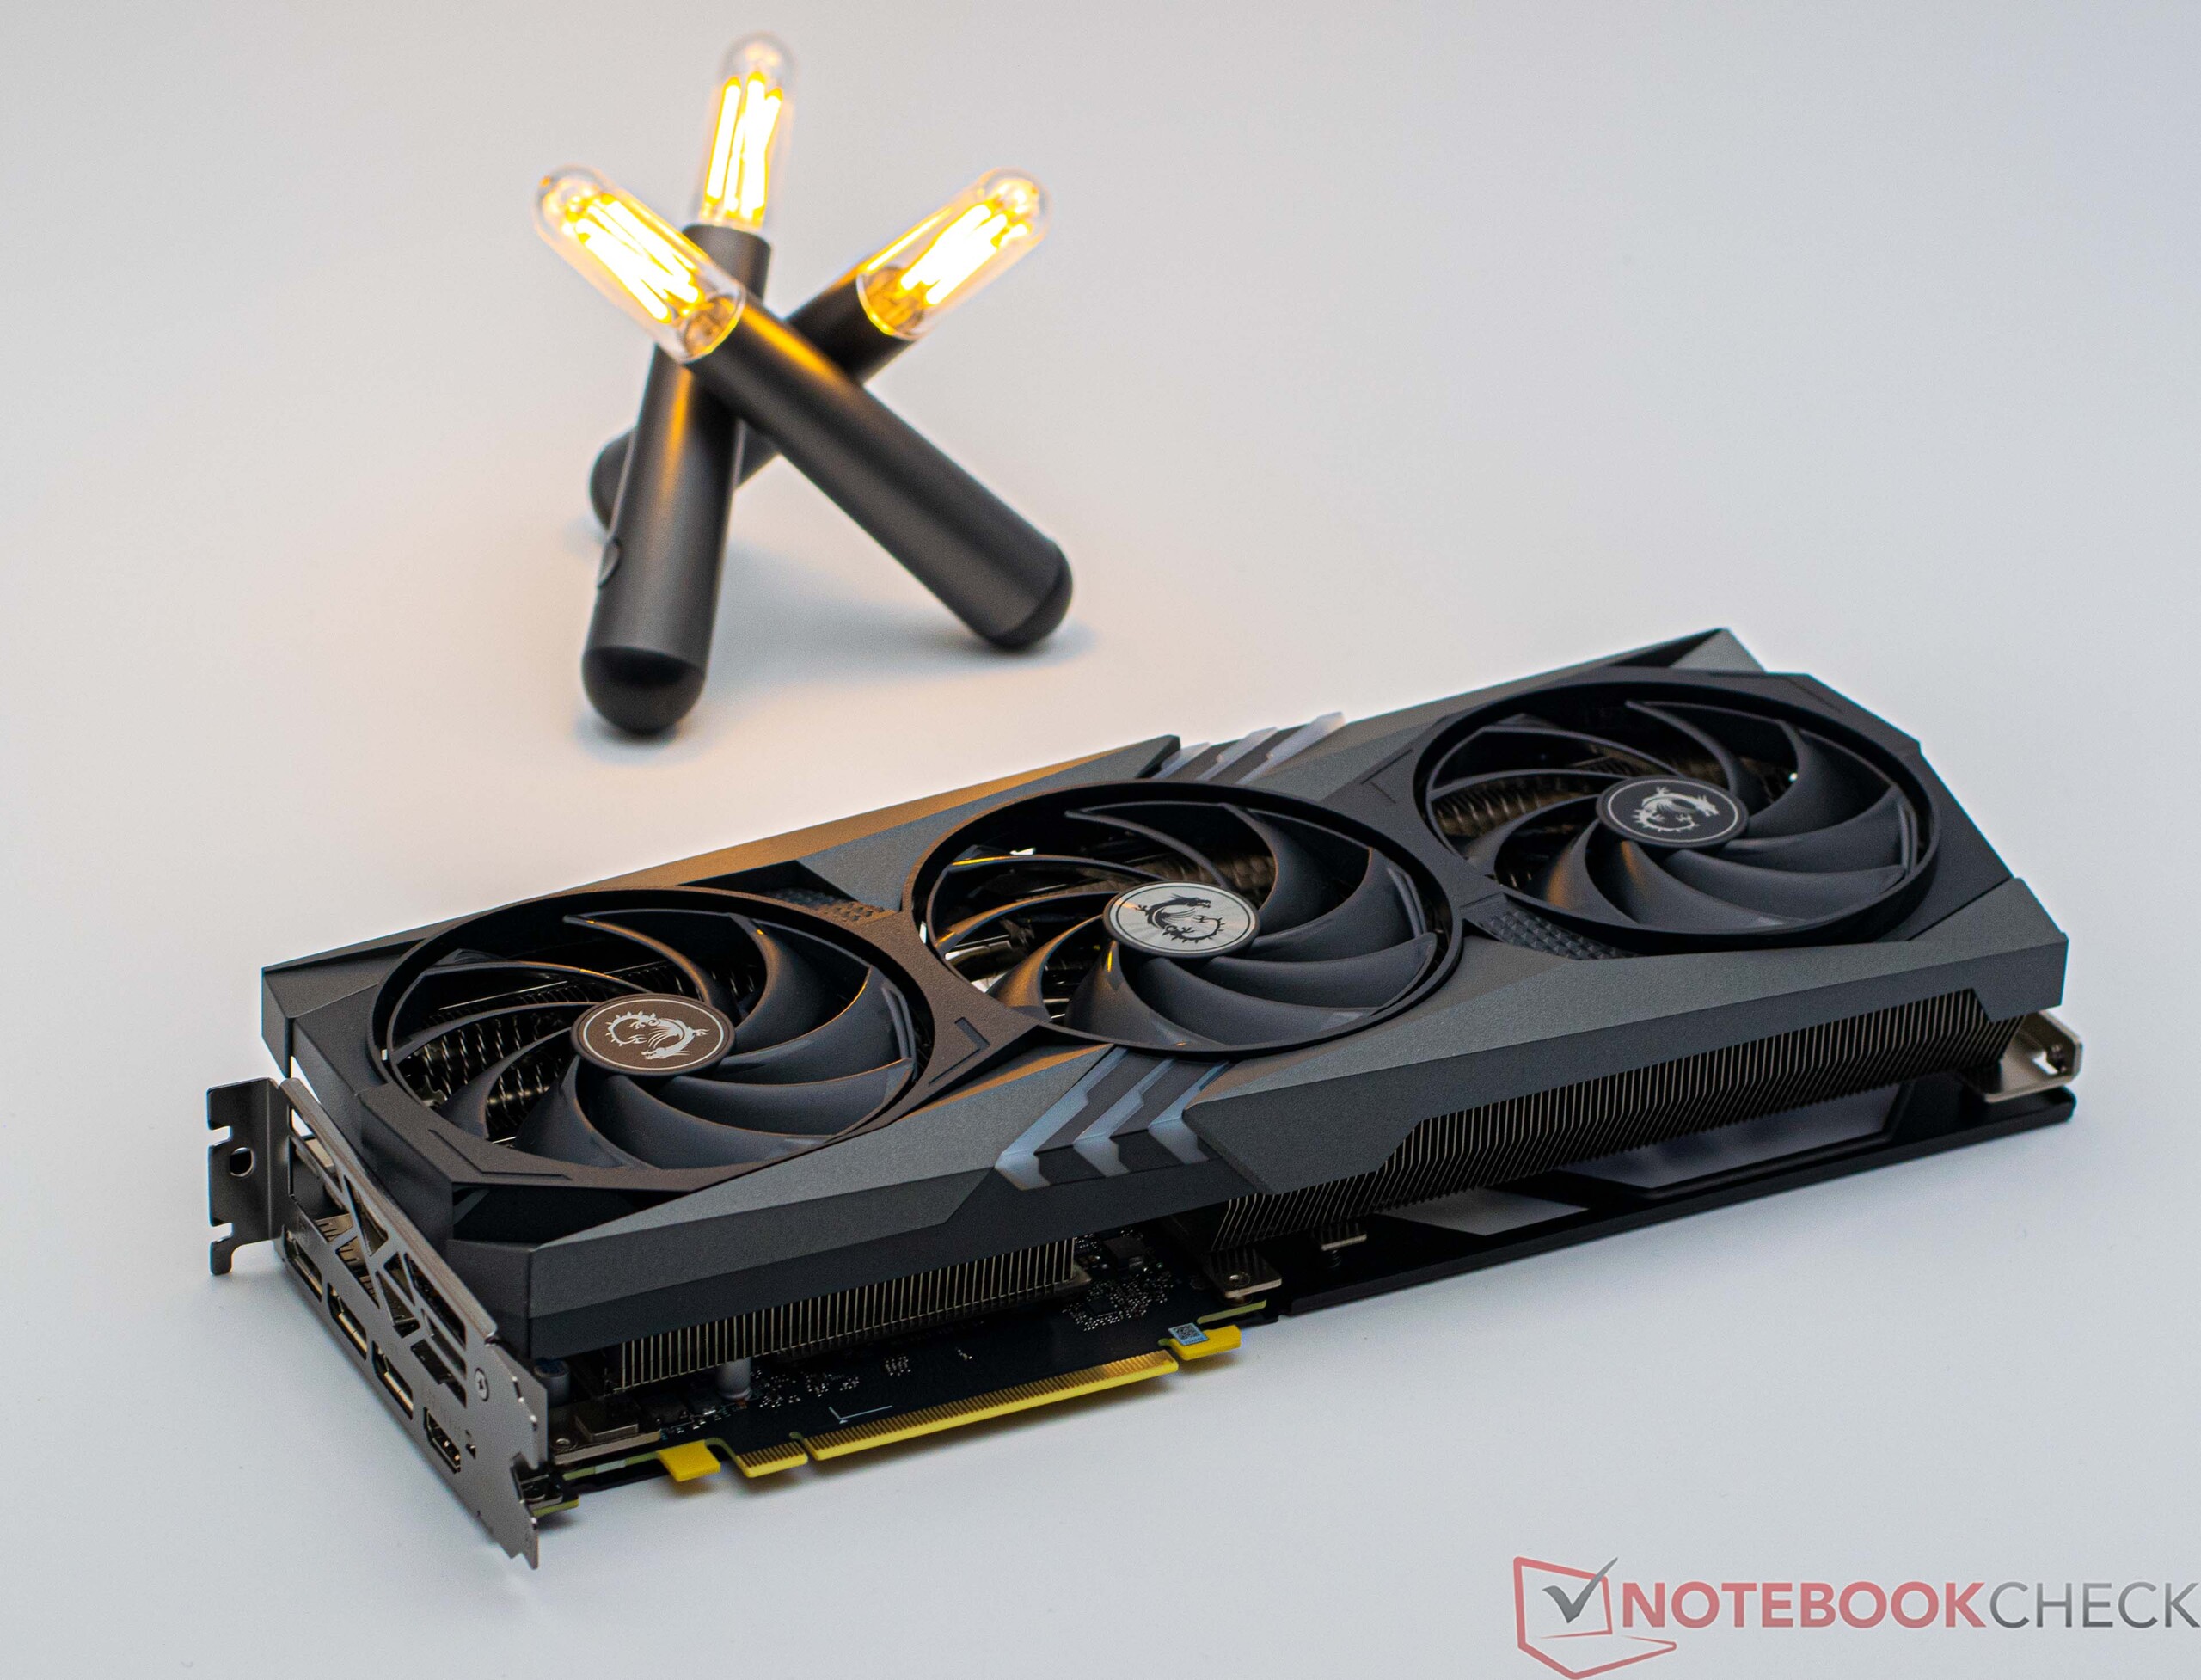
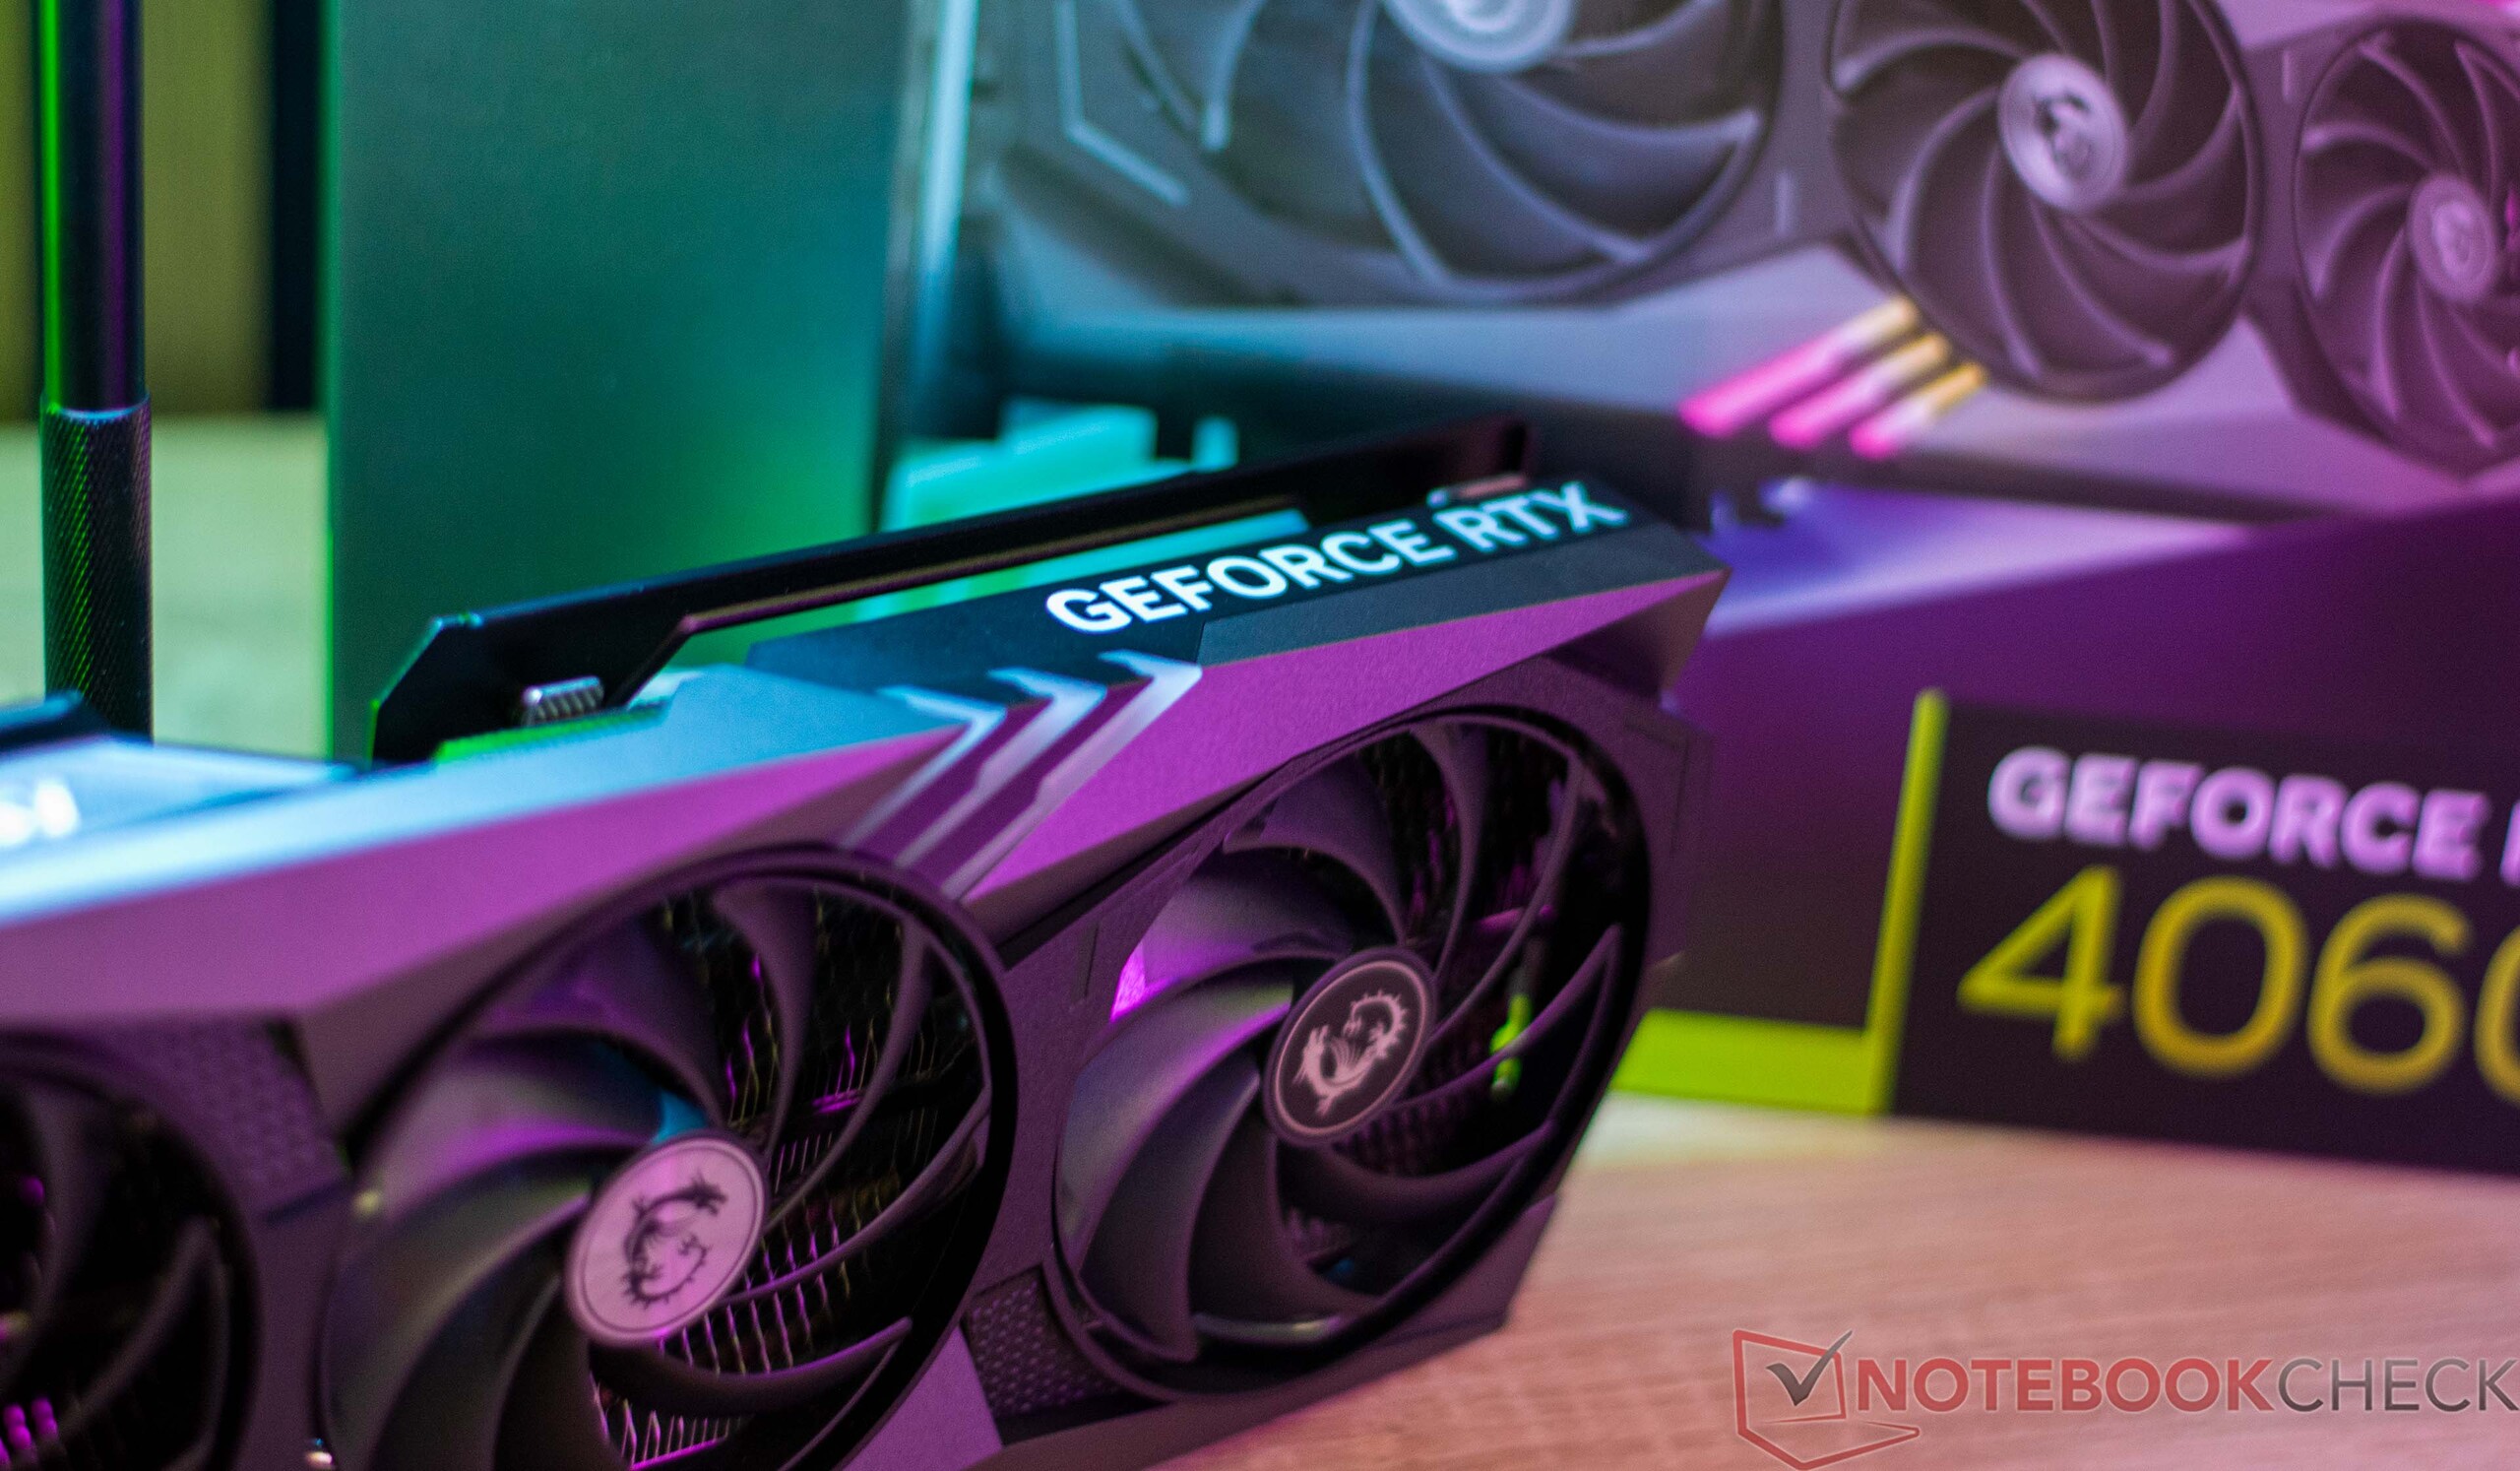
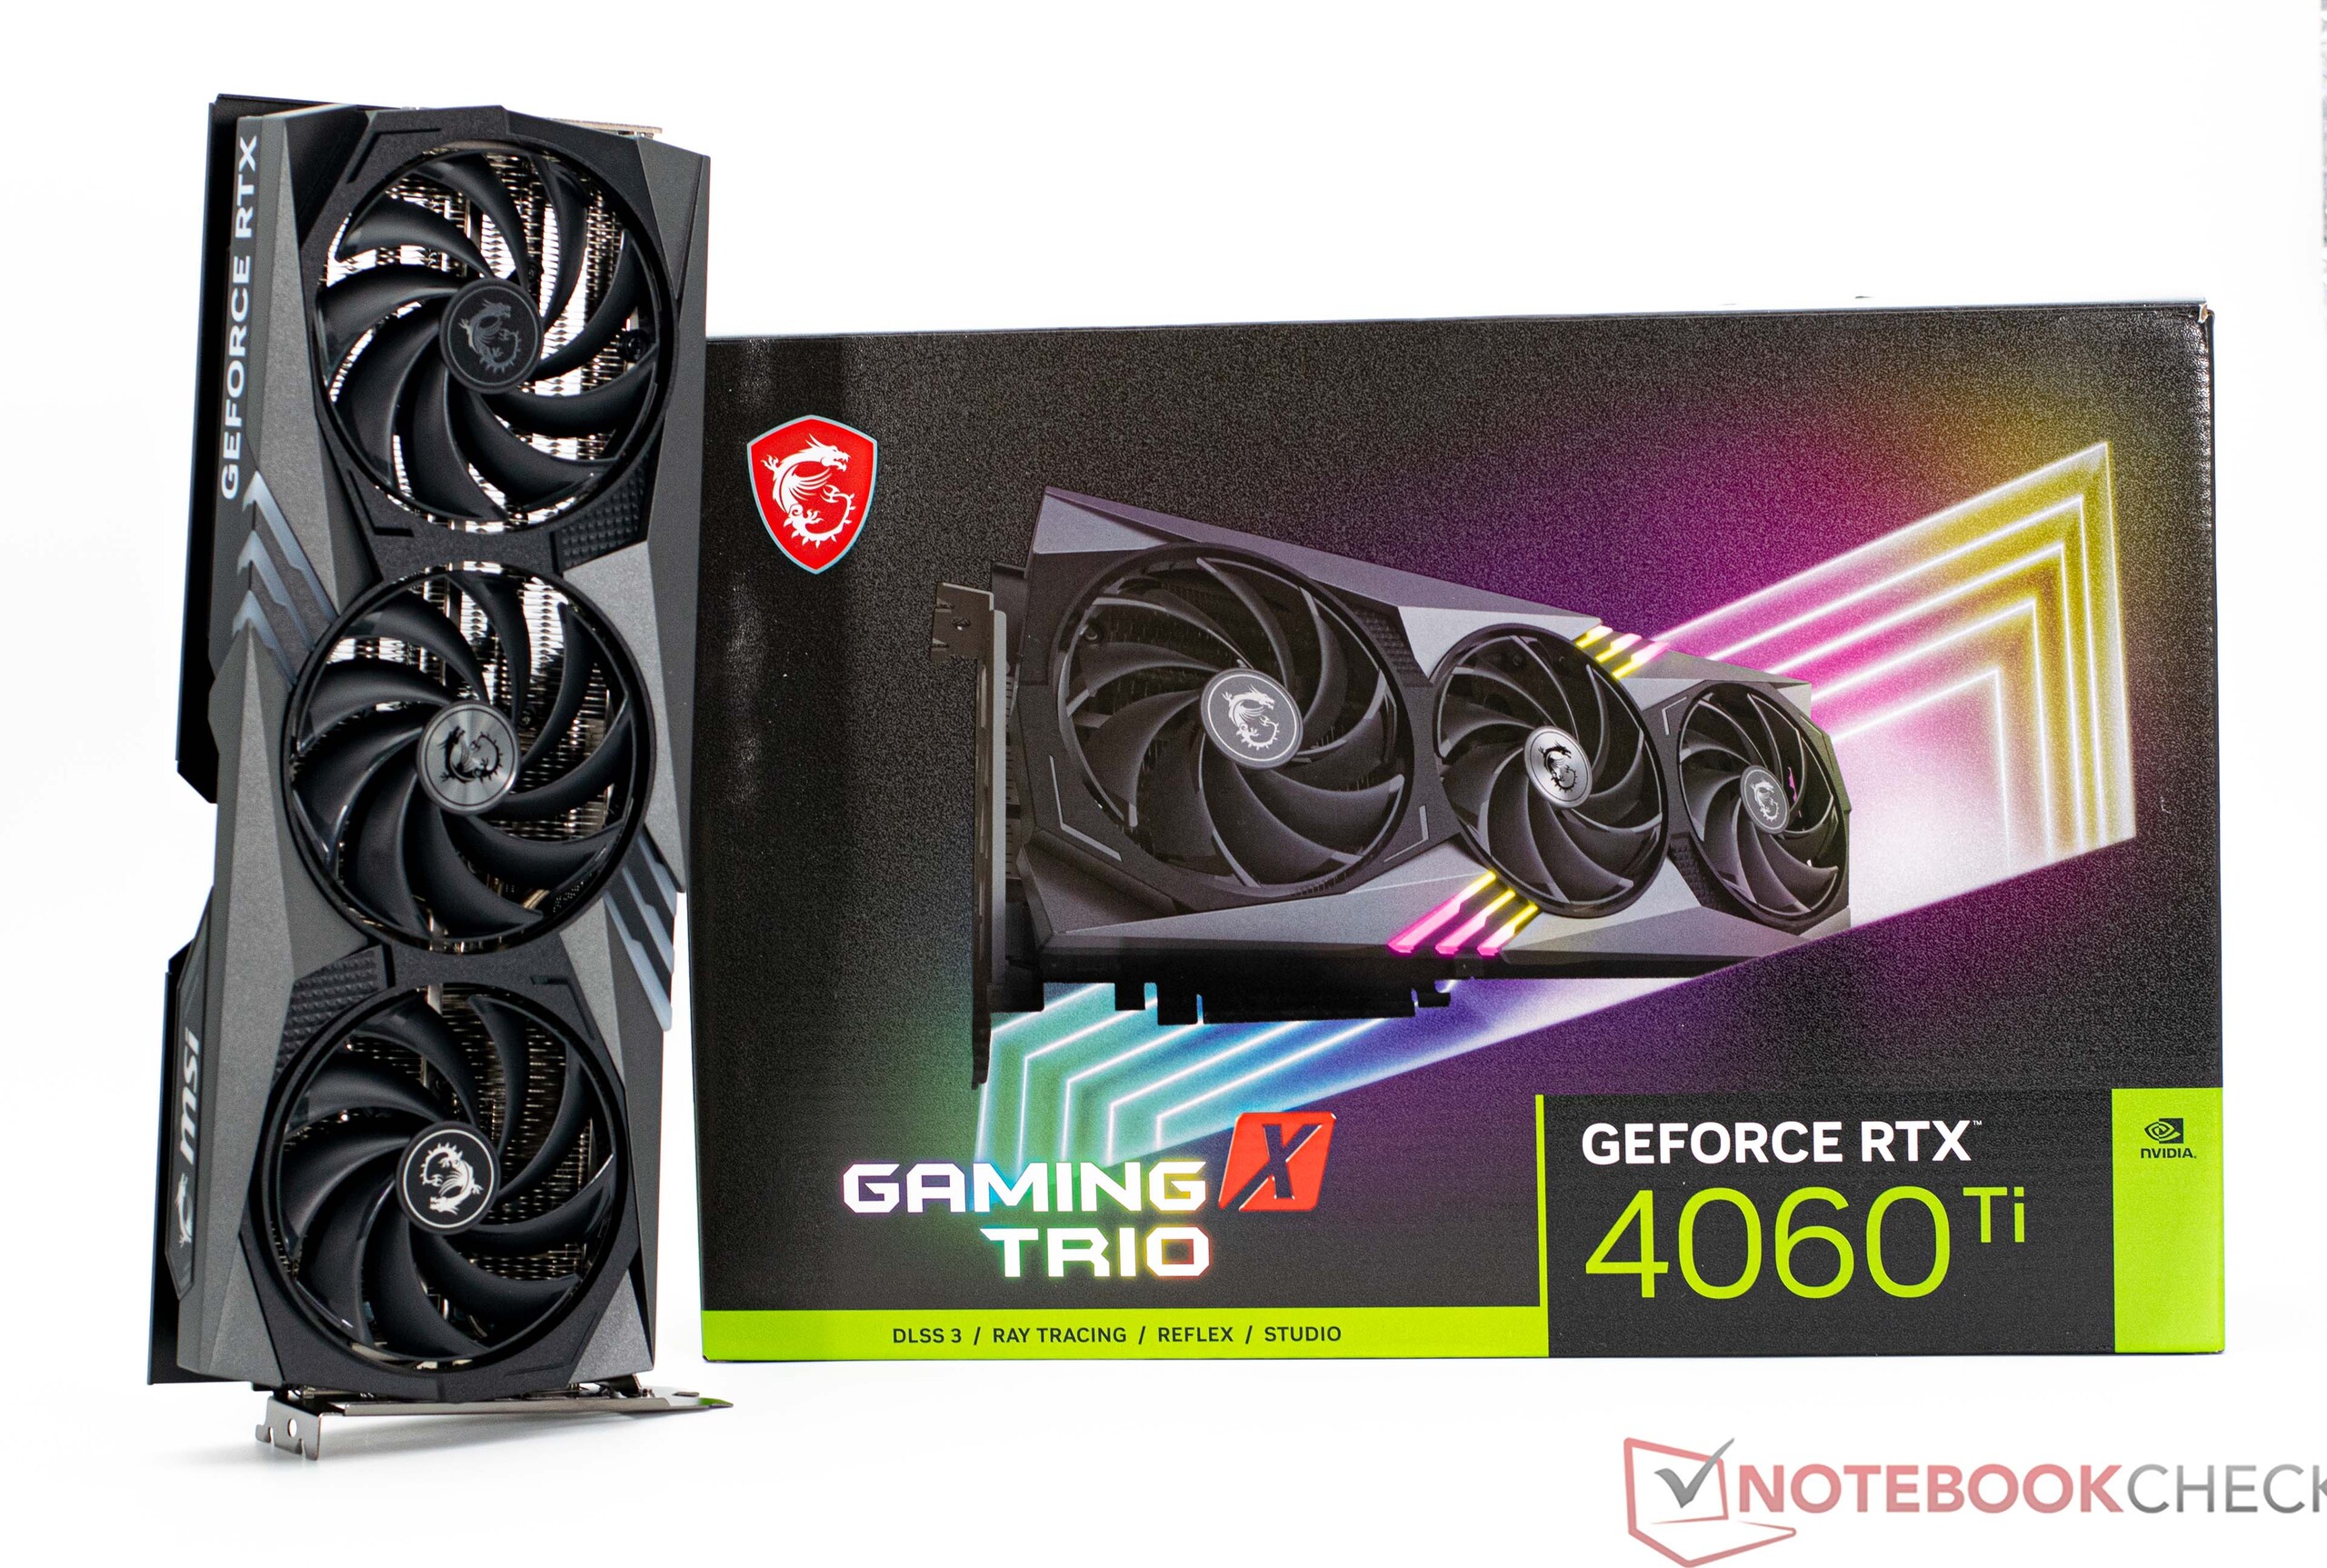
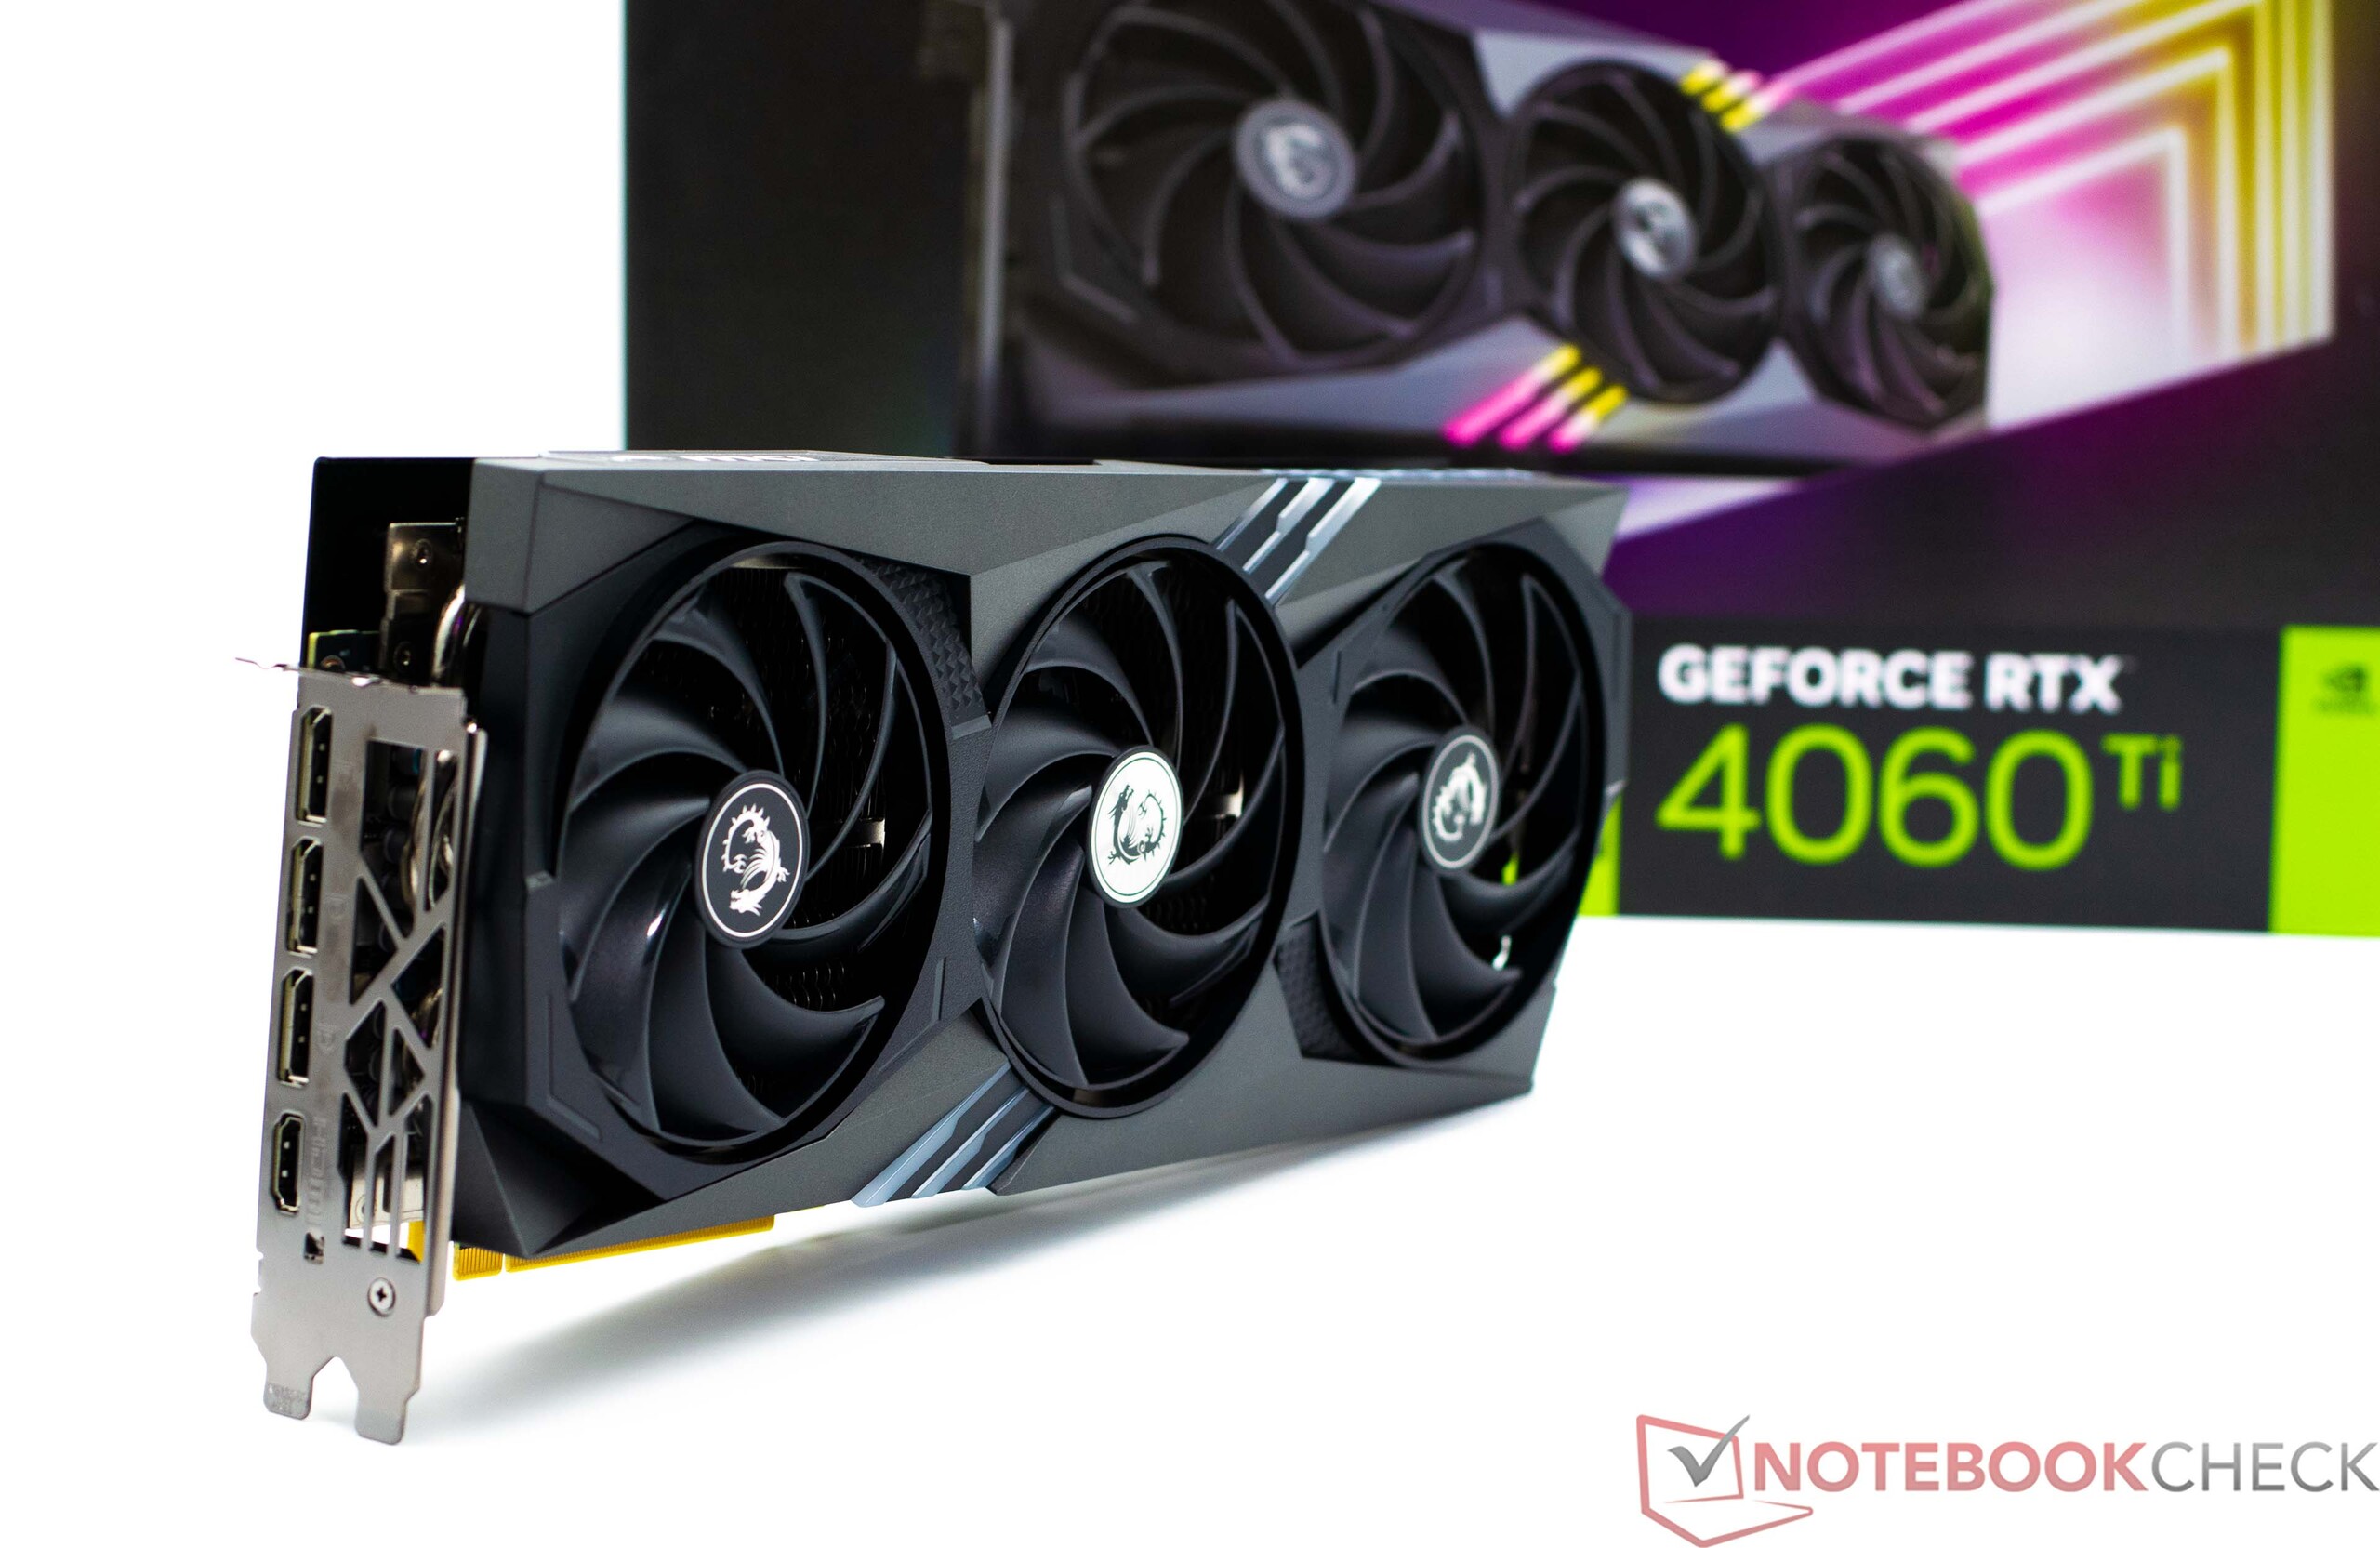
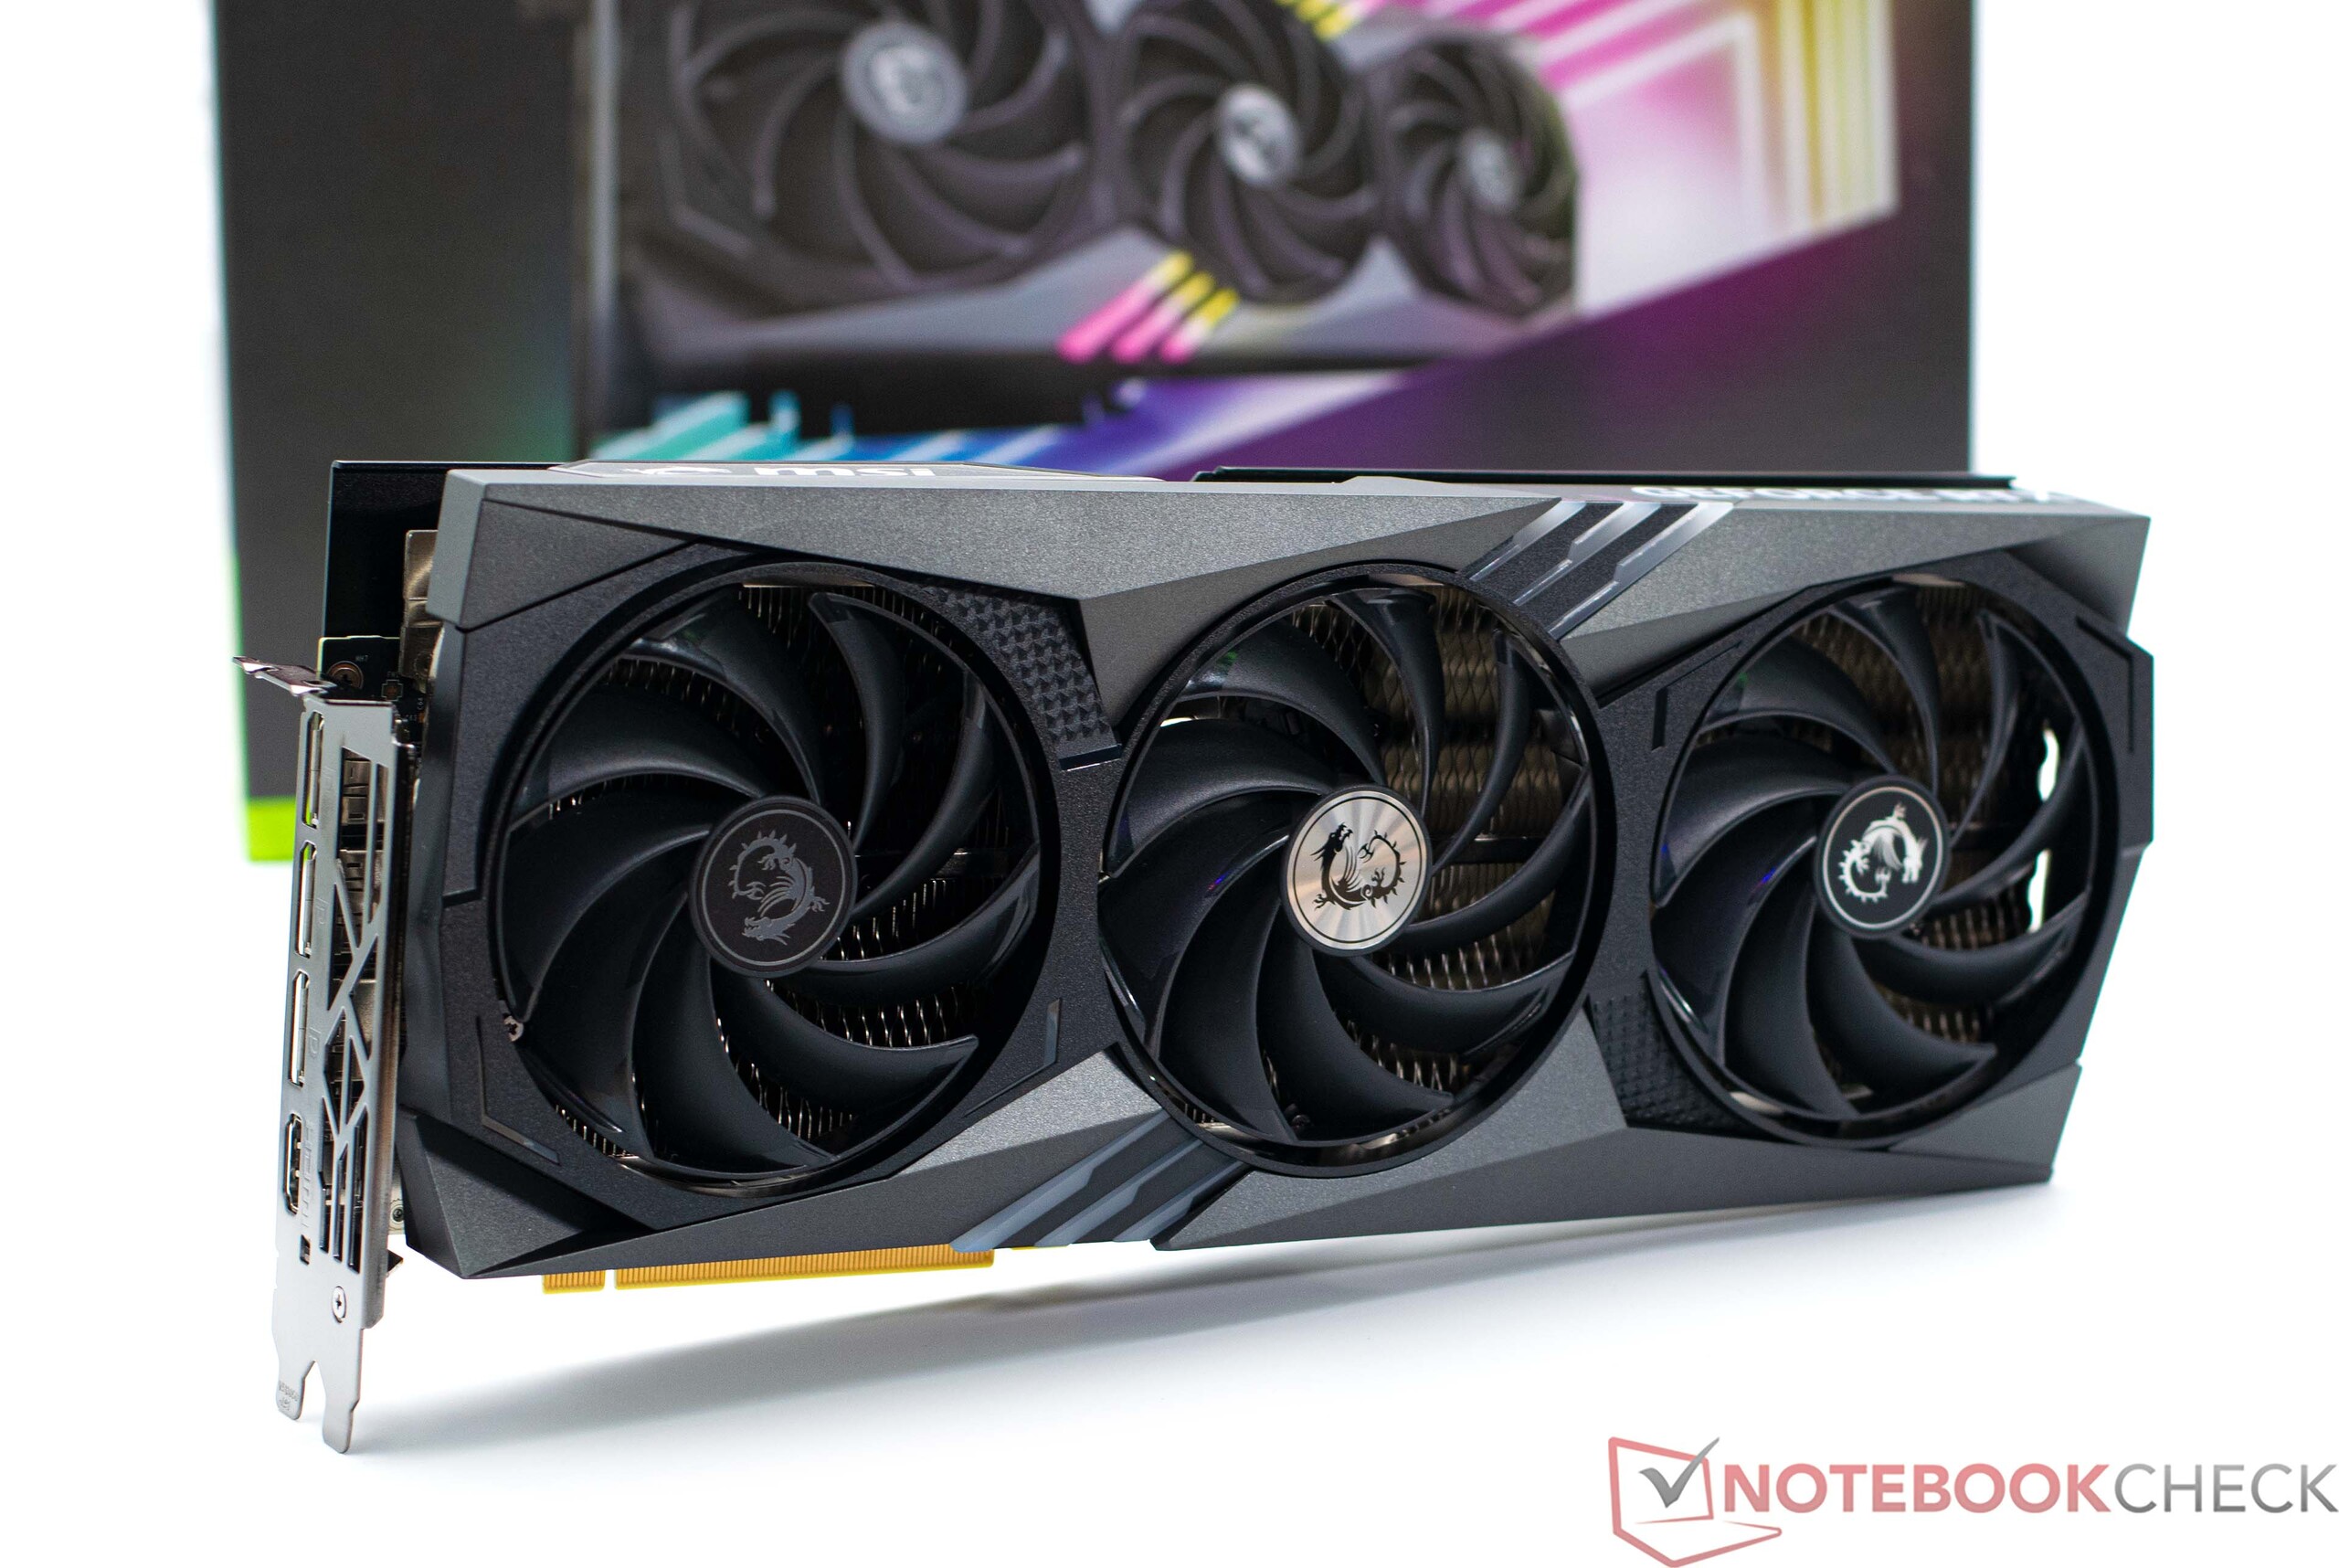
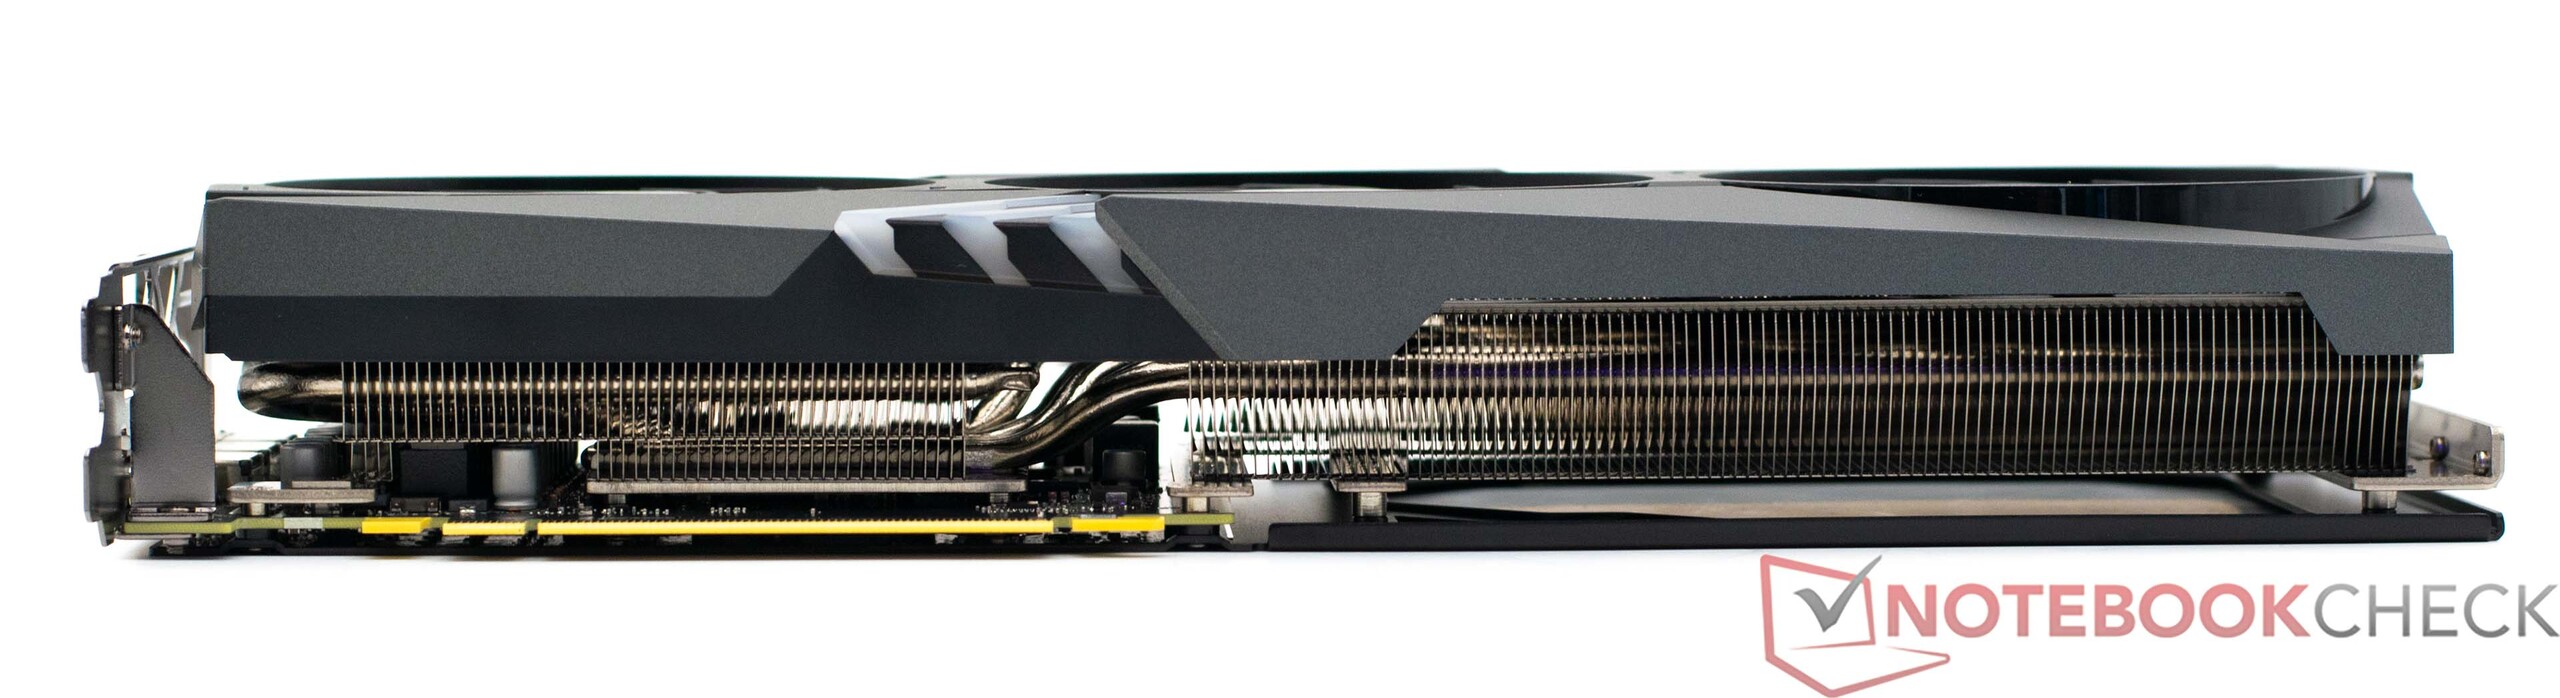
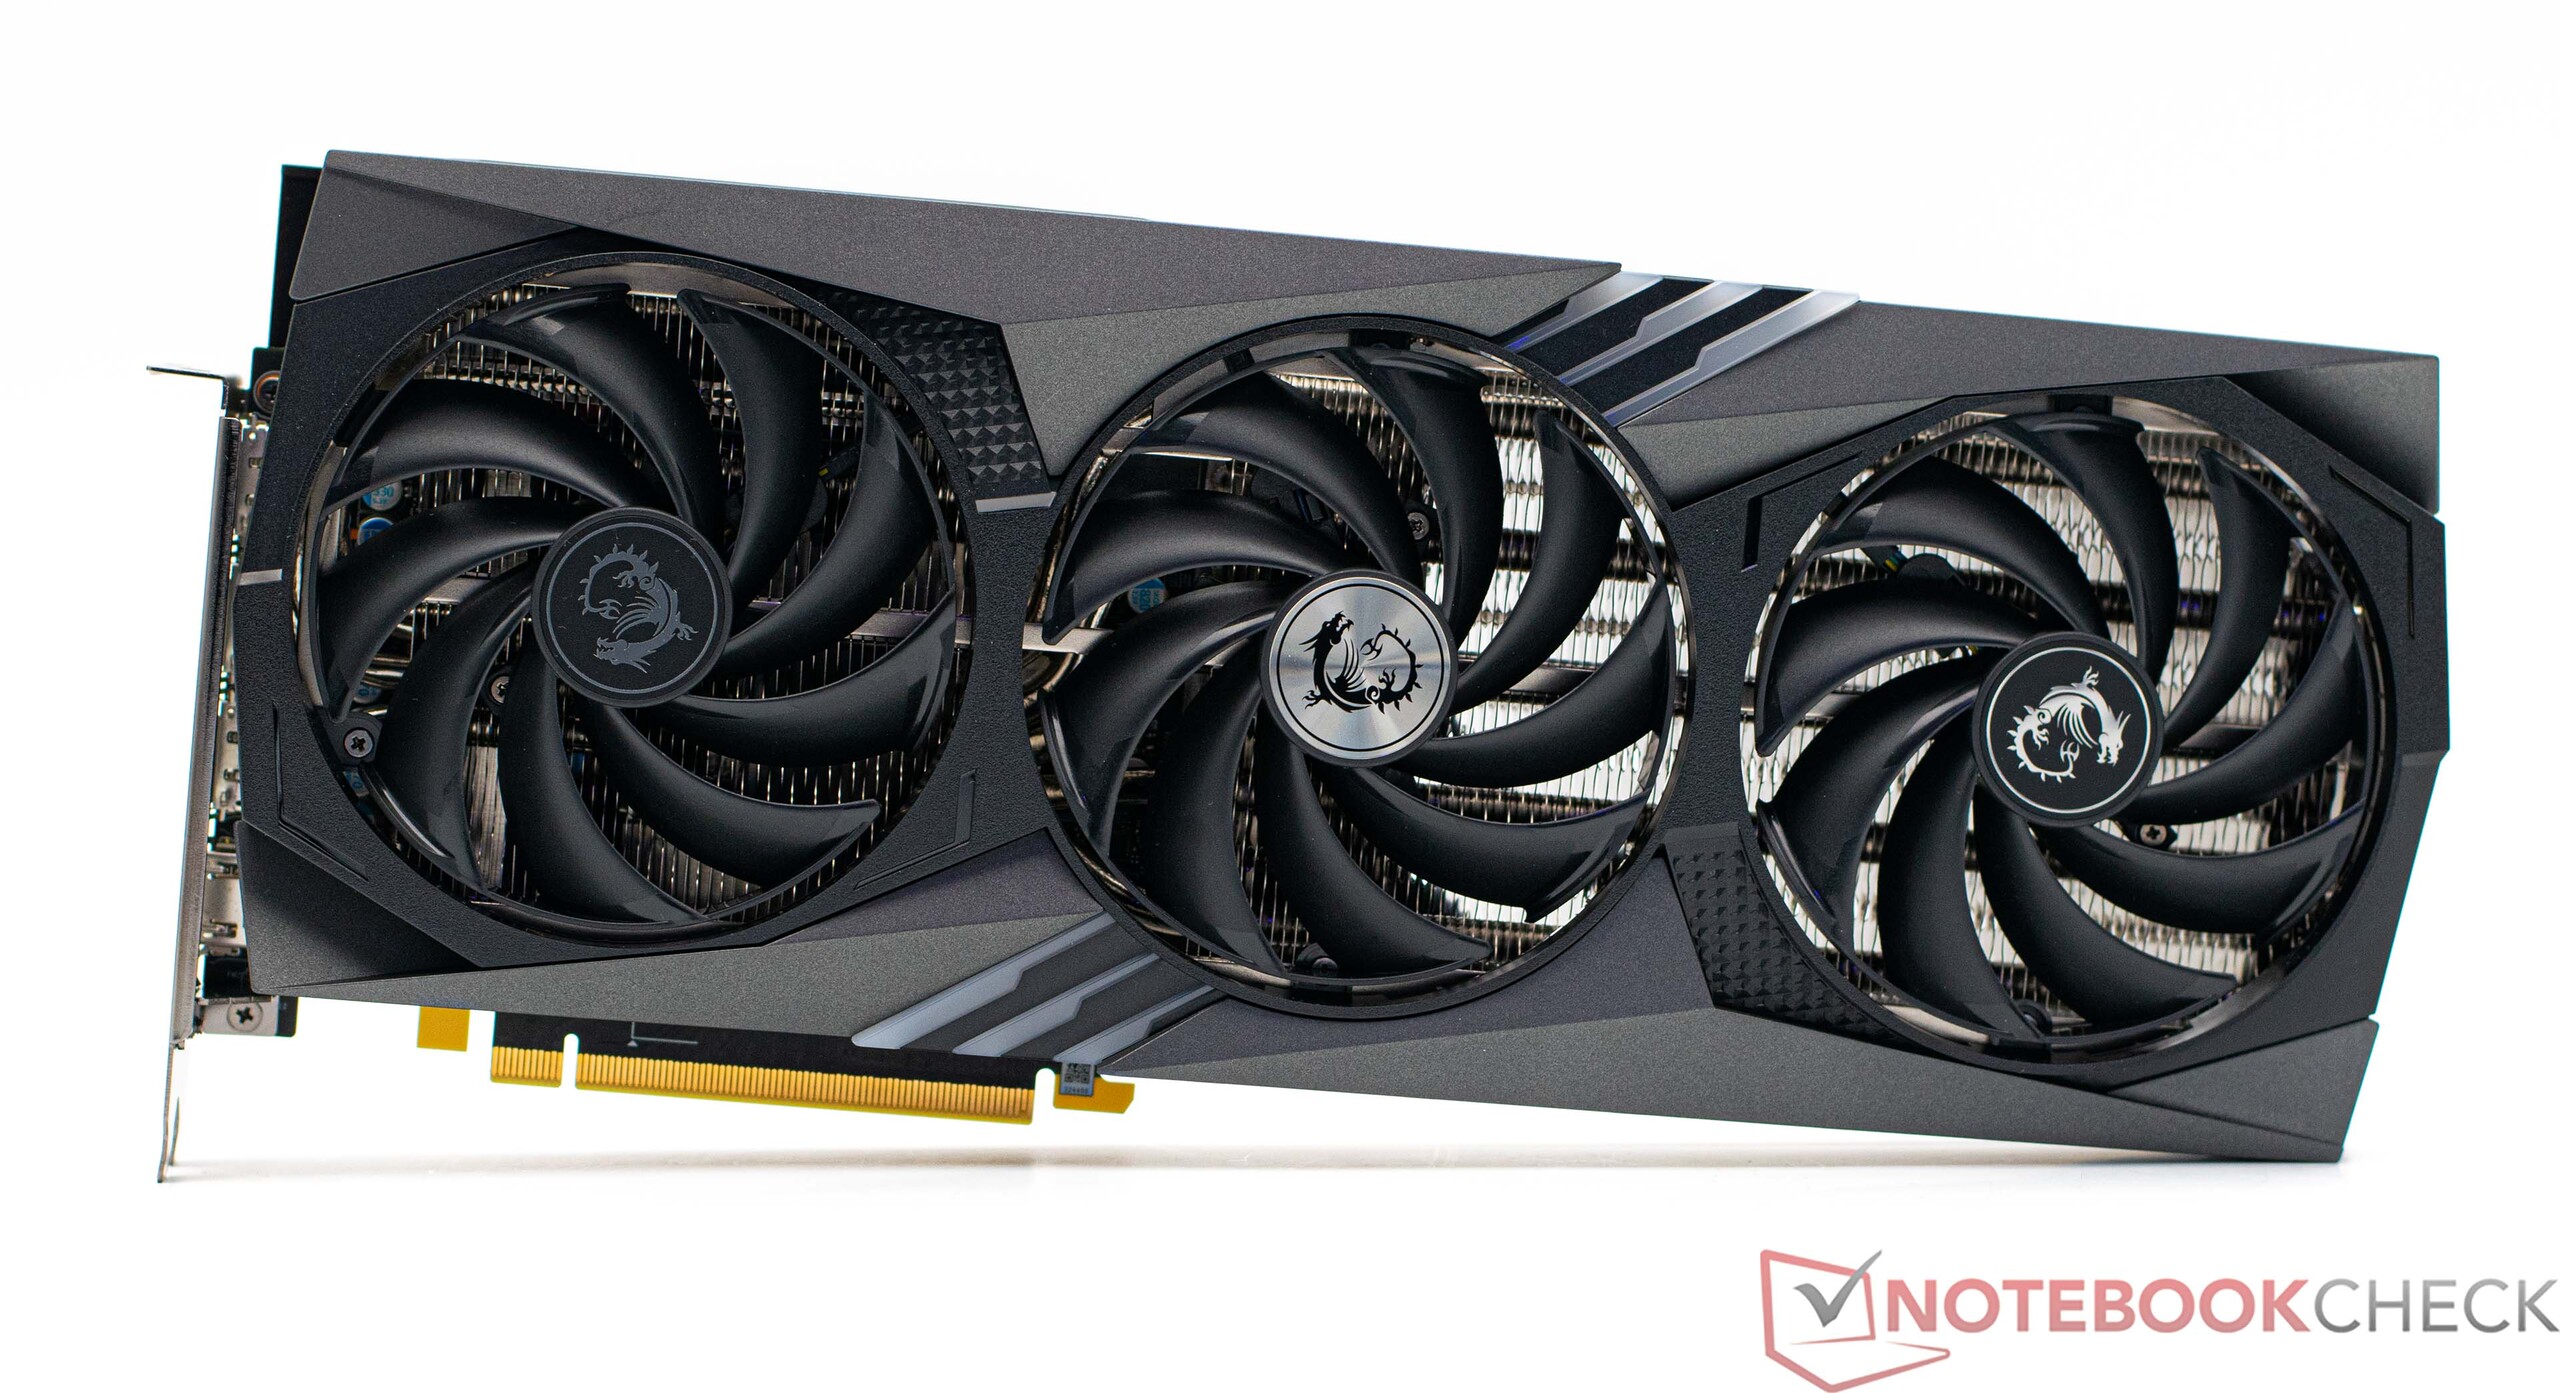
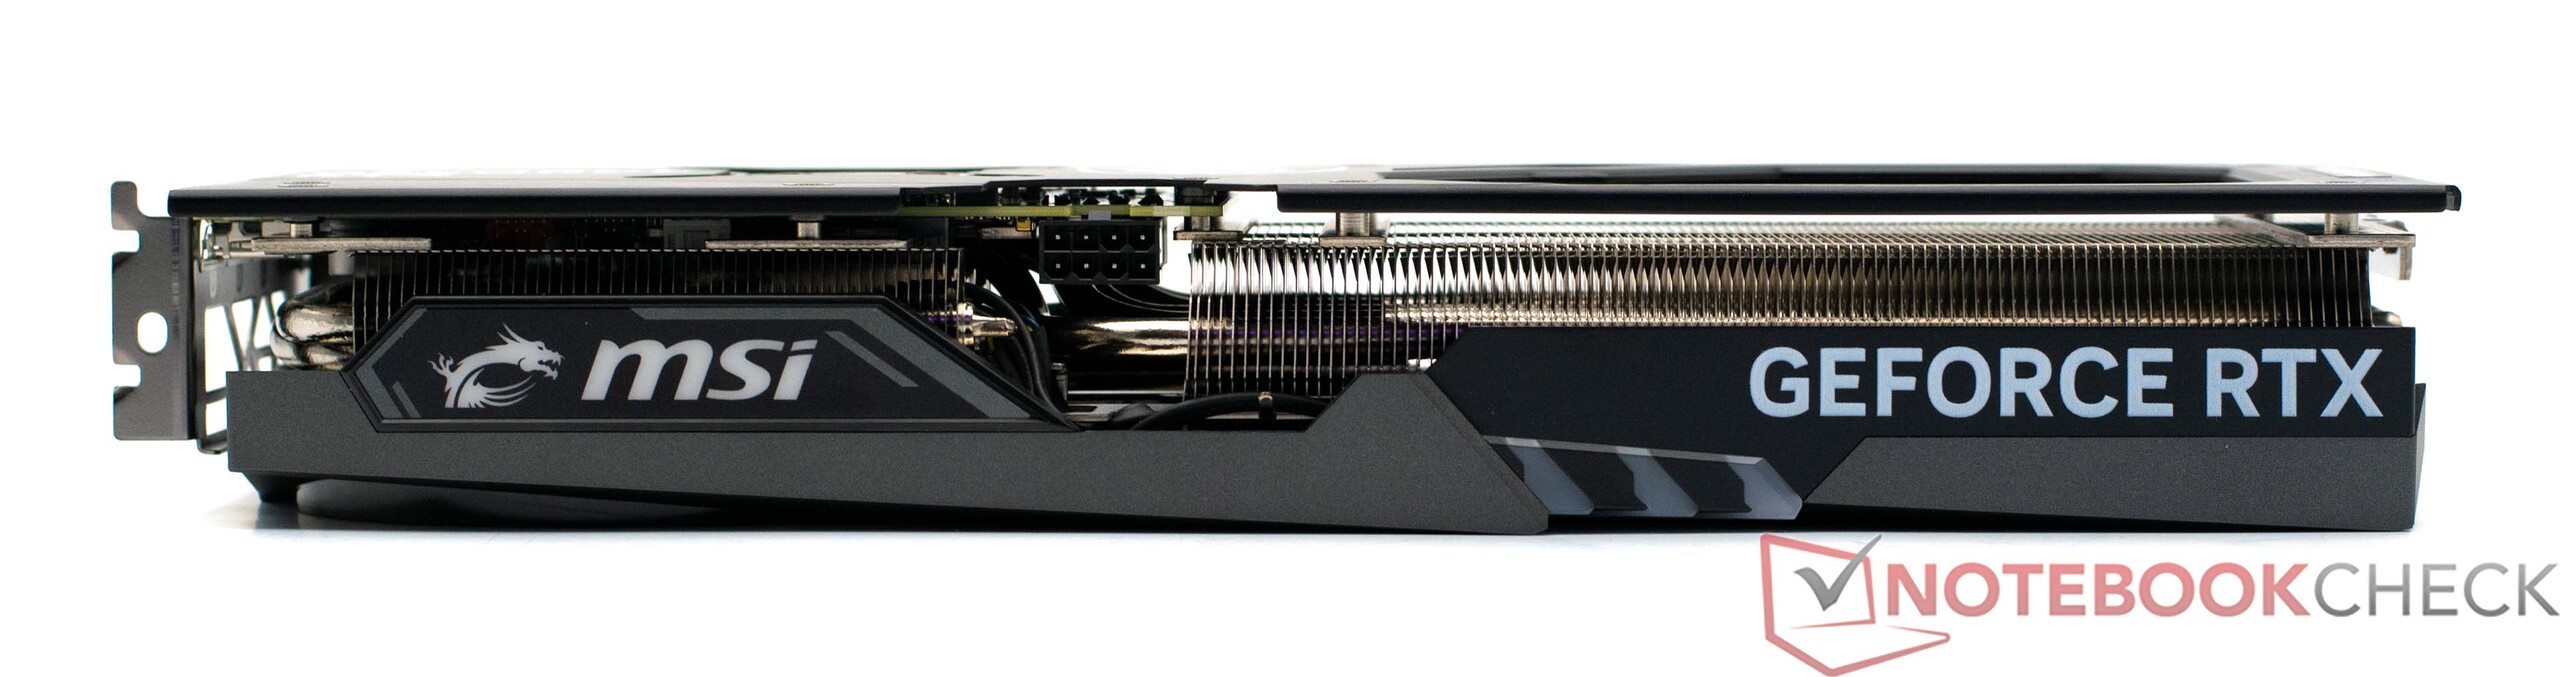
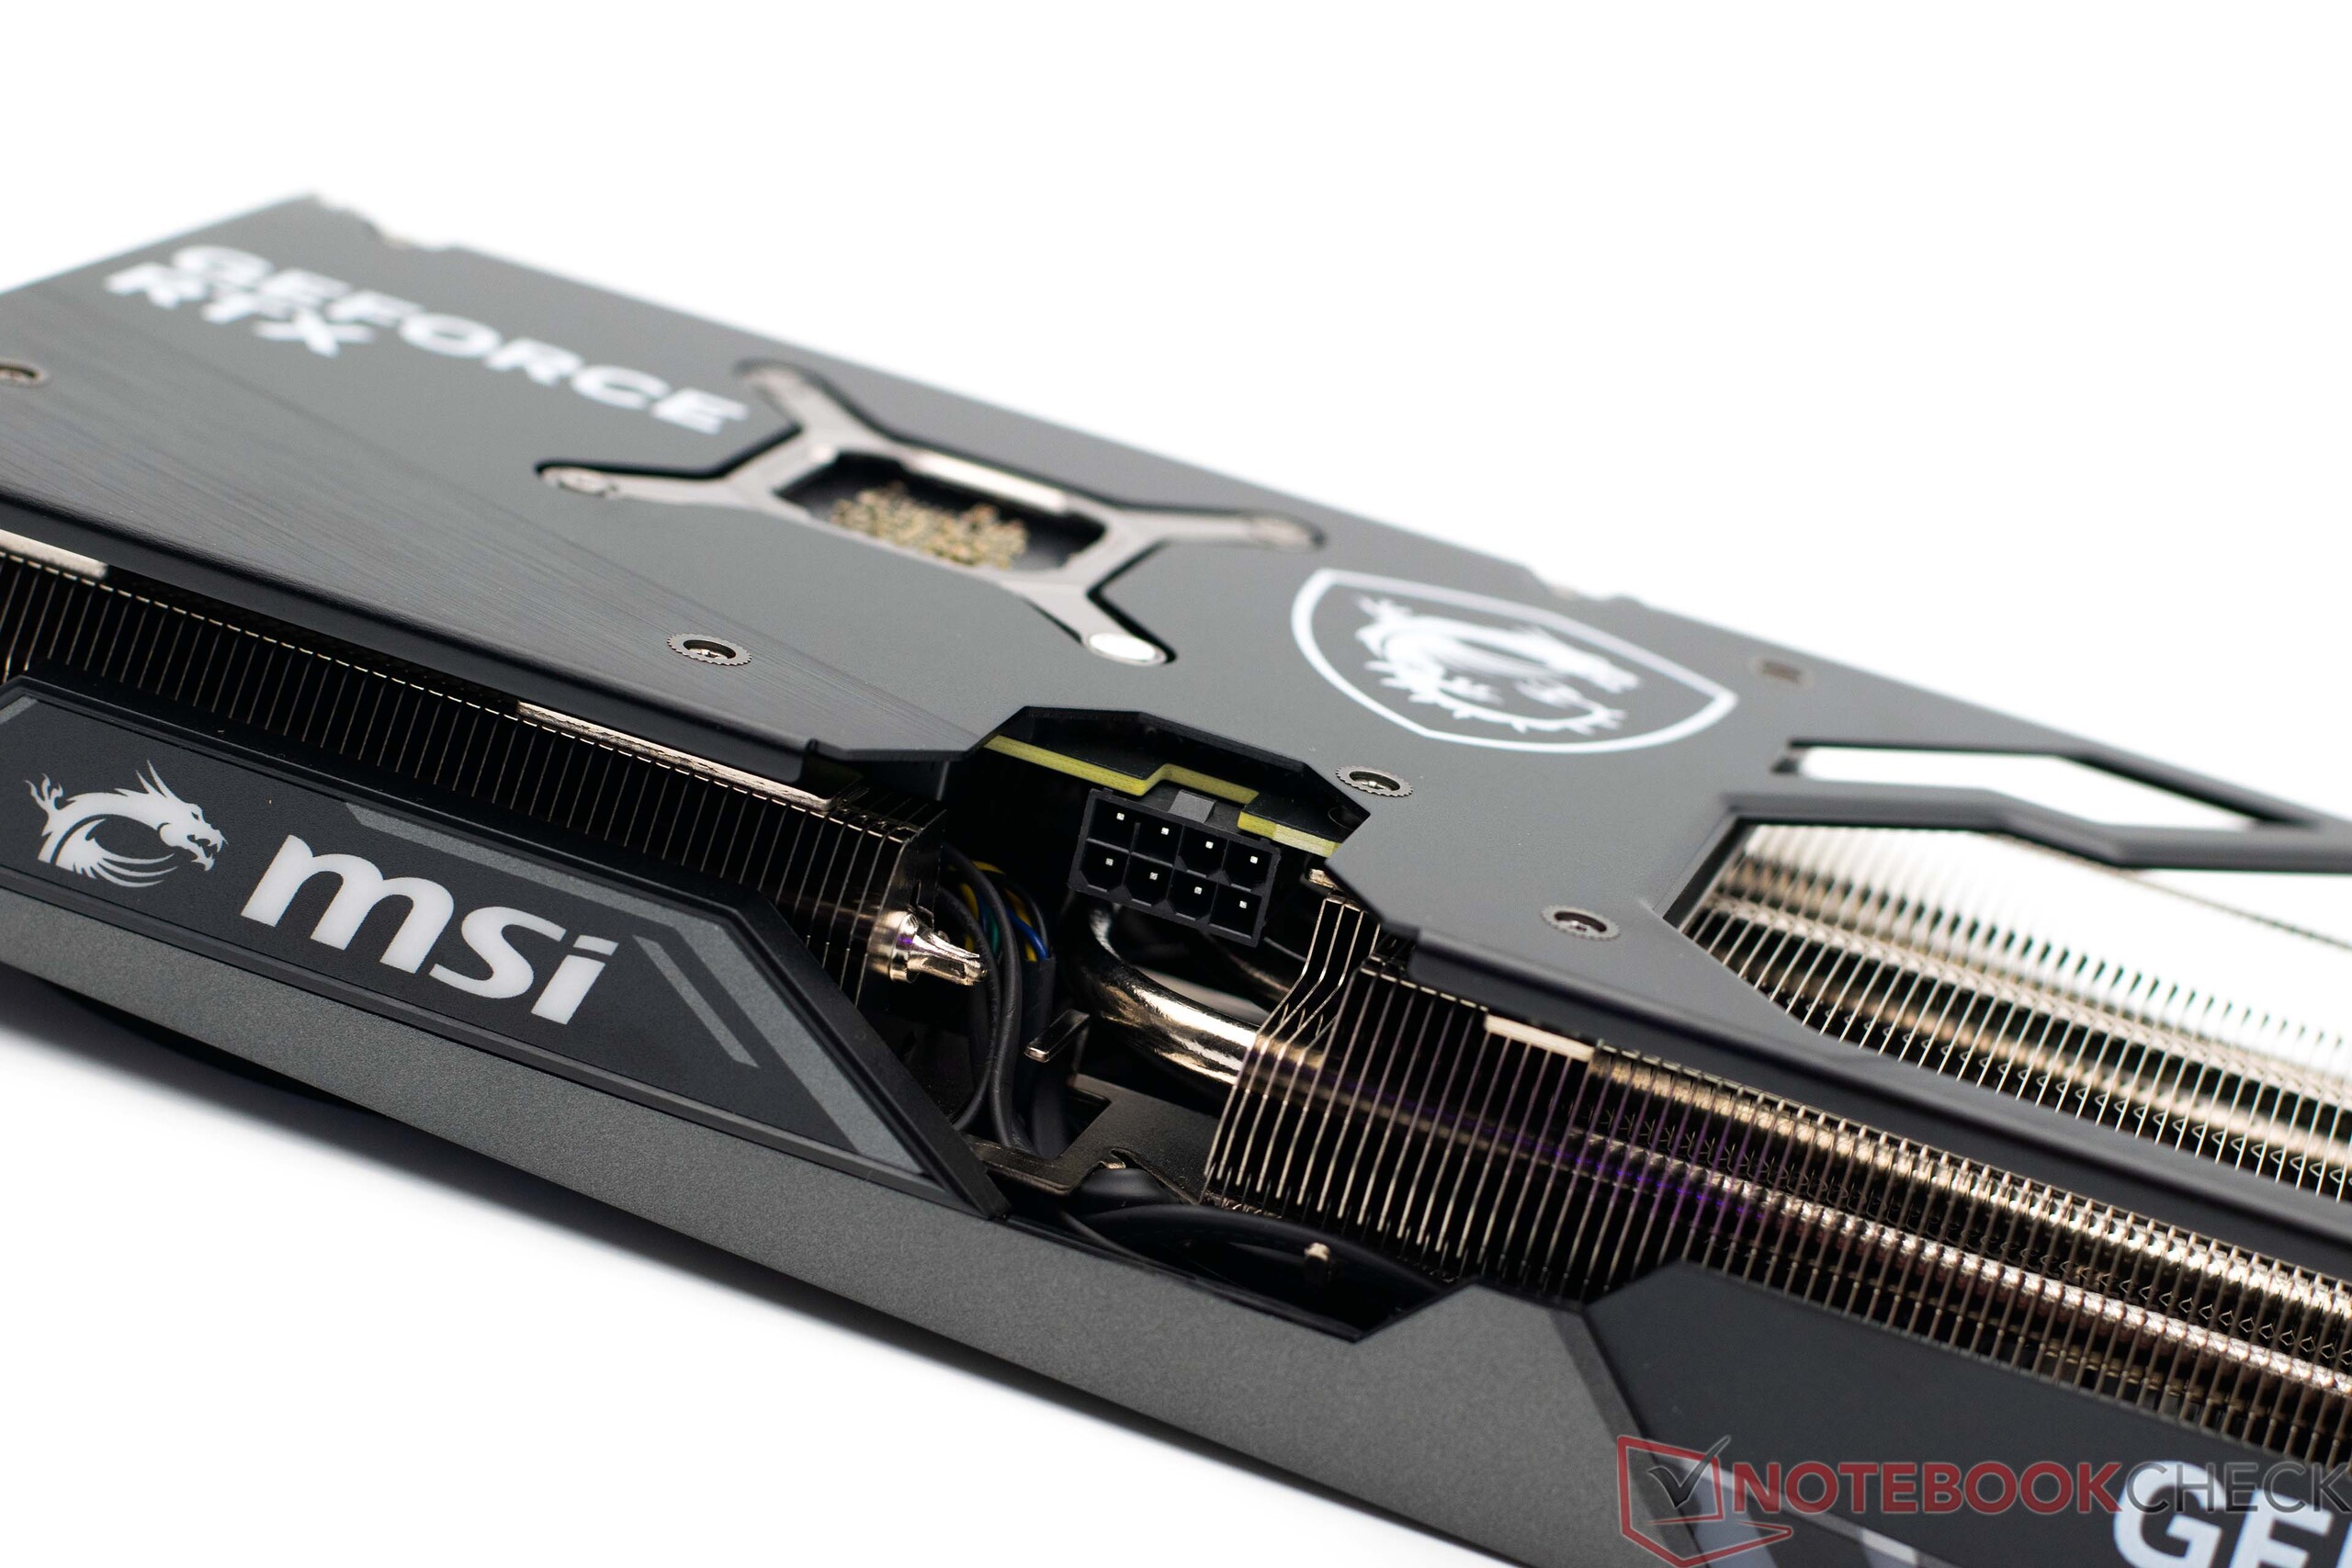
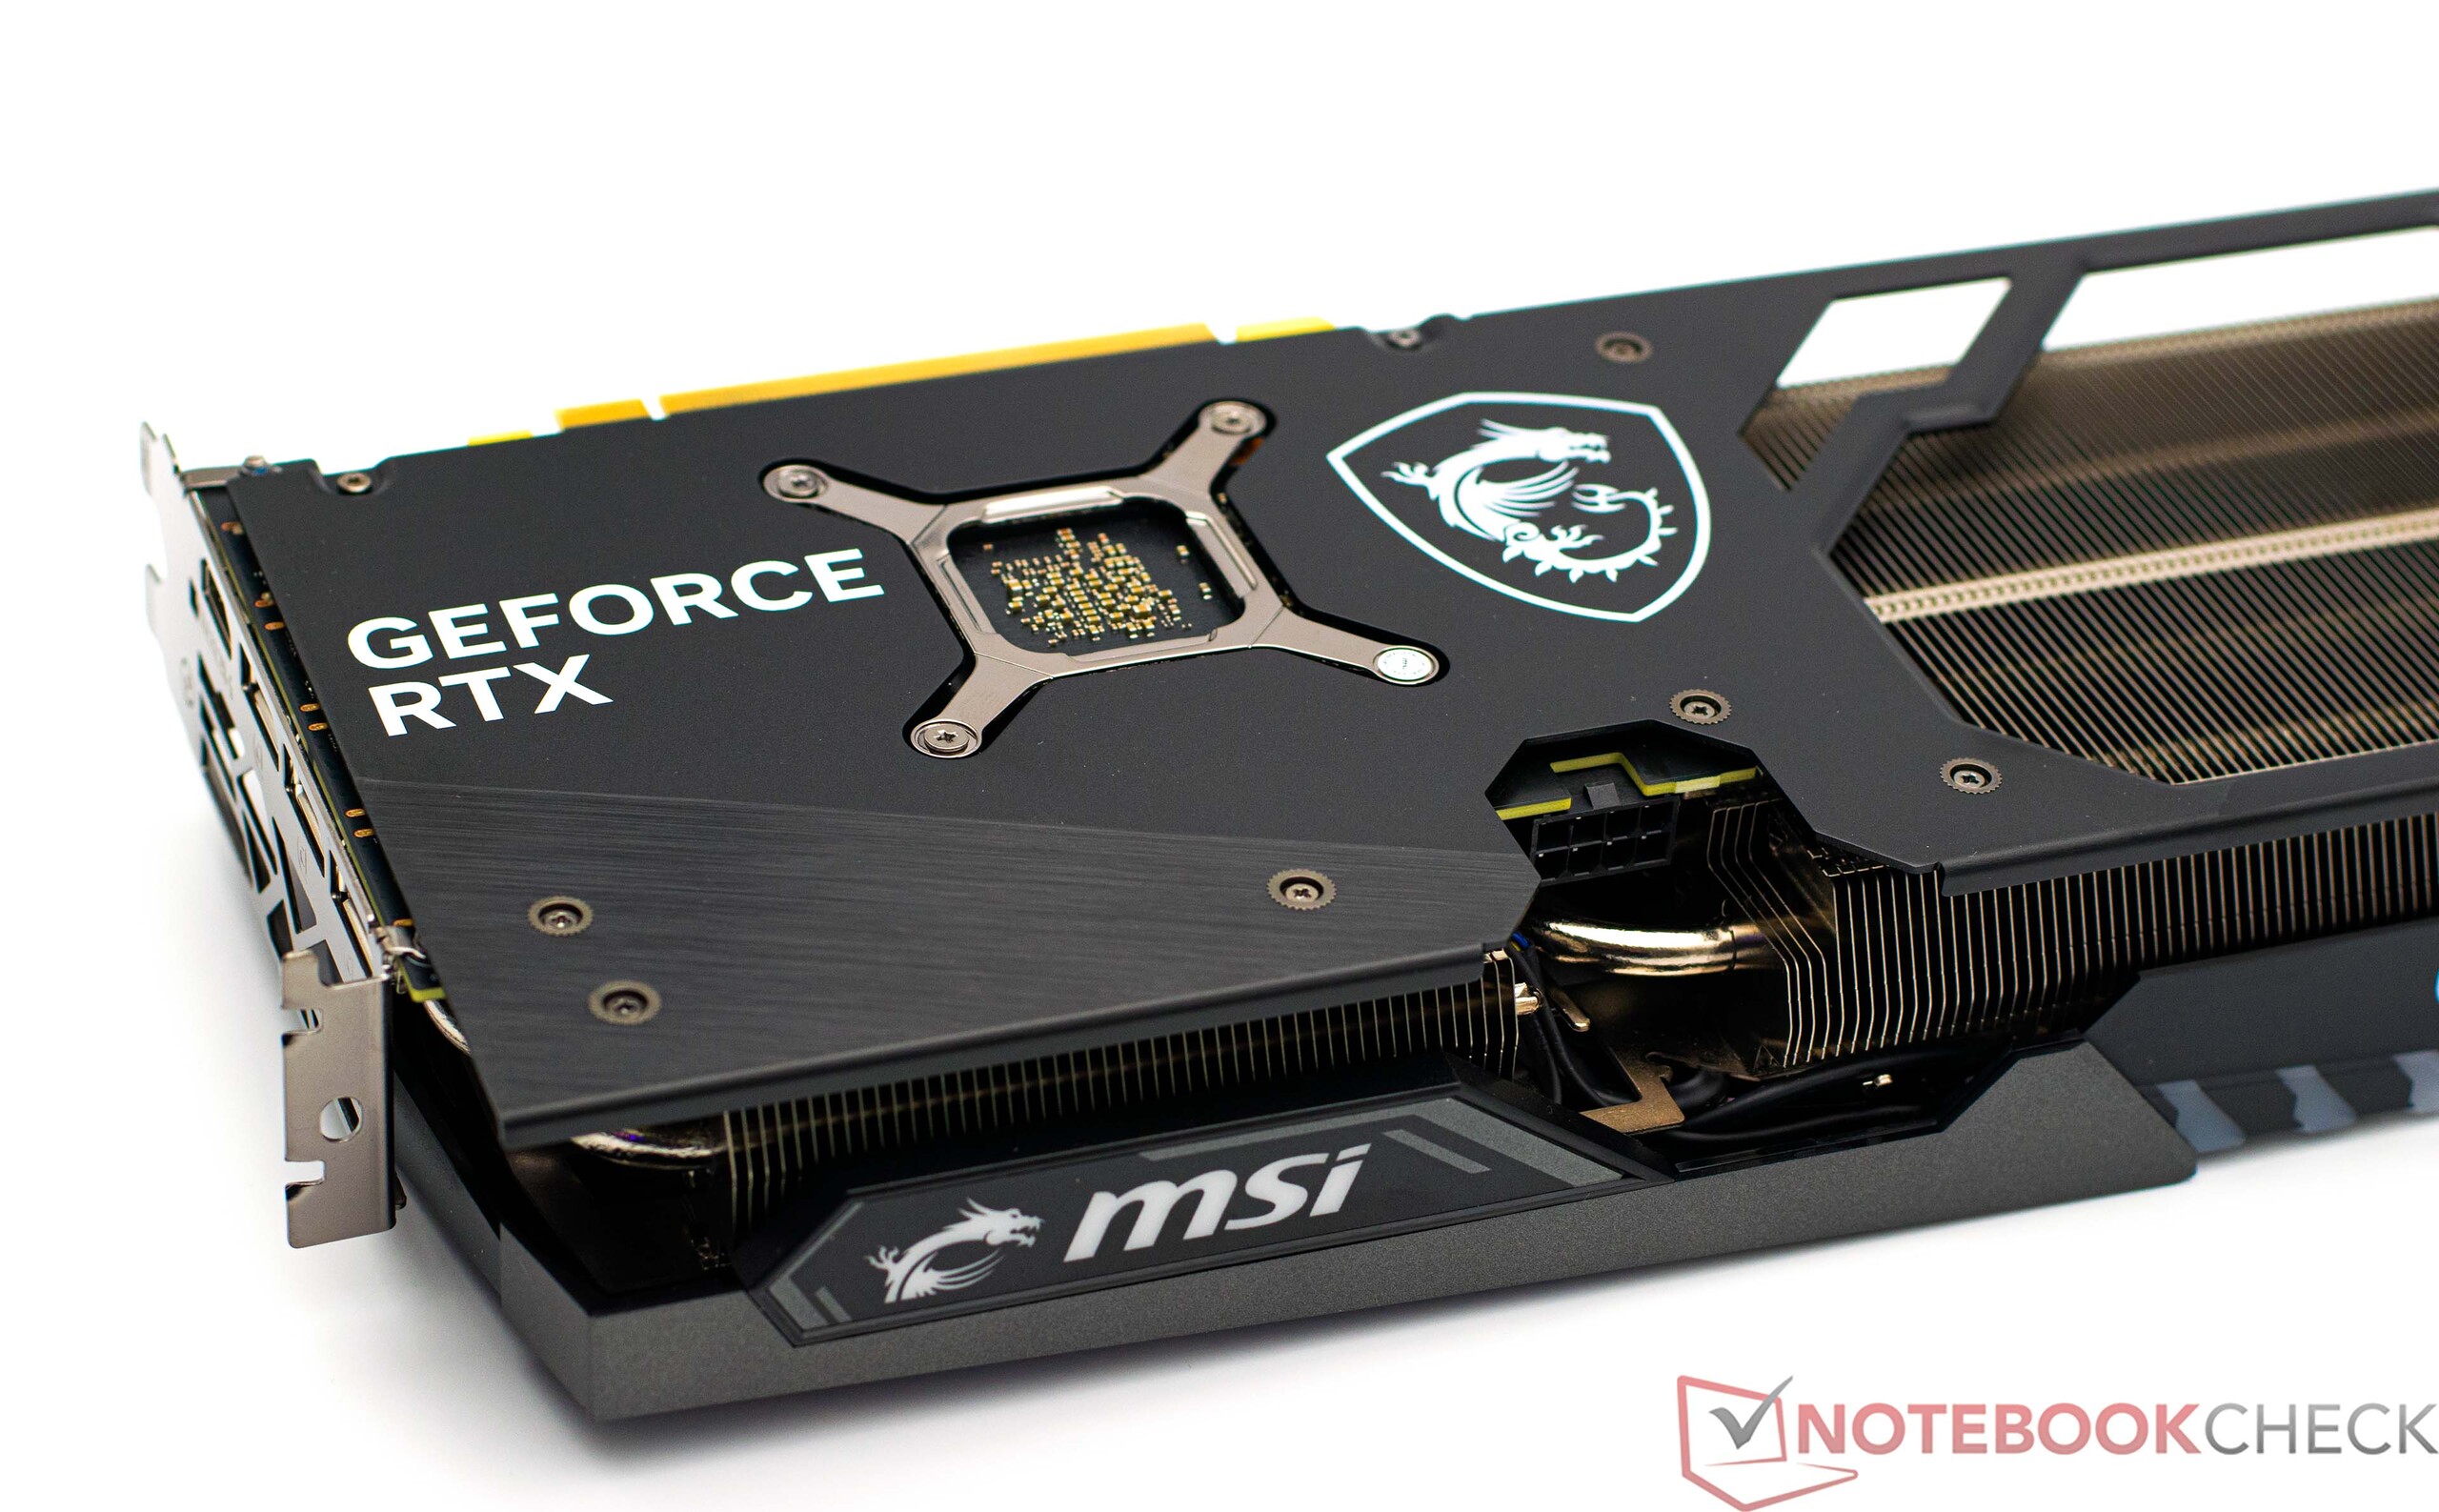
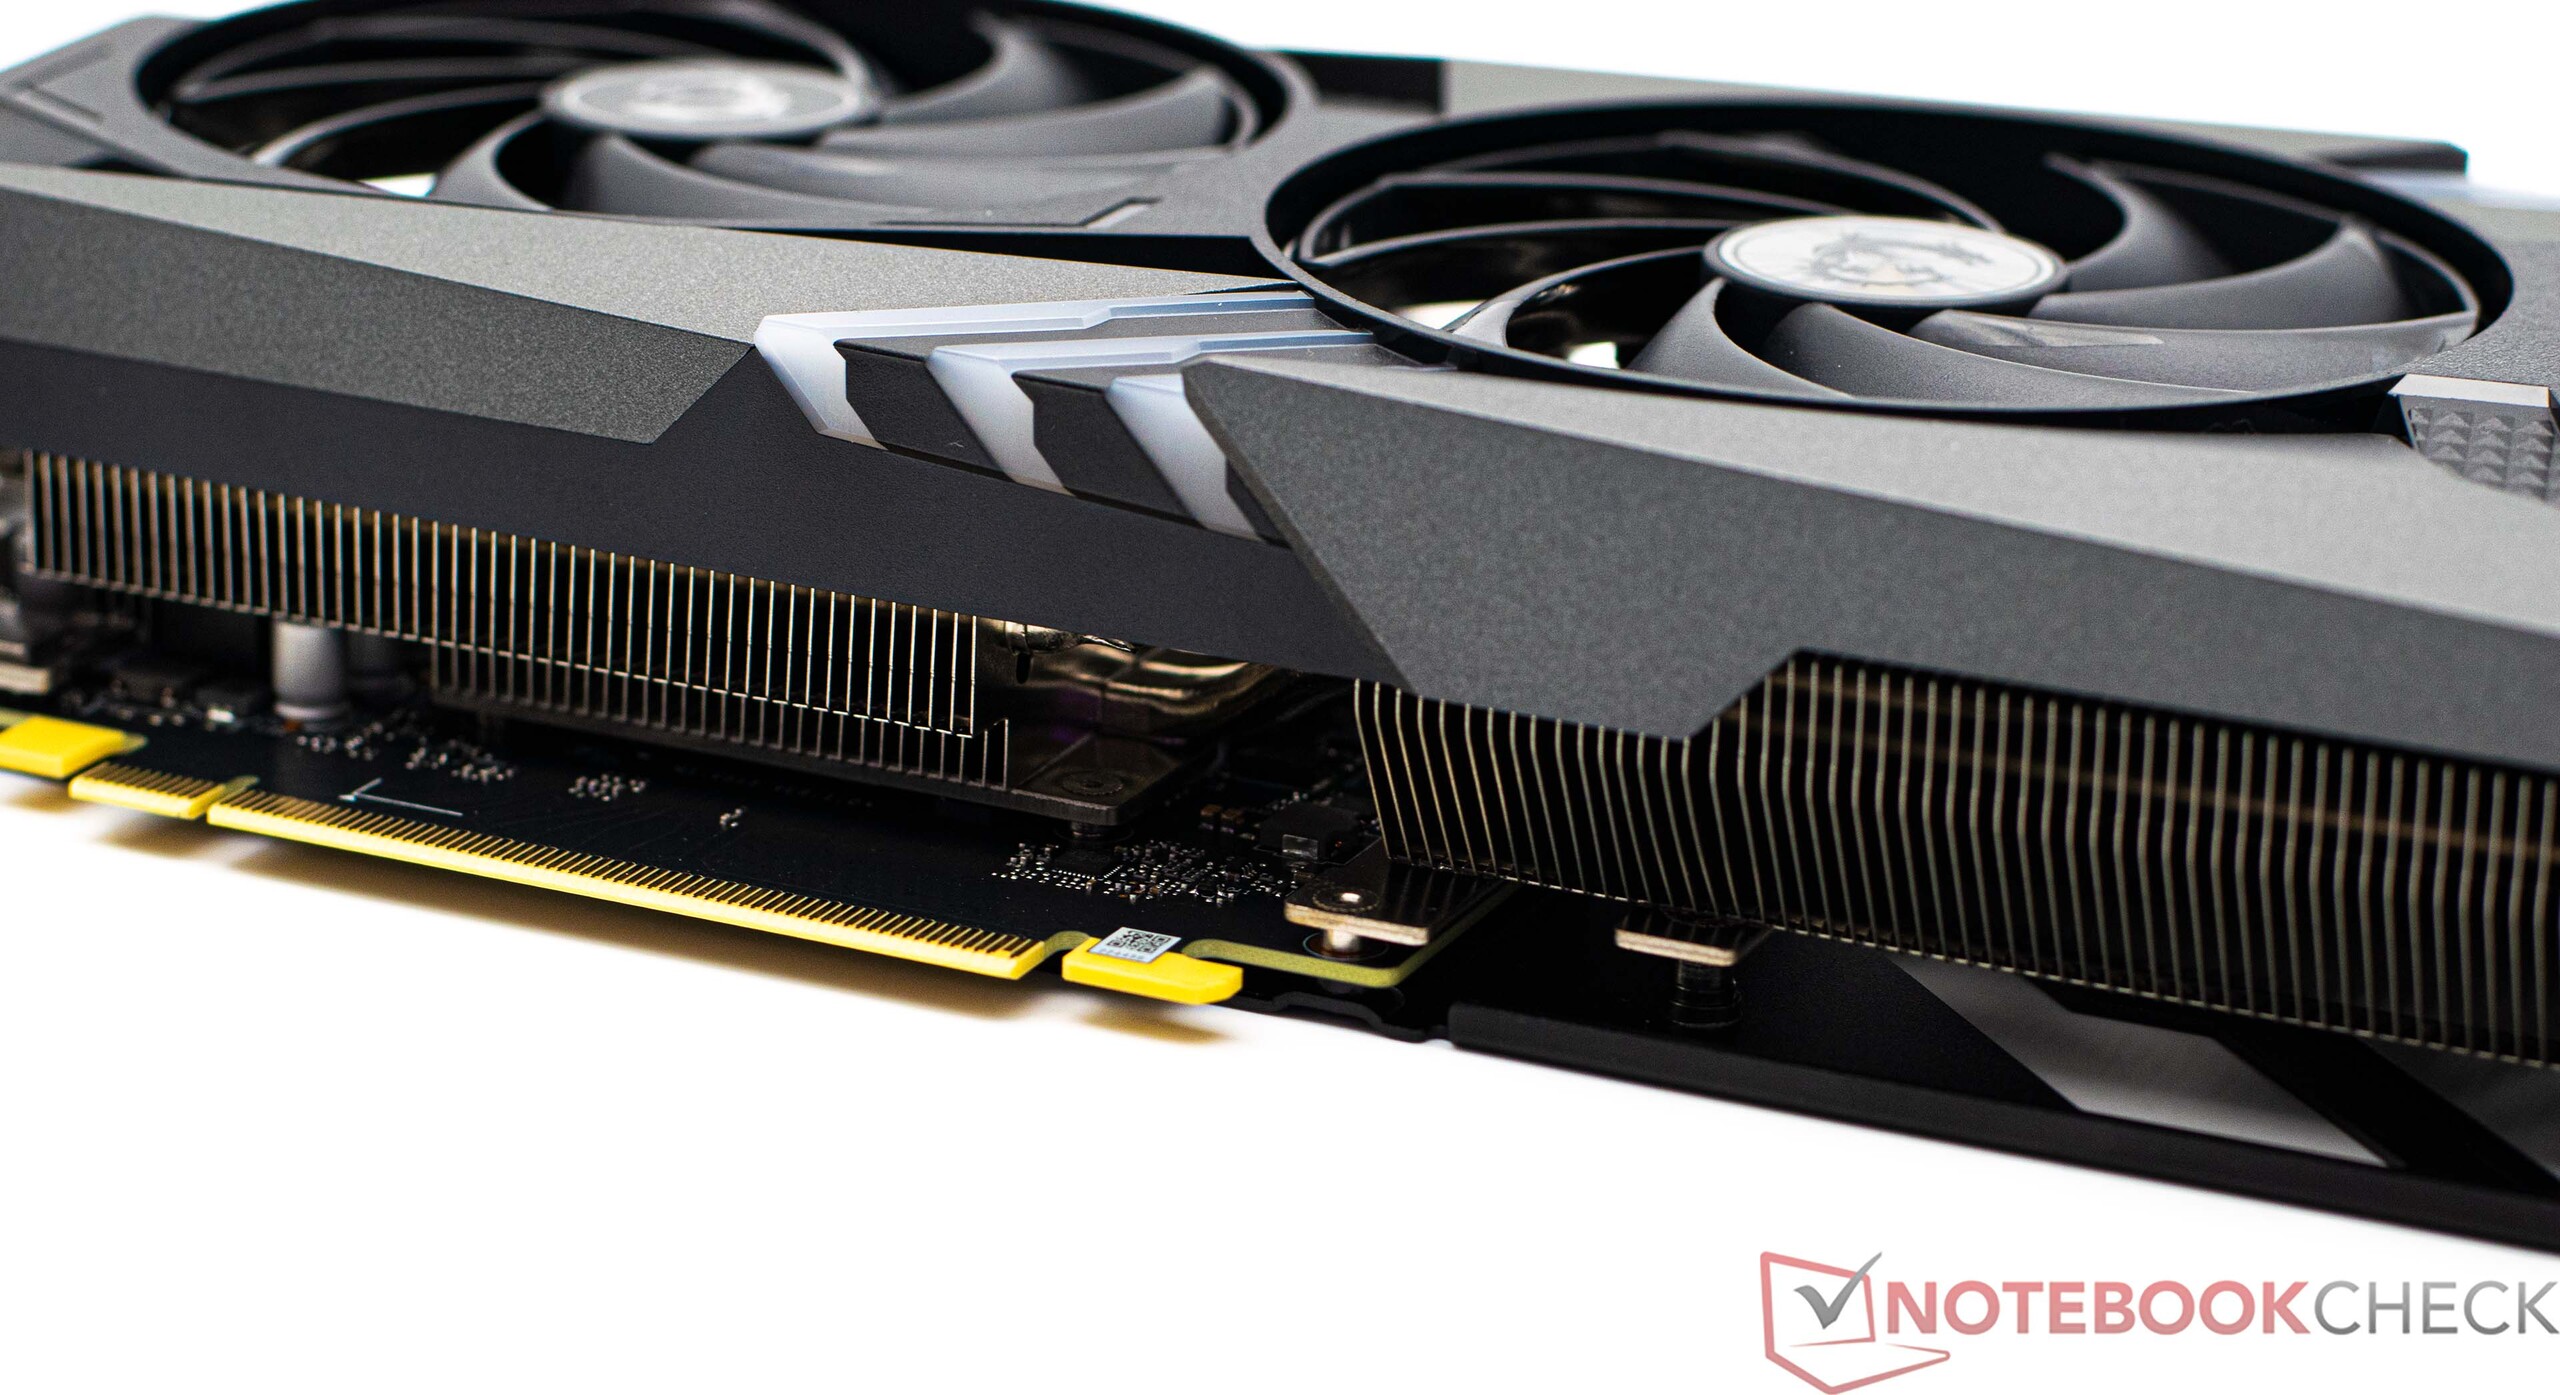
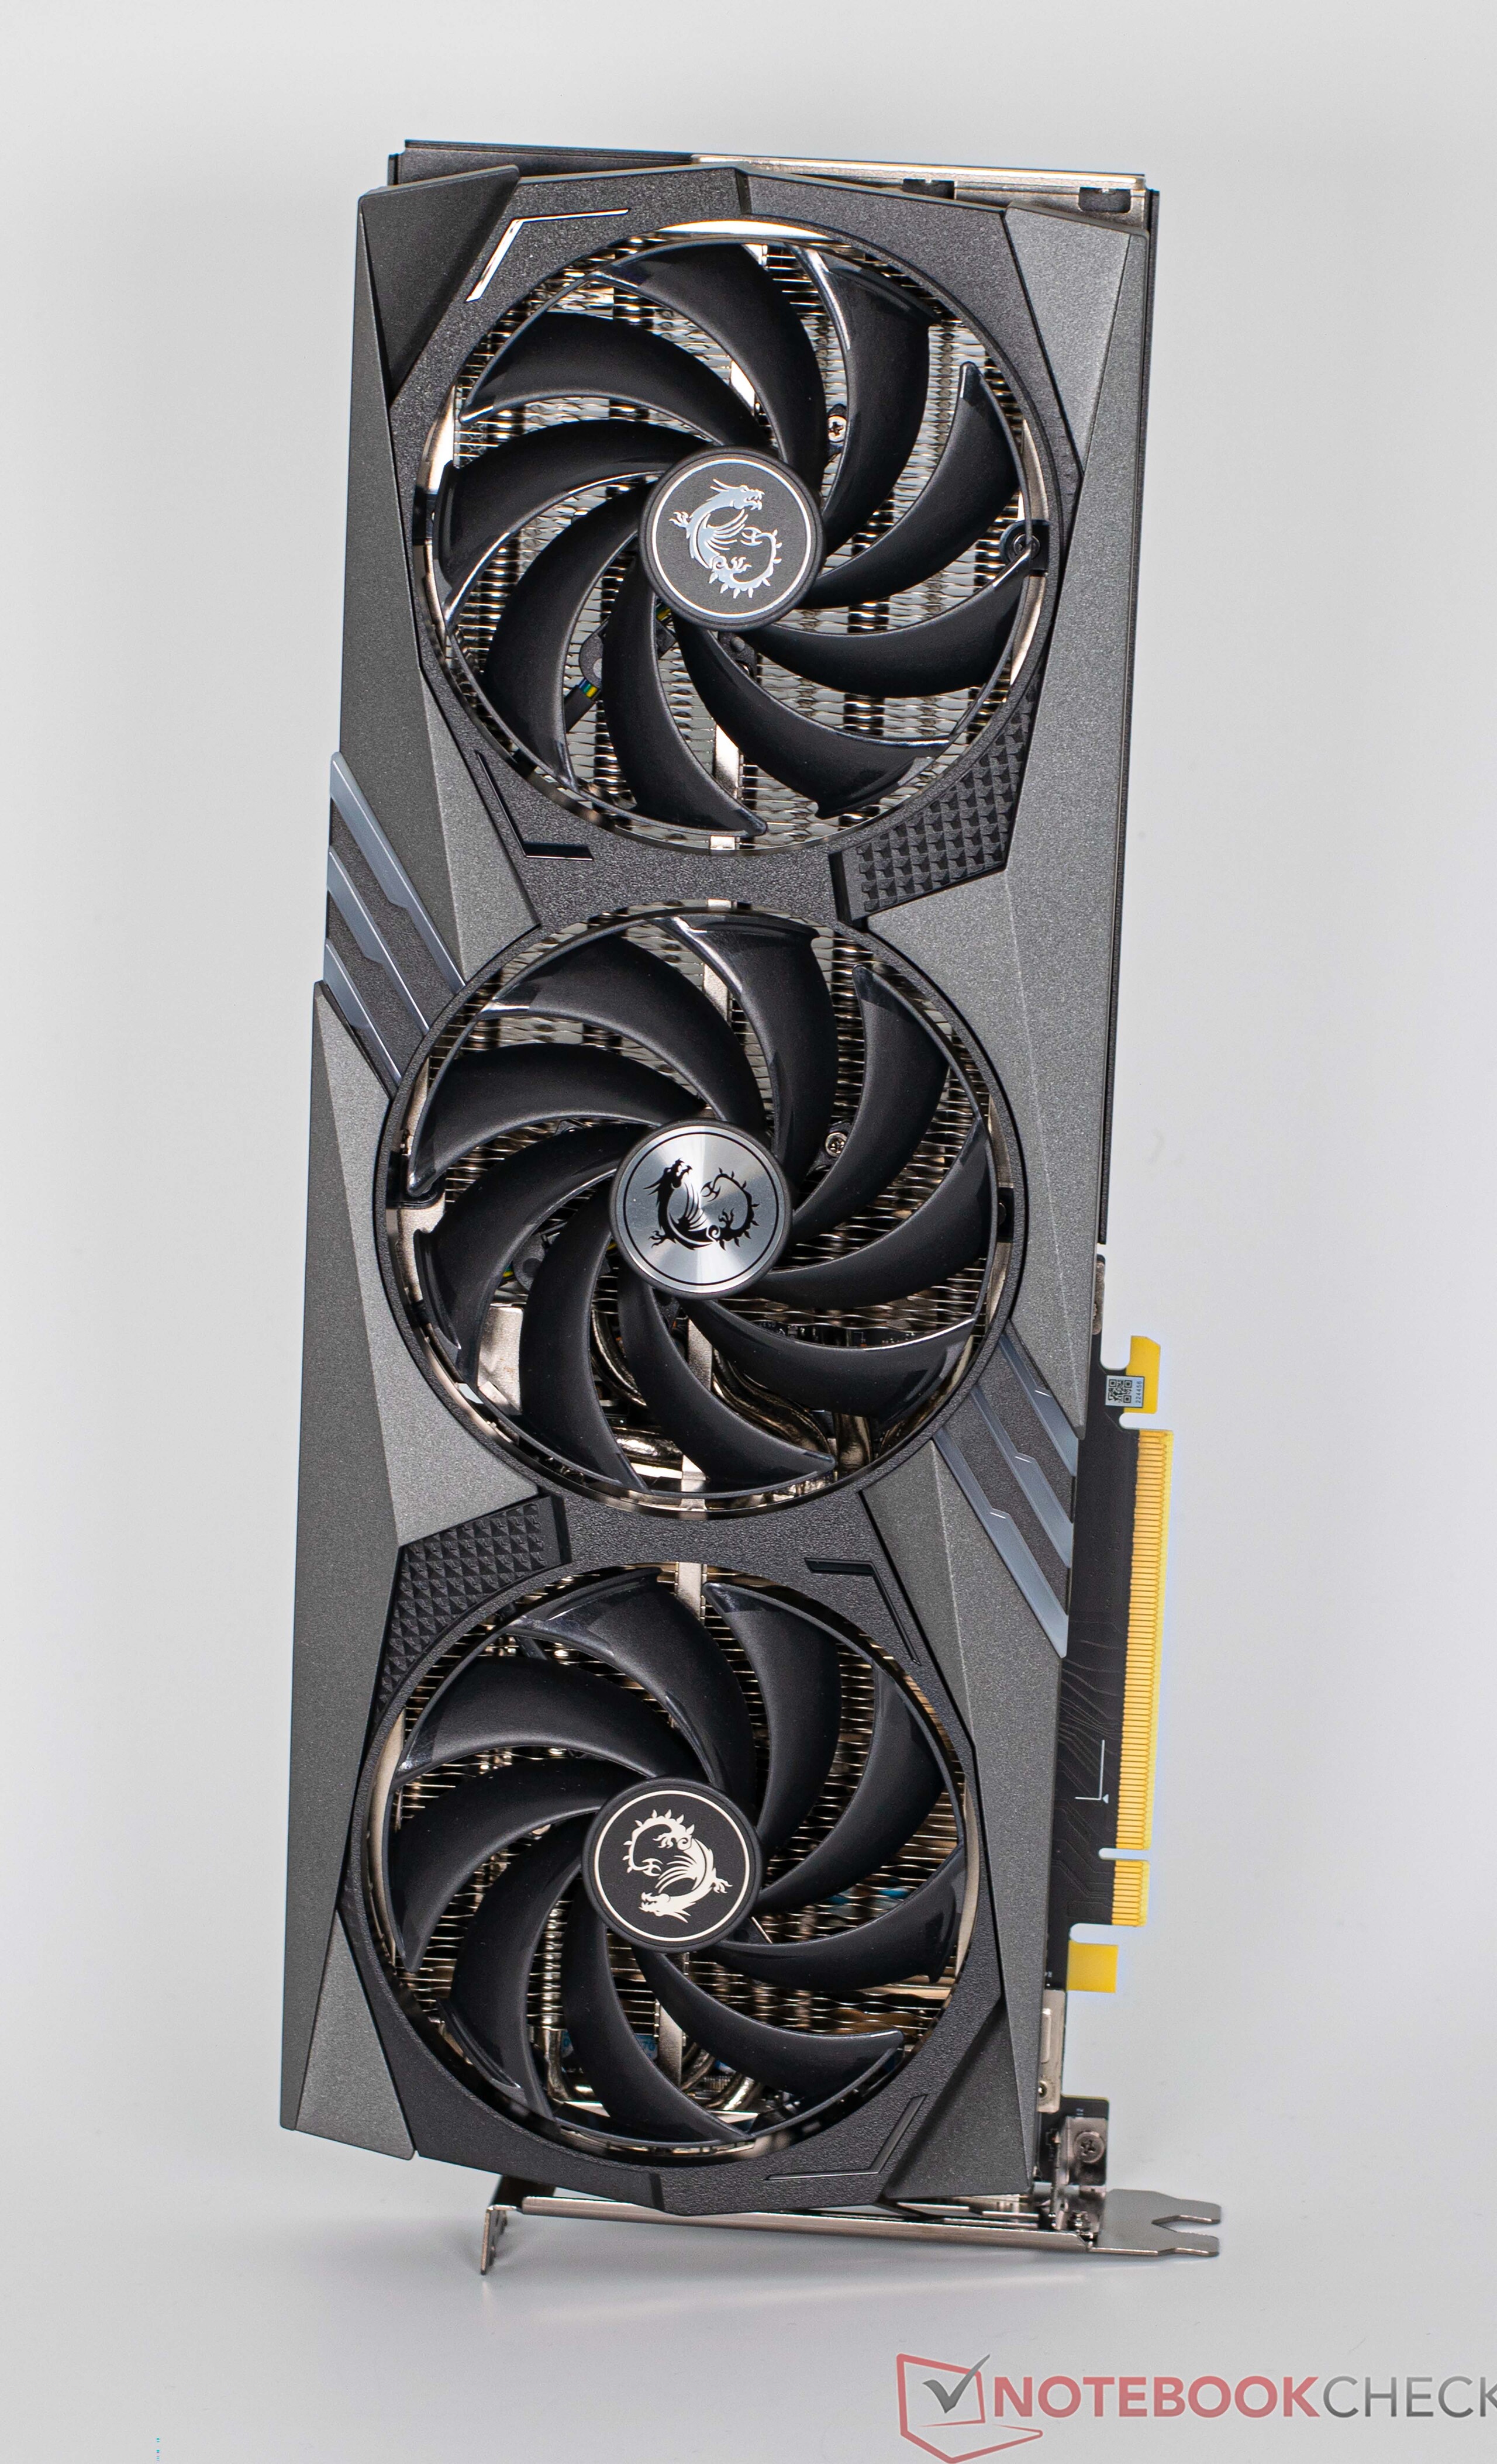
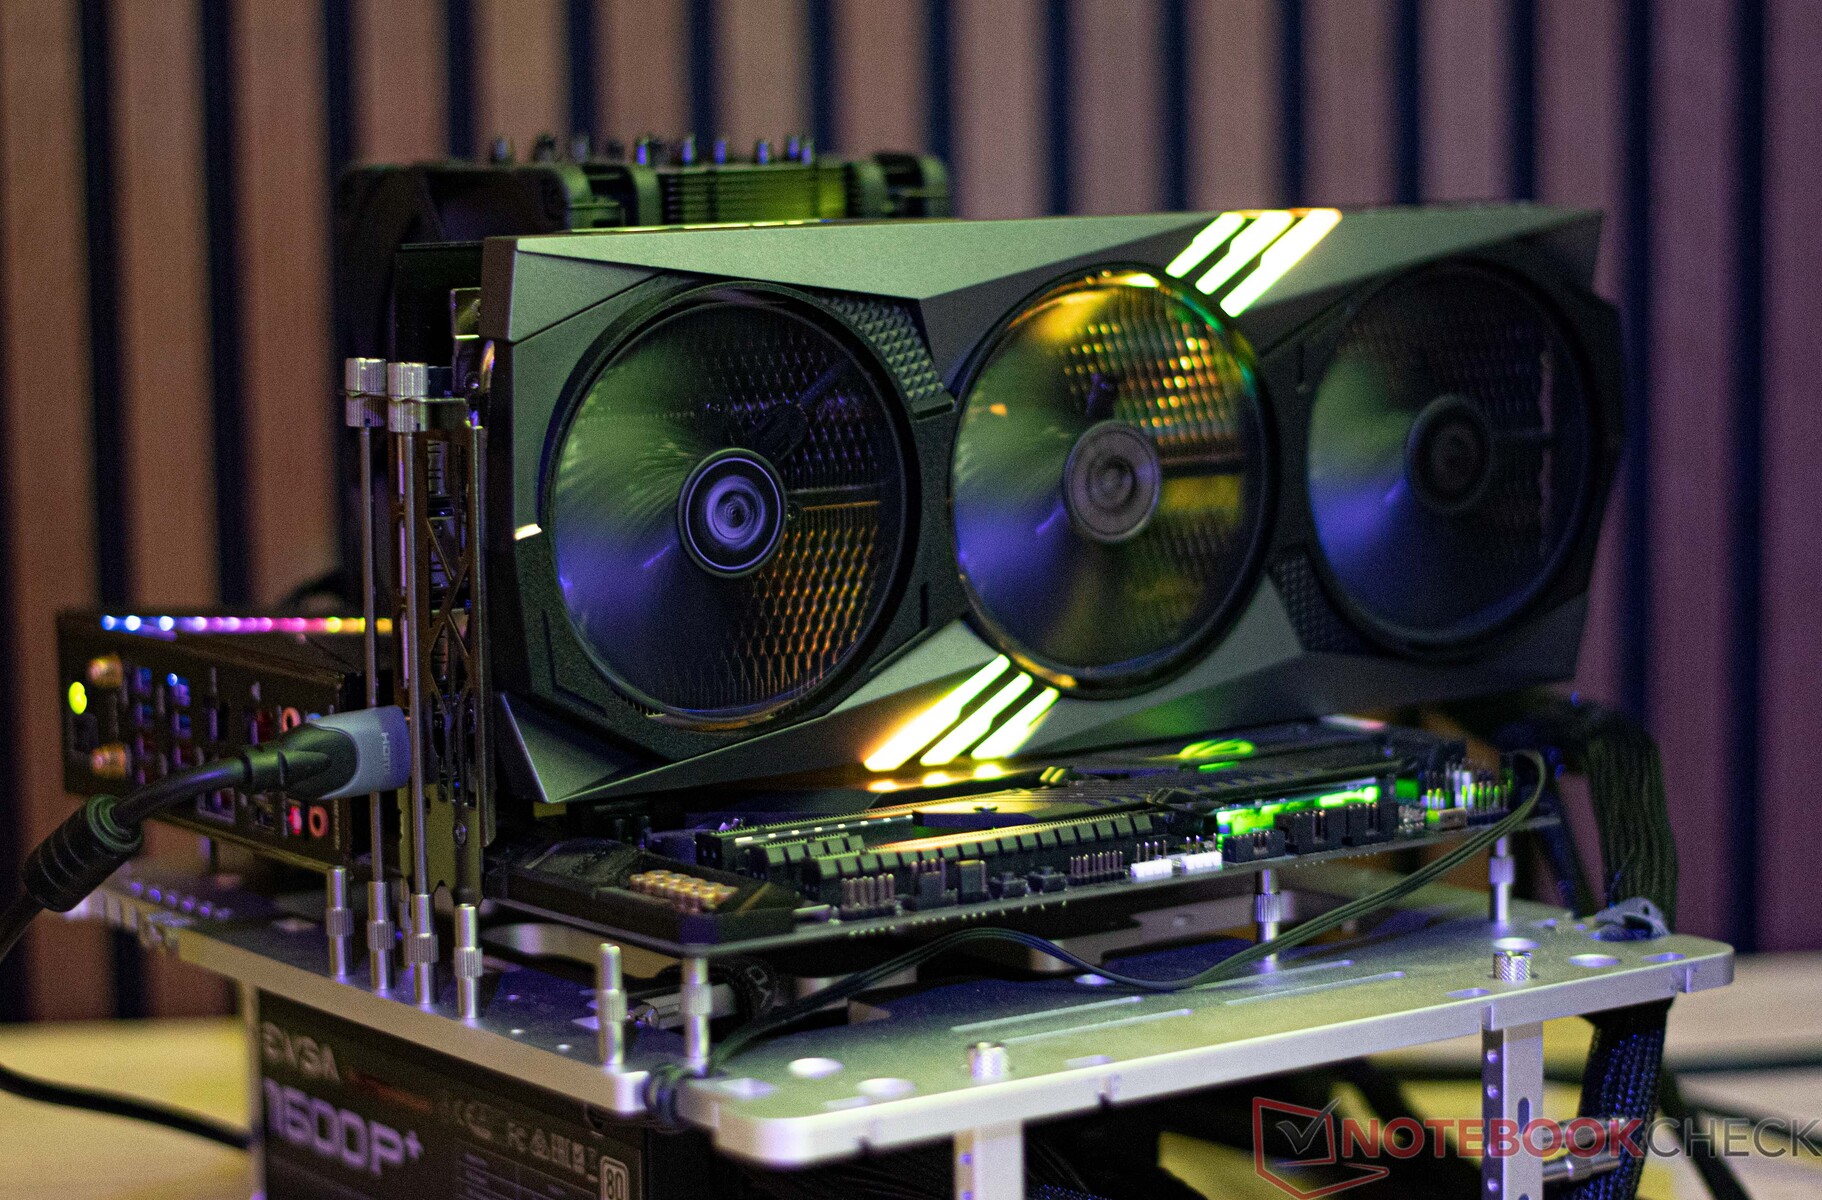
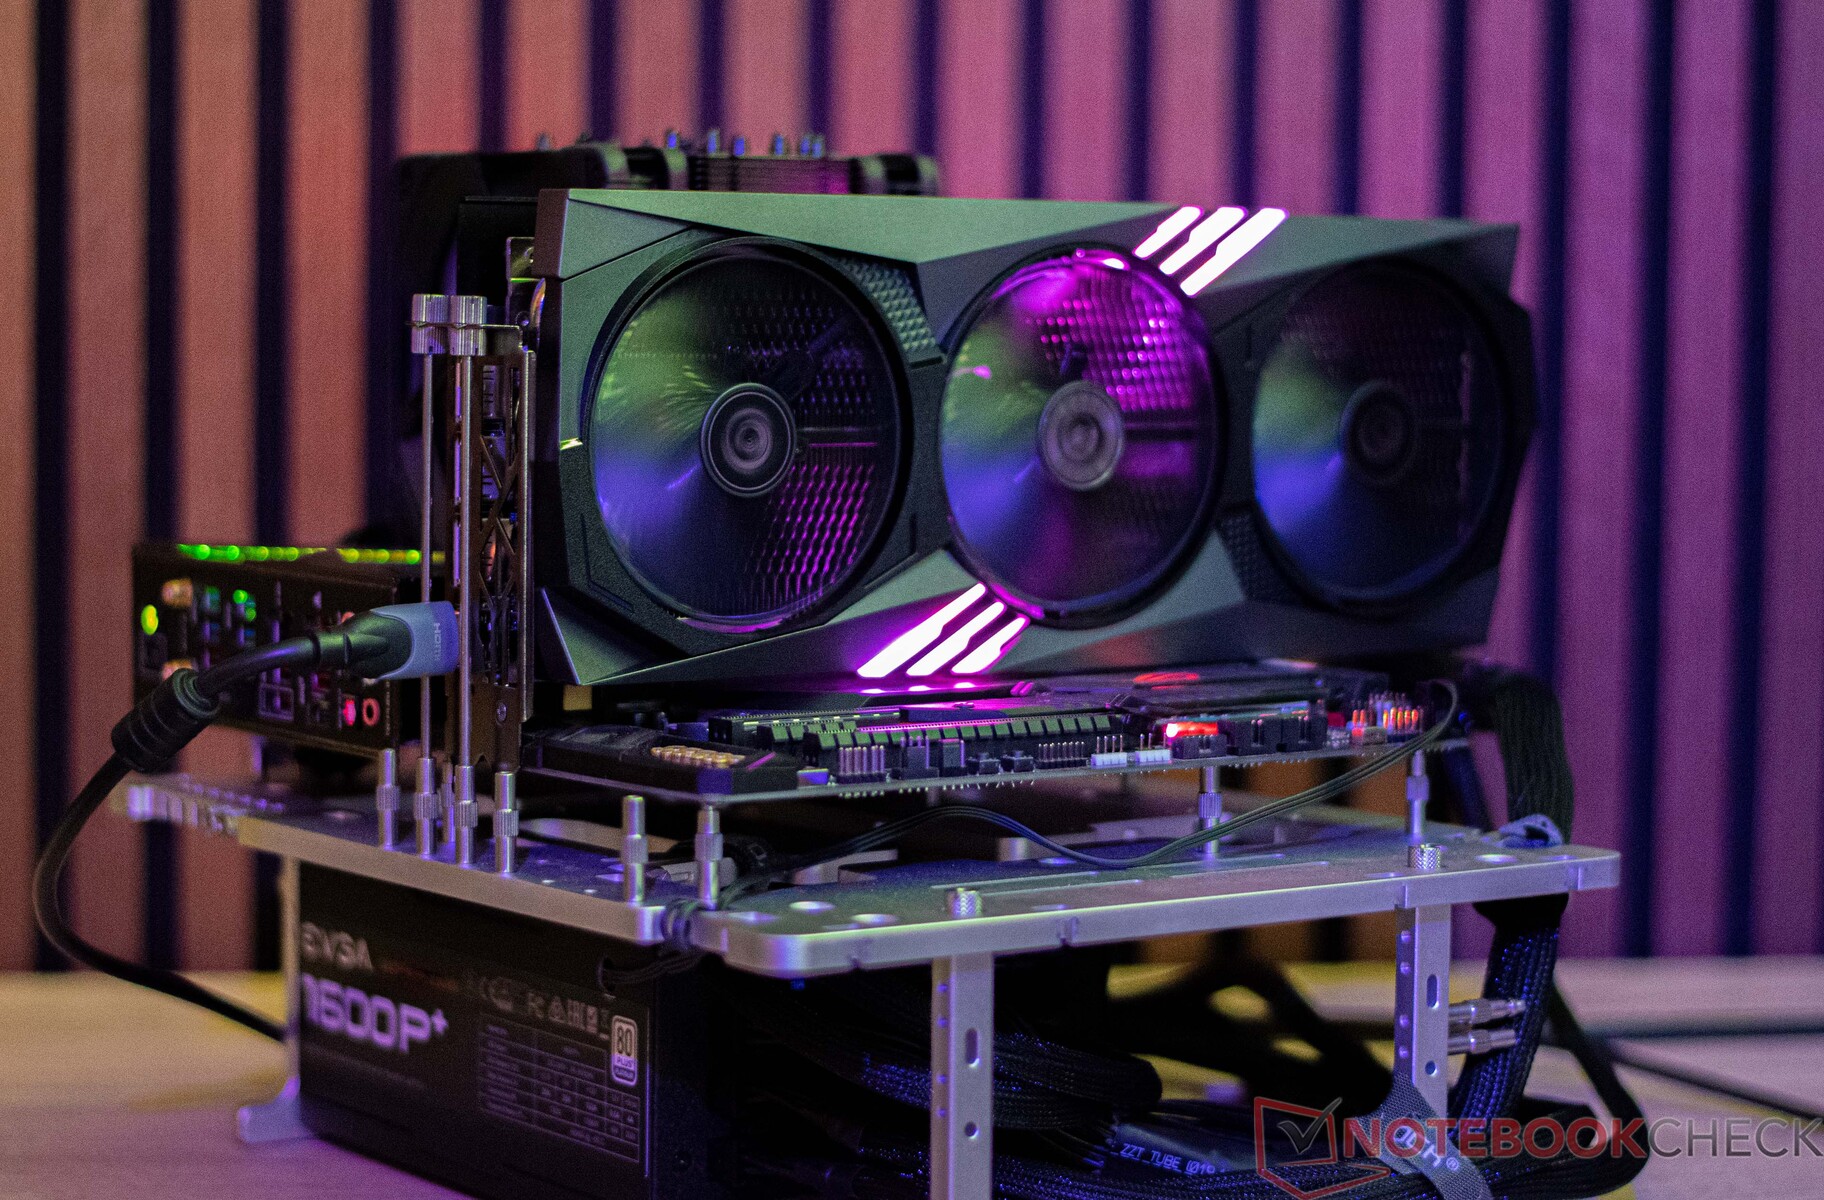
This time, our test sample of the GeForce RTX 4060 Ti is made by MSI. To be precise, it is the manufacturer's top-of-the-range model, namely the Gaming X Trio version. Despite its lower power consumption of only 160 watts, the built-in cooling system is extremely big - which promises very quiet operation. Its size is actually even longer than our GeForce RTX 4090 from Palit. In width, the MSI GeForce RTX 4060 Ti takes up 2.5 slots and 3 fans provide the massive cooling unit with fresh air.

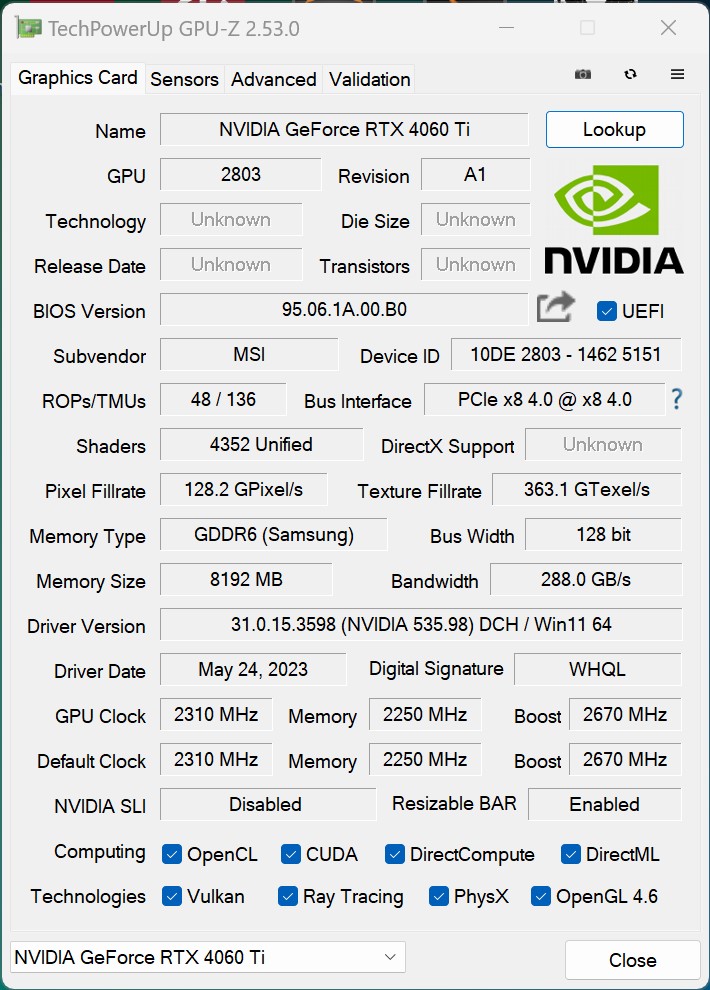
It is no secret that Nvidia have acted a little stingy in the past when it came to VRAM within their mid-range cards. For example, the Nvidia GeForce RTX 3060 Ti only had 8 GB. Now, the GeForce RTX 4060 Ti also only has 8 GB. However, they have already announced 16-GB models and they should be hitting the market quite soon. But how important is a big VRAM? After all, the GeForce RTX 4060 Ti is only supposed to cover 1,080p gaming. The 1,440p area is covered by models which feature the RTX 4070 chip and the two top-of-the-range models, the RTX 4080 and RTX 4090, take care of UHD gaming.

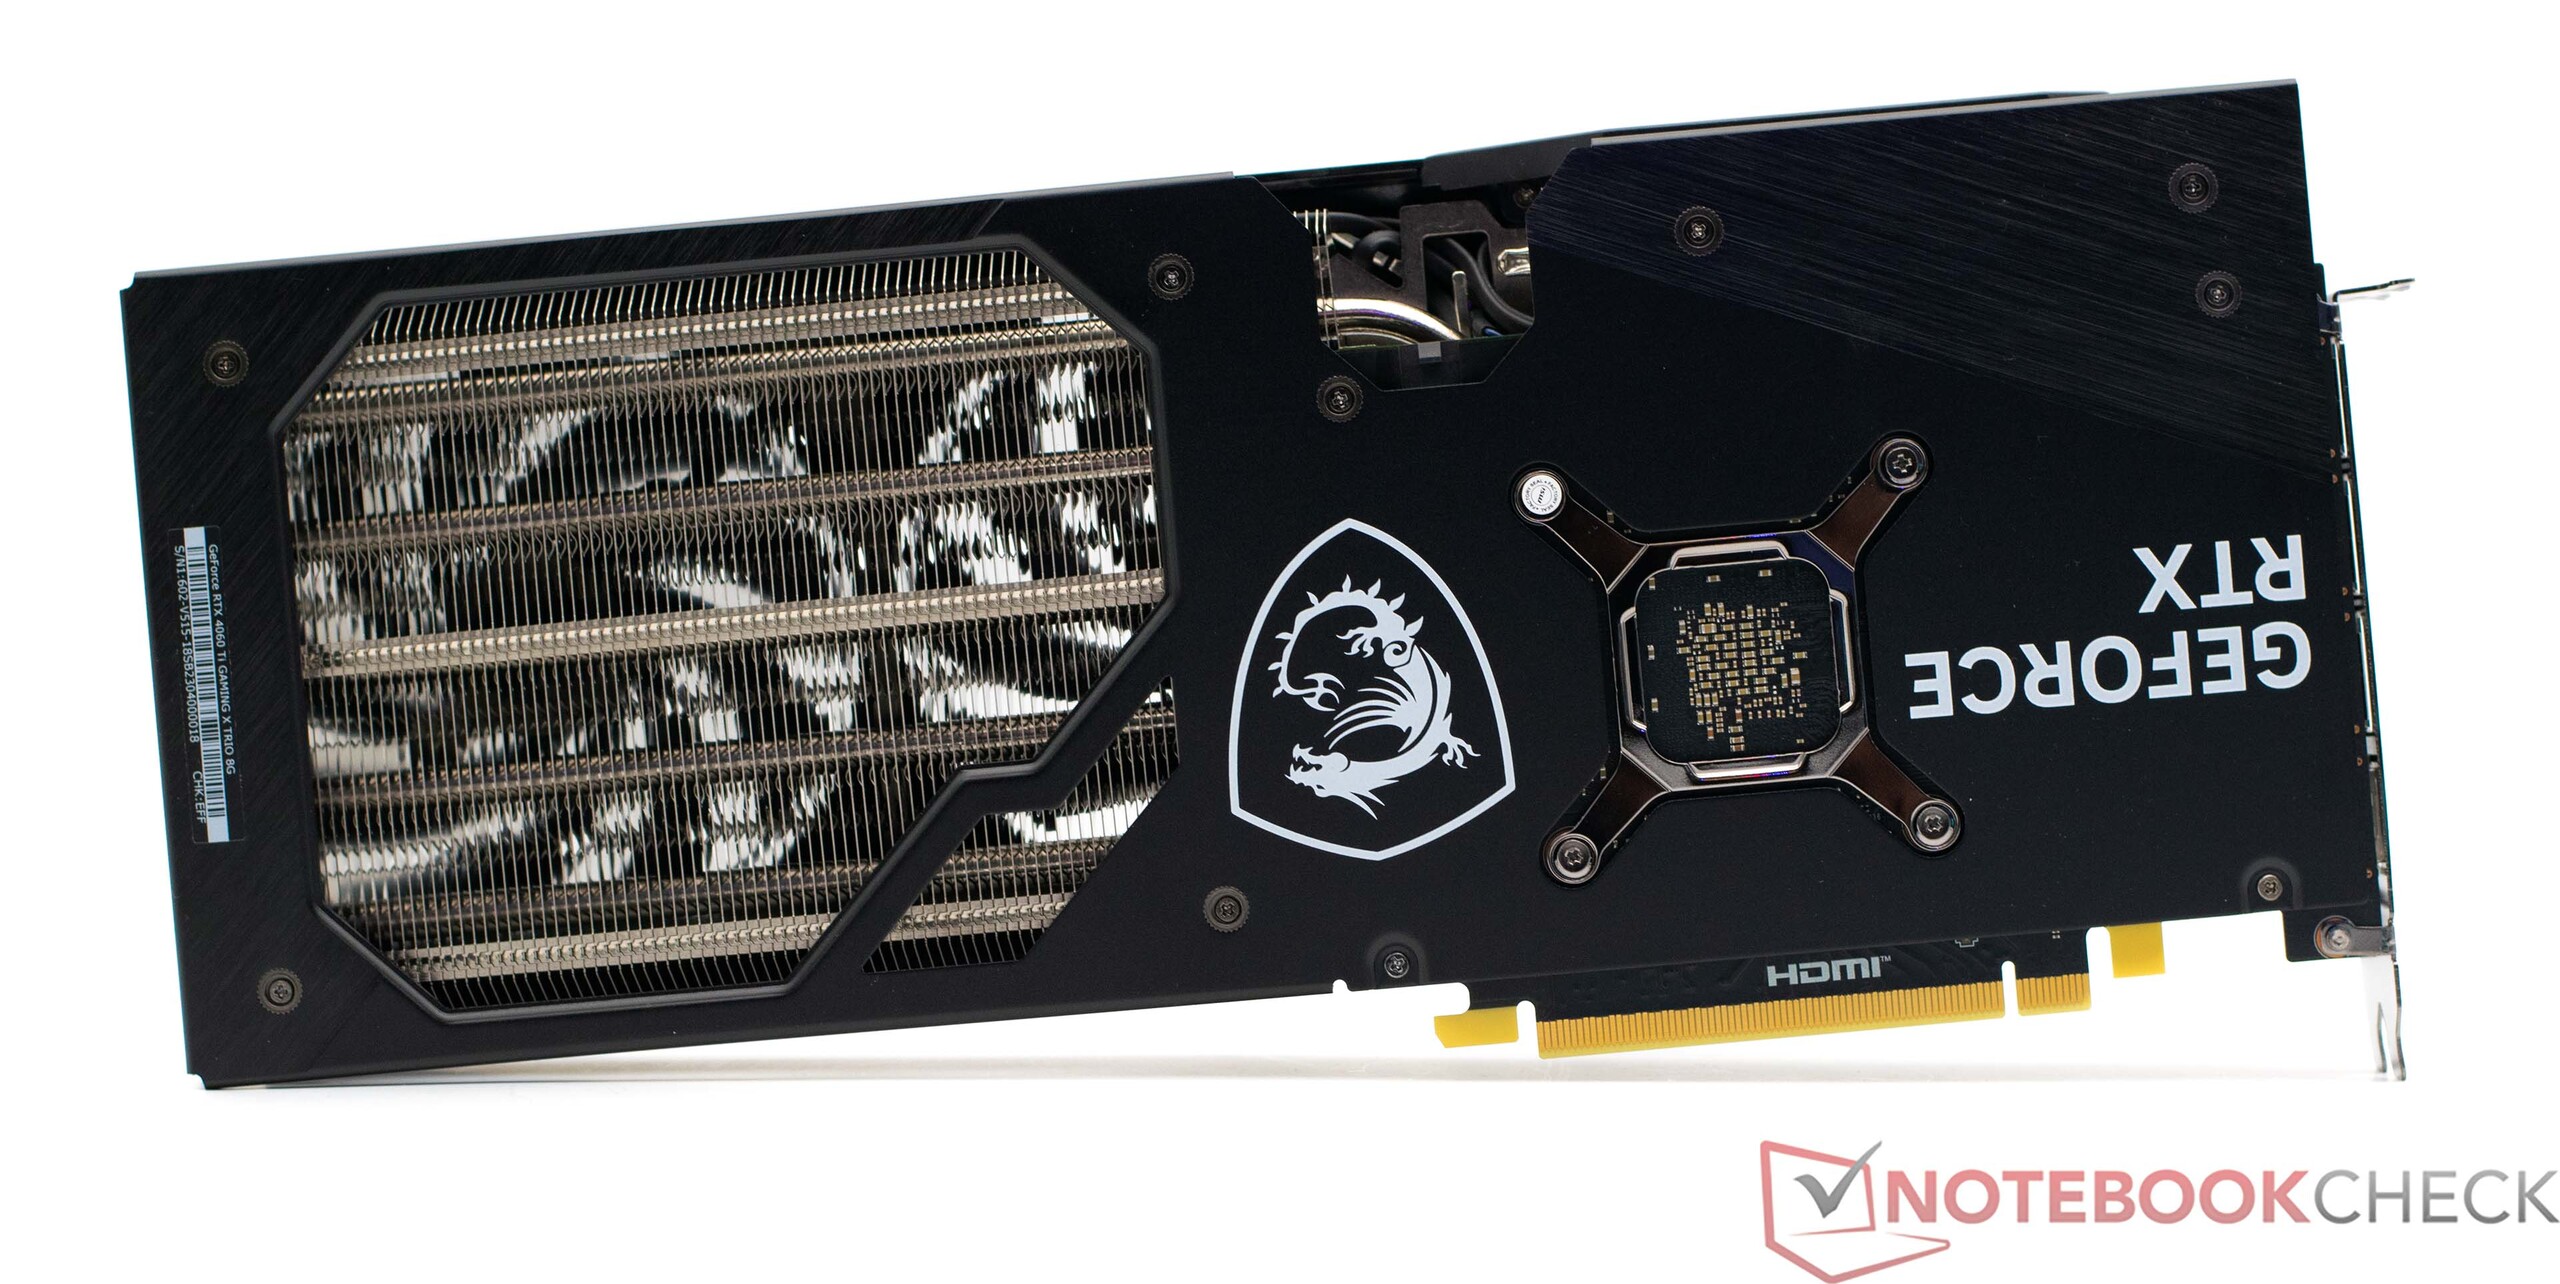
As already mentioned, its dimensions of 33.8 cm are already extremely large and these will require the correct case. At the same time, its PCB (printed circuit board) is only half as long. The GPU's low power consumption places no strain on the power supply. Our test sample comes with a 6+2 pin PCIe power connector. Nvidia's model, the Founders Edition, comes with a 12VHPWR connection.

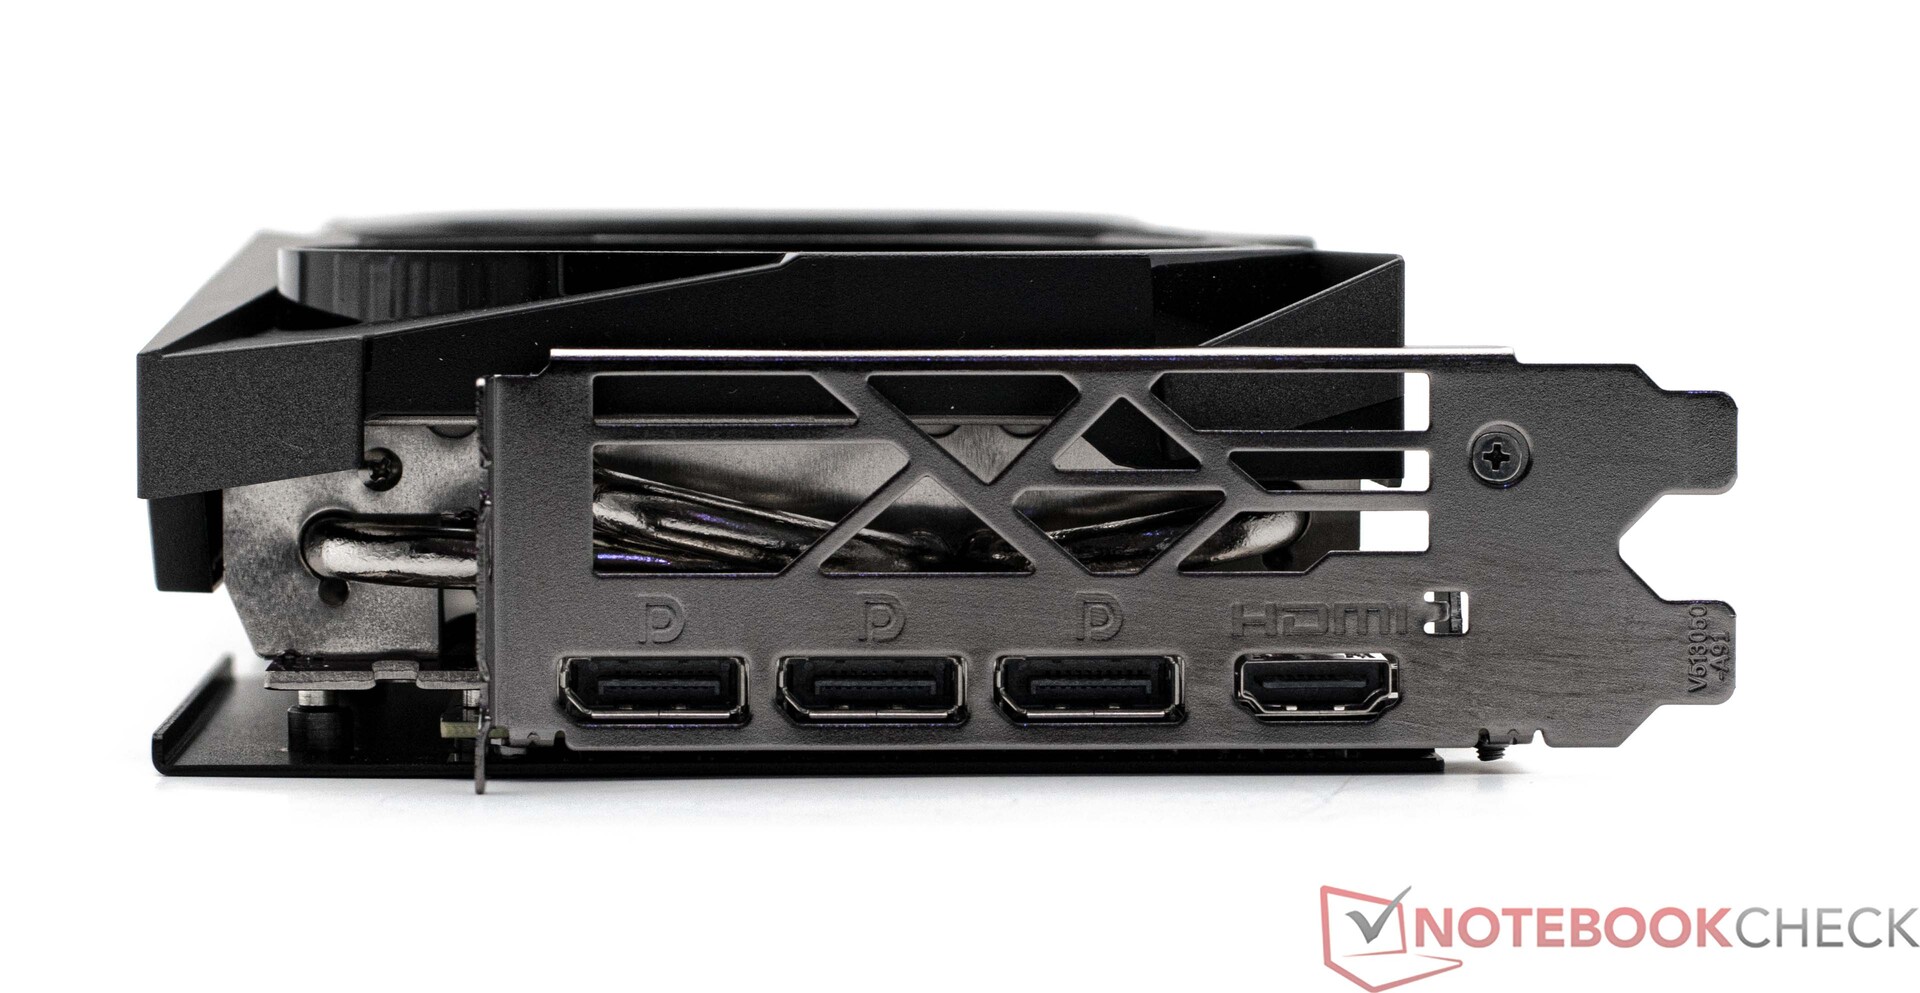
Both external connections follow the typical standard. It still doesn't feature DisplayPort 2.1. On the plus side, but does have 1 HDMI 2.1a and 3 DisplayPort 1.4a ports, which should be more than enough for most users.

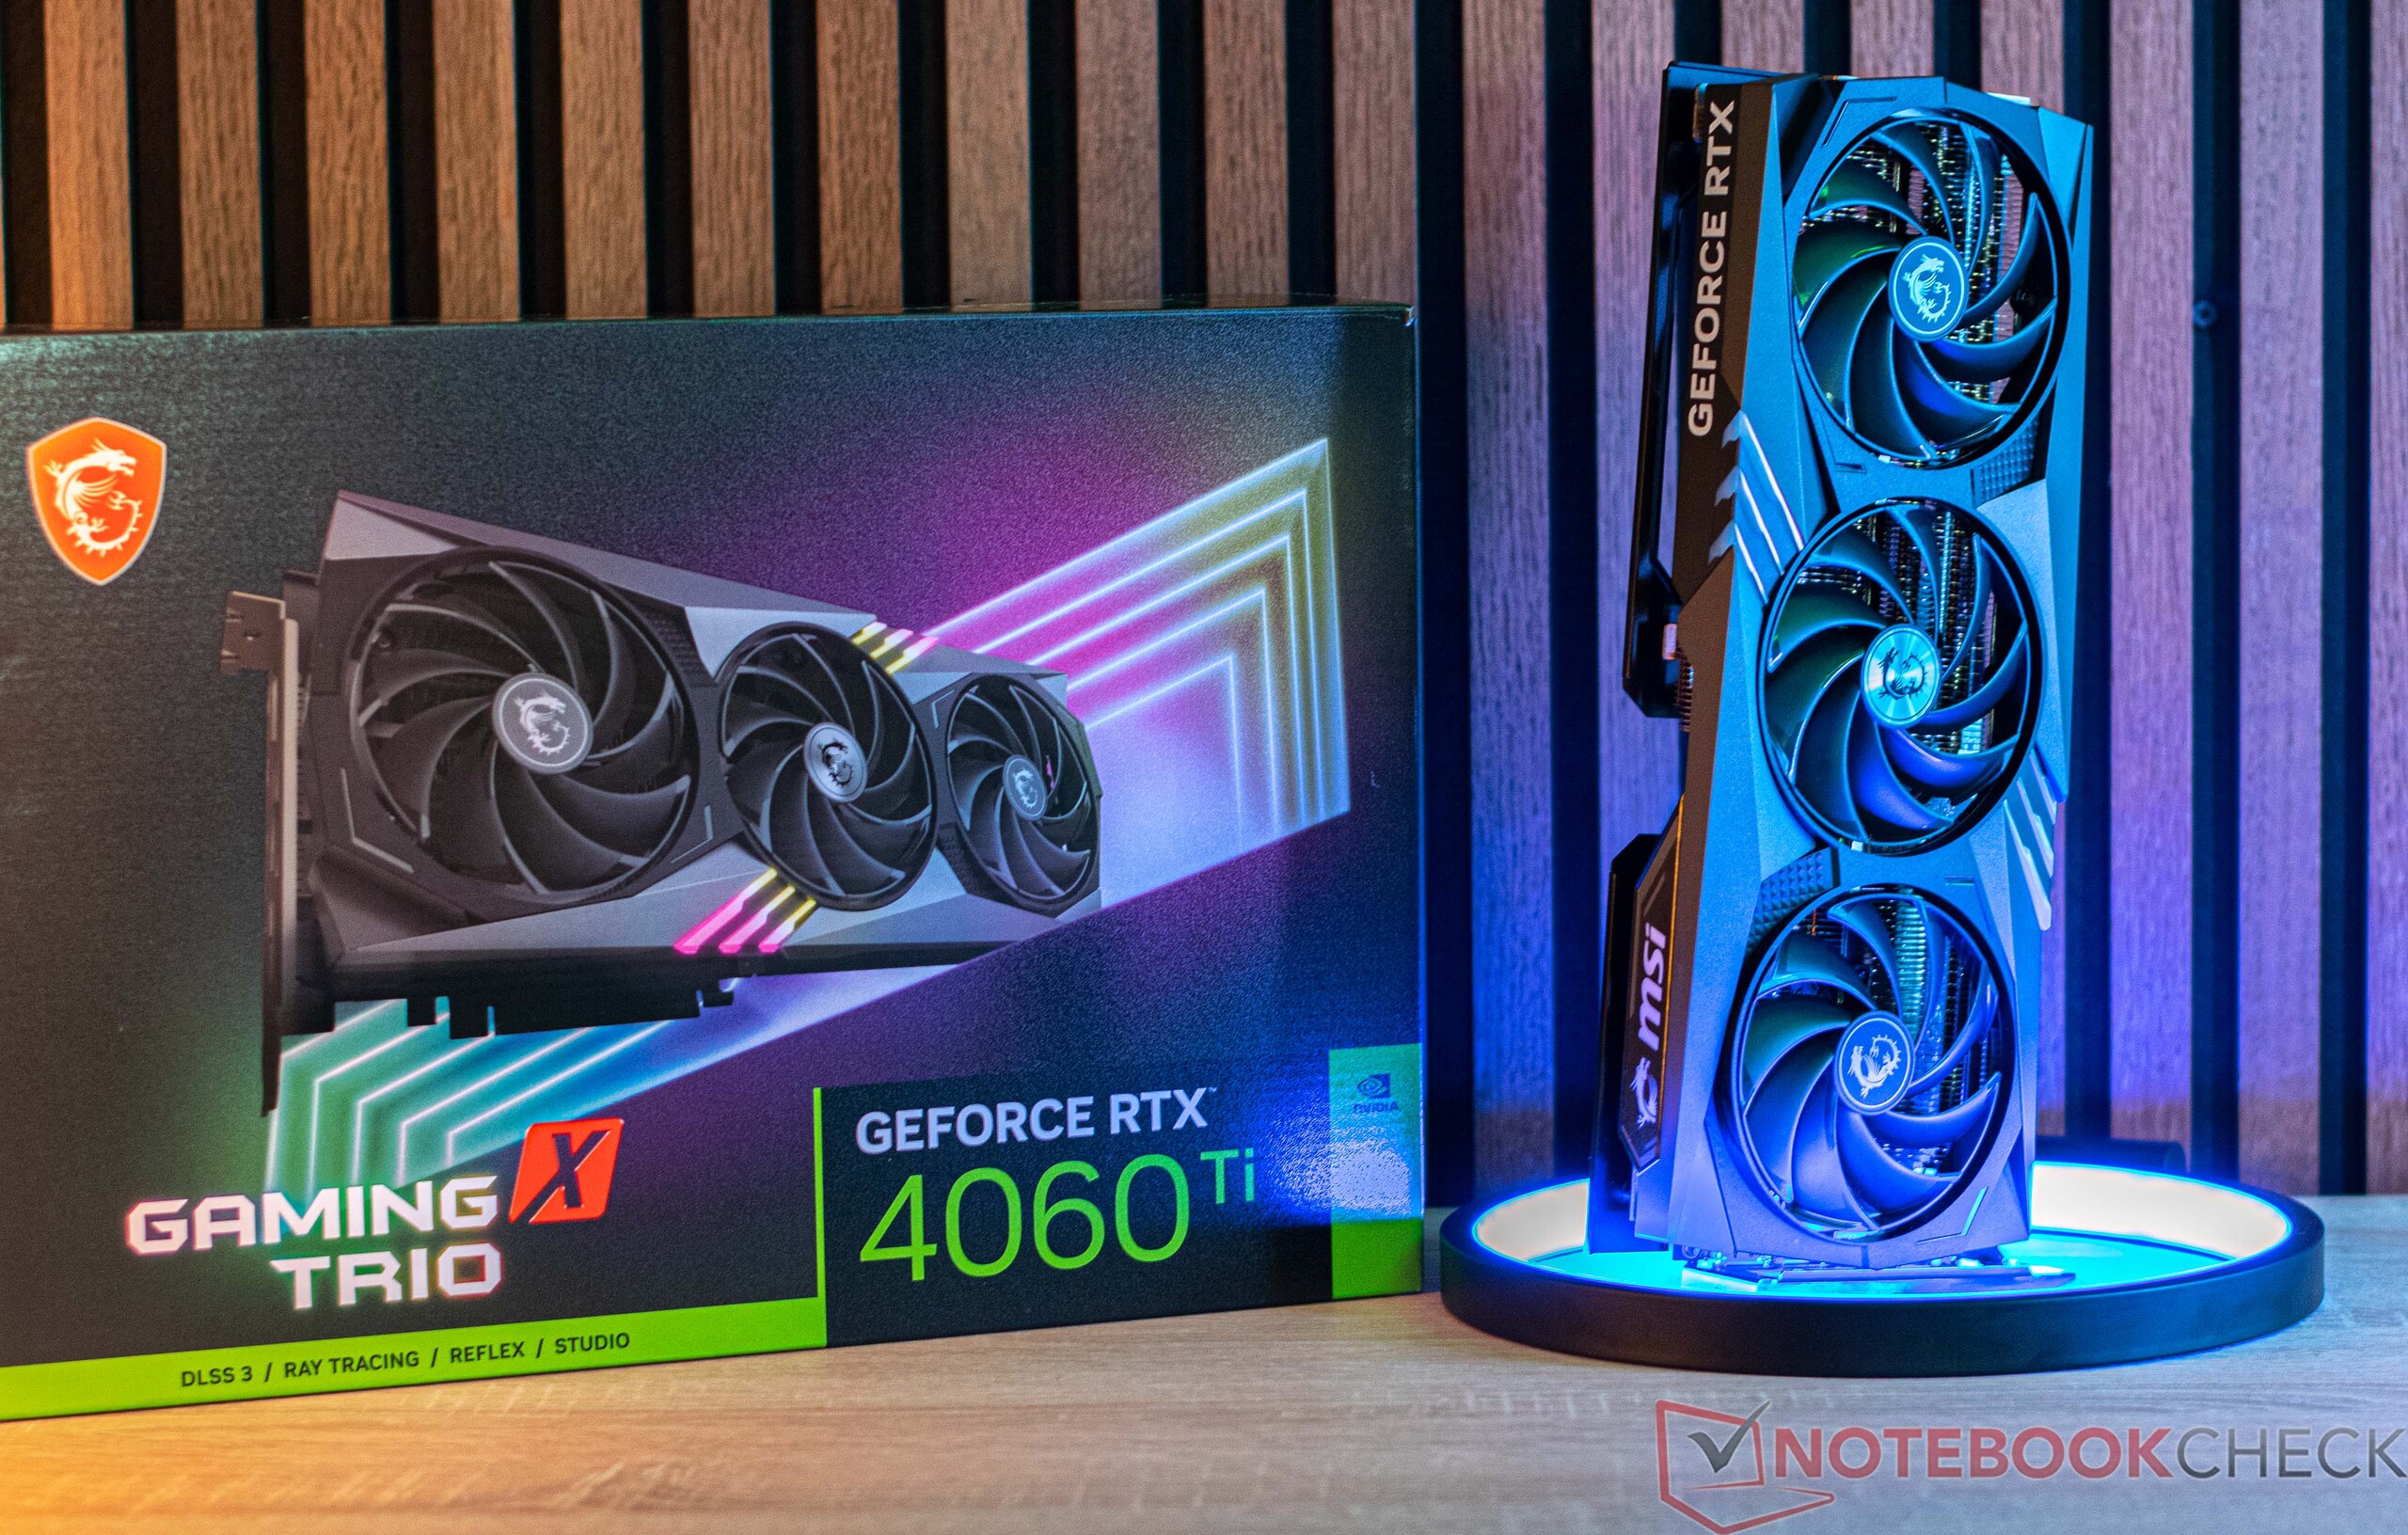
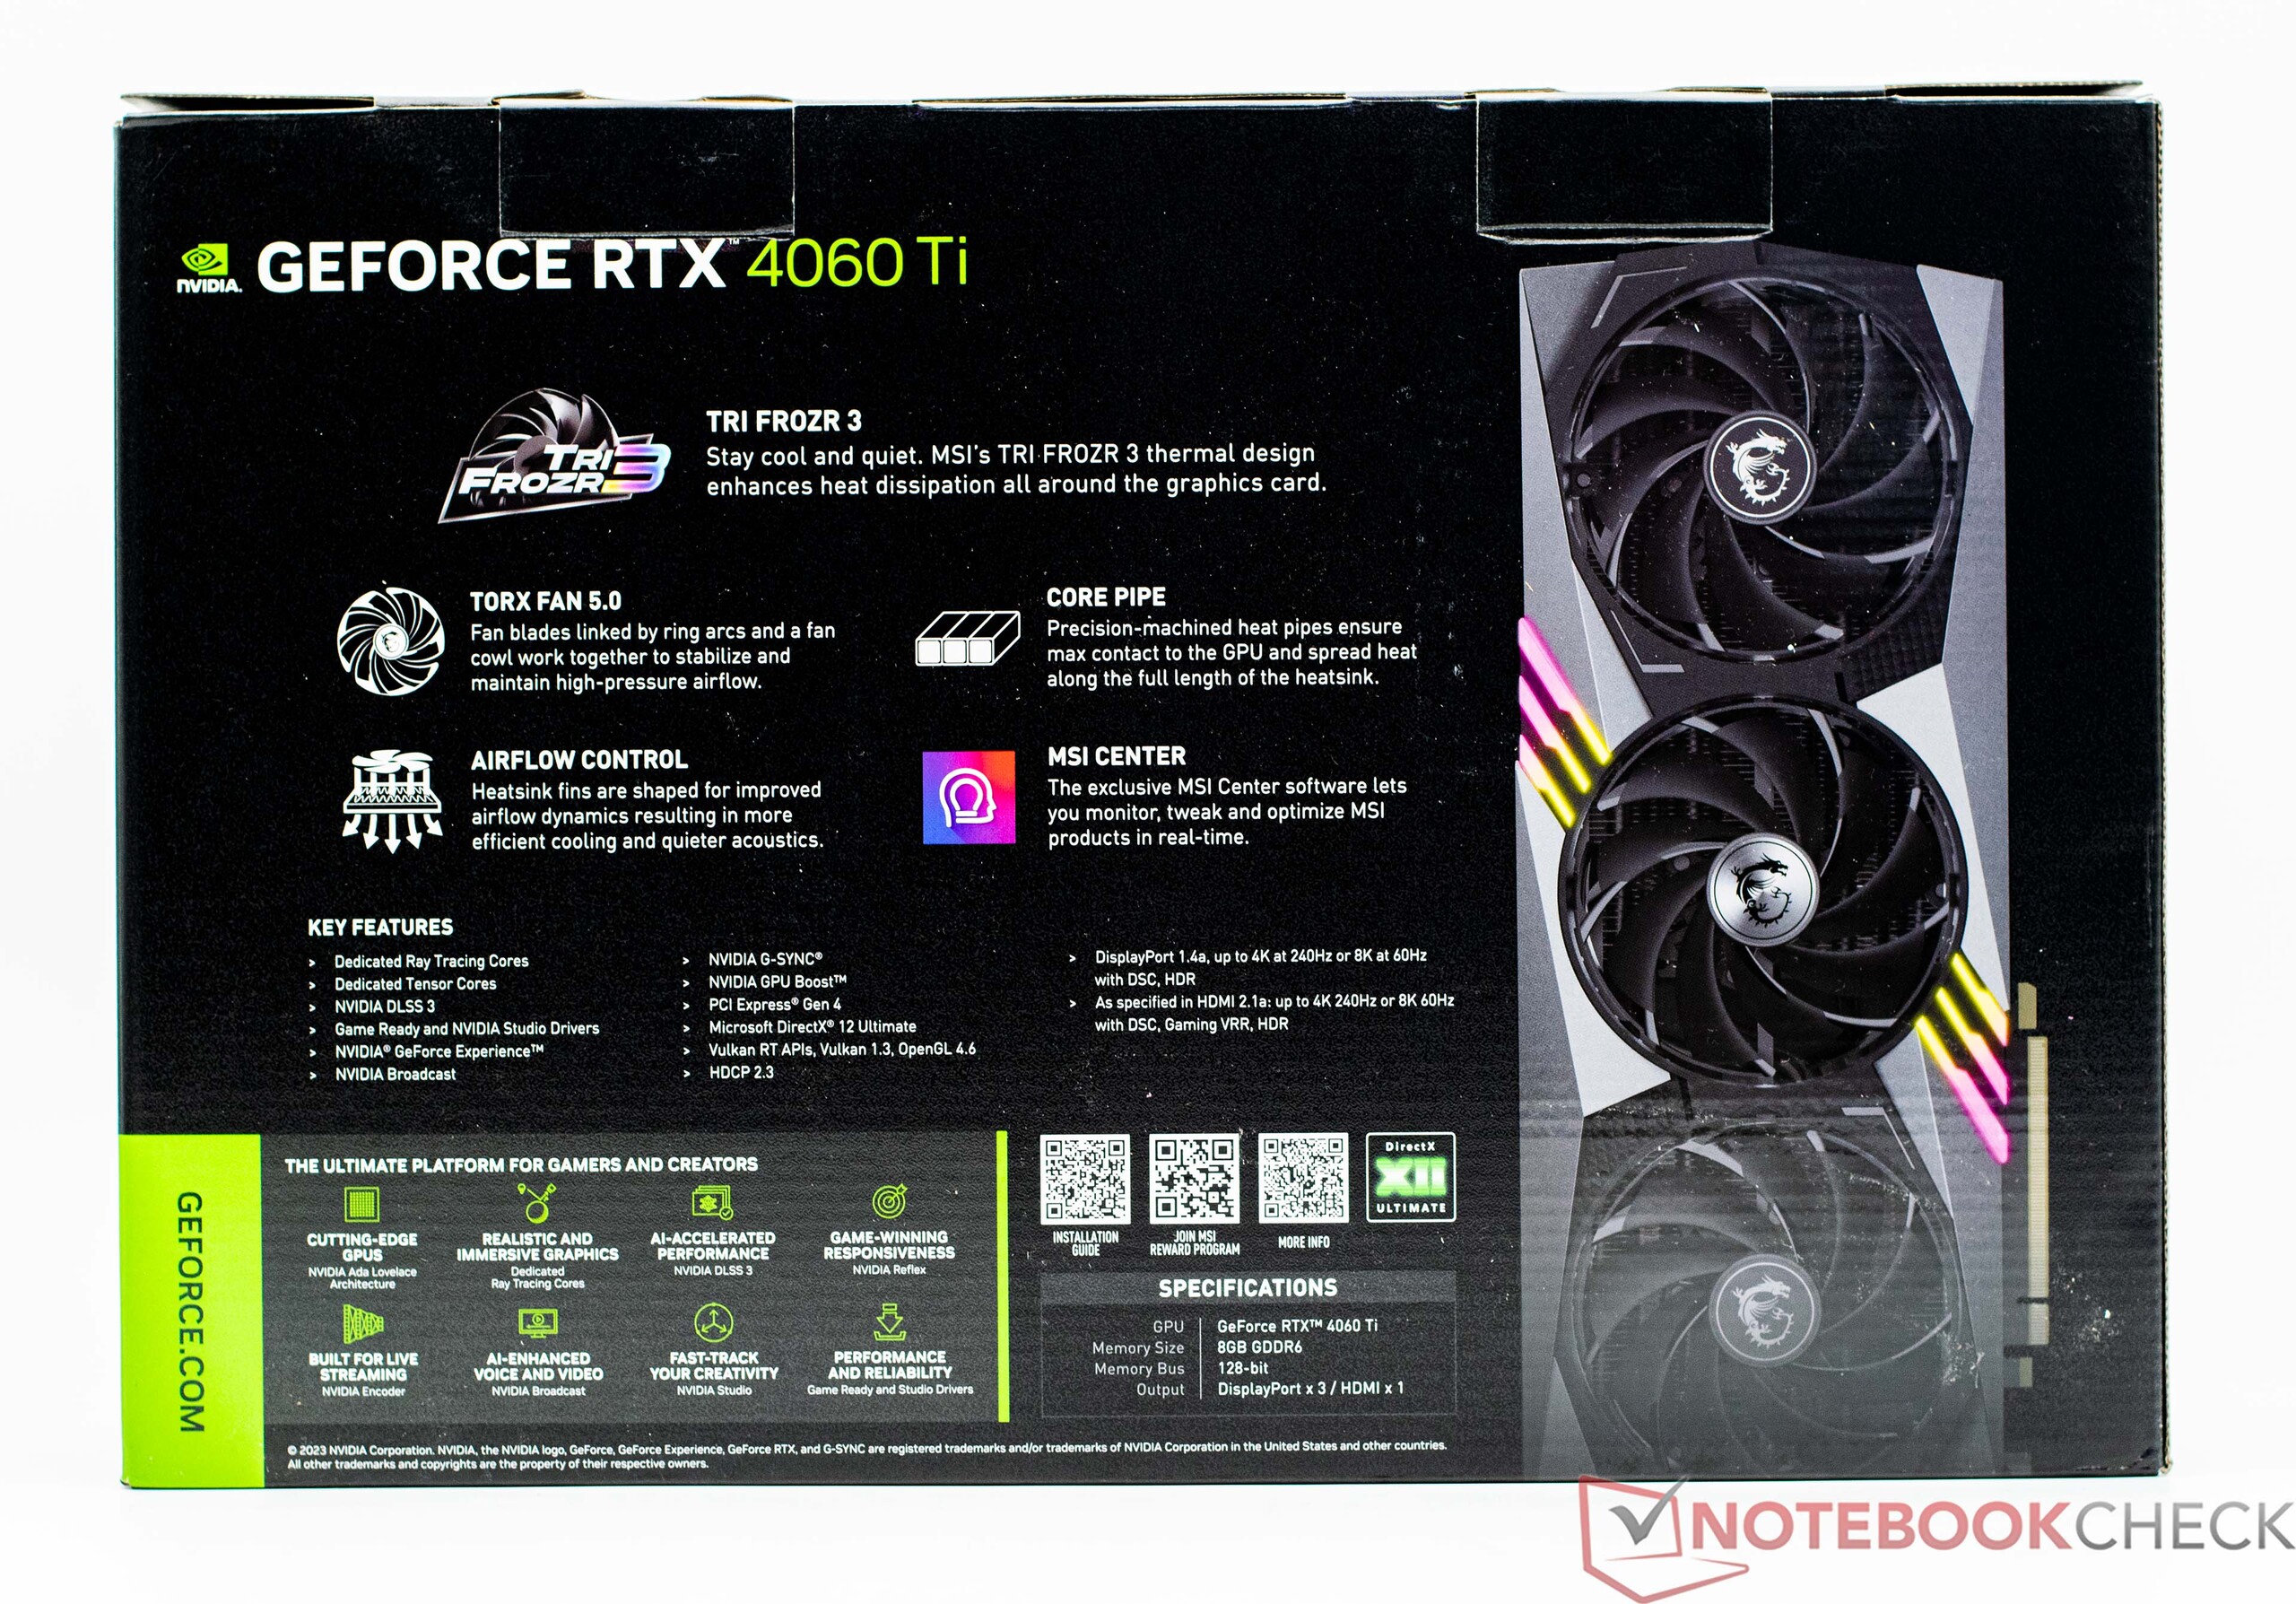
The MSI GeForce RTX 4060 Ti Gaming X Trio 8G in detail

MSI GeForce RTX 4060 Ti Gaming X Trio 8G

GeForce graphics cards specs compared

Features RTX 4090 RTX 4080 RTX 4070 Ti RTX 4070 RTX 4060 Ti RTX 3070 RTX 3060 Ti
Chip AD102 AD103 AD104 AD104 AD106 GA104 GA104
FinFET process TSMC 4N TSMC 4N TSMC 4N TSMC 4N TSMC 4N 8 nm 8 nm
CUDA cores 16.384 9.728 7.680 5.888 4.352 5.888 4.864
Texture units 512 304 240 184 136 184 152
Tensor cores 512 4th Gen. 304 4th Gen. 240 4th Gen. 184 4th Gen. 136 4th Gen. 184 3rd Gen. 152 3rd Gen.
RT cores 128 76 60 46 34 46 38
GPU base clock 2,235 MHz 2,205 MHz 2,310 MHz 1,920 MHz 2,310 MHz 1,500 MHz 1,410 MHz
GPU boost clock 2,520 MHz 2,505 MHz 2,610 MHz 2,475 MHz 2,535 MHz 1,725 MHz 1,665 MHz
Memory bus 384 Bit 256 Bit 192 Bit 192 Bit 128 Bit 256 Bit 256 Bit
Memory bandwidth 1,008 GB/s 716.8 GB/s 504.2 GB/s 504.2 GB/s 288 GB/s 448 GB/s 448 GB/s
Video memory 24 GB GDDR6X 16 GB GDDR6X 12 GB GDDR6 12 GB GDDR6X 8 GB GDDR6 8 GB GDDR6 8 GB GDDR6
Power consumption 450 W 320 W 285 W 215 W 160 W 220 W 200 W

Infos about our test system

MSI GeForce RTX 4060 Ti Gaming X Trio 8G
Processor
AMD Ryzen 9 7950X 16 x 4.5 - 5.7 GHz, 230 W PL2 / Short Burst, 170 W PL1 / Sustained, Raphael (Zen 4)
Graphics adapter
NVIDIA GeForce RTX 4060 Ti 8G - 8 GB VRAM ( including 160 W Dynamic Boost), GDDR6, Nvidia
Memory
32 GB 
, DDR5-6000 (EXPO)
Display
32.00 inch 16:9, 3840 x 2160 pixel 138 PPI, Innolux (M315DCA-K7B), 144 Hz
Storage
Corsair MP600, 2048 GB 
Size
height x width x depth (in mm): 52 x 338 x 141 ( = 2.05 x 13.31 x 5.55 in)
Operating System
Microsoft Windows 11 Pro
Additional features
36 Months Warranty
Weight
1.171 kg ( = 41.31 oz / 2.58 pounds), Power Supply: 0 g ( = 0 oz / 0 pounds)
Price
489 Euro
Note: The manufacturer may use components from different suppliers including display panels, drives or memory sticks with similar specifications.


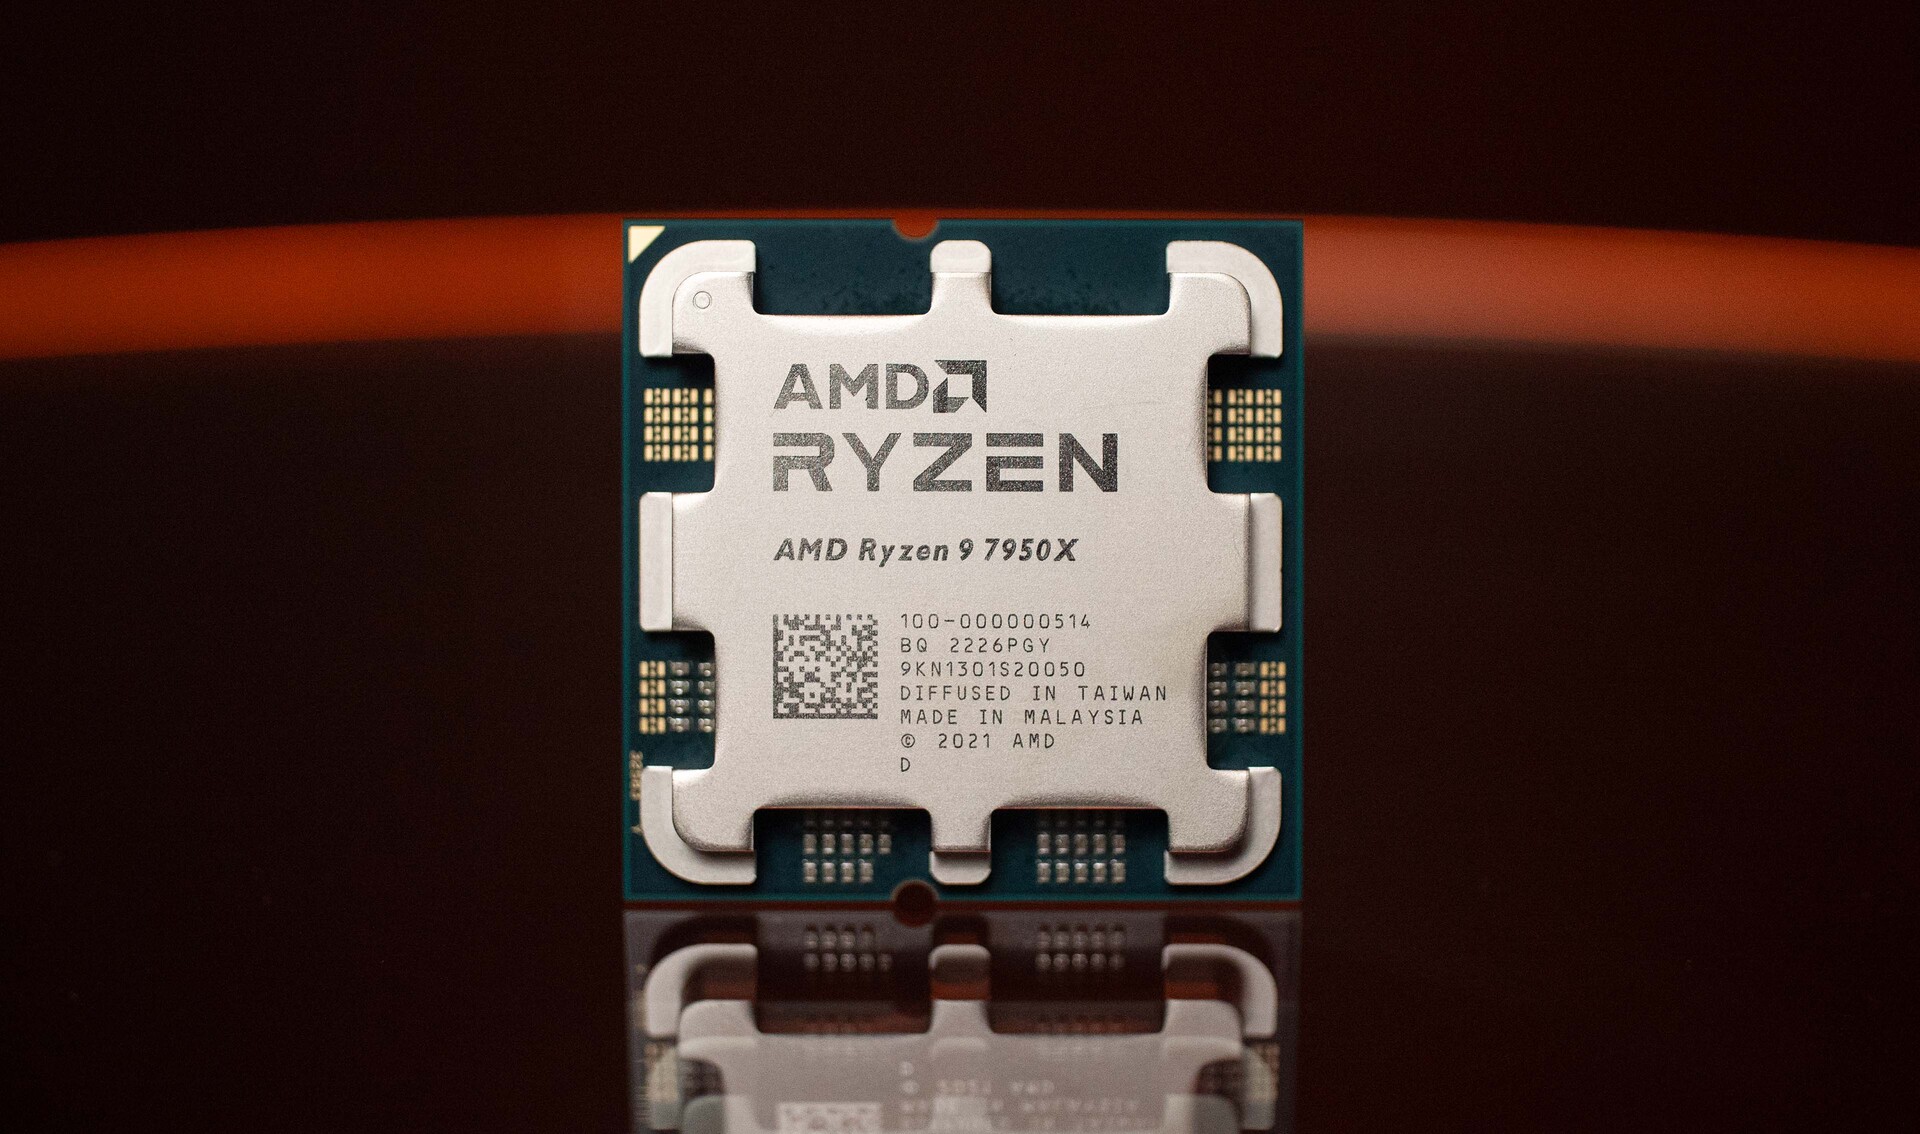
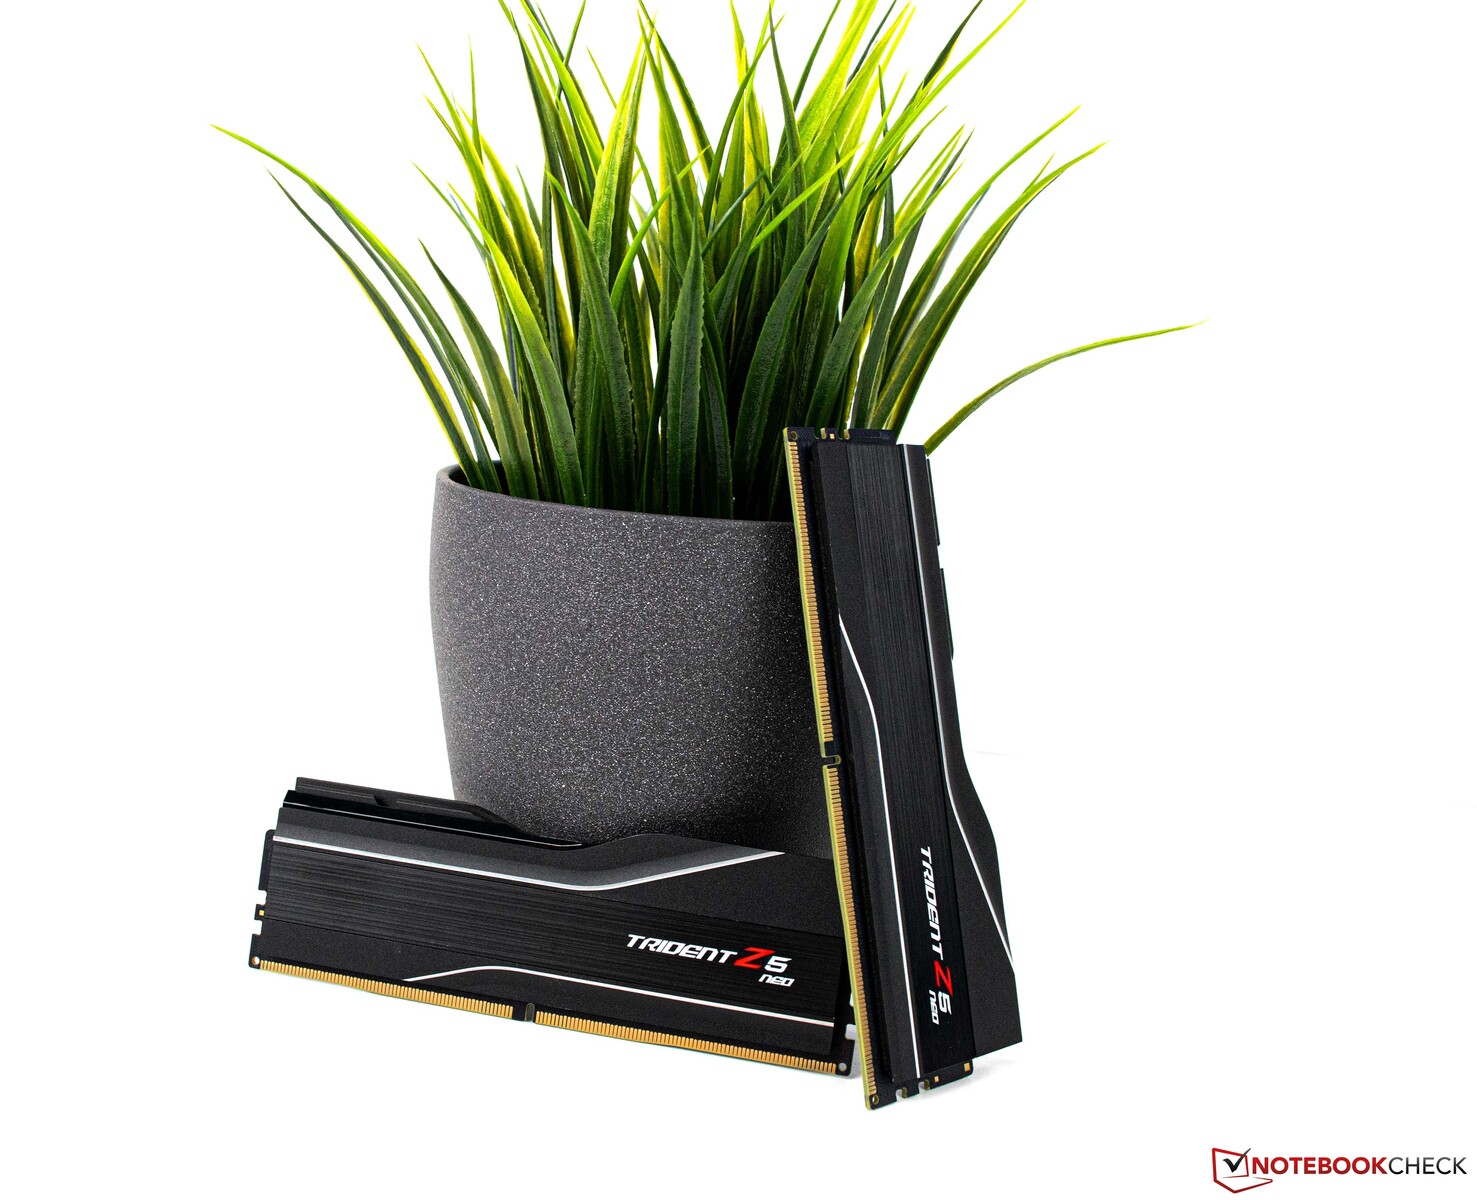
A current AMD platform based on the Gigabyte X670E Aorus Master serves as our test system. The CPU (AMD Ryzen 9 7950X) offers excellent performance, and we are using the AiO solution Deepcool LT720 as a cooling unit. The 32 GB RAM is made by G.Skill and is operated using the matching EXPO profile. As a monitor, we are using the Gigabyte M32U.

Gigabyte X670E Aorus Master
AMD Ryzen 9 7950X
AMD Ryzen 9 7950X
G.Skill Trident Z5 Neo

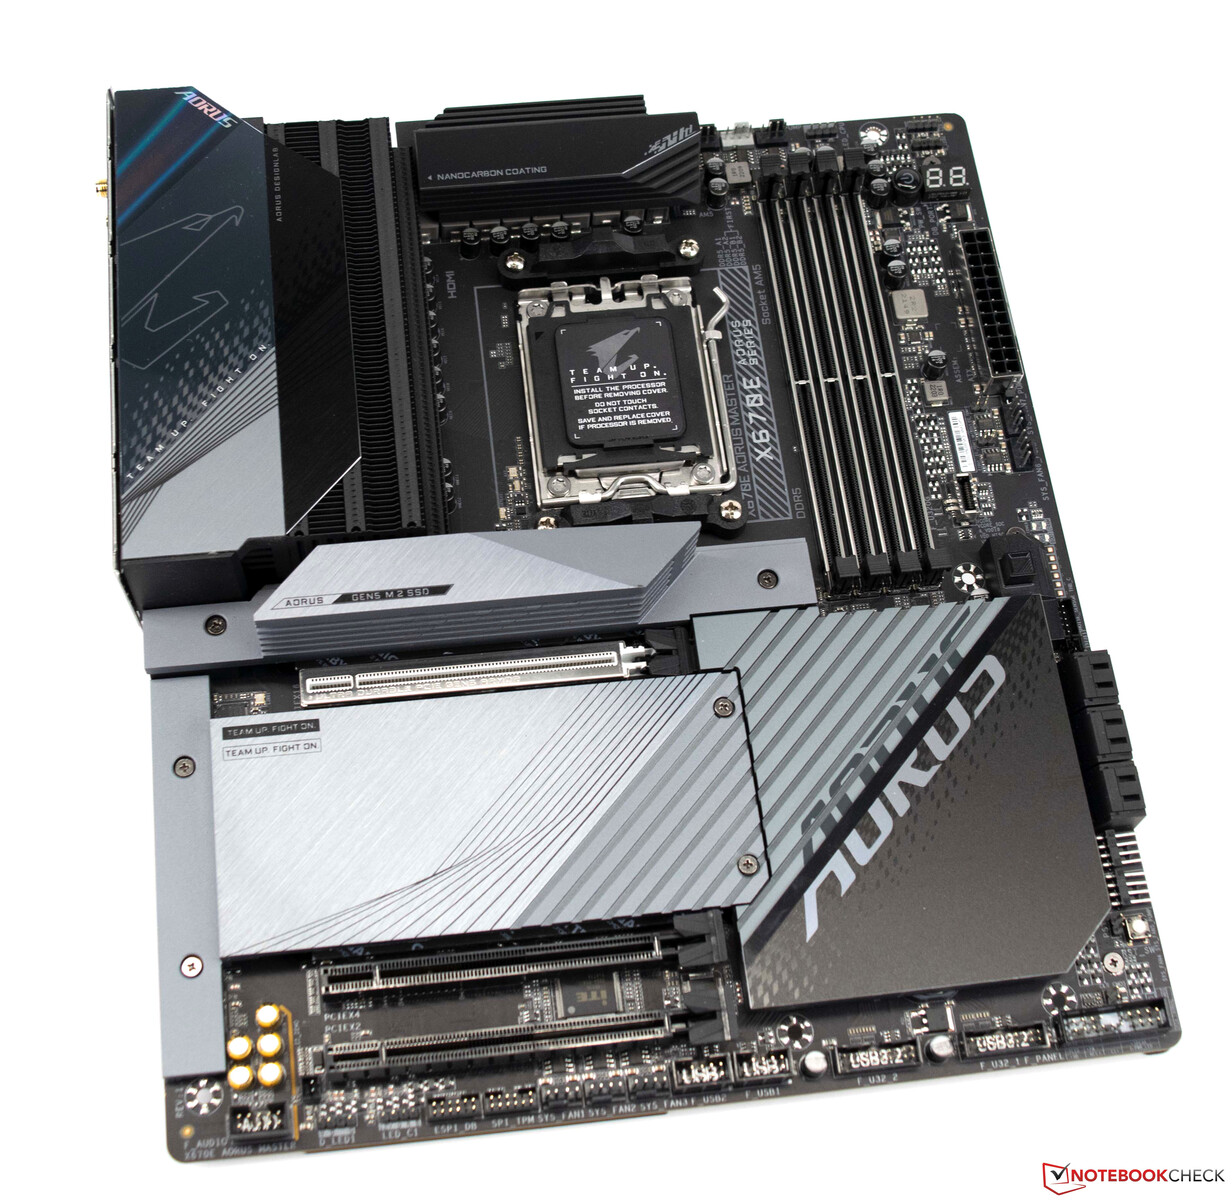
The test system in detail

We used this system for the following benchmarks and tests:

  • Lian-Li O11 Dynamic
  • AMD Ryzen 9 7950X
  • Gigabyte X670E Aorus Master, BIOS: F11
  • Deepcool LT720
  • Corsair HX1200i power supply
  • G.Skill Trident Z5 Neo DDR5-6000 2x 16 GB, EXPO (DDR5-6000 CL30-38-38-96)
  • Corsair MP600, 2 TB
  • Crucial MX500, 2 TB
  • Microsoft Windows 11 Professional 64-Bit (Version 22H2)

Details about the MSI GeForce RTX 4060 Ti Gaming X Trio 8G

In contrast to the Founders Edition of the Nvidia GeForce RTX 4060 Ti, the MSI GeForce RTX 4060 Ti Gaming X Trio 8G offers much higher boost clock rates. MSI state rates of up to 2,670 MHz - 135 MHz more than the Nvidia reference model. There are no changes in VRAM compared to the Founders Edition. Although, its bandwidth is now halved compared to an Nvidia GeForce RTX 3060 Ti, at 128 bits. Subsequently, its memory bandwidth is now also much smaller at 288 GB/s. We will find out in our benchmarks what this means in practical use. 

GPU-Z
GPU-Z
GPU-Z
GPU-Z
GPU-Z
GPU-Z

Synthetic benchmarks

In our synthetic benchmarks, the MSI GeForce RTX 4060 Ti Gaming X Trio 8G performed only 8 per cent better than the Nvidia GeForce RTX 3060 Ti. When it came to its true performance, the mid-range model was only ever so slightly able to differentiate itself from the previous generation. We didn't see the same performance increase as we did from the Nvidia GeForce RTX 3090 to the Nvidia GeForce RTX 4090. Its lower amount of shaders as well as its smaller storage connection prevented the GPU from performing better. Its 30 per cent gap to the GeForce RTX 4070 is quite considerable and a performance jump up to the level of a GeForce RTX 3070 Ti would've been a much more useful step. Compared to AMD's Sapphire Pulse Radeon RX 6750 XT, which has 12 GB VRAM, our test sample was actually only 10 per cent slower. 

Performance Rating - Percent
Palit GeForce RTX 4090 GameRock OC
99.4 pt
AMD Radeon RX 7900 XTX
81 pt
KFA2 GeForce RTX 4080 SG
79.6 pt
AMD Radeon RX 7900 XT
72 pt
KFA2 GeForce RTX 4070 Ti EX Gamer
65.9 pt
NVIDIA GeForce RTX 3090 Founders Edition
62.4 pt
KFA2 GeForce RTX 3080 SG
55.5 pt
KFA2 GeForce RTX 4070 EX Gamer
54.7 pt
Nvidia Titan RTX
50.3 pt
KFA2 GeForce RTX 3070 Ti SG
50.2 pt
Sapphire Pulse Radeon RX 6750 XT
46.1 pt
MSI GeForce RTX 4060 Ti Gaming X Trio 8G
42 pt
NVIDIA GeForce RTX 3060 Ti FE
38.9 pt
Nvidia GeForce RTX 2070 Super
36 pt
Sapphire Nitro+ Radeon RX 6650 XT
34.6 pt
Nvidia GeForce RTX 2060 Super
31.4 pt
KFA2 GeForce GTX 1660 Super
22.2 pt
PNY GeForce GTX 1660
19.9 pt
3DMark
2560x1440 Time Spy Graphics
Palit GeForce RTX 4090 GameRock OC
36836 Points +172%
AMD Radeon RX 7900 XTX
29699 Points +119%
KFA2 GeForce RTX 4080 SG
27791 Points +105%
AMD Radeon RX 7900 XT
25874 Points +91%
KFA2 GeForce RTX 4070 Ti EX Gamer
22304 Points +65%
NVIDIA GeForce RTX 3090 Founders Edition
19467 Points +44%
KFA2 GeForce RTX 3080 SG
17956 Points +33%
KFA2 GeForce RTX 4070 EX Gamer
17827 Points +32%
Nvidia Titan RTX
15106 Points +11%
KFA2 GeForce RTX 3070 Ti SG
14783 Points +9%
MSI GeForce RTX 4060 Ti Gaming X Trio 8G
13549 Points
Sapphire Pulse Radeon RX 6750 XT
13526 Points 0%
NVIDIA GeForce RTX 3060 Ti FE
11590 Points -14%
Sapphire Nitro+ Radeon RX 6650 XT
10047 Points -26%
Nvidia GeForce RTX 2070 Super
10012 Points -26%
Nvidia GeForce RTX 2060 Super
8719 Points -36%
KFA2 GeForce GTX 1660 Super
5985 Points -56%
PNY GeForce GTX 1660
5487 Points -60%
Fire Strike Extreme Graphics
Palit GeForce RTX 4090 GameRock OC
46270 Points +188%
AMD Radeon RX 7900 XTX
39570 Points +146%
KFA2 GeForce RTX 4080 SG
33912 Points +111%
AMD Radeon RX 7900 XT
33747 Points +110%
KFA2 GeForce RTX 4070 Ti EX Gamer
26694 Points +66%
NVIDIA GeForce RTX 3090 Founders Edition
24730 Points +54%
KFA2 GeForce RTX 3080 SG
22078 Points +37%
KFA2 GeForce RTX 4070 EX Gamer
21216 Points +32%
KFA2 GeForce RTX 3070 Ti SG
18417 Points +15%
Sapphire Pulse Radeon RX 6750 XT
18387 Points +15%
Nvidia Titan RTX
17759 Points +11%
MSI GeForce RTX 4060 Ti Gaming X Trio 8G
16057 Points
NVIDIA GeForce RTX 3060 Ti FE
13898 Points -13%
Sapphire Nitro+ Radeon RX 6650 XT
13581 Points -15%
Nvidia GeForce RTX 2070 Super
12017 Points -25%
Nvidia GeForce RTX 2060 Super
10726 Points -33%
KFA2 GeForce GTX 1660 Super
7205 Points -55%
PNY GeForce GTX 1660
6484 Points -60%
3840x2160 Fire Strike Ultra Graphics
Palit GeForce RTX 4090 GameRock OC
25018 Points +247%
AMD Radeon RX 7900 XTX
20214 Points +180%
KFA2 GeForce RTX 4080 SG
17120 Points +137%
AMD Radeon RX 7900 XT
17078 Points +137%
KFA2 GeForce RTX 4070 Ti EX Gamer
13189 Points +83%
NVIDIA GeForce RTX 3090 Founders Edition
12587 Points +74%
KFA2 GeForce RTX 3080 SG
11340 Points +57%
KFA2 GeForce RTX 4070 EX Gamer
9920 Points +37%
KFA2 GeForce RTX 3070 Ti SG
9301 Points +29%
Sapphire Pulse Radeon RX 6750 XT
8961 Points +24%
Nvidia Titan RTX
8755 Points +21%
MSI GeForce RTX 4060 Ti Gaming X Trio 8G
7218 Points
NVIDIA GeForce RTX 3060 Ti FE
7126 Points -1%
Sapphire Nitro+ Radeon RX 6650 XT
6780 Points -6%
Nvidia GeForce RTX 2070 Super
5822 Points -19%
Nvidia GeForce RTX 2060 Super
5194 Points -28%
KFA2 GeForce GTX 1660 Super
3159 Points -56%
PNY GeForce GTX 1660
2804 Points -61%
1920x1080 Fire Strike Graphics
Palit GeForce RTX 4090 GameRock OC
72678 Points +112%
AMD Radeon RX 7900 XTX
66967 Points +96%
KFA2 GeForce RTX 4080 SG
65190 Points +90%
AMD Radeon RX 7900 XT
63712 Points +86%
KFA2 GeForce RTX 4070 Ti EX Gamer
53736 Points +57%
NVIDIA GeForce RTX 3090 Founders Edition
48831 Points +43%
KFA2 GeForce RTX 3080 SG
44533 Points +30%
KFA2 GeForce RTX 4070 EX Gamer
44065 Points +29%
Sapphire Pulse Radeon RX 6750 XT
38117 Points +11%
KFA2 GeForce RTX 3070 Ti SG
37663 Points +10%
Nvidia Titan RTX
37257 Points +9%
MSI GeForce RTX 4060 Ti Gaming X Trio 8G
34245 Points
Sapphire Nitro+ Radeon RX 6650 XT
29566 Points -14%
NVIDIA GeForce RTX 3060 Ti FE
28145 Points -18%
Nvidia GeForce RTX 2070 Super
25491 Points -26%
Nvidia GeForce RTX 2060 Super
22686 Points -34%
KFA2 GeForce GTX 1660 Super
16123 Points -53%
PNY GeForce GTX 1660
14263 Points -58%
Unigine Superposition
7680x4320 8k Optimized
Palit GeForce RTX 4090 GameRock OC
13082 Points +269%
AMD Radeon RX 7900 XTX
8751 Points +147%
KFA2 GeForce RTX 4080 SG
8604 Points +143%
NVIDIA GeForce RTX 3090 Founders Edition
7051 Points +99%
AMD Radeon RX 7900 XT
7034 Points +98%
KFA2 GeForce RTX 3080 SG
6548 Points +85%
KFA2 GeForce RTX 4070 Ti EX Gamer
6380 Points +80%
Nvidia Titan RTX
5402 Points +52%
KFA2 GeForce RTX 3070 Ti SG
5309 Points +50%
KFA2 GeForce RTX 4070 EX Gamer
5290 Points +49%
NVIDIA GeForce RTX 3060 Ti FE
4056 Points +14%
Sapphire Pulse Radeon RX 6750 XT
3935 Points +11%
MSI GeForce RTX 4060 Ti Gaming X Trio 8G
3547 Points
Nvidia GeForce RTX 2070 Super
3419 Points -4%
Sapphire Nitro+ Radeon RX 6650 XT
2971 Points -16%
Nvidia GeForce RTX 2060 Super
2914 Points -18%
KFA2 GeForce GTX 1660 Super
1962 Points -45%
PNY GeForce GTX 1660
1706 Points -52%
3840x2160 4k Optimized
Palit GeForce RTX 4090 GameRock OC
33943 Points +252%
AMD Radeon RX 7900 XTX
23174 Points +140%
KFA2 GeForce RTX 4080 SG
22482 Points +133%
AMD Radeon RX 7900 XT
18806 Points +95%
KFA2 GeForce RTX 4070 Ti EX Gamer
16889 Points +75%
NVIDIA GeForce RTX 3090 Founders Edition
16188 Points +68%
KFA2 GeForce RTX 3080 SG
14986 Points +55%
KFA2 GeForce RTX 4070 EX Gamer
13814 Points +43%
KFA2 GeForce RTX 3070 Ti SG
12171 Points +26%
Nvidia Titan RTX
12050 Points +25%
Sapphire Pulse Radeon RX 6750 XT
10027 Points +4%
MSI GeForce RTX 4060 Ti Gaming X Trio 8G
9651 Points
NVIDIA GeForce RTX 3060 Ti FE
9224 Points -4%
Nvidia GeForce RTX 2070 Super
8096 Points -16%
Sapphire Nitro+ Radeon RX 6650 XT
7419 Points -23%
Nvidia GeForce RTX 2060 Super
6863 Points -29%
KFA2 GeForce GTX 1660 Super
4738 Points -51%
PNY GeForce GTX 1660
4281 Points -56%
1920x1080 1080p Extreme
Palit GeForce RTX 4090 GameRock OC
21824 Points +179%
AMD Radeon RX 7900 XTX
17264 Points +120%
KFA2 GeForce RTX 4080 SG
16635 Points +112%
AMD Radeon RX 7900 XT
14181 Points +81%
KFA2 GeForce RTX 4070 Ti EX Gamer
12837 Points +64%
NVIDIA GeForce RTX 3090 Founders Edition
12059 Points +54%
KFA2 GeForce RTX 3080 SG
11424 Points +46%
KFA2 GeForce RTX 4070 EX Gamer
9842 Points +26%
KFA2 GeForce RTX 3070 Ti SG
9272 Points +18%
Nvidia Titan RTX
9014 Points +15%
MSI GeForce RTX 4060 Ti Gaming X Trio 8G
7833 Points
Sapphire Pulse Radeon RX 6750 XT
7337 Points -6%
NVIDIA GeForce RTX 3060 Ti FE
7142 Points -9%
Nvidia GeForce RTX 2070 Super
6161 Points -21%
Sapphire Nitro+ Radeon RX 6650 XT
5829 Points -26%
Nvidia GeForce RTX 2060 Super
5143 Points -34%
KFA2 GeForce GTX 1660 Super
3168 Points -60%
PNY GeForce GTX 1660
2901 Points -63%
1920x1080 1080p High
Palit GeForce RTX 4090 GameRock OC
46814 Points +175%
KFA2 GeForce RTX 4080 SG
36824 Points +116%
AMD Radeon RX 7900 XTX
36536 Points +115%
AMD Radeon RX 7900 XT
31426 Points +85%
KFA2 GeForce RTX 4070 Ti EX Gamer
29062 Points +71%
NVIDIA GeForce RTX 3090 Founders Edition
26320 Points +55%
KFA2 GeForce RTX 3080 SG
24051 Points +41%
KFA2 GeForce RTX 4070 EX Gamer
23184 Points +36%
Nvidia Titan RTX
20335 Points +19%
KFA2 GeForce RTX 3070 Ti SG
19846 Points +17%
Sapphire Pulse Radeon RX 6750 XT
17503 Points +3%
MSI GeForce RTX 4060 Ti Gaming X Trio 8G
17022 Points
NVIDIA GeForce RTX 3060 Ti FE
15479 Points -9%
Nvidia GeForce RTX 2070 Super
13832 Points -19%
Sapphire Nitro+ Radeon RX 6650 XT
13809 Points -19%
Nvidia GeForce RTX 2060 Super
11742 Points -31%
KFA2 GeForce GTX 1660 Super
8392 Points -51%
PNY GeForce GTX 1660
7455 Points -56%
1280x720 720p Low
KFA2 GeForce RTX 4070 Ti EX Gamer
56396 Points +21%
Palit GeForce RTX 4090 GameRock OC
51741 Points +11%
Nvidia Titan RTX
50876 Points +9%
NVIDIA GeForce RTX 3090 Founders Edition
50487 Points +9%
KFA2 GeForce RTX 4080 SG
49734 Points +7%
KFA2 GeForce RTX 4070 EX Gamer
49545 Points +7%
KFA2 GeForce RTX 3070 Ti SG
48391 Points +4%
AMD Radeon RX 7900 XTX
47274 Points +2%
MSI GeForce RTX 4060 Ti Gaming X Trio 8G
46504 Points
AMD Radeon RX 7900 XT
45904 Points -1%
Nvidia GeForce RTX 2070 Super
45424 Points -2%
Sapphire Pulse Radeon RX 6750 XT
45149 Points -3%
Nvidia GeForce RTX 2060 Super
40961 Points -12%
NVIDIA GeForce RTX 3060 Ti FE
38414 Points -17%
KFA2 GeForce RTX 3080 SG
38209 Points -18%
KFA2 GeForce GTX 1660 Super
31343 Points -33%
Sapphire Nitro+ Radeon RX 6650 XT
31011 Points -33%
PNY GeForce GTX 1660
27631 Points -41%
Unigine Heaven 4.0
Extreme Preset DX11
Palit GeForce RTX 4090 GameRock OC
491.5 fps +171%
KFA2 GeForce RTX 4080 SG
399.9 fps +120%
AMD Radeon RX 7900 XTX
357.6 fps +97%
AMD Radeon RX 7900 XT
319.7 fps +76%
KFA2 GeForce RTX 4070 Ti EX Gamer
312.1 fps +72%
NVIDIA GeForce RTX 3090 Founders Edition
309.7 fps +71%
KFA2 GeForce RTX 3080 SG
274.3 fps +51%
KFA2 GeForce RTX 4070 EX Gamer
257.6 fps +42%
Nvidia Titan RTX
248.1 fps +37%
KFA2 GeForce RTX 3070 Ti SG
244.2 fps +34%
Sapphire Pulse Radeon RX 6750 XT
205 fps +13%
NVIDIA GeForce RTX 3060 Ti FE
188.6 (43.6min - 434.5max) fps +4%
MSI GeForce RTX 4060 Ti Gaming X Trio 8G
181.6 fps
Nvidia GeForce RTX 2070 Super
172.3 fps -5%
Sapphire Nitro+ Radeon RX 6650 XT
159.8 fps -12%
Nvidia GeForce RTX 2060 Super
146.1 fps -20%
KFA2 GeForce GTX 1660 Super
101.1 fps -44%
PNY GeForce GTX 1660
89.4 fps -51%
Extreme Preset OpenGL
Palit GeForce RTX 4090 GameRock OC
450.4 fps +156%
KFA2 GeForce RTX 4080 SG
371.1 fps +111%
AMD Radeon RX 7900 XTX
370.2 fps +110%
AMD Radeon RX 7900 XT
330.2 fps +88%
KFA2 GeForce RTX 4070 Ti EX Gamer
290.5 fps +65%
NVIDIA GeForce RTX 3090 Founders Edition
274.7 fps +56%
KFA2 GeForce RTX 3080 SG
251.4 fps +43%
KFA2 GeForce RTX 4070 EX Gamer
237.1 fps +35%
Sapphire Pulse Radeon RX 6750 XT
219.6 fps +25%
KFA2 GeForce RTX 3070 Ti SG
218.8 fps +24%
Nvidia Titan RTX
218 fps +24%
MSI GeForce RTX 4060 Ti Gaming X Trio 8G
176 fps
NVIDIA GeForce RTX 3060 Ti FE
172.3 (11.4min - 371.5max) fps -2%
Sapphire Nitro+ Radeon RX 6650 XT
169.8 fps -4%
Nvidia GeForce RTX 2070 Super
156.5 fps -11%
Nvidia GeForce RTX 2060 Super
133.9 fps -24%
KFA2 GeForce GTX 1660 Super
93.7 fps -47%
PNY GeForce GTX 1660
84.4 fps -52%
Unigine Valley 1.0
1920x1080 Extreme HD DirectX AA:x8
Palit GeForce RTX 4090 GameRock OC
270.7 fps +108%
AMD Radeon RX 7900 XTX
264.5 fps +103%
KFA2 GeForce RTX 4080 SG
257 fps +98%
AMD Radeon RX 7900 XT
243.3 fps +87%
NVIDIA GeForce RTX 3090 Founders Edition
235.4 fps +81%
KFA2 GeForce RTX 4070 Ti EX Gamer
217.2 fps +67%
KFA2 GeForce RTX 3080 SG
203.8 fps +57%
KFA2 GeForce RTX 3070 Ti SG
193.2 fps +49%
Nvidia Titan RTX
191.4 fps +47%
KFA2 GeForce RTX 4070 EX Gamer
190 fps +46%
Sapphire Pulse Radeon RX 6750 XT
168.2 fps +29%
NVIDIA GeForce RTX 3060 Ti FE
153.2 (48.2min - 297.9max) fps +18%
MSI GeForce RTX 4060 Ti Gaming X Trio 8G
130 fps
Nvidia GeForce RTX 2070 Super
127.4 fps -2%
Sapphire Nitro+ Radeon RX 6650 XT
115.1 fps -11%
Nvidia GeForce RTX 2060 Super
114.1 fps -12%
KFA2 GeForce GTX 1660 Super
79.3 fps -39%
PNY GeForce GTX 1660
65.5 fps -50%
1920x1080 Extreme HD Preset OpenGL AA:x8
Palit GeForce RTX 4090 GameRock OC
288 fps +144%
AMD Radeon RX 7900 XTX
254.2 fps +115%
KFA2 GeForce RTX 4080 SG
231.8 fps +96%
AMD Radeon RX 7900 XT
225.9 fps +91%
NVIDIA GeForce RTX 3090 Founders Edition
205.8 fps +74%
KFA2 GeForce RTX 4070 Ti EX Gamer
197.6 fps +67%
KFA2 GeForce RTX 3080 SG
186.1 fps +58%
KFA2 GeForce RTX 4070 EX Gamer
169 fps +43%
Sapphire Pulse Radeon RX 6750 XT
166.5 fps +41%
KFA2 GeForce RTX 3070 Ti SG
165.2 fps +40%
Nvidia Titan RTX
160.8 fps +36%
NVIDIA GeForce RTX 3060 Ti FE
132.9 (48.3min - 236.1max) fps +13%
MSI GeForce RTX 4060 Ti Gaming X Trio 8G
118 fps
Sapphire Nitro+ Radeon RX 6650 XT
112.2 fps -5%
Nvidia GeForce RTX 2070 Super
112 fps -5%
Nvidia GeForce RTX 2060 Super
101.5 fps -14%
KFA2 GeForce GTX 1660 Super
72.3 fps -39%
PNY GeForce GTX 1660
61 fps -48%
3DMark 11
1280x720 Performance GPU
Palit GeForce RTX 4090 GameRock OC
107723 Points +123%
KFA2 GeForce RTX 4080 SG
88359 Points +83%
AMD Radeon RX 7900 XTX
83322 Points +72%
AMD Radeon RX 7900 XT
77784 Points +61%
KFA2 GeForce RTX 4070 Ti EX Gamer
74228 Points +53%
NVIDIA GeForce RTX 3090 Founders Edition
62735 Points +30%
KFA2 GeForce RTX 4070 EX Gamer
60428 Points +25%
KFA2 GeForce RTX 3080 SG
56634 Points +17%
Nvidia Titan RTX
50900 Points +5%
KFA2 GeForce RTX 3070 Ti SG
49760 Points +3%
Sapphire Pulse Radeon RX 6750 XT
48521 Points 0%
MSI GeForce RTX 4060 Ti Gaming X Trio 8G
48363 Points
Sapphire Nitro+ Radeon RX 6650 XT
41739 Points -14%
NVIDIA GeForce RTX 3060 Ti FE
37941 Points -22%
Nvidia GeForce RTX 2070 Super
35992 Points -26%
Nvidia GeForce RTX 2060 Super
29911 Points -38%
KFA2 GeForce GTX 1660 Super
22017 Points -54%
PNY GeForce GTX 1660
21396 Points -56%
1280x720 Performance
Palit GeForce RTX 4090 GameRock OC
69323 Points +59%
KFA2 GeForce RTX 4080 SG
62760 Points +44%
AMD Radeon RX 7900 XTX
56526 Points +30%
AMD Radeon RX 7900 XT
54796 Points +26%
KFA2 GeForce RTX 4070 Ti EX Gamer
53915 Points +24%
KFA2 GeForce RTX 4070 EX Gamer
50253 Points +15%
NVIDIA GeForce RTX 3090 Founders Edition
48185 Points +10%
Nvidia Titan RTX
44979 Points +3%
KFA2 GeForce RTX 3070 Ti SG
44497 Points +2%
MSI GeForce RTX 4060 Ti Gaming X Trio 8G
43633 Points
Sapphire Pulse Radeon RX 6750 XT
41732 Points -4%
KFA2 GeForce RTX 3080 SG
41410 Points -5%
Nvidia GeForce RTX 2070 Super
35274 Points -19%
Sapphire Nitro+ Radeon RX 6650 XT
33582 Points -23%
NVIDIA GeForce RTX 3060 Ti FE
33117 Points -24%
Nvidia GeForce RTX 2060 Super
30486 Points -30%
KFA2 GeForce GTX 1660 Super
23216 Points -47%
PNY GeForce GTX 1660
22250 Points -49%
LuxMark v2.0 64Bit
Room GPUs-only
NVIDIA GeForce RTX 4090
AMD Ryzen 9 7950X, NVIDIA GeForce RTX 4090
12316 Samples/s +169%
NVIDIA GeForce RTX 4080
AMD Ryzen 9 7950X, NVIDIA GeForce RTX 4080
9757 Samples/s +113%
NVIDIA GeForce RTX 4070 Ti
AMD Ryzen 9 7950X, NVIDIA GeForce RTX 4070 Ti
7625 Samples/s +67%
NVIDIA GeForce RTX 4070
AMD Ryzen 9 7950X, NVIDIA GeForce RTX 4070
6950 Samples/s +52%
NVIDIA GeForce RTX 3090
AMD Ryzen 9 7950X, NVIDIA GeForce RTX 3090
5948 Samples/s +30%
NVIDIA GeForce RTX 3080 12 GB
AMD Ryzen 9 5900X, NVIDIA GeForce RTX 3080 12 GB
5768 Samples/s +26%
AMD Radeon RX 7900 XTX
AMD Ryzen 9 7950X, AMD Radeon RX 7900 XTX
5161 Samples/s +13%
AMD Radeon RX 6950 XT
AMD Ryzen 9 5900X, AMD Radeon RX 6950 XT
5097 Samples/s +11%
NVIDIA Titan RTX
AMD Ryzen 9 7950X, NVIDIA Titan RTX
4703 Samples/s +3%
NVIDIA GeForce RTX 4060 Ti 8G
AMD Ryzen 9 7950X, NVIDIA GeForce RTX 4060 Ti 8G
4574 Samples/s
NVIDIA GeForce RTX 3070 Ti
AMD Ryzen 9 7950X, NVIDIA GeForce RTX 3070 Ti
4481 Samples/s -2%
AMD Radeon RX 7900 XT
AMD Ryzen 9 7950X, AMD Radeon RX 7900 XT
4451 Samples/s -3%
NVIDIA GeForce RTX 3060 Ti
AMD Ryzen 9 5950X, NVIDIA GeForce RTX 3060 Ti
4046 Samples/s -12%
AMD Radeon RX 6750 XT
AMD Ryzen 9 7950X, AMD Radeon RX 6750 XT
2640 Samples/s -42%
AMD Radeon RX 6650 XT
AMD Ryzen 9 5900X, AMD Radeon RX 6650 XT
2279 Samples/s -50%
Sala GPUs-only
AMD Radeon RX 6950 XT
AMD Ryzen 9 5900X, AMD Radeon RX 6950 XT
31954 Samples/s +183%
NVIDIA GeForce RTX 4090
AMD Ryzen 9 7950X, NVIDIA GeForce RTX 4090
27201 Samples/s +141%
NVIDIA GeForce RTX 4080
AMD Ryzen 9 7950X, NVIDIA GeForce RTX 4080
23809 Samples/s +111%
NVIDIA GeForce RTX 4070 Ti
AMD Ryzen 9 7950X, NVIDIA GeForce RTX 4070 Ti
17719 Samples/s +57%
AMD Radeon RX 7900 XTX
AMD Ryzen 9 7950X, AMD Radeon RX 7900 XTX
15019 Samples/s +33%
NVIDIA GeForce RTX 3090
AMD Ryzen 9 7950X, NVIDIA GeForce RTX 3090
14990 Samples/s +33%
NVIDIA GeForce RTX 4070
AMD Ryzen 9 7950X, NVIDIA GeForce RTX 4070
14493 Samples/s +28%
NVIDIA GeForce RTX 3080 12 GB
AMD Ryzen 9 5900X, NVIDIA GeForce RTX 3080 12 GB
14204 Samples/s +26%
AMD Radeon RX 7900 XT
AMD Ryzen 9 7950X, AMD Radeon RX 7900 XT
13489 Samples/s +20%
NVIDIA GeForce RTX 4060 Ti 8G
AMD Ryzen 9 7950X, NVIDIA GeForce RTX 4060 Ti 8G
11281 Samples/s
NVIDIA GeForce RTX 3070 Ti
AMD Ryzen 9 7950X, NVIDIA GeForce RTX 3070 Ti
11083 Samples/s -2%
NVIDIA Titan RTX
AMD Ryzen 9 7950X, NVIDIA Titan RTX
10996 Samples/s -3%
NVIDIA GeForce RTX 3060 Ti
AMD Ryzen 9 5950X, NVIDIA GeForce RTX 3060 Ti
9010 Samples/s -20%
AMD Radeon RX 6750 XT
AMD Ryzen 9 7950X, AMD Radeon RX 6750 XT
6994 Samples/s -38%
AMD Radeon RX 6650 XT
AMD Ryzen 9 5900X, AMD Radeon RX 6650 XT
5182 Samples/s -54%
ComputeMark v2.1
1024x600 Normal, QJuliaRayTrace
NVIDIA GeForce RTX 4090
AMD Ryzen 9 7950X, NVIDIA GeForce RTX 4090
34332 Points +148%
NVIDIA GeForce RTX 4080
AMD Ryzen 9 7950X, NVIDIA GeForce RTX 4080
24631 Points +78%
NVIDIA GeForce RTX 4070 Ti
AMD Ryzen 9 7950X, NVIDIA GeForce RTX 4070 Ti
21107 Points +53%
AMD Radeon RX 7900 XTX
AMD Ryzen 9 7950X, AMD Radeon RX 7900 XTX
17915 Points +30%
NVIDIA GeForce RTX 3090
AMD Ryzen 9 7950X, NVIDIA GeForce RTX 3090
17713 Points +28%
NVIDIA GeForce RTX 4070
AMD Ryzen 9 7950X, NVIDIA GeForce RTX 4070
17521 Points +27%
AMD Radeon RX 7900 XT
AMD Ryzen 9 7950X, AMD Radeon RX 7900 XT
16990 Points +23%
NVIDIA GeForce RTX 3080 12 GB
AMD Ryzen 9 5900X, NVIDIA GeForce RTX 3080 12 GB
15594 Points +13%
NVIDIA GeForce RTX 4060 Ti 8G
AMD Ryzen 9 7950X, NVIDIA GeForce RTX 4060 Ti 8G
13822 Points
AMD Radeon RX 6950 XT
AMD Ryzen 9 5900X, AMD Radeon RX 6950 XT
13580 Points -2%
NVIDIA GeForce RTX 3070 Ti
AMD Ryzen 9 7950X, NVIDIA GeForce RTX 3070 Ti
12517 Points -9%
NVIDIA Titan RTX
AMD Ryzen 9 7950X, NVIDIA Titan RTX
10129 Points -27%
NVIDIA GeForce RTX 3060 Ti
AMD Ryzen 9 5950X, NVIDIA GeForce RTX 3060 Ti
10072 Points -27%
AMD Radeon RX 6750 XT
AMD Ryzen 9 7950X, AMD Radeon RX 6750 XT
7885 Points -43%
AMD Radeon RX 6650 XT
AMD Ryzen 9 5900X, AMD Radeon RX 6650 XT
6544 Points -53%
1024x600 Normal, Score
NVIDIA GeForce RTX 4090
AMD Ryzen 9 7950X, NVIDIA GeForce RTX 4090
92171 Points +184%
AMD Radeon RX 7900 XTX
AMD Ryzen 9 7950X, AMD Radeon RX 7900 XTX
62963 Points +94%
NVIDIA GeForce RTX 4080
AMD Ryzen 9 7950X, NVIDIA GeForce RTX 4080
62753 Points +94%
AMD Radeon RX 7900 XT
AMD Ryzen 9 7950X, AMD Radeon RX 7900 XT
57570 Points +78%
NVIDIA GeForce RTX 4070 Ti
AMD Ryzen 9 7950X, NVIDIA GeForce RTX 4070 Ti
51287 Points +58%
NVIDIA GeForce RTX 3090
AMD Ryzen 9 7950X, NVIDIA GeForce RTX 3090
48862 Points +51%
AMD Radeon RX 6950 XT
AMD Ryzen 9 5900X, AMD Radeon RX 6950 XT
44959 Points +39%
NVIDIA GeForce RTX 4070
AMD Ryzen 9 7950X, NVIDIA GeForce RTX 4070
43049 Points +33%
NVIDIA GeForce RTX 3080 12 GB
AMD Ryzen 9 5900X, NVIDIA GeForce RTX 3080 12 GB
42692 Points +32%
NVIDIA GeForce RTX 3070 Ti
AMD Ryzen 9 7950X, NVIDIA GeForce RTX 3070 Ti
34007 Points +5%
NVIDIA GeForce RTX 4060 Ti 8G
AMD Ryzen 9 7950X, NVIDIA GeForce RTX 4060 Ti 8G
32410 Points
NVIDIA Titan RTX
AMD Ryzen 9 7950X, NVIDIA Titan RTX
29830 Points -8%
AMD Radeon RX 6750 XT
AMD Ryzen 9 7950X, AMD Radeon RX 6750 XT
26723 Points -18%
NVIDIA GeForce RTX 3060 Ti
AMD Ryzen 9 5950X, NVIDIA GeForce RTX 3060 Ti
26245 Points -19%
AMD Radeon RX 6650 XT
AMD Ryzen 9 5900X, AMD Radeon RX 6650 XT
20446 Points -37%
1024x600 Normal, Fluid 3DTex
NVIDIA GeForce RTX 4090
AMD Ryzen 9 7950X, NVIDIA GeForce RTX 4090
10724 Points +414%
AMD Radeon RX 7900 XTX
AMD Ryzen 9 7950X, AMD Radeon RX 7900 XTX
8537 Points +309%
AMD Radeon RX 7900 XT
AMD Ryzen 9 7950X, AMD Radeon RX 7900 XT
7109 Points +240%
NVIDIA GeForce RTX 4080
AMD Ryzen 9 7950X, NVIDIA GeForce RTX 4080
6484 Points +211%
AMD Radeon RX 6950 XT
AMD Ryzen 9 5900X, AMD Radeon RX 6950 XT
5515 Points +164%
NVIDIA GeForce RTX 3090
AMD Ryzen 9 7950X, NVIDIA GeForce RTX 3090
5501 Points +163%
NVIDIA GeForce RTX 3080 12 GB
AMD Ryzen 9 5900X, NVIDIA GeForce RTX 3080 12 GB
4900 Points +135%
NVIDIA Titan RTX
AMD Ryzen 9 7950X, NVIDIA Titan RTX
4027 Points +93%
NVIDIA GeForce RTX 4070 Ti
AMD Ryzen 9 7950X, NVIDIA GeForce RTX 4070 Ti
3789 Points +81%
NVIDIA GeForce RTX 3070 Ti
AMD Ryzen 9 7950X, NVIDIA GeForce RTX 3070 Ti
3569 Points +71%
NVIDIA GeForce RTX 4070
AMD Ryzen 9 7950X, NVIDIA GeForce RTX 4070
3541 Points +70%
AMD Radeon RX 6750 XT
AMD Ryzen 9 7950X, AMD Radeon RX 6750 XT
3512 Points +68%
NVIDIA GeForce RTX 3060 Ti
AMD Ryzen 9 5950X, NVIDIA GeForce RTX 3060 Ti
2685 Points +29%
NVIDIA GeForce RTX 4060 Ti 8G
AMD Ryzen 9 7950X, NVIDIA GeForce RTX 4060 Ti 8G
2088 Points
AMD Radeon RX 6650 XT
AMD Ryzen 9 5900X, AMD Radeon RX 6650 XT
1779 Points -15%
1024x600 Normal, Fluid 2DTexArr
AMD Radeon RX 7900 XTX
AMD Ryzen 9 7950X, AMD Radeon RX 7900 XTX
7315 Points +255%
NVIDIA GeForce RTX 4090
AMD Ryzen 9 7950X, NVIDIA GeForce RTX 4090
6891 Points +235%
AMD Radeon RX 7900 XT
AMD Ryzen 9 7950X, AMD Radeon RX 7900 XT
6460 Points +214%
NVIDIA GeForce RTX 4080
AMD Ryzen 9 7950X, NVIDIA GeForce RTX 4080
5605 Points +172%
NVIDIA GeForce RTX 3090
AMD Ryzen 9 7950X, NVIDIA GeForce RTX 3090
4517 Points +119%
AMD Radeon RX 6950 XT
AMD Ryzen 9 5900X, AMD Radeon RX 6950 XT
4455 Points +116%
NVIDIA GeForce RTX 3080 12 GB
AMD Ryzen 9 5900X, NVIDIA GeForce RTX 3080 12 GB
4175 Points +103%
NVIDIA Titan RTX
AMD Ryzen 9 7950X, NVIDIA Titan RTX
3828 Points +86%
NVIDIA GeForce RTX 4070 Ti
AMD Ryzen 9 7950X, NVIDIA GeForce RTX 4070 Ti
3724 Points +81%
NVIDIA GeForce RTX 4070
AMD Ryzen 9 7950X, NVIDIA GeForce RTX 4070
3494 Points +70%
NVIDIA GeForce RTX 3070 Ti
AMD Ryzen 9 7950X, NVIDIA GeForce RTX 3070 Ti
3457 Points +68%
NVIDIA GeForce RTX 3060 Ti
AMD Ryzen 9 5950X, NVIDIA GeForce RTX 3060 Ti
2619 Points +27%
AMD Radeon RX 6750 XT
AMD Ryzen 9 7950X, AMD Radeon RX 6750 XT
2527 Points +23%
NVIDIA GeForce RTX 4060 Ti 8G
AMD Ryzen 9 7950X, NVIDIA GeForce RTX 4060 Ti 8G
2060 Points
AMD Radeon RX 6650 XT
AMD Ryzen 9 5900X, AMD Radeon RX 6650 XT
1708 Points -17%
1024x600 Normal, Mandel Vector
NVIDIA GeForce RTX 4090
AMD Ryzen 9 7950X, NVIDIA GeForce RTX 4090
17336 Points +150%
AMD Radeon RX 7900 XTX
AMD Ryzen 9 7950X, AMD Radeon RX 7900 XTX
13737 Points +98%
AMD Radeon RX 7900 XT
AMD Ryzen 9 7950X, AMD Radeon RX 7900 XT
13022 Points +88%
NVIDIA GeForce RTX 4080
AMD Ryzen 9 7950X, NVIDIA GeForce RTX 4080
11220 Points +62%
NVIDIA GeForce RTX 4070 Ti
AMD Ryzen 9 7950X, NVIDIA GeForce RTX 4070 Ti
10541 Points +52%
NVIDIA GeForce RTX 3090
AMD Ryzen 9 7950X, NVIDIA GeForce RTX 3090
9861 Points +42%
AMD Radeon RX 6950 XT
AMD Ryzen 9 5900X, AMD Radeon RX 6950 XT
9555 Points +38%
NVIDIA GeForce RTX 4070
AMD Ryzen 9 7950X, NVIDIA GeForce RTX 4070
8636 Points +25%
NVIDIA GeForce RTX 3080 12 GB
AMD Ryzen 9 5900X, NVIDIA GeForce RTX 3080 12 GB
8326 Points +20%
NVIDIA GeForce RTX 4060 Ti 8G
AMD Ryzen 9 7950X, NVIDIA GeForce RTX 4060 Ti 8G
6929 Points
NVIDIA GeForce RTX 3070 Ti
AMD Ryzen 9 7950X, NVIDIA GeForce RTX 3070 Ti
6762 Points -2%
AMD Radeon RX 6750 XT
AMD Ryzen 9 7950X, AMD Radeon RX 6750 XT
5889 Points -15%
NVIDIA Titan RTX
AMD Ryzen 9 7950X, NVIDIA Titan RTX
5440 Points -21%
AMD Radeon RX 6650 XT
AMD Ryzen 9 5900X, AMD Radeon RX 6650 XT
4844 Points -30%
NVIDIA GeForce RTX 3060 Ti
AMD Ryzen 9 5950X, NVIDIA GeForce RTX 3060 Ti
4782 Points -31%
1024x600 Normal, Mandel Scalar
NVIDIA GeForce RTX 4090
AMD Ryzen 9 7950X, NVIDIA GeForce RTX 4090
22889 Points +205%
AMD Radeon RX 7900 XTX
AMD Ryzen 9 7950X, AMD Radeon RX 7900 XTX
15458 Points +106%
NVIDIA GeForce RTX 4080
AMD Ryzen 9 7950X, NVIDIA GeForce RTX 4080
14810 Points +97%
AMD Radeon RX 7900 XT
AMD Ryzen 9 7950X, AMD Radeon RX 7900 XT
13989 Points +86%
NVIDIA GeForce RTX 4070 Ti
AMD Ryzen 9 7950X, NVIDIA GeForce RTX 4070 Ti
12126 Points +61%
AMD Radeon RX 6950 XT
AMD Ryzen 9 5900X, AMD Radeon RX 6950 XT
11854 Points +58%
NVIDIA GeForce RTX 3090
AMD Ryzen 9 7950X, NVIDIA GeForce RTX 3090
11270 Points +50%
NVIDIA GeForce RTX 4070
AMD Ryzen 9 7950X, NVIDIA GeForce RTX 4070
9857 Points +31%
NVIDIA GeForce RTX 3080 12 GB
AMD Ryzen 9 5900X, NVIDIA GeForce RTX 3080 12 GB
9698 Points +29%
NVIDIA GeForce RTX 3070 Ti
AMD Ryzen 9 7950X, NVIDIA GeForce RTX 3070 Ti
7702 Points +3%
NVIDIA GeForce RTX 4060 Ti 8G
AMD Ryzen 9 7950X, NVIDIA GeForce RTX 4060 Ti 8G
7511 Points
AMD Radeon RX 6750 XT
AMD Ryzen 9 7950X, AMD Radeon RX 6750 XT
6910 Points -8%
NVIDIA Titan RTX
AMD Ryzen 9 7950X, NVIDIA Titan RTX
6406 Points -15%
NVIDIA GeForce RTX 3060 Ti
AMD Ryzen 9 5950X, NVIDIA GeForce RTX 3060 Ti
6087 Points -19%
AMD Radeon RX 6650 XT
AMD Ryzen 9 5900X, AMD Radeon RX 6650 XT
5571 Points -26%
Photoshop PugetBench
GPU Score
AMD Radeon RX 6750 XT
AMD Ryzen 9 7950X, AMD Radeon RX 6750 XT
171.7 Points +40%
AMD Radeon RX 7900 XT
AMD Ryzen 9 7950X, AMD Radeon RX 7900 XT
169.5 Points +38%
AMD Radeon RX 7900 XTX
AMD Ryzen 9 7950X, AMD Radeon RX 7900 XTX
169.3 Points +38%
NVIDIA GeForce RTX 4080
AMD Ryzen 9 7950X, NVIDIA GeForce RTX 4080
158.4 Points +29%
NVIDIA GeForce RTX 3070 Ti
AMD Ryzen 9 7950X, NVIDIA GeForce RTX 3070 Ti
157 Points +28%
NVIDIA GeForce RTX 4090
AMD Ryzen 9 7950X, NVIDIA GeForce RTX 4090
155.7 Points +27%
NVIDIA GeForce RTX 2060 Super (Desktop)
AMD Ryzen 9 7950X, NVIDIA GeForce RTX 2060 Super (Desktop)
150.1 Points +22%
NVIDIA GeForce RTX 2070 Super (Desktop)
AMD Ryzen 9 7950X, NVIDIA GeForce RTX 2070 Super (Desktop)
146.2 Points +19%
NVIDIA GeForce GTX 1660 (Desktop)
AMD Ryzen 9 7950X, NVIDIA GeForce GTX 1660 (Desktop)
143.1 Points +16%
NVIDIA Titan RTX
AMD Ryzen 9 7950X, NVIDIA Titan RTX
132.1 Points +7%
AMD Radeon RX 6950 XT
AMD Ryzen 9 5900X, AMD Radeon RX 6950 XT
131.5 Points +7%
AMD Radeon RX 6650 XT
AMD Ryzen 9 5900X, AMD Radeon RX 6650 XT
126.7 Points +3%
NVIDIA GeForce RTX 4060 Ti 8G
AMD Ryzen 9 7950X, NVIDIA GeForce RTX 4060 Ti 8G
122.9 Points
NVIDIA GeForce RTX 4070
AMD Ryzen 9 7950X, NVIDIA GeForce RTX 4070
122.1 Points -1%
NVIDIA GeForce RTX 4070 Ti
AMD Ryzen 9 7950X, NVIDIA GeForce RTX 4070 Ti
114.9 Points -7%
NVIDIA GeForce RTX 3080 12 GB
AMD Ryzen 9 5900X, NVIDIA GeForce RTX 3080 12 GB
109.4 Points -11%
Overall Score
AMD Radeon RX 7900 XT
AMD Ryzen 9 7950X, AMD Radeon RX 7900 XT
1619 Points +12%
AMD Radeon RX 6750 XT
AMD Ryzen 9 7950X, AMD Radeon RX 6750 XT
1616 Points +12%
AMD Radeon RX 7900 XTX
AMD Ryzen 9 7950X, AMD Radeon RX 7900 XTX
1594 Points +10%
NVIDIA GeForce RTX 3070 Ti
AMD Ryzen 9 7950X, NVIDIA GeForce RTX 3070 Ti
1569 Points +8%
NVIDIA GeForce RTX 4080
AMD Ryzen 9 7950X, NVIDIA GeForce RTX 4080
1563 Points +8%
NVIDIA GeForce RTX 4090
AMD Ryzen 9 7950X, NVIDIA GeForce RTX 4090
1559 Points +8%
NVIDIA GeForce RTX 2060 Super (Desktop)
AMD Ryzen 9 7950X, NVIDIA GeForce RTX 2060 Super (Desktop)
1516 Points +5%
NVIDIA GeForce RTX 2070 Super (Desktop)
AMD Ryzen 9 7950X, NVIDIA GeForce RTX 2070 Super (Desktop)
1496 Points +3%
NVIDIA GeForce GTX 1660 (Desktop)
AMD Ryzen 9 7950X, NVIDIA GeForce GTX 1660 (Desktop)
1482 Points +2%
NVIDIA GeForce RTX 4060 Ti 8G
AMD Ryzen 9 7950X, NVIDIA GeForce RTX 4060 Ti 8G
1448 Points
NVIDIA GeForce RTX 4070
AMD Ryzen 9 7950X, NVIDIA GeForce RTX 4070
1359 Points -6%
NVIDIA Titan RTX
AMD Ryzen 9 7950X, NVIDIA Titan RTX
1346 Points -7%
NVIDIA GeForce RTX 4070 Ti
AMD Ryzen 9 7950X, NVIDIA GeForce RTX 4070 Ti
1231 Points -15%
AMD Radeon RX 6950 XT
AMD Ryzen 9 5900X, AMD Radeon RX 6950 XT
1128 Points -22%
AMD Radeon RX 6650 XT
AMD Ryzen 9 5900X, AMD Radeon RX 6650 XT
1036 Points -28%
NVIDIA GeForce RTX 3080 12 GB
AMD Ryzen 9 5900X, NVIDIA GeForce RTX 3080 12 GB
1005 Points -31%
Premiere Pro PugetBench
GPU 0.9
NVIDIA GeForce RTX 4090
AMD Ryzen 9 7950X, NVIDIA GeForce RTX 4090
100.2 Points +61%
NVIDIA GeForce RTX 4080
AMD Ryzen 9 7950X, NVIDIA GeForce RTX 4080
85.1 Points +37%
NVIDIA GeForce RTX 3080 12 GB
AMD Ryzen 9 5900X, NVIDIA GeForce RTX 3080 12 GB
81.2 Points +31%
NVIDIA GeForce RTX 4070 Ti
AMD Ryzen 9 7950X, NVIDIA GeForce RTX 4070 Ti
75.6 Points +22%
NVIDIA GeForce RTX 4070
AMD Ryzen 9 7950X, NVIDIA GeForce RTX 4070
72.9 Points +17%
AMD Radeon RX 7900 XTX
AMD Ryzen 9 7950X, AMD Radeon RX 7900 XTX
71.1 Points +14%
NVIDIA GeForce RTX 3070 Ti
AMD Ryzen 9 7950X, NVIDIA GeForce RTX 3070 Ti
70.5 Points +14%
NVIDIA Titan RTX
AMD Ryzen 9 7950X, NVIDIA Titan RTX
69.7 Points +12%
AMD Radeon RX 7900 XT
AMD Ryzen 9 7950X, AMD Radeon RX 7900 XT
67 Points +8%
AMD Radeon RX 6950 XT
AMD Ryzen 9 5900X, AMD Radeon RX 6950 XT
65.3 Points +5%
NVIDIA GeForce RTX 4060 Ti 8G
AMD Ryzen 9 7950X, NVIDIA GeForce RTX 4060 Ti 8G
62.1 Points
NVIDIA GeForce RTX 2070 Super (Desktop)
AMD Ryzen 9 7950X, NVIDIA GeForce RTX 2070 Super (Desktop)
61.1 Points -2%
NVIDIA GeForce RTX 2060 Super (Desktop)
AMD Ryzen 9 7950X, NVIDIA GeForce RTX 2060 Super (Desktop)
56 Points -10%
AMD Radeon RX 6750 XT
AMD Ryzen 9 7950X, AMD Radeon RX 6750 XT
54.4 Points -12%
AMD Radeon RX 6650 XT
AMD Ryzen 9 5900X, AMD Radeon RX 6650 XT
47.4 Points -24%
NVIDIA GeForce GTX 1660 (Desktop)
AMD Ryzen 9 7950X, NVIDIA GeForce GTX 1660 (Desktop)
40.8 Points -34%
Overall Score 0.9
NVIDIA GeForce RTX 4090
AMD Ryzen 9 7950X, NVIDIA GeForce RTX 4090
1018 Points +8%
NVIDIA GeForce RTX 4070
AMD Ryzen 9 7950X, NVIDIA GeForce RTX 4070
997 Points +6%
NVIDIA GeForce RTX 4080
AMD Ryzen 9 7950X, NVIDIA GeForce RTX 4080
962 Points +2%
NVIDIA Titan RTX
AMD Ryzen 9 7950X, NVIDIA Titan RTX
954 Points +1%
NVIDIA GeForce RTX 4070 Ti
AMD Ryzen 9 7950X, NVIDIA GeForce RTX 4070 Ti
949 Points +1%
NVIDIA GeForce RTX 4060 Ti 8G
AMD Ryzen 9 7950X, NVIDIA GeForce RTX 4060 Ti 8G
941 Points
NVIDIA GeForce RTX 2060 Super (Desktop)
AMD Ryzen 9 7950X, NVIDIA GeForce RTX 2060 Super (Desktop)
929 Points -1%
AMD Radeon RX 7900 XTX
AMD Ryzen 9 7950X, AMD Radeon RX 7900 XTX
928 Points -1%
NVIDIA GeForce RTX 2070 Super (Desktop)
AMD Ryzen 9 7950X, NVIDIA GeForce RTX 2070 Super (Desktop)
923 Points -2%
NVIDIA GeForce RTX 3070 Ti
AMD Ryzen 9 7950X, NVIDIA GeForce RTX 3070 Ti
923 Points -2%
AMD Radeon RX 7900 XT
AMD Ryzen 9 7950X, AMD Radeon RX 7900 XT
903 Points -4%
AMD Radeon RX 6750 XT
AMD Ryzen 9 7950X, AMD Radeon RX 6750 XT
893 Points -5%
NVIDIA GeForce GTX 1660 (Desktop)
AMD Ryzen 9 7950X, NVIDIA GeForce GTX 1660 (Desktop)
877 Points -7%
NVIDIA GeForce RTX 3080 12 GB
AMD Ryzen 9 5900X, NVIDIA GeForce RTX 3080 12 GB
796 Points -15%
AMD Radeon RX 6950 XT
AMD Ryzen 9 5900X, AMD Radeon RX 6950 XT
717 Points -24%
AMD Radeon RX 6650 XT
AMD Ryzen 9 5900X, AMD Radeon RX 6650 XT
685 Points -27%
Affinity Photo 2 - Combined (Single / Multi GPU)
NVIDIA GeForce RTX 4070
AMD Ryzen 9 7950X, NVIDIA GeForce RTX 4070
8704 Points +25%
NVIDIA GeForce RTX 4070 Ti
AMD Ryzen 9 7950X, NVIDIA GeForce RTX 4070 Ti
8516 Points +22%
NVIDIA GeForce RTX 4090
AMD Ryzen 9 7950X, NVIDIA GeForce RTX 4090
8448 Points +21%
NVIDIA GeForce RTX 4080
AMD Ryzen 9 7950X, NVIDIA GeForce RTX 4080
8144 Points +17%
NVIDIA GeForce RTX 2070 Super (Desktop)
AMD Ryzen 9 7950X, NVIDIA GeForce RTX 2070 Super (Desktop)
7722 Points +11%
NVIDIA GeForce RTX 3070 Ti
AMD Ryzen 9 7950X, NVIDIA GeForce RTX 3070 Ti
7682 Points +10%
NVIDIA GeForce RTX 2060 Super (Desktop)
AMD Ryzen 9 7950X, NVIDIA GeForce RTX 2060 Super (Desktop)
7590 Points +9%
AMD Radeon RX 6750 XT
AMD Ryzen 9 7950X, AMD Radeon RX 6750 XT
7323 Points +5%
NVIDIA GeForce RTX 4060 Ti 8G
AMD Ryzen 9 7950X, NVIDIA GeForce RTX 4060 Ti 8G
6970 Points
NVIDIA Titan RTX
AMD Ryzen 9 7950X, NVIDIA Titan RTX
6714 Points -4%
NVIDIA GeForce GTX 1660 (Desktop)
AMD Ryzen 9 7950X, NVIDIA GeForce GTX 1660 (Desktop)
5816 Points -17%
NVIDIA GeForce GTX 1660 Super (Desktop)
AMD Ryzen 9 7950X, NVIDIA GeForce GTX 1660 Super (Desktop)
5661 Points -19%
AMD Radeon RX 7900 XTX
AMD Ryzen 9 7950X, AMD Radeon RX 7900 XTX
2656 Points -62%
AMD Radeon RX 7900 XT
AMD Ryzen 9 7950X, AMD Radeon RX 7900 XT
2627 Points -62%

Professional uses

In the field of professional uses, our MSI GeForce RTX 4060 Ti Gaming X Trio can close the gap to the Nvidia GeForce RTX 3070 Ti slightly. However, compared to the Nvidia GeForce RTX 4070, you can see a much larger gap between the two. The Nvidia Titan RTX is a great example of what can be achieved by a professional graphics card. This model achieved almost the same synthetic test results as our test sample, but here, it lies a massive 200 per cent ahead. As a result, we wouldn't recommend using the Nvidia GeForce RTX 4060 Ti in a professional setting.

NVIDIA GeForce RTX 4060 Ti 8G
R9 7950X
NVIDIA GeForce RTX 3060 Ti
R9 5950X
NVIDIA GeForce RTX 3070 Ti
R9 7950X
NVIDIA GeForce RTX 4070
R9 7950X
NVIDIA GeForce RTX 4070 Ti
R9 7950X
NVIDIA GeForce RTX 4080
R9 7950X
NVIDIA GeForce RTX 4090
R9 7950X
AMD Radeon RX 7900 XT
R9 7950X
AMD Radeon RX 7900 XTX
R9 7950X
NVIDIA GeForce RTX 3080 12 GB
R9 5900X
NVIDIA GeForce GTX 1660 (Desktop)
R9 7950X
NVIDIA GeForce GTX 1660 Super (Desktop)
R9 7950X
NVIDIA GeForce RTX 2060 Super (Desktop)
R9 7950X
NVIDIA GeForce RTX 2070 Super (Desktop)
R9 7950X
NVIDIA Titan RTX
R9 7950X
Average of class
 
SPECviewperf 12
-20%
8%
26%
50%
74%
91%
414%
462%
-12%
-48%
-43%
-28%
-15%
262%
3%
1900x1060 3ds Max (3dsmax-05)
287
252
-12%
330
15%
382
33%
436
52%
502
75%
571
99%
502
75%
553
93%
334
16%
153
-47%
167
-42%
220
-23%
247
-14%
315
10%
192.2 ?(11 - 571, n=357)
-33%
1900x1060 Catia (catia-04)
128
109
-15%
136
6%
161
26%
192
50%
221
73%
257
101%
481
276%
536
319%
79.1
-38%
65.1
-49%
68
-47%
84.5
-34%
114
-11%
332
159%
102.3 ?(4.56 - 605, n=571)
-20%
1900x1060 Creo (creo-01)
75.4
57.8
-23%
72.6
-4%
89.1
18%
99.4
32%
110
46%
115
53%
176
133%
187
148%
74.4
-1%
46.1
-39%
45.5
-40%
58.8
-22%
65.7
-13%
197
161%
62.9 ?(0.91 - 250, n=574)
-17%
1900x1060 Energy (energy-01)
23
13.9
-40%
18
-22%
31.7
38%
48
109%
58.8
156%
54.7
138%
72.4
215%
85.2
270%
17.2
-25%
6.31
-73%
8.38
-64%
11.6
-50%
12.4
-46%
28.8
25%
14.6 ?(0.04 - 112, n=556)
-37%
1900x1060 Maya (maya-04)
254
197
-22%
279
10%
284
12%
287
13%
309
22%
317
25%
347
37%
367
44%
139
-45%
131
-48%
149
-41%
200
-21%
225
-11%
260
2%
105.4 ?(2.09 - 367, n=573)
-59%
1900x1060 Medical (medical-01)
110
59.4
-46%
106
-4%
132
20%
157
43%
171
55%
119
8%
288
162%
347
215%
40.3
-63%
36
-67%
38.2
-65%
49.5
-55%
55.9
-49%
101
-8%
51.2 ?(0.58 - 392, n=560)
-53%
1900x1060 Showcase (showcase-01)
120
144
20%
199
66%
190
58%
244
103%
333
178%
457
281%
278
132%
322
168%
226
88%
65
-46%
85.2
-29%
121
1%
135
13%
197
64%
93.9 ?(2.63 - 459, n=562)
-22%
1900x1060 Siemens NX (snx-02)
14.7
12.3
-16%
14.7
0%
16.4
12%
19
29%
21.6
47%
27.1
84%
373
2437%
400
2621%
12
-18%
9.41
-36%
9.38
-36%
10.1
-31%
13.9
-5%
283
1825%
56.3 ?(0.98 - 677, n=573)
283%
1900x1060 Solidworks (sw-03)
95.7
71.1
-26%
101
6%
109
14%
118
23%
113
18%
126
32%
342
257%
360
276%
73.8
-23%
69.3
-28%
70.7
-26%
79.7
-17%
95.1
-1%
207
116%
83.5 ?(0.97 - 403, n=574)
-13%
SPECviewperf 13
-17%
6%
27%
51%
80%
117%
401%
452%
12%
-50%
-46%
-29%
-15%
247%
25%
3ds Max (3dsmax-06)
289
252
-13%
330
14%
381
32%
433
50%
497
72%
563
95%
506
75%
564
95%
334
16%
153
-47%
166
-43%
218
-25%
247
-15%
321
11%
183.9 ?(10.8 - 575, n=455)
-36%
Catia (catia-05)
188
161
-14%
201
7%
241
28%
290
54%
340
81%
402
114%
728
287%
825
339%
206
10%
90.3
-52%
94.9
-50%
119
-37%
163
-13%
534
184%
Creo (creo-02)
299
225
-25%
286
-4%
375
25%
455
52%
529
77%
552
85%
567
90%
613
105%
324
8%
138
-54%
141
-53%
203
-32%
240
-20%
386
29%
199.9 ?(1.68 - 684, n=454)
-33%
Energy (energy-02)
45.7
25.6
-44%
30
-34%
54.2
19%
72.8
59%
92.6
103%
126
176%
147
222%
187
309%
37.6
-18%
9.93
-78%
11.3
-75%
21.9
-52%
23.8
-48%
51.8
13%
Maya (maya-05)
396
344
-13%
437
10%
510
29%
591
49%
678
71%
715
81%
670
69%
735
86%
460
16%
194
-51%
214
-46%
291
-27%
344
-13%
499
26%
Medical (medical-02)
92.9
72.2
-22%
83.6
-10%
112
21%
132
42%
150
61%
186
100%
237
155%
263
183%
102
10%
40.5
-56%
40.7
-56%
54.2
-42%
63.7
-31%
92
-1%
74.5 ?(1.96 - 479, n=448)
-20%
Showcase (showcase-02)
120
145
21%
198
65%
191
59%
244
103%
334
178%
455
279%
279
133%
323
169%
228
90%
64.9
-46%
85.3
-29%
122
2%
135
13%
198
65%
117.8 ?(4.99 - 459, n=446)
-2%
Siemens NX (snx-03)
26.4
22.3
-16%
26.4
0%
29.5
12%
34.1
29%
39
48%
49.1
86%
675
2457%
725
2646%
26.3
0%
16.9
-36%
16.9
-36%
18.2
-31%
25
-5%
512
1839%
126.1 ?(1.76 - 901, n=452)
378%
Solidworks (sw-04)
137
99.6
-27%
146
7%
157
15%
168
23%
179
31%
186
36%
307
124%
323
136%
108
-21%
102
-26%
104
-24%
119
-13%
136
-1%
218
59%
118.5 ?(3.69 - 373, n=457)
-14%
SPECviewperf 2020
-19%
11%
31%
57%
86%
140%
430%
490%
20%
-50%
-48%
-30%
-19%
300%
54%
3840x2160 Siemens NX (snx-04)
20.3
18.2
-10%
22.2
9%
23.9
18%
27.5
35%
31.9
57%
41.3
103%
476
2245%
514
2432%
21.8
7%
12.7
-37%
12.7
-37%
14
-31%
19.8
-2%
375
1747%
94.1 ?(2.25 - 974, n=248)
364%
3840x2160 Medical (medical-03)
17.7
11.4
-36%
16.3
-8%
22.2
25%
26.9
52%
32.2
82%
45.9
159%
53.9
205%
62.3
252%
18.8
6%
7.48
-58%
7.41
-58%
10.3
-42%
12
-32%
16.5
-7%
3840x2160 Maya (maya-06)
226
215
-5%
290
28%
305
35%
372
65%
447
98%
498
120%
401
77%
481
113%
314
39%
106
-53%
118
-48%
162
-28%
185
-18%
274
21%
3840x2160 Energy (energy-03)
44.9
14.5
-68%
39.1
-13%
57.6
28%
75.7
69%
90.4
101%
141
214%
99.6
122%
129
187%
37.2
-17%
12.5
-72%
13.7
-69%
22.9
-49%
17.8
-60%
93.9
109%
3840x2160 Creo (creo-03)
96.1
76.6
-20%
99.3
3%
112
17%
121
26%
128
33%
133
38%
173
80%
187
95%
90
-6%
55.2
-43%
57.7
-40%
77.2
-20%
85.8
-11%
135
40%
77.4 ?(8.75 - 211, n=248)
-19%
3840x2160 CATIA (catia-06)
39.2
37.9
-3%
48
22%
51.6
32%
61.2
56%
75.5
93%
95.3
143%
113
188%
127
224%
53.7
37%
19.2
-51%
21
-46%
30.5
-22%
36.7
-6%
90.9
132%
3840x2160 3ds Max (3dsmax-07)
74.5
80.1
8%
99
33%
122
64%
147
97%
179
140%
228
206%
143
92%
167
124%
128
72%
45.5
-39%
48.3
-35%
63.1
-15%
69.7
-6%
118
58%
Total Average (Program / Settings)
-19% / -19%
8% / 8%
28% / 28%
53% / 53%
80% / 80%
116% / 114%
415% / 414%
468% / 466%
7% / 6%
-49% / -49%
-46% / -45%
-29% / -29%
-16% / -16%
270% / 267%
27% / 25%

Gaming benchmarks

According to Nvidia, gamers who play mostly in 1,920 x 1,080 using high to maximum detail settings are the company's primary target market. This isn't completely covered by the GeForce RTX 4060 Ti if you take a closer look at the overview of all the games we tested. But, you can argue until the cows come home, as what does a high frame rate actually mean? If we set the limit at 60 FPS, then the GPU still lands in the green. However, if we set it at 144 FPS, then the results are totally different. In general, the MSI GeForce RTX 4060 Ti Gaming X Trio's gaming performance really isn't bad and is currently well suited to act as a 1,080p gaming graphics card. In our test, there were no games which the MSI GeForce RTX 4060 Ti Gaming X Trio couldn't manage. Although, we did measure the occasional frame rate drop. An example for this would be A Plague Tale Requiem. Here, we measured a relatively good average of 67 FPS in 1,080p and with the preset Ultra. At the same time, we also measured drops down to 37 FPS, meaning you can't quite speak of smooth gameplay. You have to differentiate between different genres of games, as it will not do as well running online high-FPS shooters compared to a more typical story-based game. 

Compared to its competitors, the MSI GeForce RTX 4060 Ti Gaming X Trio did comparatively well and always competed with the Sapphire Pulse Radeon RX 6750 XT especially. Even in 1,440p, where the GeForce RTX 4060 Ti's 8 GB VRAM slowly runs out of steam, the graphics card was still able to keep up with its AMD competitors, even though they show much more room for textures due to their 12 GB VRAM. 

The Witcher 3
1920x1080 Ultra Graphics & Postprocessing (HBAO+)
Palit GeForce RTX 4090 GameRock OC
AMD Ryzen 9 7950X, NVIDIA GeForce RTX 4090
320 (30min, 161.1P0.1, 244P1) fps +128%
AMD Radeon RX 7900 XTX
AMD Ryzen 9 7950X, AMD Radeon RX 7900 XTX
297 (41.3min, 167.7P0.1, 245P1) fps +111%
KFA2 GeForce RTX 4080 SG
AMD Ryzen 9 7950X, NVIDIA GeForce RTX 4080
268 (91.3min, 148.4P0.1, 218P1) fps +91%
AMD Radeon RX 7900 XT
AMD Ryzen 9 7950X, AMD Radeon RX 7900 XT
265 (104.1min, 151.5P0.1, 214P1) fps +89%
KFA2 GeForce RTX 4070 Ti EX Gamer
AMD Ryzen 9 7950X, NVIDIA GeForce RTX 4070 Ti
216.8 fps +54%
NVIDIA GeForce RTX 3090 Founders Edition
AMD Ryzen 9 7950X, NVIDIA GeForce RTX 3090
192.6 (60.2min, 115.6P0.1, 159.3P1) fps +37%
KFA2 GeForce RTX 4070 EX Gamer
AMD Ryzen 9 7950X, NVIDIA GeForce RTX 4070
171.2 fps +22%
KFA2 GeForce RTX 3080 SG
AMD Ryzen 9 5900X, NVIDIA GeForce RTX 3080 12 GB
165.1 (57.2min, 90.2P0.1, 124.4P1) fps +18%
Nvidia Titan RTX
AMD Ryzen 9 7950X, NVIDIA Titan RTX
150 (19.9min, 94.5P0.1, 127.2P1) fps +7%
KFA2 GeForce RTX 3070 Ti SG
AMD Ryzen 9 7950X, NVIDIA GeForce RTX 3070 Ti
146.8 (69.4min, 88.2P0.1, 125.5P1) fps +4%
Sapphire Pulse Radeon RX 6750 XT
AMD Ryzen 9 7950X, AMD Radeon RX 6750 XT
142.1 fps +1%
MSI GeForce RTX 4060 Ti Gaming X Trio 8G
AMD Ryzen 9 7950X, NVIDIA GeForce RTX 4060 Ti 8G
140.5 fps
Nvidia GeForce RTX 2070 Super
AMD Ryzen 9 7950X, NVIDIA GeForce RTX 2070 Super (Desktop)
109.6 (14.8min, 77.6P0.1, 94.5P1) fps -22%
NVIDIA GeForce RTX 3060 Ti FE
AMD Ryzen 9 5950X, NVIDIA GeForce RTX 3060 Ti
109 (103min, 105P1) fps -22%
Sapphire Nitro+ Radeon RX 6650 XT
AMD Ryzen 9 5900X, AMD Radeon RX 6650 XT
107.4 (9.75min, 56.3P0.1, 91.1P1) fps -24%
Nvidia GeForce RTX 2060 Super
AMD Ryzen 9 7950X, NVIDIA GeForce RTX 2060 Super (Desktop)
91.1 (47.2min, 67.2P0.1, 79.5P1) fps -35%
KFA2 GeForce GTX 1660 Super
AMD Ryzen 9 7950X, NVIDIA GeForce GTX 1660 Super (Desktop)
63.3 (35.8min, 48.6P0.1, 54.4P1) fps -55%
PNY GeForce GTX 1660
AMD Ryzen 9 7950X, NVIDIA GeForce GTX 1660 (Desktop)
58.6 (45.8min, 47.8P0.1, 51.7P1) fps -58%
1920x1080 High Graphics & Postprocessing (Nvidia HairWorks Off)
Palit GeForce RTX 4090 GameRock OC
AMD Ryzen 9 7950X, NVIDIA GeForce RTX 4090
642 (82min, 290P0.1, 469P1) fps +132%
KFA2 GeForce RTX 4080 SG
AMD Ryzen 9 7950X, NVIDIA GeForce RTX 4080
549 (71.3min, 221P0.1, 391P1) fps +98%
AMD Radeon RX 7900 XTX
AMD Ryzen 9 7950X, AMD Radeon RX 7900 XTX
538 (75.6min, 268P0.1, 424P1) fps +94%
AMD Radeon RX 7900 XT
AMD Ryzen 9 7950X, AMD Radeon RX 7900 XT
483 (95.4min, 251P0.1, 366P1) fps +74%
KFA2 GeForce RTX 4070 Ti EX Gamer
AMD Ryzen 9 7950X, NVIDIA GeForce RTX 4070 Ti
440.7 fps +59%
NVIDIA GeForce RTX 3090 Founders Edition
AMD Ryzen 9 7950X, NVIDIA GeForce RTX 3090
393 (40.2min, 209P0.1, 317P1) fps +42%
KFA2 GeForce RTX 4070 EX Gamer
AMD Ryzen 9 7950X, NVIDIA GeForce RTX 4070
351.4 fps +27%
KFA2 GeForce RTX 3080 SG
AMD Ryzen 9 5900X, NVIDIA GeForce RTX 3080 12 GB
321 (39.5min, 134.4P0.1, 209P1) fps +16%
Nvidia Titan RTX
AMD Ryzen 9 7950X, NVIDIA Titan RTX
293 (42.6min, 122.7P0.1, 242P1) fps +6%
KFA2 GeForce RTX 3070 Ti SG
AMD Ryzen 9 7950X, NVIDIA GeForce RTX 3070 Ti
292 (41.3min, 129.2P0.1, 224P1) fps +5%
MSI GeForce RTX 4060 Ti Gaming X Trio 8G
AMD Ryzen 9 7950X, NVIDIA GeForce RTX 4060 Ti 8G
276.9 fps
Sapphire Pulse Radeon RX 6750 XT
AMD Ryzen 9 7950X, AMD Radeon RX 6750 XT
242 fps -13%
NVIDIA GeForce RTX 3060 Ti FE
AMD Ryzen 9 5950X, NVIDIA GeForce RTX 3060 Ti
218 (178min, 182.56P1) fps -21%
Nvidia GeForce RTX 2070 Super
AMD Ryzen 9 7950X, NVIDIA GeForce RTX 2070 Super (Desktop)
208 (65.4min, 129.6P0.1, 175.9P1) fps -25%
Sapphire Nitro+ Radeon RX 6650 XT
AMD Ryzen 9 5900X, AMD Radeon RX 6650 XT
181.7 (98.6min, 129.6P0.1, 150.5P1) fps -34%
Nvidia GeForce RTX 2060 Super
AMD Ryzen 9 7950X, NVIDIA GeForce RTX 2060 Super (Desktop)
179.1 (19.1min, 116.3P0.1, 152.7P1) fps -35%
KFA2 GeForce GTX 1660 Super
AMD Ryzen 9 7950X, NVIDIA GeForce GTX 1660 Super (Desktop)
116.1 (14.9min, 77.1P0.1, 98.8P1) fps -58%
PNY GeForce GTX 1660
AMD Ryzen 9 7950X, NVIDIA GeForce GTX 1660 (Desktop)
103.1 (71min, 78.2P0.1, 89.8P1) fps -63%
Metro Exodus
2560x1440 Ultra Quality AF:16x
Palit GeForce RTX 4090 GameRock OC
AMD Ryzen 9 7950X, NVIDIA GeForce RTX 4090
185.8 (90.83min) fps +132%
AMD Radeon RX 7900 XTX
AMD Ryzen 9 7950X, AMD Radeon RX 7900 XTX
154.5 (90.83min) fps +93%
KFA2 GeForce RTX 4080 SG
AMD Ryzen 9 7950X, NVIDIA GeForce RTX 4080
153.7 (78.14min) fps +92%
AMD Radeon RX 7900 XT
AMD Ryzen 9 7950X, AMD Radeon RX 7900 XT
135 (79.57min) fps +69%
KFA2 GeForce RTX 4070 Ti EX Gamer
AMD Ryzen 9 7950X, NVIDIA GeForce RTX 4070 Ti
126.7 (70.16min) fps +58%
NVIDIA GeForce RTX 3090 Founders Edition
AMD Ryzen 9 7950X, NVIDIA GeForce RTX 3090
116.9 (64.78min) fps +46%
KFA2 GeForce RTX 4070 EX Gamer
AMD Ryzen 9 7950X, NVIDIA GeForce RTX 4070
103.7 (58.34min) fps +29%
KFA2 GeForce RTX 3080 SG
AMD Ryzen 9 5900X, NVIDIA GeForce RTX 3080 12 GB
97.9 (53.22min) fps +22%
Nvidia Titan RTX
AMD Ryzen 9 7950X, NVIDIA Titan RTX
90.5 (50.16min) fps +13%
KFA2 GeForce RTX 3070 Ti SG
AMD Ryzen 9 7950X, NVIDIA GeForce RTX 3070 Ti
87.9 (48.28min) fps +10%
MSI GeForce RTX 4060 Ti Gaming X Trio 8G
AMD Ryzen 9 7950X, NVIDIA GeForce RTX 4060 Ti 8G
80.1 (46.88min) fps
Sapphire Pulse Radeon RX 6750 XT
AMD Ryzen 9 7950X, AMD Radeon RX 6750 XT
76.9 (46.19min) fps -4%
NVIDIA GeForce RTX 3060 Ti FE
AMD Ryzen 9 5950X, NVIDIA GeForce RTX 3060 Ti
66.2 (36.92min) fps -17%
Nvidia GeForce RTX 2070 Super
AMD Ryzen 9 7950X, NVIDIA GeForce RTX 2070 Super (Desktop)
61.9 (35.24min) fps -23%
Nvidia GeForce RTX 2060 Super
AMD Ryzen 9 7950X, NVIDIA GeForce RTX 2060 Super (Desktop)
52.2 (30.69min) fps -35%
KFA2 GeForce GTX 1660 Super
AMD Ryzen 9 7950X, NVIDIA GeForce GTX 1660 Super (Desktop)
36.8 (21.82min) fps -54%
PNY GeForce GTX 1660
AMD Ryzen 9 7950X, NVIDIA GeForce GTX 1660 (Desktop)
33.9 (20.25min) fps -58%
1920x1080 Ultra Quality AF:16x
Palit GeForce RTX 4090 GameRock OC
AMD Ryzen 9 7950X, NVIDIA GeForce RTX 4090
201 (109.06min) fps +97%
AMD Radeon RX 7900 XTX
AMD Ryzen 9 7950X, AMD Radeon RX 7900 XTX
183.5 (102.51min) fps +80%
KFA2 GeForce RTX 4080 SG
AMD Ryzen 9 7950X, NVIDIA GeForce RTX 4080
177.7 (81.95min) fps +75%
AMD Radeon RX 7900 XT
AMD Ryzen 9 7950X, AMD Radeon RX 7900 XT
164.6 (92.11min) fps +62%
KFA2 GeForce RTX 4070 Ti EX Gamer
AMD Ryzen 9 7950X, NVIDIA GeForce RTX 4070 Ti
155.6 (75.36min) fps +53%
NVIDIA GeForce RTX 3090 Founders Edition
AMD Ryzen 9 7950X, NVIDIA GeForce RTX 3090
143.7 (74.95min) fps +41%
KFA2 GeForce RTX 4070 EX Gamer
AMD Ryzen 9 7950X, NVIDIA GeForce RTX 4070
130.2 (69.55min) fps +28%
KFA2 GeForce RTX 3080 SG
AMD Ryzen 9 5900X, NVIDIA GeForce RTX 3080 12 GB
117.7 (60.06min) fps +16%
Nvidia Titan RTX
AMD Ryzen 9 7950X, NVIDIA Titan RTX
114.7 (61.47min) fps +13%
KFA2 GeForce RTX 3070 Ti SG
AMD Ryzen 9 7950X, NVIDIA GeForce RTX 3070 Ti
109.8 (56.27min) fps +8%
MSI GeForce RTX 4060 Ti Gaming X Trio 8G
AMD Ryzen 9 7950X, NVIDIA GeForce RTX 4060 Ti 8G
101.8 (54.33min) fps
Sapphire Pulse Radeon RX 6750 XT
AMD Ryzen 9 7950X, AMD Radeon RX 6750 XT
96.7 (54.66min) fps -5%
NVIDIA GeForce RTX 3060 Ti FE
AMD Ryzen 9 5950X, NVIDIA GeForce RTX 3060 Ti
84.9 (43.89min) fps -17%
Nvidia GeForce RTX 2070 Super
AMD Ryzen 9 7950X, NVIDIA GeForce RTX 2070 Super (Desktop)
79.1 (41.36min) fps -22%
Nvidia GeForce RTX 2060 Super
AMD Ryzen 9 7950X, NVIDIA GeForce RTX 2060 Super (Desktop)
67.4 (37.12min) fps -34%
KFA2 GeForce GTX 1660 Super
AMD Ryzen 9 7950X, NVIDIA GeForce GTX 1660 Super (Desktop)
47.5 (26.37min) fps -53%
PNY GeForce GTX 1660
AMD Ryzen 9 7950X, NVIDIA GeForce GTX 1660 (Desktop)
44.1 (24.58min) fps -57%
Far Cry 5
2560x1440 Ultra Preset AA:T
Palit GeForce RTX 4090 GameRock OC
AMD Ryzen 9 7950X, NVIDIA GeForce RTX 4090
185 (140min) fps +36%
KFA2 GeForce RTX 4080 SG
AMD Ryzen 9 7950X, NVIDIA GeForce RTX 4080
185 (133min) fps +36%
KFA2 GeForce RTX 4070 Ti EX Gamer
AMD Ryzen 9 7950X, NVIDIA GeForce RTX 4070 Ti
182 (139min) fps +34%
NVIDIA GeForce RTX 3090 Founders Edition
AMD Ryzen 9 7950X, NVIDIA GeForce RTX 3090
176 (140min) fps +29%
AMD Radeon RX 7900 XTX
AMD Ryzen 9 7950X, AMD Radeon RX 7900 XTX
174 (133min) fps +28%
AMD Radeon RX 7900 XT
AMD Ryzen 9 7950X, AMD Radeon RX 7900 XT
173 (134min) fps +27%
KFA2 GeForce RTX 4070 EX Gamer
AMD Ryzen 9 7950X, NVIDIA GeForce RTX 4070
171 (138min) fps +26%
KFA2 GeForce RTX 3070 Ti SG
AMD Ryzen 9 7950X, NVIDIA GeForce RTX 3070 Ti
150 (133min) fps +10%
Nvidia Titan RTX
AMD Ryzen 9 7950X, NVIDIA Titan RTX
148 (131min) fps +9%
KFA2 GeForce RTX 3080 SG
AMD Ryzen 9 5900X, NVIDIA GeForce RTX 3080 12 GB
147 (110min) fps +8%
Sapphire Pulse Radeon RX 6750 XT
AMD Ryzen 9 7950X, AMD Radeon RX 6750 XT
146 (128min) fps +7%
MSI GeForce RTX 4060 Ti Gaming X Trio 8G
AMD Ryzen 9 7950X, NVIDIA GeForce RTX 4060 Ti 8G
136 (120min) fps
Sapphire Nitro+ Radeon RX 6650 XT
AMD Ryzen 9 5900X, AMD Radeon RX 6650 XT
114 (97min) fps -16%
Nvidia GeForce RTX 2070 Super
AMD Ryzen 9 7950X, NVIDIA GeForce RTX 2070 Super (Desktop)
105 (94min) fps -23%
Nvidia GeForce RTX 2060 Super
AMD Ryzen 9 7950X, NVIDIA GeForce RTX 2060 Super (Desktop)
91 (81min) fps -33%
KFA2 GeForce GTX 1660 Super
AMD Ryzen 9 7950X, NVIDIA GeForce GTX 1660 Super (Desktop)
66 (57min) fps -51%
PNY GeForce GTX 1660
AMD Ryzen 9 7950X, NVIDIA GeForce GTX 1660 (Desktop)
59 (53min) fps -57%
1920x1080 Ultra Preset AA:T
NVIDIA GeForce RTX 3090 Founders Edition
AMD Ryzen 9 7950X, NVIDIA GeForce RTX 3090
189 (138min) fps +5%
KFA2 GeForce RTX 4070 EX Gamer
AMD Ryzen 9 7950X, NVIDIA GeForce RTX 4070
189 (137min) fps +5%
Palit GeForce RTX 4090 GameRock OC
AMD Ryzen 9 7950X, NVIDIA GeForce RTX 4090
188 (136min) fps +4%
KFA2 GeForce RTX 4080 SG
AMD Ryzen 9 7950X, NVIDIA GeForce RTX 4080
188 (138min) fps +4%
KFA2 GeForce RTX 4070 Ti EX Gamer
AMD Ryzen 9 7950X, NVIDIA GeForce RTX 4070 Ti
188 (141min) fps +4%
Nvidia Titan RTX
AMD Ryzen 9 7950X, NVIDIA Titan RTX
184 (143min) fps +2%
KFA2 GeForce RTX 3070 Ti SG
AMD Ryzen 9 7950X, NVIDIA GeForce RTX 3070 Ti
183 (137min) fps +2%
MSI GeForce RTX 4060 Ti Gaming X Trio 8G
AMD Ryzen 9 7950X, NVIDIA GeForce RTX 4060 Ti 8G
180 (134min) fps
AMD Radeon RX 7900 XTX
AMD Ryzen 9 7950X, AMD Radeon RX 7900 XTX
175 (129min) fps -3%
AMD Radeon RX 7900 XT
AMD Ryzen 9 7950X, AMD Radeon RX 7900 XT
173 (129min) fps -4%
Sapphire Pulse Radeon RX 6750 XT
AMD Ryzen 9 7950X, AMD Radeon RX 6750 XT
167 (125min) fps -7%
KFA2 GeForce RTX 3080 SG
AMD Ryzen 9 5900X, NVIDIA GeForce RTX 3080 12 GB
151 (111min) fps -16%
Nvidia GeForce RTX 2070 Super
AMD Ryzen 9 7950X, NVIDIA GeForce RTX 2070 Super (Desktop)
148 (133min) fps -18%
Sapphire Nitro+ Radeon RX 6650 XT
AMD Ryzen 9 5900X, AMD Radeon RX 6650 XT
146 (113min) fps -19%
Nvidia GeForce RTX 2060 Super
AMD Ryzen 9 7950X, NVIDIA GeForce RTX 2060 Super (Desktop)
130 (117min) fps -28%
KFA2 GeForce GTX 1660 Super
AMD Ryzen 9 7950X, NVIDIA GeForce GTX 1660 Super (Desktop)
97 (86min) fps -46%
PNY GeForce GTX 1660
AMD Ryzen 9 7950X, NVIDIA GeForce GTX 1660 (Desktop)
87 (78min) fps -52%
Far Cry 6
3840x2160 Ultra Graphics Quality + HD Textures AA:T
Palit GeForce RTX 4090 GameRock OC
AMD Ryzen 9 7950X, NVIDIA GeForce RTX 4090
136.9 (122min) fps +540%
AMD Radeon RX 7900 XTX
AMD Ryzen 9 7950X, AMD Radeon RX 7900 XTX
124 (113min) fps +479%
KFA2 GeForce RTX 4080 SG
AMD Ryzen 9 7950X, NVIDIA GeForce RTX 4080
107 (98min) fps +400%
AMD Radeon RX 7900 XT
AMD Ryzen 9 7950X, AMD Radeon RX 7900 XT
104.1 (95min) fps +386%
KFA2 GeForce RTX 4070 Ti EX Gamer
AMD Ryzen 9 7950X, NVIDIA GeForce RTX 4070 Ti
87.8 (79min) fps +310%
NVIDIA GeForce RTX 3090 Founders Edition
AMD Ryzen 9 7950X, NVIDIA GeForce RTX 3090
84.9 (78min) fps +297%
KFA2 GeForce RTX 4070 EX Gamer
AMD Ryzen 9 7950X, NVIDIA GeForce RTX 4070
73.9 (66min) fps +245%
Nvidia Titan RTX
AMD Ryzen 9 7950X, NVIDIA Titan RTX
63.6 (56min) fps +197%
KFA2 GeForce RTX 3080 SG
AMD Ryzen 9 5900X, NVIDIA GeForce RTX 3080 12 GB
57.2 (28min) fps +167%
Sapphire Pulse Radeon RX 6750 XT
AMD Ryzen 9 7950X, AMD Radeon RX 6750 XT
55.1 (46min) fps +157%
MSI GeForce RTX 4060 Ti Gaming X Trio 8G
AMD Ryzen 9 7950X, NVIDIA GeForce RTX 4060 Ti 8G
21.4 (12min) fps
KFA2 GeForce RTX 3070 Ti SG
AMD Ryzen 9 7950X, NVIDIA GeForce RTX 3070 Ti
16 fps -25%
Nvidia GeForce RTX 2060 Super
AMD Ryzen 9 7950X, NVIDIA GeForce RTX 2060 Super (Desktop)
12.2 (10min) fps -43%
Nvidia GeForce RTX 2070 Super
AMD Ryzen 9 7950X, NVIDIA GeForce RTX 2070 Super (Desktop)
7.03 (6min) fps -67%
Sapphire Nitro+ Radeon RX 6650 XT
AMD Ryzen 9 5900X, AMD Radeon RX 6650 XT
5.52 (5min) fps -74%
KFA2 GeForce GTX 1660 Super
AMD Ryzen 9 7950X, NVIDIA GeForce GTX 1660 Super (Desktop)
1.62 fps -92%
PNY GeForce GTX 1660
AMD Ryzen 9 7950X, NVIDIA GeForce GTX 1660 (Desktop)
0.98 fps -95%
2560x1440 Ultra Graphics Quality + HD Textures AA:T
AMD Radeon RX 7900 XTX
AMD Ryzen 9 7950X, AMD Radeon RX 7900 XTX
176.4 (126min) fps +72%
Palit GeForce RTX 4090 GameRock OC
AMD Ryzen 9 7950X, NVIDIA GeForce RTX 4090
168.4 (125min) fps +64%
AMD Radeon RX 7900 XT
AMD Ryzen 9 7950X, AMD Radeon RX 7900 XT
167.9 (125min) fps +64%
KFA2 GeForce RTX 4070 Ti EX Gamer
AMD Ryzen 9 7950X, NVIDIA GeForce RTX 4070 Ti
153.4 (128min) fps +50%
KFA2 GeForce RTX 4080 SG
AMD Ryzen 9 7950X, NVIDIA GeForce RTX 4080
150.6 (112min) fps +47%
NVIDIA GeForce RTX 3090 Founders Edition
AMD Ryzen 9 7950X, NVIDIA GeForce RTX 3090
137.4 (125min) fps +34%
KFA2 GeForce RTX 4070 EX Gamer
AMD Ryzen 9 7950X, NVIDIA GeForce RTX 4070
134.1 (123min) fps +31%
KFA2 GeForce RTX 3070 Ti SG
AMD Ryzen 9 7950X, NVIDIA GeForce RTX 3070 Ti
112.8 (93min) fps +10%
Nvidia Titan RTX
AMD Ryzen 9 7950X, NVIDIA Titan RTX
106.6 (96min) fps +4%
Sapphire Pulse Radeon RX 6750 XT
AMD Ryzen 9 7950X, AMD Radeon RX 6750 XT
103.2 (94min) fps +1%
MSI GeForce RTX 4060 Ti Gaming X Trio 8G
AMD Ryzen 9 7950X, NVIDIA GeForce RTX 4060 Ti 8G
102.5 (85min) fps
KFA2 GeForce RTX 3080 SG
AMD Ryzen 9 5900X, NVIDIA GeForce RTX 3080 12 GB
92.2 (77min) fps -10%
Nvidia GeForce RTX 2070 Super
AMD Ryzen 9 7950X, NVIDIA GeForce RTX 2070 Super (Desktop)
78 (70min) fps -24%
Sapphire Nitro+ Radeon RX 6650 XT
AMD Ryzen 9 5900X, AMD Radeon RX 6650 XT
76.4 (68min) fps -25%
Nvidia GeForce RTX 2060 Super
AMD Ryzen 9 7950X, NVIDIA GeForce RTX 2060 Super (Desktop)
67.4 (61min) fps -34%
KFA2 GeForce GTX 1660 Super
AMD Ryzen 9 7950X, NVIDIA GeForce GTX 1660 Super (Desktop)
45.6 (41min) fps -56%
PNY GeForce GTX 1660
AMD Ryzen 9 7950X, NVIDIA GeForce GTX 1660 (Desktop)
12.2 (7min) fps -88%
1920x1080 Ultra Graphics Quality + HD Textures AA:T
AMD Radeon RX 7900 XTX
AMD Ryzen 9 7950X, AMD Radeon RX 7900 XTX
183.6 (130min) fps +27%
AMD Radeon RX 7900 XT
AMD Ryzen 9 7950X, AMD Radeon RX 7900 XT
181.9 (129min) fps +25%
KFA2 GeForce RTX 4070 Ti EX Gamer
AMD Ryzen 9 7950X, NVIDIA GeForce RTX 4070 Ti
174.6 (130min) fps +20%
Palit GeForce RTX 4090 GameRock OC
AMD Ryzen 9 7950X, NVIDIA GeForce RTX 4090
173.9 (130min) fps +20%
KFA2 GeForce RTX 4070 EX Gamer
AMD Ryzen 9 7950X, NVIDIA GeForce RTX 4070
167.7 (132min) fps +16%
NVIDIA GeForce RTX 3090 Founders Edition
AMD Ryzen 9 7950X, NVIDIA GeForce RTX 3090
164.1 (130min) fps +13%
KFA2 GeForce RTX 4080 SG
AMD Ryzen 9 7950X, NVIDIA GeForce RTX 4080
155 (118min) fps +7%
MSI GeForce RTX 4060 Ti Gaming X Trio 8G
AMD Ryzen 9 7950X, NVIDIA GeForce RTX 4060 Ti 8G
145 (124min) fps
KFA2 GeForce RTX 3070 Ti SG
AMD Ryzen 9 7950X, NVIDIA GeForce RTX 3070 Ti
144.1 (104min) fps -1%
Sapphire Pulse Radeon RX 6750 XT
AMD Ryzen 9 7950X, AMD Radeon RX 6750 XT
144.1 (128min) fps -1%
Nvidia Titan RTX
AMD Ryzen 9 7950X, NVIDIA Titan RTX
138.9 (122min) fps -4%
Sapphire Nitro+ Radeon RX 6650 XT
AMD Ryzen 9 5900X, AMD Radeon RX 6650 XT
110.5 (87min) fps -24%
Nvidia GeForce RTX 2070 Super
AMD Ryzen 9 7950X, NVIDIA GeForce RTX 2070 Super (Desktop)
107.8 (95min) fps -26%
KFA2 GeForce RTX 3080 SG
AMD Ryzen 9 5900X, NVIDIA GeForce RTX 3080 12 GB
100.2 (81min) fps -31%
Nvidia GeForce RTX 2060 Super
AMD Ryzen 9 7950X, NVIDIA GeForce RTX 2060 Super (Desktop)
94.6 (84min) fps -35%
KFA2 GeForce GTX 1660 Super
AMD Ryzen 9 7950X, NVIDIA GeForce GTX 1660 Super (Desktop)
72.1 (65min) fps -50%
PNY GeForce GTX 1660
AMD Ryzen 9 7950X, NVIDIA GeForce GTX 1660 (Desktop)
64.9 (48min) fps -55%
F1 2021
2560x1440 Ultra High Preset + Raytracing AA:T AF:16x
Palit GeForce RTX 4090 GameRock OC
AMD Ryzen 9 7950X, NVIDIA GeForce RTX 4090 (874931)
263 (216min, 198P1) fps +104%
KFA2 GeForce RTX 4080 SG
AMD Ryzen 9 7950X, NVIDIA GeForce RTX 4080 (874931)
240 (202min, 180P1) fps +86%
AMD Radeon RX 7900 XTX
AMD Ryzen 9 7950X, AMD Radeon RX 7900 XTX (874931)
220 (183min, 170P1) fps +71%
KFA2 GeForce RTX 4070 Ti EX Gamer
AMD Ryzen 9 7950X, NVIDIA GeForce RTX 4070 Ti (874931)
199.8 (168min, 166P1) fps +55%
AMD Radeon RX 7900 XT
AMD Ryzen 9 7950X, AMD Radeon RX 7900 XT (874931)
192.8 (158min, 160P1) fps +50%
NVIDIA GeForce RTX 3090 Founders Edition
AMD Ryzen 9 7950X, NVIDIA GeForce RTX 3090 (874931)
173.6 (150min, 147P1) fps +35%
KFA2 GeForce RTX 4070 EX Gamer
AMD Ryzen 9 7950X, NVIDIA GeForce RTX 4070 (874931)
163.6 (138min, 138P1) fps +27%
KFA2 GeForce RTX 3080 SG
AMD Ryzen 9 5900X, NVIDIA GeForce RTX 3080 12 GB (874931)
157.3 (136min, 135P1) fps +22%
KFA2 GeForce RTX 3070 Ti SG
AMD Ryzen 9 7950X, NVIDIA GeForce RTX 3070 Ti (874931)
135 (114min, 115P1) fps +5%
MSI GeForce RTX 4060 Ti Gaming X Trio 8G
AMD Ryzen 9 7950X, NVIDIA GeForce RTX 4060 Ti 8G (874931)
128.9 (110min, 109P1) fps
Nvidia Titan RTX
AMD Ryzen 9 7950X, NVIDIA Titan RTX (874931)
127.5 (111min, 110P1) fps -1%
Sapphire Pulse Radeon RX 6750 XT
AMD Ryzen 9 7950X, AMD Radeon RX 6750 XT (874931)
109.2 (91min, 91P1) fps -15%
Nvidia GeForce RTX 2070 Super
AMD Ryzen 9 7950X, NVIDIA GeForce RTX 2070 Super (Desktop) (874931)
87.7 (76min, 76P1) fps -32%
KFA2 GeForce GTX 1660 Super
AMD Ryzen 9 7950X, NVIDIA GeForce GTX 1660 Super (Desktop) (874931)
81.9 (69min, 69P1) fps -36%
Sapphire Nitro+ Radeon RX 6650 XT
AMD Ryzen 9 5900X, AMD Radeon RX 6650 XT (874931)
80.6 (68min, 68P1) fps -37%
PNY GeForce GTX 1660
AMD Ryzen 9 7950X, NVIDIA GeForce GTX 1660 (Desktop) (874931)
75.9 (64min, 64P1) fps -41%
Nvidia GeForce RTX 2060 Super
AMD Ryzen 9 7950X, NVIDIA GeForce RTX 2060 Super (Desktop) (874931)
75.1 (65min, 65P1) fps -42%
1920x1080 Ultra High Preset + Raytracing AA:T AF:16x
Palit GeForce RTX 4090 GameRock OC
AMD Ryzen 9 7950X, NVIDIA GeForce RTX 4090 (874931)
271 (224min, 205P1) fps +51%
AMD Radeon RX 7900 XTX
AMD Ryzen 9 7950X, AMD Radeon RX 7900 XTX (874931)
262 (192min, 192P1) fps +46%
KFA2 GeForce RTX 4080 SG
AMD Ryzen 9 7950X, NVIDIA GeForce RTX 4080 (874931)
256 (207min, 197P1) fps +42%
KFA2 GeForce RTX 4070 Ti EX Gamer
AMD Ryzen 9 7950X, NVIDIA GeForce RTX 4070 Ti (874931)
250 (211min, 195P1) fps +39%
AMD Radeon RX 7900 XT
AMD Ryzen 9 7950X, AMD Radeon RX 7900 XT (874931)
248 (199min, 195P1) fps +38%
NVIDIA GeForce RTX 3090 Founders Edition
AMD Ryzen 9 7950X, NVIDIA GeForce RTX 3090 (874931)
229 (193min, 191P1) fps +27%
KFA2 GeForce RTX 4070 EX Gamer
AMD Ryzen 9 7950X, NVIDIA GeForce RTX 4070 (874931)
225 (190min, 185P1) fps +25%
KFA2 GeForce RTX 3080 SG
AMD Ryzen 9 5900X, NVIDIA GeForce RTX 3080 12 GB (874931)
201 (169min, 155P1) fps +12%
KFA2 GeForce RTX 3070 Ti SG
AMD Ryzen 9 7950X, NVIDIA GeForce RTX 3070 Ti (874931)
183.9 (155min, 154P1) fps +2%
MSI GeForce RTX 4060 Ti Gaming X Trio 8G
AMD Ryzen 9 7950X, NVIDIA GeForce RTX 4060 Ti 8G (874931)
179.8 (149min, 149P1) fps
Nvidia Titan RTX
AMD Ryzen 9 7950X, NVIDIA Titan RTX (874931)
171.1 (148min, 146P1) fps -5%
Sapphire Pulse Radeon RX 6750 XT
AMD Ryzen 9 7950X, AMD Radeon RX 6750 XT (874931)
150.7 (126min, 126P1) fps -16%
Nvidia GeForce RTX 2070 Super
AMD Ryzen 9 7950X, NVIDIA GeForce RTX 2070 Super (Desktop) (874931)
120.9 (104min, 104P1) fps -33%
Sapphire Nitro+ Radeon RX 6650 XT
AMD Ryzen 9 5900X, AMD Radeon RX 6650 XT (874931)
116.6 (98min, 98P1) fps -35%
KFA2 GeForce GTX 1660 Super
AMD Ryzen 9 7950X, NVIDIA GeForce GTX 1660 Super (Desktop) (874931)
111.5 (93min, 93P1) fps -38%
Nvidia GeForce RTX 2060 Super
AMD Ryzen 9 7950X, NVIDIA GeForce RTX 2060 Super (Desktop) (874931)
104.2 (90min, 90P1) fps -42%
PNY GeForce GTX 1660
AMD Ryzen 9 7950X, NVIDIA GeForce GTX 1660 (Desktop) (874931)
102 (85min, 85P1) fps -43%
F1 22
2560x1440 Ultra High Preset AA:T AF:16x
Palit GeForce RTX 4090 GameRock OC
AMD Ryzen 9 7950X, NVIDIA GeForce RTX 4090 (923662)
157.5 (137min, 116P1) fps +179%
KFA2 GeForce RTX 4080 SG
AMD Ryzen 9 7950X, NVIDIA GeForce RTX 4080 (939134)
113.8 (99min, 92P1) fps +101%
AMD Radeon RX 7900 XTX
AMD Ryzen 9 7950X, AMD Radeon RX 7900 XTX (939134)
102.1 (74min, 75P1) fps +81%
KFA2 GeForce RTX 4070 Ti EX Gamer
AMD Ryzen 9 7950X, NVIDIA GeForce RTX 4070 Ti (959964)
94.1 (81min, 78P1) fps +67%
AMD Radeon RX 7900 XT
AMD Ryzen 9 7950X, AMD Radeon RX 7900 XT (939134)
88.1 (65min, 65P1) fps +56%
NVIDIA GeForce RTX 3090 Founders Edition
AMD Ryzen 9 7950X, NVIDIA GeForce RTX 3090 (923650)
84.4 (72min, 70P1) fps +49%
KFA2 GeForce RTX 4070 EX Gamer
AMD Ryzen 9 7950X, NVIDIA GeForce RTX 4070 (959964)
73.7 (63min, 62P1) fps +30%
KFA2 GeForce GTX 1660 Super
AMD Ryzen 9 7950X, NVIDIA GeForce GTX 1660 Super (Desktop) (928484)
70 (61min, 60P1) fps +24%
PNY GeForce GTX 1660
AMD Ryzen 9 7950X, NVIDIA GeForce GTX 1660 (Desktop) (928484)
65.8 (56min, 56P1) fps +16%
KFA2 GeForce RTX 3070 Ti SG
AMD Ryzen 9 7950X, NVIDIA GeForce RTX 3070 Ti (939134)
61 (52min, 51P1) fps +8%
Nvidia Titan RTX
AMD Ryzen 9 7950X, NVIDIA Titan RTX (923650)
58.9 (50min, 50P1) fps +4%
MSI GeForce RTX 4060 Ti Gaming X Trio 8G
AMD Ryzen 9 7950X, NVIDIA GeForce RTX 4060 Ti 8G (959964)
56.5 (48min, 47P1) fps
Sapphire Pulse Radeon RX 6750 XT
AMD Ryzen 9 7950X, AMD Radeon RX 6750 XT (959964)
44.5 (33min, 32P1) fps -21%
Nvidia GeForce RTX 2070 Super
AMD Ryzen 9 7950X, NVIDIA GeForce RTX 2070 Super (Desktop) (923662)
38.4 (33min, 32P1) fps -32%
Nvidia GeForce RTX 2060 Super
AMD Ryzen 9 7950X, NVIDIA GeForce RTX 2060 Super (Desktop) (923662)
32 (27min, 27P1) fps -43%
Sapphire Nitro+ Radeon RX 6650 XT
AMD Ryzen 9 5900X, AMD Radeon RX 6650 XT
30 fps -47%
1920x1080 Ultra High Preset AA:T AF:16x
Palit GeForce RTX 4090 GameRock OC
AMD Ryzen 9 7950X, NVIDIA GeForce RTX 4090
194.5 fps +117%
KFA2 GeForce RTX 4080 SG
AMD Ryzen 9 7950X, NVIDIA GeForce RTX 4080 (939134)
172.8 (145min, 123P1) fps +93%
AMD Radeon RX 7900 XTX
AMD Ryzen 9 7950X, AMD Radeon RX 7900 XTX (939134)
148.5 (112min, 104P1) fps +66%
KFA2 GeForce RTX 4070 Ti EX Gamer
AMD Ryzen 9 7950X, NVIDIA GeForce RTX 4070 Ti (959964)
144.5 (125min, 104P1) fps +61%
NVIDIA GeForce RTX 3090 Founders Edition
AMD Ryzen 9 7950X, NVIDIA GeForce RTX 3090 (923650)
130.1 (111min, 102P1) fps +45%
AMD Radeon RX 7900 XT
AMD Ryzen 9 7950X, AMD Radeon RX 7900 XT (939134)
129.8 (99min, 96P1) fps +45%
KFA2 GeForce RTX 4070 EX Gamer
AMD Ryzen 9 7950X, NVIDIA GeForce RTX 4070 (959964)
113.3 (99min, 92P1) fps +26%
KFA2 GeForce GTX 1660 Super
AMD Ryzen 9 7950X, NVIDIA GeForce GTX 1660 Super (Desktop) (928484)
96.9 (83min, 80P1) fps +8%
KFA2 GeForce RTX 3070 Ti SG
AMD Ryzen 9 7950X, NVIDIA GeForce RTX 3070 Ti (939134)
96.1 (83min, 78P1) fps +7%
PNY GeForce GTX 1660
AMD Ryzen 9 7950X, NVIDIA GeForce GTX 1660 (Desktop) (928484)
91.6 (79min, 76P1) fps +2%
Nvidia Titan RTX
AMD Ryzen 9 7950X, NVIDIA Titan RTX (923650)
91.5 (78min, 77P1) fps +2%
MSI GeForce RTX 4060 Ti Gaming X Trio 8G
AMD Ryzen 9 7950X, NVIDIA GeForce RTX 4060 Ti 8G (959964)
89.6 (77min, 75P1) fps
Sapphire Pulse Radeon RX 6750 XT
AMD Ryzen 9 7950X, AMD Radeon RX 6750 XT (959964)
71.8 (53min, 53P1) fps -20%
Nvidia GeForce RTX 2070 Super
AMD Ryzen 9 7950X, NVIDIA GeForce RTX 2070 Super (Desktop) (923662)
60.2 (51min, 50P1) fps -33%
Nvidia GeForce RTX 2060 Super
AMD Ryzen 9 7950X, NVIDIA GeForce RTX 2060 Super (Desktop) (923662)
51.5 (43min, 43P1) fps -43%
Sapphire Nitro+ Radeon RX 6650 XT
AMD Ryzen 9 5900X, AMD Radeon RX 6650 XT
50 fps -44%
Cyberpunk 2077 1.6
2560x1440 Ultra Preset
Palit GeForce RTX 4090 GameRock OC
AMD Ryzen 9 7950X, NVIDIA GeForce RTX 4090 (1.6)
149.6 (65.9min) fps +149%
AMD Radeon RX 7900 XTX
AMD Ryzen 9 7950X, AMD Radeon RX 7900 XTX (1.61)
141.1 (43.1min) fps +134%
KFA2 GeForce RTX 4080 SG
AMD Ryzen 9 7950X, NVIDIA GeForce RTX 4080 (1.61)
129.1 (39.6min) fps +114%
AMD Radeon RX 7900 XT
AMD Ryzen 9 7950X, AMD Radeon RX 7900 XT (1.61)
122.4 (36min) fps +103%
KFA2 GeForce RTX 4070 Ti EX Gamer
AMD Ryzen 9 7950X, NVIDIA GeForce RTX 4070 Ti
100.7 fps +67%
KFA2 GeForce RTX 4070 EX Gamer
AMD Ryzen 9 7950X, NVIDIA GeForce RTX 4070
80.3 fps +33%
KFA2 GeForce RTX 3070 Ti SG
AMD Ryzen 9 7950X, NVIDIA GeForce RTX 3070 Ti (1.61)
72.7 (60.2min) fps +21%
Sapphire Pulse Radeon RX 6750 XT
AMD Ryzen 9 7950X, AMD Radeon RX 6750 XT
62 fps +3%
MSI GeForce RTX 4060 Ti Gaming X Trio 8G
AMD Ryzen 9 7950X, NVIDIA GeForce RTX 4060 Ti 8G
60.2 fps
Nvidia GeForce RTX 2070 Super
AMD Ryzen 9 7950X, NVIDIA GeForce RTX 2070 Super (Desktop) (1.6)
47.8 (12min) fps -21%
Sapphire Nitro+ Radeon RX 6650 XT
AMD Ryzen 9 5900X, AMD Radeon RX 6650 XT
44 fps -27%
Nvidia GeForce RTX 2060 Super
AMD Ryzen 9 7950X, NVIDIA GeForce RTX 2060 Super (Desktop) (1.6)
40.6 (24min) fps -33%
KFA2 GeForce GTX 1660 Super
AMD Ryzen 9 7950X, NVIDIA GeForce GTX 1660 Super (Desktop) (1.6)
26.9 (17.7min) fps -55%
PNY GeForce GTX 1660
AMD Ryzen 9 7950X, NVIDIA GeForce GTX 1660 (Desktop) (1.6)
24.6 (16.5min) fps -59%
1920x1080 Ultra Preset
Palit GeForce RTX 4090 GameRock OC
AMD Ryzen 9 7950X, NVIDIA GeForce RTX 4090 (1.6)
207 (96.4min) fps +106%
AMD Radeon RX 7900 XTX
AMD Ryzen 9 7950X, AMD Radeon RX 7900 XTX (1.61)
199.3 (42.6min) fps +98%
KFA2 GeForce RTX 4080 SG
AMD Ryzen 9 7950X, NVIDIA GeForce RTX 4080 (1.61)
190.1 (74.5min) fps +89%
AMD Radeon RX 7900 XT
AMD Ryzen 9 7950X, AMD Radeon RX 7900 XT (1.61)
178.6 (45.1min) fps +78%
KFA2 GeForce RTX 4070 Ti EX Gamer
AMD Ryzen 9 7950X, NVIDIA GeForce RTX 4070 Ti
159.4 fps +59%
KFA2 GeForce RTX 4070 EX Gamer
AMD Ryzen 9 7950X, NVIDIA GeForce RTX 4070
131 fps +30%
KFA2 GeForce RTX 3070 Ti SG
AMD Ryzen 9 7950X, NVIDIA GeForce RTX 3070 Ti (1.61)
111.1 (57.5min) fps +11%
MSI GeForce RTX 4060 Ti Gaming X Trio 8G
AMD Ryzen 9 7950X, NVIDIA GeForce RTX 4060 Ti 8G
100.5 fps
Sapphire Pulse Radeon RX 6750 XT
AMD Ryzen 9 7950X, AMD Radeon RX 6750 XT
98.5 fps -2%
Sapphire Nitro+ Radeon RX 6650 XT
AMD Ryzen 9 5900X, AMD Radeon RX 6650 XT
78 fps -22%
Nvidia GeForce RTX 2070 Super
AMD Ryzen 9 7950X, NVIDIA GeForce RTX 2070 Super (Desktop) (1.6)
73.2 (23.4min) fps -27%
Nvidia GeForce RTX 2060 Super
AMD Ryzen 9 7950X, NVIDIA GeForce RTX 2060 Super (Desktop) (1.6)
63 (27.1min) fps -37%
KFA2 GeForce GTX 1660 Super
AMD Ryzen 9 7950X, NVIDIA GeForce GTX 1660 Super (Desktop) (1.6)
44.5 (29.4min) fps -56%
PNY GeForce GTX 1660
AMD Ryzen 9 7950X, NVIDIA GeForce GTX 1660 (Desktop) (1.6)
41.4 (28.3min) fps -59%
A Plague Tale Requiem
2560x1440 Ultra Preset
Palit GeForce RTX 4090 GameRock OC
AMD Ryzen 9 7950X, NVIDIA GeForce RTX 4090
125.8 (78min, 90.4P0.1, 101.6P1) fps +165%
AMD Radeon RX 7900 XTX
AMD Ryzen 9 7950X, AMD Radeon RX 7900 XTX
97.5 (74.2min, 78P0.1, 80.8P1) fps +106%
KFA2 GeForce RTX 4080 SG
AMD Ryzen 9 7950X, NVIDIA GeForce RTX 4080
95.4 (34.6min, 73P0.1, 80P1) fps +101%
AMD Radeon RX 7900 XT
AMD Ryzen 9 7950X, AMD Radeon RX 7900 XT
84.1 (53min, 65.3P0.1, 71.6P1) fps +77%
KFA2 GeForce RTX 4070 Ti EX Gamer
AMD Ryzen 9 7950X, NVIDIA GeForce RTX 4070 Ti
77.2 (60.6min, 63.9P0.1, 66.2P1) fps +63%
KFA2 GeForce RTX 4070 EX Gamer
AMD Ryzen 9 7950X, NVIDIA GeForce RTX 4070
61 (50.3min, 52P0.1, 53.7P1) fps +29%
KFA2 GeForce RTX 3070 Ti SG
AMD Ryzen 9 7950X, NVIDIA GeForce RTX 3070 Ti
52.8 (42.4min, 44P0.1, 45.8P1) fps +11%
Nvidia Titan RTX
AMD Ryzen 9 7950X, NVIDIA Titan RTX
51.1 (41.1min, 41.8P0.1, 43.9P1) fps +8%
MSI GeForce RTX 4060 Ti Gaming X Trio 8G
AMD Ryzen 9 7950X, NVIDIA GeForce RTX 4060 Ti 8G
47.4 (38.3min, 39.8P0.1, 41.5P1) fps
Sapphire Pulse Radeon RX 6750 XT
AMD Ryzen 9 7950X, AMD Radeon RX 6750 XT
45.1 (35.5min, 38.8P0.1, 39.9P1) fps -5%
Nvidia GeForce RTX 2070 Super
AMD Ryzen 9 7950X, NVIDIA GeForce RTX 2070 Super (Desktop)
36.1 (29.3min, 30.4P0.1, 31.8P1) fps -24%
Nvidia GeForce RTX 2060 Super
AMD Ryzen 9 7950X, NVIDIA GeForce RTX 2060 Super (Desktop)
29.2 (24min, 24.4P0.1, 25.8P1) fps -38%
KFA2 GeForce GTX 1660 Super
AMD Ryzen 9 7950X, NVIDIA GeForce GTX 1660 Super (Desktop)
20.8 (17.3min, 17.4P0.1, 18.5P1) fps -56%
PNY GeForce GTX 1660
AMD Ryzen 9 7950X, NVIDIA GeForce GTX 1660 (Desktop)
19 (16.1min, 16.1P0.1, 17P1) fps -60%
1920x1080 Ultra Preset
Palit GeForce RTX 4090 GameRock OC
AMD Ryzen 9 7950X, NVIDIA GeForce RTX 4090
154.3 (85.8min, 100.7P0.1, 123.5P1) fps +131%
KFA2 GeForce RTX 4080 SG
AMD Ryzen 9 7950X, NVIDIA GeForce RTX 4080
127 (59.5min, 71.8P0.1, 101.3P1) fps +90%
AMD Radeon RX 7900 XTX
AMD Ryzen 9 7950X, AMD Radeon RX 7900 XTX
121.4 (78.8min, 93.9P0.1, 100.1P1) fps +82%
AMD Radeon RX 7900 XT
AMD Ryzen 9 7950X, AMD Radeon RX 7900 XT
106 (76.6min, 84.5P0.1, 89.8P1) fps +59%
KFA2 GeForce RTX 4070 Ti EX Gamer
AMD Ryzen 9 7950X, NVIDIA GeForce RTX 4070 Ti
105 (51.4min, 63P0.1, 84.7P1) fps +57%
KFA2 GeForce RTX 4070 EX Gamer
AMD Ryzen 9 7950X, NVIDIA GeForce RTX 4070
85.9 (54.1min, 57.2P0.1, 71.7P1) fps +29%
KFA2 GeForce RTX 3070 Ti SG
AMD Ryzen 9 7950X, NVIDIA GeForce RTX 3070 Ti
75.5 (42.1min, 54.2P0.1, 62.2P1) fps +13%
Nvidia Titan RTX
AMD Ryzen 9 7950X, NVIDIA Titan RTX
70 (53.6min, 55.9P0.1, 58.5P1) fps +5%
MSI GeForce RTX 4060 Ti Gaming X Trio 8G
AMD Ryzen 9 7950X, NVIDIA GeForce RTX 4060 Ti 8G
66.8 (37.7min, 42.7P0.1, 55.6P1) fps
Sapphire Pulse Radeon RX 6750 XT
AMD Ryzen 9 7950X, AMD Radeon RX 6750 XT
59.4 (41.3min, 45.9P0.1, 51.2P1) fps -11%
Nvidia GeForce RTX 2070 Super
AMD Ryzen 9 7950X, NVIDIA GeForce RTX 2070 Super (Desktop)
50.2 (30.6min, 37.7P0.1, 42.6P1) fps -25%
Nvidia GeForce RTX 2060 Super
AMD Ryzen 9 7950X, NVIDIA GeForce RTX 2060 Super (Desktop)
41.6 (31.7min, 32.6P0.1, 35.1P1) fps -38%
KFA2 GeForce GTX 1660 Super
AMD Ryzen 9 7950X, NVIDIA GeForce GTX 1660 Super (Desktop)
29.8 (21.8min, 23.2P0.1, 25.8P1) fps -55%
PNY GeForce GTX 1660
AMD Ryzen 9 7950X, NVIDIA GeForce GTX 1660 (Desktop)
27.3 (21.4min, 21.7P0.1, 24P1) fps -59%
Need for Speed Unbound
2560x1440 Ultra Preset
Palit GeForce RTX 4090 GameRock OC
AMD Ryzen 9 7950X, NVIDIA GeForce RTX 4090
152.8 (58.2min, 95.3P0.1, 112.1P1) fps
KFA2 GeForce RTX 4080 SG
AMD Ryzen 9 7950X, NVIDIA GeForce RTX 4080
137.8 (40min, 79.2P0.1, 102.9P1) fps
AMD Radeon RX 7900 XTX
AMD Ryzen 9 7950X, AMD Radeon RX 7900 XTX
124.5 (81.4min, 88P0.1, 96.9P1) fps
AMD Radeon RX 7900 XT
AMD Ryzen 9 7950X, AMD Radeon RX 7900 XT
115.1 (15.7min, 77.1P0.1, 90.4P1) fps
KFA2 GeForce RTX 3070 Ti SG
AMD Ryzen 9 7950X, NVIDIA GeForce RTX 3070 Ti
98.7 (2.11min, 40.9P0.1, 69.8P1) fps
Nvidia Titan RTX
AMD Ryzen 9 7950X, NVIDIA Titan RTX
98 (30.3min, 60P0.1, 77.4P1) fps
Nvidia GeForce RTX 2070 Super
AMD Ryzen 9 7950X, NVIDIA GeForce RTX 2070 Super (Desktop)
68.2 (39.7min, 46.2P0.1, 52.8P1) fps
Nvidia GeForce RTX 2060 Super
AMD Ryzen 9 7950X, NVIDIA GeForce RTX 2060 Super (Desktop)
59.9 (4.4min, 31.7P0.1, 46.8P1) fps
KFA2 GeForce GTX 1660 Super
AMD Ryzen 9 7950X, NVIDIA GeForce GTX 1660 Super (Desktop)
34.2 (17.6min, 22.6P0.1, 27.6P1) fps
PNY GeForce GTX 1660
AMD Ryzen 9 7950X, NVIDIA GeForce GTX 1660 (Desktop)
31.9 (24.1min, 24.7P0.1, 26P1) fps
1920x1080 Ultra Preset
Palit GeForce RTX 4090 GameRock OC
AMD Ryzen 9 7950X, NVIDIA GeForce RTX 4090
153.7 (81.7min, 95P0.1, 110P1) fps
AMD Radeon RX 7900 XTX
AMD Ryzen 9 7950X, AMD Radeon RX 7900 XTX
142.5 (48.5min, 92.1P0.1, 108P1) fps
KFA2 GeForce RTX 4080 SG
AMD Ryzen 9 7950X, NVIDIA GeForce RTX 4080
140.3 (50.9min, 88.1P0.1, 106.3P1) fps
AMD Radeon RX 7900 XT
AMD Ryzen 9 7950X, AMD Radeon RX 7900 XT
134.2 (51.8min, 89.1P0.1, 102.4P1) fps
KFA2 GeForce RTX 3070 Ti SG
AMD Ryzen 9 7950X, NVIDIA GeForce RTX 3070 Ti
129.8 (1.33min, 39.5P0.1, 90.2P1) fps
Nvidia Titan RTX
AMD Ryzen 9 7950X, NVIDIA Titan RTX
126.6 (51.8min, 69P0.1, 89.3P1) fps
Nvidia GeForce RTX 2070 Super
AMD Ryzen 9 7950X, NVIDIA GeForce RTX 2070 Super (Desktop)
97 (58.3min, 64.2P0.1, 74.6P1) fps
Nvidia GeForce RTX 2060 Super
AMD Ryzen 9 7950X, NVIDIA GeForce RTX 2060 Super (Desktop)
83.9 (25.1min, 52.6P0.1, 66P1) fps
KFA2 GeForce GTX 1660 Super
AMD Ryzen 9 7950X, NVIDIA GeForce GTX 1660 Super (Desktop)
57.7 (22.9min, 38.2P0.1, 45.7P1) fps
PNY GeForce GTX 1660
AMD Ryzen 9 7950X, NVIDIA GeForce GTX 1660 (Desktop)
53.7 (22.4min, 30P0.1, 42.8P1) fps
Spider-Man Miles Morales
2560x1440 Very High Preset AA:T
KFA2 GeForce RTX 4080 SG
AMD Ryzen 9 7950X, NVIDIA GeForce RTX 4080
202 (80.4min, 94.3P0.1, 151.7P1) fps +109%
Palit GeForce RTX 4090 GameRock OC
AMD Ryzen 9 7950X, NVIDIA GeForce RTX 4090
174.4 (68.4min, 88.2P0.1, 127.9P1) fps +81%
AMD Radeon RX 7900 XTX
AMD Ryzen 9 7950X, AMD Radeon RX 7900 XTX
146.3 (77.4min, 85.4P0.1, 114.1P1) fps +51%
KFA2 GeForce RTX 4070 Ti EX Gamer
AMD Ryzen 9 7950X, NVIDIA GeForce RTX 4070 Ti
143.9 (74.9min, 88.7P0.1, 118.9P1) fps +49%
AMD Radeon RX 7900 XT
AMD Ryzen 9 7950X, AMD Radeon RX 7900 XT
135 (82min, 84.7P0.1, 104.7P1) fps +40%
KFA2 GeForce RTX 4070 EX Gamer
AMD Ryzen 9 7950X, NVIDIA GeForce RTX 4070
124.2 (73.8min, 87.3P0.1, 101.6P1) fps +29%
KFA2 GeForce RTX 3070 Ti SG
AMD Ryzen 9 7950X, NVIDIA GeForce RTX 3070 Ti
110.7 (70.5min, 83.3P0.1, 89.7P1) fps +15%
Nvidia Titan RTX
AMD Ryzen 9 7950X, NVIDIA Titan RTX
102.5 (77.2min, 79.3P0.1, 84.4P1) fps +6%
MSI GeForce RTX 4060 Ti Gaming X Trio 8G
AMD Ryzen 9 7950X, NVIDIA GeForce RTX 4060 Ti 8G
96.6 (14.3min, 28.6P0.1, 80.5P1) fps
Sapphire Pulse Radeon RX 6750 XT
AMD Ryzen 9 7950X, AMD Radeon RX 6750 XT
87.7 (66.9min, 69.8P0.1, 72.6P1) fps -9%
Nvidia GeForce RTX 2070 Super
AMD Ryzen 9 7950X, NVIDIA GeForce RTX 2070 Super (Desktop)
80 (29.7min, 33.5P0.1, 61.7P1) fps -17%
Nvidia GeForce RTX 2060 Super
AMD Ryzen 9 7950X, NVIDIA GeForce RTX 2060 Super (Desktop)
67.8 (31.4min, 32.1P0.1, 57.1P1) fps -30%
PNY GeForce GTX 1660
AMD Ryzen 9 7950X, NVIDIA GeForce GTX 1660 (Desktop)
41 (24.9min, 25.3P0.1, 30.5P1) fps -58%
KFA2 GeForce GTX 1660 Super
AMD Ryzen 9 7950X, NVIDIA GeForce GTX 1660 Super (Desktop)
37.9 (10.3min, 16.1P0.1, 20.6P1) fps -61%
1920x1080 Very High Preset AA:T
Palit GeForce RTX 4090 GameRock OC
AMD Ryzen 9 7950X, NVIDIA GeForce RTX 4090
175.4 (80.4min, 89.7P0.1, 128.7P1) fps +33%
KFA2 GeForce RTX 4070 Ti EX Gamer
AMD Ryzen 9 7950X, NVIDIA GeForce RTX 4070 Ti
169.9 (67min, 83.9P0.1, 129P1) fps +29%
AMD Radeon RX 7900 XTX
AMD Ryzen 9 7950X, AMD Radeon RX 7900 XTX
162.8 (76.5min, 84P0.1, 125.2P1) fps +24%
KFA2 GeForce RTX 4070 EX Gamer
AMD Ryzen 9 7950X, NVIDIA GeForce RTX 4070
160.3 (72.4min, 93P0.1, 123.2P1) fps +22%
KFA2 GeForce RTX 4080 SG
AMD Ryzen 9 7950X, NVIDIA GeForce RTX 4080
157.3 (69.1min, 89.3P0.1, 120.5P1) fps +19%
AMD Radeon RX 7900 XT
AMD Ryzen 9 7950X, AMD Radeon RX 7900 XT
156.2 (81.9min, 86.6P0.1, 116P1) fps +19%
KFA2 GeForce RTX 3070 Ti SG
AMD Ryzen 9 7950X, NVIDIA GeForce RTX 3070 Ti
143.3 (24min, 84.4P0.1, 109.5P1) fps +9%
Nvidia Titan RTX
AMD Ryzen 9 7950X, NVIDIA Titan RTX
136.1 (77.8min, 90.3P0.1, 107.7P1) fps +3%
MSI GeForce RTX 4060 Ti Gaming X Trio 8G
AMD Ryzen 9 7950X, NVIDIA GeForce RTX 4060 Ti 8G
131.7 (19.1min, 58.9P0.1, 102.9P1) fps
Sapphire Pulse Radeon RX 6750 XT
AMD Ryzen 9 7950X, AMD Radeon RX 6750 XT
113.9 (80.1min, 83P0.1, 89.9P1) fps -14%
Nvidia GeForce RTX 2070 Super
AMD Ryzen 9 7950X, NVIDIA GeForce RTX 2070 Super (Desktop)
106.4 fps -19%
Nvidia GeForce RTX 2060 Super
AMD Ryzen 9 7950X, NVIDIA GeForce RTX 2060 Super (Desktop)
97.8 (52.9min, 67.9P0.1, 75.7P1) fps -26%
KFA2 GeForce GTX 1660 Super
AMD Ryzen 9 7950X, NVIDIA GeForce GTX 1660 Super (Desktop)
69 (13.5min, 32.1P0.1, 57.7P1) fps -48%
PNY GeForce GTX 1660
AMD Ryzen 9 7950X, NVIDIA GeForce GTX 1660 (Desktop)
62.3 (28.2min, 37P0.1, 51.9P1) fps -53%
Borderlands 3
2560x1440 Badass Overall Quality (DX11)
Palit GeForce RTX 4090 GameRock OC
AMD Ryzen 9 7950X, NVIDIA GeForce RTX 4090
186 fps +118%
KFA2 GeForce RTX 4080 SG
AMD Ryzen 9 7950X, NVIDIA GeForce RTX 4080
163.2 fps +92%
AMD Radeon RX 7900 XTX
AMD Ryzen 9 7950X, AMD Radeon RX 7900 XTX
152.2 fps +79%
AMD Radeon RX 7900 XT
AMD Ryzen 9 7950X, AMD Radeon RX 7900 XT
135.2 fps +59%
KFA2 GeForce RTX 4070 Ti EX Gamer
AMD Ryzen 9 7950X, NVIDIA GeForce RTX 4070 Ti
134.3 fps +58%
NVIDIA GeForce RTX 3090 Founders Edition
AMD Ryzen 9 7950X, NVIDIA GeForce RTX 3090
129.1 fps +52%
KFA2 GeForce RTX 4070 EX Gamer
AMD Ryzen 9 7950X, NVIDIA GeForce RTX 4070
111.2 fps +31%
KFA2 GeForce RTX 3080 SG
AMD Ryzen 9 5900X, NVIDIA GeForce RTX 3080 12 GB
104 fps +22%
KFA2 GeForce RTX 3070 Ti SG
AMD Ryzen 9 7950X, NVIDIA GeForce RTX 3070 Ti
95.9 fps +13%
Nvidia Titan RTX
AMD Ryzen 9 7950X, NVIDIA Titan RTX
91.6 fps +8%
MSI GeForce RTX 4060 Ti Gaming X Trio 8G
AMD Ryzen 9 7950X, NVIDIA GeForce RTX 4060 Ti 8G
85.2 fps
Sapphire Pulse Radeon RX 6750 XT
AMD Ryzen 9 7950X, AMD Radeon RX 6750 XT
78 fps -8%
NVIDIA GeForce RTX 3060 Ti FE
AMD Ryzen 9 5950X, NVIDIA GeForce RTX 3060 Ti
70.2 fps -18%
Sapphire Nitro+ Radeon RX 6650 XT
AMD Ryzen 9 5900X, AMD Radeon RX 6650 XT
60 fps -30%
Nvidia GeForce RTX 2070 Super
AMD Ryzen 9 7950X, NVIDIA GeForce RTX 2070 Super (Desktop)
59.9 fps -30%
Nvidia GeForce RTX 2060 Super
AMD Ryzen 9 7950X, NVIDIA GeForce RTX 2060 Super (Desktop)
51.7 fps -39%
KFA2 GeForce GTX 1660 Super
AMD Ryzen 9 7950X, NVIDIA GeForce GTX 1660 Super (Desktop)
36.5 fps -57%
PNY GeForce GTX 1660
AMD Ryzen 9 7950X, NVIDIA GeForce GTX 1660 (Desktop)
33.8 fps -60%
1920x1080 Badass Overall Quality (DX11)
KFA2 GeForce RTX 4080 SG
AMD Ryzen 9 7950X, NVIDIA GeForce RTX 4080
187.2 fps +52%
Palit GeForce RTX 4090 GameRock OC
AMD Ryzen 9 7950X, NVIDIA GeForce RTX 4090
186.8 fps +51%
AMD Radeon RX 7900 XTX
AMD Ryzen 9 7950X, AMD Radeon RX 7900 XTX
180.2 fps +46%
KFA2 GeForce RTX 4070 Ti EX Gamer
AMD Ryzen 9 7950X, NVIDIA GeForce RTX 4070 Ti
171.4 fps +39%
AMD Radeon RX 7900 XT
AMD Ryzen 9 7950X, AMD Radeon RX 7900 XT
169.4 fps +37%
NVIDIA GeForce RTX 3090 Founders Edition
AMD Ryzen 9 7950X, NVIDIA GeForce RTX 3090
164.7 fps +33%
KFA2 GeForce RTX 4070 EX Gamer
AMD Ryzen 9 7950X, NVIDIA GeForce RTX 4070
156.3 fps +27%
KFA2 GeForce RTX 3070 Ti SG
AMD Ryzen 9 7950X, NVIDIA GeForce RTX 3070 Ti
131.8 fps +7%
Nvidia Titan RTX
AMD Ryzen 9 7950X, NVIDIA Titan RTX
128.7 fps +4%
KFA2 GeForce RTX 3080 SG
AMD Ryzen 9 5900X, NVIDIA GeForce RTX 3080 12 GB
128.5 fps +4%
MSI GeForce RTX 4060 Ti Gaming X Trio 8G
AMD Ryzen 9 7950X, NVIDIA GeForce RTX 4060 Ti 8G
123.5 fps
Sapphire Pulse Radeon RX 6750 XT
AMD Ryzen 9 7950X, AMD Radeon RX 6750 XT
111 fps -10%
NVIDIA GeForce RTX 3060 Ti FE
AMD Ryzen 9 5950X, NVIDIA GeForce RTX 3060 Ti
96 fps -22%
Sapphire Nitro+ Radeon RX 6650 XT
AMD Ryzen 9 5900X, AMD Radeon RX 6650 XT
86.8 fps -30%
Nvidia GeForce RTX 2070 Super
AMD Ryzen 9 7950X, NVIDIA GeForce RTX 2070 Super (Desktop)
86 fps -30%
Nvidia GeForce RTX 2060 Super
AMD Ryzen 9 7950X, NVIDIA GeForce RTX 2060 Super (Desktop)
74.1 fps -40%
KFA2 GeForce GTX 1660 Super
AMD Ryzen 9 7950X, NVIDIA GeForce GTX 1660 Super (Desktop)
53 fps -57%
PNY GeForce GTX 1660
AMD Ryzen 9 7950X, NVIDIA GeForce GTX 1660 (Desktop)
49.3 fps -60%
God of War
2560x1440 Ultra Preset
Palit GeForce RTX 4090 GameRock OC
AMD Ryzen 9 7950X, NVIDIA GeForce RTX 4090
179.5 (89min, 124P0.1, 149.2P1) fps +157%
AMD Radeon RX 7900 XTX
AMD Ryzen 9 7950X, AMD Radeon RX 7900 XTX
153.8 (118min, 124.2P0.1, 129.7P1) fps +120%
AMD Radeon RX 7900 XT
AMD Ryzen 9 7950X, AMD Radeon RX 7900 XT
136.7 (105.2min, 115.2P0.1, 118.2P1) fps +96%
KFA2 GeForce RTX 4080 SG
AMD Ryzen 9 7950X, NVIDIA GeForce RTX 4080
136.3 (52.3min, 80.9P0.1, 116.8P1) fps +95%
NVIDIA GeForce RTX 3090 Founders Edition
AMD Ryzen 9 7950X, NVIDIA GeForce RTX 3090
110.3 (73.1min, 88.9P0.1, 95.3P1) fps +58%
KFA2 GeForce RTX 4070 EX Gamer
AMD Ryzen 9 7950X, NVIDIA GeForce RTX 4070
92.6 (50.7min, 60.4P0.1, 80.2P1) fps +32%
Nvidia Titan RTX
AMD Ryzen 9 7950X, NVIDIA Titan RTX
85.9 (69.7min, 72.2P0.1, 75.2P1) fps +23%
KFA2 GeForce RTX 3080 SG
AMD Ryzen 9 5900X, NVIDIA GeForce RTX 3080 12 GB
85.5 (61.9min, 66.1P0.1, 71.8P1) fps +22%
KFA2 GeForce RTX 3070 Ti SG
AMD Ryzen 9 7950X, NVIDIA GeForce RTX 3070 Ti
81 (44.9min, 68.1P0.1, 70.7P1) fps +16%
Sapphire Pulse Radeon RX 6750 XT
AMD Ryzen 9 7950X, AMD Radeon RX 6750 XT
74.2 (64.8min, 65.5P0.1, 66.5P1) fps +6%
MSI GeForce RTX 4060 Ti Gaming X Trio 8G
AMD Ryzen 9 7950X, NVIDIA GeForce RTX 4060 Ti 8G
69.9 (44.4min, 56.5P0.1, 61.1P1) fps
Nvidia GeForce RTX 2070 Super
AMD Ryzen 9 7950X, NVIDIA GeForce RTX 2070 Super (Desktop)
58.6 (39.6min, 47.2P0.1, 51.6P1) fps -16%
Sapphire Nitro+ Radeon RX 6650 XT
AMD Ryzen 9 5900X, AMD Radeon RX 6650 XT
50.8 (42.5min, 43.2P0.1, 44.5P1) fps -27%
Nvidia GeForce RTX 2060 Super
AMD Ryzen 9 7950X, NVIDIA GeForce RTX 2060 Super (Desktop)
47.2 (37.4min, 40.4P0.1, 41.9P1) fps -32%
KFA2 GeForce GTX 1660 Super
AMD Ryzen 9 7950X, NVIDIA GeForce GTX 1660 Super (Desktop)
32.6 (27.2min, 27.4P0.1, 28P1) fps -53%
PNY GeForce GTX 1660
AMD Ryzen 9 7950X, NVIDIA GeForce GTX 1660 (Desktop)
28.7 (25.6min, 25.6P0.1, 25.9P1) fps -59%
1920x1080 Ultra Preset
Palit GeForce RTX 4090 GameRock OC
AMD Ryzen 9 7950X, NVIDIA GeForce RTX 4090
212 (72.4min, 116.3P0.1, 164.5P1) fps +149%
AMD Radeon RX 7900 XTX
AMD Ryzen 9 7950X, AMD Radeon RX 7900 XTX
185.3 (65.2min, 124P0.1, 138.6P1) fps +118%
AMD Radeon RX 7900 XT
AMD Ryzen 9 7950X, AMD Radeon RX 7900 XT
165 (56.4min, 131P0.1, 136.9P1) fps +94%
KFA2 GeForce RTX 4080 SG
AMD Ryzen 9 7950X, NVIDIA GeForce RTX 4080
164.9 (17.5min, 86.4P0.1, 134.3P1) fps +94%
NVIDIA GeForce RTX 3090 Founders Edition
AMD Ryzen 9 7950X, NVIDIA GeForce RTX 3090
124.4 (92.2min, 96.6P0.1, 105.4P1) fps +46%
KFA2 GeForce RTX 4070 EX Gamer
AMD Ryzen 9 7950X, NVIDIA GeForce RTX 4070
105.6 (41.1min, 72.4P0.1, 86.1P1) fps +24%
Nvidia Titan RTX
AMD Ryzen 9 7950X, NVIDIA Titan RTX
101.9 (71.5min, 84.6P0.1, 87.3P1) fps +20%
KFA2 GeForce RTX 3080 SG
AMD Ryzen 9 5900X, NVIDIA GeForce RTX 3080 12 GB
100.8 (52.7min, 73.3P0.1, 81.5P1) fps +19%
KFA2 GeForce RTX 3070 Ti SG
AMD Ryzen 9 7950X, NVIDIA GeForce RTX 3070 Ti
94.2 (54.6min, 60.8P0.1, 79.9P1) fps +11%
Sapphire Pulse Radeon RX 6750 XT
AMD Ryzen 9 7950X, AMD Radeon RX 6750 XT
90.4 (31.2min, 75.7P0.1, 78.3P1) fps +6%
MSI GeForce RTX 4060 Ti Gaming X Trio 8G
AMD Ryzen 9 7950X, NVIDIA GeForce RTX 4060 Ti 8G
85 (48.1min, 58.3P0.1, 71.5P1) fps
Nvidia GeForce RTX 2070 Super
AMD Ryzen 9 7950X, NVIDIA GeForce RTX 2070 Super (Desktop)
71.1 (45.6min, 58.2P0.1, 62.5P1) fps -16%
Sapphire Nitro+ Radeon RX 6650 XT
AMD Ryzen 9 5900X, AMD Radeon RX 6650 XT
64.7 (6.02min, 19.8P0.1, 54P1) fps -24%
Nvidia GeForce RTX 2060 Super
AMD Ryzen 9 7950X, NVIDIA GeForce RTX 2060 Super (Desktop)
58.3 (37.4min, 40.5P0.1, 50.7P1) fps -31%
KFA2 GeForce GTX 1660 Super
AMD Ryzen 9 7950X, NVIDIA GeForce GTX 1660 Super (Desktop)
41 (32.3min, 33.8P0.1, 34.8P1) fps -52%
PNY GeForce GTX 1660
AMD Ryzen 9 7950X, NVIDIA GeForce GTX 1660 (Desktop)
36.3 (30.8min, 30.9P0.1, 31.2P1) fps -57%
GTA V
1920x1080 Highest Settings possible AA:4xMSAA + FX AF:16x
NVIDIA GeForce RTX 3090 Founders Edition
AMD Ryzen 9 7950X, NVIDIA GeForce RTX 3090
164.9 (3.74min, 125P1) fps +14%
KFA2 GeForce RTX 4080 SG
AMD Ryzen 9 7950X, NVIDIA GeForce RTX 4080
164.3 (6.85min, 111.1P1) fps +14%
Palit GeForce RTX 4090 GameRock OC
AMD Ryzen 9 7950X, NVIDIA GeForce RTX 4090
162 (3.52min, 111.1P1) fps +12%
KFA2 GeForce RTX 4070 EX Gamer
AMD Ryzen 9 7950X, NVIDIA GeForce RTX 4070
160.9 (3.73min, 111.1P1) fps +12%
AMD Radeon RX 7900 XT
AMD Ryzen 9 7950X, AMD Radeon RX 7900 XT
159.9 (3.47min, 100P1) fps +11%
AMD Radeon RX 7900 XTX
AMD Ryzen 9 7950X, AMD Radeon RX 7900 XTX
159.4 (5.55min, 100P1) fps +11%
KFA2 GeForce RTX 3070 Ti SG
AMD Ryzen 9 7950X, NVIDIA GeForce RTX 3070 Ti
159.1 (4.05min, 111.1P1) fps +10%
KFA2 GeForce RTX 4070 Ti EX Gamer
AMD Ryzen 9 7950X, NVIDIA GeForce RTX 4070 Ti
158.4 (6.48min, 111.1P1) fps +10%
Nvidia Titan RTX
AMD Ryzen 9 7950X, NVIDIA Titan RTX
156.6 (3.86min, 111.1P1) fps +9%
MSI GeForce RTX 4060 Ti Gaming X Trio 8G
AMD Ryzen 9 7950X, NVIDIA GeForce RTX 4060 Ti 8G
144.2 (6.03min, 90.9P1) fps
Sapphire Pulse Radeon RX 6750 XT
AMD Ryzen 9 7950X, AMD Radeon RX 6750 XT
144 (4.63min, 100P1) fps 0%
Nvidia GeForce RTX 2070 Super
AMD Ryzen 9 7950X, NVIDIA GeForce RTX 2070 Super (Desktop)
131.1 (6.16min, 83.3P1) fps -9%
KFA2 GeForce RTX 3080 SG
AMD Ryzen 9 5900X, NVIDIA GeForce RTX 3080 12 GB
128.2 (11.2min, 83.3P1) fps -11%
Nvidia GeForce RTX 2060 Super
AMD Ryzen 9 7950X, NVIDIA GeForce RTX 2060 Super (Desktop)
122.7 (6.41min, 83.3P1) fps -15%
Sapphire Nitro+ Radeon RX 6650 XT
AMD Ryzen 9 5900X, AMD Radeon RX 6650 XT
107.6 (4.45min, 71.4P1) fps -25%
KFA2 GeForce GTX 1660 Super
AMD Ryzen 9 7950X, NVIDIA GeForce GTX 1660 Super (Desktop)
88.3 (2.06min, 58.8P1) fps -39%
PNY GeForce GTX 1660
AMD Ryzen 9 7950X, NVIDIA GeForce GTX 1660 (Desktop)
75.6 (7.08min, 52.6P1) fps -48%
2560x1440 Highest Settings possible AA:4xMSAA + FX AF:16x
Palit GeForce RTX 4090 GameRock OC
AMD Ryzen 9 7950X, NVIDIA GeForce RTX 4090
164.8 (6.47min, 125P1) fps +59%
AMD Radeon RX 7900 XTX
AMD Ryzen 9 7950X, AMD Radeon RX 7900 XTX
160.4 (10.4min, 100P1) fps +55%
KFA2 GeForce RTX 4080 SG
AMD Ryzen 9 7950X, NVIDIA GeForce RTX 4080
159.2 (3.49min, 111.1P1) fps +54%
AMD Radeon RX 7900 XT
AMD Ryzen 9 7950X, AMD Radeon RX 7900 XT
159.2 (9.41min, 100P1) fps +54%
NVIDIA GeForce RTX 3090 Founders Edition
AMD Ryzen 9 7950X, NVIDIA GeForce RTX 3090
155.3 (3.28min, 111.1P1) fps +50%
KFA2 GeForce RTX 4070 Ti EX Gamer
AMD Ryzen 9 7950X, NVIDIA GeForce RTX 4070 Ti
146.7 (4.54min, 100P1) fps +42%
KFA2 GeForce RTX 3070 Ti SG
AMD Ryzen 9 7950X, NVIDIA GeForce RTX 3070 Ti
137.3 (6.47min, 90.9P1) fps +33%
Nvidia Titan RTX
AMD Ryzen 9 7950X, NVIDIA Titan RTX
136.4 (4.92min, 90.9P1) fps +32%
KFA2 GeForce RTX 4070 EX Gamer
AMD Ryzen 9 7950X, NVIDIA GeForce RTX 4070
136.2 (8.88min, 90.9P1) fps +32%
KFA2 GeForce RTX 3080 SG
AMD Ryzen 9 5900X, NVIDIA GeForce RTX 3080 12 GB
129.5 (9.14min, 90.9P1) fps +25%
Sapphire Pulse Radeon RX 6750 XT
AMD Ryzen 9 7950X, AMD Radeon RX 6750 XT
107.8 (7.17min, 71.4P1) fps +4%
MSI GeForce RTX 4060 Ti Gaming X Trio 8G
AMD Ryzen 9 7950X, NVIDIA GeForce RTX 4060 Ti 8G
103.4 (12min, 66.7P1) fps
Nvidia GeForce RTX 2070 Super
AMD Ryzen 9 7950X, NVIDIA GeForce RTX 2070 Super (Desktop)
95.6 (8.45min, 66.7P1) fps -8%
Nvidia GeForce RTX 2060 Super
AMD Ryzen 9 7950X, NVIDIA GeForce RTX 2060 Super (Desktop)
86.9 (4.77min, 62.5P1) fps -16%
Sapphire Nitro+ Radeon RX 6650 XT
AMD Ryzen 9 5900X, AMD Radeon RX 6650 XT
74.9 (9.33min, 50P1) fps -28%
KFA2 GeForce GTX 1660 Super
AMD Ryzen 9 7950X, NVIDIA GeForce GTX 1660 Super (Desktop)
62.1 (2.1min, 43.5P1) fps -40%
PNY GeForce GTX 1660
AMD Ryzen 9 7950X, NVIDIA GeForce GTX 1660 (Desktop)
51.8 (21.7min, 35.7P1) fps -50%
The Quarry
2560x1440 Ultra Preset
Palit GeForce RTX 4090 GameRock OC
AMD Ryzen 9 7950X, NVIDIA GeForce RTX 4090
193.8 (42.6min, 70.5P0.1, 155.8P1) fps +168%
KFA2 GeForce RTX 4080 SG
AMD Ryzen 9 7950X, NVIDIA GeForce RTX 4080
149 (34.3min, 46P0.1, 119.7P1) fps +106%
AMD Radeon RX 7900 XTX
AMD Ryzen 9 7950X, AMD Radeon RX 7900 XTX
136.9 (51.4min, 70.5P0.1, 114.2P1) fps +89%
AMD Radeon RX 7900 XT
AMD Ryzen 9 7950X, AMD Radeon RX 7900 XT
118.7 (47.8min, 58.3P0.1, 100P1) fps +64%
KFA2 GeForce RTX 4070 Ti EX Gamer
AMD Ryzen 9 7950X, NVIDIA GeForce RTX 4070 Ti
114.1 (25.5min, 44.5P0.1, 96.6P1) fps +58%
NVIDIA GeForce RTX 3090 Founders Edition
AMD Ryzen 9 7950X, NVIDIA GeForce RTX 3090
104.2 (24.3min, 44P0.1, 87.8P1) fps +44%
KFA2 GeForce RTX 4070 EX Gamer
AMD Ryzen 9 7950X, NVIDIA GeForce RTX 4070
90.9 (17.1min, 36.9P0.1, 75.4P1) fps +26%
KFA2 GeForce RTX 3070 Ti SG
AMD Ryzen 9 7950X, NVIDIA GeForce RTX 3070 Ti
81.1 (24.1min, 36P0.1, 68.5P1) fps +12%
Nvidia Titan RTX
AMD Ryzen 9 7950X, NVIDIA Titan RTX
75.3 (18min, 35.6P0.1, 65.1P1) fps +4%
MSI GeForce RTX 4060 Ti Gaming X Trio 8G
AMD Ryzen 9 7950X, NVIDIA GeForce RTX 4060 Ti 8G
72.3 (33min, 34.9P0.1, 59.2P1) fps
Sapphire Pulse Radeon RX 6750 XT
AMD Ryzen 9 7950X, AMD Radeon RX 6750 XT
59.7 (22.5min, 24.4P0.1, 50.4P1) fps -17%
Nvidia GeForce RTX 2070 Super
AMD Ryzen 9 7950X, NVIDIA GeForce RTX 2070 Super (Desktop)
51 (24.1min, 24.5P0.1, 45.2P1) fps -29%
Sapphire Nitro+ Radeon RX 6650 XT
AMD Ryzen 9 5900X, AMD Radeon RX 6650 XT
44.5 (5.43min, 13.9P0.1, 36.7P1) fps -38%
Nvidia GeForce RTX 2060 Super
AMD Ryzen 9 7950X, NVIDIA GeForce RTX 2060 Super (Desktop)
44 (18.4min, 19.6P0.1, 38.5P1) fps -39%
KFA2 GeForce GTX 1660 Super
AMD Ryzen 9 7950X, NVIDIA GeForce GTX 1660 Super (Desktop)
26.5 (9.63min, 11.3P0.1, 18.5P1) fps -63%
PNY GeForce GTX 1660
AMD Ryzen 9 7950X, NVIDIA GeForce GTX 1660 (Desktop)
15.1 (9.01min, 9.21P0.1, 10.4P1) fps -79%
1920x1080 Ultra Preset
Palit GeForce RTX 4090 GameRock OC
AMD Ryzen 9 7950X, NVIDIA GeForce RTX 4090
256 (40min, 99.7P0.1, 185.8P1) fps +135%
KFA2 GeForce RTX 4080 SG
AMD Ryzen 9 7950X, NVIDIA GeForce RTX 4080
207 (12.7min, 79.6P0.1, 161.9P1) fps +90%
AMD Radeon RX 7900 XTX
AMD Ryzen 9 7950X, AMD Radeon RX 7900 XTX
196.5 fps +81%
AMD Radeon RX 7900 XT
AMD Ryzen 9 7950X, AMD Radeon RX 7900 XT
169.3 (56.2min, 94.1P0.1, 138P1) fps +56%
KFA2 GeForce RTX 4070 Ti EX Gamer
AMD Ryzen 9 7950X, NVIDIA GeForce RTX 4070 Ti
166.2 (37.3min, 79.5P0.1, 133.6P1) fps +53%
NVIDIA GeForce RTX 3090 Founders Edition
AMD Ryzen 9 7950X, NVIDIA GeForce RTX 3090
144.5 (28.1min, 46.8P0.1, 115.6P1) fps +33%
KFA2 GeForce RTX 4070 EX Gamer
AMD Ryzen 9 7950X, NVIDIA GeForce RTX 4070
132.8 (27.4min, 43.6P0.1, 108.7P1) fps +22%
KFA2 GeForce RTX 3070 Ti SG
AMD Ryzen 9 7950X, NVIDIA GeForce RTX 3070 Ti
115.6 (32.7min, 55.8P0.1, 95P1) fps +6%
Nvidia Titan RTX
AMD Ryzen 9 7950X, NVIDIA Titan RTX
109.4 (30.7min, 59.4P0.1, 92.2P1) fps +1%
MSI GeForce RTX 4060 Ti Gaming X Trio 8G
AMD Ryzen 9 7950X, NVIDIA GeForce RTX 4060 Ti 8G
108.8 (24.2min, 44P0.1, 90.8P1) fps
Sapphire Pulse Radeon RX 6750 XT
AMD Ryzen 9 7950X, AMD Radeon RX 6750 XT
85 (1.743min, 18.7P0.1, 68.6P1) fps -22%
Nvidia GeForce RTX 2070 Super
AMD Ryzen 9 7950X, NVIDIA GeForce RTX 2070 Super (Desktop)
76.7 (31.3min, 39.2P0.1, 65.5P1) fps -30%
Sapphire Nitro+ Radeon RX 6650 XT
AMD Ryzen 9 5900X, AMD Radeon RX 6650 XT
69.2 (30.8min, 32.3P0.1, 56.7P1) fps -36%
Nvidia GeForce RTX 2060 Super
AMD Ryzen 9 7950X, NVIDIA GeForce RTX 2060 Super (Desktop)
65.1 (23.4min, 31.3P0.1, 55.9P1) fps -40%
KFA2 GeForce GTX 1660 Super
AMD Ryzen 9 7950X, NVIDIA GeForce GTX 1660 Super (Desktop)
45.6 (11.5min, 20.7P0.1, 38.4P1) fps -58%
PNY GeForce GTX 1660
AMD Ryzen 9 7950X, NVIDIA GeForce GTX 1660 (Desktop)
32.9 (19.2min, 19.3P0.1, 28.1P1) fps -70%
Tiny Tina's Wonderlands
2560x1440 Badass Preset (DX12)
Palit GeForce RTX 4090 GameRock OC
AMD Ryzen 9 7950X, NVIDIA GeForce RTX 4090
229 fps +182%
KFA2 GeForce RTX 4080 SG
AMD Ryzen 9 7950X, NVIDIA GeForce RTX 4080
165.8 fps +104%
AMD Radeon RX 7900 XTX
AMD Ryzen 9 7950X, AMD Radeon RX 7900 XTX
160.7 fps +98%
AMD Radeon RX 7900 XT
AMD Ryzen 9 7950X, AMD Radeon RX 7900 XT
136 fps +68%
KFA2 GeForce RTX 4070 Ti EX Gamer
AMD Ryzen 9 7950X, NVIDIA GeForce RTX 4070 Ti
129.8 fps +60%
NVIDIA GeForce RTX 3090 Founders Edition
AMD Ryzen 9 7950X, NVIDIA GeForce RTX 3090
122.1 fps +51%
KFA2 GeForce RTX 3080 SG
AMD Ryzen 9 5900X, NVIDIA GeForce RTX 3080 12 GB
112.6 fps +39%
KFA2 GeForce RTX 4070 EX Gamer
AMD Ryzen 9 7950X, NVIDIA GeForce RTX 4070
106.9 fps +32%
KFA2 GeForce RTX 3070 Ti SG
AMD Ryzen 9 7950X, NVIDIA GeForce RTX 3070 Ti
92.1 fps +14%
Nvidia Titan RTX
AMD Ryzen 9 7950X, NVIDIA Titan RTX
86.5 fps +7%
Sapphire Pulse Radeon RX 6750 XT
AMD Ryzen 9 7950X, AMD Radeon RX 6750 XT
86 fps +6%
MSI GeForce RTX 4060 Ti Gaming X Trio 8G
AMD Ryzen 9 7950X, NVIDIA GeForce RTX 4060 Ti 8G
81.1 fps
Sapphire Nitro+ Radeon RX 6650 XT
AMD Ryzen 9 5900X, AMD Radeon RX 6650 XT
64.6 fps -20%
Nvidia GeForce RTX 2070 Super
AMD Ryzen 9 7950X, NVIDIA GeForce RTX 2070 Super (Desktop)
58.8 fps -27%
Nvidia GeForce RTX 2060 Super
AMD Ryzen 9 7950X, NVIDIA GeForce RTX 2060 Super (Desktop)
49.1 fps -39%
KFA2 GeForce GTX 1660 Super
AMD Ryzen 9 7950X, NVIDIA GeForce GTX 1660 Super (Desktop)
35.7 fps -56%
PNY GeForce GTX 1660
AMD Ryzen 9 7950X, NVIDIA GeForce GTX 1660 (Desktop)
33 fps -59%
1920x1080 Badass Preset (DX12)
Palit GeForce RTX 4090 GameRock OC
AMD Ryzen 9 7950X, NVIDIA GeForce RTX 4090
289 fps +141%
KFA2 GeForce RTX 4080 SG
AMD Ryzen 9 7950X, NVIDIA GeForce RTX 4080
226 fps +89%
AMD Radeon RX 7900 XTX
AMD Ryzen 9 7950X, AMD Radeon RX 7900 XTX
226 fps +89%
AMD Radeon RX 7900 XT
AMD Ryzen 9 7950X, AMD Radeon RX 7900 XT
194.2 fps +62%
KFA2 GeForce RTX 4070 Ti EX Gamer
AMD Ryzen 9 7950X, NVIDIA GeForce RTX 4070 Ti
187.1 fps +56%
NVIDIA GeForce RTX 3090 Founders Edition
AMD Ryzen 9 7950X, NVIDIA GeForce RTX 3090
168.3 fps +41%
KFA2 GeForce RTX 4070 EX Gamer
AMD Ryzen 9 7950X, NVIDIA GeForce RTX 4070
153.9 fps +29%
KFA2 GeForce RTX 3080 SG
AMD Ryzen 9 5900X, NVIDIA GeForce RTX 3080 12 GB
152.7 fps +28%
KFA2 GeForce RTX 3070 Ti SG
AMD Ryzen 9 7950X, NVIDIA GeForce RTX 3070 Ti
129.9 fps +9%
Sapphire Pulse Radeon RX 6750 XT
AMD Ryzen 9 7950X, AMD Radeon RX 6750 XT
124.1 fps +4%
Nvidia Titan RTX
AMD Ryzen 9 7950X, NVIDIA Titan RTX
122.9 fps +3%
MSI GeForce RTX 4060 Ti Gaming X Trio 8G
AMD Ryzen 9 7950X, NVIDIA GeForce RTX 4060 Ti 8G
119.7 fps
Sapphire Nitro+ Radeon RX 6650 XT
AMD Ryzen 9 5900X, AMD Radeon RX 6650 XT
96.2 fps -20%
Nvidia GeForce RTX 2070 Super
AMD Ryzen 9 7950X, NVIDIA GeForce RTX 2070 Super (Desktop)
86 fps -28%
Nvidia GeForce RTX 2060 Super
AMD Ryzen 9 7950X, NVIDIA GeForce RTX 2060 Super (Desktop)
71.7 fps -40%
KFA2 GeForce GTX 1660 Super
AMD Ryzen 9 7950X, NVIDIA GeForce GTX 1660 Super (Desktop)
52.7 fps -56%
PNY GeForce GTX 1660
AMD Ryzen 9 7950X, NVIDIA GeForce GTX 1660 (Desktop)
49.1 fps -59%
GRID Legends
2560x1440 Ultra Preset
AMD Radeon RX 7900 XTX
AMD Ryzen 9 7950X, AMD Radeon RX 7900 XTX (643827)
259 (75.5min) fps +89%
Palit GeForce RTX 4090 GameRock OC
AMD Ryzen 9 7950X, NVIDIA GeForce RTX 4090 (591708)
244 (83.7min) fps +78%
AMD Radeon RX 7900 XT
AMD Ryzen 9 7950X, AMD Radeon RX 7900 XT (643827)
241 (68.5min) fps +76%
KFA2 GeForce RTX 4080 SG
AMD Ryzen 9 7950X, NVIDIA GeForce RTX 4080 (643827)
233 (70.3min) fps +70%
KFA2 GeForce RTX 4070 Ti EX Gamer
AMD Ryzen 9 7950X, NVIDIA GeForce RTX 4070 Ti (712825)
198 (81.4min) fps +44%
NVIDIA GeForce RTX 3090 Founders Edition
AMD Ryzen 9 7950X, NVIDIA GeForce RTX 3090 (591708)
185.9 (59.5min) fps +35%
KFA2 GeForce RTX 3070 Ti SG
AMD Ryzen 9 7950X, NVIDIA GeForce RTX 3070 Ti (643827)
175.6 (24.8min) fps +28%
KFA2 GeForce RTX 4070 EX Gamer
AMD Ryzen 9 7950X, NVIDIA GeForce RTX 4070 (712825)
166.8 (68min) fps +21%
Sapphire Pulse Radeon RX 6750 XT
AMD Ryzen 9 7950X, AMD Radeon RX 6750 XT (712825)
157.1 (93.9min) fps +14%
Nvidia Titan RTX
AMD Ryzen 9 7950X, NVIDIA Titan RTX (591708)
147.7 (66.6min) fps +8%
MSI GeForce RTX 4060 Ti Gaming X Trio 8G
AMD Ryzen 9 7950X, NVIDIA GeForce RTX 4060 Ti 8G (800660)
137.3 (21.4min) fps
Sapphire Nitro+ Radeon RX 6650 XT
AMD Ryzen 9 5900X, AMD Radeon RX 6650 XT
121 fps -12%
Nvidia GeForce RTX 2070 Super
AMD Ryzen 9 7950X, NVIDIA GeForce RTX 2070 Super (Desktop) (591708)
107.4 (45.5min) fps -22%
Nvidia GeForce RTX 2060 Super
AMD Ryzen 9 7950X, NVIDIA GeForce RTX 2060 Super (Desktop) (623651)
96.5 (47.9min) fps -30%
KFA2 GeForce GTX 1660 Super
AMD Ryzen 9 7950X, NVIDIA GeForce GTX 1660 Super (Desktop) (623651)
70.9 (54.4min) fps -48%
PNY GeForce GTX 1660
AMD Ryzen 9 7950X, NVIDIA GeForce GTX 1660 (Desktop) (623651)
65.9 (51.8min) fps -52%
1920x1080 Ultra Preset
AMD Radeon RX 7900 XTX
AMD Ryzen 9 7950X, AMD Radeon RX 7900 XTX (643827)
289 (43.8min) fps +76%
AMD Radeon RX 7900 XT
AMD Ryzen 9 7950X, AMD Radeon RX 7900 XT (643827)
273 (73.9min) fps +66%
Palit GeForce RTX 4090 GameRock OC
AMD Ryzen 9 7950X, NVIDIA GeForce RTX 4090 (591708)
252 (82.5min) fps +53%
KFA2 GeForce RTX 4080 SG
AMD Ryzen 9 7950X, NVIDIA GeForce RTX 4080 (643827)
237 (70.3min) fps +44%
KFA2 GeForce RTX 4070 Ti EX Gamer
AMD Ryzen 9 7950X, NVIDIA GeForce RTX 4070 Ti (712825)
220 (87.2min) fps +34%
NVIDIA GeForce RTX 3090 Founders Edition
AMD Ryzen 9 7950X, NVIDIA GeForce RTX 3090 (591708)
215 (50.1min) fps +31%
KFA2 GeForce RTX 4070 EX Gamer
AMD Ryzen 9 7950X, NVIDIA GeForce RTX 4070 (712825)
207 (42.8min) fps +26%
Sapphire Pulse Radeon RX 6750 XT
AMD Ryzen 9 7950X, AMD Radeon RX 6750 XT (712825)
191.4 (89.8min) fps +17%
KFA2 GeForce RTX 3070 Ti SG
AMD Ryzen 9 7950X, NVIDIA GeForce RTX 3070 Ti (643827)
185.6 (24.8min) fps +13%
Nvidia Titan RTX
AMD Ryzen 9 7950X, NVIDIA Titan RTX (591708)
181.7 (77min) fps +11%
MSI GeForce RTX 4060 Ti Gaming X Trio 8G
AMD Ryzen 9 7950X, NVIDIA GeForce RTX 4060 Ti 8G (800660)
164.2 (76.2min) fps
Sapphire Nitro+ Radeon RX 6650 XT
AMD Ryzen 9 5900X, AMD Radeon RX 6650 XT
155 fps -6%
Nvidia GeForce RTX 2070 Super
AMD Ryzen 9 7950X, NVIDIA GeForce RTX 2070 Super (Desktop) (591708)
137.7 (67.5min) fps -16%
Nvidia GeForce RTX 2060 Super
AMD Ryzen 9 7950X, NVIDIA GeForce RTX 2060 Super (Desktop) (623651)
125.5 (67min) fps -24%
KFA2 GeForce GTX 1660 Super
AMD Ryzen 9 7950X, NVIDIA GeForce GTX 1660 Super (Desktop) (623651)
94.6 (65min) fps -42%
PNY GeForce GTX 1660
AMD Ryzen 9 7950X, NVIDIA GeForce GTX 1660 (Desktop) (623651)
88.5 (53.5min) fps -46%
Final Fantasy XV Benchmark
1920x1080 High Quality
Palit GeForce RTX 4090 GameRock OC
AMD Ryzen 9 7950X, NVIDIA GeForce RTX 4090 (1.3)
233 fps +74%
KFA2 GeForce RTX 4080 SG
AMD Ryzen 9 7950X, NVIDIA GeForce RTX 4080 (1.3)
225 fps +68%
AMD Radeon RX 7900 XTX
AMD Ryzen 9 7950X, AMD Radeon RX 7900 XTX (1.3)
216 fps +61%
KFA2 GeForce RTX 4070 Ti EX Gamer
AMD Ryzen 9 7950X, NVIDIA GeForce RTX 4070 Ti (1.3)
204 fps +52%
AMD Radeon RX 7900 XT
AMD Ryzen 9 7950X, AMD Radeon RX 7900 XT (1.3)
197.2 fps +47%
NVIDIA GeForce RTX 3090 Founders Edition
AMD Ryzen 9 7950X, NVIDIA GeForce RTX 3090 (1.3)
188.8 fps +41%
KFA2 GeForce RTX 4070 EX Gamer
AMD Ryzen 9 7950X, NVIDIA GeForce RTX 4070 (1.3)
182.6 fps +36%
KFA2 GeForce RTX 3080 SG
AMD Ryzen 9 5900X, NVIDIA GeForce RTX 3080 12 GB (1.3)
156.2 fps +17%
Nvidia Titan RTX
AMD Ryzen 9 7950X, NVIDIA Titan RTX (1.3)
150.4 fps +12%
KFA2 GeForce RTX 3070 Ti SG
AMD Ryzen 9 7950X, NVIDIA GeForce RTX 3070 Ti (1.3)
148.9 fps +11%
MSI GeForce RTX 4060 Ti Gaming X Trio 8G
AMD Ryzen 9 7950X, NVIDIA GeForce RTX 4060 Ti 8G (1.3)
133.8 fps
Sapphire Pulse Radeon RX 6750 XT
AMD Ryzen 9 7950X, AMD Radeon RX 6750 XT (1.3)
127.5 fps -5%
Nvidia GeForce RTX 2070 Super
AMD Ryzen 9 7950X, NVIDIA GeForce RTX 2070 Super (Desktop) (1.3)
108.9 fps -19%
Sapphire Nitro+ Radeon RX 6650 XT
AMD Ryzen 9 5900X, AMD Radeon RX 6650 XT (1.3)
102 fps -24%
Nvidia GeForce RTX 2060 Super
AMD Ryzen 9 7950X, NVIDIA GeForce RTX 2060 Super (Desktop) (1.3)
93.8 fps -30%
KFA2 GeForce GTX 1660 Super
AMD Ryzen 9 7950X, NVIDIA GeForce GTX 1660 Super (Desktop) (1.3)
64.4 fps -52%
PNY GeForce GTX 1660
AMD Ryzen 9 7950X, NVIDIA GeForce GTX 1660 (Desktop) (1.3)
56.1 fps -58%
2560x1440 High Quality
Palit GeForce RTX 4090 GameRock OC
AMD Ryzen 9 7950X, NVIDIA GeForce RTX 4090 (1.3)
225 fps +136%
KFA2 GeForce RTX 4080 SG
AMD Ryzen 9 7950X, NVIDIA GeForce RTX 4080 (1.3)
195.7 fps +105%
AMD Radeon RX 7900 XTX
AMD Ryzen 9 7950X, AMD Radeon RX 7900 XTX (1.3)
172.8 fps +81%
KFA2 GeForce RTX 4070 Ti EX Gamer
AMD Ryzen 9 7950X, NVIDIA GeForce RTX 4070 Ti (1.3)
160.1 fps +68%
AMD Radeon RX 7900 XT
AMD Ryzen 9 7950X, AMD Radeon RX 7900 XT (1.3)
149.9 fps +57%
NVIDIA GeForce RTX 3090 Founders Edition
AMD Ryzen 9 7950X, NVIDIA GeForce RTX 3090 (1.3)
143.9 fps +51%
KFA2 GeForce RTX 4070 EX Gamer
AMD Ryzen 9 7950X, NVIDIA GeForce RTX 4070 (1.3)
135.2 fps +42%
KFA2 GeForce RTX 3080 SG
AMD Ryzen 9 5900X, NVIDIA GeForce RTX 3080 12 GB (1.3)
125.5 fps +31%
KFA2 GeForce RTX 3070 Ti SG
AMD Ryzen 9 7950X, NVIDIA GeForce RTX 3070 Ti (1.3)
112.7 fps +18%
Nvidia Titan RTX
AMD Ryzen 9 7950X, NVIDIA Titan RTX (1.3)
111.2 fps +16%
MSI GeForce RTX 4060 Ti Gaming X Trio 8G
AMD Ryzen 9 7950X, NVIDIA GeForce RTX 4060 Ti 8G (1.3)
95.5 fps
Sapphire Pulse Radeon RX 6750 XT
AMD Ryzen 9 7950X, AMD Radeon RX 6750 XT (1.3)
94.9 fps -1%
Nvidia GeForce RTX 2070 Super
AMD Ryzen 9 7950X, NVIDIA GeForce RTX 2070 Super (Desktop) (1.3)
78.2 fps -18%
Sapphire Nitro+ Radeon RX 6650 XT
AMD Ryzen 9 5900X, AMD Radeon RX 6650 XT (1.3)
72.7 fps -24%
Nvidia GeForce RTX 2060 Super
AMD Ryzen 9 7950X, NVIDIA GeForce RTX 2060 Super (Desktop) (1.3)
67.9 fps -29%
KFA2 GeForce GTX 1660 Super
AMD Ryzen 9 7950X, NVIDIA GeForce GTX 1660 Super (Desktop) (1.3)
47.2 fps -51%
PNY GeForce GTX 1660
AMD Ryzen 9 7950X, NVIDIA GeForce GTX 1660 (Desktop) (1.3)
41.2 fps -57%
X-Plane 11.11
1920x1080 med (fps_test=2)
Nvidia Titan RTX
AMD Ryzen 9 7950X, NVIDIA Titan RTX
198.9 fps +1%
Nvidia GeForce RTX 2060 Super
AMD Ryzen 9 7950X, NVIDIA GeForce RTX 2060 Super (Desktop)
198.6 fps +1%
KFA2 GeForce GTX 1660 Super
AMD Ryzen 9 7950X, NVIDIA GeForce GTX 1660 Super (Desktop)
197.3 fps +1%
NVIDIA GeForce RTX 3090 Founders Edition
AMD Ryzen 9 7950X, NVIDIA GeForce RTX 3090
196.7 fps 0%
Palit GeForce RTX 4090 GameRock OC
AMD Ryzen 9 7950X, NVIDIA GeForce RTX 4090
196.3 fps 0%
MSI GeForce RTX 4060 Ti Gaming X Trio 8G
AMD Ryzen 9 7950X, NVIDIA GeForce RTX 4060 Ti 8G
196.2 fps
KFA2 GeForce RTX 4080 SG
AMD Ryzen 9 7950X, NVIDIA GeForce RTX 4080
193.6 fps -1%
KFA2 GeForce RTX 3070 Ti SG
AMD Ryzen 9 7950X, NVIDIA GeForce RTX 3070 Ti
192 fps -2%
KFA2 GeForce RTX 4070 EX Gamer
AMD Ryzen 9 7950X, NVIDIA GeForce RTX 4070
189.1 fps -4%
Nvidia GeForce RTX 2070 Super
AMD Ryzen 9 7950X, NVIDIA GeForce RTX 2070 Super (Desktop)
188.9 fps -4%
PNY GeForce GTX 1660
AMD Ryzen 9 7950X, NVIDIA GeForce GTX 1660 (Desktop)
180.5 fps -8%
KFA2 GeForce RTX 4070 Ti EX Gamer
AMD Ryzen 9 7950X, NVIDIA GeForce RTX 4070 Ti
163.2 fps -17%
AMD Radeon RX 7900 XTX
AMD Ryzen 9 7950X, AMD Radeon RX 7900 XTX
150.7 fps -23%
KFA2 GeForce RTX 3080 SG
AMD Ryzen 9 5900X, NVIDIA GeForce RTX 3080 12 GB
143.2 fps -27%
AMD Radeon RX 7900 XT
AMD Ryzen 9 7950X, AMD Radeon RX 7900 XT
140.4 fps -28%
Sapphire Nitro+ Radeon RX 6650 XT
AMD Ryzen 9 5900X, AMD Radeon RX 6650 XT
80.4 fps -59%
Sapphire Pulse Radeon RX 6750 XT
AMD Ryzen 9 7950X, AMD Radeon RX 6750 XT
75.4 fps -62%
1920x1080 high (fps_test=3)
Nvidia Titan RTX
AMD Ryzen 9 7950X, NVIDIA Titan RTX
157.5 fps +6%
NVIDIA GeForce RTX 3090 Founders Edition
AMD Ryzen 9 7950X, NVIDIA GeForce RTX 3090
154.7 fps +4%
Nvidia GeForce RTX 2060 Super
AMD Ryzen 9 7950X, NVIDIA GeForce RTX 2060 Super (Desktop)
152.9 fps +3%
Palit GeForce RTX 4090 GameRock OC
AMD Ryzen 9 7950X, NVIDIA GeForce RTX 4090
151.6 fps +2%
KFA2 GeForce RTX 4070 EX Gamer
AMD Ryzen 9 7950X, NVIDIA GeForce RTX 4070
150 fps +1%
KFA2 GeForce RTX 3070 Ti SG
AMD Ryzen 9 7950X, NVIDIA GeForce RTX 3070 Ti
149.6 fps 0%
KFA2 GeForce RTX 4080 SG
AMD Ryzen 9 7950X, NVIDIA GeForce RTX 4080
149.4 fps 0%
MSI GeForce RTX 4060 Ti Gaming X Trio 8G
AMD Ryzen 9 7950X, NVIDIA GeForce RTX 4060 Ti 8G
149.1 fps
KFA2 GeForce GTX 1660 Super
AMD Ryzen 9 7950X, NVIDIA GeForce GTX 1660 Super (Desktop)
147.4 fps -1%
Nvidia GeForce RTX 2070 Super
AMD Ryzen 9 7950X, NVIDIA GeForce RTX 2070 Super (Desktop)
145.5 fps -2%
PNY GeForce GTX 1660
AMD Ryzen 9 7950X, NVIDIA GeForce GTX 1660 (Desktop)
144.9 fps -3%
KFA2 GeForce RTX 4070 Ti EX Gamer
AMD Ryzen 9 7950X, NVIDIA GeForce RTX 4070 Ti
138.1 fps -7%
AMD Radeon RX 7900 XTX
AMD Ryzen 9 7950X, AMD Radeon RX 7900 XTX
117.1 fps -21%
KFA2 GeForce RTX 3080 SG
AMD Ryzen 9 5900X, NVIDIA GeForce RTX 3080 12 GB
114.7 fps -23%
AMD Radeon RX 7900 XT
AMD Ryzen 9 7950X, AMD Radeon RX 7900 XT
109.8 fps -26%
Sapphire Nitro+ Radeon RX 6650 XT
AMD Ryzen 9 5900X, AMD Radeon RX 6650 XT
64 fps -57%
Sapphire Pulse Radeon RX 6750 XT
AMD Ryzen 9 7950X, AMD Radeon RX 6750 XT
62.9 fps -58%

Ray tracing, DLSS and FG (Frame Generation)

With the release of Ada Lovelace, Nvidia have improved on their ray tracing and DLSS features - the 3rd version of DLSS van currently be exclusively found within the RTX 4000 GPUs. This means the MSI GeForce RTX 4060 Ti Gaming X Trio also benefits from these new features and Frame Generation can magic up even higher frame rates onto your screen. However, this first has to be implemented into all of the games and in future, they will likely be more and more optimized for this function. Definitely a feature which GeForce RTX 4060 Ti owners will be able to take advantage of in the future, in order to achieve playable frame rates. If the graphics card's computing power isn't quite enough for this in the future, then you can use DLSS and FG to solve the issue. Here, we can again use A Plague Tale Requiem as an example. We achieved a good 50 FPS in UHD with DLSS and FG activated. Without these features, we only managed 25 FPS, which definitely isn't enough to properly enjoy the game.

The GPU's ray tracing features are about on the same level as an Nvidia GeForce RTX 2080 Ti. With the feature activated, however, you do have to take into account a higher drop in performance. Even so, we often measured an average of 60 FPS. AMD, with their Radeon RX 6750 XT, simply cannot keep up.

Spider-Man Miles Morales - 1920x0180 Very High Preset + Ray-Tracing AA:T
Palit GeForce RTX 4090 GameRock OC
AMD Ryzen 9 7950X, NVIDIA GeForce RTX 4090
122.2 (60.2min, 67.7P0.1, 89P1) fps +77%
KFA2 GeForce RTX 4080 SG
AMD Ryzen 9 7950X, NVIDIA GeForce RTX 4080
114.7 (49.8min, 65.7P0.1, 93.2P1) fps +66%
KFA2 GeForce RTX 4070 Ti EX Gamer
AMD Ryzen 9 7950X, NVIDIA GeForce RTX 4070 Ti
104.4 (49.4min, 68.4P0.1, 86.8P1) fps +51%
AMD Radeon RX 7900 XTX
AMD Ryzen 9 7950X, AMD Radeon RX 7900 XTX
98.6 (68.4min, 71.9P0.1, 82.3P1) fps +43%
AMD Radeon RX 7900 XT
AMD Ryzen 9 7950X, AMD Radeon RX 7900 XT
88.5 (67.1min, 70.7P0.1, 74.7P1) fps +28%
KFA2 GeForce RTX 4070 EX Gamer
AMD Ryzen 9 7950X, NVIDIA GeForce RTX 4070
88.2 (67.7min, 70.6P0.1, 73.5P1) fps +28%
KFA2 GeForce RTX 3070 Ti SG
AMD Ryzen 9 7950X, NVIDIA GeForce RTX 3070 Ti
78.6 (44.1min, 48.9P0.1, 61.7P1) fps +14%
MSI GeForce RTX 4060 Ti Gaming X Trio 8G
AMD Ryzen 9 7950X, NVIDIA GeForce RTX 4060 Ti 8G
69 (14.3min, 23.4P0.1, 54.5P1) fps
Nvidia Titan RTX
AMD Ryzen 9 7950X, NVIDIA Titan RTX
66.7 (52.9min, 54P0.1, 55.9P1) fps -3%
Sapphire Pulse Radeon RX 6750 XT
AMD Ryzen 9 7950X, AMD Radeon RX 6750 XT
56 (43.8min, 44.2P0.1, 45.6P1) fps -19%
Nvidia GeForce RTX 2070 Super
AMD Ryzen 9 7950X, NVIDIA GeForce RTX 2070 Super (Desktop)
50.9 (23.9min, 24.2P0.1, 32.7P1) fps -26%
Nvidia GeForce RTX 2060 Super
AMD Ryzen 9 7950X, NVIDIA GeForce RTX 2060 Super (Desktop)
39.5 (22.7min, 23P0.1, 28.8P1) fps -43%
Metro Exodus - 1920x1080 Ultra Quality DXR AF:16x
Palit GeForce RTX 4090 GameRock OC
AMD Ryzen 9 7950X, NVIDIA GeForce RTX 4090
157.3 (96.47min) fps +83%
KFA2 GeForce RTX 4080 SG
AMD Ryzen 9 7950X, NVIDIA GeForce RTX 4080
148.6 (73.78min) fps +73%
AMD Radeon RX 7900 XTX
AMD Ryzen 9 7950X, AMD Radeon RX 7900 XTX
141.2 (89.03min) fps +64%
KFA2 GeForce RTX 4070 Ti EX Gamer
AMD Ryzen 9 7950X, NVIDIA GeForce RTX 4070 Ti
132.6 (69.27min) fps +54%
AMD Radeon RX 7900 XT
AMD Ryzen 9 7950X, AMD Radeon RX 7900 XT
124.3 (78.88min) fps +44%
NVIDIA GeForce RTX 3090 Founders Edition
AMD Ryzen 9 7950X, NVIDIA GeForce RTX 3090
121 (68.44min) fps +41%
KFA2 GeForce RTX 4070 EX Gamer
AMD Ryzen 9 7950X, NVIDIA GeForce RTX 4070
109.4 (61.5min) fps +27%
KFA2 GeForce RTX 3080 SG
AMD Ryzen 9 5900X, NVIDIA GeForce RTX 3080 12 GB
101.5 (53.72min) fps +18%
KFA2 GeForce RTX 3070 Ti SG
AMD Ryzen 9 7950X, NVIDIA GeForce RTX 3070 Ti
92.4 (50.51min) fps +7%
Nvidia Titan RTX
AMD Ryzen 9 7950X, NVIDIA Titan RTX
91.8 (51.42min) fps +7%
MSI GeForce RTX 4060 Ti Gaming X Trio 8G
AMD Ryzen 9 7950X, NVIDIA GeForce RTX 4060 Ti 8G
86.1 (48.46min) fps
NVIDIA GeForce RTX 3060 Ti FE
AMD Ryzen 9 5950X, NVIDIA GeForce RTX 3060 Ti
70.8 (38.7min) fps -18%
Sapphire Pulse Radeon RX 6750 XT
AMD Ryzen 9 7950X, AMD Radeon RX 6750 XT
70.5 (43.91min) fps -18%
Nvidia GeForce RTX 2070 Super
AMD Ryzen 9 7950X, NVIDIA GeForce RTX 2070 Super (Desktop)
62.1 (35.93min) fps -28%
Nvidia GeForce RTX 2060 Super
AMD Ryzen 9 7950X, NVIDIA GeForce RTX 2060 Super (Desktop)
53.3 (31.47min) fps -38%
Far Cry 6 - 1920x1080 Ultra Graphics Quality + HD Textures + DXR AA:T
AMD Radeon RX 7900 XTX
AMD Ryzen 9 7950X, AMD Radeon RX 7900 XTX
152.1 (75min) fps +146%
AMD Radeon RX 7900 XT
AMD Ryzen 9 7950X, AMD Radeon RX 7900 XT
143.6 (46min) fps +132%
KFA2 GeForce RTX 4070 Ti EX Gamer
AMD Ryzen 9 7950X, NVIDIA GeForce RTX 4070 Ti
136.8 (113min) fps +121%
Palit GeForce RTX 4090 GameRock OC
AMD Ryzen 9 7950X, NVIDIA GeForce RTX 4090
133.4 (108min) fps +116%
KFA2 GeForce RTX 4070 EX Gamer
AMD Ryzen 9 7950X, NVIDIA GeForce RTX 4070
132 (110min) fps +113%
NVIDIA GeForce RTX 3090 Founders Edition
AMD Ryzen 9 7950X, NVIDIA GeForce RTX 3090
127.5 (109min) fps +106%
KFA2 GeForce RTX 4080 SG
AMD Ryzen 9 7950X, NVIDIA GeForce RTX 4080
126.7 (103min) fps +105%
Nvidia Titan RTX
AMD Ryzen 9 7950X, NVIDIA Titan RTX
109.3 (98min) fps +77%
Sapphire Pulse Radeon RX 6750 XT
AMD Ryzen 9 7950X, AMD Radeon RX 6750 XT
101.4 (33min) fps +64%
MSI GeForce RTX 4060 Ti Gaming X Trio 8G
AMD Ryzen 9 7950X, NVIDIA GeForce RTX 4060 Ti 8G
61.9 (35min) fps
KFA2 GeForce RTX 3070 Ti SG
AMD Ryzen 9 7950X, NVIDIA GeForce RTX 3070 Ti
55.4 fps -11%
Nvidia GeForce RTX 2070 Super
AMD Ryzen 9 7950X, NVIDIA GeForce RTX 2070 Super (Desktop)
49.6 (32min) fps -20%
Nvidia GeForce RTX 2060 Super
AMD Ryzen 9 7950X, NVIDIA GeForce RTX 2060 Super (Desktop)
47.7 (30min) fps -23%
Cyberpunk 2077 1.6
3840x2160 Ray Tracing Ultra Preset (DLSS off)
Palit GeForce RTX 4090 GameRock OC
AMD Ryzen 9 7950X, NVIDIA GeForce RTX 4090 (1.6)
42.5 (31.9min) fps +1671%
KFA2 GeForce RTX 4080 SG
AMD Ryzen 9 7950X, NVIDIA GeForce RTX 4080 (1.61)
29.8 (22.7min) fps +1142%
KFA2 GeForce RTX 4070 Ti EX Gamer
AMD Ryzen 9 7950X, NVIDIA GeForce RTX 4070 Ti
23.5 fps +879%
AMD Radeon RX 7900 XTX
AMD Ryzen 9 7950X, AMD Radeon RX 7900 XTX (1.61)
20.7 (14.4min) fps +763%
KFA2 GeForce RTX 4070 EX Gamer
AMD Ryzen 9 7950X, NVIDIA GeForce RTX 4070
17.9 fps +646%
AMD Radeon RX 7900 XT
AMD Ryzen 9 7950X, AMD Radeon RX 7900 XT (1.61)
17.6 (12min) fps +633%
Sapphire Pulse Radeon RX 6750 XT
AMD Ryzen 9 7950X, AMD Radeon RX 6750 XT
7.7 fps +221%
KFA2 GeForce RTX 3070 Ti SG
AMD Ryzen 9 7950X, NVIDIA GeForce RTX 3070 Ti (1.61)
3.19 (2.21min) fps +33%
Nvidia GeForce RTX 2070 Super
AMD Ryzen 9 7950X, NVIDIA GeForce RTX 2070 Super (Desktop) (1.6)
2.58 (1.427min) fps +8%
MSI GeForce RTX 4060 Ti Gaming X Trio 8G
AMD Ryzen 9 7950X, NVIDIA GeForce RTX 4060 Ti 8G
2.4 fps
1920x1080 Ray Tracing Ultra Preset (DLSS off)
Palit GeForce RTX 4090 GameRock OC
AMD Ryzen 9 7950X, NVIDIA GeForce RTX 4090 (1.6)
118.6 (69.3min) fps +139%
KFA2 GeForce RTX 4080 SG
AMD Ryzen 9 7950X, NVIDIA GeForce RTX 4080 (1.61)
96.1 (60.6min) fps +94%
KFA2 GeForce RTX 4070 Ti EX Gamer
AMD Ryzen 9 7950X, NVIDIA GeForce RTX 4070 Ti
78.9 fps +59%
AMD Radeon RX 7900 XTX
AMD Ryzen 9 7950X, AMD Radeon RX 7900 XTX (1.61)
64.6 (49.1min) fps +30%
KFA2 GeForce RTX 4070 EX Gamer
AMD Ryzen 9 7950X, NVIDIA GeForce RTX 4070
63.1 fps +27%
AMD Radeon RX 7900 XT
AMD Ryzen 9 7950X, AMD Radeon RX 7900 XT (1.61)
57.1 (41.7min) fps +15%
MSI GeForce RTX 4060 Ti Gaming X Trio 8G
AMD Ryzen 9 7950X, NVIDIA GeForce RTX 4060 Ti 8G
49.6 fps
KFA2 GeForce RTX 3070 Ti SG
AMD Ryzen 9 7950X, NVIDIA GeForce RTX 3070 Ti (1.61)
47.6 (6.07min) fps -4%
Nvidia GeForce RTX 2070 Super
AMD Ryzen 9 7950X, NVIDIA GeForce RTX 2070 Super (Desktop) (1.6)
33.4 fps -33%
Sapphire Pulse Radeon RX 6750 XT
AMD Ryzen 9 7950X, AMD Radeon RX 6750 XT
28.6 fps -42%
Nvidia GeForce RTX 2060 Super
AMD Ryzen 9 7950X, NVIDIA GeForce RTX 2060 Super (Desktop) (1.6)
25.4 (19.1min) fps -49%
The Callisto Protocol - 1920x1080 Ultra Preset (without FSR Upscaling) + Full Ray-Tracing
AMD Radeon RX 7900 XTX
AMD Ryzen 9 7950X, AMD Radeon RX 7900 XTX
98 fps +47%
KFA2 GeForce RTX 4070 Ti EX Gamer
AMD Ryzen 9 7950X, NVIDIA GeForce RTX 4070 Ti
97.5 fps +46%
Palit GeForce RTX 4090 GameRock OC
AMD Ryzen 9 7950X, NVIDIA GeForce RTX 4090
92 fps +38%
AMD Radeon RX 7900 XT
AMD Ryzen 9 7950X, AMD Radeon RX 7900 XT
89 fps +33%
KFA2 GeForce RTX 4080 SG
AMD Ryzen 9 7950X, NVIDIA GeForce RTX 4080
87 fps +30%
KFA2 GeForce RTX 4070 EX Gamer
AMD Ryzen 9 7950X, NVIDIA GeForce RTX 4070
78.6 fps +18%
MSI GeForce RTX 4060 Ti Gaming X Trio 8G
AMD Ryzen 9 7950X, NVIDIA GeForce RTX 4060 Ti 8G
66.8 fps
KFA2 GeForce RTX 3070 Ti SG
AMD Ryzen 9 7950X, NVIDIA GeForce RTX 3070 Ti
65.6 fps -2%
Nvidia Titan RTX
AMD Ryzen 9 7950X, NVIDIA Titan RTX
58.7 fps -12%
Nvidia GeForce RTX 2070 Super
AMD Ryzen 9 7950X, NVIDIA GeForce RTX 2070 Super (Desktop)
45.6 fps -32%
Nvidia GeForce RTX 2060 Super
AMD Ryzen 9 7950X, NVIDIA GeForce RTX 2060 Super (Desktop)
37.5 fps -44%
Sapphire Pulse Radeon RX 6750 XT
AMD Ryzen 9 7950X, AMD Radeon RX 6750 XT
28.8 fps -57%
PNY GeForce GTX 1660
AMD Ryzen 9 7950X, NVIDIA GeForce GTX 1660 (Desktop)
8 fps -88%
KFA2 GeForce GTX 1660 Super
AMD Ryzen 9 7950X, NVIDIA GeForce GTX 1660 Super (Desktop)
7.8 fps -88%
Guardians of the Galaxy - 1920x1080 Ultra Preset + Ultra Ray-Tracing
KFA2 GeForce RTX 4070 Ti EX Gamer
AMD Ryzen 9 7950X, NVIDIA GeForce RTX 4070 Ti
156 fps +56%
AMD Radeon RX 7900 XTX
AMD Ryzen 9 7950X, AMD Radeon RX 7900 XTX
137 fps +37%
KFA2 GeForce RTX 4070 EX Gamer
AMD Ryzen 9 7950X, NVIDIA GeForce RTX 4070
131 fps +31%
AMD Radeon RX 7900 XT
AMD Ryzen 9 7950X, AMD Radeon RX 7900 XT
122 fps +22%
MSI GeForce RTX 4060 Ti Gaming X Trio 8G
AMD Ryzen 9 7950X, NVIDIA GeForce RTX 4060 Ti 8G
100 fps
Nvidia Titan RTX
AMD Ryzen 9 7950X, NVIDIA Titan RTX
94 fps -6%
Nvidia GeForce RTX 2070 Super
AMD Ryzen 9 7950X, NVIDIA GeForce RTX 2070 Super (Desktop)
68 fps -32%
Sapphire Pulse Radeon RX 6750 XT
AMD Ryzen 9 7950X, AMD Radeon RX 6750 XT
62 fps -38%
Nvidia GeForce RTX 2060 Super
AMD Ryzen 9 7950X, NVIDIA GeForce RTX 2060 Super (Desktop)
54 fps -46%
A Plague Tale Requiem
3840x2160 Ultra DLSS Quality + Frame Generation
KFA2 GeForce RTX 4070 Ti EX Gamer
AMD Ryzen 9 7950X, NVIDIA GeForce RTX 4070 Ti
84.5 (52.8min, 74.8P0.1, 76.2P1) fps +66%
KFA2 GeForce RTX 4070 EX Gamer
AMD Ryzen 9 7950X, NVIDIA GeForce RTX 4070
68.5 (54.9min, 59.2P0.1, 61.8P1) fps +35%
MSI GeForce RTX 4060 Ti Gaming X Trio 8G
AMD Ryzen 9 7950X, NVIDIA GeForce RTX 4060 Ti 8G
50.8 (40.9min, 42.6P0.1, 46.1P1) fps
3840x2160 Ultra DLSS Quality
KFA2 GeForce RTX 4070 Ti EX Gamer
AMD Ryzen 9 7950X, NVIDIA GeForce RTX 4070 Ti
63.5 (49.7min, 52.5P0.1, 54.5P1) fps +68%
KFA2 GeForce RTX 4070 EX Gamer
AMD Ryzen 9 7950X, NVIDIA GeForce RTX 4070
49.9 (38.9min, 42.9P0.1, 44.1P1) fps +32%
MSI GeForce RTX 4060 Ti Gaming X Trio 8G
AMD Ryzen 9 7950X, NVIDIA GeForce RTX 4060 Ti 8G
37.9 (32.8min, 33P0.1, 33.8P1) fps
Control
1920x1080 High Quality Preset & High Ray Tracing Preset (DX12)
Palit GeForce RTX 4090 GameRock OC
AMD Ryzen 9 7950X, NVIDIA GeForce RTX 4090
189.9 (19.4min, 126.6P0.1, 139.6P1) fps +158%
KFA2 GeForce RTX 4080 SG
AMD Ryzen 9 7950X, NVIDIA GeForce RTX 4080
159.4 (18.2min, 92.7P0.1, 125.9P1) fps +117%
AMD Radeon RX 7900 XTX
AMD Ryzen 9 7950X, AMD Radeon RX 7900 XTX
133.7 (23.2min, 92.6P0.1, 104.6P1) fps +82%
KFA2 GeForce RTX 4070 Ti EX Gamer
AMD Ryzen 9 7950X, NVIDIA GeForce RTX 4070 Ti
123.5 (18.3min, 65.2P0.1, 100.8P1) fps +68%
AMD Radeon RX 7900 XT
AMD Ryzen 9 7950X, AMD Radeon RX 7900 XT
116.1 (8.47min, 62.1P0.1, 91.4P1) fps +58%
KFA2 GeForce RTX 3080 SG
AMD Ryzen 9 5900X, NVIDIA GeForce RTX 3080 12 GB
103.6 (9.89min, 74P0.1, 81.8P1) fps +41%
KFA2 GeForce RTX 4070 EX Gamer
AMD Ryzen 9 7950X, NVIDIA GeForce RTX 4070
102 (17.8min, 80P0.1, 85.2P1) fps +39%
Nvidia Titan RTX
AMD Ryzen 9 7950X, NVIDIA Titan RTX
81.2 (17.2min, 63.1P0.1, 68.4P1) fps +10%
MSI GeForce RTX 4060 Ti Gaming X Trio 8G
AMD Ryzen 9 7950X, NVIDIA GeForce RTX 4060 Ti 8G
73.6 fps
NVIDIA GeForce RTX 3060 Ti FE
AMD Ryzen 9 5950X, NVIDIA GeForce RTX 3060 Ti
67.7 (23.8min, 27.3P0.1, 58.1P1) fps -8%
Sapphire Pulse Radeon RX 6750 XT
AMD Ryzen 9 7950X, AMD Radeon RX 6750 XT
61.6 (16.8min, 32.3P0.1, 50.4P1) fps -16%
Nvidia GeForce RTX 2070 Super
AMD Ryzen 9 7950X, NVIDIA GeForce RTX 2070 Super (Desktop)
54.2 (9.54min, 24.1P0.1, 47.1P1) fps -26%
Nvidia GeForce RTX 2060 Super
AMD Ryzen 9 7950X, NVIDIA GeForce RTX 2060 Super (Desktop)
47.2 (6.41min, 13.7P0.1, 41.5P1) fps -36%
Sapphire Nitro+ Radeon RX 6650 XT
AMD Ryzen 9 5900X, AMD Radeon RX 6650 XT
43.6 (6.25min, 23.9P0.1, 35P1) fps -41%
3840x2160 High Quality Preset & High Ray Tracing Preset (DX12)
KFA2 GeForce RTX 4070 Ti EX Gamer
AMD Ryzen 9 7950X, NVIDIA GeForce RTX 4070 Ti
37.3 (28.1min, 31P0.1, 34.1P1) fps +110%
KFA2 GeForce RTX 4070 EX Gamer
AMD Ryzen 9 7950X, NVIDIA GeForce RTX 4070
30.8 (9.56min, 10.9P0.1, 28.2P1) fps +73%
MSI GeForce RTX 4060 Ti Gaming X Trio 8G
AMD Ryzen 9 7950X, NVIDIA GeForce RTX 4060 Ti 8G
17.8 fps
Sapphire Pulse Radeon RX 6750 XT
AMD Ryzen 9 7950X, AMD Radeon RX 6750 XT
17.7 (14.6min, 14.9P0.1, 15.7P1) fps -1%
3840x2160 High Quality, High Ray Tracing, DLSS
KFA2 GeForce RTX 4070 Ti EX Gamer
AMD Ryzen 9 7950X, NVIDIA GeForce RTX 4070 Ti
73.1 (60.4min, 61.1P0.1, 63P1) fps +68%
KFA2 GeForce RTX 4070 EX Gamer
AMD Ryzen 9 7950X, NVIDIA GeForce RTX 4070
60.7 (49.6min, 52.5P0.1, 53.5P1) fps +40%
MSI GeForce RTX 4060 Ti Gaming X Trio 8G
AMD Ryzen 9 7950X, NVIDIA GeForce RTX 4060 Ti 8G
43.5 fps
The Last of Us - 3840x2160 Ultra Preset + Quality DLSS
Palit GeForce RTX 4090 GameRock OC
AMD Ryzen 9 7950X, NVIDIA GeForce RTX 4090
118.1 (47.9min, 57.5P0.1, 73.1P1) fps +224%
KFA2 GeForce RTX 4070 Ti EX Gamer
AMD Ryzen 9 7950X, NVIDIA GeForce RTX 4070 Ti
72.6 (49.6min, 53.9P0.1, 58.4P1) fps +99%
KFA2 GeForce RTX 4070 EX Gamer
AMD Ryzen 9 7950X, NVIDIA GeForce RTX 4070
58 (44.4min, 45P0.1, 46.7P1) fps +59%
Nvidia Titan RTX
AMD Ryzen 9 7950X, NVIDIA Titan RTX
46.2 (33.8min, 37P0.1, 37.8P1) fps +27%
MSI GeForce RTX 4060 Ti Gaming X Trio 8G
AMD Ryzen 9 7950X, NVIDIA GeForce RTX 4060 Ti 8G
36.5 (7.83min, 11P0.1, 25.4P1) fps
Nvidia GeForce RTX 2070 Super
AMD Ryzen 9 7950X, NVIDIA GeForce RTX 2070 Super (Desktop)
6.09 (1.761min, 1.943P0.1, 3.07P1) fps -83%
low med. high ultraQHD4K DLSS4K
GTA V (2015) 187.8 187.8 187.5 144.2 103.4 103.2
The Witcher 3 (2015) 706.6 475.7 276.9 140.5 78.5
Dota 2 Reborn (2015) 297.3 262 257.4 228.4 165.8
Final Fantasy XV Benchmark (2018) 236 193.5 133.8 95.5 52.7
X-Plane 11.11 (2018) 218 196.2 149.1 126.2
Far Cry 5 (2018) 238 200 193 180 136 68
Strange Brigade (2018) 697 351 276 239 154 80.1
Shadow of the Tomb Raider (2018) 342 225 204 184 121.2 58.7
Far Cry New Dawn (2019) 197 173 166 147 127 70
Metro Exodus (2019) 311 173.6 130.8 101.8 80.1 49.3
Control (2019) 239.9 162.4 120.2 75.2 43.5 37.3
Borderlands 3 (2019) 241 206 157.3 123.5 85.2 43.7
F1 2020 (2020) 548 426 342 232 177.8 97
F1 2021 (2021) 671 471 359 179.8 128.9 67.2
Far Cry 6 (2021) 233 190.4 163.2 145 102.5 21.4
Guardians of the Galaxy (2021) 201 196 195 187 129 67
God of War (2022) 178.3 146.2 116.4 85 69.9 46.6
GRID Legends (2022) 243 218 194.6 164.2 137.3 84.7
Cyberpunk 2077 1.6 (2022) 176.6 137.6 115.7 100.5 60.2 25.3
Ghostwire Tokyo (2022) 235 224 221 207 128.8 58.3
Tiny Tina's Wonderlands (2022) 303 237 155.3 119.7 81.1 36.9
F1 22 (2022) 358 346 258 89.6 56.5 28.2
The Quarry (2022) 228 167.4 137.2 108.8 72.3 23
A Plague Tale Requiem (2022) 151.5 117 88.3 66.8 47.4 50.8 25.2
Uncharted Legacy of Thieves Collection (2022) 113.6 109.8 102.9 99.4 70.7 30.3
Spider-Man Miles Morales (2022) 154.4 149.1 141.9 131.7 96.6 54.8
The Callisto Protocol (2022) 232.1 178 167.8 103.6 79.5 48.8
High On Life (2023) 346 225 167.3 139 78.3 32.3
The Witcher 3 v4.00 (2023) 278 226 187.3 151.8 98.9 52.4
Dead Space Remake (2023) 128.5 122.9 106.2 105.5 65.9 32
Hogwarts Legacy (2023) 177.5 135.1 108 85 54.7 30.8
Returnal (2023) 136 129 116 101 73 41
Atomic Heart (2023) 264 202 116 93.7 69.5 38.9
Company of Heroes 3 (2023) 293.5 243.8 180.6 179.6 133.6 72.3
Sons of the Forest (2023) 118.1 109.9 105.6 103.1 81.9 49.6
Resident Evil 4 Remake (2023) 207 135.7 150.4 98.6 69.1 37.9
The Last of Us (2023) 126.1 102.1 89.6 74.6 46.5 36.5 19.6
Dead Island 2 (2023) 289 263 224 162.5 110.5 56.9
Star Wars Jedi Survivor (2023) 114.2 98.6 91.3 84.7 54.4 25.7
Diablo 4 (2023) 341 290 256 217 138.8 92.8 66

The MSI GeForce RTX 4060 Ti Gaming X Trio 8G's emissions

Noise emissions

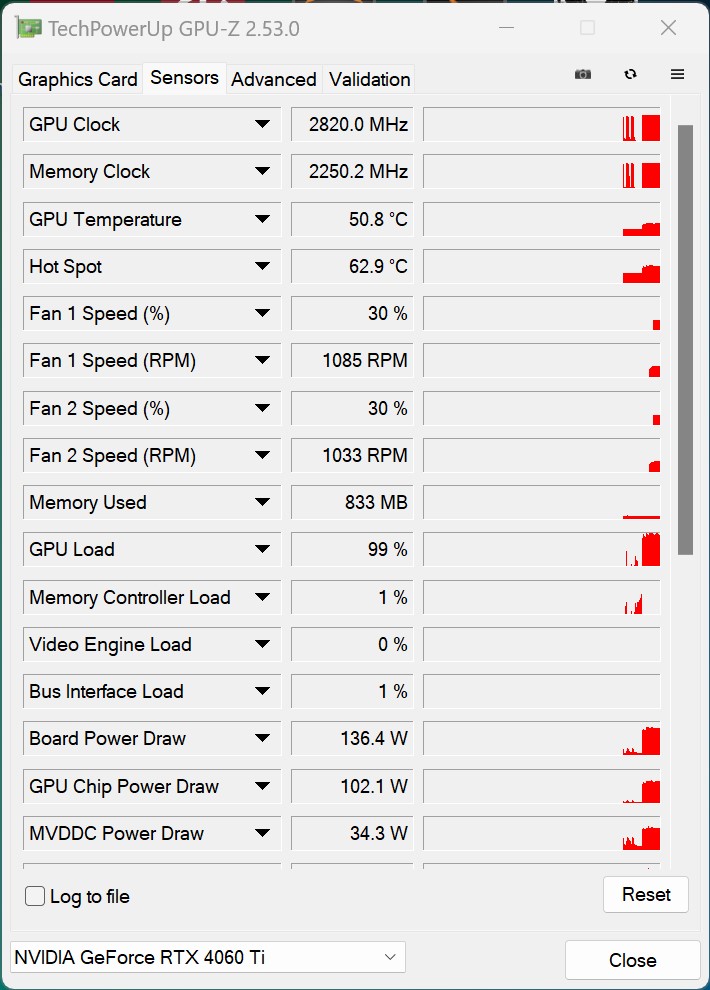
In order to measure the MSI GeForce RTX 4060 Ti Gaming X Trio 8G's noise emissions, we used it open and without any additional CPU or power supply cooling. In idle mode and under low load, the model we tested was effectively silent. Even when the 100 millimetre fans began their work, the graphics card was still extremely quiet. In our stress test, we measured only 31 dB(A) and a fan rotation speed of only 1,100 rotations per minute. When we raised the power target to 121 per cent, the fans worked at 1,310 rotations per minute and its noise emissions of 32.5 dB(A) were still incredibly quiet. 

The MSI GeForce RTX 4060 Ti Gaming X Trio 8G during our noise emission test

Noise Level

Idle
30.1 / 30.1 / 30.1 dB(A)
Load
30.15 / 31 dB(A)
  red to green bar
 
 
30 dB
silent
40 dB(A)
audible
50 dB(A)
loud
 
min: dark, med: mid, max: light   Earthworks M23R, Arta (15 cm distance)   environment noise: 29.7 dB(A)
dB(A) 0102030405060708090Deep BassMiddle BassHigh BassLower RangeMidsHigher MidsLower HighsMid HighsUpper HighsSuper Highs2032.531.930.529.22529.530.629.1313130.531.129.6304027.227.826.428.35030.229.92829.26324.82824278023.723.824.225.610024.924.425.327.212522.722.722.425.616021.721.420.825.820020.821.619.723.825019.720.319.923.331519.819.719.123.440018.81918.320.150018.418.317.619.963017.918.117.31980017.817.516.718.5100017.417.516.918.512501716.916.618.7160016.916.916.318.22000171716.517.325001717.116.717.3315017.317.41717.4400017.817.717.618500018.518.117.918.4630018.818.418.619800019.219.119.119.31000019.619.619.619.91250020.220.120.220.41600021.421.320.821.7SPL30.230.129.830.9N1.31.31.31.5median 18.8median 18.4median 18.3median 19.3Delta1.61.51.51.8hearing rangehide median Fan NoiseMSI GeForce RTX 4060 Ti Gaming X Trio 8G

Temperatures and power consumption

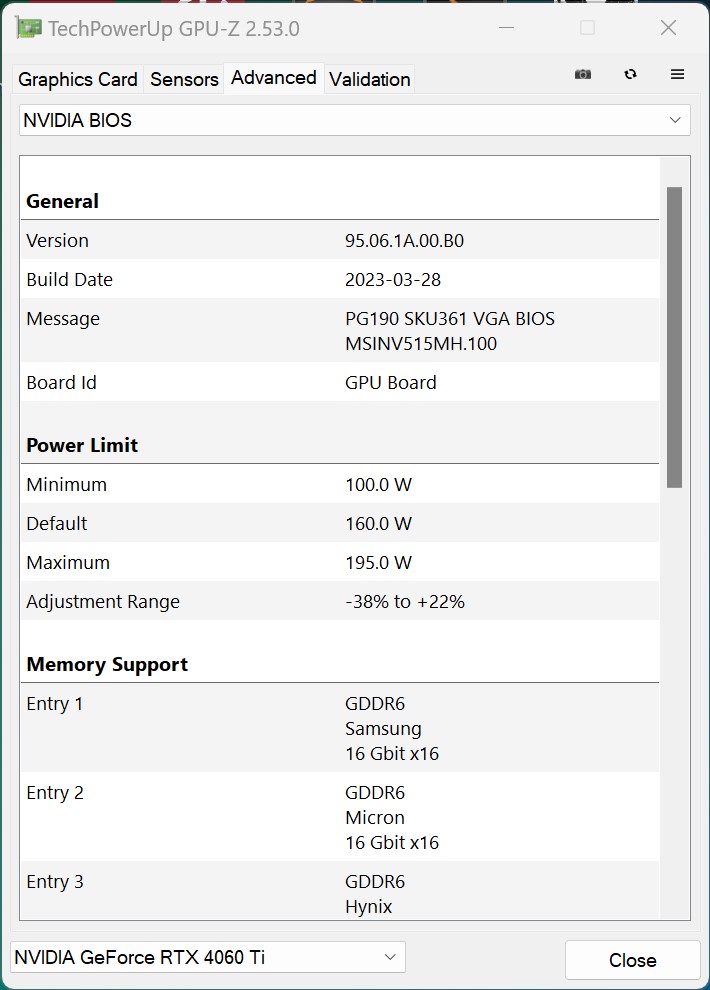
MSI have given the GeForce RTX 4060 Ti Gaming X Trio 8G an extremely large cooler with three axial fans. Taking into consideration its power consumption of 160 watts (PT 100 per cent) at most, the manufacturer may have overreacted a little. MSI haven't changed anything when it comes to this top model's power limit and have instead kept close to Nvidia's guidelines. However, you can manually change the power target by up to 21 per cent, meaning the graphics card uses up to 195 watts. In our stress test as well as in our gaming tests, the graphics card's power limit was easily hit. Our entire test system, excluding a monitor, uses around 300 watts. This makes the MSI GeForce RTX 4060 Ti Gaming X Trio 8G 90 watts more frugal than the Sapphire Pulse Radeon RX 6750 XT in the same test system. This, again, shows just how efficient this graphics card truly is. So, according to the manufacturer, it only requires a 550-watt power supply.

Temperature problems are foreign to the MSI GeForce RTX 4060 Ti Gaming X Trio 8G, of course due to its extremely large cooler. We only measured a hotspot temperature of 64 °C at most, and the chip's average temperatures during the stress test were 54.7 °C.

Power consumption test system (idle)
Power consumption test system (FurMark PT, 100 per cent)
Power consumption test system (during gameplay - The Witcher 3, Ultra preset)
Stress test FurMark (PT, 100 per cent)
Stress test FurMark (PT, 121 per cent)
Power Consumption / The Witcher 3 ultra (external Monitor)
AMD Radeon RX 7900 XTX
AMD Radeon RX 7900 XTX, AMD Ryzen 9 7950X (Idle: 86.5 W)
540 (527min, 530P1 - 564max) Watt * -76%
NVIDIA GeForce RTX 3090 Founders Edition
NVIDIA GeForce RTX 3090 Founders Edition, AMD Ryzen 9 7950X
538 (532min, 532P1 - 570max) Watt * -75%
Palit GeForce RTX 4090 GameRock OC
Palit GeForce RTX 4090 GameRock OC, AMD Ryzen 9 7950X
531.8 (520min - 571max) Watt * -73%
KFA2 GeForce RTX 3080 SG
KFA2 GeForce RTX 3080 SG, AMD Ryzen 9 5900X
518 (509min, 510P1 - 539max) Watt * -69%
KFA2 GeForce RTX 4080 SG
KFA2 GeForce RTX 4080 SG, AMD Ryzen 9 7950X (Idle: 86.4 W)
461 (450min, 453P1 - 476max) Watt * -50%
AMD Radeon RX 7900 XT
AMD Radeon RX 7900 XT, AMD Ryzen 9 7950X (Idle: 84.6 W)
459 (451min, 453P1 - 488max) Watt * -50%
KFA2 GeForce RTX 3070 Ti SG
KFA2 GeForce RTX 3070 Ti SG, AMD Ryzen 9 7950X (Idle: 88.9 W)
453 (447min, 448P1 - 469max) Watt * -48%
KFA2 GeForce RTX 4070 Ti EX Gamer
KFA2 GeForce RTX 4070 Ti EX Gamer, AMD Ryzen 9 7950X
426 (418min, 421P1 - 437max) Watt * -39%
Sapphire Pulse Radeon RX 6750 XT
Sapphire Pulse Radeon RX 6750 XT, AMD Ryzen 9 7950X
395 (384min, 385P1 - 420max) Watt * -29%
NVIDIA GeForce RTX 3060 Ti Founders Edition
NVIDIA GeForce RTX 3060 Ti FE, AMD Ryzen 9 5950X (Idle: 111.39 W)
379 (270min, 364P1 - 409max) Watt * -23%
KFA2 GeForce RTX 4070 EX Gamer
KFA2 GeForce RTX 4070 EX Gamer, AMD Ryzen 9 7950X
359 (356min, 356P1 - 375max) Watt * -17%
Sapphire Nitro+ Radeon RX 6650 XT
Sapphire Nitro+ Radeon RX 6650 XT, AMD Ryzen 9 5900X
339 (332min, 334P1 - 366max) Watt * -10%
MSI GeForce RTX 4060 Ti Gaming X Trio 8G
MSI GeForce RTX 4060 Ti Gaming X Trio 8G, AMD Ryzen 9 7950X
307 (304min, 305P1 - 317max) Watt *
Power Consumption / FurMark 1.19 GPU Stress Test (external Monitor)
Palit GeForce RTX 4090 GameRock OC
Palit GeForce RTX 4090 GameRock OC, AMD Ryzen 9 7950X
611 (597.78min - 648.9max) Watt * -98%
AMD Radeon RX 7900 XTX
AMD Radeon RX 7900 XTX, AMD Ryzen 9 7950X (Idle: 86.5 W)
518 (501min, 502P1 - 525max) Watt * -68%
NVIDIA GeForce RTX 3090 Founders Edition
NVIDIA GeForce RTX 3090 Founders Edition, AMD Ryzen 9 7950X
516 (512min, 514P1 - 541max) Watt * -68%
AMD Radeon RX 7900 XT
AMD Radeon RX 7900 XT, AMD Ryzen 9 7950X (Idle: 84.6 W)
513 (500min, 506P1 - 527max) Watt * -67%
KFA2 GeForce RTX 3080 SG
KFA2 GeForce RTX 3080 SG, AMD Ryzen 9 5900X
487 (475min, 477P1 - 501max) Watt * -58%
KFA2 GeForce RTX 3070 Ti SG
KFA2 GeForce RTX 3070 Ti SG, AMD Ryzen 9 7950X (Idle: 88.9 W)
472 (464min, 465P1 - 531max) Watt * -53%
KFA2 GeForce RTX 4080 SG
KFA2 GeForce RTX 4080 SG, AMD Ryzen 9 7950X (Idle: 86.4 W)
468 (453min, 459P1 - 480max) Watt * -52%
KFA2 GeForce RTX 4070 Ti EX Gamer
KFA2 GeForce RTX 4070 Ti EX Gamer, AMD Ryzen 9 7950X
451 (345min, 415P1 - 474max) Watt * -46%
Sapphire Pulse Radeon RX 6750 XT
Sapphire Pulse Radeon RX 6750 XT, AMD Ryzen 9 7950X
414 (410min, 411P1 - 423max) Watt * -34%
NVIDIA GeForce RTX 3060 Ti Founders Edition
NVIDIA GeForce RTX 3060 Ti FE, AMD Ryzen 9 5950X (Idle: 111.39 W)
350 (336min, 336P1 - 398max) Watt * -14%
Sapphire Nitro+ Radeon RX 6650 XT
Sapphire Nitro+ Radeon RX 6650 XT, AMD Ryzen 9 5900X
329 (305min, 319P1 - 354max) Watt * -7%
KFA2 GeForce RTX 4070 EX Gamer
KFA2 GeForce RTX 4070 EX Gamer, AMD Ryzen 9 7950X
329 (257min, 289P1 - 337max) Watt * -7%
MSI GeForce RTX 4060 Ti Gaming X Trio 8G
MSI GeForce RTX 4060 Ti Gaming X Trio 8G, AMD Ryzen 9 7950X
308 (300min, 304P1 - 317max) Watt *
Power Consumption / Witcher 3 ultra Efficiency (external Monitor)
Palit GeForce RTX 4090 GameRock OC
Palit GeForce RTX 4090 GameRock OC, AMD Ryzen 9 7950X
0.602 fps per Watt +32%
KFA2 GeForce RTX 4080 SG
KFA2 GeForce RTX 4080 SG, AMD Ryzen 9 7950X
0.581 fps per Watt +27%
AMD Radeon RX 7900 XT
AMD Radeon RX 7900 XT, AMD Ryzen 9 7950X
0.577 fps per Watt +26%
AMD Radeon RX 7900 XTX
AMD Radeon RX 7900 XTX, AMD Ryzen 9 7950X
0.55 fps per Watt +20%
KFA2 GeForce RTX 4070 Ti EX Gamer
KFA2 GeForce RTX 4070 Ti EX Gamer, AMD Ryzen 9 7950X
0.509 fps per Watt +11%
KFA2 GeForce RTX 4070 EX Gamer
KFA2 GeForce RTX 4070 EX Gamer, AMD Ryzen 9 7950X
0.4769 fps per Watt +4%
MSI GeForce RTX 4060 Ti Gaming X Trio 8G
MSI GeForce RTX 4060 Ti Gaming X Trio 8G, AMD Ryzen 9 7950X
0.4577 fps per Watt
Sapphire Pulse Radeon RX 6750 XT
Sapphire Pulse Radeon RX 6750 XT, AMD Ryzen 9 7950X
0.3597 fps per Watt -21%
NVIDIA GeForce RTX 3090 Founders Edition
NVIDIA GeForce RTX 3090 Founders Edition, AMD Ryzen 9 7950X
0.358 fps per Watt -22%
KFA2 GeForce RTX 3070 Ti SG
KFA2 GeForce RTX 3070 Ti SG, AMD Ryzen 9 7950X
0.3241 fps per Watt -29%
KFA2 GeForce RTX 3080 SG
KFA2 GeForce RTX 3080 SG, AMD Ryzen 9 5900X
0.3187 fps per Watt -30%
Sapphire Nitro+ Radeon RX 6650 XT
Sapphire Nitro+ Radeon RX 6650 XT, AMD Ryzen 9 5900X
0.3168 fps per Watt -31%
NVIDIA GeForce RTX 3060 Ti Founders Edition
NVIDIA GeForce RTX 3060 Ti FE, AMD Ryzen 9 5950X
0.2876 fps per Watt -37%

* ... smaller is better

Power consumption with external monitor

020406080100120140160180200220240260280300Tooltip
MSI GeForce RTX 4060 Ti Gaming X Trio 8G; 1280x720 FurMark 1.19 GPU Stress Test (external Monitor): Ø308 (300-317)
MSI GeForce RTX 4060 Ti Gaming X Trio 8G; 1920x1080 The Witcher 3 ultra (external Monitor): Ø307 (304-317)
MSI GeForce RTX 4060 Ti Gaming X Trio 8G; Idle 1min (external Monitor): Ø106.1 (98.4-121.1)

Pros

+ frugal and very efficient
+ DLSS 3 including Frame Generation
+ Fan Stop mode
+ extremely quiet under load
+ well-known 6+2 pin power connection
+ modern 5 nm architecture

Cons

- only slightly more powerful than its predecessor
- no DisplayPort 2.1
- very long (be aware of case compatibility)

Verdict - Very quiet and very frugal

MSI GeForce RTX 4060 Ti Gaming X Trio 8G review: test sample provided by Nvidia Germany

In this review, we took a closer look at the MSI GeForce RTX 4060 Ti Gaming X Trio 8G, another graphics card meant to appeal to the masses. The Ada Lovelace graphics cards' increase in performance was huge, but its disadvantages in the form of storage connection and processing units mean that the GeForce RTX 4060 Ti performs only marginally better than an Nvidia GeForce RTX 3060 Ti. However, we do see their goal of creating a graphics card made for 1,080p gaming as being achieved. At the same time, the Nvidia GeForce RTX 4060 Ti does lie quite a bit behind the Nvidia GeForce RTX 4070, which begs the question of whether Nvidia will close this gap with a further model at some point. Soon, there will be versions of the RTX 4060 Ti with 16 GB VRAM. Although, at the moment, we don't assume these will bring a huge boost in performance compared to the 8 GB model.

The MSI model impressed us during our tests with its excellent emission rates. The graphics card consistently works almost silently and temperature problems are foreign to the component. In turn, the graphics card features a massive cooling unit - even bigger in length than our Palit GeForce RTX 4090 Gamerock OC. You have to take this into consideration when purchasing, as the MSI GeForce RTX 4060 Ti Gaming X Trio 8G won't fit into every PC case. Its performance is generally good, although, you have to deal with some dropped frames every now due to the low FPS that occur when using the Ultra preset.

The MSI GeForce RTX 4060 Ti Gaming X Trio 8G is perfect if you are looking to build an extremely quiet PC. The graphics card's low power consumption will go easy on your wallet, but currently, its 8 GB RAM are a bit difficult to market.

For whom does this prove to be an interesting graphics card? That's a difficult question and primarily, it really depends on your own personal preferences. We would only partially call the Nvidia GeForce RTX 4060 Ti future-proof. At least Nvidia haven't gotten rid of exclusive features such as DLSS 3.0 and FG (Frame Generation). This is a point which speaks for the graphics card when it comes to its life span.

Price-wise, the MSI GeForce RTX 4060 Ti Gaming X Trio 8G can be placed at the upper end of the GeForce RTX 4060 Ti models. No wonder, as the manufacturer has always charged a bit more for their top-of-the-range models. Currently, it can be purchased for around $699. You will have to invest at least another $100 into an Nvidia GeForce RTX 4070 and AMD charge at least $450 for their Radeon RX 6750 XT. You can find alternative cheaper Nvidia GeForce RTX 4060 Ti models for around $350. 

Price and availability

Currently, you can buy the MSI GeForce RTX 4060 Ti Gaming X Trio 8G at many online retailers, such as Amazon, for $699.

Transparency

The present review sample was made available to the author as a loan by the manufacturer or a shop for the purposes of review. The lender had no influence on this review, nor did the manufacturer receive a copy of this review before publication. There was no obligation to publish this review.

Read all 5 comments / answer
static version load dynamic
Loading comments
Comment on this article
Please share our article, every link counts!
> Expert Reviews and News on Laptops, Smartphones and Tech Innovations > Reviews > MSI GeForce RTX 4060 Ti desktop graphics card review: The mid-range GPU that is larger than an RTX 4090
Sebastian Bade, 2023-06-27 (Update: 2023-06-27)