MSI Raider GE68 HX 13VF laptop review: A complete design change

The GE68HX directly succeeds last year's GE67HX with both refreshed internals and a new chassis design. Aside from the expected 13th gen Raptor Lake-HX CPUs and Nvidia Ada Lovelace GPUs to replace the older 12th gen Alder Lake-HX and Ampere options, the newer model also offers a larger 16:10 16-inch screen size up from the declining 16:9 15.6-inch aspect ratio.
Our unit in review is the base configuration with the Core i7-13950HX, 140 W GeForce RTX 4060, and 1080p 144 Hz IPS display retailing for about $1700 USD or $1300 if on sale. Higher-end SKUs include the Core i9-13980HX, RTX 4090, and 1440p 240 Hz display for over $3500.
Competitors to the GE68HX include other high-end 16-inch gaming laptops like the HP Omen 16, Alienware m16 R1, Lenovo Legion Slim 7i 16 Gen 8, or the Asus ROG Zephyrus M16.
More MSI reviews:
Potential Competitors in Comparison
Rating | Date | Model | Weight | Height | Size | Resolution | Price |
|---|---|---|---|---|---|---|---|
| 86.9 % v7 (old) | 09 / 2023 | MSI Raider GE68HX 13VF i9-13950HX, GeForce RTX 4060 Laptop GPU | 2.7 kg | 27.9 mm | 16.00" | 1900x1200 | |
| 87.7 % v7 (old) | 07 / 2022 | MSI GE67 HX 12UGS i7-12800HX, GeForce RTX 3070 Ti Laptop GPU | 2.5 kg | 23.4 mm | 15.60" | 1920x1080 | |
| 86.6 % v7 (old) | 09 / 2023 | HP Omen 16-xf0376ng R7 7840HS, GeForce RTX 4070 Laptop GPU | 2.4 kg | 23.5 mm | 16.10" | 1920x1080 | |
| 89.2 % v7 (old) | 08 / 2023 | Alienware m16 R1 AMD R9 7845HX, GeForce RTX 4080 Laptop GPU | 3.1 kg | 25.4 mm | 16.00" | 2560x1600 | |
| 90 % v7 (old) | 07 / 2023 | Lenovo Legion Slim 7i 16 Gen 8 i9-13900H, GeForce RTX 4070 Laptop GPU | 2.1 kg | 19.9 mm | 16.00" | 2560x1600 | |
| 89.4 % v7 (old) | 03 / 2023 | Asus ROG Zephyrus M16 GU604VY-NM042X i9-13900H, GeForce RTX 4090 Laptop GPU | 2.3 kg | 22.9 mm | 16.00" | 2560x1600 |
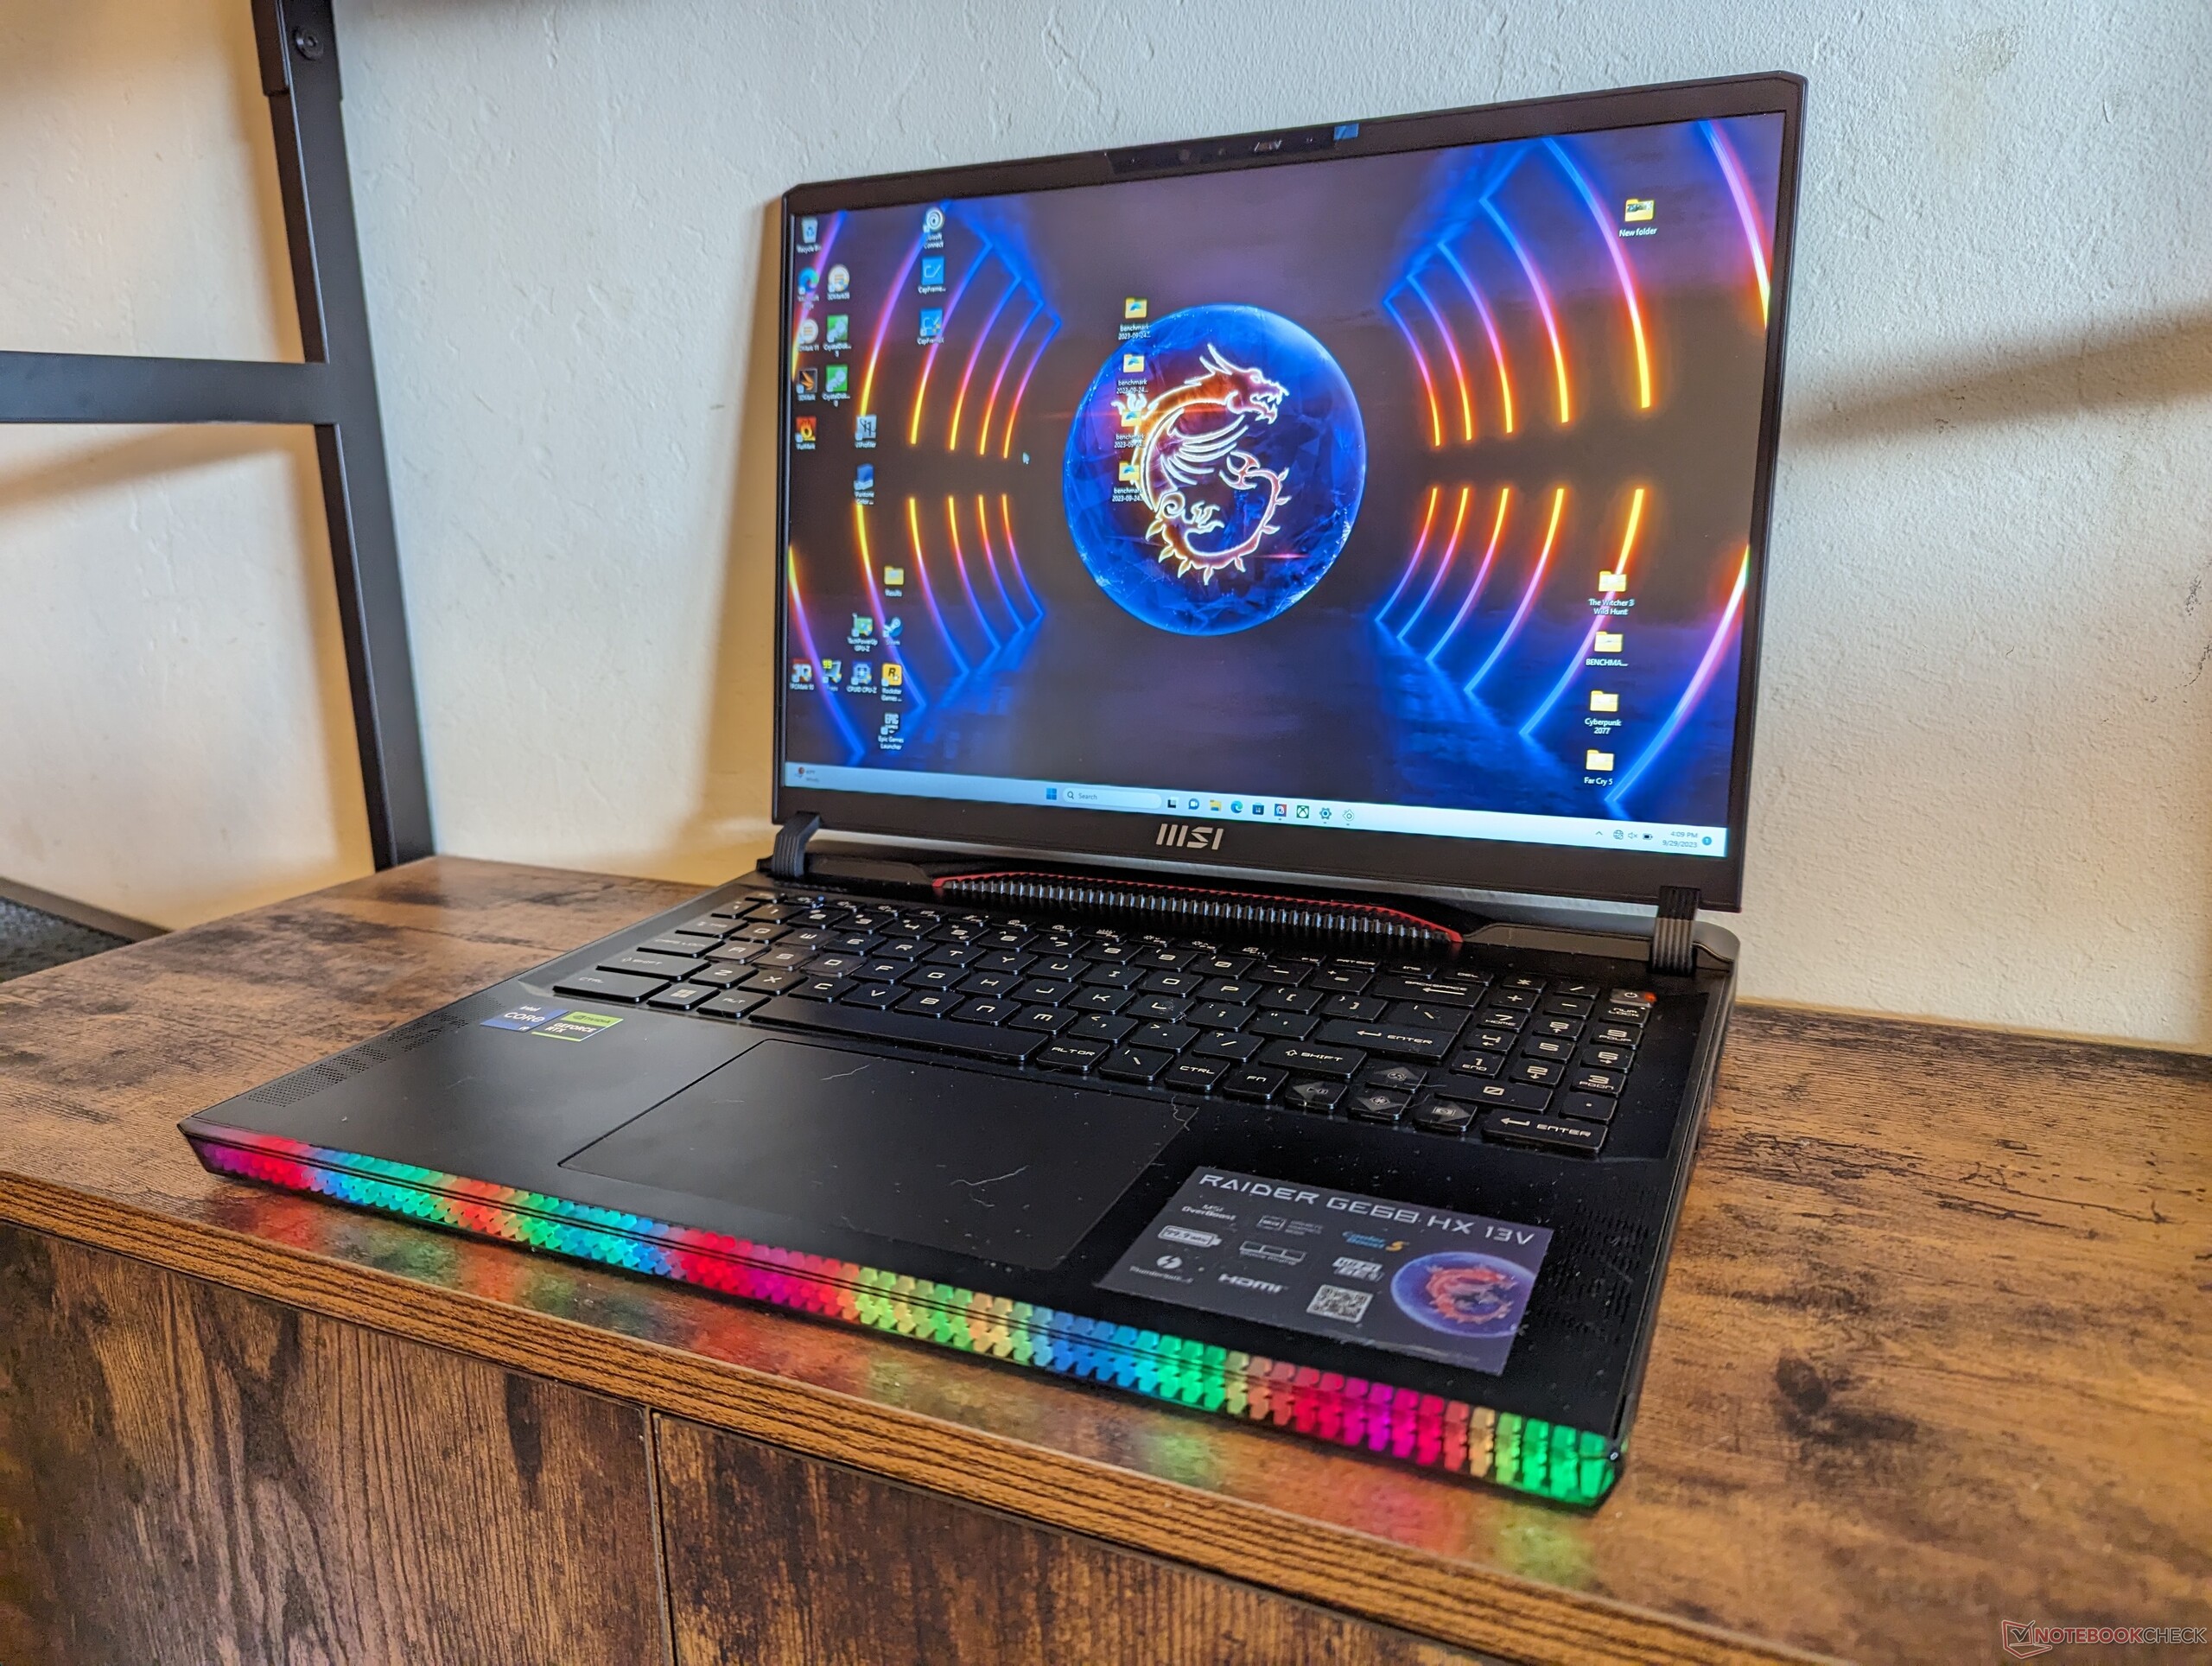
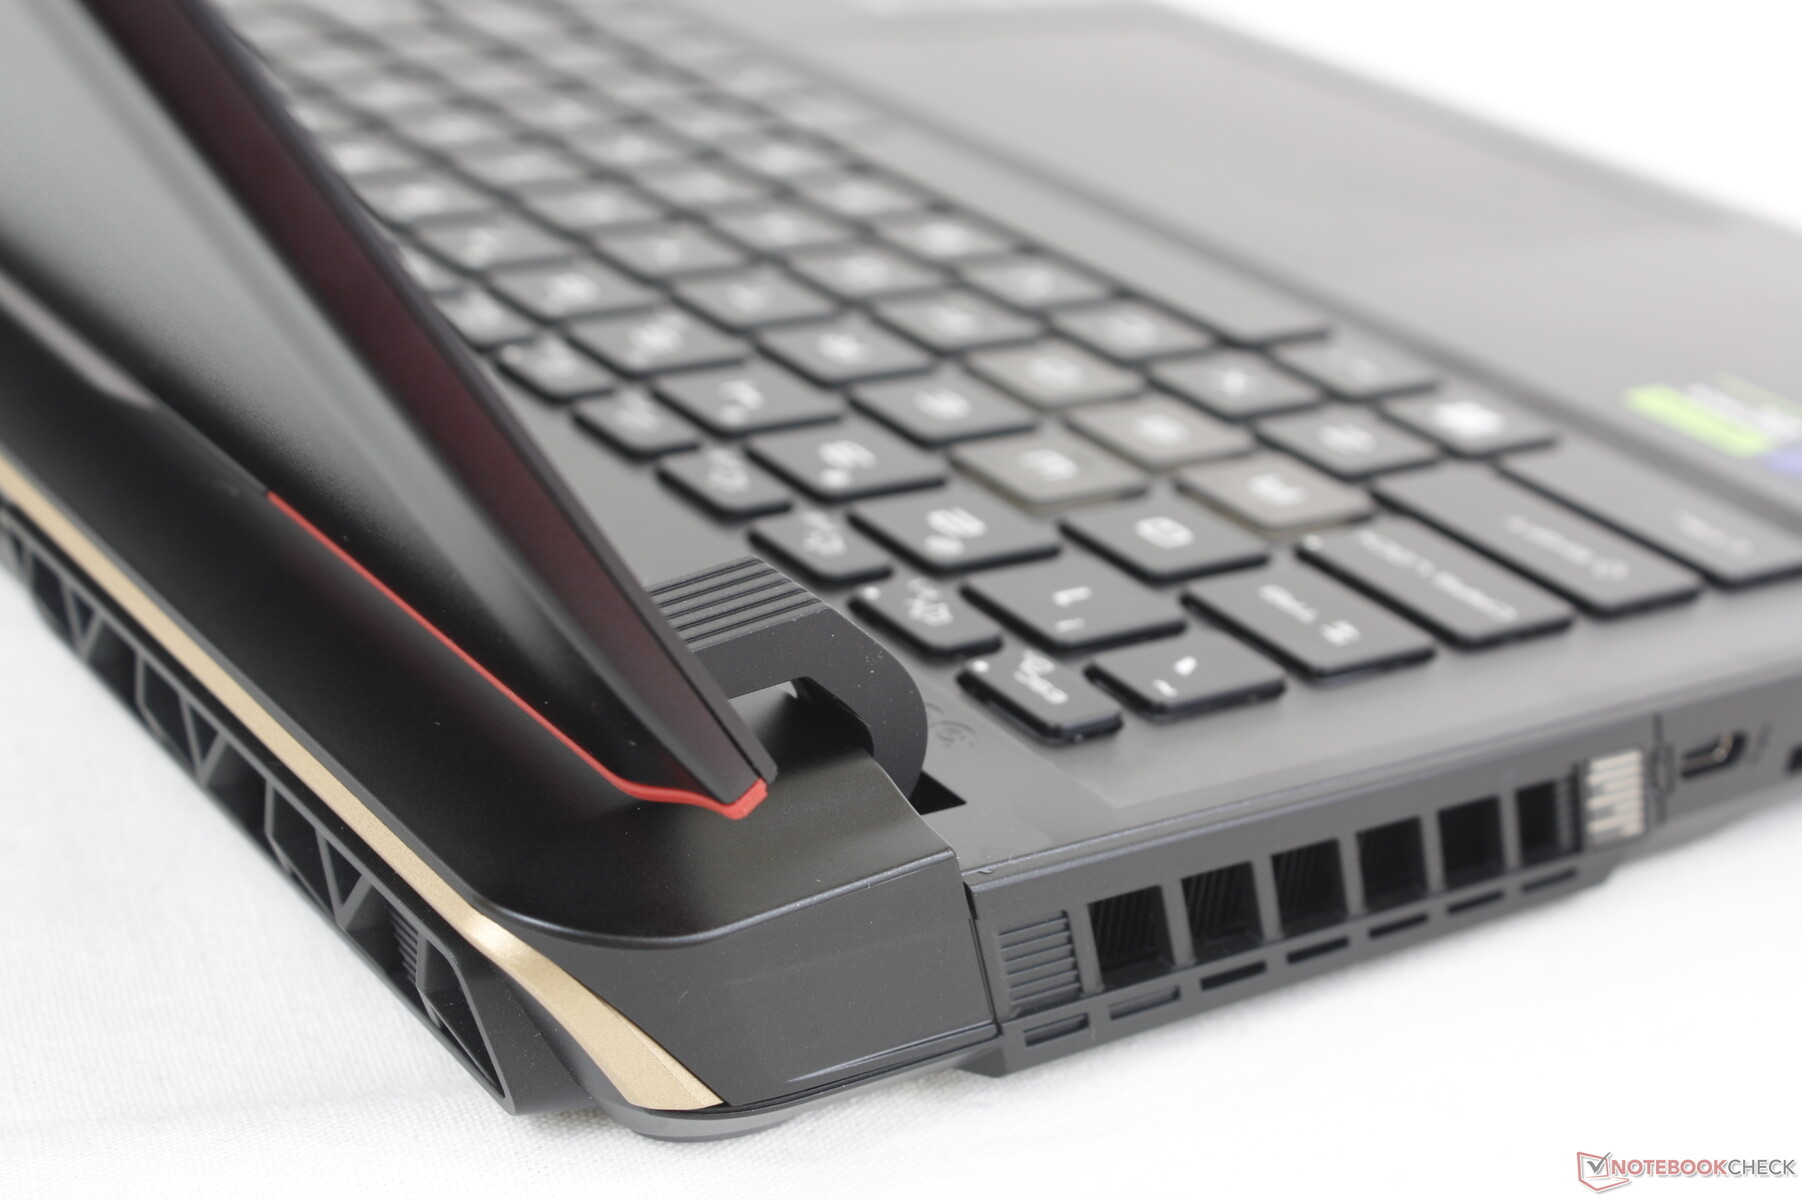
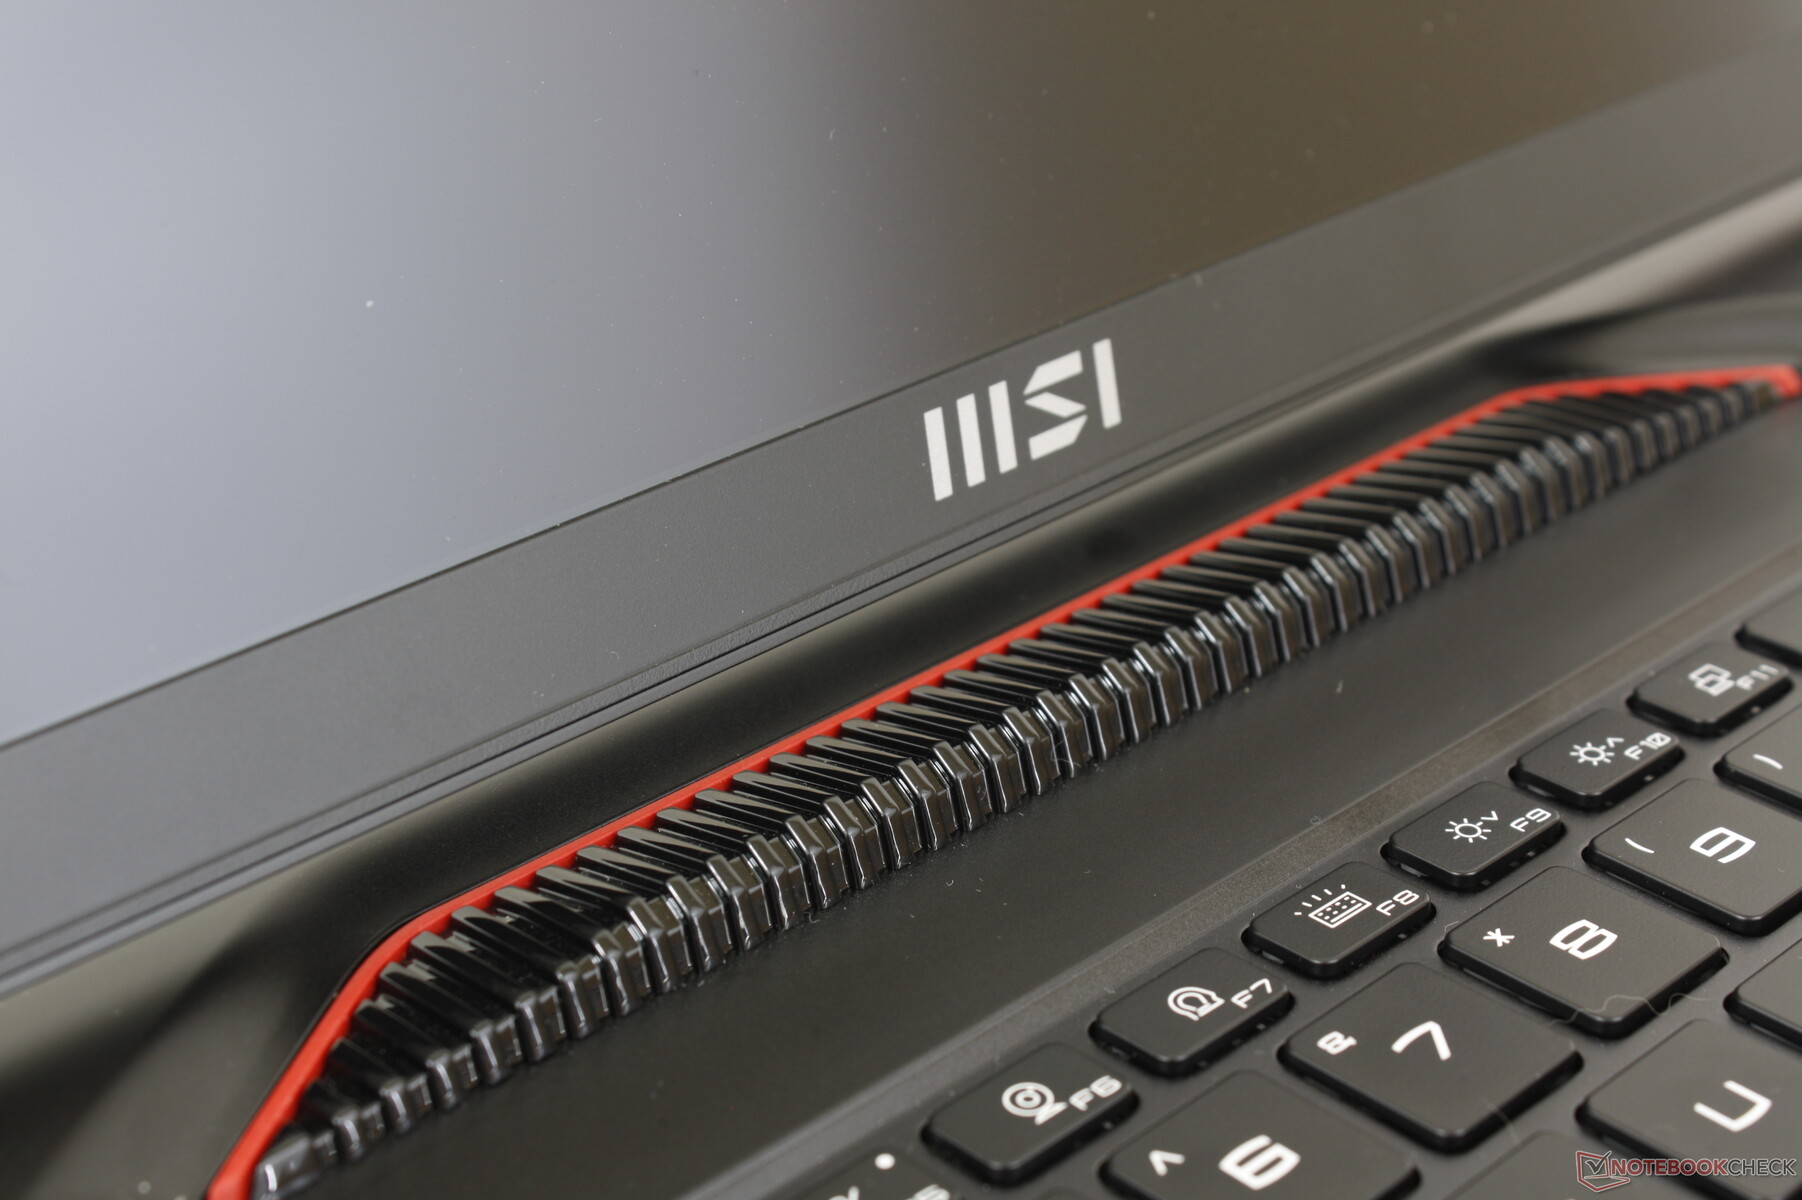
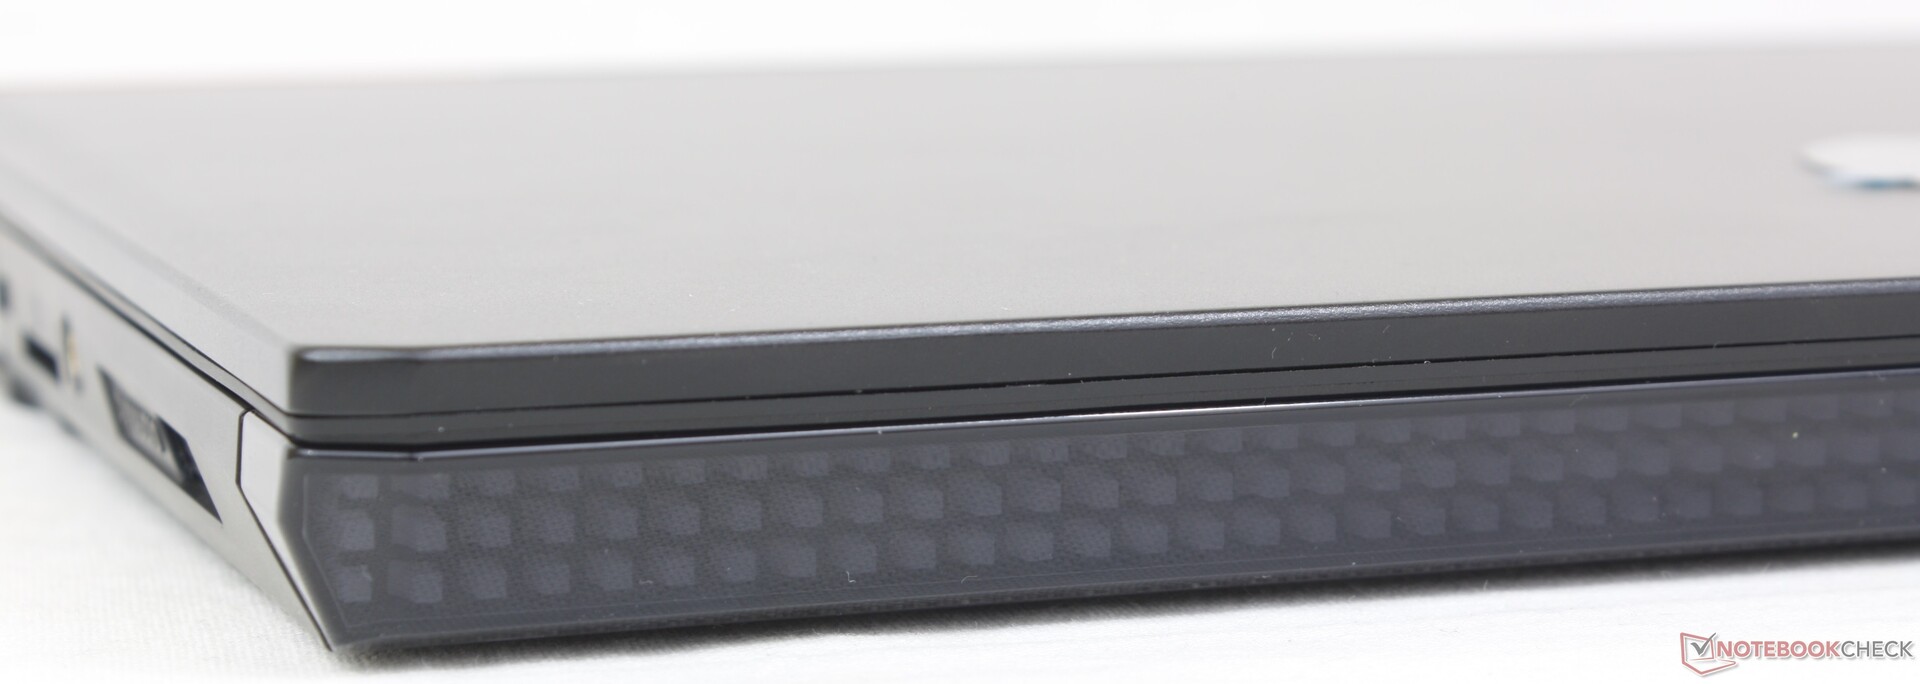
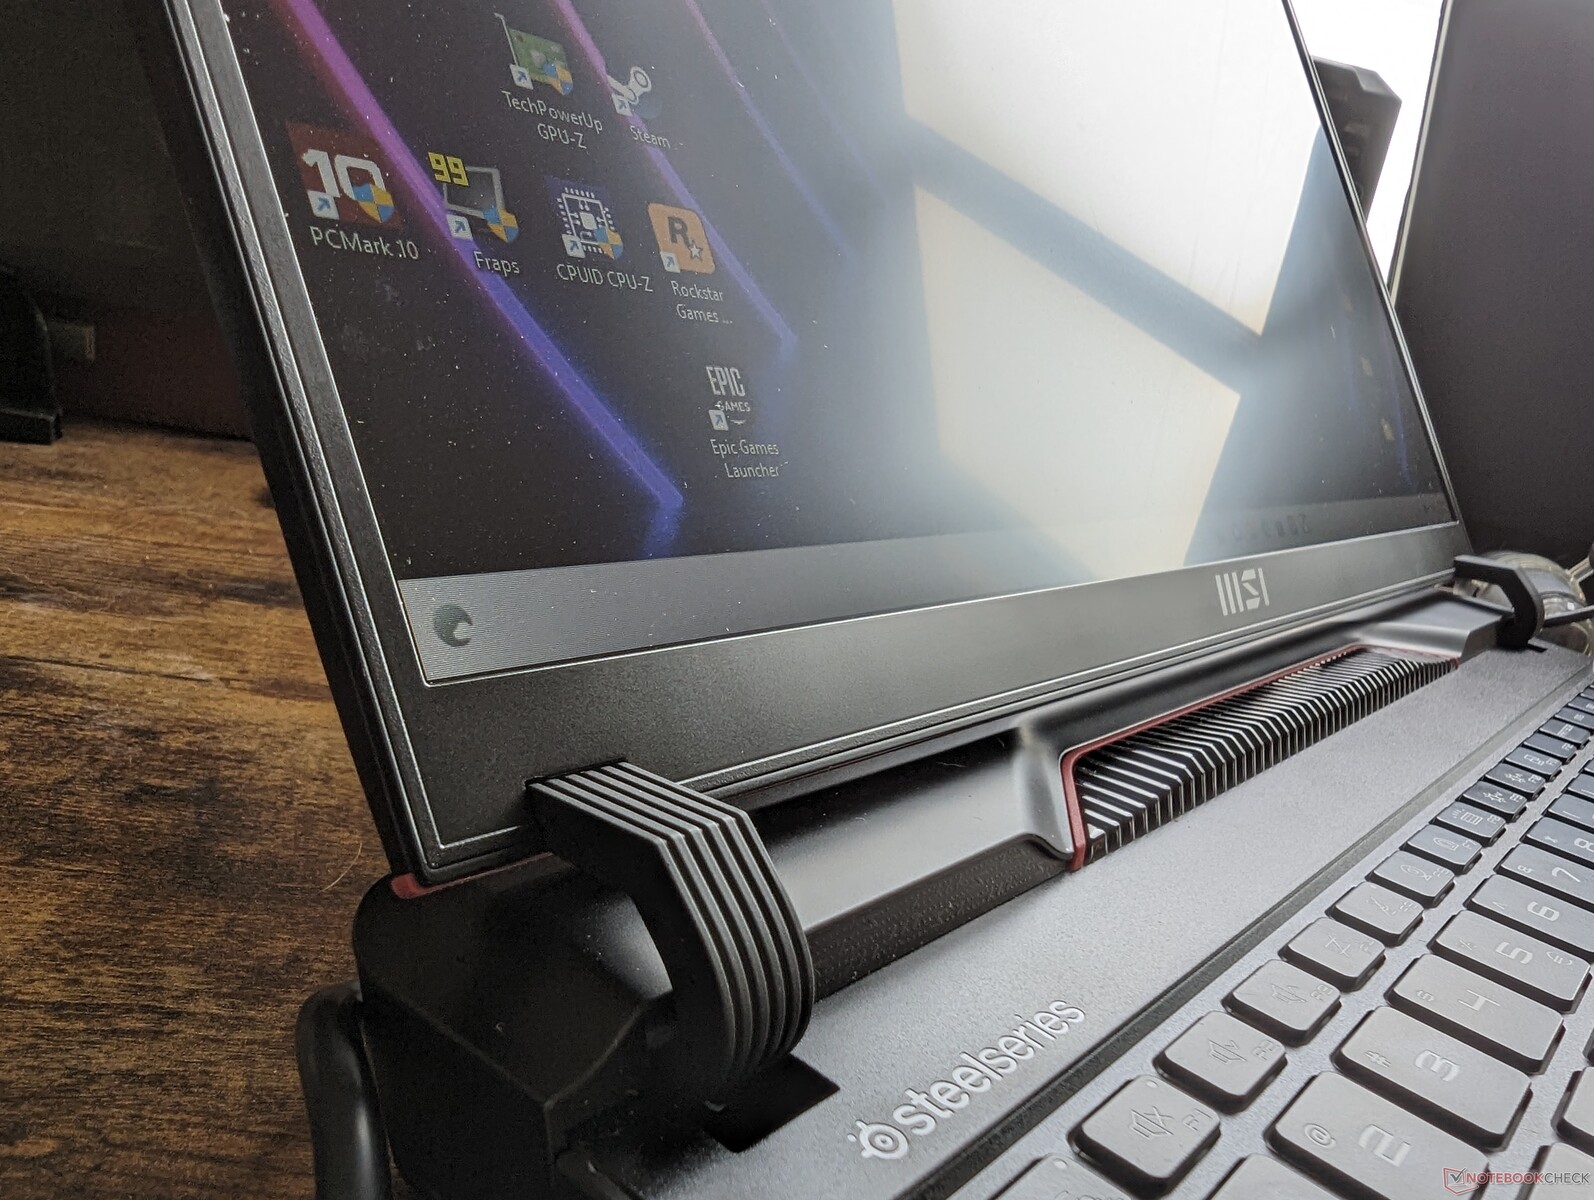
Case — Bigger Than Before
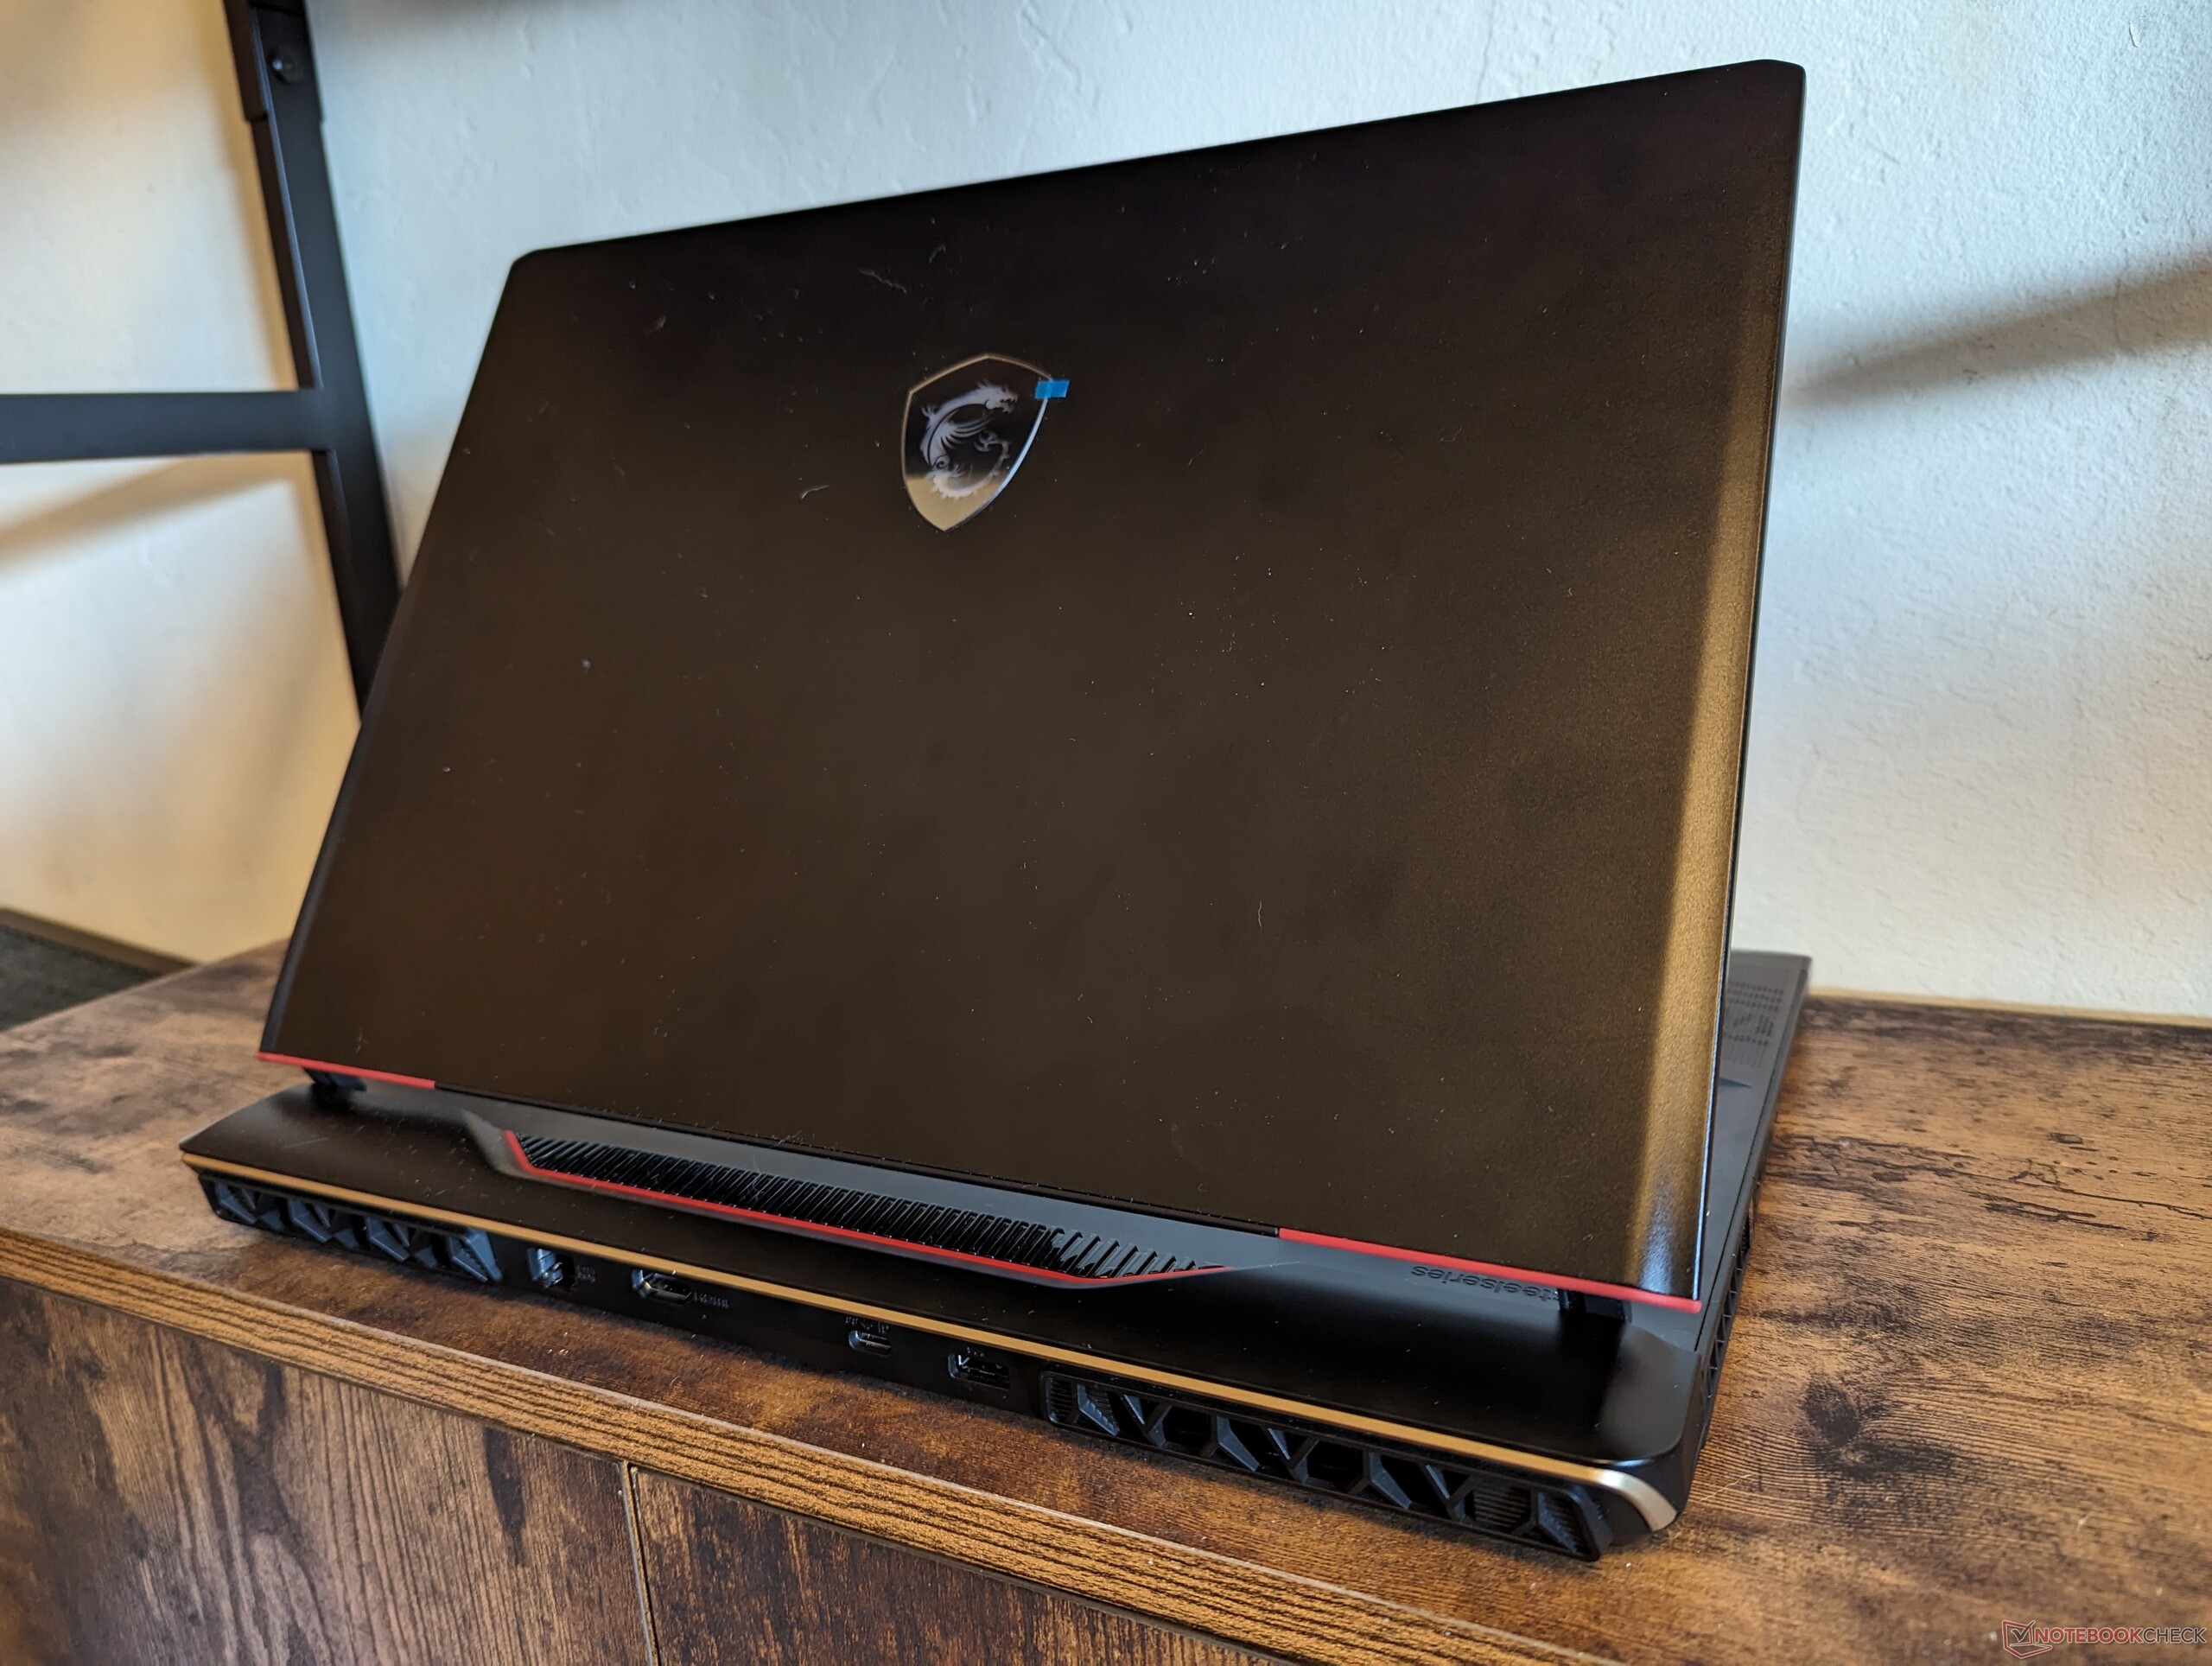
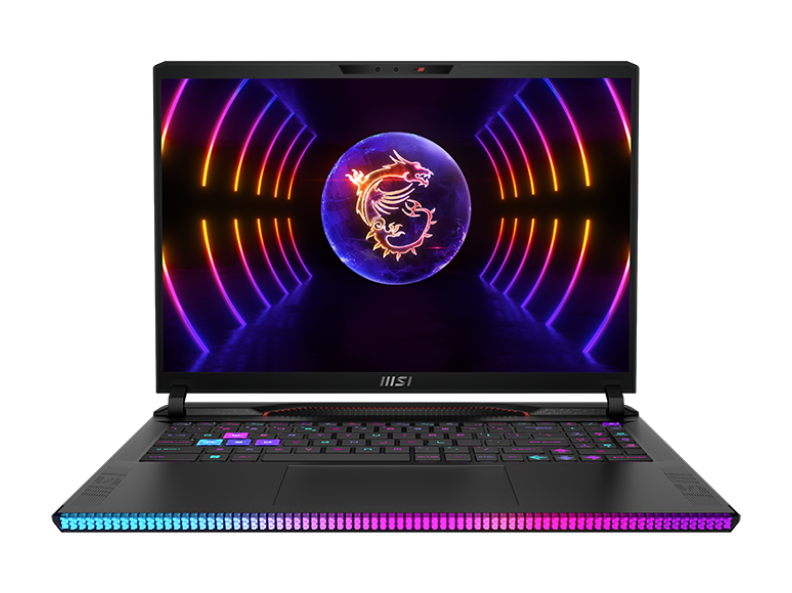
The chassis can be best described as a smaller version of the 17-inch Raider GE78HX. The LED pixel bar upfront replaces the continuous lighting on last year's model while the rear is now more stylized with gold, red, and glossy trims. One of MSI's goals this year was to create more visually interesting laptop designs instead of the increasingly common jet-black and minimalist aesthetic. The manufacturer has succeeded in this regard as the GE68HX design is certainly unmistakable and very different from other gaming laptops from competitors.
Chassis rigidity is excellent despite all the curves and pieces that make up the non-unibody skeleton. Applying pressure down the keyboard center or attempting to twist the corners would result in very little flexing and no audible creaking. We especially appreciate the larger and sturdier hinges when compared to last year's GE67HX for a better sense of longevity.
The new model is both bigger and heavier than the outgoing GE67HX by noticeable margins as shown by our size comparison chart below. In fact, the GE68HX is one of the larger and heavier 16-inch gaming laptops available.
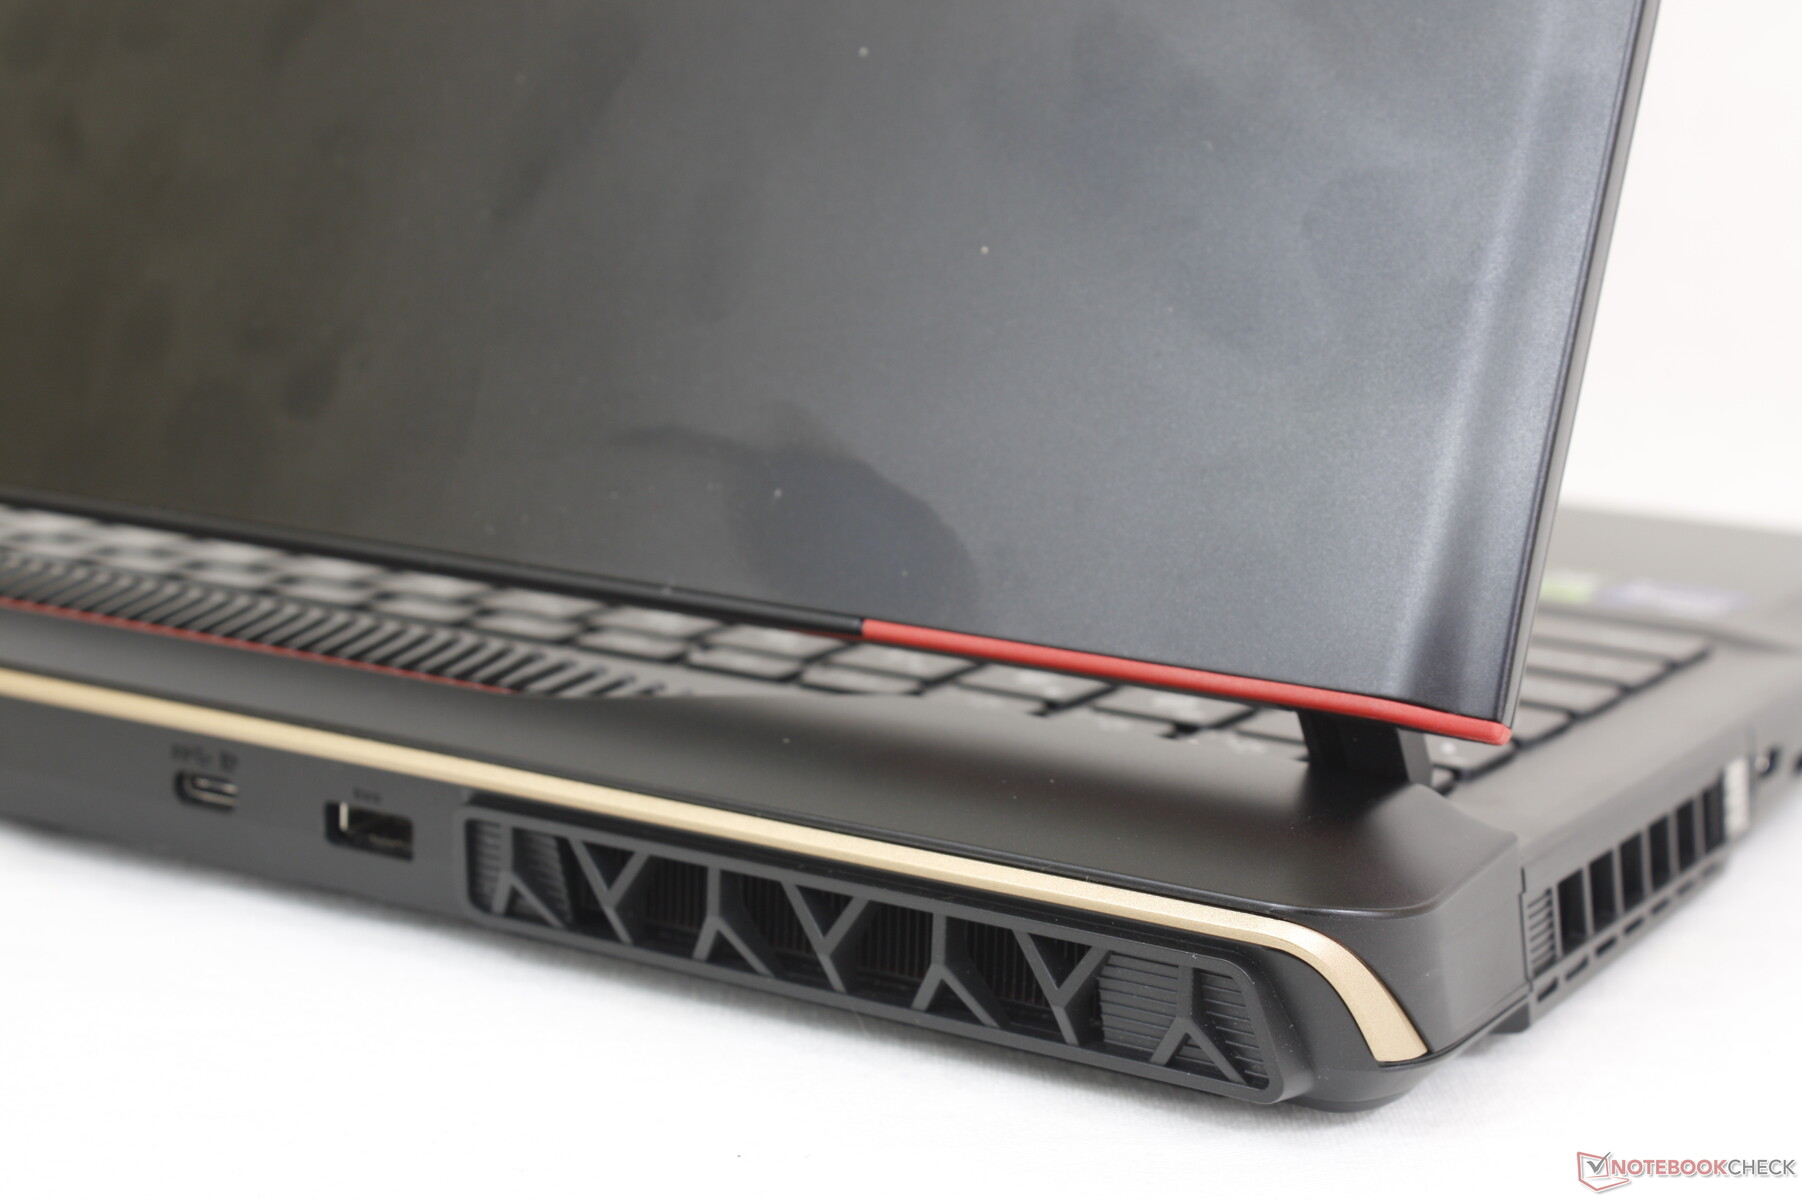
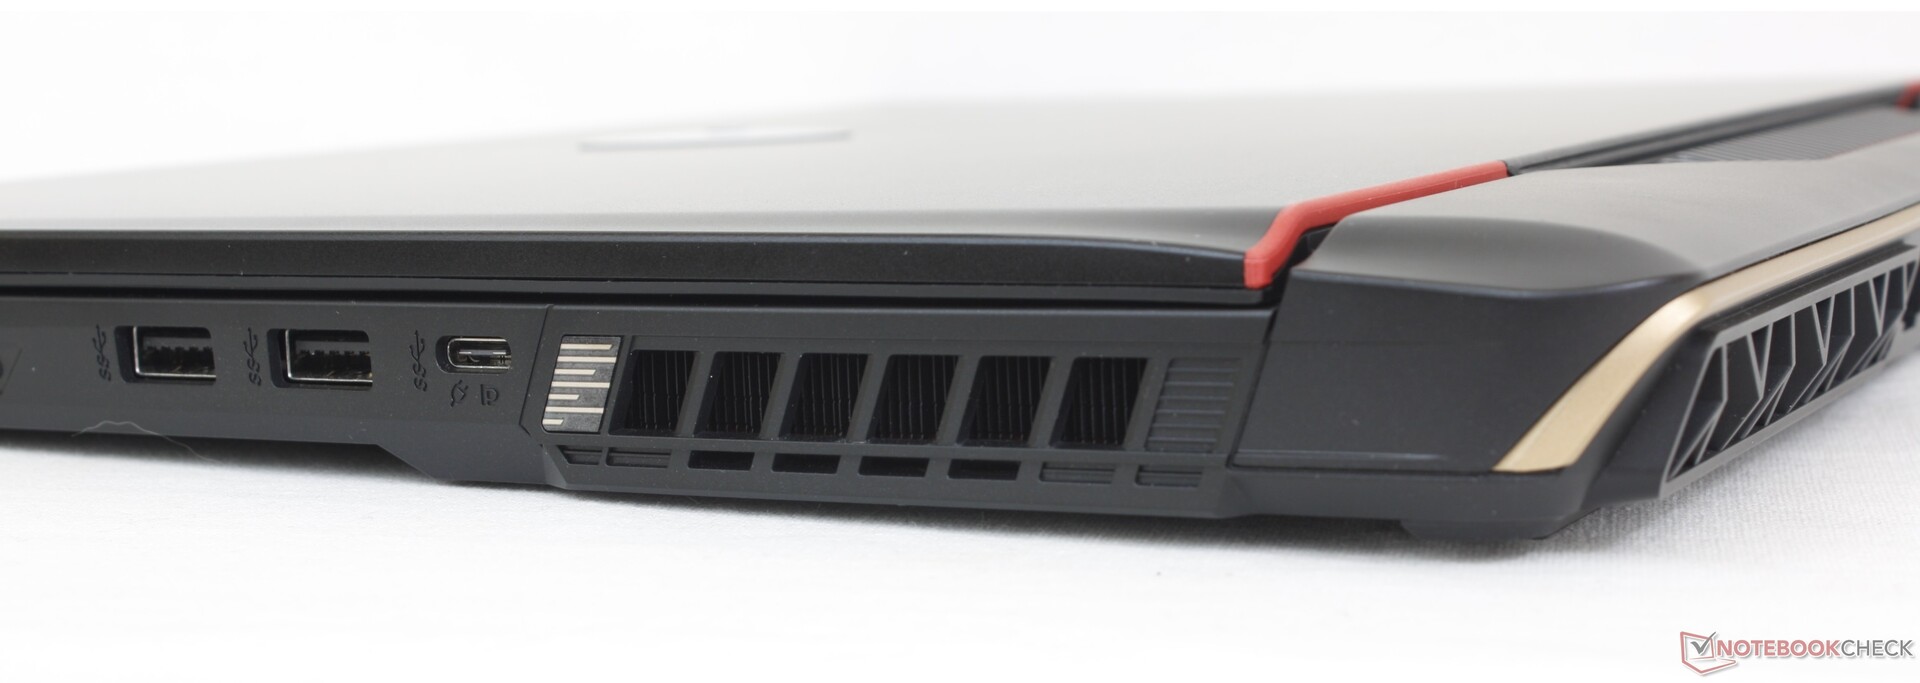
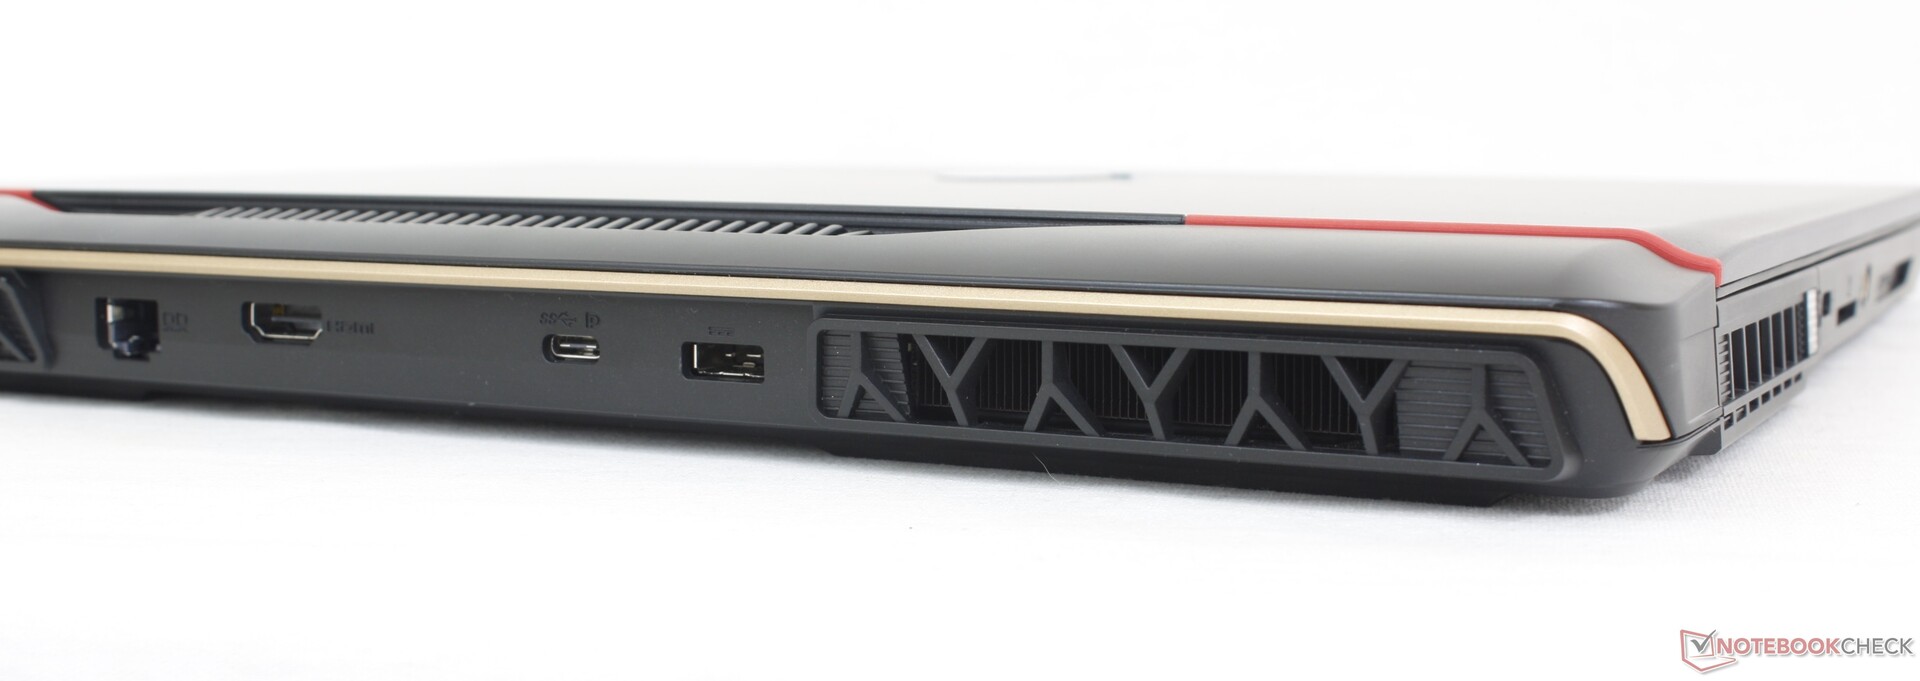
Connectivity
Port options have changed slightly from last year's GE67HX. Whereas the GE67HX would have 3x USB-A ports and 2x USB-C ports, the GE68HX ships with 2x USB-A ports and 3x USB-C ports. All three USB-C ports support Displayport, but only the one along the left edge is compatible with Thunderbolt 4.
Strangely, MSI has opted to drop the Kensington lock on this year's design. There is no mini-DisplayPort either unlike on the Alienware m16 R1.
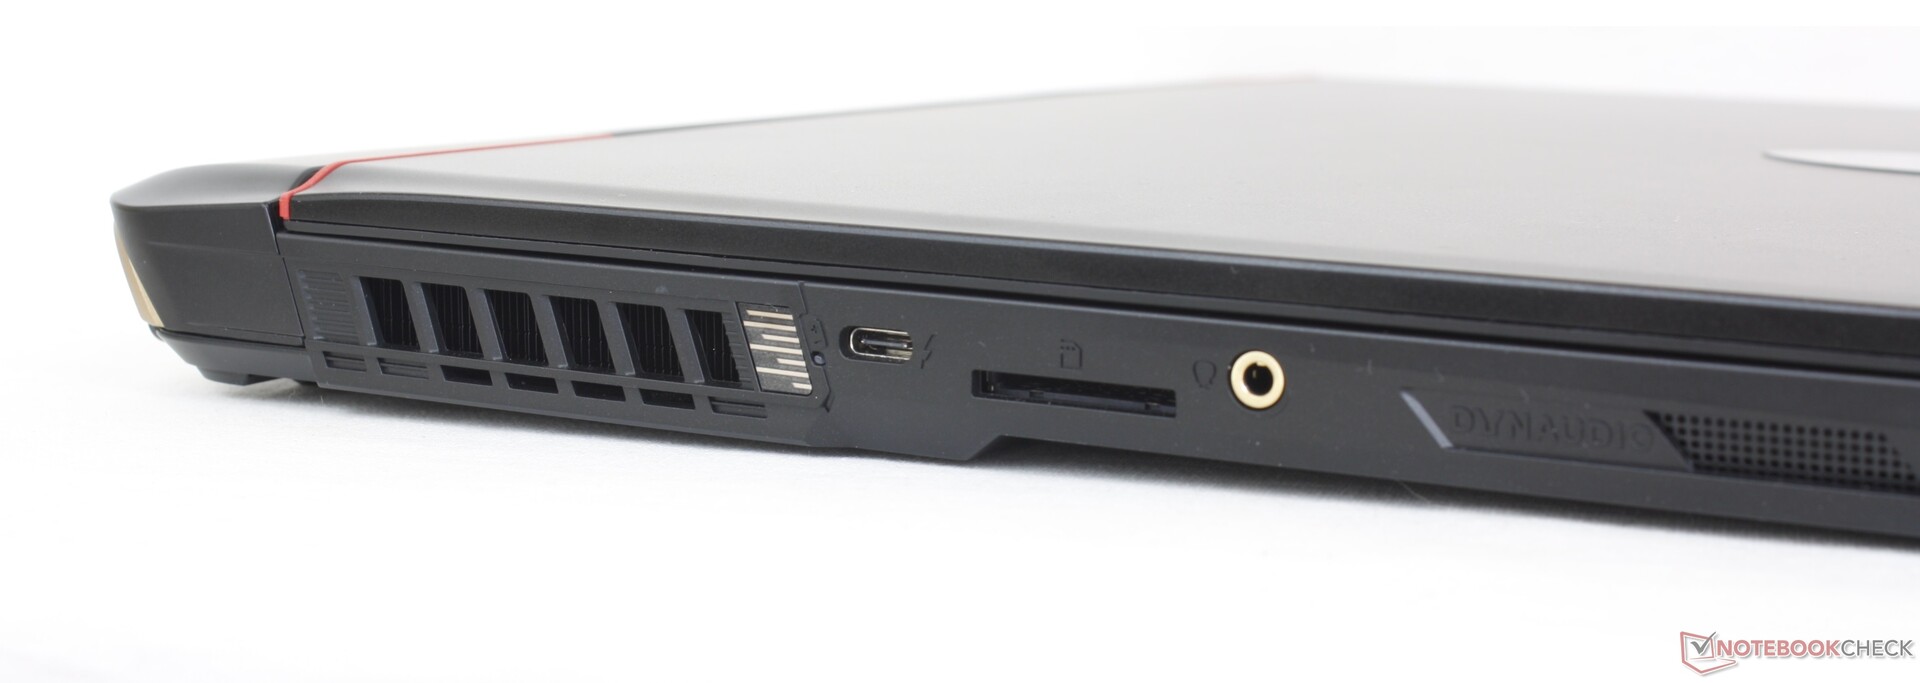
SD Card Reader
The integrated SD card reader is a little slow for what is supposed to be an upper-midrange gaming model. Transferring 1 GB of pictures from our UHS-II test card to desktop would take a little over 12 seconds while the same test on the Alienware m16 R1 would be over 2x faster.
| SD Card Reader | |
| average JPG Copy Test (av. of 3 runs) | |
| Alienware m16 R1 AMD (Toshiba Exceria Pro SDXC 64 GB UHS-II) | |
| Asus ROG Zephyrus M16 GU604VY-NM042X | |
| Lenovo Legion Slim 7i 16 Gen 8 (Toshiba Exceria Pro SDXC 64 GB UHS-II) | |
| MSI GE67 HX 12UGS (Toshiba Exceria Pro SDXC 64 GB UHS-II) | |
| MSI Raider GE68HX 13VF (Toshiba Exceria Pro SDXC 64 GB UHS-II) | |
| maximum AS SSD Seq Read Test (1GB) | |
| Alienware m16 R1 AMD (Toshiba Exceria Pro SDXC 64 GB UHS-II) | |
| Asus ROG Zephyrus M16 GU604VY-NM042X | |
| Lenovo Legion Slim 7i 16 Gen 8 (Toshiba Exceria Pro SDXC 64 GB UHS-II) | |
| MSI Raider GE68HX 13VF (Toshiba Exceria Pro SDXC 64 GB UHS-II) | |
| MSI GE67 HX 12UGS (Toshiba Exceria Pro SDXC 64 GB UHS-II) | |
Communication
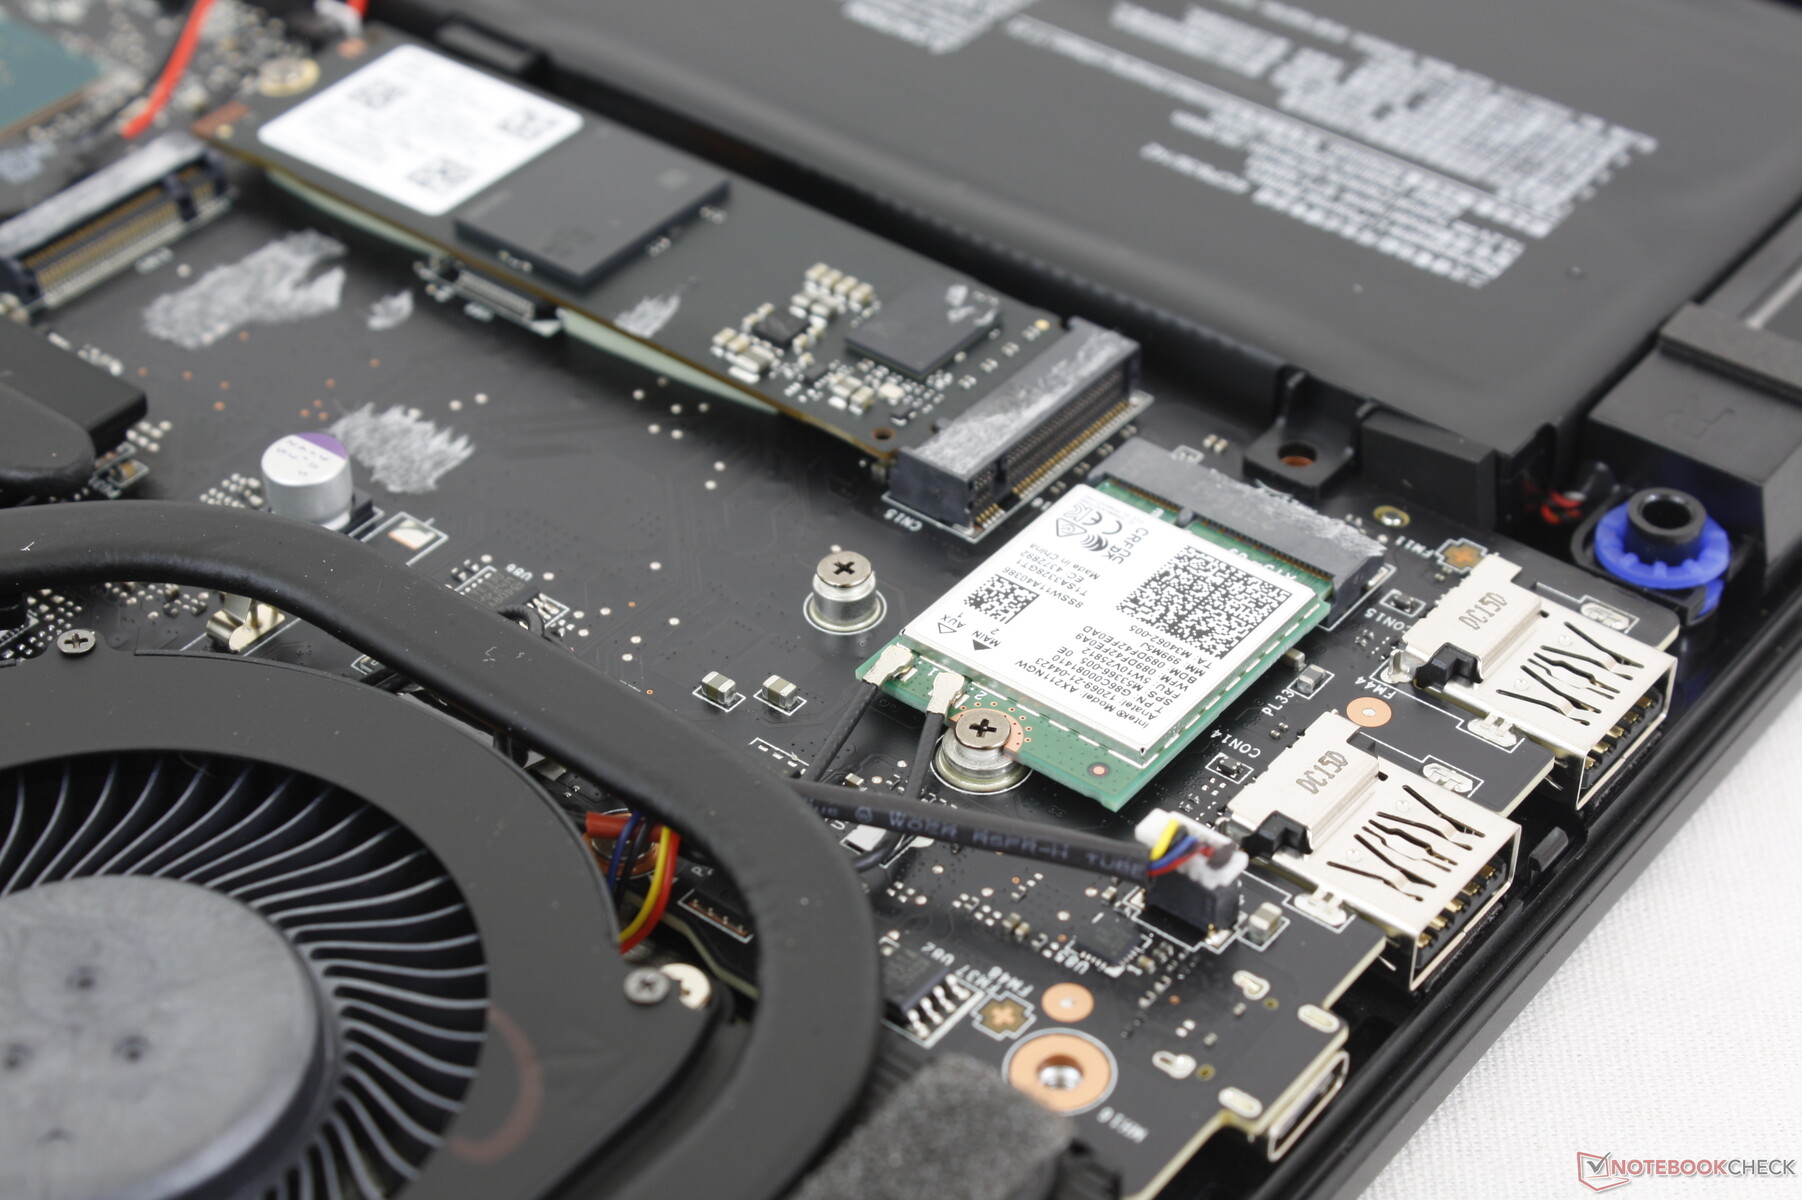
An Intel AX211 comes standard for Wi-Fi 6E and Bluetooth 5.3 support. We experienced no connectivity issues when paired to our AXE11000 6 GHz test network.
| Networking | |
| iperf3 transmit AXE11000 | |
| Alienware m16 R1 AMD | |
| MSI Raider GE68HX 13VF | |
| HP Omen 16-xf0376ng | |
| Lenovo Legion Slim 7i 16 Gen 8 | |
| iperf3 receive AXE11000 | |
| HP Omen 16-xf0376ng | |
| Alienware m16 R1 AMD | |
| Lenovo Legion Slim 7i 16 Gen 8 | |
| MSI Raider GE68HX 13VF | |
| iperf3 transmit AXE11000 6GHz | |
| Alienware m16 R1 AMD | |
| Asus ROG Zephyrus M16 GU604VY-NM042X | |
| Lenovo Legion Slim 7i 16 Gen 8 | |
| MSI Raider GE68HX 13VF | |
| MSI GE67 HX 12UGS | |
| iperf3 receive AXE11000 6GHz | |
| Asus ROG Zephyrus M16 GU604VY-NM042X | |
| Alienware m16 R1 AMD | |
| Lenovo Legion Slim 7i 16 Gen 8 | |
| MSI Raider GE68HX 13VF | |
| MSI GE67 HX 12UGS | |
Webcam
While the 2 MP quality hasn't changed, there are still a couple of differences surrounding the webcam. The shutter, for example, is now a physical slider next to the lens instead of an electronic switch on the keyboard. And secondly, an IR sensor is now built in for Hello support.


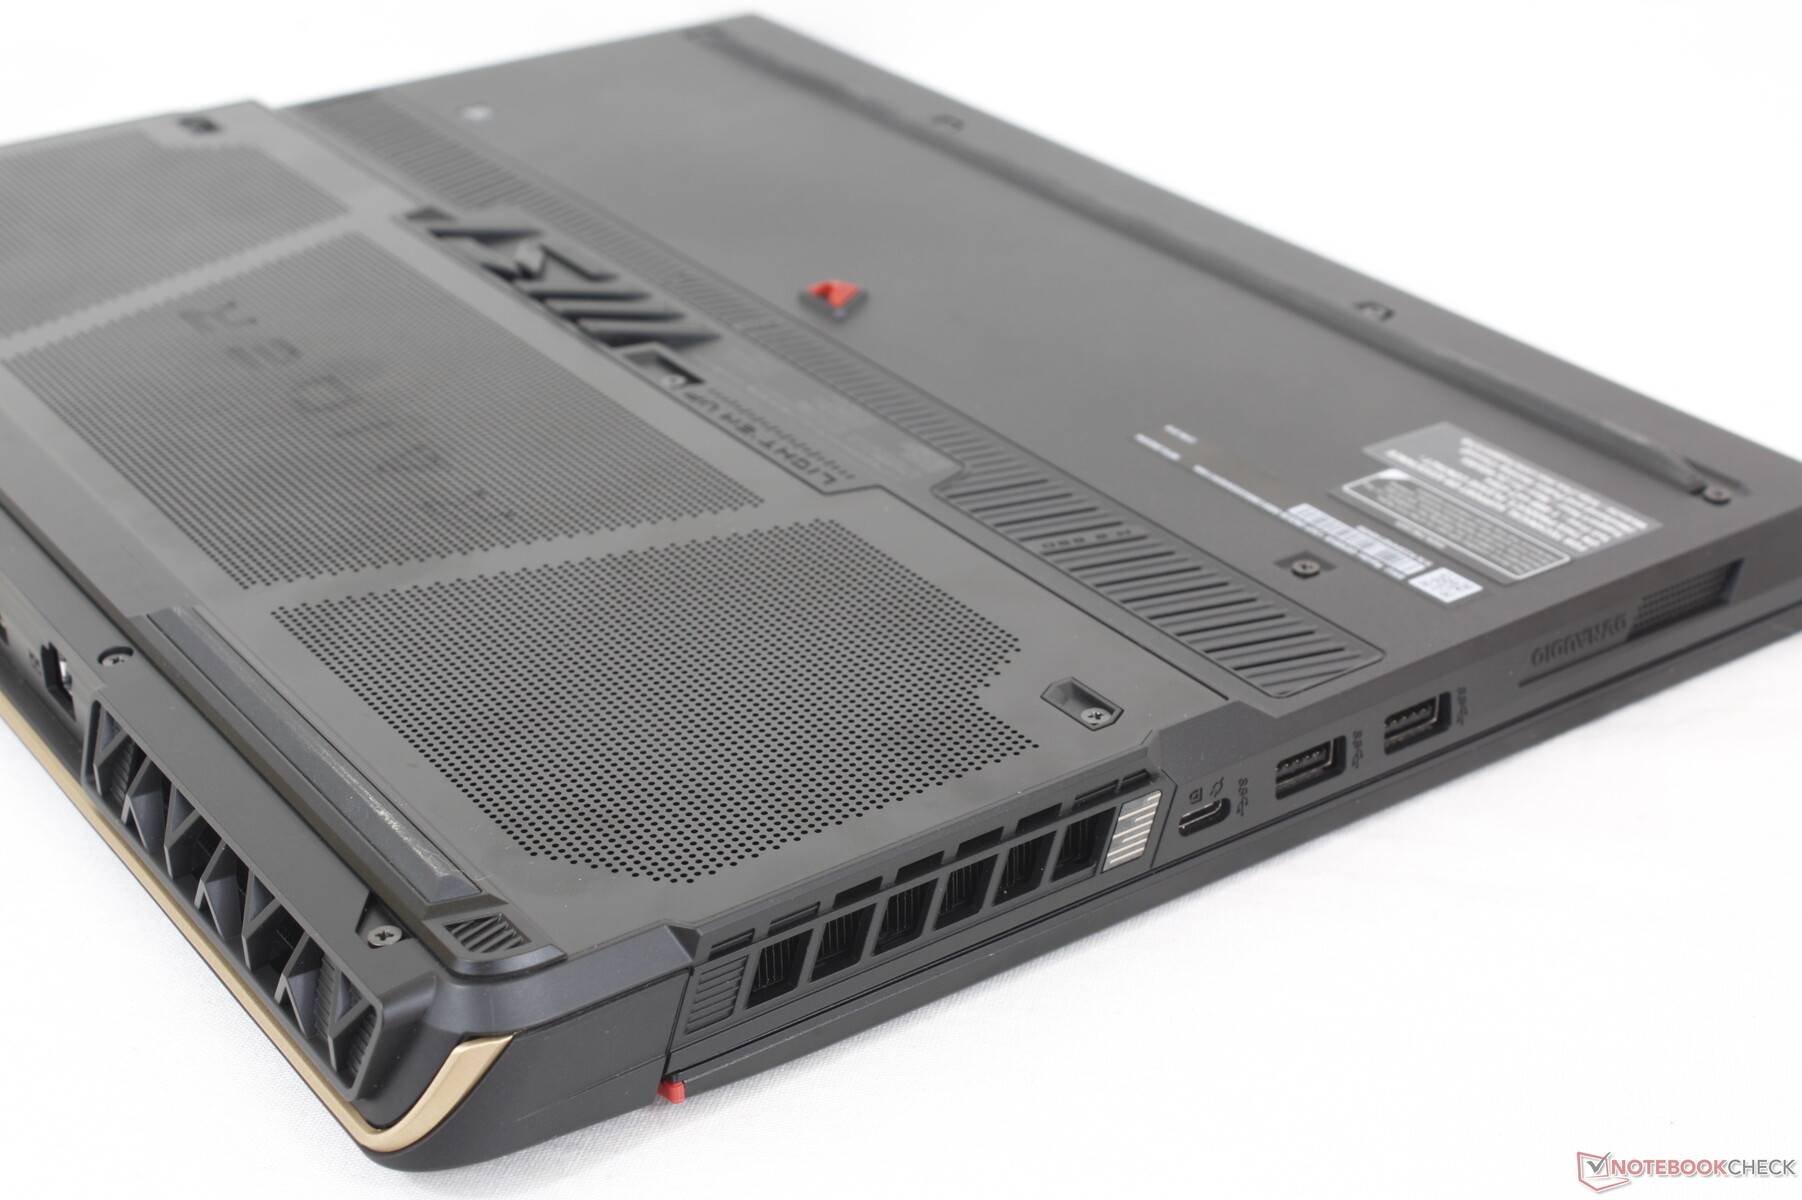
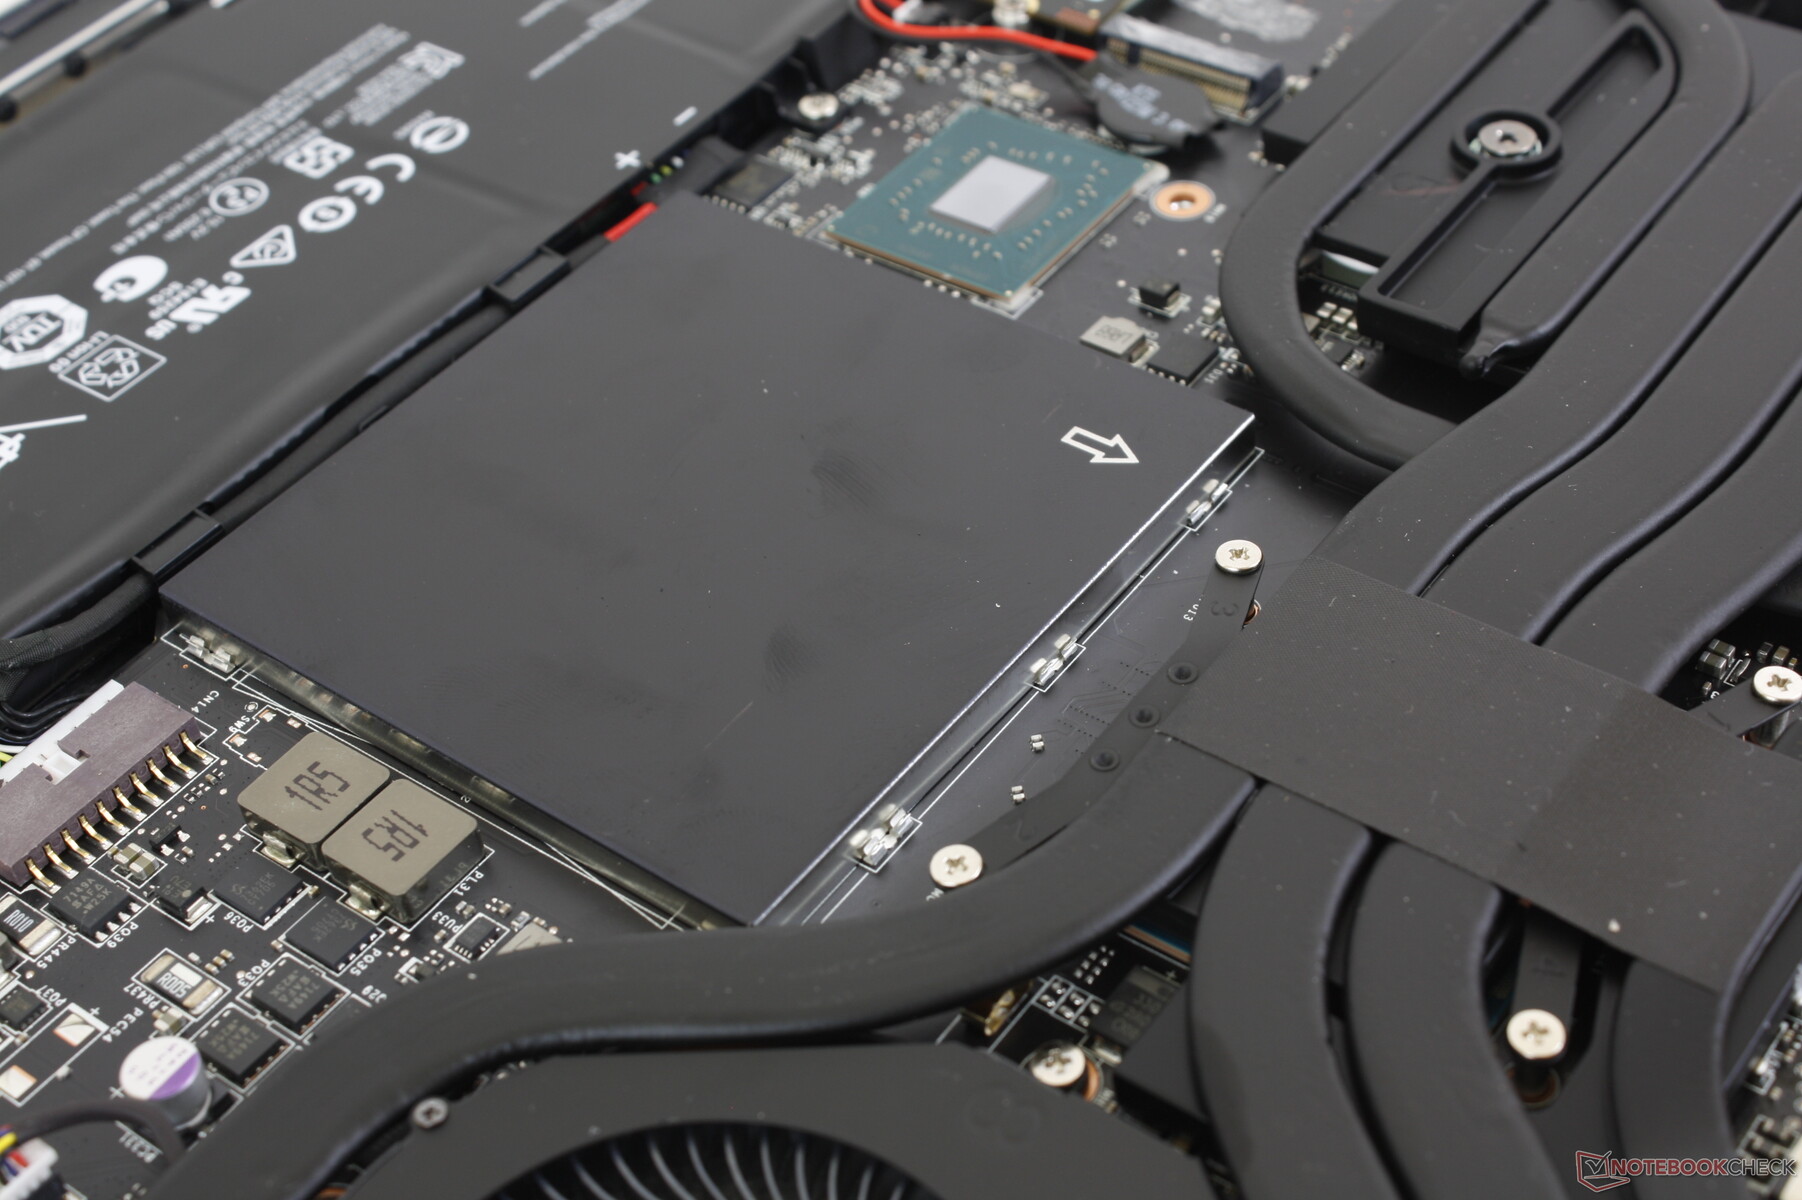
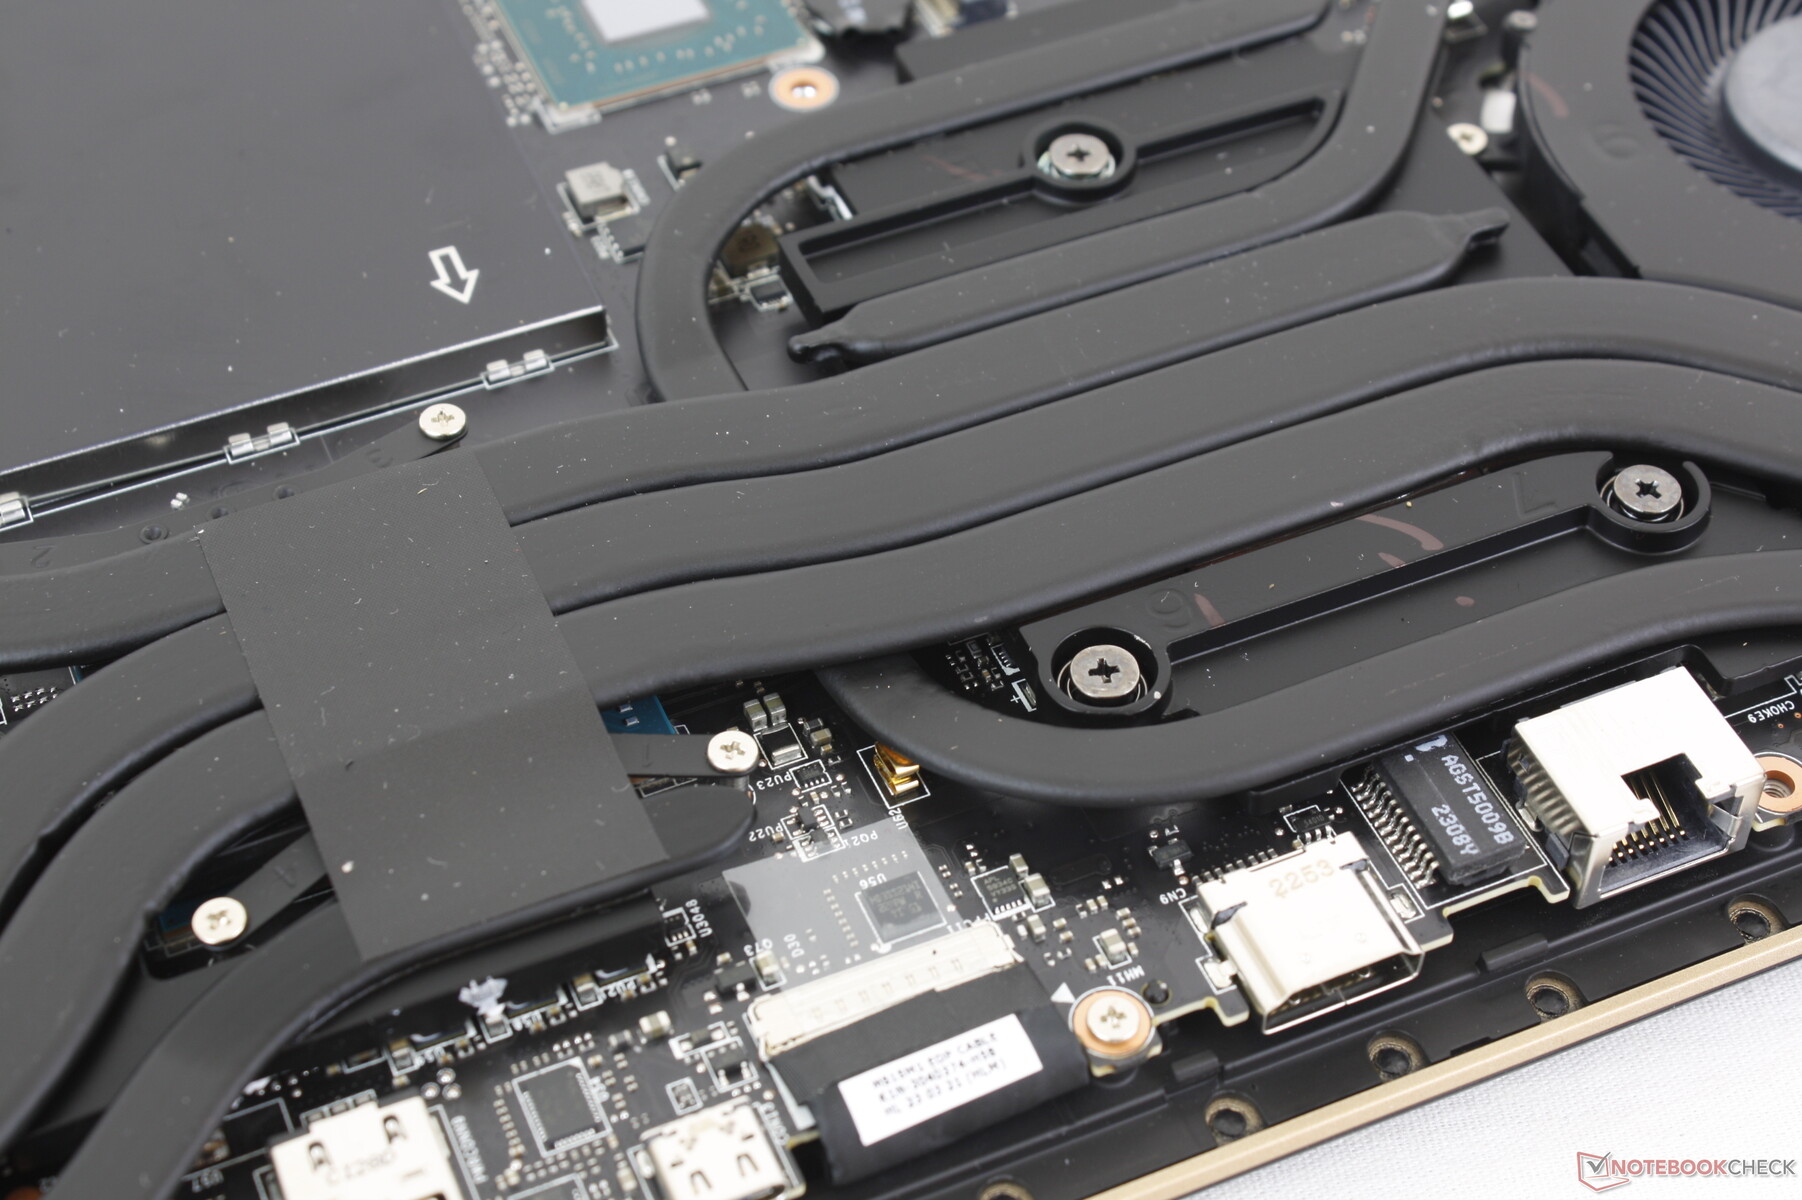
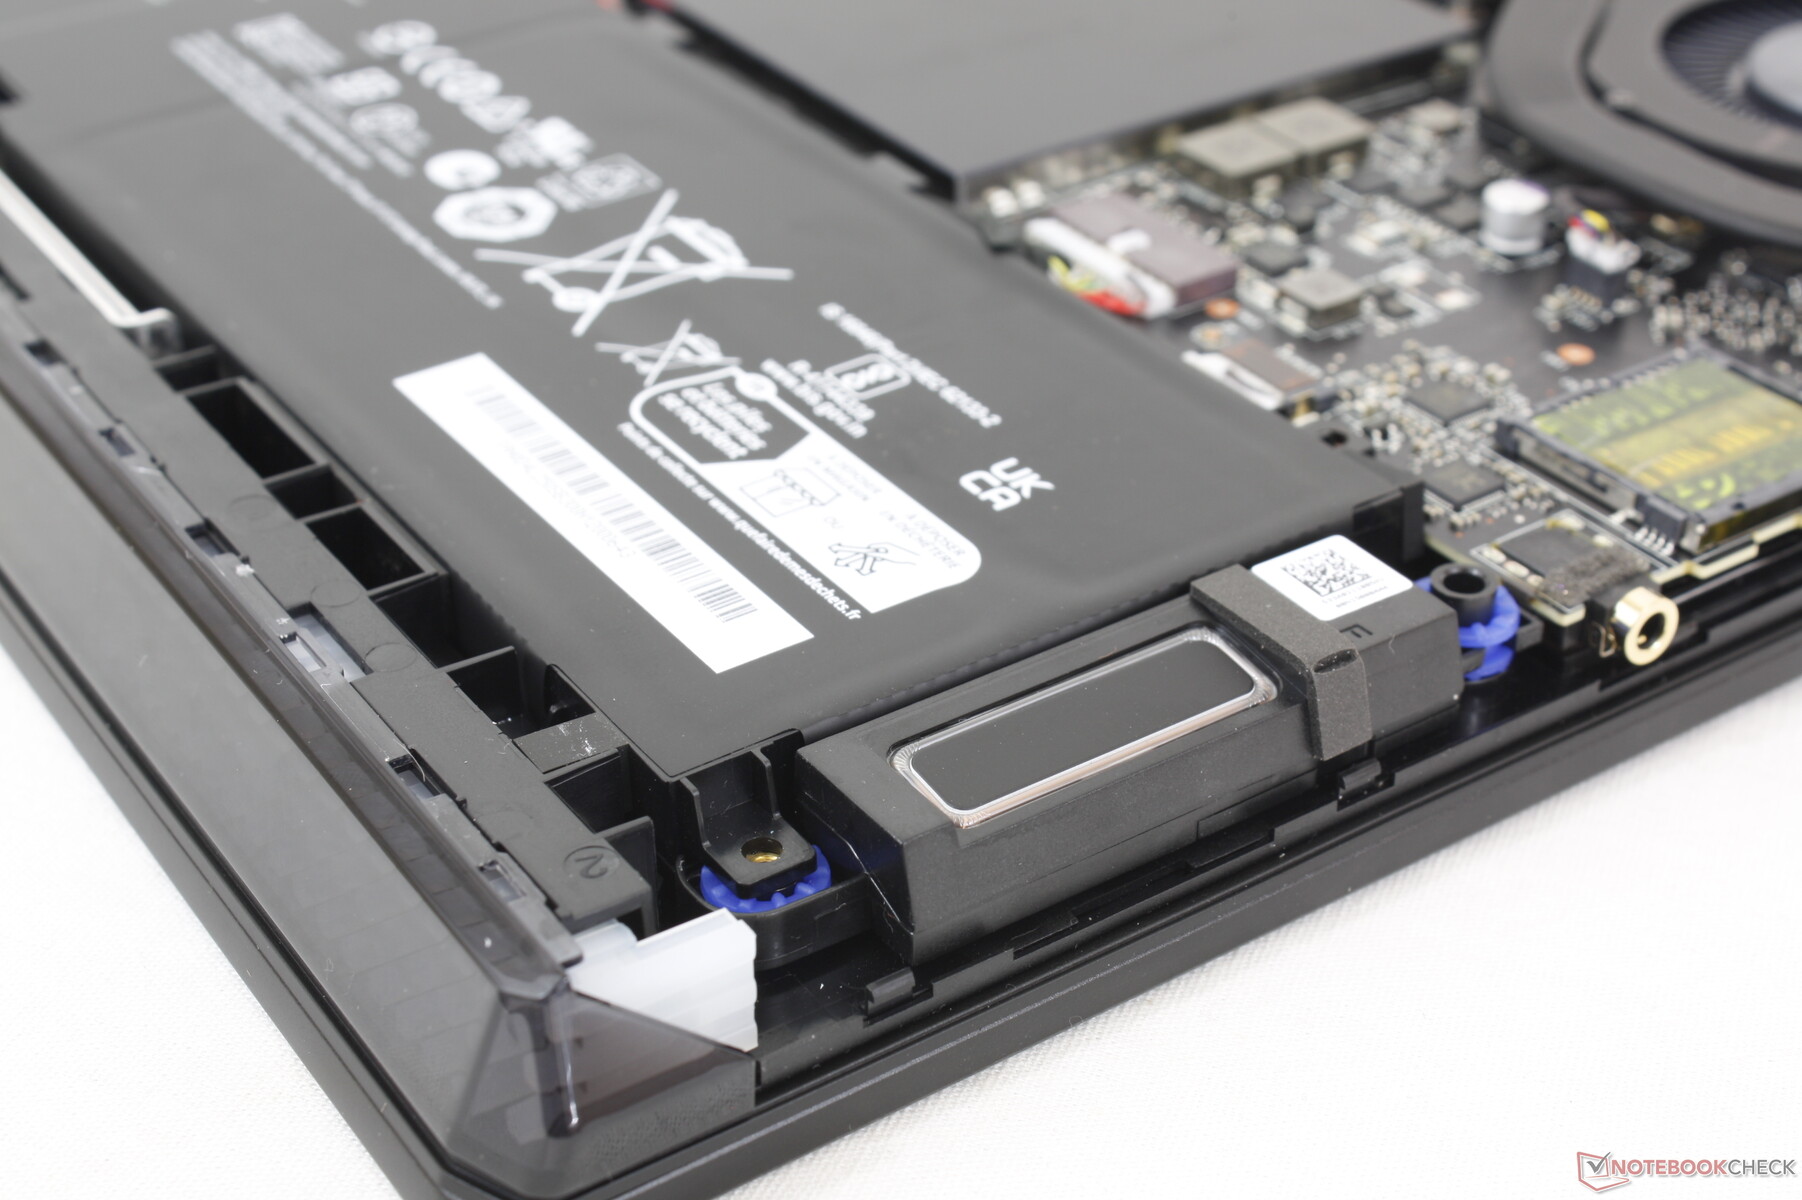
Maintenance
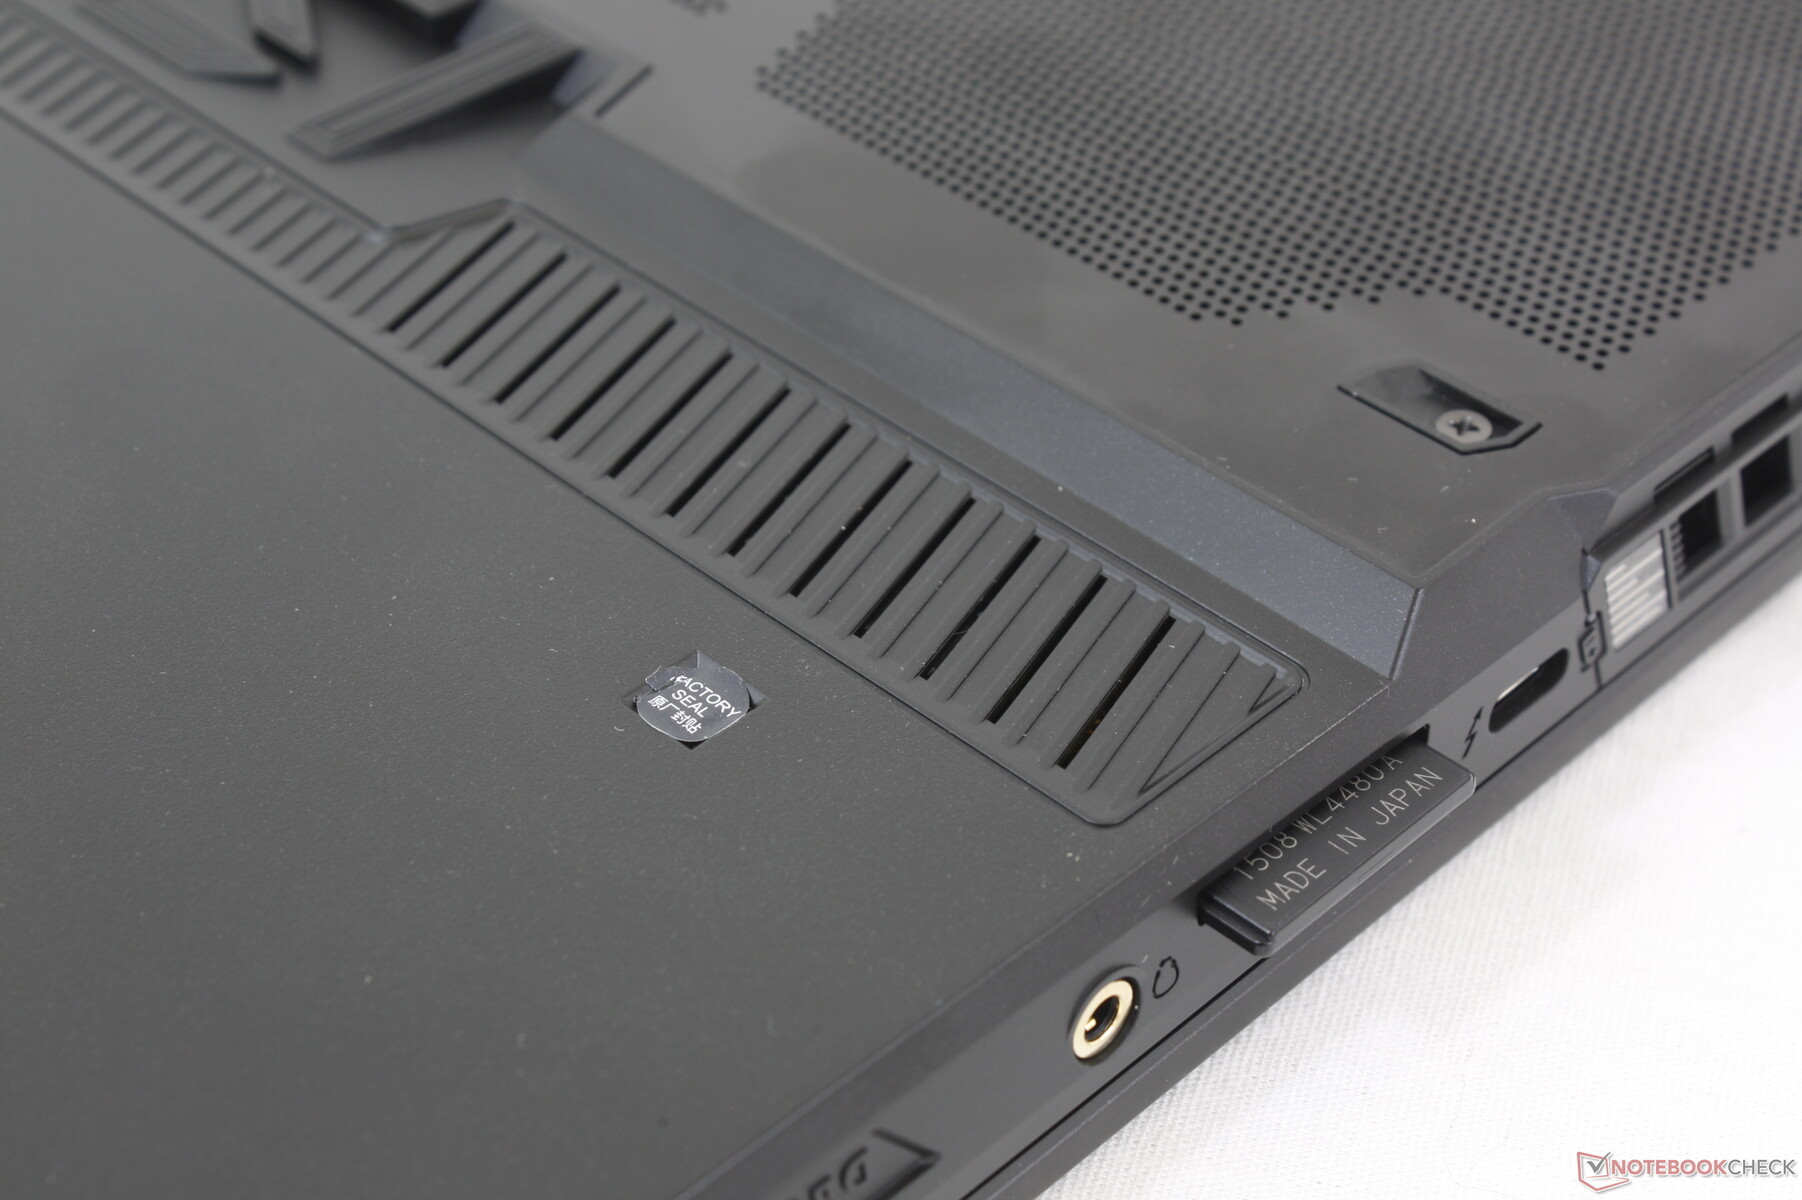
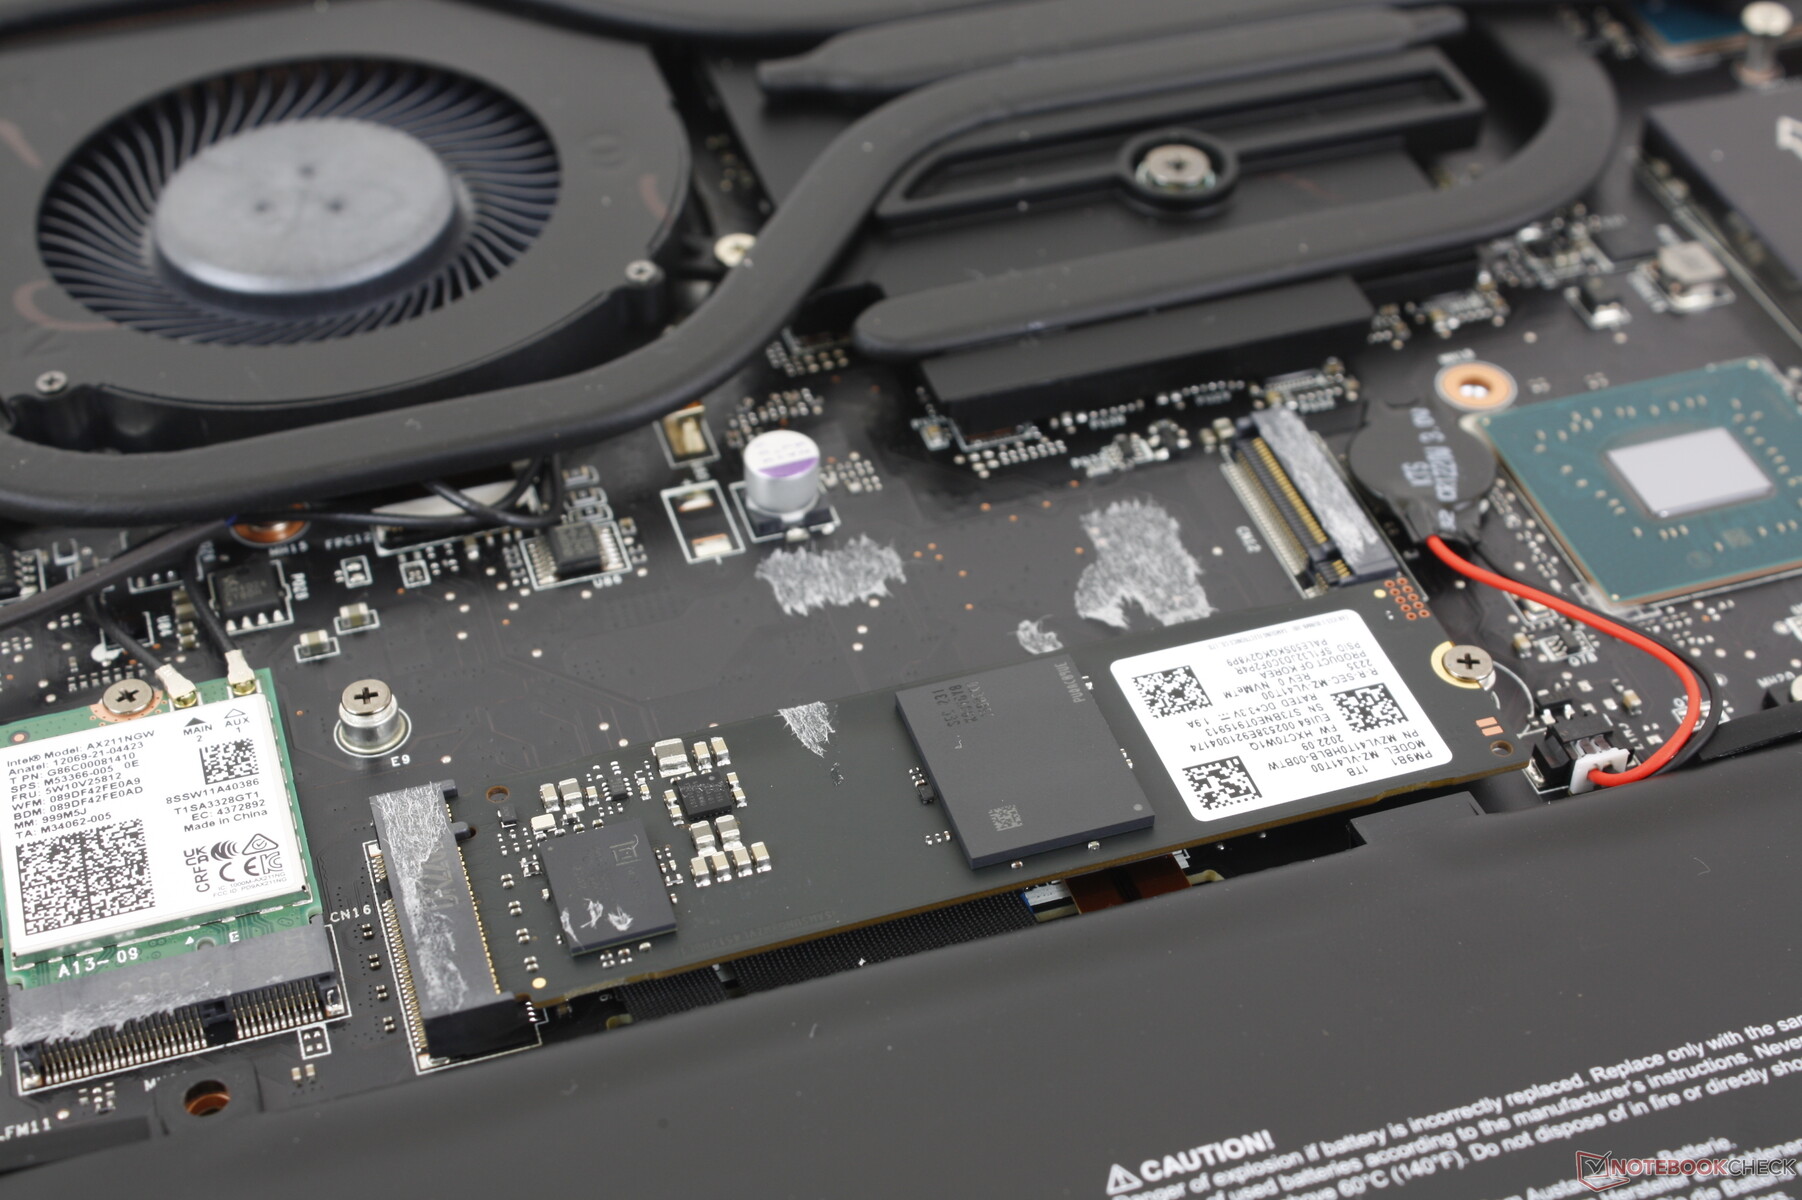
Unfortunately, MSI laptops are becoming more difficult to service nowadays. The bottom panel is secured by 13 Phillips screws one of which is behind an anti-tamper sticker to discourage end-user servicing. The main problem is that the plastic hooks along the edges of the panel are angled and tightly latched to the base especially along the rear. These hooks are difficult to detach and even more difficult to reinstall.
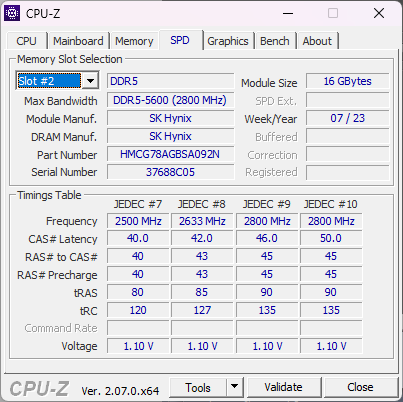
Users have direct access to two M.2 2280 storage bays, two DDR5 SODIMM slots, and the WLAN module and battery once inside.
Accessories And Warranty
The retail box included a cleaning cloth in addition to the AC adapter and paperwork. A one-year limited manufacturer warranty applies if purchased in the US.
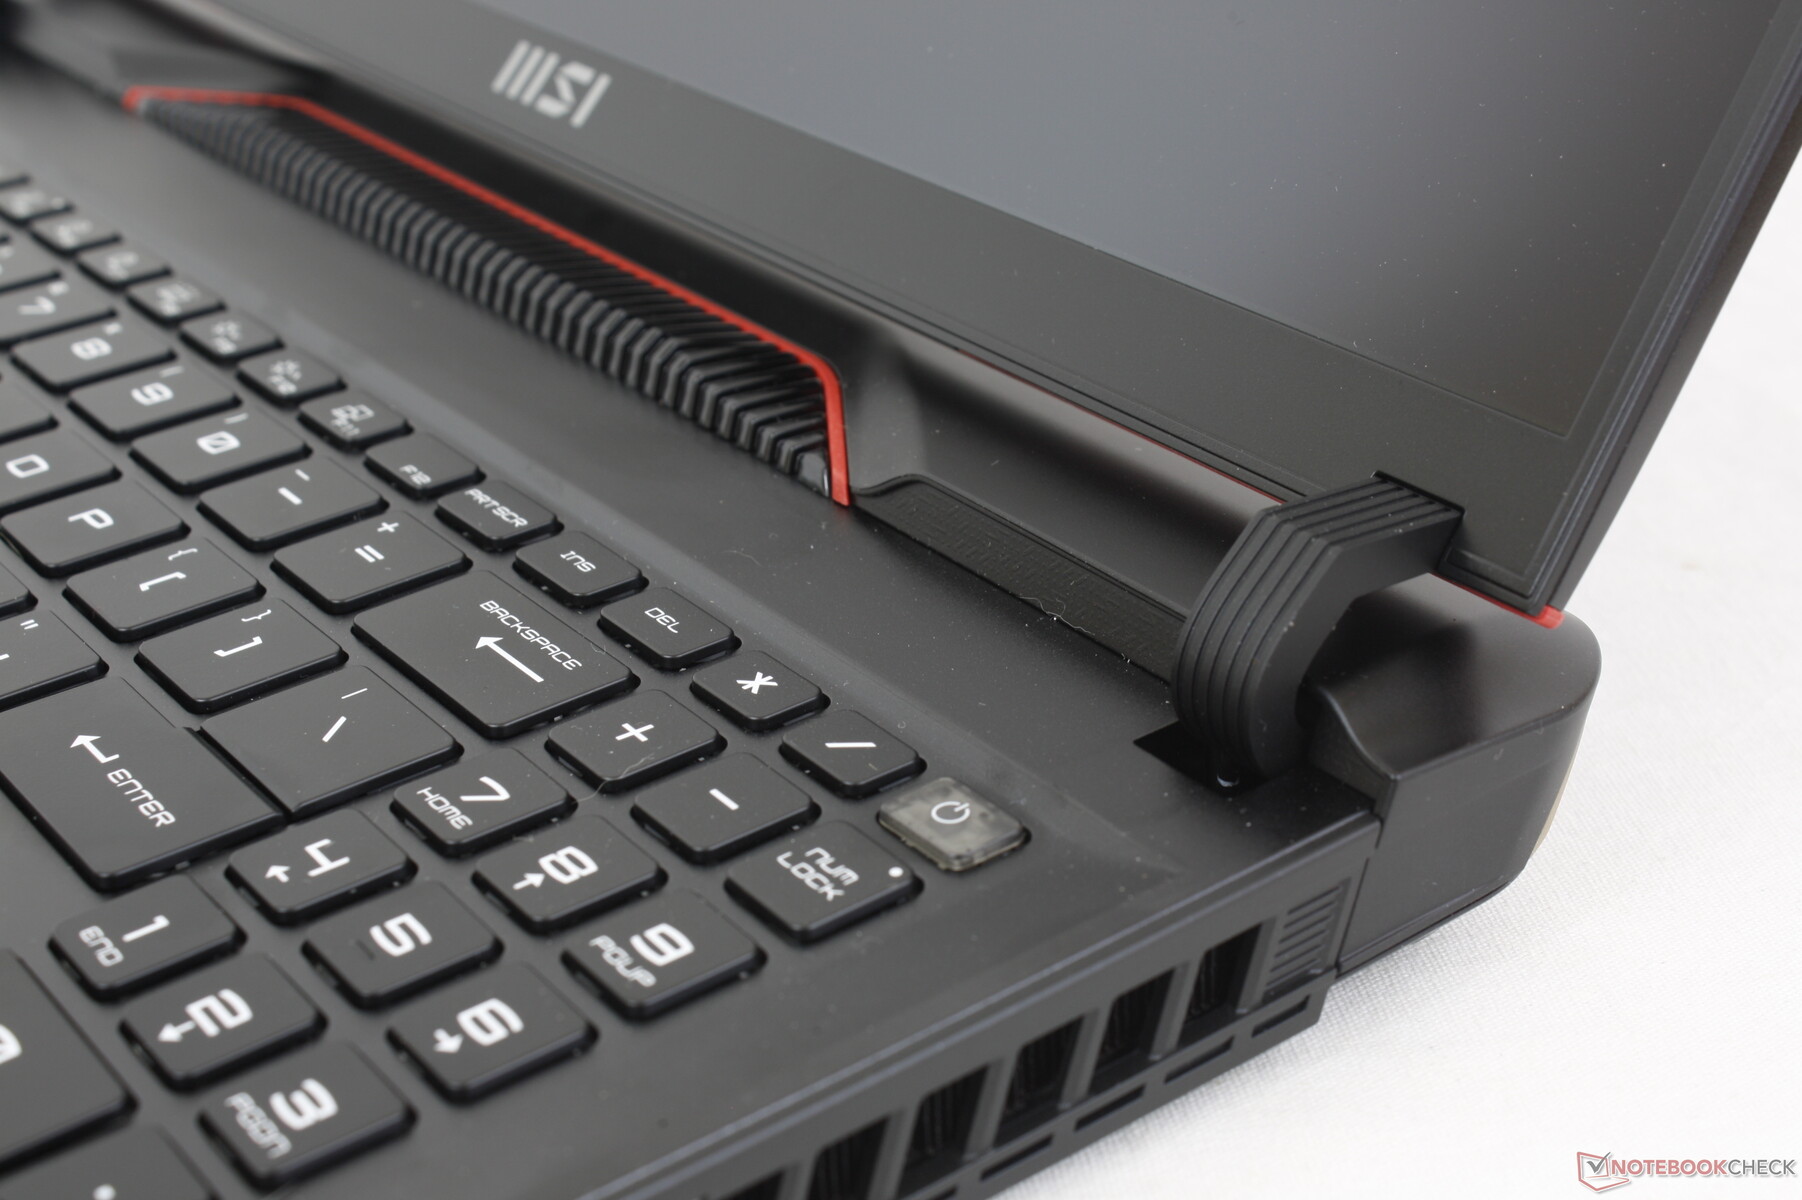
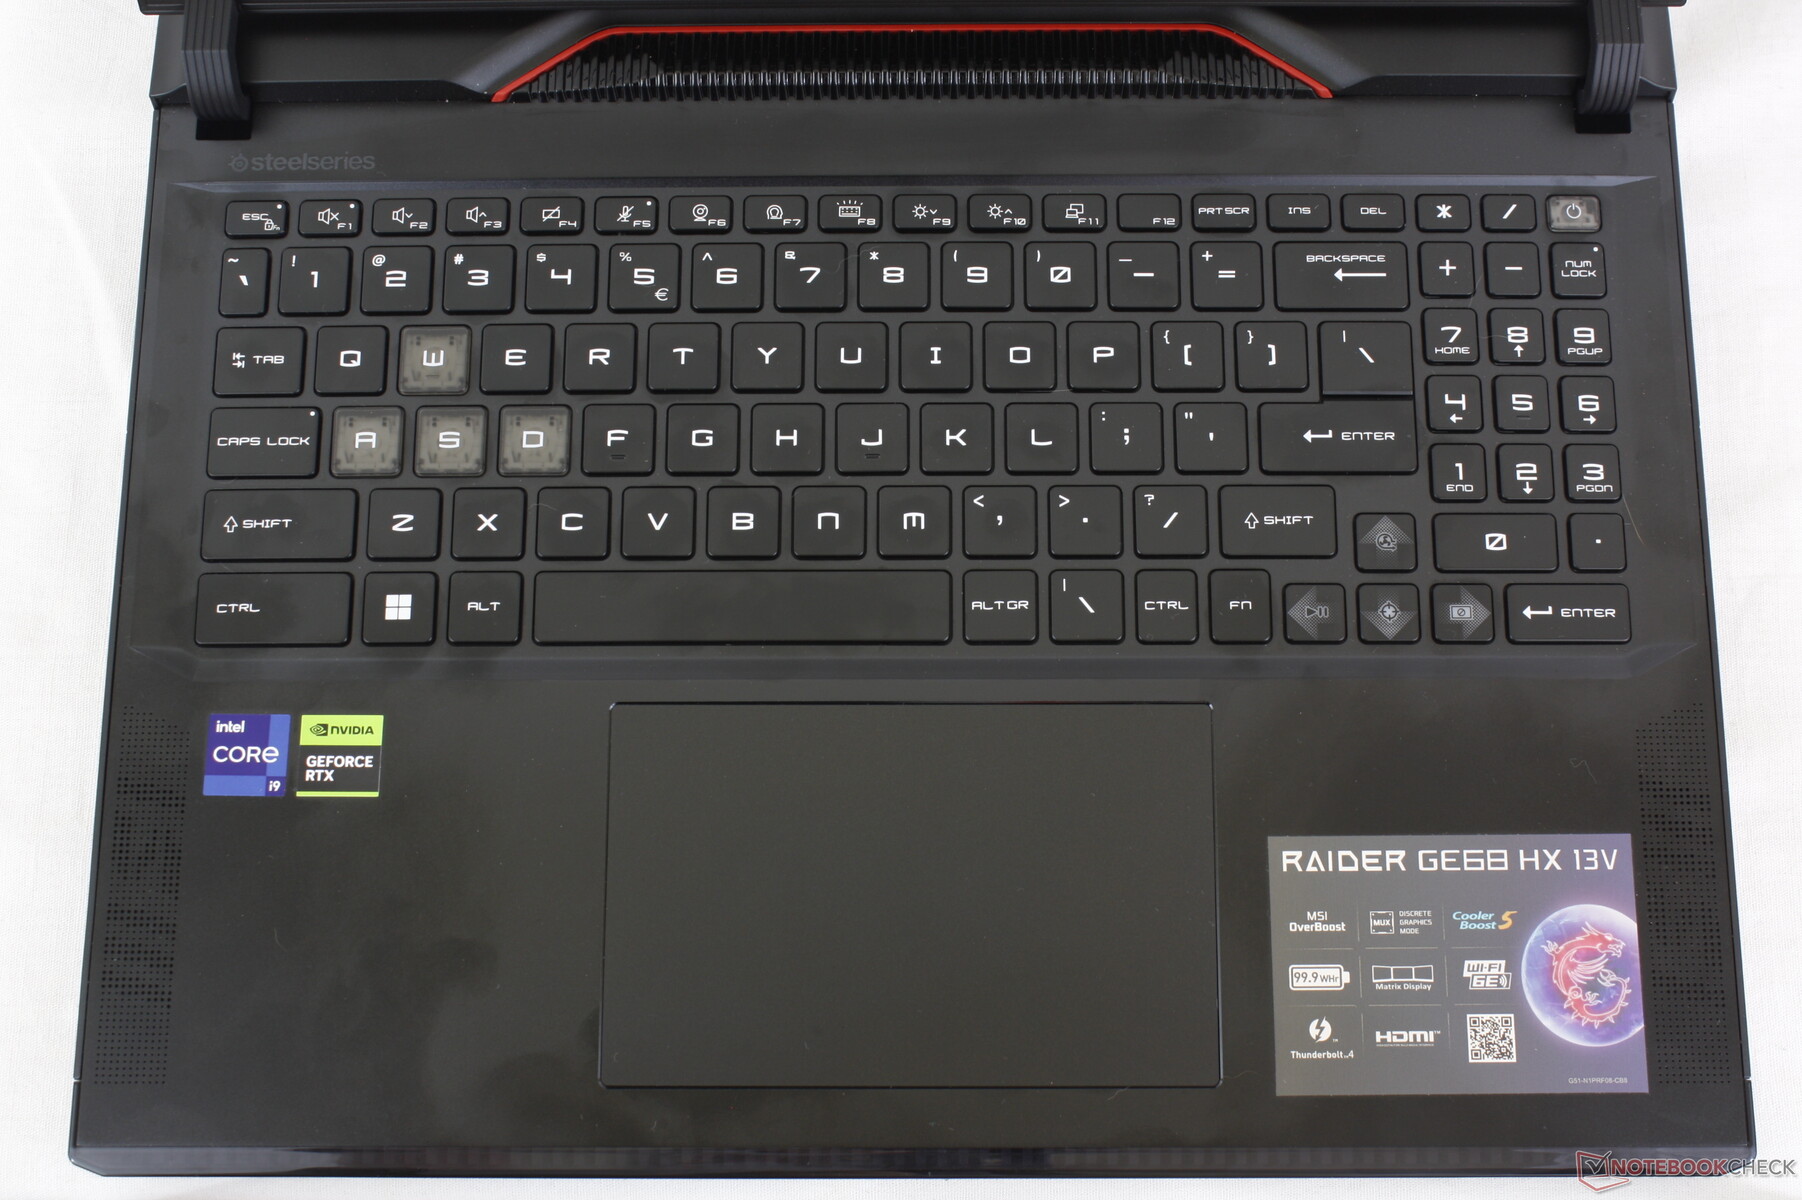
Input Devices — Larger Clickpad And New Numpad
Keyboard
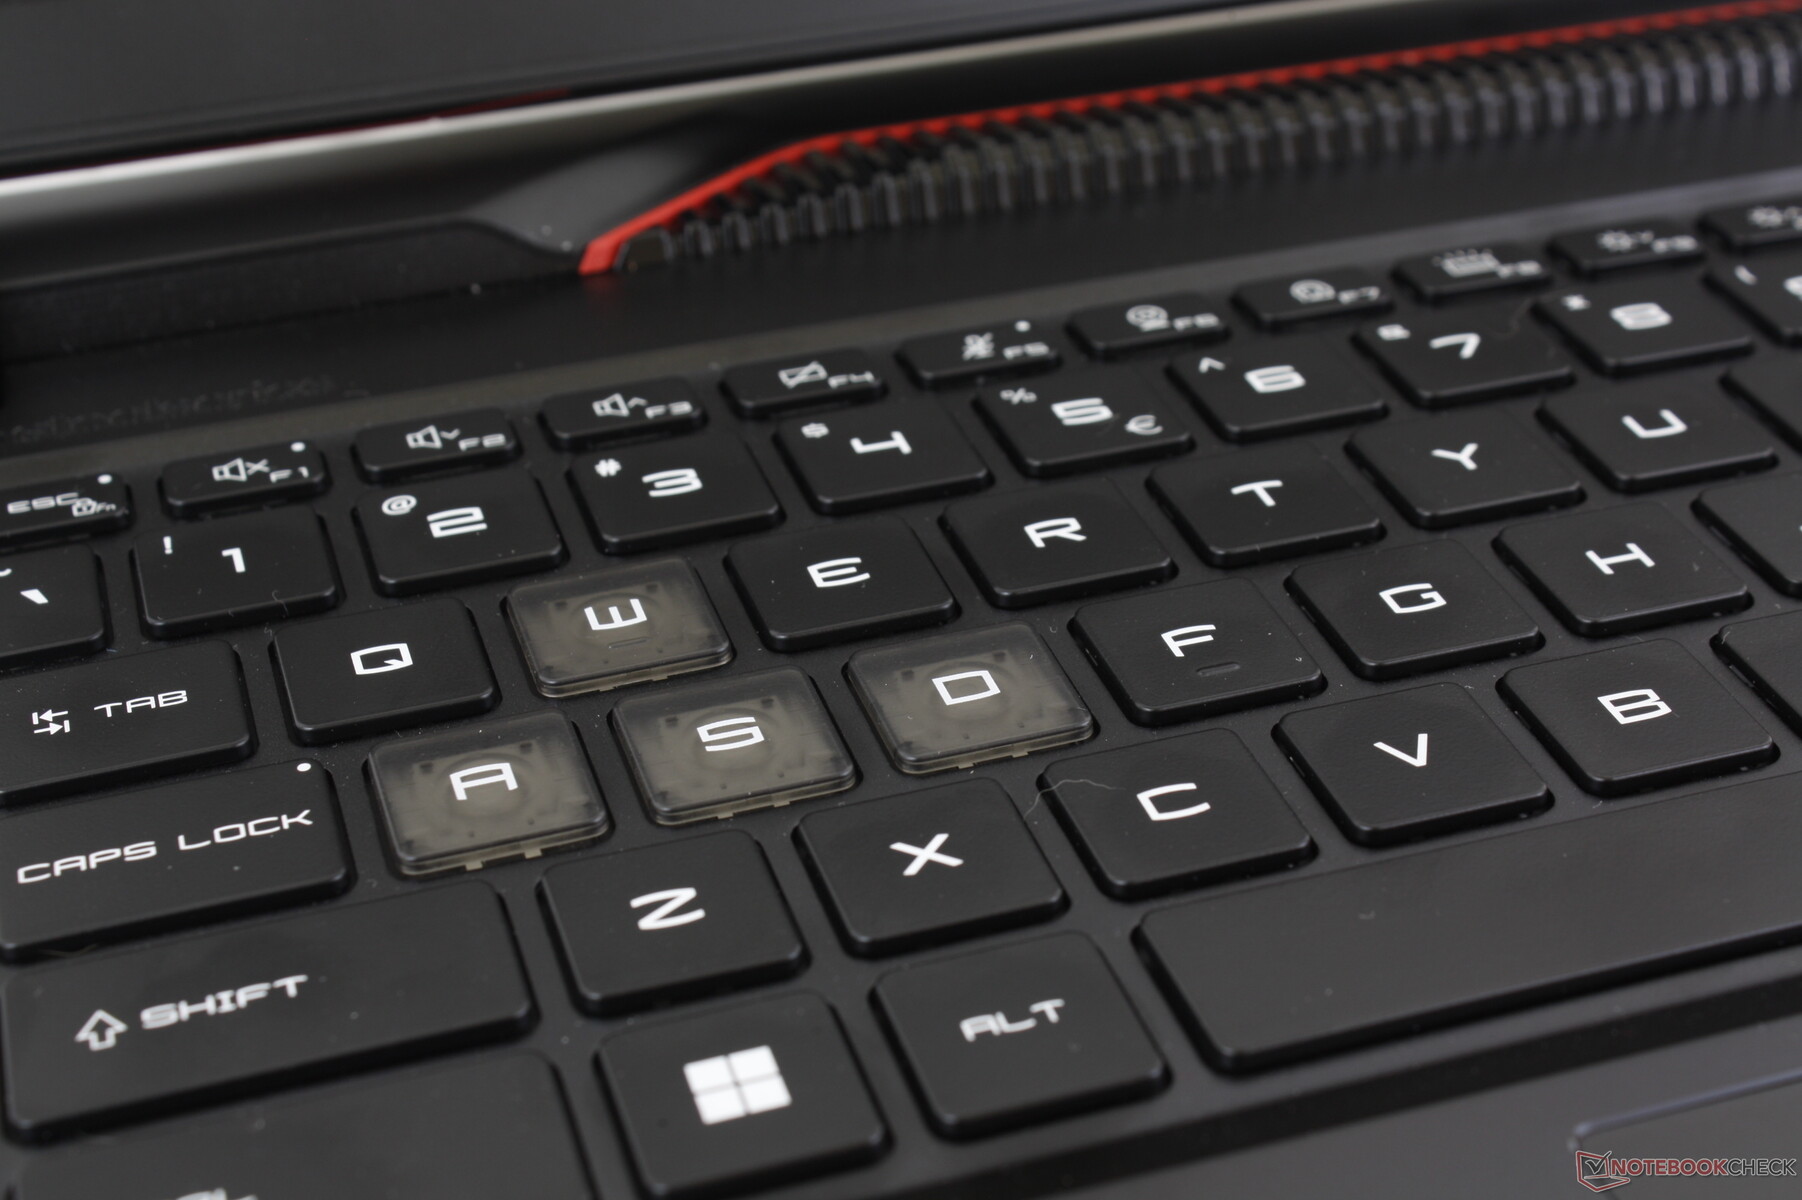
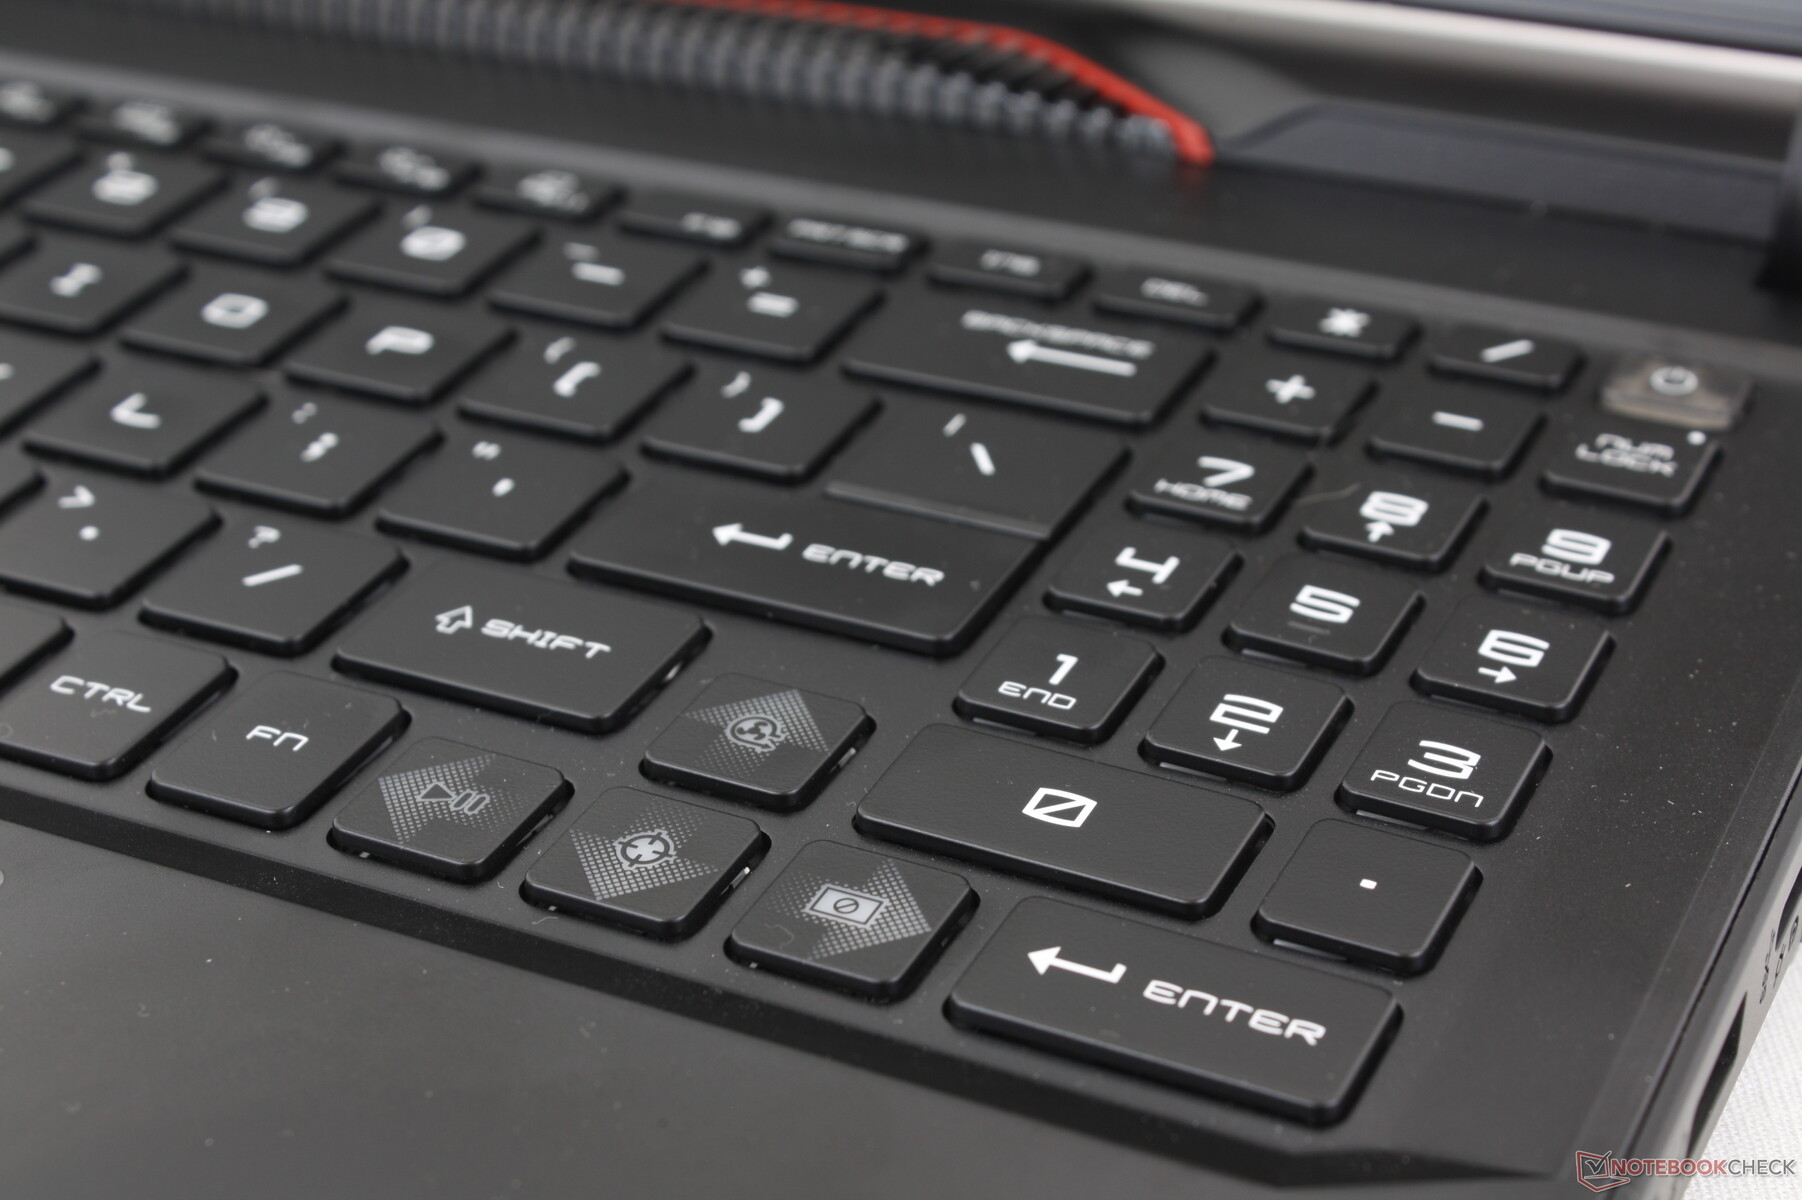
MSI has revamped the keyboard layout when compared to the GE67HX. There is now an integrated numpad while the Ctrl and Fn keys are no longer awkwardly squished together. Unfortunately, the arrow keys have been reduced in size to make room for the new numpad.
Key feedback is otherwise excellent with firm and uniform feedback between the main QWERTY keys. The Space and Enter keys in particular are noticeably louder for a more satisfying feel.
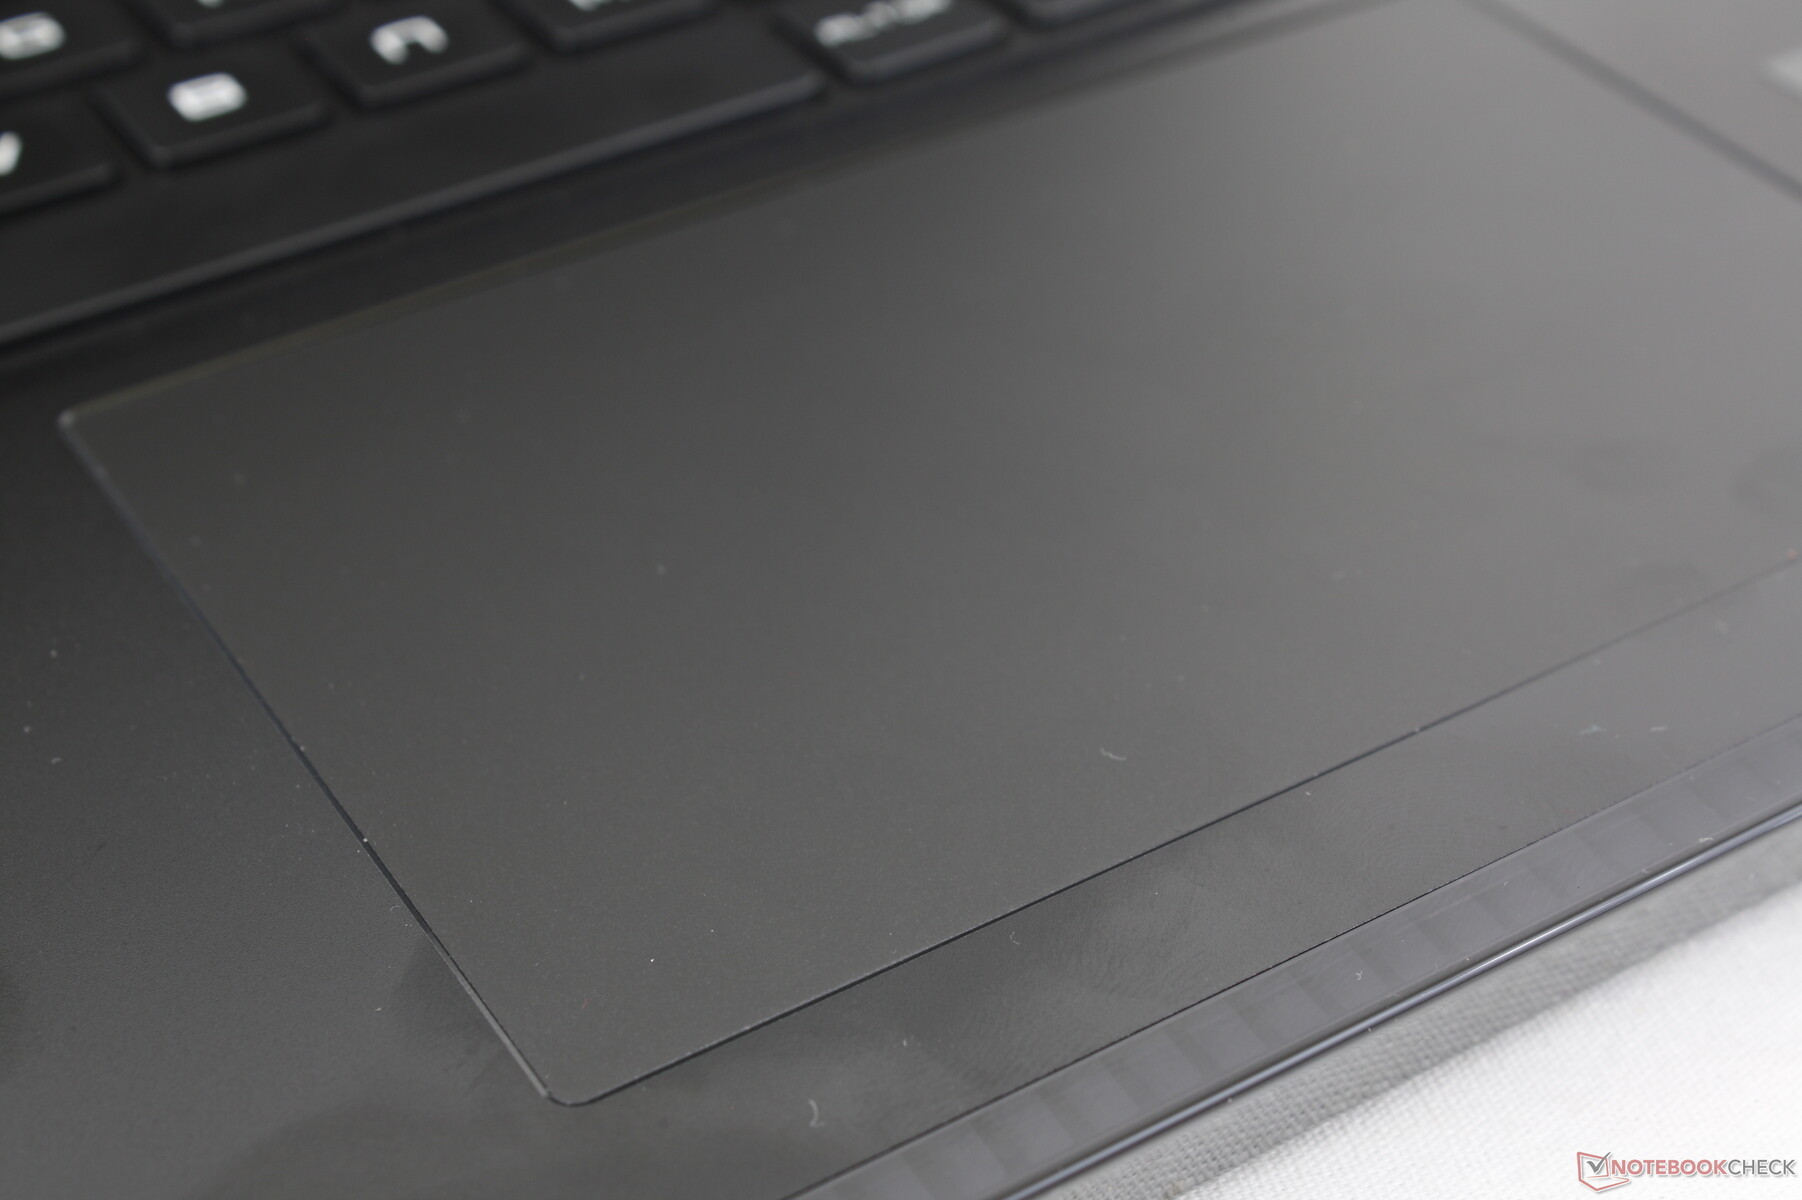
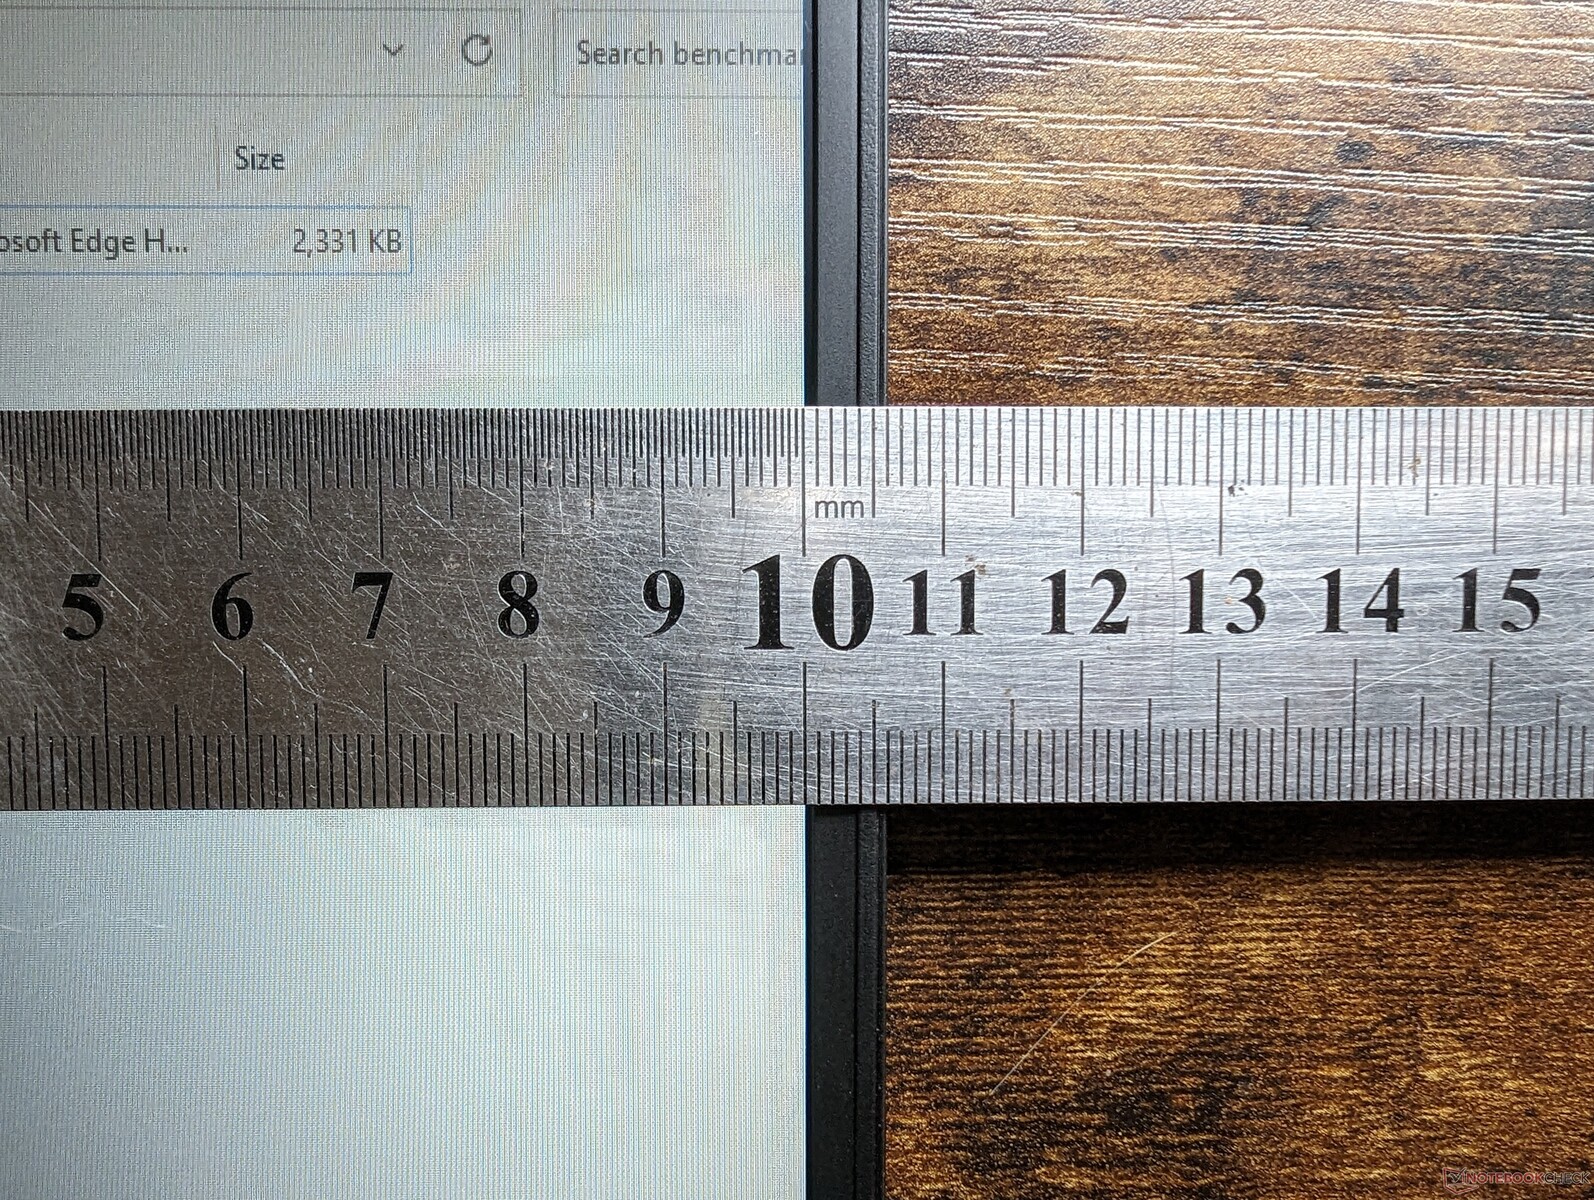
Touchpad
Clickpad size has increased significantly from just 10.5 x 6.5 cm on the GE67HX to 13 x 8.3 cm on the GE68HX. Glide is very smooth and responsive and with almost no sticking even when moving at slower speeds. Clicking is also satisfactory, but feedback is not perfectly uniform as it feels clickier when pressing down the center whereas the bottom corners feel spongier.
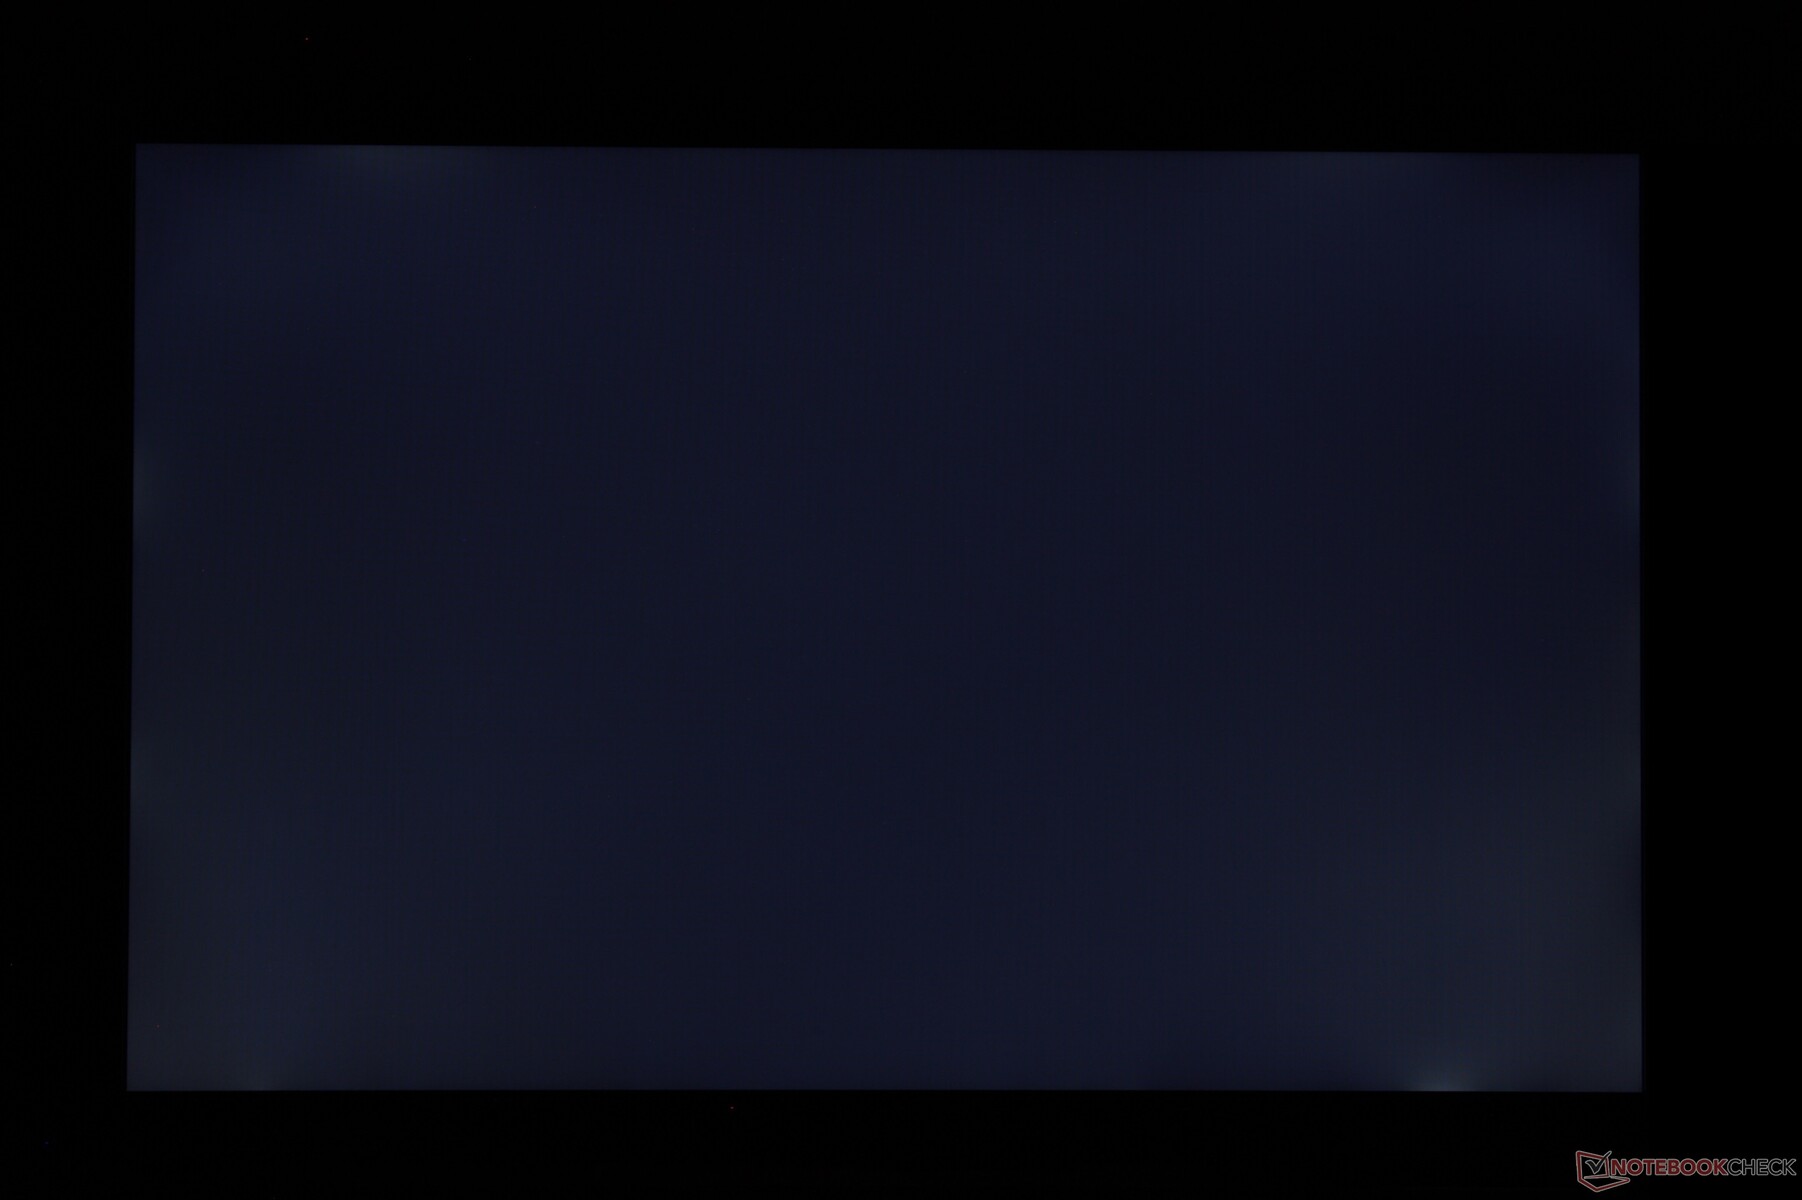
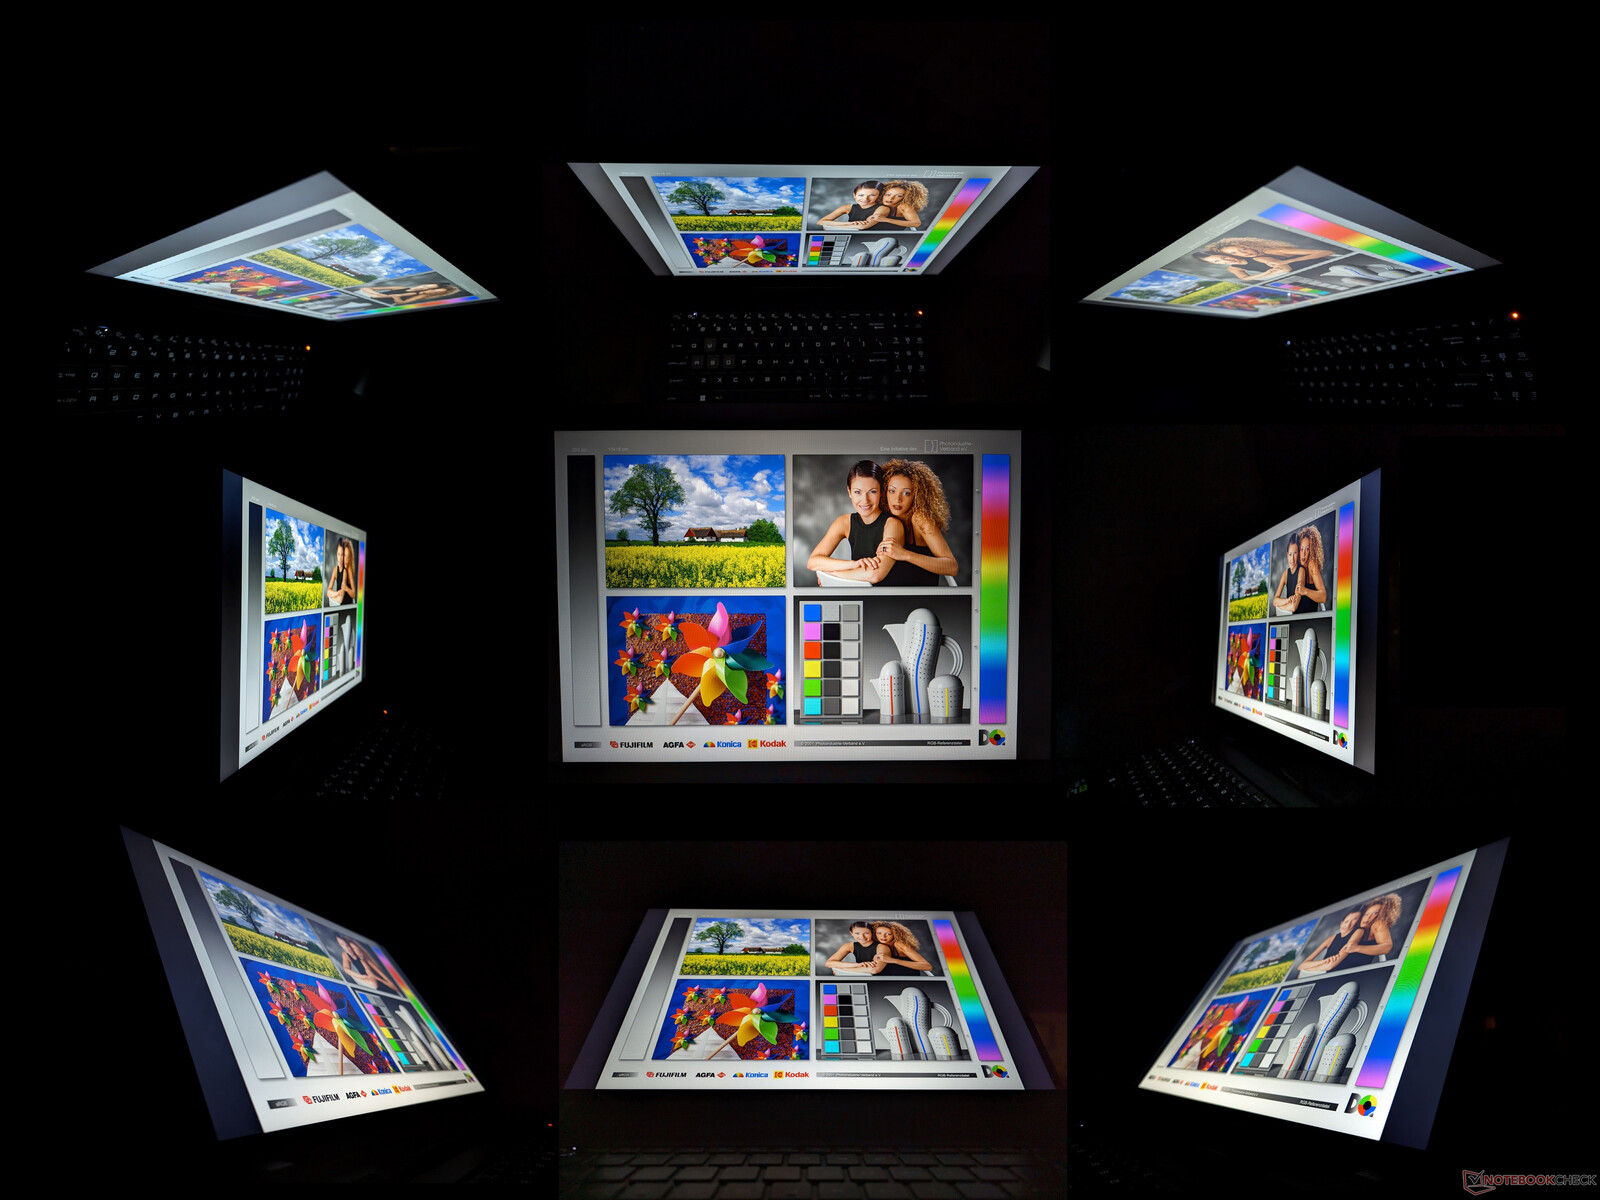
Display — Poor Colors
The Raider GE68HX ships with two different panel options. Our specific review unit comes with the bolded option below:
- 2560 x 1600, 240 Hz, 100% DCI-P3, 3 ms, IPS
- 1920 x 1200, 144 Hz, 60% sRGB, 11 ms, IPS
The cheaper 144 Hz option is not recommended due to its narrower color coverage and slower response times for more noticeable ghosting. The shallower colors are hard to overlook even if you don't do much graphics editing. This panel is more fit for cheaper gaming laptops like the MSI Pulse 17 where narrow color ranges are common.
G-Sync is notably absent on all current configurations of the GE68HX.

| |||||||||||||||||||||||||
Brightness Distribution: 93 %
Center on Battery: 300.9 cd/m²
Contrast: 971:1 (Black: 0.31 cd/m²)
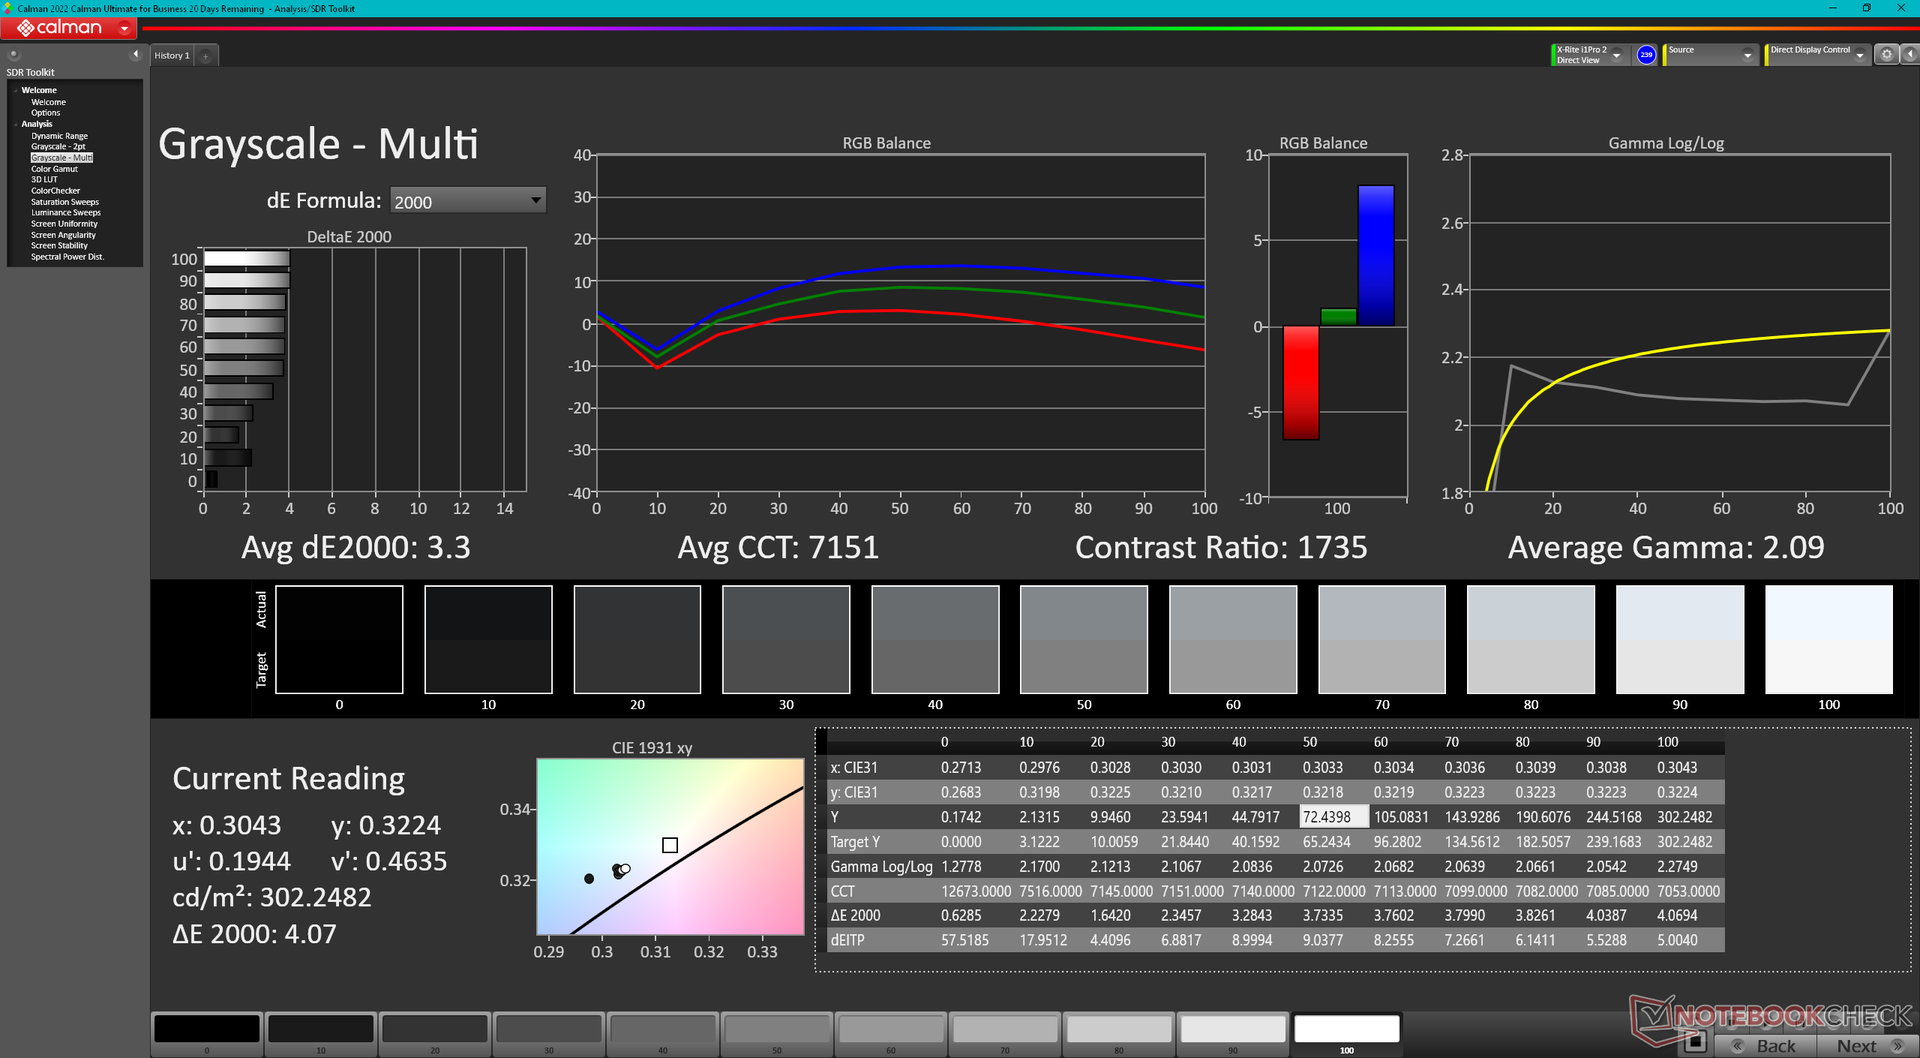
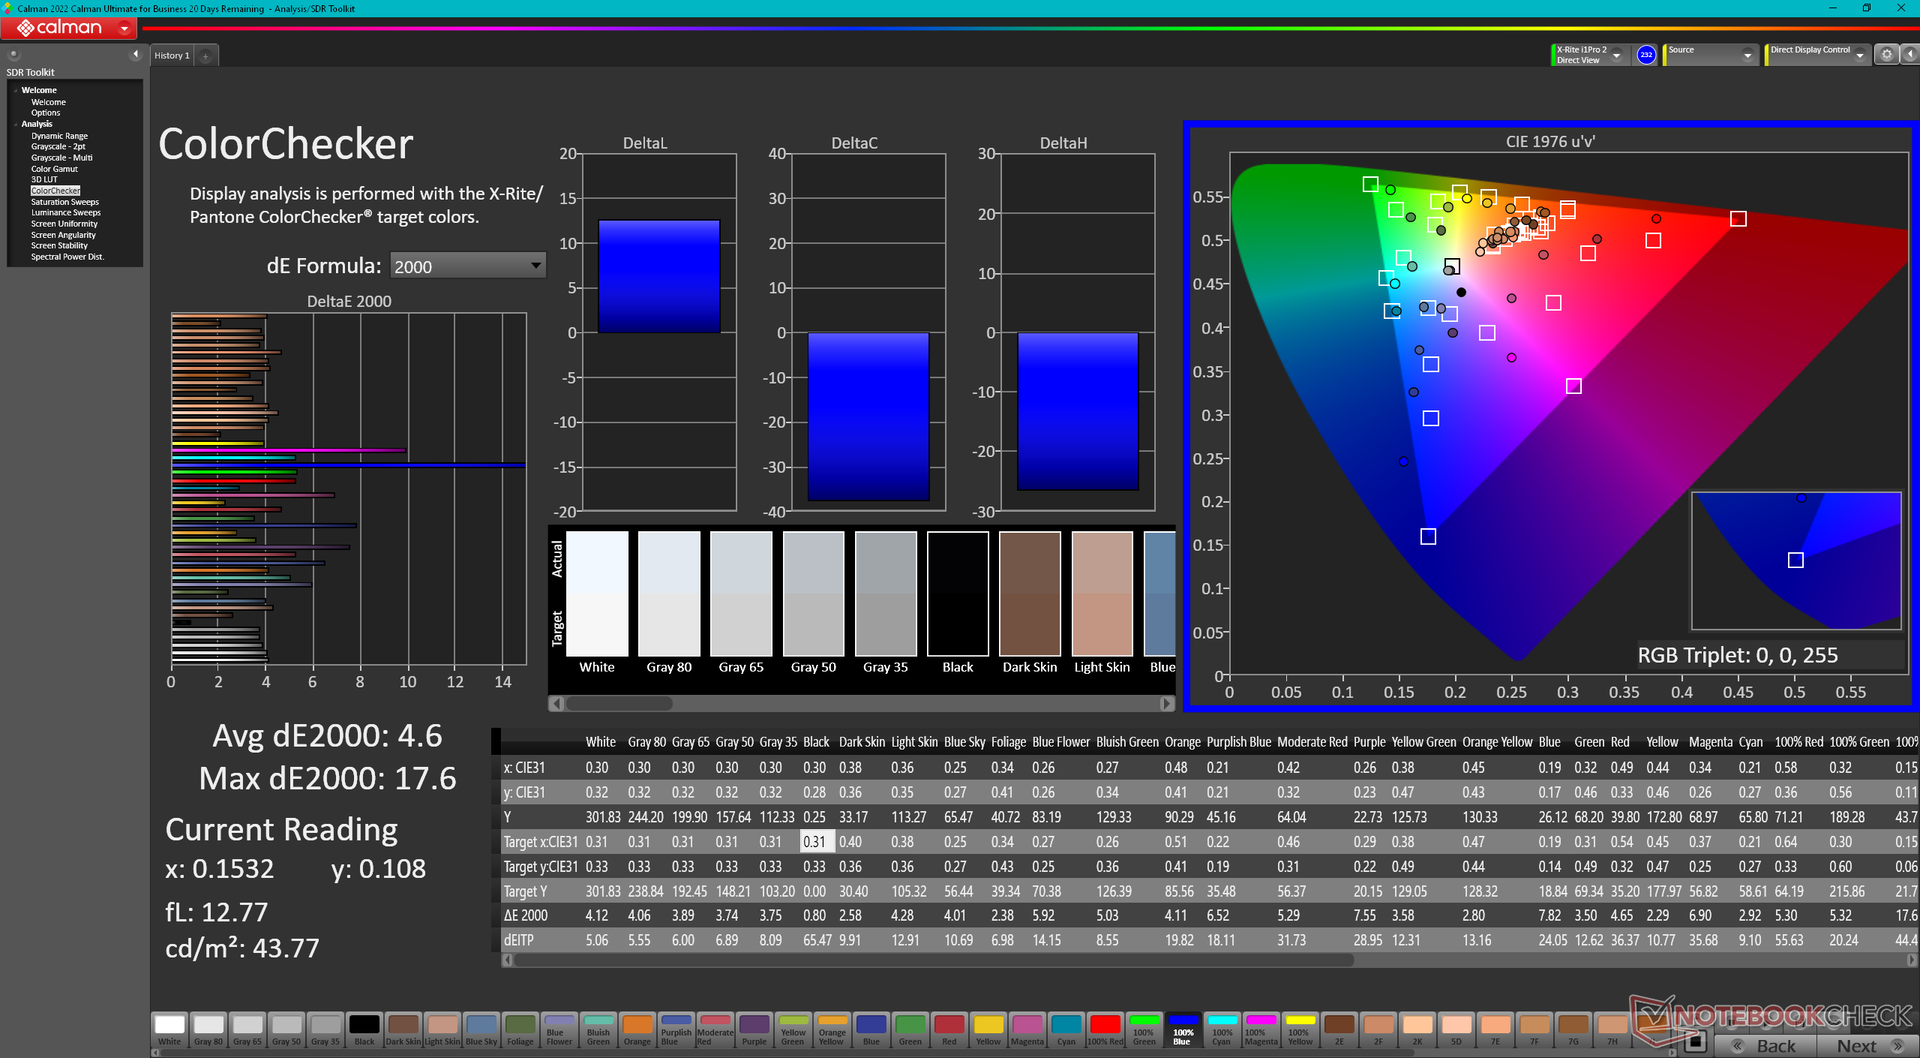
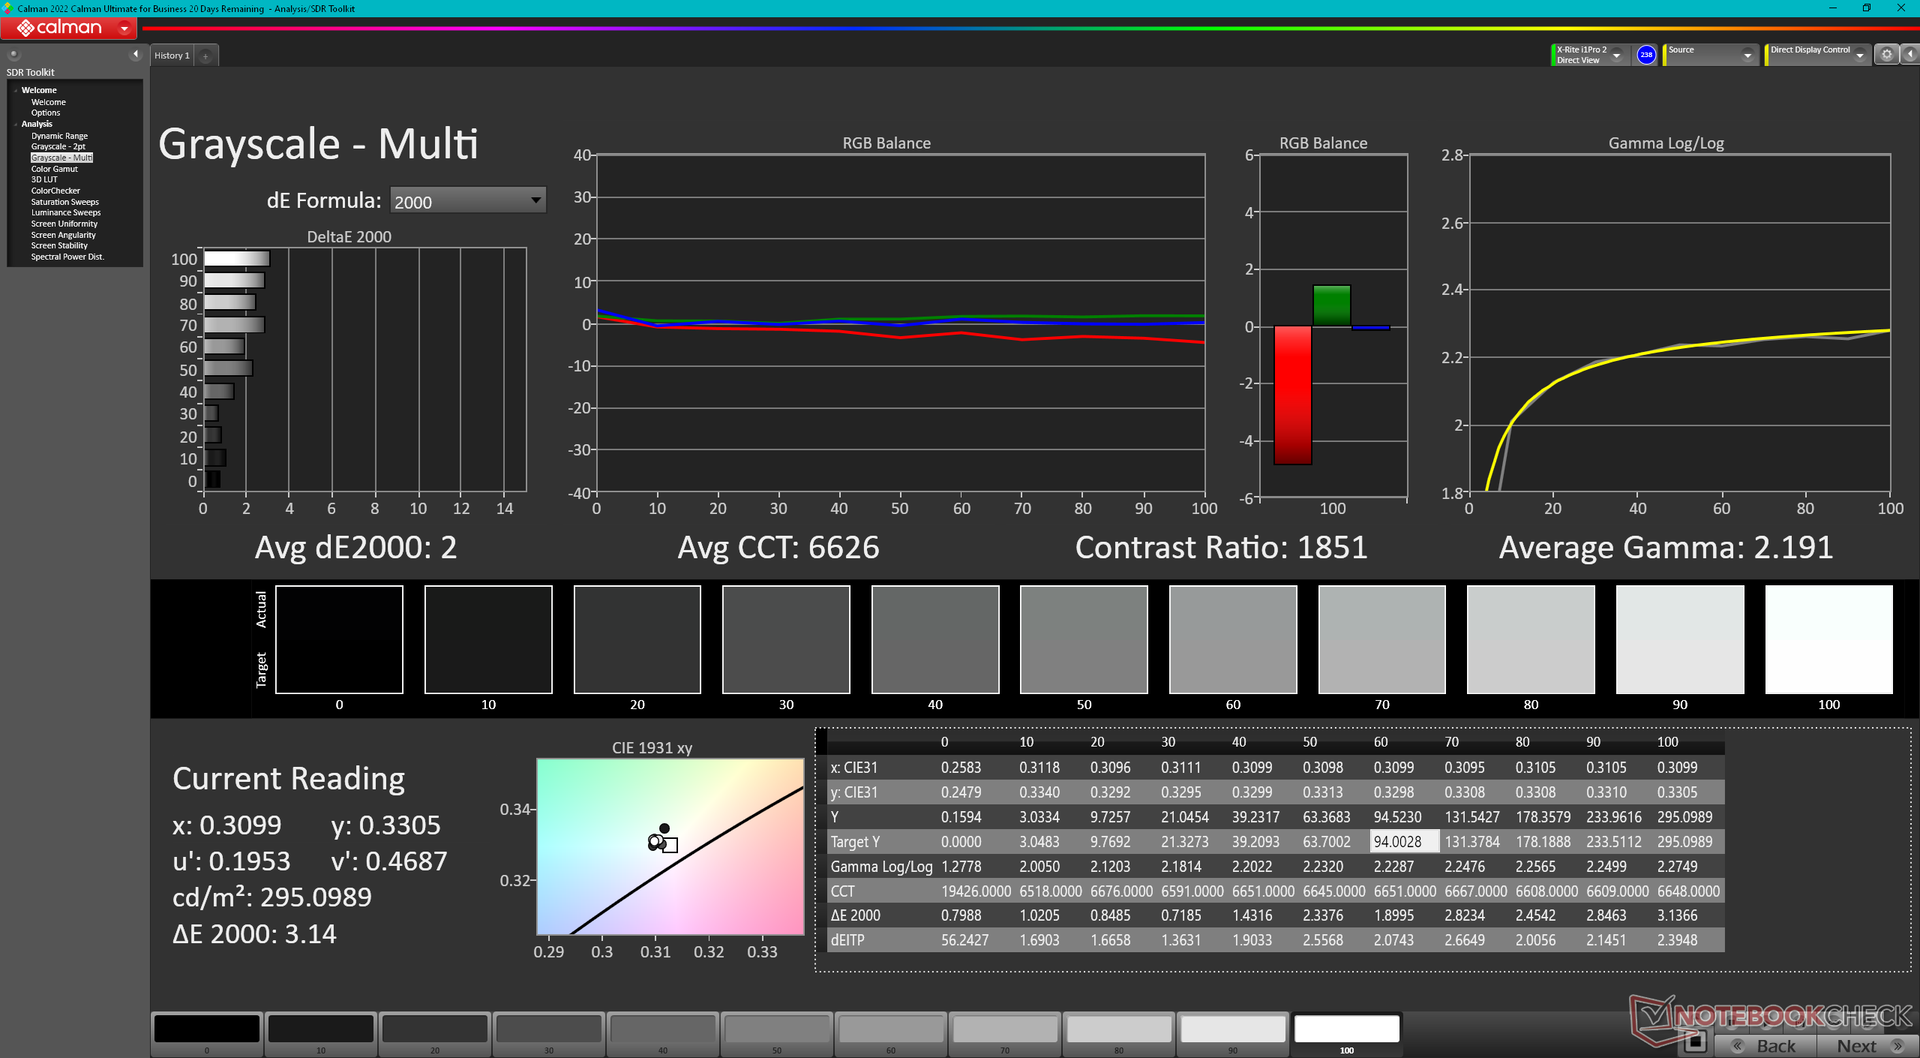
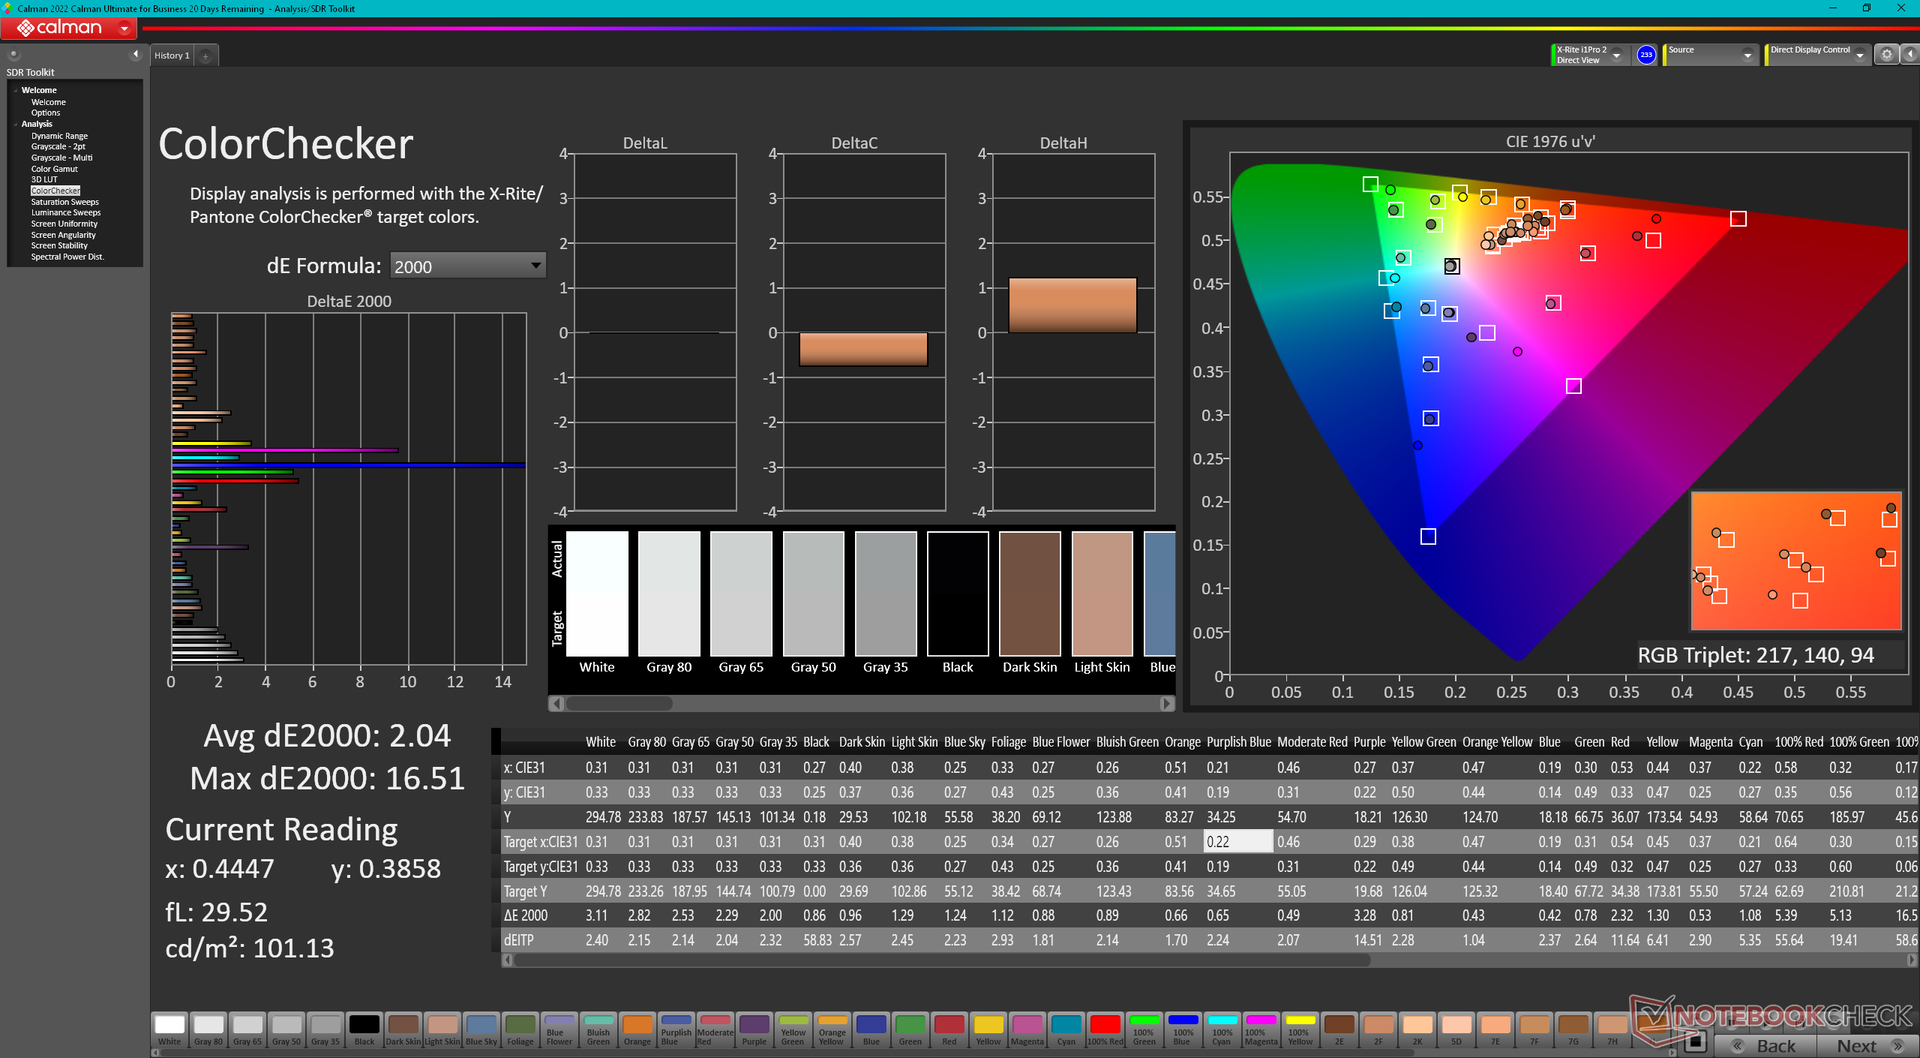
ΔE ColorChecker Calman: 4.6 | ∀{0.5-29.43 Ø4.72}
calibrated: 2.04
ΔE Greyscale Calman: 3.3 | ∀{0.09-98 Ø4.97}
43% AdobeRGB 1998 (Argyll 3D)
62.2% sRGB (Argyll 3D)
41.6% Display P3 (Argyll 3D)
Gamma: 2.09
CCT: 7151 K
| MSI Raider GE68HX 13VF Chi Mei N160JME-GTK, IPS, 1900x1200, 16" | MSI GE67 HX 12UGS Samsung ATNA562P02-0, OLED, 1920x1080, 15.6" | HP Omen 16-xf0376ng BOE0B81, IPS, 1920x1080, 16.1" | Alienware m16 R1 AMD BOE NE16NZ4, IPS, 2560x1600, 16" | Lenovo Legion Slim 7i 16 Gen 8 CSOT T3 MNG007DA2-3, IPS, 2560x1600, 16" | Asus ROG Zephyrus M16 GU604VY-NM042X BOE0B74 (NE160QDM-NM4, IPS, 2560x1600, 16" | |
|---|---|---|---|---|---|---|
| Display | 64% | 67% | 102% | 66% | 103% | |
| Display P3 Coverage (%) | 41.6 | 71.7 72% | 72.1 73% | 98.6 137% | 70.4 69% | 99.33 139% |
| sRGB Coverage (%) | 62.2 | 89.7 44% | 99.6 60% | 99.9 61% | 99.4 60% | 99.9 61% |
| AdobeRGB 1998 Coverage (%) | 43 | 75.2 75% | 72.3 68% | 88.9 107% | 72.5 69% | 90.01 109% |
| Response Times | 99% | 50% | 67% | 47% | -108% | |
| Response Time Grey 50% / Grey 80% * (ms) | 17.3 ? | 0.25 ? 99% | 12.3 ? 29% | 5.1 ? 71% | 12 ? 31% | 50.8 ? -194% |
| Response Time Black / White * (ms) | 24.2 ? | 0.4 ? 98% | 7.2 ? 70% | 9 ? 63% | 8.9 ? 63% | 29.6 ? -22% |
| PWM Frequency (Hz) | 480.4 ? | 12000 | ||||
| Screen | 17% | 10% | 10% | 34% | 297% | |
| Brightness middle (cd/m²) | 300.9 | 356.1 18% | 350 16% | 329 9% | 474.6 58% | 634 111% |
| Brightness (cd/m²) | 302 | 358 19% | 338 12% | 317 5% | 445 47% | 627 108% |
| Brightness Distribution (%) | 93 | 99 6% | 91 -2% | 89 -4% | 86 -8% | 92 -1% |
| Black Level * (cd/m²) | 0.31 | 0.35 -13% | 0.32 -3% | 0.39 -26% | 0.03 90% | |
| Contrast (:1) | 971 | 1000 3% | 1028 6% | 1217 25% | 21133 2076% | |
| Colorchecker dE 2000 * | 4.6 | 4.83 -5% | 3.29 28% | 3.71 19% | 2.12 54% | 0.89 81% |
| Colorchecker dE 2000 max. * | 17.6 | 7.94 55% | 8.47 52% | 7.23 59% | 4.73 73% | 1.79 90% |
| Colorchecker dE 2000 calibrated * | 2.04 | 2.23 -9% | 2.82 -38% | 0.57 72% | 0.91 55% | |
| Greyscale dE 2000 * | 3.3 | 3.1 6% | 3.2 3% | 2.2 33% | 2.8 15% | 1.13 66% |
| Gamma | 2.09 105% | 2.2 100% | 2.131 103% | 2.3 96% | 2.22 99% | 2.47 89% |
| CCT | 7151 91% | 5938 109% | 6317 103% | 6270 104% | 6542 99% | 6497 100% |
| Total Average (Program / Settings) | 60% /
44% | 42% /
28% | 60% /
38% | 49% /
43% | 97% /
198% |
* ... smaller is better
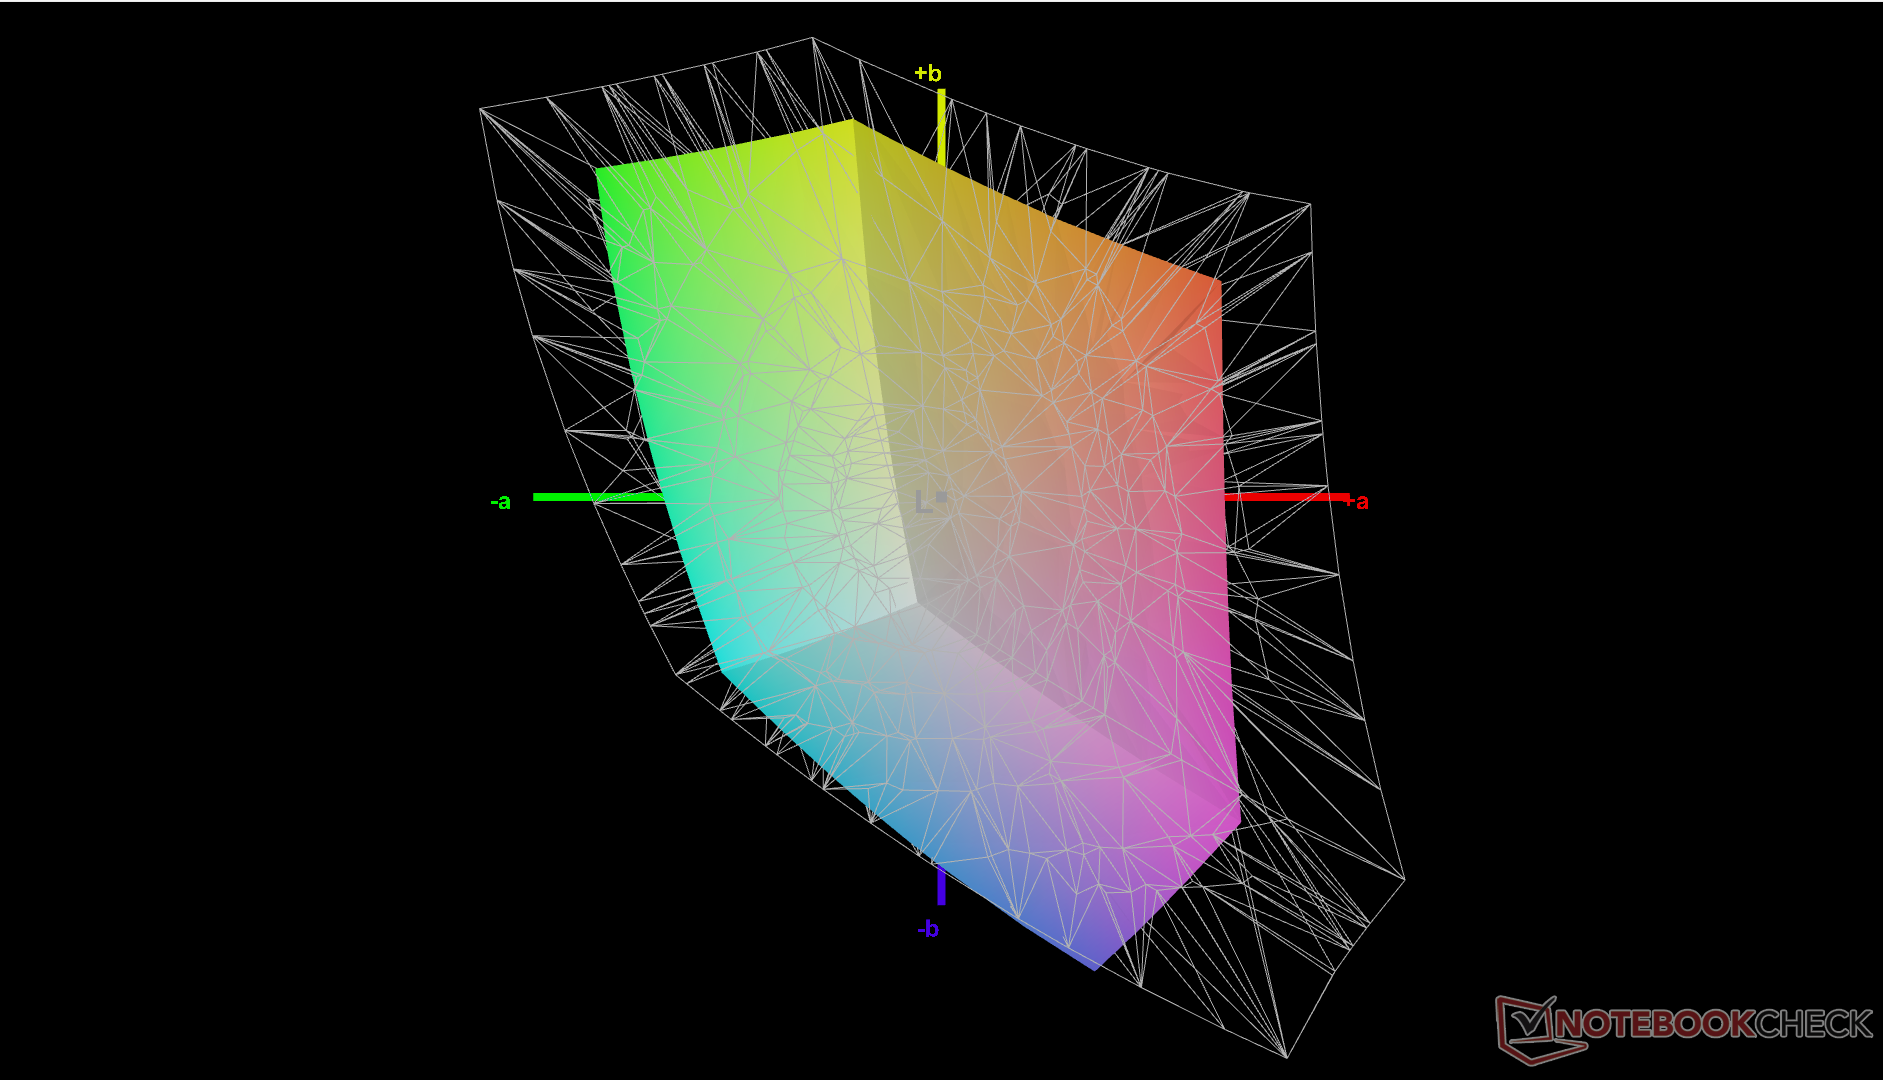
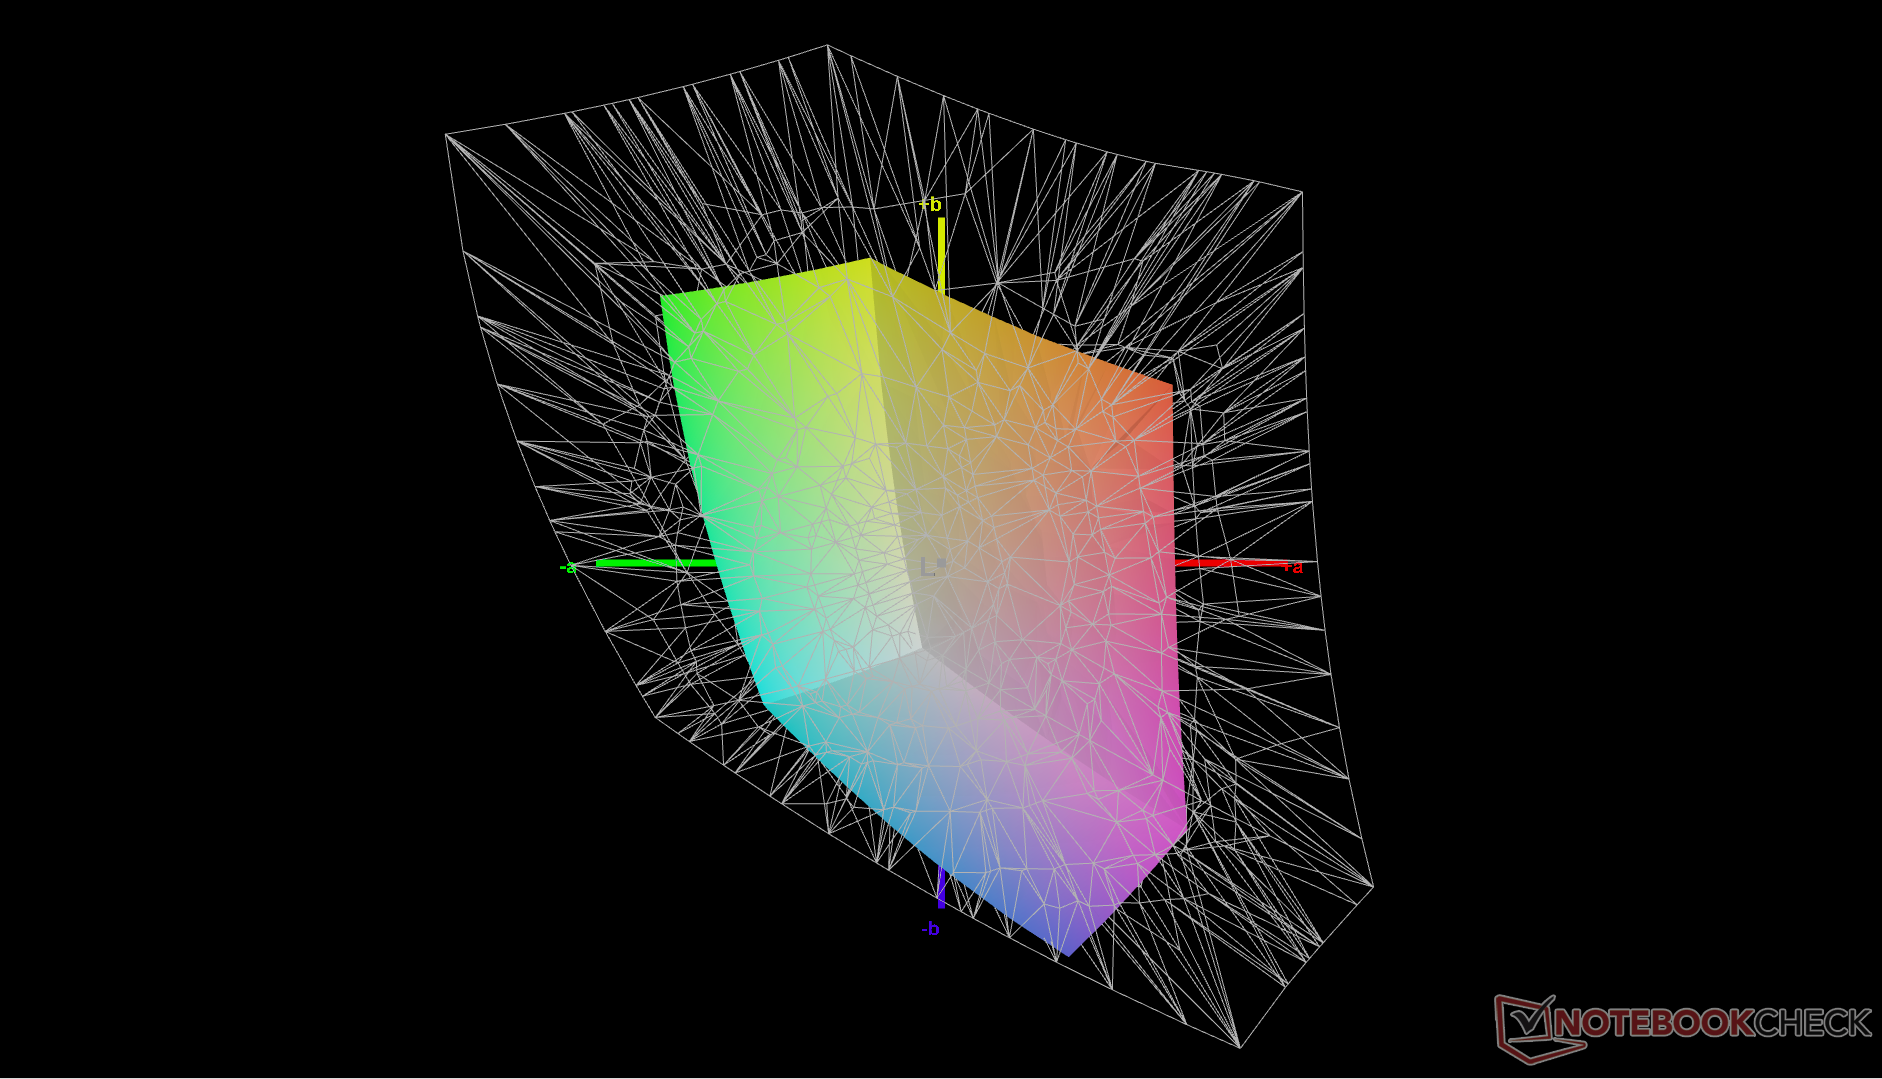
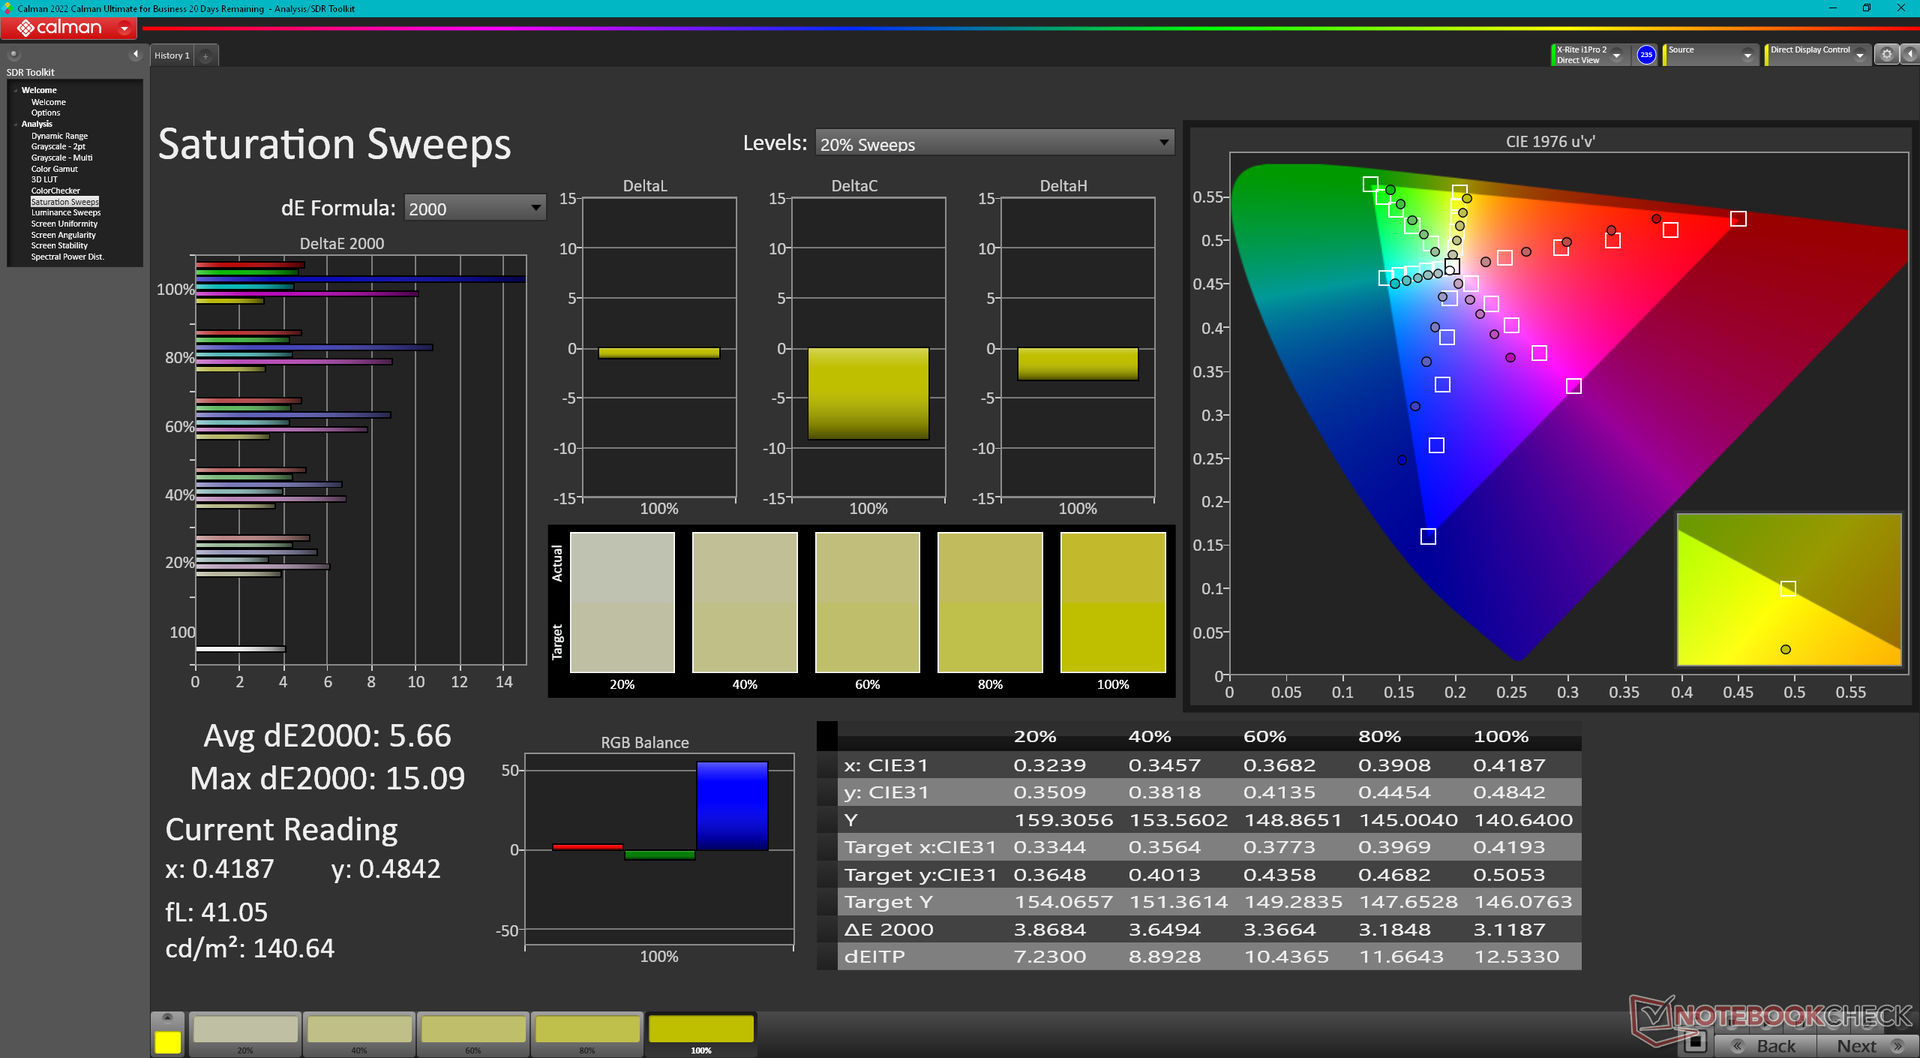
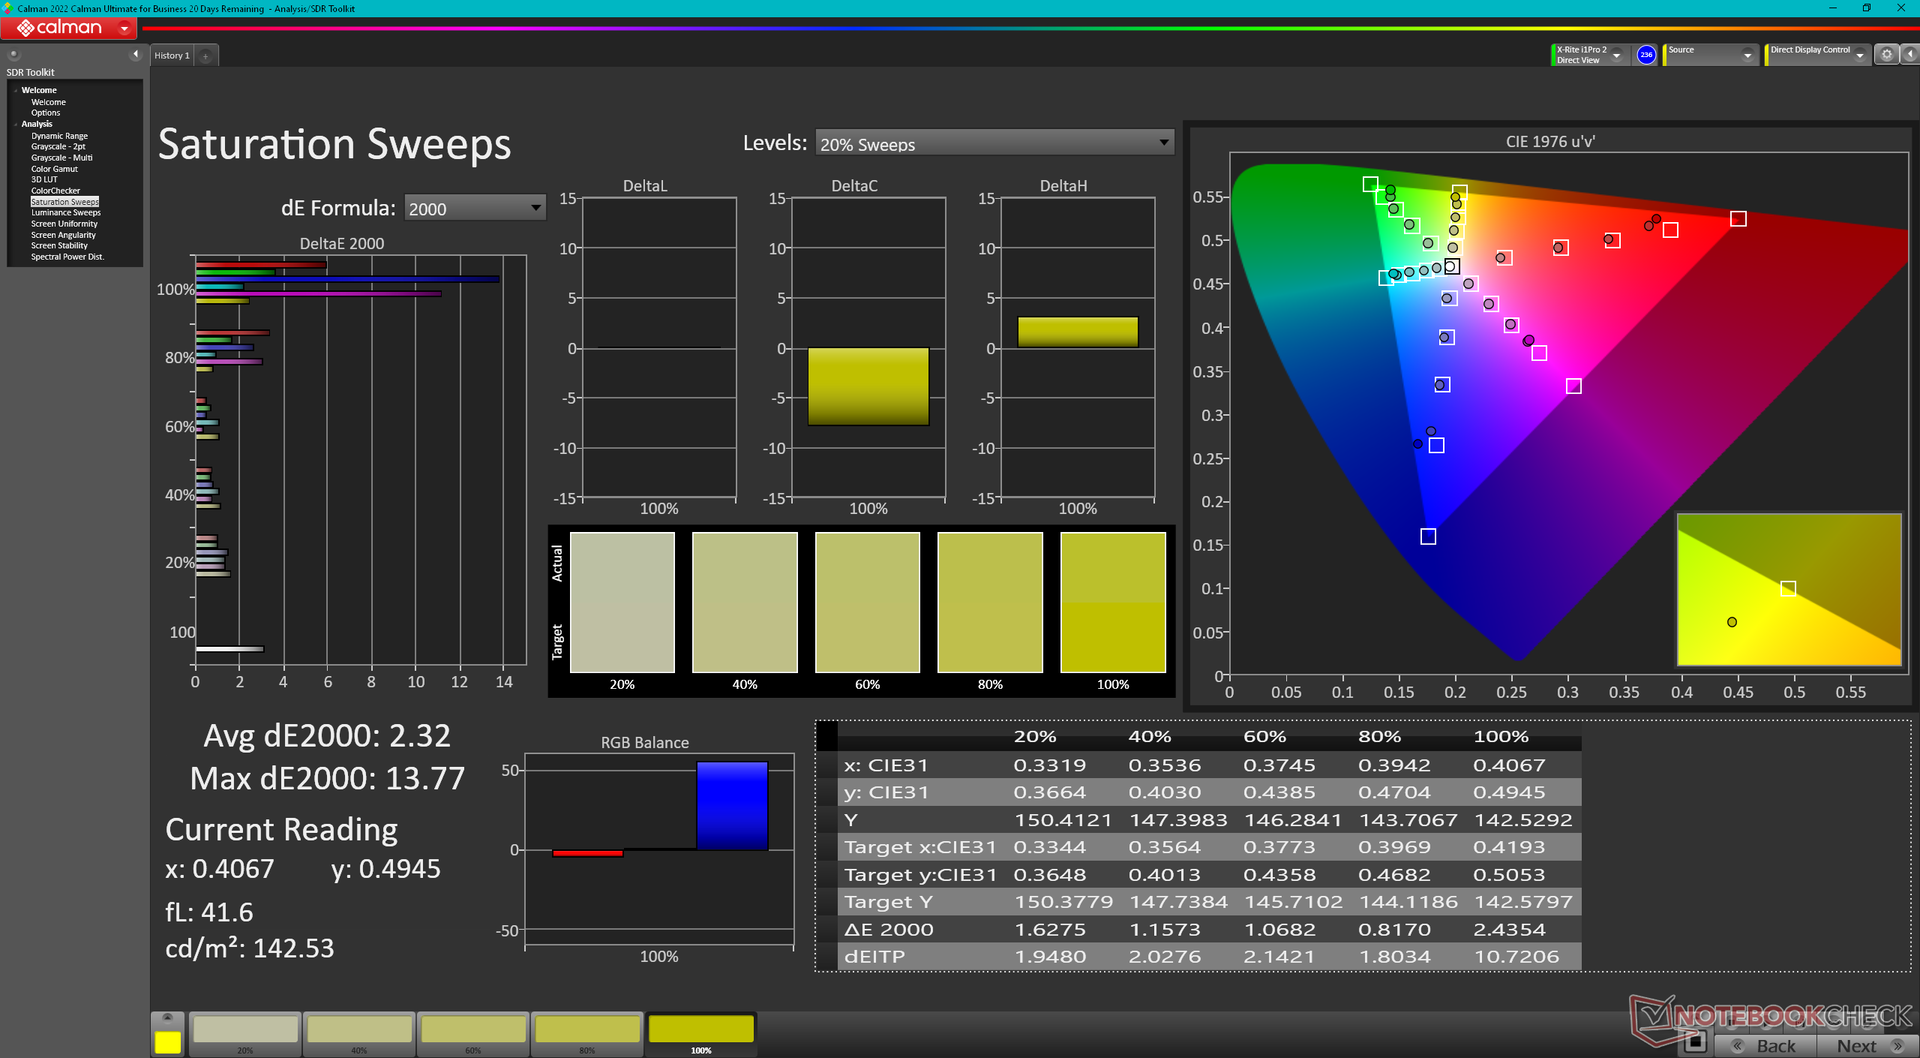
The display does not come pre-calibrated, but average color accuracy isn't bad all things considered. Calibrating the panel ourselves with an X-Rite colorimeter would improve average grayscale and color DeltaE values from 3.3 and 4.6 to just 2 and 2.04, respectively. Colors would still become increasingly inaccurate at higher saturation levels no matter how much you calibrate it due to the limited color space of the panel. Blue is perhaps the worst offender as it would appear slightly Violet instead. Our ICM profile is available above to download for free.
Display Response Times
| ↔ Response Time Black to White | ||
|---|---|---|
| 24.2 ms ... rise ↗ and fall ↘ combined | ↗ 10.6 ms rise | 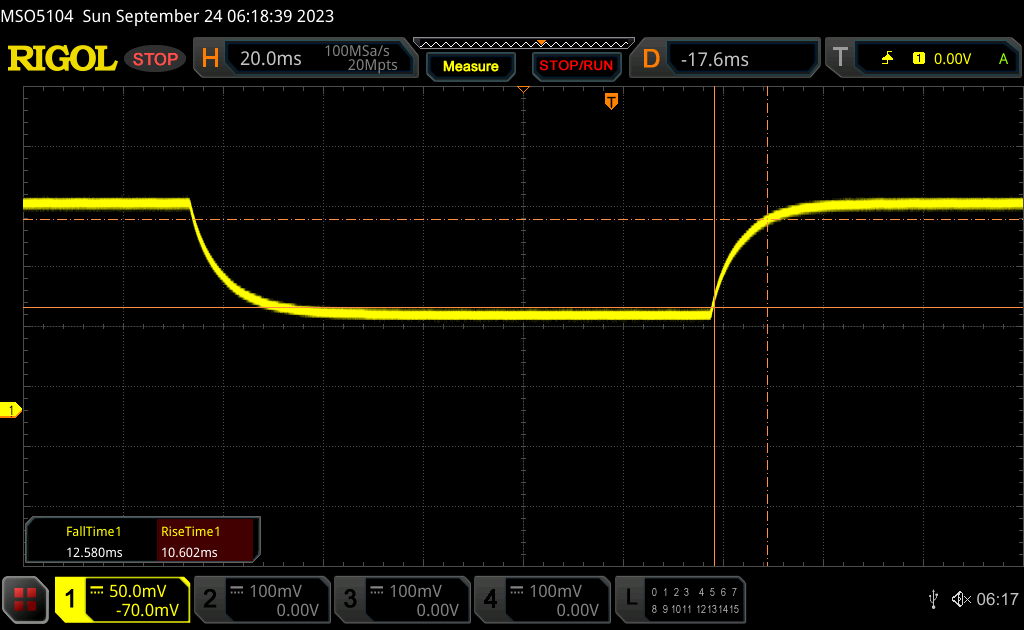 |
| ↘ 12.6 ms fall | ||
| The screen shows good response rates in our tests, but may be too slow for competitive gamers. In comparison, all tested devices range from 0.1 (minimum) to 240 (maximum) ms. » 57 % of all devices are better. This means that the measured response time is worse than the average of all tested devices (19.9 ms). | ||
| ↔ Response Time 50% Grey to 80% Grey | ||
| 17.3 ms ... rise ↗ and fall ↘ combined | ↗ 9.4 ms rise | 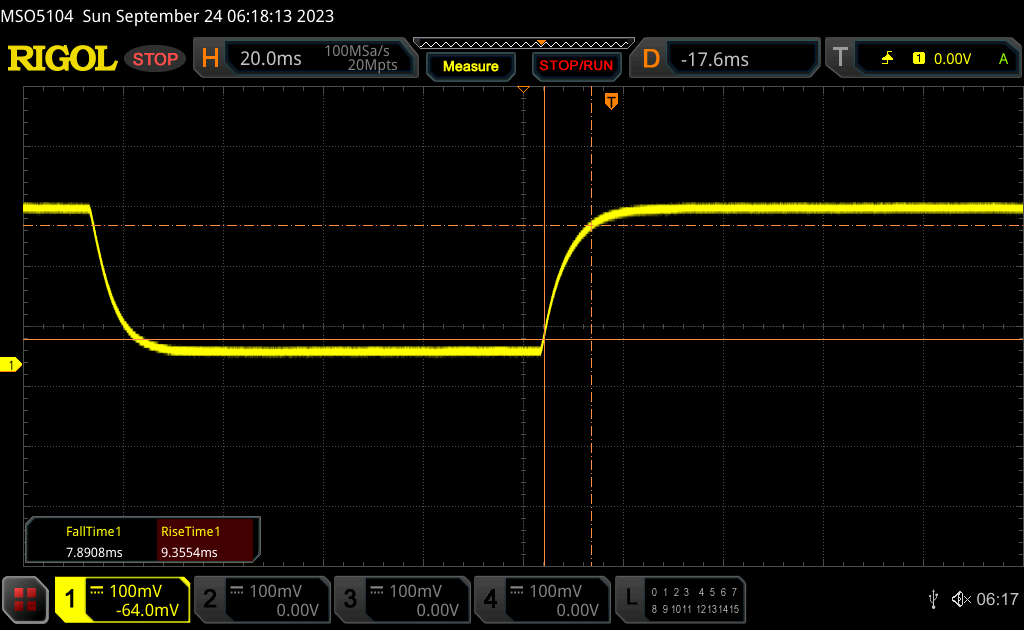 |
| ↘ 7.9 ms fall | ||
| The screen shows good response rates in our tests, but may be too slow for competitive gamers. In comparison, all tested devices range from 0.165 (minimum) to 636 (maximum) ms. » 31 % of all devices are better. This means that the measured response time is better than the average of all tested devices (31.1 ms). | ||
Screen Flickering / PWM (Pulse-Width Modulation)
| Screen flickering / PWM not detected |  | ||
In comparison: 52 % of all tested devices do not use PWM to dim the display. If PWM was detected, an average of 7784 (minimum: 5 - maximum: 343500) Hz was measured. | |||
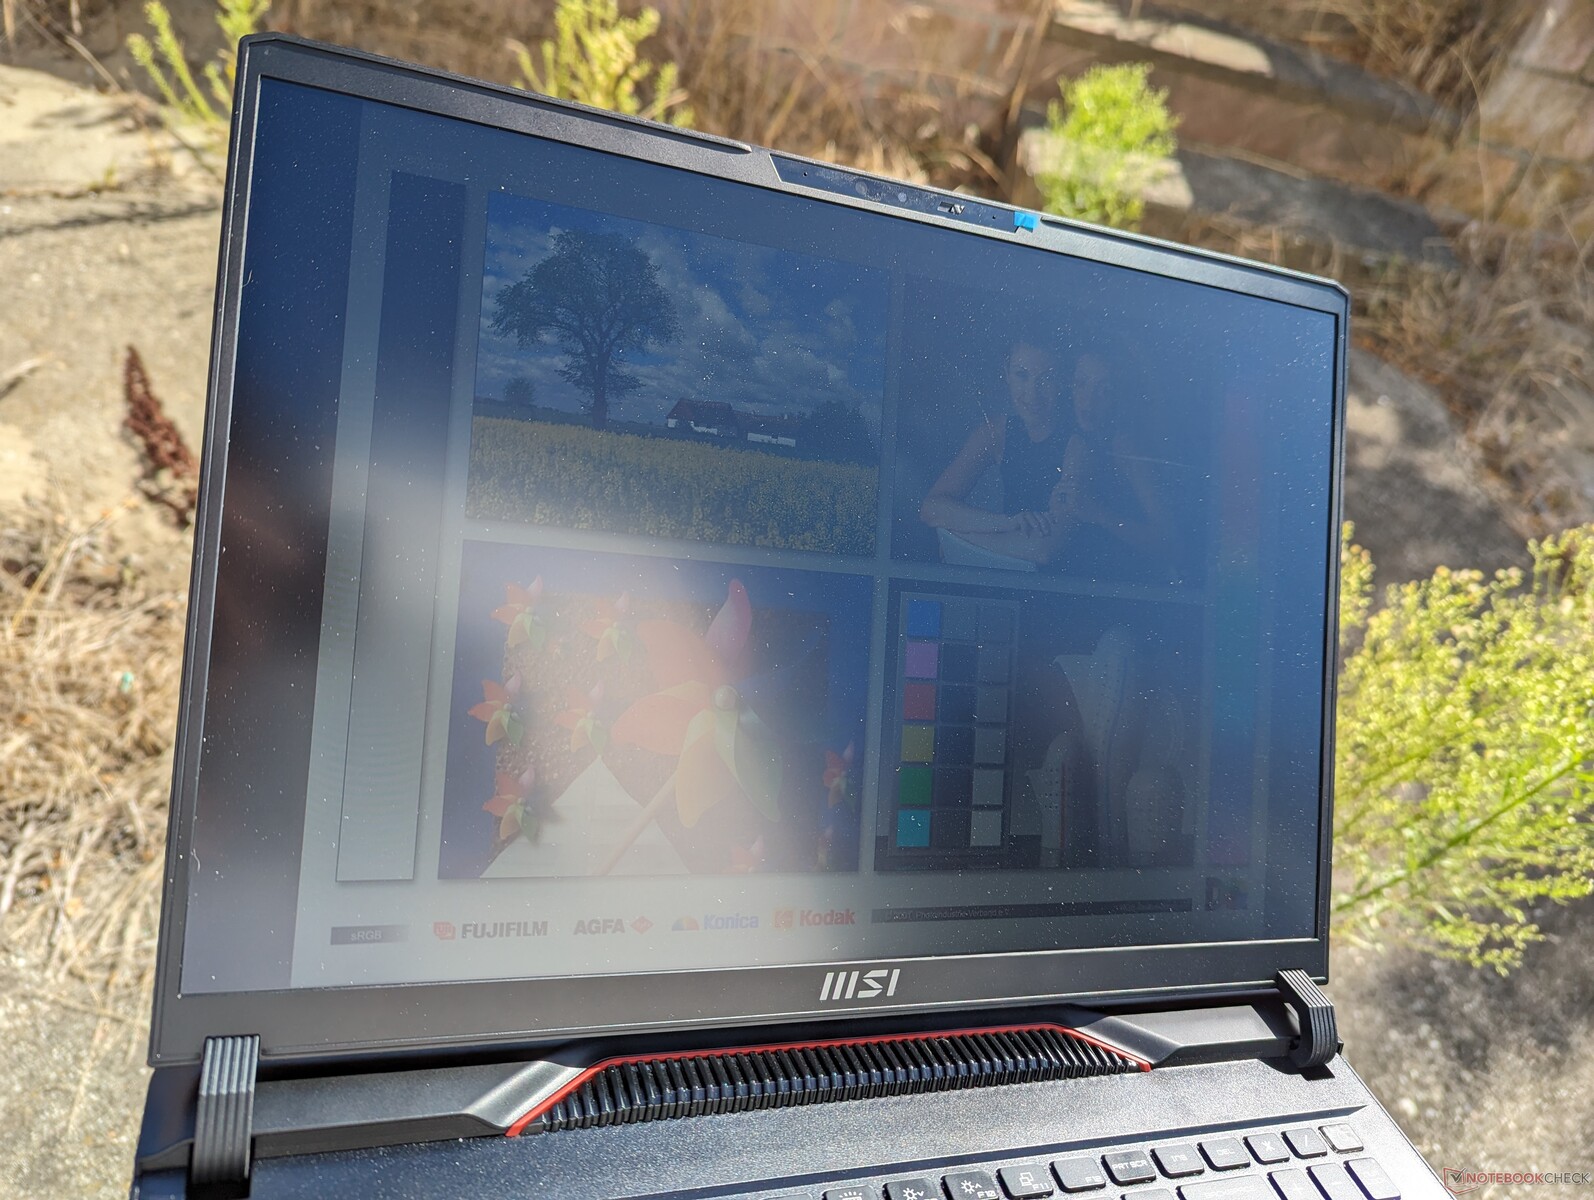
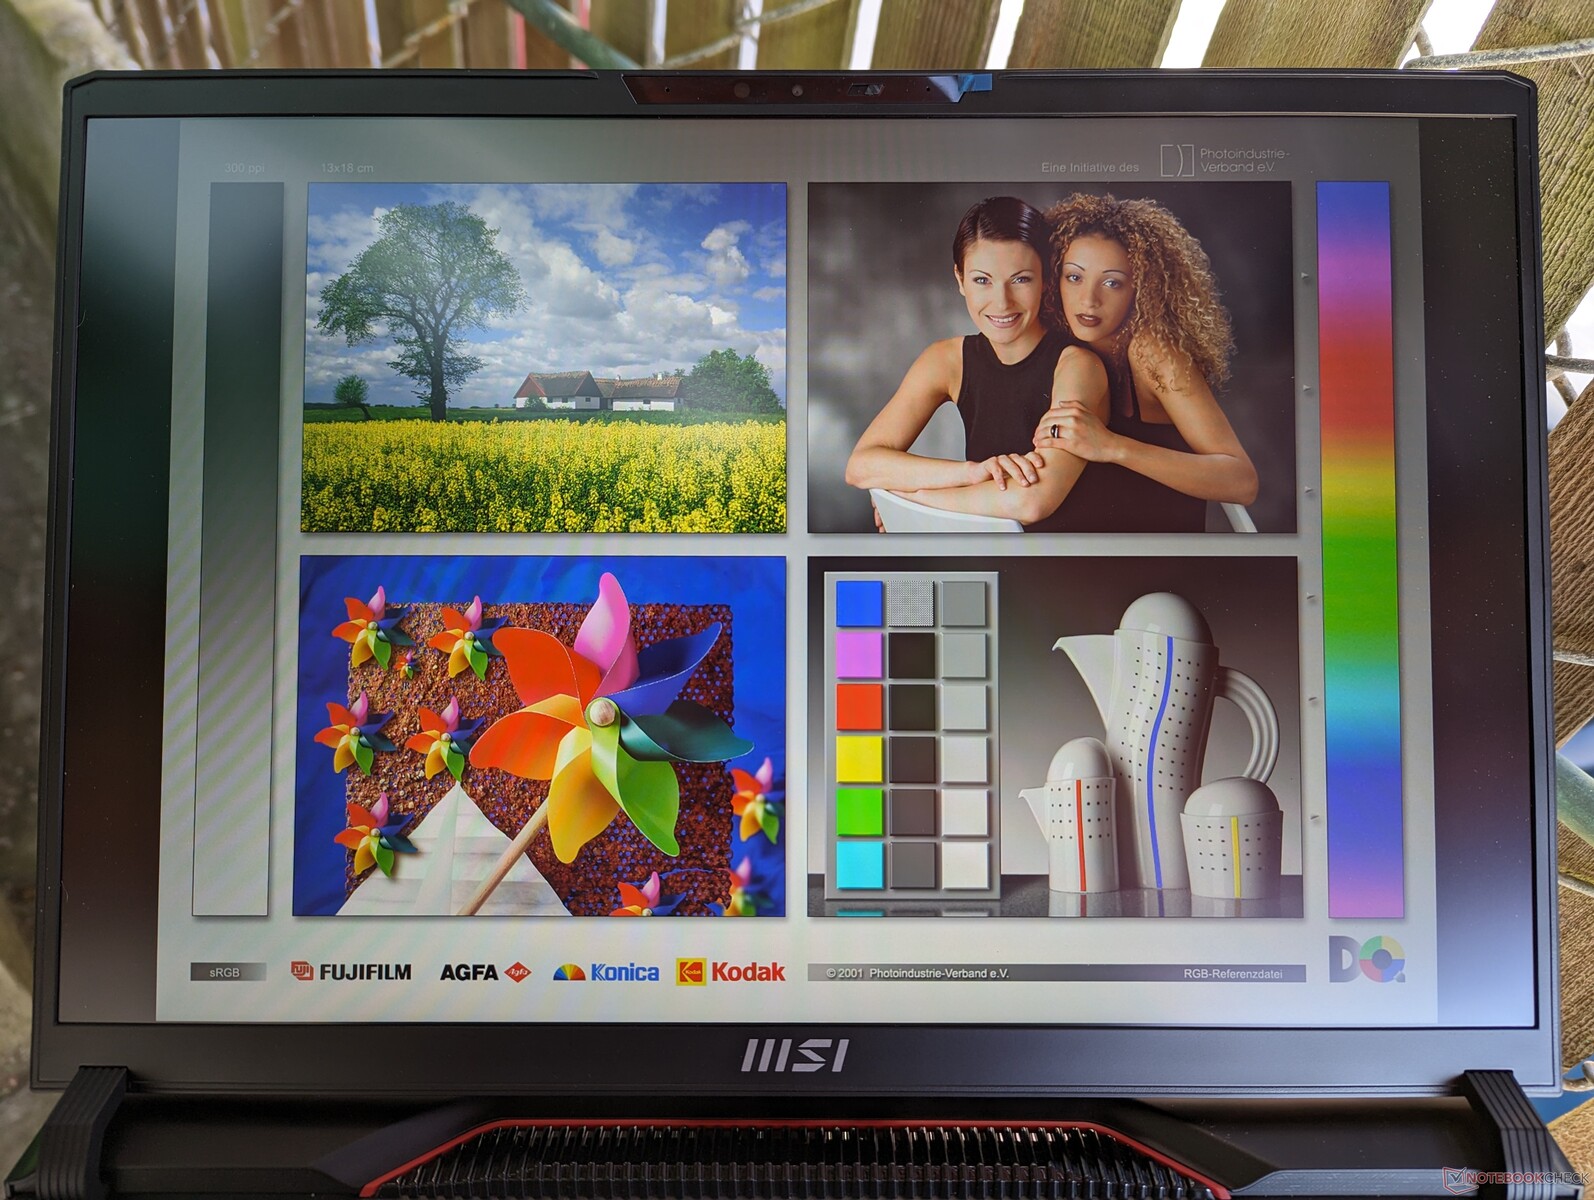
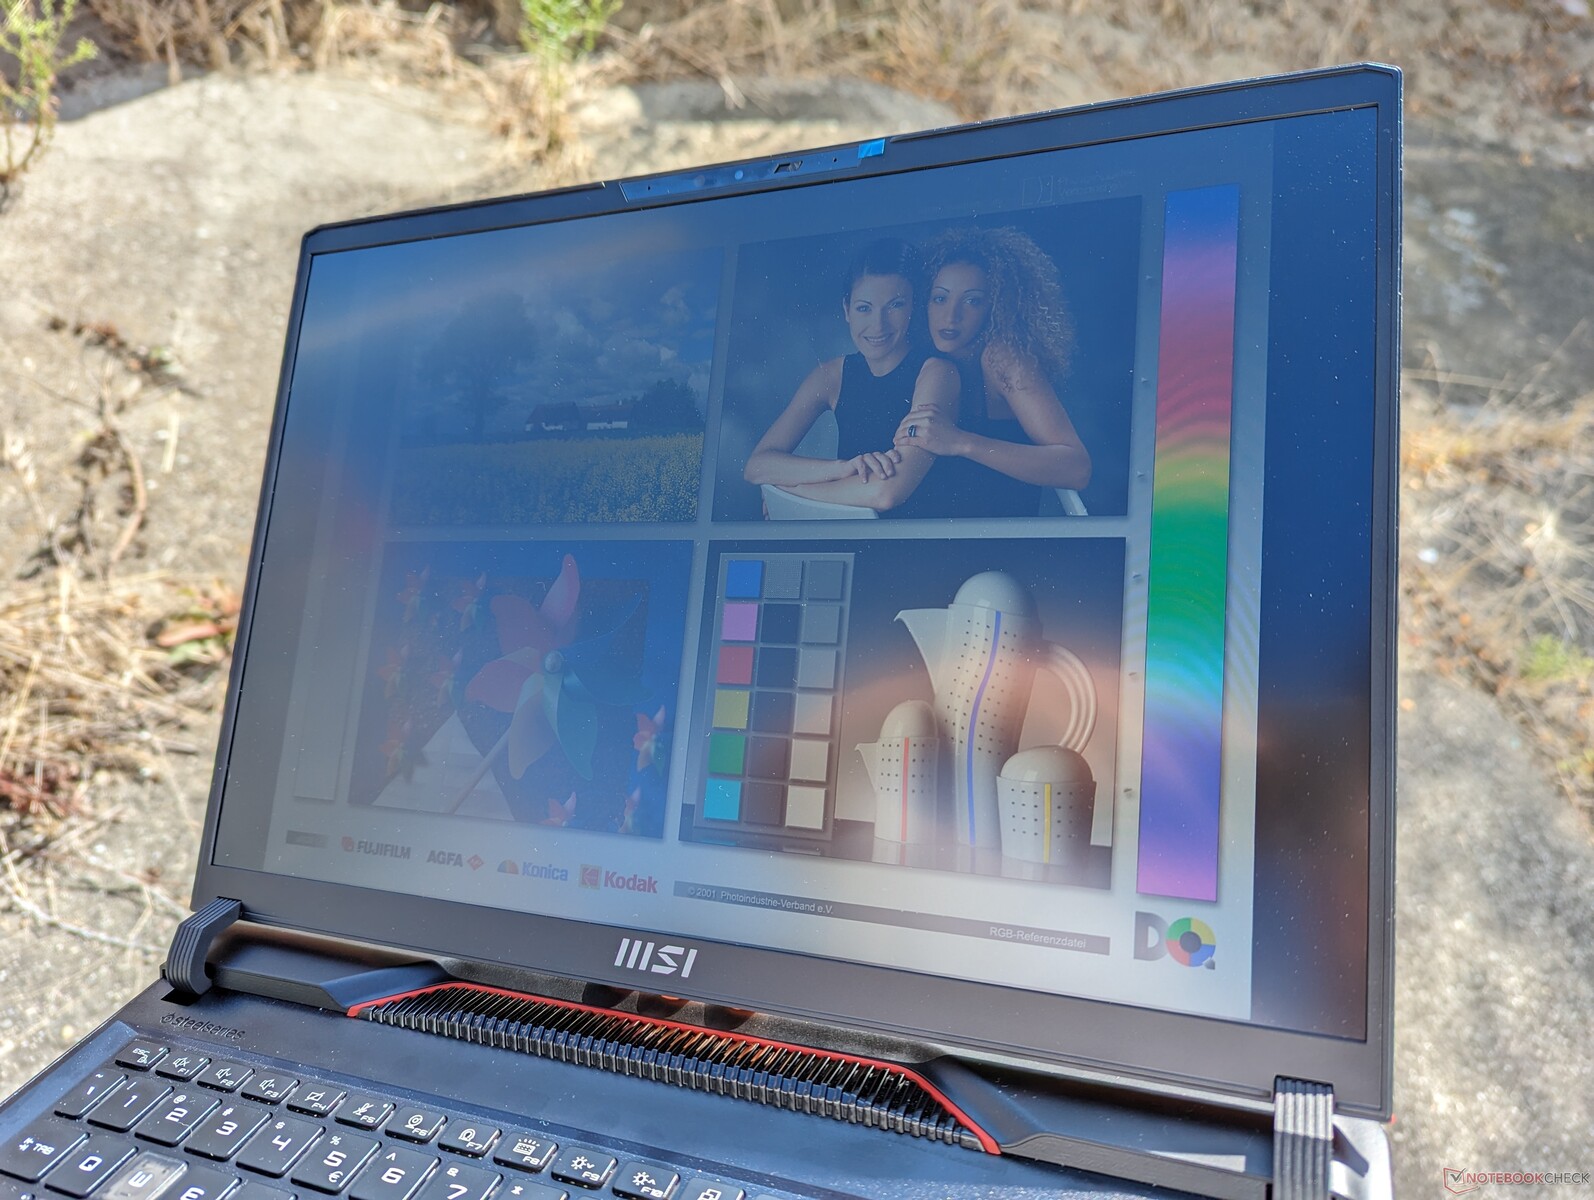
The 300-nit maximum brightness is typical of most gaming laptops. Direct sunlight should be avoided or else colors become washed out. For better outdoor visibility, users may want to consider the Zephyrus M16 and its 2x brighter display instead.
Performance — Impressive Year-Over-Year Boost
Testing Conditions
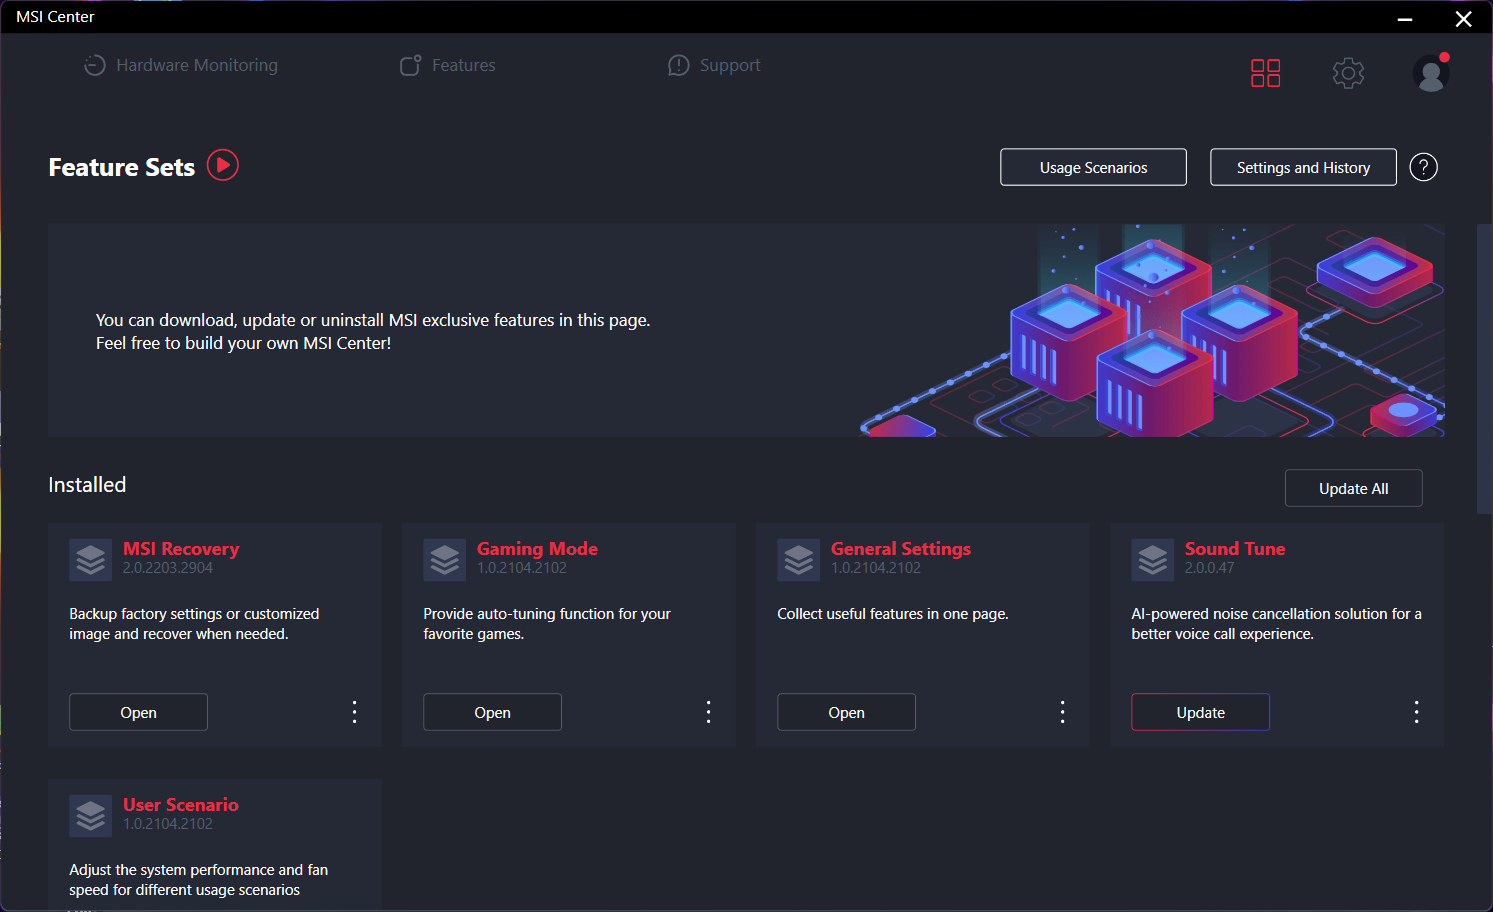
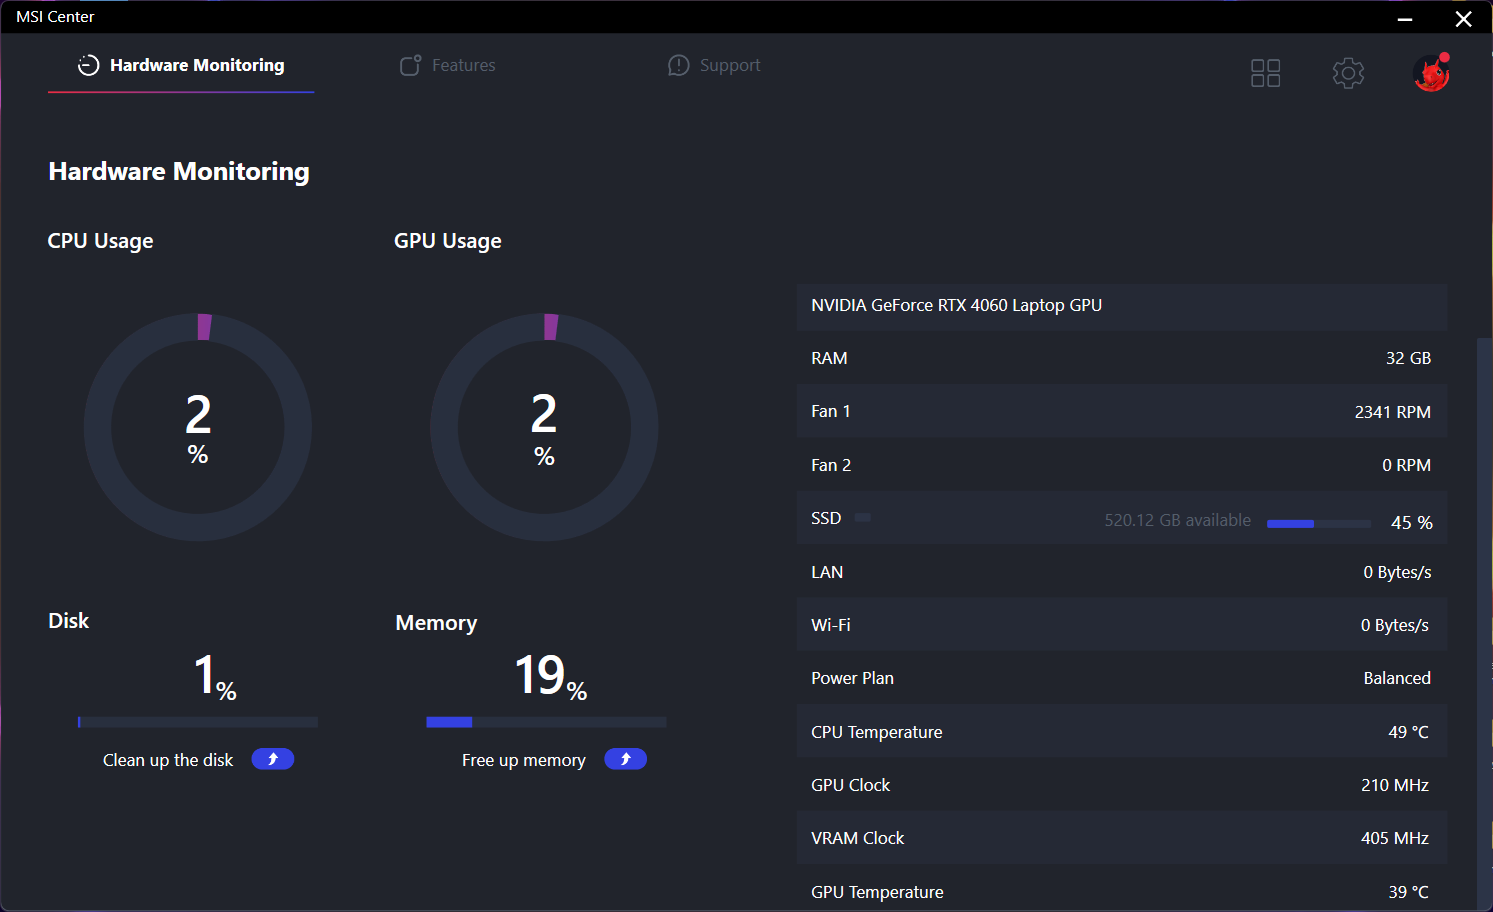
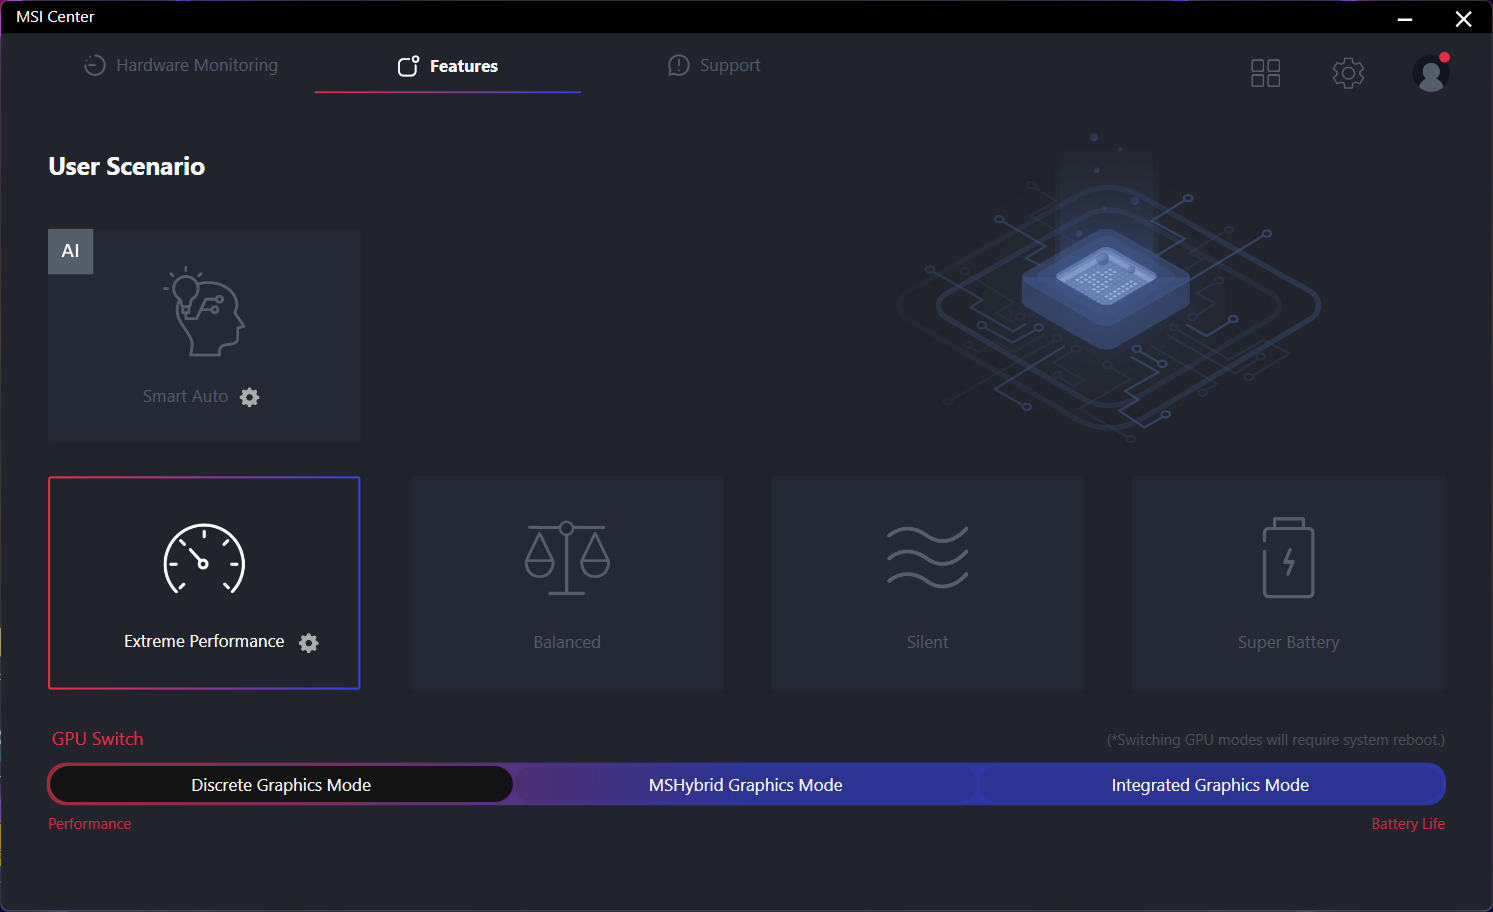
We set Windows to Performance mode and MSI Center to both Extreme Performance mode and dGPU mode prior to running the benchmarks below. MSI Center is the control hub for system updates, vitals, power profiles, GPU modes, and more. However, RGB settings are handled by a separate app called SteelSeries GG.
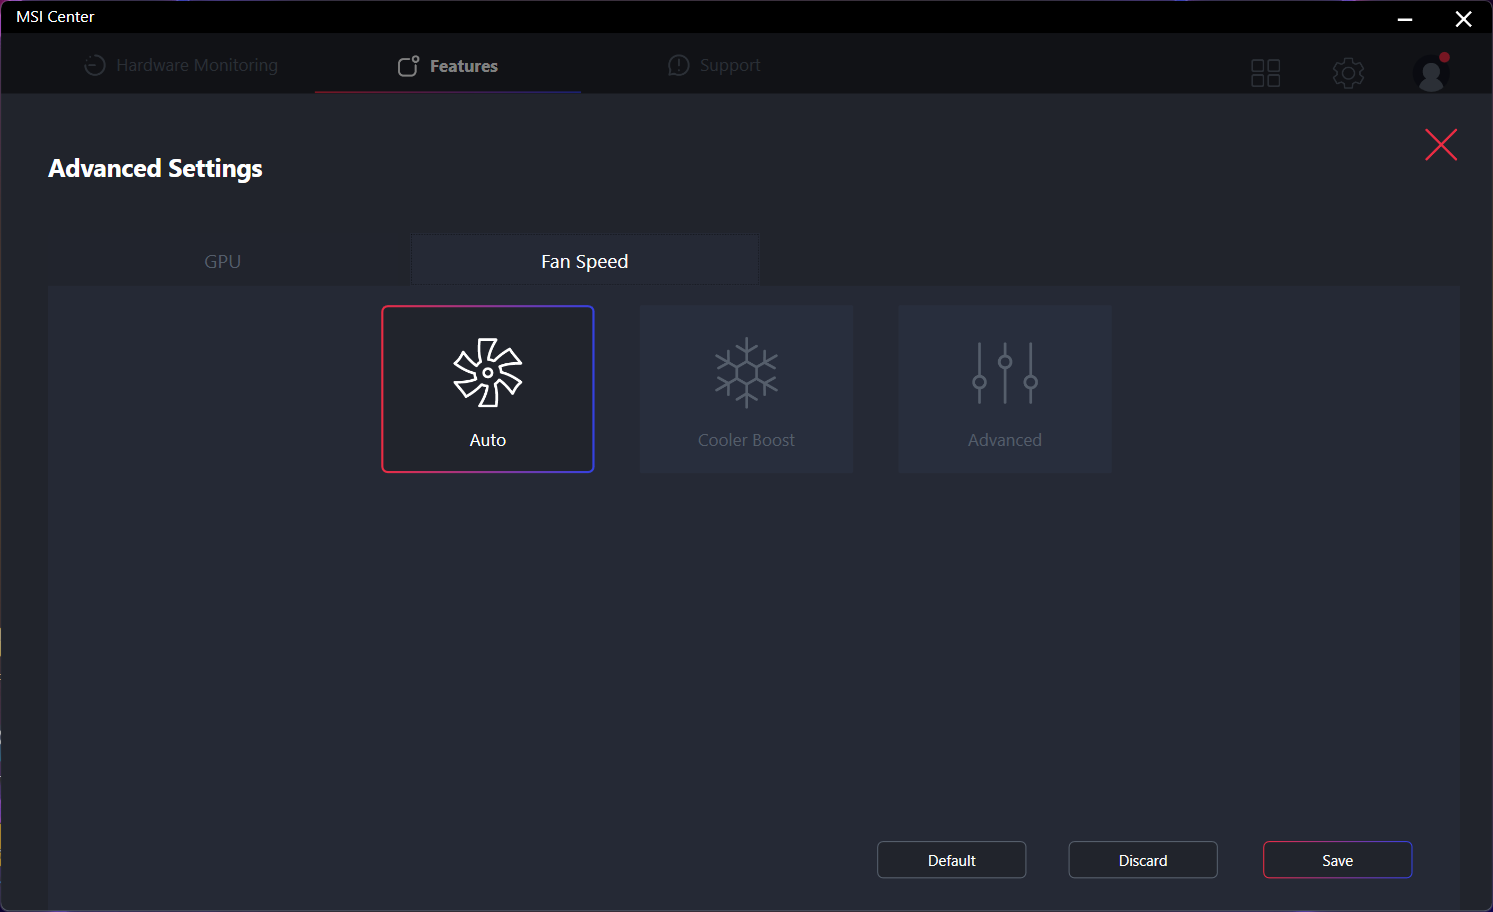
Cooler Boost is a submenu setting within Extreme Performance mode. Enabling it will run the internals fans at their maximum RPMs no matter the onscreen load.
The RTX 4060 configuration supports MUX but not Advanced Optimus meaning a reboot is required when switching between dGPU, MSHybrid, and iGPU modes.
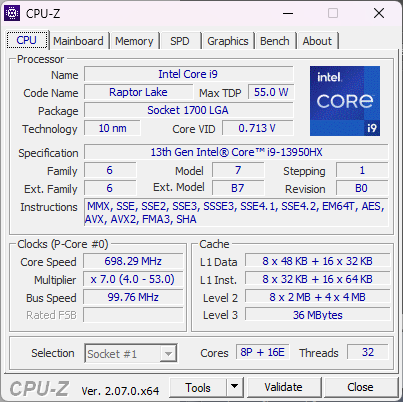
Processor
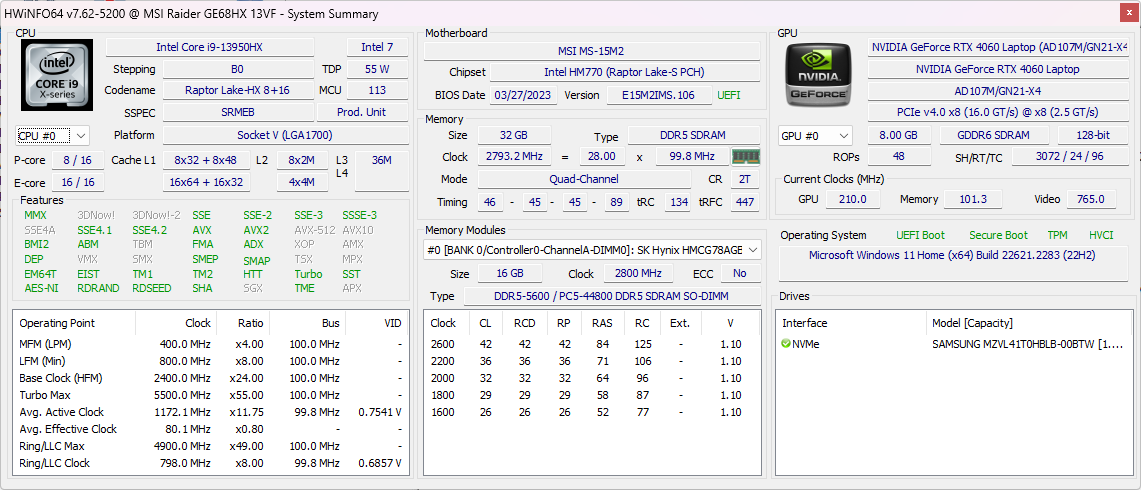
CPU performance and clock rate stability are excellent with results that are 5 to 10 percent faster than the average Core i9-13950HX in our database or almost 2x faster than the Core i7-13700H commonly found on most other gaming laptops. This is one of the fastest mobile CPUs in the market at the moment and it competes with the Zen 4 Ryzen 9 7945HX for the top three spots.
Upgrading to the pricier Core i9-13980HX option is only expected to boost performance by about 5 percent based on our time with the Alienware m18 R1. The benefits are so marginal that we recommend sticking with the Core i9-13950HX to save a few hundred dollars.
Cinebench R15 Multi Loop
Cinebench R23: Multi Core | Single Core
Cinebench R20: CPU (Multi Core) | CPU (Single Core)
Cinebench R15: CPU Multi 64Bit | CPU Single 64Bit
Blender: v2.79 BMW27 CPU
7-Zip 18.03: 7z b 4 | 7z b 4 -mmt1
Geekbench 5.5: Multi-Core | Single-Core
HWBOT x265 Benchmark v2.2: 4k Preset
LibreOffice : 20 Documents To PDF
R Benchmark 2.5: Overall mean
* ... smaller is better
AIDA64: FP32 Ray-Trace | FPU Julia | CPU SHA3 | CPU Queen | FPU SinJulia | FPU Mandel | CPU AES | CPU ZLib | FP64 Ray-Trace | CPU PhotoWorxx
| Performance rating | |
| Alienware m16 R1 AMD | |
| MSI Raider GE68HX 13VF | |
| Average Intel Core i9-13950HX | |
| HP Omen 16-xf0376ng | |
| Asus ROG Zephyrus M16 GU604VY-NM042X | |
| Lenovo Legion Slim 7i 16 Gen 8 | |
| MSI GE67 HX 12UGS | |
| AIDA64 / FP32 Ray-Trace | |
| Alienware m16 R1 AMD | |
| MSI Raider GE68HX 13VF | |
| HP Omen 16-xf0376ng | |
| Average Intel Core i9-13950HX (17993 - 28957, n=9) | |
| Asus ROG Zephyrus M16 GU604VY-NM042X | |
| Lenovo Legion Slim 7i 16 Gen 8 | |
| MSI GE67 HX 12UGS | |
| AIDA64 / FPU Julia | |
| Alienware m16 R1 AMD | |
| MSI Raider GE68HX 13VF | |
| Average Intel Core i9-13950HX (89362 - 144303, n=9) | |
| HP Omen 16-xf0376ng | |
| Asus ROG Zephyrus M16 GU604VY-NM042X | |
| Lenovo Legion Slim 7i 16 Gen 8 | |
| MSI GE67 HX 12UGS | |
| AIDA64 / CPU SHA3 | |
| Alienware m16 R1 AMD | |
| MSI Raider GE68HX 13VF | |
| Average Intel Core i9-13950HX (4518 - 7093, n=9) | |
| HP Omen 16-xf0376ng | |
| Asus ROG Zephyrus M16 GU604VY-NM042X | |
| MSI GE67 HX 12UGS | |
| Lenovo Legion Slim 7i 16 Gen 8 | |
| AIDA64 / CPU Queen | |
| Alienware m16 R1 AMD | |
| MSI Raider GE68HX 13VF | |
| Average Intel Core i9-13950HX (131931 - 140103, n=8) | |
| Lenovo Legion Slim 7i 16 Gen 8 | |
| Asus ROG Zephyrus M16 GU604VY-NM042X | |
| HP Omen 16-xf0376ng | |
| MSI GE67 HX 12UGS | |
| AIDA64 / FPU SinJulia | |
| Alienware m16 R1 AMD | |
| MSI Raider GE68HX 13VF | |
| HP Omen 16-xf0376ng | |
| Average Intel Core i9-13950HX (12318 - 17057, n=9) | |
| MSI GE67 HX 12UGS | |
| Asus ROG Zephyrus M16 GU604VY-NM042X | |
| Lenovo Legion Slim 7i 16 Gen 8 | |
| AIDA64 / FPU Mandel | |
| Alienware m16 R1 AMD | |
| MSI Raider GE68HX 13VF | |
| HP Omen 16-xf0376ng | |
| Average Intel Core i9-13950HX (44372 - 71038, n=9) | |
| Asus ROG Zephyrus M16 GU604VY-NM042X | |
| Lenovo Legion Slim 7i 16 Gen 8 | |
| MSI GE67 HX 12UGS | |
| AIDA64 / CPU AES | |
| Average Intel Core i9-13950HX (99981 - 204491, n=9) | |
| MSI Raider GE68HX 13VF | |
| MSI GE67 HX 12UGS | |
| Alienware m16 R1 AMD | |
| Asus ROG Zephyrus M16 GU604VY-NM042X | |
| Lenovo Legion Slim 7i 16 Gen 8 | |
| HP Omen 16-xf0376ng | |
| AIDA64 / CPU ZLib | |
| MSI Raider GE68HX 13VF | |
| Alienware m16 R1 AMD | |
| Average Intel Core i9-13950HX (1263 - 2069, n=9) | |
| MSI GE67 HX 12UGS | |
| Lenovo Legion Slim 7i 16 Gen 8 | |
| Asus ROG Zephyrus M16 GU604VY-NM042X | |
| HP Omen 16-xf0376ng | |
| AIDA64 / FP64 Ray-Trace | |
| Alienware m16 R1 AMD | |
| MSI Raider GE68HX 13VF | |
| HP Omen 16-xf0376ng | |
| Average Intel Core i9-13950HX (9649 - 15573, n=9) | |
| Asus ROG Zephyrus M16 GU604VY-NM042X | |
| Lenovo Legion Slim 7i 16 Gen 8 | |
| MSI GE67 HX 12UGS | |
| AIDA64 / CPU PhotoWorxx | |
| MSI Raider GE68HX 13VF | |
| Asus ROG Zephyrus M16 GU604VY-NM042X | |
| Average Intel Core i9-13950HX (40233 - 50864, n=9) | |
| HP Omen 16-xf0376ng | |
| MSI GE67 HX 12UGS | |
| Alienware m16 R1 AMD | |
| Lenovo Legion Slim 7i 16 Gen 8 | |
System Performance
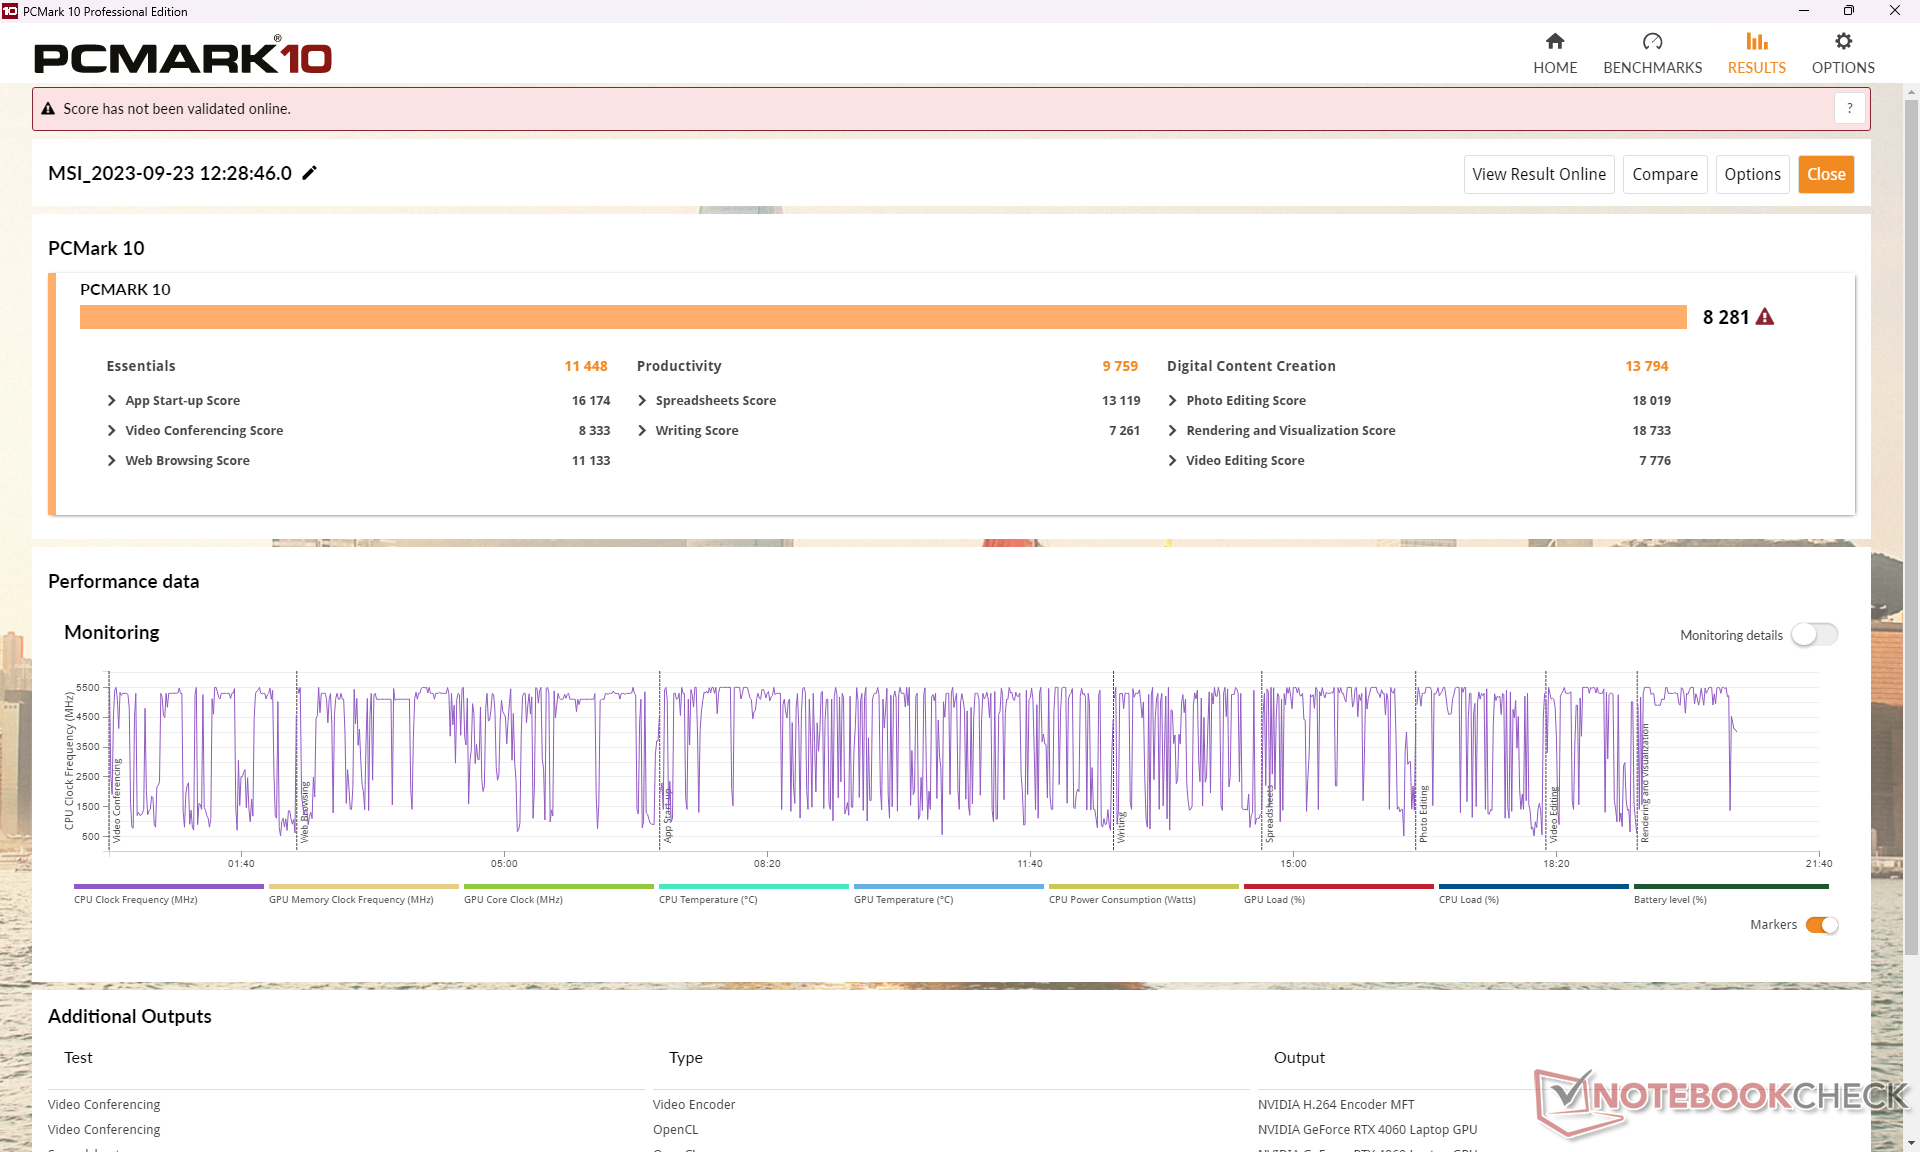
PCMark benchmarks are comparable to other 16-inch gaming laptops like the Alienware m16 R1 or Lenovo Legion Slim 7i 16 by just a few percentage points. We experienced no wake-from-sleep issues or other notable problems with our test unit during testing.
CrossMark: Overall | Productivity | Creativity | Responsiveness
| PCMark 10 / Score | |
| Alienware m16 R1 AMD | |
| Lenovo Legion Slim 7i 16 Gen 8 | |
| MSI Raider GE68HX 13VF | |
| Average Intel Core i9-13950HX, NVIDIA GeForce RTX 4060 Laptop GPU (n=1) | |
| Asus ROG Zephyrus M16 GU604VY-NM042X | |
| HP Omen 16-xf0376ng | |
| MSI GE67 HX 12UGS | |
| PCMark 10 / Essentials | |
| Asus ROG Zephyrus M16 GU604VY-NM042X | |
| Alienware m16 R1 AMD | |
| MSI Raider GE68HX 13VF | |
| Average Intel Core i9-13950HX, NVIDIA GeForce RTX 4060 Laptop GPU (n=1) | |
| Lenovo Legion Slim 7i 16 Gen 8 | |
| HP Omen 16-xf0376ng | |
| MSI GE67 HX 12UGS | |
| PCMark 10 / Productivity | |
| Asus ROG Zephyrus M16 GU604VY-NM042X | |
| Lenovo Legion Slim 7i 16 Gen 8 | |
| Alienware m16 R1 AMD | |
| HP Omen 16-xf0376ng | |
| MSI GE67 HX 12UGS | |
| MSI Raider GE68HX 13VF | |
| Average Intel Core i9-13950HX, NVIDIA GeForce RTX 4060 Laptop GPU (n=1) | |
| PCMark 10 / Digital Content Creation | |
| Alienware m16 R1 AMD | |
| MSI Raider GE68HX 13VF | |
| Average Intel Core i9-13950HX, NVIDIA GeForce RTX 4060 Laptop GPU (n=1) | |
| Lenovo Legion Slim 7i 16 Gen 8 | |
| HP Omen 16-xf0376ng | |
| MSI GE67 HX 12UGS | |
| Asus ROG Zephyrus M16 GU604VY-NM042X | |
| CrossMark / Overall | |
| Alienware m16 R1 AMD | |
| Lenovo Legion Slim 7i 16 Gen 8 | |
| MSI GE67 HX 12UGS | |
| Asus ROG Zephyrus M16 GU604VY-NM042X | |
| MSI Raider GE68HX 13VF | |
| Average Intel Core i9-13950HX, NVIDIA GeForce RTX 4060 Laptop GPU (n=1) | |
| CrossMark / Productivity | |
| Lenovo Legion Slim 7i 16 Gen 8 | |
| Alienware m16 R1 AMD | |
| MSI GE67 HX 12UGS | |
| Asus ROG Zephyrus M16 GU604VY-NM042X | |
| MSI Raider GE68HX 13VF | |
| Average Intel Core i9-13950HX, NVIDIA GeForce RTX 4060 Laptop GPU (n=1) | |
| CrossMark / Creativity | |
| MSI Raider GE68HX 13VF | |
| Average Intel Core i9-13950HX, NVIDIA GeForce RTX 4060 Laptop GPU (n=1) | |
| Asus ROG Zephyrus M16 GU604VY-NM042X | |
| Alienware m16 R1 AMD | |
| MSI GE67 HX 12UGS | |
| Lenovo Legion Slim 7i 16 Gen 8 | |
| CrossMark / Responsiveness | |
| MSI GE67 HX 12UGS | |
| Lenovo Legion Slim 7i 16 Gen 8 | |
| Alienware m16 R1 AMD | |
| Asus ROG Zephyrus M16 GU604VY-NM042X | |
| MSI Raider GE68HX 13VF | |
| Average Intel Core i9-13950HX, NVIDIA GeForce RTX 4060 Laptop GPU (n=1) | |
| PCMark 10 Score | 8281 points | |
Help | ||
| AIDA64 / Memory Copy | |
| MSI Raider GE68HX 13VF | |
| Average Intel Core i9-13950HX (61938 - 78813, n=9) | |
| Asus ROG Zephyrus M16 GU604VY-NM042X | |
| HP Omen 16-xf0376ng | |
| MSI GE67 HX 12UGS | |
| Alienware m16 R1 AMD | |
| Lenovo Legion Slim 7i 16 Gen 8 | |
| AIDA64 / Memory Read | |
| MSI Raider GE68HX 13VF | |
| Average Intel Core i9-13950HX (62368 - 86831, n=9) | |
| Asus ROG Zephyrus M16 GU604VY-NM042X | |
| HP Omen 16-xf0376ng | |
| MSI GE67 HX 12UGS | |
| Alienware m16 R1 AMD | |
| Lenovo Legion Slim 7i 16 Gen 8 | |
| AIDA64 / Memory Write | |
| HP Omen 16-xf0376ng | |
| MSI Raider GE68HX 13VF | |
| Average Intel Core i9-13950HX (59501 - 80441, n=9) | |
| Asus ROG Zephyrus M16 GU604VY-NM042X | |
| MSI GE67 HX 12UGS | |
| Alienware m16 R1 AMD | |
| Lenovo Legion Slim 7i 16 Gen 8 | |
| AIDA64 / Memory Latency | |
| MSI GE67 HX 12UGS | |
| Alienware m16 R1 AMD | |
| HP Omen 16-xf0376ng | |
| Average Intel Core i9-13950HX (84.4 - 99.5, n=9) | |
| Asus ROG Zephyrus M16 GU604VY-NM042X | |
| MSI Raider GE68HX 13VF | |
| Lenovo Legion Slim 7i 16 Gen 8 | |
* ... smaller is better
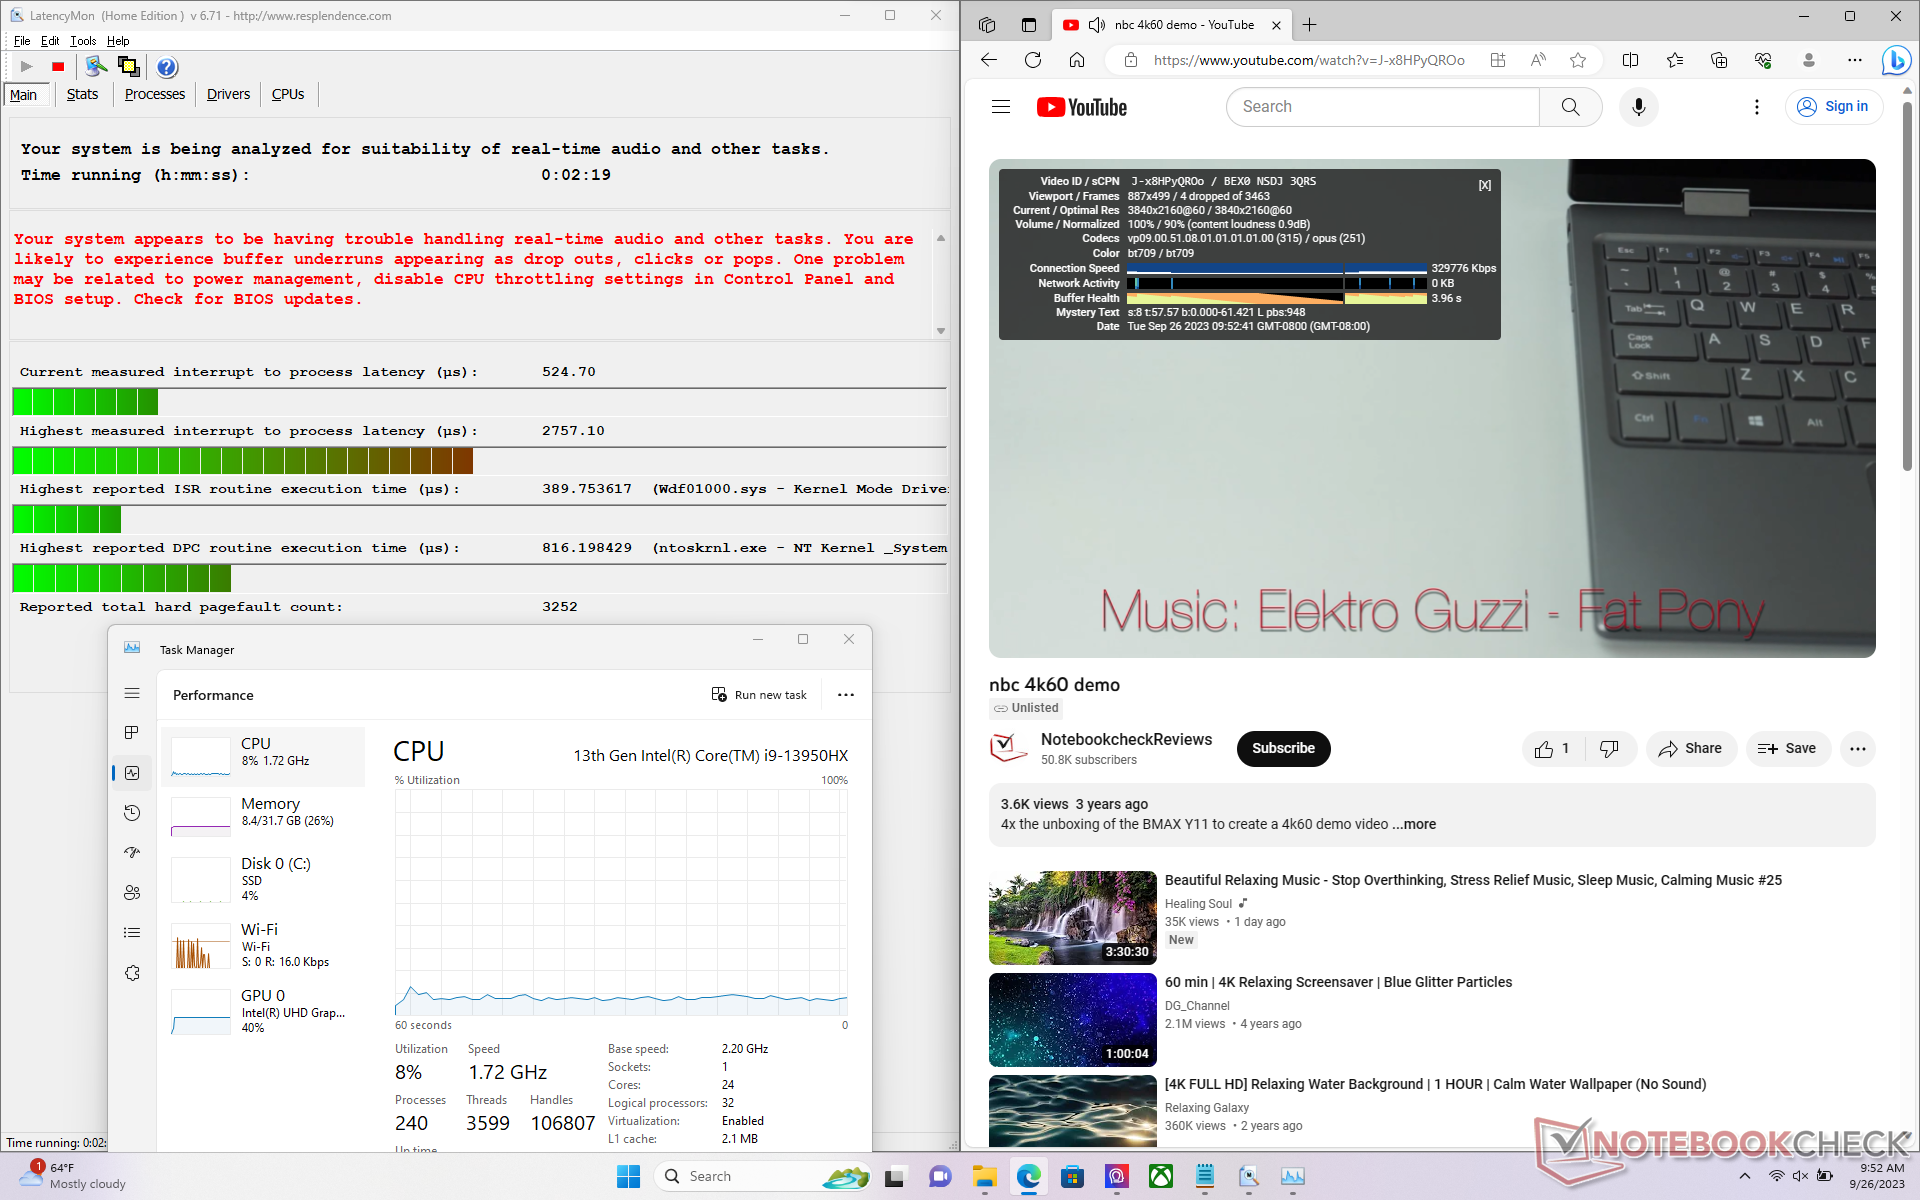
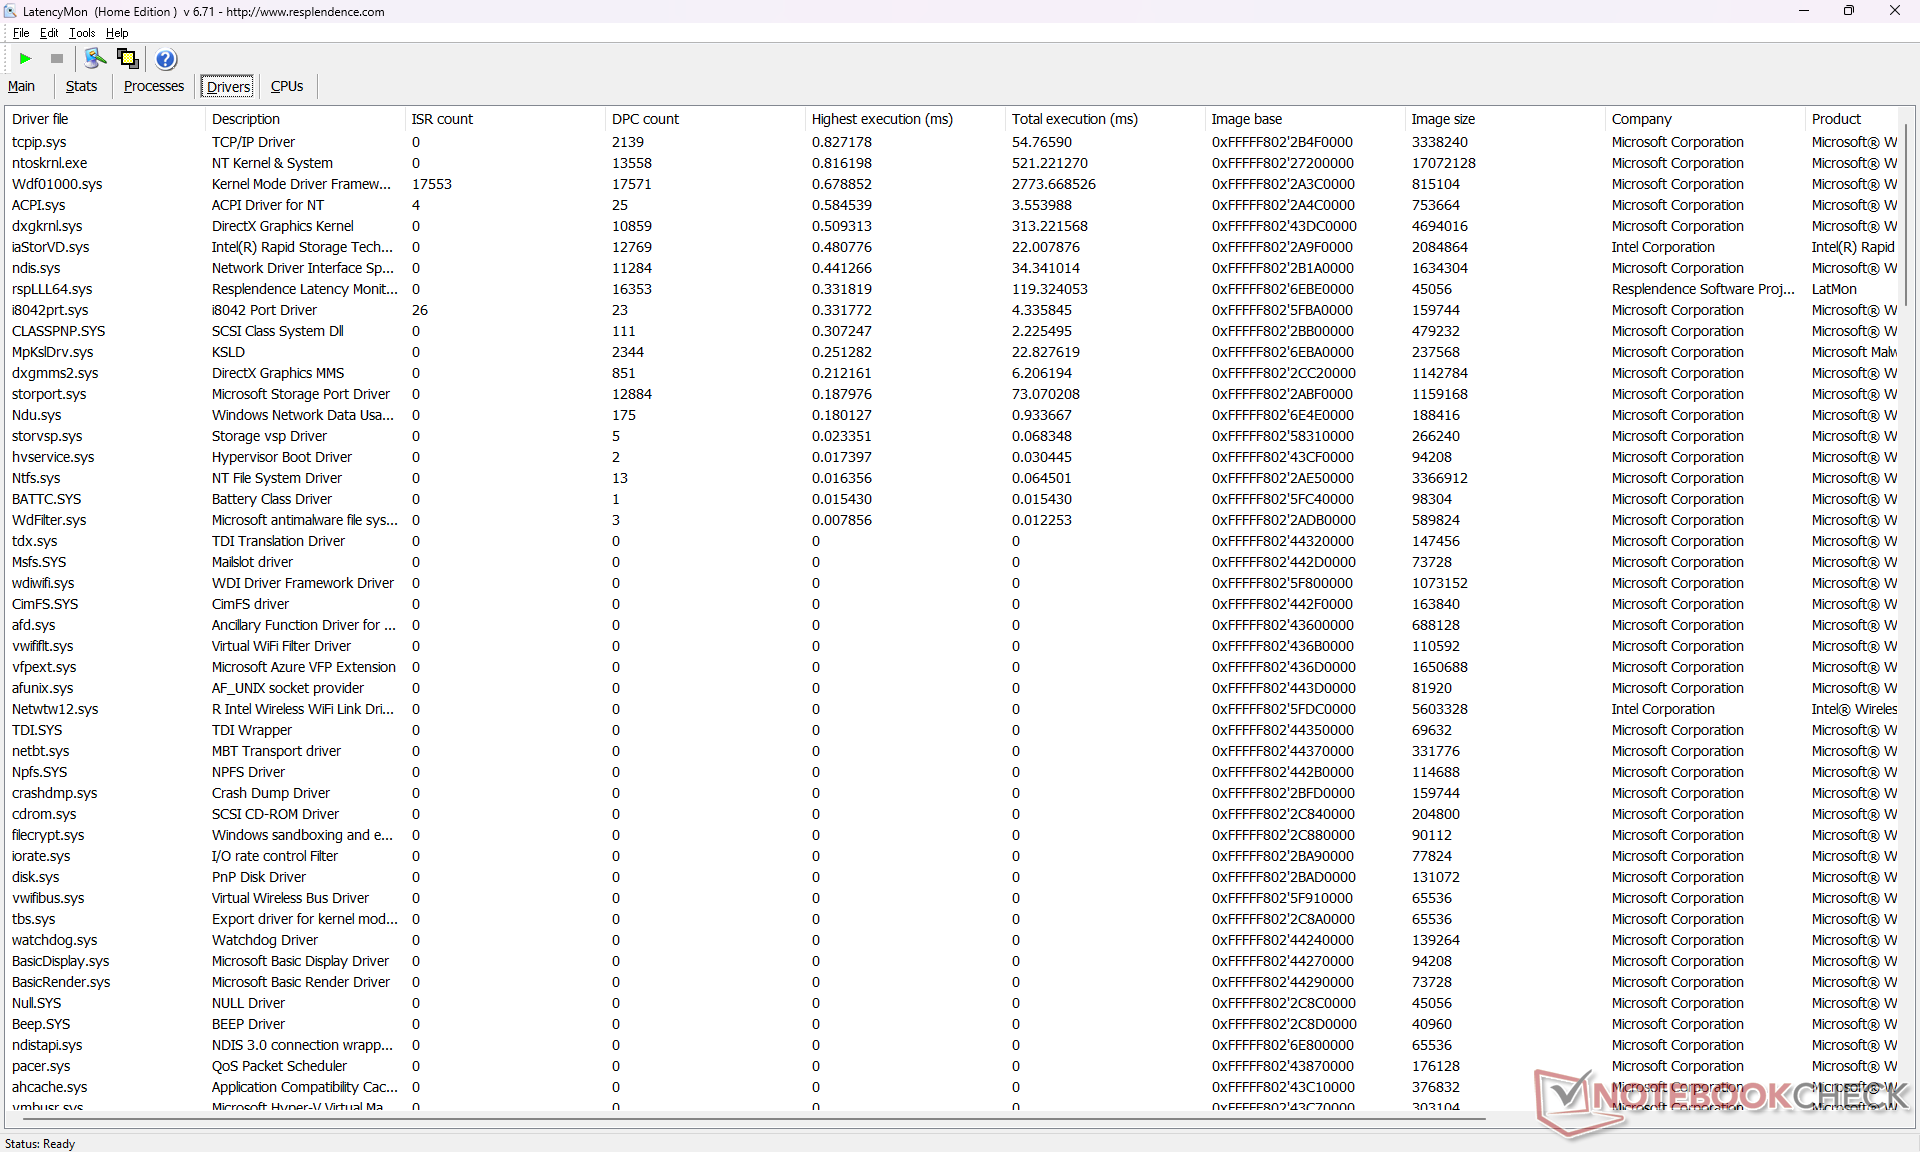
DPC Latency
LatencyMon reveals DPC issues when opening multiple browser tabs of our homepage. 4K video playback at 60 FPS is imperfect with 4 dropped frames recorded during a 60-second window.
| DPC Latencies / LatencyMon - interrupt to process latency (max), Web, Youtube, Prime95 | |
| Lenovo Legion Slim 7i 16 Gen 8 | |
| Asus ROG Zephyrus M16 GU604VY-NM042X | |
| MSI Raider GE68HX 13VF | |
| HP Omen 16-xf0376ng | |
| Alienware m16 R1 AMD | |
| MSI GE67 HX 12UGS | |
* ... smaller is better
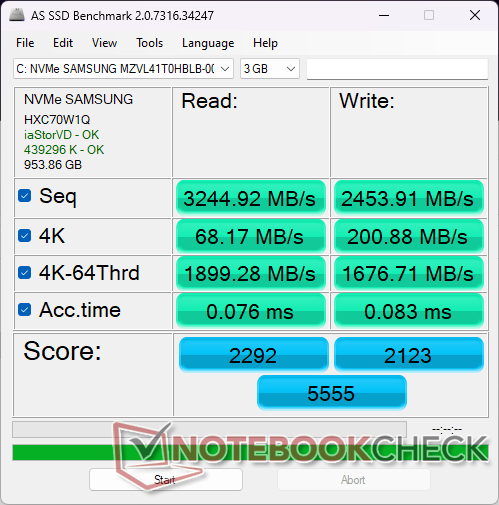
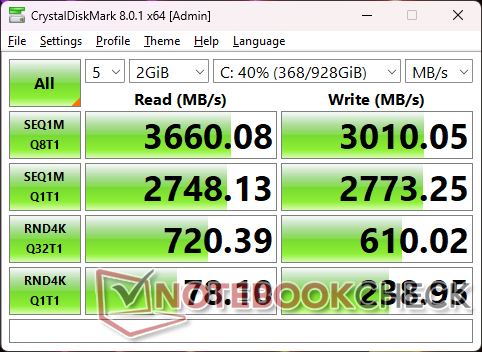
Storage Devices
Our unit ships with the cheaper 1 TB Samsung PM9B1 instead of the pricier Samsung PM9A1 likely to save on costs. The PM9B1 is almost half as fast with maximum sequential read rates of around 3600 MB/s compared to ~7000 MB/s on the PM9A1. SSD performance is stable nonetheless with no throttling.

| Drive Performance rating - Percent | |
| MSI GE67 HX 12UGS | |
| Lenovo Legion Slim 7i 16 Gen 8 | |
| Alienware m16 R1 AMD | |
| Asus ROG Zephyrus M16 GU604VY-NM042X | |
| HP Omen 16-xf0376ng | |
| MSI Raider GE68HX 13VF -11! | |
* ... smaller is better
Disk Throttling: DiskSpd Read Loop, Queue Depth 8
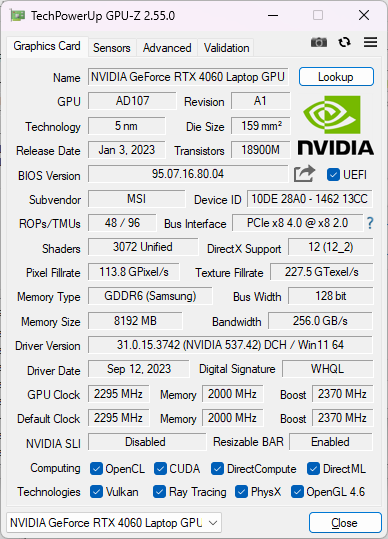
GPU Performance
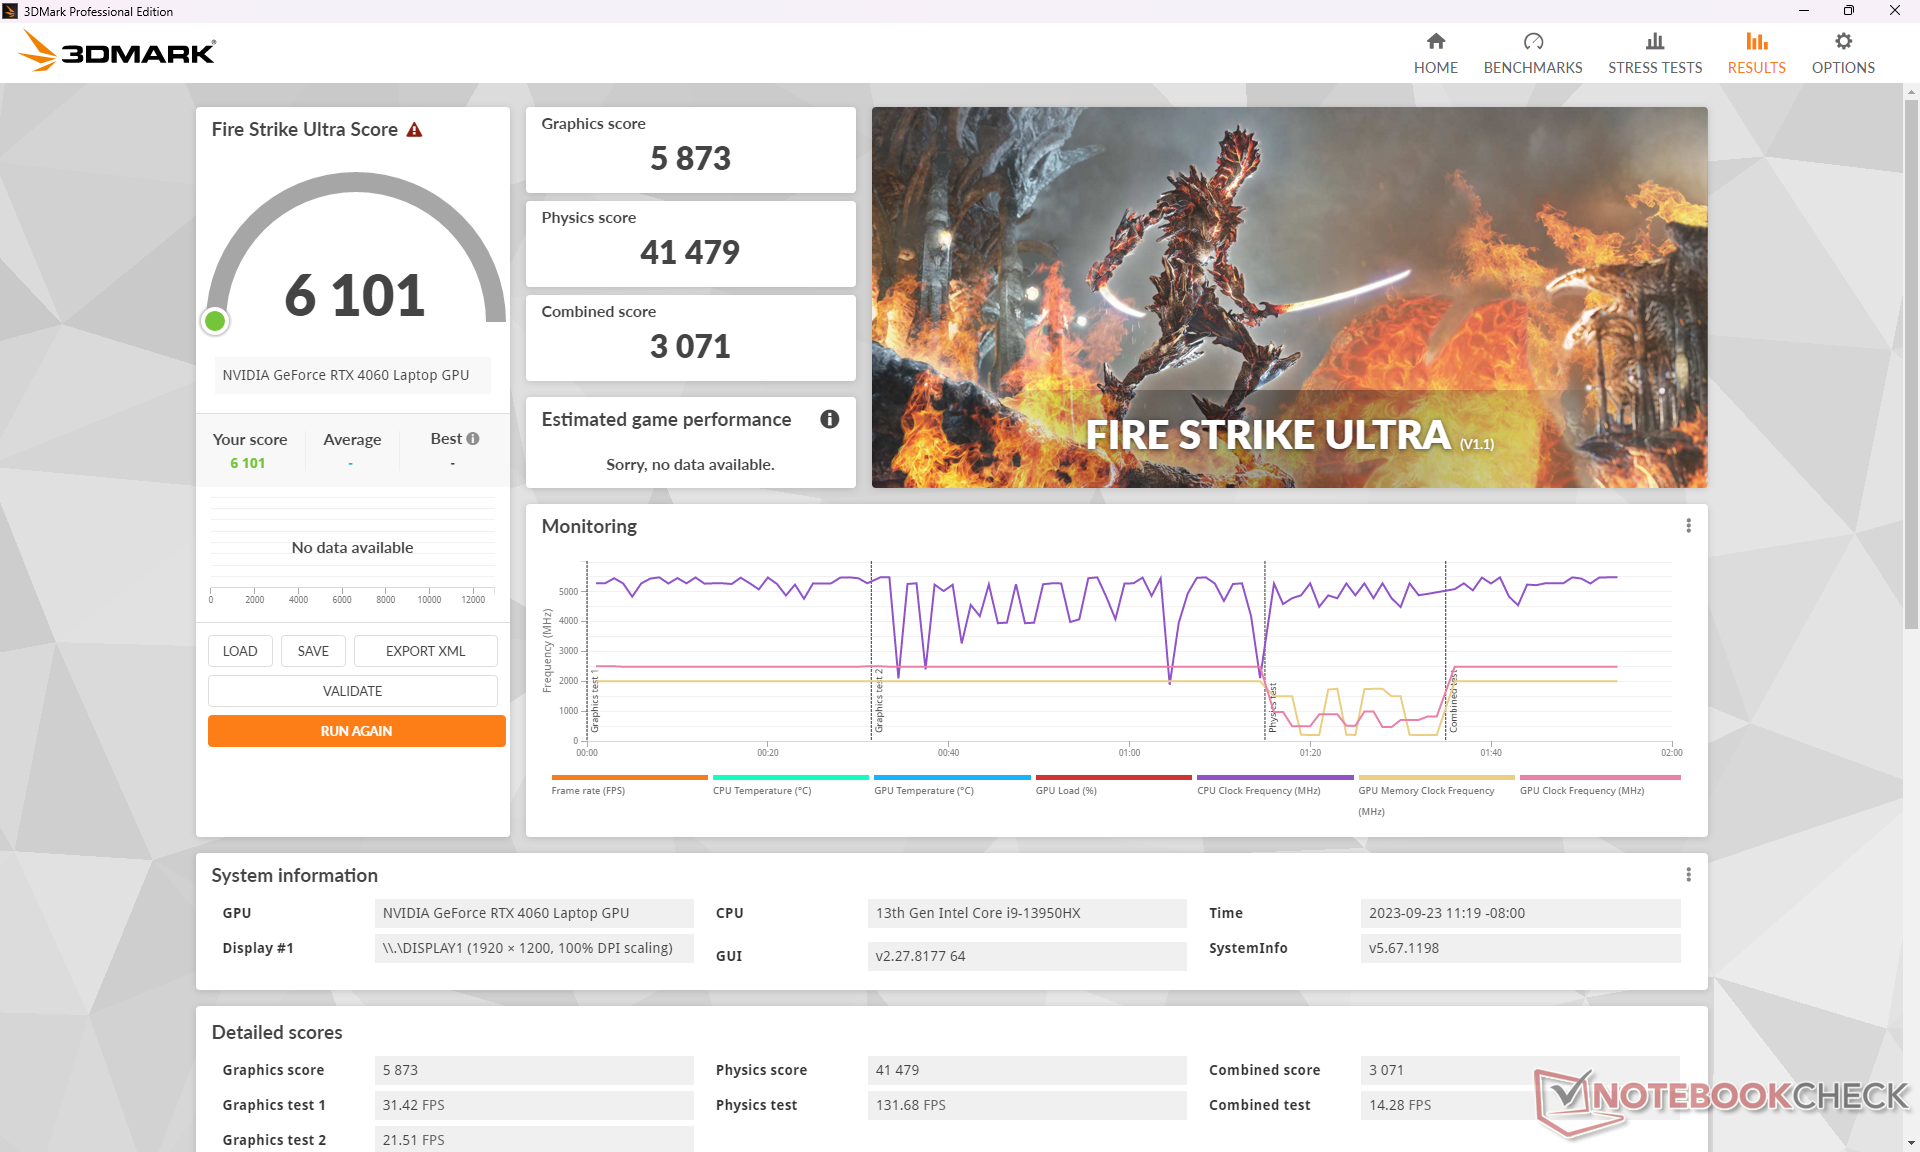
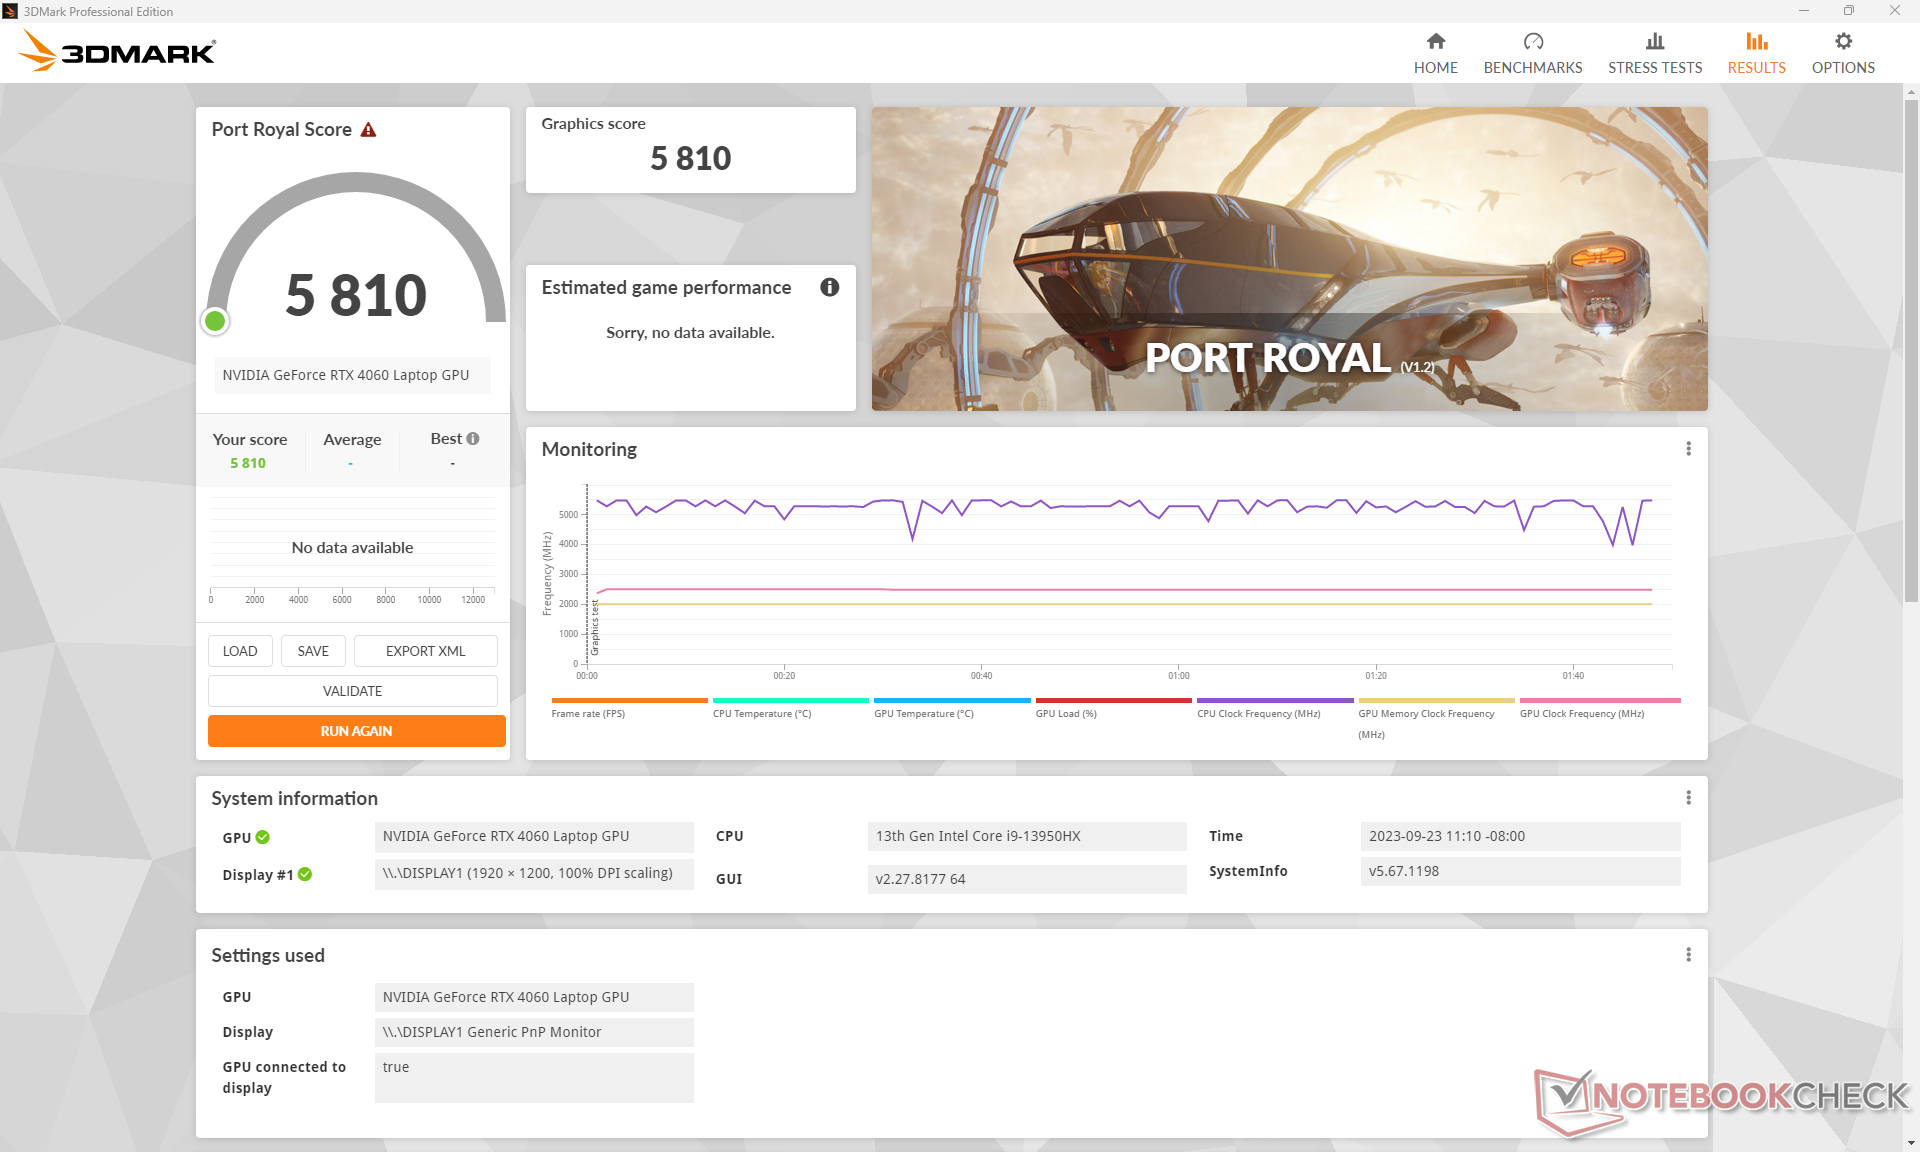
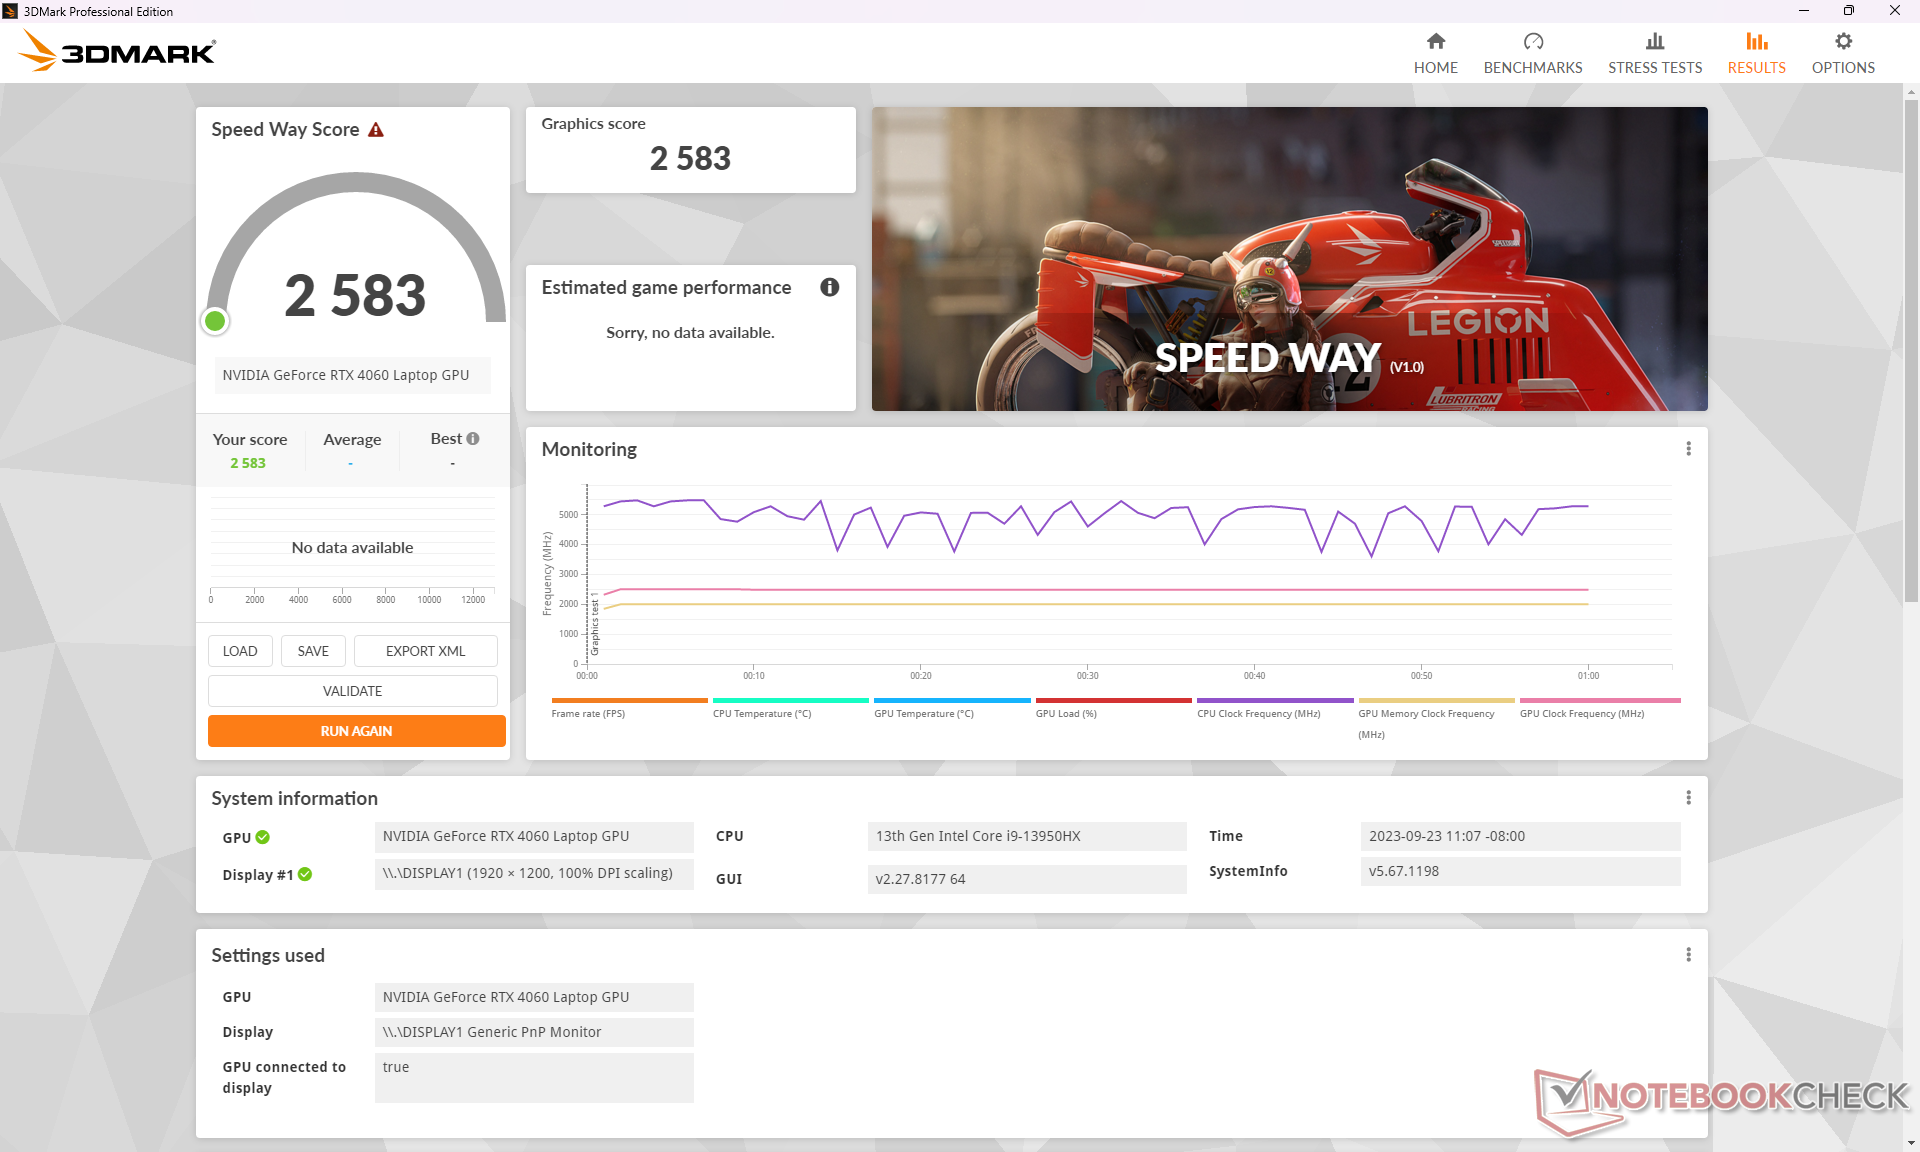
Our RTX 4060 performs well with results that are just slightly above the average gaming laptop in our database equipped with the same GPU. Upgrading to the RTX 4070, 4080, or 4090 is expected to boost performance by 10 to 20 percent, 60 to 80 percent, and 80 to 100 percent, respectively, over the RTX 4060. The performance gap is widest between the RTX 4070 and 4080.
Annoyingly, MSI has programmed MSI Center to automatically switch to Extreme Performance mode whenever it detects that 3DMark is running and there is unfortunately no easy way to disable this. We find this frustrating as it takes control away from the end user. The automatic switching would not occur when running games.
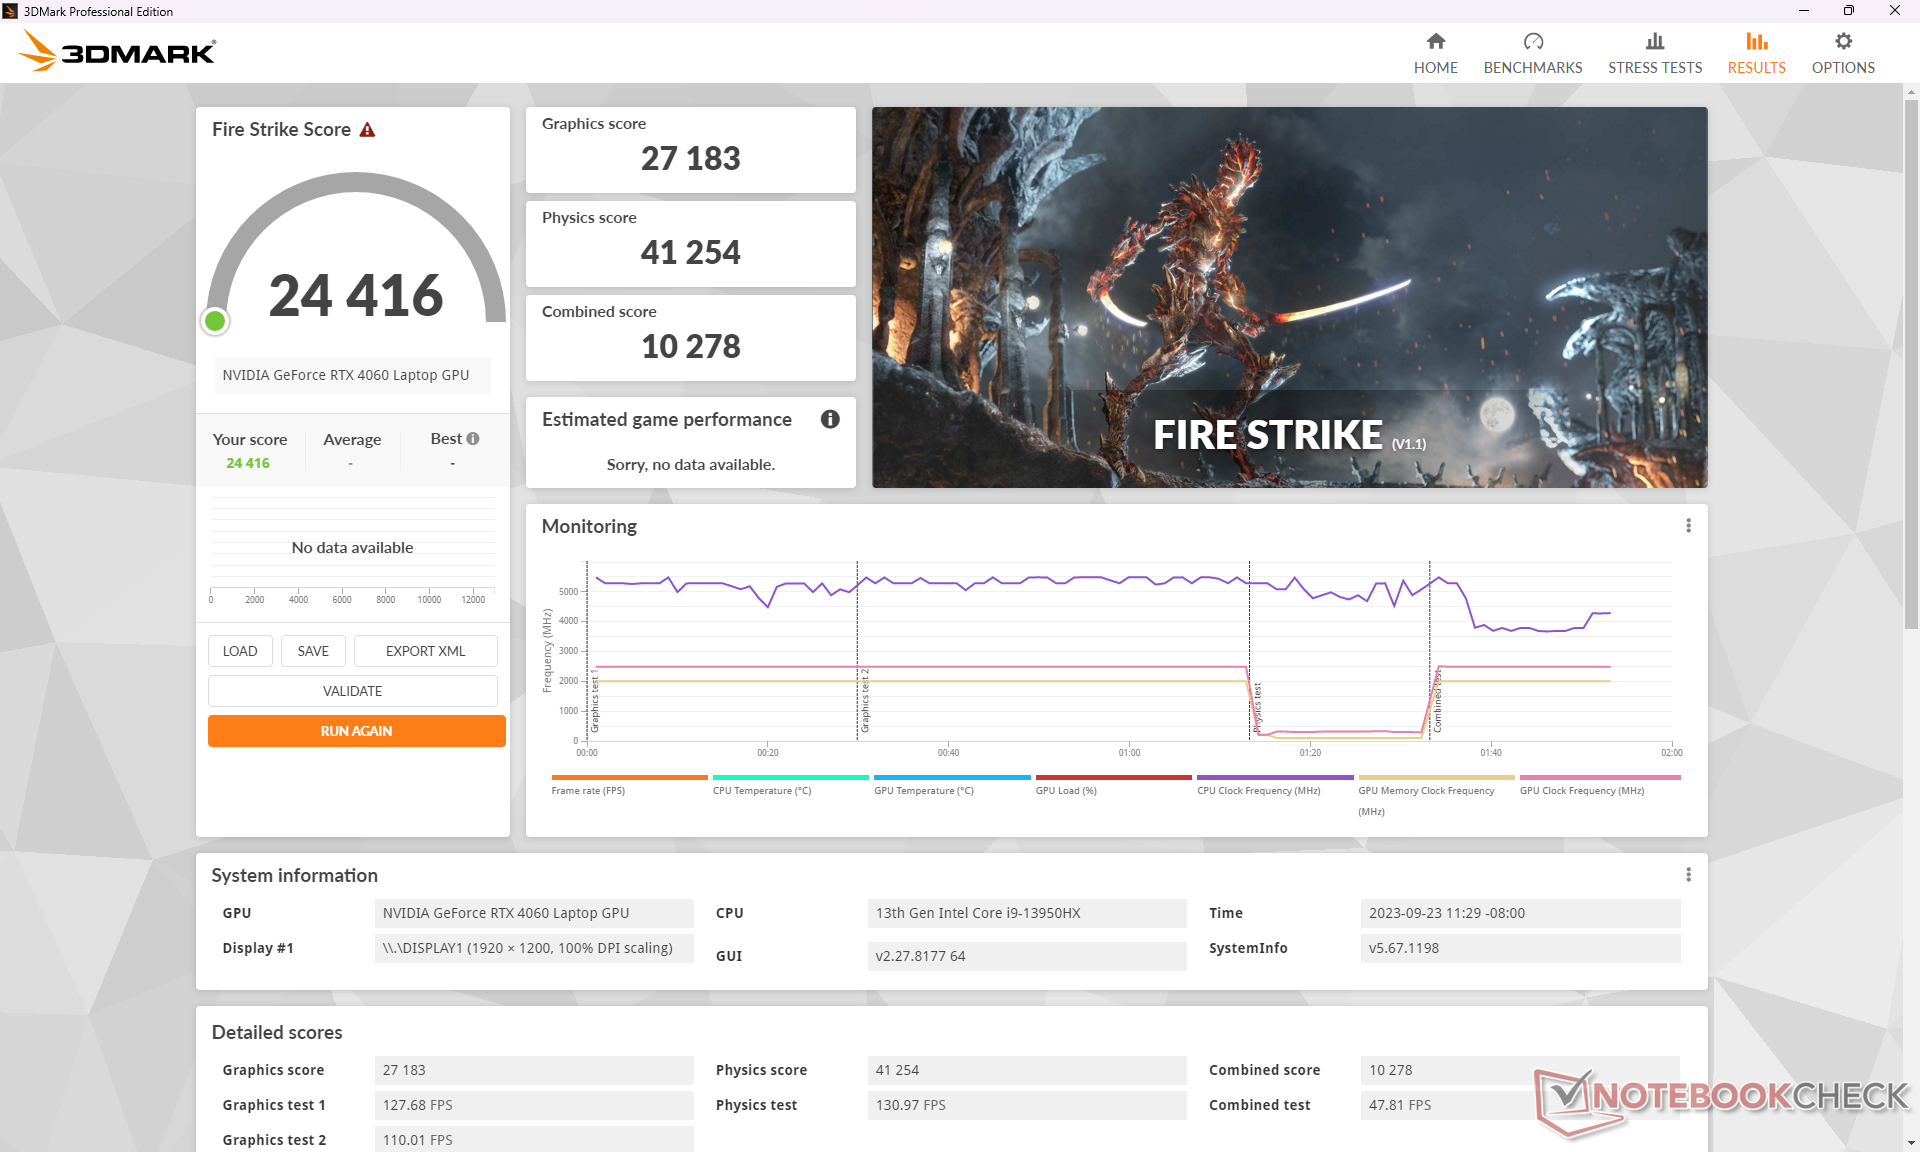
Enabling Cooler Boost does not appear to significantly impact CPU or GPU performance as shown by our Fire Strike results below. Thus, the feature is not vital for maximum performance and it's only recommended if cooler running temperatures are desired.
| Power Profile | Fire Strike Graphics | Fire Strike Physics | Combined Score |
| Extreme Performance mode (Cooler Boost on) | 27127 | 41525 | 11480 |
| Extreme Performance mode (Cooler Boost off) | 27183 (0%) | 41254 (-1%) | 10278 (-10%) |
| Battery Power | 19528 (-28%) | 18623 (-55%) | 5986 (-48%) |
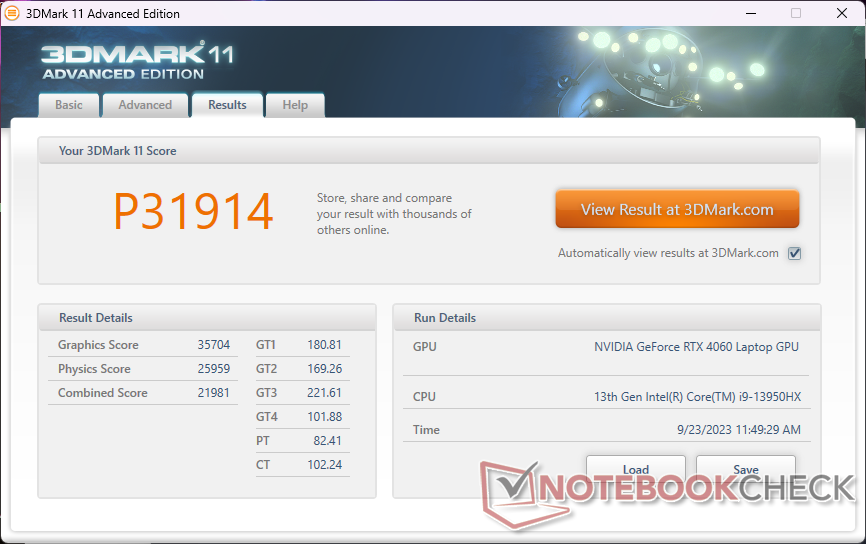
| 3DMark 11 Performance | 31914 points | |
| 3DMark Fire Strike Score | 24416 points | |
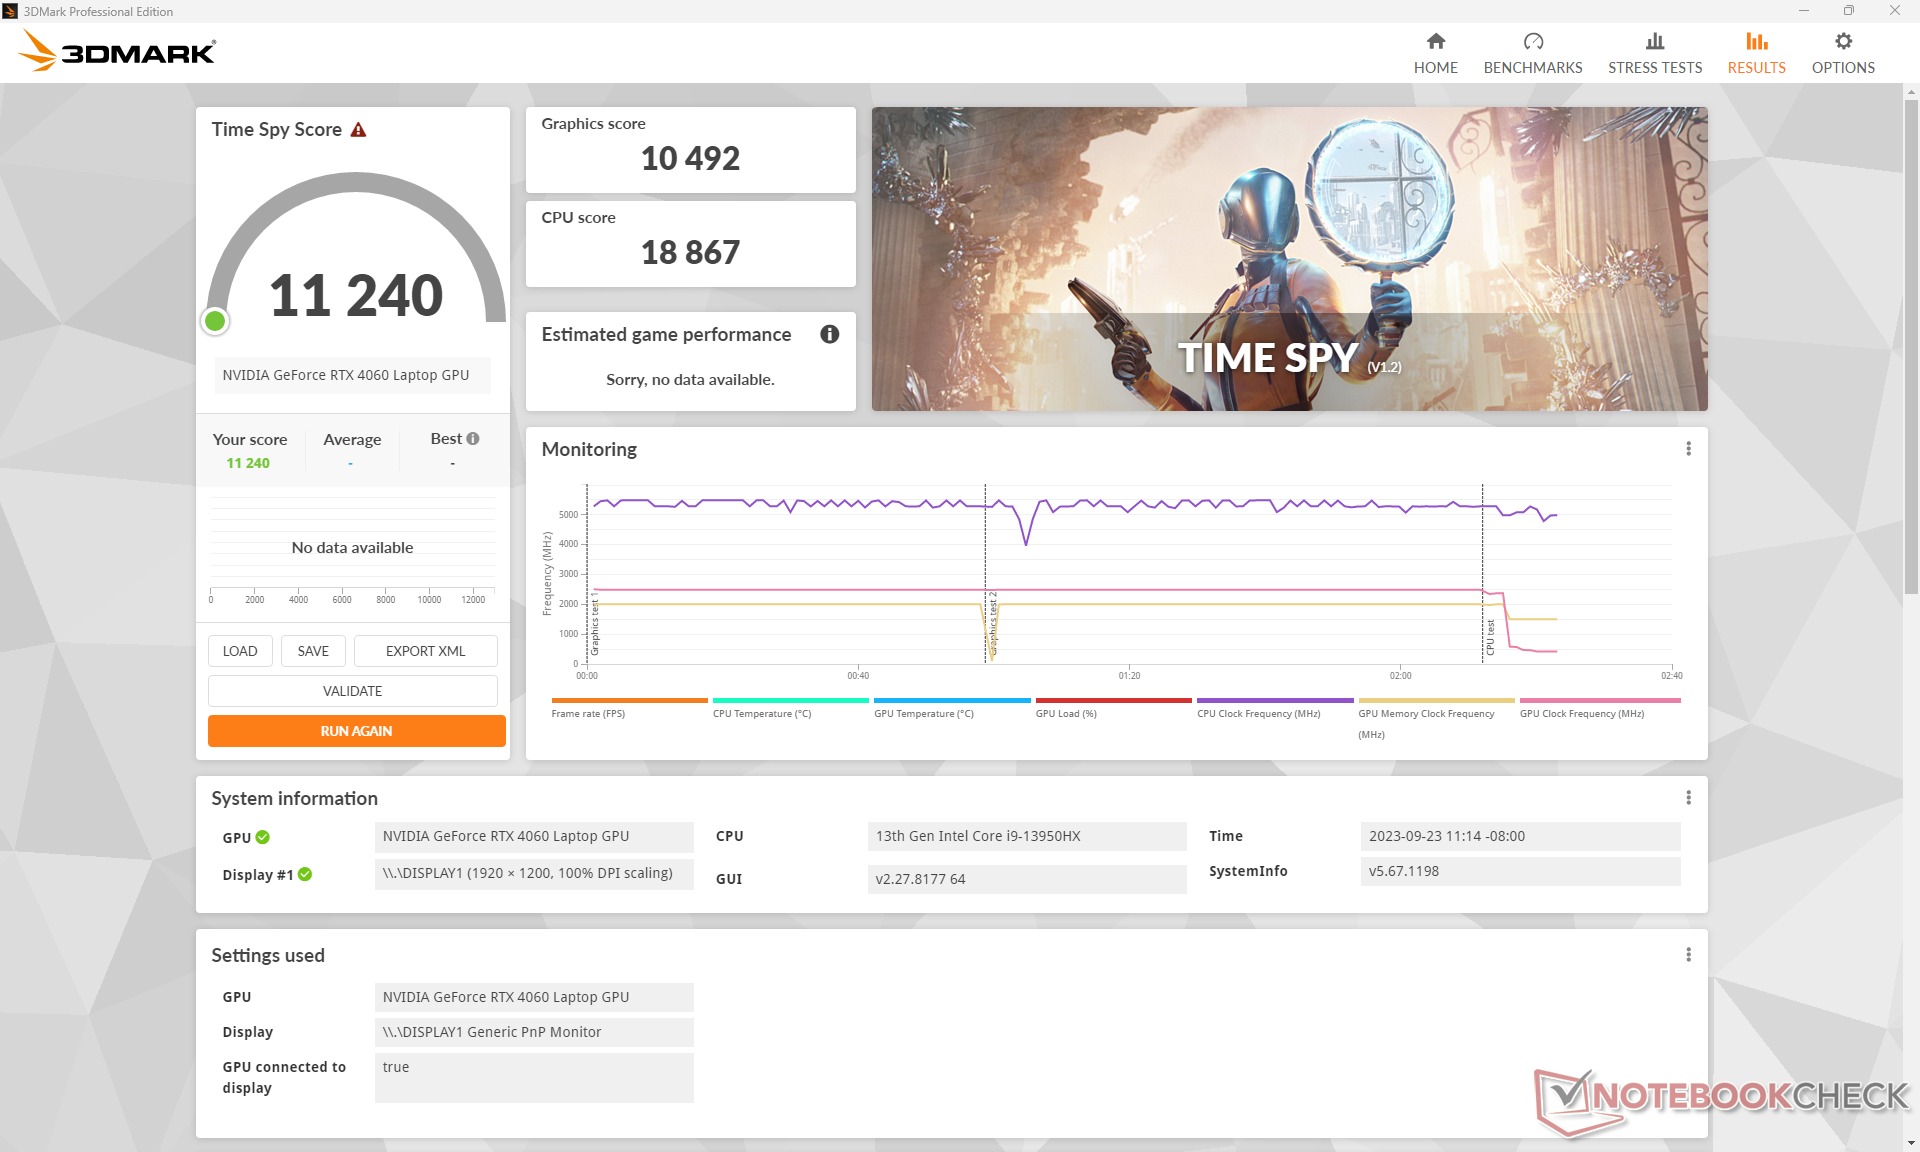
| 3DMark Time Spy Score | 11240 points | |
Help | ||
* ... smaller is better
Gaming Performance
Much like the RTX 2060 and RTX 3060 before it, the RTX 4060 is perfect for 1080p60 gaming. All tested games run very well at 1080p maximum settings, but newer and more demanding games like Ratchet and Clank Rift Apart tend to drop below 60 FPS. Lower settings or DLSS are recommended in such cases especially since the main display lacks G-Sync support.
| Tiny Tina's Wonderlands | |
| 1920x1080 Low Preset (DX12) | |
| Alienware m16 R1 AMD | |
| Lenovo Legion Slim 7i 16 Gen 8 | |
| MSI Raider GE68HX 13VF | |
| Average NVIDIA GeForce RTX 4060 Laptop GPU (164.4 - 235, n=9) | |
| 1920x1080 Medium Preset (DX12) | |
| Alienware m16 R1 AMD | |
| Lenovo Legion Slim 7i 16 Gen 8 | |
| MSI Raider GE68HX 13VF | |
| Average NVIDIA GeForce RTX 4060 Laptop GPU (116 - 192.3, n=9) | |
| 1920x1080 High Preset (DX12) | |
| Alienware m16 R1 AMD | |
| Lenovo Legion Slim 7i 16 Gen 8 | |
| MSI Raider GE68HX 13VF | |
| Average NVIDIA GeForce RTX 4060 Laptop GPU (86.6 - 121.2, n=10) | |
| 1920x1080 Badass Preset (DX12) | |
| Asus Zephyrus Duo 16 GX650PY-NM006W | |
| Alienware m16 R1 AMD | |
| Lenovo Legion Slim 7i 16 Gen 8 | |
| MSI Raider GE68HX 13VF | |
| Average NVIDIA GeForce RTX 4060 Laptop GPU (67.5 - 92.7, n=11) | |
| Ratchet & Clank Rift Apart | |
| 1920x1080 Low Preset | |
| Average NVIDIA GeForce RTX 4060 Laptop GPU (84.7 - 86, n=3) | |
| MSI Raider GE68HX 13VF | |
| 1920x1080 Medium Preset AA:T | |
| MSI Raider GE68HX 13VF | |
| Average NVIDIA GeForce RTX 4060 Laptop GPU (73.4 - 75, n=4) | |
| 1920x1080 High Preset AA:T | |
| Average NVIDIA GeForce RTX 4060 Laptop GPU (59 - 60.6, n=4) | |
| MSI Raider GE68HX 13VF | |
| 1920x1080 Very High Preset AA:T | |
| Average NVIDIA GeForce RTX 4060 Laptop GPU (51.6 - 54.8, n=4) | |
| MSI Raider GE68HX 13VF | |
Witcher 3 FPS Chart
| low | med. | high | ultra | |
|---|---|---|---|---|
| The Witcher 3 (2015) | 556.3 | 364.9 | 213.1 | 103.5 |
| Dota 2 Reborn (2015) | 232 | 207 | 199 | 182.2 |
| Final Fantasy XV Benchmark (2018) | 223 | 151.3 | 103.2 | |
| X-Plane 11.11 (2018) | 209 | 184 | 141.1 | |
| Far Cry 5 (2018) | 191 | 158 | 147 | 138 |
| Strange Brigade (2018) | 487 | 291 | 232 | 194 |
| Cyberpunk 2077 1.6 (2022) | 129.1 | 103 | 88.3 | 80.4 |
| Tiny Tina's Wonderlands (2022) | 233.9 | 184.6 | 116.5 | 88.3 |
| F1 22 (2022) | 288 | 271 | 206 | 65.5 |
| Ratchet & Clank Rift Apart (2023) | 84.7 | 75 | 59 | 51.6 |
Emissions
System Noise — Balanced Mode Is Recommended For Most Scenarios
Fan noise is a mixed bag. The two fans are very sensitive to onscreen loads meaning they will ramp up sharply and quickly when simply launching applications or browsing the web even when set to the Balanced power profile. There is audible fan noise on Silent mode as well, but pulsing is much less frequent. In general, users can expect a noise level in the 25 to 38 dB(A) range when browsing or streaming video even if on Silent mode.
Fan noise when gaming can vary wildly depending on the power profile selected. Running Witcher 3 on Balanced or Extreme Performance modes would result in a noise level of 46.2 dB(A) or 57 dB(A), respectively. If Cooler Boost is enabled, the maximum would jump even higher to 60.1 dB(A) to be one of the loudest 16-inch gaming laptops. Thankfully, the graphics performance loss when gaming on Balanced mode is very marginal and so the Extreme Performance and Cooler Boost settings are only recommended if you desire cooler running temperatures or are manually overclocking the GPU.

Noise level
| Idle |
| 25 / 31.3 / 37.5 dB(A) |
| Load |
| 44 / 60.1 dB(A) |
 | ||
30 dB silent 40 dB(A) audible 50 dB(A) loud |
||
min: | ||
| MSI Raider GE68HX 13VF GeForce RTX 4060 Laptop GPU, i9-13950HX, Samsung PM9B1 1024GB MZVL41T0HBLB | MSI GE67 HX 12UGS GeForce RTX 3070 Ti Laptop GPU, i7-12800HX, Samsung PM9A1 MZVL21T0HCLR | HP Omen 16-xf0376ng GeForce RTX 4070 Laptop GPU, R7 7840HS, WDC PC SN810 512GB | Alienware m16 R1 AMD GeForce RTX 4080 Laptop GPU, R9 7845HX, Kioxia XG8 KXG80ZNV1T02 | Lenovo Legion Slim 7i 16 Gen 8 GeForce RTX 4070 Laptop GPU, i9-13900H, Samsung PM9A1 MZVL21T0HCLR | Asus ROG Zephyrus M16 GU604VY-NM042X GeForce RTX 4090 Laptop GPU, i9-13900H, Samsung PM9A1 MZVL22T0HBLB | |
|---|---|---|---|---|---|---|
| Noise | 12% | 9% | 12% | 16% | 5% | |
| off / environment * (dB) | 23.3 | 22.7 3% | 24 -3% | 22.9 2% | 22.8 2% | 24 -3% |
| Idle Minimum * (dB) | 25 | 22.9 8% | 25 -0% | 22.9 8% | 23.6 6% | 24 4% |
| Idle Average * (dB) | 31.3 | 22.9 27% | 29 7% | 29.7 5% | 23.6 25% | 29.96 4% |
| Idle Maximum * (dB) | 37.5 | 22.9 39% | 32 15% | 29.7 21% | 25.7 31% | 34.27 9% |
| Load Average * (dB) | 44 | 44.4 -1% | 44 -0% | 29.8 32% | 27.6 37% | 35.89 18% |
| Witcher 3 ultra * (dB) | 57 | 55.7 2% | 44 23% | 54.7 4% | 54.4 5% | 57.5 -1% |
| Load Maximum * (dB) | 60.1 | 57.4 4% | 46 23% | 54.7 9% | 54.4 9% | 57.54 4% |
* ... smaller is better
Temperature
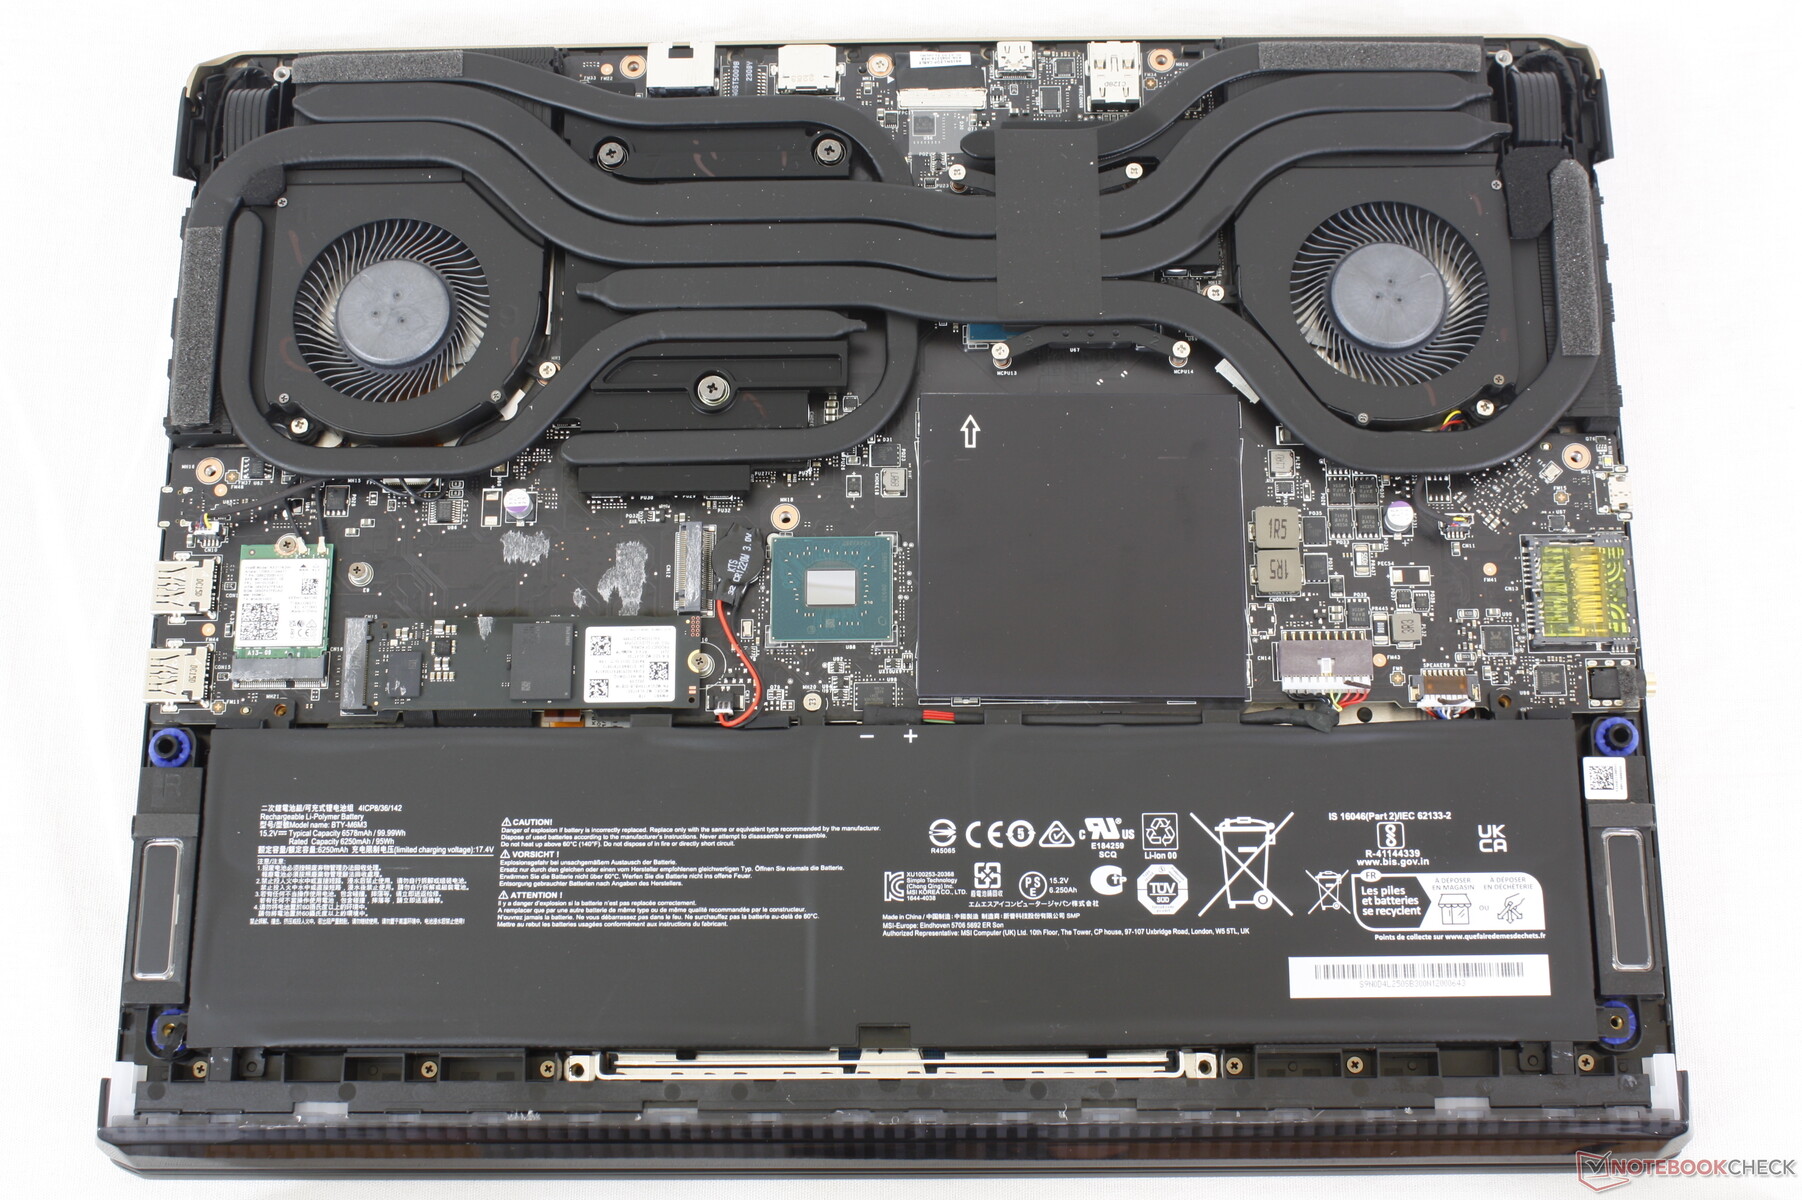
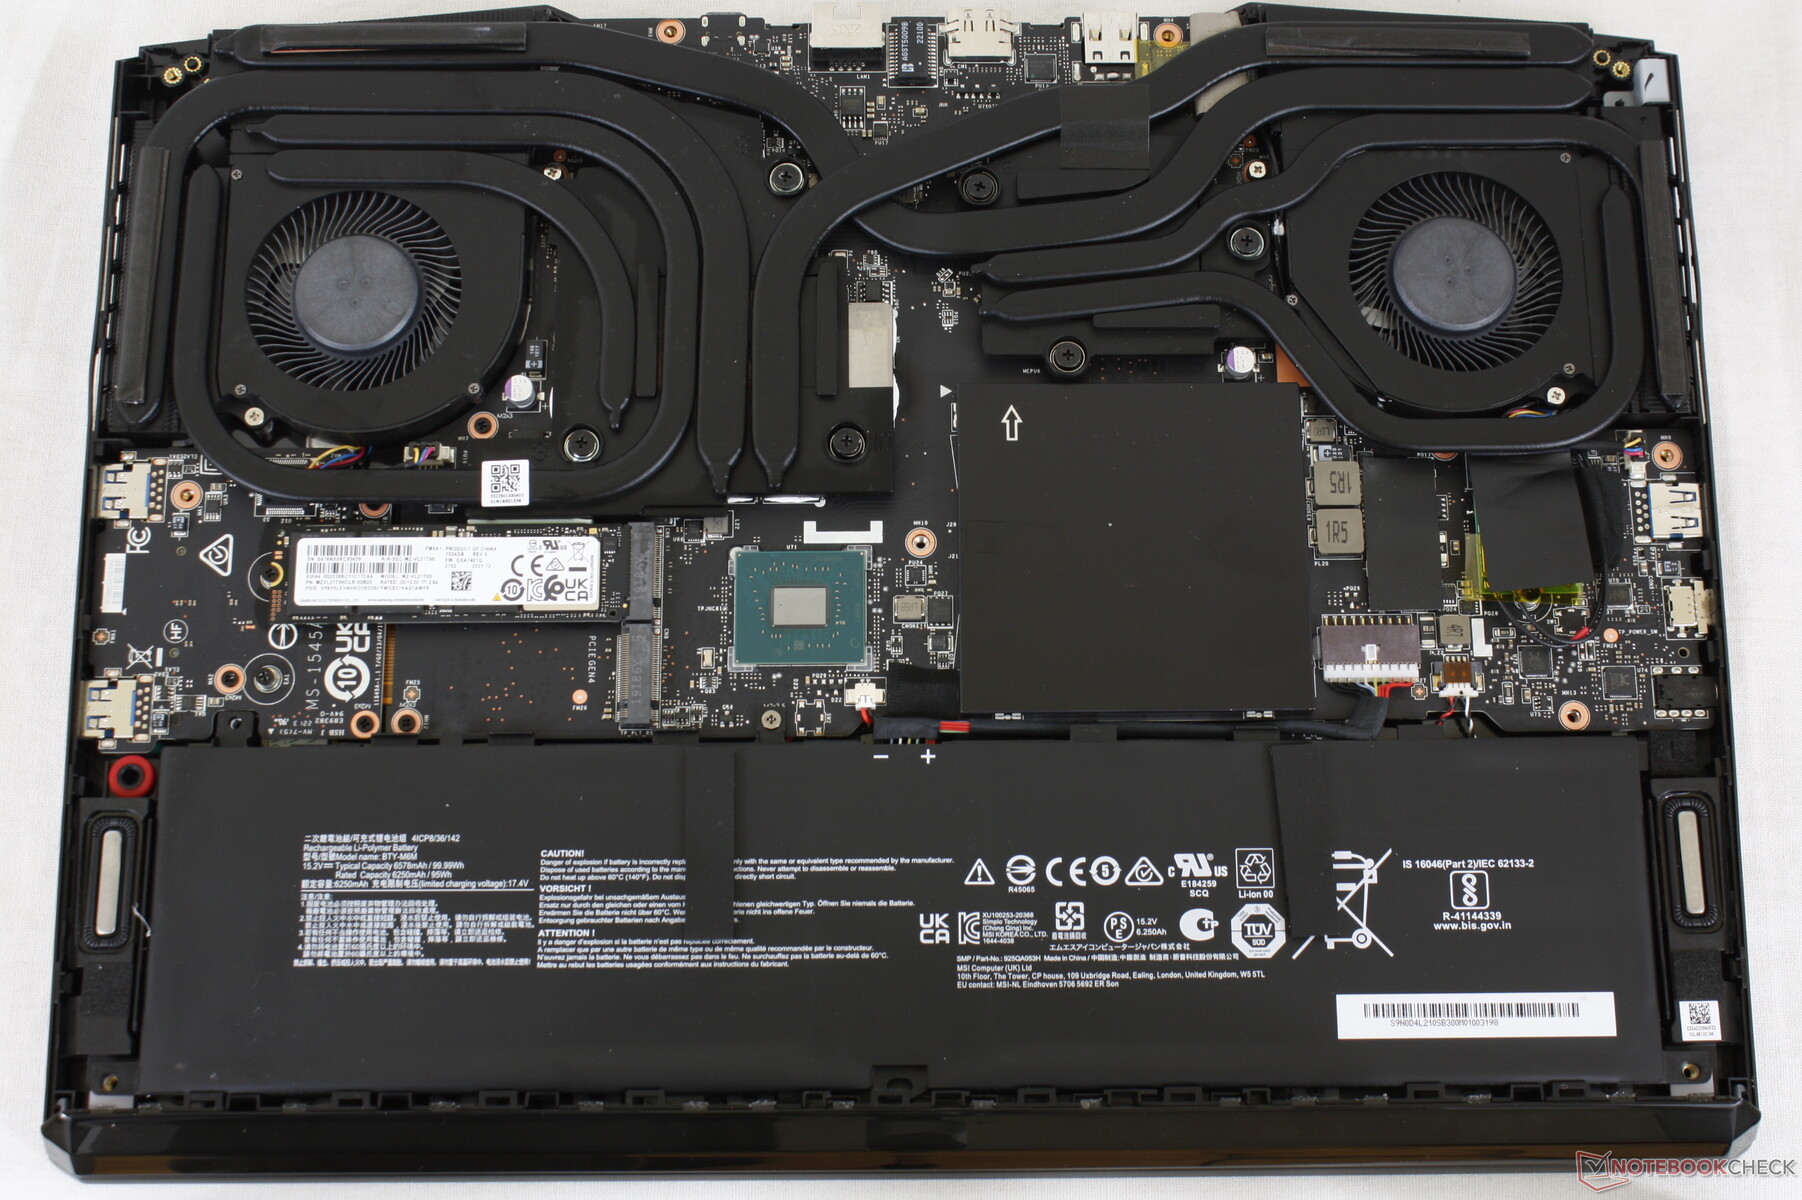
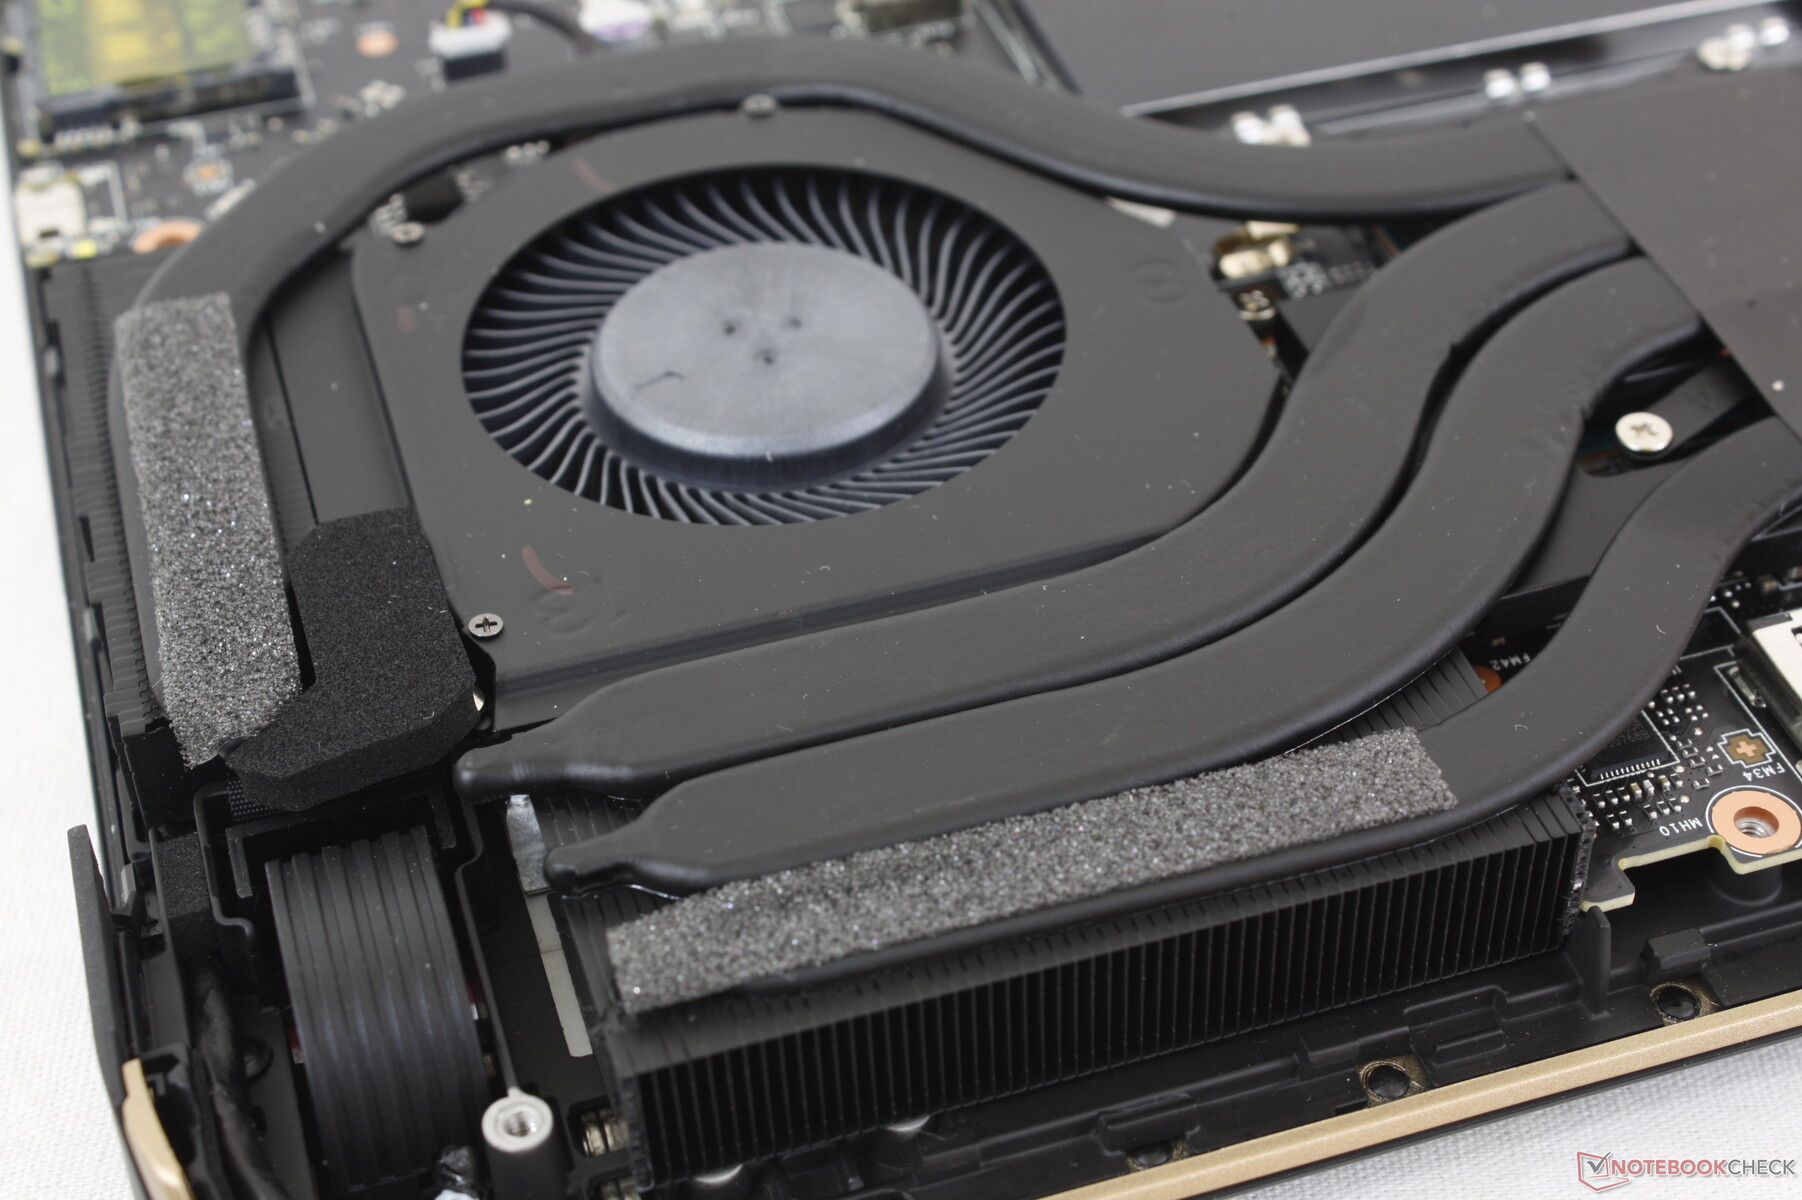
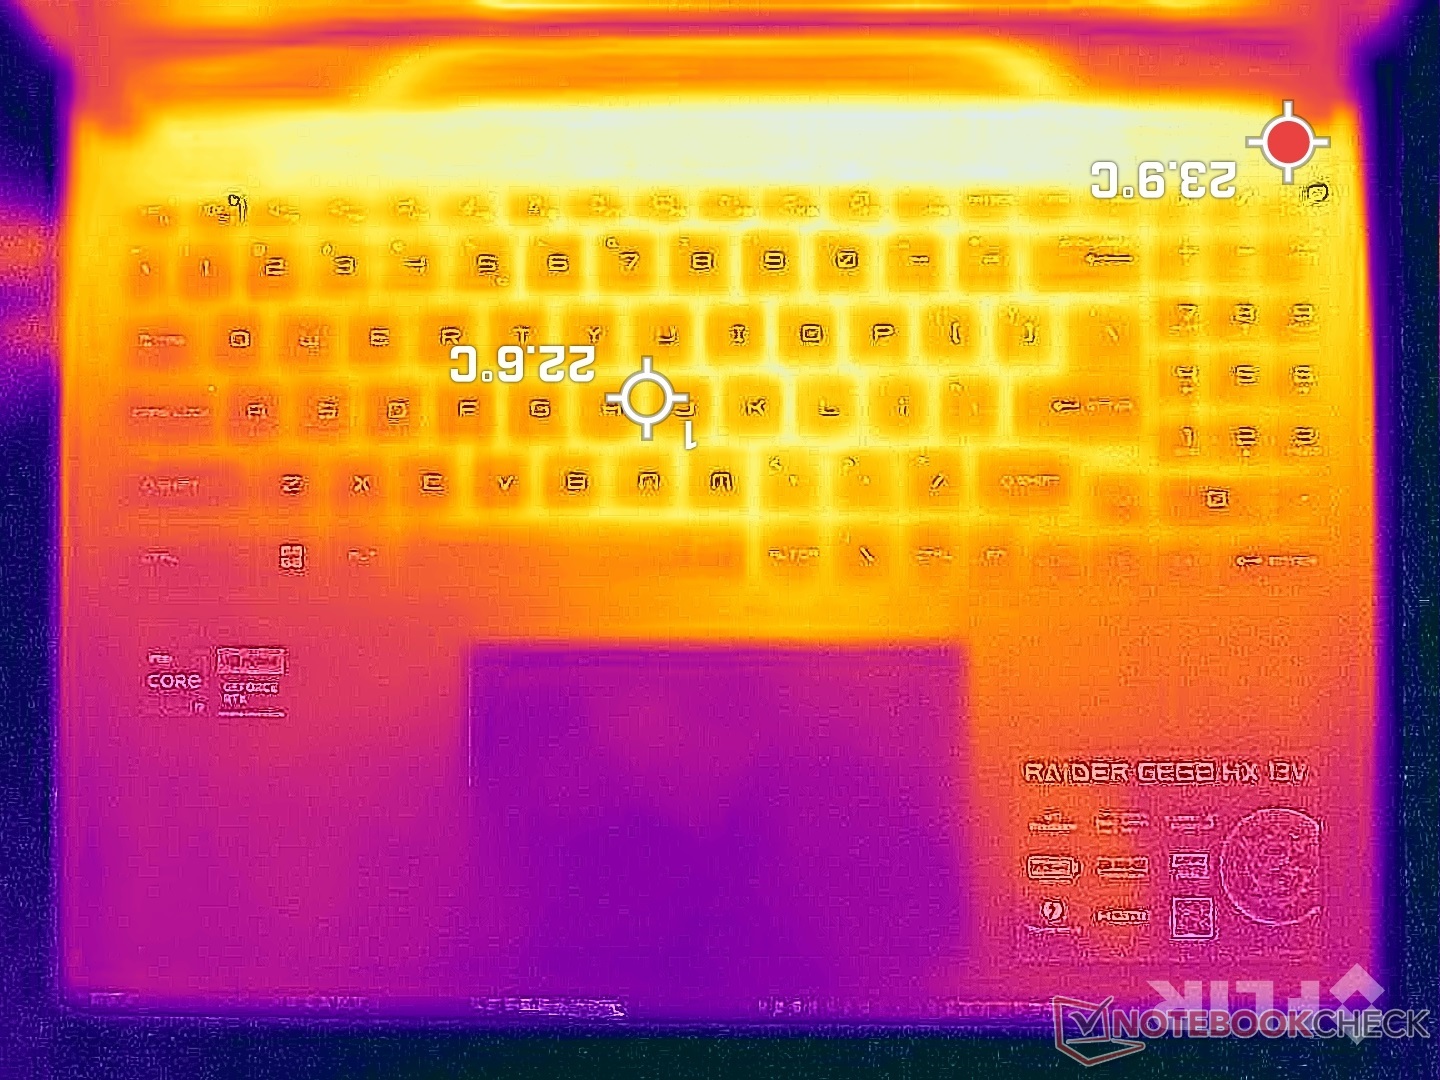
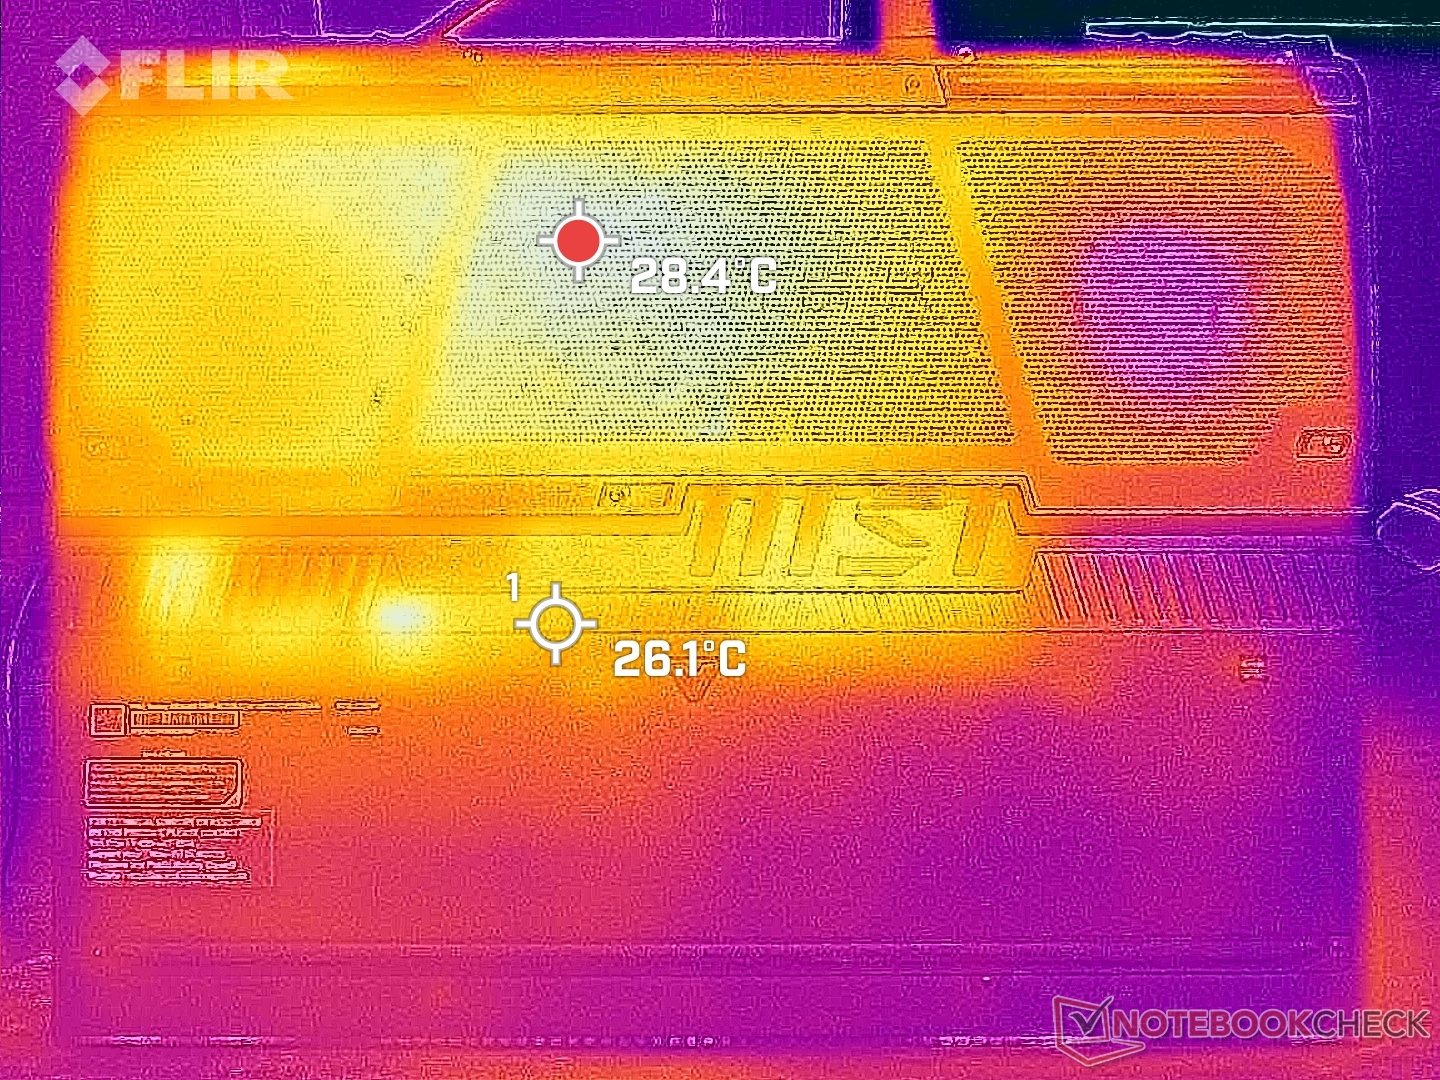
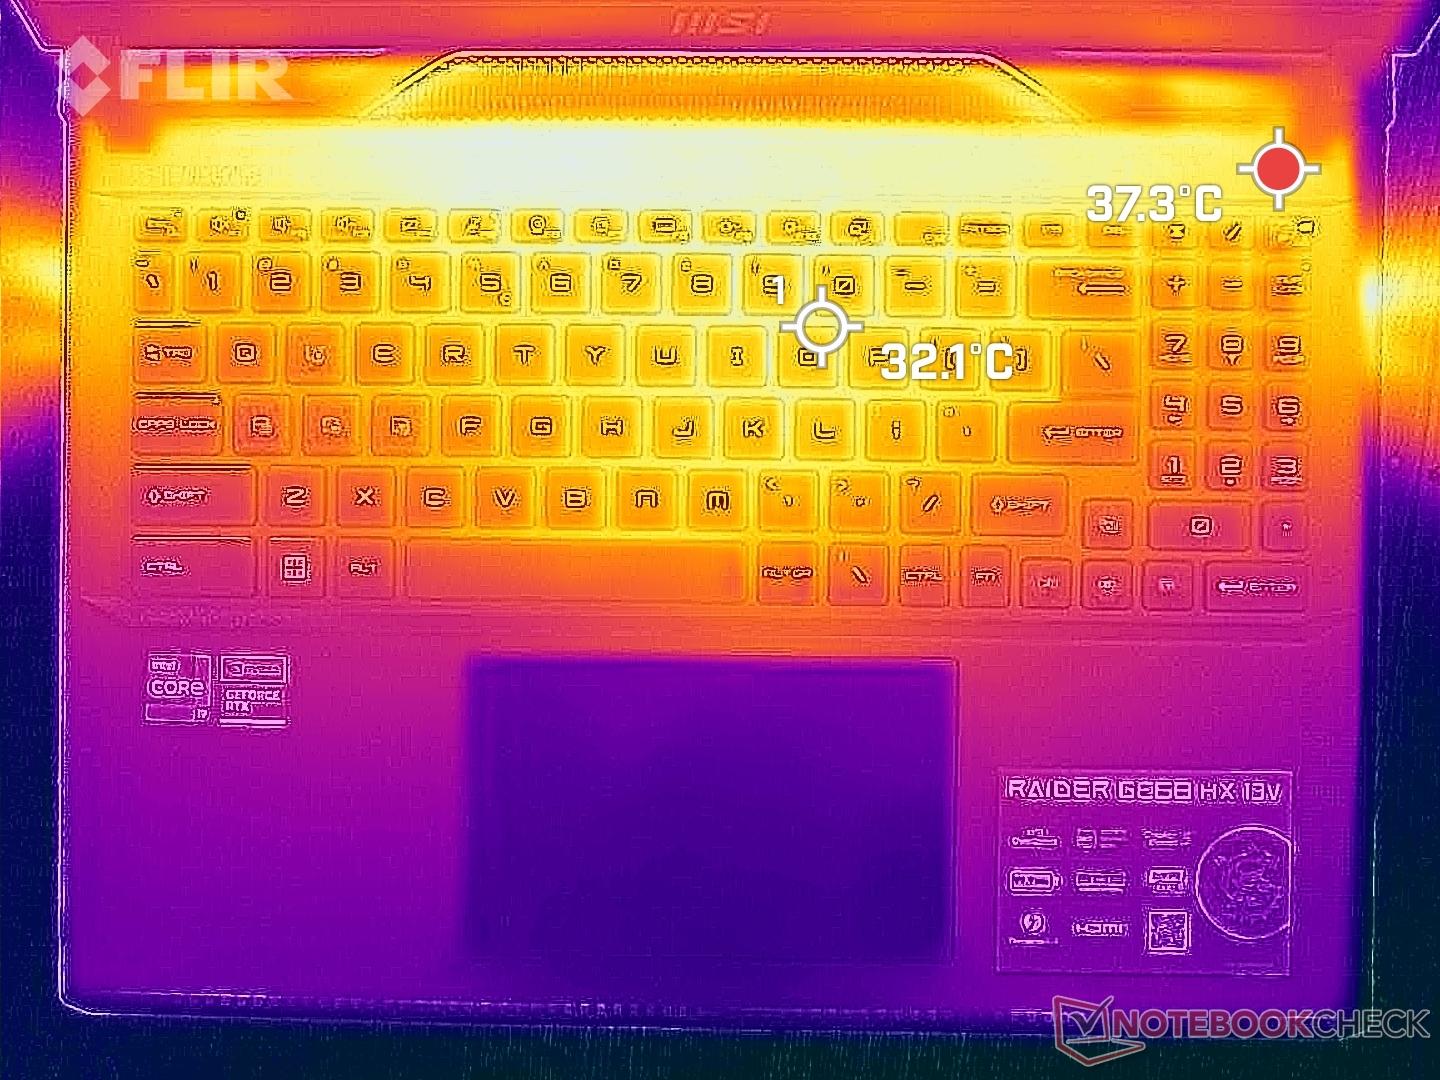
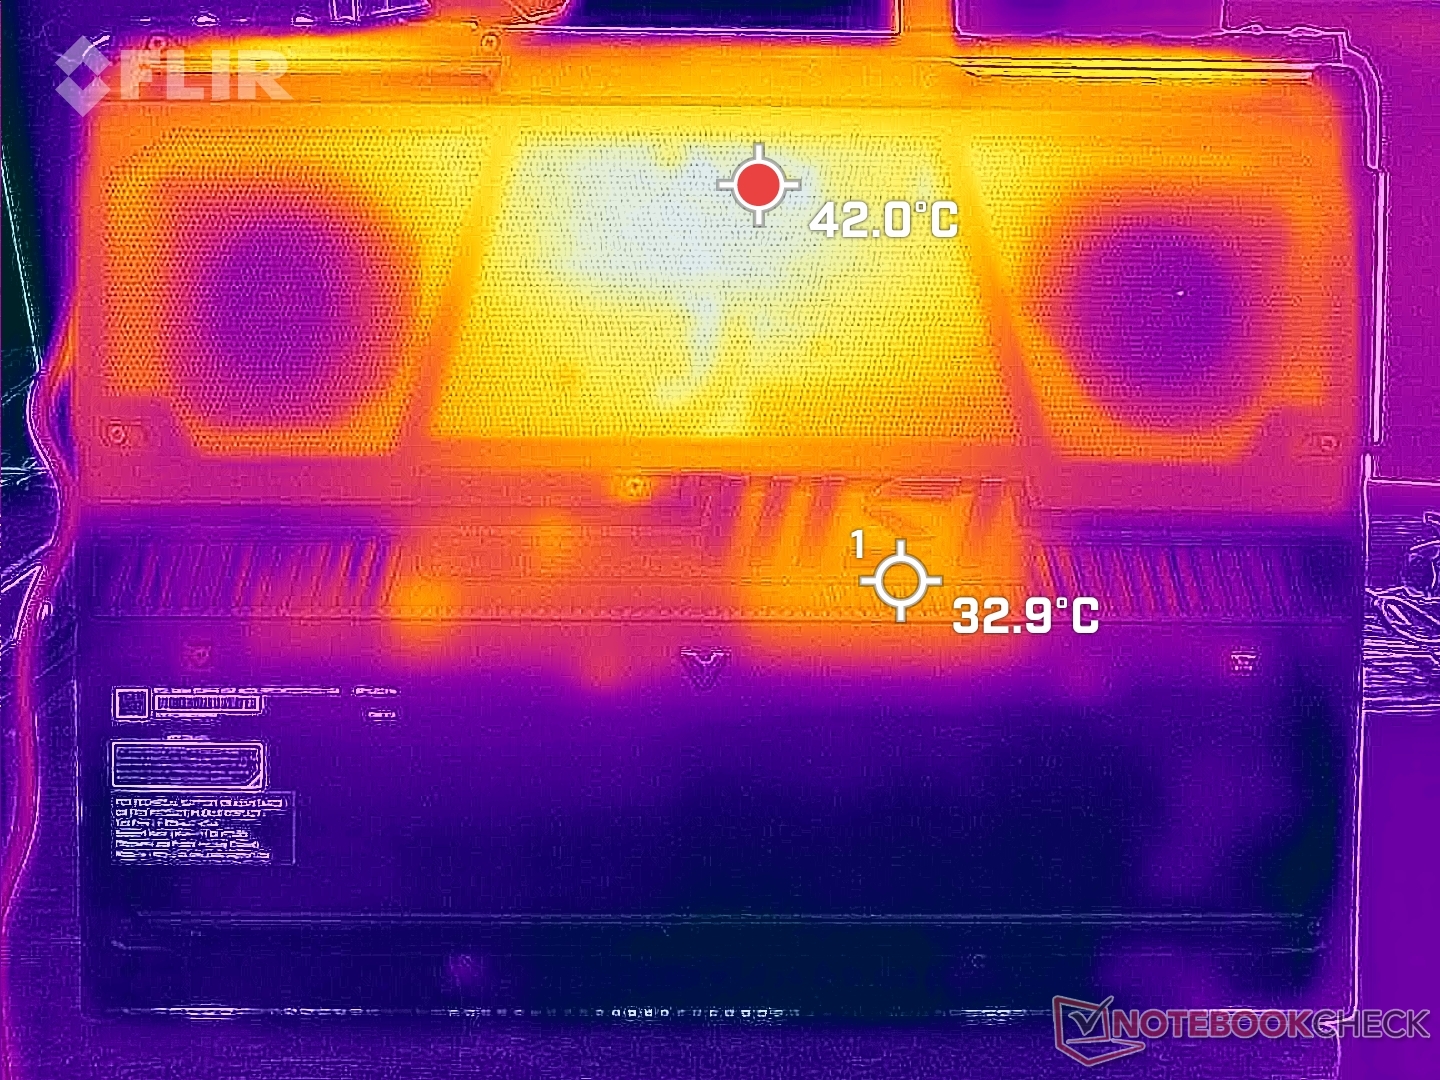
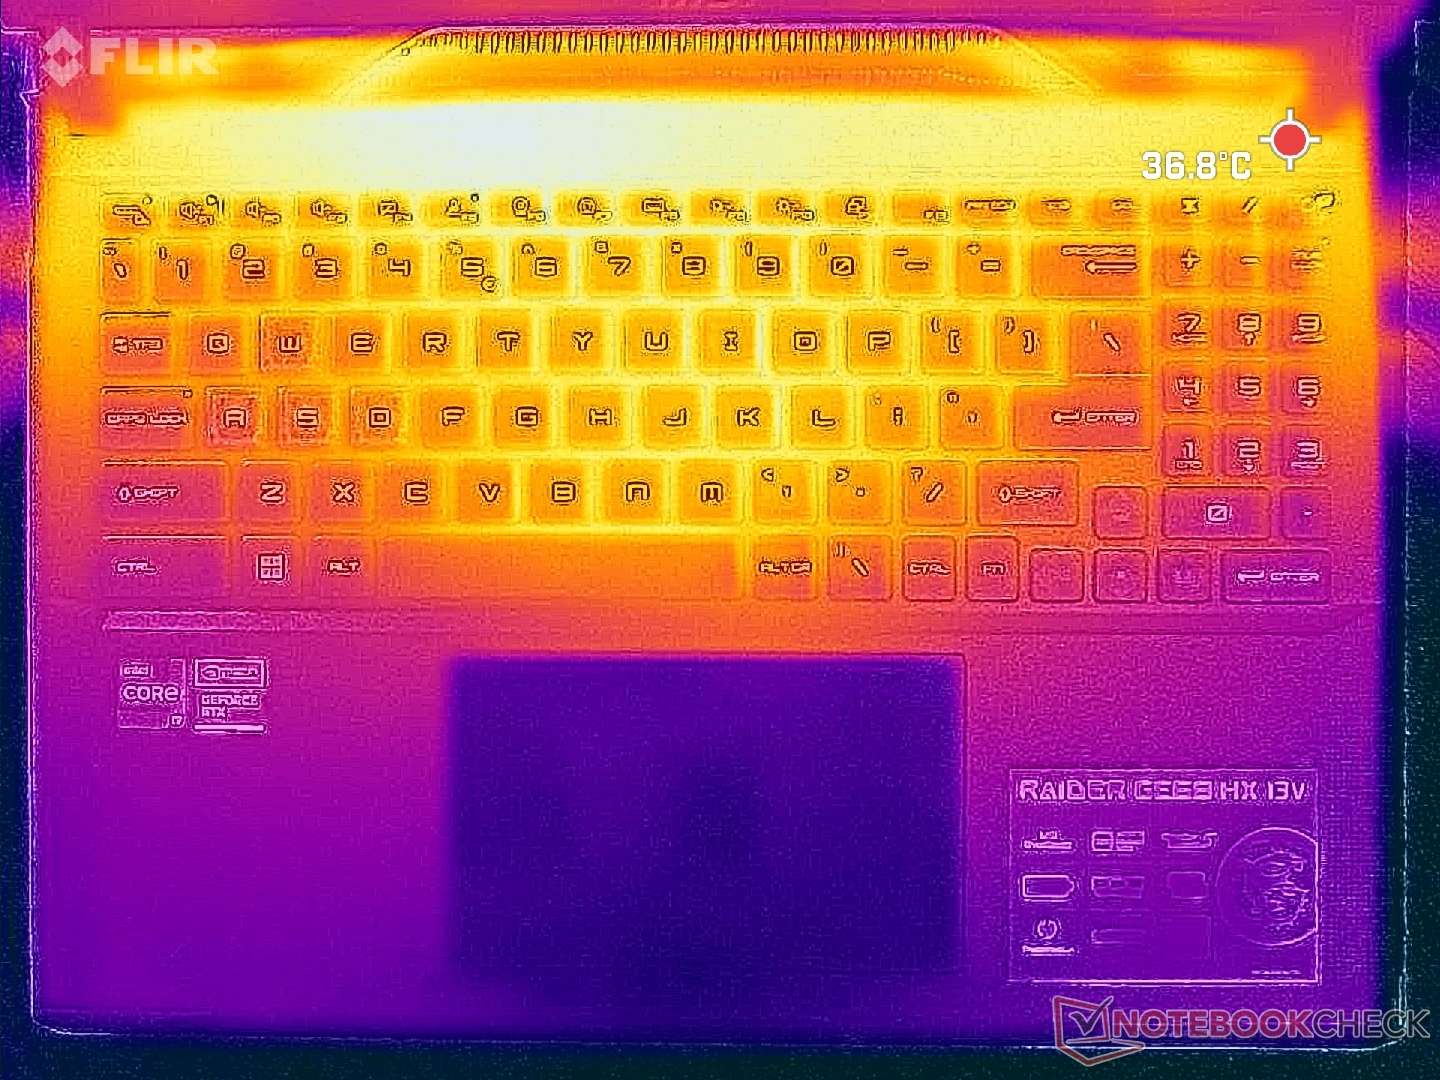
Surface temperature development is symmetrical due to how the cooling solution is designed. The keyboard center can reach up to 40 C which is much cooler than what we recorded on the HP Omen 16 or Legion Slim 7i 16 G8 where hotspots can be up to 45 to 50 C each. The generally louder fans and thicker build of the GE68HX work in favor of MSI from this perspective.
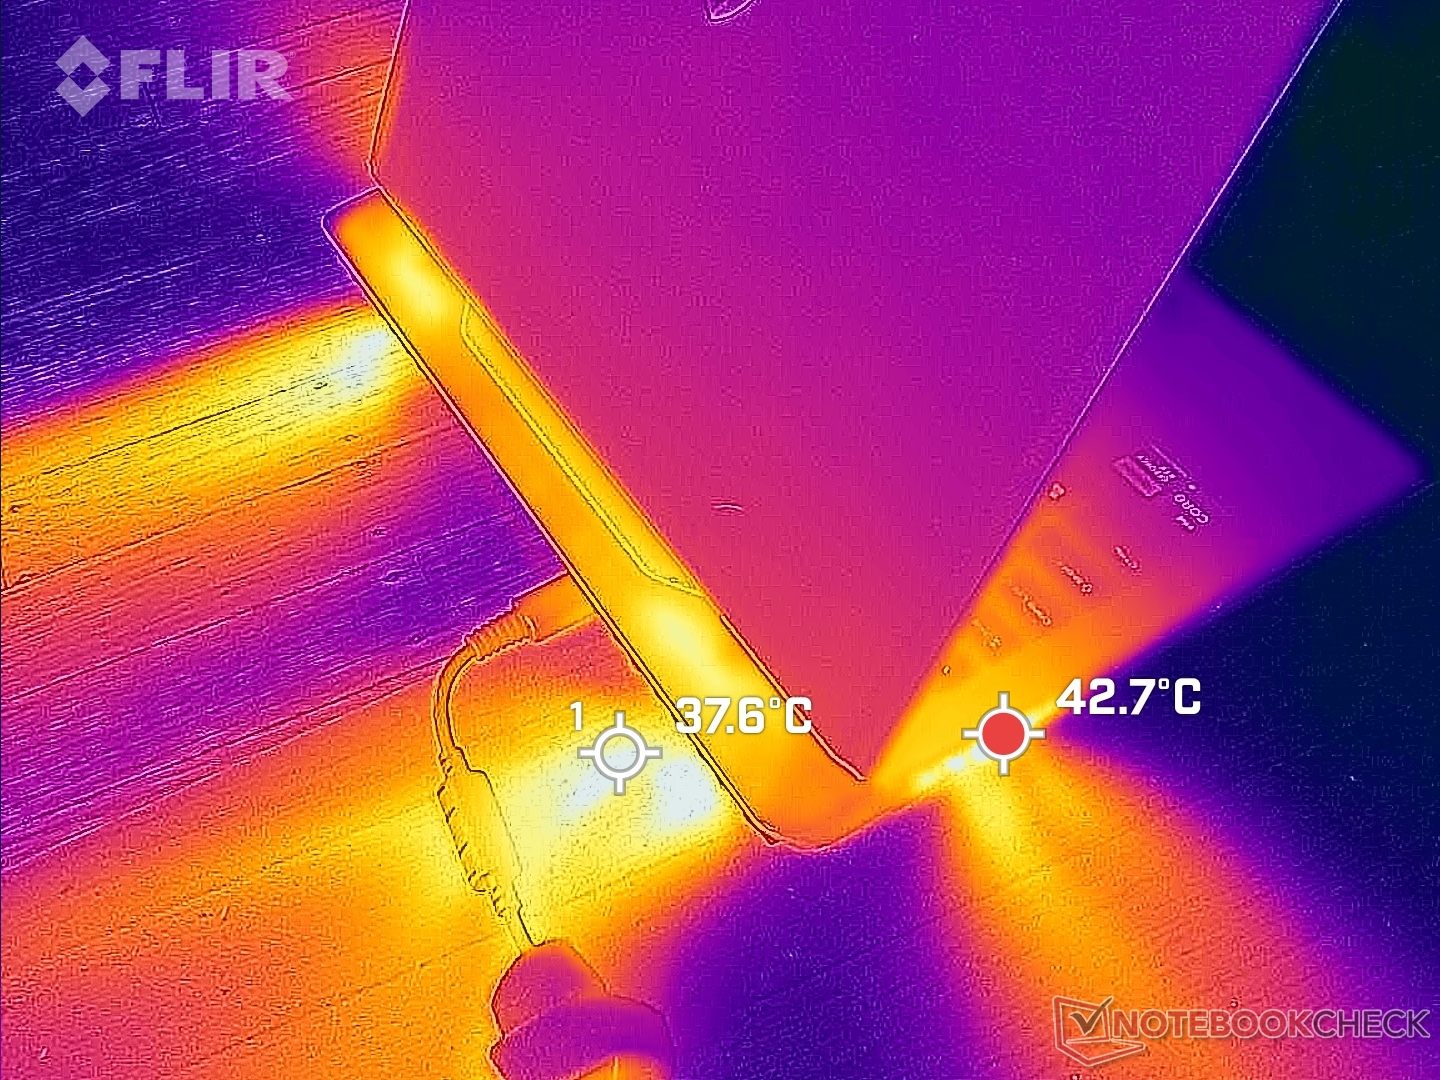
(±) The maximum temperature on the upper side is 41.4 °C / 107 F, compared to the average of 40.4 °C / 105 F, ranging from 21.2 to 68.8 °C for the class Gaming.
(-) The bottom heats up to a maximum of 45.4 °C / 114 F, compared to the average of 43.2 °C / 110 F
(+) In idle usage, the average temperature for the upper side is 27.7 °C / 82 F, compared to the device average of 33.9 °C / 93 F.
(±) Playing The Witcher 3, the average temperature for the upper side is 34 °C / 93 F, compared to the device average of 33.9 °C / 93 F.
(+) The palmrests and touchpad are cooler than skin temperature with a maximum of 29.6 °C / 85.3 F and are therefore cool to the touch.
(±) The average temperature of the palmrest area of similar devices was 28.8 °C / 83.8 F (-0.8 °C / -1.5 F).

| MSI Raider GE68HX 13VF Intel Core i9-13950HX, NVIDIA GeForce RTX 4060 Laptop GPU | MSI GE67 HX 12UGS Intel Core i7-12800HX, NVIDIA GeForce RTX 3070 Ti Laptop GPU | HP Omen 16-xf0376ng AMD Ryzen 7 7840HS, NVIDIA GeForce RTX 4070 Laptop GPU | Alienware m16 R1 AMD AMD Ryzen 9 7845HX, NVIDIA GeForce RTX 4080 Laptop GPU | Lenovo Legion Slim 7i 16 Gen 8 Intel Core i9-13900H, NVIDIA GeForce RTX 4070 Laptop GPU | Asus ROG Zephyrus M16 GU604VY-NM042X Intel Core i9-13900H, NVIDIA GeForce RTX 4090 Laptop GPU | |
|---|---|---|---|---|---|---|
| Heat | 9% | -12% | -10% | -6% | -6% | |
| Maximum Upper Side * (°C) | 41.4 | 34.4 17% | 49 -18% | 48 -16% | 49.8 -20% | 50 -21% |
| Maximum Bottom * (°C) | 45.4 | 42 7% | 57 -26% | 39 14% | 48.8 -7% | 58 -28% |
| Idle Upper Side * (°C) | 29.8 | 24 19% | 31 -4% | 37 -24% | 29.4 1% | 26 13% |
| Idle Bottom * (°C) | 31.4 | 33.2 -6% | 31 1% | 36.2 -15% | 30 4% | 28 11% |
* ... smaller is better
Stress Test
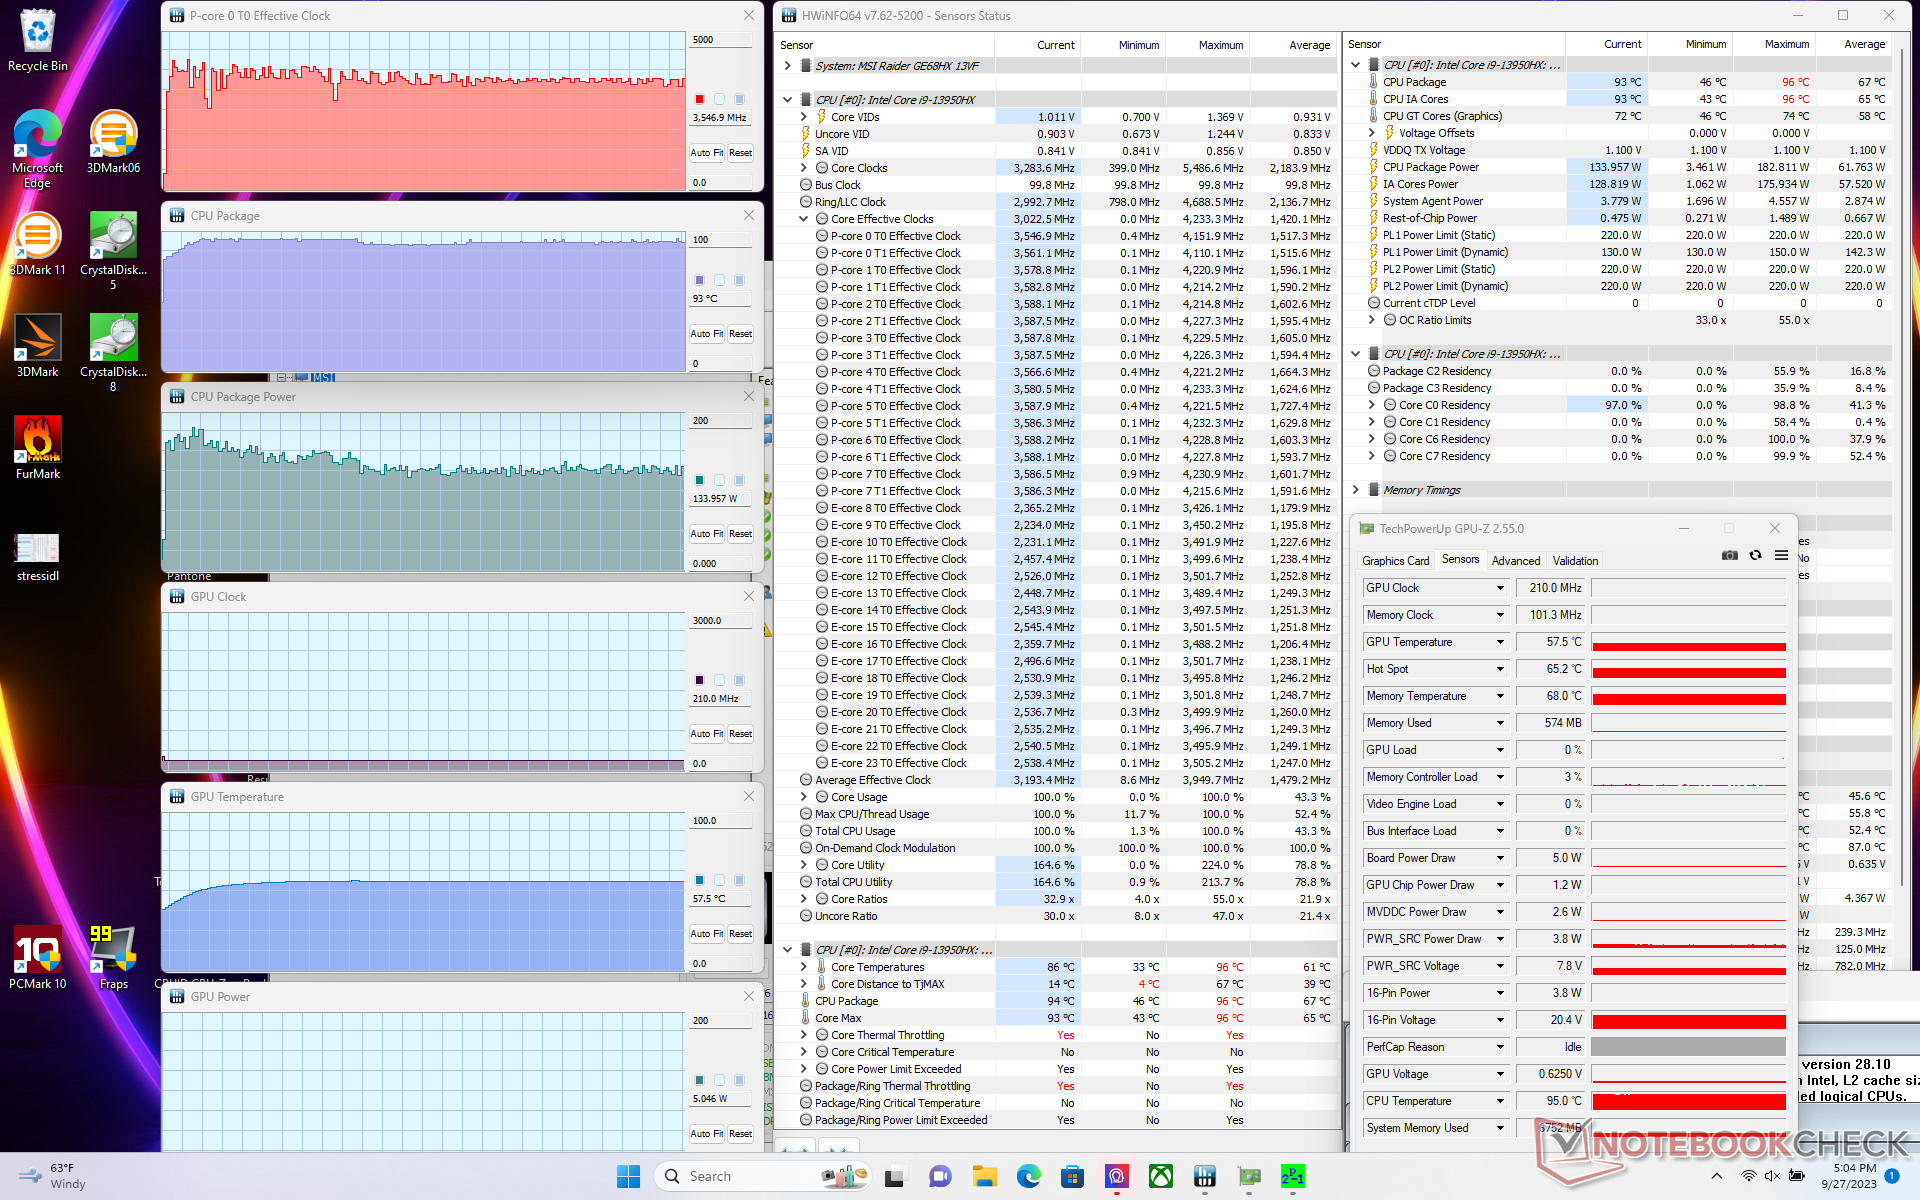
The CPU would boost to 4.1 GHz and 183 W when initiating Prime95 stress before settling at 3.6 GHz, 134 W, and 93 C just a few seconds later. Repeating this test on last year's model with the older 12th gen Core i7-12800HX would result in a much lower CPU package power of just 55 W to show how much more demanding the new 13th gen CPU can be.
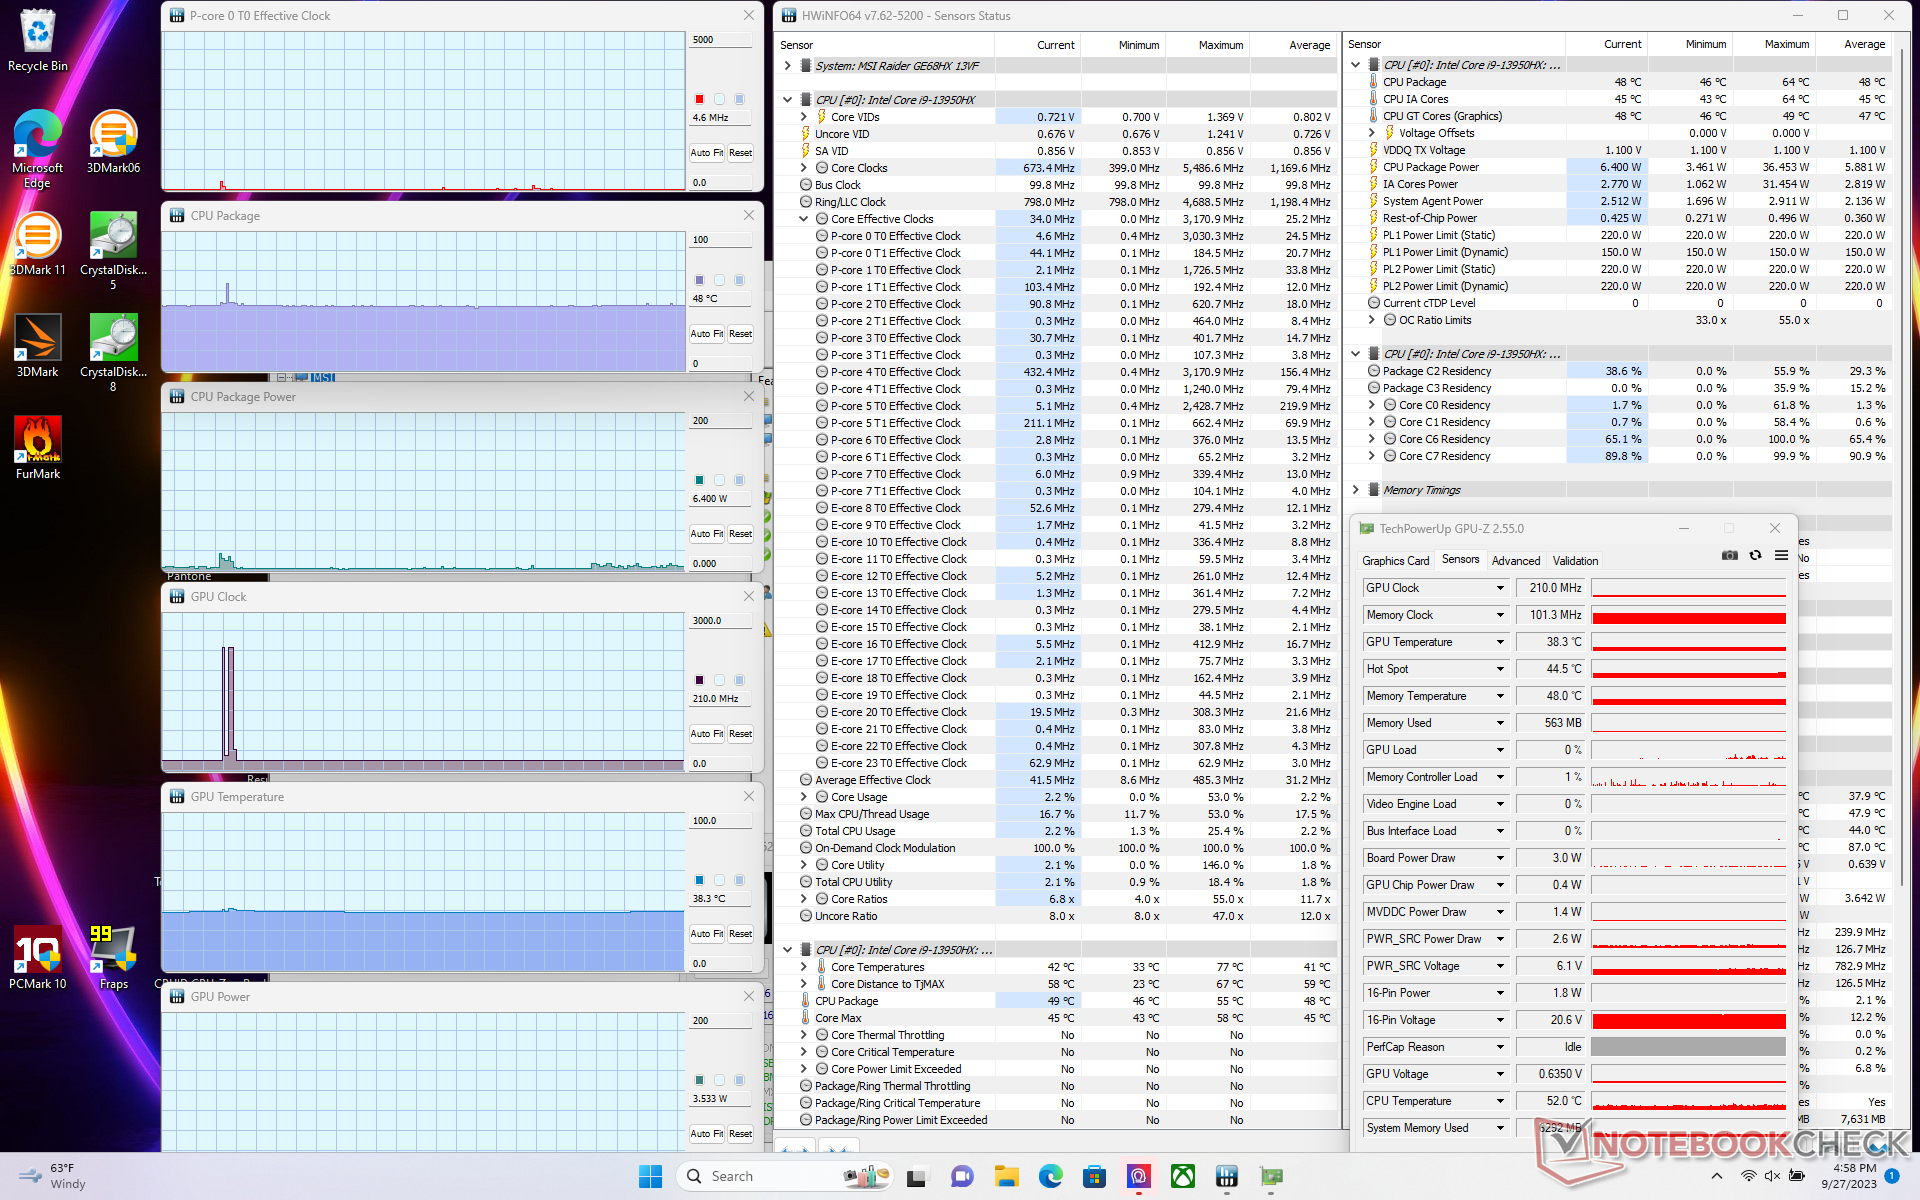
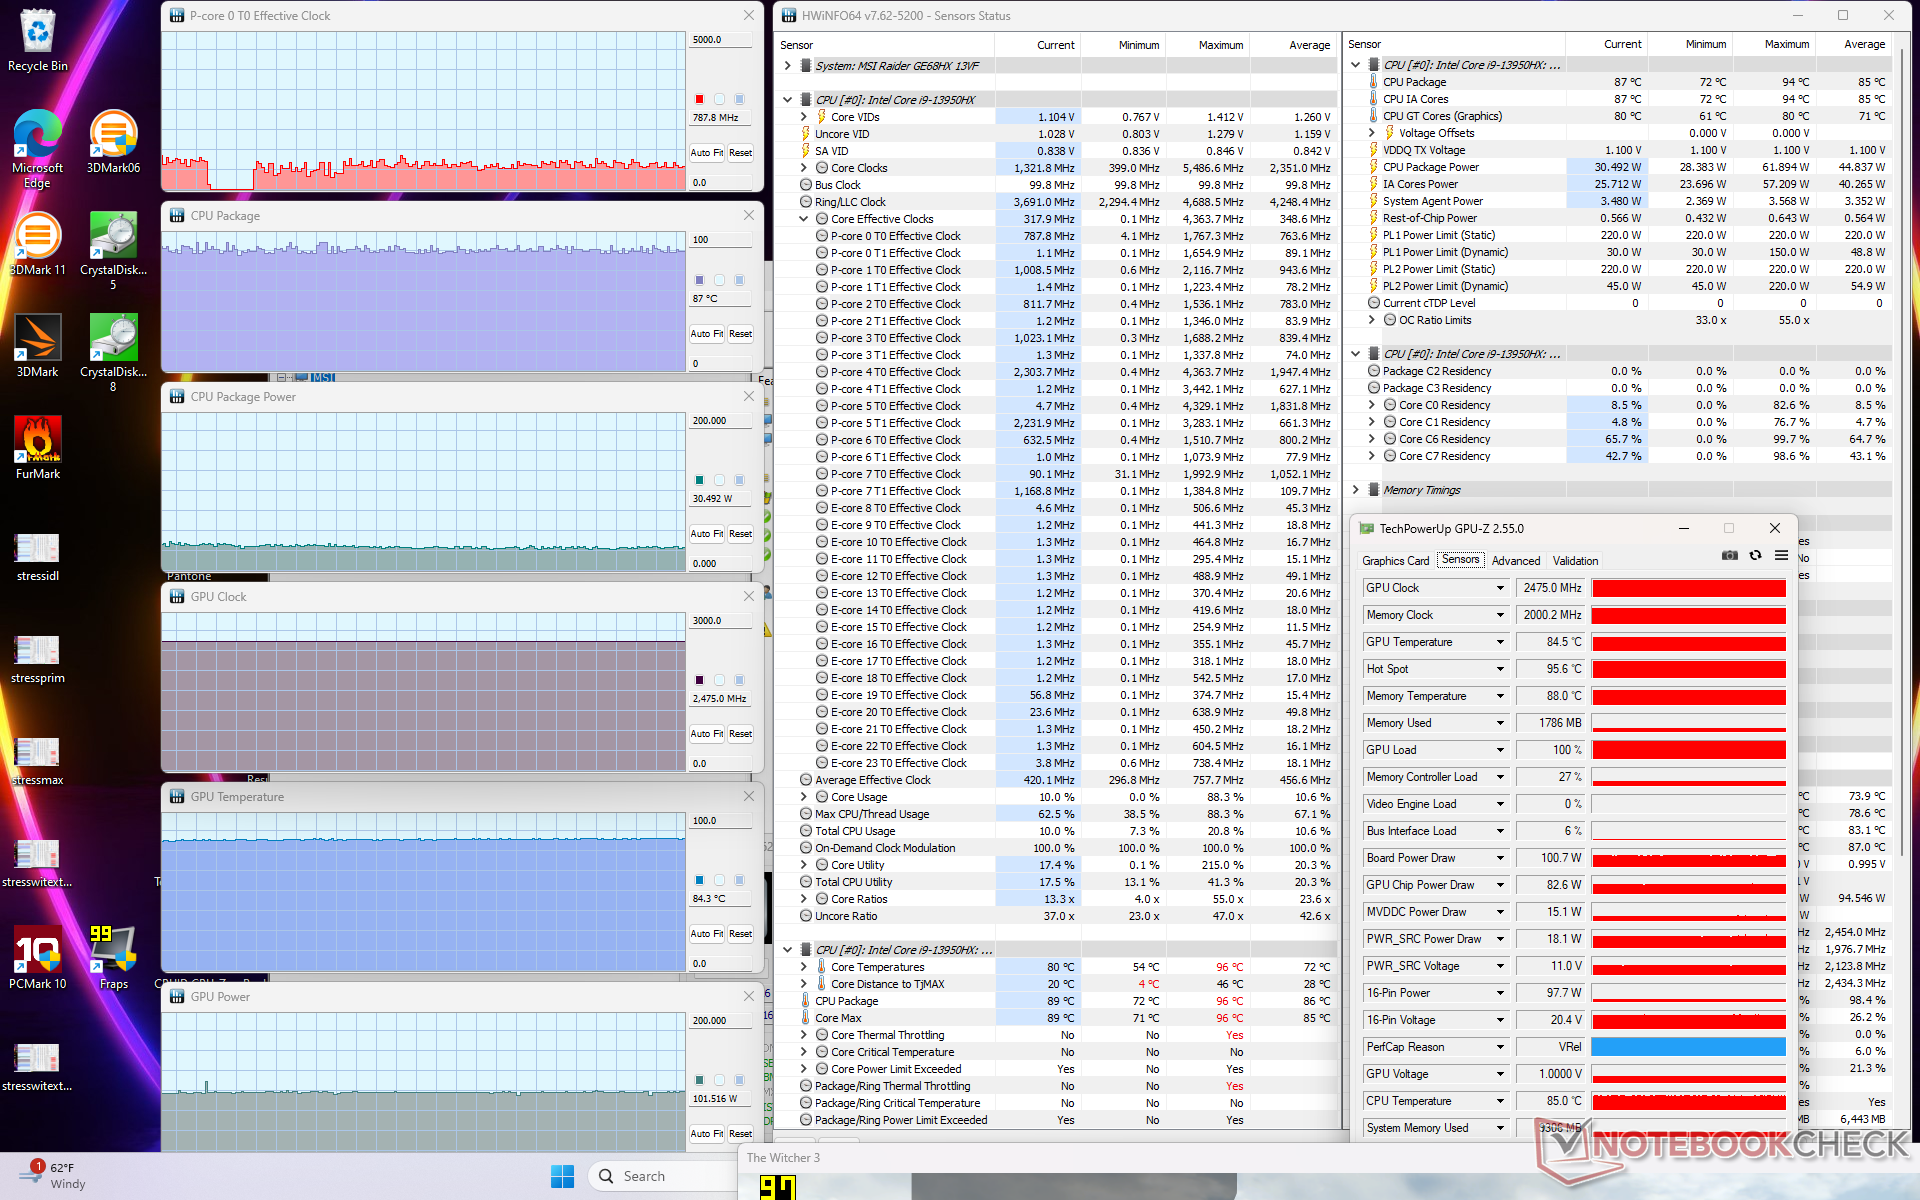
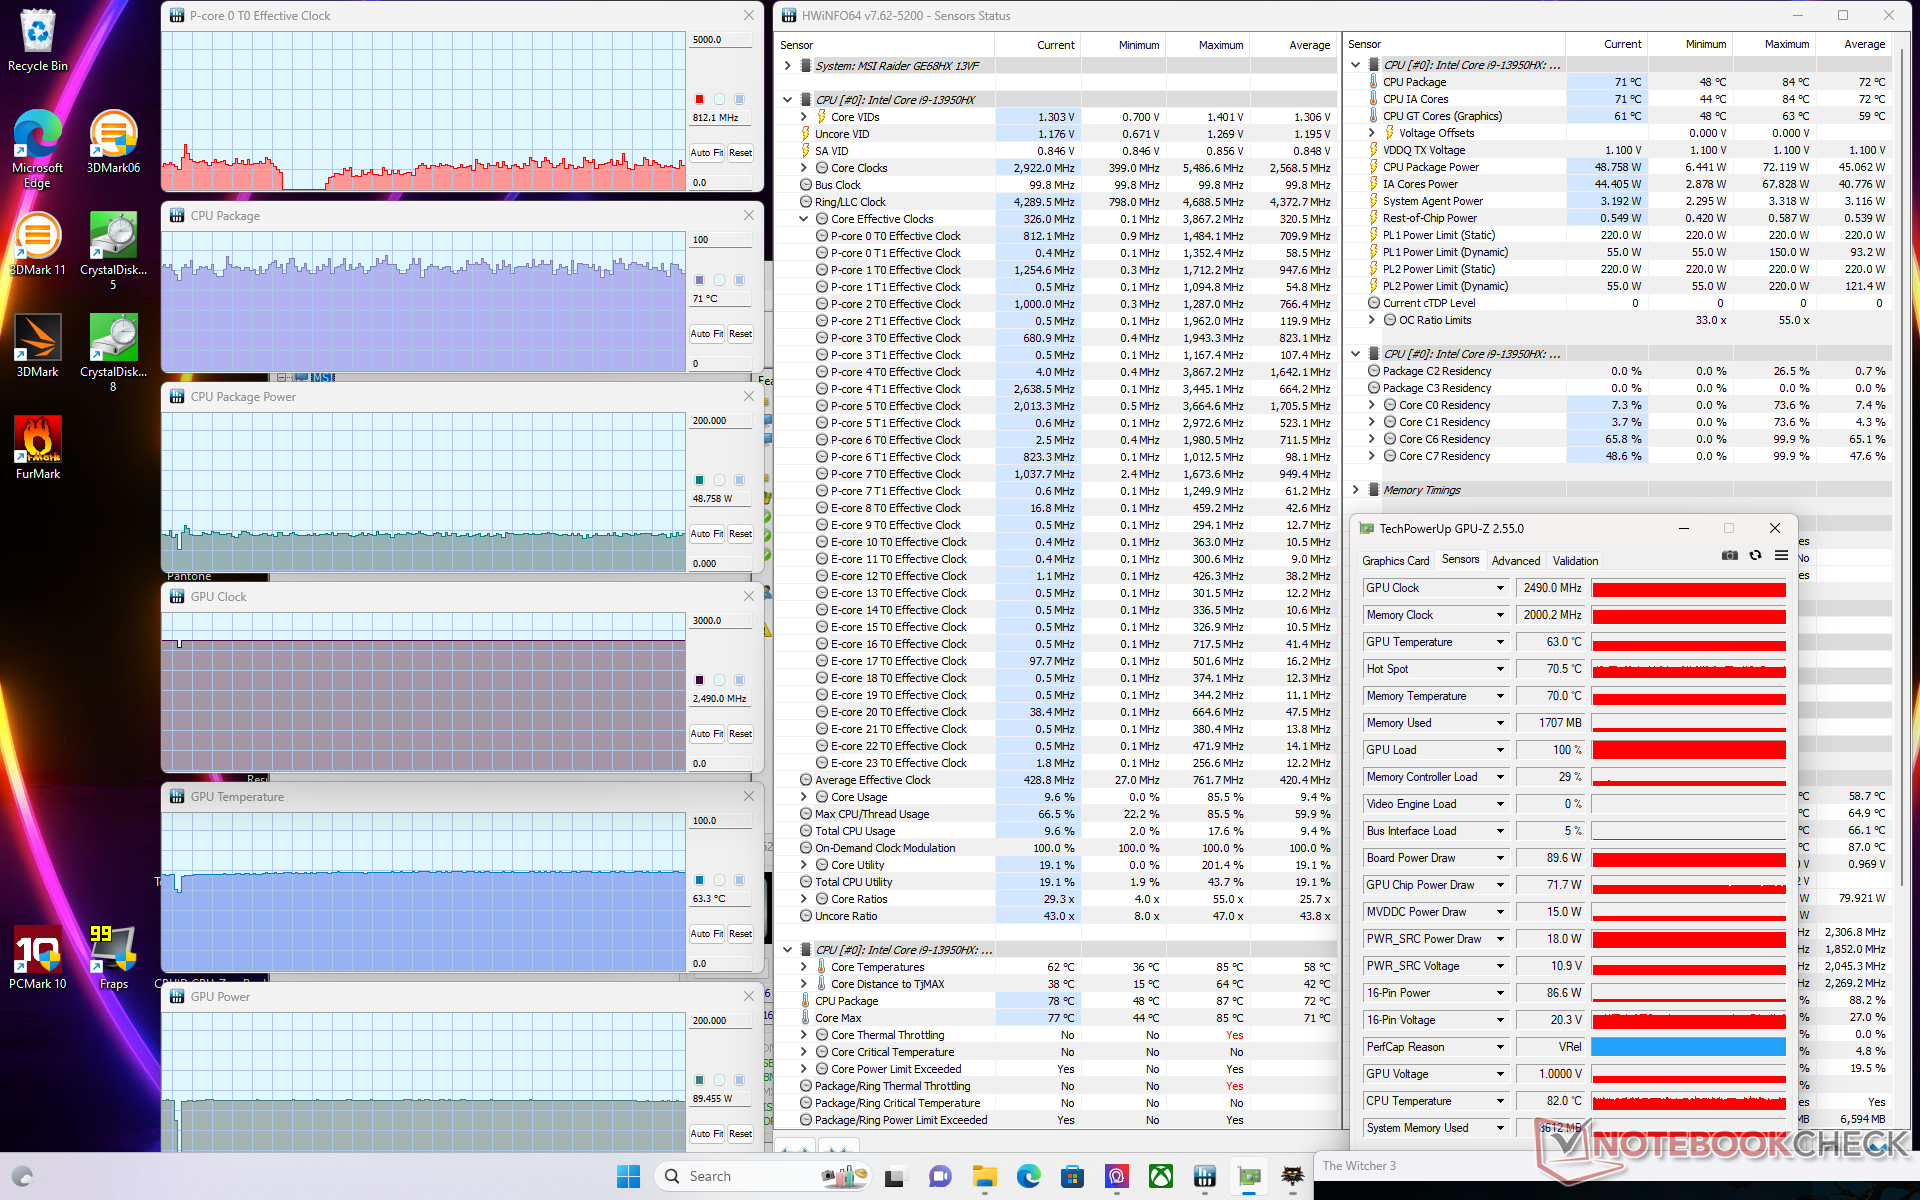
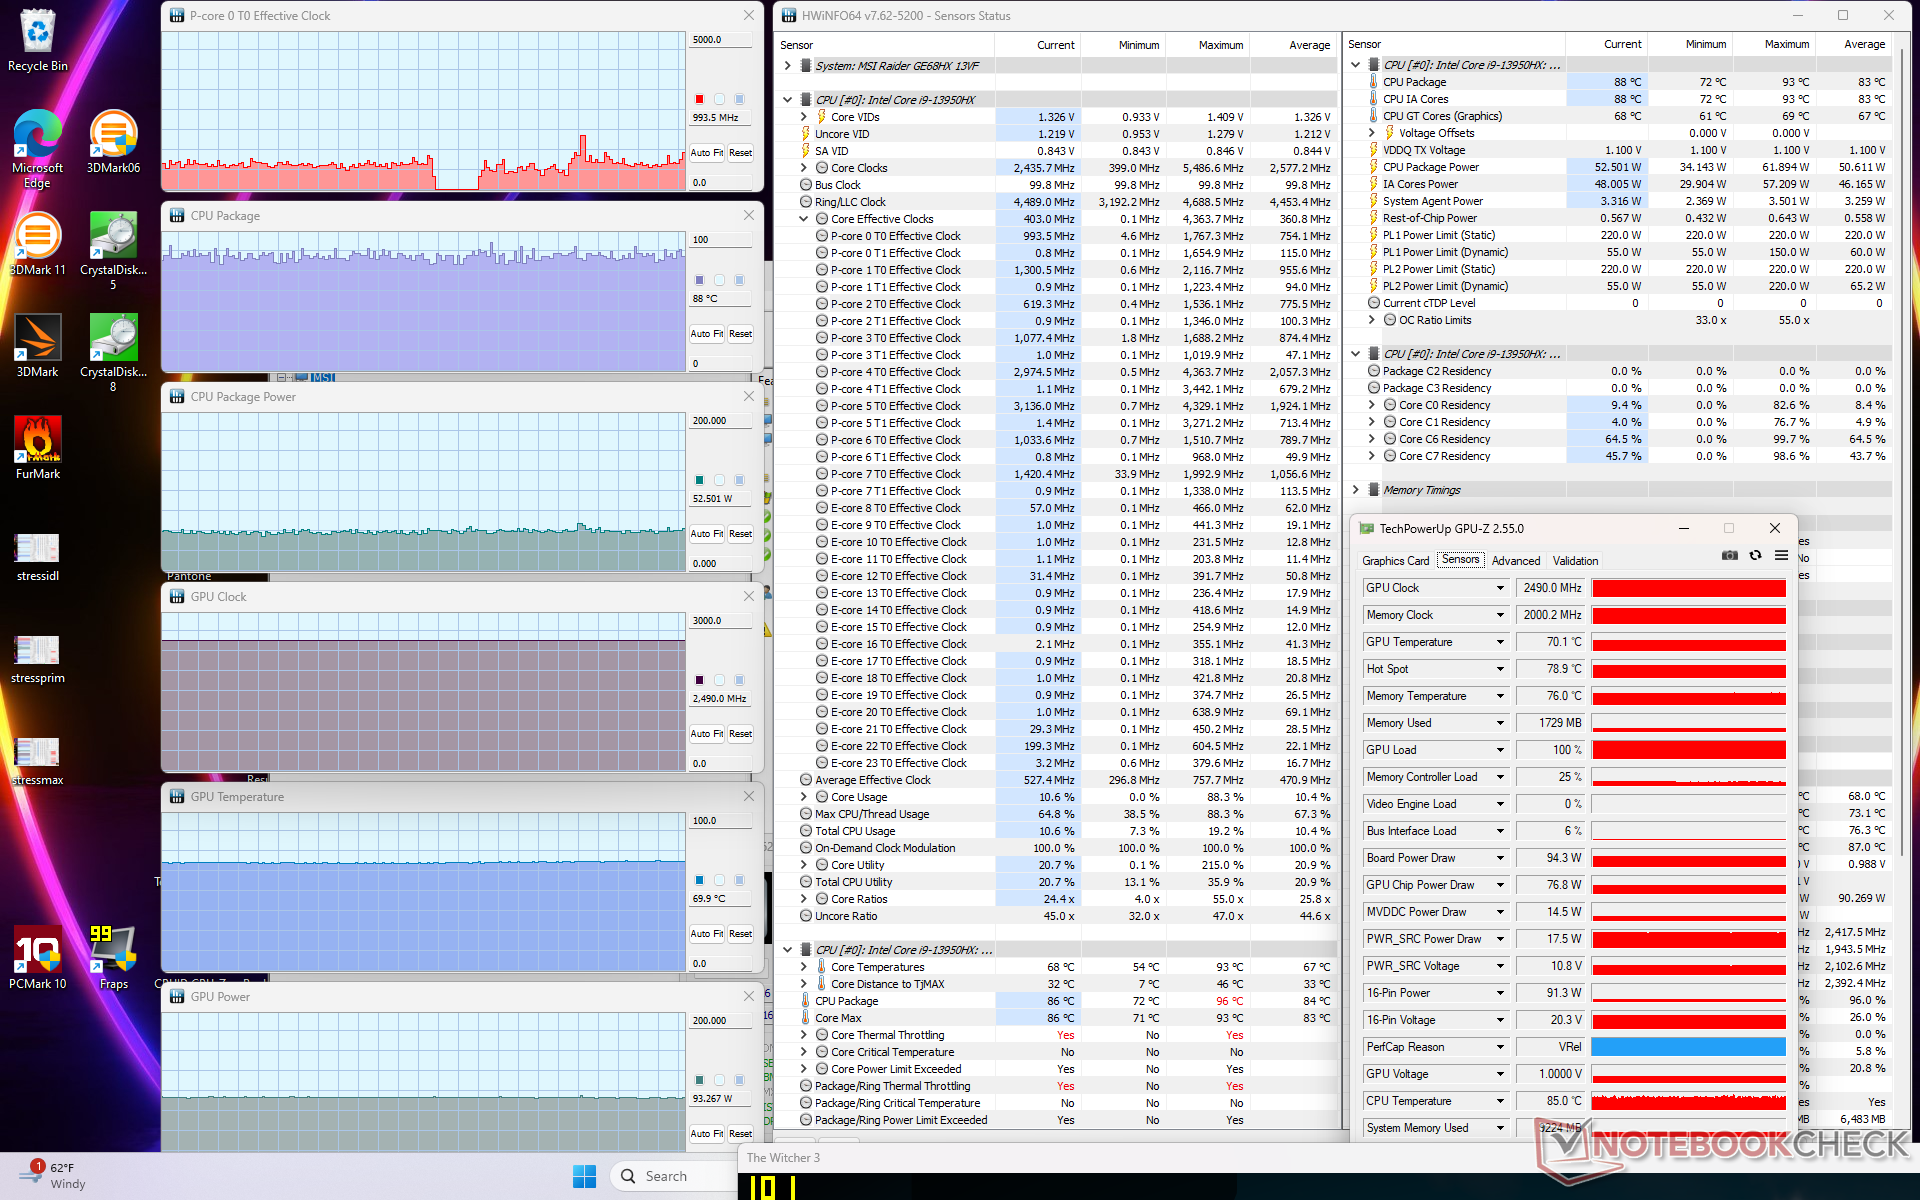
GPU clock rate and temperature would stabilize at 2475 MHz and 84 C when running Witcher 3 on Balanced mode. Interestingly, the clock rate would increase just marginally to 2490 MHz if running on Extreme Performance mode while GPU temperature would decrease more significantly to 70 C or even just 63 C if Cooler Boost is active as shown by our screenshots and table below. Most other MSI gaming laptops would exhibit similar results as well. It's therefore recommended to game on Balanced mode as the hit to GPU performance is very marginal relative to the immense fan noise differences between the preset power profiles. The performance differences between Balanced and Performance modes are usually more significant on other gaming laptops such as on the Asus Zephyrus series.
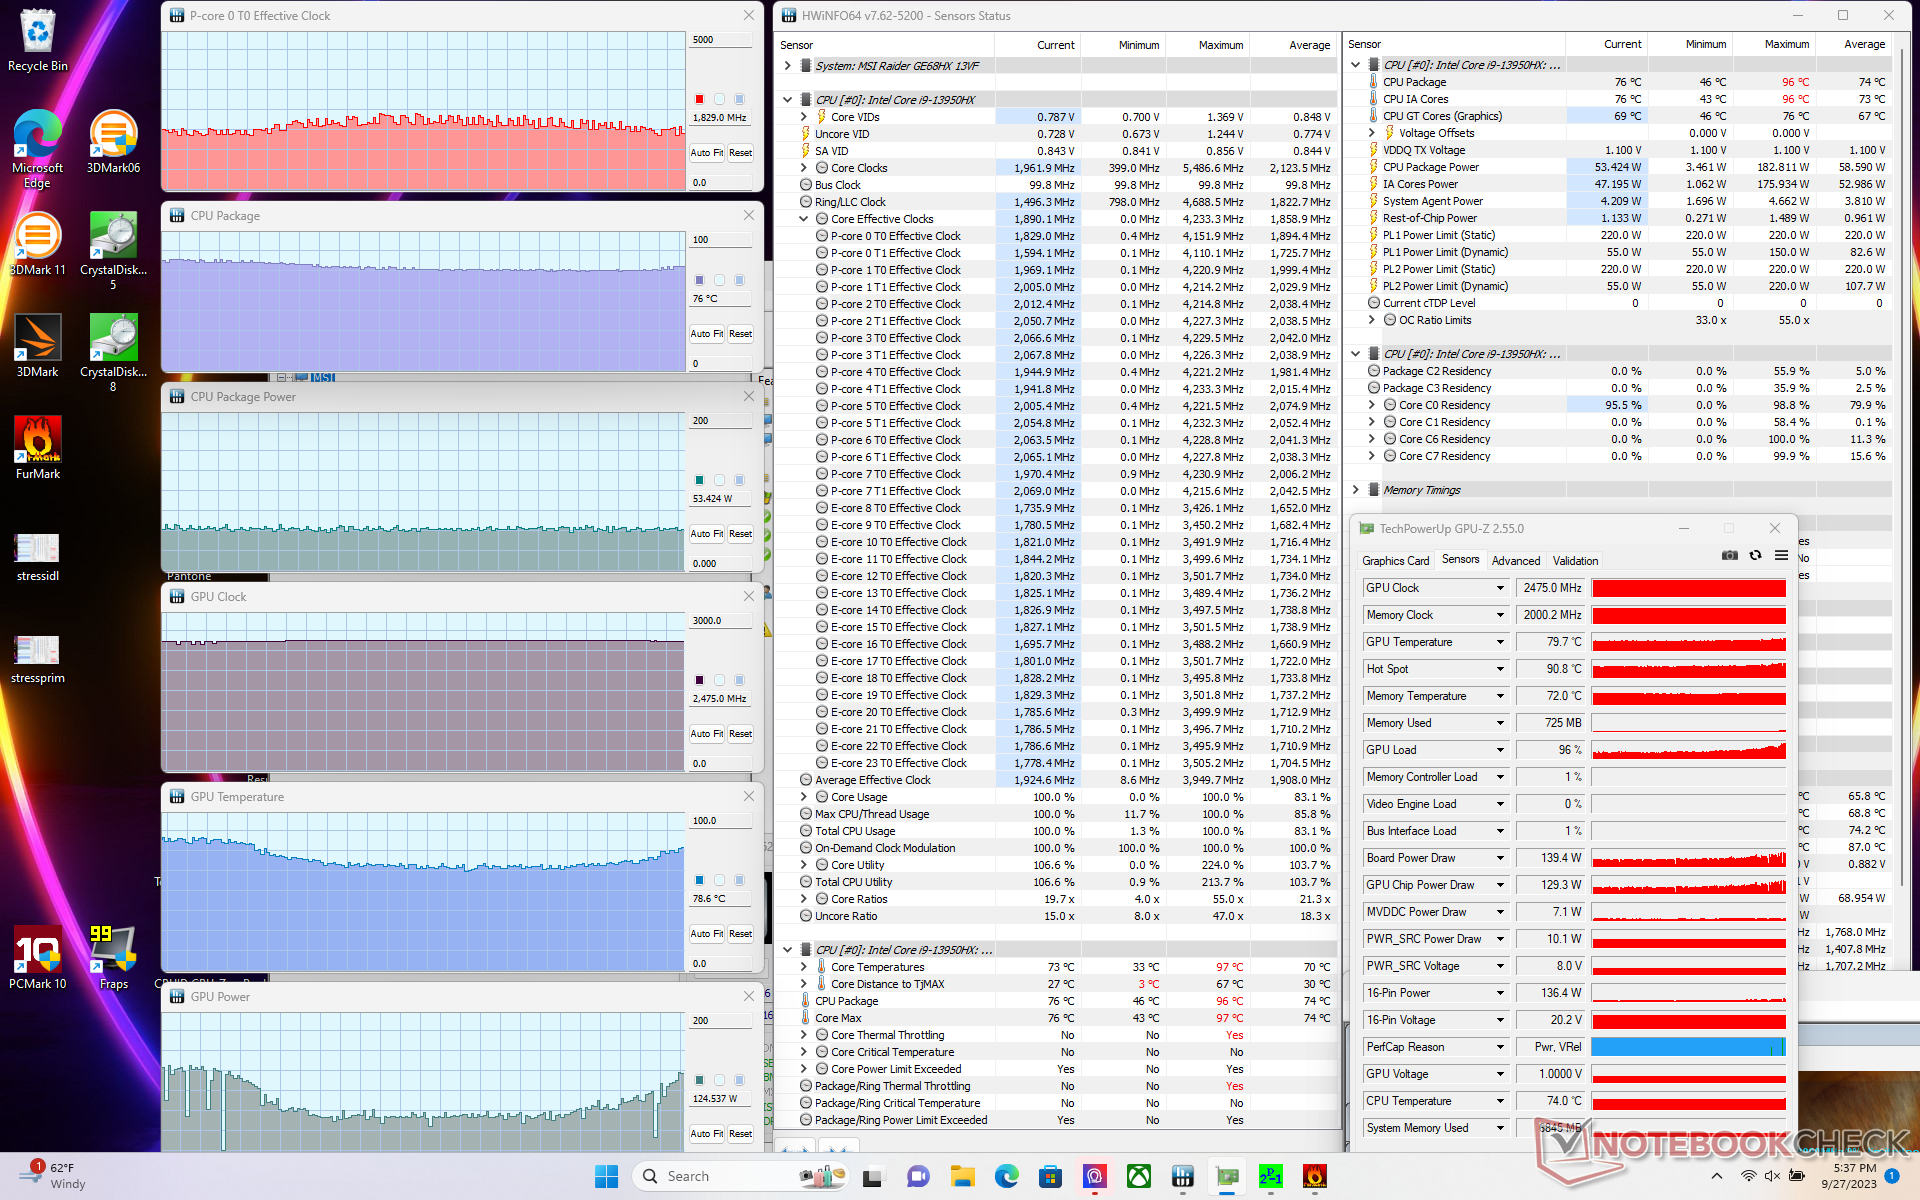
| CPU Clock (GHz) | GPU Clock (MHz) | Average CPU Temperature (°C) | Average GPU Temperature (°C) | |
| System Idle | -- | -- | 48 | 38 |
| Prime95 Stress (Extreme Performance mode w/ Cooler Boost off) | ~3.6 | -- | 93 | 58 |
| Prime95 + FurMark Stress (Extreme Performance mode w/ Cooler Boost off) | ~1.9 | 2475 | 73 - 78 | 63 - 81 |
| Witcher 3 Stress (Balanced mode) | ~0.8 | 2475 | 87 | 84 |
| Witcher 3 Stress (Extreme Performance mode w/ Cooler Boost off) | ~0.8 | 2490 | 88 | 70 |
| Witcher 3 Stress (Extreme Performance mode w/ Cooler Boost on) | ~0.8 | 2490 | 71 | 63 |
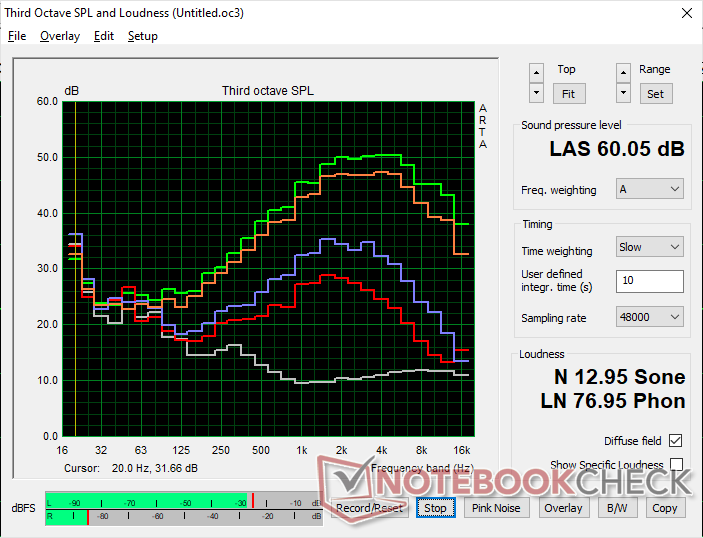
Speakers
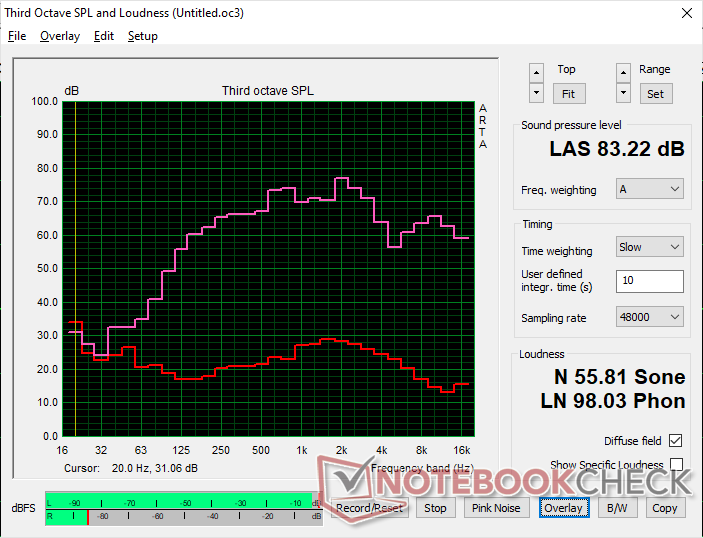
MSI Raider GE68HX 13VF audio analysis
(+) | speakers can play relatively loud (83.2 dB)
Bass 100 - 315 Hz
(±) | reduced bass - on average 6% lower than median
(±) | linearity of bass is average (9.5% delta to prev. frequency)
Mids 400 - 2000 Hz
(±) | higher mids - on average 5.6% higher than median
(+) | mids are linear (5.8% delta to prev. frequency)
Highs 2 - 16 kHz
(+) | balanced highs - only 4.5% away from median
(±) | linearity of highs is average (9.5% delta to prev. frequency)
Overall 100 - 16.000 Hz
(+) | overall sound is linear (13.3% difference to median)
Compared to same class
» 19% of all tested devices in this class were better, 5% similar, 76% worse
» The best had a delta of 6%, average was 18%, worst was 132%
Compared to all devices tested
» 14% of all tested devices were better, 3% similar, 83% worse
» The best had a delta of 4%, average was 24%, worst was 134%
Apple MacBook Pro 16 2021 M1 Pro audio analysis
(+) | speakers can play relatively loud (84.7 dB)
Bass 100 - 315 Hz
(+) | good bass - only 3.8% away from median
(+) | bass is linear (5.2% delta to prev. frequency)
Mids 400 - 2000 Hz
(+) | balanced mids - only 1.3% away from median
(+) | mids are linear (2.1% delta to prev. frequency)
Highs 2 - 16 kHz
(+) | balanced highs - only 1.9% away from median
(+) | highs are linear (2.7% delta to prev. frequency)
Overall 100 - 16.000 Hz
(+) | overall sound is linear (4.6% difference to median)
Compared to same class
» 0% of all tested devices in this class were better, 0% similar, 100% worse
» The best had a delta of 5%, average was 17%, worst was 45%
Compared to all devices tested
» 0% of all tested devices were better, 0% similar, 100% worse
» The best had a delta of 4%, average was 24%, worst was 134%
Energy Management — Higher Performance, Higher Consumption
Power Consumption
Power consumption when idling on desktop is about the same as on last year's model. Idling on iGPU mode with the LEDs off would save as much as 8 W compared to idling on dGPU mode with the front LEDs active.
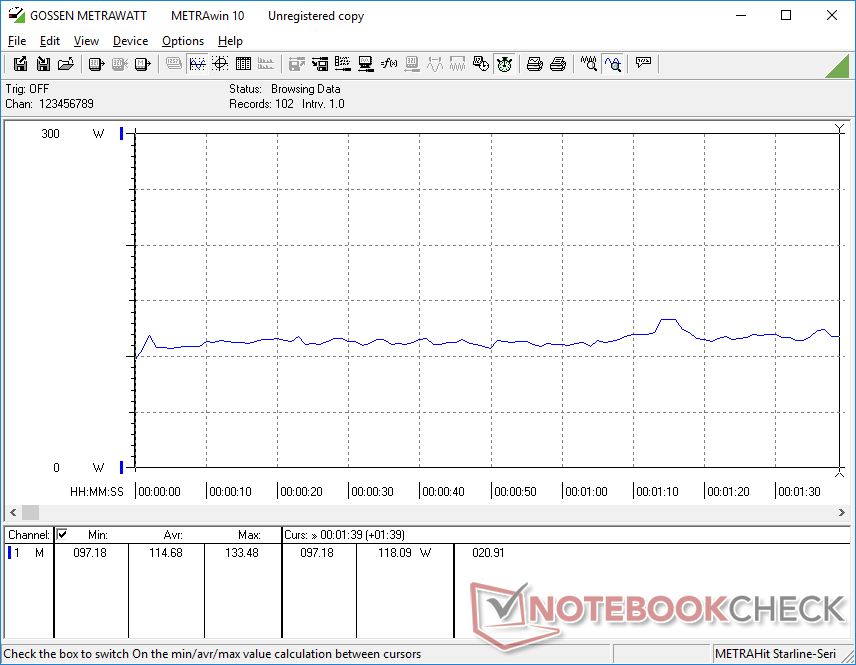
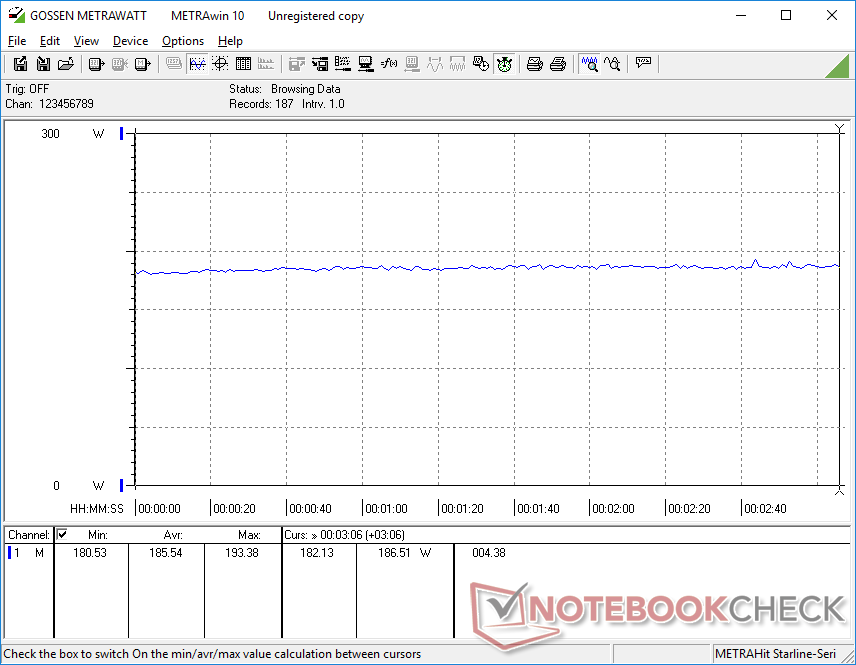
Running Witcher 3 would demand 22 percent less power than on last year's RTX 3070 Ti-powered GE67HX which correlates with the 10 to 15 slower raw graphics performance of our RTX 4060. Conversely, running Prime95 would demand 21 percent more power than before for a 35 to 40 percent increase in multi-thread performance.
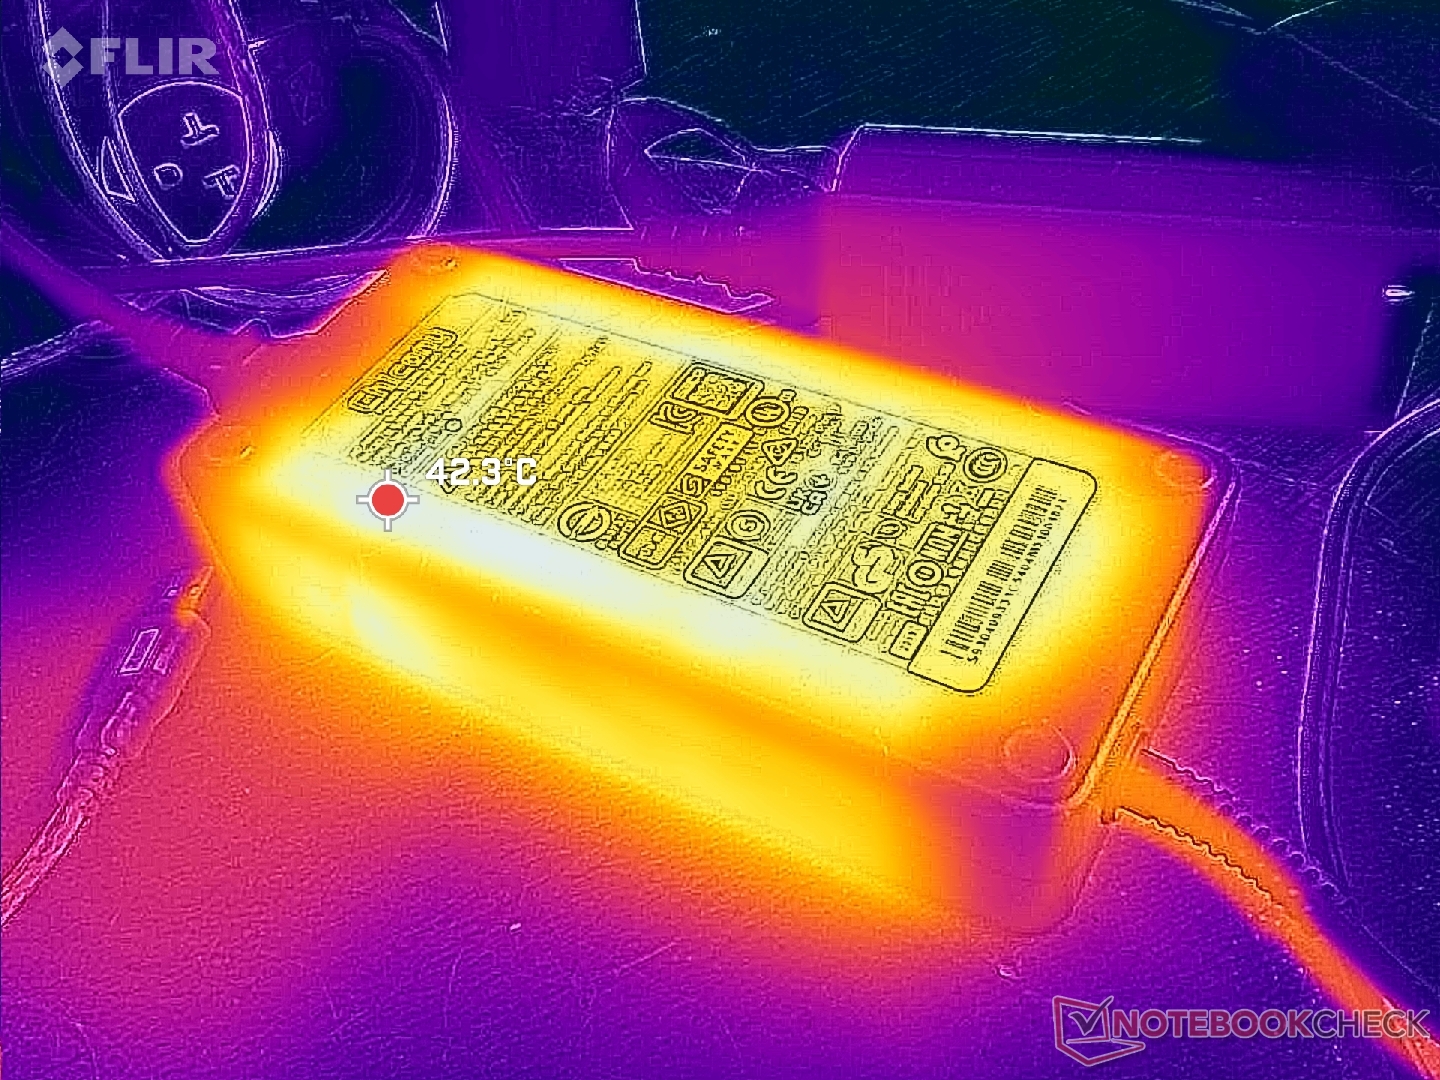
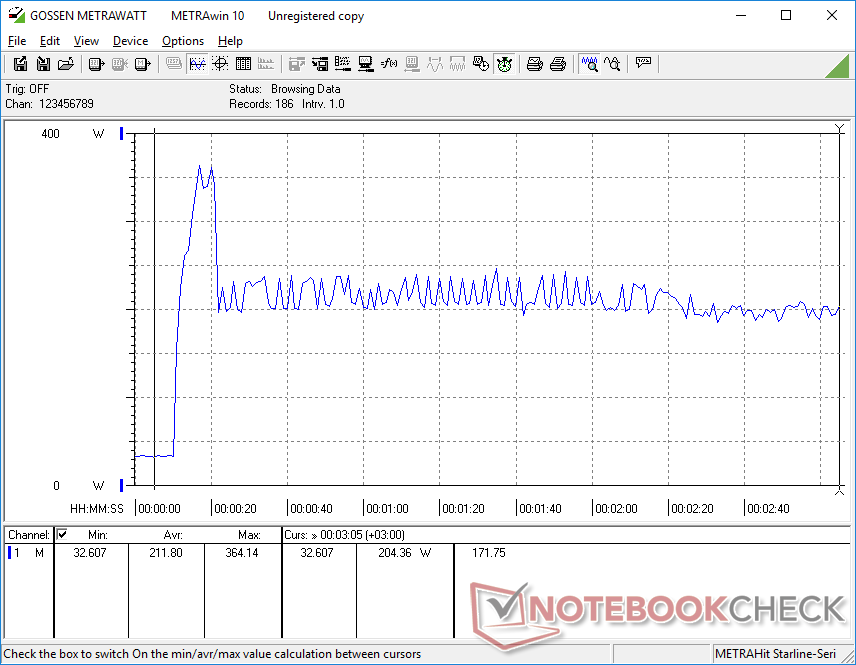
We're able to record a temporary maximum draw of 365 W from the large (~18 x 8.5 x 3.5 cm) 280 W AC adapter when initiating both Prime95 and FurMark stress. This rate would fall and stabilize at around 204 W after just a few seconds as shown by the graphs below. MSI has yet to adopt GaN charging unlike on the latest Razer Blade laptops.

| Off / Standby | |
| Idle | |
| Load |
|
Key:
min: | |
| MSI Raider GE68HX 13VF i9-13950HX, GeForce RTX 4060 Laptop GPU, Samsung PM9B1 1024GB MZVL41T0HBLB, IPS, 1900x1200, 16" | MSI GE67 HX 12UGS i7-12800HX, GeForce RTX 3070 Ti Laptop GPU, Samsung PM9A1 MZVL21T0HCLR, OLED, 1920x1080, 15.6" | HP Omen 16-xf0376ng R7 7840HS, GeForce RTX 4070 Laptop GPU, WDC PC SN810 512GB, IPS, 1920x1080, 16.1" | Alienware m16 R1 AMD R9 7845HX, GeForce RTX 4080 Laptop GPU, Kioxia XG8 KXG80ZNV1T02, IPS, 2560x1600, 16" | Lenovo Legion Slim 7i 16 Gen 8 i9-13900H, GeForce RTX 4070 Laptop GPU, Samsung PM9A1 MZVL21T0HCLR, IPS, 2560x1600, 16" | Asus ROG Zephyrus M16 GU604VY-NM042X i9-13900H, GeForce RTX 4090 Laptop GPU, Samsung PM9A1 MZVL22T0HBLB, IPS, 2560x1600, 16" | |
|---|---|---|---|---|---|---|
| Power Consumption | 1% | 34% | -81% | -12% | -4% | |
| Idle Minimum * (Watt) | 15.8 | 16.1 -2% | 9 43% | 39 -147% | 22 -39% | 20 -27% |
| Idle Average * (Watt) | 19.4 | 17.1 12% | 14 28% | 44.6 -130% | 29 -49% | 24 -24% |
| Idle Maximum * (Watt) | 27.3 | 26.6 3% | 20 27% | 68.1 -149% | 39.5 -45% | 25 8% |
| Load Average * (Watt) | 114.7 | 116.3 -1% | 84 27% | 129.8 -13% | 98.7 14% | 107 7% |
| Witcher 3 ultra * (Watt) | 185.5 | 237 -28% | 140.9 24% | 285 -54% | 171.8 7% | 208 -12% |
| Load Maximum * (Watt) | 364.2 | 291.1 20% | 176 52% | 327.3 10% | 213.2 41% | 267 27% |
* ... smaller is better
Power Consumption Witcher 3 / Stresstest
Power Consumption external Monitor
Battery Life

Battery capacity is as high as it can legally be at 99.9 Wh. Runtimes are very good for a 16-inch gaming laptop at just over 6.5 hours of real-world WLAN browsing on the Balanced power profile with the iGPU active. This is one of the longer-lasting 16-inch gaming laptops we've tested to date.
Unfortunately, charging from empty to full capacity is relatively slow at 2.5 hours compared to 1.5 hours on most other laptops. Additionally, none of our USB-C AC adapters would charge the laptop through any of the three USB-C ports even though MSI advertises Power Delivery.
| MSI Raider GE68HX 13VF i9-13950HX, GeForce RTX 4060 Laptop GPU, 99.9 Wh | MSI GE67 HX 12UGS i7-12800HX, GeForce RTX 3070 Ti Laptop GPU, 99.9 Wh | HP Omen 16-xf0376ng R7 7840HS, GeForce RTX 4070 Laptop GPU, 83 Wh | Alienware m16 R1 AMD R9 7845HX, GeForce RTX 4080 Laptop GPU, 86 Wh | Lenovo Legion Slim 7i 16 Gen 8 i9-13900H, GeForce RTX 4070 Laptop GPU, 99.9 Wh | Asus ROG Zephyrus M16 GU604VY-NM042X i9-13900H, GeForce RTX 4090 Laptop GPU, 90 Wh | |
|---|---|---|---|---|---|---|
| Battery runtime | -2% | -16% | -52% | -42% | 12% | |
| Reader / Idle (h) | 8.8 | 8.4 -5% | 4 -55% | 5.1 -42% | ||
| WiFi v1.3 (h) | 6.8 | 5.6 -18% | 5.7 -16% | 3.7 -46% | 4.4 -35% | 4.3 -37% |
| Load (h) | 1.8 | 2.1 17% | 0.8 -56% | 0.9 -50% | 2.9 61% | |
| H.264 (h) | 4.8 |
Pros
Cons
Verdict — Not Bad, But Misses The Mark
While we appreciate the manufacturer for going in a different direction with its gaming laptop designs, we firmly believe that the changes should not come at the expense of end-user serviceability. The GE68HX is more difficult to open up than on last year's design and this can be especially problematic on a gaming laptop where owners are more likely to add additional RAM and storage themselves. Secondly, the new design is noticeably thicker and heavier than the "cleaner" look of the GE67HX which may not sit well with a lot of users.
There are still a handful of benefits with the newer chassis. Firstly, the hinges feel sturdier than before while the rest of the chassis is just as strong. Secondly, core temperatures are cooler than on the GE67HX for better overclocking potential. Performance is even slightly faster than expected on the default power profile and settings. And lastly, some users might appreciate the larger clickpad and new numpad for applications other than gaming.
Performance and temperatures benefit from the thicker chassis design, but not everyone will be happy about the heavier weight, more difficult serviceability, and low-end display options considering the high starting price.
For $1700 USD and up, however, the cut corners to display colors, G-Sync, and SSD performance seem unnecessary for a model in the high-end GE series. Such compromises are more expected for models in the lower-end MSI Sword or Katana series instead. The manufacturer is also falling behind in charging technology; smaller and more portable GaN chargers from Razer can output just as much power while USB-C charging support on the GE68HX appears unreliable.
Alternatives like the Lenovo Legion Slim 7i 16 Gen 8, Asus ROG Zephyrus M16, or Razer Blade 16 may not always offer Core-HX CPUs, but they are much more portable while carrying similar graphics options and better displays.
Price and Availability
MSI Raider GE68HX 13VF
- 09/30/2023 v7 (old)
Allen Ngo
