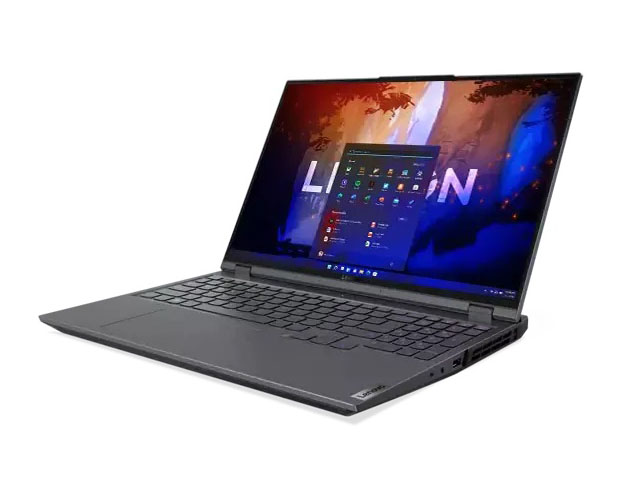
Lenovo Legion 5 Pro Gen 7 laptop review: Ryzen 7 6800H or Ryzen 9 6900HX?
The Legion 5 Pro Gen 7 is an upper midrange gaming laptop sitting right below the even more expensive Legion 7 16 series. It joins the increasingly common lineup of 16-inch gaming laptops like the HP Omen 16, Asus ROG Zephyrus M16, Dell G16, or the Gigabyte Aero 16 all of which are alternatives to the Lenovo model in review.
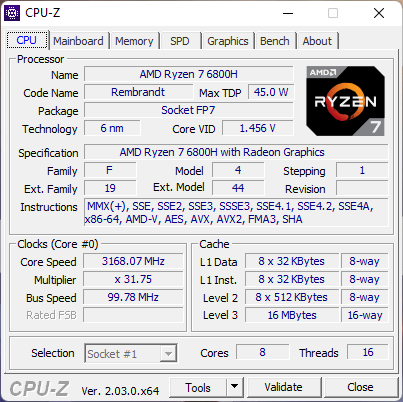
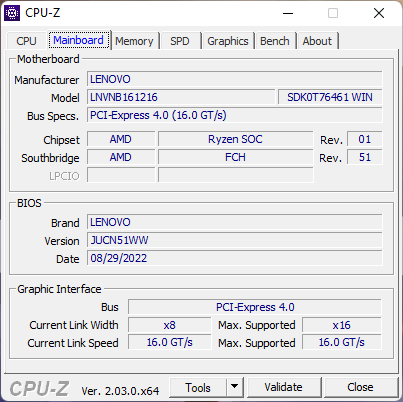
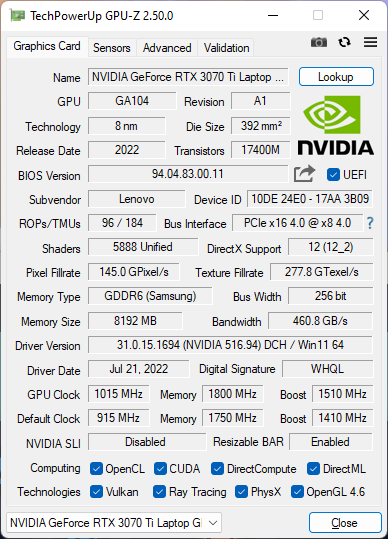
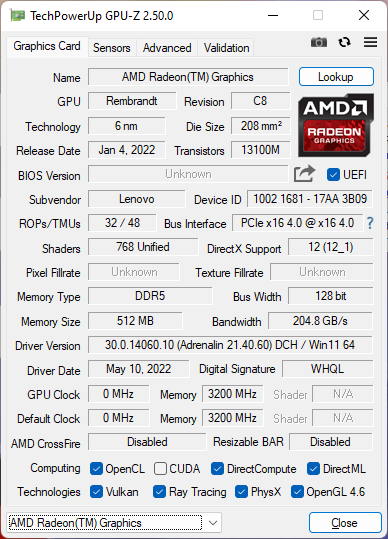
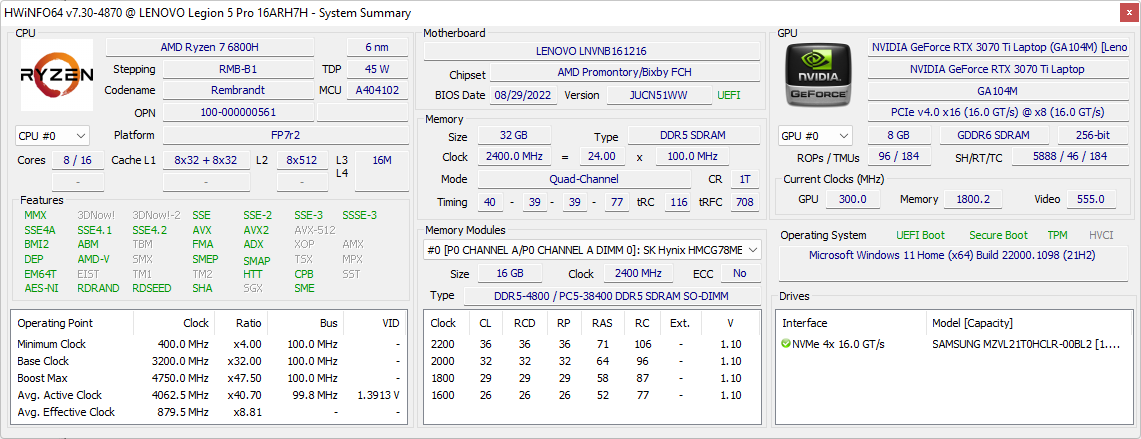
Our test unit ships with the AMD Zen 3+ Ryzen 7 6800H CPU with 150 W TGP GeForce RTX 3070 Ti graphics for approximately $1900 USD. Other SKUs are available with the Ryzen 9 6900HX, RTX 3070, RTX 3060, or RTX 3050 Ti, but all options otherwise come with the same 16:10 2560 x 1600 IPS display with G-Sync support.
The 2022 Legion 5 Pro Gen 7 shares the same chassis design as on last year's model and so we recommend checking out our existing review of the 2021 model for more information on the physical features of the device. The older version utilizes slower Zen 3 Ryzen 7 5800H and 140 W TGP GeForce RTX 3070 processors in comparison.
More Lenovo reviews:
Potential Competitors in Comparison
Rating | Date | Model | Weight | Height | Size | Resolution | Price |
|---|---|---|---|---|---|---|---|
| 87.7 % v7 (old) | 10 / 2022 | Lenovo Legion 5 Pro 16ARH7H RTX 3070 Ti R7 6800H, GeForce RTX 3070 Ti Laptop GPU | 2.6 kg | 26.6 mm | 16.00" | 2560x1600 | |
| 86.6 % v7 (old) | 07 / 2022 | Lenovo Legion 5 Pro 16IAH7H i7-12700H, GeForce RTX 3060 Laptop GPU | 2.6 kg | 27 mm | 16.00" | 2560x1600 | |
| 85.6 % v7 (old) | 07 / 2021 | Asus ROG Zephyrus M16 GU603H i9-11900H, GeForce RTX 3070 Laptop GPU | 2 kg | 20 mm | 16.00" | 2560x1600 | |
| 90.8 % v7 (old) | 09 / 2022 | Lenovo Legion 7 16ARHA7 R9 6900HX, Radeon RX 6850M XT | 2.6 kg | 19.4 mm | 16.00" | 2560x1600 | |
| 82.3 % v7 (old) | 05 / 2022 | HP Victus 16-e0145ng R5 5600H, GeForce RTX 3050 Ti Laptop GPU | 2.4 kg | 23.5 mm | 16.10" | 1920x1080 | |
| 86.1 % v7 (old) | 10 / 2022 | Dell G16 7620 i7-12700H, GeForce RTX 3060 Laptop GPU | 2.6 kg | 26.9 mm | 16.00" | 2560x1600 |
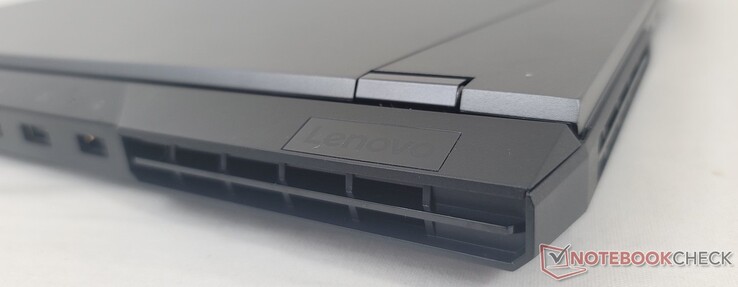
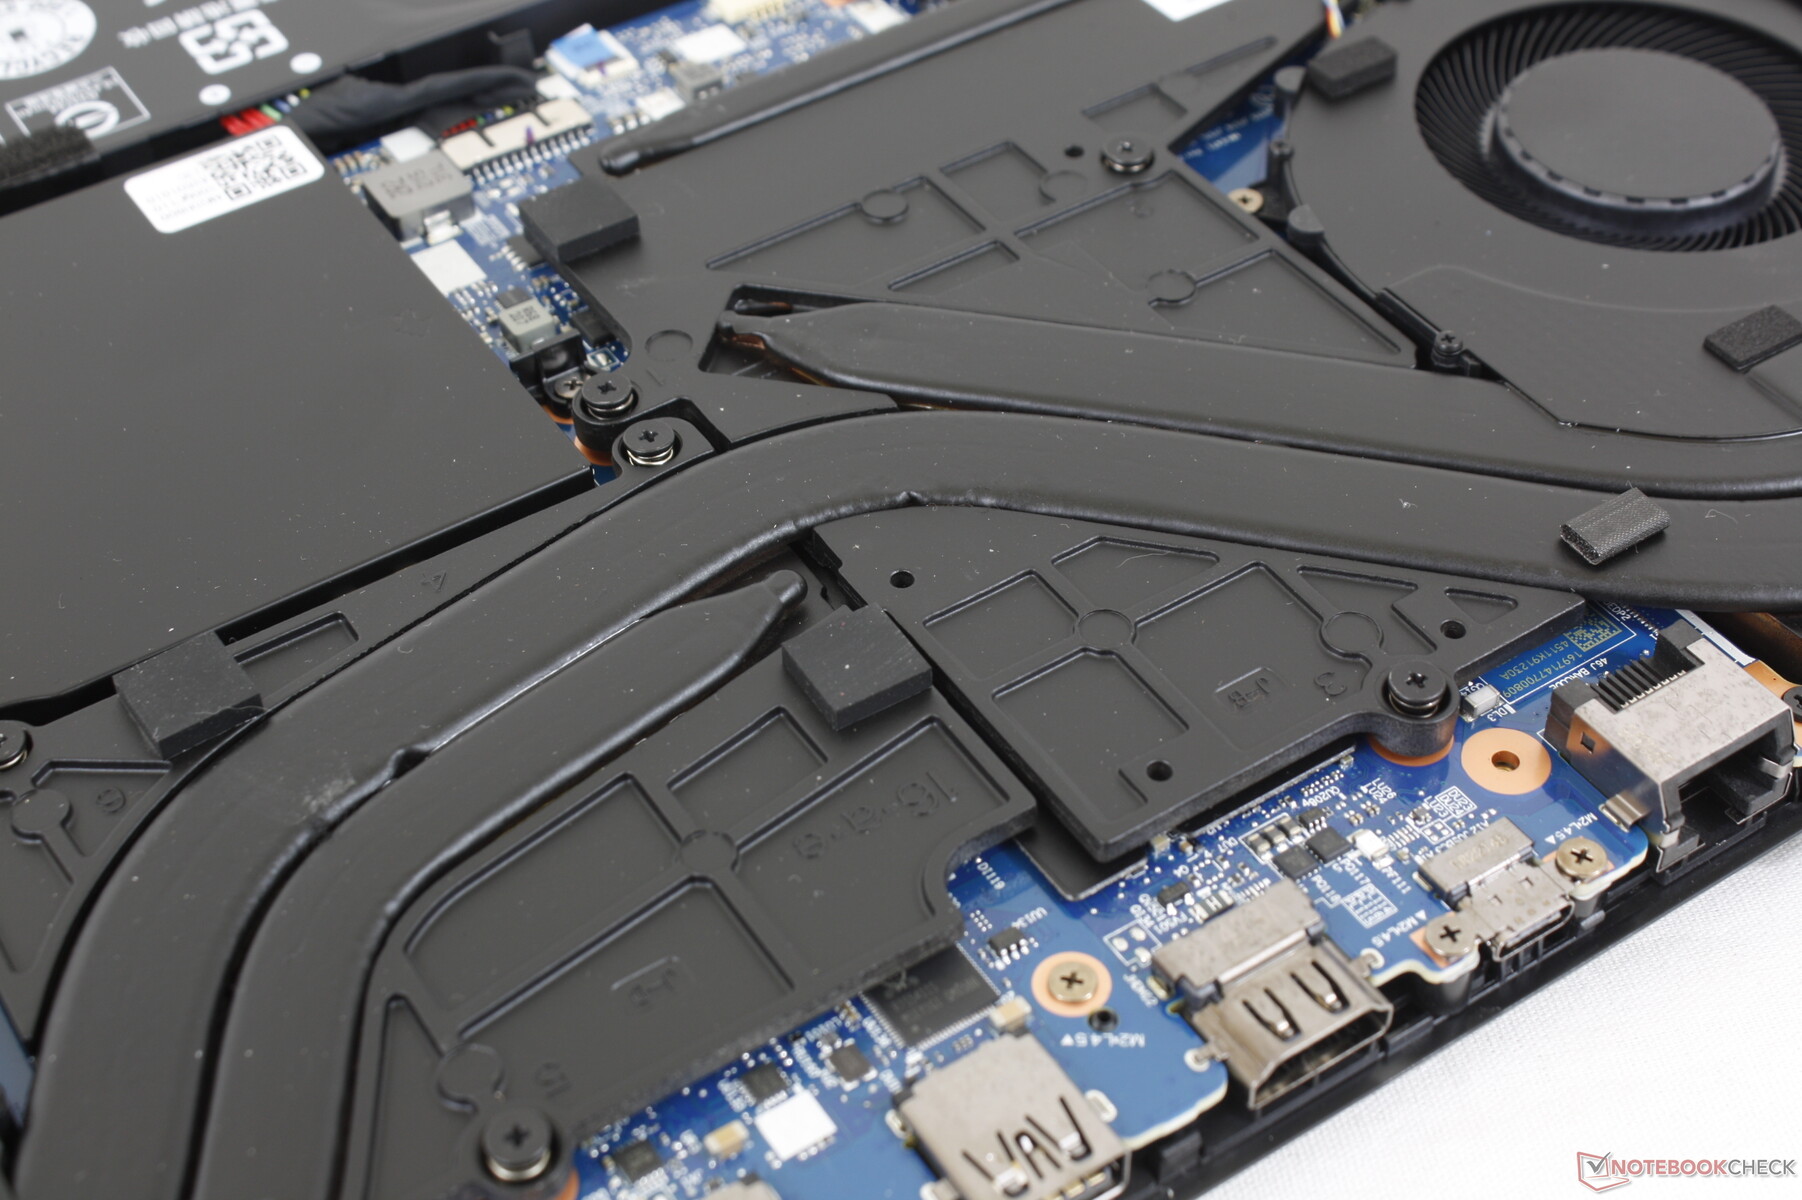
Case — Aluminum Outer Lid And Bottom Base
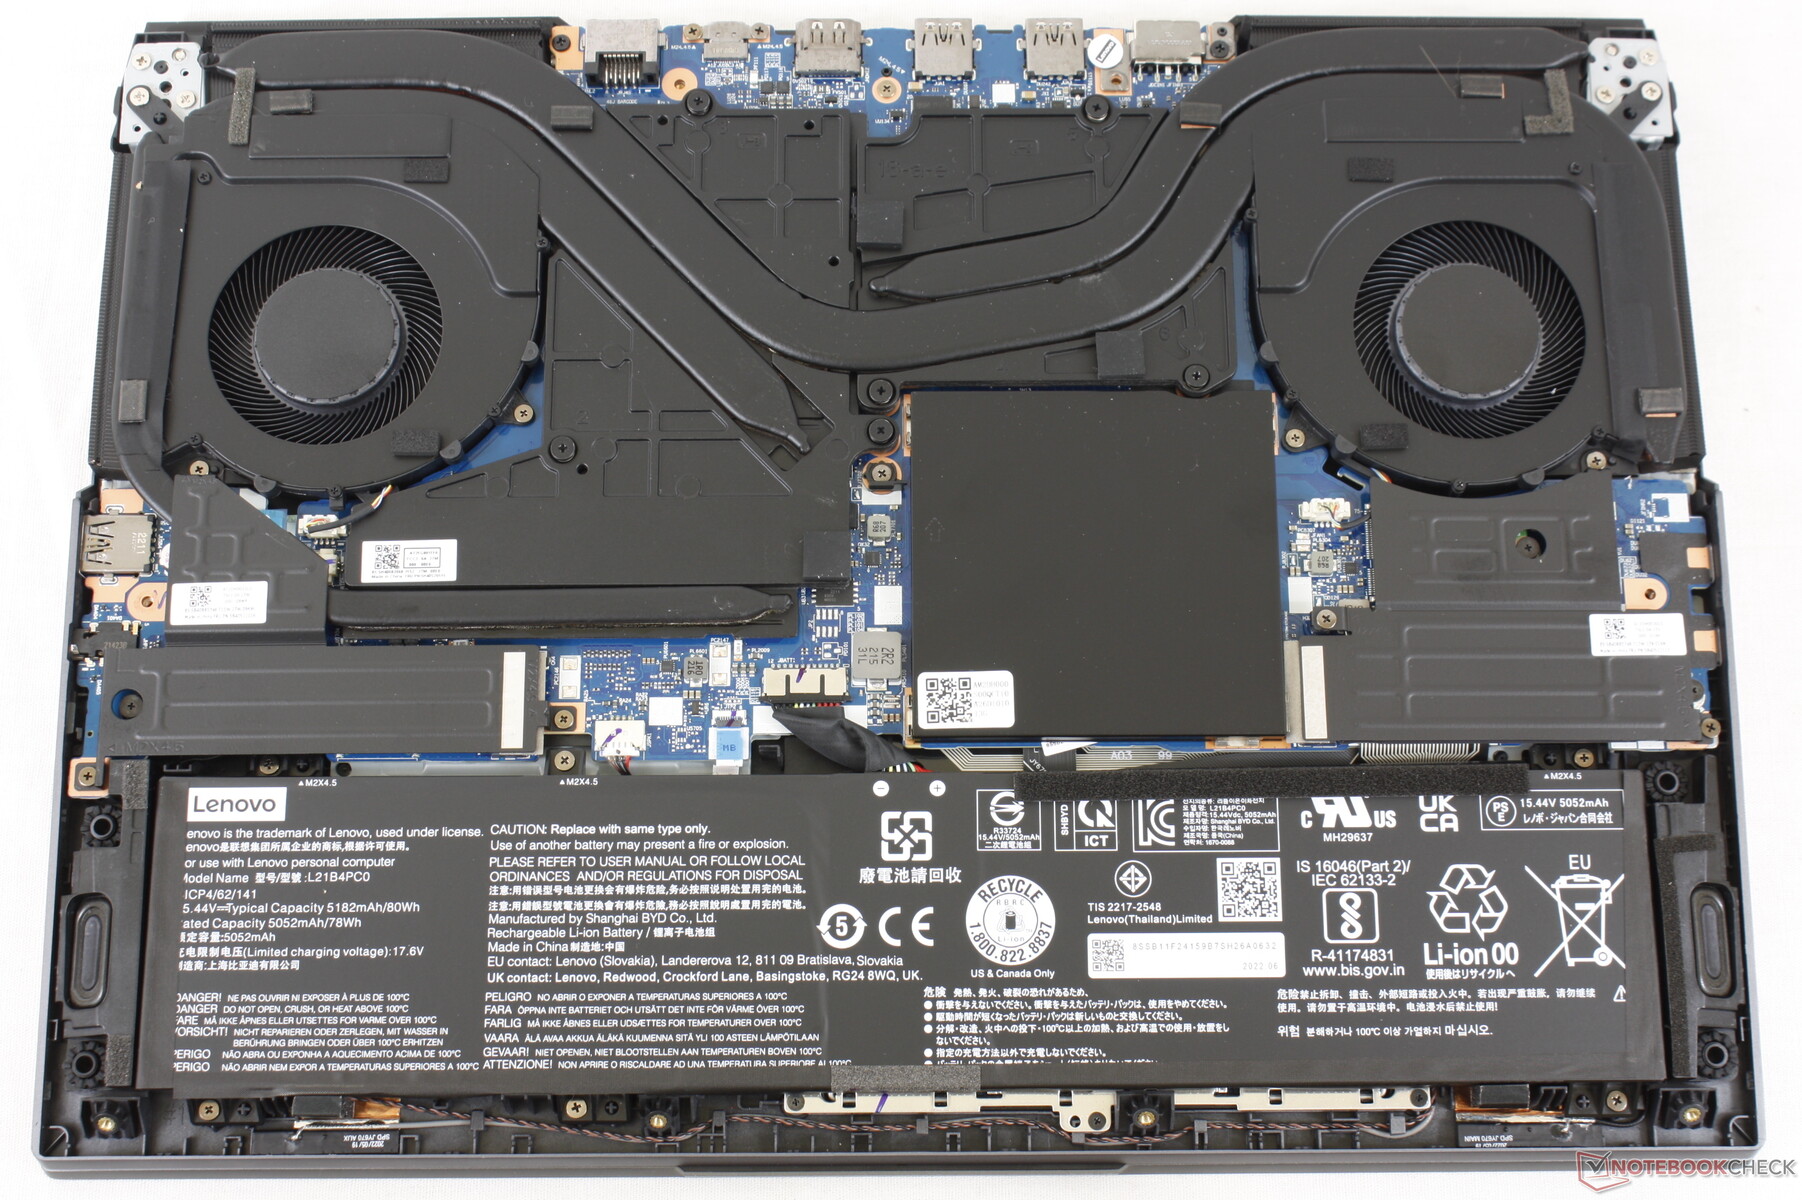
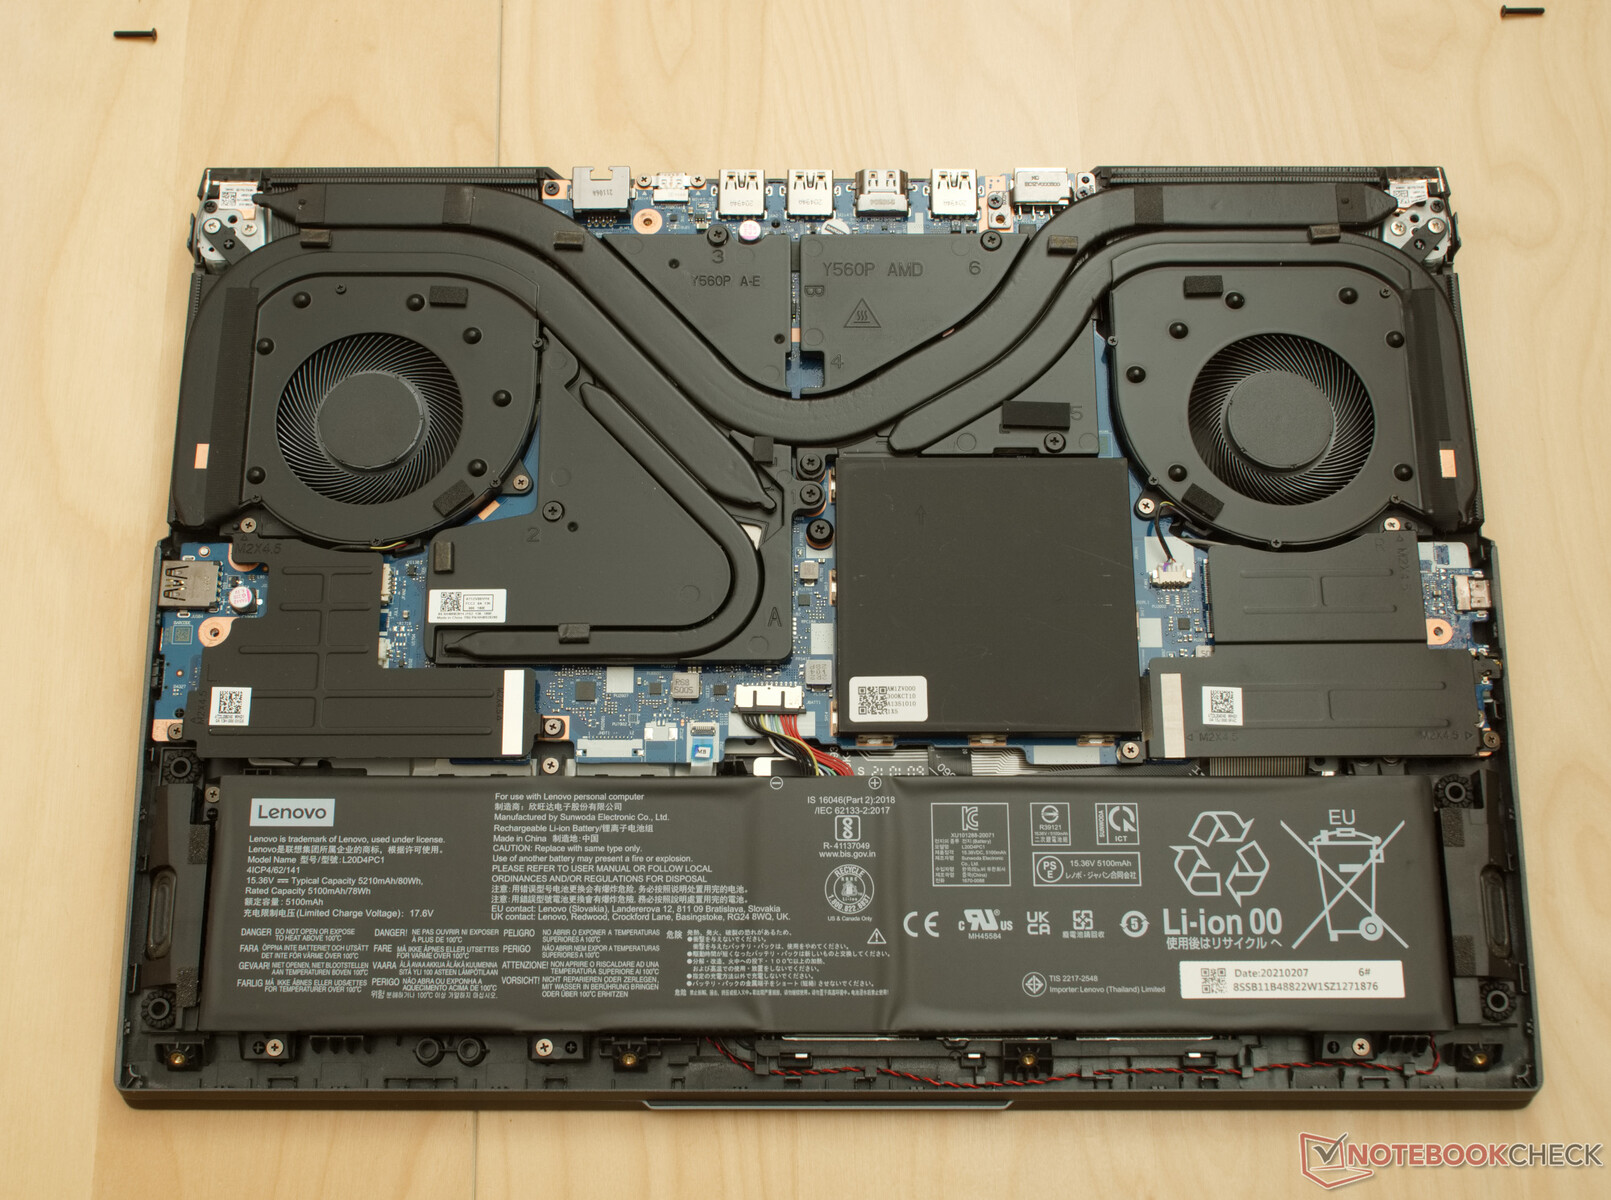
There is one easy way to distinguish the 2022 Legion 5 Pro 16 from the 2021 Legion 5 Pro 16. The 2022 model has one more USB-C port along the left edge for three total whereas the 2021 model only has two. Meanwhile, the number of USB-A ports has dropped from four to three. The two models are otherwise visually identical.
Communication
| Networking | |
| iperf3 transmit AX12 | |
| Asus ROG Zephyrus M16 GU603H | |
| iperf3 receive AX12 | |
| Asus ROG Zephyrus M16 GU603H | |
| iperf3 receive AXE11000 6GHz | |
| Lenovo Legion 5 Pro 16ARH7H RTX 3070 Ti | |
| Lenovo Legion 7 16ARHA7 | |
| iperf3 receive AXE11000 | |
| Dell G16 7620 | |
| HP Victus 16-e0145ng | |
| iperf3 transmit AXE11000 6GHz | |
| Lenovo Legion 7 16ARHA7 | |
| Lenovo Legion 5 Pro 16ARH7H RTX 3070 Ti | |
| iperf3 transmit AXE11000 | |
| Dell G16 7620 | |
| HP Victus 16-e0145ng | |
Webcam
Webcam continues to be only 720p with no IR.


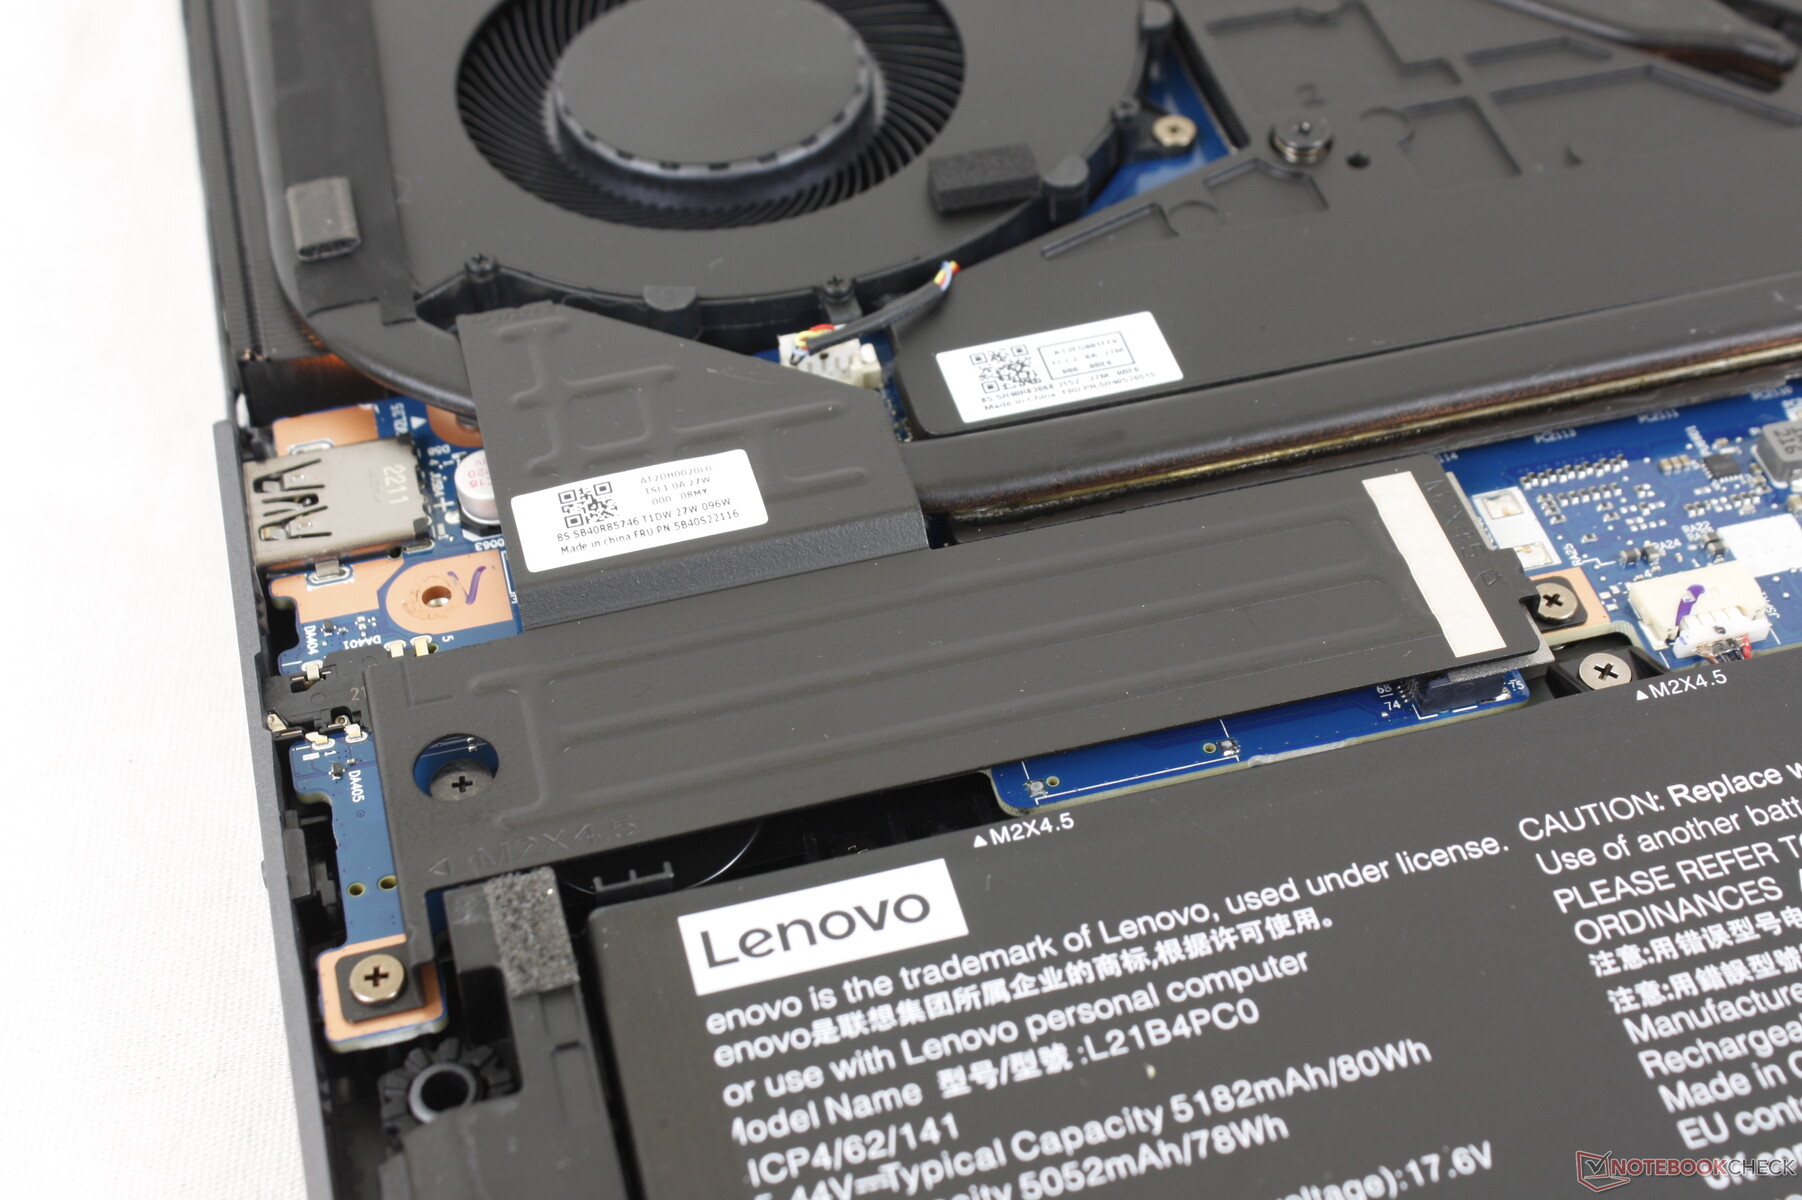
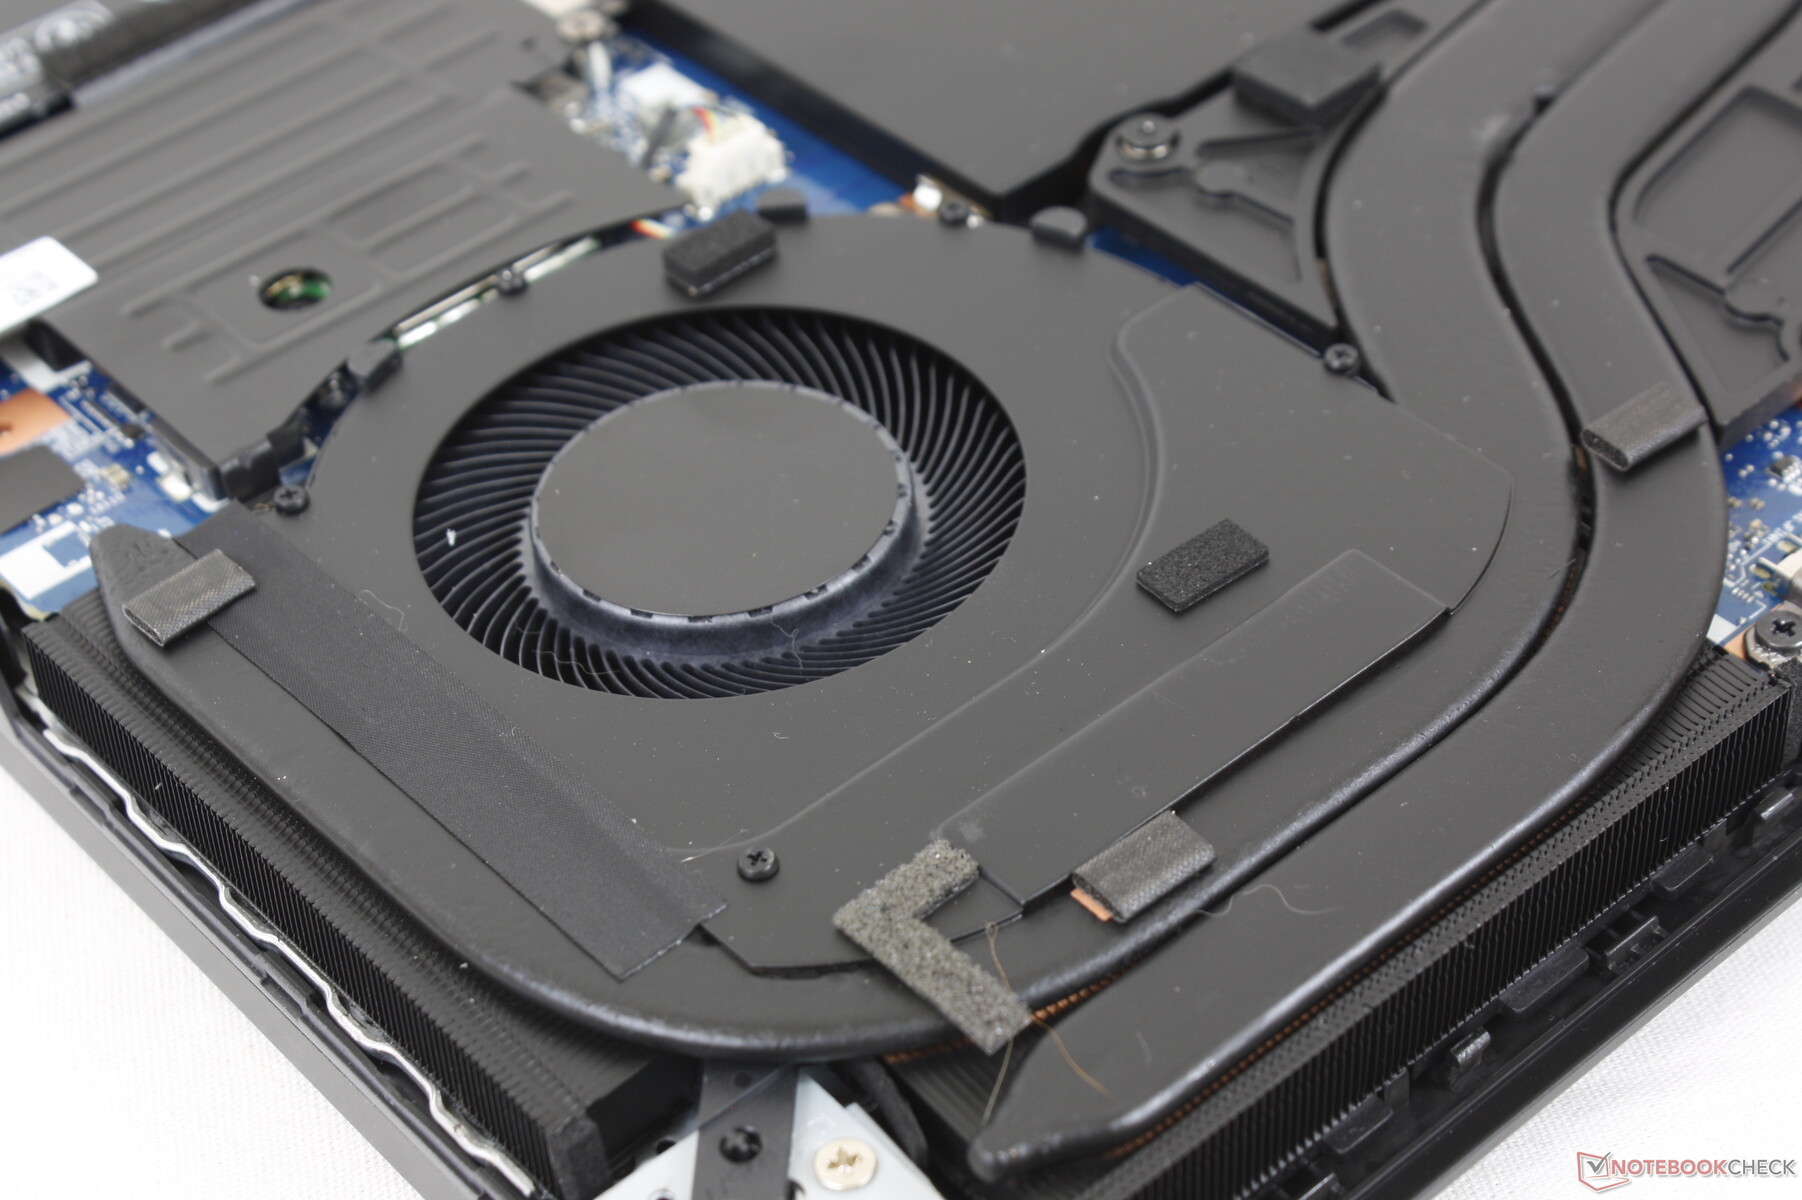
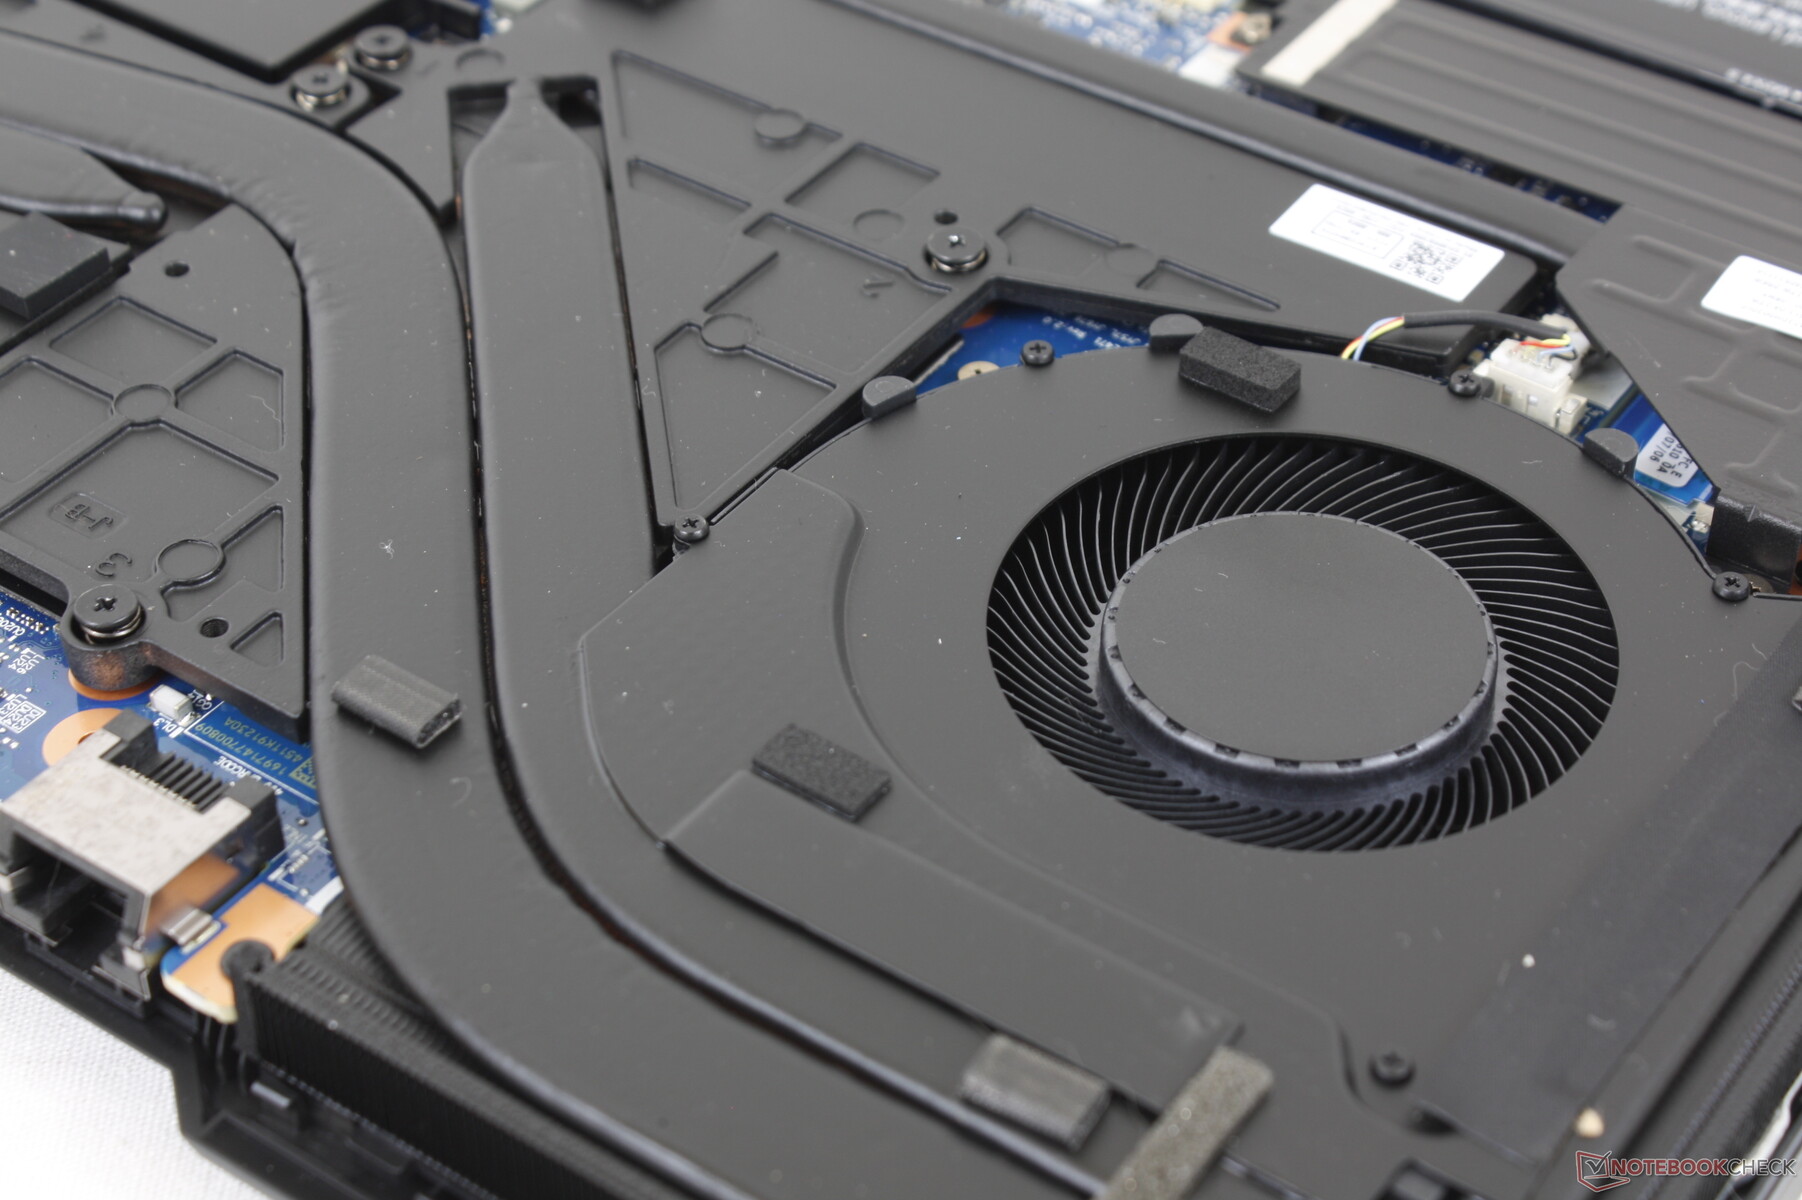
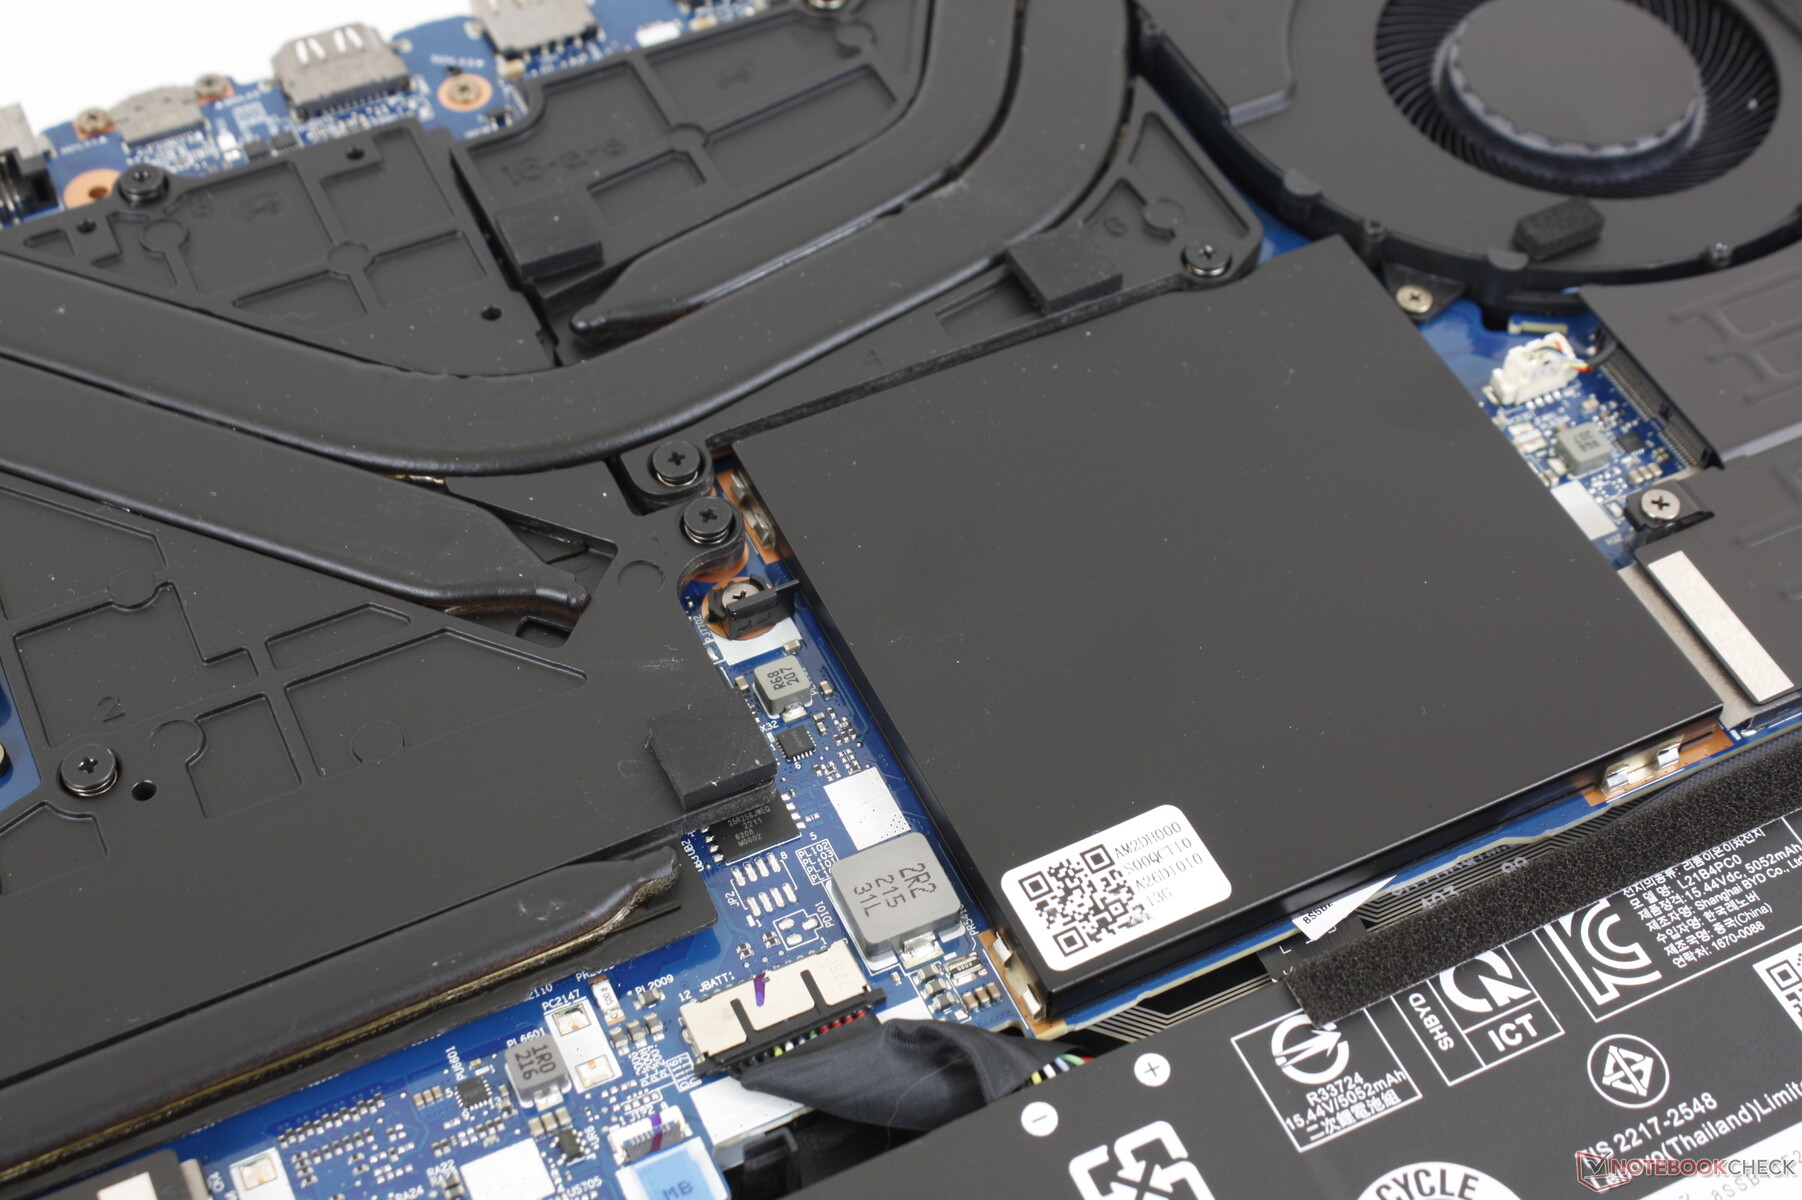
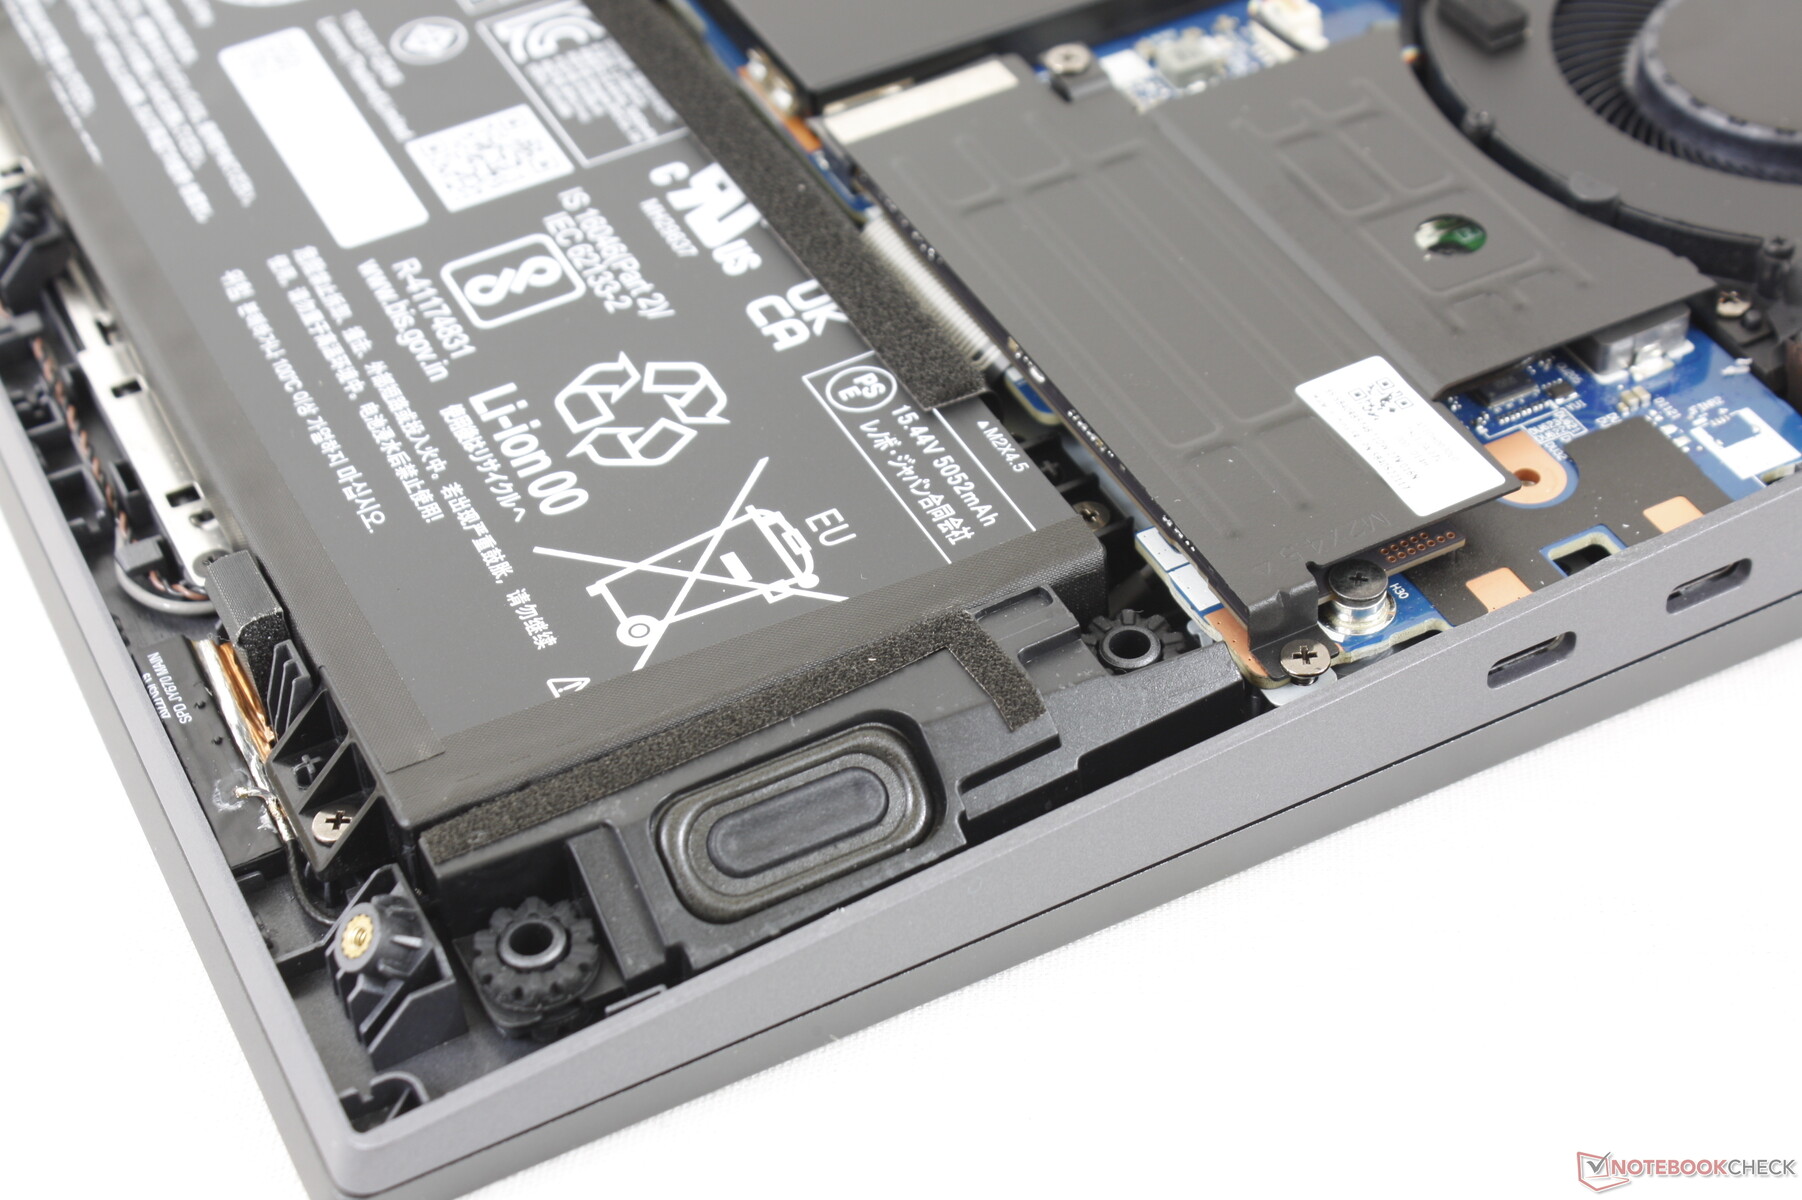
Maintenance
Accessories and Warranty
There are no extras in the box beyond the AC adapter and paperwork. The standard one-year limited manufacturer warranty applies if purchased in the US.
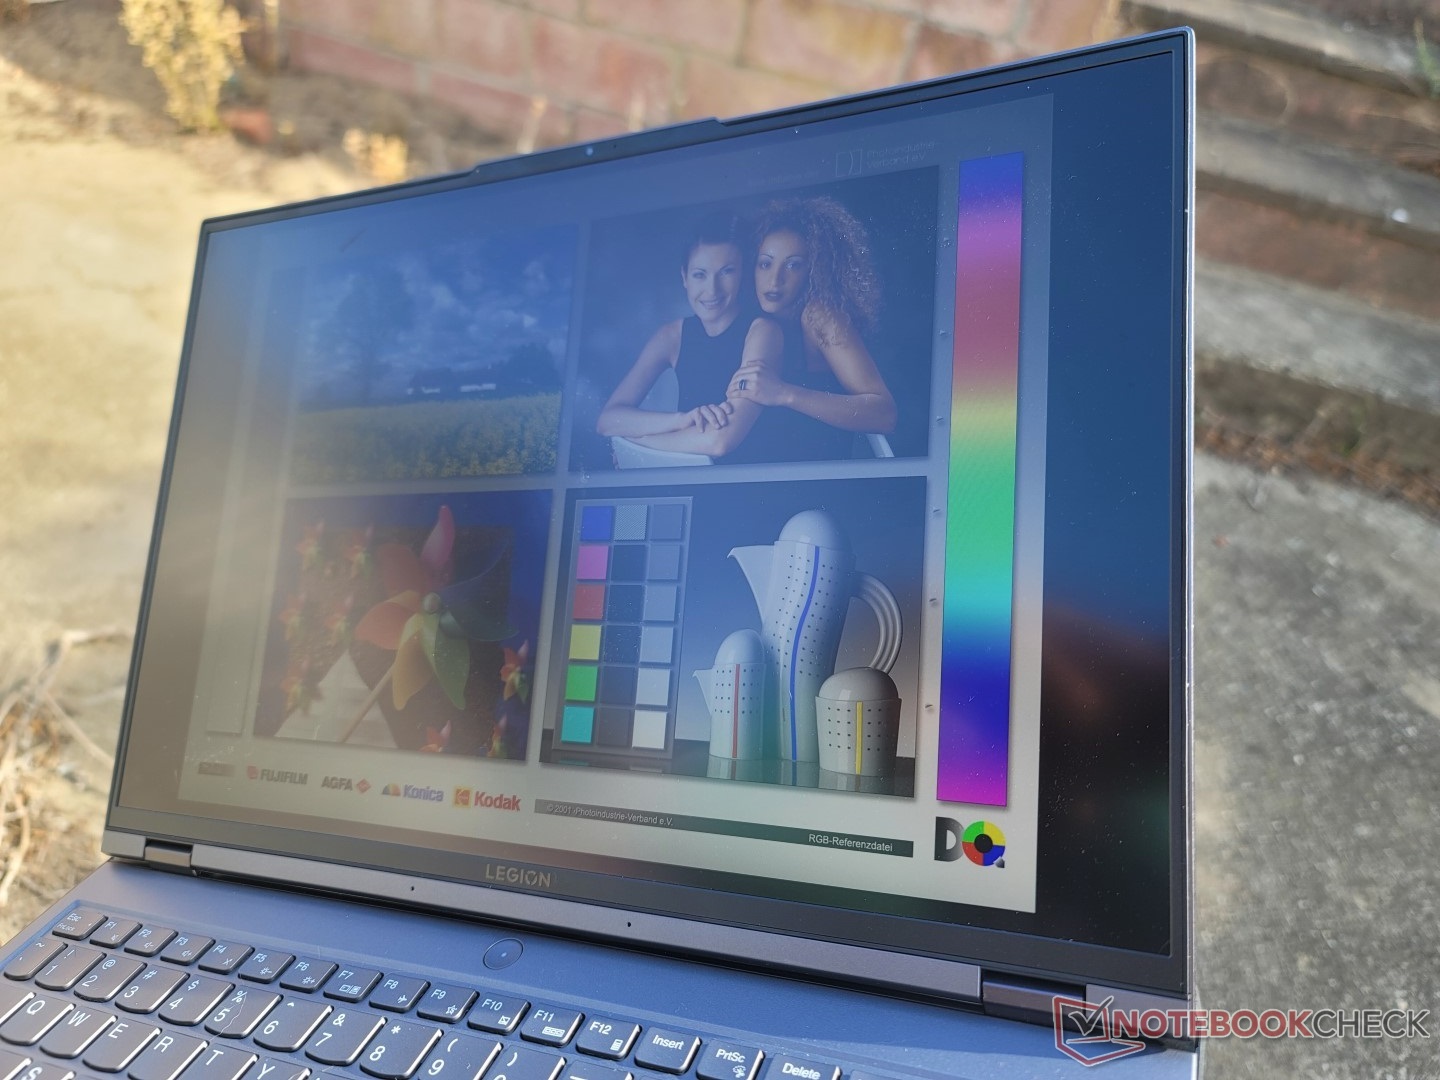
Display — One Option Only
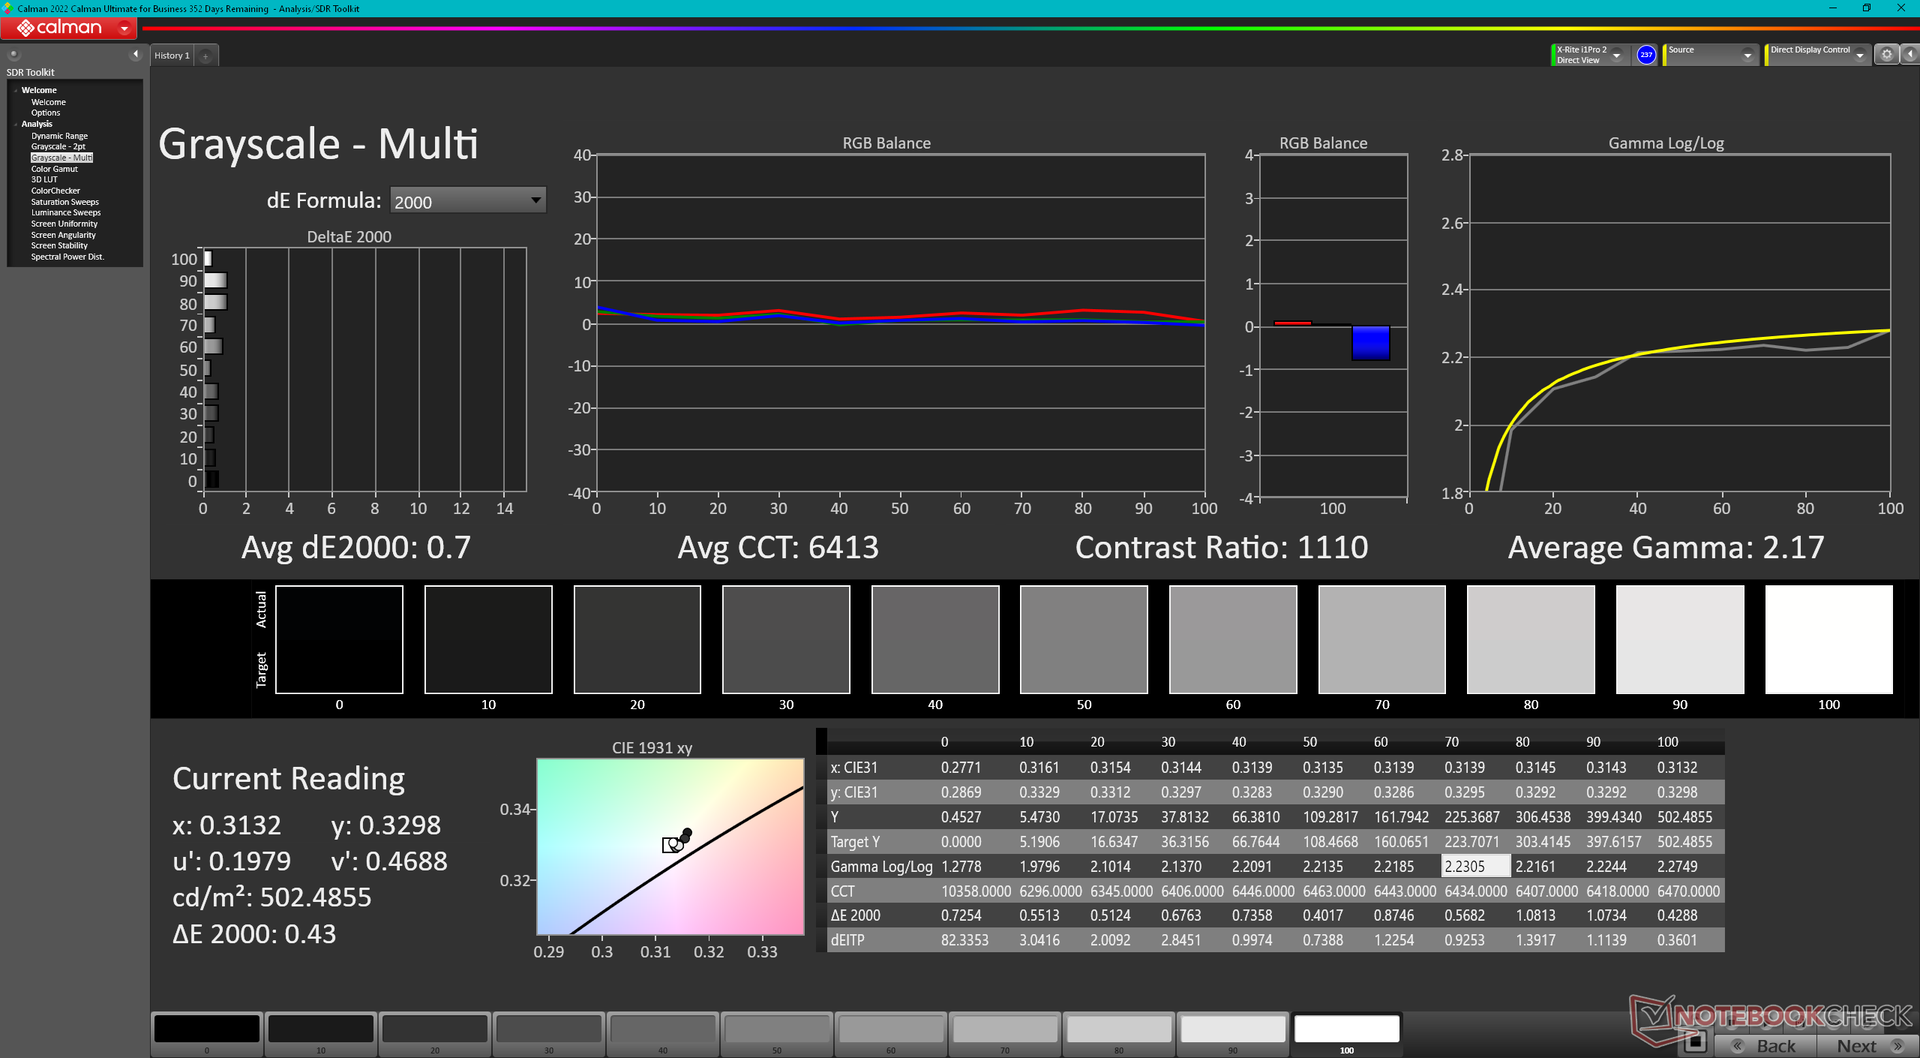
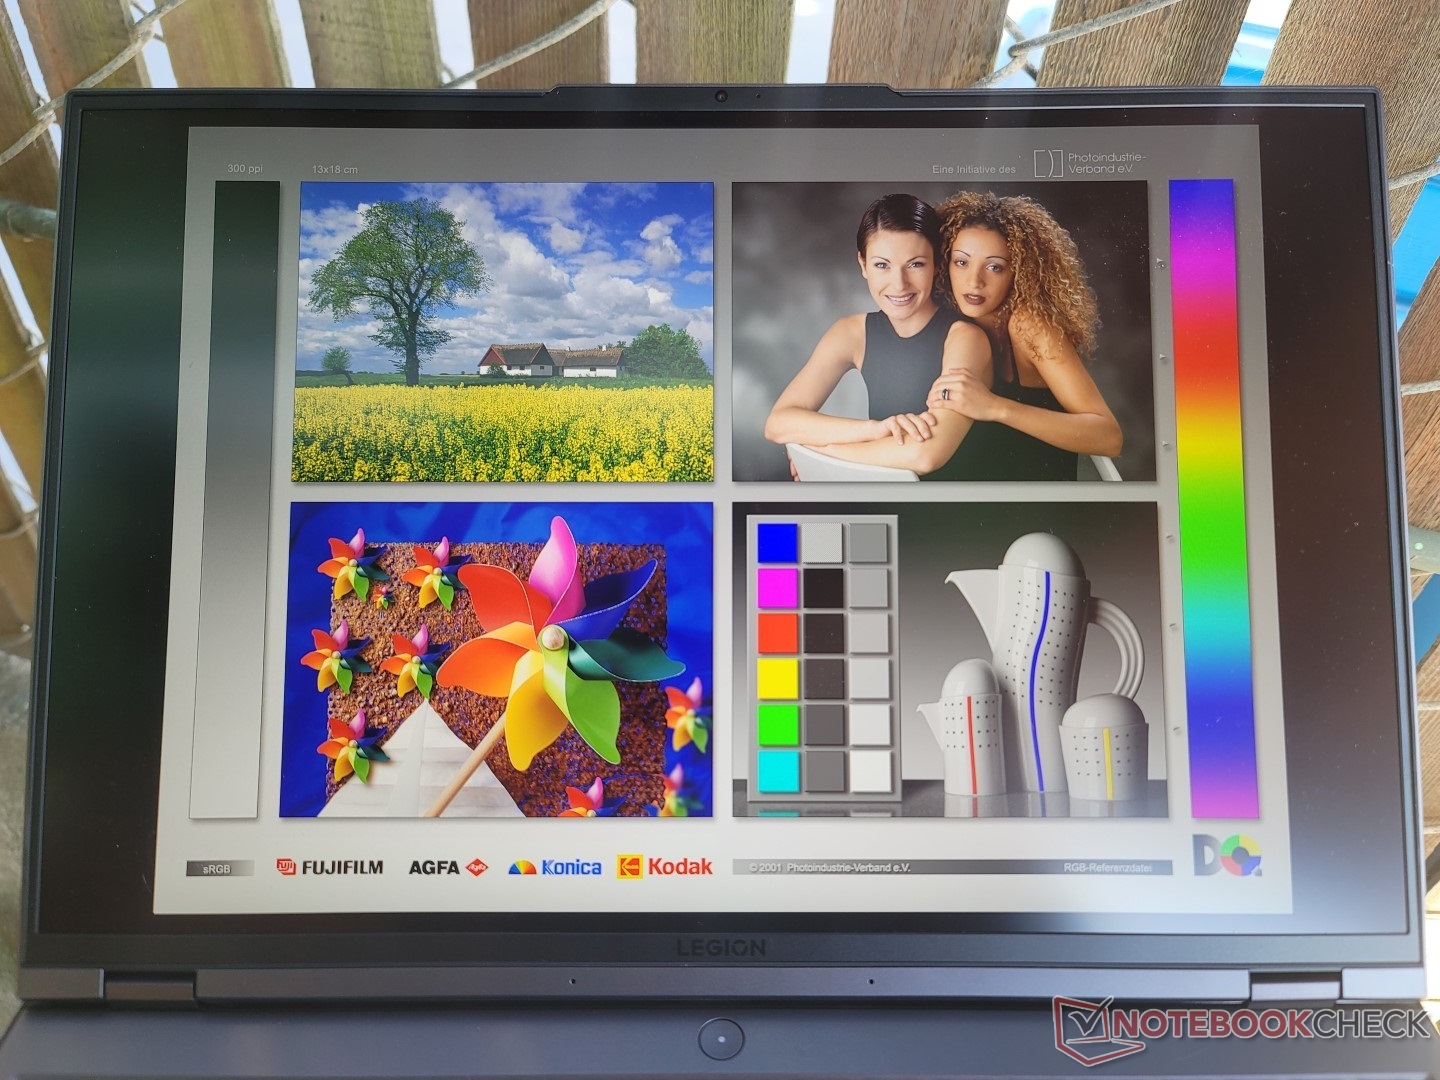
Lenovo has not changed anything about the BOE CQ NE160QDM-NY1 IPS panel from last year's Legion 5 Pro 16 model. Our measurements below show similar attributes across the board including the full sRGB coverage, fast black-white response times, ~1000:1 contrast ratio, and bright 500-nit backlight.
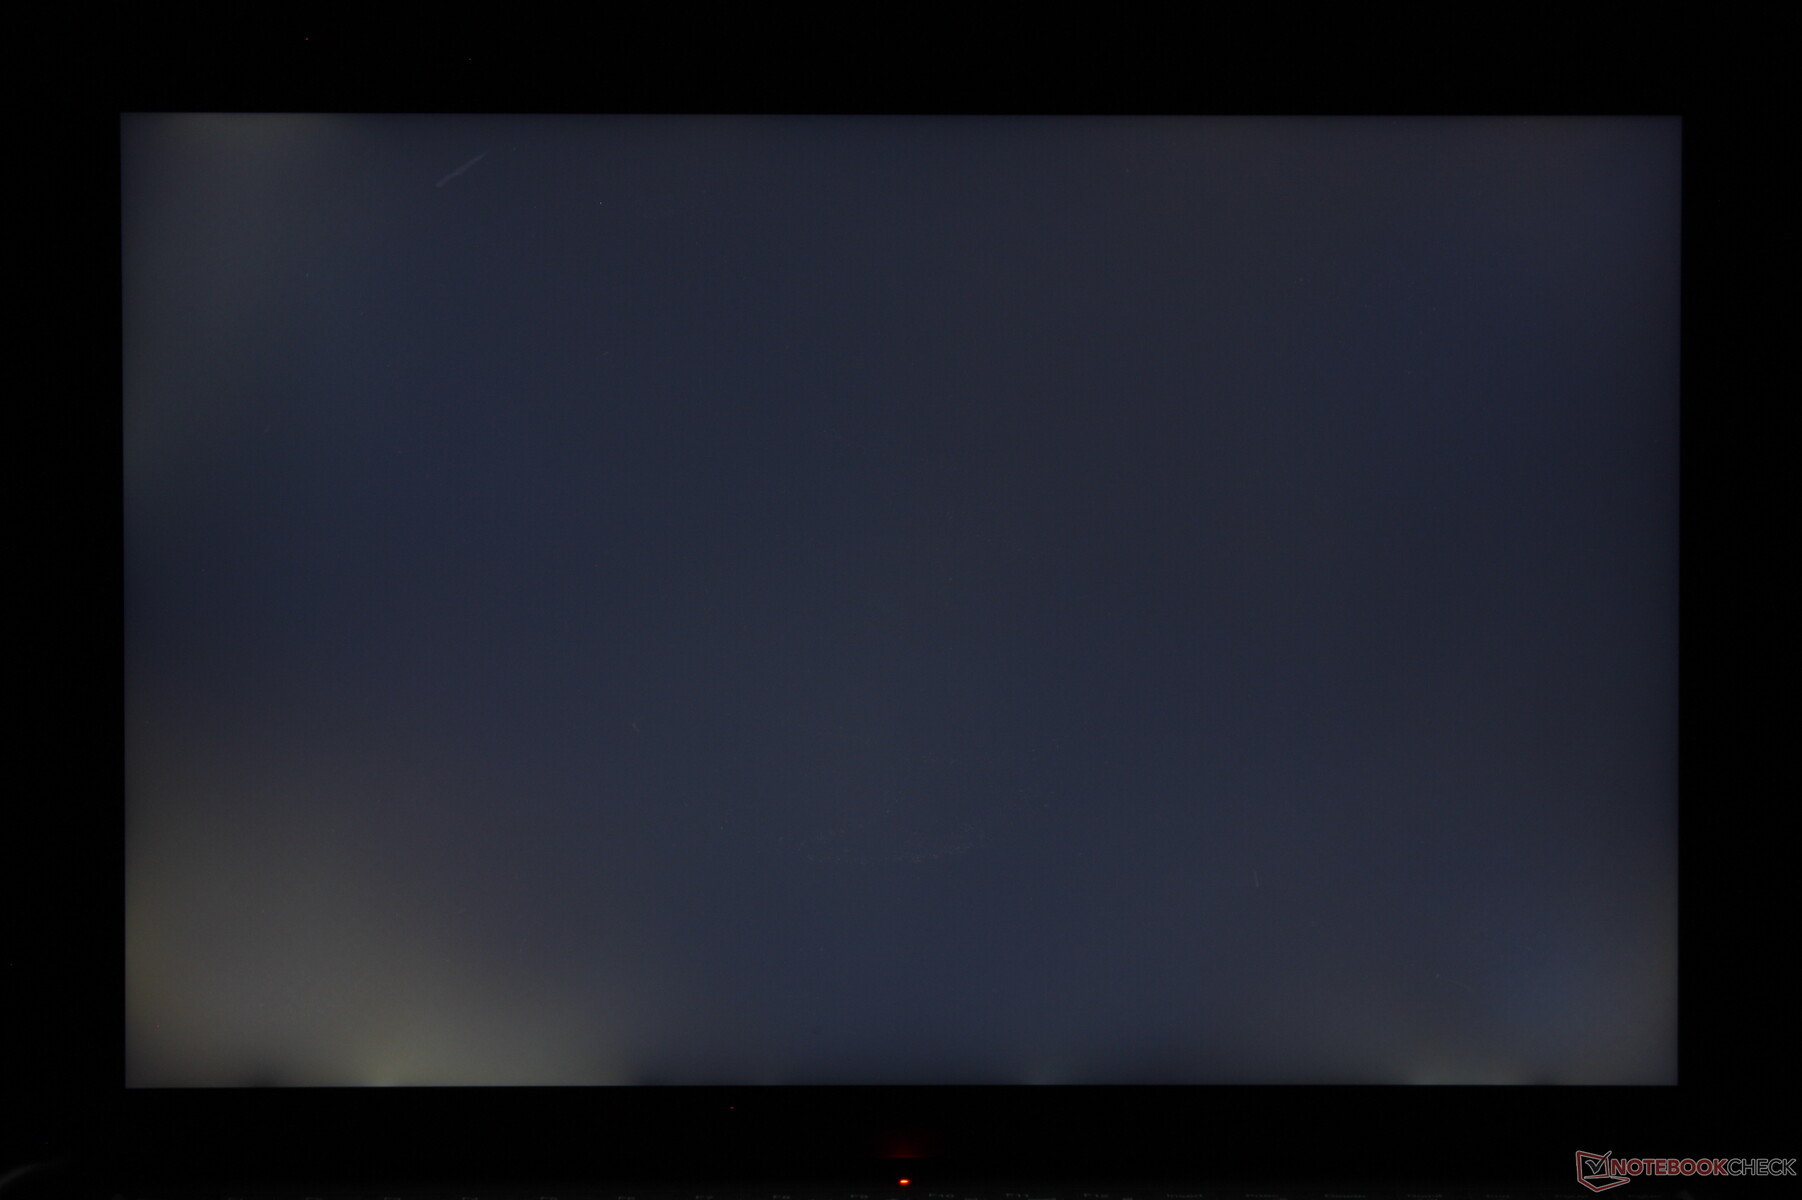
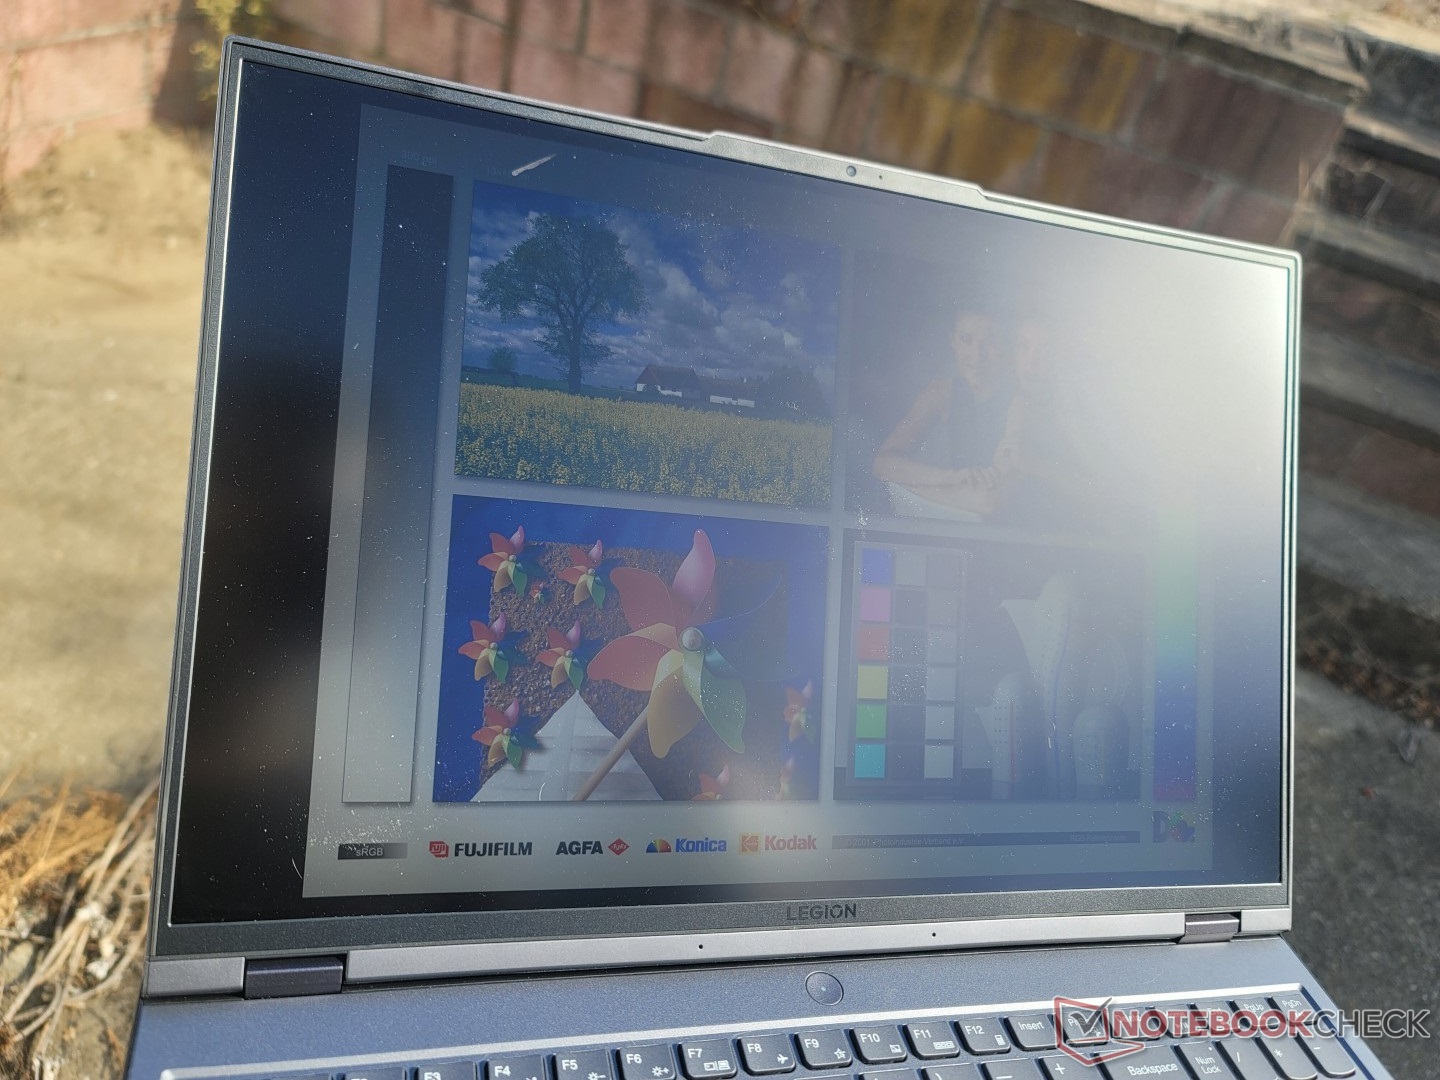
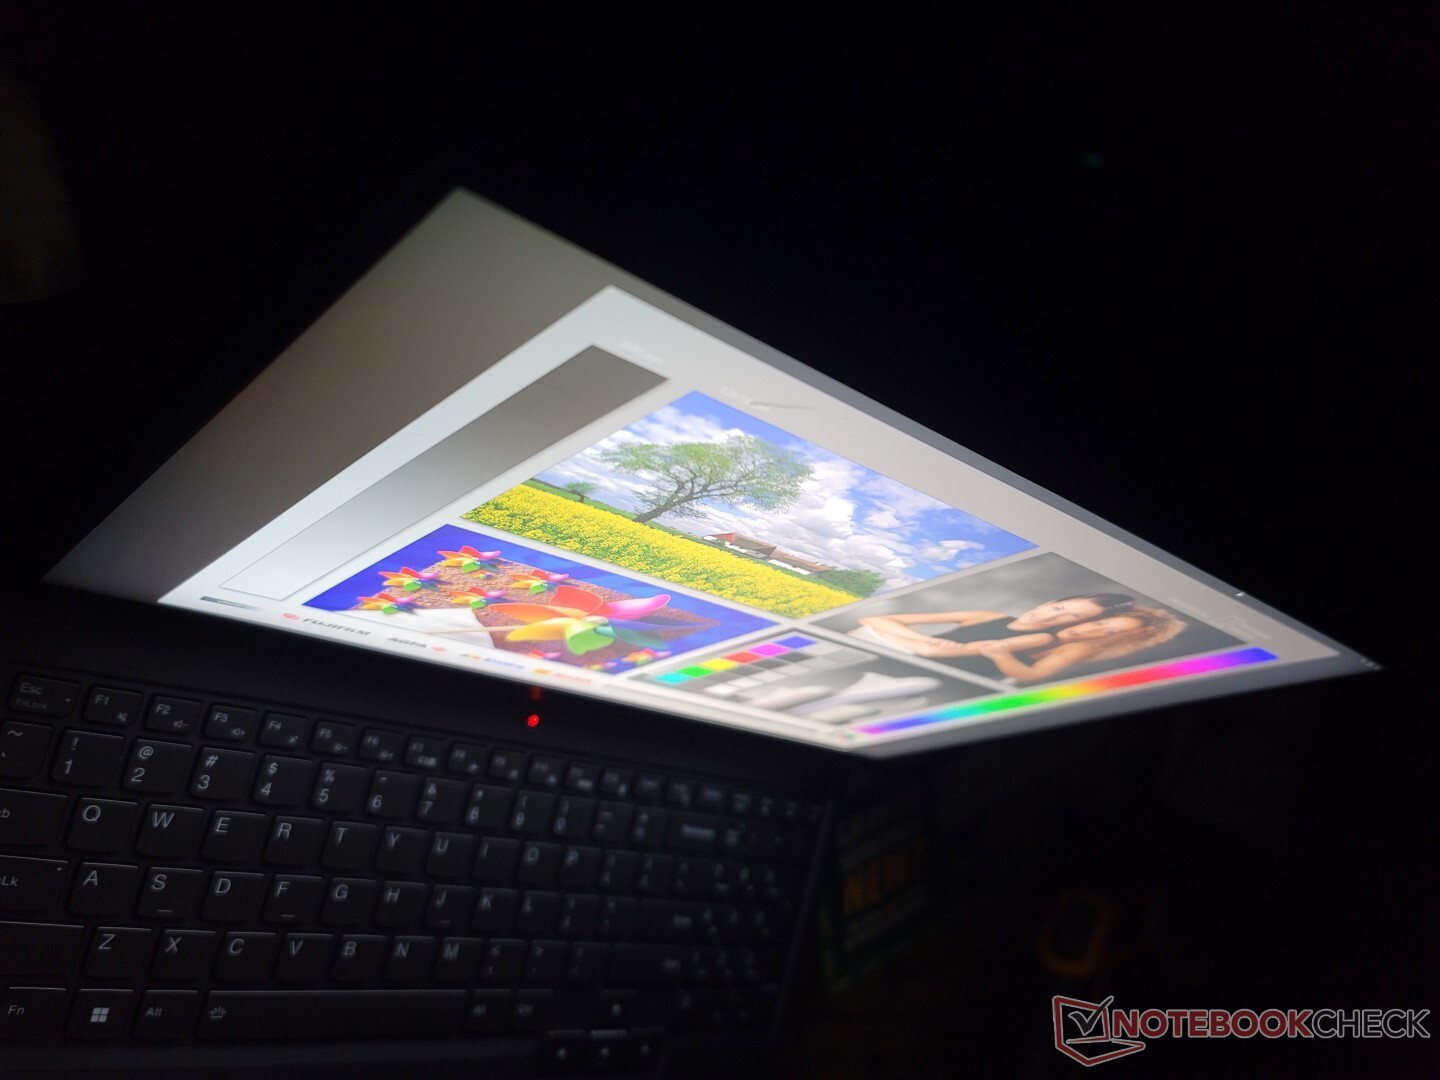
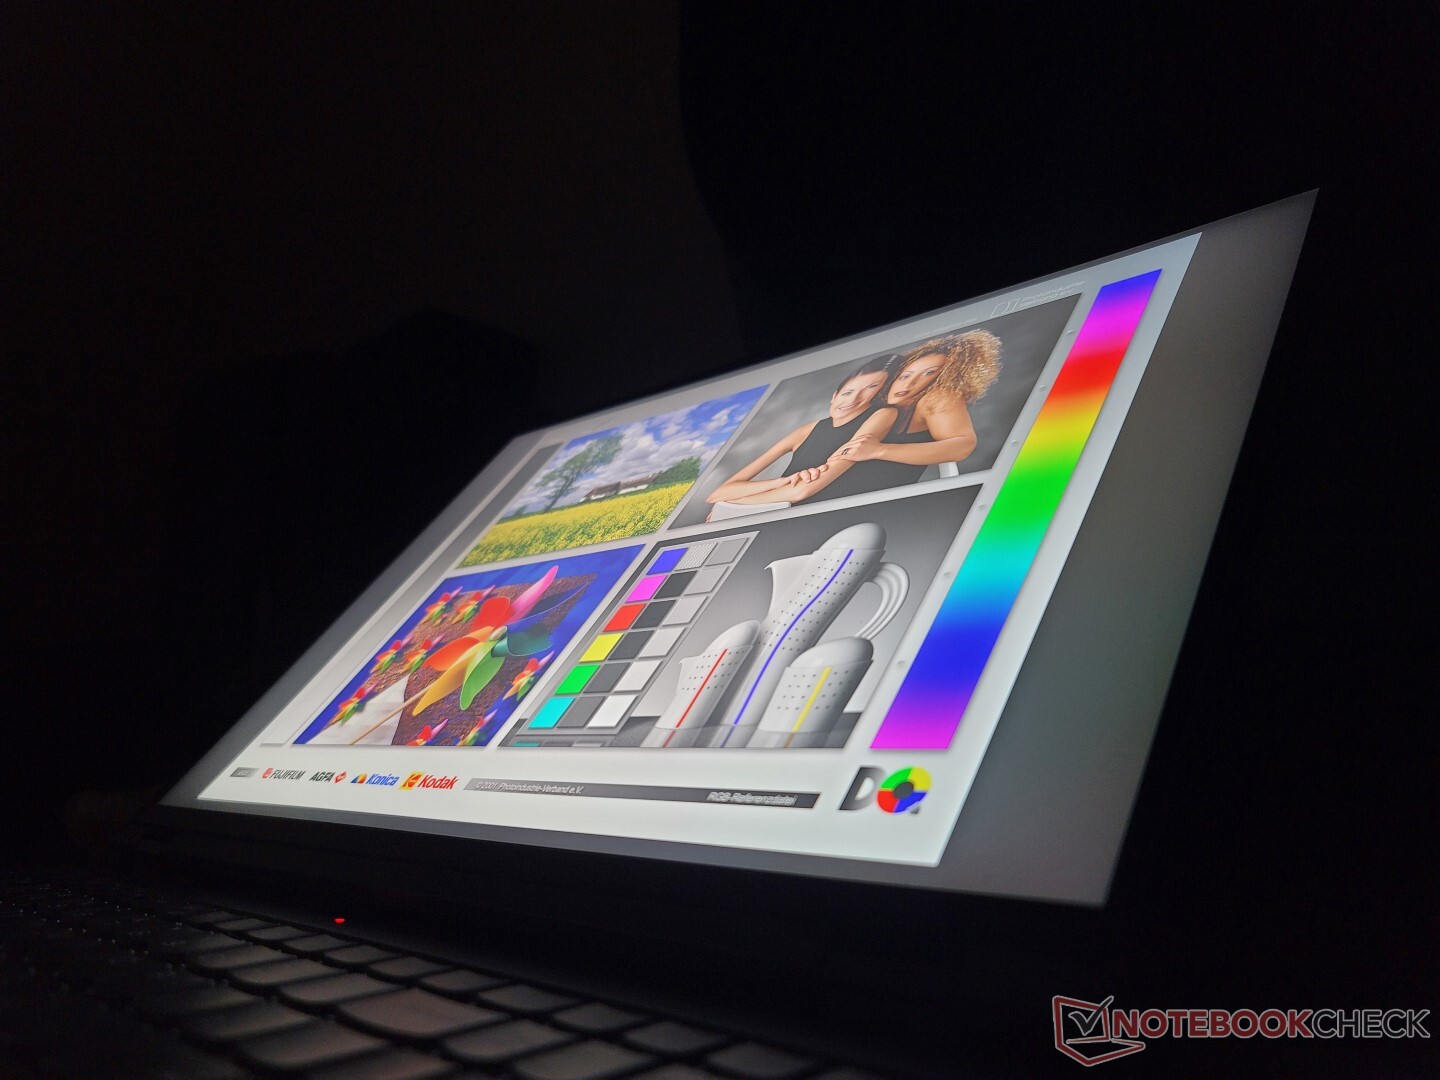
Nonetheless, our specific unit suffers from moderate-heavy backlight bleeding as shown by our picture below. Some uneven light bleeding is expected from most IPS panels, but this intensity is particularly upsetting to see on a higher-end gaming machine like the Legion 5 Pro 16.

| |||||||||||||||||||||||||
Brightness Distribution: 84 %
Center on Battery: 522.8 cd/m²
Contrast: 1275:1 (Black: 0.41 cd/m²)
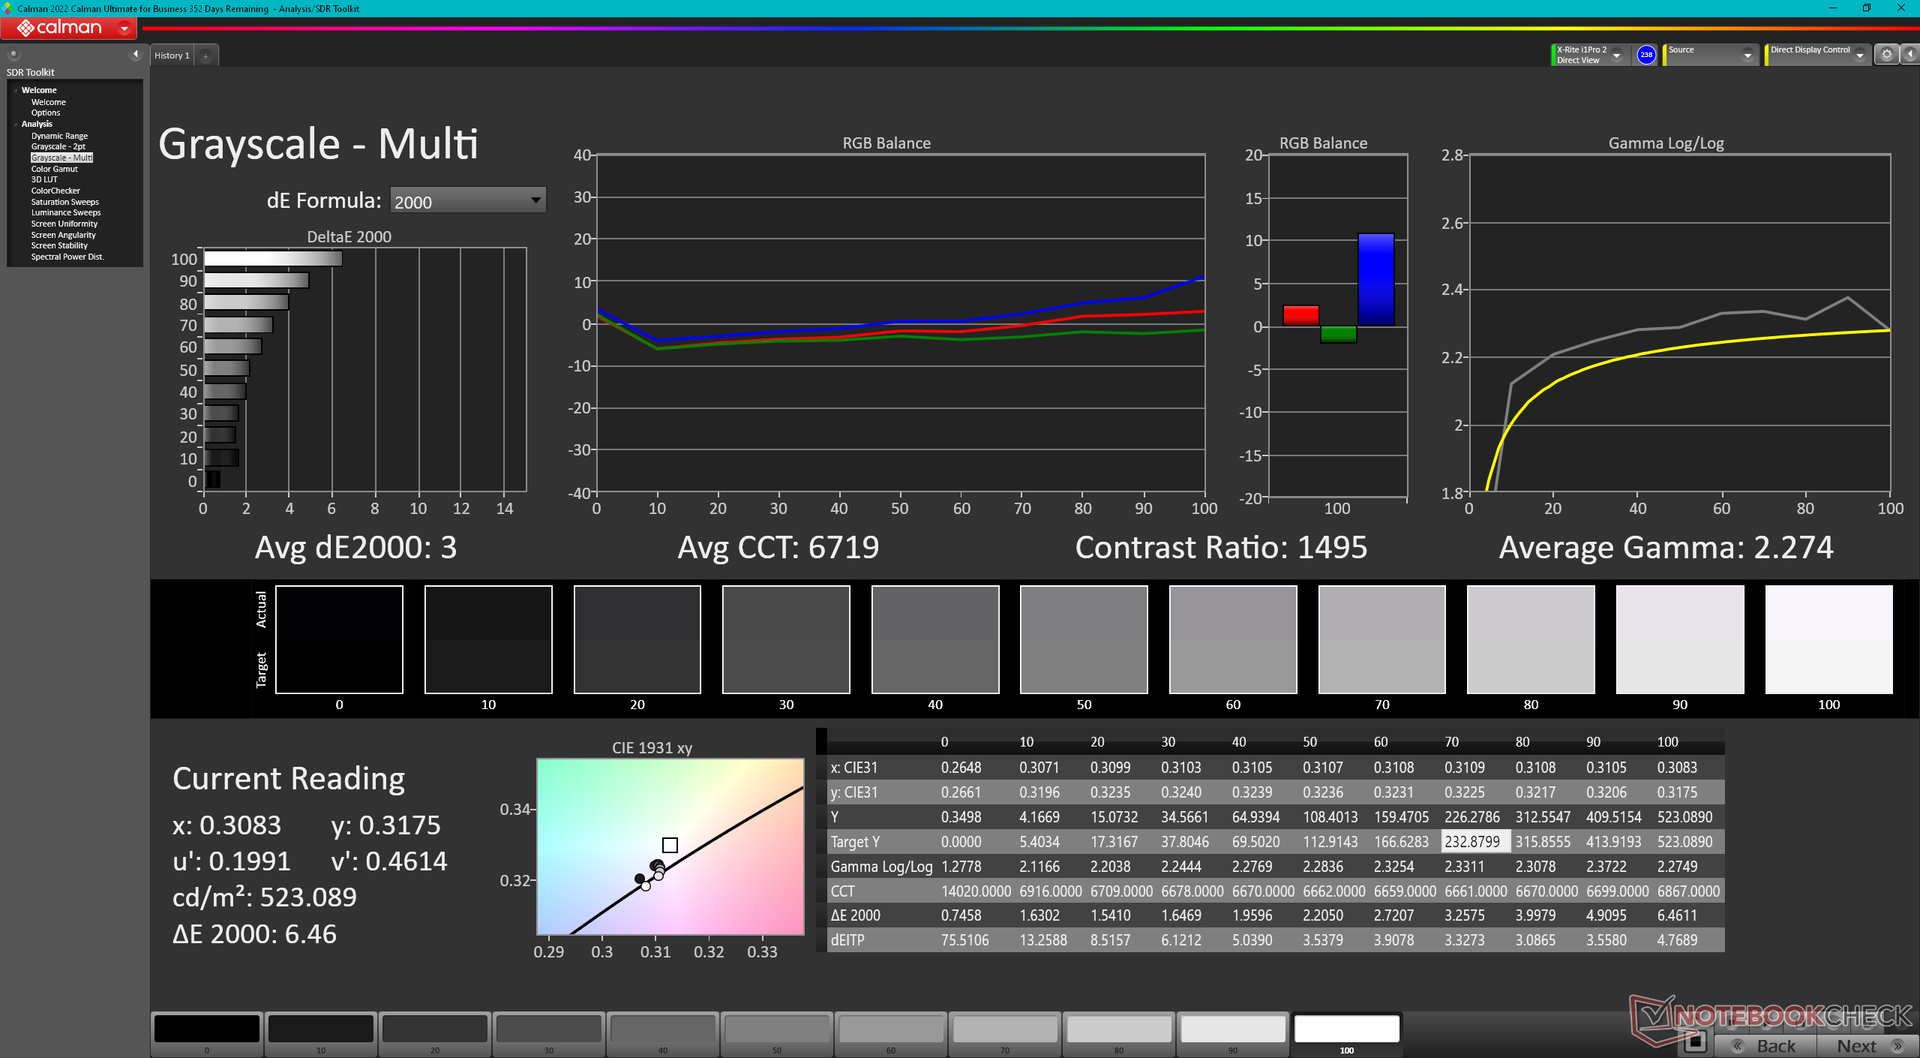
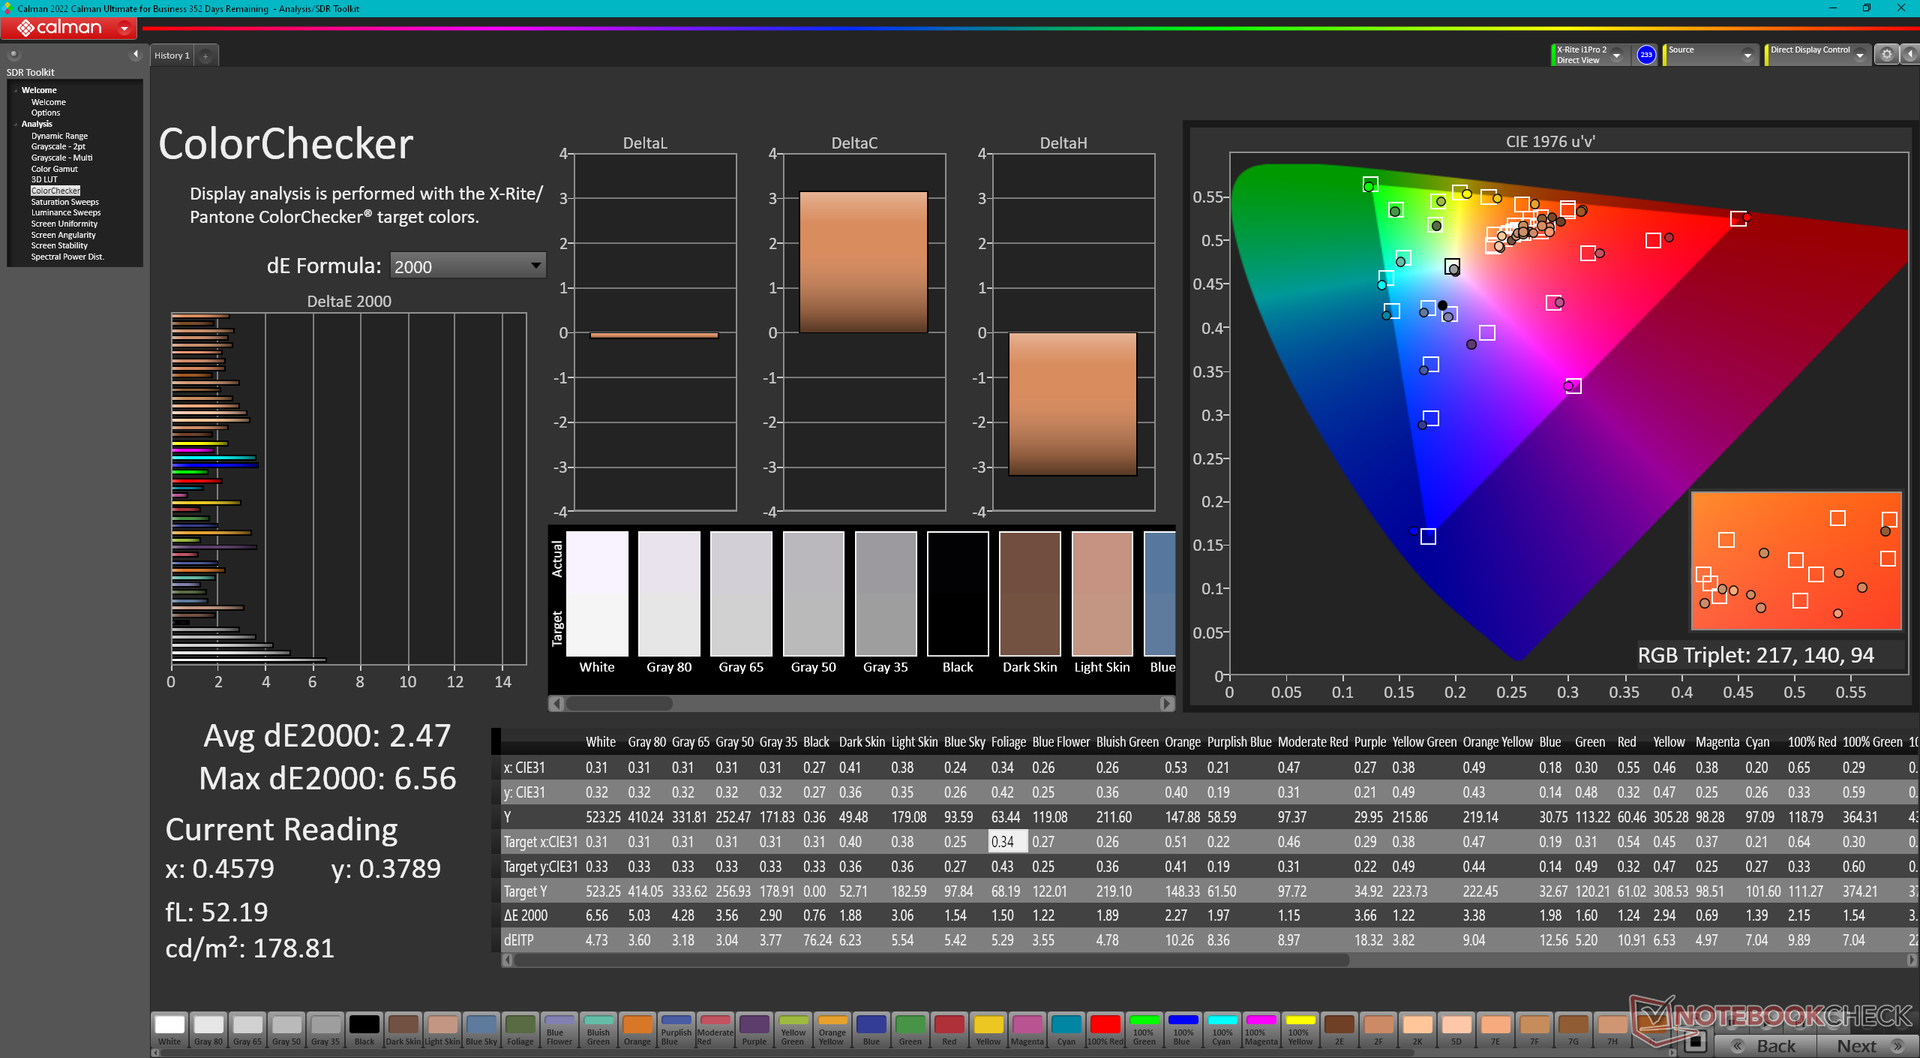
ΔE ColorChecker Calman: 2.47 | ∀{0.5-29.43 Ø4.75}
calibrated: 0.61
ΔE Greyscale Calman: 3 | ∀{0.09-98 Ø5}
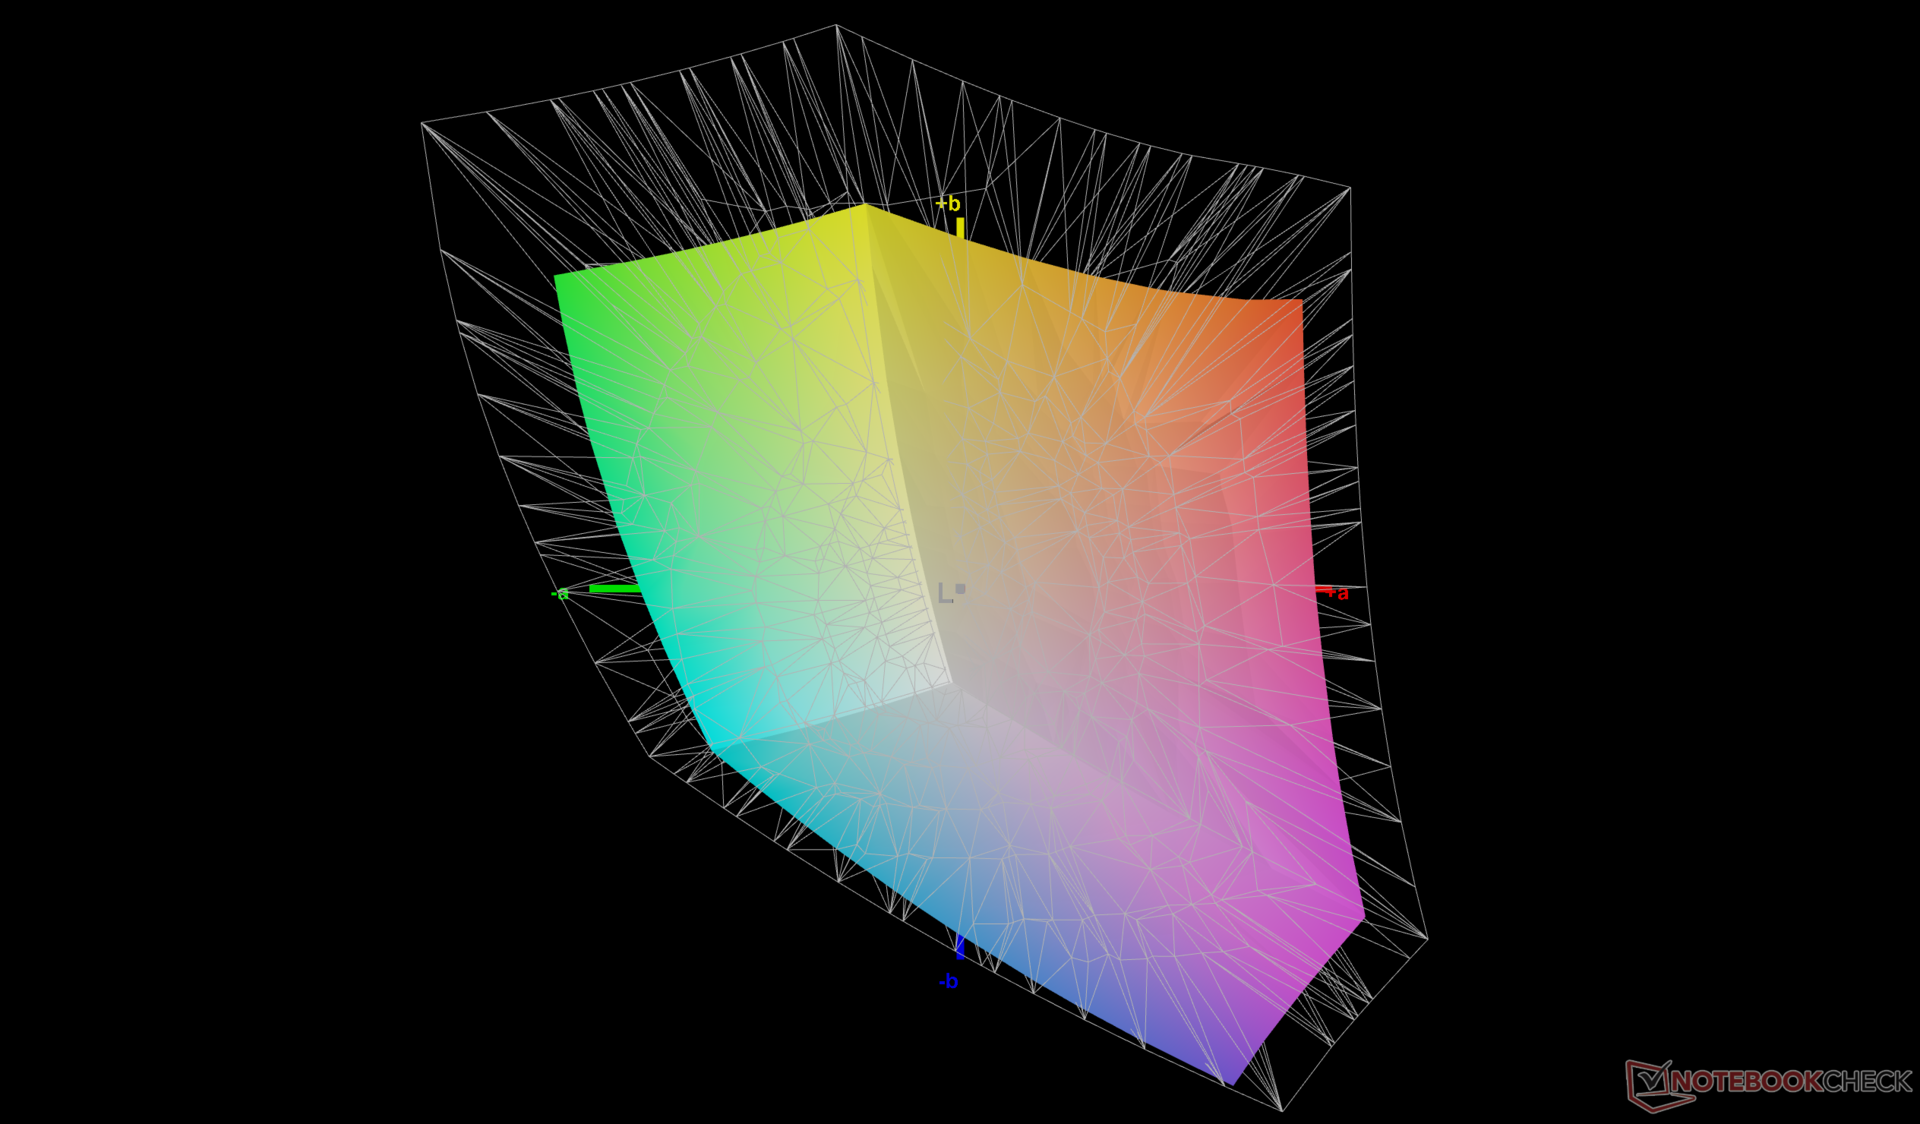
69.5% AdobeRGB 1998 (Argyll 3D)
96.1% sRGB (Argyll 3D)
67.3% Display P3 (Argyll 3D)
Gamma: 2.27
CCT: 6719 K
| Lenovo Legion 5 Pro 16ARH7H RTX 3070 Ti BOE CQ NE160QDM-NY1, IPS, 2560x1600, 16" | Lenovo Legion 5 Pro 16IAH7H BOE CCQ_NE160QDM_NY1, IPS, 2560x1600, 16" | Asus ROG Zephyrus M16 GU603H AU Optronics AUOC199, IPS, 2560x1600, 16" | Lenovo Legion 7 16ARHA7 BOE CQ NE160QDM-NY1, IPS, 2560x1600, 16" | HP Victus 16-e0145ng CMN1609, IPS, 1920x1080, 16.1" | Dell G16 7620 BOE NE16QDM, IPS, 2560x1600, 16" | |
|---|---|---|---|---|---|---|
| Display | 2% | -4% | -37% | 1% | ||
| Display P3 Coverage (%) | 67.3 | 68.53 2% | 63.7 -5% | 41.6 -38% | 68.3 1% | |
| sRGB Coverage (%) | 96.1 | 98.38 2% | 95.3 -1% | 61.9 -36% | 98 2% | |
| AdobeRGB 1998 Coverage (%) | 69.5 | 70.45 1% | 65.7 -5% | 43 -38% | 70.5 1% | |
| Response Times | 25% | 57% | 25% | -90% | 24% | |
| Response Time Grey 50% / Grey 80% * (ms) | 14.4 ? | 14 ? 3% | 4.8 ? 67% | 9.2 ? 36% | 29.6 ? -106% | 8.6 ? 40% |
| Response Time Black / White * (ms) | 11.2 ? | 6 ? 46% | 6 ? 46% | 9.6 ? 14% | 19.4 ? -73% | 10.4 ? 7% |
| PWM Frequency (Hz) | ||||||
| Screen | -7% | -51% | -19% | -127% | -10% | |
| Brightness middle (cd/m²) | 522.8 | 515 -1% | 448 -14% | 478.8 -8% | 257 -51% | 369.4 -29% |
| Brightness (cd/m²) | 503 | 475 -6% | 446 -11% | 477 -5% | 239 -52% | 348 -31% |
| Brightness Distribution (%) | 84 | 85 1% | 86 2% | 90 7% | 88 5% | 83 -1% |
| Black Level * (cd/m²) | 0.41 | 0.45 -10% | 0.48 -17% | 0.43 -5% | 0.25 39% | 0.32 22% |
| Contrast (:1) | 1275 | 1144 -10% | 933 -27% | 1113 -13% | 1028 -19% | 1154 -9% |
| Colorchecker dE 2000 * | 2.47 | 2.38 4% | 2.76 -12% | 2.24 9% | 6.91 -180% | 1.78 28% |
| Colorchecker dE 2000 max. * | 6.56 | 4.37 33% | 7.09 -8% | 4.49 32% | 22.27 -239% | 4.41 33% |
| Colorchecker dE 2000 calibrated * | 0.61 | 1.1 -80% | 2.86 -369% | 1.89 -210% | 3.61 -492% | 1.22 -100% |
| Greyscale dE 2000 * | 3 | 2.71 10% | 3.1 -3% | 2.3 23% | 7.5 -150% | 3.2 -7% |
| Gamma | 2.27 97% | 2.49 88% | 2.153 102% | 2.25 98% | 2.125 104% | 2.2 100% |
| CCT | 6719 97% | 6117 106% | 6826 95% | 6955 93% | 6025 108% | 6750 96% |
| Color Space (Percent of AdobeRGB 1998) (%) | 87 | |||||
| Color Space (Percent of sRGB) (%) | 100 | |||||
| Total Average (Program / Settings) | 7% /
-0% | 3% /
-31% | 1% /
-9% | -85% /
-102% | 5% /
-3% |
* ... smaller is better
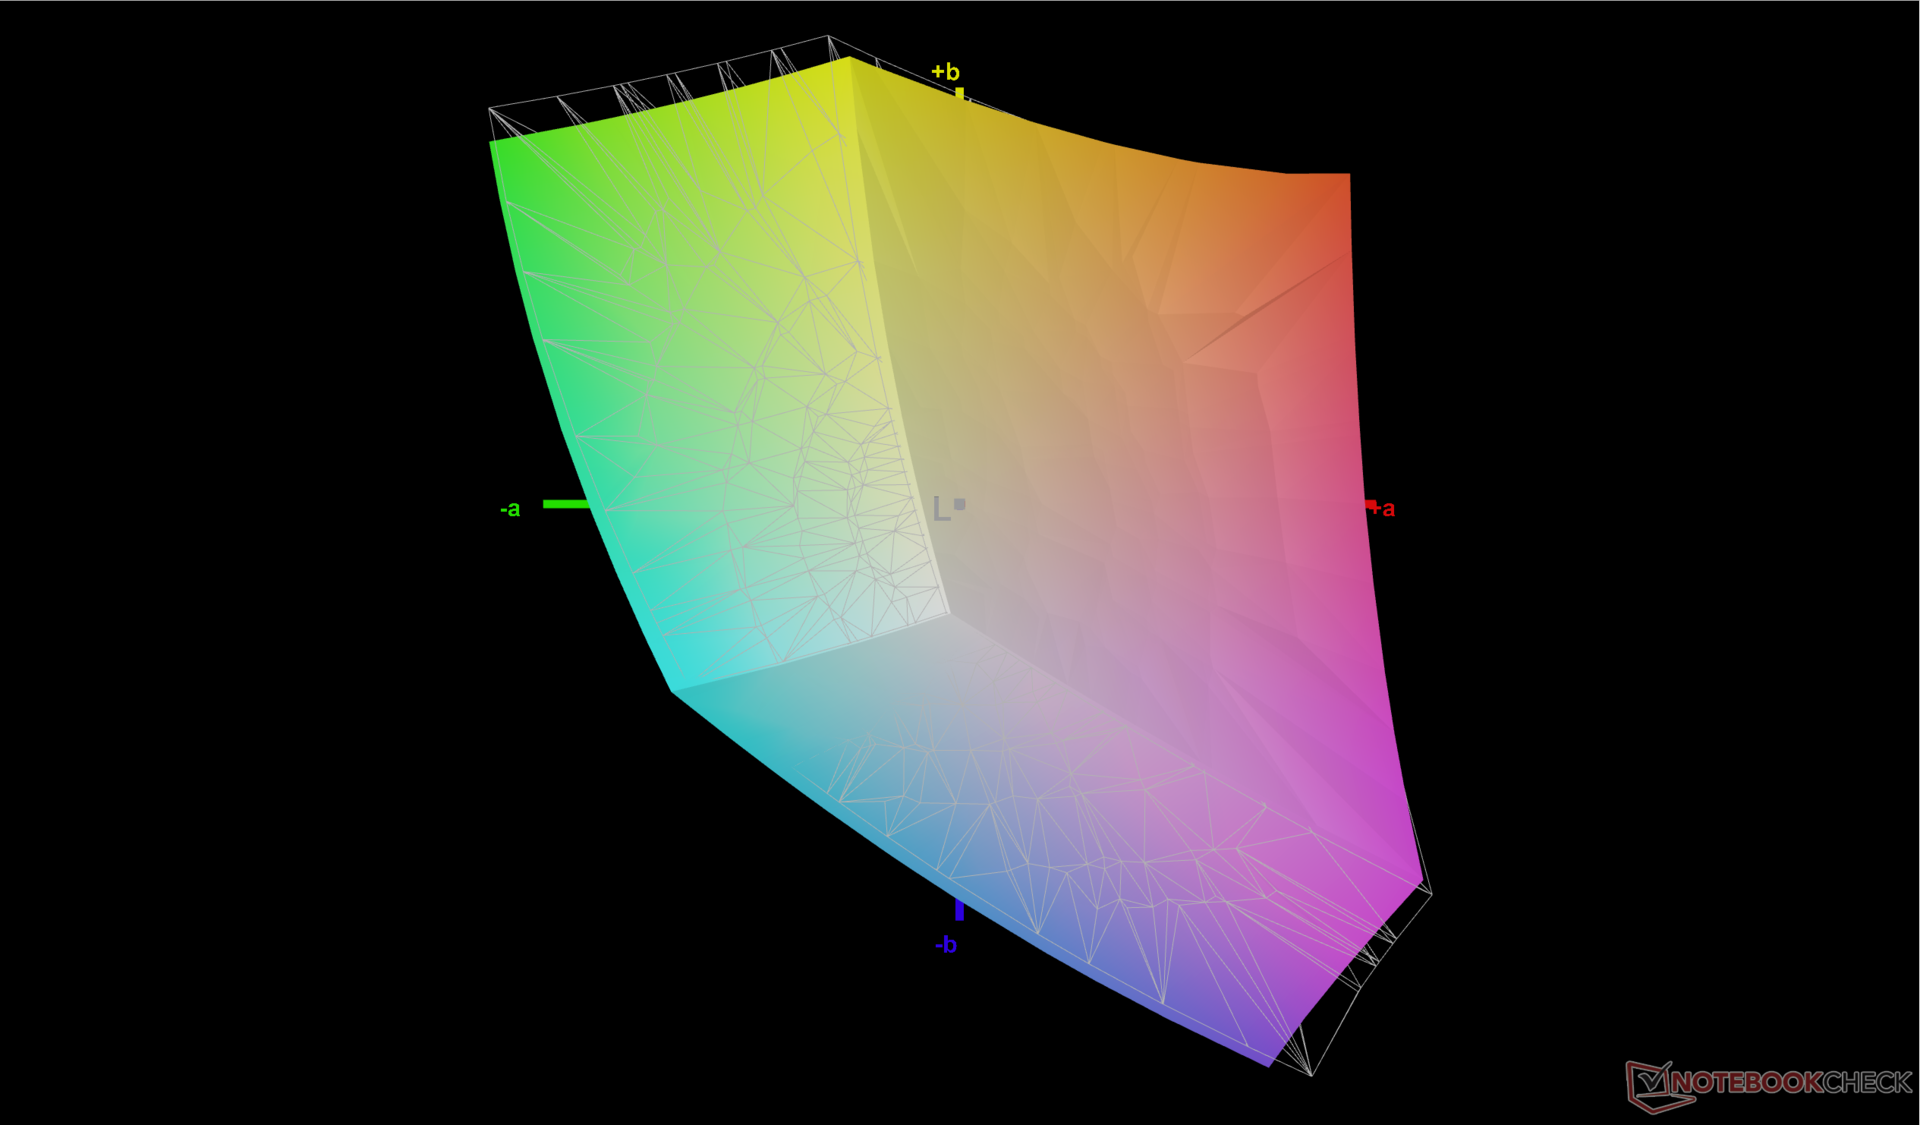
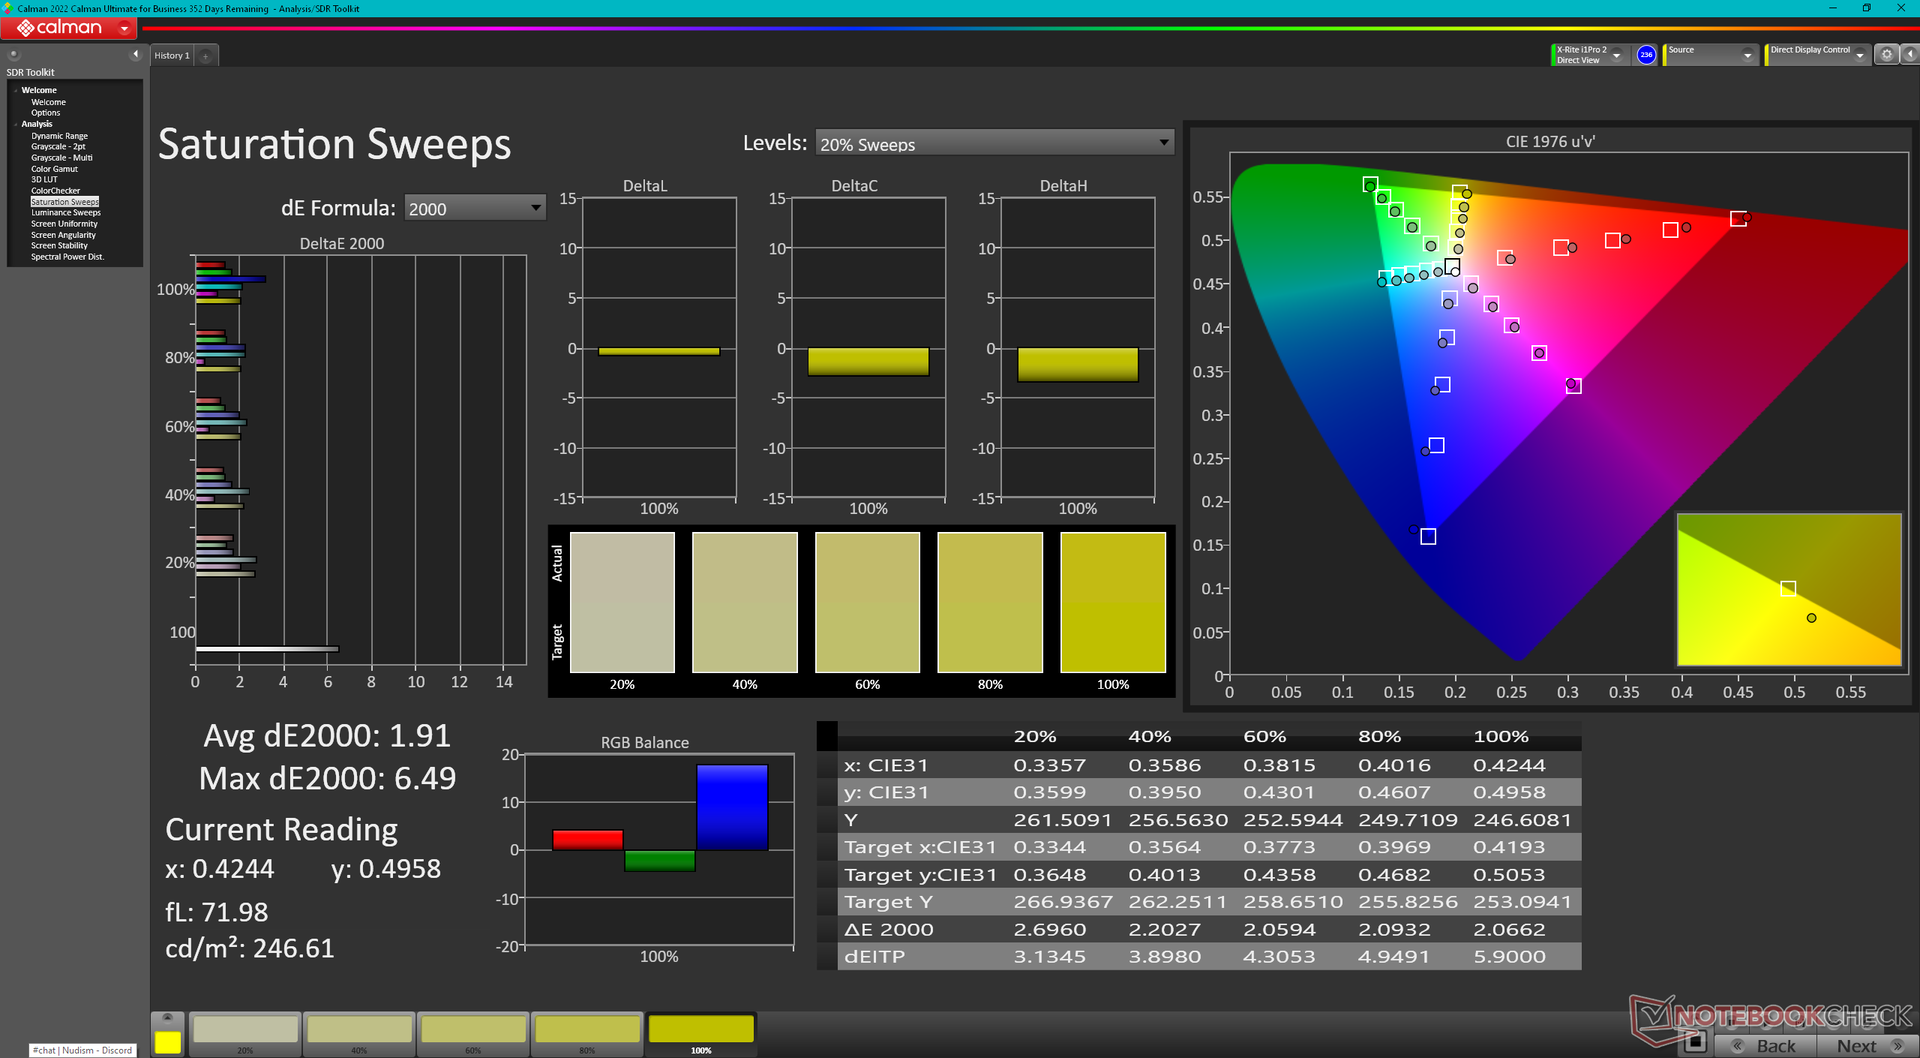
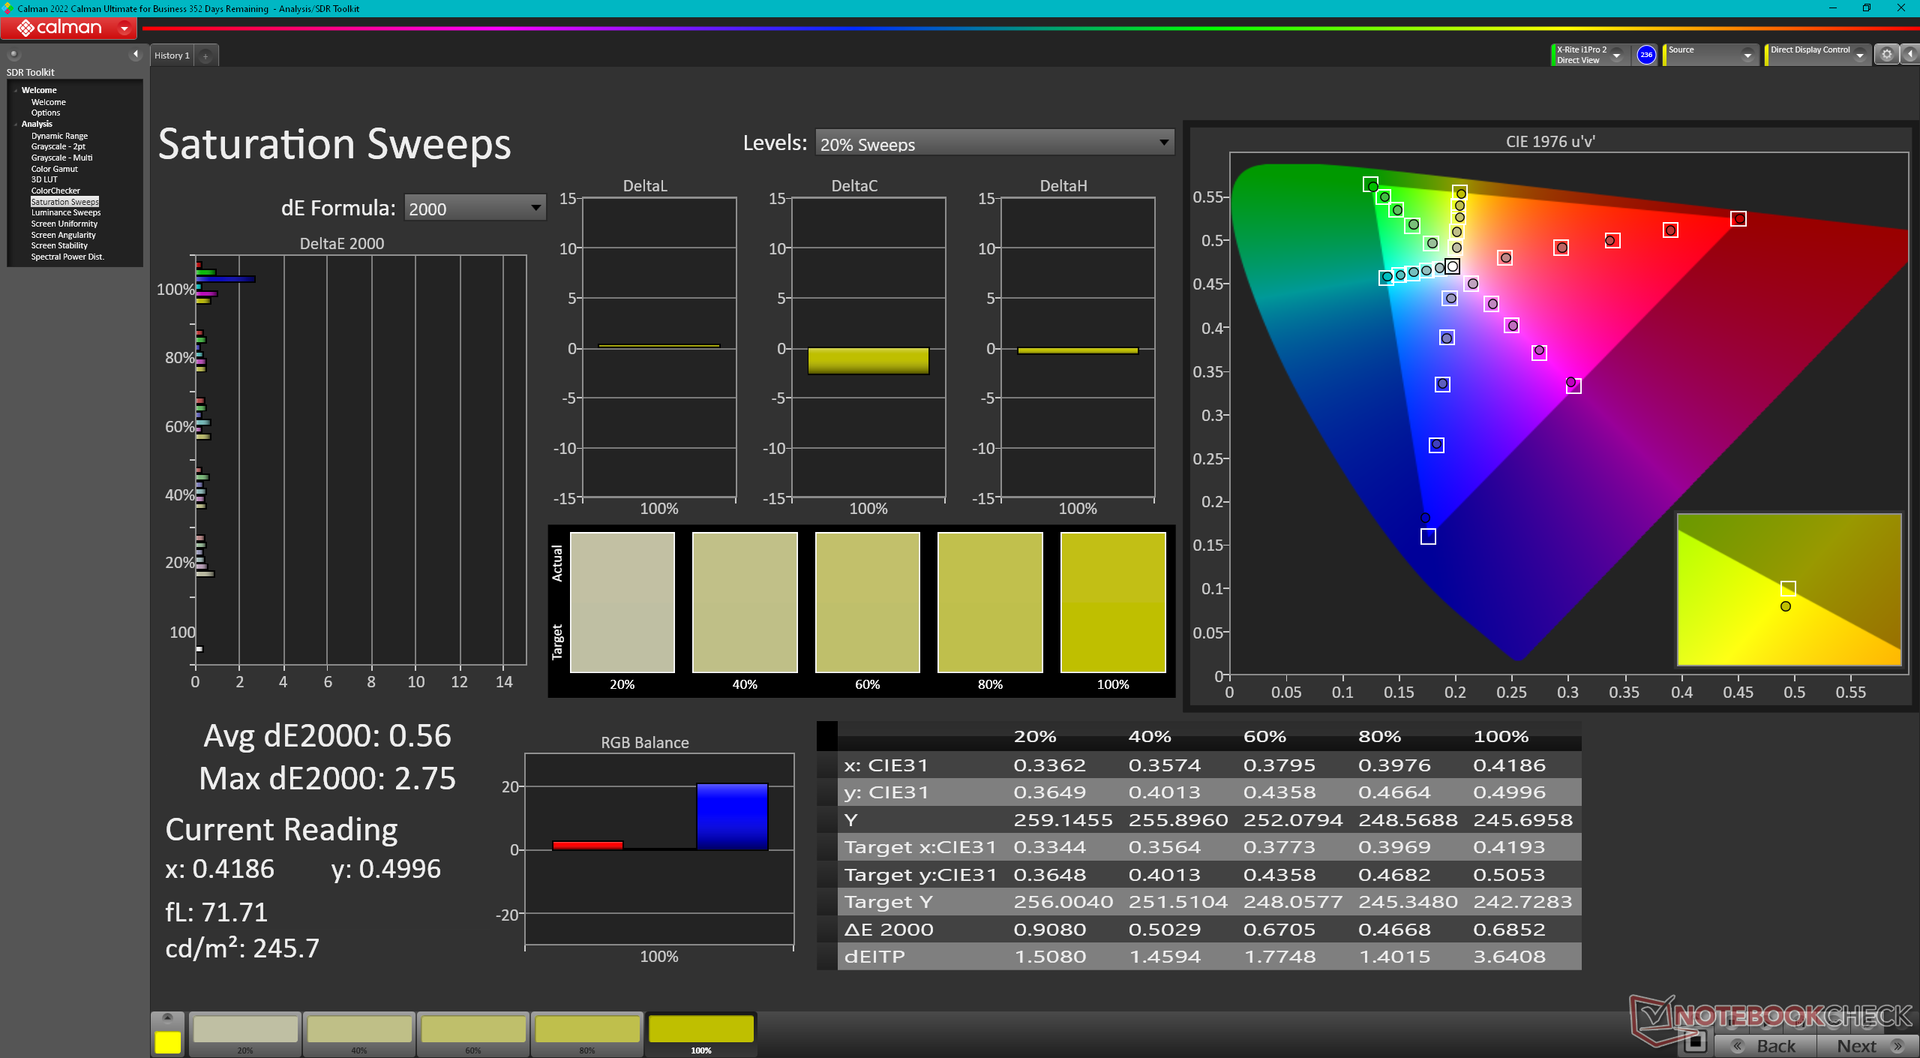
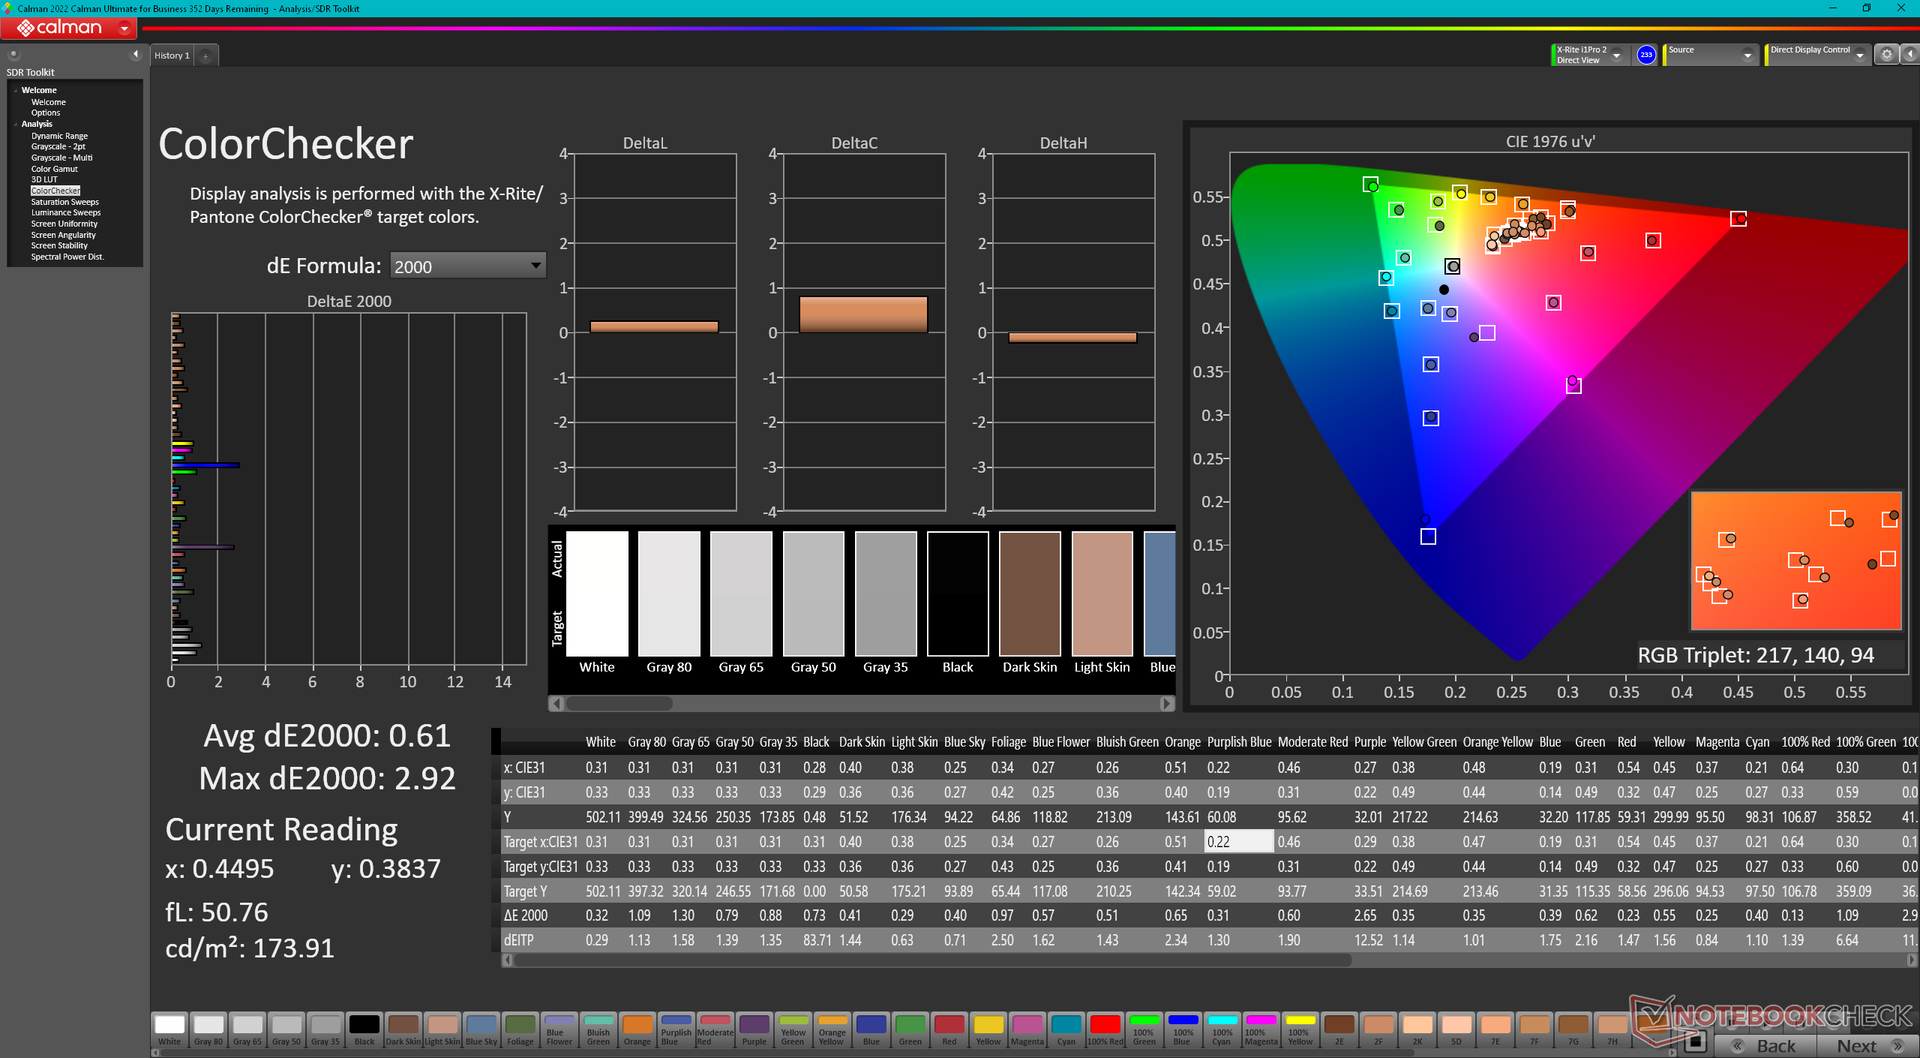
The display comes pre-calibrated with average grayscale and color deltaE values of just 3 and 2.47, respectively, on our specific unit. Calibrating the panel ourselves with an X-Rite colorimeter would improve the deltaE values even further to just 0.7 and 0.6. We recommend applying our calibrated ICM profile above to better exploit the full sRGB coverage of the display.
Display Response Times
| ↔ Response Time Black to White | ||
|---|---|---|
| 11.2 ms ... rise ↗ and fall ↘ combined | ↗ 6 ms rise | 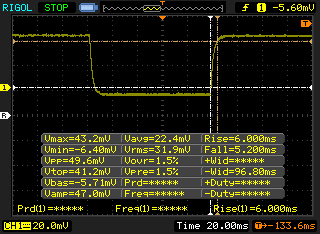 |
| ↘ 5.2 ms fall | ||
| The screen shows good response rates in our tests, but may be too slow for competitive gamers. In comparison, all tested devices range from 0.1 (minimum) to 240 (maximum) ms. » 29 % of all devices are better. This means that the measured response time is better than the average of all tested devices (20.1 ms). | ||
| ↔ Response Time 50% Grey to 80% Grey | ||
| 14.4 ms ... rise ↗ and fall ↘ combined | ↗ 7.6 ms rise | 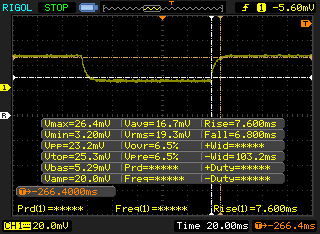 |
| ↘ 6.8 ms fall | ||
| The screen shows good response rates in our tests, but may be too slow for competitive gamers. In comparison, all tested devices range from 0.165 (minimum) to 636 (maximum) ms. » 28 % of all devices are better. This means that the measured response time is better than the average of all tested devices (31.4 ms). | ||
Screen Flickering / PWM (Pulse-Width Modulation)
| Screen flickering / PWM not detected | 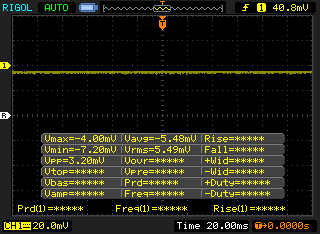 | ||
In comparison: 53 % of all tested devices do not use PWM to dim the display. If PWM was detected, an average of 7996 (minimum: 5 - maximum: 343500) Hz was measured. | |||

Performance — Just A Bit Faster
Testing Conditions
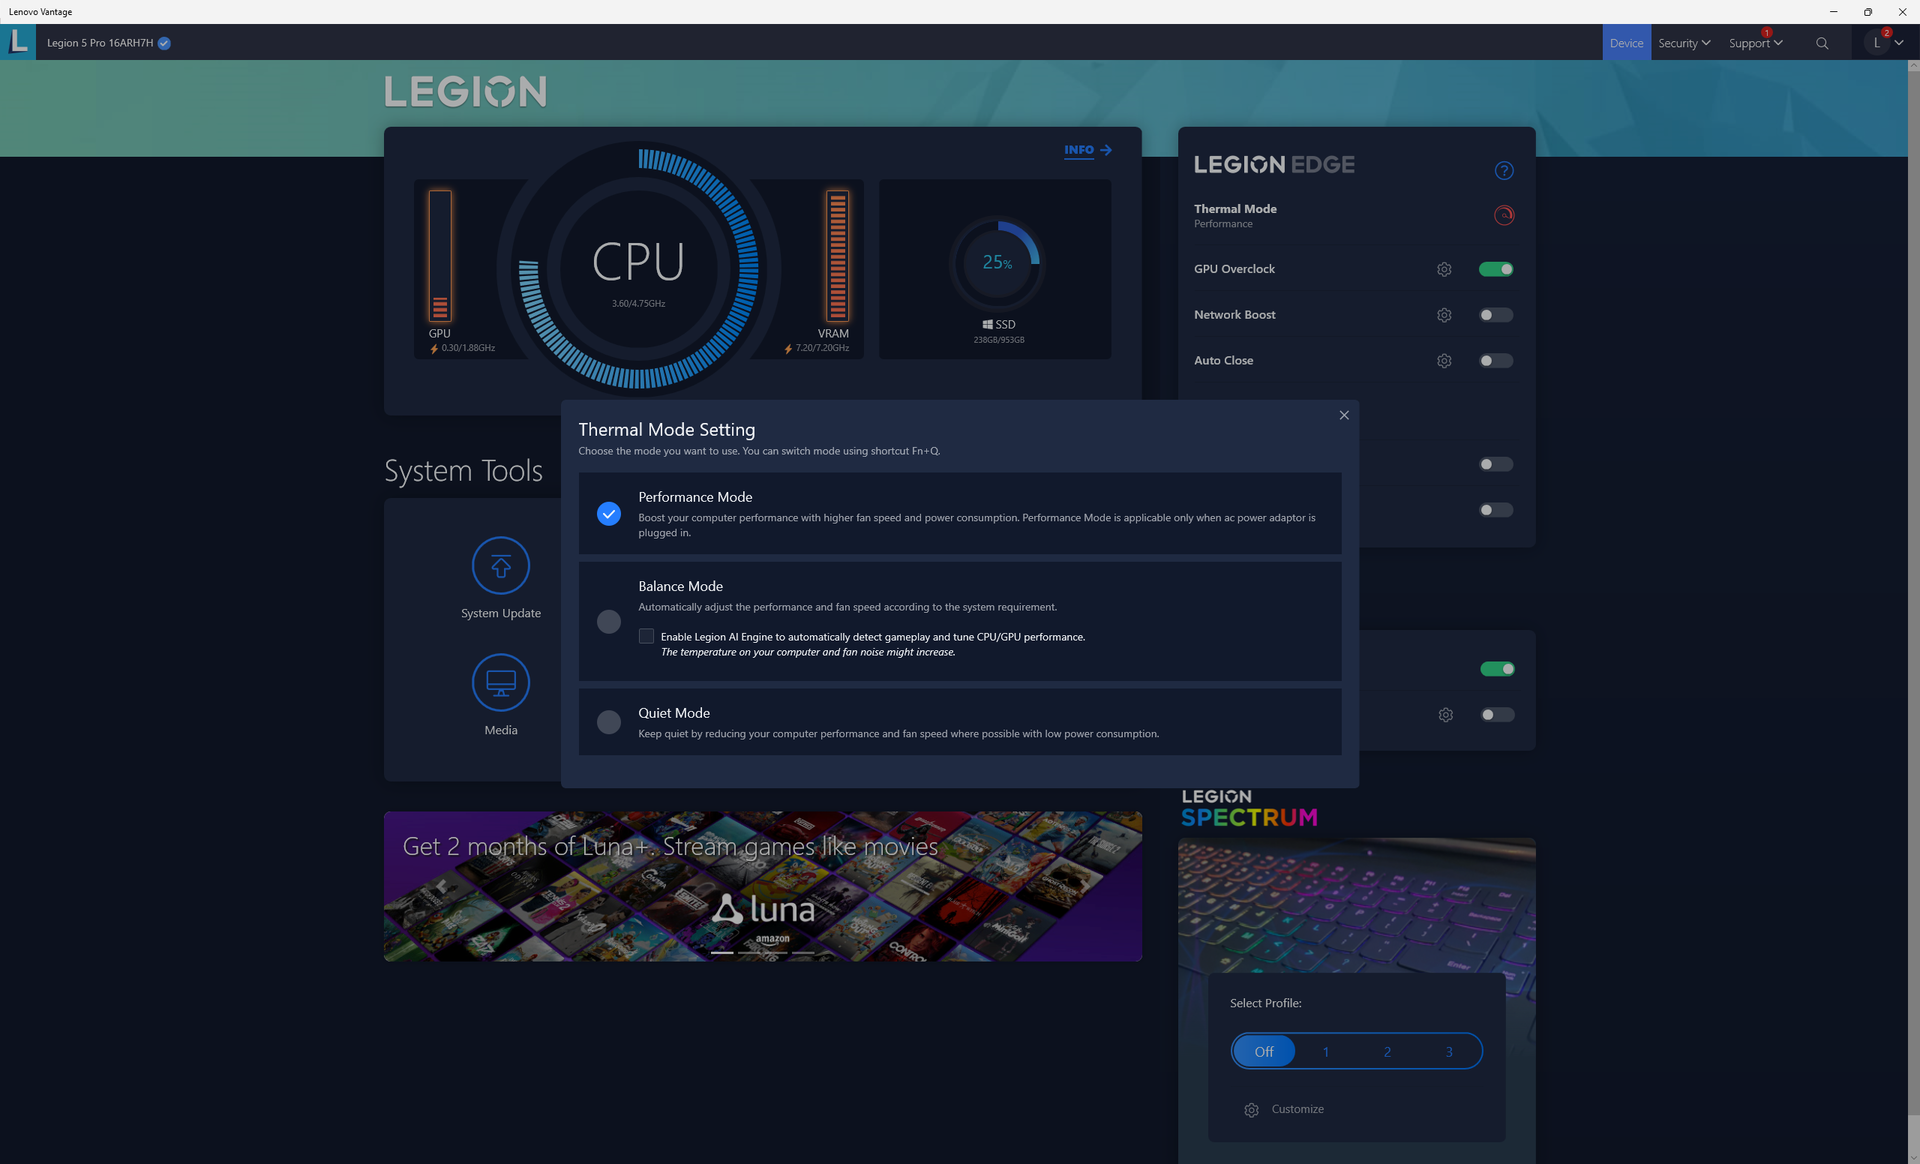
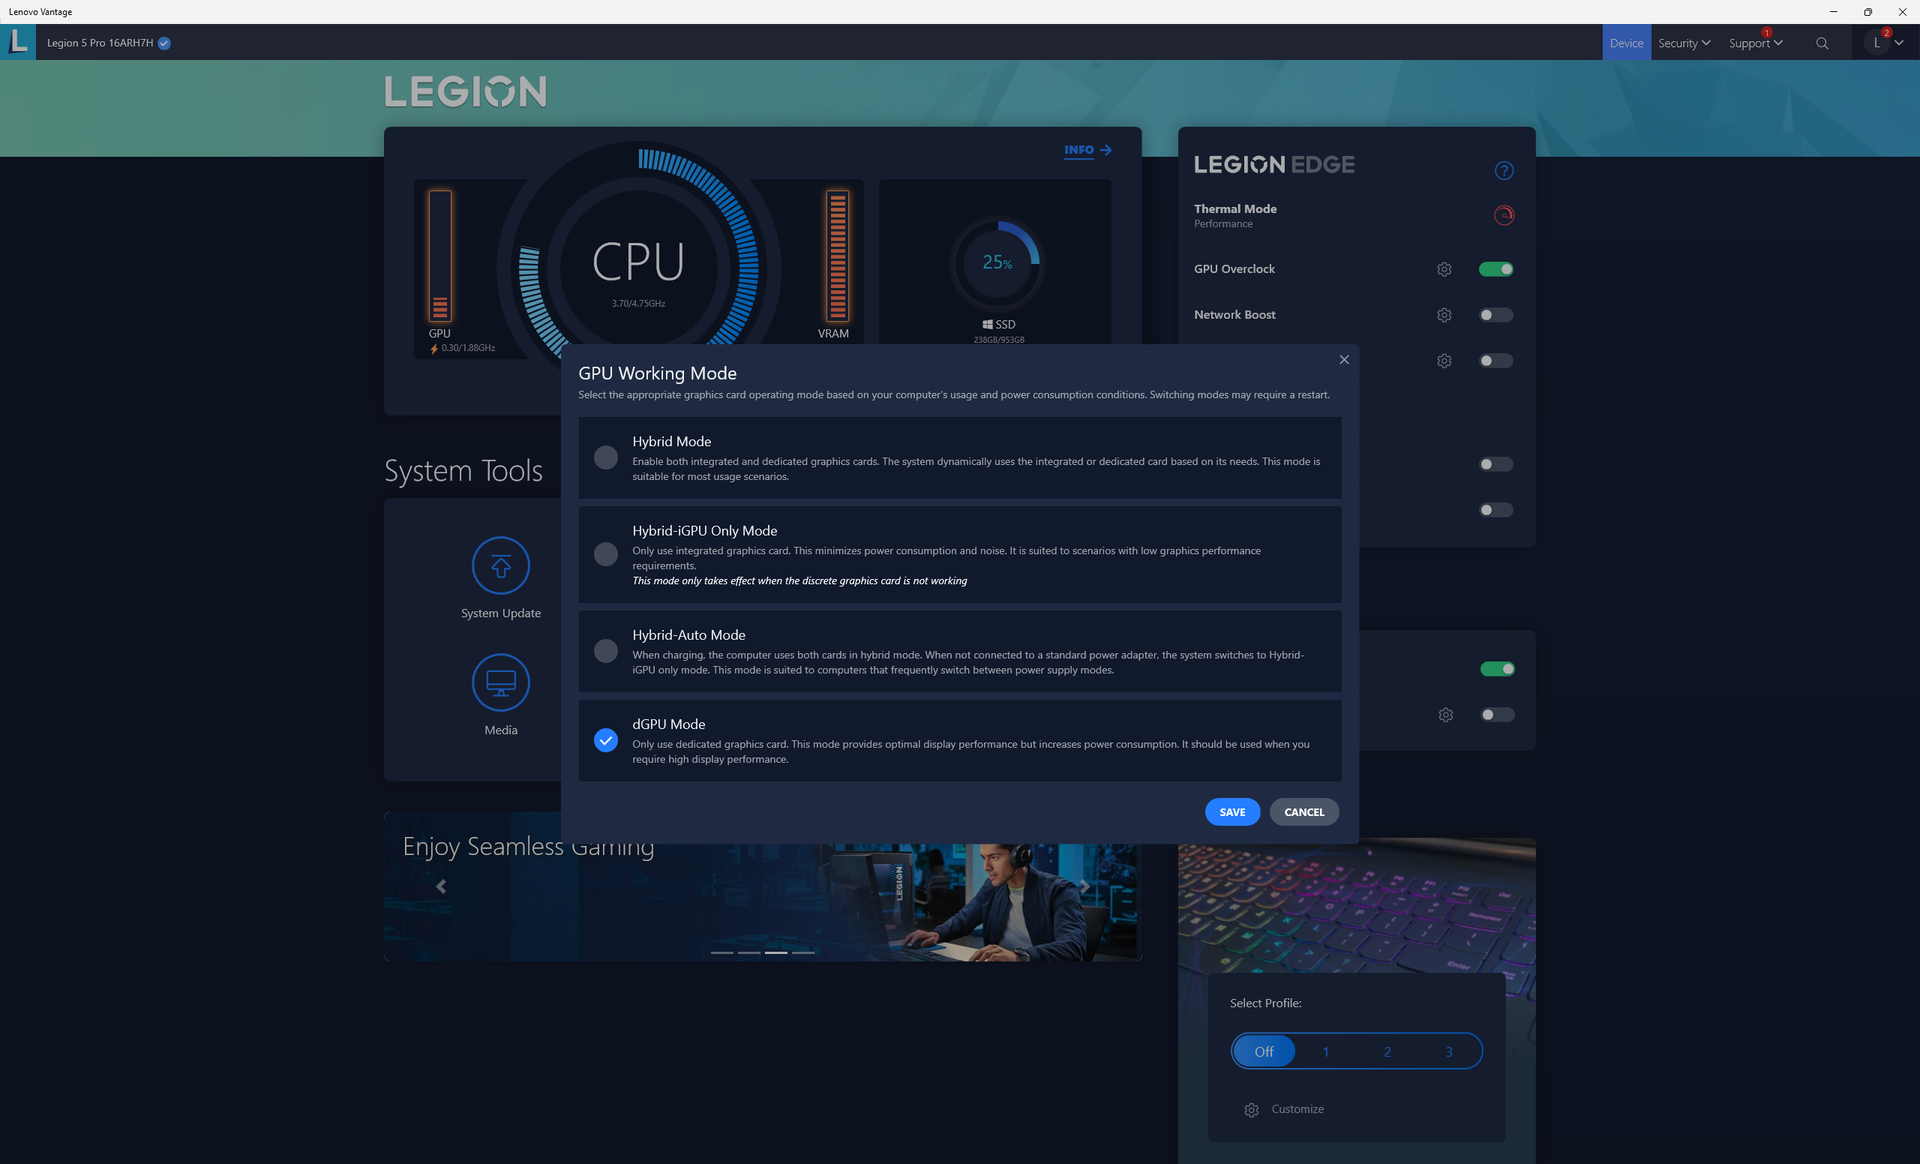
We set our unit to Performance mode via both Windows and the Lenovo Vantage software prior to running any benchmarks below. We also made sure to toggle on GPU Overclock and the GPU Working Mode to "dGPU only" for maximum performance. Owners should absolutely become familiar with the Vantage software and its various settings as exemplified by the screenshots below.

Processor
Single- and multi-thread performance is about 10 percent and 20 percent faster than on the last generation Ryzen 7 5800H, respectively, based on our time with the HP Omen 16 and the 2021 Lenovo Legion 5 Pro 16. Though not insignificant, the year-over-year performance boost isn't nearly as big as the jump from 11th gen to 12th gen Intel. The Core i7-12700H, for example, is still roughly 15 to 30 percent faster than our Ryzen 7 6800H.
Upgrading to the Ryzen 9 6900HX from our Ryzen 7 6800H is expected to bring just marginal gains at best as shown by our comparison charts below. Thus, budget-conscious buyers may want to consider a less expensive Ryzen 7 6800H SKU instead.
Cinebench R15 Multi Loop
Cinebench R23: Multi Core | Single Core
Cinebench R15: CPU Multi 64Bit | CPU Single 64Bit
Blender: v2.79 BMW27 CPU
7-Zip 18.03: 7z b 4 | 7z b 4 -mmt1
Geekbench 5.5: Multi-Core | Single-Core
HWBOT x265 Benchmark v2.2: 4k Preset
LibreOffice : 20 Documents To PDF
R Benchmark 2.5: Overall mean
| HWBOT x265 Benchmark v2.2 / 4k Preset | |
| Lenovo Legion 5 Pro 16IAH7H | |
| Alienware x15 R2 P111F | |
| Dell G16 7620 | |
| Lenovo Legion 5 Pro 16ARH7H RTX 3070 Ti | |
| Lenovo Legion 7 16ARHA7 | |
| Gigabyte A5 X1 | |
| Average AMD Ryzen 7 6800H (14.9 - 18.5, n=9) | |
| HP Omen 16-c0077ng | |
| Asus ROG Zephyrus M16 GU603H | |
| HP Victus 16-e0145ng | |
| Lenovo Legion C7 15IMH05 82EH0030GE | |
* ... smaller is better
AIDA64: FP32 Ray-Trace | FPU Julia | CPU SHA3 | CPU Queen | FPU SinJulia | FPU Mandel | CPU AES | CPU ZLib | FP64 Ray-Trace | CPU PhotoWorxx
| Performance rating | |
| Lenovo Legion 7 16ARHA7 | |
| Lenovo Legion 5 Pro 16ARH7H RTX 3070 Ti | |
| Average AMD Ryzen 7 6800H | |
| Dell G16 7620 | |
| Lenovo Legion 5 Pro 16IAH7H | |
| HP Victus 16-e0145ng | |
| Asus ROG Zephyrus M16 GU603H -9! | |
| AIDA64 / FP32 Ray-Trace | |
| Lenovo Legion 7 16ARHA7 | |
| Lenovo Legion 5 Pro 16ARH7H RTX 3070 Ti | |
| Average AMD Ryzen 7 6800H (12876 - 17031, n=8) | |
| Dell G16 7620 | |
| Lenovo Legion 5 Pro 16IAH7H | |
| Lenovo Legion 5 Pro 16IAH7H | |
| HP Victus 16-e0145ng | |
| AIDA64 / FPU Julia | |
| Lenovo Legion 7 16ARHA7 | |
| Lenovo Legion 5 Pro 16ARH7H RTX 3070 Ti | |
| Average AMD Ryzen 7 6800H (82673 - 105987, n=8) | |
| Dell G16 7620 | |
| Lenovo Legion 5 Pro 16IAH7H | |
| Lenovo Legion 5 Pro 16IAH7H | |
| HP Victus 16-e0145ng | |
| AIDA64 / CPU SHA3 | |
| Dell G16 7620 | |
| Lenovo Legion 7 16ARHA7 | |
| Lenovo Legion 5 Pro 16ARH7H RTX 3070 Ti | |
| Lenovo Legion 5 Pro 16IAH7H | |
| Lenovo Legion 5 Pro 16IAH7H | |
| Average AMD Ryzen 7 6800H (2886 - 3634, n=8) | |
| HP Victus 16-e0145ng | |
| AIDA64 / CPU Queen | |
| Lenovo Legion 5 Pro 16ARH7H RTX 3070 Ti | |
| Lenovo Legion 7 16ARHA7 | |
| Dell G16 7620 | |
| Lenovo Legion 5 Pro 16IAH7H | |
| Average AMD Ryzen 7 6800H (75117 - 106322, n=8) | |
| HP Victus 16-e0145ng | |
| AIDA64 / FPU SinJulia | |
| Lenovo Legion 7 16ARHA7 | |
| Lenovo Legion 5 Pro 16ARH7H RTX 3070 Ti | |
| Average AMD Ryzen 7 6800H (11771 - 13120, n=8) | |
| Lenovo Legion 5 Pro 16IAH7H | |
| Lenovo Legion 5 Pro 16IAH7H | |
| Dell G16 7620 | |
| HP Victus 16-e0145ng | |
| AIDA64 / FPU Mandel | |
| Lenovo Legion 7 16ARHA7 | |
| Lenovo Legion 5 Pro 16ARH7H RTX 3070 Ti | |
| Average AMD Ryzen 7 6800H (45287 - 58327, n=8) | |
| HP Victus 16-e0145ng | |
| Lenovo Legion 5 Pro 16IAH7H | |
| Lenovo Legion 5 Pro 16IAH7H | |
| Dell G16 7620 | |
| AIDA64 / CPU AES | |
| Lenovo Legion 7 16ARHA7 | |
| Lenovo Legion 5 Pro 16ARH7H RTX 3070 Ti | |
| Lenovo Legion 5 Pro 16IAH7H | |
| Lenovo Legion 5 Pro 16IAH7H | |
| Average AMD Ryzen 7 6800H (67816 - 137383, n=8) | |
| Dell G16 7620 | |
| HP Victus 16-e0145ng | |
| AIDA64 / FP64 Ray-Trace | |
| Lenovo Legion 7 16ARHA7 | |
| Lenovo Legion 5 Pro 16ARH7H RTX 3070 Ti | |
| Average AMD Ryzen 7 6800H (6917 - 8980, n=8) | |
| Dell G16 7620 | |
| Lenovo Legion 5 Pro 16IAH7H | |
| Lenovo Legion 5 Pro 16IAH7H | |
| HP Victus 16-e0145ng | |
| AIDA64 / CPU PhotoWorxx | |
| Dell G16 7620 | |
| Lenovo Legion 5 Pro 16IAH7H | |
| Lenovo Legion 5 Pro 16IAH7H | |
| Lenovo Legion 7 16ARHA7 | |
| Lenovo Legion 5 Pro 16ARH7H RTX 3070 Ti | |
| Average AMD Ryzen 7 6800H (26496 - 30360, n=8) | |
| HP Victus 16-e0145ng | |
System Performance
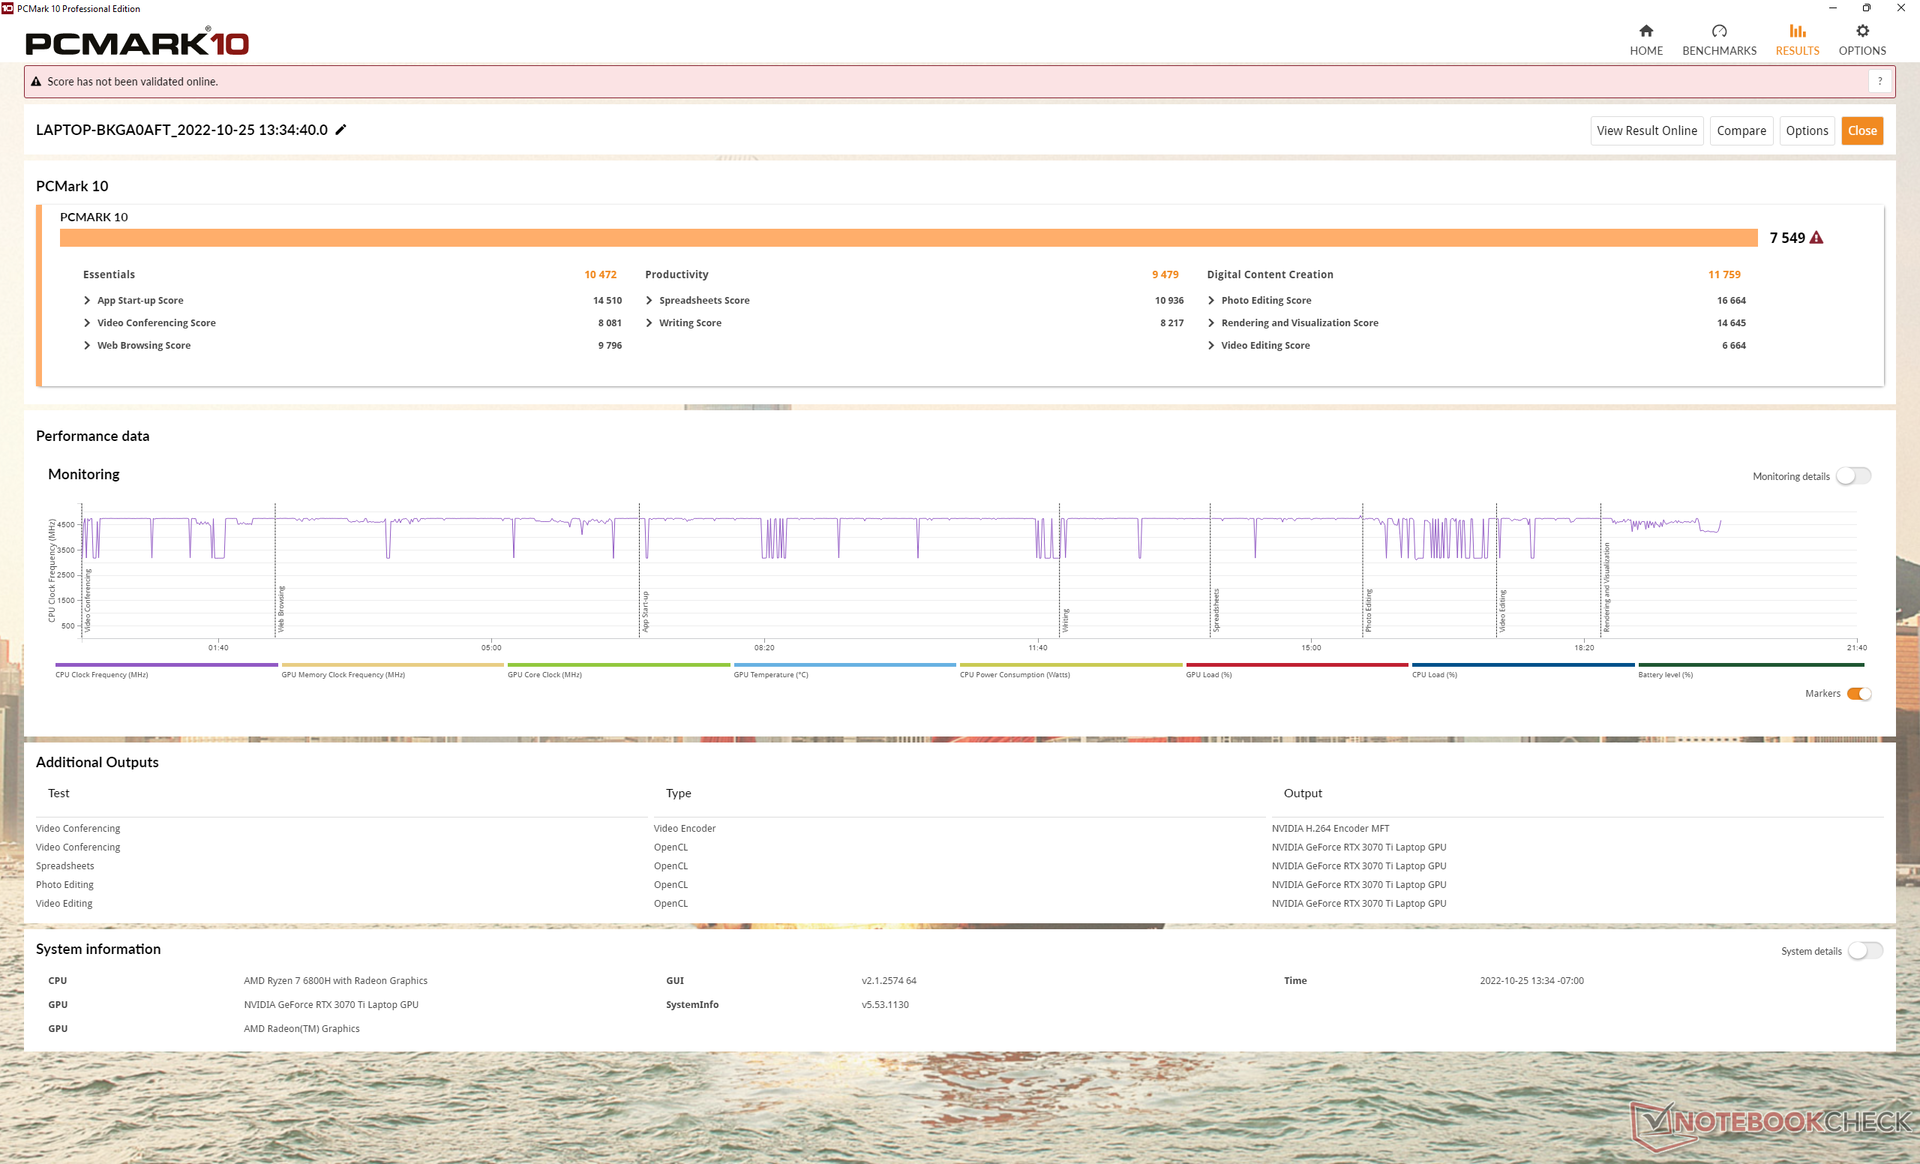
PCMark results are within single-digit percentage points of other high-end Intel-based gaming laptops like the Dell G16 7620 even if the Ryzen 7 6800H can't keep up with the latest 12th gen Core CPUs.
CrossMark: Overall | Productivity | Creativity | Responsiveness
| PCMark 10 / Score | |
| Lenovo Legion 5 Pro 16ARH7H RTX 3070 Ti | |
| Lenovo Legion 5 Pro 16IAH7H | |
| Lenovo Legion 7 16ARHA7 | |
| Dell G16 7620 | |
| Average AMD Ryzen 7 6800H, NVIDIA GeForce RTX 3070 Ti Laptop GPU (6783 - 7549, n=2) | |
| Asus ROG Zephyrus M16 GU603H | |
| HP Victus 16-e0145ng | |
| PCMark 10 / Essentials | |
| Lenovo Legion 5 Pro 16IAH7H | |
| Asus ROG Zephyrus M16 GU603H | |
| Lenovo Legion 7 16ARHA7 | |
| Lenovo Legion 5 Pro 16ARH7H RTX 3070 Ti | |
| Average AMD Ryzen 7 6800H, NVIDIA GeForce RTX 3070 Ti Laptop GPU (10343 - 10472, n=2) | |
| Dell G16 7620 | |
| HP Victus 16-e0145ng | |
| PCMark 10 / Productivity | |
| Lenovo Legion 5 Pro 16ARH7H RTX 3070 Ti | |
| Lenovo Legion 5 Pro 16IAH7H | |
| Average AMD Ryzen 7 6800H, NVIDIA GeForce RTX 3070 Ti Laptop GPU (8991 - 9479, n=2) | |
| Asus ROG Zephyrus M16 GU603H | |
| Lenovo Legion 7 16ARHA7 | |
| Dell G16 7620 | |
| HP Victus 16-e0145ng | |
| PCMark 10 / Digital Content Creation | |
| Lenovo Legion 5 Pro 16ARH7H RTX 3070 Ti | |
| Lenovo Legion 7 16ARHA7 | |
| Lenovo Legion 5 Pro 16IAH7H | |
| Dell G16 7620 | |
| Average AMD Ryzen 7 6800H, NVIDIA GeForce RTX 3070 Ti Laptop GPU (9108 - 11759, n=2) | |
| Asus ROG Zephyrus M16 GU603H | |
| HP Victus 16-e0145ng | |
| CrossMark / Overall | |
| Dell G16 7620 | |
| Lenovo Legion 5 Pro 16IAH7H | |
| Lenovo Legion 5 Pro 16ARH7H RTX 3070 Ti | |
| Lenovo Legion 7 16ARHA7 | |
| Average AMD Ryzen 7 6800H, NVIDIA GeForce RTX 3070 Ti Laptop GPU (1522 - 1643, n=2) | |
| CrossMark / Productivity | |
| Lenovo Legion 5 Pro 16IAH7H | |
| Dell G16 7620 | |
| Lenovo Legion 5 Pro 16ARH7H RTX 3070 Ti | |
| Average AMD Ryzen 7 6800H, NVIDIA GeForce RTX 3070 Ti Laptop GPU (1530 - 1600, n=2) | |
| Lenovo Legion 7 16ARHA7 | |
| CrossMark / Creativity | |
| Dell G16 7620 | |
| Lenovo Legion 5 Pro 16IAH7H | |
| Lenovo Legion 7 16ARHA7 | |
| Lenovo Legion 5 Pro 16ARH7H RTX 3070 Ti | |
| Average AMD Ryzen 7 6800H, NVIDIA GeForce RTX 3070 Ti Laptop GPU (1589 - 1746, n=2) | |
| CrossMark / Responsiveness | |
| Lenovo Legion 5 Pro 16IAH7H | |
| Dell G16 7620 | |
| Lenovo Legion 5 Pro 16ARH7H RTX 3070 Ti | |
| Average AMD Ryzen 7 6800H, NVIDIA GeForce RTX 3070 Ti Laptop GPU (1316 - 1481, n=2) | |
| Lenovo Legion 7 16ARHA7 | |
| PCMark 10 Score | 7549 points | |
Help | ||
| AIDA64 / Memory Copy | |
| Lenovo Legion 5 Pro 16IAH7H | |
| Lenovo Legion 5 Pro 16IAH7H | |
| Dell G16 7620 | |
| Lenovo Legion 5 Pro 16ARH7H RTX 3070 Ti | |
| Lenovo Legion 7 16ARHA7 | |
| Average AMD Ryzen 7 6800H (48209 - 51186, n=8) | |
| HP Victus 16-e0145ng | |
| AIDA64 / Memory Read | |
| Dell G16 7620 | |
| Lenovo Legion 5 Pro 16IAH7H | |
| Lenovo Legion 5 Pro 16IAH7H | |
| Lenovo Legion 7 16ARHA7 | |
| Lenovo Legion 5 Pro 16ARH7H RTX 3070 Ti | |
| Average AMD Ryzen 7 6800H (43828 - 51778, n=8) | |
| HP Victus 16-e0145ng | |
| AIDA64 / Memory Write | |
| Lenovo Legion 5 Pro 16IAH7H | |
| Lenovo Legion 5 Pro 16IAH7H | |
| Dell G16 7620 | |
| Lenovo Legion 5 Pro 16ARH7H RTX 3070 Ti | |
| Lenovo Legion 7 16ARHA7 | |
| Average AMD Ryzen 7 6800H (51116 - 55307, n=8) | |
| HP Victus 16-e0145ng | |
| AIDA64 / Memory Latency | |
| Lenovo Legion 5 Pro 16IAH7H | |
| Lenovo Legion 5 Pro 16IAH7H | |
| Dell G16 7620 | |
| Average AMD Ryzen 7 6800H (83.1 - 104.1, n=8) | |
| Lenovo Legion 5 Pro 16ARH7H RTX 3070 Ti | |
| Lenovo Legion 7 16ARHA7 | |
| HP Victus 16-e0145ng | |
| Asus ROG Zephyrus M16 GU603H | |
* ... smaller is better
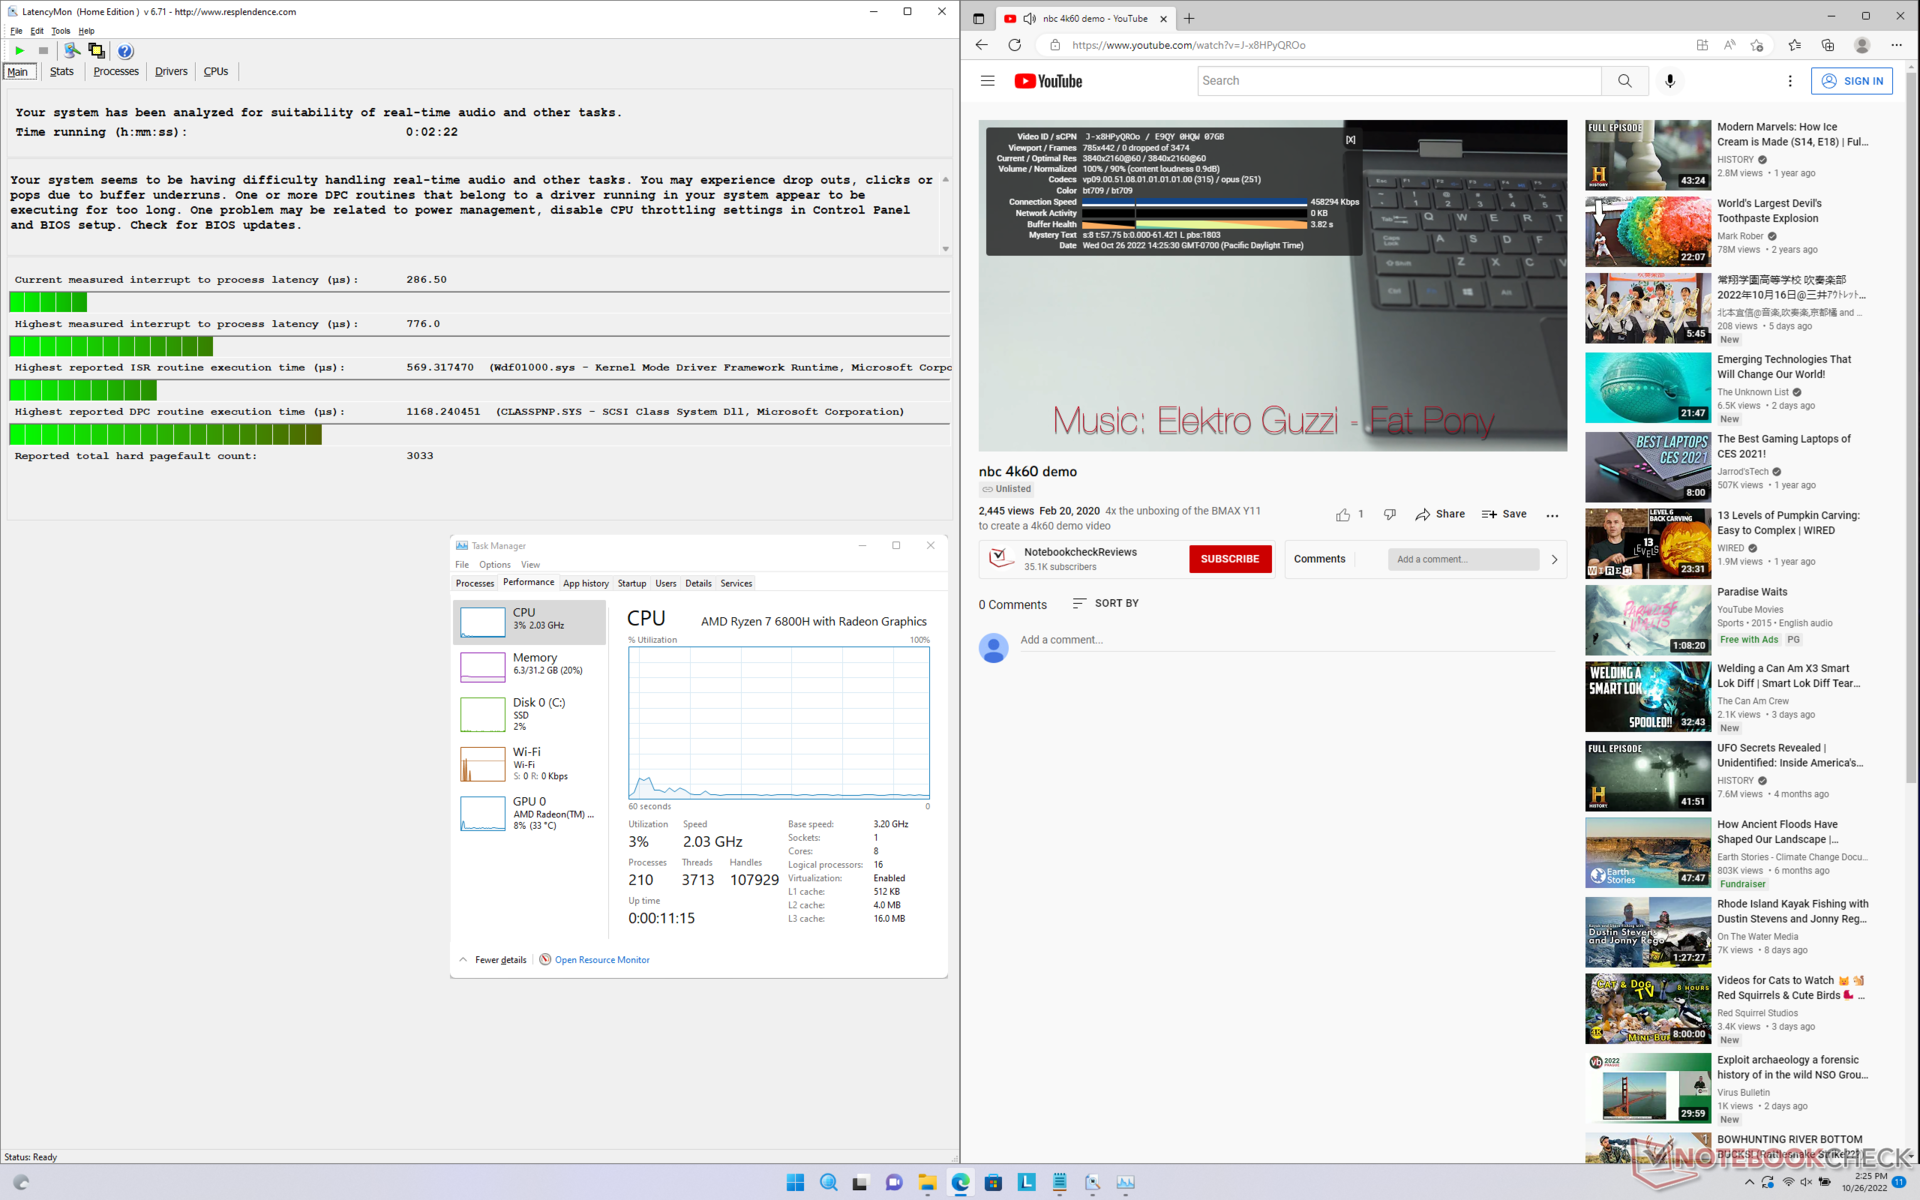
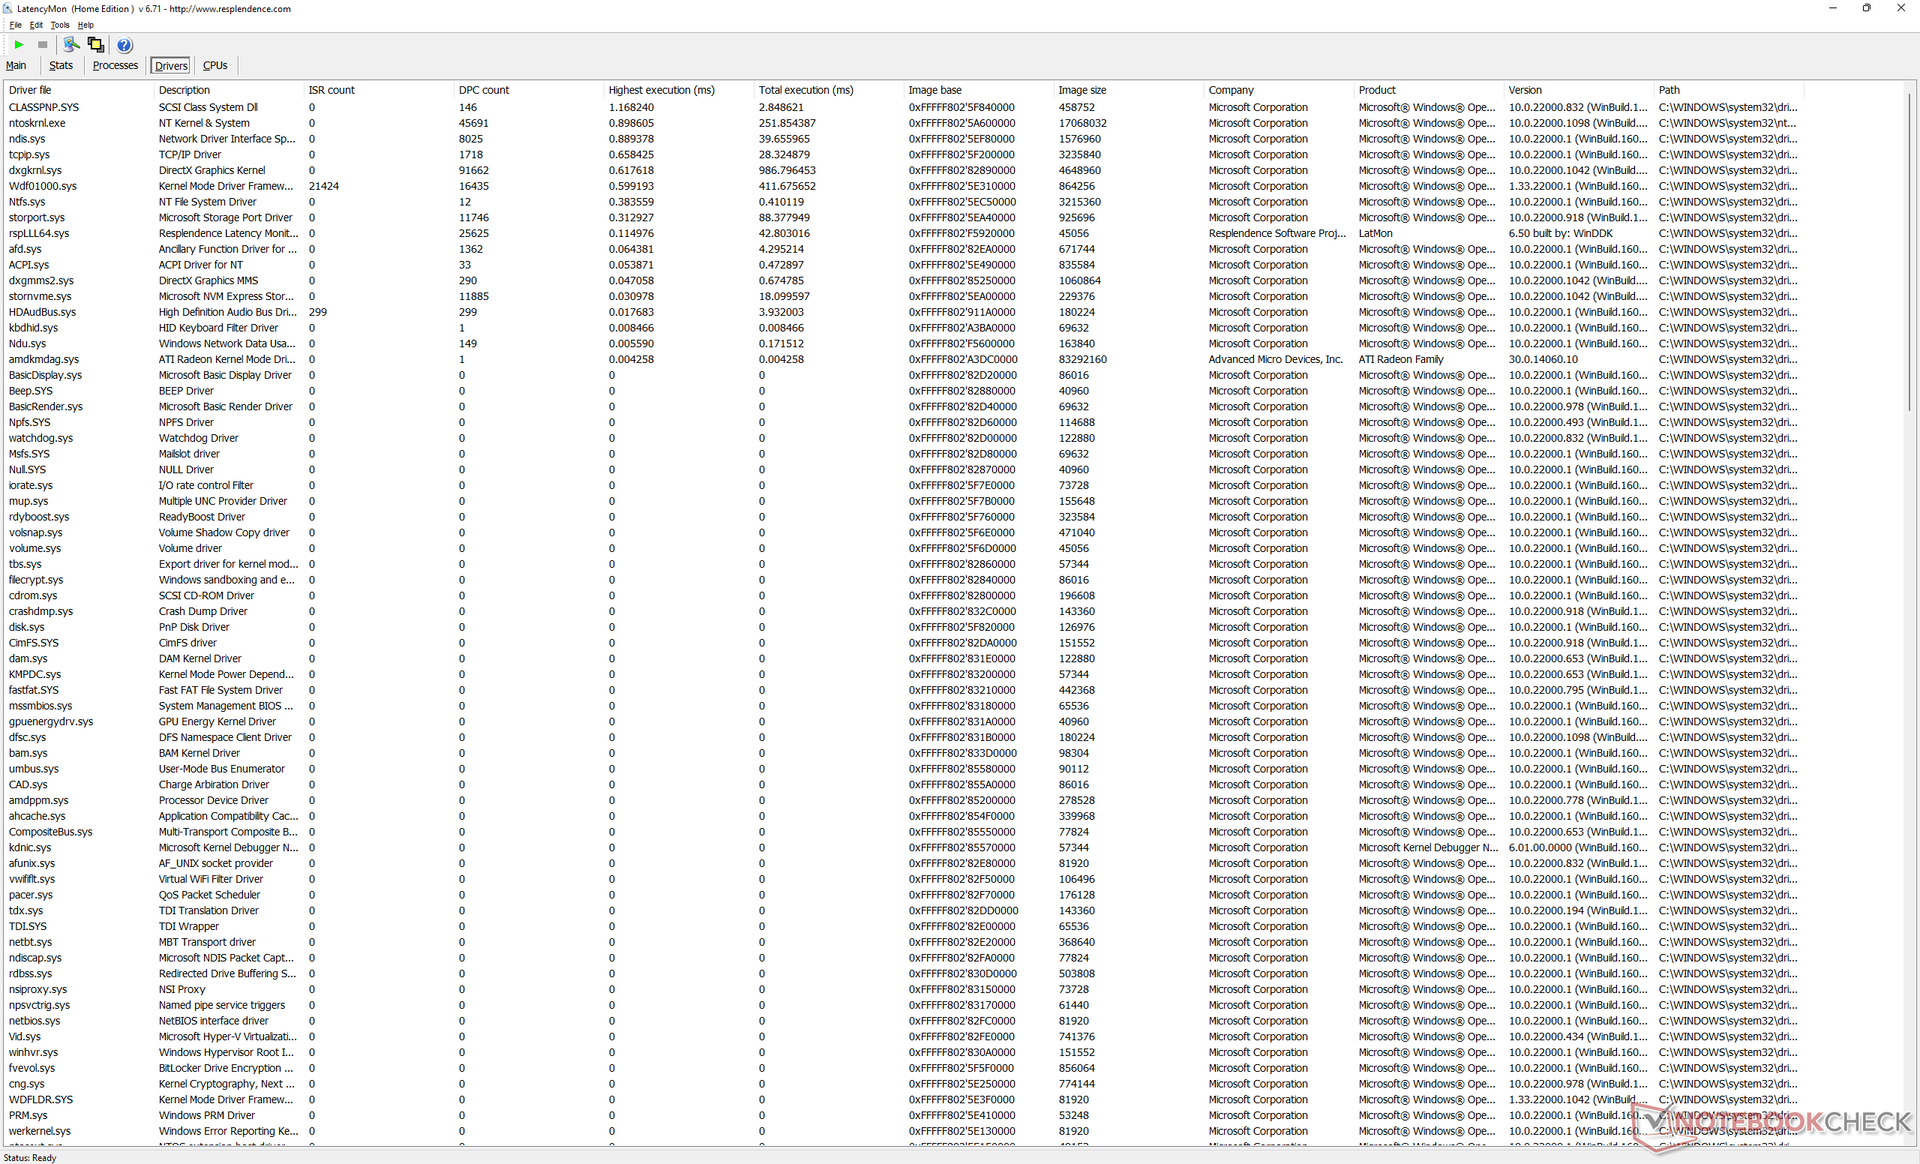
DPC Latency
LatencyMon reveals minor DPC issues when opening multiple browser tabs of our homepage. 4K video playback at 60 FPS is otherwise perfect and with no dropped frames.
| DPC Latencies / LatencyMon - interrupt to process latency (max), Web, Youtube, Prime95 | |
| Lenovo Legion 7 16ARHA7 | |
| Asus ROG Zephyrus M16 GU603H | |
| Dell G16 7620 | |
| HP Victus 16-e0145ng | |
| Lenovo Legion 5 Pro 16ARH7H RTX 3070 Ti | |
| Lenovo Legion 5 Pro 16IAH7H | |
* ... smaller is better
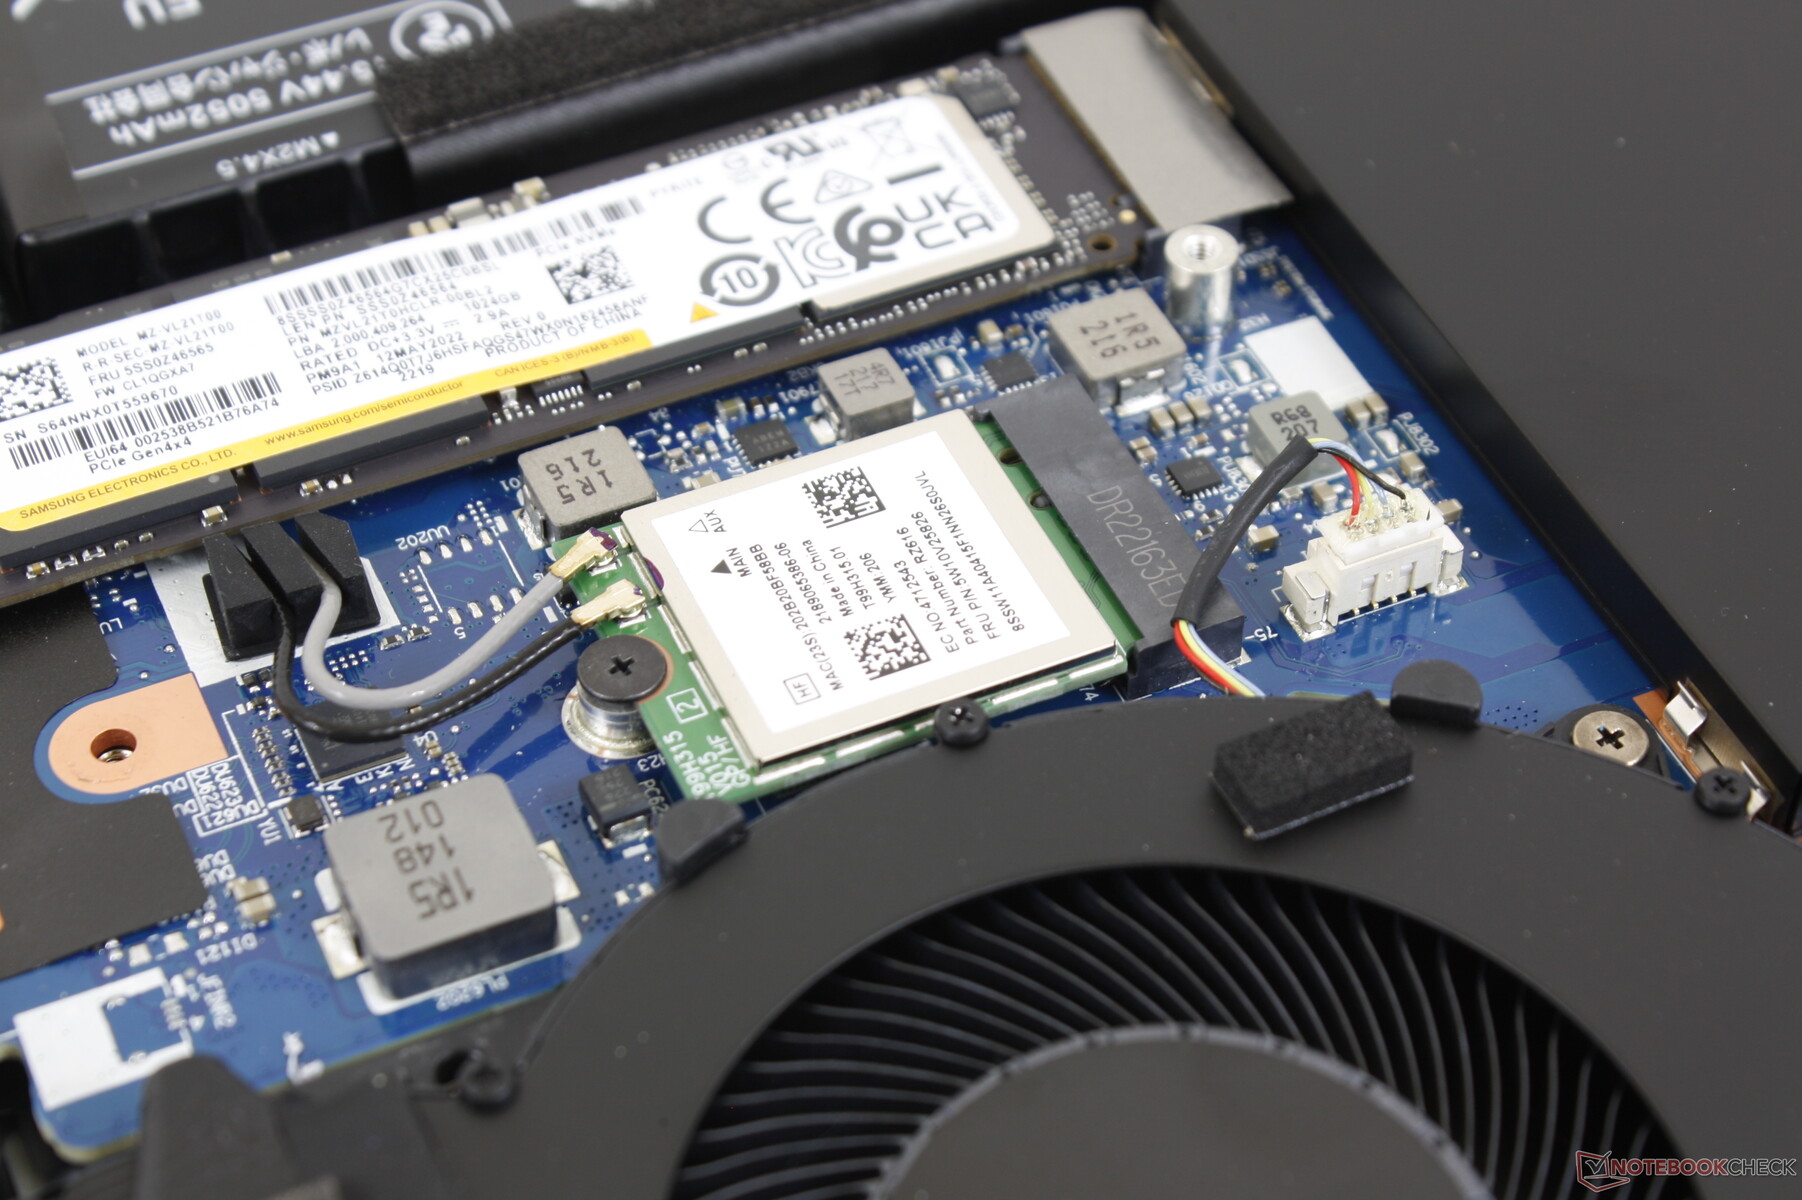
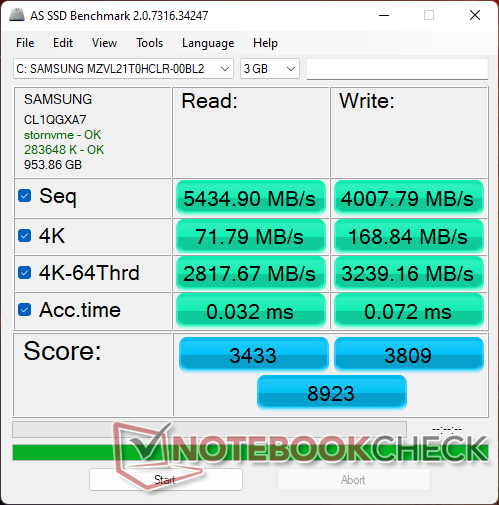
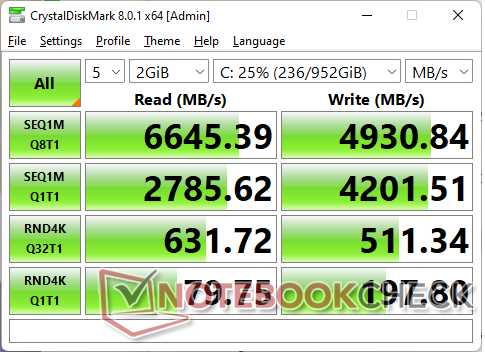
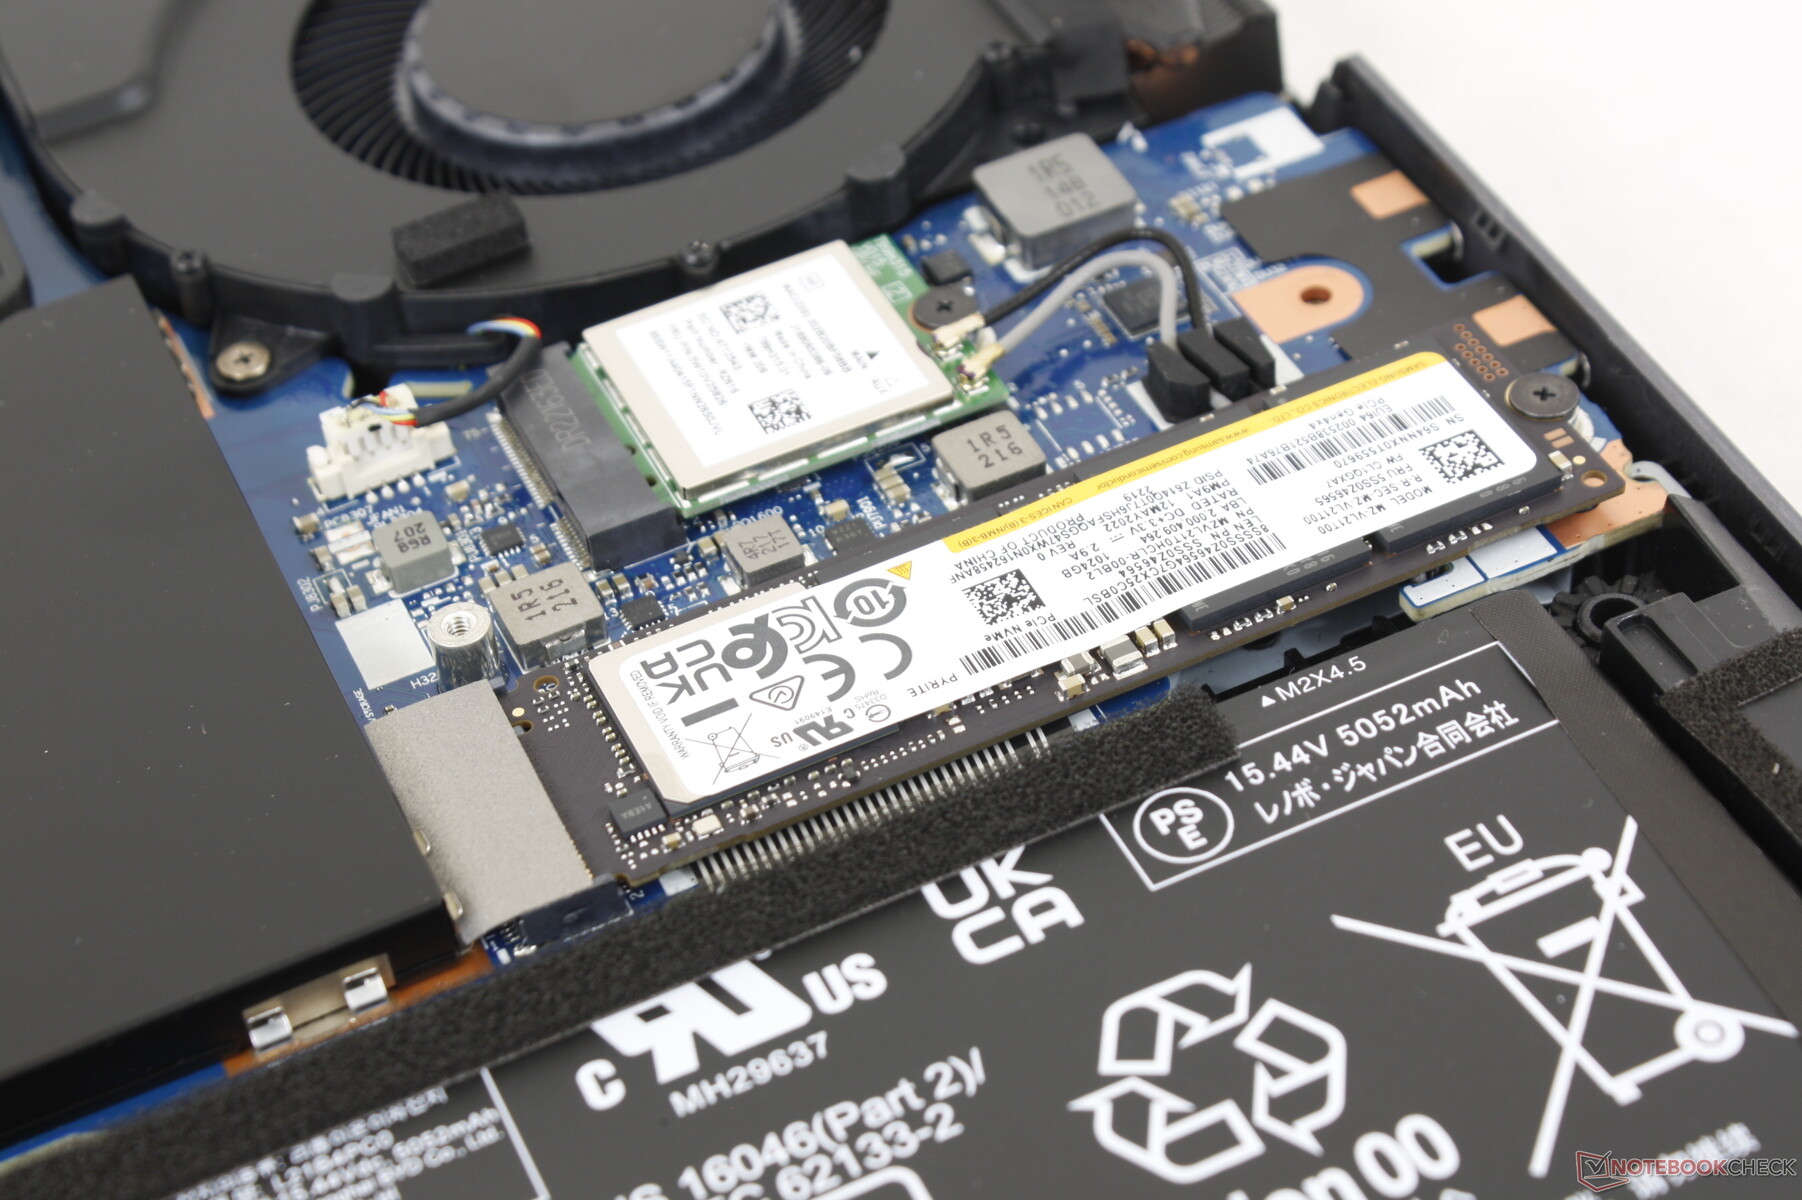
Storage Devices — Up To Two PCIe4 NVMe SSDs

| Drive Performance rating - Percent | |
| Lenovo Legion 5 Pro 16IAH7H | |
| Lenovo Legion 5 Pro 16ARH7H RTX 3070 Ti | |
| Asus ROG Zephyrus M16 GU603H | |
| Dell G16 7620 | |
| Lenovo Legion 7 16ARHA7 | |
| HP Victus 16-e0145ng | |
* ... smaller is better
Disk Throttling: DiskSpd Read Loop, Queue Depth 8
GPU Performance — 150 W Graphics
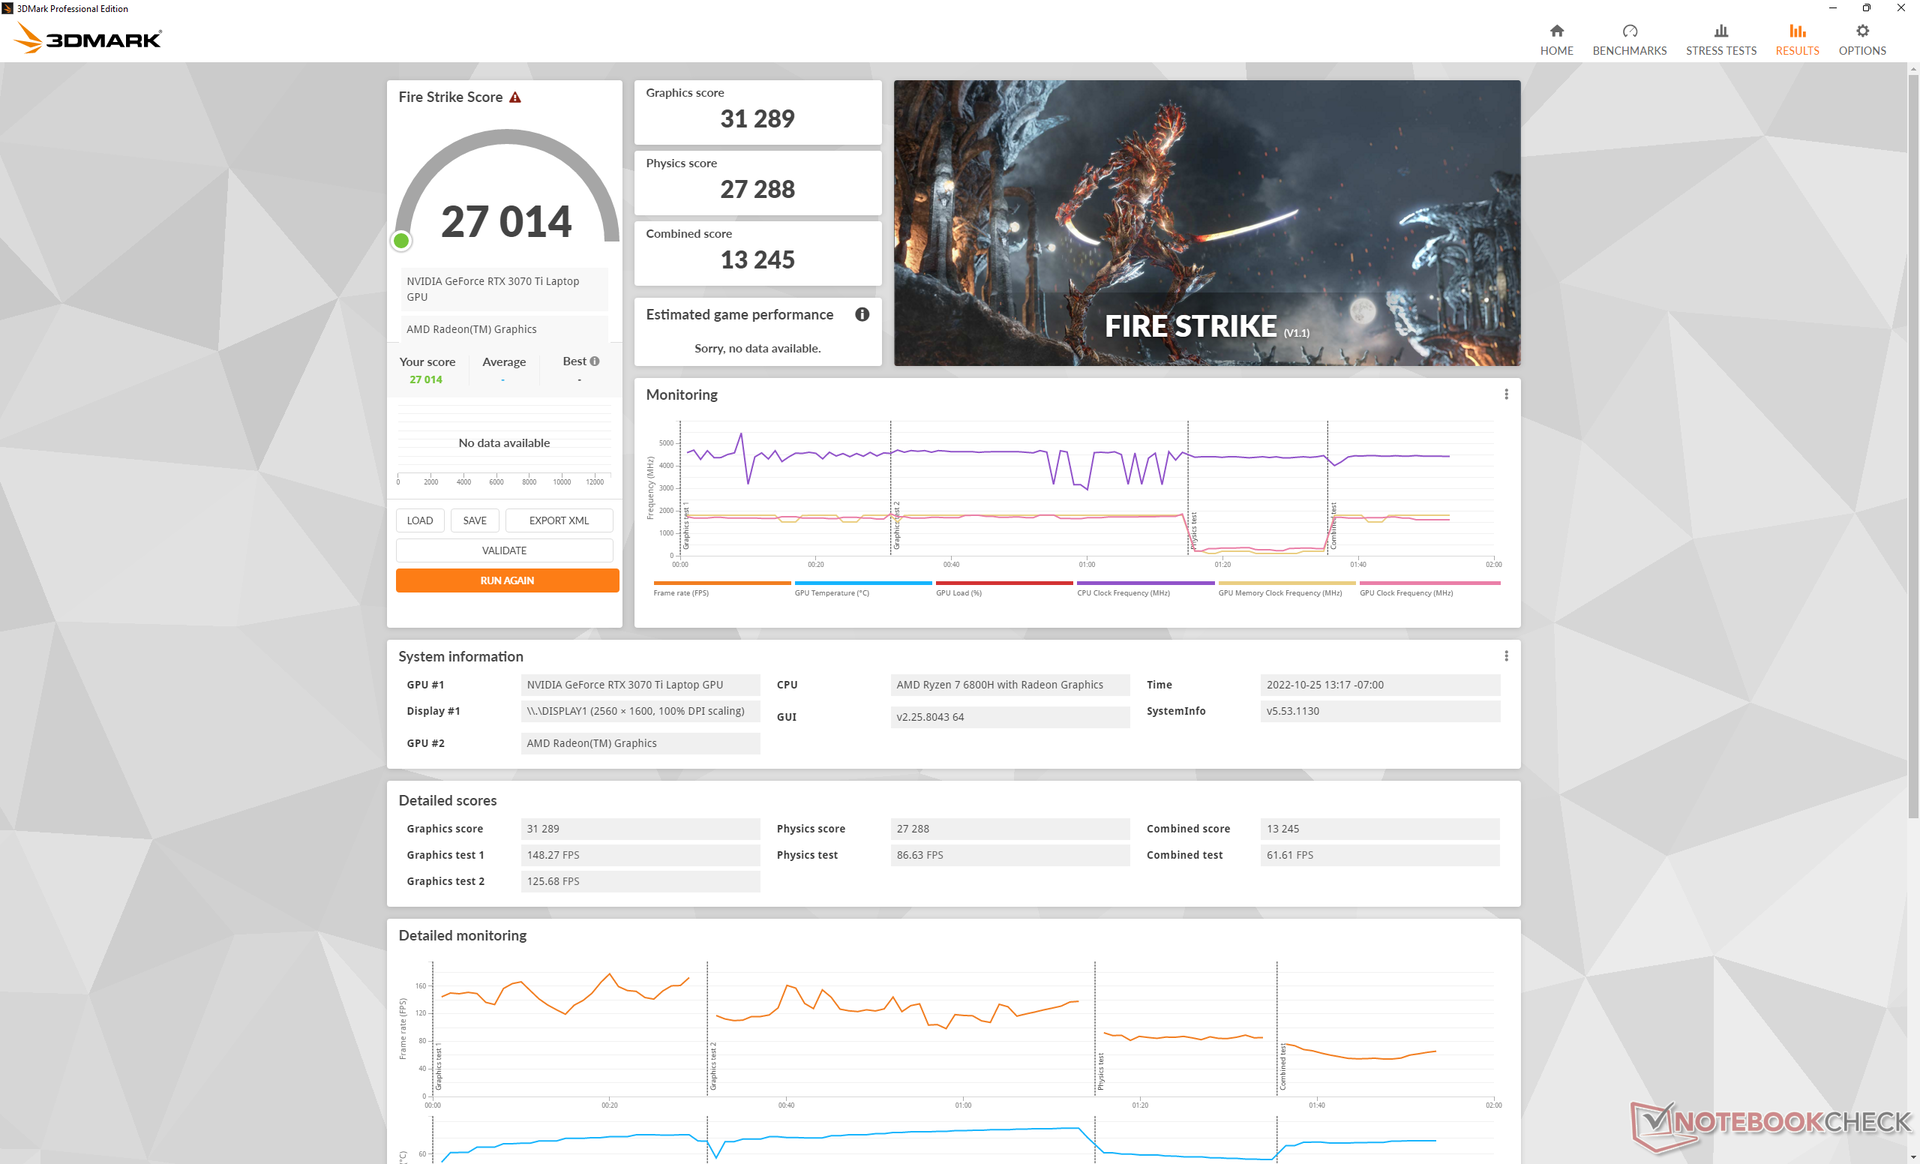
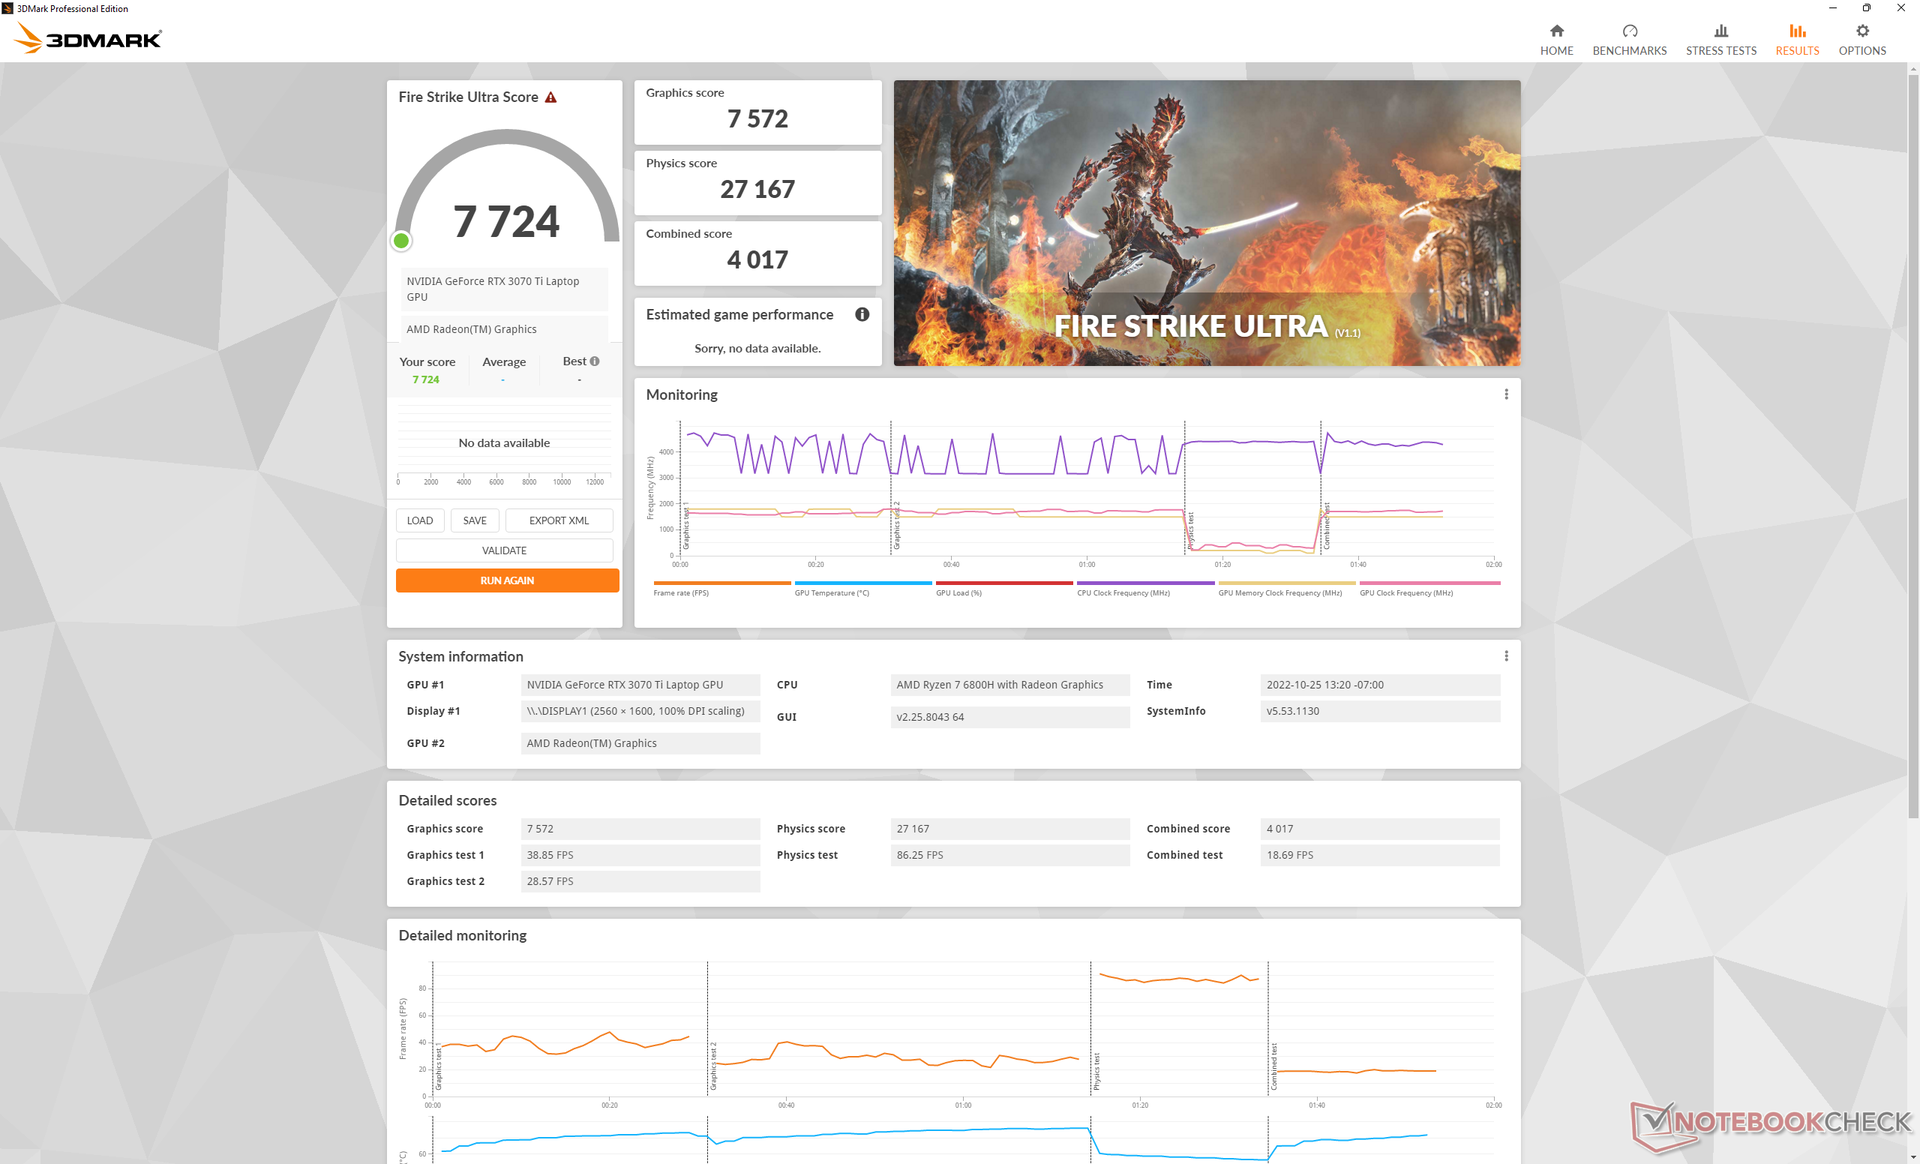
Graphics performance is excellent with 3DMark results that are almost 15 percent faster than the average laptop in our database with the same GeForce RTX 3070 Ti GPU. In fact, it even edges out the RTX 3080 Ti in the Alienware x15 R2.
Performance only drops by about 5 percent if Turbo mode is toggled off. Thus, users must remember to enable Turbo mode through Lenovo Vantage if they want to run the laptop at its fastest.
Downgrading to the lower-end RTX 3070 or RTX 3060 SKU will entail a performance dip of about 10 percent and 30 percent, respectively, based on our experience with multiple RTX 3070 or 3060 laptops.
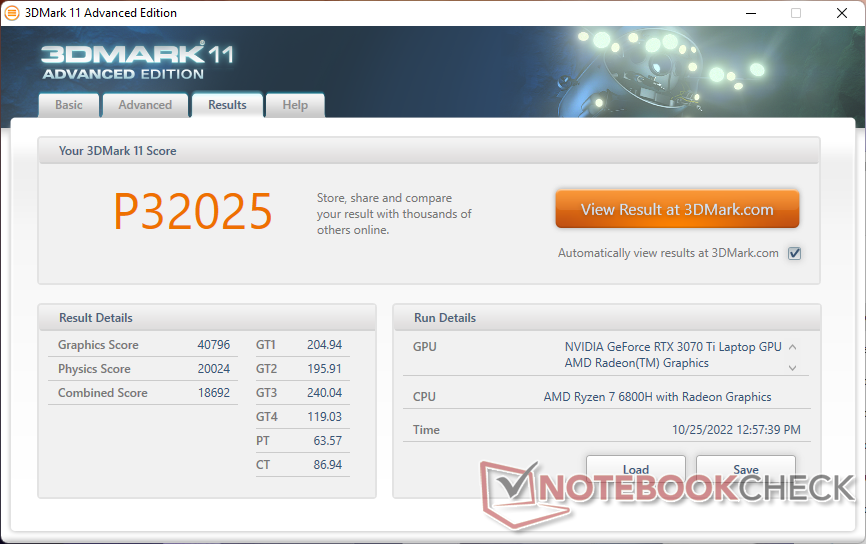
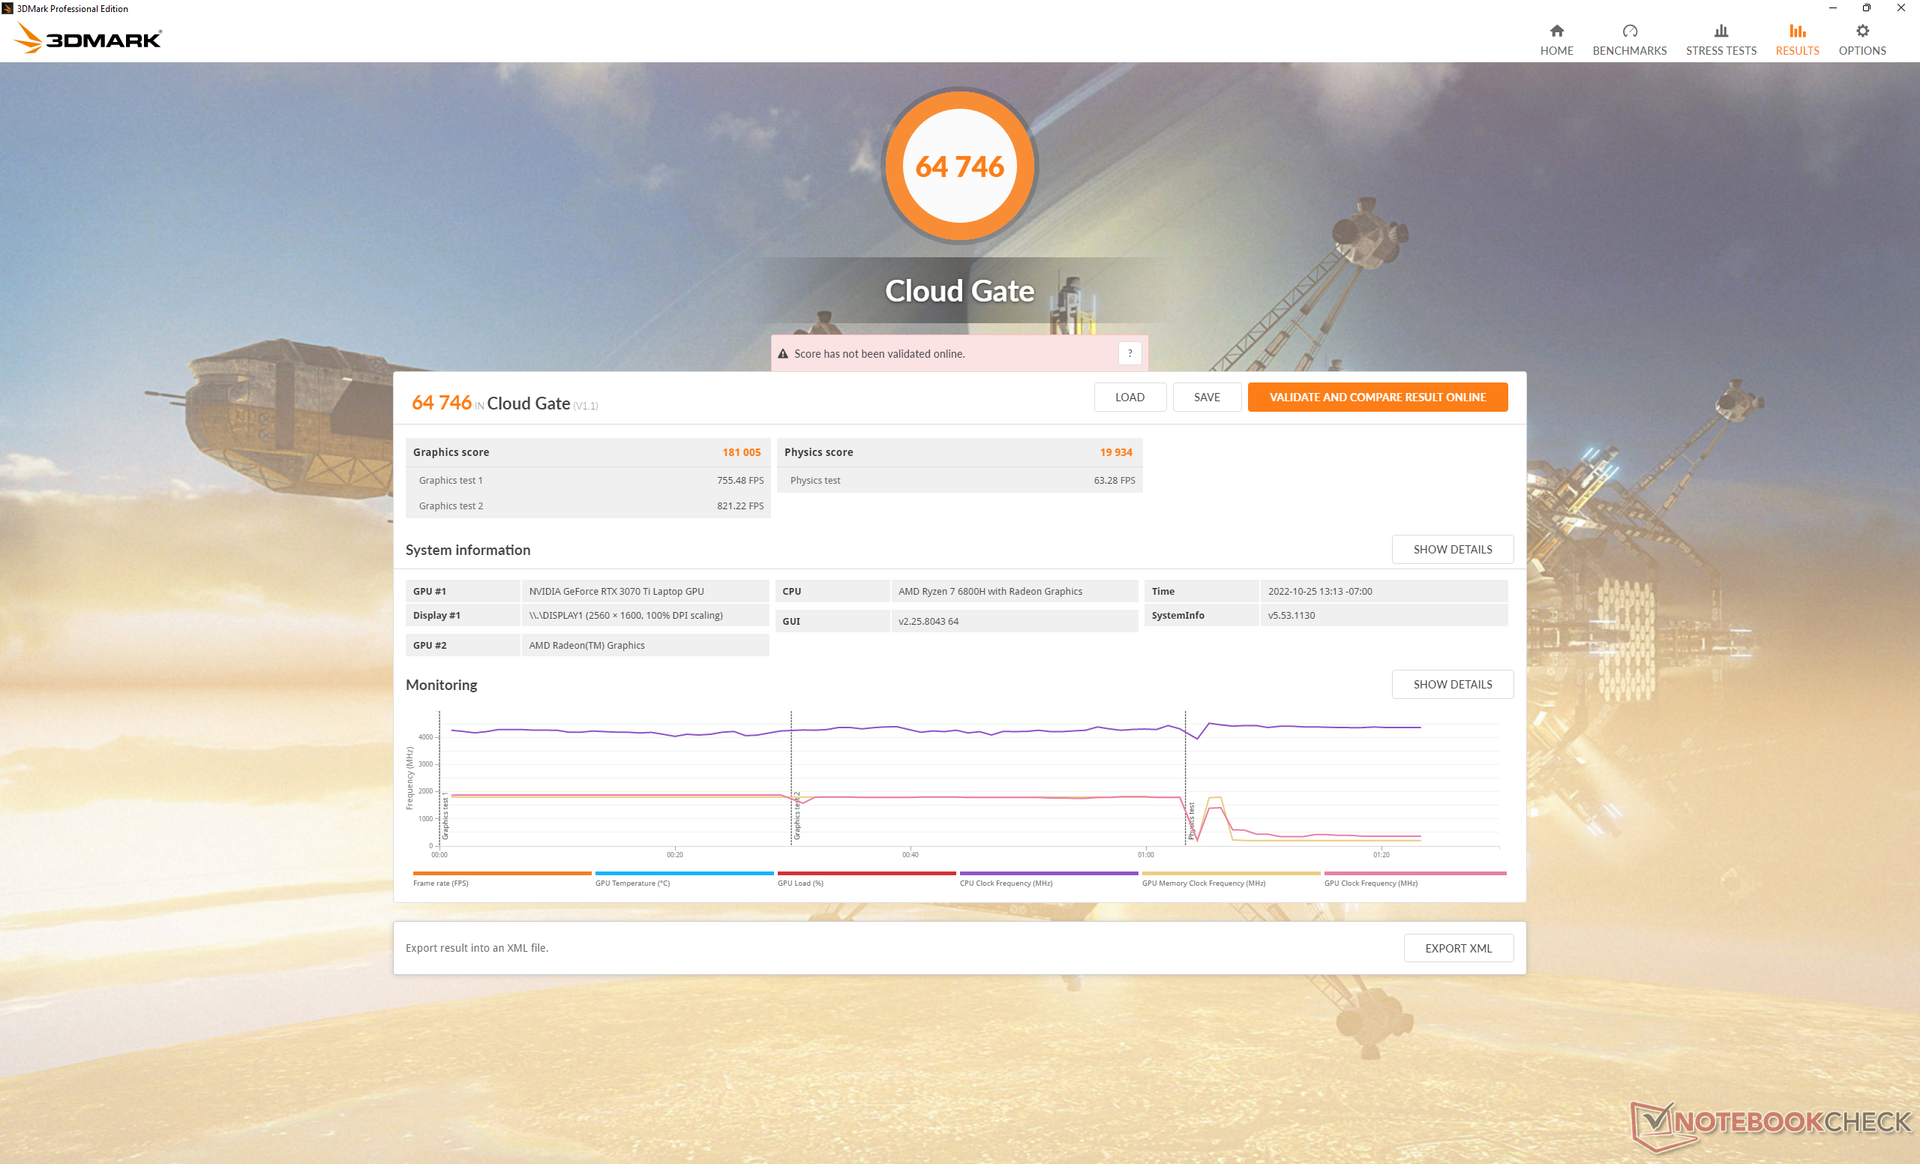
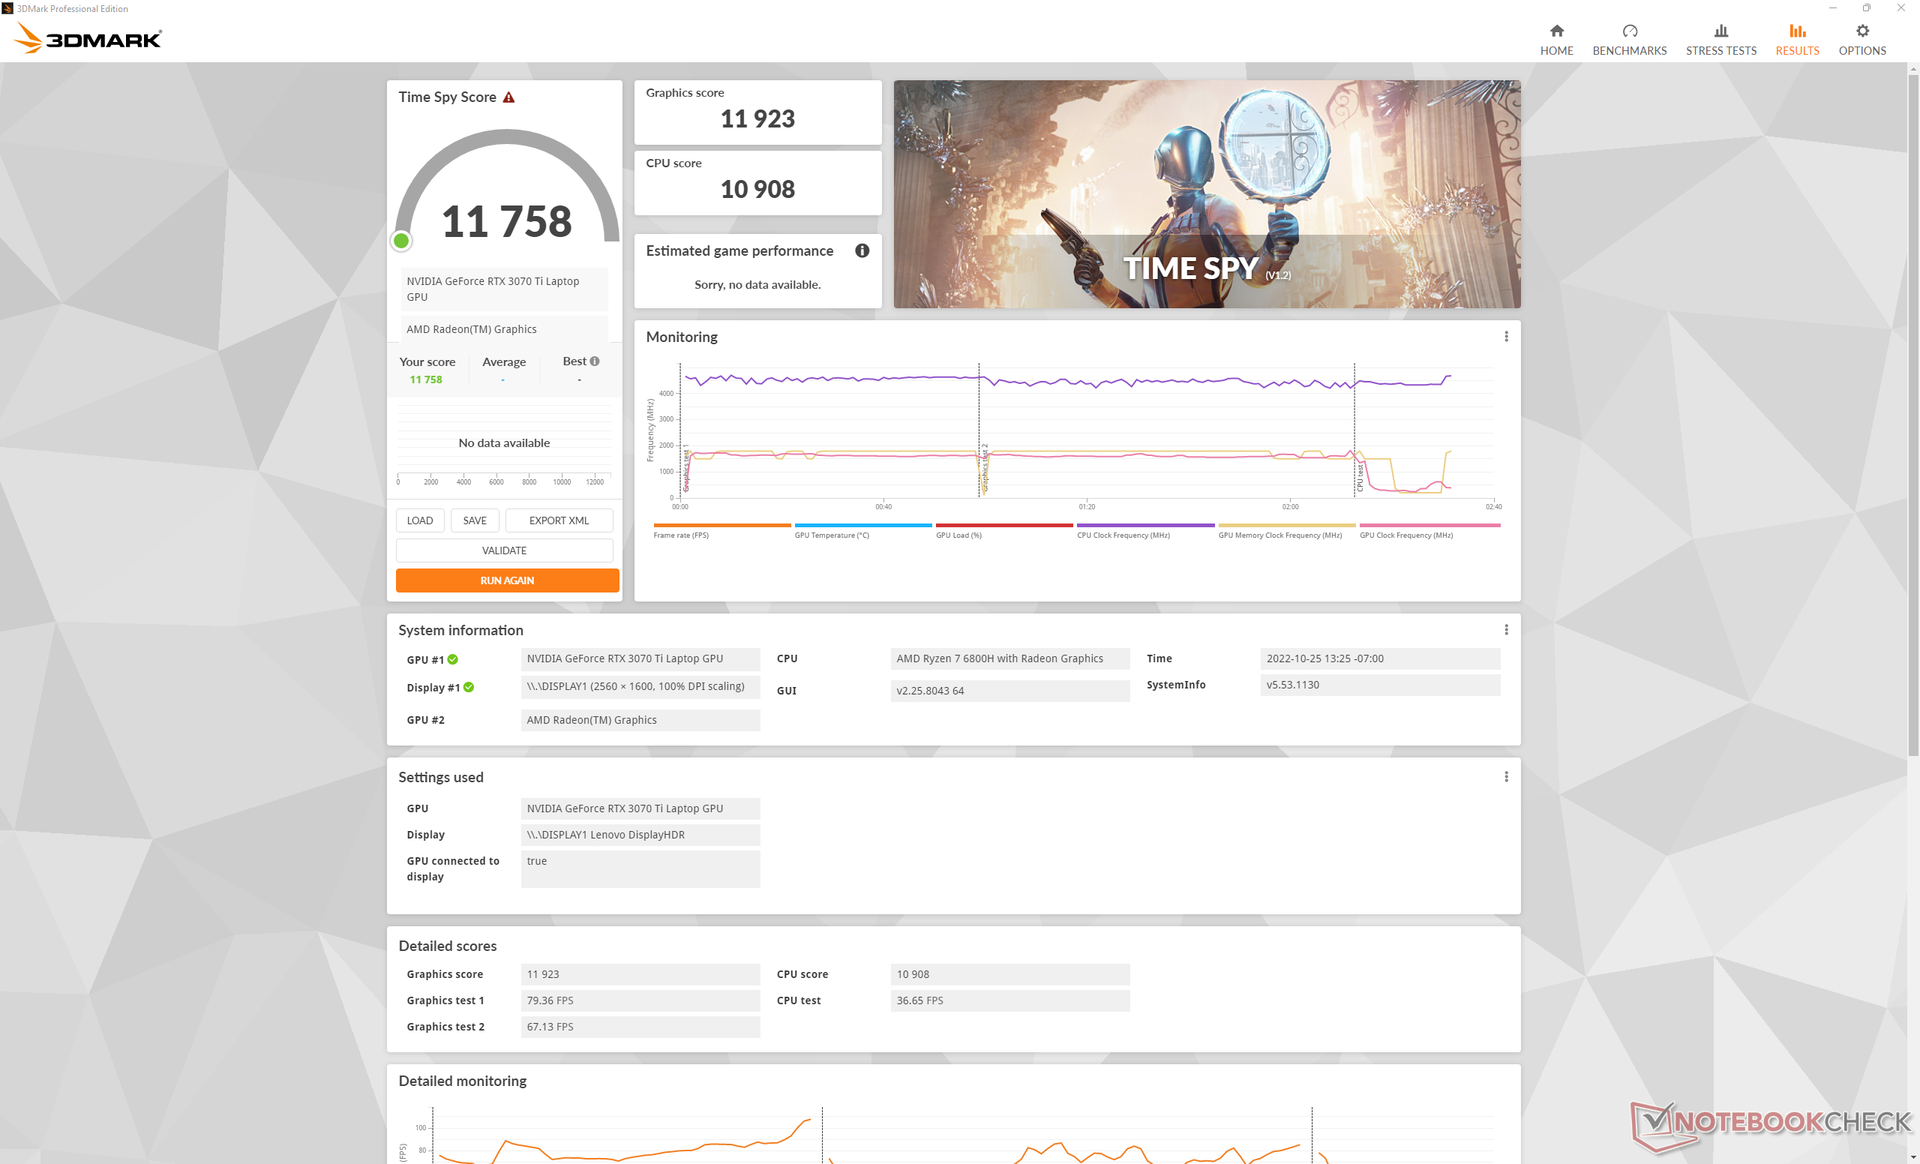
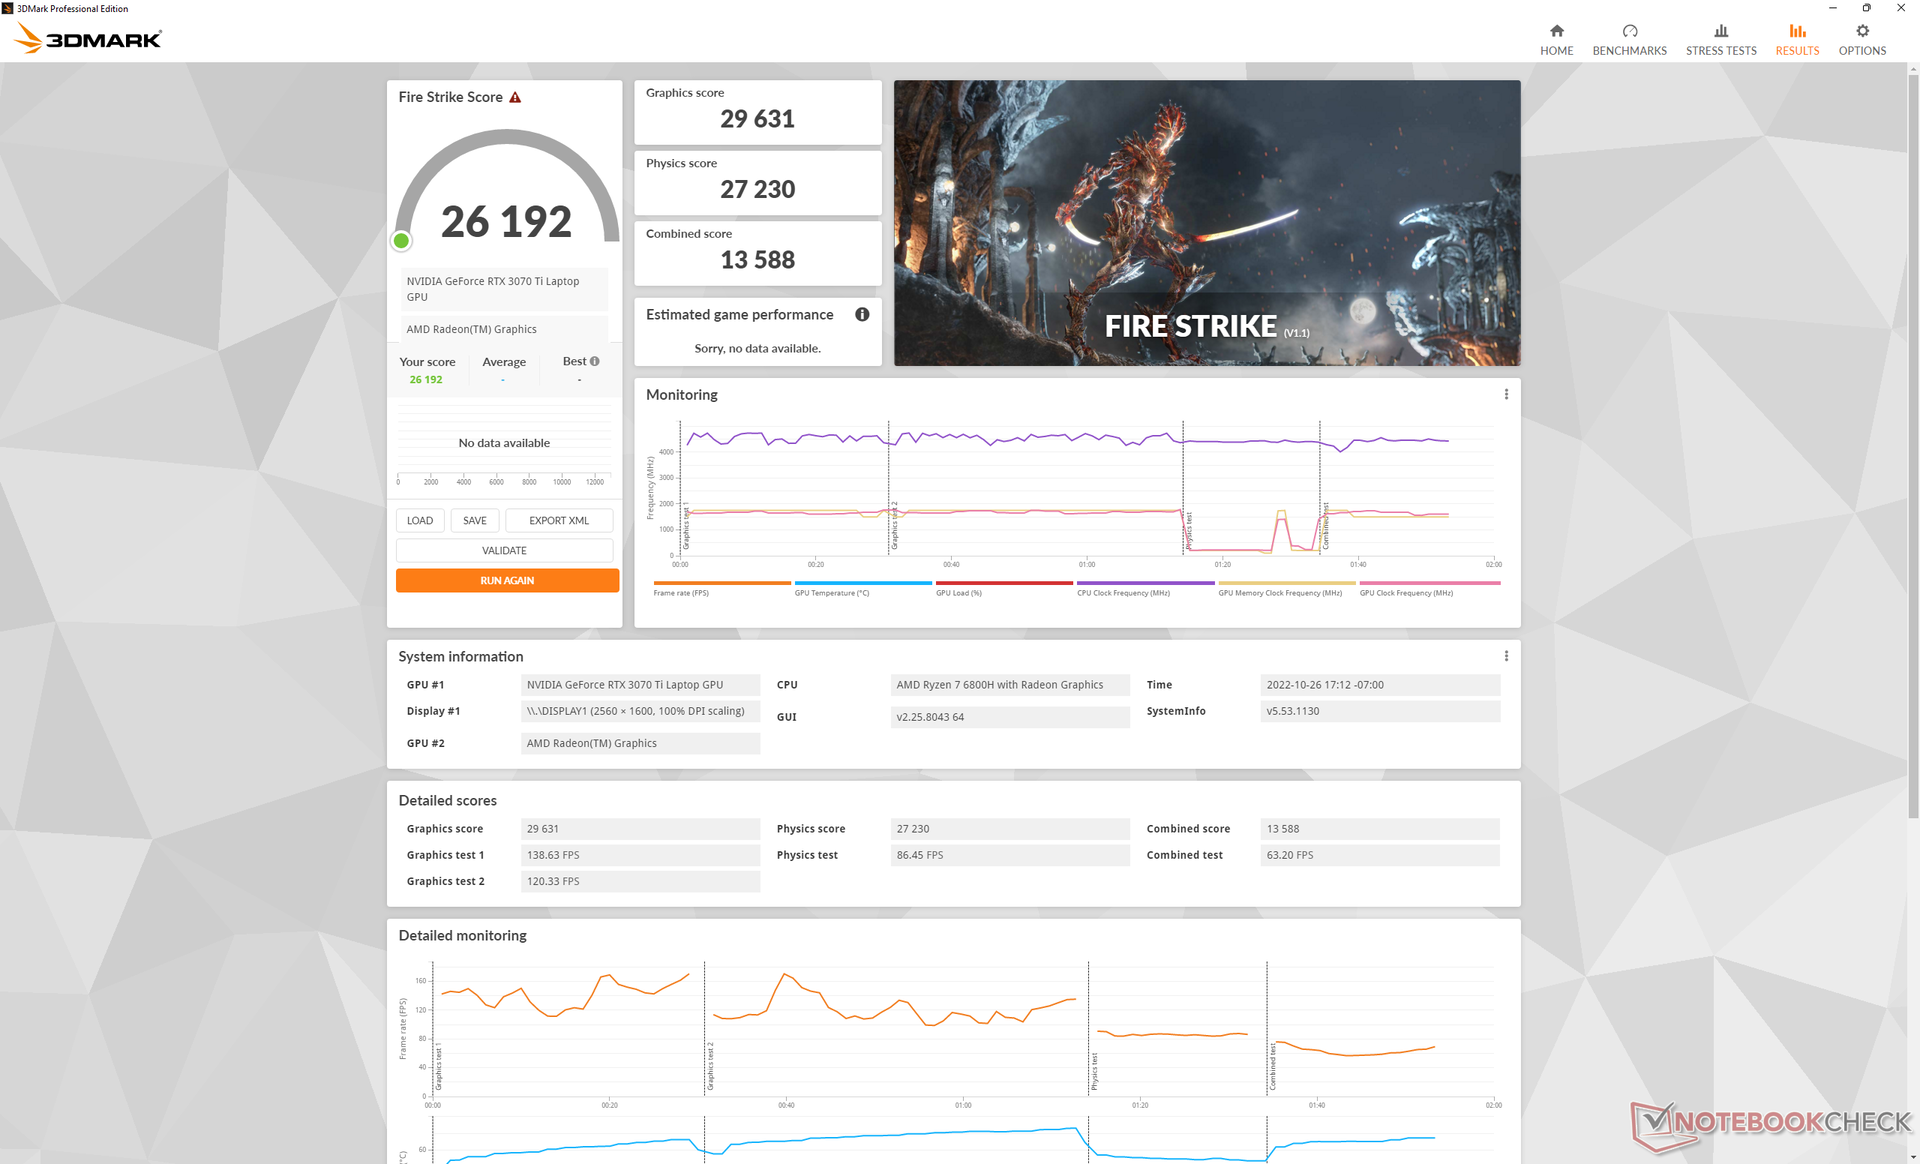
| 3DMark 11 Performance | 32025 points | |
| 3DMark Cloud Gate Standard Score | 64746 points | |
| 3DMark Fire Strike Score | 27014 points | |
| 3DMark Time Spy Score | 11758 points | |
Help | ||
* ... smaller is better
Witcher 3 FPS Chart
| low | med. | high | ultra | QHD | |
|---|---|---|---|---|---|
| GTA V (2015) | 181.5 | 176.5 | 167.6 | 104 | 98.8 |
| The Witcher 3 (2015) | 370.5 | 308.8 | 226 | 117 | |
| Dota 2 Reborn (2015) | 150.4 | 138 | 132.2 | 126.6 | |
| Final Fantasy XV Benchmark (2018) | 187.2 | 156 | 115.6 | 90.4 | |
| X-Plane 11.11 (2018) | 119.6 | 103.6 | 83.9 | ||
| Strange Brigade (2018) | 383 | 298 | 248 | 217 | 160.5 |
| Cyberpunk 2077 1.6 (2022) | 148.9 | 130.2 | 102.1 | 86 | 54.4 |
Emissions — Pretty Noisy
System Noise
Fan noise behavior is tied to the power profile setting. When on Power Saver mode with the discrete GPU disabled, for example, the system would remain quiet at 23.7 dB(A) against a silent background of 23.5 dB(A). Unfortunately, light multitasking or video streaming are enough to bump up the noise to a more audible 32 dB(A) much like what we observed on last year's model.
Gaming induces a fan noise of almost 55 dB(A) even if Turbo mode is disabled. Thus, you may as well enable Turbo mode when gaming as it doesn't seem to make the system any louder or quieter. The mid 50 dB(A) range is louder than what we recorded on the HP Victus 16 or Dell G16 under similar conditions.
Noise level
| Idle |
| 23.7 / 31.1 / 32.2 dB(A) |
| Load |
| 38.4 / 54.8 dB(A) |
 | ||
30 dB silent 40 dB(A) audible 50 dB(A) loud |
||
min: | ||
| Lenovo Legion 5 Pro 16ARH7H RTX 3070 Ti GeForce RTX 3070 Ti Laptop GPU, R7 6800H, Samsung PM9A1 MZVL21T0HCLR | Lenovo Legion 5 Pro 16IAH7H GeForce RTX 3060 Laptop GPU, i7-12700H, 2x Samsung PM9A1 MZVL21T0HCLR (RAID 0) | Asus ROG Zephyrus M16 GU603H GeForce RTX 3070 Laptop GPU, i9-11900H, Samsung PM9A1 MZVL22T0HBLB | Lenovo Legion 7 16ARHA7 Radeon RX 6850M XT, R9 6900HX, Samsung PM9A1 MZVL22T0HBLB | HP Victus 16-e0145ng GeForce RTX 3050 Ti Laptop GPU, R5 5600H, Samsung SSD PM981a MZVLB512HBJQ | Dell G16 7620 GeForce RTX 3060 Laptop GPU, i7-12700H, WDC PC SN810 512GB | |
|---|---|---|---|---|---|---|
| Noise | -8% | -9% | 13% | -2% | 6% | |
| off / environment * (dB) | 23.5 | 24.6 -5% | 25 -6% | 22.8 3% | 26 -11% | 23.2 1% |
| Idle Minimum * (dB) | 23.7 | 28.7 -21% | 25 -5% | 23 3% | 26 -10% | 28.3 -19% |
| Idle Average * (dB) | 31.1 | 32 -3% | 31 -0% | 23 26% | 28 10% | 28.8 7% |
| Idle Maximum * (dB) | 32.2 | 32 1% | 42 -30% | 23 29% | 34 -6% | 28.9 10% |
| Load Average * (dB) | 38.4 | 45.2 -18% | 48 -25% | 26.8 30% | 44 -15% | 32.4 16% |
| Witcher 3 ultra * (dB) | 54.8 | 52 5% | 54.3 1% | 48 12% | 48.3 12% | |
| Load Maximum * (dB) | 54.8 | 54.4 1% | 56 -2% | 54.2 1% | 53 3% | 48.1 12% |
* ... smaller is better
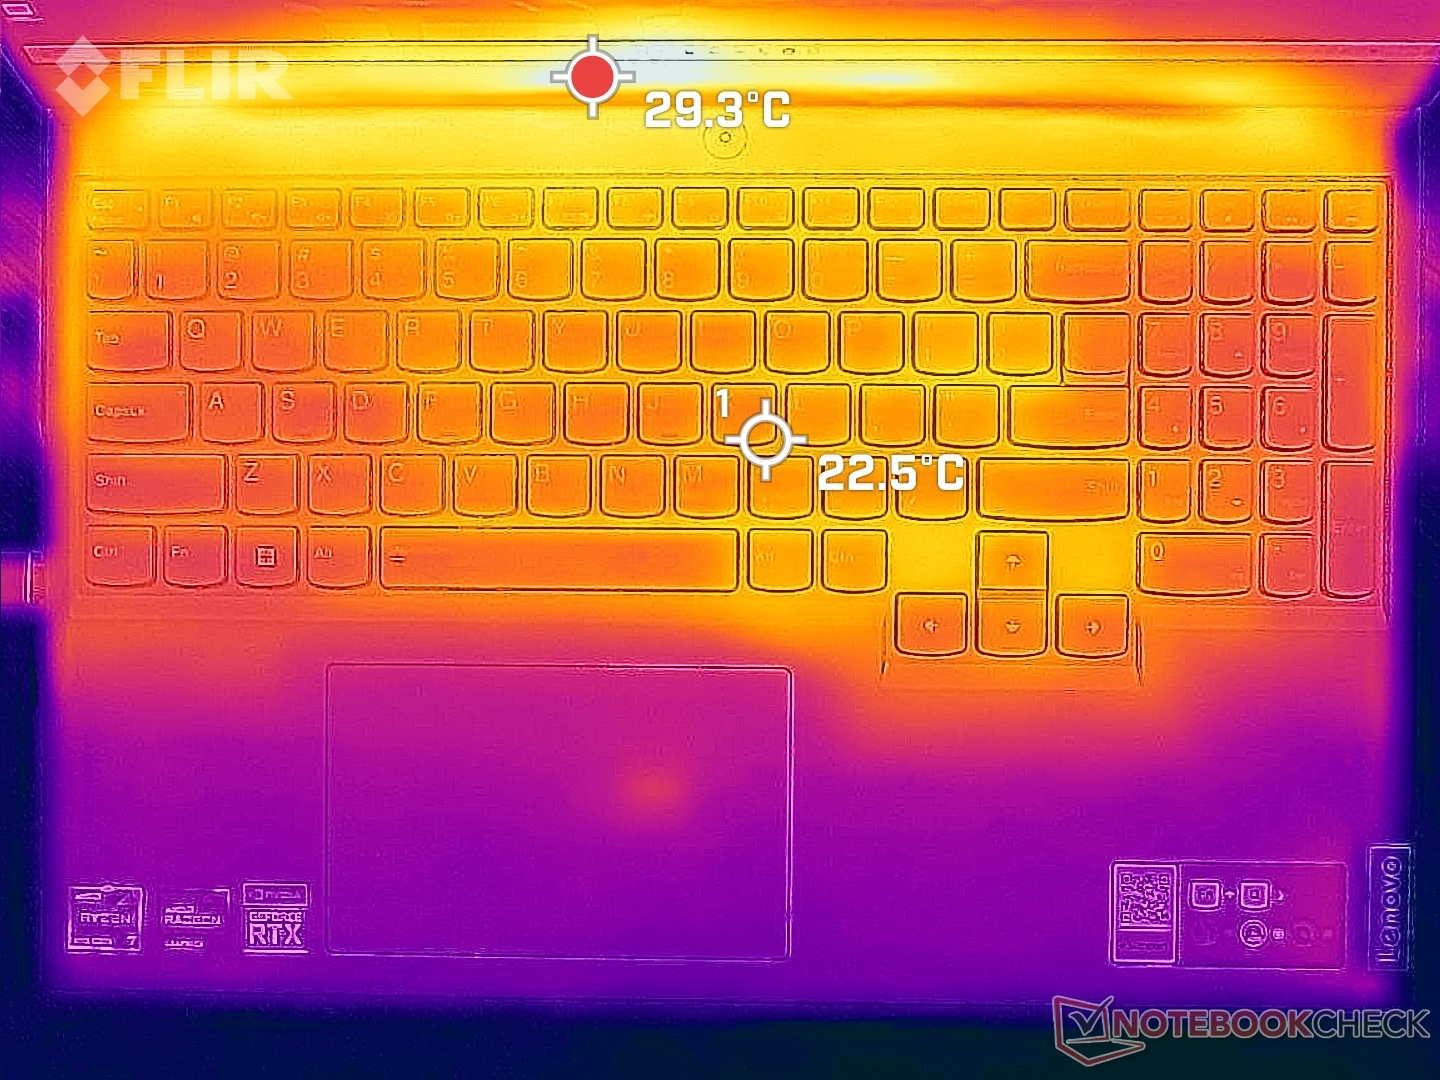
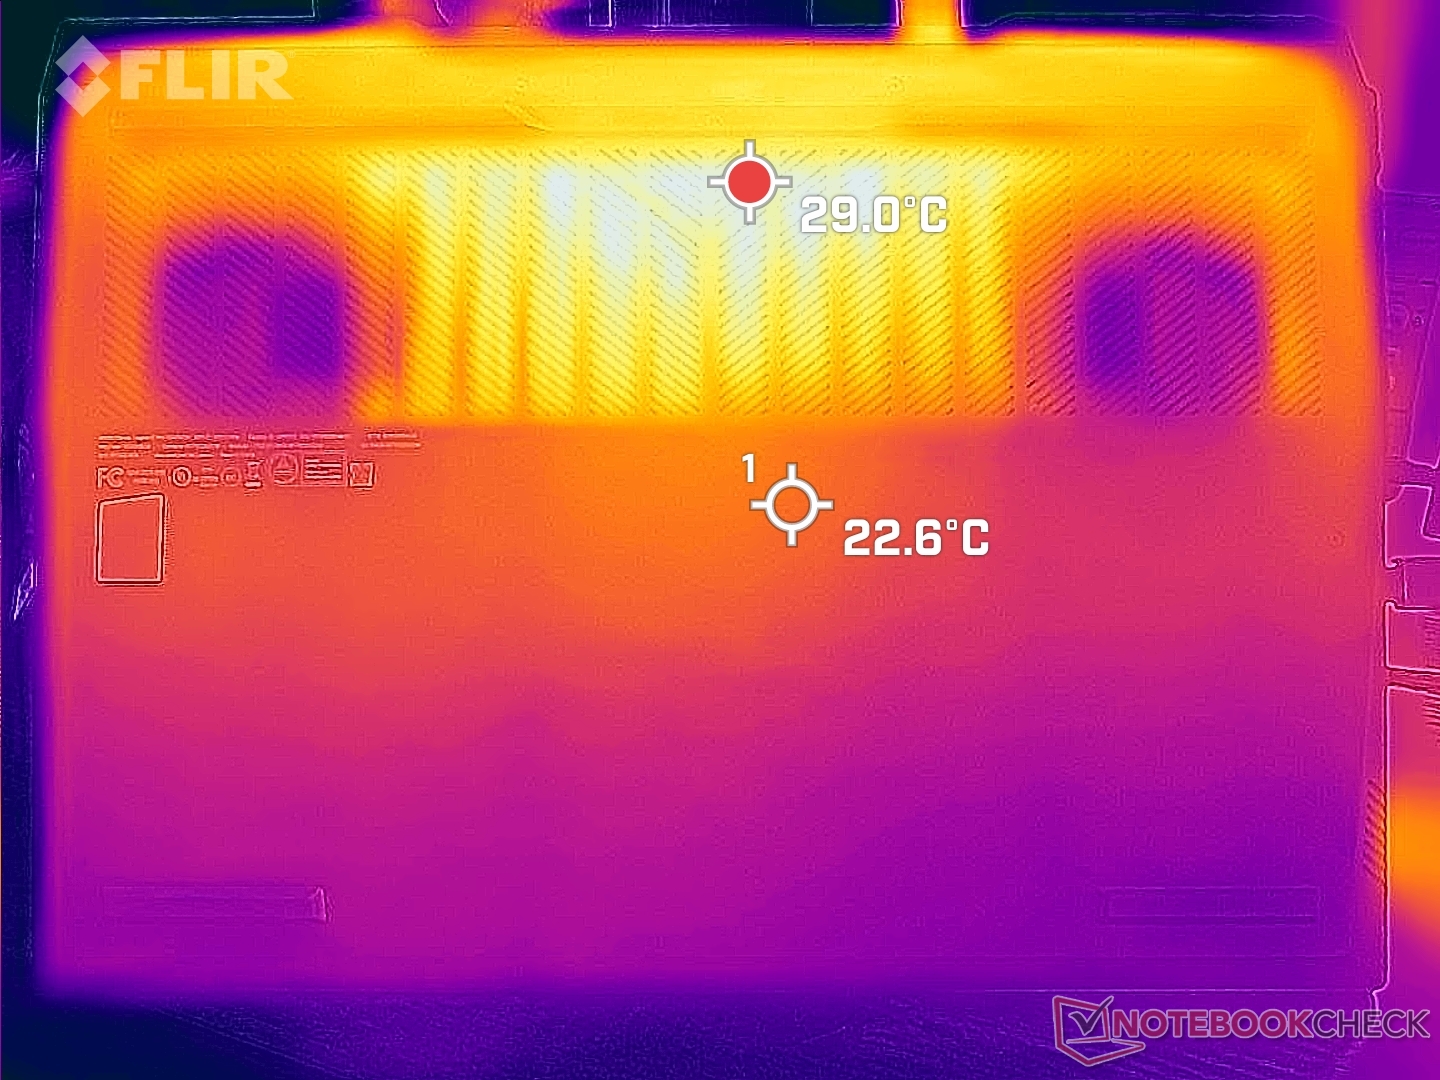
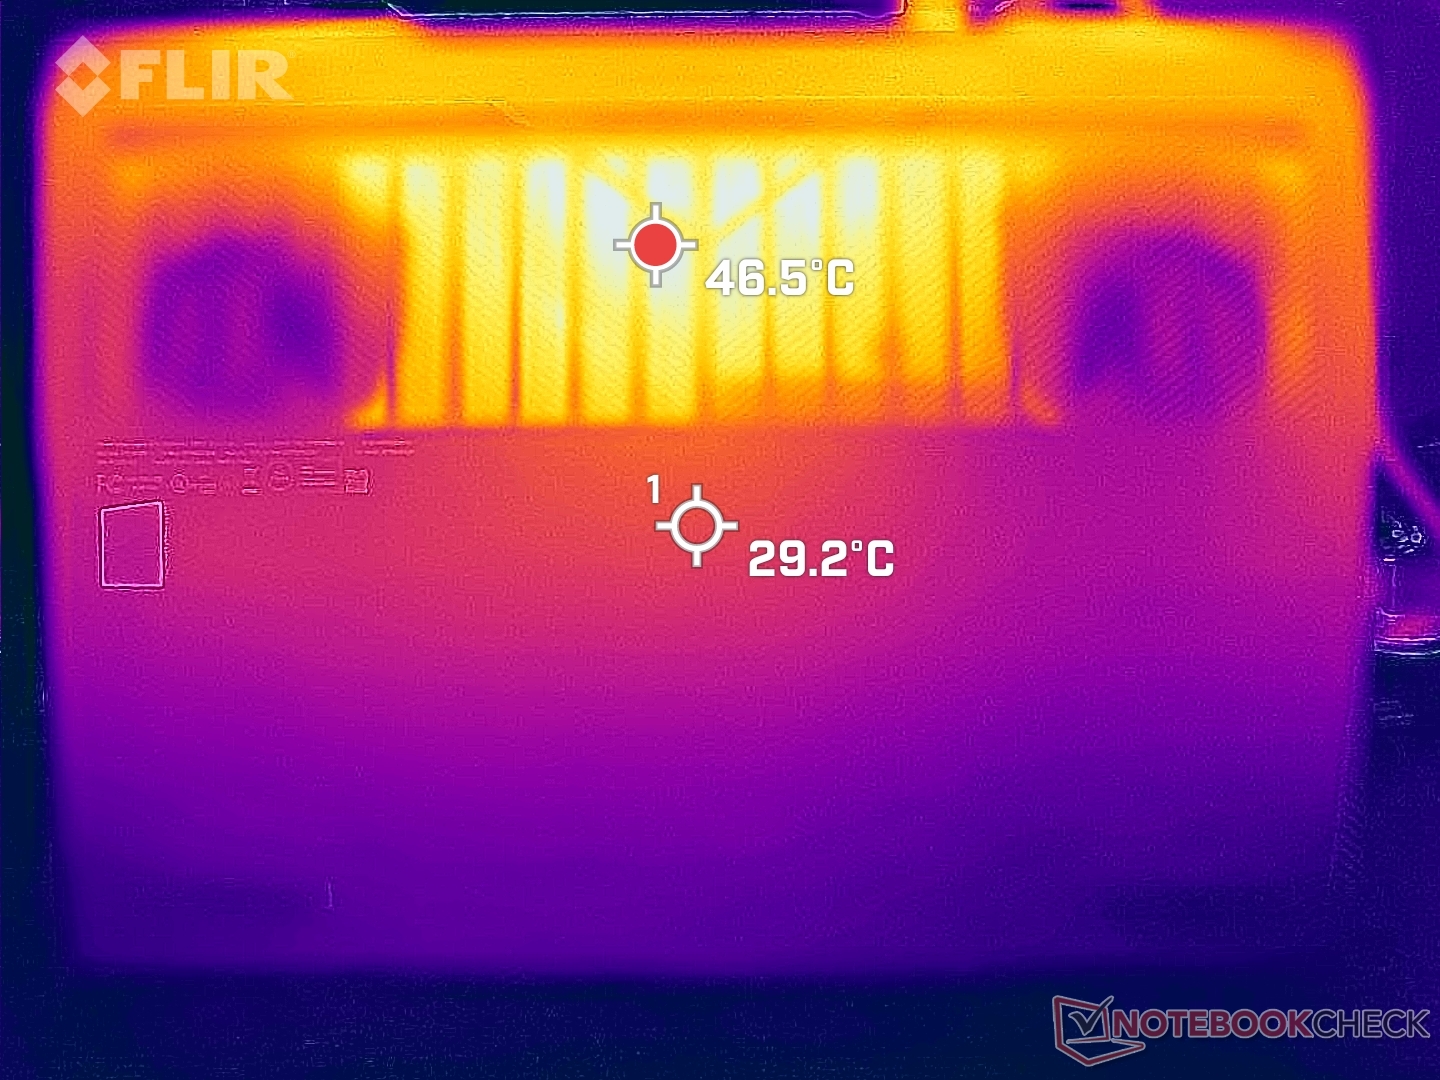
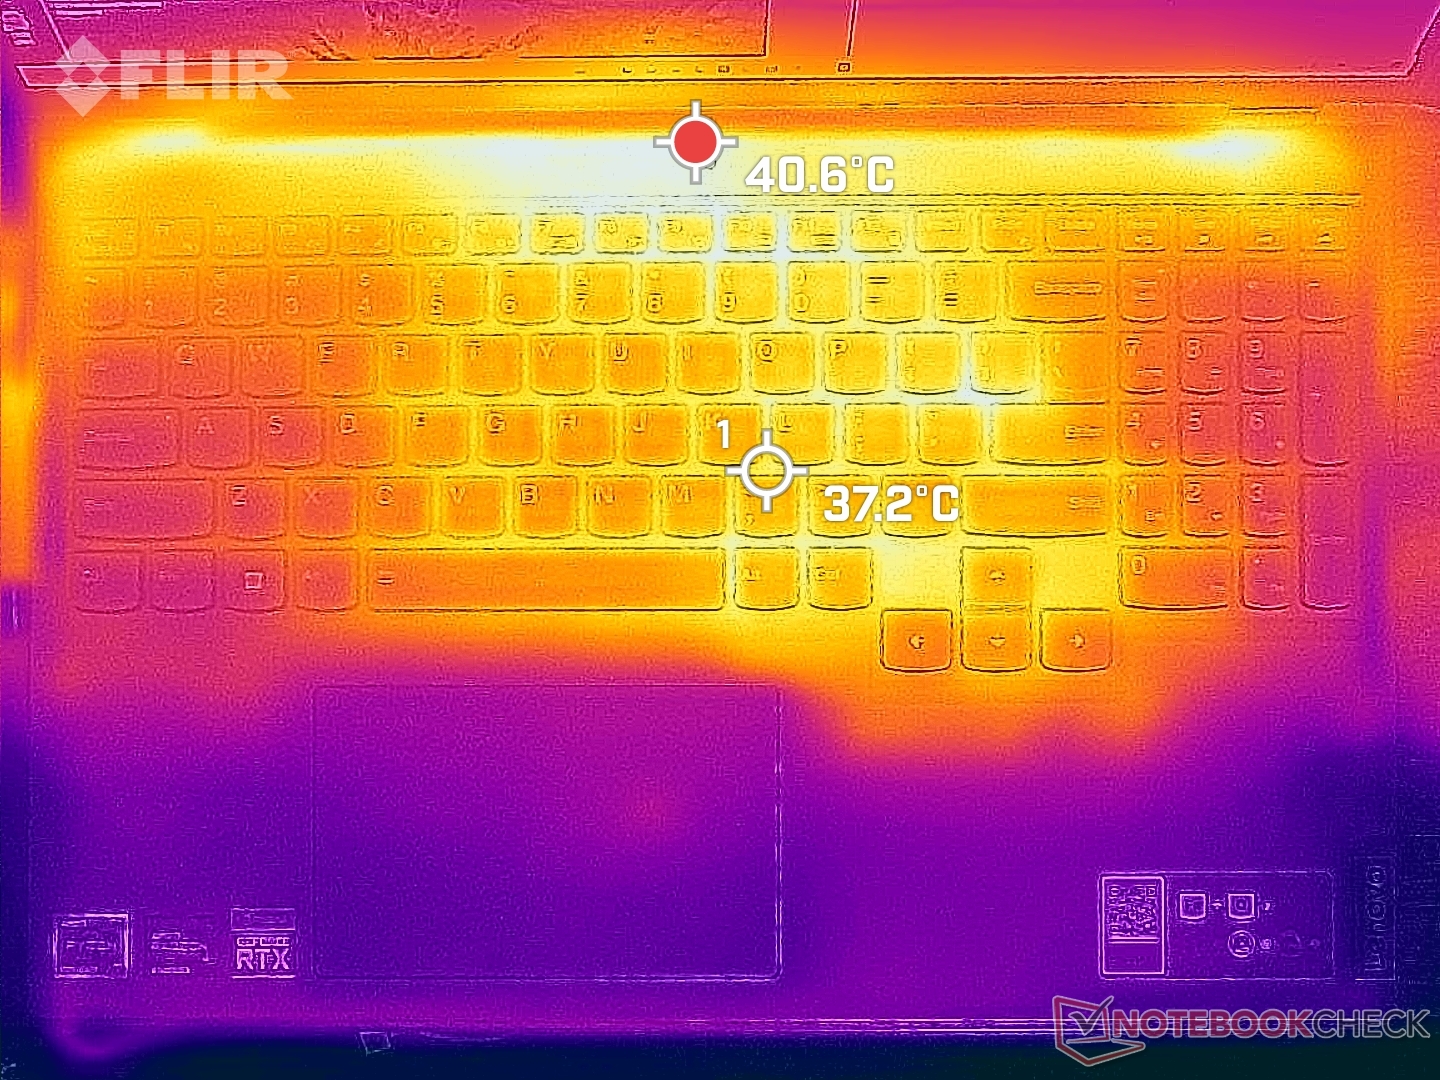
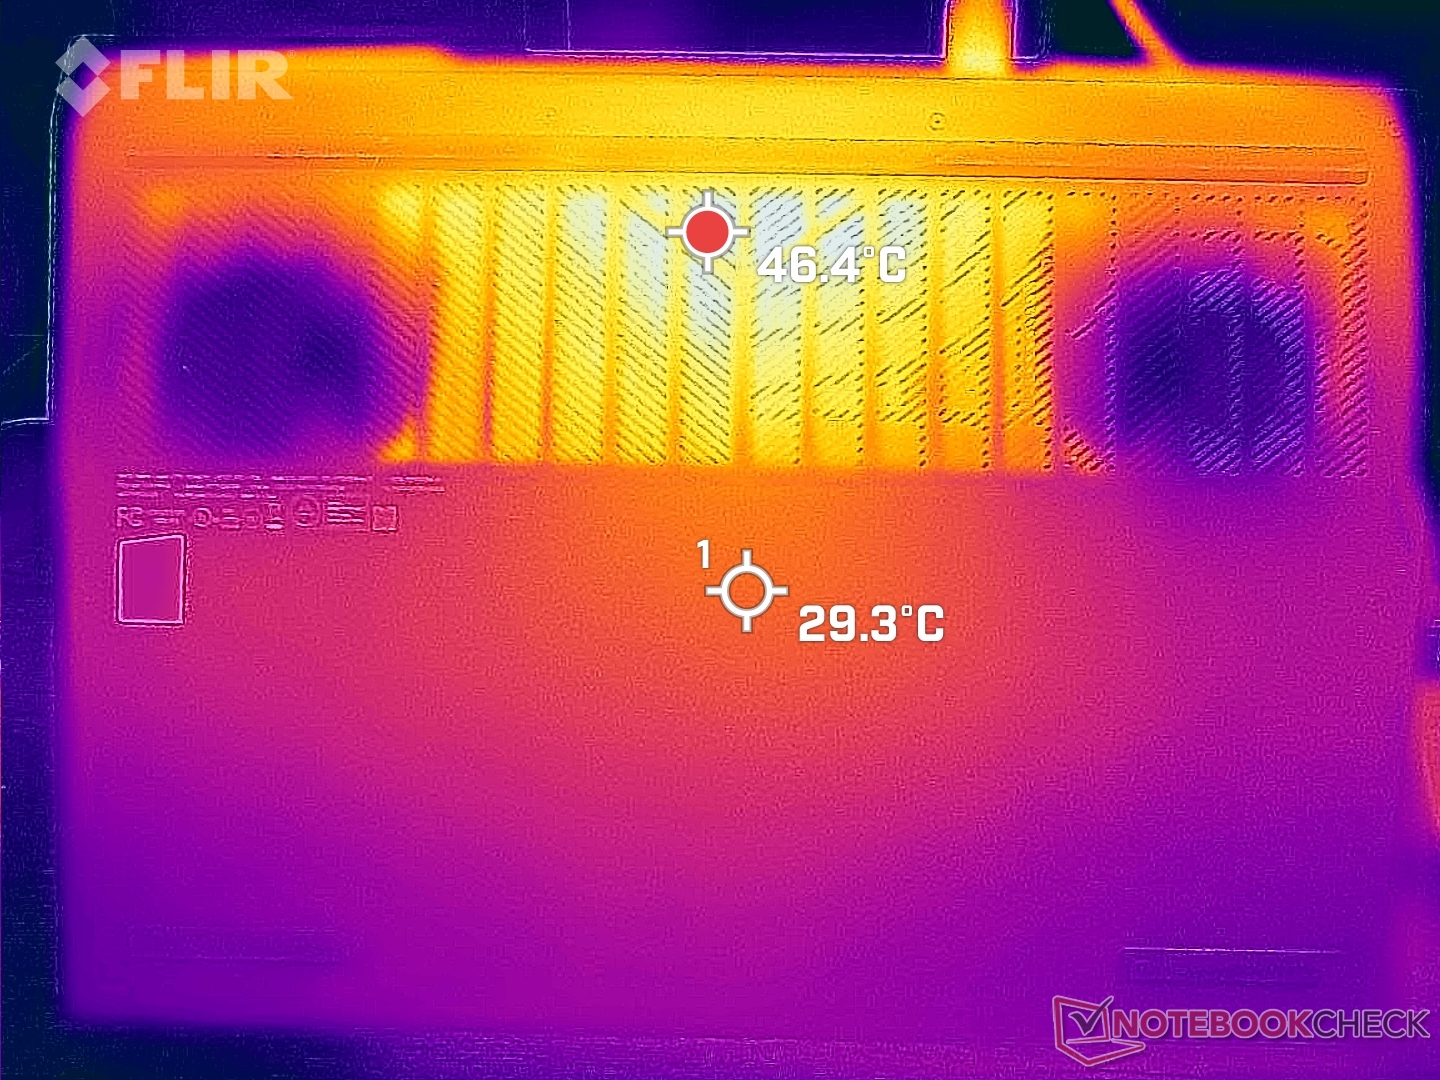
Temperature
Average surface temperatures are much cooler than on the Asus ROG Zephyrus M16 even though their hot spots are similar. For example, the hottest spots on the Lenovo and Asus can reach up to 53 C each, but the palm rests and keyboard areas on the Lenovo remain noticeably cooler and thus more comfortable to game on.
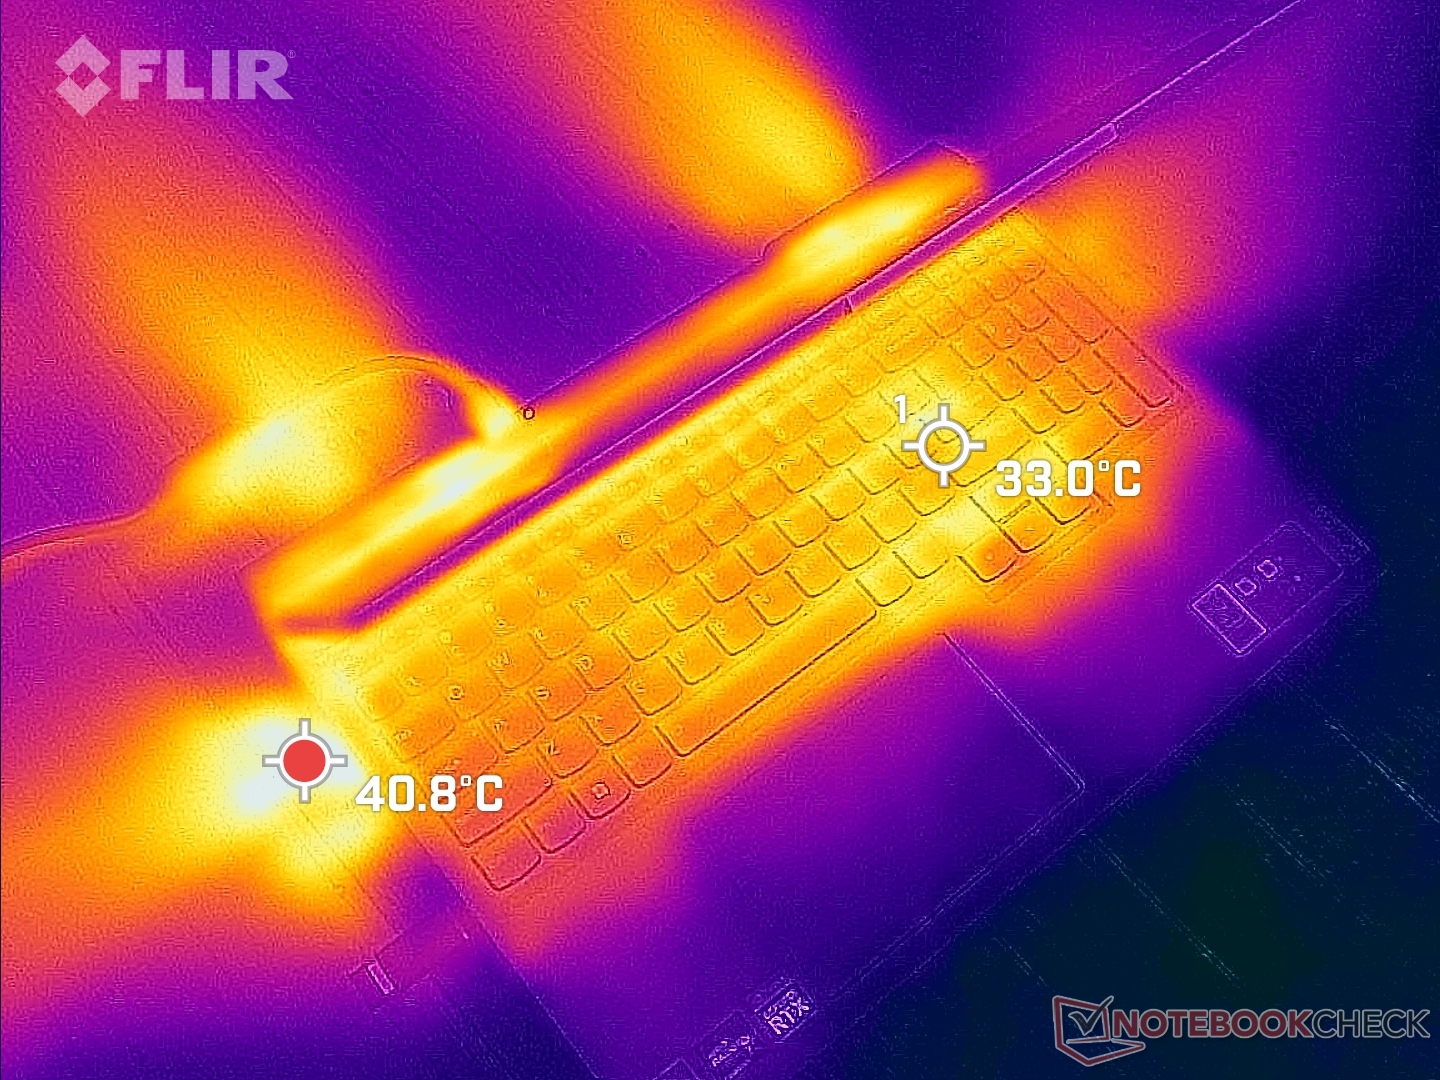
(±) The maximum temperature on the upper side is 43.8 °C / 111 F, compared to the average of 40.4 °C / 105 F, ranging from 21.2 to 68.8 °C for the class Gaming.
(-) The bottom heats up to a maximum of 53 °C / 127 F, compared to the average of 43.3 °C / 110 F
(+) In idle usage, the average temperature for the upper side is 27.4 °C / 81 F, compared to the device average of 33.9 °C / 93 F.
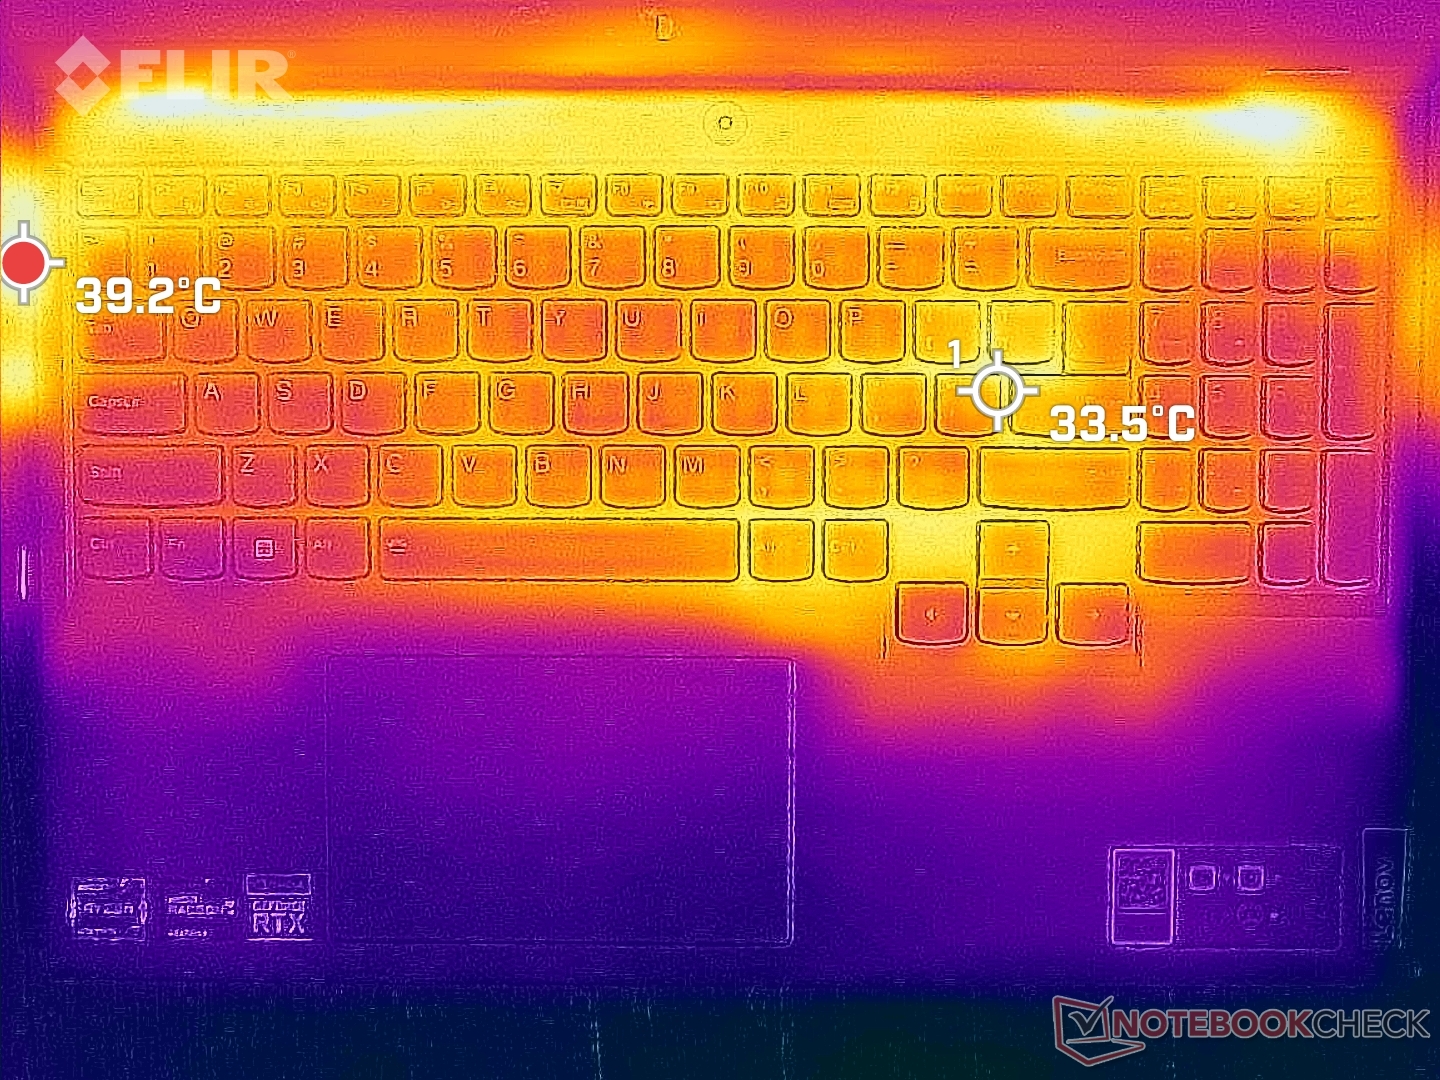
(±) Playing The Witcher 3, the average temperature for the upper side is 33.5 °C / 92 F, compared to the device average of 33.9 °C / 93 F.
(+) The palmrests and touchpad are cooler than skin temperature with a maximum of 29.4 °C / 84.9 F and are therefore cool to the touch.
(±) The average temperature of the palmrest area of similar devices was 28.8 °C / 83.8 F (-0.6 °C / -1.1 F).
| Lenovo Legion 5 Pro 16ARH7H RTX 3070 Ti AMD Ryzen 7 6800H, NVIDIA GeForce RTX 3070 Ti Laptop GPU | Lenovo Legion 5 Pro 16IAH7H Intel Core i7-12700H, NVIDIA GeForce RTX 3060 Laptop GPU | Asus ROG Zephyrus M16 GU603H Intel Core i9-11900H, NVIDIA GeForce RTX 3070 Laptop GPU | Lenovo Legion 7 16ARHA7 AMD Ryzen 9 6900HX, AMD Radeon RX 6850M XT | HP Victus 16-e0145ng AMD Ryzen 5 5600H, NVIDIA GeForce RTX 3050 Ti Laptop GPU | Dell G16 7620 Intel Core i7-12700H, NVIDIA GeForce RTX 3060 Laptop GPU | |
|---|---|---|---|---|---|---|
| Heat | -7% | -19% | 5% | -12% | 9% | |
| Maximum Upper Side * (°C) | 43.8 | 45.8 -5% | 52 -19% | 37.2 15% | 54 -23% | 47.6 -9% |
| Maximum Bottom * (°C) | 53 | 66.3 -25% | 53 -0% | 43 19% | 47 11% | 54 -2% |
| Idle Upper Side * (°C) | 30 | 30.4 -1% | 38 -27% | 34 -13% | 41 -37% | 23 23% |
| Idle Bottom * (°C) | 31.8 | 30.4 4% | 41 -29% | 32.8 -3% | 31 3% | 24.6 23% |
* ... smaller is better
Stress Test
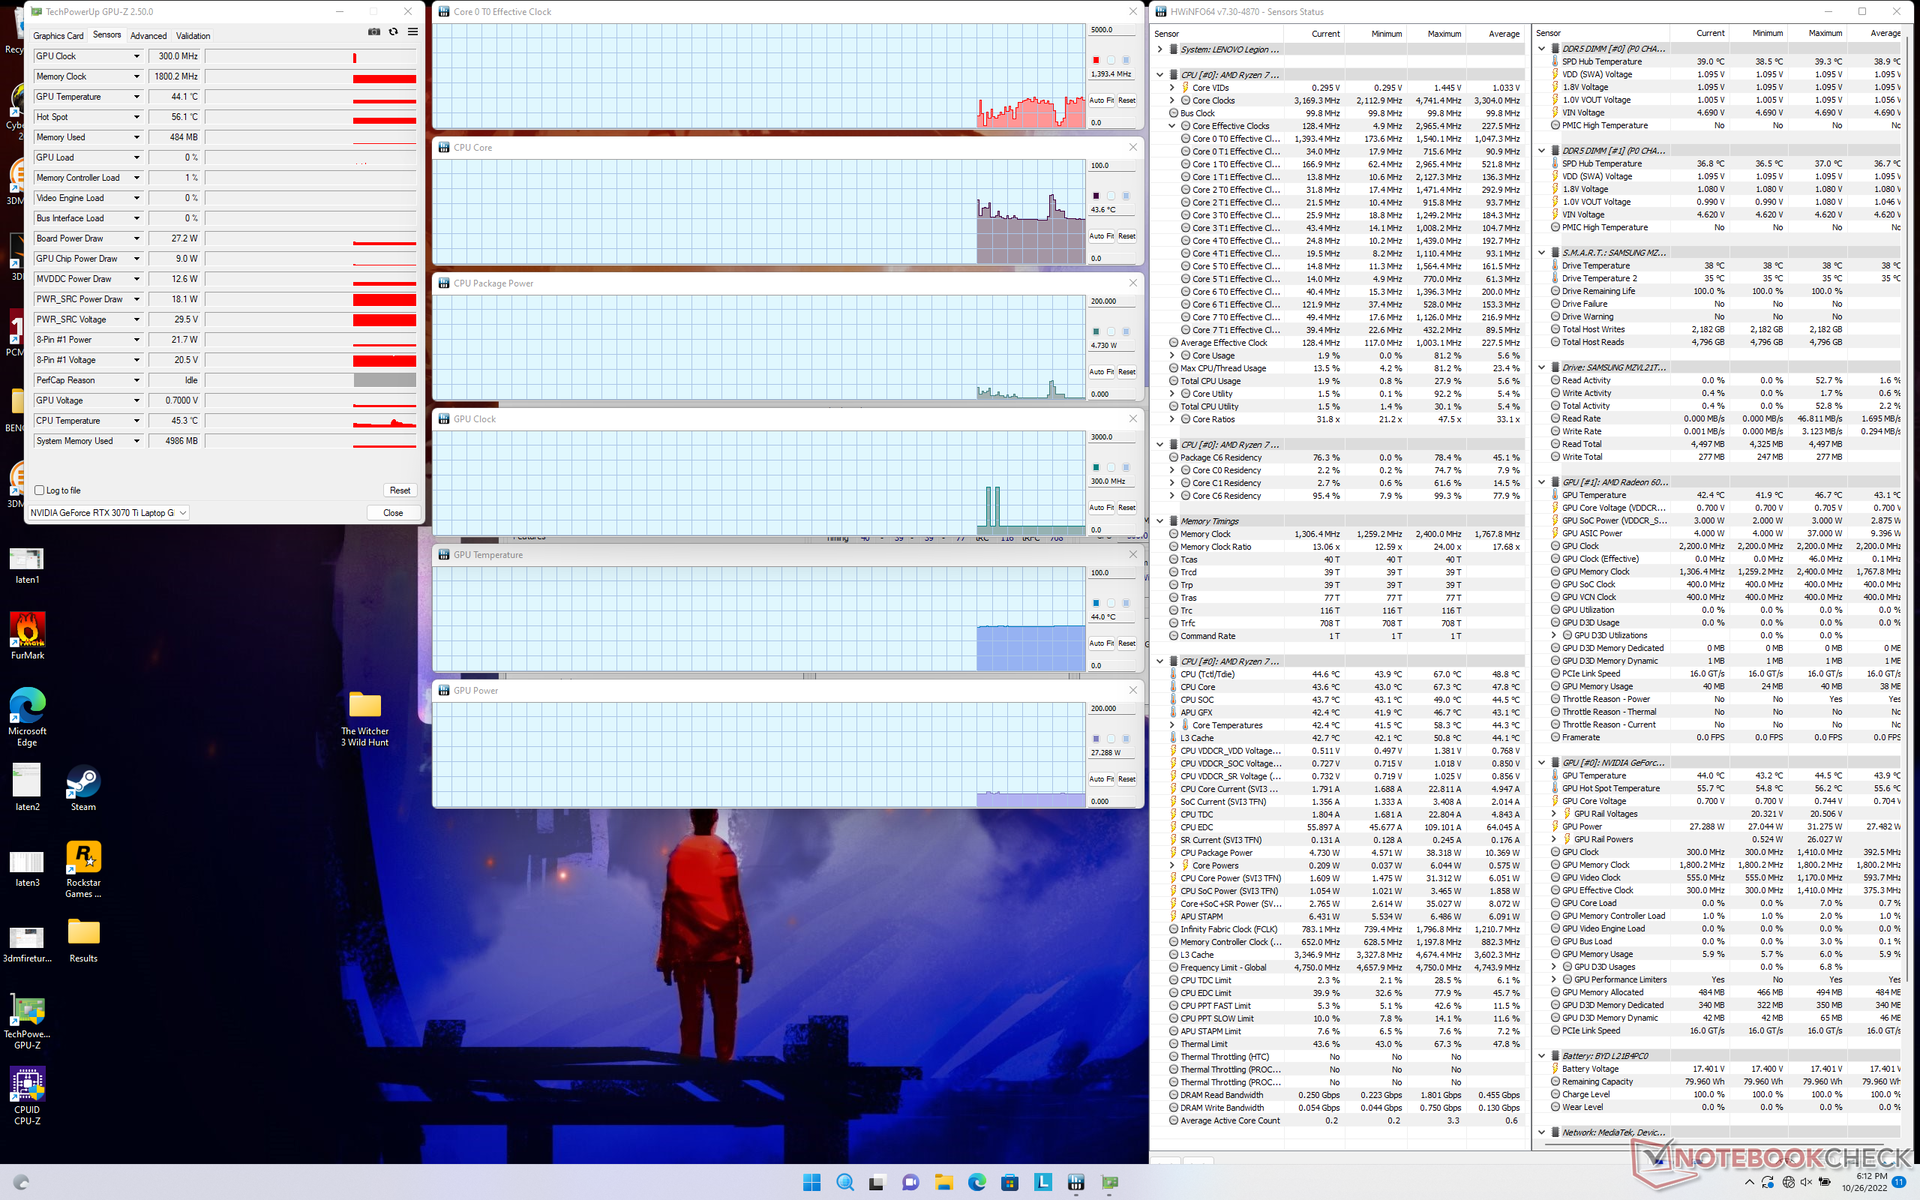
When under Prime95 stress, the CPU would boost to 4.2 GHz and 90 W indefinitely with no need to throttle. Unfortunately, core temperatures will become very warm at just under 95 C which is warmer than on most other gaming laptops.
When running Witcher 3 with Turbo mode active, the Nvidia GPU would stabilize at 1620 MHz core, 1800 MHz memory, and 136 W power draw. Interestingly, repeating this test with Turbo mode disabled would result in slower core and memory clocks of 1605 MHz and 1750 MHz, respectively, but a higher board power draw of 149 W. You'll want to enable Turbo mode anyway as graphics performance is still slightly faster than with Turbo mode disabled.
Running on battery power limits performance. A Fire Strike test on batteries would return Physics and Graphics scores of 20957 and 13153 points, respectively, compared to 27288 and 31289 points when on mains.
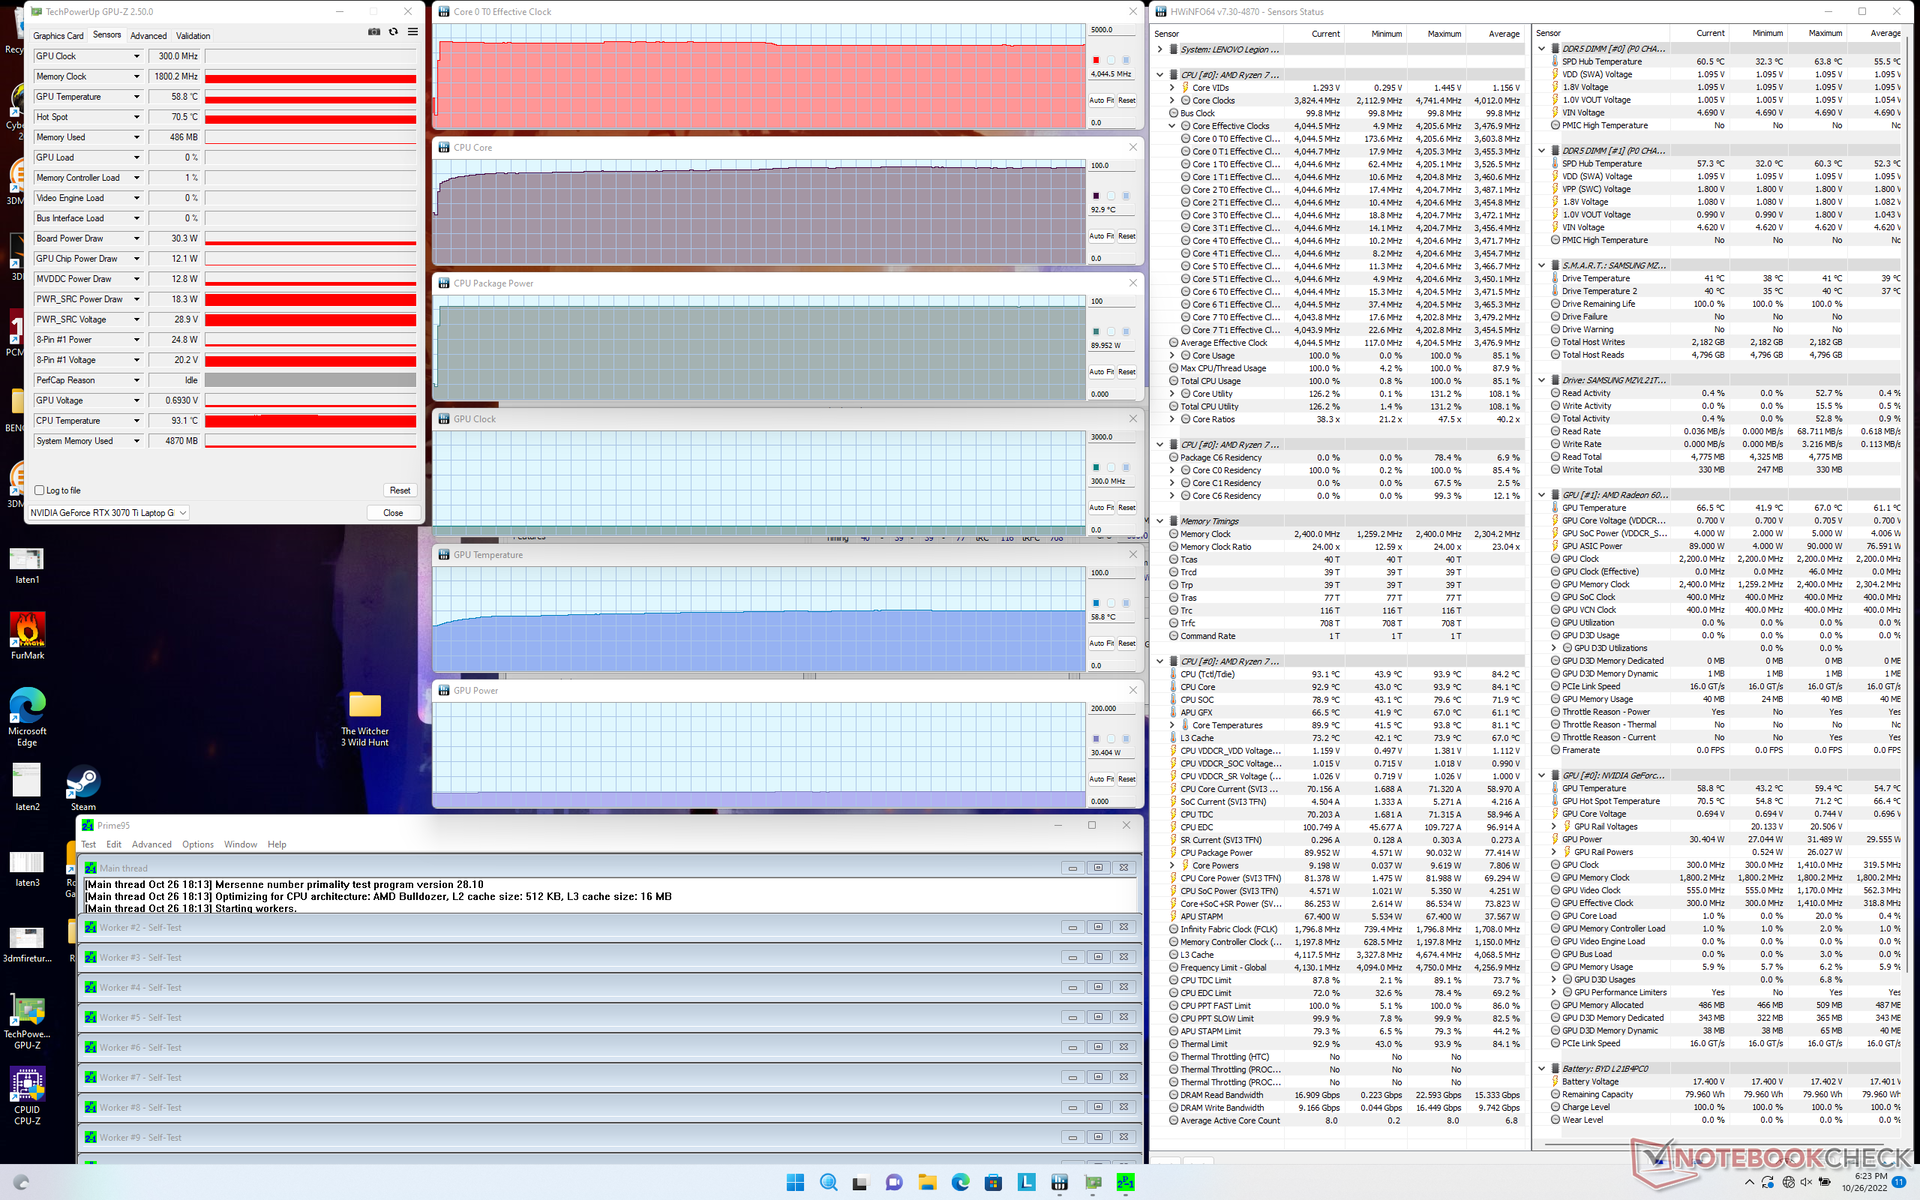
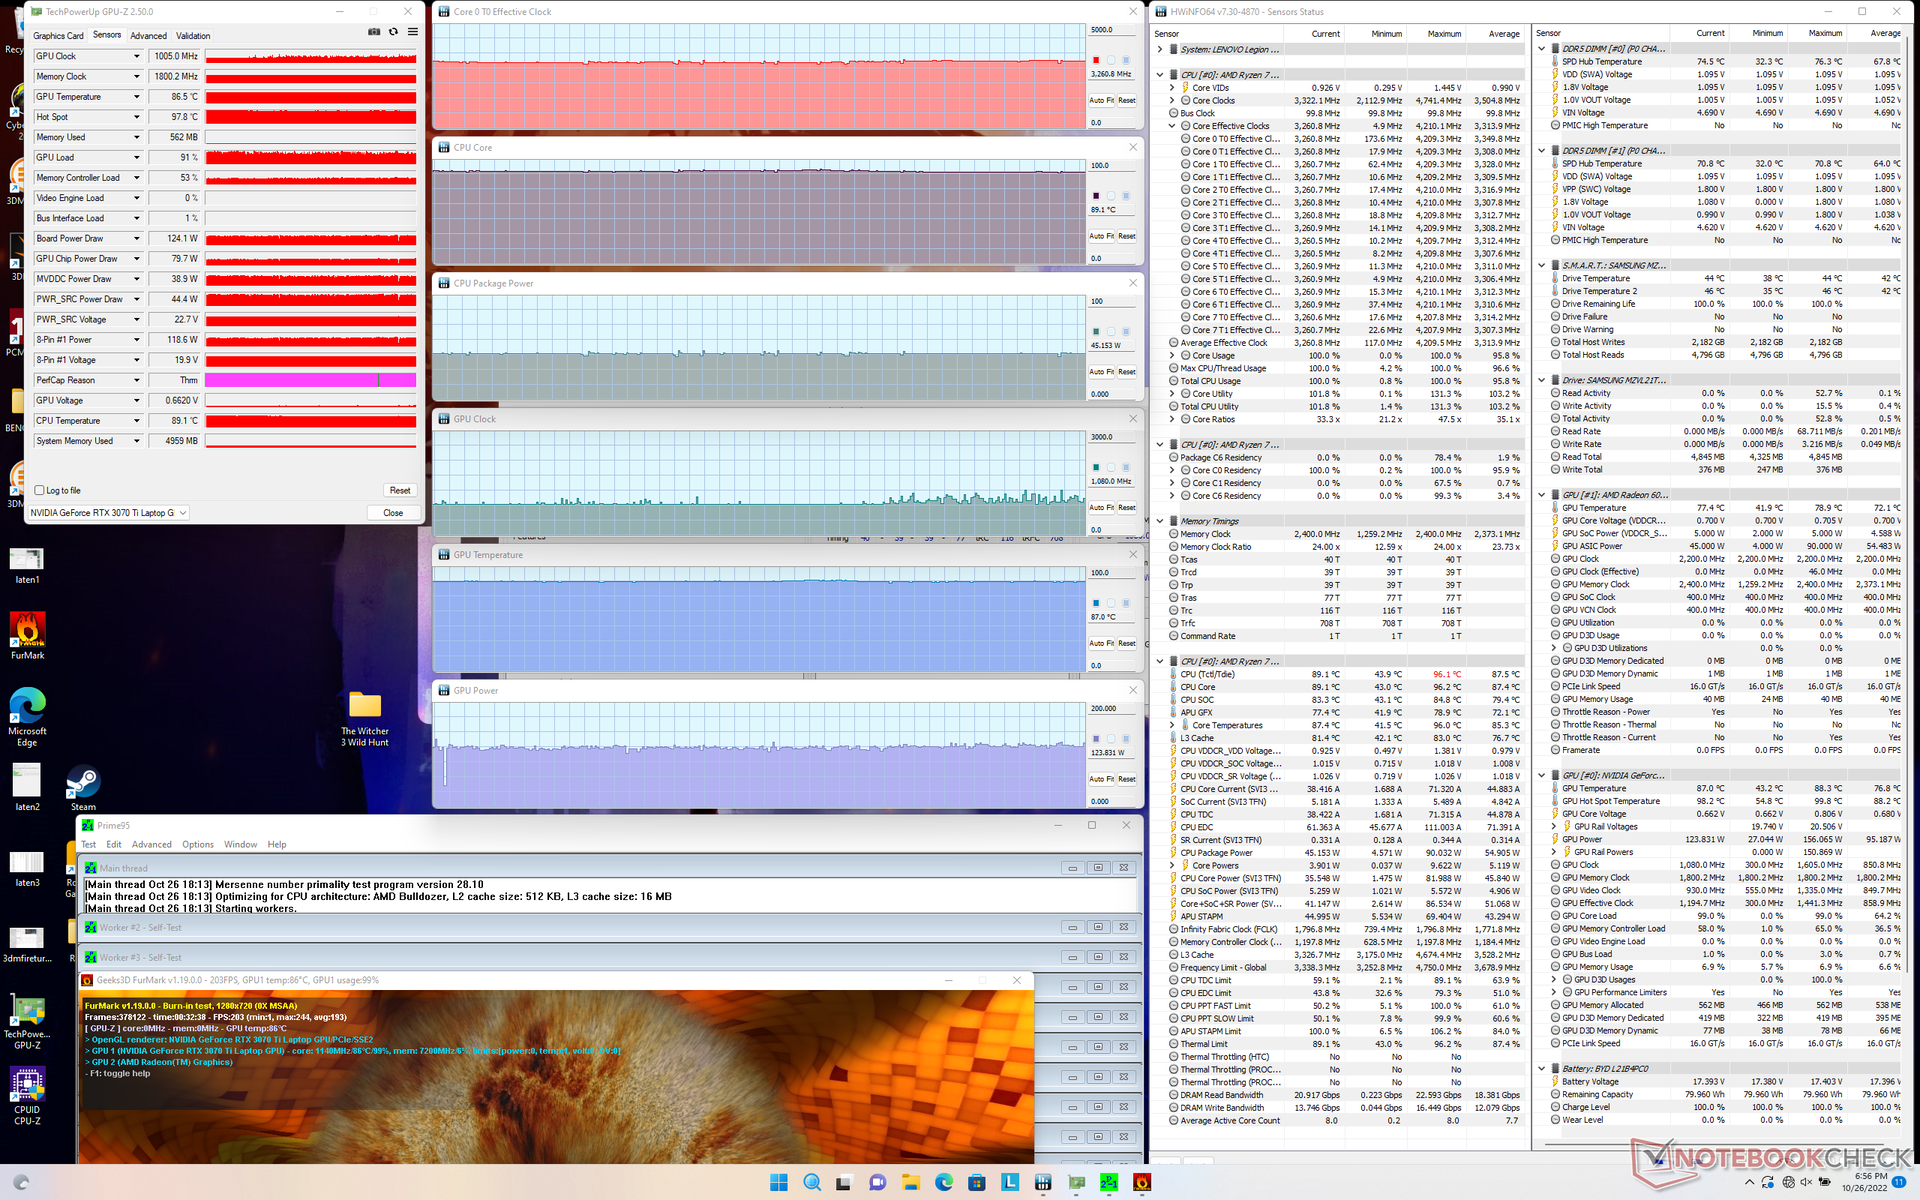
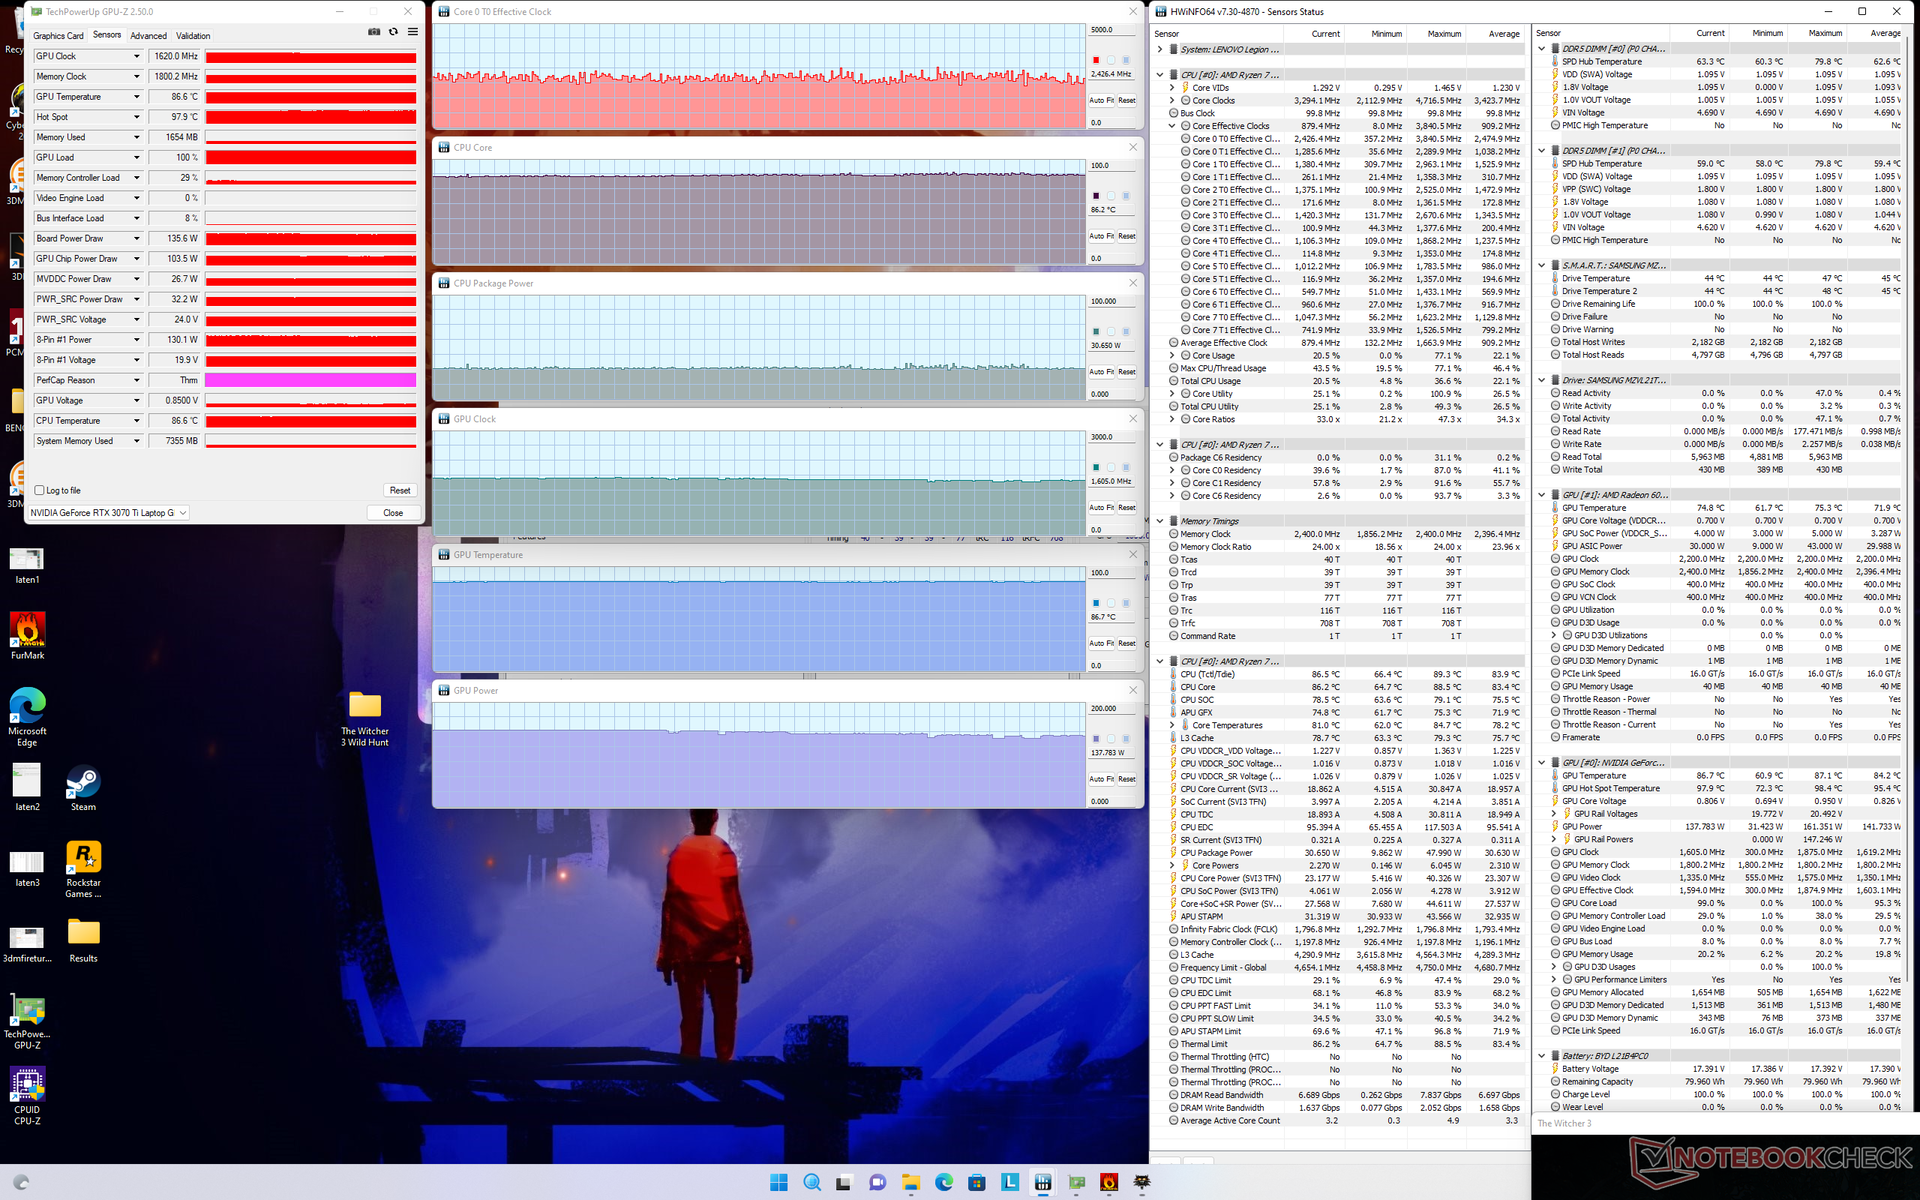
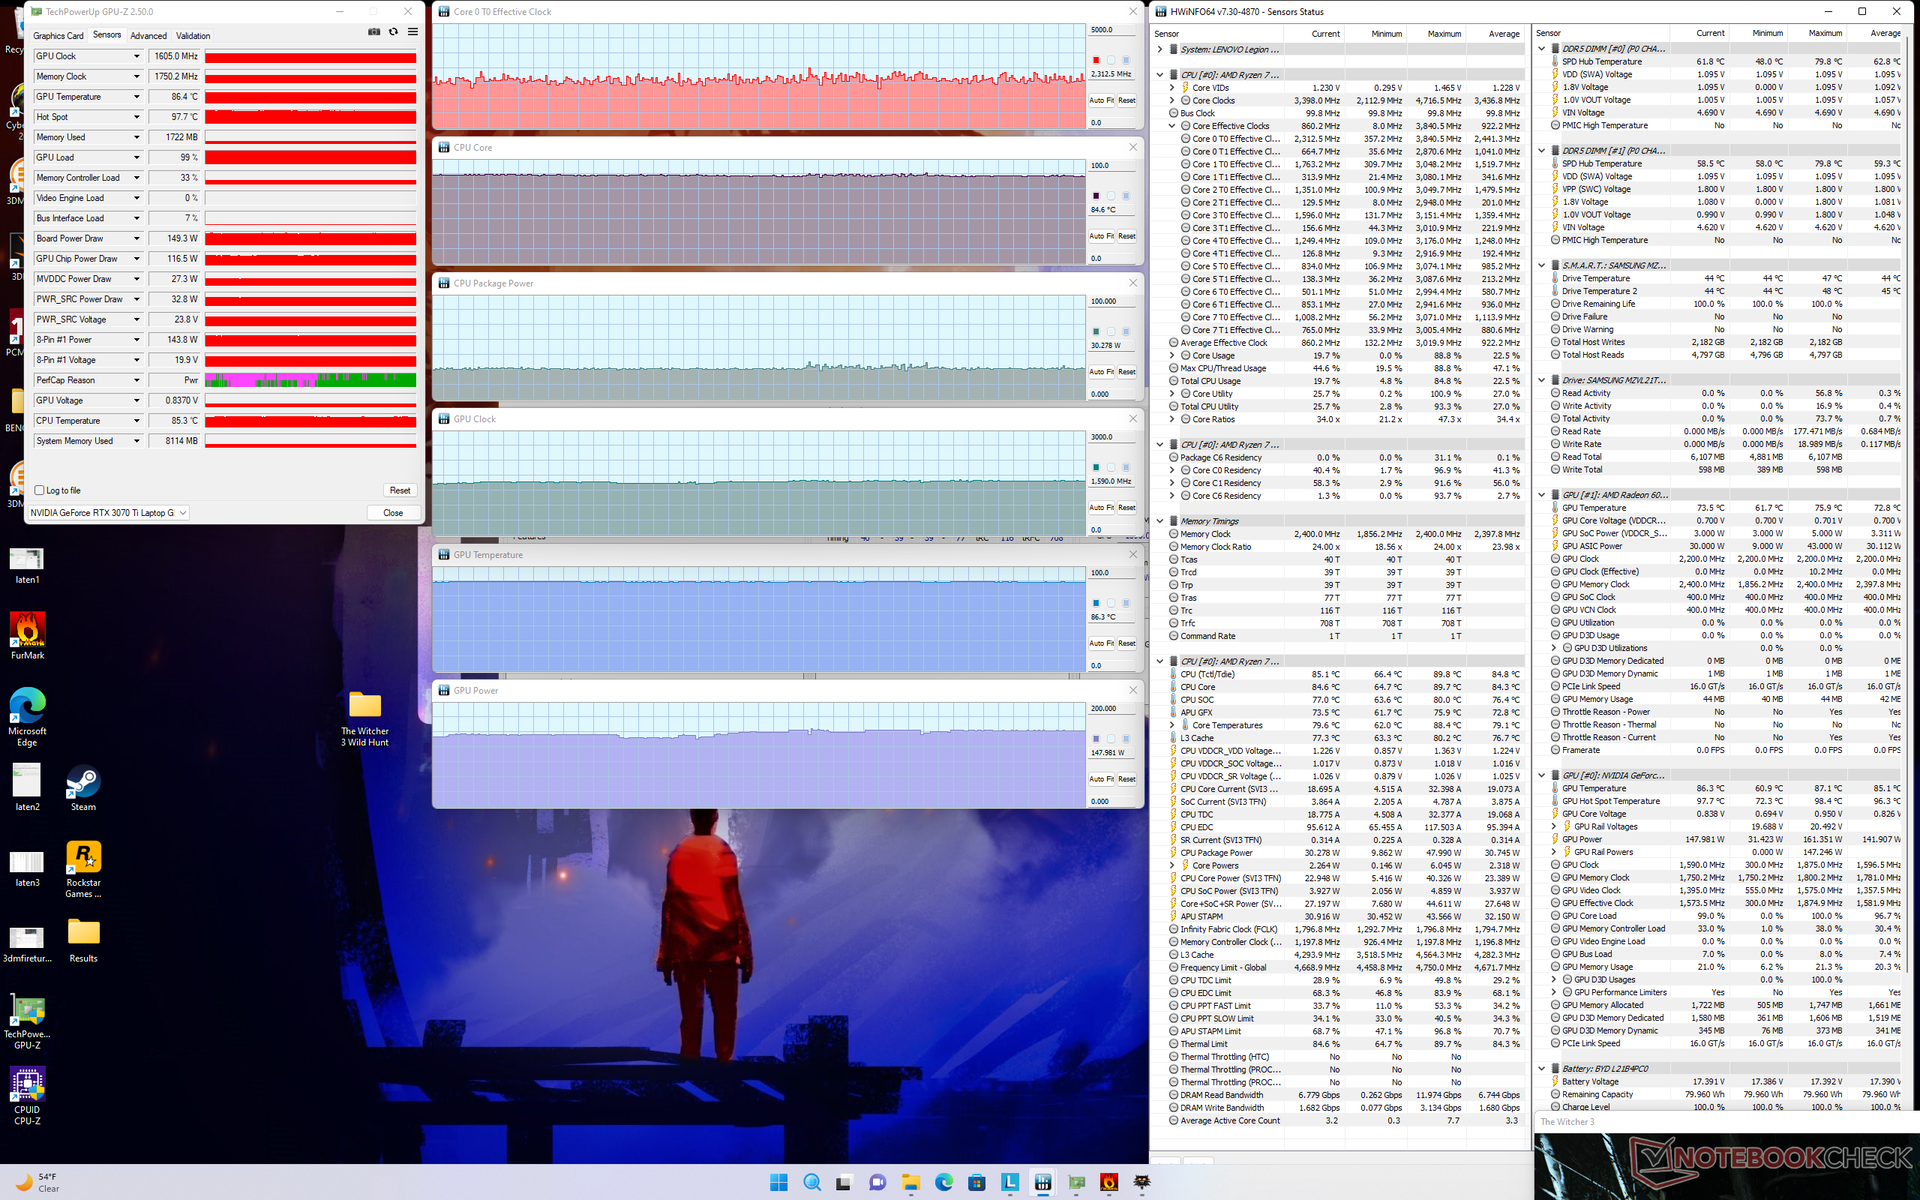
| CPU Clock (GHz) | GPU Clock (MHz) | Average CPU Temperature (°C) | Average GPU Temperature (°C) | |
| System Idle | -- | -- | 44 | 44 |
| Prime95 Stress | 4.1 | -- | 93 | 59 |
| Prime95 + FurMark Stress | 3.3 | 1005 | 89 | 87 |
| Witcher 3 Stress (Turbo on) | ~2.3 | 1620 | 86 | 87 |
| Witcher 3 Stress (Turbo off) | ~2.3 | 1605 | 85 | 86 |
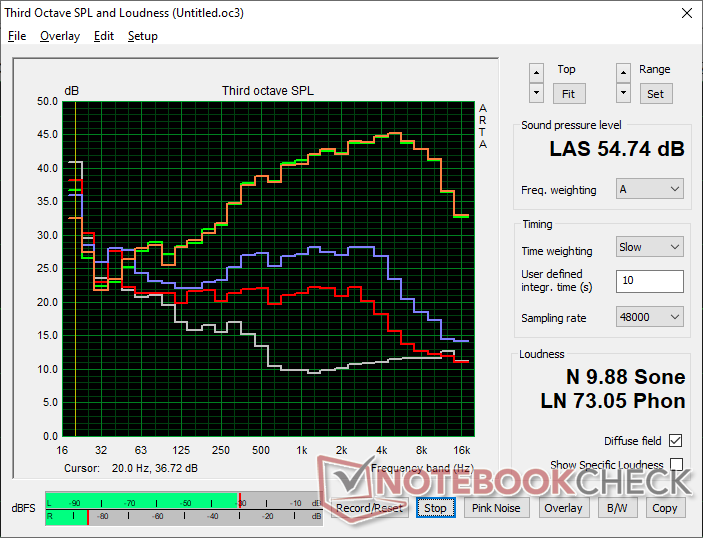
Speakers
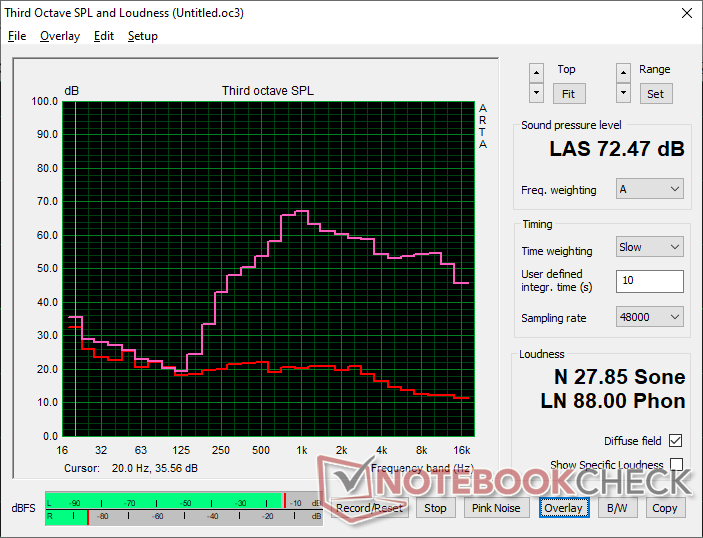
Lenovo Legion 5 Pro 16ARH7H RTX 3070 Ti audio analysis
(±) | speaker loudness is average but good (72.5 dB)
Bass 100 - 315 Hz
(-) | nearly no bass - on average 22.3% lower than median
(-) | bass is not linear (15.4% delta to prev. frequency)
Mids 400 - 2000 Hz
(±) | higher mids - on average 7.1% higher than median
(±) | linearity of mids is average (9.5% delta to prev. frequency)
Highs 2 - 16 kHz
(+) | balanced highs - only 1.9% away from median
(+) | highs are linear (3.6% delta to prev. frequency)
Overall 100 - 16.000 Hz
(-) | overall sound is not linear (30.3% difference to median)
Compared to same class
» 96% of all tested devices in this class were better, 2% similar, 3% worse
» The best had a delta of 6%, average was 18%, worst was 132%
Compared to all devices tested
» 88% of all tested devices were better, 3% similar, 9% worse
» The best had a delta of 4%, average was 24%, worst was 134%
Asus ROG Zephyrus M16 GU603H audio analysis
(±) | speaker loudness is average but good (80 dB)
Bass 100 - 315 Hz
(±) | reduced bass - on average 7.4% lower than median
(±) | linearity of bass is average (9.2% delta to prev. frequency)
Mids 400 - 2000 Hz
(±) | higher mids - on average 5.6% higher than median
(+) | mids are linear (4% delta to prev. frequency)
Highs 2 - 16 kHz
(+) | balanced highs - only 2.6% away from median
(+) | highs are linear (6.7% delta to prev. frequency)
Overall 100 - 16.000 Hz
(+) | overall sound is linear (12.1% difference to median)
Compared to same class
» 12% of all tested devices in this class were better, 4% similar, 84% worse
» The best had a delta of 6%, average was 18%, worst was 132%
Compared to all devices tested
» 9% of all tested devices were better, 2% similar, 88% worse
» The best had a delta of 4%, average was 24%, worst was 134%
Energy Management — Demanding Machine
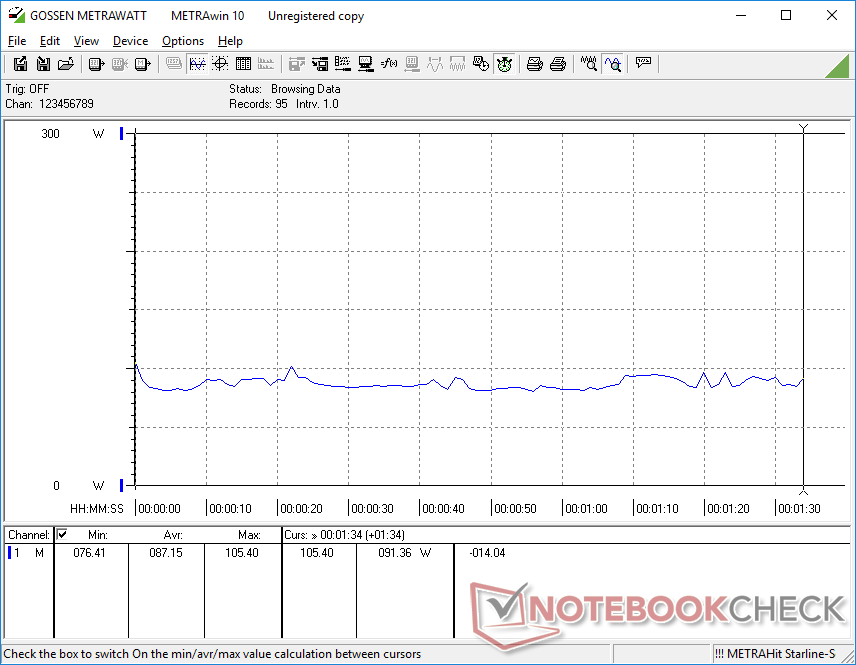
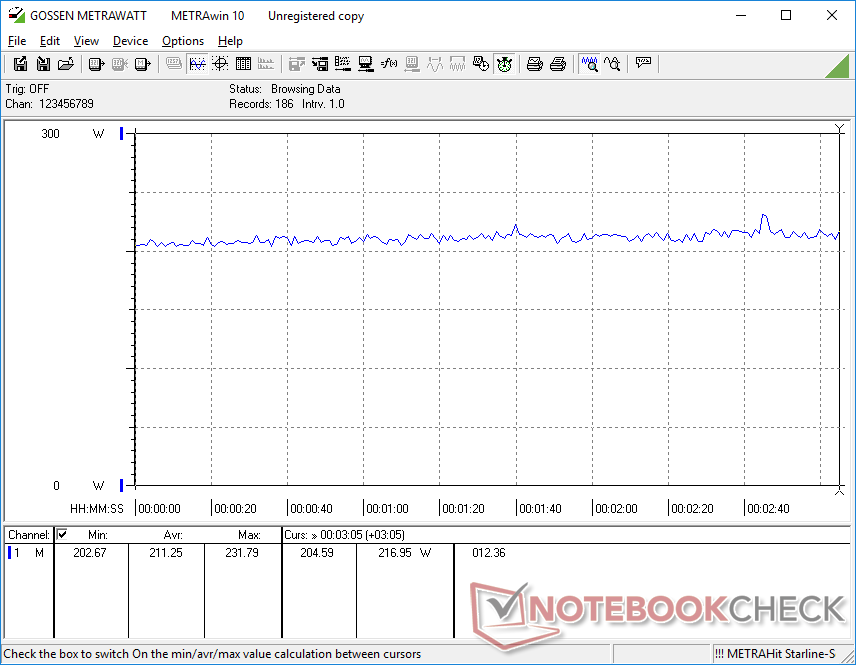
Power Consumption
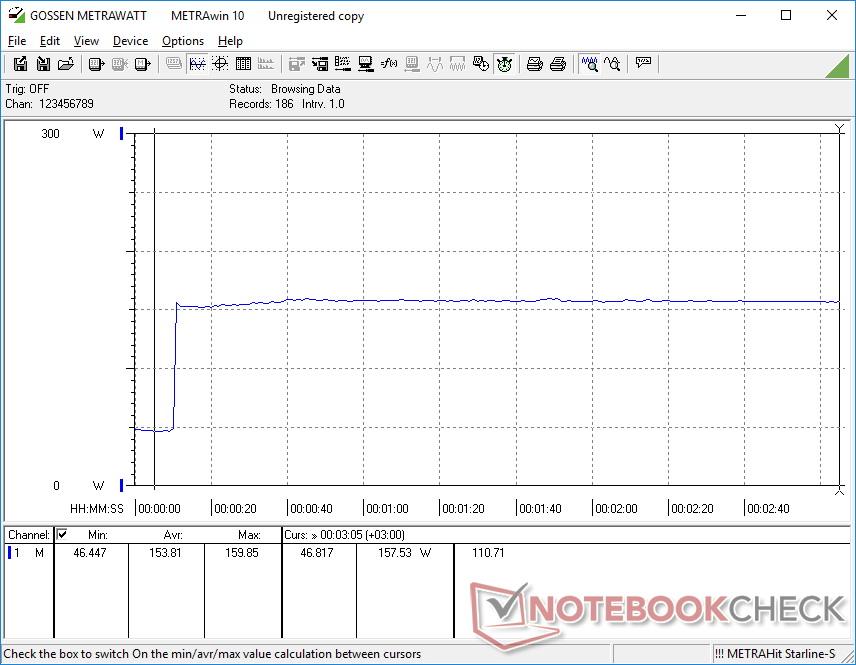
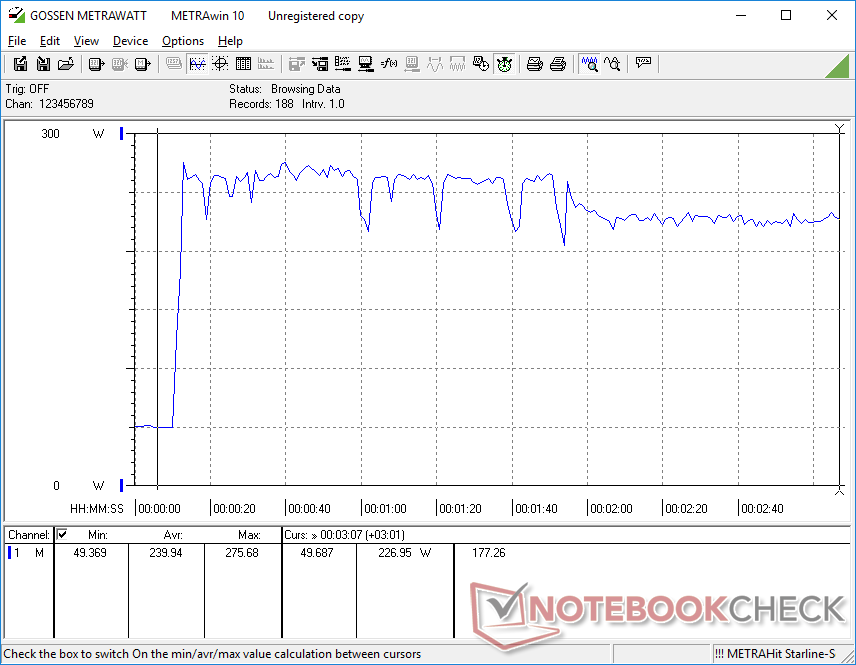
Though the Ryzen 7 6800H is about 25 percent slower than the Core i7-12700H, it's not necessarily 25 percent more power efficient. In fact, power consumption between the AMD and Intel versions of the Legion 5 Pro 16 is about 160 W on each system when running Prime95. Power consumption also remains fairly similar between them when running Witcher 3.
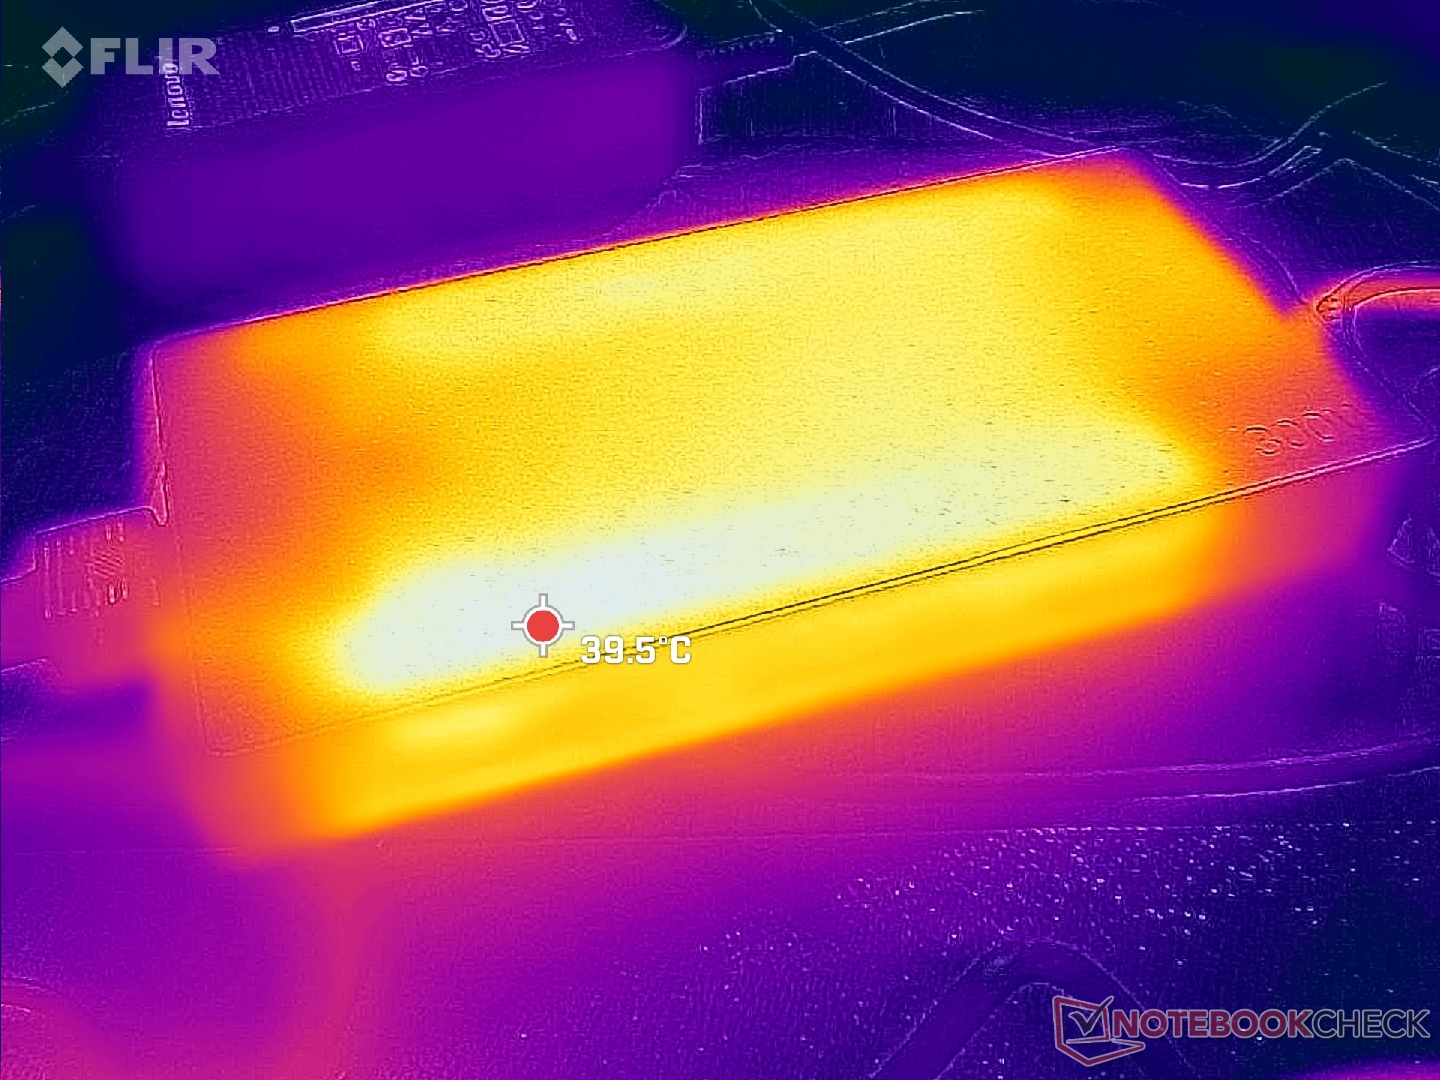
We're able to record a temporary maximum draw of 275 W from the large (~19.9 x 9.8 x 2.6 cm) 300 W AC adapter when both the CPU and GPU are at 100 percent utilization. The system can charge at a reasonable rate and run demanding loads simultaneously.
| Off / Standby | |
| Idle | |
| Load |
|
Key:
min: | |
| Lenovo Legion 5 Pro 16ARH7H RTX 3070 Ti R7 6800H, GeForce RTX 3070 Ti Laptop GPU, Samsung PM9A1 MZVL21T0HCLR, IPS, 2560x1600, 16" | Lenovo Legion 5 Pro 16IAH7H i7-12700H, GeForce RTX 3060 Laptop GPU, 2x Samsung PM9A1 MZVL21T0HCLR (RAID 0), IPS, 2560x1600, 16" | Asus ROG Zephyrus M16 GU603H i9-11900H, GeForce RTX 3070 Laptop GPU, Samsung PM9A1 MZVL22T0HBLB, IPS, 2560x1600, 16" | Lenovo Legion 7 16ARHA7 R9 6900HX, Radeon RX 6850M XT, Samsung PM9A1 MZVL22T0HBLB, IPS, 2560x1600, 16" | HP Victus 16-e0145ng R5 5600H, GeForce RTX 3050 Ti Laptop GPU, Samsung SSD PM981a MZVLB512HBJQ, IPS, 1920x1080, 16.1" | Dell G16 7620 i7-12700H, GeForce RTX 3060 Laptop GPU, WDC PC SN810 512GB, IPS, 2560x1600, 16" | |
|---|---|---|---|---|---|---|
| Power Consumption | -50% | 2% | -5% | 33% | -4% | |
| Idle Minimum * (Watt) | 9.7 | 22.8 -135% | 11 -13% | 9.9 -2% | 7 28% | 14.4 -48% |
| Idle Average * (Watt) | 14.8 | 26.5 -79% | 20 -35% | 22 -49% | 9 39% | 17.8 -20% |
| Idle Maximum * (Watt) | 45.8 | 41 10% | 30 34% | 23.1 50% | 15 67% | 31.5 31% |
| Load Average * (Watt) | 87.2 | 191 -119% | 111 -27% | 94.4 -8% | 93 -7% | 101.2 -16% |
| Witcher 3 ultra * (Watt) | 209 | 194.7 7% | 156 25% | 249 -19% | 134.5 36% | 176.9 15% |
| Load Maximum * (Watt) | 275.3 | 238 14% | 197 28% | 276 -0% | 185 33% | 242.9 12% |
* ... smaller is better
Power Consumption Witcher 3 / Stresstest
Power Consumption external Monitor
Battery Life — Not Too Bad
WLAN runtime is almost an hour longer than on the Intel version of the Legion 5 Pro 16 when set to the Balanced power profile with the iGPU active. The improved battery life is likely due to the more efficient AMD CPU when running less loads as shown by our Power Consumption section above. Nonetheless, it is still relatively short at just under 4.5 hours compared to almost 8 hours on the Asus ROG Zephyrus M16.
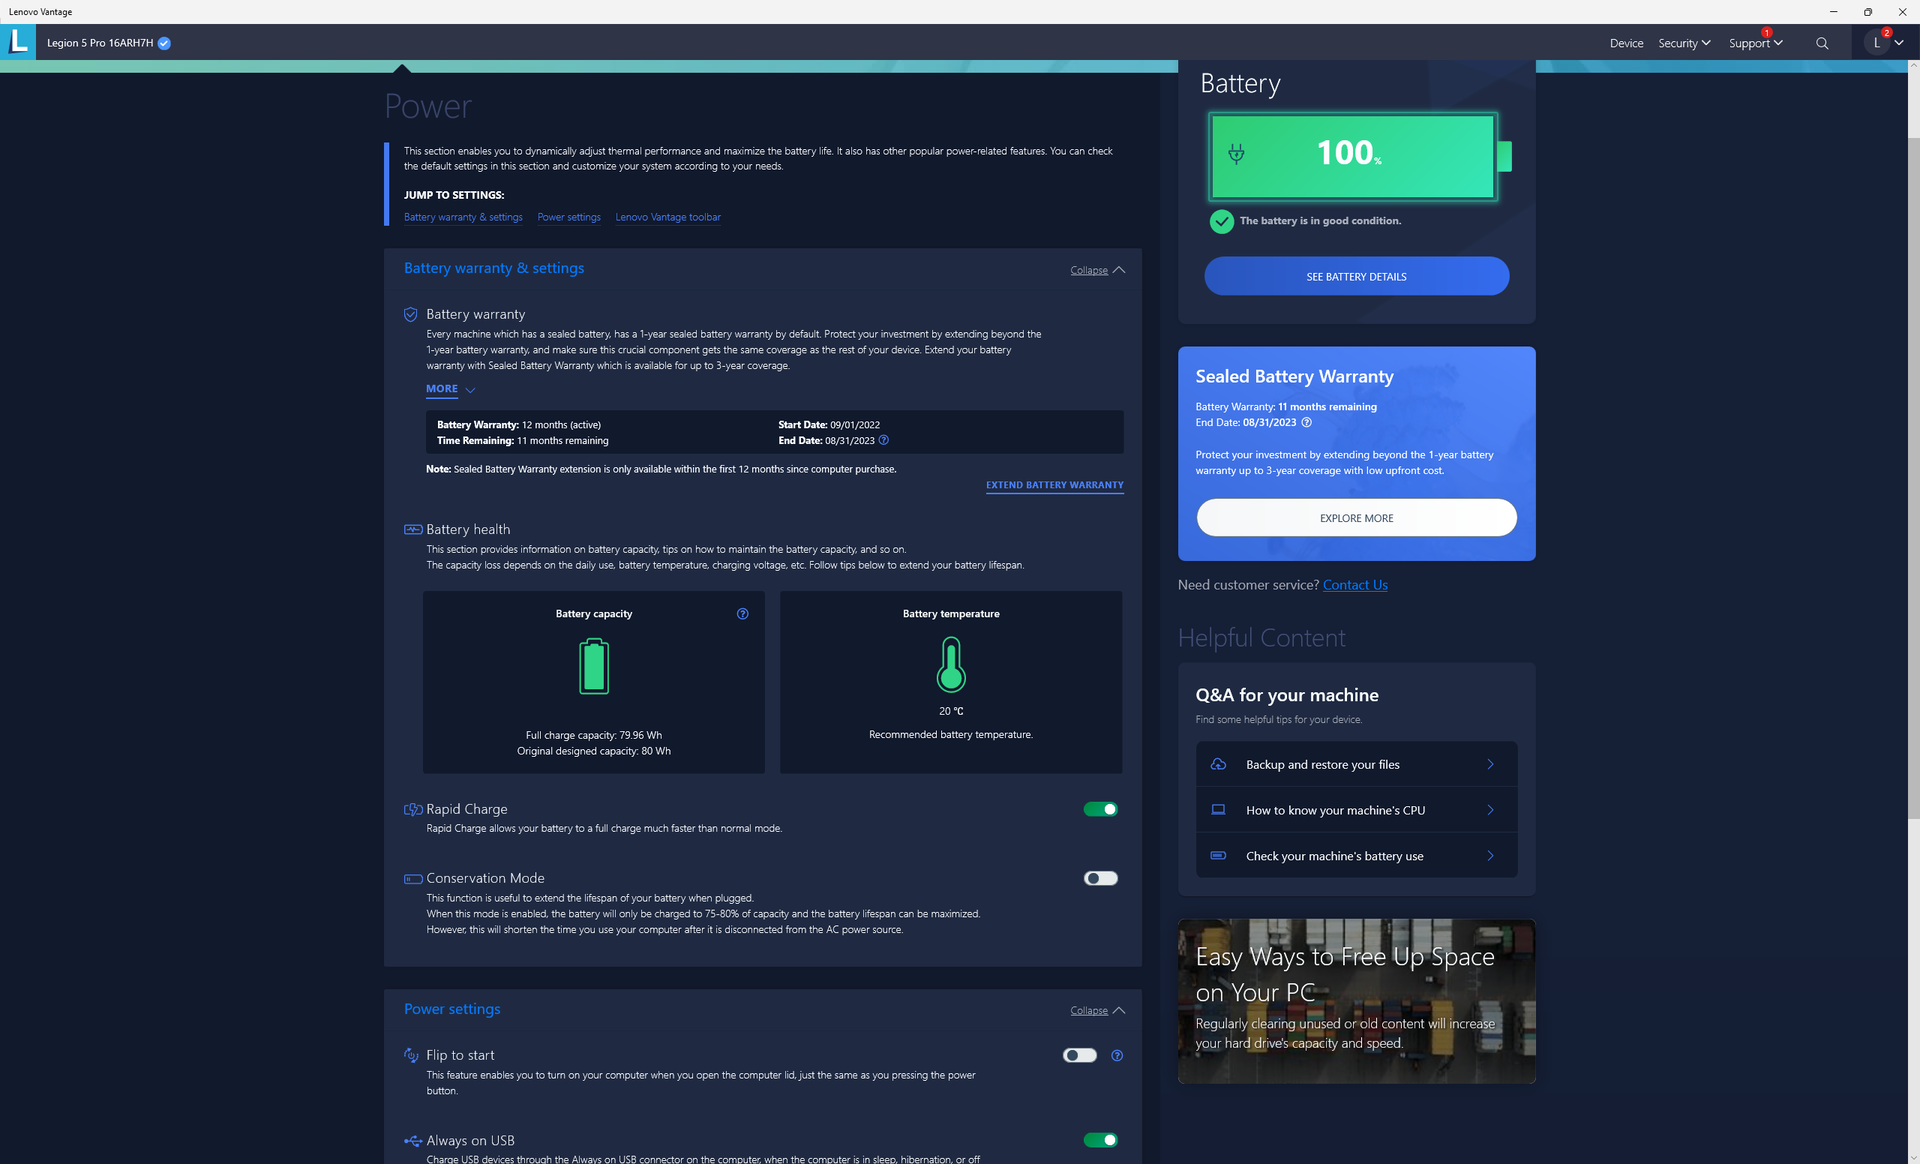
Charging from empty to full capacity takes just under an hour when the Rapid Charge feature is enabled. Most other laptops take between 1.5 to 2 hours.
| Lenovo Legion 5 Pro 16ARH7H RTX 3070 Ti R7 6800H, GeForce RTX 3070 Ti Laptop GPU, 80 Wh | Lenovo Legion 5 Pro 16IAH7H i7-12700H, GeForce RTX 3060 Laptop GPU, 80 Wh | Asus ROG Zephyrus M16 GU603H i9-11900H, GeForce RTX 3070 Laptop GPU, 90 Wh | Lenovo Legion 7 16ARHA7 R9 6900HX, Radeon RX 6850M XT, 99 Wh | HP Victus 16-e0145ng R5 5600H, GeForce RTX 3050 Ti Laptop GPU, 70 Wh | Dell G16 7620 i7-12700H, GeForce RTX 3060 Laptop GPU, 84 Wh | |
|---|---|---|---|---|---|---|
| Battery runtime | -18% | 75% | 66% | 61% | 14% | |
| WiFi v1.3 (h) | 4.4 | 3.6 -18% | 7.7 75% | 7.3 66% | 7.1 61% | 5 14% |
| H.264 (h) | 4.1 | |||||
| Witcher 3 ultra (h) | 2.1 | |||||
| Load (h) | 0.6 | 1.6 | 1.8 | 0.7 | ||
| Reader / Idle (h) | 13.3 | 4.9 | 7.1 |
Pros
Cons
Verdict — Just A Tad Faster
The Ryzen 7 6800H and 150 W GeForce RTX 3070 Ti are each about 10 percent faster than the Ryzen 7 5800H and 140 W GeForce RTX 3070 on last year's Legion 5 Pro. The 2022 refresh is therefore merely just a minor upgrade over the 2021 model with no major external or internal changes.
If you already own the 2021 Lenovo Legion 5 Pro 16, then you're not missing much by skipping the 2022 version. Lenovo will likely fully refresh the series in the next one to two years for more major improvements.
The closest alternatives to the Legion 5 Pro 16 at the moment are the Dell G16 and the Asus ROG Zephyrus M16 each with similar 165 Hz refresh rate and H-series CPU options. The Asus model is significantly smaller and lighter, but it runs even warmer and is just as loud. Meanwhile, the Dell model runs quieter but its size and core temperatures are slightly warmer and heavier than the already warm and heavy Lenovo.
For future revisions, we would love to see cooler core temperatures and a more straightforward software for controlling performance. At the current version of Vantage, users must enable four separate settings individually (MUX, GPU Overclock, Vantage Performance, and Windows Performance modes) in order to fully exploit the power of the laptop which can get annoying when switching between different power modes.
Price and Availability
Lenovo Legion 5 Pro 16ARH7H RTX 3070 Ti
- 10/29/2022 v7 (old)
Allen Ngo
Price comparison
