For gamers and content creators: Lenovo Legion 5 Pro Notebook Review
Last year, Lenovo delivered an exceptionally impressive and extremely popular high-end gaming laptop in the Legion 5 Pro. We have already tested the Nvidia’s RTX 3070 Ti version, so we thought we’d now take a closer look at the slightly cheaper 120W RTX 3060 version. For gamers who prioritize value for money and who are satisfied with running at 60 FPS on the latest games in QHD, or creatives who focus on CPU performance, Lenovo has put together a convincing combination here. Competitors will include both other RTX-3060 laptops with comparable Intel i7 or AMD Ryzen 7 CPUs, such as the recently tested HP Omen 16, or significantly more expensive notebooks such as the Gigabyte Aero 16 with an i9 on board. The latter will be hard pressed to develop its performance potential to the same degree.
Potential Competitors in Comparison
Rating | Date | Model | Weight | Height | Size | Resolution | Price |
|---|---|---|---|---|---|---|---|
| 86.6 % v7 (old) | 07 / 2022 | Lenovo Legion 5 Pro 16IAH7H i7-12700H, GeForce RTX 3060 Laptop GPU | 2.6 kg | 27 mm | 16.00" | 2560x1600 | |
| 85.5 % v7 (old) | 05 / 2022 | HP Omen 16-b1090ng i7-12700H, GeForce RTX 3070 Ti Laptop GPU | 2.3 kg | 23 mm | 16.10" | 2560x1440 | |
| 86 % v7 (old) | 04 / 2022 | HP Omen 16-c0077ng R7 5800H, Radeon RX 6600M | 2.3 kg | 26 mm | 16.10" | 2560x1440 | |
| 84.7 % v7 (old) | 03 / 2022 | Gigabyte Aero 16 YE5 i9-12900HK, GeForce RTX 3080 Ti Laptop GPU | 2.3 kg | 22.4 mm | 16.00" | 3840x2400 | |
| 86.7 % v7 (old) | 03 / 2022 | Alienware x14 i7 RTX 3060 i7-12700H, GeForce RTX 3060 Laptop GPU | 1.8 kg | 14.5 mm | 14.00" | 1920x1080 | |
| 88 % v7 (old) | 03 / 2022 | Lenovo Legion 5 Pro 16 G7 i7 RTX 3070Ti i7-12700H, GeForce RTX 3070 Ti Laptop GPU | 2.6 kg | 26.6 mm | 16.00" | 2560x1600 |
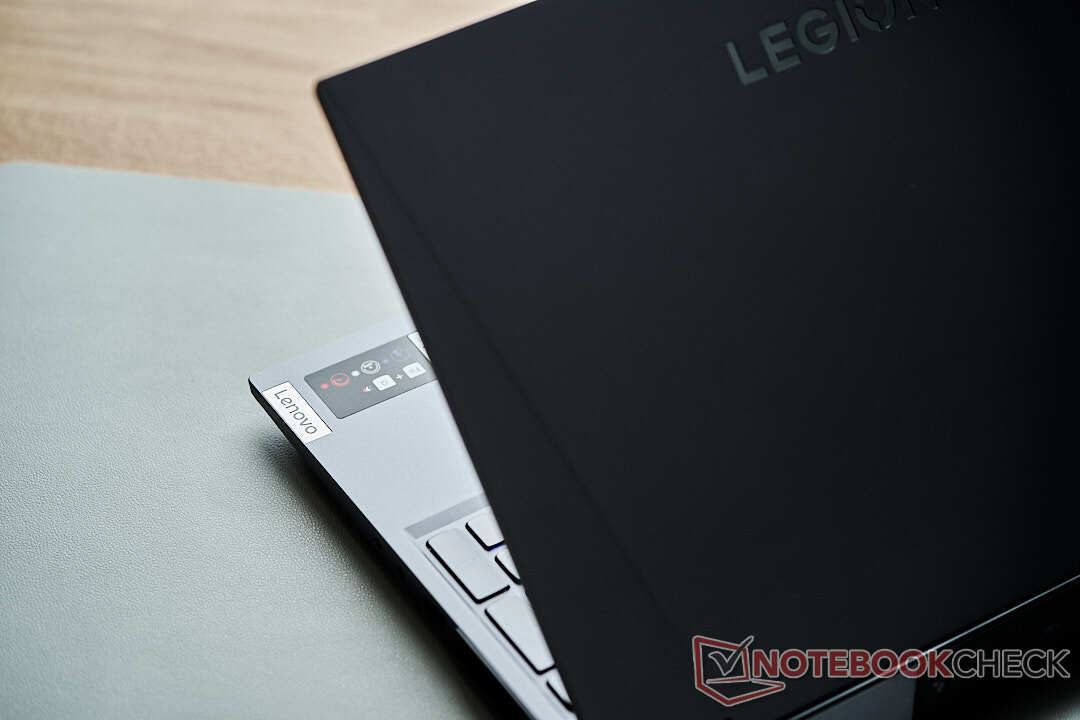
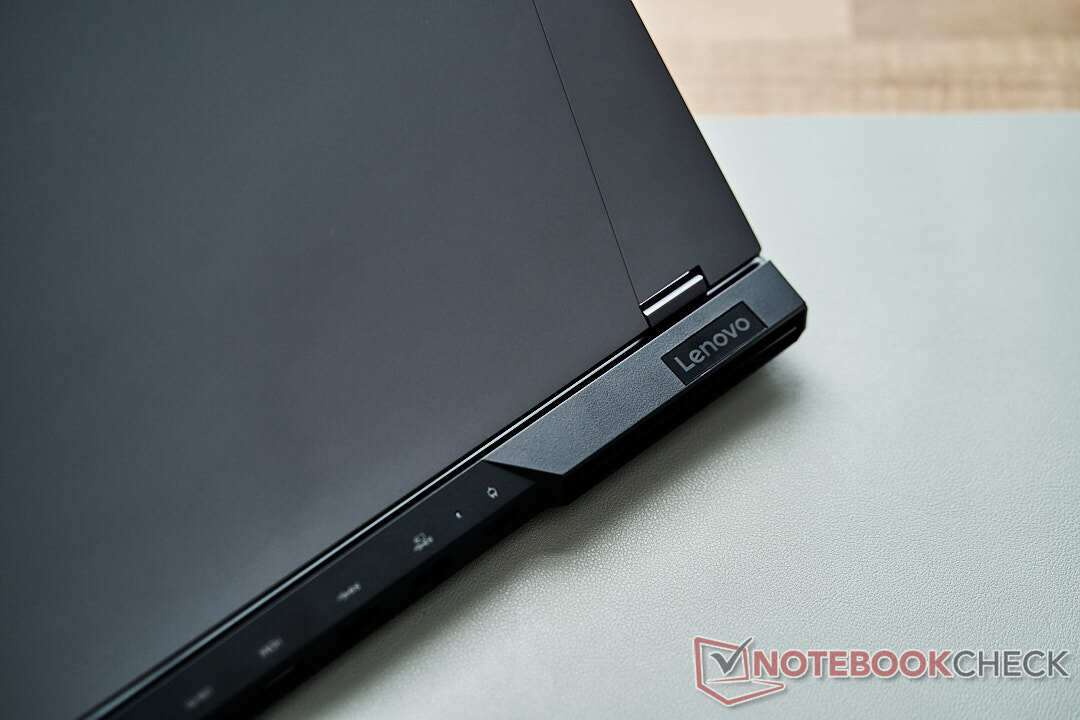
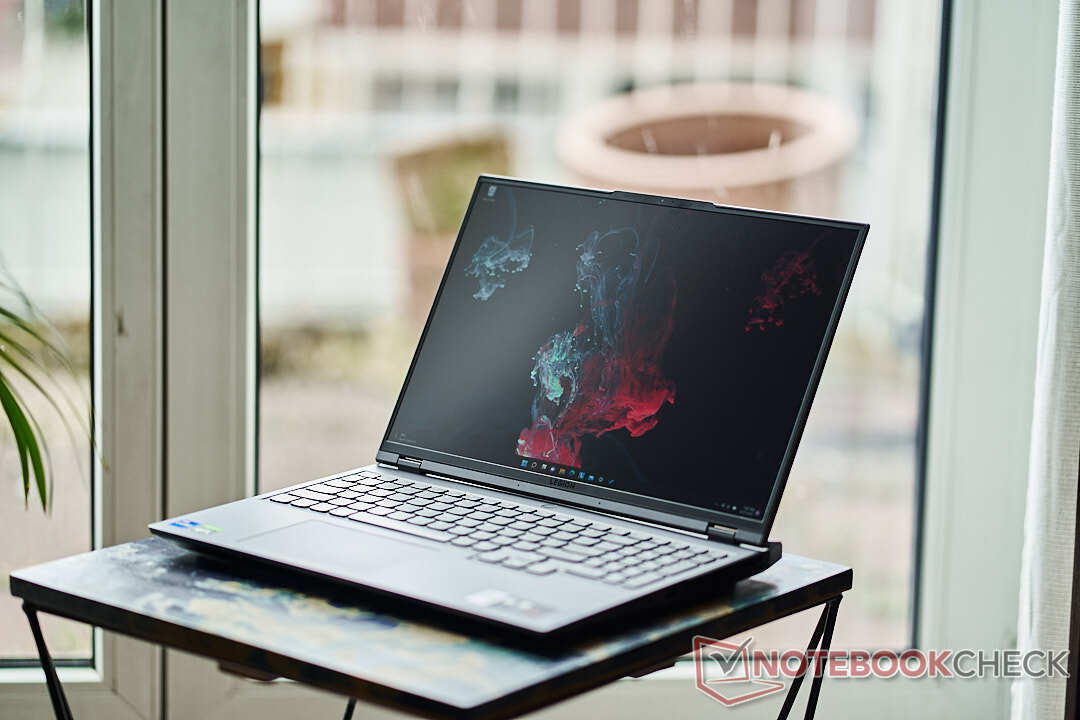
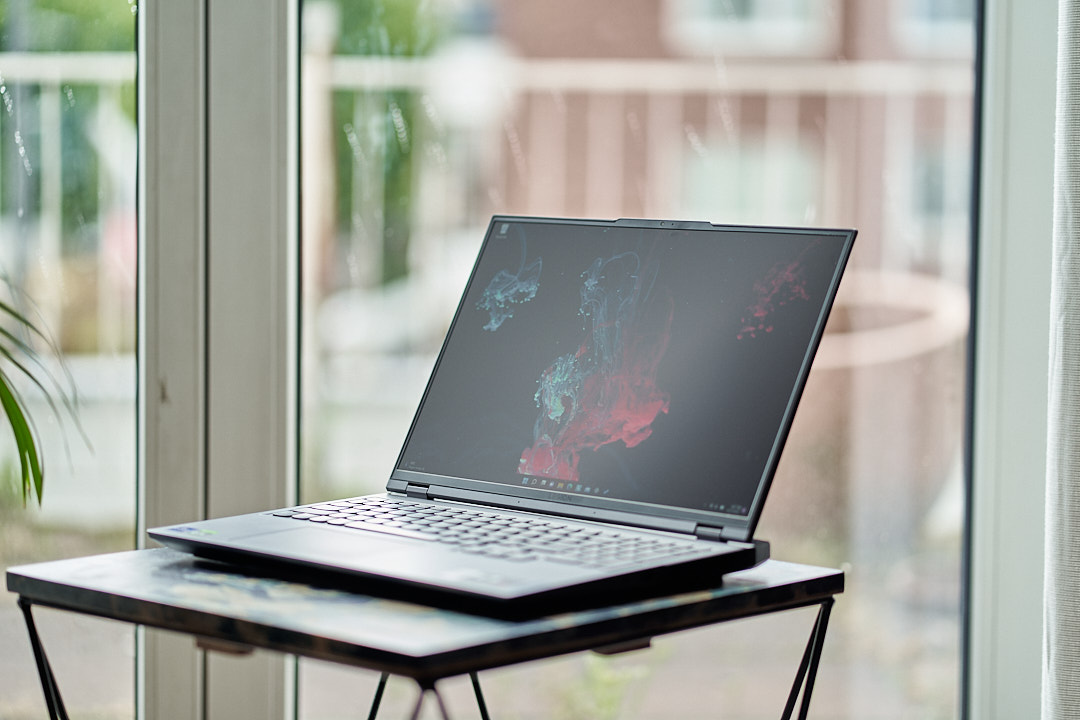
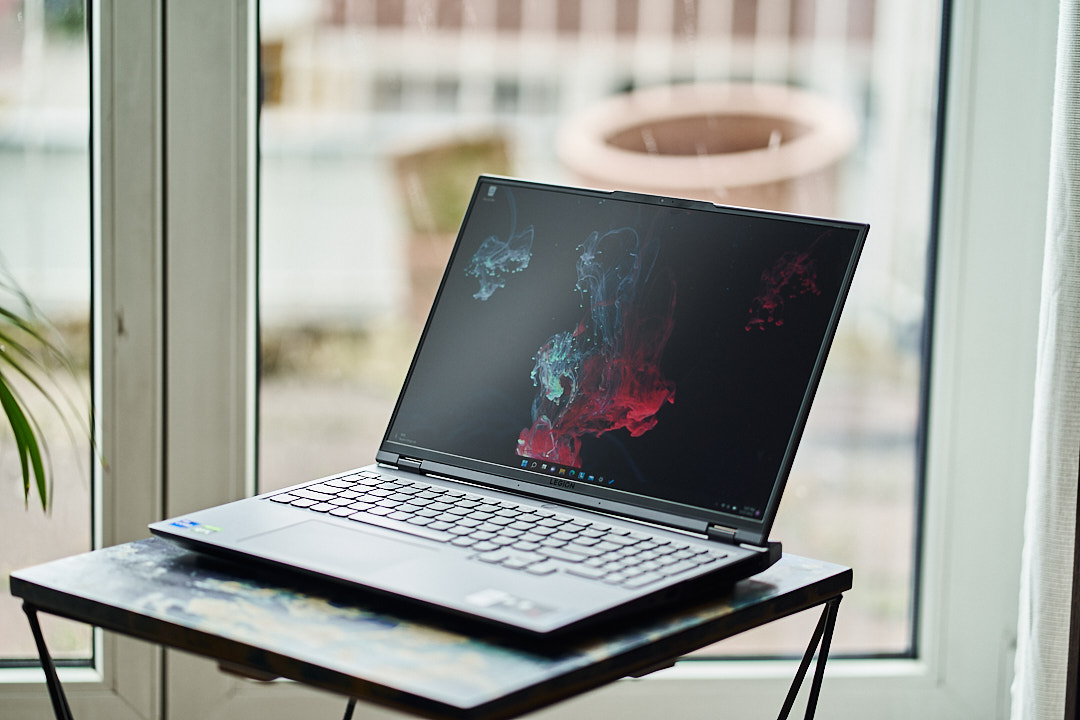
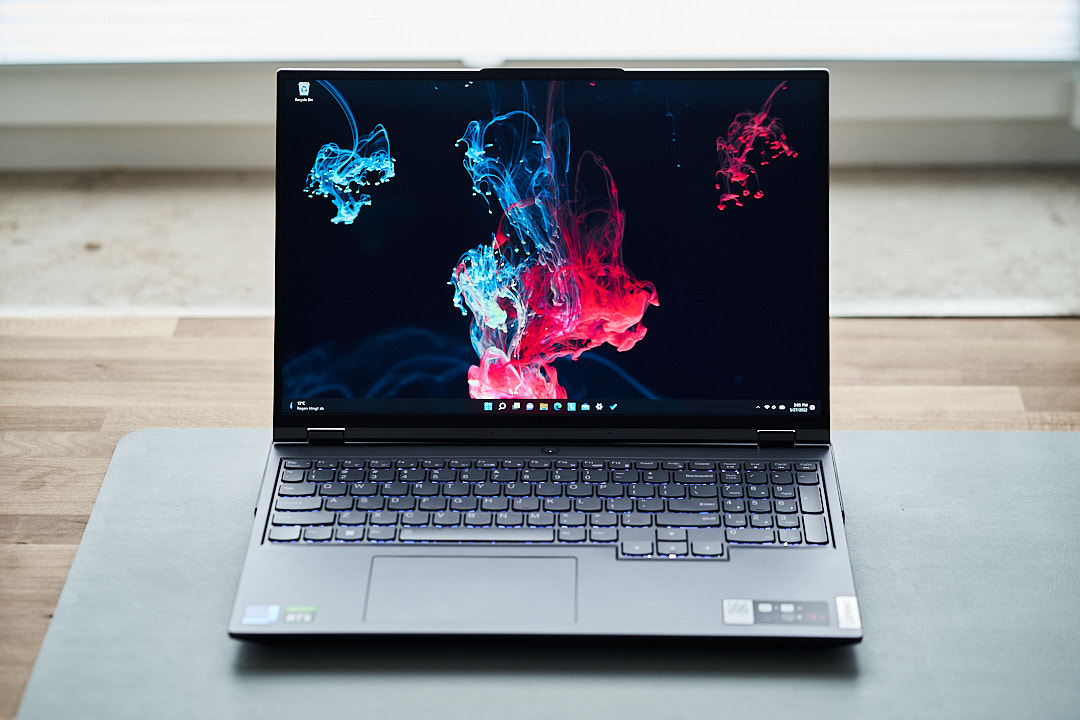
Case - Legion 5 Pro with plenty of Metal
Lenovo provides a solid metal case for the Legion 5 Pro. Its workmanship is flawless, the 16-inch gaming laptop oozes quality, and neither casual or deliberate handling results in flexing surfaces or evokes any untoward creaking noises. Even the lid, which is often an Achilles heel in many competitive laptops, tested firm leaving the display rigidly in the desired position.
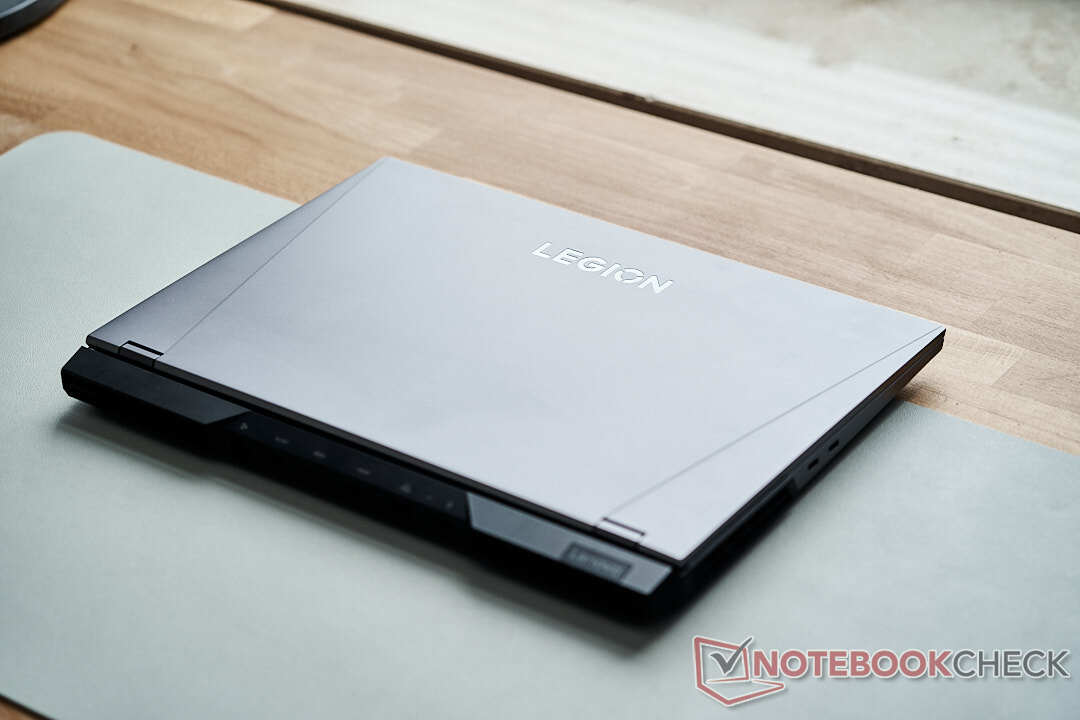
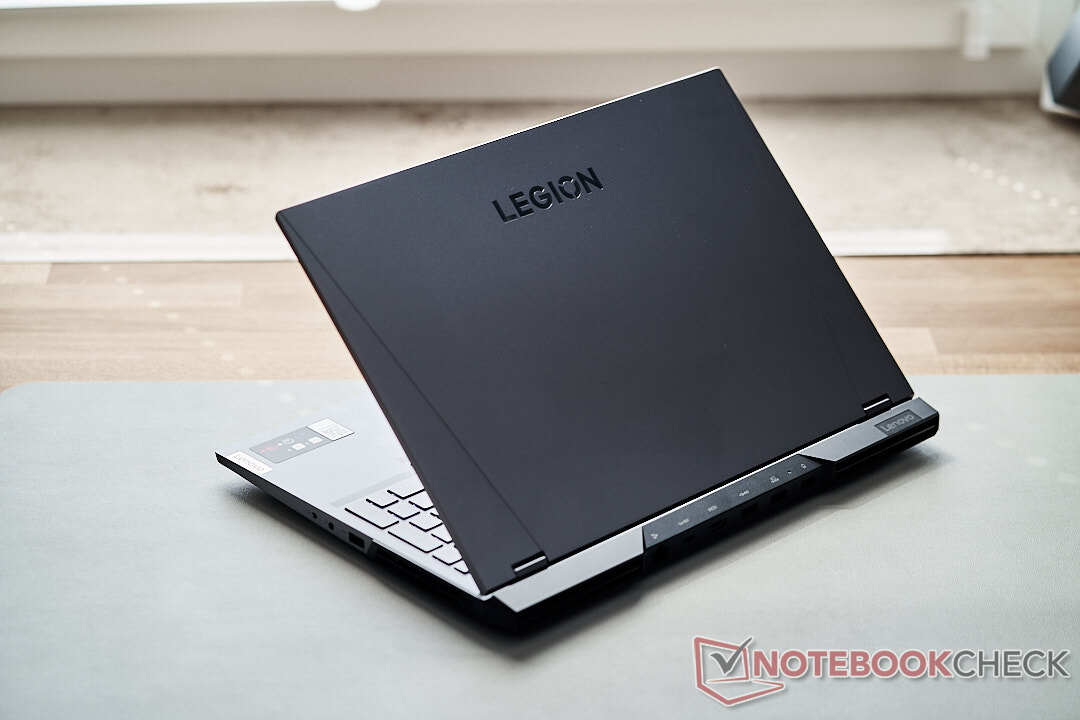
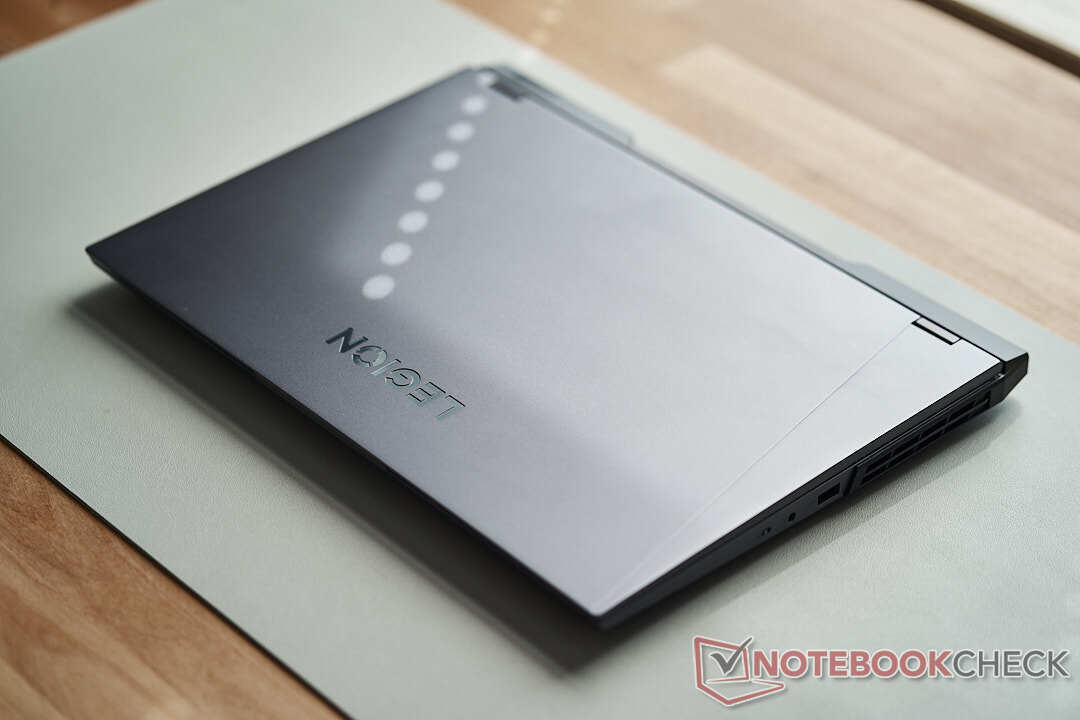
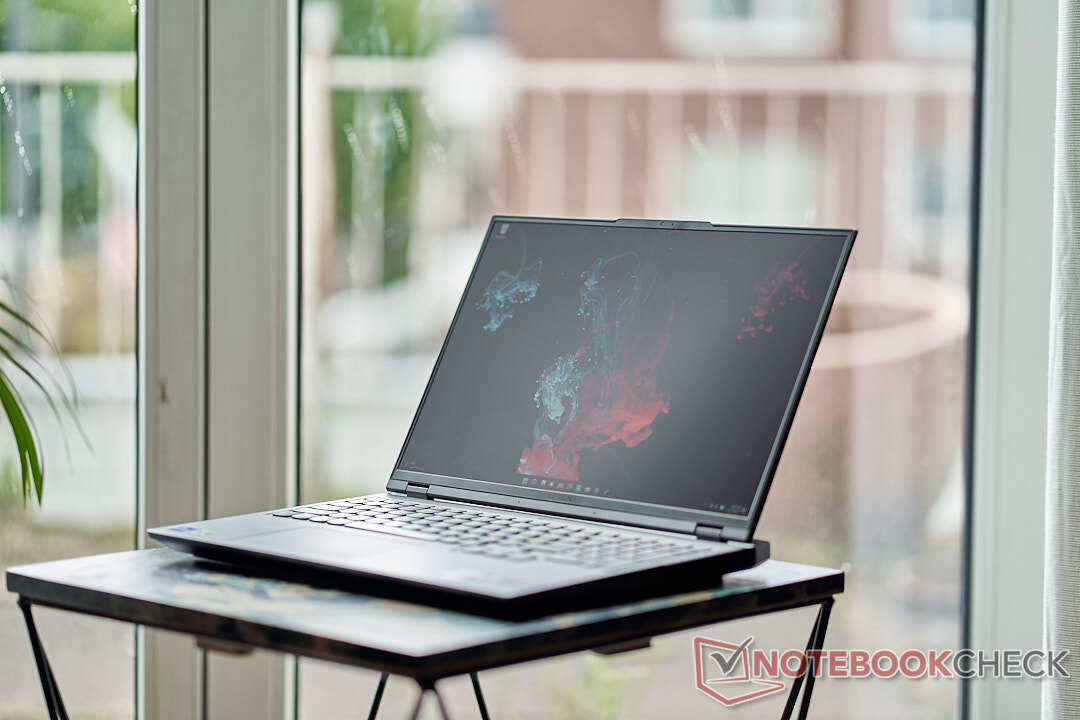
In terms of weight, the heavy use of metallic materials is noticeable. The Legion is one of the heaviest of any comparable devices. The cooling vents are spread right across the base of the unit. Lenovo is bucking the trend of presenting ever thinner and smaller devices and has clearly focused on robustness and cooling potential for this potent exposition of hardware.
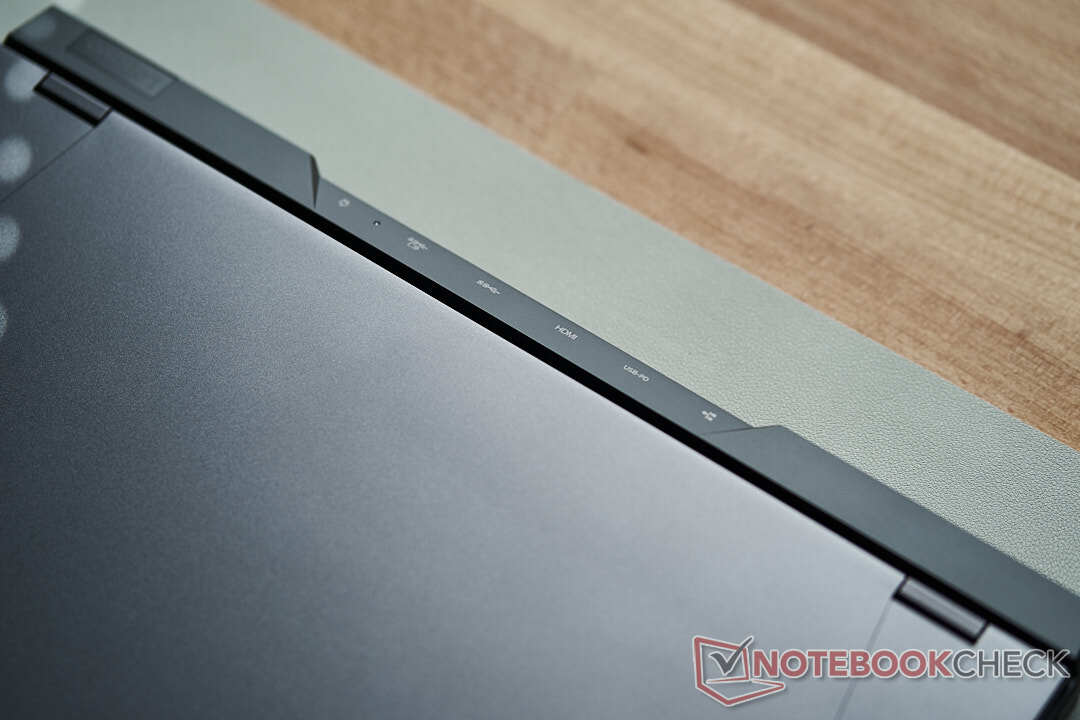
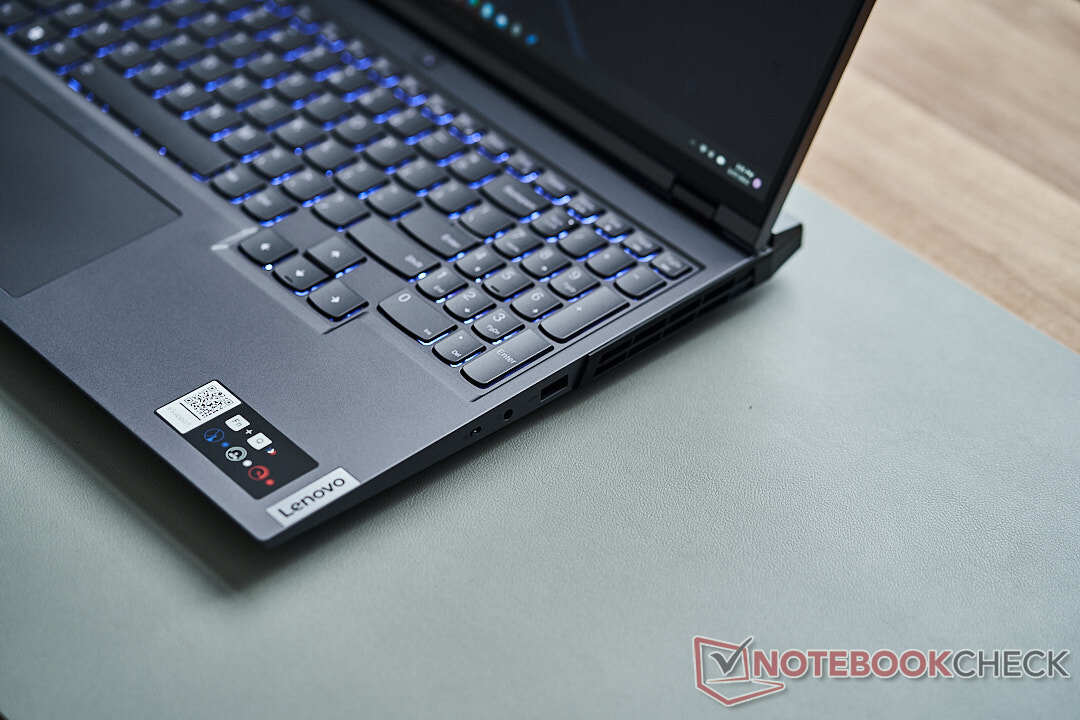
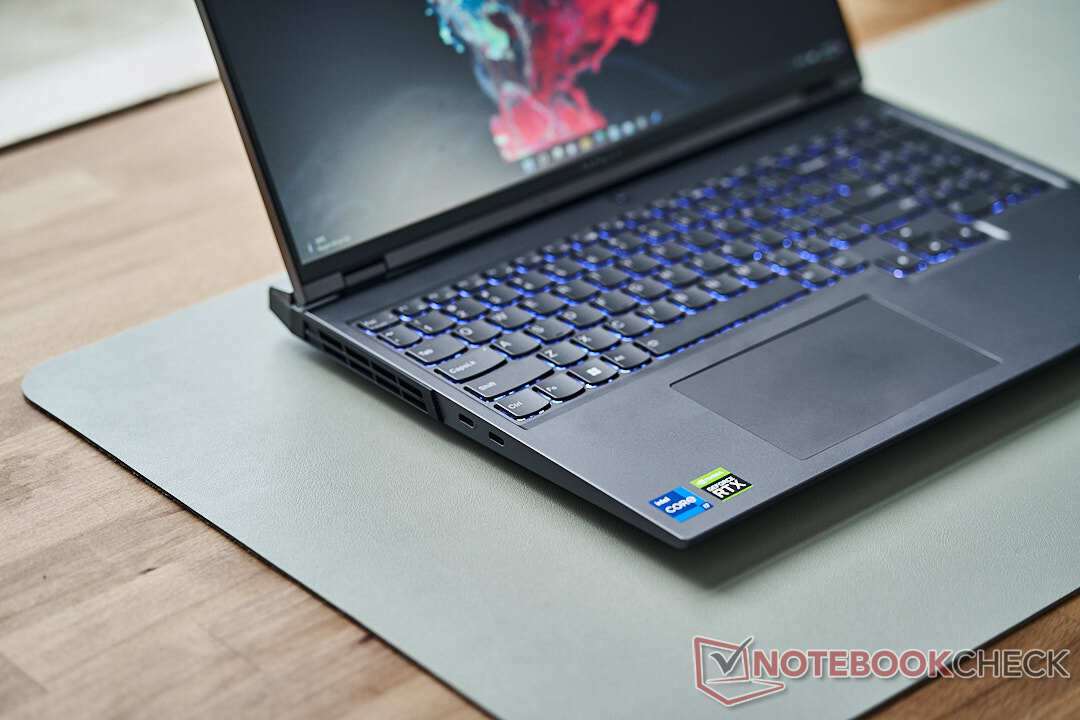
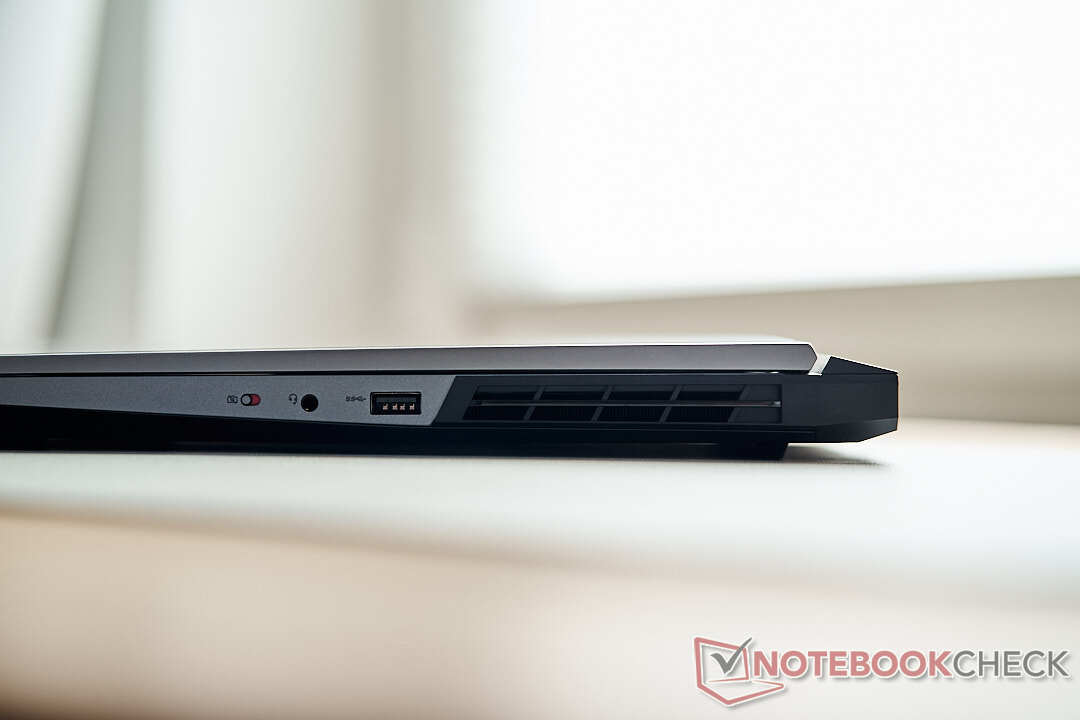
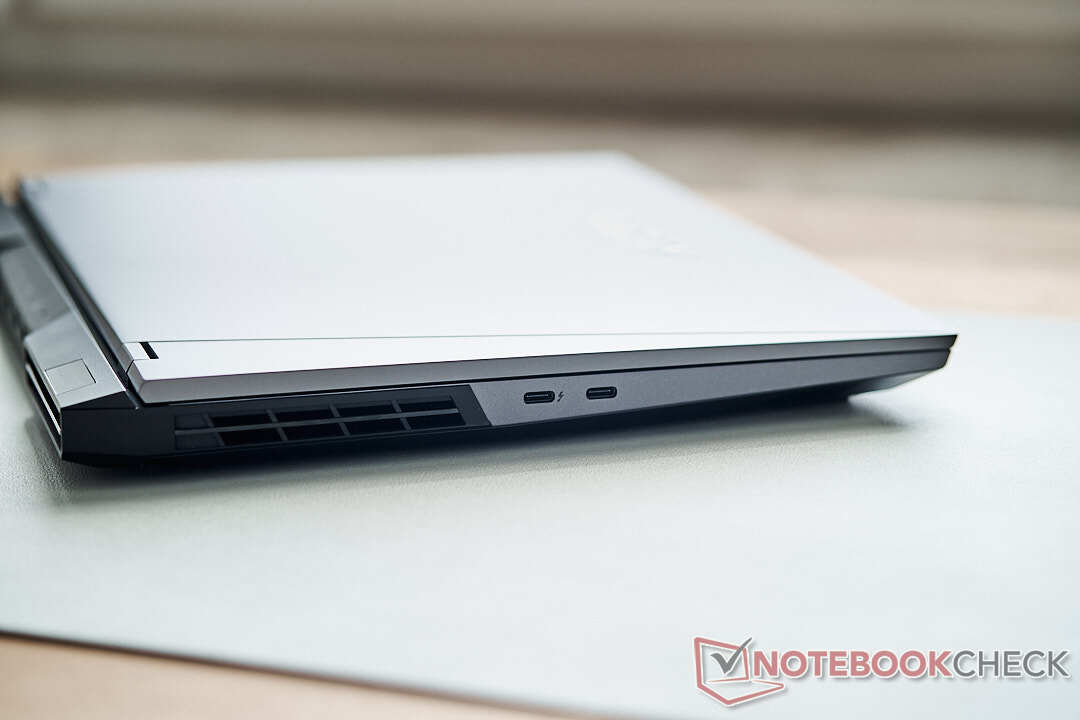
Connectivity – It’s all there with Thunderbolt 4 and USB-C Power Delivery
Lenovo also sets a good example in terms of both the type and number of ports and slots that are distributed over three sides of the case. Ergonomically it favors right-handed users providing just a single USB-A port (USB 3.2 Gen 1) on the right-hand side of the case. This reduces the risk of getting tangled up in display or network cables with a mouse. By way of example, this port is ideal for wireless dongles for peripheral devices.
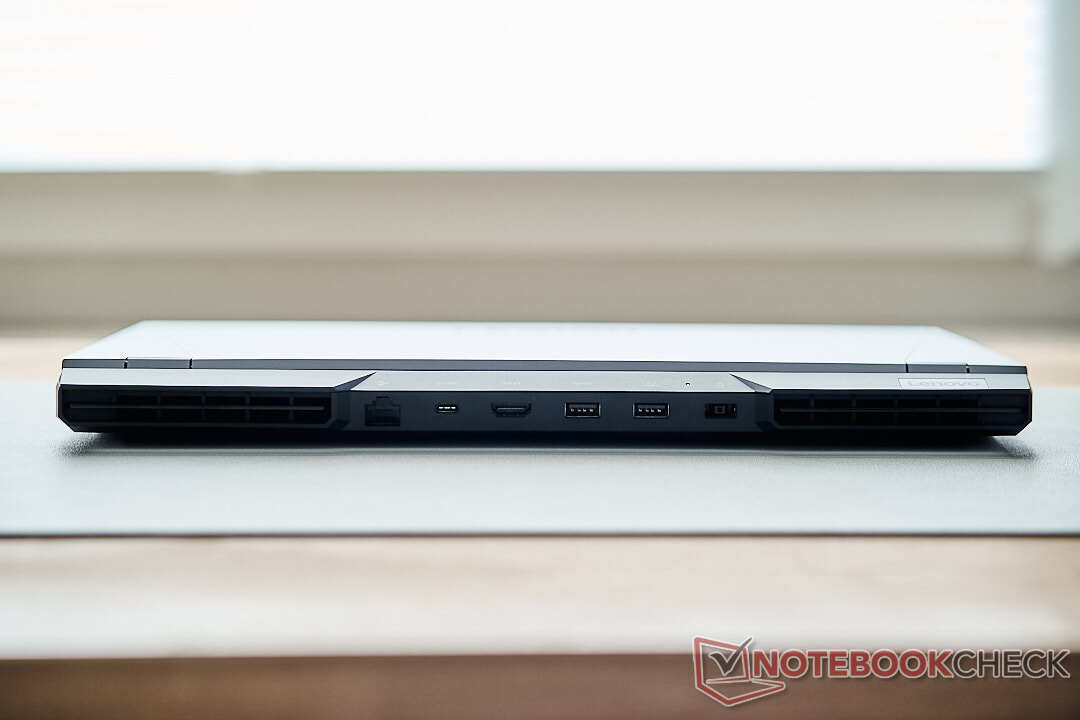
To the left there are two state-of-the-art USB-C ports, one is Thunderbolt 4 and the other conforms to the USB 3.2 Gen 2 standard with full 20 Gbit/s and Displayport 1.4 support. The rest of the ports can be found on the back of the case, where Lenovo has fully exploited the available space. In addition to two other USB-A 3.2 Gen-1 ports, there is a third USB-C port, via which the laptop can also be charged at up to 135 W. Connectivity is topped off by an HDMI port and an RJ45 port for wired networks. The power plug slot is also at the back of the case.
Given the variety and placement of ports and slots, the Legion 5 Pro can be readily deployed as a desktop replacement device with multiple monitors and peripherals, and as a mobile device it is equipped for any situation. There’s also the opportunity to limit the use of dongles to the DisplayPort adapter.
Communication
The Legion 5 Pro is equipped with the extremely popular Intel AX211 WLAN module. With Wi-Fi 6E on board it doesn’t just provide the most current Wi-Fi standard. The card delivers up to its full potential and occupies top position among comparable devices. It’s not just that data transfer speeds are impressive, but also that it doesn’t disappoint as a gaming notebook in everyday use. With stable and fast transfer rates, even large game downloads are of no consequence. A Gigabit Ethernet port is available for wired connections. Here we would have preferred the faster 2.5 GbE port, given that it is already installed in many competing devices. The speed advantages in commensurate networks or when connecting to NAS systems are enormous and would have been well matched to the rest of the hardware configuration.
| Networking | |
| iperf3 transmit AX12 | |
| Alienware x14 i7 RTX 3060 | |
| Average Intel Wi-Fi 6E AX211 (1003 - 1501, n=4) | |
| HP Omen 16-c0077ng | |
| iperf3 receive AX12 | |
| Average Intel Wi-Fi 6E AX211 (1178 - 1623, n=4) | |
| Alienware x14 i7 RTX 3060 | |
| HP Omen 16-c0077ng | |
| iperf3 receive AXE11000 6GHz | |
| Lenovo Legion 5 Pro 16IAH7H | |
| Average of class Gaming (975 - 1775, n=37, last 2 years) | |
| Average Intel Wi-Fi 6E AX211 (700 - 1857, n=226) | |
| iperf3 transmit AXE11000 6GHz | |
| Lenovo Legion 5 Pro 16IAH7H | |
| Average of class Gaming (723 - 2355, n=38, last 2 years) | |
| Average Intel Wi-Fi 6E AX211 (385 - 1851, n=226) | |
Webcam
When it comes to the webcam, Lenovo offers standard fare; unfortunately, no better than we have been accustomed to with gaming laptops for years. The image quality is undoubtedly acceptable for one or the other zoom call, but here we would have liked to see across the board improvements in color rendition, resolution and dynamic range.

")
")
Accessories
Apart from the laptop itself, only the power supply is in the box. This has been standardized for all Legion 5 Pro configurations, so our RTX-3060 model also gets the somewhat oversized 300 W power supply. The additional 1 kg (~2.2 lb) weight just for the power supply should be taken into account if you plan to be on the road with the Legion.
Maintenance
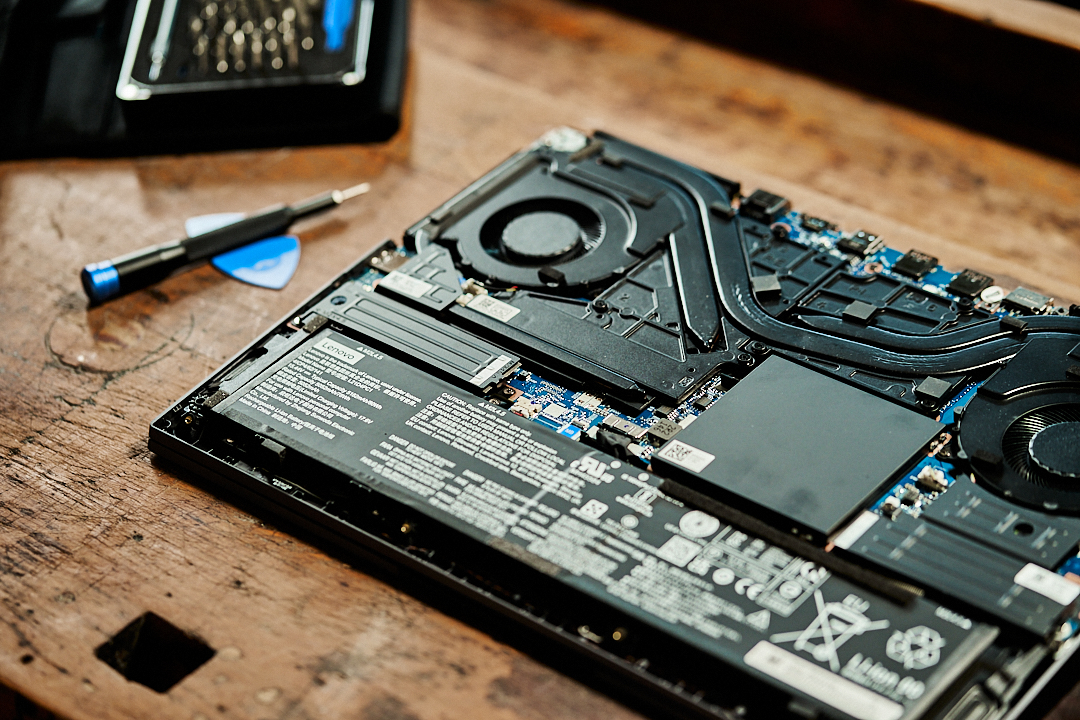
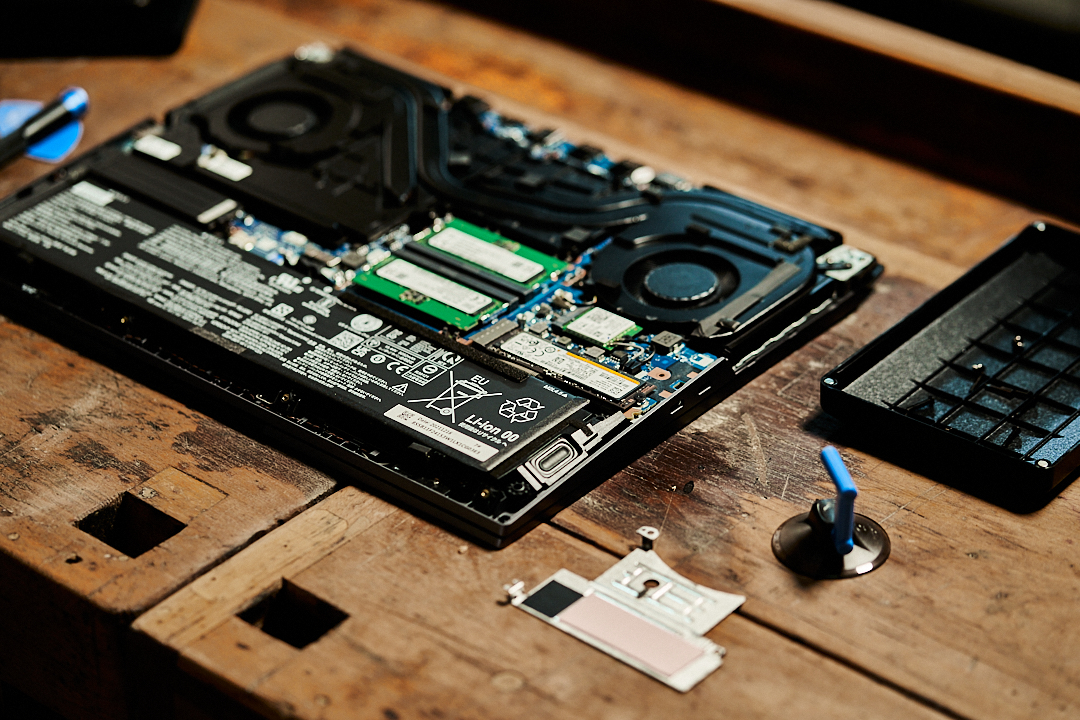
For repairs or upgrades, the Legion requires ten Philips head screws to be loosened. Lenovo uses three different sizes, so you should take care to remember where the different screws belong. Removing the base plate requires more effort than we would like. Particularly the plastic elements in the back third of the plate are secured very tightly. We progressively worked our way from front center to the back of the plate with appropriate aids. To loosen the plastic covers, it might be best to use appropriate tools from iFixit (affiliate link). Alternatively, one could use a plastic credit card with deftly applied force until they come loose.
Inside the case, we can expect a tidy picture and above all an insight into the elaborate cooling solution for the powerful hardware. In principle, users have access to the two M.2 slots and RAM. To cool them, massive heat sinks cover the fast drives, and the RAM is under a plastic cover.
Warranty
In Germany, the Legion 5 Pro Lenovo is covered by a basic 2-year carry-in warranty.
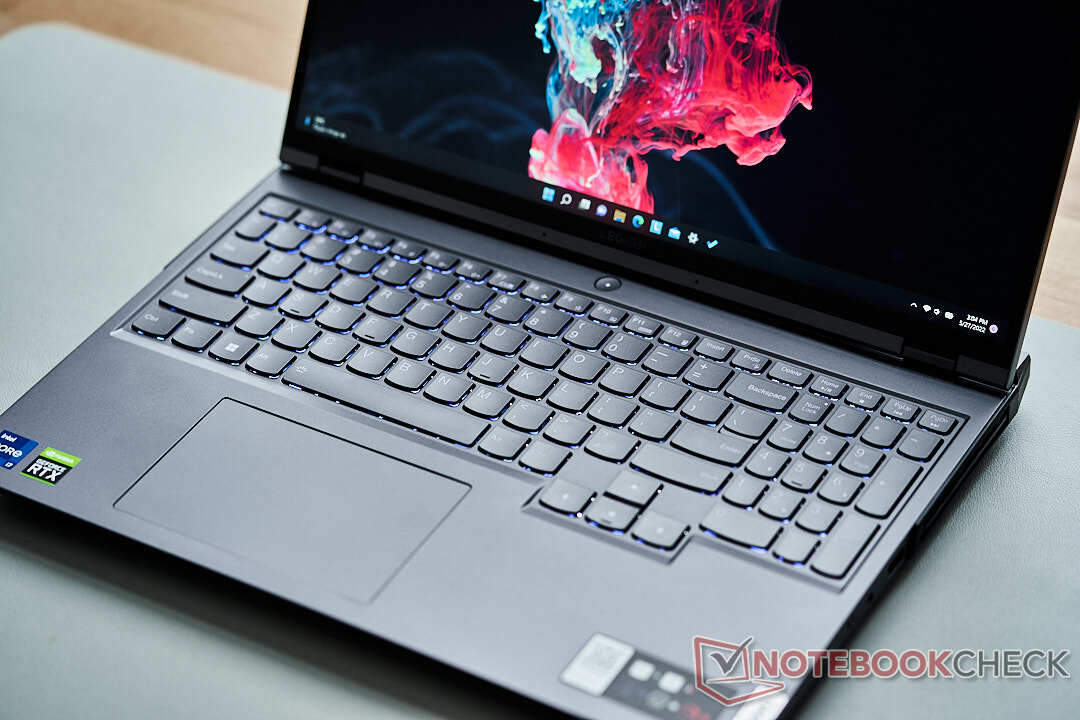
Input Devices - a compelling and comprehensive solution for both gamers and content-creators
Keyboard
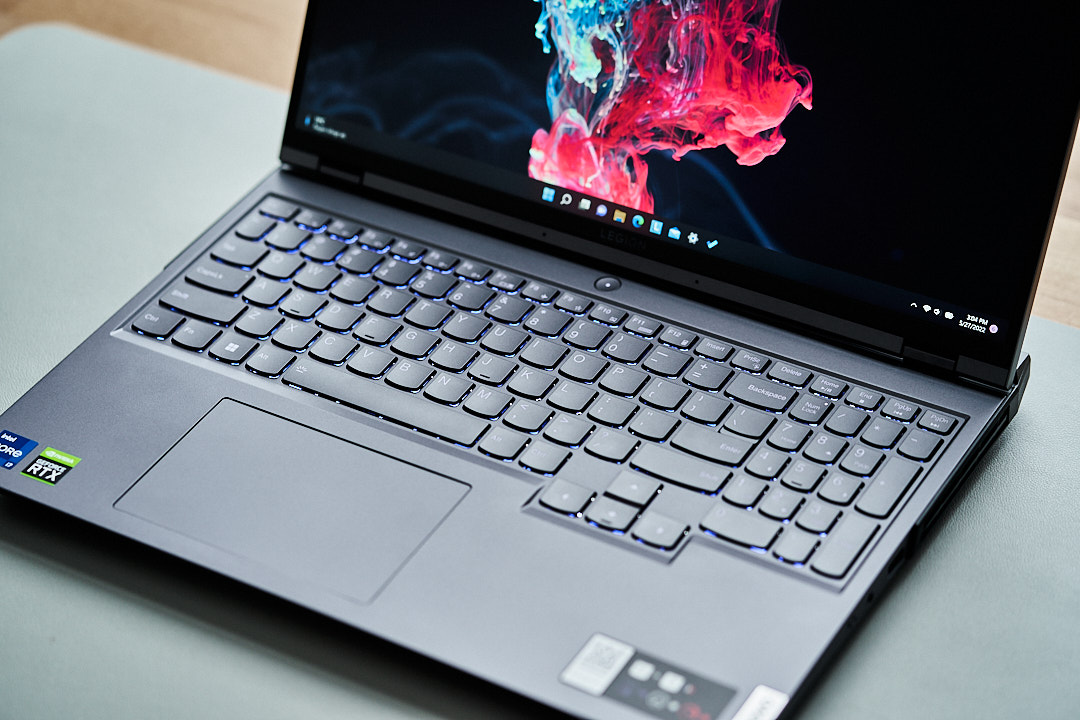
Keyboard performance for intensive gaming sessions is nothing less than outstanding on this sixteen-inch device. The chiclet keys with their somewhat unusual shape and curvature offer a palpable pressure point, pleasant resistance as well as solid stroke. The RGB key backlights can be adjusted for four zones on the keyboard and illumination works well. Visually, the slightly smaller keys on the numeric pad and the regular-sized arrow keys are not quite as well defined as they might be, but there is no reason for complaint in purely functional terms.
Touchpad
The touchpad is sufficiently large for a gaming laptop and allows for smooth gliding across its surface. Haptic properties when scrolling and clicking are of high-quality. The mouse touchpad is offset slightly to the left, which on occasion leads to right-clicking instead of left-clicking when used too casually. As a result of the high 165 Hz refresh rate using the Legion seemed very smooth and precise. Although most gamers will use a mouse, no one should have any issues navigating in Windows or scrolling through websites.
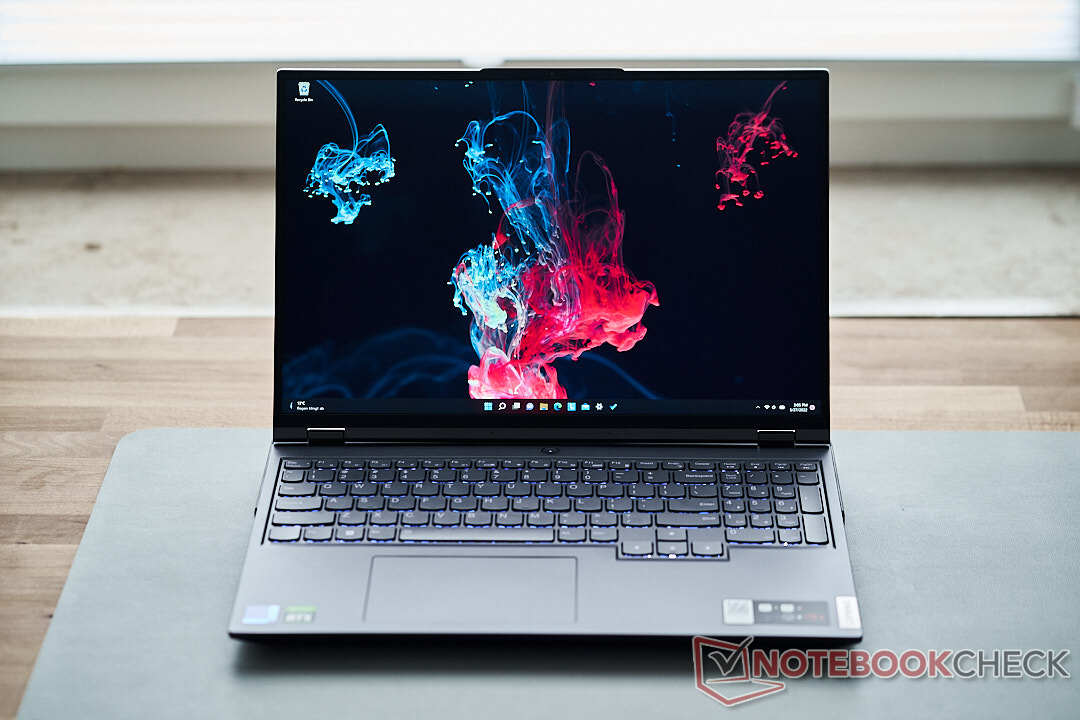
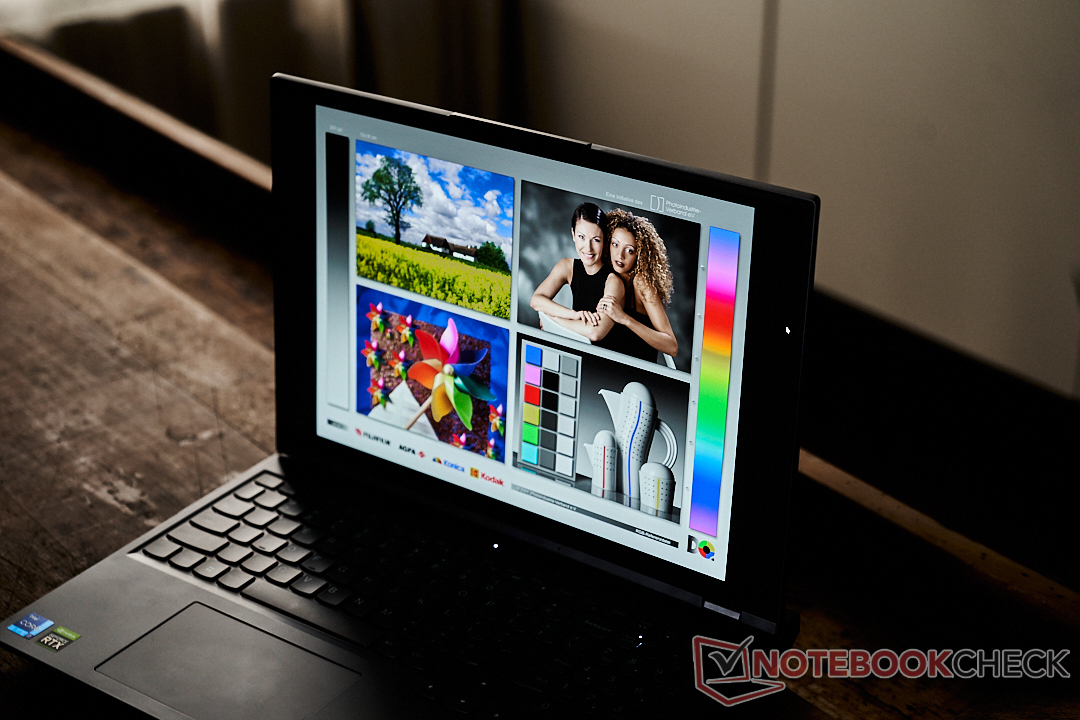
Display - fast 165 Hz meets G-Sync and WQHD resolution

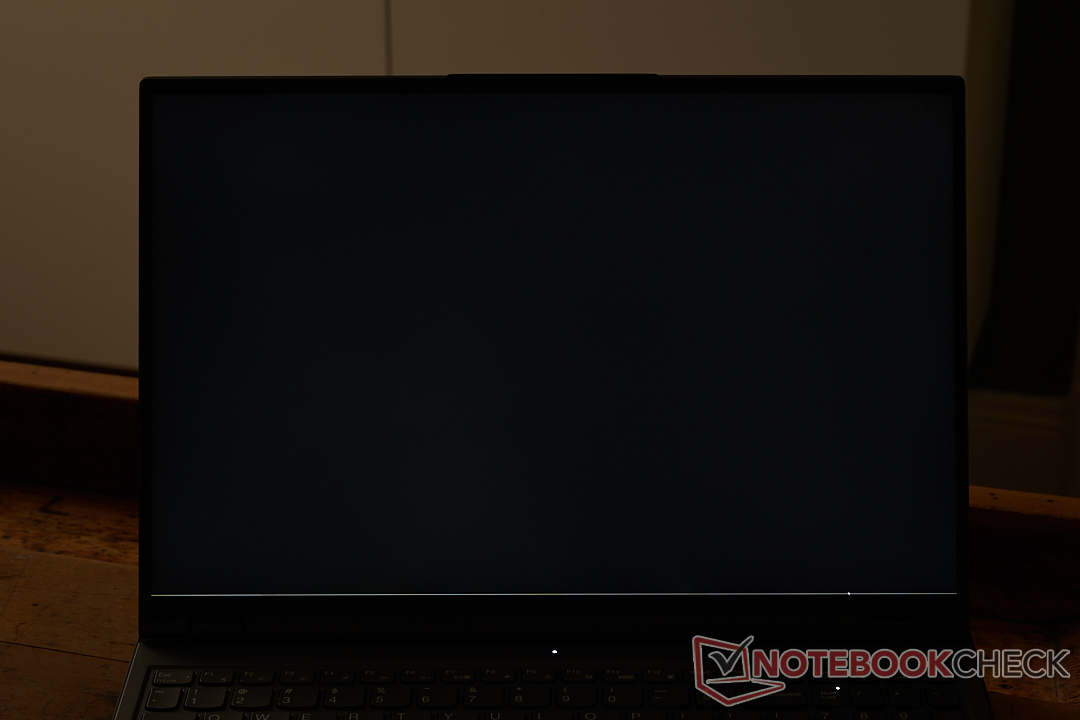
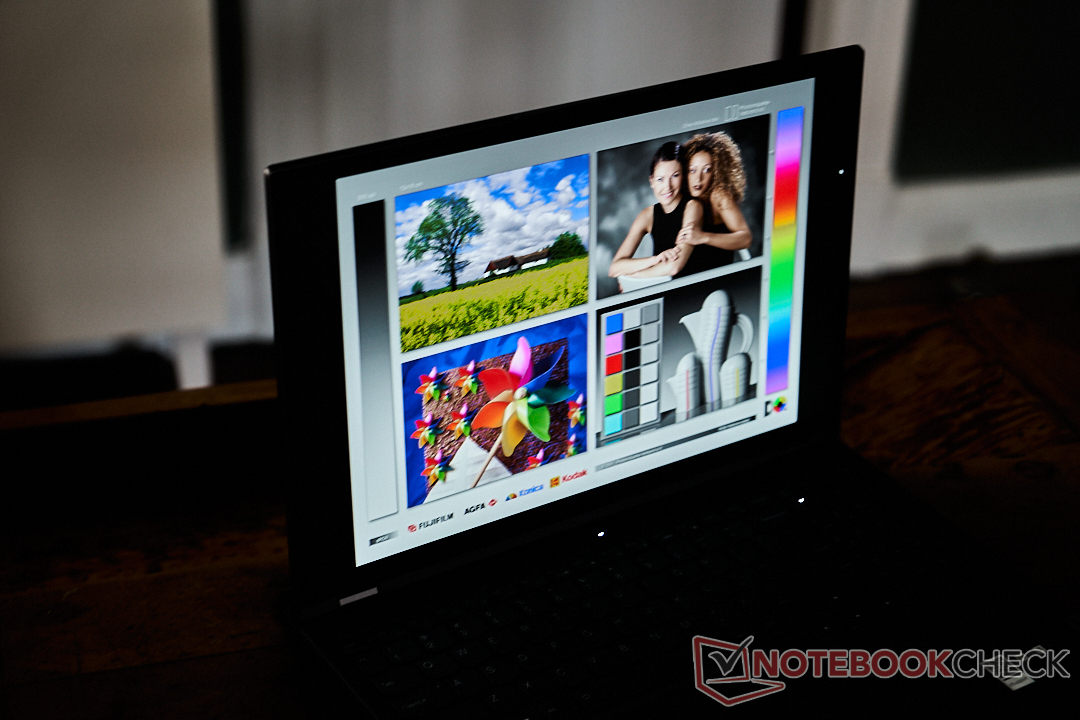
16-inch displays are becoming more and more standard in the latest gaming notebooks, and the Legion version is an excellent example. There’s quite a lot on offer here for gamers, content writers as well as for everyday use. The matte display offers typical IPS contrast and excellent readability from virtually any angle. Compared to the competition, the Lenovo has the highest maximum brightness level, although display luminance at only about 85% could be better.
The QHD resolution in the 16:10 version with 2,560 by 1,600 pixels provides a clear image in every usage scenario, and the combination of the matte display and its high brightness level even make outdoor use feasible. Gamers will appreciate the high refresh rate of 165 Hz and the pleasantly fast response times. Although this display doesn’t pose a serious challenge for the 360 Hz 4 ms screen on the recently tested MSI Vector GP76, it still cuts the mustard for fast shooters.
| |||||||||||||||||||||||||
Brightness Distribution: 85 %
Contrast: 1144:1 (Black: 0.45 cd/m²)
ΔE ColorChecker Calman: 2.38 | ∀{0.5-29.43 Ø4.73}
calibrated: 1.1
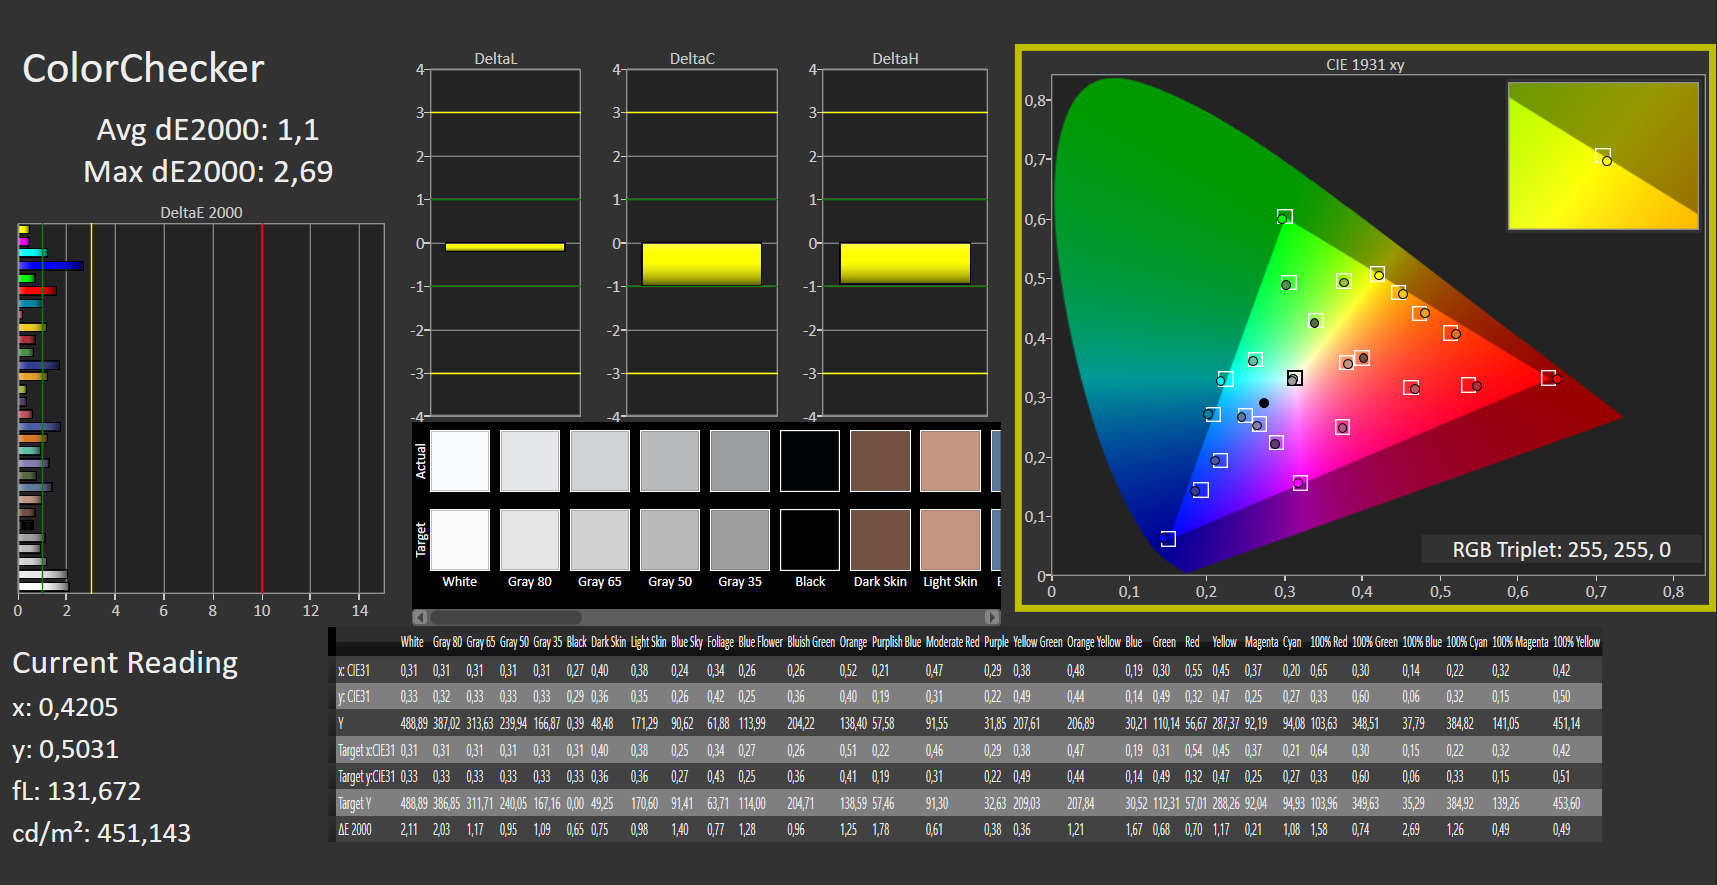
ΔE Greyscale Calman: 2.71 | ∀{0.09-98 Ø4.97}
70.45% AdobeRGB 1998 (Argyll 3D)
98.38% sRGB (Argyll 3D)
68.53% Display P3 (Argyll 3D)
Gamma: 2.49
CCT: 6117 K
| Lenovo Legion 5 Pro 16IAH7H BOE CCQ_NE160QDM_NY1, IPS, 2560x1600, 16" | HP Omen 16-b1090ng BOE09E5, IPS, 2560x1440, 16.1" | HP Omen 16-c0077ng BOE09E5, IPS, 2560x1440, 16.1" | Gigabyte Aero 16 YE5 Samsung SDC416B, AMOLED, 3840x2400, 16" | Alienware x14 i7 RTX 3060 SHP154D, IPS, 1920x1080, 14" | |
|---|---|---|---|---|---|
| Display | 3% | -0% | 24% | ||
| Display P3 Coverage (%) | 68.53 | 71 4% | 68.8 0% | 99.6 45% | |
| sRGB Coverage (%) | 98.38 | 97.9 0% | 96.9 -2% | 100 2% | |
| AdobeRGB 1998 Coverage (%) | 70.45 | 73.3 4% | 71.1 1% | 87.6 24% | |
| Response Times | -31% | -30% | 75% | 2% | |
| Response Time Grey 50% / Grey 80% * (ms) | 14 ? | 14.5 ? -4% | 13 ? 7% | 2.4 ? 83% | 9.6 ? 31% |
| Response Time Black / White * (ms) | 6 ? | 9.4 ? -57% | 10 ? -67% | 2 ? 67% | 7.6 ? -27% |
| PWM Frequency (Hz) | 60 ? | ||||
| Screen | -44% | -27% | 406% | -8% | |
| Brightness middle (cd/m²) | 515 | 335 -35% | 297 -42% | 368 -29% | 434 -16% |
| Brightness (cd/m²) | 475 | 319 -33% | 283 -40% | 368 -23% | 411 -13% |
| Brightness Distribution (%) | 85 | 90 6% | 91 7% | 93 9% | 89 5% |
| Black Level * (cd/m²) | 0.45 | 0.28 38% | 0.22 51% | 0.01 98% | 0.25 44% |
| Contrast (:1) | 1144 | 1196 5% | 1350 18% | 36800 3117% | 1736 52% |
| Colorchecker dE 2000 * | 2.38 | 4.38 -84% | 3.25 -37% | 2.33 2% | 3 -26% |
| Colorchecker dE 2000 max. * | 4.37 | 9.48 -117% | 6.33 -45% | 4.34 1% | 7.1 -62% |
| Colorchecker dE 2000 calibrated * | 1.1 | 1.33 -21% | 1.11 -1% | 0.7 36% | |
| Greyscale dE 2000 * | 2.71 | 7 -158% | 6.97 -157% | 0.8 70% | 5.1 -88% |
| Gamma | 2.49 88% | 2.103 105% | 2.3 96% | 2.119 104% | 2.19 100% |
| CCT | 6117 106% | 6244 104% | 6050 107% | 6569 99% | 6204 105% |
| Total Average (Program / Settings) | -24% /
-32% | -19% /
-22% | 241% /
340% | 6% /
1% |
* ... smaller is better
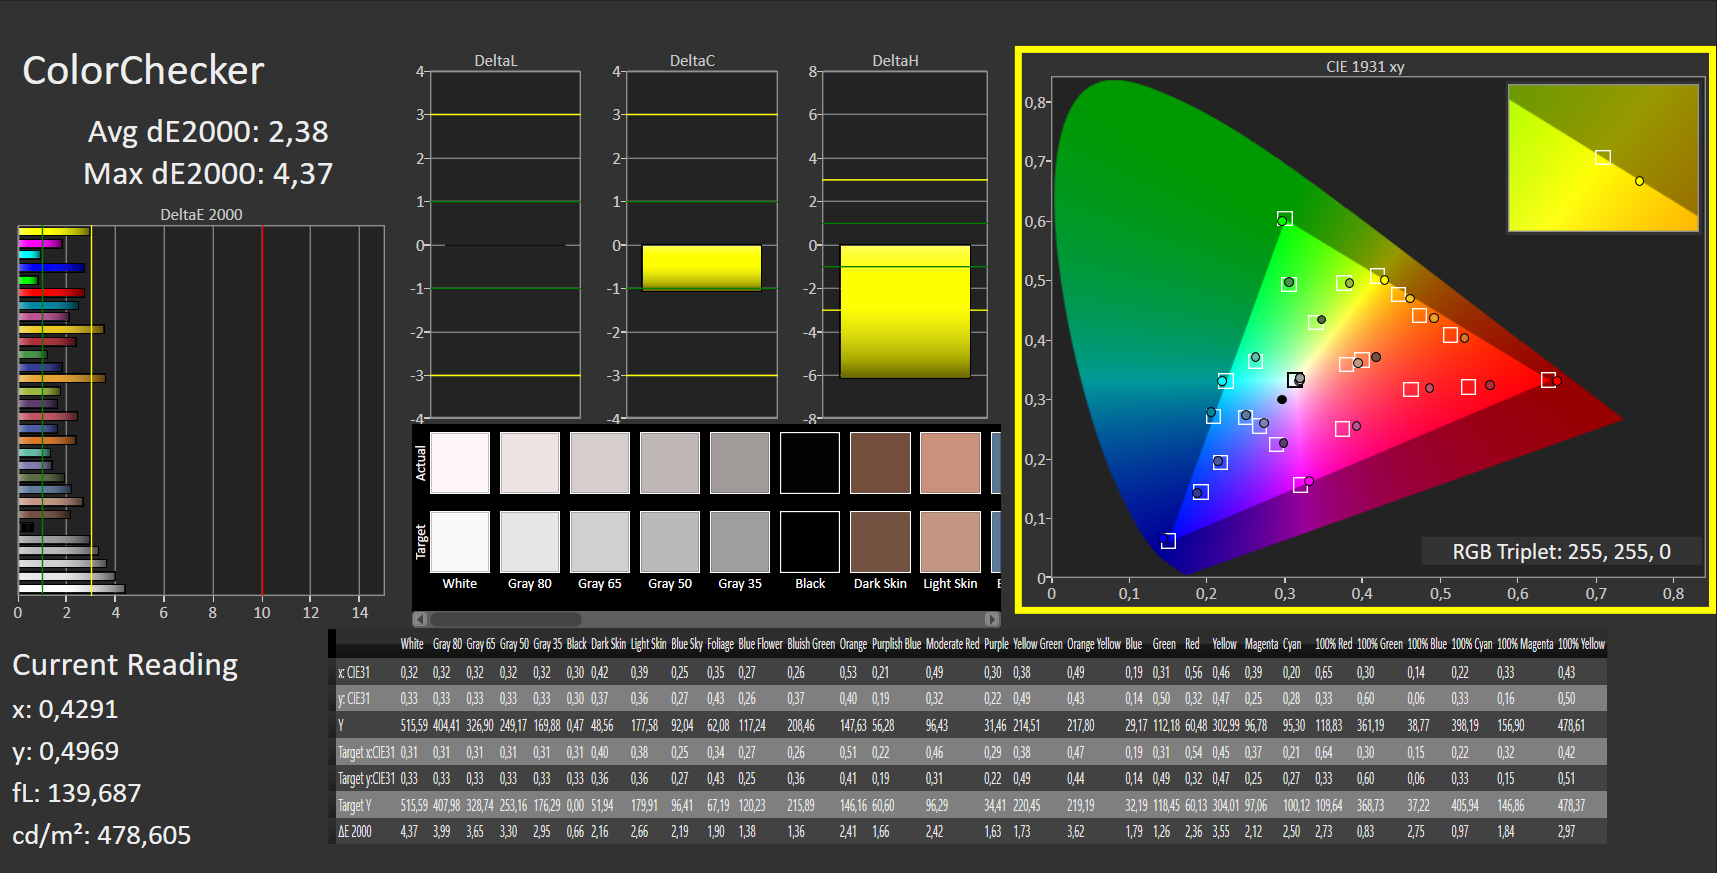


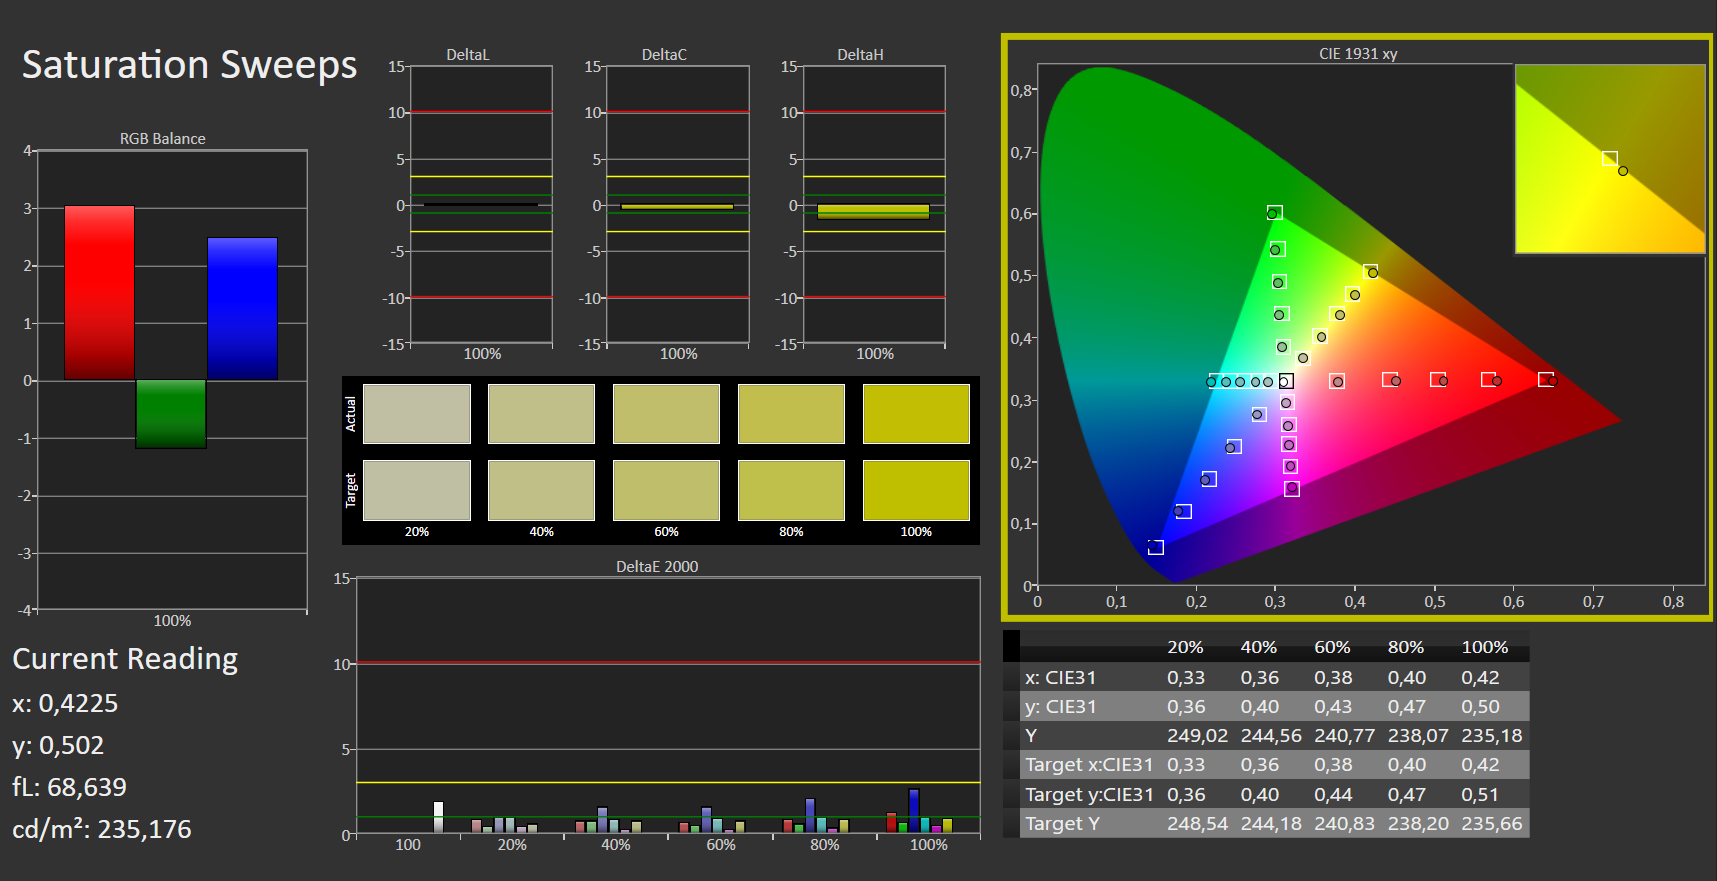
With solid values for common color spaces and good factory calibration, color reproduction on the Legion 5 Pro is unquestionably suitable for everyday use. With an average color difference of around 2.5 DeltaE ex works, the color rendition on the 16-inch device is immediately ready for semi-professional image editing, while professionals can get even more out of the display with some manual calibration.
Our calibration with professional equipment reduces the DeltaE to less than 1 (the profile is available above for download) and thus delivers excellent color reproduction within the limits of sRGB. In order to be able to do without an external monitor for professional and color-critical applications, we would have liked to have better coverage in the AdobeRGB and DCI-P3 color spaces. In this regard, especially photographers and image editors come off somewhat short. For videographers who primarily produce for the web, however, the display is more than adequate.
The X-Rite color application on the Lenovo allows it to offer several additional presets for frequently used color spaces, something that is enormously helpful for everyday creative content work. For example, sRGB mode may be of interest for online design, while videographers using the Rec709 profile can even colorize video material with some degree of confidence.
Display Response Times
| ↔ Response Time Black to White | ||
|---|---|---|
| 6 ms ... rise ↗ and fall ↘ combined | ↗ 2 ms rise |  |
| ↘ 4 ms fall | ||
| The screen shows very fast response rates in our tests and should be very well suited for fast-paced gaming. In comparison, all tested devices range from 0.1 (minimum) to 240 (maximum) ms. » 18 % of all devices are better. This means that the measured response time is better than the average of all tested devices (19.9 ms). | ||
| ↔ Response Time 50% Grey to 80% Grey | ||
| 14 ms ... rise ↗ and fall ↘ combined | ↗ 6 ms rise |  |
| ↘ 8 ms fall | ||
| The screen shows good response rates in our tests, but may be too slow for competitive gamers. In comparison, all tested devices range from 0.165 (minimum) to 636 (maximum) ms. » 27 % of all devices are better. This means that the measured response time is better than the average of all tested devices (31.1 ms). | ||
Screen Flickering / PWM (Pulse-Width Modulation)
| Screen flickering / PWM not detected |  | ||
In comparison: 52 % of all tested devices do not use PWM to dim the display. If PWM was detected, an average of 7810 (minimum: 5 - maximum: 343500) Hz was measured. | |||
As already mentioned, the high brightness level of over 500 cd/m² helps outdoors. Direct sunlight should still be avoided, but that applies to the majority of all laptop displays. The matte coating certainly prevents you from seeing more of yourself than the screen content.


Performance - unbridled i7-12700H meets fast RTX 3060
While Lenovo has been able to deliver more than most of its competitors so far (a plethora of ports, an excellent case and a great display), the performance it delivers is virtually unrivalled. The i7 outclasses its competition, even though it is partly equipped with i9 processors. The RTX 3060 also delivers thoroughly impressive performance. To achieve such stellar system performance, Lenovo underpins its core components with 16 GB of state-of-the-art DDR5 4800 RAM and a responsive 2 TB RAID-0 NVME SSD array.
Testing Conditions
The Vantage software that comes with the unit may be somewhat of an overkill but does offer three different performance modes. All our performance tests were conducted in power mode, which lives up to its name and provides the i7 with up to 120 W for peak and 100 W for constant power. The colored LED in the power button changes, serving as a visual indicator (red: power mode, white: balanced, blue: silent). Silent mode also lives up to its name: After an initial 120 W peak, the processor consumes 65 W, and the fans sound pleasantly restrained. If you are not necessarily looking for the highest Cinebench scores, then balanced mode is also a good choice for CPU-intensive computing. The power consumption is about 85-90 W, but compared to power mode, the fan noise is a little quieter.
Processor
It’s mid-2022 and the i7-12700H has become a familiar acquaintance. It has become the Intel standard for fast content creators and gaming notebooks. Performance varies greatly from device to device and is dependent on both the manufacturer’s configuration as well as the cooling management for a specific device.
The i7 is the mainstream powerhouse of Intel’s latest Alder Lake generation and delivers six performance cores with hyper-threading support and clock rates of 2.4 to 4.7 GHz. Background tasks or multi-core support are provided by the eight efficiency cores (1.8-3.5 GHz) and complete the 14 cores delivering a total of 20 threads.
Lenovo allows the CPU to work unrestrained in the Legion, allowing the 16-inch notebook to easily reach the top of the leader table as soon as multi-core performance is a requirement. Some notebooks deliver slightly more single-core performance, and notebooks with the i9 have a slight lead here. However, single-core performance is relevant for very few applications nowadays and such performance advantage is virtually undetectable in everyday usage.
The Legion 5 Pro cuts an excellent figure especially under constant load: While many notebooks can only maintain performance of their hardware for the renowned first or second Cinebench run, the Legion 5 Pro delivers persistent performance without fluctuations. There is always enough power for gaming as well as for creative-content applications.
In addition to our standardized test sequences, we also used the laptop with our YouTube channel. We cut, colorized and exported our videos with BlackMagics DaVinci Resolve 17. In contrast to the common Adobe applications, that mainly use just the processor, the CPU and GPU are used equally in this editing software. Due to generous power levels, our source material (4k, BlackMagic RAW) was processed without any issues and without dropped frames. Furthermore, the image editing in PhaseOnes Capture One and the class leader Photoshop did not cause us any problems.
Cinebench R15 Multi Loop
Cinebench R23: Multi Core | Single Core
Cinebench R20: CPU (Multi Core) | CPU (Single Core)
Cinebench R15: CPU Multi 64Bit | CPU Single 64Bit
Blender: v2.79 BMW27 CPU
7-Zip 18.03: 7z b 4 | 7z b 4 -mmt1
Geekbench 5.5: Multi-Core | Single-Core
HWBOT x265 Benchmark v2.2: 4k Preset
LibreOffice : 20 Documents To PDF
R Benchmark 2.5: Overall mean
| CPU Performance rating | |
| Average of class Gaming | |
| Gigabyte Aero 16 YE5 | |
| Lenovo Legion 5 Pro 16IAH7H | |
| HP Omen 16-b1090ng | |
| Alienware x14 i7 RTX 3060 | |
| Average Intel Core i7-12700H | |
| HP Omen 16-c0077ng -1! | |
| Cinebench R23 / Multi Core | |
| Average of class Gaming (10488 - 40970, n=112, last 2 years) | |
| Lenovo Legion 5 Pro 16IAH7H | |
| Gigabyte Aero 16 YE5 | |
| HP Omen 16-b1090ng | |
| Alienware x14 i7 RTX 3060 | |
| Average Intel Core i7-12700H (4032 - 19330, n=64) | |
| HP Omen 16-c0077ng | |
| Cinebench R23 / Single Core | |
| Average of class Gaming (1166 - 2356, n=112, last 2 years) | |
| Gigabyte Aero 16 YE5 | |
| HP Omen 16-b1090ng | |
| Alienware x14 i7 RTX 3060 | |
| Average Intel Core i7-12700H (778 - 1826, n=63) | |
| Lenovo Legion 5 Pro 16IAH7H | |
| HP Omen 16-c0077ng | |
| Cinebench R20 / CPU (Multi Core) | |
| Average of class Gaming (4029 - 16108, n=111, last 2 years) | |
| Lenovo Legion 5 Pro 16IAH7H | |
| Gigabyte Aero 16 YE5 | |
| Alienware x14 i7 RTX 3060 | |
| Average Intel Core i7-12700H (1576 - 7407, n=64) | |
| HP Omen 16-b1090ng | |
| HP Omen 16-c0077ng | |
| Cinebench R20 / CPU (Single Core) | |
| Average of class Gaming (442 - 895, n=111, last 2 years) | |
| HP Omen 16-b1090ng | |
| Gigabyte Aero 16 YE5 | |
| Alienware x14 i7 RTX 3060 | |
| Average Intel Core i7-12700H (300 - 704, n=64) | |
| Lenovo Legion 5 Pro 16IAH7H | |
| HP Omen 16-c0077ng | |
| Cinebench R15 / CPU Multi 64Bit | |
| Average of class Gaming (1578 - 6271, n=112, last 2 years) | |
| Lenovo Legion 5 Pro 16IAH7H | |
| HP Omen 16-b1090ng | |
| Gigabyte Aero 16 YE5 | |
| Alienware x14 i7 RTX 3060 | |
| Average Intel Core i7-12700H (1379 - 2916, n=70) | |
| HP Omen 16-c0077ng | |
| Cinebench R15 / CPU Single 64Bit | |
| Average of class Gaming (188.8 - 343, n=111, last 2 years) | |
| Gigabyte Aero 16 YE5 | |
| HP Omen 16-b1090ng | |
| Average Intel Core i7-12700H (113 - 263, n=65) | |
| Alienware x14 i7 RTX 3060 | |
| Lenovo Legion 5 Pro 16IAH7H | |
| HP Omen 16-c0077ng | |
| Blender / v2.79 BMW27 CPU | |
| HP Omen 16-c0077ng | |
| Average Intel Core i7-12700H (168 - 732, n=63) | |
| Alienware x14 i7 RTX 3060 | |
| Gigabyte Aero 16 YE5 | |
| HP Omen 16-b1090ng | |
| Lenovo Legion 5 Pro 16IAH7H | |
| Average of class Gaming (80 - 330, n=109, last 2 years) | |
| 7-Zip 18.03 / 7z b 4 | |
| Average of class Gaming (33491 - 148086, n=110, last 2 years) | |
| HP Omen 16-b1090ng | |
| Lenovo Legion 5 Pro 16IAH7H | |
| Gigabyte Aero 16 YE5 | |
| Alienware x14 i7 RTX 3060 | |
| Average Intel Core i7-12700H (22844 - 73067, n=63) | |
| 7-Zip 18.03 / 7z b 4 -mmt1 | |
| Average of class Gaming (4199 - 7436, n=110, last 2 years) | |
| Gigabyte Aero 16 YE5 | |
| HP Omen 16-b1090ng | |
| Average Intel Core i7-12700H (2743 - 5972, n=63) | |
| Alienware x14 i7 RTX 3060 | |
| Lenovo Legion 5 Pro 16IAH7H | |
| HP Omen 16-c0077ng | |
| Geekbench 5.5 / Multi-Core | |
| Average of class Gaming (6460 - 27010, n=110, last 2 years) | |
| Gigabyte Aero 16 YE5 | |
| HP Omen 16-b1090ng | |
| Alienware x14 i7 RTX 3060 | |
| Lenovo Legion 5 Pro 16IAH7H | |
| Average Intel Core i7-12700H (5144 - 13745, n=64) | |
| HP Omen 16-c0077ng | |
| Geekbench 5.5 / Single-Core | |
| Average of class Gaming (986 - 2474, n=110, last 2 years) | |
| Gigabyte Aero 16 YE5 | |
| HP Omen 16-b1090ng | |
| Alienware x14 i7 RTX 3060 | |
| Average Intel Core i7-12700H (803 - 1851, n=64) | |
| Lenovo Legion 5 Pro 16IAH7H | |
| HP Omen 16-c0077ng | |
| HWBOT x265 Benchmark v2.2 / 4k Preset | |
| Average of class Gaming (11.5 - 44.3, n=110, last 2 years) | |
| Lenovo Legion 5 Pro 16IAH7H | |
| HP Omen 16-b1090ng | |
| Gigabyte Aero 16 YE5 | |
| Alienware x14 i7 RTX 3060 | |
| Average Intel Core i7-12700H (4.67 - 21.8, n=64) | |
| HP Omen 16-c0077ng | |
| LibreOffice / 20 Documents To PDF | |
| HP Omen 16-c0077ng | |
| Average of class Gaming (19 - 88.8, n=110, last 2 years) | |
| Average Intel Core i7-12700H (34.2 - 95.3, n=63) | |
| HP Omen 16-b1090ng | |
| Lenovo Legion 5 Pro 16IAH7H | |
| Alienware x14 i7 RTX 3060 | |
| Gigabyte Aero 16 YE5 | |
| R Benchmark 2.5 / Overall mean | |
| HP Omen 16-c0077ng | |
| Lenovo Legion 5 Pro 16IAH7H | |
| Average Intel Core i7-12700H (0.4441 - 1.052, n=63) | |
| Alienware x14 i7 RTX 3060 | |
| HP Omen 16-b1090ng | |
| Average of class Gaming (0.3439 - 0.759, n=111, last 2 years) | |
| Gigabyte Aero 16 YE5 | |
* ... smaller is better
AIDA64: FP32 Ray-Trace | FPU Julia | CPU SHA3 | CPU Queen | FPU SinJulia | FPU Mandel | CPU AES | CPU ZLib | FP64 Ray-Trace | CPU PhotoWorxx
| Performance rating | |
| Average of class Gaming | |
| HP Omen 16-c0077ng | |
| Lenovo Legion 5 Pro 16IAH7H | |
| Alienware x14 i7 RTX 3060 | |
| Average Intel Core i7-12700H | |
| Gigabyte Aero 16 YE5 | |
| HP Omen 16-b1090ng | |
| AIDA64 / FP32 Ray-Trace | |
| Average of class Gaming (10227 - 85542, n=109, last 2 years) | |
| Lenovo Legion 5 Pro 16IAH7H | |
| Lenovo Legion 5 Pro 16IAH7H | |
| HP Omen 16-c0077ng | |
| Average Intel Core i7-12700H (2585 - 17957, n=64) | |
| Alienware x14 i7 RTX 3060 | |
| Gigabyte Aero 16 YE5 | |
| HP Omen 16-b1090ng | |
| AIDA64 / FPU Julia | |
| Average of class Gaming (51376 - 238426, n=109, last 2 years) | |
| HP Omen 16-c0077ng | |
| Lenovo Legion 5 Pro 16IAH7H | |
| Lenovo Legion 5 Pro 16IAH7H | |
| Average Intel Core i7-12700H (12439 - 90760, n=64) | |
| Alienware x14 i7 RTX 3060 | |
| Gigabyte Aero 16 YE5 | |
| HP Omen 16-b1090ng | |
| AIDA64 / CPU SHA3 | |
| Average of class Gaming (2180 - 9817, n=109, last 2 years) | |
| Lenovo Legion 5 Pro 16IAH7H | |
| Lenovo Legion 5 Pro 16IAH7H | |
| HP Omen 16-c0077ng | |
| Average Intel Core i7-12700H (833 - 4242, n=64) | |
| Gigabyte Aero 16 YE5 | |
| Alienware x14 i7 RTX 3060 | |
| HP Omen 16-b1090ng | |
| AIDA64 / CPU Queen | |
| Average of class Gaming (49785 - 173351, n=101, last 2 years) | |
| Gigabyte Aero 16 YE5 | |
| HP Omen 16-b1090ng | |
| Alienware x14 i7 RTX 3060 | |
| HP Omen 16-c0077ng | |
| Lenovo Legion 5 Pro 16IAH7H | |
| Average Intel Core i7-12700H (57923 - 103202, n=63) | |
| AIDA64 / FPU SinJulia | |
| Average of class Gaming (4424 - 33636, n=109, last 2 years) | |
| HP Omen 16-c0077ng | |
| Lenovo Legion 5 Pro 16IAH7H | |
| Lenovo Legion 5 Pro 16IAH7H | |
| Gigabyte Aero 16 YE5 | |
| Alienware x14 i7 RTX 3060 | |
| HP Omen 16-b1090ng | |
| Average Intel Core i7-12700H (3249 - 9939, n=64) | |
| AIDA64 / FPU Mandel | |
| Average of class Gaming (25115 - 128721, n=109, last 2 years) | |
| HP Omen 16-c0077ng | |
| Lenovo Legion 5 Pro 16IAH7H | |
| Lenovo Legion 5 Pro 16IAH7H | |
| Average Intel Core i7-12700H (7135 - 44760, n=64) | |
| Gigabyte Aero 16 YE5 | |
| Alienware x14 i7 RTX 3060 | |
| HP Omen 16-b1090ng | |
| AIDA64 / CPU AES | |
| Lenovo Legion 5 Pro 16IAH7H | |
| Lenovo Legion 5 Pro 16IAH7H | |
| HP Omen 16-c0077ng | |
| Average of class Gaming (39258 - 247074, n=109, last 2 years) | |
| Alienware x14 i7 RTX 3060 | |
| Gigabyte Aero 16 YE5 | |
| Average Intel Core i7-12700H (31839 - 144360, n=64) | |
| HP Omen 16-b1090ng | |
| AIDA64 / CPU ZLib | |
| Average of class Gaming (574 - 2531, n=109, last 2 years) | |
| Lenovo Legion 5 Pro 16IAH7H | |
| Lenovo Legion 5 Pro 16IAH7H | |
| Alienware x14 i7 RTX 3060 | |
| Gigabyte Aero 16 YE5 | |
| Average Intel Core i7-12700H (305 - 1171, n=64) | |
| HP Omen 16-b1090ng | |
| HP Omen 16-c0077ng | |
| AIDA64 / FP64 Ray-Trace | |
| Average of class Gaming (5509 - 45446, n=109, last 2 years) | |
| Lenovo Legion 5 Pro 16IAH7H | |
| Lenovo Legion 5 Pro 16IAH7H | |
| HP Omen 16-c0077ng | |
| Average Intel Core i7-12700H (1437 - 9692, n=64) | |
| Alienware x14 i7 RTX 3060 | |
| Gigabyte Aero 16 YE5 | |
| HP Omen 16-b1090ng | |
| AIDA64 / CPU PhotoWorxx | |
| Alienware x14 i7 RTX 3060 | |
| Average of class Gaming (12271 - 89891, n=109, last 2 years) | |
| HP Omen 16-b1090ng | |
| Gigabyte Aero 16 YE5 | |
| Lenovo Legion 5 Pro 16IAH7H | |
| Lenovo Legion 5 Pro 16IAH7H | |
| Average Intel Core i7-12700H (12863 - 52207, n=64) | |
| HP Omen 16-c0077ng | |
System Performance
The system performance of this top-drawer laptop is irrefutable, and despite the ‘small’ Ampere graphics card, our test configuration is very well positioned relative to other laptops. As shown by both our PC Mark results and our own observations, the Legion masters everyday tasks at lightning speed and nothing will shift it out of its stride. It’s easy to edit an image in Photoshop, jump across to a video editing program, and watch a 4k vlog on YouTube along the way; and then there’s still ample capacity even with a ton of open browser tabs.
CrossMark: Overall | Productivity | Creativity | Responsiveness
| PCMark 10 / Score | |
| Average of class Gaming (5828 - 11574, n=95, last 2 years) | |
| Gigabyte Aero 16 YE5 | |
| Lenovo Legion 5 Pro 16IAH7H | |
| HP Omen 16-b1090ng | |
| Average Intel Core i7-12700H, NVIDIA GeForce RTX 3060 Laptop GPU (5986 - 8156, n=12) | |
| Alienware x14 i7 RTX 3060 | |
| HP Omen 16-c0077ng | |
| PCMark 10 / Essentials | |
| Lenovo Legion 5 Pro 16IAH7H | |
| Gigabyte Aero 16 YE5 | |
| Average of class Gaming (8810 - 12600, n=99, last 2 years) | |
| Average Intel Core i7-12700H, NVIDIA GeForce RTX 3060 Laptop GPU (9289 - 12144, n=12) | |
| HP Omen 16-c0077ng | |
| Alienware x14 i7 RTX 3060 | |
| HP Omen 16-b1090ng | |
| PCMark 10 / Productivity | |
| Average of class Gaming (6845 - 18766, n=97, last 2 years) | |
| Gigabyte Aero 16 YE5 | |
| Alienware x14 i7 RTX 3060 | |
| HP Omen 16-b1090ng | |
| Lenovo Legion 5 Pro 16IAH7H | |
| HP Omen 16-c0077ng | |
| Average Intel Core i7-12700H, NVIDIA GeForce RTX 3060 Laptop GPU (6161 - 10362, n=12) | |
| PCMark 10 / Digital Content Creation | |
| Average of class Gaming (7602 - 19657, n=97, last 2 years) | |
| Gigabyte Aero 16 YE5 | |
| Lenovo Legion 5 Pro 16IAH7H | |
| HP Omen 16-b1090ng | |
| Average Intel Core i7-12700H, NVIDIA GeForce RTX 3060 Laptop GPU (8950 - 12554, n=12) | |
| HP Omen 16-c0077ng | |
| Alienware x14 i7 RTX 3060 | |
| CrossMark / Overall | |
| Gigabyte Aero 16 YE5 | |
| Average of class Gaming (1366 - 2409, n=97, last 2 years) | |
| Alienware x14 i7 RTX 3060 | |
| Average Intel Core i7-12700H, NVIDIA GeForce RTX 3060 Laptop GPU (1649 - 2017, n=11) | |
| Lenovo Legion 5 Pro 16IAH7H | |
| CrossMark / Productivity | |
| Gigabyte Aero 16 YE5 | |
| Average of class Gaming (1386 - 2254, n=97, last 2 years) | |
| Alienware x14 i7 RTX 3060 | |
| Average Intel Core i7-12700H, NVIDIA GeForce RTX 3060 Laptop GPU (1536 - 1958, n=11) | |
| Lenovo Legion 5 Pro 16IAH7H | |
| CrossMark / Creativity | |
| Average of class Gaming (1343 - 2729, n=97, last 2 years) | |
| Gigabyte Aero 16 YE5 | |
| Alienware x14 i7 RTX 3060 | |
| Average Intel Core i7-12700H, NVIDIA GeForce RTX 3060 Laptop GPU (1816 - 2084, n=11) | |
| Lenovo Legion 5 Pro 16IAH7H | |
| CrossMark / Responsiveness | |
| Gigabyte Aero 16 YE5 | |
| Alienware x14 i7 RTX 3060 | |
| Lenovo Legion 5 Pro 16IAH7H | |
| Average of class Gaming (1226 - 2334, n=97, last 2 years) | |
| Average Intel Core i7-12700H, NVIDIA GeForce RTX 3060 Laptop GPU (1210 - 2207, n=11) | |
| PCMark 10 Score | 7531 points | |
Help | ||
| AIDA64 / Memory Copy | |
| Alienware x14 i7 RTX 3060 | |
| Average of class Gaming (21750 - 129946, n=109, last 2 years) | |
| HP Omen 16-b1090ng | |
| Gigabyte Aero 16 YE5 | |
| Lenovo Legion 5 Pro 16IAH7H | |
| Lenovo Legion 5 Pro 16IAH7H | |
| Average Intel Core i7-12700H (25615 - 80511, n=64) | |
| HP Omen 16-c0077ng | |
| AIDA64 / Memory Read | |
| Alienware x14 i7 RTX 3060 | |
| Average of class Gaming (22956 - 118858, n=109, last 2 years) | |
| HP Omen 16-b1090ng | |
| Gigabyte Aero 16 YE5 | |
| Lenovo Legion 5 Pro 16IAH7H | |
| Lenovo Legion 5 Pro 16IAH7H | |
| Average Intel Core i7-12700H (25586 - 79442, n=64) | |
| HP Omen 16-c0077ng | |
| AIDA64 / Memory Write | |
| Average of class Gaming (22297 - 135096, n=109, last 2 years) | |
| HP Omen 16-b1090ng | |
| Alienware x14 i7 RTX 3060 | |
| Gigabyte Aero 16 YE5 | |
| Lenovo Legion 5 Pro 16IAH7H | |
| Lenovo Legion 5 Pro 16IAH7H | |
| Average Intel Core i7-12700H (23679 - 88660, n=64) | |
| HP Omen 16-c0077ng | |
| AIDA64 / Memory Latency | |
| Lenovo Legion 5 Pro 16IAH7H | |
| Lenovo Legion 5 Pro 16IAH7H | |
| Alienware x14 i7 RTX 3060 | |
| Average of class Gaming (75.3 - 259, n=109, last 2 years) | |
| HP Omen 16-b1090ng | |
| Gigabyte Aero 16 YE5 | |
| HP Omen 16-c0077ng | |
| Average Intel Core i7-12700H (76.2 - 133.9, n=62) | |
* ... smaller is better
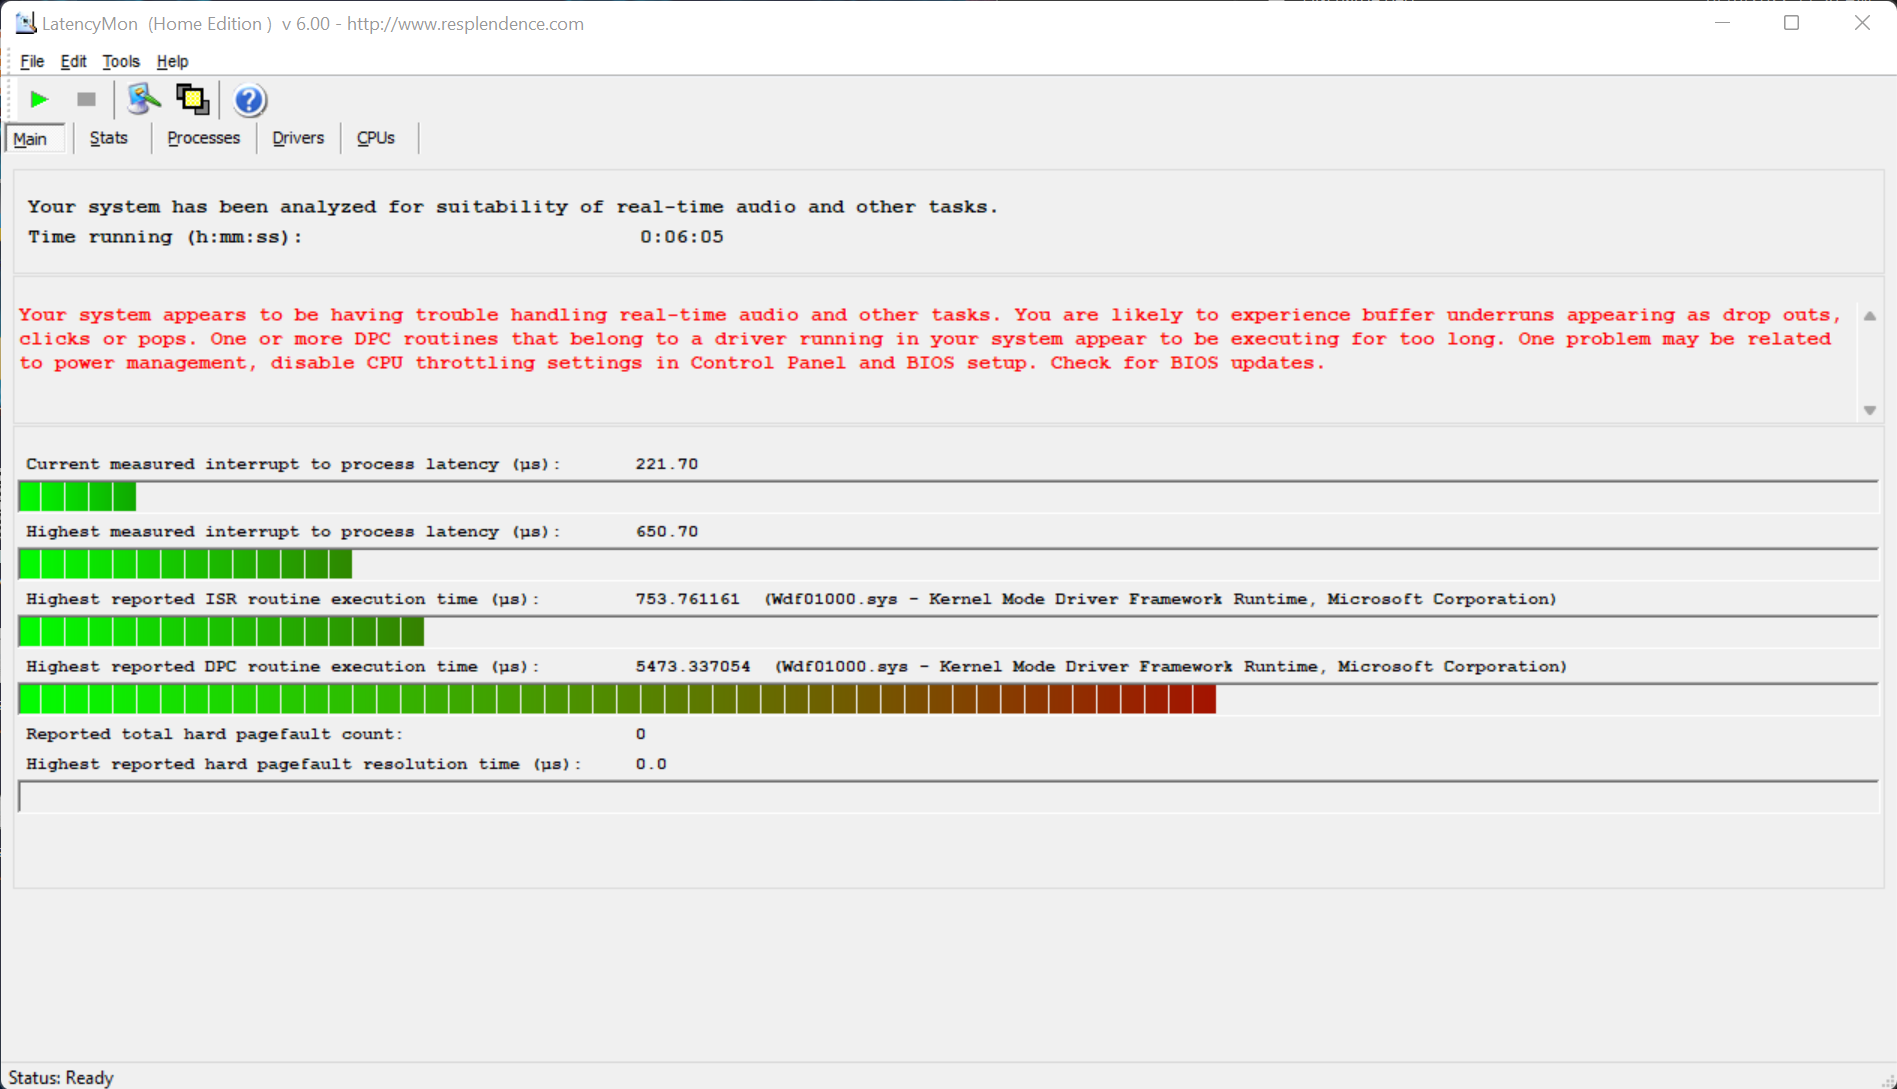
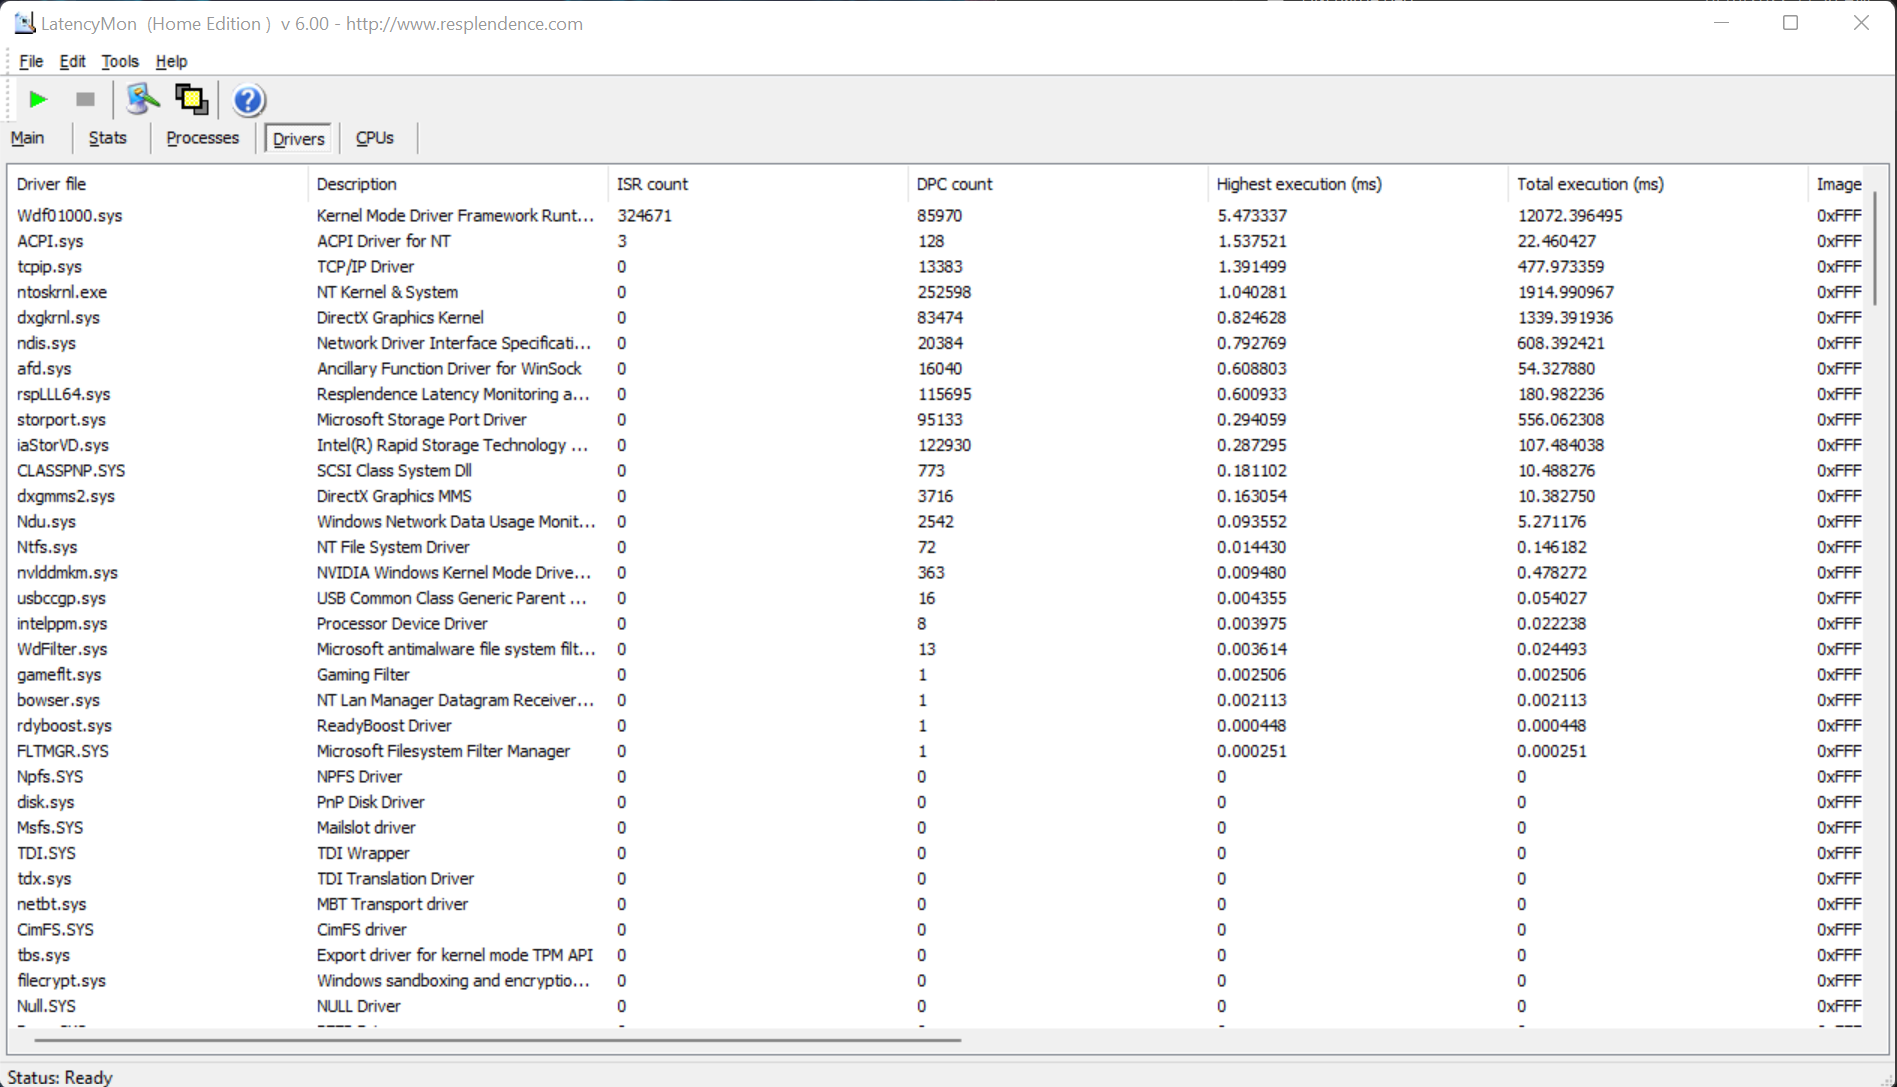
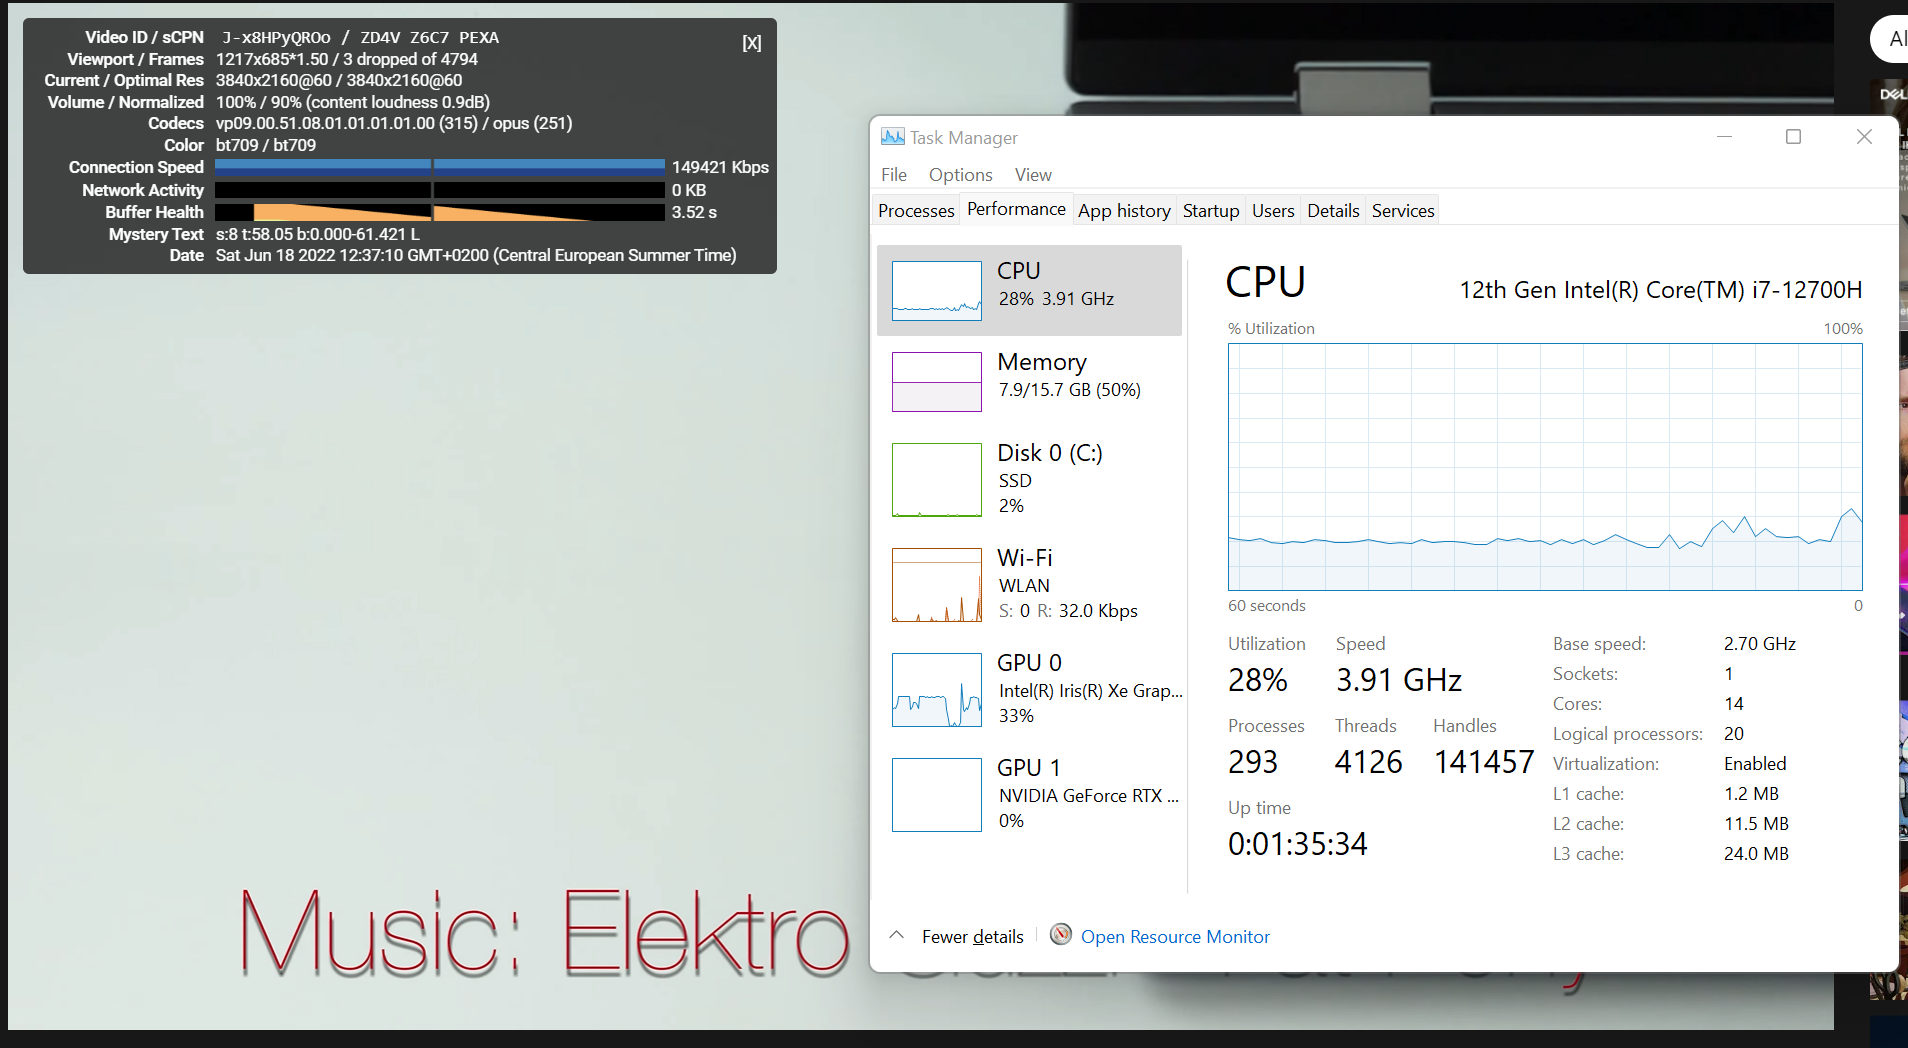
DPC Latency
LatencyMon test results of our review device are in part much better than those of the competition, but the Legion is not the device of choice when it comes to real-time audio editing. However, given that it’s essentially a gaming laptop, and given that our YouTube video dropped just a handful of frames, the LatencyMon results may be acceptable. However, the CPU/GPU load during 4K video playback was indeed quite high and we would have liked to see a somewhat more effective deployment of system resources.
| DPC Latencies / LatencyMon - interrupt to process latency (max), Web, Youtube, Prime95 | |
| HP Omen 16-c0077ng | |
| Alienware x14 i7 RTX 3060 | |
| HP Omen 16-b1090ng | |
| Lenovo Legion 5 Pro 16IAH7H | |
| Gigabyte Aero 16 YE5 | |
* ... smaller is better
Storage Devices
The latest PCI-E Gen 4 NVME SSDs are in effect already so fast that their performance differences in everyday usage hardly play a role and are almost imperceptible. Nevertheless, Lenovo has decided to include two of their fastest exponents in a RAID-0 array on the Legion 5i Pro.
While each of these SSDs scores well individually and top our performance tables, they almost double their read and write rates in a double array. Around 12 GB in peak measurements sounds extremely impressive on paper, but there are probably not many applications that will benefit from such break-neck speeds. Of course, this is by no means a complaint, given that there’s 2 TB of total storage space available for games, pictures or high-resolution video data. Especially in everyday work, the annoyance of having to work with various external hard drives becomes avoidable. The SSD endurance test does show repeated drops after longer periods. This could be an indication of excessively high temperatures, which occur under high constant SSD load.

* ... smaller is better
Disk Throttling: DiskSpd Read Loop, Queue Depth 8
GPU Performance
As with the CPU, modelling tools are no longer adequate to reliably assess the performance of graphics cards. Nvidia leaves a lot of leeway for manufacturers in terms of power consumption, and so it is sometimes difficult to predict how a graphics chip will perform in modern laptops. Once again, Lenovo is setting a good example here: The mid-range RTX 3060 uses a continuous 120 W in the Legion 5 and maxes out at around 140 W. While the 3070 Ti in its sister model (see our review here) is about 20% faster, the 3080 Ti in the Gigabyte Aero 16, for example, is just a few percentage points ahead. The smaller Ampere card also performs well compared to laptops with the same GPU. The Legion 5 Pro with the RTX 3060 lies a good 14% above the category average, and even outperforms the 3060 in the Alienware x14 by 20%.
| 3DMark 11 Performance | 27368 points | |
| 3DMark Cloud Gate Standard Score | 55891 points | |
| 3DMark Fire Strike Score | 20491 points | |
| 3DMark Fire Strike Extreme Score | 10399 points | |
| 3DMark Time Spy Score | 9640 points | |
| 3DMark Steel Nomad Score | 1882 points | |
| 3DMark Steel Nomad Light Score | 8440 points | |
Help | ||
Gaming Performance
Synthetic benchmarks aside, the exceptionally good impression persists for gaming. Performance is excellent and enables around 60 FPS in high detail in almost all current titles. If the native refresh rate of the QHD display runs out of steam, resolution should be reduced to Full HD and possibly even HD.
| The Witcher 3 - 1920x1080 Ultra Graphics & Postprocessing (HBAO+) | |
| Average of class Gaming (95 - 240, n=8, last 2 years) | |
| Lenovo Legion 5 Pro 16 G7 i7 RTX 3070Ti | |
| HP Omen 16-b1090ng | |
| Gigabyte Aero 16 YE5 | |
| Lenovo Legion 5 Pro 16IAH7H | |
| HP Omen 16-c0077ng | |
| Average NVIDIA GeForce RTX 3060 Laptop GPU (58.2 - 91.5, n=48) | |
| Alienware x14 i7 RTX 3060 | |
| Alienware x14 i7 RTX 3060 | |
| F1 2021 - 1920x1080 Ultra High Preset + Raytracing AA:T AF:16x | |
| Lenovo Legion 5 Pro 16 G7 i7 RTX 3070Ti | |
| Lenovo Legion 5 Pro 16IAH7H | |
| Gigabyte Aero 16 YE5 | |
| Alienware x14 i7 RTX 3060 | |
| Average NVIDIA GeForce RTX 3060 Laptop GPU (67 - 112.8, n=9) | |
| Far Cry 6 - 1920x1080 Ultra Graphics Quality + HD Textures AA:T | |
| Average of class Gaming (96.3 - 135.7, n=3, last 2 years) | |
| Lenovo Legion 5 Pro 16IAH7H | |
| Average NVIDIA GeForce RTX 3060 Laptop GPU (59.8 - 94.3, n=6) | |
| Tiny Tina's Wonderlands | |
| 1920x1080 High Preset (DX12) | |
| Average of class Gaming (72.1 - 203, n=5, last 2 years) | |
| HP Omen 16-b1090ng | |
| Lenovo Legion 5 Pro 16IAH7H | |
| Average NVIDIA GeForce RTX 3060 Laptop GPU (94.8 - 102.7, n=2) | |
| 1920x1080 Badass Preset (DX12) | |
| Average of class Gaming (55 - 159.4, n=5, last 2 years) | |
| HP Omen 16-b1090ng | |
| Lenovo Legion 5 Pro 16IAH7H | |
| Average NVIDIA GeForce RTX 3060 Laptop GPU (72.3 - 80.5, n=3) | |
The RTX 3060 can also maintain constant performance, as our benchmarks and especially our Witcher 3 test show. In the 30-minute test, the refresh rates only drop by a few frames at the beginning and can then be maintained permanently without further drops.
For maximum performance on the internal display, Lenovo equips the Legion 5 Pro with an MUX switch and Advanced Optimus to bypass the GPU. Using Lenovo’s Vantage software, the GPU can also be overclocked with the switch. In our tests, this was noticeable with an average 50-100 MHz higher core clock speed.
Witcher 3 FPS-Diagram
| low | med. | high | ultra | QHD DLSS | QHD FSR | QHD | 4K DLSS | 4K FSR | 4K | |
|---|---|---|---|---|---|---|---|---|---|---|
| GTA V (2015) | 185.4 | 181.3 | 161.8 | 107.8 | 83.1 | |||||
| The Witcher 3 (2015) | 389 | 276.8 | 184.6 | 88.2 | ||||||
| Dota 2 Reborn (2015) | 172.1 | 159.4 | 148.9 | 142.8 | ||||||
| Civilization 6 (2016) | 349 | 149 | 131 | |||||||
| Final Fantasy XV Benchmark (2018) | 199.2 | 117.8 | 87.2 | 63.8 | ||||||
| X-Plane 11.11 (2018) | 150.4 | 138 | 105.6 | |||||||
| World of Tanks enCore (2018) | 121.1 | |||||||||
| Far Cry 5 (2018) | 165 | 135 | 128 | 120 | 90 | |||||
| Strange Brigade (2018) | 393 | 235 | 186.6 | 160.7 | ||||||
| Apex Legends (2019) | 164.7 | 163.9 | 135.1 | 92.4 | 73.5 | 48.6 | ||||
| Borderlands 3 (2019) | 72.1 | 51.3 | ||||||||
| Gears Tactics (2020) | 109 | 73.3 | ||||||||
| Valorant (2020) | 189.4 | 304 | ||||||||
| Assassin´s Creed Valhalla (2020) | 152 | 106 | 85 | 62 | 53 | |||||
| F1 2021 (2021) | 360 | 287 | 227 | 112.8 | ||||||
| Far Cry 6 (2021) | 148.1 | 119.8 | 104.1 | 94.3 | 70.3 | |||||
| Cyberpunk 2077 1.6 (2022) | 61.9 | 38.6 | ||||||||
| Tiny Tina's Wonderlands (2022) | 180.27 | 147.17 | 102.73 | 80.51 | 56.25 | |||||
| F1 22 (2022) | 184.2 | 171.6 | 141.2 | 50.4 | 31.4 | |||||
| FIFA 23 (2022) | 116.9 | 118.2 | 111.9 | 88.9 | 62.8 | |||||
| A Plague Tale Requiem (2022) | 40.5 | 28.8 | ||||||||
| Uncharted Legacy of Thieves Collection (2022) | 57 | 34.3 | ||||||||
| Call of Duty Modern Warfare 2 2022 (2022) | 76 | 54 | ||||||||
| Spider-Man Miles Morales (2022) | 75.8 | 63.8 | ||||||||
| Starfield (2023) | 40.1 | 35.3 | 28.6 | 18.8 | ||||||
| Baldur's Gate 3 (2023) | 90.6 | 60.6 | ||||||||
| Cyberpunk 2077 (2023) | 107.6 | 85.8 | 73.3 | 63.6 | 46 | 38.2 | 22.2 | 17 | ||
| Counter-Strike 2 (2023) | 122.9 | 82.2 | 49.2 | |||||||
| EA Sports FC 24 (2023) | 125.6 | 101 | 58.2 | |||||||
| Total War Pharaoh (2023) | 97.3 | 69.3 | 36.5 | |||||||
| The Finals (2023) | 120.9 | 75.4 | 35 | |||||||
| Helldivers 2 (2024) | 73.9 | 37.9 | 27.6 | |||||||
| Horizon Forbidden West (2024) | 33.3 | 26.7 | 12.1 | |||||||
| Senua's Saga Hellblade 2 (2024) | 23.9 | 17.7 | 9.25 | |||||||
| F1 24 (2024) | 130.9 | 106.2 | 66.3 | 31 | 31.3 | 29.4 | 19.8 | 15.3 | 14 | 9.08 |
| Black Myth: Wukong (2024) | 41 | 32 | 18 | 15 | ||||||
| Star Wars Outlaws (2024) | 29.8 | 27.8 | 23.7 | 19.2 | 25.2 | 17.8 | ||||
| Space Marine 2 (2024) | 61.9 | 56.9 | 43 | 22.5 | ||||||
| Final Fantasy XVI (2024) | 49.7 | 43.8 | 40.9 | |||||||
| EA Sports FC 25 (2024) | 73.6 | 58 | 32.3 | |||||||
| Stalker 2 (2024) | 54.7 | 16.1 | 11.6 | 13.9 | 4 | |||||
| Marvel Rivals (2024) | 81 | 64 | 57 | 34 | 21 | |||||
| Kingdom Come Deliverance 2 (2025) | 60.4 | 44.2 | 43.6 | 31.6 | ||||||
| Monster Hunter Wilds (2025) | 59.6 | 49.3 | 27 | 25.5 | 18.8 | |||||
| Civilization 7 (2025) | 110.3 | 103.2 | 70.8 | 46.5 | 30.6 | |||||
| The Elder Scrolls IV Oblivion Remastered (2025) | 69 | 58.9 | 49.4 | 19.7 | 11.9 | |||||
| Doom: The Dark Ages (2025) | 62.5 | 58.1 | 50.4 | 49.9 | 40.9 | 44.8 | 31.6 | 12.7 | 10.3 | 10.4 |
| F1 25 (2025) | 186.8 | 165.1 | 126.5 | 10.4 | 10.7 | 6 | 4.54 | 1.697 | ||
| Borderlands 4 (2025) | 39.1 | 30.7 | 23.2 | 13.8 | ||||||
| Battlefield 6 (2025) | 94.1 | 82.3 | 67.9 | 45.2 | 41.1 | 26.9 | ||||
| The Outer Worlds 2 (2025) | 86.1 | 64.3 | 47.1 | 23.4 | 14.6 | |||||
| ARC Raiders (2025) | 143.8 | 90.5 | 70 | 37.5 | 27.2 | |||||
| Anno 117: Pax Romana (2025) | 80 | 59.2 | 44.6 | 24.3 | 24.9 | 17.2 | ||||
| Call of Duty Black Ops 7 (2025) | 122 | 111 | 83 | 27 | 15 | 3 | ||||
| Resident Evil Requiem (2026) | 86.1 | 60.6 | 57 | |||||||
| Death Stranding 2 (2026) | 67 | 57.2 | 51.8 | 38.8 | 42 | 26 | ||||
| Crimson Desert (2026) | 84.9 | 52 | 48.8 | 41.7 | 35 | 31.9 | ||||
| Pragmata (2026) | 58.2 | 53.8 | 39.5 | 25.2 | 19.1 | |||||
| War Thunder (2026) | 245 | 261 | 240 | 62.3 | 37.7 | 19.6 | ||||
| Forza Horizon 6 (2026) | 79 | 47 | 21 | 19 | 14 | |||||
| 007 First Light (2026) | 53.9 | 51.1 | 44.7 | 41.6 | 35.5 | 13.2 |
Emissions - Typical Gamer
System Noise
Although Lenovo provides a very generous allowance for power consumption for both the CPU and the GPU, the Legion 5 behaves unremarkably when compared to the competition in the noise test. Although the fans also run during simple activities, we did not find this annoying. Since the fans do not pulsate and register their deployment with a slow increase in speed and without annoying interference frequencies, you can also cut videos or edit images without your headphones on. As soon as the CPU and graphics card run at up to 120 W, the resulting waste heat must be dispelled from the case. When this occurs, the fans kick in but maintain their unobtrusive characteristics even at higher speeds.
However, you should keep your headphones or the headset on stand-by when cranking it up, this applies to pretty much every gaming laptop in 2022, even when the hardware is not as effectively exploited as in the Legion 5 Pro.
Noise level
| Idle |
| 28.7 / 32 / 32 dB(A) |
| Load |
| 45.2 / 54.4 dB(A) |
 | ||
30 dB silent 40 dB(A) audible 50 dB(A) loud |
||
min: | ||
| Lenovo Legion 5 Pro 16IAH7H GeForce RTX 3060 Laptop GPU, i7-12700H, 2x Samsung PM9A1 MZVL21T0HCLR (RAID 0) | HP Omen 16-b1090ng GeForce RTX 3070 Ti Laptop GPU, i7-12700H, WDC PC SN810 1TB | HP Omen 16-c0077ng Radeon RX 6600M, R7 5800H, Samsung PM981a MZVLB1T0HBLR | Gigabyte Aero 16 YE5 GeForce RTX 3080 Ti Laptop GPU, i9-12900HK, Phison ESR01TBMFCT | Alienware x14 i7 RTX 3060 GeForce RTX 3060 Laptop GPU, i7-12700H, WDC PC SN810 1TB | |
|---|---|---|---|---|---|
| Noise | -4% | -3% | -1% | 10% | |
| off / environment * (dB) | 24.6 | 26 -6% | 25 -2% | 25 -2% | 24.7 -0% |
| Idle Minimum * (dB) | 28.7 | 30 -5% | 25 13% | 30 -5% | 24.7 14% |
| Idle Average * (dB) | 32 | 31 3% | 31.2 2% | 32 -0% | 24.7 23% |
| Idle Maximum * (dB) | 32 | 33 -3% | 33.8 -6% | 33 -3% | 30.9 3% |
| Load Average * (dB) | 45.2 | 49 -8% | 55.4 -23% | 45 -0% | 40 12% |
| Load Maximum * (dB) | 54.4 | 57 -5% | 56 -3% | 52 4% | 51.5 5% |
| Witcher 3 ultra * (dB) | 53 | 50 | 51.5 |
* ... smaller is better
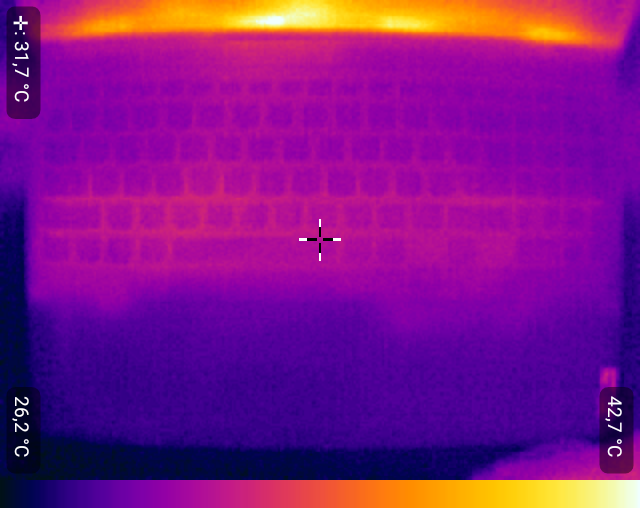
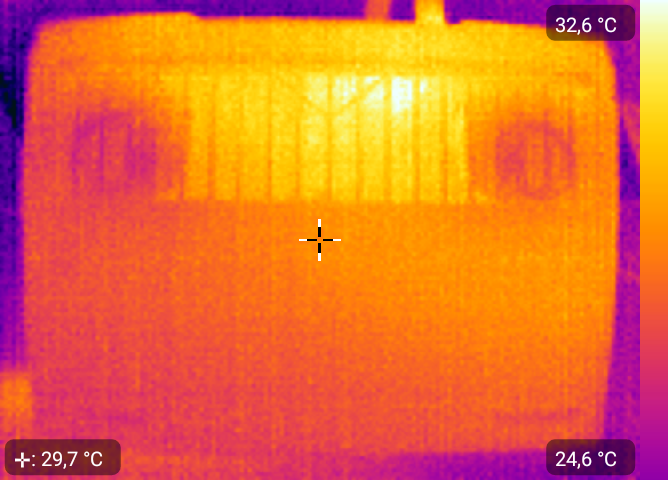
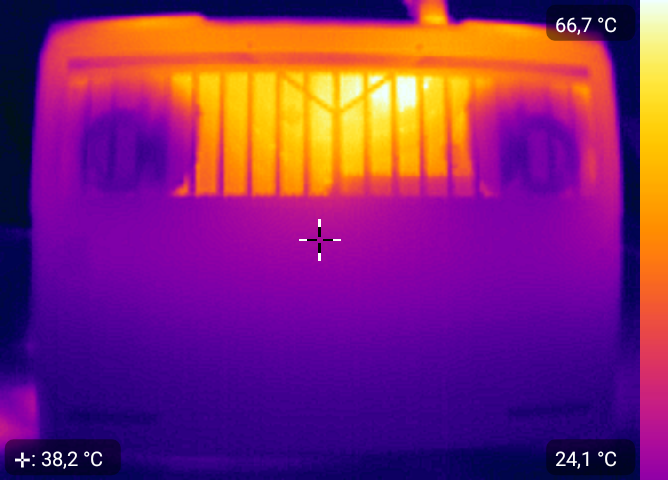
Temperature
The top metal surfaces of this 16 inch unit heat up moderately under load. It can also get very warm near the display, but neither the keyboard nor the wrist rest were unpleasantly warm during our tests. On the bottom and in the vicinity of the cooling elements on the back of the laptop, it can get reasonably hot. Let’s just say, the Legion would rather be perched on a desk while gaming.
(-) The maximum temperature on the upper side is 45.8 °C / 114 F, compared to the average of 40.4 °C / 105 F, ranging from 21.2 to 68.8 °C for the class Gaming.
(-) The bottom heats up to a maximum of 66.3 °C / 151 F, compared to the average of 43.2 °C / 110 F
(+) In idle usage, the average temperature for the upper side is 27.8 °C / 82 F, compared to the device average of 33.9 °C / 93 F.
(+) The palmrests and touchpad are cooler than skin temperature with a maximum of 29 °C / 84.2 F and are therefore cool to the touch.
(±) The average temperature of the palmrest area of similar devices was 28.8 °C / 83.8 F (-0.2 °C / -0.4 F).

| Lenovo Legion 5 Pro 16IAH7H Intel Core i7-12700H, NVIDIA GeForce RTX 3060 Laptop GPU | HP Omen 16-b1090ng Intel Core i7-12700H, NVIDIA GeForce RTX 3070 Ti Laptop GPU | HP Omen 16-c0077ng AMD Ryzen 7 5800H, AMD Radeon RX 6600M | Gigabyte Aero 16 YE5 Intel Core i9-12900HK, NVIDIA GeForce RTX 3080 Ti Laptop GPU | Alienware x14 i7 RTX 3060 Intel Core i7-12700H, NVIDIA GeForce RTX 3060 Laptop GPU | |
|---|---|---|---|---|---|
| Heat | 12% | 9% | -2% | 11% | |
| Maximum Upper Side * (°C) | 45.8 | 41 10% | 40.6 11% | 49 -7% | 51.3 -12% |
| Maximum Bottom * (°C) | 66.3 | 62 6% | 36 46% | 55 17% | 44.4 33% |
| Idle Upper Side * (°C) | 30.4 | 25 18% | 31.3 -3% | 33 -9% | 27.2 11% |
| Idle Bottom * (°C) | 30.4 | 26 14% | 36 -18% | 33 -9% | 26.6 12% |
* ... smaller is better
| CPU Clock (GHz) | GPU Clock (MHz) | durchschnittlich. CPU-Temperatur (°C) | durchschnittliche GPU-Temperatur (°C) | |
| System Idle | 3.910 | 210 | 46 | 48 |
| Prime95 Stress | 3.352 | 210 | 91 | 61 |
| Prime95 + FurMark Stress | 2.773 | 1.568 | 93 | 86 |
| Witcher 3 Stress | 3.800 | 1.810 | 79 | 86 |
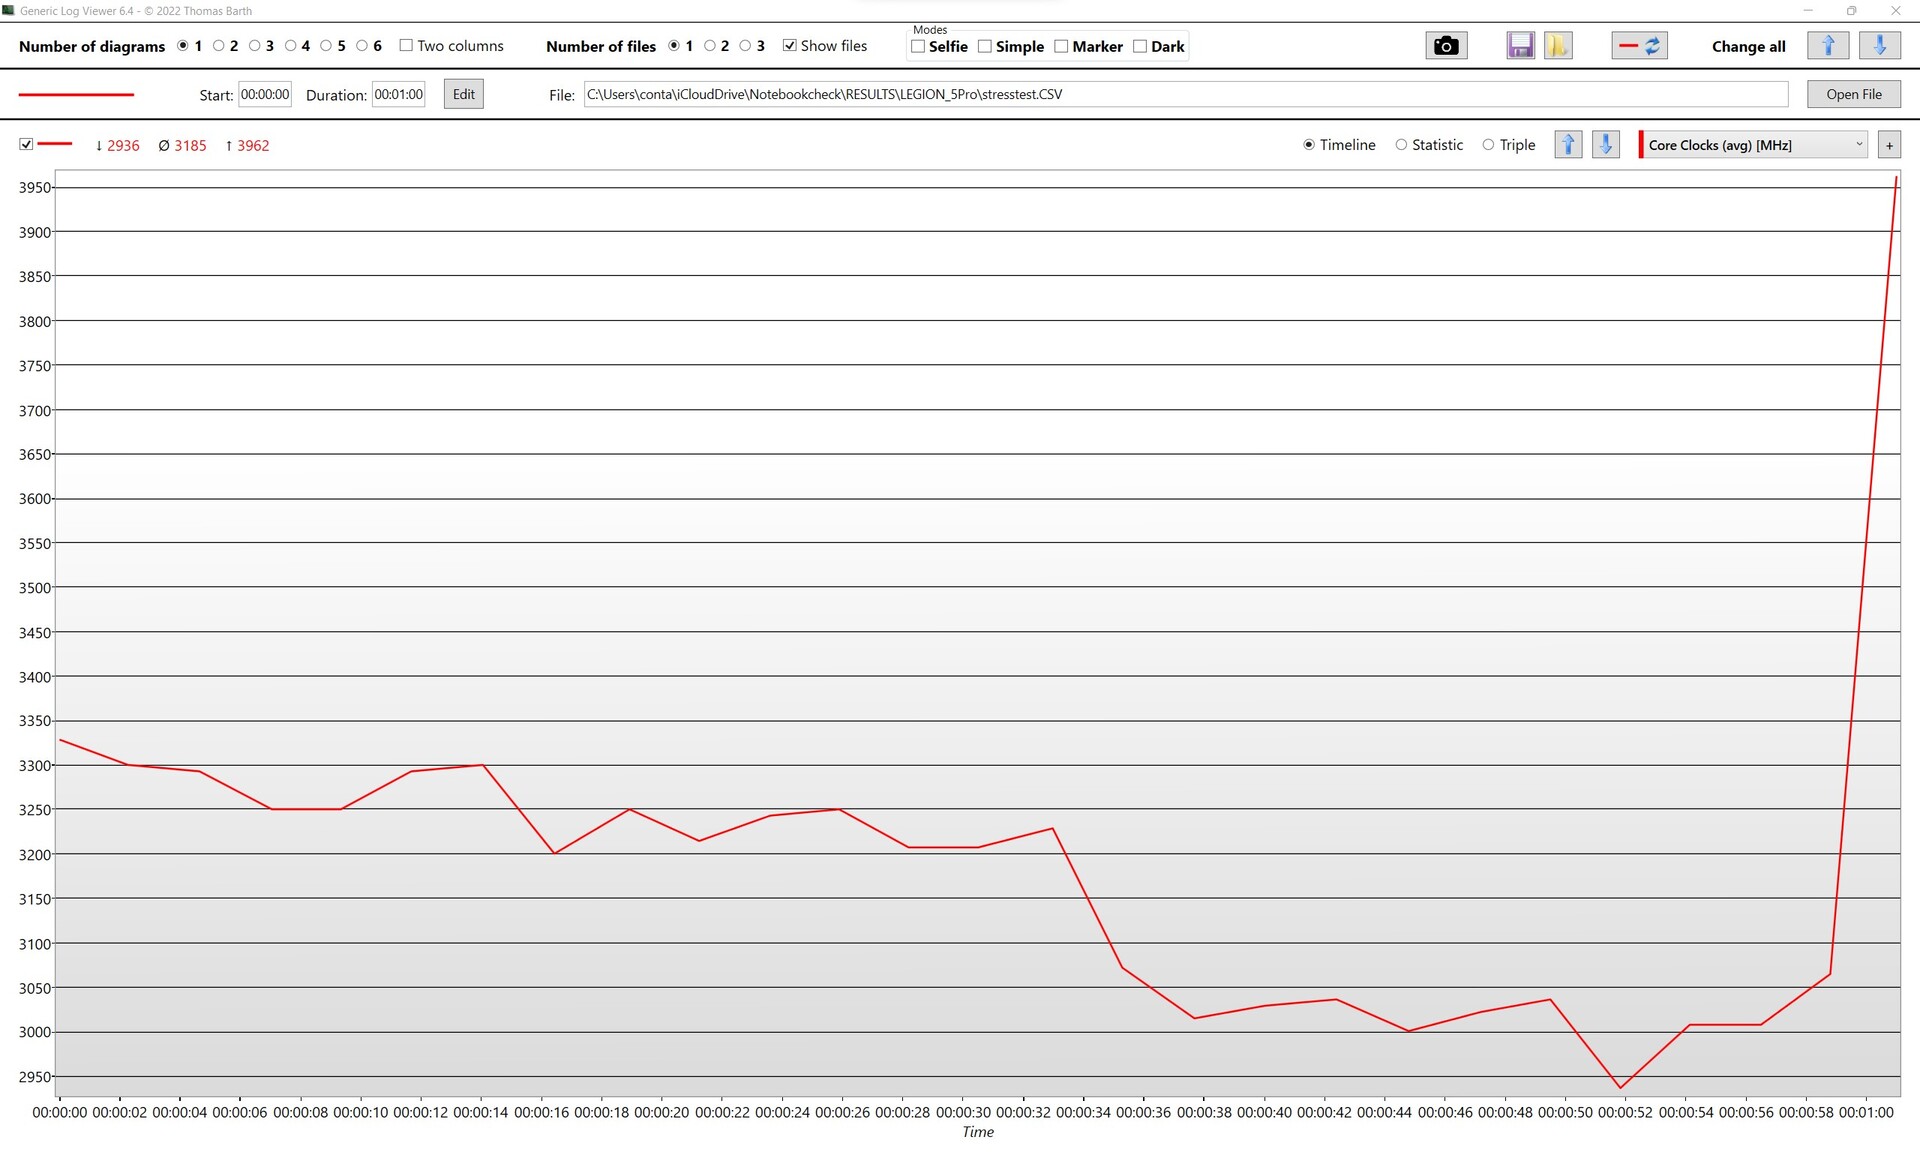
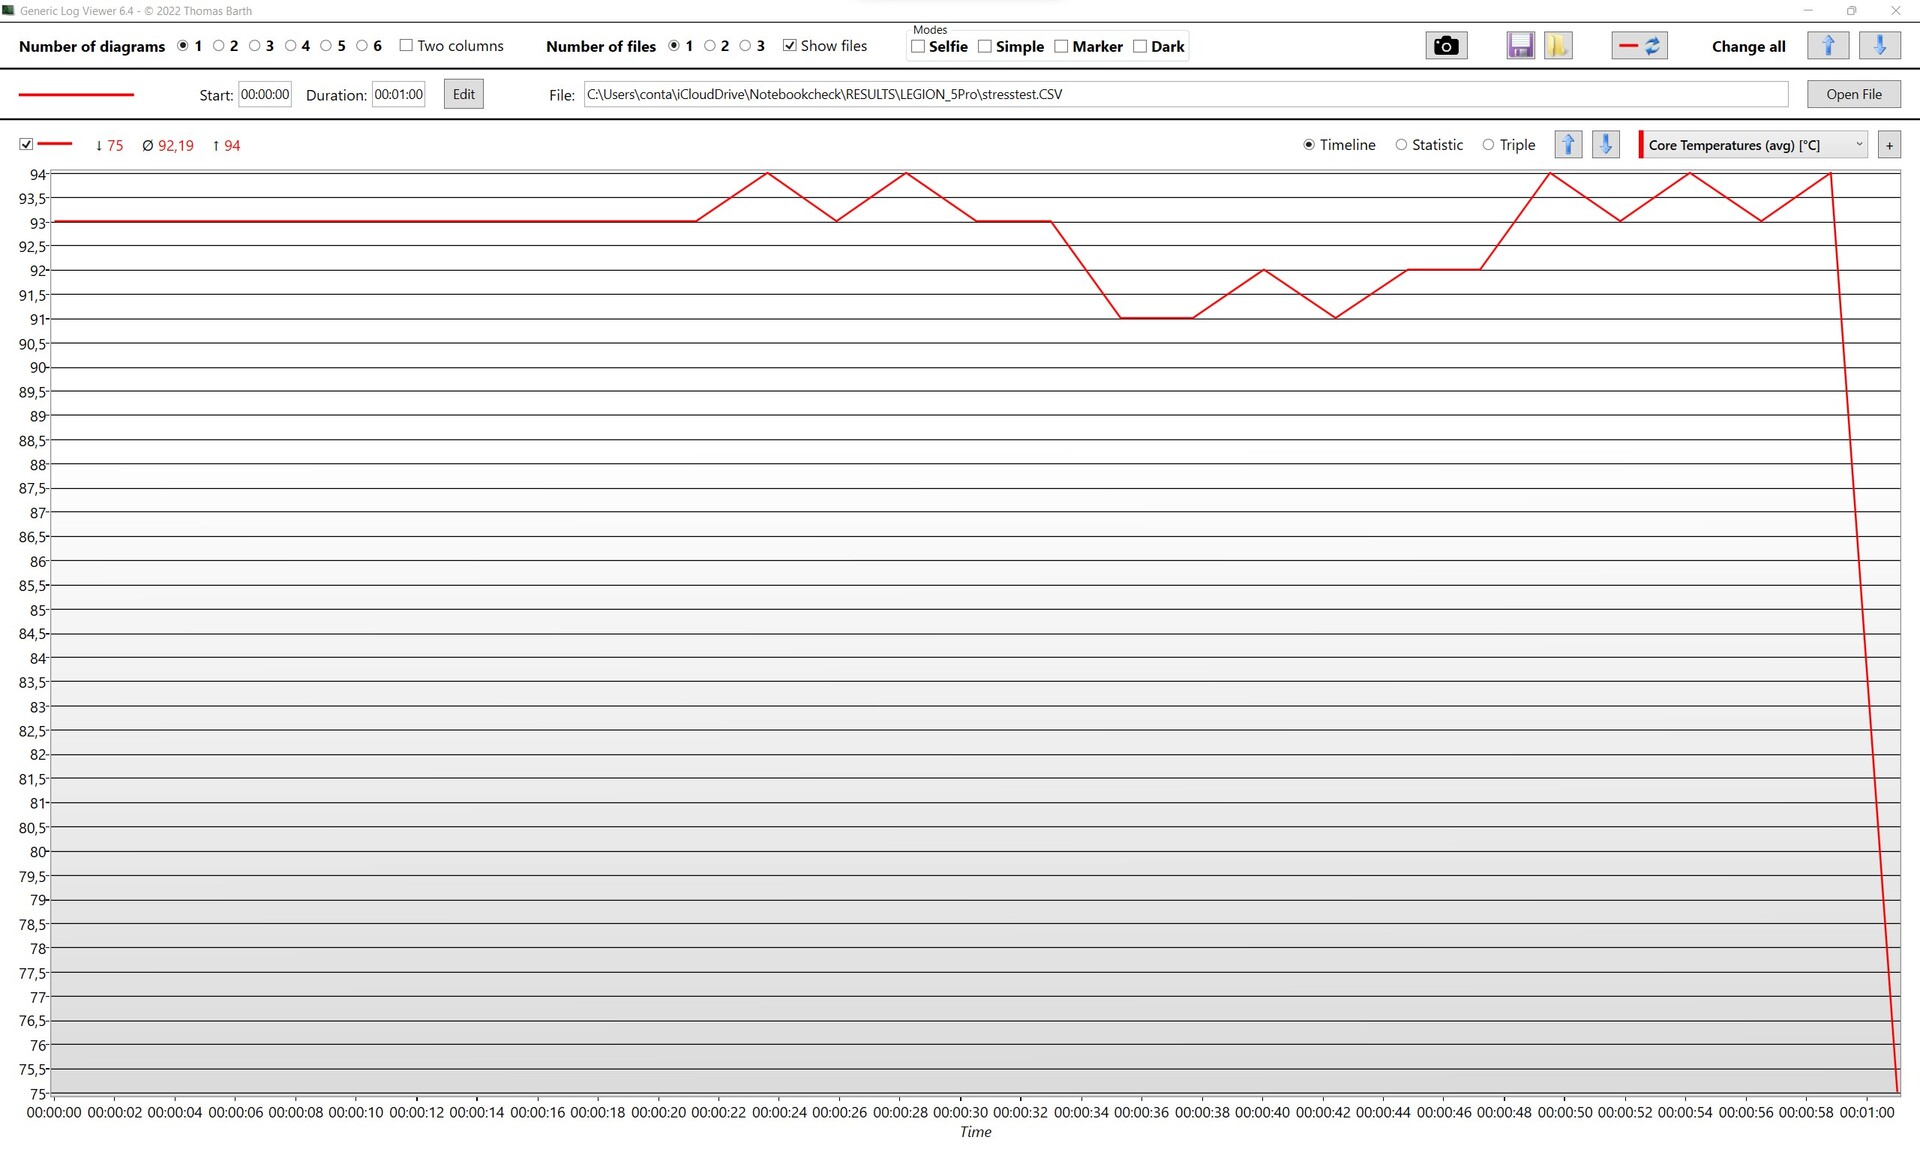
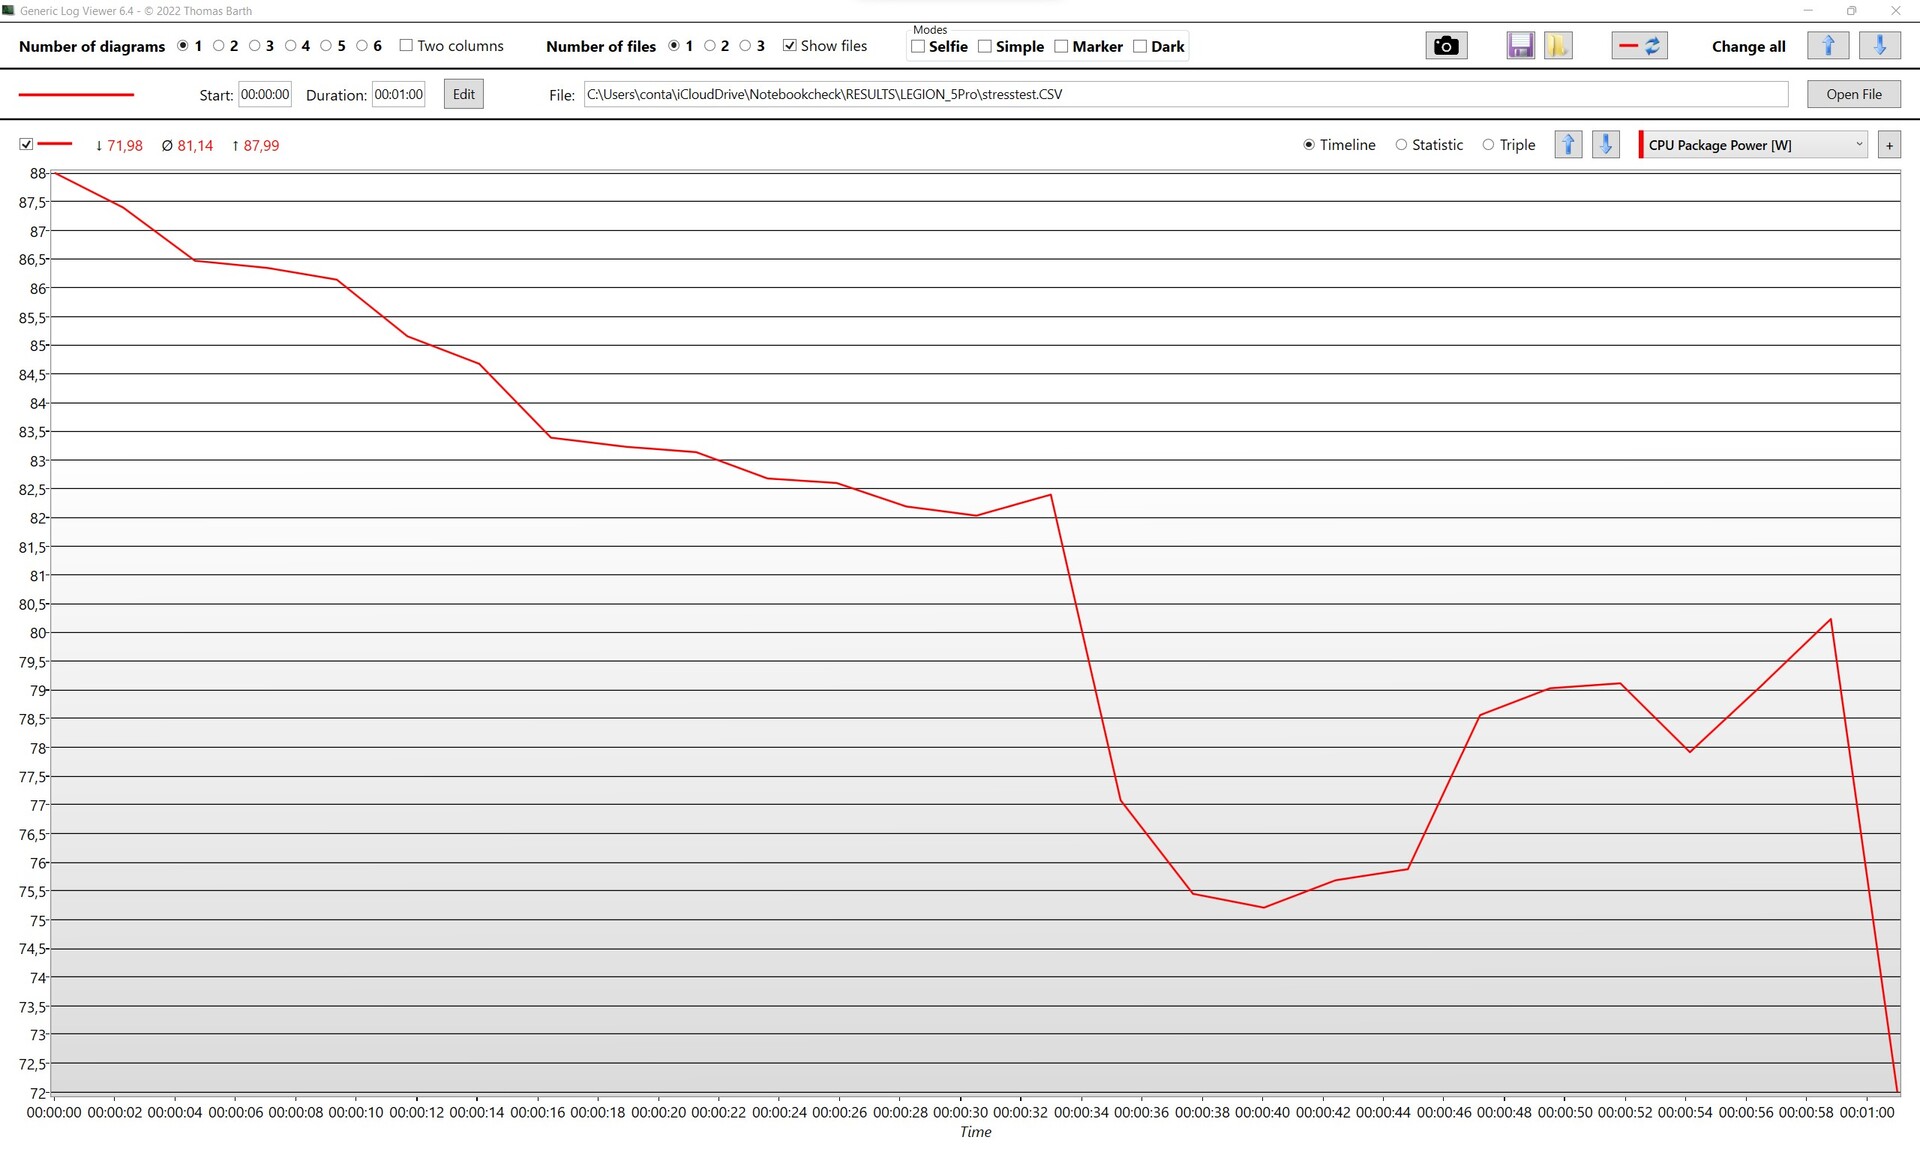
Stress test
In our one-hour stress test using Prime 95 and FurMark, we wanted to explore extreme case heat and/or power consumption issues. Not even in a contrived scenario that would generally never occur under normal usage patterns did the Legion 5 Pro fold. While the temperatures were high, they were within the Intel and Nvidia specifications and the clock rates were still acceptable. Neither the i7 nor the RTX 3060 fell below their base clock rates, and the clock rates of the processor and graphics card remained consistently high in normal gaming.

Speakers
The integrated speakers do their job more than appropriately for the odd YouTube video or even for a movie night. The quality is really quite outstanding, and unfortunately not typical for laptops. That’s something where we would like to see a little more attention from almost all manufacturers.
In the Legion 5, the mid frequencies and trebles are completely satisfactory and deliver a clear sound, while the volume might need to be slightly higher for larger rooms or groups of people. Unfortunately, we almost completely miss basses, but that’s not at all uncommon for laptops. In contrast to the other product categories, this 16 inch device offers only standard fare. But for a gaming laptop, which the likely gamer probably uses with a headset most of the time, this is acceptable in our opinion.
Lenovo Legion 5 Pro 16IAH7H audio analysis
(±) | speaker loudness is average but good (72.7 dB)
Bass 100 - 315 Hz
(-) | nearly no bass - on average 21.7% lower than median
(±) | linearity of bass is average (12.8% delta to prev. frequency)
Mids 400 - 2000 Hz
(±) | higher mids - on average 5% higher than median
(+) | mids are linear (3.4% delta to prev. frequency)
Highs 2 - 16 kHz
(+) | balanced highs - only 1.7% away from median
(+) | highs are linear (4.1% delta to prev. frequency)
Overall 100 - 16.000 Hz
(±) | linearity of overall sound is average (18% difference to median)
Compared to same class
» 55% of all tested devices in this class were better, 9% similar, 36% worse
» The best had a delta of 6%, average was 18%, worst was 132%
Compared to all devices tested
» 38% of all tested devices were better, 8% similar, 54% worse
» The best had a delta of 4%, average was 24%, worst was 134%
HP Omen 16-b1090ng audio analysis
(+) | speakers can play relatively loud (83 dB)
Bass 100 - 315 Hz
(-) | nearly no bass - on average 24.4% lower than median
(±) | linearity of bass is average (13.8% delta to prev. frequency)
Mids 400 - 2000 Hz
(+) | balanced mids - only 1.9% away from median
(+) | mids are linear (2.8% delta to prev. frequency)
Highs 2 - 16 kHz
(+) | balanced highs - only 2.2% away from median
(+) | highs are linear (3.8% delta to prev. frequency)
Overall 100 - 16.000 Hz
(±) | linearity of overall sound is average (15.1% difference to median)
Compared to same class
» 32% of all tested devices in this class were better, 6% similar, 62% worse
» The best had a delta of 6%, average was 18%, worst was 132%
Compared to all devices tested
» 21% of all tested devices were better, 4% similar, 75% worse
» The best had a delta of 4%, average was 24%, worst was 134%
Energy Management - high power levels require a lot of energy
Power Consumption
The high power targets for the installed hardware are noticeable in power consumption: Even in idle, the Legion sometimes consumes more than twice as much energy compared to the competition. Under load, it turns out that the large 300 W power supply is a bit oversized, but certainly not over-specified. The Legion undoubtedly leads the field in power consumption with a maximum consumption of 240 W, but in view of the delivered performance that’s absolutely acceptable.
| Off / Standby | |
| Idle | |
| Load |
|
Key:
min: | |
| Lenovo Legion 5 Pro 16IAH7H i7-12700H, GeForce RTX 3060 Laptop GPU, 2x Samsung PM9A1 MZVL21T0HCLR (RAID 0), IPS, 2560x1600, 16" | HP Omen 16-b1090ng i7-12700H, GeForce RTX 3070 Ti Laptop GPU, WDC PC SN810 1TB, IPS, 2560x1440, 16.1" | HP Omen 16-c0077ng R7 5800H, Radeon RX 6600M, Samsung PM981a MZVLB1T0HBLR, IPS, 2560x1440, 16.1" | Gigabyte Aero 16 YE5 i9-12900HK, GeForce RTX 3080 Ti Laptop GPU, Phison ESR01TBMFCT, AMOLED, 3840x2400, 16" | Alienware x14 i7 RTX 3060 i7-12700H, GeForce RTX 3060 Laptop GPU, WDC PC SN810 1TB, IPS, 1920x1080, 14" | Apple MacBook Pro 16 2021 M1 Pro M1 Pro, M1 Pro 16-Core GPU, Apple SSD AP1024R, Mini-LED, 3456x2234, 16.2" | Average NVIDIA GeForce RTX 3060 Laptop GPU | Average of class Gaming | |
|---|---|---|---|---|---|---|---|---|
| Power Consumption | 42% | 29% | 5% | 54% | 63% | 41% | 29% | |
| Idle Minimum * (Watt) | 22.8 | 4 82% | 12 47% | 26 -14% | 7.9 65% | 5 78% | 10.4 ? 54% | 13.4 ? 41% |
| Idle Average * (Watt) | 26.5 | 10 62% | 12.8 52% | 30 -13% | 11.1 58% | 15.1 43% | 14.5 ? 45% | 19.1 ? 28% |
| Idle Maximum * (Watt) | 41 | 19 54% | 18.5 55% | 37 10% | 11.8 71% | 15.5 62% | 21.4 ? 48% | 24.7 ? 40% |
| Load Average * (Watt) | 191 | 114 40% | 190 1% | 127 34% | 107.4 44% | 54 72% | 109.3 ? 43% | 108.4 ? 43% |
| Witcher 3 ultra * (Watt) | 194.7 | 183.2 6% | 194 -0% | 176 10% | 111 43% | |||
| Load Maximum * (Watt) | 238 | 221 7% | 200 16% | 236 1% | 140.4 41% | 90 62% | 206 ? 13% | 254 ? -7% |
* ... smaller is better
Witcher 3 power consumption / Stress test
Power consumption external monitor
Battery Life
Our test shows the shadow side of high energy demand without being plugged in to a wall socket. Here, the competition leaves the Legion for dust. Lenovo did not win an endurance prize for the 3.5 hours it managed in our web surfing test with a fixed screen brightness of 150 nits. 30 minutes runtime under load are also just not competitive. Approximately 2 hours of gaming gives the Legion a few consolation points. But here too we think that the results need to be considered in the context of likely everyday usage. You probably don’t buy such a powerful gaming notebook to write emails all day in a café or to host a series marathon while camping.
| Lenovo Legion 5 Pro 16IAH7H i7-12700H, GeForce RTX 3060 Laptop GPU, 80 Wh | HP Omen 16-b1090ng i7-12700H, GeForce RTX 3070 Ti Laptop GPU, 83 Wh | HP Omen 16-c0077ng R7 5800H, Radeon RX 6600M, 70 Wh | Gigabyte Aero 16 YE5 i9-12900HK, GeForce RTX 3080 Ti Laptop GPU, 99 Wh | Alienware x14 i7 RTX 3060 i7-12700H, GeForce RTX 3060 Laptop GPU, 80 Wh | Average of class Gaming | |
|---|---|---|---|---|---|---|
| Battery runtime | 137% | 36% | 109% | 62% | 113% | |
| H.264 (h) | 4.1 | 7 71% | 7.5 83% | 9.4 129% | 8.26 ? 101% | |
| WiFi v1.3 (h) | 3.6 | 5.6 56% | 6.1 69% | 6.4 78% | 8.9 147% | 6.94 ? 93% |
| Witcher 3 ultra (h) | 2.1 | 1.4 -33% | 0.8 -62% | |||
| Load (h) | 0.6 | 1.9 217% | 1.6 167% | 0.8 33% | 1.47 ? 145% | |
| Reader / Idle (h) | 10.1 | 8.9 | 8.71 ? |
Pros
Cons
Verdict - A well-balanced package that shows what a CPU and a GPU can really achieve
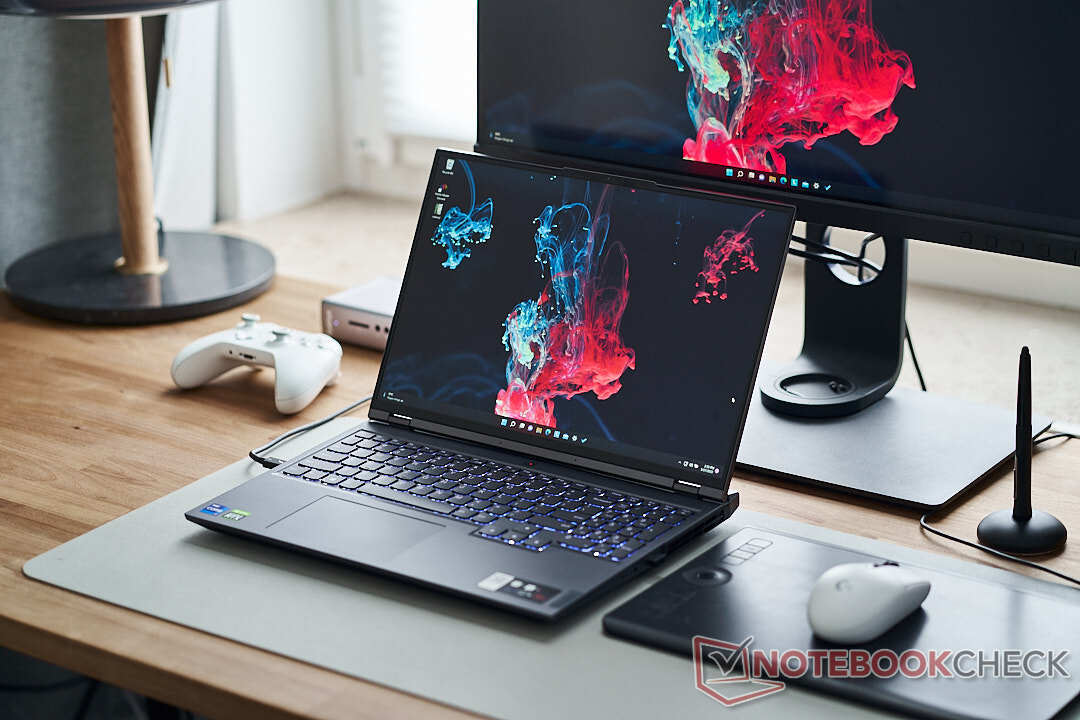
Lenovo is again doing a lot right this year after having delivered the Legion 5 Pro that was one of the most popular gaming notebooks on the market last year. The case is clearly aimed at the gaming market, but the eye-catching logos have been tastefully de-emphasized, thus providing easy passage for this 16-inch device as a performance workhorse.
Both gamers and image editors/videographers will be pleased about the enormous variety of connectivity options. It’s refreshing to see Lenovo resisting the trend to forgo essential ports and slots in favour of slimmer cases. The 16-inch 16:10 QHD display also provides little reason for criticism. For games, it is beyond reproach and is more than just fired up by the RTX 3060. While we would have liked more AdobeRGB coverage for professional image editing or photographers, video editors will also get their money’s worth here. The X–Rite software included is available with turnkey sRGB and Rec.709 profiles – that’s one huge bonus.
The standout feature of the Legion 5 Pro is its performance. The installed components are deployed with finesse and provide a showcase of what they are capable of. This applies to both the exceptionally powerful i7-12700H as well as the high-end RTX 3060. It’s hard to imagine that one might require more and, as such, it's future proof for a few years yet.
It took quite some effort to come up with any flaws of substance at all, and even when we did, they are negligible in the context of a gaming laptop (viz. battery life); or they contribute to other strengths in some way. The Legion 5 Pro may be slightly larger, heavier, and bulkier than its competitors, but that's what paves the way for an effective cooling system and heaps of connectivity. If you’re really after something a little lighter, you might want to take a look at the HP Omen 16 (YouTube review). Its CPU performance is far from that of the Legion, but with an RTX 3070 Ti you get significantly better GPU performance and a slimmer case. If your everyday life has more to do with actual work, you might want to take a look at the Gigabyte Aero 16. Although the i9’s higher price is barely worth it (in our Cinebench R23 test it’s even beaten by the i7 on the Legion 5 Pro), the RTX 3080 Ti and the great OLED panel are shoe-in for video and photo editing.
Price and Availability
With a price of around 1,800 Euros (US$ 1,825) for the 1 TB SSD unit, the Lenovo Legion 5 Pro is an almost perfect all-rounder for every application and can confidently nix the competition’s 3070 Ti surcharge with its RTX 3060.
Lenovo Legion 5 Pro 16IAH7H
- 07/25/2022 v7 (old)
Alexander Wätzel
Price comparison

