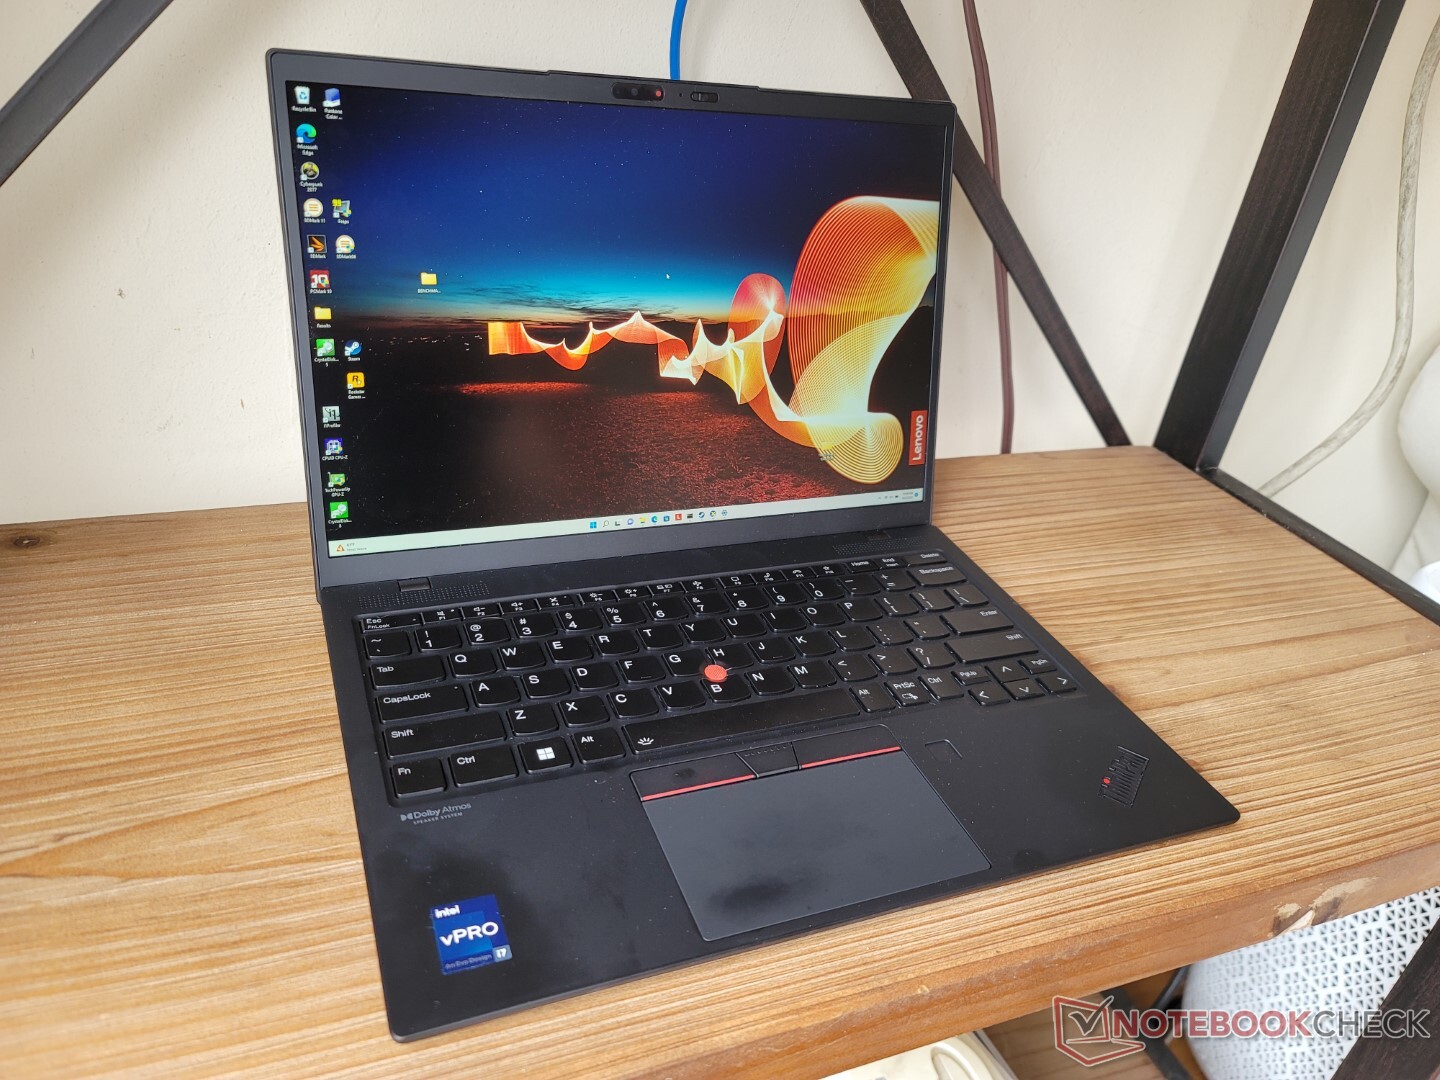
Lenovo ThinkPad X1 Nano Gen 2 review: Smallest X1 laptop ever
")
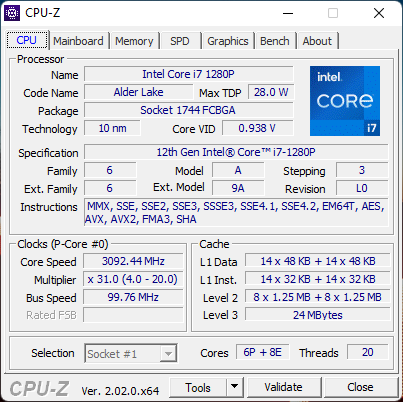
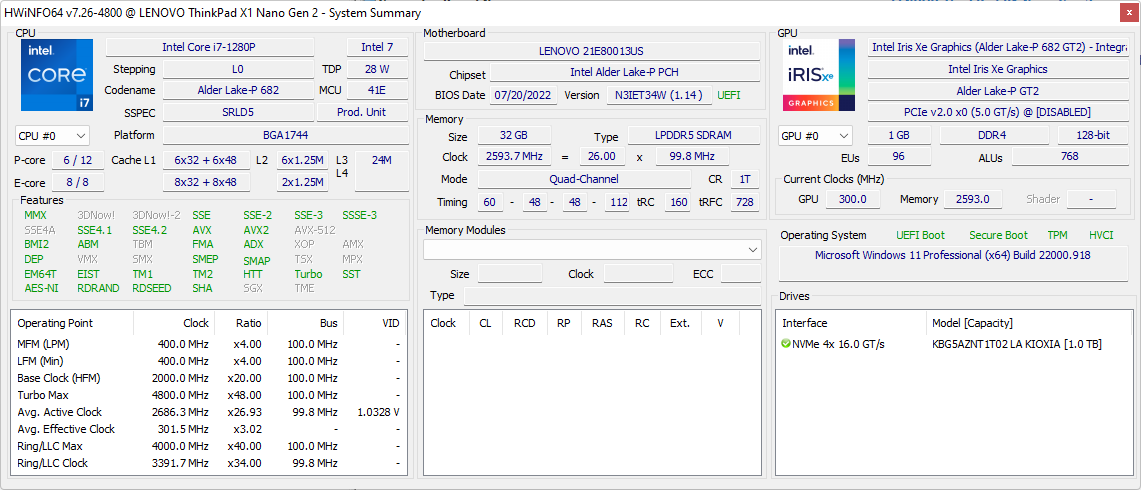
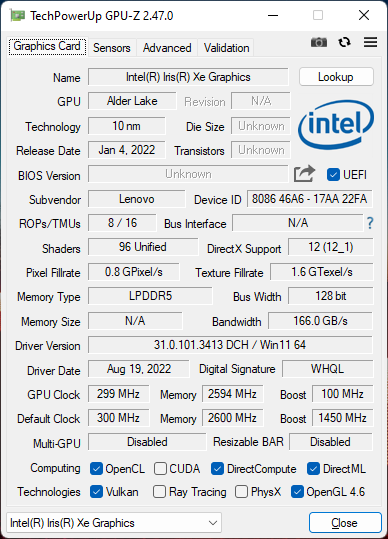
One of the biggest complaints about the ThinkPad X1 Nano Gen 1 was its slow processor. While most other subnotebooks were running on full-fledged 28 W Core i5-1135G7 or i7-1165G7 11th gen CPUs, the Nano Gen 1 was stuck with the 15 W i7-1160G7. The model may have been super lightweight, but it gave the sense that the low weight had a direct impact on performance levels. The new ThinkPad X1 Nano Gen 2 addresses this issue by swapping out the i7-1160G7 for a proper 12th gen 28 W i7-1280P vPro option which should make the X1 Nano Gen 2 one of the fastest 13.0-inch business laptops, at least on paper.
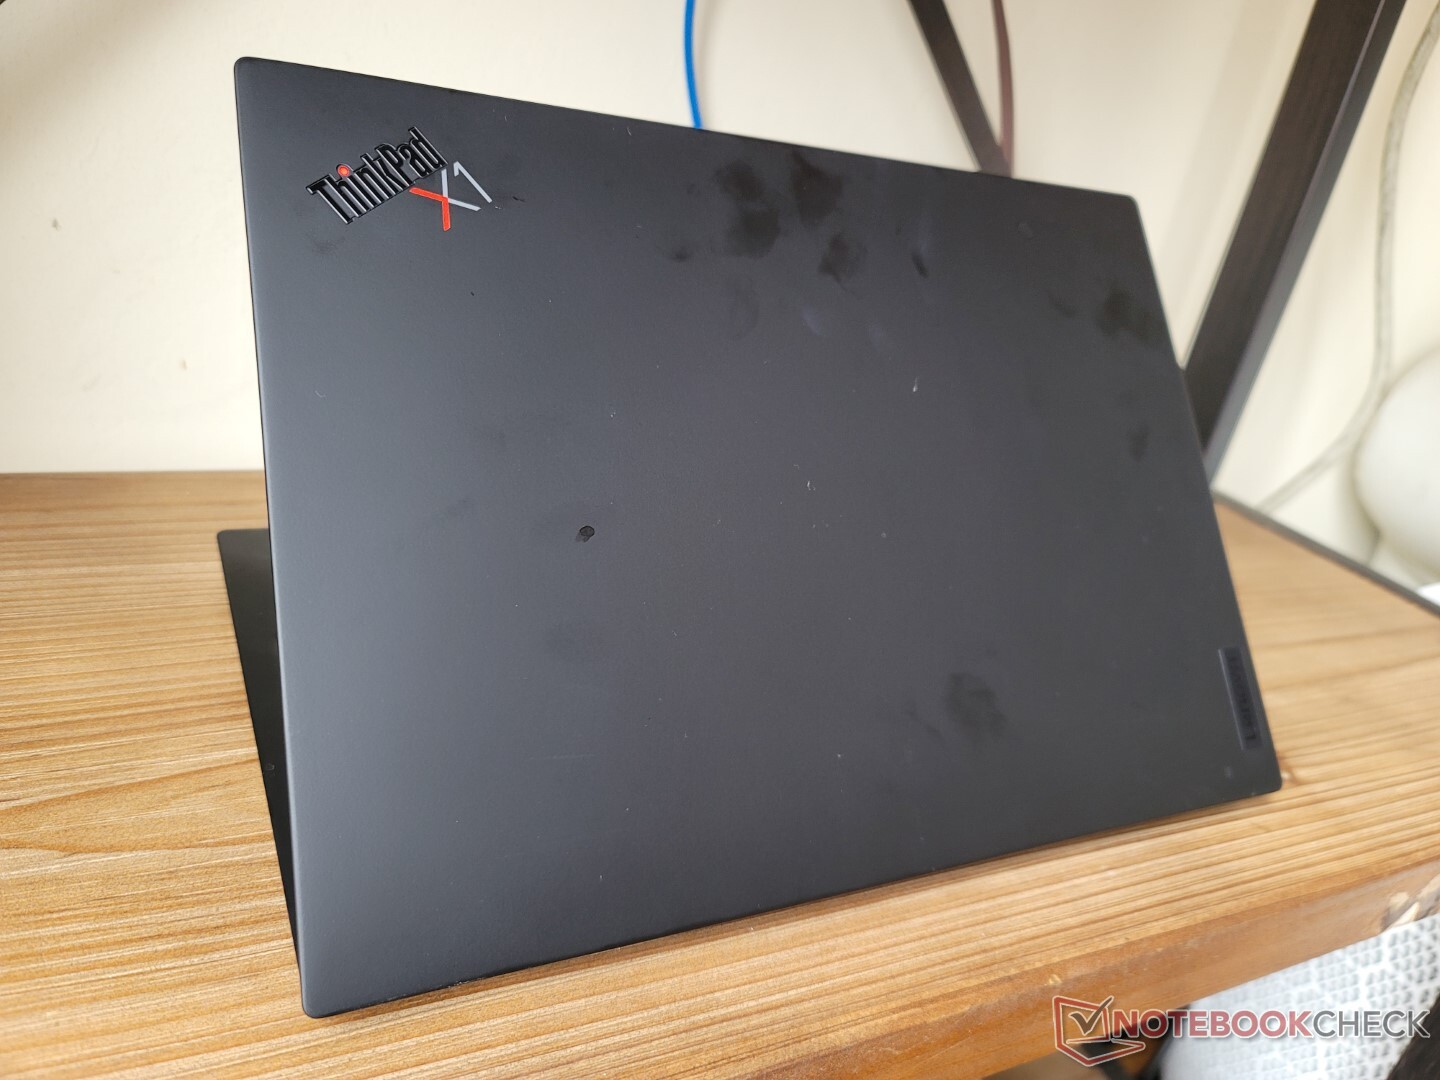
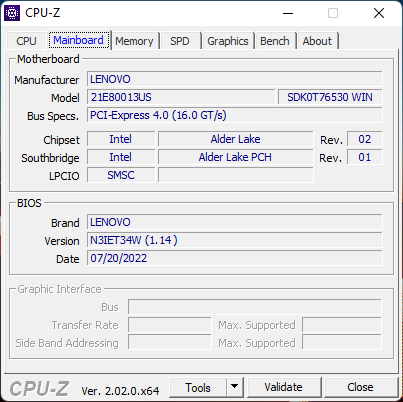
Aside from the CPU upgrade, the Gen 2 model brings a few other changes including a higher resolution webcam, faster Wi-Fi, and 5G WAN support. The exterior design is otherwise identical to the 2021 Gen 1 model and so we recommend checking out our existing review to learn more about the physical features of the laptop.
Competitors in this space include other super lightweight 13-inch business laptops like the HP Elite Dragonfly G3, Dell Latitude 13 7330, LG Gram series, or the Dynabook Portege X30L.
More Lenovo reviews:
Potential Competitors in Comparison
Rating | Date | Model | Weight | Height | Size | Resolution | Price |
|---|---|---|---|---|---|---|---|
| 88.9 % v7 (old) | 09 / 2022 | Lenovo ThinkPad X1 Nano Gen 2 Core i7-1280P i7-1280P, Iris Xe G7 96EUs | 958 g | 14.4 mm | 13.00" | 2160x1350 | |
| 89.8 % v7 (old) | 02 / 2021 | Lenovo ThinkPad X1 Nano-20UN002UGE i7-1160G7, Iris Xe G7 96EUs | 946 g | 16 mm | 13.00" | 2160x1350 | |
| 91 % v7 (old) | 08 / 2022 | HP Elite Dragonfly G3 i7-1265U, Iris Xe G7 96EUs | 1.2 kg | 16.3 mm | 13.50" | 1920x1280 | |
| 89 % v7 (old) | 07 / 2022 | Dell Latitude 13 7330 i7-1265U, Iris Xe G7 96EUs | 1 kg | 16.96 mm | 13.30" | 1920x1080 | |
| 85.1 % v7 (old) | 07 / 2022 | Framework Laptop 13.5 12th Gen Intel i7-1260P, Iris Xe G7 96EUs | 1.3 kg | 15.85 mm | 13.50" | 2256x1504 | |
| 87.8 % v7 (old) | 03 / 2021 | Huawei MateBook X Pro 2021 i7-1165G7, Iris Xe G7 96EUs | 1.3 kg | 14.6 mm | 13.90" | 3000x2000 |
Case
Communication
The WLAN module has been upgraded from the Intel AX201 to the AX211 for Wi-Fi 6E support. We experienced no connectivity issues when paired to our 6 GHz network.
LTE 5G Cat 20 or 4G CAT 9 are optional WWAN upgrades. There will be a Nano-SIM slot if configured with the feature.
| Networking | |
| iperf3 transmit AX12 | |
| Lenovo ThinkPad X1 Nano-20UN002UGE | |
| Huawei MateBook X Pro 2021 | |
| iperf3 receive AX12 | |
| Huawei MateBook X Pro 2021 | |
| Lenovo ThinkPad X1 Nano-20UN002UGE | |
| iperf3 receive AXE11000 6GHz | |
| Framework Laptop 13.5 12th Gen Intel | |
| Lenovo ThinkPad X1 Nano Gen 2 Core i7-1280P | |
| HP Elite Dragonfly G3 | |
| Dell Latitude 13 7330 | |
| iperf3 transmit AXE11000 6GHz | |
| Dell Latitude 13 7330 | |
| Framework Laptop 13.5 12th Gen Intel | |
| HP Elite Dragonfly G3 | |
| Lenovo ThinkPad X1 Nano Gen 2 Core i7-1280P | |
Webcam
Dell has updated the webcam from 720p on the Gen 1 model to 1080p for this year's Gen 2 version. The picture isn't as muddy as a result, but colors remain subpar.
Both IR and a physical webcam shutter come standard for privacy.


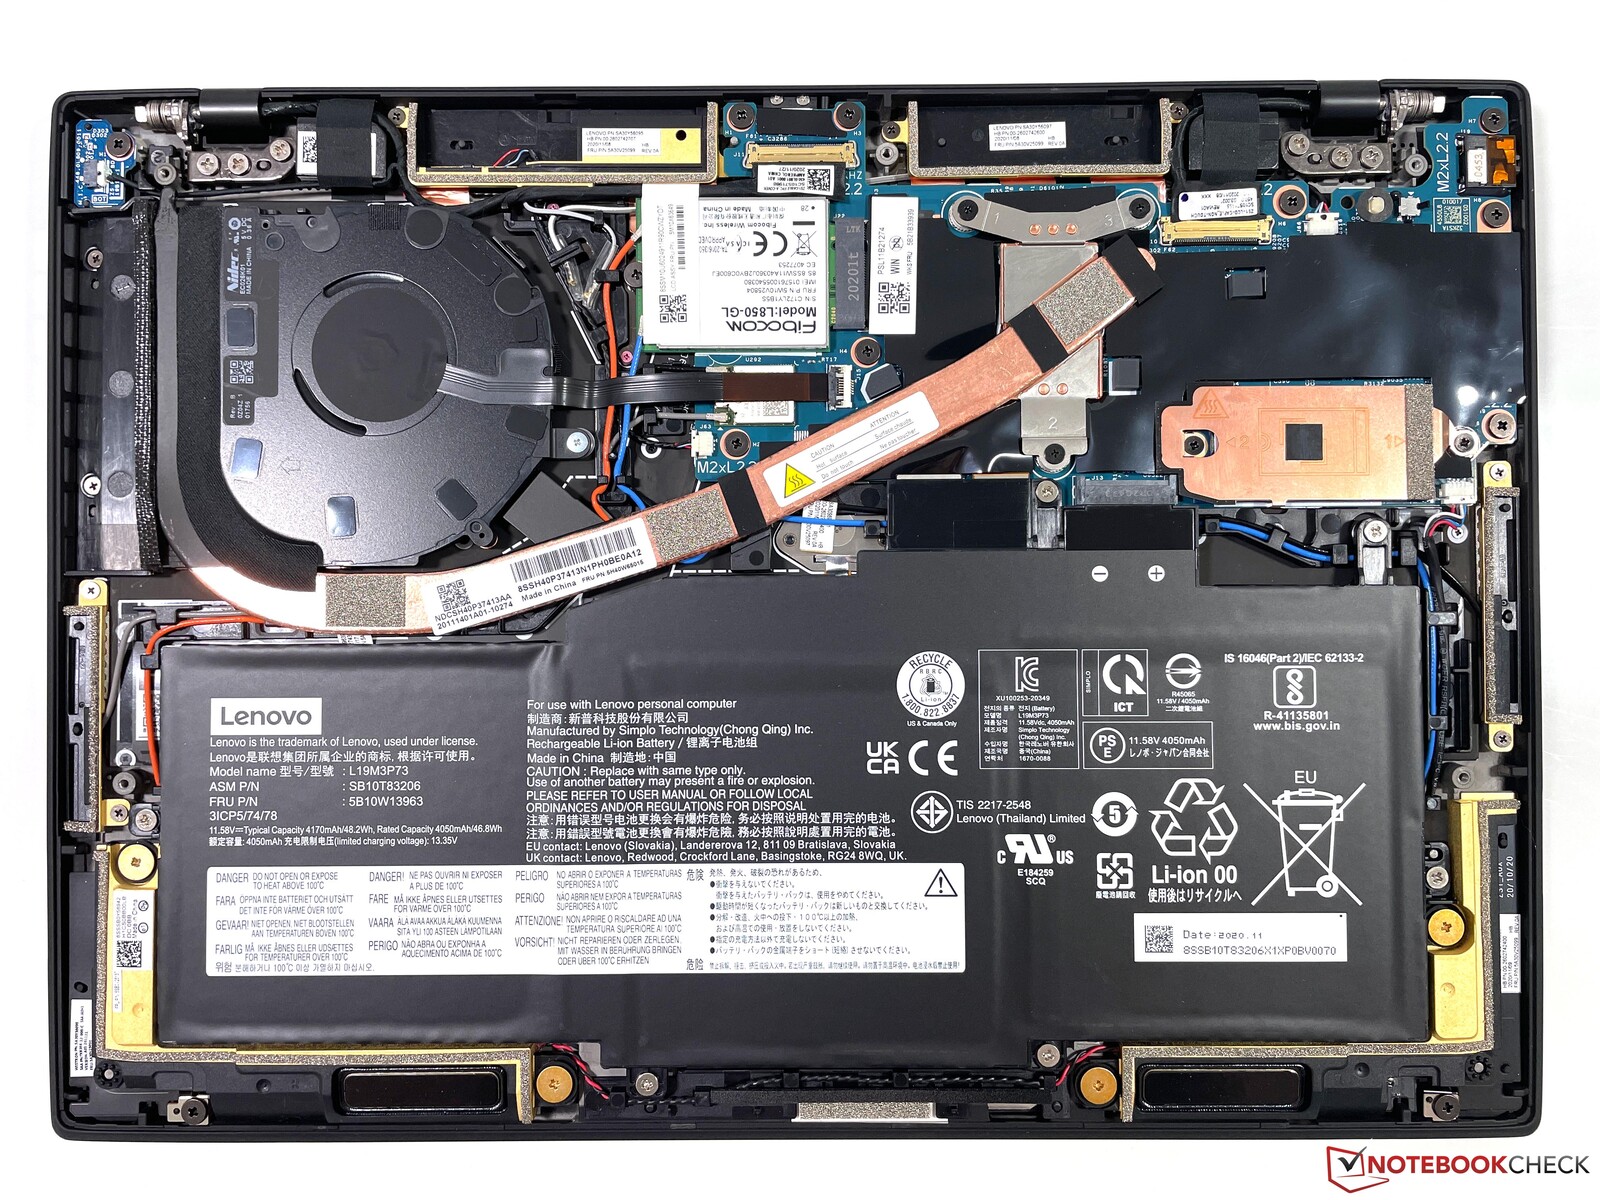
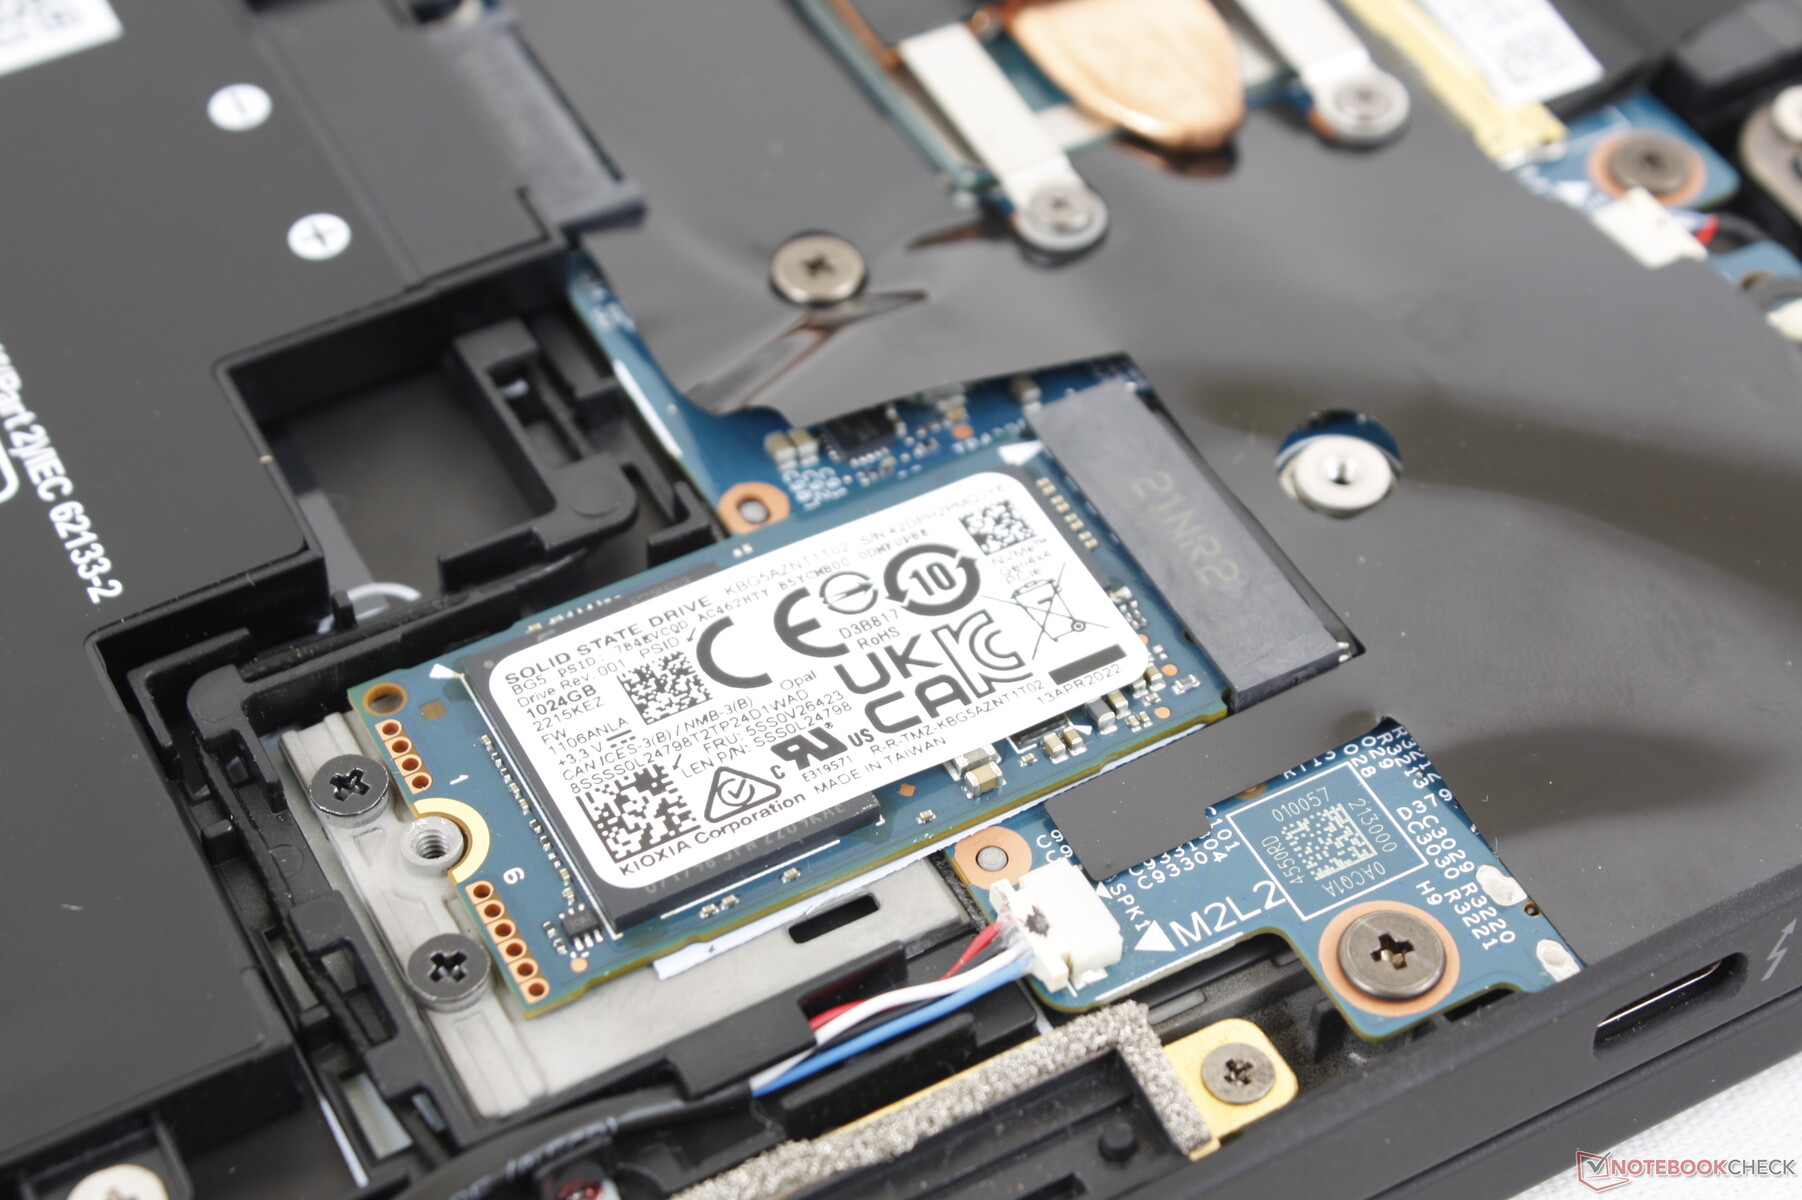
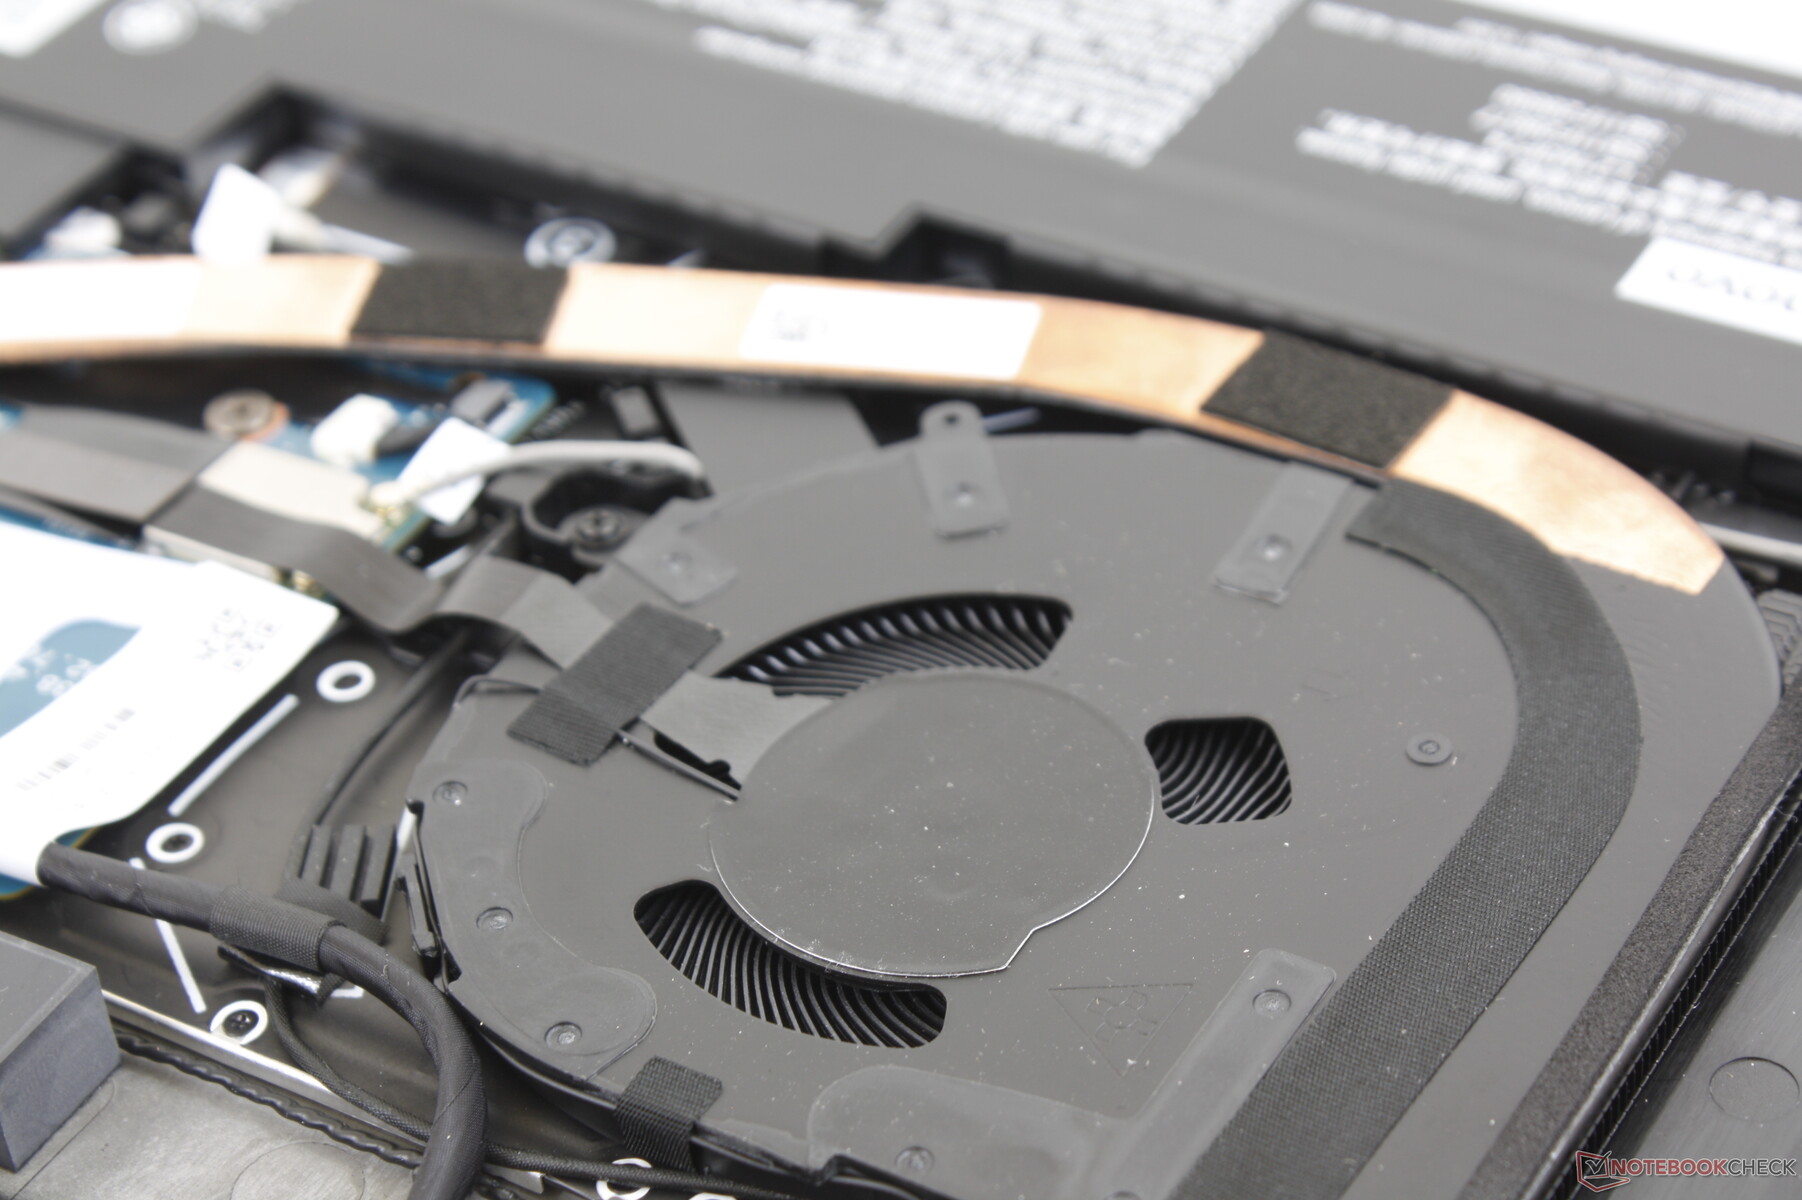
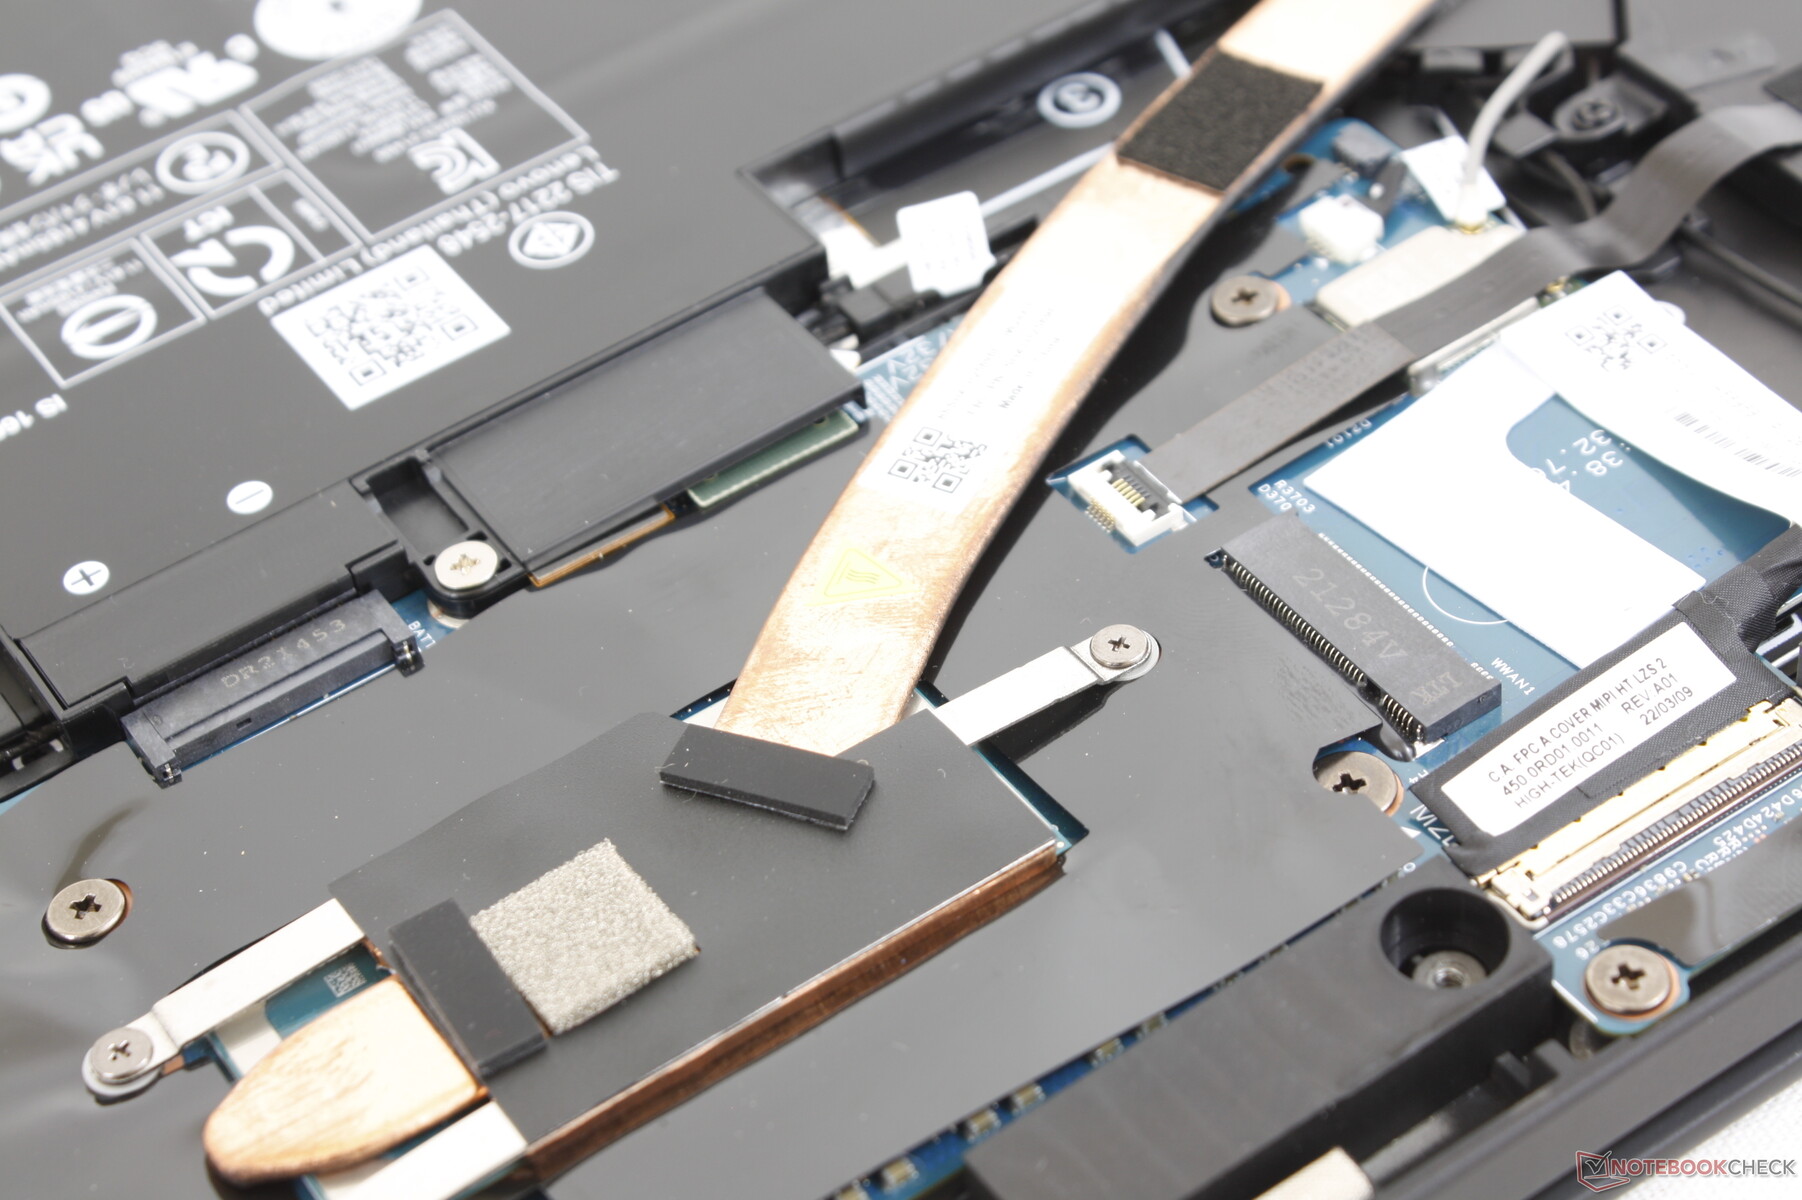
Maintenance
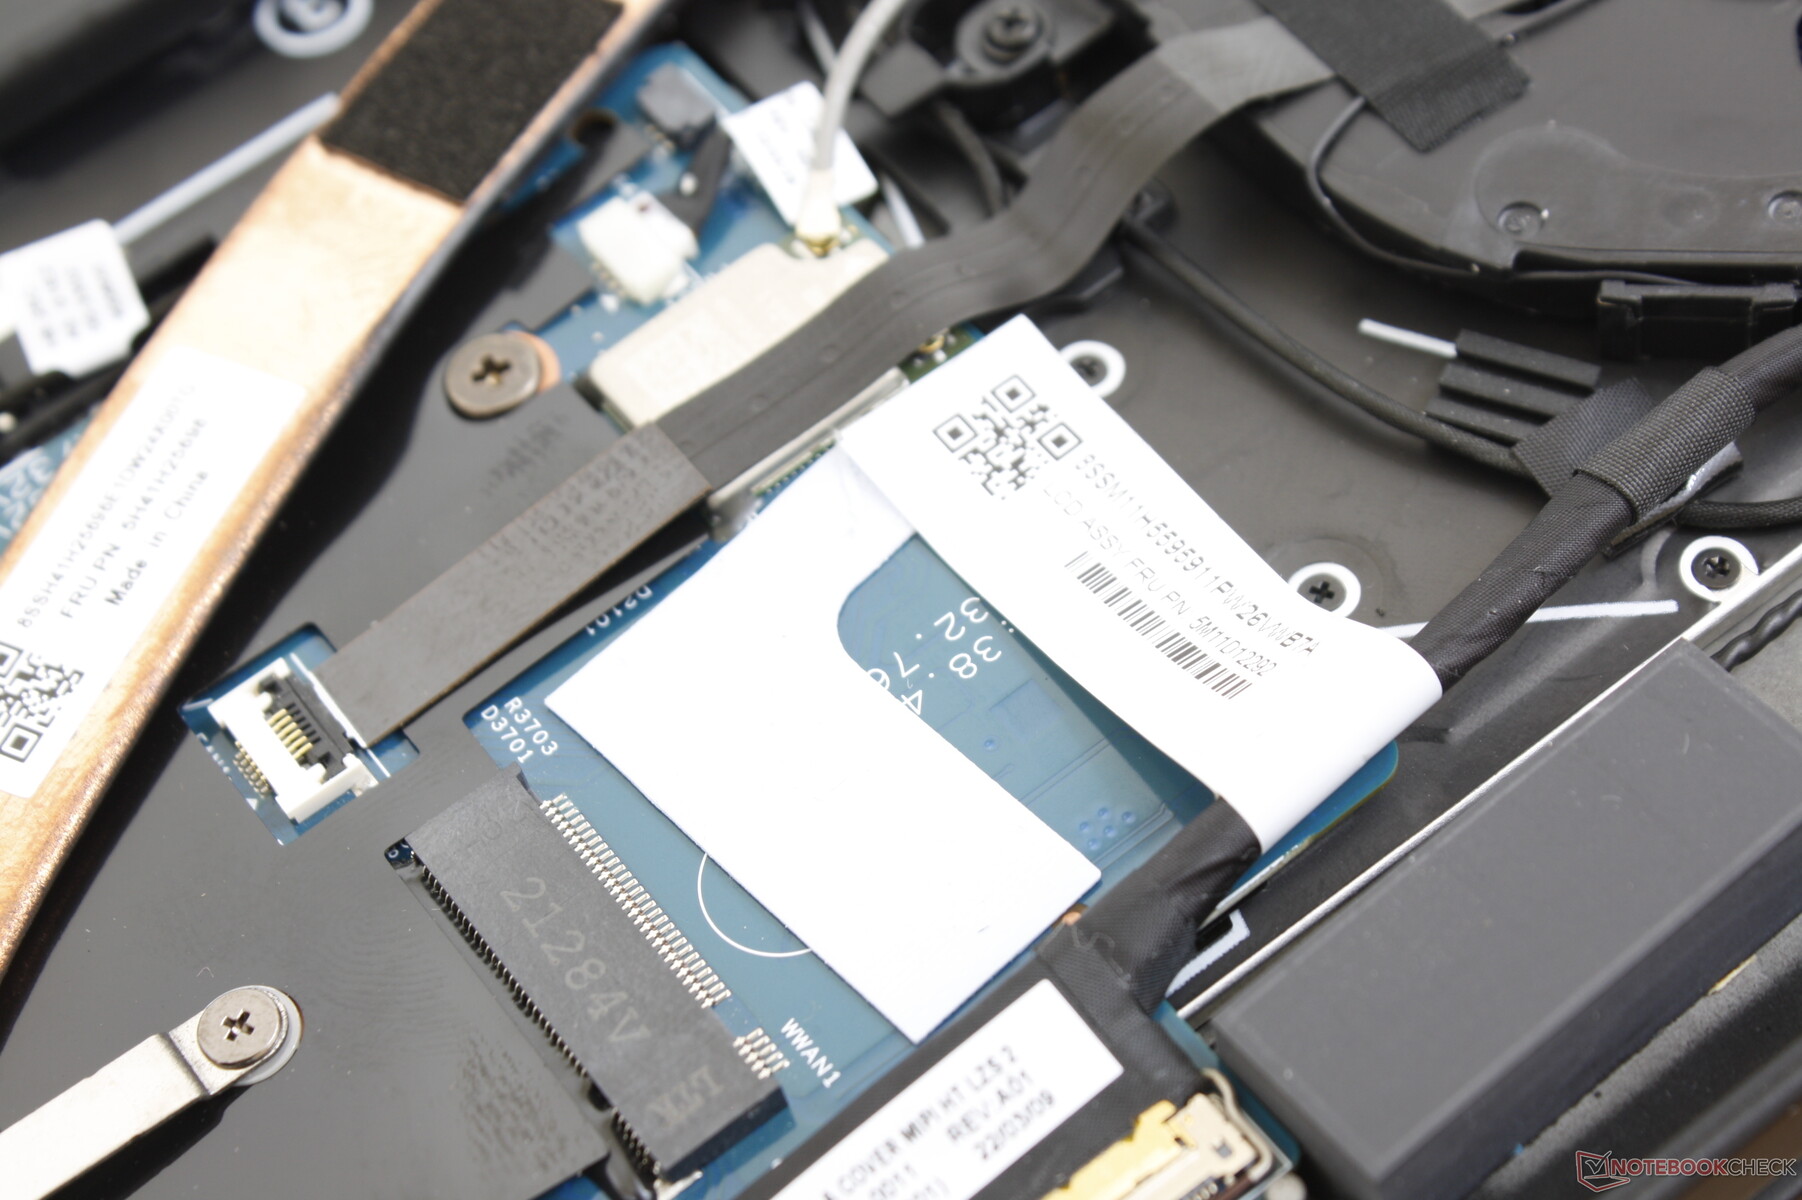
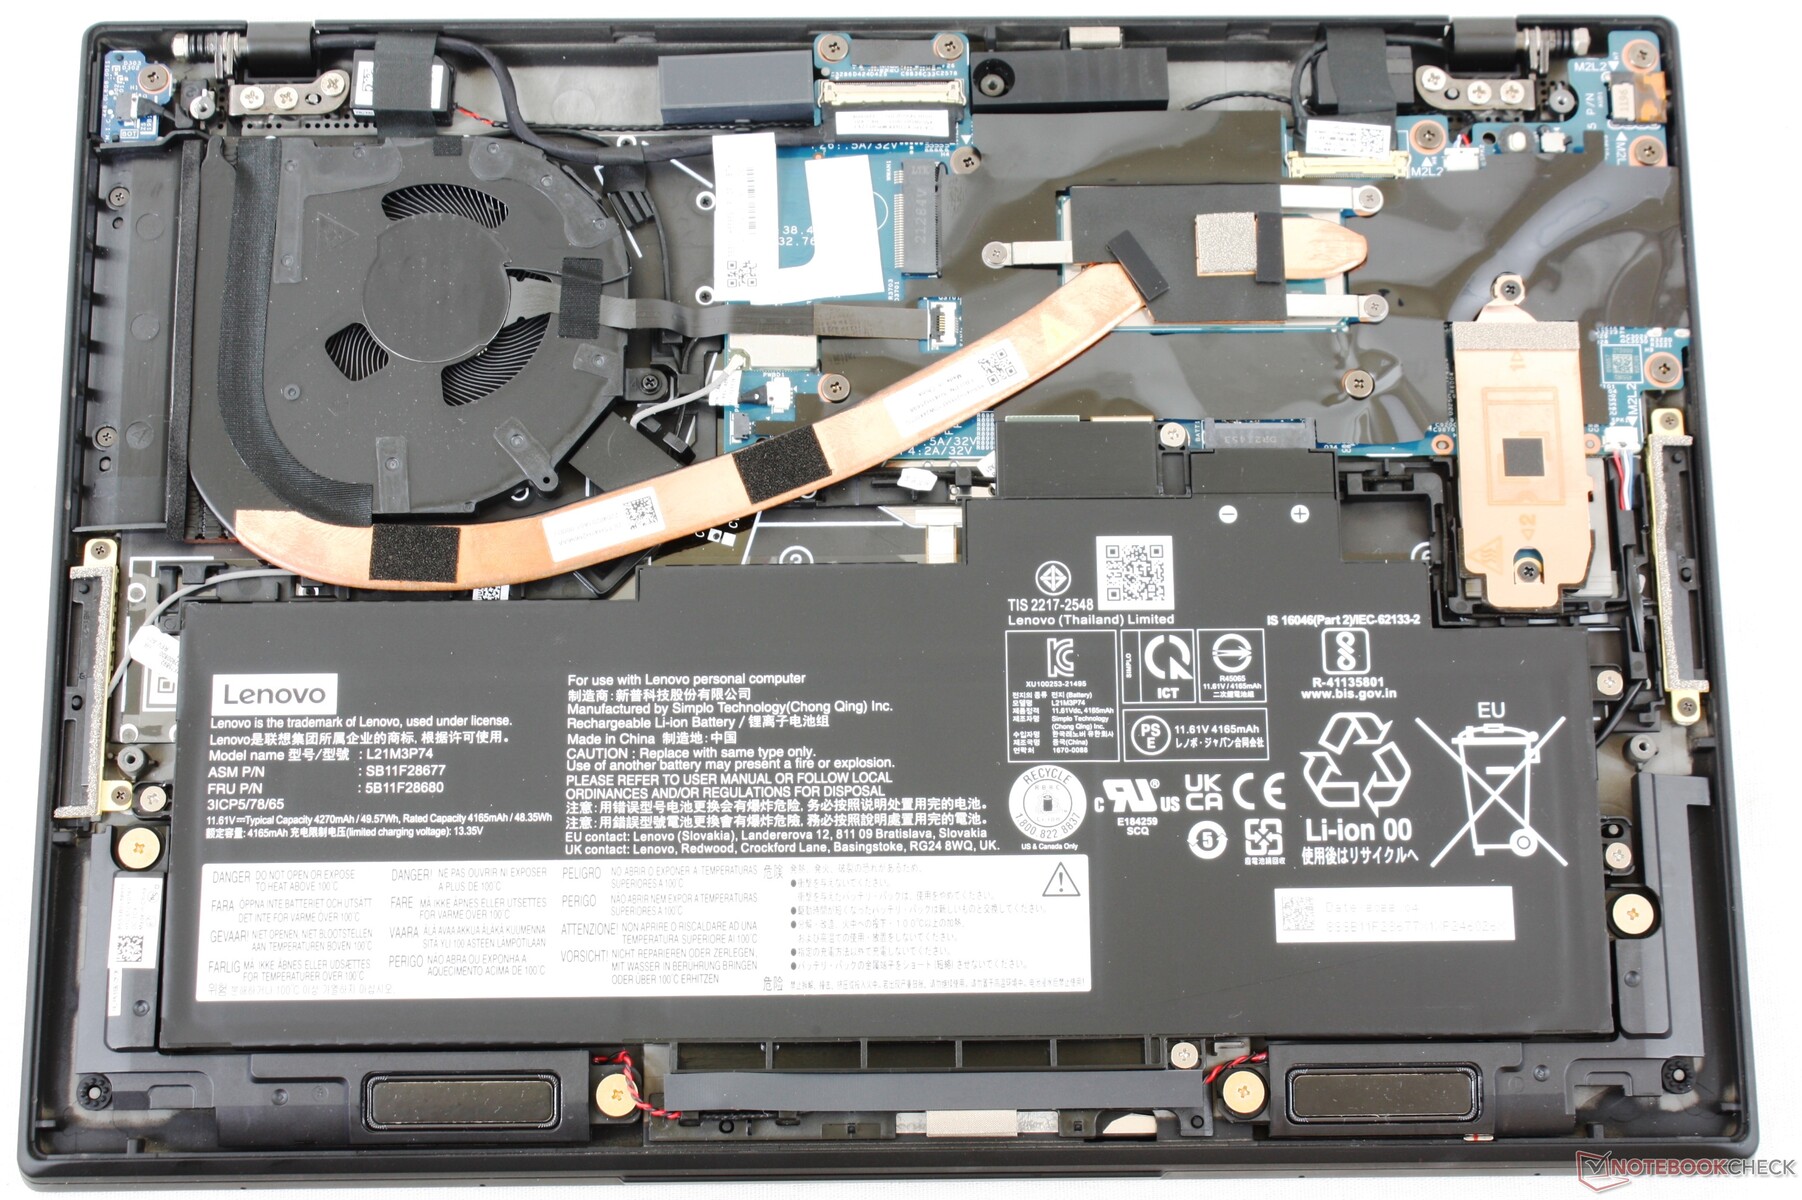
The bottom panel comes off easily with just a Philips screwdriver. The internals are mostly the same as the Gen 1 model save for the repositioned M.2 2242 SSD and other minor tweaks as shown by the images below.
Accessories and Warranty
There are no extras in the box beyond the AC adapter and paperwork. A one-year limited manufacturer warranty applies which is disappointing considering the high starting price of the model. A 3-year coverage should have been standard.
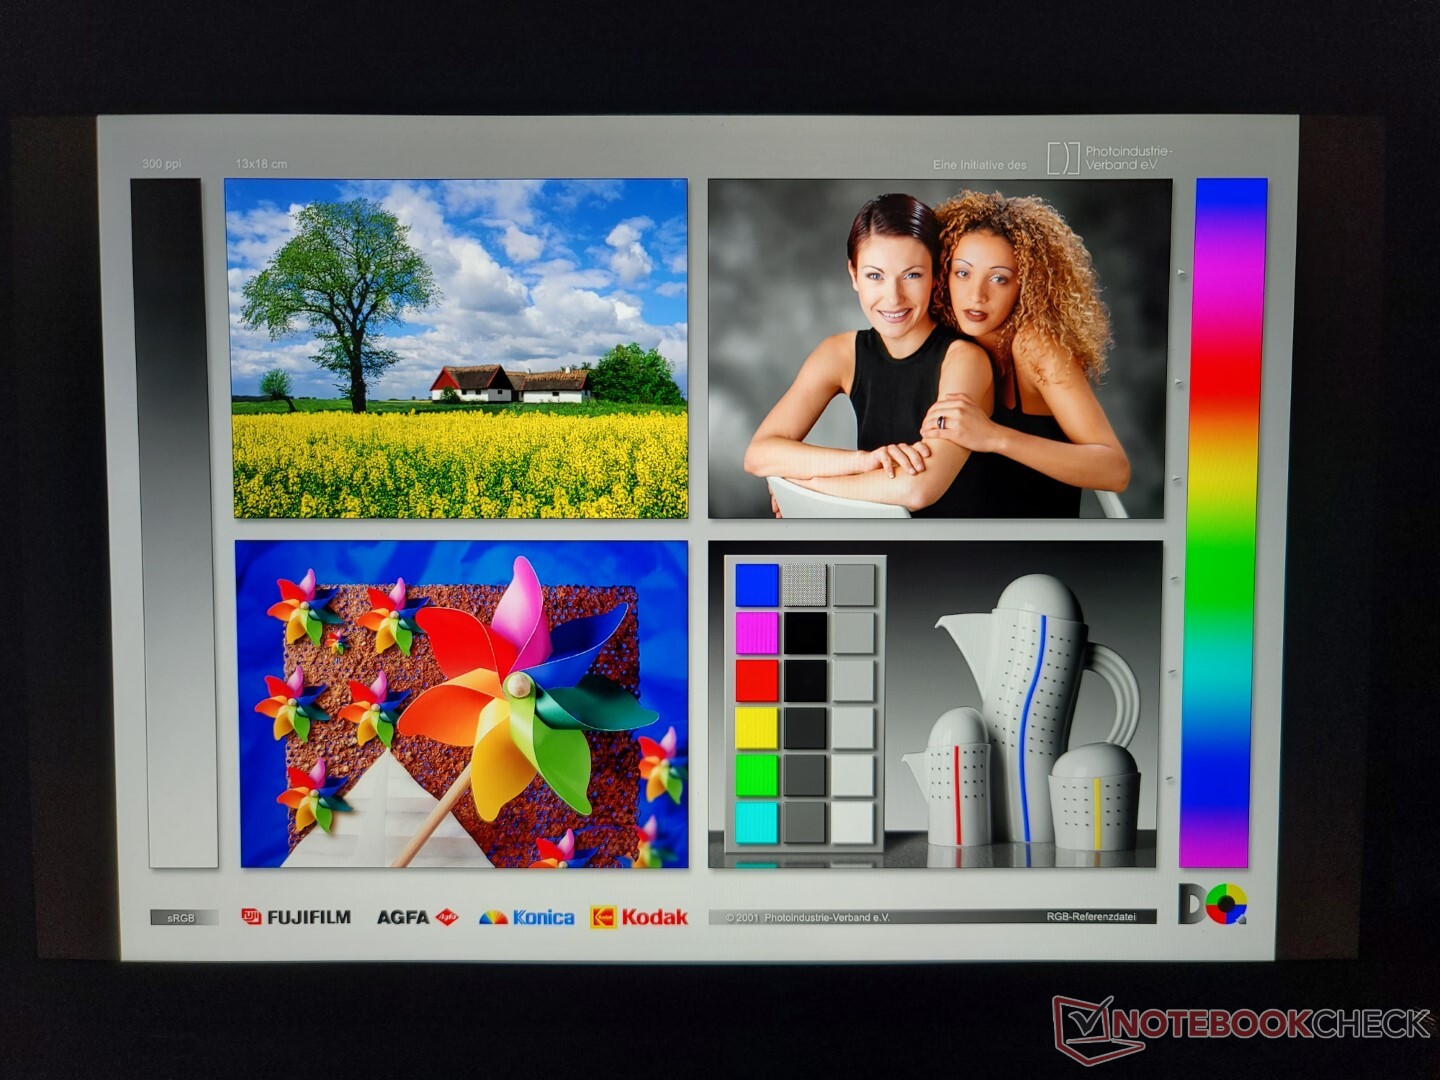
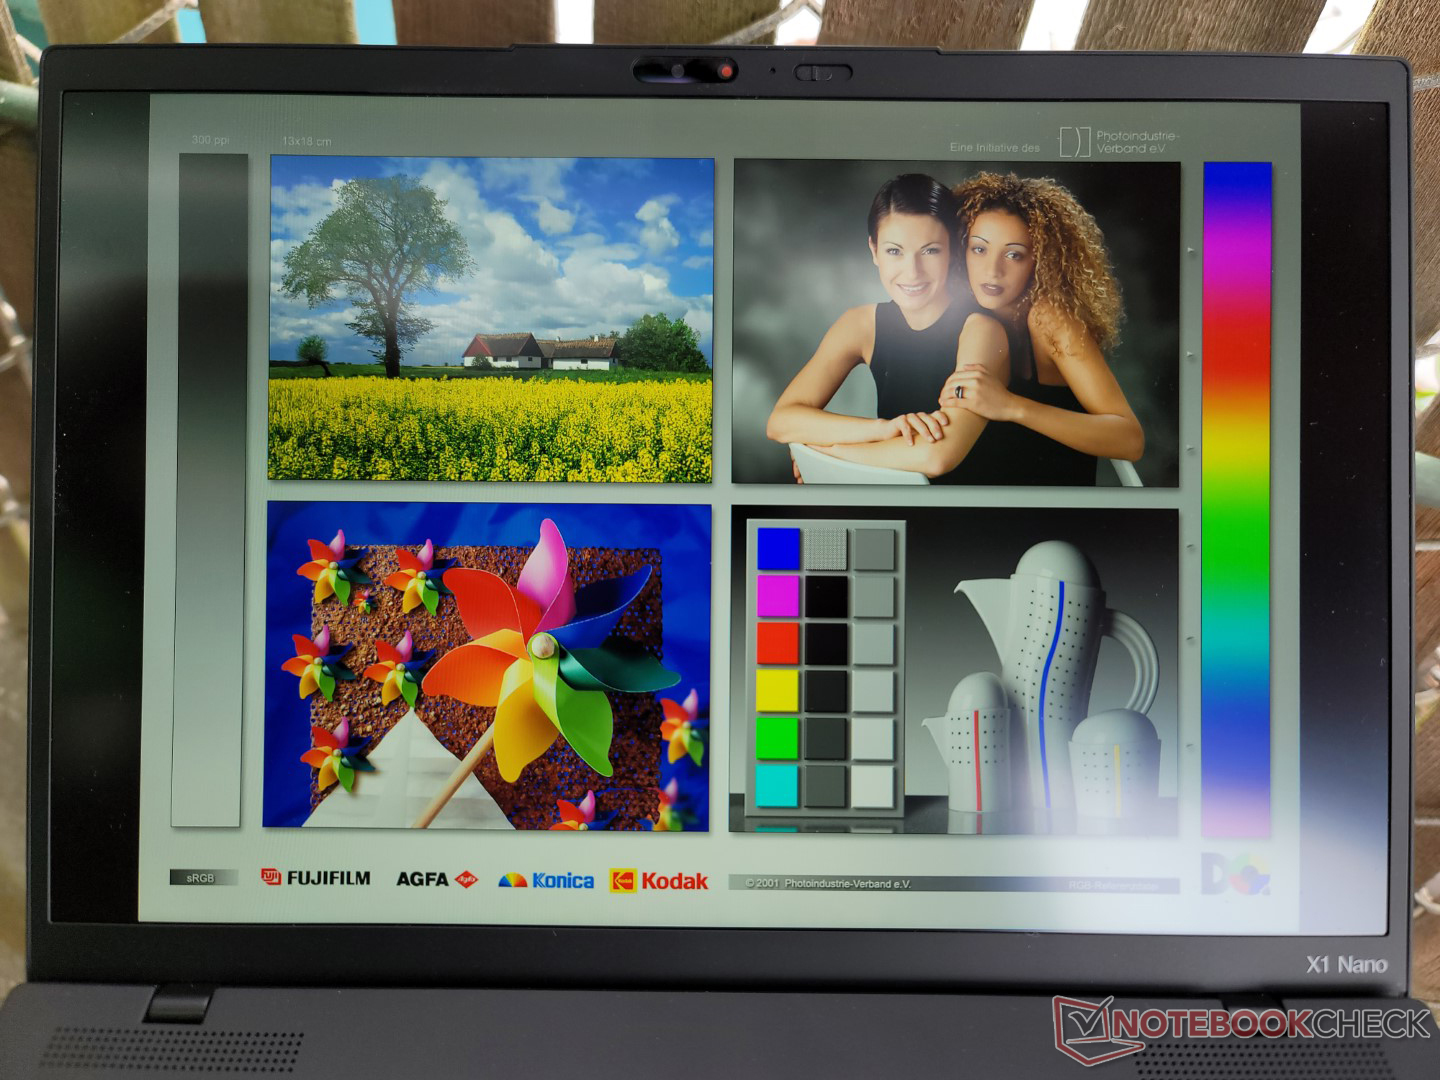
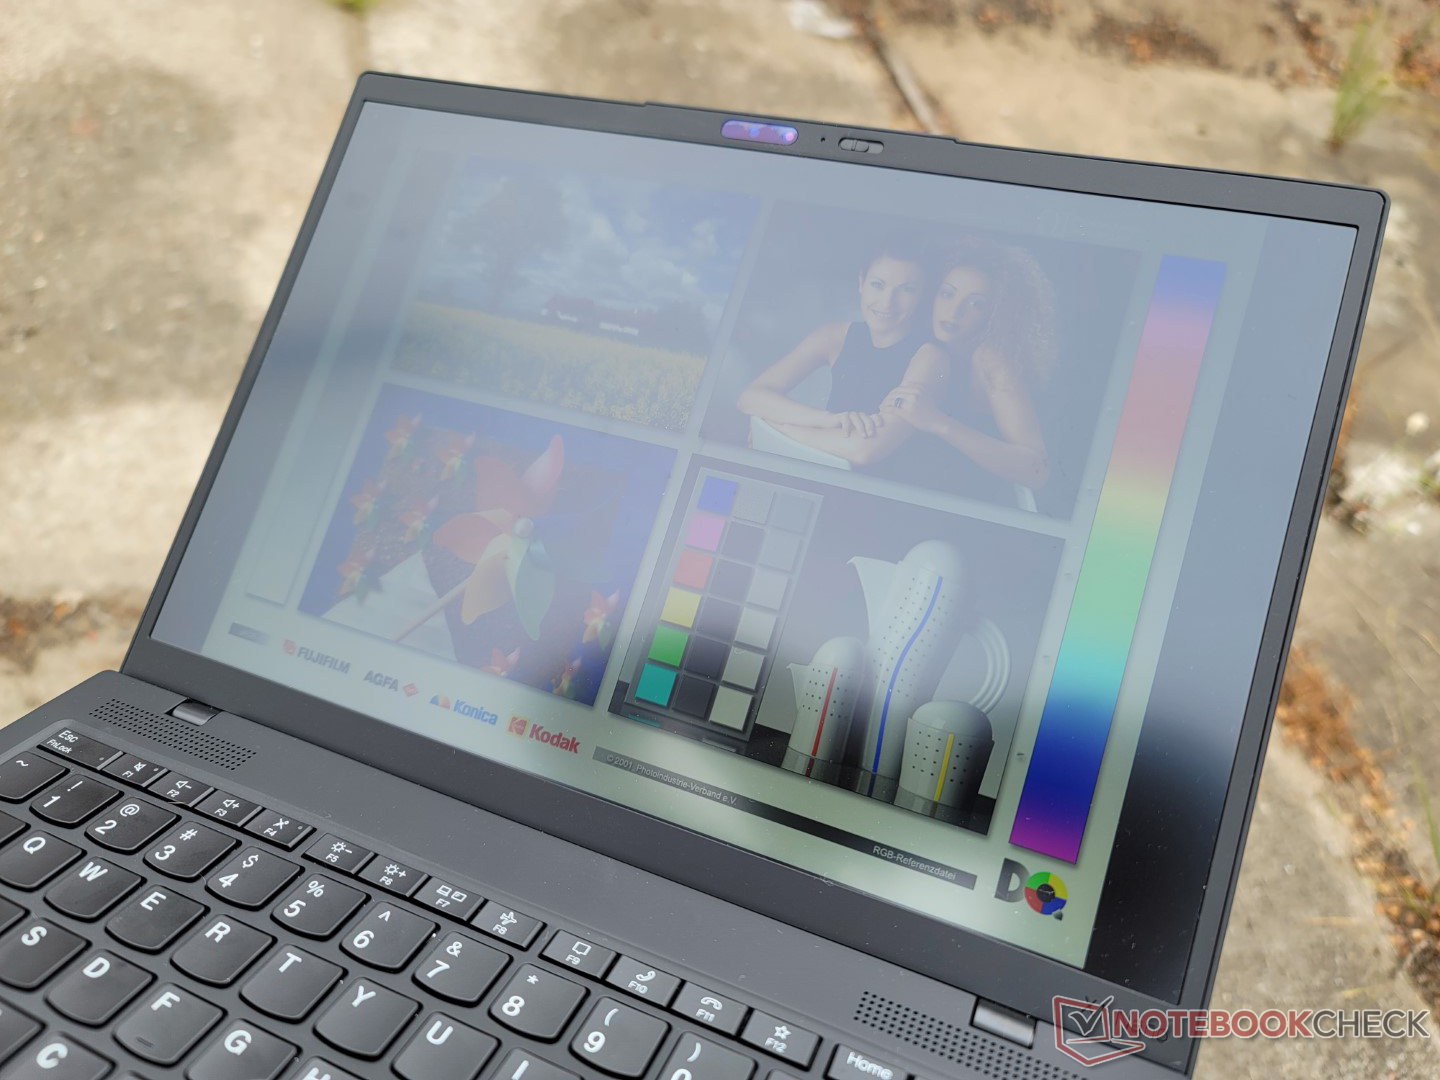
Display
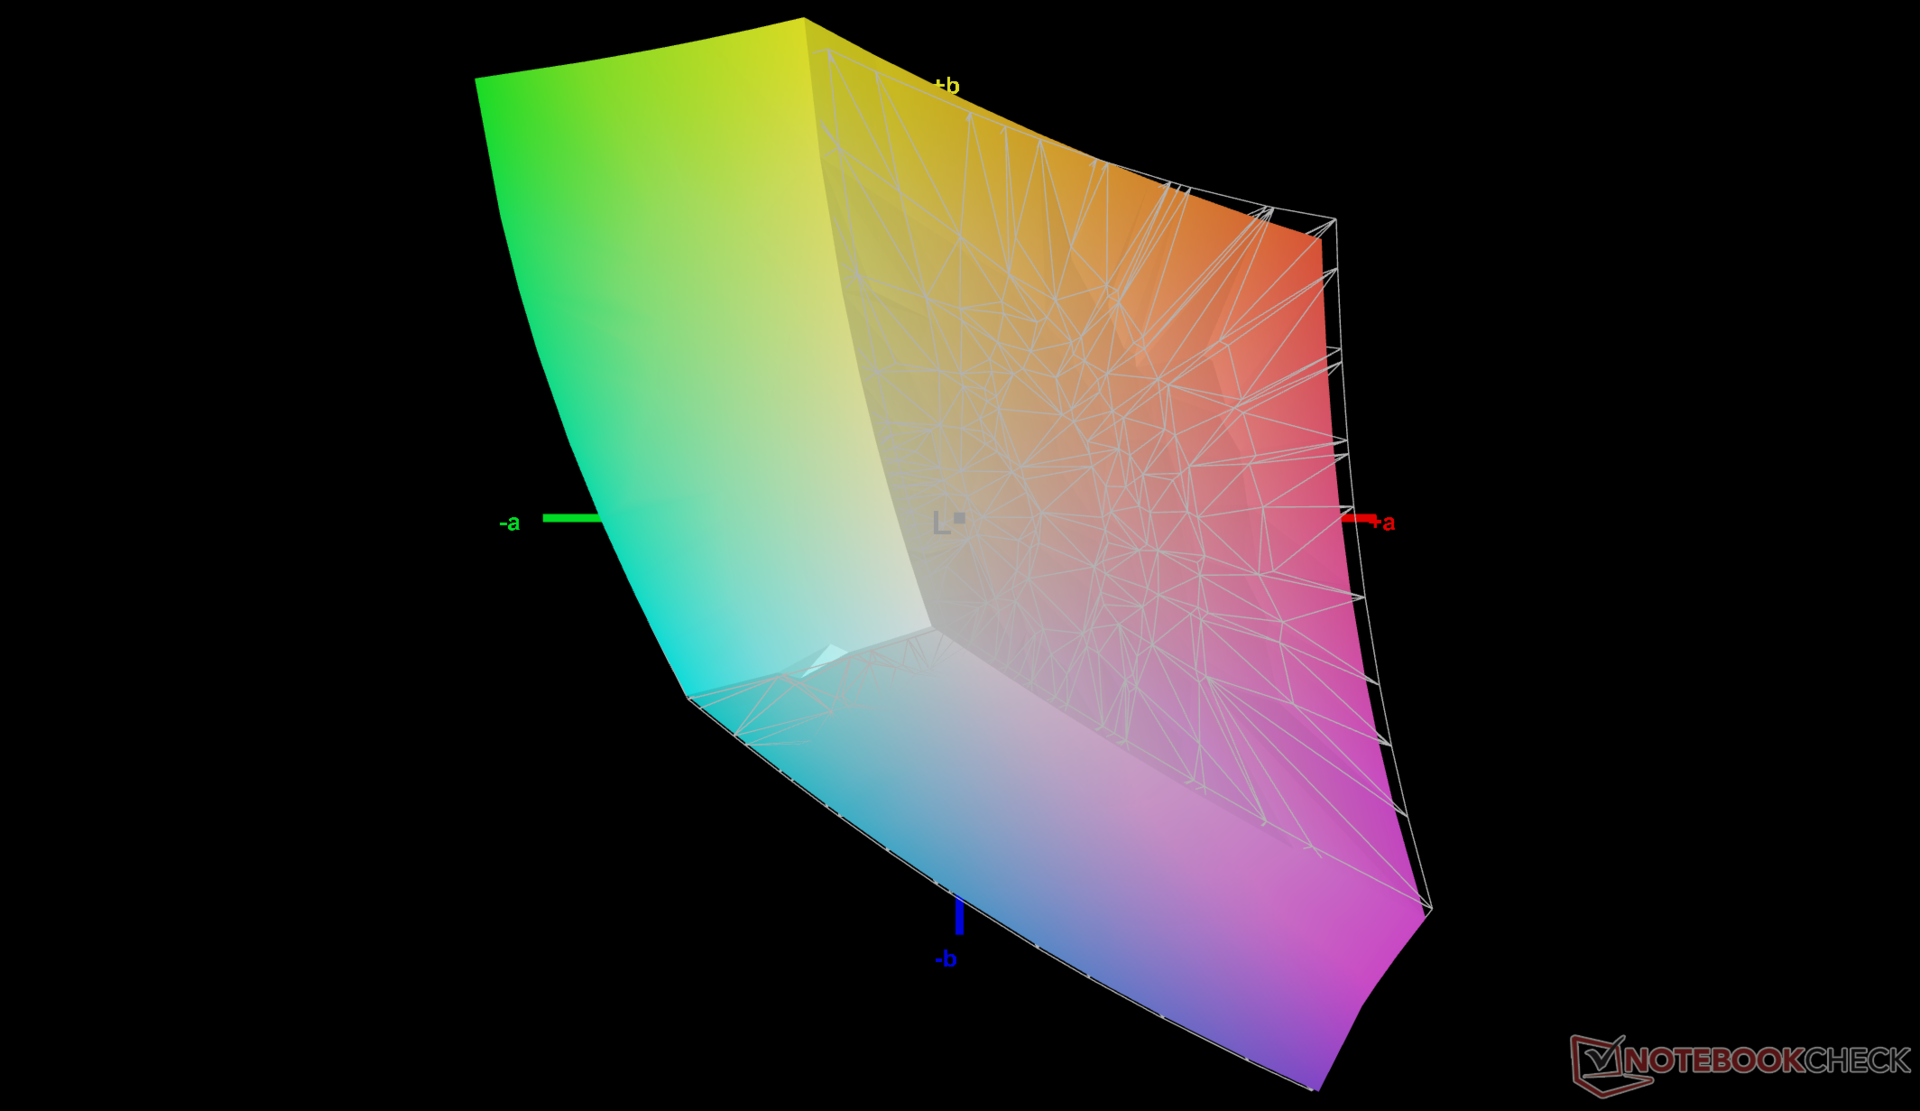
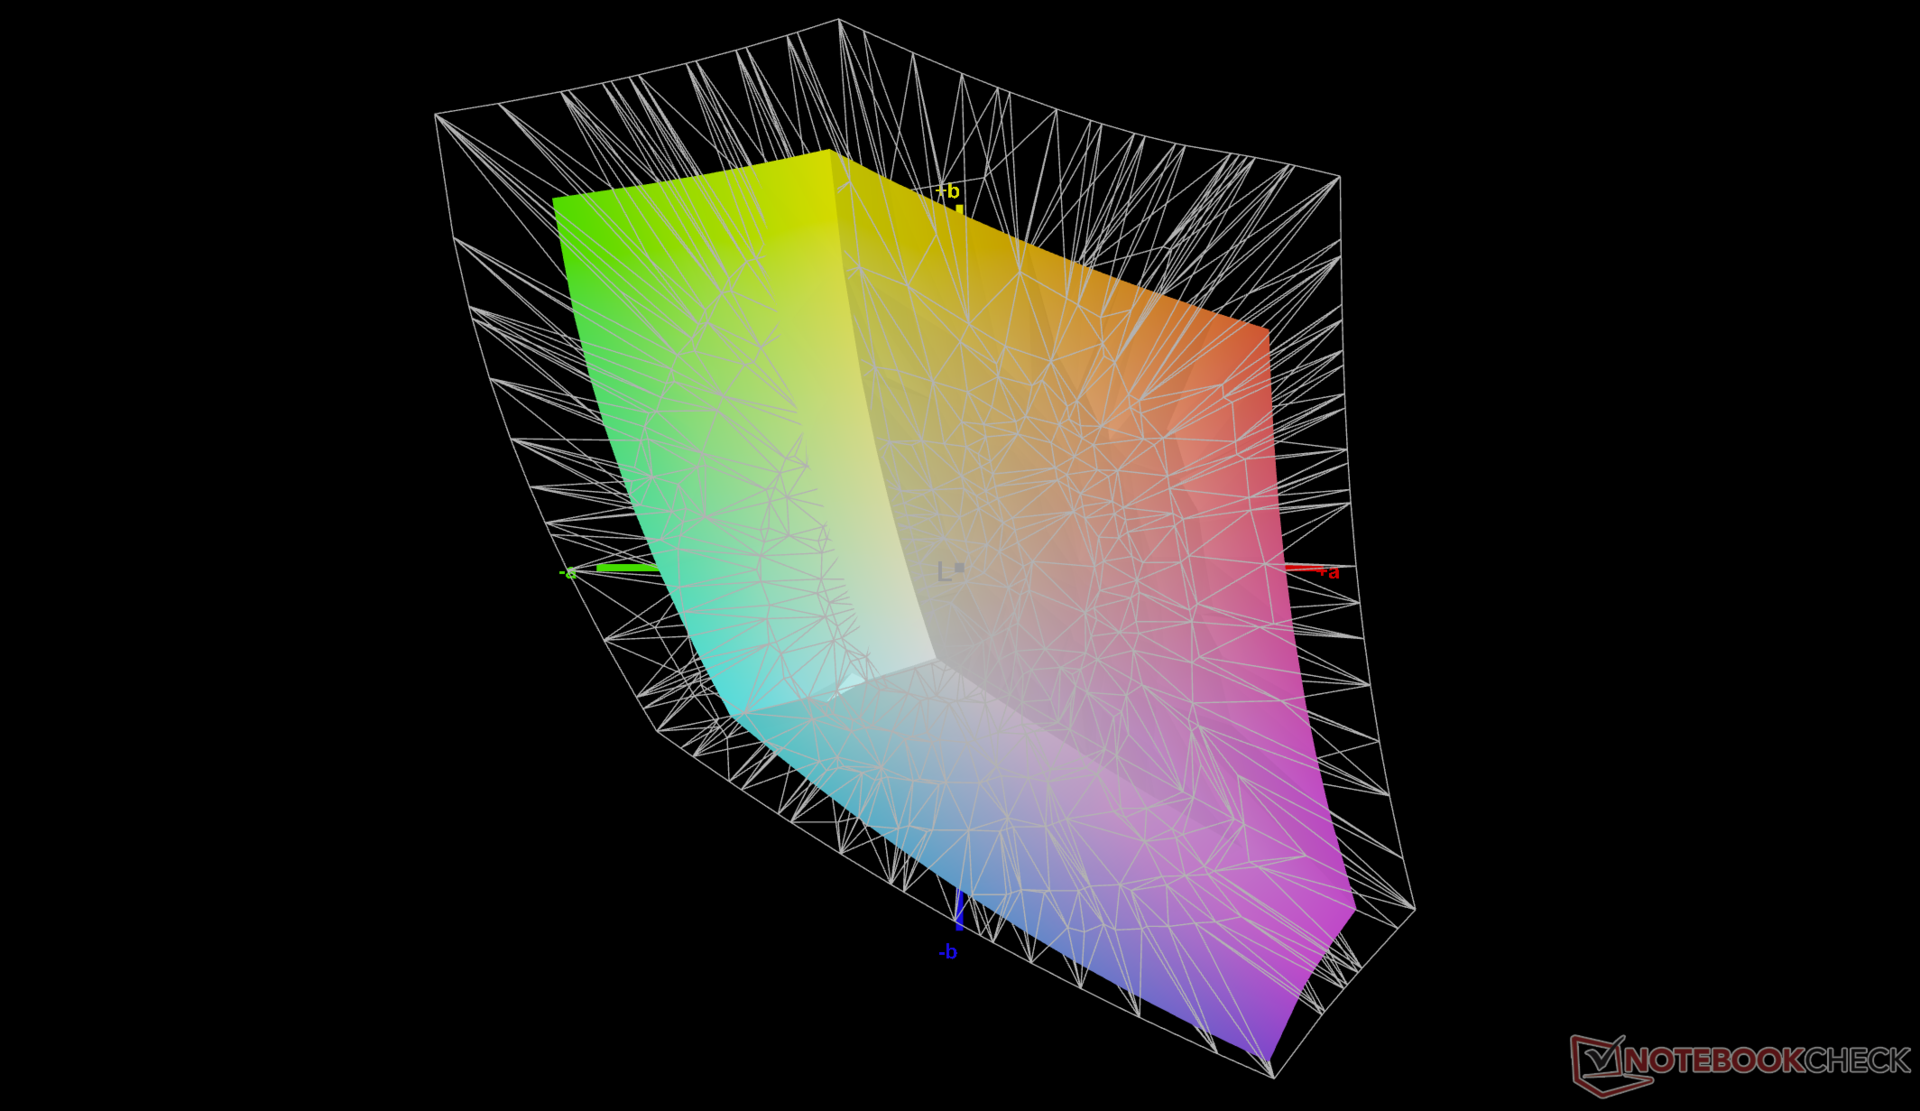
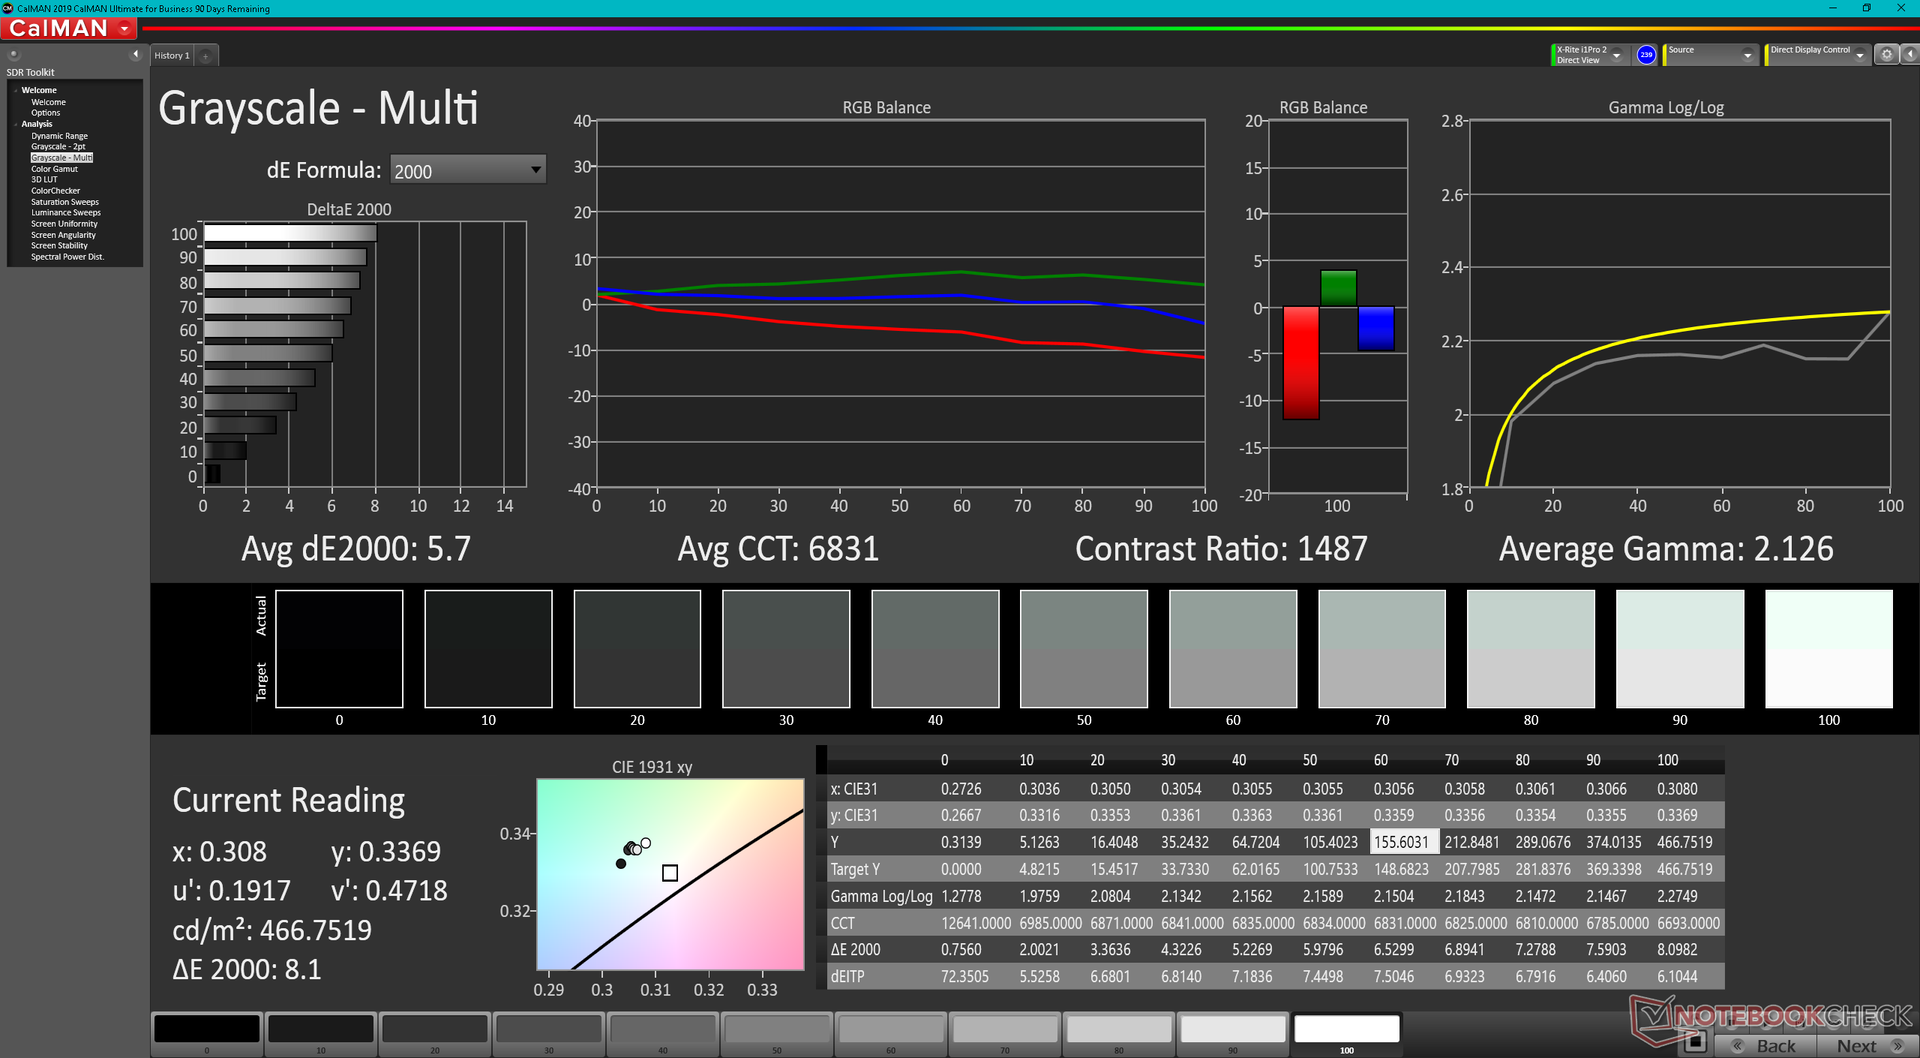
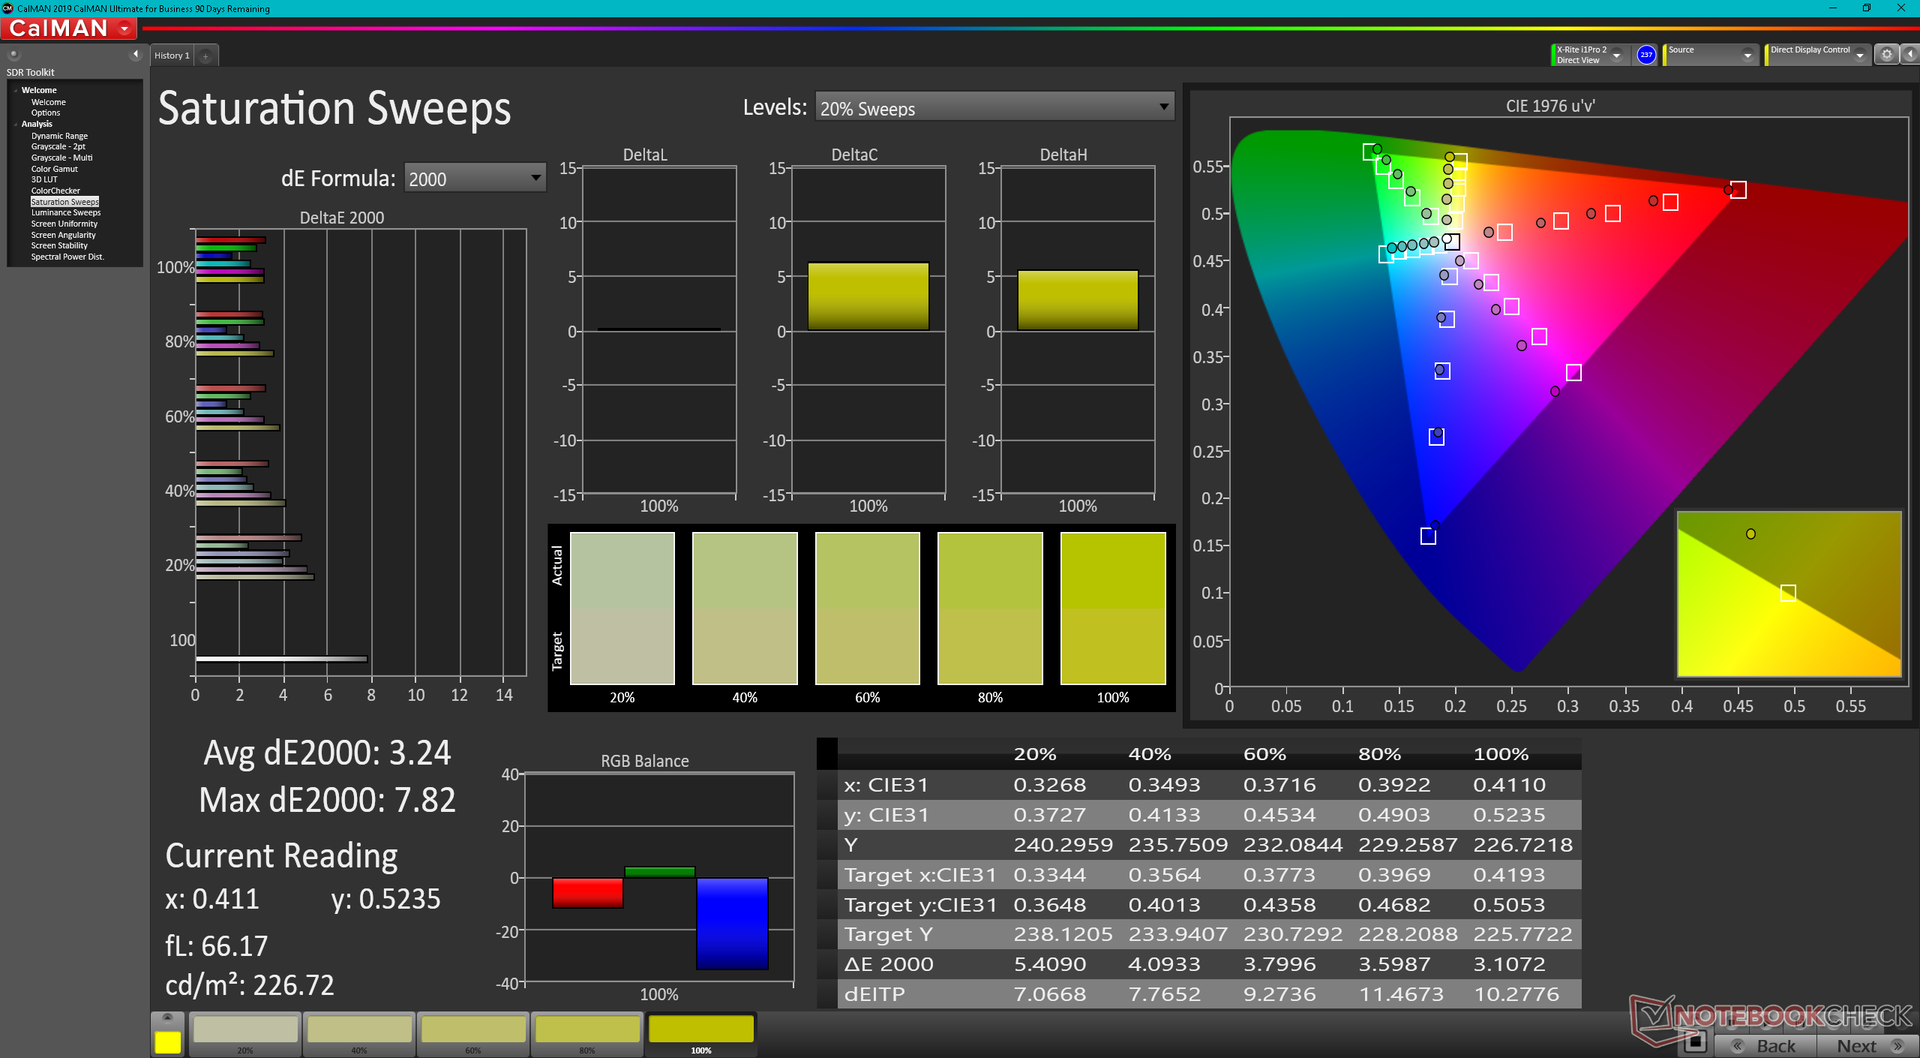
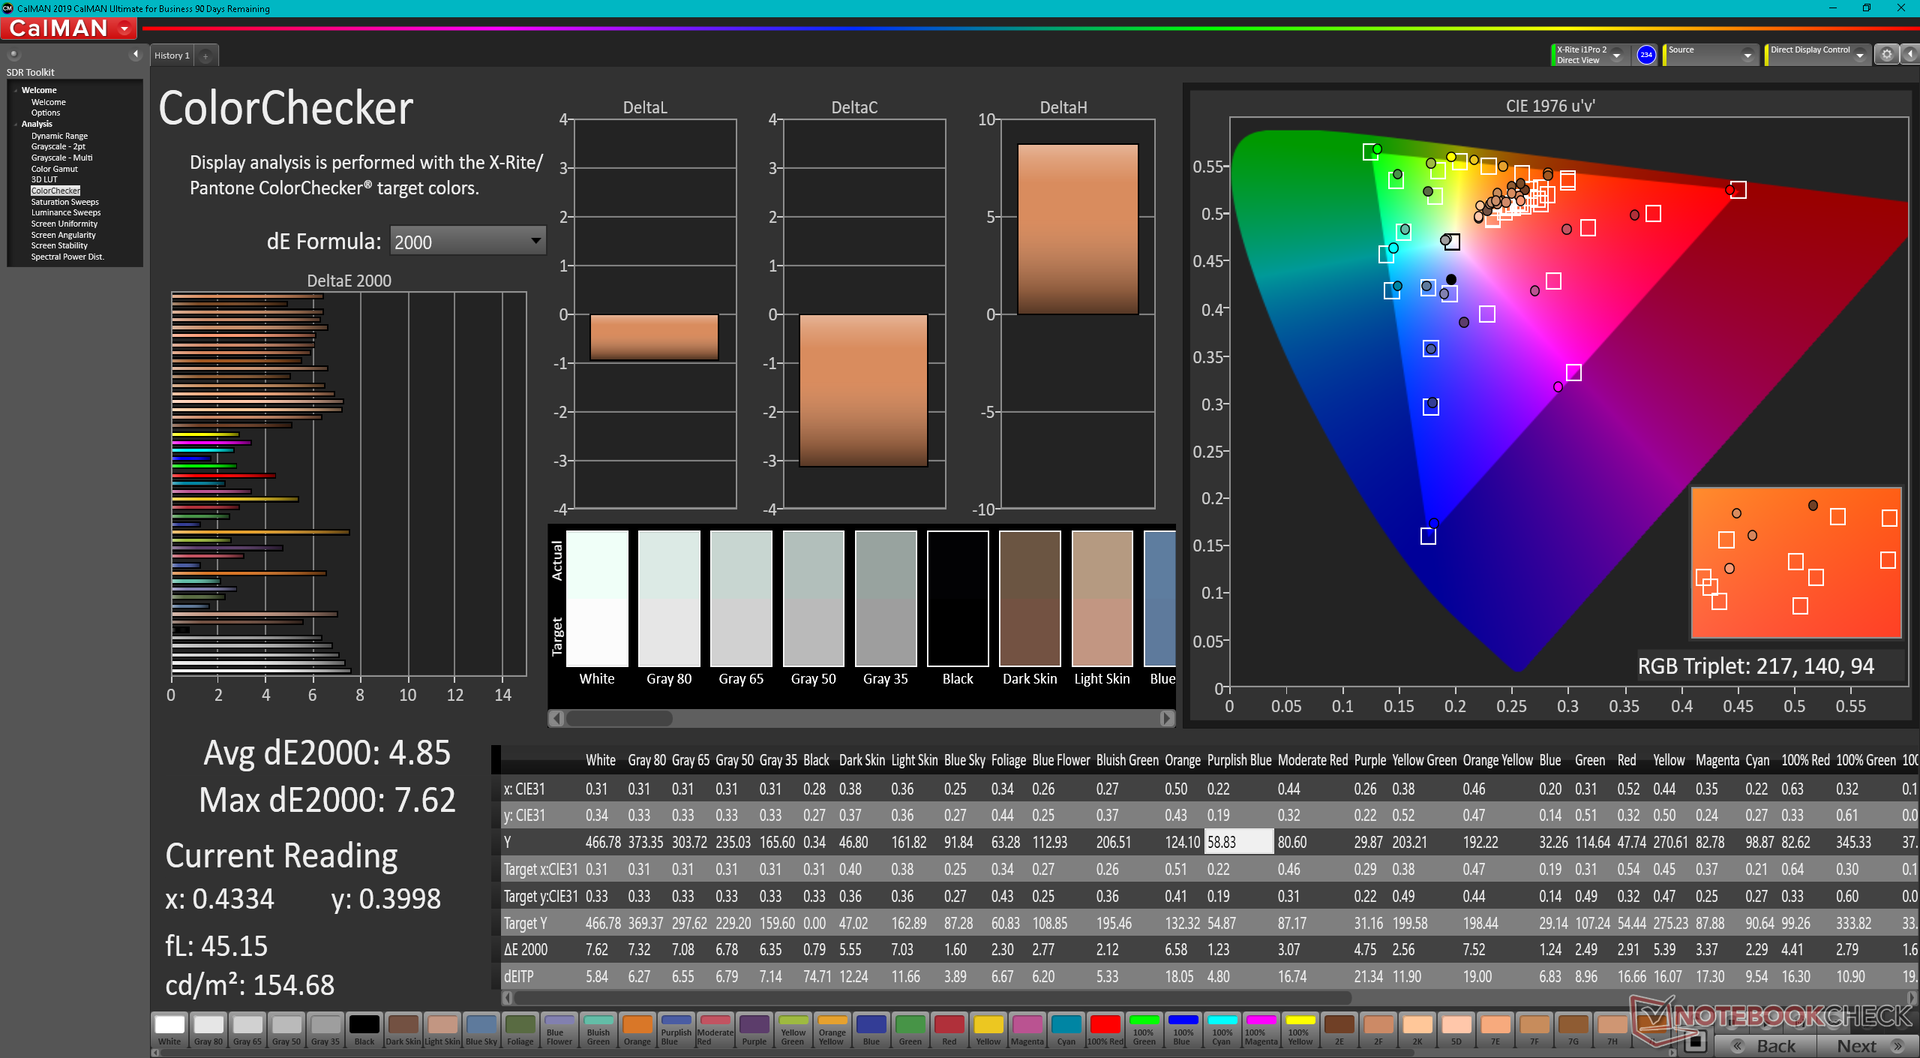
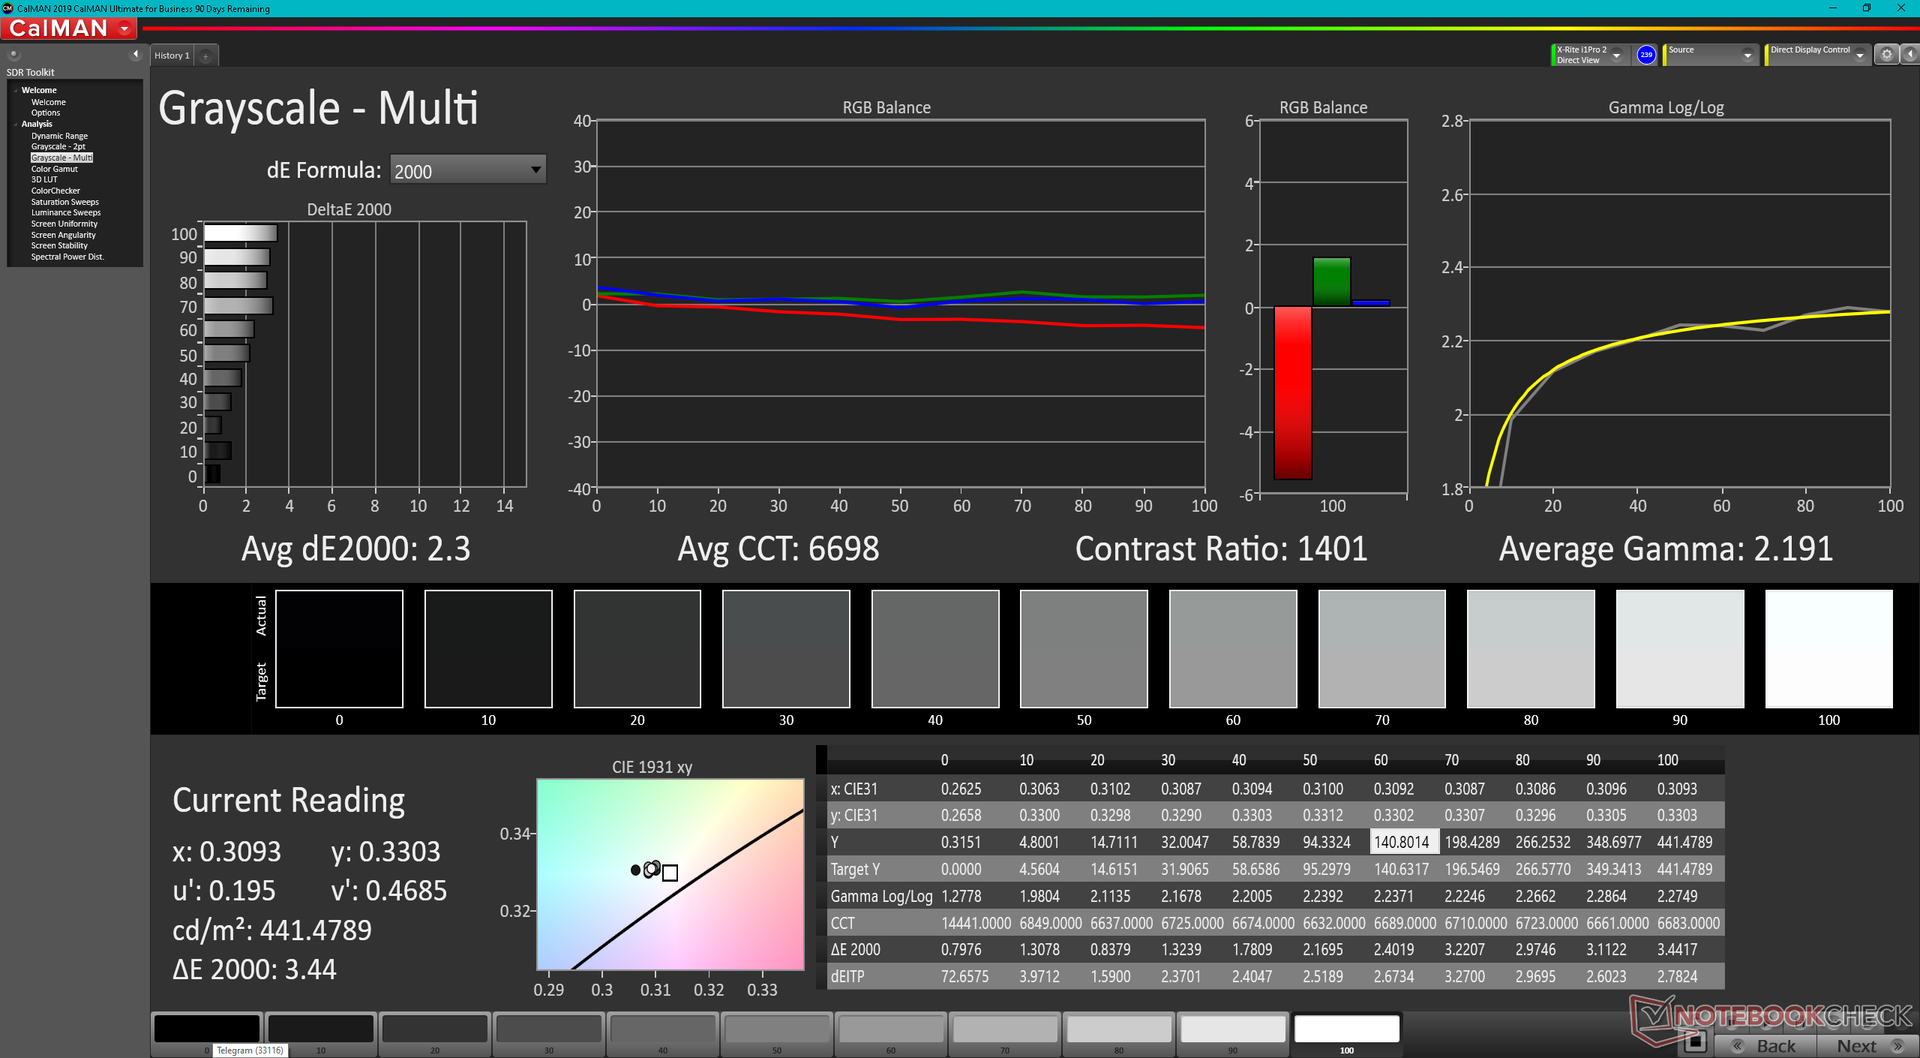
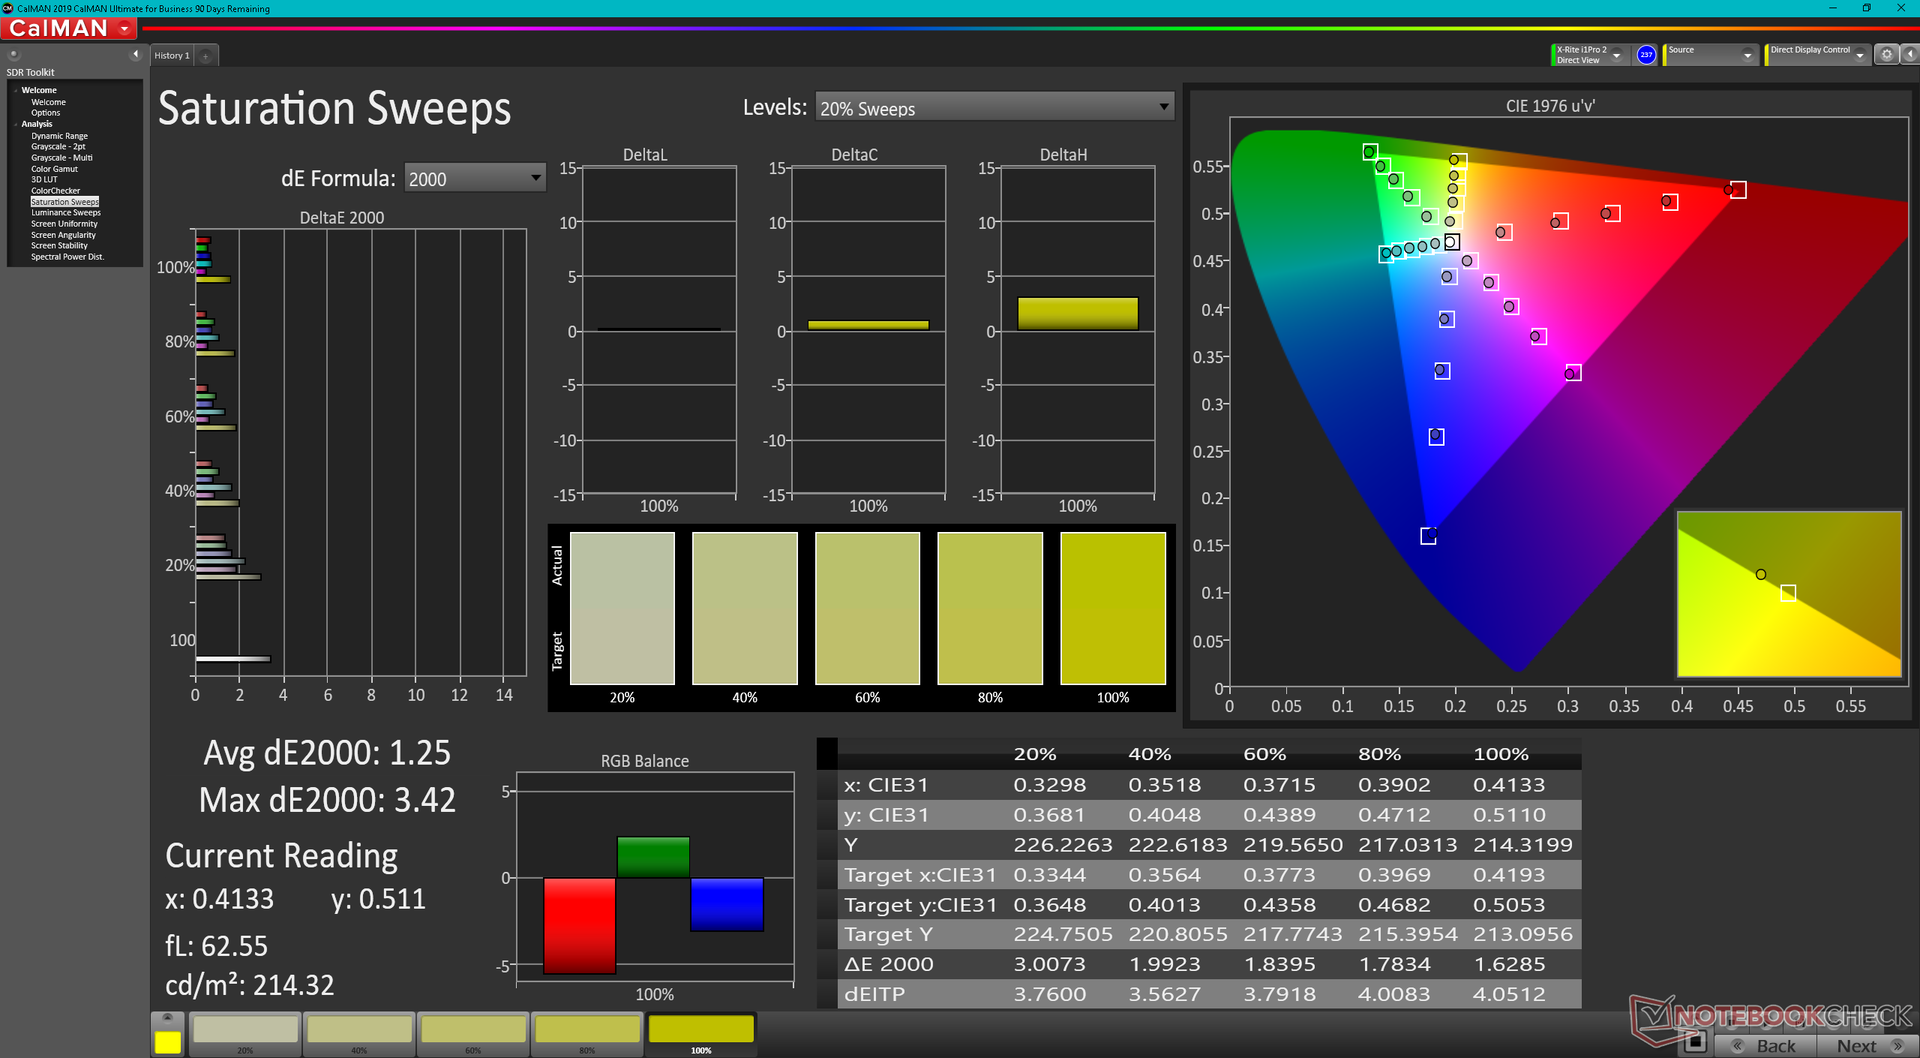
Our Gen 2 test unit utilizes a different IPS panel as the one found on the original Gen 1 version (P101ZFZ-BH2 vs. MND007ZA1-2). Nonetheless, their core attributes remain nearly identical for essentially the same viewing experience. Users are still getting a 450-nit panel with full sRGB coverage and >1000:1 contrast ratio. Black-white and gray-gray response times could be better, but this isn't an issue for browsing or office-type workloads.


| |||||||||||||||||||||||||
Brightness Distribution: 94 %
Center on Battery: 469.6 cd/m²
Contrast: 1269:1 (Black: 0.37 cd/m²)
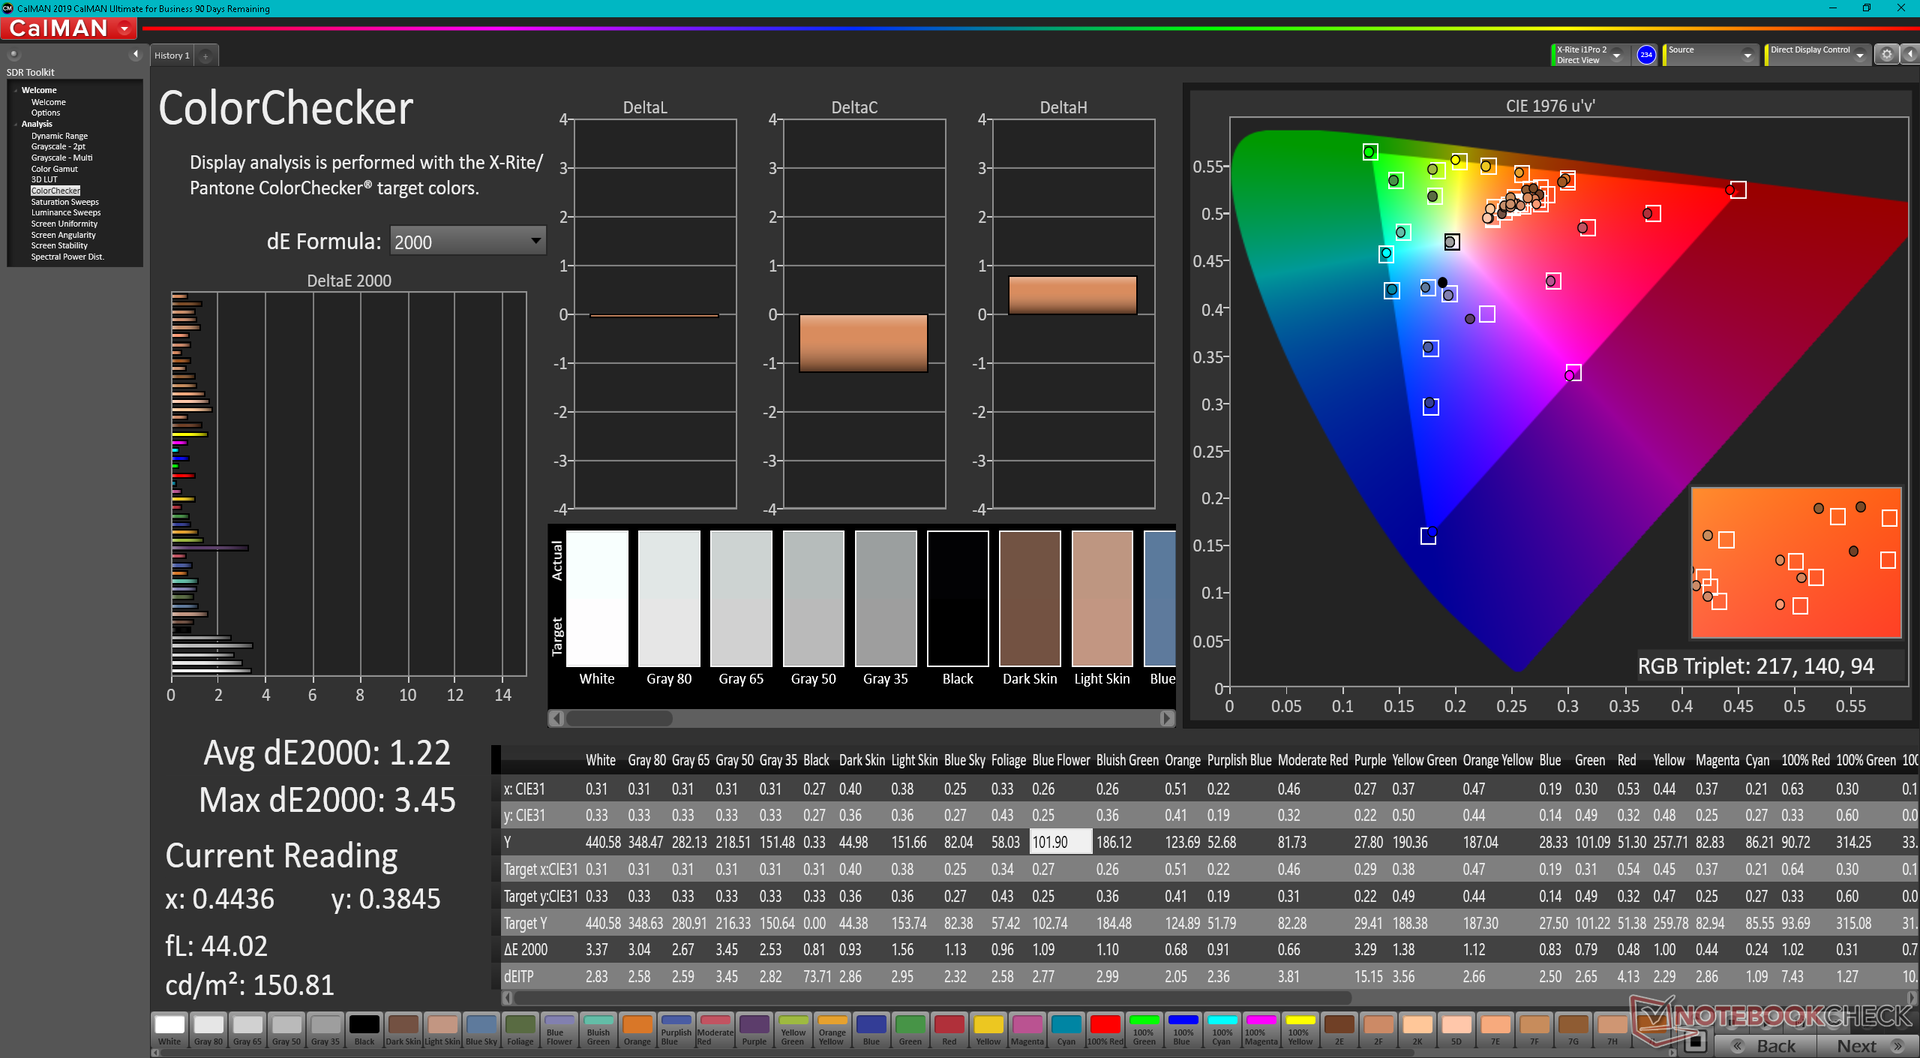
ΔE ColorChecker Calman: 4.85 | ∀{0.5-29.43 Ø4.71}
calibrated: 1.22
ΔE Greyscale Calman: 5.7 | ∀{0.09-98 Ø4.96}
68.3% AdobeRGB 1998 (Argyll 3D)
96.1% sRGB (Argyll 3D)
66.2% Display P3 (Argyll 3D)
Gamma: 2.13
CCT: 6931 K
| Lenovo ThinkPad X1 Nano Gen 2 Core i7-1280P P101ZFZ-BH2, IPS, 2160x1350, 13" | Lenovo ThinkPad X1 Nano-20UN002UGE MND007ZA1-2, IPS, 2160x1350, 13" | HP Elite Dragonfly G3 Chi Mei CMN13C0, IPS, 1920x1280, 13.5" | Dell Latitude 13 7330 LG Philips 133WF9, IPS, 1920x1080, 13.3" | Framework Laptop 13.5 12th Gen Intel BOE CQ NE135FBM-N41, IPS, 2256x1504, 13.5" | Huawei MateBook X Pro 2021 TIANMA XM, IPS, 3000x2000, 13.9" | |
|---|---|---|---|---|---|---|
| Display | 5% | 2% | -1% | 4% | -2% | |
| Display P3 Coverage (%) | 66.2 | 70.4 6% | 68 3% | 66.1 0% | 69.9 6% | 64.9 -2% |
| sRGB Coverage (%) | 96.1 | 99.9 4% | 98.3 2% | 93.5 -3% | 99.4 3% | 94.4 -2% |
| AdobeRGB 1998 Coverage (%) | 68.3 | 72 5% | 69.9 2% | 68.2 0% | 71.1 4% | 66.3 -3% |
| Response Times | -8% | -28% | -14% | 7% | 6% | |
| Response Time Grey 50% / Grey 80% * (ms) | 43.6 ? | 46.8 ? -7% | 50.8 ? -17% | 48.4 ? -11% | 34.7 ? 20% | 37.6 ? 14% |
| Response Time Black / White * (ms) | 25.6 ? | 28 ? -9% | 35.2 ? -38% | 29.6 ? -16% | 27.5 ? -7% | 26.4 ? -3% |
| PWM Frequency (Hz) | ||||||
| Screen | 29% | 19% | 24% | 13% | 26% | |
| Brightness middle (cd/m²) | 469.6 | 460 -2% | 387.2 -18% | 460.1 -2% | 449.6 -4% | 502 7% |
| Brightness (cd/m²) | 460 | 434 -6% | 360 -22% | 445 -3% | 431 -6% | 474 3% |
| Brightness Distribution (%) | 94 | 92 -2% | 80 -15% | 89 -5% | 90 -4% | 89 -5% |
| Black Level * (cd/m²) | 0.37 | 0.27 27% | 0.26 30% | 0.31 16% | 0.31 16% | 0.33 11% |
| Contrast (:1) | 1269 | 1704 34% | 1489 17% | 1484 17% | 1450 14% | 1521 20% |
| Colorchecker dE 2000 * | 4.85 | 1.1 77% | 2.36 51% | 2.42 50% | 2.76 43% | 1.35 72% |
| Colorchecker dE 2000 max. * | 7.62 | 4.5 41% | 4.79 37% | 3.97 48% | 7.96 -4% | 3.67 52% |
| Colorchecker dE 2000 calibrated * | 1.22 | 1 18% | 0.63 48% | 0.77 37% | 0.58 52% | 1.2 2% |
| Greyscale dE 2000 * | 5.7 | 1.6 72% | 3 47% | 2.3 60% | 5.2 9% | 1.7 70% |
| Gamma | 2.13 103% | 2.2 100% | 2.17 101% | 2.23 99% | 2.23 99% | 2.24 98% |
| CCT | 6931 94% | 6475 100% | 6137 106% | 6262 104% | 6475 100% | 6440 101% |
| Color Space (Percent of AdobeRGB 1998) (%) | 65.7 | 61.1 | ||||
| Color Space (Percent of sRGB) (%) | 99.9 | 94.3 | ||||
| Total Average (Program / Settings) | 9% /
18% | -2% /
9% | 3% /
13% | 8% /
10% | 10% /
17% |
* ... smaller is better
The panel is not well calibrated out of the box. Calibrating it ourselves would greatly improve average grayscale and color deltaE values from 5.7 and 4.85 to just 2.3 and 1.22, respectively. We recommend an end-user calibration to better exploit the full sRGB coverage of the panel.
Display Response Times
| ↔ Response Time Black to White | ||
|---|---|---|
| 25.6 ms ... rise ↗ and fall ↘ combined | ↗ 13.2 ms rise | 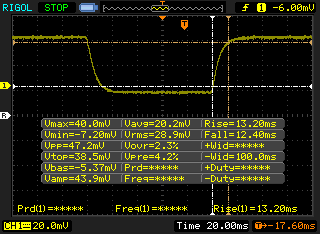 |
| ↘ 12.4 ms fall | ||
| The screen shows relatively slow response rates in our tests and may be too slow for gamers. In comparison, all tested devices range from 0.1 (minimum) to 240 (maximum) ms. » 61 % of all devices are better. This means that the measured response time is worse than the average of all tested devices (19.8 ms). | ||
| ↔ Response Time 50% Grey to 80% Grey | ||
| 43.6 ms ... rise ↗ and fall ↘ combined | ↗ 22 ms rise | 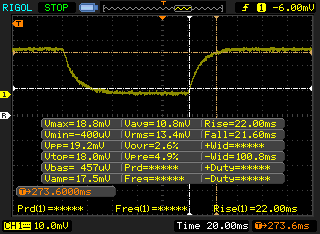 |
| ↘ 21.6 ms fall | ||
| The screen shows slow response rates in our tests and will be unsatisfactory for gamers. In comparison, all tested devices range from 0.165 (minimum) to 636 (maximum) ms. » 73 % of all devices are better. This means that the measured response time is worse than the average of all tested devices (31 ms). | ||
Screen Flickering / PWM (Pulse-Width Modulation)
| Screen flickering / PWM not detected | 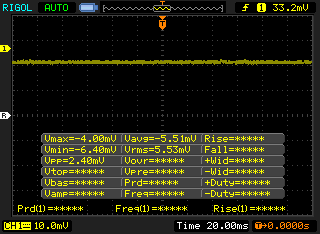 | ||
In comparison: 52 % of all tested devices do not use PWM to dim the display. If PWM was detected, an average of 7747 (minimum: 5 - maximum: 343500) Hz was measured. | |||
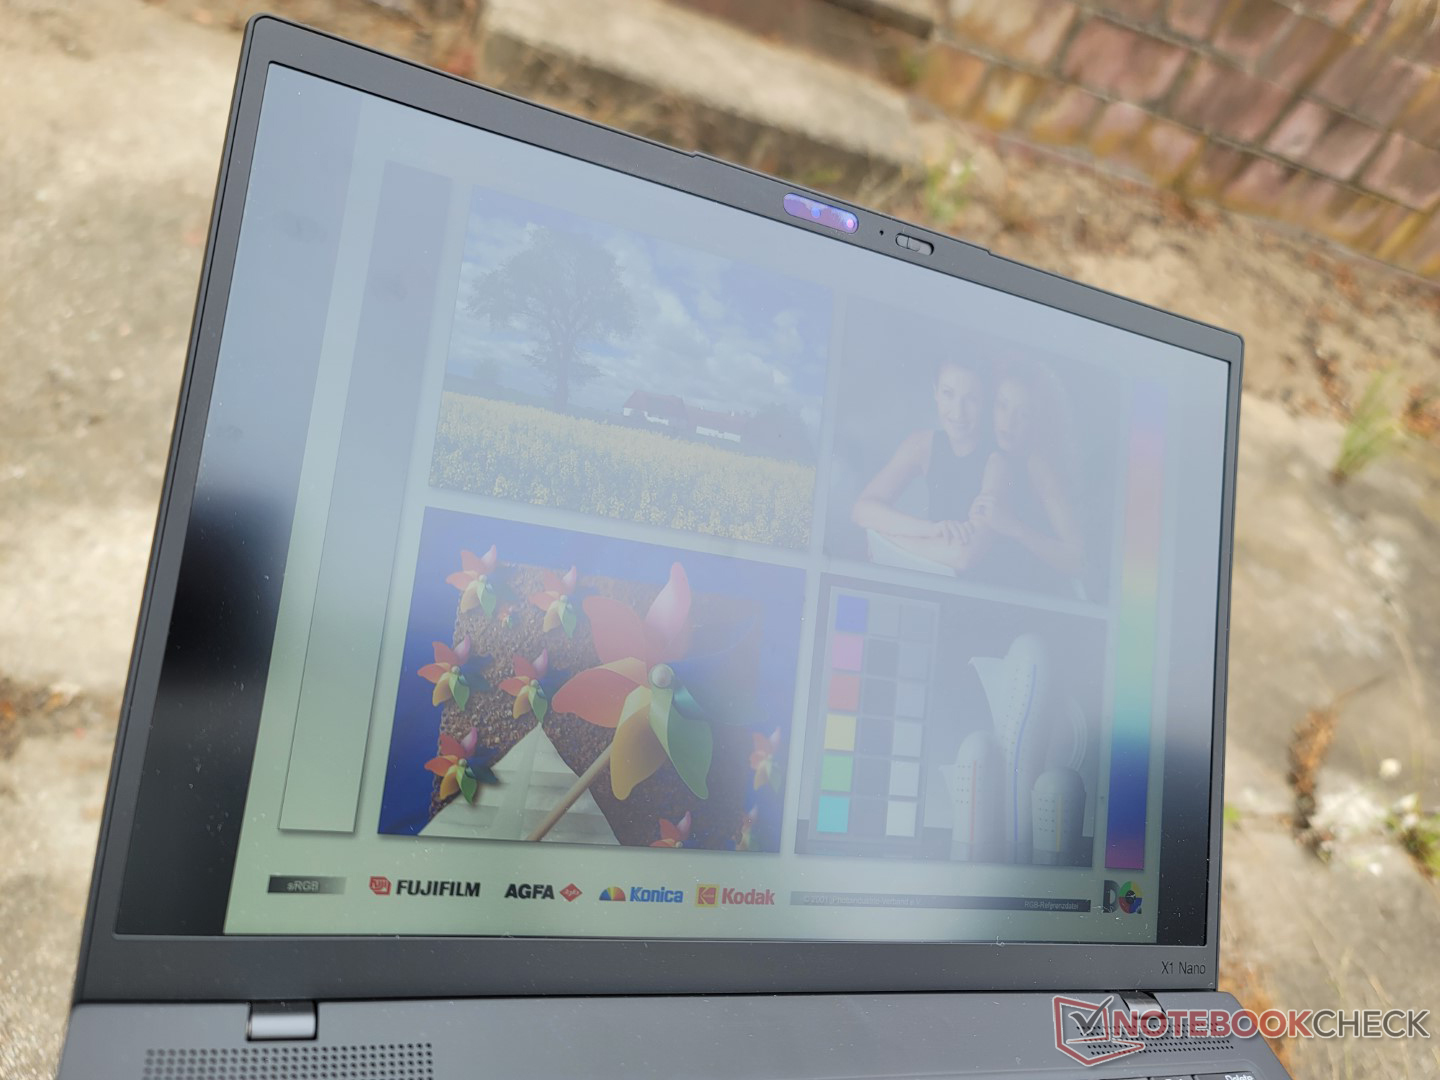
Outdoor visibility and viewing angles remain mostly the same as on the Gen 1 model as Lenovo hasn't upped the brightness or contrast of the display for this year's model.


Performance
Testing Conditions
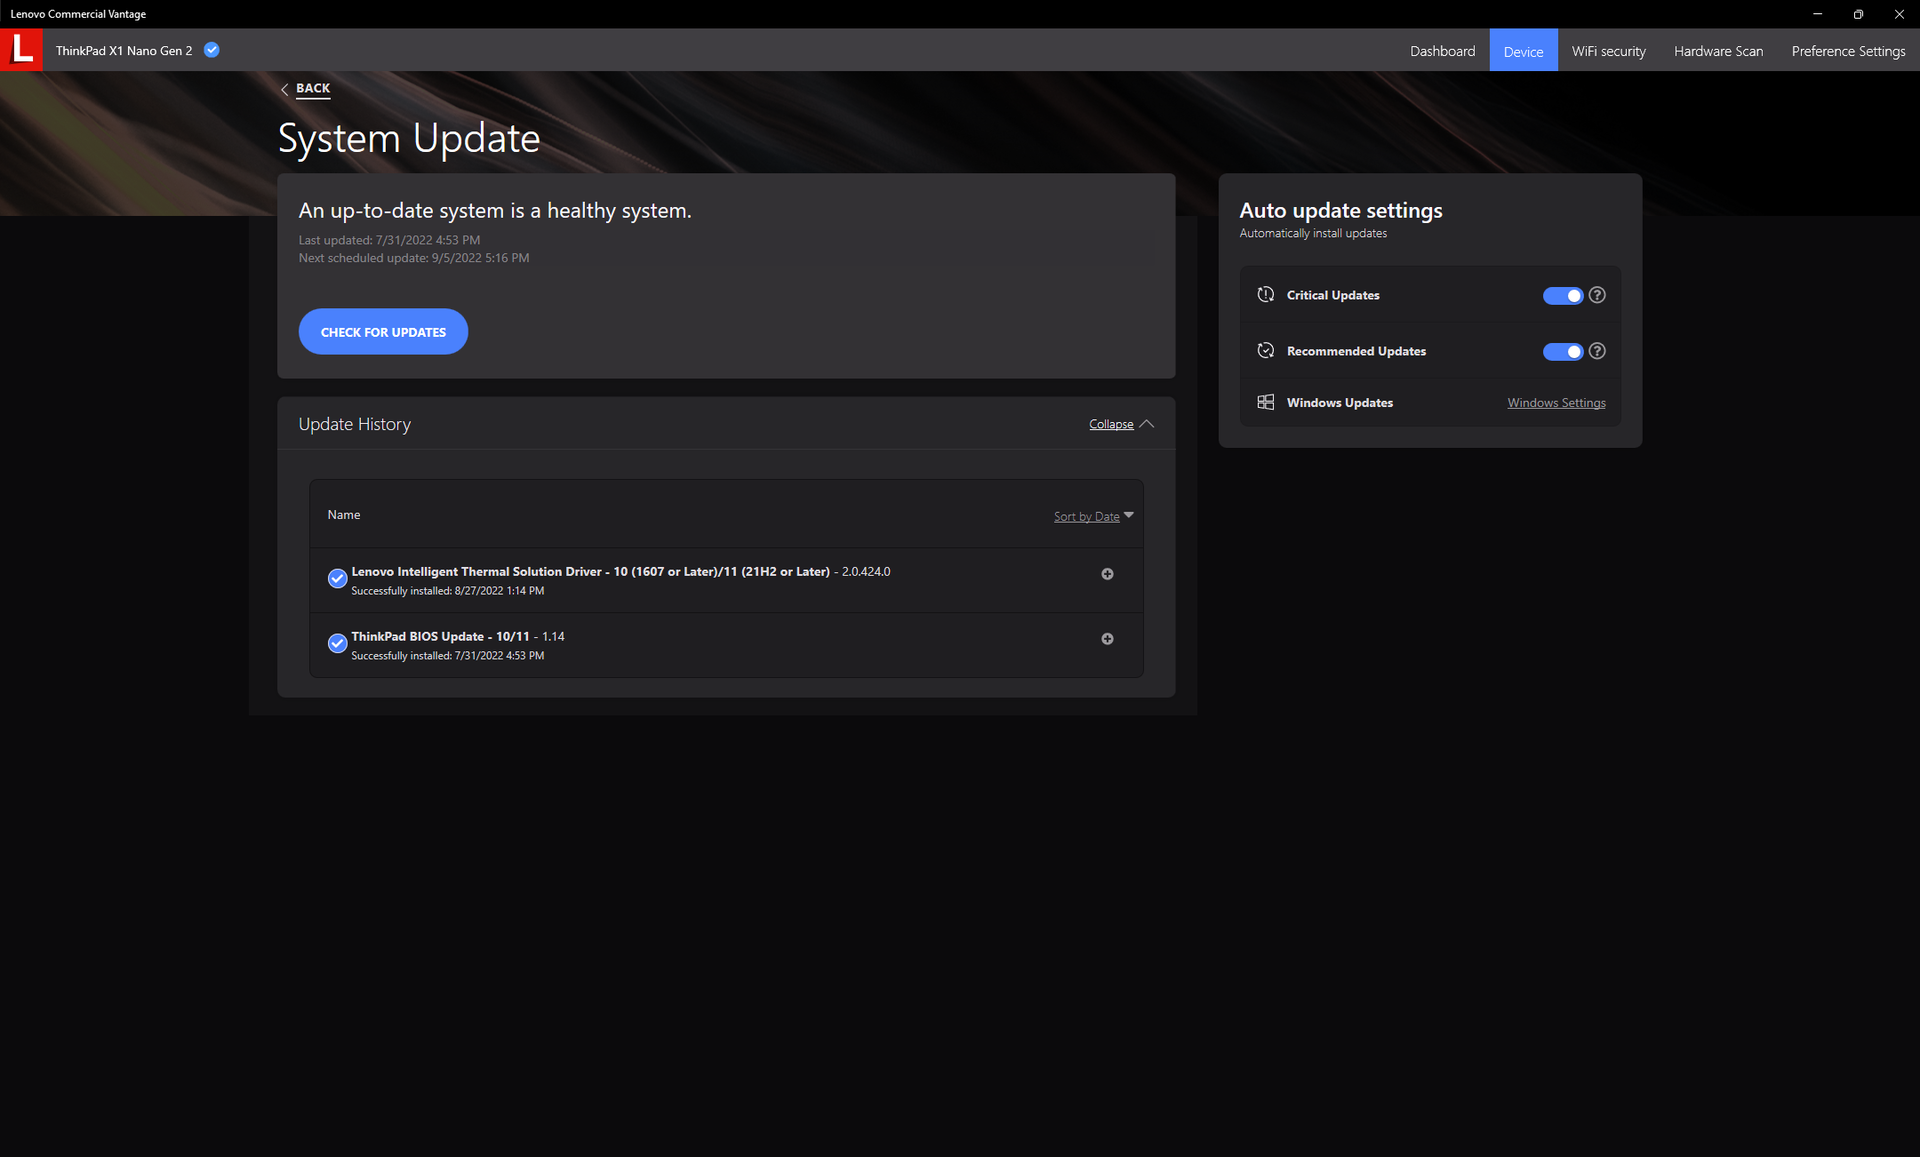
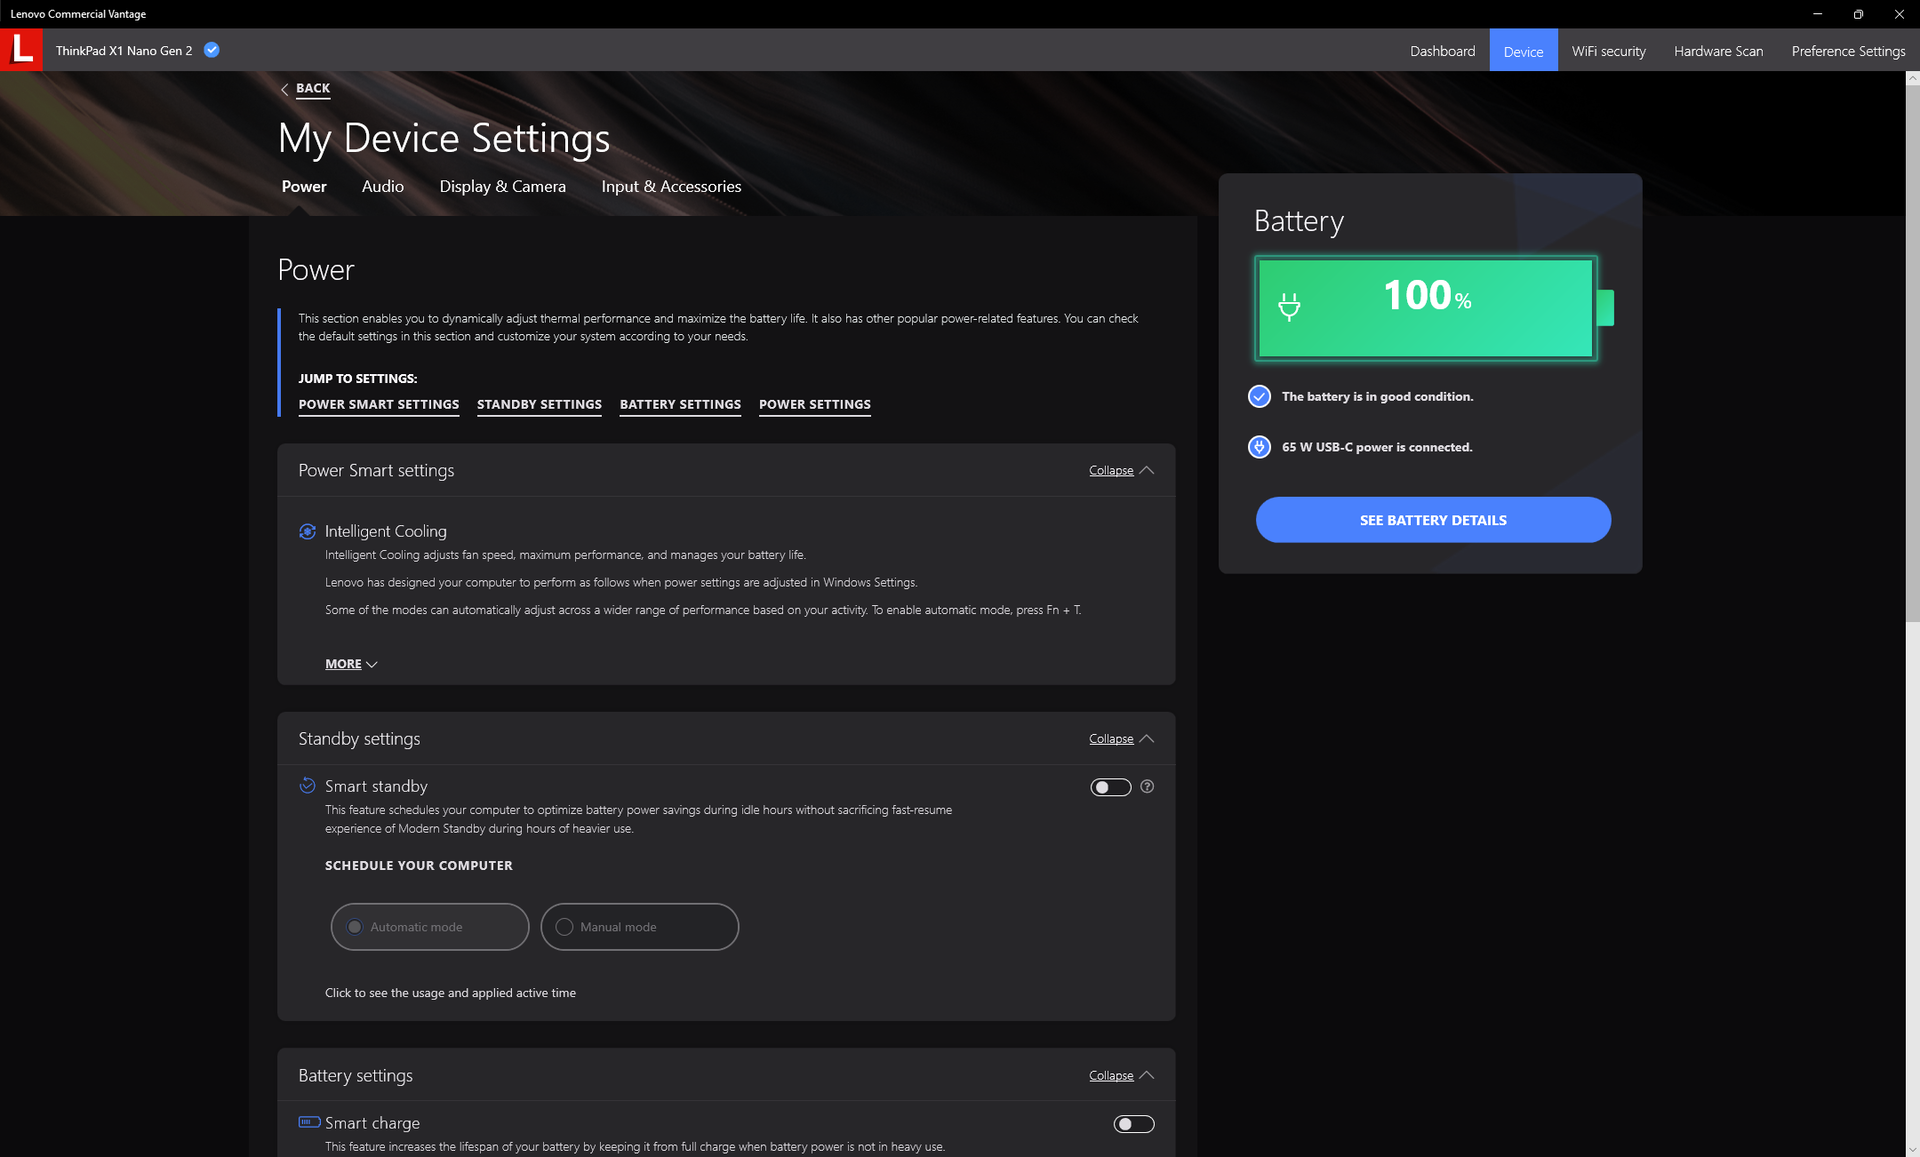
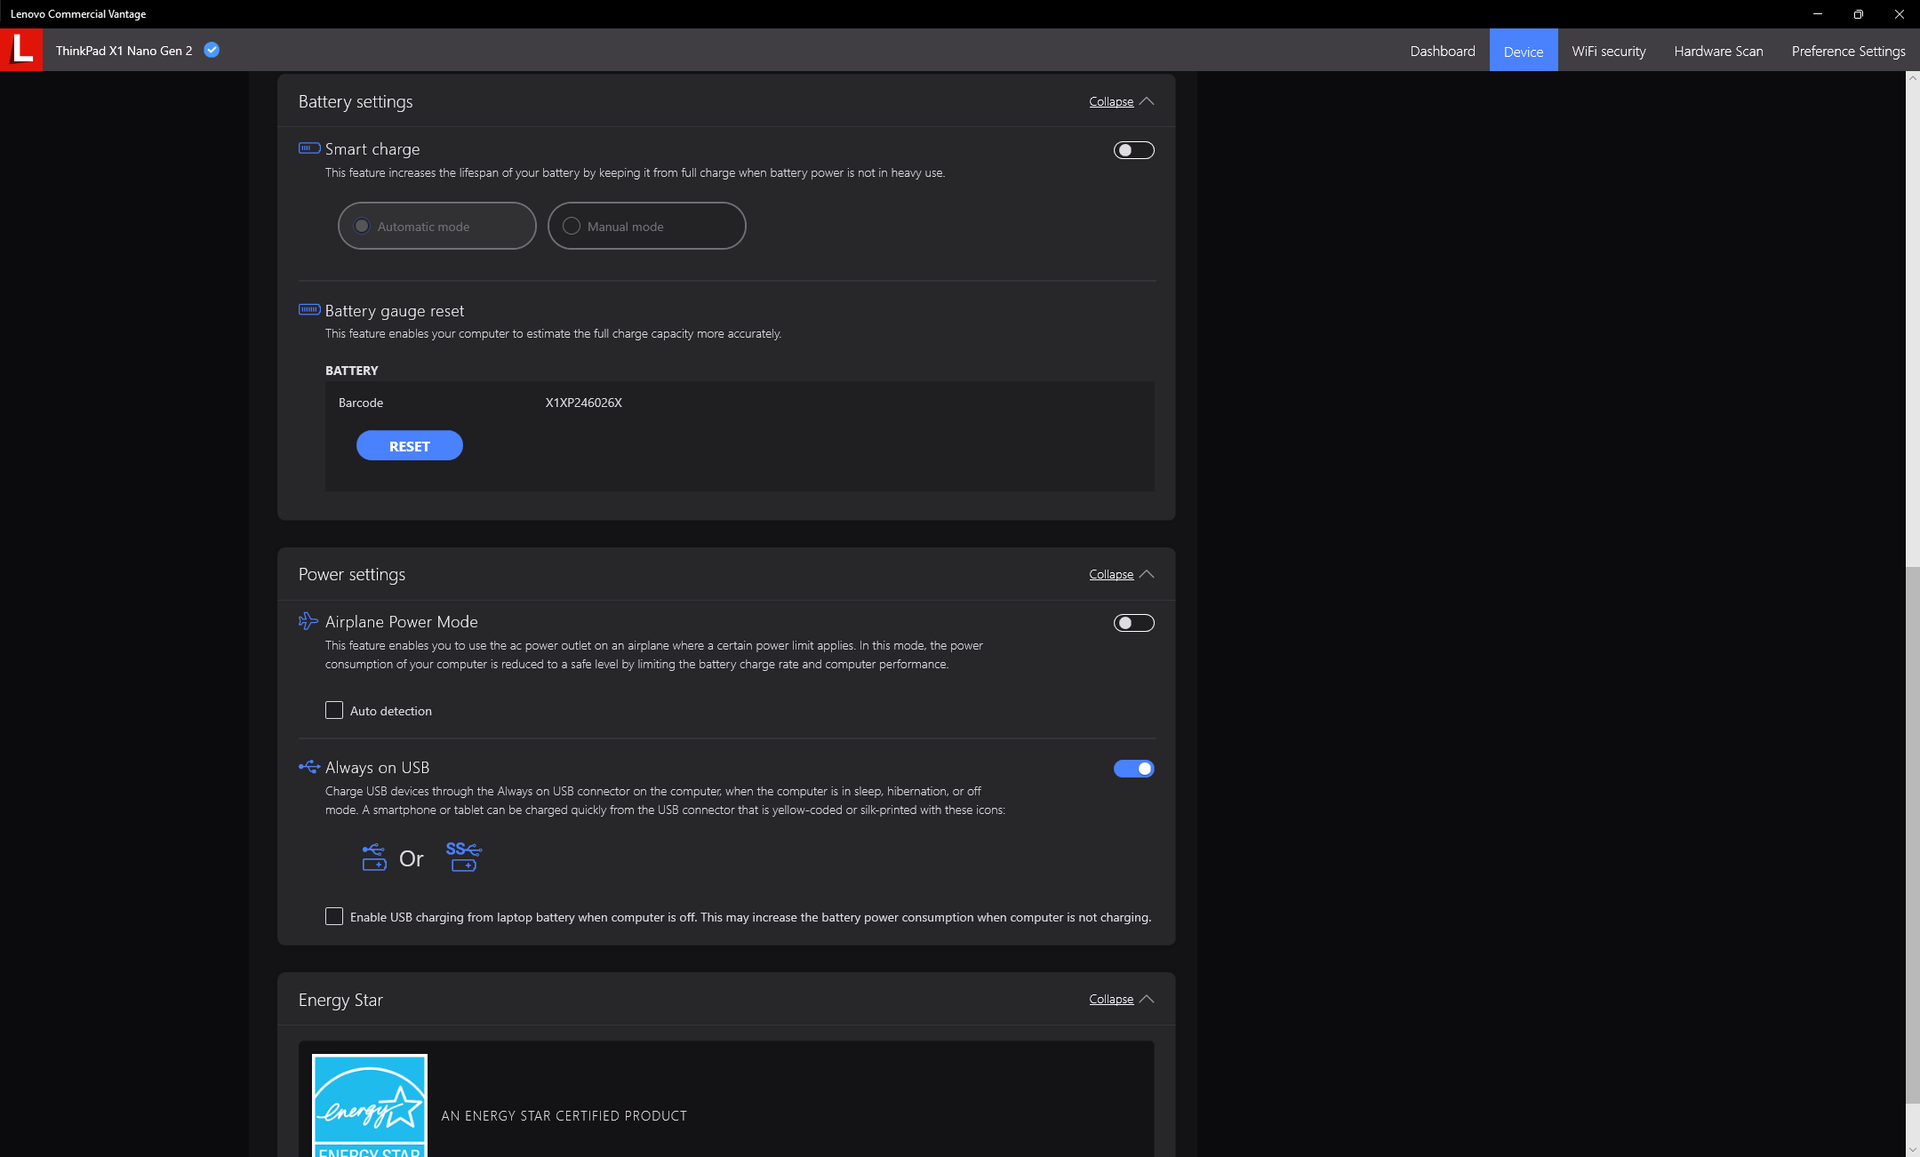
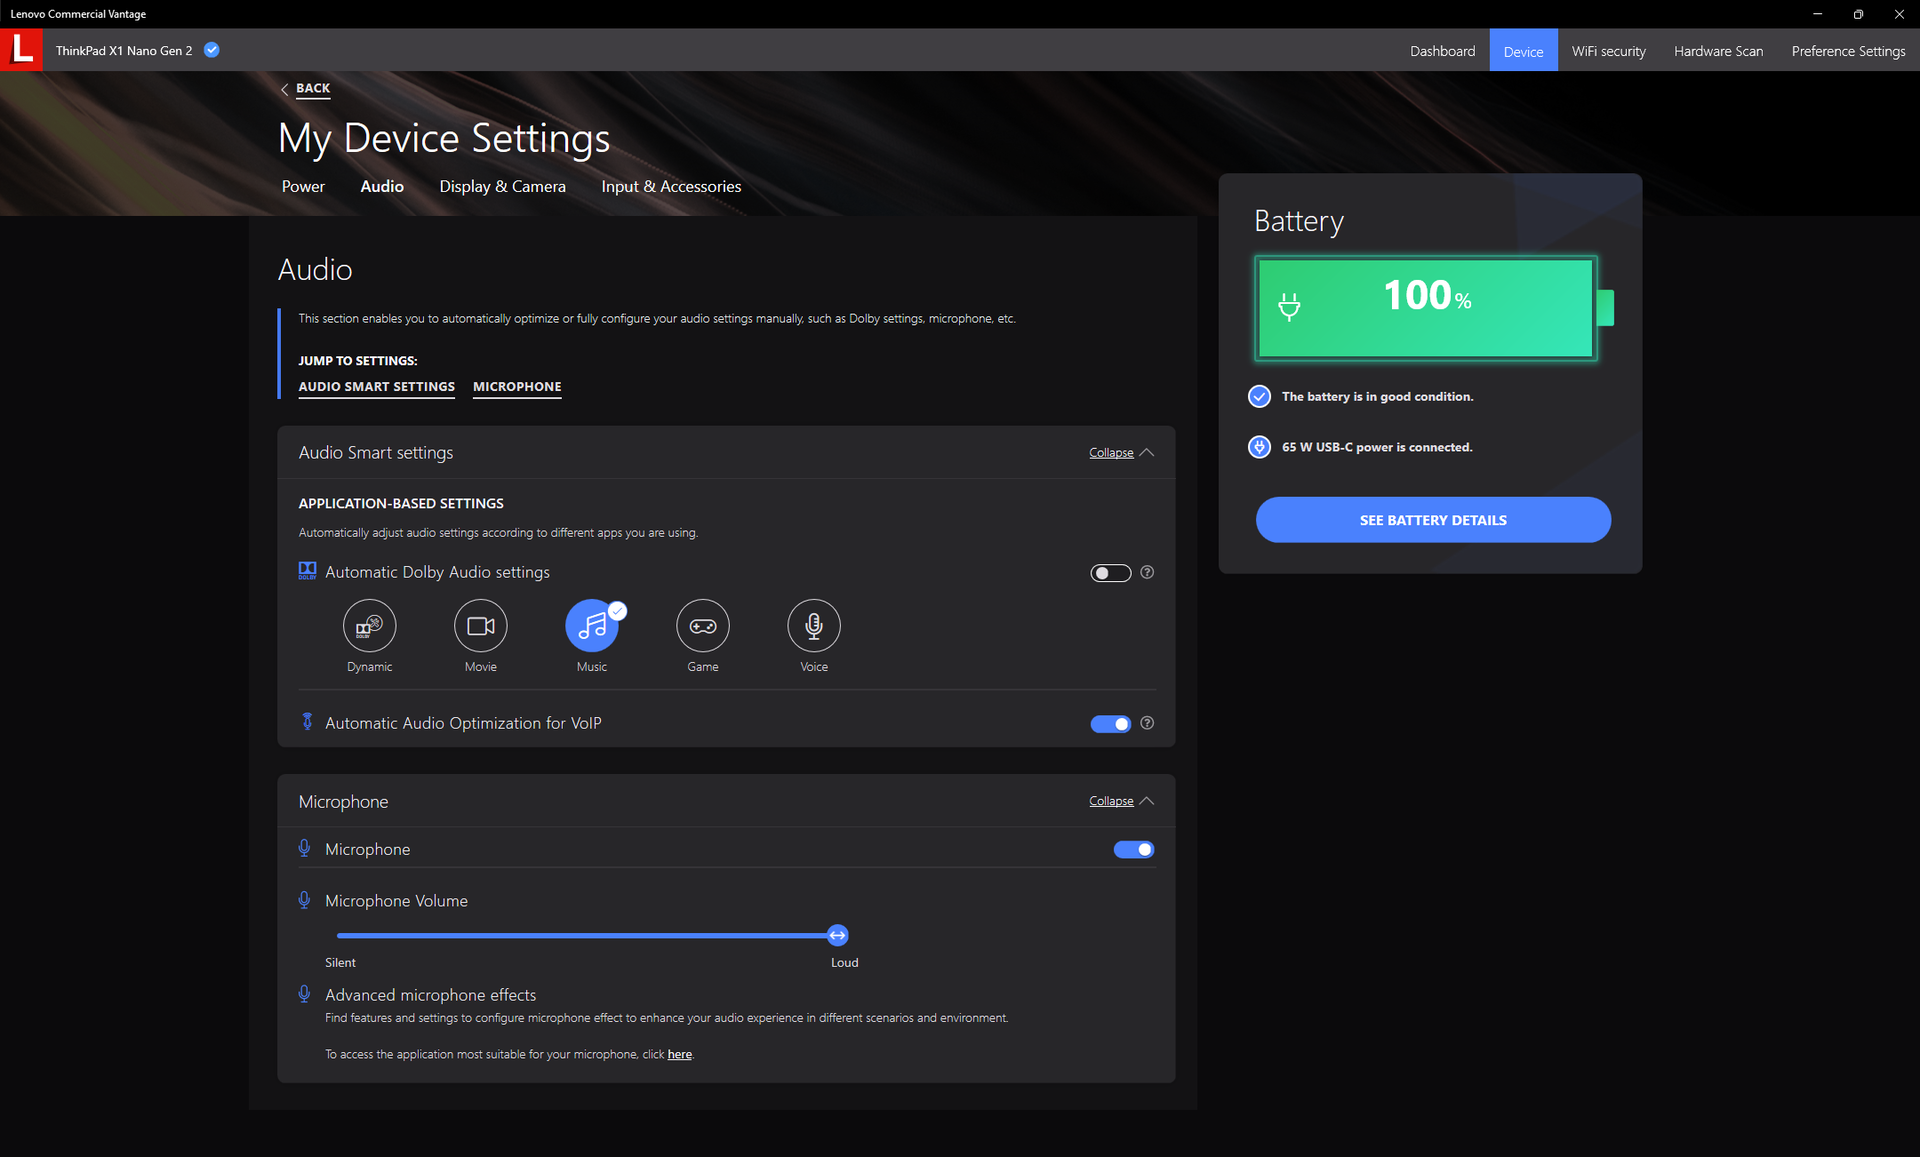
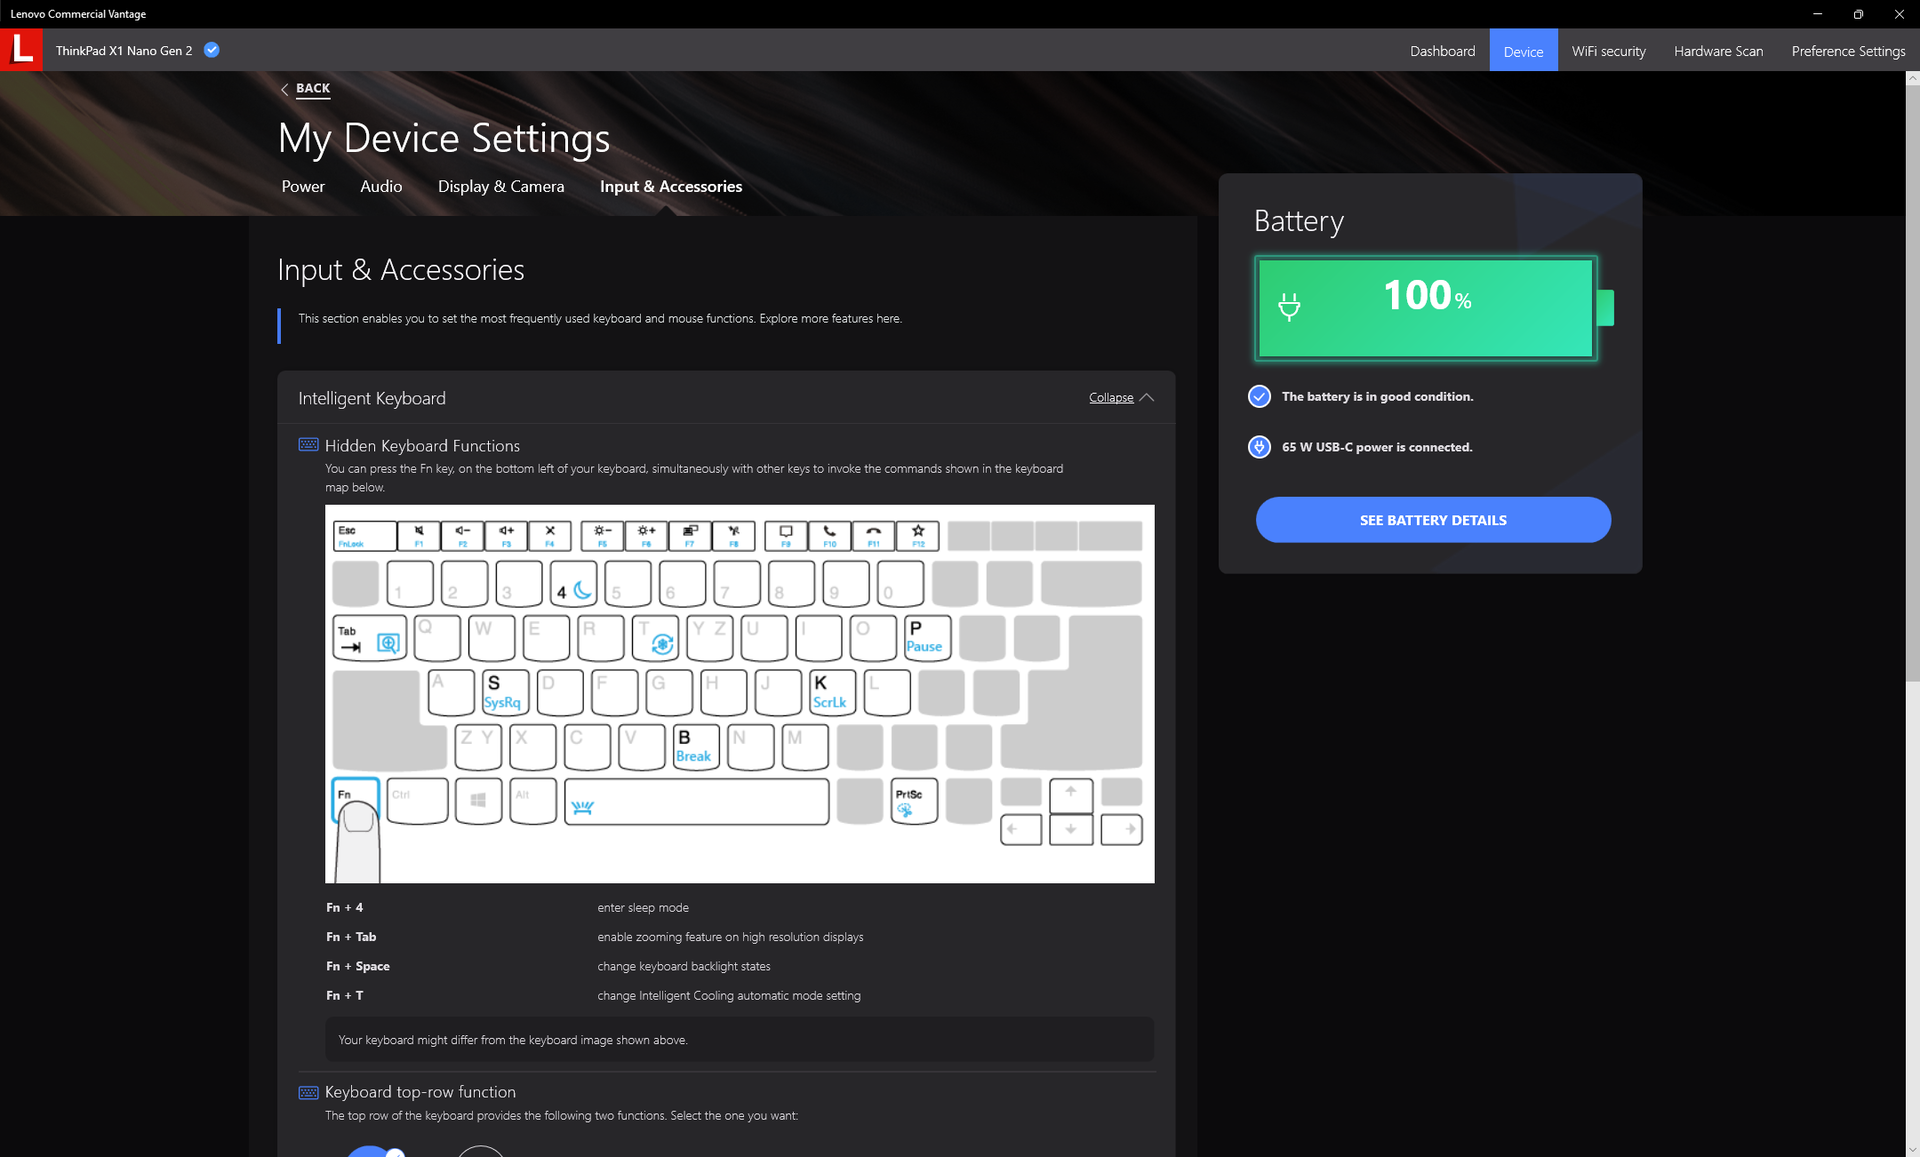
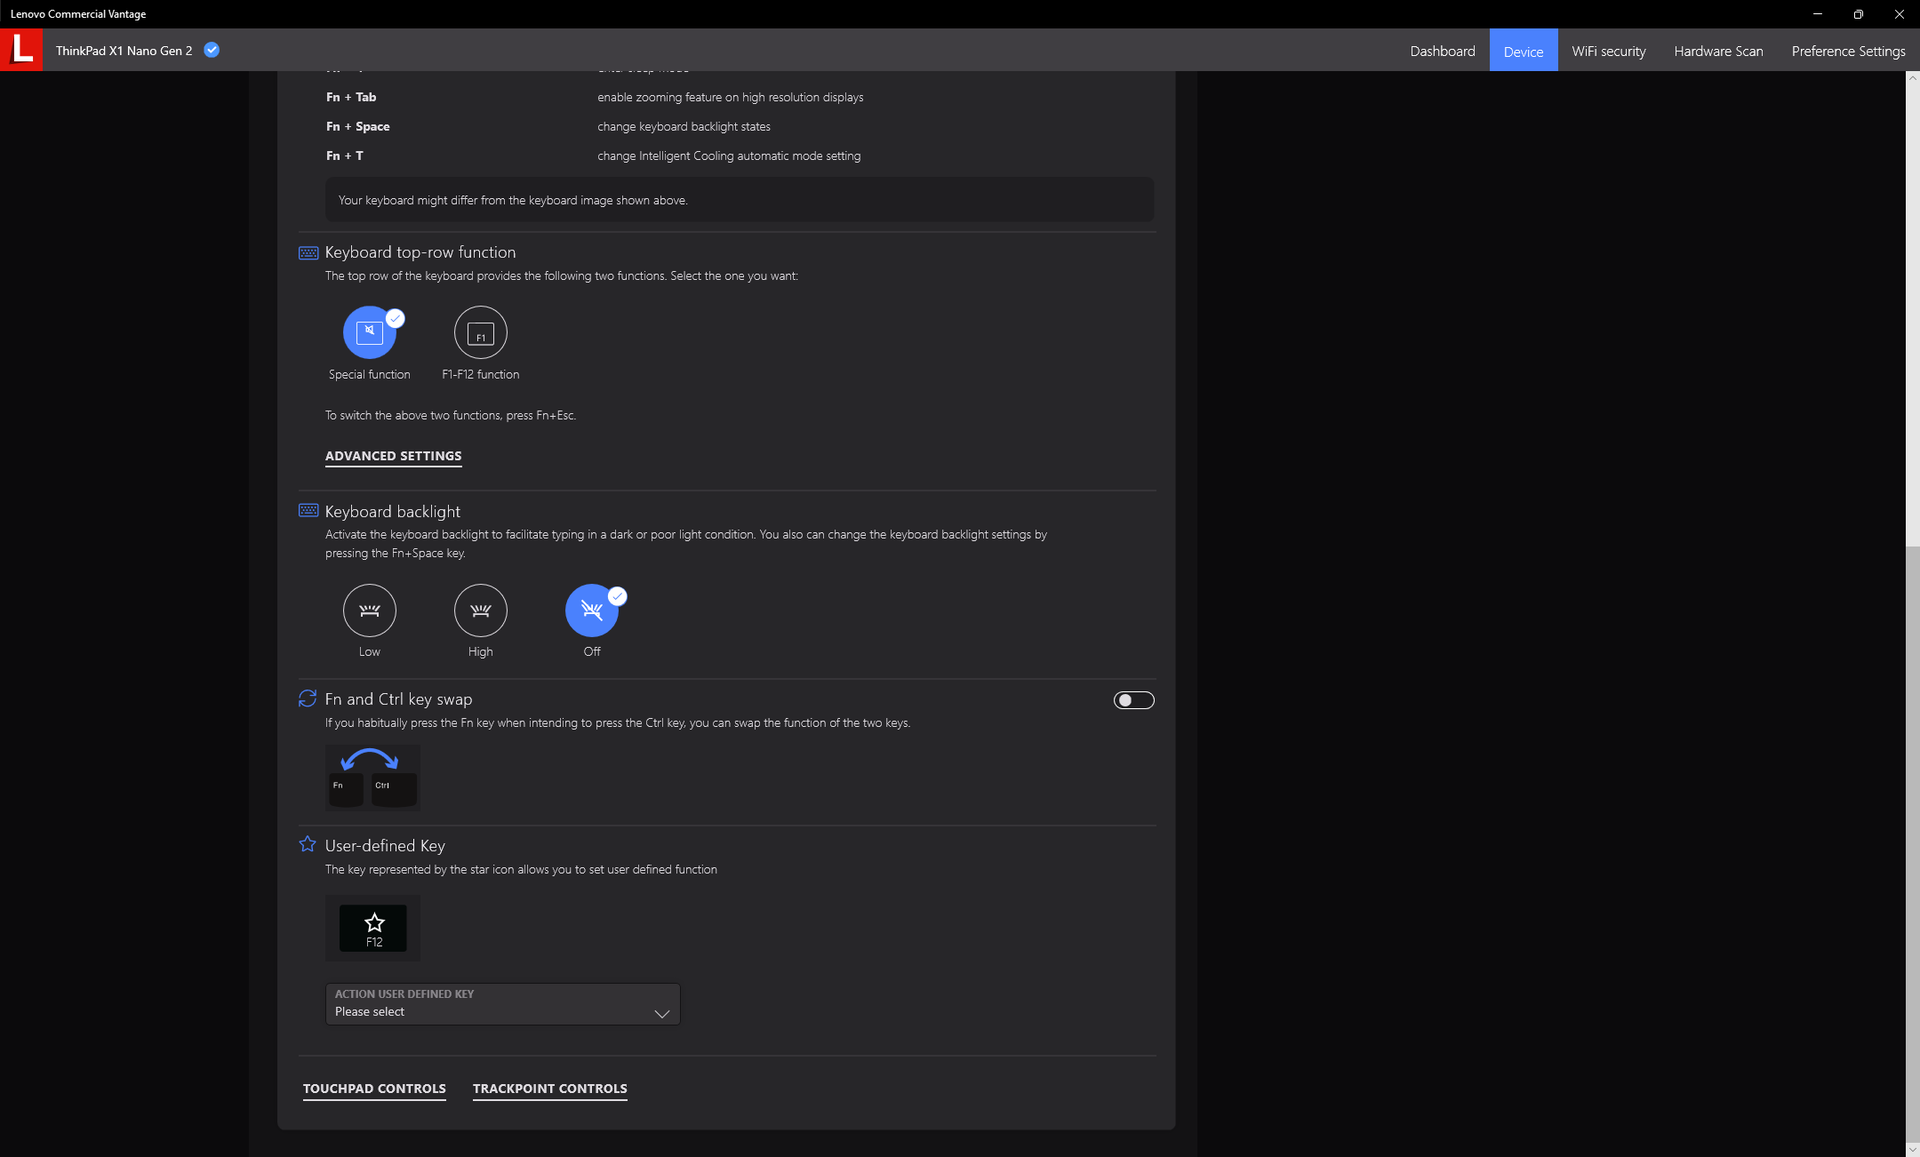
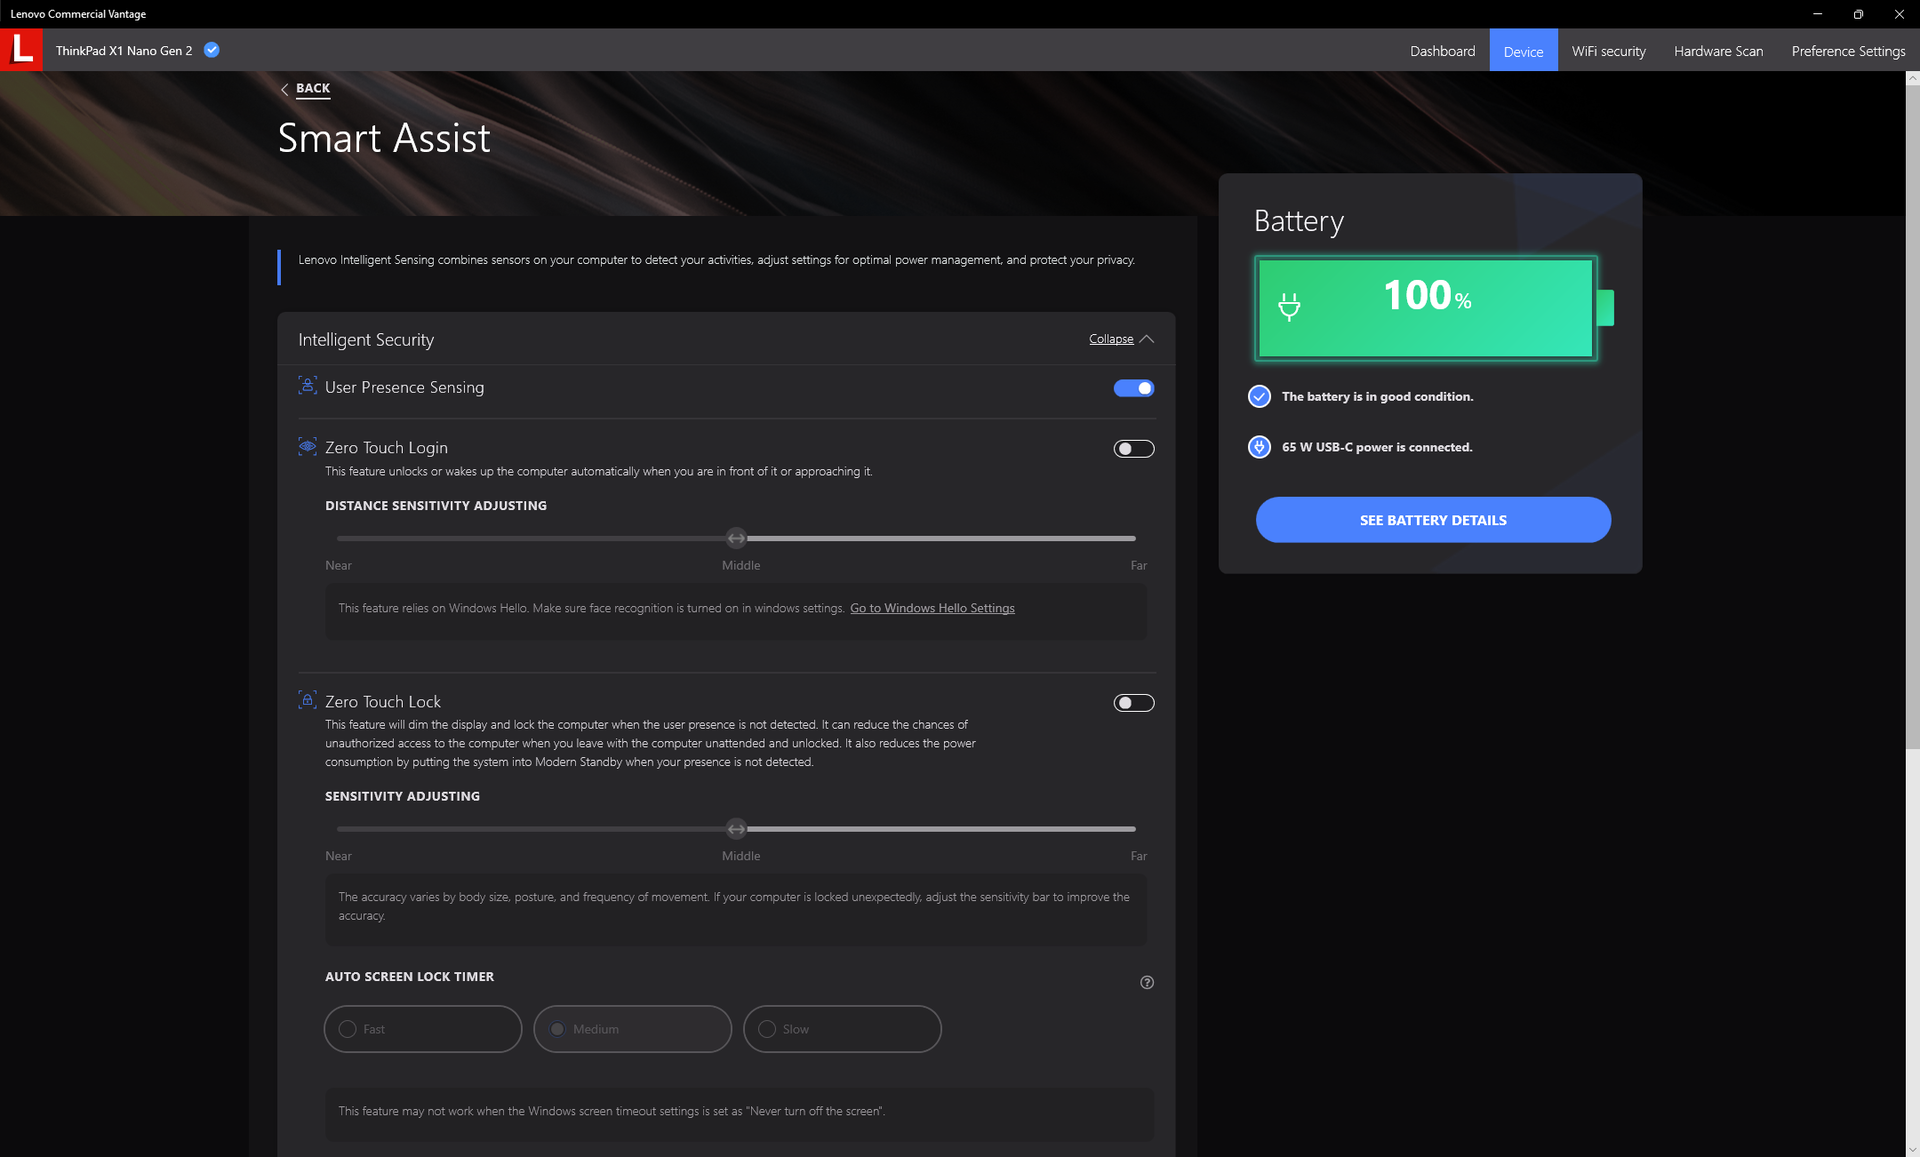
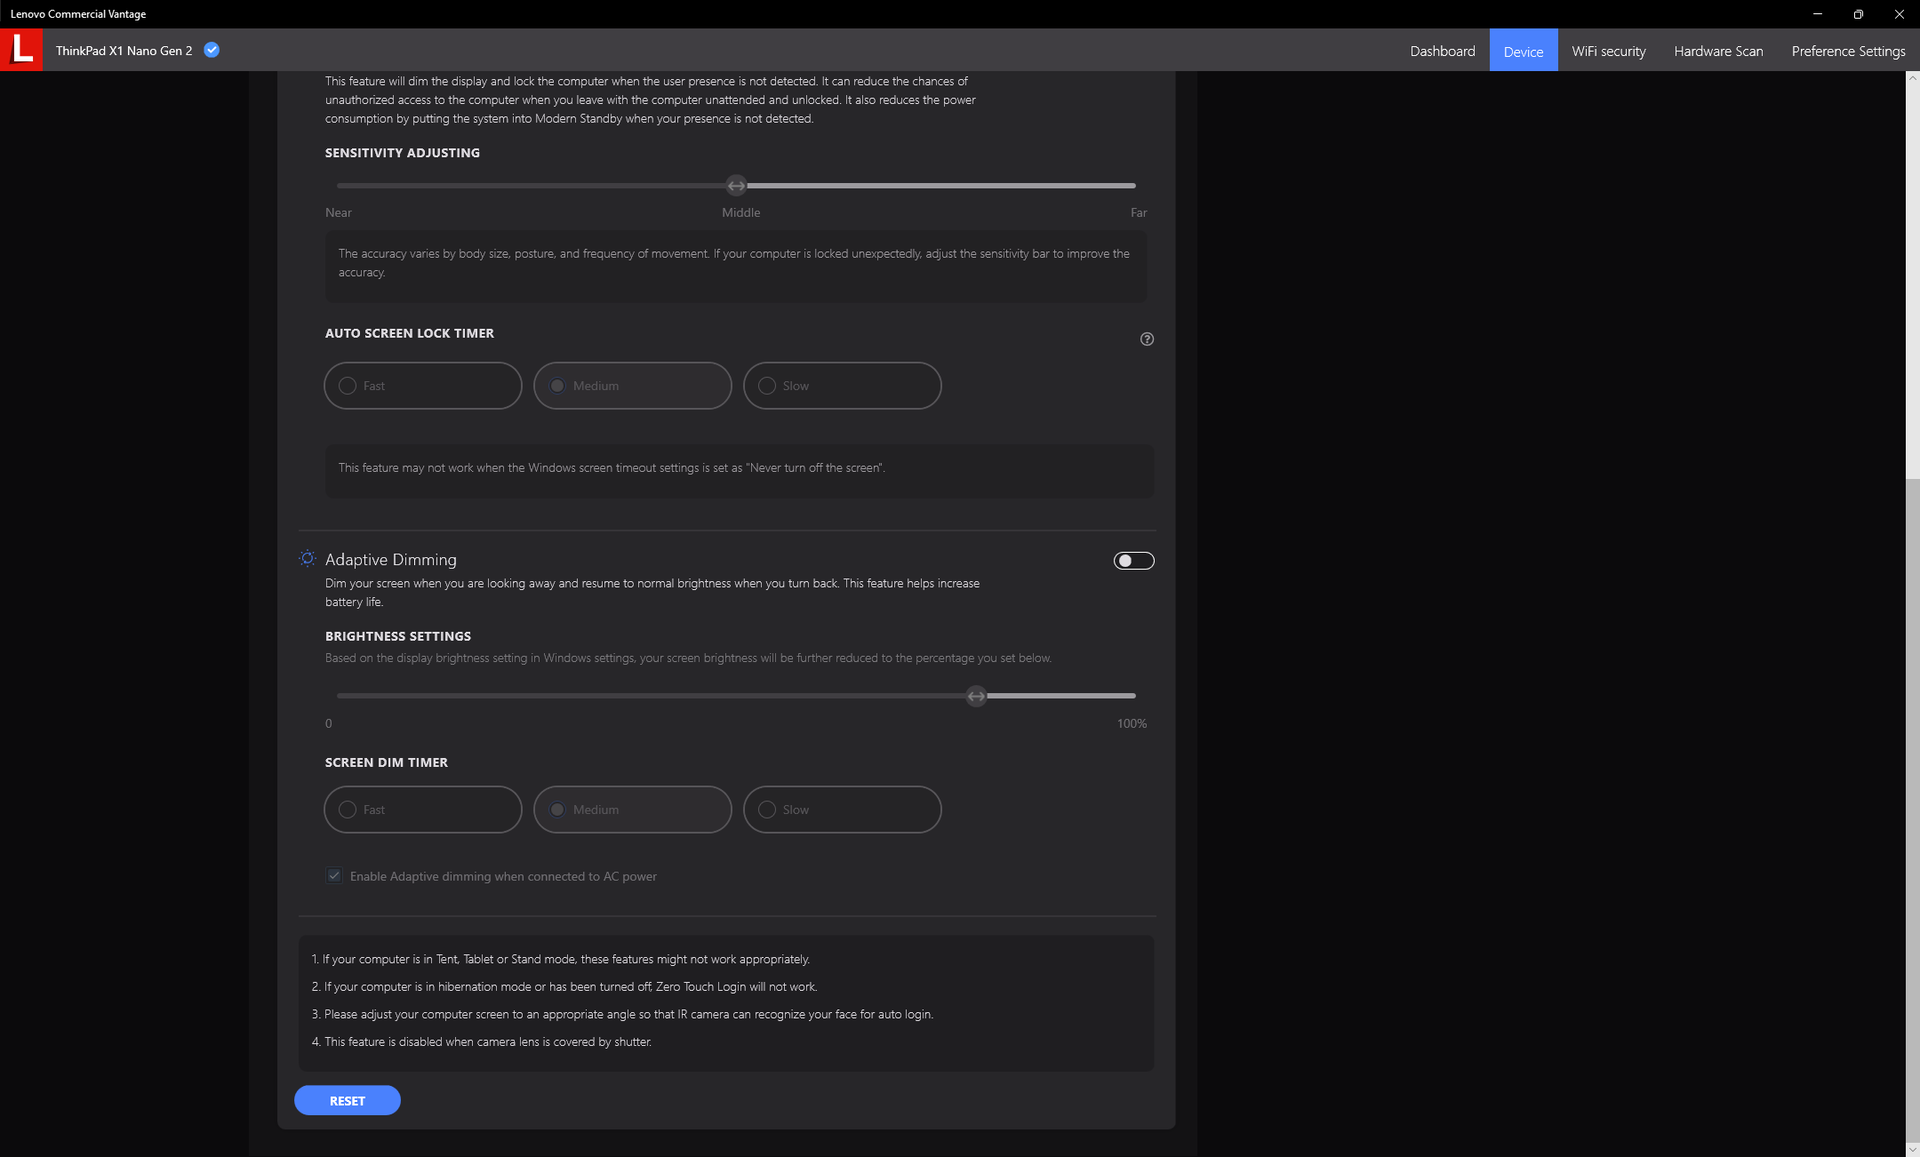
We set our unit to "Best performance" mode via Windows prior to running any performance benchmarks below. It's recommended that users become familiar with the pre-installed Vantage software as many Lenovo-specific software updates and features like User Presence Sensing are toggled here as shown by the screenshots below.
Processor
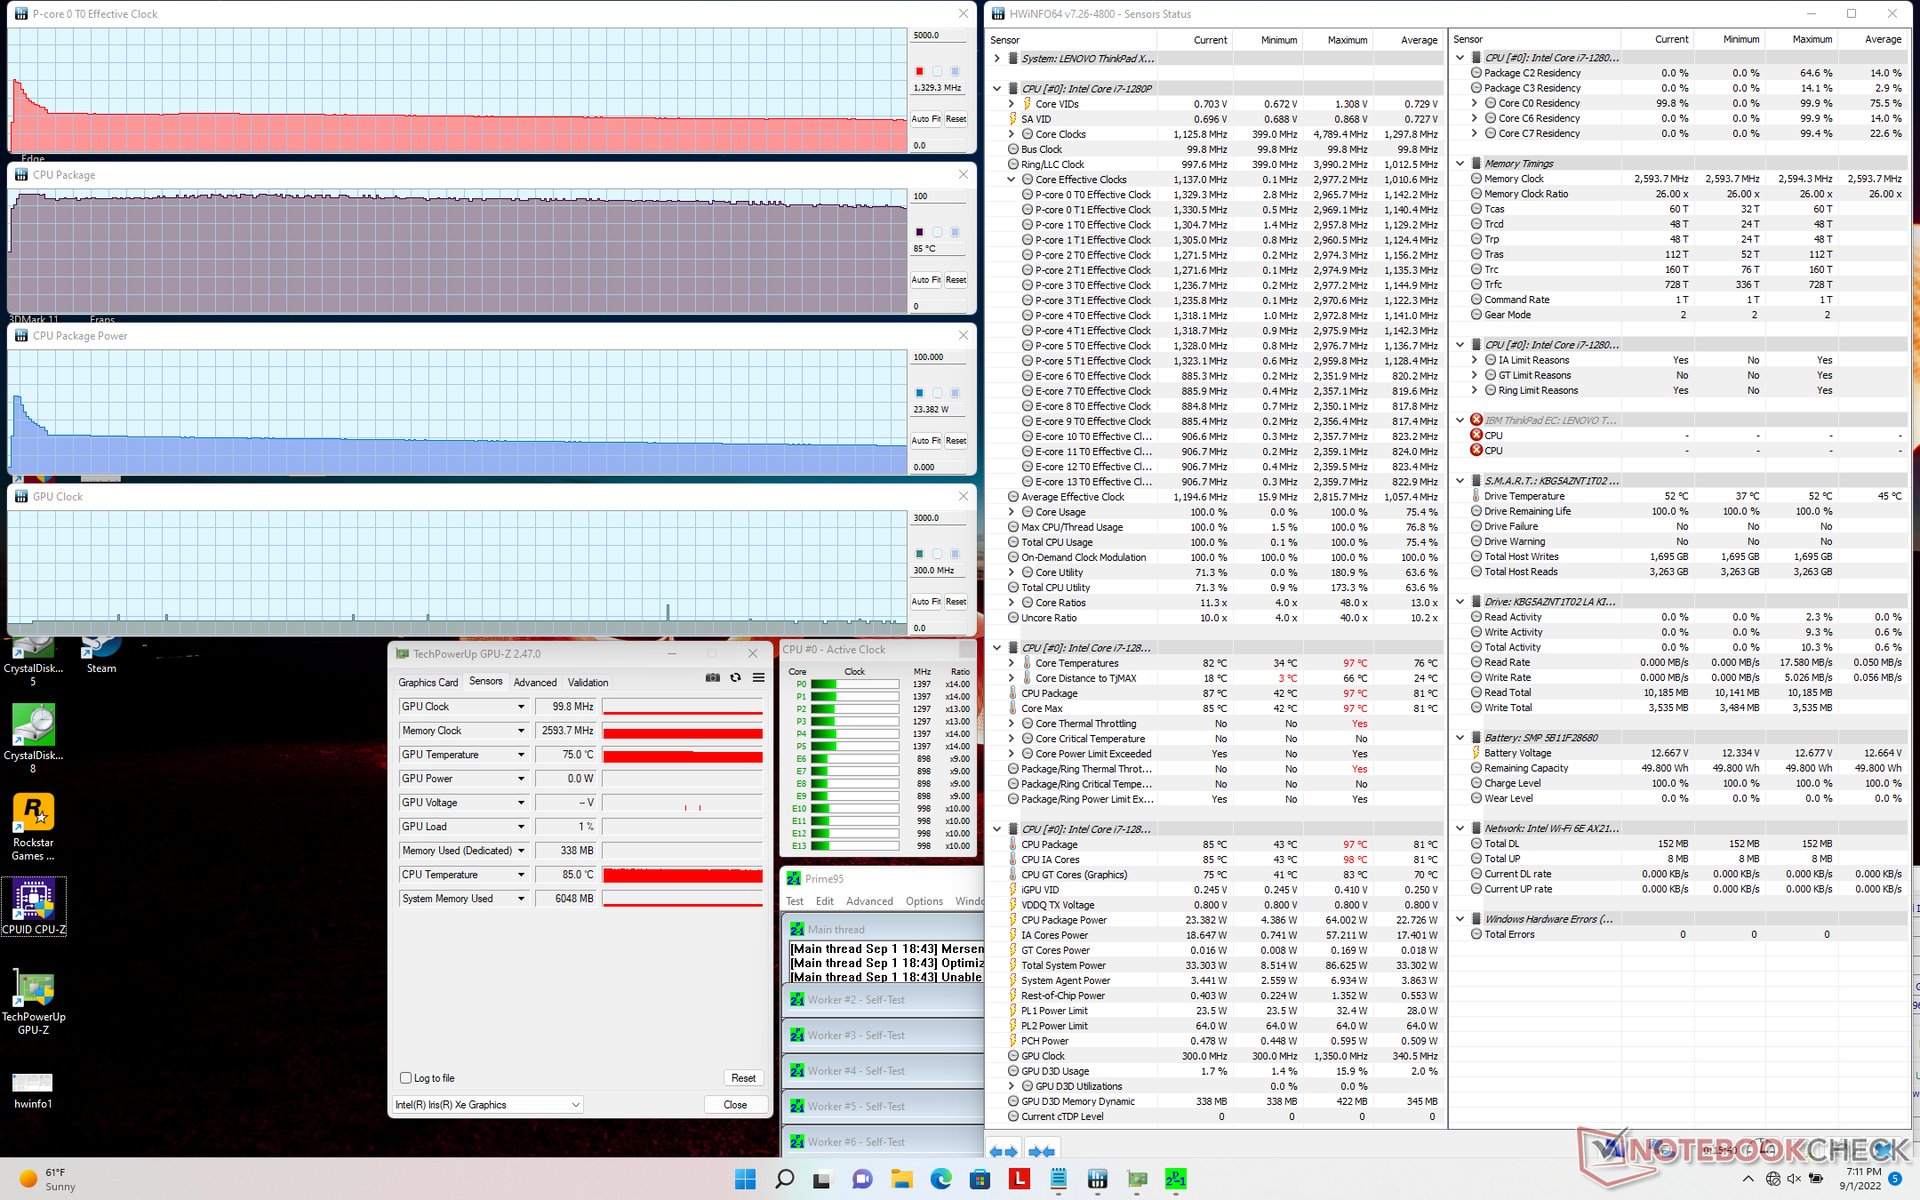
CPU performance is a mixed bag. The high initial CineBench R15 multi-thread score of 2118 points is excellent, but this falls dramatically to 1485 points after the next consecutive run to represent poor Turbo Boost sustainability and steeper throttling than most other laptops. In fact, multi-thread performance can drop by as much as 48 percent when stressed as shown by our CineBench R15 xT loop test below. The Framework Laptop with the supposedly slower Core i7-1260P is able to outperform our i7-1280P over longer periods. In other words, users can enjoy the initial short burst of speed from the i7-1280P in the Lenovo before it falls off a cliff.
Despite its somewhat disappointing performance, our i7-1280P CPU in the X1 Nano Gen 2 is still handily faster than the Core i7-1160G7 in the X1 Nano Gen 1 by about 80 percent even after accounting for any throttling issues.
Cinebench R15 Multi Loop
Cinebench R23: Multi Core | Single Core
Cinebench R15: CPU Multi 64Bit | CPU Single 64Bit
Blender: v2.79 BMW27 CPU
7-Zip 18.03: 7z b 4 | 7z b 4 -mmt1
Geekbench 5.5: Multi-Core | Single-Core
HWBOT x265 Benchmark v2.2: 4k Preset
LibreOffice : 20 Documents To PDF
R Benchmark 2.5: Overall mean
Cinebench R23: Multi Core | Single Core
Cinebench R15: CPU Multi 64Bit | CPU Single 64Bit
Blender: v2.79 BMW27 CPU
7-Zip 18.03: 7z b 4 | 7z b 4 -mmt1
Geekbench 5.5: Multi-Core | Single-Core
HWBOT x265 Benchmark v2.2: 4k Preset
LibreOffice : 20 Documents To PDF
R Benchmark 2.5: Overall mean
* ... smaller is better
AIDA64: FP32 Ray-Trace | FPU Julia | CPU SHA3 | CPU Queen | FPU SinJulia | FPU Mandel | CPU AES | CPU ZLib | FP64 Ray-Trace | CPU PhotoWorxx
| Performance rating | |
| Average Intel Core i7-1280P | |
| Lenovo ThinkPad X1 Nano Gen 2 Core i7-1280P | |
| Framework Laptop 13.5 12th Gen Intel | |
| Lenovo ThinkPad X1 Nano-20UN002UGE | |
| Dell Latitude 13 7330 | |
| HP Elite Dragonfly G3 | |
| Huawei MateBook X Pro 2021 | |
| AIDA64 / FP32 Ray-Trace | |
| Average Intel Core i7-1280P (7466 - 13068, n=6) | |
| Lenovo ThinkPad X1 Nano Gen 2 Core i7-1280P | |
| Lenovo ThinkPad X1 Nano-20UN002UGE | |
| Dell Latitude 13 7330 | |
| HP Elite Dragonfly G3 | |
| Framework Laptop 13.5 12th Gen Intel | |
| Huawei MateBook X Pro 2021 | |
| AIDA64 / FPU SinJulia | |
| Average Intel Core i7-1280P (5880 - 8571, n=6) | |
| Framework Laptop 13.5 12th Gen Intel | |
| Lenovo ThinkPad X1 Nano Gen 2 Core i7-1280P | |
| Dell Latitude 13 7330 | |
| HP Elite Dragonfly G3 | |
| Lenovo ThinkPad X1 Nano-20UN002UGE | |
| Huawei MateBook X Pro 2021 | |
| AIDA64 / FPU Mandel | |
| Average Intel Core i7-1280P (18907 - 32766, n=6) | |
| Lenovo ThinkPad X1 Nano Gen 2 Core i7-1280P | |
| Lenovo ThinkPad X1 Nano-20UN002UGE | |
| Dell Latitude 13 7330 | |
| HP Elite Dragonfly G3 | |
| Framework Laptop 13.5 12th Gen Intel | |
| Huawei MateBook X Pro 2021 | |
| AIDA64 / FP64 Ray-Trace | |
| Average Intel Core i7-1280P (4006 - 7184, n=6) | |
| Lenovo ThinkPad X1 Nano Gen 2 Core i7-1280P | |
| Lenovo ThinkPad X1 Nano-20UN002UGE | |
| Dell Latitude 13 7330 | |
| HP Elite Dragonfly G3 | |
| Framework Laptop 13.5 12th Gen Intel | |
| Huawei MateBook X Pro 2021 | |
| AIDA64 / CPU PhotoWorxx | |
| Average Intel Core i7-1280P (36663 - 48416, n=6) | |
| Huawei MateBook X Pro 2021 | |
| Lenovo ThinkPad X1 Nano Gen 2 Core i7-1280P | |
| HP Elite Dragonfly G3 | |
| Lenovo ThinkPad X1 Nano-20UN002UGE | |
| Framework Laptop 13.5 12th Gen Intel | |
| Dell Latitude 13 7330 | |
System Performance
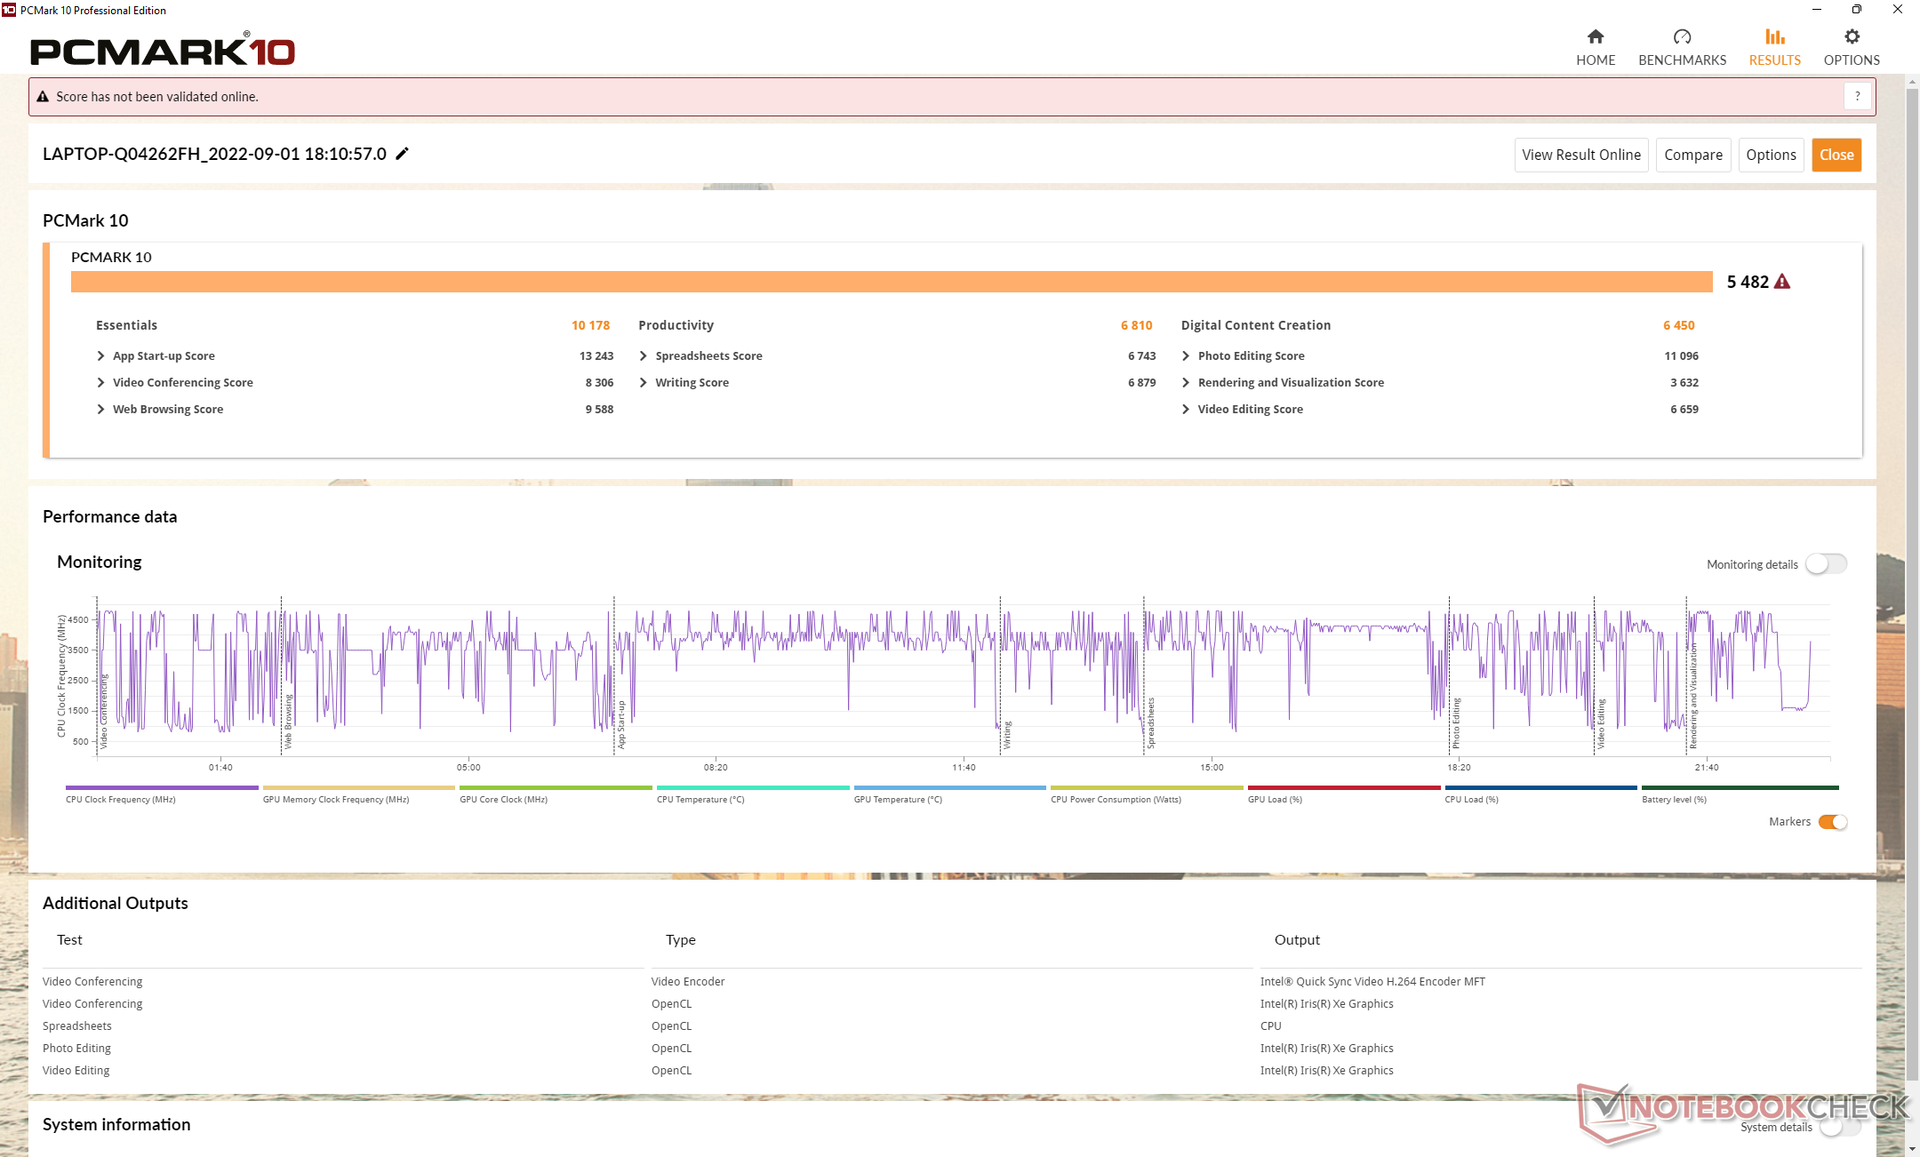
PCMark 10 results are consistently higher than the Gen 1 model and most other 13.0-inch laptops for that matter due to the Core P-series CPU. The difference is widest in the Digital Content Creation subtest.
CrossMark: Overall | Productivity | Creativity | Responsiveness
| PCMark 10 / Score | |
| Framework Laptop 13.5 12th Gen Intel | |
| Average Intel Core i7-1280P, Intel Iris Xe Graphics G7 96EUs (5410 - 5994, n=4) | |
| Lenovo ThinkPad X1 Nano Gen 2 Core i7-1280P | |
| Dell Latitude 13 7330 | |
| Huawei MateBook X Pro 2021 | |
| HP Elite Dragonfly G3 | |
| Lenovo ThinkPad X1 Nano-20UN002UGE | |
| PCMark 10 / Essentials | |
| Framework Laptop 13.5 12th Gen Intel | |
| Dell Latitude 13 7330 | |
| Average Intel Core i7-1280P, Intel Iris Xe Graphics G7 96EUs (9719 - 10920, n=4) | |
| Huawei MateBook X Pro 2021 | |
| Lenovo ThinkPad X1 Nano Gen 2 Core i7-1280P | |
| Lenovo ThinkPad X1 Nano-20UN002UGE | |
| HP Elite Dragonfly G3 | |
| PCMark 10 / Productivity | |
| Framework Laptop 13.5 12th Gen Intel | |
| Dell Latitude 13 7330 | |
| Average Intel Core i7-1280P, Intel Iris Xe Graphics G7 96EUs (6301 - 7453, n=4) | |
| Lenovo ThinkPad X1 Nano Gen 2 Core i7-1280P | |
| Huawei MateBook X Pro 2021 | |
| Lenovo ThinkPad X1 Nano-20UN002UGE | |
| HP Elite Dragonfly G3 | |
| PCMark 10 / Digital Content Creation | |
| Average Intel Core i7-1280P, Intel Iris Xe Graphics G7 96EUs (6450 - 7180, n=4) | |
| Framework Laptop 13.5 12th Gen Intel | |
| Lenovo ThinkPad X1 Nano Gen 2 Core i7-1280P | |
| HP Elite Dragonfly G3 | |
| Dell Latitude 13 7330 | |
| Huawei MateBook X Pro 2021 | |
| Lenovo ThinkPad X1 Nano-20UN002UGE | |
| CrossMark / Overall | |
| Average Intel Core i7-1280P, Intel Iris Xe Graphics G7 96EUs (1677 - 1773, n=4) | |
| Lenovo ThinkPad X1 Nano Gen 2 Core i7-1280P | |
| Framework Laptop 13.5 12th Gen Intel | |
| Dell Latitude 13 7330 | |
| HP Elite Dragonfly G3 | |
| CrossMark / Productivity | |
| Average Intel Core i7-1280P, Intel Iris Xe Graphics G7 96EUs (1585 - 1709, n=4) | |
| Framework Laptop 13.5 12th Gen Intel | |
| Lenovo ThinkPad X1 Nano Gen 2 Core i7-1280P | |
| Dell Latitude 13 7330 | |
| HP Elite Dragonfly G3 | |
| CrossMark / Creativity | |
| Lenovo ThinkPad X1 Nano Gen 2 Core i7-1280P | |
| Average Intel Core i7-1280P, Intel Iris Xe Graphics G7 96EUs (1849 - 1928, n=4) | |
| Framework Laptop 13.5 12th Gen Intel | |
| HP Elite Dragonfly G3 | |
| Dell Latitude 13 7330 | |
| CrossMark / Responsiveness | |
| Average Intel Core i7-1280P, Intel Iris Xe Graphics G7 96EUs (1394 - 1746, n=4) | |
| Framework Laptop 13.5 12th Gen Intel | |
| Lenovo ThinkPad X1 Nano Gen 2 Core i7-1280P | |
| Dell Latitude 13 7330 | |
| HP Elite Dragonfly G3 | |
| PCMark 10 Score | 5482 points | |
Help | ||
| AIDA64 / Memory Copy | |
| Lenovo ThinkPad X1 Nano Gen 2 Core i7-1280P | |
| Average Intel Core i7-1280P (56337 - 73486, n=6) | |
| HP Elite Dragonfly G3 | |
| Huawei MateBook X Pro 2021 | |
| Lenovo ThinkPad X1 Nano-20UN002UGE | |
| Framework Laptop 13.5 12th Gen Intel | |
| Dell Latitude 13 7330 | |
| AIDA64 / Memory Read | |
| Lenovo ThinkPad X1 Nano Gen 2 Core i7-1280P | |
| Average Intel Core i7-1280P (63221 - 73719, n=6) | |
| Huawei MateBook X Pro 2021 | |
| HP Elite Dragonfly G3 | |
| Lenovo ThinkPad X1 Nano-20UN002UGE | |
| Framework Laptop 13.5 12th Gen Intel | |
| Dell Latitude 13 7330 | |
| AIDA64 / Memory Write | |
| Huawei MateBook X Pro 2021 | |
| Lenovo ThinkPad X1 Nano Gen 2 Core i7-1280P | |
| Average Intel Core i7-1280P (58729 - 68247, n=6) | |
| HP Elite Dragonfly G3 | |
| Lenovo ThinkPad X1 Nano-20UN002UGE | |
| Framework Laptop 13.5 12th Gen Intel | |
| Dell Latitude 13 7330 | |
| AIDA64 / Memory Latency | |
| Average Intel Core i7-1280P (93.1 - 153.3, n=6) | |
| HP Elite Dragonfly G3 | |
| Lenovo ThinkPad X1 Nano-20UN002UGE | |
| Lenovo ThinkPad X1 Nano Gen 2 Core i7-1280P | |
| Huawei MateBook X Pro 2021 | |
| Framework Laptop 13.5 12th Gen Intel | |
| Dell Latitude 13 7330 | |
* ... smaller is better
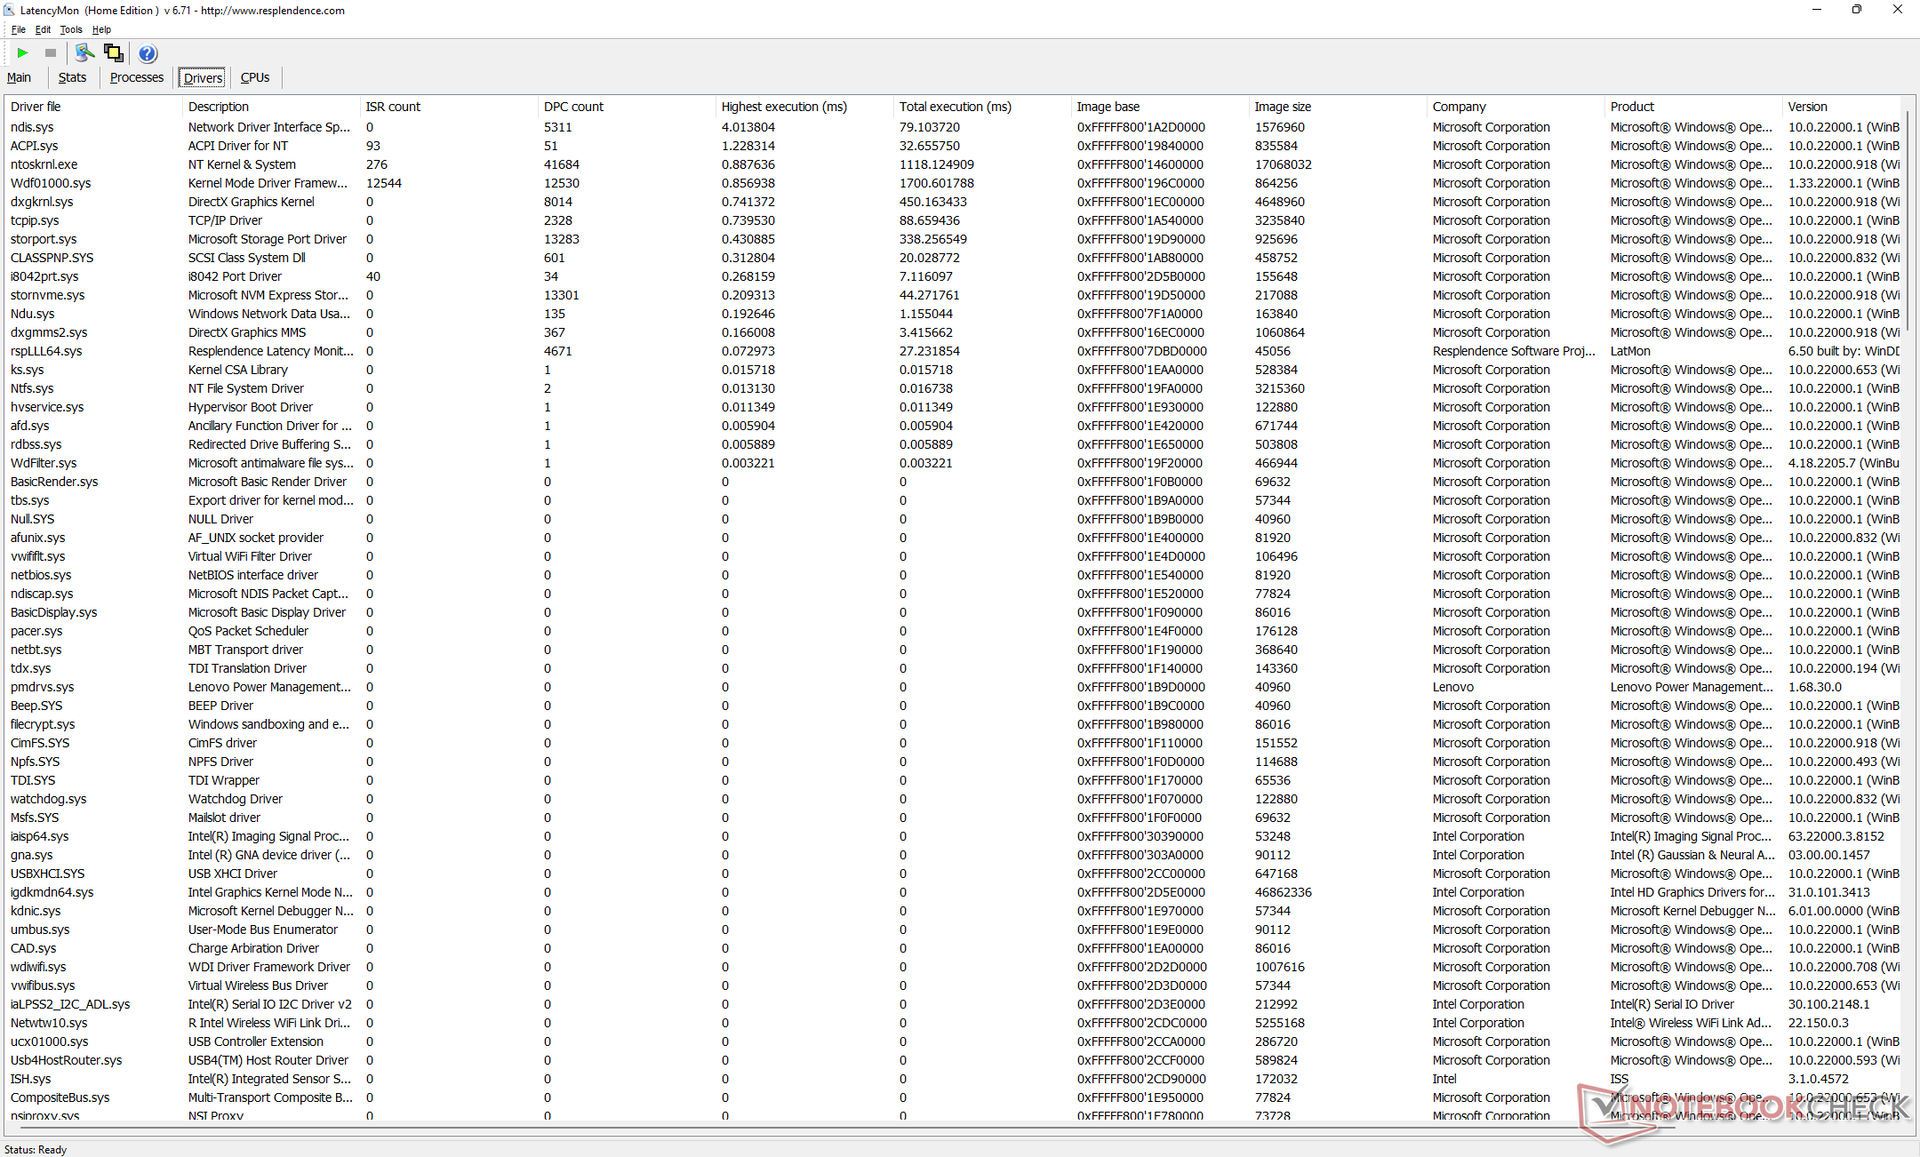
DPC Latency
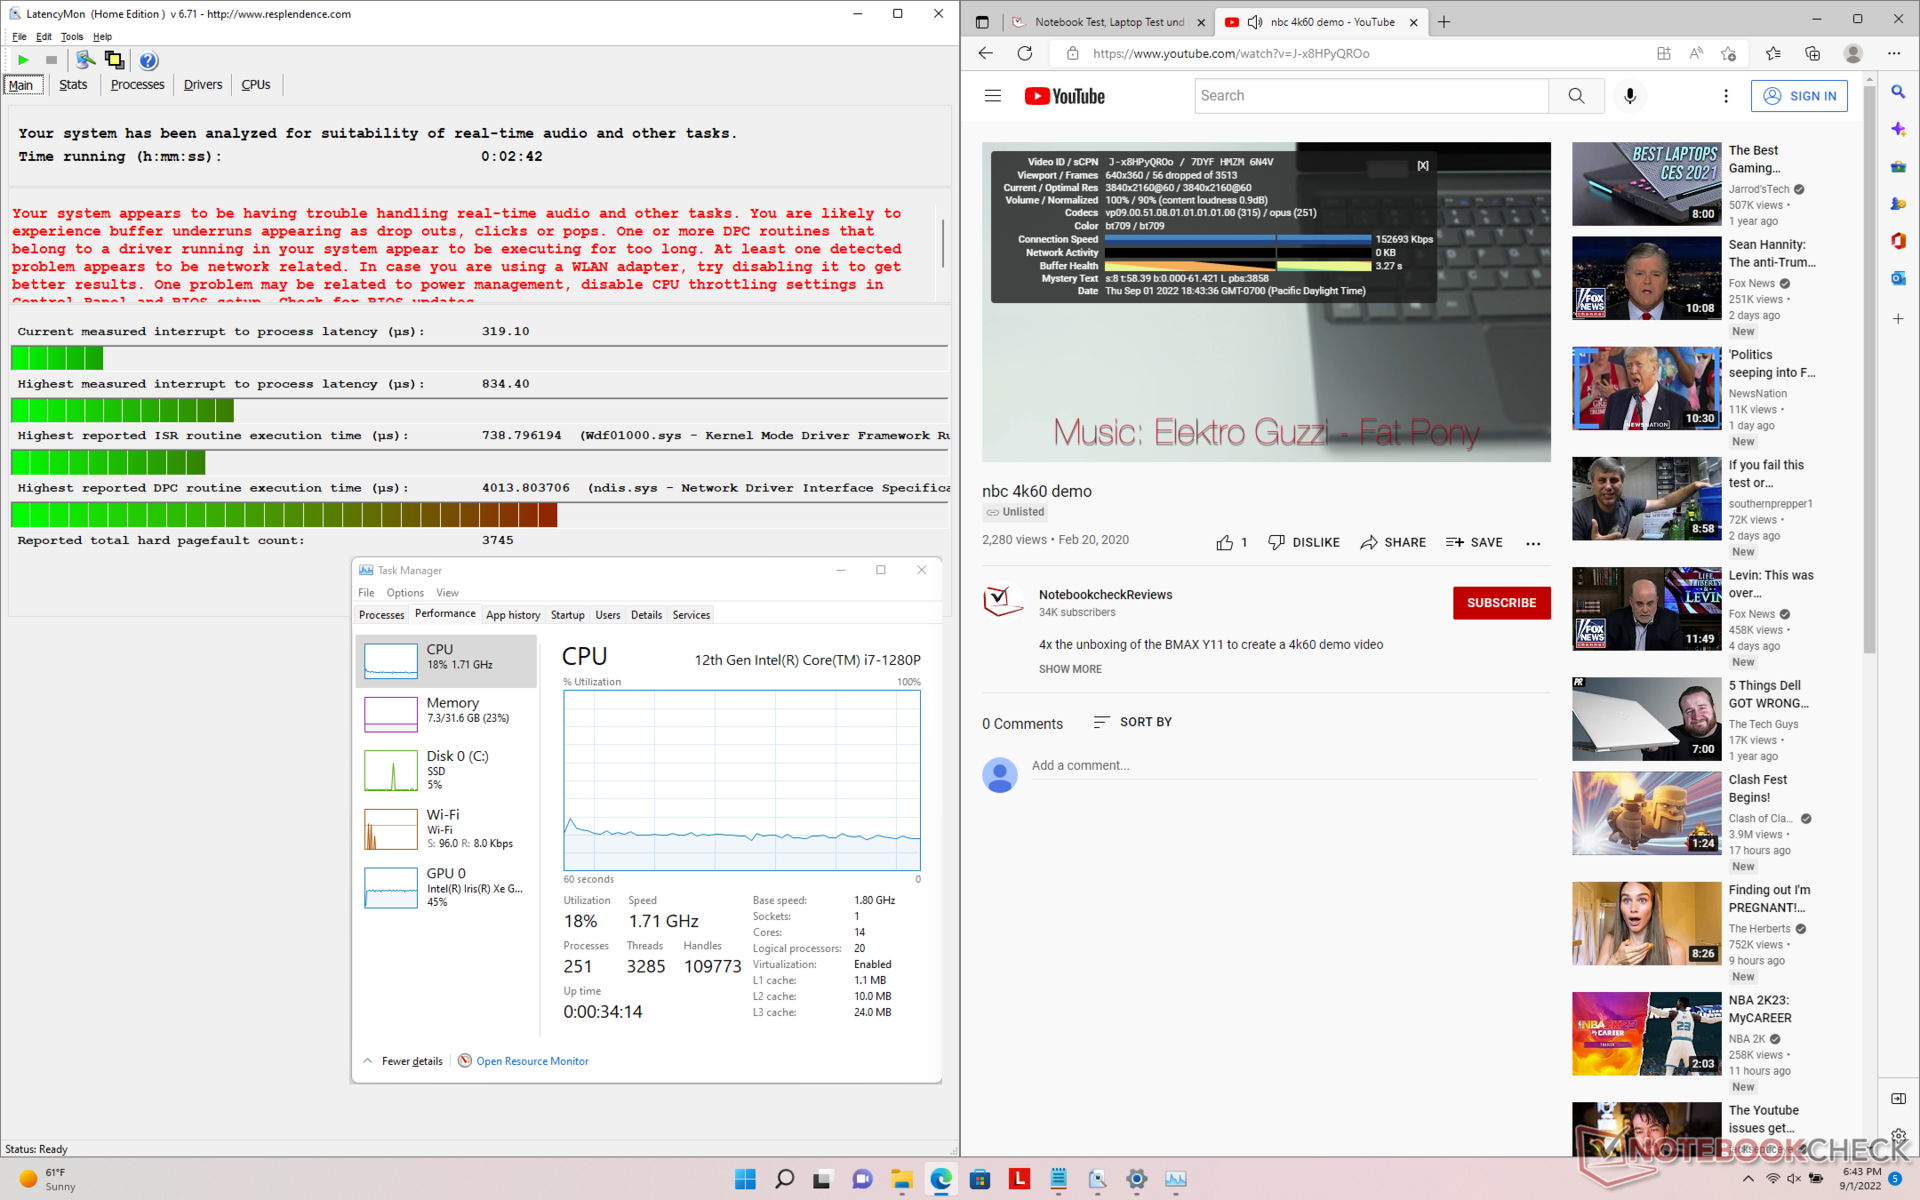
LatencyMon reveals DPC issues when opening multiple browser tabs on our homepage. 4K video playback at 60 FPS could have been better as well as we're able to record 56 dropped frames during our minute-long video test even when on the latest graphics drivers as of this publishing date.
| DPC Latencies / LatencyMon - interrupt to process latency (max), Web, Youtube, Prime95 | |
| Lenovo ThinkPad X1 Nano-20UN002UGE | |
| Huawei MateBook X Pro 2021 | |
| Framework Laptop 13.5 12th Gen Intel | |
| Lenovo ThinkPad X1 Nano Gen 2 Core i7-1280P | |
| Dell Latitude 13 7330 | |
| HP Elite Dragonfly G3 | |
* ... smaller is better
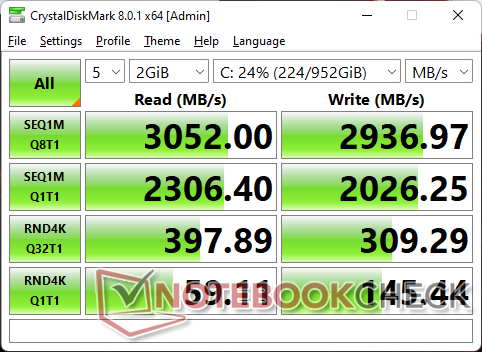
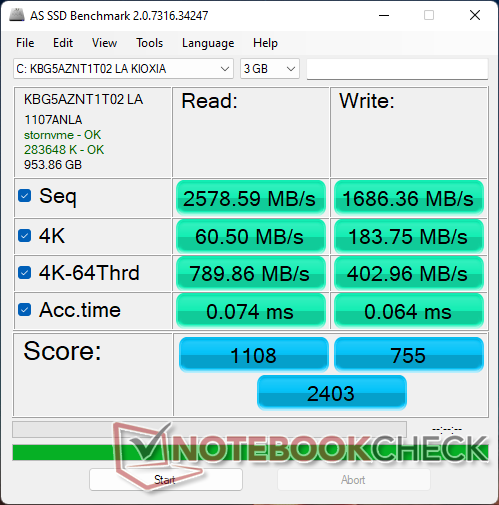
Storage Devices
Our test unit comes equipped with the Kioxia KBG5AZNT1T02 PCIe3 NVMe SSD for maximum sustained read rates of up to 2700 MB/s. It's disappointing that there are no PCIe4 options at checkout considering the high price of the ThinkPad X1 Nano, but at least the model comes with a copper plate over the SSD to aid in heat dissipation.
Keep in mind that full-length 2280 M.2 drives are not supported.

* ... smaller is better
Disk Throttling: DiskSpd Read Loop, Queue Depth 8
GPU Performance
Graphics performance is decent in spite of the steep CPU performance throttling mentioned above. 3DMark scores are where they should be relative to other laptops with the same Iris Xe 96 EUs GPU, but throttling kicks in when running actual games. For example, frame rates when idling on Witcher 3 at the lowest 768p settings can be as high as 106 FPS during the start of the test before quickly falling to just 80 FPS a couple of minutes later as shown by our graph below.
Overall graphics performance is still faster than on last year's Gen 1 model by about 30 percent or so before accounting for any performance throttling.
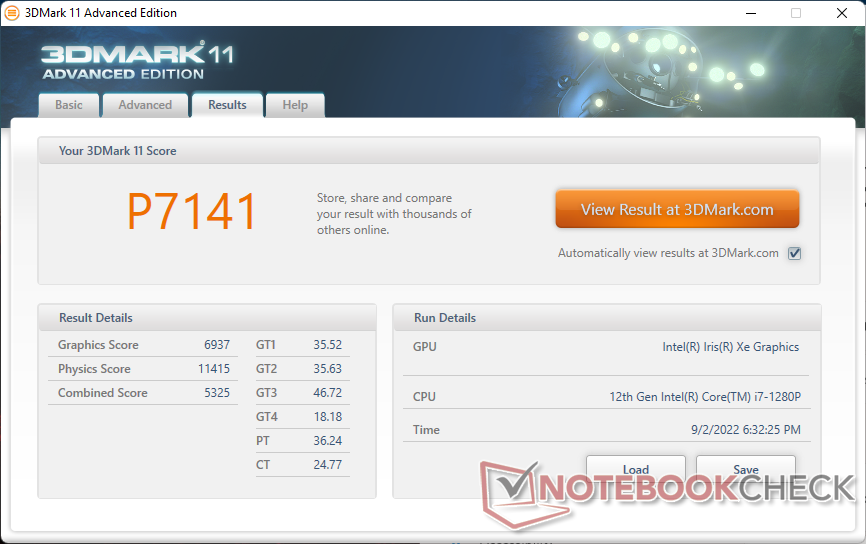
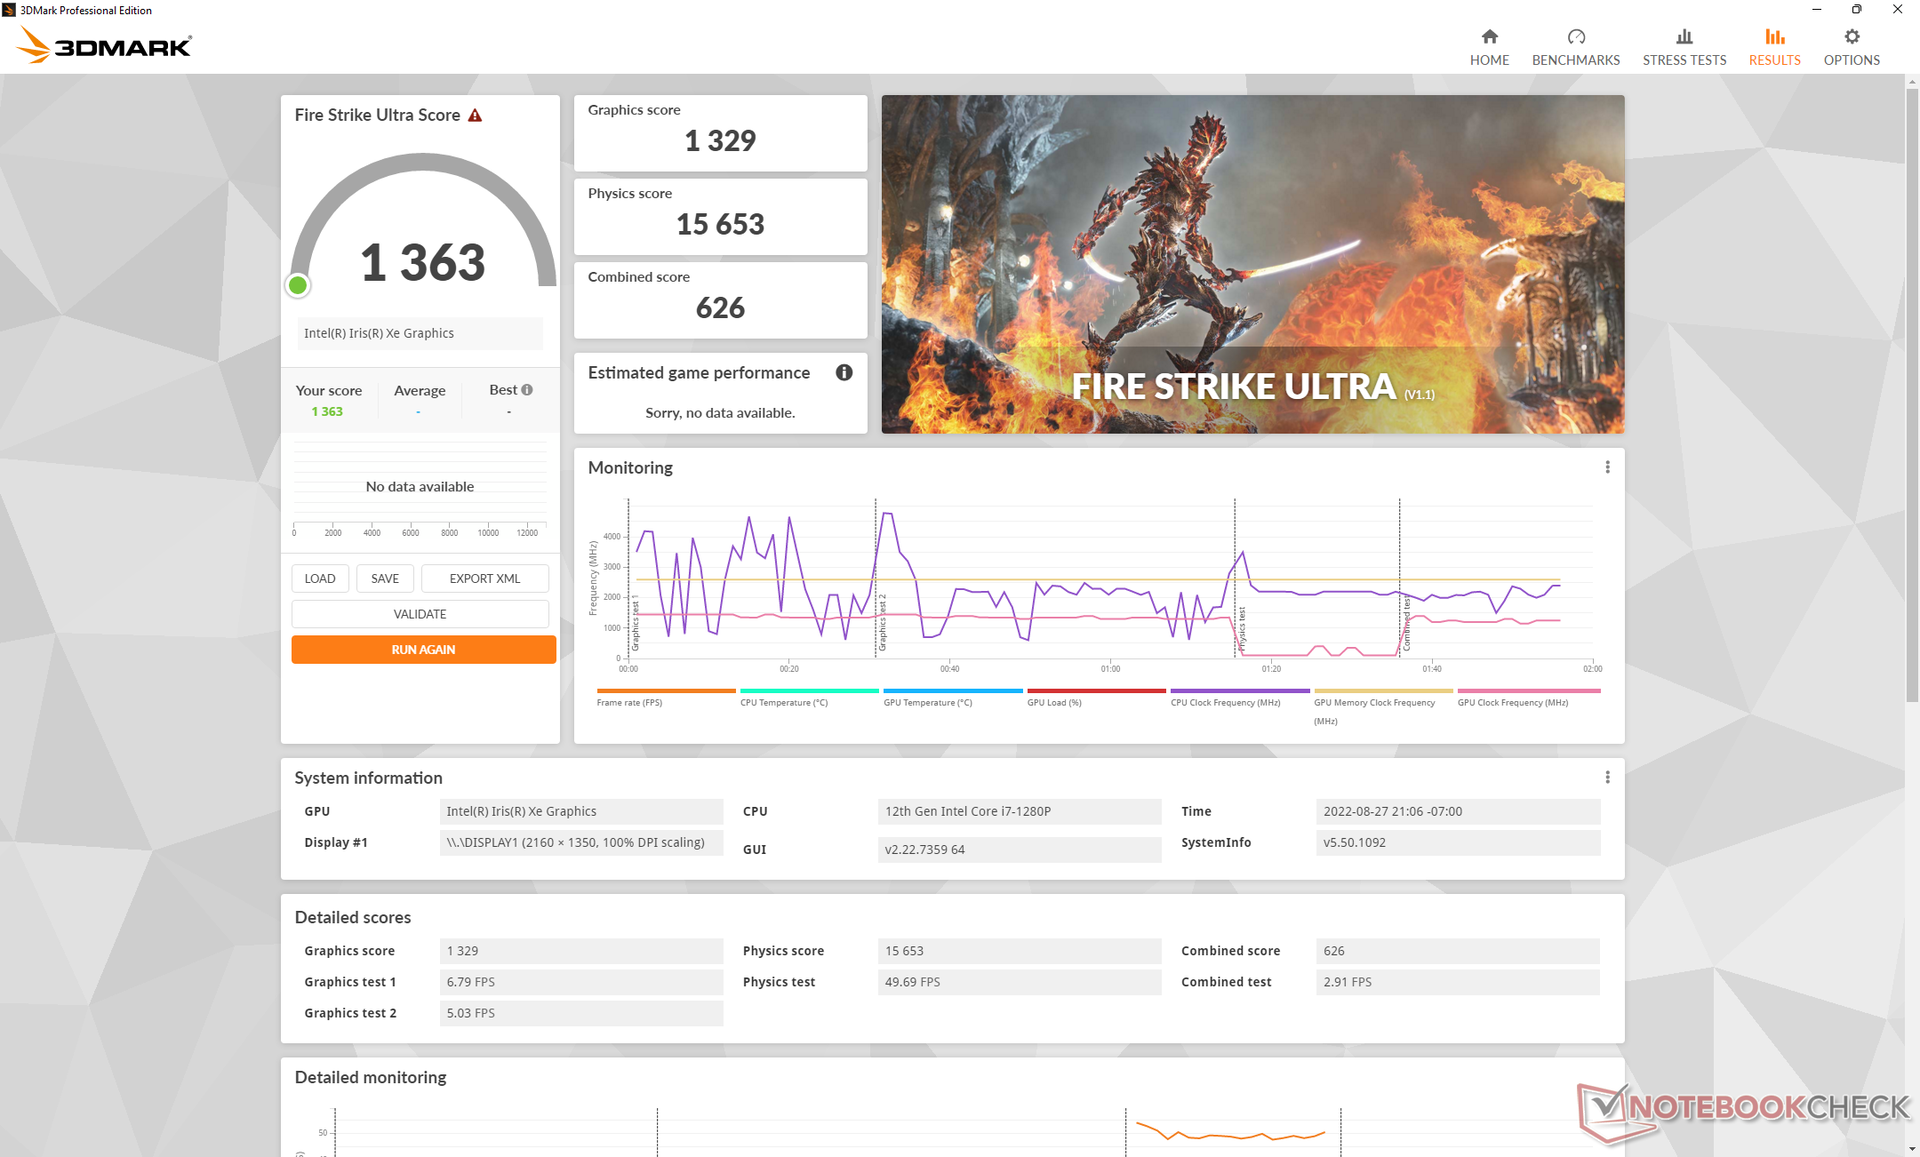
| 3DMark 11 Performance | 7141 points | |
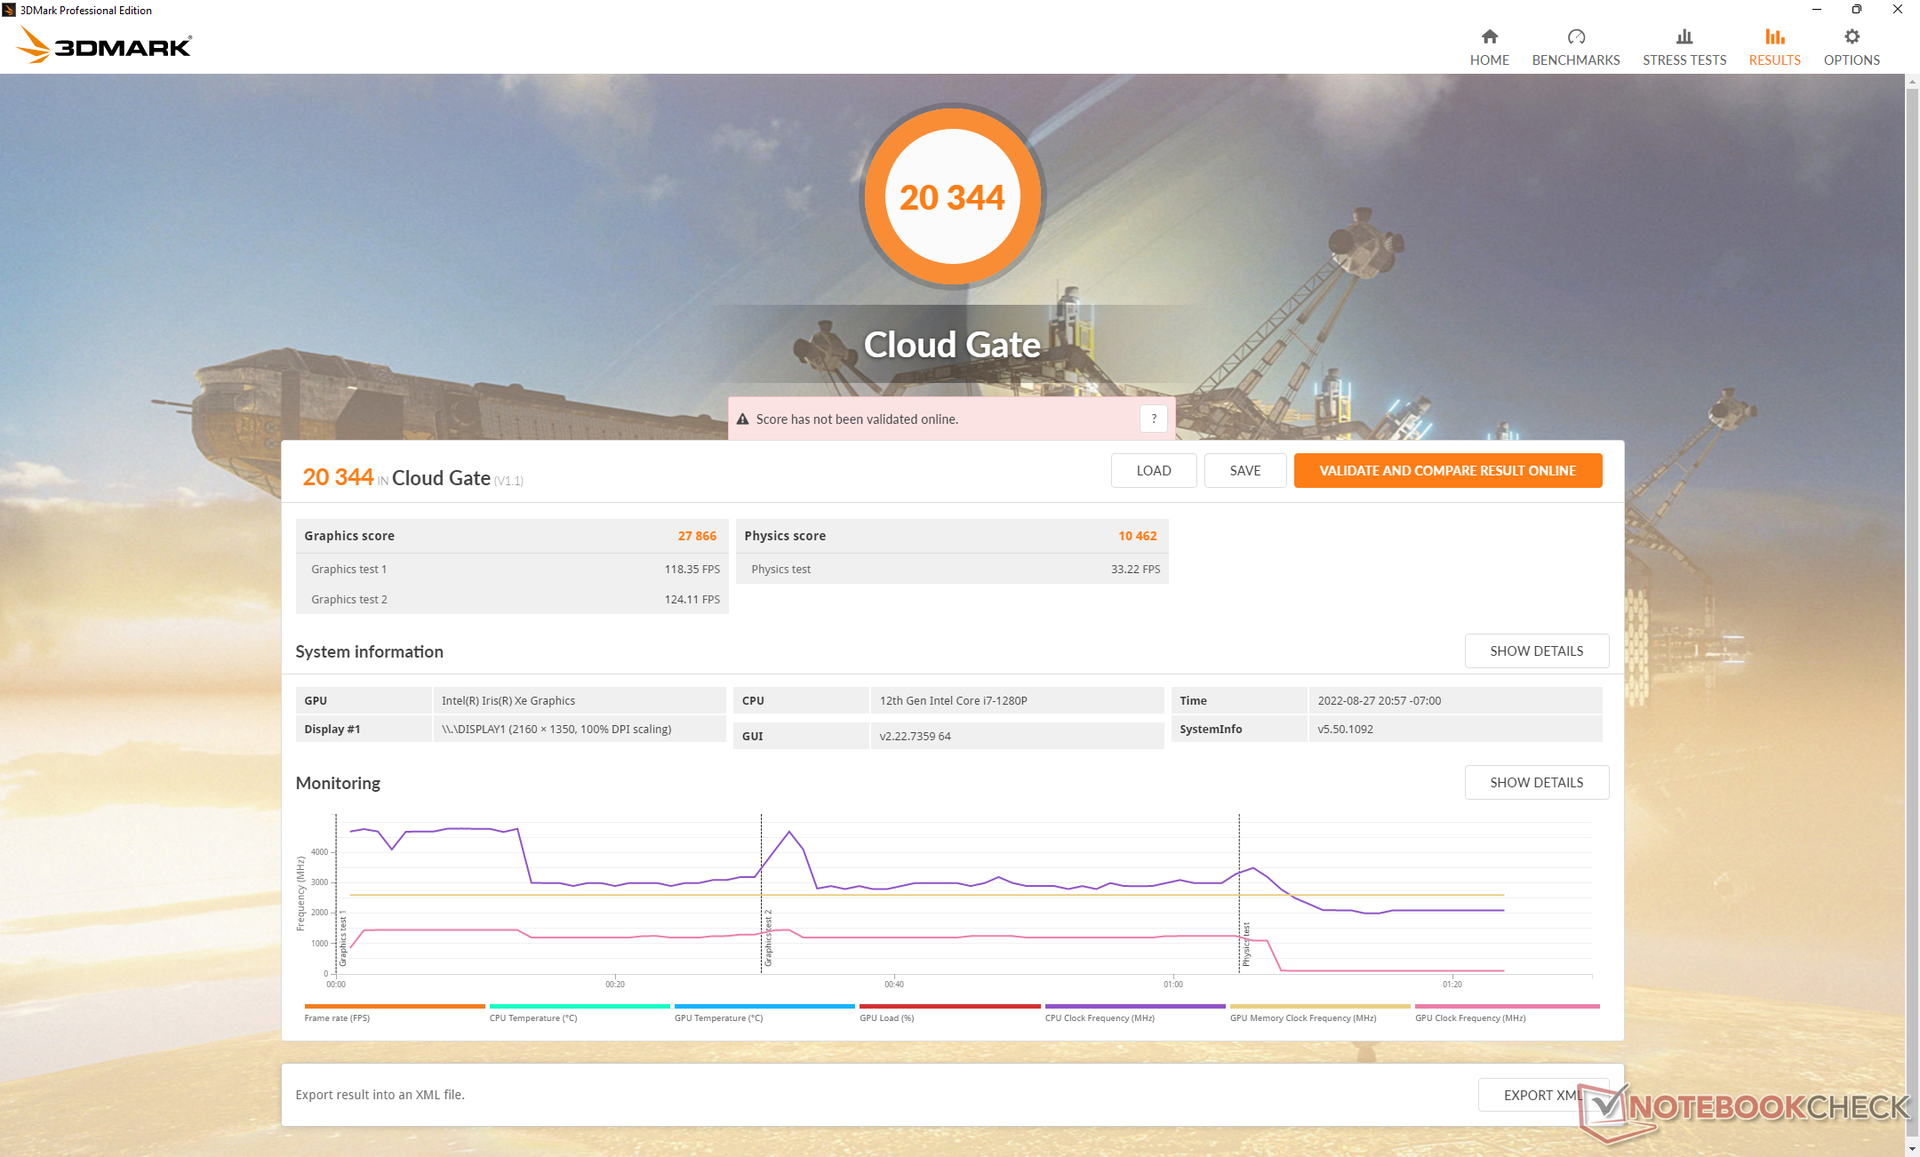
| 3DMark Cloud Gate Standard Score | 20344 points | |
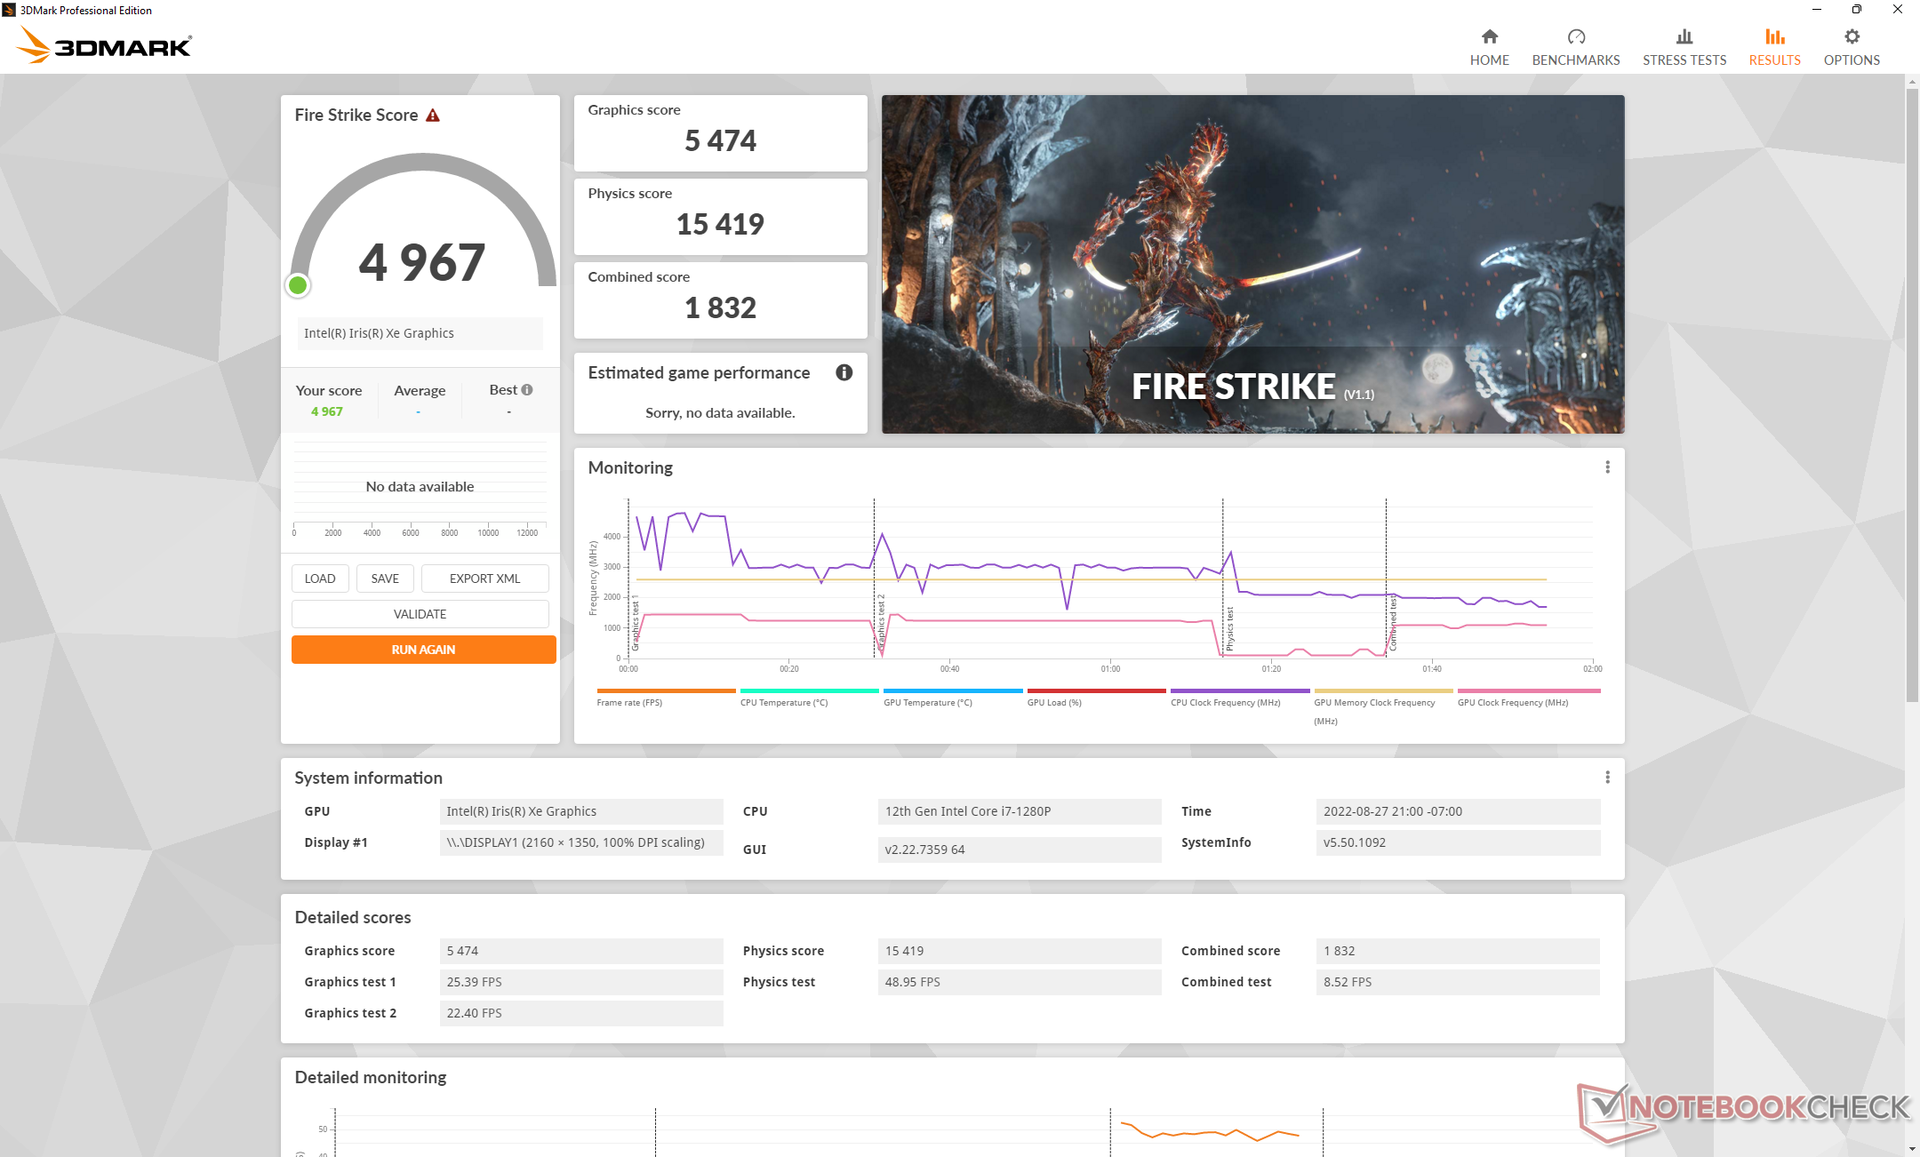
| 3DMark Fire Strike Score | 4967 points | |
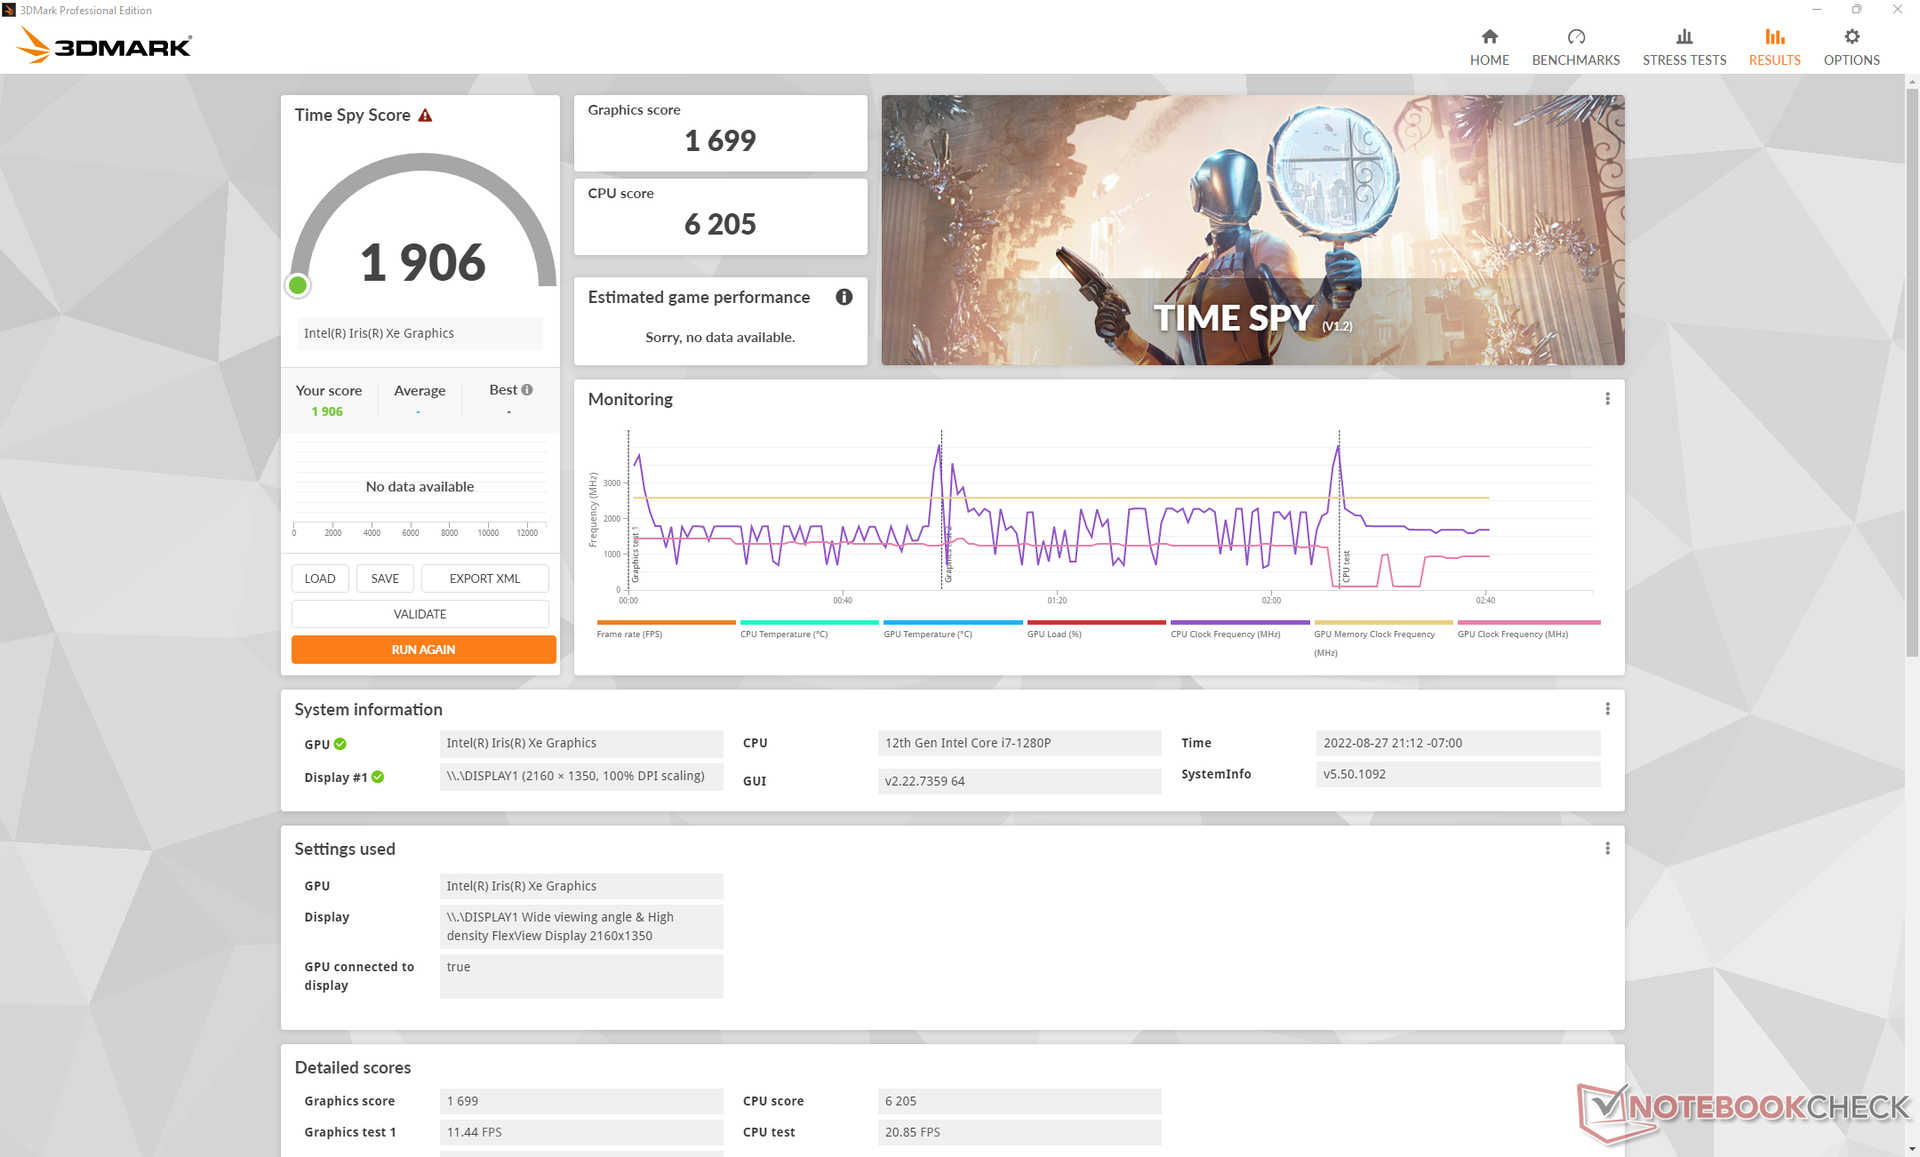
| 3DMark Time Spy Score | 1906 points | |
Help | ||
Witcher 3 FPS Chart
| low | med. | high | ultra | |
|---|---|---|---|---|
| GTA V (2015) | 97.2 | 82.3 | 21.9 | 9.84 |
| The Witcher 3 (2015) | 107.2 | 67.3 | 35 | 15.1 |
| Dota 2 Reborn (2015) | 106.1 | 76 | 55.6 | 49 |
| Final Fantasy XV Benchmark (2018) | 35.8 | 20.7 | 20.7 | |
| X-Plane 11.11 (2018) | 38.8 | 39.9 | 35.4 | |
| Strange Brigade (2018) | 88.1 | 41 | 32 | 25.1 |
| Cyberpunk 2077 1.6 (2022) | 18.3 | 16.1 | 12.3 | 9.5 |
Emissions
System Noise
Fan noise is tied to the three Lenovo Vantage power profiles: Quiet, Balanced or Intelligent Cooling, and Best Performance. The system is quieter than expected even when on the default Intelligent Cooling profile. When running the first benchmark scene of 3DMark 06, for example, the internal fan would remain very quiet throughout the entire scene much like what we observed on the Dragonfly G3 or MateBook X Pro under similar conditions. When set to Best Performance, however, expect the fan to pulse more frequently at up to 40 dB(A) when running higher loads like games. Otherwise, we recommend sticking to Intelligent Cooling for most scenarios.
It's worth noting that our test unit would exhibit electronic noise or coil whine when idling on desktop. The noise would go away temporarily when running 3DMark 06 which explains why our noise measurements when running the benchmark is lower than our noise measurement when idling on desktop (23.9 vs. 23.3 dB(A)).
Noise level
| Idle |
| 23.9 / 23.9 / 23.9 dB(A) |
| Load |
| 23.3 / 40.9 dB(A) |
 | ||
30 dB silent 40 dB(A) audible 50 dB(A) loud |
||
min: | ||
| Lenovo ThinkPad X1 Nano Gen 2 Core i7-1280P Iris Xe G7 96EUs, i7-1280P, Kioxia BG5 KBG5AZNT1T02 | Lenovo ThinkPad X1 Nano-20UN002UGE Iris Xe G7 96EUs, i7-1160G7, WDC PC SN530 SDBPNPZ-512G | HP Elite Dragonfly G3 Iris Xe G7 96EUs, i7-1265U, Micron 3400 MTFDKBA512TFH 512GB | Dell Latitude 13 7330 Iris Xe G7 96EUs, i7-1265U, Toshiba KBG40ZNS512G NVMe | Framework Laptop 13.5 12th Gen Intel Iris Xe G7 96EUs, i7-1260P, WDC PC SN730 SDBPNTY-512G | Huawei MateBook X Pro 2021 Iris Xe G7 96EUs, i7-1165G7, Samsung PM981a MZVLB1T0HBLR | |
|---|---|---|---|---|---|---|
| Noise | -11% | 6% | -8% | -18% | -3% | |
| off / environment * (dB) | 23.3 | 24.9 -7% | 22.8 2% | 23.4 -0% | 22.8 2% | 25.4 -9% |
| Idle Minimum * (dB) | 23.9 | 24.9 -4% | 23.2 3% | 23.4 2% | 23 4% | 25.6 -7% |
| Idle Average * (dB) | 23.9 | 26.3 -10% | 23.2 3% | 23.4 2% | 23 4% | 25.6 -7% |
| Idle Maximum * (dB) | 23.9 | 31.8 -33% | 23.2 3% | 23.4 2% | 23 4% | 25.6 -7% |
| Load Average * (dB) | 23.3 | 34.3 -47% | 25.1 -8% | 37.8 -62% | 47.3 -103% | 28.7 -23% |
| Witcher 3 ultra * (dB) | 40.9 | 34.3 16% | 32 22% | 39.2 4% | 47.3 -16% | 32 22% |
| Load Maximum * (dB) | 40.9 | 37.5 8% | 35.2 14% | 43 -5% | 49.8 -22% | 38.2 7% |
* ... smaller is better
Temperature
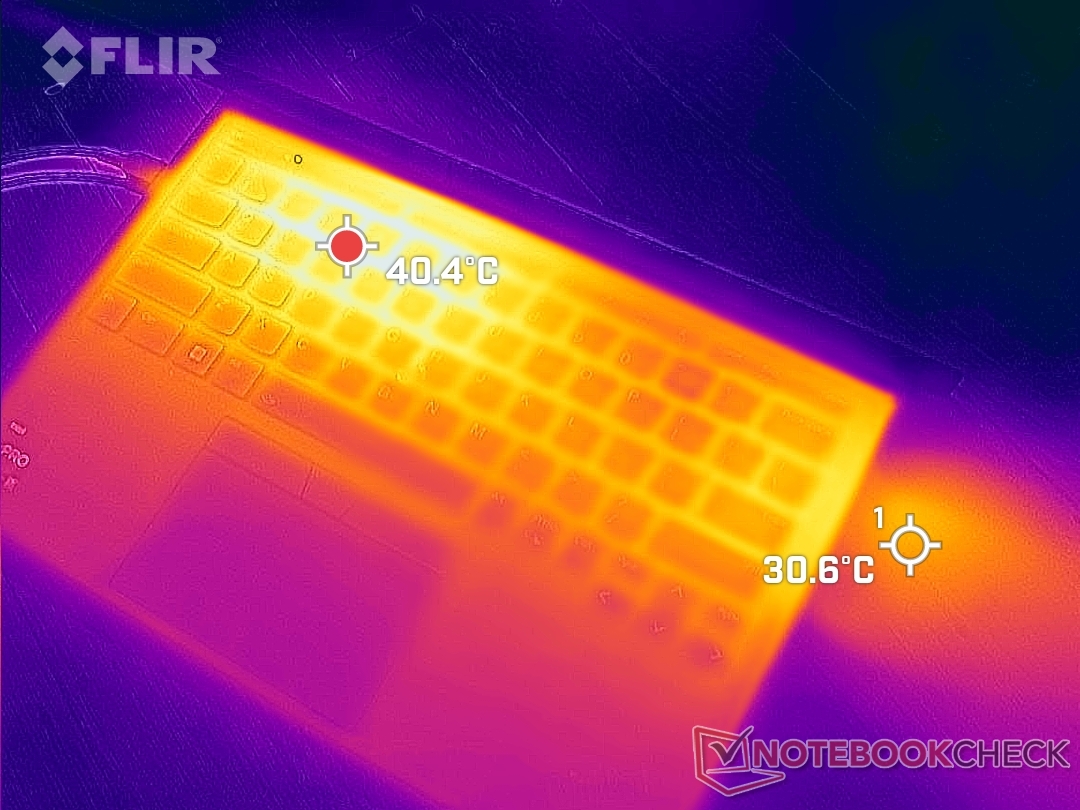
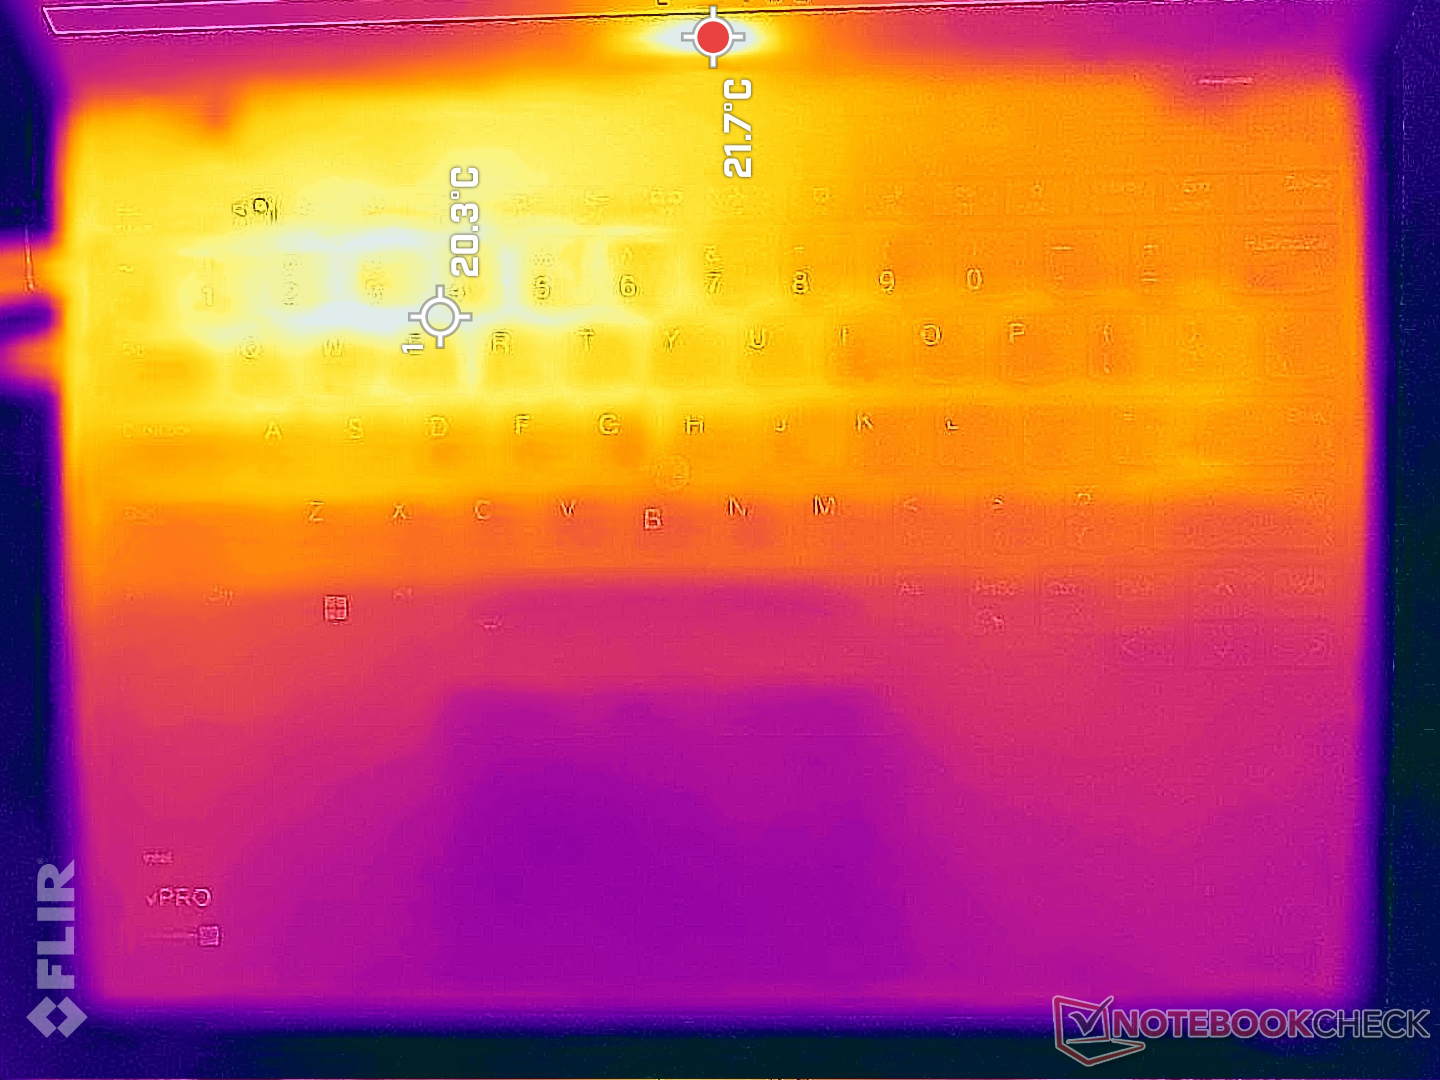
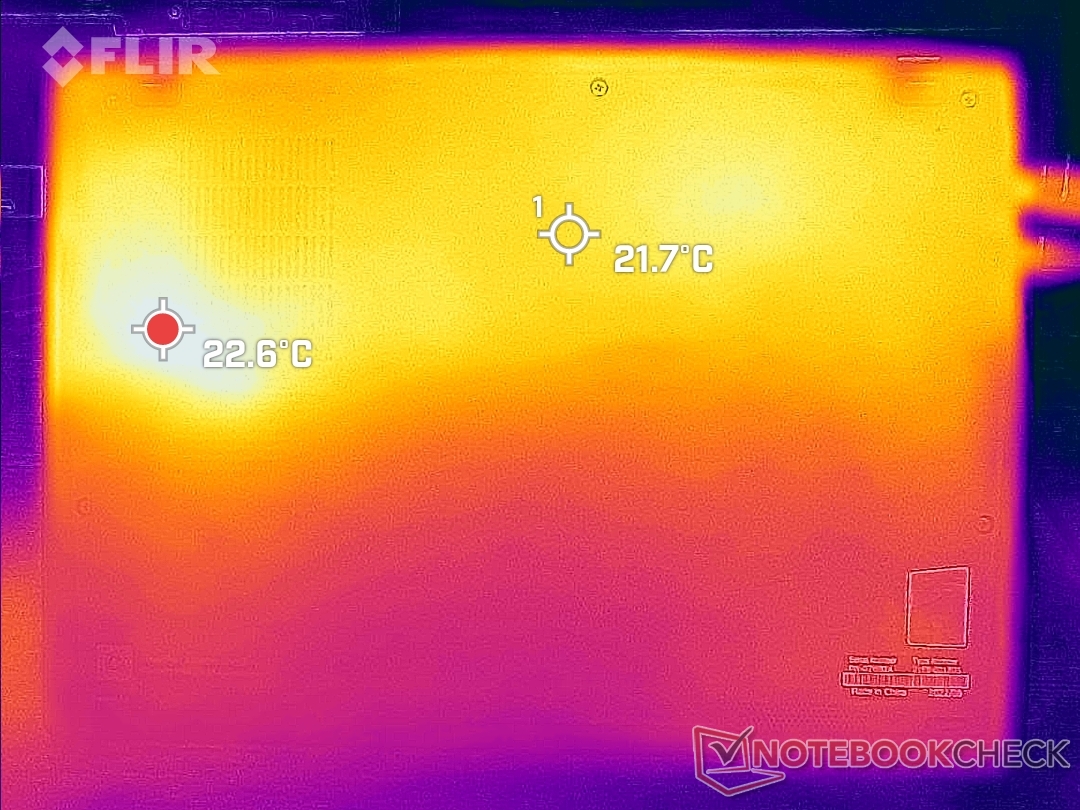
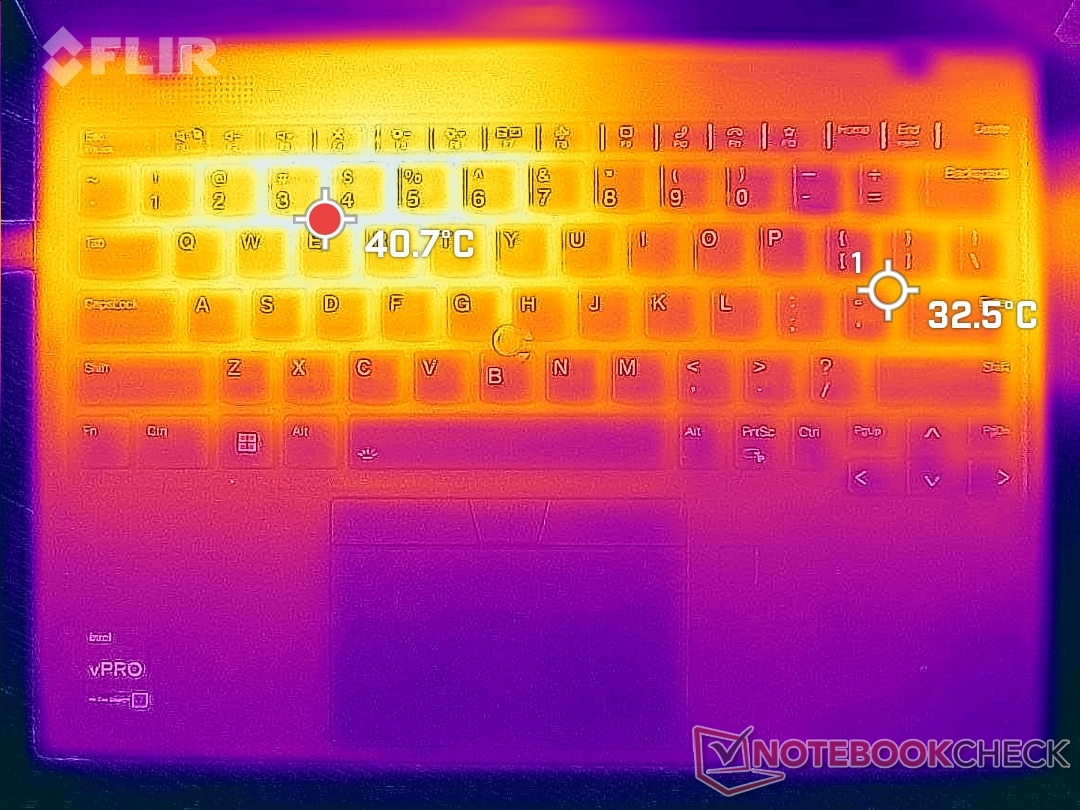
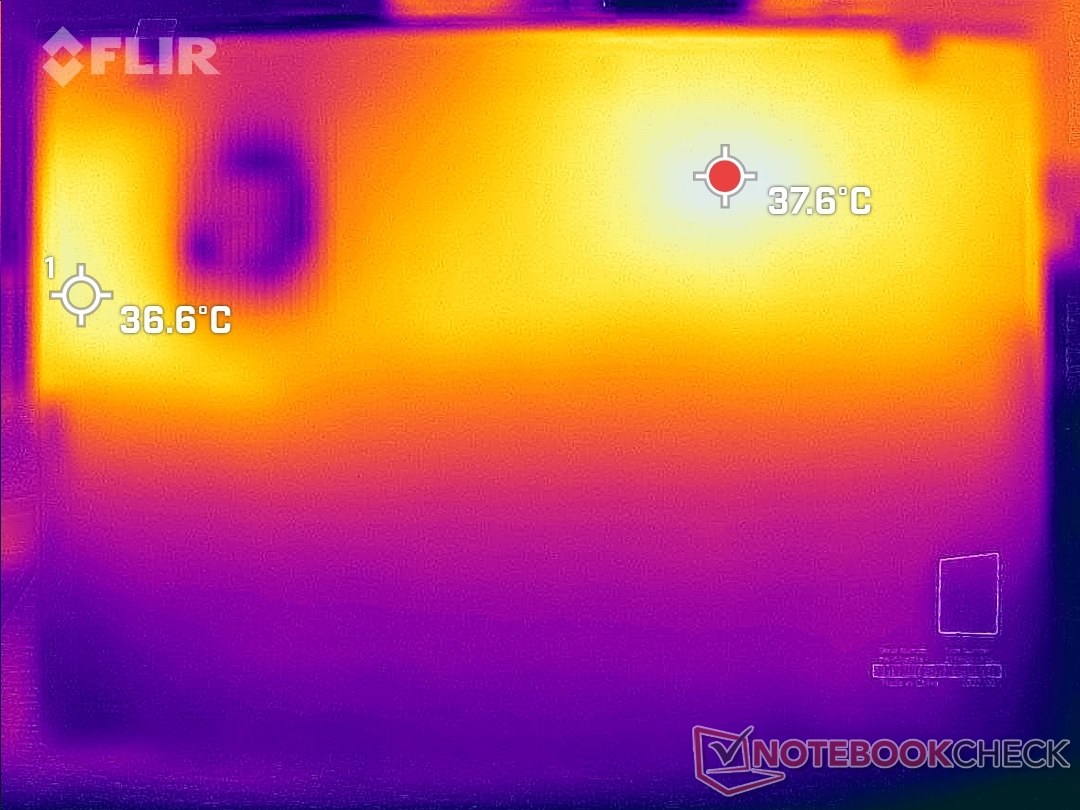
Surface temperatures aren't any warmer on our newer Gen 2 unit when compared to Gen 1. In fact, the hot spot on the bottom is cooler at just 40 C compared to 48 C on last year's model possibly due to the steep performance throttling mentioned above. Expect the left half of the keyboard to always be warmer than the right half as shown by the temperature maps below since the CPU is positioned on the left side of the chassis.
(±) The maximum temperature on the upper side is 42.4 °C / 108 F, compared to the average of 35.9 °C / 97 F, ranging from 21.4 to 59 °C for the class Subnotebook.
(±) The bottom heats up to a maximum of 40.2 °C / 104 F, compared to the average of 39.2 °C / 103 F
(+) In idle usage, the average temperature for the upper side is 25.3 °C / 78 F, compared to the device average of 30.8 °C / 87 F.
(+) The palmrests and touchpad are cooler than skin temperature with a maximum of 30.2 °C / 86.4 F and are therefore cool to the touch.
(±) The average temperature of the palmrest area of similar devices was 28.2 °C / 82.8 F (-2 °C / -3.6 F).
| Lenovo ThinkPad X1 Nano Gen 2 Core i7-1280P Intel Core i7-1280P, Intel Iris Xe Graphics G7 96EUs | Lenovo ThinkPad X1 Nano-20UN002UGE Intel Core i7-1160G7, Intel Iris Xe Graphics G7 96EUs | HP Elite Dragonfly G3 Intel Core i7-1265U, Intel Iris Xe Graphics G7 96EUs | Dell Latitude 13 7330 Intel Core i7-1265U, Intel Iris Xe Graphics G7 96EUs | Framework Laptop 13.5 12th Gen Intel Intel Core i7-1260P, Intel Iris Xe Graphics G7 96EUs | Huawei MateBook X Pro 2021 Intel Core i7-1165G7, Intel Iris Xe Graphics G7 96EUs | |
|---|---|---|---|---|---|---|
| Heat | 1% | 2% | 8% | 4% | -7% | |
| Maximum Upper Side * (°C) | 42.4 | 42.2 -0% | 39 8% | 38.6 9% | 36.8 13% | 42.2 -0% |
| Maximum Bottom * (°C) | 40.2 | 47.5 -18% | 42.2 -5% | 42 -4% | 42.4 -5% | 40.4 -0% |
| Idle Upper Side * (°C) | 27.8 | 24.3 13% | 26.8 4% | 23.8 14% | 24.2 13% | 31.2 -12% |
| Idle Bottom * (°C) | 27.8 | 25.3 9% | 28.2 -1% | 24.6 12% | 29 -4% | 32.2 -16% |
* ... smaller is better
Stress Test
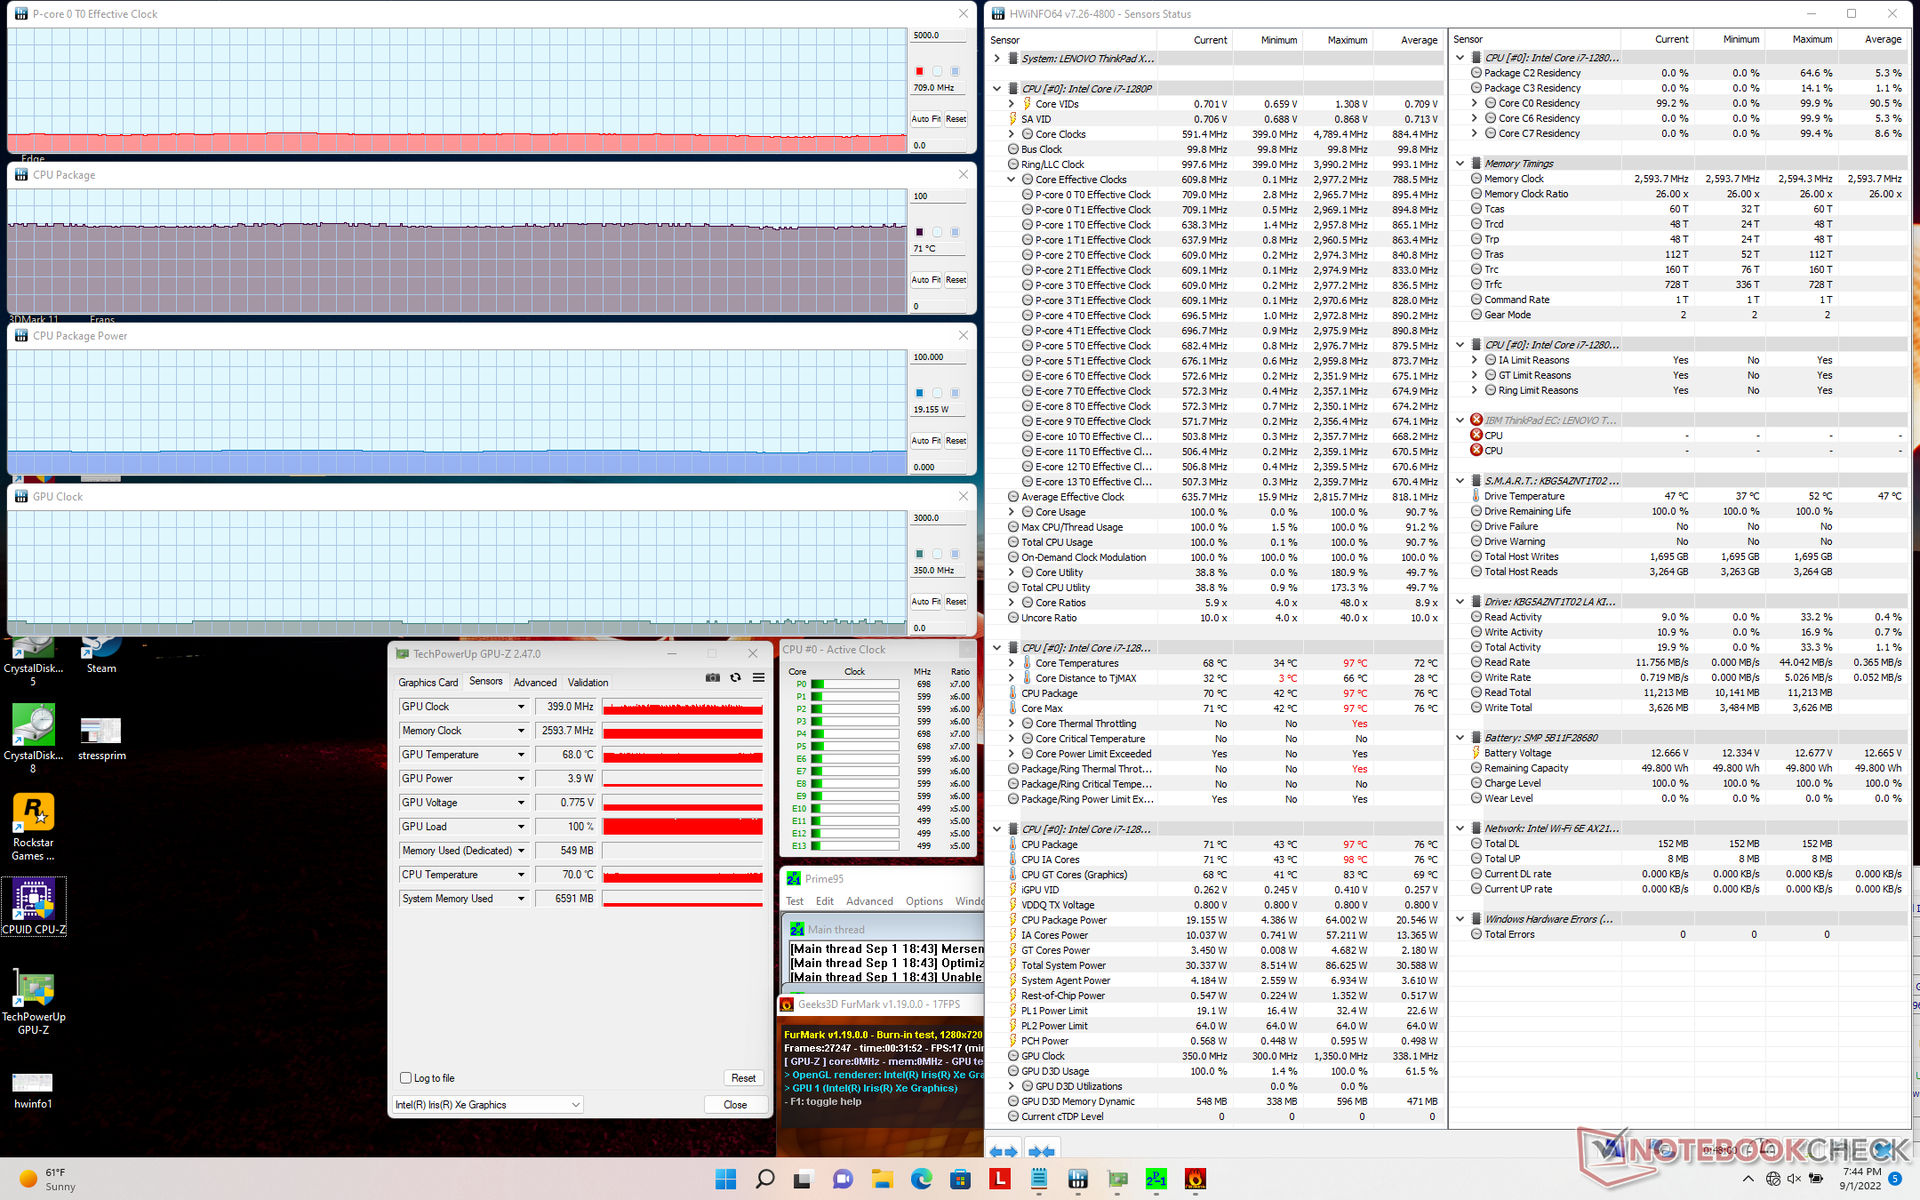
When stressed under Prime95, CPU clock rates and board power draw would spike to 3 GHz and 64 W, respectively. However, temperature would also spike to an alarming 97 C and so this maximum Turbo Boost would last for just a few seconds at most before clock rates and board power draw fall to just 1.3 GHz and 23 W, respectively, for a slightly cooler core temperature of 85 C. Running this same test on the larger and heavier Framework Laptop equipped with the i7-1260P CPU would result in higher stable clock rates of around 2.5 GHz in comparison.
GPU clock rates and temperature when running Witcher 3 would stabilize at 948 MHz and 69 C, respectively, compared to 1396 MHz and 83 C on the aforementioned Framework.
Performance is not reduced if running on battery power. A 3DMark 11 test on batteries would return Physics and Graphics scores 13122 and 6668 points, respectively, compared to 11415 and 6937 points when on mains.
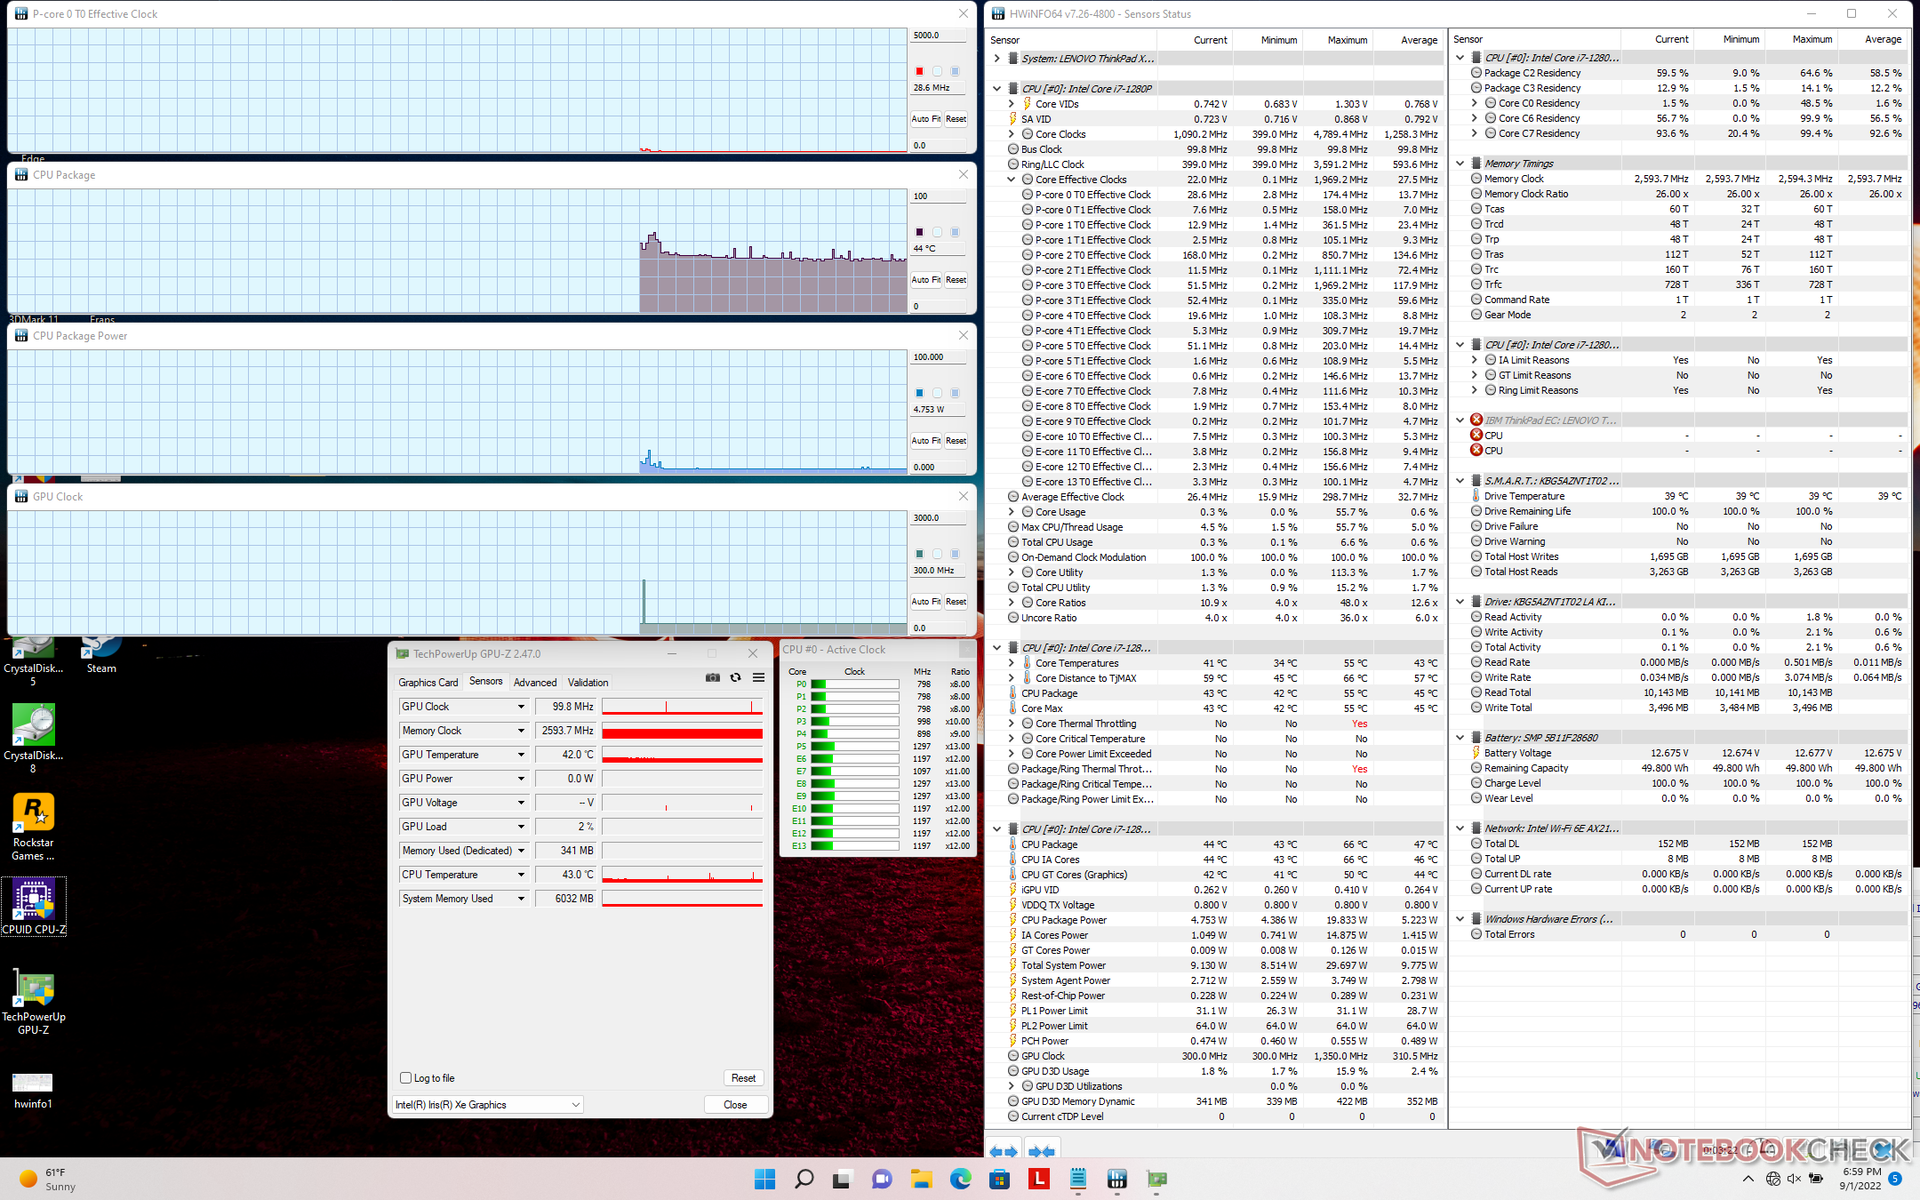
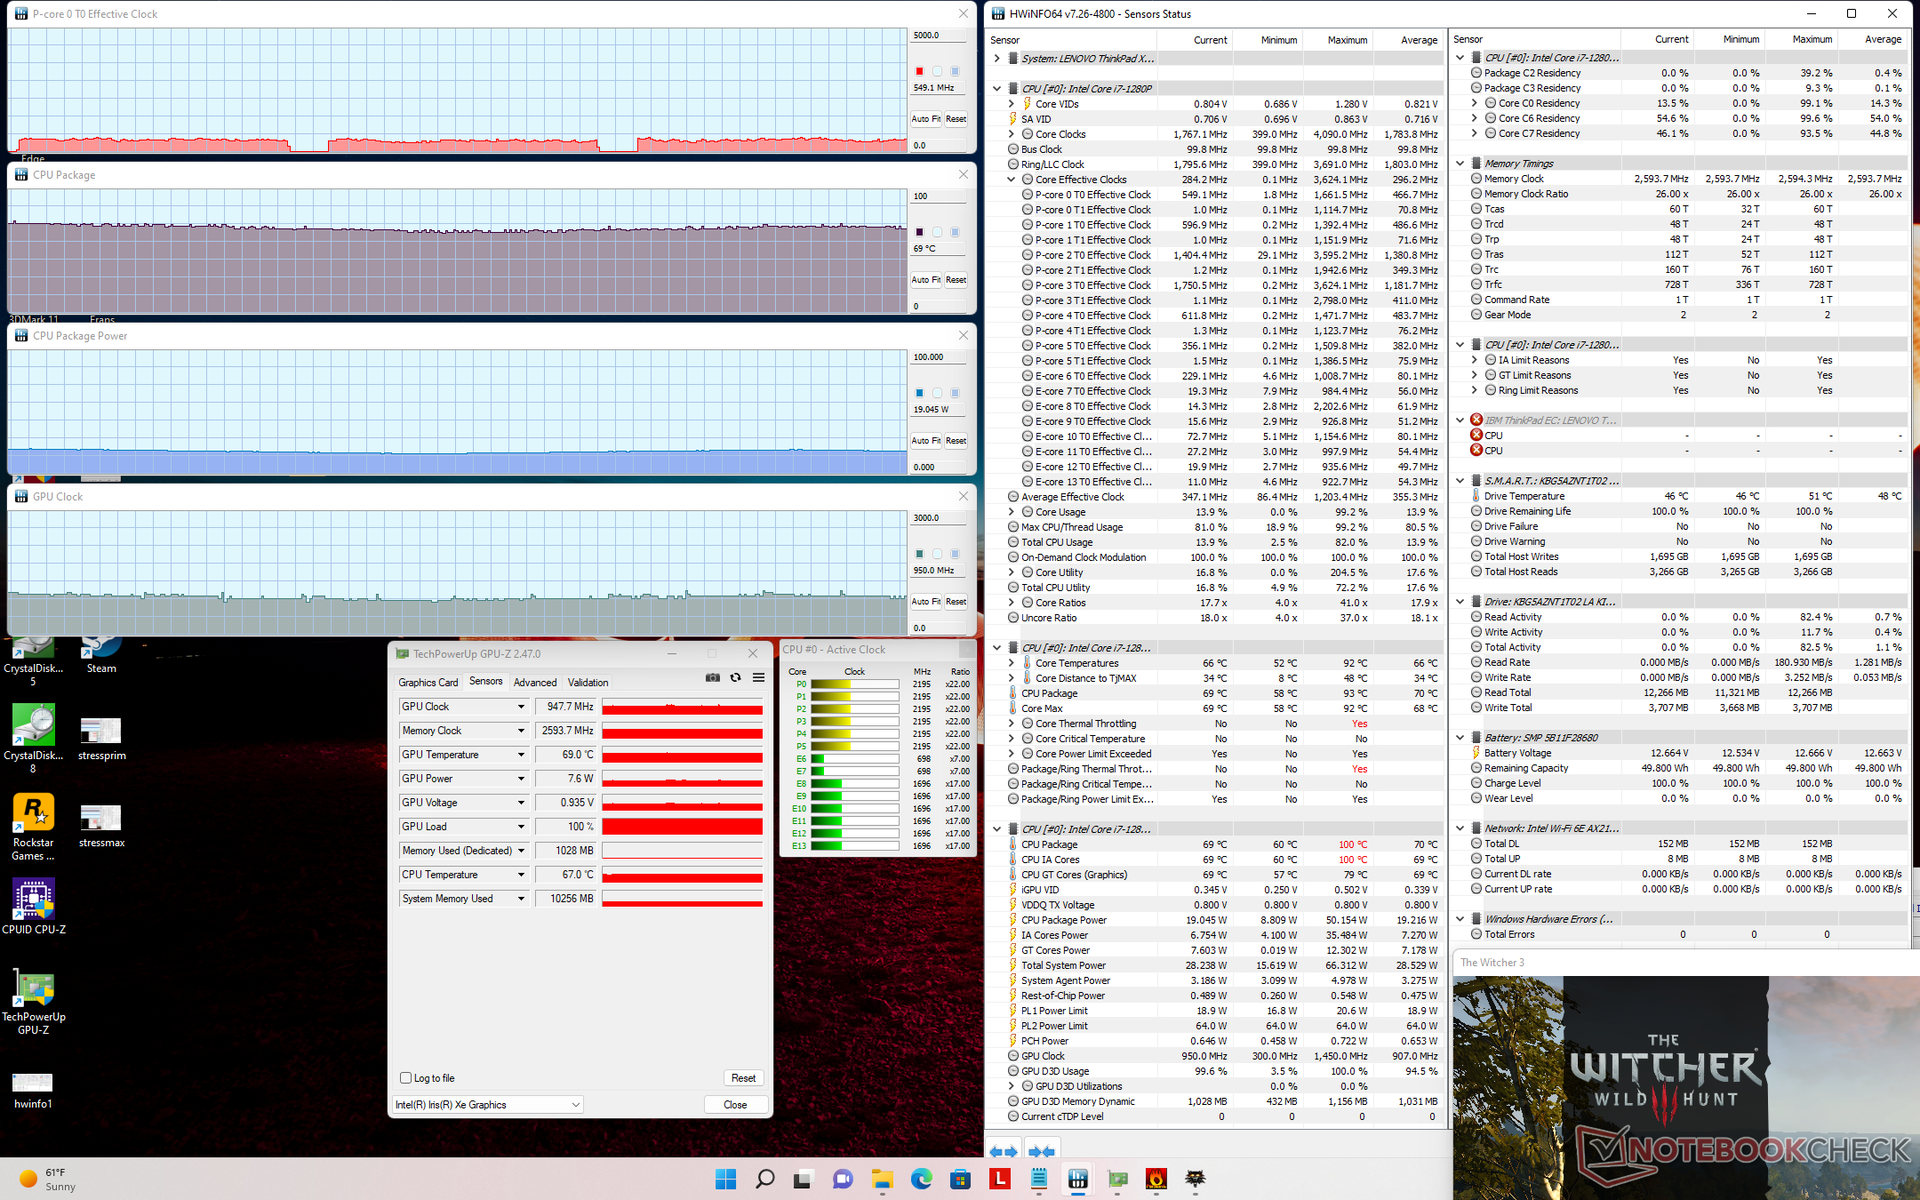
| CPU Clock (GHz) | GPU Clock (MHz) | Average CPU Temperature (°C) | |
| System Idle | -- | -- | 44 |
| Prime95 Stress | 1.3 | -- | 85 |
| Prime95 + FurMark Stress | 0.7 | 399 | 71 |
| Witcher 3 Stress | ~0.5 | 948 | 69 |
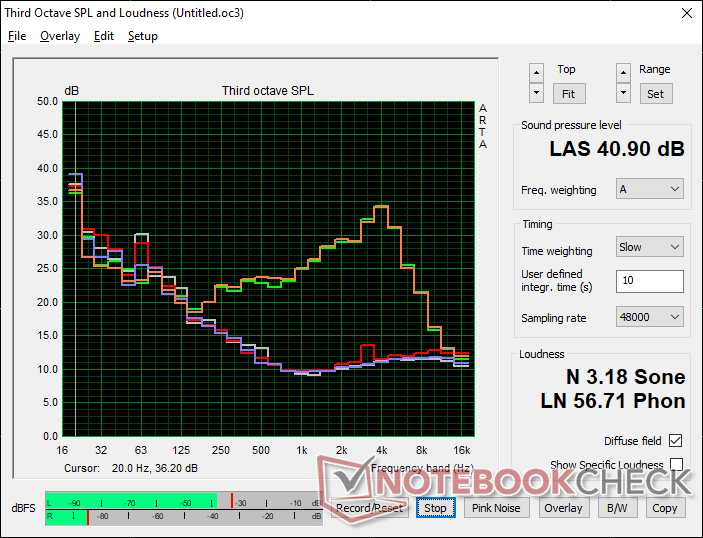
Speakers
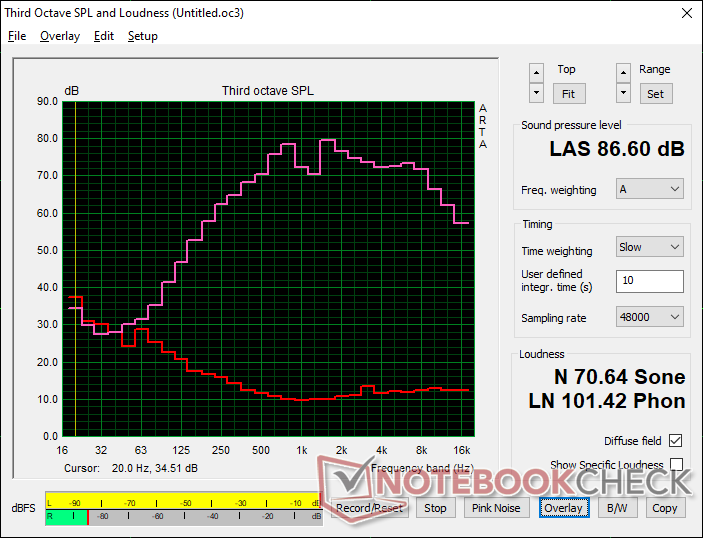
Lenovo ThinkPad X1 Nano Gen 2 Core i7-1280P audio analysis
(+) | speakers can play relatively loud (86.6 dB)
Bass 100 - 315 Hz
(-) | nearly no bass - on average 16.3% lower than median
(±) | linearity of bass is average (8.4% delta to prev. frequency)
Mids 400 - 2000 Hz
(+) | balanced mids - only 4% away from median
(±) | linearity of mids is average (7.3% delta to prev. frequency)
Highs 2 - 16 kHz
(+) | balanced highs - only 2.7% away from median
(+) | highs are linear (3% delta to prev. frequency)
Overall 100 - 16.000 Hz
(+) | overall sound is linear (12.8% difference to median)
Compared to same class
» 19% of all tested devices in this class were better, 4% similar, 76% worse
» The best had a delta of 5%, average was 18%, worst was 53%
Compared to all devices tested
» 12% of all tested devices were better, 3% similar, 85% worse
» The best had a delta of 4%, average was 23%, worst was 134%
Apple MacBook Pro 16 2021 M1 Pro audio analysis
(+) | speakers can play relatively loud (84.7 dB)
Bass 100 - 315 Hz
(+) | good bass - only 3.8% away from median
(+) | bass is linear (5.2% delta to prev. frequency)
Mids 400 - 2000 Hz
(+) | balanced mids - only 1.3% away from median
(+) | mids are linear (2.1% delta to prev. frequency)
Highs 2 - 16 kHz
(+) | balanced highs - only 1.9% away from median
(+) | highs are linear (2.7% delta to prev. frequency)
Overall 100 - 16.000 Hz
(+) | overall sound is linear (4.6% difference to median)
Compared to same class
» 0% of all tested devices in this class were better, 0% similar, 100% worse
» The best had a delta of 5%, average was 17%, worst was 45%
Compared to all devices tested
» 0% of all tested devices were better, 0% similar, 100% worse
» The best had a delta of 4%, average was 23%, worst was 134%
Energy Management
Power Consumption
The system is generally more demanding than other 13-inch subnotebooks since it is one of the few with a Core P-series CPU. Simply idling on desktop draws between 3 W and 15 W whereas the HP Dragonfly G3, Latitude 7330, or original ThinkPad X1 Nano would top out at just 7 W or 9 W under similar conditions.
Power consumption differences balloon even further when running more demanding loads. 3DMark 06 or Witcher 3, for example, would demand between 44 W and 55 W to be significantly more than the aforementioned HP, Dell, or original X1 Nano. The Core i7-1280P CPU may be faster, but it certainly comes at a cost.
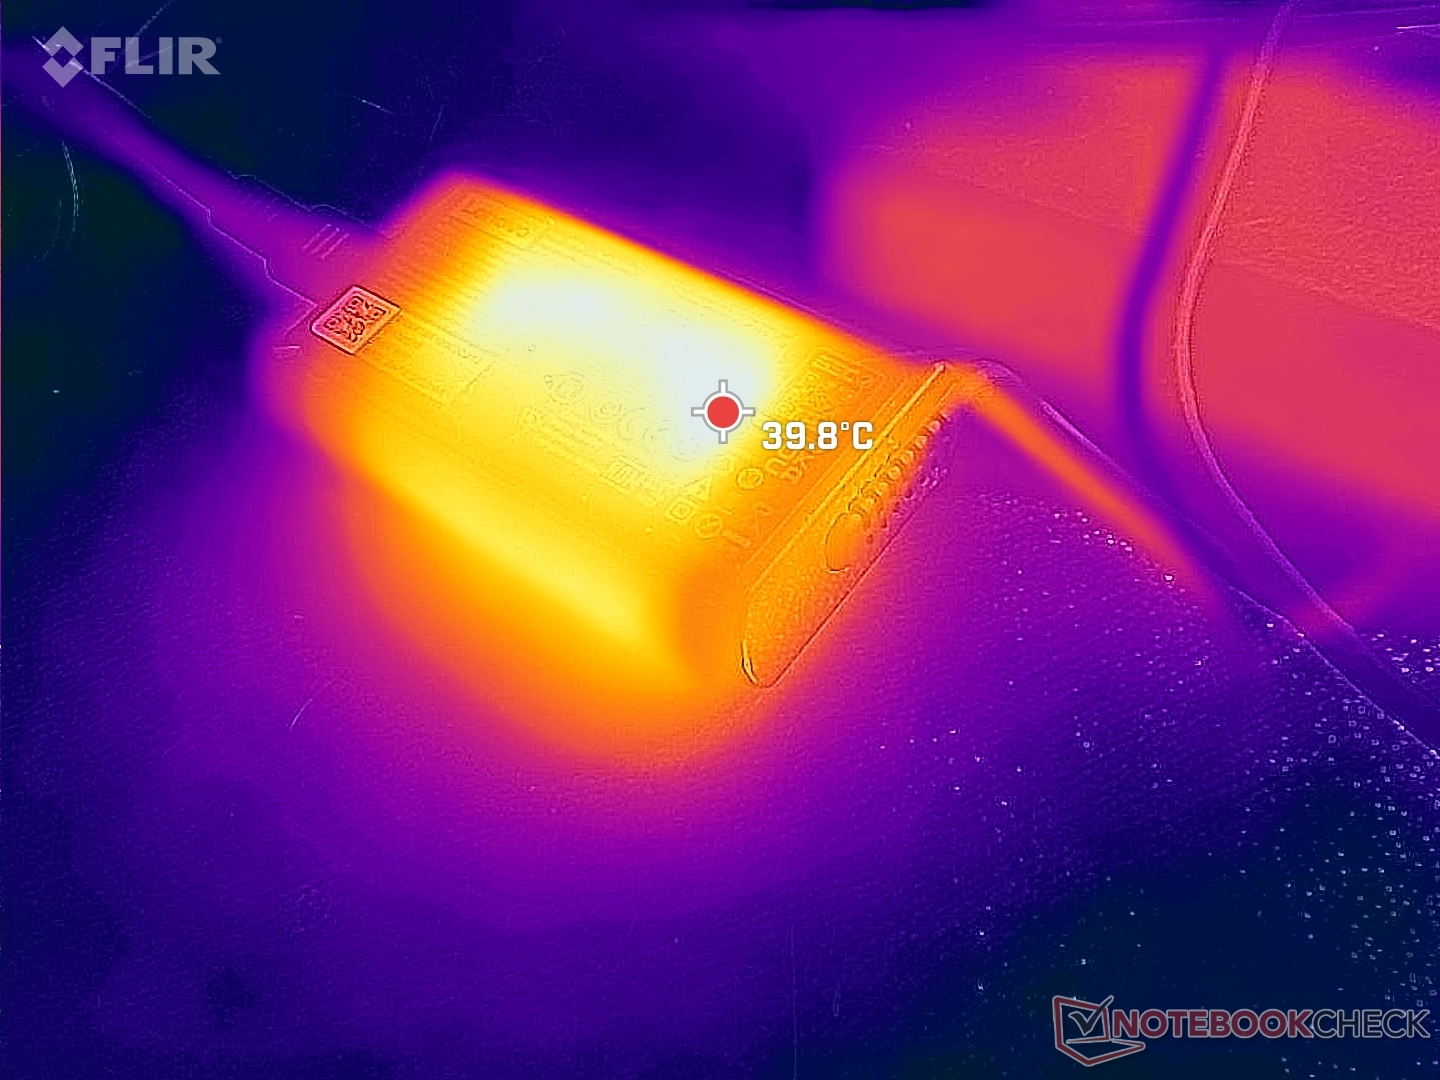
We're able to record a temporary maximum draw of 65.4 W from the small (~8.7 x 5.2 x 2.2 cm) 65 W AC adapter before throttling kicks in as shown by our screenshots below.
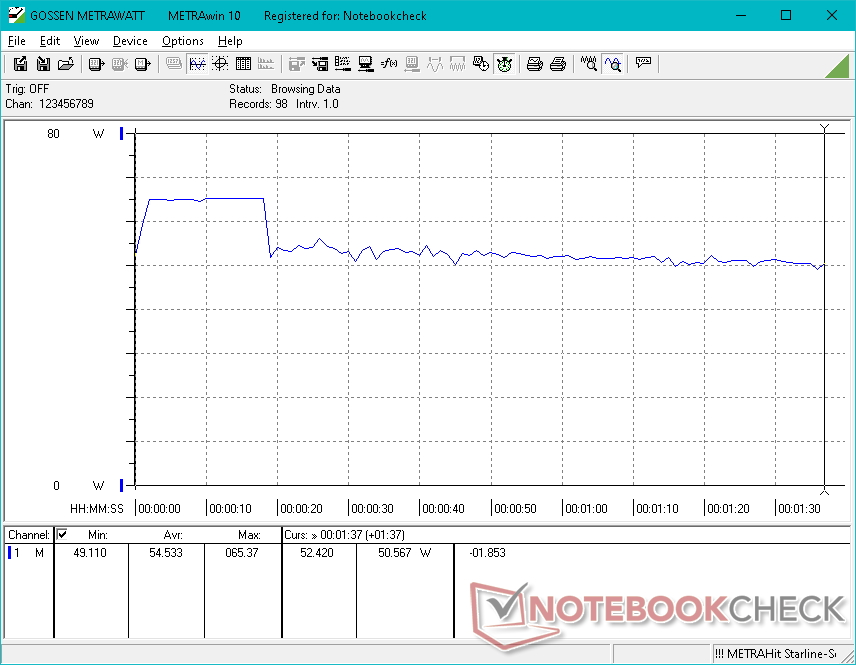
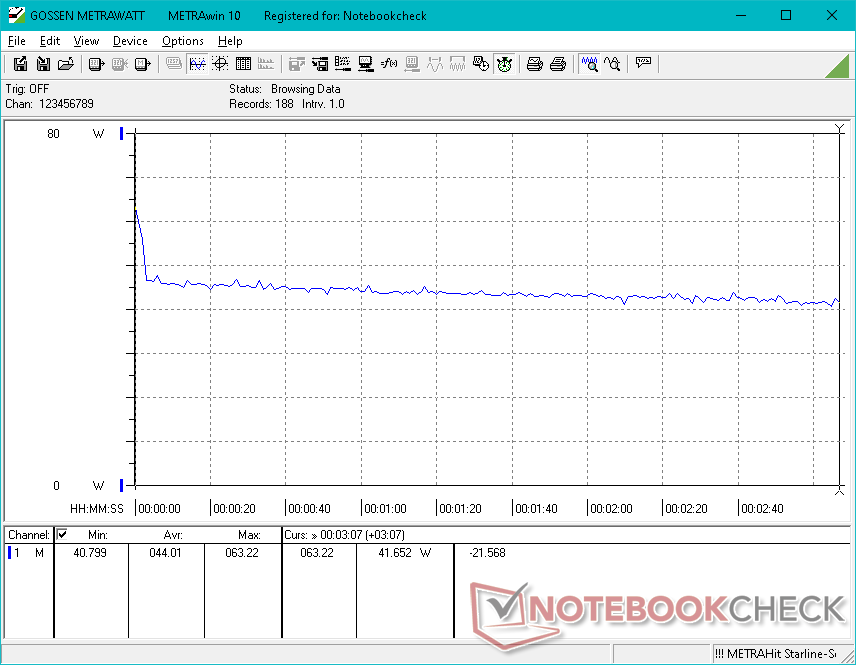
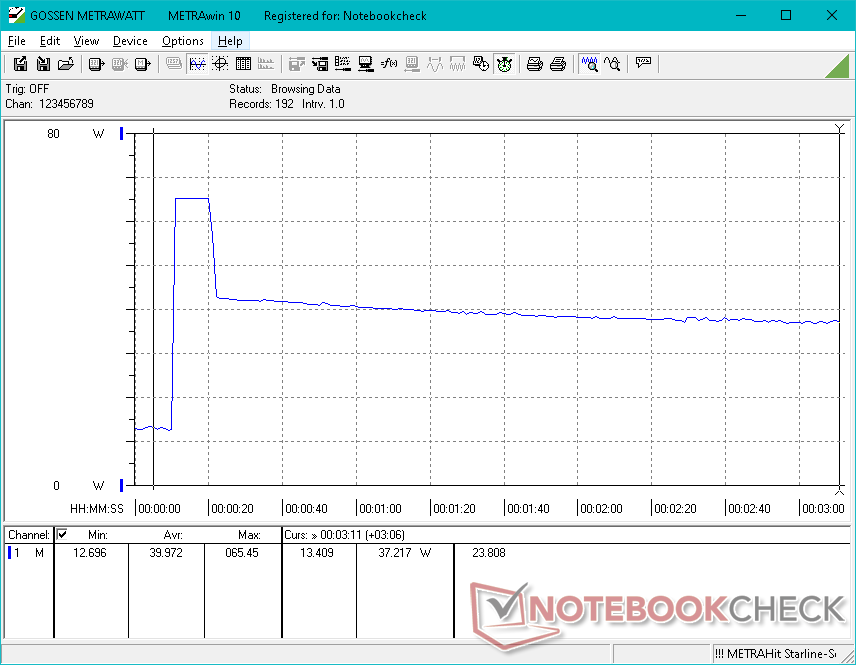
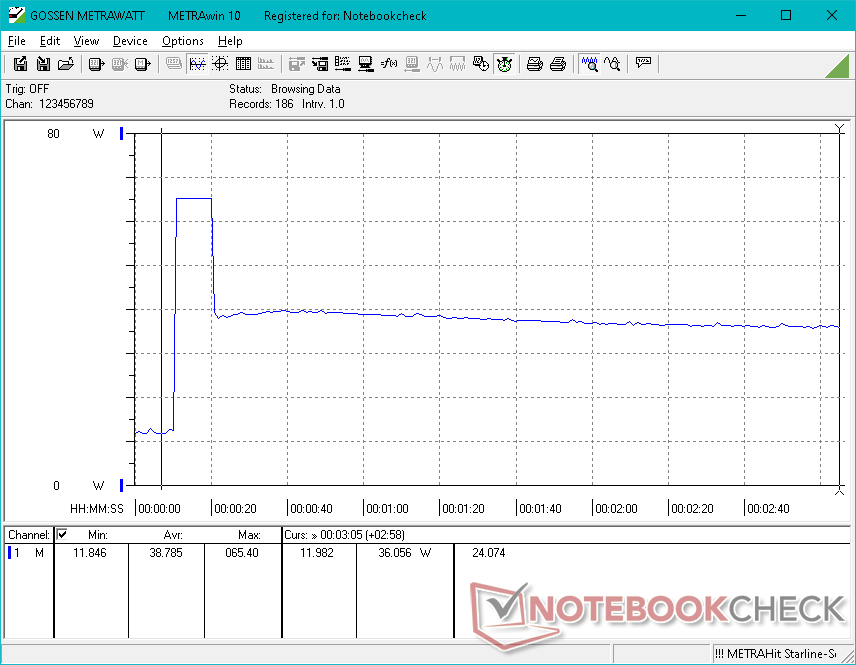
| Off / Standby | |
| Idle | |
| Load |
|
Key:
min: | |
| Lenovo ThinkPad X1 Nano Gen 2 Core i7-1280P i7-1280P, Iris Xe G7 96EUs, Kioxia BG5 KBG5AZNT1T02, IPS, 2160x1350, 13" | Lenovo ThinkPad X1 Nano-20UN002UGE i7-1160G7, Iris Xe G7 96EUs, WDC PC SN530 SDBPNPZ-512G, IPS, 2160x1350, 13" | HP Elite Dragonfly G3 i7-1265U, Iris Xe G7 96EUs, Micron 3400 MTFDKBA512TFH 512GB, IPS, 1920x1280, 13.5" | Dell Latitude 13 7330 i7-1265U, Iris Xe G7 96EUs, Toshiba KBG40ZNS512G NVMe, IPS, 1920x1080, 13.3" | Framework Laptop 13.5 12th Gen Intel i7-1260P, Iris Xe G7 96EUs, WDC PC SN730 SDBPNTY-512G, IPS, 2256x1504, 13.5" | Huawei MateBook X Pro 2021 i7-1165G7, Iris Xe G7 96EUs, Samsung PM981a MZVLB1T0HBLR, IPS, 3000x2000, 13.9" | |
|---|---|---|---|---|---|---|
| Power Consumption | 25% | 16% | 21% | -11% | -11% | |
| Idle Minimum * (Watt) | 3.4 | 3.3 3% | 3.4 -0% | 2.8 18% | 5.3 -56% | 6.7 -97% |
| Idle Average * (Watt) | 6.5 | 5.7 12% | 5.6 14% | 4.8 26% | 8.4 -29% | 10 -54% |
| Idle Maximum * (Watt) | 14.4 | 9.1 37% | 8.4 42% | 7.3 49% | 11.2 22% | 10.3 28% |
| Load Average * (Watt) | 54.5 | 29.6 46% | 40.8 25% | 48.1 12% | 57.4 -5% | 35.7 34% |
| Witcher 3 ultra * (Watt) | 44 | 27.7 37% | 35.5 19% | 35.4 20% | 46.7 -6% | 32.7 26% |
| Load Maximum * (Watt) | 65.4 | 55.1 16% | 68.4 -5% | 63.6 3% | 61.2 6% | 67.6 -3% |
* ... smaller is better
Power Consumption Witcher 3 / Stresstest
Power Consumption external Monitor
Battery Life
Runtimes are much shorter than on last year's model by almost half (!) even when on the Balanced power profile likely due to the more demanding Core P-series CPU. At just 5 hours of real-world WLAN usage, the X1 Nano Gen 2 isn't going to last nearly as long as most other subnotebooks.
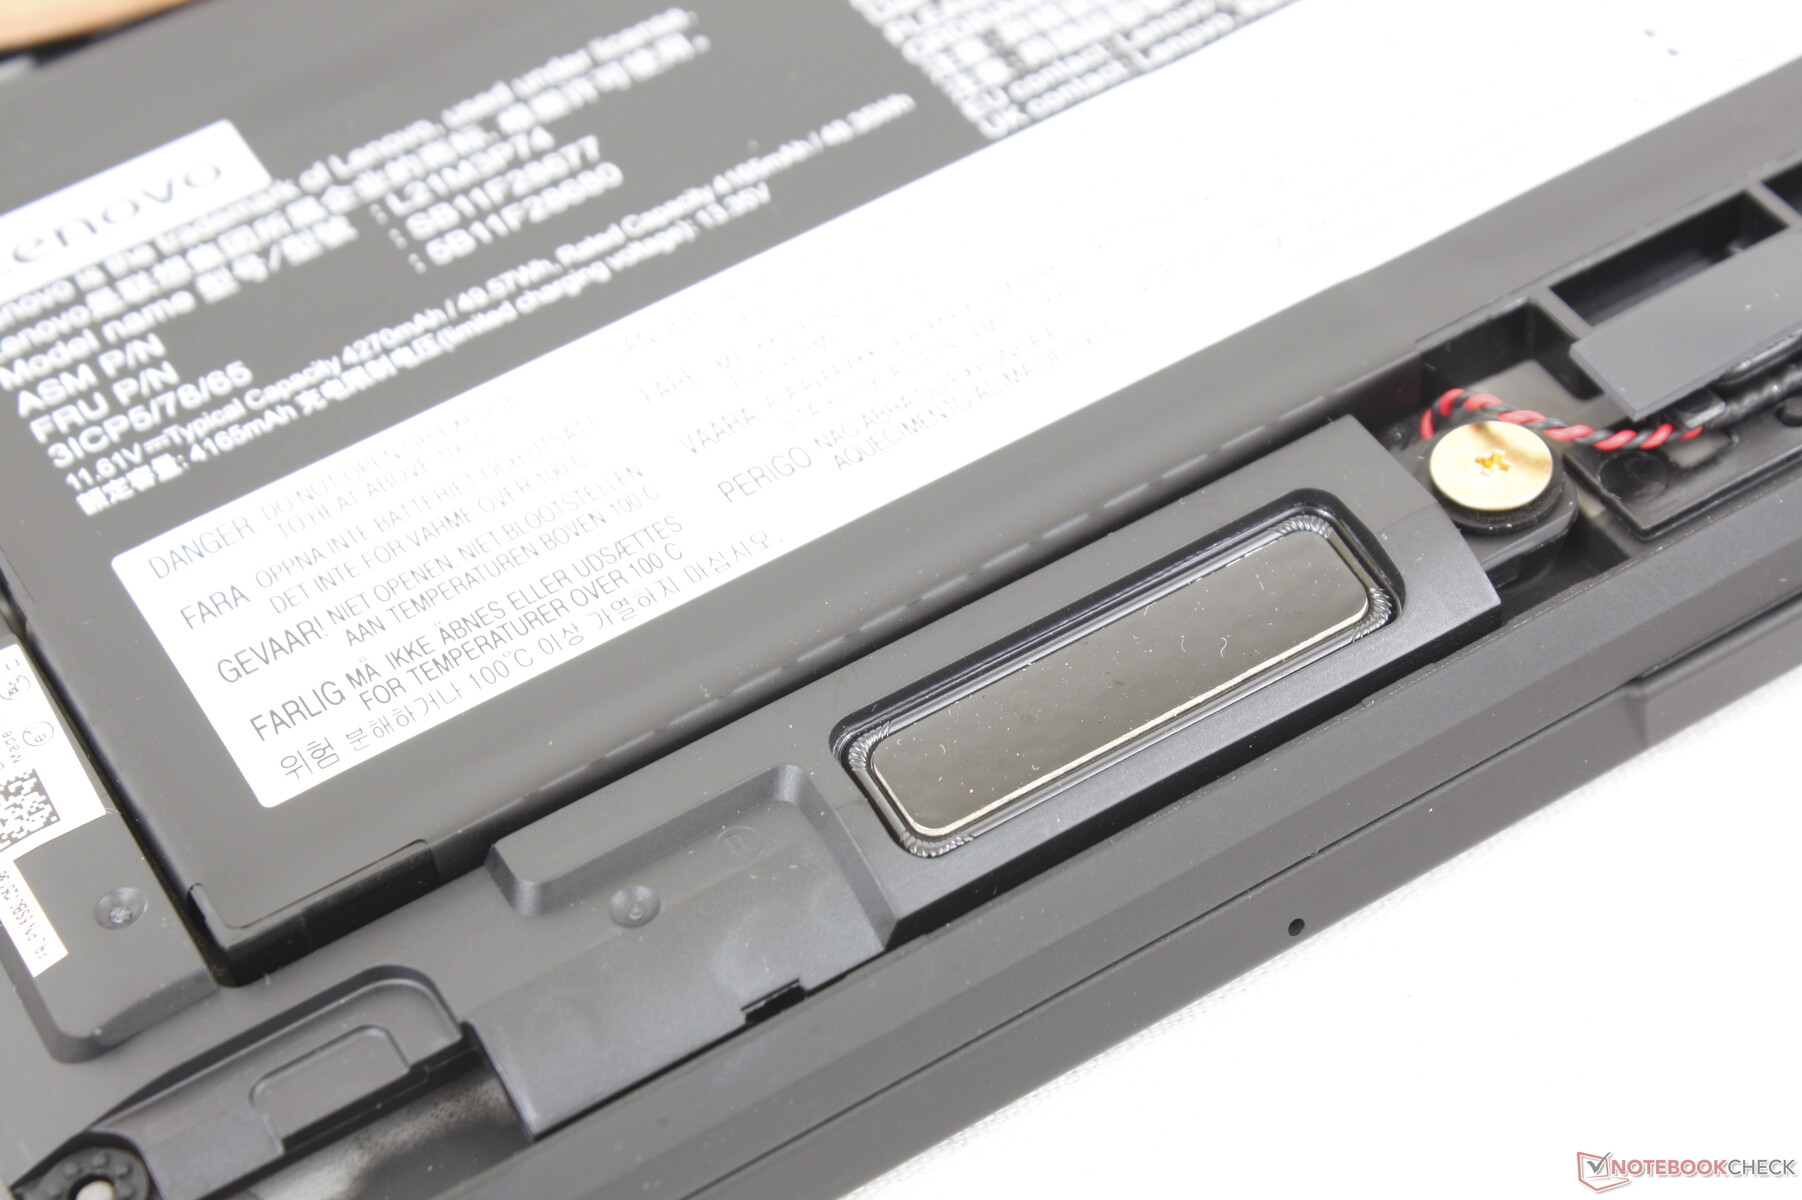
| Lenovo ThinkPad X1 Nano Gen 2 Core i7-1280P i7-1280P, Iris Xe G7 96EUs, 49.5 Wh | Lenovo ThinkPad X1 Nano-20UN002UGE i7-1160G7, Iris Xe G7 96EUs, 48.2 Wh | HP Elite Dragonfly G3 i7-1265U, Iris Xe G7 96EUs, 68 Wh | Dell Latitude 13 7330 i7-1265U, Iris Xe G7 96EUs, 41 Wh | Framework Laptop 13.5 12th Gen Intel i7-1260P, Iris Xe G7 96EUs, 55 Wh | Huawei MateBook X Pro 2021 i7-1165G7, Iris Xe G7 96EUs, 56 Wh | |
|---|---|---|---|---|---|---|
| Battery runtime | 94% | 131% | 63% | 47% | 106% | |
| WiFi v1.3 (h) | 5.1 | 9.9 94% | 11.8 131% | 8.3 63% | 7.5 47% | 10.5 106% |
| H.264 (h) | 15.4 | |||||
| Load (h) | 1.6 | 3.5 | 1.4 | 3 | ||
| Reader / Idle (h) | 37.8 | 21.9 | 19.5 |
Pros
Cons
Verdict — A Lightweight Sprinter, But Not A Marathon Runner

The ThinkPad X1 Nano Gen 2 is the perfect example of what happens when you swap out a 15 W CPU for a 28 W CPU on a laptop originally designed to run a 15 W CPU. You're going to see faster performance, but that performance boost will only be in short bursts due to the limitations of the cooling solution. The system is therefore at its best where short bursts of high performance can come in handy such as when launching applications, the occasional picture editing, or unzipping of small files. If you intend to use the laptop for CPU-intensive workloads lasting for longer periods of time, however, then the CPU here may not be as fast as you might be hoping for. Keep in mind that this is a common drawback across most if not all super lightweight (<1 kg) laptops thus far like the Dragonfly G3, Latitude 7330, or LG Gram.
Another important aspect to consider is that battery life has been significantly cut since battery capacity remains essentially unchanged despite the newer and more power-demanding CPU. You may need to be more mindful of charging when traveling as a result.
The ThinkPad X1 Nano Gen 2 is undeniably faster than the original Gen 1 model, but it comes at the cost of shorter runtimes and potential performance throttling.
Despite the limited Turbo Boost sustainability of the CPU, the X1 Nano Gen 2 is still a much faster system than the older Gen 1 model without needing to change anything about the chassis, display, or weight. Users looking to maximize processor performance may want to consider heavier laptops with stronger cooling solutions like the ThinkPad T series instead.
Price and Availability
The ThinkPad X1 Nano Gen 2 is now widely available via resellers such as Amazon and Newegg for $1700 USD if configured with the Core i5 and FHD display up to $2300 USD if configured with the Core i7 and 2K display. Alternatives, users can purchase directly from Lenovo.
Lenovo ThinkPad X1 Nano Gen 2 Core i7-1280P
- 09/04/2022 v7 (old)
Allen Ngo
Price comparison
