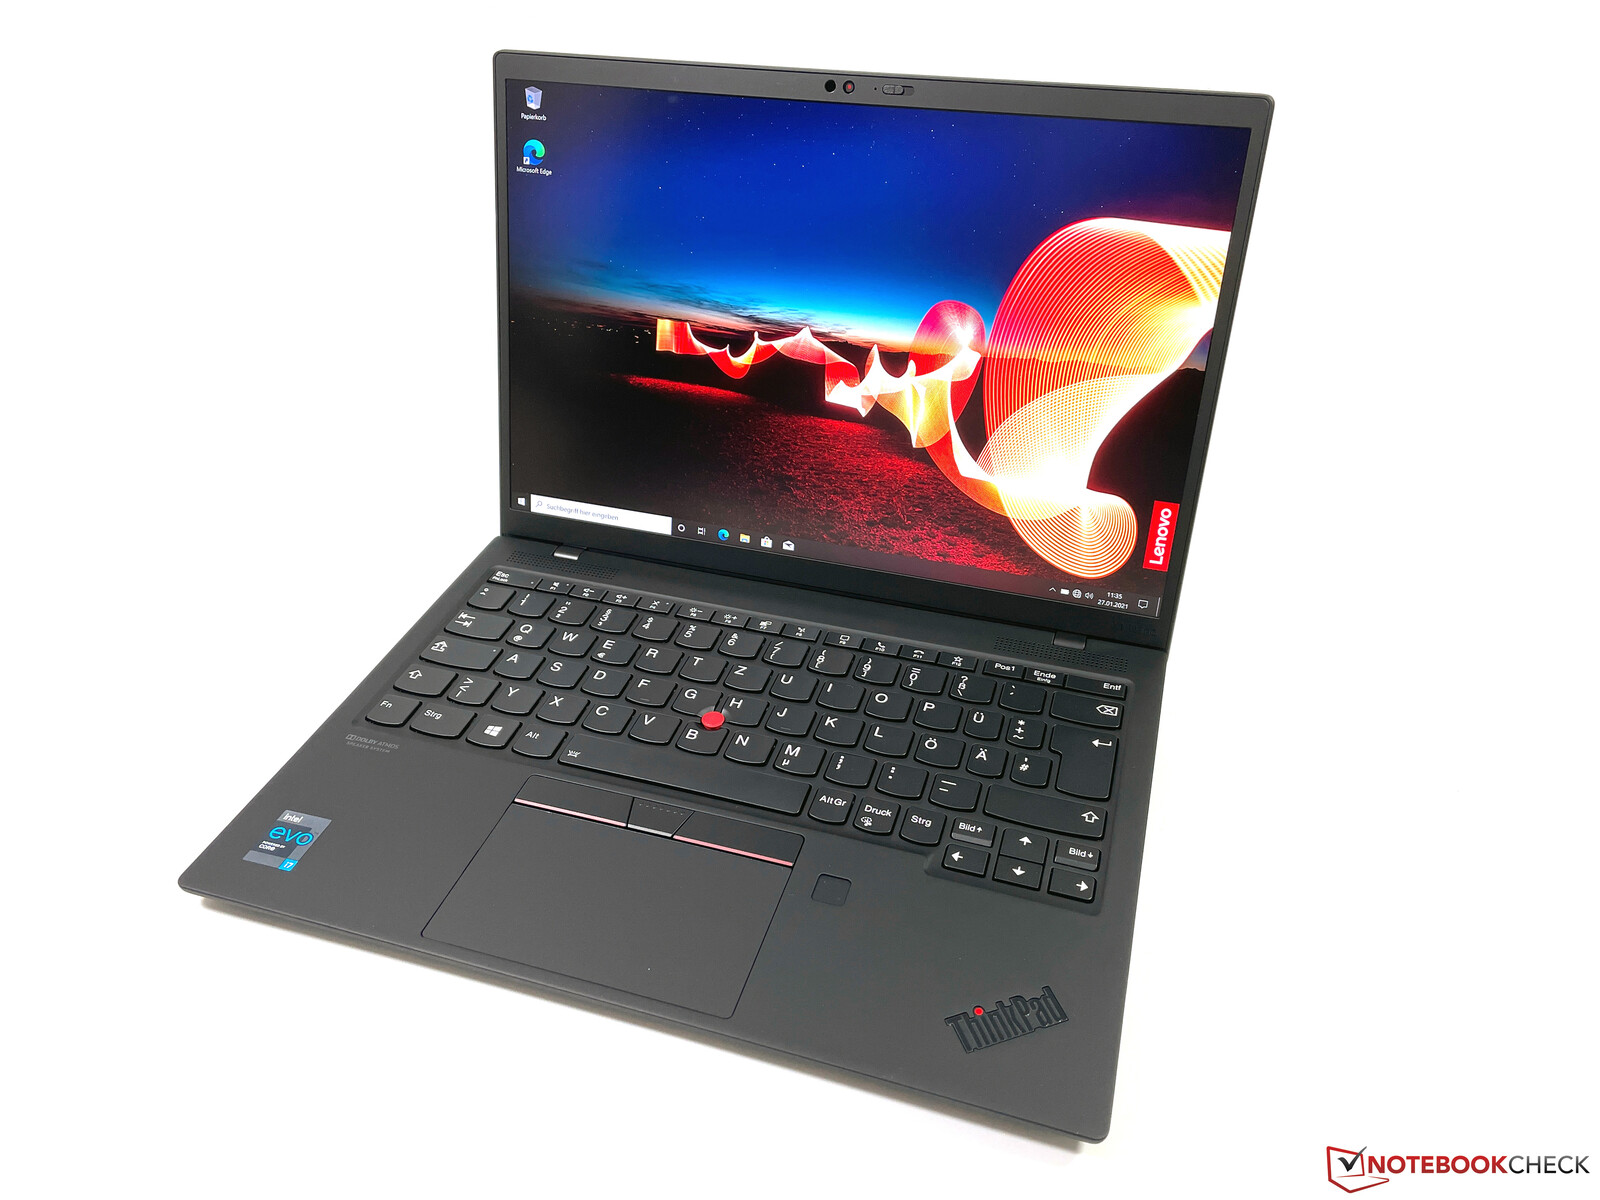
Lenovo ThinkPad X1 Nano Laptop Review - Less than 1 kg for the Business Subnotebook with LTE
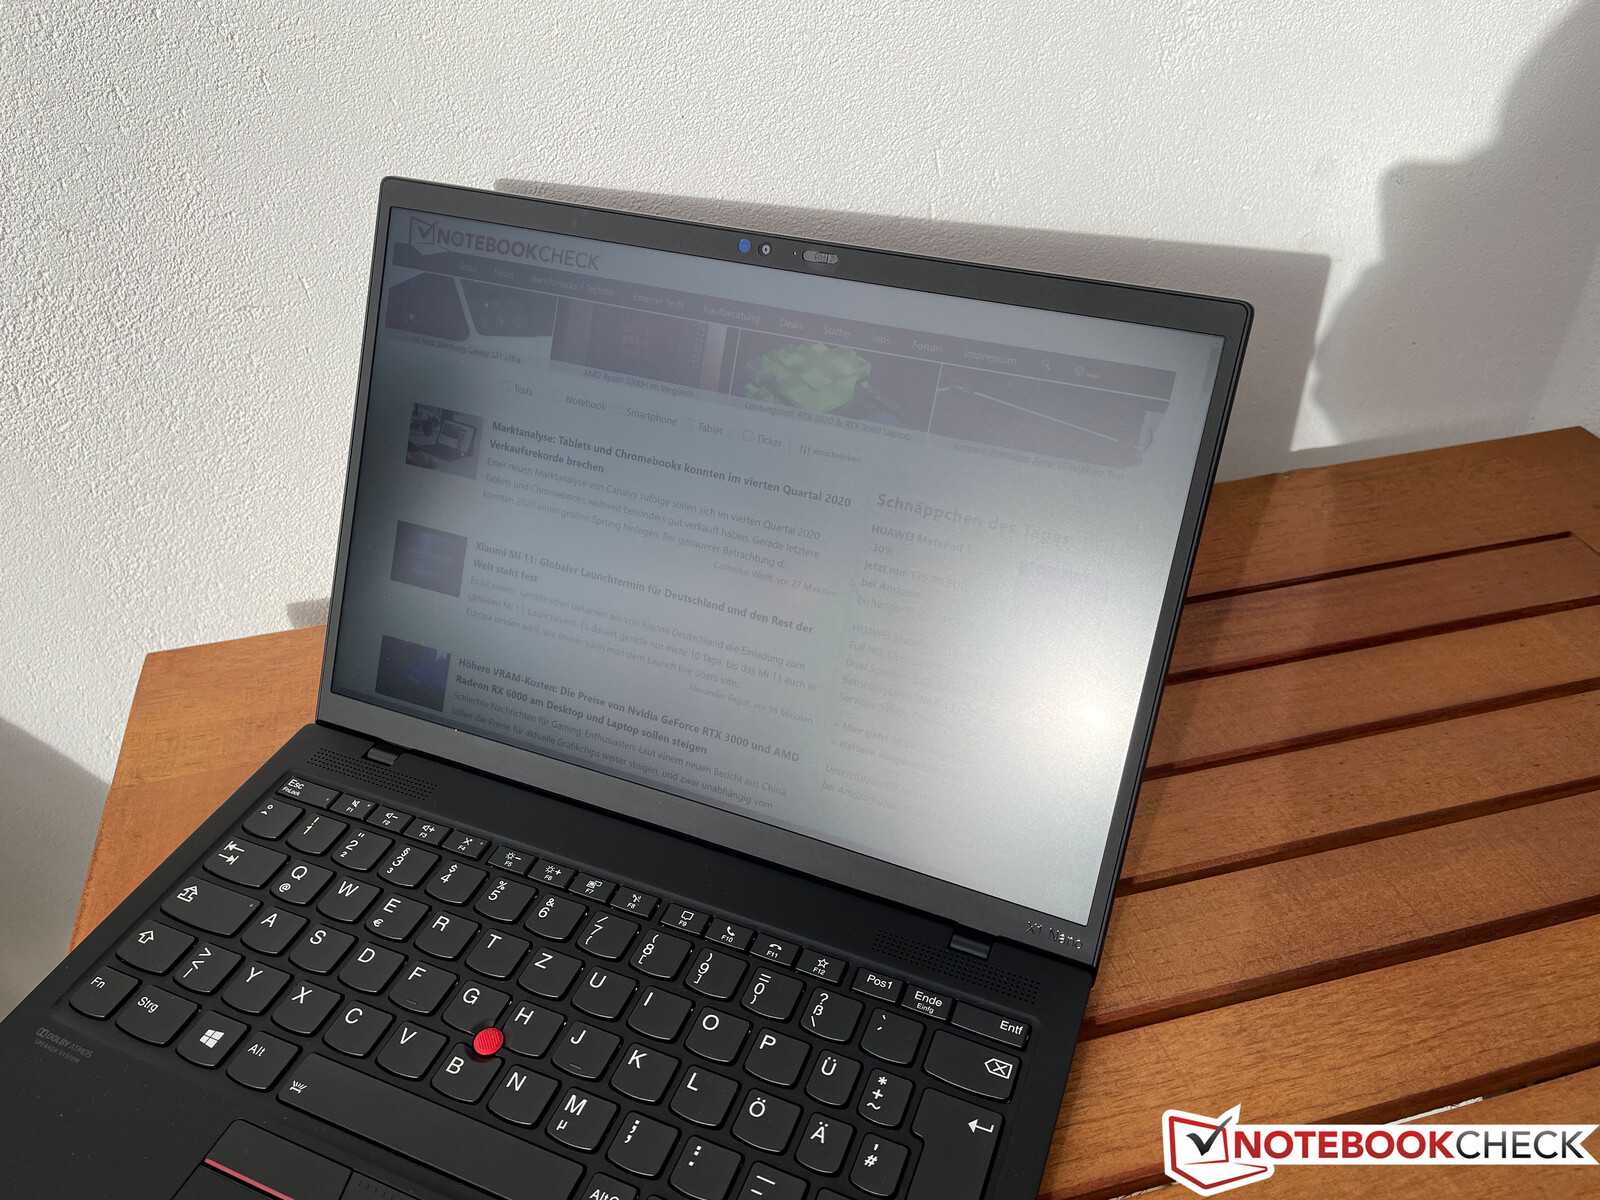
Lenovo expands its ThinkPad X1-series with the new 13-inch X1 Nano, which is the first ThinkPad that returns to a 16:10-inch screen. It tips the scale at little more than 900 grams, so it is a very mobile companion and reminds us of the old ThinkPad X300 from 2008, which was a direct competitor for the new MacBook Air back then. The technology has evolved quite a bit in 13 years, and pretty much every manufacturer offers very mobile business laptops.
Our review unit carries the designation ThinkPad X1 Nano 20UN002UGE for about 2200 Euros. Customers with access to Lenovo's Campus program pay ~1900 Euros for this spec. You get a modern Core i7 CPU from Intel (Tiger Lake UP4), 16 GB LPDDR4x-RAM, 512 GB PCIe SSD storage, an integrated LTE modem, and a matte 13-inch IPS panel (16:10) with the 2K resolution (2160 x 1350 pixels).
The primary rivals for the X1 Nano are devices like the Dell XPS 13 9310, Fujitsu LifeBook U9310X, HP Elite Dragonfly or the MacBook Air M1. We will also include the ThinkPad X13 AMD in the comparison tables. It is a bit bulkier and heavier, but also more affordable and powered by a much faster AMD CPU in return.
Update 02/04/21: Our original news about the upcoming ThinkPad X1 Carbon G9 and ThinkPad X1 Yoga G6 included incorrect information about the keyboard. Both models will get an updated keyboard, but the key travel stays at 1.5 mm for most keys like on the current models. Only the upper row with the function keys will get a reduced key travel of 1.35 mm similar to the ThinkPad X1 Nano.
mögliche Konkurrenten im Vergleich
Rating | Date | Model | Weight | Height | Size | Resolution | Price |
|---|---|---|---|---|---|---|---|
| 89.8 % v7 (old) | 02 / 2021 | Lenovo ThinkPad X1 Nano-20UN002UGE i7-1160G7, Iris Xe G7 96EUs | 946 g | 16 mm | 13.00" | 2160x1350 | |
| 88.1 % v7 (old) | 10 / 2020 | Dell XPS 13 9310 Core i7 FHD i7-1165G7, Iris Xe G7 96EUs | 1.3 kg | 14.8 mm | 13.40" | 1920x1200 | |
| 86.2 % v7 (old) | 01 / 2021 | Fujitsu LifeBook U9310X i5-10210U, UHD Graphics 620 | 1 kg | 17 mm | 13.30" | 1920x1080 | |
| 90.3 % v7 (old) | 04 / 2020 | HP Elite Dragonfly-8MK79EA i5-8265U, UHD Graphics 620 | 1.1 kg | 16.1 mm | 13.30" | 1920x1080 | |
| 91.1 % v7 (old) | 12 / 2020 | Apple MacBook Air Late 2020 (M1, 8 Core GPU, 8 GB RAM) M1, M1 8-Core GPU | 1.3 kg | 16.1 mm | 13.30" | 2560x1600 | |
| 89.5 % v7 (old) | 08 / 2020 | Lenovo ThinkPad X13-20UGS00800 R7 PRO 4750U, Vega 7 | 1.3 kg | 16.9 mm | 13.30" | 1920x1080 |
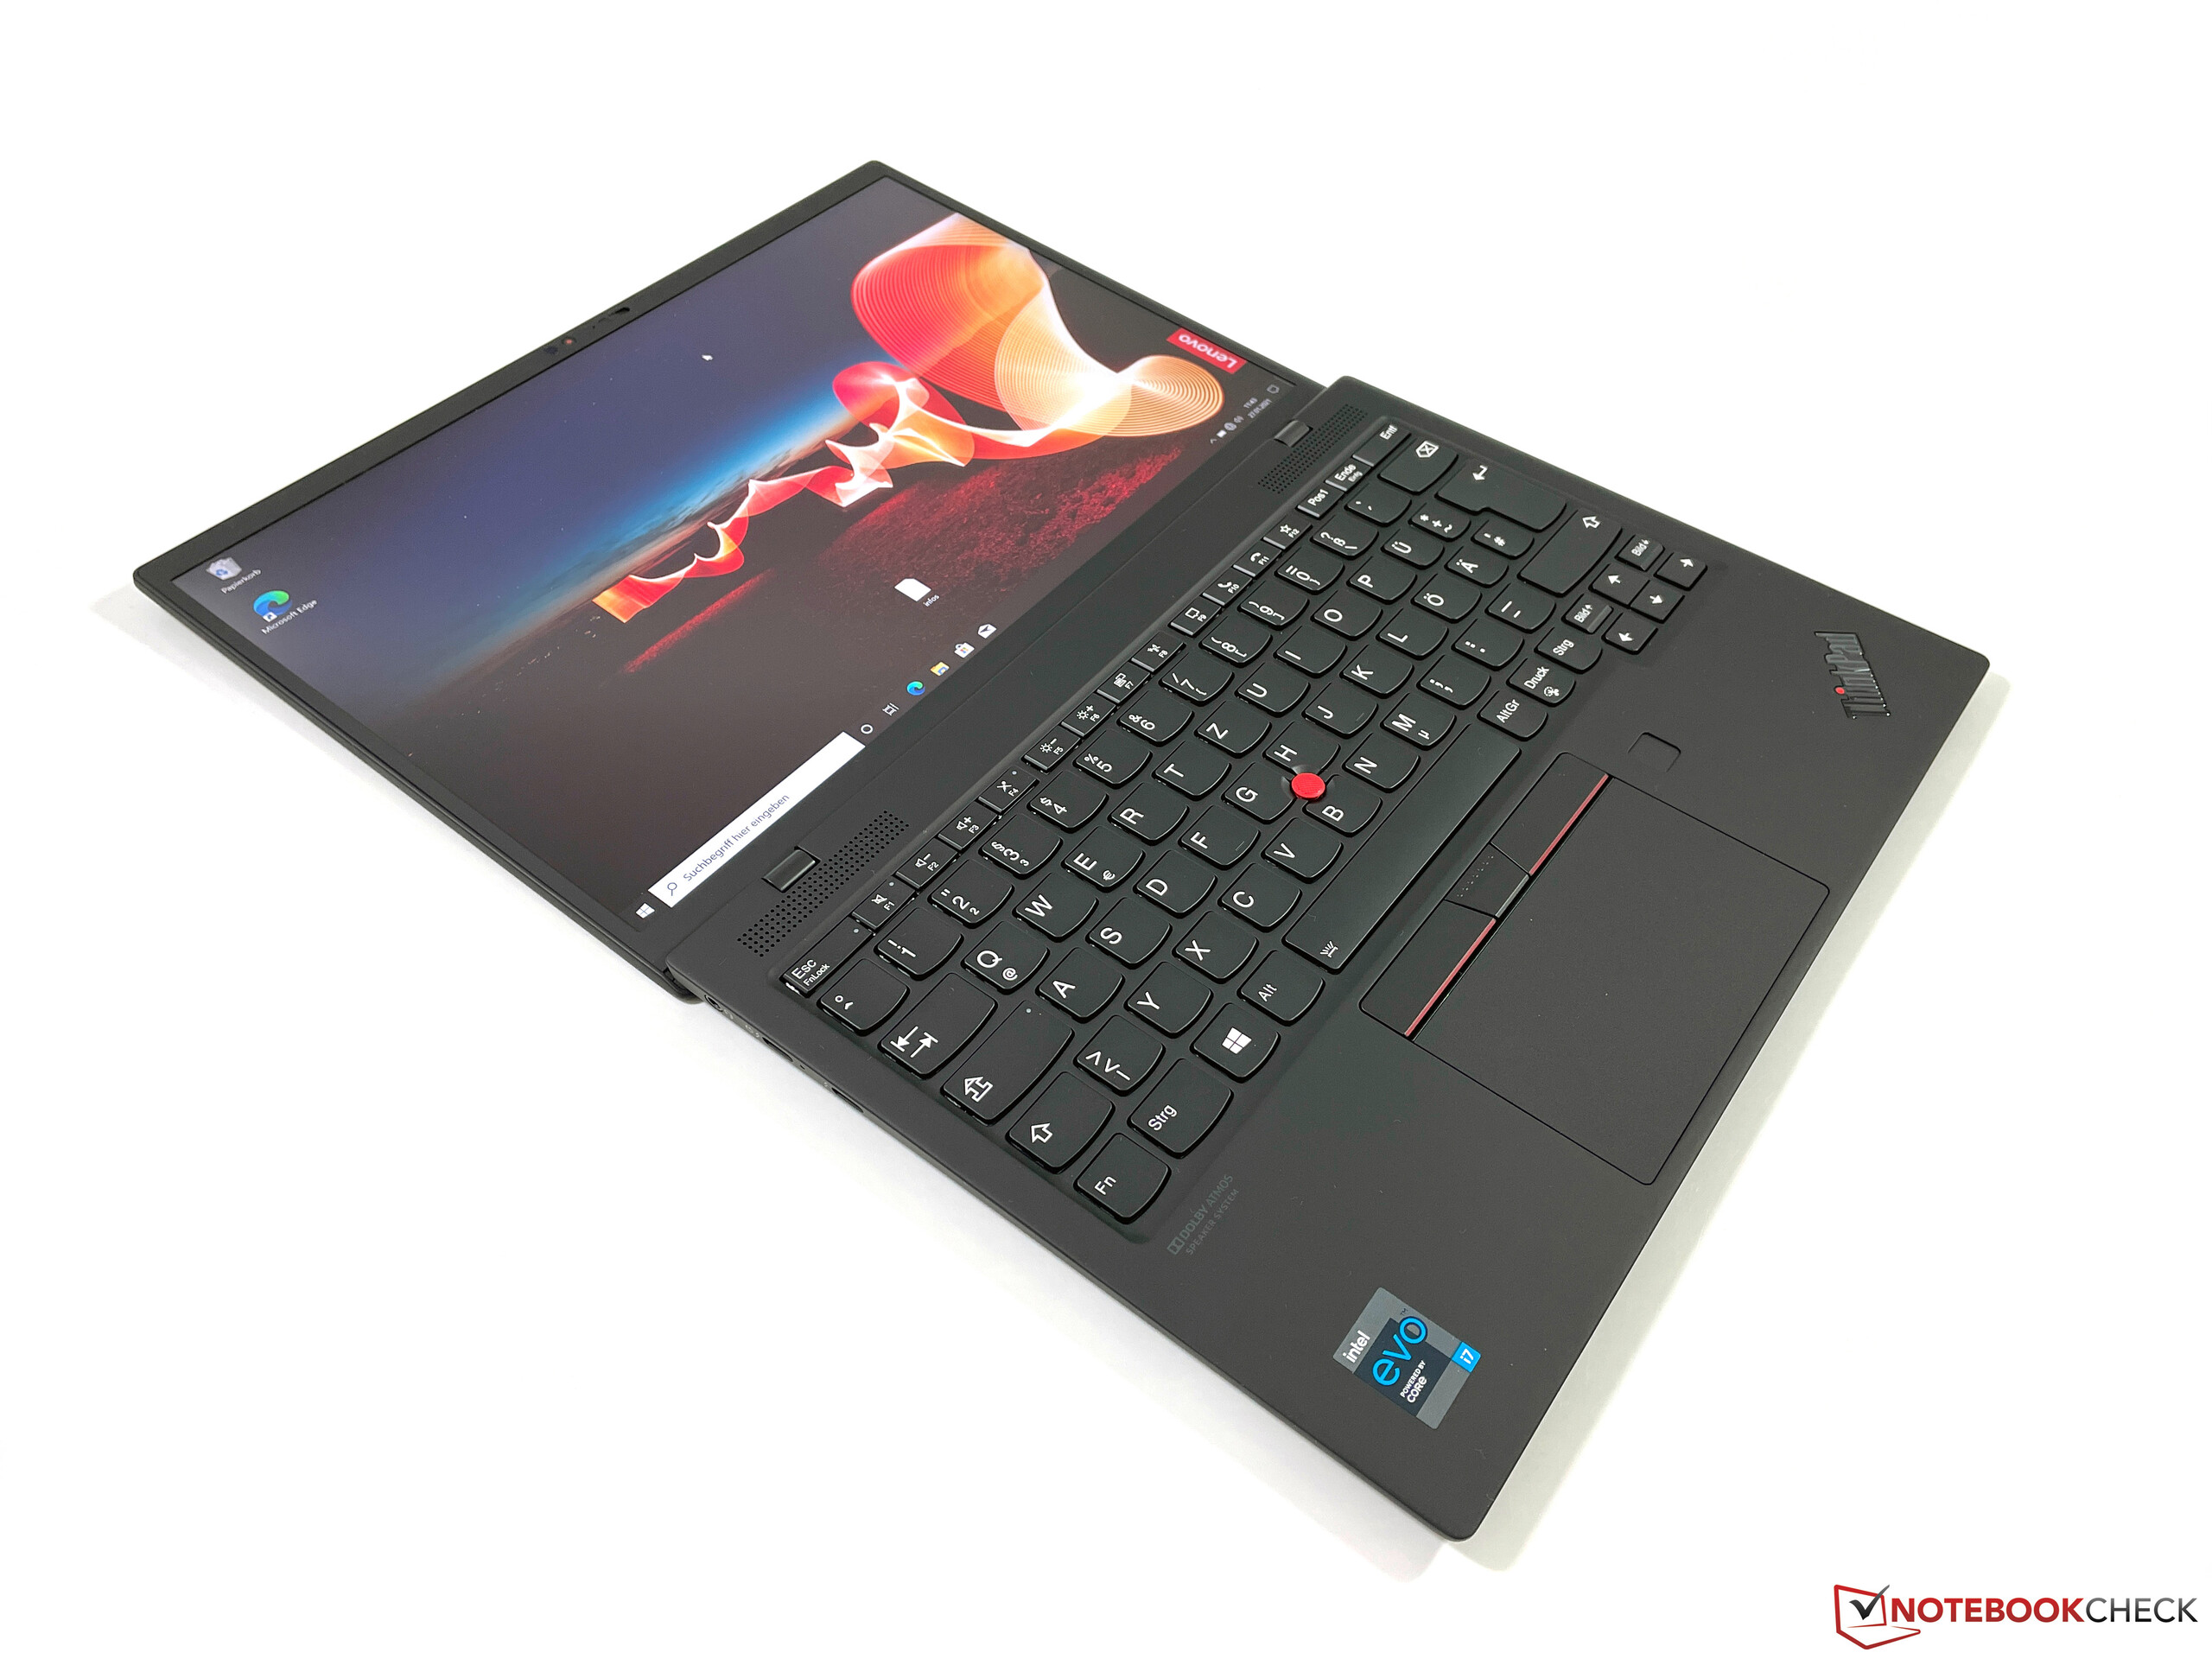
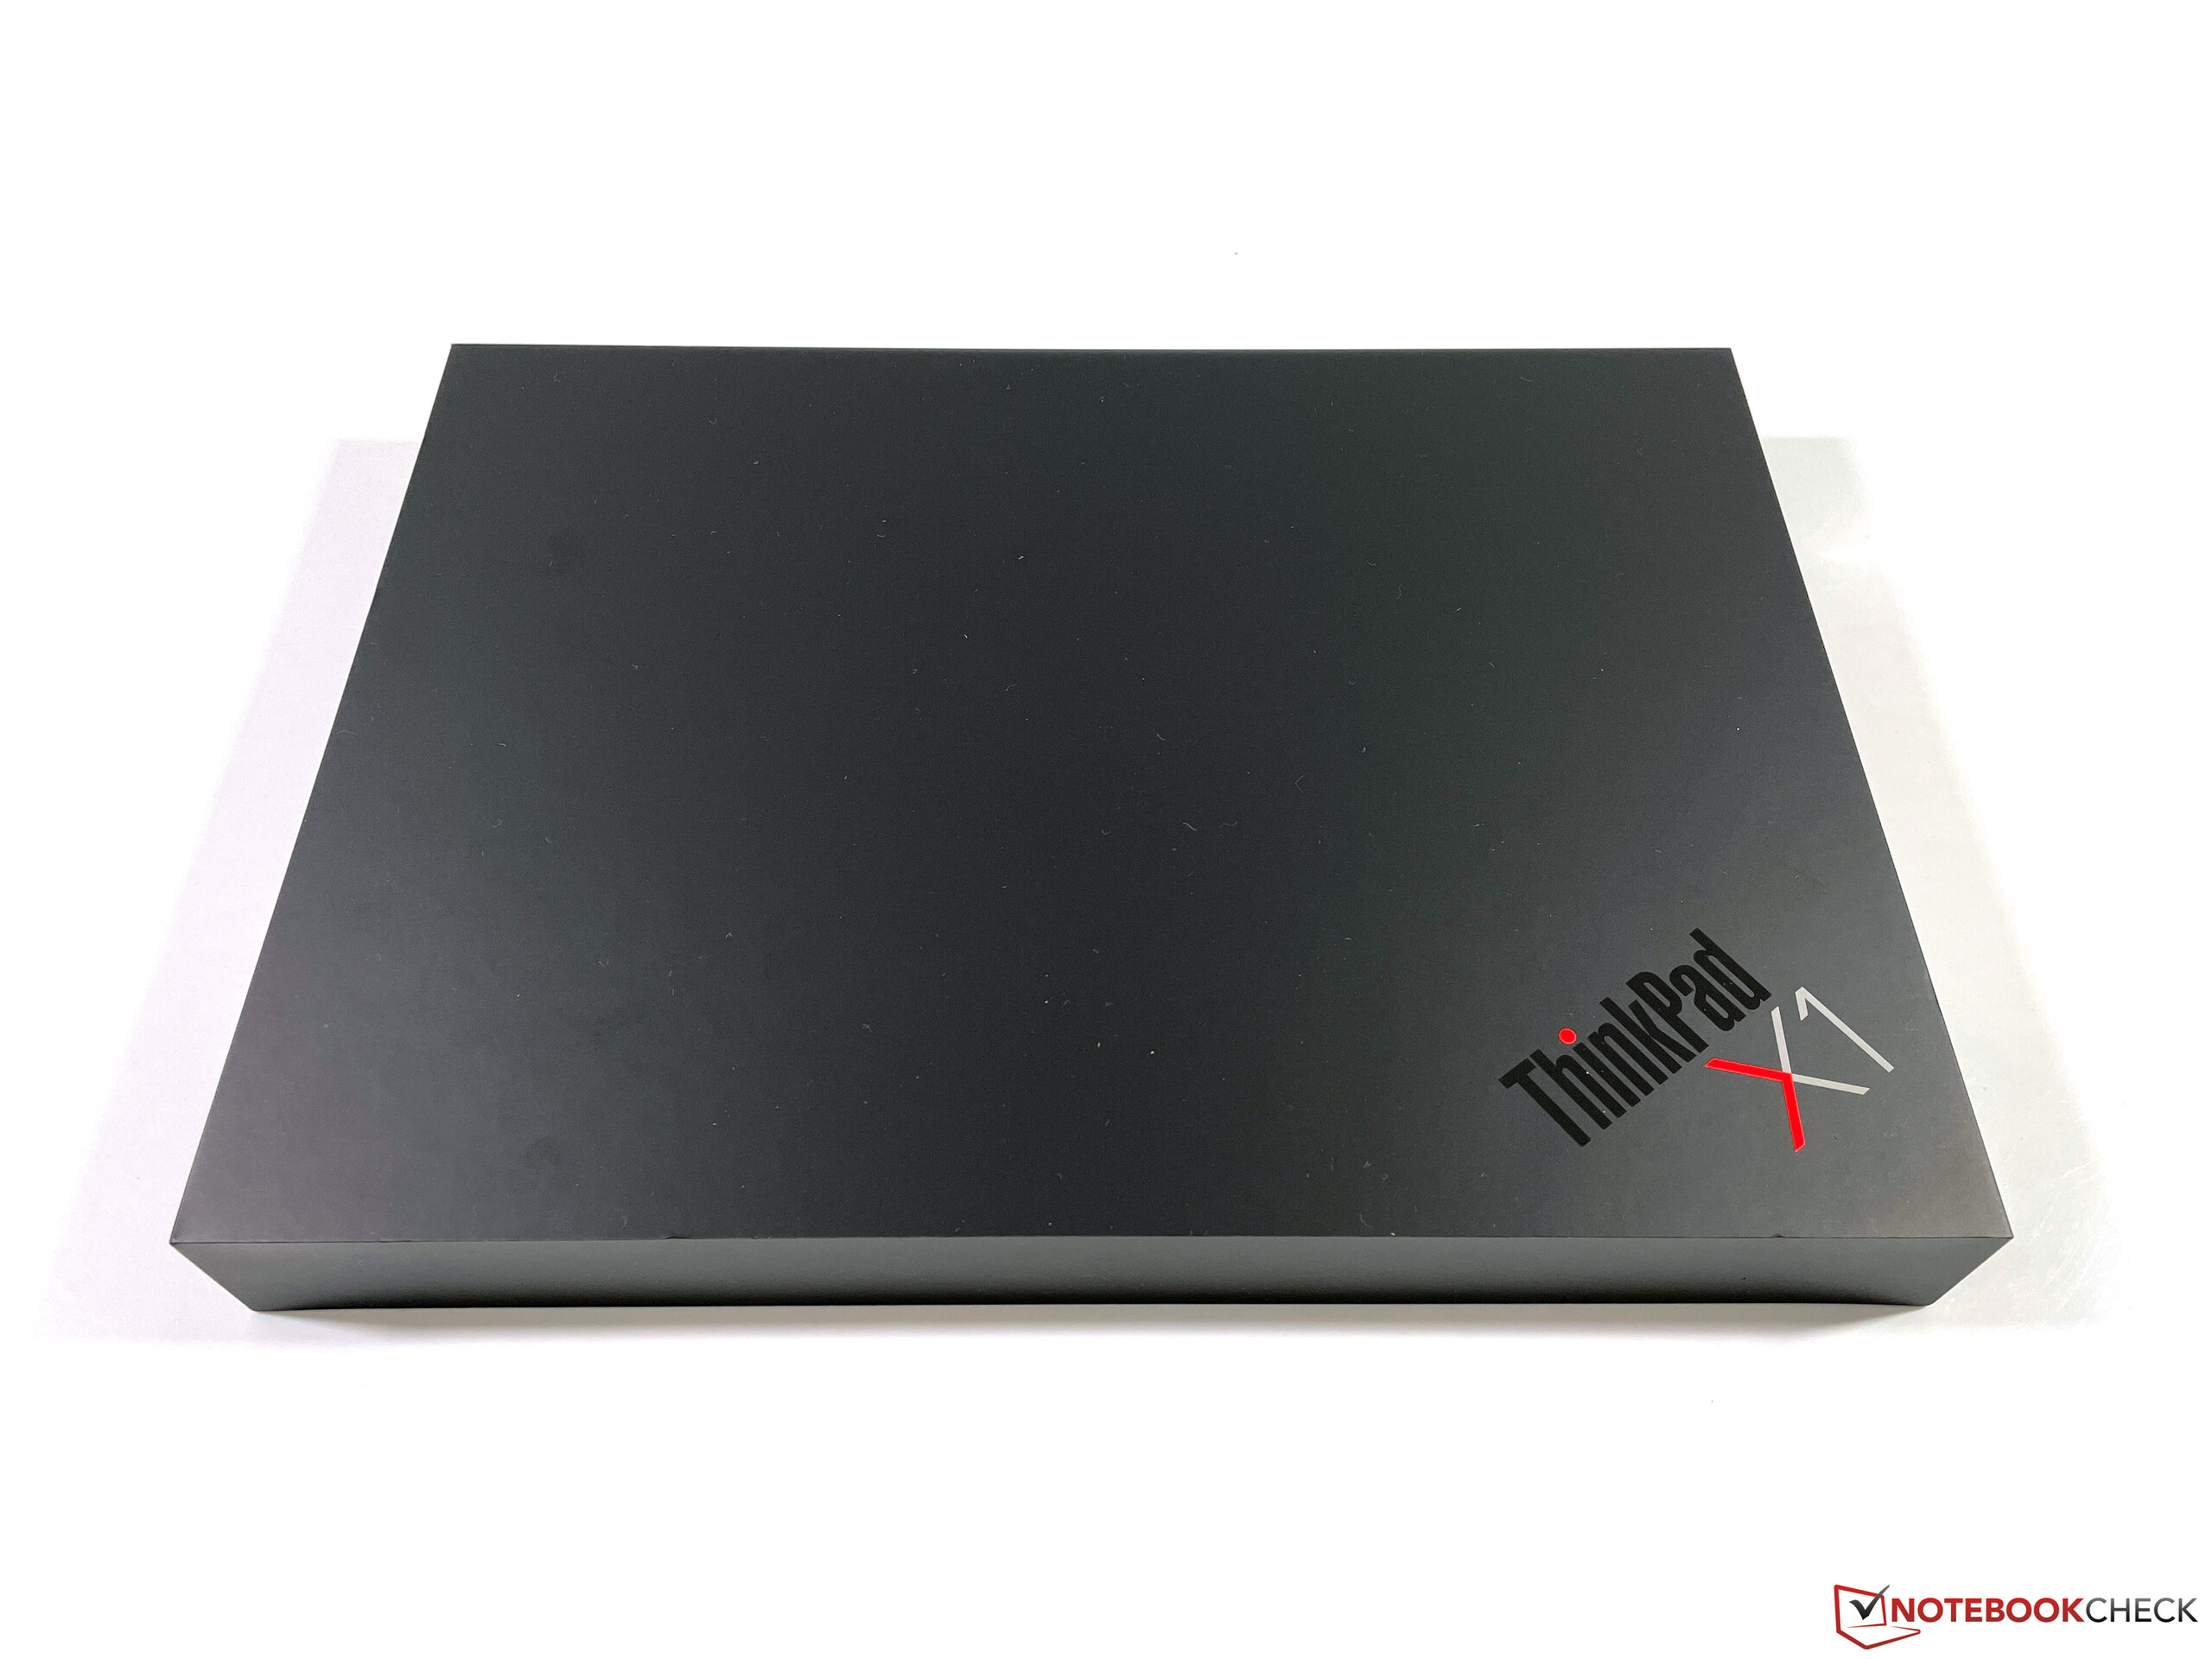
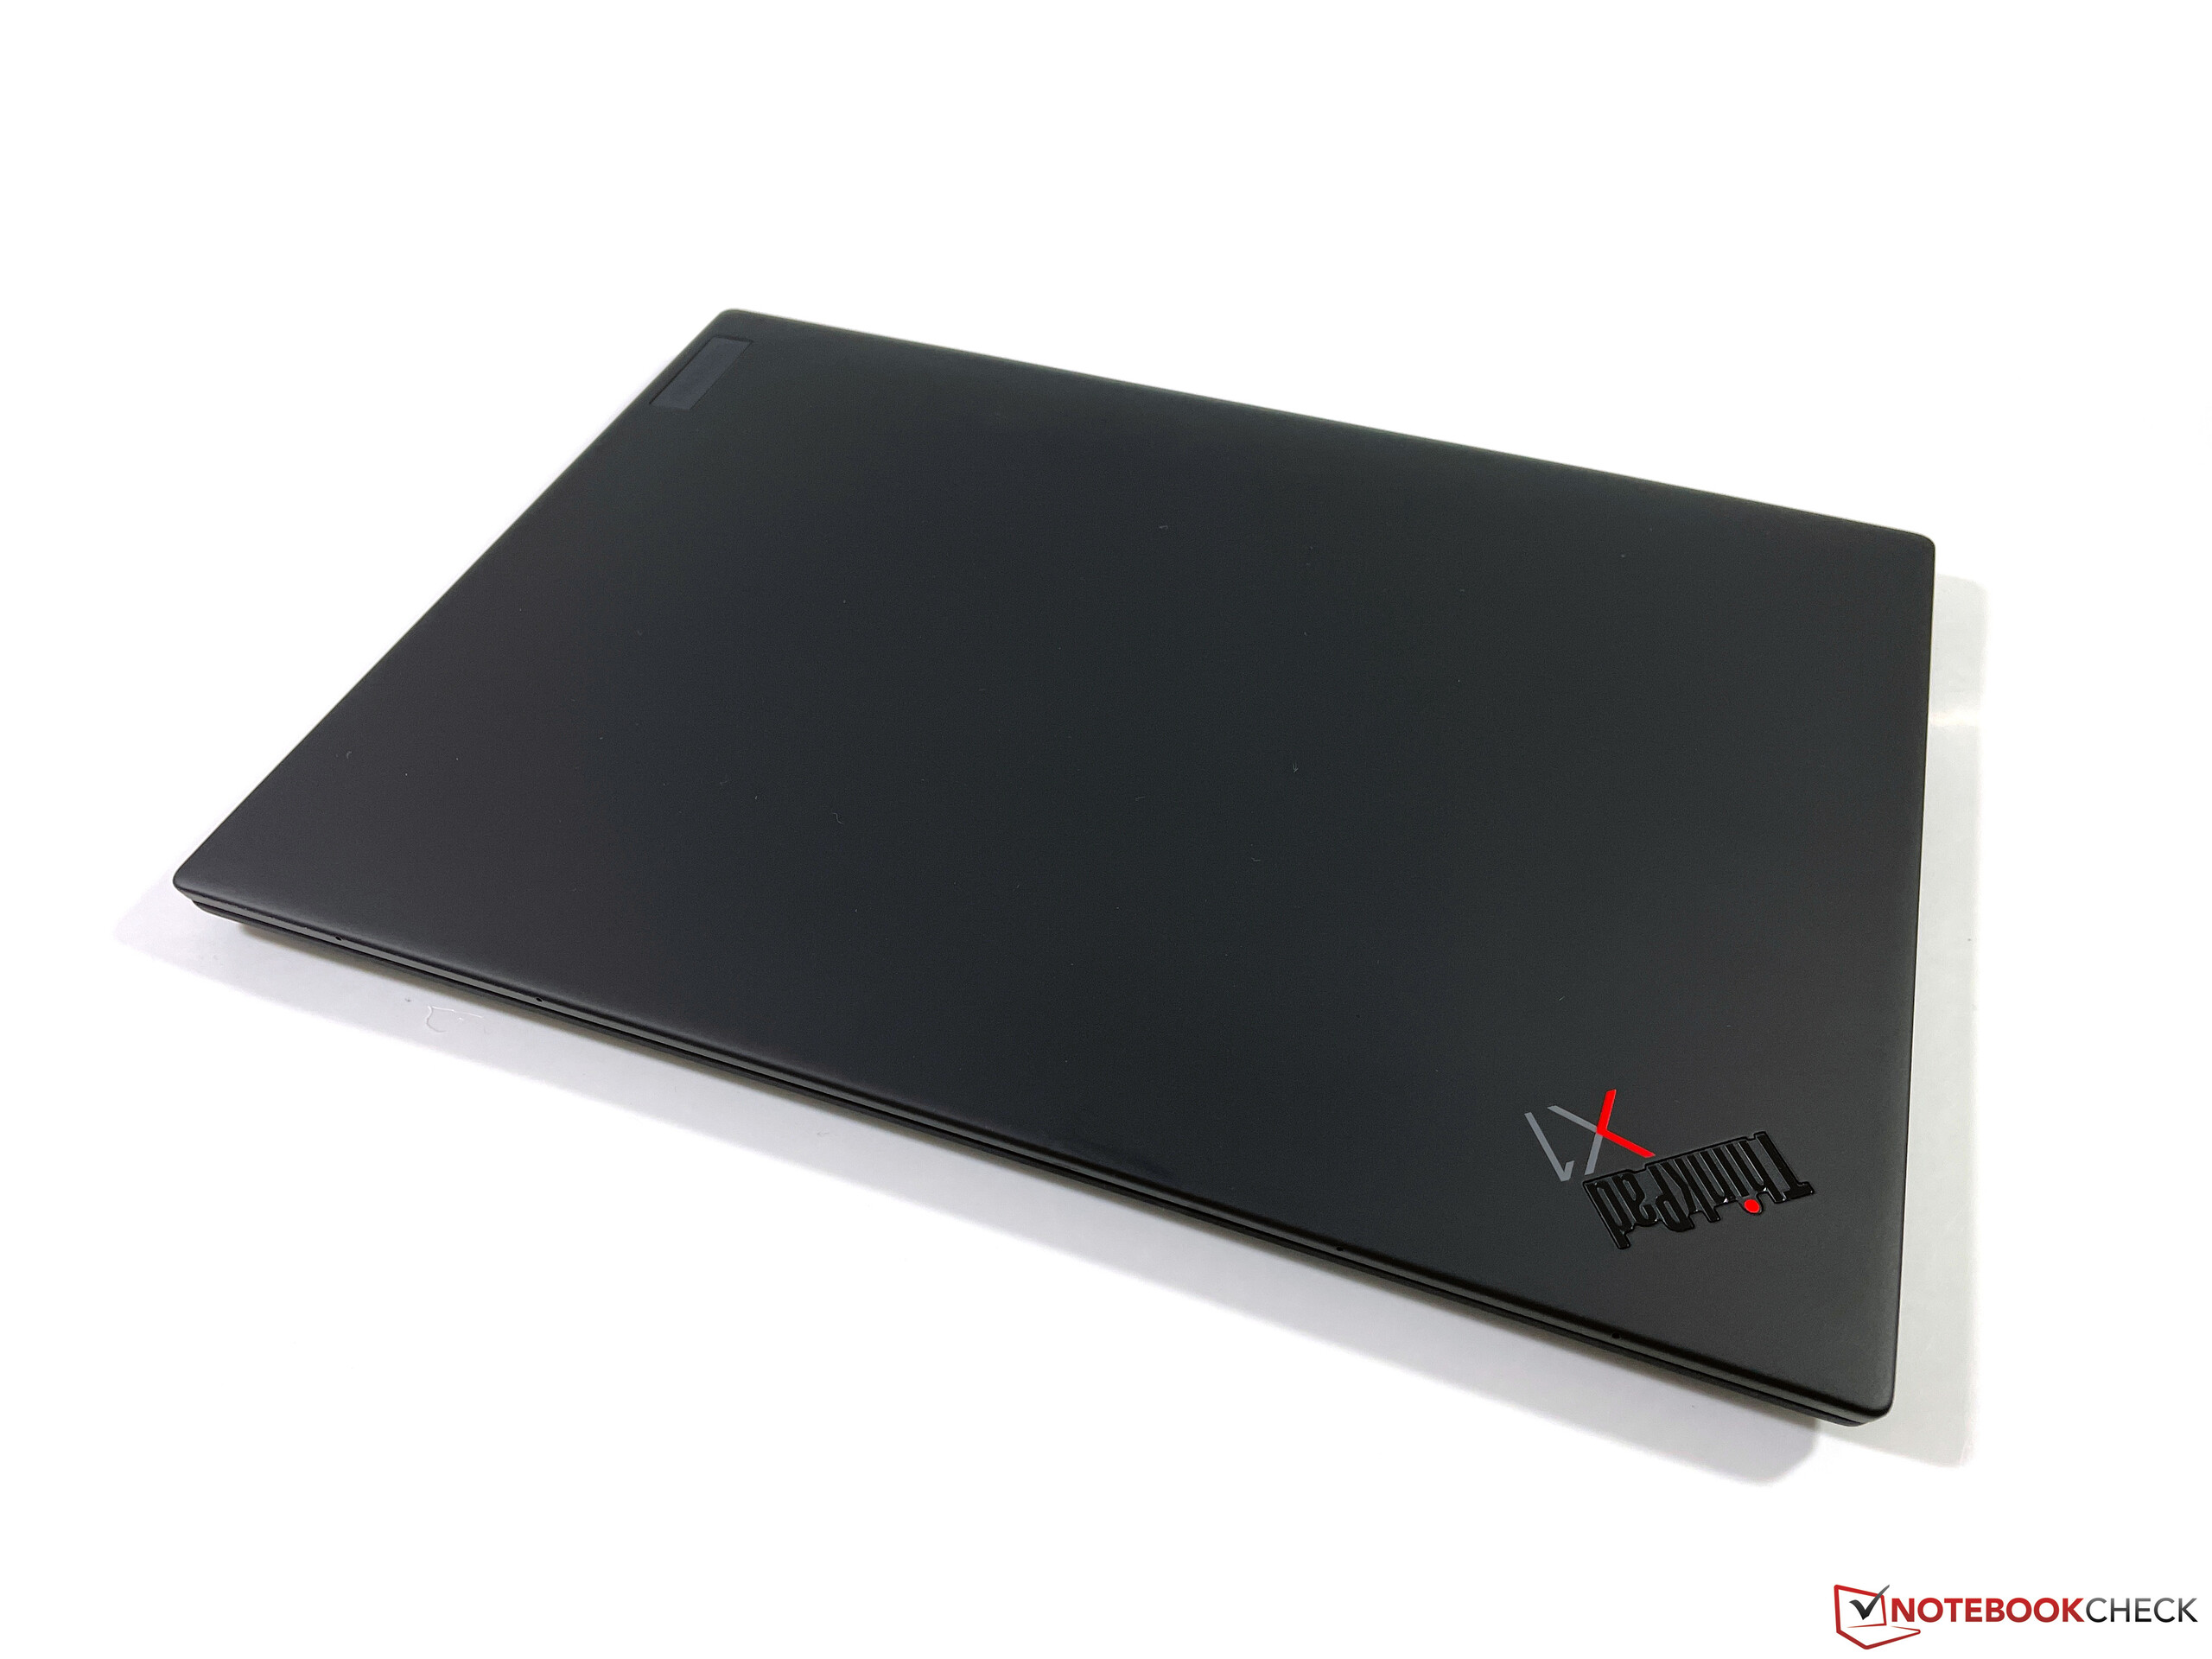
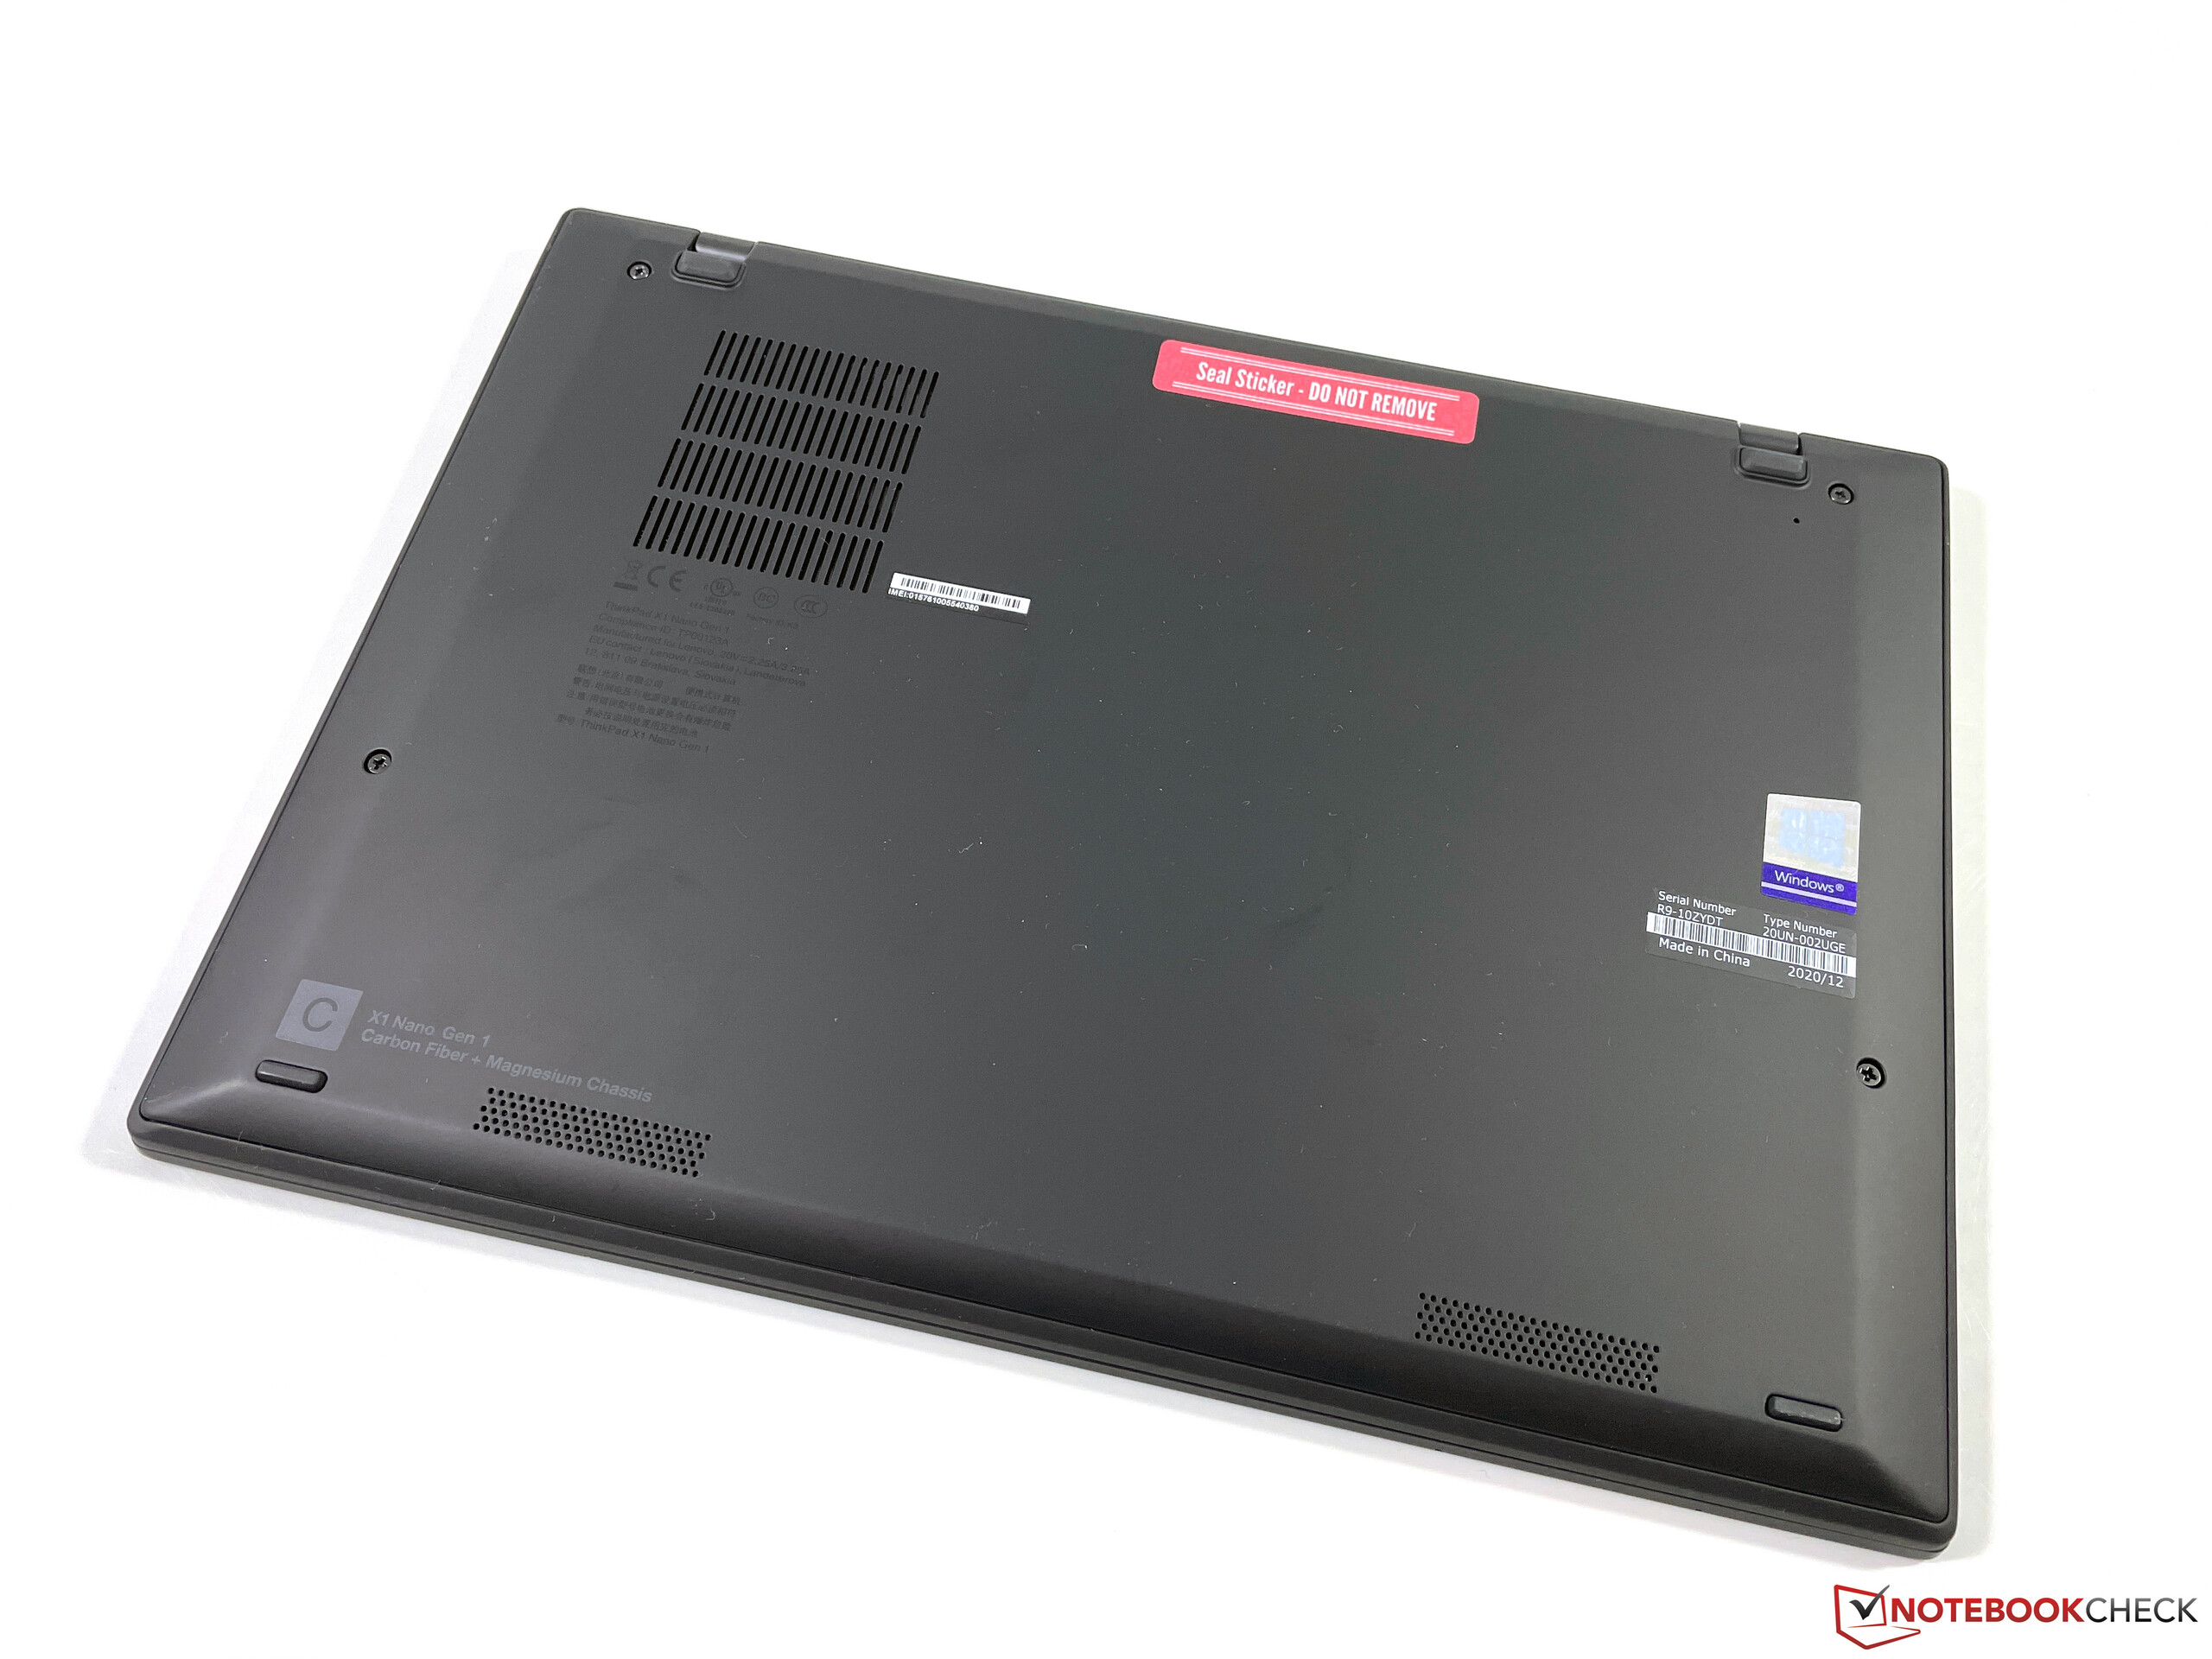
Case - X1 Nano with Carbon Fiber and Magnesium Chassis
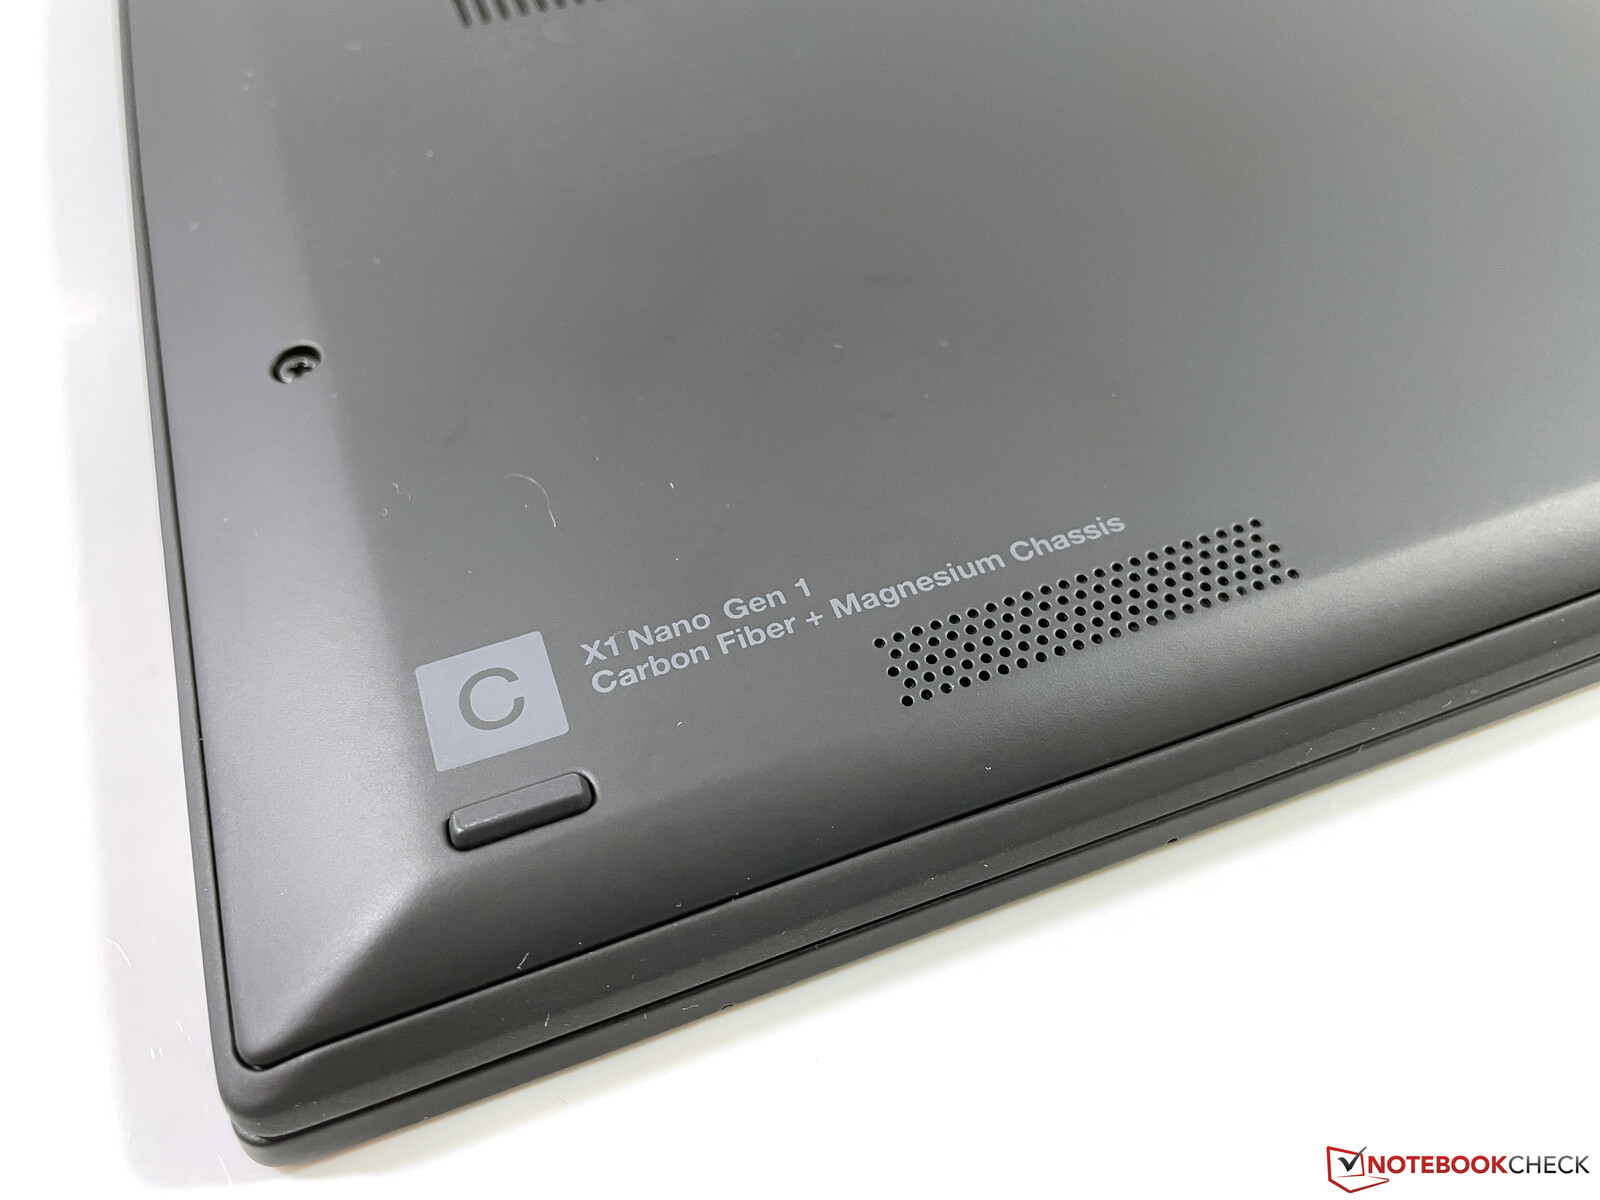
The design of the new X1 Nano does not offer any surprises; it is pretty much a slimmed-down version of the ThinkPad X1 Carbon. This includes the black chassis as well as the tapered front of the base unit. The height is just ~14 mm at the front and 16.7 mm at the rear. If you get the optional touchscreen, the unit will be a bit thicker (14.27-17.2 mm) and about 60 grams heavier.
The haptic feeling of the smooth surfaces is also identical to the larger ThinkPad X1 Carbon, but this also includes the susceptibility for dirt and fingerprints. You can get the X1 Nano either with the black lid or a carbon fiber pattern, but the latter is just printed on the lid.
Lenovo still uses a magnesium alloy construction for the base unit, which is very sturdy. Twisting attempts are no problem, only the center area of the keyboard can be pushed down a bit under a lot of pressure. However, this should not be an issue in practice.
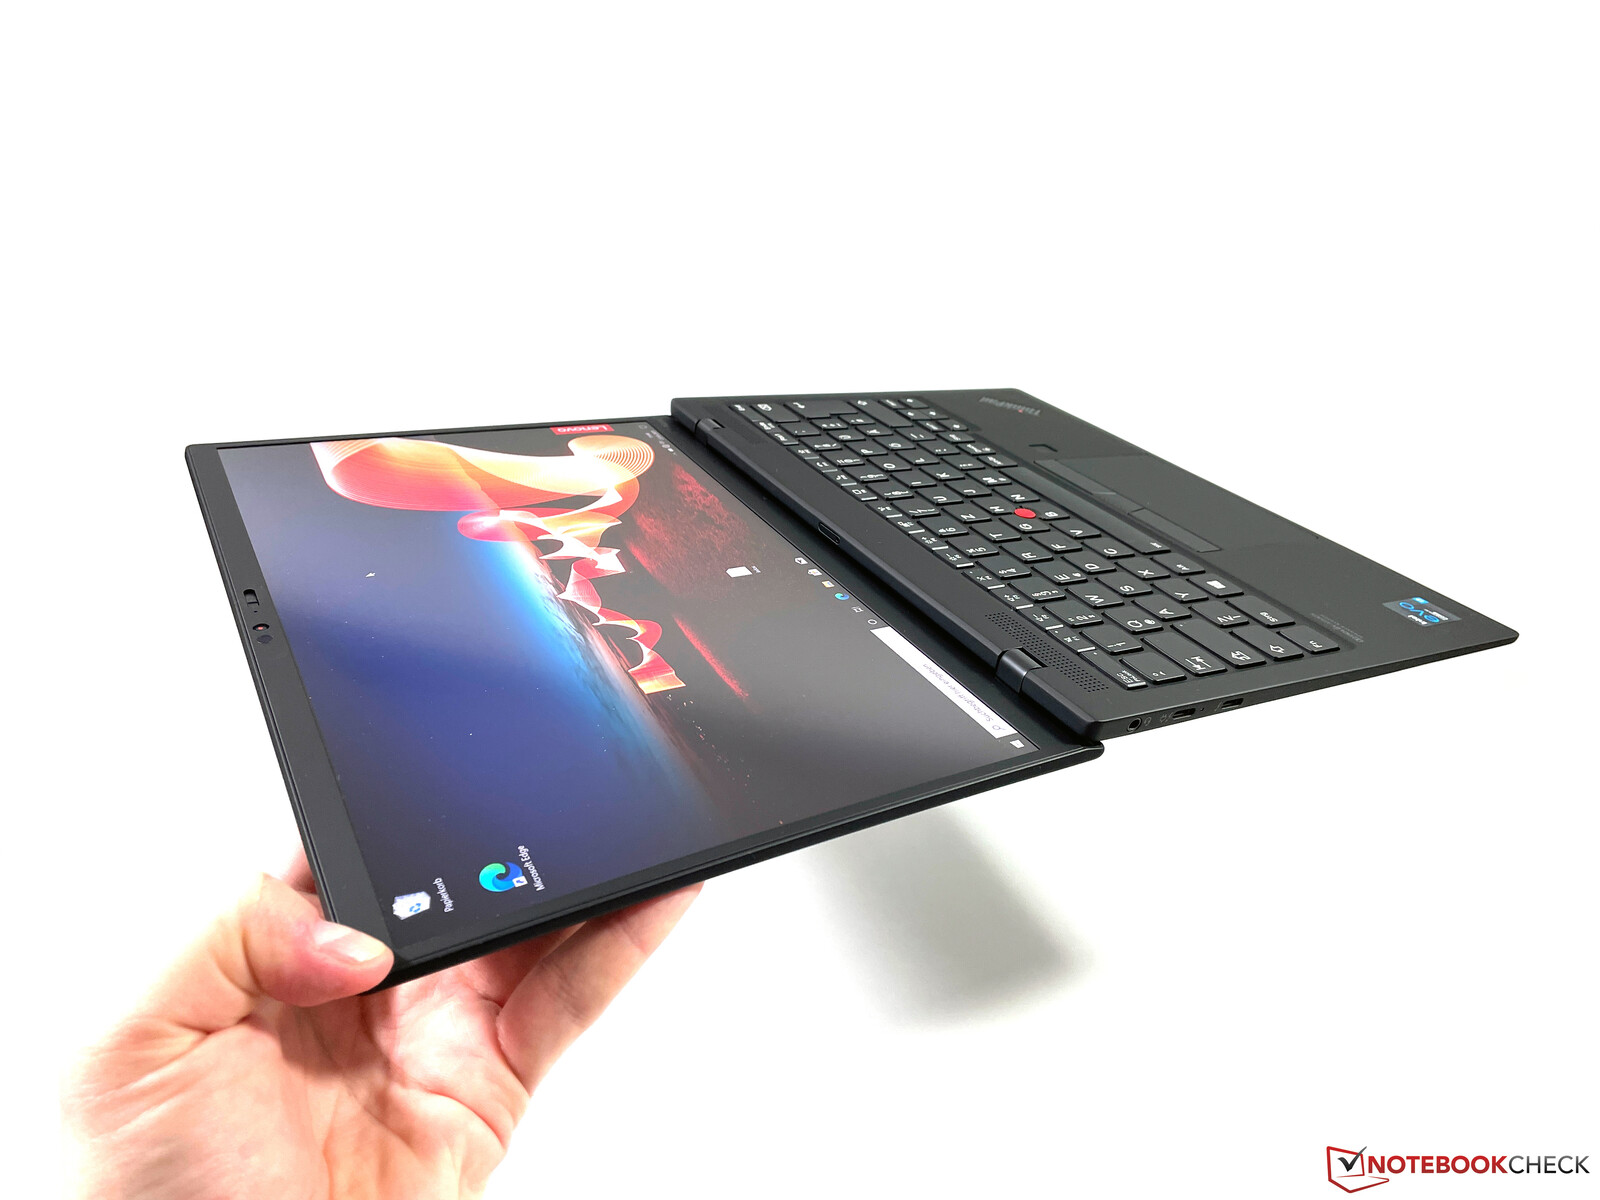
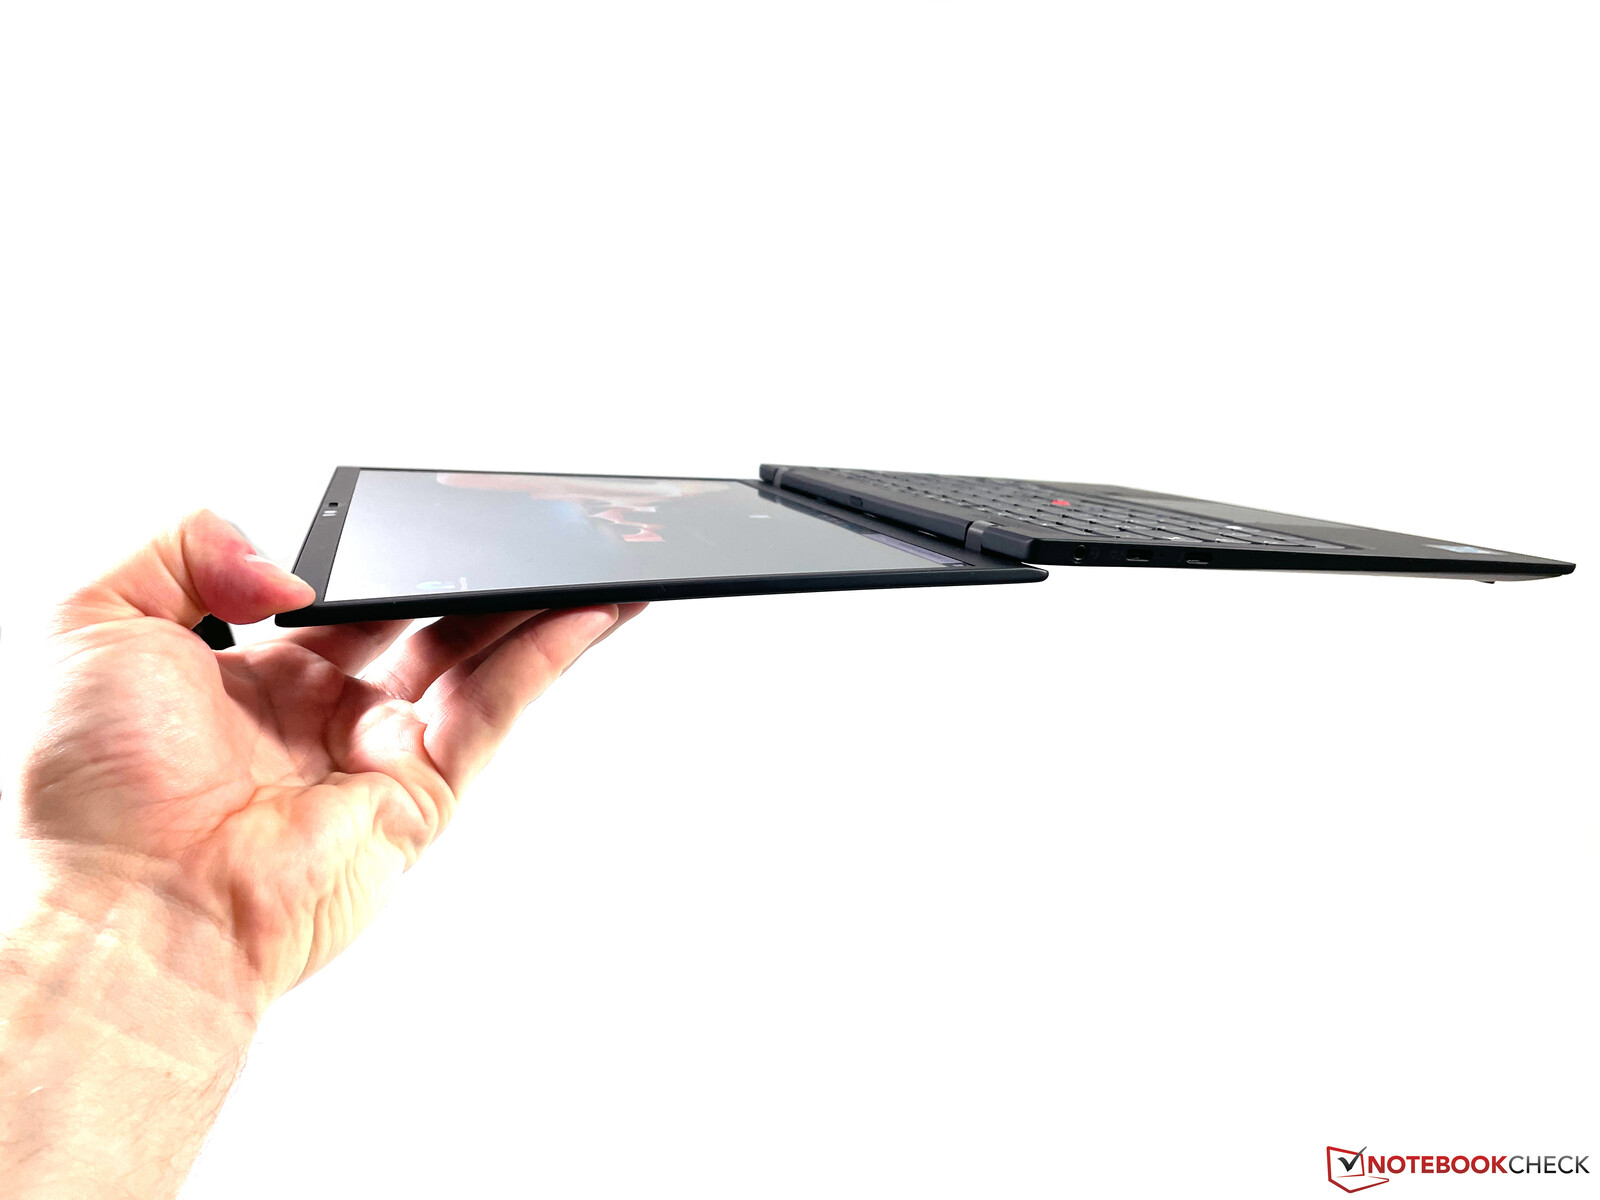
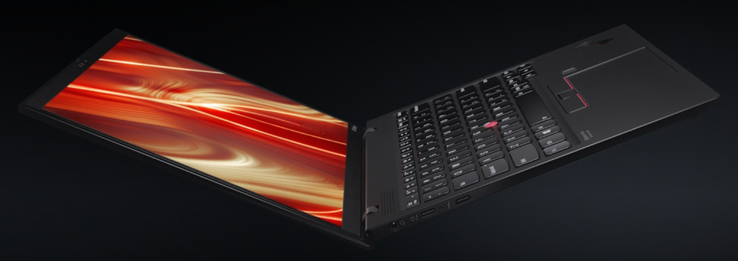
The lid is made of carbon fiber and also very sturdy. We cannot provoke picture distortions or ripples on the screen, even with a lot of concentrated pressure from behind. Twisting attempts are no problem, either, and you can even lift the whole laptop at one of the upper display corners as you can see in the two pictures (the brightness difference on the screen is a reflection from the background and no picture distortion caused by the lifting at the corner).
The two hinges are very well adjusted, because they keep the display securely in position at every opening angle (up to 180 degrees). it is still possible to open the lid with just one hand. All in all, a very convincing performance of the new X1 Nano.
Only the XPS 13 is slightly thinner than the X1 Nano in our size comparison, and the two models are also neck and neck and the most compact ones here in terms of footprint.
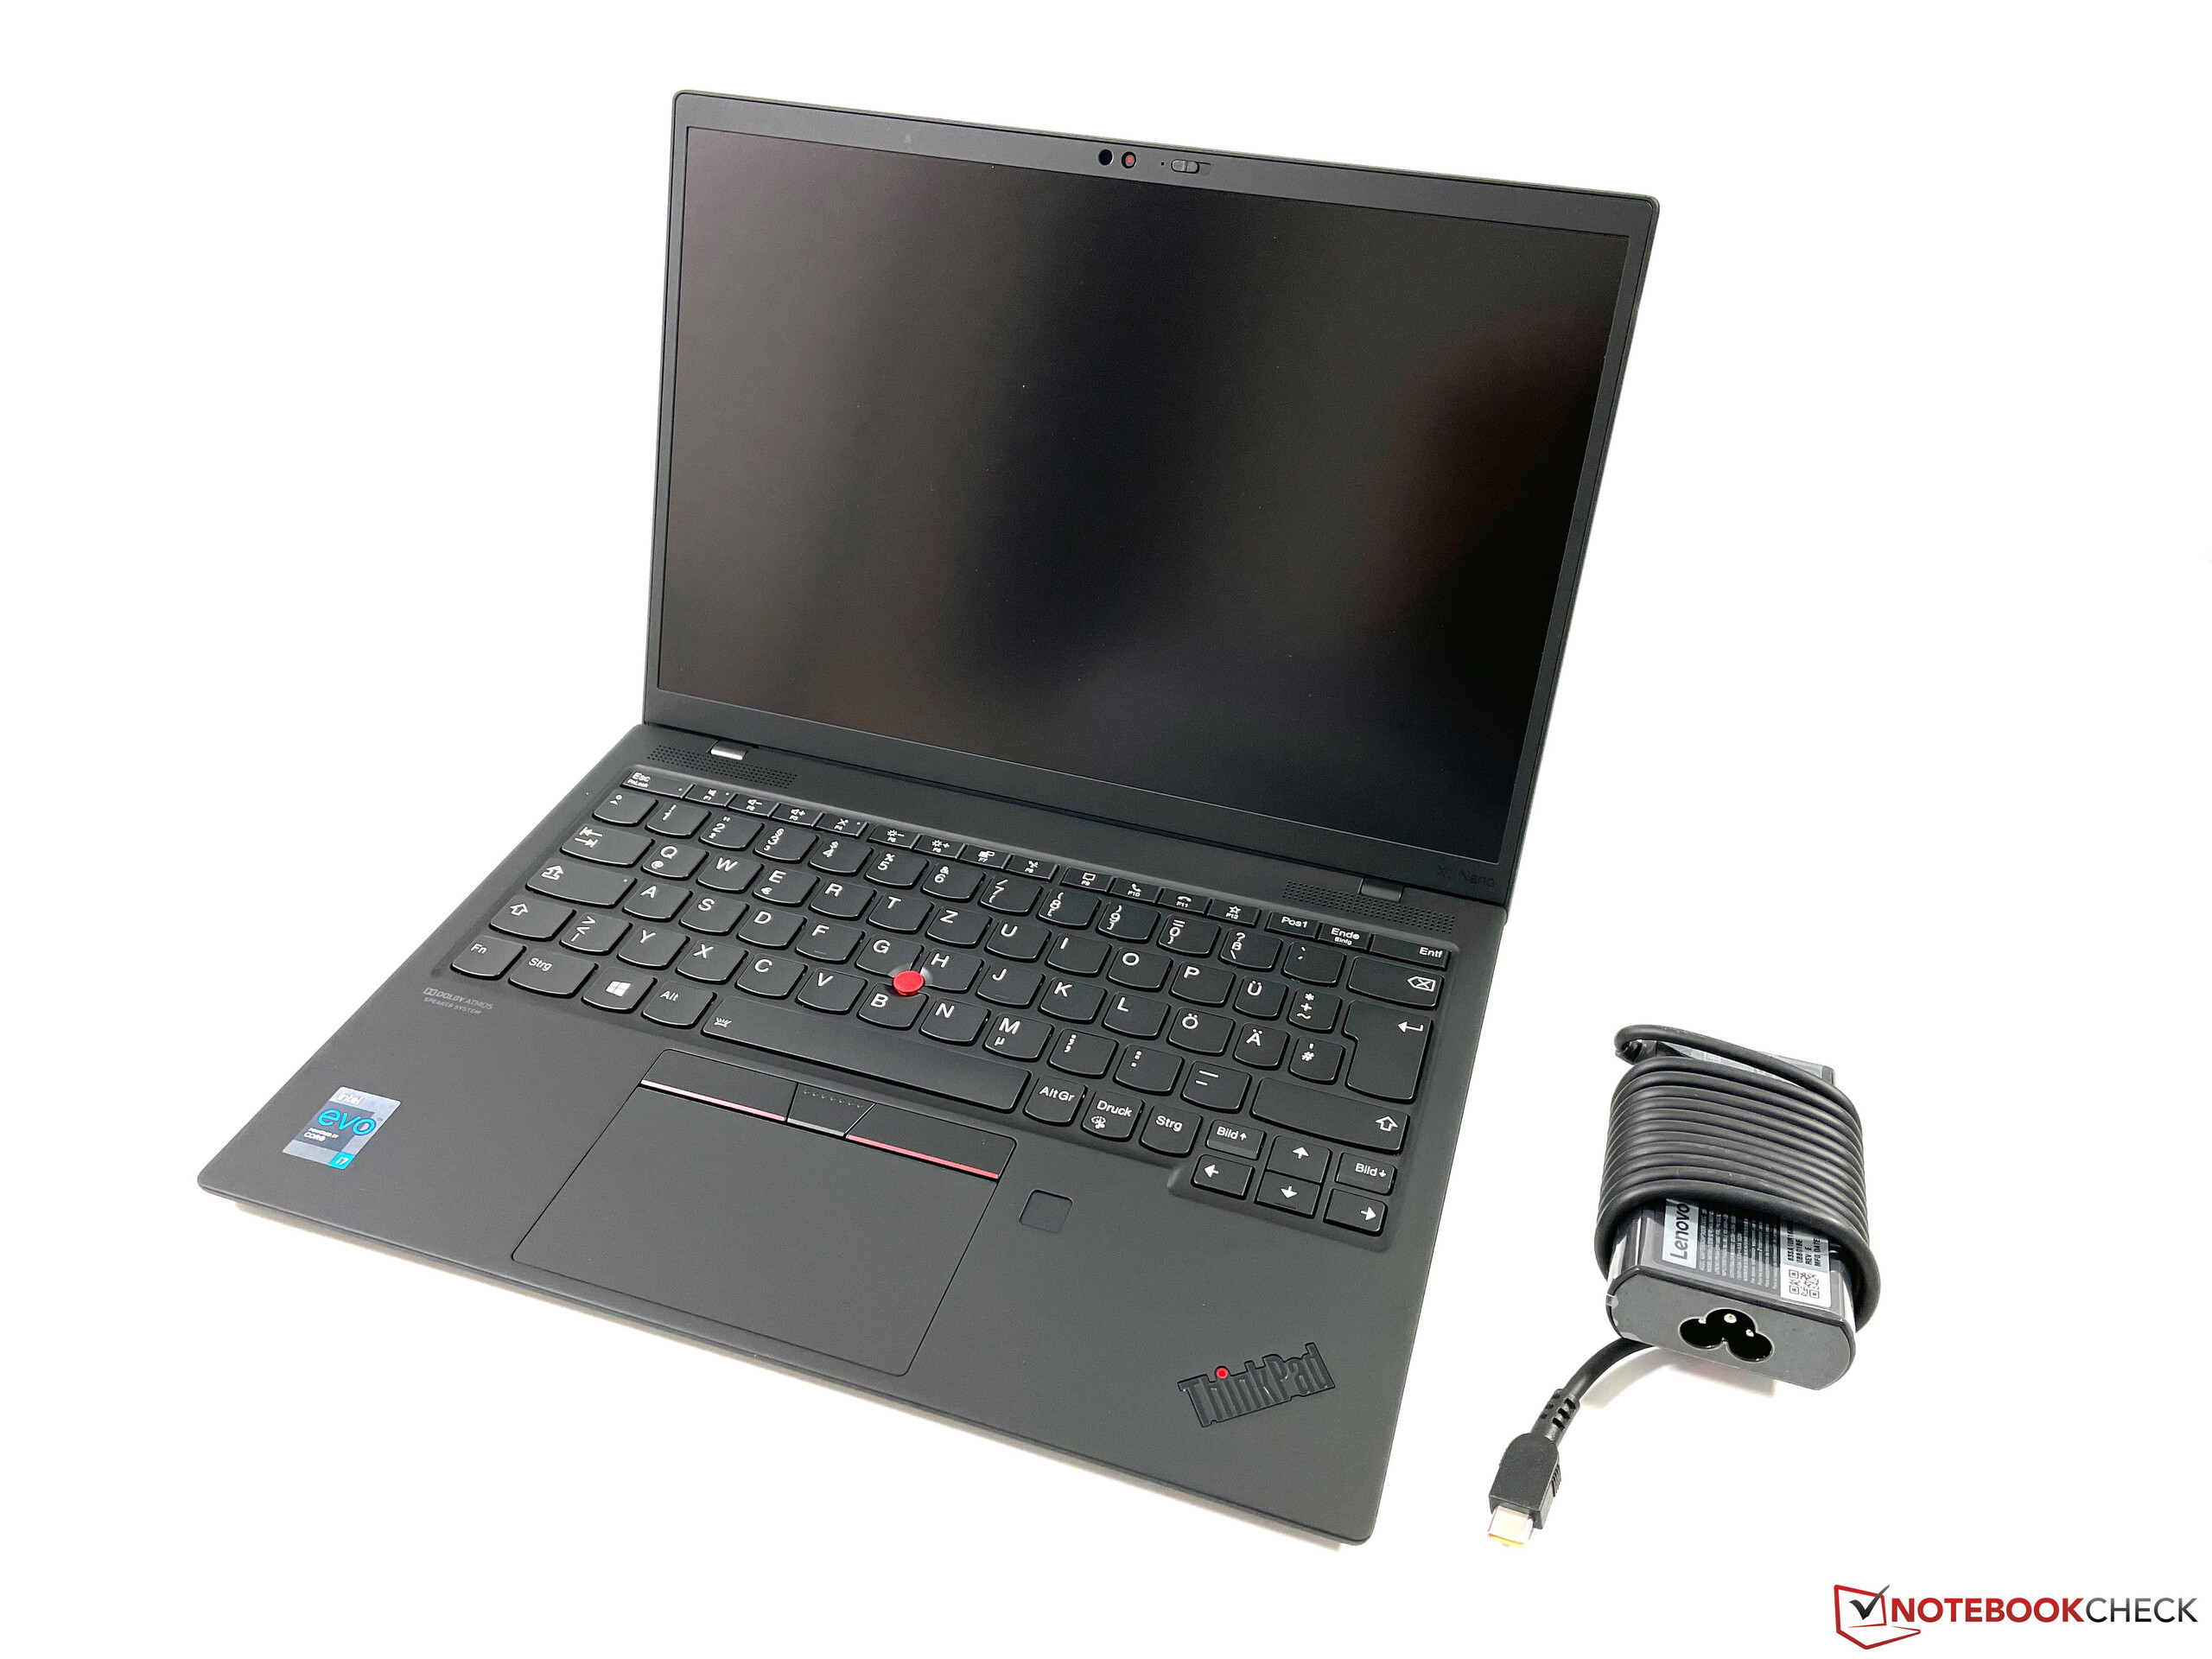
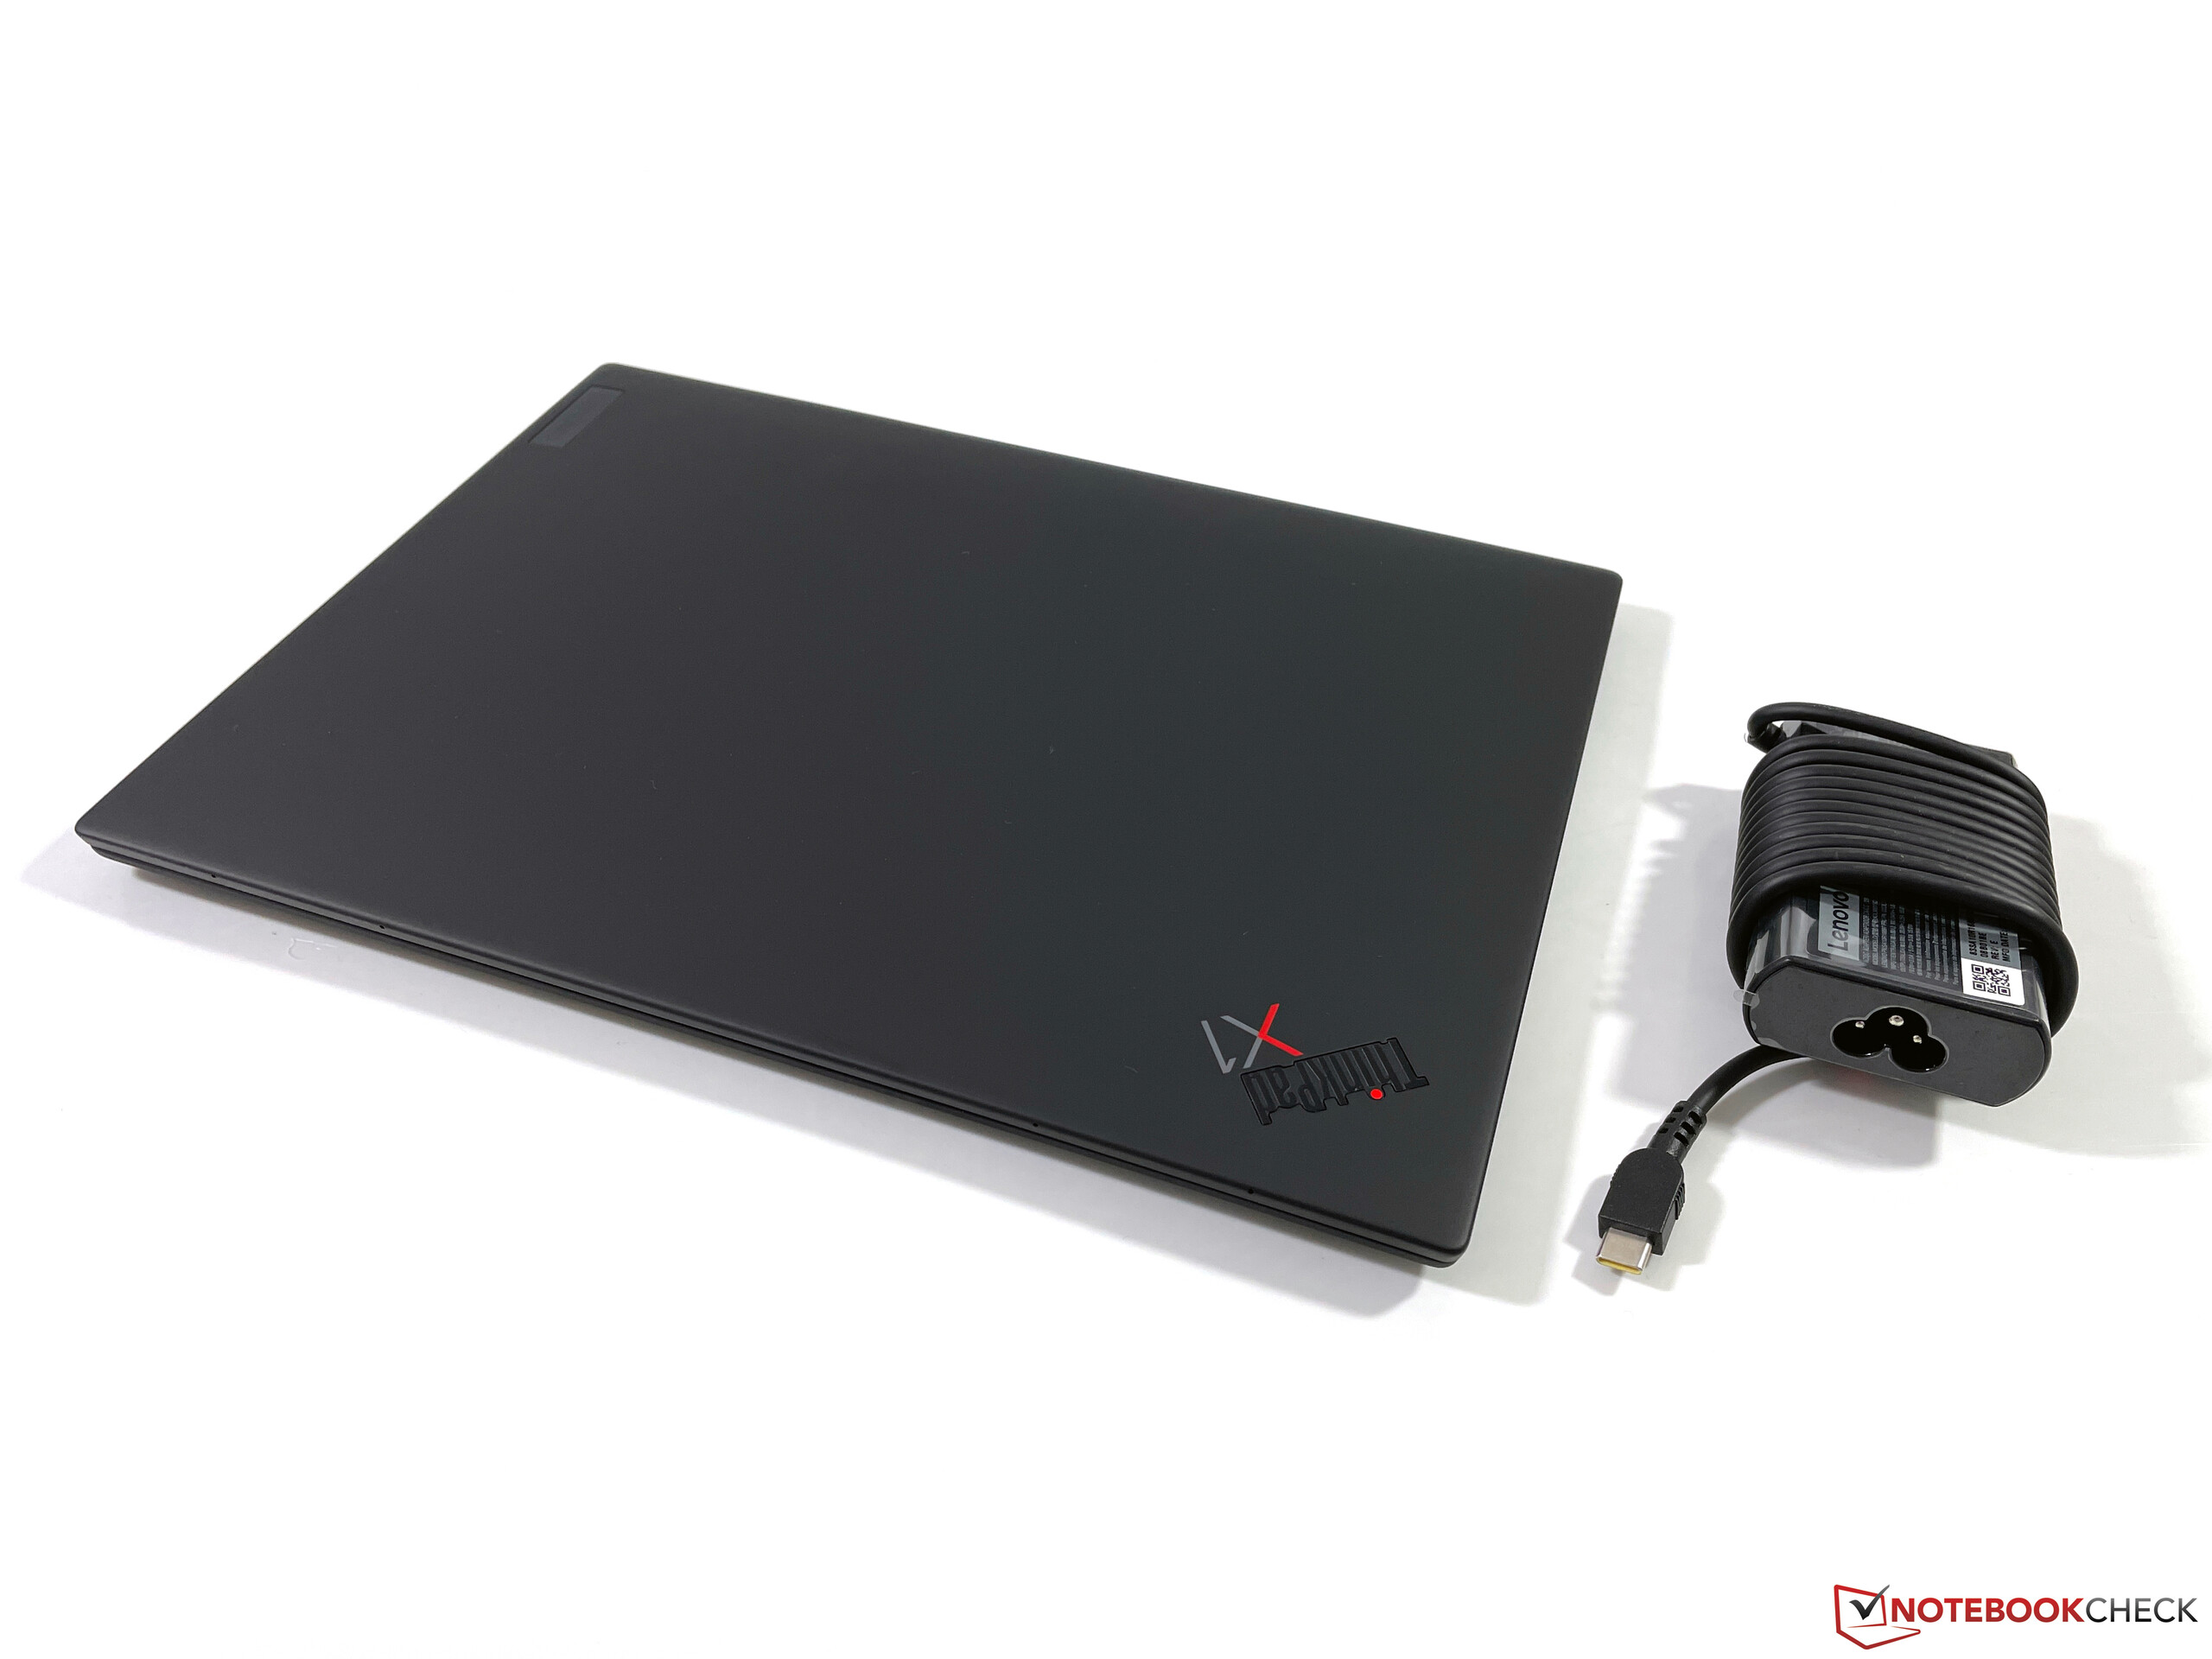
The X1 Nano has the edge when we look at the weight, and especially the XPS 13 and the MacBook Air are more than 300 grams heavier. The compact 65W power adapter tips the scale at 323 grams.
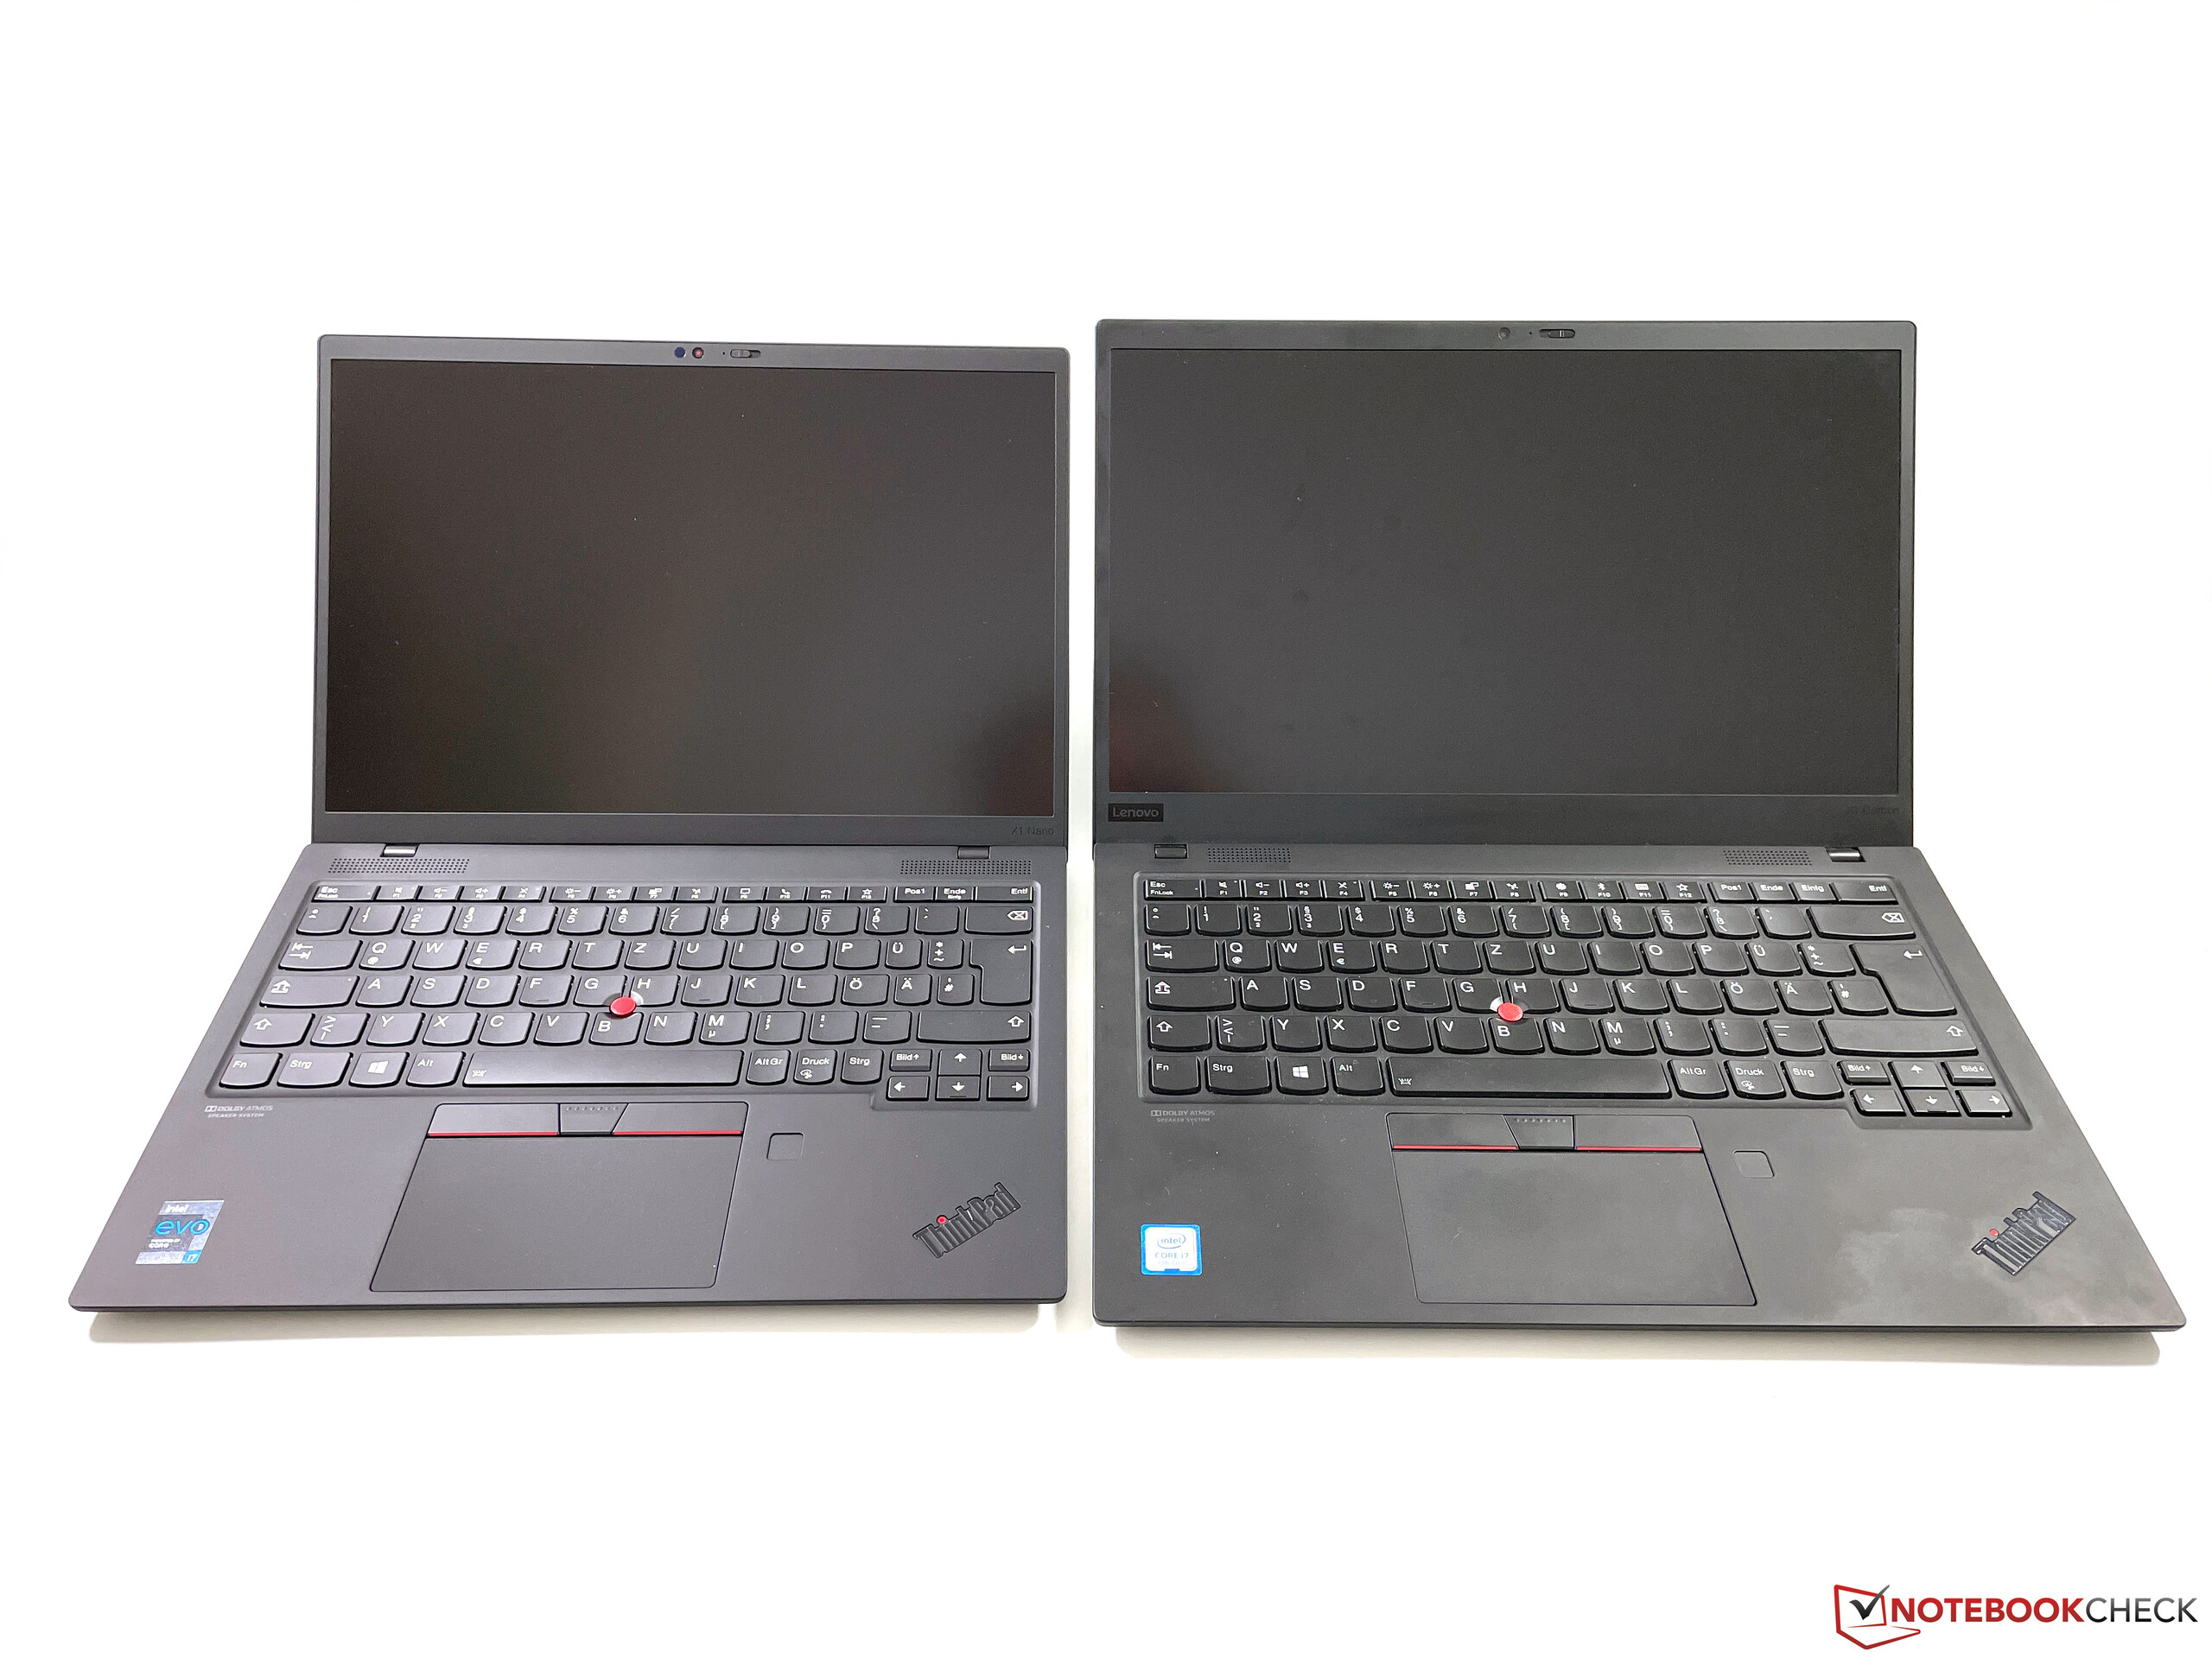
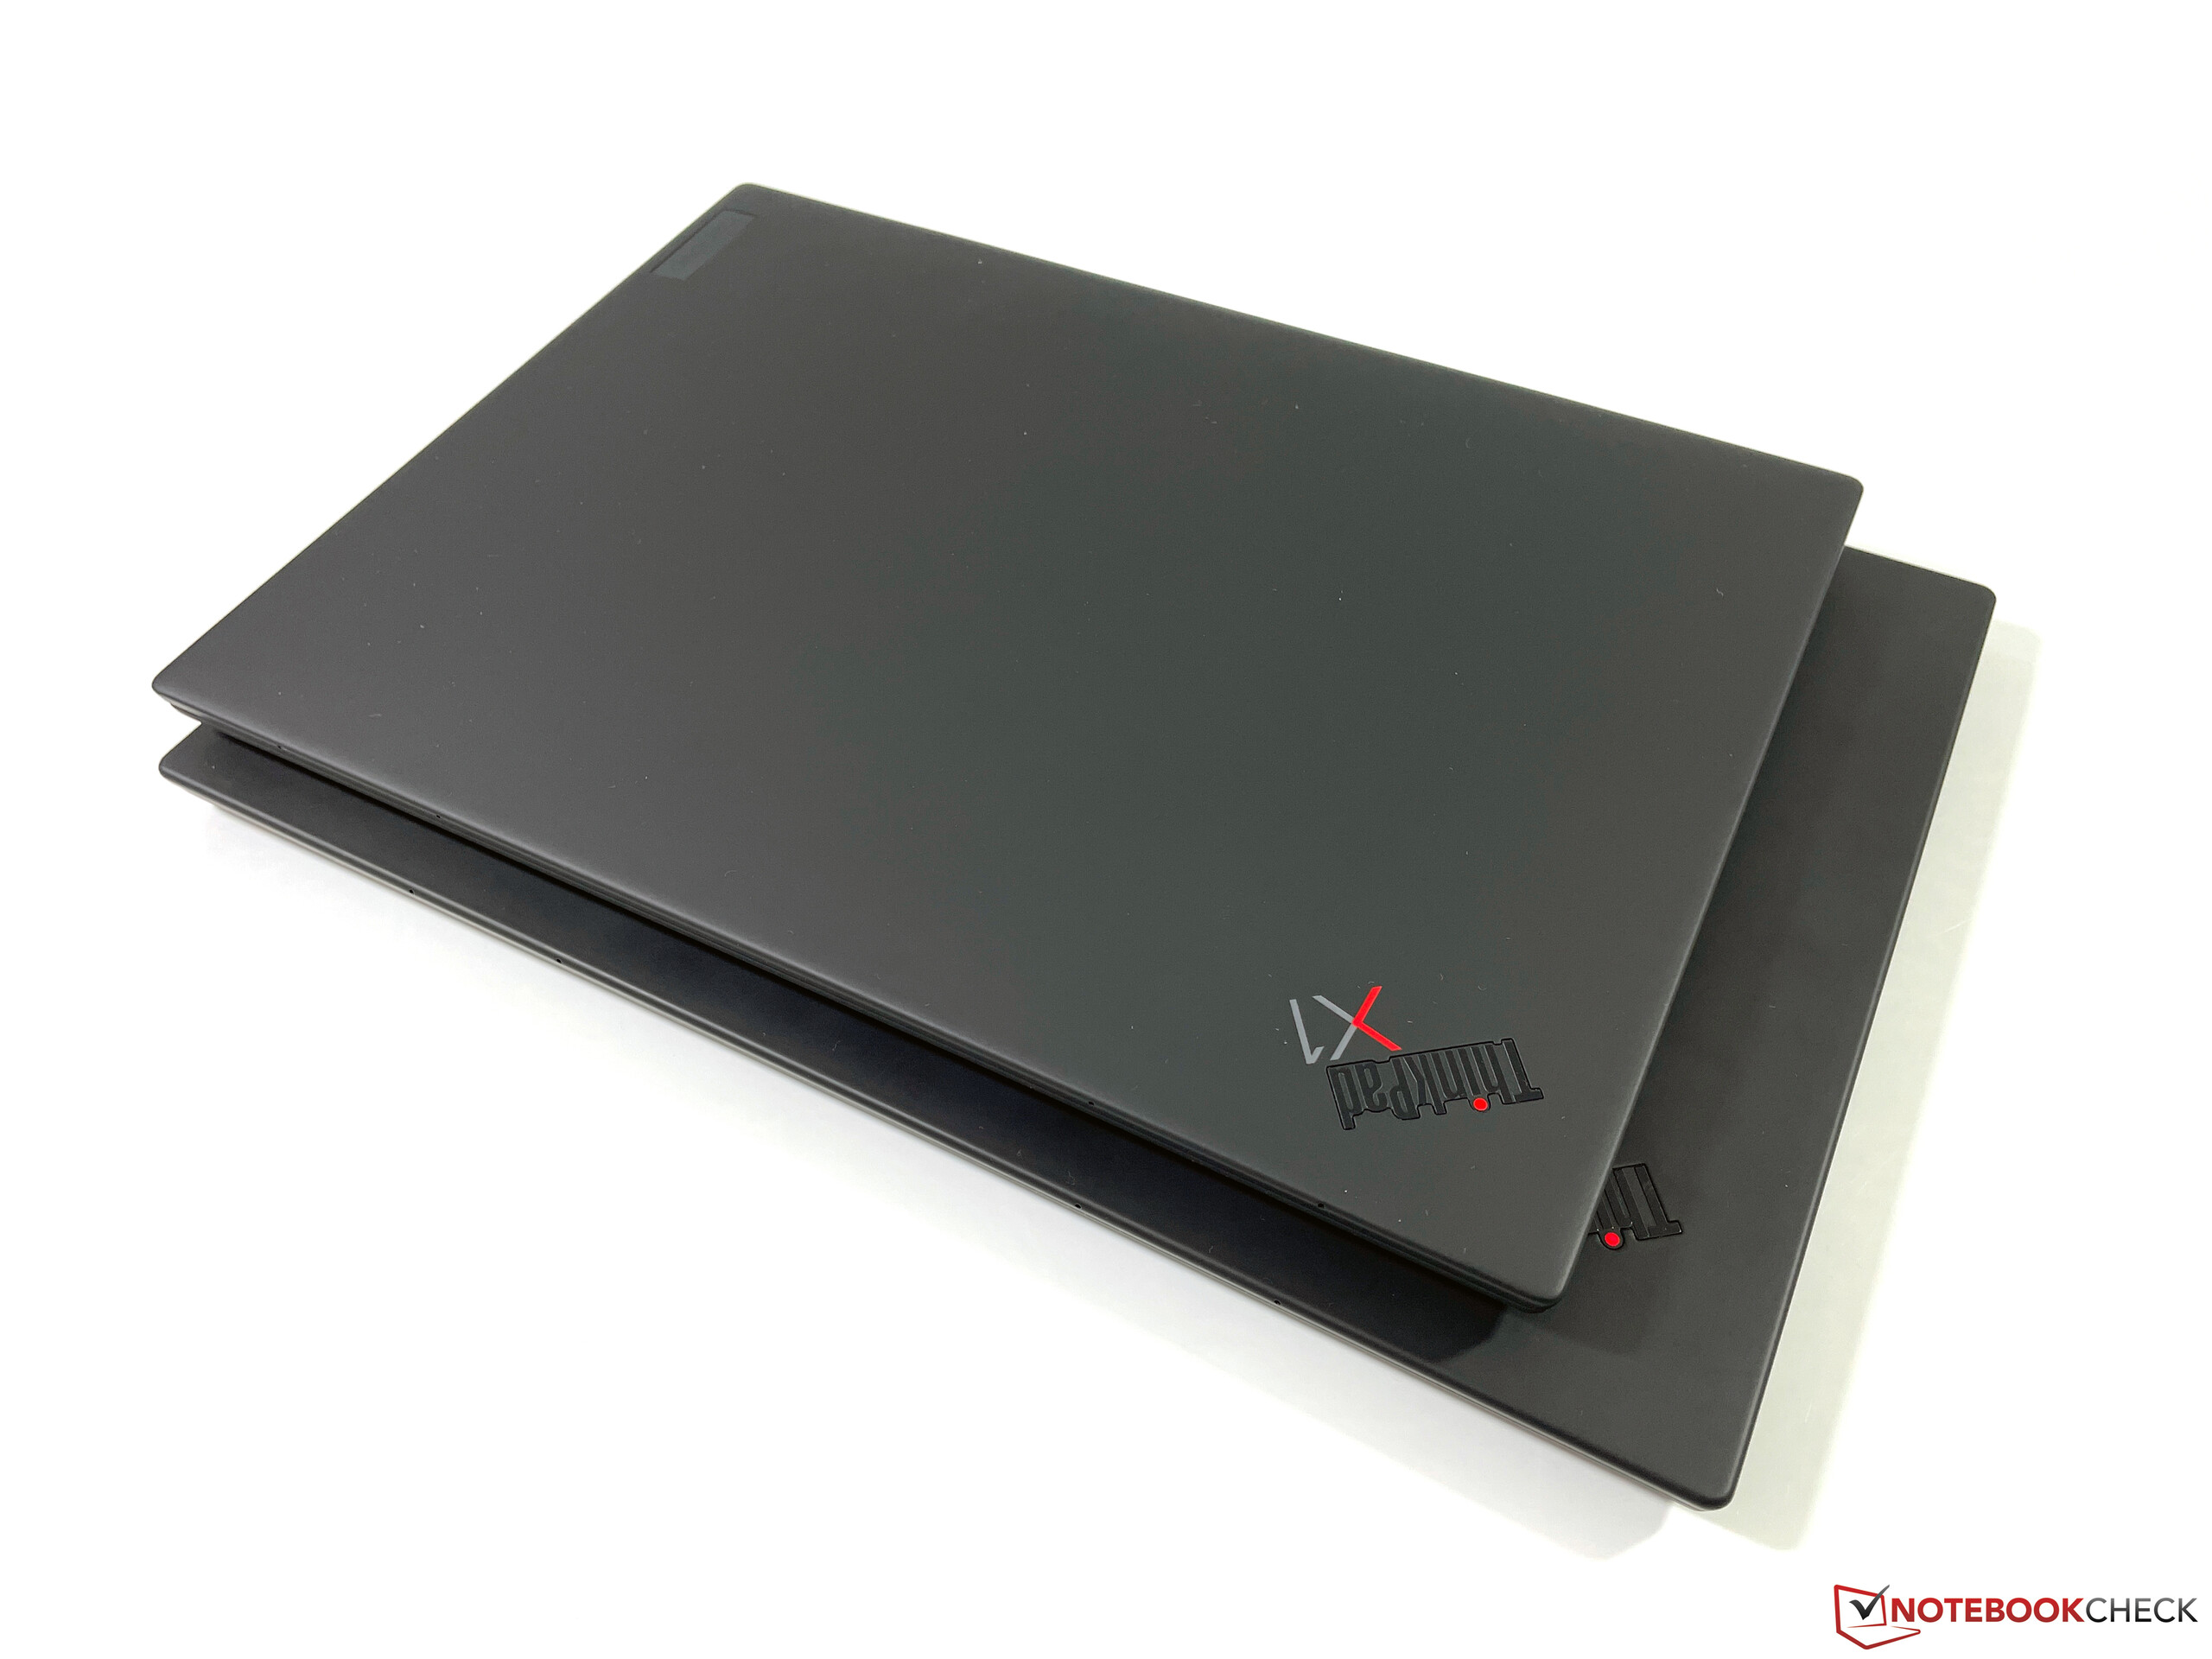
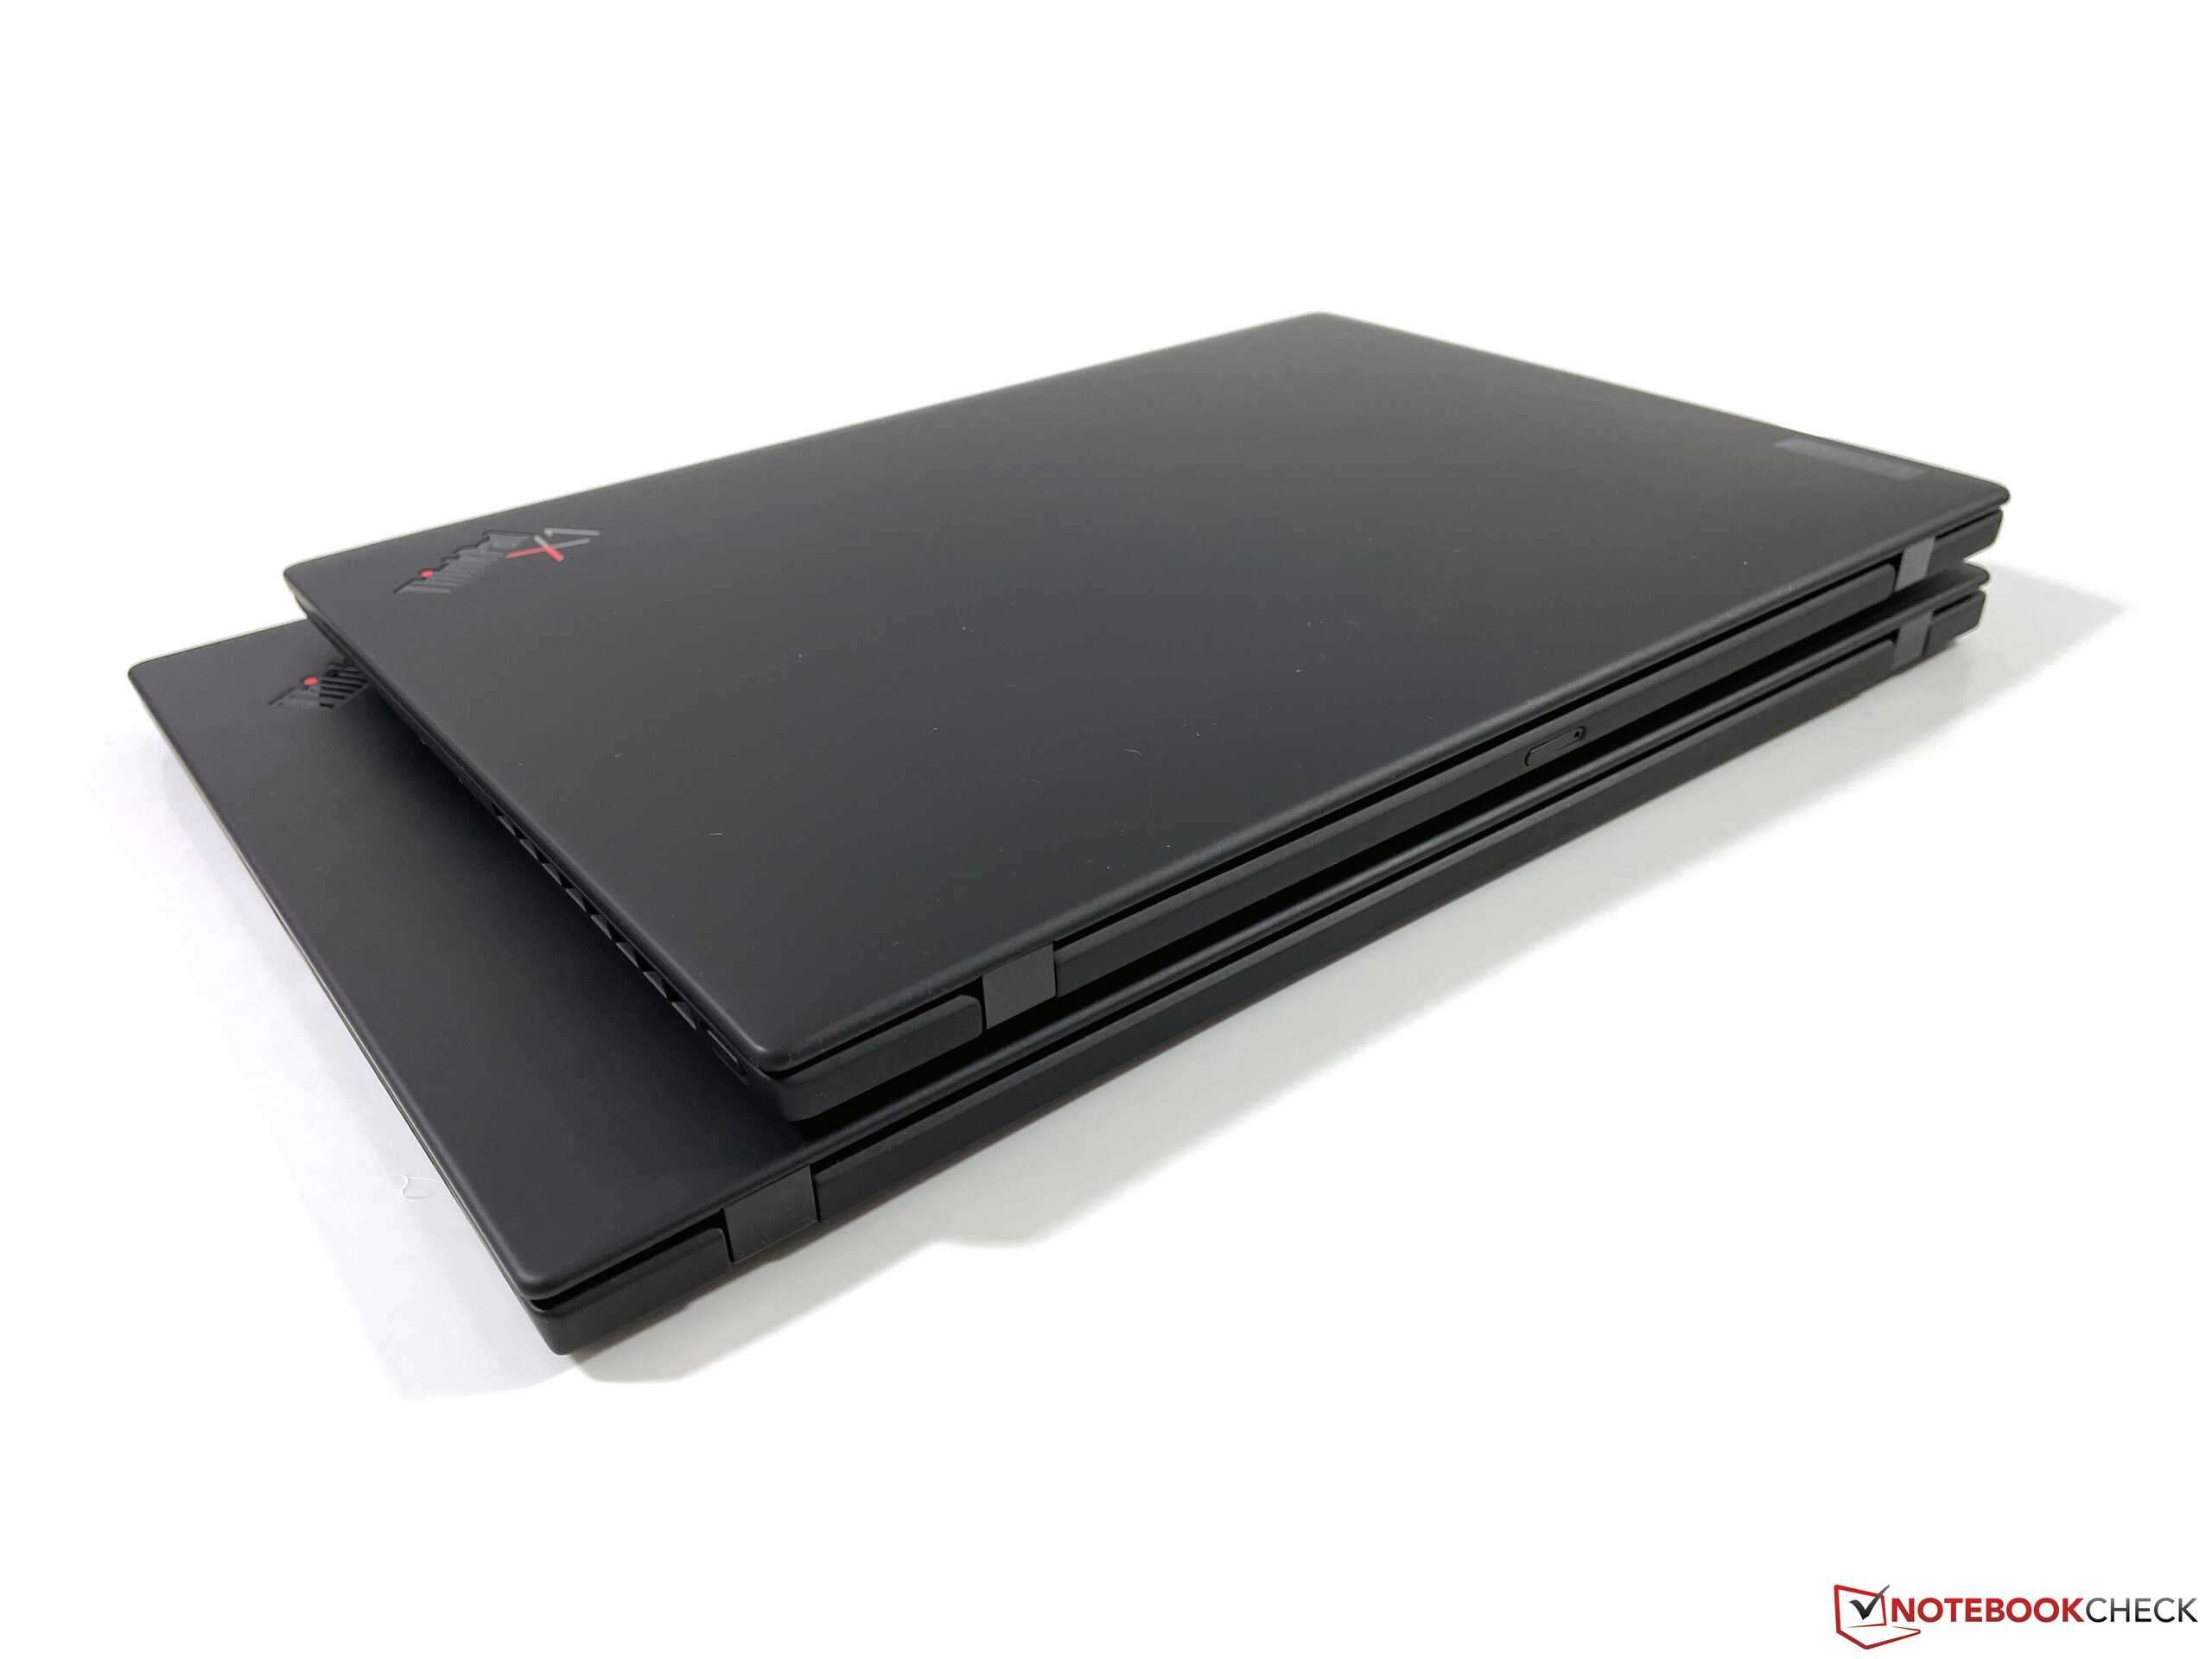
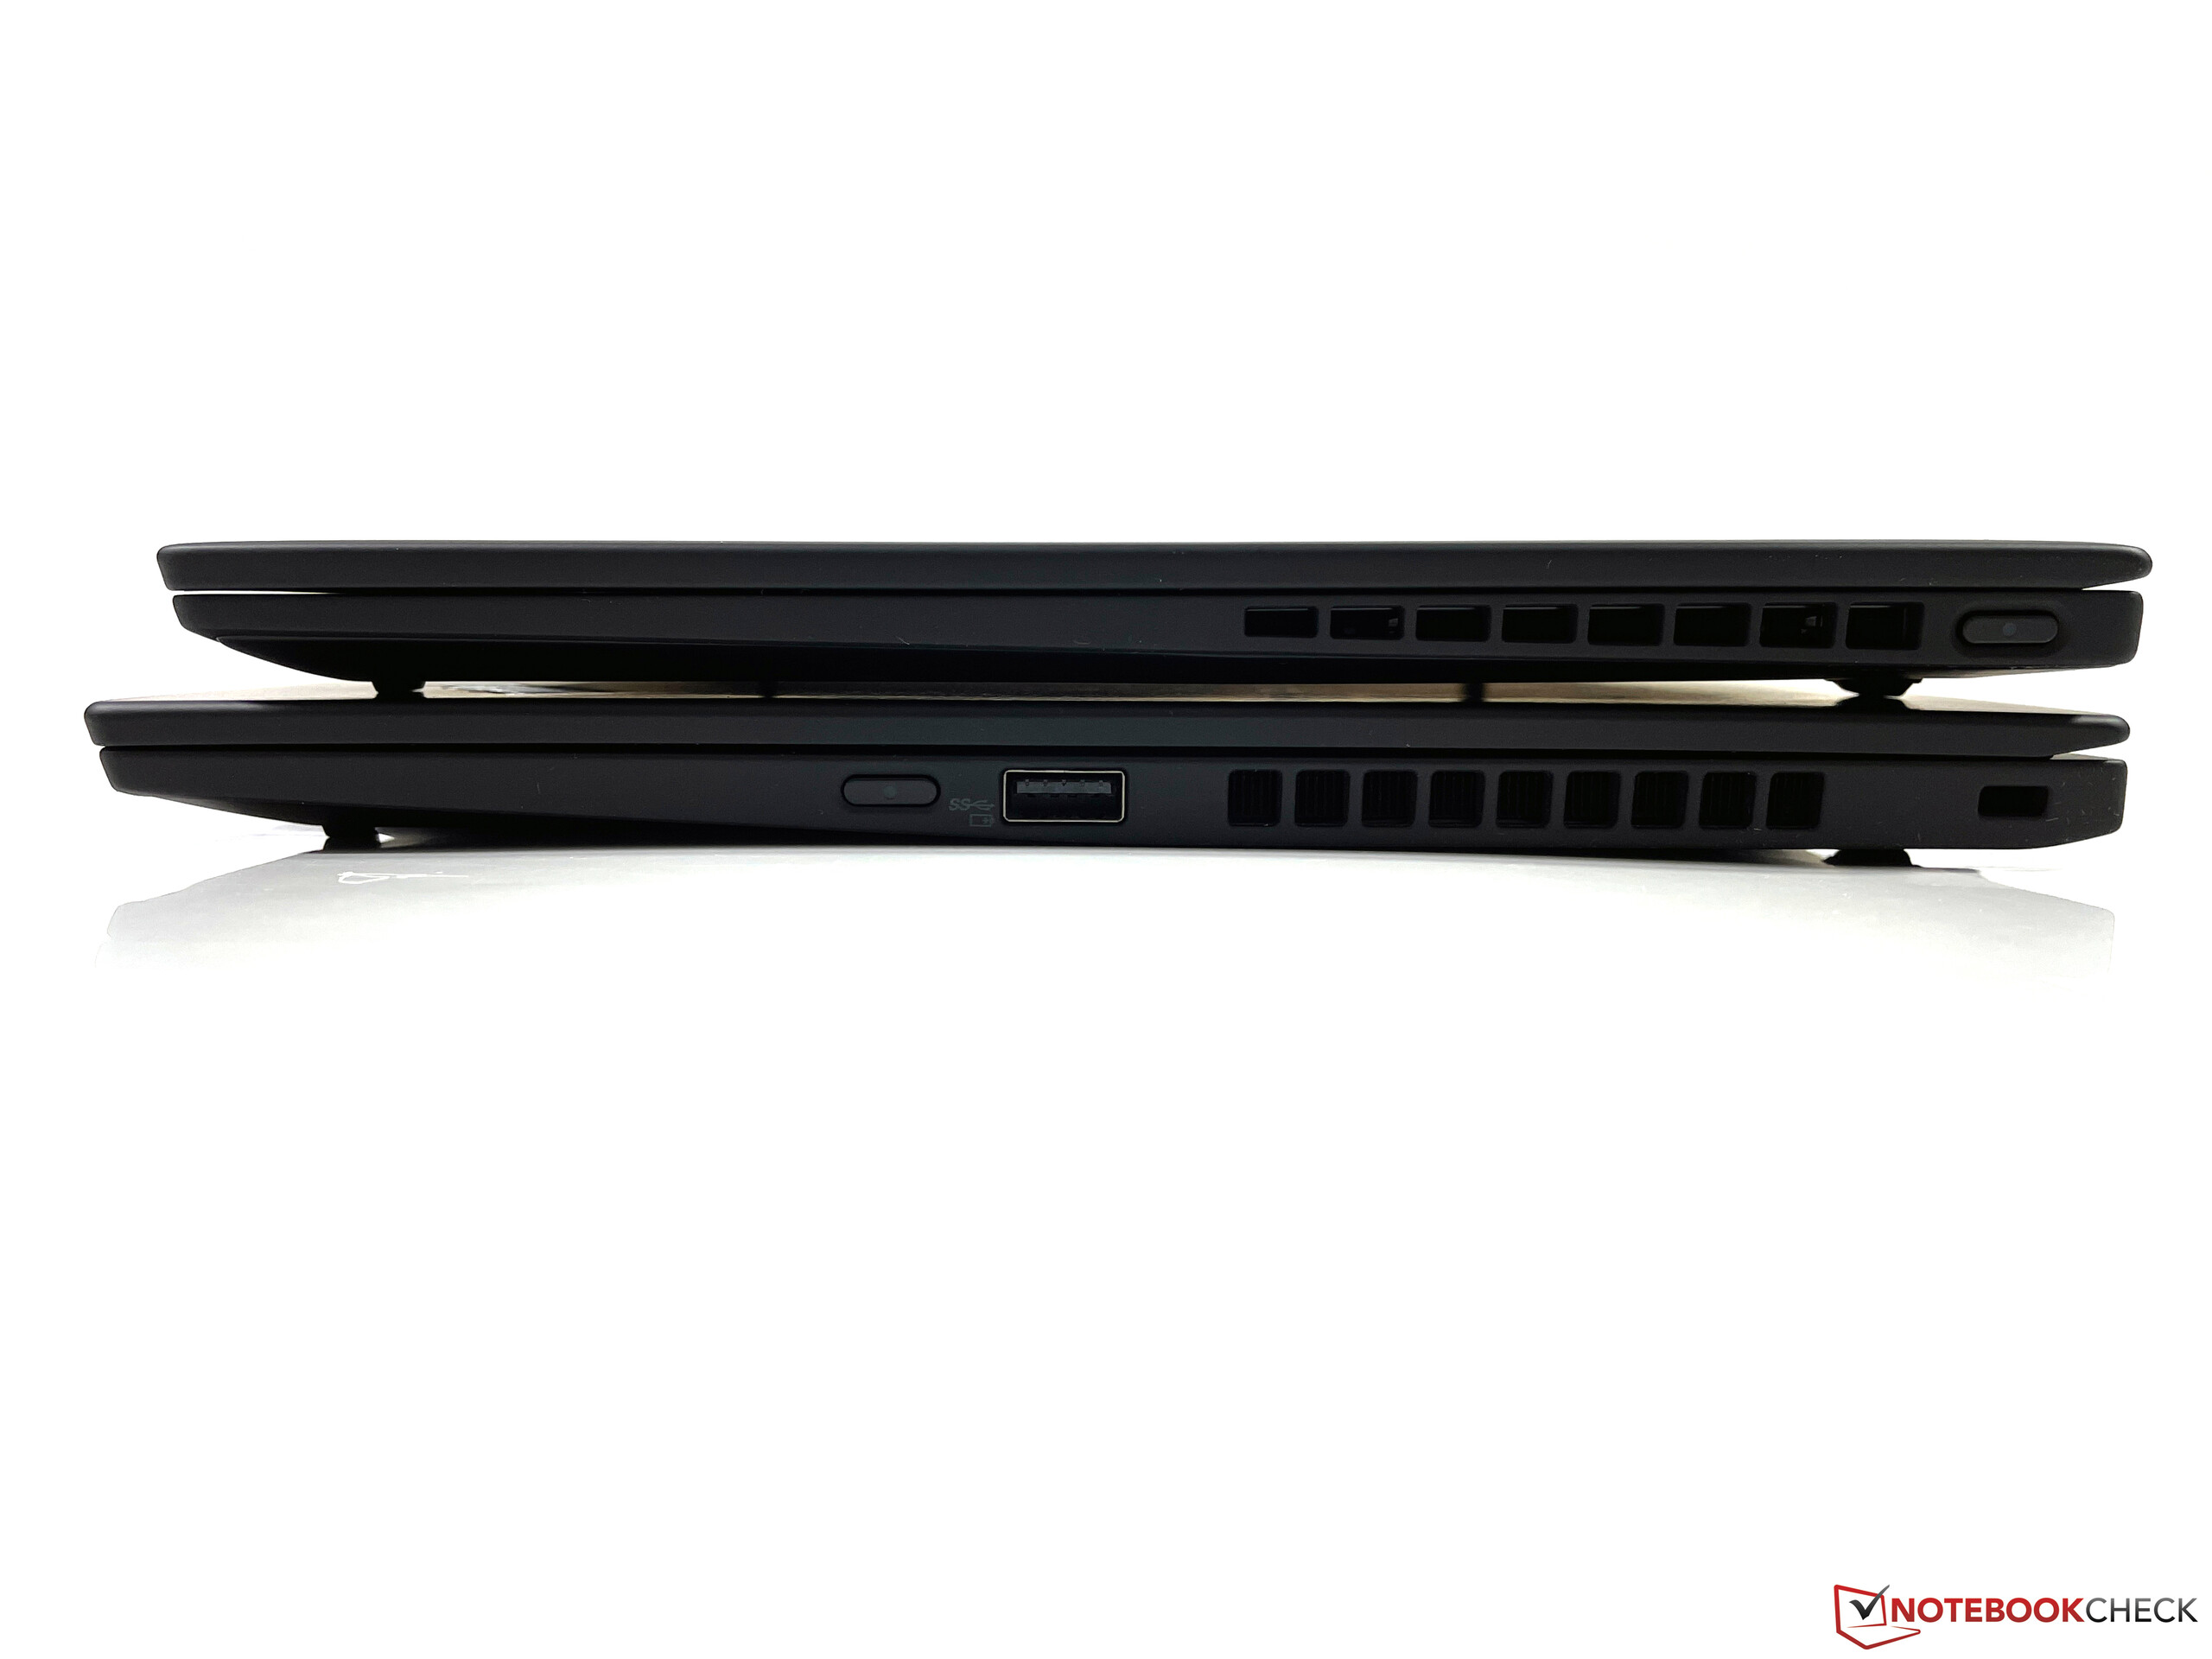
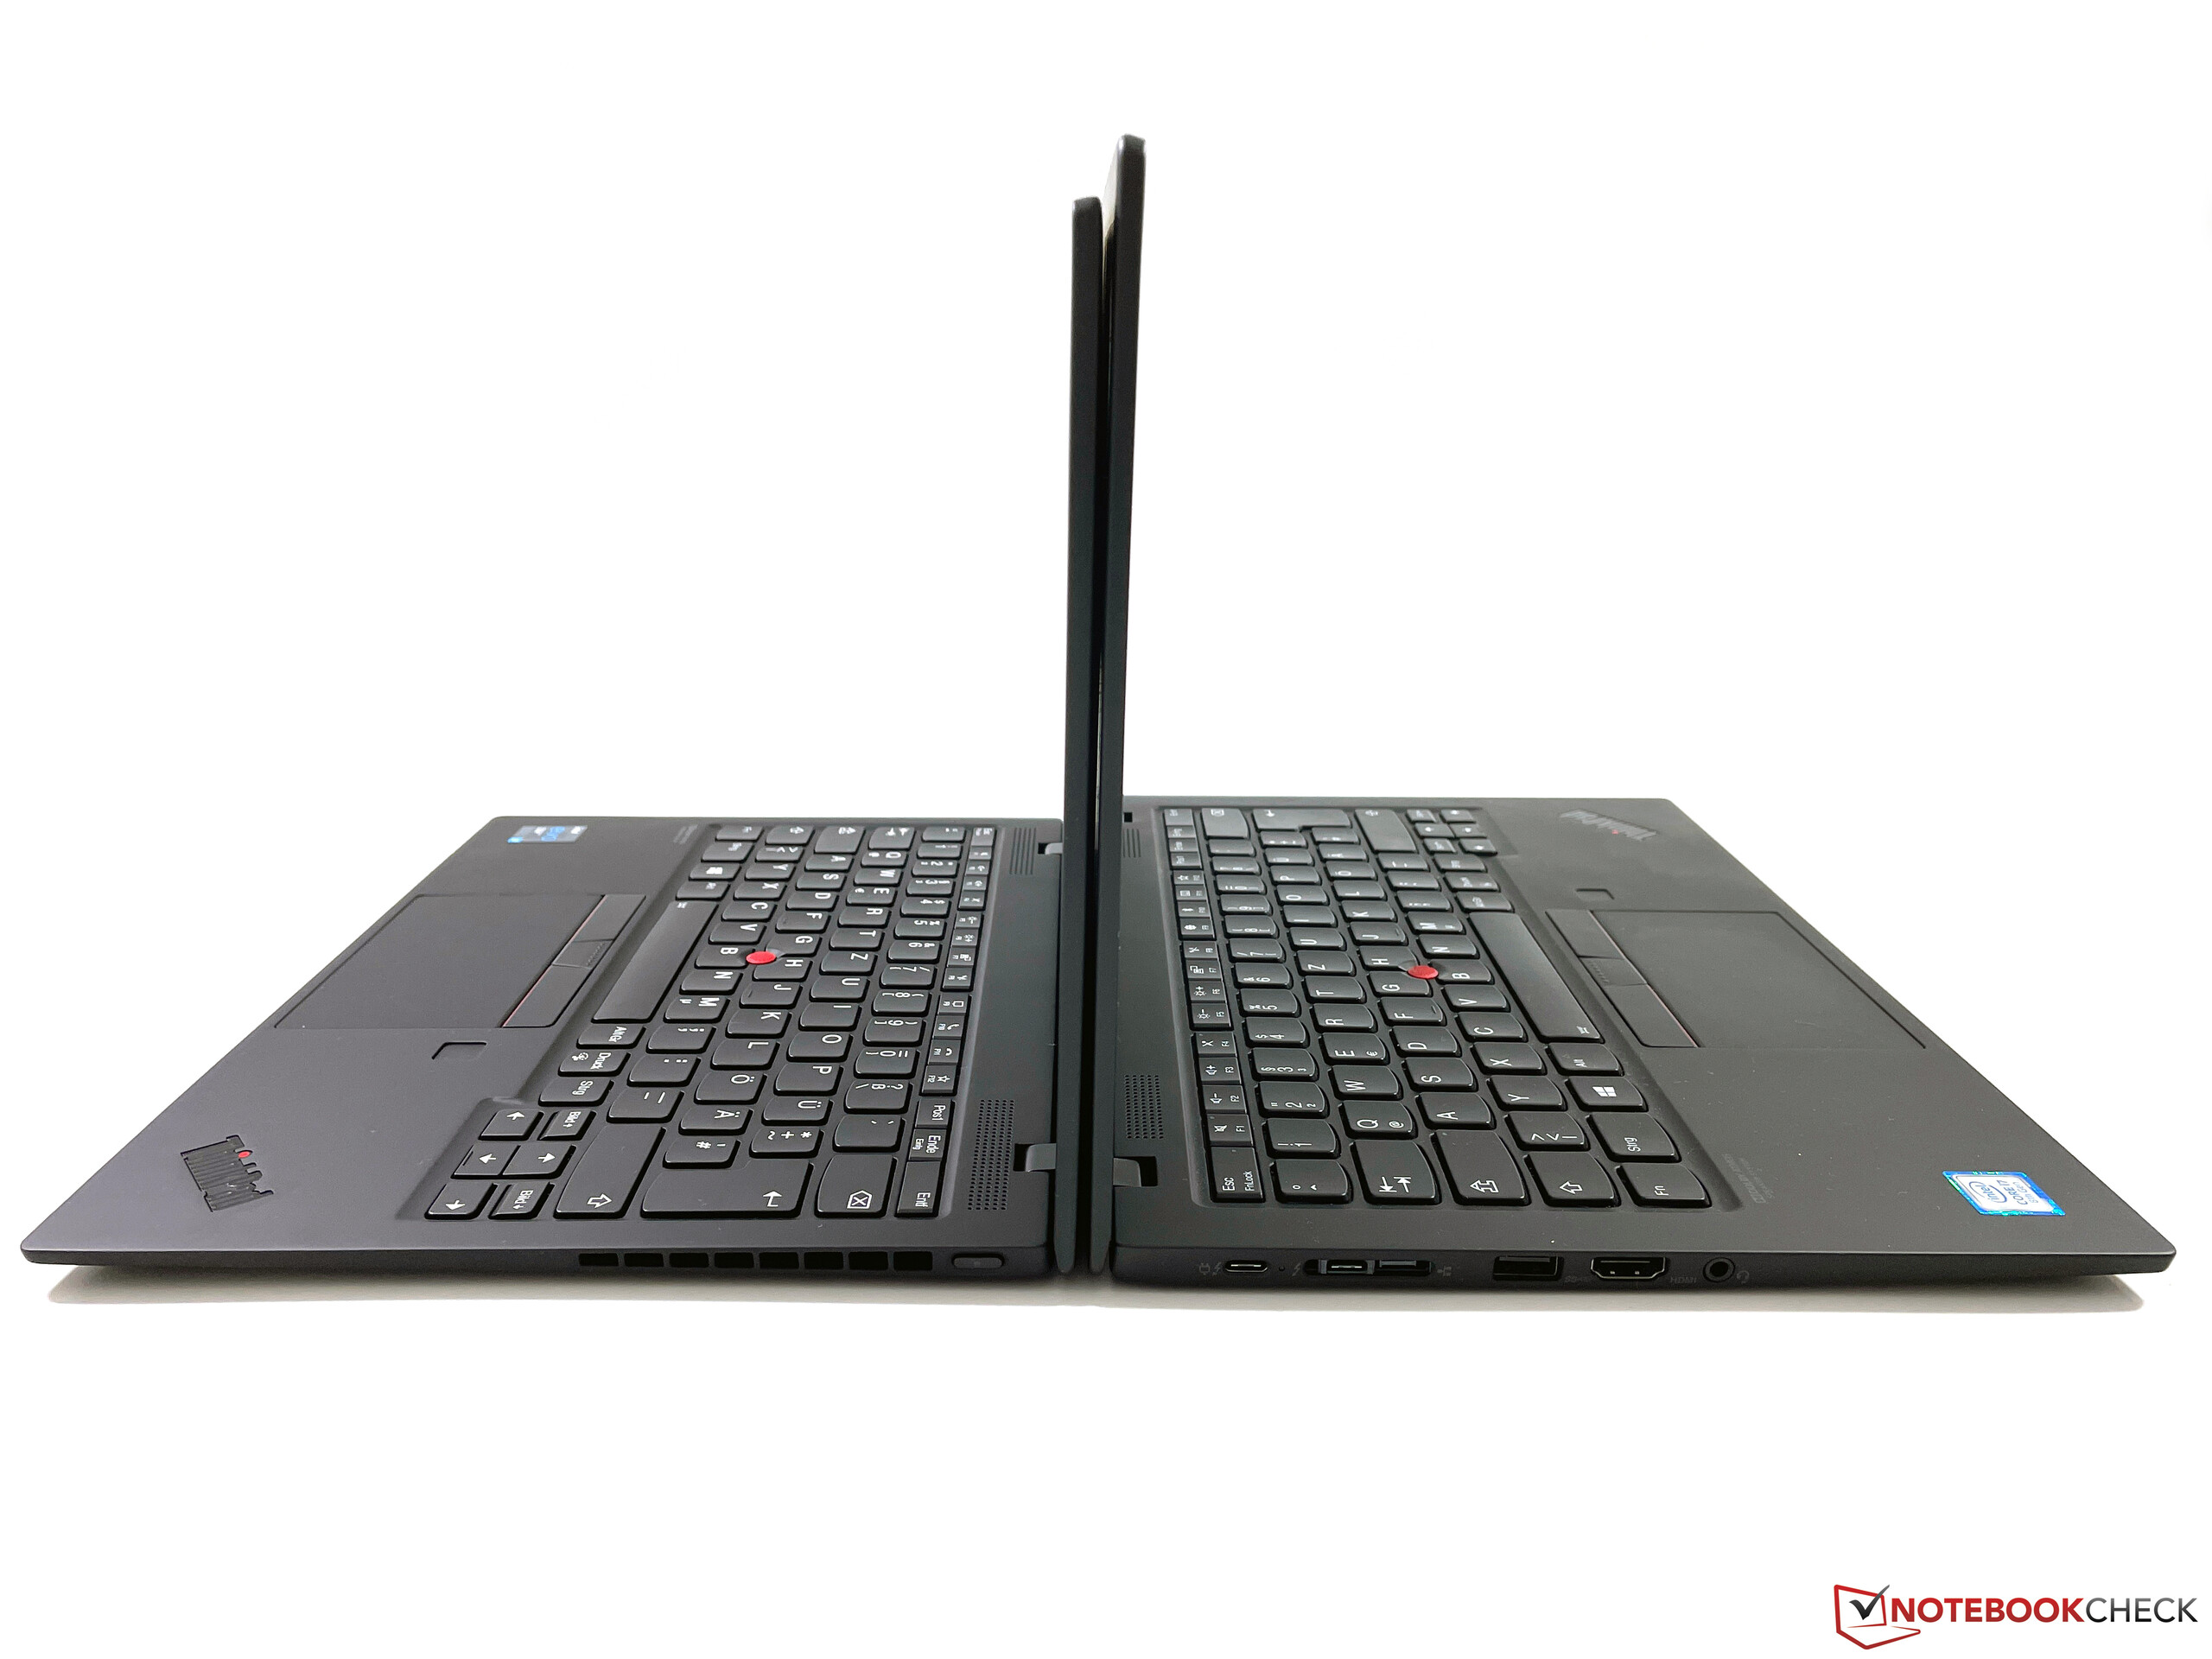
X1 Nano vs. X1 Carbon
Even though the X1 Carbon G7 is not a direct competitor to the new X1 Nano due to the larger screen, we still compared the two devices. The larger X1 Carbon is actually just ~130 grams heavier and the thickness is comparable as well. The footprint on the other hand is a noticeable difference. The X1 Carbon is already pretty compact for a 14-inch device, but the X1 Nano is noticeably smaller.
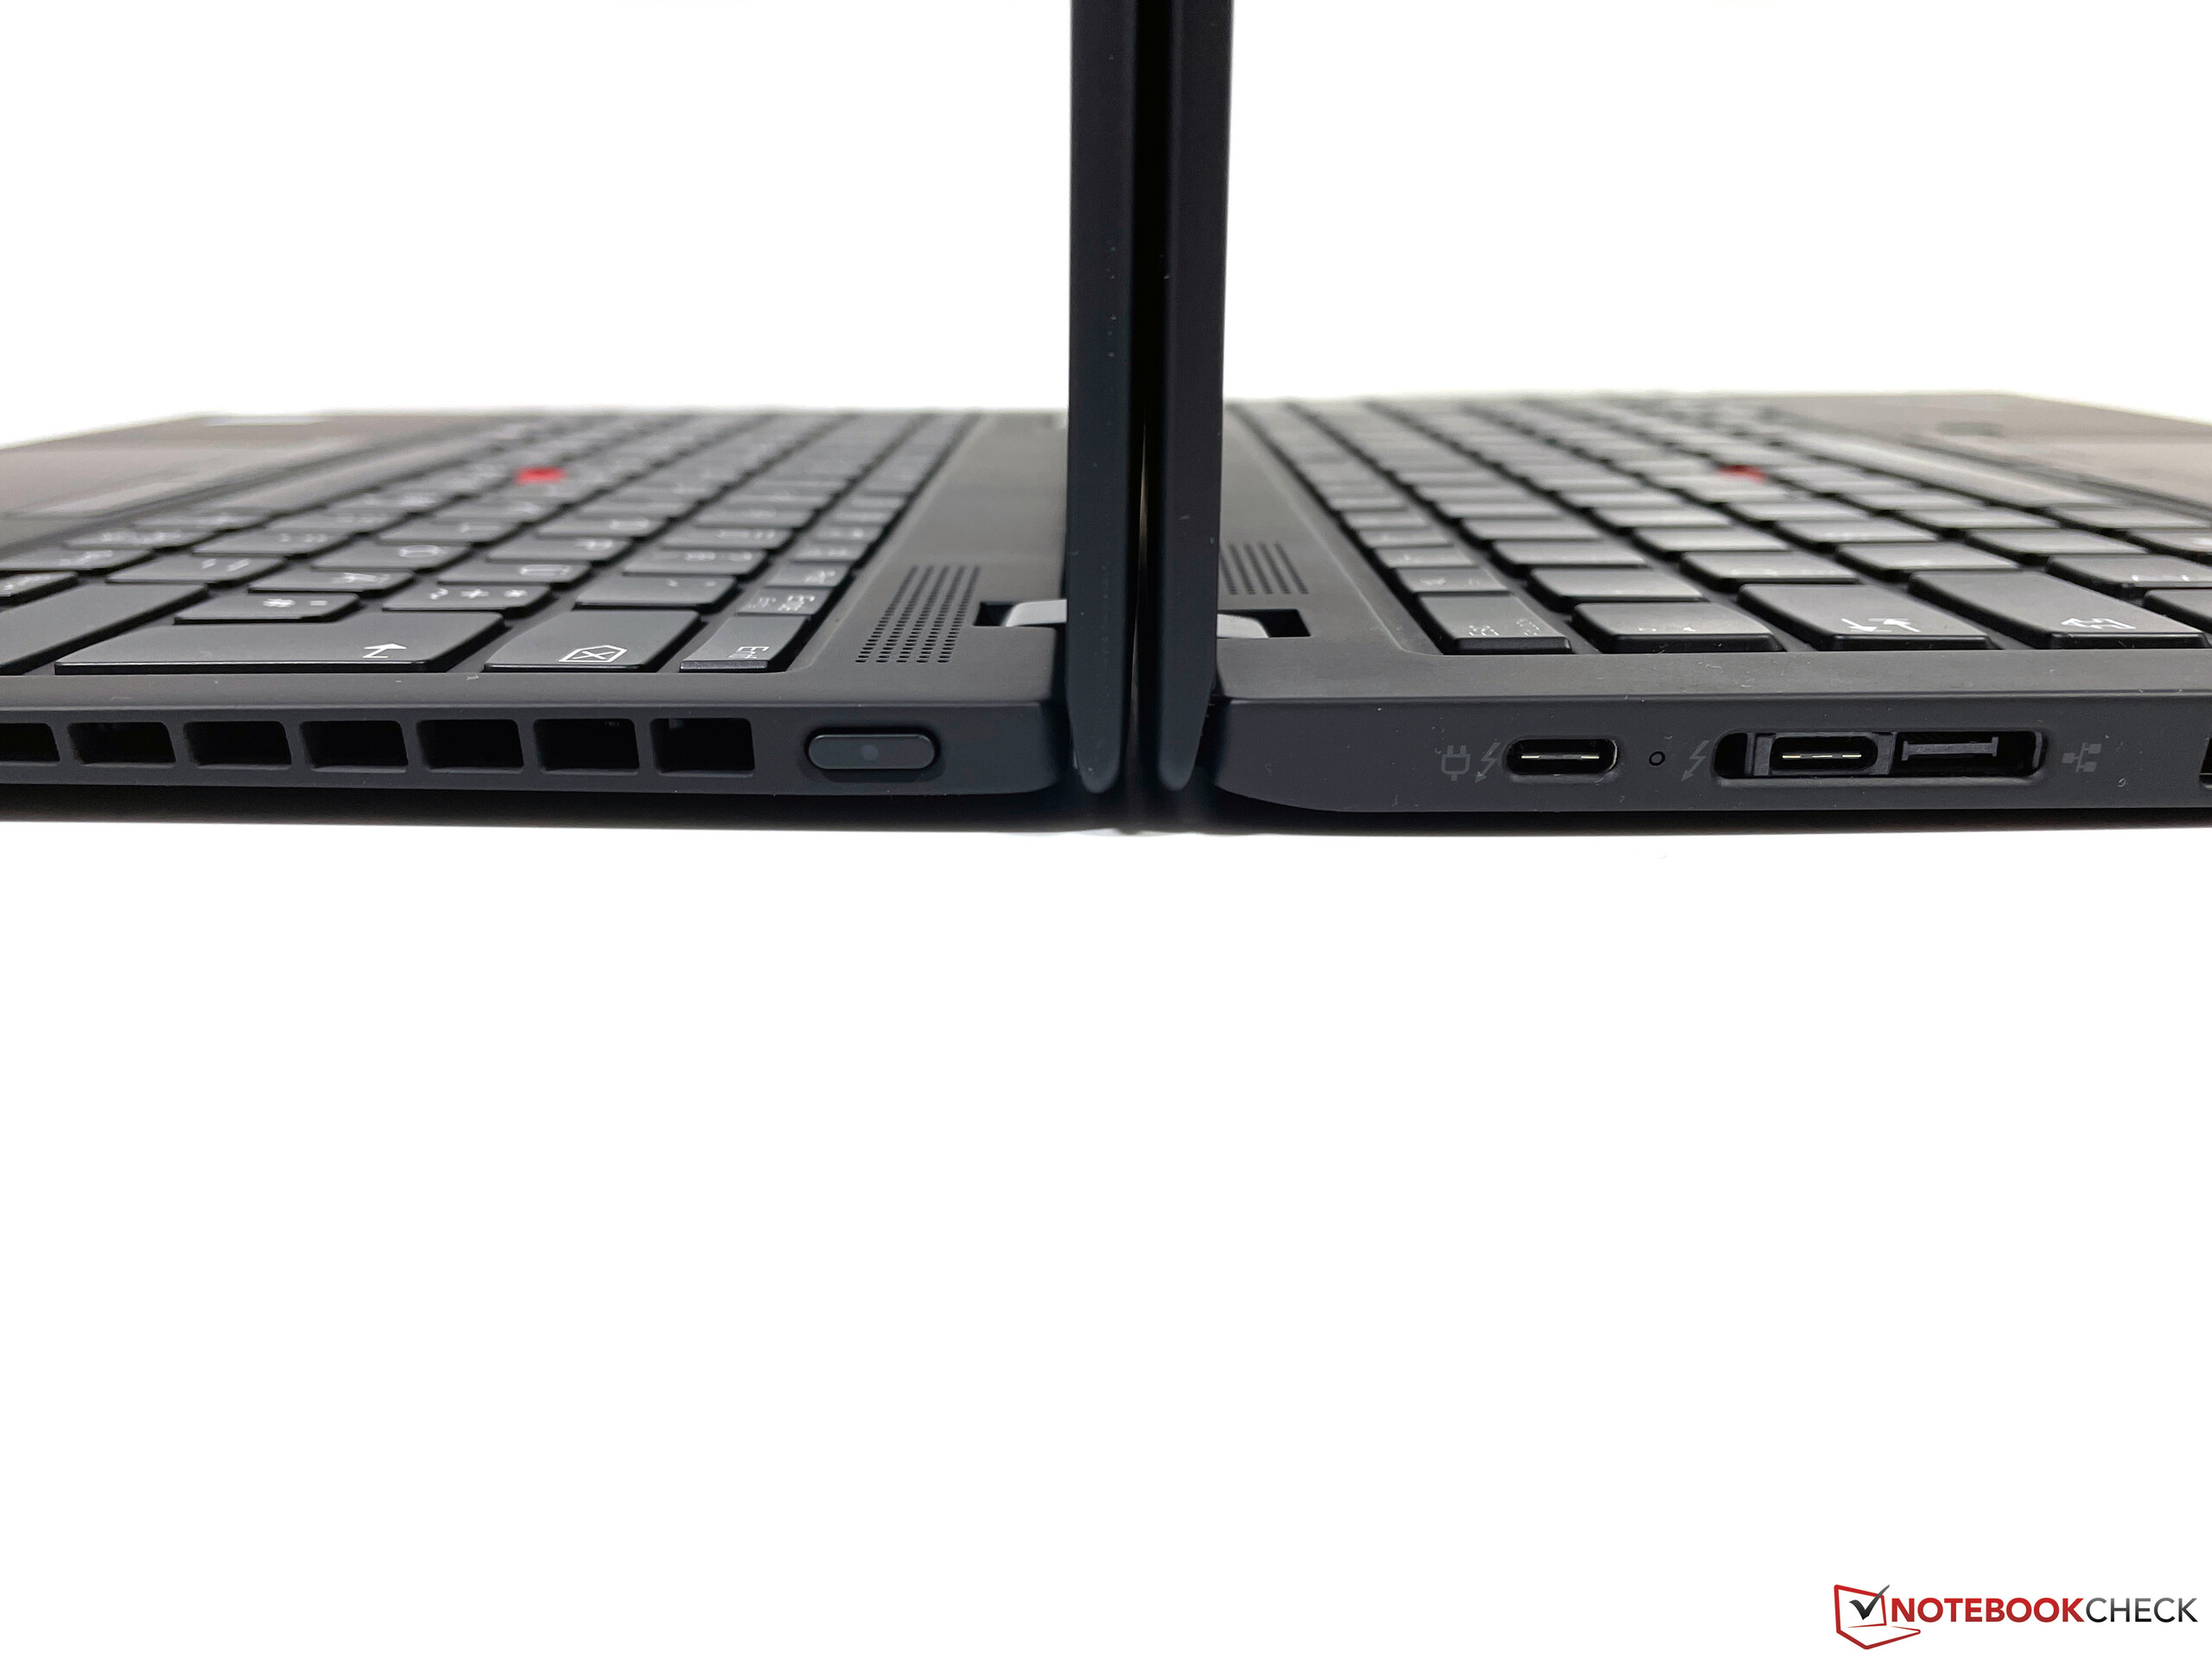
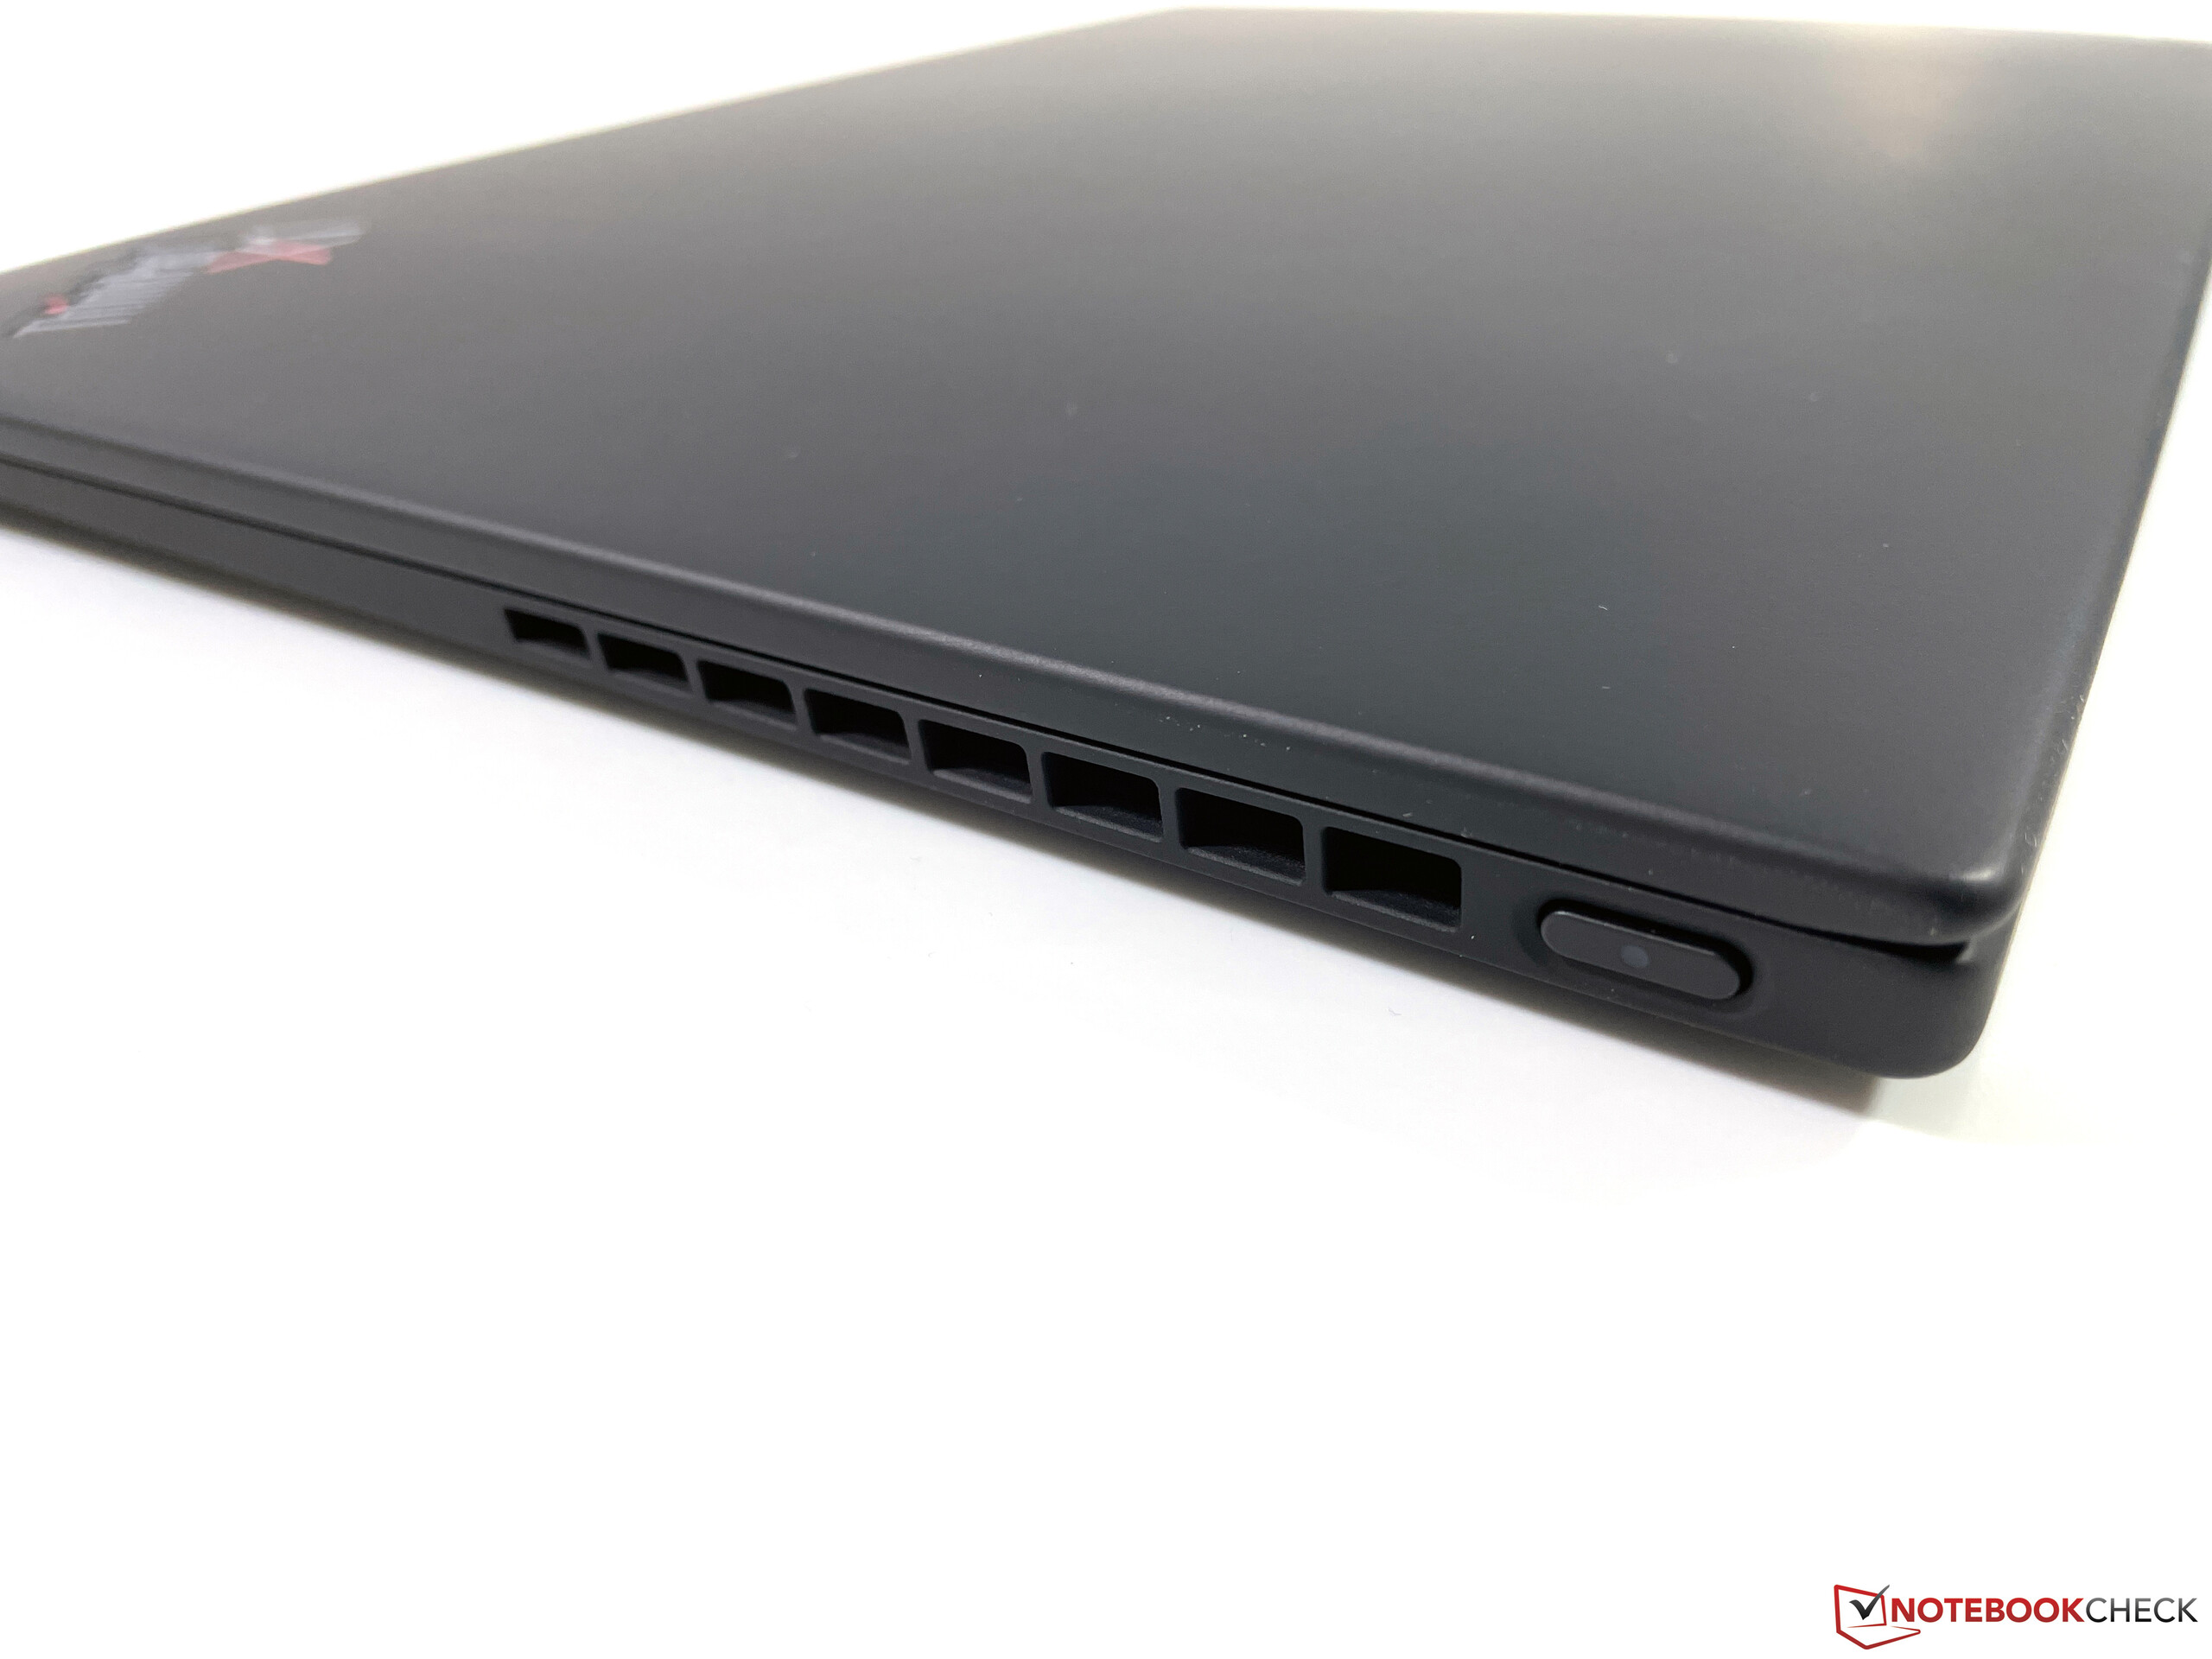
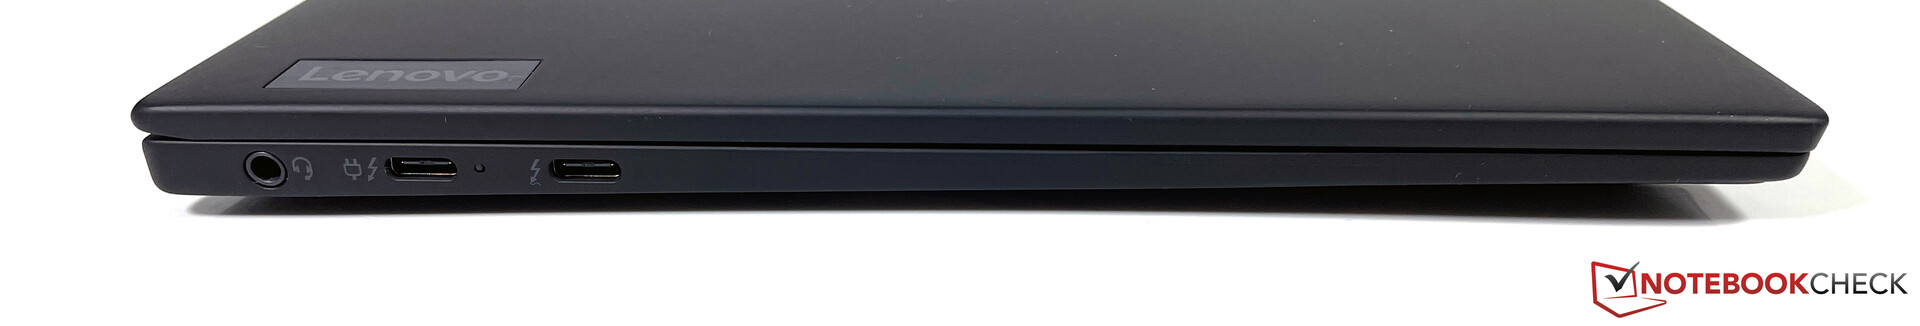
Connectivity - Lenovo implements 2x Thunderbolt 4
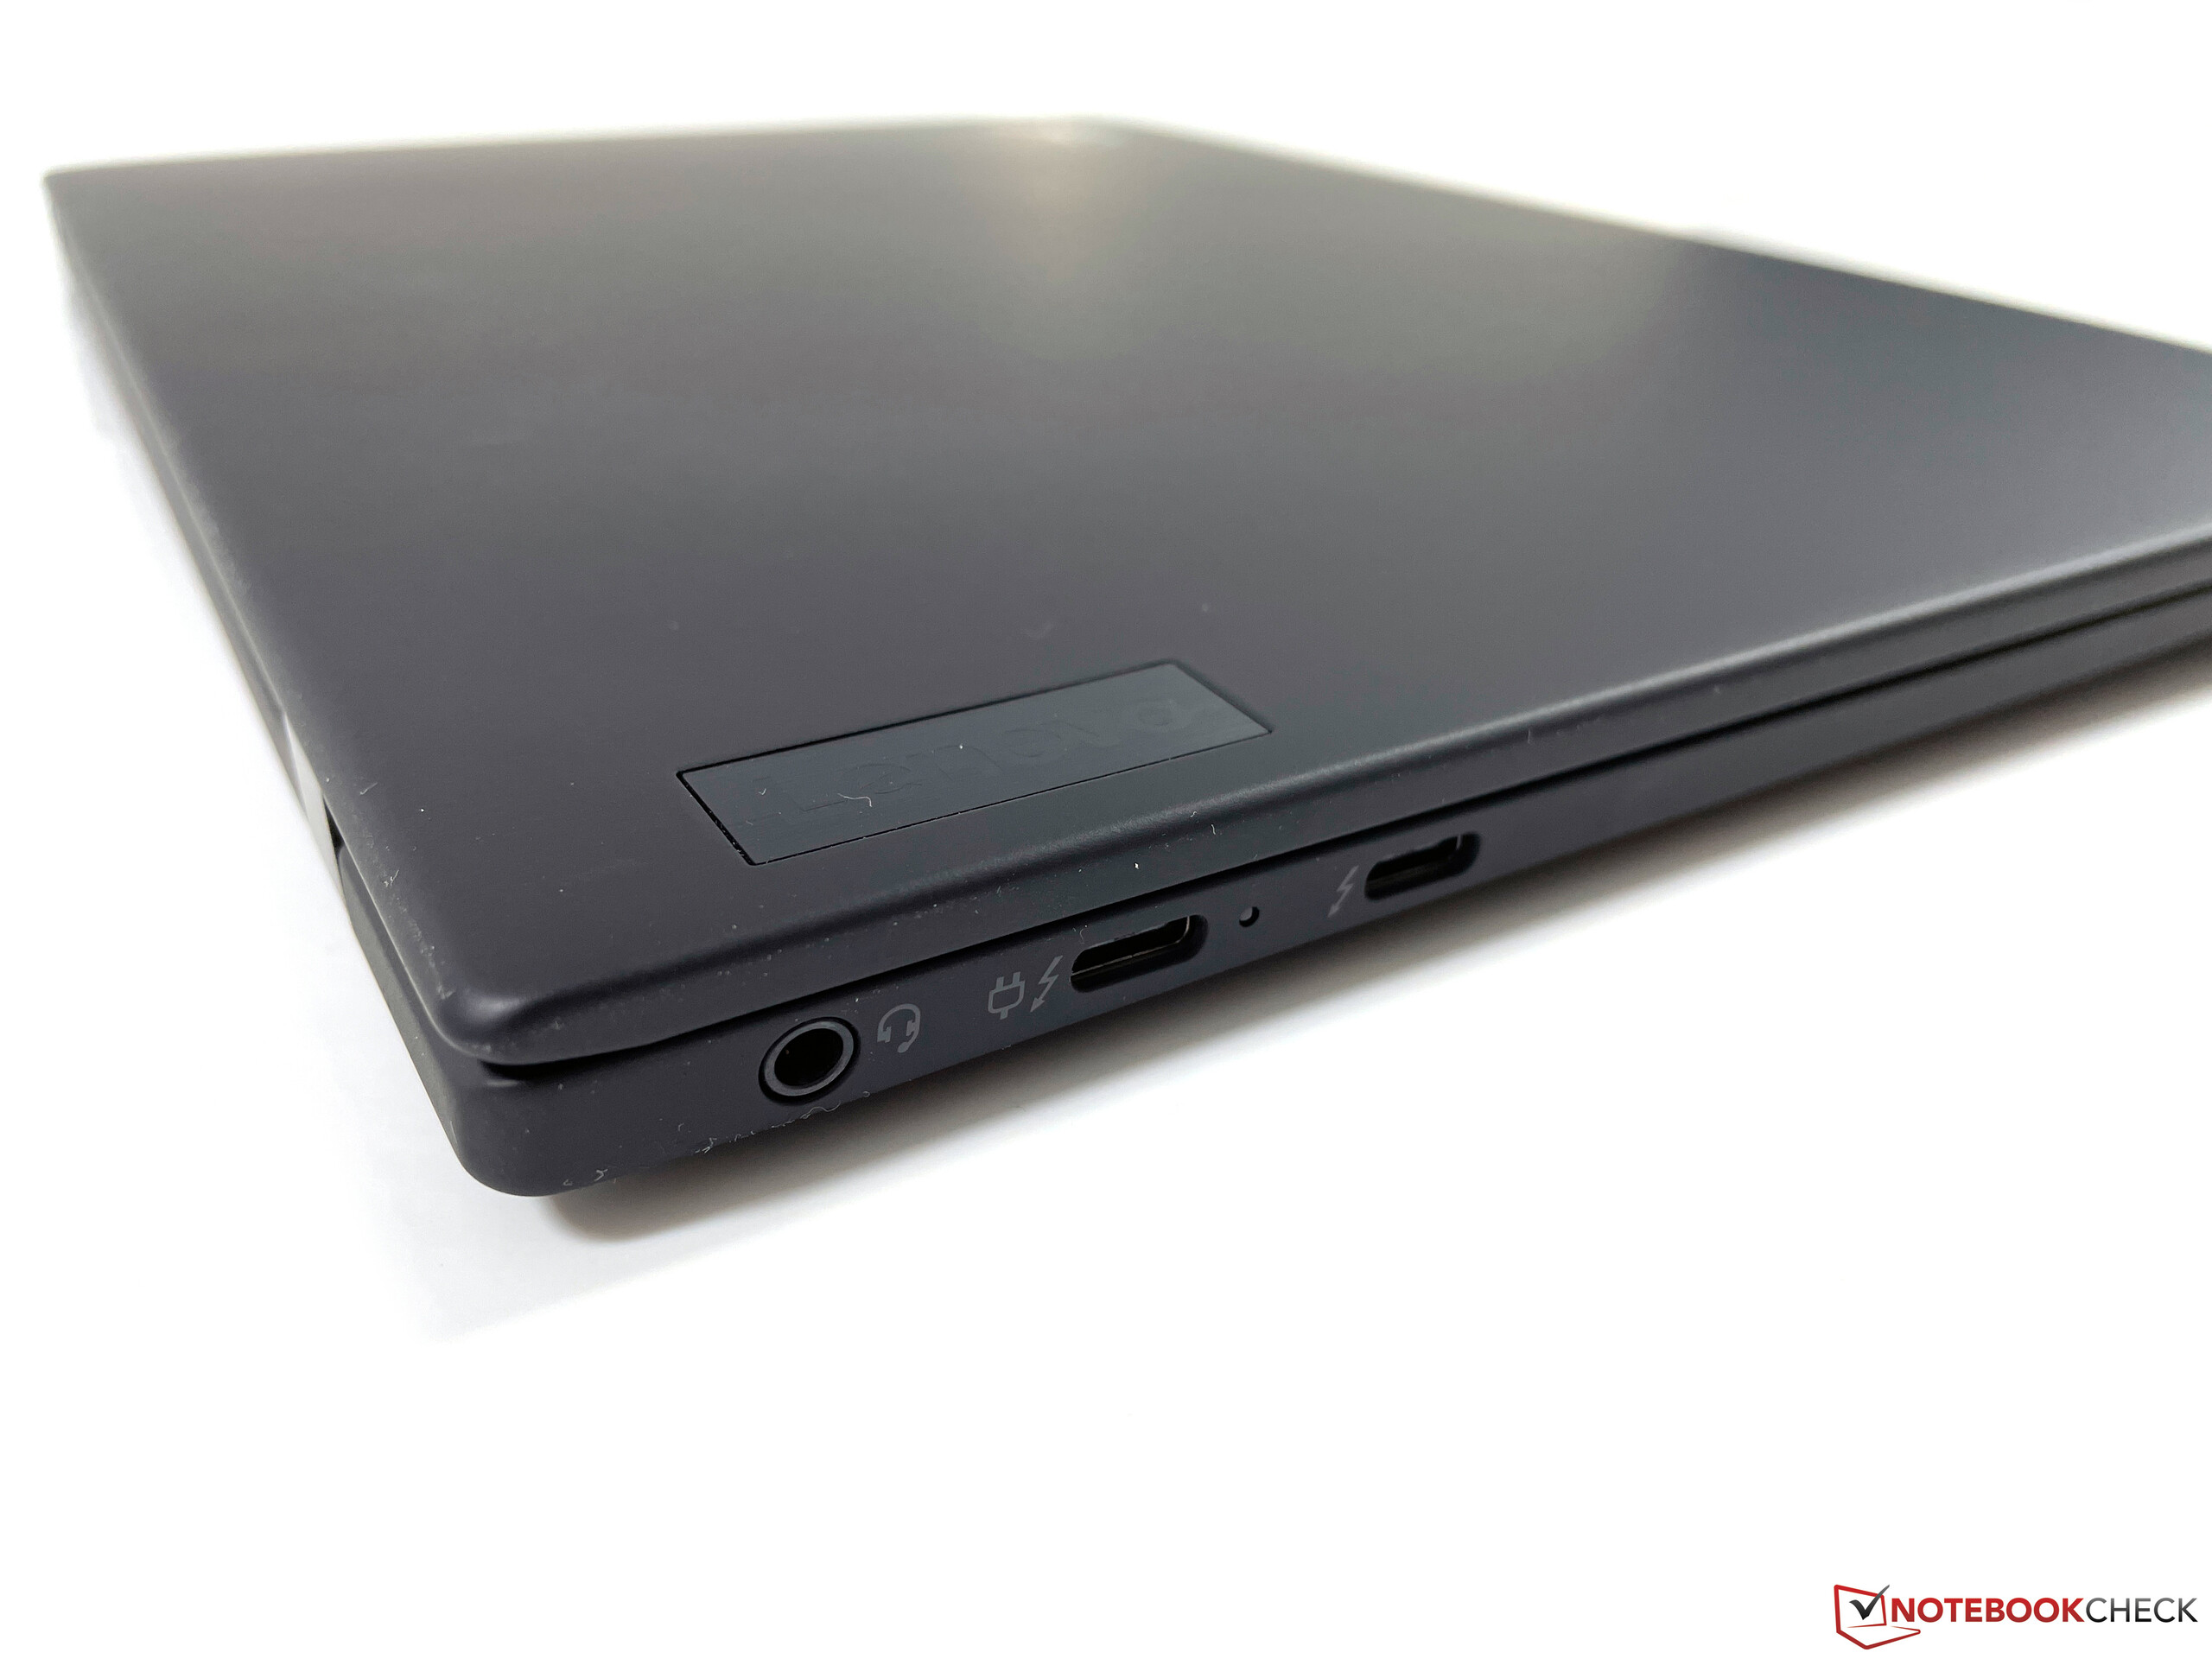
The port variety of the X1 Nano is heavily limited compared to other ThinkPads. You only get a 3.5 mm stereo jack and two modern USB-C ports with USB 4 and Thunderbolt 4 support, which can be used for charging and external displays DisplayPort 1.4a, maximum resolution 5120 x 3200 @60 Hz). It can drive up to three independent displays.
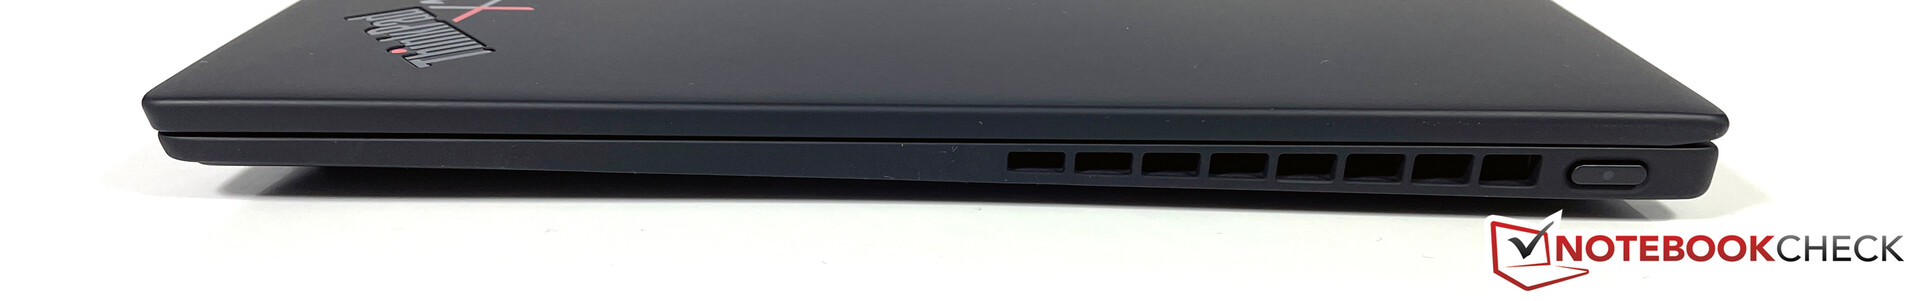
This means you will often need adapters and one of the two USB-C ports is often blocked by the power adapter. The right side only accompanies the fan exhaust and the power button. Lenovo could have relocated it to the top of the base unit (similar to the upcoming X1 Carbon G9) in order to make room for a regular USB-A port. There is no slot for a Kensington Lock, either.
Communication - Wi-Fi 6 and integrated LTE
The ThinkPad X1 Nano is equipped with the current AX201 Wi-Fi module from Intel, which supports all common standards including 802.11ax (Wi-Fi 6). We determine decent transfer rates above 1.2 Gbps in our standardized test with the router Netgear Nighthawk RAX120. We also tested the X1 Nano with a Frtiz!Box 7590 and there were no problems.
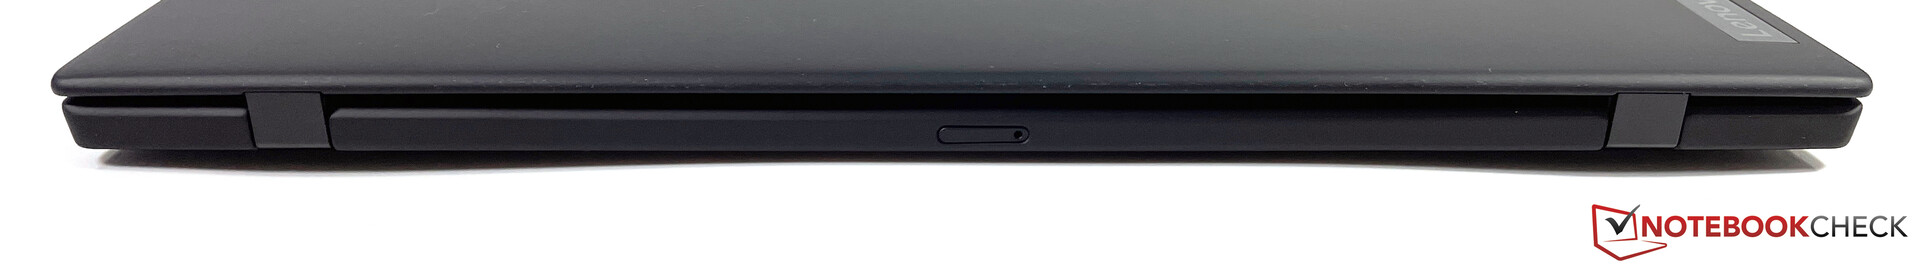
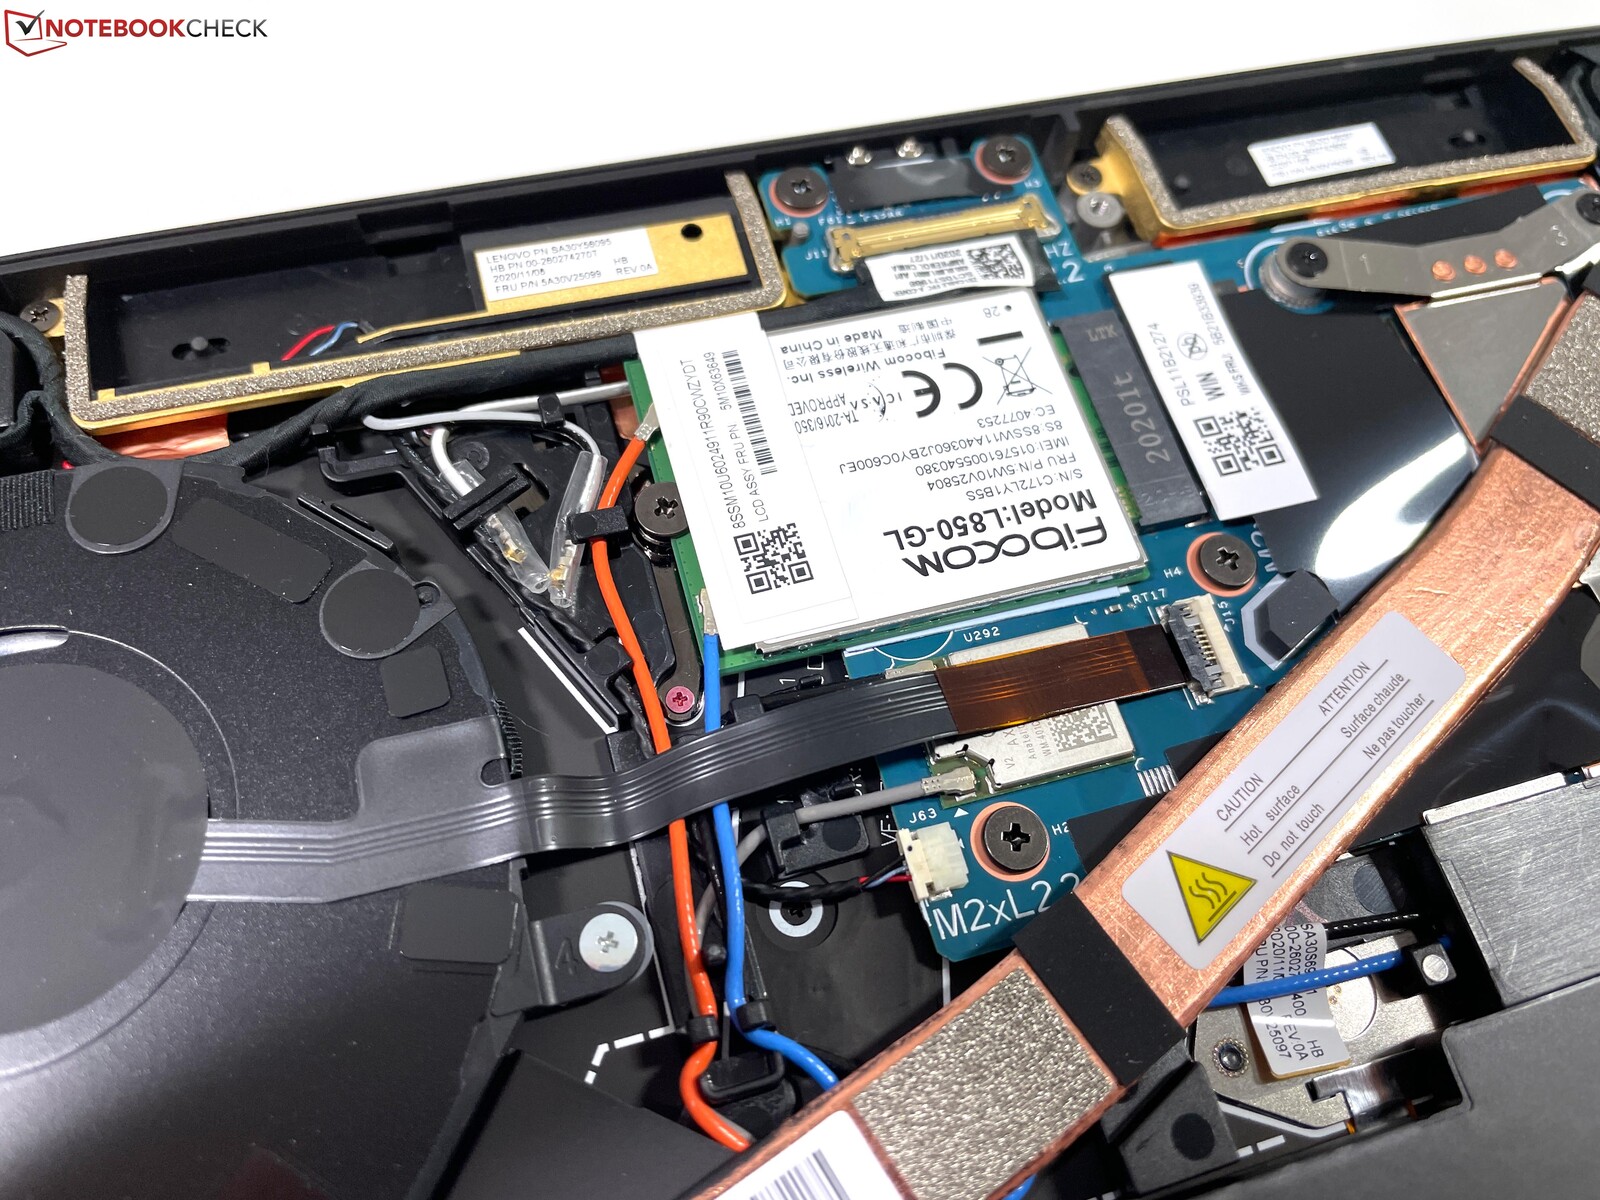
You can order the notebook with a WWAN module, but you cannot upgrade it later (antennas and SIM slot are not installed). Our test unit uses an LTE module from Fibocom (Cat.9), which worked perfectly with our Nano-SIM from T-Mobile. Lenovo also offers a 5G WWAN module from Qualcomm (Snapdragon X55).
Webcam - 720p with Mechanical Shutter
The webcam is still a simple 720p module and the picture quality is mediocre as we expected it. It does its job, but considering the current situation with home-office and plenty of video conferences, we would like to see better modules. You also get a mechanical shutter (Think Shutter), which is easy to use. Lenovo also implements an IR camera for Windows Hello.


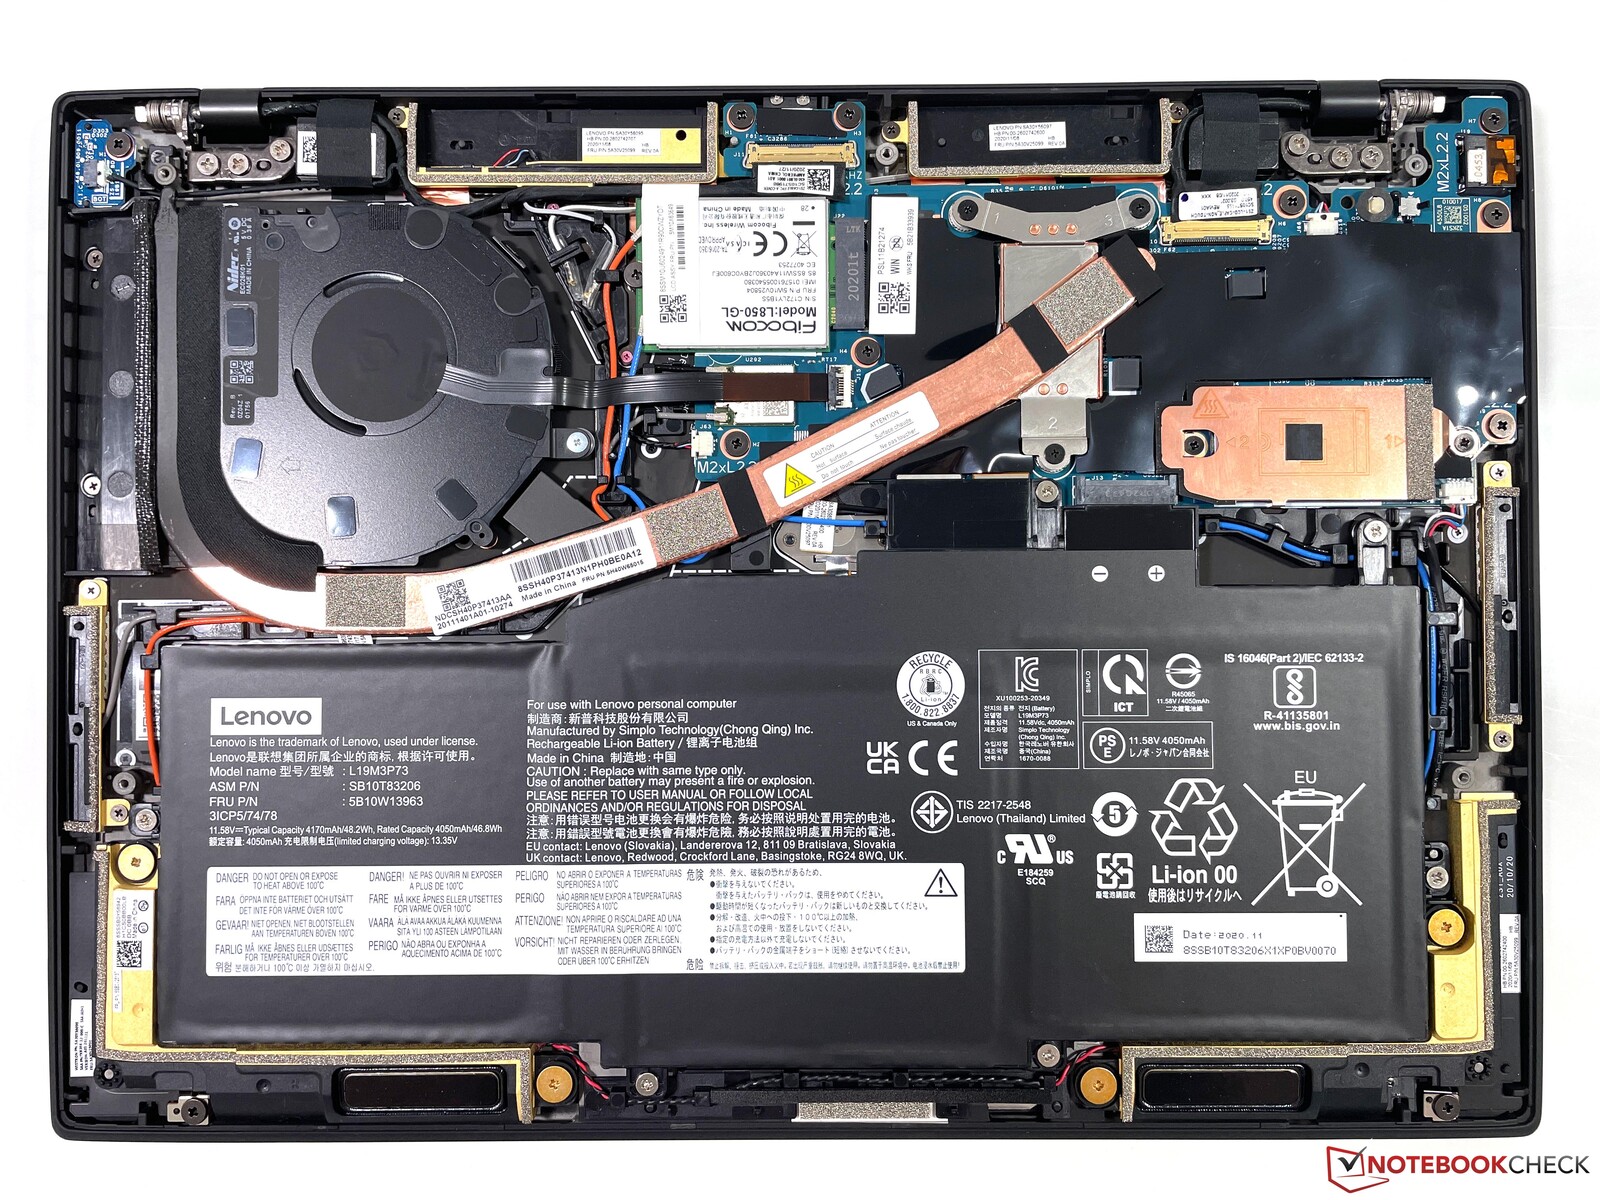
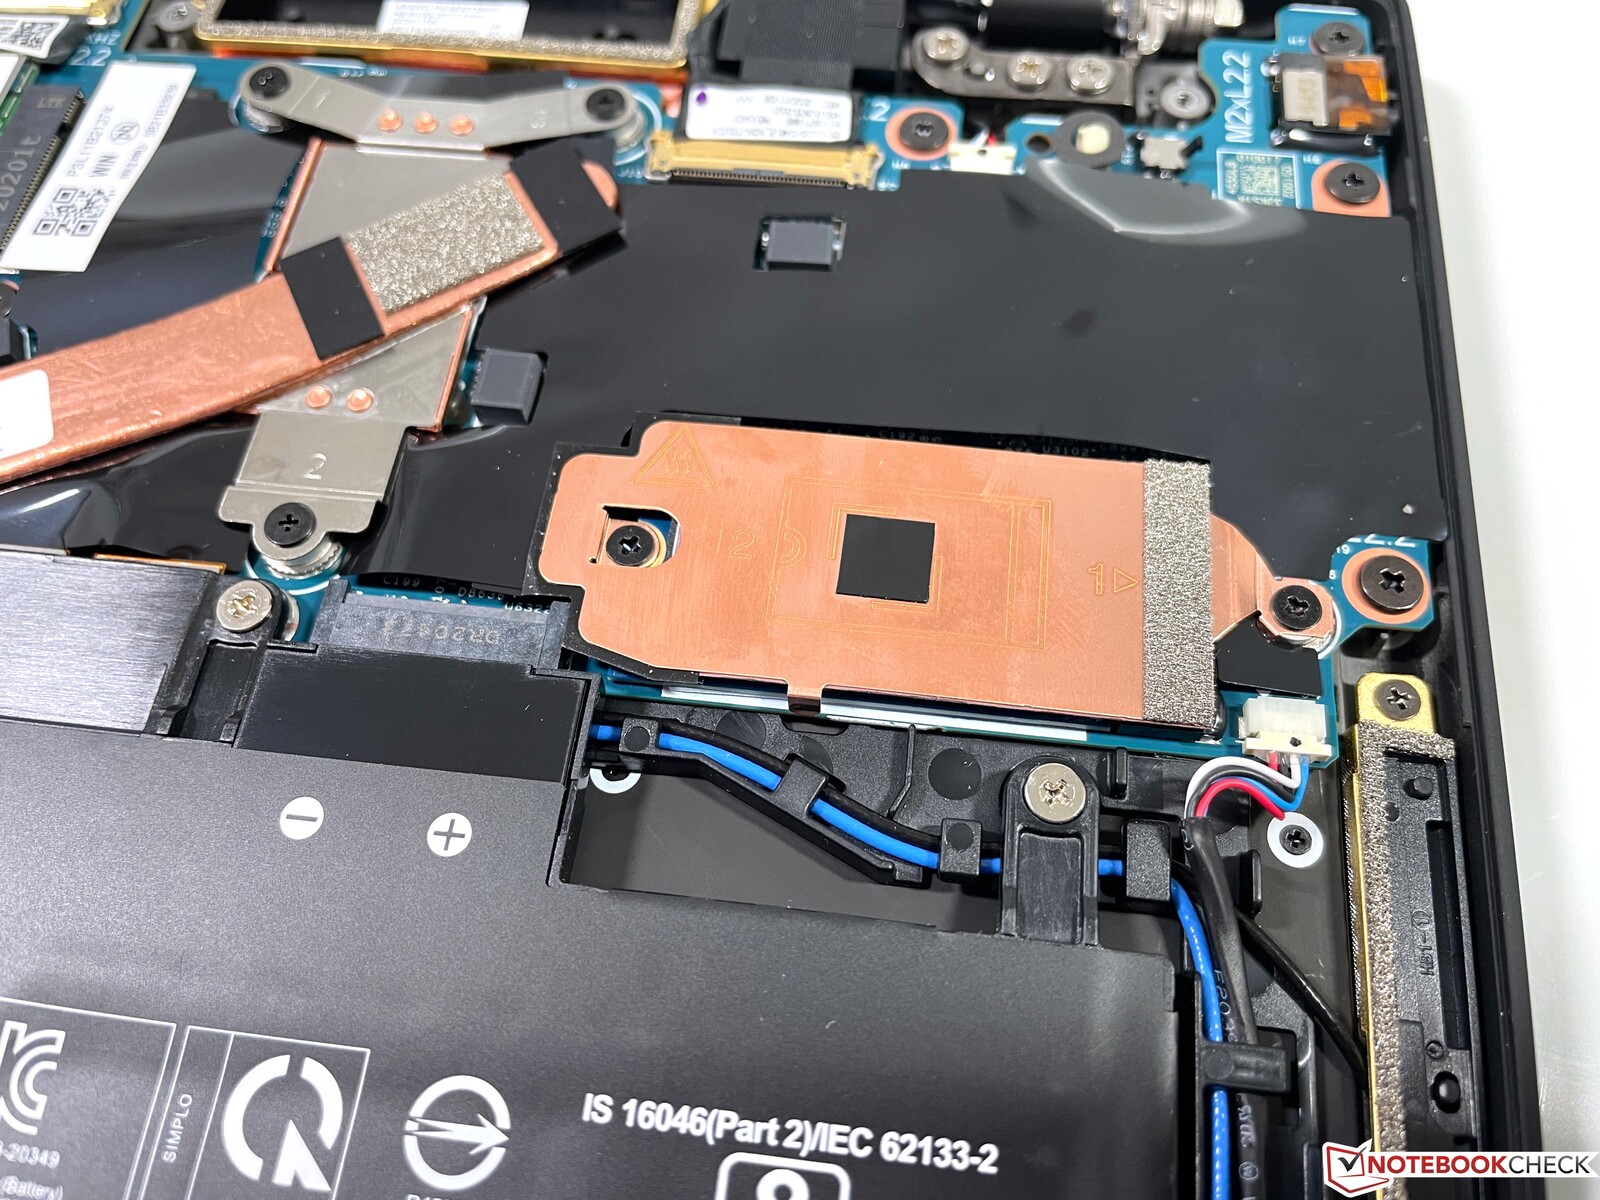
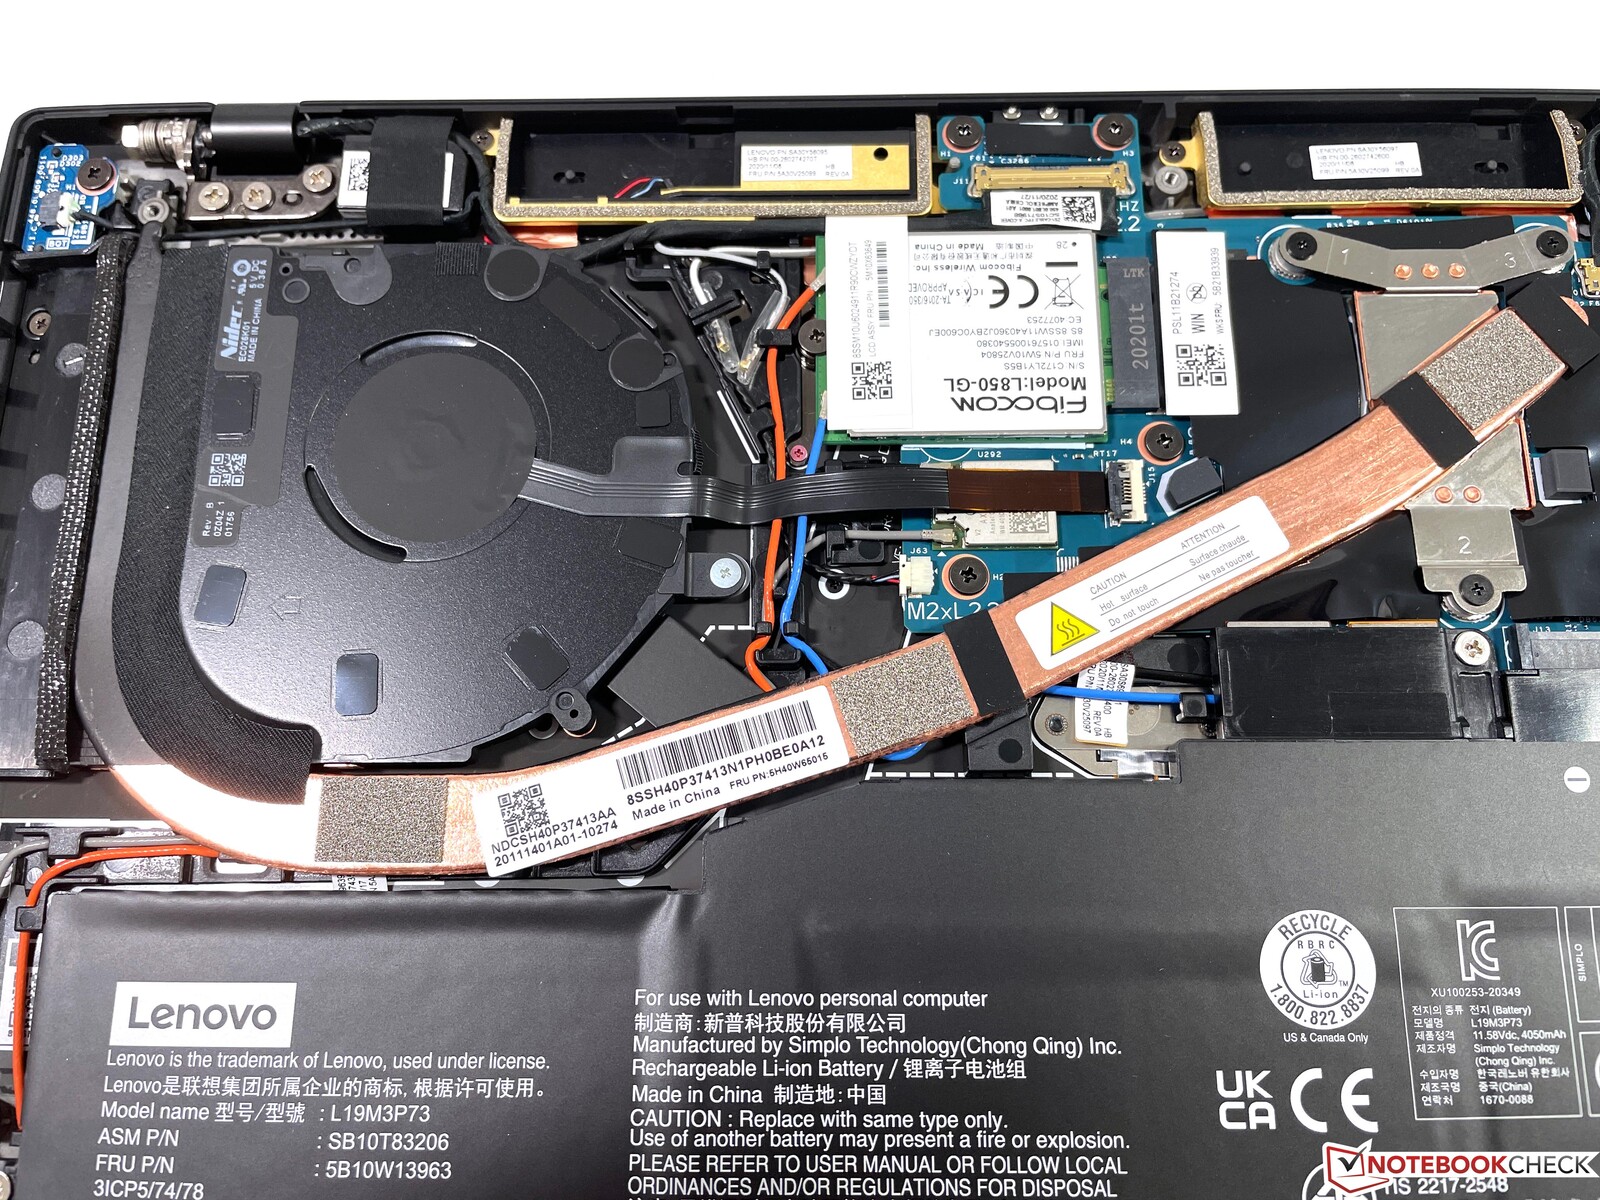
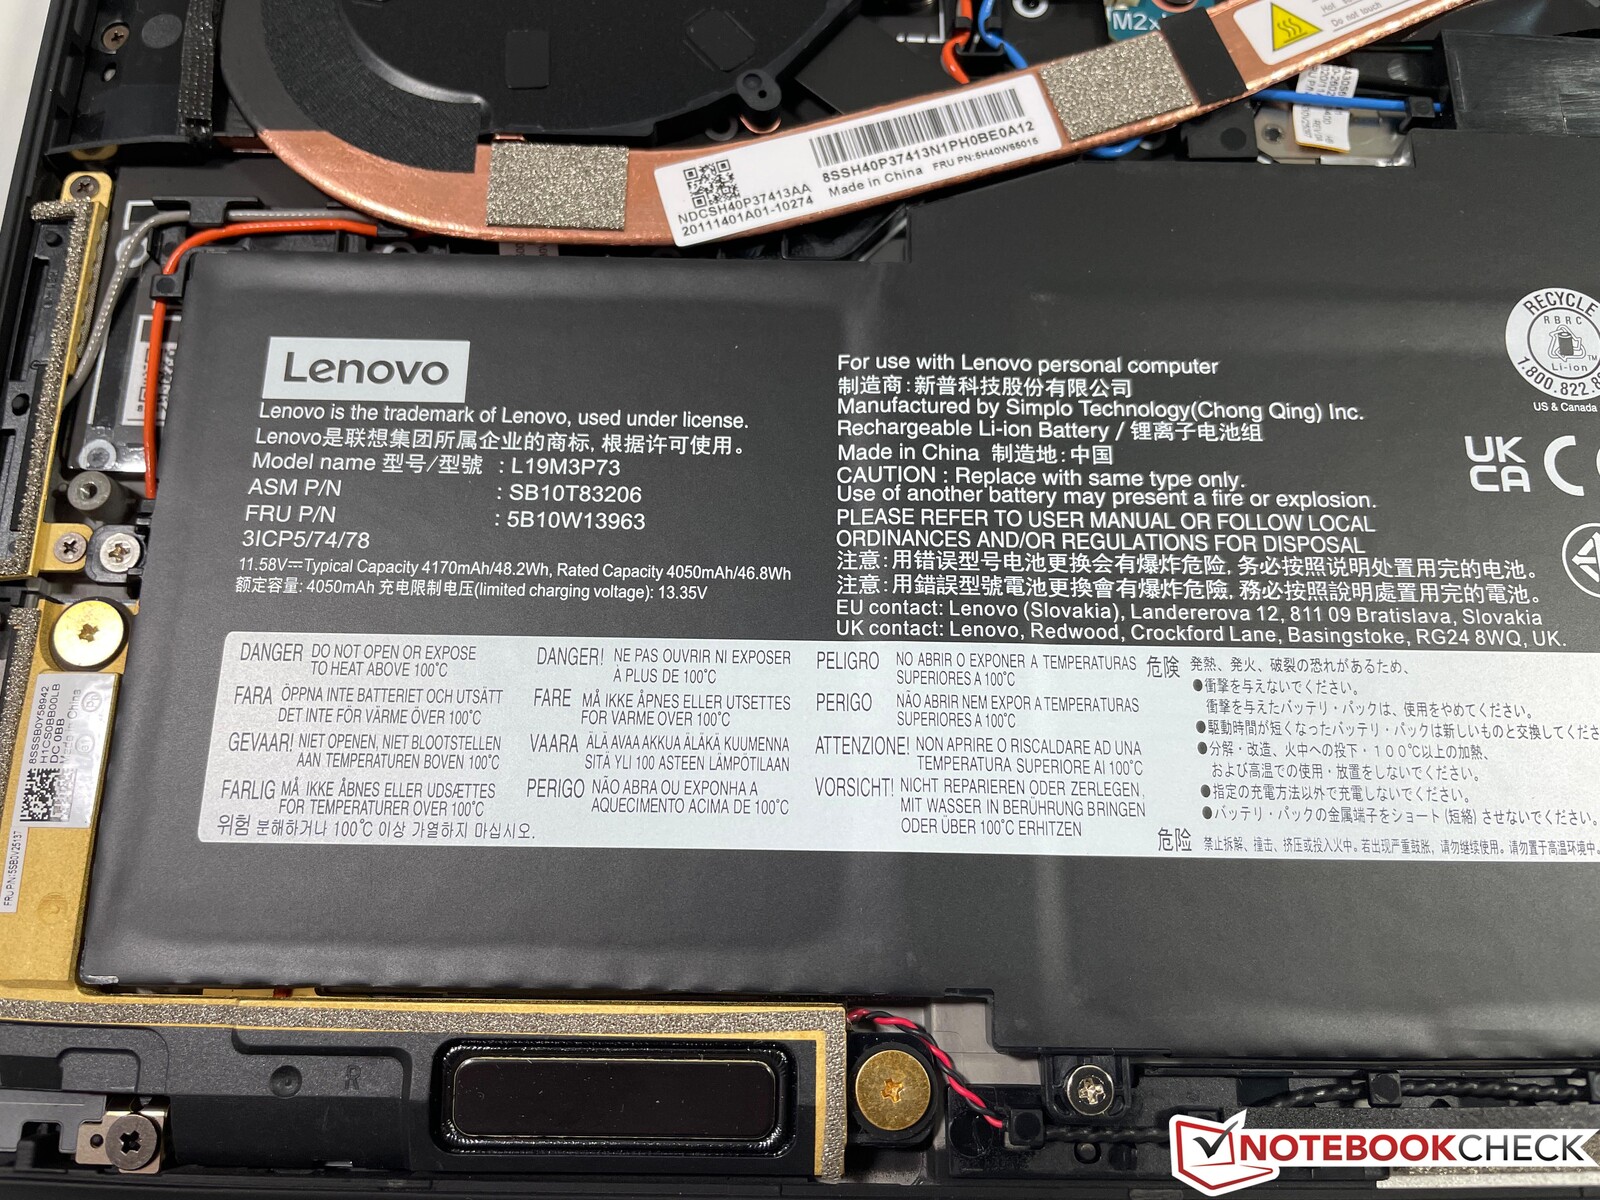
Maintenance
The bottom panel can easily be removed with a simple Philips screw driver. There are no annoying plastic clips. However, there is not that much to do on the inside, because you can only access the WWAN module and the M.2-2242 SSD. RAM and WLAN module are soldered onto the mainboard. The battery is secured with screws and can also be removed. The fan on the other hand is completely covered.
Input Devices - Reduced Key Travel
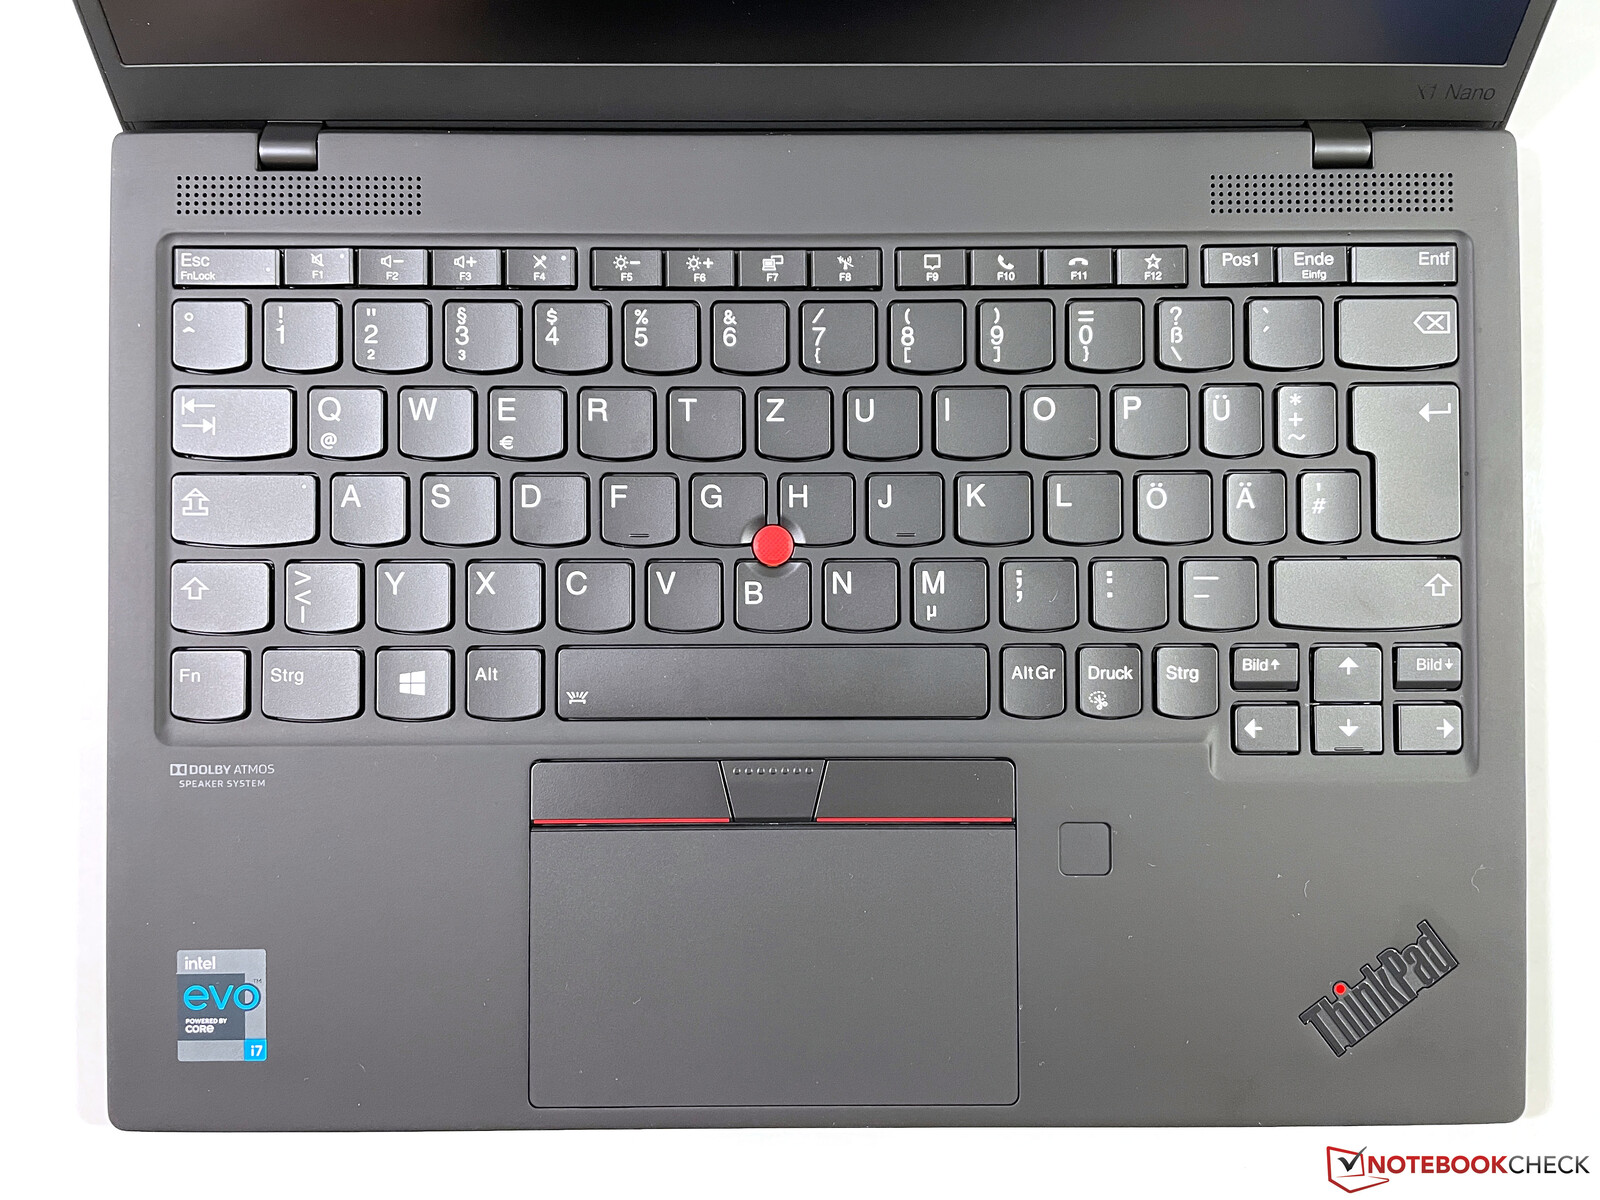
Keyboard
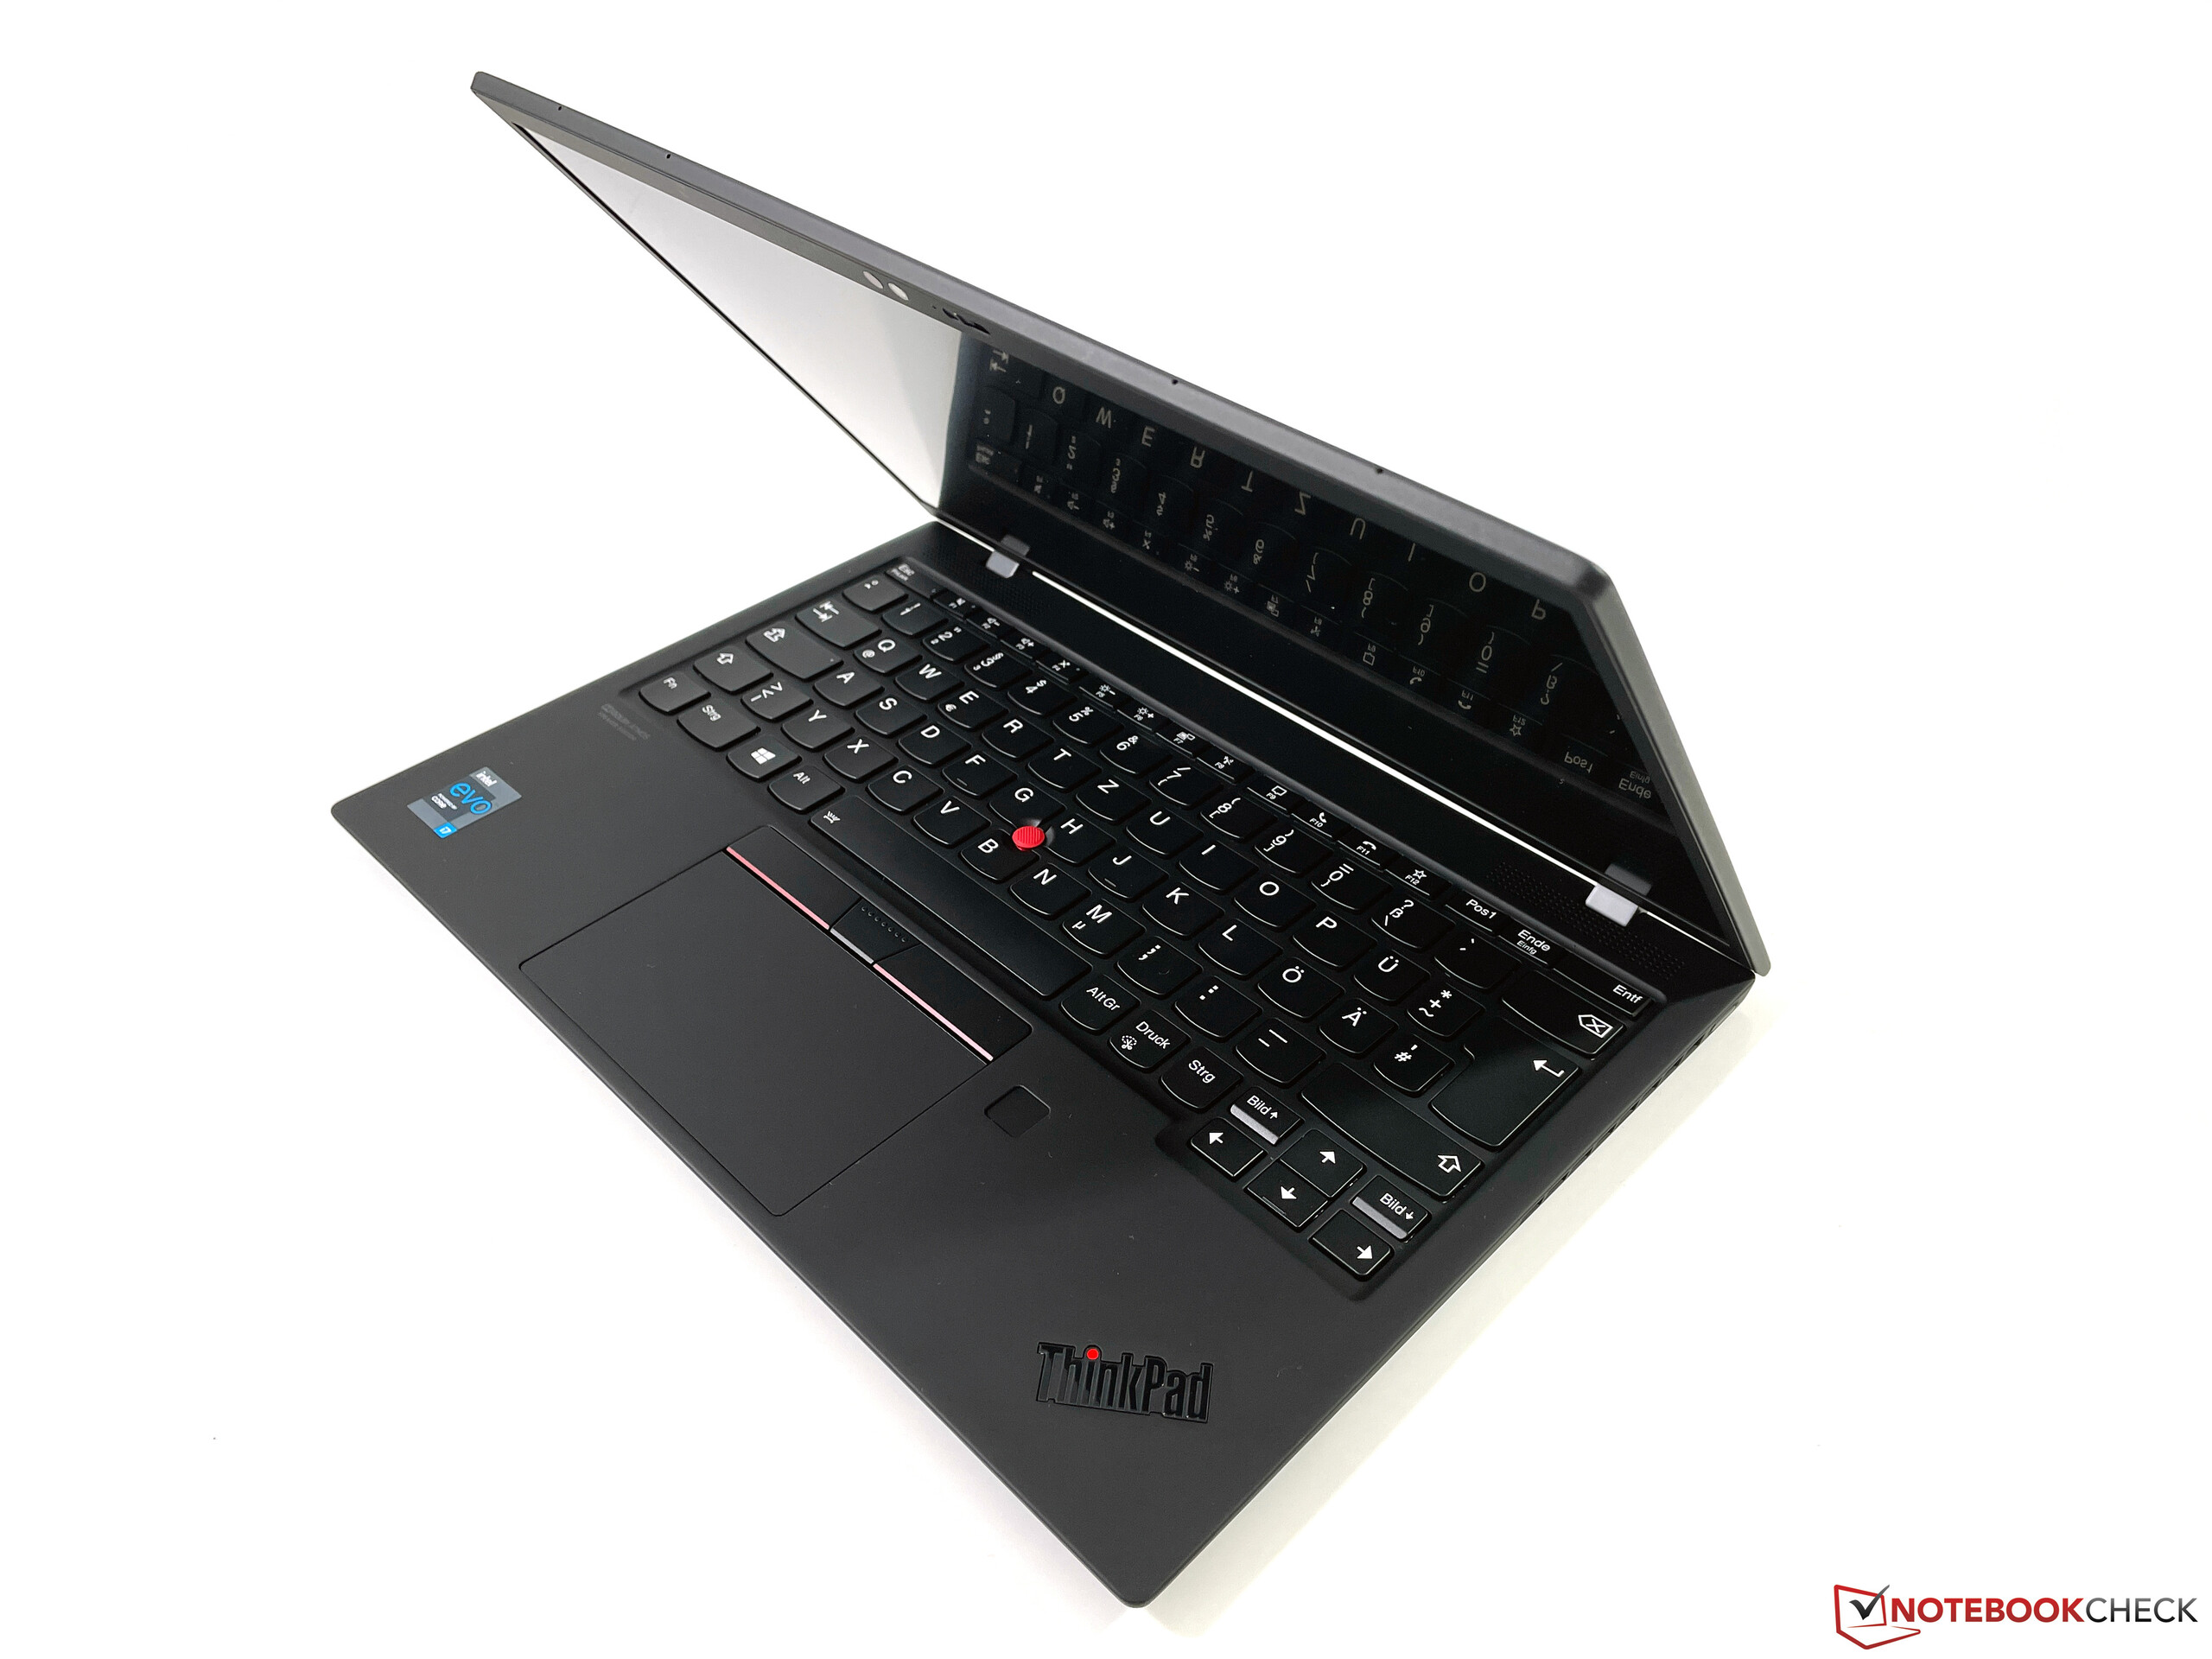
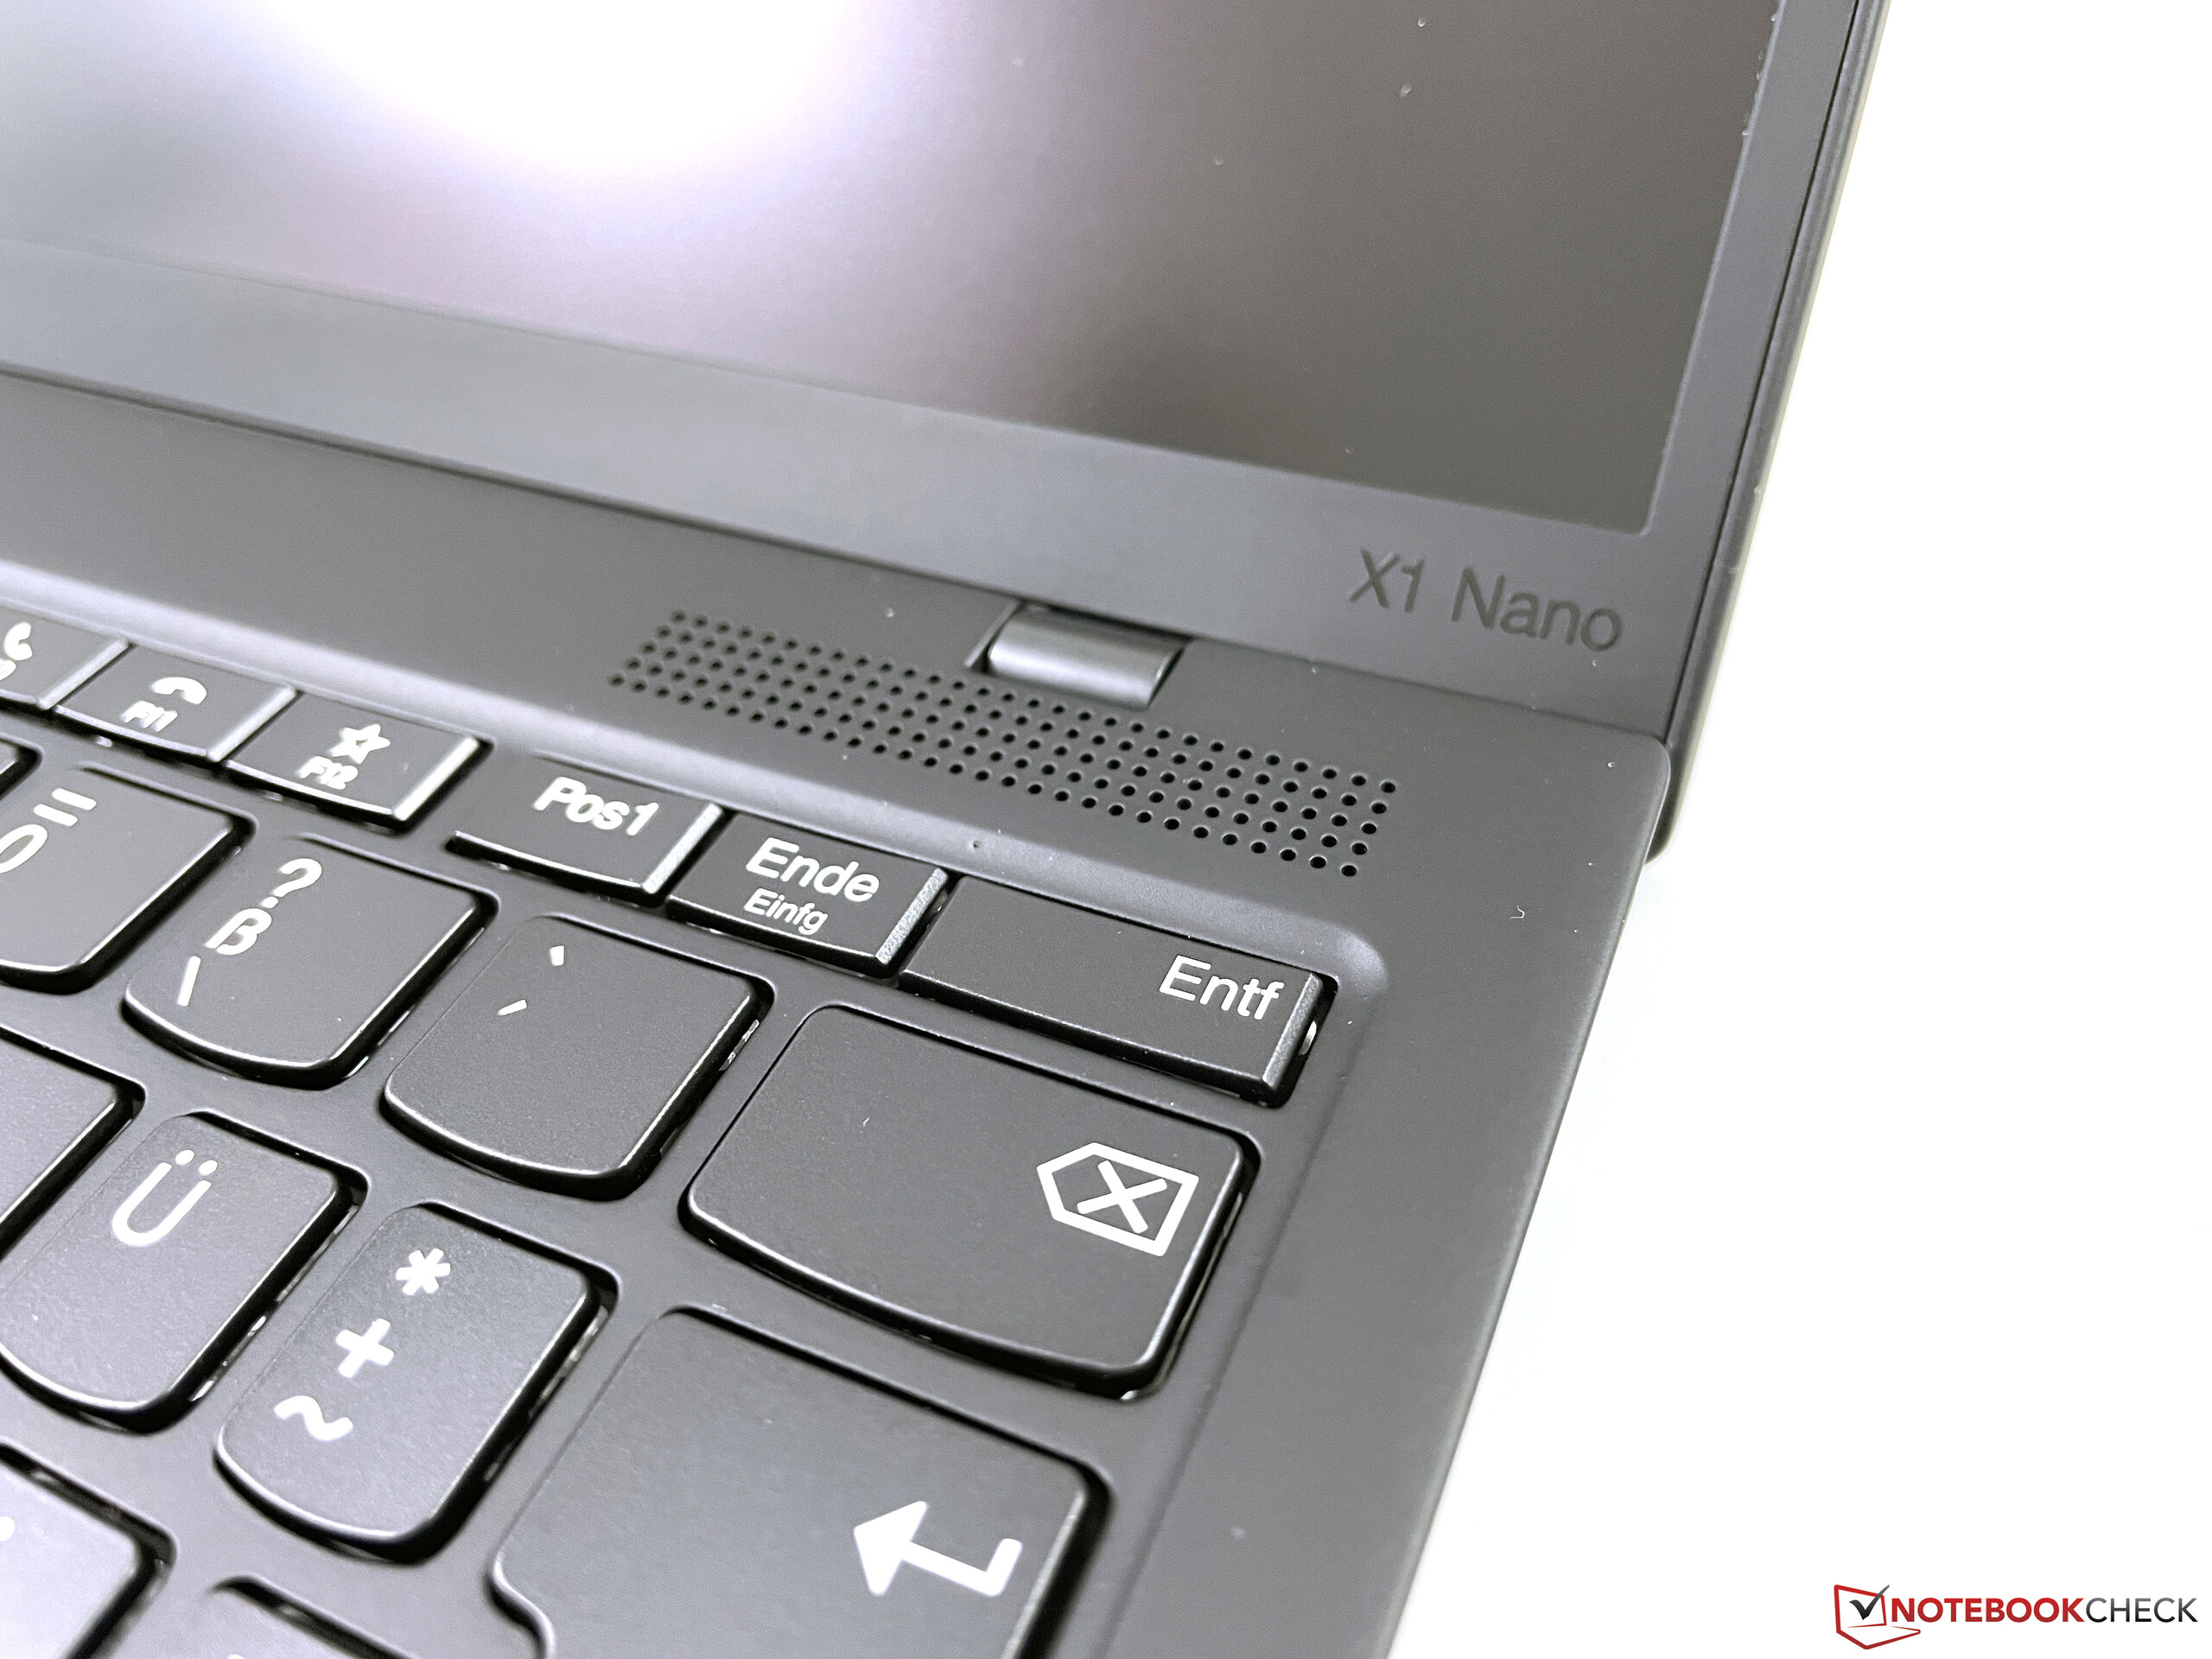
The smaller chassis also results in a reduced keyboard size, which can be noticed at many spots: The upper row of function keys is slimmer (8 vs. 10 mm on the X1 Carbon), the regular letter keys are smaller (15x15 vs. 16x16 mm on the X1 Carbon) and some of the keys on the right side of the keyboard are even narrower at just 12 mm. The reason is the limited chassis width of the X1 Nano so we can understand this compromise. We also believe you will get used to it after a little adjustment period.
The bigger problem is the key travel. Lenovo has already reduced the key travel on the X1 Carbon from 1.8 mm to 1.5 mm two generations ago, which is definitely noticeable during typing. The new X1 Nano (and also the upcoming X1 Carbon G9 and X1 Yoga G6) only gets 1.35 mm key travel. This does not sound like a big difference, but it is clearly perceptible. The familiar rich feedback is gone and it is the worst ThinkPad keyboard you can get in terms of typing experience. Even entry-level models from the ThinkPad E and L-series have an advantage in this respect.
In isolation, the keyboard is not bad, because the key stroke is still very precise and there is no clattering. You also get used to the keyboard pretty quickly. We did use it to write some texts and it was okay, but the problem is when you go back to another ThinkPad (in our case a ThinkPad X1 Carbon G7) and you immediately notice that the quality of the new keyboard is worse. The trend towards slimmer devices seems to be unstoppable, but we believe Lenovo unnecessarily gives up a major strength of previous ThinkPad generations.
The keyboard of the X1 Nano is still better compared to the Fujitsu LifeBook or the MacBook Air, but the input devices of the Dell XPS 13 and the HP Elite Dragonfly are not worse. The ThinkPad X13 on the other hand has a better keyboard.
Lenovo uses two different suppliers for the keyboard. our review unit is equipped with the model from Chicony, but there is another version from Lite-On. At this point we cannot say if and how the two versions differ.
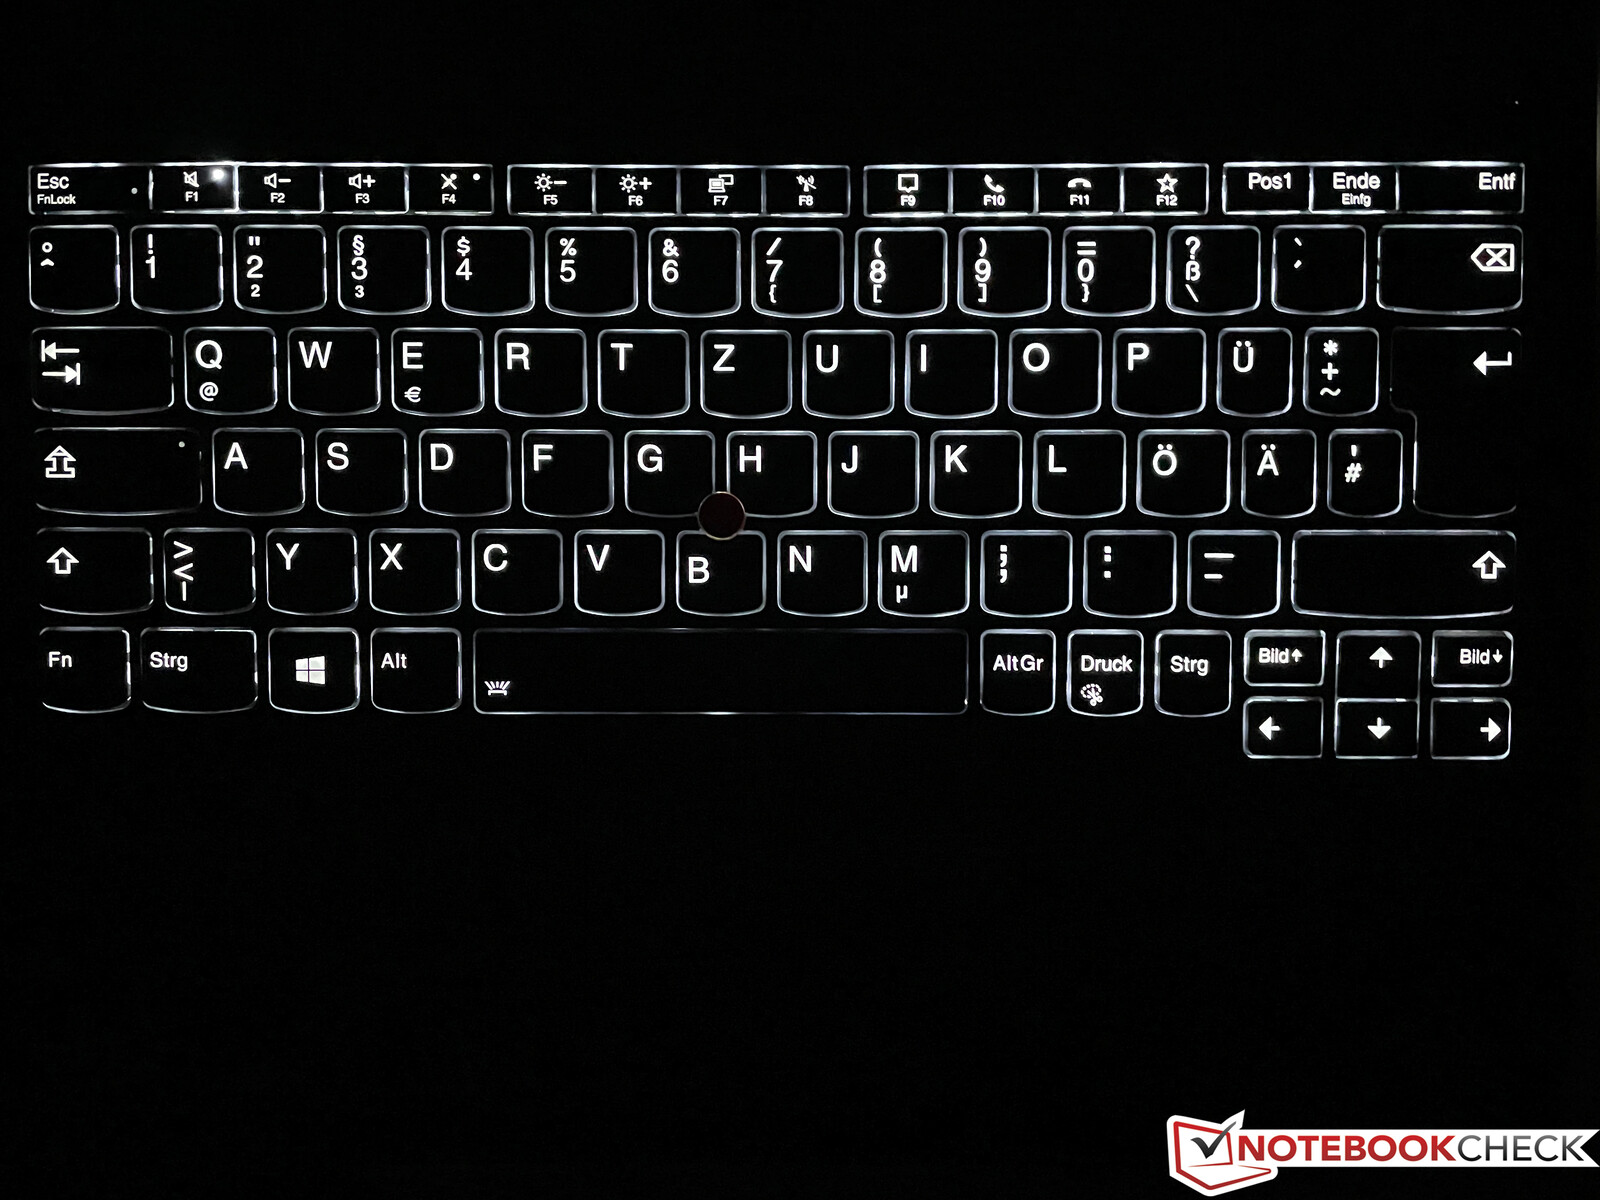
As per usual, the keyboard is spill-water resistant and equipped with a two-stage background illumination.
Touchpad & TrackPoint
Lenovo does not remove the familiar TrackPoint and also includes the according buttons above the touchpad. However, this means the space for the touchpad is limited (10 x 5.6 cm). Both input methods work well in practice and all the buttons create an even and dull clicking noise.
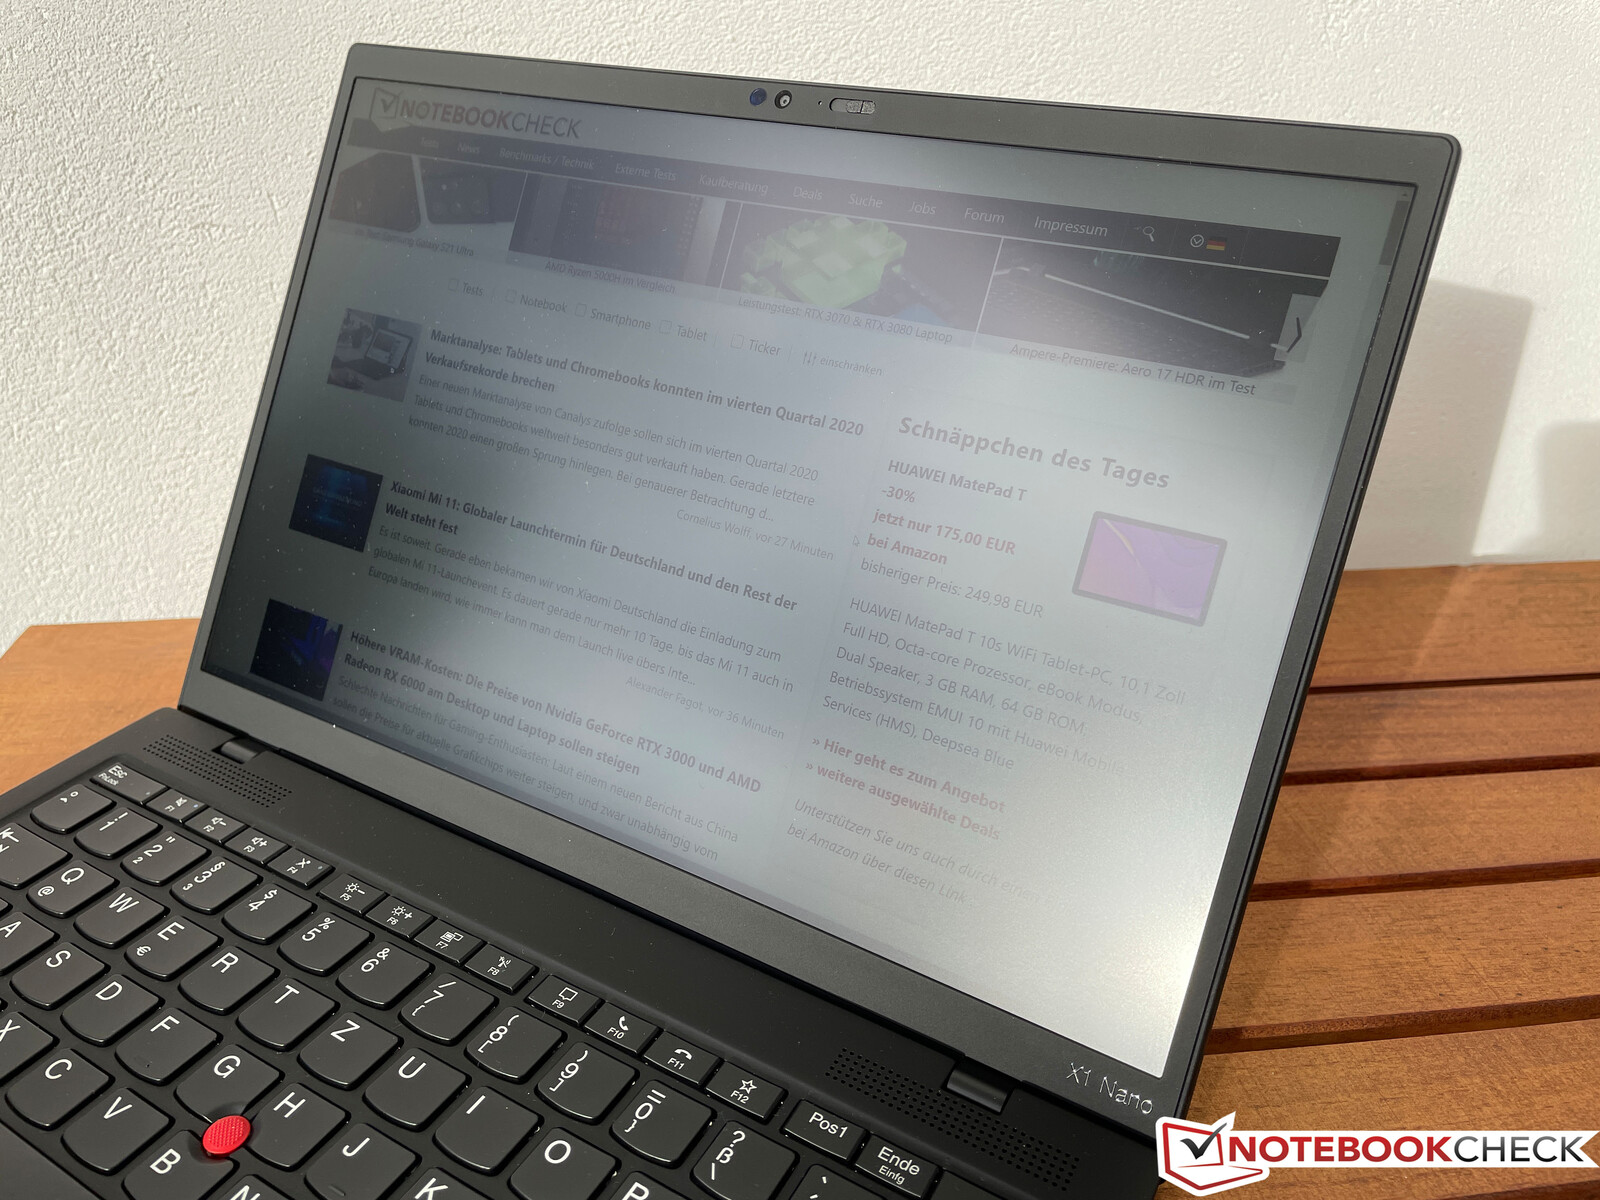
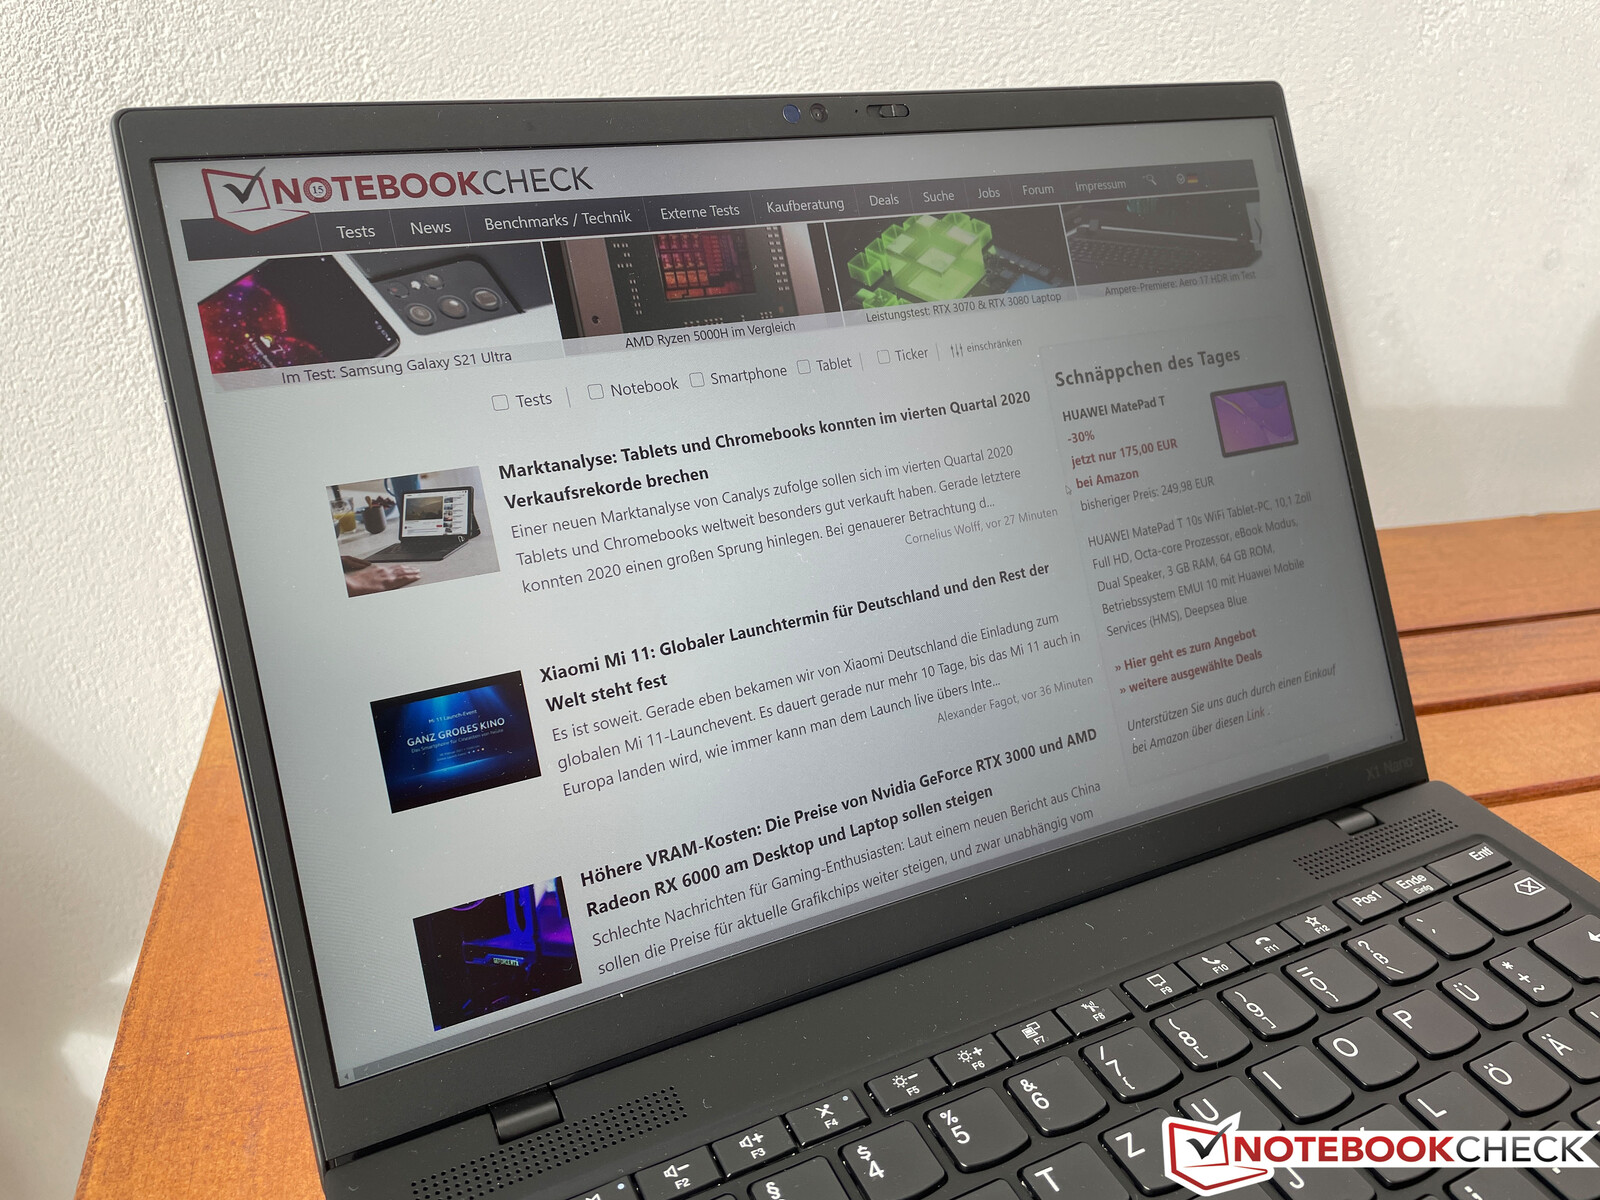
Display - ThinkPad with 16:10 Screen

Lenovo offers two different display, but they share the same basic specs and the only difference is the additional touch layer. The IPS panel with an aspect ratio of 16:10 offers a resolution of 2160 x 1350 pixels (196 ppi) and creates sharp images. The colors also look very rich and the response times are okay. The subjective picture quality is very good.
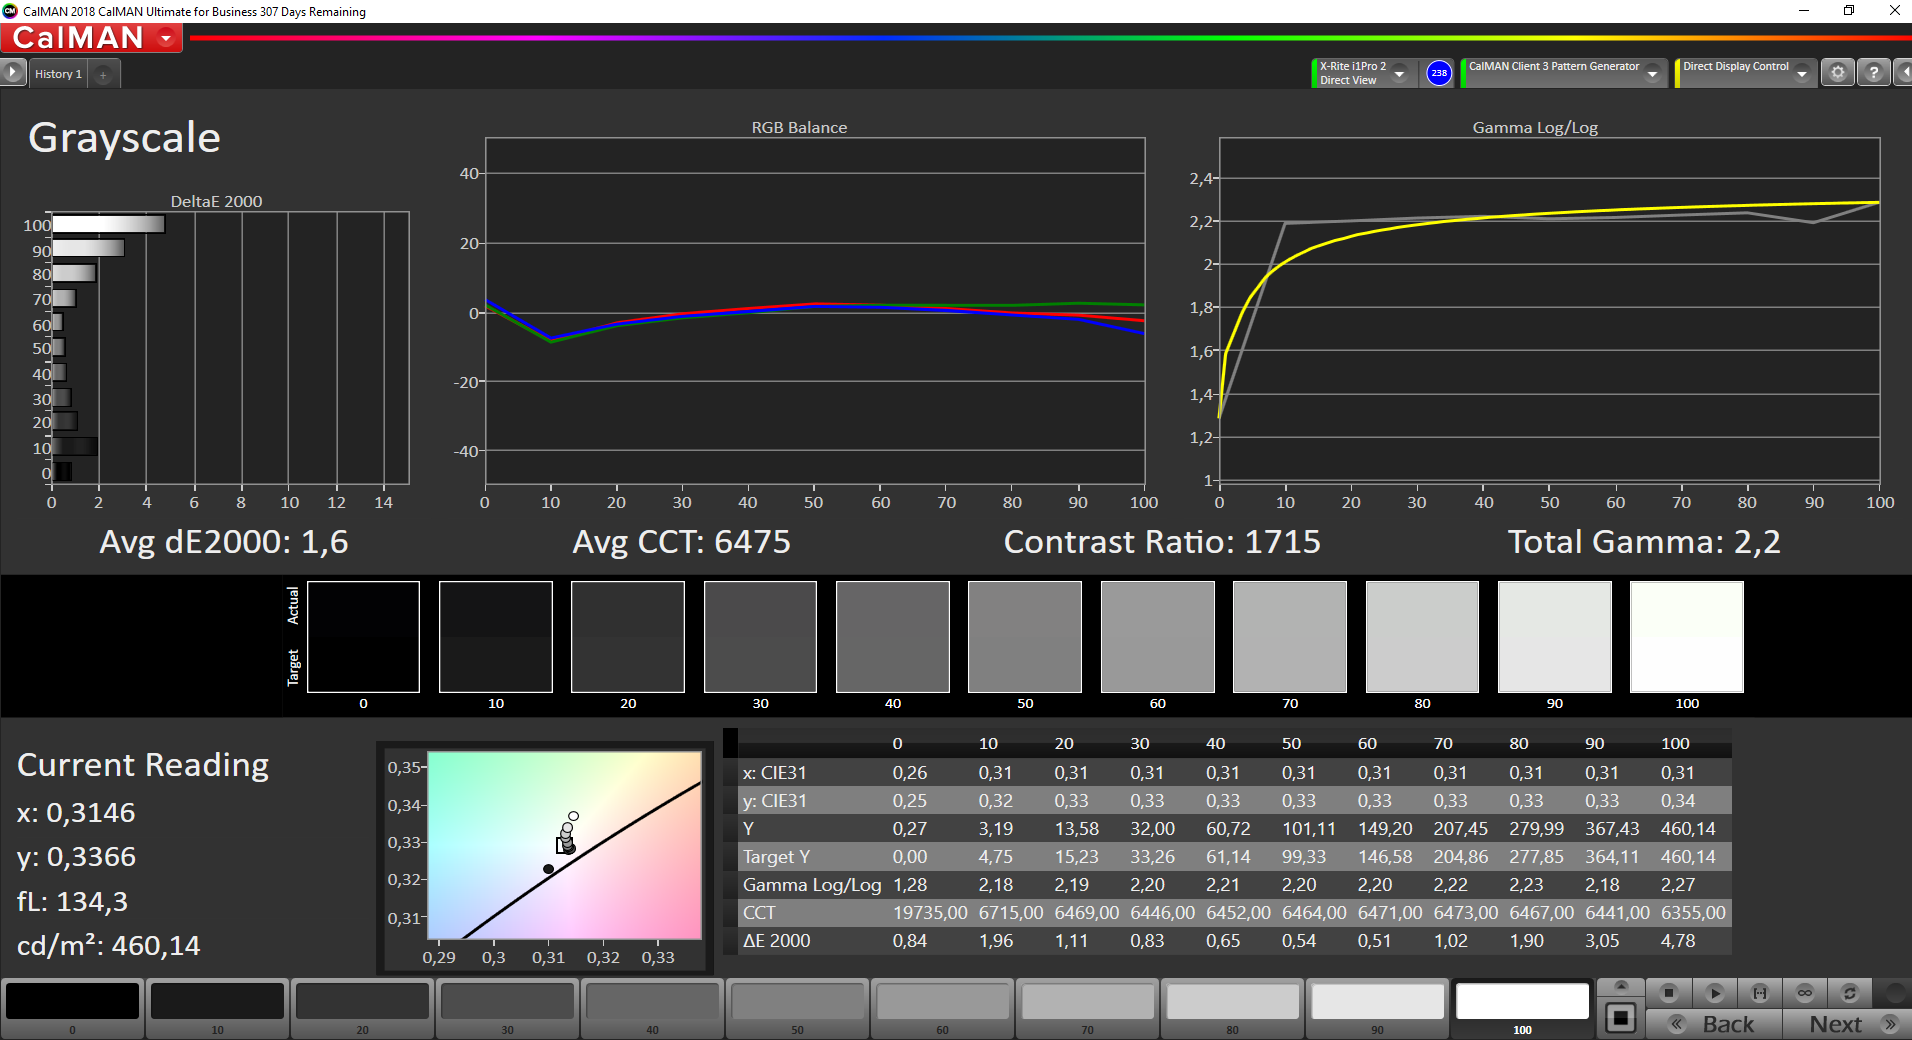
We can only confirm the advertised brightness of 450 nits in the center of the screen; the average value is slightly lower at 434 nits. The black value is decent at 0.27 cd/m², which results in an excellent contrast ratio of more than 1700:1. The screen also supports HDR contents.
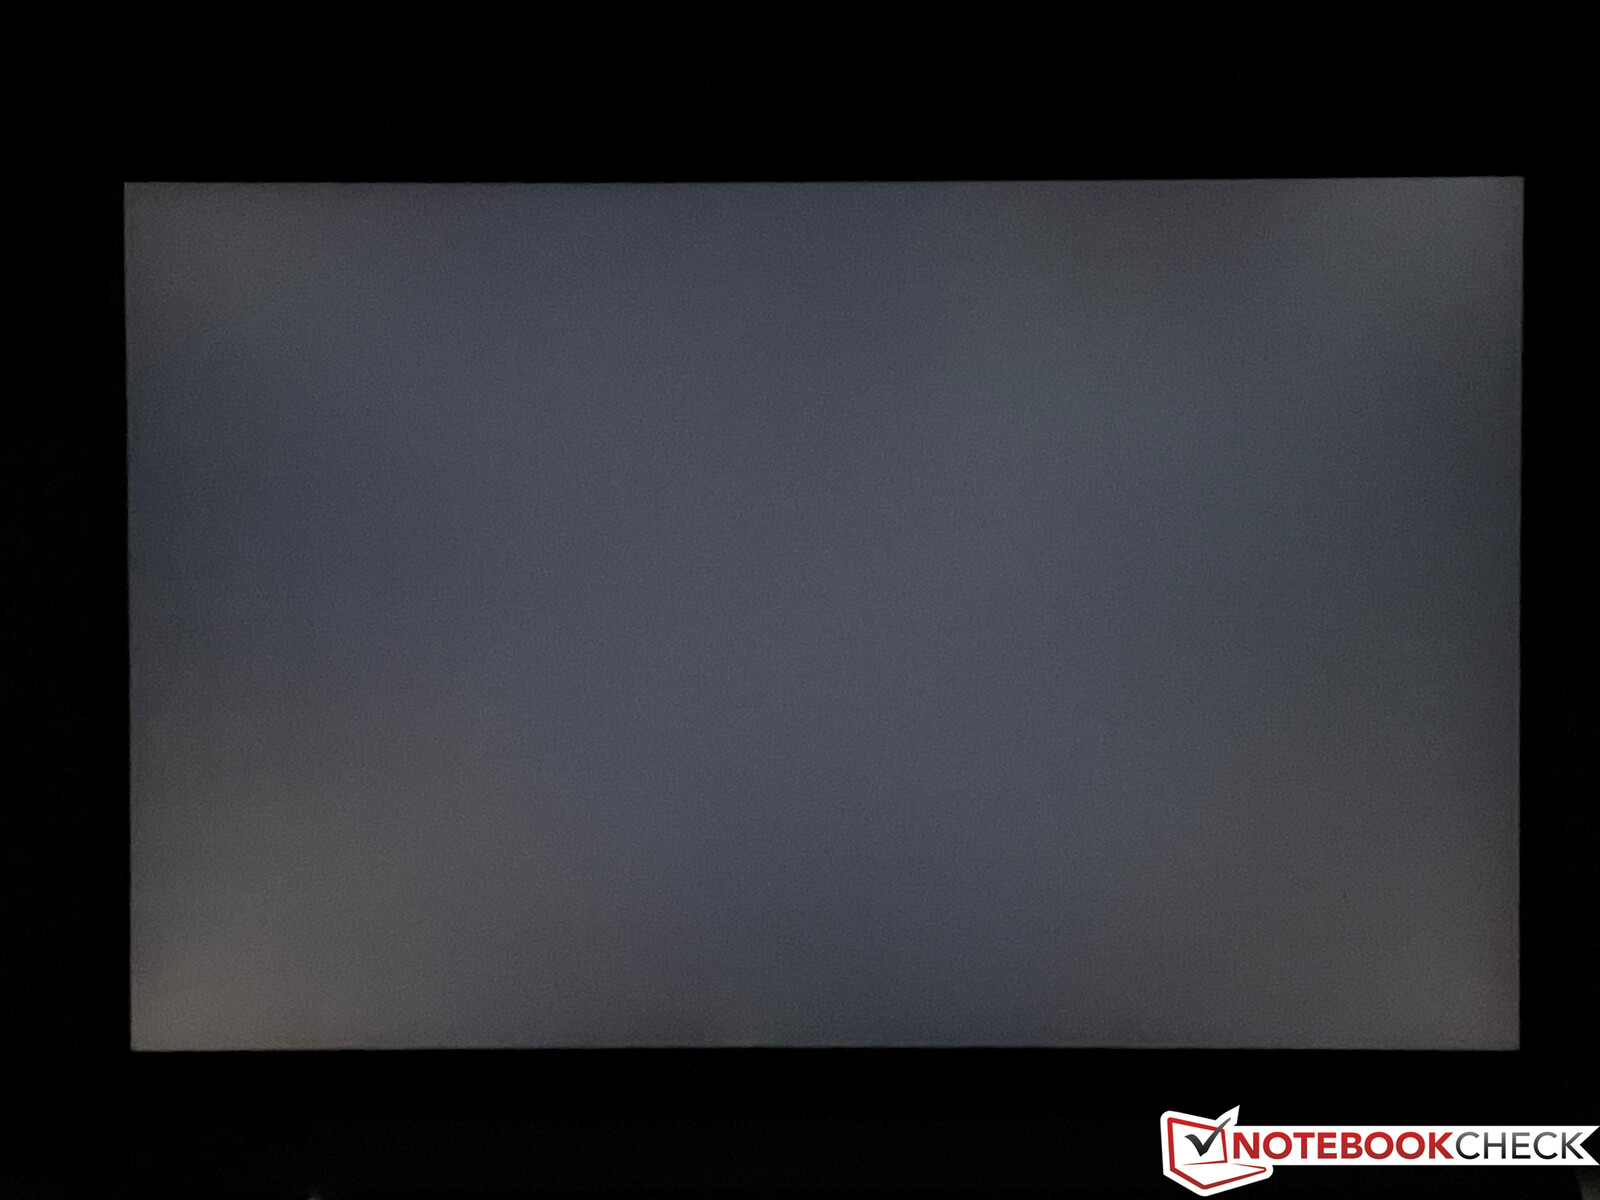
We did not detect PWM flickering and there is no visible backlight bleeding even on a black screen at maximum brightness.
| |||||||||||||||||||||||||
Brightness Distribution: 92 %
Center on Battery: 462 cd/m²
Contrast: 1704:1 (Black: 0.27 cd/m²)
ΔE ColorChecker Calman: 1.1 | ∀{0.5-29.43 Ø4.73}
calibrated: 1
ΔE Greyscale Calman: 1.6 | ∀{0.09-98 Ø4.97}
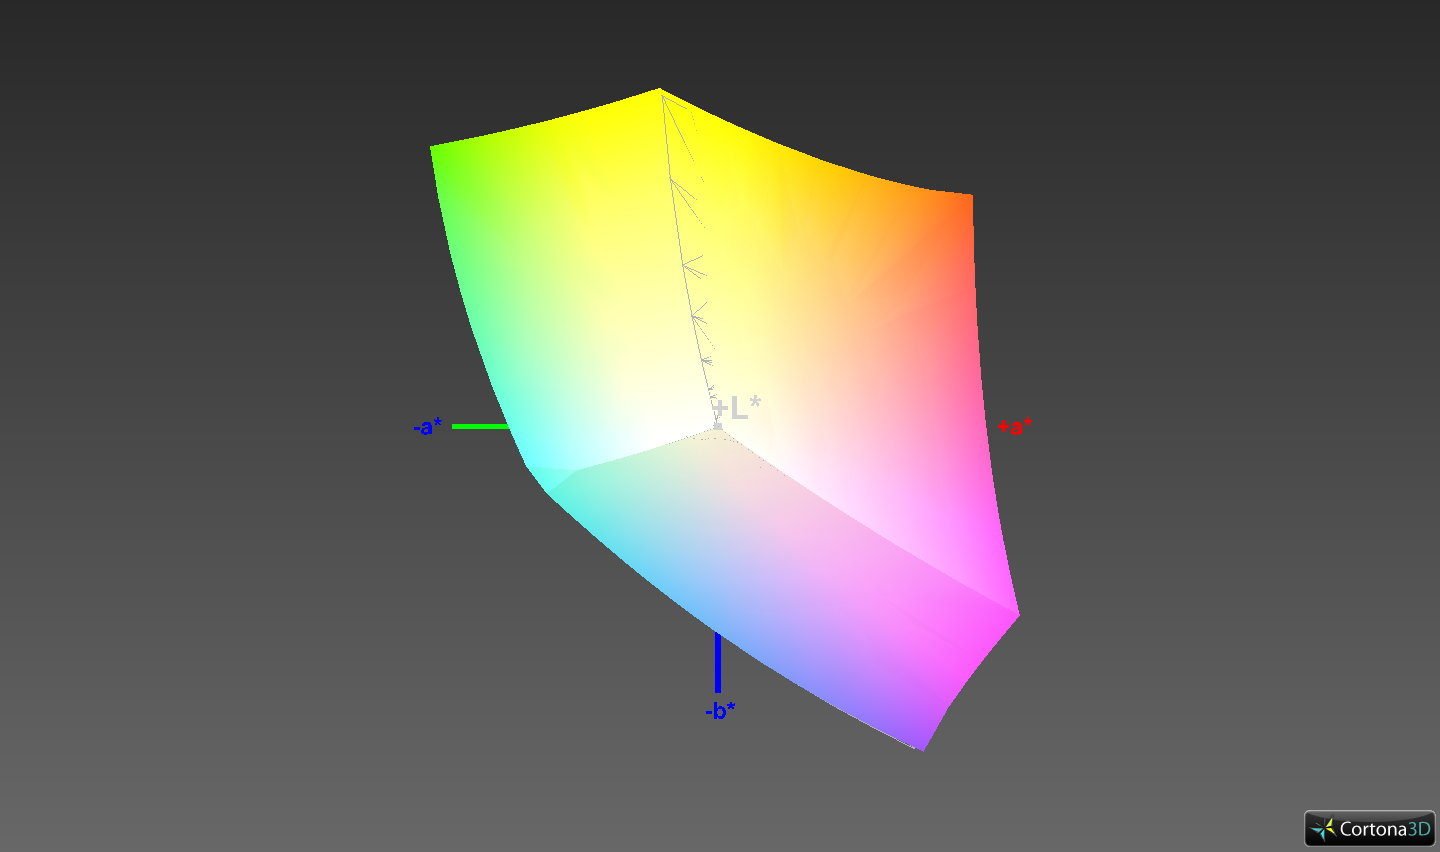
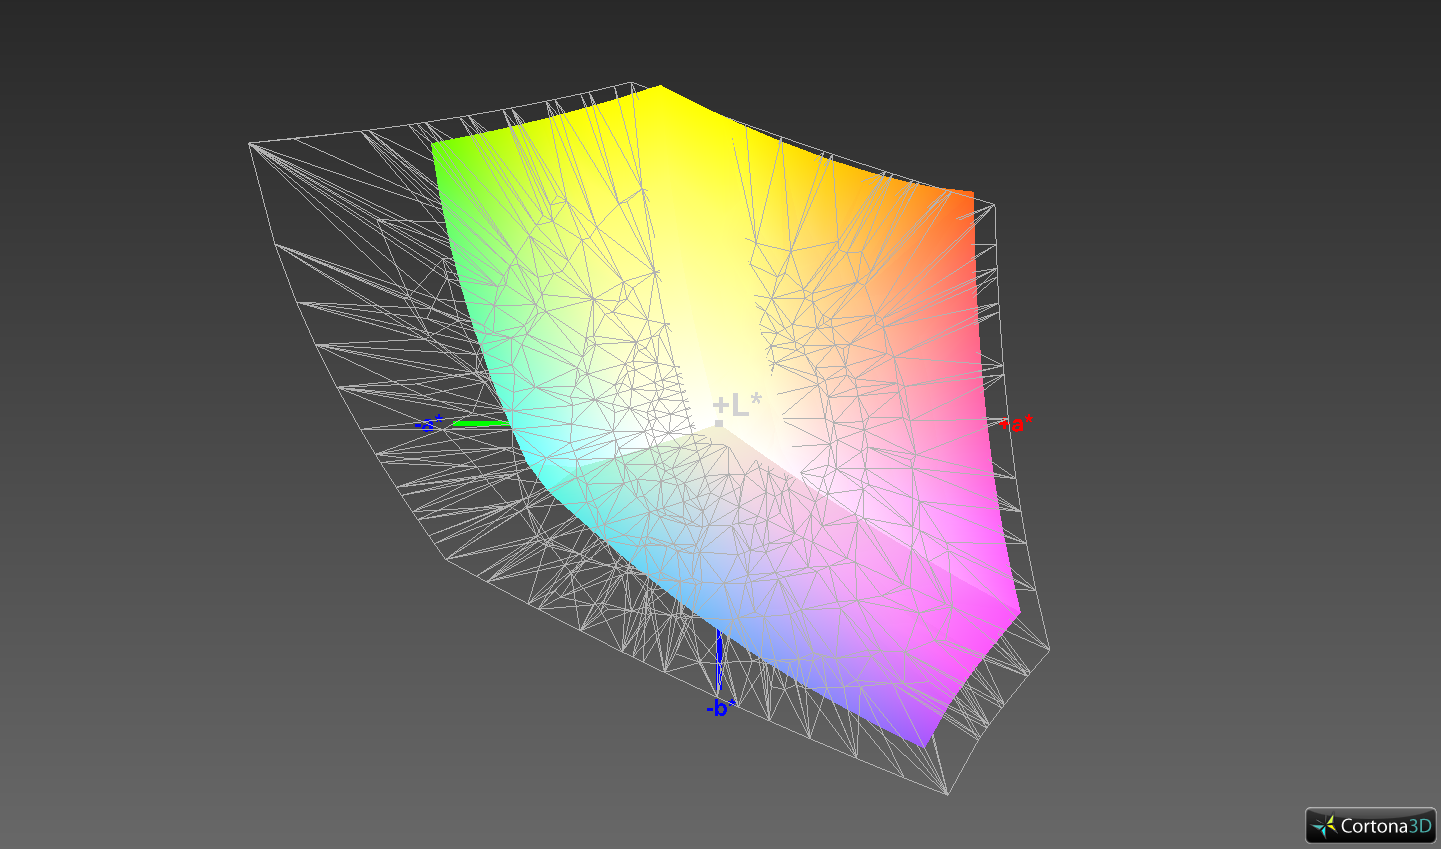
99.9% sRGB (Argyll 1.6.3 3D)
65.7% AdobeRGB 1998 (Argyll 1.6.3 3D)
72% AdobeRGB 1998 (Argyll 3D)
99.9% sRGB (Argyll 3D)
70.4% Display P3 (Argyll 3D)
Gamma: 2.2
CCT: 6475 K
| Lenovo ThinkPad X1 Nano-20UN002UGE MND007ZA1-2, IPS, 2160x1350, 13" | Dell XPS 13 9310 Core i7 FHD Sharp LQ134N1, IPS, 1920x1200, 13.4" | Fujitsu LifeBook U9310X LQ133M1JW48, IPS, 1920x1080, 13.3" | HP Elite Dragonfly-8MK79EA AUO5E2D, IPS, 1920x1080, 13.3" | Apple MacBook Air 2020 M1 Entry IPS, 2560x1600, 13.3" | Lenovo ThinkPad X13-20UGS00800 B133HAK01.1, IPS LED, 1920x1080, 13.3" | |
|---|---|---|---|---|---|---|
| Display | 0% | -5% | -2% | 20% | -7% | |
| Display P3 Coverage (%) | 70.4 | 70.9 1% | 66.4 -6% | 69 -2% | 98.6 40% | 64.8 -8% |
| sRGB Coverage (%) | 99.9 | 99.1 -1% | 96.9 -3% | 99.4 -1% | 100 0% | 95.6 -4% |
| AdobeRGB 1998 Coverage (%) | 72 | 72.9 1% | 67.4 -6% | 70.9 -2% | 85.9 19% | 65.7 -9% |
| Response Times | -15% | -28% | -26% | 21% | -14% | |
| Response Time Grey 50% / Grey 80% * (ms) | 46.8 ? | 52 ? -11% | 62.4 ? -33% | 60.8 ? -30% | 31 ? 34% | 56.8 ? -21% |
| Response Time Black / White * (ms) | 28 ? | 33.2 ? -19% | 34.4 ? -23% | 33.8 ? -21% | 26.1 ? 7% | 30 ? -7% |
| PWM Frequency (Hz) | 2475 ? | 211.9 ? | 118000 ? | |||
| Screen | -45% | -29% | -10% | -5% | -86% | |
| Brightness middle (cd/m²) | 460 | 543.3 18% | 345 -25% | 411 -11% | 417 -9% | 331 -28% |
| Brightness (cd/m²) | 434 | 524 21% | 317 -27% | 388 -11% | 395 -9% | 315 -27% |
| Brightness Distribution (%) | 92 | 92 0% | 86 -7% | 87 -5% | 91 -1% | 90 -2% |
| Black Level * (cd/m²) | 0.27 | 0.38 -41% | 0.24 11% | 0.22 19% | 0.39 -44% | 0.21 22% |
| Contrast (:1) | 1704 | 1430 -16% | 1438 -16% | 1868 10% | 1069 -37% | 1576 -8% |
| Colorchecker dE 2000 * | 1.1 | 3.02 -175% | 2.7 -145% | 1.8 -64% | 1.12 -2% | 6.1 -455% |
| Colorchecker dE 2000 max. * | 4.5 | 7.61 -69% | 4.2 7% | 4.1 9% | 2.71 40% | 10 -122% |
| Colorchecker dE 2000 calibrated * | 1 | 1.23 -23% | 1 -0% | 1 -0% | 0.77 23% | 1.2 -20% |
| Greyscale dE 2000 * | 1.6 | 5 -213% | 3.3 -106% | 2.5 -56% | 1.7 -6% | 6.3 -294% |
| Gamma | 2.2 100% | 2.02 109% | 2.31 95% | 2.26 97% | 2207 0% | 2.77 79% |
| CCT | 6475 100% | 6550 99% | 7188 90% | 6448 101% | 6870 95% | 6938 94% |
| Color Space (Percent of AdobeRGB 1998) (%) | 65.7 | 66.8 2% | 62.4 -5% | 64.7 -2% | 60.7 -8% | |
| Color Space (Percent of sRGB) (%) | 99.9 | 99.6 0% | 96.9 -3% | 99.3 -1% | 95.4 -5% | |
| Total Average (Program / Settings) | -20% /
-33% | -21% /
-24% | -13% /
-11% | 12% /
4% | -36% /
-62% |
* ... smaller is better
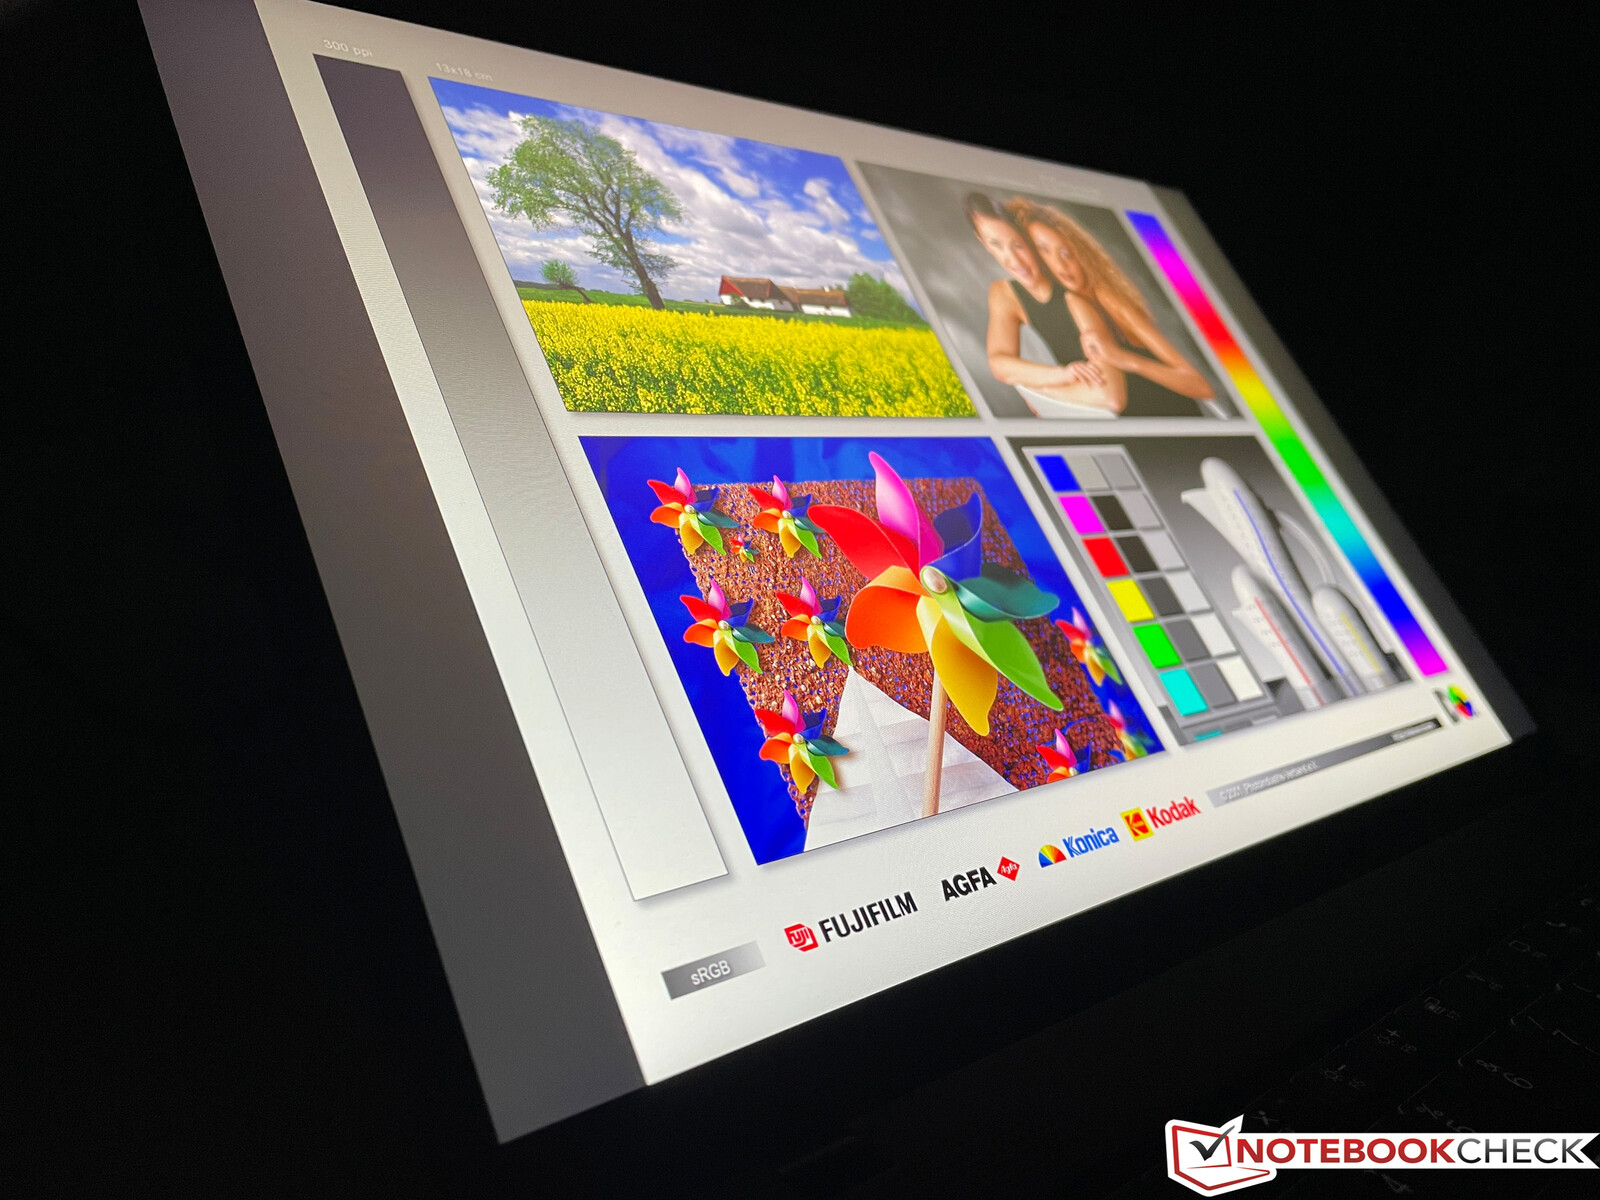
We use the professional CalMAN software in combination with the X-Rite i1 Pro 2 spectrophotometer for our analysis. The factory calibration is already very good. There is no color cast in the grayscale, the color temperature is fine and even the color deviations (compared to the sRGB reference) are lower than 3, which means the human eye cannot see a deviation from the ideal colors.
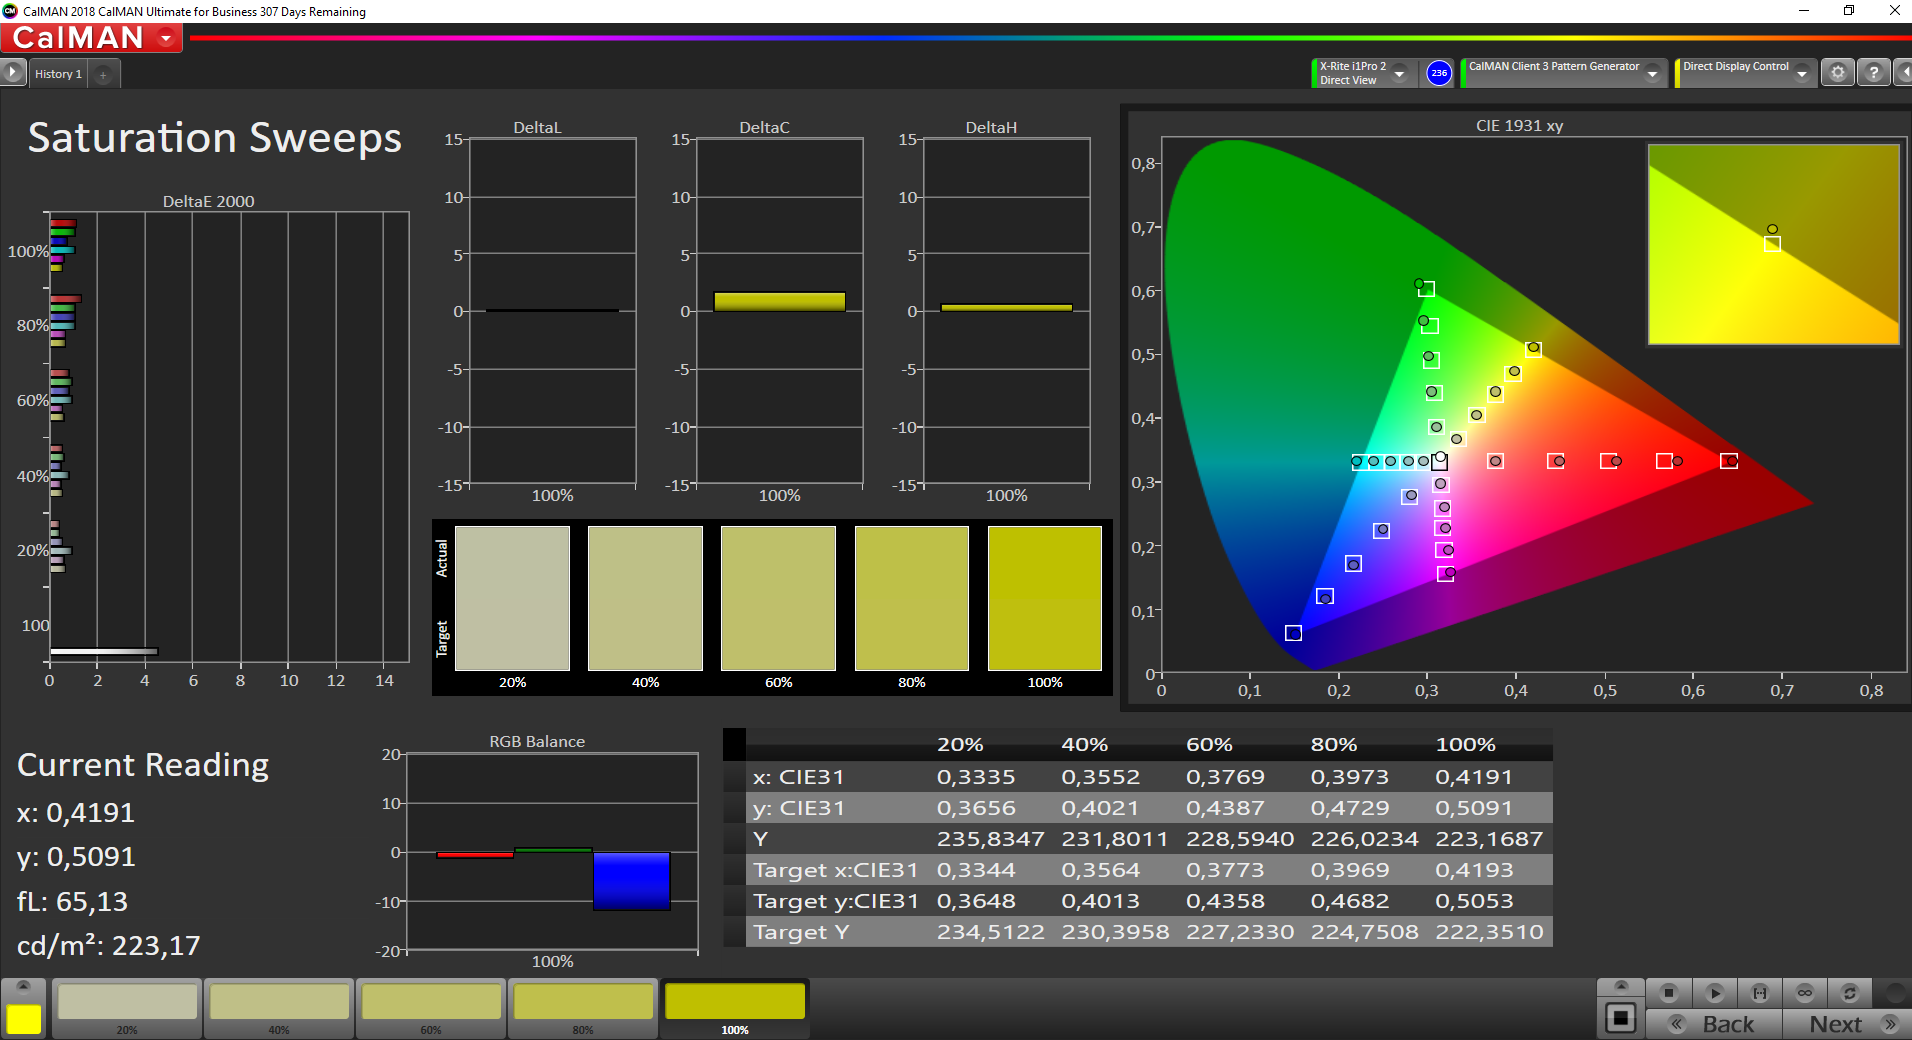
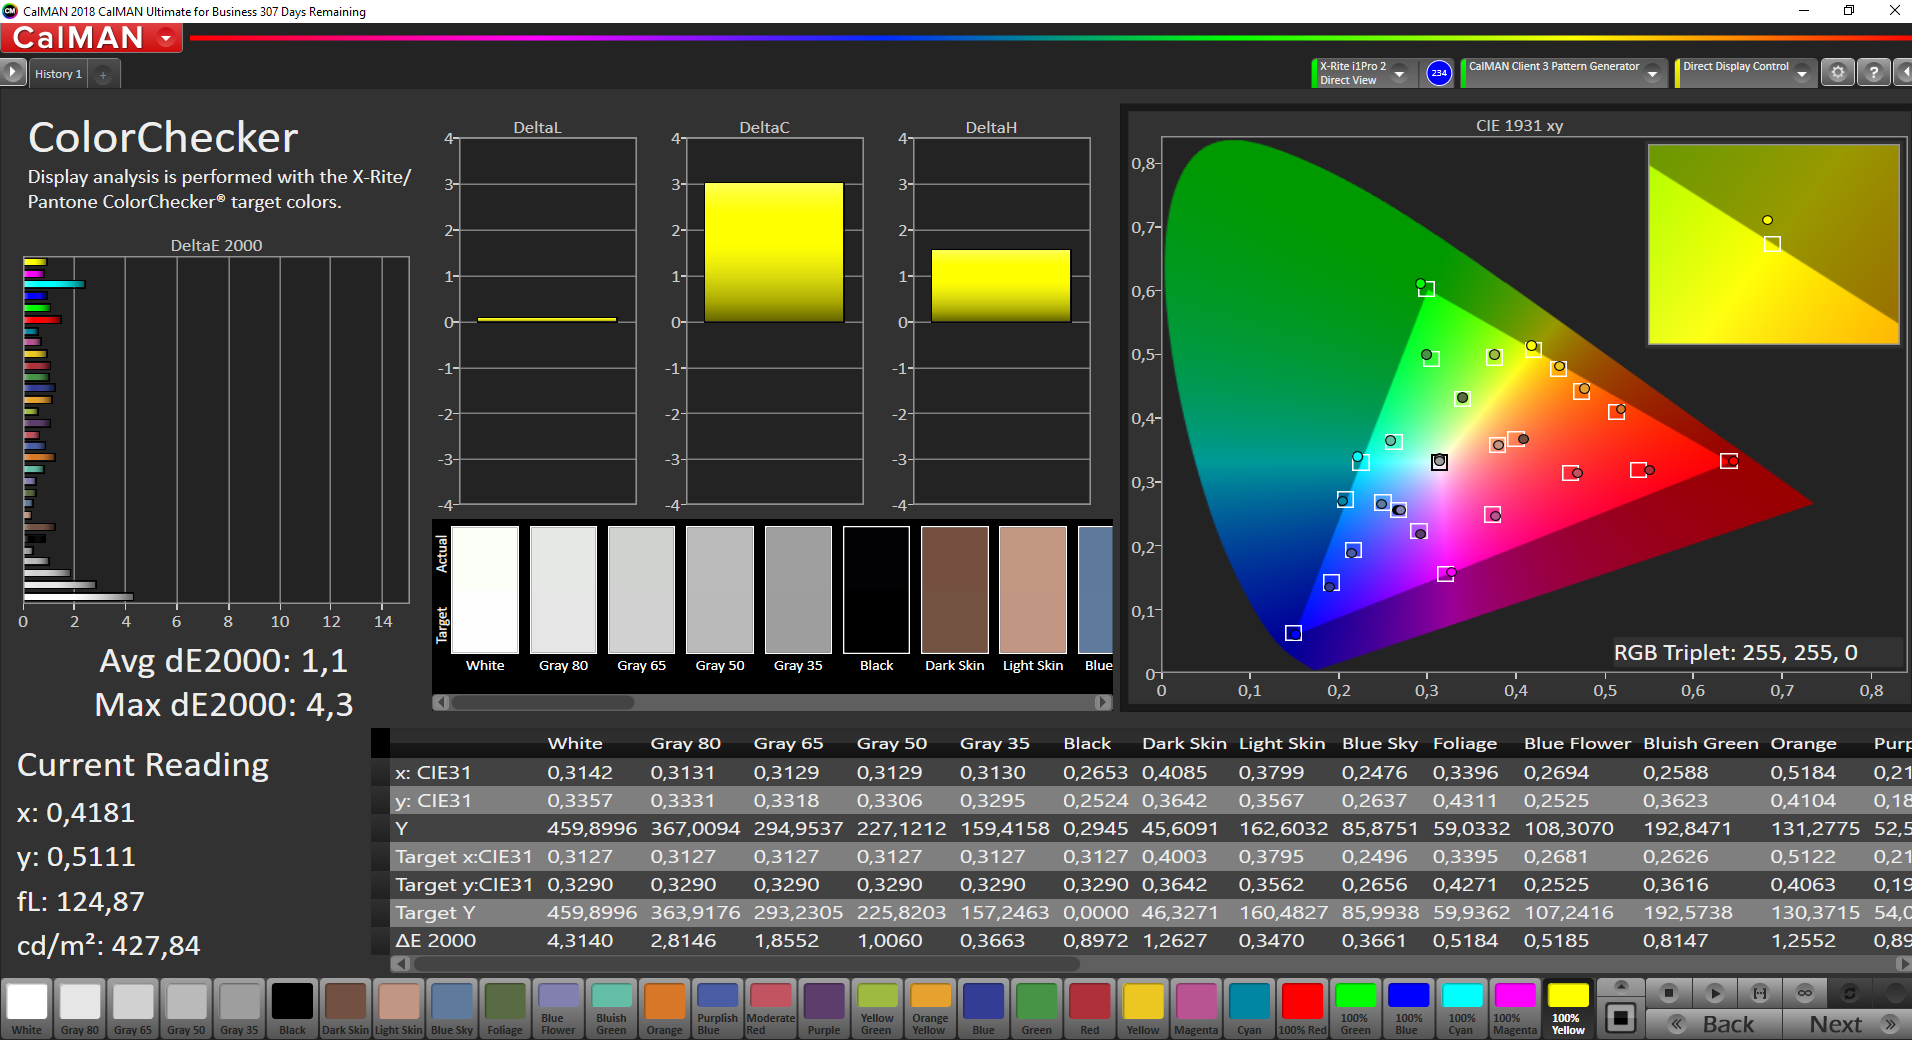
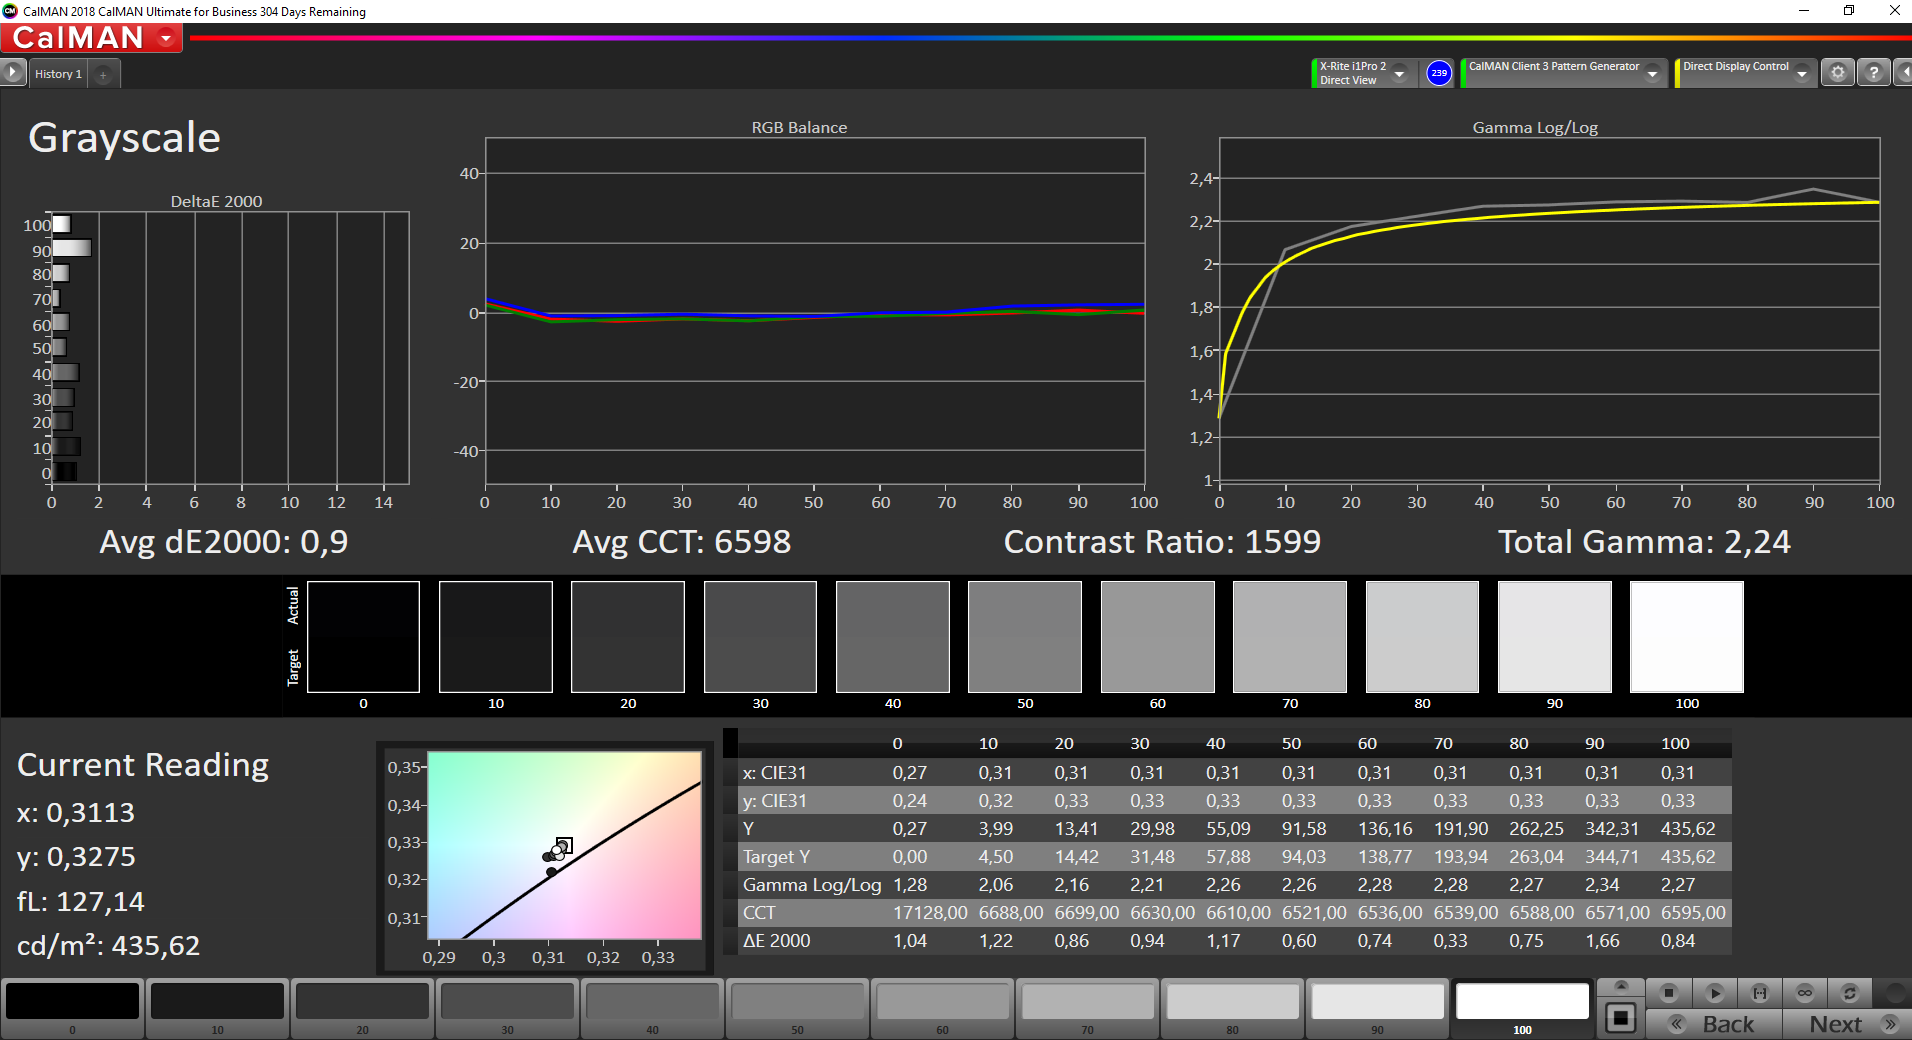
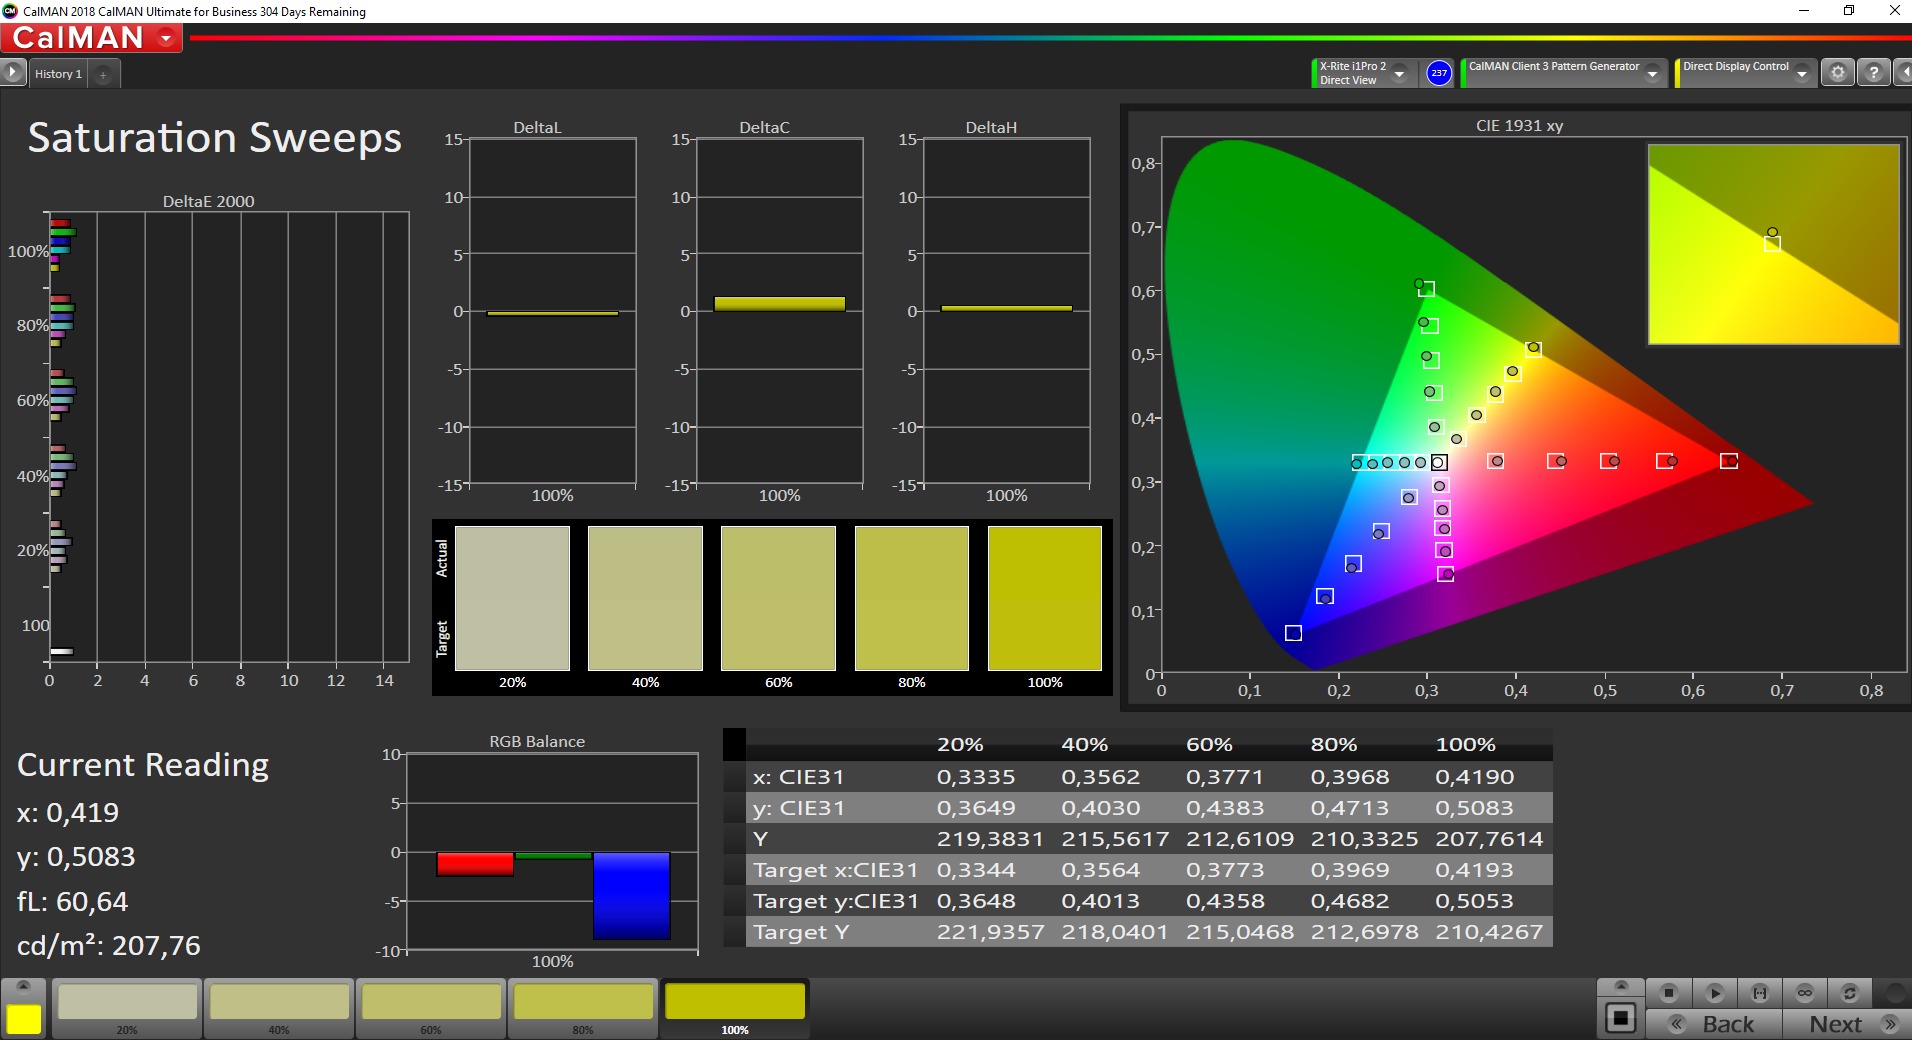
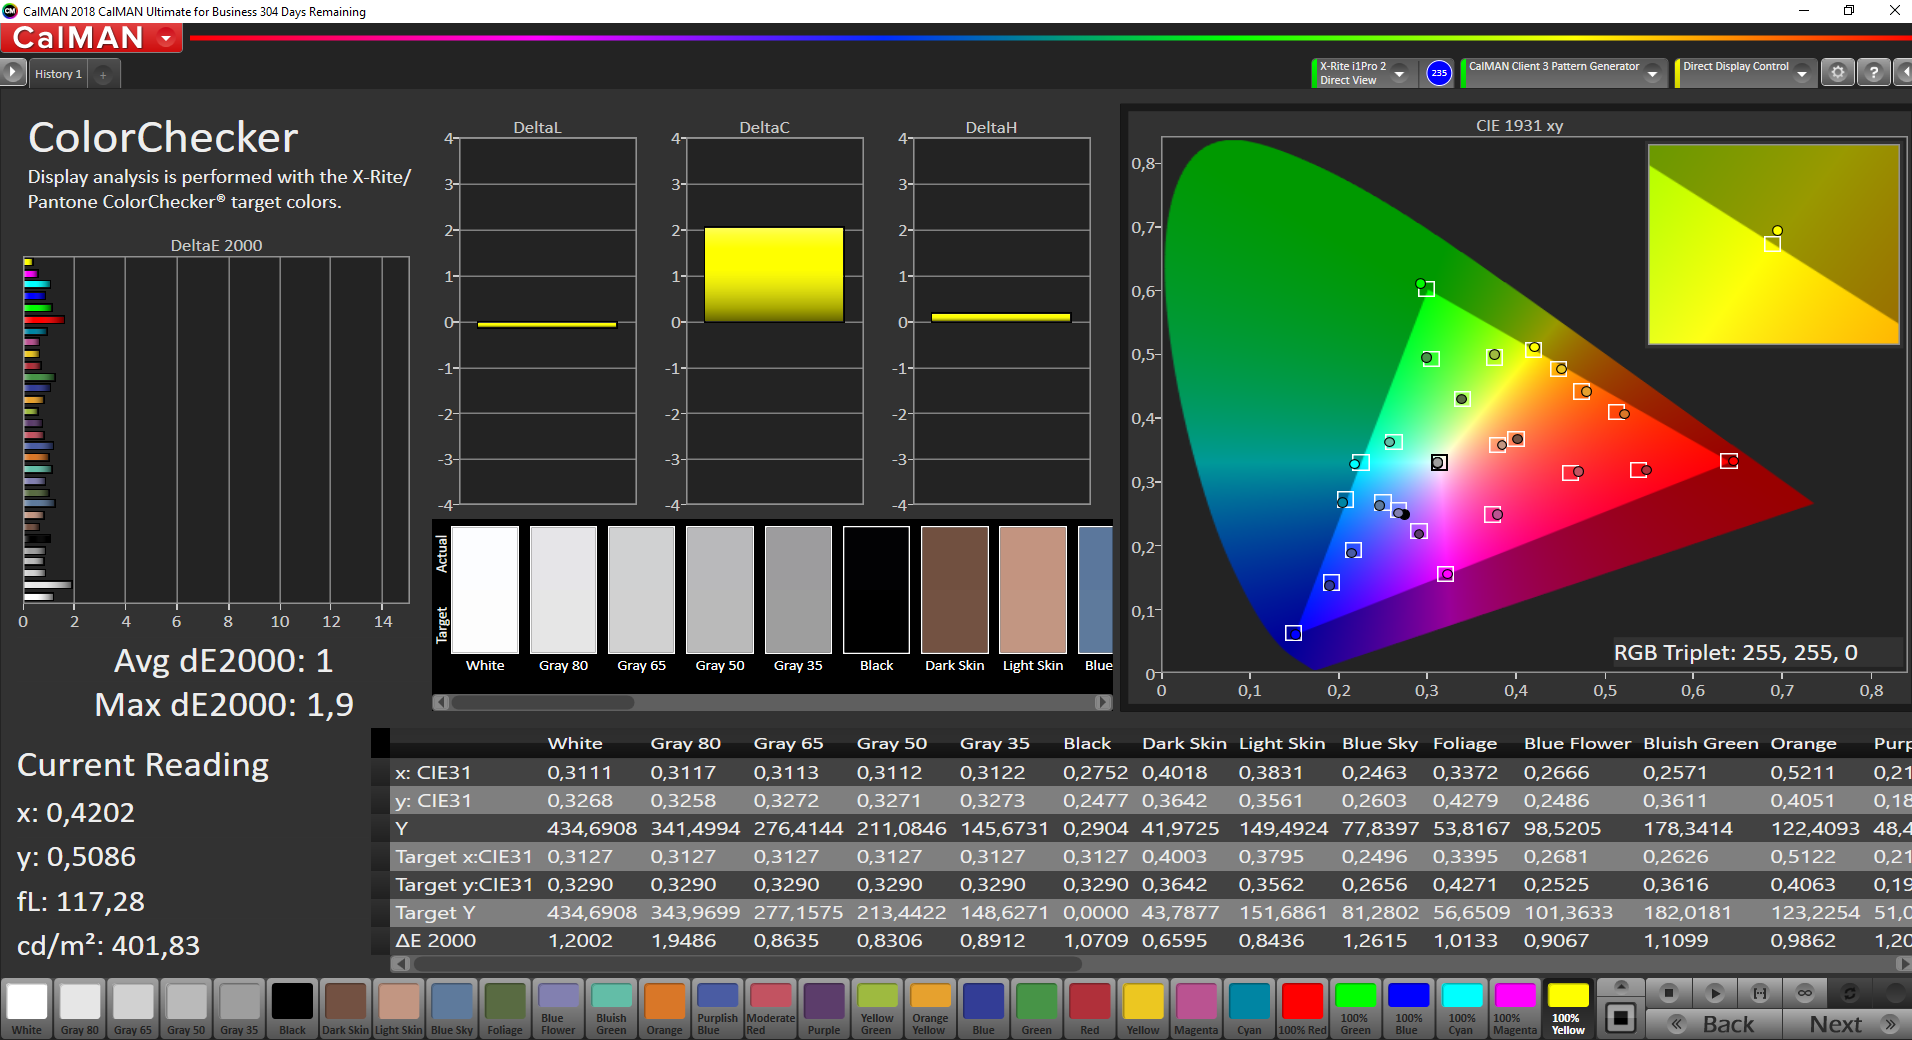
A calibration by the user is therefore not necessary. We tried it anyway, but only got minor improvements. The panel also covers sRGB, which means you can use it for picture/video editing.
Display Response Times
| ↔ Response Time Black to White | ||
|---|---|---|
| 28 ms ... rise ↗ and fall ↘ combined | ↗ 13.2 ms rise |  |
| ↘ 14.8 ms fall | ||
| The screen shows relatively slow response rates in our tests and may be too slow for gamers. In comparison, all tested devices range from 0.1 (minimum) to 240 (maximum) ms. » 71 % of all devices are better. This means that the measured response time is worse than the average of all tested devices (19.9 ms). | ||
| ↔ Response Time 50% Grey to 80% Grey | ||
| 46.8 ms ... rise ↗ and fall ↘ combined | ↗ 22 ms rise |  |
| ↘ 24.8 ms fall | ||
| The screen shows slow response rates in our tests and will be unsatisfactory for gamers. In comparison, all tested devices range from 0.165 (minimum) to 636 (maximum) ms. » 80 % of all devices are better. This means that the measured response time is worse than the average of all tested devices (31.1 ms). | ||
Screen Flickering / PWM (Pulse-Width Modulation)
| Screen flickering / PWM not detected |  | ||
In comparison: 52 % of all tested devices do not use PWM to dim the display. If PWM was detected, an average of 7798 (minimum: 5 - maximum: 343500) Hz was measured. | |||
You obviously benefit from the matte surface outdoors. We took our test pictures in the winter sun, and reflections can be challenging. If you turn away from the sun, however, you can use the panel very comfortably even in this bright environment. The viewing angle stability of the IPS panel is very good.
Performance - Tiger Lake and M.2-2242-SSD
Lenovo offers two processors from Intel's current Tiger Lake generation for the X1 Nano. However, these CPUs are not the "standard" UP3 chips, which are available for a couple of months now, but more efficient UP4 chips (Core i5-1130G7 & Core i7-1160G7) with a lower TDP specification (at least in theory). The X1 Nano is always equipped with 16 GB memory (LPDDR4x-4266) in the EMEA region, other regions also get models with 8 GB. The memory is soldered onto the mainboard and cannot be upgraded.
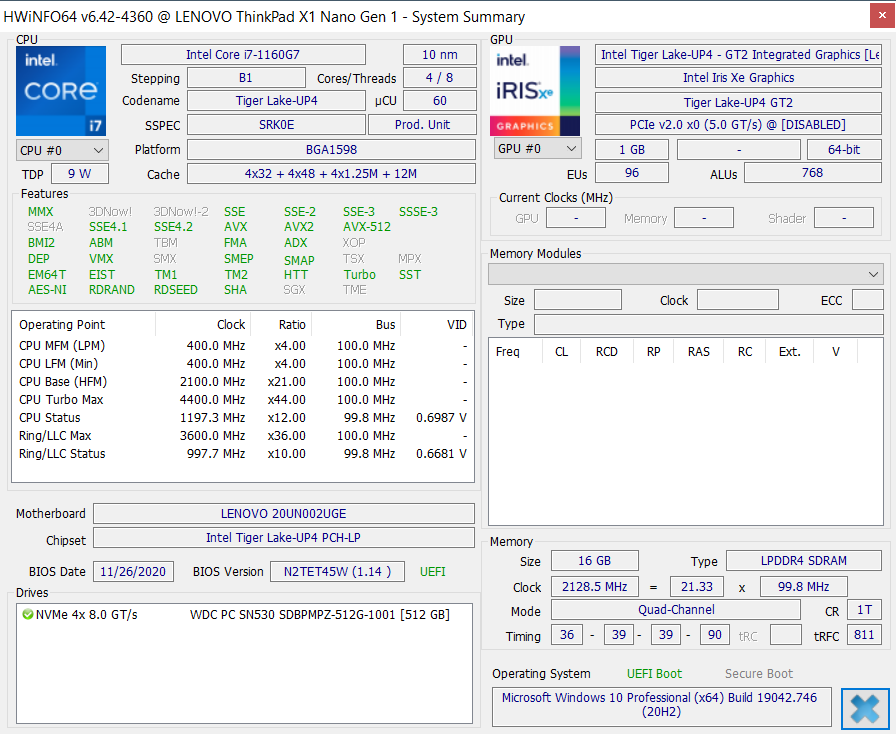
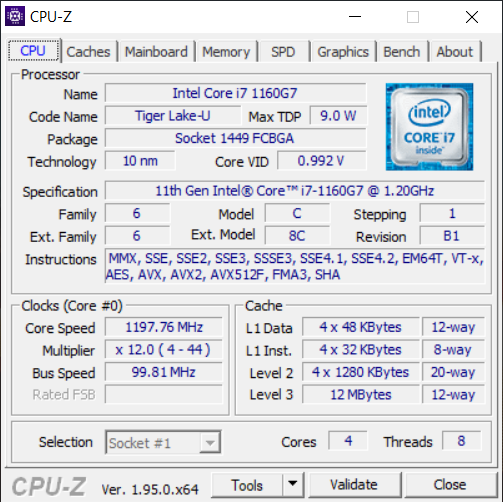
Processor - Core i7-1160G7
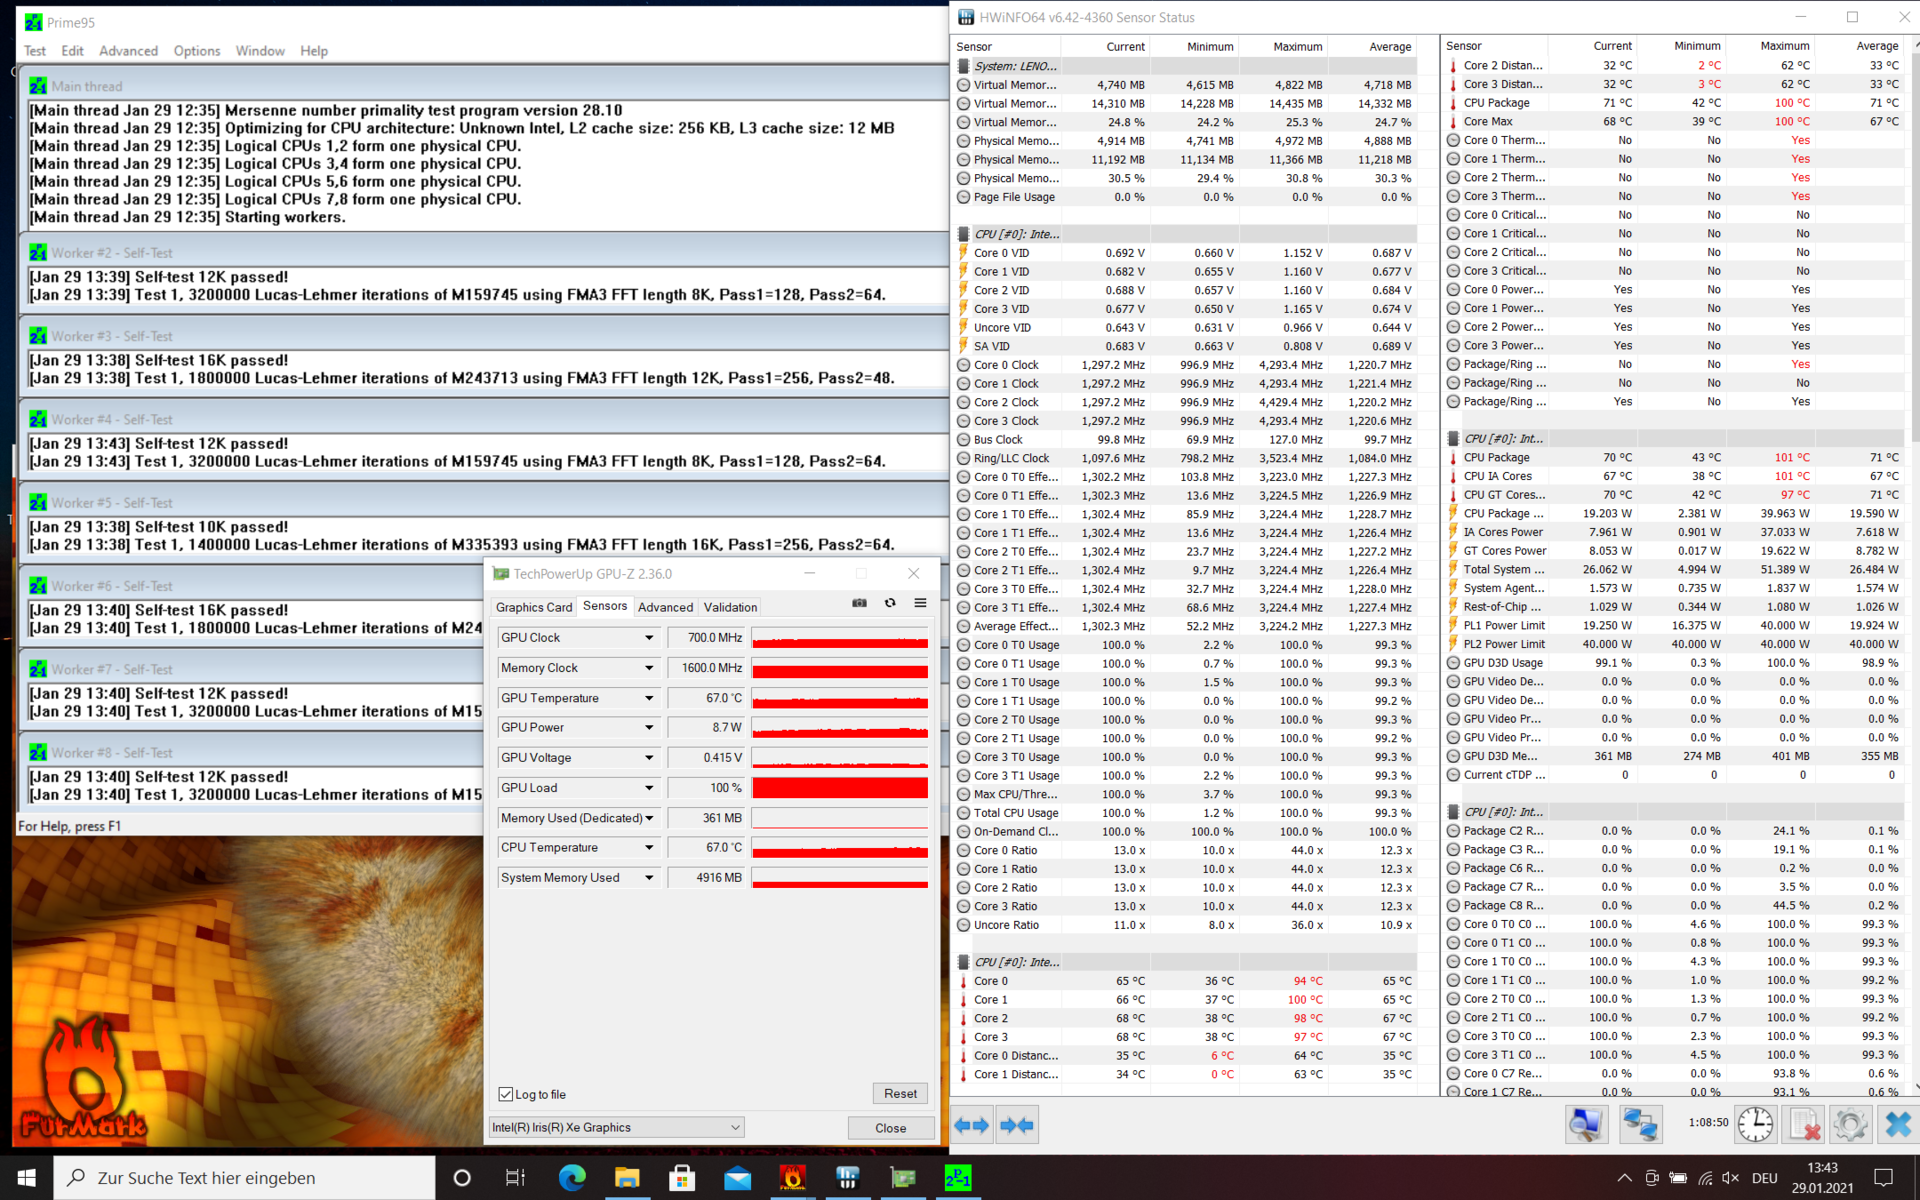
Our test unit uses the faster Core i7 chip. The Core i7-1160G7 is a Tiger Lake chip with four cores (8 threads) and all four cores can reach up to 3.6 GHz; one active core up to 4.4 GHz. Intel specifies the TDP with 7-15W for the UP4 chip, but Lenovo sets both limits to 40W. This means the chip temperature is the deciding factor for the performance.
The good news is that all four cores can maintain their maximum clock for about one minute, while the CPU consumes 36W. This begs the question why Lenovo uses a supposedly slower UP4 processor in the first place.
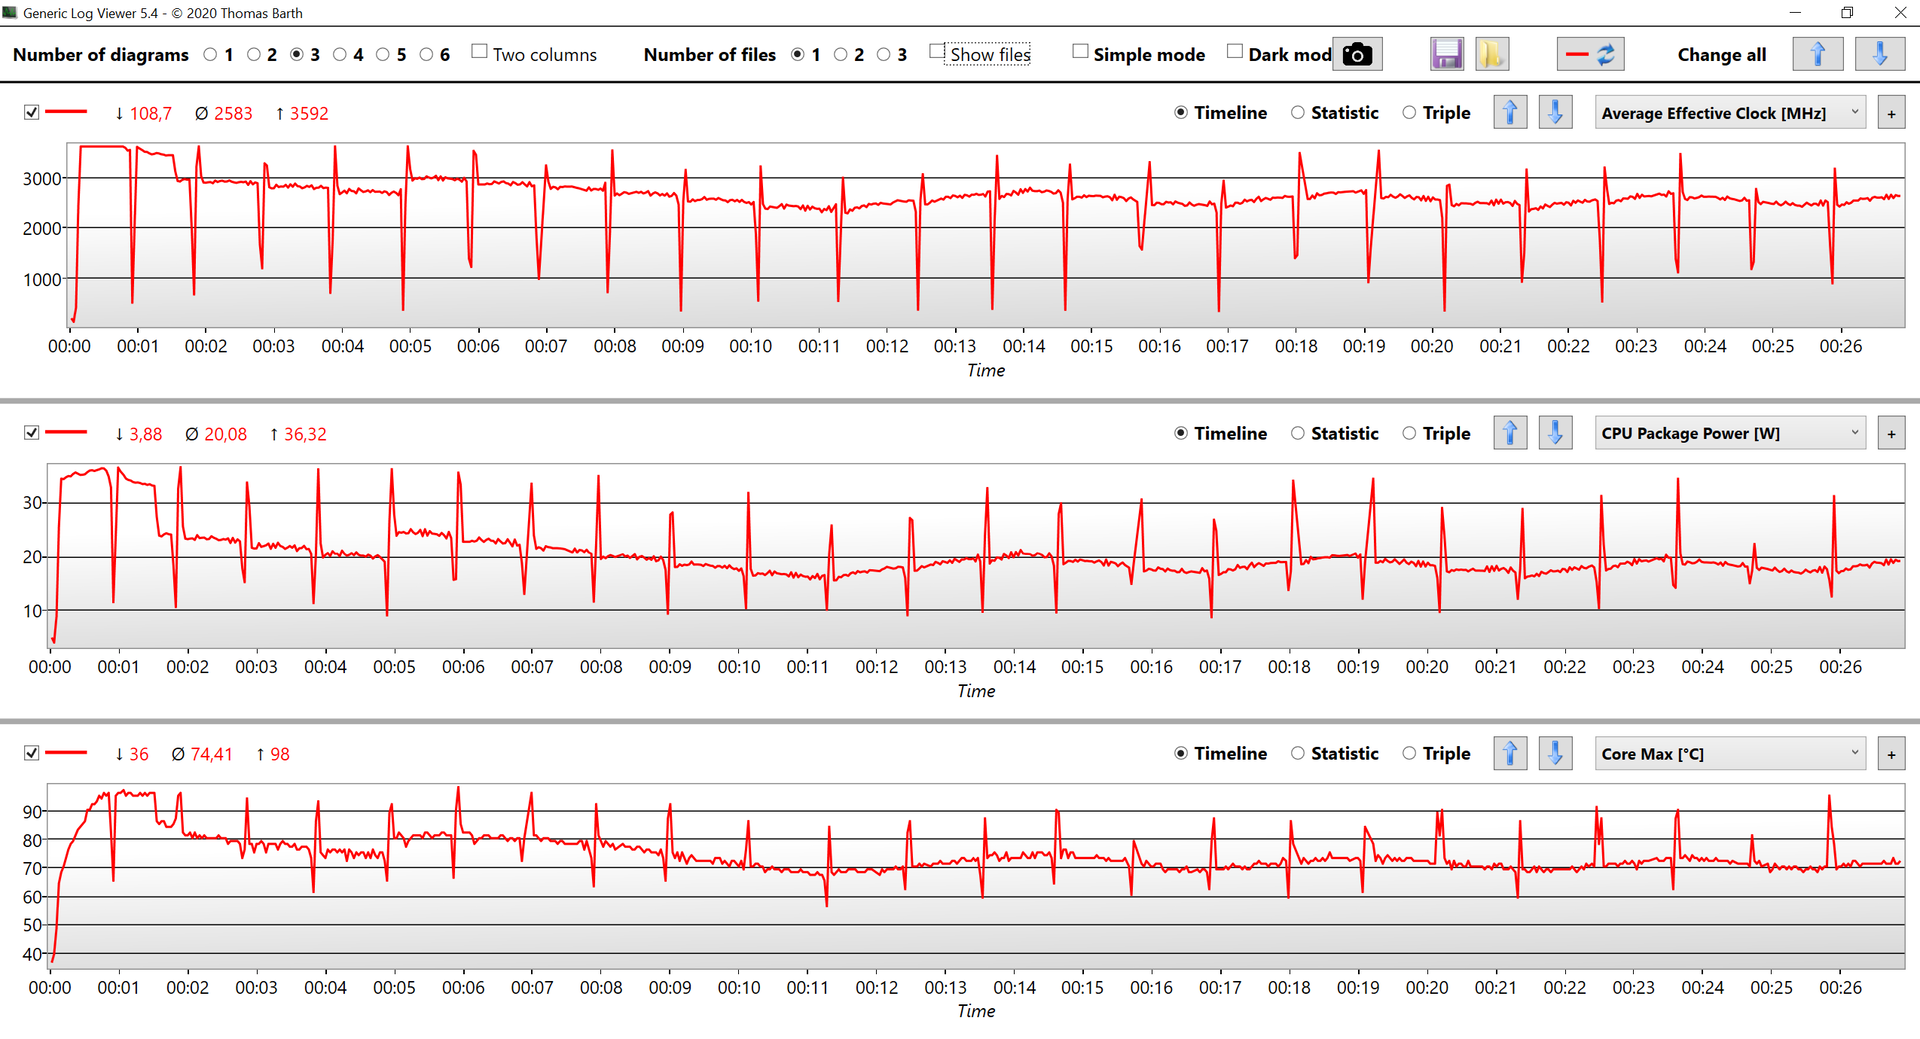
A closer look at the Cinebench R15 Multi loop shows that the performance is not perfectly steady, and it depends how long the chip can higher clocks in the beginning of each run. The power consumption levels off at around 19W (~2.5-2.6 GHz). The results are slightly behind the XPS 13 with the UP3 Tiger Lake CPU and clearly ahead of the old Comet Lake CPUs. The passively cooled MacBook Air, however, is even faster, even though Cinebench R15 has to be emulated on the Air M1. The ThinkPad X13 with the AMD Ryzen processor is clearly superior in multi-core tests and offers almost twice the performance.
Cinebench R15: CPU Single 64Bit | CPU Multi 64Bit
Blender: v2.79 BMW27 CPU
7-Zip 18.03: 7z b 4 -mmt1 | 7z b 4
Geekbench 5.5: Single-Core | Multi-Core
HWBOT x265 Benchmark v2.2: 4k Preset
LibreOffice : 20 Documents To PDF
R Benchmark 2.5: Overall mean
| Cinebench R20 / CPU (Single Core) | |
| Average of class Subnotebook (128 - 832, n=57, last 2 years) | |
| Dell XPS 13 9310 Core i7 FHD | |
| Lenovo ThinkPad X1 Nano-20UN002UGE | |
| Average Intel Core i7-1160G7 (484 - 544, n=4) | |
| Lenovo ThinkPad X13-20UGS00800 | |
| Fujitsu LifeBook U9310X | |
| Apple MacBook Air 2020 M1 Entry | |
| HP Elite Dragonfly-8MK79EA | |
| Cinebench R20 / CPU (Multi Core) | |
| Average of class Subnotebook (579 - 8541, n=57, last 2 years) | |
| Lenovo ThinkPad X13-20UGS00800 | |
| Dell XPS 13 9310 Core i7 FHD | |
| Apple MacBook Air 2020 M1 Entry | |
| Lenovo ThinkPad X1 Nano-20UN002UGE | |
| Average Intel Core i7-1160G7 (1224 - 2068, n=4) | |
| Fujitsu LifeBook U9310X | |
| HP Elite Dragonfly-8MK79EA | |
| Cinebench R15 / CPU Single 64Bit | |
| Average of class Subnotebook (72.4 - 322, n=57, last 2 years) | |
| Dell XPS 13 9310 Core i7 FHD | |
| Apple MacBook Air 2020 M1 Entry | |
| Lenovo ThinkPad X1 Nano-20UN002UGE | |
| Average Intel Core i7-1160G7 (170 - 208, n=4) | |
| Lenovo ThinkPad X13-20UGS00800 | |
| Fujitsu LifeBook U9310X | |
| HP Elite Dragonfly-8MK79EA | |
| Cinebench R15 / CPU Multi 64Bit | |
| Average of class Subnotebook (327 - 3345, n=57, last 2 years) | |
| Lenovo ThinkPad X13-20UGS00800 | |
| Apple MacBook Air 2020 M1 Entry | |
| Dell XPS 13 9310 Core i7 FHD | |
| Lenovo ThinkPad X1 Nano-20UN002UGE | |
| Average Intel Core i7-1160G7 (753 - 864, n=4) | |
| Fujitsu LifeBook U9310X | |
| HP Elite Dragonfly-8MK79EA | |
| Blender / v2.79 BMW27 CPU | |
| HP Elite Dragonfly-8MK79EA | |
| Average Intel Core i7-1160G7 (625 - 1115, n=4) | |
| Fujitsu LifeBook U9310X | |
| Apple MacBook Air 2020 M1 Entry | |
| Dell XPS 13 9310 Core i7 FHD | |
| Lenovo ThinkPad X1 Nano-20UN002UGE | |
| Lenovo ThinkPad X13-20UGS00800 | |
| Average of class Subnotebook (159 - 2271, n=58, last 2 years) | |
| 7-Zip 18.03 / 7z b 4 -mmt1 | |
| Average of class Subnotebook (2643 - 6699, n=59, last 2 years) | |
| Apple MacBook Air 2020 M1 Entry | |
| Dell XPS 13 9310 Core i7 FHD | |
| Lenovo ThinkPad X1 Nano-20UN002UGE | |
| Average Intel Core i7-1160G7 (4448 - 4621, n=3) | |
| Lenovo ThinkPad X13-20UGS00800 | |
| Fujitsu LifeBook U9310X | |
| HP Elite Dragonfly-8MK79EA | |
| 7-Zip 18.03 / 7z b 4 | |
| Average of class Subnotebook (11668 - 77867, n=57, last 2 years) | |
| Lenovo ThinkPad X13-20UGS00800 | |
| Apple MacBook Air 2020 M1 Entry | |
| Lenovo ThinkPad X1 Nano-20UN002UGE | |
| Dell XPS 13 9310 Core i7 FHD | |
| Average Intel Core i7-1160G7 (15740 - 22305, n=4) | |
| Fujitsu LifeBook U9310X | |
| HP Elite Dragonfly-8MK79EA | |
| Geekbench 5.5 / Single-Core | |
| Average of class Subnotebook (726 - 2224, n=48, last 2 years) | |
| Apple MacBook Air Late 2020 (M1, 8 Core GPU, 8 GB RAM) | |
| Apple MacBook Air 2020 M1 Entry | |
| Dell XPS 13 9310 Core i7 FHD | |
| Average Intel Core i7-1160G7 (1406 - 1484, n=4) | |
| Lenovo ThinkPad X1 Nano-20UN002UGE | |
| Lenovo ThinkPad X13-20UGS00800 | |
| Fujitsu LifeBook U9310X | |
| Geekbench 5.5 / Multi-Core | |
| Average of class Subnotebook (2557 - 17218, n=48, last 2 years) | |
| Apple MacBook Air 2020 M1 Entry | |
| Apple MacBook Air Late 2020 (M1, 8 Core GPU, 8 GB RAM) | |
| Dell XPS 13 9310 Core i7 FHD | |
| Lenovo ThinkPad X13-20UGS00800 | |
| Average Intel Core i7-1160G7 (4660 - 5258, n=4) | |
| Lenovo ThinkPad X1 Nano-20UN002UGE | |
| Fujitsu LifeBook U9310X | |
| HWBOT x265 Benchmark v2.2 / 4k Preset | |
| Average of class Subnotebook (0.97 - 25.1, n=57, last 2 years) | |
| Lenovo ThinkPad X13-20UGS00800 | |
| Lenovo ThinkPad X1 Nano-20UN002UGE | |
| Dell XPS 13 9310 Core i7 FHD | |
| Average Intel Core i7-1160G7 (3.75 - 6.06, n=4) | |
| Fujitsu LifeBook U9310X | |
| HP Elite Dragonfly-8MK79EA | |
| LibreOffice / 20 Documents To PDF | |
| Lenovo ThinkPad X13-20UGS00800 | |
| Average of class Subnotebook (39.9 - 220, n=56, last 2 years) | |
| Fujitsu LifeBook U9310X | |
| Average Intel Core i7-1160G7 (49.8 - 61.3, n=4) | |
| Lenovo ThinkPad X1 Nano-20UN002UGE | |
| Dell XPS 13 9310 Core i7 FHD | |
| Apple MacBook Air 2020 M1 Entry | |
| R Benchmark 2.5 / Overall mean | |
| Apple MacBook Air 2020 M1 Entry | |
| Fujitsu LifeBook U9310X | |
| Average Intel Core i7-1160G7 (0.64 - 0.76, n=4) | |
| Lenovo ThinkPad X1 Nano-20UN002UGE | |
| Lenovo ThinkPad X13-20UGS00800 | |
| Dell XPS 13 9310 Core i7 FHD | |
| Average of class Subnotebook (0.4024 - 1.456, n=58, last 2 years) | |
* ... smaller is better
The i7-1160G7 benefits from the high clock (4.4 GHz) in the single-core benchmarks, and we see the maximum clock in the tests. The X1 Nano is only beaten by the more powerful Core i7-1165G7 in the XPS 13 and in some tests also by the Apple M1. The AMD processor of the X13 on the other hand is beaten. The CPU performance is not reduced on battery power.
All in all, the CPU performance of the X1 Nano is much better than we expected (considering the supposedly low TDP of the UP4 processor).
System Performance
The ThinkPad X1 Nano is a very fast system in everyday scenarios and all inputs are executed without delays. This impression is supported by the synthetic benchmarks and we did not experience any issues during our review period.
| PCMark 10 Score | 4615 points | |
Help | ||
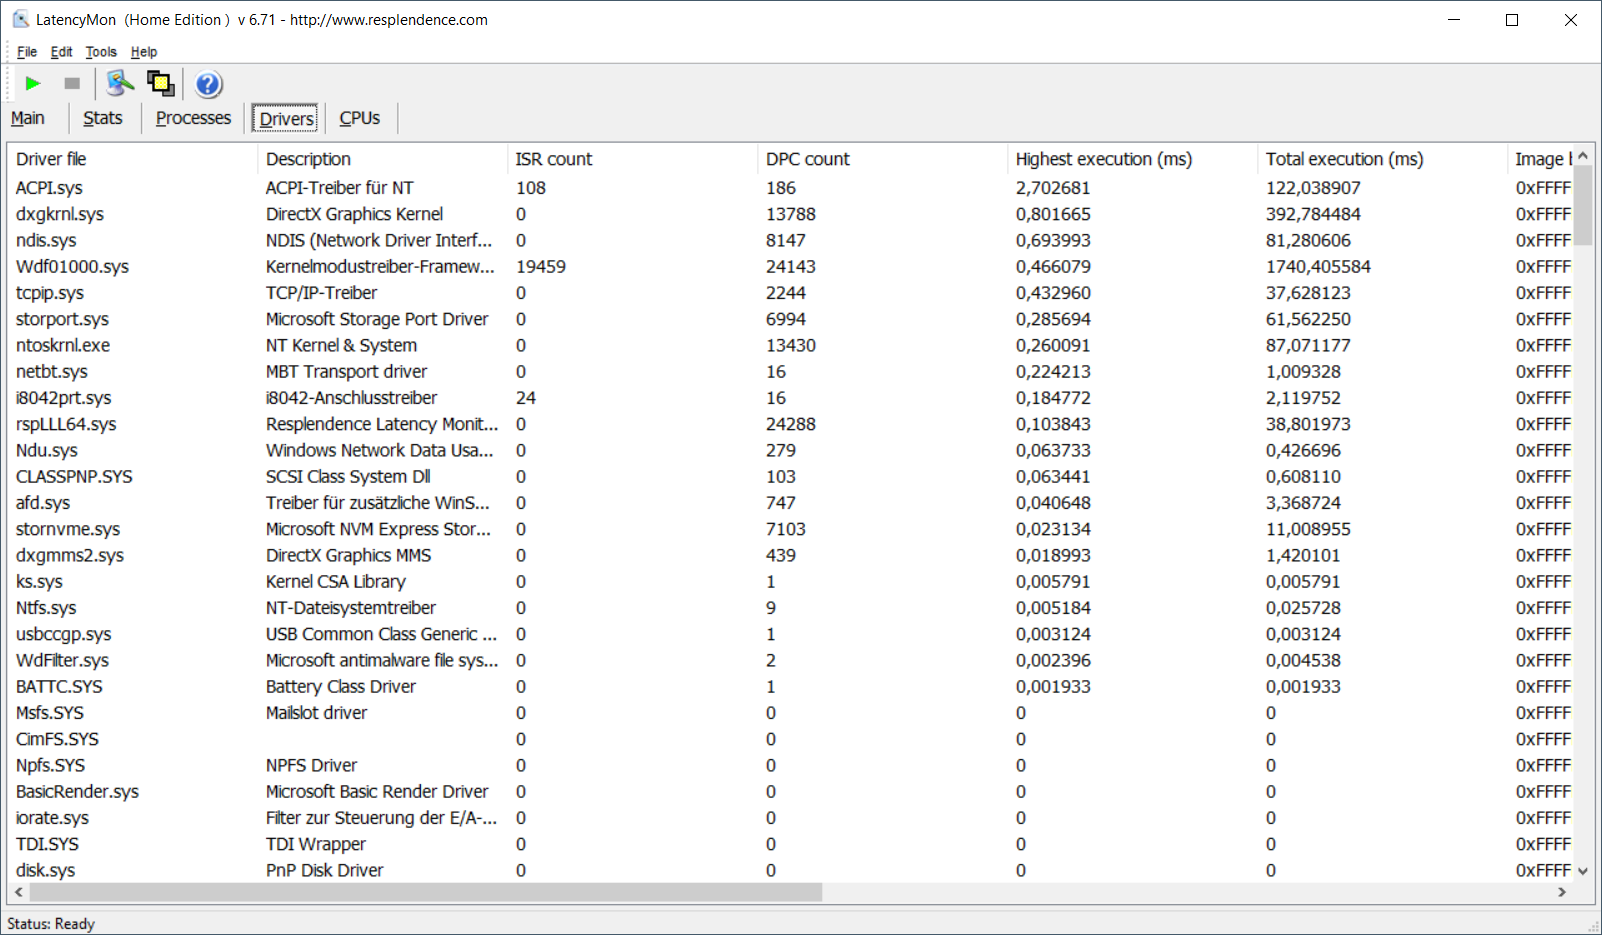
DPC Latency
The X1 Nano does not perform very well in our standardized DPC Latency test, so there can be limitations when you handle real-time audio files. There were also dropped frames (36/3683) during a 4K YouTube video.
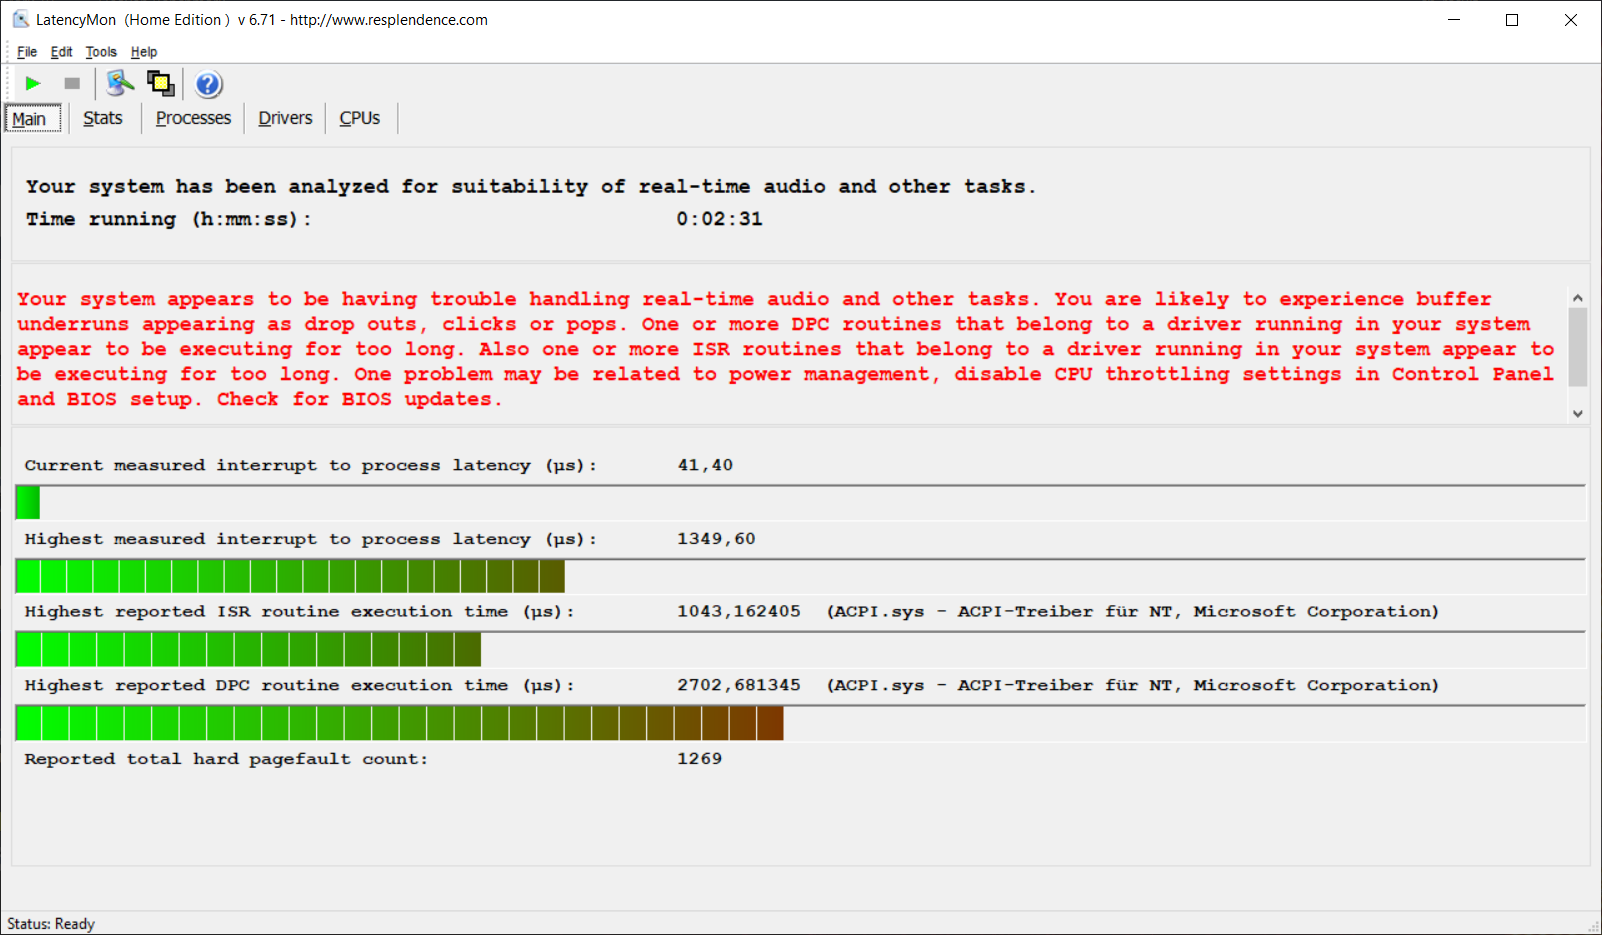
| DPC Latencies / LatencyMon - interrupt to process latency (max), Web, Youtube, Prime95 | |
| Fujitsu LifeBook U9310X | |
| Lenovo ThinkPad X13-20UGS00800 | |
| Lenovo ThinkPad X1 Nano-20UN002UGE | |
| Dell XPS 13 9310 Core i7 FHD | |
* ... smaller is better
Storage Devices - Only PCIe 3.0
Lenovo implements a compact M.2-2242 SSD, which is provided by Western Digital (SN530) in the case of our review unit. We do not understand why Lenovo does not use the modern PCIe 4.0 interface, which is supported by Intel's Tiger Lake chips. However, PCIe-3.0-x4 is still a very fast interface and you will not notice the difference in practice.
| Lenovo ThinkPad X1 Nano-20UN002UGE WDC PC SN530 SDBPNPZ-512G | Dell XPS 13 9310 Core i7 FHD Micron 2300 512GB MTFDHBA512TDV | Fujitsu LifeBook U9310X Toshiba KBG40ZNS512G NVMe | HP Elite Dragonfly-8MK79EA Intel Optane Memory H10 with Solid State Storage 32GB + 512GB HBRPEKNX0202A(L/H) | Lenovo ThinkPad X13-20UGS00800 Samsung SSD PM981a MZVLB512HBJQ | Average WDC PC SN530 SDBPNPZ-512G | |
|---|---|---|---|---|---|---|
| CrystalDiskMark 5.2 / 6 | -4% | -26% | -21% | 1% | -14% | |
| Write 4K (MB/s) | 269.4 | 97.5 -64% | 134.2 -50% | 88 -67% | 95.7 -64% | 170.1 ? -37% |
| Read 4K (MB/s) | 54.1 | 50.9 -6% | 53.4 -1% | 132.1 144% | 37.47 -31% | 49.4 ? -9% |
| Write Seq (MB/s) | 1739 | 1811 4% | 1216 -30% | 503 -71% | 2032 17% | 1731 ? 0% |
| Read Seq (MB/s) | 1671 | 1836 10% | 1291 -23% | 1306 -22% | 2207 32% | 1643 ? -2% |
| Write 4K Q32T1 (MB/s) | 580 | 521 -10% | 401.5 -31% | 237.3 -59% | 517 -11% | 453 ? -22% |
| Read 4K Q32T1 (MB/s) | 708 | 357.5 -50% | 491.4 -31% | 287.4 -59% | 387 -45% | 488 ? -31% |
| Write Seq Q32T1 (MB/s) | 1812 | 2879 59% | 1224 -32% | 1242 -31% | 2977 64% | 1791 ? -1% |
| Read Seq Q32T1 (MB/s) | 2485 | 3204 29% | 2314 -7% | 2480 0% | 3556 43% | 2272 ? -9% |
| AS SSD | -32% | -26% | -42% | 2% | -18% | |
| Seq Read (MB/s) | 2228 | 2091 -6% | 2030 -9% | 1096 -51% | 2553 15% | 1862 ? -16% |
| Seq Write (MB/s) | 1707 | 1396 -18% | 1071 -37% | 305 -82% | 1406 -18% | 1392 ? -18% |
| 4K Read (MB/s) | 47.12 | 49.29 5% | 49.16 4% | 62.3 32% | 48.53 3% | 42.1 ? -11% |
| 4K Write (MB/s) | 237.4 | 104.2 -56% | 117.3 -51% | 110.7 -53% | 119.6 -50% | 163.8 ? -31% |
| 4K-64 Read (MB/s) | 916 | 827 -10% | 1268 38% | 393.7 -57% | 808 -12% | 813 ? -11% |
| 4K-64 Write (MB/s) | 1245 | 1636 31% | 699 -44% | 438.5 -65% | 1846 48% | 876 ? -30% |
| Access Time Read * (ms) | 0.053 | 0.066 -25% | 0.067 -26% | 0.078 -47% | 0.062 -17% | 0.07875 ? -49% |
| Access Time Write * (ms) | 0.069 | 0.365 -429% | 0.168 -143% | 0.045 35% | 0.031 55% | 0.08225 ? -19% |
| Score Read (Points) | 1186 | 1086 -8% | 1520 28% | 566 -52% | 1112 -6% | 1041 ? -12% |
| Score Write (Points) | 1654 | 1880 14% | 923 -44% | 580 -65% | 2107 27% | 1179 ? -29% |
| Score Total (Points) | 3431 | 3499 2% | 3179 -7% | 1420 -59% | 3742 9% | 2738 ? -20% |
| Copy ISO MB/s (MB/s) | 1520 | 1544 2% | 1395 -8% | 1427 ? -6% | ||
| Copy Program MB/s (MB/s) | 546 | 613 12% | 491.8 -10% | 612 ? 12% | ||
| Copy Game MB/s (MB/s) | 1080 | 1451 34% | 948 -12% | 1001 ? -7% | ||
| Total Average (Program / Settings) | -18% /
-22% | -26% /
-26% | -32% /
-33% | 2% /
1% | -16% /
-16% |
* ... smaller is better

DiskSpd Read Loop, Queue Depth 8
GPU Performance - Xe Graphics G7 with 96 EUs
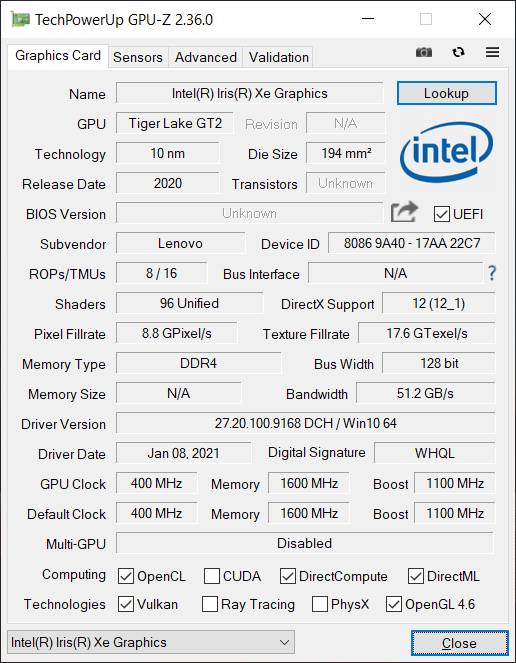
Even though it is a more efficient UP4 processor, Intel still combines it with the powerful integrated Xe Graphics G7 with 96 execution units. The ThinkPad X1 Nano benefits from the TDP and the fast LPDDR4x memory. As we have seen in our reviews, the performance of the iGPU will be slightly reduced with common DDR4 memory. there is also one limitation compared to a regular UP3 Xe Graphics G7: The core clock is lower at 1100 MHz compared to 1300-1350 MHz (depending on the CPU).
The synthetic 3DMark benchmarks show that the X1 Nano is 10-14 % slower than the average values for the Xe Graphics G7 in our database. Intel's iGPU is still faster than the RX Vega 7 of the ThinkPad X13. We use GFXBench for the comparison with Apple's M1 GPU. Both models of Apple's GPUs (with 7 or 8 cores) are much faster and Intel's iGPU does not stand a chance (+80-115 % depending on the setting). The old UHD Graphics chips from the Comet Lake generation are clearly beaten.
The performance of the iGPU can be maintained; the 3DMark stress test (Fire Strike) is passed at 99 %. There is no performance reduction on battery power.
| 3DMark 11 Performance | 5870 points | |
| 3DMark Fire Strike Score | 3859 points | |
| 3DMark Time Spy Score | 1401 points | |
Help | ||
Gaming Performance
You can play some games with the Xe Graphics G7 as long as the title is not too demanding. Witcher 3, for example, runs smoothly at around 50 fps in the medium preset and the performance is also steady (except for one small outlier). The corresponding core clock is ~1000 MHz and the CPU runs with ~1.3 GHz on average (the CPU load is not very high in Witcher 3). The overall power consumption of the processor is little more than 16W. Please see our tech section for more gaming benchmarks of the Xe Graphics G7.
| low | med. | high | ultra | |
|---|---|---|---|---|
| The Witcher 3 (2015) | 78.5 | 45.9 | 26 | 11 |
| Dota 2 Reborn (2015) | 76.3 | 67.7 | 44 | 35.8 |
| X-Plane 11.11 (2018) | 28.8 | 28.6 | 26.7 | |
| Far Cry 5 (2018) | 47 | 23 | 20 | 17 |
| F1 2020 (2020) | 68 | 38 | 27 | 19 |
Emissions - X1 Nano with good thermal management
System Noise
The cooling solution is interesting, because Lenovo uses an unusually long heat pipe across the whole chassis. The single fan dissipates the warm air at the right side of the chassis. The X1 Nano is a very quiet device in everyday scenarios and short peak load can usually be compensated without noticing the fan. If the fan is running, the noise is not high-pitched. Medium workloads (like 3DMark 06 or Witcher 3) result in 34.3 dB(A); more CPU load results in the maximum fan noise of 37.5 dB(A). However, this value will drop to 34.3 dB(A) under sustained workloads when the TDP drops.
We did not hear any electronic noises or coil whine during our review.
Noise level
| Idle |
| 24.9 / 26.3 / 31.8 dB(A) |
| Load |
| 34.3 / 37.5 dB(A) |
 | ||
30 dB silent 40 dB(A) audible 50 dB(A) loud |
||
min: | ||
| Lenovo ThinkPad X1 Nano-20UN002UGE Iris Xe G7 96EUs, i7-1160G7, WDC PC SN530 SDBPNPZ-512G | Dell XPS 13 9310 Core i7 FHD Iris Xe G7 96EUs, i7-1165G7, Micron 2300 512GB MTFDHBA512TDV | Fujitsu LifeBook U9310X UHD Graphics 620, i5-10210U, Toshiba KBG40ZNS512G NVMe | HP Elite Dragonfly-8MK79EA UHD Graphics 620, i5-8265U, Intel Optane Memory H10 with Solid State Storage 32GB + 512GB HBRPEKNX0202A(L/H) | Lenovo ThinkPad X13-20UGS00800 Vega 7, R7 PRO 4750U, Samsung SSD PM981a MZVLB512HBJQ | |
|---|---|---|---|---|---|
| Noise | 5% | -5% | -4% | -2% | |
| off / environment * (dB) | 24.9 | 25.7 -3% | 29.4 -18% | 29.5 -18% | 29.1 -17% |
| Idle Minimum * (dB) | 24.9 | 25.7 -3% | 29.4 -18% | 29.5 -18% | 29.1 -17% |
| Idle Average * (dB) | 26.3 | 25.7 2% | 29.4 -12% | 30 -14% | 29.1 -11% |
| Idle Maximum * (dB) | 31.8 | 25.9 19% | 30.7 3% | 30.3 5% | 29.1 8% |
| Load Average * (dB) | 34.3 | 26.2 24% | 32.6 5% | 31.6 8% | 31.1 9% |
| Witcher 3 ultra * (dB) | 34.3 | 36.5 -6% | |||
| Load Maximum * (dB) | 37.5 | 36.6 2% | 33.7 10% | 31.6 16% | 31.8 15% |
* ... smaller is better
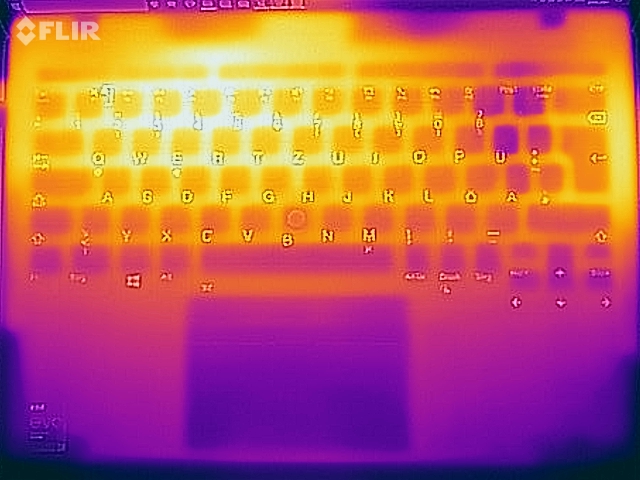
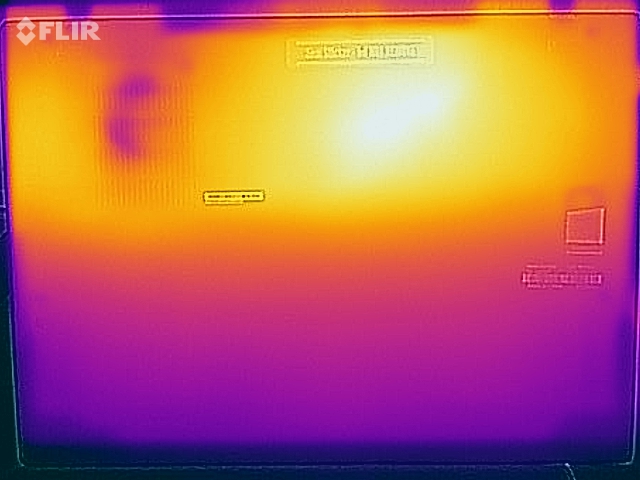
Temperature
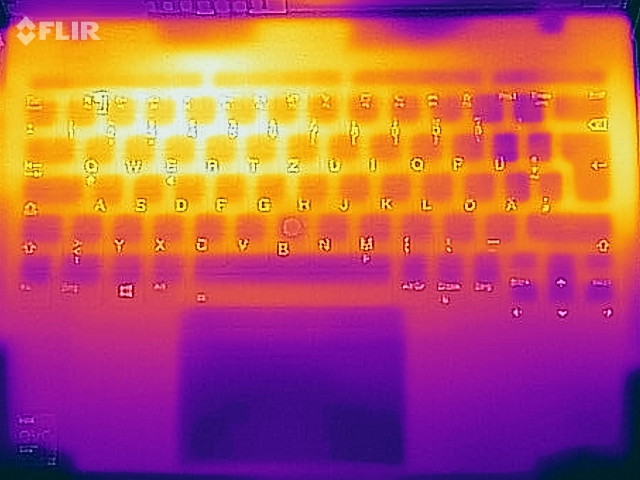
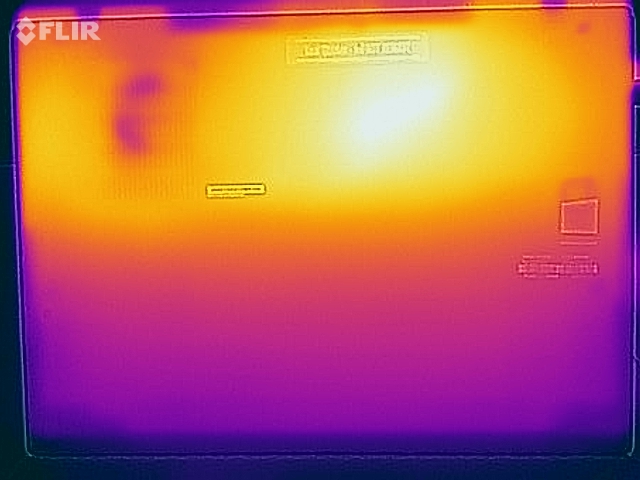
The device hardly warms up at all while idling or under light workloads and stays slightly above room temperature. We can see two hotspots under load, one at the position of the processor and also at the fan exhaust. But all the temperature measurements stay well below 50 °C even under maximum load. Only one spot at the bottom shows more than 45 °C, and the keyboard stays cooler at up to 42 °C. You will notice these temperatures when you type, but there are no limitations.
The power consumption is 40W at the beginning of the stress test, but levels off at around 19W (similar to pure CPU load). Both components get roughly the same power in this scenario; the processor runs at 4x 1.3 GHz and the iGPU at 700 MHz. The performance is not reduced immediately after the stress test.
(±) The maximum temperature on the upper side is 42.2 °C / 108 F, compared to the average of 35.9 °C / 97 F, ranging from 21.4 to 59 °C for the class Subnotebook.
(-) The bottom heats up to a maximum of 47.5 °C / 118 F, compared to the average of 39.2 °C / 103 F
(+) In idle usage, the average temperature for the upper side is 23.6 °C / 74 F, compared to the device average of 30.8 °C / 87 F.
(±) Playing The Witcher 3, the average temperature for the upper side is 36.7 °C / 98 F, compared to the device average of 30.8 °C / 87 F.
(+) The palmrests and touchpad are cooler than skin temperature with a maximum of 31.2 °C / 88.2 F and are therefore cool to the touch.
(-) The average temperature of the palmrest area of similar devices was 28.2 °C / 82.8 F (-3 °C / -5.4 F).
Speakers - Dolby Atmos in the X1 Nano
Similar to the bigger ThinkPad X1 Carbon, the X1 Nano gets a total of four speakers (2x 2W woofers at the front of the base unit + 2x 1W tweeters above the keyboard), which are higher rated than the X1 Carbon G8 (2x 0.8W tweeters). A direct comparison between the two, however, reveals that the sound of the X1 Nano is not quite as rich. The speakers also tend to distort a little bit more at speaker settings of more than 60 %. It is still a good setup that easily beat typical ThinkPad speakers like on the ThinkPad X13. The maximum volume of more than 85 dB(A) is also pretty high.
The X1 Nano is very close to the Dell XPS 13, only the MacBook Air is better across the dynamic range and stays the benchmark in this category.
The preinstalled Dolby Atmos software includes several profiles, which have a noticeable effect on the sound. You can either let the software decide automatically based on the content or select a preset manually (like movie, music, communication). We did like communication, where voices are clearly enhanced.
Lenovo ThinkPad X1 Nano-20UN002UGE audio analysis
(+) | speakers can play relatively loud (86.4 dB)
Bass 100 - 315 Hz
(±) | reduced bass - on average 14.6% lower than median
(±) | linearity of bass is average (9.3% delta to prev. frequency)
Mids 400 - 2000 Hz
(+) | balanced mids - only 3.8% away from median
(+) | mids are linear (6.4% delta to prev. frequency)
Highs 2 - 16 kHz
(+) | balanced highs - only 2.2% away from median
(+) | highs are linear (3.5% delta to prev. frequency)
Overall 100 - 16.000 Hz
(+) | overall sound is linear (11.9% difference to median)
Compared to same class
» 13% of all tested devices in this class were better, 5% similar, 82% worse
» The best had a delta of 5%, average was 18%, worst was 53%
Compared to all devices tested
» 9% of all tested devices were better, 2% similar, 89% worse
» The best had a delta of 4%, average was 24%, worst was 134%
Dell XPS 13 9310 Core i7 FHD audio analysis
(+) | speakers can play relatively loud (84.6 dB)
Bass 100 - 315 Hz
(-) | nearly no bass - on average 16.1% lower than median
(±) | linearity of bass is average (13.1% delta to prev. frequency)
Mids 400 - 2000 Hz
(+) | balanced mids - only 2.6% away from median
(+) | mids are linear (4.6% delta to prev. frequency)
Highs 2 - 16 kHz
(+) | balanced highs - only 1.3% away from median
(+) | highs are linear (4% delta to prev. frequency)
Overall 100 - 16.000 Hz
(+) | overall sound is linear (10.7% difference to median)
Compared to same class
» 9% of all tested devices in this class were better, 3% similar, 88% worse
» The best had a delta of 5%, average was 18%, worst was 53%
Compared to all devices tested
» 6% of all tested devices were better, 2% similar, 93% worse
» The best had a delta of 4%, average was 24%, worst was 134%
Apple MacBook Air 2020 M1 Entry audio analysis
(±) | speaker loudness is average but good (79.6 dB)
Bass 100 - 315 Hz
(±) | reduced bass - on average 7.1% lower than median
(±) | linearity of bass is average (9.5% delta to prev. frequency)
Mids 400 - 2000 Hz
(+) | balanced mids - only 2.2% away from median
(+) | mids are linear (5.3% delta to prev. frequency)
Highs 2 - 16 kHz
(+) | balanced highs - only 2.3% away from median
(+) | highs are linear (4% delta to prev. frequency)
Overall 100 - 16.000 Hz
(+) | overall sound is linear (8.7% difference to median)
Compared to same class
» 3% of all tested devices in this class were better, 1% similar, 96% worse
» The best had a delta of 5%, average was 18%, worst was 53%
Compared to all devices tested
» 3% of all tested devices were better, 1% similar, 97% worse
» The best had a delta of 4%, average was 24%, worst was 134%
Energy Management - Good Stamina
Power Consumption

The X1 Nano performs well in our consumption measurements, but it does not set any highlights. We recommend avoiding the maximum keyboard illumination on battery power, because it increases the consumption by 2.2W; the first stage is much more efficient at +0.5W.
The maximum consumption under load is 57W for the whole system, but this value levels off at around 27W after a few minutes. The provided 65W power adapter, which was introduced with the ThinkPad X1 Carbon G8), is therefore completely sufficient.
| Off / Standby | |
| Idle | |
| Load |
|
Key:
min: | |
| Lenovo ThinkPad X1 Nano-20UN002UGE i7-1160G7, Iris Xe G7 96EUs, WDC PC SN530 SDBPNPZ-512G, IPS, 2160x1350, 13" | Dell XPS 13 9310 Core i7 FHD i7-1165G7, Iris Xe G7 96EUs, Micron 2300 512GB MTFDHBA512TDV, IPS, 1920x1200, 13.4" | Fujitsu LifeBook U9310X i5-10210U, UHD Graphics 620, Toshiba KBG40ZNS512G NVMe, IPS, 1920x1080, 13.3" | HP Elite Dragonfly-8MK79EA i5-8265U, UHD Graphics 620, Intel Optane Memory H10 with Solid State Storage 32GB + 512GB HBRPEKNX0202A(L/H), IPS, 1920x1080, 13.3" | Apple MacBook Air 2020 M1 Entry M1, M1 7-Core GPU, Apple SSD AP0256Q, IPS, 2560x1600, 13.3" | Lenovo ThinkPad X13-20UGS00800 R7 PRO 4750U, Vega 7, Samsung SSD PM981a MZVLB512HBJQ, IPS LED, 1920x1080, 13.3" | Average Intel Iris Xe Graphics G7 96EUs | Average of class Subnotebook | |
|---|---|---|---|---|---|---|---|---|
| Power Consumption | -6% | -1% | 3% | 23% | -29% | -43% | -16% | |
| Idle Minimum * (Watt) | 3.3 | 3.9 -18% | 2.9 12% | 3.5 -6% | 1.9 42% | 6 -82% | 5.51 ? -67% | 3.82 ? -16% |
| Idle Average * (Watt) | 5.7 | 5.9 -4% | 5.8 -2% | 5.1 11% | 6.4 -12% | 8.9 -56% | 8.66 ? -52% | 6.61 ? -16% |
| Idle Maximum * (Watt) | 9.1 | 6.3 31% | 9.6 -5% | 8.1 11% | 7 23% | 11.3 -24% | 10.9 ? -20% | 7.99 ? 12% |
| Load Average * (Watt) | 29.6 | 39.7 -34% | 34.6 -17% | 35.6 -20% | 25 16% | 34.2 -16% | 45.6 ? -54% | 41.9 ? -42% |
| Witcher 3 ultra * (Watt) | 27.7 | 34.8 -26% | ||||||
| Load Maximum * (Watt) | 55.1 | 47.5 14% | 50.7 8% | 44.7 19% | 30.3 45% | 37.2 32% | 67.8 ? -23% | 64.1 ? -16% |
* ... smaller is better
Battery Runtime
Lenovo implements a 48.2 Wh battery, which is the smallest capacity in our comparison group together with the ThinkPad X13. The battery runtimes are decent, but the difference between the Wi-Fi test (~10 hours) and the video test (~15 hours) at 150 nits each is pretty substantial. We repeated the tests, but the results did not change. We have also performed the Wi-Fi test with the enabled Windows power saver mode, which improved the runtime by around 1 hour. We also checked the battery runtime with the integrated LTE module and summarized the results in the following table:
| Wi-Fi Test (default) | Wi-Fi Test (Power Saver) | Wi-Fi Test (max. brightness) | Wi-Fi Test (LTE) | Wi-Fi Test (LTE, max. brightness) |
|---|---|---|---|---|
| 9:56 h | 11:10 h | 8:23 h | 9:38 h | 7:37 h |
All the rivals (especially the MacBook Air M1) except for the ThinkPad X13 manage better results. We already said the performance is not reduced on battery power, which explains the comparatively short minimum runtime of 98 minutes.
The X1 Nano supports Rapid Charge and Lenovo advertises 80 % of the capacity after a charging time of 60 minutes. We can confirm this value, because we recorded 62 minutes for 80 % when the device was turned on; 50 % is available after 36 minutes. The charging curve flattens significantly after 80 %, and the remaining 20 % take more than one hour.
| Lenovo ThinkPad X1 Nano-20UN002UGE i7-1160G7, Iris Xe G7 96EUs, 48.2 Wh | Dell XPS 13 9310 Core i7 FHD i7-1165G7, Iris Xe G7 96EUs, 52 Wh | Fujitsu LifeBook U9310X i5-10210U, UHD Graphics 620, 50 Wh | HP Elite Dragonfly-8MK79EA i5-8265U, UHD Graphics 620, 56.2 Wh | Apple MacBook Air 2020 M1 Entry M1, M1 7-Core GPU, 49.9 Wh | Lenovo ThinkPad X13-20UGS00800 R7 PRO 4750U, Vega 7, 48 Wh | Average of class Subnotebook | |
|---|---|---|---|---|---|---|---|
| Battery runtime | 56% | 56% | 18% | 62% | -21% | 21% | |
| H.264 (h) | 15.4 | 12 -22% | 8.3 -46% | 15.6 ? 1% | |||
| WiFi v1.3 (h) | 9.9 | 11 11% | 11.6 17% | 10.1 2% | 16 62% | 8.7 -12% | 14 ? 41% |
| Load (h) | 1.6 | 3.2 100% | 3.1 94% | 2.8 75% | 1.5 -6% | 1.946 ? 22% |
Pros
Cons
Verdict - X1 Nano convinces in many regards
Lenovo delivers a very good performance in many regards. The X1 nano is an interesting new member for the X1 family as an ultra-mobile business subnotebook with a weight under 1 kg. Lenovo also returns to the roots of the X300 and X1 with a 13-inch screen. The X1 Nano is also the first modern ThinkPad with a 16:10 panel, and the result is very good: matte screen, brightness above 400 nits, high contrast ratio no PWM, accurate colors, and full sRGB coverage.
The chassis also leaves a very good impression. The low weight does not affect the stability and the X1 Nano should fit in any bag thanks to the compact footprint. However, you have to make compromises in terms of ports with two USB-C ports, which often requires adapters. It is unfortunate that Lenovo did not move the power button from the right side to the top of the base unit (like on the upcoming X1 Carbon G9) and implemented a regular USB-A port instead. There is not even a slot for a Kensington Lock.
Lenovo's new ThinkPad X1 Nano is an extremely lightweight 13-inch laptop with a very good 16:10 screen. The performance utilization is decent and there is not much criticism for the battery runtimes, but the X1 Nano (unnecessarily) disappoints in terms of the keyboard, which might be reason enough to avoid the device for long-term ThinkPad users.
There are some smaller drawbacks like the unnecessary limitation of the WWAN module (cannot be upgraded), the M.2-2242 SSD without PCIe 4.0 or the pretty much non-existent maintenance options. The latter is, however, a necessary compromise if you want a very slim device.
The much bigger issue is the keyboard. It is smaller than usual and has reduced key travel. The keyboard is still good and offers a precise key stroke, but the typing experience is worse compared to any other ThinkPad. The keyboard used to be a highlight of a ThinkPad in the past, but this is not the case here. Maybe you will not even notice this if you come from another manufacturer, but long-term ThinkPad users will notice the difference immediately.
The X1 nano is still a very good business subnotebook if you can live with the keyboard in favor of a very light and compact device. If you want to purchase a ThinkPad because of the high keyboard quality, however, we recommend you should get a model from the T or X-series, which will probably get a 16:10 update this year as well.
Price and availability
The ThinkPad x1 Nano is still a very new device and not all retailers have it on stock. You can get a very similar spec to our test unit directly from Lenovo for about 1850$ US right now (regular price $3079).
Lenovo ThinkPad X1 Nano-20UN002UGE
- 02/01/2021 v7 (old)
Andreas Osthoff
Price comparison
