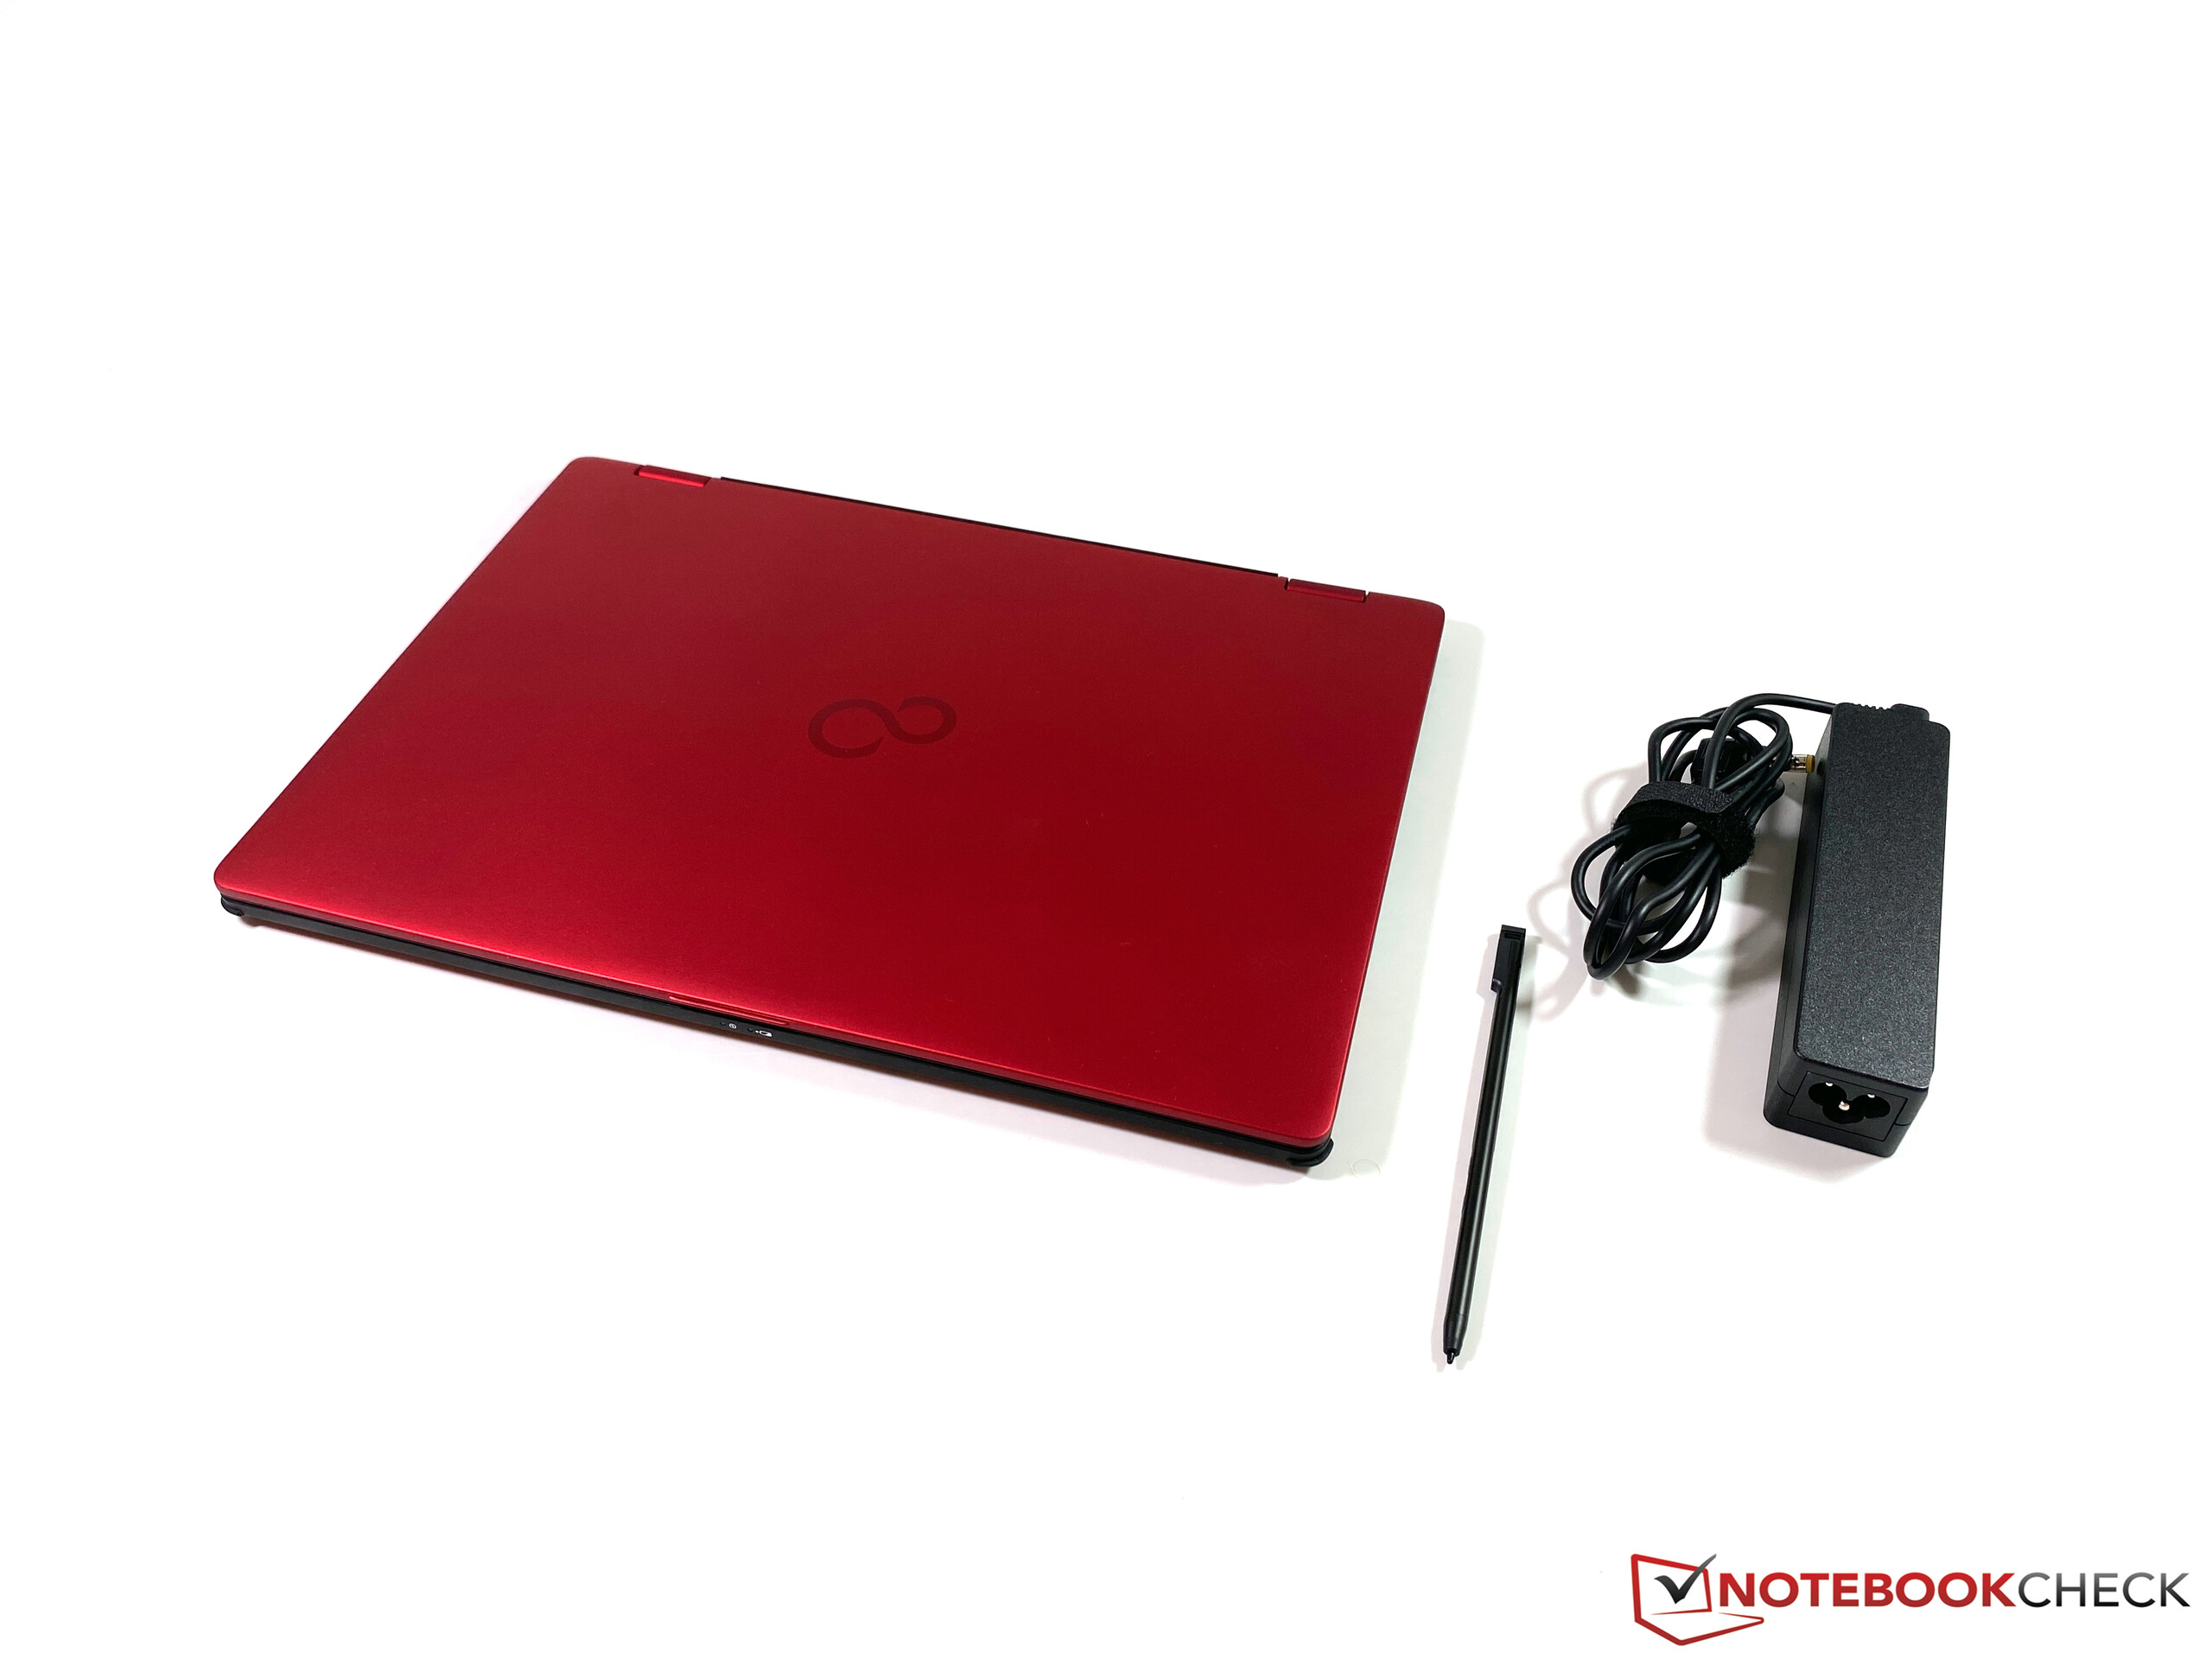
Fujitsu Lifebook U9310X - 1 kg business convertible with LTE in review
Possible competitors in comparison
Rating | Date | Model | Weight | Height | Size | Resolution | Price |
|---|---|---|---|---|---|---|---|
| 86.2 % v7 (old) | 01 / 2021 | Fujitsu LifeBook U9310X i5-10210U, UHD Graphics 620 | 1 kg | 17 mm | 13.30" | 1920x1080 | |
| 90.3 % v7 (old) | 04 / 2020 | HP Elite Dragonfly-8MK79EA i5-8265U, UHD Graphics 620 | 1.1 kg | 16.1 mm | 13.30" | 1920x1080 | |
| 87.9 % v7 (old) | 10 / 2020 | Lenovo ThinkPad X13 Yoga 20SX0004GE i7-10510U, UHD Graphics 620 | 1.3 kg | 15.95 mm | 13.30" | 1920x1080 | |
| 86.3 % v7 (old) | 10 / 2019 | Dell XPS 13 7390 2-in-1 Core i7 i7-1065G7, Iris Plus Graphics G7 (Ice Lake 64 EU) | 1.3 kg | 13 mm | 13.40" | 1920x1200 | |
| 84.7 % v7 (old) | 07 / 2020 | Fujitsu Lifebook U939X i5-8265U, UHD Graphics 620 | 1 kg | 17 mm | 13.30" | 1920x1080 |
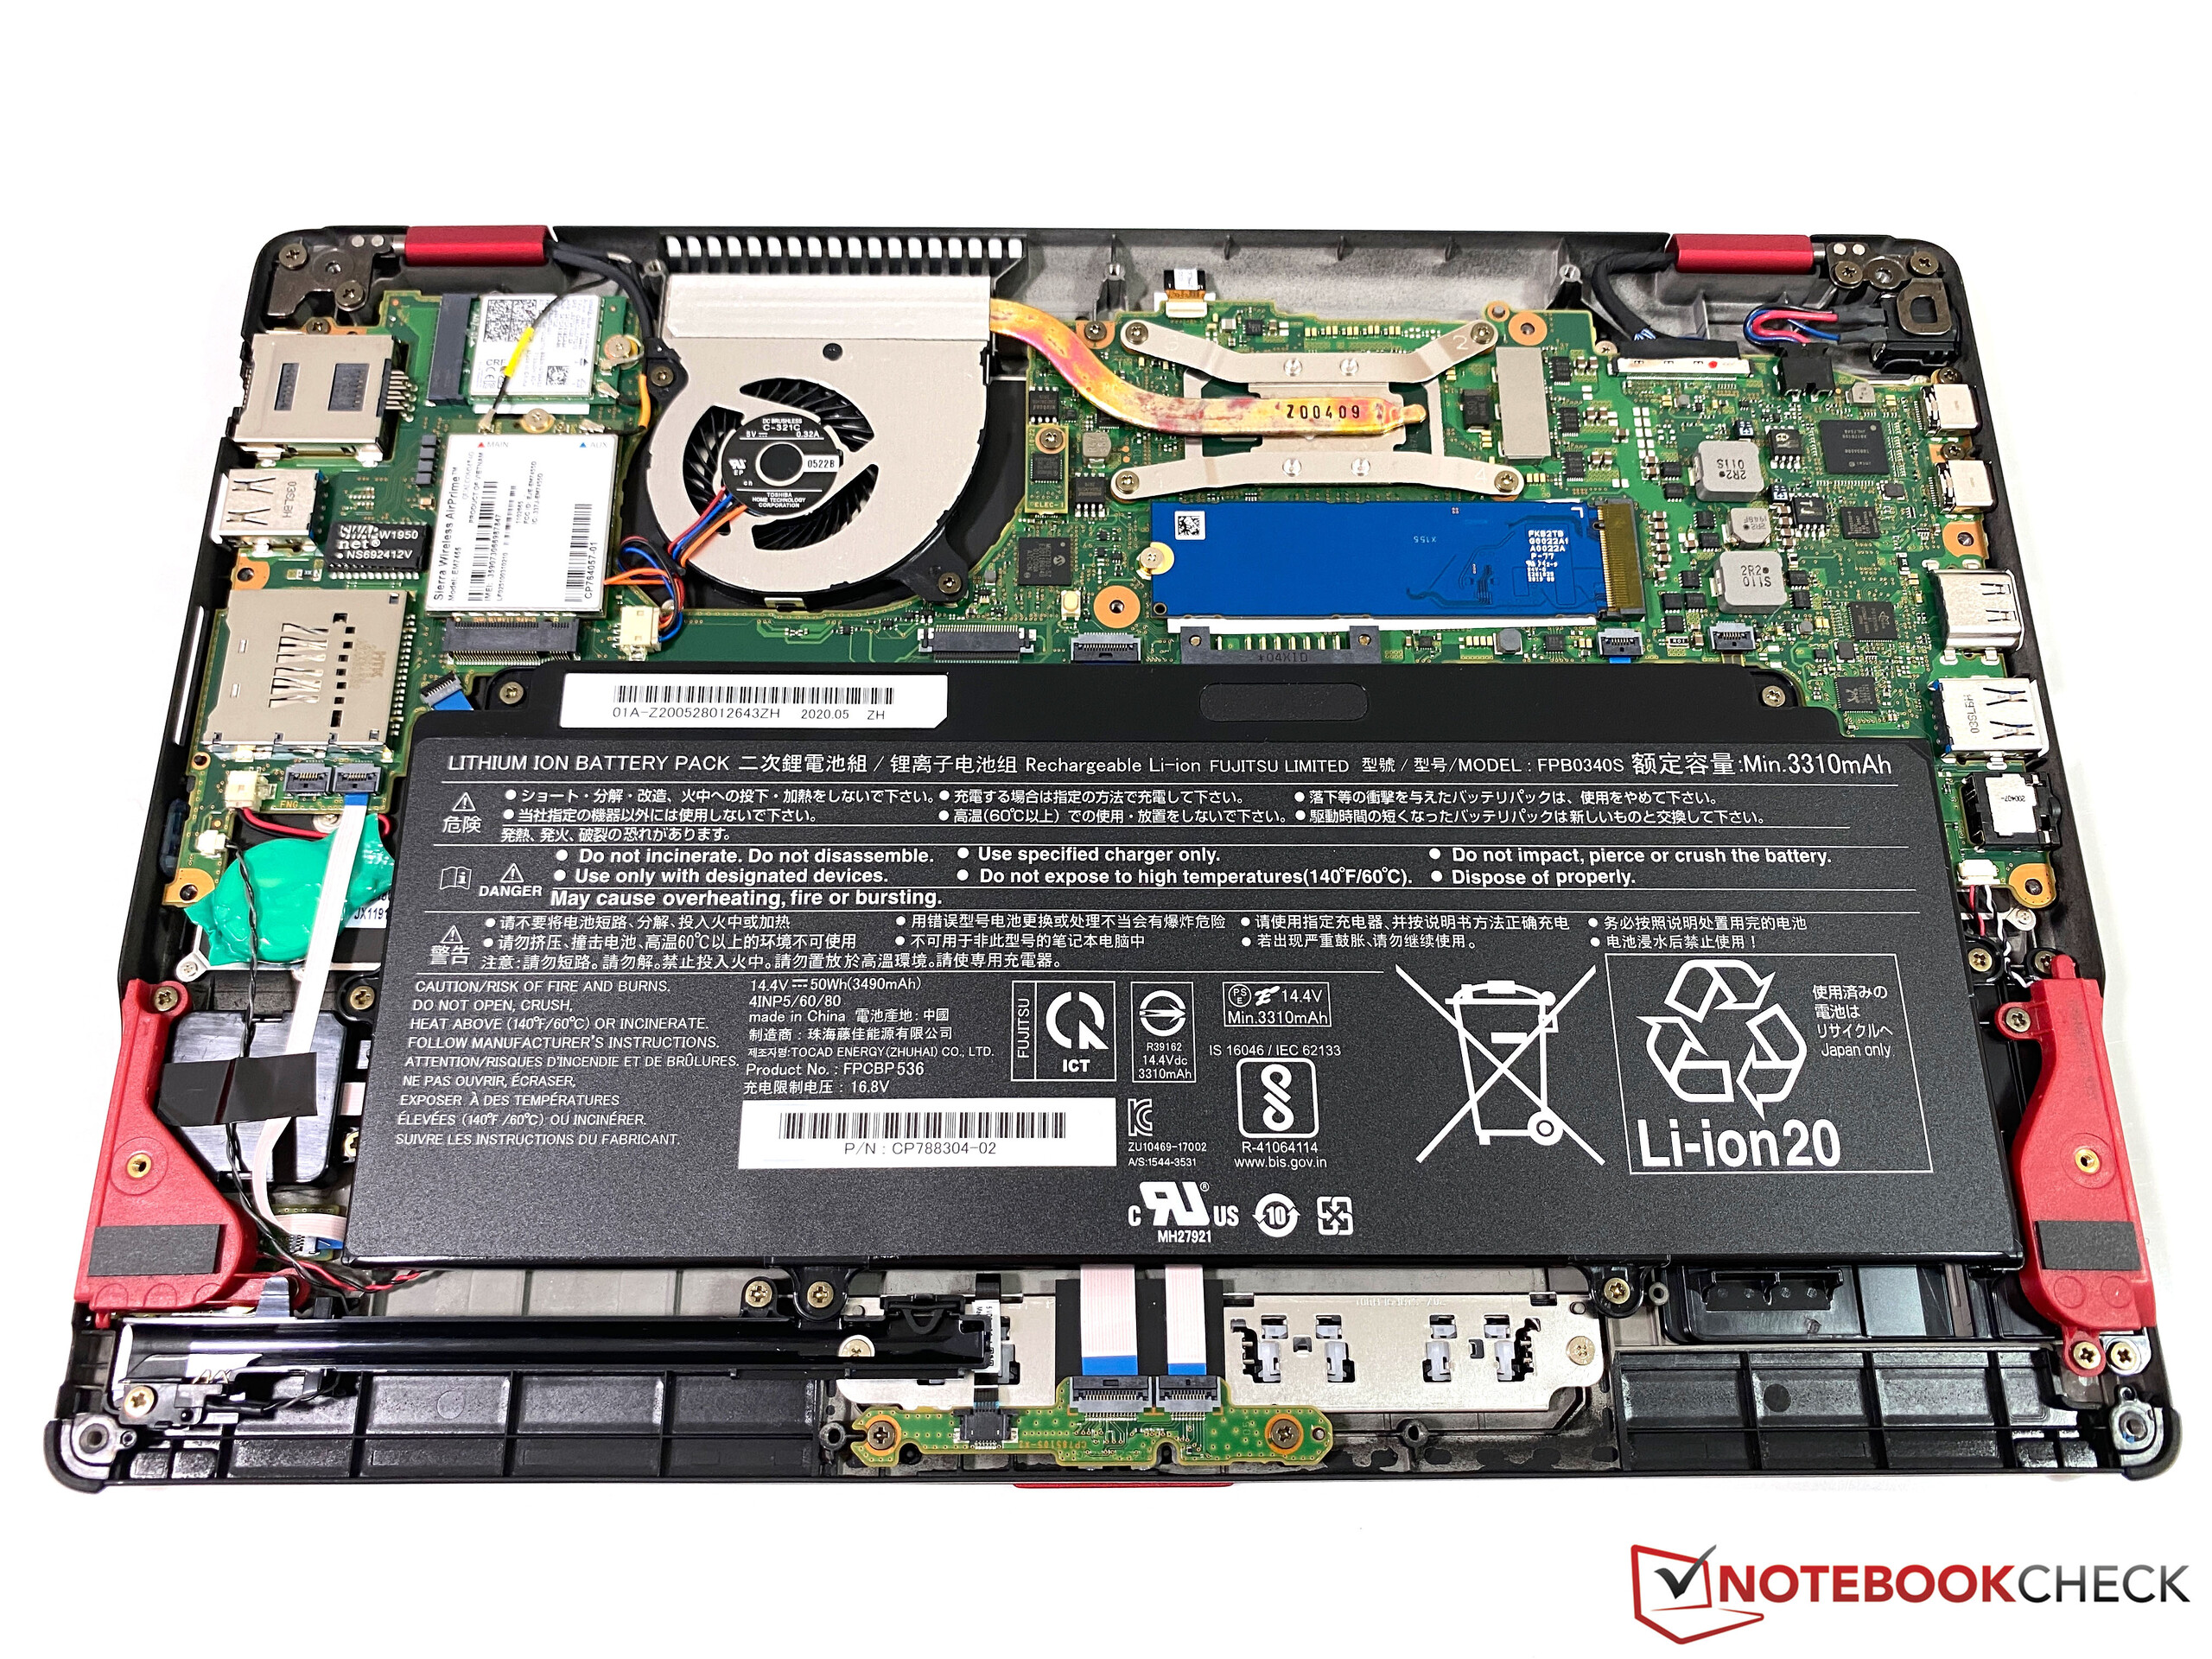
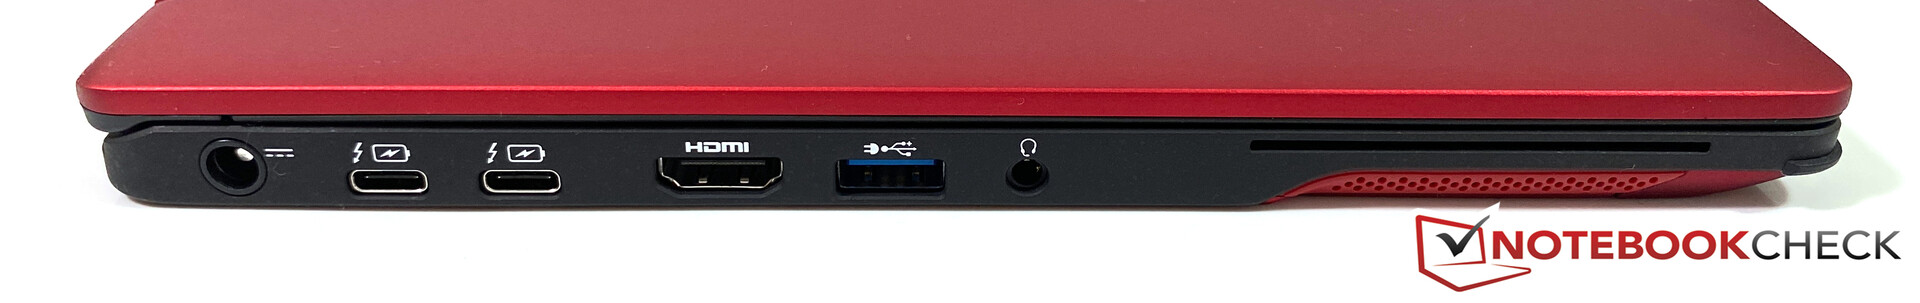
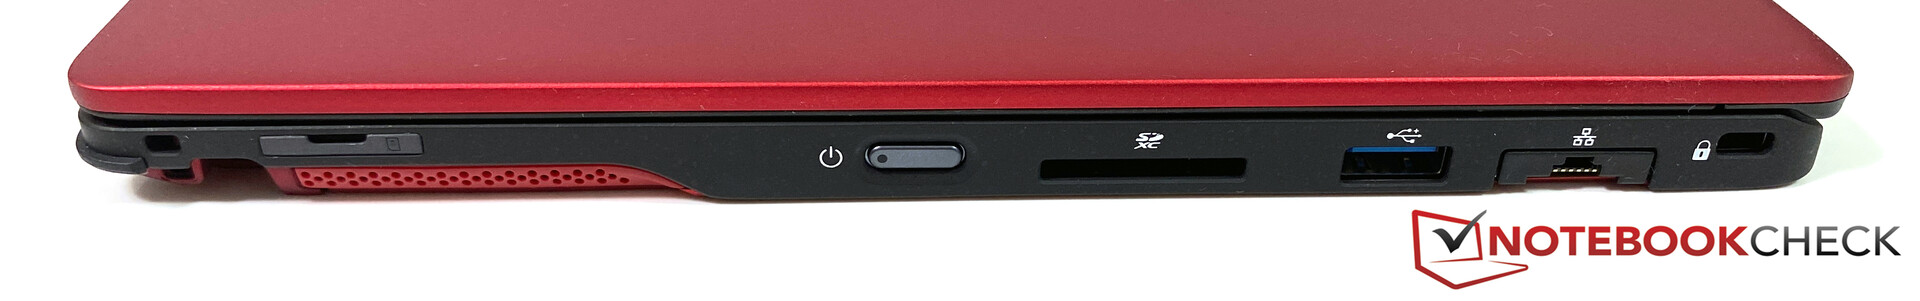
Case, equipment and input devices
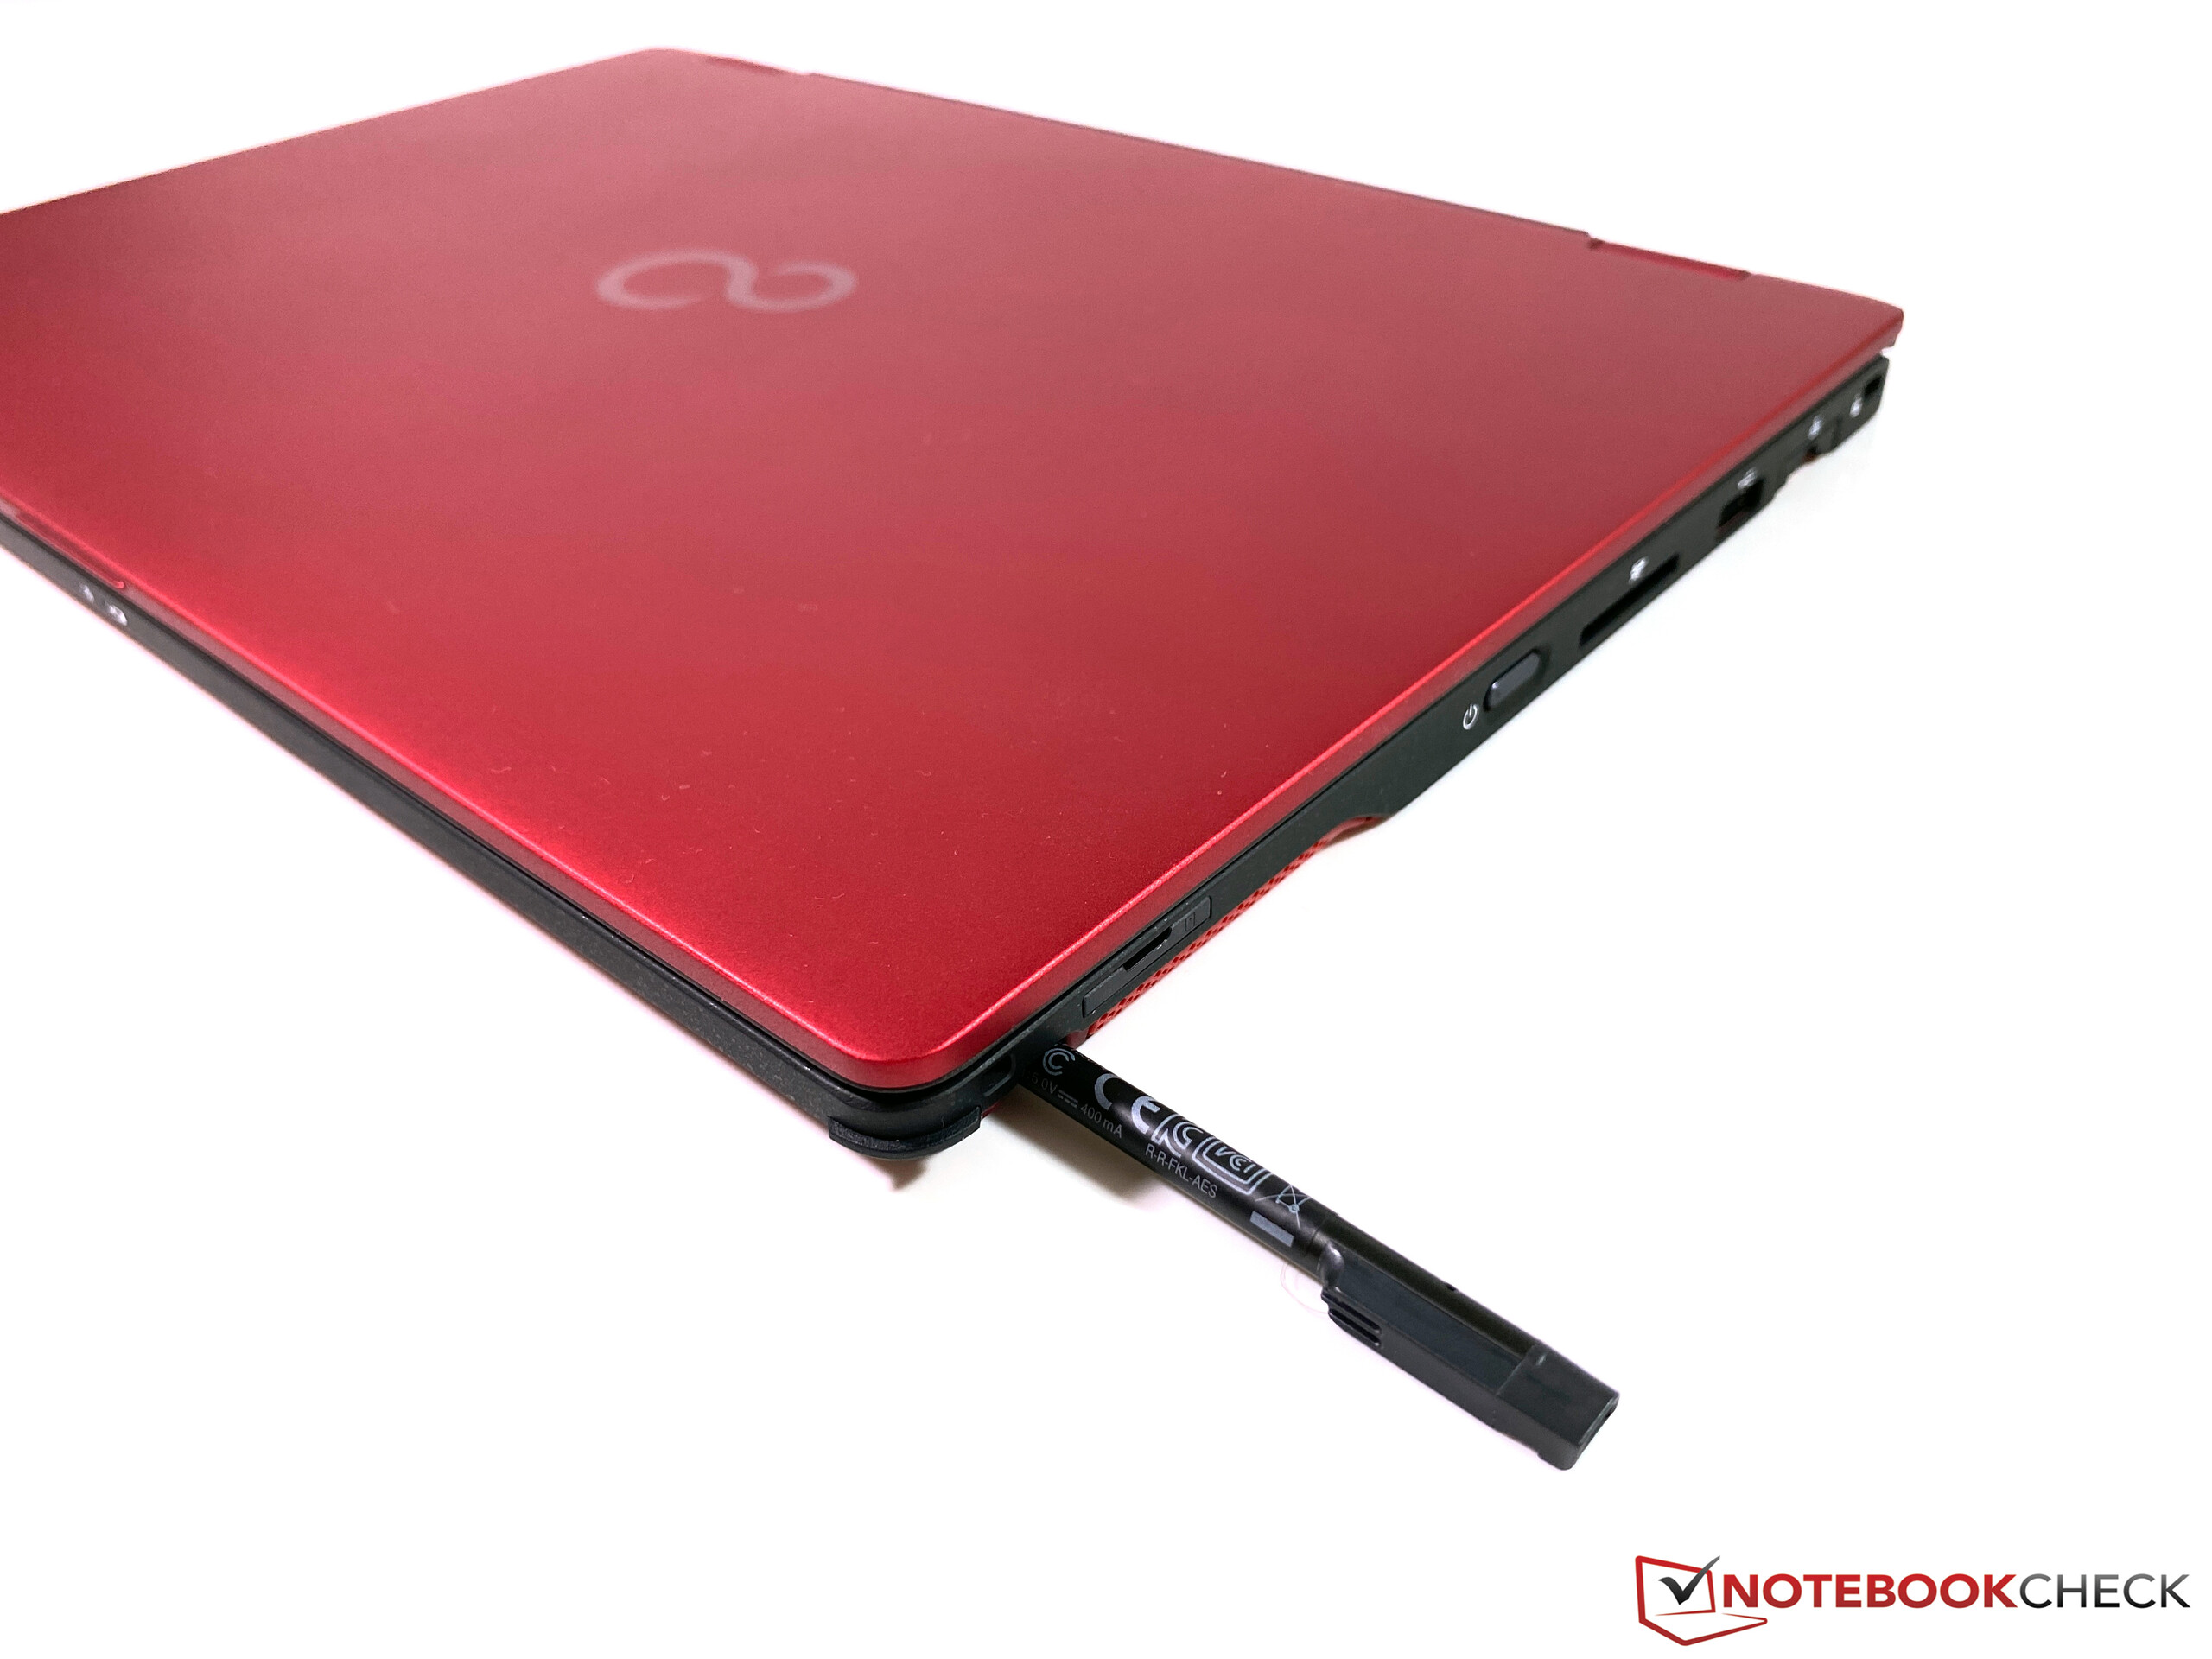
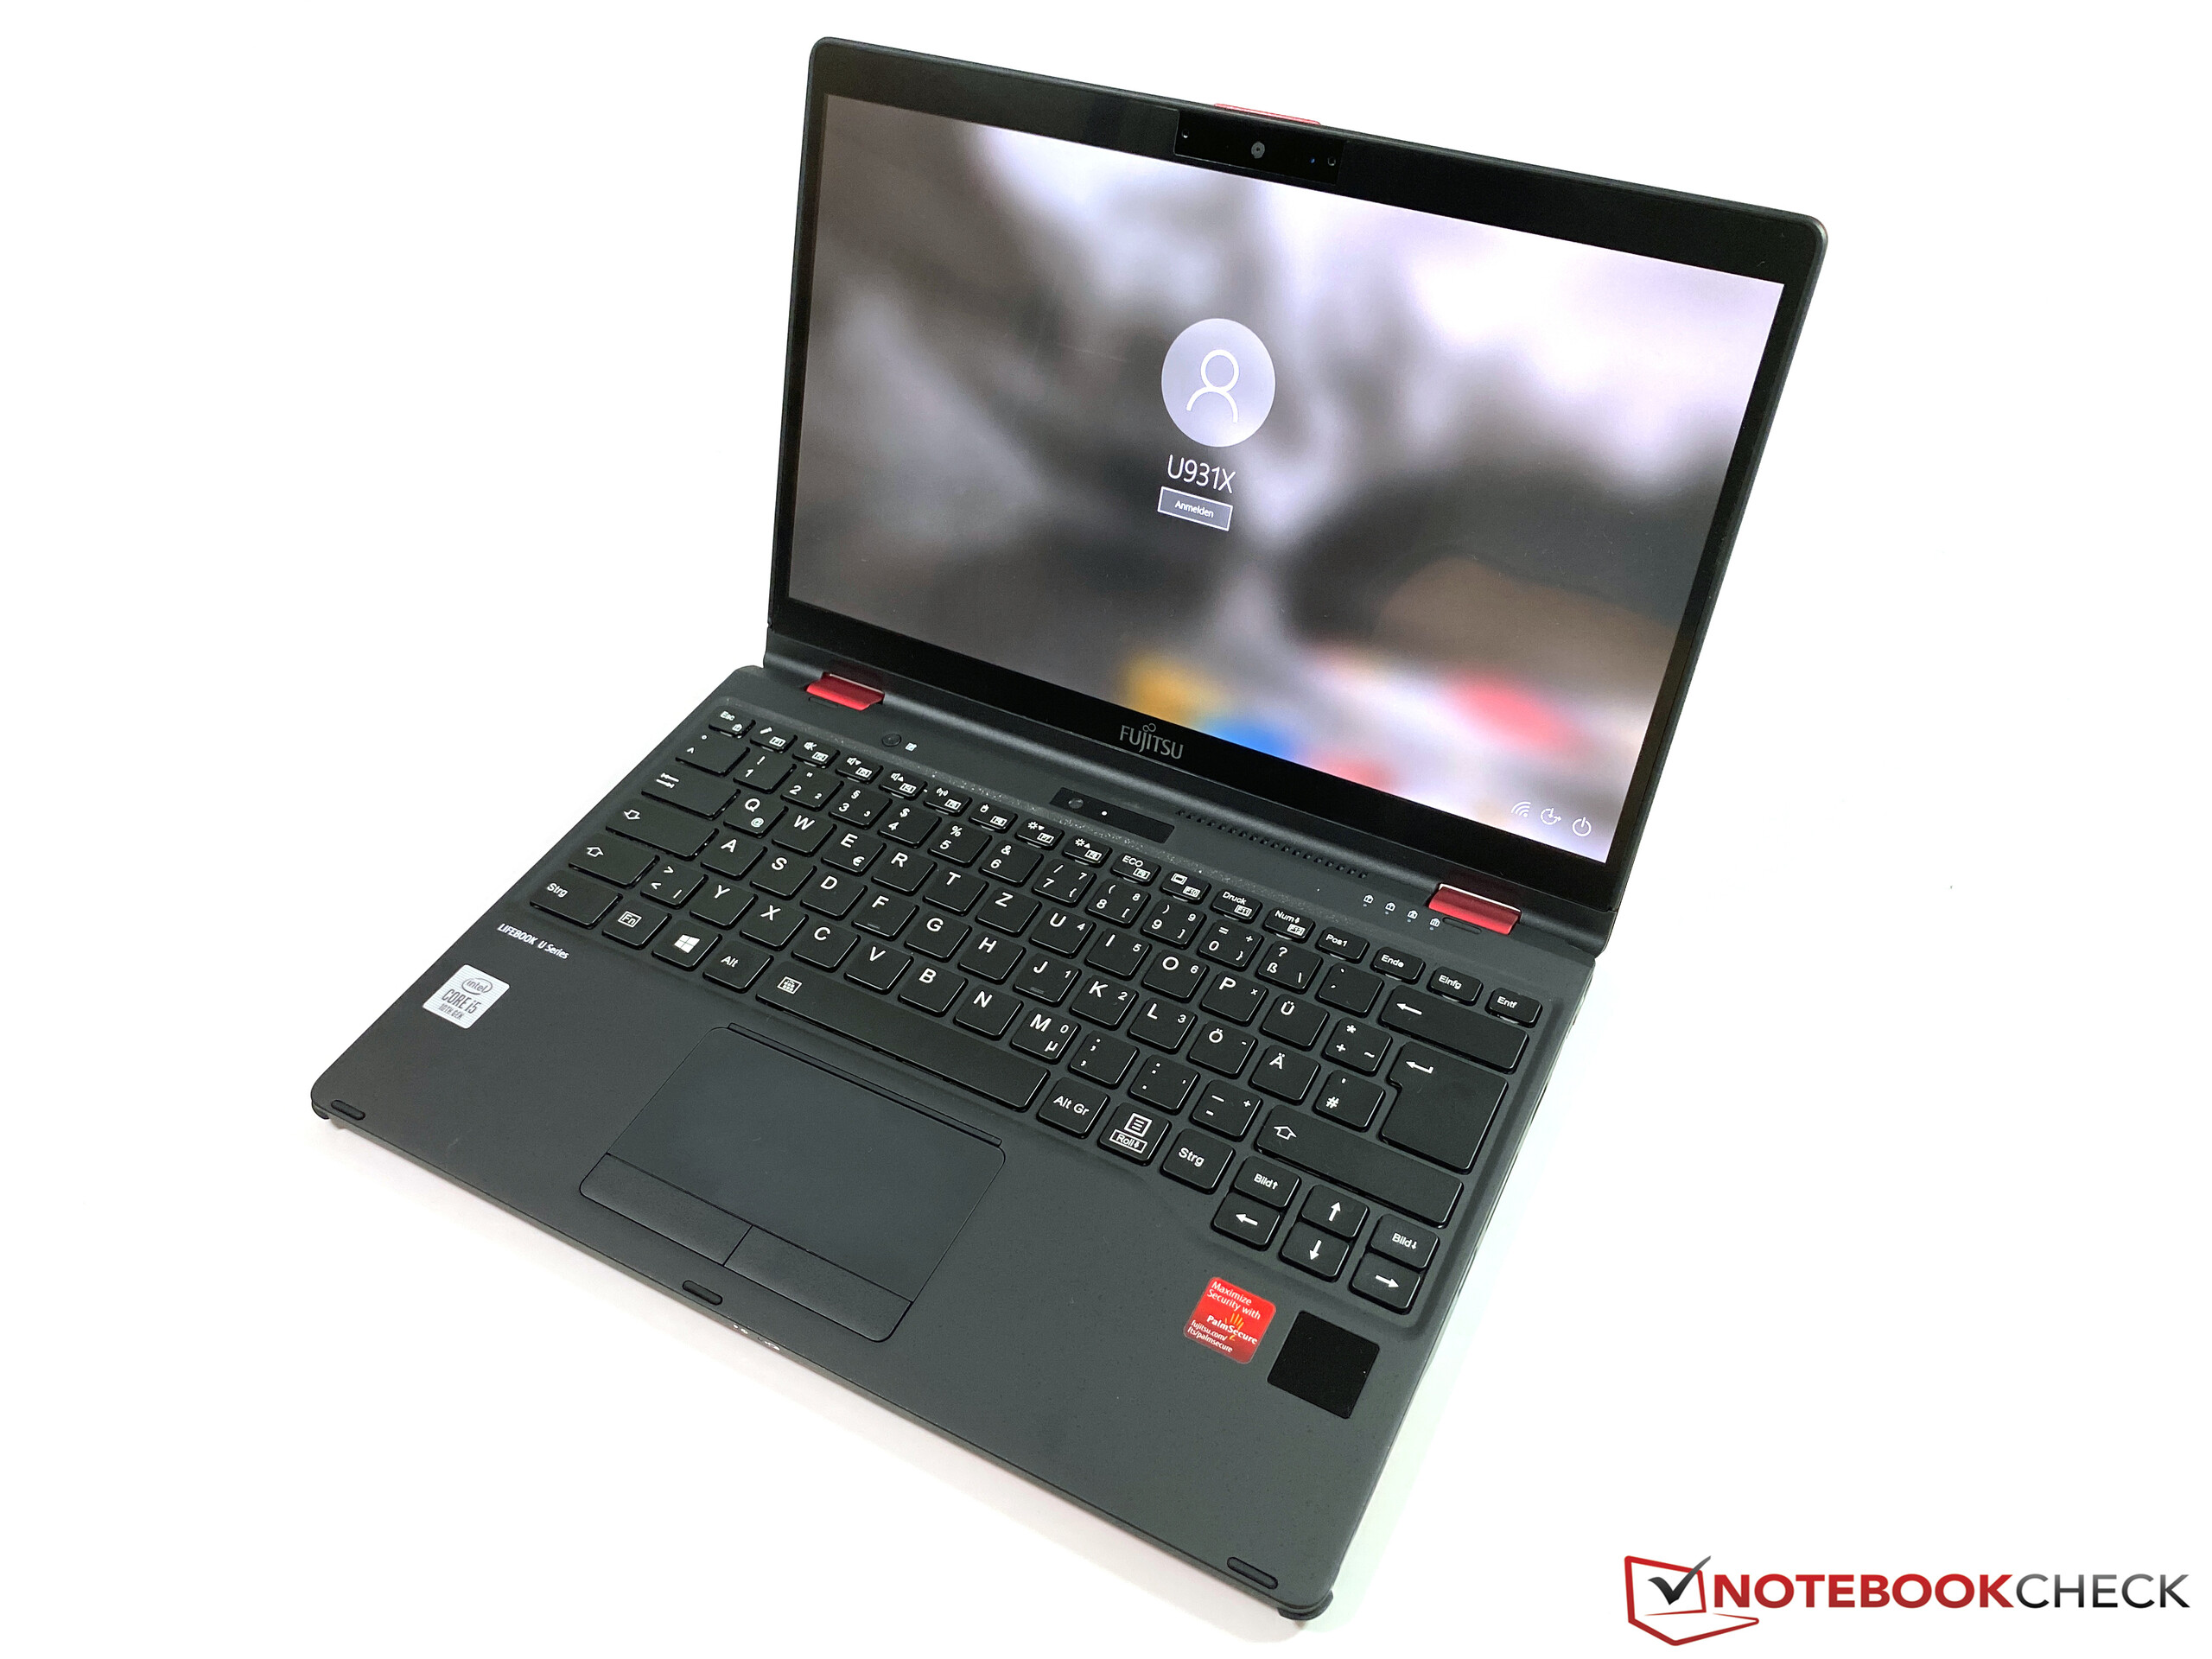
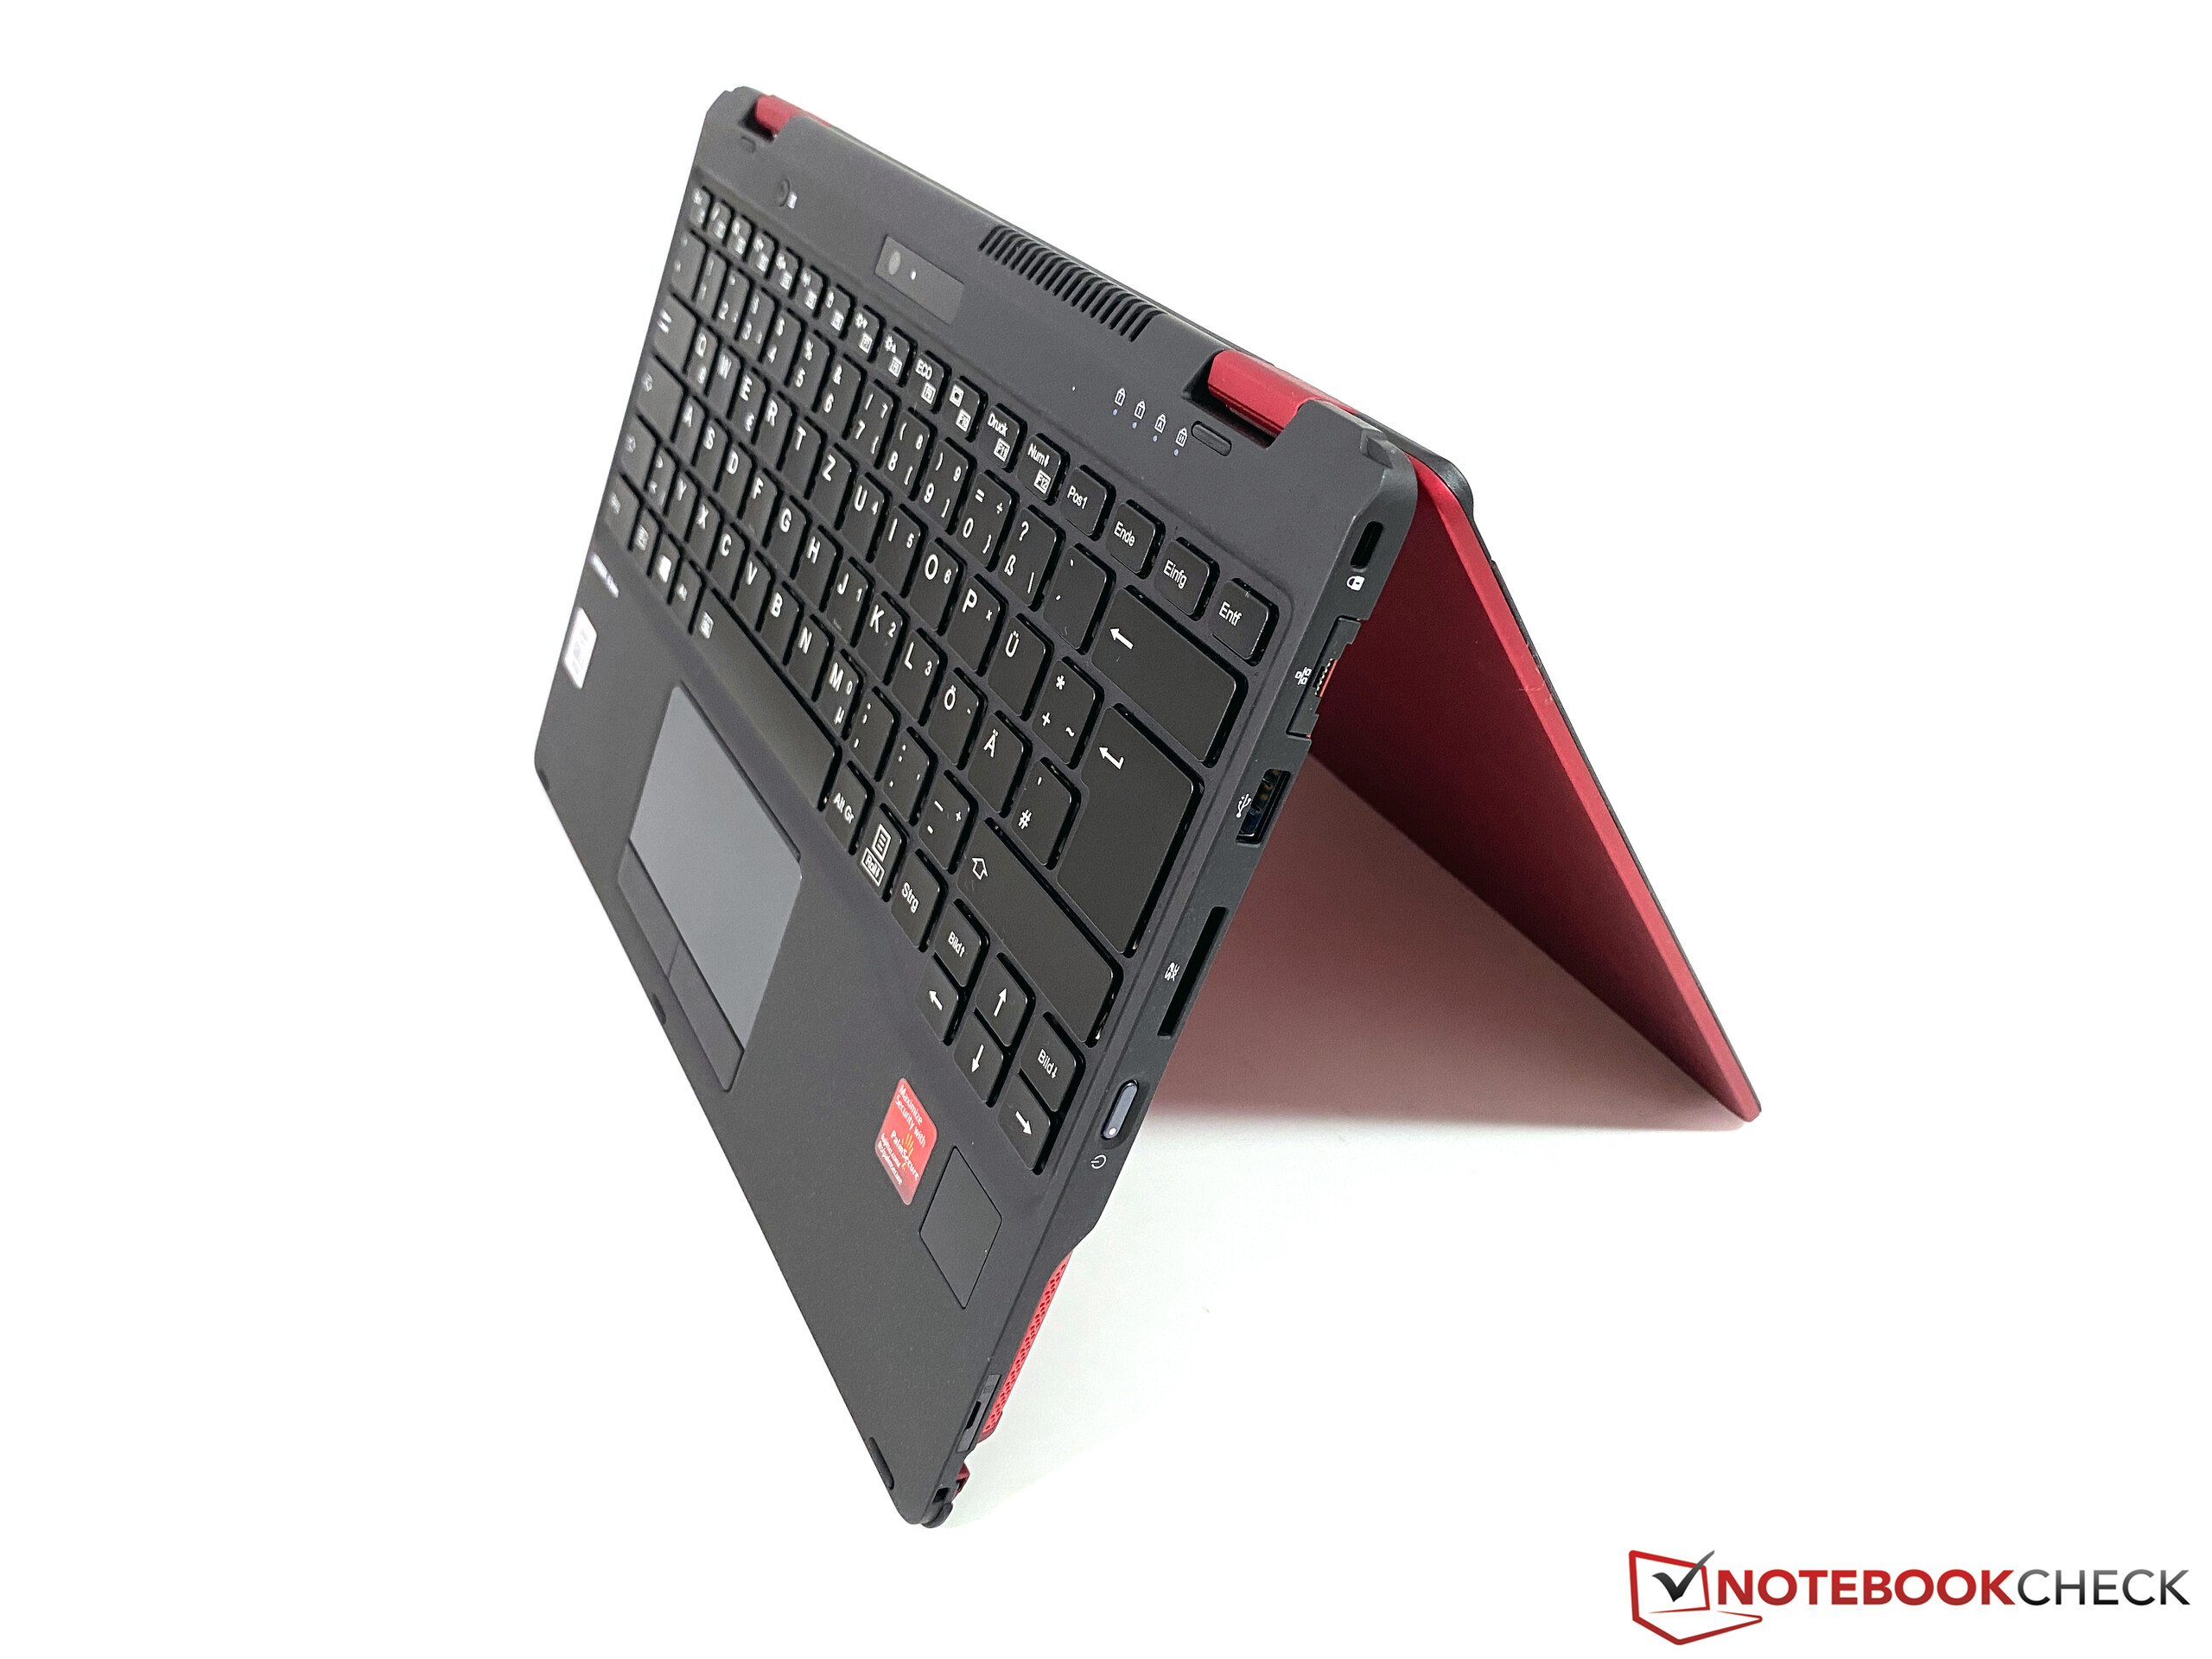
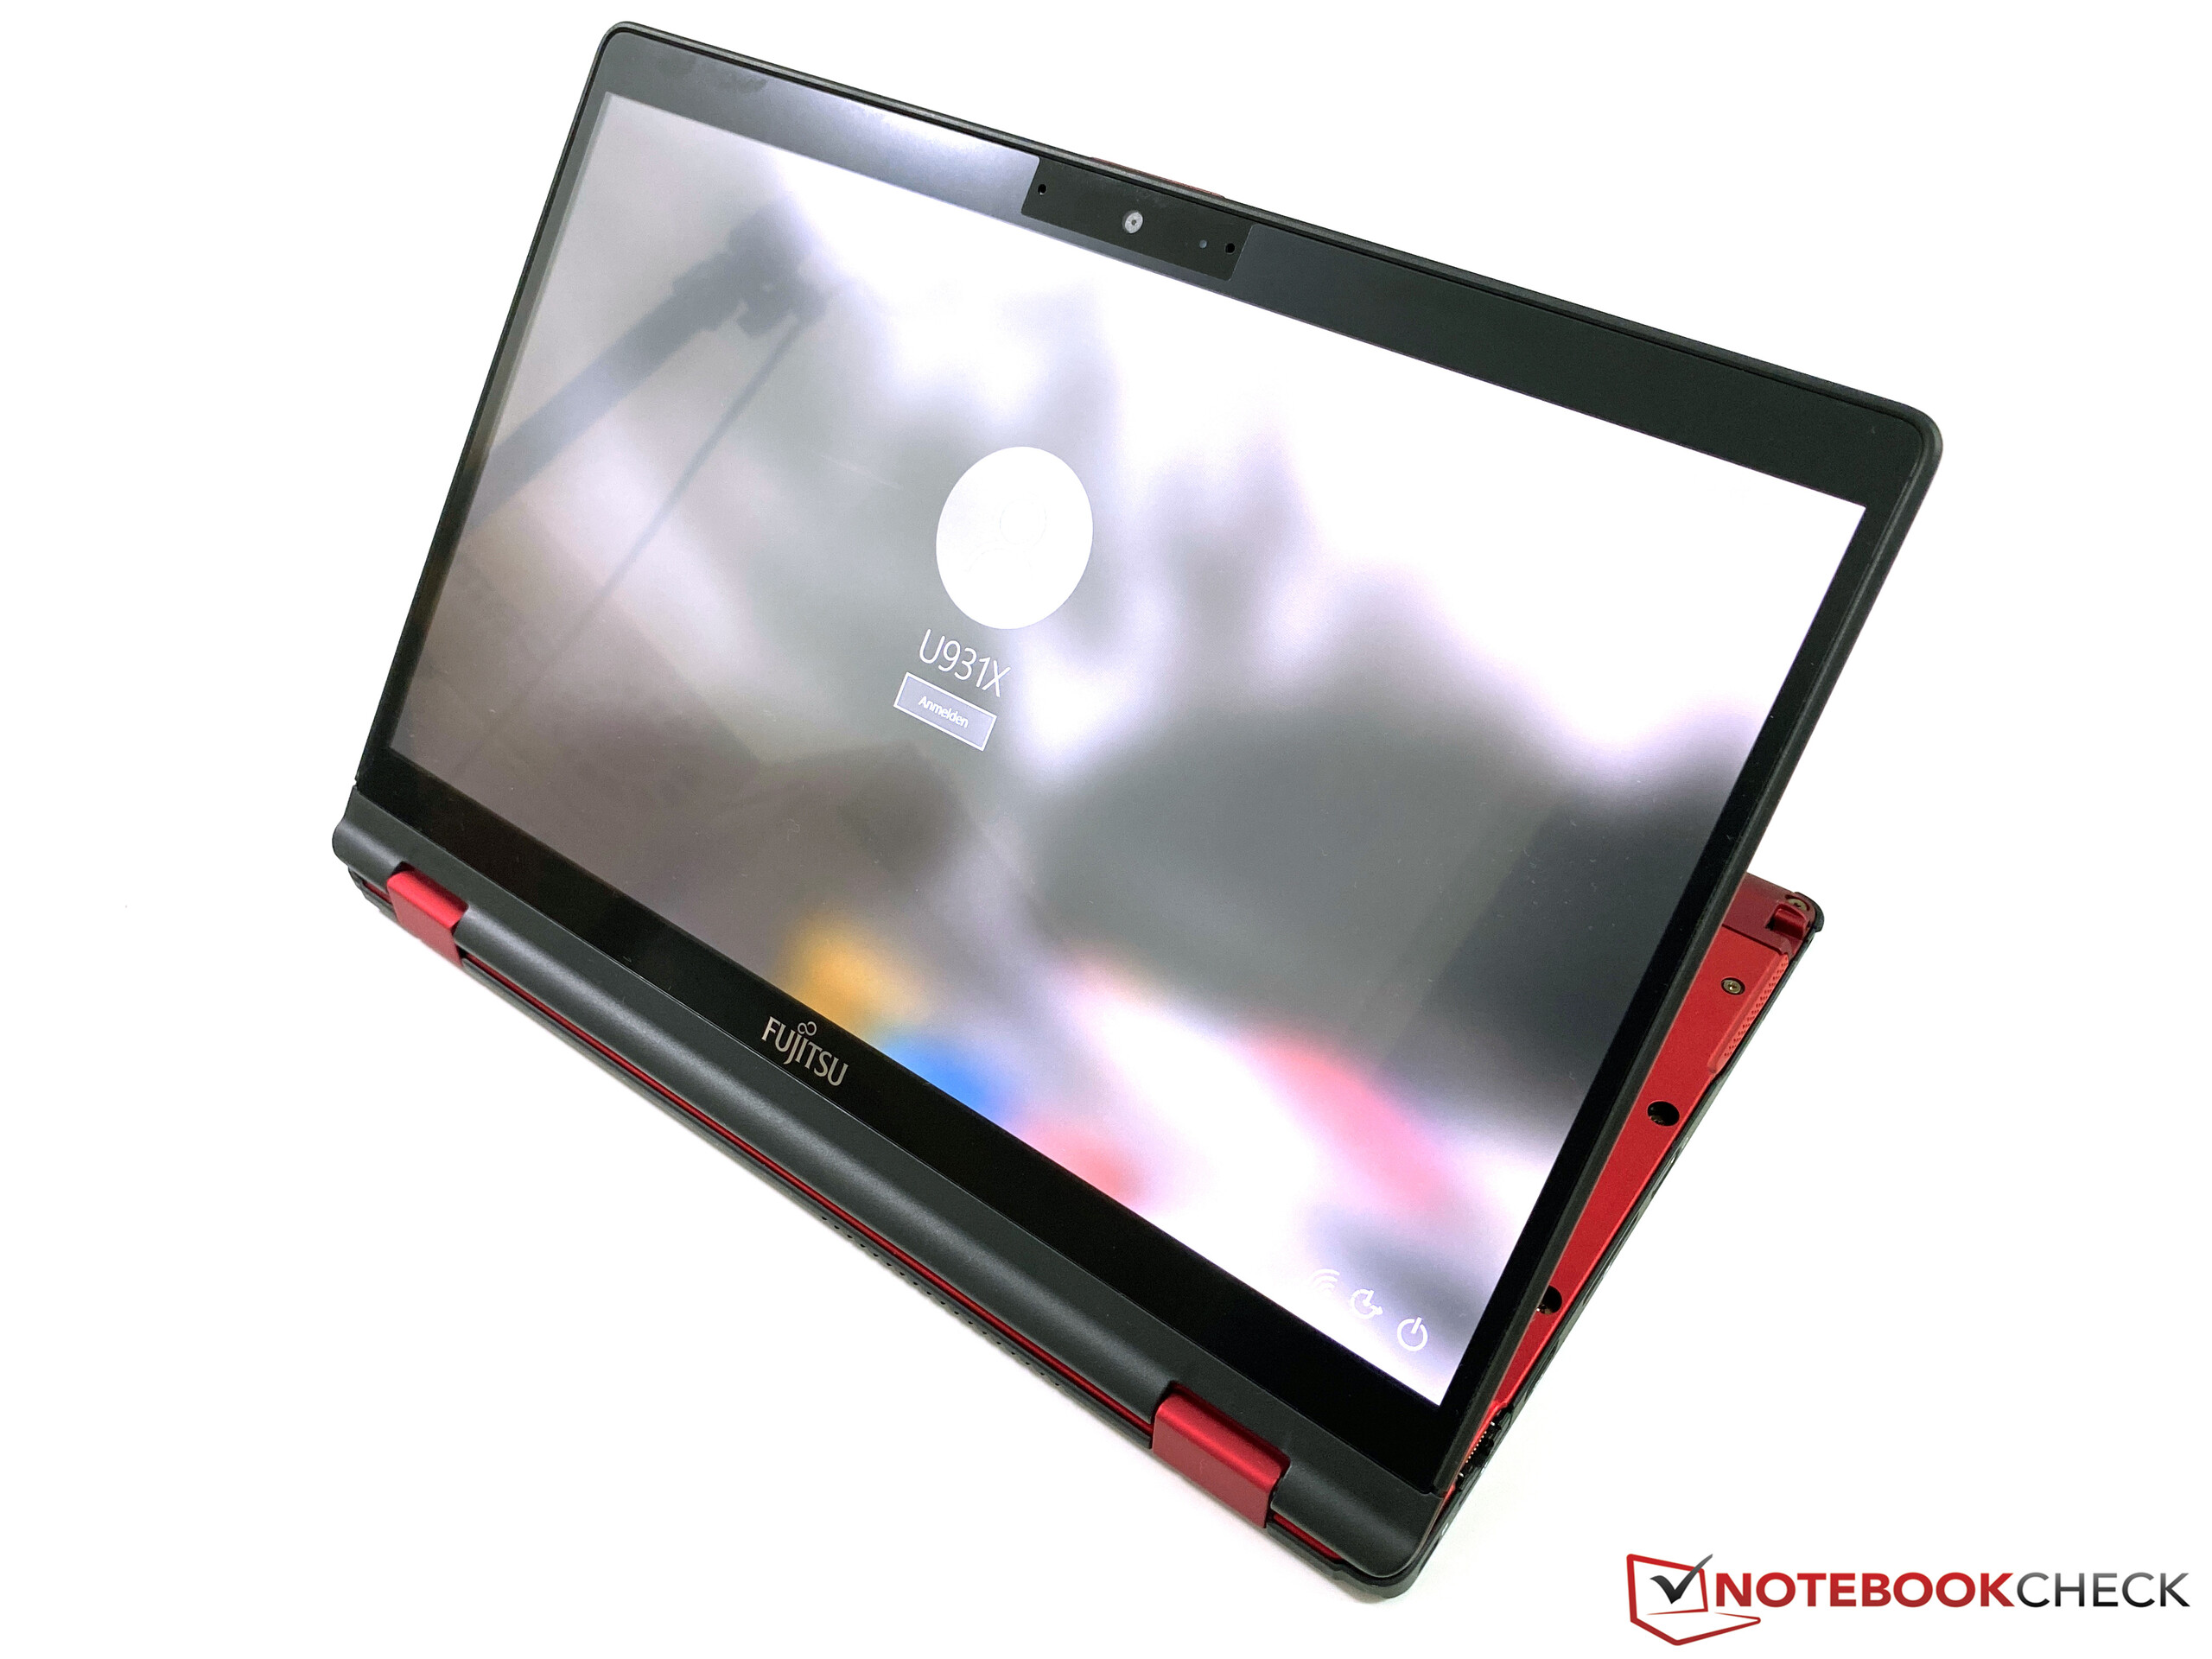
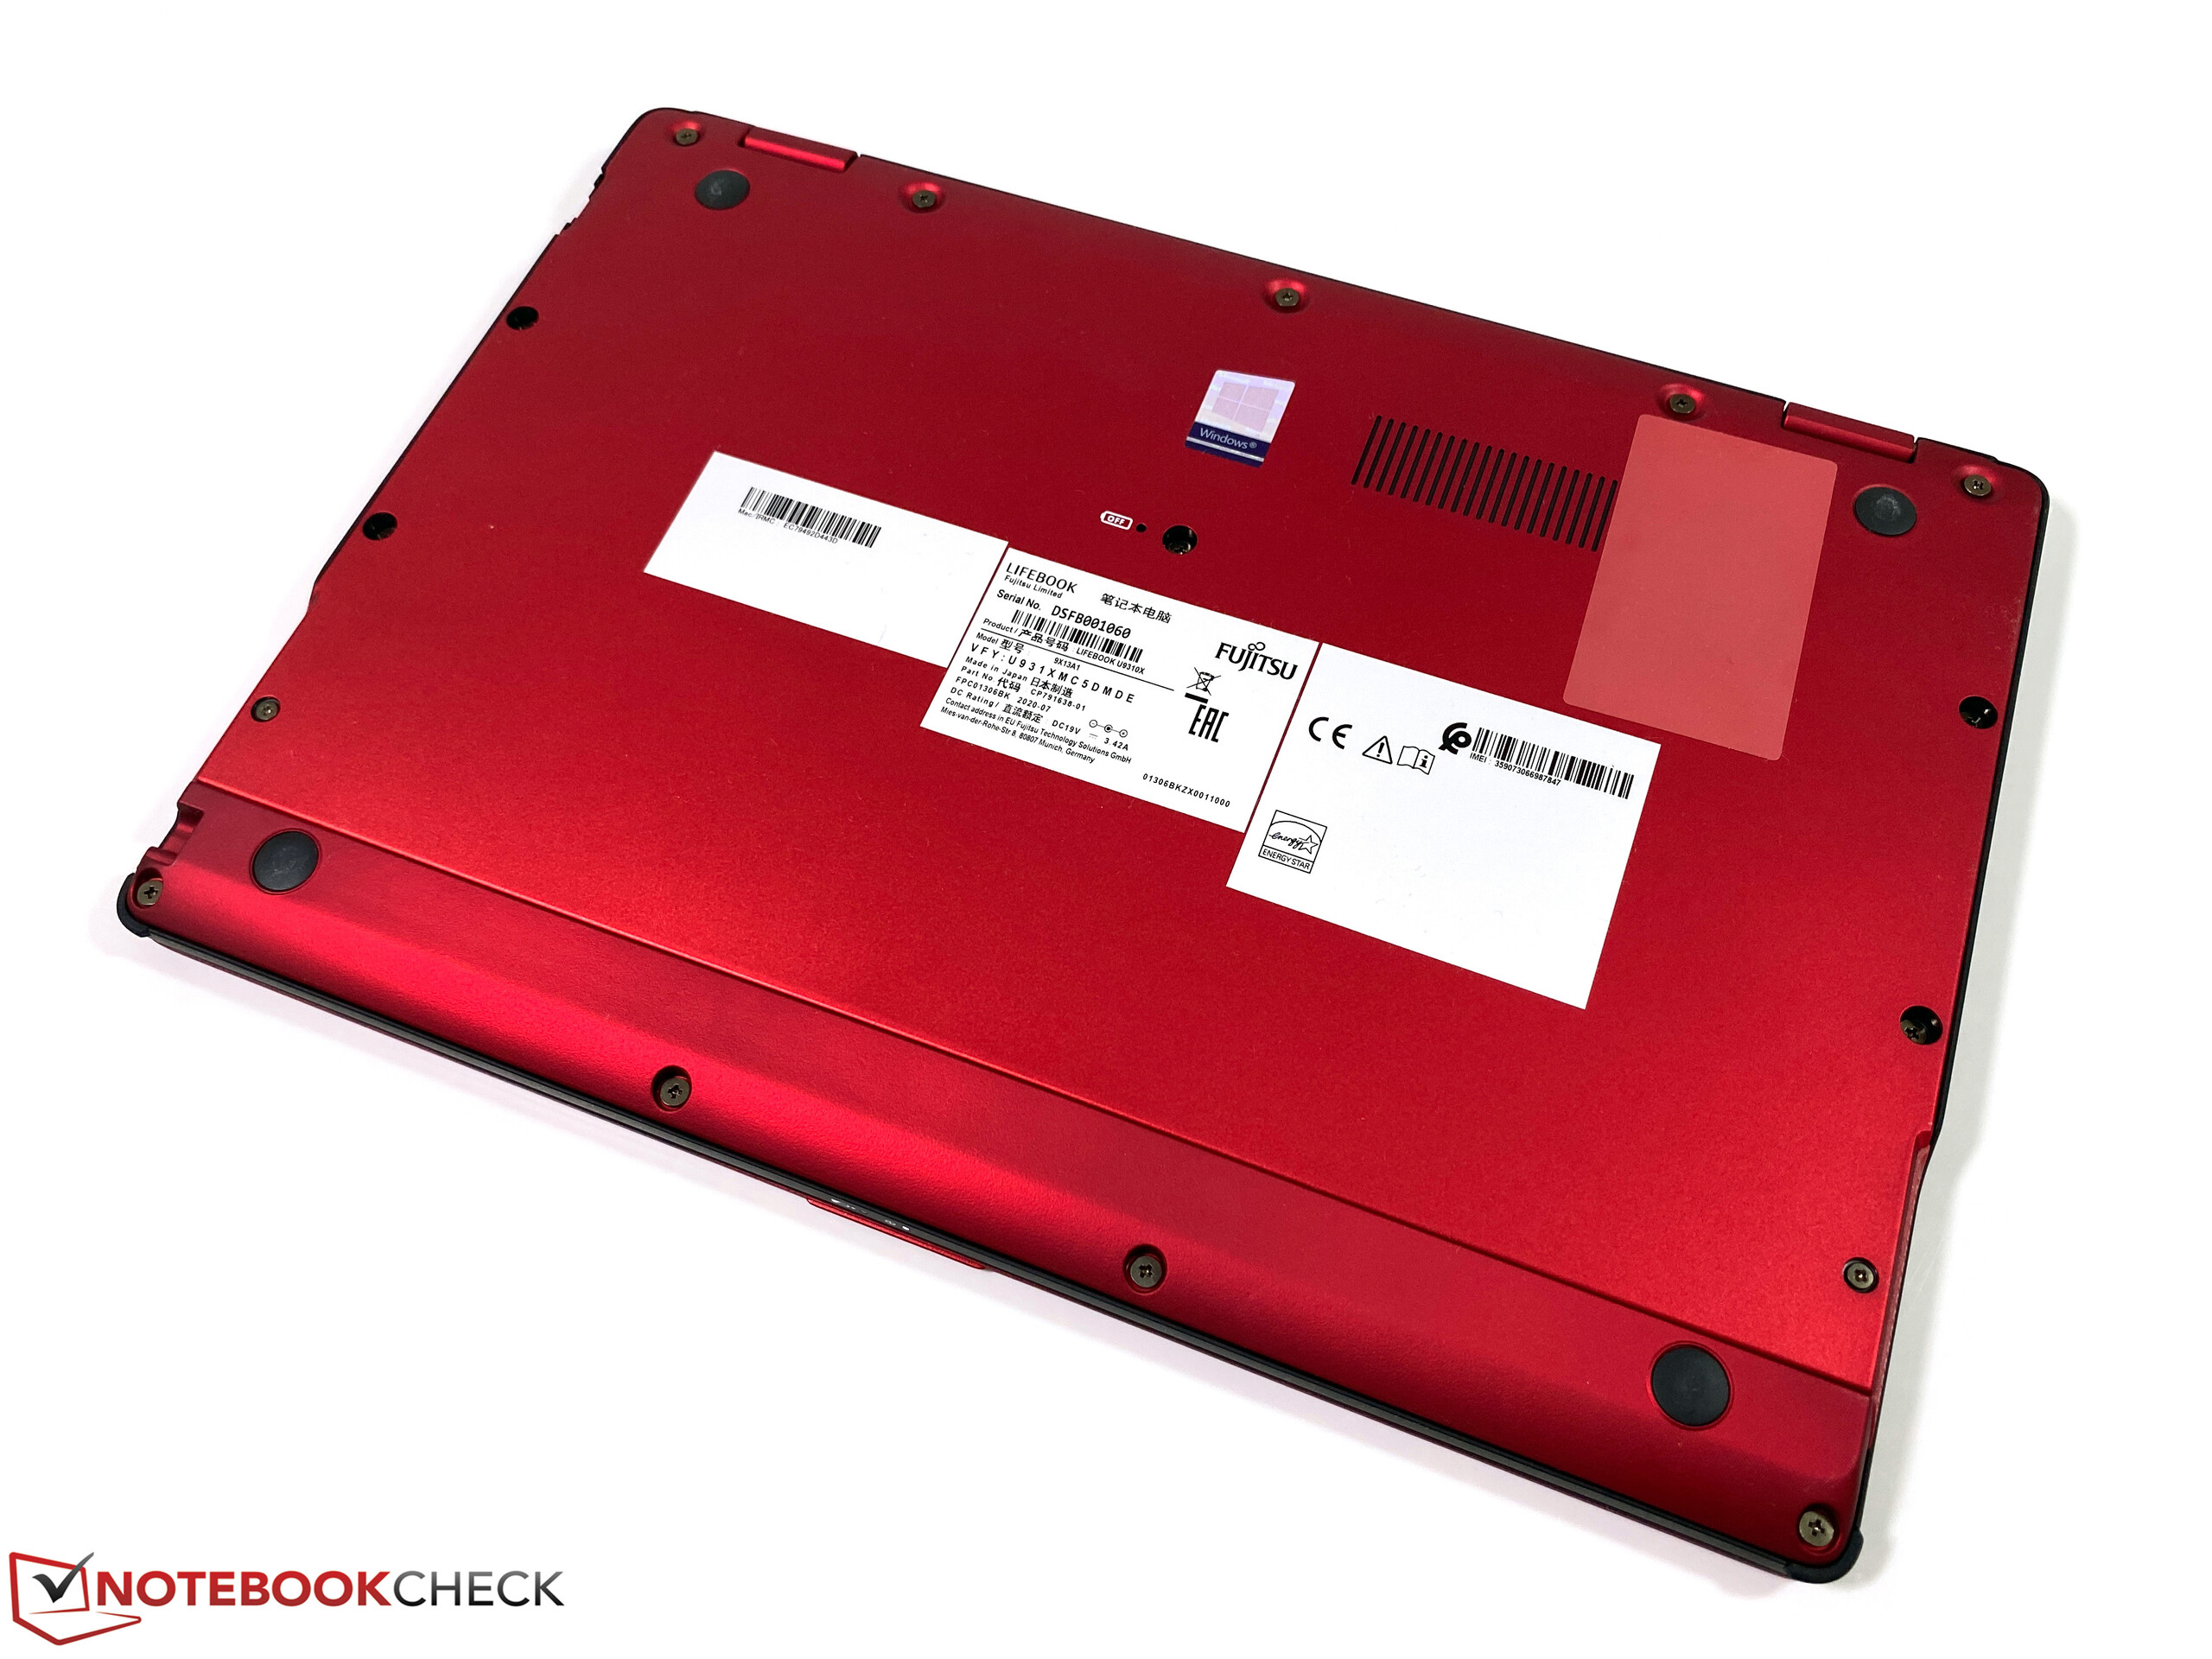
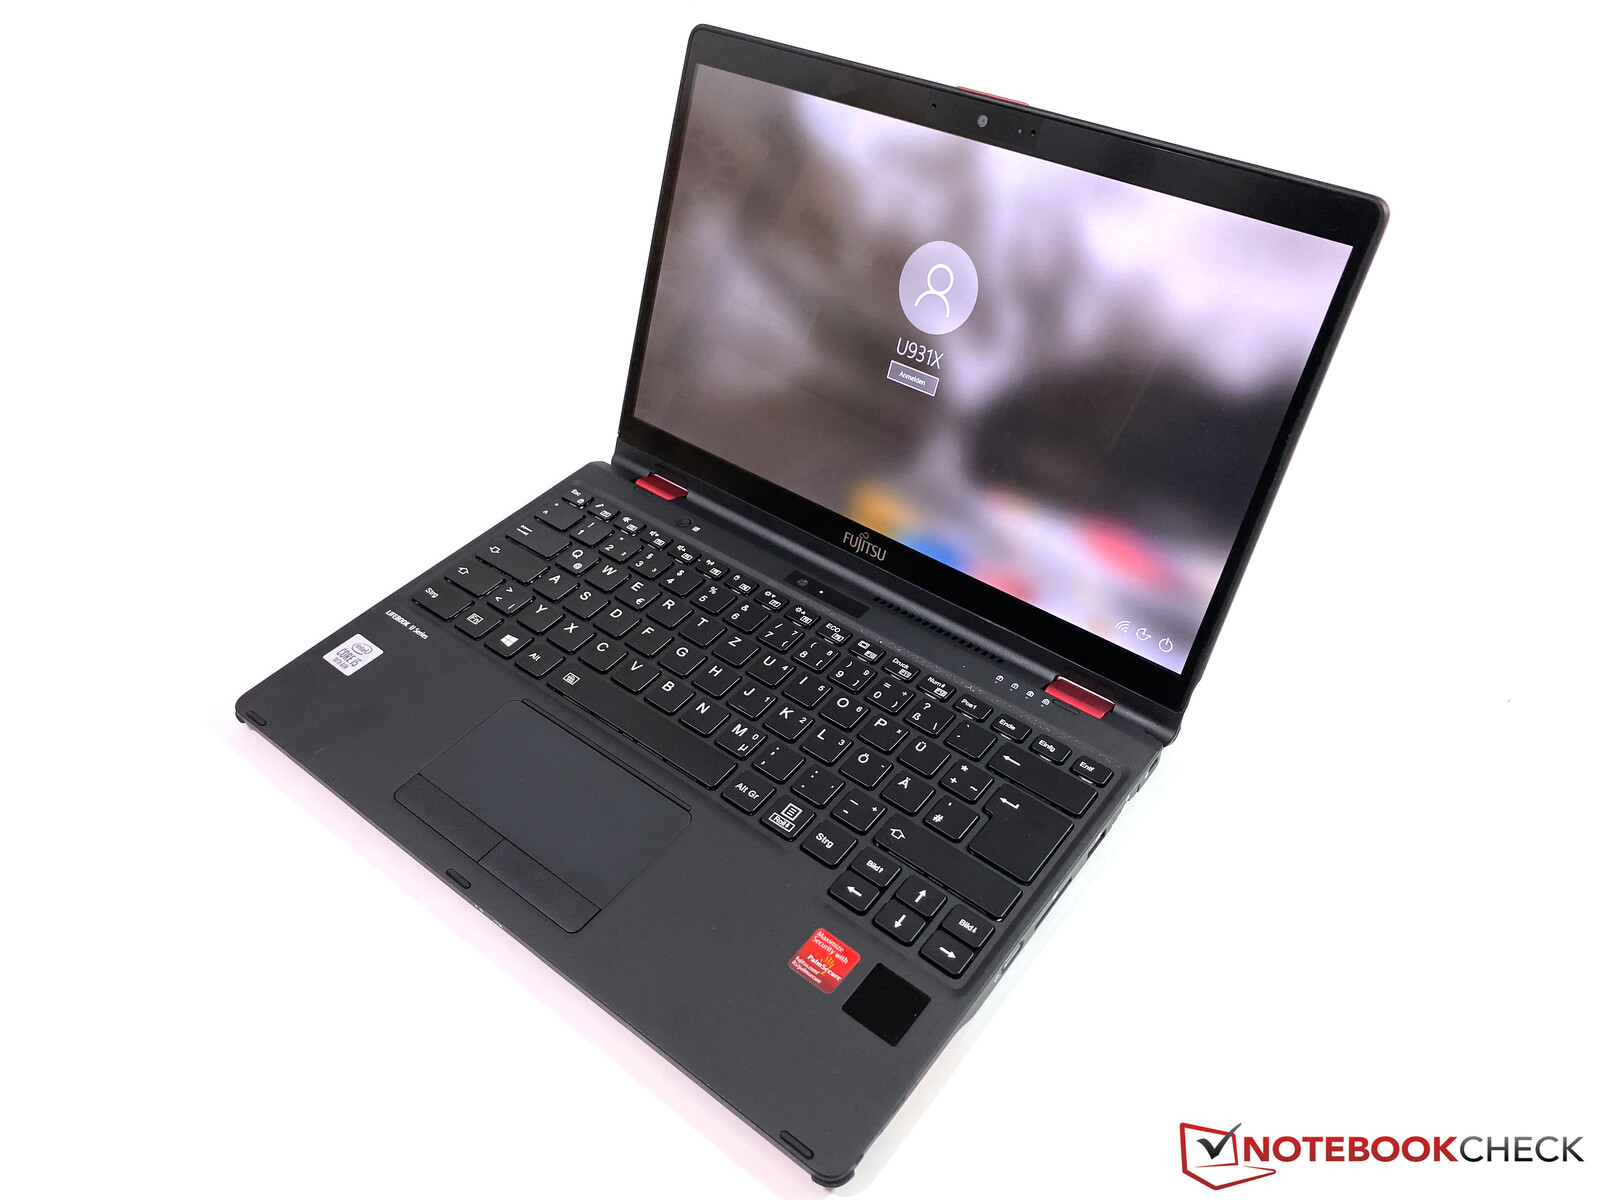
We already know the Lifebook U9310X's magnesium casing from the Lifebook U939X. At 1.024 kg, the convertible is extremely light and also looks very good in red, but the device is also available in black as an alternative. The stability is very good, but the device does not feel extremely high-end due to the low weight. The screen can be completely folded down and therefore allows different operating modes.
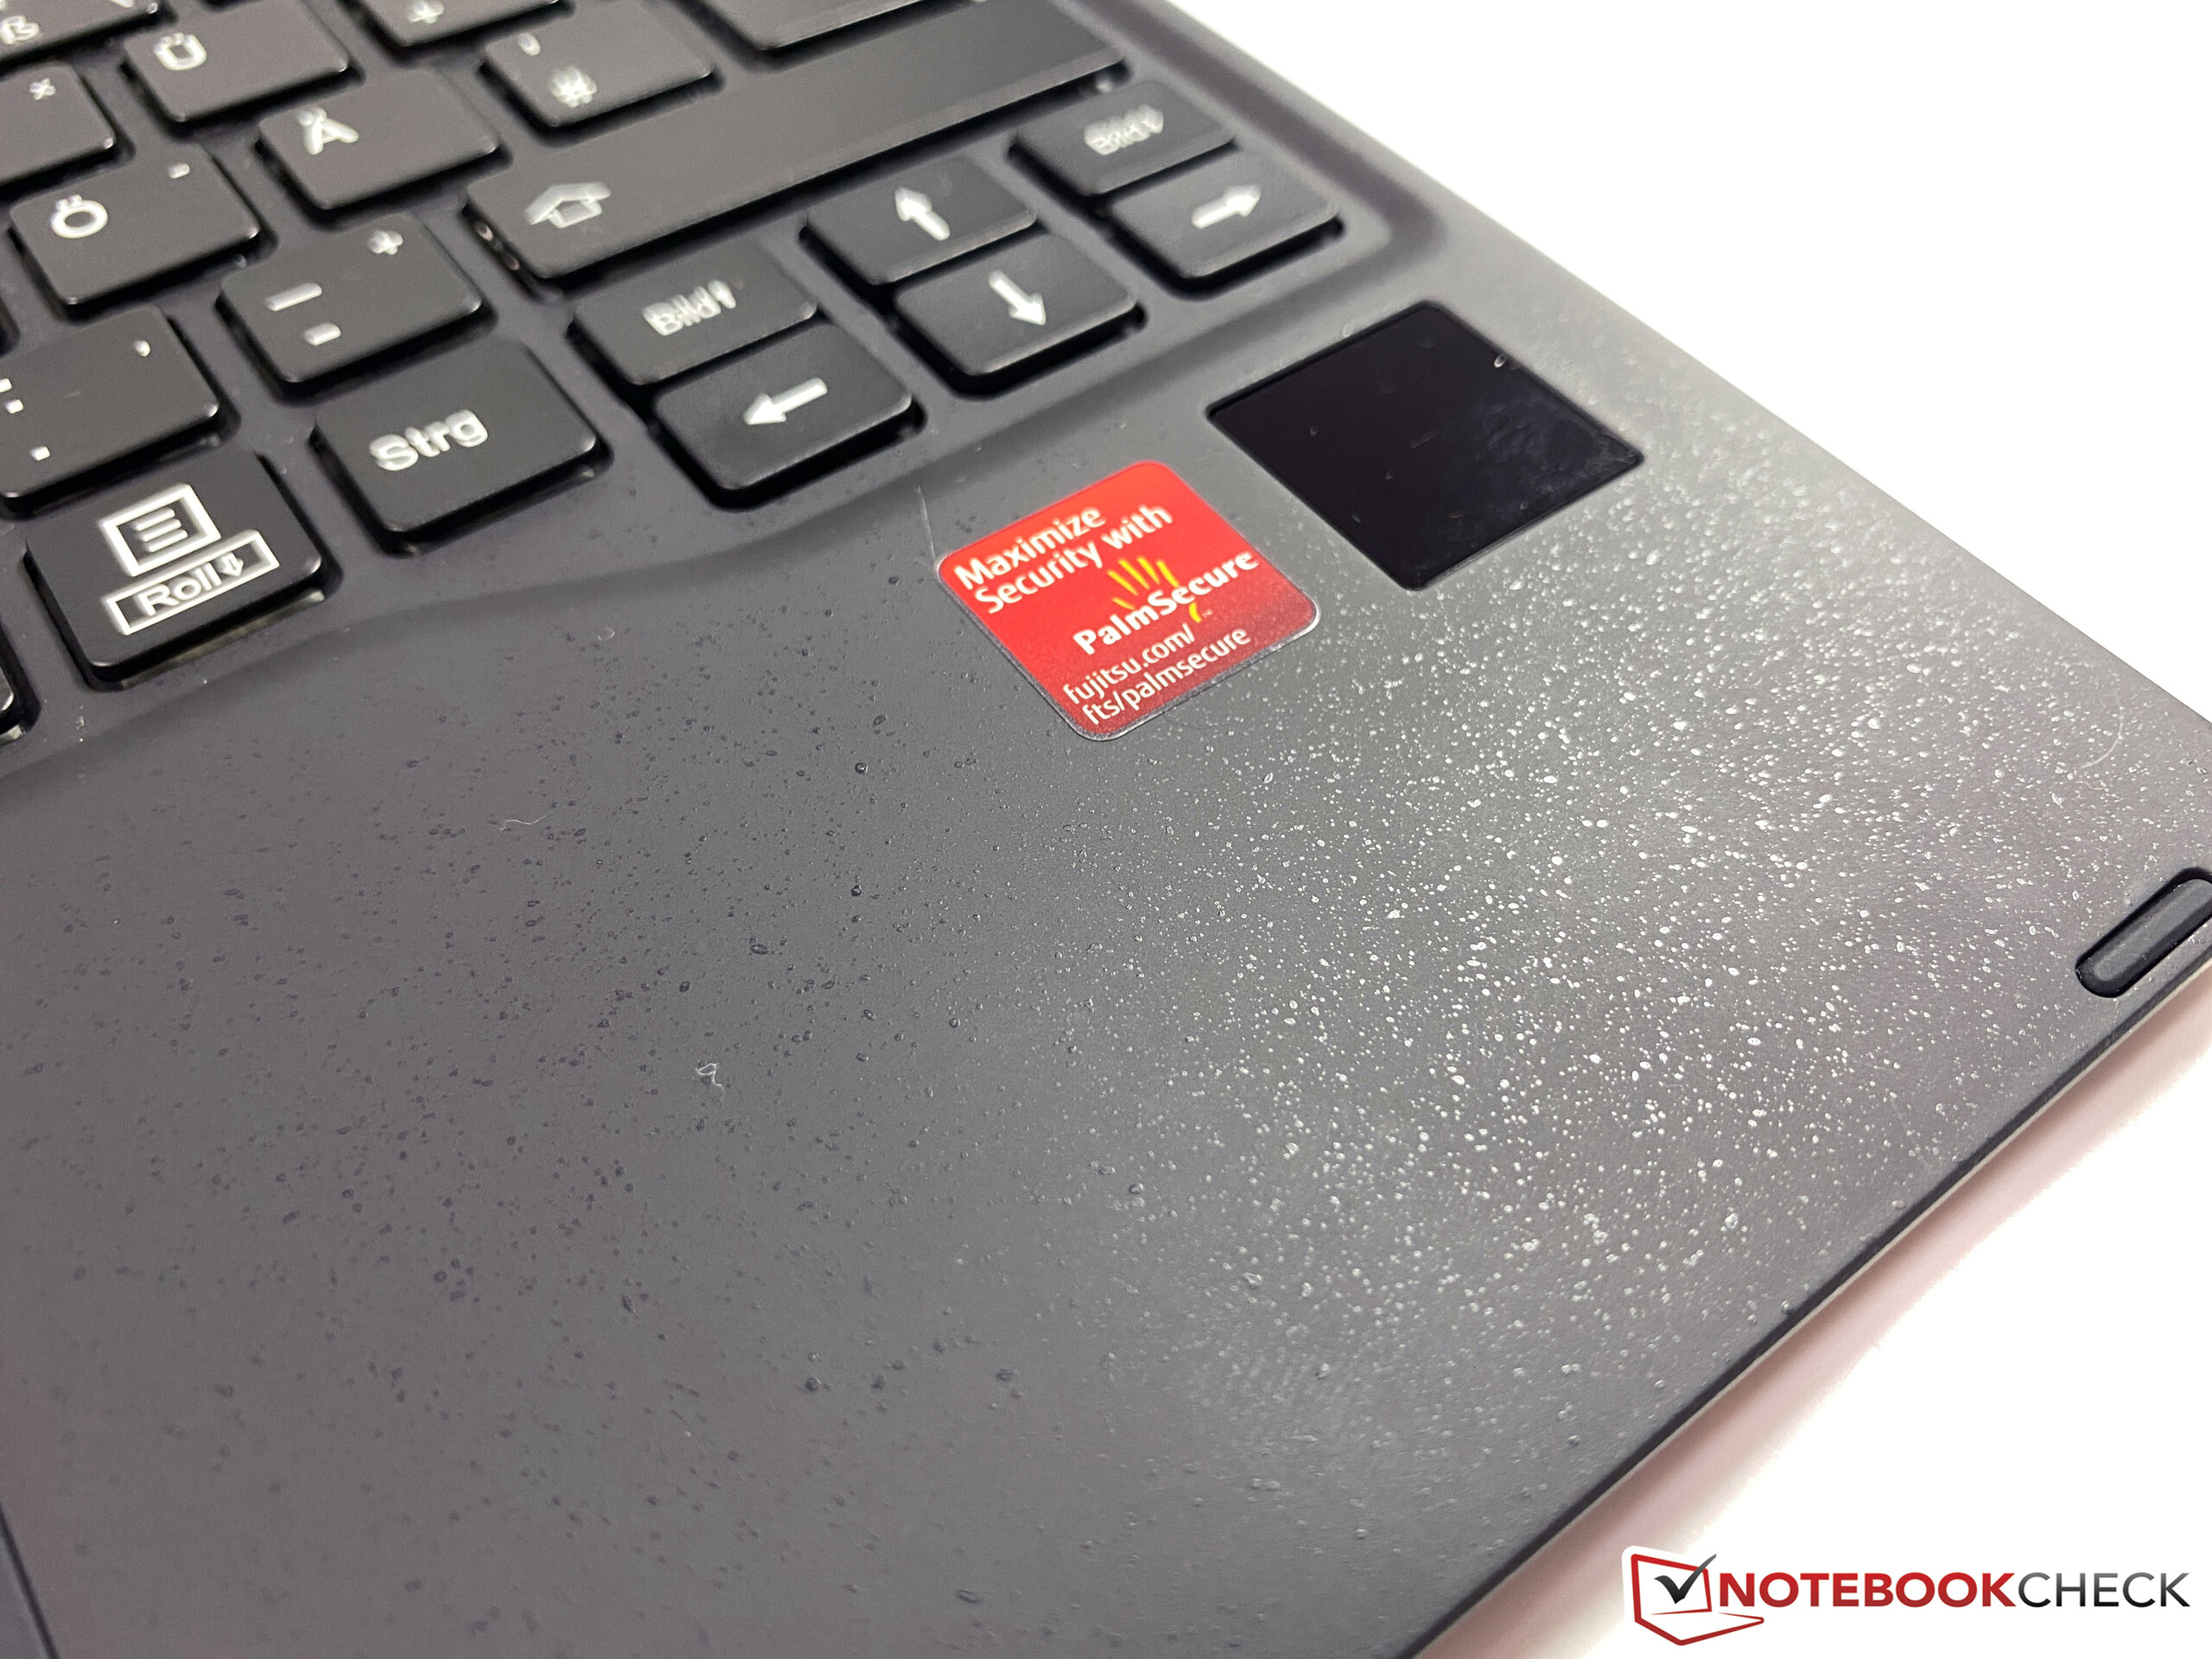
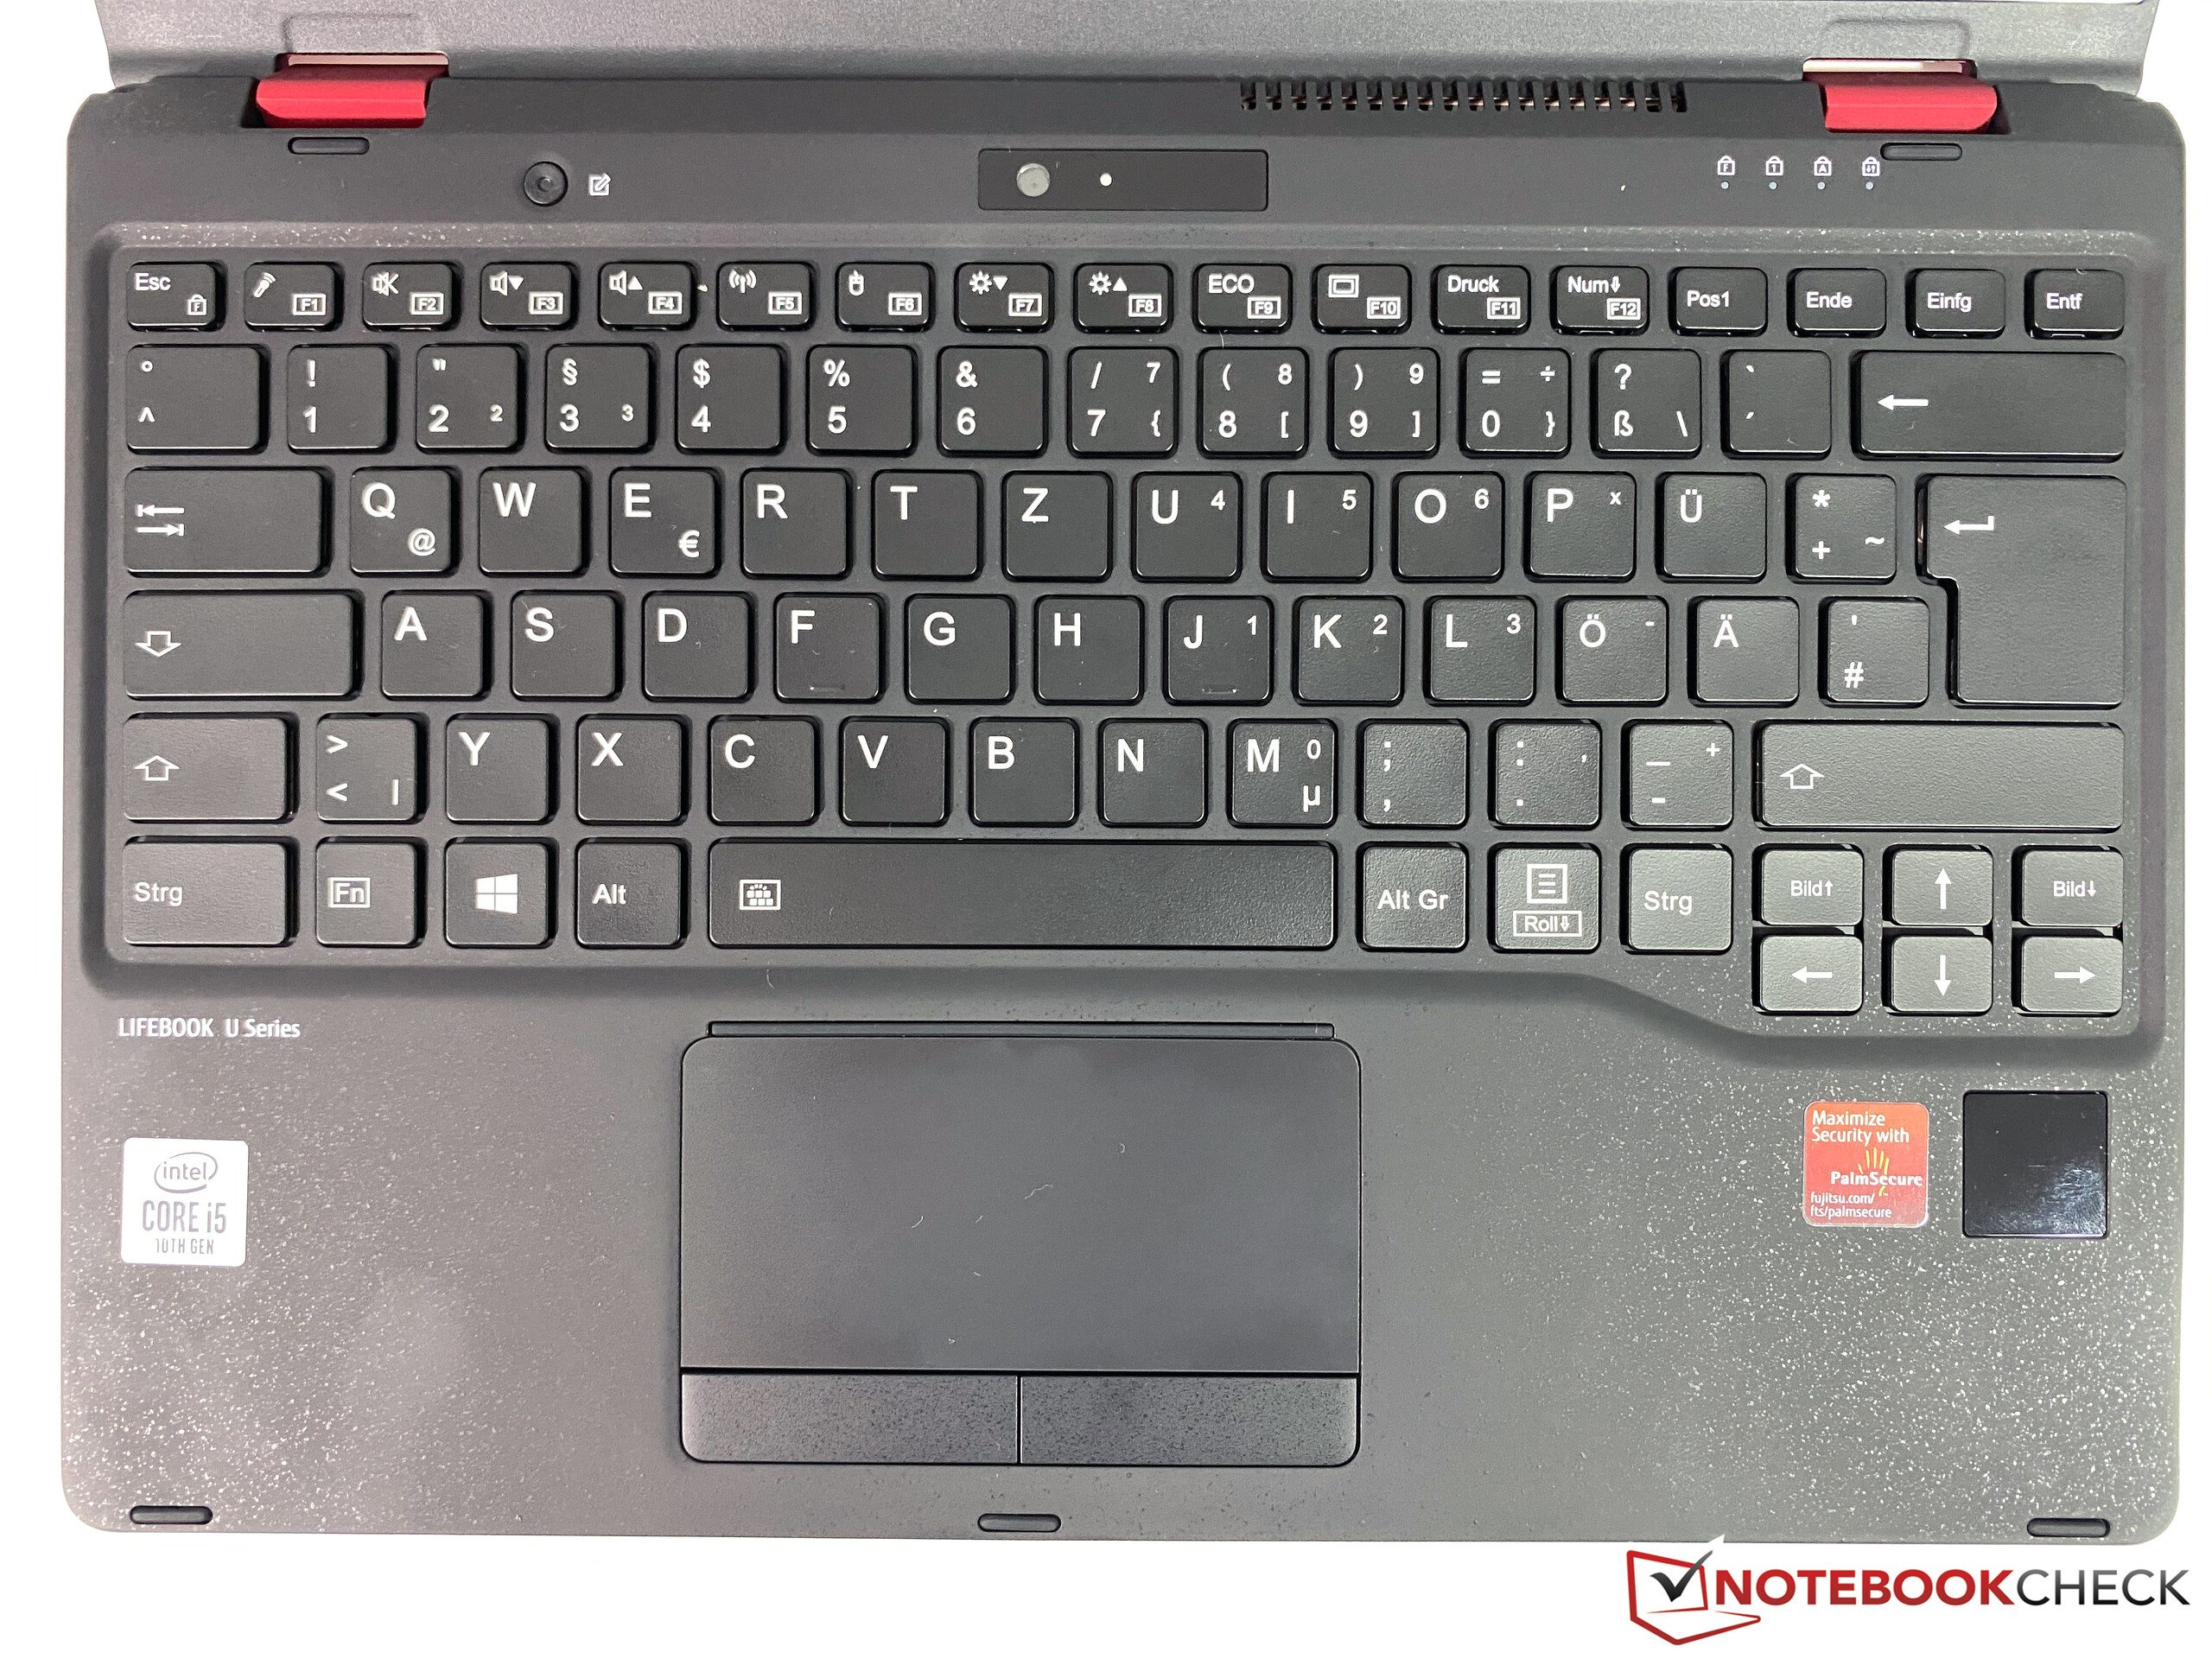
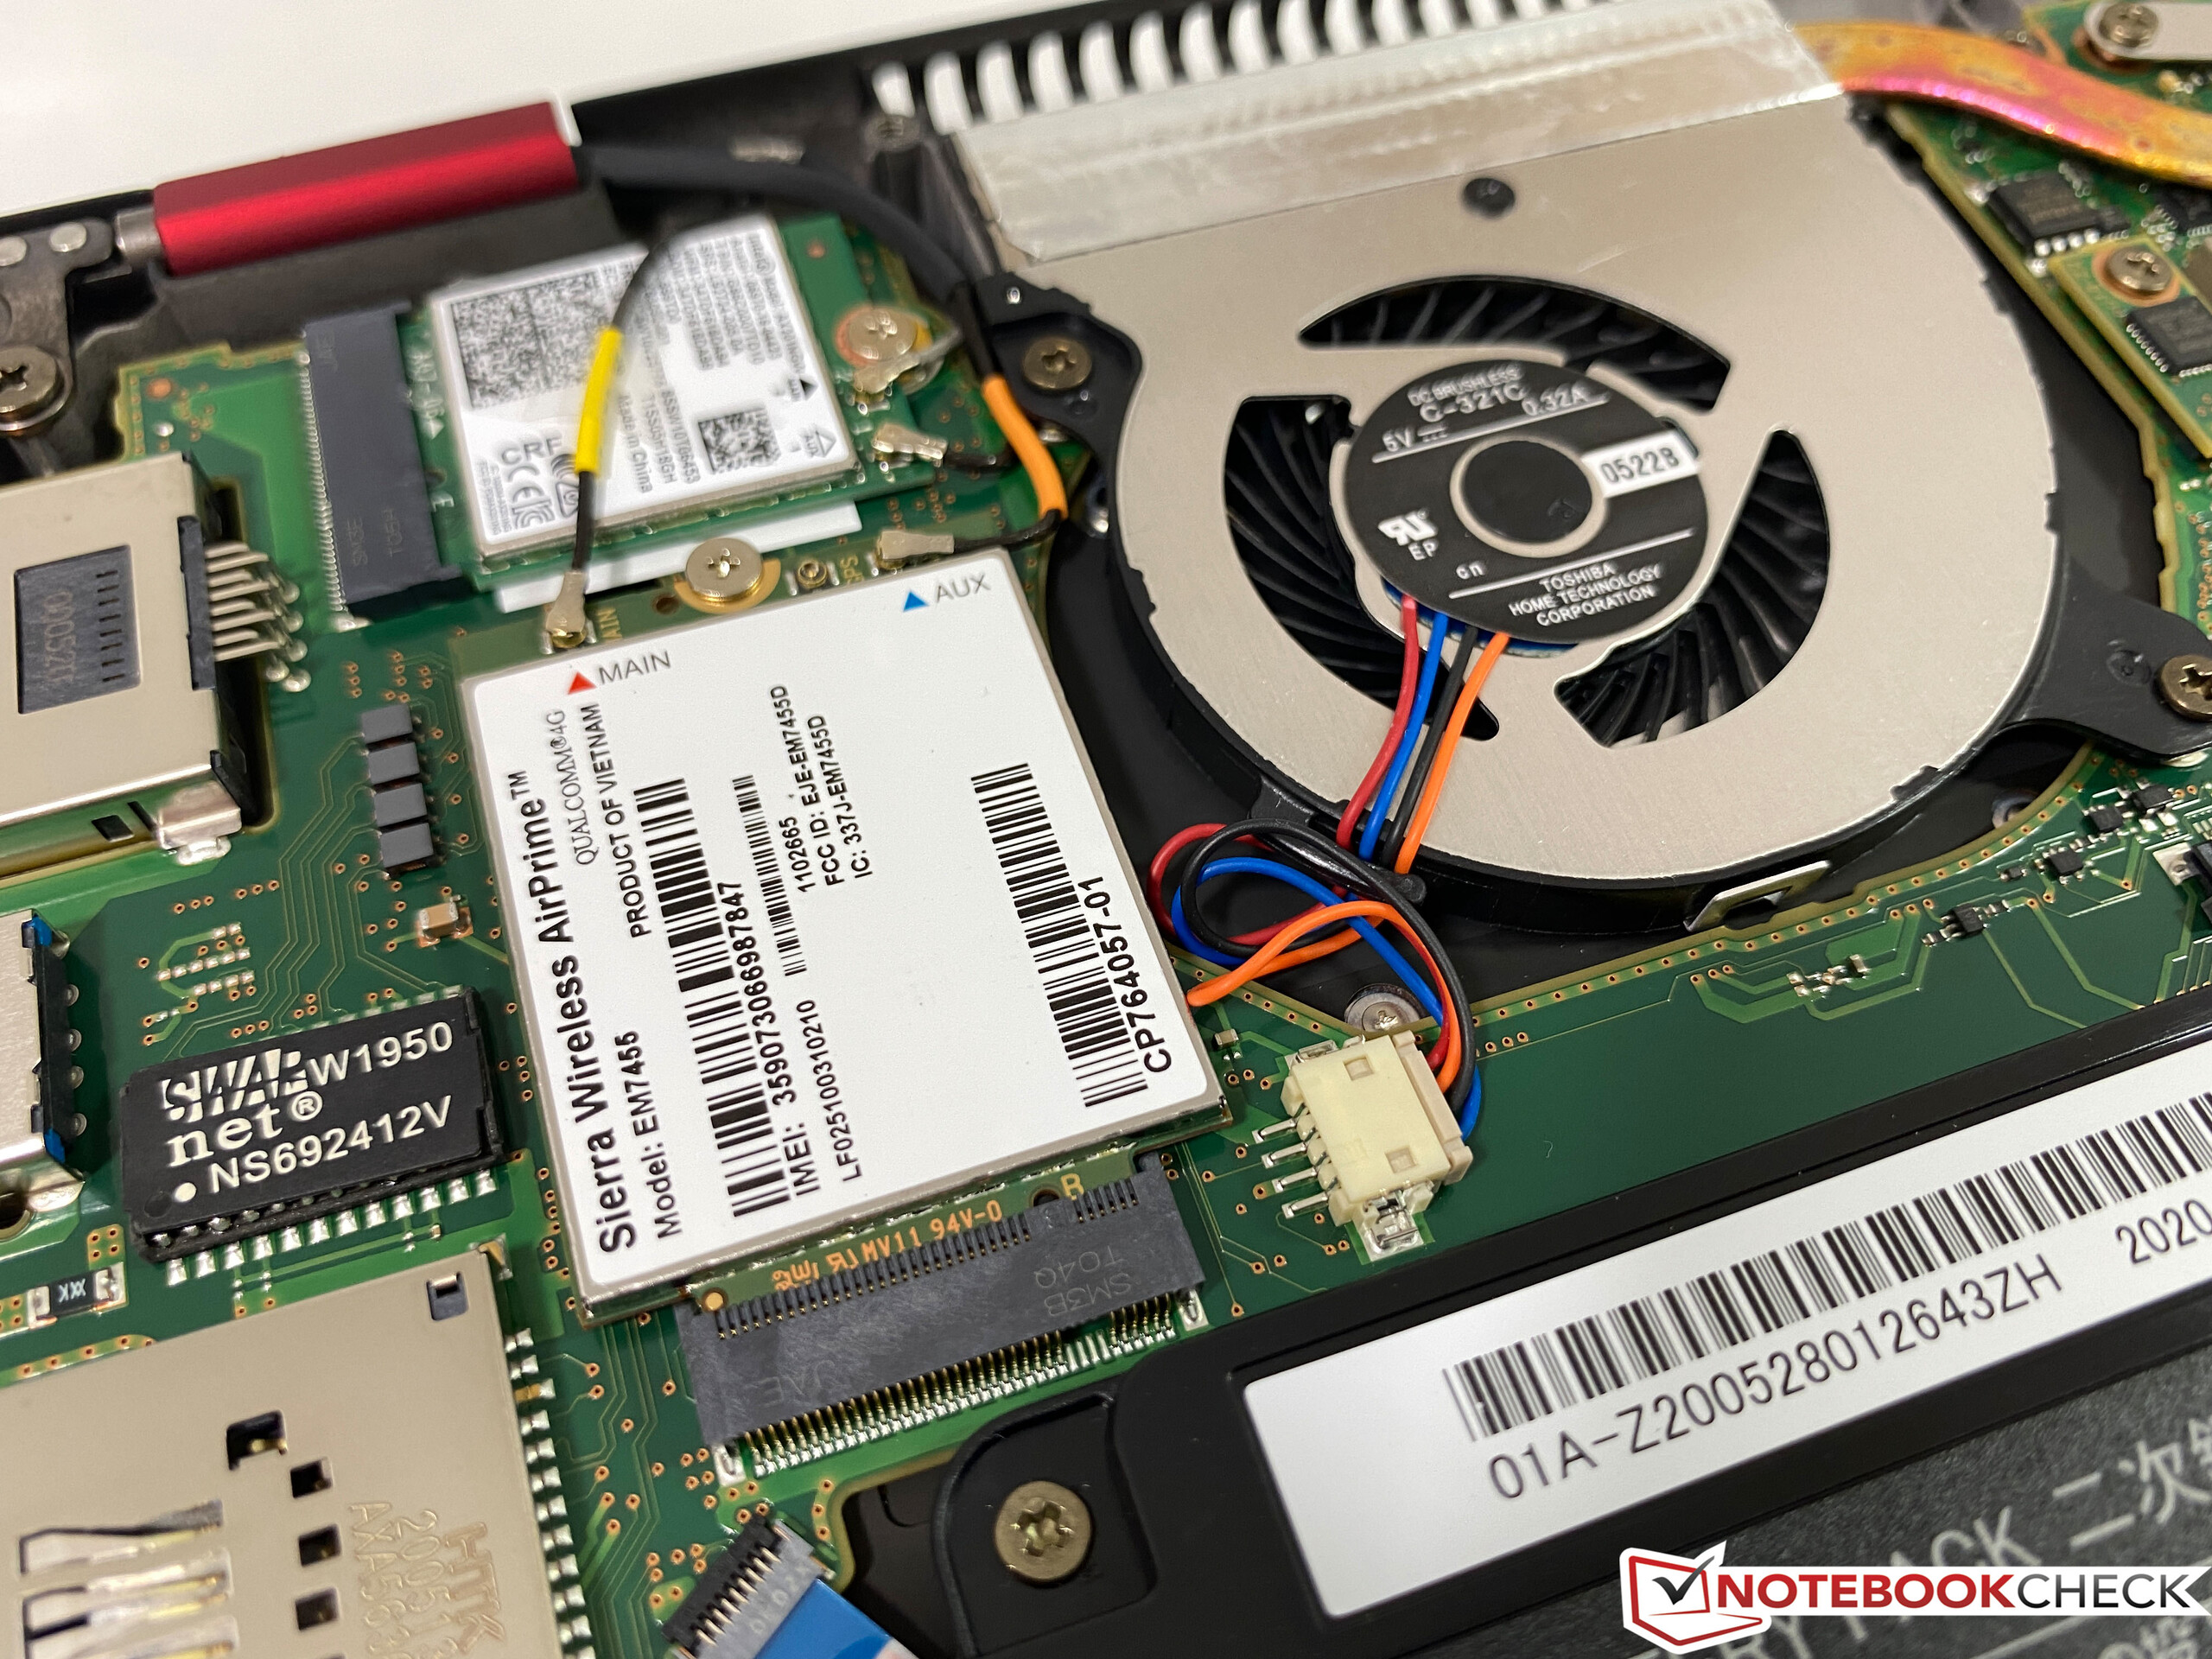
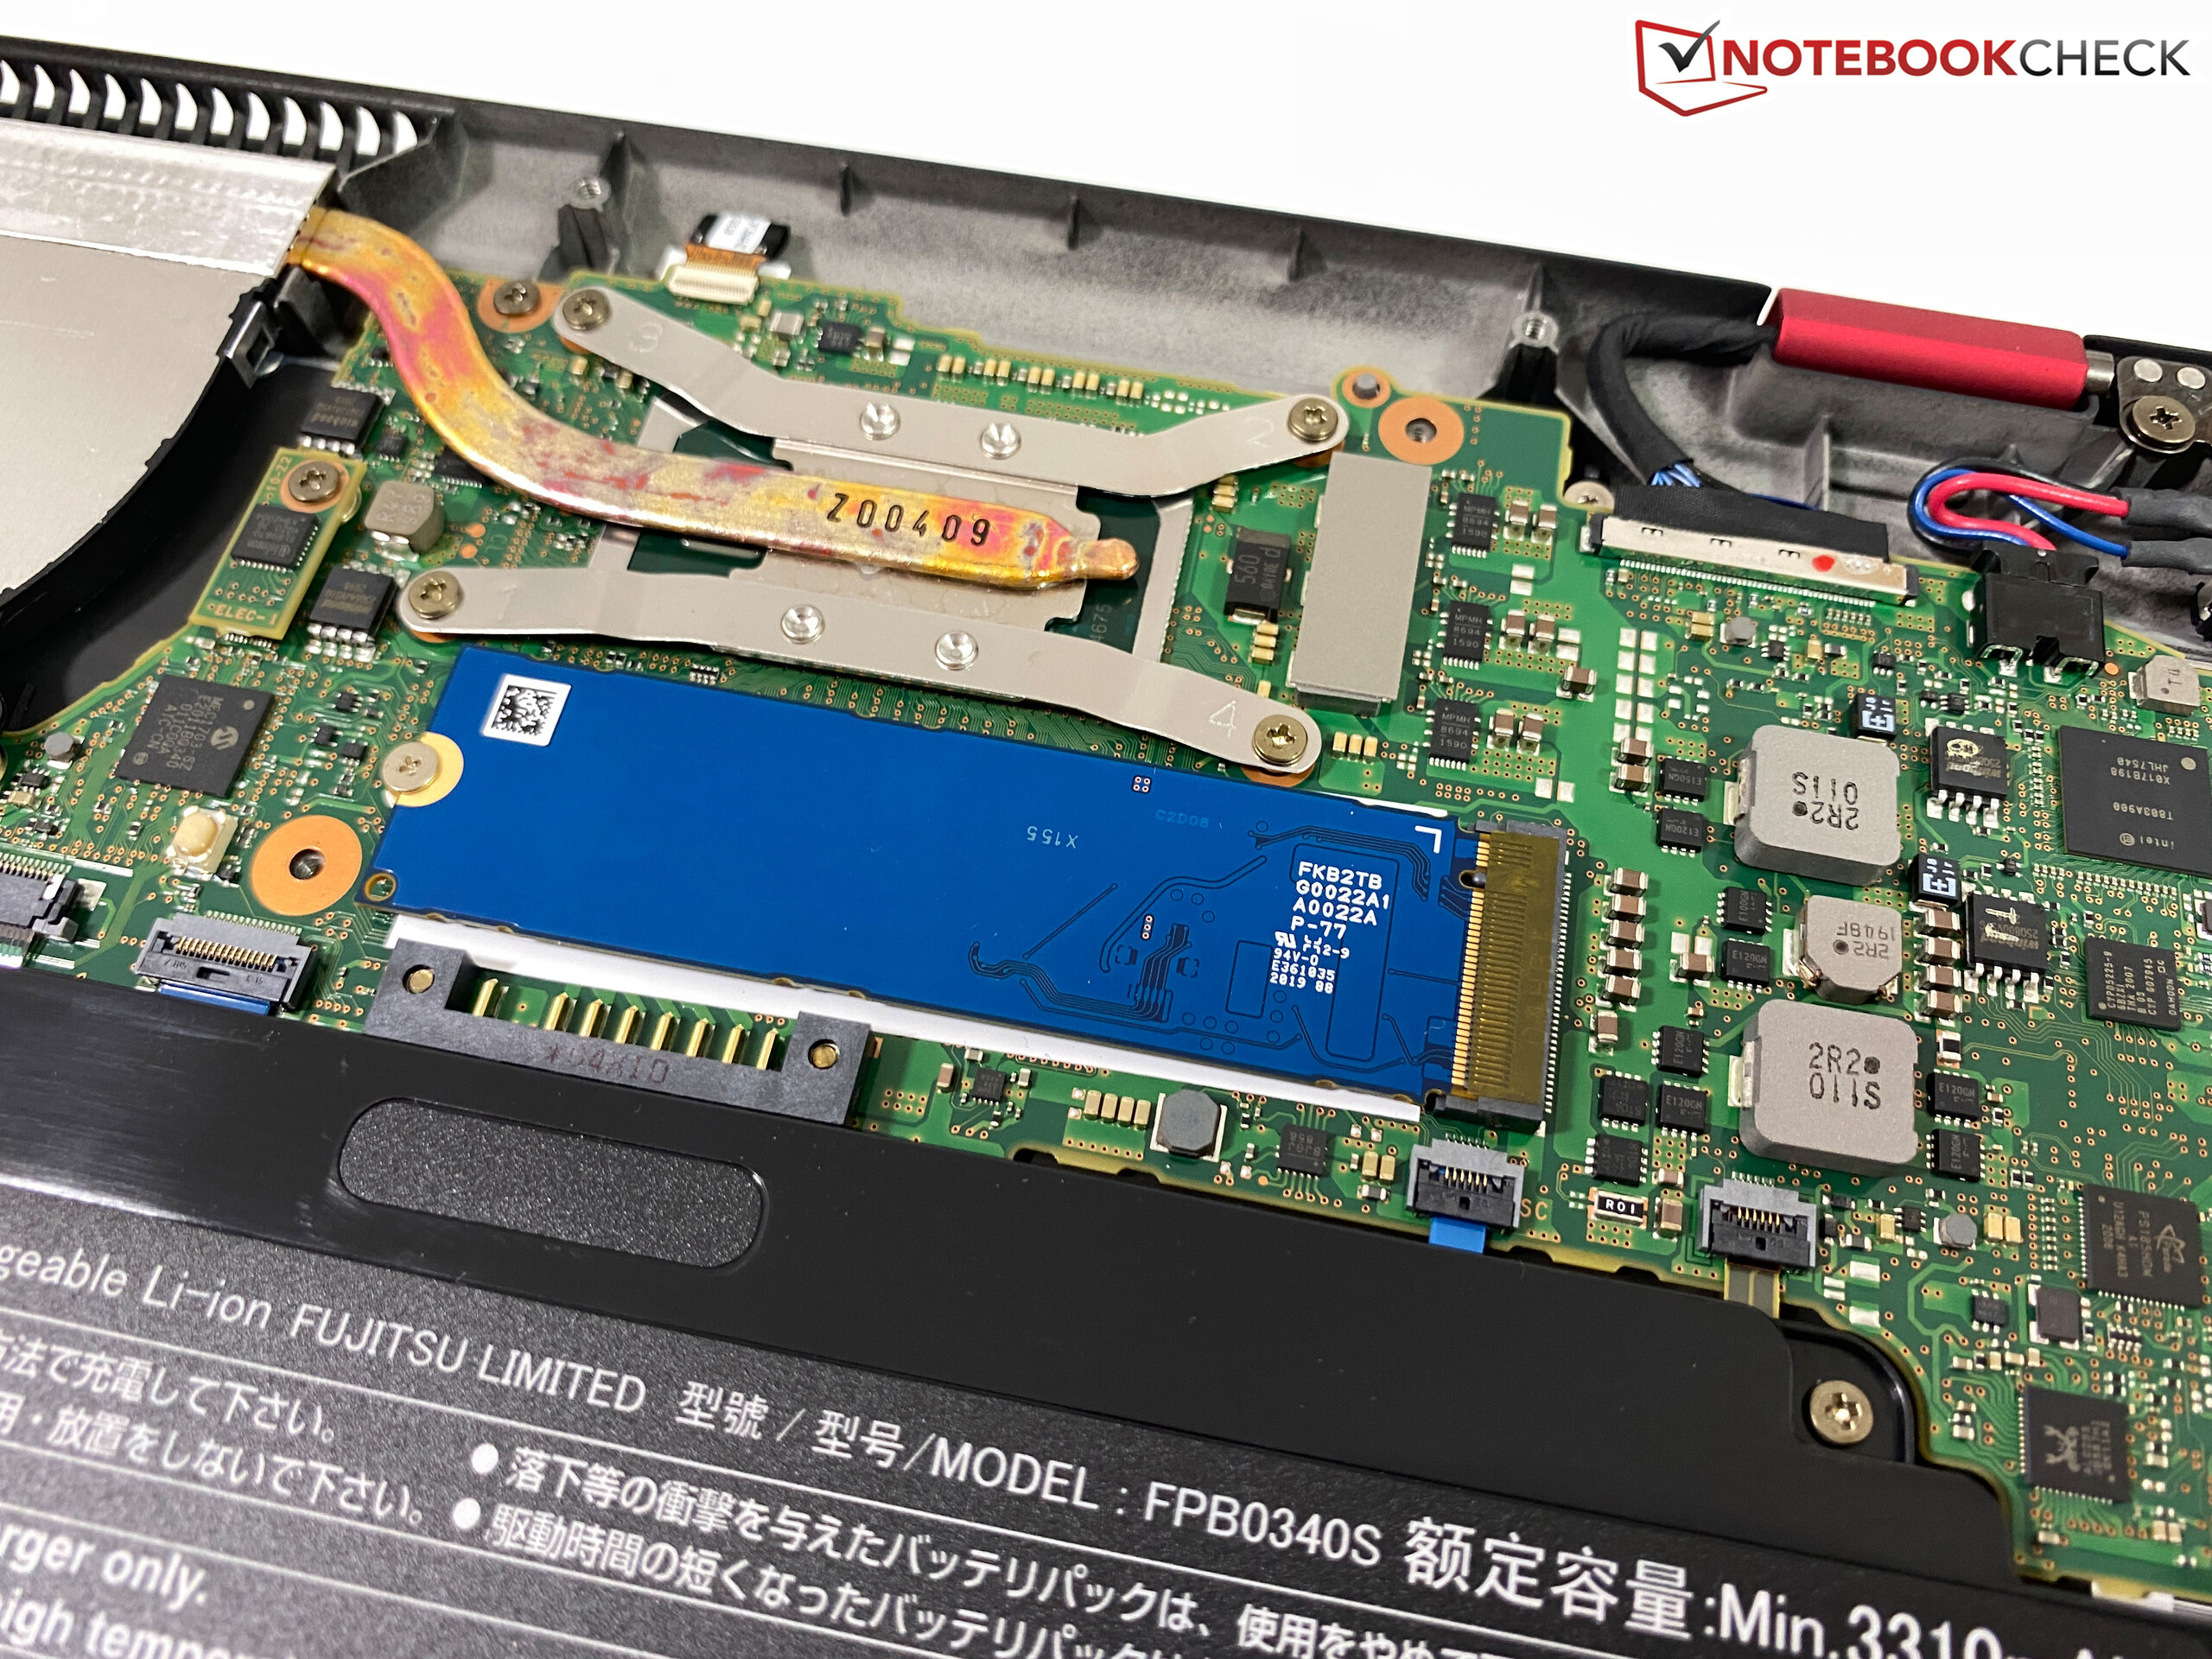
One advantage of the Fujitsu computer are the extensive ports including 2x Thunderbolt 3, but you also do not have to do without normal USB-A connectors or an Ethernet port. The stylus for the touchscreen can also be accommodated in the casing.The keyboard (illuminated) is quite small and the pressure point is also a bit spongy. Other business devices offer better inputs here. Our model also has an LTE modem, which means you do not always have to rely on Wi-Fi networks when you are on the road.

| SD Card Reader | |
| average JPG Copy Test (av. of 3 runs) | |
| Fujitsu Lifebook U939X (Toshiba Exceria Pro SDXC 64 GB UHS-II) | |
| Dell XPS 13 7390 2-in-1 Core i7 (Toshiba Exceria Pro M501 64 GB UHS-II) | |
| Fujitsu LifeBook U9310X (Toshiba Exceria Pro SDXC 64 GB UHS-II) | |
| Lenovo ThinkPad X13 Yoga 20SX0004GE (Toshiba Exceria Pro M501 64 GB UHS-II) | |
| Average of class Convertible (29.4 - 141, n=21, last 2 years) | |
| maximum AS SSD Seq Read Test (1GB) | |
| Dell XPS 13 7390 2-in-1 Core i7 (Toshiba Exceria Pro M501 64 GB UHS-II) | |
| Fujitsu Lifebook U939X (Toshiba Exceria Pro SDXC 64 GB UHS-II) | |
| Average of class Convertible (67.5 - 254, n=20, last 2 years) | |
| Fujitsu LifeBook U9310X (Toshiba Exceria Pro SDXC 64 GB UHS-II) | |
| Lenovo ThinkPad X13 Yoga 20SX0004GE (Toshiba Exceria Pro M501 64 GB UHS-II) | |


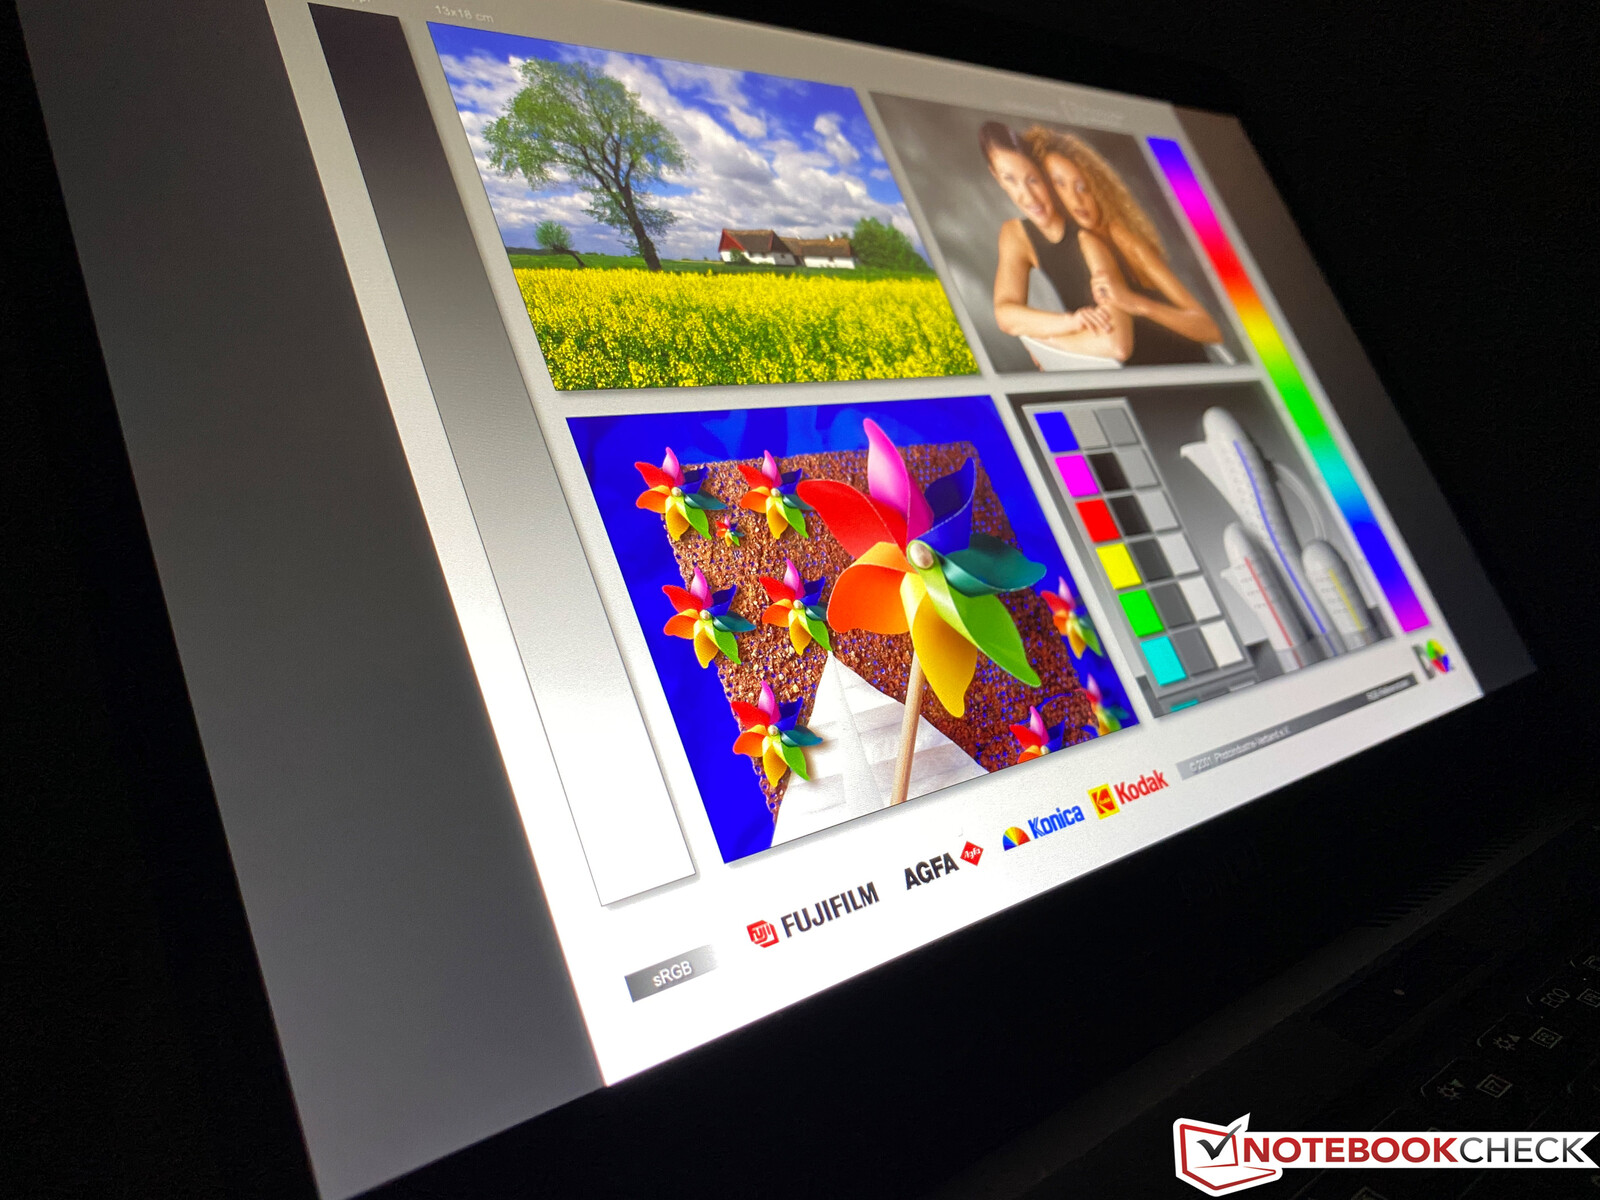
Display - Lifebook with IPS touchscreen
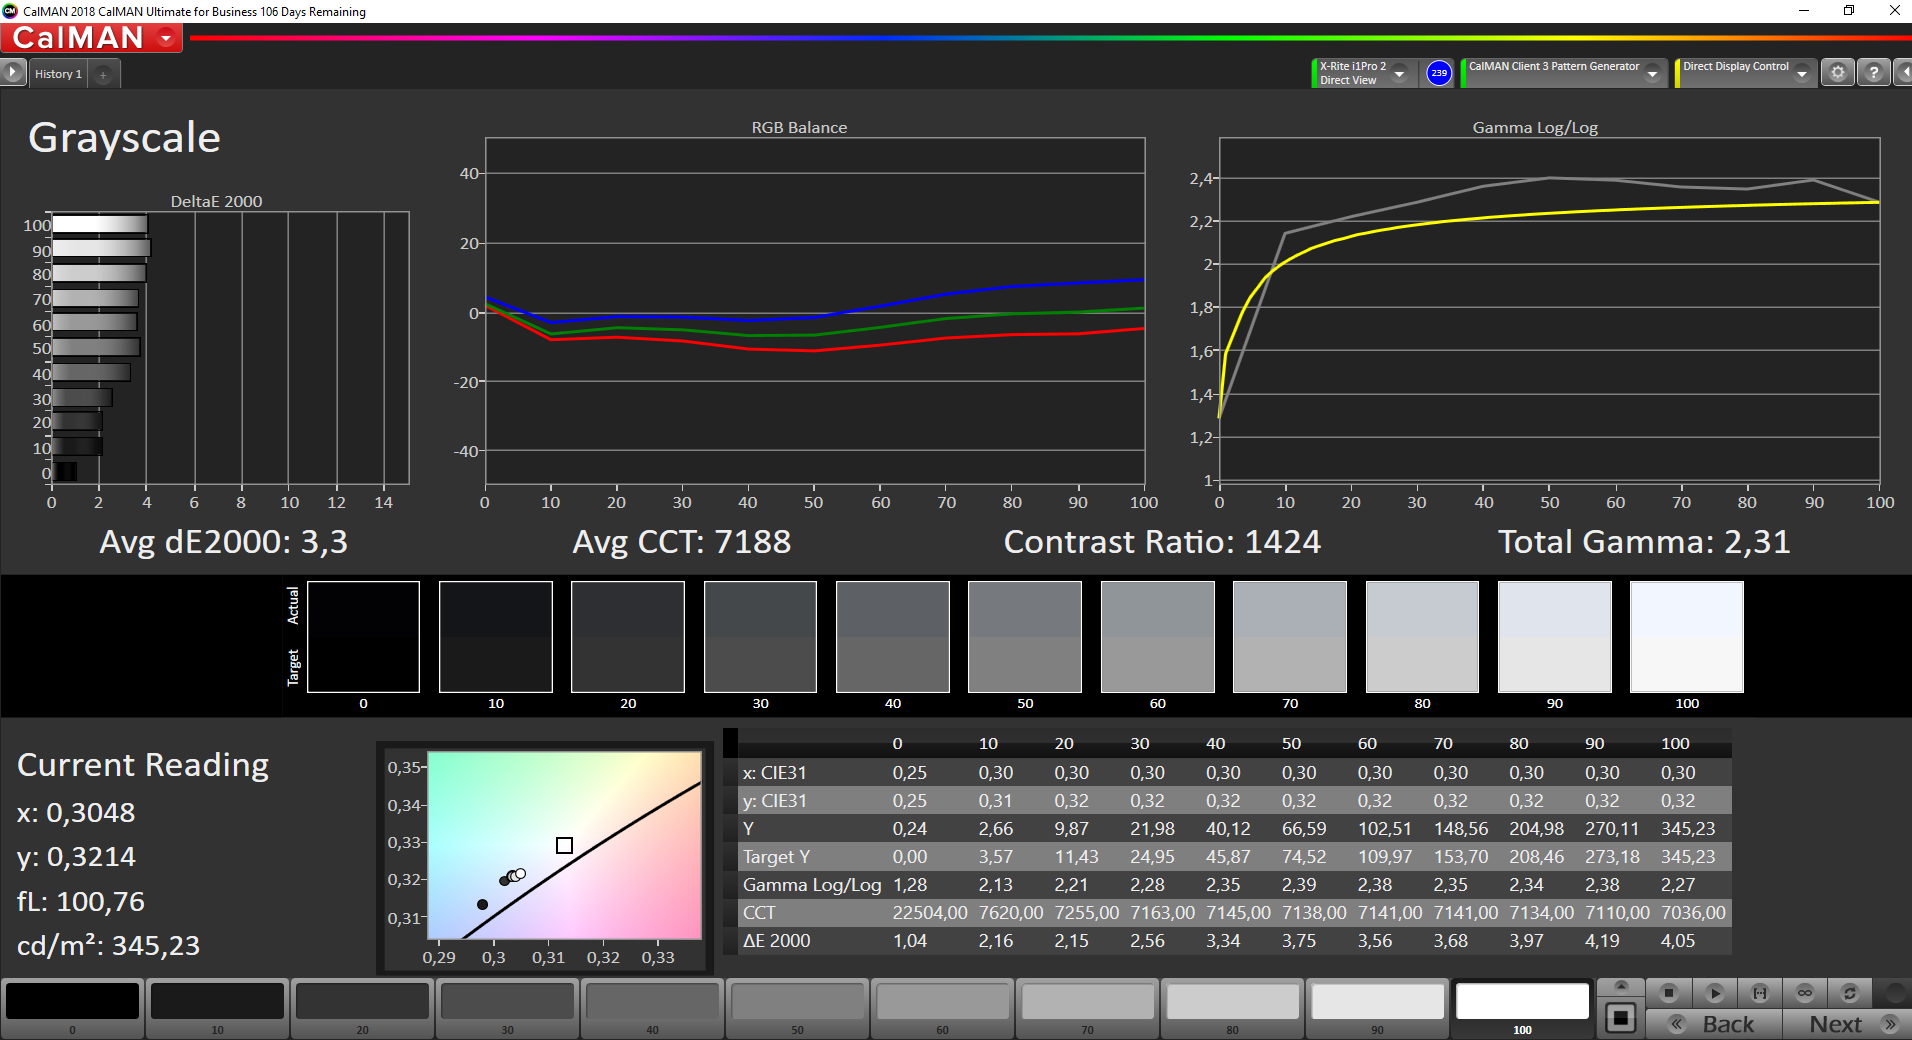
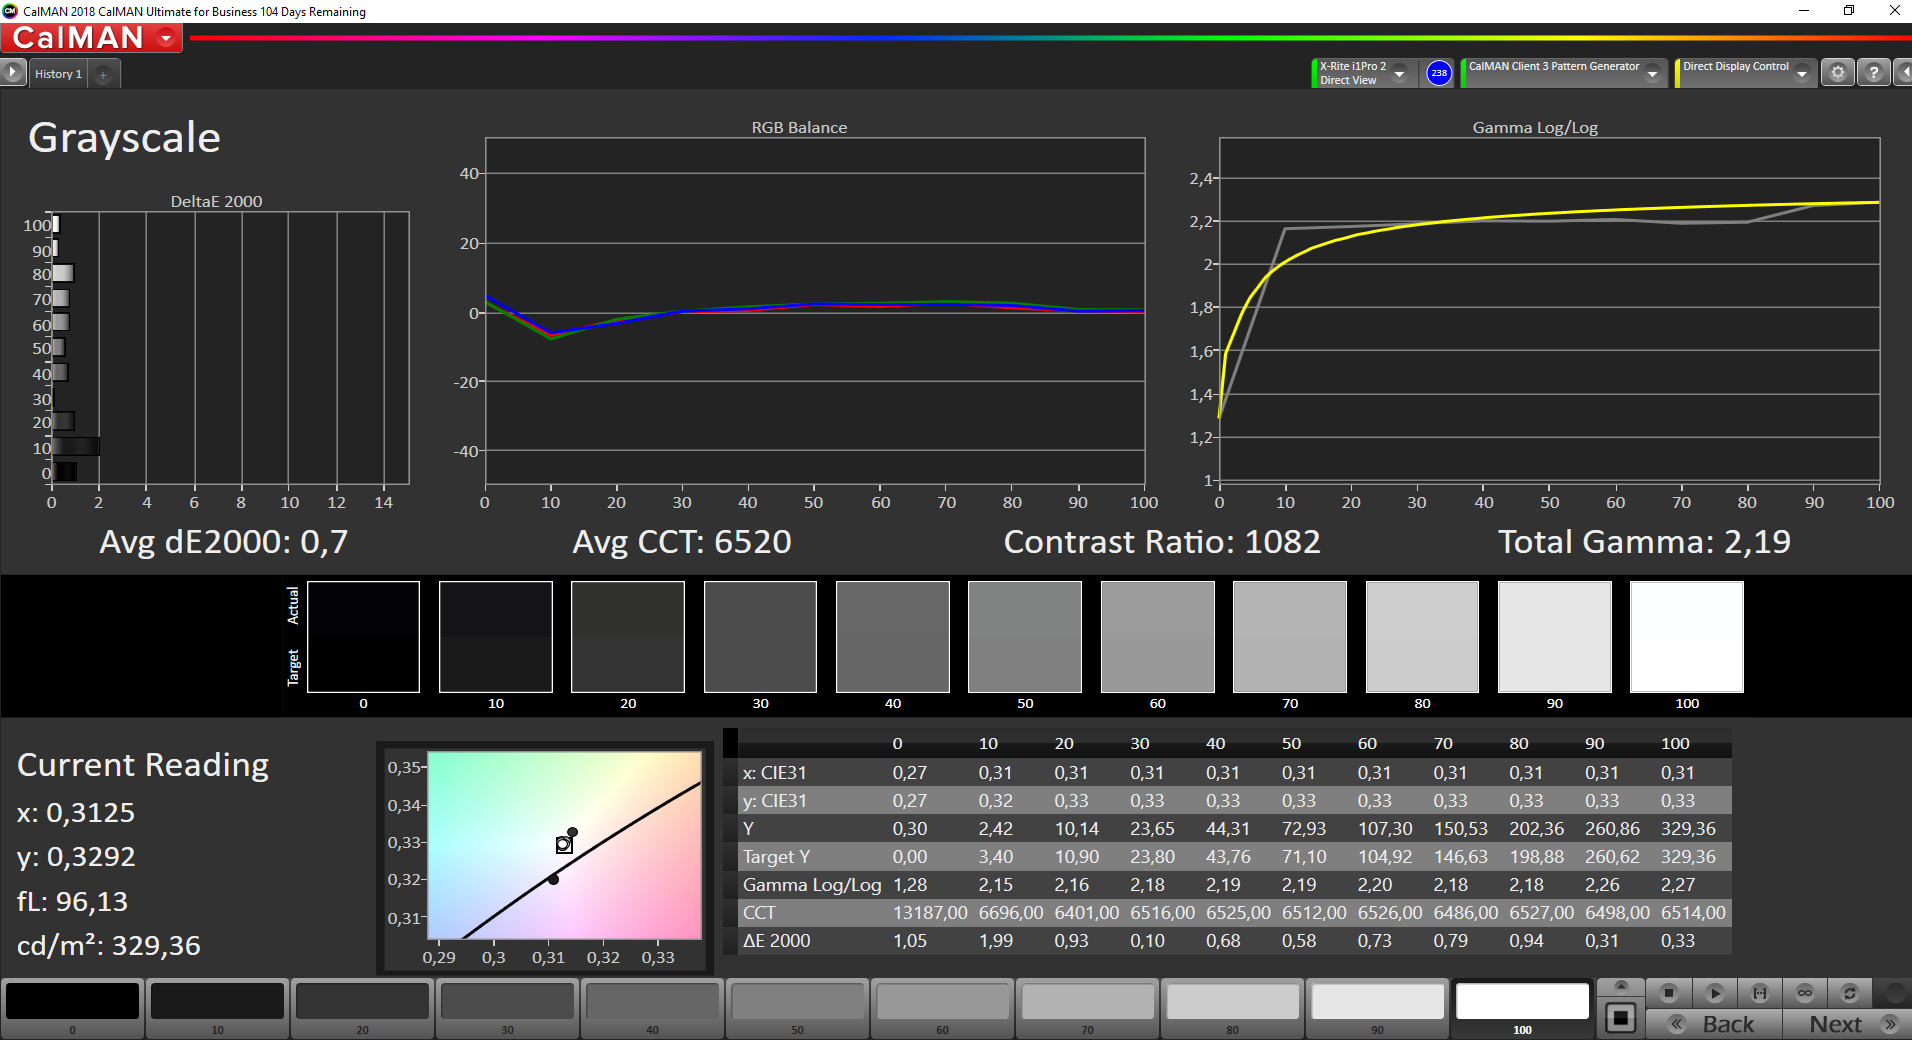
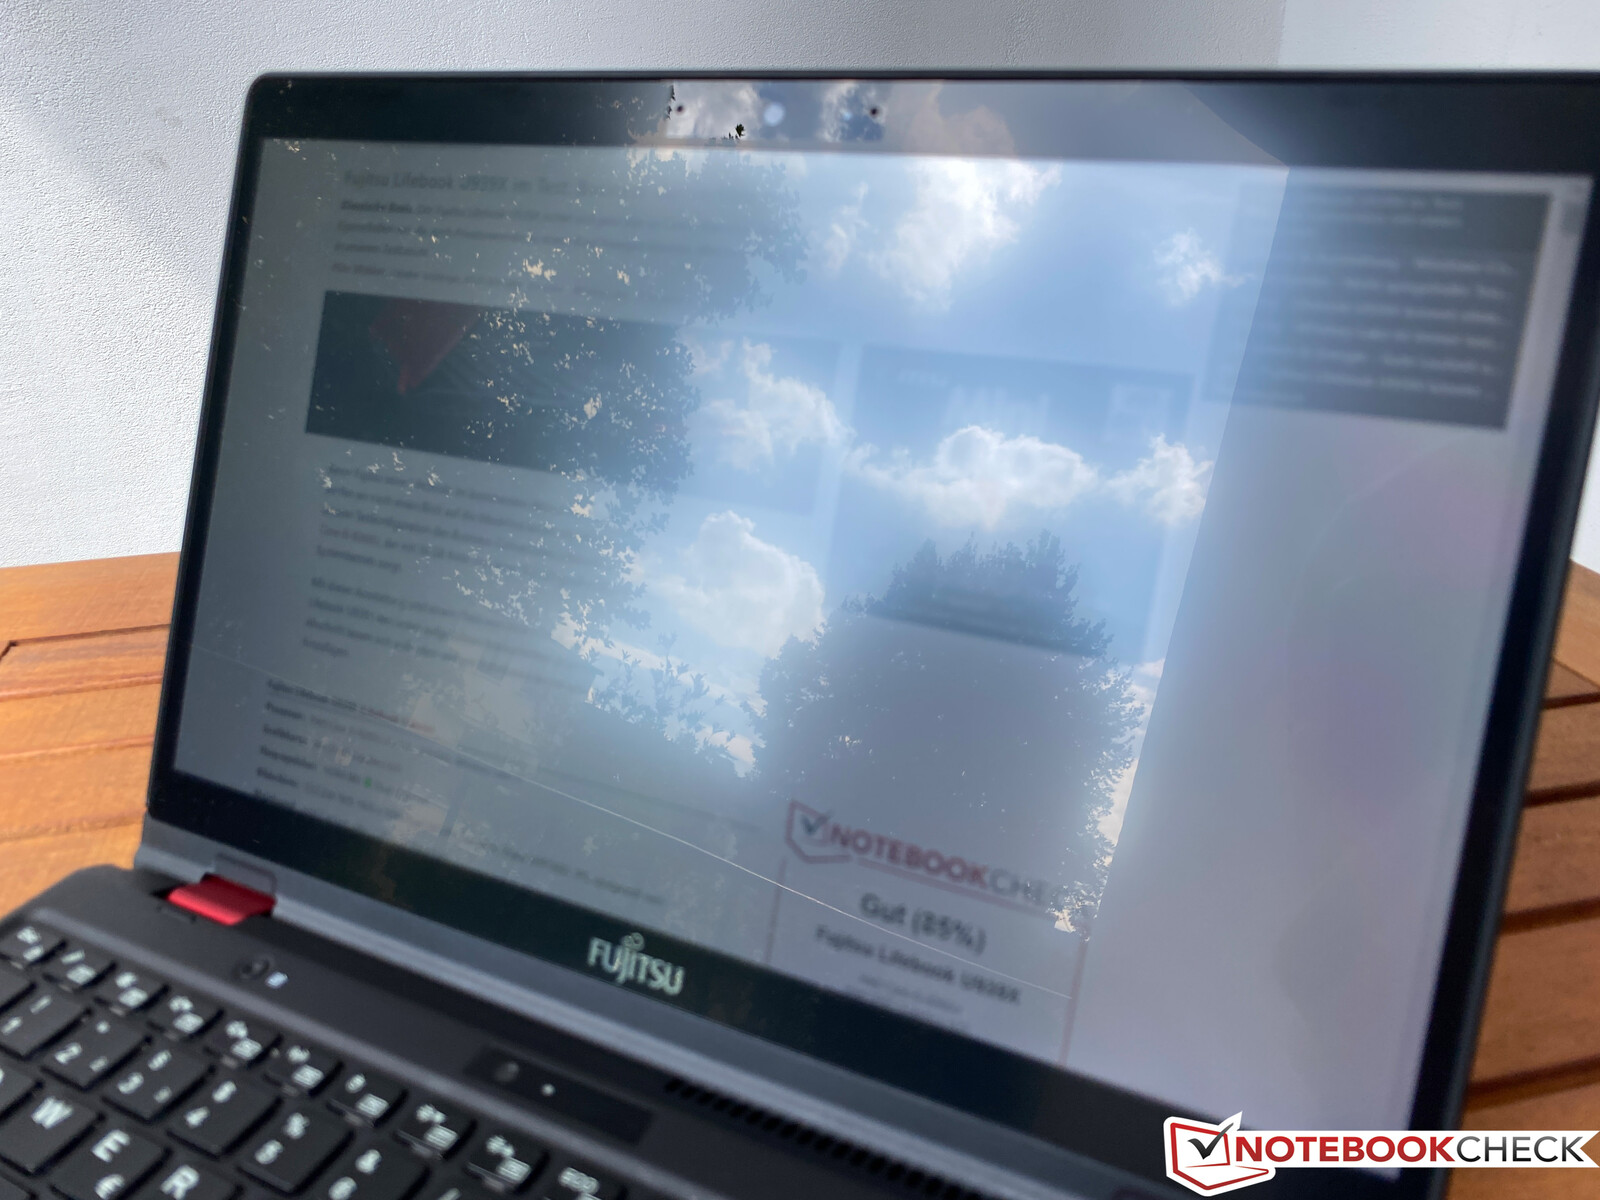
The IPS touchscreen offers an anti-reflective surface, but bright areas look a bit grainy. The resolution is still 1920 x 1080 pixels, but a different panel is used compared to the old Lifebook U939X. The subjective picture impression is decent, but we measure PWM flickering at only 211 Hz from a brightness of 30% or less, which can lead to problems.
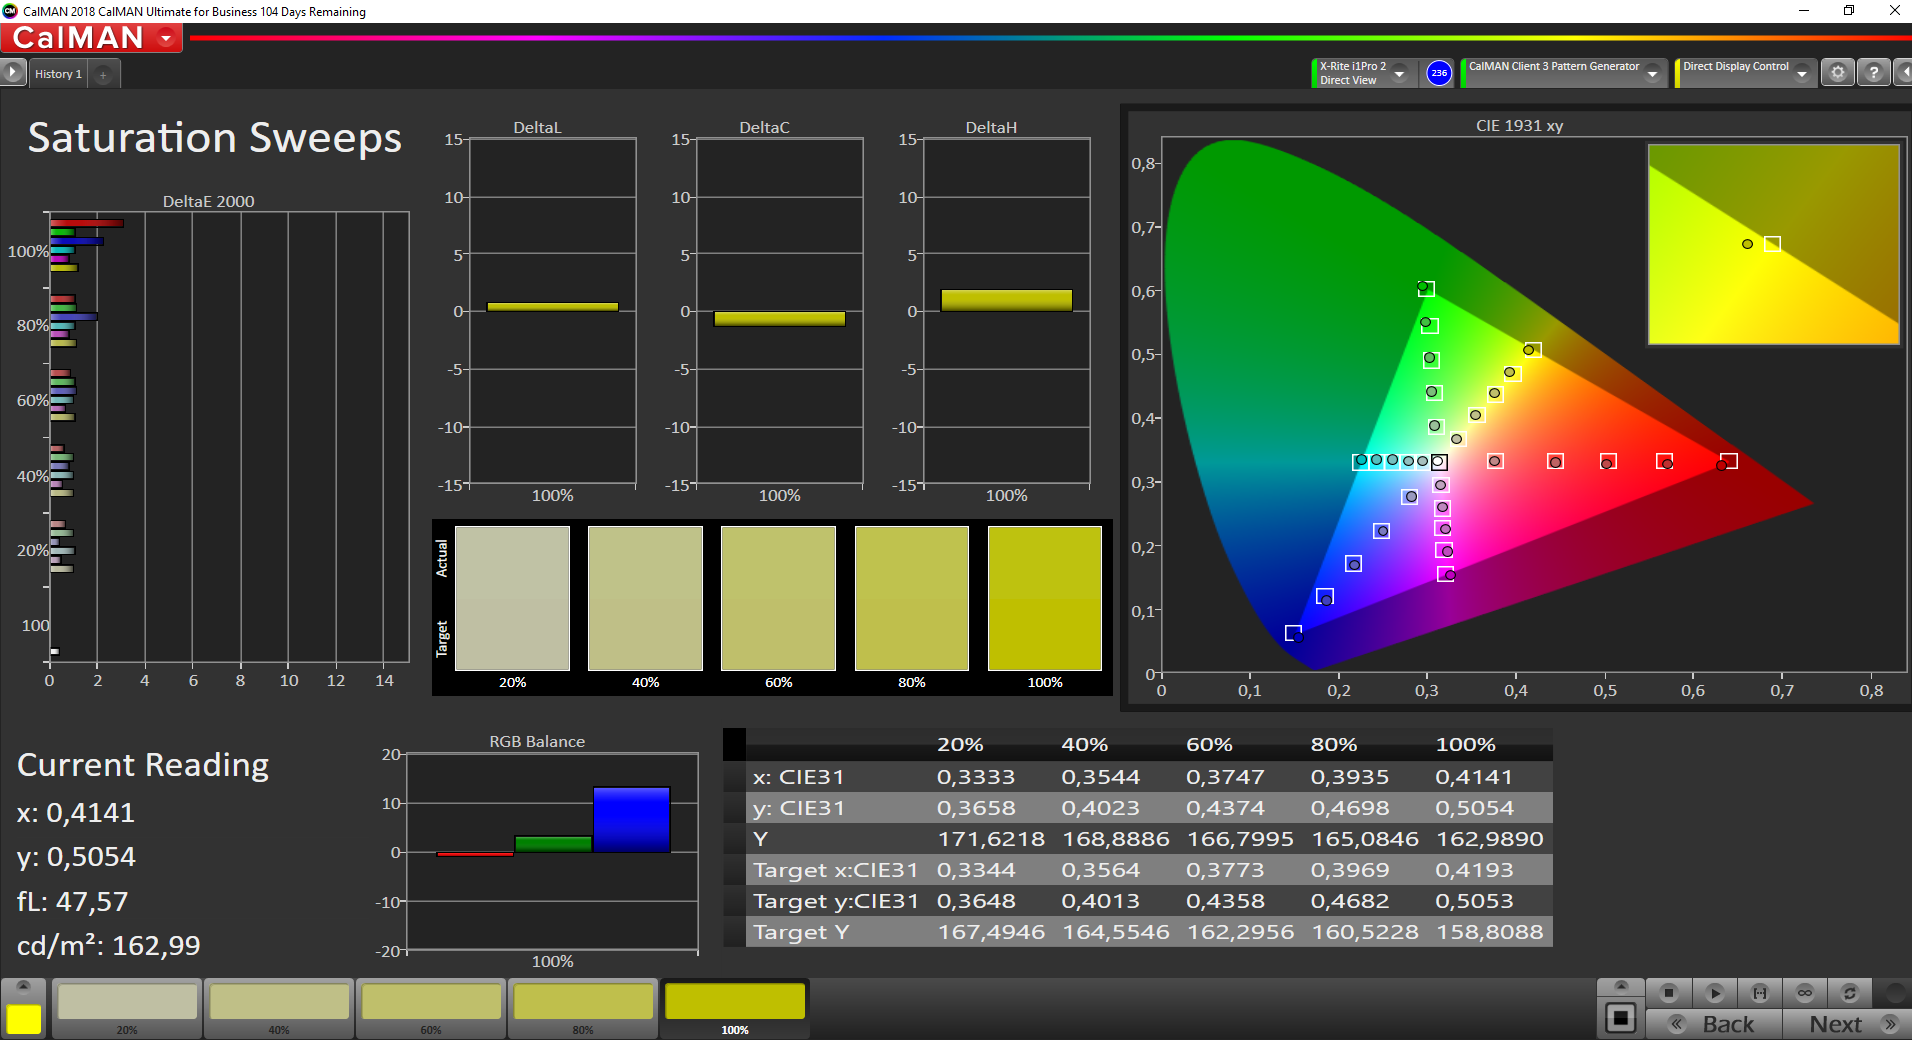
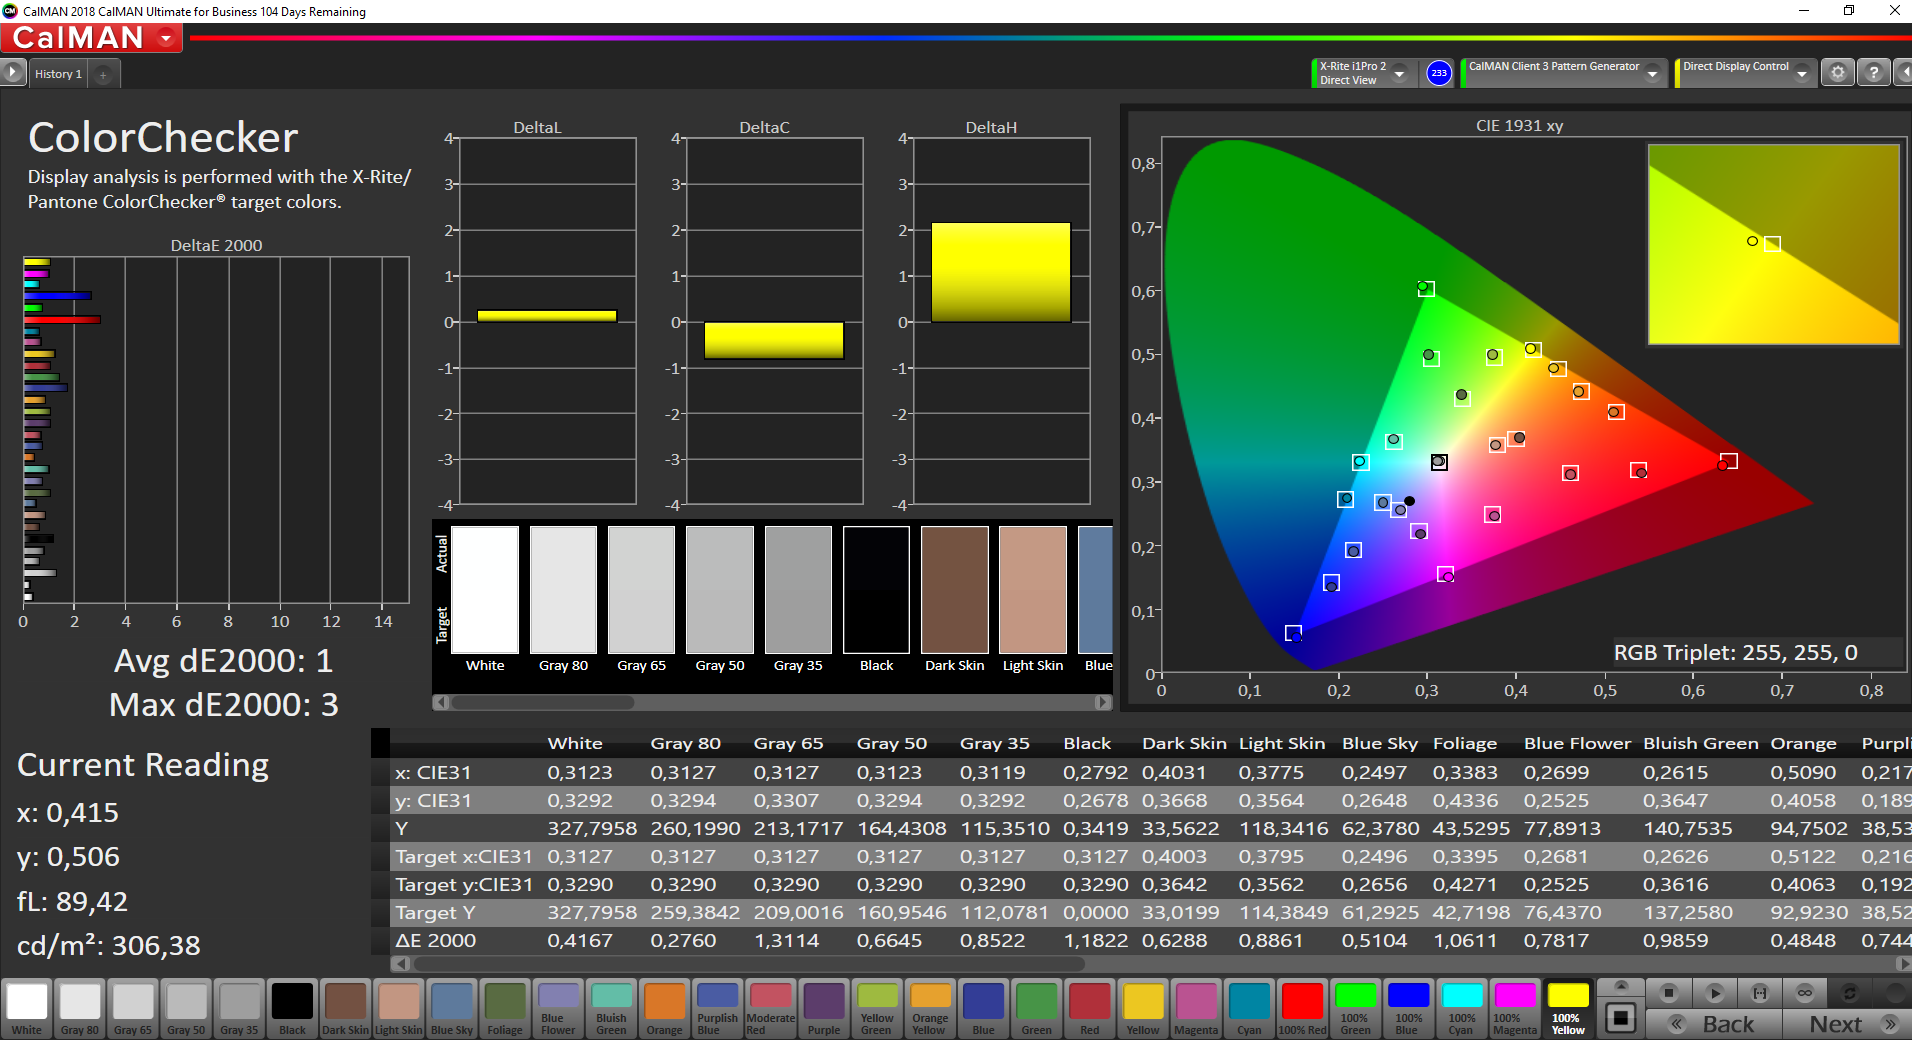
The brightness is more than 300 cd/m² and the contrast ratio (1400:1) does not disappoint either. The sRGB color space is almost completely covered and calibration is already very decent ex-factory. Thus, the U9310X is also suitable for editing pictures. The convertible can be used outdoors, but we would have wished for an even brighter panel. There are no problems with the viewing angle stability.
| |||||||||||||||||||||||||
Brightness Distribution: 86 %
Center on Battery: 344 cd/m²
Contrast: 1438:1 (Black: 0.24 cd/m²)
ΔE ColorChecker Calman: 2.7 | ∀{0.5-29.43 Ø4.72}
calibrated: 1
ΔE Greyscale Calman: 3.3 | ∀{0.09-98 Ø4.97}
96.9% sRGB (Argyll 1.6.3 3D)
62.4% AdobeRGB 1998 (Argyll 1.6.3 3D)
67.4% AdobeRGB 1998 (Argyll 3D)
96.9% sRGB (Argyll 3D)
66.4% Display P3 (Argyll 3D)
Gamma: 2.31
CCT: 7188 K
| Fujitsu LifeBook U9310X LQ133M1JW48, IPS, 1920x1080, 13.3" | HP Elite Dragonfly-8MK79EA AUO5E2D, IPS, 1920x1080, 13.3" | Lenovo ThinkPad X13 Yoga 20SX0004GE N133HCG-GR3, IPS, 1920x1080, 13.3" | Dell XPS 13 7390 2-in-1 Core i7 Sharp LQ134N1, IPS, 1920x1200, 13.4" | Fujitsu Lifebook U939X Sharp SHP14B0, IPS, 1920x1080, 13.3" | |
|---|---|---|---|---|---|
| Display | 4% | 1% | 4% | 0% | |
| Display P3 Coverage (%) | 66.4 | 69 4% | 67.2 1% | 69.9 5% | 66.6 0% |
| sRGB Coverage (%) | 96.9 | 99.4 3% | 98.1 1% | 99.2 2% | 96.9 0% |
| AdobeRGB 1998 Coverage (%) | 67.4 | 70.9 5% | 69 2% | 71.5 6% | 67.9 1% |
| Response Times | 3% | 15% | 20% | 9% | |
| Response Time Grey 50% / Grey 80% * (ms) | 62.4 ? | 60.8 ? 3% | 56 ? 10% | 47.6 ? 24% | 54.4 ? 13% |
| Response Time Black / White * (ms) | 34.4 ? | 33.8 ? 2% | 28 ? 19% | 29.2 ? 15% | 32.8 ? 5% |
| PWM Frequency (Hz) | 211.9 ? | 2500 ? | |||
| Screen | 13% | 15% | 8% | -14% | |
| Brightness middle (cd/m²) | 345 | 411 19% | 401 16% | 549.8 59% | 325 -6% |
| Brightness (cd/m²) | 317 | 388 22% | 383 21% | 520 64% | 310 -2% |
| Brightness Distribution (%) | 86 | 87 1% | 91 6% | 86 0% | 89 3% |
| Black Level * (cd/m²) | 0.24 | 0.22 8% | 0.16 33% | 0.39 -63% | 0.29 -21% |
| Contrast (:1) | 1438 | 1868 30% | 2506 74% | 1410 -2% | 1121 -22% |
| Colorchecker dE 2000 * | 2.7 | 1.8 33% | 2.6 4% | 2.12 21% | 3.2 -19% |
| Colorchecker dE 2000 max. * | 4.2 | 4.1 2% | 4.2 -0% | 3.66 13% | 6.2 -48% |
| Colorchecker dE 2000 calibrated * | 1 | 1 -0% | 0.9 10% | 1.37 -37% | 1.1 -10% |
| Greyscale dE 2000 * | 3.3 | 2.5 24% | 3.3 -0% | 2.6 21% | 4.4 -33% |
| Gamma | 2.31 95% | 2.26 97% | 2.01 109% | 2.3 96% | 2.21 100% |
| CCT | 7188 90% | 6448 101% | 6076 107% | 6884 94% | 7430 87% |
| Color Space (Percent of AdobeRGB 1998) (%) | 62.4 | 64.7 4% | 62.7 0% | 65.4 5% | 62.9 1% |
| Color Space (Percent of sRGB) (%) | 96.9 | 99.3 2% | 98.1 1% | 99.7 3% | 96.6 0% |
| Total Average (Program / Settings) | 7% /
10% | 10% /
12% | 11% /
9% | -2% /
-9% |
* ... smaller is better
Display Response Times
| ↔ Response Time Black to White | ||
|---|---|---|
| 34.4 ms ... rise ↗ and fall ↘ combined | ↗ 18 ms rise | 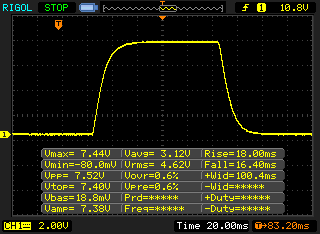 |
| ↘ 16.4 ms fall | ||
| The screen shows slow response rates in our tests and will be unsatisfactory for gamers. In comparison, all tested devices range from 0.1 (minimum) to 240 (maximum) ms. » 92 % of all devices are better. This means that the measured response time is worse than the average of all tested devices (19.8 ms). | ||
| ↔ Response Time 50% Grey to 80% Grey | ||
| 62.4 ms ... rise ↗ and fall ↘ combined | ↗ 25.6 ms rise | 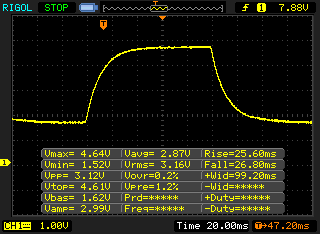 |
| ↘ 26.8 ms fall | ||
| The screen shows slow response rates in our tests and will be unsatisfactory for gamers. In comparison, all tested devices range from 0.165 (minimum) to 636 (maximum) ms. » 97 % of all devices are better. This means that the measured response time is worse than the average of all tested devices (31 ms). | ||
Screen Flickering / PWM (Pulse-Width Modulation)
| Screen flickering / PWM detected | 211.9 Hz | ≤ 30 % brightness setting | 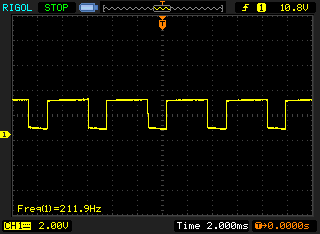 |
The display backlight flickers at 211.9 Hz (worst case, e.g., utilizing PWM) Flickering detected at a brightness setting of 30 % and below. There should be no flickering or PWM above this brightness setting. The frequency of 211.9 Hz is relatively low, so sensitive users will likely notice flickering and experience eyestrain at the stated brightness setting and below. In comparison: 52 % of all tested devices do not use PWM to dim the display. If PWM was detected, an average of 7747 (minimum: 5 - maximum: 343500) Hz was measured. | |||
Performance, emissions and battery life
The Core i5-10210U (4 cores/8 threads) is run with 18/30 watts, which leads to average results within the comparison group. You have to reckon with a performance reduction of about 15% during longer load. On the other hand, the performance drops by about 40% in battery mode.
Thanks to the fast PCIe-SSD, the general system performance is very good, which is also supported by the PCMark 10 results. The integrated UHD Graphics 620 is well-suited for everyday office use and can also easily handle high-resolution video playback. However, the performance is also significantly reduced here on battery power (-60%). The performance yield is good thanks to the dual-channel working memory, but the overall performance is still too low for gaming.
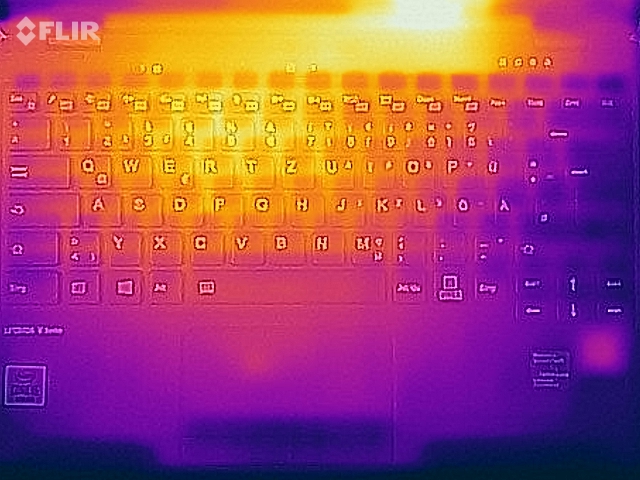
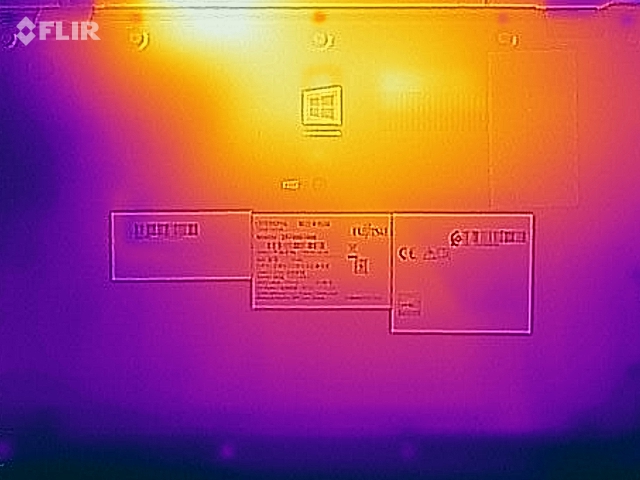
The single fan remains very quiet in everyday use and is only noticeable with a quiet noise even under load. The surface temperatures are still harmless under load and the convertible also stays very cool during everyday tasks
The battery life is very good. You can expect at least 3 hours under load, and it is even 11.5 hours in our WLAN test with 150 cd/m². Even at maximum screen brightness, a bit more than 8 hours are still possible in the WLAN test.
Cinebench R15 Loop
Cinebench R15: CPU Single 64Bit | CPU Multi 64Bit
Blender: v2.79 BMW27 CPU
7-Zip 18.03: 7z b 4 -mmt1 | 7z b 4
Geekbench 5.5: Single-Core | Multi-Core
HWBOT x265 Benchmark v2.2: 4k Preset
LibreOffice : 20 Documents To PDF
R Benchmark 2.5: Overall mean
| Cinebench R20 / CPU (Single Core) | |
| Average of class Convertible (273 - 834, n=49, last 2 years) | |
| Dell XPS 13 7390 2-in-1 Core i7 | |
| Fujitsu LifeBook U9310X | |
| Lenovo ThinkPad X13 Yoga 20SX0004GE | |
| Average Intel Core i5-10210U (322 - 428, n=30) | |
| Fujitsu Lifebook U939X | |
| HP Elite Dragonfly-8MK79EA | |
| Cinebench R20 / CPU (Multi Core) | |
| Average of class Convertible (595 - 12102, n=49, last 2 years) | |
| Dell XPS 13 7390 2-in-1 Core i7 | |
| Fujitsu LifeBook U9310X | |
| Average Intel Core i5-10210U (722 - 1820, n=30) | |
| Lenovo ThinkPad X13 Yoga 20SX0004GE | |
| Fujitsu Lifebook U939X | |
| HP Elite Dragonfly-8MK79EA | |
| Cinebench R15 / CPU Single 64Bit | |
| Average of class Convertible (149.8 - 317, n=48, last 2 years) | |
| Dell XPS 13 7390 2-in-1 Core i7 | |
| Lenovo ThinkPad X13 Yoga 20SX0004GE | |
| Average Intel Core i5-10210U (134 - 174, n=35) | |
| Fujitsu LifeBook U9310X | |
| Fujitsu Lifebook U939X | |
| HP Elite Dragonfly-8MK79EA | |
| Cinebench R15 / CPU Multi 64Bit | |
| Average of class Convertible (478 - 4940, n=48, last 2 years) | |
| Dell XPS 13 7390 2-in-1 Core i7 | |
| Fujitsu LifeBook U9310X | |
| Average Intel Core i5-10210U (320 - 790, n=35) | |
| Fujitsu Lifebook U939X | |
| Lenovo ThinkPad X13 Yoga 20SX0004GE | |
| HP Elite Dragonfly-8MK79EA | |
| Blender / v2.79 BMW27 CPU | |
| HP Elite Dragonfly-8MK79EA | |
| Fujitsu Lifebook U939X | |
| Fujitsu LifeBook U9310X | |
| Average Intel Core i5-10210U (585 - 1339, n=24) | |
| Lenovo ThinkPad X13 Yoga 20SX0004GE | |
| Dell XPS 13 7390 2-in-1 Core i7 | |
| Average of class Convertible (105 - 1051, n=48, last 2 years) | |
| 7-Zip 18.03 / 7z b 4 -mmt1 | |
| Average of class Convertible (3672 - 6655, n=48, last 2 years) | |
| Lenovo ThinkPad X13 Yoga 20SX0004GE | |
| Dell XPS 13 7390 2-in-1 Core i7 | |
| Average Intel Core i5-10210U (3504 - 4467, n=24) | |
| Fujitsu LifeBook U9310X | |
| Fujitsu Lifebook U939X | |
| HP Elite Dragonfly-8MK79EA | |
| 7-Zip 18.03 / 7z b 4 | |
| Average of class Convertible (12977 - 121368, n=48, last 2 years) | |
| Dell XPS 13 7390 2-in-1 Core i7 | |
| Average Intel Core i5-10210U (10920 - 21679, n=24) | |
| Lenovo ThinkPad X13 Yoga 20SX0004GE | |
| Fujitsu LifeBook U9310X | |
| Fujitsu Lifebook U939X | |
| HP Elite Dragonfly-8MK79EA | |
| Geekbench 5.5 / Single-Core | |
| Average of class Convertible (806 - 2275, n=49, last 2 years) | |
| Lenovo ThinkPad X13 Yoga 20SX0004GE | |
| Fujitsu LifeBook U9310X | |
| Average Intel Core i5-10210U (949 - 1133, n=27) | |
| Fujitsu Lifebook U939X | |
| Geekbench 5.5 / Multi-Core | |
| Average of class Convertible (1608 - 22023, n=49, last 2 years) | |
| Fujitsu LifeBook U9310X | |
| Fujitsu Lifebook U939X | |
| Lenovo ThinkPad X13 Yoga 20SX0004GE | |
| Average Intel Core i5-10210U (2079 - 4256, n=27) | |
| HWBOT x265 Benchmark v2.2 / 4k Preset | |
| Average of class Convertible (3.43 - 36.2, n=48, last 2 years) | |
| Dell XPS 13 7390 2-in-1 Core i7 | |
| Lenovo ThinkPad X13 Yoga 20SX0004GE | |
| Average Intel Core i5-10210U (2.36 - 6.28, n=24) | |
| Fujitsu LifeBook U9310X | |
| Fujitsu Lifebook U939X | |
| HP Elite Dragonfly-8MK79EA | |
| LibreOffice / 20 Documents To PDF | |
| Average Intel Core i5-10210U (49.6 - 80.3, n=18) | |
| Fujitsu Lifebook U939X | |
| Lenovo ThinkPad X13 Yoga 20SX0004GE | |
| Fujitsu LifeBook U9310X | |
| Average of class Convertible (42.5 - 84.3, n=48, last 2 years) | |
| R Benchmark 2.5 / Overall mean | |
| Fujitsu Lifebook U939X | |
| Average Intel Core i5-10210U (0.658 - 0.901, n=24) | |
| Fujitsu LifeBook U9310X | |
| Lenovo ThinkPad X13 Yoga 20SX0004GE | |
| Average of class Convertible (0.3915 - 0.84, n=48, last 2 years) | |
* ... smaller is better
| DPC Latencies / LatencyMon - interrupt to process latency (max), Web, Youtube, Prime95 | |
| Fujitsu LifeBook U9310X | |
| Lenovo ThinkPad X13 Yoga 20SX0004GE | |
| Fujitsu Lifebook U939X | |
* ... smaller is better
| Fujitsu LifeBook U9310X Toshiba KBG40ZNS512G NVMe | HP Elite Dragonfly-8MK79EA Intel Optane Memory H10 with Solid State Storage 32GB + 512GB HBRPEKNX0202A(L/H) | Lenovo ThinkPad X13 Yoga 20SX0004GE Samsung SSD PM981a MZVLB512HBJQ | Dell XPS 13 7390 2-in-1 Core i7 Toshiba BG4 KBG40ZPZ512G | Fujitsu Lifebook U939X Samsung SSD PM981 MZVLB512HAJQ | Average Toshiba KBG40ZNS512G NVMe | Average of class Convertible | |
|---|---|---|---|---|---|---|---|
| CrystalDiskMark 5.2 / 6 | -3% | 10% | 1% | 17% | -3% | 89% | |
| Write 4K (MB/s) | 134.2 | 88 -34% | 134.5 0% | 106.7 -20% | 158.5 18% | 126.4 ? -6% | 144.6 ? 8% |
| Read 4K (MB/s) | 53.4 | 132.1 147% | 61.2 15% | 49.94 -6% | 47.62 -11% | 50 ? -6% | 67.2 ? 26% |
| Write Seq (MB/s) | 1216 | 503 -59% | 931 -23% | 1223 1% | 1573 29% | 1207 ? -1% | 2553 ? 110% |
| Read Seq (MB/s) | 1291 | 1306 1% | 2534 96% | 1801 40% | 1411 9% | 1567 ? 21% | 2965 ? 130% |
| Write 4K Q32T1 (MB/s) | 401.5 | 237.3 -41% | 375.9 -6% | 325.3 -19% | 366.1 -9% | 347 ? -14% | 452 ? 13% |
| Read 4K Q32T1 (MB/s) | 491.4 | 287.4 -42% | 343.7 -30% | 551 12% | 451.9 -8% | 425 ? -14% | 582 ? 18% |
| Write Seq Q32T1 (MB/s) | 1224 | 1242 1% | 934 -24% | 1224 0% | 1985 62% | 1224 ? 0% | 4383 ? 258% |
| Read Seq Q32T1 (MB/s) | 2314 | 2480 7% | 3548 53% | 2350 2% | 3451 49% | 2278 ? -2% | 5831 ? 152% |
| low | med. | high | ultra | |
|---|---|---|---|---|
| The Witcher 3 (2015) | 17 | |||
| Dota 2 Reborn (2015) | 77.1 | 48.1 | 21 | 17.6 |
| X-Plane 11.11 (2018) | 12.3 | 11.1 | 11.6 |
Noise emissions
Noise level
| Idle |
| 29.4 / 29.4 / 30.7 dB(A) |
| Load |
| 32.6 / 33.7 dB(A) |
 | ||
30 dB silent 40 dB(A) audible 50 dB(A) loud |
||
min: | ||
| Fujitsu LifeBook U9310X UHD Graphics 620, i5-10210U, Toshiba KBG40ZNS512G NVMe | HP Elite Dragonfly-8MK79EA UHD Graphics 620, i5-8265U, Intel Optane Memory H10 with Solid State Storage 32GB + 512GB HBRPEKNX0202A(L/H) | Lenovo ThinkPad X13 Yoga 20SX0004GE UHD Graphics 620, i7-10510U, Samsung SSD PM981a MZVLB512HBJQ | Dell XPS 13 7390 2-in-1 Core i7 Iris Plus Graphics G7 (Ice Lake 64 EU), i7-1065G7, Toshiba BG4 KBG40ZPZ512G | Fujitsu Lifebook U939X UHD Graphics 620, i5-8265U, Samsung SSD PM981 MZVLB512HAJQ | |
|---|---|---|---|---|---|
| Noise | 1% | -1% | -1% | -2% | |
| off / environment * (dB) | 29.4 | 29.5 -0% | 29.3 -0% | 28.1 4% | 29.8 -1% |
| Idle Minimum * (dB) | 29.4 | 29.5 -0% | 29.3 -0% | 28.1 4% | 29.8 -1% |
| Idle Average * (dB) | 29.4 | 30 -2% | 29.3 -0% | 28.1 4% | 29.8 -1% |
| Idle Maximum * (dB) | 30.7 | 30.3 1% | 31.4 -2% | 28.1 8% | 29.8 3% |
| Load Average * (dB) | 32.6 | 31.6 3% | 33 -1% | 31.7 3% | 33.5 -3% |
| Load Maximum * (dB) | 33.7 | 31.6 6% | 34.9 -4% | 43.4 -29% | 36.3 -8% |
| Witcher 3 ultra * (dB) | 43.4 |
* ... smaller is better
Temperature
(±) The maximum temperature on the upper side is 42.6 °C / 109 F, compared to the average of 35.4 °C / 96 F, ranging from 19.6 to 60 °C for the class Convertible.
(-) The bottom heats up to a maximum of 45.7 °C / 114 F, compared to the average of 36.9 °C / 98 F
(+) In idle usage, the average temperature for the upper side is 23.5 °C / 74 F, compared to the device average of 30.3 °C / 87 F.
(+) The palmrests and touchpad are cooler than skin temperature with a maximum of 28 °C / 82.4 F and are therefore cool to the touch.
(±) The average temperature of the palmrest area of similar devices was 28 °C / 82.4 F (0 °C / 0 F).
Speakers
Fujitsu LifeBook U9310X audio analysis
(±) | speaker loudness is average but good (74.6 dB)
Bass 100 - 315 Hz
(-) | nearly no bass - on average 15.4% lower than median
(±) | linearity of bass is average (11.9% delta to prev. frequency)
Mids 400 - 2000 Hz
(±) | higher mids - on average 11.1% higher than median
(±) | linearity of mids is average (12.5% delta to prev. frequency)
Highs 2 - 16 kHz
(±) | higher highs - on average 8.7% higher than median
(±) | linearity of highs is average (10.1% delta to prev. frequency)
Overall 100 - 16.000 Hz
(-) | overall sound is not linear (39.7% difference to median)
Compared to same class
» 97% of all tested devices in this class were better, 1% similar, 2% worse
» The best had a delta of 6%, average was 20%, worst was 57%
Compared to all devices tested
» 95% of all tested devices were better, 0% similar, 5% worse
» The best had a delta of 4%, average was 23%, worst was 134%
Lenovo ThinkPad X13 Yoga 20SX0004GE audio analysis
(±) | speaker loudness is average but good (76.4 dB)
Bass 100 - 315 Hz
(-) | nearly no bass - on average 17.7% lower than median
(±) | linearity of bass is average (14.9% delta to prev. frequency)
Mids 400 - 2000 Hz
(±) | higher mids - on average 7.8% higher than median
(+) | mids are linear (3.9% delta to prev. frequency)
Highs 2 - 16 kHz
(±) | reduced highs - on average 6.6% lower than median
(±) | linearity of highs is average (7.6% delta to prev. frequency)
Overall 100 - 16.000 Hz
(±) | linearity of overall sound is average (28.8% difference to median)
Compared to same class
» 89% of all tested devices in this class were better, 2% similar, 8% worse
» The best had a delta of 7%, average was 21%, worst was 53%
Compared to all devices tested
» 86% of all tested devices were better, 3% similar, 11% worse
» The best had a delta of 4%, average was 23%, worst was 134%
Energy absorption
| Off / Standby | |
| Idle | |
| Load |
|
Key:
min: | |
Battery life
Pros
Cons
Verdict - Lifebook U9310X remains an extremely mobile convertible with many ports
Fujitsu only slightly updates its business convertible with the Lifebook UX9310X, because there are no changes apart from a Wi-Fi 6 module and the Comet Lake processor. The great strength remains the sturdy and light magnesium case as well as the numerous ports and security features. You do not have to rely on adapters here. In addition, the convertible is versatile with its matte touchscreen, and you are always connected to the Internet thanks to integrated LTE. The battery life is also good.
The power yield is not overwhelming, but it is perfectly sufficient for many common office applications. The performance (especially iGPU) is only reduced significantly in battery mode. At the same time, temperatures and fan noise remain within limits
The Fujitsu Lifebook U9310X convinces with its mobility including built-in LTE and extensive connectivity. However, we would like to see improved input devices and a 16:10 touchscreen for the next update.
The weak points are still the input devices. They are not bad, but other business convertibles clearly have an advantage here. Fujitsu should definitely keep the matte touchscreen, but a change to a 16:10 panel would be desirable. We also expect a change to Intel's Tiger-Lake CPUs or perhaps even AMD's Ryzen CPUs for the next model, although AMD is hardly represented in business convertibles so far (which is true for almost all manufacturers).
Price and availability
The tested model is currently available at Cyberport, among others, for just under 1,800 Euros. Alternatively, a cheaper configuration without LTE is also available for around 1,400 Euros.
Fujitsu LifeBook U9310X
- 01/09/2021 v7 (old)
Andreas Osthoff
Price comparison

