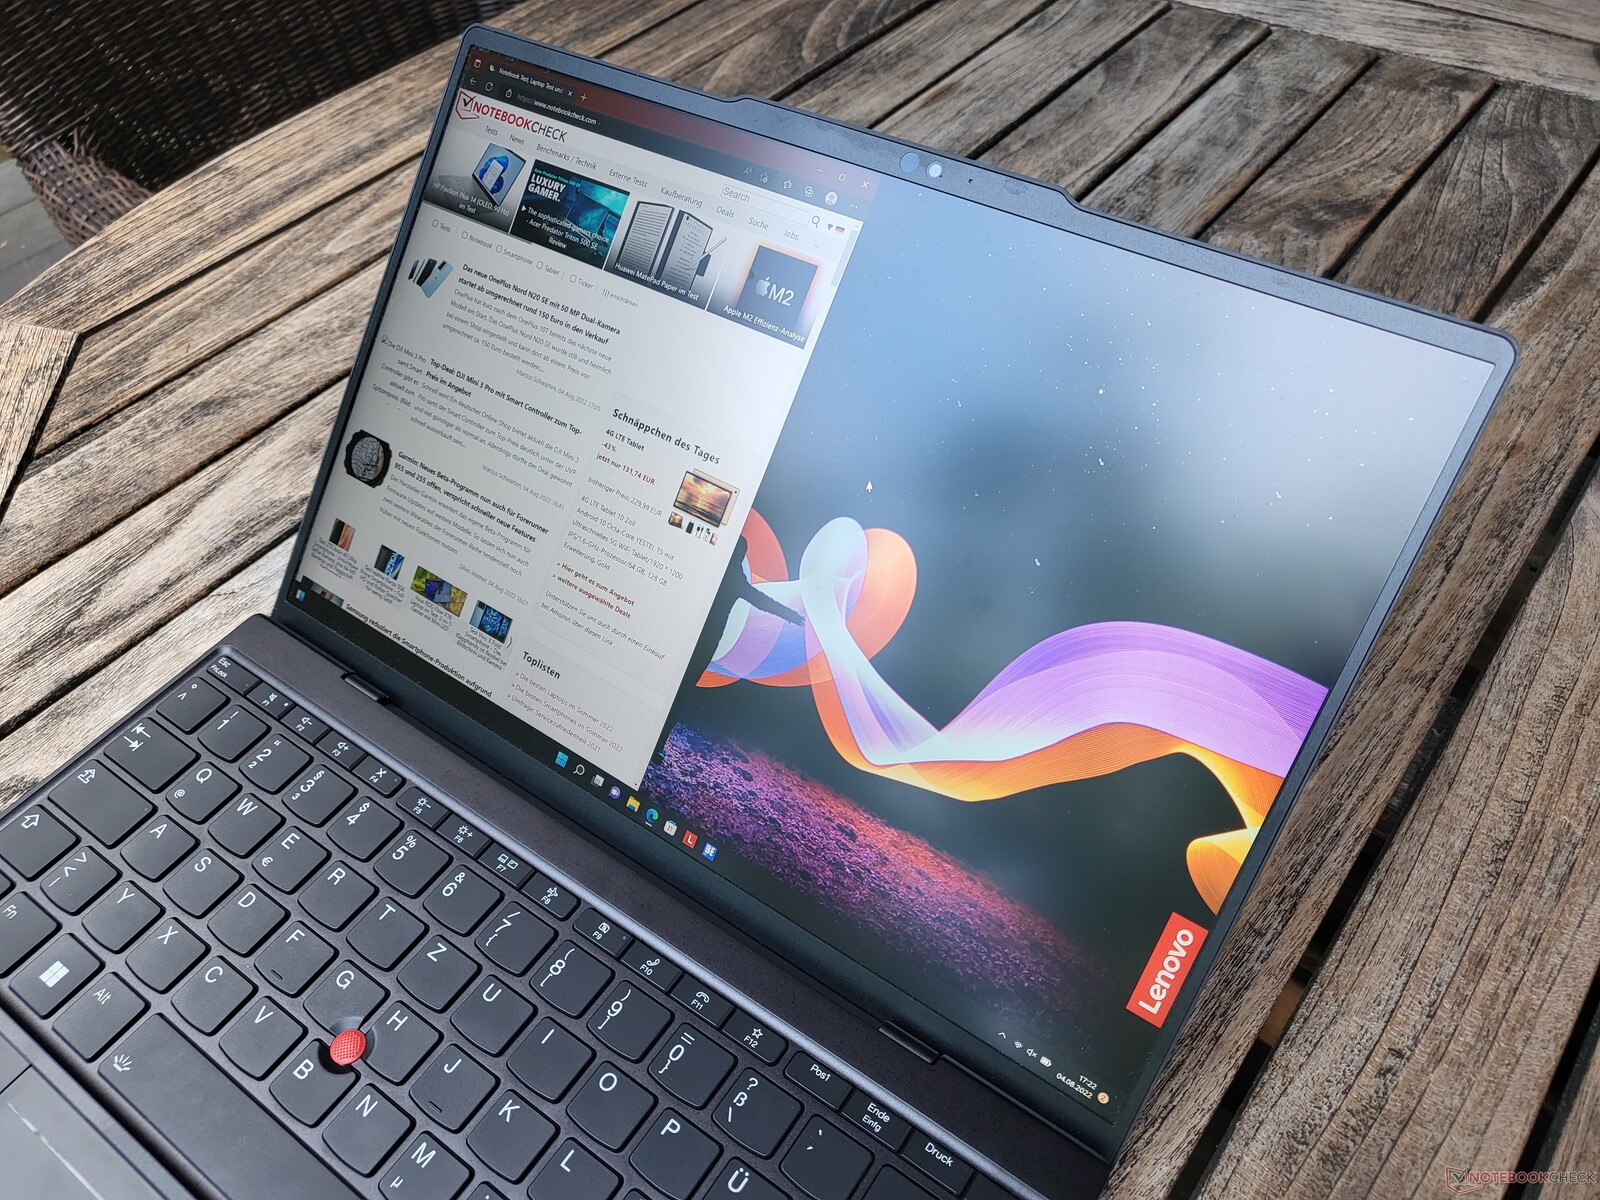
Lenovo ThinkPad Z13 laptop review: AMD's premium ThinkPad with long battery life

It's not every day that PC manufacturers want to establish a new brand in the premium segment. However, Lenovo has taken this path with the ThinkPad Z series: Alongside the already existing ThinkPad X1 series, Lenovo has introduced the ThinkPad Z13 and the ThinkPad Z16 to the market, which are to compete in the high-end segment in terms of price and quality. In order to differentiate its two premium series for business customers, Lenovo has focused exclusively on AMD processors for the Z series as well as on a new design that is supposed to reach other, younger customer tiers.
According to its name, today's review unit, the compact Lenovo ThinkPad Z13, targets the 13-inch segment, making it a competitor to the Dell XPS 13 Plus and the Apple MacBook Air.
Possible contenders in comparison
Rating | Date | Model | Weight | Height | Size | Resolution | Price |
|---|---|---|---|---|---|---|---|
| 90.5 % v7 (old) | 08 / 2022 | Lenovo ThinkPad Z13 21D2CTO1WW R5 PRO 6650U, Radeon 660M | 1.2 kg | 13.99 mm | 13.30" | 1920x1200 | |
| 86.9 % v7 (old) | 07 / 2022 | Dell XPS 13 Plus 9320 4K i7-1260P, Iris Xe G7 96EUs | 1.2 kg | 15.3 mm | 13.40" | 3840x2400 | |
| 90.2 % v7 (old) | 06 / 2022 | Lenovo ThinkPad X1 Carbon G10 21CC001RGE i5-1250P, Iris Xe G7 80EUs | 1.2 kg | 15.36 mm | 14.00" | 1920x1200 | |
| 92.3 % v7 (old) | 07 / 2022 | Apple MacBook Air M2 Entry M2, M2 8-Core GPU | 1.2 kg | 11.3 mm | 13.60" | 2560x1664 | |
| 89.8 % v7 (old) | 02 / 2021 | Lenovo ThinkPad X1 Nano-20UN002UGE i7-1160G7, Iris Xe G7 96EUs | 946 g | 16 mm | 13.00" | 2160x1350 |
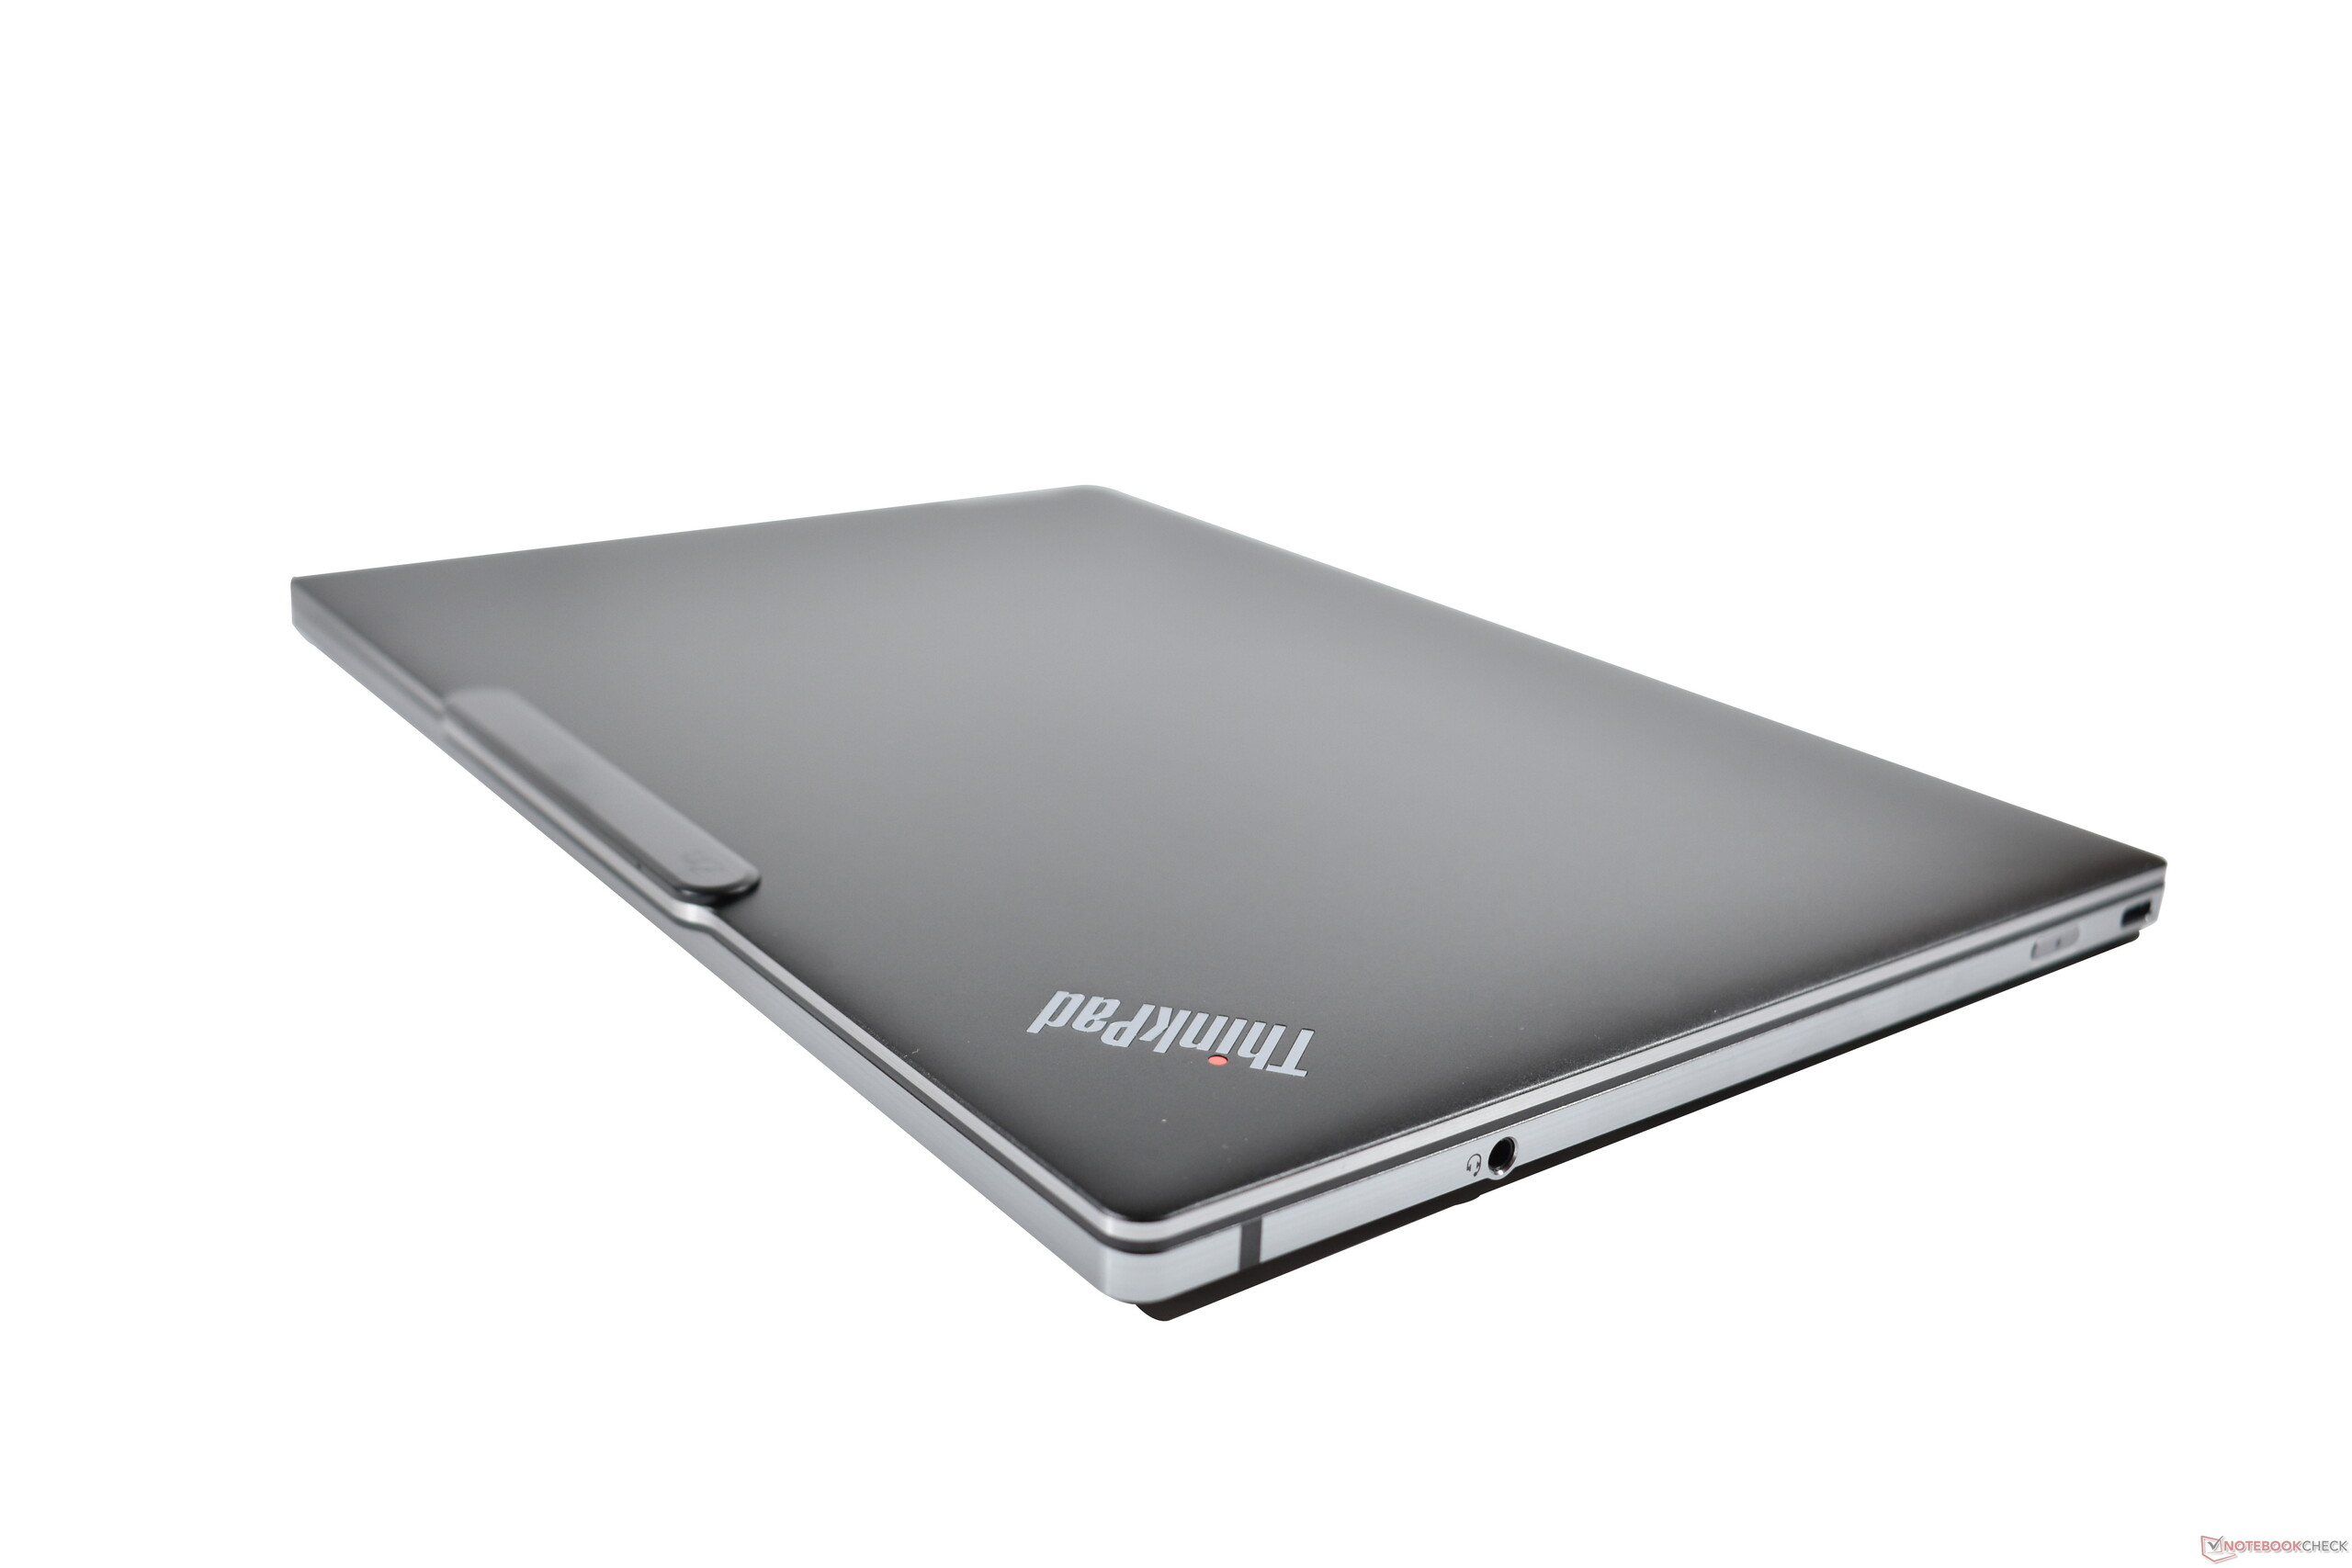
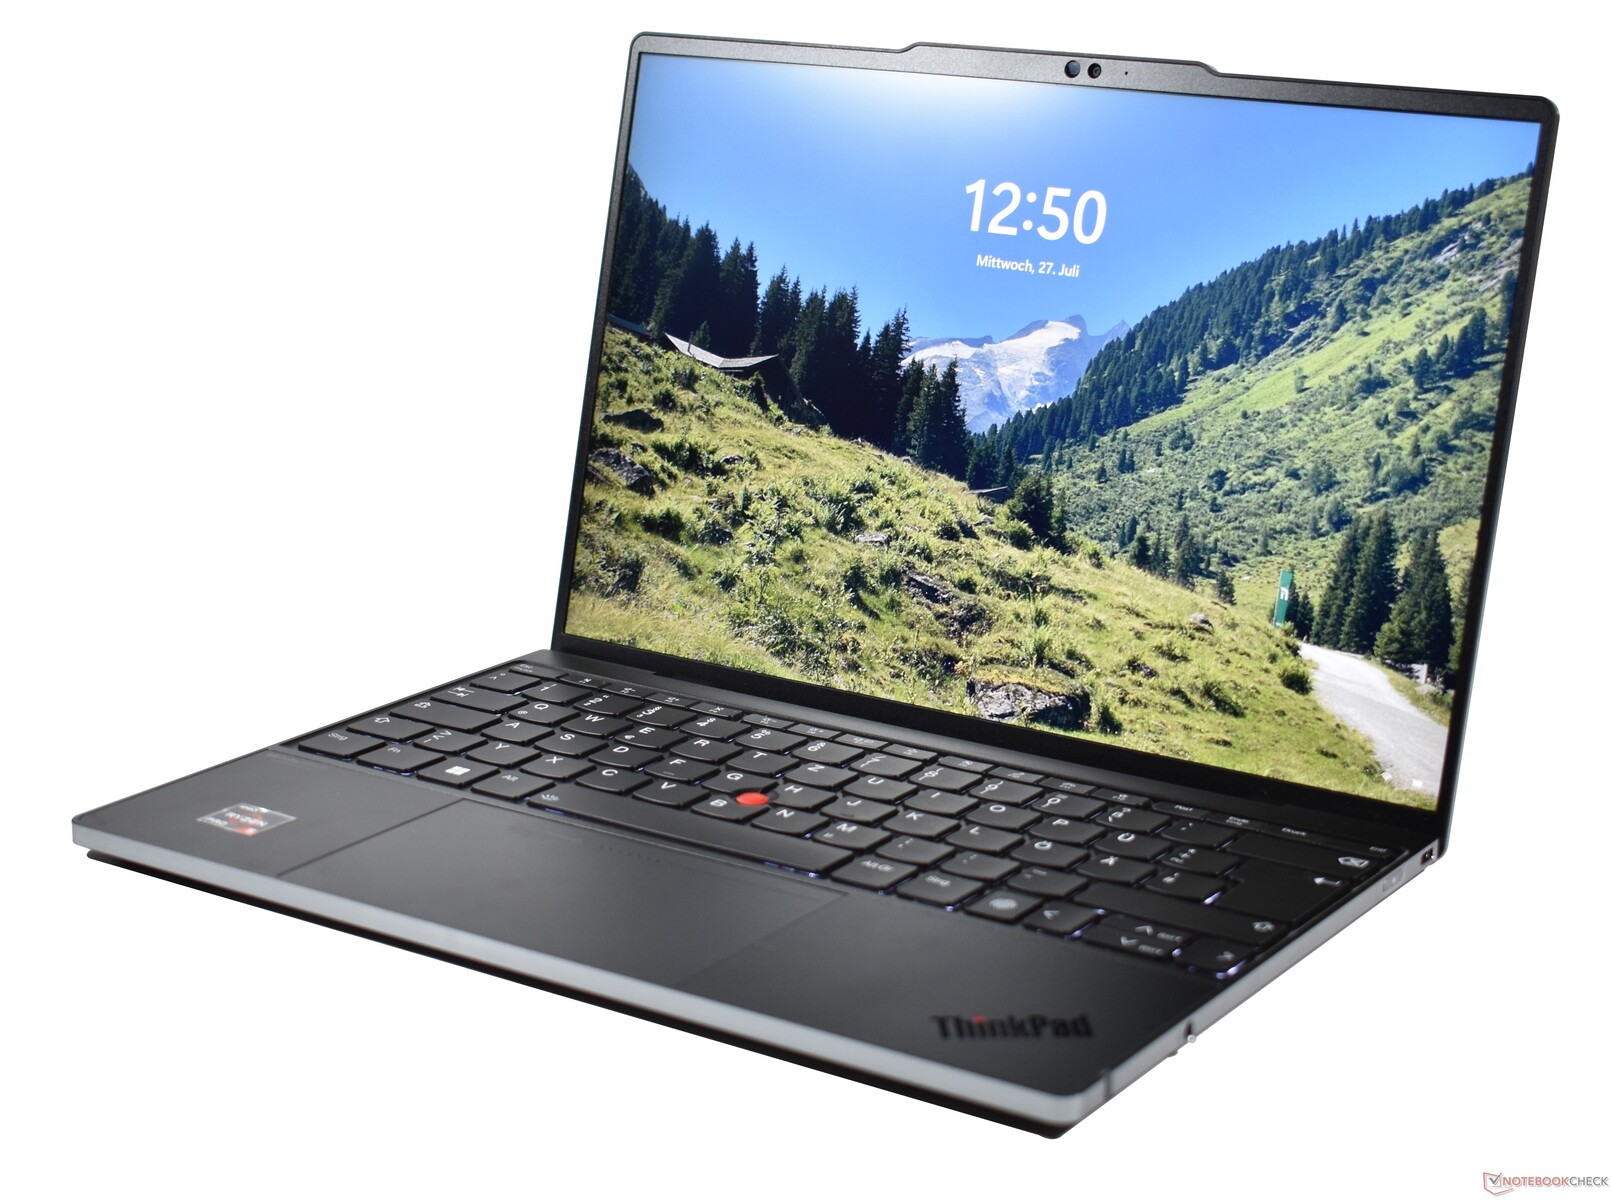
Case: ThinkPad made of glass and aluminum
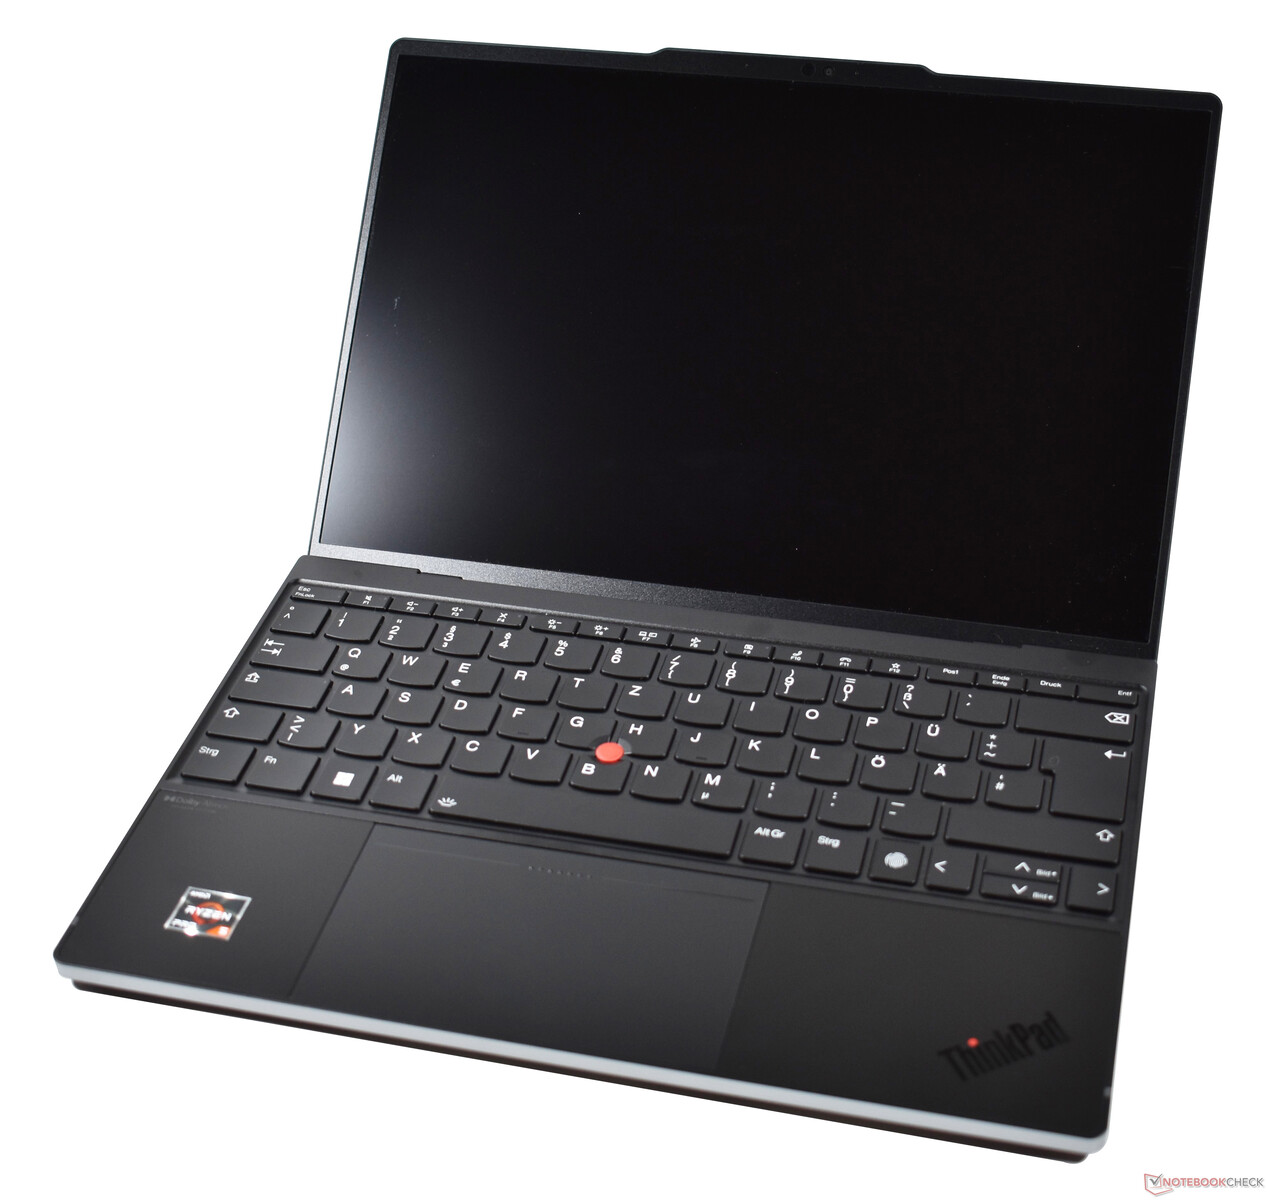
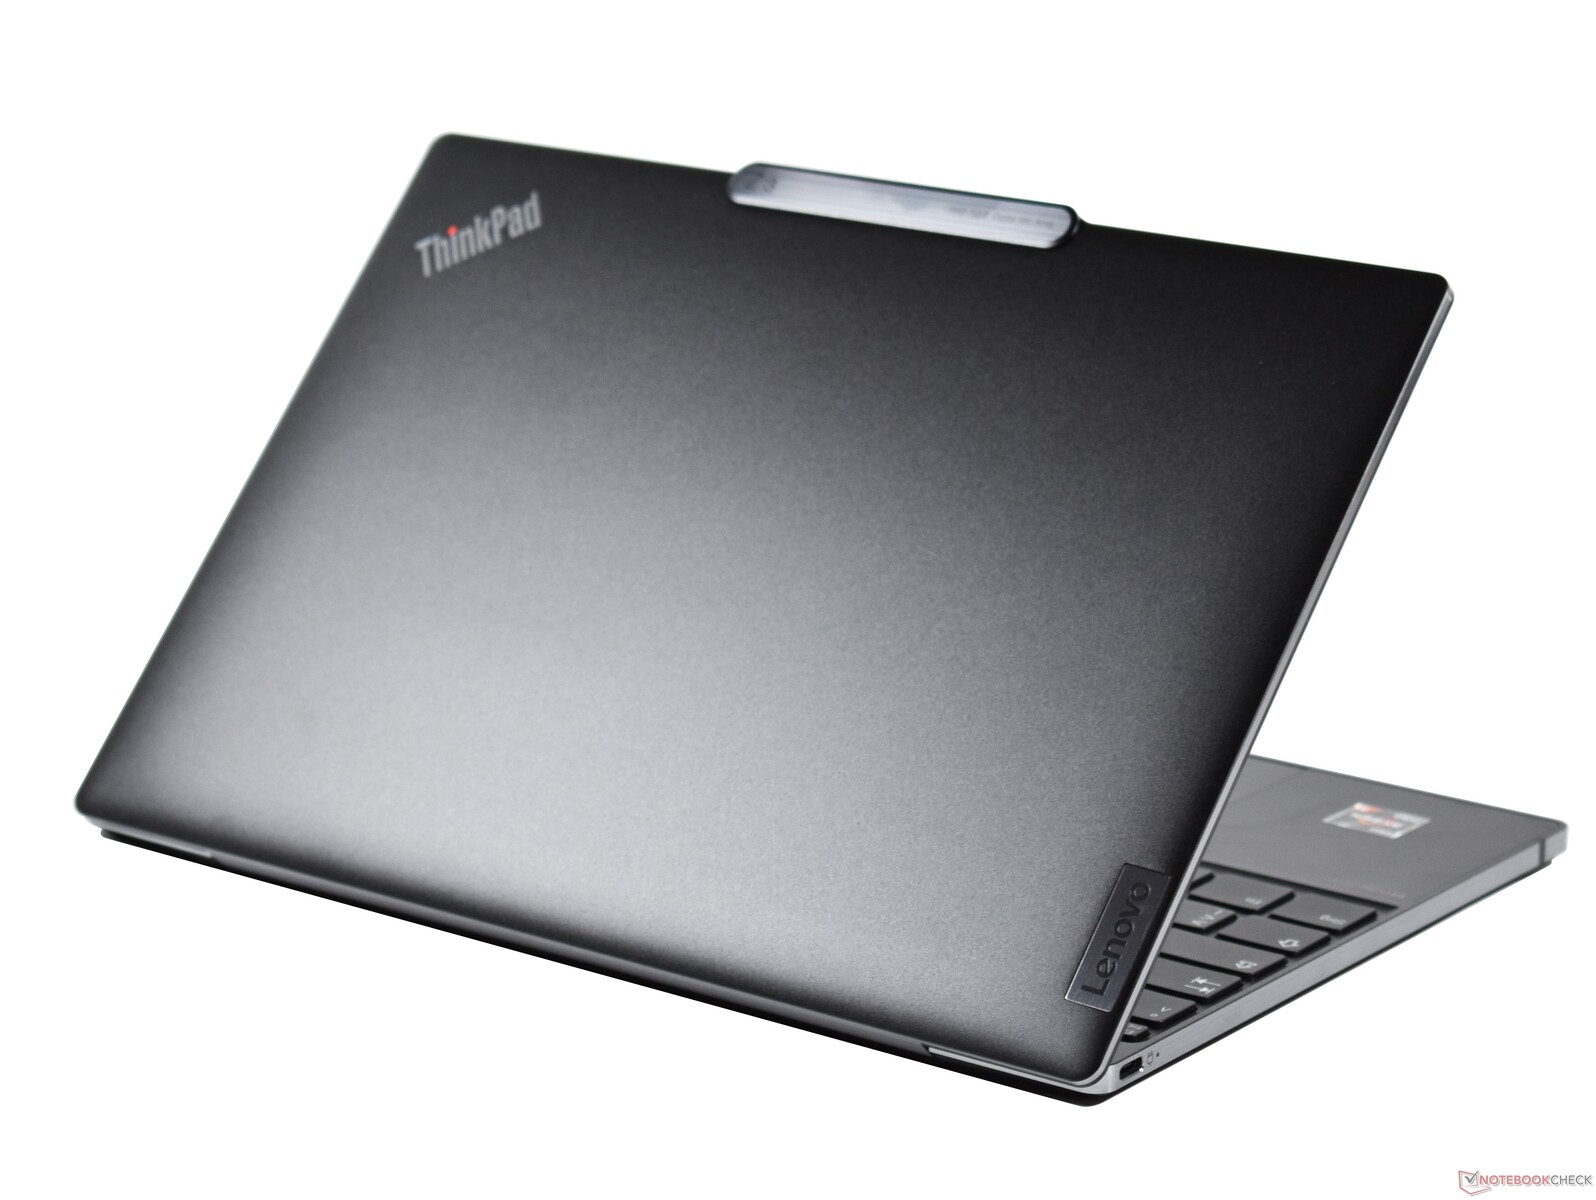
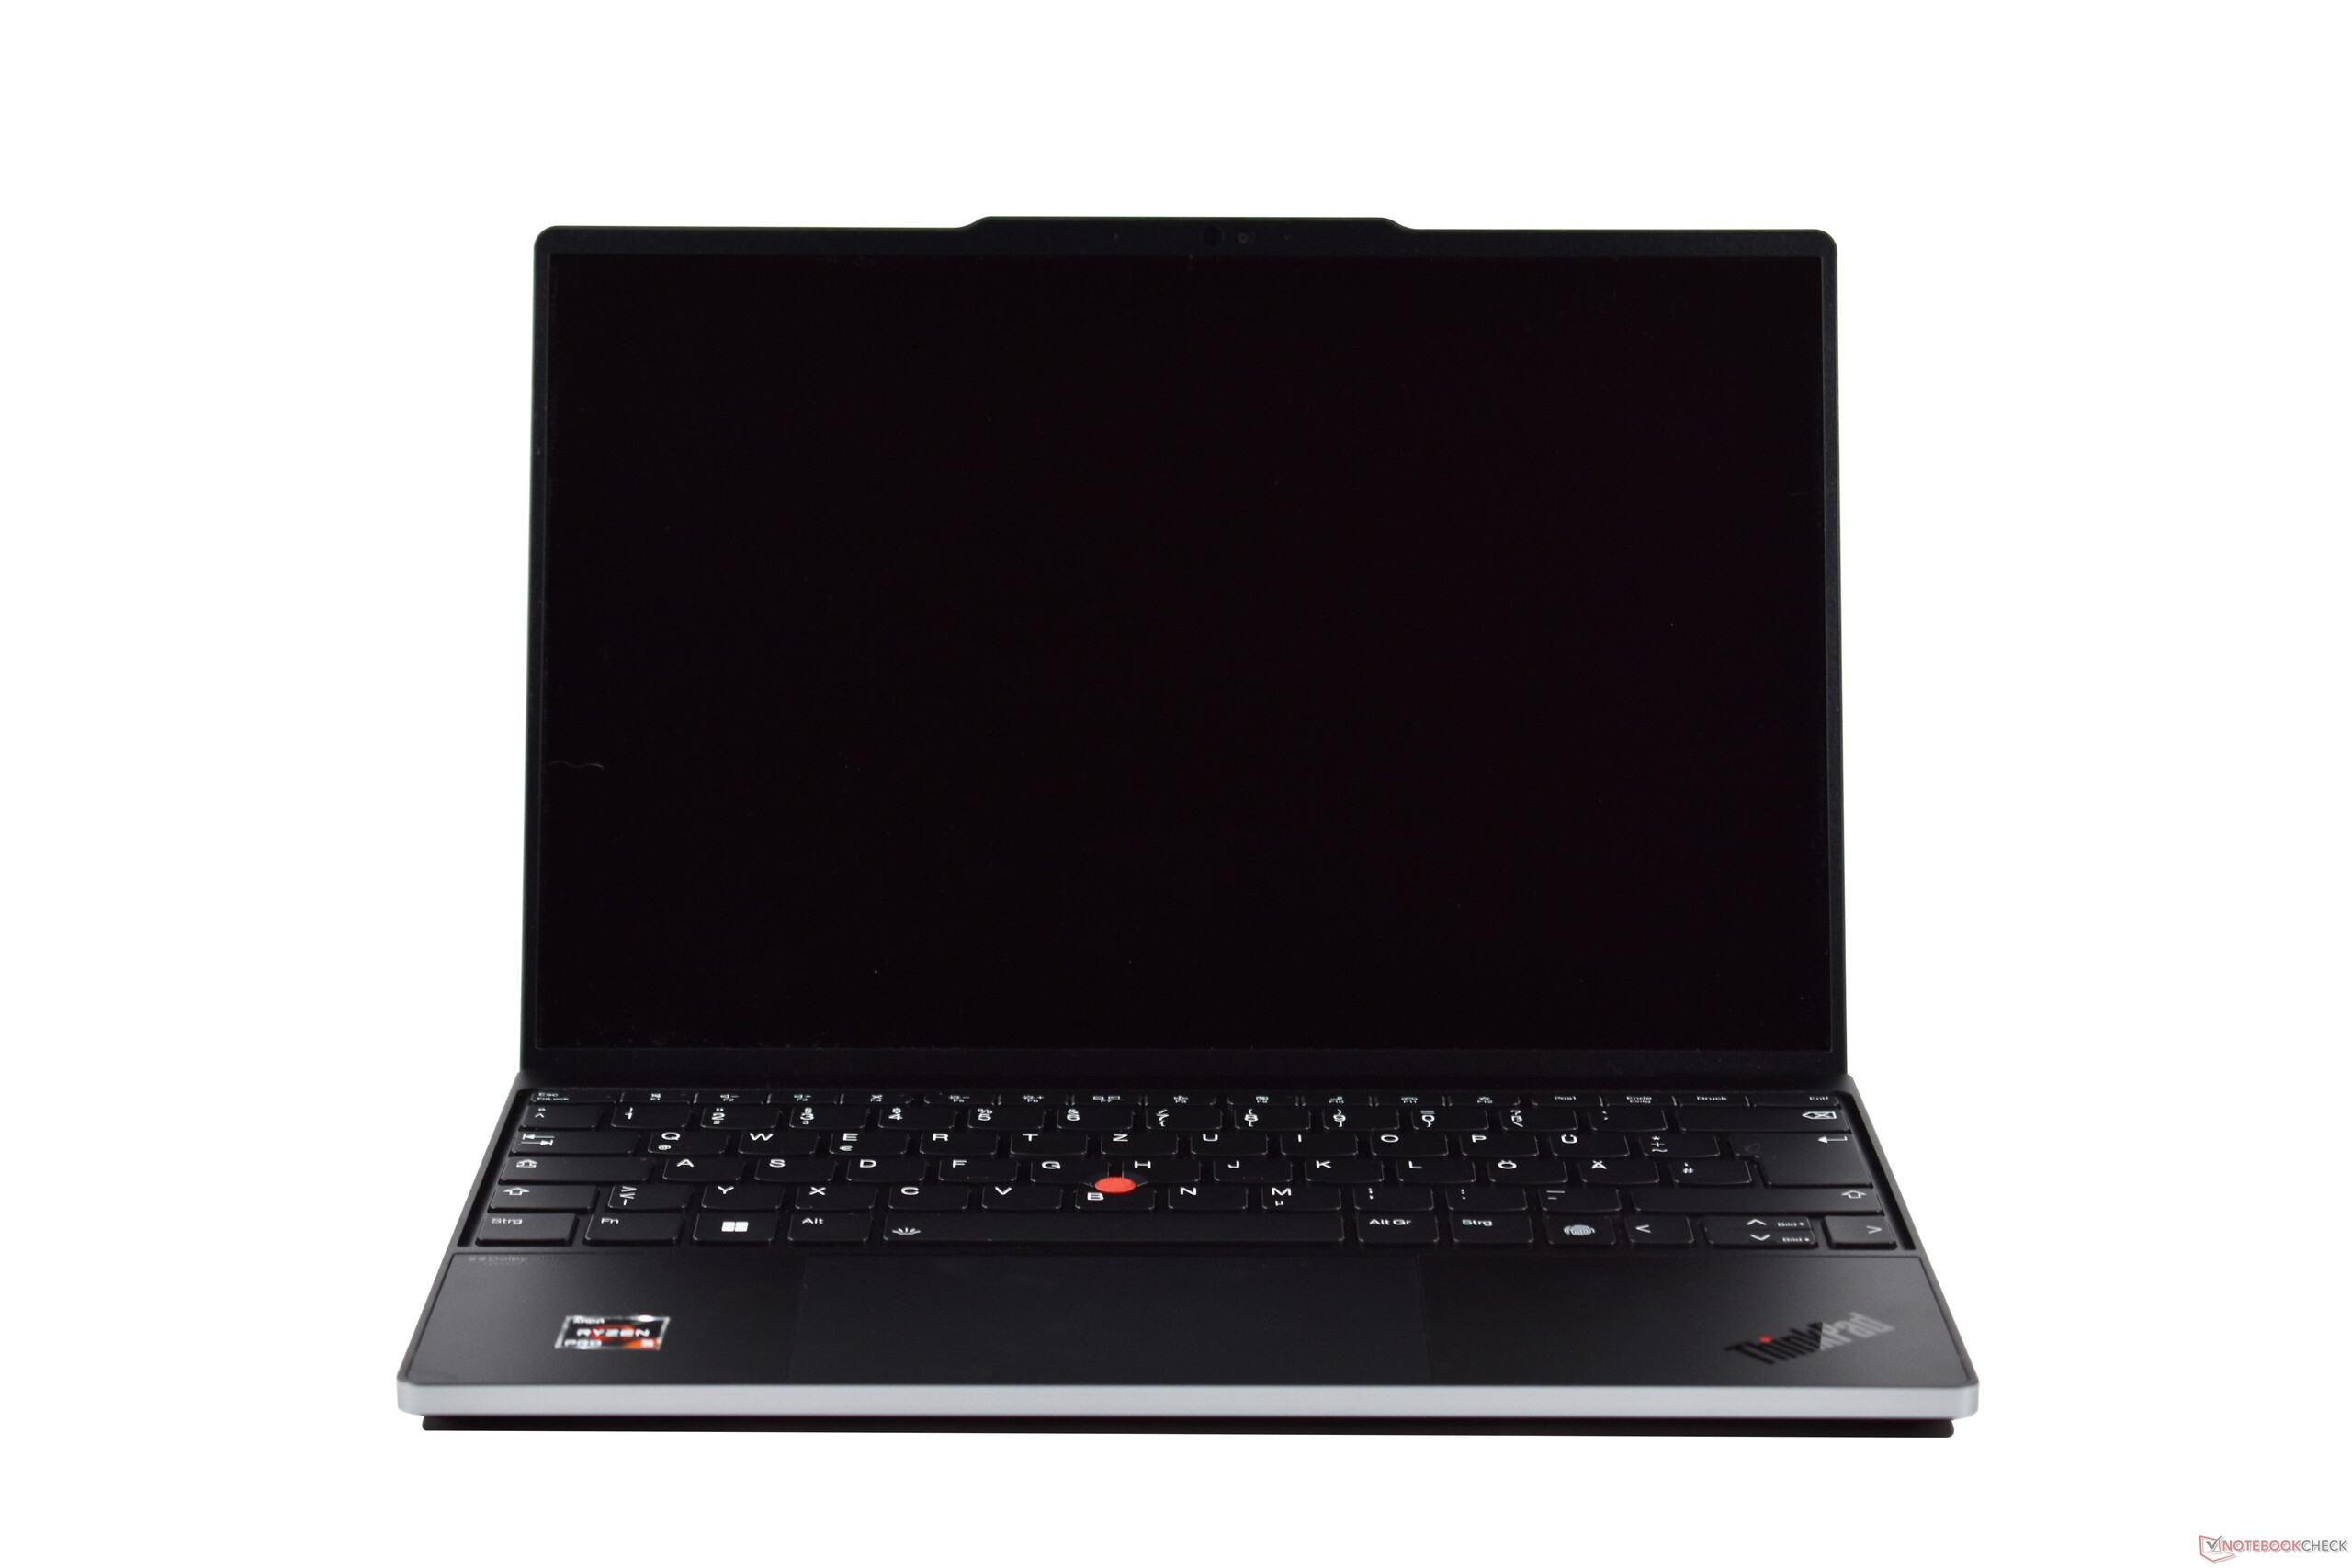
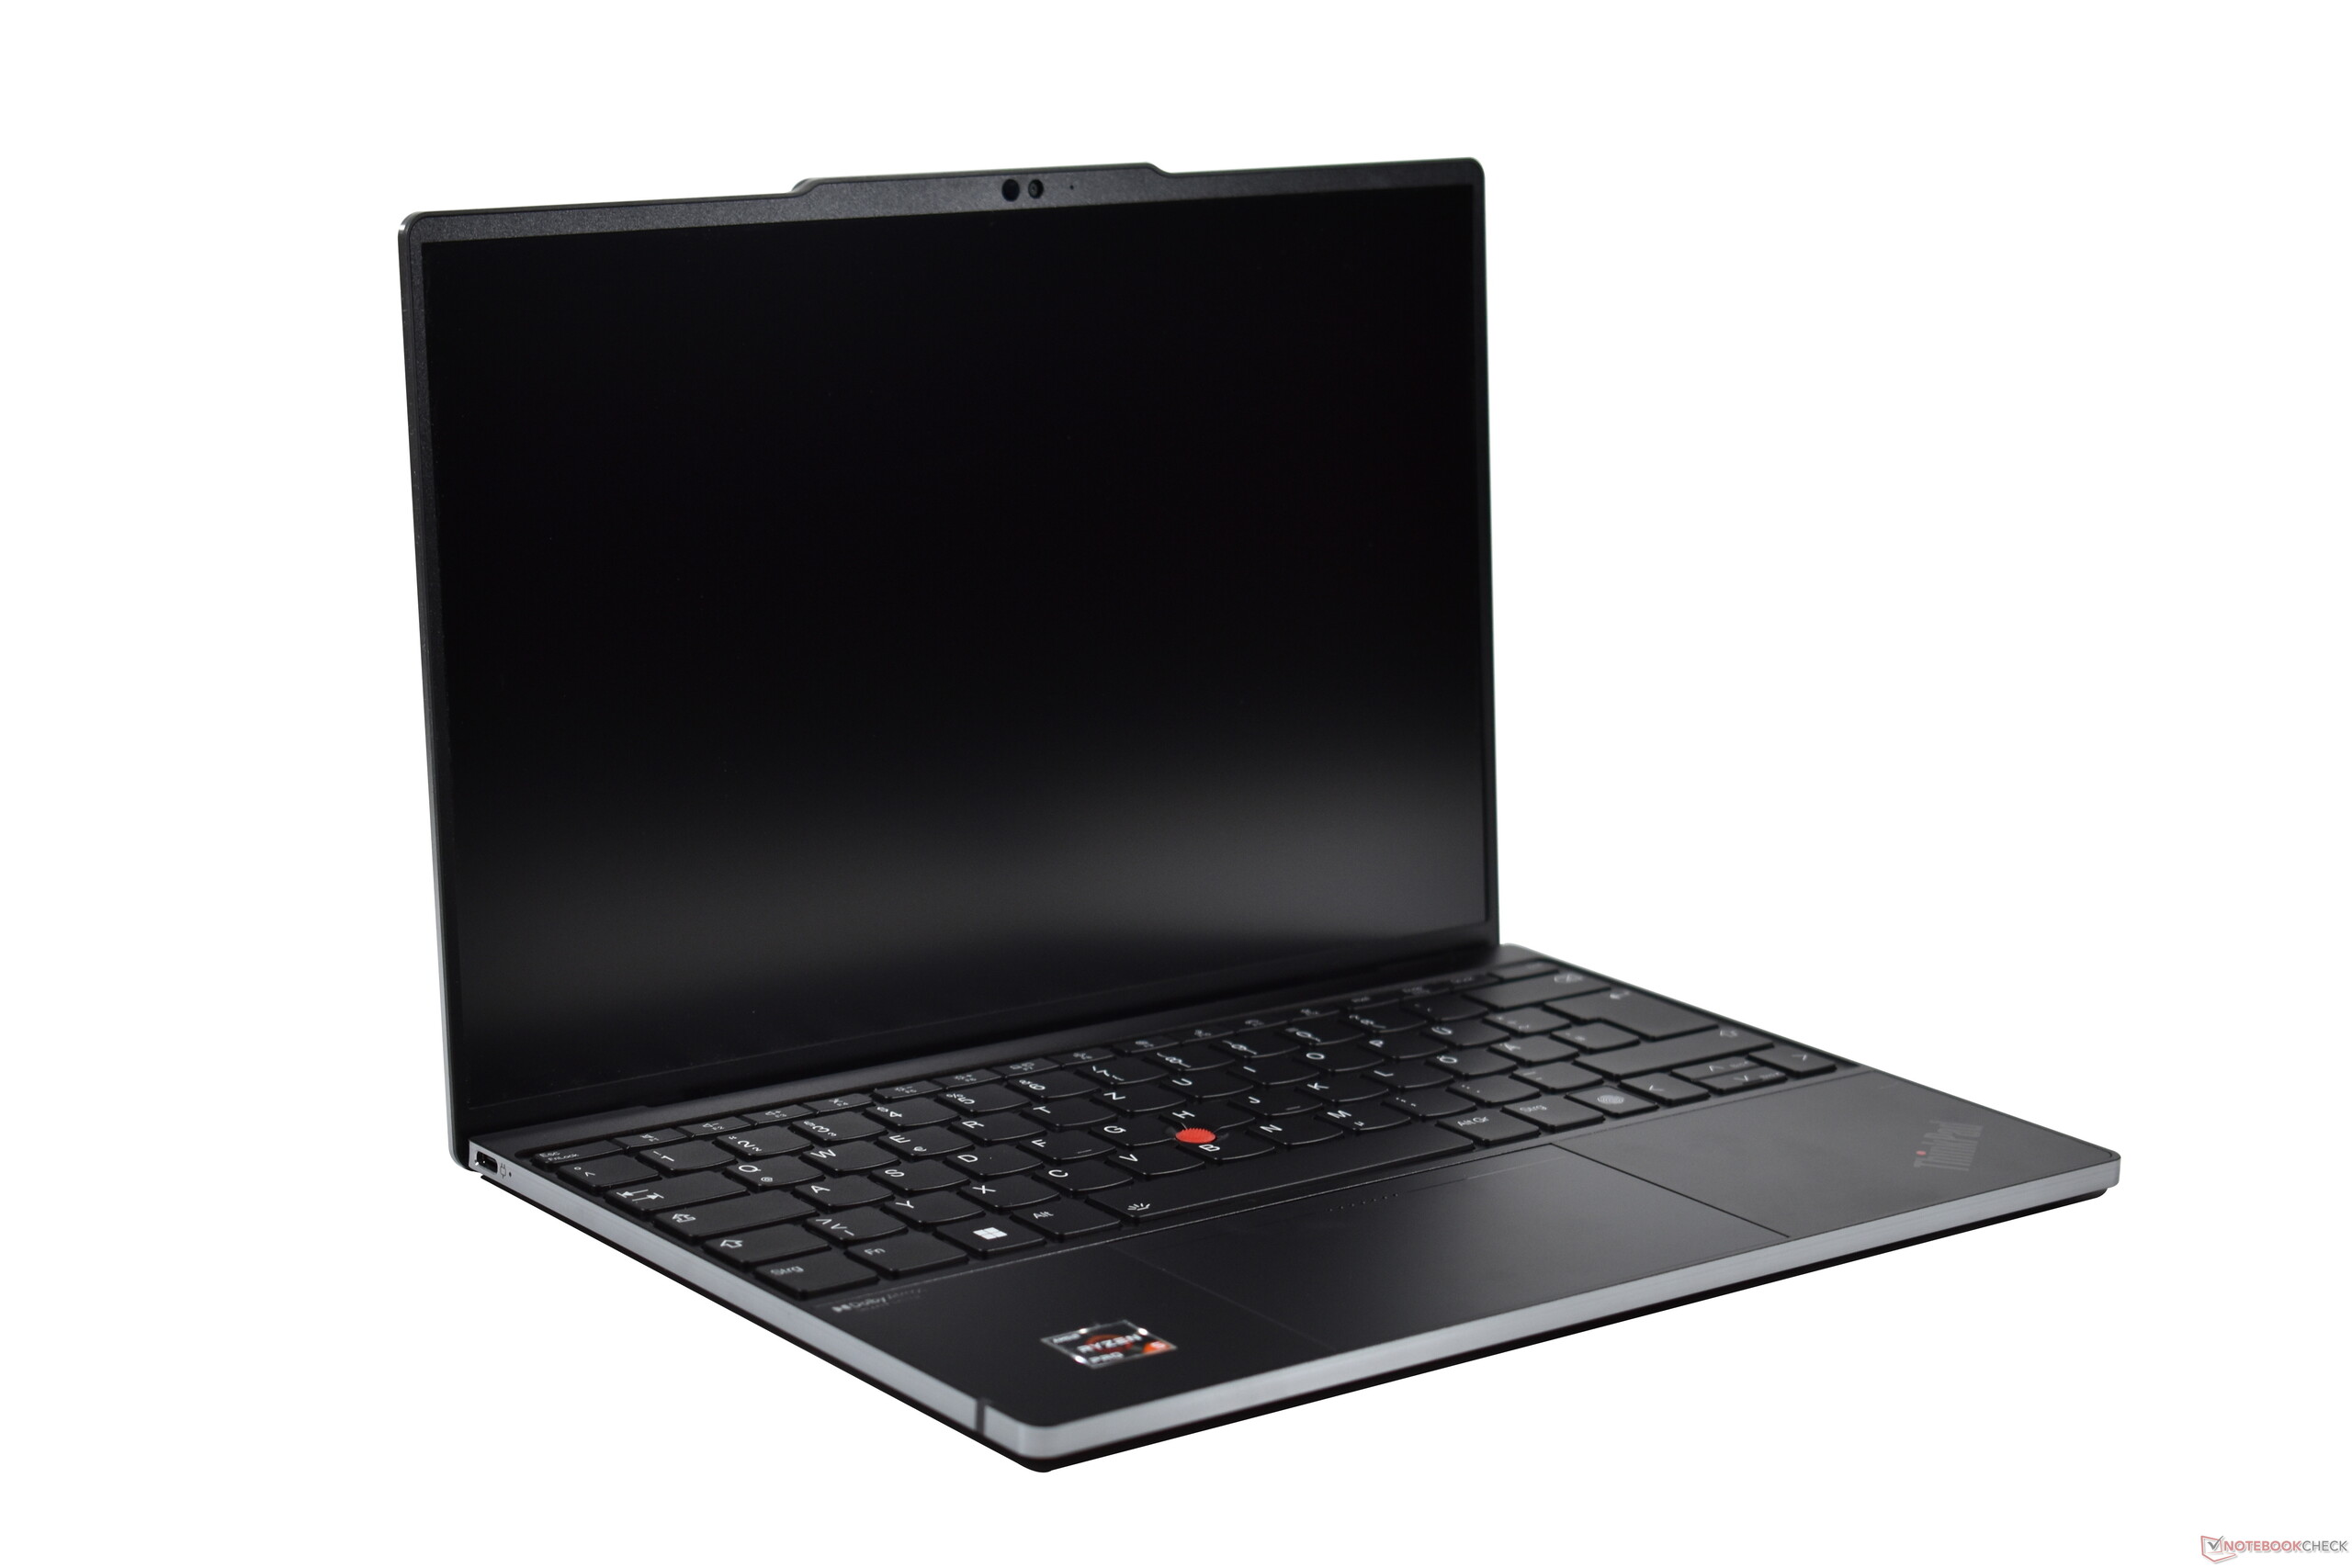
ThinkPads have a reputation: Black boxes, a lot of plastic, utilitarianism. The ThinkPad Z13 doesn't completely distance itself from these roots, but it clearly tries to push the design in another direction. This is why we have the silver metal side surfaces and also the palm rest made of matte glass. Moreover, the corners are rounded, which isn't that common for ThinkPads - the original ThinkPad Z series, which was launched in 2005 and heralded the widescreen era at Lenovo at the time, was one such case. The design of the new Z series is perhaps not quite as groundbreaking, but with its barely existent display bezels, it already looks significantly more modern than other ThinkPads.
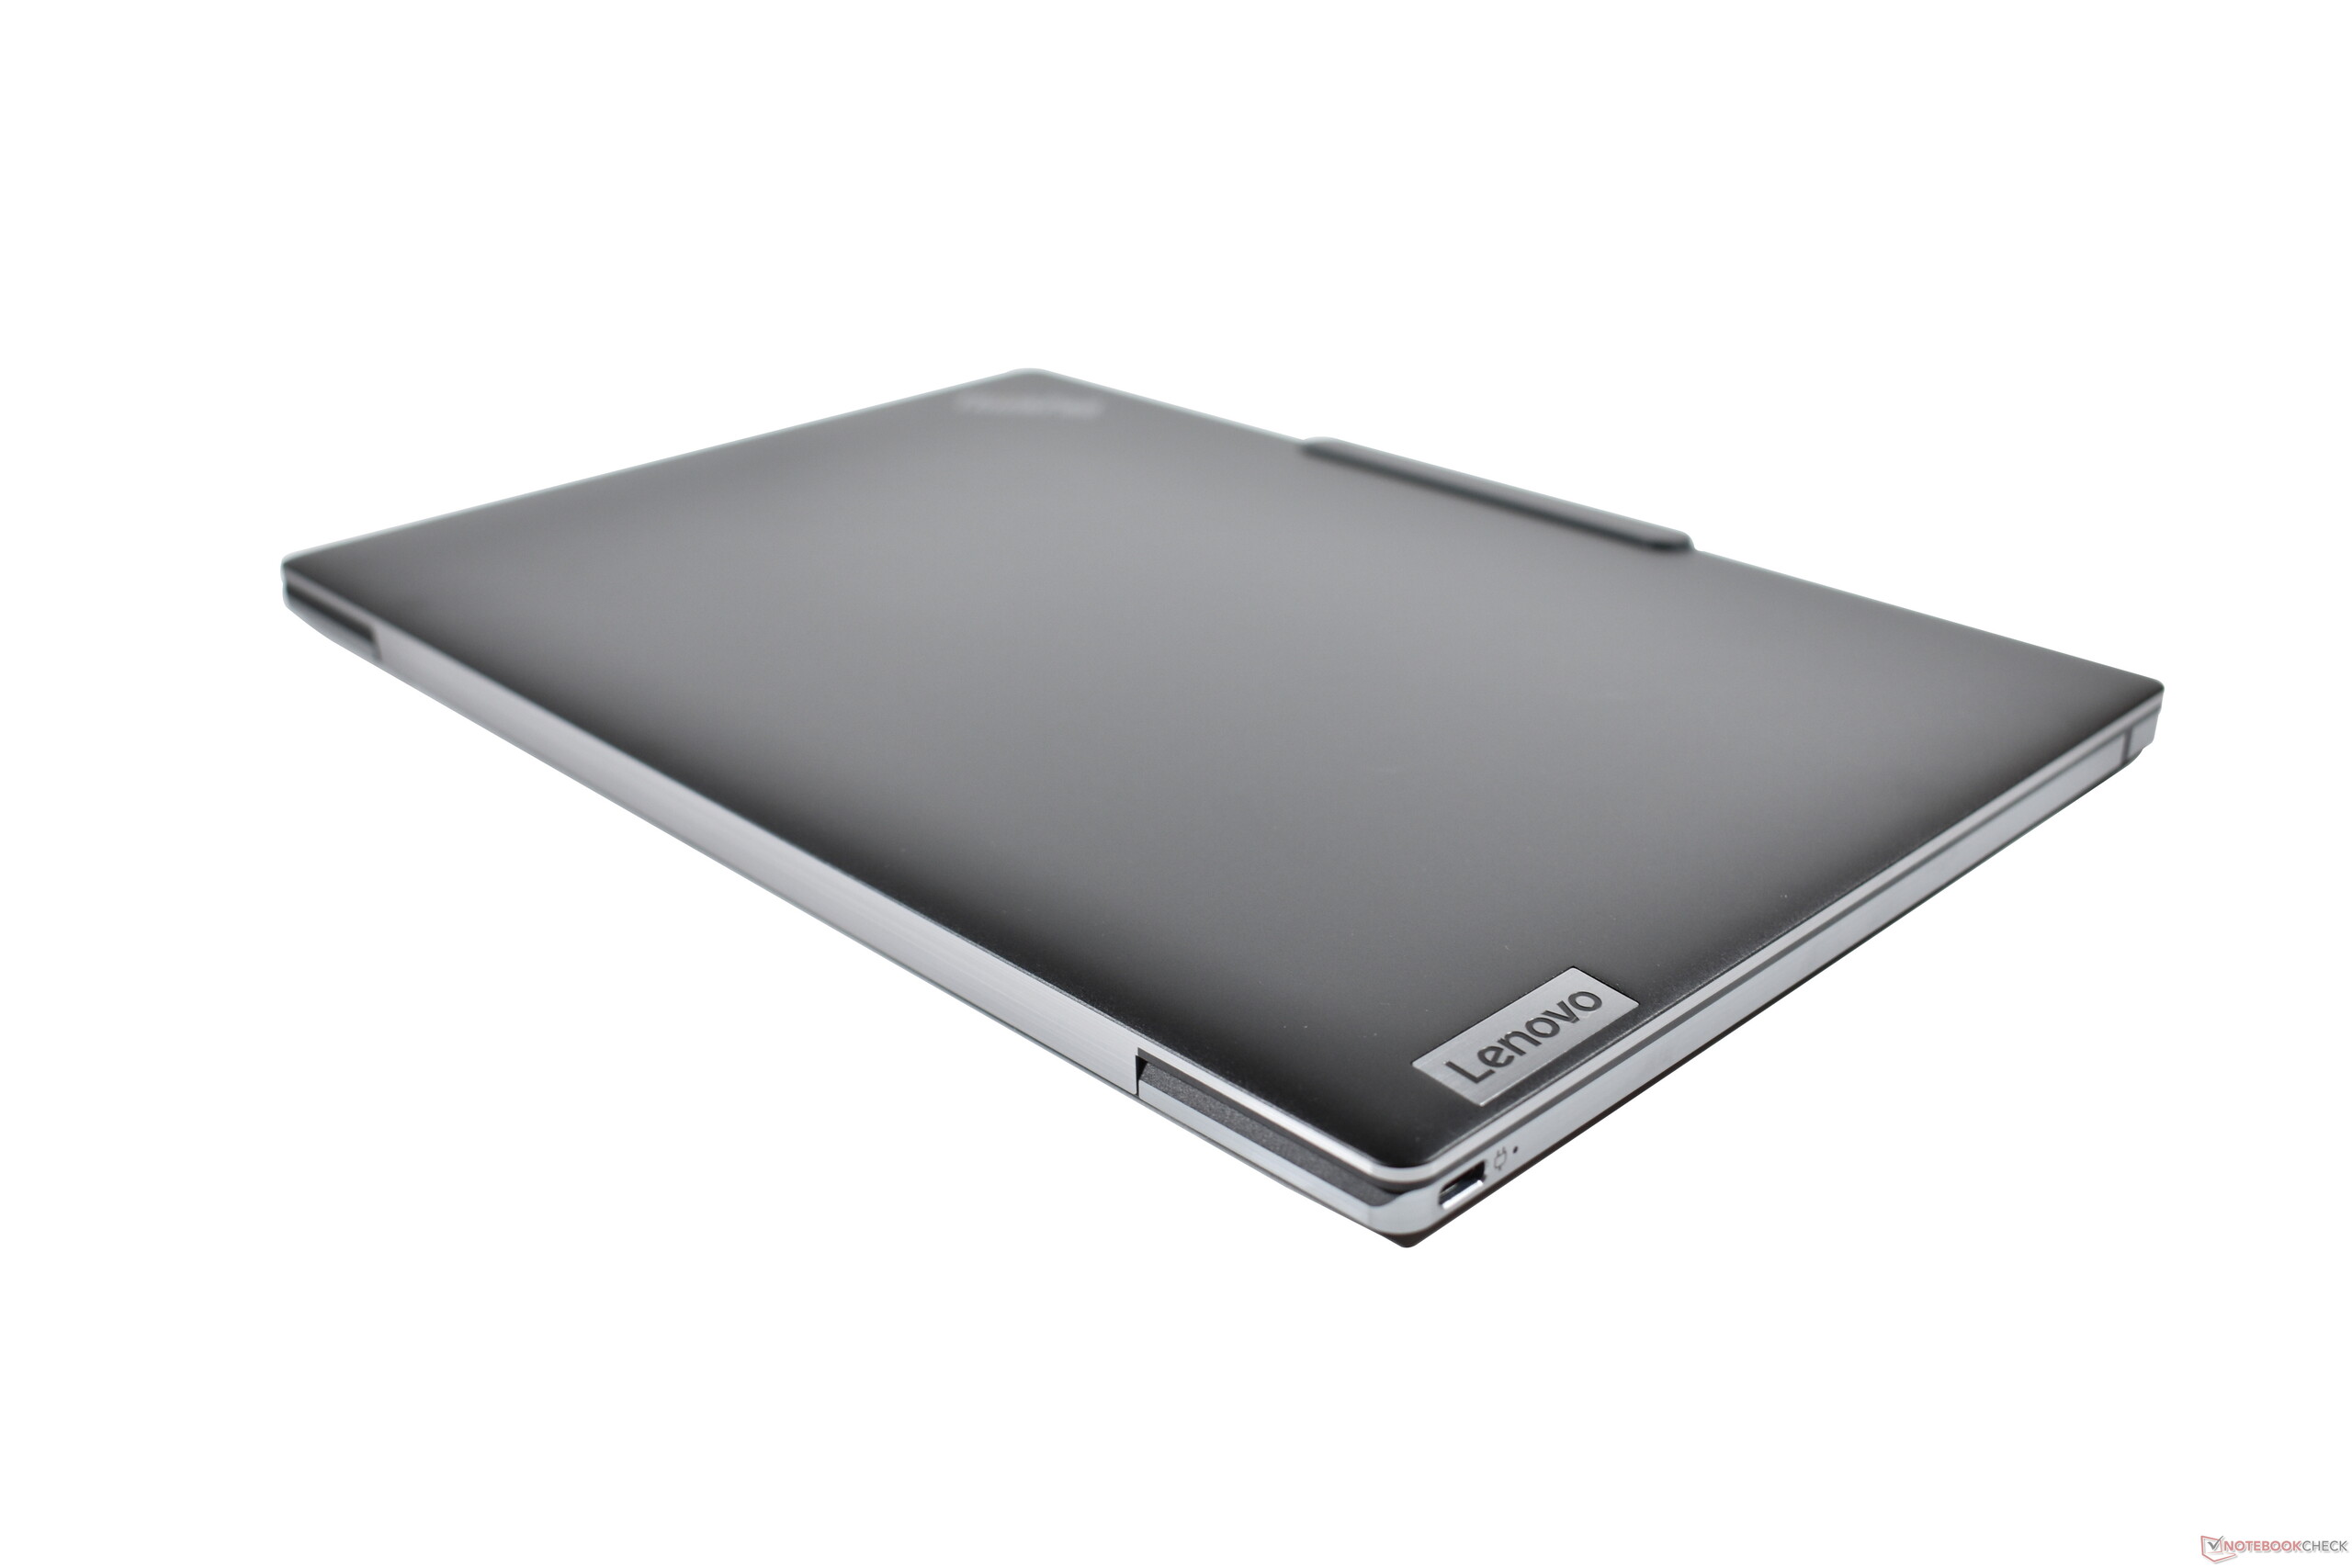
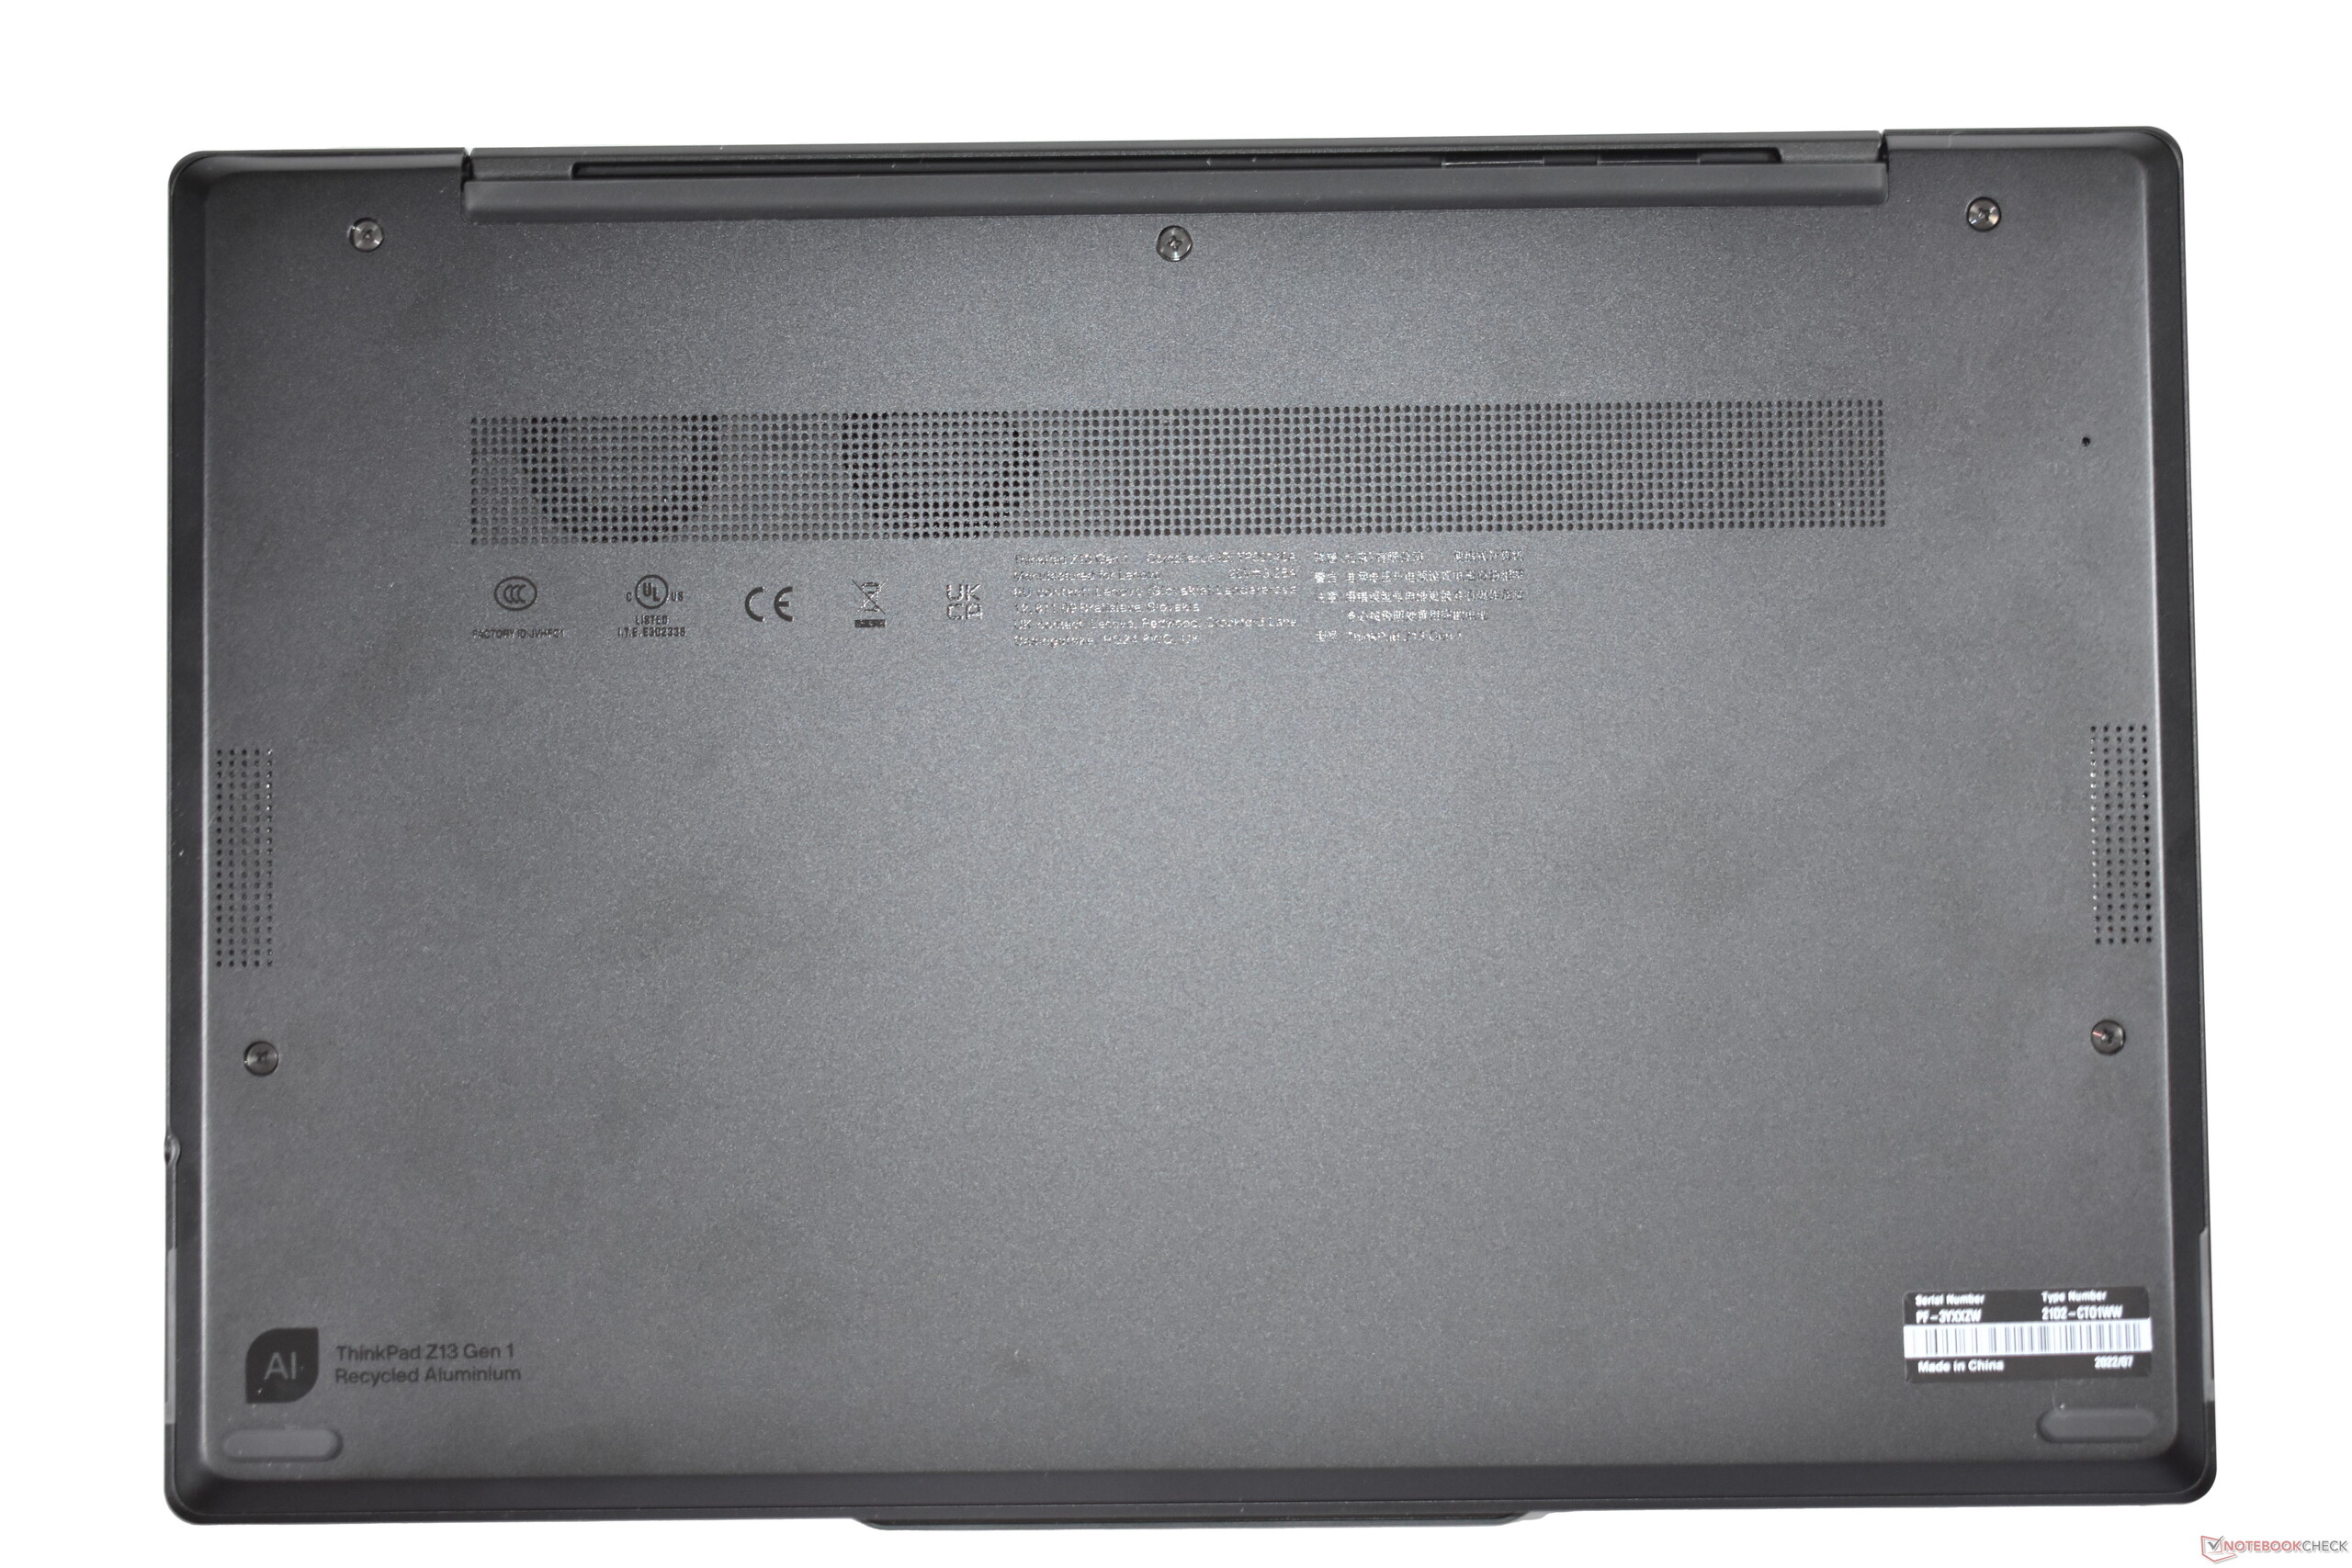
The bulk of the ThinkPad Z13 Gen 1 is made of aluminum. Plastic is only found on the bottom cover and the display bezels. Speaking of the display lid: Our variant has the black aluminum lid, but it's also available in silver and in black faux leather. The imitation leather model doesn't have silver sides, but it comes with bronze-colored sides instead.
In terms of build quality and sturdiness, the ThinkPad Z13's base unit is beyond reproach; the case is extremely high-quality and robust. The display lid is sturdy as well, although not as much as the base unit, since the latter is thicker than the slim lid.
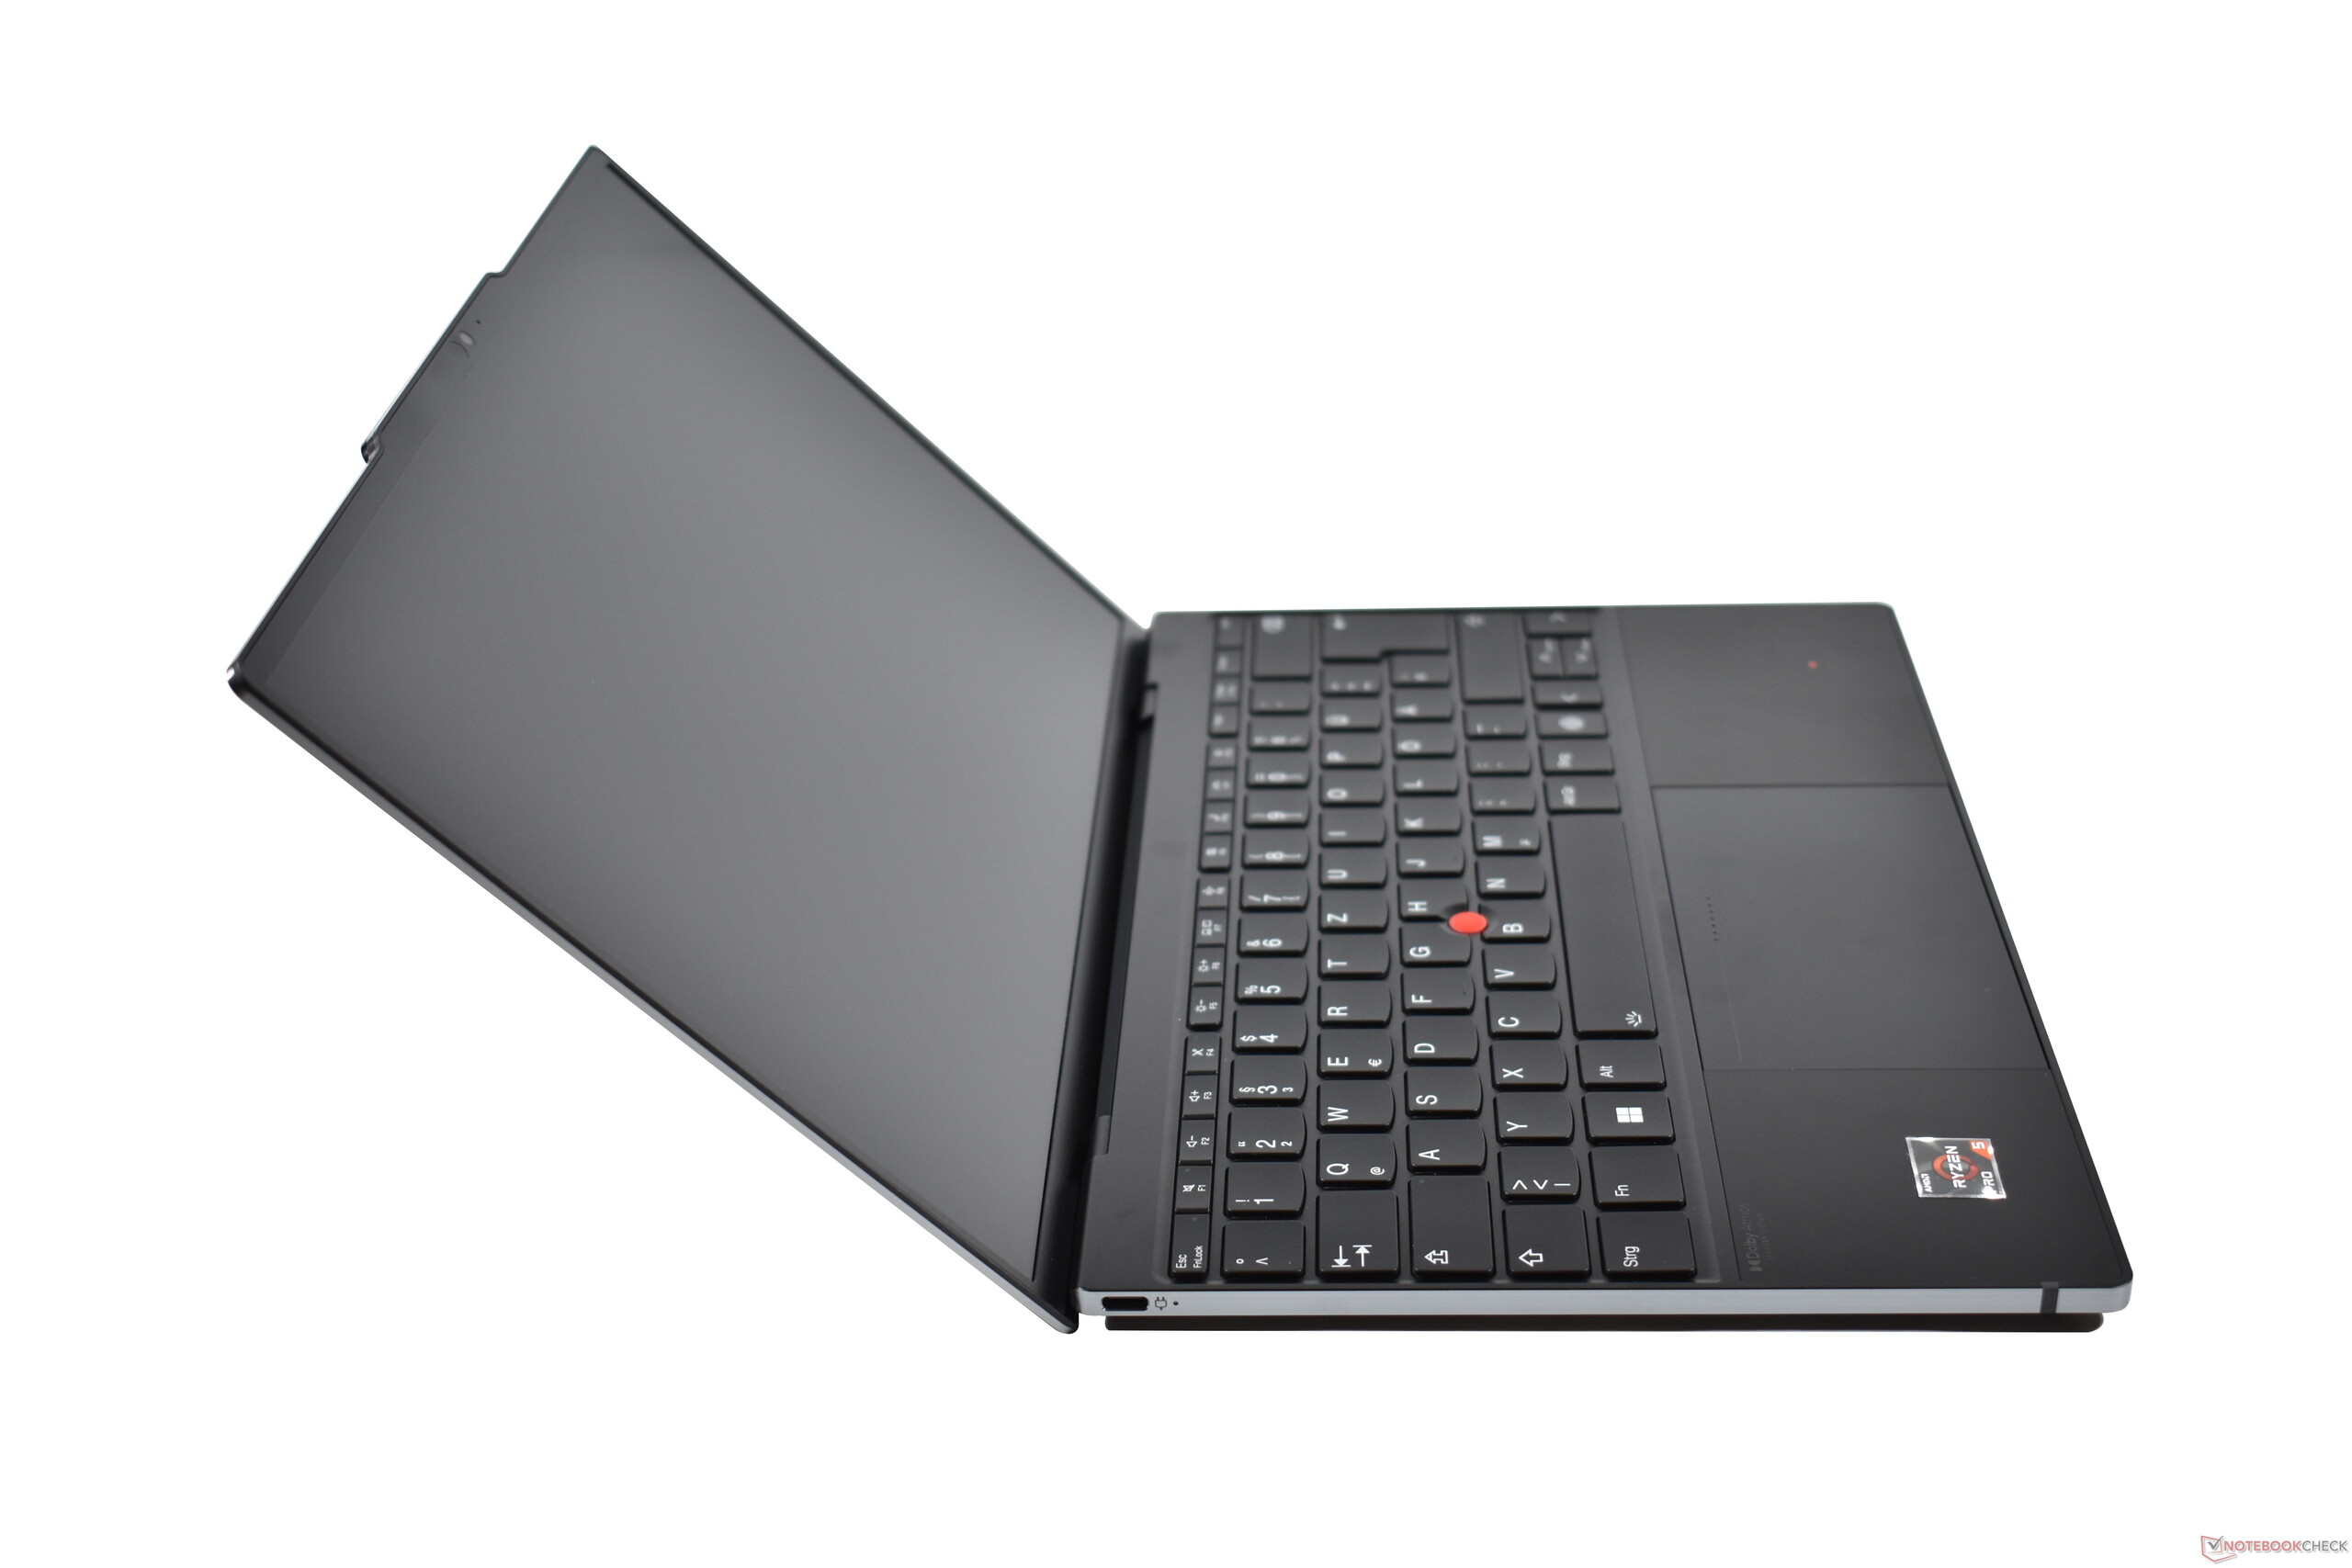
Lenovo also breaks new ground when it comes to the hinges, since this kind of design hasn't been seen on ThinkPads before. The hinges are practically hidden, and they allow opening the display lid with just one hand. However, they become stiff starting at an opening angle of about 100 degrees. Shortly after that, they stop working, and the maximum opening angle is only 135 degrees. This is a pity, since the 180-degree hinges are actually a ThinkPad trademark.
The very noticeable reverse notch on the display lid is no previous trademark. For the ThinkPad Z series, it's a distinguishing feature, though, and it also has a practical use: It can be used to hold the screen when opening the laptop.

The Dell XPS 13 Plus and the Apple MacBook Air are about as heavy as the Z13. This is also true for the ThinkPad X1 Carbon Gen 10, which, however, has a larger display. The ThinkPad X1 Nano is noticeably lighter at less than one kilogram. So while the X1 series is ahead in terms of weight, the ThinkPad Z13 is more compact in return. It's practically the same size as the Dell XPS 13 Plus 9320, but a bit less thick. The MacBook Air is thinner, but also bigger.
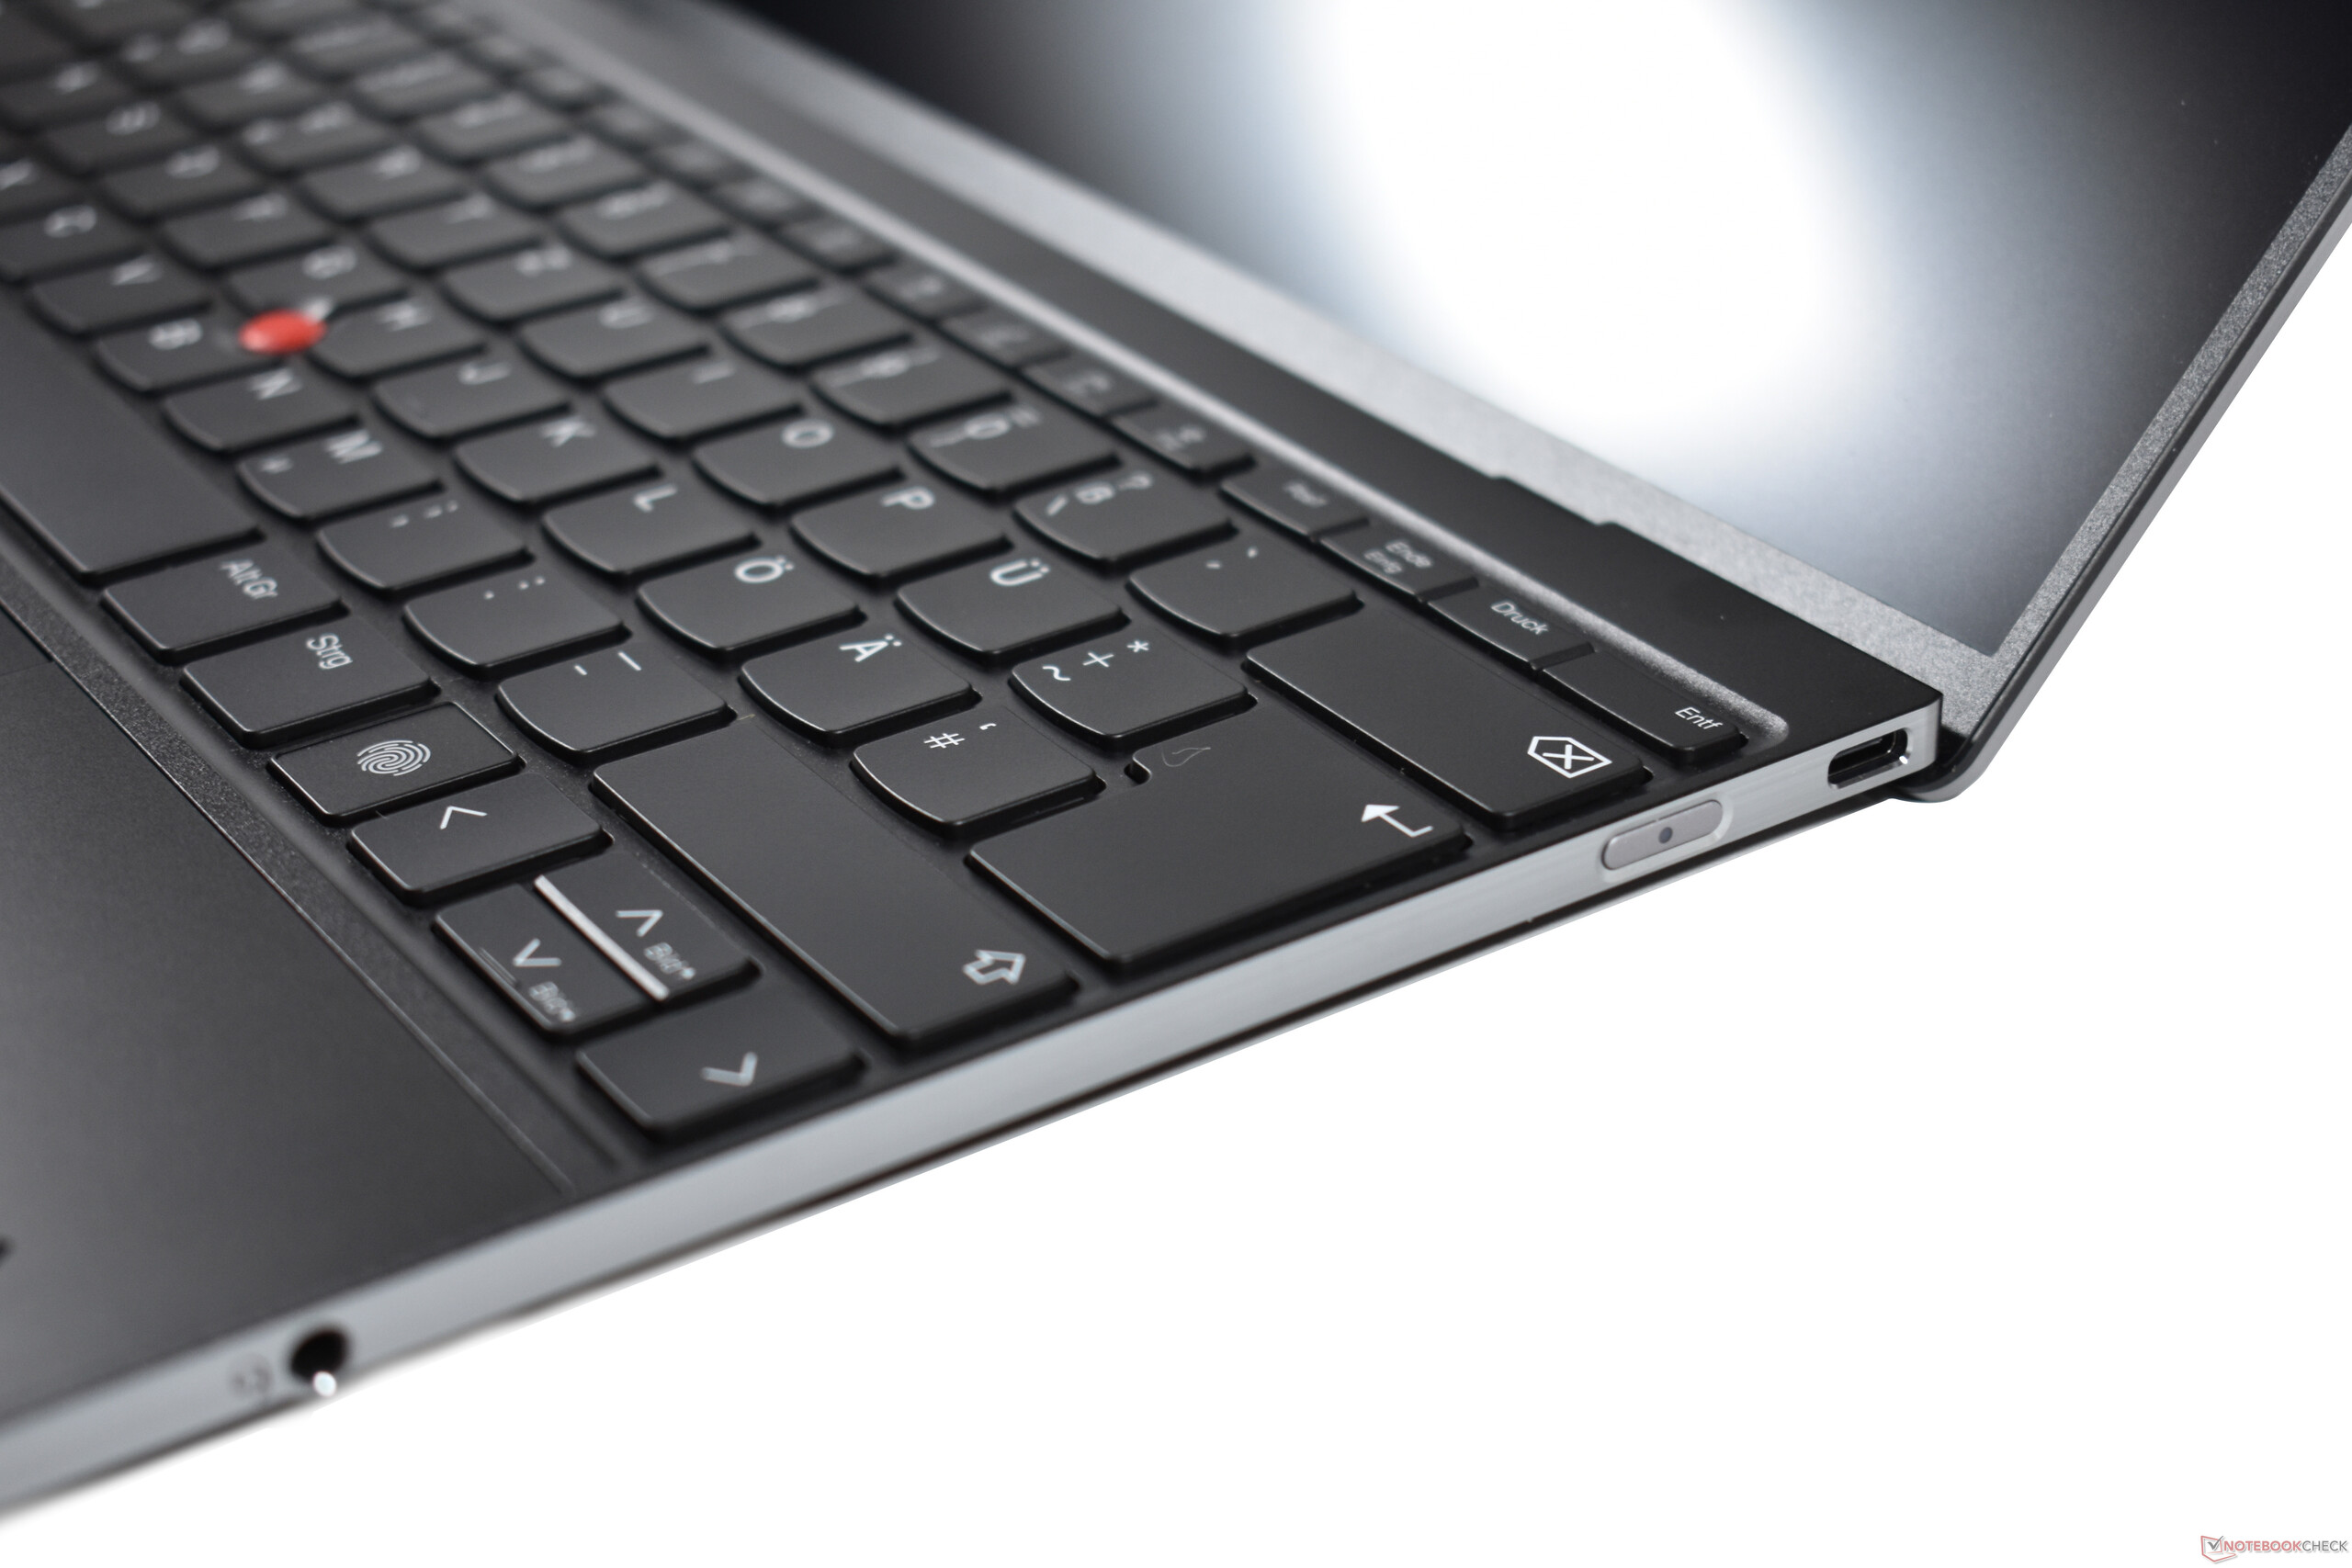
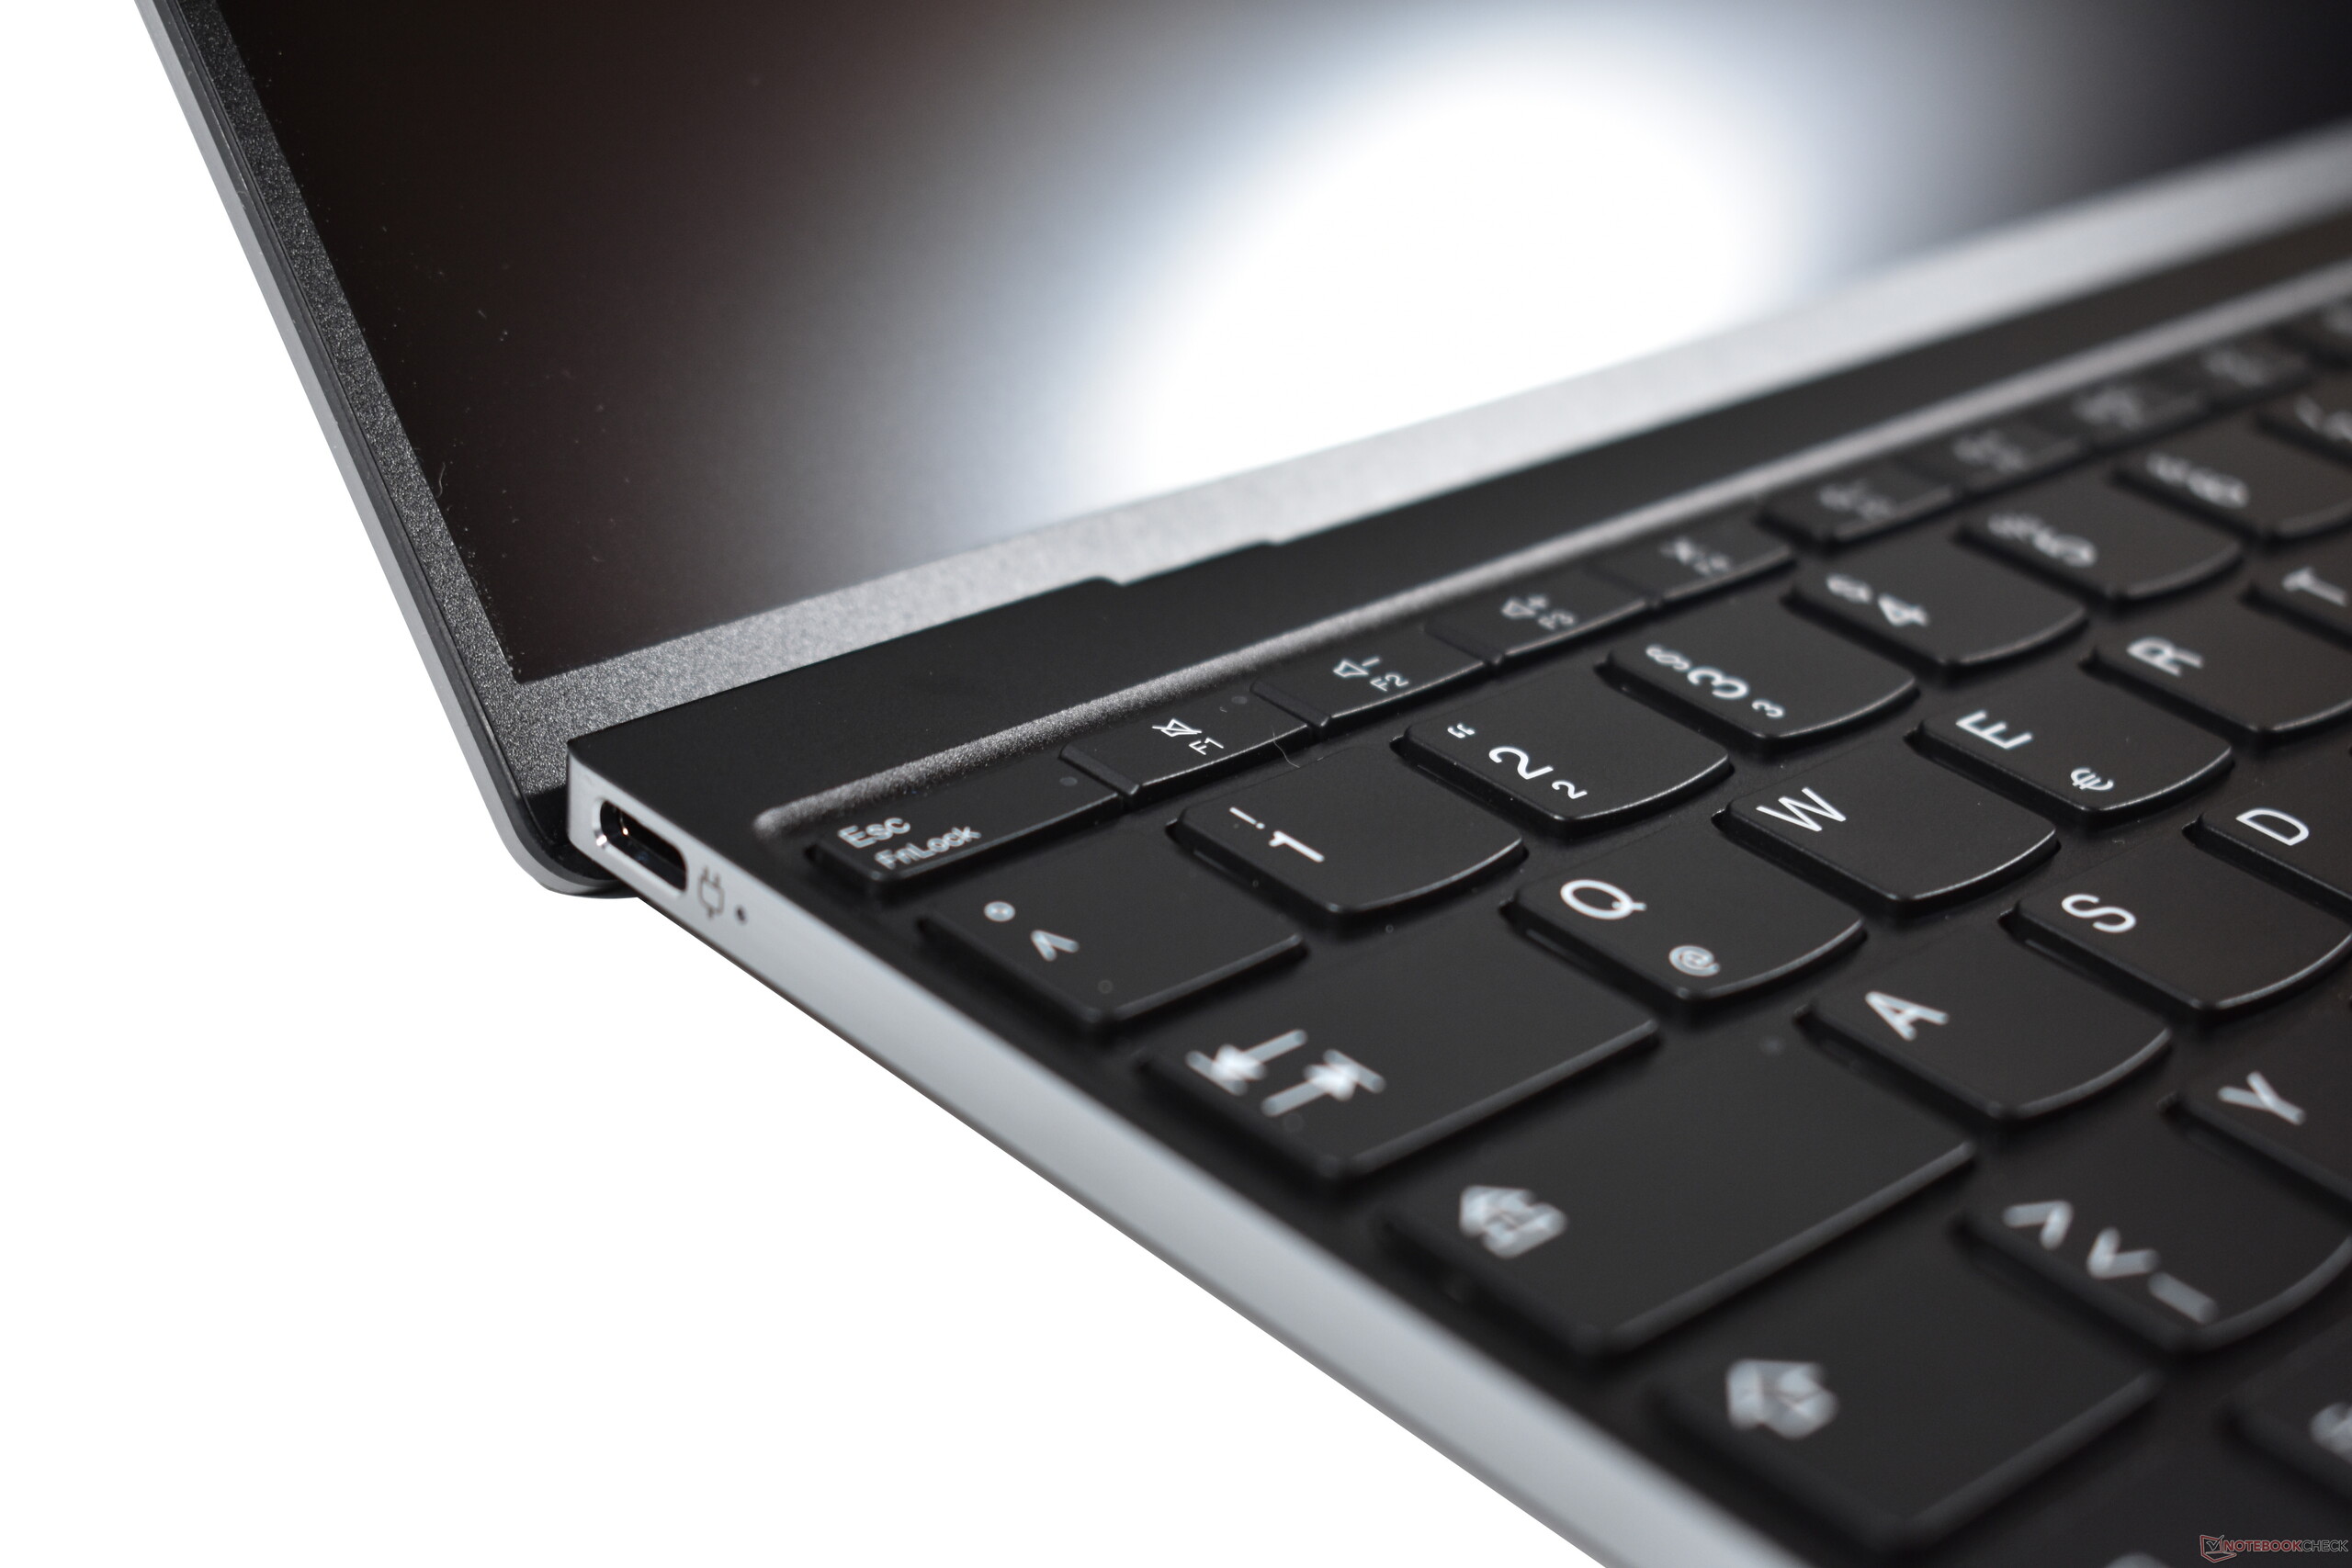
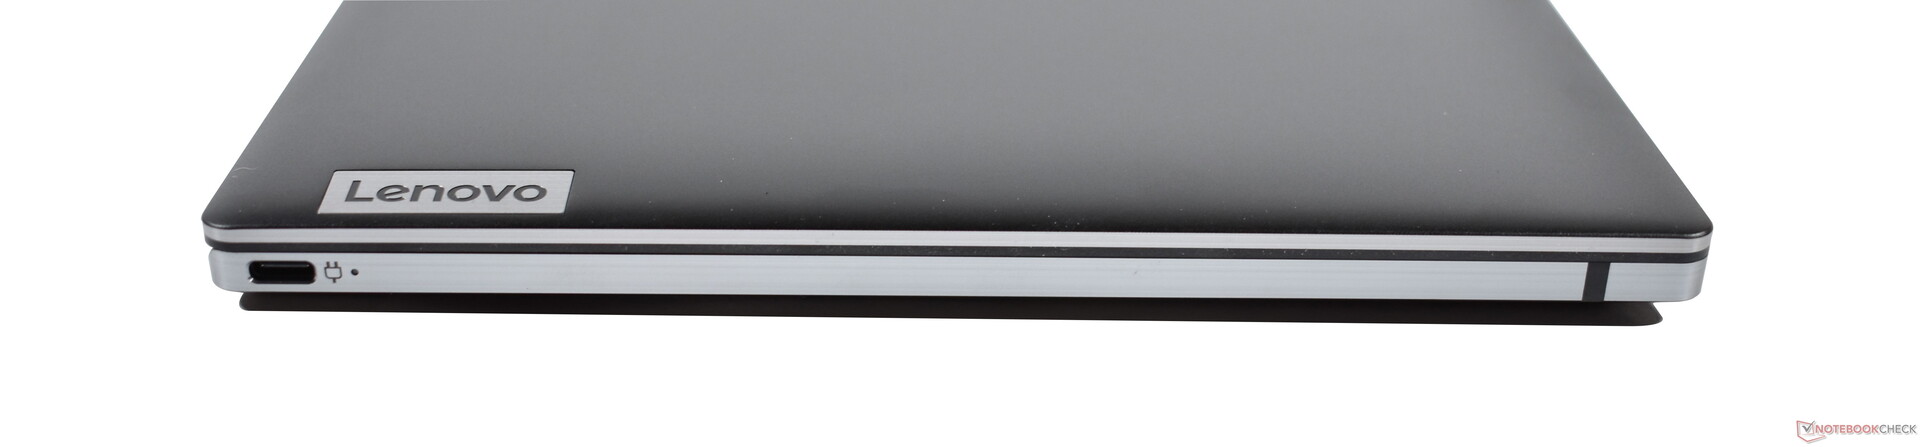
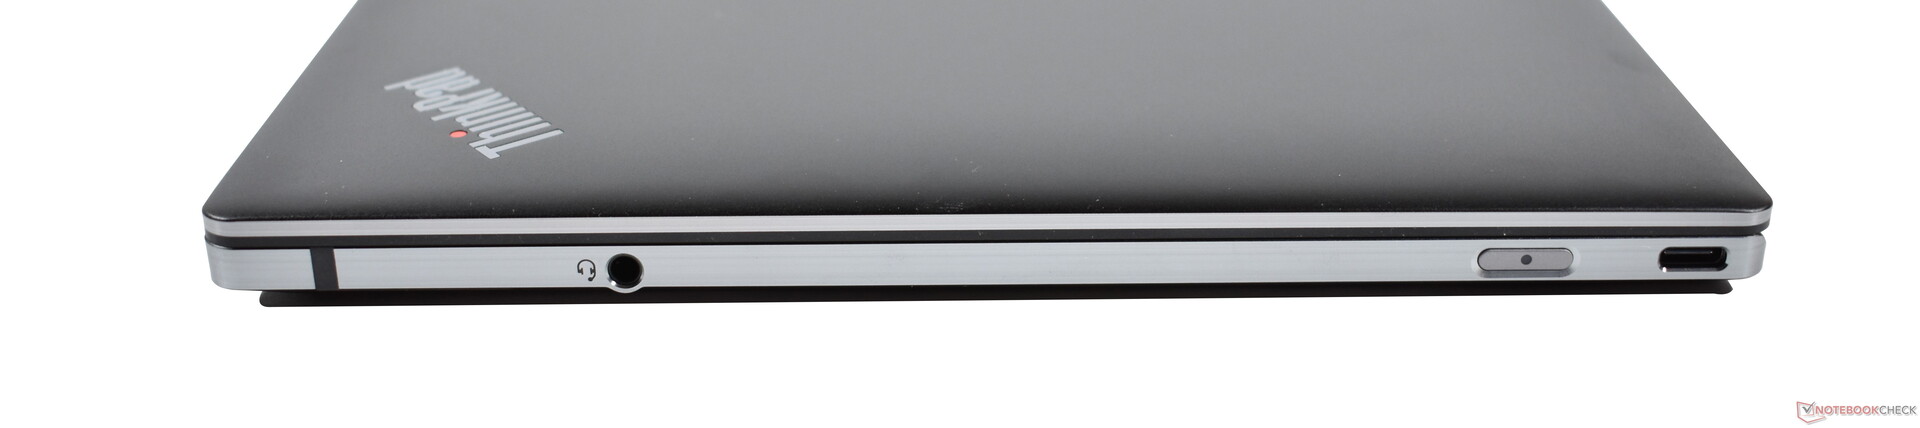
Connectivity: ThinkPad laptop with USB4
Lenovo only offers a limited number of ports with the ThinkPad Z13 G1 - two USB4 and a 3.5 mm audio jack. Therefore, the ThinkPad Z13 has exactly the same ports as the X1 Nano. However, the Z13 has one USB-C port on each side, which means that it can be conveniently charged on both sides. Thanks to the audio output, it's better equipped than the XPS 13 Plus.
Of course, this only applies when USB4 really supports Thunderbolt. Fortunately, we have a Thunderbolt 3 eGPU dock: It works flawlessly with the ThinkPad Z13, so we can say: Thunderbolt via USB4 works.
Communication
All variants of the Lenovo ThinkPad Z13 support the modern Wi-Fi 6E standard - but not with a Wi-Fi solution from Intel, but from Qualcomm. The Qualcomm WCN685x, also marketed as Qualcomm NFA-75A, is a 2x2 Wi-Fi 6E module that does its job without any major issues in the ThinkPad Z13, even though there are a few fluctuations. Overall, high transfer rates were achieved, but they were limited to Wi-Fi 6 speeds in our test.
The ThinkPad Z13 is optionally available with a 4G module. Nevertheless, there's no WWAN configuration, so it can't be retrofitted.
| Networking | |
| iperf3 receive AXE11000 | |
| Dell XPS 13 Plus 9320 4K | |
| Average Qualcomm WCN685x (852 - 1777, n=21) | |
| Average of class Subnotebook (504 - 1827, n=52, last 2 years) | |
| Apple MacBook Air M2 Entry | |
| iperf3 transmit AXE11000 | |
| Dell XPS 13 Plus 9320 4K | |
| Average Qualcomm WCN685x (521 - 1838, n=21) | |
| Average of class Subnotebook (467 - 1811, n=52, last 2 years) | |
| Apple MacBook Air M2 Entry | |
| iperf3 transmit AX12 | |
| Lenovo ThinkPad X1 Nano-20UN002UGE | |
| Average Qualcomm WCN685x (1049 - 1094, n=2) | |
| iperf3 receive AX12 | |
| Average Qualcomm WCN685x (1371 - 1537, n=2) | |
| Lenovo ThinkPad X1 Nano-20UN002UGE | |
Webcam
The webcam is very prominently placed on the display cover. Its quality is good for a laptop, but not outstanding.


Security
In addition to the fingerprint sensor, the Lenovo ThinkPad Z13 also has an infrared camera for biometric login. The eShutter is new: Instead of using a physical shutter, the camera can be locked electronically by pressing F9. Another new feature is the Microsoft Pluton security chip, which performs the task of a dTPM chip. It also blocks a Linux installation by default, but this can be easily changed in the BIOS.
Accessories
There are no other accessories included apart from the 65-watt power adapter.
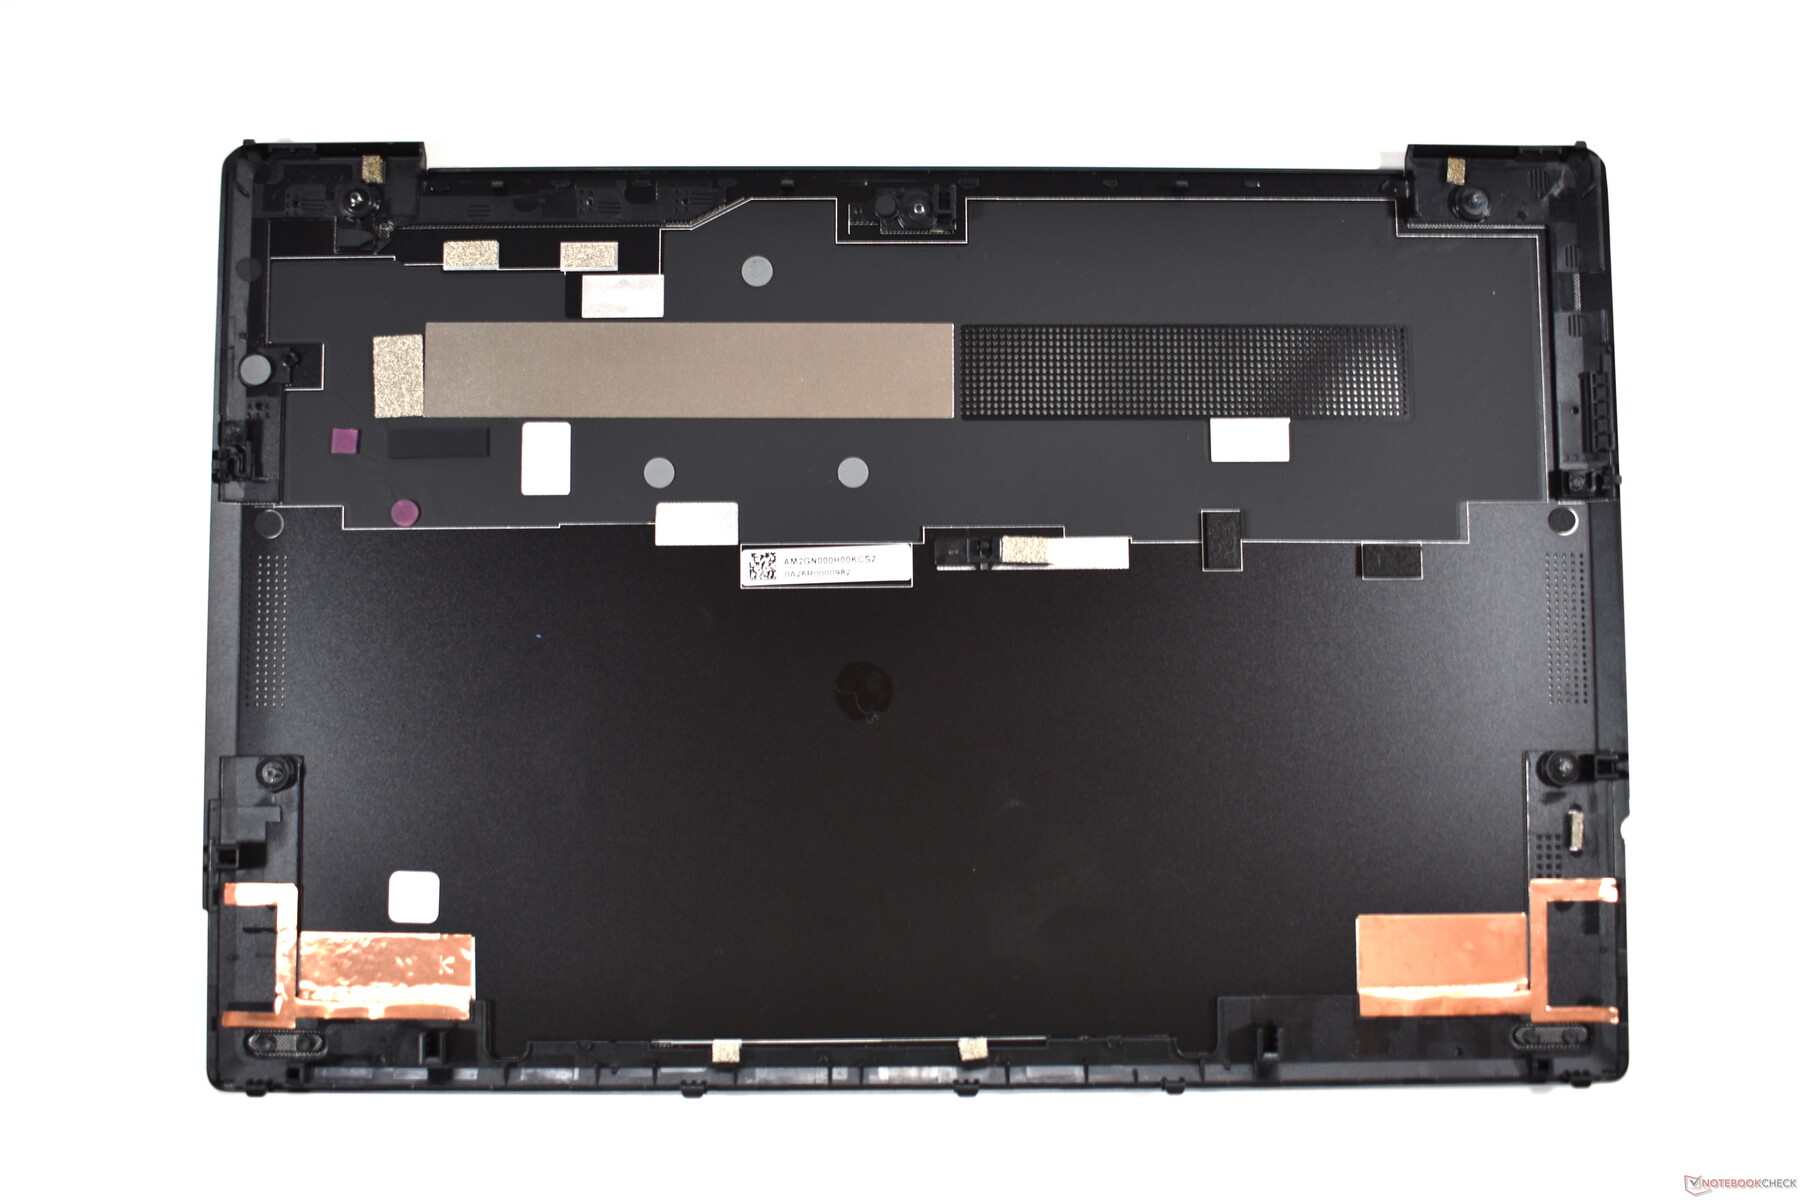
Maintenance
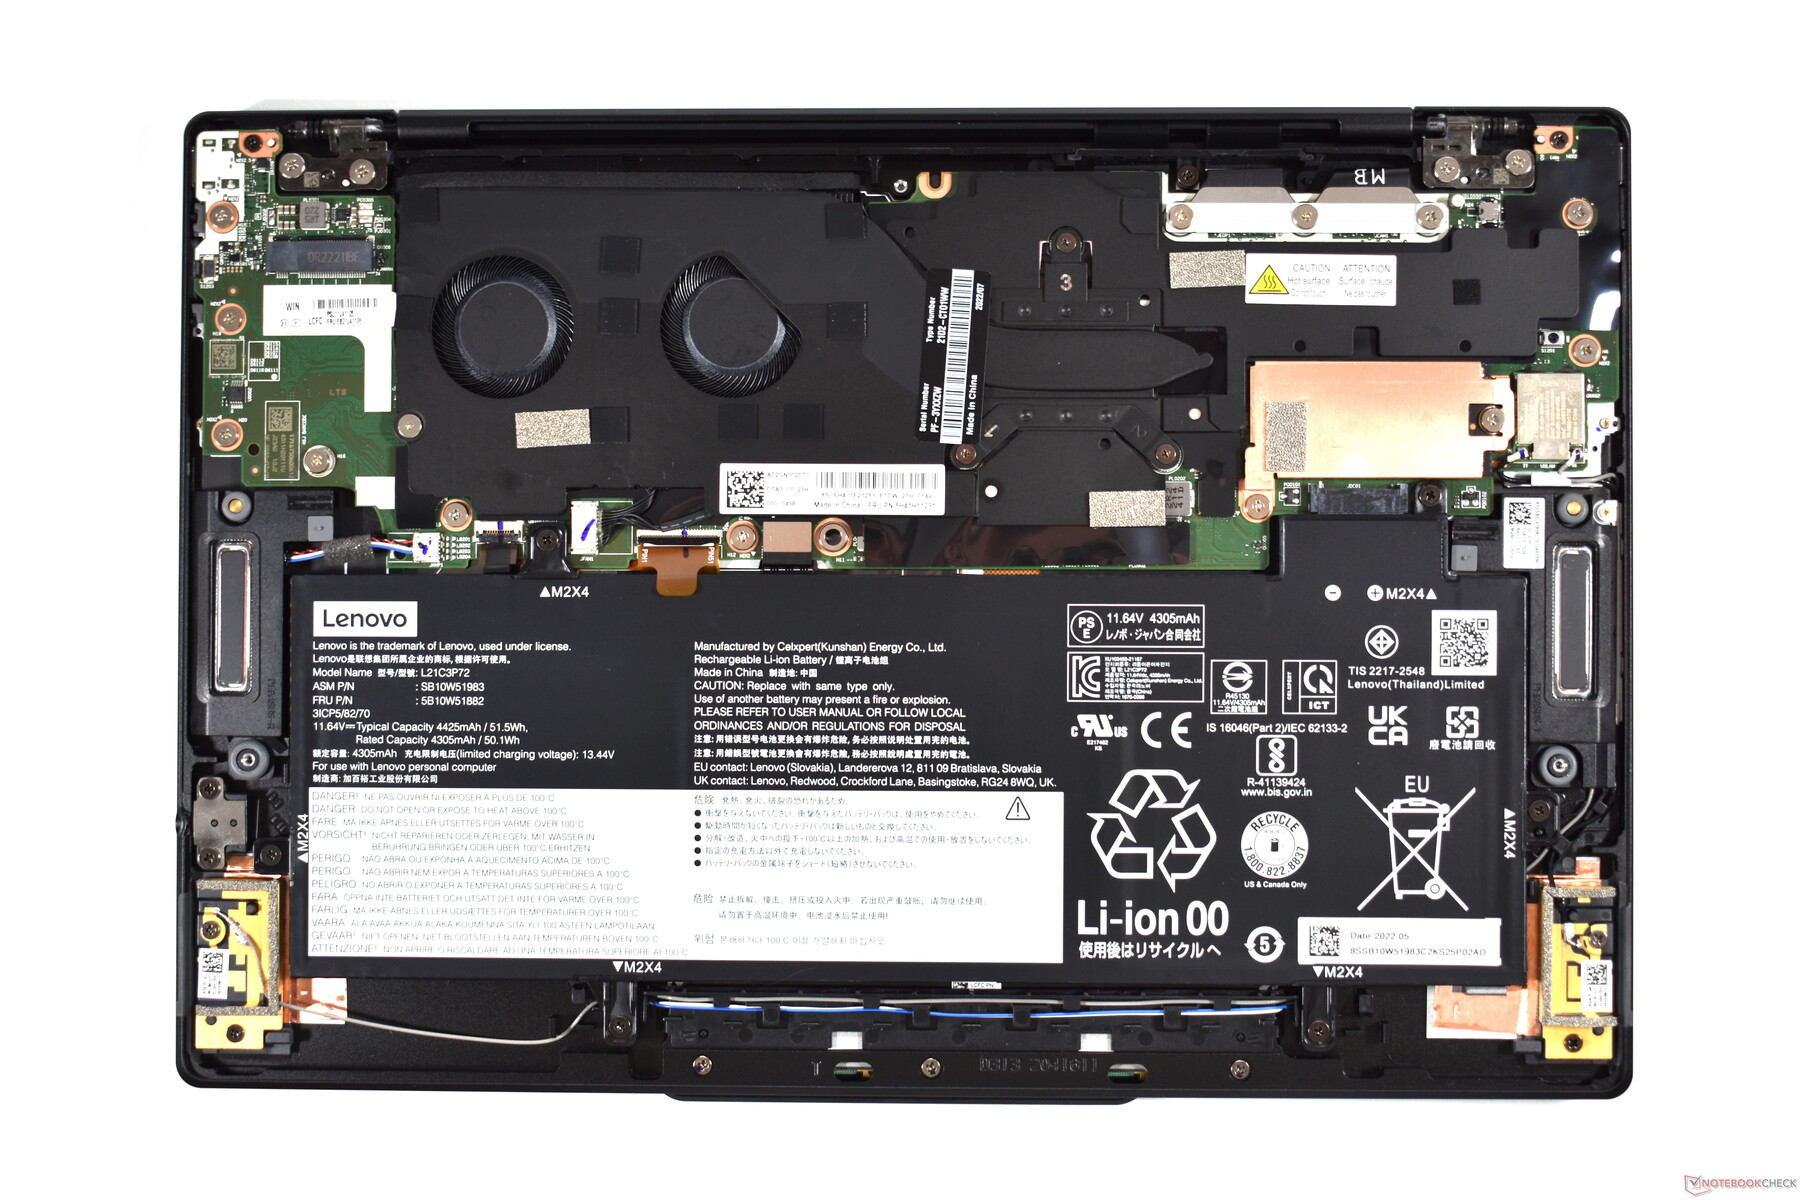
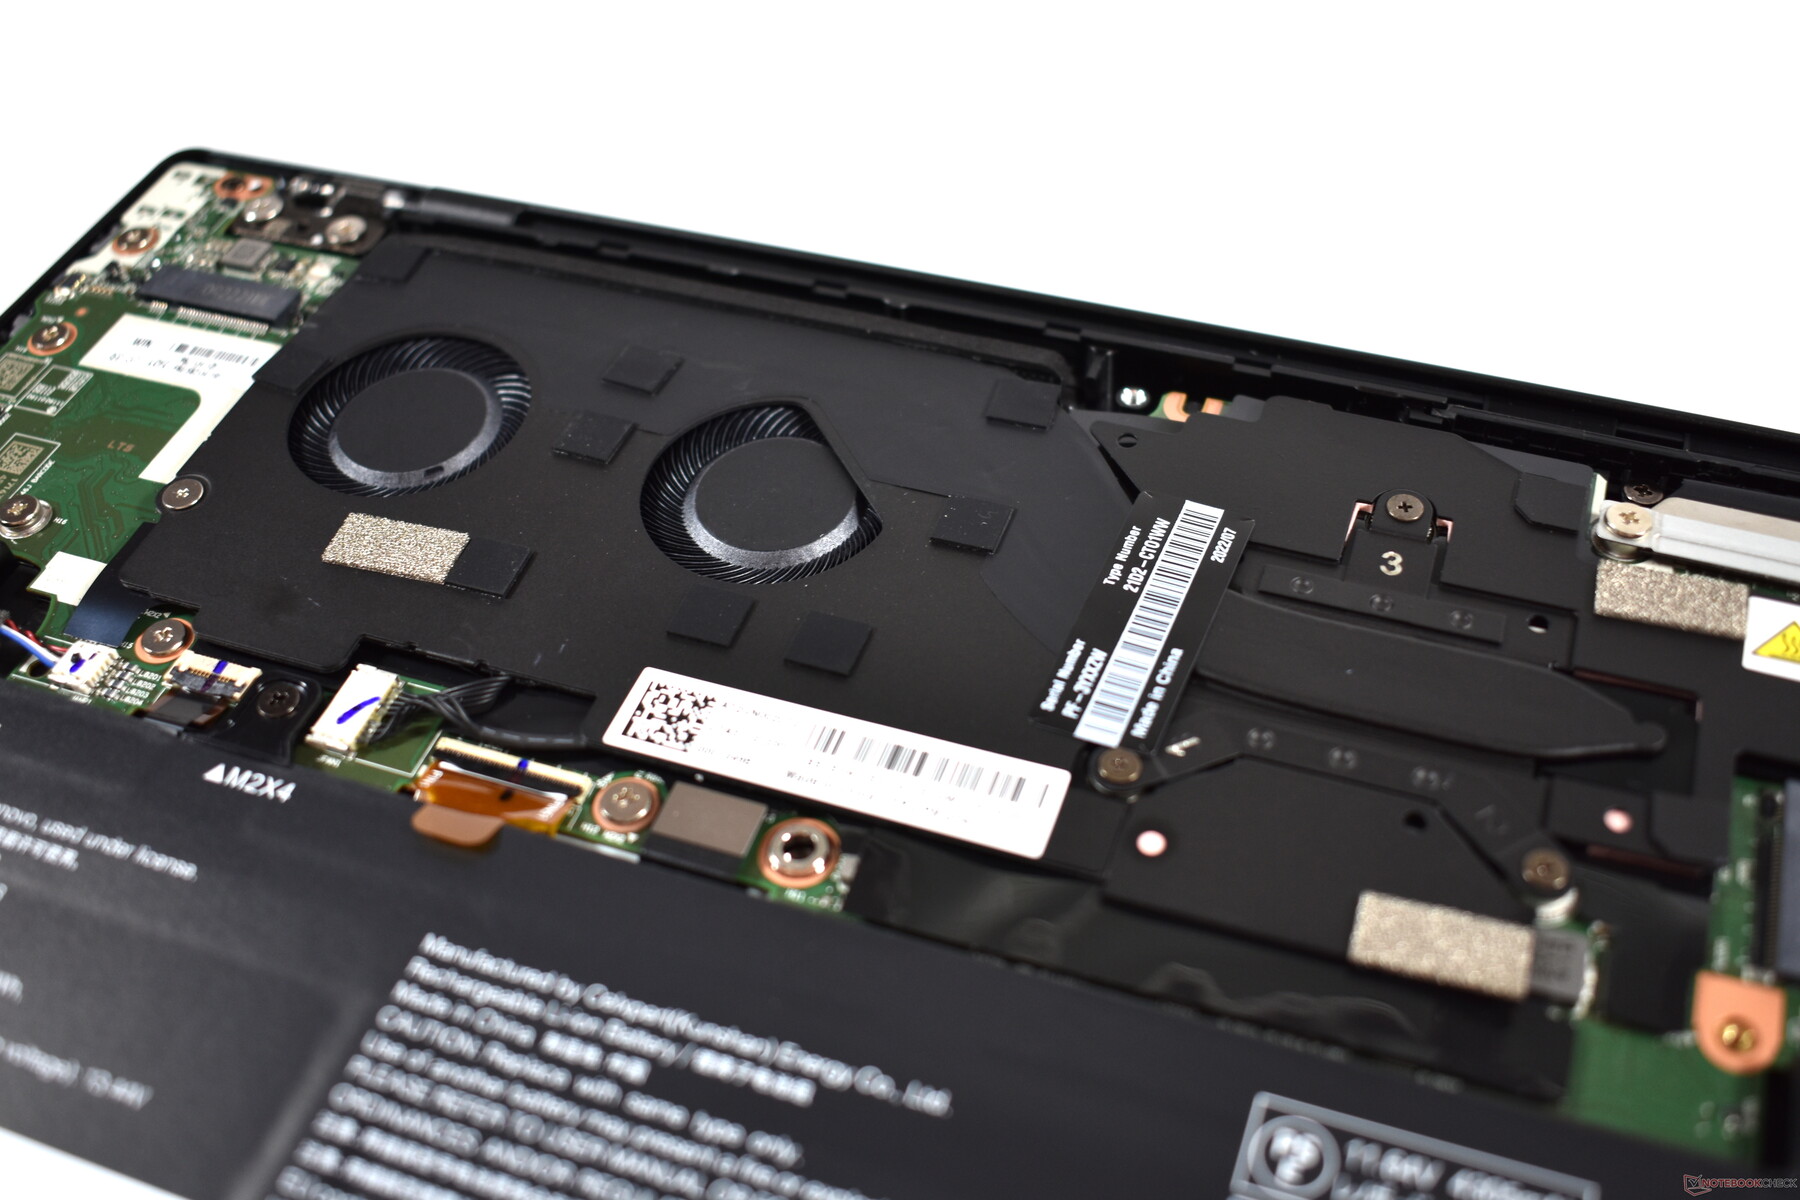
Lenovo doesn't make it too difficult to take a look inside. Only five cross-head screws need to be loosened, and they remain stuck in the cover. Then, there are a few clips in the area around the hinges. These can be released quickly with a spudger tool, and the bottom cover can then be taken off right away.
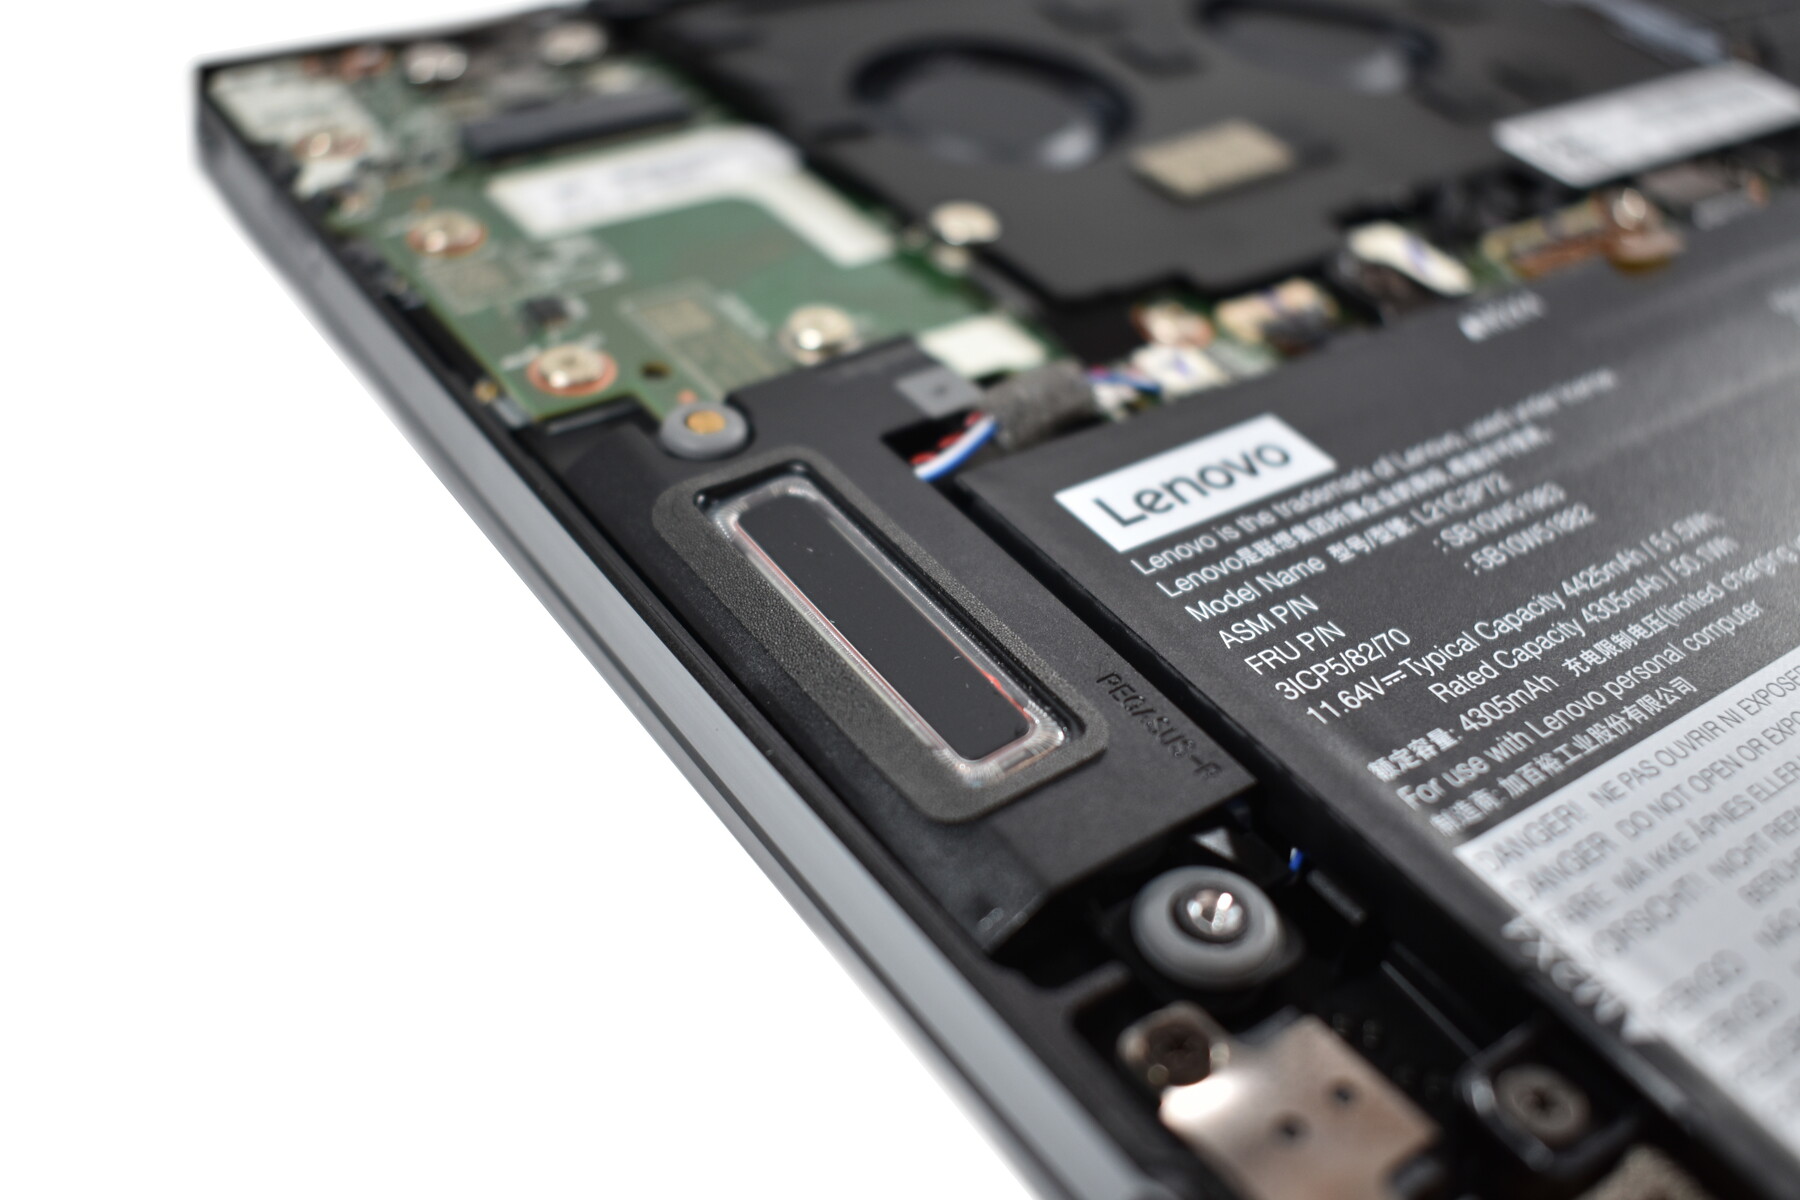
Only the M.2 SSD is upgradeable in the Lenovo ThinkPad Z13; the RAM as well as the Wi-Fi card are soldered, while there's no WWAN configuration. It should be noted that the M.2 SSD is a single-sided 2242 SSD; a model with storage chips on both sides will not fit. Of course, apart from the SSD upgrade, you can also replace the battery or clean the fans.
Warranty
The Z13 has a three-year warranty with Bring-In service by default. Extending it to up to five years is possible, as well as adding services like Accidental Damage Protection or Premier Support.
Input devices: Full-width keyboard and haptic trackpad
Keyboard
The two-stage backlit keyboard is similar to that of the Lenovo ThinkPad X1 Nano, but it's not identical. The common factor is the key travel of 1.35 mm. The size of the keyboard is different: Lenovo has installed a standard-width keyboard in the ThinkPad Z13, which results in the keypad barely having borders on the sides. This is a welcome change, as the larger keys increase the comfort when typing. The Z13 is the only ThinkPad in its size class with a full-sized keyboard.
The redesign of the arrow keys is less welcome, and the fact that the Z13 no longer has dedicated Page Up/Down keys. A business laptop should have these keys. Lenovo has also modified the layout of the Ctrl key, which is now located to the left of the Fn key for the first time on a ThinkPad - the standard layout for almost every laptop. This will certainly be an adjustment for long-time ThinkPad users, but the key layout can be changed in the BIOS if desired.
Overall, the keyboard is excellent, and surely one of the best available in this size and weight class. Larger ThinkPads with deeper key travel definitely have their advantages, but longer text can still be typed very comfortably on the ThinkPad Z13.
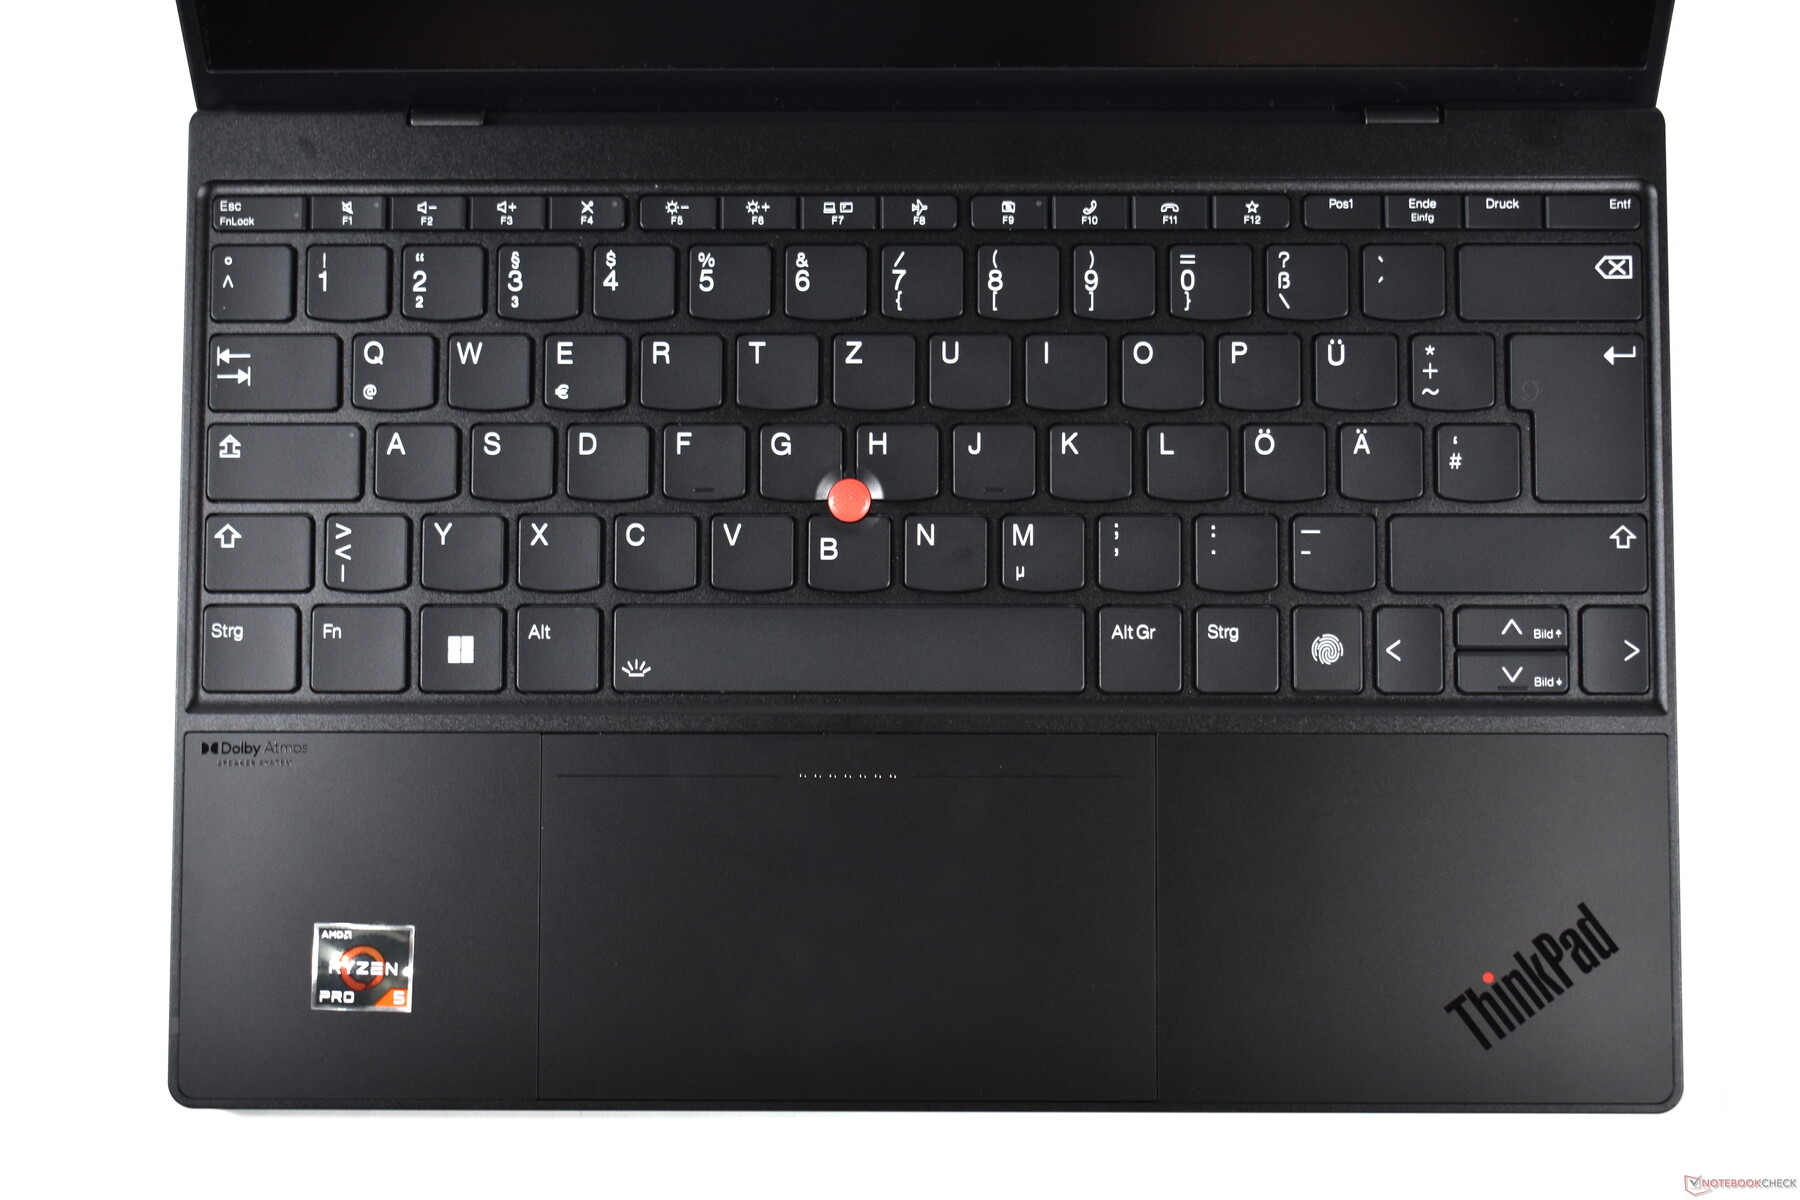
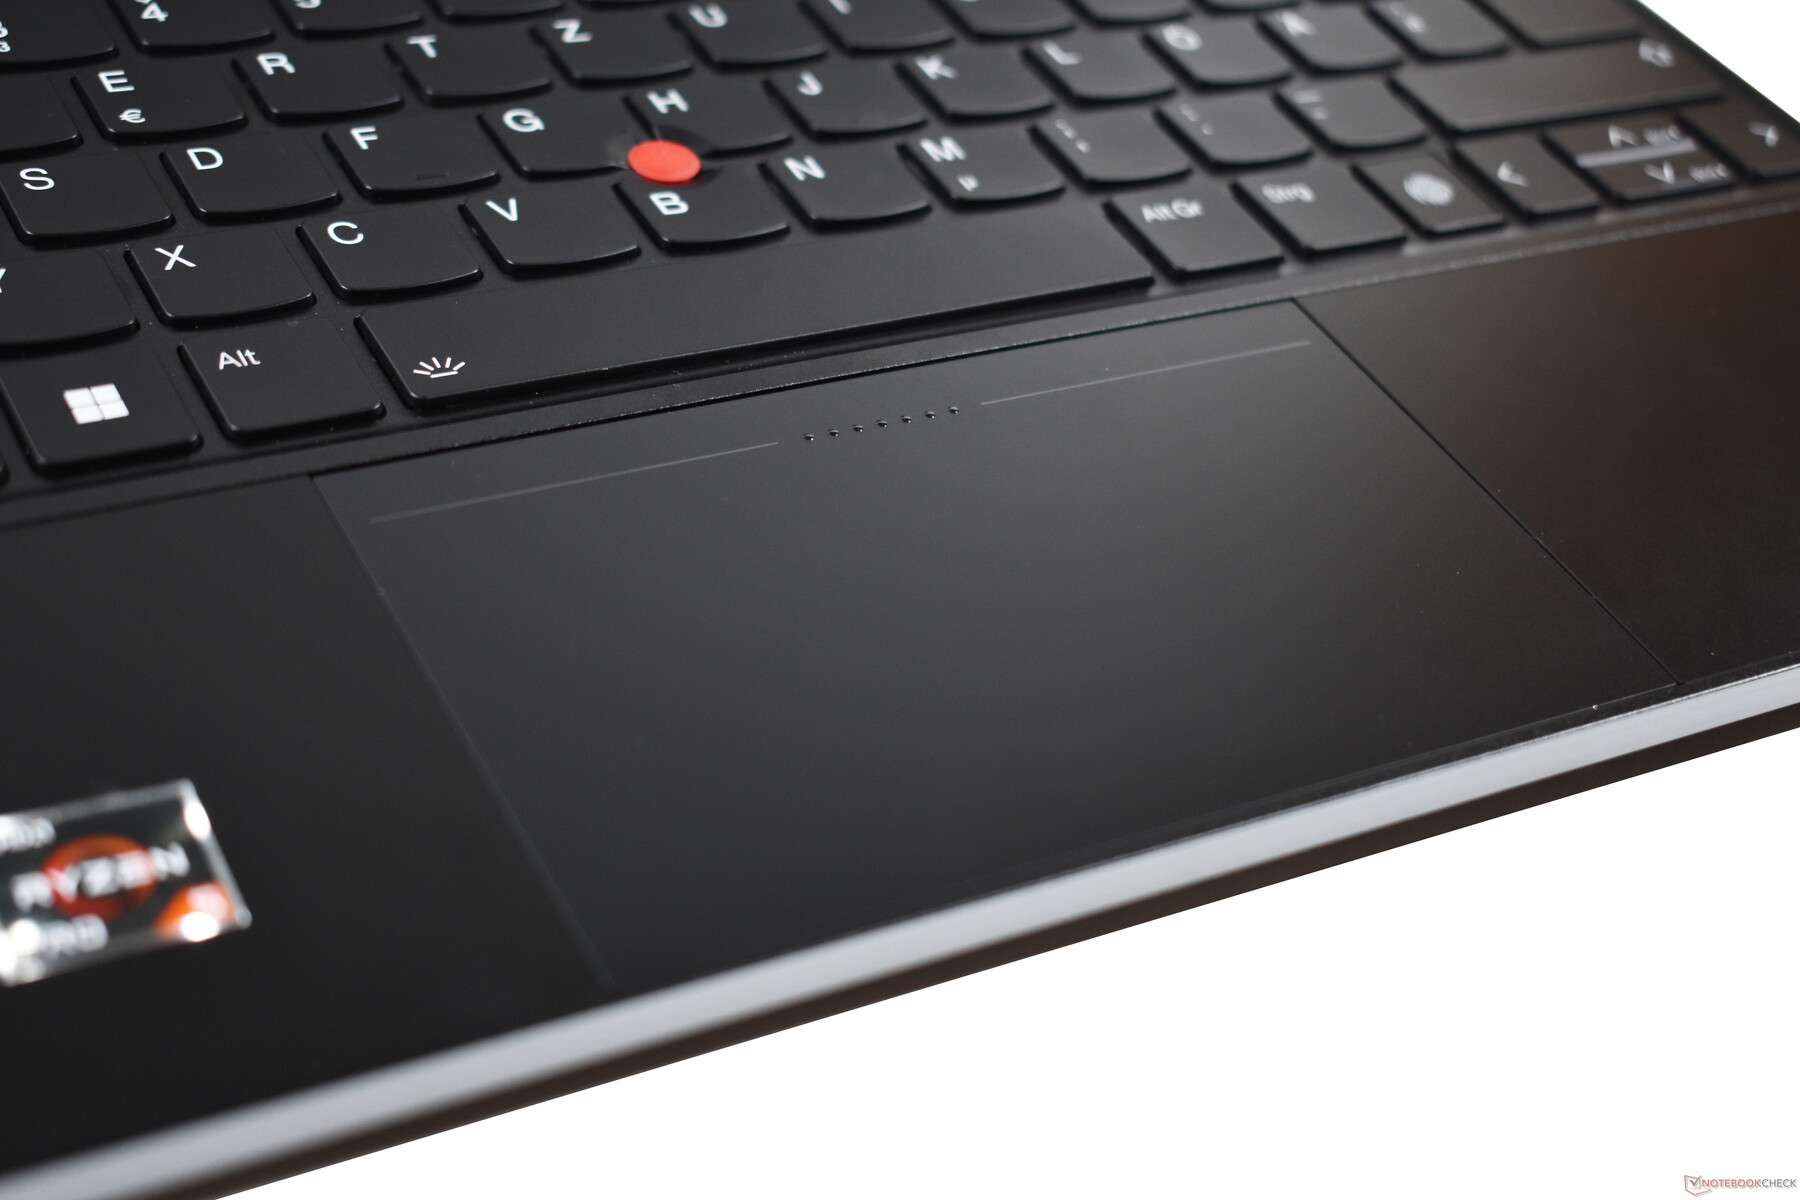
Touchpad and TrackPoint
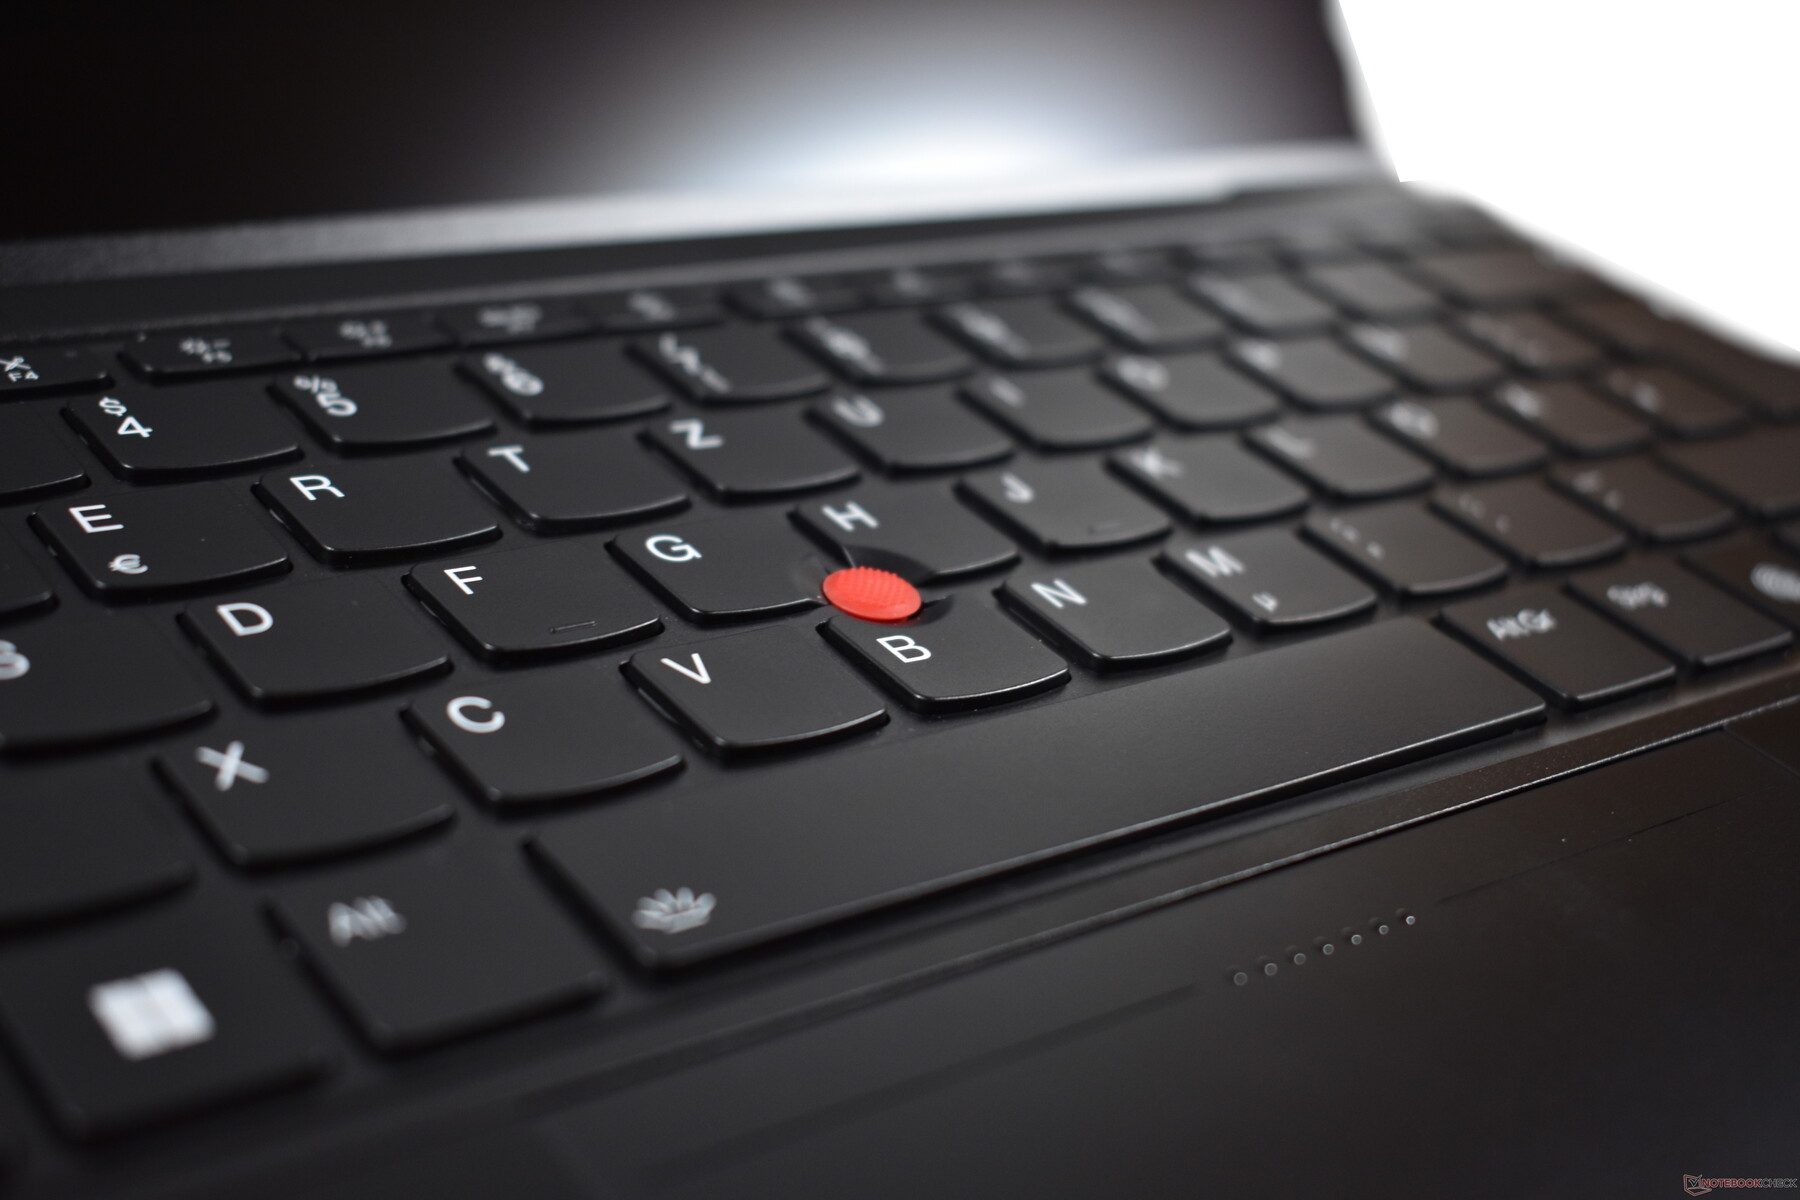
The new trackpad is considerably more groundbreaking than the changes made to the keyboard. For the first time since 2014 and the X1 Carbon Gen 2, Lenovo has once again released a ThinkPad without dedicated TrackPoint buttons. However, unlike back then, we now have a haptic solution, i.e. the click is only simulated, and the ClickPad doesn't move. By doing so, Lenovo achieves one thing above all: An increase in the touchpad's area.
The modifications are beneficial for the glass touchpad's user experience, because it's better than the touchpads of other ThinkPads. The gliding properties are excellent, and gestures like pinch-to-zoom are implemented smoothly. The larger surface also makes it less likely that your finger will run out of room to move the pointer. Moreover, the touchpad can now be clicked everywhere.
The changes made to the iconic red pointing stick, the TrackPoint, are less beneficial. One thing first: The new design is much better than the one from 2014, as the virtual TrackPoint buttons are very easy to configure. Users can decide how much force is needed to trigger a click and how loud the click should be - it can even be silent.
However, Lenovo was unable to solve one fundamental problem of this design: Without the physical buttons, there's no way to blindly sense where to press for a right or left click. This is only possible with the center button, where Lenovo places some tactile dots on the touchpad. This means that you sometimes fail to trigger the desired button during use. Over time, such errors will decrease, and you'll get used to the new solution, but it's not better than having dedicated buttons.
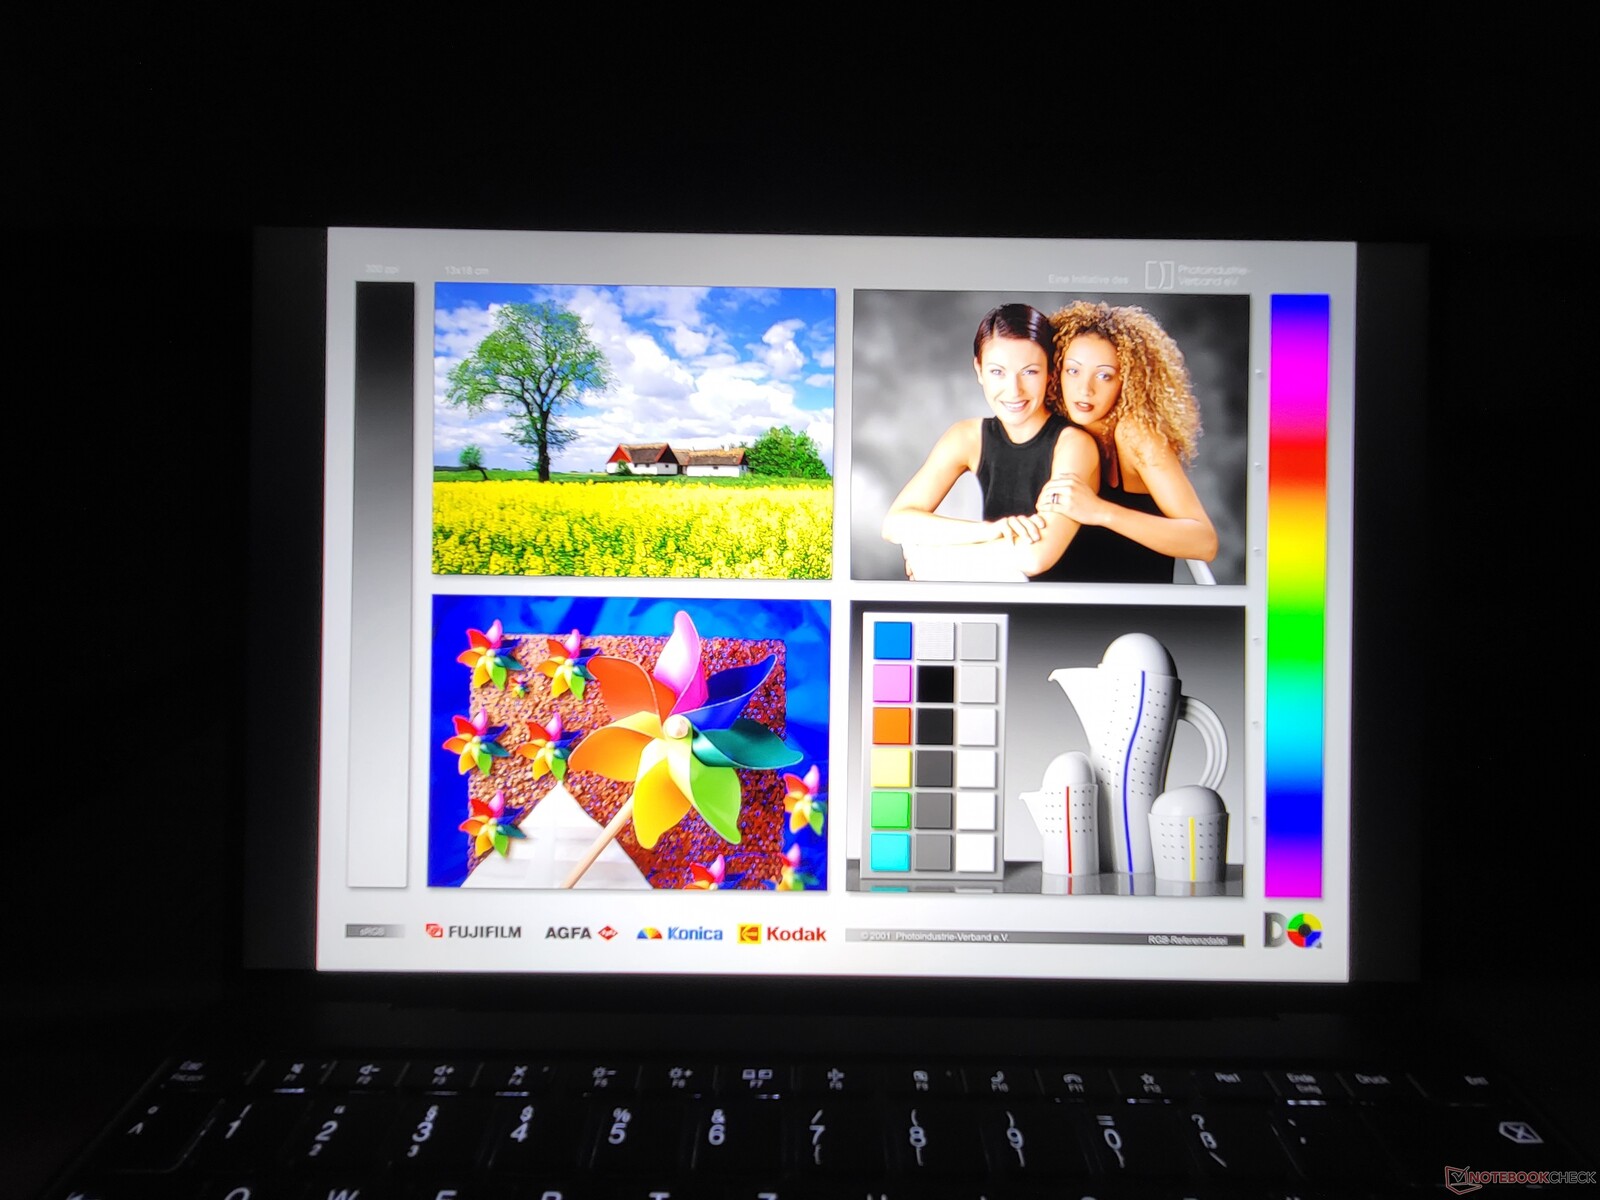
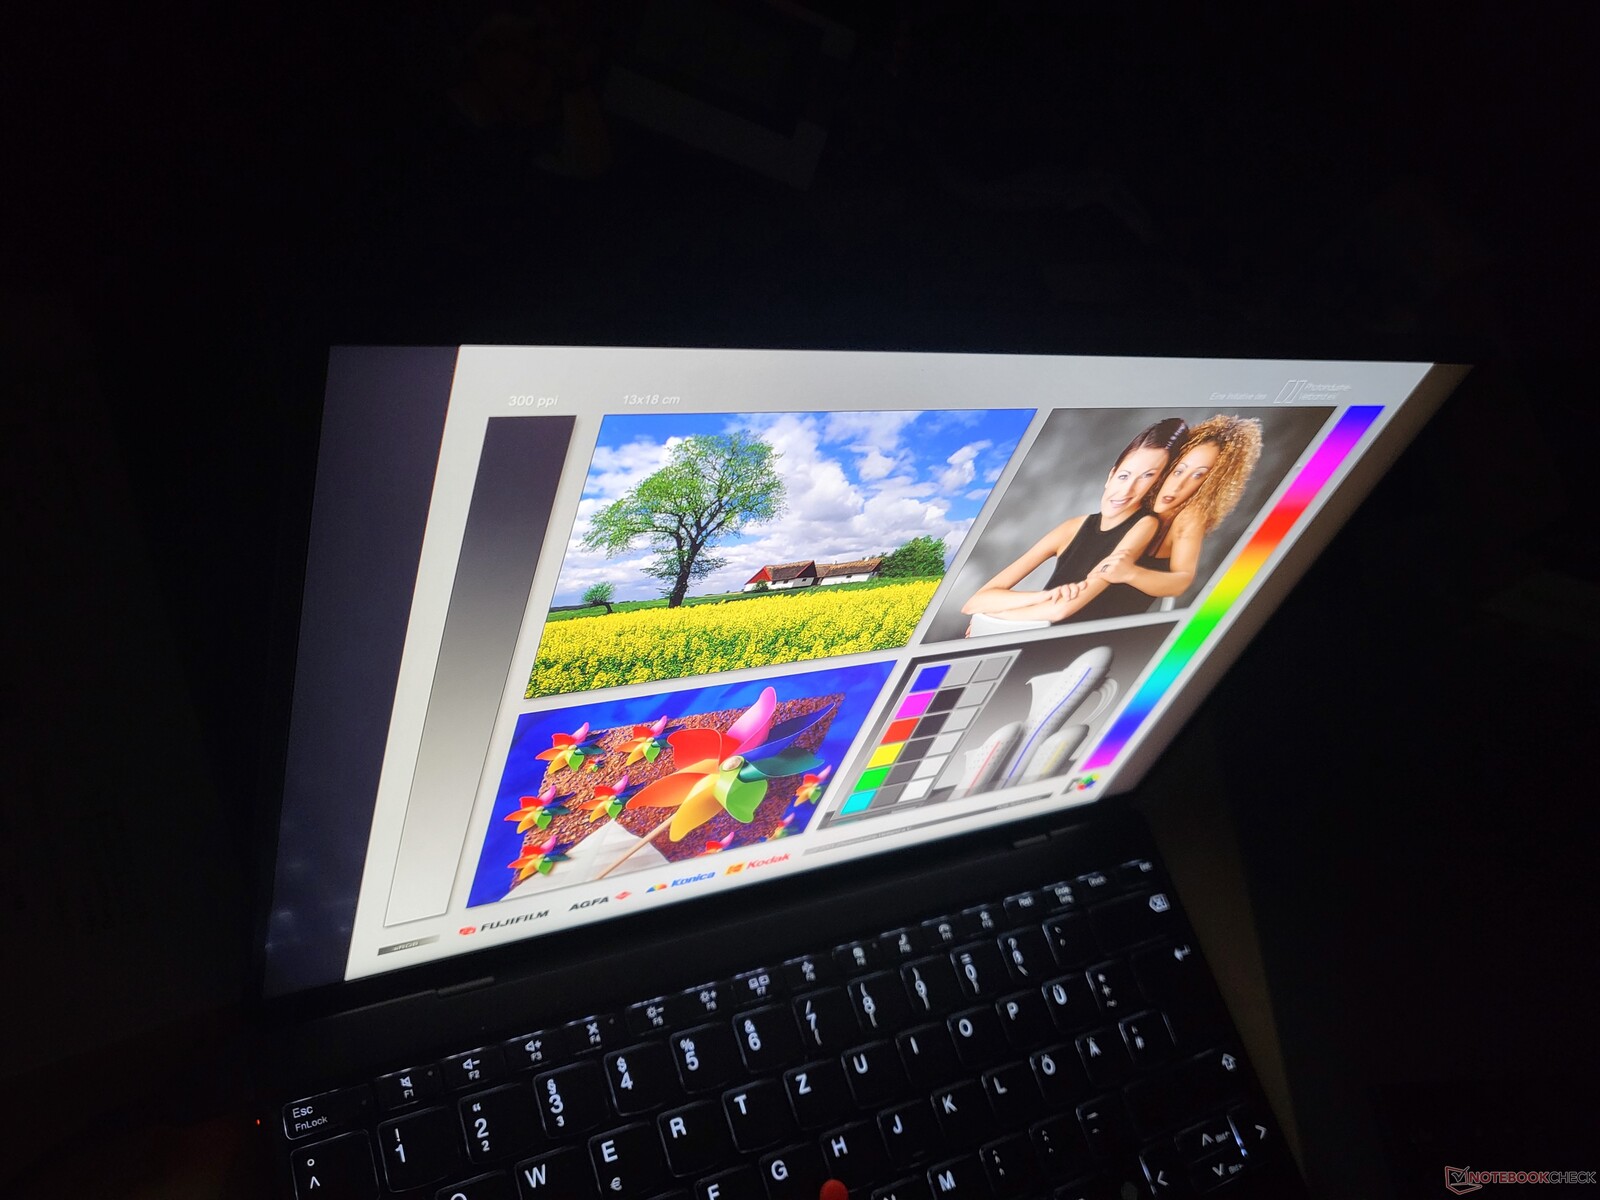
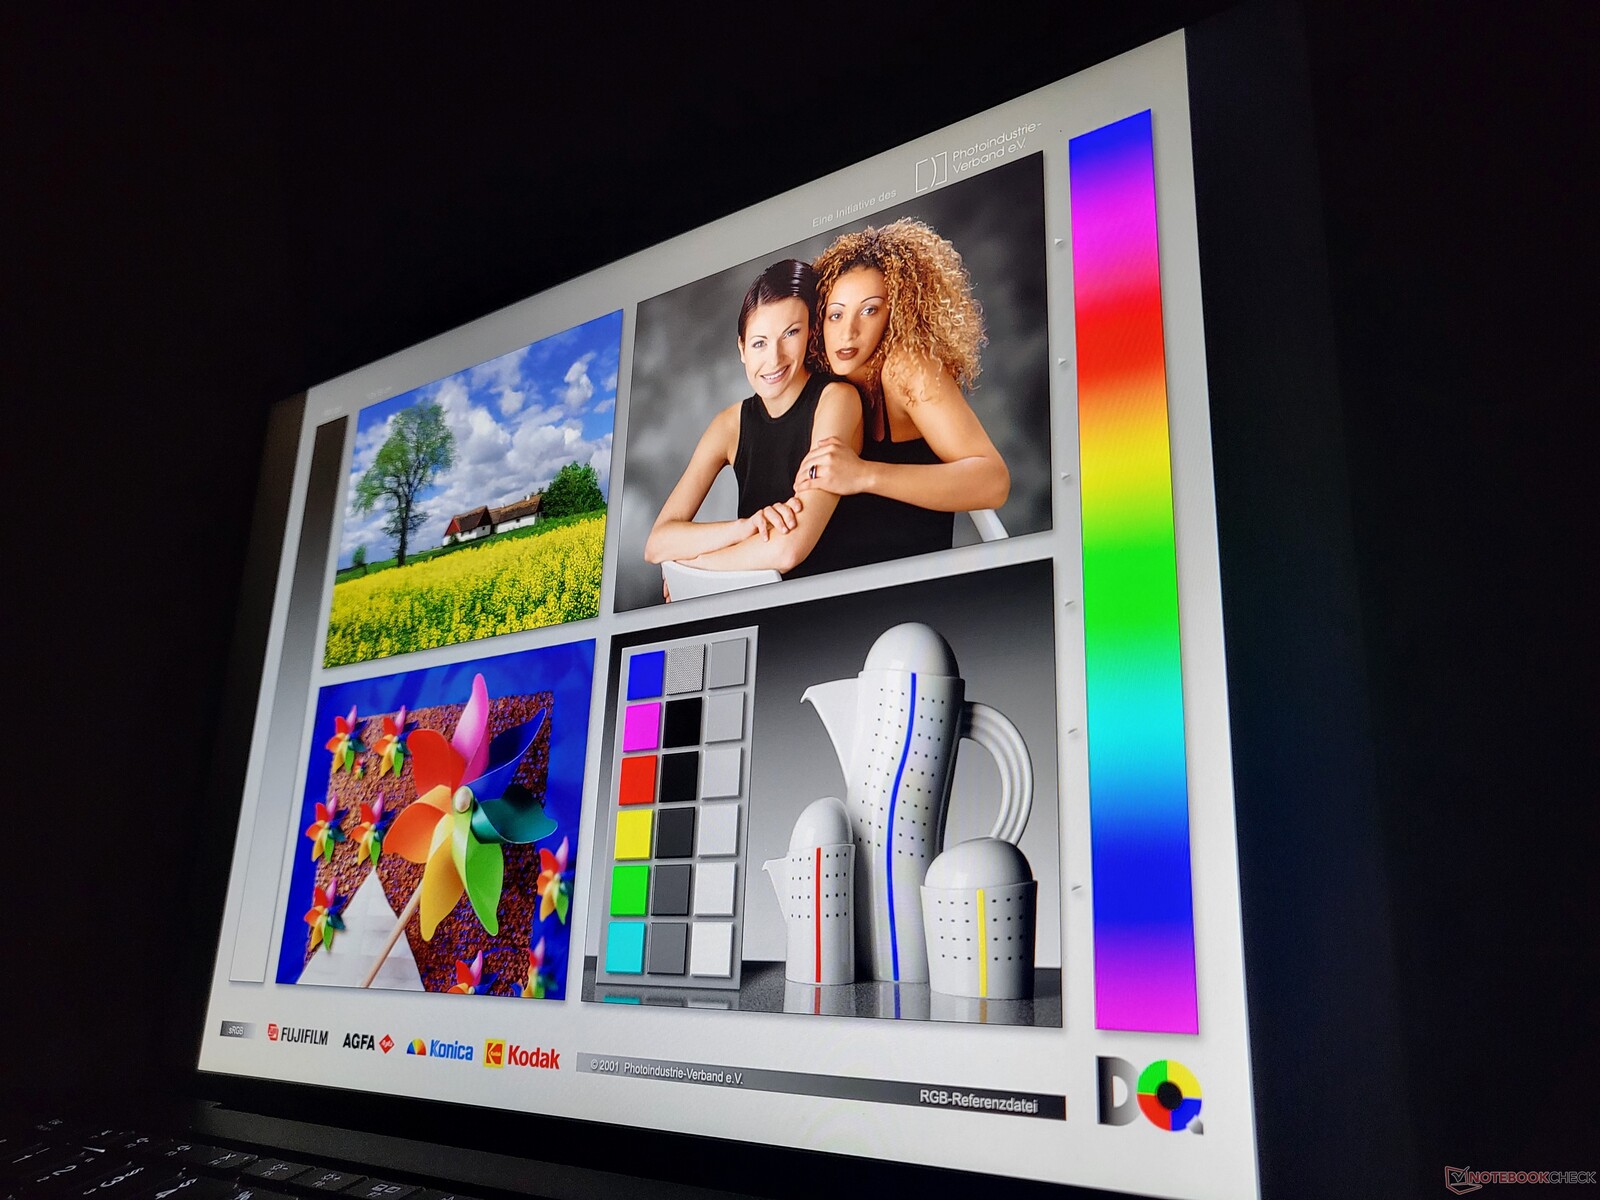
Display: Lenovo laptop with matte Full HD LCD
Lenovo offers a total of three 13.3-inch display options in the 16:10 format for the ThinkPad Z13 G1:
- WUXGA (1,920x1,200), IPS, 400 cd/m², 100% sRGB, matte, Low Power
- WUXGA (1,920x1,200), IPS, 400 cd/m², 100% sRGB, glossy with anti-reflective coating, Low Power, touch
- 2.8K (2,880x1,800), OLED, 400 cd/m², 100% DCI-P3, glossy with anti-reflective coating, touch
We measure a peak of 418 cd/m², but the average of 378 cd/m² is a bit less than the intended 400 cd/m². This value puts the ThinkPad Z13 below its rivals, which tend to be in the range between 450 and 500 cd/m².
| |||||||||||||||||||||||||
Brightness Distribution: 81 %
Center on Battery: 418 cd/m²
Contrast: 1267:1 (Black: 0.33 cd/m²)
ΔE ColorChecker Calman: 1.7 | ∀{0.5-29.43 Ø4.71}
calibrated: 1.1
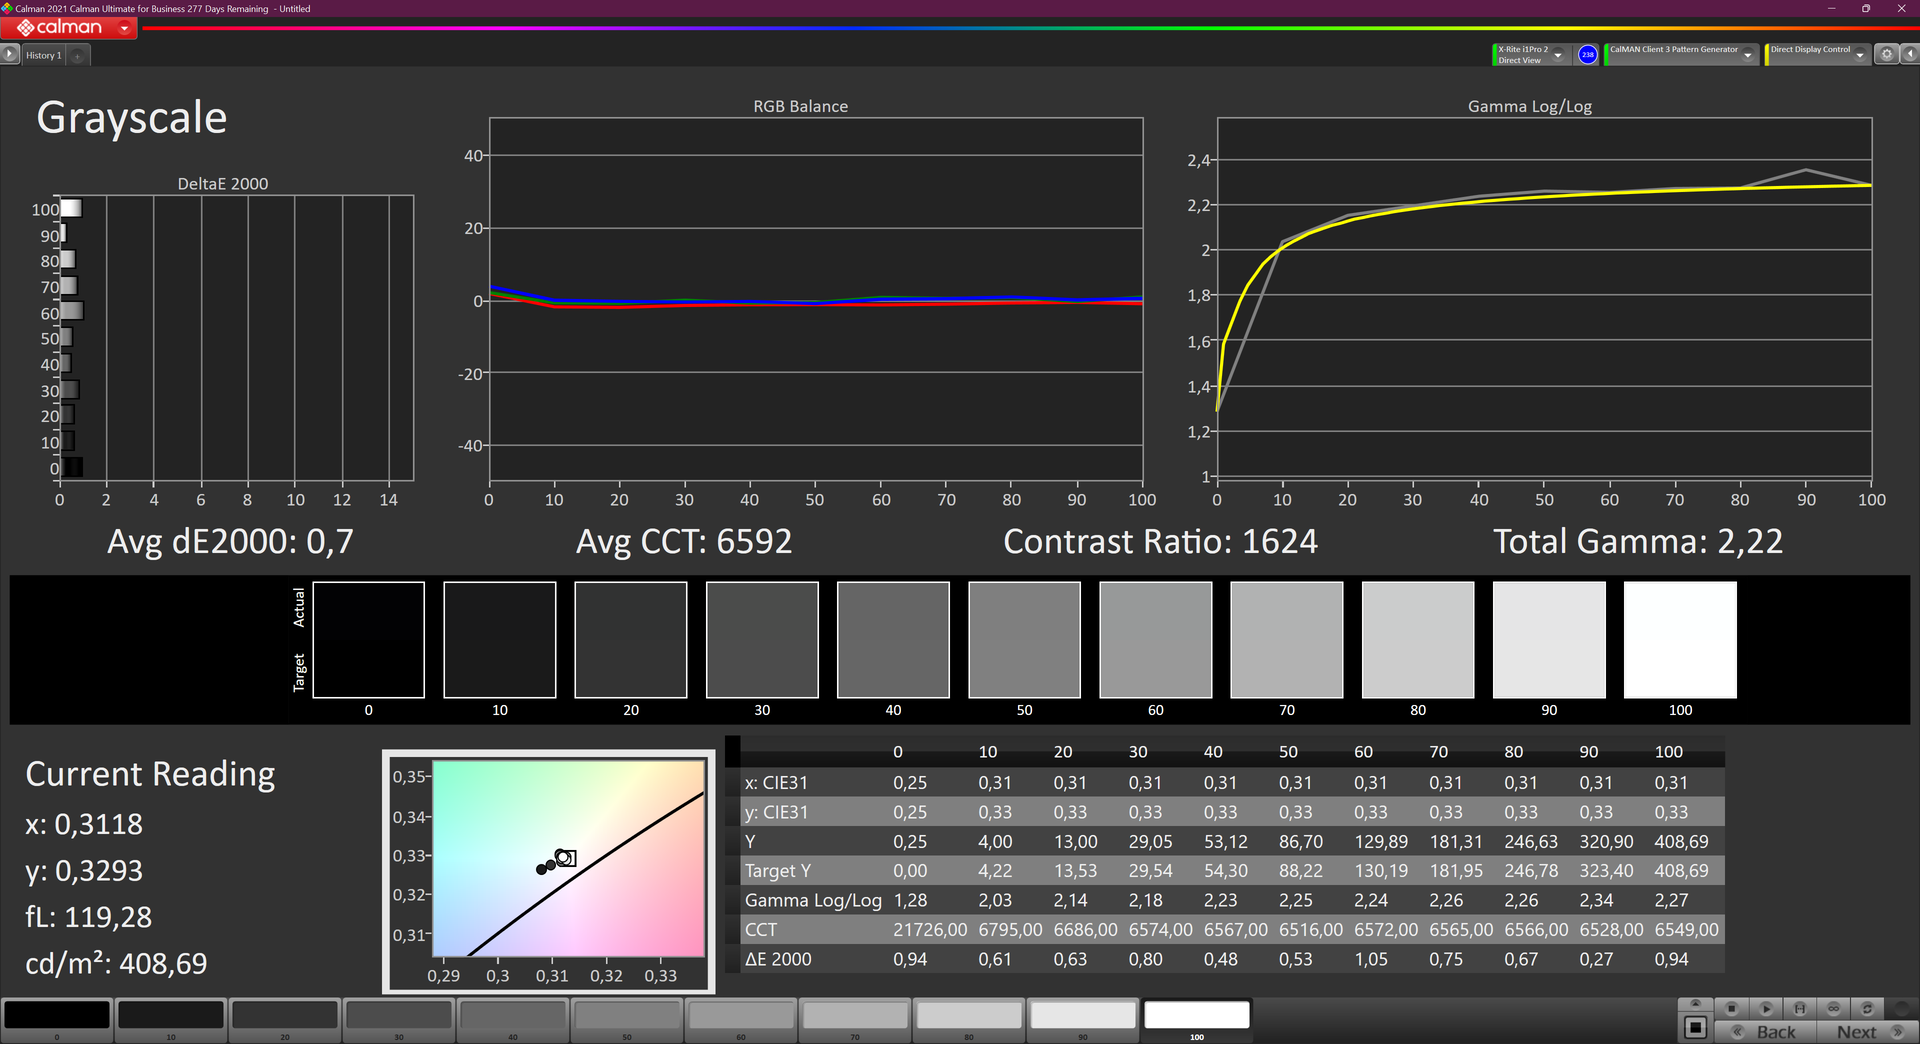
ΔE Greyscale Calman: 2.3 | ∀{0.09-98 Ø4.96}
69.7% AdobeRGB 1998 (Argyll 3D)
96.5% sRGB (Argyll 3D)
67.7% Display P3 (Argyll 3D)
Gamma: 2.14
CCT: 6499 K
| Lenovo ThinkPad Z13 21D2CTO1WW NV133WUM-N63, IPS LED, 1920x1200, 13.3" | Dell XPS 13 Plus 9320 i5-1240p Sharp SHP1548 LQ134N1, IPS, 1920x1200, 13.4" | Lenovo ThinkPad X1 Carbon G10 21CC001RGE B140UAN02.1, IPS LED, 1920x1200, 14" | Apple MacBook Air M2 Entry IPS, 2560x1664, 13.6" | Lenovo ThinkPad X1 Nano-20UN002UGE MND007ZA1-2, IPS, 2160x1350, 13" | Dell XPS 13 Plus 9320 4K LQ134R1, IPS, 3840x2400, 13.4" | |
|---|---|---|---|---|---|---|
| Display | 2% | 7% | 25% | 4% | 9% | |
| Display P3 Coverage (%) | 67.7 | 69 2% | 74.6 10% | 98.4 45% | 70.4 4% | 76.5 13% |
| sRGB Coverage (%) | 96.5 | 99 3% | 98.6 2% | 99.9 4% | 99.9 4% | 100 4% |
| AdobeRGB 1998 Coverage (%) | 69.7 | 71 2% | 76.5 10% | 87.6 26% | 72 3% | 76 9% |
| Response Times | 9% | 2% | 13% | -9% | 13% | |
| Response Time Grey 50% / Grey 80% * (ms) | 49 ? | 45 ? 8% | 45.5 ? 7% | 32.9 ? 33% | 46.8 ? 4% | 38.9 ? 21% |
| Response Time Black / White * (ms) | 23 ? | 21 ? 9% | 24 ? -4% | 24.9 ? -8% | 28 ? -22% | 21.9 ? 5% |
| PWM Frequency (Hz) | 53050 ? | |||||
| Screen | -50% | -27% | 16% | 14% | -9% | |
| Brightness middle (cd/m²) | 418 | 498 19% | 372 -11% | 526 26% | 460 10% | 494 18% |
| Brightness (cd/m²) | 379 | 460 21% | 362 -4% | 486 28% | 434 15% | 474 25% |
| Brightness Distribution (%) | 81 | 85 5% | 94 16% | 87 7% | 92 14% | 89 10% |
| Black Level * (cd/m²) | 0.33 | 0.53 -61% | 0.18 45% | 0.38 -15% | 0.27 18% | 0.28 15% |
| Contrast (:1) | 1267 | 940 -26% | 2067 63% | 1384 9% | 1704 34% | 1764 39% |
| Colorchecker dE 2000 * | 1.7 | 3.65 -115% | 3.4 -100% | 1.3 24% | 1.1 35% | 3.1 -82% |
| Colorchecker dE 2000 max. * | 3.3 | 7.11 -115% | 6.7 -103% | 2.7 18% | 4.5 -36% | 4.2 -27% |
| Colorchecker dE 2000 calibrated * | 1.1 | 2.16 -96% | 1.8 -64% | 0.7 36% | 1 9% | 1.5 -36% |
| Greyscale dE 2000 * | 2.3 | 4.25 -85% | 4.3 -87% | 2 13% | 1.6 30% | 3.2 -39% |
| Gamma | 2.14 103% | 2.45 90% | 2.13 103% | 2.25 98% | 2.2 100% | 2.41 91% |
| CCT | 6499 100% | 6690 97% | 6158 106% | 6858 95% | 6475 100% | 6189 105% |
| Color Space (Percent of AdobeRGB 1998) (%) | 65.7 | |||||
| Color Space (Percent of sRGB) (%) | 99.9 | |||||
| Total Average (Program / Settings) | -13% /
-31% | -6% /
-16% | 18% /
18% | 3% /
9% | 4% /
-2% |
* ... smaller is better
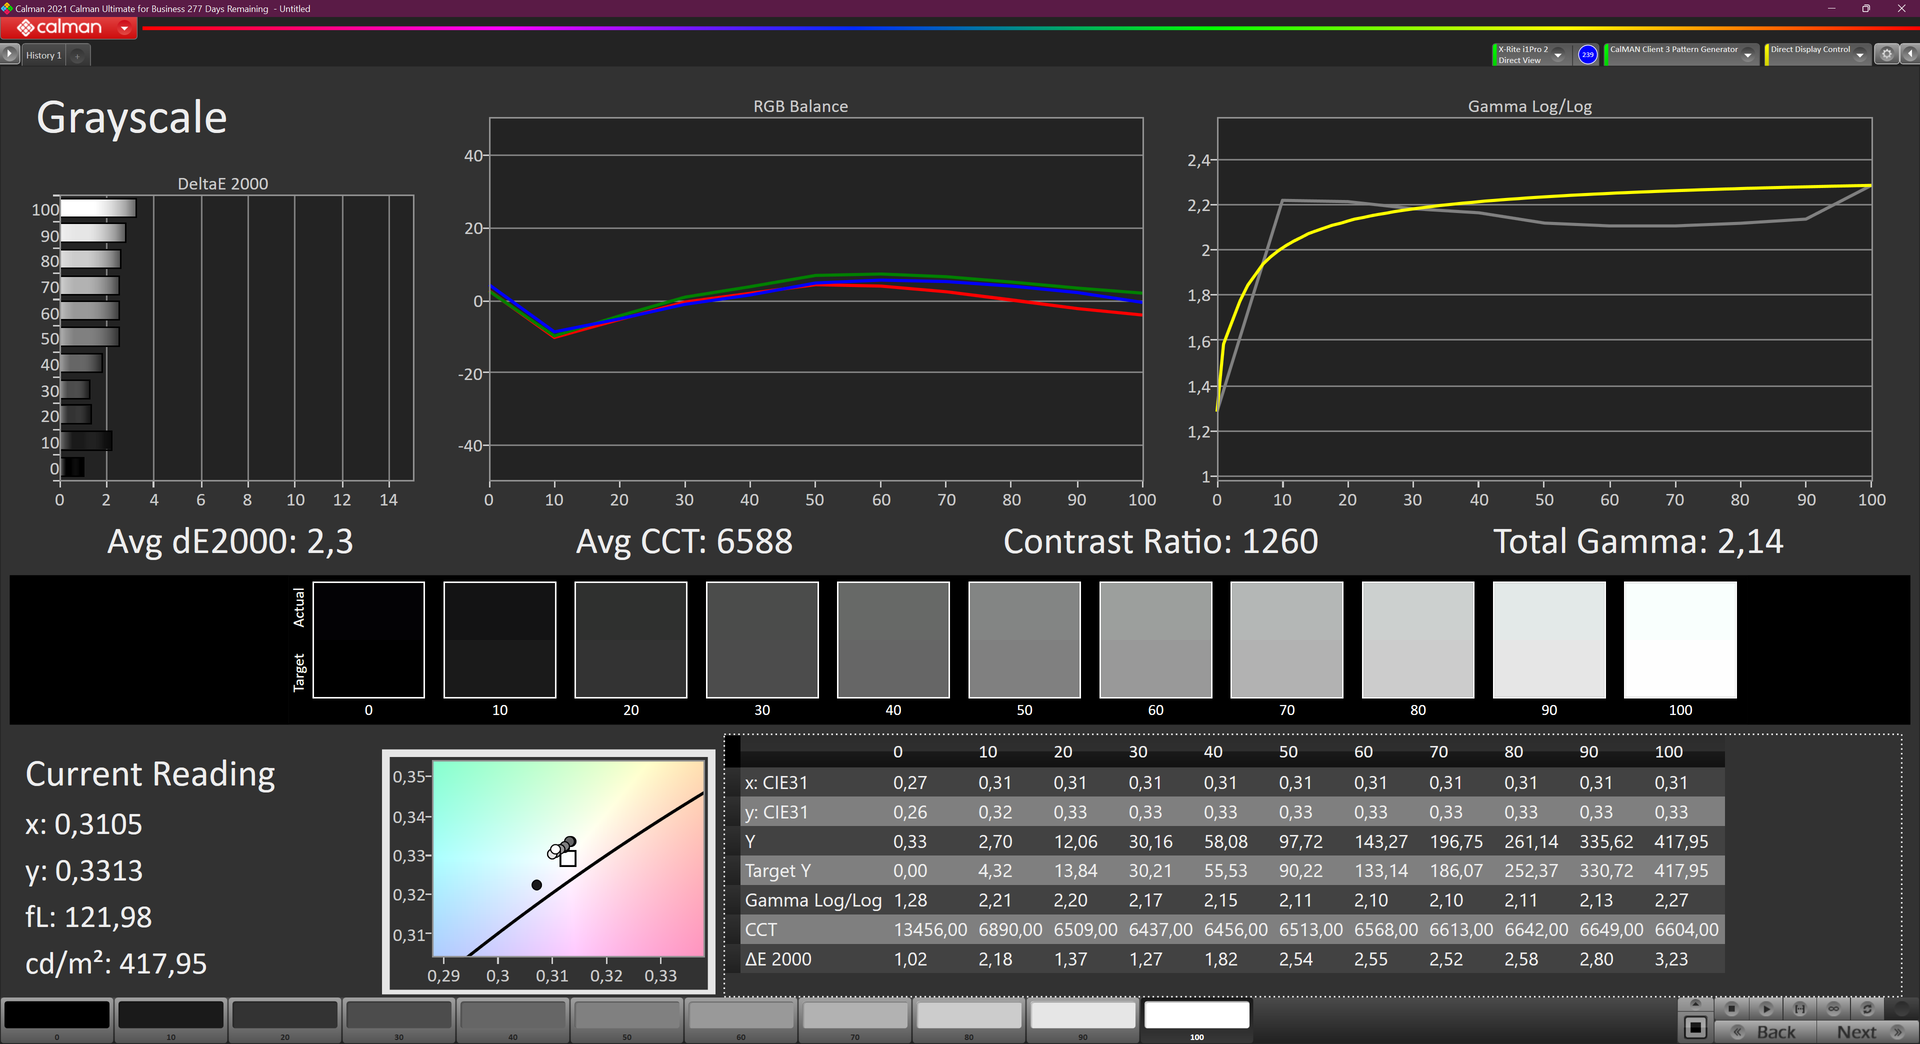
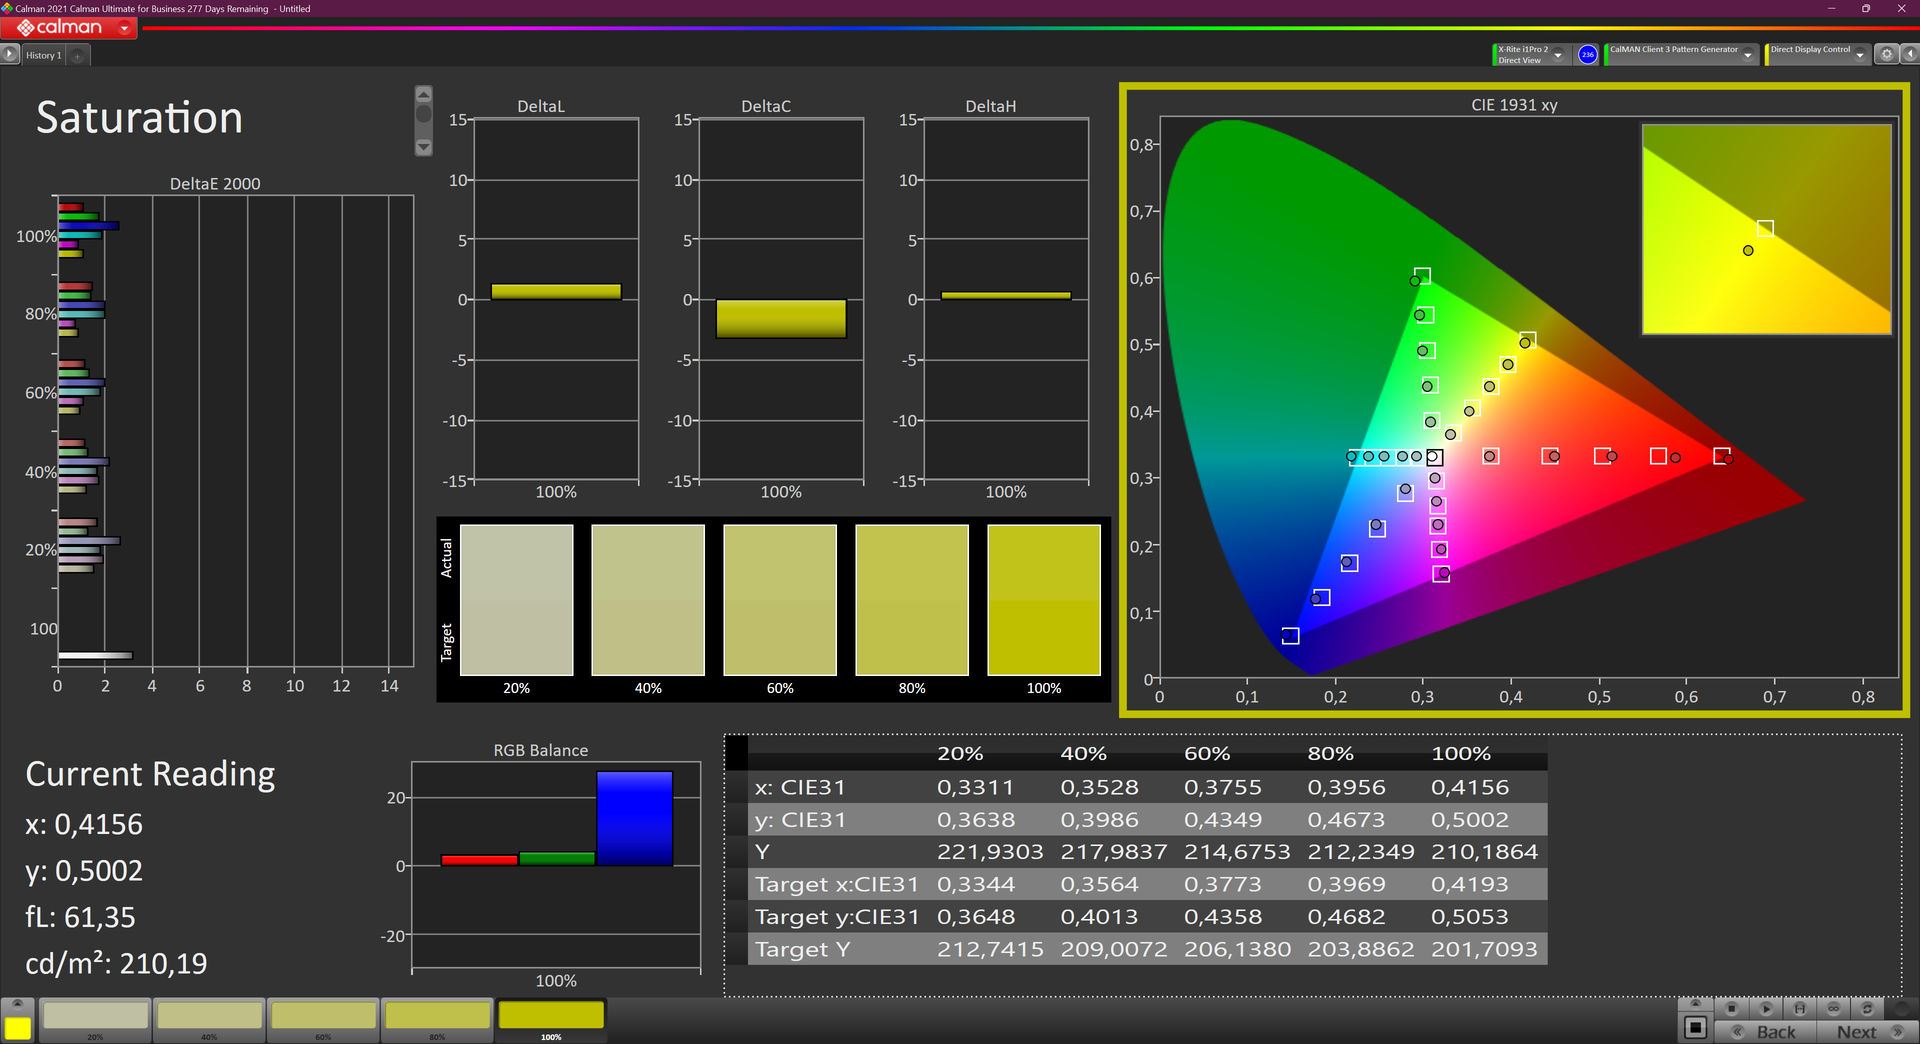
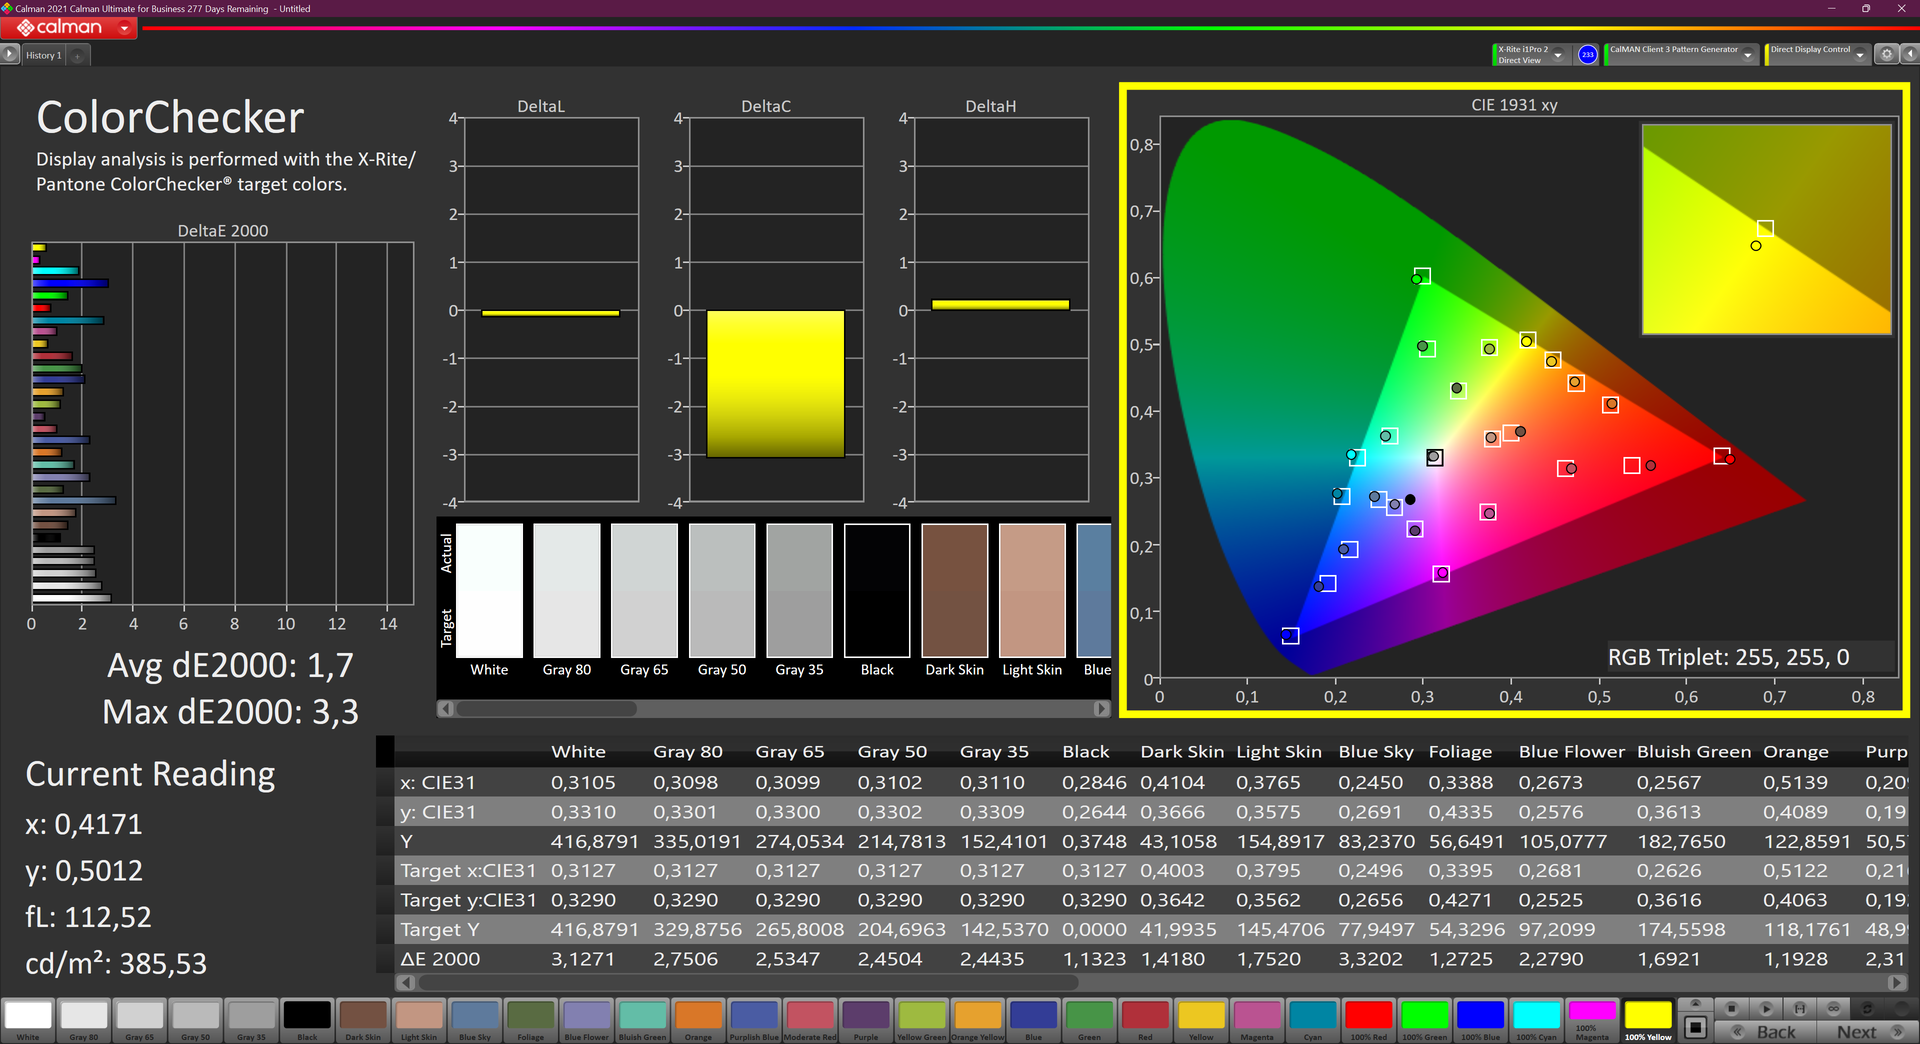
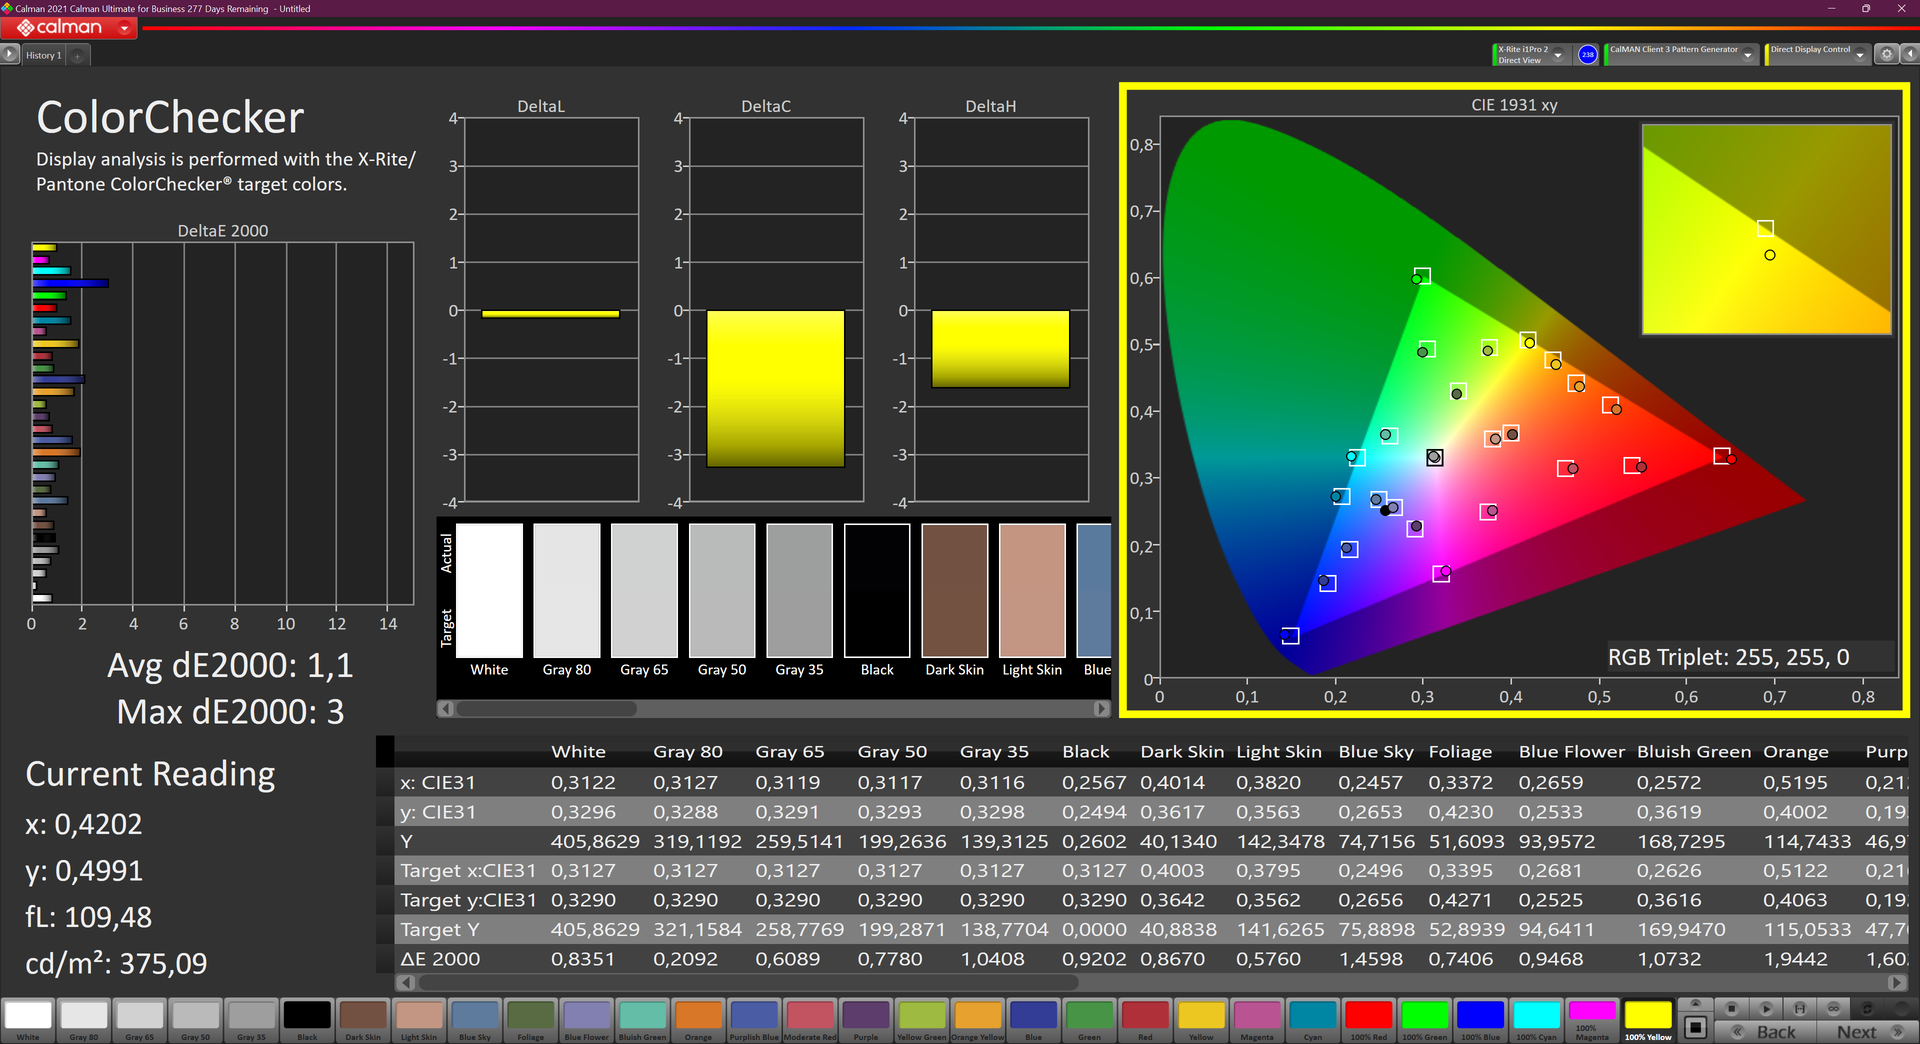
Already out of the box, the deviations from the ideal value aren't huge, which is indicated by the Delta E Colorchecker value of 1.7. We tested the display with CalMan and the i1Pro 2 colorimeter, which we also used for calibration in combination with the i1Profiler. As a result, the Delta E value was reduced to 1.1
The color-space values are okay, but there's still a lot of room for improvement when it comes to the P3 and AdobeRGB color spaces. But at least the small sRGB space is almost completely covered with 96.5%, so that the Z13 can be used for simple image editing.
The matte surface of the non-touch Full HD display clearly benefits the ThinkPad Z13 in outdoor use. However, a higher display brightness would improve outdoor suitability even more.
Display Response Times
| ↔ Response Time Black to White | ||
|---|---|---|
| 23 ms ... rise ↗ and fall ↘ combined | ↗ 11 ms rise |  |
| ↘ 12 ms fall | ||
| The screen shows good response rates in our tests, but may be too slow for competitive gamers. In comparison, all tested devices range from 0.1 (minimum) to 240 (maximum) ms. » 52 % of all devices are better. This means that the measured response time is worse than the average of all tested devices (19.8 ms). | ||
| ↔ Response Time 50% Grey to 80% Grey | ||
| 49 ms ... rise ↗ and fall ↘ combined | ↗ 22 ms rise |  |
| ↘ 27 ms fall | ||
| The screen shows slow response rates in our tests and will be unsatisfactory for gamers. In comparison, all tested devices range from 0.165 (minimum) to 636 (maximum) ms. » 85 % of all devices are better. This means that the measured response time is worse than the average of all tested devices (30.9 ms). | ||
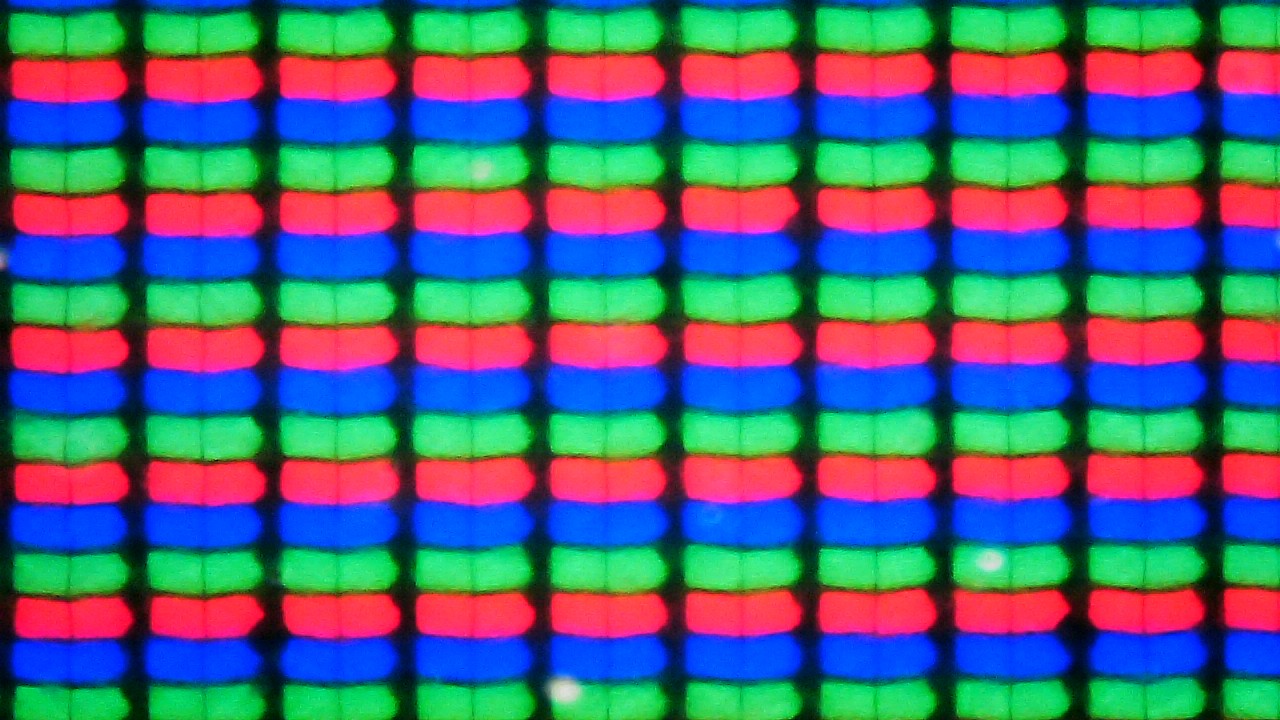
Screen Flickering / PWM (Pulse-Width Modulation)
| Screen flickering / PWM not detected | 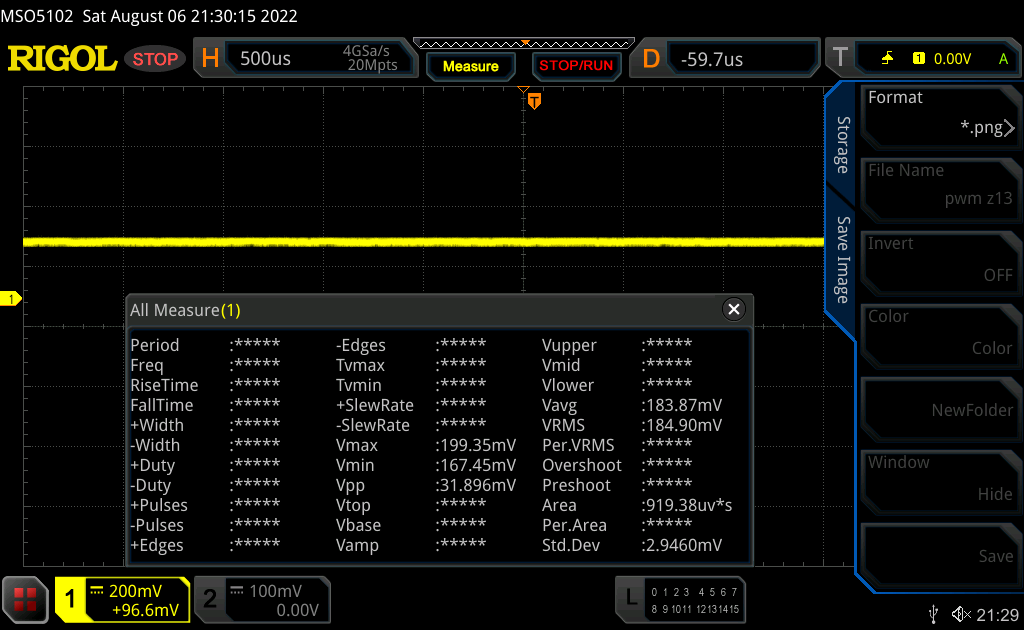 | ||
In comparison: 52 % of all tested devices do not use PWM to dim the display. If PWM was detected, an average of 7744 (minimum: 5 - maximum: 343500) Hz was measured. | |||
Performance: AMD Ryzen 6000U beats Intel in terms of efficiency
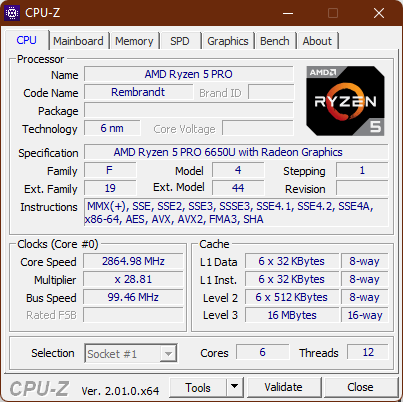
There are three different CPUs available for the Lenovo ThinkPad Z13, all part of the Ryzen Pro series: The AMD Ryzen 5 Pro 6650U, the AMD Ryzen 7 Pro 6850U as well as the AMD Ryzen 7 Pro 6860Z, a special model that AMD developed just for the Z13. There's no dedicated GPU, so buyers only have the choice between the AMD Radeon 660M (in the Ryzen 5) and the Radeon 680M (in the Ryzen 7). Memory is soldered, and it's of the fast LPDDR5-6400 type, with either 16 or 32 GB of RAM available in the Z13. The M.2 2242 SSD has a maximum capacity of one terabyte.
Test conditions
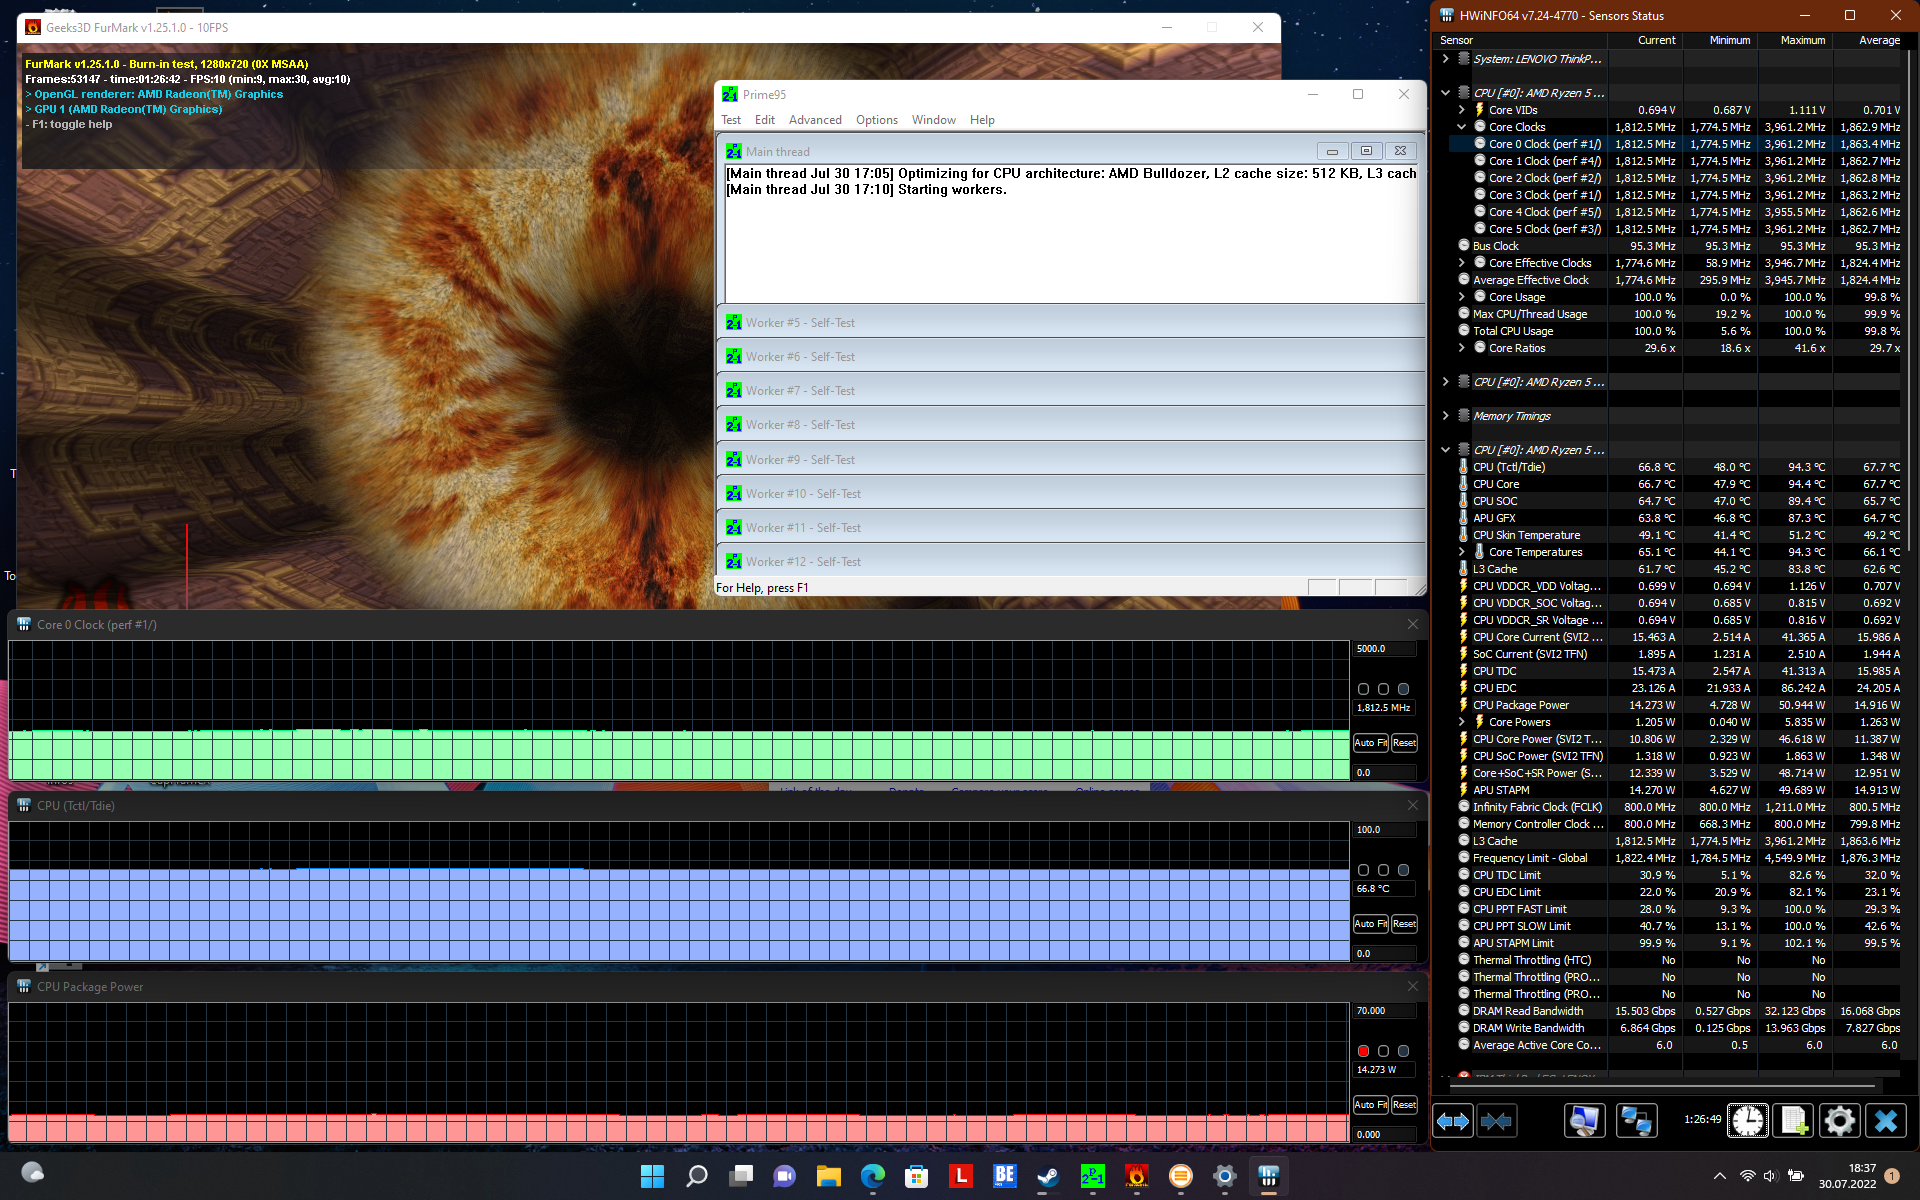
As always with Lenovo ThinkPads, we use the Windows power management feature to select the performance mode. Our performance tests were all conducted using the maximum performance mode, and we disabled Lenovo's "Auto" mode via the FN+T key combination. As a result, the upper power limit for short-term load is around 55 watts, and it's still around 22.5 watts for prolonged load.
Processor
The AMD Ryzen 5 Pro 6650U is a mid-range processor belonging to the current Ryzen 6000 generation. As a U processor, its six cores have a typical consumption of 15 watts, with maximum clock rates of 4.5 gigahertz (base clock rate: 2.9 gigahertz). Our CPU Benchmarks article can be consulted to make more extensive comparisons with other processors.
The Lenovo ThinkPad Z13 scores well in the CPU benchmarks. Its CPU performance is superior to that of its many Intel rivals as well as to that of the Apple MacBook Air M2, despite the fact that this is only the entry-level variant of the Z13. Although performance takes a bit of a dive under sustained load, it still remains better than the CPU performance of the much larger Lenovo ThinkPad X1 Carbon G10 at all times.
Even on battery power, the CPU performance is fully available.
Cinebench R15 Multi endurance test
Cinebench R23: Multi Core | Single Core
Cinebench R20: CPU (Multi Core) | CPU (Single Core)
Cinebench R15: CPU Multi 64Bit | CPU Single 64Bit
Blender: v2.79 BMW27 CPU
7-Zip 18.03: 7z b 4 | 7z b 4 -mmt1
Geekbench 5.5: Multi-Core | Single-Core
HWBOT x265 Benchmark v2.2: 4k Preset
LibreOffice : 20 Documents To PDF
R Benchmark 2.5: Overall mean
| CPU Performance rating | |
| Average of class Subnotebook | |
| Dell XPS 13 Plus 9320 4K | |
| Asus Zenbook S 13 OLED | |
| Average AMD Ryzen 5 PRO 6650U | |
| Lenovo ThinkPad Z13 21D2CTO1WW | |
| Apple MacBook Air M2 Entry -5! | |
| Lenovo ThinkPad X1 Carbon G10 21CC001RGE | |
| Lenovo ThinkPad X1 Nano-20UN002UGE -1! | |
| Cinebench R23 / Multi Core | |
| Average of class Subnotebook (1555 - 21812, n=60, last 2 years) | |
| Asus Zenbook S 13 OLED | |
| Dell XPS 13 Plus 9320 4K | |
| Lenovo ThinkPad Z13 21D2CTO1WW | |
| Average AMD Ryzen 5 PRO 6650U (7805 - 9534, n=4) | |
| Apple MacBook Air M2 Entry | |
| Lenovo ThinkPad X1 Carbon G10 21CC001RGE | |
| Lenovo ThinkPad X1 Nano-20UN002UGE | |
| Cinebench R23 / Single Core | |
| Average of class Subnotebook (358 - 2213, n=61, last 2 years) | |
| Dell XPS 13 Plus 9320 4K | |
| Apple MacBook Air M2 Entry | |
| Lenovo ThinkPad X1 Carbon G10 21CC001RGE | |
| Asus Zenbook S 13 OLED | |
| Average AMD Ryzen 5 PRO 6650U (1439 - 1476, n=4) | |
| Lenovo ThinkPad Z13 21D2CTO1WW | |
| Cinebench R20 / CPU (Multi Core) | |
| Average of class Subnotebook (579 - 8541, n=57, last 2 years) | |
| Asus Zenbook S 13 OLED | |
| Dell XPS 13 Plus 9320 4K | |
| Lenovo ThinkPad Z13 21D2CTO1WW | |
| Average AMD Ryzen 5 PRO 6650U (3057 - 3684, n=4) | |
| Lenovo ThinkPad X1 Carbon G10 21CC001RGE | |
| Apple MacBook Air M2 Entry | |
| Lenovo ThinkPad X1 Nano-20UN002UGE | |
| Cinebench R20 / CPU (Single Core) | |
| Average of class Subnotebook (128 - 832, n=57, last 2 years) | |
| Dell XPS 13 Plus 9320 4K | |
| Average AMD Ryzen 5 PRO 6650U (548 - 578, n=4) | |
| Lenovo ThinkPad Z13 21D2CTO1WW | |
| Asus Zenbook S 13 OLED | |
| Lenovo ThinkPad X1 Nano-20UN002UGE | |
| Lenovo ThinkPad X1 Carbon G10 21CC001RGE | |
| Apple MacBook Air M2 Entry | |
| Cinebench R15 / CPU Multi 64Bit | |
| Average of class Subnotebook (327 - 3345, n=57, last 2 years) | |
| Asus Zenbook S 13 OLED | |
| Dell XPS 13 Plus 9320 4K | |
| Dell XPS 13 Plus 9320 4K | |
| Lenovo ThinkPad Z13 21D2CTO1WW | |
| Lenovo ThinkPad X1 Carbon G10 21CC001RGE | |
| Average AMD Ryzen 5 PRO 6650U (1299 - 1555, n=4) | |
| Apple MacBook Air M2 Entry | |
| Lenovo ThinkPad X1 Nano-20UN002UGE | |
| Cinebench R15 / CPU Single 64Bit | |
| Average of class Subnotebook (72.4 - 322, n=57, last 2 years) | |
| Dell XPS 13 Plus 9320 4K | |
| Asus Zenbook S 13 OLED | |
| Lenovo ThinkPad Z13 21D2CTO1WW | |
| Average AMD Ryzen 5 PRO 6650U (230 - 234, n=4) | |
| Apple MacBook Air M2 Entry | |
| Lenovo ThinkPad X1 Nano-20UN002UGE | |
| Lenovo ThinkPad X1 Carbon G10 21CC001RGE | |
| Blender / v2.79 BMW27 CPU | |
| Apple MacBook Air M2 Entry | |
| Lenovo ThinkPad X1 Nano-20UN002UGE | |
| Lenovo ThinkPad X1 Carbon G10 21CC001RGE | |
| Lenovo ThinkPad Z13 21D2CTO1WW | |
| Average AMD Ryzen 5 PRO 6650U (328 - 548, n=5) | |
| Average of class Subnotebook (159 - 2271, n=58, last 2 years) | |
| Dell XPS 13 Plus 9320 4K | |
| Asus Zenbook S 13 OLED | |
| 7-Zip 18.03 / 7z b 4 | |
| Asus Zenbook S 13 OLED | |
| Average of class Subnotebook (11668 - 77867, n=57, last 2 years) | |
| Dell XPS 13 Plus 9320 4K | |
| Average AMD Ryzen 5 PRO 6650U (32613 - 41530, n=4) | |
| Lenovo ThinkPad Z13 21D2CTO1WW | |
| Lenovo ThinkPad X1 Carbon G10 21CC001RGE | |
| Lenovo ThinkPad X1 Nano-20UN002UGE | |
| 7-Zip 18.03 / 7z b 4 -mmt1 | |
| Average of class Subnotebook (2643 - 6699, n=59, last 2 years) | |
| Asus Zenbook S 13 OLED | |
| Dell XPS 13 Plus 9320 4K | |
| Average AMD Ryzen 5 PRO 6650U (5175 - 5427, n=4) | |
| Lenovo ThinkPad Z13 21D2CTO1WW | |
| Lenovo ThinkPad X1 Nano-20UN002UGE | |
| Lenovo ThinkPad X1 Carbon G10 21CC001RGE | |
| Geekbench 5.5 / Multi-Core | |
| Average of class Subnotebook (2557 - 17218, n=49, last 2 years) | |
| Dell XPS 13 Plus 9320 4K | |
| Apple MacBook Air M2 Entry | |
| Lenovo ThinkPad X1 Carbon G10 21CC001RGE | |
| Asus Zenbook S 13 OLED | |
| Lenovo ThinkPad Z13 21D2CTO1WW | |
| Average AMD Ryzen 5 PRO 6650U (6171 - 7227, n=4) | |
| Lenovo ThinkPad X1 Nano-20UN002UGE | |
| Geekbench 5.5 / Single-Core | |
| Average of class Subnotebook (726 - 2224, n=49, last 2 years) | |
| Apple MacBook Air M2 Entry | |
| Dell XPS 13 Plus 9320 4K | |
| Lenovo ThinkPad X1 Carbon G10 21CC001RGE | |
| Asus Zenbook S 13 OLED | |
| Lenovo ThinkPad Z13 21D2CTO1WW | |
| Average AMD Ryzen 5 PRO 6650U (1433 - 1487, n=4) | |
| Lenovo ThinkPad X1 Nano-20UN002UGE | |
| HWBOT x265 Benchmark v2.2 / 4k Preset | |
| Average of class Subnotebook (0.97 - 25.1, n=57, last 2 years) | |
| Asus Zenbook S 13 OLED | |
| Dell XPS 13 Plus 9320 4K | |
| Average AMD Ryzen 5 PRO 6650U (8.71 - 11.8, n=4) | |
| Lenovo ThinkPad Z13 21D2CTO1WW | |
| Lenovo ThinkPad X1 Carbon G10 21CC001RGE | |
| Lenovo ThinkPad X1 Nano-20UN002UGE | |
| LibreOffice / 20 Documents To PDF | |
| Average AMD Ryzen 5 PRO 6650U (50.3 - 63.2, n=4) | |
| Lenovo ThinkPad Z13 21D2CTO1WW | |
| Average of class Subnotebook (39.9 - 220, n=56, last 2 years) | |
| Asus Zenbook S 13 OLED | |
| Lenovo ThinkPad X1 Carbon G10 21CC001RGE | |
| Lenovo ThinkPad X1 Nano-20UN002UGE | |
| Dell XPS 13 Plus 9320 4K | |
| R Benchmark 2.5 / Overall mean | |
| Lenovo ThinkPad X1 Nano-20UN002UGE | |
| Lenovo ThinkPad X1 Carbon G10 21CC001RGE | |
| Lenovo ThinkPad Z13 21D2CTO1WW | |
| Average AMD Ryzen 5 PRO 6650U (0.521 - 0.59, n=4) | |
| Asus Zenbook S 13 OLED | |
| Average of class Subnotebook (0.4024 - 1.456, n=58, last 2 years) | |
| Dell XPS 13 Plus 9320 4K | |
* ... smaller is better
AIDA64: FP32 Ray-Trace | FPU Julia | CPU SHA3 | CPU Queen | FPU SinJulia | FPU Mandel | CPU AES | CPU ZLib | FP64 Ray-Trace | CPU PhotoWorxx
| Performance rating | |
| Average of class Subnotebook | |
| Average AMD Ryzen 5 PRO 6650U | |
| Lenovo ThinkPad Z13 21D2CTO1WW | |
| Dell XPS 13 Plus 9320 4K | |
| Lenovo ThinkPad X1 Nano-20UN002UGE | |
| Lenovo ThinkPad X1 Carbon G10 21CC001RGE | |
| AIDA64 / FP32 Ray-Trace | |
| Average of class Subnotebook (1135 - 32888, n=58, last 2 years) | |
| Average AMD Ryzen 5 PRO 6650U (8854 - 10630, n=4) | |
| Lenovo ThinkPad Z13 21D2CTO1WW | |
| Lenovo ThinkPad X1 Nano-20UN002UGE | |
| Dell XPS 13 Plus 9320 4K | |
| Lenovo ThinkPad X1 Carbon G10 21CC001RGE | |
| AIDA64 / FPU Julia | |
| Average of class Subnotebook (5218 - 123315, n=58, last 2 years) | |
| Average AMD Ryzen 5 PRO 6650U (56214 - 68106, n=4) | |
| Lenovo ThinkPad Z13 21D2CTO1WW | |
| Lenovo ThinkPad X1 Nano-20UN002UGE | |
| Dell XPS 13 Plus 9320 4K | |
| Lenovo ThinkPad X1 Carbon G10 21CC001RGE | |
| AIDA64 / CPU SHA3 | |
| Average of class Subnotebook (444 - 5287, n=58, last 2 years) | |
| Lenovo ThinkPad Z13 21D2CTO1WW | |
| Average AMD Ryzen 5 PRO 6650U (1881 - 2326, n=4) | |
| Lenovo ThinkPad X1 Nano-20UN002UGE | |
| Dell XPS 13 Plus 9320 4K | |
| Lenovo ThinkPad X1 Carbon G10 21CC001RGE | |
| AIDA64 / CPU Queen | |
| Lenovo ThinkPad Z13 21D2CTO1WW | |
| Dell XPS 13 Plus 9320 4K | |
| Average AMD Ryzen 5 PRO 6650U (69023 - 78797, n=4) | |
| Lenovo ThinkPad X1 Carbon G10 21CC001RGE | |
| Average of class Subnotebook (10579 - 95002, n=48, last 2 years) | |
| Lenovo ThinkPad X1 Nano-20UN002UGE | |
| AIDA64 / FPU SinJulia | |
| Average AMD Ryzen 5 PRO 6650U (8320 - 9488, n=4) | |
| Lenovo ThinkPad Z13 21D2CTO1WW | |
| Average of class Subnotebook (744 - 18418, n=58, last 2 years) | |
| Dell XPS 13 Plus 9320 4K | |
| Lenovo ThinkPad X1 Carbon G10 21CC001RGE | |
| Lenovo ThinkPad X1 Nano-20UN002UGE | |
| AIDA64 / FPU Mandel | |
| Average AMD Ryzen 5 PRO 6650U (30969 - 37461, n=4) | |
| Lenovo ThinkPad Z13 21D2CTO1WW | |
| Average of class Subnotebook (3341 - 65433, n=58, last 2 years) | |
| Lenovo ThinkPad X1 Nano-20UN002UGE | |
| Dell XPS 13 Plus 9320 4K | |
| Lenovo ThinkPad X1 Carbon G10 21CC001RGE | |
| AIDA64 / CPU AES | |
| Lenovo ThinkPad X1 Nano-20UN002UGE | |
| Average AMD Ryzen 5 PRO 6650U (37259 - 93914, n=4) | |
| Average of class Subnotebook (638 - 96917, n=58, last 2 years) | |
| Lenovo ThinkPad Z13 21D2CTO1WW | |
| Dell XPS 13 Plus 9320 4K | |
| Lenovo ThinkPad X1 Carbon G10 21CC001RGE | |
| AIDA64 / CPU ZLib | |
| Average of class Subnotebook (164.9 - 1379, n=58, last 2 years) | |
| Dell XPS 13 Plus 9320 4K | |
| Average AMD Ryzen 5 PRO 6650U (504 - 602, n=4) | |
| Lenovo ThinkPad Z13 21D2CTO1WW | |
| Lenovo ThinkPad X1 Carbon G10 21CC001RGE | |
| Lenovo ThinkPad X1 Nano-20UN002UGE | |
| AIDA64 / FP64 Ray-Trace | |
| Average of class Subnotebook (610 - 17495, n=58, last 2 years) | |
| Average AMD Ryzen 5 PRO 6650U (4620 - 5468, n=4) | |
| Lenovo ThinkPad Z13 21D2CTO1WW | |
| Lenovo ThinkPad X1 Nano-20UN002UGE | |
| Dell XPS 13 Plus 9320 4K | |
| Lenovo ThinkPad X1 Carbon G10 21CC001RGE | |
| AIDA64 / CPU PhotoWorxx | |
| Average of class Subnotebook (6569 - 85600, n=58, last 2 years) | |
| Dell XPS 13 Plus 9320 4K | |
| Lenovo ThinkPad X1 Nano-20UN002UGE | |
| Lenovo ThinkPad X1 Carbon G10 21CC001RGE | |
| Lenovo ThinkPad Z13 21D2CTO1WW | |
| Average AMD Ryzen 5 PRO 6650U (19643 - 26137, n=4) | |
System performance
We can hardly find anything to complain about when it comes to the system performance of the Lenovo ThinkPad Z13. It performs well in everyday use and in benchmarks. Only when copying data does it occasionally take a bit more time.
CrossMark: Overall | Productivity | Creativity | Responsiveness
| PCMark 10 / Score | |
| Average of class Subnotebook (4920 - 9939, n=46, last 2 years) | |
| Average AMD Ryzen 5 PRO 6650U, AMD Radeon 660M (5513 - 5958, n=4) | |
| Dell XPS 13 Plus 9320 4K | |
| Lenovo ThinkPad Z13 21D2CTO1WW | |
| Lenovo ThinkPad X1 Carbon G10 21CC001RGE | |
| Lenovo ThinkPad X1 Nano-20UN002UGE | |
| PCMark 10 / Essentials | |
| Average of class Subnotebook (8552 - 11646, n=46, last 2 years) | |
| Dell XPS 13 Plus 9320 4K | |
| Lenovo ThinkPad X1 Carbon G10 21CC001RGE | |
| Average AMD Ryzen 5 PRO 6650U, AMD Radeon 660M (9578 - 9982, n=4) | |
| Lenovo ThinkPad Z13 21D2CTO1WW | |
| Lenovo ThinkPad X1 Nano-20UN002UGE | |
| PCMark 10 / Productivity | |
| Average of class Subnotebook (5435 - 16606, n=46, last 2 years) | |
| Average AMD Ryzen 5 PRO 6650U, AMD Radeon 660M (7848 - 9094, n=4) | |
| Lenovo ThinkPad Z13 21D2CTO1WW | |
| Dell XPS 13 Plus 9320 4K | |
| Lenovo ThinkPad X1 Carbon G10 21CC001RGE | |
| Lenovo ThinkPad X1 Nano-20UN002UGE | |
| PCMark 10 / Digital Content Creation | |
| Average of class Subnotebook (5722 - 13779, n=46, last 2 years) | |
| Dell XPS 13 Plus 9320 4K | |
| Average AMD Ryzen 5 PRO 6650U, AMD Radeon 660M (5837 - 6447, n=4) | |
| Lenovo ThinkPad Z13 21D2CTO1WW | |
| Lenovo ThinkPad X1 Carbon G10 21CC001RGE | |
| Lenovo ThinkPad X1 Nano-20UN002UGE | |
| CrossMark / Overall | |
| Average of class Subnotebook (365 - 2356, n=60, last 2 years) | |
| Dell XPS 13 Plus 9320 4K | |
| Lenovo ThinkPad X1 Carbon G10 21CC001RGE | |
| Apple MacBook Air M2 Entry | |
| Lenovo ThinkPad Z13 21D2CTO1WW | |
| Average AMD Ryzen 5 PRO 6650U, AMD Radeon 660M (1338 - 1432, n=3) | |
| CrossMark / Productivity | |
| Average of class Subnotebook (364 - 2277, n=60, last 2 years) | |
| Dell XPS 13 Plus 9320 4K | |
| Lenovo ThinkPad X1 Carbon G10 21CC001RGE | |
| Lenovo ThinkPad Z13 21D2CTO1WW | |
| Average AMD Ryzen 5 PRO 6650U, AMD Radeon 660M (1366 - 1440, n=3) | |
| Apple MacBook Air M2 Entry | |
| CrossMark / Creativity | |
| Average of class Subnotebook (372 - 2743, n=60, last 2 years) | |
| Dell XPS 13 Plus 9320 4K | |
| Apple MacBook Air M2 Entry | |
| Lenovo ThinkPad X1 Carbon G10 21CC001RGE | |
| Lenovo ThinkPad Z13 21D2CTO1WW | |
| Average AMD Ryzen 5 PRO 6650U, AMD Radeon 660M (1397 - 1517, n=3) | |
| CrossMark / Responsiveness | |
| Dell XPS 13 Plus 9320 4K | |
| Lenovo ThinkPad X1 Carbon G10 21CC001RGE | |
| Average of class Subnotebook (312 - 1854, n=60, last 2 years) | |
| Lenovo ThinkPad Z13 21D2CTO1WW | |
| Average AMD Ryzen 5 PRO 6650U, AMD Radeon 660M (1106 - 1229, n=3) | |
| Apple MacBook Air M2 Entry | |
| PCMark 10 Score | 5513 points | |
Help | ||
| AIDA64 / Memory Copy | |
| Average of class Subnotebook (14554 - 131023, n=58, last 2 years) | |
| Dell XPS 13 Plus 9320 4K | |
| Lenovo ThinkPad X1 Carbon G10 21CC001RGE | |
| Lenovo ThinkPad Z13 21D2CTO1WW | |
| Lenovo ThinkPad X1 Nano-20UN002UGE | |
| Average AMD Ryzen 5 PRO 6650U (31014 - 48558, n=4) | |
| AIDA64 / Memory Read | |
| Average of class Subnotebook (15948 - 127174, n=58, last 2 years) | |
| Lenovo ThinkPad X1 Carbon G10 21CC001RGE | |
| Dell XPS 13 Plus 9320 4K | |
| Lenovo ThinkPad X1 Nano-20UN002UGE | |
| Lenovo ThinkPad Z13 21D2CTO1WW | |
| Average AMD Ryzen 5 PRO 6650U (34690 - 39833, n=4) | |
| AIDA64 / Memory Write | |
| Average of class Subnotebook (15709 - 135141, n=58, last 2 years) | |
| Dell XPS 13 Plus 9320 4K | |
| Lenovo ThinkPad X1 Carbon G10 21CC001RGE | |
| Lenovo ThinkPad Z13 21D2CTO1WW | |
| Lenovo ThinkPad X1 Nano-20UN002UGE | |
| Average AMD Ryzen 5 PRO 6650U (34563 - 51117, n=4) | |
| AIDA64 / Memory Latency | |
| Lenovo ThinkPad Z13 21D2CTO1WW | |
| Average AMD Ryzen 5 PRO 6650U (91.6 - 126.5, n=4) | |
| Lenovo ThinkPad X1 Nano-20UN002UGE | |
| Average of class Subnotebook (6.1 - 159.9, n=56, last 2 years) | |
| Lenovo ThinkPad X1 Carbon G10 21CC001RGE | |
| Lenovo ThinkPad X1 Carbon G10 21CC001RGE | |
* ... smaller is better
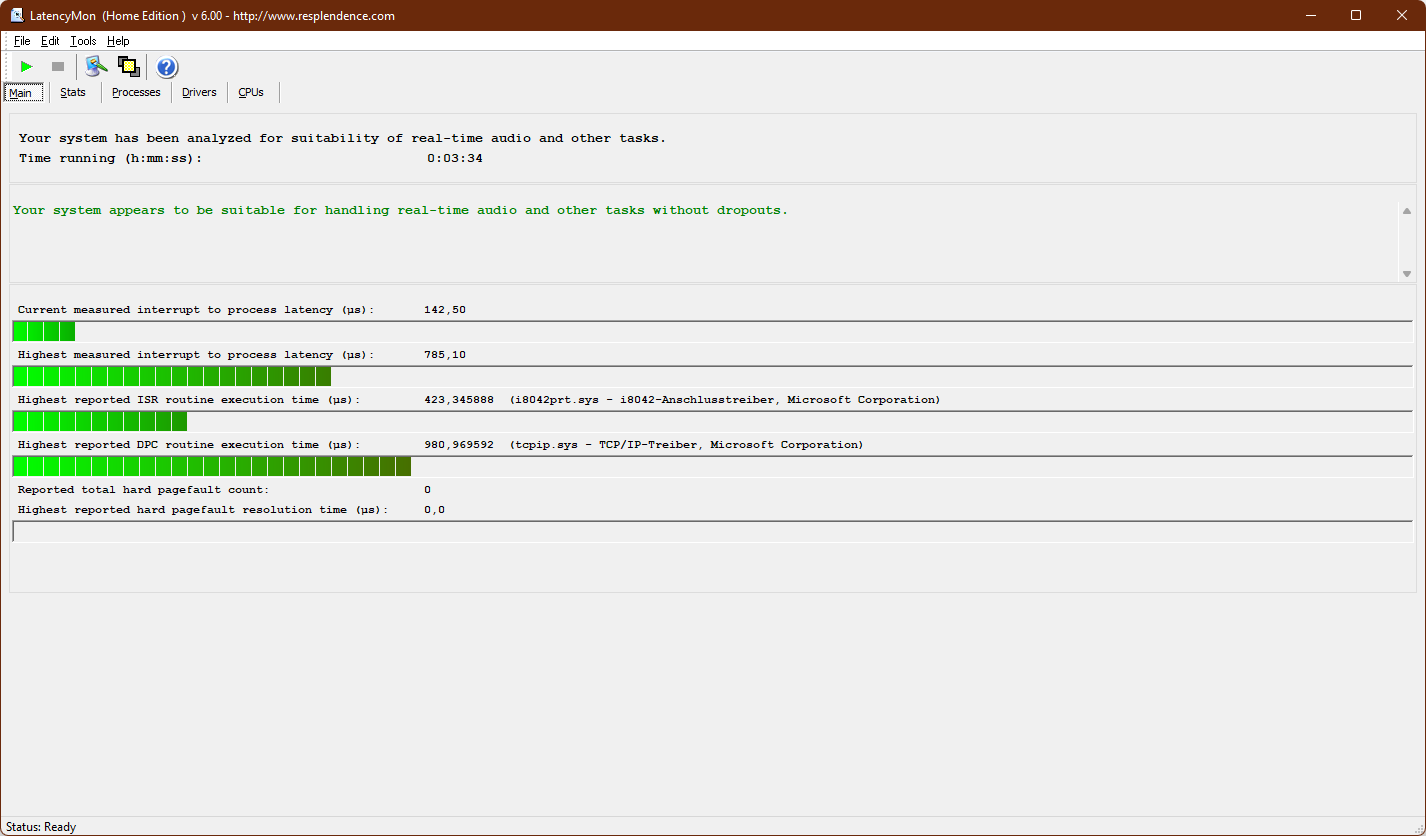
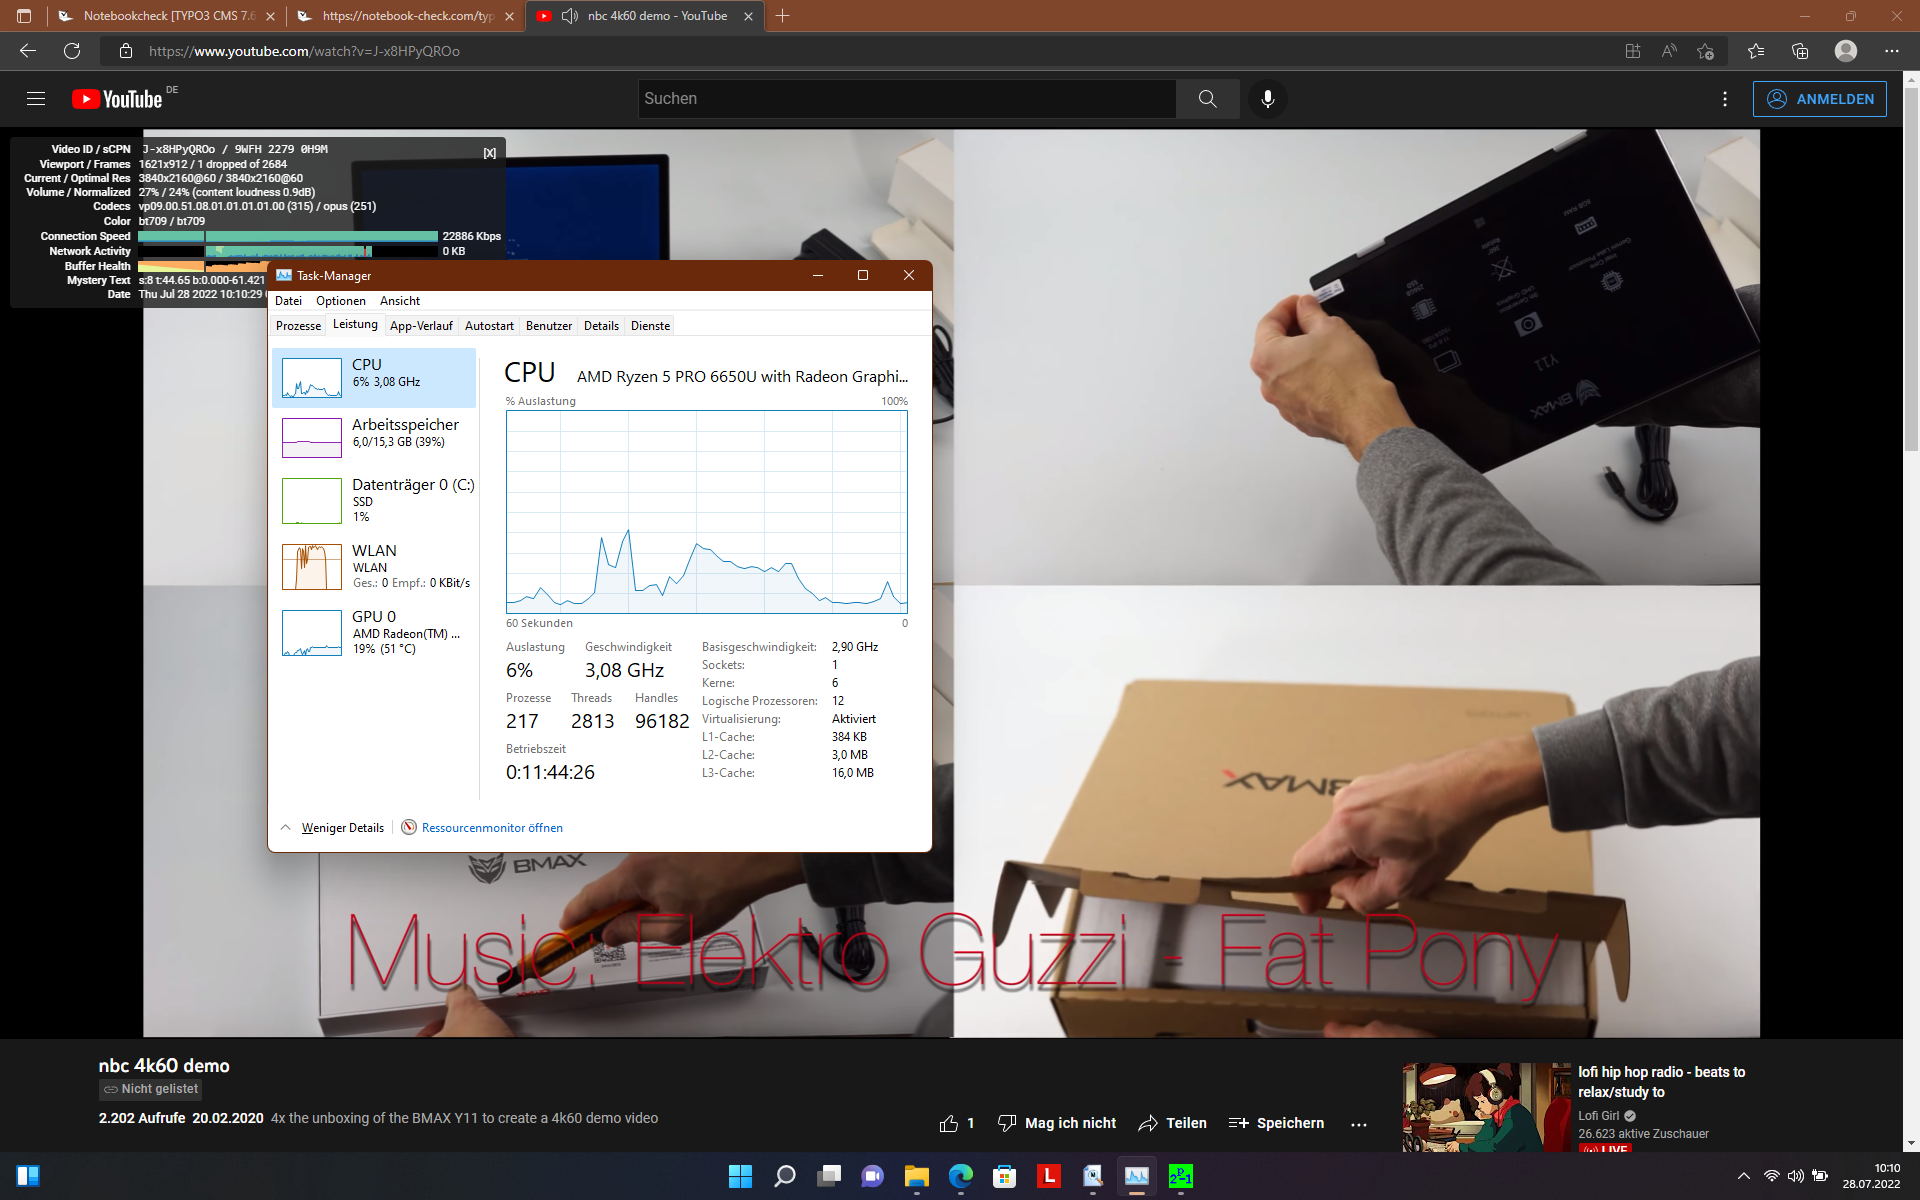
DPC latencies
The Lenovo ThinkPad Z13 doesn't have any latency issues, and the ThinkPad only dropped one frame in our YouTube test.
| DPC Latencies / LatencyMon - interrupt to process latency (max), Web, Youtube, Prime95 | |
| Lenovo ThinkPad X1 Carbon G10 21CC001RGE | |
| Lenovo ThinkPad X1 Nano-20UN002UGE | |
| Lenovo ThinkPad Z13 21D2CTO1WW | |
| Dell XPS 13 Plus 9320 4K | |
* ... smaller is better
Storage
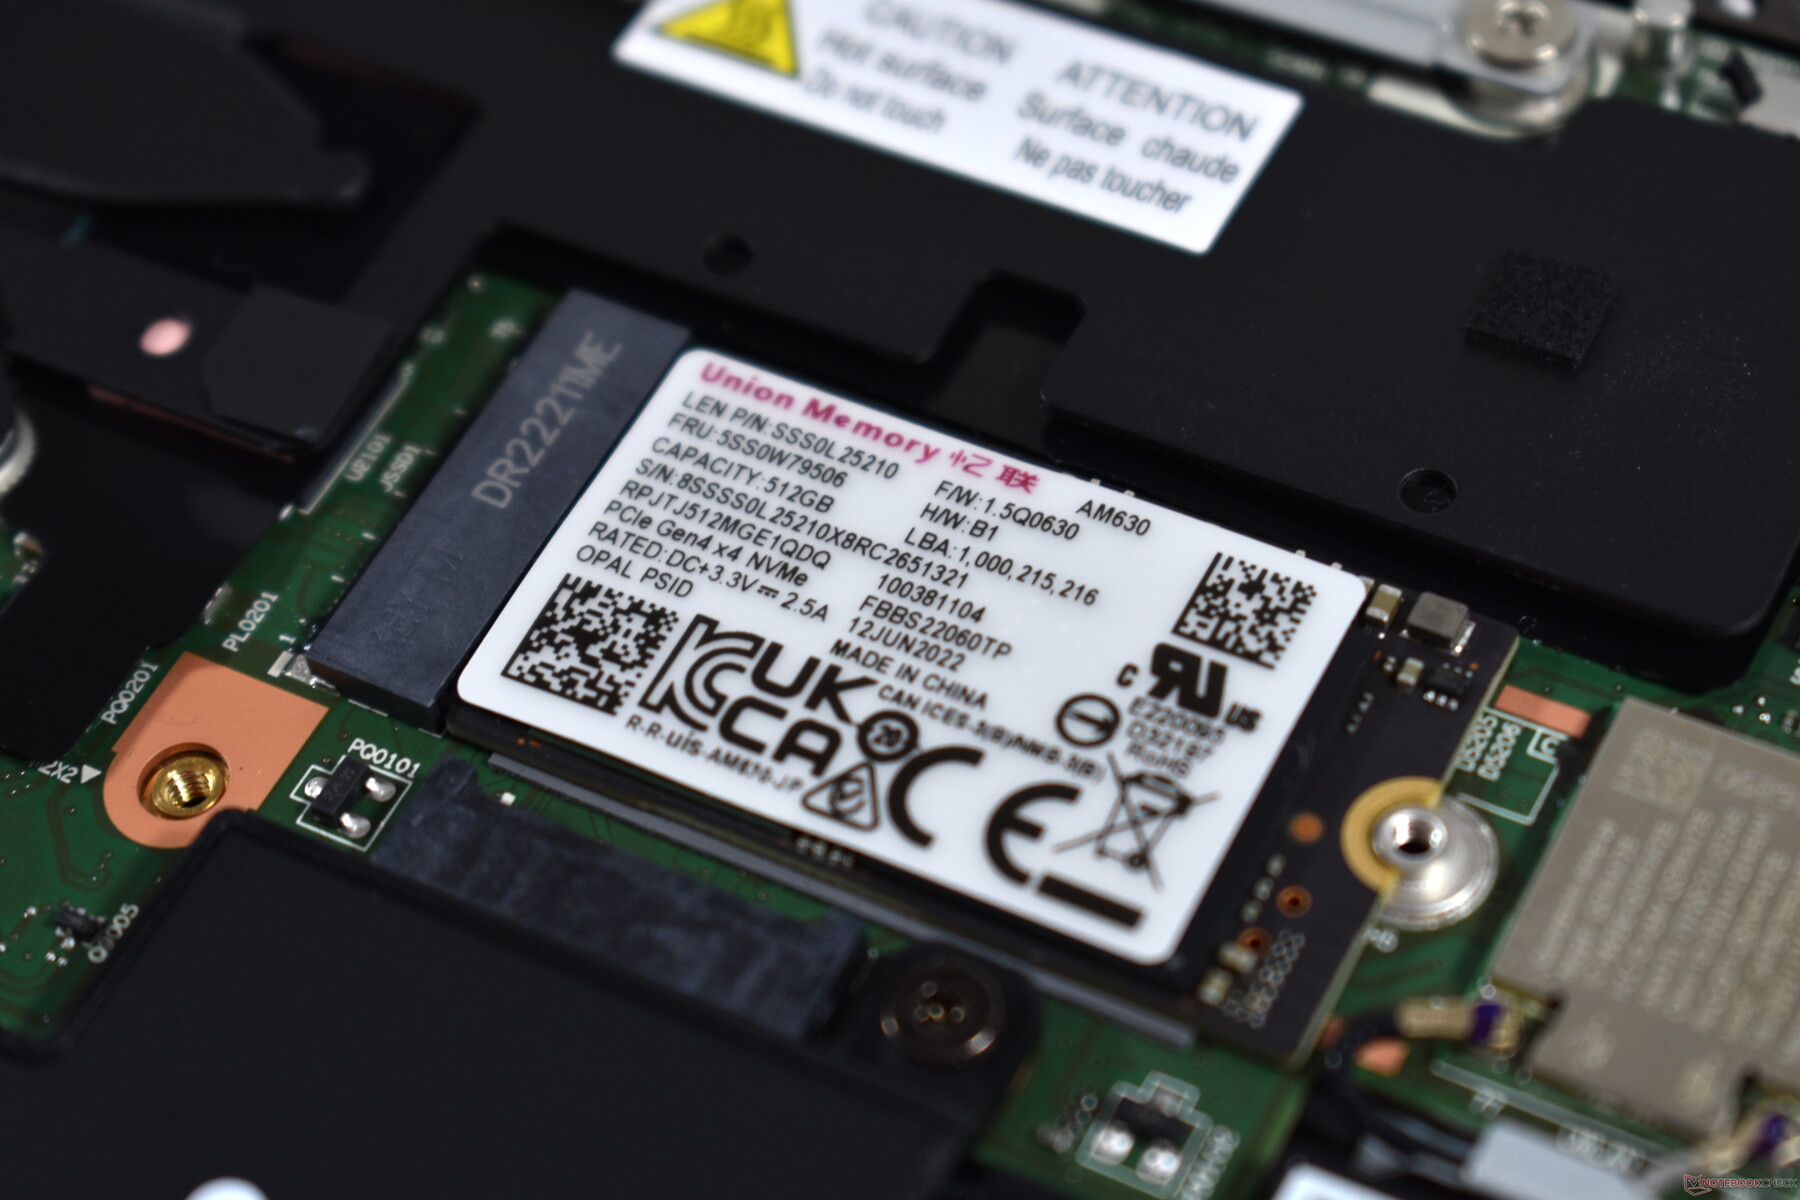
The small M.2 2242 SSD comes from Union Memory, and it has a capacity of 512 GB. Its performance is disappointing, even though it's an NVMe PCIe 4.0 SSD. The SSD is noticeably slow when copying large data volumes, but otherwise, you won't notice much of this in everyday use.

* ... smaller is better
Continuous load read: DiskSpd Read Loop, Queue Depth 8
Graphics card
The AMD Radeon 660M is the weaker of the two GPUs that Lenovo offers for the ThinkPad Z13. As an integrated graphics chip, it depends on the main memory; it doesn't have its own memory - therefore, it's positive that the memory in the Z13 works in a quad-channel configuration.
GPU performance is above the Intel competition in the 3DMark tests, but the AMD Radeon 680M is about 30% faster. The ThinkPad Z13 performs a bit weaker in the gaming tests: The Radeon 680M is clearly better here, and some of the Intel models are also ahead of the Radeon 660M. We also noticed that the GPU performance gets slightly throttled under continuous load in our The Witcher 3 loop test.
The GPU performance was entirely available on battery power.
| 3DMark 06 Standard Score | 27171 points | |
| 3DMark Vantage P Result | 23590 points | |
| 3DMark 11 Performance | 6940 points | |
| 3DMark Ice Storm Standard Score | 133252 points | |
| 3DMark Cloud Gate Standard Score | 19921 points | |
| 3DMark Fire Strike Score | 4119 points | |
| 3DMark Time Spy Score | 1776 points | |
Help | ||
The Witcher 3 FPS diagram
| low | med. | high | ultra | |
|---|---|---|---|---|
| GTA V (2015) | 128.8 | 99.7 | 31.2 | 14.1 |
| The Witcher 3 (2015) | 82.2 | 45.9 | 19.7 | 12.6 |
| Dota 2 Reborn (2015) | 101 | 74.4 | 47.1 | 41.3 |
| Final Fantasy XV Benchmark (2018) | 43.8 | 20.7 | 15 | |
| X-Plane 11.11 (2018) | 34.8 | 25 | 23 | |
| Strange Brigade (2018) | 117.7 | 38.6 | 32.7 | 25.5 |
| F1 2021 (2021) | 103.8 | 47.3 | 36 | 14.1 |
| Elex 2 (2022) | 33.5 | 25.8 | 22.8 | |
| Ghostwire Tokyo (2022) | 16.1 |
Emissions: ThinkPad Z13 with good cooling system
Noise emissions
In idle usage and under low load, the two small fans of the Lenovo ThinkPad Z13 remain virtually silent throughout. When they do run, it's usually at 32.35 dB(a), which is barely audible. The maximum noise level is 39.53 dB(a), which is slightly above the other ThinkPads, but considerably below the fan volume of the Dell XPS 13 Plus.
Coil whine wasn't a problem in our review sample of the ThinkPad Z13.
Noise level
| Idle |
| 23.71 / 23.71 / 23.71 dB(A) |
| Load |
| 32.35 / 39.53 dB(A) |
 | ||
30 dB silent 40 dB(A) audible 50 dB(A) loud |
||
min: | ||
| Lenovo ThinkPad Z13 21D2CTO1WW Radeon 660M, R5 PRO 6650U, Lenovo UMIS AM630 RPJTJ512MGE1QDQ | Dell XPS 13 Plus 9320 4K Iris Xe G7 96EUs, i7-1260P, Samsung PM9A1 MZVL21T0HCLR | Lenovo ThinkPad X1 Carbon G10 21CC001RGE Iris Xe G7 80EUs, i5-1250P, Samsung PM9A1 MZVL2512HCJQ | Lenovo ThinkPad X1 Nano-20UN002UGE Iris Xe G7 96EUs, i7-1160G7, WDC PC SN530 SDBPNPZ-512G | Lenovo ThinkPad X13 G2 AMD 20XH001KGE Vega 7, R5 PRO 5650U, Samsung SSD PM981a MZVLB512HBJQ | |
|---|---|---|---|---|---|
| Noise | -11% | 5% | -6% | 3% | |
| off / environment * (dB) | 23.71 | 24.4 -3% | 22.81 4% | 24.9 -5% | 24.17 -2% |
| Idle Minimum * (dB) | 23.71 | 24.4 -3% | 22.81 4% | 24.9 -5% | 24.17 -2% |
| Idle Average * (dB) | 23.71 | 24.4 -3% | 22.81 4% | 26.3 -11% | 24.17 -2% |
| Idle Maximum * (dB) | 23.71 | 25.5 -8% | 22.81 4% | 31.8 -34% | 24.17 -2% |
| Load Average * (dB) | 32.35 | 40.4 -25% | 31.59 2% | 34.3 -6% | 29.92 8% |
| Witcher 3 ultra * (dB) | 38.8 | 45.5 -17% | 35.59 8% | 34.3 12% | |
| Load Maximum * (dB) | 39.53 | 45.5 -15% | 35.47 10% | 37.5 5% | 31.52 20% |
* ... smaller is better
Temperature
When it comes to the top side of the Lenovo ThinkPad Z13, practically only the area above the keyboard and the keyboard spacing heated up in the stress test and during our The Witcher 3 test. In contrast, the palm rest remained relatively cool - sweaty hands shouldn't be a problem. In the stress test, the ThinkPad gets noticeably warm on the bottom with 44.3 °C (~112 °F), which can become uncomfortable when placed on the lap for a longer period of time.
The processor had a consumption of around 14 watts after over an hour of stress testing. The Lenovo ThinkPad Z13 has to cool down before the CPU can access its full performance again, because the score is slightly lower in 3DMark 11 when running it directly after the stress test.
(±) The maximum temperature on the upper side is 44.9 °C / 113 F, compared to the average of 35.9 °C / 97 F, ranging from 21.4 to 59 °C for the class Subnotebook.
(±) The bottom heats up to a maximum of 44.3 °C / 112 F, compared to the average of 39.2 °C / 103 F
(+) In idle usage, the average temperature for the upper side is 29.2 °C / 85 F, compared to the device average of 30.8 °C / 87 F.
(±) Playing The Witcher 3, the average temperature for the upper side is 37.5 °C / 100 F, compared to the device average of 30.8 °C / 87 F.
(+) The palmrests and touchpad are reaching skin temperature as a maximum (32.5 °C / 90.5 F) and are therefore not hot.
(-) The average temperature of the palmrest area of similar devices was 28.2 °C / 82.8 F (-4.3 °C / -7.7 F).
| Lenovo ThinkPad Z13 21D2CTO1WW AMD Ryzen 5 PRO 6650U, AMD Radeon 660M | Dell XPS 13 Plus 9320 4K Intel Core i7-1260P, Intel Iris Xe Graphics G7 96EUs | Lenovo ThinkPad X1 Carbon G10 21CC001RGE Intel Core i5-1250P, Intel Iris Xe Graphics G7 80EUs | Apple MacBook Air M2 Entry Apple M2, Apple M2 8-Core GPU | Lenovo ThinkPad X1 Nano-20UN002UGE Intel Core i7-1160G7, Intel Iris Xe Graphics G7 96EUs | |
|---|---|---|---|---|---|
| Heat | 4% | -1% | 13% | 11% | |
| Maximum Upper Side * (°C) | 44.9 | 41.1 8% | 45 -0% | 44.5 1% | 42.2 6% |
| Maximum Bottom * (°C) | 44.3 | 48.8 -10% | 44 1% | 44.4 -0% | 47.5 -7% |
| Idle Upper Side * (°C) | 31.4 | 28 11% | 31.2 1% | 23.9 24% | 24.3 23% |
| Idle Bottom * (°C) | 31.5 | 29.3 7% | 33.2 -5% | 23.6 25% | 25.3 20% |
* ... smaller is better
Speakers
Lenovo places the stereo speakers in the Z13 at the bottom - not quite an ideal positioning unless the laptop is placed on a tabletop. Apart from that, they are comparatively good laptop speakers that also deliver a bit of bass. However, the Z13 doesn't entirely keep up in this category compared to the direct rivals.
Lenovo ThinkPad Z13 21D2CTO1WW audio analysis
(±) | speaker loudness is average but good (74.33 dB)
Bass 100 - 315 Hz
(±) | reduced bass - on average 11.9% lower than median
(-) | bass is not linear (16.1% delta to prev. frequency)
Mids 400 - 2000 Hz
(±) | higher mids - on average 5.4% higher than median
(±) | linearity of mids is average (9.7% delta to prev. frequency)
Highs 2 - 16 kHz
(+) | balanced highs - only 1.1% away from median
(+) | highs are linear (4.1% delta to prev. frequency)
Overall 100 - 16.000 Hz
(±) | linearity of overall sound is average (15.2% difference to median)
Compared to same class
» 35% of all tested devices in this class were better, 5% similar, 60% worse
» The best had a delta of 5%, average was 18%, worst was 53%
Compared to all devices tested
» 22% of all tested devices were better, 4% similar, 74% worse
» The best had a delta of 4%, average was 23%, worst was 134%
Dell XPS 13 Plus 9320 4K audio analysis
(±) | speaker loudness is average but good (79 dB)
Bass 100 - 315 Hz
(±) | reduced bass - on average 7.3% lower than median
(±) | linearity of bass is average (9.4% delta to prev. frequency)
Mids 400 - 2000 Hz
(+) | balanced mids - only 3.7% away from median
(+) | mids are linear (5.7% delta to prev. frequency)
Highs 2 - 16 kHz
(+) | balanced highs - only 3.4% away from median
(+) | highs are linear (4.3% delta to prev. frequency)
Overall 100 - 16.000 Hz
(+) | overall sound is linear (10.7% difference to median)
Compared to same class
» 9% of all tested devices in this class were better, 3% similar, 88% worse
» The best had a delta of 5%, average was 18%, worst was 53%
Compared to all devices tested
» 6% of all tested devices were better, 2% similar, 93% worse
» The best had a delta of 4%, average was 23%, worst was 134%
Apple MacBook Air M2 Entry audio analysis
(+) | speakers can play relatively loud (82.7 dB)
Bass 100 - 315 Hz
(±) | reduced bass - on average 12.2% lower than median
(±) | linearity of bass is average (12.6% delta to prev. frequency)
Mids 400 - 2000 Hz
(+) | balanced mids - only 1.1% away from median
(+) | mids are linear (3.1% delta to prev. frequency)
Highs 2 - 16 kHz
(+) | balanced highs - only 2.4% away from median
(+) | highs are linear (1.9% delta to prev. frequency)
Overall 100 - 16.000 Hz
(+) | overall sound is linear (9.5% difference to median)
Compared to same class
» 5% of all tested devices in this class were better, 2% similar, 93% worse
» The best had a delta of 5%, average was 18%, worst was 53%
Compared to all devices tested
» 4% of all tested devices were better, 1% similar, 95% worse
» The best had a delta of 4%, average was 23%, worst was 134%
Lenovo ThinkPad X1 Nano-20UN002UGE audio analysis
(+) | speakers can play relatively loud (86.4 dB)
Bass 100 - 315 Hz
(±) | reduced bass - on average 14.6% lower than median
(±) | linearity of bass is average (9.3% delta to prev. frequency)
Mids 400 - 2000 Hz
(+) | balanced mids - only 3.8% away from median
(+) | mids are linear (6.4% delta to prev. frequency)
Highs 2 - 16 kHz
(+) | balanced highs - only 2.2% away from median
(+) | highs are linear (3.5% delta to prev. frequency)
Overall 100 - 16.000 Hz
(+) | overall sound is linear (11.9% difference to median)
Compared to same class
» 13% of all tested devices in this class were better, 5% similar, 82% worse
» The best had a delta of 5%, average was 18%, worst was 53%
Compared to all devices tested
» 9% of all tested devices were better, 2% similar, 89% worse
» The best had a delta of 4%, average was 23%, worst was 134%
Energy management: This Lenovo ThinkPad impresses with long battery life
Energy consumption
AMD and Lenovo seem to have optimized the ThinkPad Z13 very well. The minimum consumption of 2.4 watts is only undercut by the Apple MacBook Air M2. The other idle rates are also compelling - at full display brightness, maximum performance mode, and all wireless devices enabled, the Z13 consumes just over 5.1 watts in idle usage - less than all comparison devices.
The 65-watt power adapter has sufficient capacity for the maximum consumption of about 63 watts.
| Off / Standby | |
| Idle | |
| Load |
|
Key:
min: | |
| Lenovo ThinkPad Z13 21D2CTO1WW R5 PRO 6650U, Radeon 660M, Lenovo UMIS AM630 RPJTJ512MGE1QDQ, IPS LED, 1920x1200, 13.3" | Dell XPS 13 Plus 9320 4K i7-1260P, Iris Xe G7 96EUs, Samsung PM9A1 MZVL21T0HCLR, IPS, 3840x2400, 13.4" | Lenovo ThinkPad X1 Carbon G10 21CC001RGE i5-1250P, Iris Xe G7 80EUs, Samsung PM9A1 MZVL2512HCJQ, IPS LED, 1920x1200, 14" | Apple MacBook Air M2 Entry M2, M2 8-Core GPU, Apple SSD AP0256Z, IPS, 2560x1664, 13.6" | Lenovo ThinkPad X1 Nano-20UN002UGE i7-1160G7, Iris Xe G7 96EUs, WDC PC SN530 SDBPNPZ-512G, IPS, 2160x1350, 13" | Average AMD Radeon 660M | Average of class Subnotebook | |
|---|---|---|---|---|---|---|---|
| Power Consumption | -91% | -6% | -10% | -14% | -42% | -27% | |
| Idle Minimum * (Watt) | 2.4 | 7 -192% | 2.9 -21% | 1.87 22% | 3.3 -38% | 4.68 ? -95% | 3.71 ? -55% |
| Idle Average * (Watt) | 4.6 | 11 -139% | 4.9 -7% | 9.2 -100% | 5.7 -24% | 7.08 ? -54% | 6.54 ? -42% |
| Idle Maximum * (Watt) | 5.1 | 11.4 -124% | 6 -18% | 9.3 -82% | 9.1 -78% | 9.12 ? -79% | 7.89 ? -55% |
| Load Average * (Watt) | 53.1 | 59.7 -12% | 29.3 45% | 28.5 46% | 29.6 44% | 44.2 ? 17% | 42.1 ? 21% |
| Witcher 3 ultra * (Watt) | 27.6 | 49.4 -79% | 36.6 -33% | 27.4 1% | 27.7 -0% | ||
| Load Maximum * (Watt) | 63.7 | 63 1% | 63.3 1% | 31 51% | 55.1 14% | 62.4 ? 2% | 65.1 ? -2% |
* ... smaller is better
Energy consumption during The Witcher 3 / stress test
Energy consumption with an external monitor
Battery life
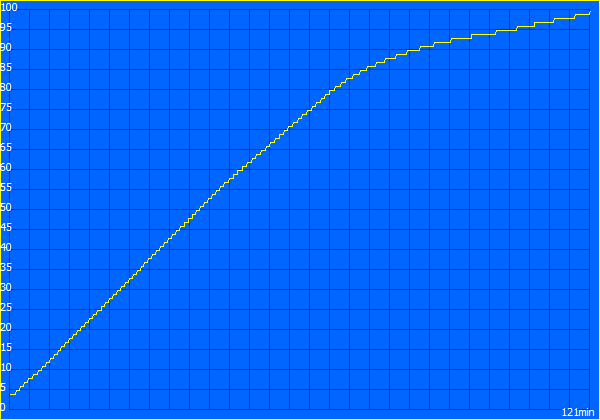
The internal battery of the Lenovo ThinkPad Z13 G1 has a capacity of 51.5 watt hours. Only the X1 Nano has a smaller battery among the comparison laptops. Despite this, the Lenovo laptop achieves excellent battery runtimes, easily beating the Intel representatives in this discipline. Compared to the Apple MacBook Air, the best in class in this category, it's competitive, admittedly at a lower display resolution. However, over 14 hours in our Wi-Fi test (150 cd/m²) is definitely a very good result.
| Lenovo ThinkPad Z13 21D2CTO1WW R5 PRO 6650U, Radeon 660M, 51.5 Wh | Dell XPS 13 Plus 9320 4K i7-1260P, Iris Xe G7 96EUs, 55 Wh | Lenovo ThinkPad X1 Carbon G10 21CC001RGE i5-1250P, Iris Xe G7 80EUs, 57 Wh | Apple MacBook Air M2 Entry M2, M2 8-Core GPU, 52.6 Wh | Lenovo ThinkPad X1 Nano-20UN002UGE i7-1160G7, Iris Xe G7 96EUs, 48.2 Wh | Average of class Subnotebook | |
|---|---|---|---|---|---|---|
| Battery runtime | -39% | -12% | 11% | -18% | -1% | |
| H.264 (h) | 16.3 | 11 -33% | 10.9 -33% | 16.5 1% | 15.4 -6% | 15.3 ? -6% |
| WiFi v1.3 (h) | 14.4 | 6.9 -52% | 10.2 -29% | 15.2 6% | 9.9 -31% | 14.1 ? -2% |
| Load (h) | 1.9 | 1.3 -32% | 2.4 26% | 2.4 26% | 1.6 -16% | 1.998 ? 5% |
Pros
Cons
Verdict: Lenovo almost nails it with the ThinkPad Z13
A close cooperation between Lenovo and AMD, the first premium ThinkPad with Ryzen CPUs: The Lenovo ThinkPad Z13 is an important milestone in the history of the ThinkPad brand - because this history has been mainly dominated by Intel so far. The combination of high-quality components and AMD has been a success.
The ThinkPad Z13 attacks competitors like the Dell XPS 13 Plus or the Apple MacBook Air head-on. The ThinkPad Z13 masters this difficult task against strong competitors well, as it only has a few weaknesses and many strengths. A very compact and high-quality case made of metal and glass is combined with very good input devices that are likely to convince users switching from other laptop brands in particular. The integrated TrackPoint buttons have also turned out better than in the first attempt in 2014. The AMD CPU provides high performance without making big compromises on efficiency in terms of temperatures or fan noise. Conversely, battery life is excellent and is only just surpassed by the Apple MacBook Air.
There are only a few drawbacks that have to be accepted in exchange for this strong overall package. These include the rather slow SSD as well as the moderate display brightness, which lags behind the competition. The Z13 does offer WWAN, but it's not preconfigured in the case of models without WWAN. Moreover, unlike with the X1 series, Lenovo doesn't offer the future-proof 5G. The port configuration is typical for such compact ultrabooks, but at least a full-size HDMI port would certainly be a big plus especially in the business sector. Two minor points of criticism: The screen can't be opened to 180 degrees, contrary to almost all other ThinkPads, and the Page Up/Down keys are missing.
Premium quality plus AMD - the result is the Lenovo ThinkPad Z13.
All in all, the Lenovo ThinkPad Z13 is certainly one of the most interesting 13-inch laptops so far in this year, which is reflected in its high score. Compared to the Dell XPS 13 Plus, it offers more efficient CPUs and forgoes odd experiments like the touch bar. And compared to the Apple MacBook Air, it offers more CPU power without sacrificing aspects like battery life. The ThinkPad X1 Carbon G10 offers better features, but it's larger and much less enduring.
Price and availability
At the time of writing, you can find several configurations of the Lenovo ThinkPad Z13 in the manufacturer's online store, with our review configuration currently costing around $1,465 (take the first, less expensive model and add more storage through the "Build Your PC" option).
Lenovo ThinkPad Z13 21D2CTO1WW
- 08/07/2022 v7 (old)
Benjamin Herzig
Price comparison

