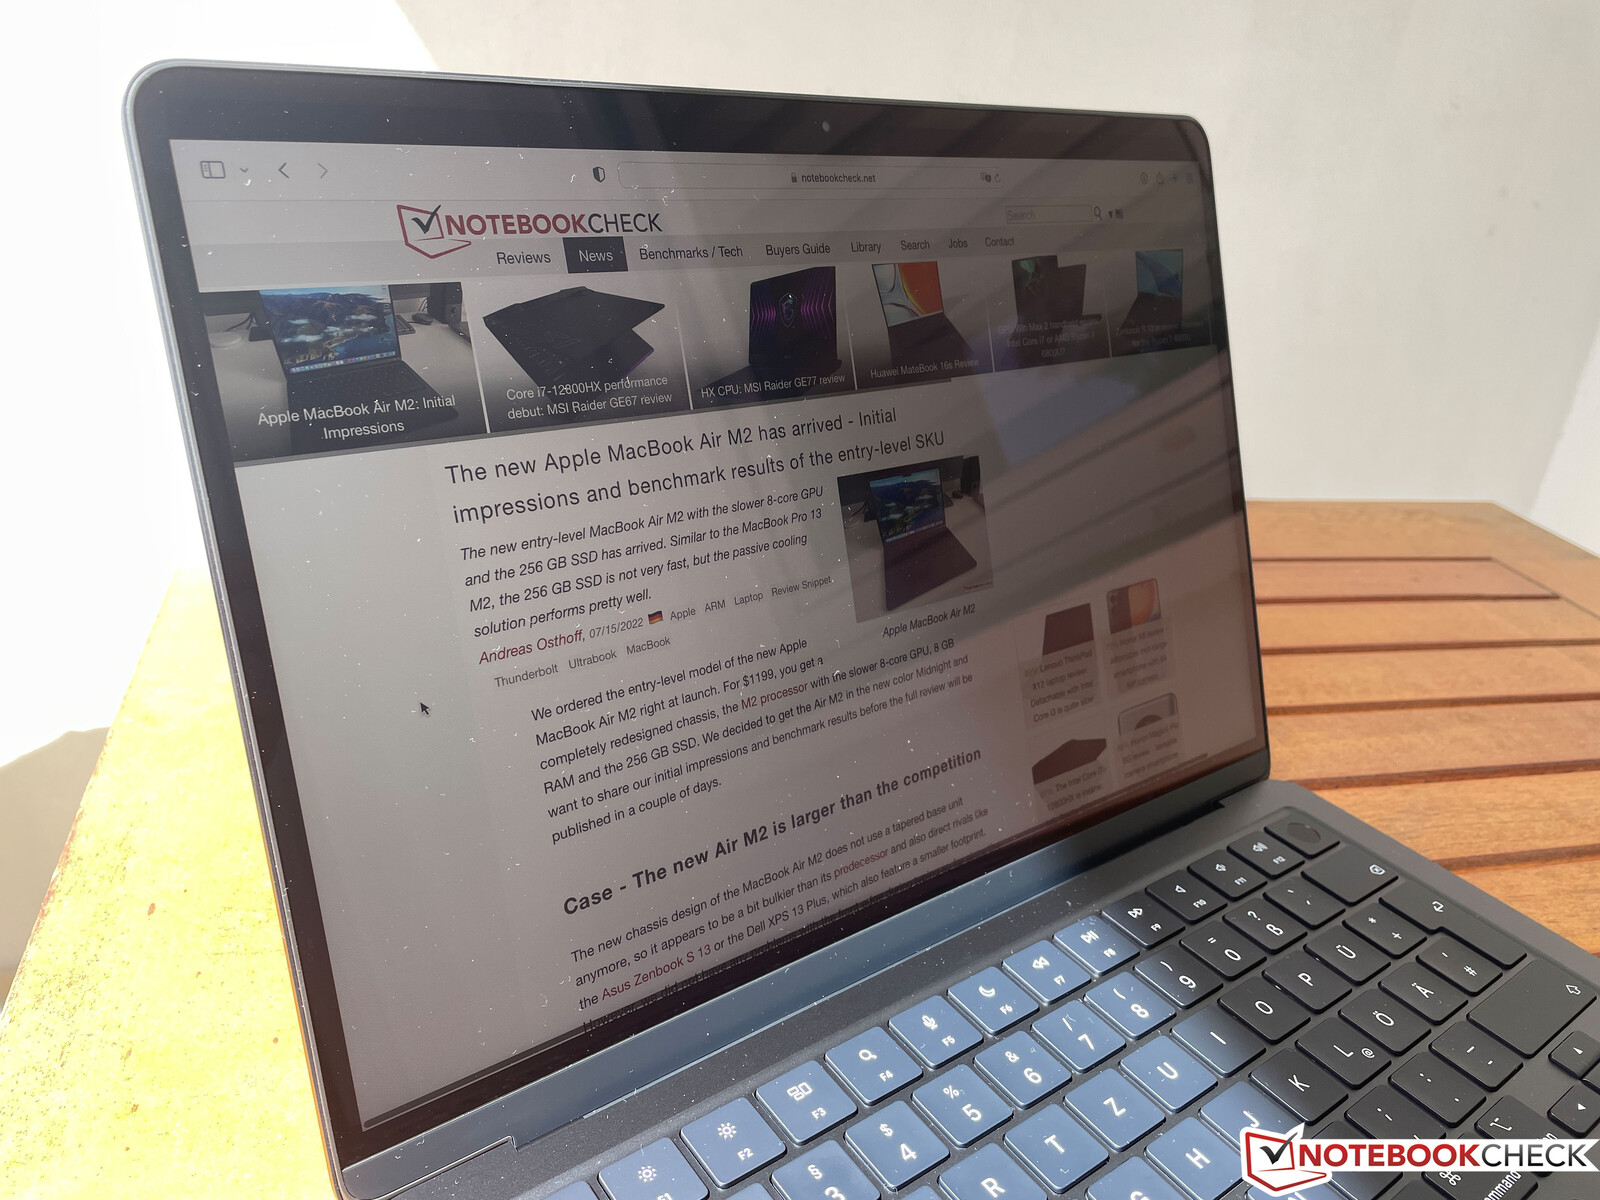
Apple MacBook Air M2 Entry Review – A very good, but too expensive daily MacBook
The old MacBook Pro 13 with the new Apple M2 chip launched a couple of weeks ago, and now we finally get the completely redesigned MacBook Air M2. The new Air has big shoes to fill, because the previous MacBook Air M1 was one of the best compact laptops of the last two years. Apple wants to continue this success story with a completely redesigned chassis, which was developed for Apple’s own M2 processor. The new display now supports the larger P3 color gamut like the larger MacBook Pro models and the panel is brighter, you get new speakers, there is a 1080p webcam and the popular MagSafe connector has returned. However, the new model has a much higher starting price of $1199 for the base model with just 8 GB RAM and 256 GB SSD storage.
It seems Apple is not really sure about the pricing, either, and still offers the MacBook Air M1 with the slower 7-core GPU (for now), most likely to offer a product in the $1000 range. We want to find out what the new MacBook Air M2 is like to live with, how the passive cooling solution handles the new M2 chip, and if you really notice the slower 256 GB SSD in your daily routine.
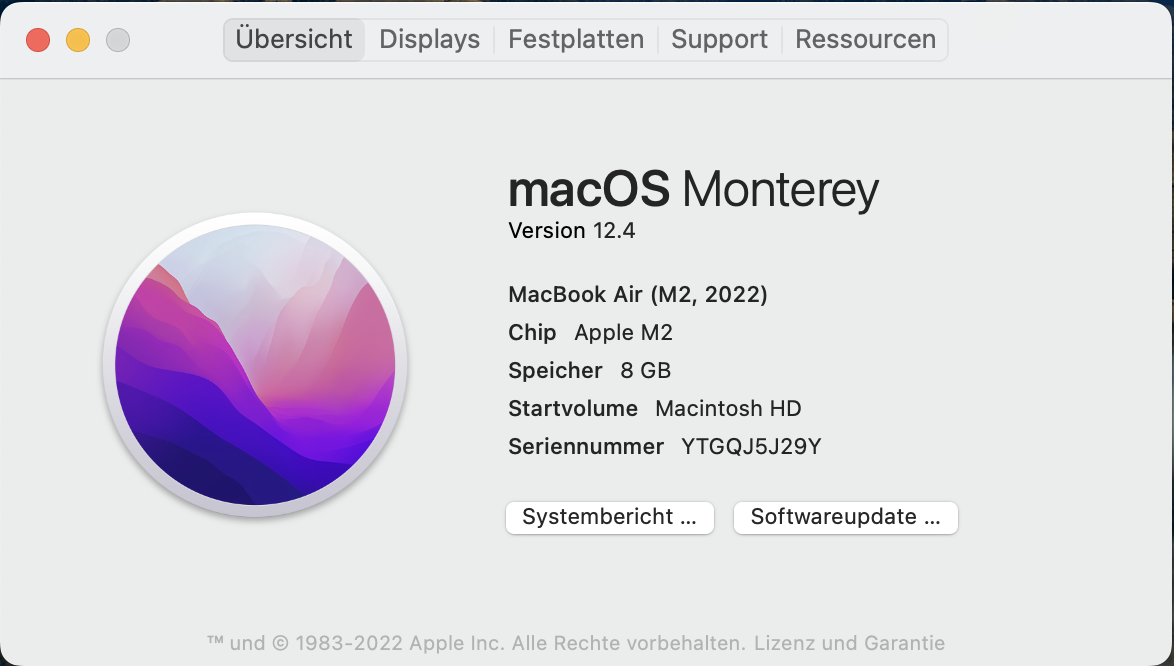
We review the base model of the MacBook Air M2 in the new Midnight color, which we purchased in Apple’s online store (no press unit). If you get all the options (24 GB RAM, 2 TB SSD), the price of the new Air M2 will rise to $2499. We currently also have a MacBook Air M2 with the faster 10-core GPU, 16 GB RAM, and a 1 TB SSD in our editorial office; the corresponding review will be published soon.
Potential Rivals
Rating | Date | Model | Weight | Height | Size | Resolution | Price |
|---|---|---|---|---|---|---|---|
| 92.3 % v7 (old) | 07 / 2022 | Apple MacBook Air M2 Entry M2, M2 8-Core GPU | 1.2 kg | 11.3 mm | 13.60" | 2560x1664 | |
| 91.1 % v7 (old) | 12 / 2020 | Apple MacBook Air 2020 M1 Entry M1, M1 7-Core GPU | 1.3 kg | 16.1 mm | 13.30" | 2560x1600 | |
| 91.9 % v7 (old) | 06 / 2022 | Apple MacBook Pro 13 2022 M2 M2, M2 10-Core GPU | 1.4 kg | 15.6 mm | 13.30" | 2560x1600 | |
| 86.9 % v7 (old) | 07 / 2022 | Dell XPS 13 Plus 9320 4K i7-1260P, Iris Xe G7 96EUs | 1.2 kg | 15.3 mm | 13.40" | 3840x2400 | |
| 90.1 % v7 (old) | 07 / 2022 | Asus Zenbook S 13 OLED R7 6800U, Radeon 680M | 1.1 kg | 14.9 mm | 13.30" | 2880x1800 | |
| 88.8 % v7 (old) | 02 / 2022 | Huawei MateBook 13s i5 11300H i5-11300H, Iris Xe G7 80EUs | 1.3 kg | 16.5 mm | 13.40" | 2520x1680 | |
| 87.8 % v7 (old) | 01 / 2022 | Lenovo ThinkBook 13s G3 20YA0005GE R7 5800U, Vega 8 | 1.3 kg | 14.9 mm | 13.30" | 1920x1200 |
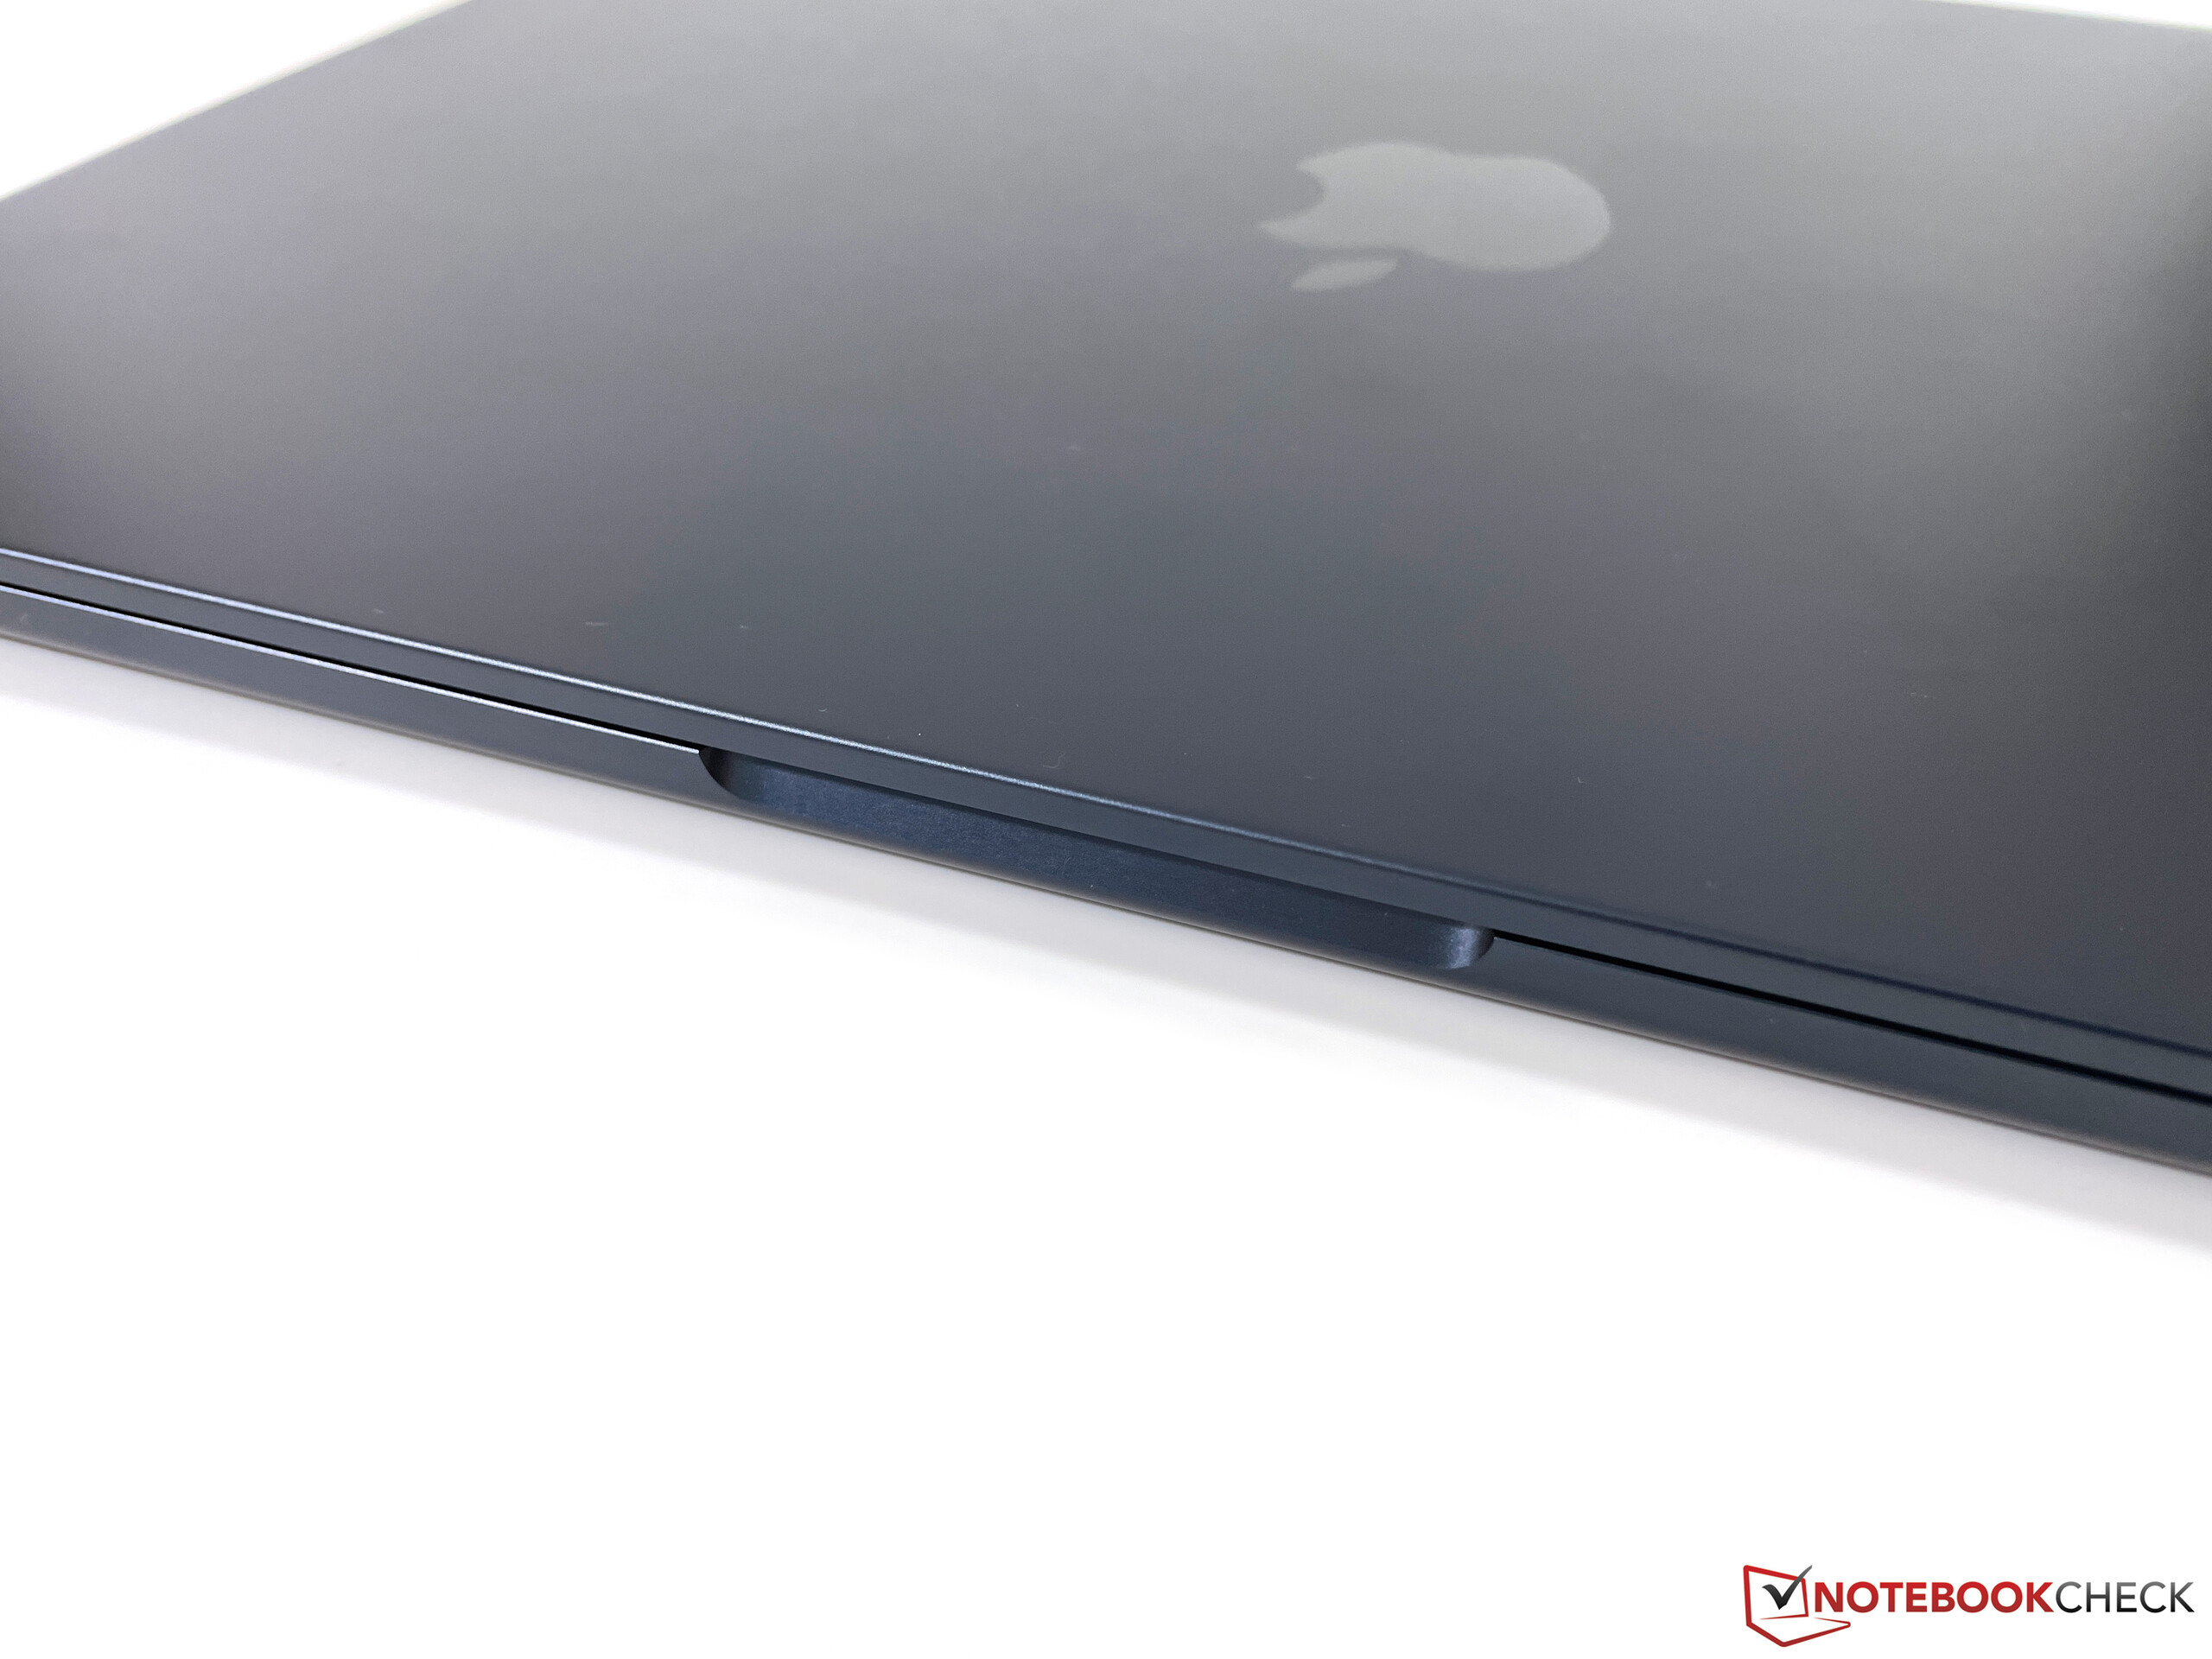
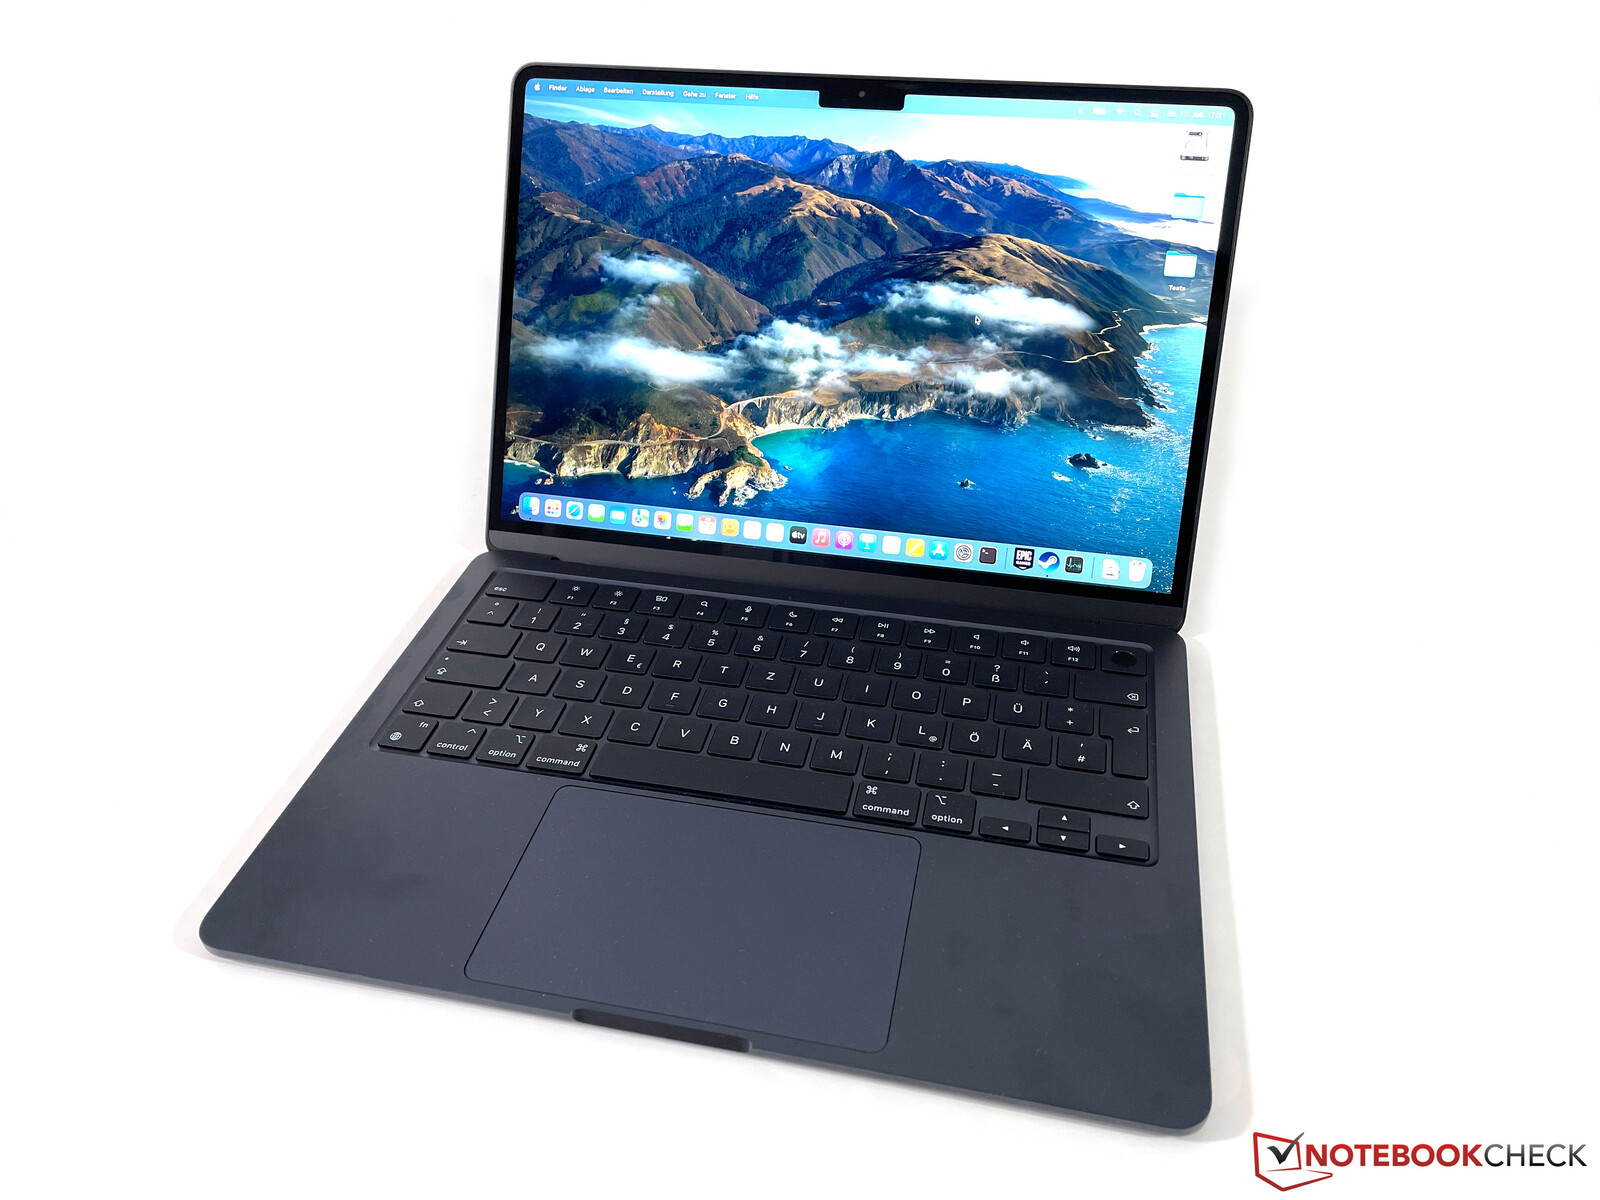
Case - The new MacBook Air M2 is slimmer and bigger
Apple does not use the familiar design of the old MacBook Air with the wedge-shaped base unit anymore and the basic design of the new MacBook Air M2 is no similar to the other MacBook models. The chassis height is identical at the front and the rear, and the new Air is extremely thin at just 11.3 mm. The old Air was thinner at the front, but thicker at the rear. If you have used a MacBook Pro before, you know that the sharp edge of the base unit can quickly leave marks on your wrists, which can be uncomfortable. We thought this might be a problem here as well, but the base unit is fortunately extremely thin and we did not have any issues.
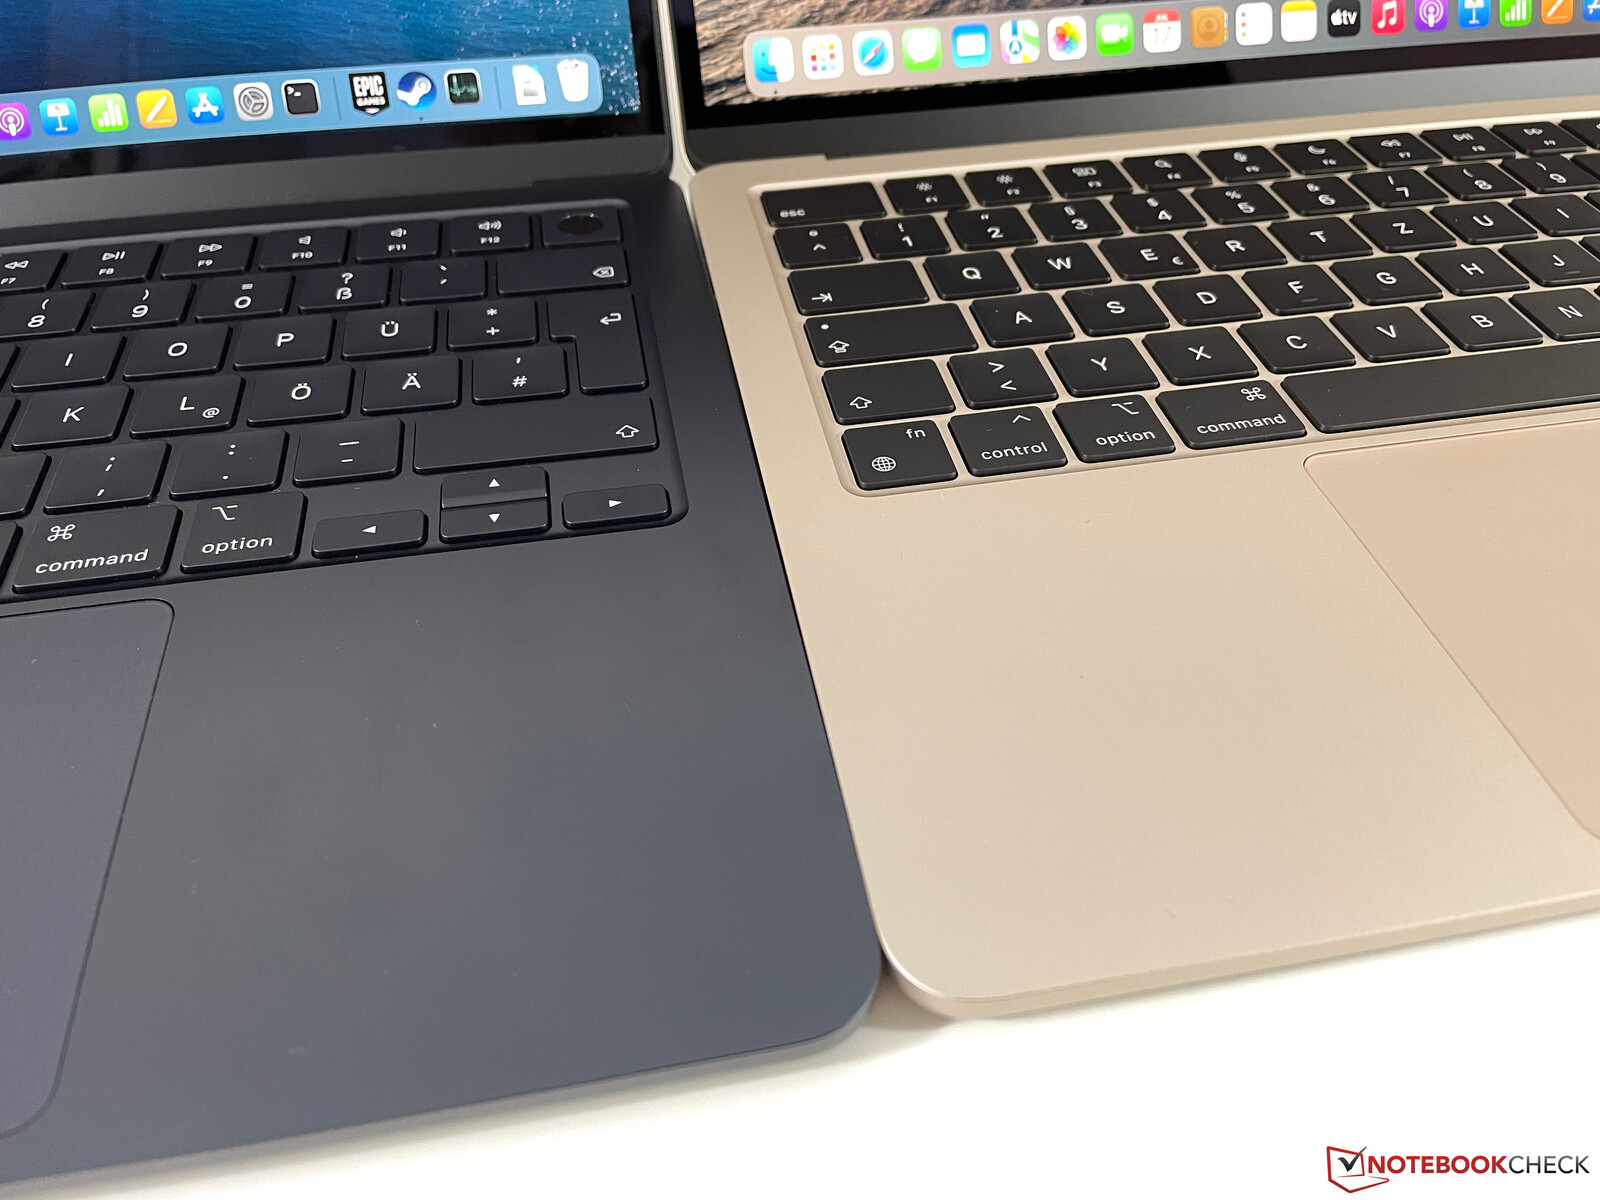
It is very easy to open the lid with one hand thanks to the indentation at the front and the well-adjusted hinges. The device uses the familiar keyboard with standard height function keys and the current Touch-ID fingerprint scanner. Contrary to the current MacBook Pro 14, the space between the individual keys is not black, but still in the chassis color instead. The lid design with the rounded corners is also identical to the MBP 14. All in all, we have to say Apple uses comparatively wide bezels, especially underneath the display and the body-to-screen ratio is “just” 84 % (and we did not subtract the notch).
The thinner design does not affect the stability or the quality impression. Both the base unit as well as the lid are very sturdy and can hardly be dent or twisted at all. We did not manage to provoke picture distortions, either. The hinges are well-adjusted and there is no visible bouncing, but the maximum opening angle is limited to around 130 degrees.
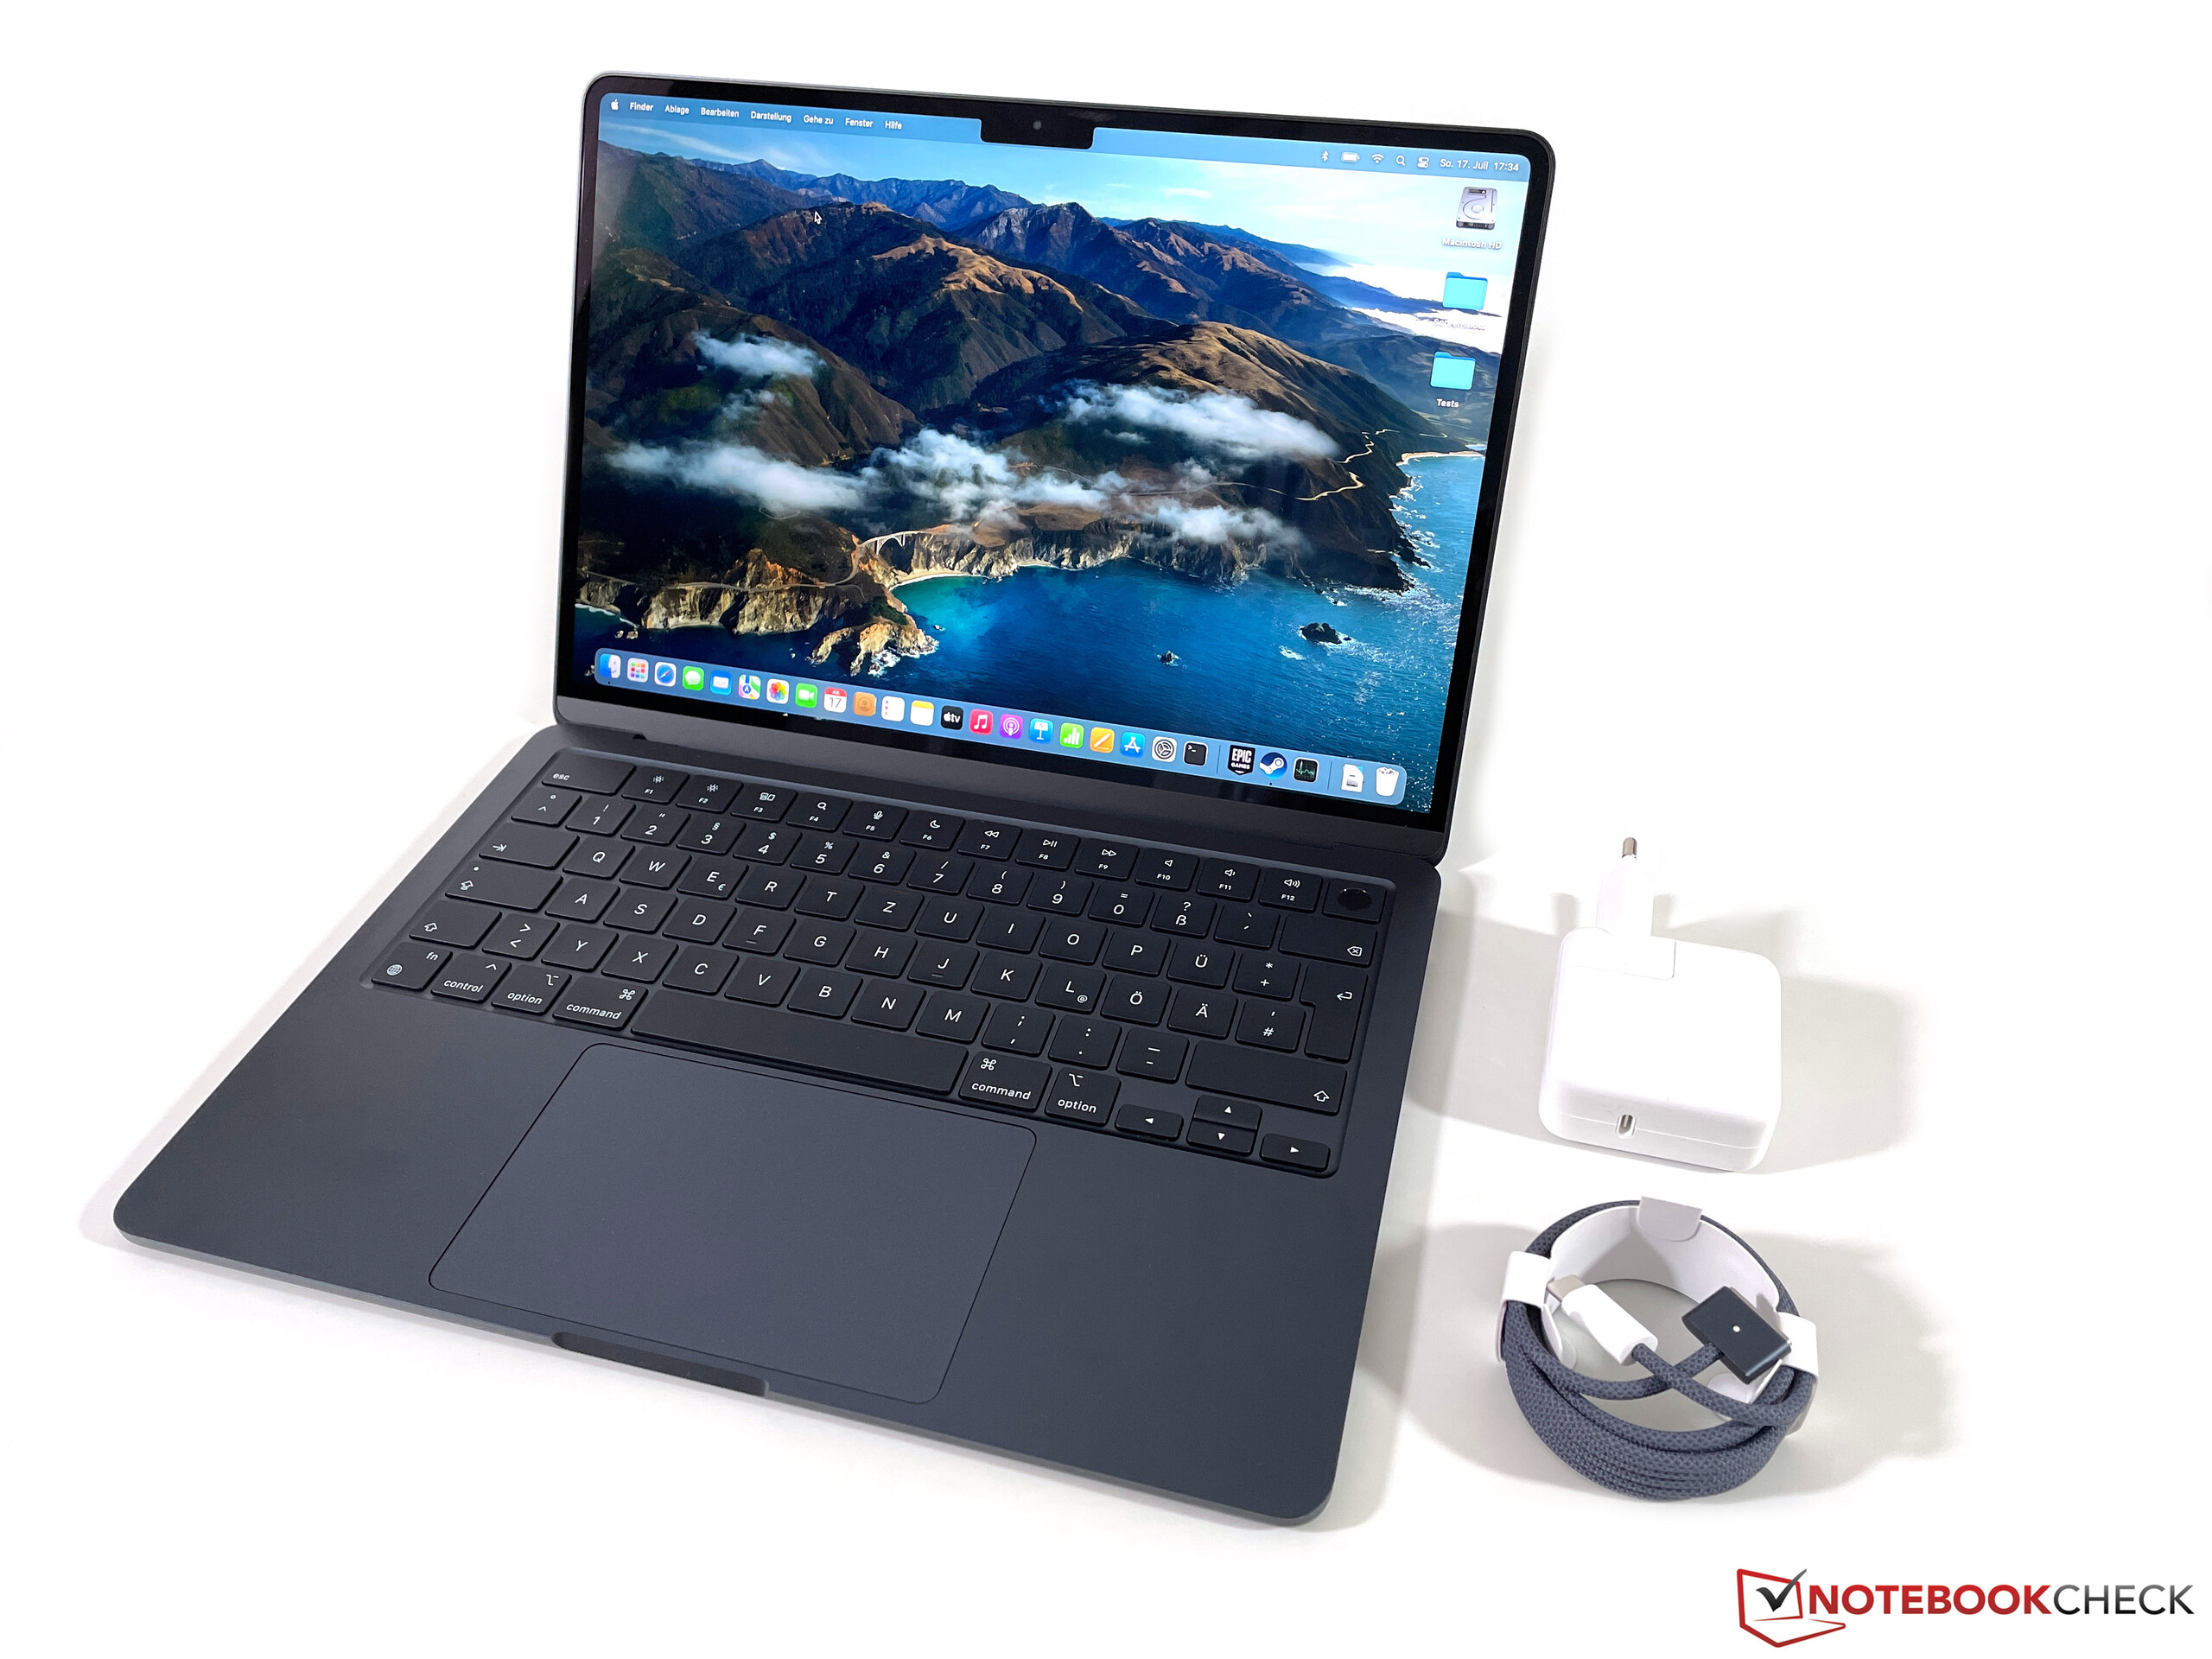
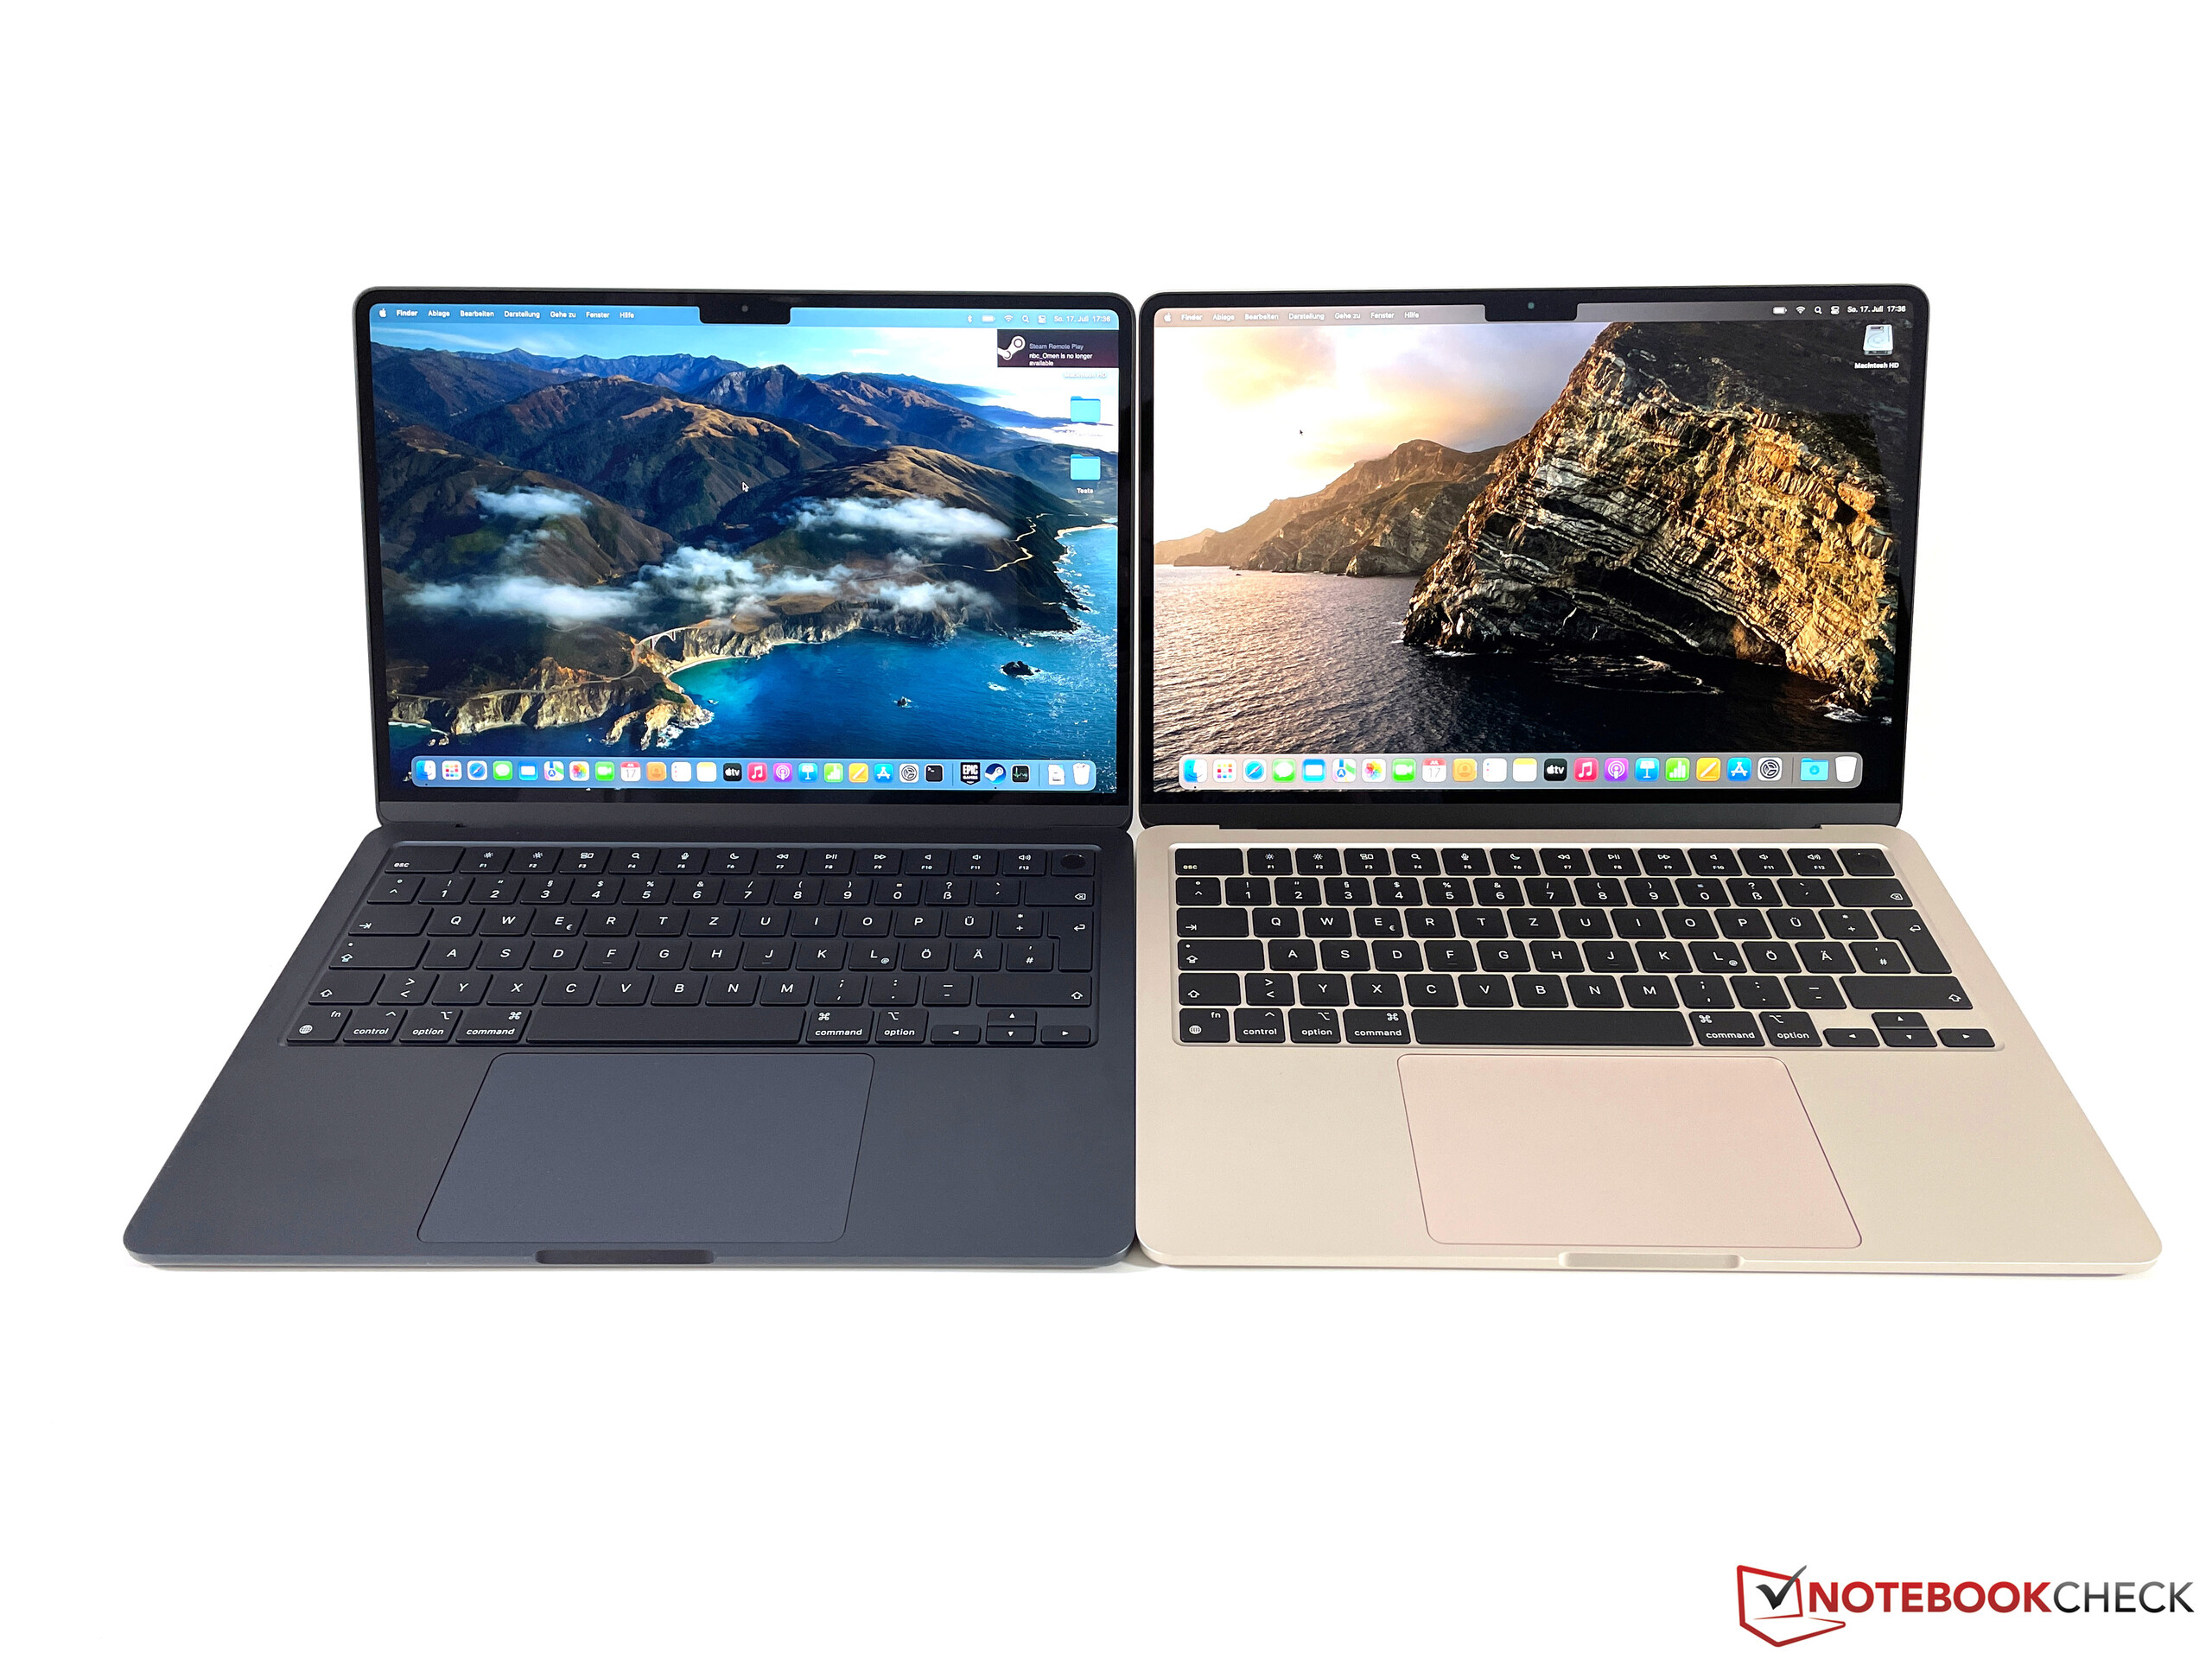
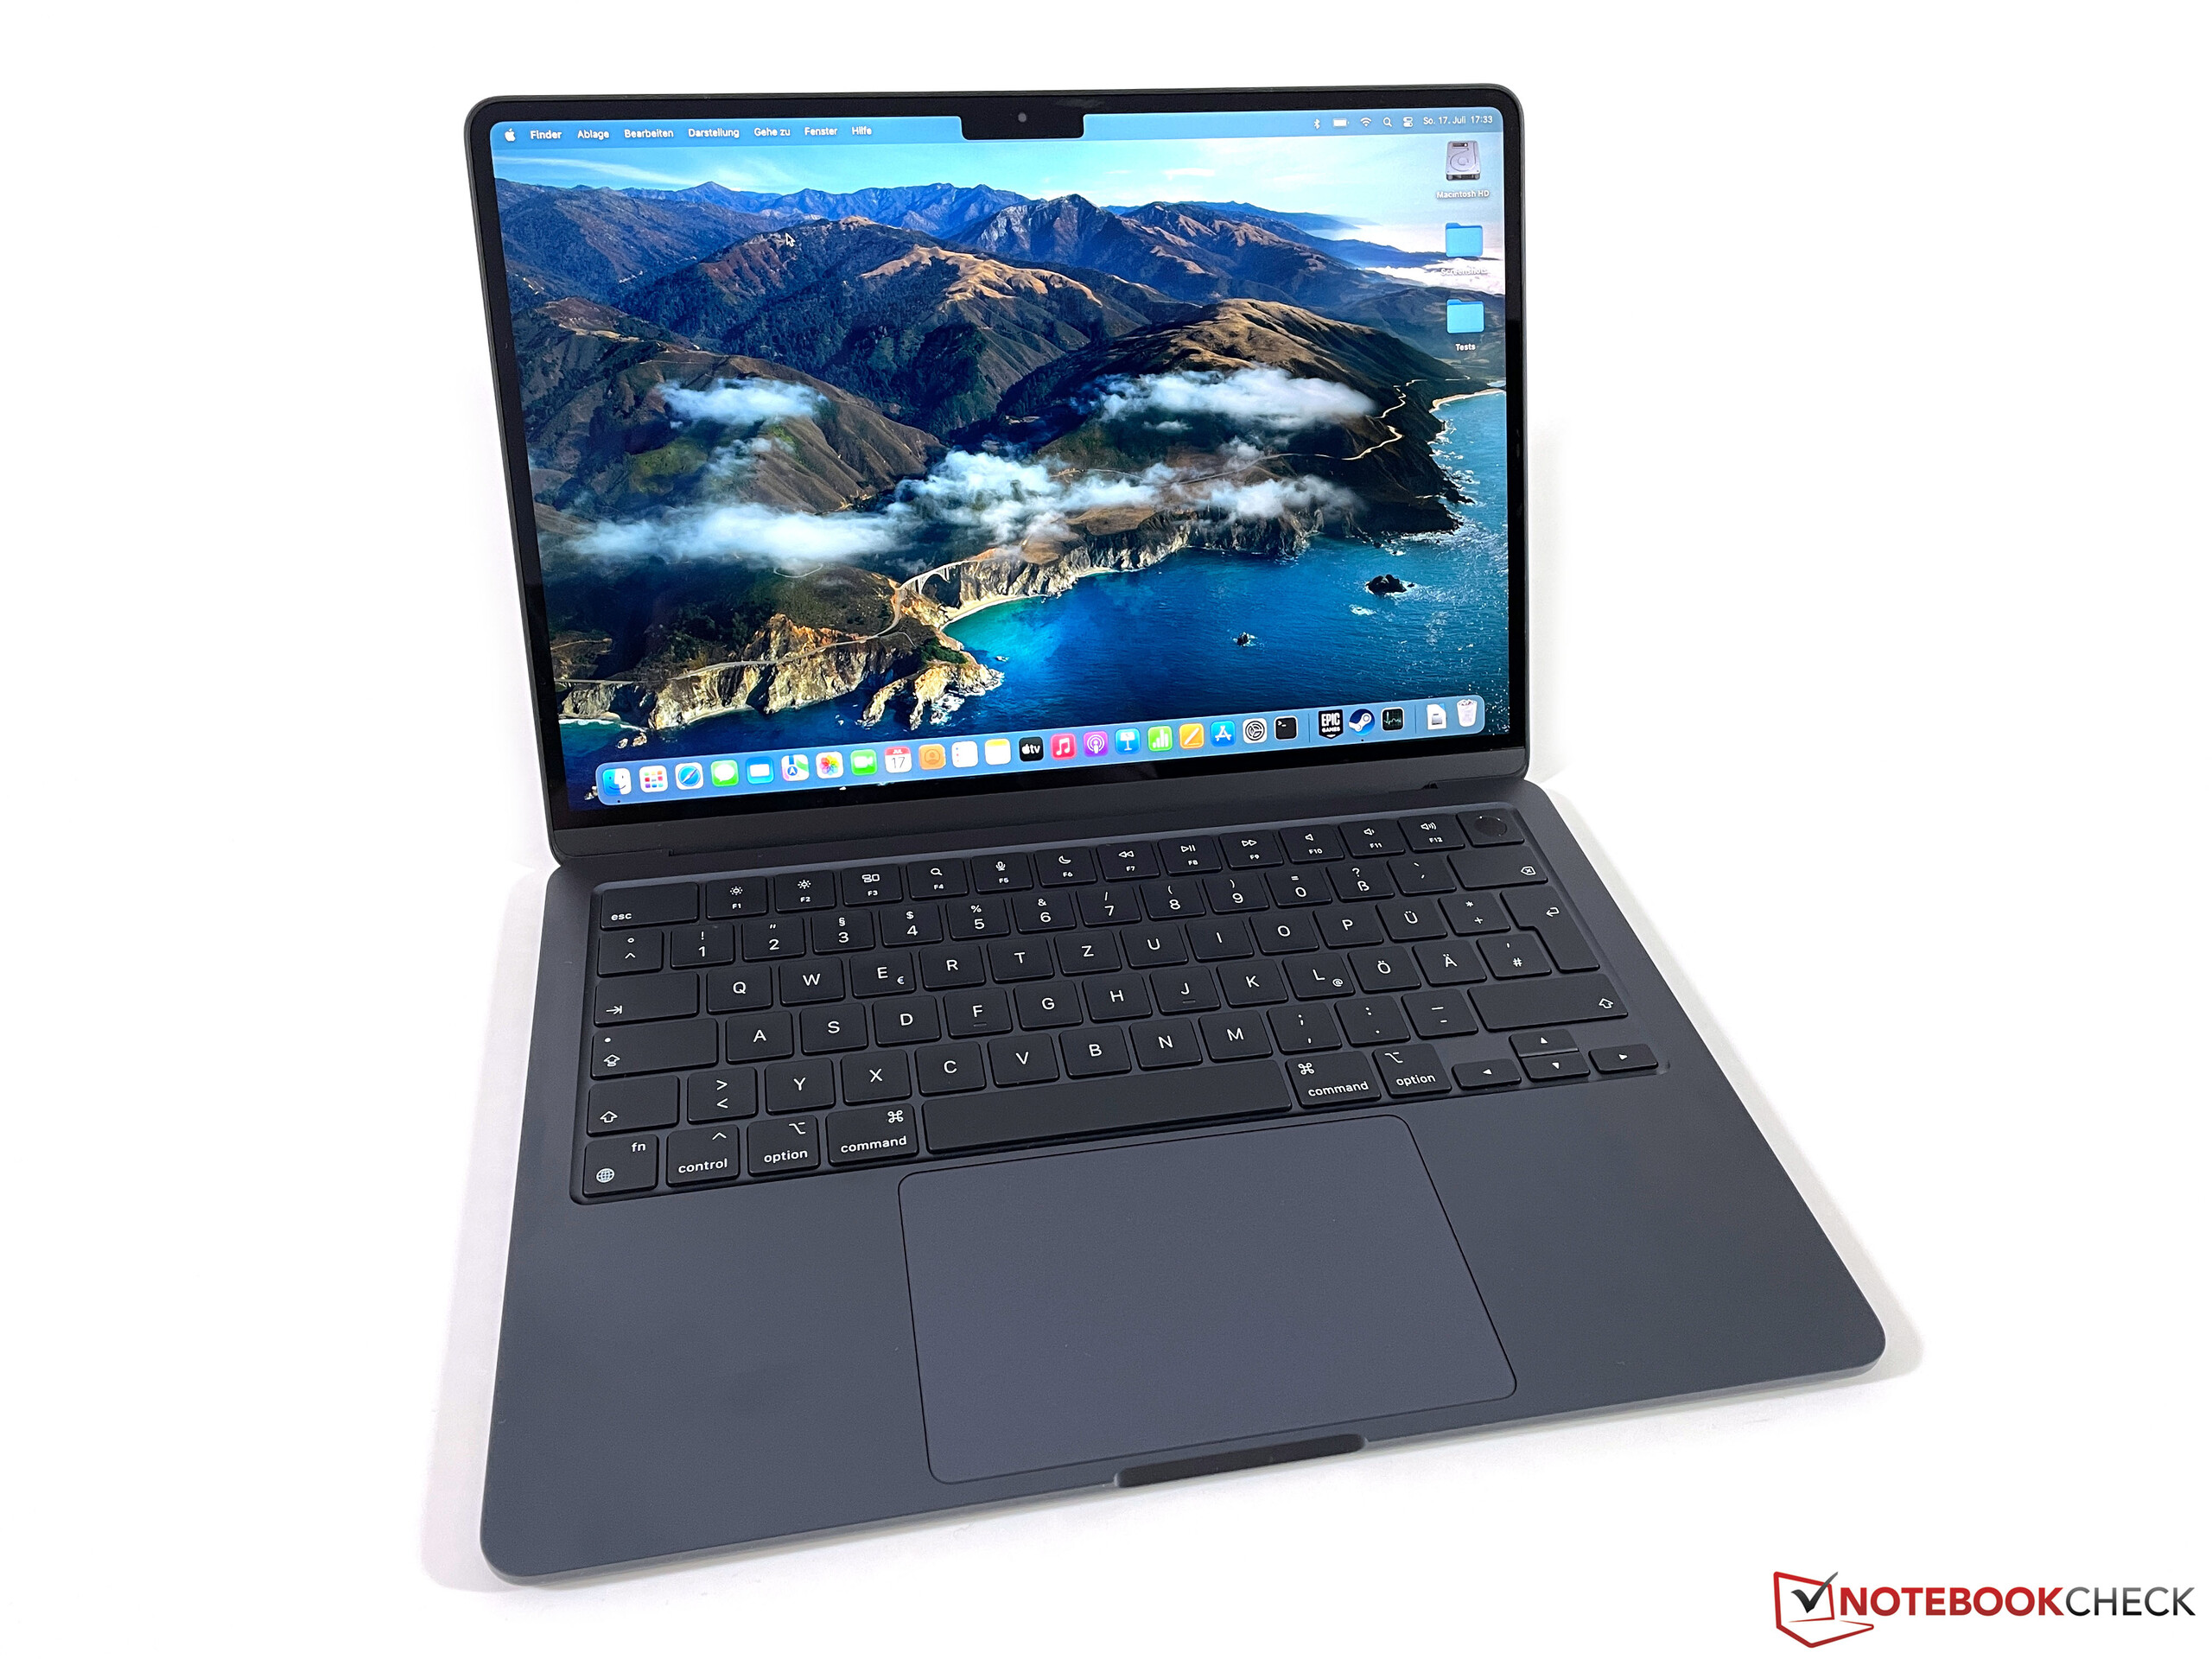
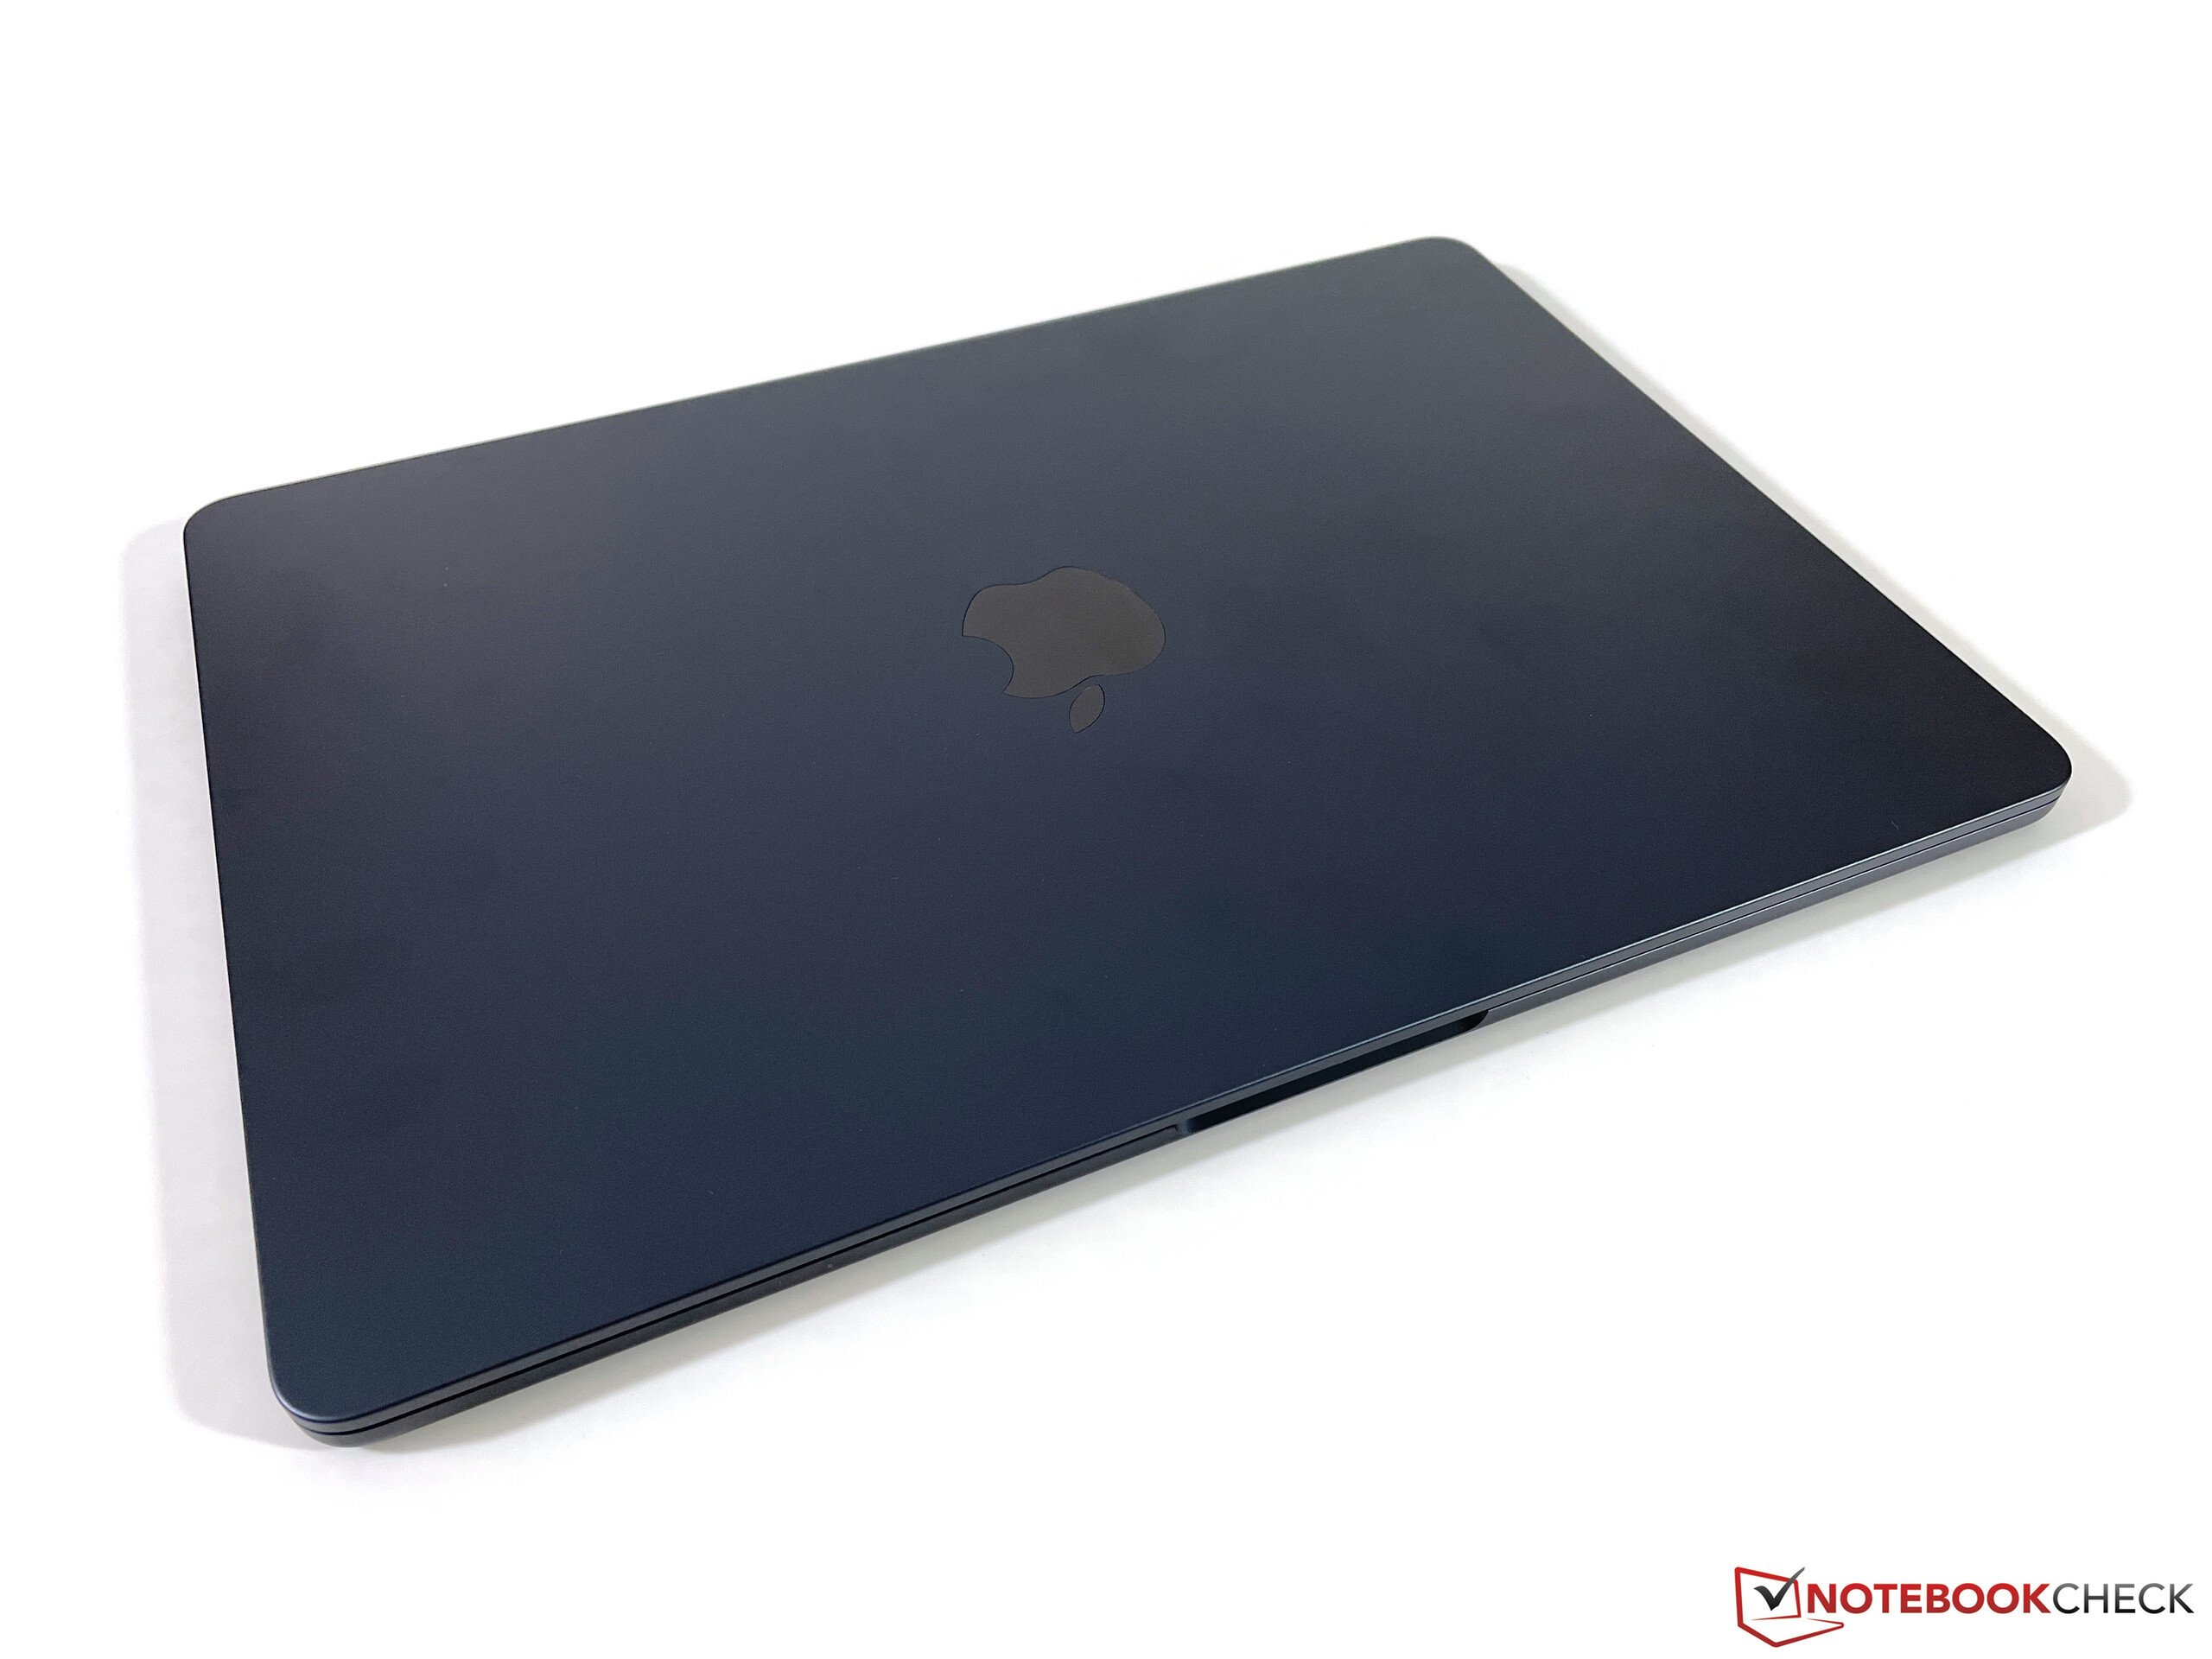
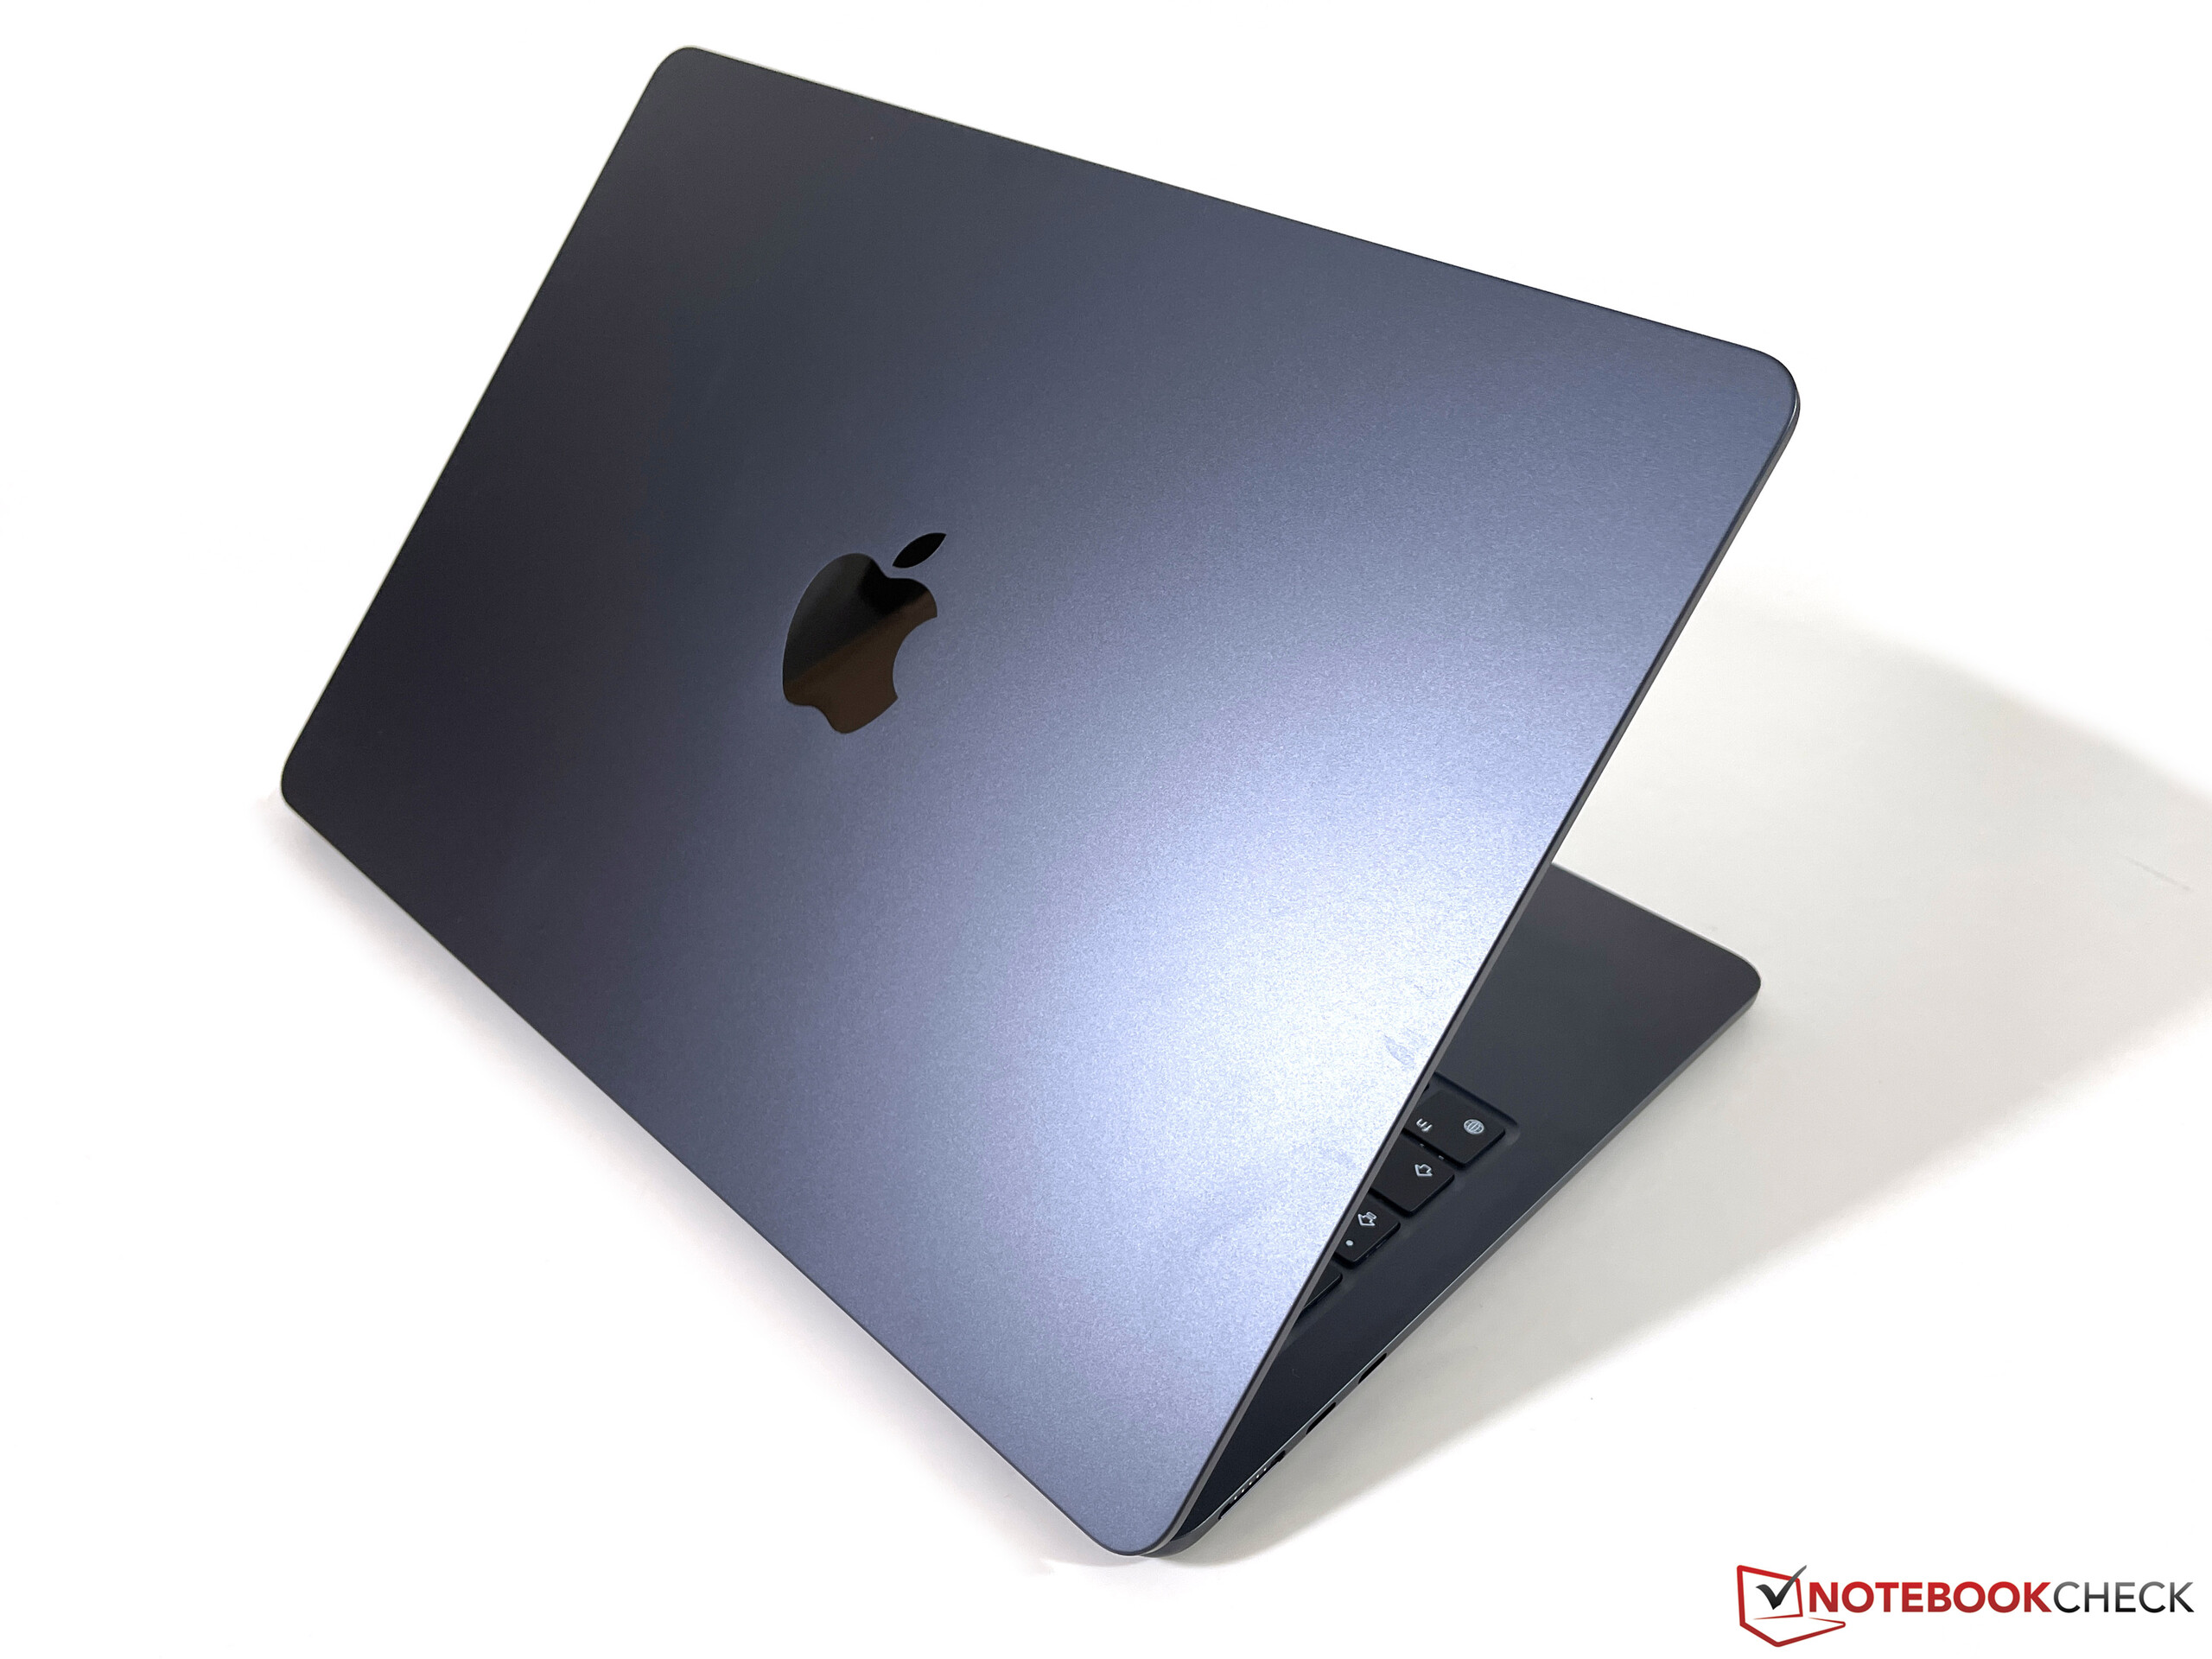
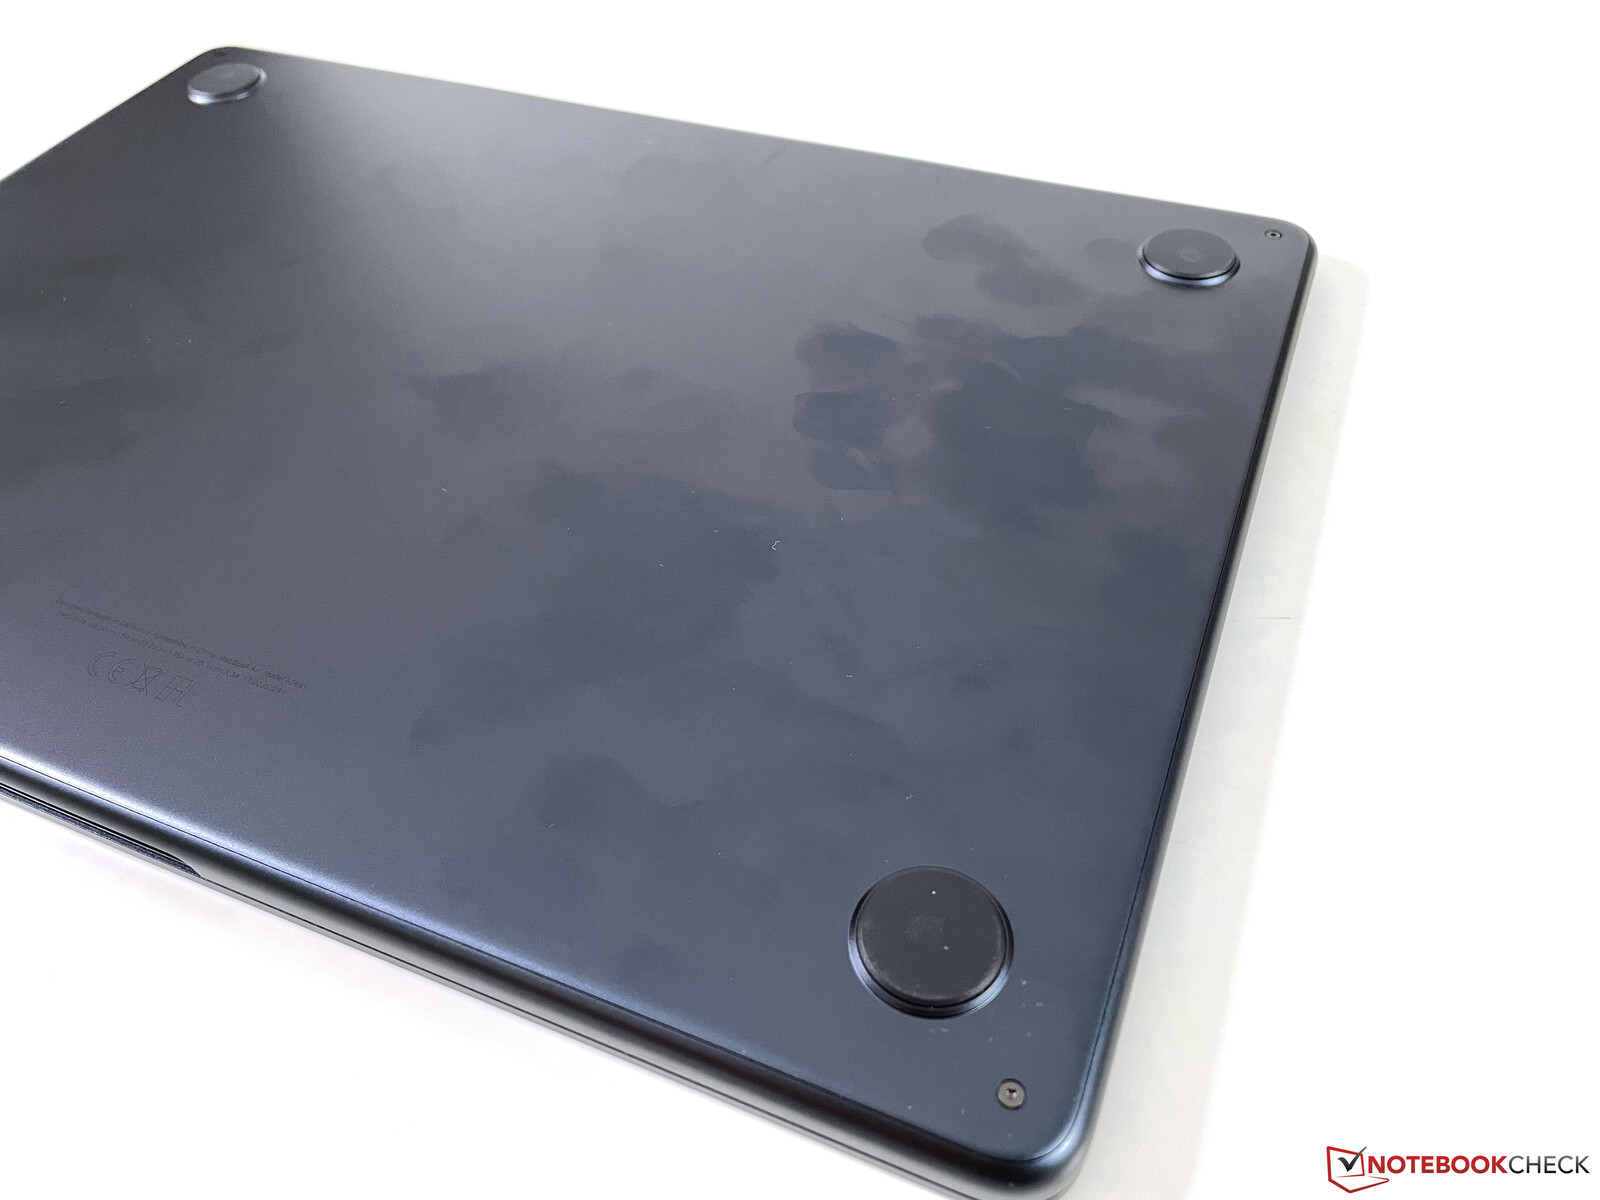
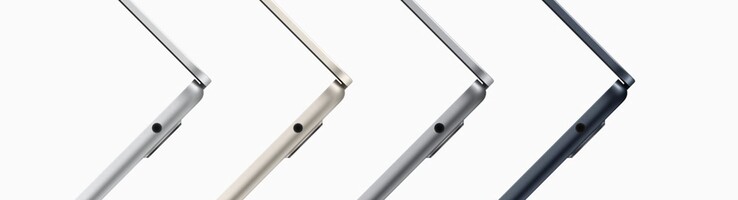
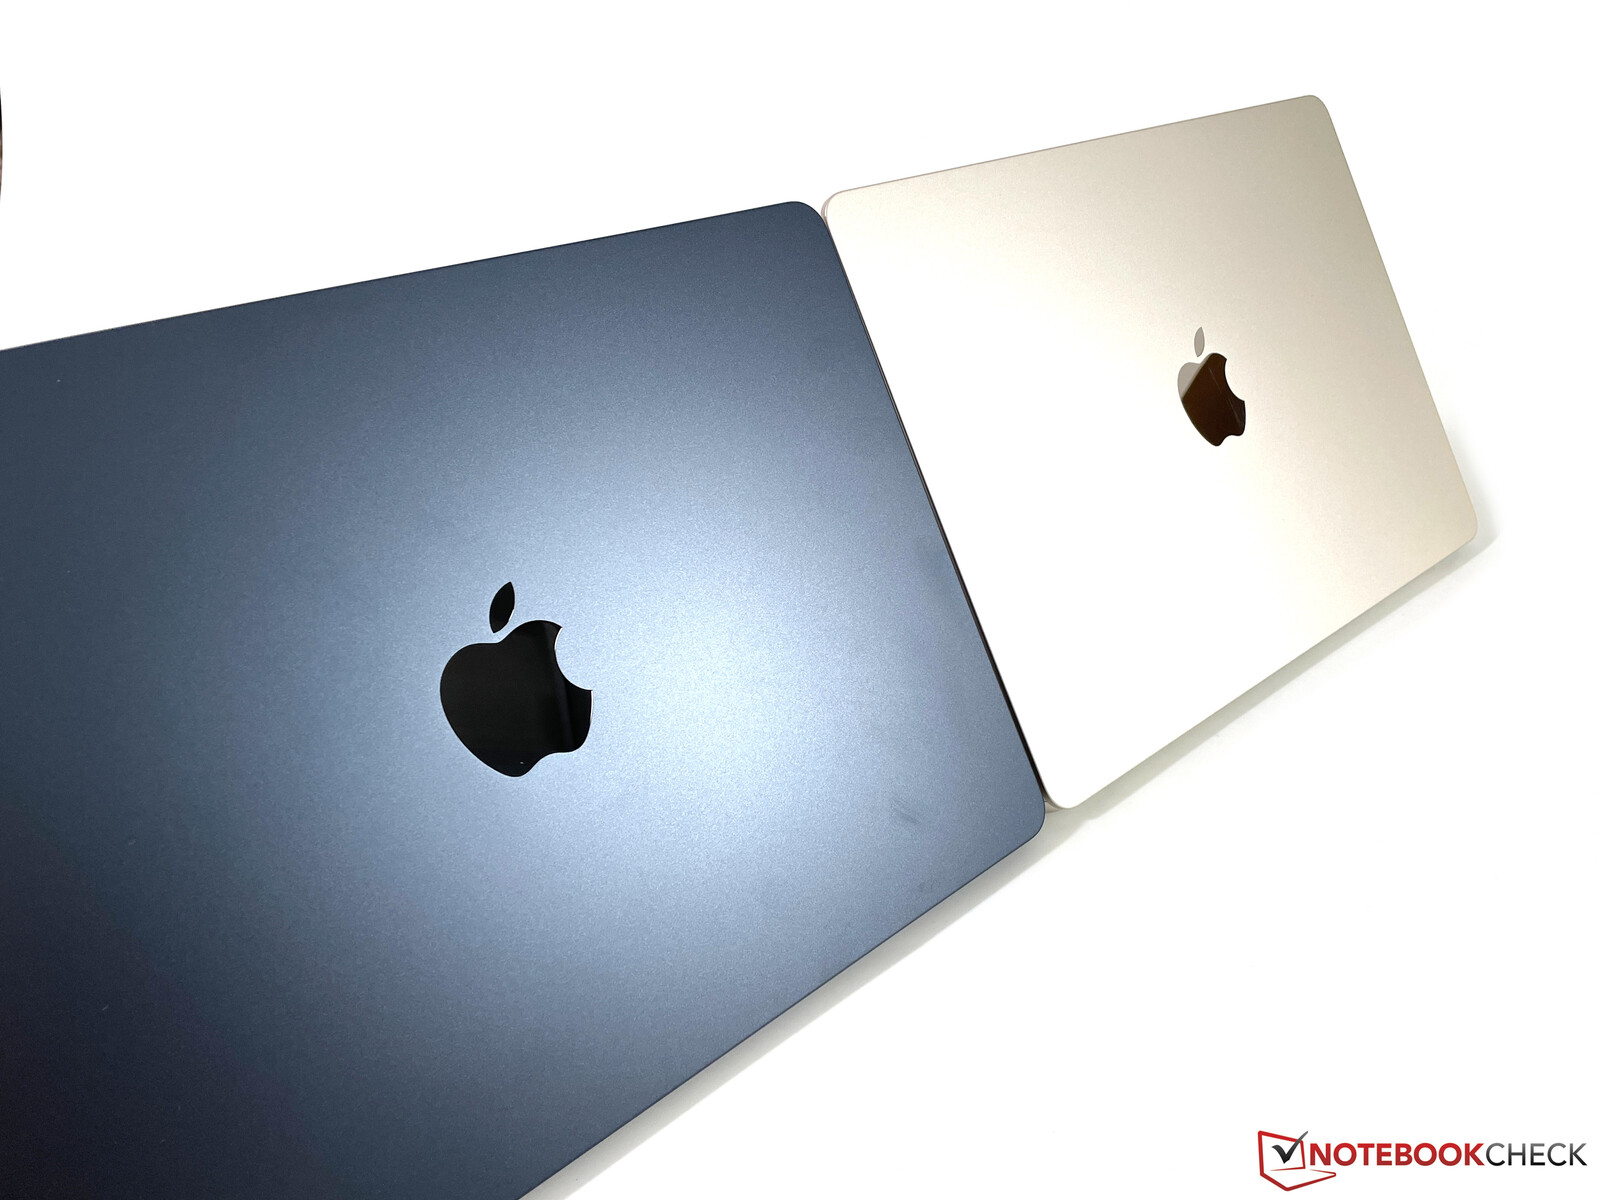
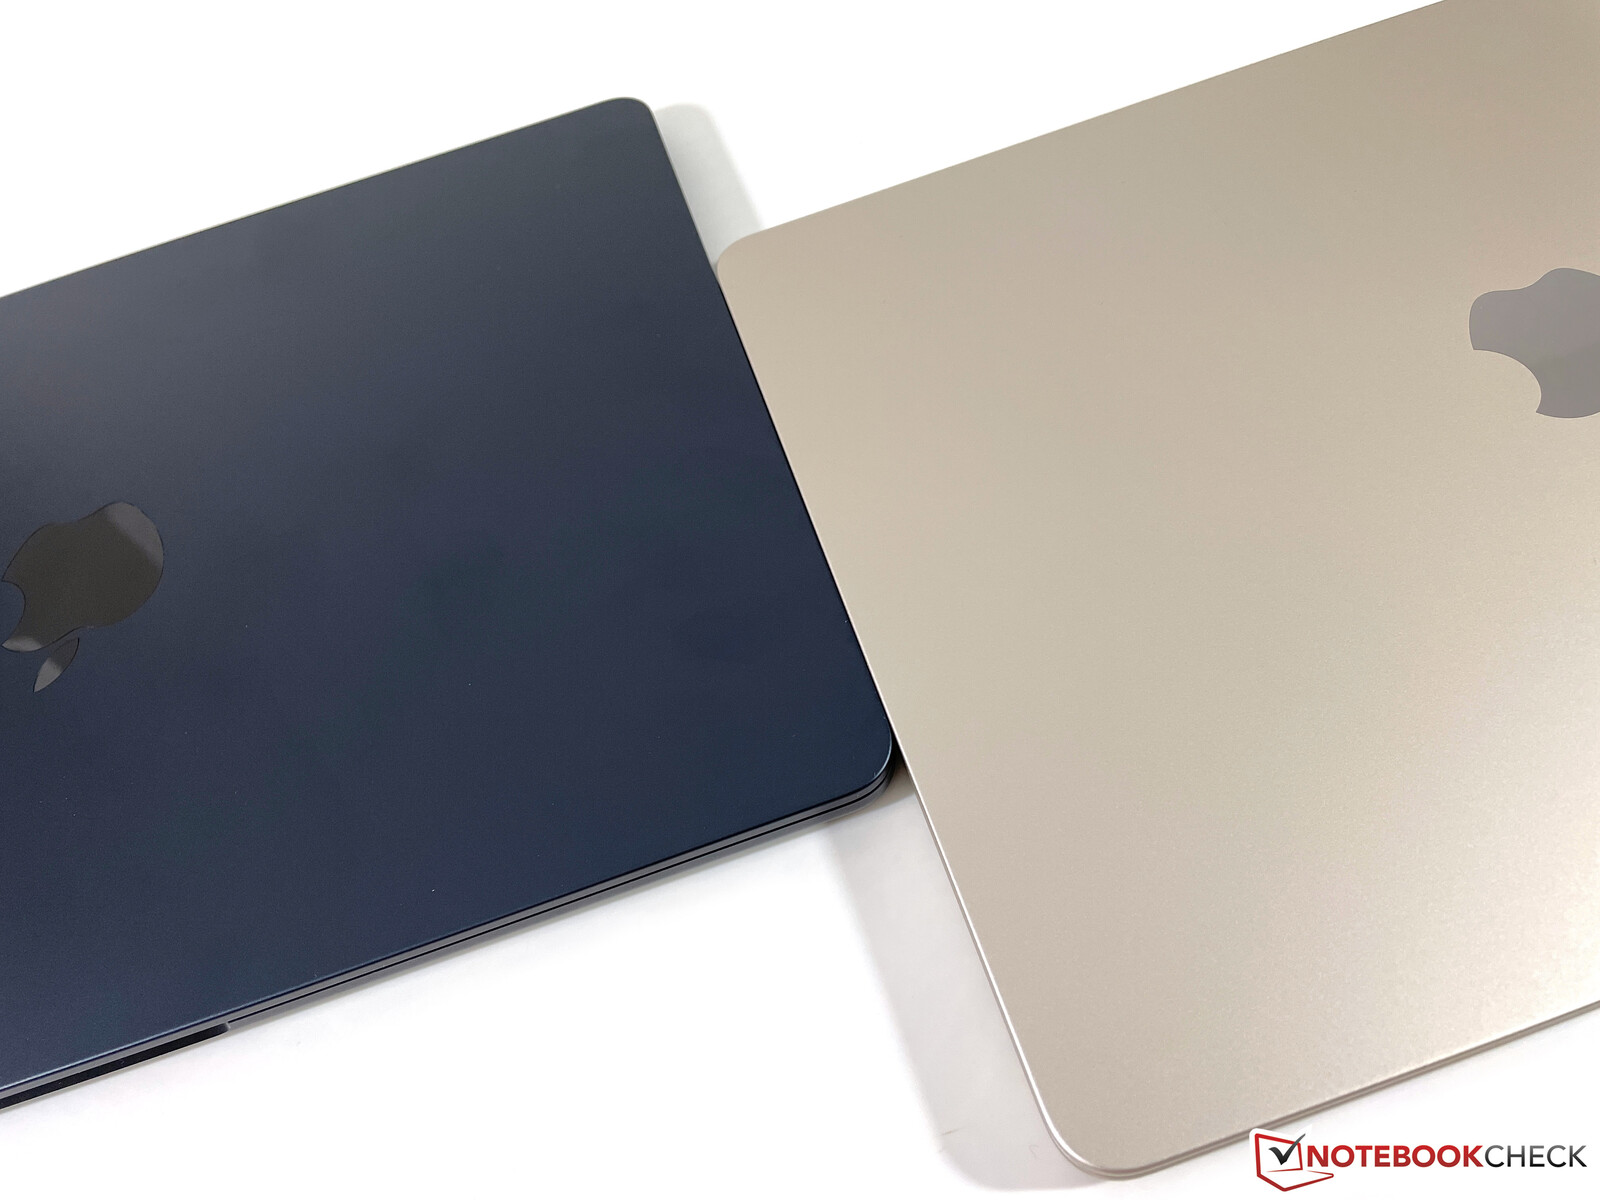
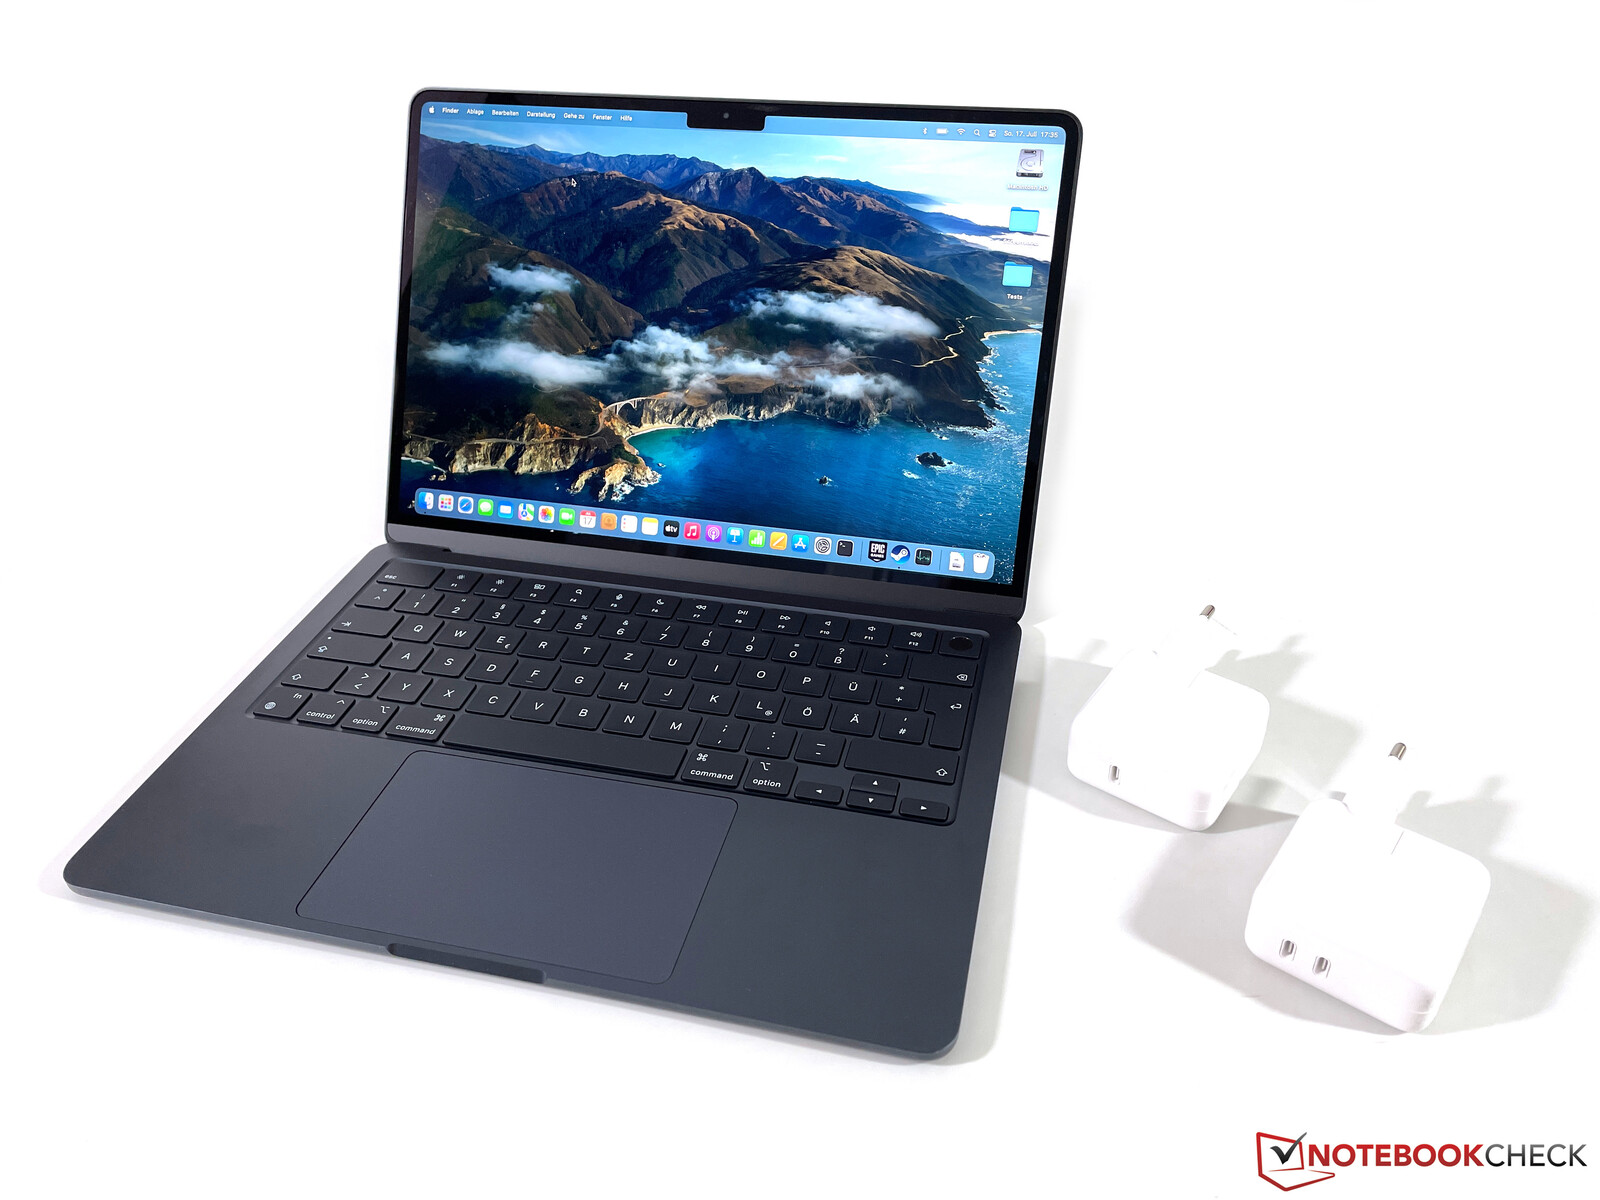
In addition to the familiar colors Silver and Space Gray, Apple also offers the MacBook Air M2 in two new color options Midnight and Starlight. We purchased the Midnight version, which is a dark blue that almost looks black depending on the lighting. The color looks great on pictures and when you open the box, but the surfaces are extremely susceptible to fingerprints and dirt, and it is almost impossible to keep it clean. The USB-C ports quickly reveal some scratches, which are more noticeable compared to the other versions due to the darker color. The new Starlight model (a bright silver with a slight gold hue) is much better in this respect and similar to the familiar colors Silver and Space Gray.
The new MacBook Air M2 is actually slightly deeper than before and also has a slightly larger footprint than the MacBook Air M1 and even the MacBook Pro 13 M2. Thanks to the thin chassis and the rounded corners, however, the new MacBook still leaves a very compact impression.
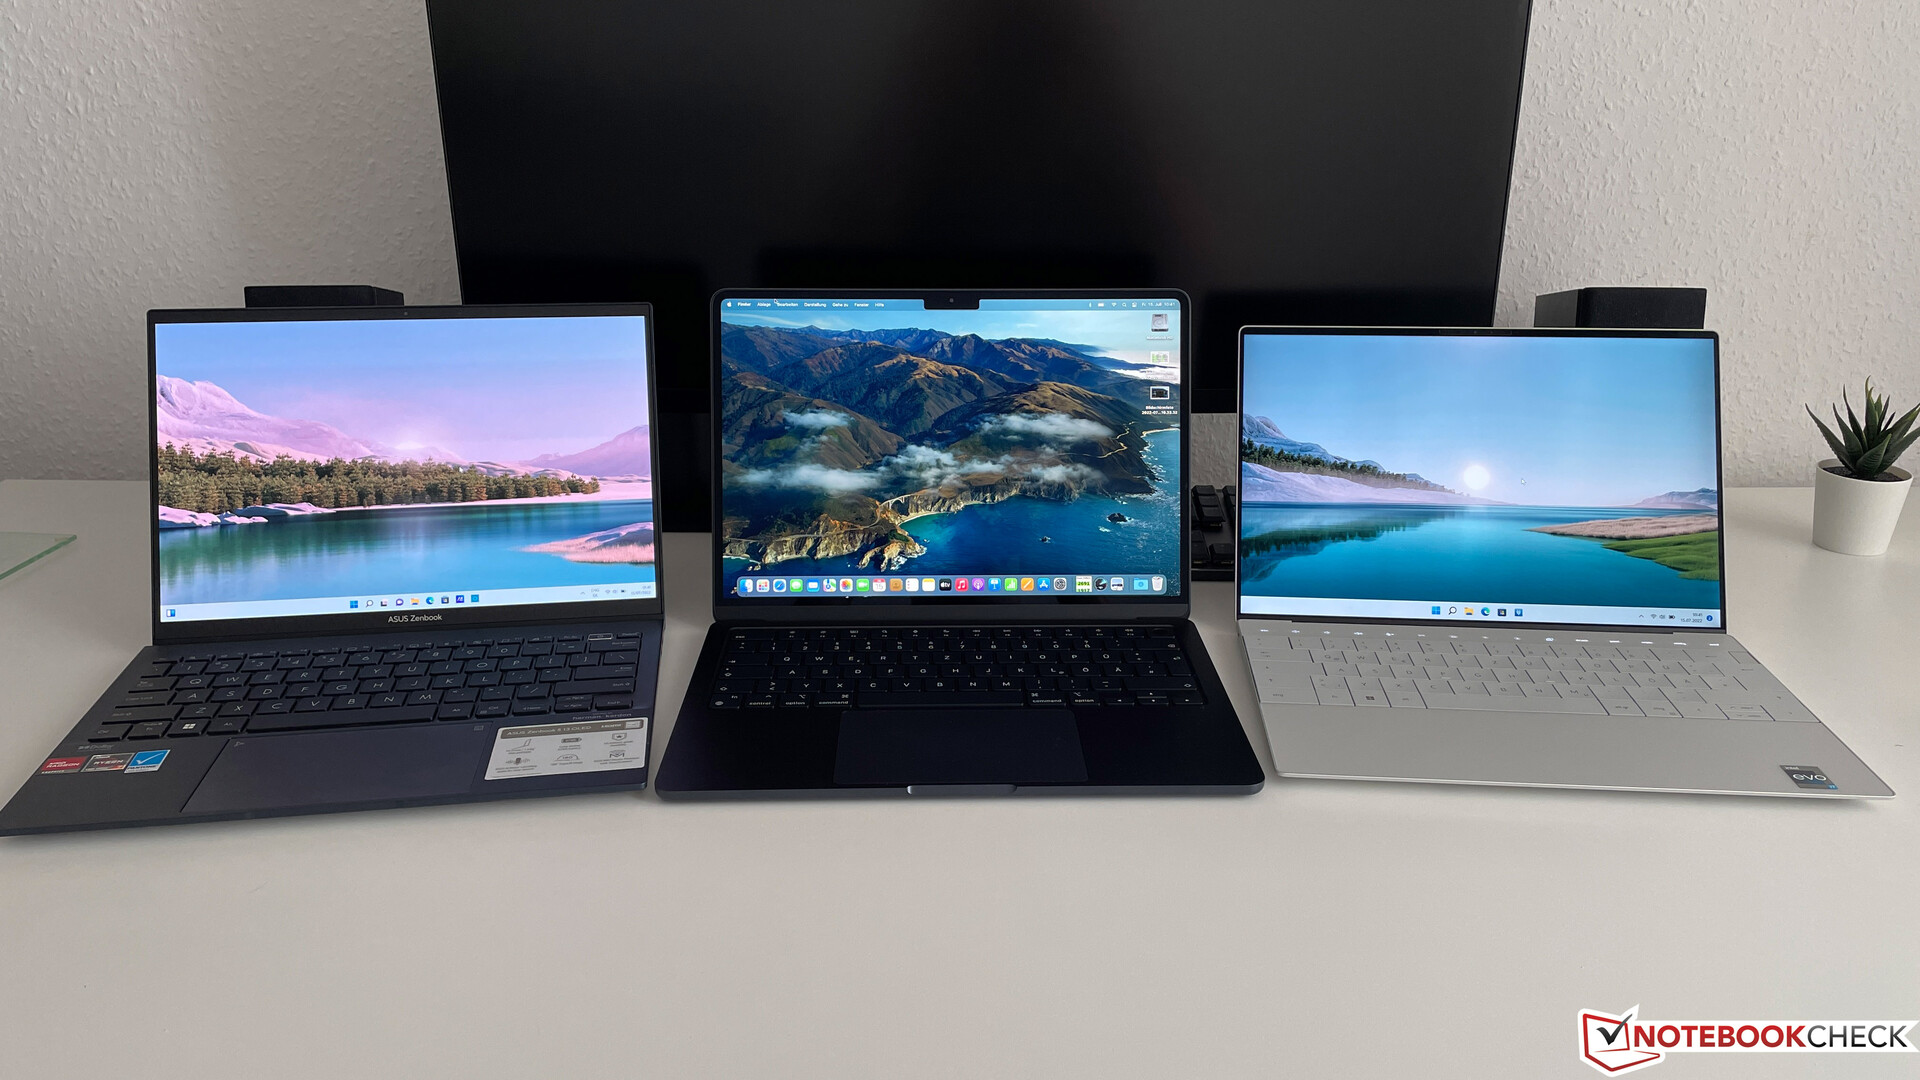
Some of the rivals are superior in this regard, including the new Dell XPS 13 Plus as well as the Asus Zenbook S 13. This might be an important difference if you often work in tight spaces (like trains, planes).
Despite the slightly larger chassis, Apple managed to reduce the weight of the new Air M2 to 1.215 kg, so it is about 60 grams lighter than the predecessor, even though you will hardly notice that. Some of the rivals are heavier, only the Zenbook S 13 is noticeably lighter at ~1.1 kg (or ~1 kg for the non-touch SKU, respectively). The compact 30W power adapter of the MacBook Air M2 tips the scale at 174 grams including the MagSafe cable.
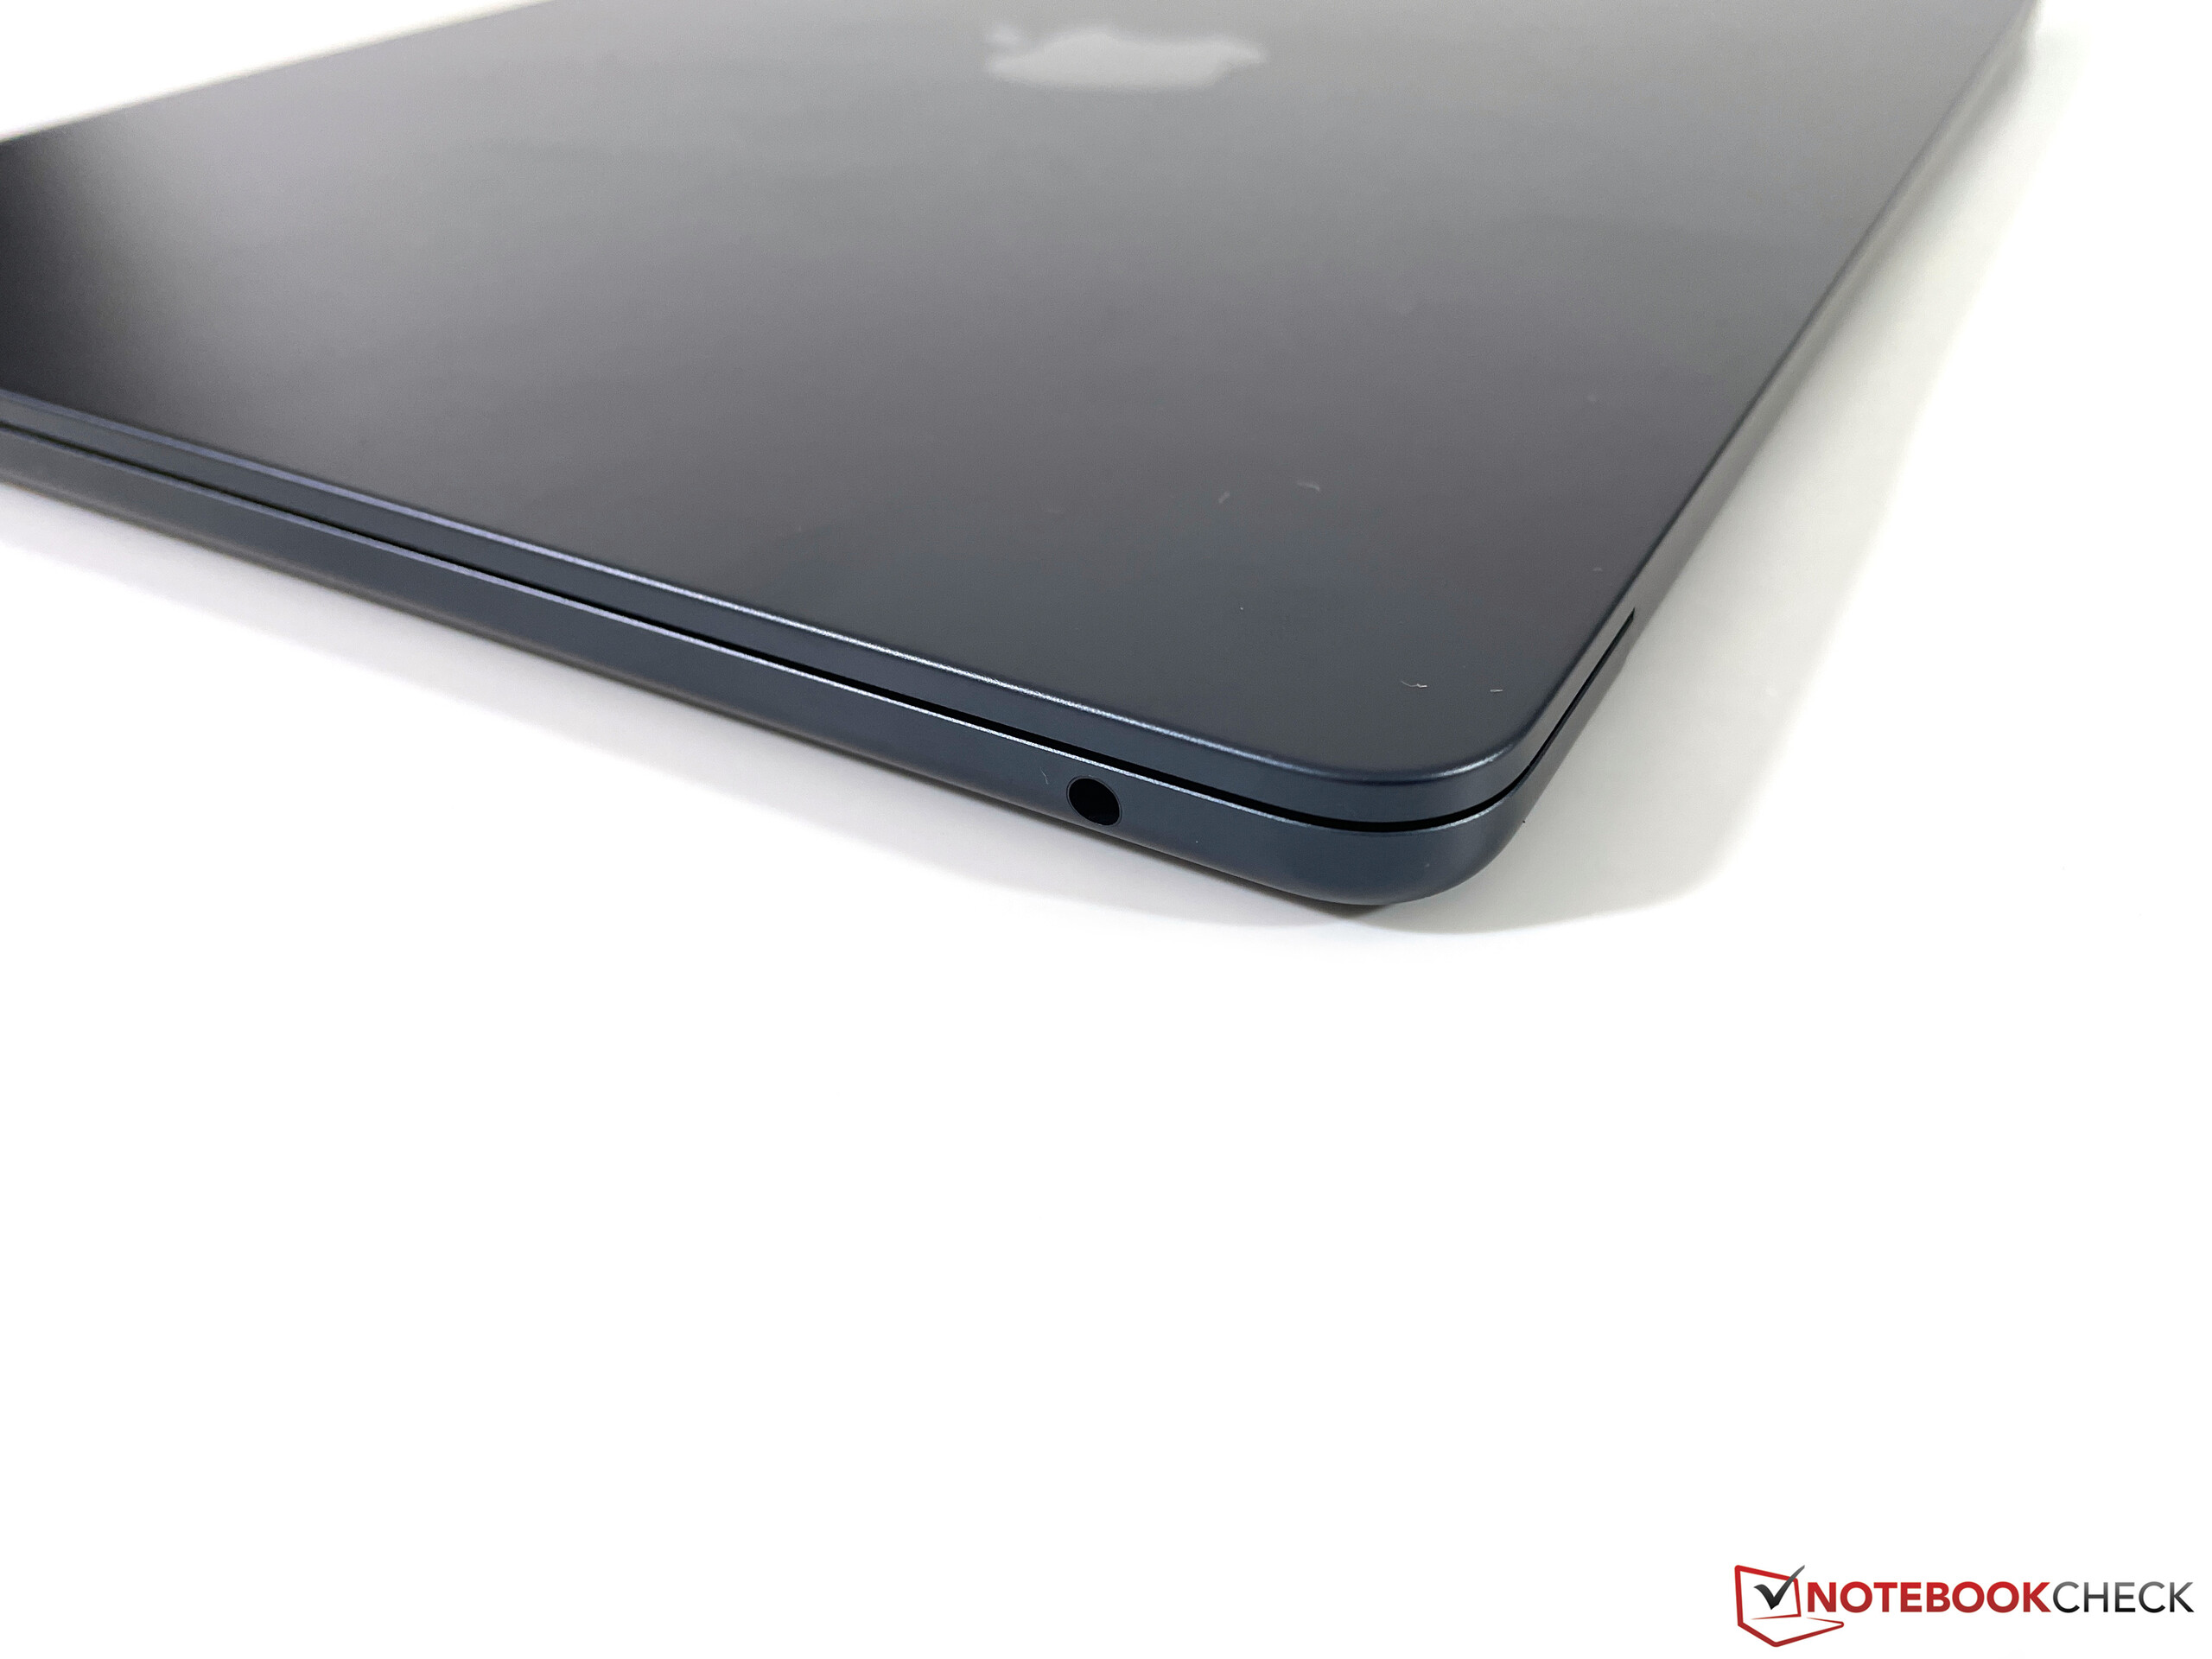
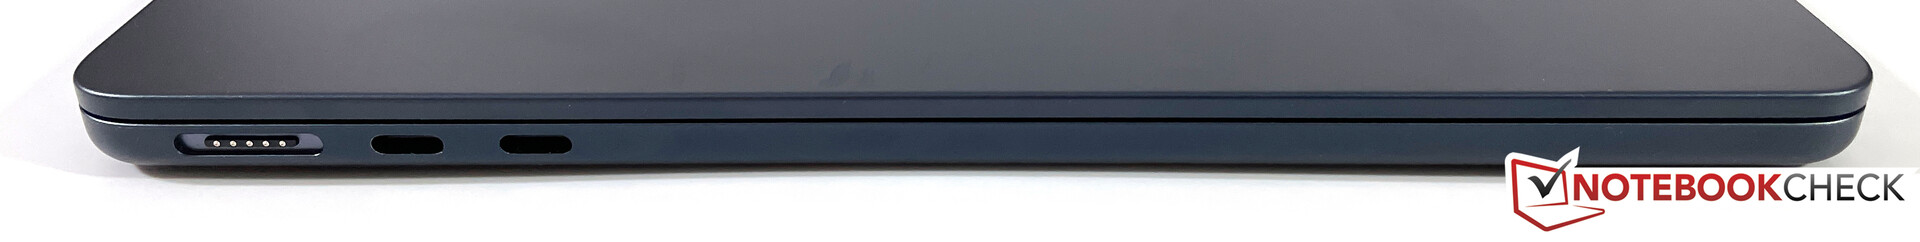
Connectivity - MagSafe is back, but Wi-Fi still limited to 80 MHz
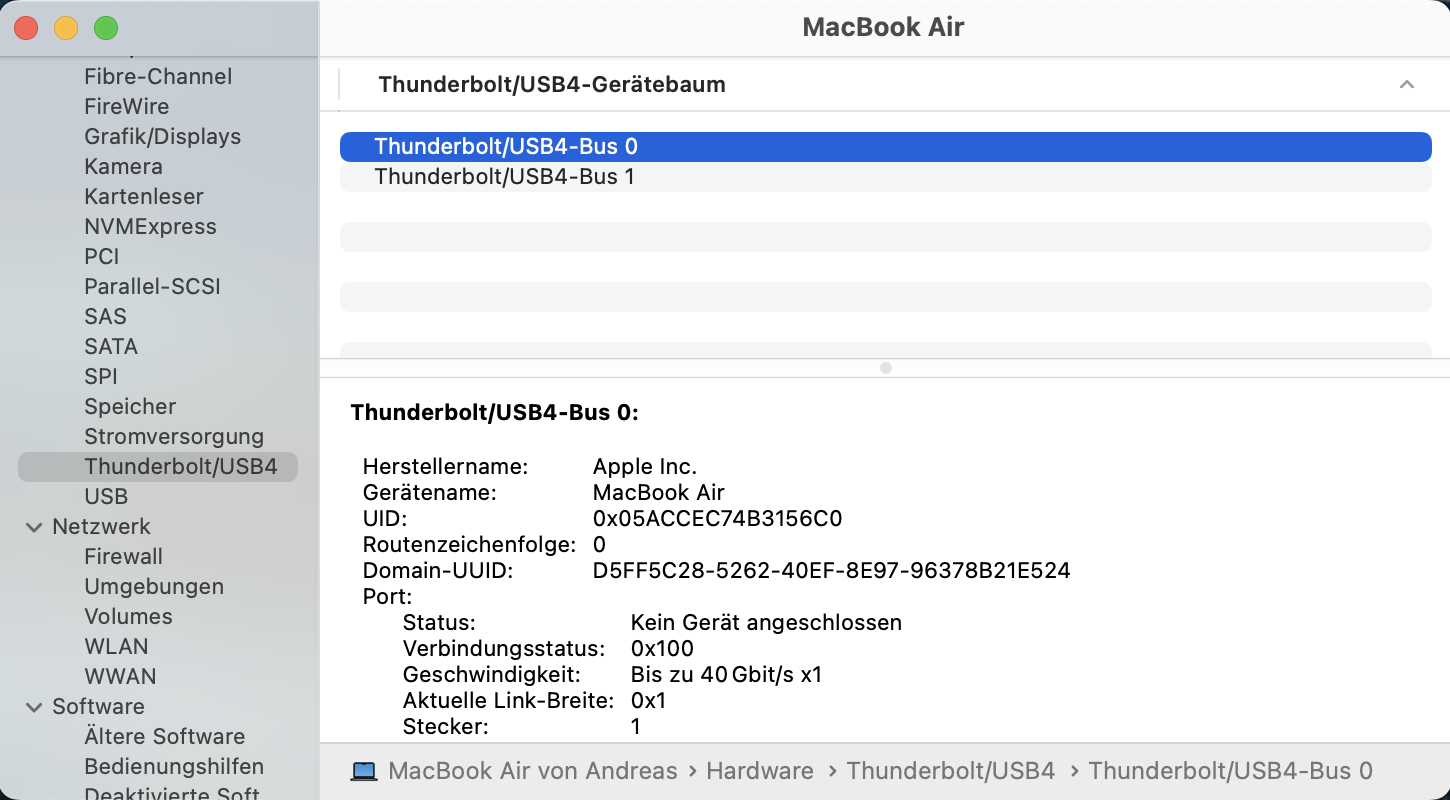
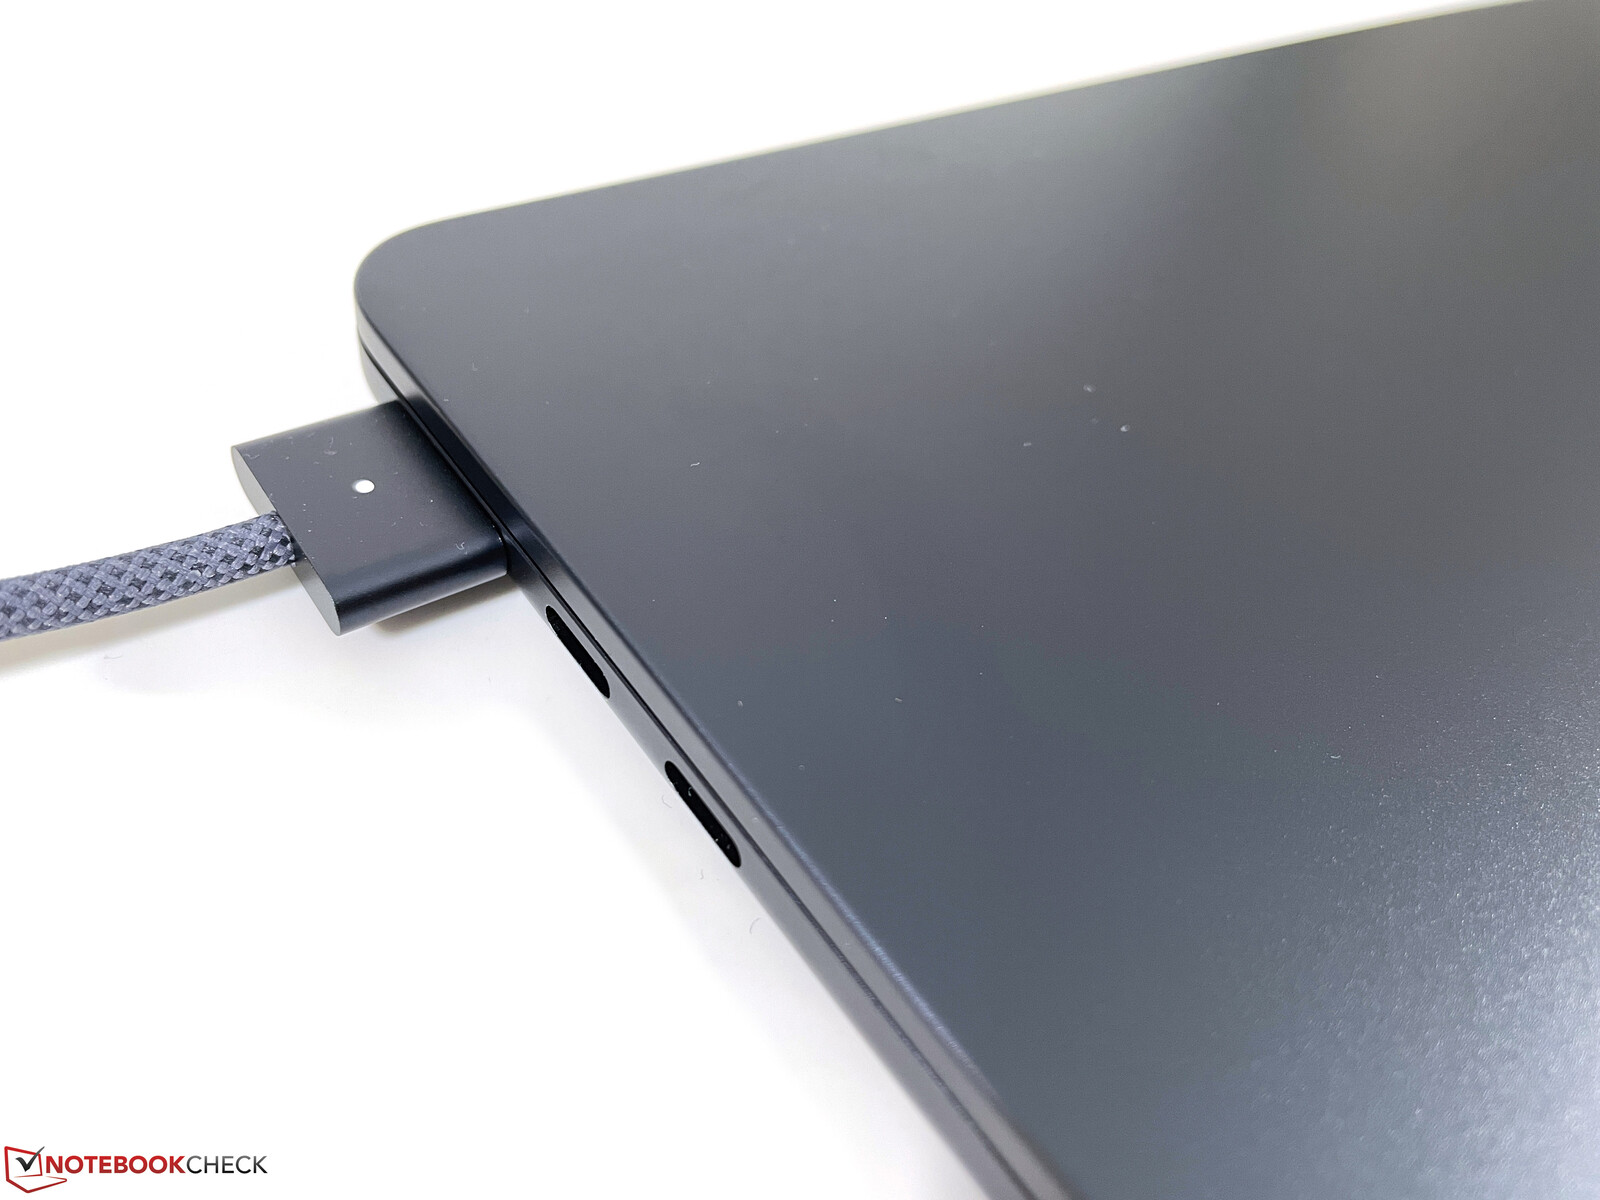
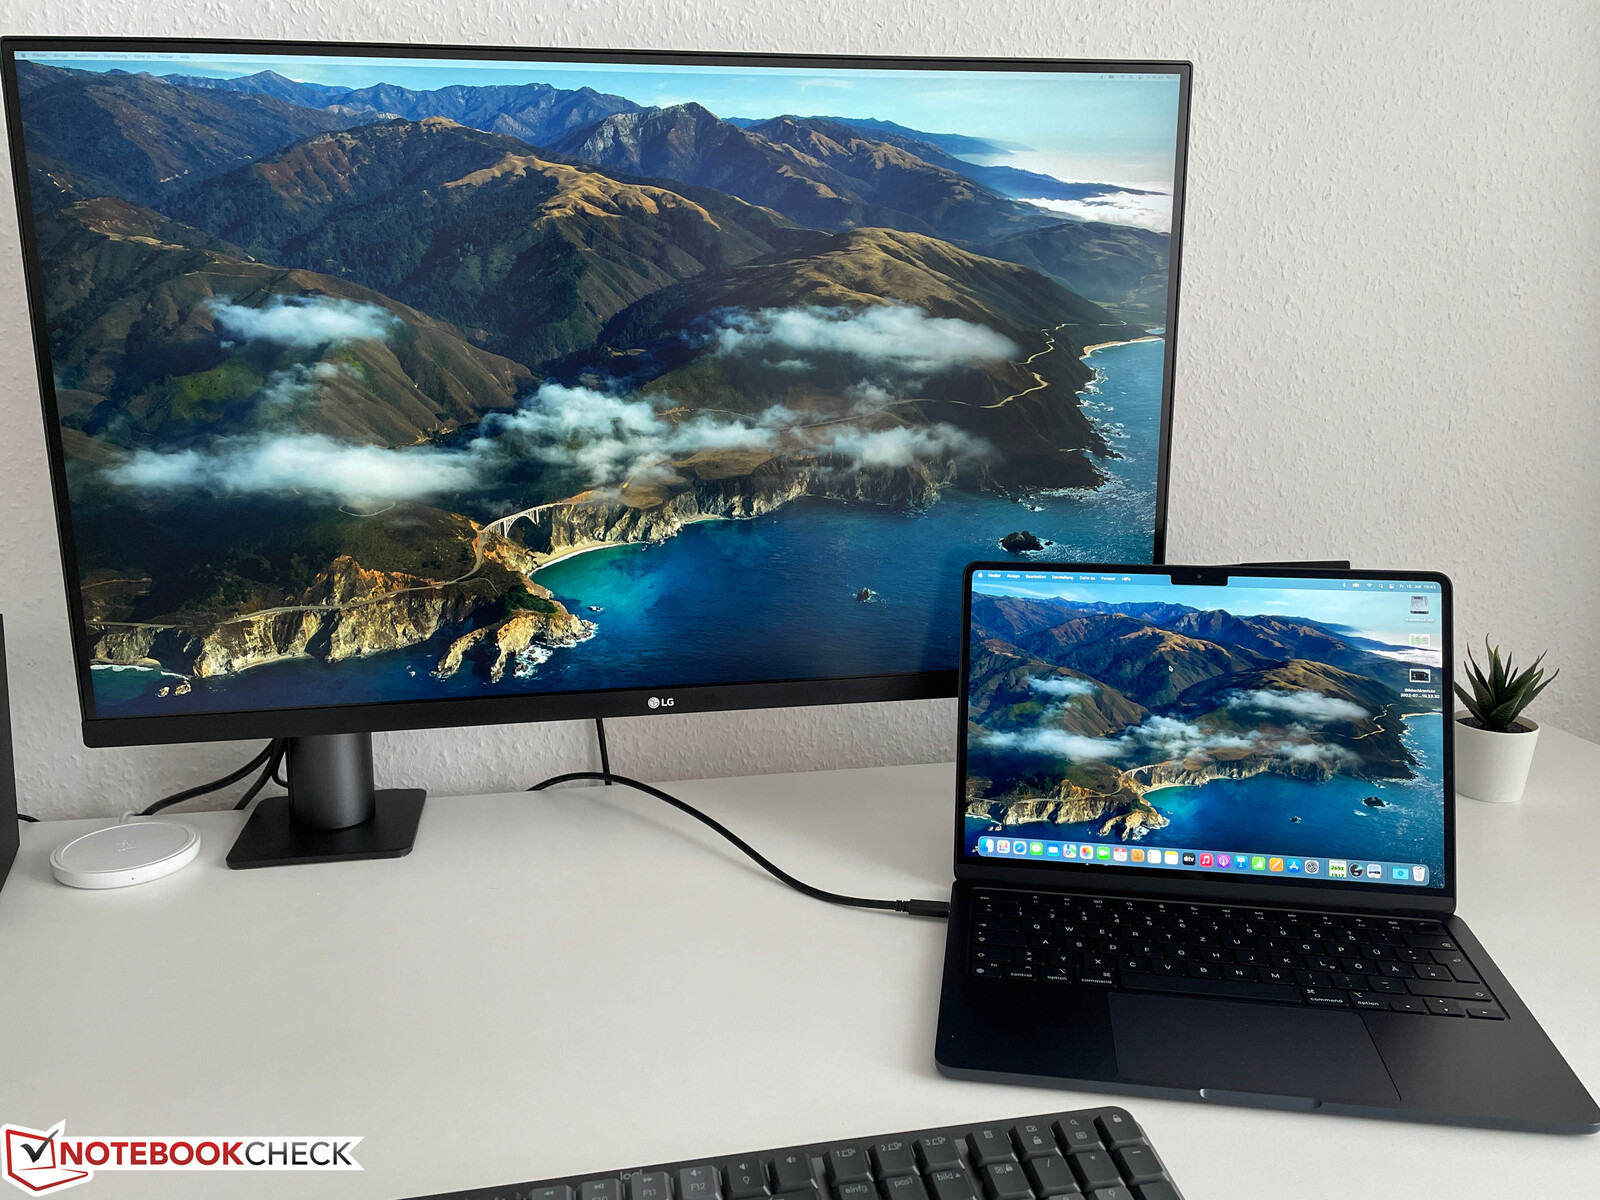
The MacBook Air M2 is equipped with a MagSafe connector at the left side, which can be used to charge the device (charging via USB-C is also still possible). Otherwise, however, not much has changed compared to the old MacBook Air M1, because the new M2 chip is still limited to Thunderbolt 3 and you can only attach one external screen (up to 6K @60 Hz). One USB-C port on each side would also be more convenient.

Communication
Just like the old MacBook Air M1, the new M2 SoC is once again limited to Wi-Fi (802.11ax) at 80 MHz. There is no support for faster 160 MHz networks or Wi-Fi 6E, and Bluetooth is also limited to the old 5.0 standard. Considering the high price, it is annoying that you do not get the latest standards.
The transfer rates are still good considering the 80 MHz limitation and we can also see an improvement with our new reference router from Asus (AXE1100), because the results are steady between 850-950 Mbps, sop the new Air M2 is a bit faster than the MacBook Pro 13 M2 and the old MacBook Air M1. Some of the Windows rivals on the other hand reach more than 1.5 Gbps.
Webcam
The webcam situation is similar to the larger MacBook Pro 14 and Apple equips the new Air M2 with a 1080p sensor. The results are actually okay in combination with the image processing of the M2, but considering the size of the notch, we are pretty sure a larger sensor from the iPad (with Center Stage support) would have fitted as well.


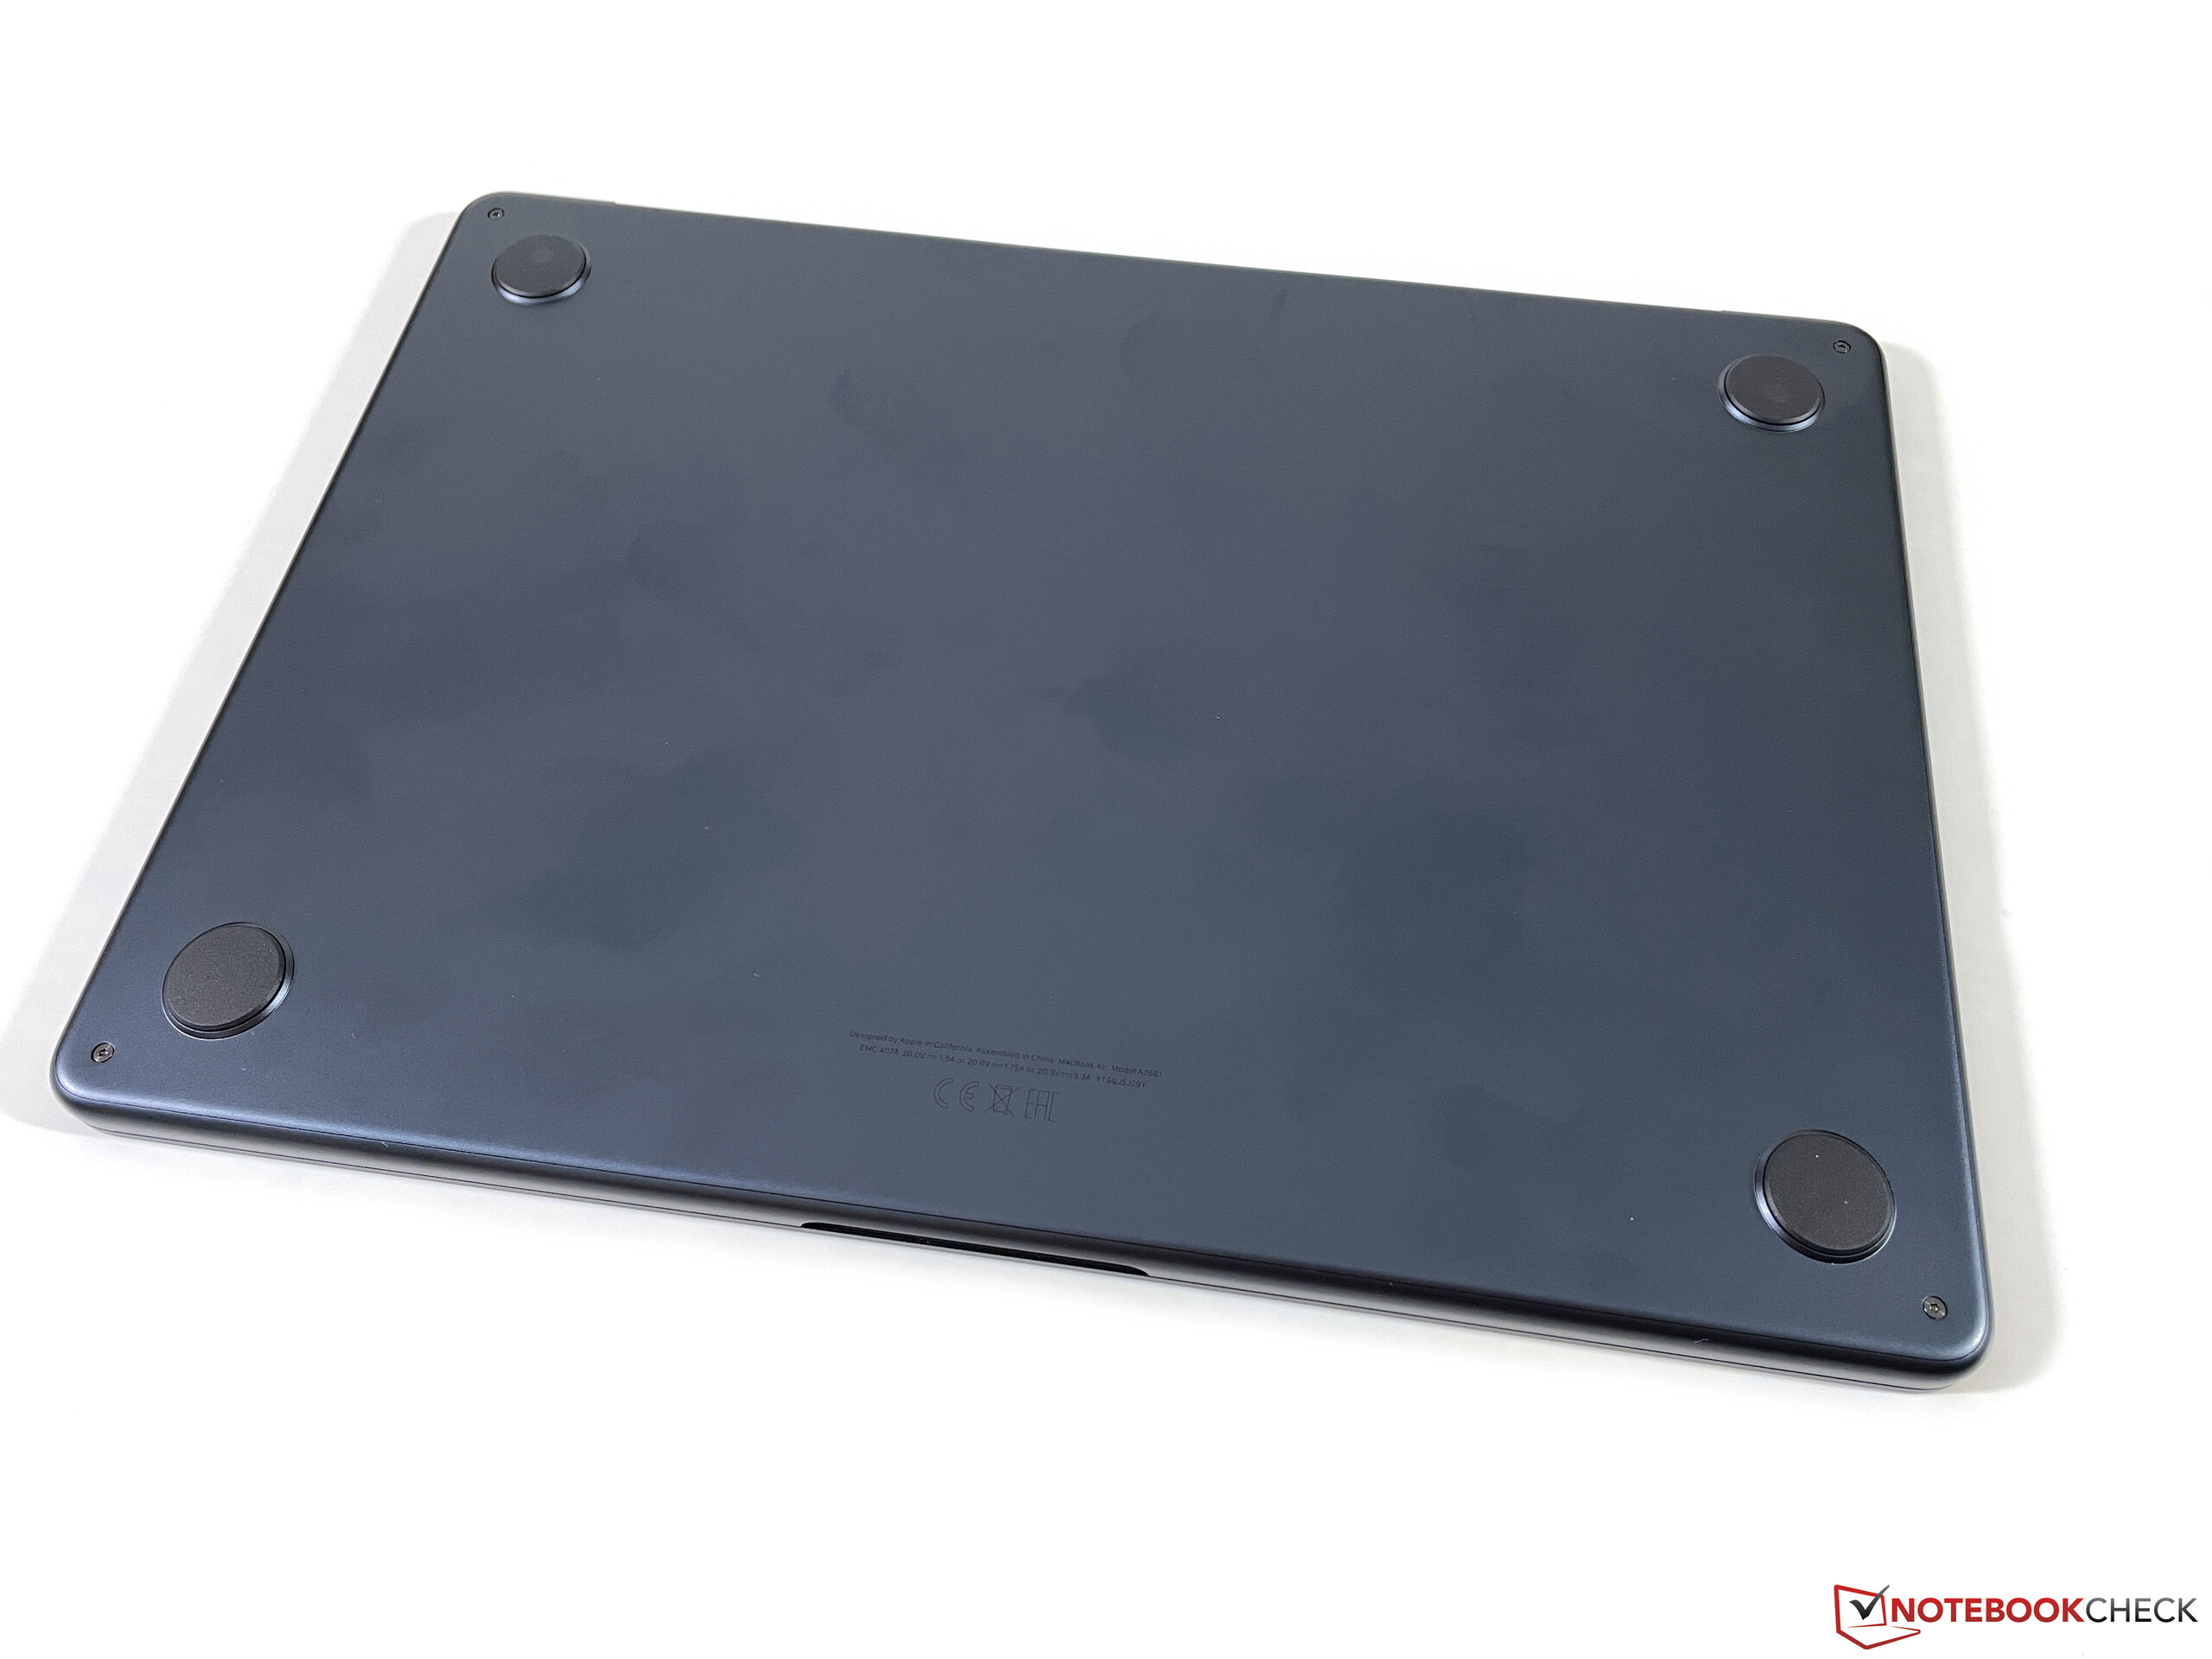
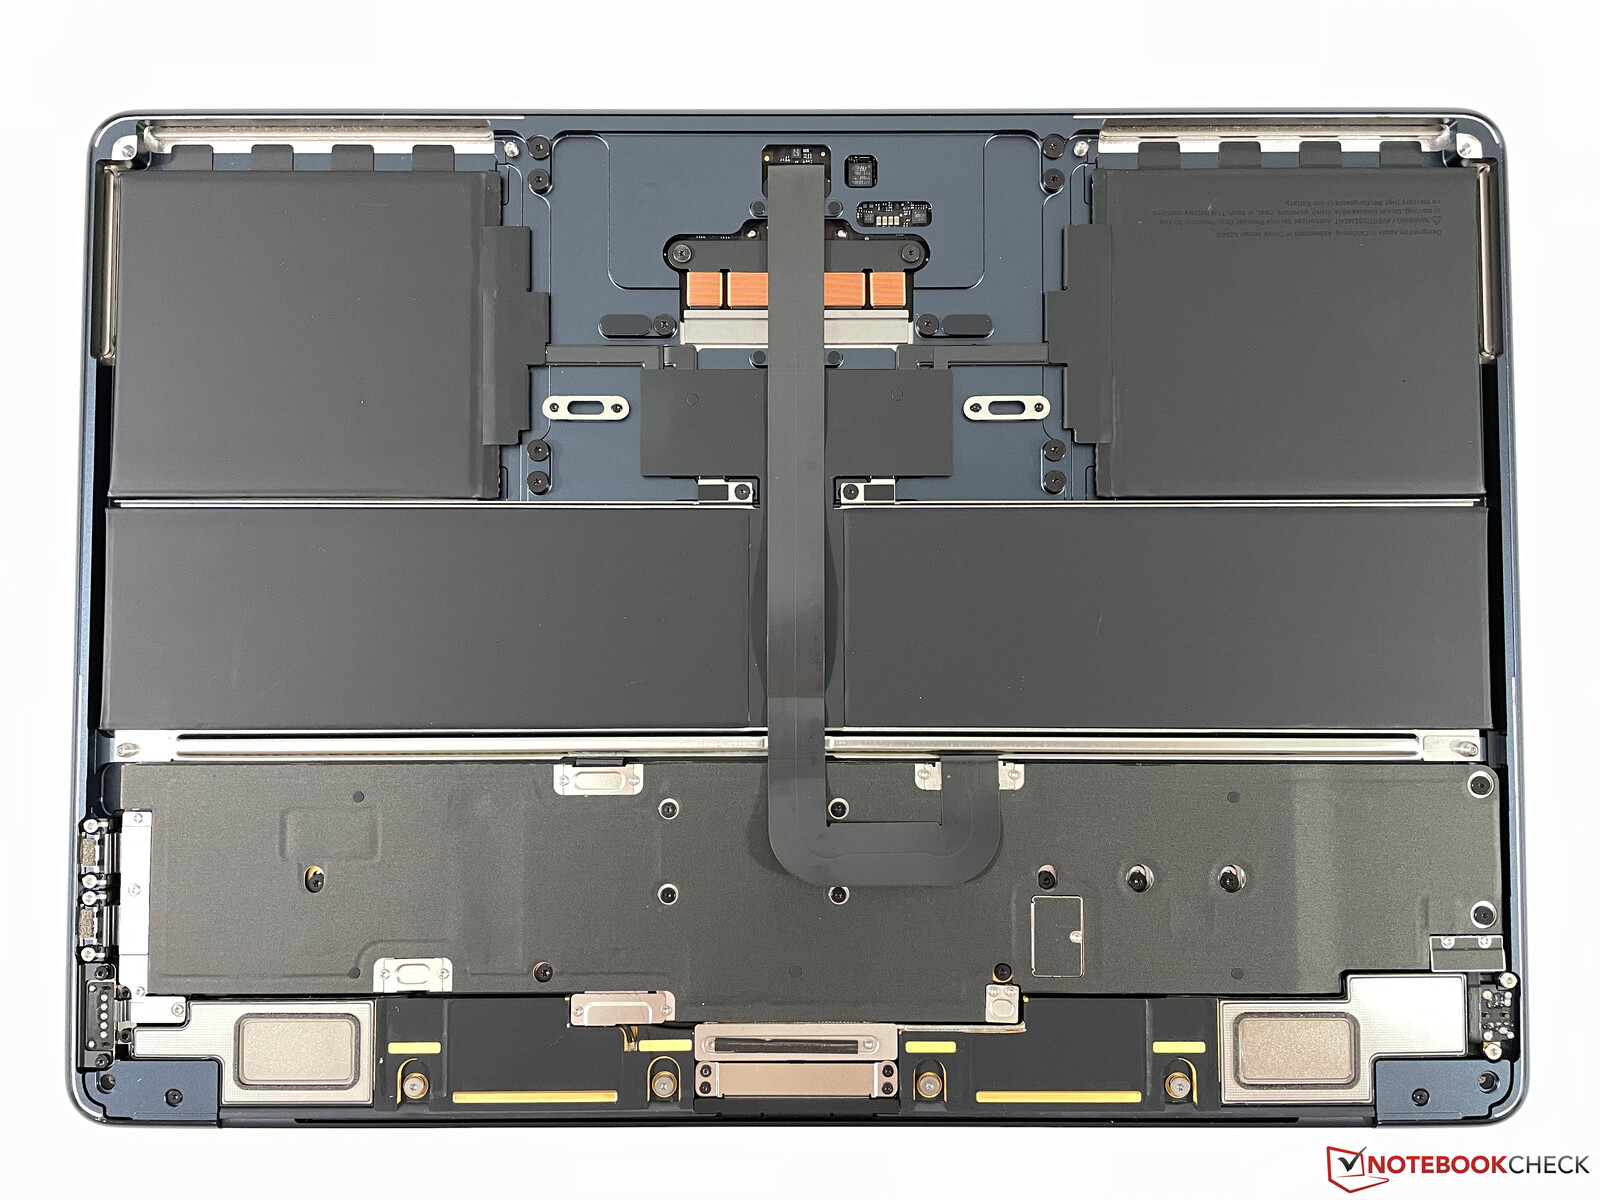
Maintenance
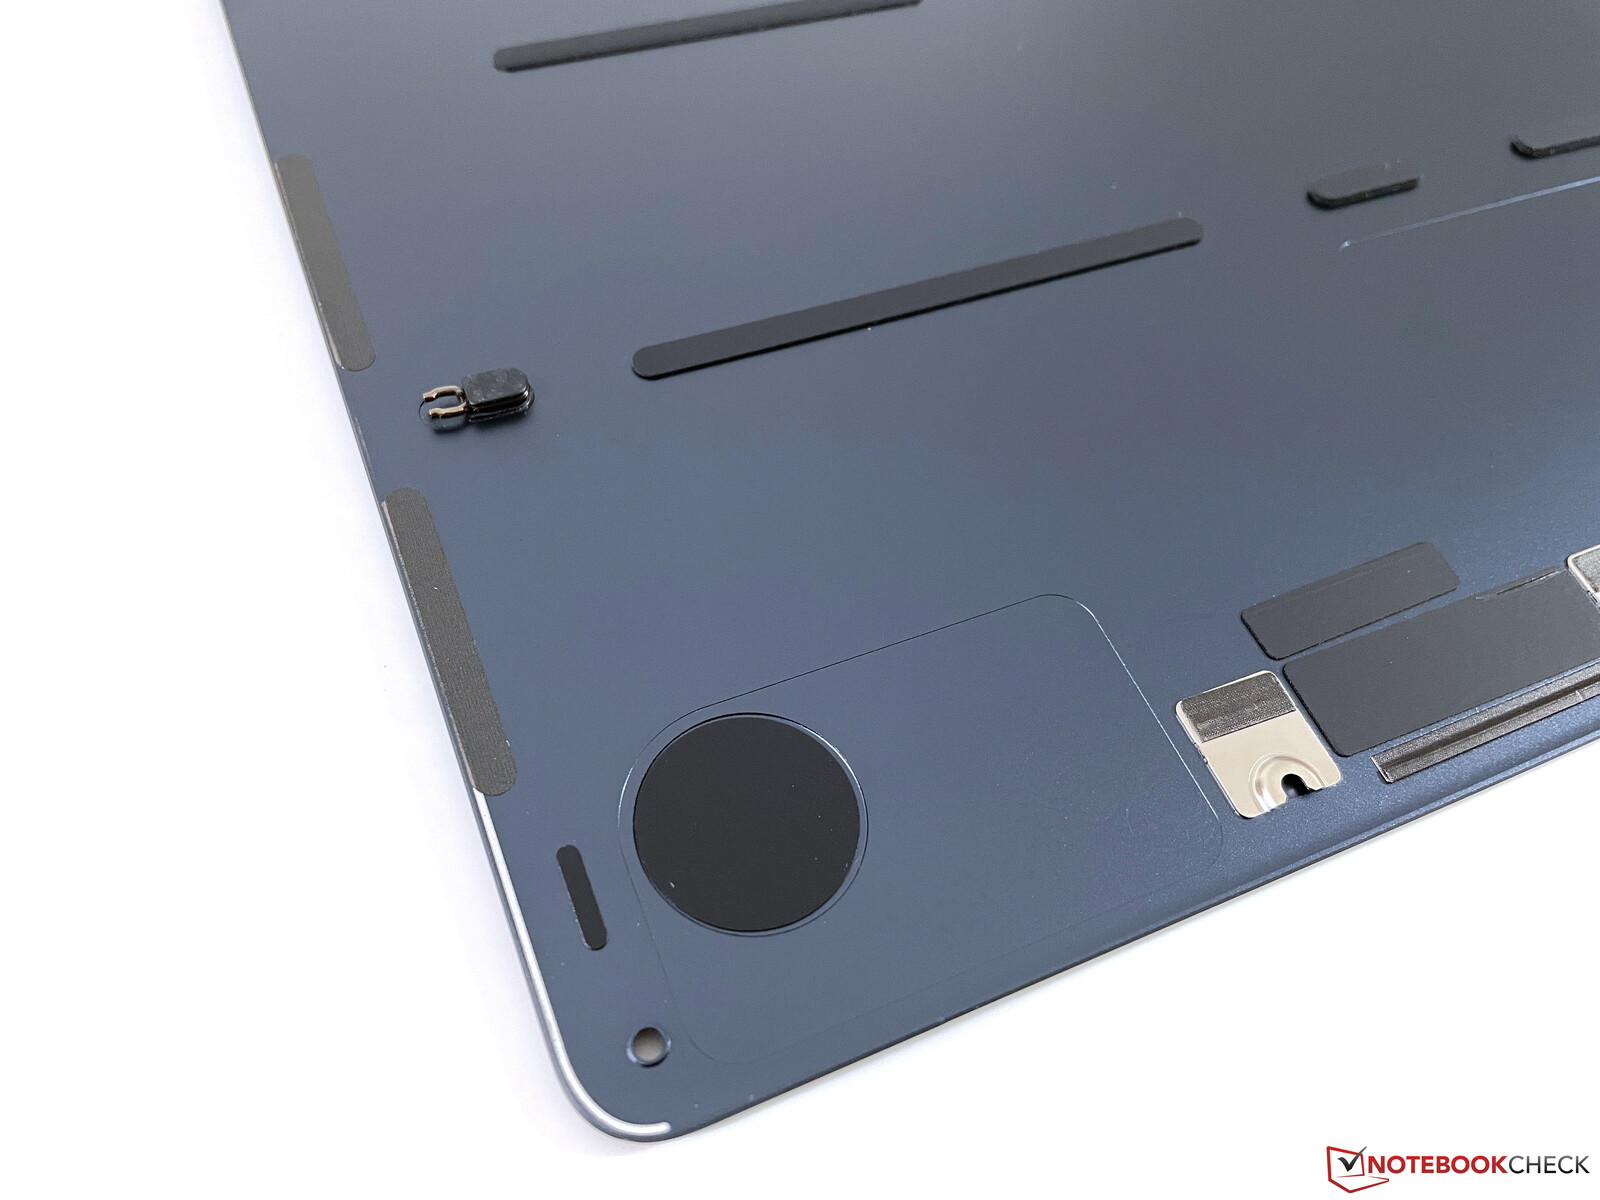
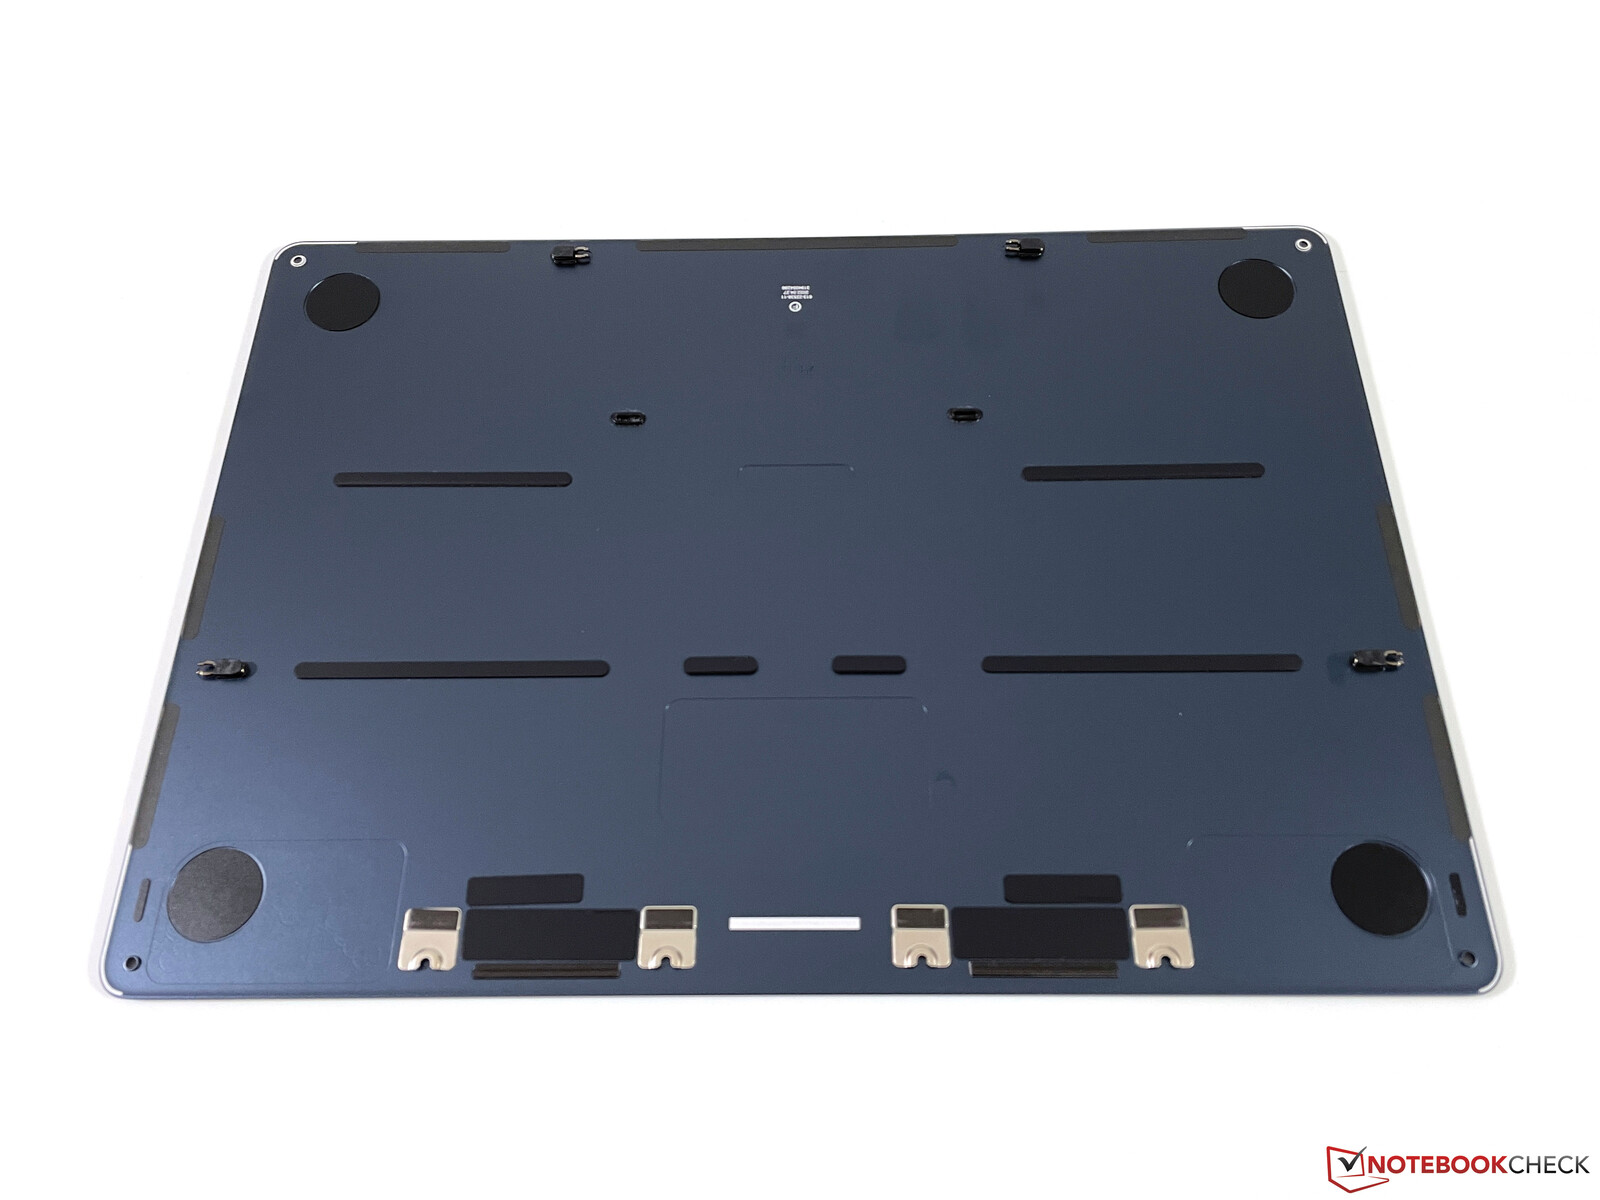
It is tricky to remove the bottom panel. You need a corresponding Pentalobe screw driver (P5) and a we would recommend a suction cup. There are clamps at the front and the sides, which have to be loosened, as well as four additional mountings. After the removal of the screws, we recommend to place the suction cup underneath the trackpad area and then pull quite heavily to loosen the clamps. After that, you can slide the panel towards the front and remove it.
There is not really a good reason to do this, though. There is nothing you co since there is no fan you could clean and all the components are glued or soldered onto the logic board.
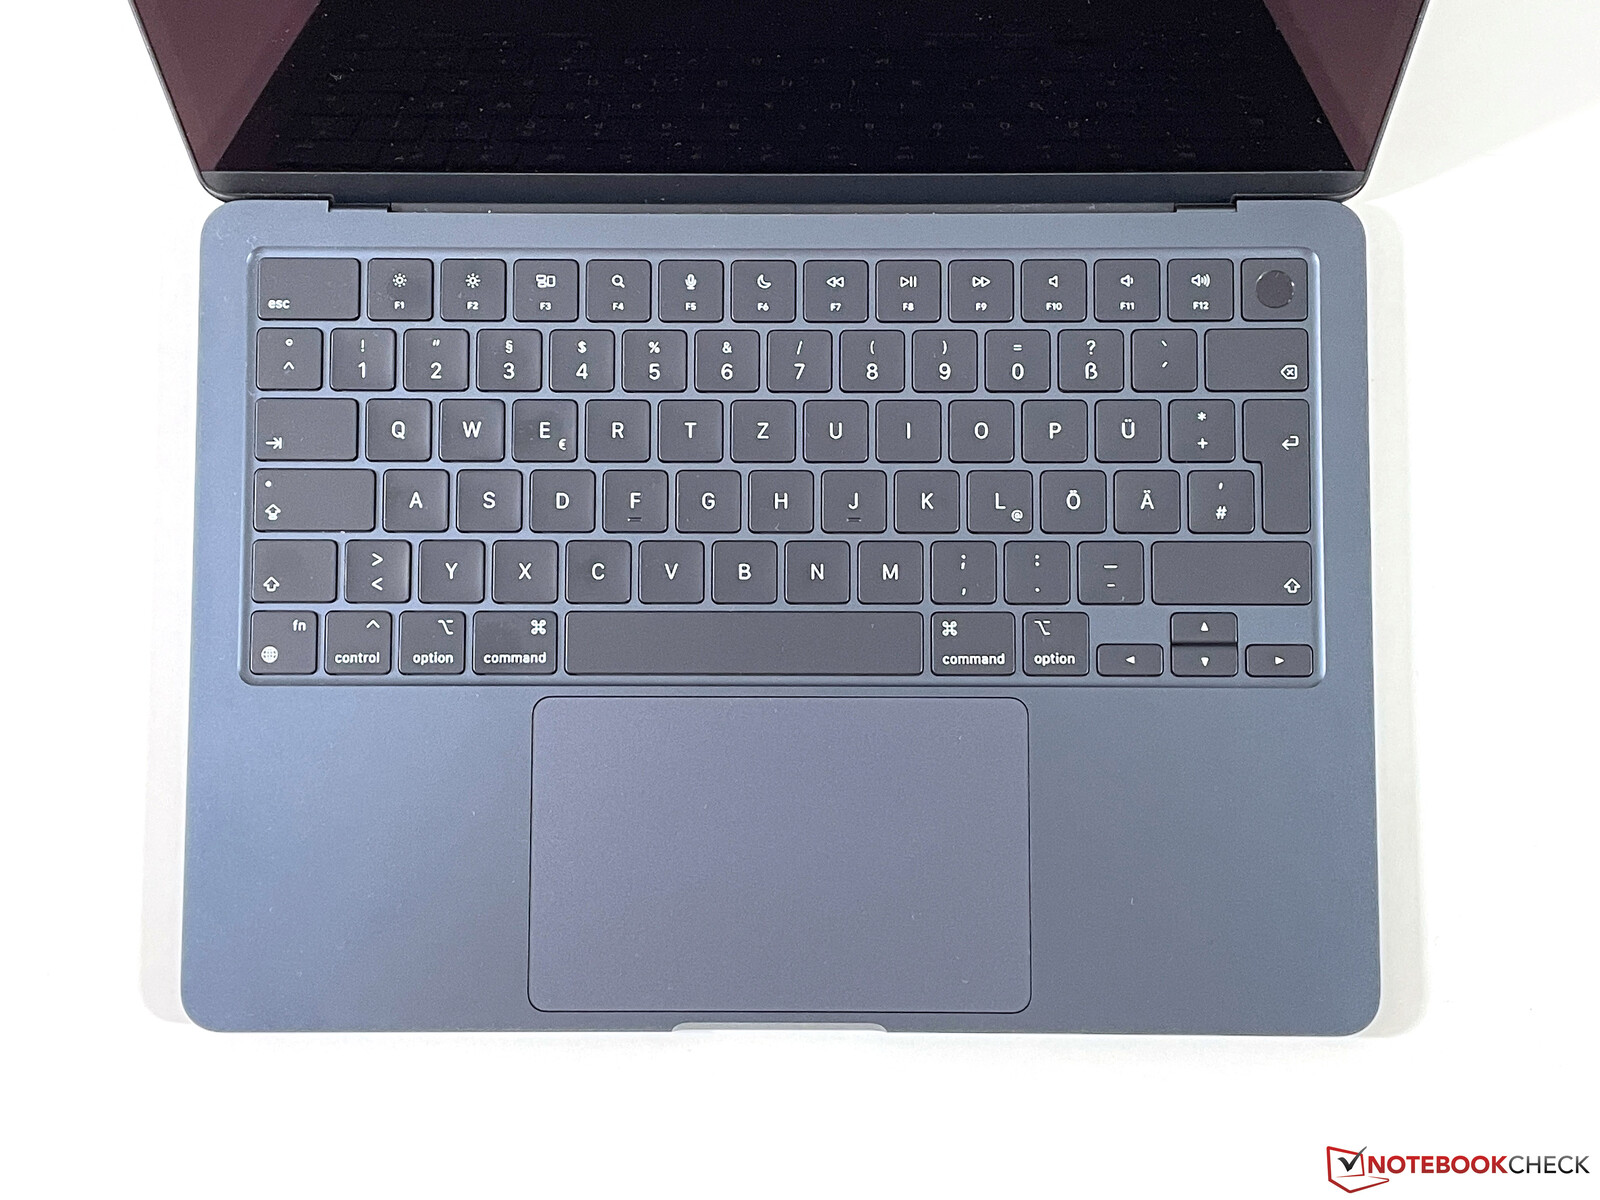
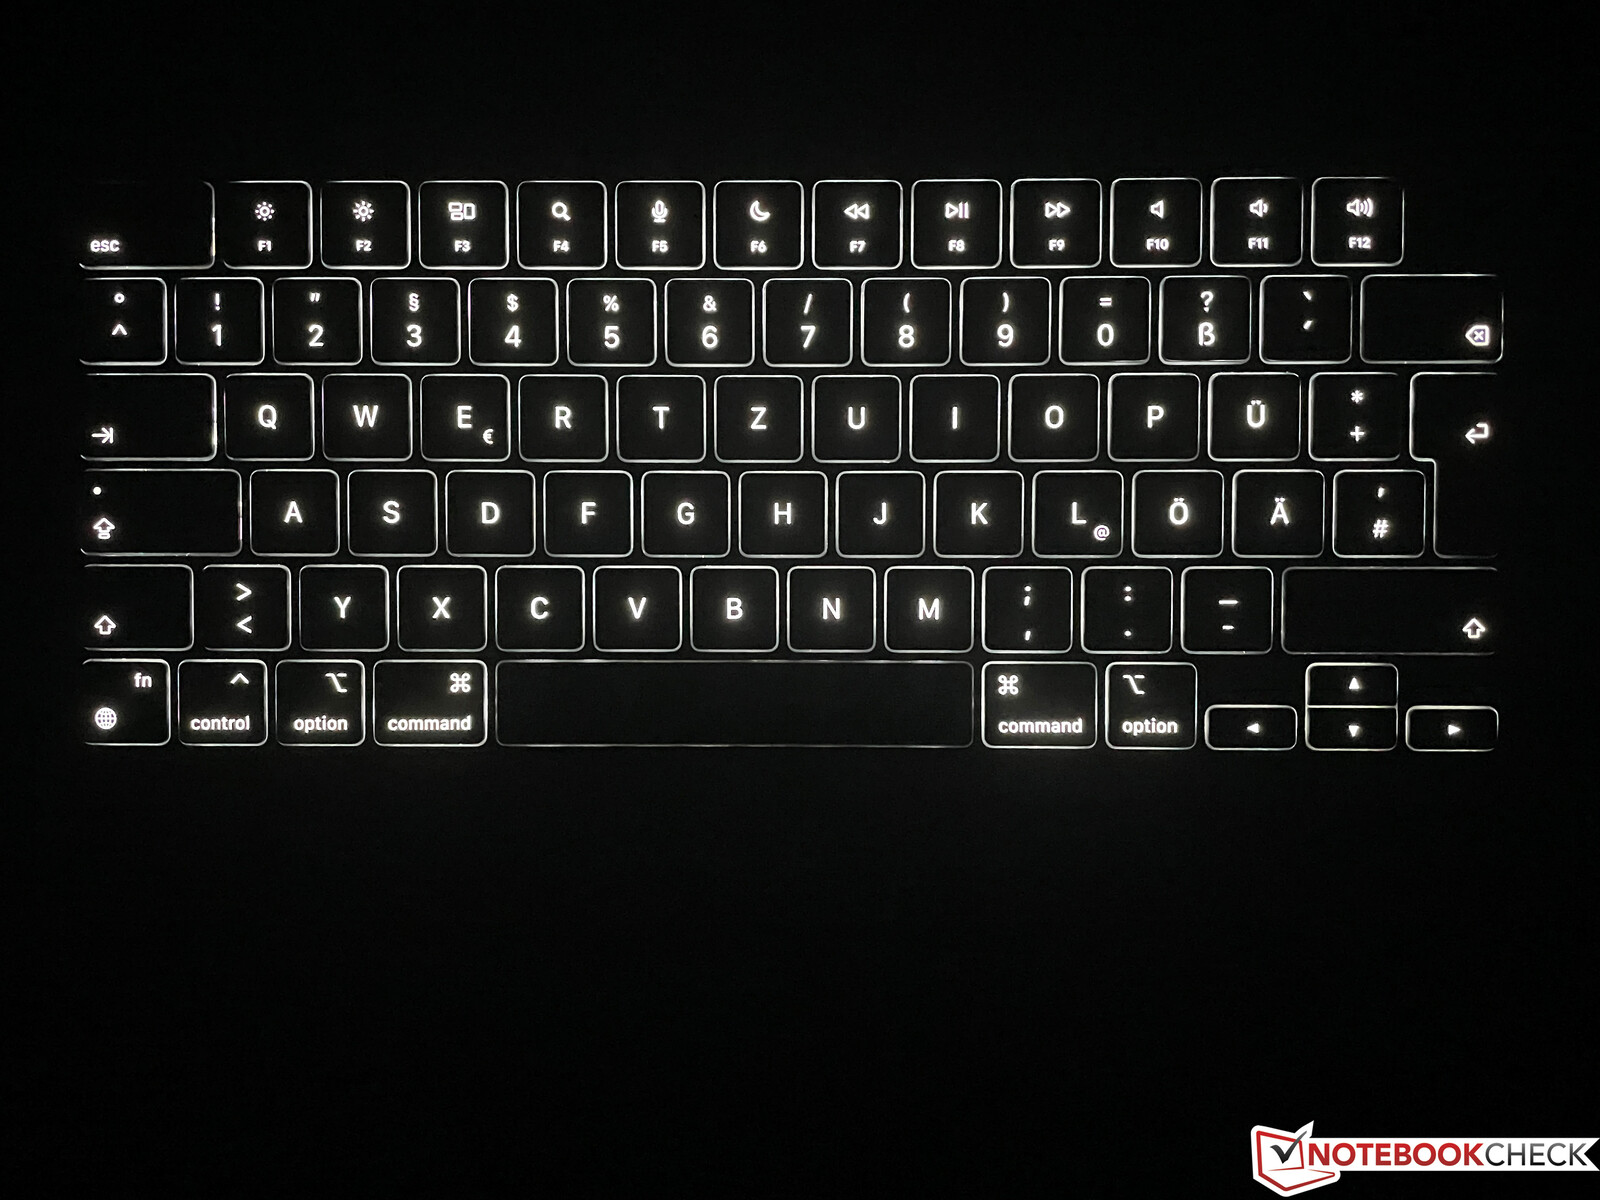
Input Devices - Apple uses familiar Magic Keyboard
We can keep it short for the keyboard and the trackpad since there is not much to talk about. Apple now uses the standard height function keys we already know from the larger MacBook Pro models, including the current Touch-ID design of the power button. The keyboard itself offers a precise typing experience, but the key travel is still very shallow. You will get used to it though and the typing experience is good considering the slim base unit. Compared to the MacBook Air M1, the new keyboard leaves a slightly firmer and more precise impression, but the differences are not big. The background illumination is still excellent and the fine regulation via sensor is still unrivaled.
The trackpad also works just as great as before and the integration into the OS is perfect. It is still the best trackpad in the mobile segment.
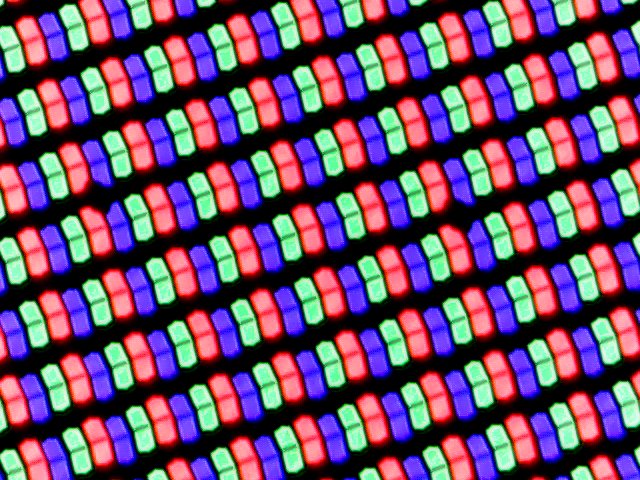
Display - The Air with P3 and a notch
The new MacBook Air M2 now features a central display notch, which accommodates sensors as well as the webcam and that we already know from the larger MacBook Pro models. The area next to the notch is used for the macOS menu bar and the additional vertical pixels (64) are added to the regular 16:10 panel, so you get slightly more screen space compared to the MacBook Air M1. You can also select that the menu bar is hidden when you use apps in full-screen mode, so you basically only see the 16:10 screen. There can still be occasional compatibility issues, but it works well in general and you get used to the notch.
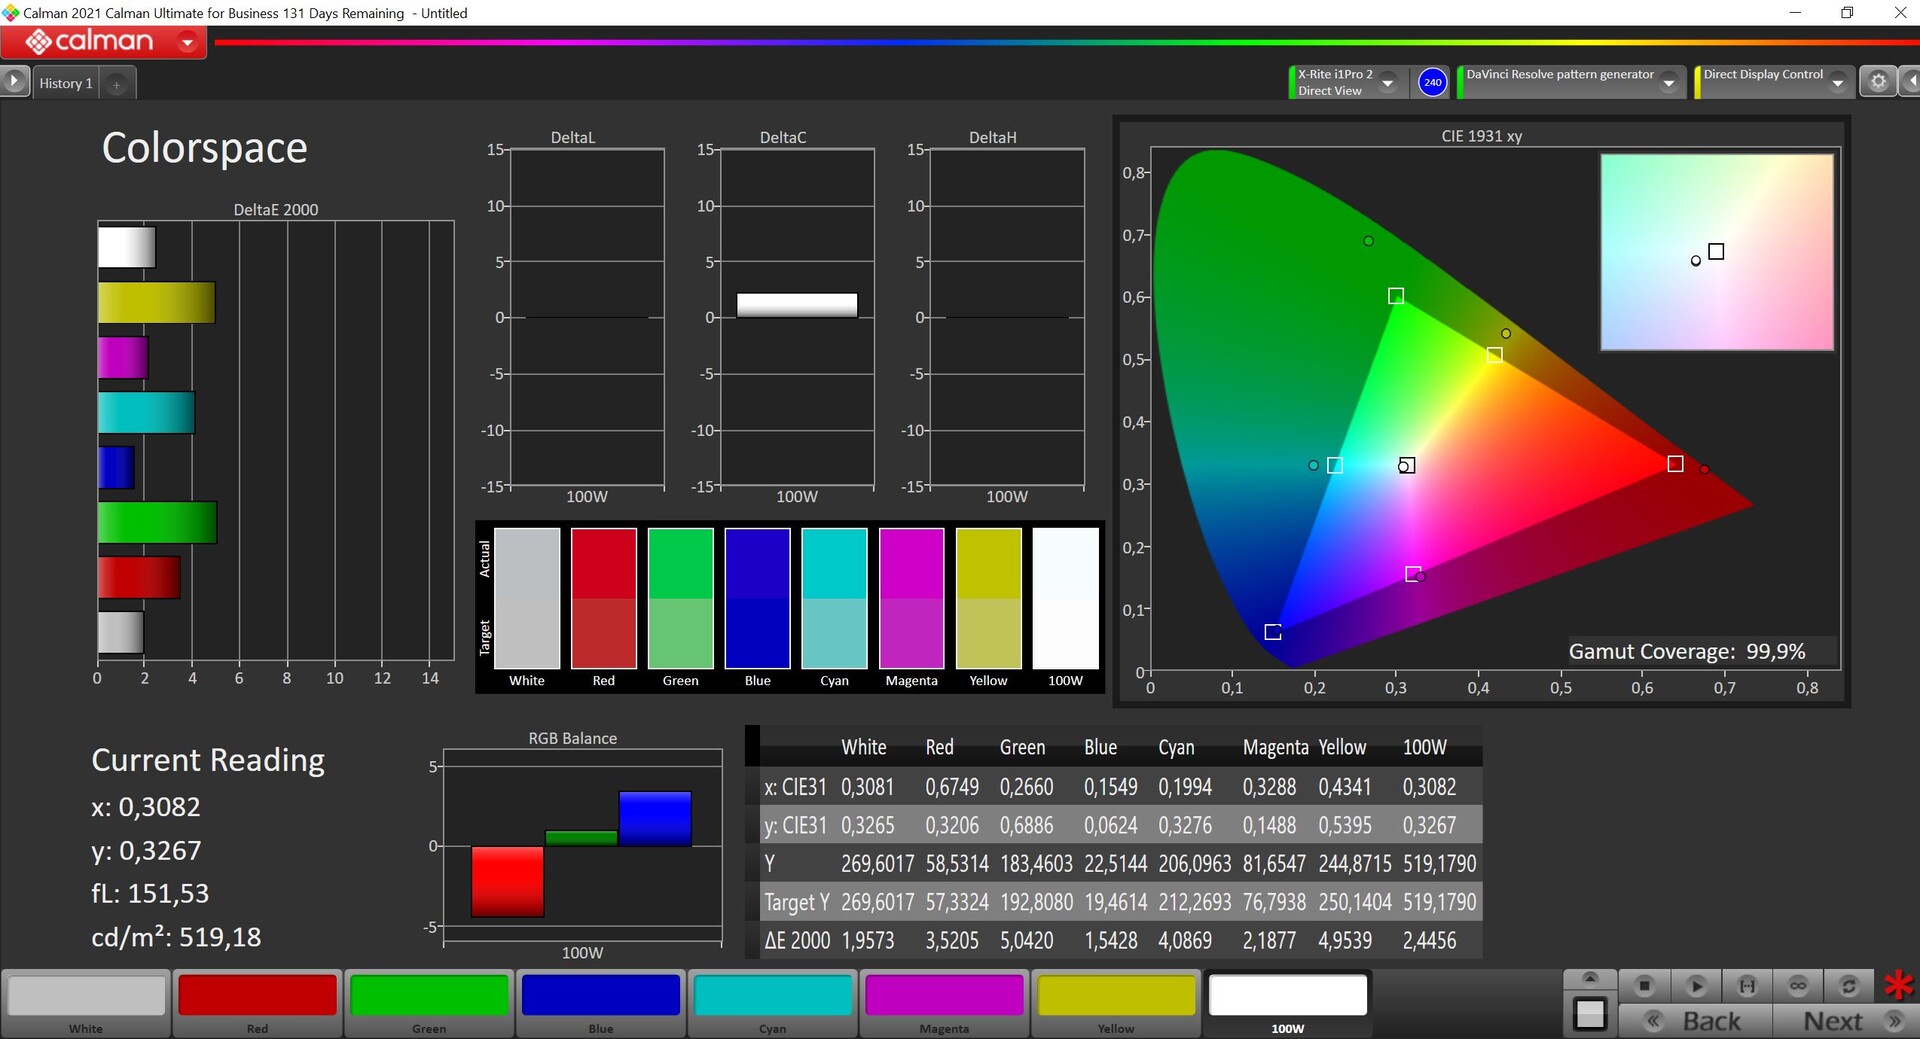
Besides the slightly higher resolution of 2560 x 1664 pixels, Apple also bumped other specs of the liquid retina panel (IPS). The brightness climbs to 500 nits like on the MBP 13 and the panel now supports the wider P3 color gamut. We can confirm the higher brightness, but the black value (0.38) is comparatively high, so the contrast ratio is "only" 1400:1.
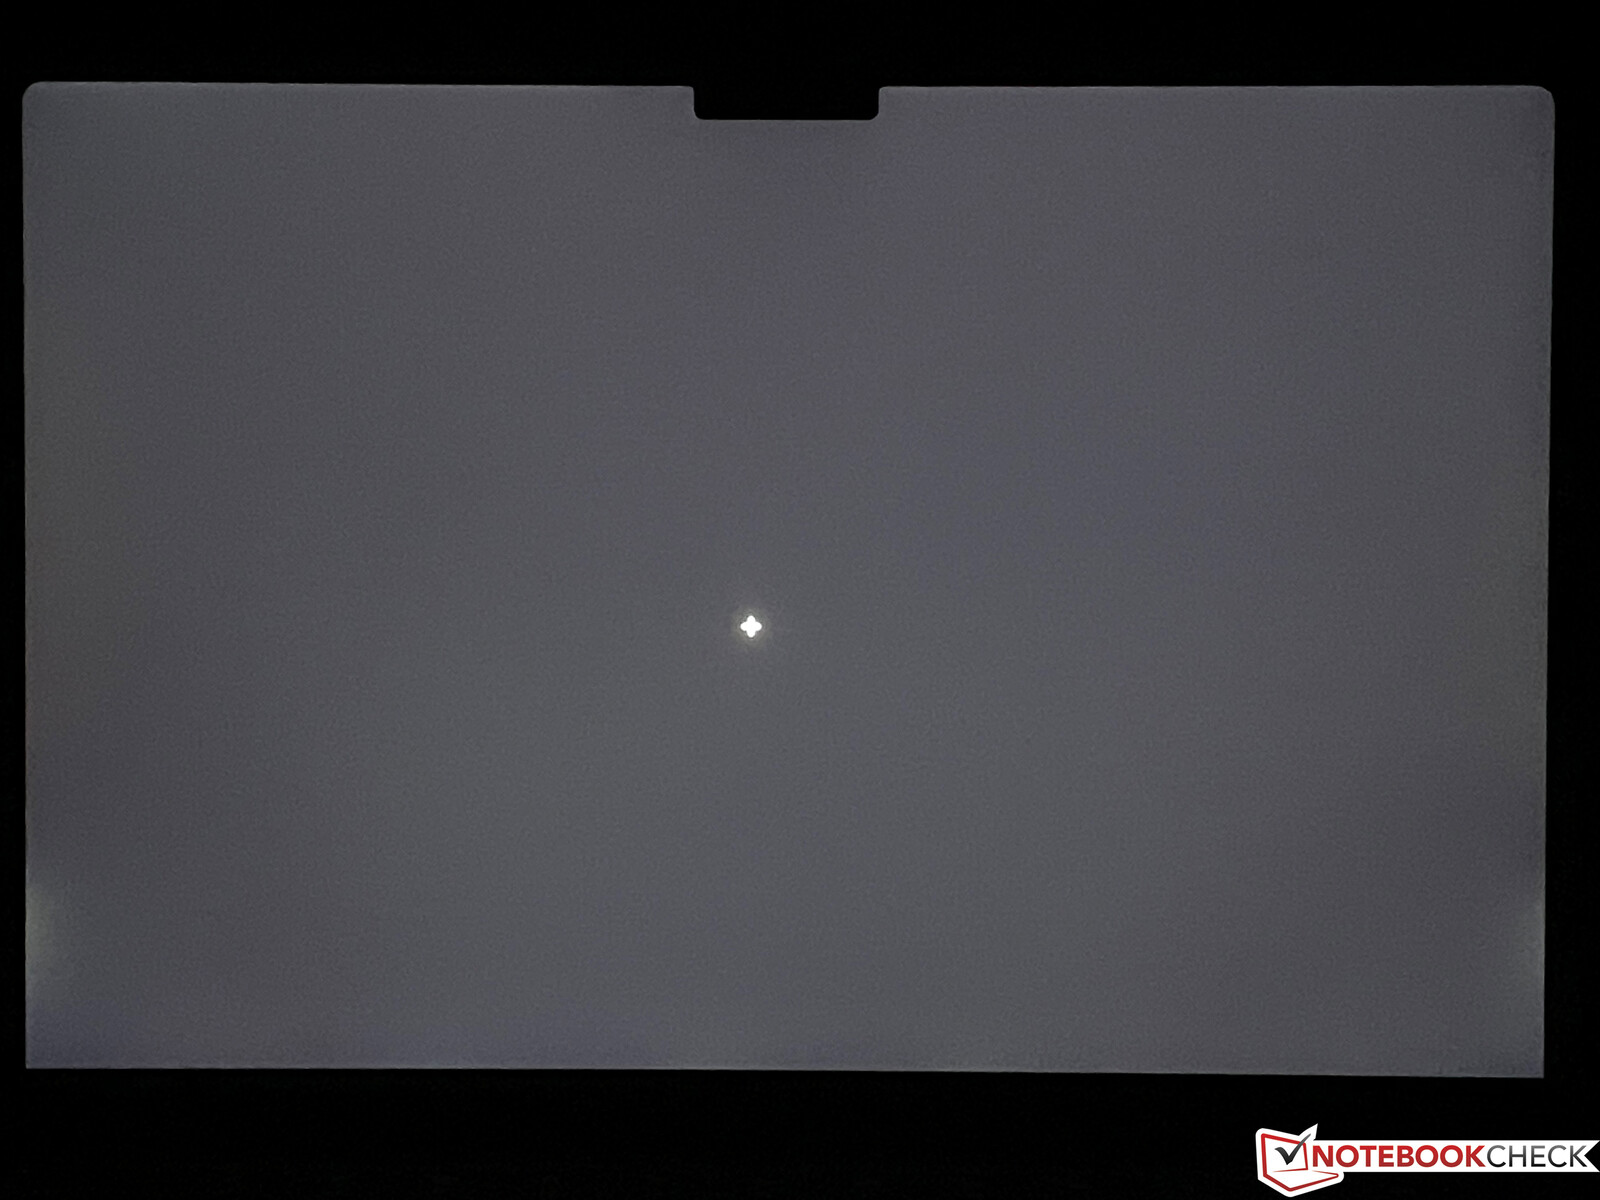
The subjective picture quality is very good, even though modern OLED screens and also the Mini-LED panels of the larger MacBook Pro models offer even crisper images. However, the new MacBook Air M2 shows no sign of PWM flickering in return, which will definitely be an advantage for some users. High-re Windows laptops still suffer from occasional scaling issues, which is absolutely no problem with for macOS. Features like the precisely working automatic brightness control or True Tone are very convenient. The response times are decent for an IPS screen and the viewing angle stability is very good as well. There is only minor backlight bleeding on a dark picture at the highest brightness, which does not really matter.
| |||||||||||||||||||||||||
Brightness Distribution: 87 %
Center on Battery: 520 cd/m²
Contrast: 1384:1 (Black: 0.38 cd/m²)
ΔE ColorChecker Calman: 1.3 | ∀{0.5-29.43 Ø4.73}
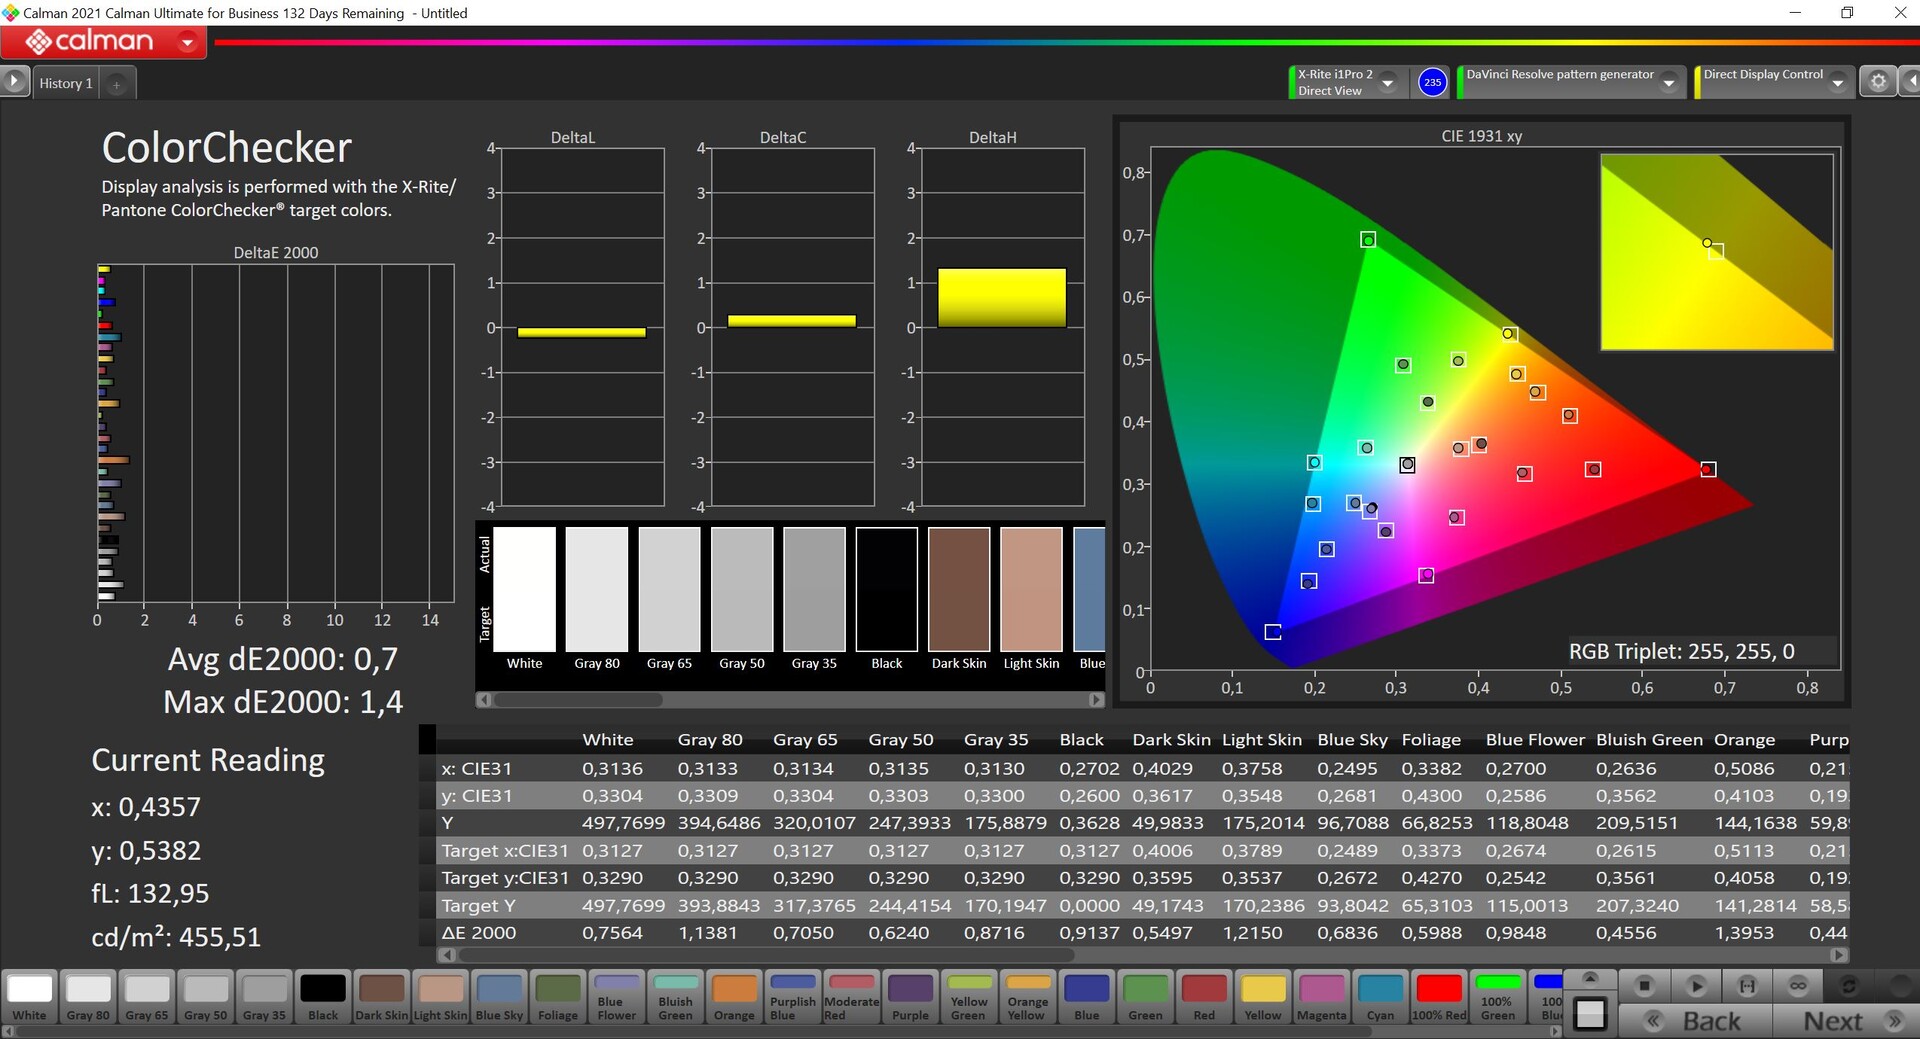
calibrated: 0.7
ΔE Greyscale Calman: 2 | ∀{0.09-98 Ø4.97}
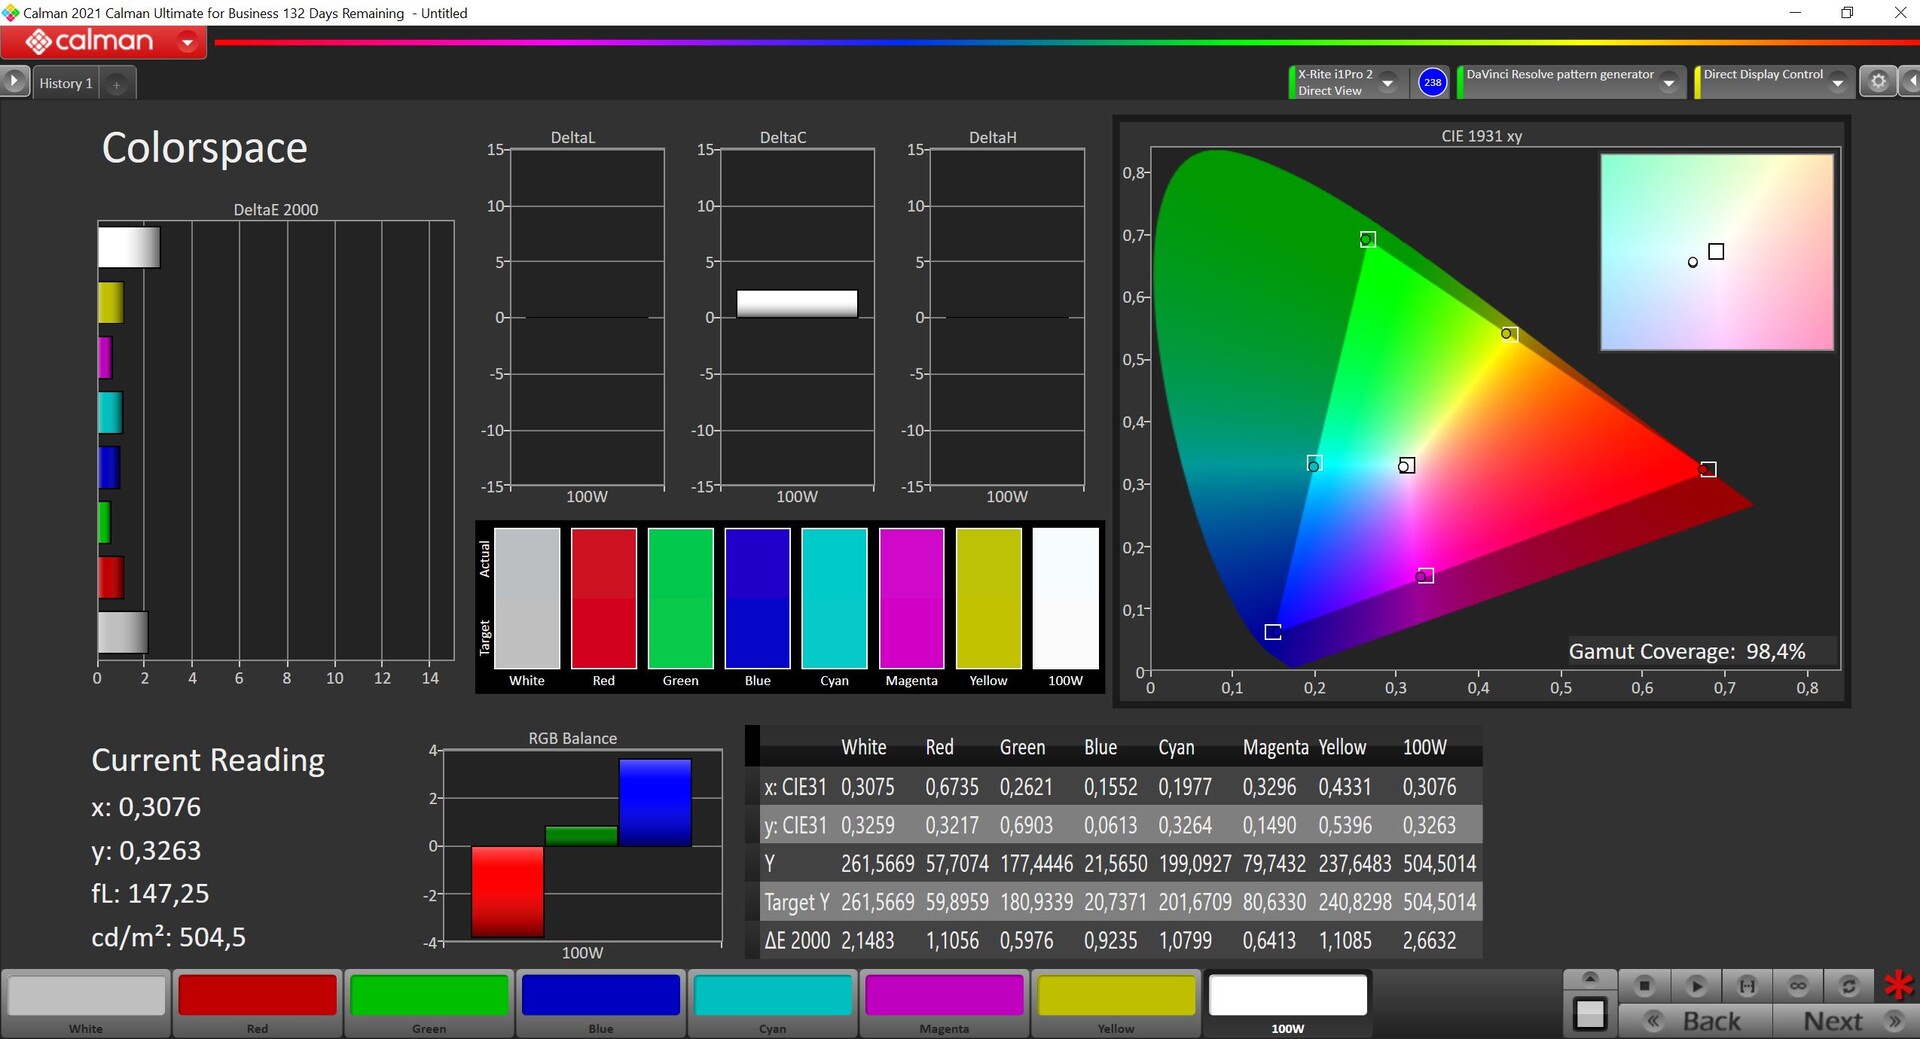
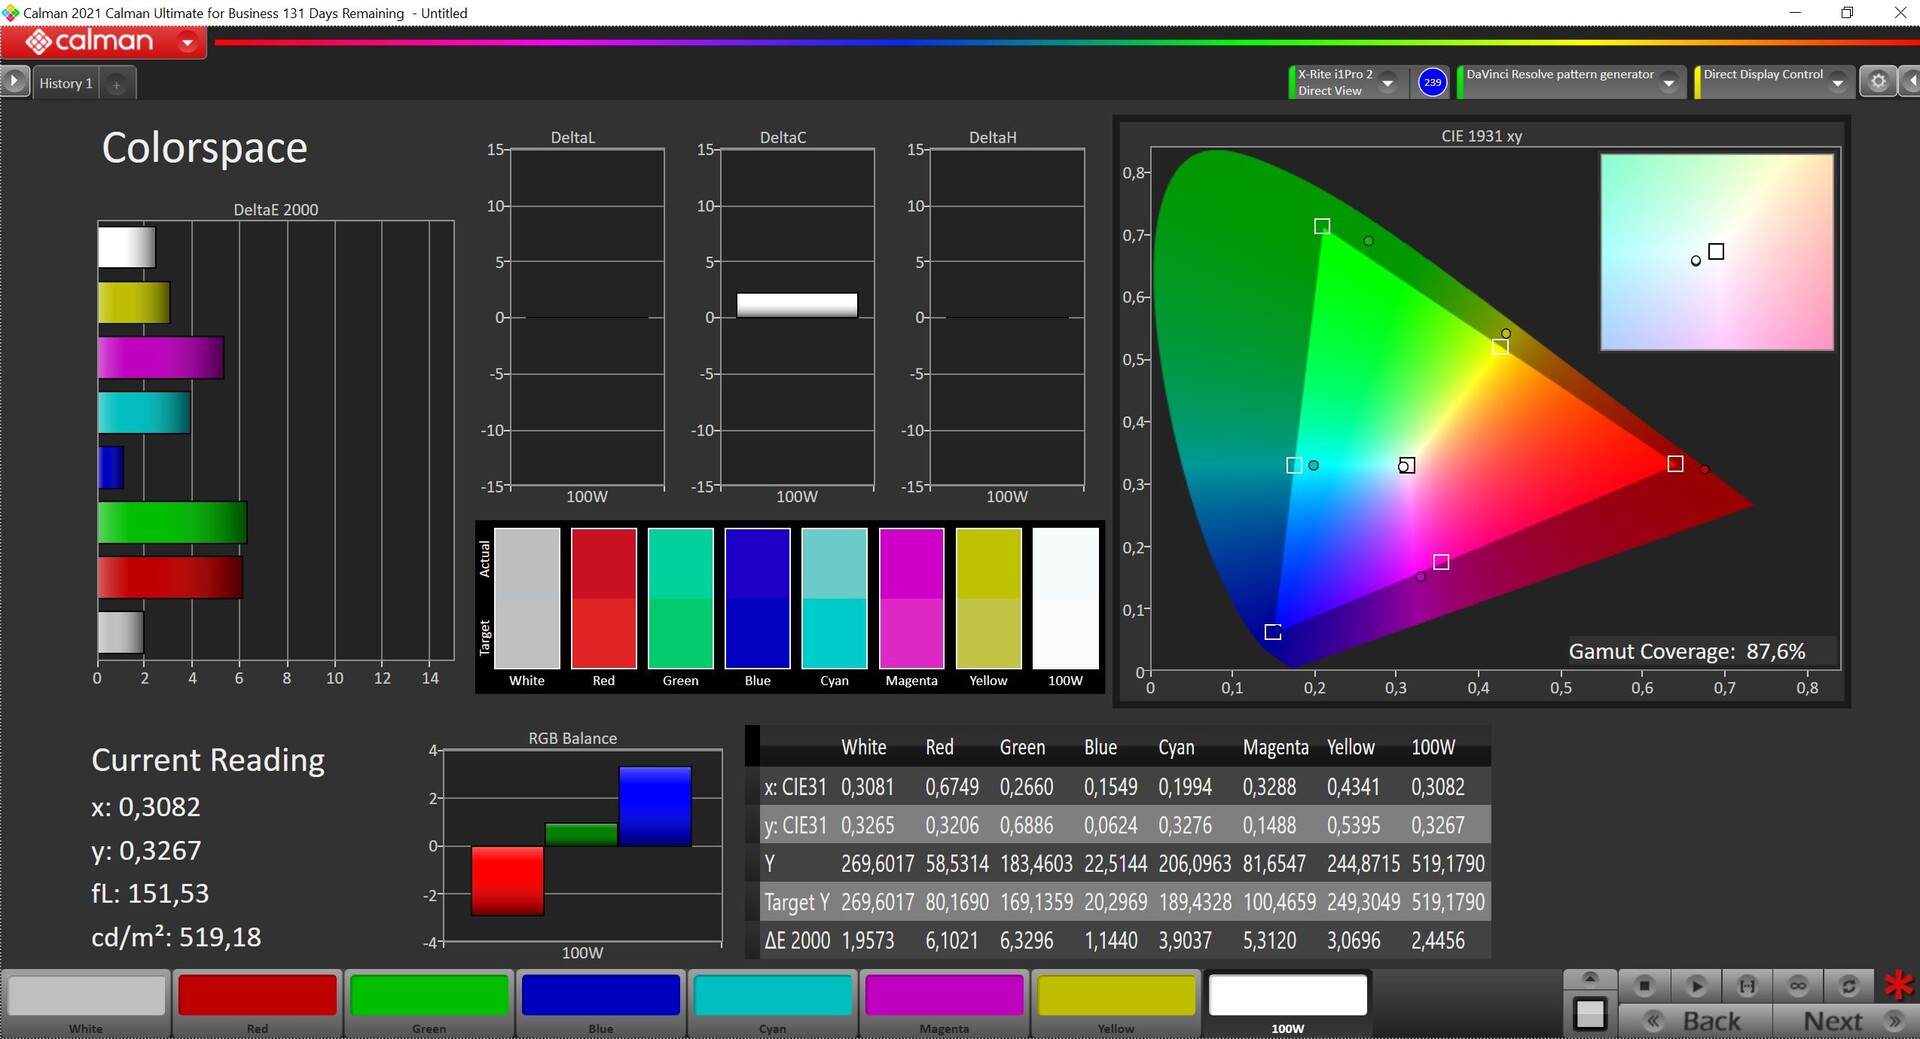
87.6% AdobeRGB 1998 (Argyll 3D)
99.9% sRGB (Argyll 3D)
98.4% Display P3 (Argyll 3D)
Gamma: 2.25
CCT: 6858 K
| Apple MacBook Air M2 Entry IPS, 2560x1664, 13.6" | Apple MacBook Air 2020 M1 Entry IPS, 2560x1600, 13.3" | Apple MacBook Pro 13 2022 M2 IPS, 2560x1600, 13.3" | Dell XPS 13 Plus 9320 4K LQ134R1, IPS, 3840x2400, 13.4" | Asus Zenbook S 13 OLED SDC4172, OLED, 2880x1800, 13.3" | Huawei MateBook 13s i5 11300H TL134GDXP02-0, LTPS, 2520x1680, 13.4" | Lenovo ThinkBook 13s G3 20YA0005GE M133NW4JR0, IPS, 1920x1200, 13.3" | |
|---|---|---|---|---|---|---|---|
| Display | -1% | 0% | -12% | 4% | -22% | -18% | |
| Display P3 Coverage (%) | 98.4 | 98.6 0% | 98.8 0% | 76.5 -22% | 99.8 1% | 65.2 -34% | 67.5 -31% |
| sRGB Coverage (%) | 99.9 | 100 0% | 100 0% | 100 0% | 100 0% | 92 -8% | 97.1 -3% |
| AdobeRGB 1998 Coverage (%) | 87.6 | 85.9 -2% | 87.9 0% | 76 -13% | 97.8 12% | 67.5 -23% | 68.8 -21% |
| Response Times | 1% | -20% | -3% | 94% | -14% | -47% | |
| Response Time Grey 50% / Grey 80% * (ms) | 32.9 ? | 31 ? 6% | 42 ? -28% | 38.9 ? -18% | 2.1 ? 94% | 44.8 ? -36% | 53.2 ? -62% |
| Response Time Black / White * (ms) | 24.9 ? | 26.1 ? -5% | 27.8 ? -12% | 21.9 ? 12% | 1.68 ? 93% | 22.8 ? 8% | 32.8 ? -32% |
| PWM Frequency (Hz) | 118000 ? | 117780 ? | 240.4 ? | 9804 ? | |||
| Screen | -5% | 11% | -36% | 108% | -25% | -7% | |
| Brightness middle (cd/m²) | 526 | 417 -21% | 514 -2% | 494 -6% | 336 -36% | 468 -11% | 379 -28% |
| Brightness (cd/m²) | 486 | 395 -19% | 497 2% | 474 -2% | 338 -30% | 450 -7% | 356 -27% |
| Brightness Distribution (%) | 87 | 91 5% | 93 7% | 89 2% | 99 14% | 92 6% | 88 1% |
| Black Level * (cd/m²) | 0.38 | 0.39 -3% | 0.31 18% | 0.28 26% | 0.02 95% | 0.23 39% | 0.23 39% |
| Contrast (:1) | 1384 | 1069 -23% | 1658 20% | 1764 27% | 16800 1114% | 2035 47% | 1648 19% |
| Colorchecker dE 2000 * | 1.3 | 1.12 14% | 1.1 15% | 3.1 -138% | 1.8 -38% | 2 -54% | 1.6 -23% |
| Colorchecker dE 2000 max. * | 2.7 | 2.71 -0% | 2.3 15% | 4.2 -56% | 3.8 -41% | 5.5 -104% | 2.7 -0% |
| Colorchecker dE 2000 calibrated * | 0.7 | 0.77 -10% | 0.6 14% | 1.5 -114% | 1.8 -157% | 1.5 -114% | 1 -43% |
| Greyscale dE 2000 * | 2 | 1.7 15% | 1.8 10% | 3.2 -60% | 0.9 55% | 2.6 -30% | 2 -0% |
| Gamma | 2.25 98% | 2207 0% | 2.23 99% | 2.41 91% | 2.22 99% | 2.17 101% | 2.25 98% |
| CCT | 6858 95% | 6870 95% | 6764 96% | 6189 105% | 6580 99% | 6511 100% | 6835 95% |
| Total Average (Program / Settings) | -2% /
-3% | -3% /
4% | -17% /
-26% | 69% /
84% | -20% /
-23% | -24% /
-15% |
* ... smaller is better
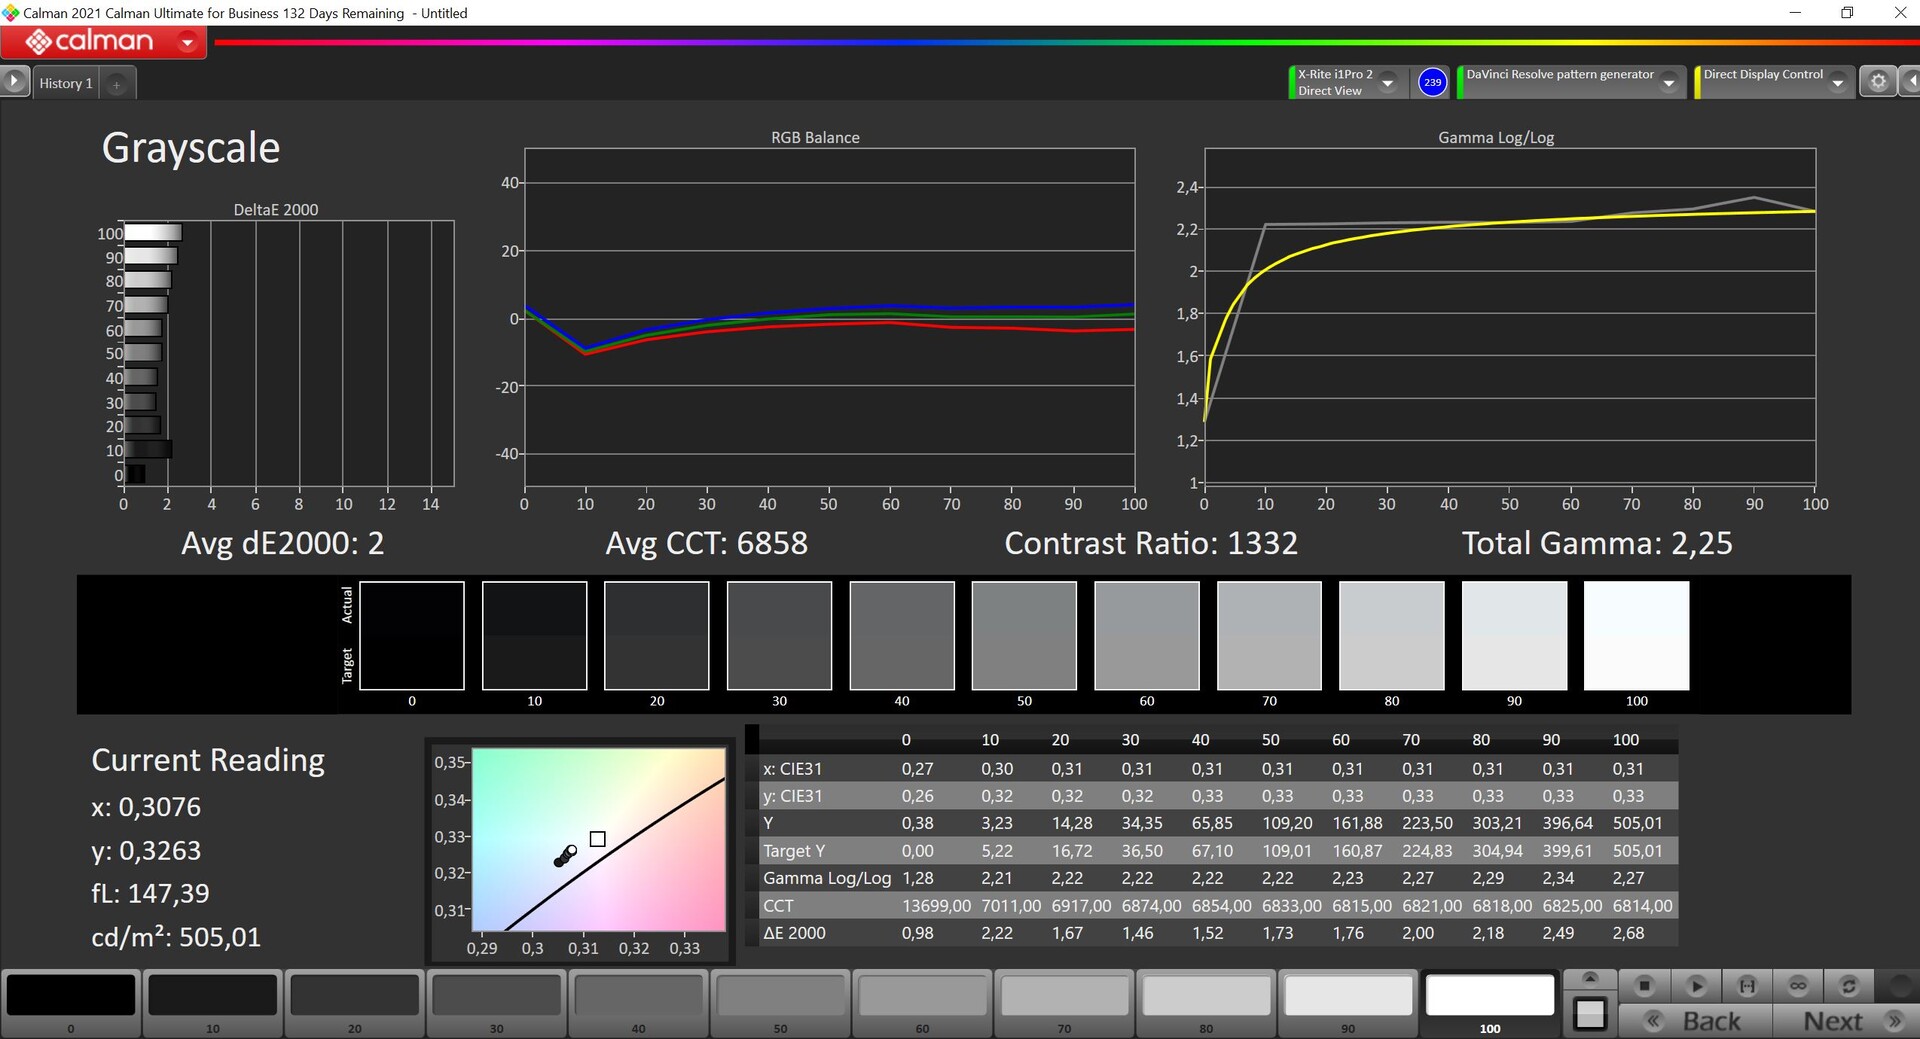
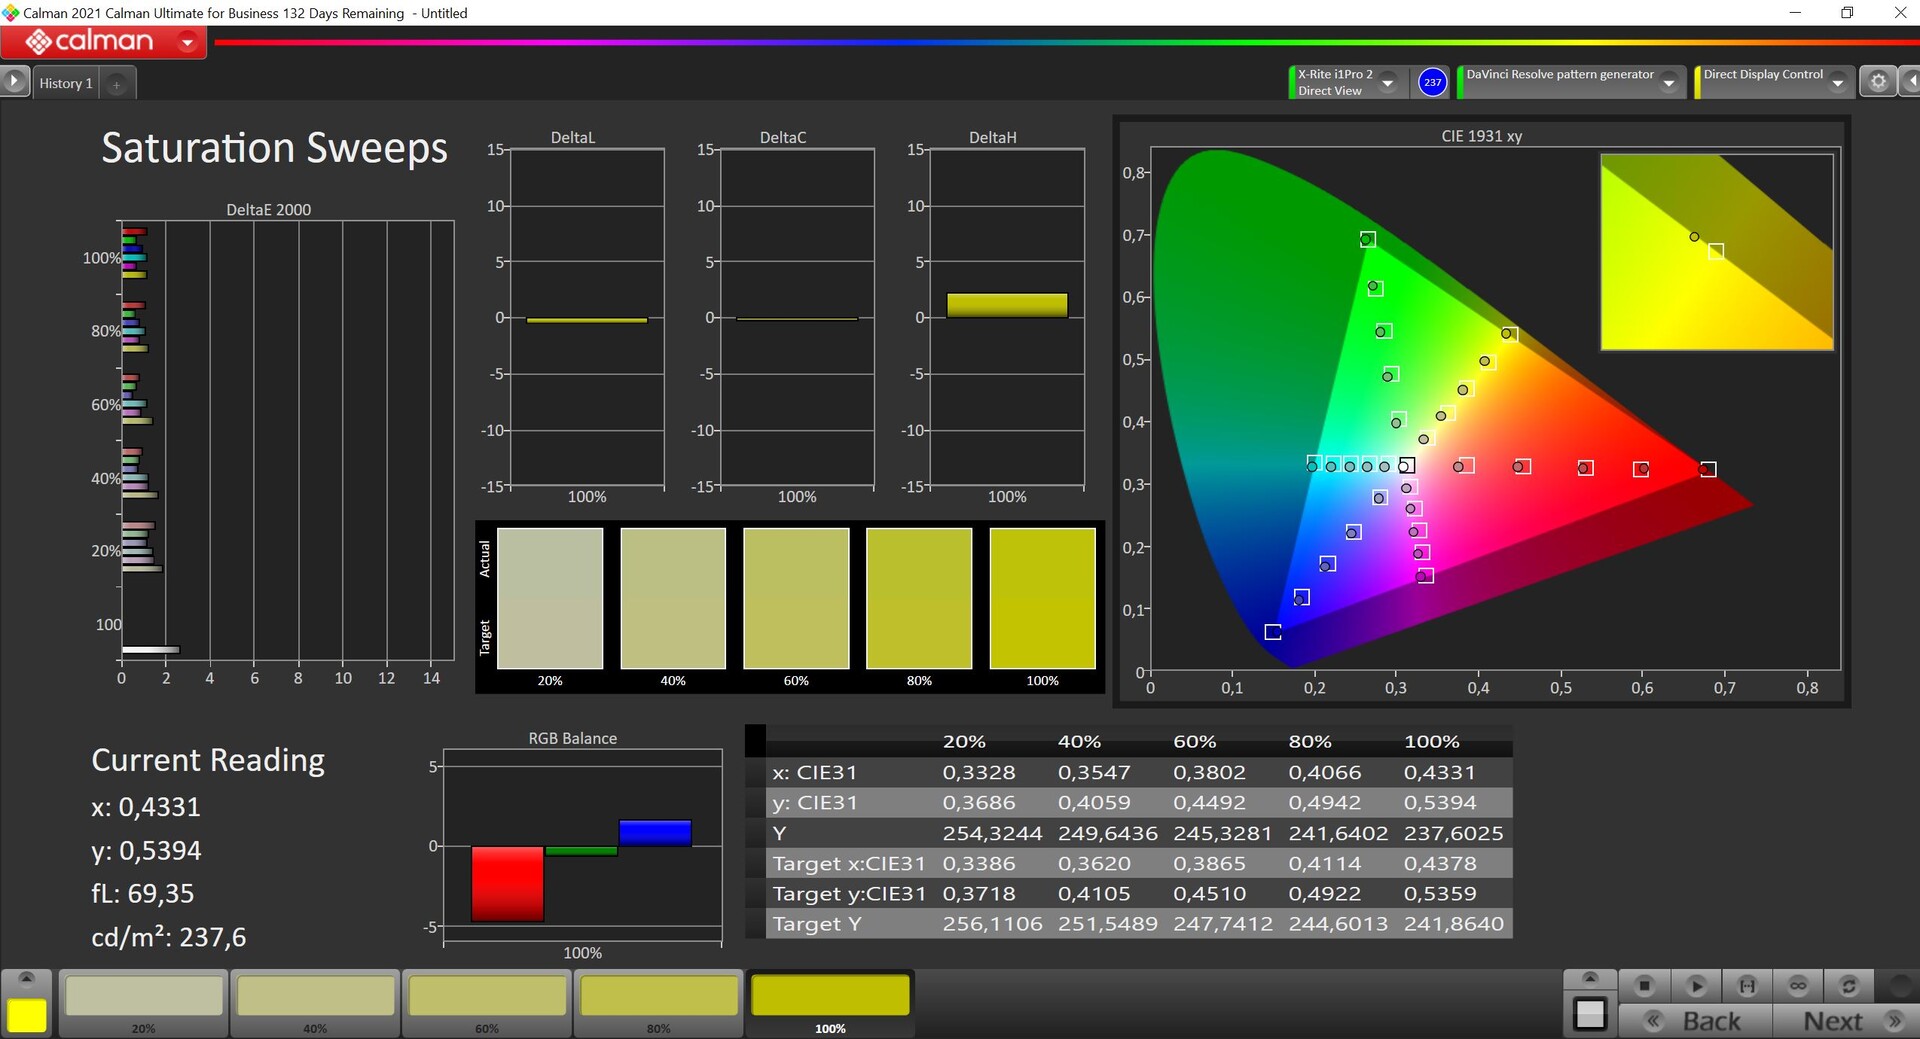
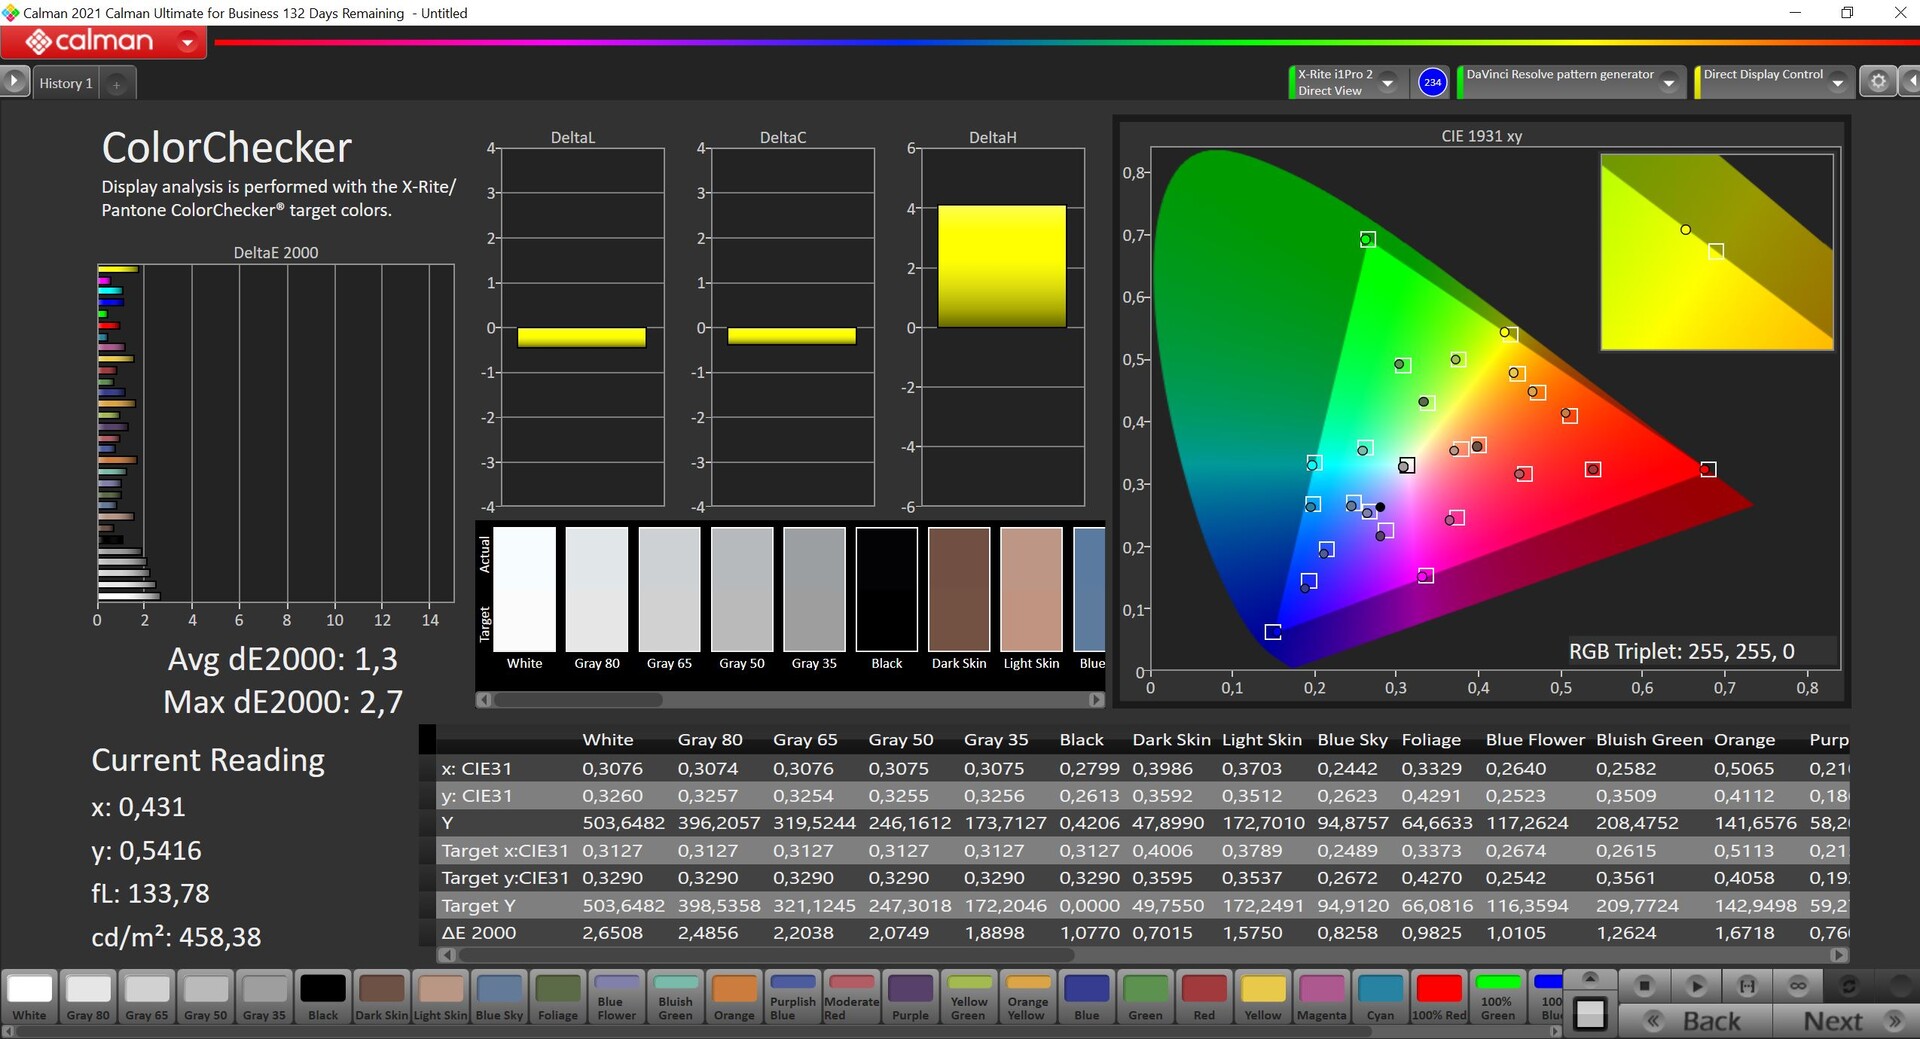
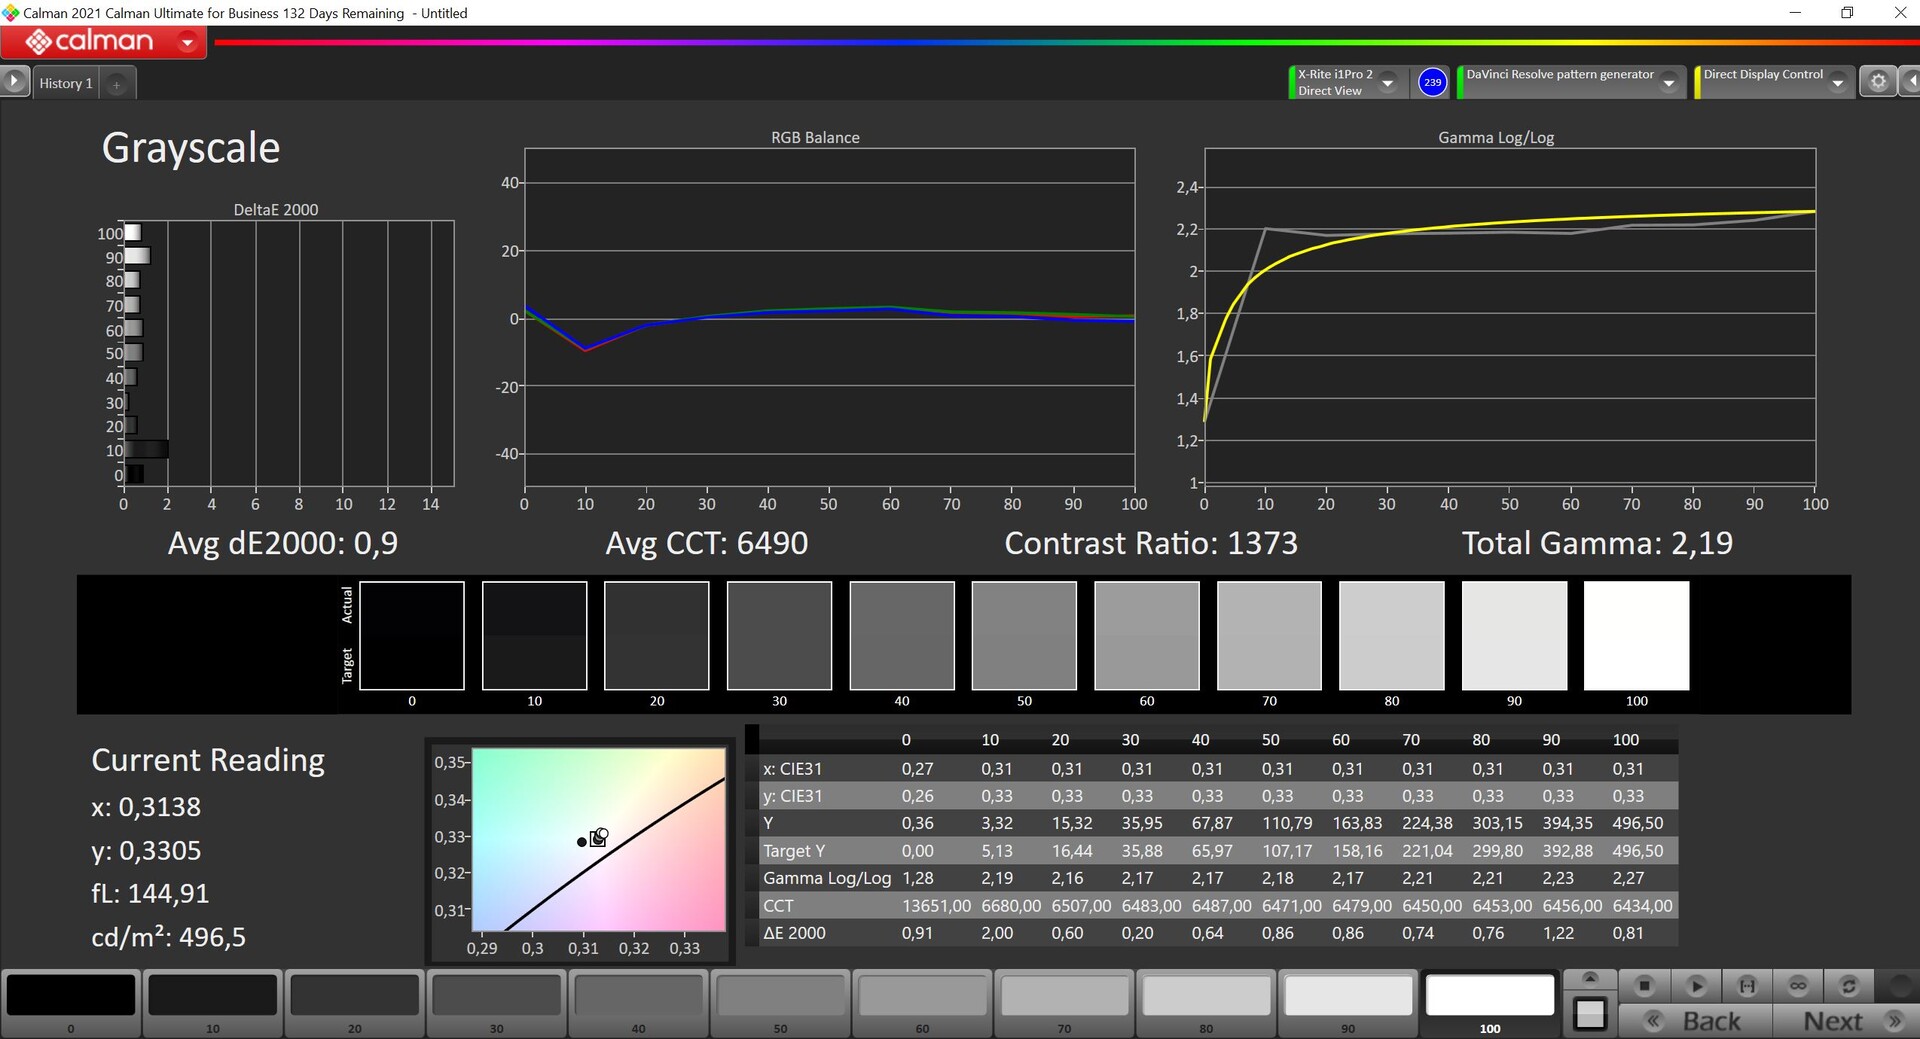
The display calibration is already pretty good out of the box and the color deviations compared to the P3 reference color space are already within the desired range (smaller 3), but our measurements with the professional CalMAN software (X-Rite i1 Pro 2) still reveal a slight color cast towards blue/green in combination with a slightly cool color temperature. You will probably not notice that, especially if you use True Tone.
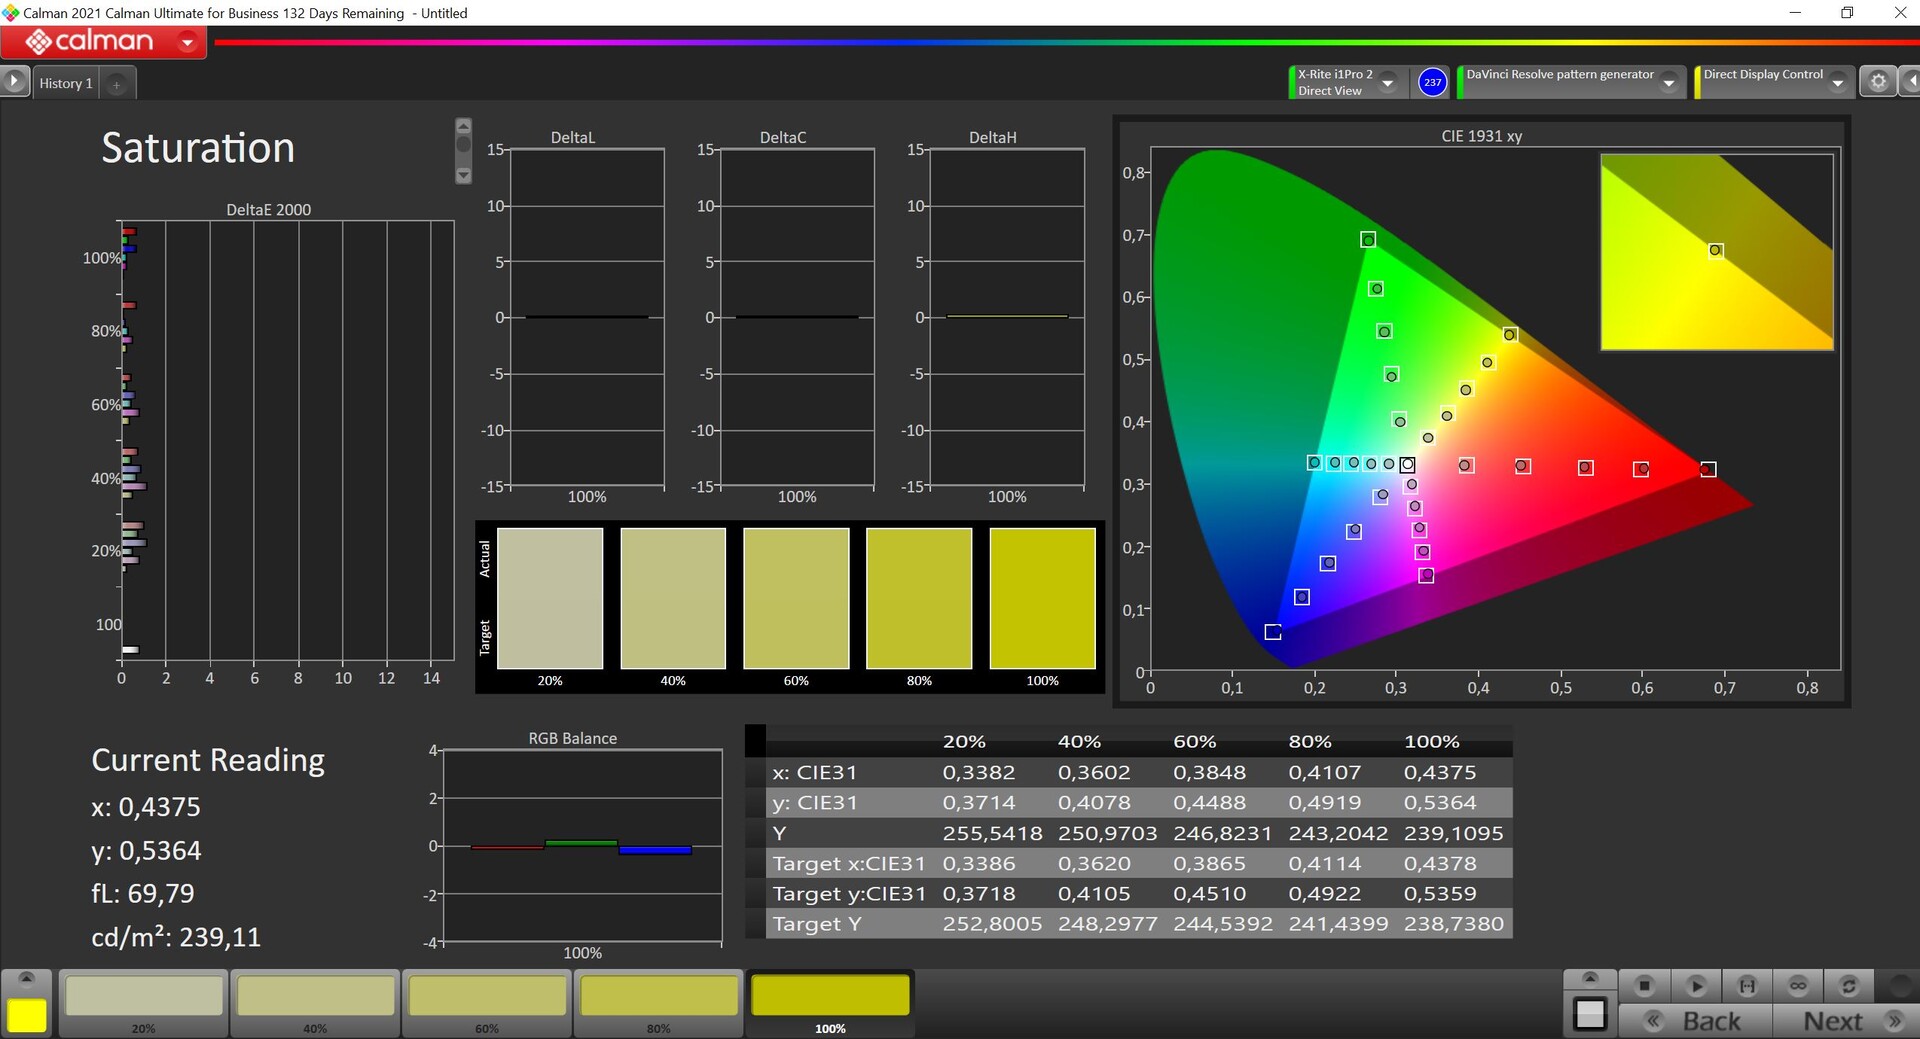
Our own calibration (profile can be downloaded for free in the box above) can improve the performance even further and also removes the color cast. The P3 color gamut is almost covered completely.
Display Response Times
| ↔ Response Time Black to White | ||
|---|---|---|
| 24.9 ms ... rise ↗ and fall ↘ combined | ↗ 10.4 ms rise | 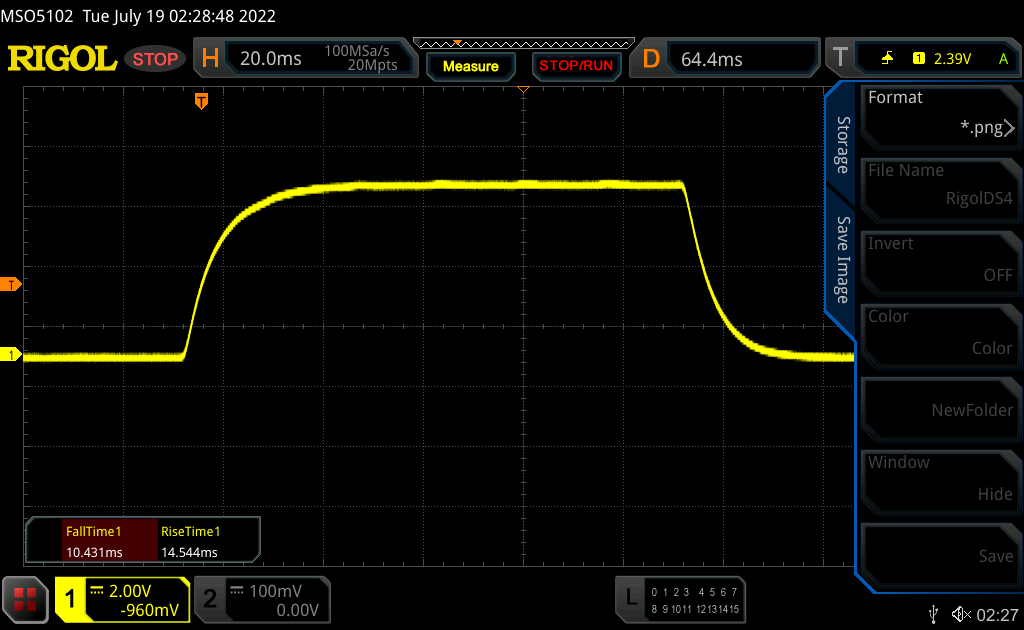 |
| ↘ 14.5 ms fall | ||
| The screen shows good response rates in our tests, but may be too slow for competitive gamers. In comparison, all tested devices range from 0.1 (minimum) to 240 (maximum) ms. » 59 % of all devices are better. This means that the measured response time is worse than the average of all tested devices (19.9 ms). | ||
| ↔ Response Time 50% Grey to 80% Grey | ||
| 32.9 ms ... rise ↗ and fall ↘ combined | ↗ 17.8 ms rise | 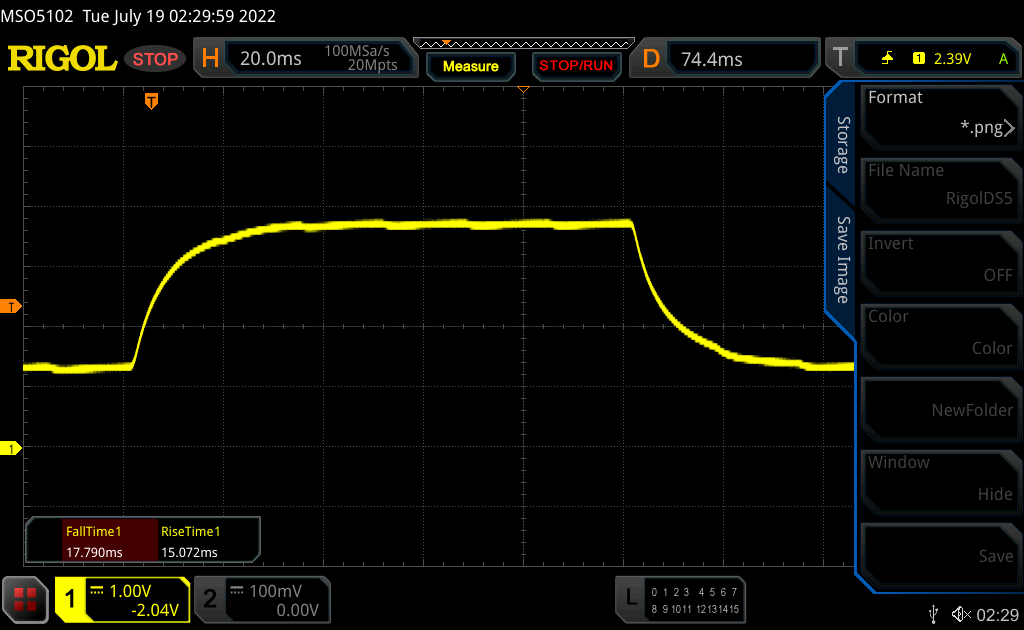 |
| ↘ 15.1 ms fall | ||
| The screen shows slow response rates in our tests and will be unsatisfactory for gamers. In comparison, all tested devices range from 0.165 (minimum) to 636 (maximum) ms. » 45 % of all devices are better. This means that the measured response time is similar to the average of all tested devices (31.1 ms). | ||
Screen Flickering / PWM (Pulse-Width Modulation)
| Screen flickering / PWM not detected |  | ||
In comparison: 52 % of all tested devices do not use PWM to dim the display. If PWM was detected, an average of 7798 (minimum: 5 - maximum: 343500) Hz was measured. | |||
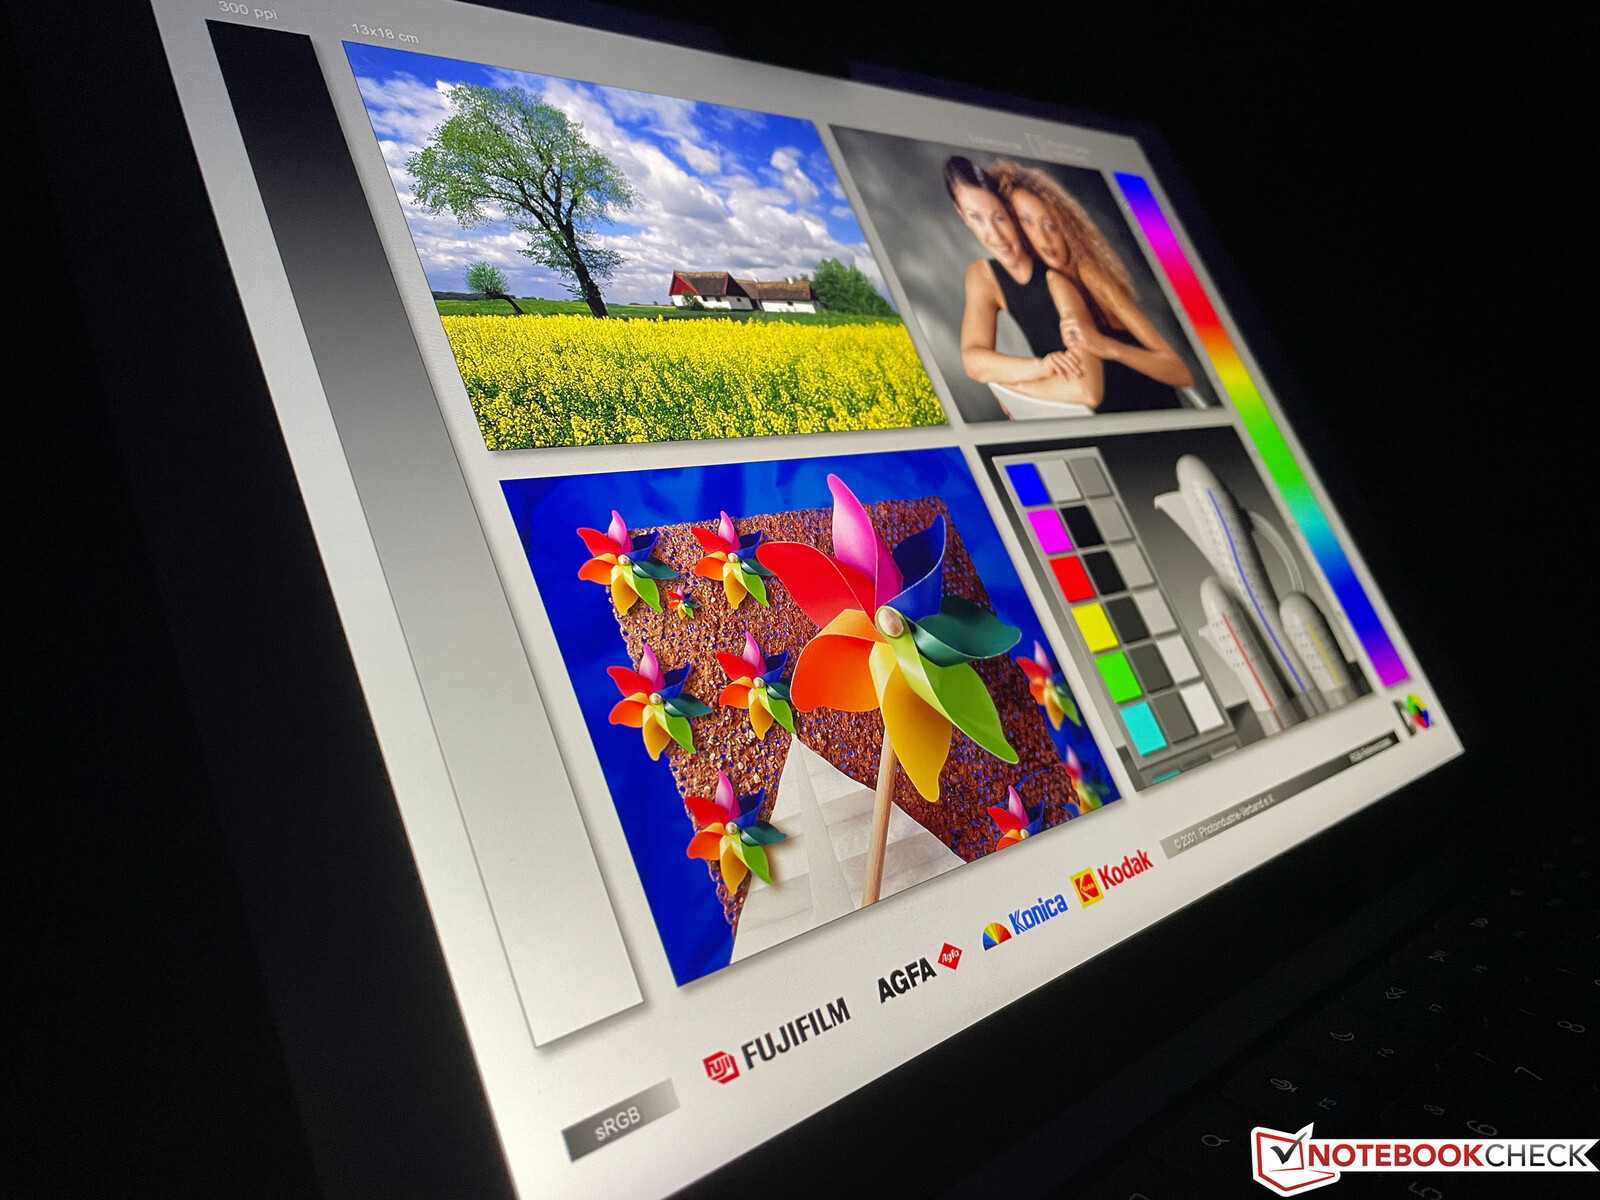
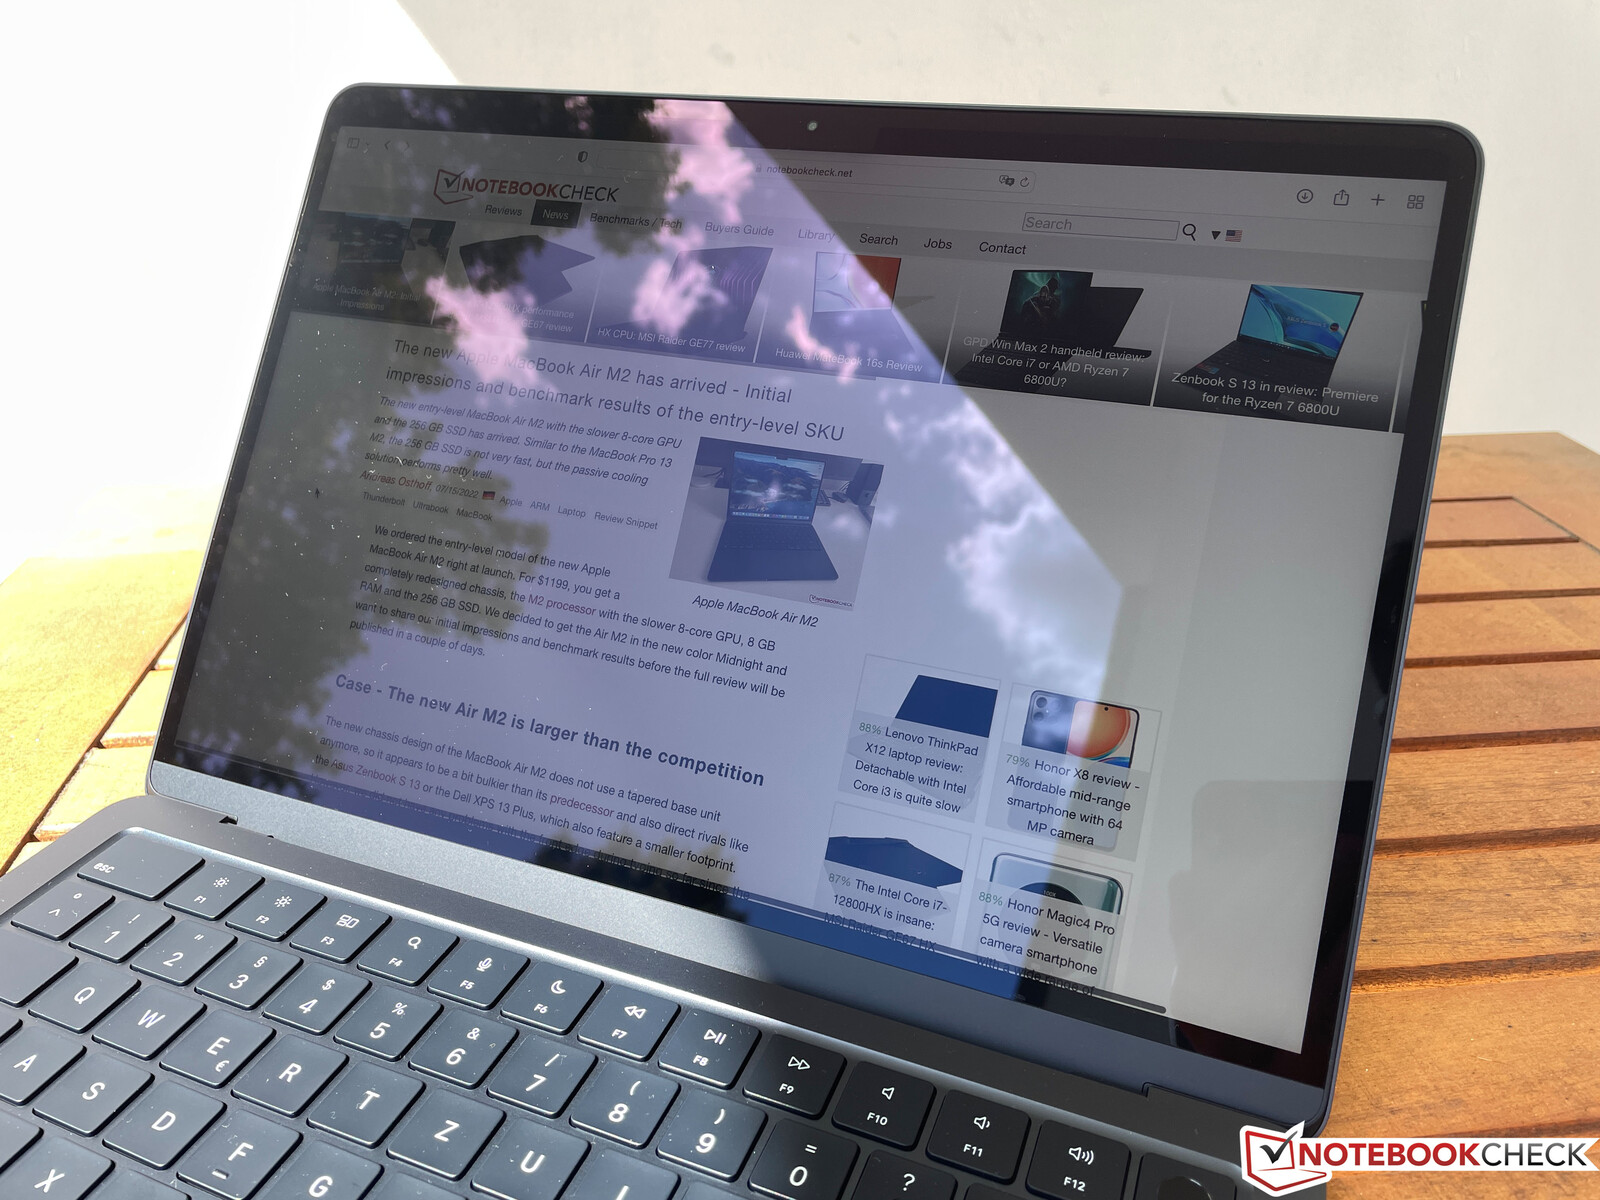
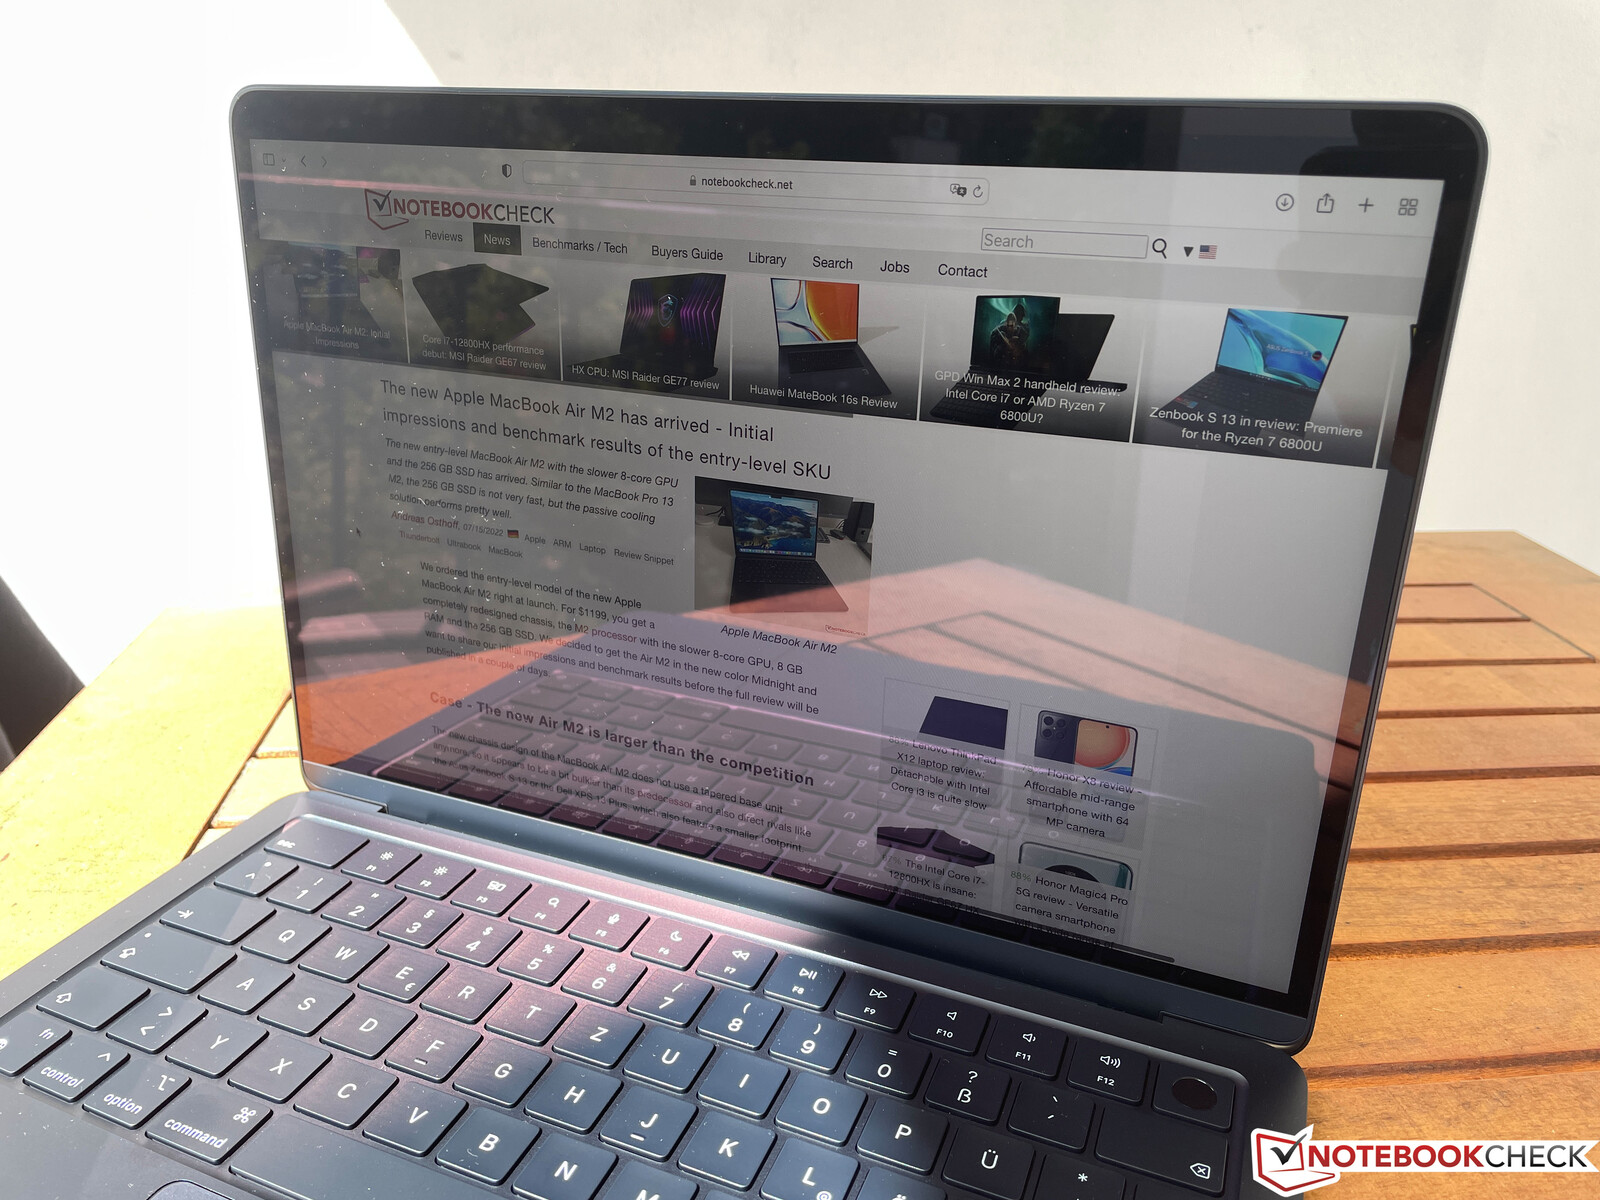
Apple traditionally uses glossy panels with a low degree of reflection, so it works well outdoors as long as you can avoid direct reflections from light sources. The increased maximum brightness of the new MacBook Air M2 obviously helps as well.
Performance - Apple M2 and slow SSD
The MacBook Air is available with two different versions of the new Apple M2 chip. You always get a CPU with 8 cores (4x performance, 4x efficiency), but there are GPUs with 8 cores and 10 cores (+ $100). The base model for $1199 only gets 8 GB RAM and a 256 GB SSD, and Apple charges $200 each for upgrades to 16 GB RAM and a 512 GB SSD. The new model is now available with up to 24 GB RAM and 2 TB SSD storage.
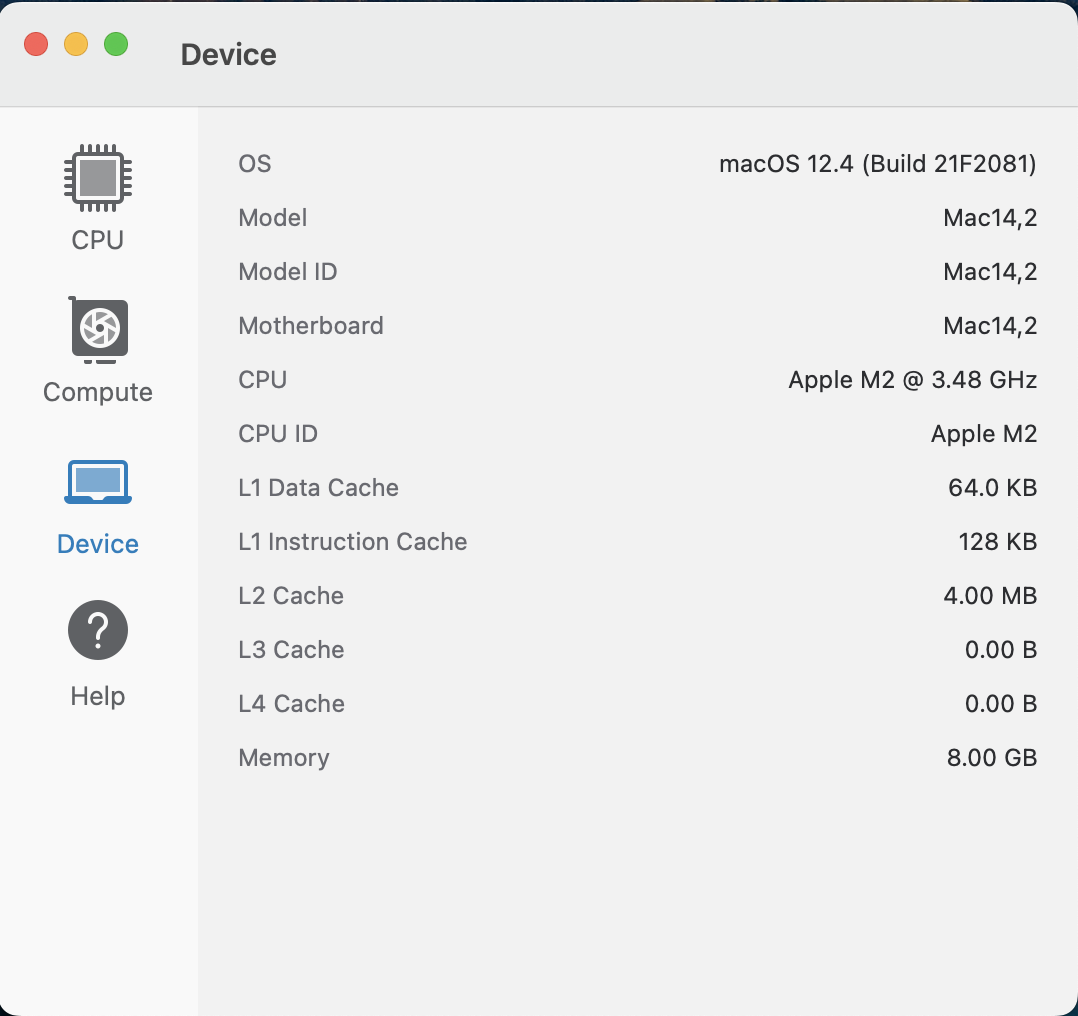
Processor - Apple M2
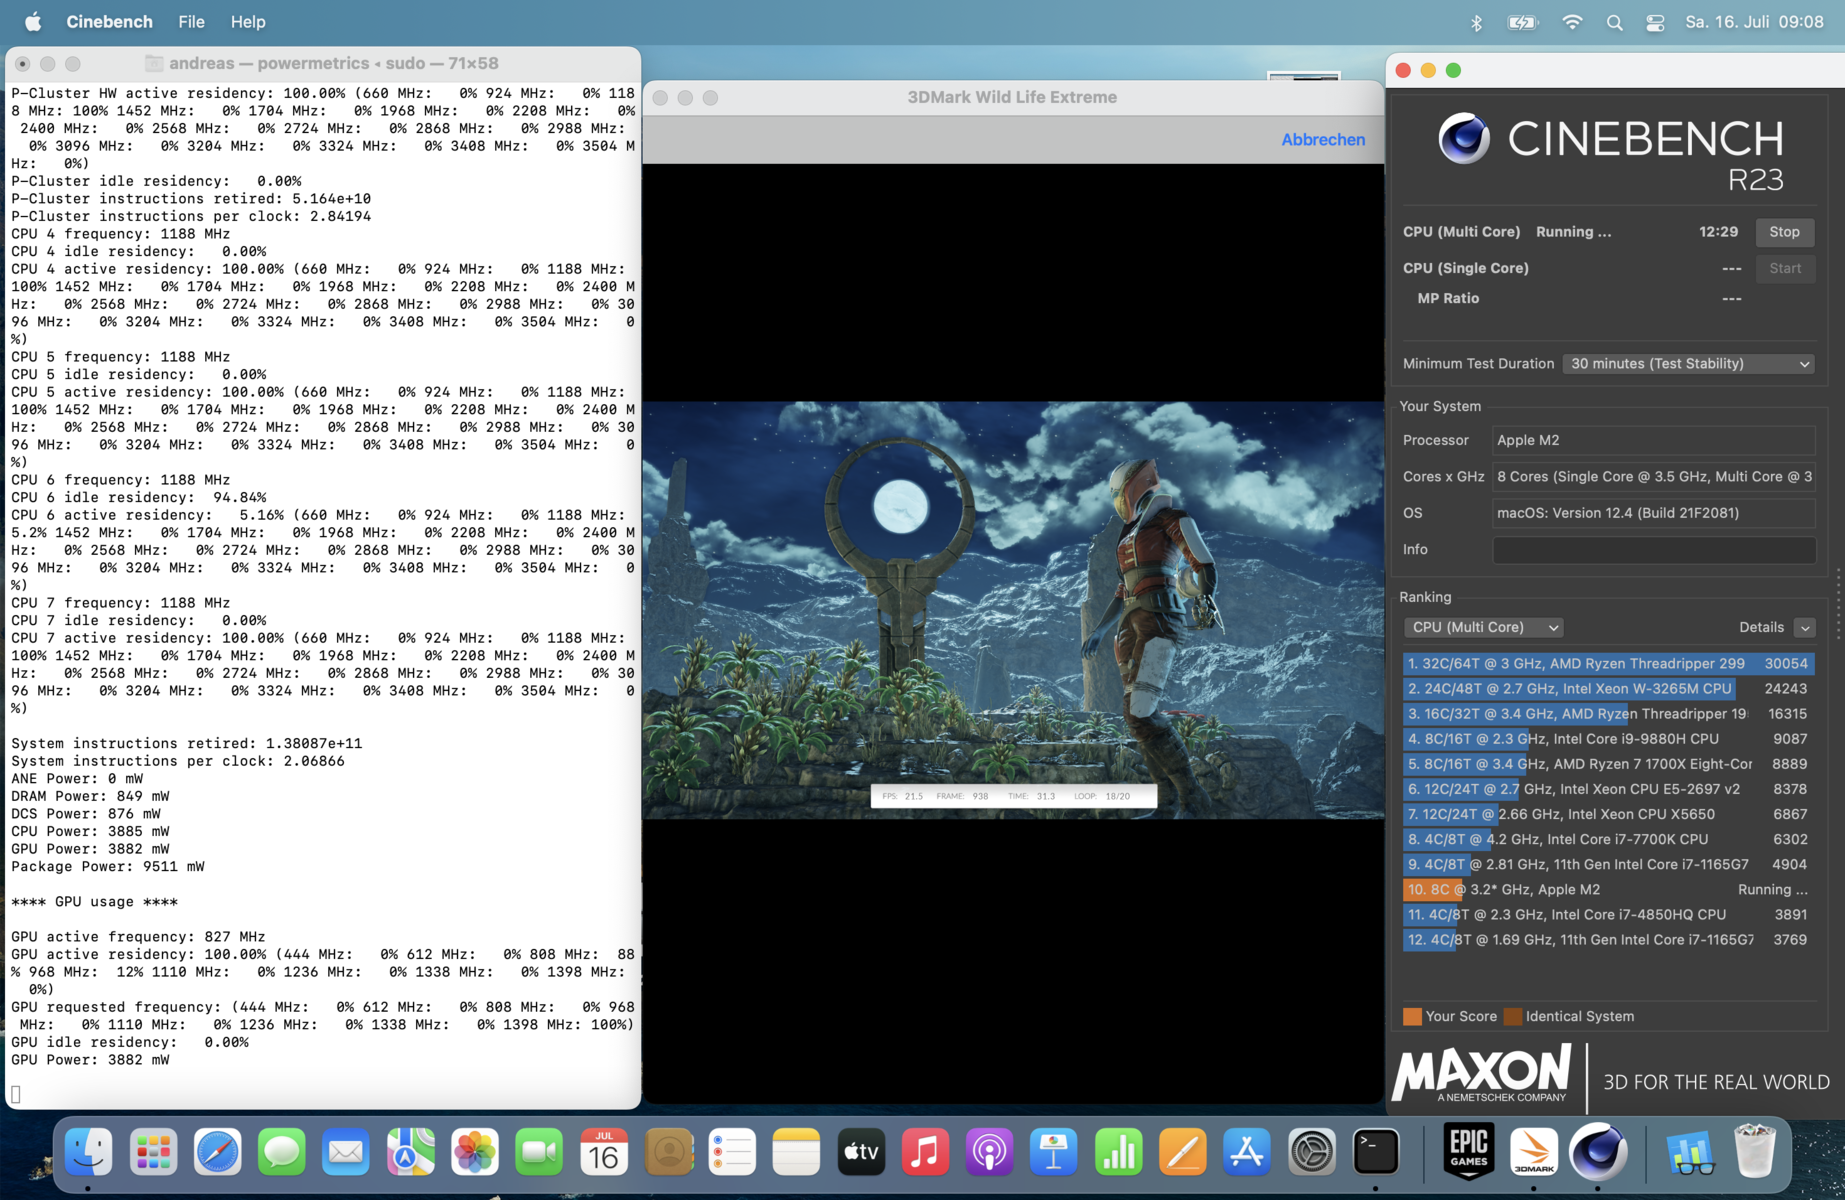
The basic processor architecture of the Apple M2 did not change compared to the old M1 and you still get a total of 8 cores distributed in two clusters (performance and efficiency cluster with 4 cores each). Apple did increase the maximum clock, which can be up to 400 MHz higher. However, this requires additional power and we will look at the efficiency below, but the single core consumption is increased from ~3.7 to ~5.3W and multi-core consumption from ~15 to ~20 Watts.
Cinebench R15 Multi loop
Cinebench R15 is not running natively on the MacBook Air M2, but our loop shows that the new Air can maintain the maximum performance a bit longer than the predecessor. The two devices are getting closer over the course of the test though and the difference is not that big after a few minutes. All in all, you have to expect a performance drop of around 30 % in multi-core scenarios, but the single-core performance is completely stable.
We focus on native benchmarks like Cinebench R23 and Geekbench 5 for performance comparisons. The single-core performance is 7 % better and the multi-core performance ~18 %. Thanks to the higher clock, the single-core results are even slightly better compared to the M1 Pro and M1 Max chips in the larger MacBook Pro models.
The CPU performance does not change on battery power and more benchmarks are listed in our tech section.
Cinebench R23: Multi Core | Single Core
Cinebench R20: CPU (Multi Core) | CPU (Single Core)
Cinebench R15: CPU Multi 64Bit | CPU Single 64Bit
Blender: v2.79 BMW27 CPU
Geekbench 5.5: Multi-Core | Single-Core
| CPU Performance rating | |
| Average of class Subnotebook | |
| Dell XPS 13 Plus 9320 4K | |
| Apple MacBook Pro 16 2021 M1 Pro | |
| Apple MacBook Pro 14 2021 M1 Pro Entry -3! | |
| Asus Zenbook S 13 OLED | |
| Lenovo ThinkBook 13s G3 20YA0005GE | |
| Apple MacBook Pro 13 2022 M2 | |
| Average Apple M2 | |
| Apple MacBook Air M2 Entry | |
| Apple MacBook Air 2020 M1 Entry | |
| Huawei MateBook 13s i5 11300H | |
| Cinebench R23 / Single Core | |
| Average of class Subnotebook (358 - 2213, n=62, last 2 years) | |
| Dell XPS 13 Plus 9320 4K | |
| Average Apple M2 (1580 - 1638, n=5) | |
| Apple MacBook Air M2 Entry | |
| Apple MacBook Pro 13 2022 M2 | |
| Apple MacBook Pro 16 2021 M1 Pro | |
| Apple MacBook Pro 14 2021 M1 Pro Entry | |
| Apple MacBook Air 2020 M1 Entry | |
| Asus Zenbook S 13 OLED | |
| Lenovo ThinkBook 13s G3 20YA0005GE | |
| Huawei MateBook 13s i5 11300H | |
| Cinebench R20 / CPU (Multi Core) | |
| Average of class Subnotebook (579 - 8541, n=58, last 2 years) | |
| Asus Zenbook S 13 OLED | |
| Dell XPS 13 Plus 9320 4K | |
| Lenovo ThinkBook 13s G3 20YA0005GE | |
| Apple MacBook Pro 16 2021 M1 Pro | |
| Apple MacBook Pro 13 2022 M2 | |
| Average Apple M2 (2231 - 2416, n=5) | |
| Apple MacBook Air M2 Entry | |
| Huawei MateBook 13s i5 11300H | |
| Apple MacBook Air 2020 M1 Entry (Rosetta) | |
| Cinebench R20 / CPU (Single Core) | |
| Average of class Subnotebook (128 - 832, n=58, last 2 years) | |
| Dell XPS 13 Plus 9320 4K | |
| Asus Zenbook S 13 OLED | |
| Lenovo ThinkBook 13s G3 20YA0005GE | |
| Huawei MateBook 13s i5 11300H | |
| Apple MacBook Air 2020 M1 Entry (Rosetta) | |
| Apple MacBook Pro 16 2021 M1 Pro | |
| Apple MacBook Pro 13 2022 M2 | |
| Average Apple M2 (216 - 446, n=5) | |
| Apple MacBook Air M2 Entry | |
| Cinebench R15 / CPU Multi 64Bit | |
| Average of class Subnotebook (327 - 3345, n=58, last 2 years) | |
| Lenovo ThinkBook 13s G3 20YA0005GE (max. Performance) | |
| Lenovo ThinkBook 13s G3 20YA0005GE | |
| Asus Zenbook S 13 OLED | |
| Apple MacBook Pro 16 2021 M1 Pro | |
| Dell XPS 13 Plus 9320 4K (Ultra-Performance) | |
| Dell XPS 13 Plus 9320 4K (Optimized) | |
| Apple MacBook Pro 14 2021 M1 Pro Entry (Rosetta 2) | |
| Apple MacBook Pro 13 2022 M2 | |
| Average Apple M2 (1210 - 1243, n=5) | |
| Apple MacBook Air M2 Entry | |
| Apple MacBook Air 2020 M1 Entry (Rosetta 2) | |
| Huawei MateBook 13s i5 11300H (Standard) | |
| Huawei MateBook 13s i5 11300H (Performance) | |
| Cinebench R15 / CPU Single 64Bit | |
| Average of class Subnotebook (72.4 - 322, n=58, last 2 years) | |
| Dell XPS 13 Plus 9320 4K | |
| Asus Zenbook S 13 OLED | |
| Lenovo ThinkBook 13s G3 20YA0005GE | |
| Average Apple M2 (222 - 229, n=5) | |
| Apple MacBook Pro 13 2022 M2 | |
| Apple MacBook Air M2 Entry | |
| Apple MacBook Pro 14 2021 M1 Pro Entry (Rosetta 2) | |
| Apple MacBook Pro 16 2021 M1 Pro | |
| Apple MacBook Air 2020 M1 Entry (Rosetta 2) | |
| Huawei MateBook 13s i5 11300H | |
| Blender / v2.79 BMW27 CPU | |
| Apple MacBook Air M2 Entry | |
| Apple MacBook Air 2020 M1 Entry | |
| Average Apple M2 (549 - 713, n=5) | |
| Apple MacBook Pro 13 2022 M2 | |
| Huawei MateBook 13s i5 11300H | |
| Lenovo ThinkBook 13s G3 20YA0005GE | |
| Average of class Subnotebook (159 - 2271, n=59, last 2 years) | |
| Dell XPS 13 Plus 9320 4K | |
| Asus Zenbook S 13 OLED | |
| Apple MacBook Pro 16 2021 M1 Pro (Blender 3.0 Beta M1) | |
| Geekbench 5.5 / Single-Core | |
| Apple MacBook Pro 13 2022 M2 | |
| Apple MacBook Air M2 Entry | |
| Average Apple M2 (1887 - 1953, n=8) | |
| Average of class Subnotebook (726 - 2224, n=49, last 2 years) | |
| Apple MacBook Pro 14 2021 M1 Pro Entry | |
| Apple MacBook Pro 16 2021 M1 Pro | |
| Apple MacBook Air 2020 M1 Entry | |
| Dell XPS 13 Plus 9320 4K | |
| Asus Zenbook S 13 OLED | |
| Lenovo ThinkBook 13s G3 20YA0005GE | |
| Huawei MateBook 13s i5 11300H | |
* ... smaller is better
We also want to have a look at the efficiency of the new Apple M2 and compare it with the M1. We ran Cinebench R23 Single & Multi on both machines and logged the package power, which allows us to compare the efficiency. The numbers clearly show that the performance increase is based on higher consumption figures (+42 % @single-core, ~41 %@multi-core), which means the efficiency is significantly worse compared to the M1 SoC. However, even the M2 is still clearly ahead of Intel and AMD in terms of single-core efficiency. The multi-core advantage over Intel’s Alder Lake chips is also still impressive, but AMD is not that far off with the new Ryzen 7 6800U.
Package Power Cinebench R23 Multi
* ... smaller is better
System Performance
Both the MacBook Pro 13 M2 and the new MacBook Air M2 are extremely responsive and fast devices. The operating system runs extremely smooth, there are no stutters and the MacBook wakes up instantly from standby. Native apps for Apple silicon launch very quickly, including complex apps like Adobe Photoshop, Premiere Pro or DaVinci Resolve. The performance is also very good in synthetic benchmarks like CrossMark and browser tests.
We once again included the PugetBench results (Photoshop and Premiere Pro) for the sake of completeness, but the benchmarks are only compatible with the Intel versions of the apps and are therefore not representative for the performance. The Intel versions are also noticeably more sluggish than their native counterparts.
The base model of the Air M2 uses the same Media Engine, so even editing of high-resolution videos including parallel editing of multiple 4K ProRes streams is supported. You will eventually notice a performance drop when you export large files, but the performance is completely sufficient for occasional projects (vacation videos, for example).
Blackmagic RAW Speed Test: 12:1 8K Metal | 12:1 8K CPU
Photoshop PugetBench: Filter Score | General Score | GPU Score | Overall Score
Premiere Pro PugetBench: GPU 0.9 | Live Playback 0.9 | Export 0.9 | Overall Score 0.9
Jetstream 2: 2.0 Total
WebXPRT 3: Overall
WebXPRT 4: Overall
Speedometer 2.0: Result 2.0
| CrossMark / Overall | |
| Dell XPS 13 Plus 9320 4K | |
| Average of class Subnotebook (365 - 2356, n=61, last 2 years) | |
| Apple MacBook Pro 13 2022 M2 | |
| Apple MacBook Air M2 Entry | |
| Average Apple M2, Apple M2 8-Core GPU (n=1) | |
| Asus Zenbook S 13 OLED | |
| Apple MacBook Air 2020 M1 Entry | |
| Huawei MateBook 13s i5 11300H | |
| Lenovo ThinkBook 13s G3 20YA0005GE | |
| CrossMark / Productivity | |
| Dell XPS 13 Plus 9320 4K | |
| Average of class Subnotebook (364 - 2277, n=61, last 2 years) | |
| Asus Zenbook S 13 OLED | |
| Huawei MateBook 13s i5 11300H | |
| Apple MacBook Pro 13 2022 M2 | |
| Apple MacBook Air M2 Entry | |
| Average Apple M2, Apple M2 8-Core GPU (n=1) | |
| Lenovo ThinkBook 13s G3 20YA0005GE | |
| Apple MacBook Air 2020 M1 Entry | |
| CrossMark / Creativity | |
| Dell XPS 13 Plus 9320 4K | |
| Apple MacBook Air M2 Entry | |
| Average Apple M2, Apple M2 8-Core GPU (n=1) | |
| Average of class Subnotebook (372 - 2743, n=61, last 2 years) | |
| Apple MacBook Pro 13 2022 M2 | |
| Apple MacBook Air 2020 M1 Entry | |
| Asus Zenbook S 13 OLED | |
| Lenovo ThinkBook 13s G3 20YA0005GE | |
| Huawei MateBook 13s i5 11300H | |
| CrossMark / Responsiveness | |
| Huawei MateBook 13s i5 11300H | |
| Dell XPS 13 Plus 9320 4K | |
| Average of class Subnotebook (312 - 1854, n=61, last 2 years) | |
| Asus Zenbook S 13 OLED | |
| Lenovo ThinkBook 13s G3 20YA0005GE | |
| Apple MacBook Pro 13 2022 M2 | |
| Apple MacBook Air M2 Entry | |
| Average Apple M2, Apple M2 8-Core GPU (n=1) | |
| Apple MacBook Air 2020 M1 Entry | |
| Blackmagic RAW Speed Test / 12:1 8K Metal | |
| Apple MacBook Pro 13 2022 M2 | |
| Average of class Subnotebook (41 - 99, n=5, last 2 years) | |
| Apple MacBook Air M2 Entry | |
| Average Apple M2, Apple M2 8-Core GPU (n=1) | |
| Blackmagic RAW Speed Test / 12:1 8K CPU | |
| Average of class Subnotebook (22 - 49, n=5, last 2 years) | |
| Apple MacBook Pro 13 2022 M2 | |
| Apple MacBook Air M2 Entry | |
| Average Apple M2, Apple M2 8-Core GPU (n=1) | |
| Photoshop PugetBench / Filter Score | |
| Apple MacBook Pro 13 2022 M2 | |
| Apple MacBook Air M2 Entry | |
| Average Apple M2, Apple M2 8-Core GPU (n=1) | |
| Apple MacBook Air 2020 M1 Entry | |
| Photoshop PugetBench / General Score | |
| Apple MacBook Pro 13 2022 M2 | |
| Apple MacBook Air M2 Entry | |
| Average Apple M2, Apple M2 8-Core GPU (n=1) | |
| Apple MacBook Air 2020 M1 Entry | |
| Photoshop PugetBench / GPU Score | |
| Apple MacBook Pro 13 2022 M2 | |
| Apple MacBook Air M2 Entry | |
| Average Apple M2, Apple M2 8-Core GPU (n=1) | |
| Apple MacBook Air 2020 M1 Entry | |
| Photoshop PugetBench / Overall Score | |
| Apple MacBook Pro 13 2022 M2 | |
| Apple MacBook Air M2 Entry | |
| Average Apple M2, Apple M2 8-Core GPU (n=1) | |
| Apple MacBook Air 2020 M1 Entry | |
| Premiere Pro PugetBench / GPU 0.9 | |
| Apple MacBook Pro 13 2022 M2 | |
| Apple MacBook Air M2 Entry | |
| Average Apple M2, Apple M2 8-Core GPU (n=1) | |
| Apple MacBook Air 2020 M1 Entry | |
| Premiere Pro PugetBench / Live Playback 0.9 | |
| Apple MacBook Pro 13 2022 M2 | |
| Apple MacBook Air M2 Entry | |
| Average Apple M2, Apple M2 8-Core GPU (n=1) | |
| Apple MacBook Air 2020 M1 Entry | |
| Premiere Pro PugetBench / Export 0.9 | |
| Apple MacBook Pro 13 2022 M2 | |
| Apple MacBook Air M2 Entry | |
| Average Apple M2, Apple M2 8-Core GPU (n=1) | |
| Apple MacBook Air 2020 M1 Entry | |
| Premiere Pro PugetBench / Overall Score 0.9 | |
| Apple MacBook Pro 13 2022 M2 | |
| Apple MacBook Air M2 Entry | |
| Average Apple M2, Apple M2 8-Core GPU (n=1) | |
| Apple MacBook Air 2020 M1 Entry | |
| Jetstream 2 / 2.0 Total | |
| Average of class Subnotebook (117 - 476, n=29, last 2 years) | |
| Dell XPS 13 Plus 9320 4K | |
| Apple MacBook Pro 13 2022 M2 | |
| Average Apple M2, Apple M2 8-Core GPU (n=1) | |
| Apple MacBook Air M2 Entry | |
| Asus Zenbook S 13 OLED | |
| Lenovo ThinkBook 13s G3 20YA0005GE | |
| Apple MacBook Air 2020 M1 Entry | |
| Apple MacBook Air 2020 M1 Entry | |
| Huawei MateBook 13s i5 11300H | |
| WebXPRT 3 / Overall | |
| Apple MacBook Pro 13 2022 M2 | |
| Apple MacBook Air M2 Entry | |
| Average Apple M2, Apple M2 8-Core GPU (n=1) | |
| Average of class Subnotebook (156 - 530, n=57, last 2 years) | |
| Apple MacBook Air 2020 M1 Entry | |
| Apple MacBook Air 2020 M1 Entry | |
| Dell XPS 13 Plus 9320 4K | |
| Asus Zenbook S 13 OLED | |
| Lenovo ThinkBook 13s G3 20YA0005GE | |
| Huawei MateBook 13s i5 11300H | |
| WebXPRT 4 / Overall | |
| Average of class Subnotebook (132 - 378, n=62, last 2 years) | |
| Dell XPS 13 Plus 9320 4K | |
| Apple MacBook Air M2 Entry | |
| Average Apple M2, Apple M2 8-Core GPU (n=1) | |
| Apple MacBook Air 2020 M1 Entry | |
| Speedometer 2.0 / Result 2.0 | |
| Average of class Subnotebook (110 - 793, n=27, last 2 years) | |
| Apple MacBook Pro 13 2022 M2 | |
| Apple MacBook Air M2 Entry | |
| Average Apple M2, Apple M2 8-Core GPU (n=1) | |
| Apple MacBook Air 2020 M1 Entry | |
| Apple MacBook Air 2020 M1 Entry | |
| Dell XPS 13 Plus 9320 4K | |
| Lenovo ThinkBook 13s G3 20YA0005GE | |
| Huawei MateBook 13s i5 11300H | |
| Asus Zenbook S 13 OLED | |
Storage Devices
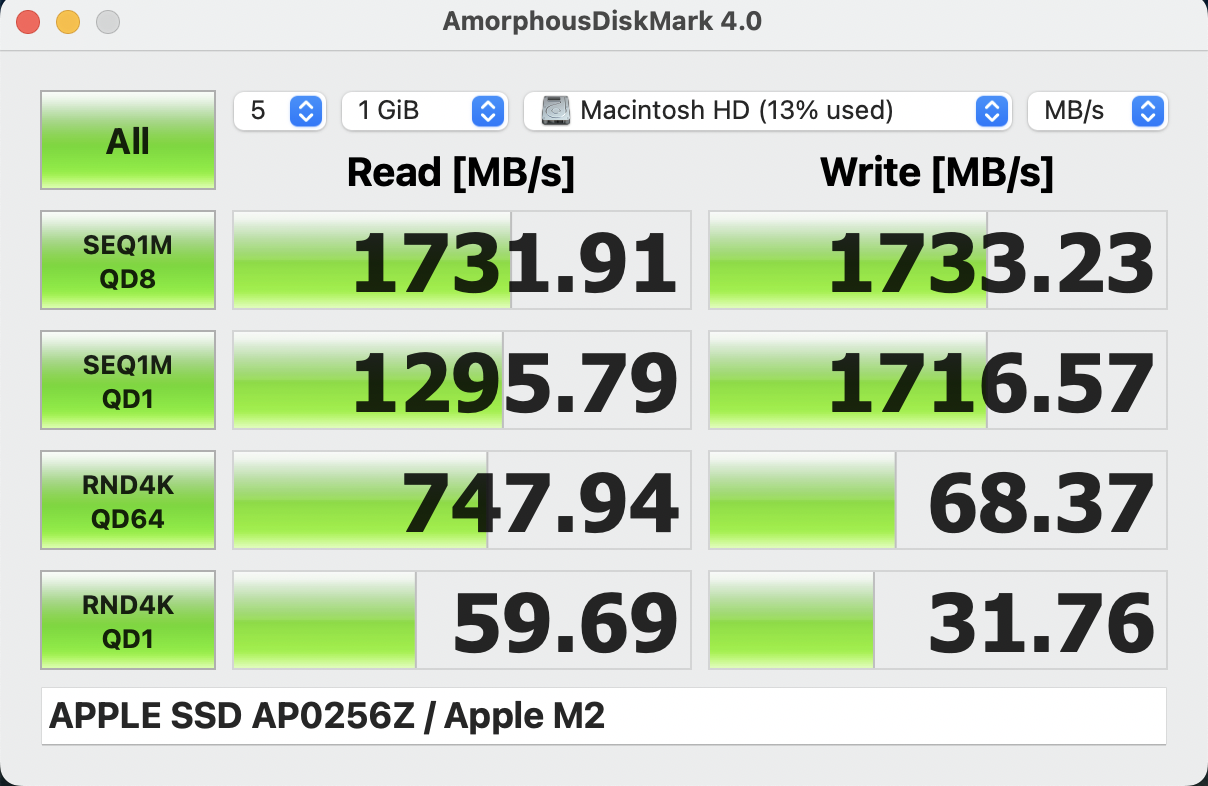
Both base models the MacBook Pro 13 M2 and the MacBook Air M2 are shipped with a 256 GB SSD with just one NAND chip, so the transfer rates are much lower compared to the models with 512 GB SSDs (two NAND chips) or even the base model of the old MacBook Air M1. However, we do not know whether Apple switched the Air M1 to the slower drives as well.
The transfer rates are basically still fine for your daily stuff and you will probably not even notice any limitations, but the M2 chip with shared memory puts data on the SSD (swap memory) when the memory is full, which will then result in lower performance. During our review, we only really noticed it during the Adobe Premiere Pro PugetBench test, where the video export took much longer compared to the MacBook Air M2 with the 1 TB SSD. It really depends on how you are planning to use the Air M2. If you run multiple apps or numerous browser tabs at the same time (especially with third-party browsers like Chrome), there will most likely be noticeable performance drops. You should also use native apps if possible, since emulated apps via Rosetta 2 will also require more memory. If you want a device for the next couple of years, we would definitely recommend the upgrade to 512 GB, which costs $200.
GPU Performance
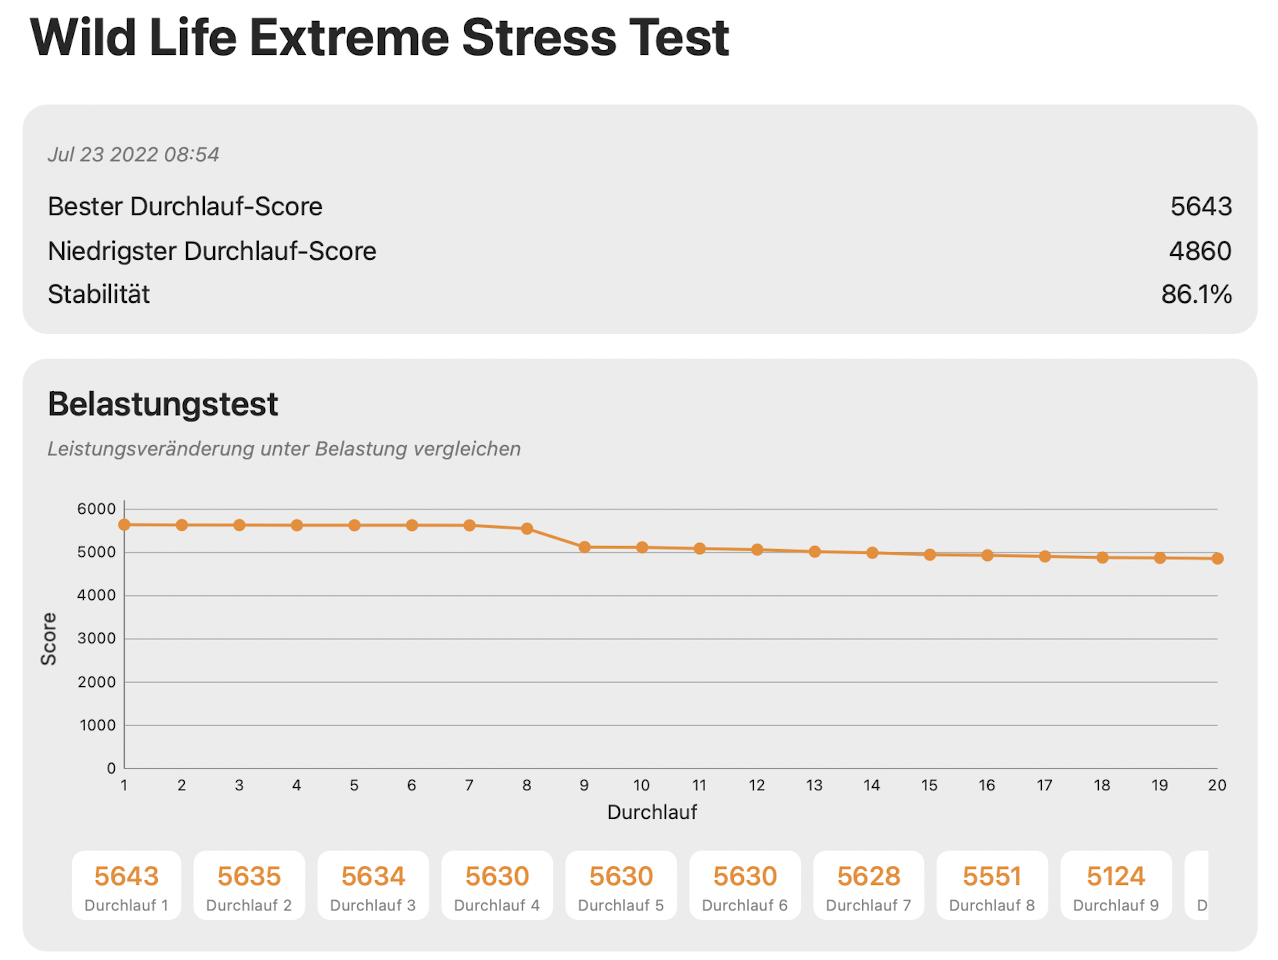
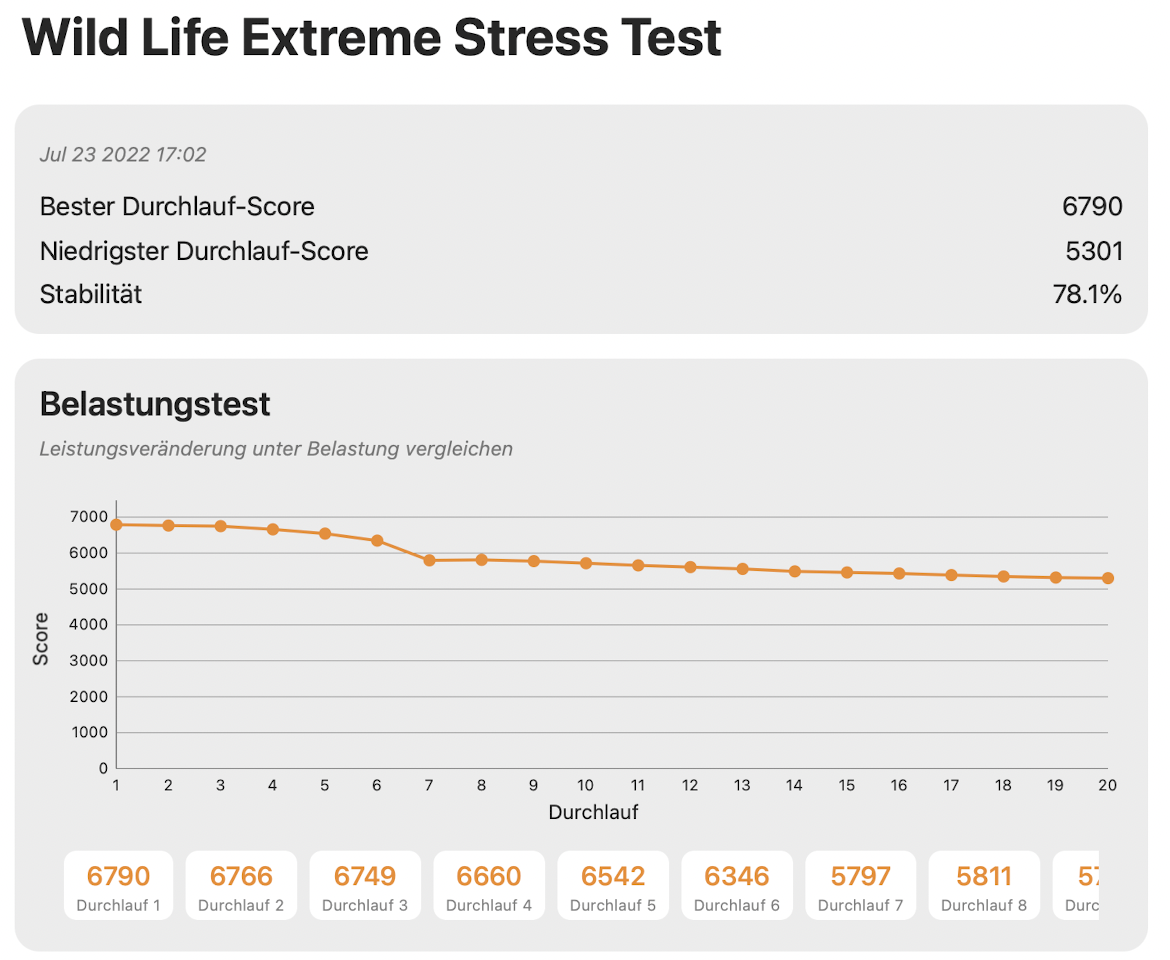
Our base model of the MacBook Air M2 is equipped with the slower 8-core GPU with a maximum core clock of 1398 MHz. The maximum power consumption in our tests was ~10W and therefore comparable to the old 8-core M1 GPU. Apple still managed to improve the GPU performance and we see an advantage of ~15 % over the 8-core M1 GPU and ~25 % over the base 7-core M1 GPU in synthetic benchmarks. The 10-core M2 GPU on the other hand is about 20 % faster, while the 14-core M1 Pro GPU is significantly more powerful.
So what does that all mean for you standard daily apps? The 8-core M2 GPU is more than capable enough for all your daily stuff and the upgrade to 10 GPU cores is not really necessary. Except for the number of GPU cores, there is no difference anyway, and the supposedly faster GPU does not even have a huge advantage under sustained workloads, where both models lose performance. The faster 10-core GPU even loses more performance faster (22 %), while the base model “only” loses 14 %. The advantage of the 10-core GPU comes down to just 9 % after our 20-minute stress test, so we do not recommend the GPU upgrade.
The graphics performance is not reduced on battery power. Please see our tech section for more GPU benchmarks.
Gaming Performance
It is not easy to evaluate the gaming performance of MacBooks. There are some native games (like World of Warcraft), but even then it is a problem to record the fps numbers reliably. There are also emulated titles like Shadow of the Tomb Raider or Borderlands 3, and you can even use software like CrossOver to play Windows titles like The Witcher 3, but there can always be issues like graphic problems. The best way to play on you Mac is Apple’s Arcade collection or a streaming service.
| Total War: Three Kingdoms | |
| 1920x1080 High (incl textures) | |
| Apple MacBook Pro 13 2022 M2 | |
| Apple MacBook Air Late 2020 (M1, 8 Core GPU, 8 GB RAM) | |
| Apple MacBook Pro 13 Late 2020 M1 Entry (8 / 256 GB) | |
| Apple MacBook Air M2 Entry | |
| Average Apple M2 8-Core GPU (n=1) | |
| Apple MacBook Air 2020 M1 Entry | |
| 1920x1080 Ultra (incl textures) | |
| Apple MacBook Pro 13 2022 M2 | |
| Apple MacBook Air M2 Entry | |
| Average Apple M2 8-Core GPU (n=1) | |
| low | med. | high | ultra | |
|---|---|---|---|---|
| Shadow of the Tomb Raider (2018) | 62 | 28 | 24 | 20 |
| Total War: Three Kingdoms (2019) | 77 | 39 | 18 | 14 |
| Borderlands 3 (2019) | 43 | 29.7 | 16.6 | 13.4 |
Emissions - Silent Operation
System Noise
The new MacBook Air M2 once again uses a passive cooling solution, so there is no annoying fan noise. We did not notice any electronic sounds during our review period, either.
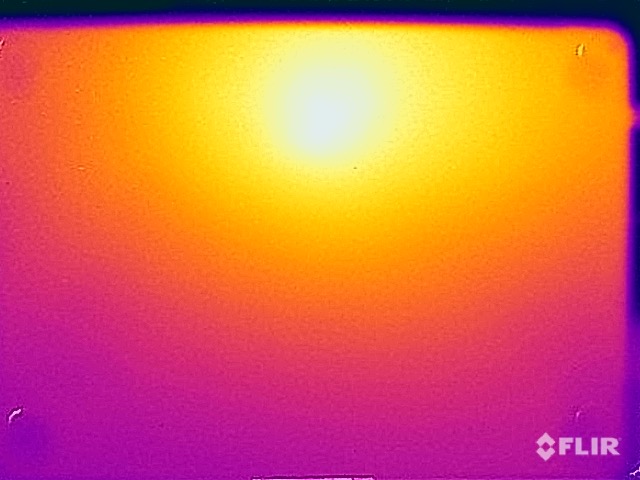
Temperature
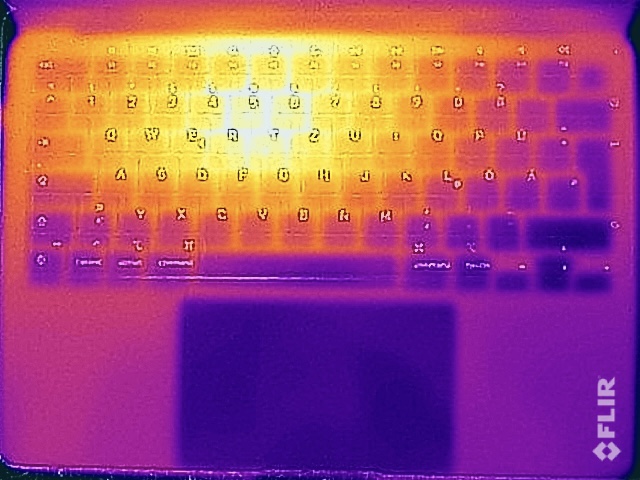
Apple manages the surface temperatures very well, despite the passive cooling unit. You can usually only notice lukewarm surfaces during everyday tasks, and even the maximum temperature under load did not exceed 45 °C, which is comparable to the old model. The chip itself, however, gets quite toasty at 108 °C in multi-core load scenarios.
(±) The maximum temperature on the upper side is 44.5 °C / 112 F, compared to the average of 35.9 °C / 97 F, ranging from 21.4 to 59 °C for the class Subnotebook.
(±) The bottom heats up to a maximum of 44.4 °C / 112 F, compared to the average of 39.2 °C / 103 F
(+) In idle usage, the average temperature for the upper side is 23.6 °C / 74 F, compared to the device average of 30.8 °C / 87 F.
(-) Playing The Witcher 3, the average temperature for the upper side is 38.1 °C / 101 F, compared to the device average of 30.8 °C / 87 F.
(+) The palmrests and touchpad are reaching skin temperature as a maximum (35.1 °C / 95.2 F) and are therefore not hot.
(-) The average temperature of the palmrest area of similar devices was 28.2 °C / 82.8 F (-6.9 °C / -12.4 F).
| Apple MacBook Air M2 Entry Apple M2, Apple M2 8-Core GPU | Apple MacBook Air 2020 M1 Entry Apple M1, Apple M1 7-Core GPU | Apple MacBook Pro 13 2022 M2 Apple M2, Apple M2 10-Core GPU | Dell XPS 13 Plus 9320 4K Intel Core i7-1260P, Intel Iris Xe Graphics G7 96EUs | Asus Zenbook S 13 OLED AMD Ryzen 7 6800U, AMD Radeon 680M | Huawei MateBook 13s i5 11300H Intel Core i5-11300H, Intel Iris Xe Graphics G7 80EUs | Lenovo ThinkBook 13s G3 20YA0005GE AMD Ryzen 7 5800U, AMD Radeon RX Vega 8 (Ryzen 4000/5000) | |
|---|---|---|---|---|---|---|---|
| Heat | -6% | -3% | -11% | -16% | -4% | 5% | |
| Maximum Upper Side * (°C) | 44.5 | 44 1% | 45.1 -1% | 41.1 8% | 47.9 -8% | 42.8 4% | 36.5 18% |
| Maximum Bottom * (°C) | 44.4 | 44 1% | 43 3% | 48.8 -10% | 56.1 -26% | 46.9 -6% | 39.6 11% |
| Idle Upper Side * (°C) | 23.9 | 27 -13% | 25.2 -5% | 28 -17% | 26.8 -12% | 25.2 -5% | 24.5 -3% |
| Idle Bottom * (°C) | 23.6 | 27 -14% | 25.4 -8% | 29.3 -24% | 27.3 -16% | 26 -10% | 25 -6% |
* ... smaller is better
Stress test
The analysis of the CPU & GPU data clearly shows that the chip continuously reduces the performance and eventually levels of at 9.5W after around 9 minutes, which is actually comparable to the MacBook Air M1, which is also clearly shown by the following diagram. The performance is reduced immediately after the stress test and the chip has to cool down before it can deliver peak performance again.

Speakers
Apple equips the MacBook Air M2 with a new speaker system that consists of four modules, which are located in the hinge area between the base unit and the display. The sound is directed towards the screen, where it is reflected towards the user. The new system performs very well in our measurement, but not better than the old MacBook Air M1. The maximum volume is a bit higher and mid are a bit more precise, but the bass is lower. Subjectively, we cannot hear a big difference between the two, either, but the performance is still very good nonetheless, especially for a compact system. The speakers of the MacBook Pro 14 on the other hand are even better.
Apple MacBook Air M2 Entry audio analysis
(+) | speakers can play relatively loud (82.7 dB)
Bass 100 - 315 Hz
(±) | reduced bass - on average 12.2% lower than median
(±) | linearity of bass is average (12.6% delta to prev. frequency)
Mids 400 - 2000 Hz
(+) | balanced mids - only 1.1% away from median
(+) | mids are linear (3.1% delta to prev. frequency)
Highs 2 - 16 kHz
(+) | balanced highs - only 2.4% away from median
(+) | highs are linear (1.9% delta to prev. frequency)
Overall 100 - 16.000 Hz
(+) | overall sound is linear (9.5% difference to median)
Compared to same class
» 5% of all tested devices in this class were better, 2% similar, 93% worse
» The best had a delta of 5%, average was 18%, worst was 53%
Compared to all devices tested
» 4% of all tested devices were better, 1% similar, 95% worse
» The best had a delta of 4%, average was 24%, worst was 134%
Apple MacBook Air 2020 M1 Entry audio analysis
(±) | speaker loudness is average but good (79.6 dB)
Bass 100 - 315 Hz
(±) | reduced bass - on average 7.1% lower than median
(±) | linearity of bass is average (9.5% delta to prev. frequency)
Mids 400 - 2000 Hz
(+) | balanced mids - only 2.2% away from median
(+) | mids are linear (5.3% delta to prev. frequency)
Highs 2 - 16 kHz
(+) | balanced highs - only 2.3% away from median
(+) | highs are linear (4% delta to prev. frequency)
Overall 100 - 16.000 Hz
(+) | overall sound is linear (8.7% difference to median)
Compared to same class
» 3% of all tested devices in this class were better, 1% similar, 96% worse
» The best had a delta of 5%, average was 18%, worst was 53%
Compared to all devices tested
» 3% of all tested devices were better, 1% similar, 97% worse
» The best had a delta of 4%, average was 24%, worst was 134%
Apple MacBook Pro 14 2021 M1 Pro Entry audio analysis
(+) | speakers can play relatively loud (84.9 dB)
Bass 100 - 315 Hz
(+) | good bass - only 4.3% away from median
(+) | bass is linear (5.9% delta to prev. frequency)
Mids 400 - 2000 Hz
(+) | balanced mids - only 1.1% away from median
(+) | mids are linear (1.9% delta to prev. frequency)
Highs 2 - 16 kHz
(+) | balanced highs - only 2.9% away from median
(+) | highs are linear (3% delta to prev. frequency)
Overall 100 - 16.000 Hz
(+) | overall sound is linear (5.6% difference to median)
Compared to same class
» 2% of all tested devices in this class were better, 1% similar, 97% worse
» The best had a delta of 5%, average was 17%, worst was 45%
Compared to all devices tested
» 0% of all tested devices were better, 0% similar, 100% worse
» The best had a delta of 4%, average was 24%, worst was 134%
Energy Management - MacBook Air with long stamina
Power Consumption
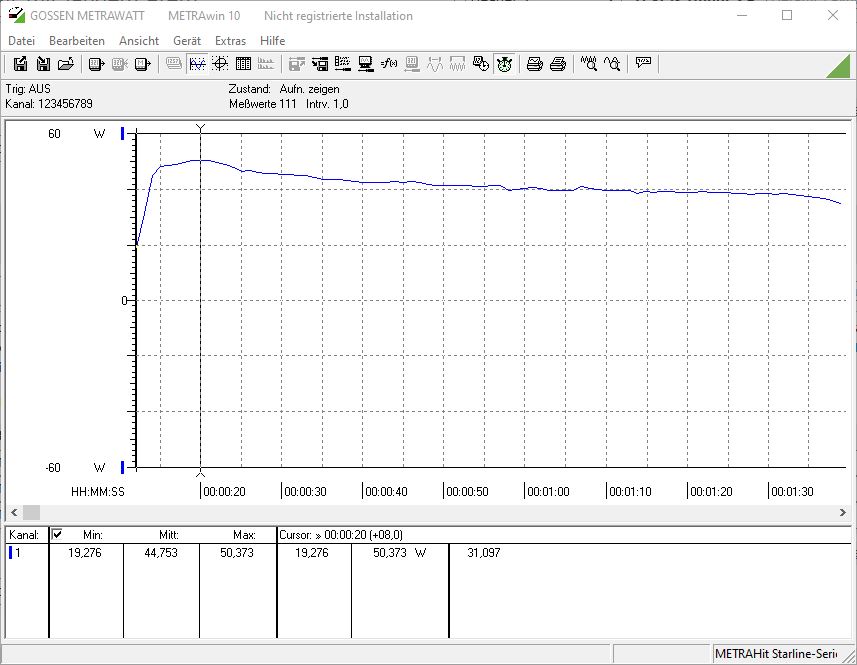
Our idle measurements are obviously affected by the higher maximum brightness of the new display, so the results are not really comparable with the predecessor. The M2 requires more power under load, but the 30W power adapter is the limiting factor and it is only sufficient when the TDP drops to around 19 Watts. The 35W PSU is not sufficient, either, and we actually managed to record a maximum power consumption of 50.4W with a 100W USB-C power adapter.
The MacBook Air M2 supports quick-charging when the PSU delivers at least 67W. We tested it with a 100W unit (corresponds with the maximum charging rate) and the charging time is significantly reduced to less than 1.5 hours. It takes almost 2.5 hours before the battery is fully charged with the default 30W adapter, and little more than two hours with then optional 35W PSU.
| 30 % | 50 % | 80 % | 90 % | 100 % | |
|---|---|---|---|---|---|
| 30-Watt PSU | 41 minutes | 69 minutes | 111 minutes | 126 minutes | 147 minutes |
| 35-Watt PSU | 34 minutes | 57 minutes | 92 minutes | 108 minutes | 122 minutes |
| 100-Watt PSU | 17 minutes | 28 minutes | 51 minutes | 66 minutes | 85 minutes |
| Off / Standby | |
| Idle | |
| Load |
|
Key:
min: | |
| Apple MacBook Air M2 Entry M2, M2 8-Core GPU, Apple SSD AP0256Z, IPS, 2560x1664, 13.6" | Apple MacBook Air 2020 M1 Entry M1, M1 7-Core GPU, Apple SSD AP0256Q, IPS, 2560x1600, 13.3" | Apple MacBook Pro 13 2022 M2 M2, M2 10-Core GPU, Apple SSD AP1024Z, IPS, 2560x1600, 13.3" | Dell XPS 13 Plus 9320 4K i7-1260P, Iris Xe G7 96EUs, Samsung PM9A1 MZVL21T0HCLR, IPS, 3840x2400, 13.4" | Asus Zenbook S 13 OLED R7 6800U, Radeon 680M, Samsung PM9A1 MZVL21T0HCLR, OLED, 2880x1800, 13.3" | Huawei MateBook 13s i5 11300H i5-11300H, Iris Xe G7 80EUs, Phison Electronics PS5012, LTPS, 2520x1680, 13.4" | Lenovo ThinkBook 13s G3 20YA0005GE R7 5800U, Vega 8, WDC PC SN530 SDBPNPZ-512G, IPS, 1920x1200, 13.3" | Average Apple M2 8-Core GPU | Average of class Subnotebook | |
|---|---|---|---|---|---|---|---|---|---|
| Power Consumption | 13% | -12% | -102% | -56% | -54% | -57% | 0% | -43% | |
| Idle Minimum * (Watt) | 1.87 | 1.9 -2% | 1.77 5% | 7 -274% | 4.8 -157% | 4.2 -125% | 5 -167% | 1.87 ? -0% | 3.79 ? -103% |
| Idle Average * (Watt) | 9.2 | 6.4 30% | 6.7 27% | 11 -20% | 8.7 5% | 8.1 12% | 8.2 11% | 9.2 ? -0% | 6.57 ? 29% |
| Idle Maximum * (Watt) | 9.3 | 7 25% | 6.9 26% | 11.4 -23% | 10.1 -9% | 9 3% | 9 3% | 9.3 ? -0% | 7.94 ? 15% |
| Load Average * (Watt) | 28.5 | 25 12% | 30.9 -8% | 59.7 -109% | 45.6 -60% | 41.7 -46% | 45 -58% | 28.5 ? -0% | 41.8 ? -47% |
| Witcher 3 ultra * (Watt) | 27.4 | 38.9 -42% | 49.4 -80% | 42.4 -55% | 40.1 -46% | 45.1 -65% | |||
| Load Maximum * (Watt) | 31 | 30.3 2% | 56 -81% | 63 -103% | 49.5 -60% | 68 -119% | 51.2 -65% | 31 ? -0% | 64.1 ? -107% |
* ... smaller is better
Power Consumption Witcher 3 / Stress test
Power Consumption external screen
Battery Runtime
Apple increased the battery capacity slightly from 49.9 Wh to 52.6 Wh, but the Wi-Fi runtime is still a bit shorter compared to the predecessor. The slightly larger panel will certainly play a role here as well. The Wi-Fi runtime at an adjusted luminance of 150 nits (-7 large steps and -2 small steps from the maximum brightness) is still very good at 15:10 hours, but the maximum brightness shortens that to just 06:35 hours. The situation is similar in the video test, where the runtime drops from 16:29 hours at 150 nits to just 06:56 hours on max. brightness.
The runtime under loads depends on the time the M2 can use high TDP values and how much you let it cool down between load periods. We simulated this scenario with the 10-minute test of Cinebench R23 Multi and waited one minute to let the chip cool down before we started the test again. The result was a runtime of around 2.5 hours.
| Apple MacBook Air M2 Entry M2, M2 8-Core GPU, 52.6 Wh | Apple MacBook Air 2020 M1 Entry M1, M1 7-Core GPU, 49.9 Wh | Apple MacBook Pro 13 2022 M2 M2, M2 10-Core GPU, 58.2 Wh | Dell XPS 13 Plus 9320 4K i7-1260P, Iris Xe G7 96EUs, 55 Wh | Asus Zenbook S 13 OLED R7 6800U, Radeon 680M, 67 Wh | Huawei MateBook 13s i5 11300H i5-11300H, Iris Xe G7 80EUs, 60 Wh | Lenovo ThinkBook 13s G3 20YA0005GE R7 5800U, Vega 8, 56 Wh | Average of class Subnotebook | |
|---|---|---|---|---|---|---|---|---|
| Battery runtime | 5% | 21% | -45% | -16% | -35% | -28% | -11% | |
| H.264 (h) | 16.5 | 19.2 16% | 11 -33% | 15.2 -8% | 11 -33% | 15.6 ? -5% | ||
| WiFi v1.3 (h) | 15.2 | 16 5% | 19.1 26% | 6.9 -55% | 9.2 -39% | 9.4 -38% | 11 -28% | 14 ? -8% |
| Load (h) | 2.4 | 1.3 -46% | 2.4 0% | 1.6 -33% | 1.946 ? -19% |
Pros
Cons
Verdict - The base price of the MacBook Air M2 is too high
The new MacBook Air M2 is undoubtedly once again a very good mobile companion, but we are still a little bit disappointed on a very high level, which is definitely connected with the increased price point. The new chassis is extremely slim and the front edge is no problem during typing, but the bezels are pretty wide for a modern device and in addition with the vertical space required for the notch, the new Air has larger footprint than some Windows rivals. The new colors look good, but the Midnight version (dark blue) is almost impossible to keep clean, so we would not recommend it.
Other new features include the return of the MagSafe connector, the 1080p webcam and the display. It now covers the wider P3 gamut similar to the MacBook Pro models, but we cannot imagine many customers of the Air will care about that. The increased brightness on the other hand is definitely an advantage, especially if you often use the Air on the road, but it also affects the battery runtime. The notch does not look particularly good, but there are no practical limitations and the you actually get more screen estate compared to the old MacBook Air M1 since the notch and the surrounding display area is sitting on top of the regular 16:10 screen.
Apple faces the same problems as other manufacturers and the additional performance of the new M2 comes at the cost of much higher consumption figures, which is why the new M2 is not as efficient as the old M1 SoC. It also has the same limitations like Wi-Fi 6 at 80 MHz, Bluetooth 5.0, or the support for just one external display.
The new M2 chip shows that the basic potential of the M1 or M2, respectively, is exhausted, because Apple follows Intel’s example and just increases the frequency of the cores, which requires more energy. The efficiency of the new M2 is therefore noticeably worse compared to the M1. The passive cooling solution performs well and the peak performance can be maintained for longer, which is perfectly fine for everyday situations, but the M2 is actually not that much faster than the M1 under sustained workloads. The situation is similar for the GPU of the M2, even though it looks like there have been additional improvements. However, the GPU performance is not stable, either, and the optional 10-core GPU just does not make such sense since the performance advantage drops to less than 10 % compared to the base model under sustained workloads like gaming.
The new MacBook Air M2 is once again a very good laptops, despite the issues. However, considering the increased price of $1199, the base model is just too expensive and Apple should have shipped it with a 512 GB SSD by default. If you only need 8 GB RAM and 256 GB storage, we recommend you get the old MacBook Air M1, which is much more affordable, not really slower and it even lasts longer on battery.
The problem with the slower 256GB drive would have not been necessary, but to be honest, it will probably not bother most users. We also do not know if Apple also switched to the slower drives for the old MacBook Air M1 by now. The list of cons is pretty long and some of the are a bit annoying considering the price (even though insufficient PSUs are getting more popular for Windows laptops as well), but there is no denying that the overall package of the MacBook Air M2 with the fan-less design just works really well and the mentioned limitations will probably not be noticeable when you just use it for your daily apps. However, the price difference compared to the old MacBook Air M1 will certainly be an issue and we cannot imagine that Apple will sell the same number of units. Then there is the MacBook Pro 13 M2, which is actually $20 cheaper when you get the same specs (10-Core GPU/67W PSU). It is also a very good MacBook, but it only makes sense if you need the full performance of the M2 in a 13-inch form factor (and the much more powerful MBP 14 is too bulky) or if you just want to avoid a display notch.
Initially, we raised the question whether the price of the new MacBook Air M2 is justified. We think it is not, at least as long as you can still get the MacBook Air M1.
Price and Availability
You can order the new MacBook Air from the Apple store. Our review unit is sold for $1199, but it will take 3-4 weeks before shipping. We recommend you check your local stores for faster availability.
Apple MacBook Air M2 Entry
- 07/23/2022 v7 (old)
Andreas Osthoff
Price comparison
