Apple MacBook Air M2 review - The faster 10-core GPU isn't worth it

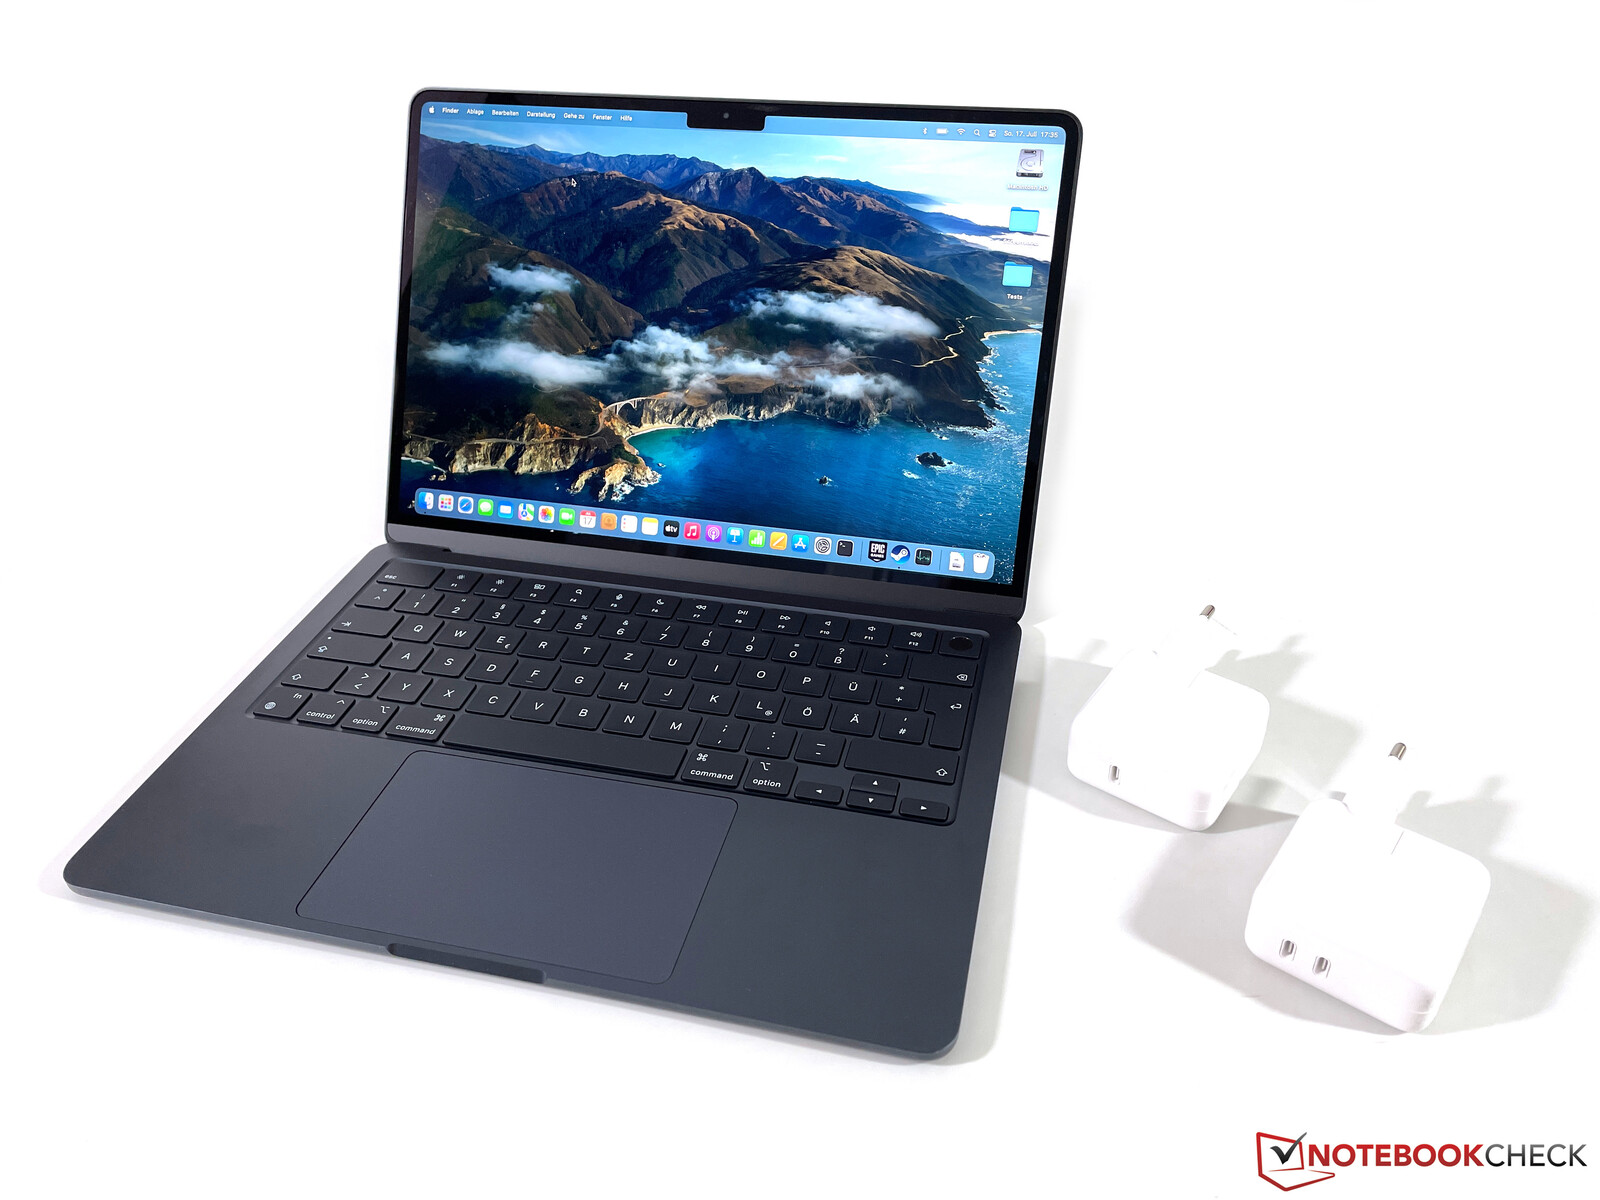
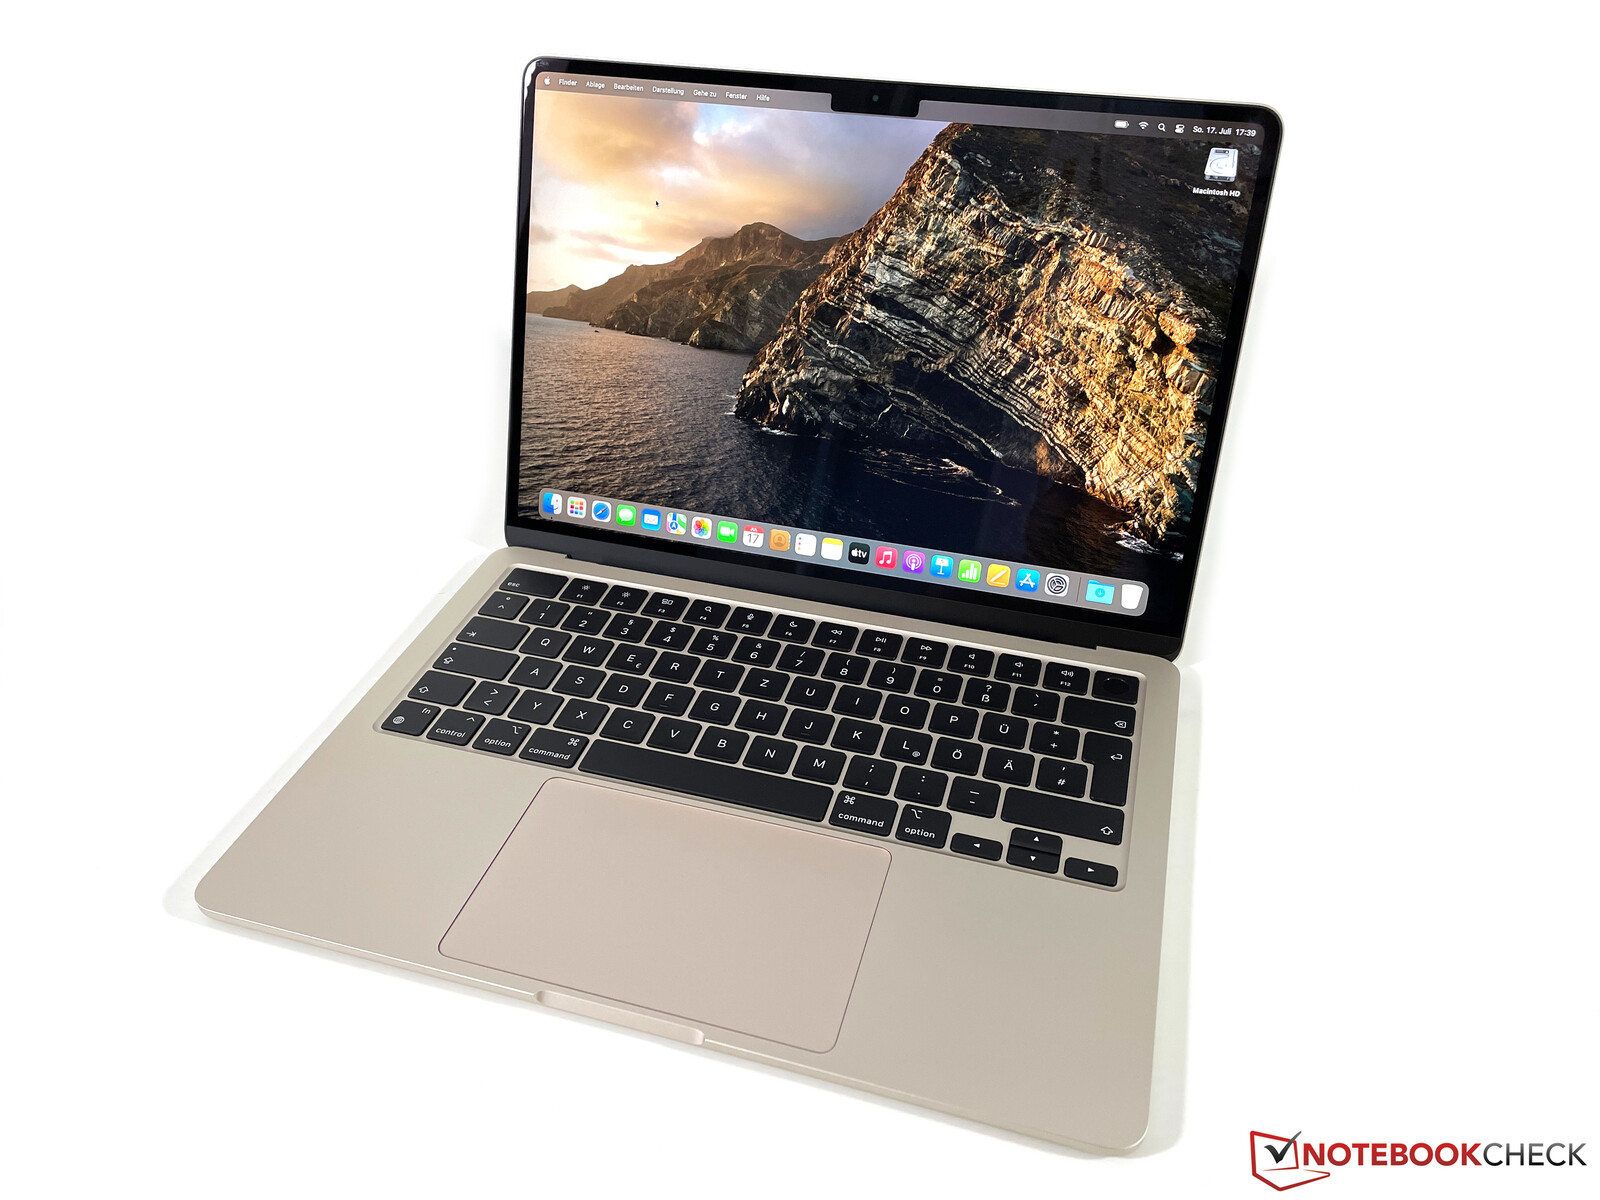
We were already able to extensively test the new MacBook Air M2, and now we have a model with the faster 10-core GPU and more storage in our test. This is the configuration in the Starlight color with the faster M2 chip, 16 GB of shared working memory, and a large, 1-TB SSD. In this review, we mainly want to concentrate on the differences to the basic model. For other segments such as the case, equipment, input devices, display, and speakers, we refer you to our review of the basic version, since there are no differences in those regards:
We already knew that the new MacBook Air M2 has become significantly more expensive. With a well-equipped model as we have here (MSRP 2,309 Euros, ~$2,380), you already get into the range of a MacBook Pro 14, which is clearly superior in many areas (performance, Mini-LED display, connections, speakers). The basic model of the MBP 14 with 16 GB of RAM and a 512 GB SSD is currently available on the market for around 1,950 to 2,000 Euros (~$2,010-$2,061), and the model with a 1-TB SSD is available for about 2,300 Euros (~$2,371), which is the same price as our test unit of the Air M2. Of course, the Air targets a different audience with the better mobility, but we also include the Pro in our comparison charts.
Possible Competitors in Comparison
Rating | Date | Model | Weight | Height | Size | Resolution | Price |
|---|---|---|---|---|---|---|---|
| 92 % v7 (old) | 08 / 2022 | Apple MacBook Air M2 10C GPU M2, M2 10-Core GPU | 1.2 kg | 11.3 mm | 13.60" | 2560x1664 | |
| 92.3 % v7 (old) | 07 / 2022 | Apple MacBook Air M2 Entry M2, M2 8-Core GPU | 1.2 kg | 11.3 mm | 13.60" | 2560x1664 | |
| 91.9 % v7 (old) | 06 / 2022 | Apple MacBook Pro 13 2022 M2 M2, M2 10-Core GPU | 1.4 kg | 15.6 mm | 13.30" | 2560x1600 | |
| 92.7 % v7 (old) | 11 / 2021 | Apple MacBook Pro 14 2021 M1 Pro Entry M1 Pro 8-Core, M1 Pro 14-Core GPU | 1.6 kg | 15.5 mm | 14.20" | 3024x1964 | |
| 90.1 % v7 (old) | 07 / 2022 | Asus Zenbook S 13 OLED R7 6800U, Radeon 680M | 1.1 kg | 14.9 mm | 13.30" | 2880x1800 | |
| 86.9 % v7 (old) | 07 / 2022 | Dell XPS 13 Plus 9320 4K i7-1260P, Iris Xe G7 96EUs | 1.2 kg | 15.3 mm | 13.40" | 3840x2400 |
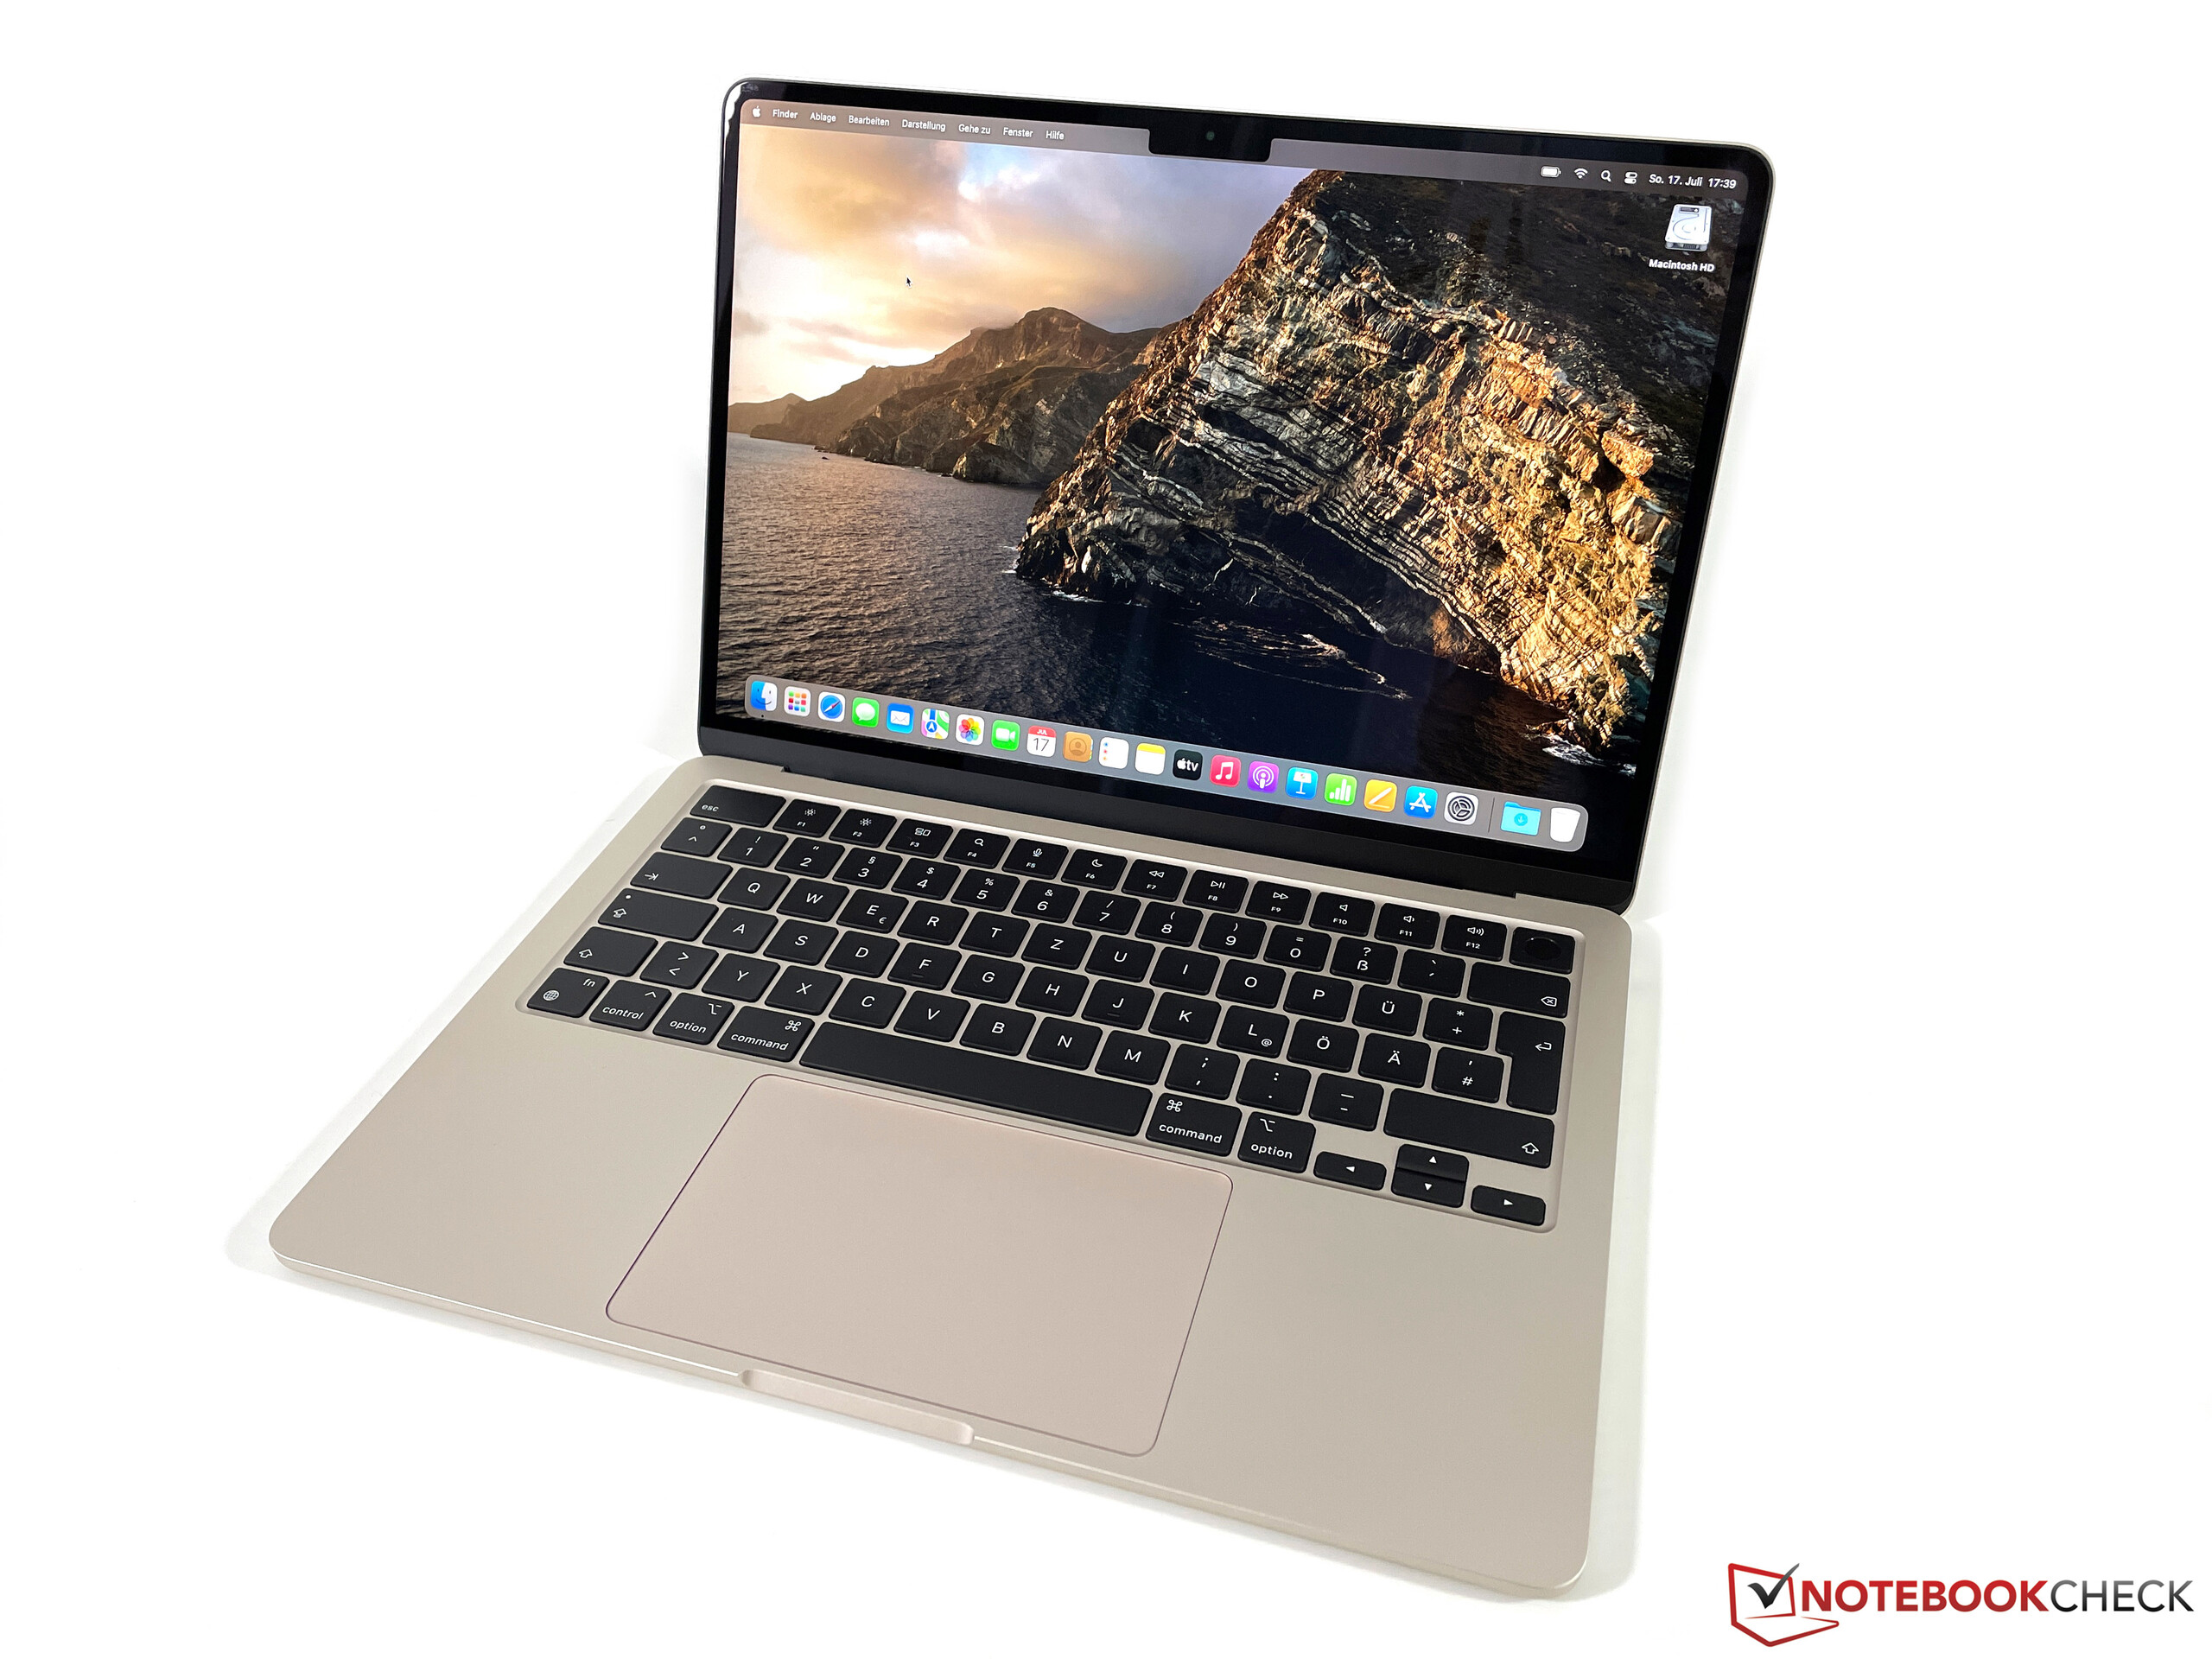
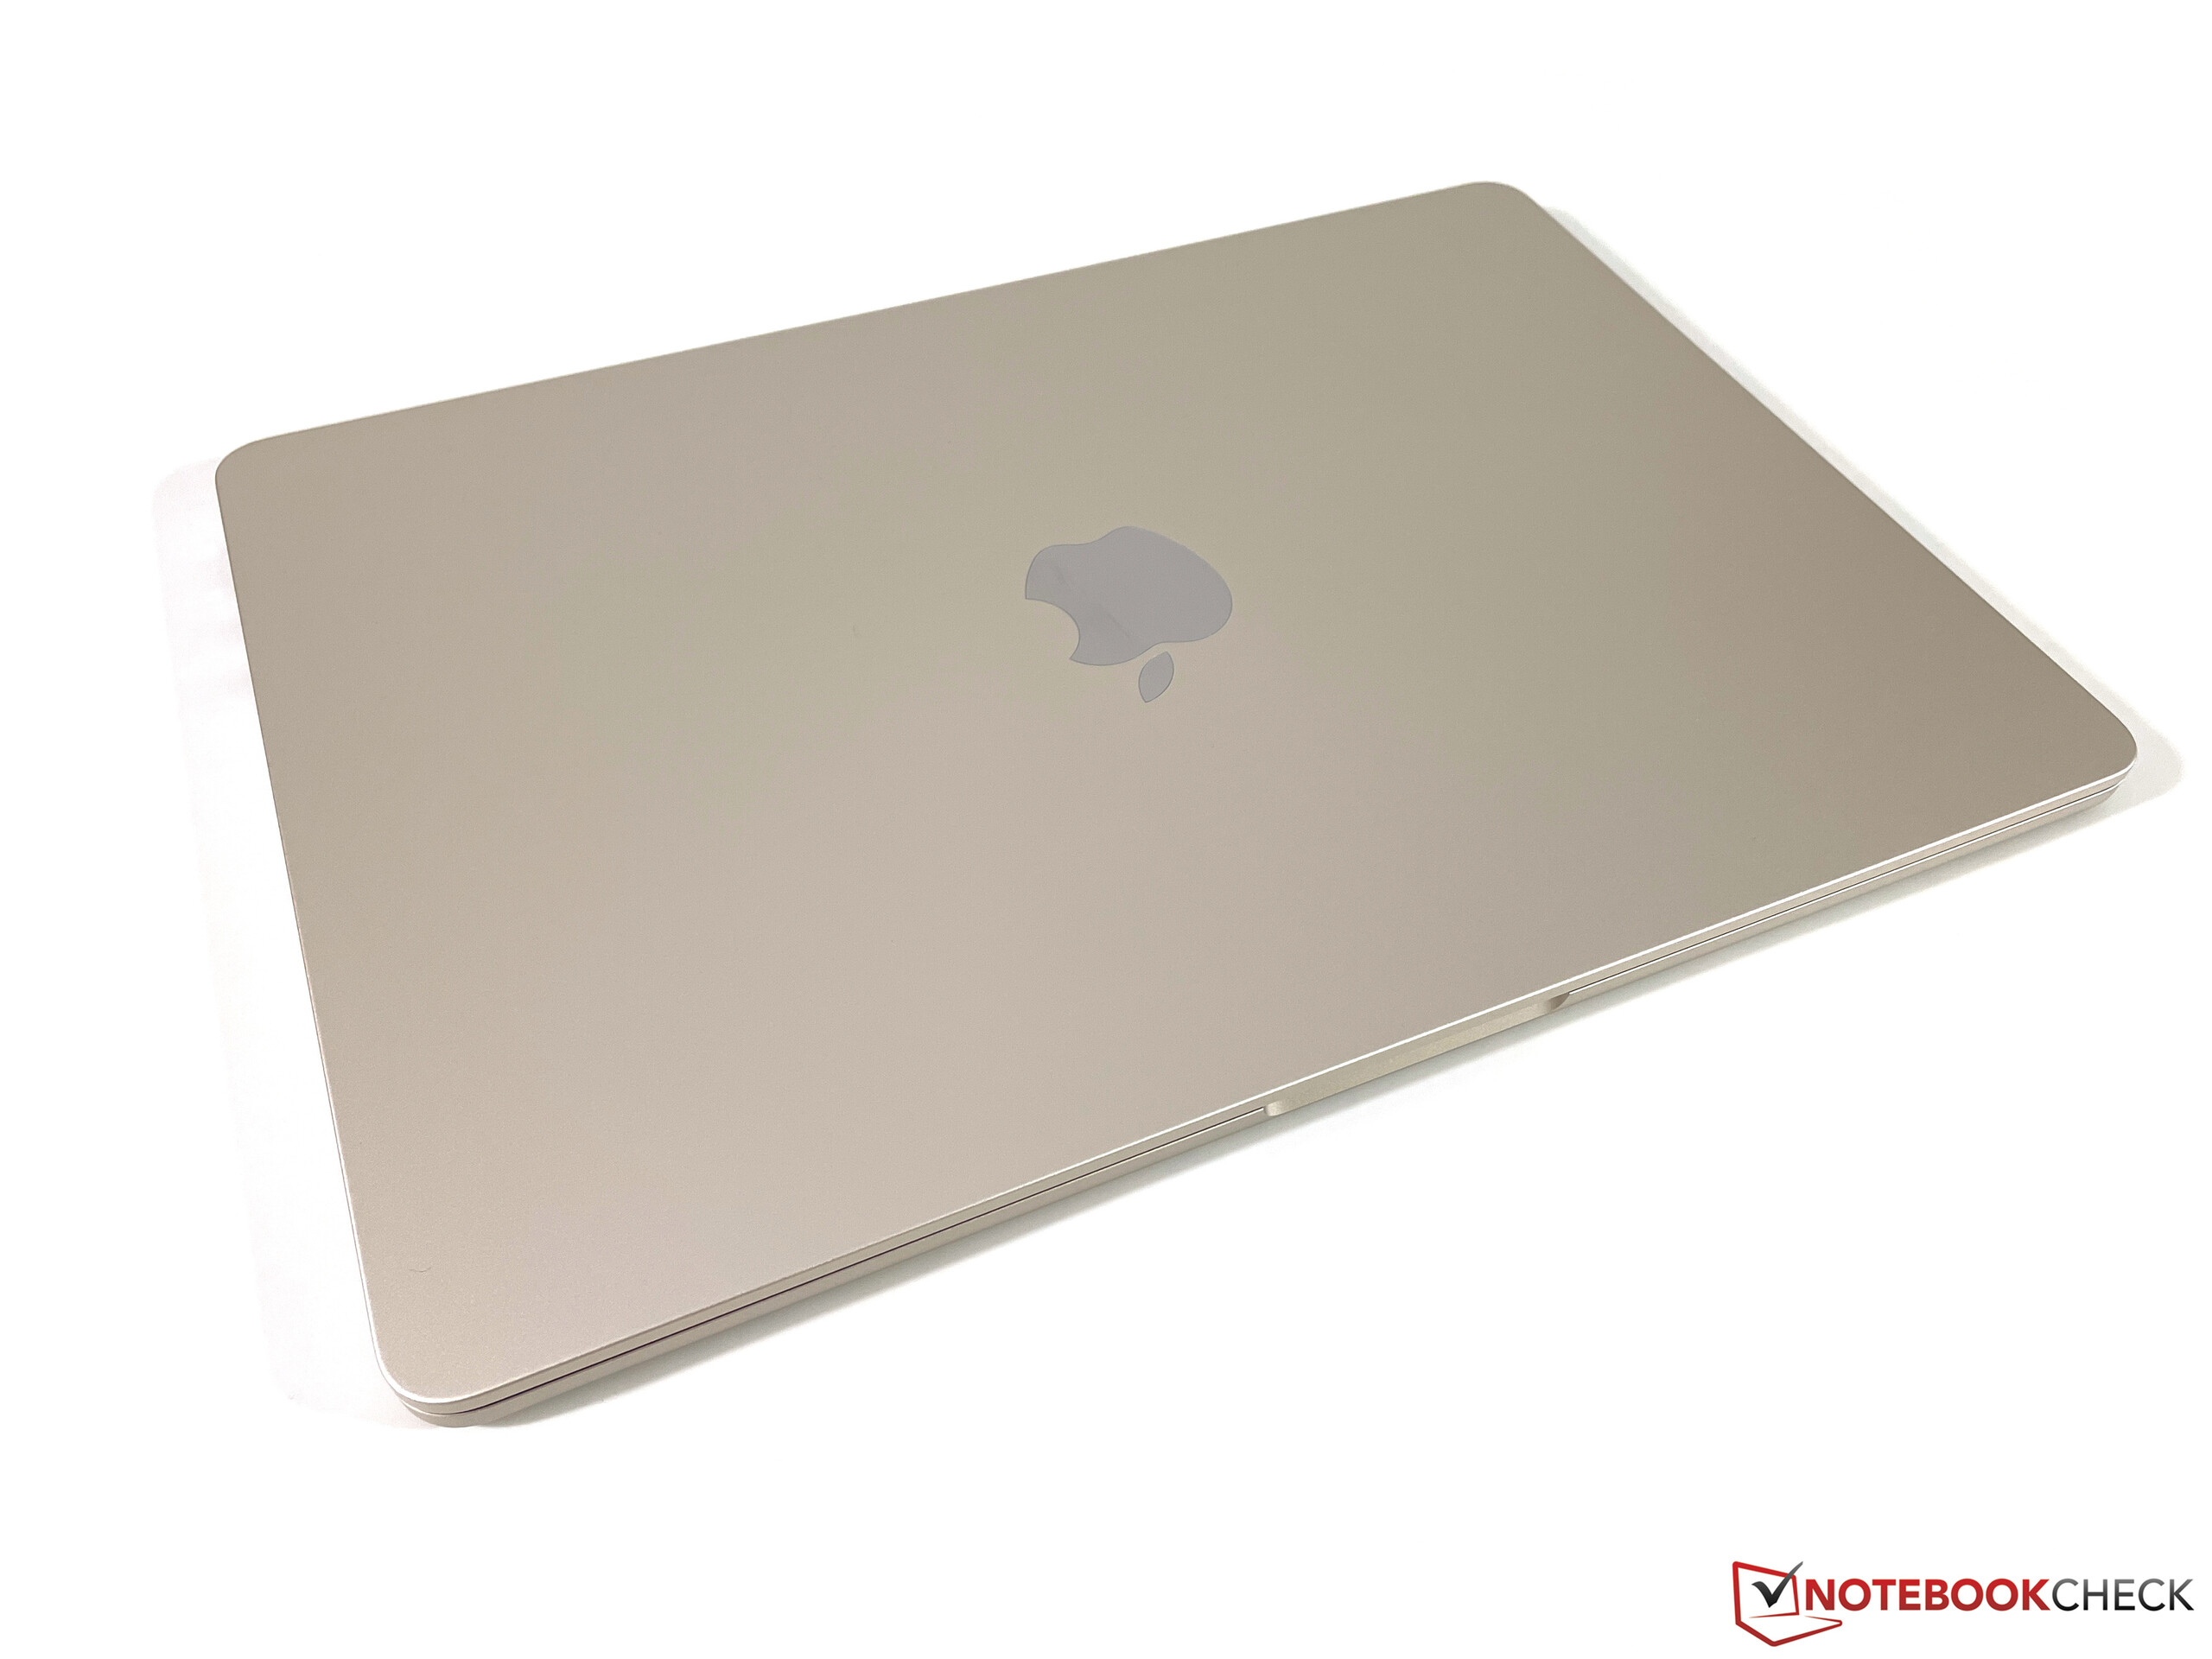
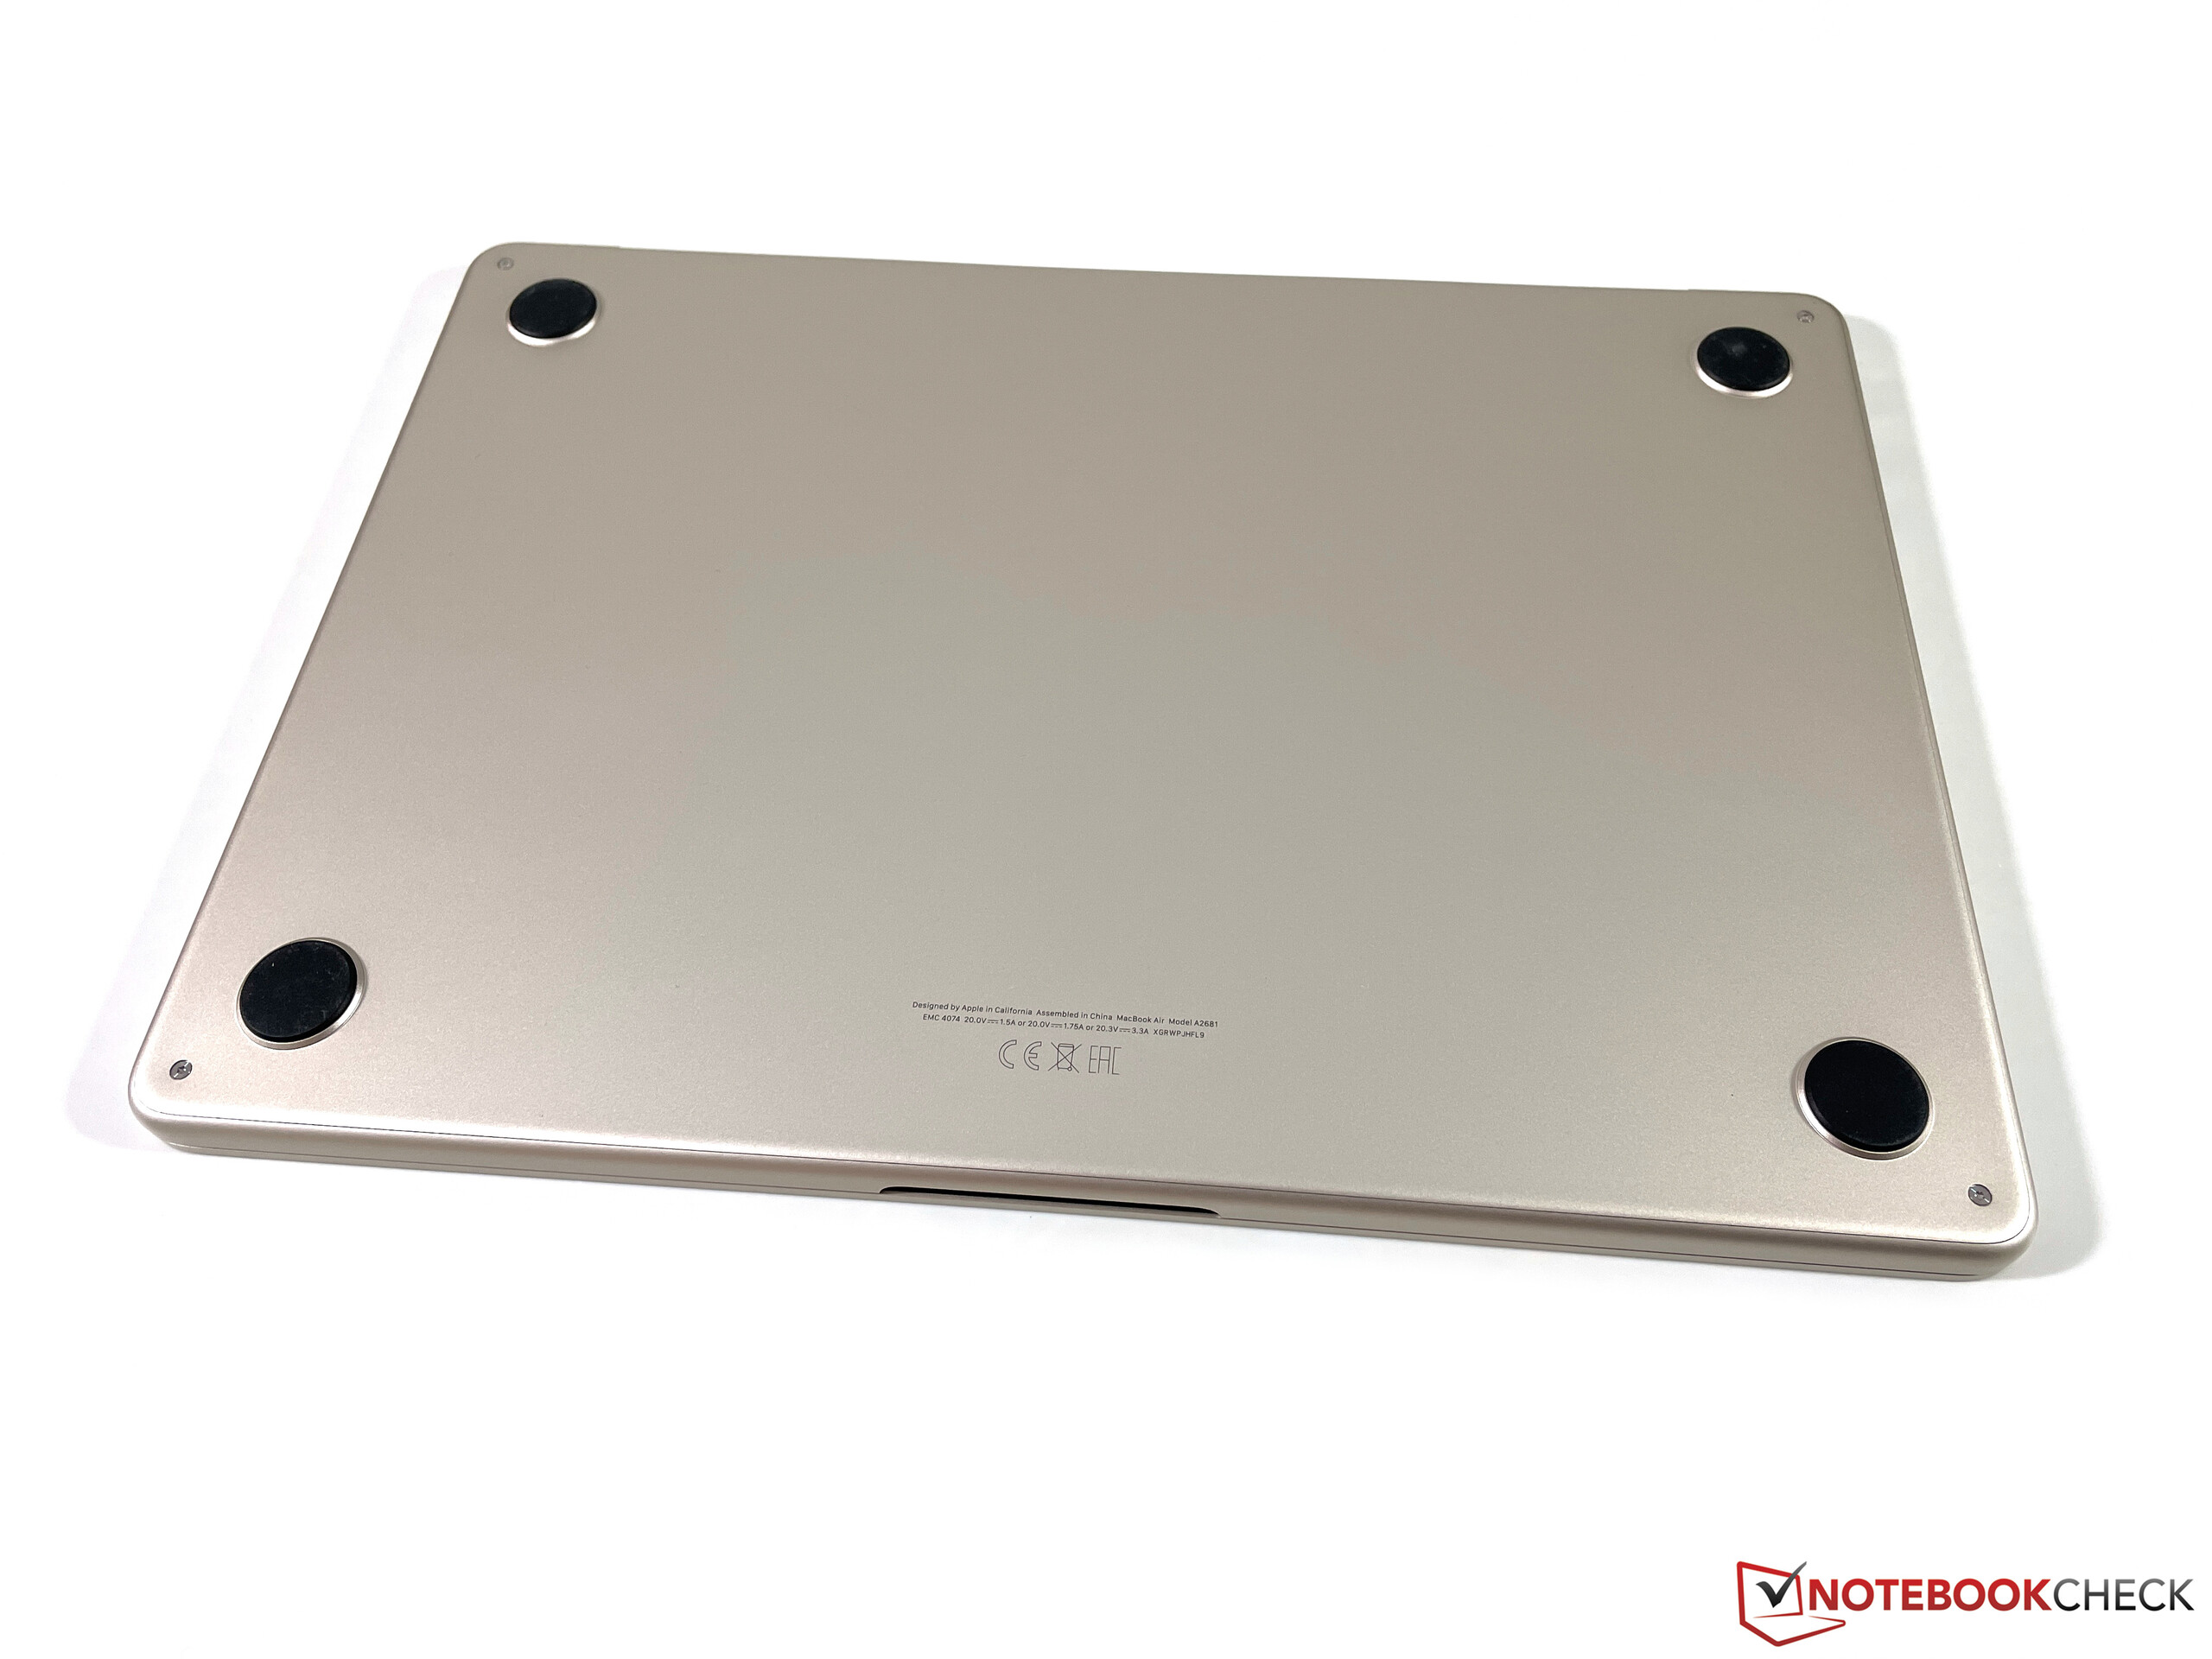
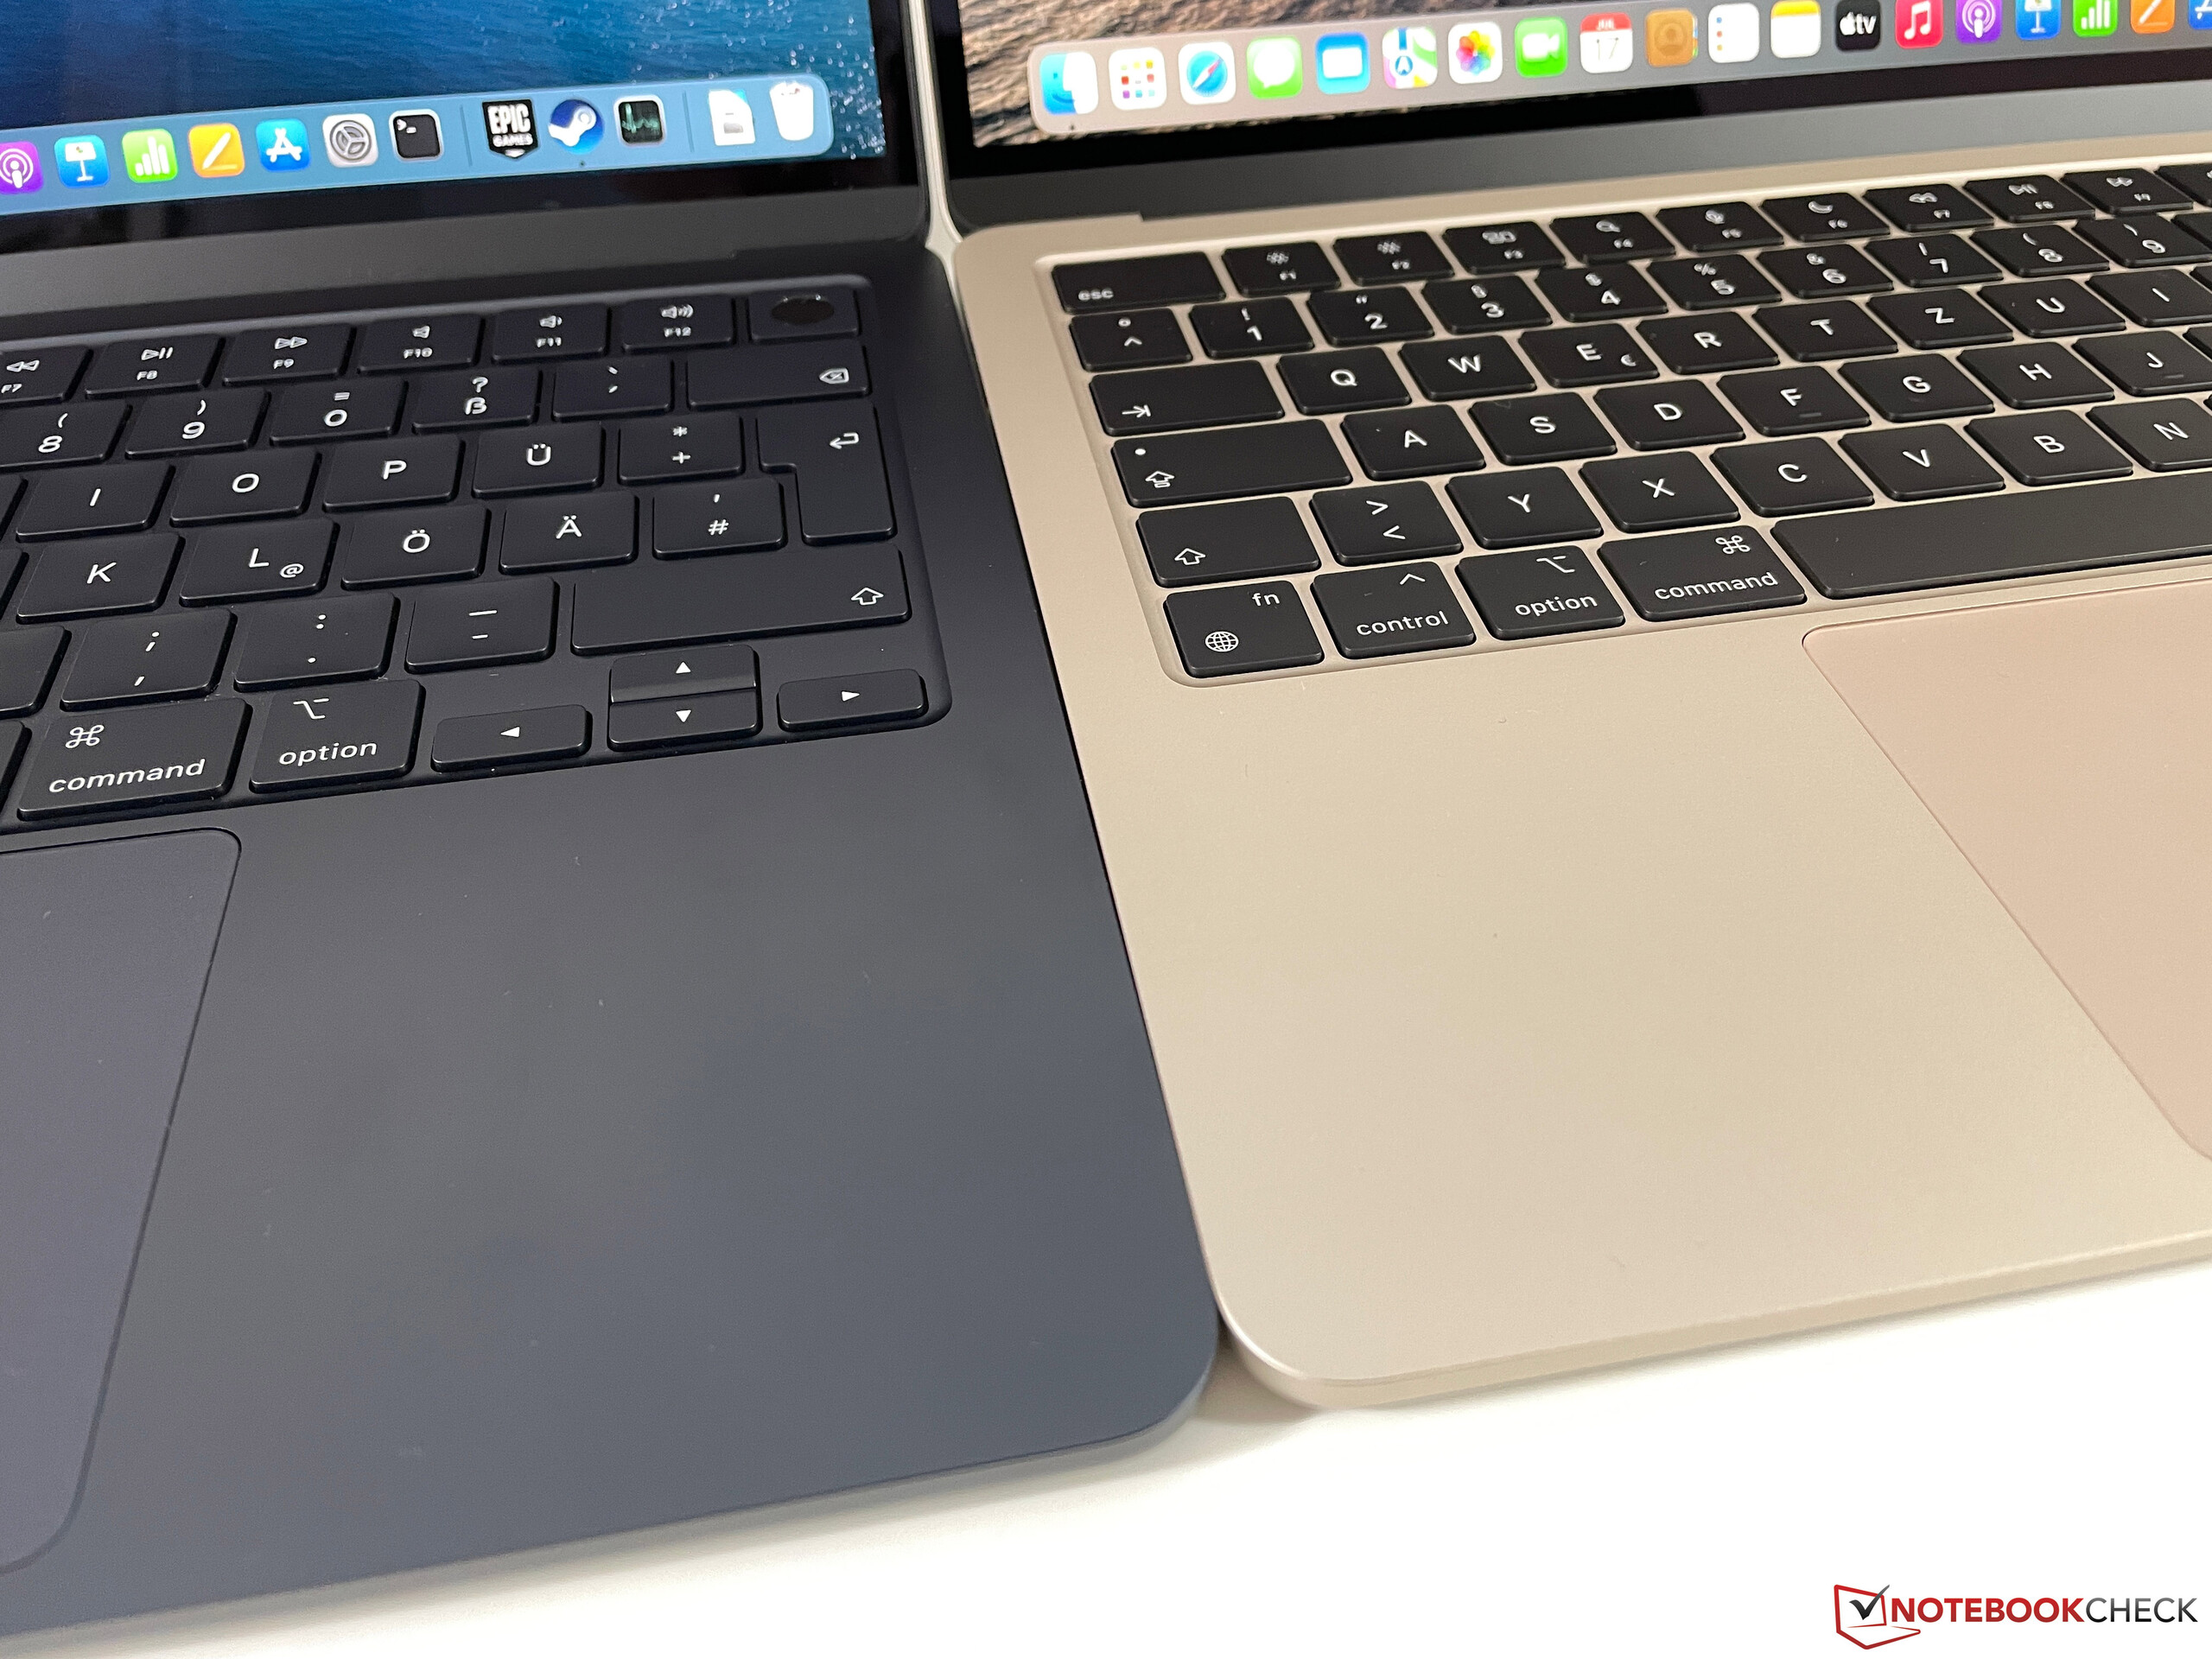
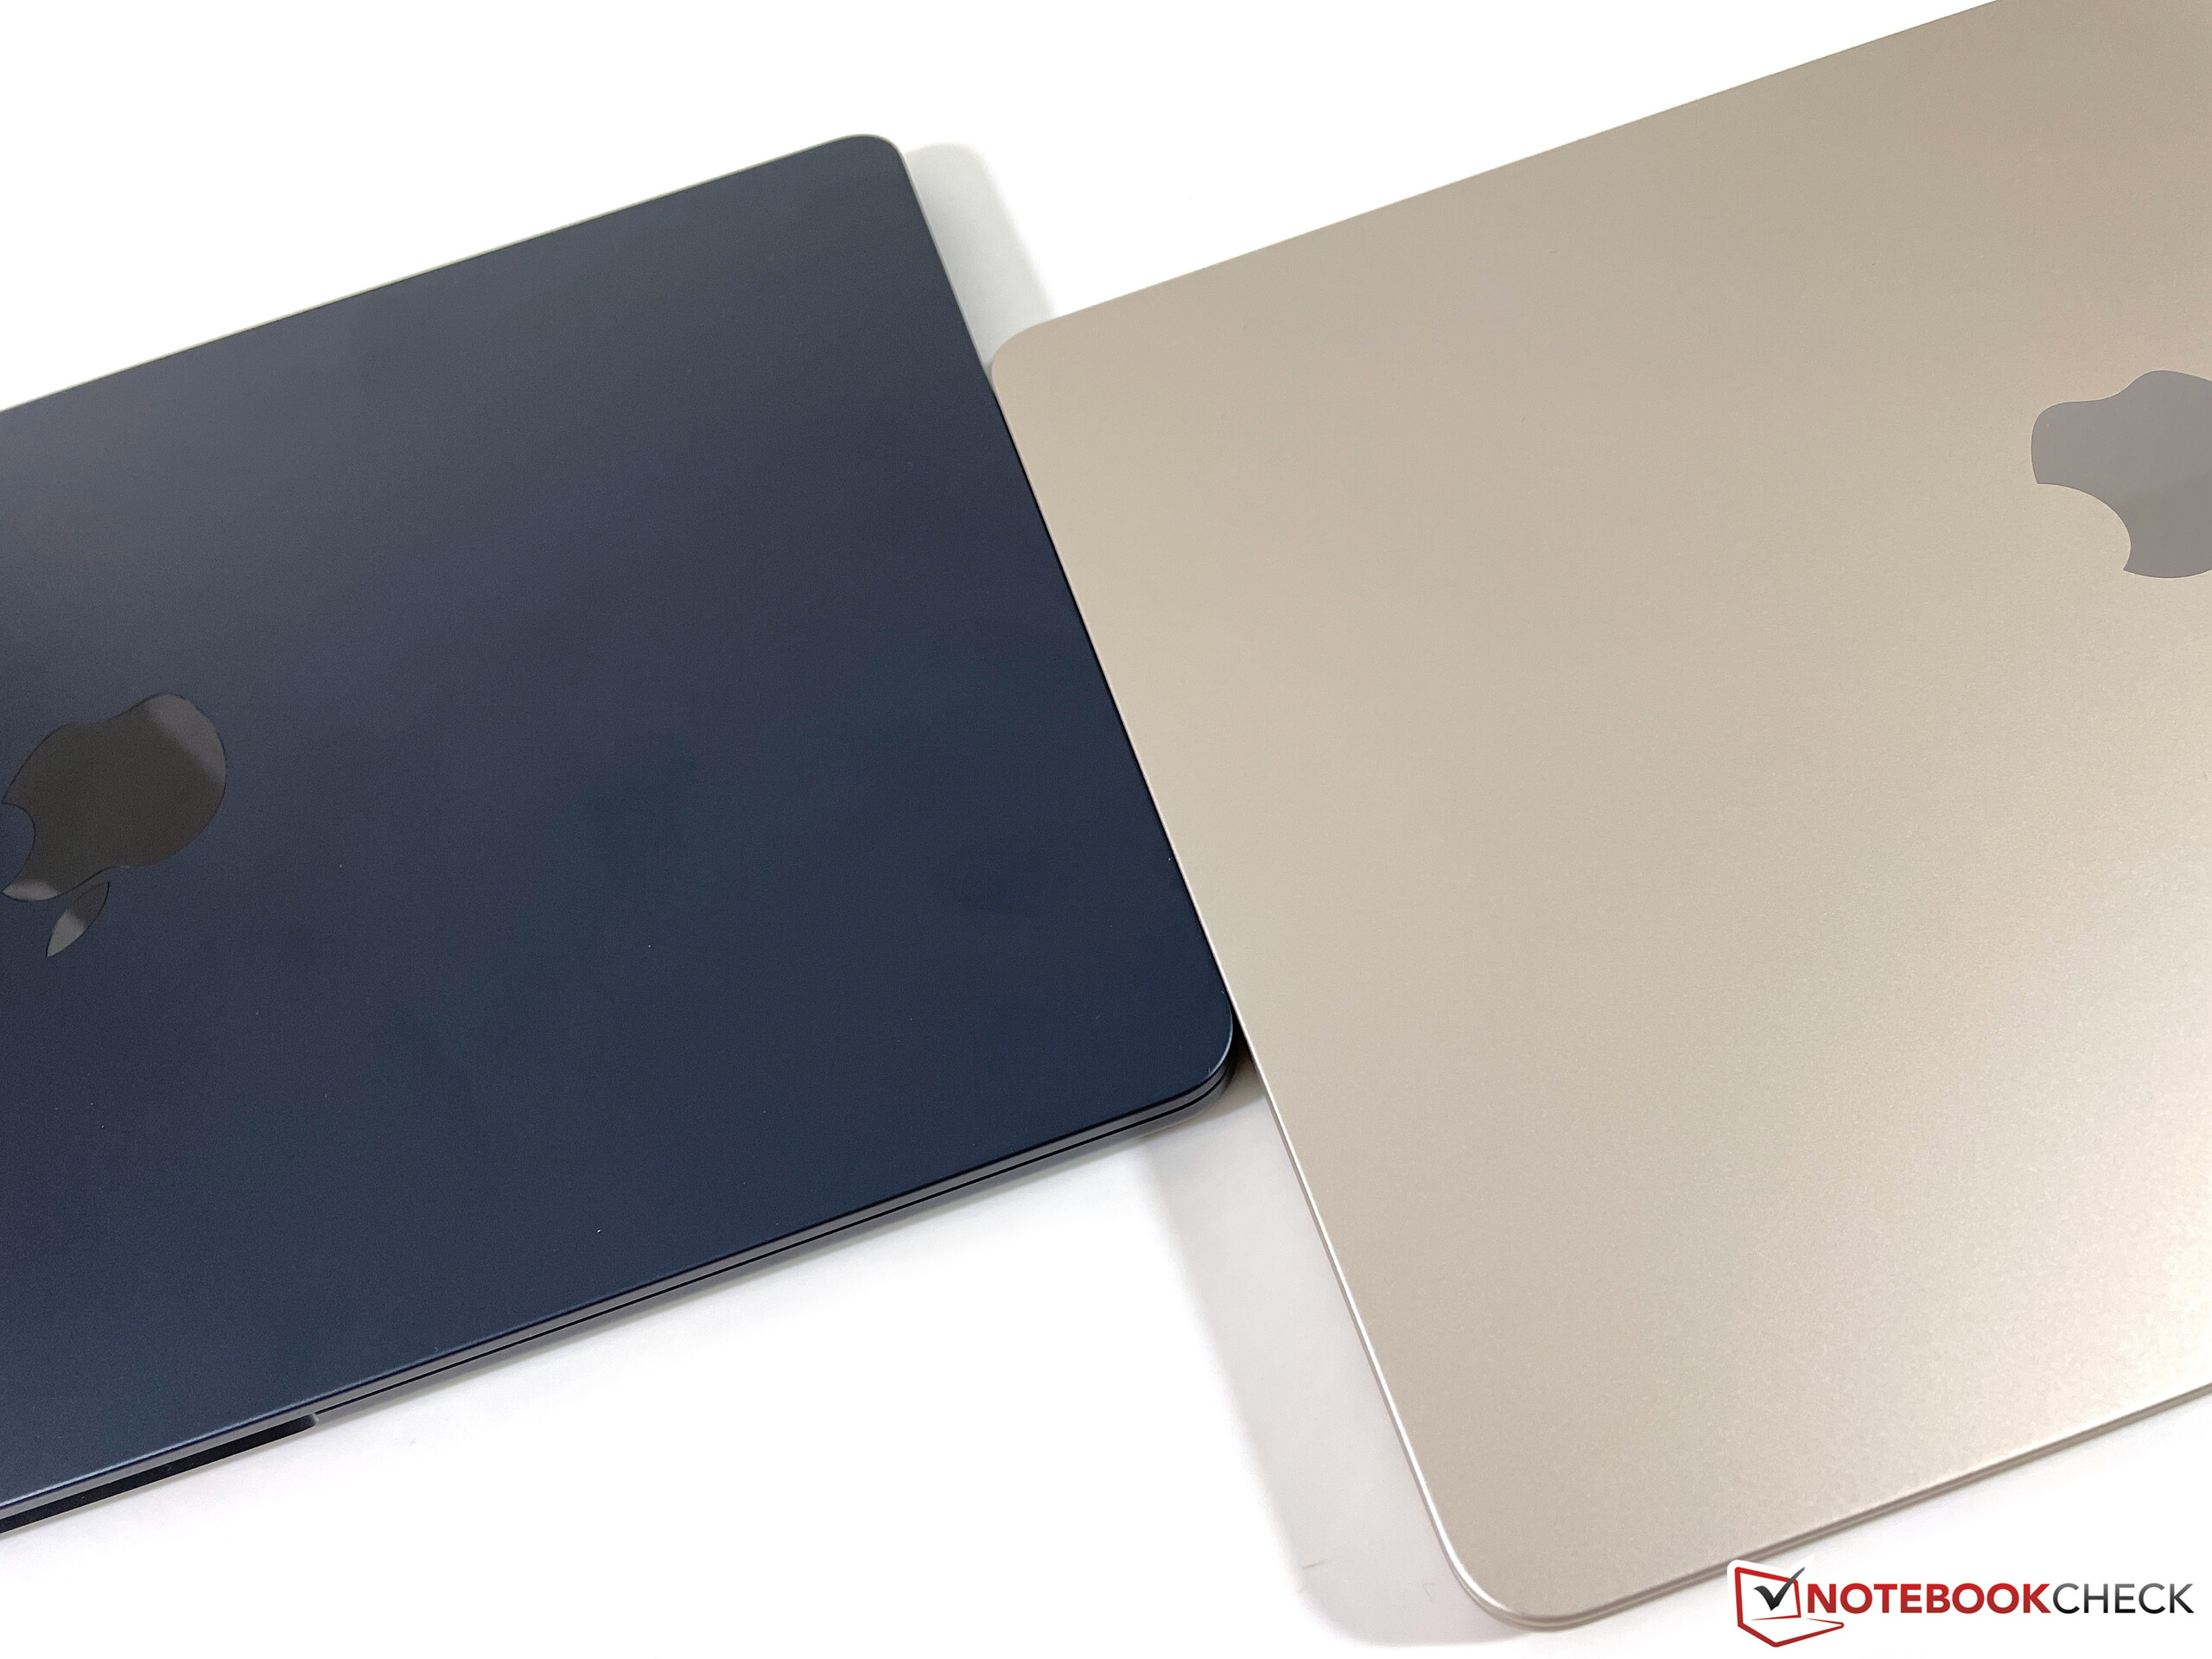
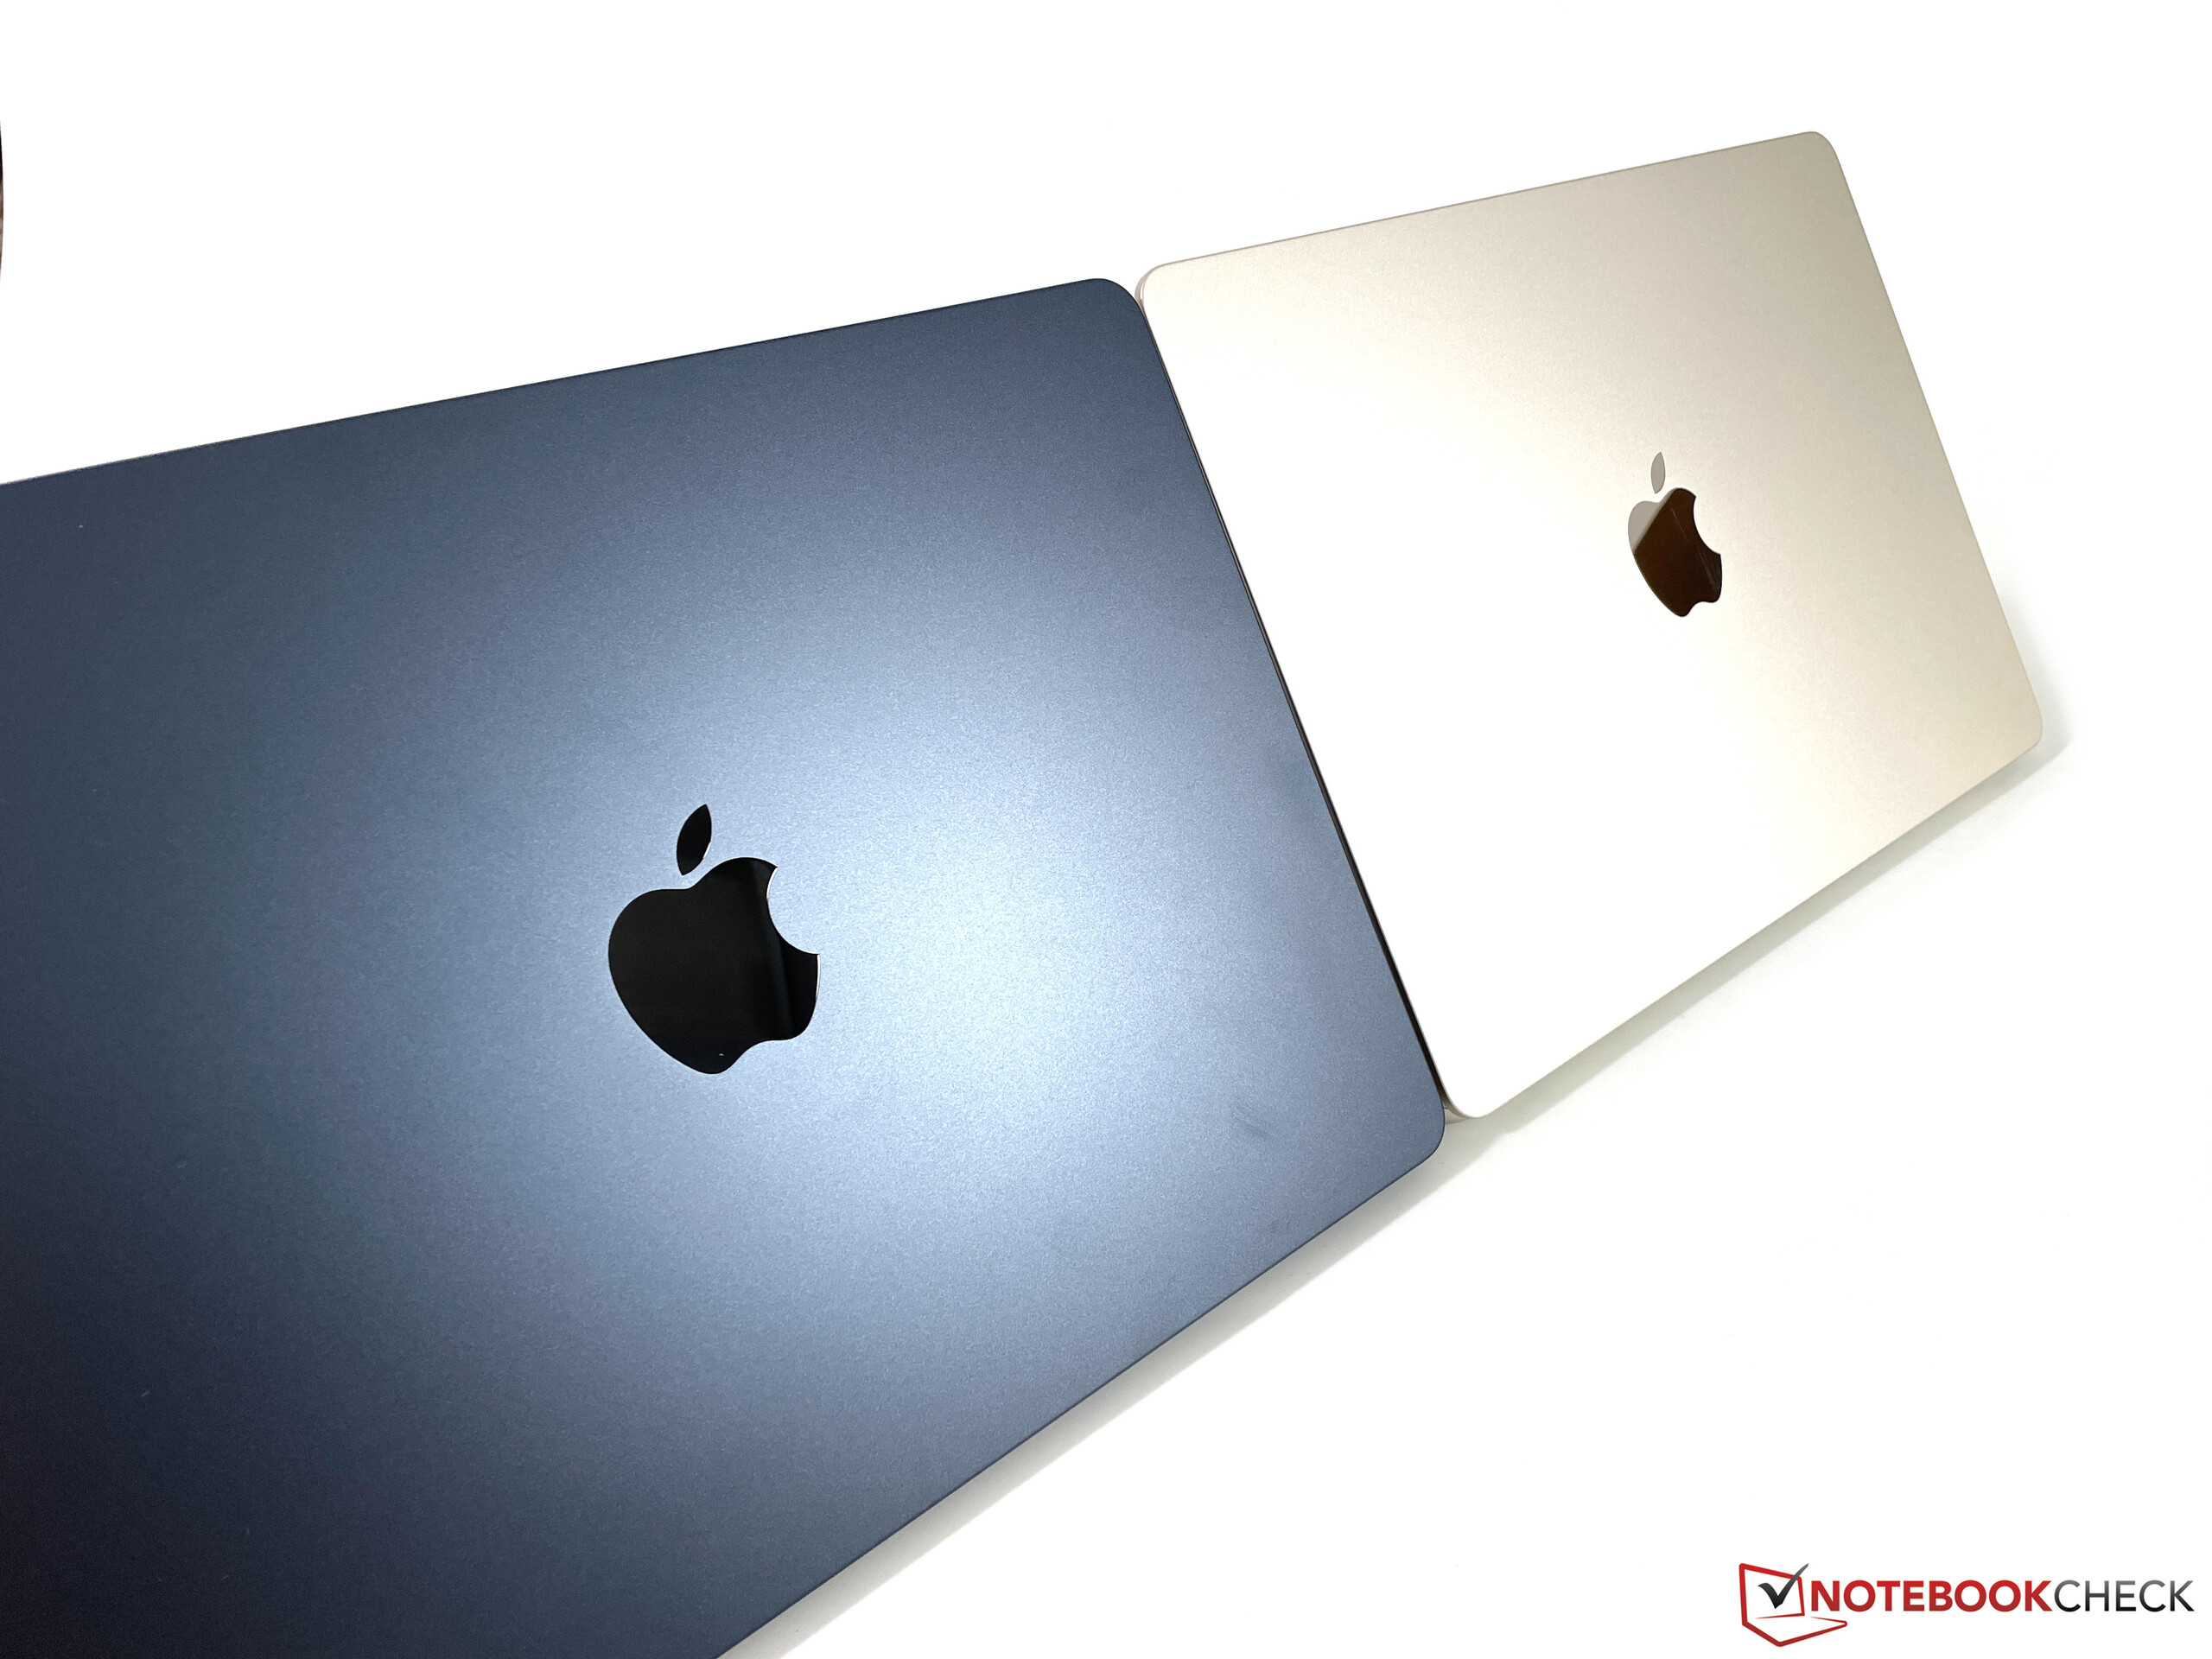
Case - Starlight color is significantly less susceptible
With the new MacBook Air M2 in the Midnight color, we determined that while the dark blue color looks very good, it is also very susceptible to dirt and fingerprints. The current test unit in the also new Starlight color version (silver with a slight golden hue) is significantly less susceptible in these regards and corresponds more to the known versions in Silver and Space Gray.
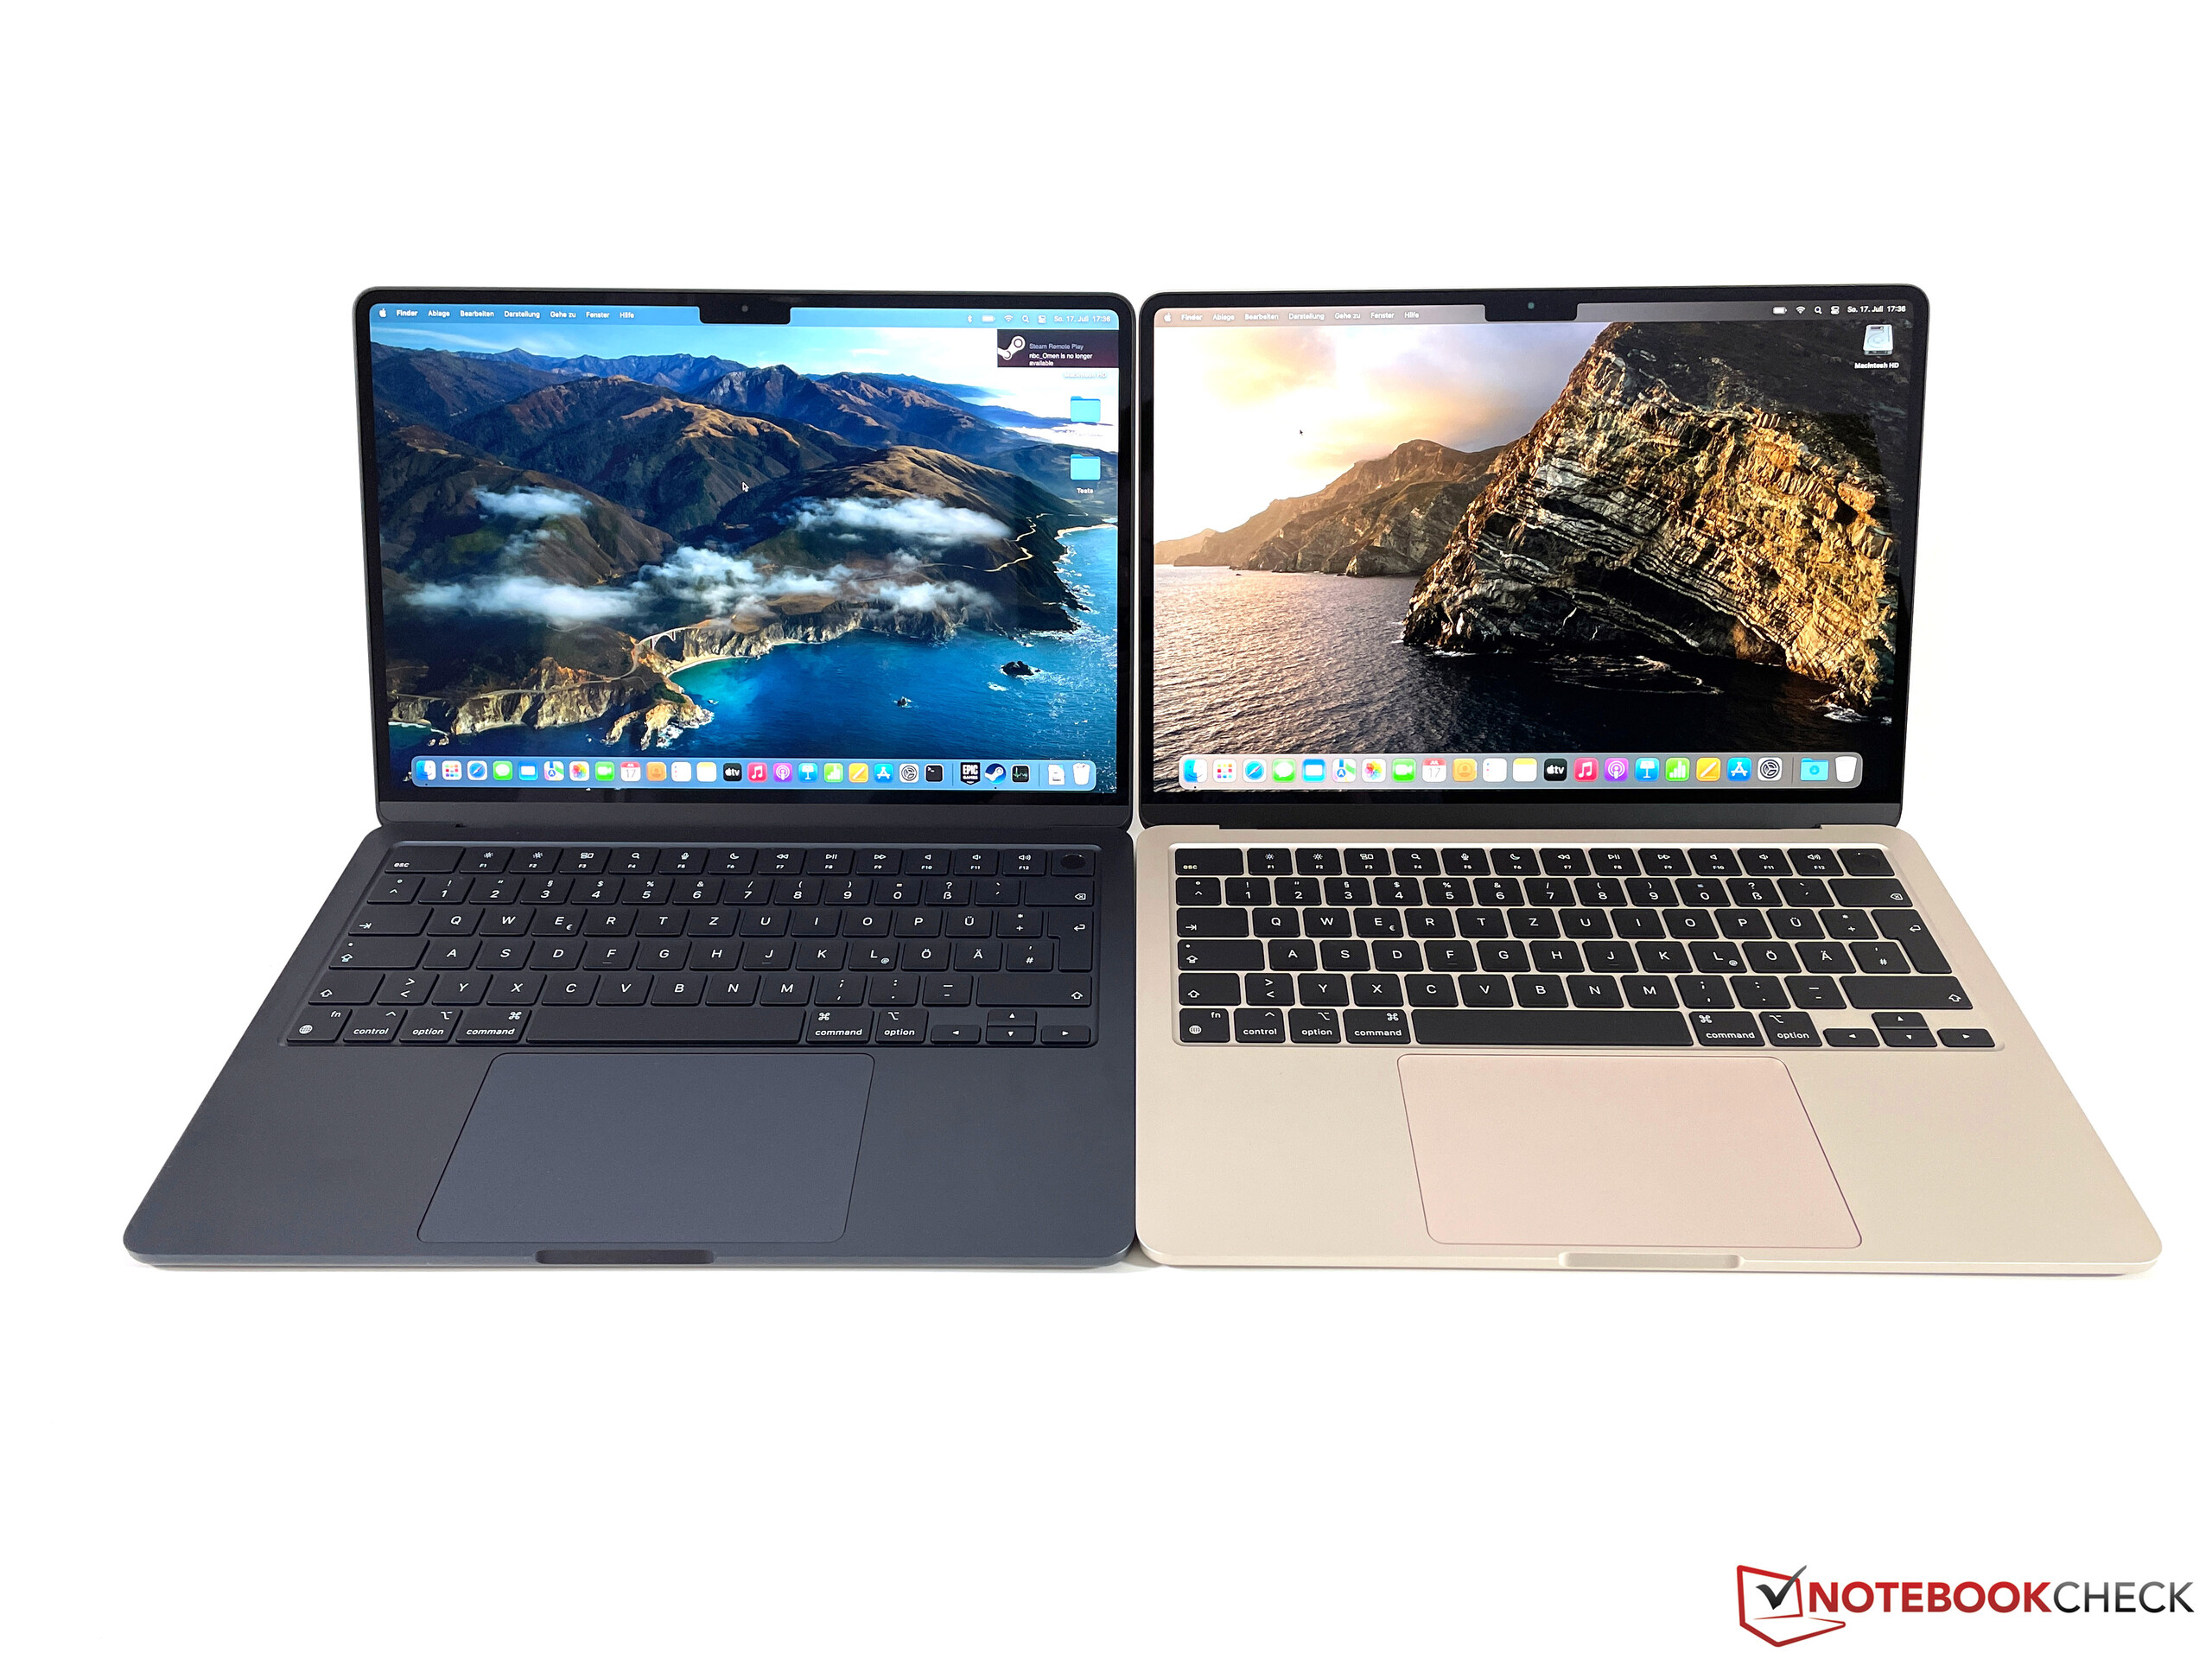
In our review of the basic version, we already mentioned that although the new MacBook Air M2 is very slim, it still has a larger footprint than the direct competitors such as the Dell XPS 13 Plus or the Asus ZenBook S 13. If we also compare it to the MacBook Pro 14, the Pro subjectively appears significantly bulkier and is, of course, also thicker and about 400 grams (~0.9 lb.) heavier. However, in terms of pure footprint, the difference isn't that large.
Display - An IPS panel without temporal dithering
We refer you to our review of the basic version for information on the display. In the comments section, we were asked about temporal dithering (it is used to create the illusion of more color depth). So, we examined the IPS panel of the Air M2 with a microscope and created a slow-motion recording with 240 images per second. While we were able to detect temporal dithering, for example, in the current MacBook Pro 16 with the Mini-LED panel in some particular gray color tones, this was neither the case in the old MacBook Air M1 nor in the new MacBook Air M2.
Performance - Apple M2 with 10 GPU cores
Processor
Since the processor module of the new MacBook Air always remains the same regardless of the configuration (with a total of 8 cores consisting of 4 Performance and 4 Efficiency cores), we can be brief here: The performance is basically identical. In the Cinebench loop, we see a slight advantage to the basic model after several runs, and in the final runs, the high-end Air is also minimally faster. However, this could also be explained with normal differences between the chips themselves. In practice, the difference is not noticeable.
Cinebench R15 Multi Constant Load Test
Apple was able to increase both the single and multi-core performance due to the higher clock speed compared to the M1 processor, but you also pay for it with a higher power consumption. We have already shown in a separate article that the M2 therefore also doesn't run as efficiently as its predecessor in terms of the processor performance.
However, the new M2 chip produces more than sufficient performance for everyday work overall, even in combination with the passive cooling of the MacBook Air. In fact, the new Air M2 is almost able to compete with the 8-core M1 Pro of the MacBook Pro 14, at least in the short multi-core benchmarks, although the performance of the Pro 14 remains completely stable without dropping.
Cinebench R23: Multi Core | Single Core
Cinebench R20: CPU (Multi Core) | CPU (Single Core)
Cinebench R15: CPU Multi 64Bit | CPU Single 64Bit
Blender: v2.79 BMW27 CPU
Geekbench 5.5: Multi-Core | Single-Core
| CPU Performance rating | |
| Average of class Subnotebook | |
| Dell XPS 13 Plus 9320 4K | |
| Apple MacBook Pro 14 2021 M1 Pro Entry -3! | |
| Asus Zenbook S 13 OLED | |
| Apple MacBook Pro 13 2022 M2 | |
| Apple MacBook Air M2 10C GPU | |
| Average Apple M2 | |
| Apple MacBook Air M2 Entry | |
| Cinebench R23 / Multi Core | |
| Average of class Subnotebook (1555 - 21812, n=66, last 2 years) | |
| Asus Zenbook S 13 OLED | |
| Dell XPS 13 Plus 9320 4K | |
| Apple MacBook Pro 14 2021 M1 Pro Entry | |
| Apple MacBook Pro 13 2022 M2 | |
| Apple MacBook Air M2 Entry | |
| Average Apple M2 (8517 - 8772, n=5) | |
| Apple MacBook Air M2 10C GPU | |
| Cinebench R23 / Single Core | |
| Average of class Subnotebook (358 - 2165, n=67, last 2 years) | |
| Dell XPS 13 Plus 9320 4K | |
| Average Apple M2 (1580 - 1638, n=5) | |
| Apple MacBook Air M2 Entry | |
| Apple MacBook Pro 13 2022 M2 | |
| Apple MacBook Air M2 10C GPU | |
| Apple MacBook Pro 14 2021 M1 Pro Entry | |
| Asus Zenbook S 13 OLED | |
| Cinebench R20 / CPU (Multi Core) | |
| Average of class Subnotebook (579 - 8541, n=63, last 2 years) | |
| Asus Zenbook S 13 OLED | |
| Dell XPS 13 Plus 9320 4K | |
| Apple MacBook Pro 13 2022 M2 | |
| Average Apple M2 (2231 - 2416, n=5) | |
| Apple MacBook Air M2 10C GPU | |
| Apple MacBook Air M2 Entry | |
| Cinebench R20 / CPU (Single Core) | |
| Dell XPS 13 Plus 9320 4K | |
| Average of class Subnotebook (128 - 826, n=63, last 2 years) | |
| Asus Zenbook S 13 OLED | |
| Apple MacBook Pro 13 2022 M2 | |
| Apple MacBook Air M2 10C GPU | |
| Average Apple M2 (216 - 446, n=5) | |
| Apple MacBook Air M2 Entry | |
| Cinebench R15 / CPU Multi 64Bit | |
| Average of class Subnotebook (327 - 3345, n=63, last 2 years) | |
| Asus Zenbook S 13 OLED | |
| Dell XPS 13 Plus 9320 4K | |
| Dell XPS 13 Plus 9320 4K | |
| Apple MacBook Pro 14 2021 M1 Pro Entry | |
| Apple MacBook Pro 13 2022 M2 | |
| Average Apple M2 (1210 - 1243, n=5) | |
| Apple MacBook Air M2 Entry | |
| Apple MacBook Air M2 10C GPU | |
| Cinebench R15 / CPU Single 64Bit | |
| Average of class Subnotebook (72.4 - 322, n=63, last 2 years) | |
| Dell XPS 13 Plus 9320 4K | |
| Asus Zenbook S 13 OLED | |
| Average Apple M2 (222 - 229, n=5) | |
| Apple MacBook Pro 13 2022 M2 | |
| Apple MacBook Air M2 10C GPU | |
| Apple MacBook Air M2 Entry | |
| Apple MacBook Pro 14 2021 M1 Pro Entry | |
| Blender / v2.79 BMW27 CPU | |
| Apple MacBook Air M2 Entry | |
| Apple MacBook Air M2 10C GPU | |
| Average Apple M2 (549 - 713, n=5) | |
| Apple MacBook Pro 13 2022 M2 | |
| Average of class Subnotebook (159 - 2271, n=64, last 2 years) | |
| Dell XPS 13 Plus 9320 4K | |
| Asus Zenbook S 13 OLED | |
| Geekbench 5.5 / Multi-Core | |
| Average of class Subnotebook (2557 - 17218, n=54, last 2 years) | |
| Apple MacBook Pro 14 2021 M1 Pro Entry | |
| Dell XPS 13 Plus 9320 4K | |
| Apple MacBook Air M2 10C GPU | |
| Apple MacBook Pro 13 2022 M2 | |
| Apple MacBook Air M2 Entry | |
| Average Apple M2 (8491 - 8994, n=8) | |
| Asus Zenbook S 13 OLED | |
| Geekbench 5.5 / Single-Core | |
| Apple MacBook Pro 13 2022 M2 | |
| Apple MacBook Air M2 10C GPU | |
| Apple MacBook Air M2 Entry | |
| Average Apple M2 (1887 - 1953, n=8) | |
| Average of class Subnotebook (726 - 2191, n=54, last 2 years) | |
| Apple MacBook Pro 14 2021 M1 Pro Entry | |
| Dell XPS 13 Plus 9320 4K | |
| Asus Zenbook S 13 OLED | |
* ... smaller is better
System Performance
In terms of the subjective performance, we initially don't notice any difference to the basic model of the MacBook Air M2, especially in everyday tasks such as writing mails, playing videos, or surfing the Internet. However, in some benchmarks, the larger storage and also the faster SSD become noticeable. Basically, emulated programs also run without any problems via Rosetta 2, but the native apps for Apple chips are generally faster and more efficient on resources. A good example are the Adobe Photoshop and Premiere Pro apps that all run acceptably as Intel versions but are significantly slower than the native apps. The PugetBench results are therefore also only of limited use, but they still show the advantage of the increased working memory and faster SSD compared to the basic model of the MacBook Air M2.
Blackmagic RAW Speed Test: 12:1 8K Metal | 12:1 8K CPU
Photoshop PugetBench: Overall Score | GPU Score | General Score | Filter Score
Premiere Pro PugetBench: Overall Score 0.9 | Export 0.9 | Live Playback 0.9 | GPU 0.9
Jetstream 2: 2.0 Total
WebXPRT 3: Overall
WebXPRT 4: Overall
Speedometer 2.0: Result 2.0
| CrossMark / Overall | |
| Dell XPS 13 Plus 9320 4K | |
| Average of class Subnotebook (365 - 2356, n=66, last 2 years) | |
| Average Apple M2, Apple M2 10-Core GPU (1437 - 1585, n=8) | |
| Apple MacBook Pro 13 2022 M2 | |
| Apple MacBook Air M2 Entry | |
| Apple MacBook Air M2 10C GPU | |
| Apple MacBook Pro 14 2021 M1 Pro Entry | |
| Asus Zenbook S 13 OLED | |
| CrossMark / Productivity | |
| Dell XPS 13 Plus 9320 4K | |
| Average of class Subnotebook (364 - 2277, n=66, last 2 years) | |
| Asus Zenbook S 13 OLED | |
| Average Apple M2, Apple M2 10-Core GPU (1319 - 1441, n=8) | |
| Apple MacBook Pro 13 2022 M2 | |
| Apple MacBook Air M2 10C GPU | |
| Apple MacBook Air M2 Entry | |
| Apple MacBook Pro 14 2021 M1 Pro Entry | |
| CrossMark / Creativity | |
| Apple MacBook Pro 14 2021 M1 Pro Entry | |
| Dell XPS 13 Plus 9320 4K | |
| Apple MacBook Air M2 Entry | |
| Apple MacBook Pro 13 2022 M2 | |
| Average Apple M2, Apple M2 10-Core GPU (1765 - 1967, n=8) | |
| Average of class Subnotebook (372 - 2743, n=66, last 2 years) | |
| Apple MacBook Air M2 10C GPU | |
| Asus Zenbook S 13 OLED | |
| CrossMark / Responsiveness | |
| Dell XPS 13 Plus 9320 4K | |
| Average of class Subnotebook (312 - 1889, n=66, last 2 years) | |
| Asus Zenbook S 13 OLED | |
| Average Apple M2, Apple M2 10-Core GPU (1008 - 1182, n=8) | |
| Apple MacBook Pro 13 2022 M2 | |
| Apple MacBook Air M2 10C GPU | |
| Apple MacBook Air M2 Entry | |
| Apple MacBook Pro 14 2021 M1 Pro Entry | |
| Blackmagic RAW Speed Test / 12:1 8K Metal | |
| Apple MacBook Pro 14 2021 M1 Pro Entry | |
| Apple MacBook Pro 13 2022 M2 | |
| Apple MacBook Air M2 10C GPU | |
| Average of class Subnotebook (41 - 99, n=5, last 2 years) | |
| Apple MacBook Air M2 Entry | |
| Average Apple M2, Apple M2 10-Core GPU (59 - 85, n=4) | |
| Blackmagic RAW Speed Test / 12:1 8K CPU | |
| Average of class Subnotebook (22 - 49, n=5, last 2 years) | |
| Average Apple M2, Apple M2 10-Core GPU (24 - 26, n=4) | |
| Apple MacBook Pro 13 2022 M2 | |
| Apple MacBook Air M2 Entry | |
| Apple MacBook Air M2 10C GPU | |
| Apple MacBook Pro 14 2021 M1 Pro Entry | |
| Photoshop PugetBench / Overall Score | |
| Apple MacBook Air M2 10C GPU | |
| Apple MacBook Pro 13 2022 M2 | |
| Average Apple M2, Apple M2 10-Core GPU (747 - 828, n=3) | |
| Apple MacBook Pro 14 2021 M1 Pro Entry | |
| Apple MacBook Air M2 Entry | |
| Photoshop PugetBench / GPU Score | |
| Apple MacBook Pro 13 2022 M2 | |
| Apple MacBook Air M2 10C GPU | |
| Average Apple M2, Apple M2 10-Core GPU (75.6 - 83.8, n=3) | |
| Apple MacBook Pro 14 2021 M1 Pro Entry | |
| Apple MacBook Air M2 Entry | |
| Photoshop PugetBench / General Score | |
| Average Apple M2, Apple M2 10-Core GPU (78.7 - 86.6, n=3) | |
| Apple MacBook Pro 13 2022 M2 | |
| Apple MacBook Air M2 10C GPU | |
| Apple MacBook Pro 14 2021 M1 Pro Entry | |
| Apple MacBook Air M2 Entry | |
| Photoshop PugetBench / Filter Score | |
| Apple MacBook Air M2 10C GPU | |
| Apple MacBook Pro 13 2022 M2 | |
| Average Apple M2, Apple M2 10-Core GPU (62.8 - 86.9, n=3) | |
| Apple MacBook Air M2 Entry | |
| Apple MacBook Pro 14 2021 M1 Pro Entry | |
| Premiere Pro PugetBench / Overall Score 0.9 | |
| Apple MacBook Pro 14 2021 M1 Pro Entry | |
| Apple MacBook Pro 13 2022 M2 | |
| Average Apple M2, Apple M2 10-Core GPU (500 - 537, n=2) | |
| Apple MacBook Air M2 10C GPU | |
| Apple MacBook Air M2 Entry | |
| Premiere Pro PugetBench / Export 0.9 | |
| Apple MacBook Pro 13 2022 M2 | |
| Average Apple M2, Apple M2 10-Core GPU (45.4 - 48, n=2) | |
| Apple MacBook Air M2 10C GPU | |
| Apple MacBook Air M2 Entry | |
| Apple MacBook Pro 14 2021 M1 Pro Entry | |
| Premiere Pro PugetBench / Live Playback 0.9 | |
| Apple MacBook Pro 14 2021 M1 Pro Entry | |
| Apple MacBook Pro 13 2022 M2 | |
| Average Apple M2, Apple M2 10-Core GPU (79.5 - 81.8, n=2) | |
| Apple MacBook Air M2 10C GPU | |
| Apple MacBook Air M2 Entry | |
| Premiere Pro PugetBench / GPU 0.9 | |
| Apple MacBook Pro 14 2021 M1 Pro Entry | |
| Apple MacBook Pro 13 2022 M2 | |
| Average Apple M2, Apple M2 10-Core GPU (24.2 - 26.2, n=2) | |
| Apple MacBook Air M2 10C GPU | |
| Apple MacBook Air M2 Entry | |
| Jetstream 2 / 2.0 Total | |
| Average of class Subnotebook (117 - 476, n=34, last 2 years) | |
| Dell XPS 13 Plus 9320 4K | |
| Average Apple M2, Apple M2 10-Core GPU (220 - 257, n=8) | |
| Apple MacBook Pro 13 2022 M2 | |
| Apple MacBook Air M2 10C GPU | |
| Apple MacBook Air M2 Entry | |
| Asus Zenbook S 13 OLED | |
| Apple MacBook Pro 14 2021 M1 Pro Entry | |
| WebXPRT 3 / Overall | |
| Apple MacBook Pro 13 2022 M2 | |
| Apple MacBook Air M2 Entry | |
| Apple MacBook Air M2 10C GPU | |
| Average Apple M2, Apple M2 10-Core GPU (342 - 387, n=7) | |
| Apple MacBook Pro 14 2021 M1 Pro Entry | |
| Average of class Subnotebook (156 - 530, n=62, last 2 years) | |
| Dell XPS 13 Plus 9320 4K | |
| Asus Zenbook S 13 OLED | |
| WebXPRT 4 / Overall | |
| Average of class Subnotebook (132 - 378, n=67, last 2 years) | |
| Dell XPS 13 Plus 9320 4K | |
| Average Apple M2, Apple M2 10-Core GPU (223 - 256, n=7) | |
| Apple MacBook Air M2 Entry | |
| Apple MacBook Air M2 10C GPU | |
| Speedometer 2.0 / Result 2.0 | |
| Average of class Subnotebook (110 - 793, n=31, last 2 years) | |
| Apple MacBook Pro 13 2022 M2 | |
| Apple MacBook Air M2 10C GPU | |
| Apple MacBook Air M2 Entry | |
| Average Apple M2, Apple M2 10-Core GPU (437 - 445, n=9) | |
| Apple MacBook Pro 14 2021 M1 Pro Entry | |
| Dell XPS 13 Plus 9320 4K | |
| Asus Zenbook S 13 OLED | |
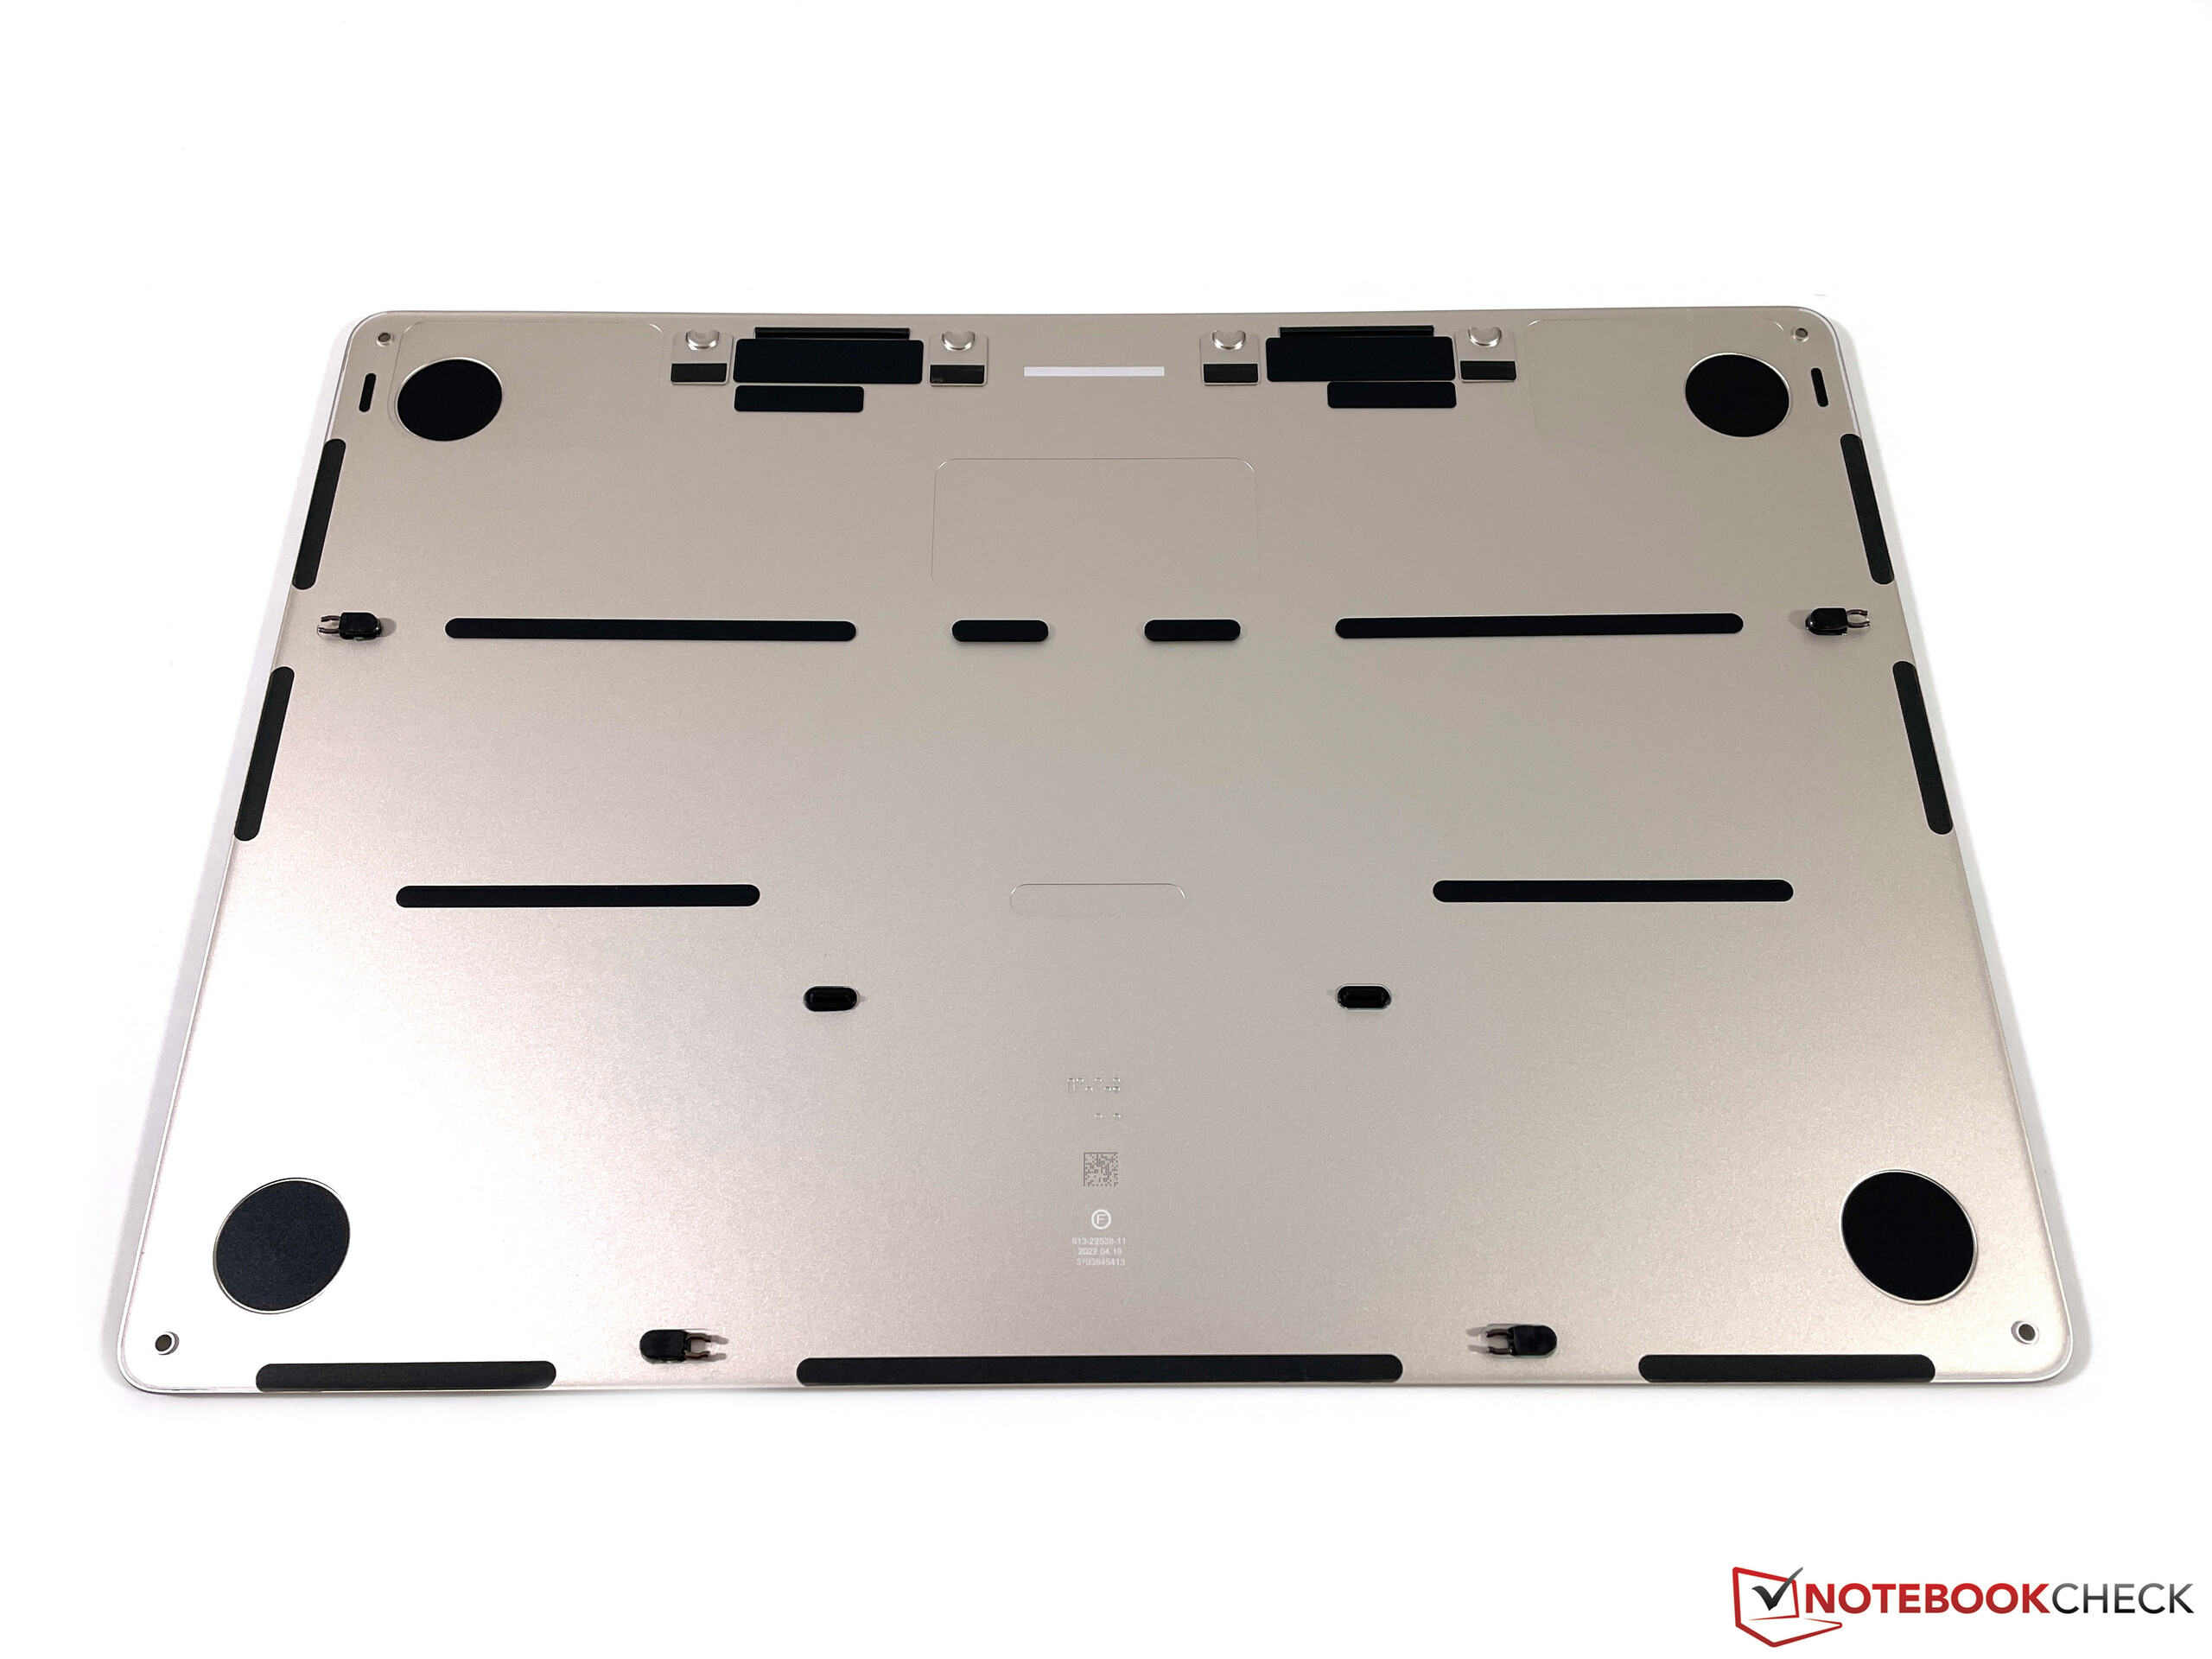
Storage Solution
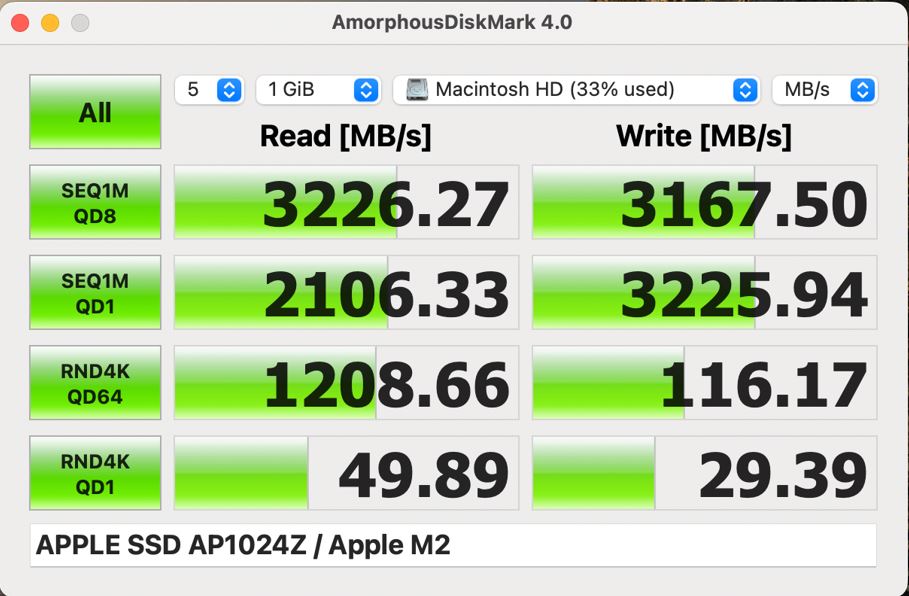
After all the discussion about the new 256-GB SSDs of the new MacBook models that only use a single storage chip and are therefore significantly slower, the 1-TB SD in the MacBook Air M2 again reaches the usual transfer rates of more than 3 GB/s. However, even that isn't current state of the art, since despite the heavy premium of 460 Euros (~$474) for the 1-TB SSD, it continues to use a dated PCIe 3.0 connection. The larger MacBook Pro 14 has a clear advantage here, since it already uses the faster PCIe 4.0 models.
Graphics Card
Except for the amount of cores, there are no differences in the GPUs of the new Apple M2, since the cores reach a maximum clock speed of 1,398 MHz in both the basic model with 8 cores and the faster 10-core version. Apple was able to improve the graphics performance with the M2 compared to the old M1 overall, and in contrast to the CPU cores, Apple succeeded in slightly increasing the efficiency here.
However, at around 13.5 watts, the power consumption has still slightly increased overall. This leads to the necessity for a quicker and stronger reduction of the graphics performance under constant load, for example during gaming, than was the case in the basic model. The result is a shrinking advantage from 19% to only about 9% compared to the 8-core GPU of the M2 after a few minutes.
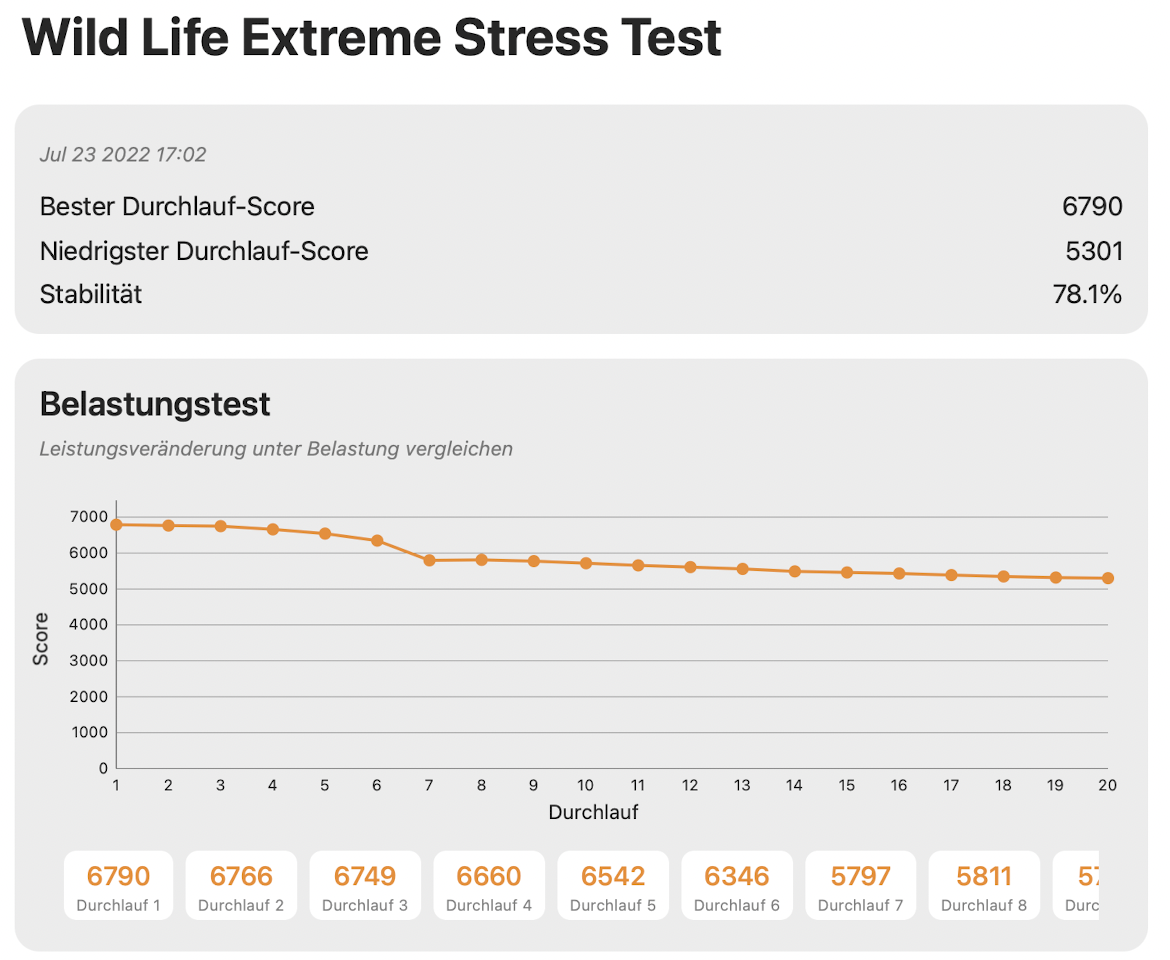
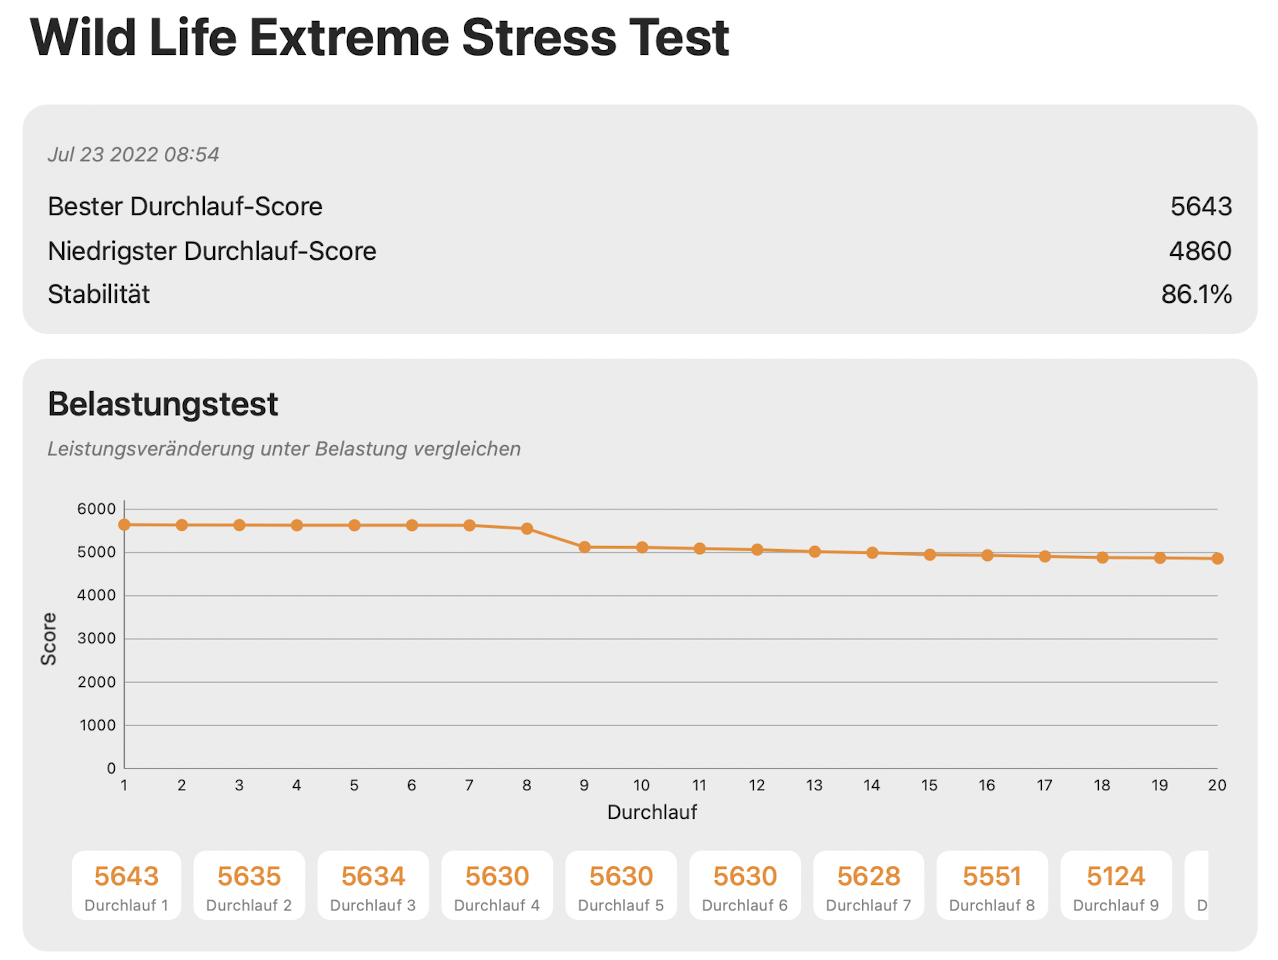
Therefore, there is only a real advantage during short benchmarks. In everyday operation, the 8-core GPU is already more than sufficient. So there is no real reason to pay up the additional premium for the 10-core GPU in the new MacBook Air M2. However, we also want to make a brief comparison with the larger MacBook Pro 14 here, with even the 14-core GPU of the basic model being at least 30-40% faster and also remaining constant at this performance level.
| low | med. | high | ultra | |
|---|---|---|---|---|
| Shadow of the Tomb Raider (2018) | 60 | 28 | 25 | 21 |
| Total War: Three Kingdoms (2019) | 88.6 | 46.3 | 26.3 | 15.9 |
| Borderlands 3 (2019) | 53.1 | 34.2 | 23.8 | 16.4 |
Emissions and Power Management
Noise Emissions
The more expensive MacBook Air M2 is, of course, also passively cooled, so it remains completely silent during operation. We were also unable to detect any other electronic noises.
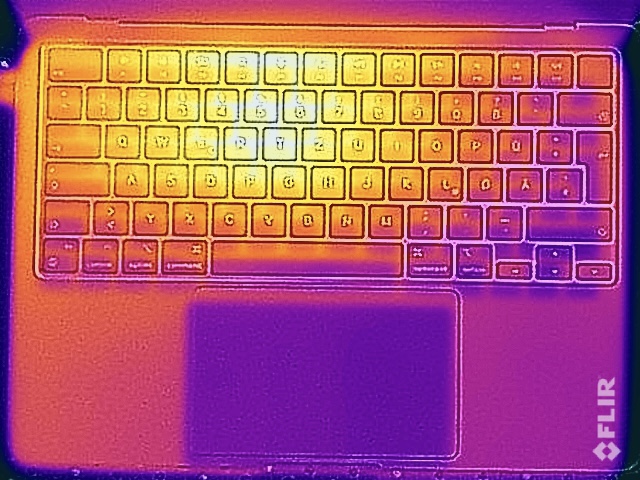
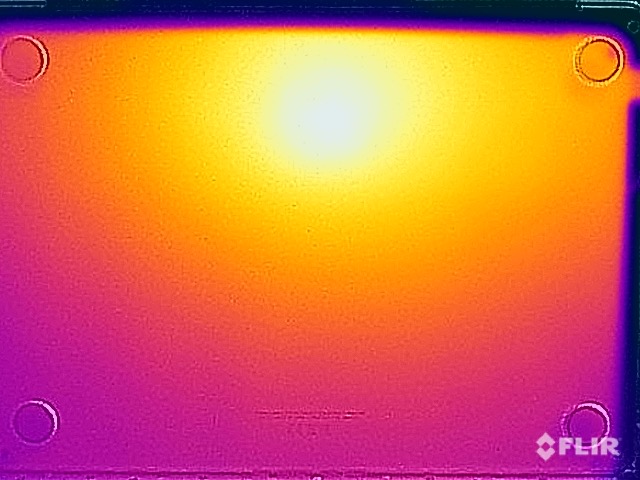
Temperatures
Since the passive cooling is identical in both models, there are also no real differences in the surface temperatures. There are no problems during everyday operation anyway, and even under high loads, Apple has a good handle on the case temperatures, so you can still run the MacBook Air M2 on top of your lap without any concerns.
(±) The maximum temperature on the upper side is 44.7 °C / 112 F, compared to the average of 35.9 °C / 97 F, ranging from 21.4 to 59 °C for the class Subnotebook.
(±) The bottom heats up to a maximum of 44.6 °C / 112 F, compared to the average of 39.2 °C / 103 F
(+) In idle usage, the average temperature for the upper side is 24.9 °C / 77 F, compared to the device average of 30.8 °C / 87 F.
(±) Playing The Witcher 3, the average temperature for the upper side is 37.9 °C / 100 F, compared to the device average of 30.8 °C / 87 F.
(+) The palmrests and touchpad are reaching skin temperature as a maximum (35.1 °C / 95.2 F) and are therefore not hot.
(-) The average temperature of the palmrest area of similar devices was 28.2 °C / 82.8 F (-6.9 °C / -12.4 F).
| Apple MacBook Air M2 10C GPU Apple M2, Apple M2 10-Core GPU | Apple MacBook Air M2 Entry Apple M2, Apple M2 8-Core GPU | Apple MacBook Pro 13 2022 M2 Apple M2, Apple M2 10-Core GPU | Apple MacBook Pro 14 2021 M1 Pro Entry Apple M1 Pro 8-Core, Apple M1 Pro 14-Core GPU | Asus Zenbook S 13 OLED AMD Ryzen 7 6800U, AMD Radeon 680M | Dell XPS 13 Plus 9320 4K Intel Core i7-1260P, Intel Iris Xe Graphics G7 96EUs | |
|---|---|---|---|---|---|---|
| Heat | 3% | 1% | 3% | -12% | -7% | |
| Maximum Upper Side * (°C) | 44.7 | 44.5 -0% | 45.1 -1% | 46.8 -5% | 47.9 -7% | 41.1 8% |
| Maximum Bottom * (°C) | 44.6 | 44.4 -0% | 43 4% | 40.9 8% | 56.1 -26% | 48.8 -9% |
| Idle Upper Side * (°C) | 25.1 | 23.9 5% | 25.2 -0% | 24.2 4% | 26.8 -7% | 28 -12% |
| Idle Bottom * (°C) | 25.3 | 23.6 7% | 25.4 -0% | 24.2 4% | 27.3 -8% | 29.3 -16% |
* ... smaller is better
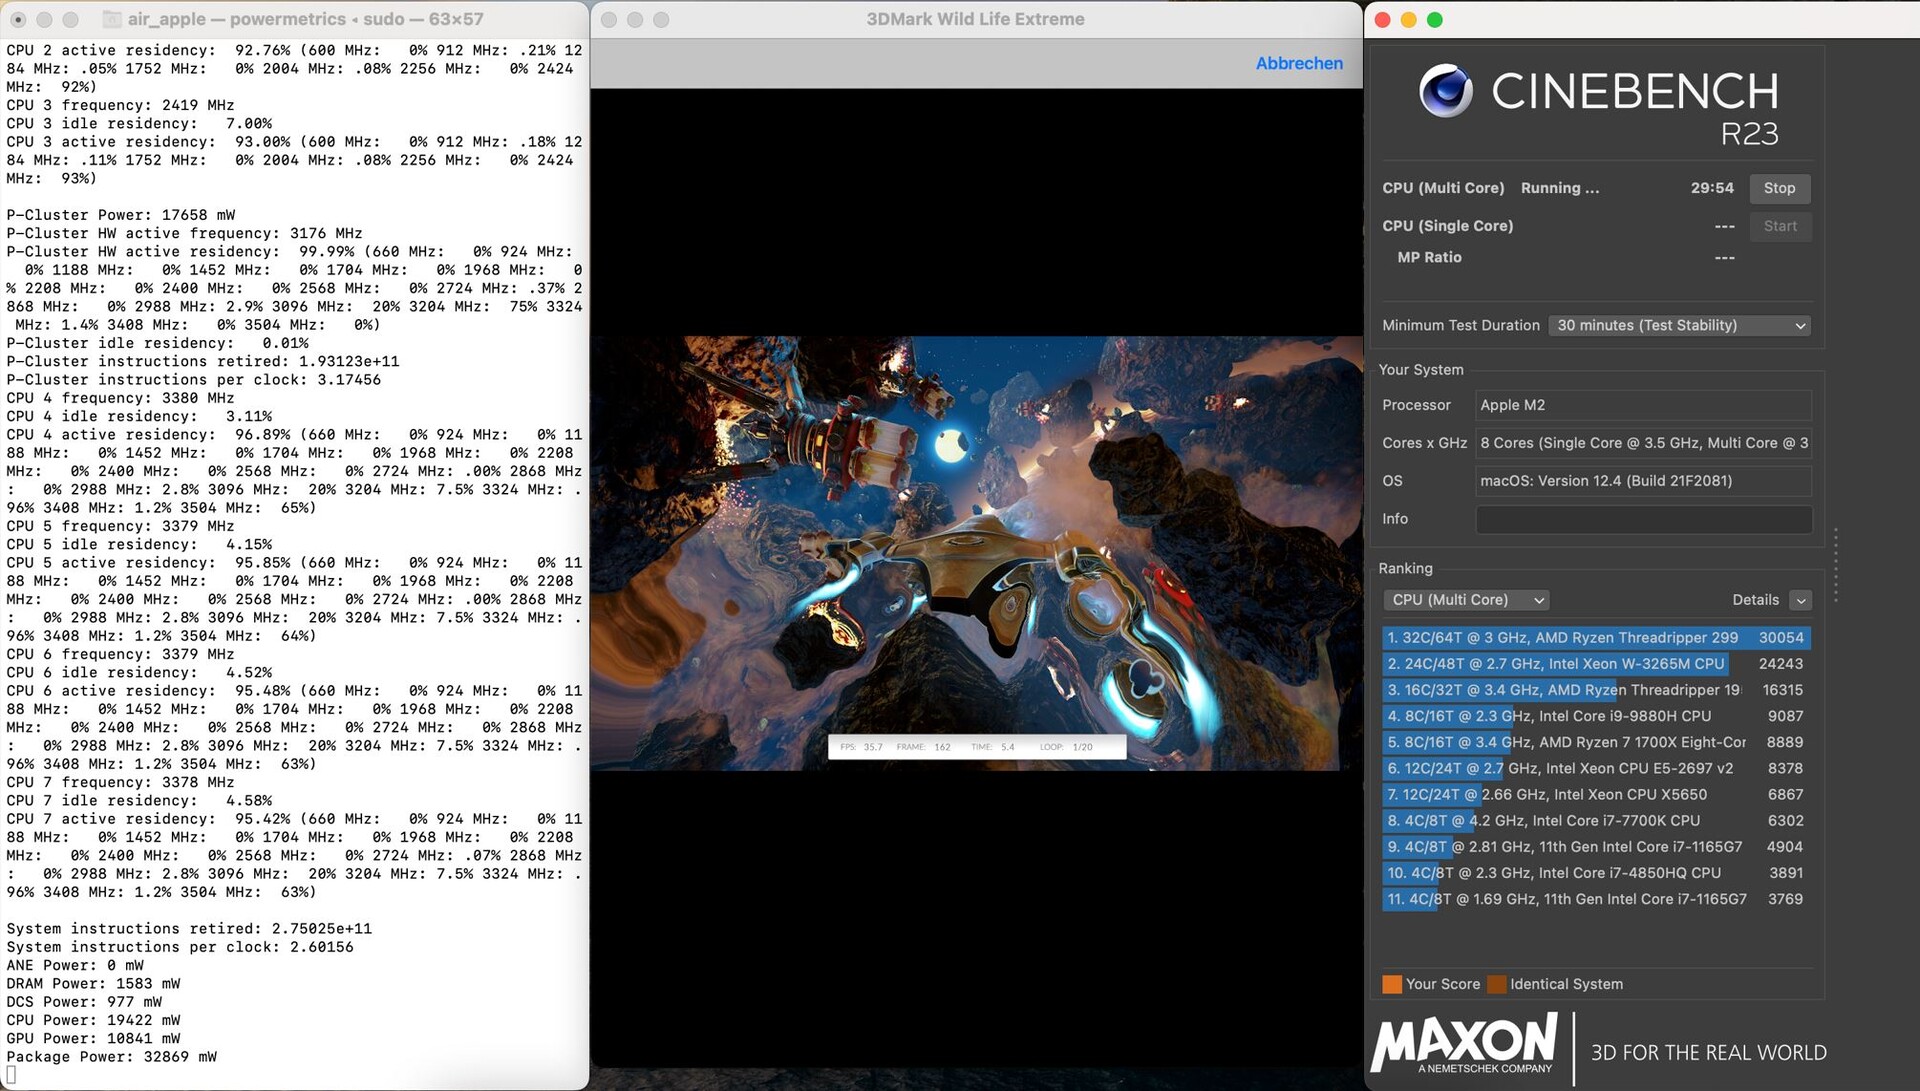
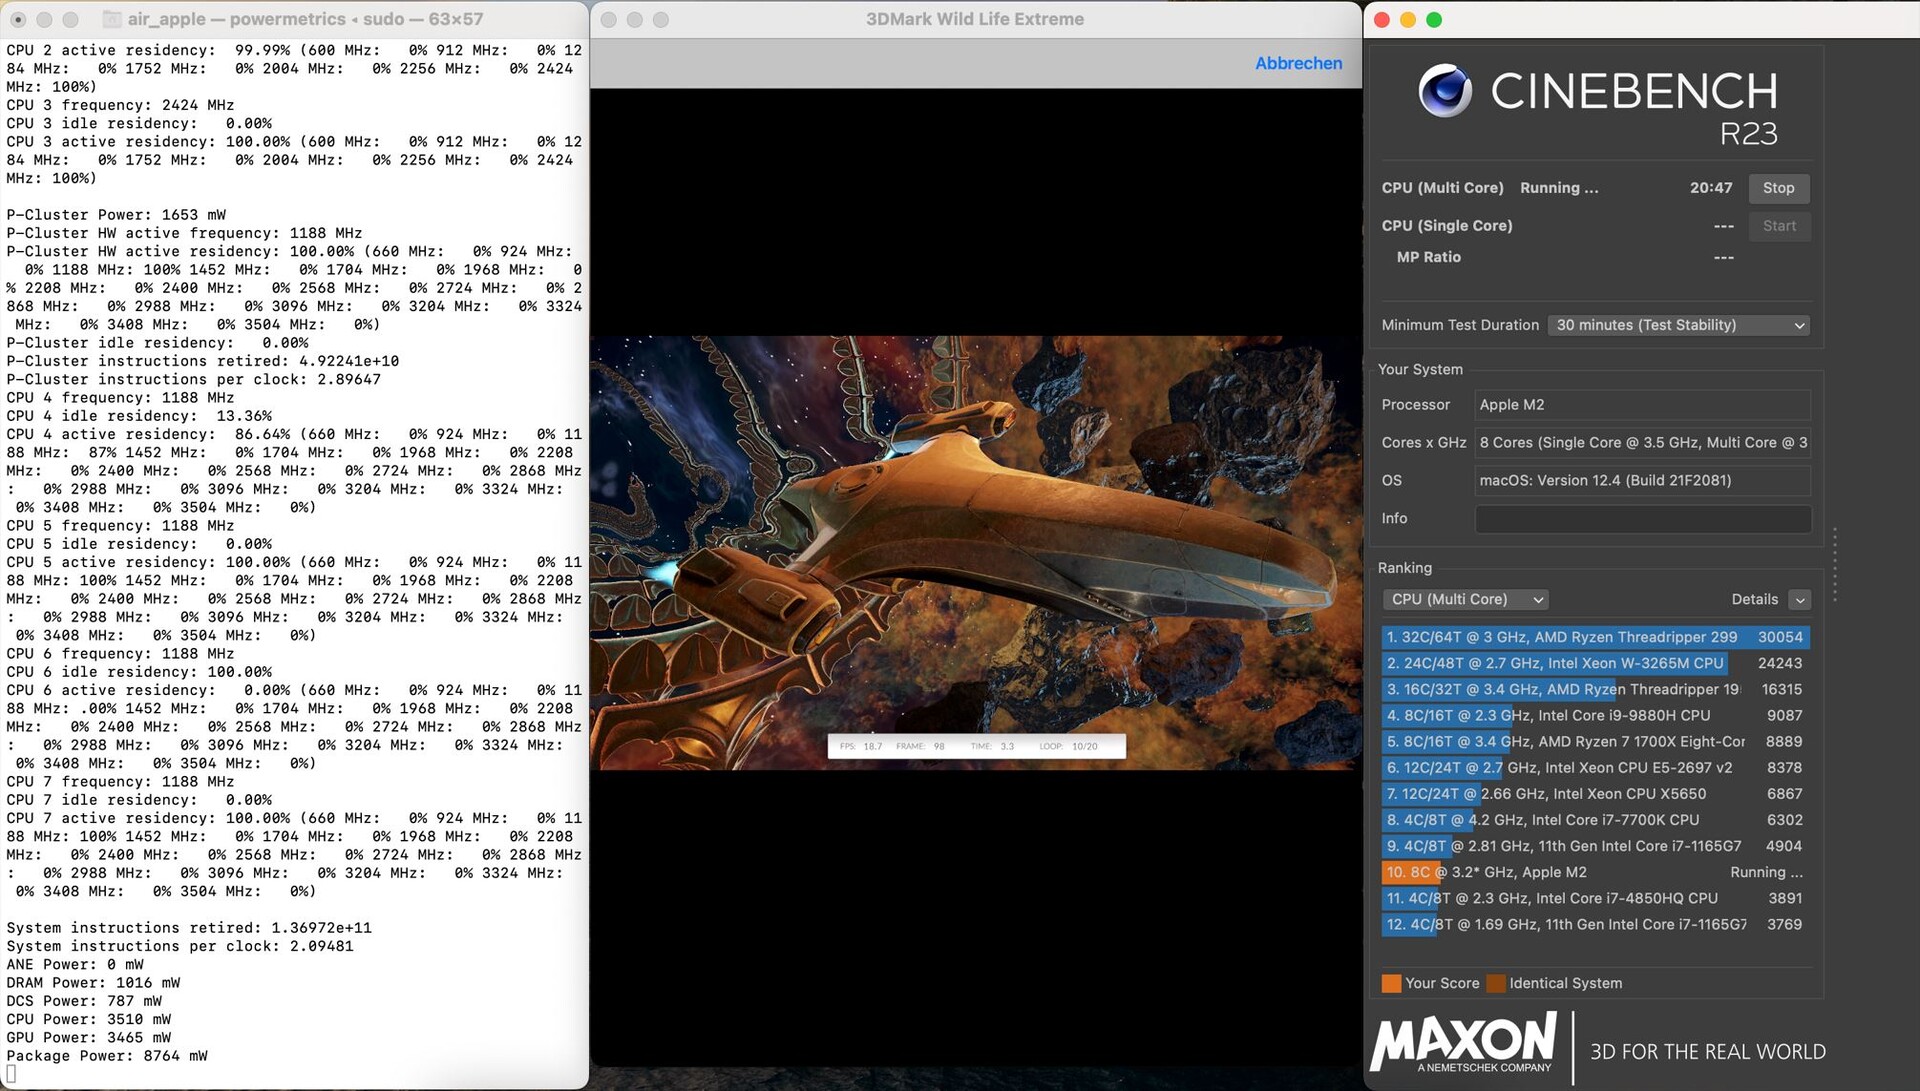
Stress Test
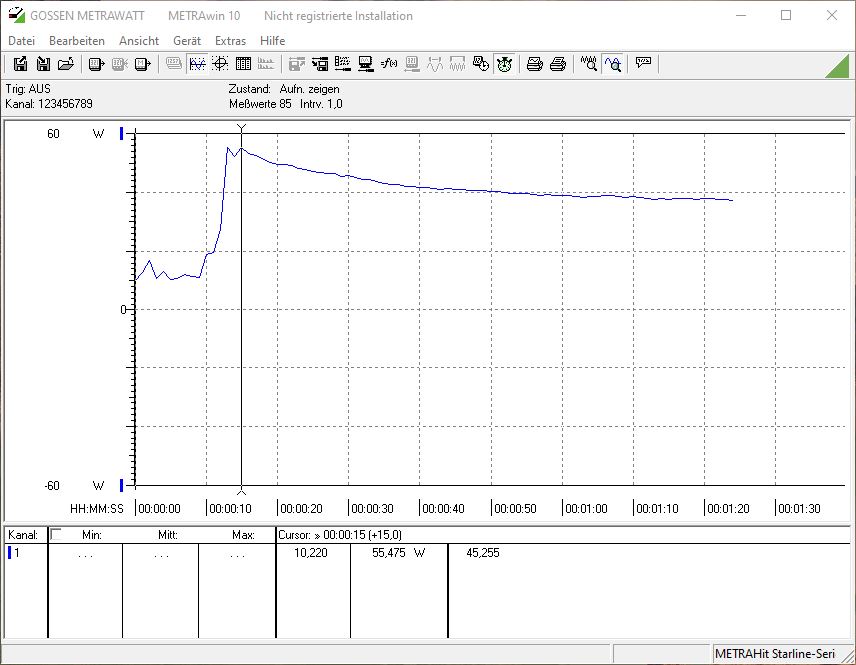
During our stress test, we see basically the same behavior as in the basic model. In the beginning, the M2 is allowed to briefly consume about 33 watts, before the consumption drops rapidly to finally also level out more quickly at a slightly lower package power of less than 9 watts. This is also easy to see in the chart below, which compares the package power, CPU power, and GPU power of the two MacBook Air M2 models in our stress test with each other.
However, it is also the case here that the performance is completely sufficient for everyday tasks, and that the MacBook Air M2 was simply not designed for constant load. Those who want to access the full performance of the M2 constantly will not be able to avoid the actively cooled MacBook Pro 13 M2.
Speakers
We already saw in the test of the basic model that the new speaker system of the MacBook Air M2 is again very good but doesn't represent a significant improvement compared to the previous MacBook Air M1. The MacBook Pro 14 with the additional modules is again better here and is only surpassed by the even larger MacBook Pro 16.
Apple MacBook Air M2 10C GPU audio analysis
(+) | speakers can play relatively loud (82.7 dB)
Bass 100 - 315 Hz
(±) | reduced bass - on average 12.2% lower than median
(±) | linearity of bass is average (12.6% delta to prev. frequency)
Mids 400 - 2000 Hz
(+) | balanced mids - only 1.1% away from median
(+) | mids are linear (3.1% delta to prev. frequency)
Highs 2 - 16 kHz
(+) | balanced highs - only 2.4% away from median
(+) | highs are linear (1.9% delta to prev. frequency)
Overall 100 - 16.000 Hz
(+) | overall sound is linear (9.5% difference to median)
Compared to same class
» 5% of all tested devices in this class were better, 2% similar, 93% worse
» The best had a delta of 5%, average was 18%, worst was 53%
Compared to all devices tested
» 4% of all tested devices were better, 1% similar, 96% worse
» The best had a delta of 4%, average was 24%, worst was 134%
Apple MacBook Pro 14 2021 M1 Pro Entry audio analysis
(+) | speakers can play relatively loud (84.9 dB)
Bass 100 - 315 Hz
(+) | good bass - only 4.3% away from median
(+) | bass is linear (5.9% delta to prev. frequency)
Mids 400 - 2000 Hz
(+) | balanced mids - only 1.1% away from median
(+) | mids are linear (1.9% delta to prev. frequency)
Highs 2 - 16 kHz
(+) | balanced highs - only 2.9% away from median
(+) | highs are linear (3% delta to prev. frequency)
Overall 100 - 16.000 Hz
(+) | overall sound is linear (5.6% difference to median)
Compared to same class
» 2% of all tested devices in this class were better, 1% similar, 97% worse
» The best had a delta of 5%, average was 17%, worst was 45%
Compared to all devices tested
» 0% of all tested devices were better, 0% similar, 100% worse
» The best had a delta of 4%, average was 24%, worst was 134%
Power Consumption
In our measurements during idle operation, the more expensive version of the MacBook Air M2 consumes slightly more power than the basic version. Here, the differences between the chips might play a role, but our test unit also has more storage/RAM modules that also require power. As soon as you put a heavier load on the MacBook, you will then again see clearly that the 35-Watt charger is the limiting factor. Using a 100-Watt charger, we were able to see a maximum power consumption of slightly higher than 55 watts and afterwards also of ~38 watts for some time.
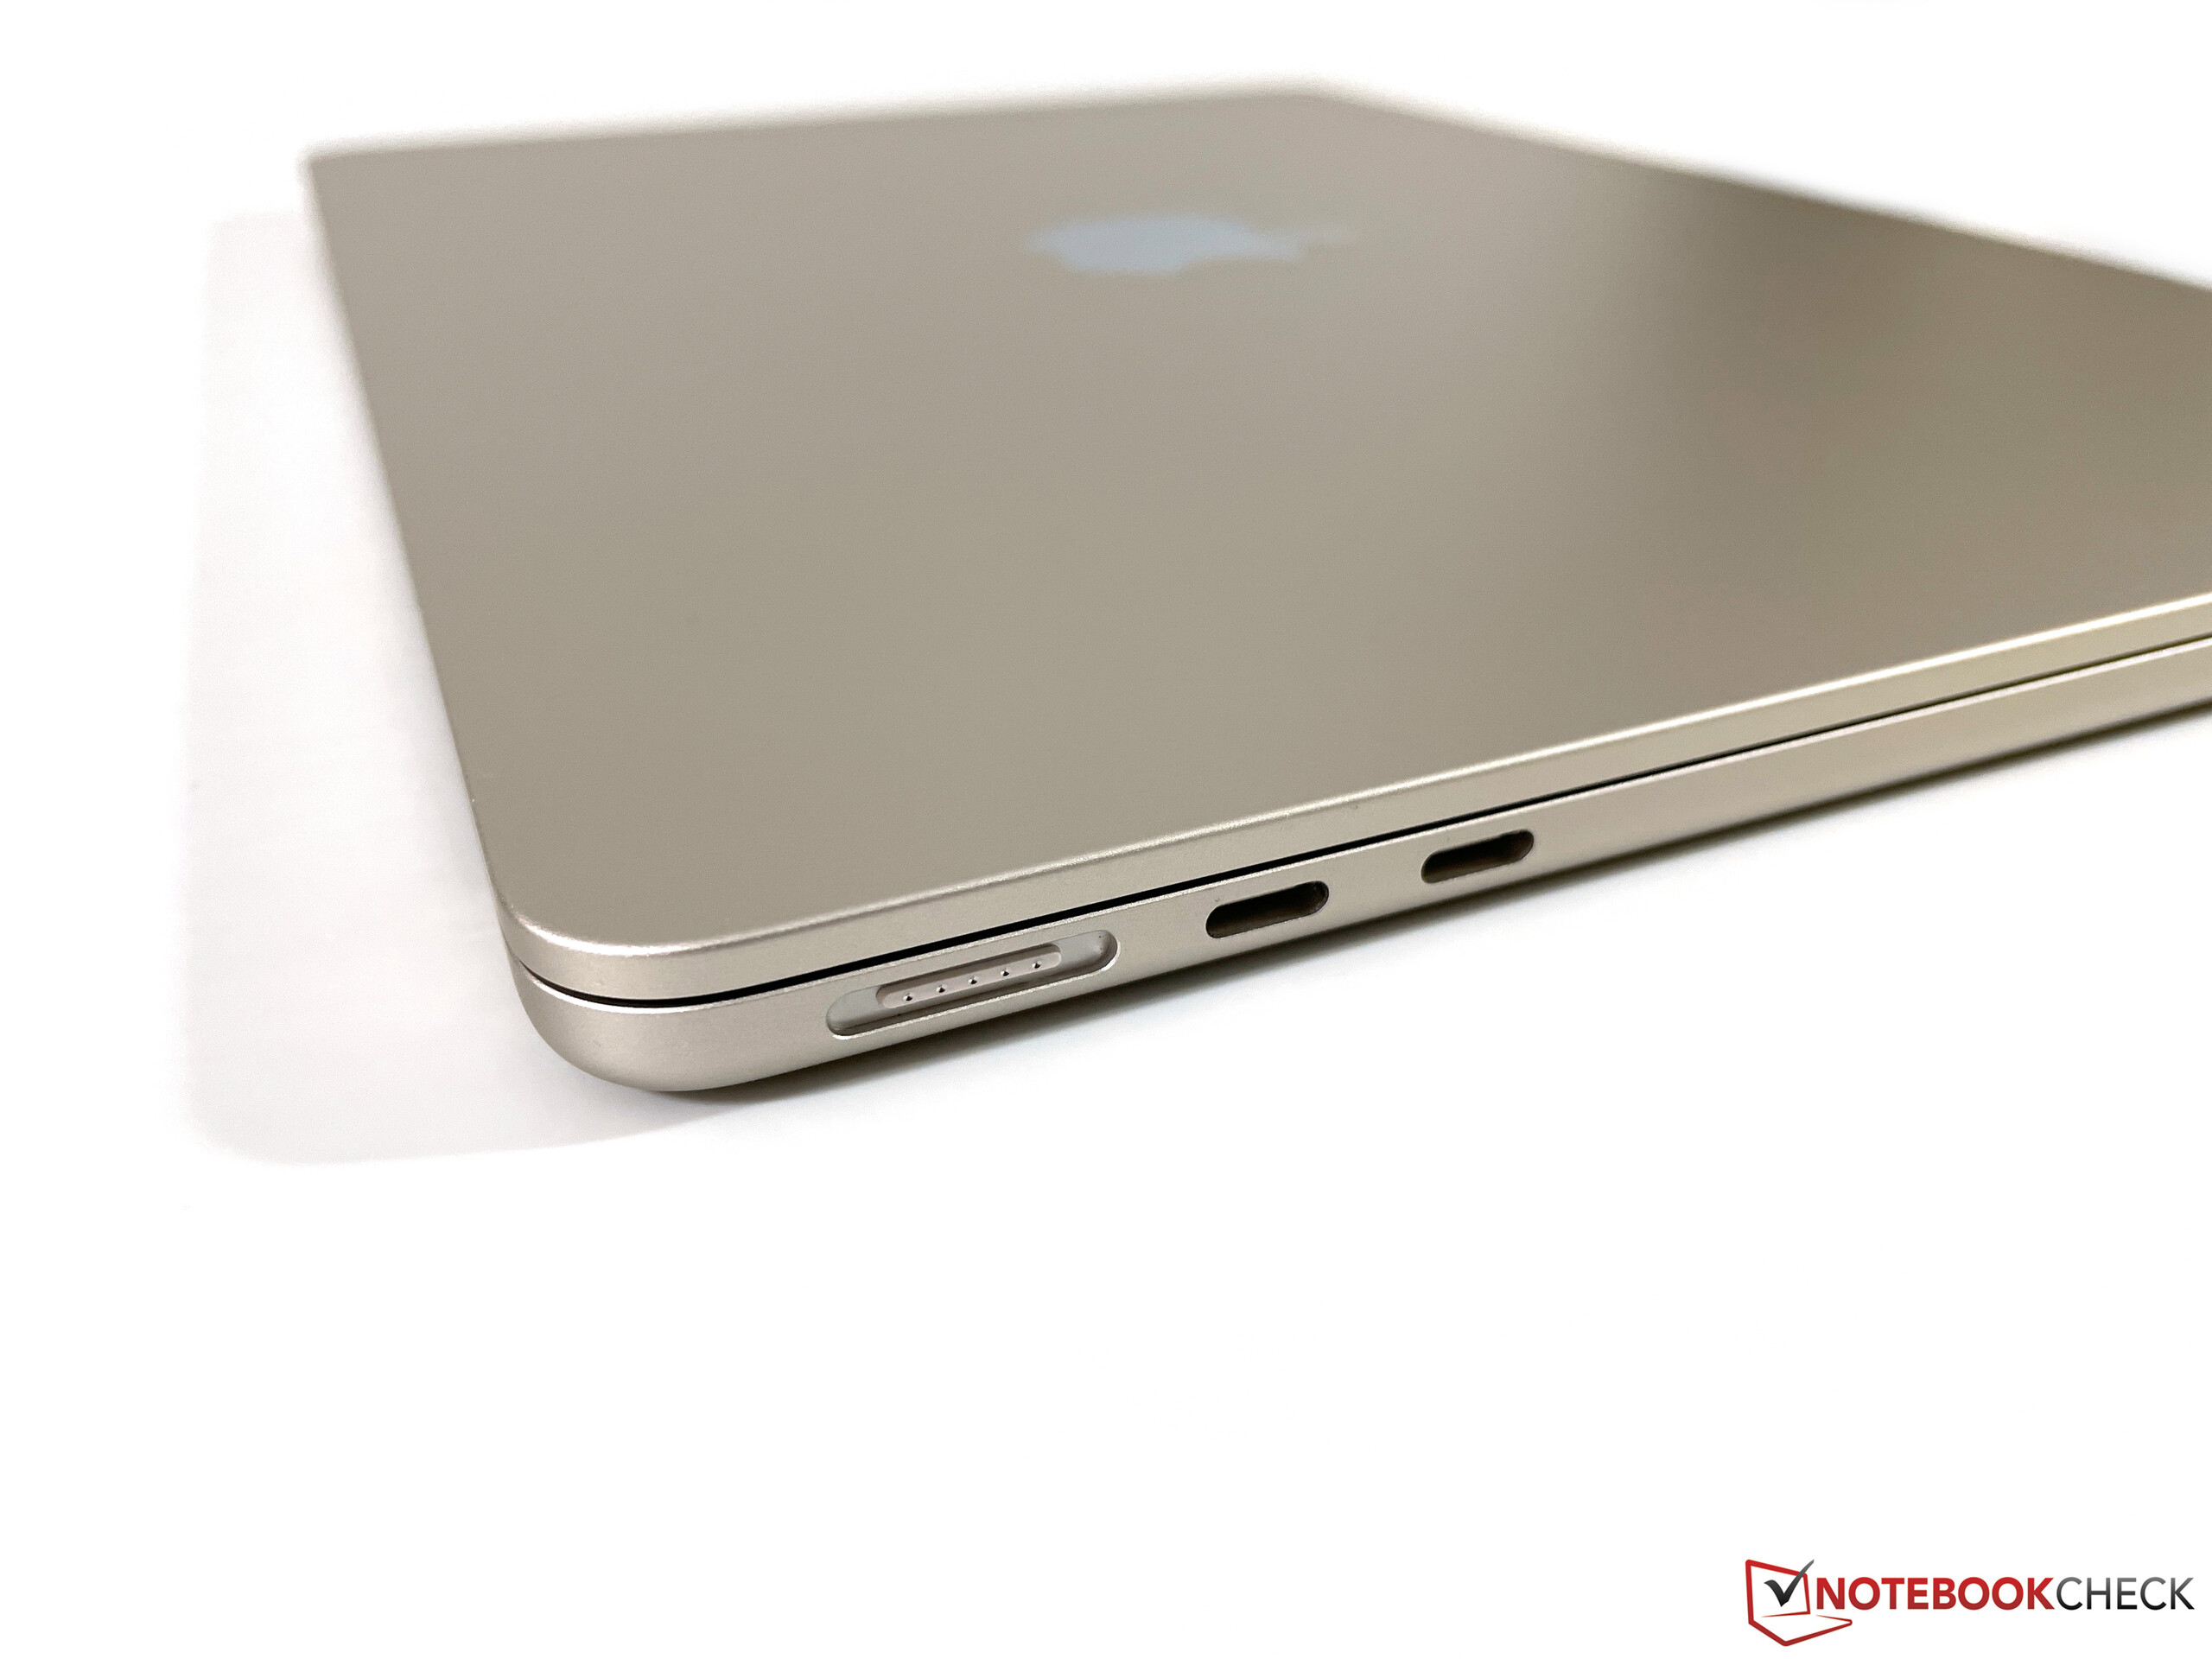
In the more-expensive models of the MacBook Air M2, the new dual USB-C charger is also included. This should be completely sufficient for most users, and the second USB-C connection can also be helpful in many situations. Optionally (and at no additional cost), you can also switch to the more powerful 67-Watt charger, which has a positive effect particularly on the recharging time, since the new MacBook Air M2 will then also support faster charging.
| 30% | 50% | 80% | 90% | 100% | |
|---|---|---|---|---|---|
| 30-Watt charger | 41 minutes | 69 minutes | 111 minutes | 126 minutes | 147 minutes |
| 35-Watt charger | 34 minutes | 57 minutes | 92 minutes | 108 minutes | 122 minutes |
| 100-Watt charger | 17 minutes | 28 minutes | 51 minutes | 66 minutes | 85 minutes |
| Off / Standby | |
| Idle | |
| Load |
|
Key:
min: | |
| Apple MacBook Air M2 10C GPU M2 10-Core GPU, M2, Apple SSD AP1024Z | Apple MacBook Air M2 Entry M2 8-Core GPU, M2, Apple SSD AP0256Z | Apple MacBook Pro 13 2022 M2 M2 10-Core GPU, M2, Apple SSD AP1024Z | Apple MacBook Pro 14 2021 M1 Pro Entry M1 Pro 14-Core GPU, M1 Pro 8-Core, Apple SSD AP0512 | Asus Zenbook S 13 OLED Radeon 680M, R7 6800U, Samsung PM9A1 MZVL21T0HCLR | Dell XPS 13 Plus 9320 4K Iris Xe G7 96EUs, i7-1260P, Samsung PM9A1 MZVL21T0HCLR | |
|---|---|---|---|---|---|---|
| Power Consumption | 8% | -2% | -55% | -44% | -87% | |
| Idle Minimum * (Watt) | 1.9 | 1.87 2% | 1.77 7% | 2.9 -53% | 4.8 -153% | 7 -268% |
| Idle Average * (Watt) | 9.6 | 9.2 4% | 6.7 30% | 11.6 -21% | 8.7 9% | 11 -15% |
| Idle Maximum * (Watt) | 9.7 | 9.3 4% | 6.9 29% | 11.9 -23% | 10.1 -4% | 11.4 -18% |
| Load Average * (Watt) | 32.4 | 28.5 12% | 30.9 5% | 49.5 -53% | 45.6 -41% | 59.7 -84% |
| Witcher 3 ultra * (Watt) | 30.8 | 27.4 11% | 38.9 -26% | 58.2 -89% | 42.4 -38% | 49.4 -60% |
| Load Maximum * (Watt) | 35.7 | 31 13% | 56 -57% | 68.5 -92% | 49.5 -39% | 63 -76% |
* ... smaller is better
Power Consumption The Witcher 3 / Stress Test
Power Consumption With External Monitor
Battery Life
Due to the slightly higher power consumption, the measured battery life also turns out slightly worse than was the case with the basic model. However, the runtimes in the WLAN test and when playing videos are still very good if the display brightness is adjusted to 150 cd/m². At full brightness, the battery life is significantly shorter.
The comparison with the MacBook Pro 14 is interesting again here, since although the runtime is about one hour shorter at 150 cd/m², the MacBook Pro 14 lasts even slightly longer when adjusted to the full SDR brightness (which is comparable to that of the new MacBook Air M2). While the new Air M2 doesn't quite last for a full 6 hours in the WLAN test, the MacBook Pro 14 is able to last for 6.5 hours.
| Apple MacBook Air M2 10C GPU M2, M2 10-Core GPU, 52.6 Wh | Apple MacBook Air M2 Entry M2, M2 8-Core GPU, 52.6 Wh | Apple MacBook Pro 13 2022 M2 M2, M2 10-Core GPU, 58.2 Wh | Apple MacBook Pro 14 2021 M1 Pro Entry M1 Pro 8-Core, M1 Pro 14-Core GPU, 69.9 Wh | Asus Zenbook S 13 OLED R7 6800U, Radeon 680M, 67 Wh | Dell XPS 13 Plus 9320 4K i7-1260P, Iris Xe G7 96EUs, 55 Wh | Average of class Subnotebook | |
|---|---|---|---|---|---|---|---|
| Battery runtime | 4% | 26% | -6% | -21% | -42% | -4% | |
| H.264 (h) | 15.8 | 16.5 4% | 19.2 22% | 15 -5% | 15.2 -4% | 11 -30% | 15.7 ? -1% |
| WiFi v1.3 (h) | 14.7 | 15.2 3% | 19.1 30% | 13.6 -7% | 9.2 -37% | 6.9 -53% | 13.8 ? -6% |
Pros
Cons
Verdict - The upgrades make the MacBook Air M2 too expensive
After we already tested the basic version of the new MacBook Air M2 extensively, now the upgrades are only able to impress us to a limited extent. Because of the speed problems with the new 256-GB drives, particularly the larger and faster SSD will probably make most sense for consumers. However, we still have to hold it against Apple that this is a PCIe 3.0 connection instead of a faster PCIe 4.0 drive, despite the hefty additional cost. In addition, we think that the basic version for 1,499 Euros (~$1,545) should already be equipped with a 512 GB SSD. The upgrade to more working memory might also make sense, particularly if you often use third-party software (such as Google Chrome with a bunch of open tabs) or emulated software.
On the other hand, the faster GPU is completely pointless in our opinion. Functionally, there is no difference to the basic model, and the performance advantage already shrinks considerably after a few minutes, so that while gaming, for example, there is no significant advantage compared to the 8-core GPU anymore. Although there is an advantage of about 20% in short benchmarks, this doesn't make much of a difference in practice, since the faster GPU also has to throttle faster due to the higher power consumption. Those who want to take advantage of the full graphics performance of the M2 on a constant basis are forced to choose the MacBook Pro 13 M2 with the active cooling.
The additional premium for the faster 10-core GPU in the new MacBook Air M2 isn't worth it. Even though the upgrades for the RAM and SSD are very expensive as is typical for Apple, particularly the SSD upgrade to at least 512 GB is definitely worth a recommendation. If you then also upgrade the working memory, you end up in the price range of the significantly more powerful and better-equipped MacBook Pro 14.
However, the largest problem of the new MacBook Air M2 with the upgrades is the price, since the MacBook Air M2 is currently slightly more expensive than a comparably-equipped MacBook Pro 14 (starting from ~1,950 Euros (~$2,010) with 16 GB RAM and 512-GB SSD), although that offers many advantages (more connections, significantly higher performance, Mini-LED panel with high HDR brightness, better speakers). The footprint of the new Air M2 is not that much smaller (the new Air is also bested by the Asus ZenBook S 13 and Dell XPS 13 Plus competitors here). The only two real advantages are the significantly slimmer case and the weight being around 400 grams (~0.9 lb.) lighter. So those who don't necessarily need the lightest MacBook and are willing to pay around 2,000 Euros (~$2,061) are perhaps better served with the MacBook Pro 14.
But all that doesn't change the fact that the more-expensive version of the MacBook Air M2 also works extremely well in everyday operation and is also simply a very good subnotebook. While you can definitely debate the price-performance ratio, this doesn't play any role in the evaluation of the device qualities.
Price and Availability
The MacBook Air M2 can be configured in the Apple Store and has a price starting from $1,199. Our test configuration is available for $1,899. Amazon also lists a version for $1,499.
Apple MacBook Air M2 10C GPU
- 08/11/2022 v7 (old)
Andreas Osthoff
Price comparison

