Huawei MateBook 13s Review: Great subnotebook with 90 Hz display
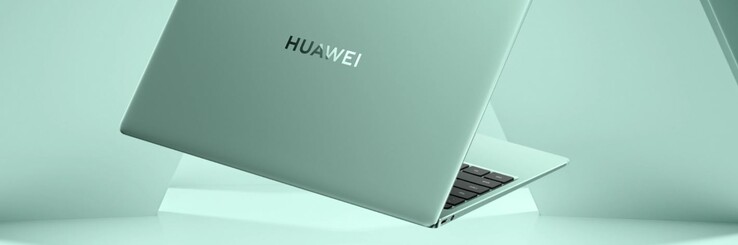
In addition to the 14-inch MateBook 14s we reviewed a couple of months ago, Huawei also offers a more compact version with a 13.4-inch display. The MateBook 13s also uses an Intel Tiger Lake-H35 processor, but contrary to the 14-inch device the slightly slower Core i5-11300H. Priced at 1120 Euros, the subnotebook also offers 16 GB RAM, 512 GB NVMe SSD storage as well as a high-resolution 2.5K touchscreen with a 3:2 aspect ratio and a fresh rate of 90 Hz.
Potential rivals
Rating | Date | Model | Weight | Height | Size | Resolution | Price |
|---|---|---|---|---|---|---|---|
| 88.8 % v7 (old) | 02 / 2022 | Huawei MateBook 13s i5 11300H i5-11300H, Iris Xe G7 80EUs | 1.3 kg | 16.5 mm | 13.40" | 2520x1680 | |
| 87.8 % v7 (old) | 01 / 2022 | Lenovo ThinkBook 13s G3 20YA0005GE R7 5800U, Vega 8 | 1.3 kg | 14.9 mm | 13.30" | 1920x1200 | |
| 85.2 % v7 (old) | 05 / 2021 | Microsoft Surface Laptop 4 13 Ryzen 5 R5 4680U, Vega 7 | 1.3 kg | 14 mm | 13.50" | 2256x1504 | |
| 88.9 % v7 (old) | 05 / 2021 | Asus ZenBook 13 UX325EA i7-1165G7, Iris Xe G7 96EUs | 1.2 kg | 13.9 mm | 13.30" | 1920x1080 | |
| 91.1 % v7 (old) | 12 / 2020 | Apple MacBook Air 2020 M1 Entry M1, M1 7-Core GPU | 1.3 kg | 16.1 mm | 13.30" | 2560x1600 | |
| 87.7 % v7 (old) | 05 / 2021 | Dell XPS 13 9305 Core i5 FHD i5-1135G7, Iris Xe G7 80EUs | 1.2 kg | 16 mm | 13.30" | 1920x1080 | |
| 84.4 % v7 (old) | 08 / 2021 | HP Pavilion Aero 13 be0097nr R7 5800U, Vega 8 | 953 g | 17 mm | 13.30" | 1920x1200 |
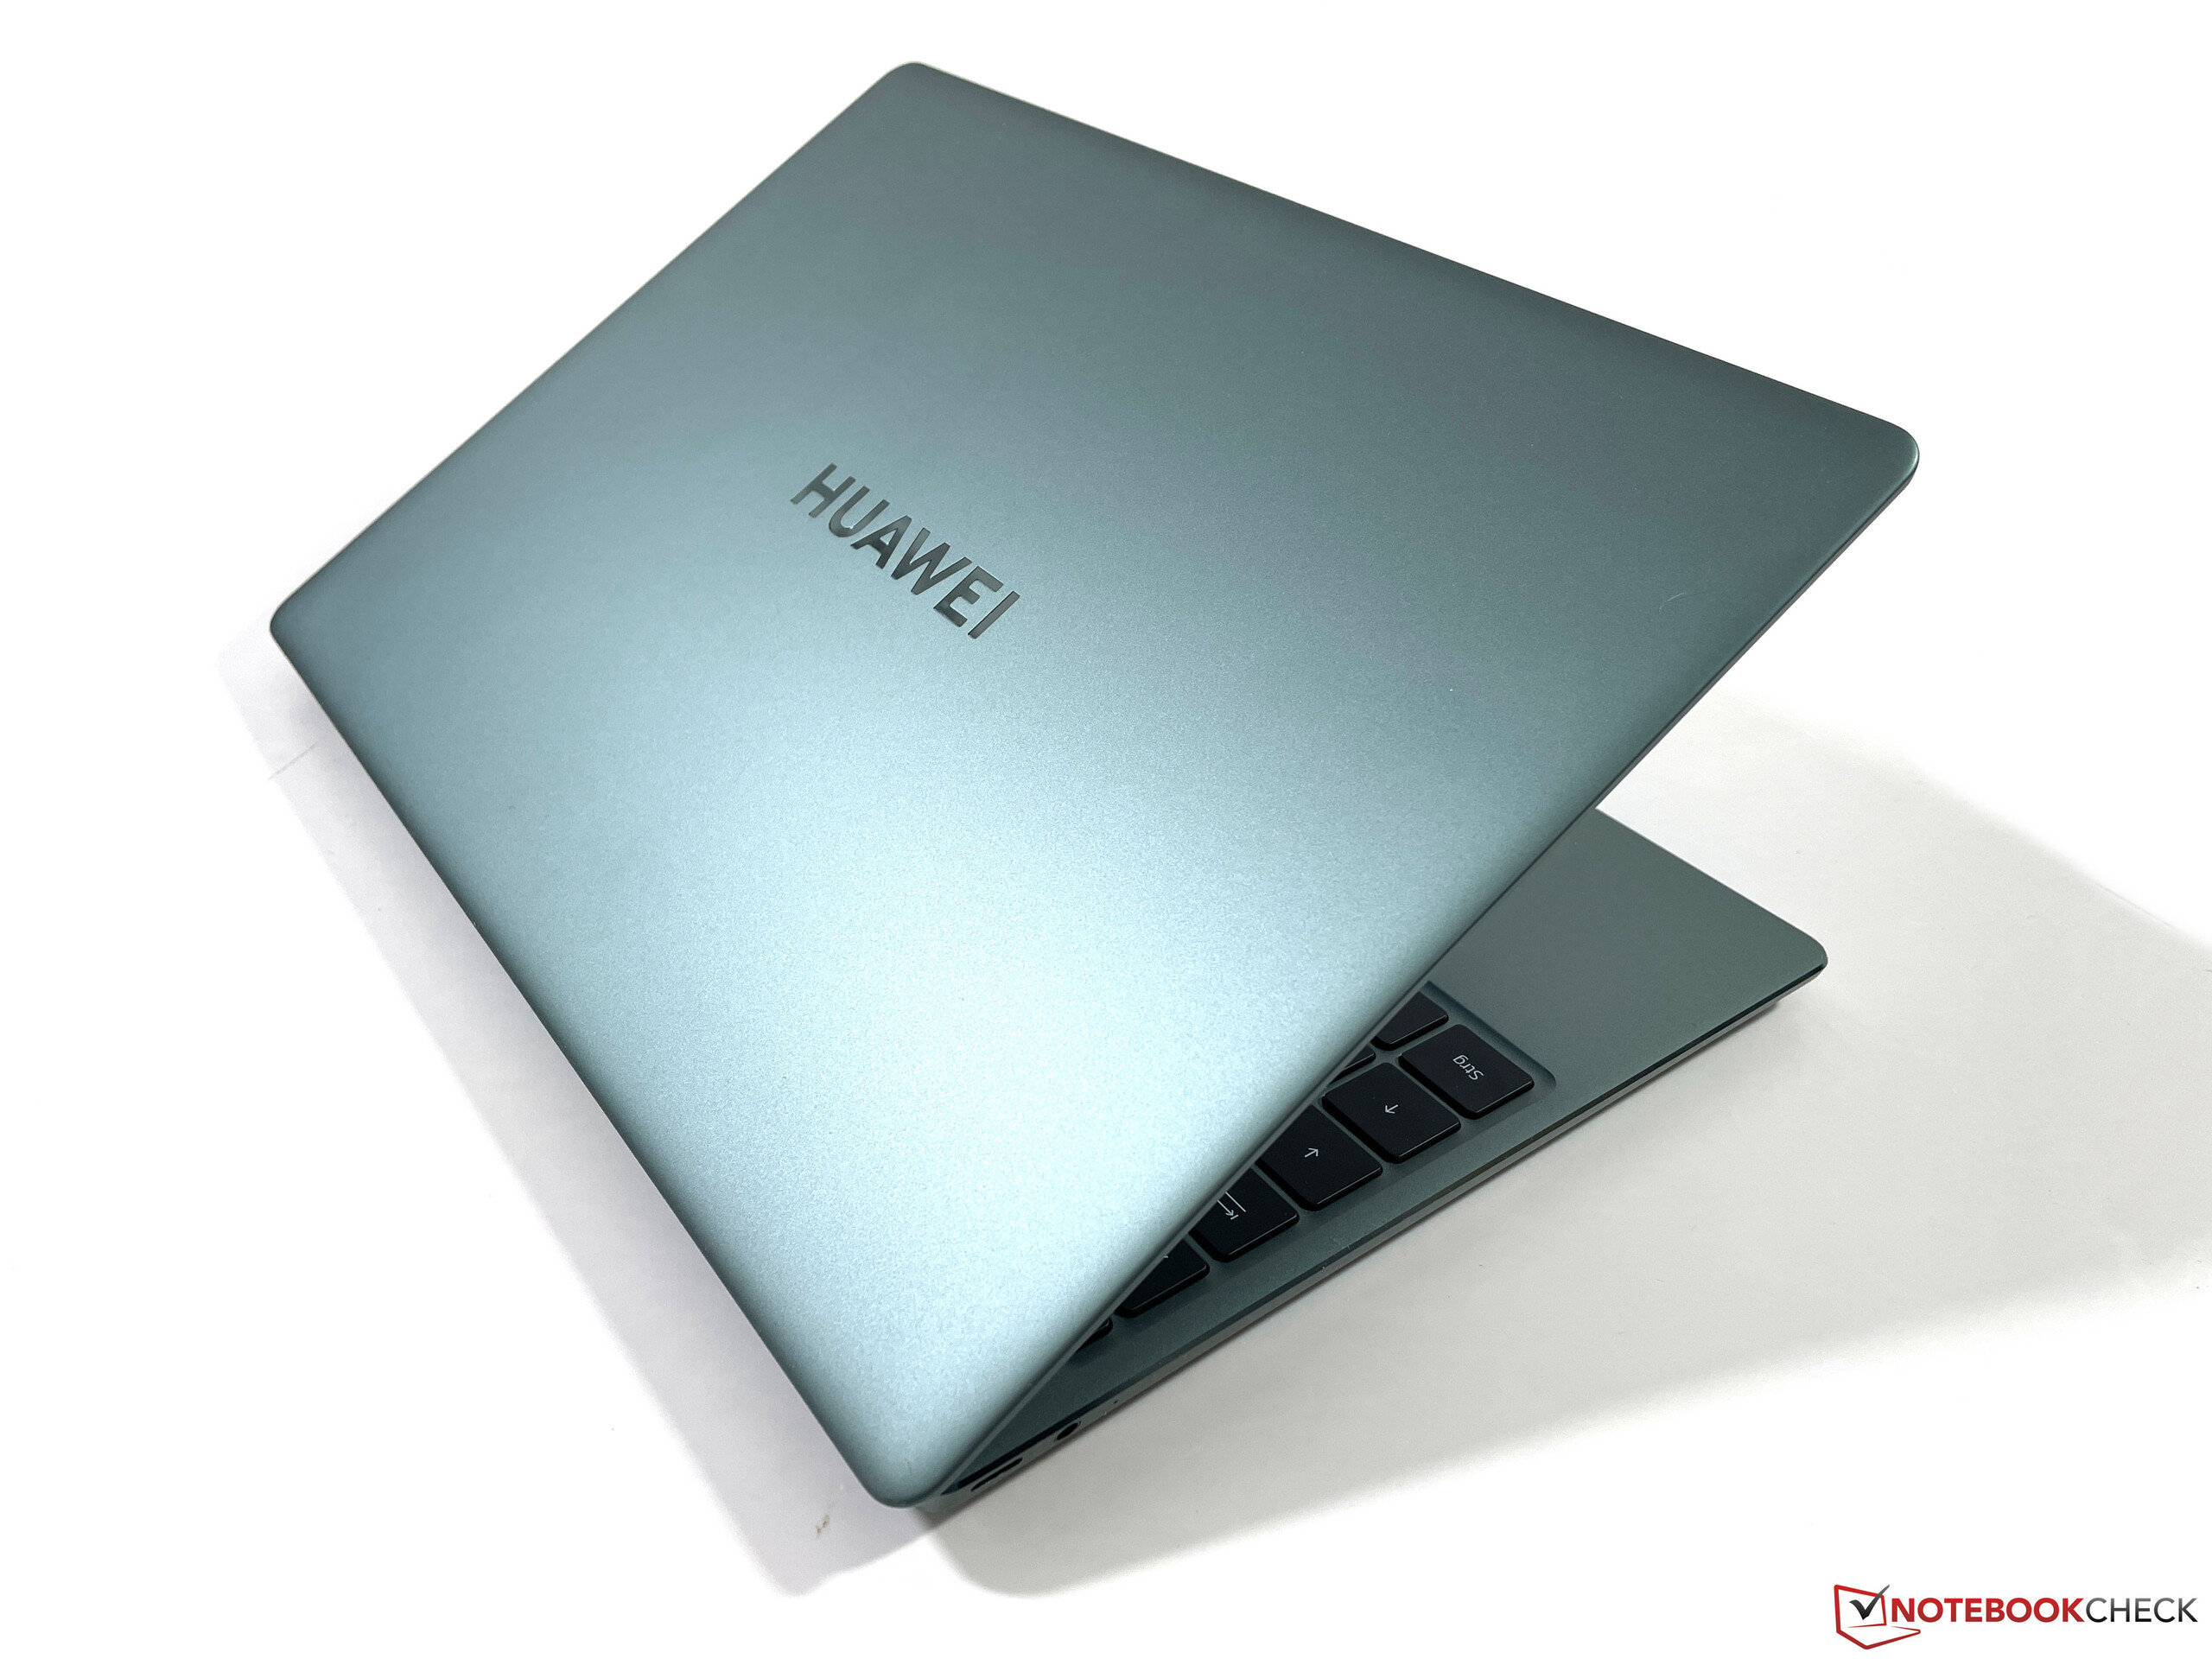
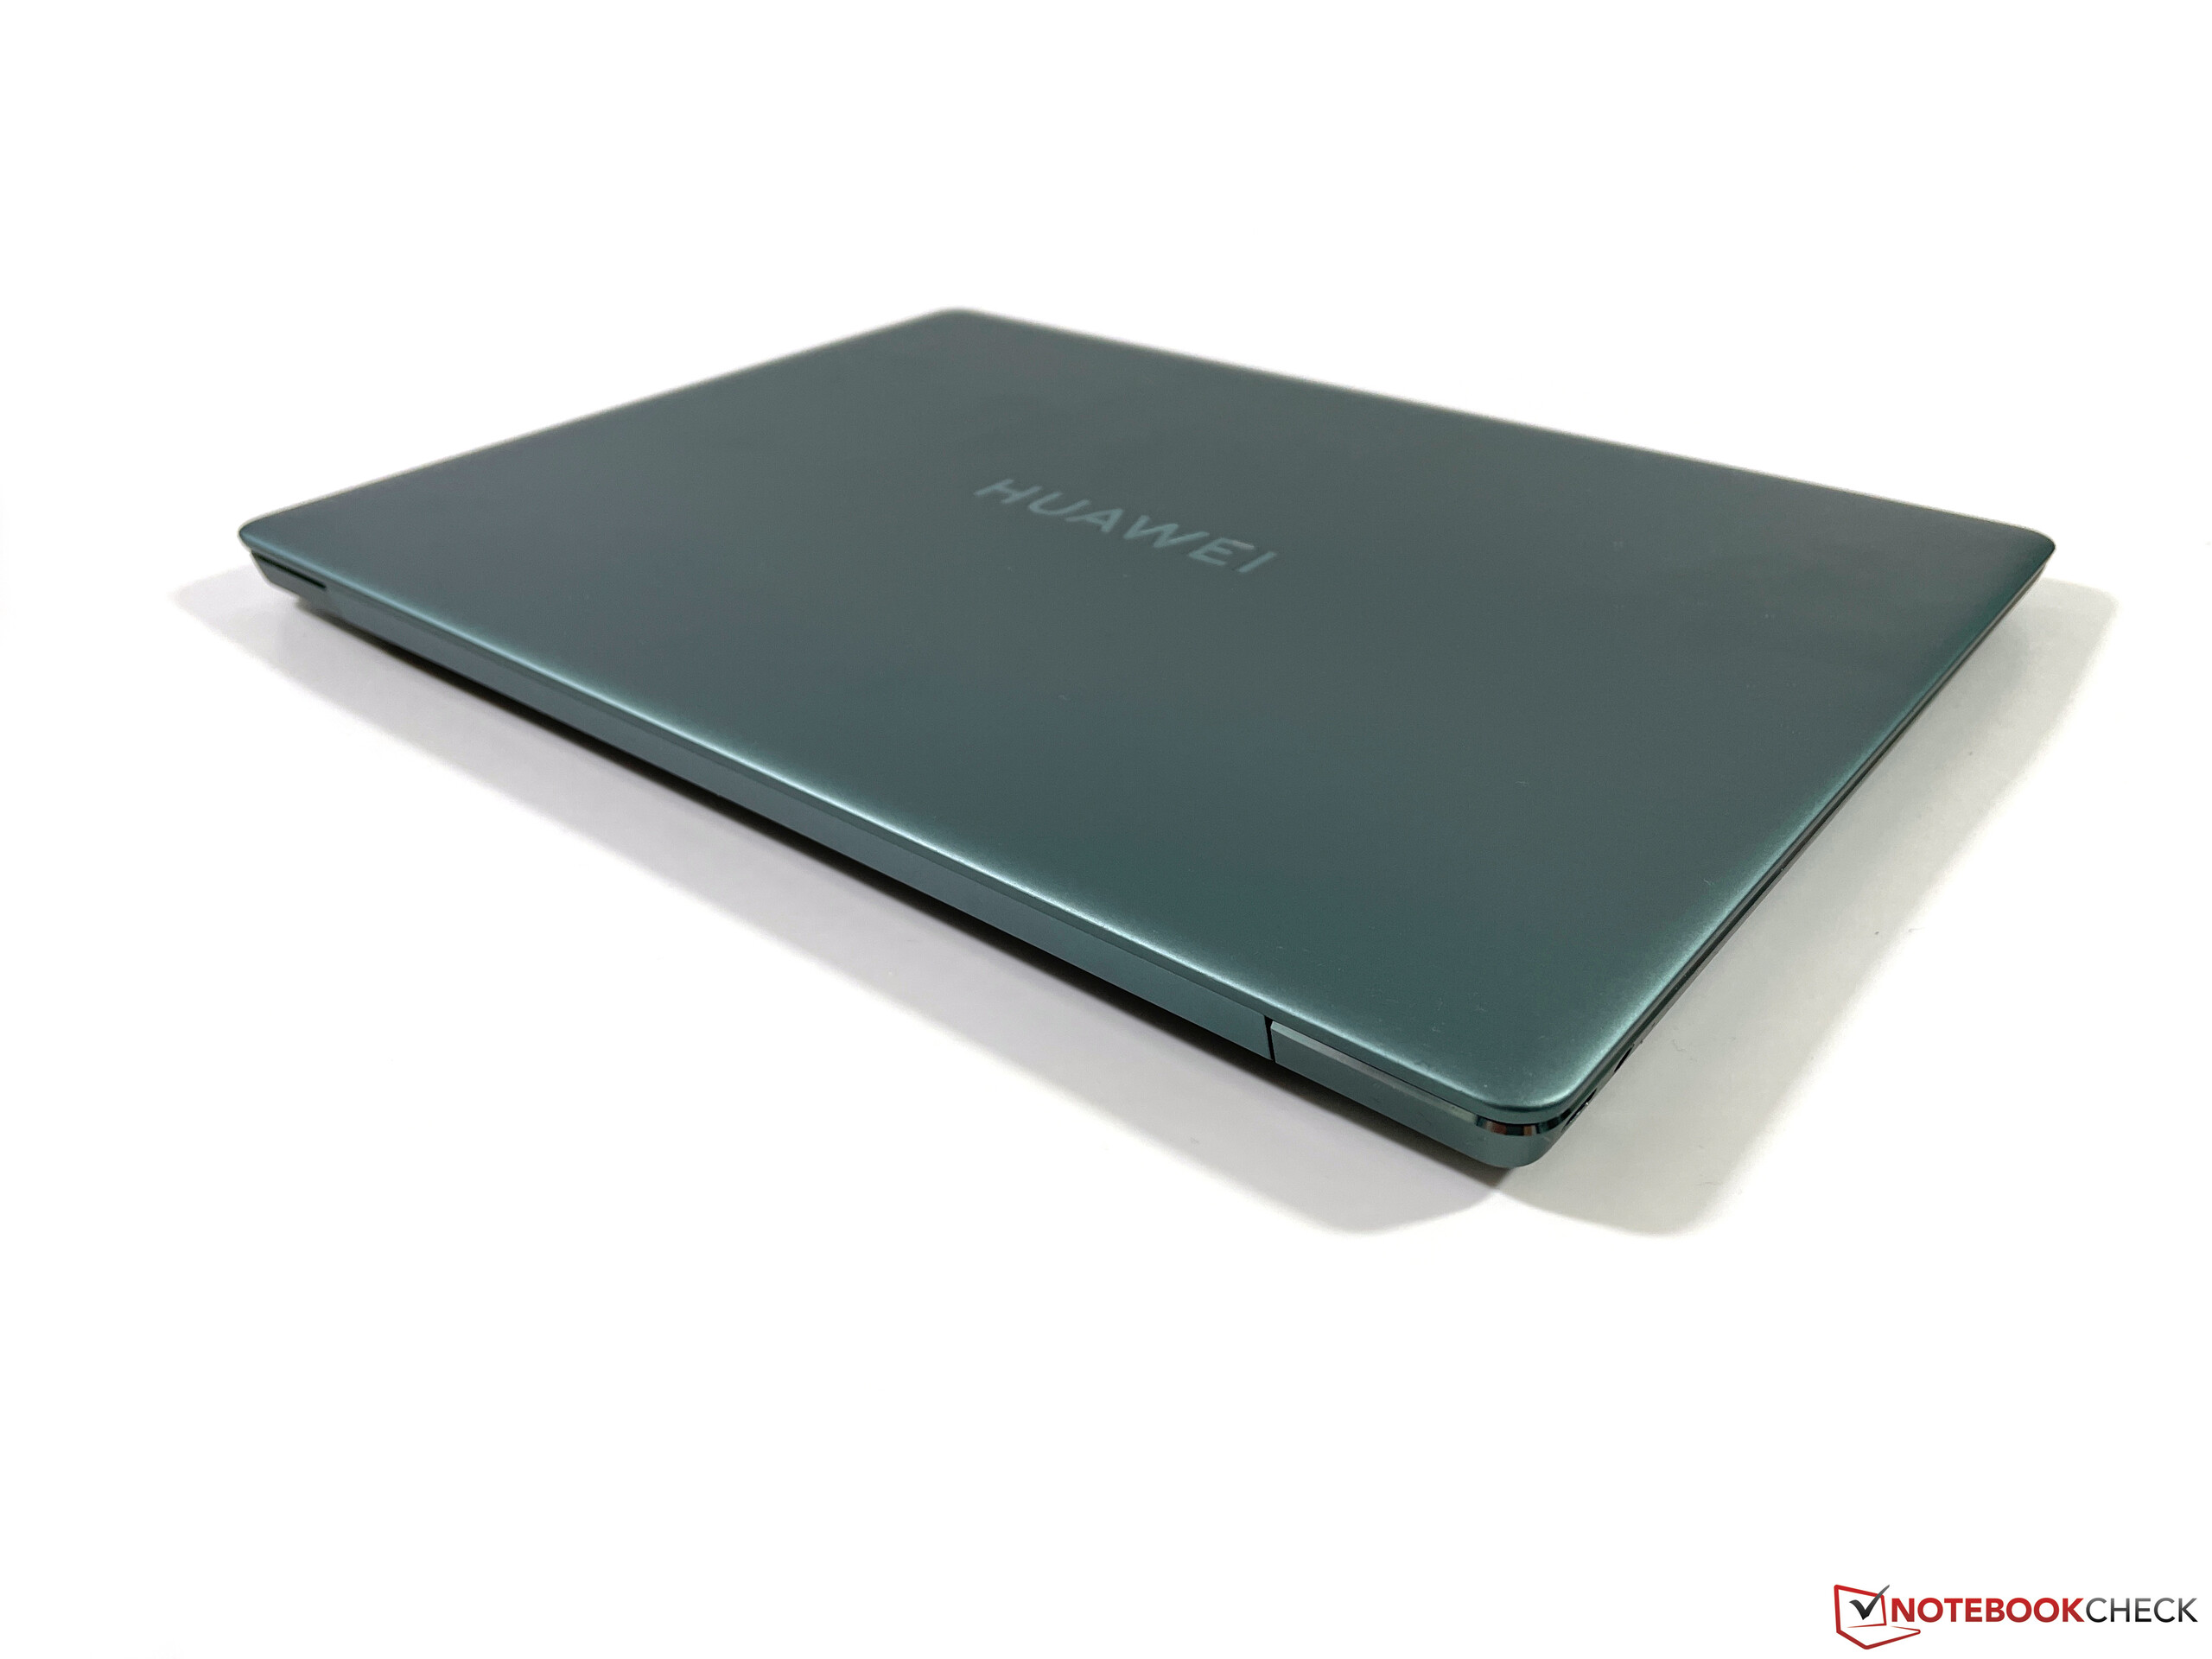
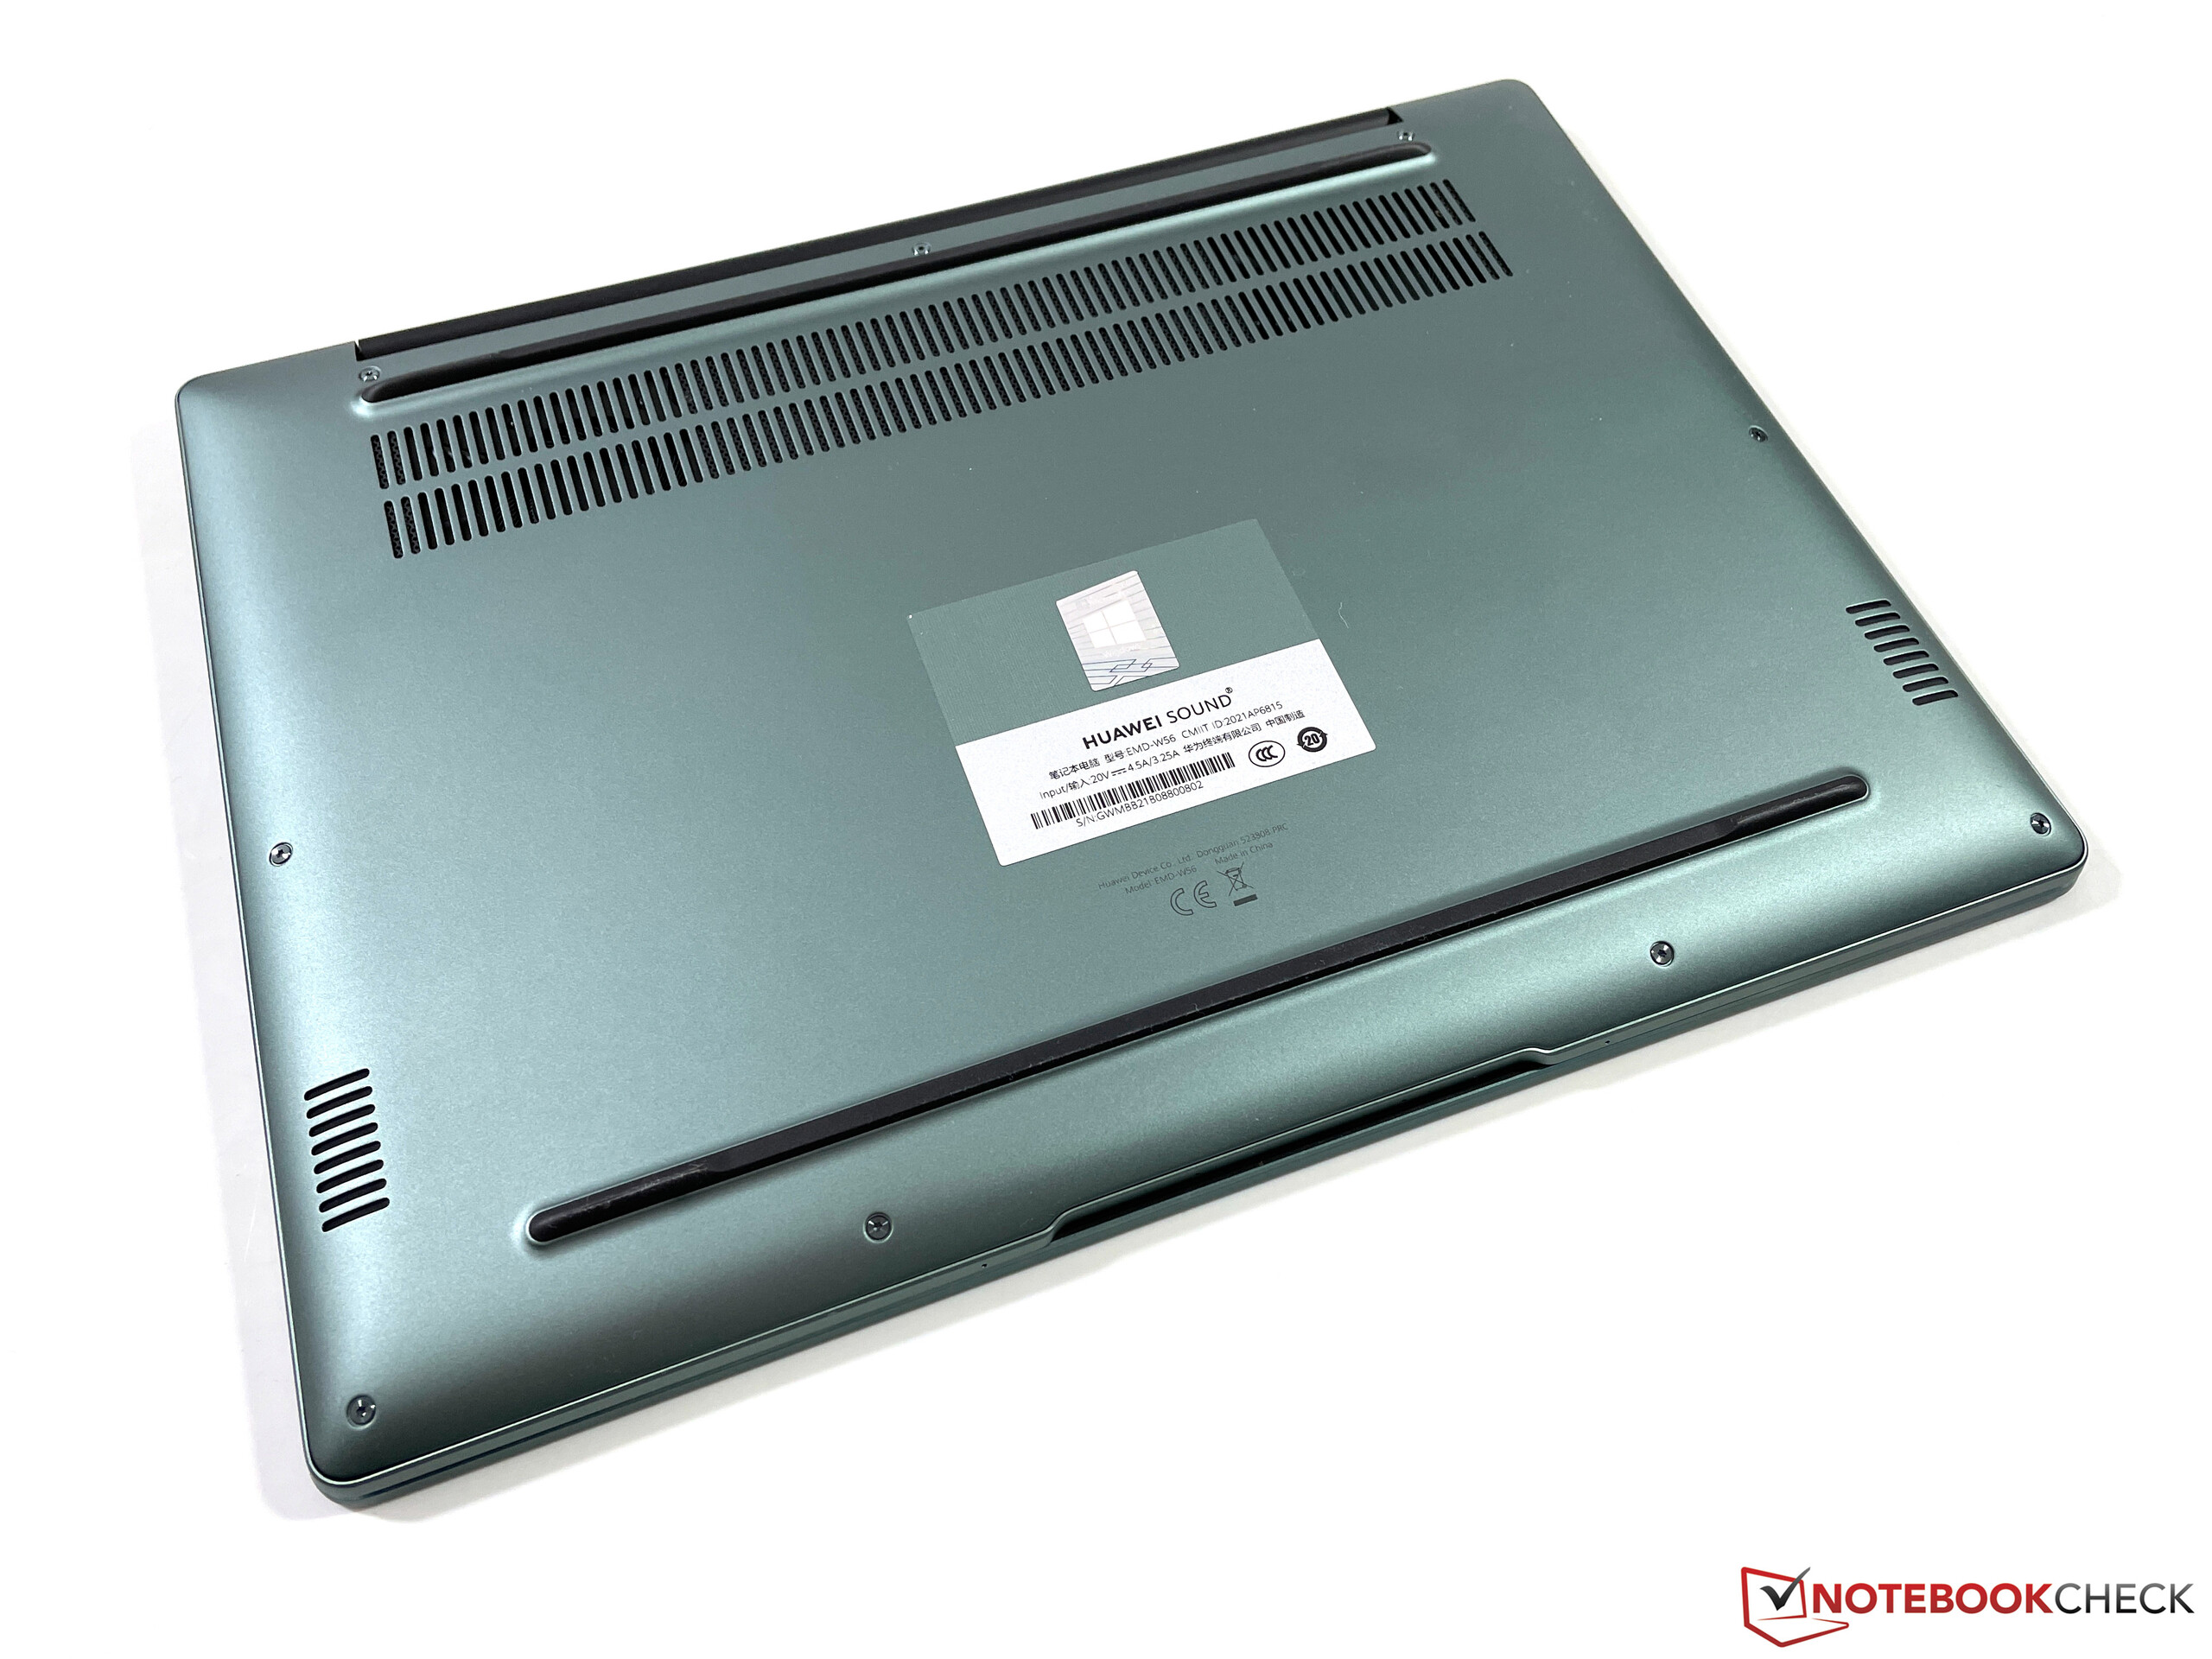
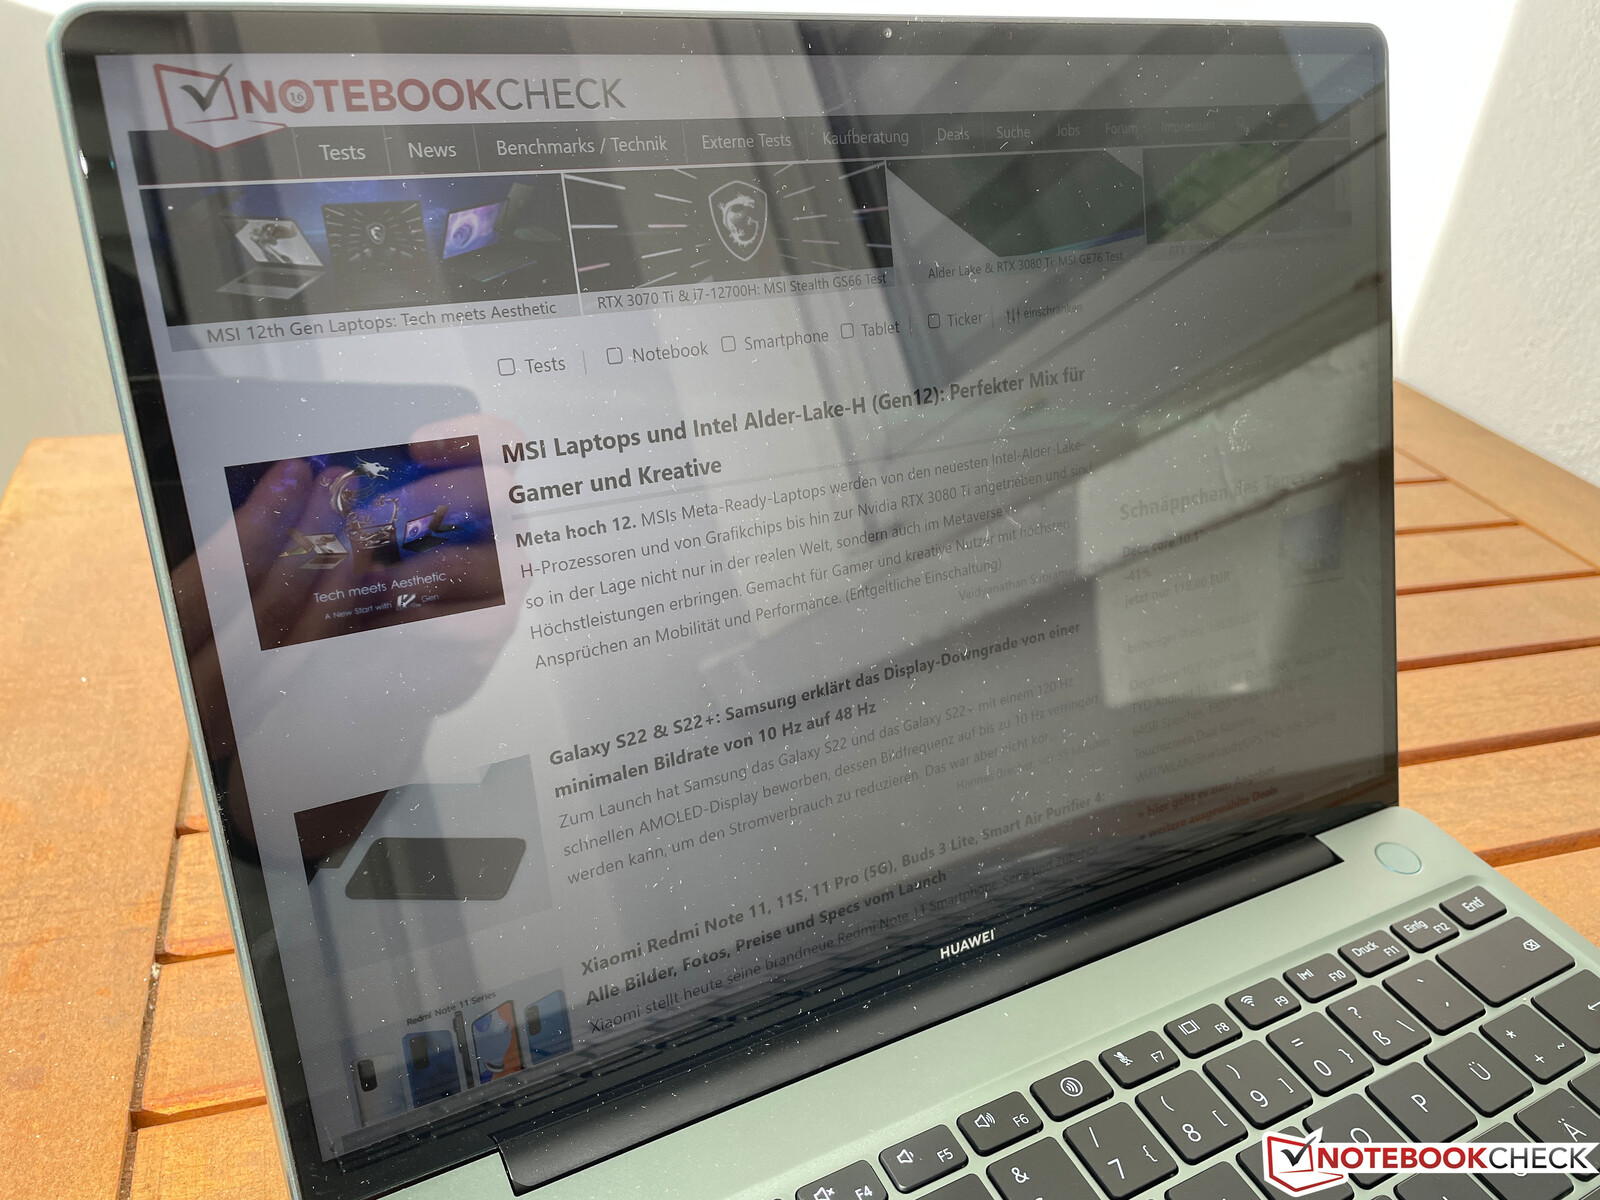
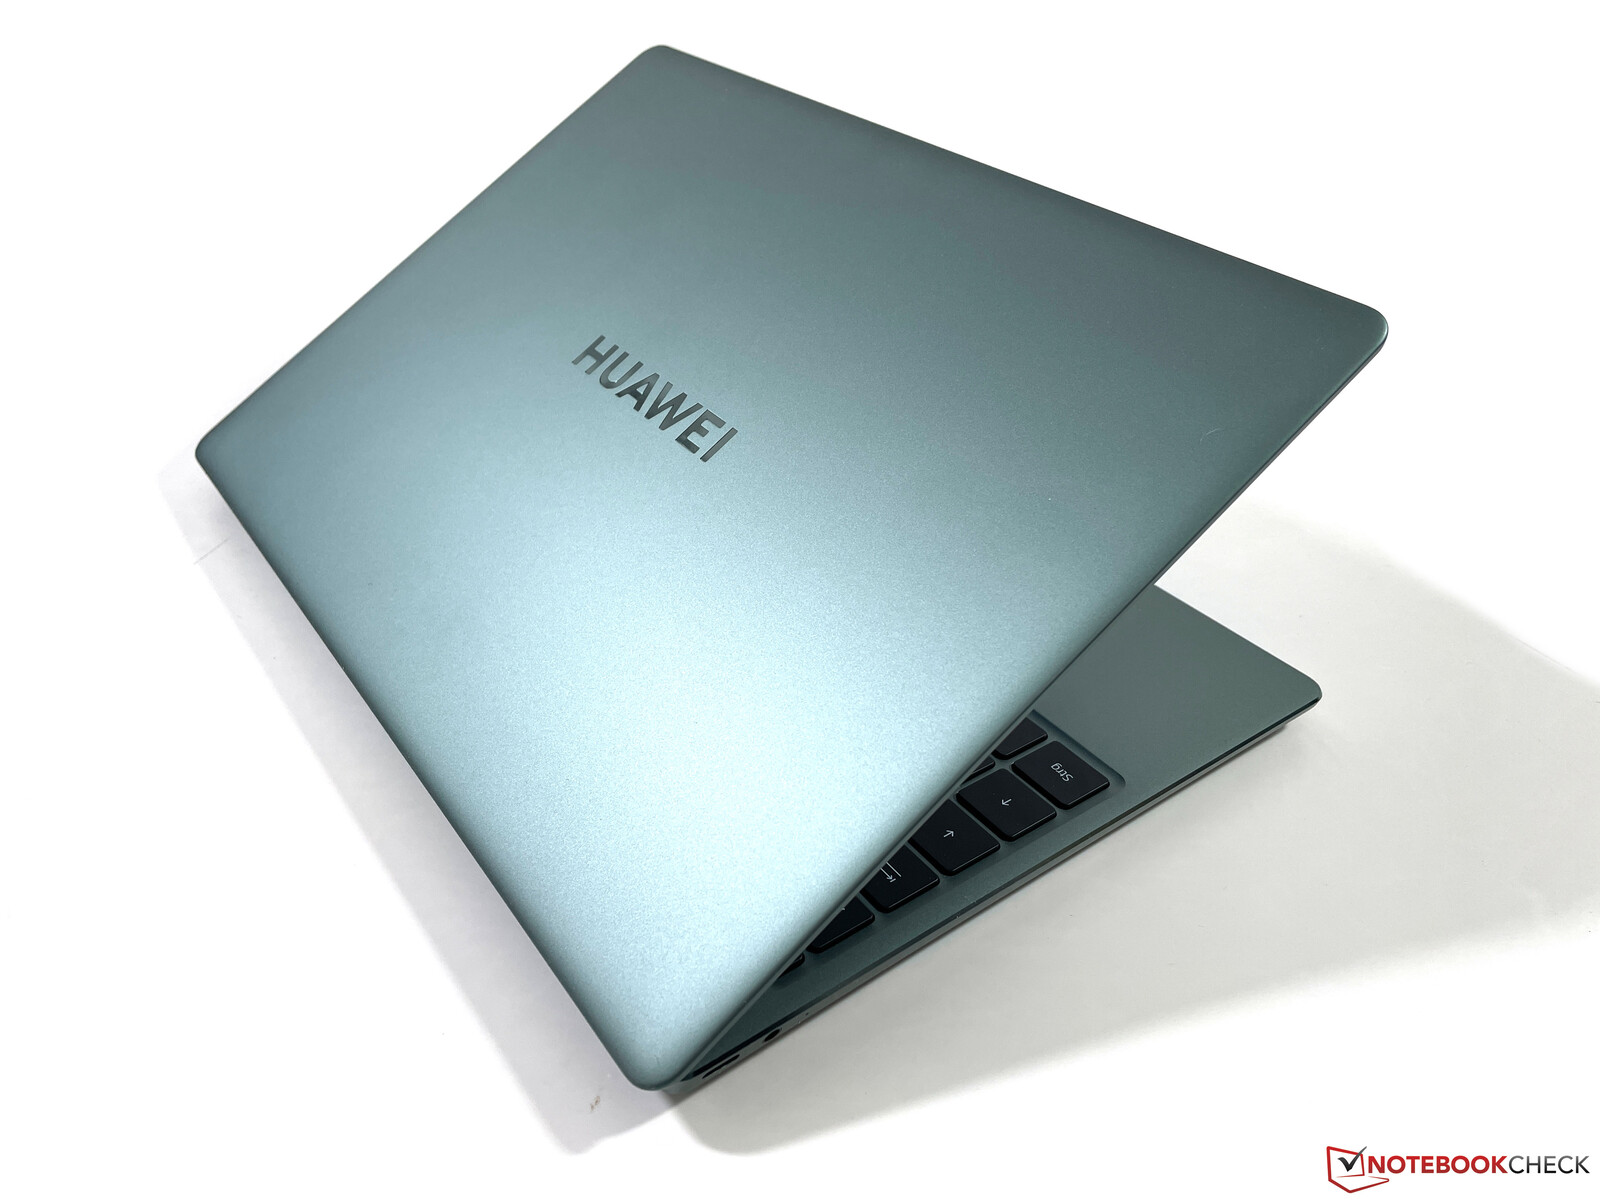
Case - MateBook 13s with metal chassis in spruce green
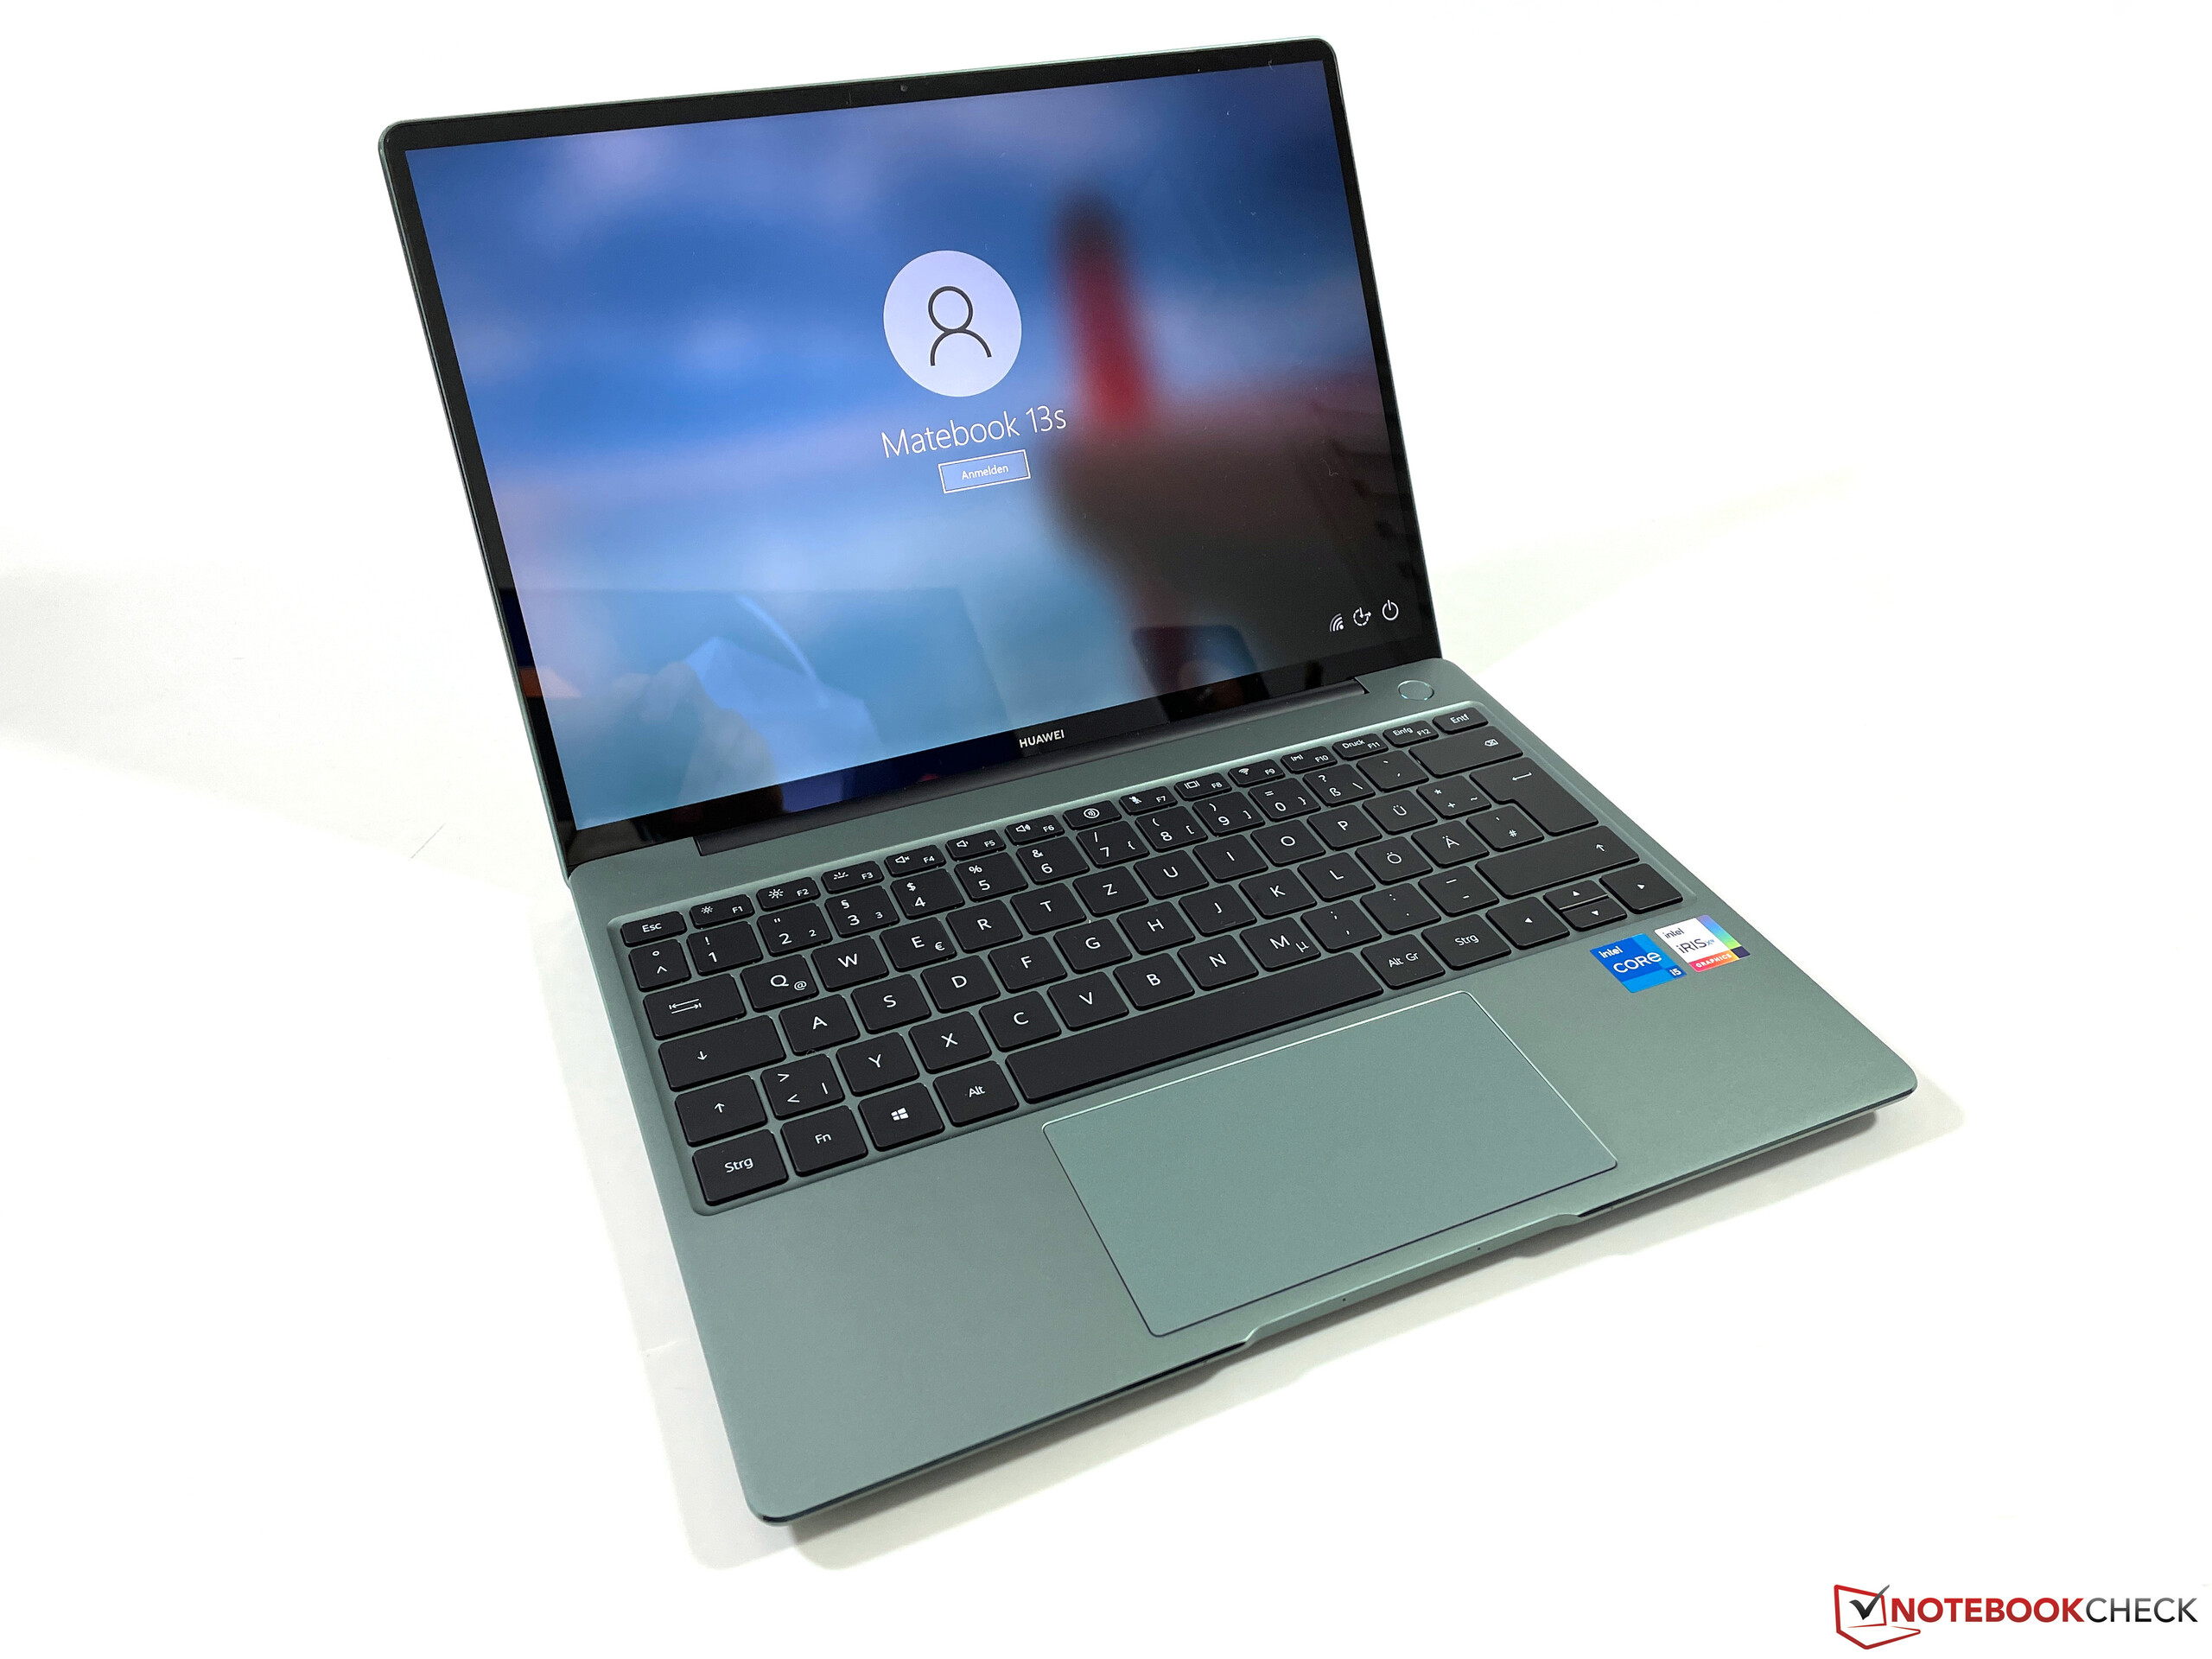
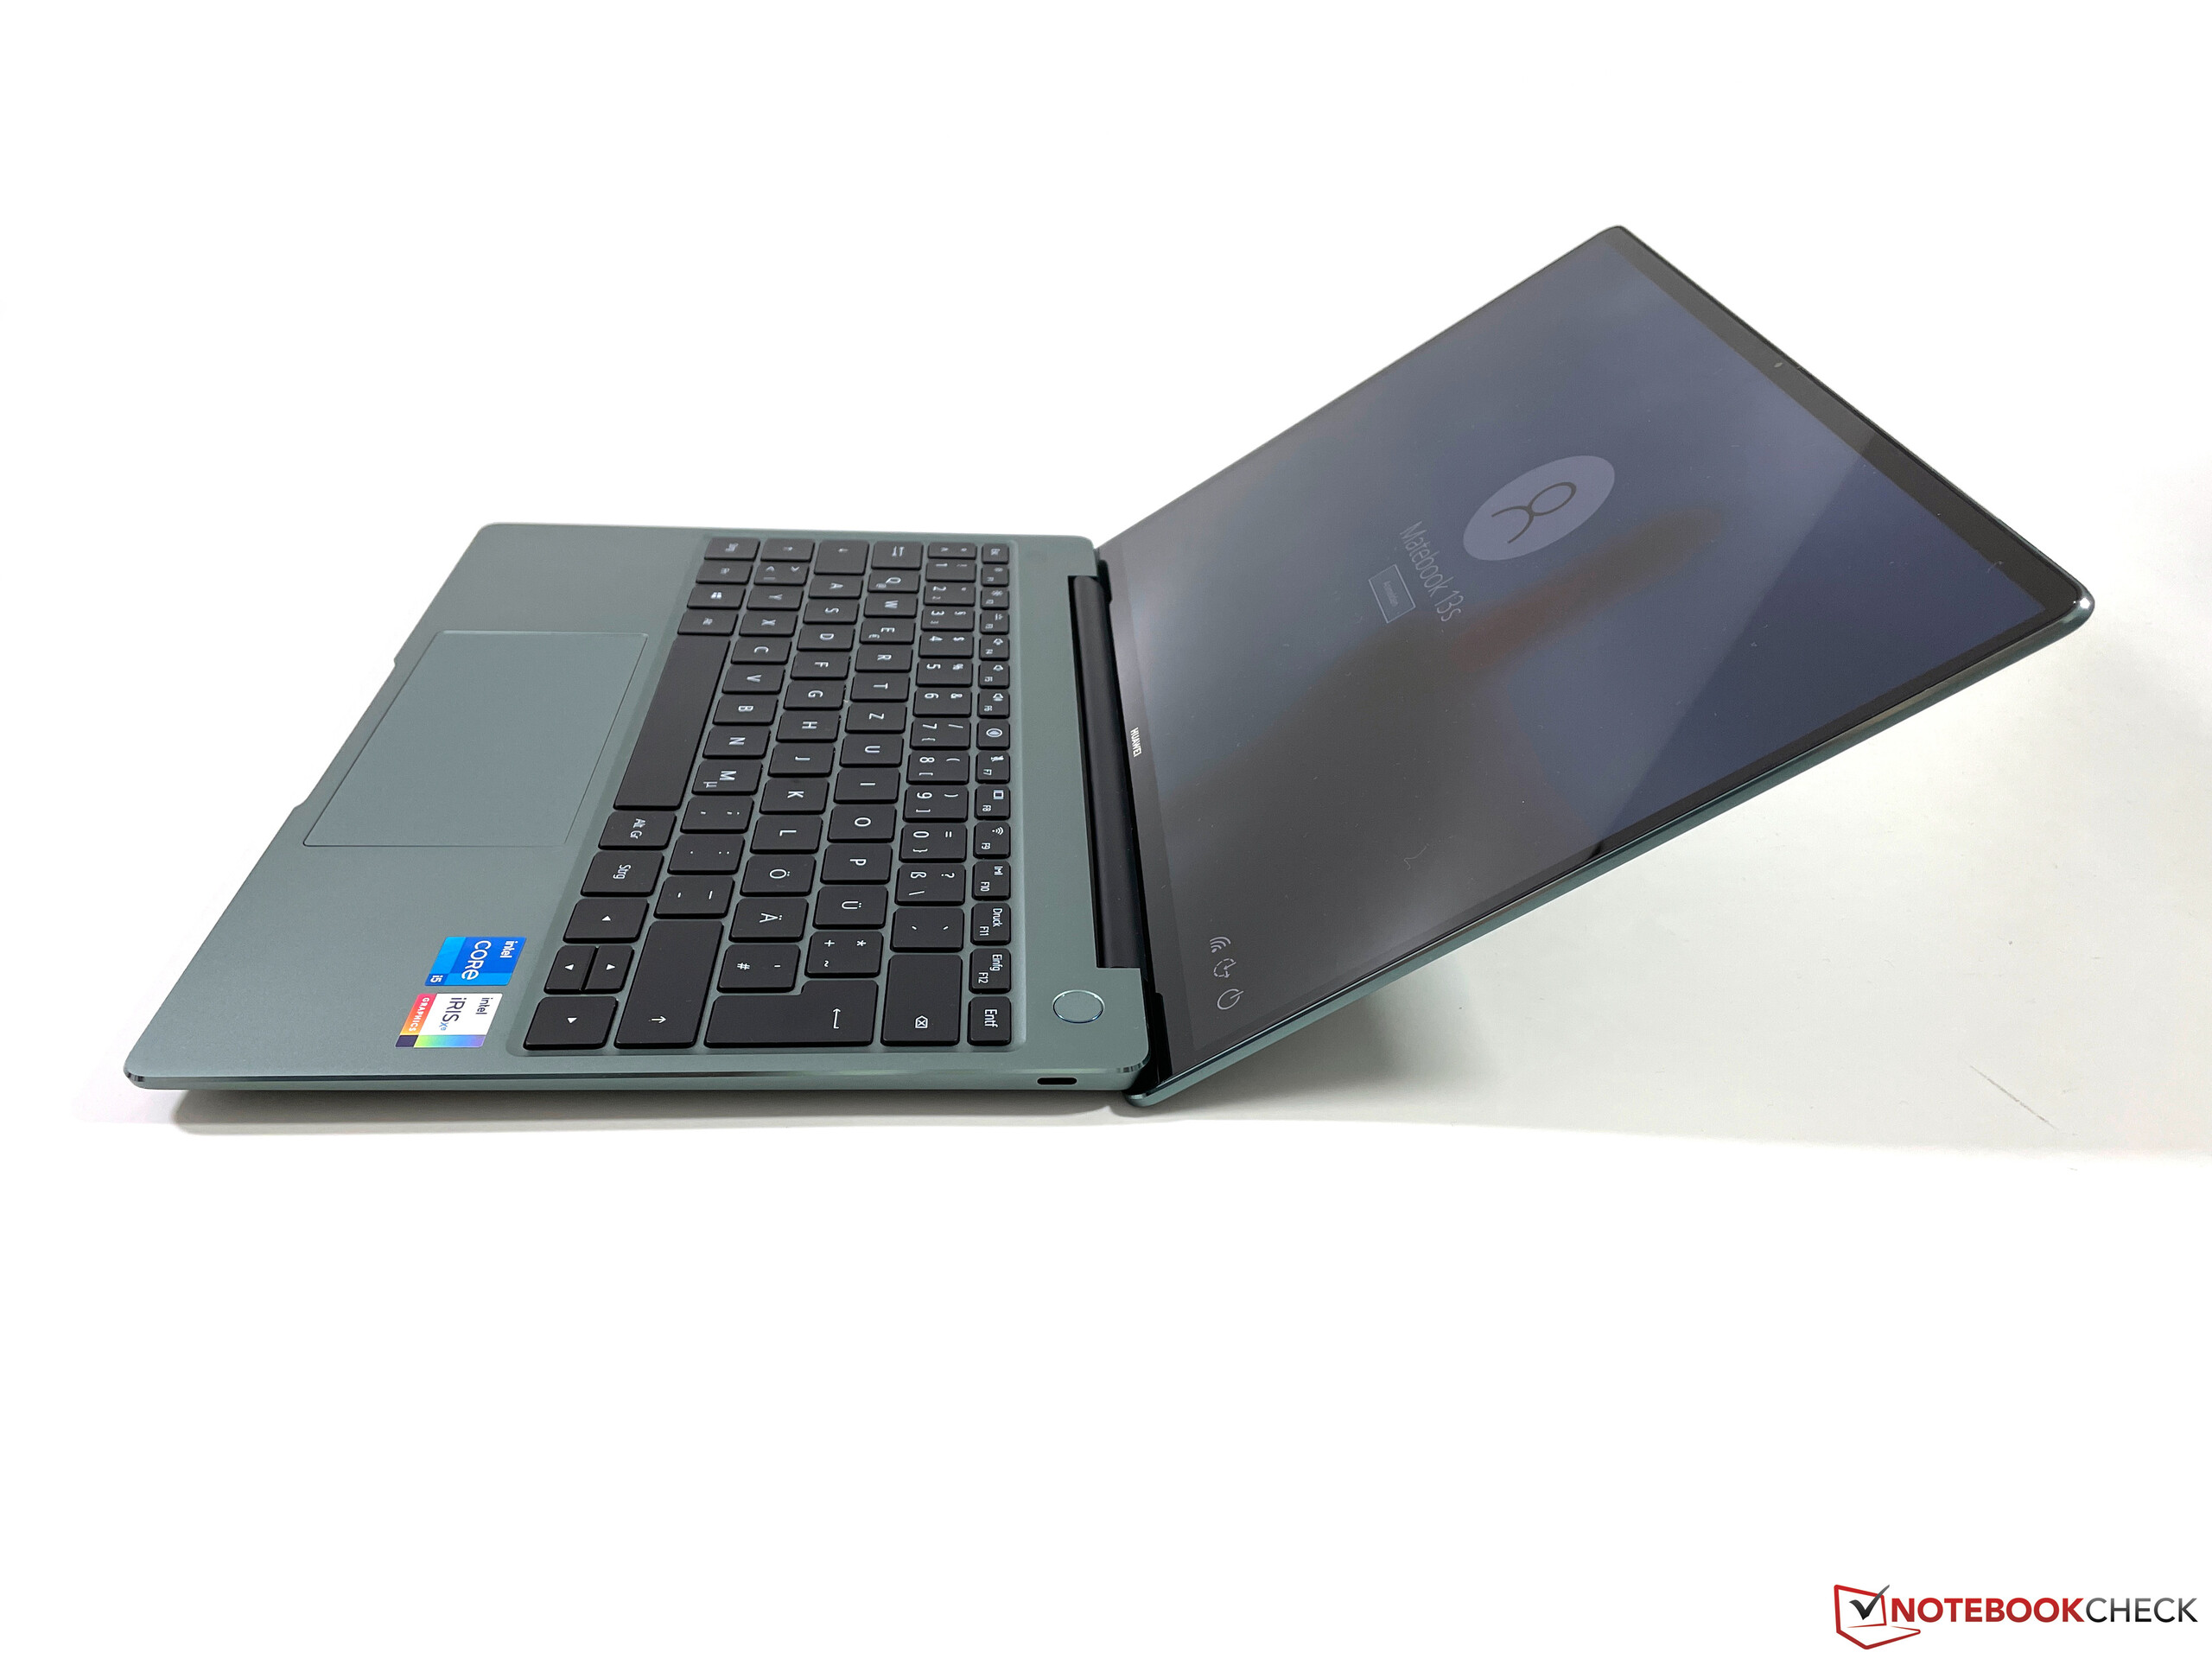
The aluminum chassis is a smaller version of the recently reviewed MateBook 14s and the review unit with the Spruce Green color scheme looks very elegant. Compared to the larger 14-inch model, the side areas next to the keyboard are narrower and the clickpad is not as high, but the size of the keyboard itself is identical. We like the design with the narrow bezels and the quality impression of the MateBook 13s is also great. The build quality is perfect and it just feels like a high-quality item when you use it.
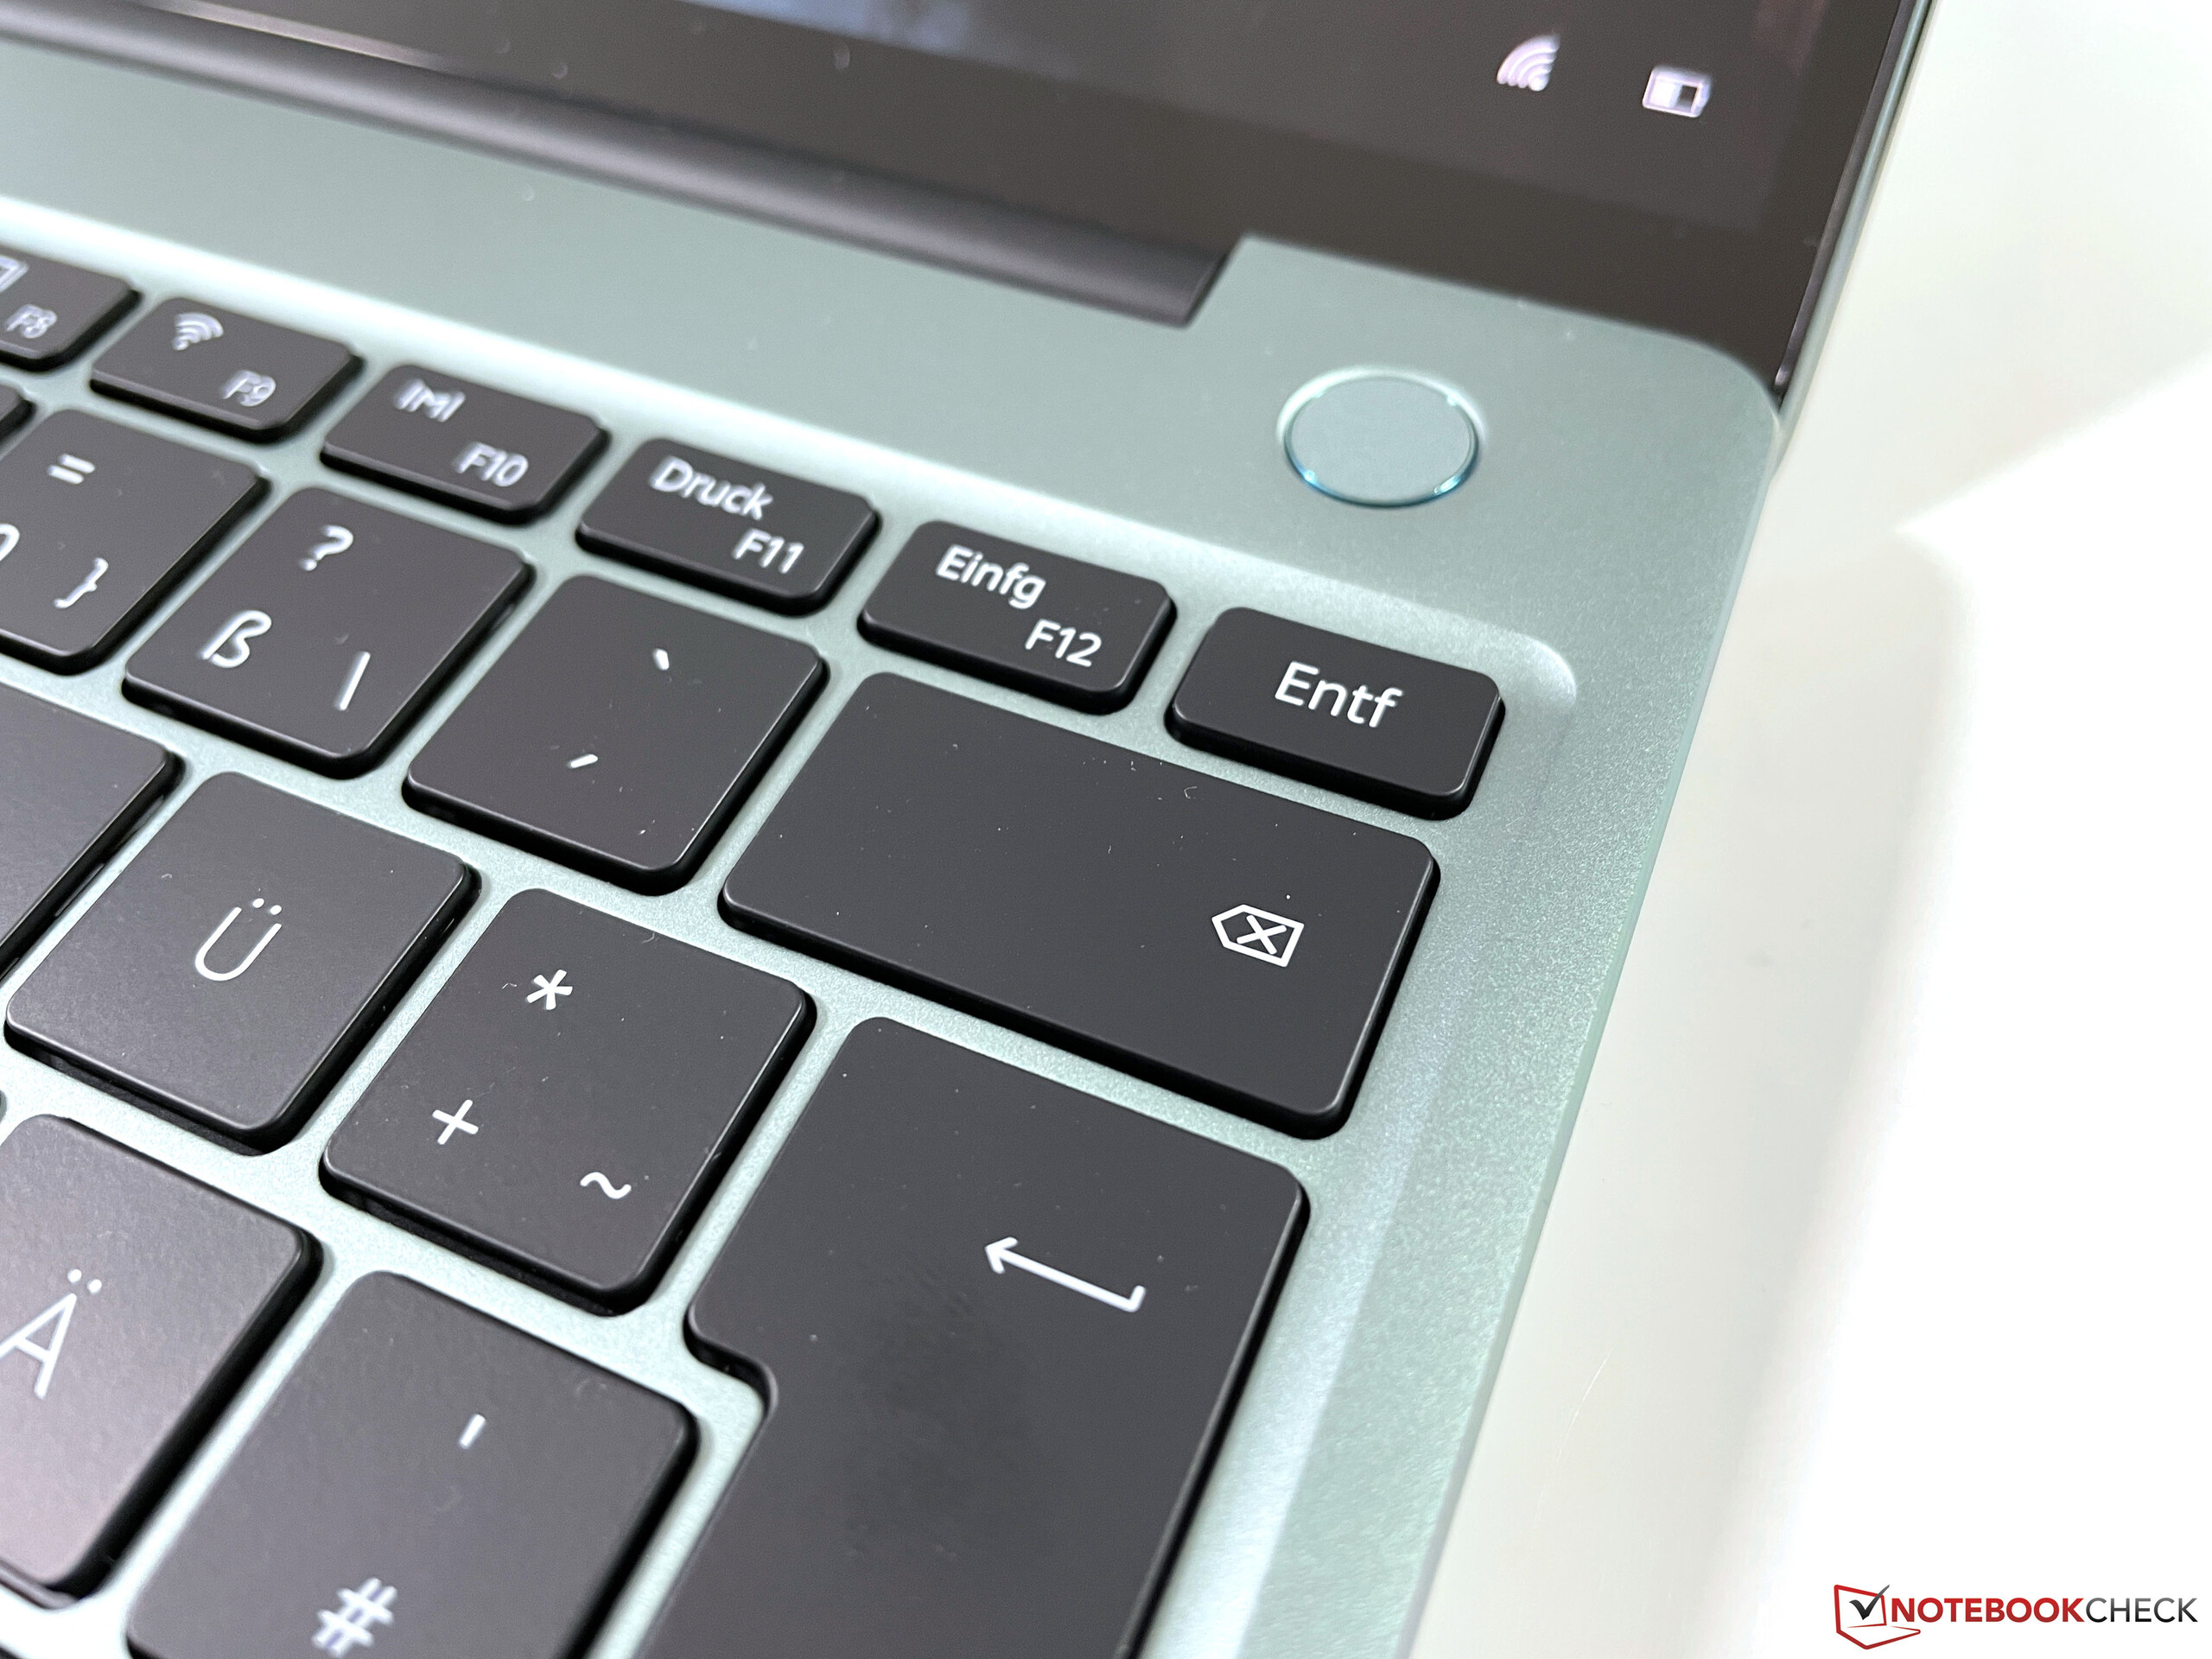
The compact device is also convincing in terms of stability; the keyboard deck only flexes slightly under a lot pressure, which is also required to provoke minor ripples on the screen. However, this should not be an issue in practice. Huawei adjusted the central hinge well and it keeps the display in position up to the maximum opening angle of around 150 degrees. Thanks to the small indentation on the front of the base unit, it is very easy to open the lid. The power button with the fingerprint scanner (which works well) is located on the right side above the keyboard.
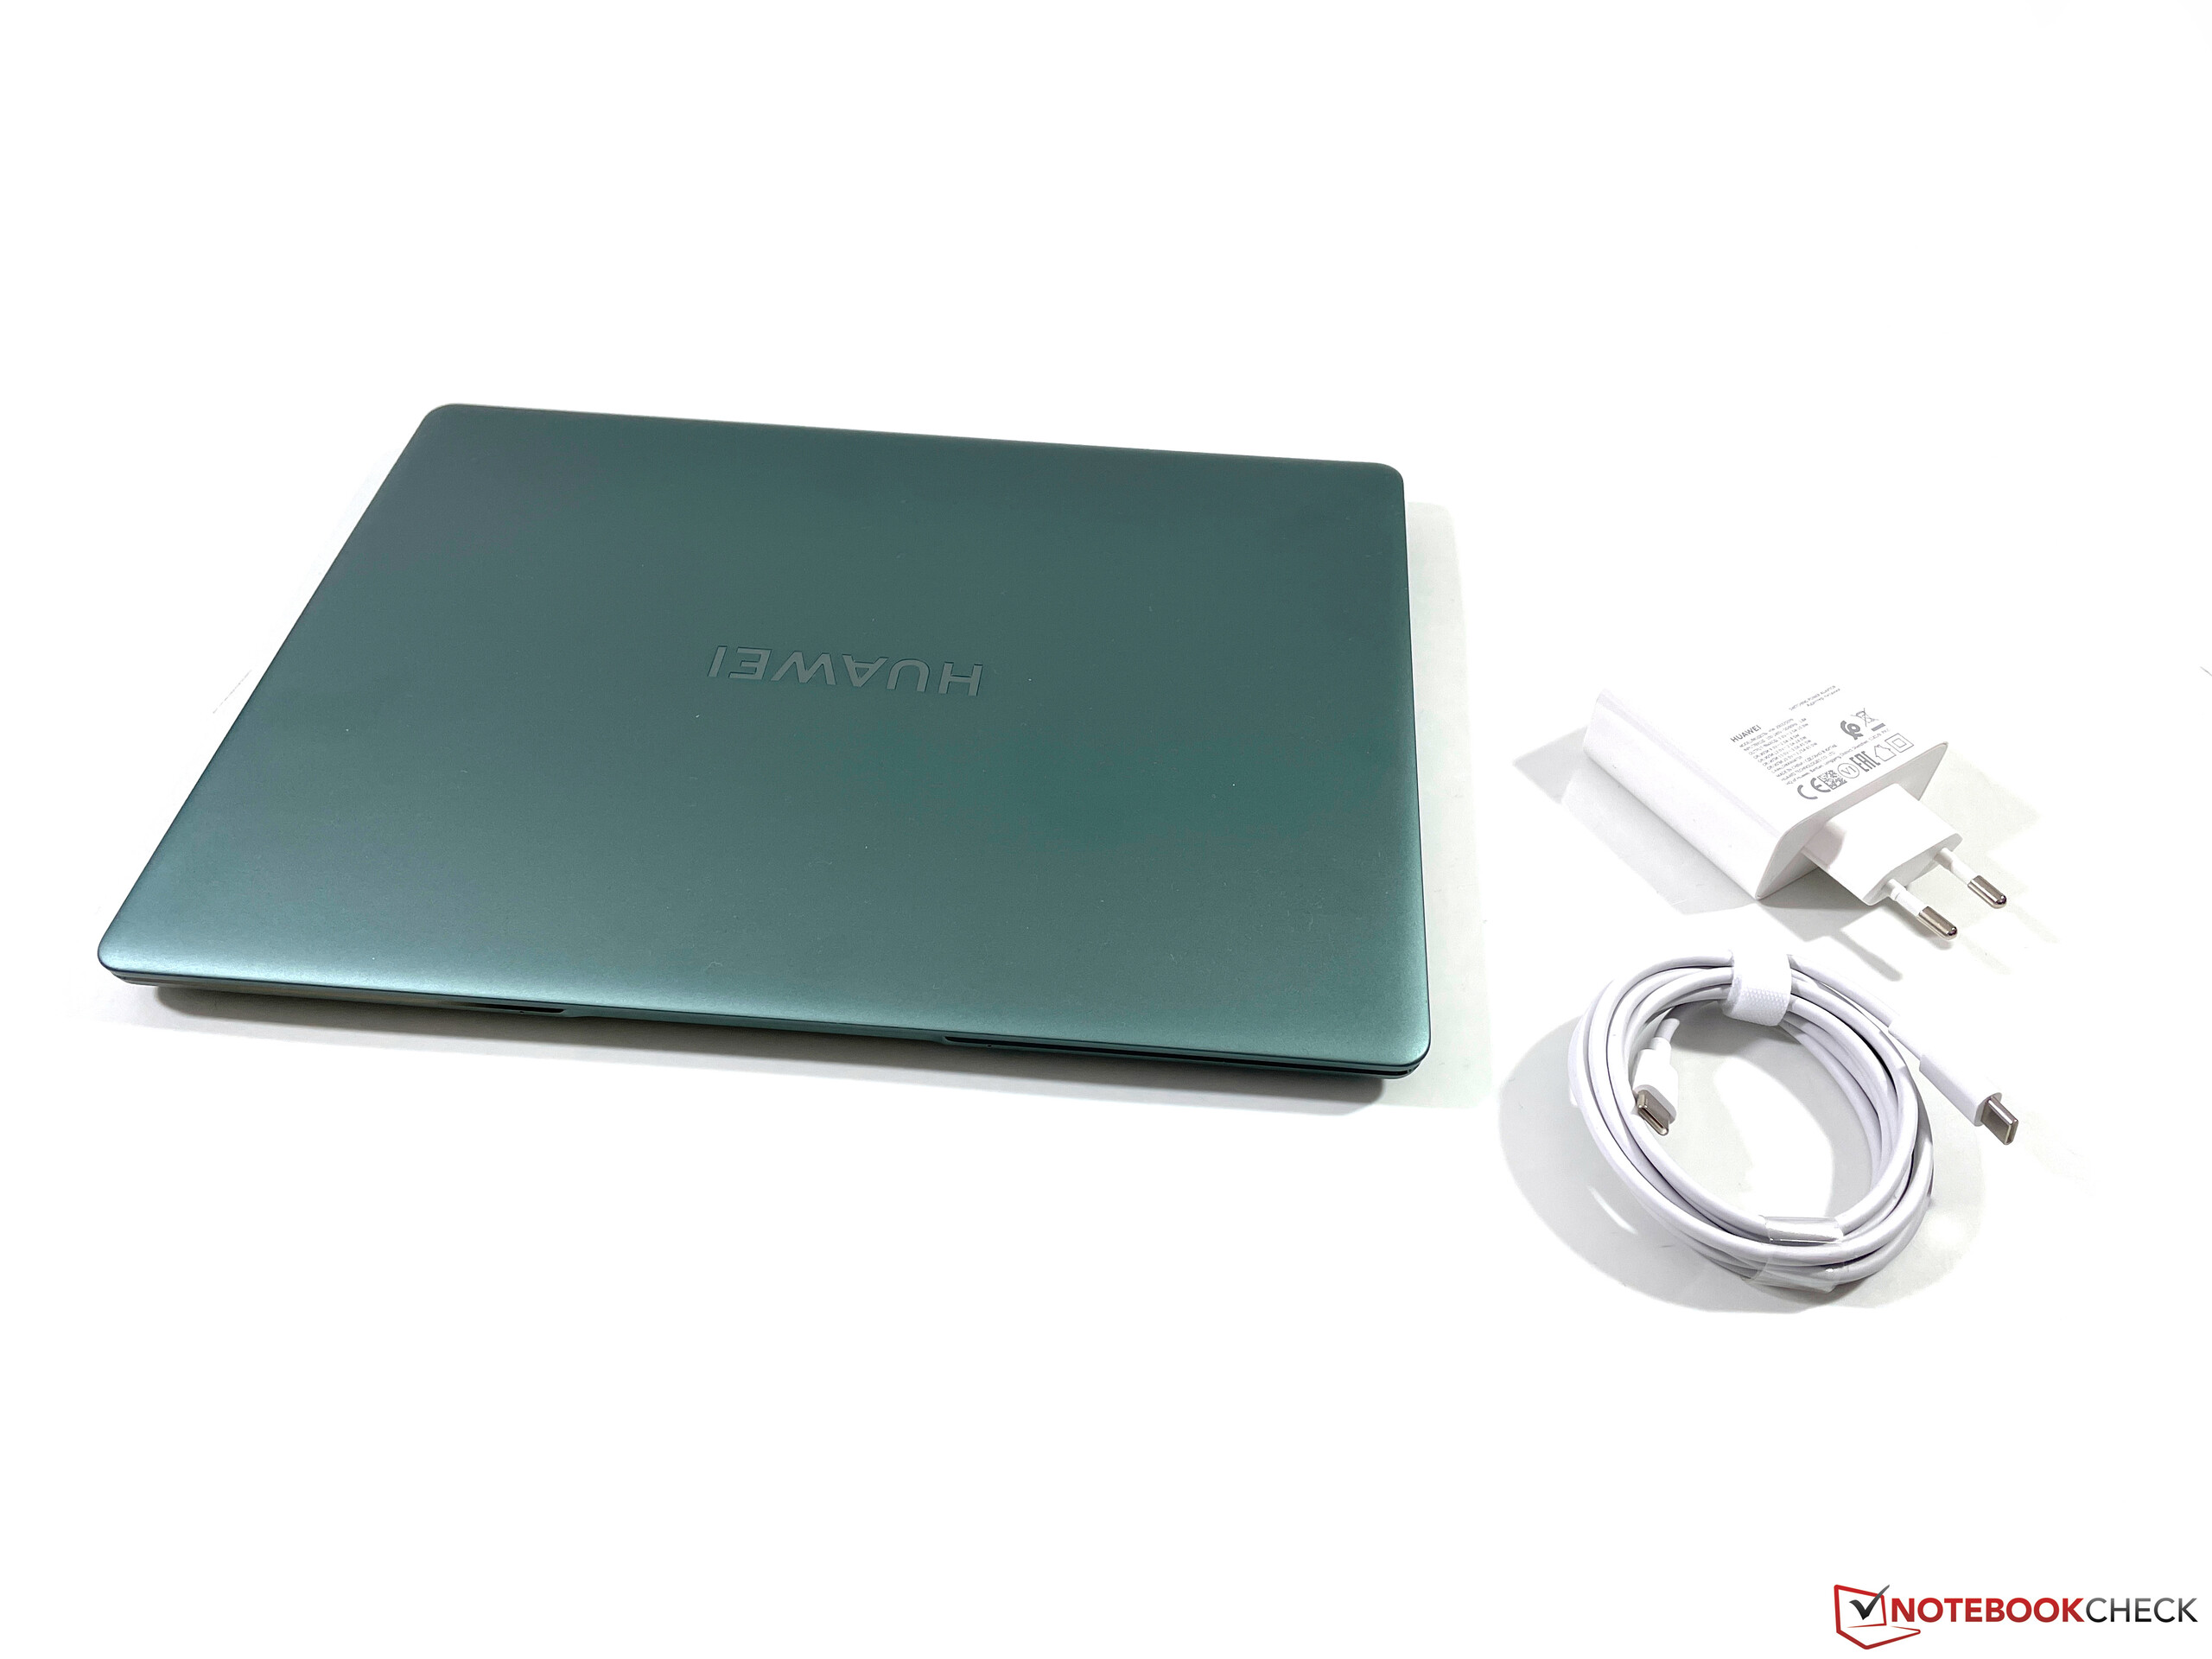
The 3:2 aspect ratio screen of the MateBook 13s results in a deeper, but narrower chassis compared to the rivals. Overall, however, the competitors are pretty similar. The weight is little more than 1.3 kg and the power adapter (with the USB-C cable) tips the scale at another 200 grams.
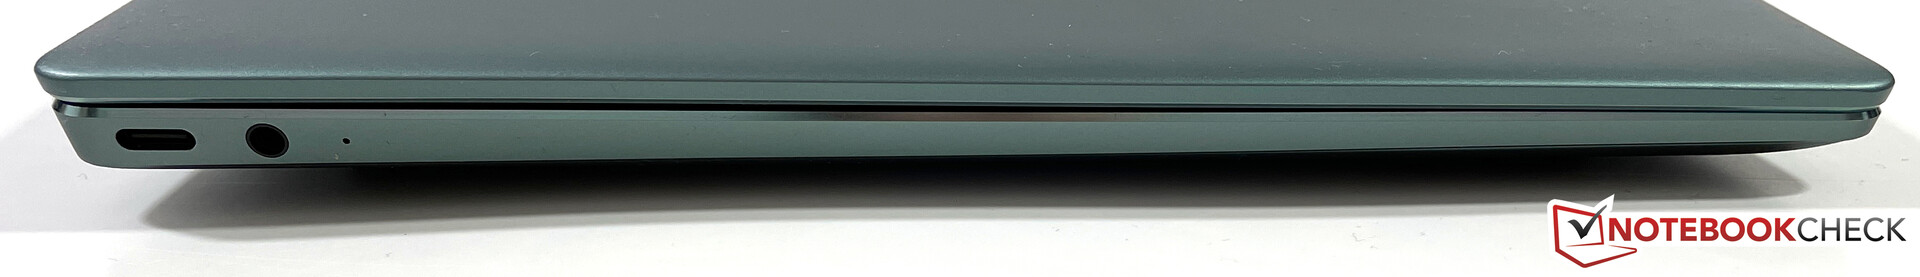
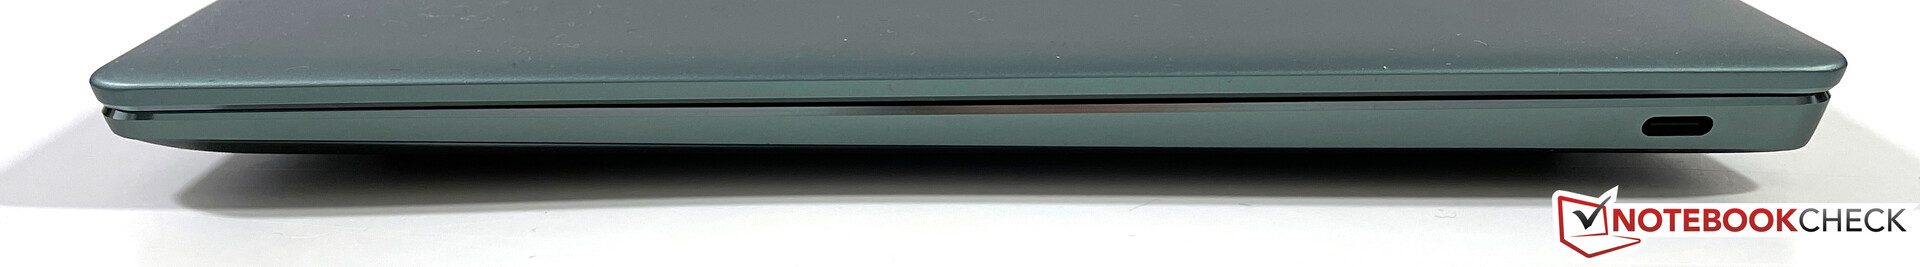
Connectivity - Huawei does not support Thunderbolt
This is the section where we find the biggest difference compared to the MateBook 14s, because Huawei only equips the smaller MateBook 13s with two USB-C ports without Thunderbolt 4 support. There is no apparent technical reason for this, it seems the manufacturer just wanted to save licensing fees. Both ports can be used to charge the battery and drive external displays, however, so there should not be massive limitations in practice. It will not be possible to attach an external GPU, though.
Communication
The Wi-Fi module is from Intel (AX201) and supports the Wi-Fi 6 standard as well as Bluetooth 5.1. Our Wi-Fi test with the reference router Netgear RAX120 determines very good transfer rates when receiving data, but the transmitting performance is a bit lower than expected. There is no WWAN module (LTE or 5G). The signal quality was stable, both with the Wi-Fi 6 router as well as a FritzBox 7490 (Wi-Fi 5).
Webcam
The webcam is not hidden inside the keyboard anymore, but back at the regular position above the display. This is certainly not as secure and there is no mechanical shutter, but the webcam angle is not distorted anymore. It is still a 720p sensor though, which means the picture quality is still poor.


Maintenance
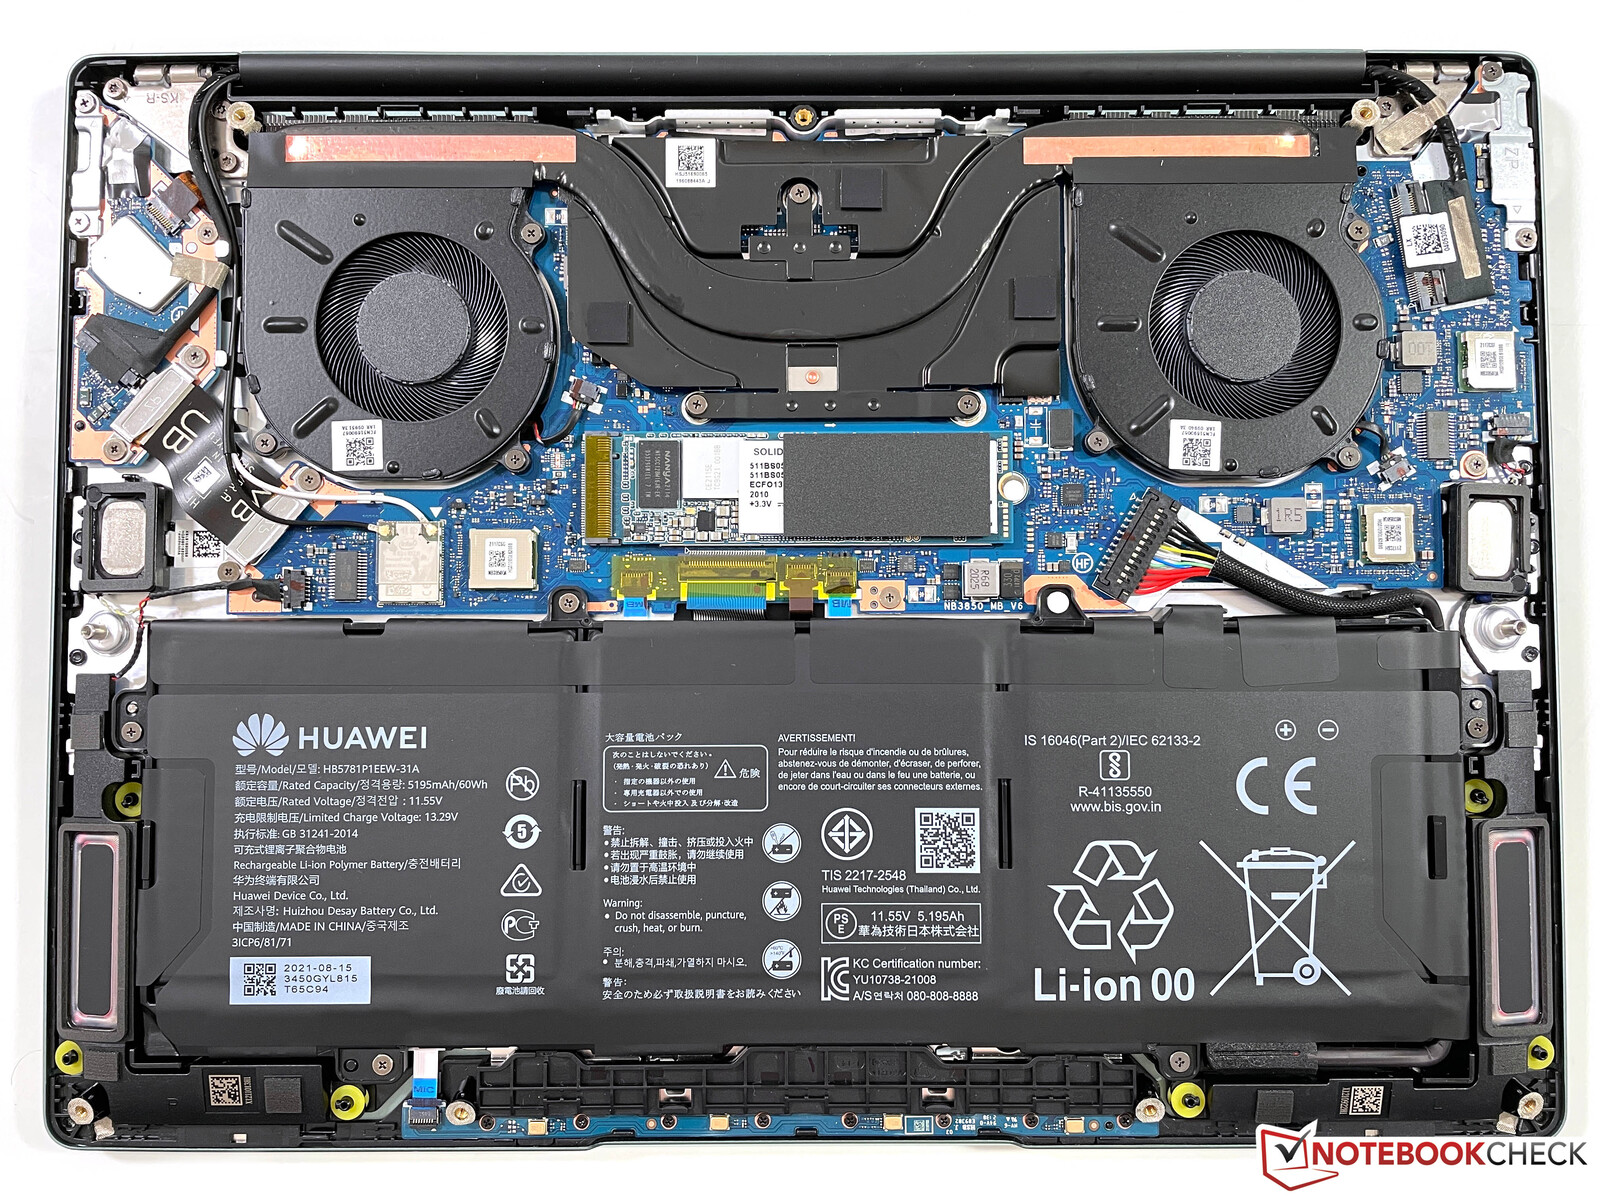
The bottom chassis panel is secured by multiple Torx screws (T5) and is easy to remove. However, many of the components are soldered onto the mainboard and you can only clean the fans and replace the M.2-2280 SSD.
Input Devices - MateBook 13s with 1.5 mm key travel
Keyboard
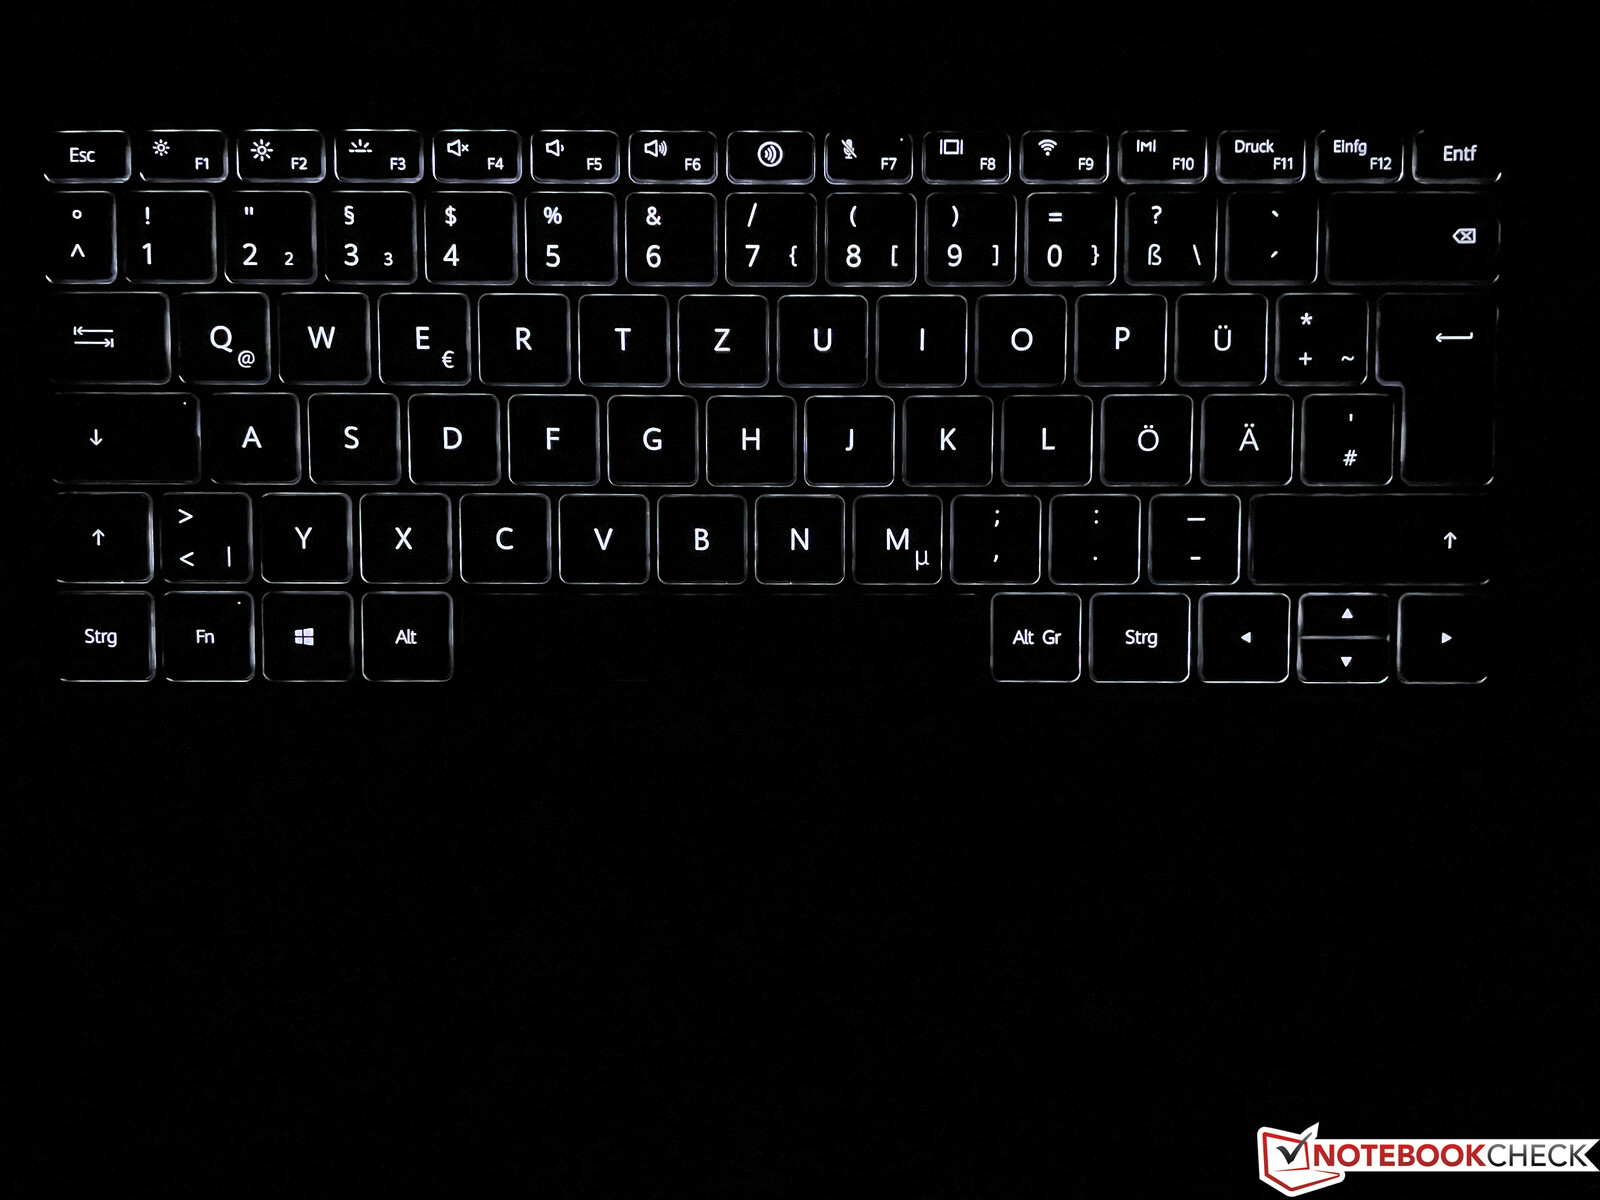
As mentioned before, the keyboard is identical to the larger MateBook 14s, so the smaller 13s also gets a generous key travel of 1.5 mm. Combined with the precise pressure point, the typing experience is very comfortable and it is no problem to type longer texts. Only the space bar tends to clatter a bit and the vertical arrow keys are pretty small, but otherwise, the layout does not require any learning period. The black keys with the white lettering provide a good contrast and a two-stage white illumination makes it easy to type in darker environments. You can comfortably adjust the duration (or the time before deactivation) in Huawei’s PC Manager.
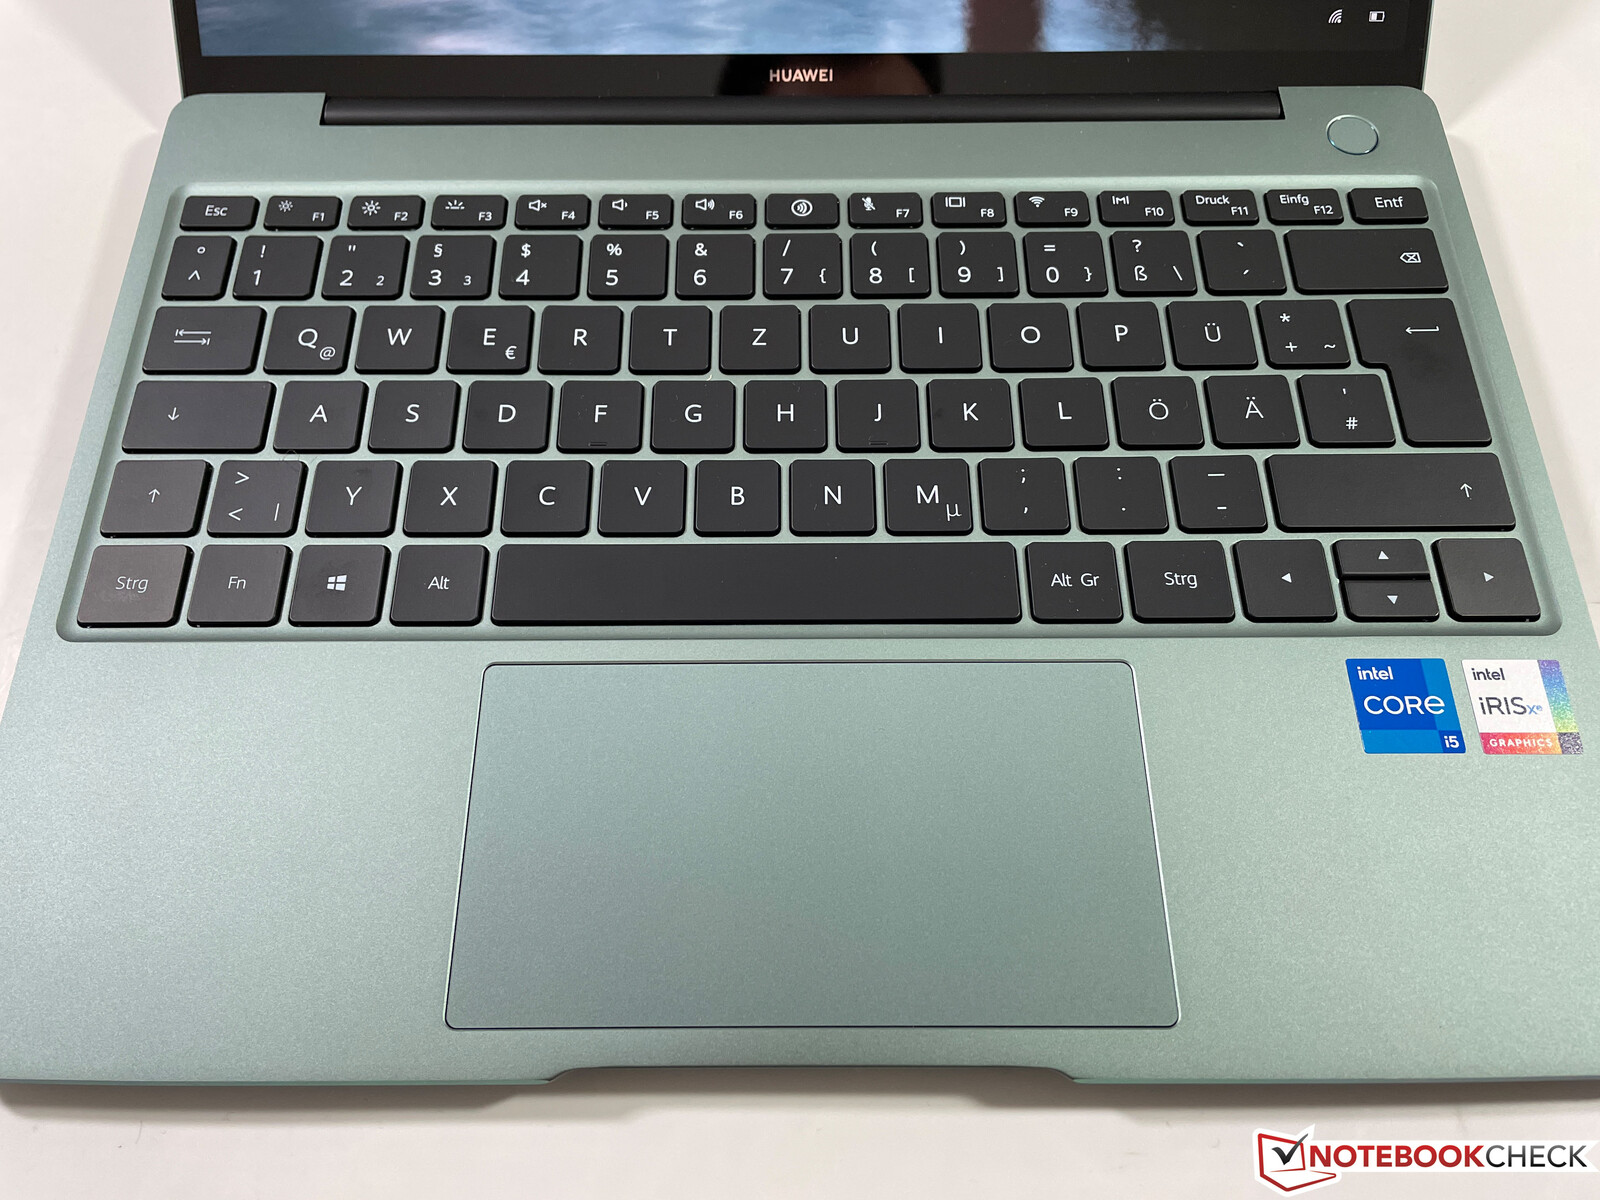
Touchpad & Touchscreen
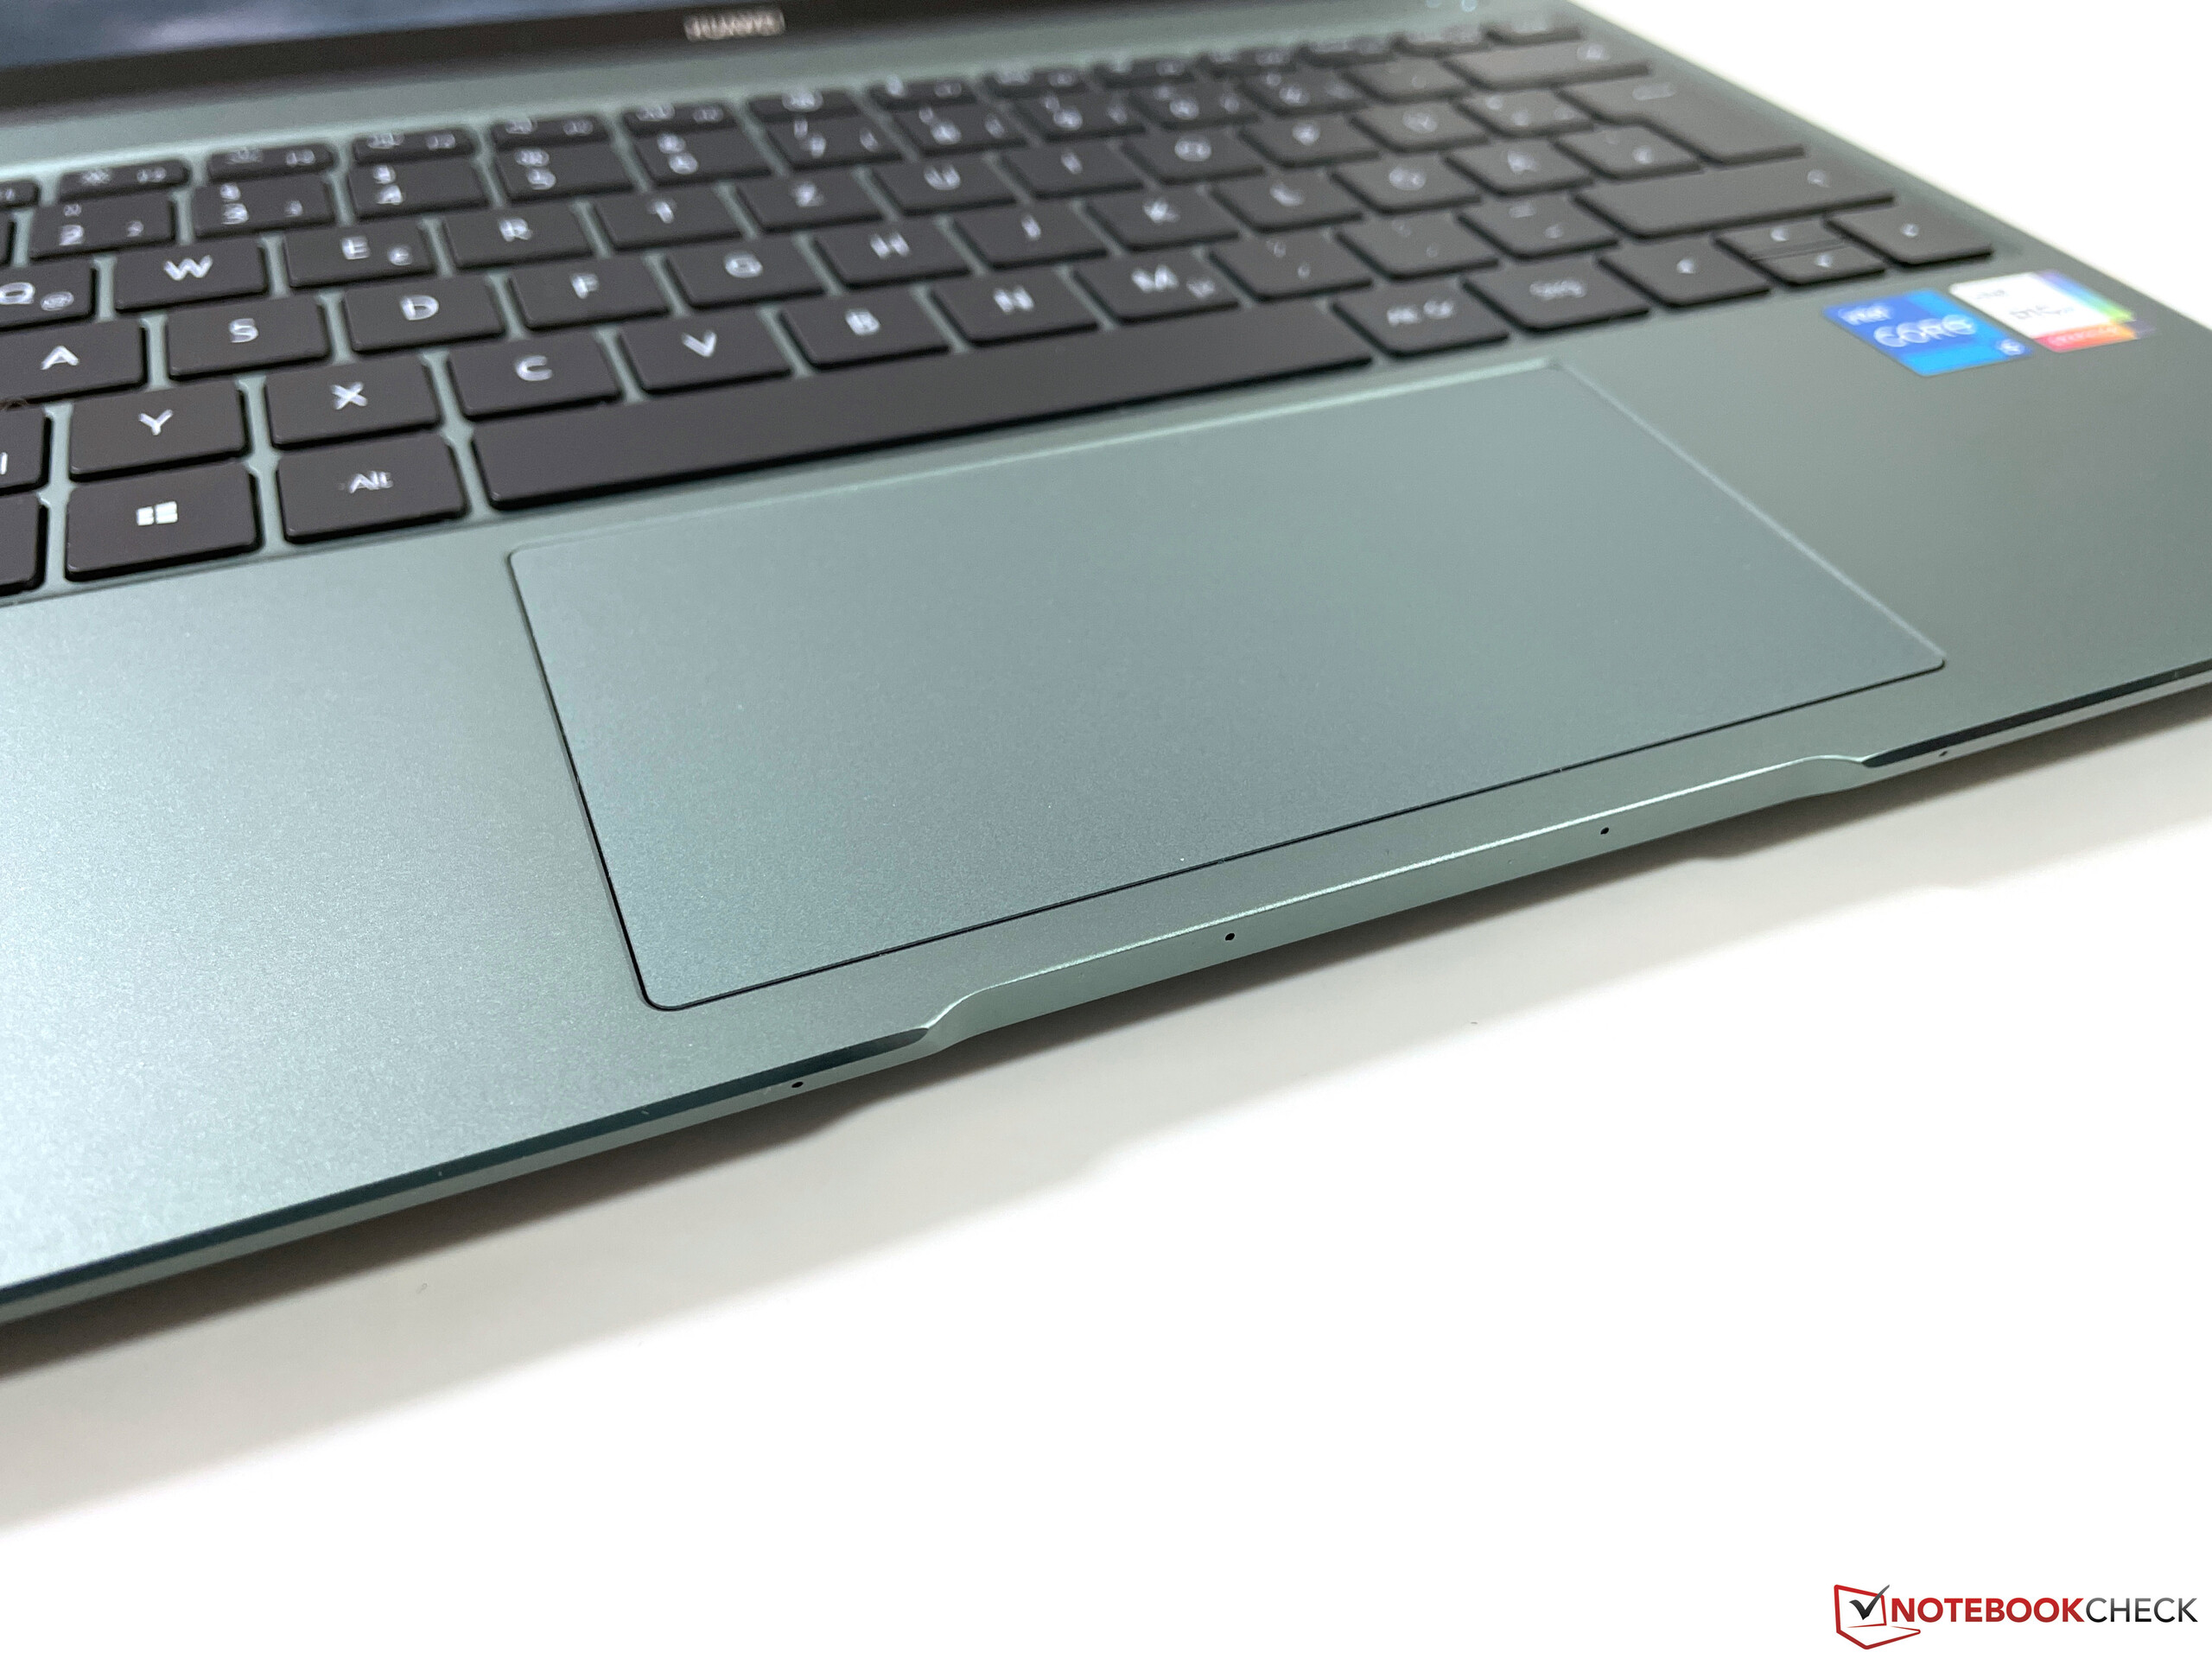
Because of the more compact chassis, the height of the clickpad is smaller than on the 14-inch model at 12 x 6.4 cm. The gliding capabilities of the smooth surface are very good and cursor movements work well, just like gestures with up to four fingers. You can physically click the pad in the lower half, but that results in a rather loud and cheap clicking sound. You can also use the capacitive touchscreen for inputs, which works just as expected.
Display - MateBook 13s with 90 Hz and 3:2 aspect ratio
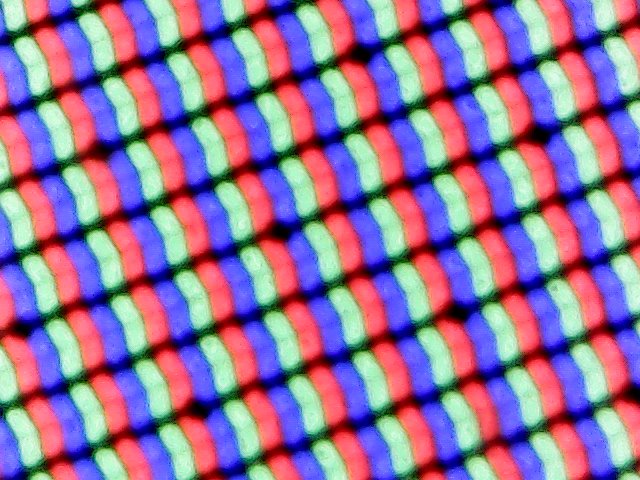
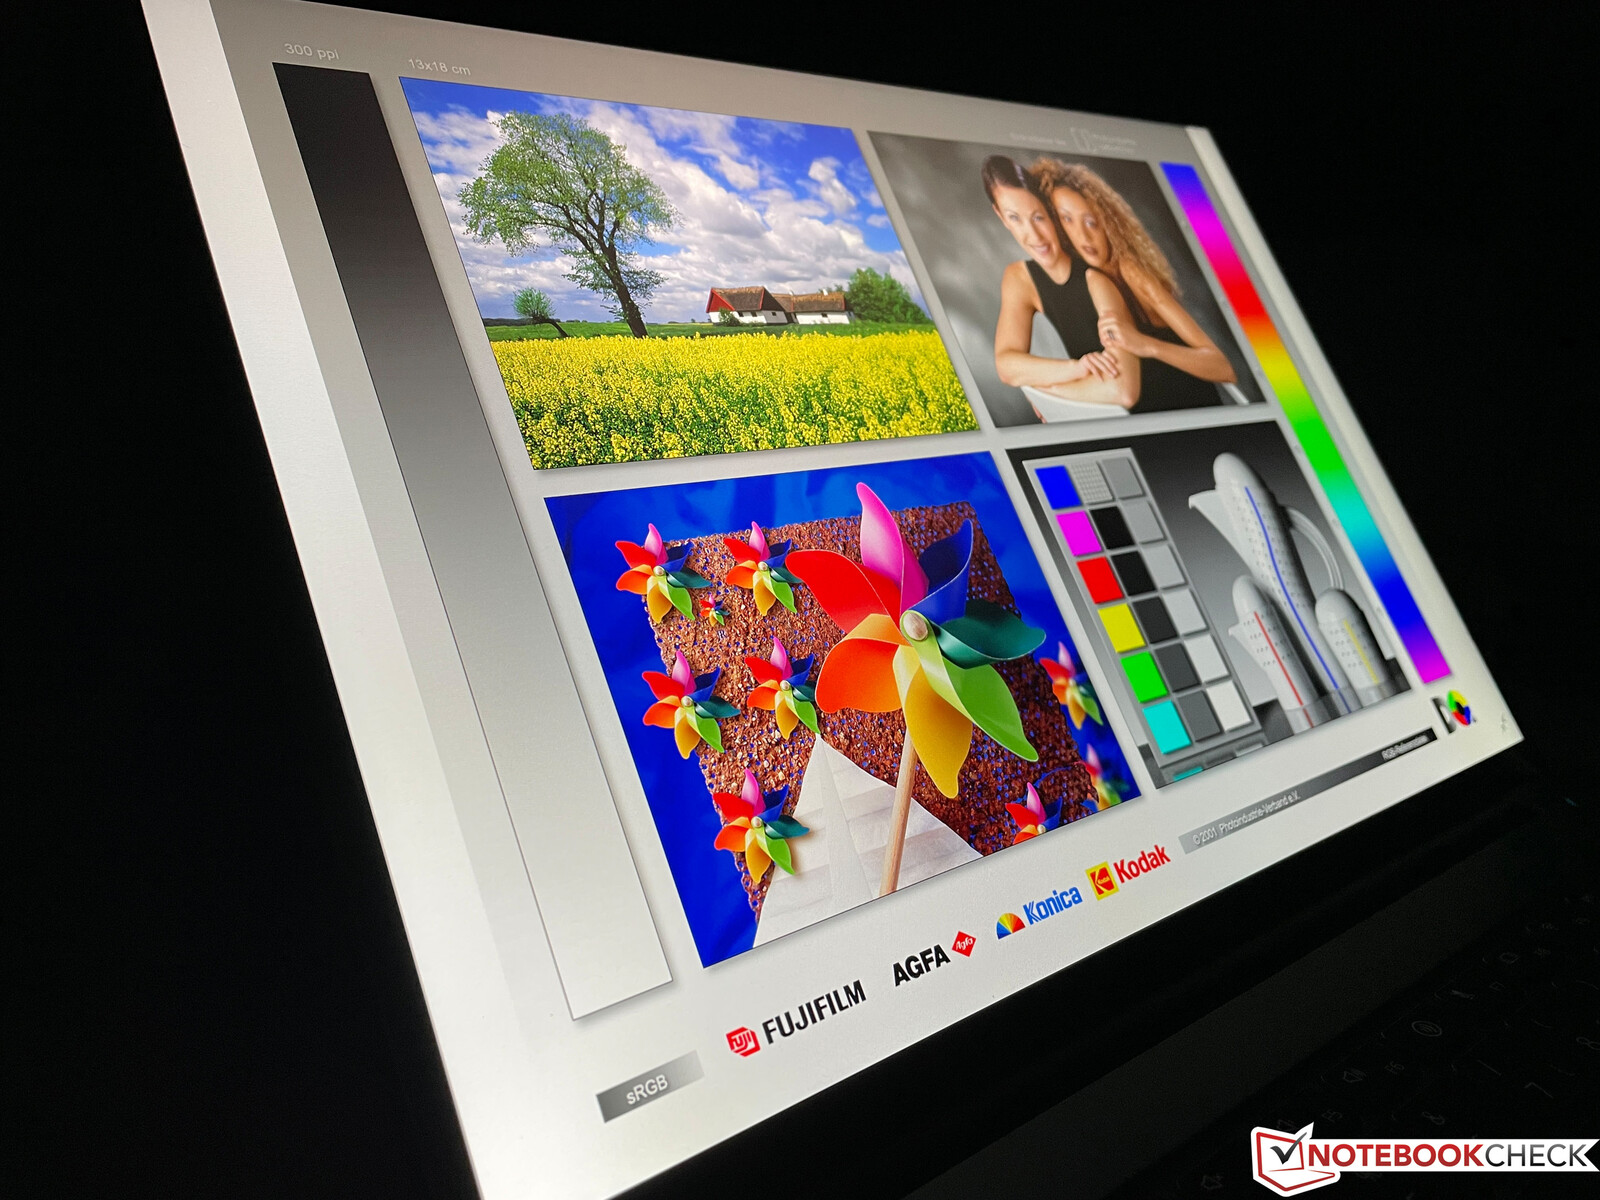
Huawei uses a so called LTPS panel (Low Temperature Poly Silcon), which enables higher pixel density and therefore higher resolutions. The 13.4-inch screen with a 3:2 aspect ratio has a resolution of 2520 x 1680 pixels and a pixel density of 226 ppi. The subjective picture impression of the glossy screen is excellent; all contents are very crisp with rich colors. Thanks to the integrated brightness sensor, the brightness can automatically be adjusted based on the environment lighting.
The manufacturer advertises a luminance of 400 nits, which is clearly surpassed by our review unit with an average brightness of 450 nits. The black value is also very low and results in an excellent contrast ratio of 2035:1. Backlight bleeding is no problem, despite the high brightness, and the response times are also okay. We can detect PWM flickering at 20% brightness or lower (corresponds with a brightness of 47 nits), but the determined frequency of 9.8 kHz is very high and should not cause any problems.
| |||||||||||||||||||||||||
Brightness Distribution: 92 %
Center on Battery: 468 cd/m²
Contrast: 2035:1 (Black: 0.23 cd/m²)
ΔE ColorChecker Calman: 2 | ∀{0.5-29.43 Ø4.71}
calibrated: 1.5
ΔE Greyscale Calman: 2.6 | ∀{0.09-98 Ø4.96}
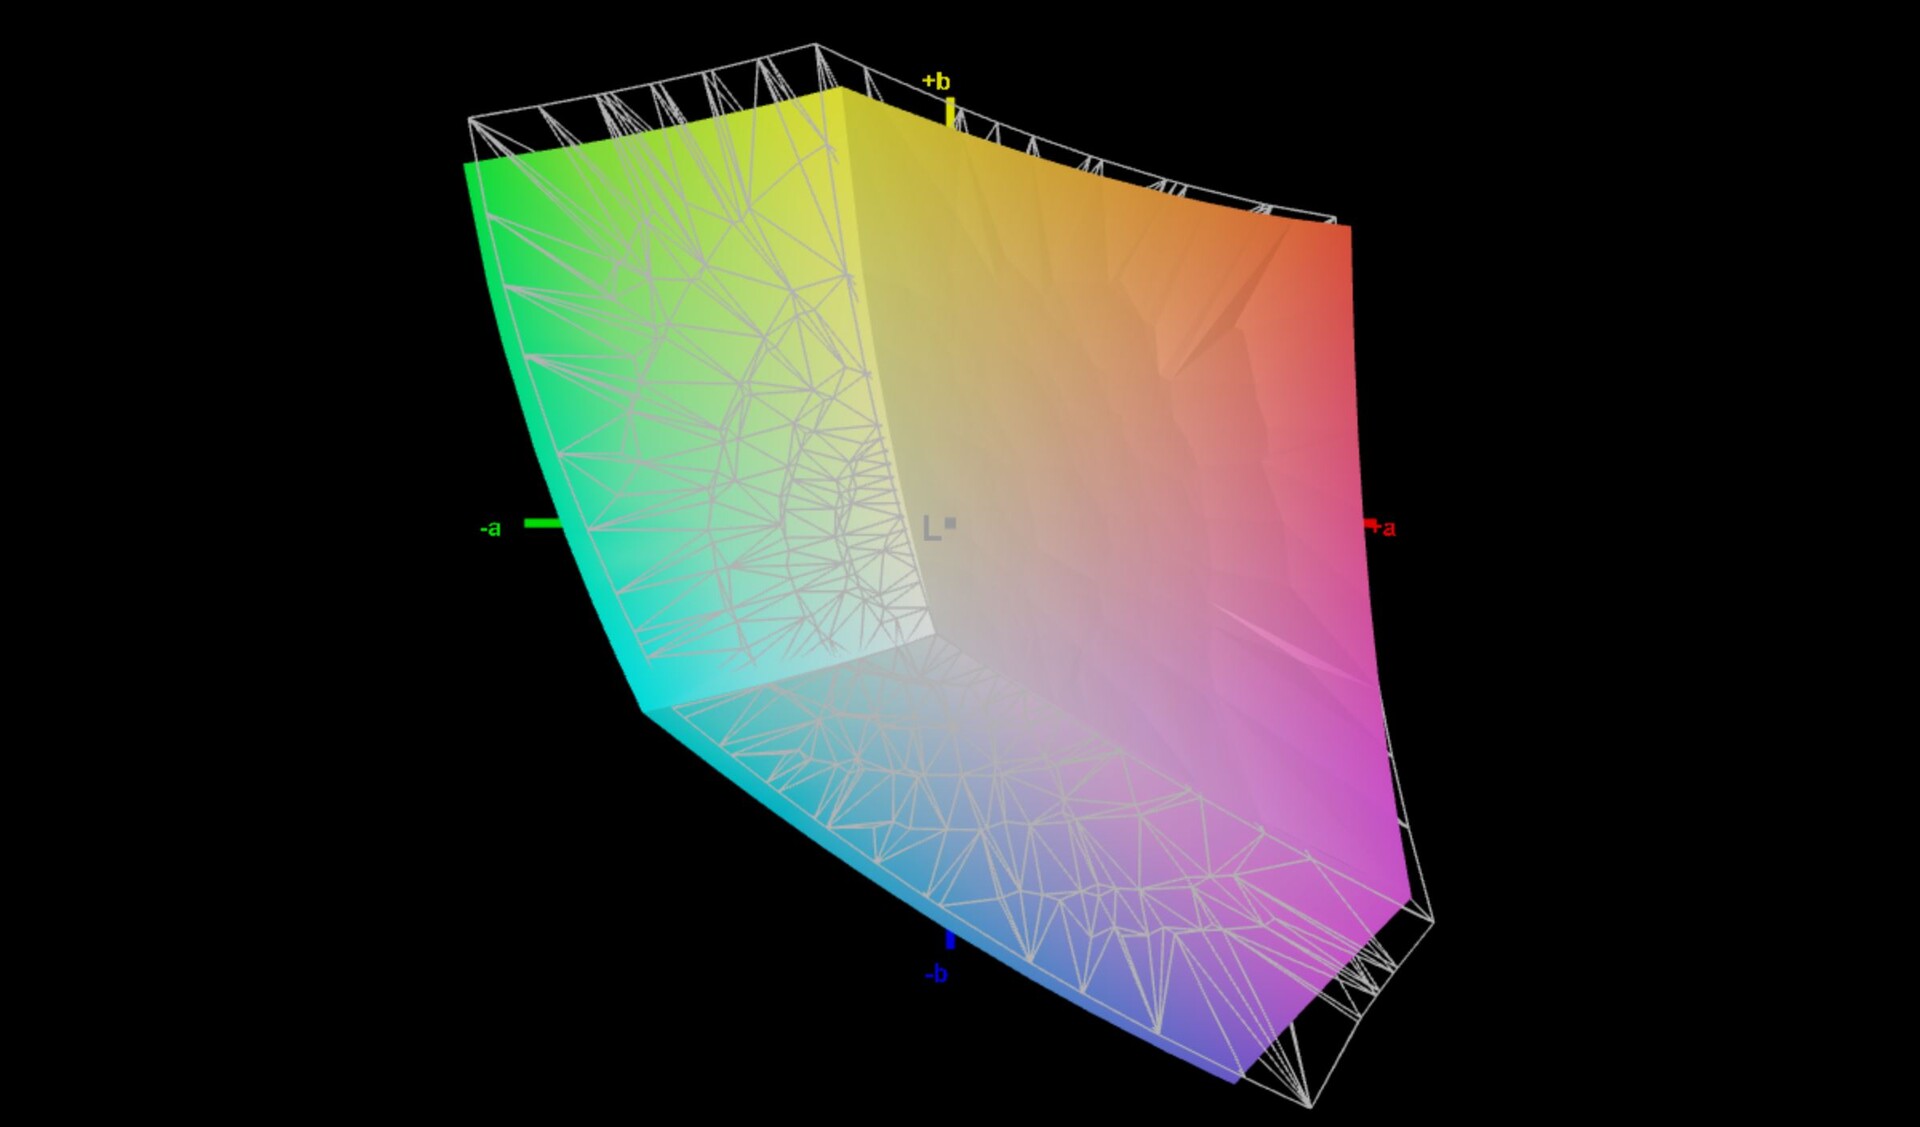
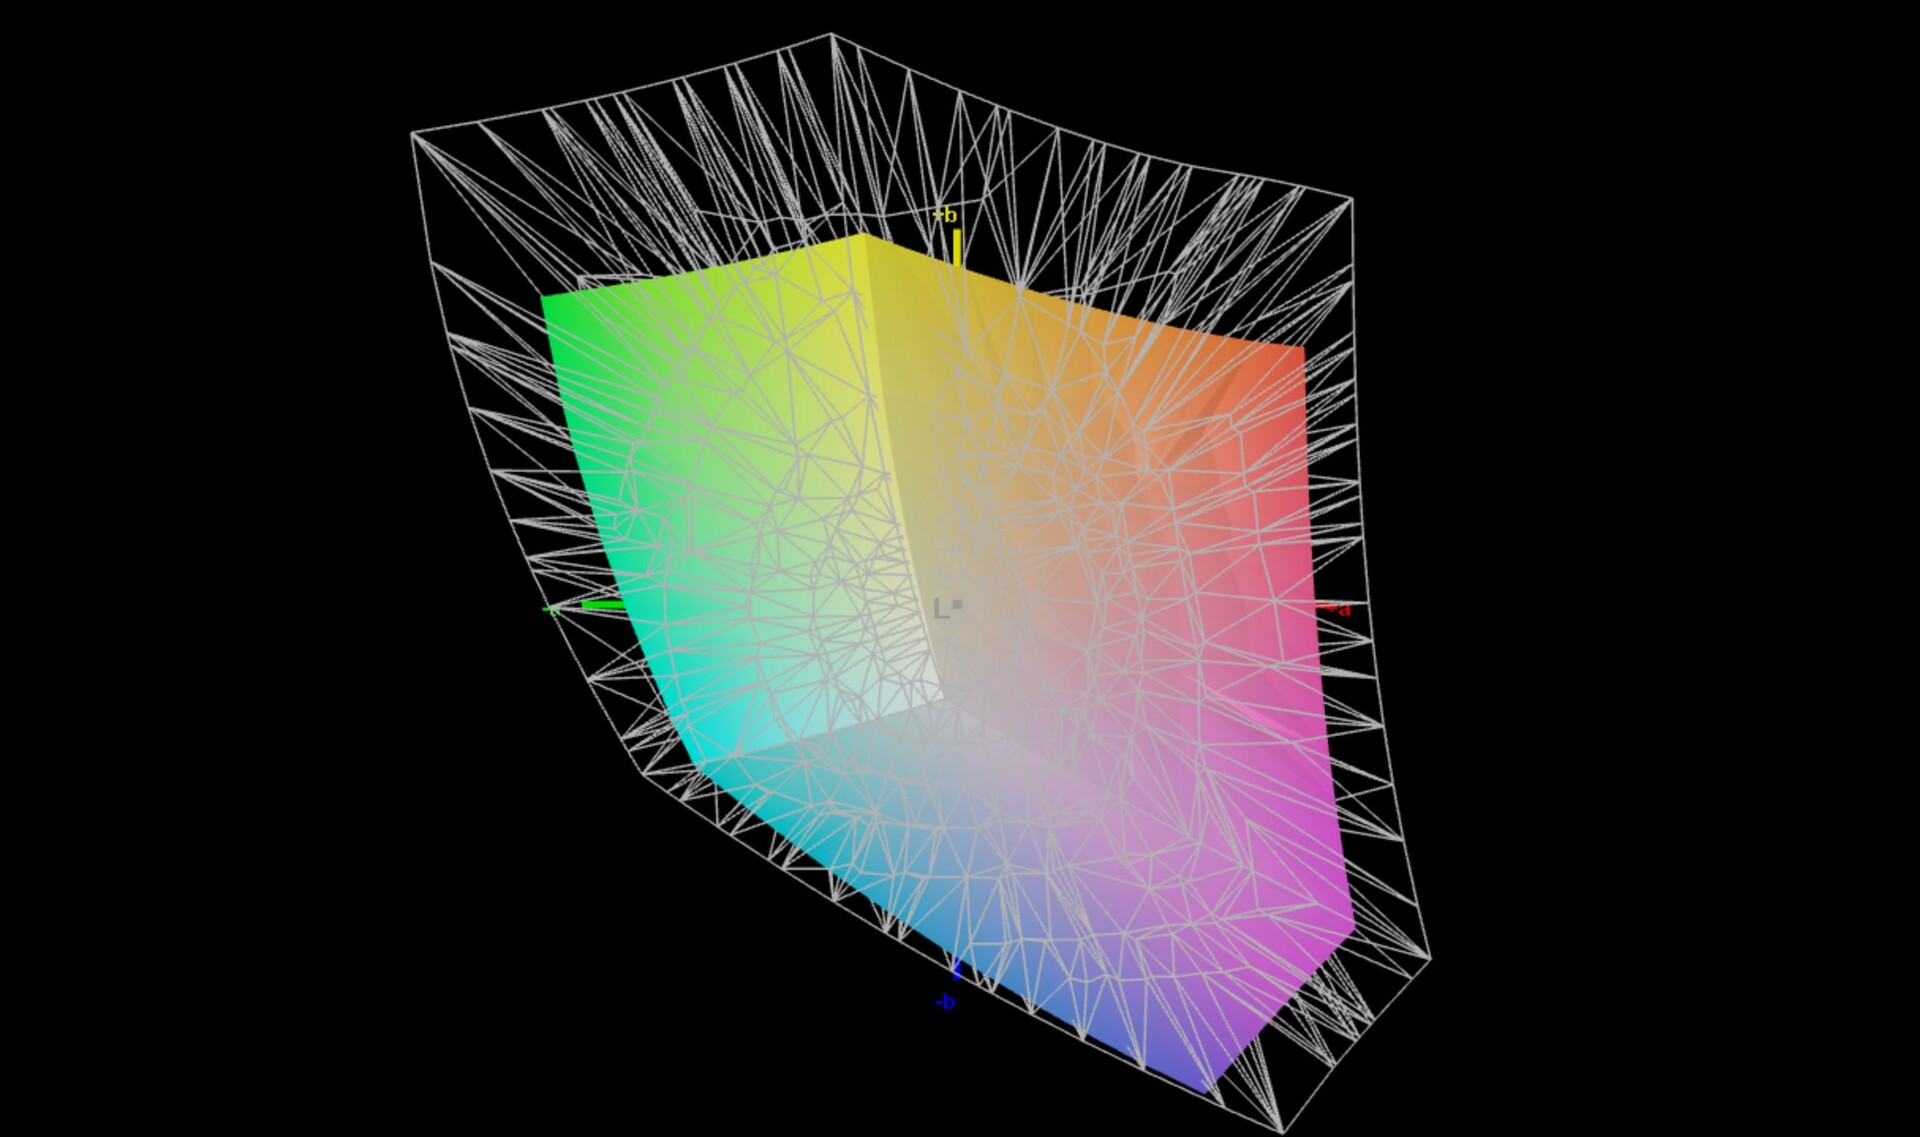
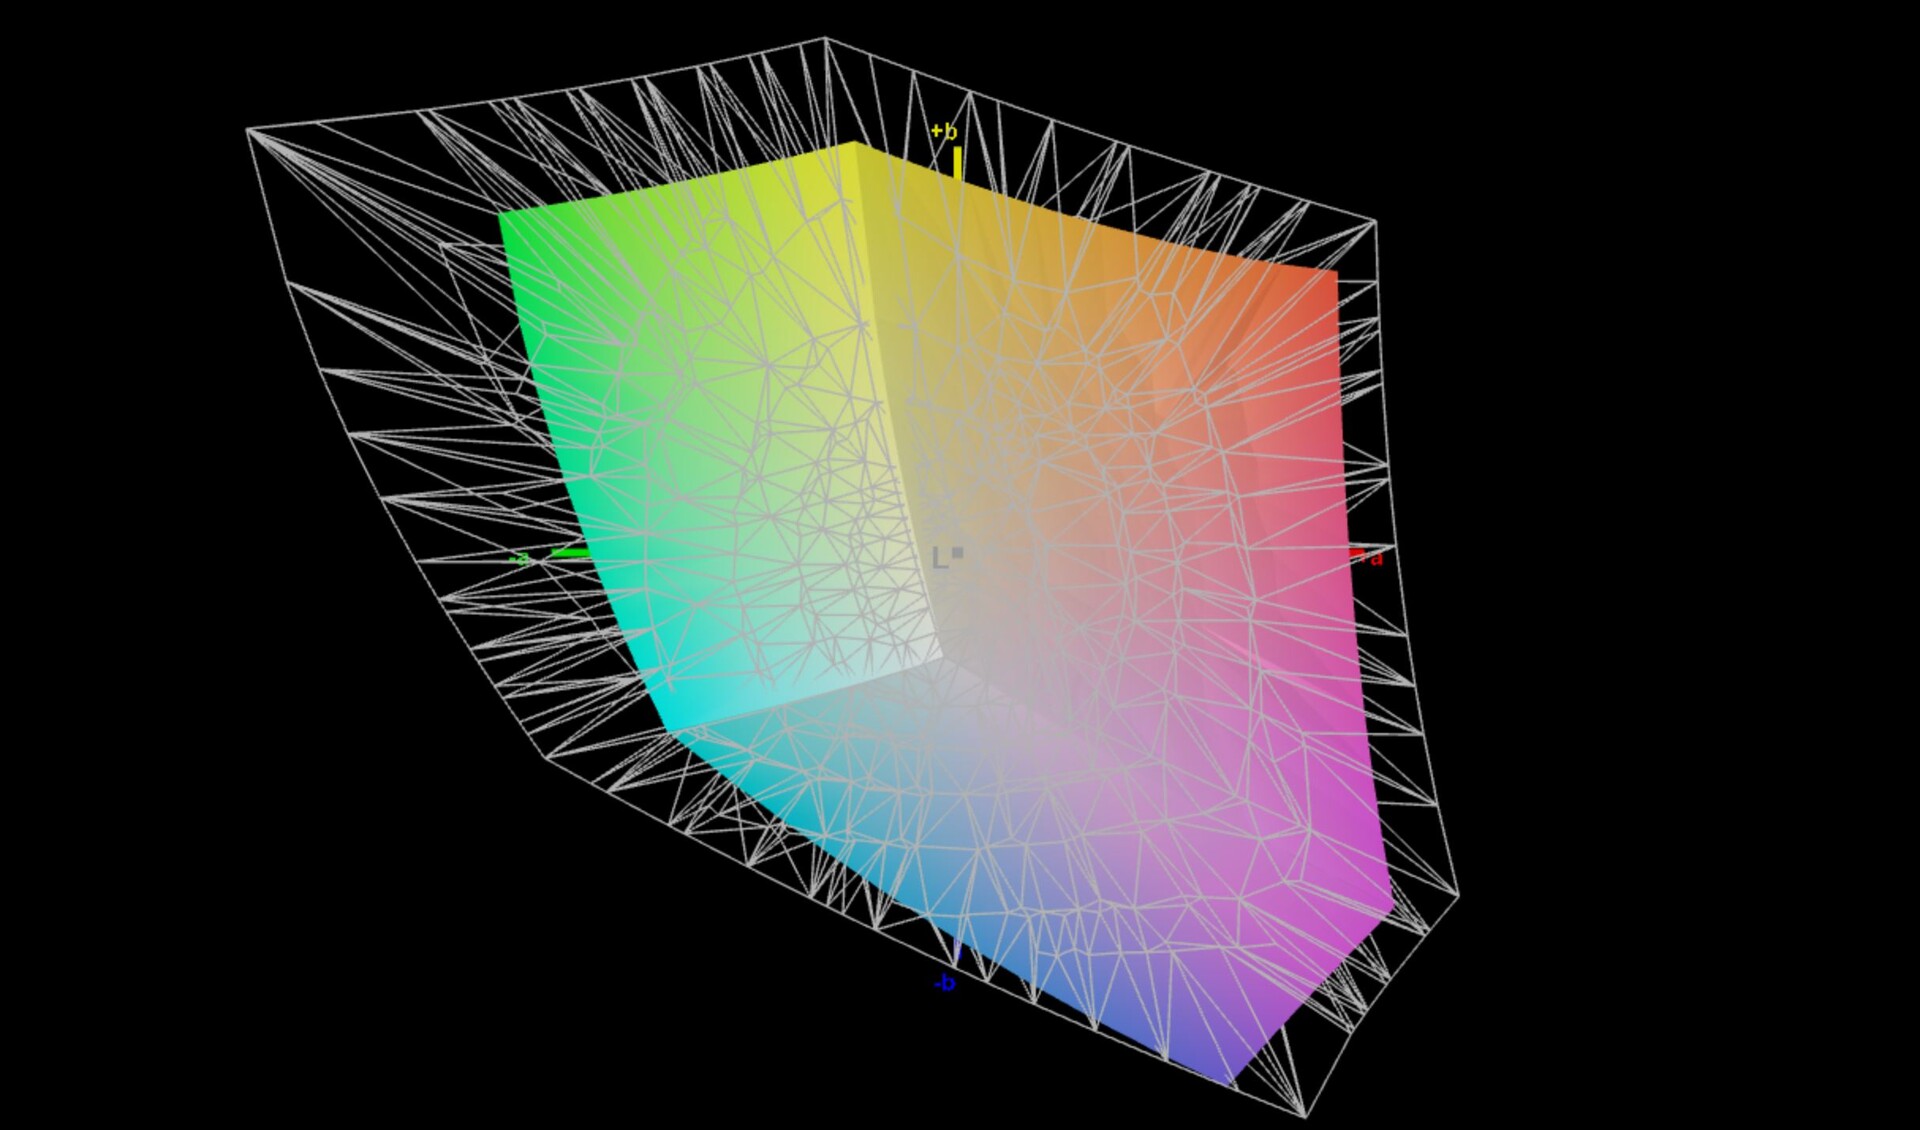
67.5% AdobeRGB 1998 (Argyll 3D)
92% sRGB (Argyll 3D)
65.2% Display P3 (Argyll 3D)
Gamma: 2.17
CCT: 6511 K
| Huawei MateBook 13s i5 11300H TL134GDXP02-0, LTPS, 2520x1680, 13.4" | Lenovo ThinkBook 13s G3 20YA0005GE M133NW4JR0, IPS, 1920x1200, 13.3" | Asus ZenBook 13 UX325EA Samsung SDC4155 (ATNA33XC09-0), OLED, 1920x1080, 13.3" | Apple MacBook Air 2020 M1 Entry IPS, 2560x1600, 13.3" | Microsoft Surface Laptop 4 13 i7 LQ135P1JX51, IPS, 2256x1504, 13.5" | Dell XPS 13 9305 Core i5 FHD Sharp SHP14AE, IPS, 1920x1080, 13.3" | HP Pavilion Aero 13 be0097nr AU Optronics AUO6496, IPS, 1920x1200, 13.3" | |
|---|---|---|---|---|---|---|---|
| Display | 4% | 35% | 29% | 1% | 2% | 11% | |
| Display P3 Coverage (%) | 65.2 | 67.5 4% | 99.9 53% | 98.6 51% | 64.7 -1% | 66.3 2% | 73.4 13% |
| sRGB Coverage (%) | 92 | 97.1 6% | 100 9% | 100 9% | 97.2 6% | 97.1 6% | 99.8 8% |
| AdobeRGB 1998 Coverage (%) | 67.5 | 68.8 2% | 97.5 44% | 85.9 27% | 66.9 -1% | 67.1 -1% | 74.8 11% |
| Response Times | -32% | 94% | 9% | -58% | -21% | -17% | |
| Response Time Grey 50% / Grey 80% * (ms) | 44.8 ? | 53.2 ? -19% | 2 ? 96% | 31 ? 31% | 62.8 ? -40% | 55 ? -23% | 42.4 ? 5% |
| Response Time Black / White * (ms) | 22.8 ? | 32.8 ? -44% | 2 ? 91% | 26.1 ? -14% | 39.8 ? -75% | 27 ? -18% | 31.6 ? -39% |
| PWM Frequency (Hz) | 9804 ? | 60 ? | 118000 ? | 21930 ? | 996 ? | ||
| Screen | 7% | -11% | 4% | -8% | -10% | -16% | |
| Brightness middle (cd/m²) | 468 | 379 -19% | 390 -17% | 417 -11% | 413 -12% | 486 4% | 473.9 1% |
| Brightness (cd/m²) | 450 | 356 -21% | 368 -18% | 395 -12% | 400 -11% | 446 -1% | 458 2% |
| Brightness Distribution (%) | 92 | 88 -4% | 66 -28% | 91 -1% | 94 2% | 77 -16% | 91 -1% |
| Black Level * (cd/m²) | 0.23 | 0.23 -0% | 0.39 -70% | 0.29 -26% | 0.4 -74% | 0.36 -57% | |
| Contrast (:1) | 2035 | 1648 -19% | 1069 -47% | 1424 -30% | 1215 -40% | 1316 -35% | |
| Colorchecker dE 2000 * | 2 | 1.6 20% | 2.03 -1% | 1.12 44% | 2.8 -40% | 2.54 -27% | 2.99 -50% |
| Colorchecker dE 2000 max. * | 5.5 | 2.7 51% | 3.14 43% | 2.71 51% | 7.2 -31% | 4.34 21% | 4.35 21% |
| Colorchecker dE 2000 calibrated * | 1.5 | 1 33% | 3.1 -107% | 0.77 49% | 0.8 47% | 1.04 31% | 1.1 27% |
| Greyscale dE 2000 * | 2.6 | 2 23% | 1.28 51% | 1.7 35% | 1.9 27% | 2.34 10% | 4 -54% |
| Gamma | 2.17 101% | 2.25 98% | 2.4 92% | 2207 0% | 2.12 104% | 2.28 96% | 2.35 94% |
| CCT | 6511 100% | 6835 95% | 6359 102% | 6870 95% | 6510 100% | 6864 95% | 6269 104% |
| Color Space (Percent of AdobeRGB 1998) (%) | 87 | 61.6 | 62 | ||||
| Color Space (Percent of sRGB) (%) | 100 | 97.2 | 97 | ||||
| Total Average (Program / Settings) | -7% /
1% | 39% /
18% | 14% /
10% | -22% /
-13% | -10% /
-9% | -7% /
-11% |
* ... smaller is better
The MateBook 13s offers a 90 Hz mode, but it is not active by default. You can activate it via graphics settings or via key combination (Fn+R). The 90 Hz mode results in a smoother picture impression, especially during scrolling.
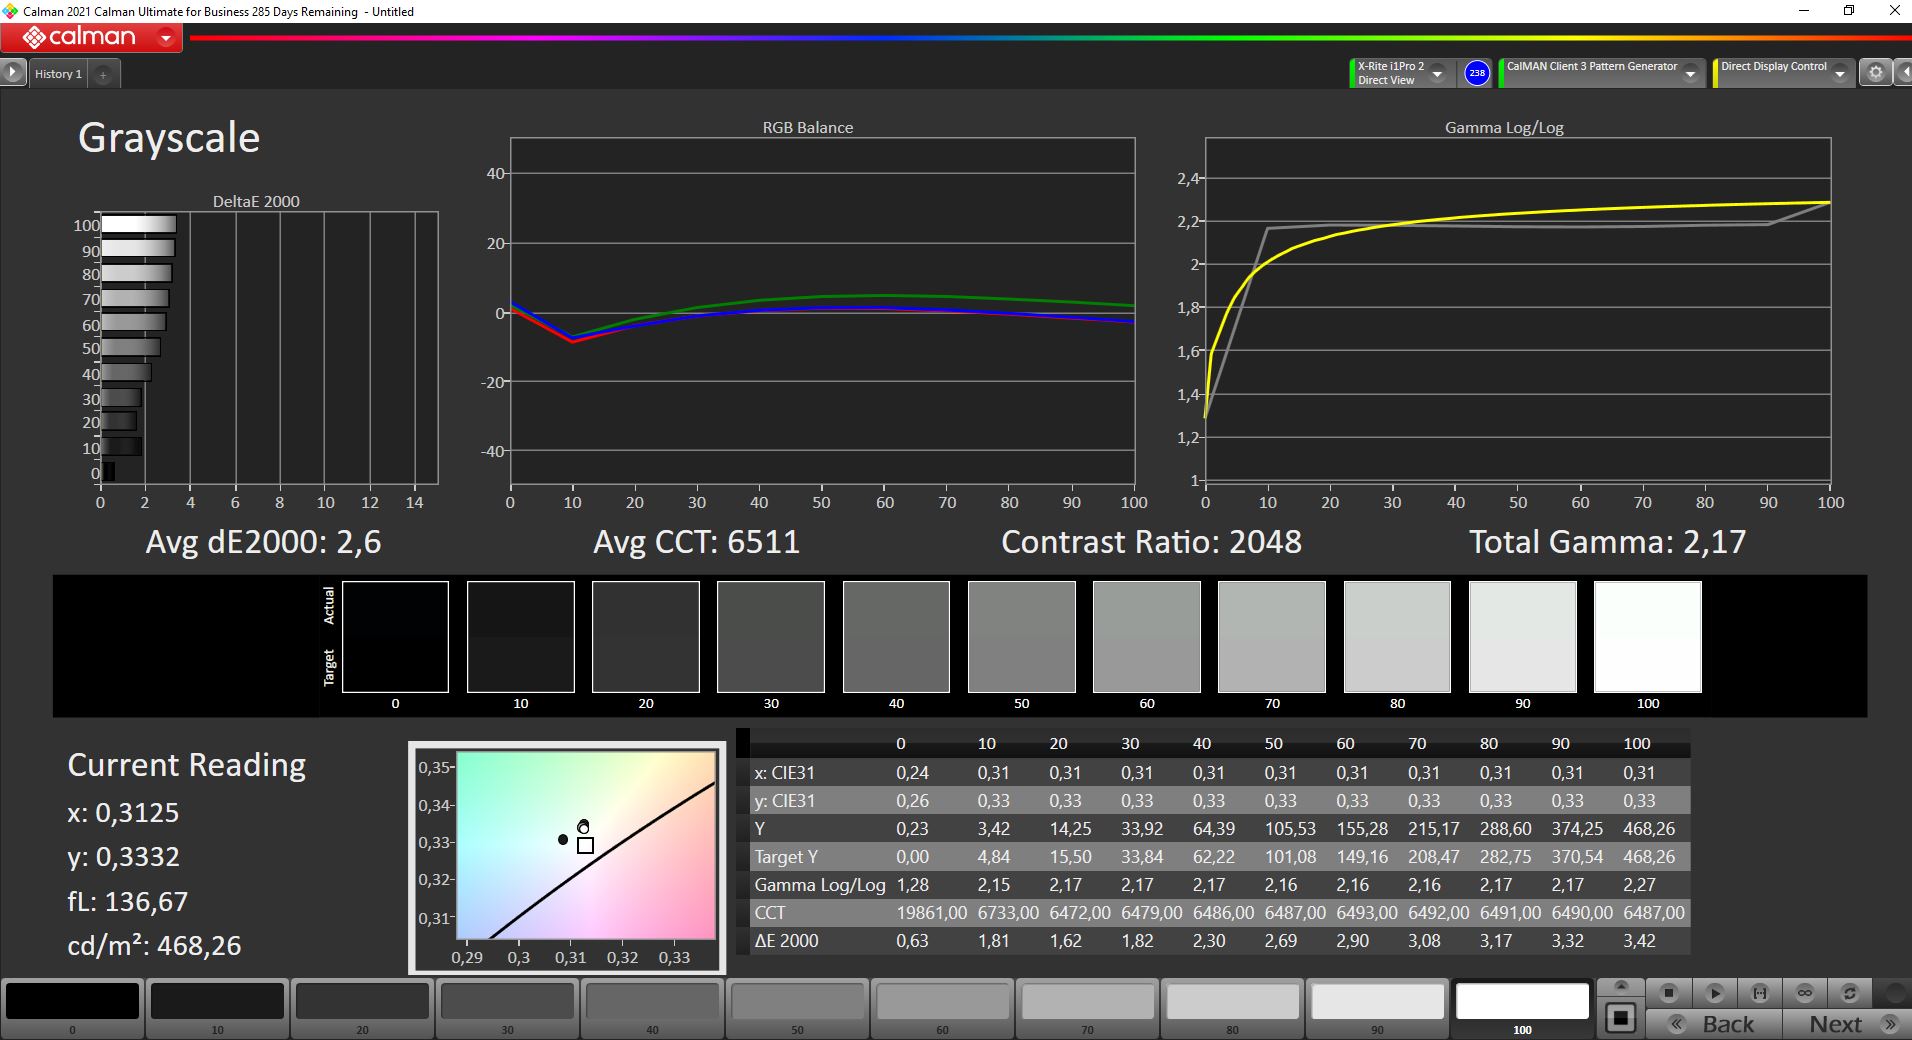

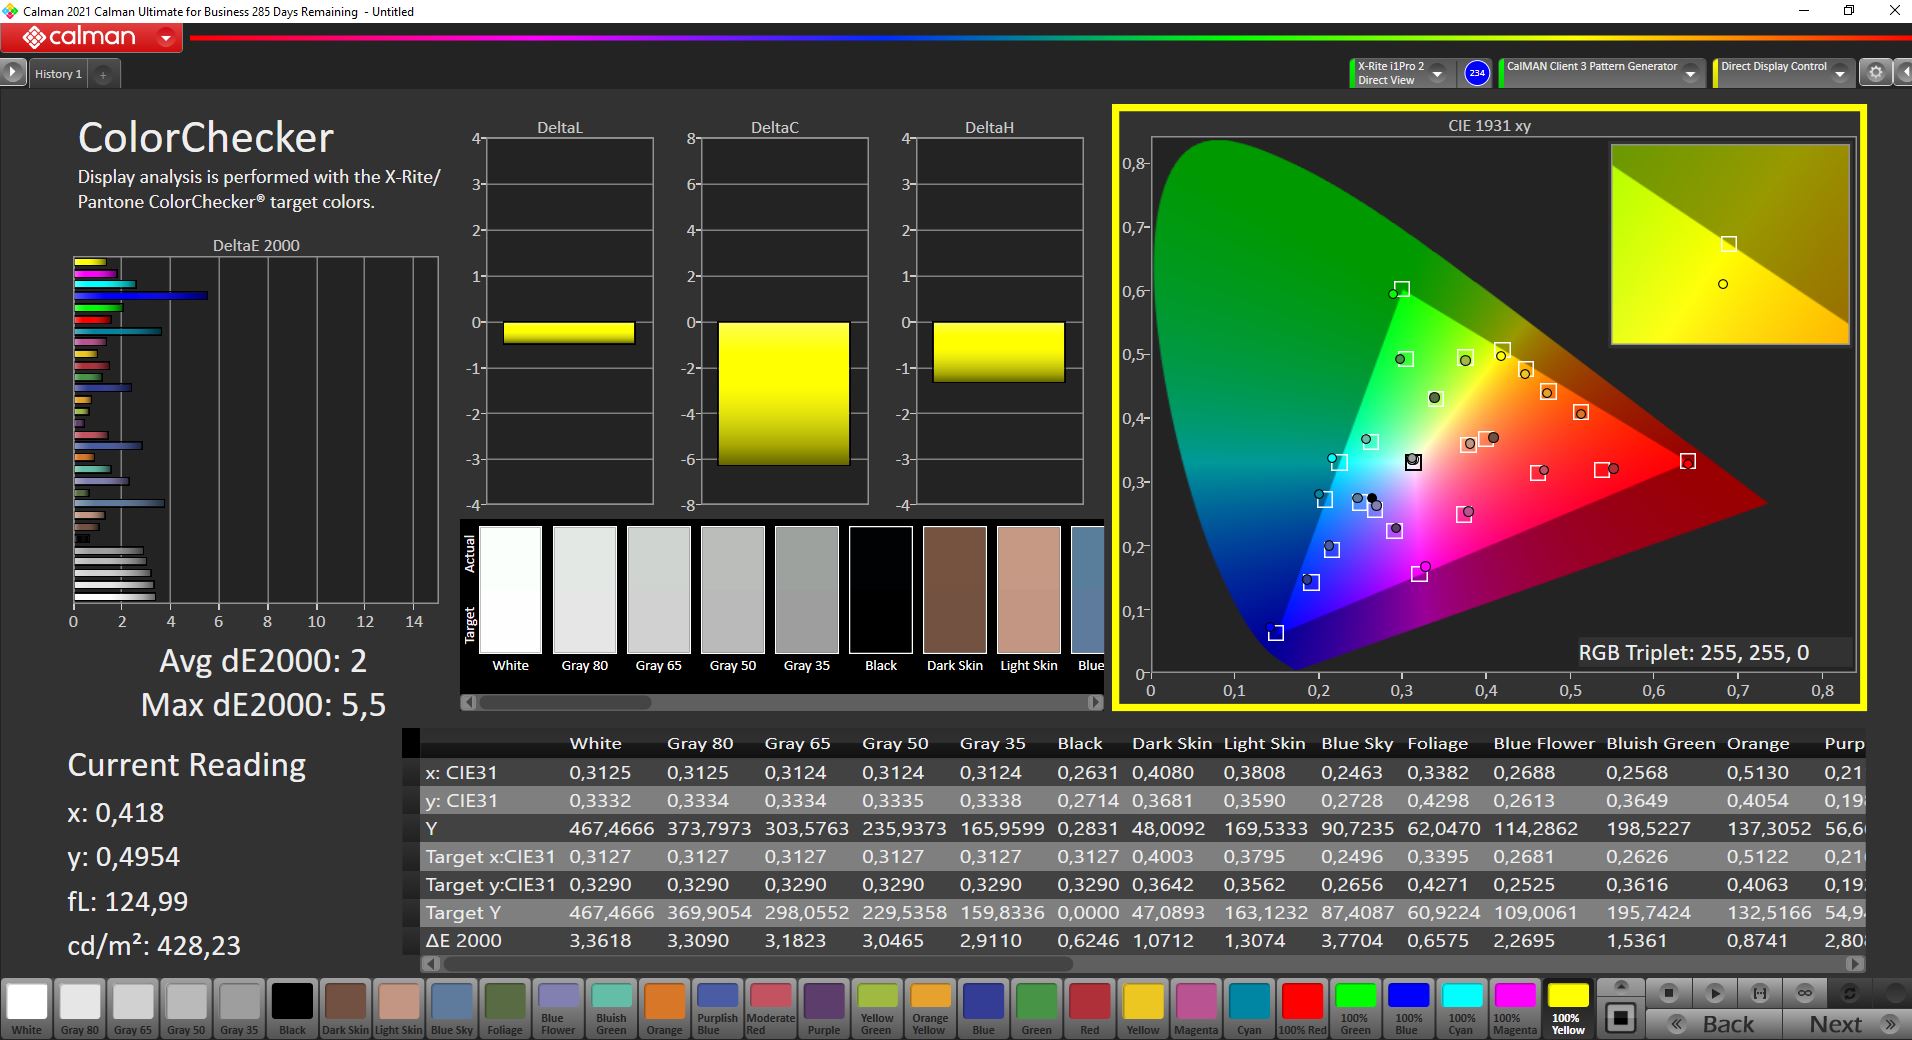
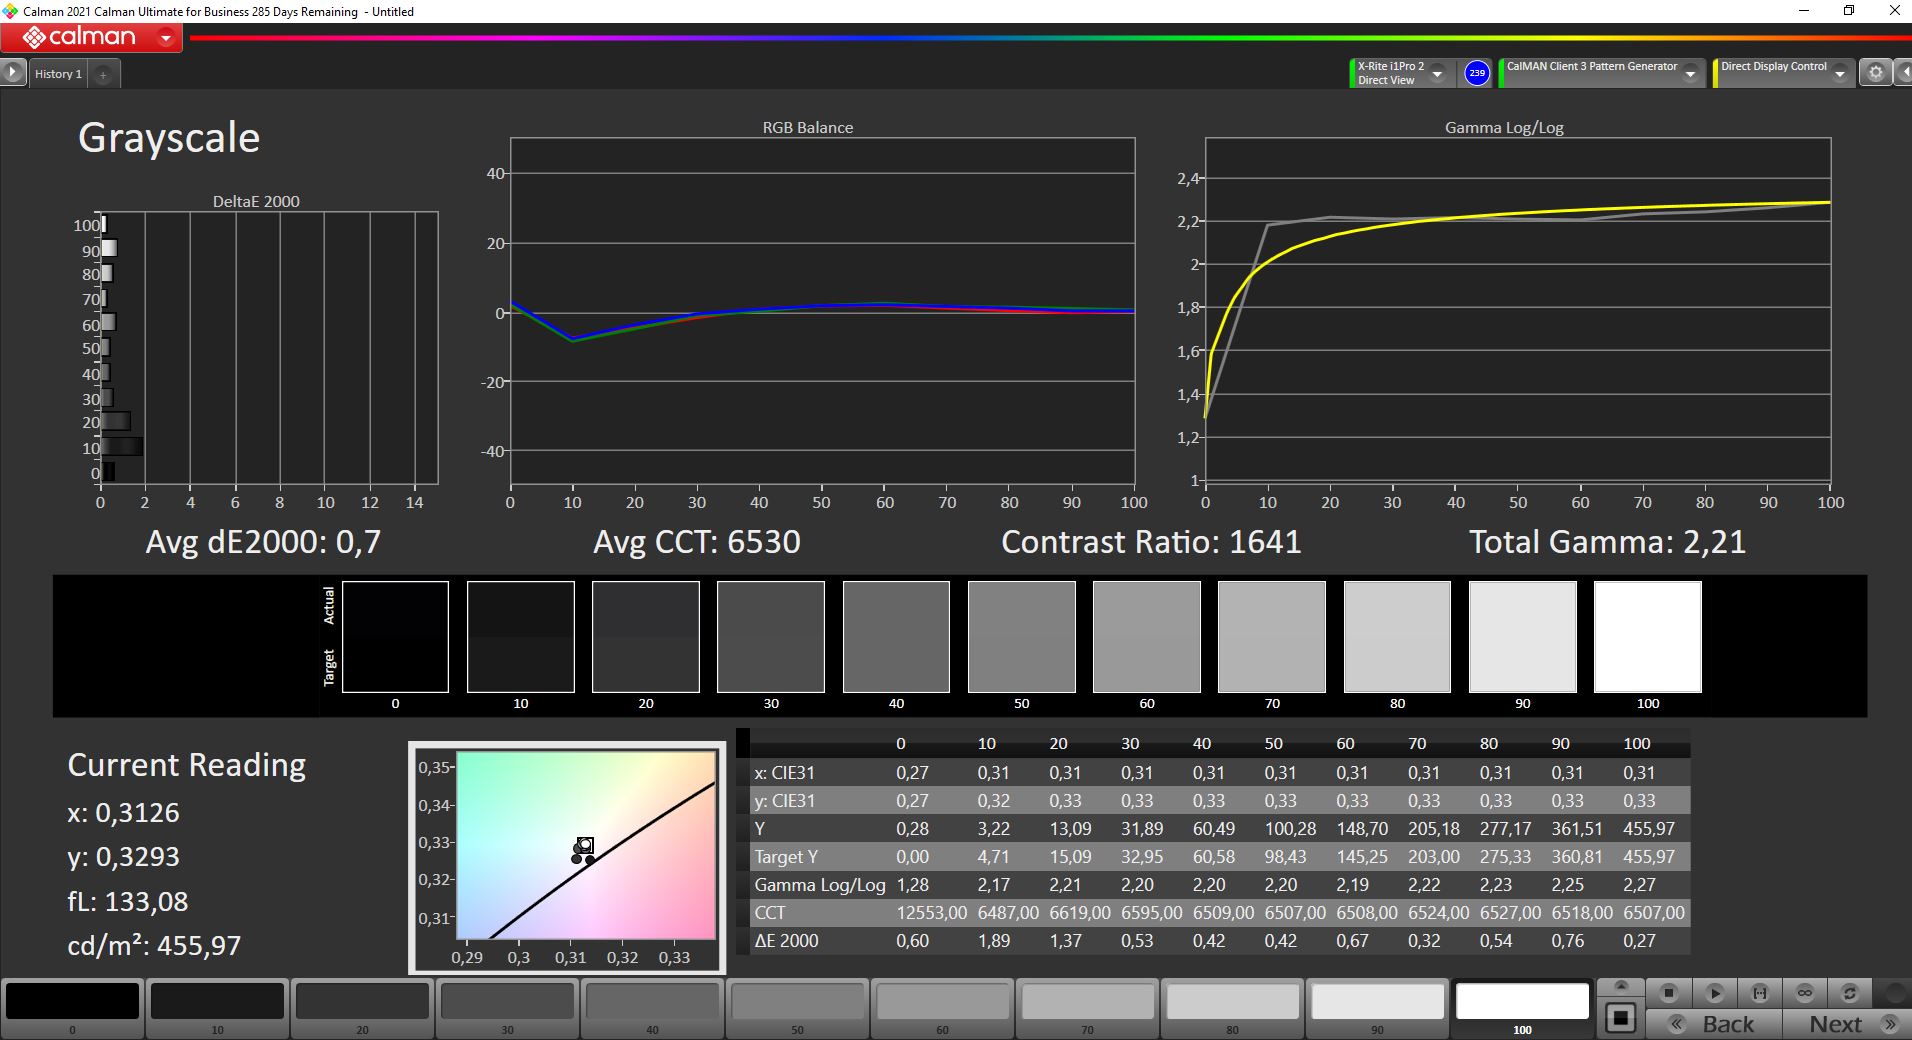
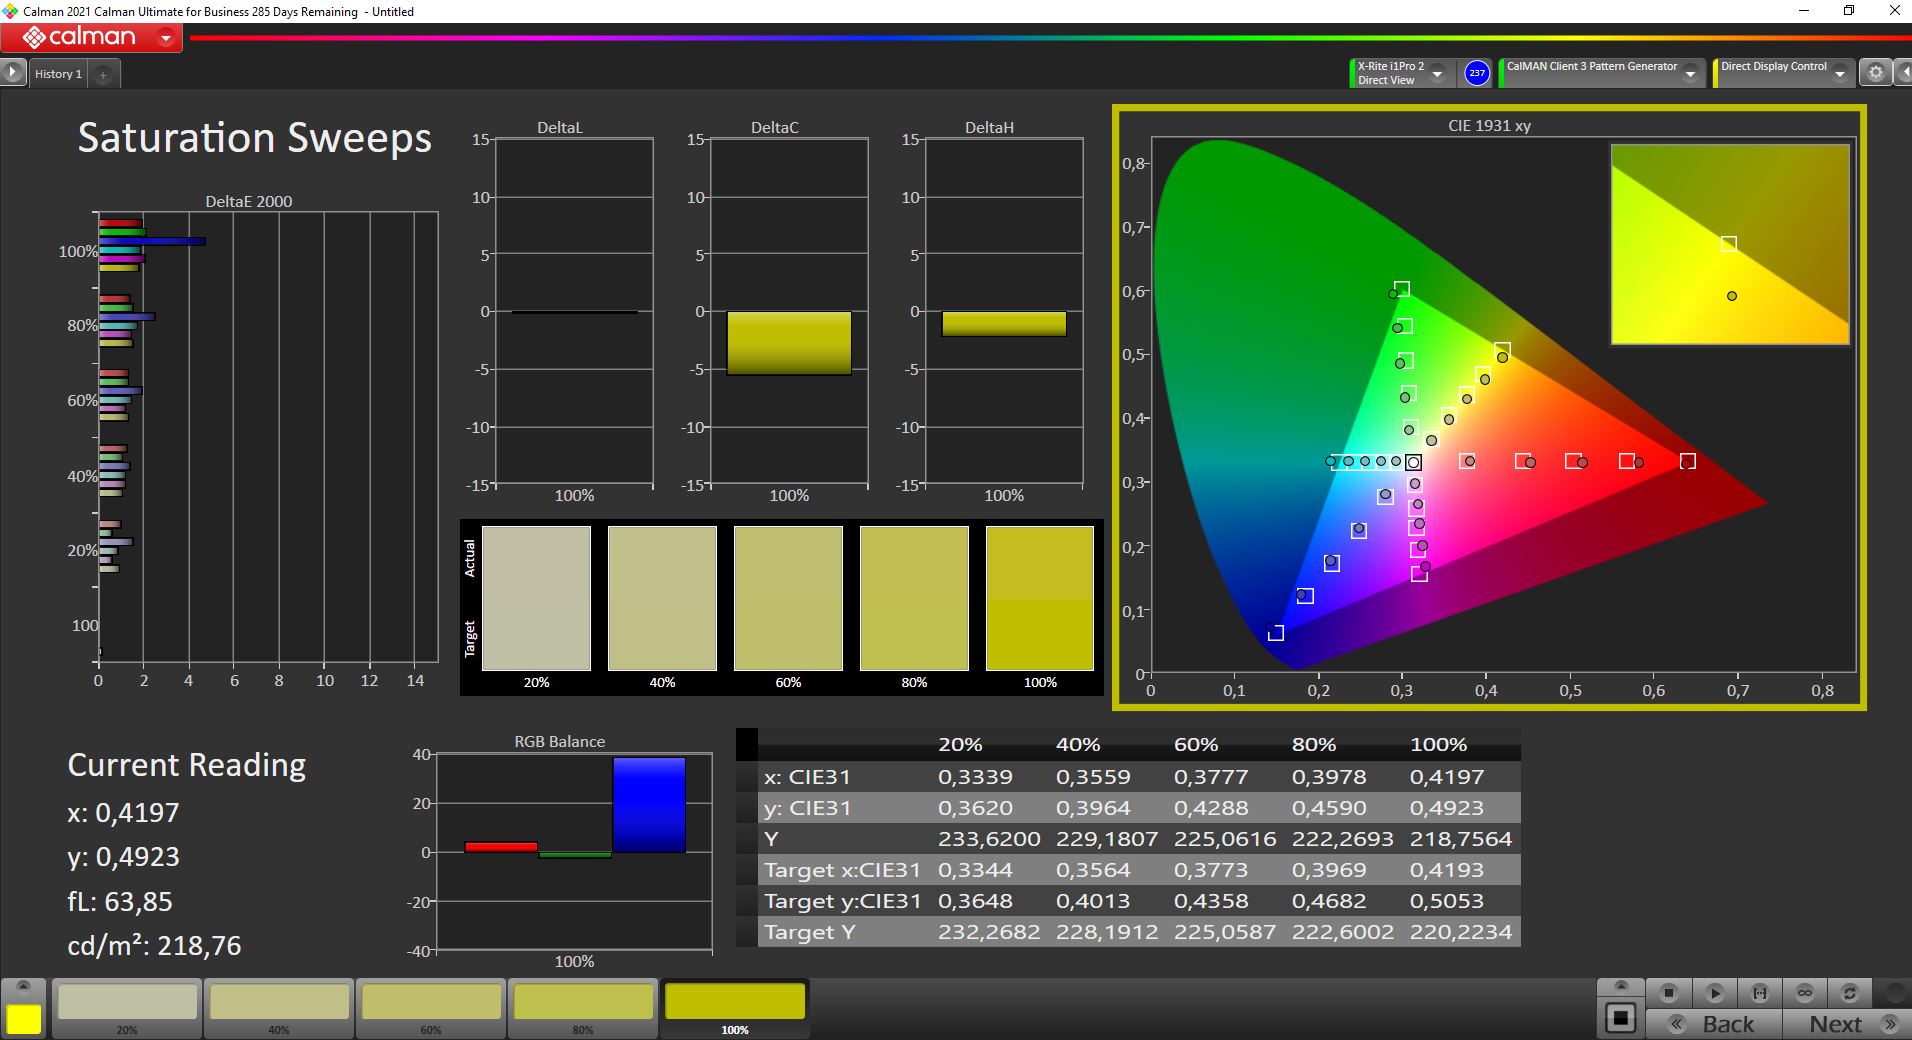
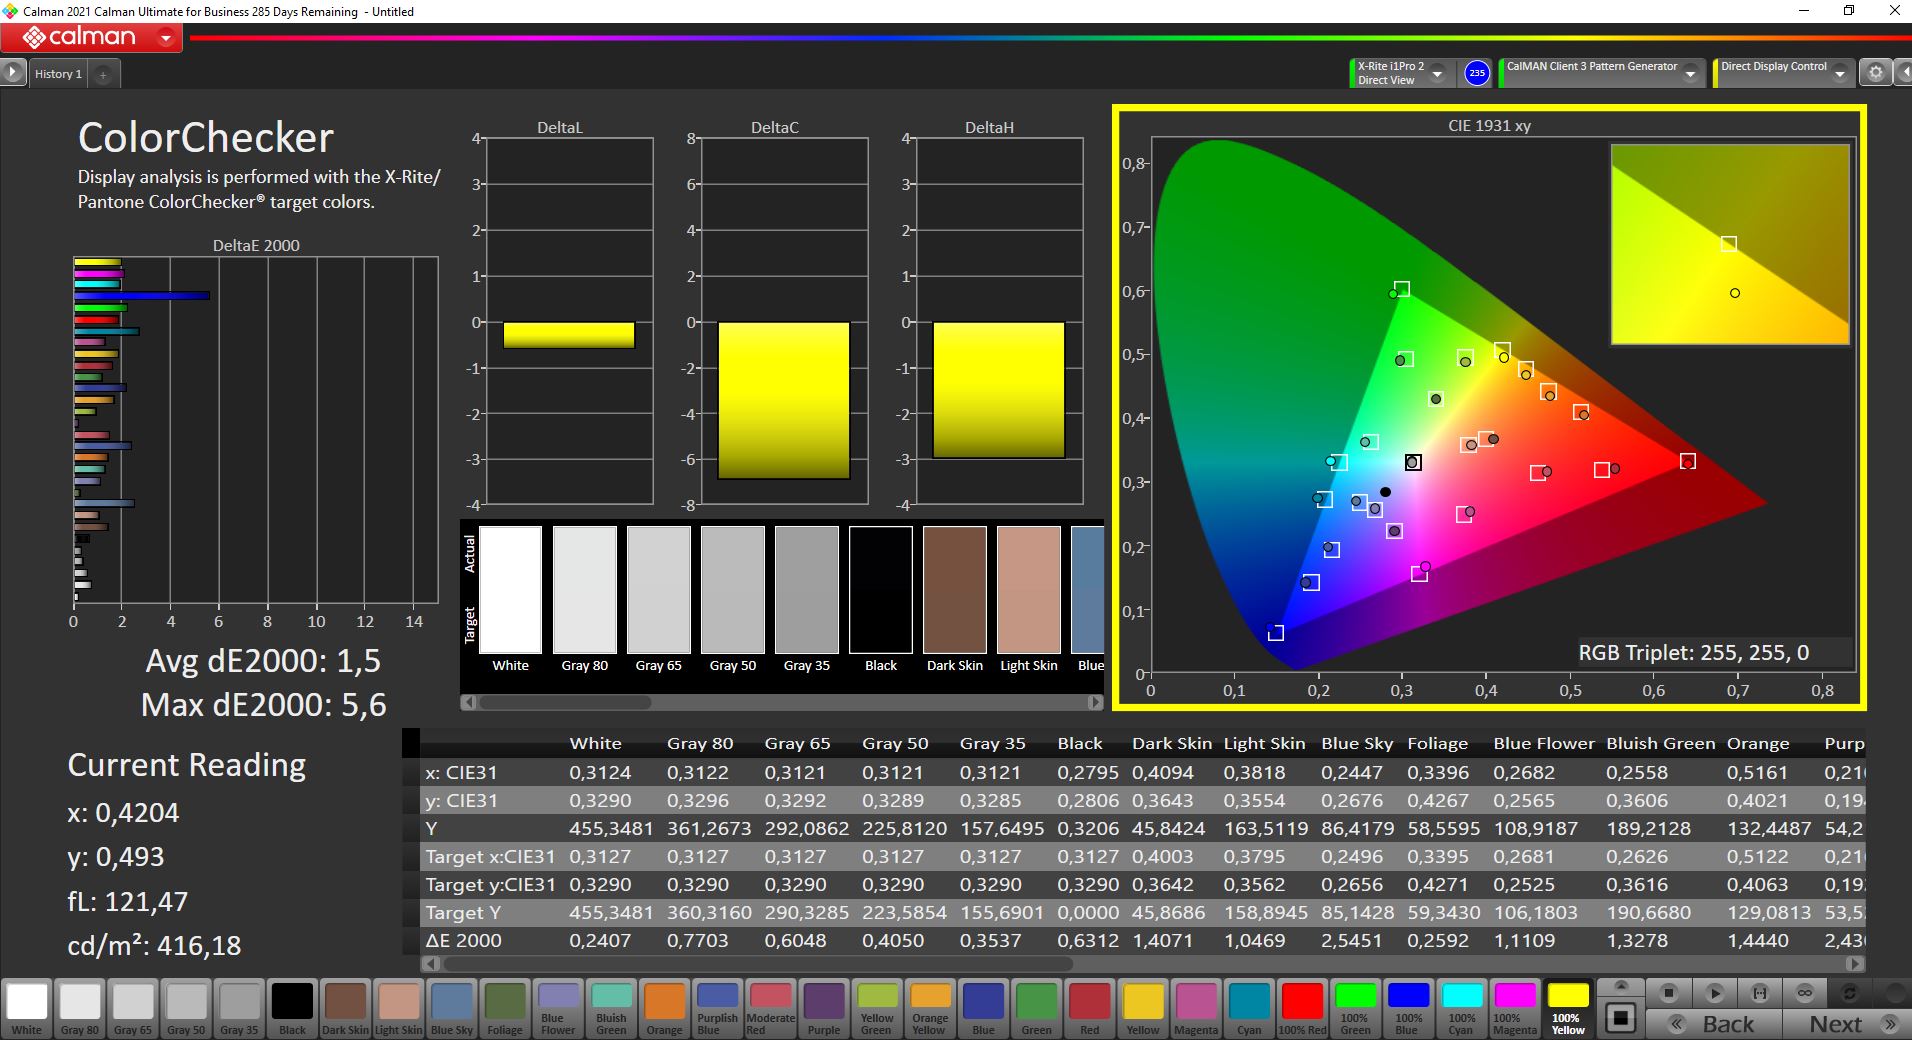
We analyzed the display with the professional CalMAN software and the X-Rite i1 Pro 2 spectrophotometer. The picture quality is already very good out of the box and there is no visible color cast, but there are some shades of blue with slightly elevated deviations (higher 3). Our own calibration (profile can be downloaded for free in the box above) can improve the results, but 100% blue still deviates, so this is just a limitation of the display. Still, the MateBook 13s is suited for picture editing in the small sRGB color space, which is almost covered completely.
Display Response Times
| ↔ Response Time Black to White | ||
|---|---|---|
| 22.8 ms ... rise ↗ and fall ↘ combined | ↗ 10.4 ms rise | 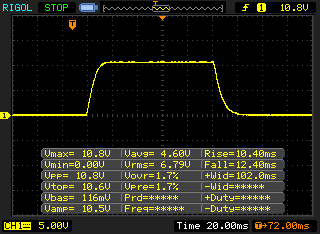 |
| ↘ 12.4 ms fall | ||
| The screen shows good response rates in our tests, but may be too slow for competitive gamers. In comparison, all tested devices range from 0.1 (minimum) to 240 (maximum) ms. » 52 % of all devices are better. This means that the measured response time is worse than the average of all tested devices (19.8 ms). | ||
| ↔ Response Time 50% Grey to 80% Grey | ||
| 44.8 ms ... rise ↗ and fall ↘ combined | ↗ 22 ms rise | 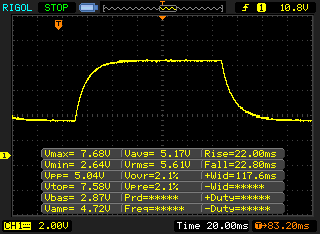 |
| ↘ 22.8 ms fall | ||
| The screen shows slow response rates in our tests and will be unsatisfactory for gamers. In comparison, all tested devices range from 0.165 (minimum) to 636 (maximum) ms. » 76 % of all devices are better. This means that the measured response time is worse than the average of all tested devices (30.9 ms). | ||
Screen Flickering / PWM (Pulse-Width Modulation)
| Screen flickering / PWM detected | 9804 Hz | ≤ 20 % brightness setting | 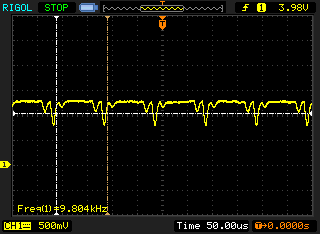 |
| ≤ 47 cd/m² brightness | |||
The display backlight flickers at 9804 Hz (worst case, e.g., utilizing PWM) Flickering detected at a brightness setting of 20 % (47 cd/m²) and below. There should be no flickering or PWM above this brightness setting. The frequency of 9804 Hz is quite high, so most users sensitive to PWM should not notice any flickering. As the flickering occurs only on very low brightness settings, it should not be an issue in typical office settings. Nonetheless, use in low light conditions may be straining to the eyes. In comparison: 52 % of all tested devices do not use PWM to dim the display. If PWM was detected, an average of 7744 (minimum: 5 - maximum: 343500) Hz was measured. | |||
The glossy display is a problem outdoors and it is hard to see the display contents on sunny days, despite the high brightness. It is more comfortable in the shade or on overcast days. There are nor problems with the viewing angle stability.
Performance - Huawei uses Tiger Lake-H35
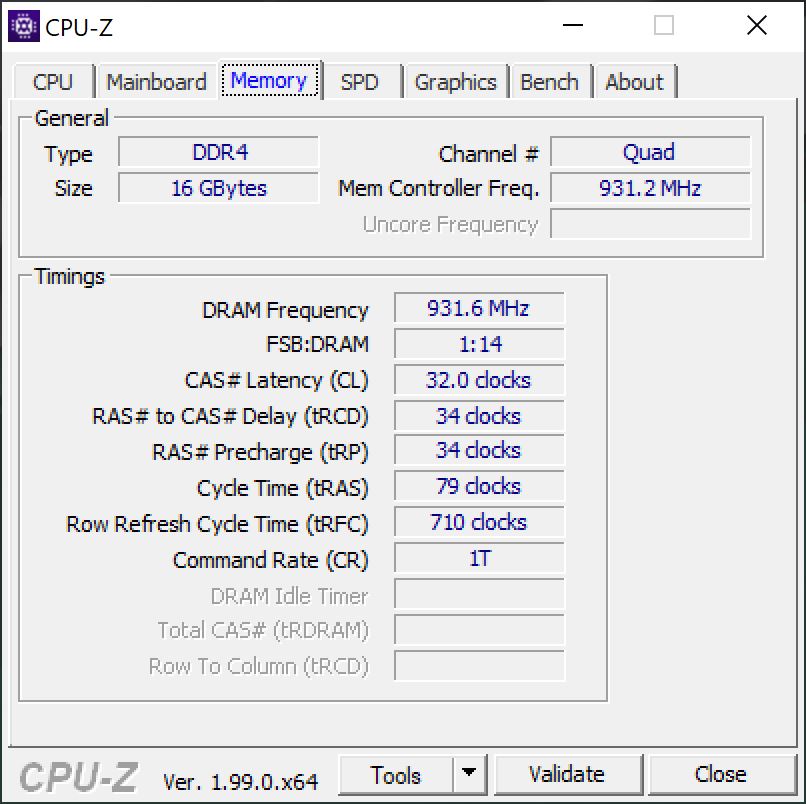
Huawei only offers one configuration of the MateBook 13s. Similar to the larger MateBook 14s, the manufacturer uses 35W CPUs from Intel’s Tiger Lake generation, but in this case with the slower Core i5-11300H as well as the slightly slower version of the integrated Intel Iris Xe Graphics G7 with 80 EUs. Combined with 16 GB RAM (LPDDR4x-3733) in a dual-channel configuration, you get plenty of performance for pretty much every common task.
Huawei’s preinstalled PC Manager offers two power modes; the default "Balanced" setting and "Performance", but the latter only has a small effect on the performance (42 vs. 35 Watts during sustained workloads) and does not really make a difference in everyday tasks. You can also switch between the two modes with the key combination Fn+P. All the following benchmarks and measurements were performed with the "Balanced" mode and the Windows power setting "Best Performance".
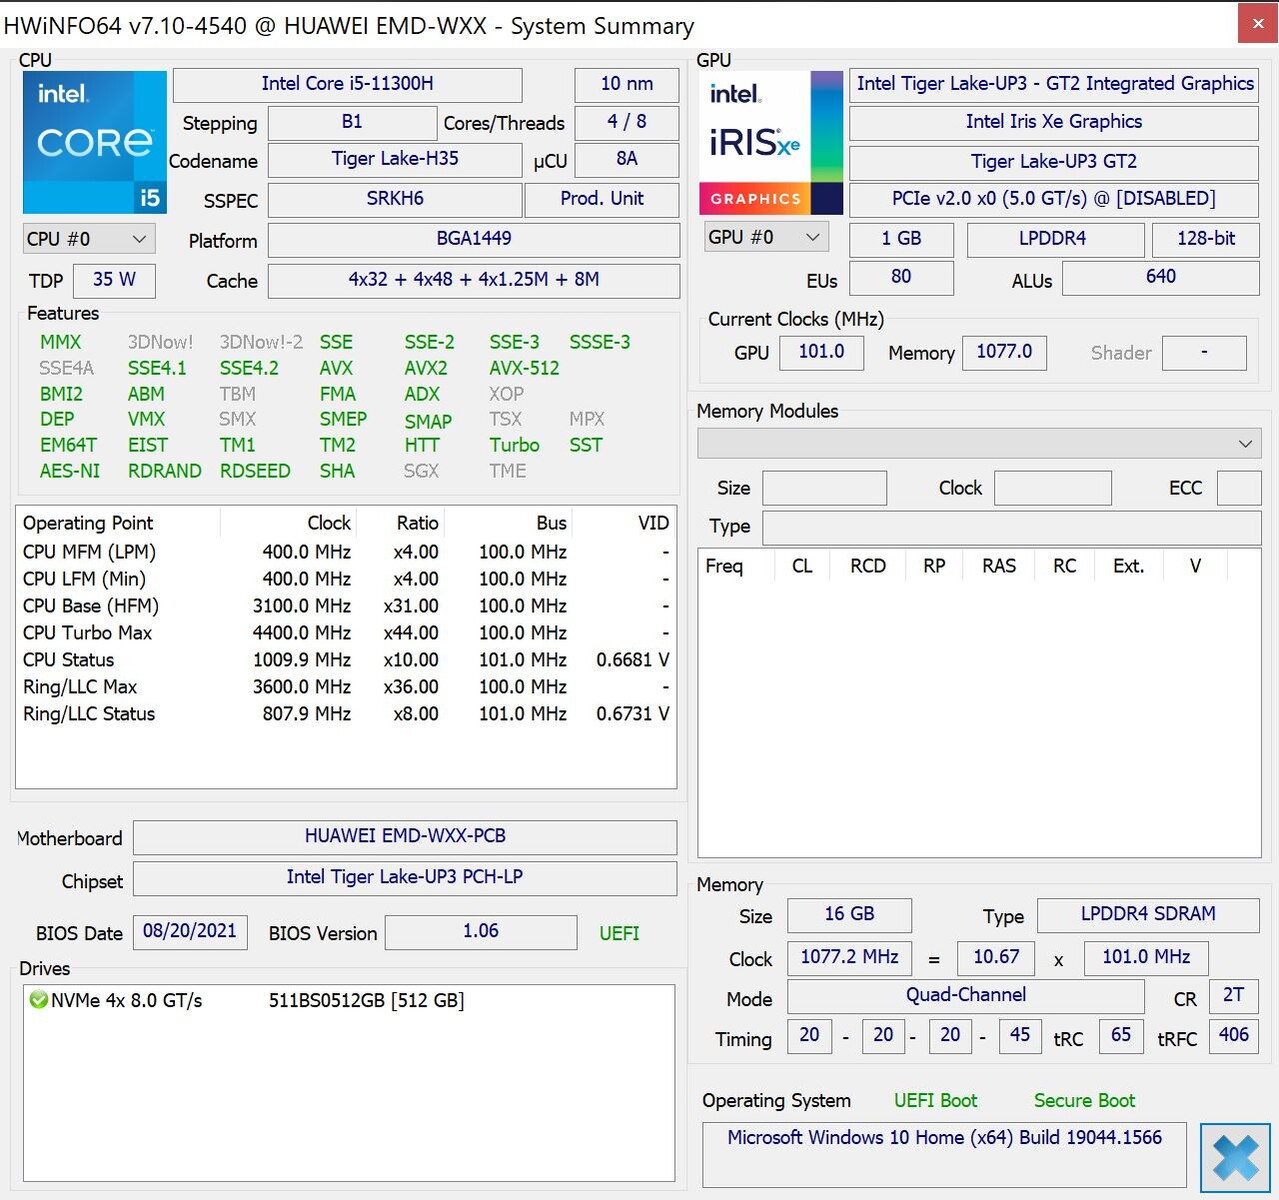
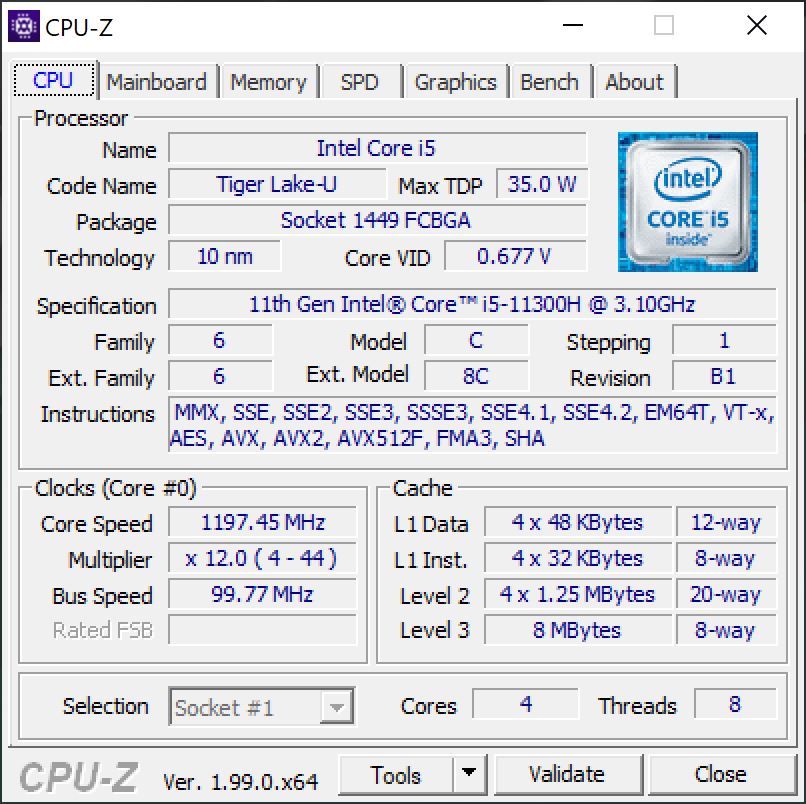
Processor - Core i5-11300H
Intel’s Core i5-11300H is a Tiger Lake CPU with four cores (8 threads) and a nominal TDP of 35 Watts. These H35 CPUs are basically regular Tiger Lake-U processors like the Core i5-1135G7 with higher power levels. The benchmark results are also pretty sobering and the Core i5 does not stand a chance against the AMD U-series processors as well as Apple’s M1 processor in M1 native tests like Cinebench R23, for example.
Cinebench R15 Multi Loop
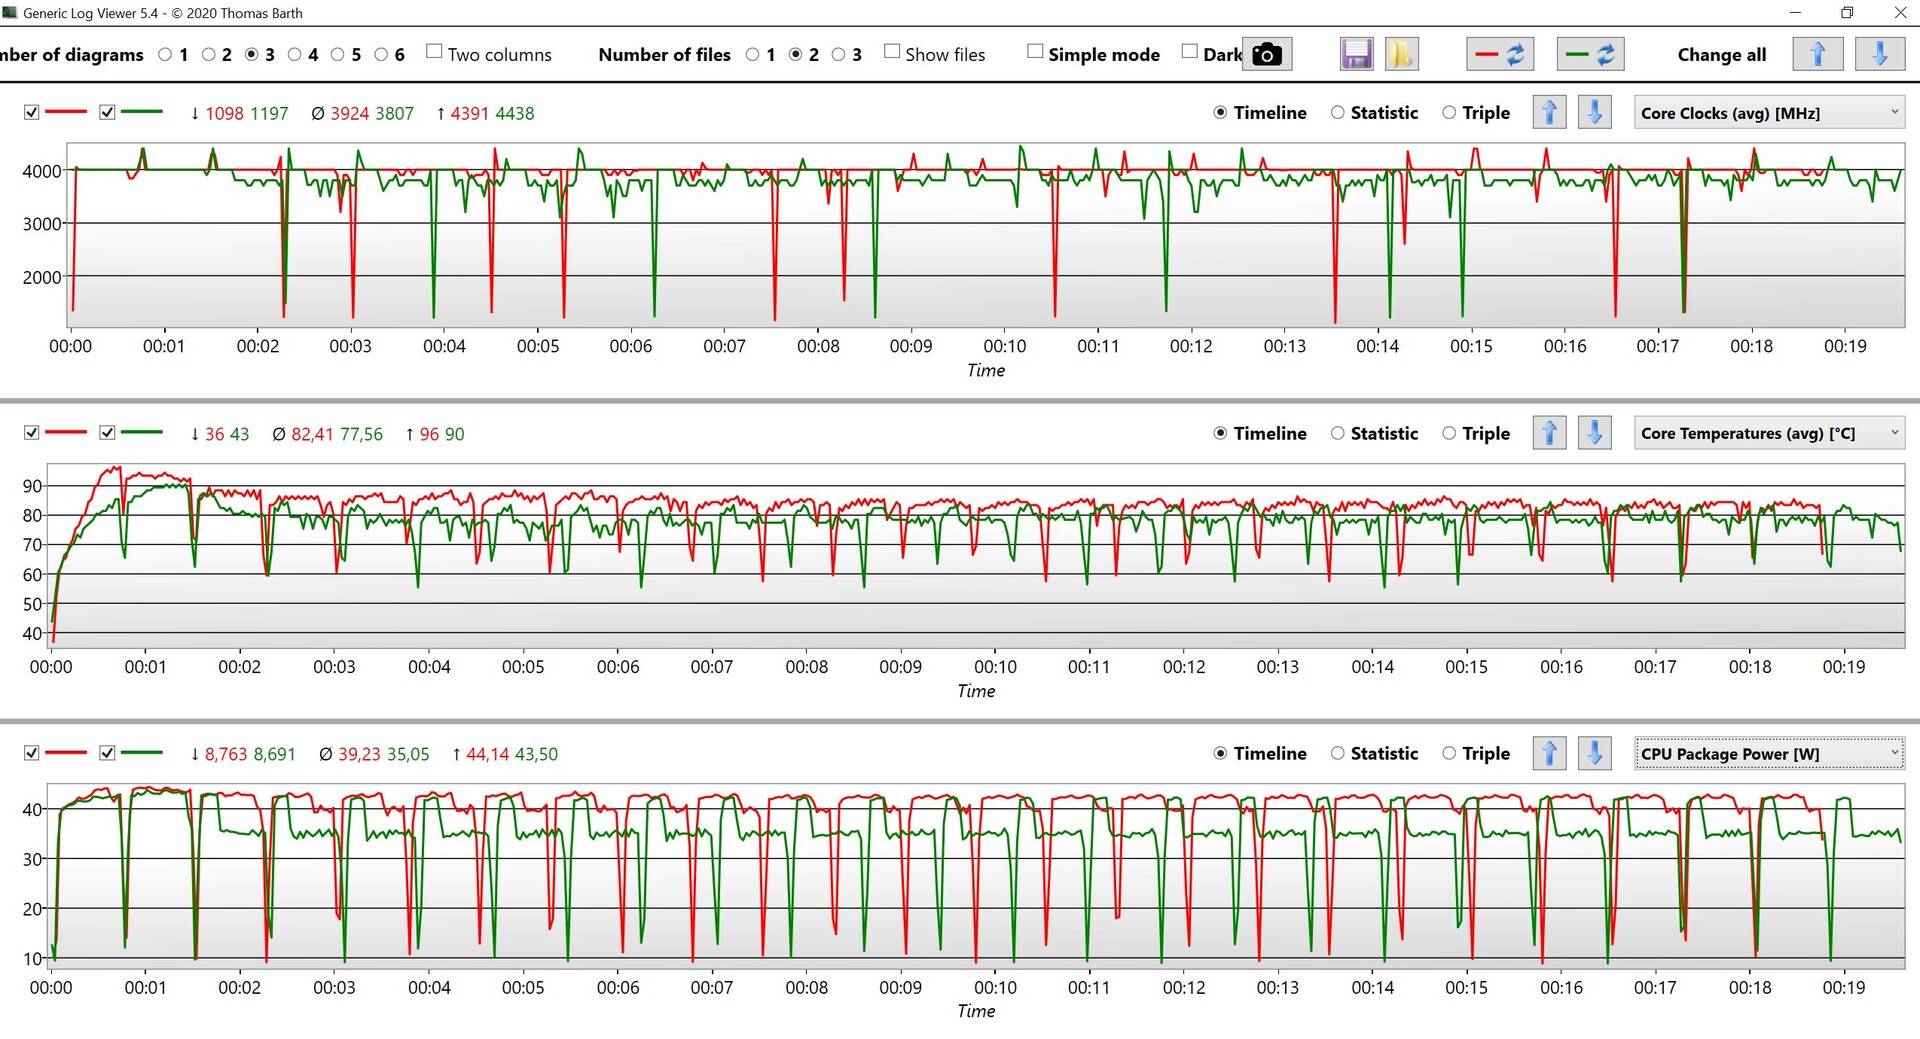
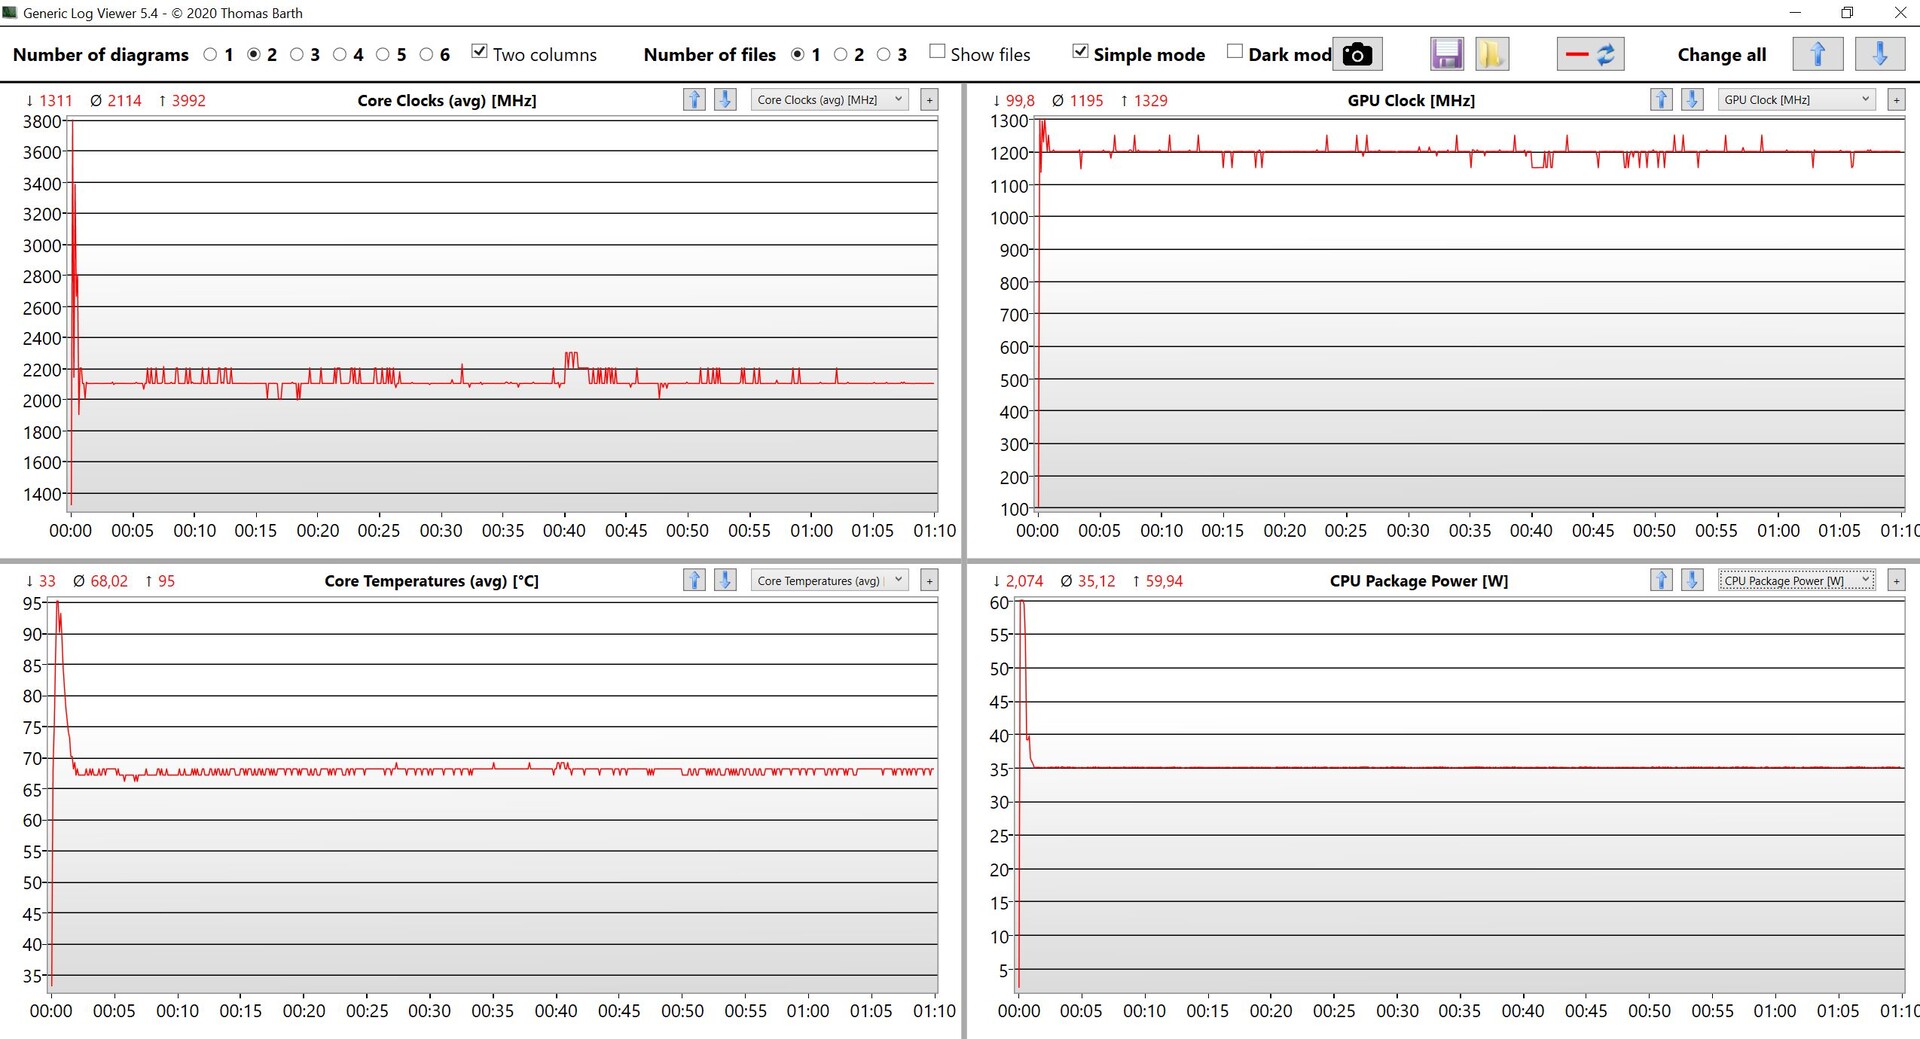
The Cinebench R15 Multi loop clearly shows that the difference between the two performance modes is negligible. If you need the maximum amount of CPU performance, you can certainly use the performance mode. The cooling performance of the MateBook 13s is good, because the CPU can consume more than 40 Watts at the beginning of the tests and then maintain the nominal 35 Watts. The weak performance is therefore caused by the Core i5-11300H itself; the results would be much better with a current AMD chip or one of the brand-new Alder Lake processors. The larger MateBook 14s with the Core i7-11370H can use 45W and is a bit faster, but the difference is once again very small in everyday scenarios.
Overall, the CPU performance is still more than sufficient for everyday tasks and should not be a bottleneck in the foreseeable future, either. The CPU performance is not reduced on battery power. More processor benchmarks are available in our tech section.
Cinebench R23: Multi Core | Single Core
Cinebench R20: CPU (Multi Core) | CPU (Single Core)
Cinebench R15: CPU Multi 64Bit | CPU Single 64Bit
Blender: v2.79 BMW27 CPU
7-Zip 18.03: 7z b 4 | 7z b 4 -mmt1
Geekbench 5.5: Multi-Core | Single-Core
HWBOT x265 Benchmark v2.2: 4k Preset
LibreOffice : 20 Documents To PDF
R Benchmark 2.5: Overall mean
| CPU Performance rating | |
| Average of class Subnotebook | |
| Lenovo ThinkBook 13s G3 20YA0005GE | |
| HP Pavilion Aero 13 be0097nr -2! | |
| Apple MacBook Air 2020 M1 Entry -1! | |
| Huawei MateBook 13s i5 11300H | |
| Average Intel Core i5-11300H | |
| Microsoft Surface Laptop 4 13 Ryzen 5 | |
| Asus ZenBook 13 UX325EA | |
| Dell XPS 13 9305 Core i5 FHD -2! | |
| Cinebench R23 / Multi Core | |
| Average of class Subnotebook (1555 - 21812, n=59, last 2 years) | |
| Lenovo ThinkBook 13s G3 20YA0005GE | |
| HP Pavilion Aero 13 be0097nr | |
| Apple MacBook Air 2020 M1 Entry | |
| Microsoft Surface Laptop 4 13 Ryzen 5 | |
| Average Intel Core i5-11300H (3313 - 6581, n=10) | |
| Dell XPS 13 9305 Core i5 FHD | |
| Huawei MateBook 13s i5 11300H | |
| Asus ZenBook 13 UX325EA | |
| Cinebench R23 / Single Core | |
| Average of class Subnotebook (358 - 2213, n=60, last 2 years) | |
| Apple MacBook Air 2020 M1 Entry | |
| Lenovo ThinkBook 13s G3 20YA0005GE | |
| Asus ZenBook 13 UX325EA | |
| HP Pavilion Aero 13 be0097nr | |
| Average Intel Core i5-11300H (1218 - 1431, n=11) | |
| Dell XPS 13 9305 Core i5 FHD | |
| Huawei MateBook 13s i5 11300H | |
| Microsoft Surface Laptop 4 13 Ryzen 5 | |
| Cinebench R20 / CPU (Multi Core) | |
| Average of class Subnotebook (579 - 8541, n=56, last 2 years) | |
| HP Pavilion Aero 13 be0097nr | |
| Lenovo ThinkBook 13s G3 20YA0005GE | |
| Microsoft Surface Laptop 4 13 Ryzen 5 | |
| Average Intel Core i5-11300H (1300 - 2533, n=10) | |
| Huawei MateBook 13s i5 11300H | |
| Apple MacBook Air 2020 M1 Entry | |
| Dell XPS 13 9305 Core i5 FHD | |
| Asus ZenBook 13 UX325EA | |
| Cinebench R20 / CPU (Single Core) | |
| Average of class Subnotebook (128 - 832, n=56, last 2 years) | |
| Lenovo ThinkBook 13s G3 20YA0005GE | |
| HP Pavilion Aero 13 be0097nr | |
| Asus ZenBook 13 UX325EA | |
| Average Intel Core i5-11300H (431 - 548, n=11) | |
| Dell XPS 13 9305 Core i5 FHD | |
| Microsoft Surface Laptop 4 13 Ryzen 5 | |
| Huawei MateBook 13s i5 11300H | |
| Apple MacBook Air 2020 M1 Entry | |
| Cinebench R15 / CPU Multi 64Bit | |
| Average of class Subnotebook (327 - 3345, n=56, last 2 years) | |
| Lenovo ThinkBook 13s G3 20YA0005GE | |
| Lenovo ThinkBook 13s G3 20YA0005GE | |
| HP Pavilion Aero 13 be0097nr | |
| Microsoft Surface Laptop 4 13 Ryzen 5 | |
| Apple MacBook Air 2020 M1 Entry | |
| Huawei MateBook 13s i5 11300H | |
| Huawei MateBook 13s i5 11300H | |
| Average Intel Core i5-11300H (632 - 990, n=11) | |
| Asus ZenBook 13 UX325EA | |
| Dell XPS 13 9305 Core i5 FHD | |
| Cinebench R15 / CPU Single 64Bit | |
| Average of class Subnotebook (72.4 - 322, n=56, last 2 years) | |
| HP Pavilion Aero 13 be0097nr | |
| Lenovo ThinkBook 13s G3 20YA0005GE | |
| Asus ZenBook 13 UX325EA | |
| Apple MacBook Air 2020 M1 Entry | |
| Huawei MateBook 13s i5 11300H | |
| Average Intel Core i5-11300H (123 - 211, n=8) | |
| Microsoft Surface Laptop 4 13 Ryzen 5 | |
| Blender / v2.79 BMW27 CPU | |
| Asus ZenBook 13 UX325EA | |
| Apple MacBook Air 2020 M1 Entry | |
| Dell XPS 13 9305 Core i5 FHD | |
| Average Intel Core i5-11300H (466 - 862, n=10) | |
| Huawei MateBook 13s i5 11300H | |
| Microsoft Surface Laptop 4 13 Ryzen 5 | |
| Lenovo ThinkBook 13s G3 20YA0005GE | |
| Average of class Subnotebook (159 - 2271, n=57, last 2 years) | |
| HP Pavilion Aero 13 be0097nr | |
| 7-Zip 18.03 / 7z b 4 | |
| Average of class Subnotebook (11668 - 77867, n=56, last 2 years) | |
| HP Pavilion Aero 13 be0097nr | |
| Lenovo ThinkBook 13s G3 20YA0005GE | |
| Apple MacBook Air 2020 M1 Entry | |
| Microsoft Surface Laptop 4 13 Ryzen 5 | |
| Huawei MateBook 13s i5 11300H | |
| Dell XPS 13 9305 Core i5 FHD | |
| Average Intel Core i5-11300H (17573 - 26001, n=10) | |
| Asus ZenBook 13 UX325EA | |
| 7-Zip 18.03 / 7z b 4 -mmt1 | |
| Average of class Subnotebook (2643 - 6699, n=58, last 2 years) | |
| Apple MacBook Air 2020 M1 Entry | |
| HP Pavilion Aero 13 be0097nr | |
| Lenovo ThinkBook 13s G3 20YA0005GE | |
| Asus ZenBook 13 UX325EA | |
| Average Intel Core i5-11300H (4603 - 4969, n=10) | |
| Huawei MateBook 13s i5 11300H | |
| Dell XPS 13 9305 Core i5 FHD | |
| Microsoft Surface Laptop 4 13 Ryzen 5 | |
| Geekbench 5.5 / Multi-Core | |
| Average of class Subnotebook (2557 - 17218, n=49, last 2 years) | |
| Apple MacBook Air 2020 M1 Entry | |
| Lenovo ThinkBook 13s G3 20YA0005GE | |
| Microsoft Surface Laptop 4 13 Ryzen 5 | |
| Asus ZenBook 13 UX325EA | |
| Huawei MateBook 13s i5 11300H | |
| Dell XPS 13 9305 Core i5 FHD | |
| Average Intel Core i5-11300H (3631 - 5499, n=10) | |
| Geekbench 5.5 / Single-Core | |
| Average of class Subnotebook (726 - 2224, n=49, last 2 years) | |
| Apple MacBook Air 2020 M1 Entry | |
| Asus ZenBook 13 UX325EA | |
| Lenovo ThinkBook 13s G3 20YA0005GE | |
| Huawei MateBook 13s i5 11300H | |
| Average Intel Core i5-11300H (1342 - 1462, n=10) | |
| Dell XPS 13 9305 Core i5 FHD | |
| Microsoft Surface Laptop 4 13 Ryzen 5 | |
| HWBOT x265 Benchmark v2.2 / 4k Preset | |
| Average of class Subnotebook (0.97 - 25.1, n=56, last 2 years) | |
| HP Pavilion Aero 13 be0097nr | |
| Lenovo ThinkBook 13s G3 20YA0005GE | |
| Microsoft Surface Laptop 4 13 Ryzen 5 | |
| Huawei MateBook 13s i5 11300H | |
| Average Intel Core i5-11300H (4.32 - 8.38, n=10) | |
| Asus ZenBook 13 UX325EA | |
| LibreOffice / 20 Documents To PDF | |
| Microsoft Surface Laptop 4 13 Ryzen 5 | |
| Dell XPS 13 9305 Core i5 FHD | |
| Average of class Subnotebook (39.9 - 220, n=55, last 2 years) | |
| Asus ZenBook 13 UX325EA | |
| HP Pavilion Aero 13 be0097nr | |
| Lenovo ThinkBook 13s G3 20YA0005GE | |
| Average Intel Core i5-11300H (43.6 - 59.4, n=10) | |
| Huawei MateBook 13s i5 11300H | |
| Apple MacBook Air 2020 M1 Entry | |
| R Benchmark 2.5 / Overall mean | |
| Apple MacBook Air 2020 M1 Entry | |
| Microsoft Surface Laptop 4 13 Ryzen 5 | |
| Dell XPS 13 9305 Core i5 FHD | |
| Huawei MateBook 13s i5 11300H | |
| Average Intel Core i5-11300H (0.6 - 0.644, n=10) | |
| Asus ZenBook 13 UX325EA | |
| Lenovo ThinkBook 13s G3 20YA0005GE | |
| HP Pavilion Aero 13 be0097nr | |
| Average of class Subnotebook (0.4024 - 1.456, n=57, last 2 years) | |
* ... smaller is better
AIDA64: FP32 Ray-Trace | FPU Julia | CPU SHA3 | CPU Queen | FPU SinJulia | FPU Mandel | CPU AES | CPU ZLib | FP64 Ray-Trace | CPU PhotoWorxx
| Performance rating | |
| Lenovo ThinkBook 13s G3 20YA0005GE | |
| Average of class Subnotebook | |
| HP Pavilion Aero 13 be0097nr | |
| Microsoft Surface Laptop 4 13 Ryzen 5 | |
| Huawei MateBook 13s i5 11300H | |
| Average Intel Core i5-11300H | |
| Asus ZenBook 13 UX325EA | |
| AIDA64 / FP32 Ray-Trace | |
| Average of class Subnotebook (1135 - 32888, n=57, last 2 years) | |
| Lenovo ThinkBook 13s G3 20YA0005GE | |
| HP Pavilion Aero 13 be0097nr | |
| Microsoft Surface Laptop 4 13 Ryzen 5 | |
| Huawei MateBook 13s i5 11300H | |
| Average Intel Core i5-11300H (6128 - 8440, n=9) | |
| Asus ZenBook 13 UX325EA | |
| AIDA64 / FPU Julia | |
| Lenovo ThinkBook 13s G3 20YA0005GE | |
| HP Pavilion Aero 13 be0097nr | |
| Average of class Subnotebook (5218 - 123315, n=57, last 2 years) | |
| Microsoft Surface Laptop 4 13 Ryzen 5 | |
| Huawei MateBook 13s i5 11300H | |
| Average Intel Core i5-11300H (25739 - 33986, n=9) | |
| Asus ZenBook 13 UX325EA | |
| AIDA64 / CPU SHA3 | |
| Average of class Subnotebook (444 - 5287, n=57, last 2 years) | |
| Lenovo ThinkBook 13s G3 20YA0005GE | |
| Huawei MateBook 13s i5 11300H | |
| HP Pavilion Aero 13 be0097nr | |
| Average Intel Core i5-11300H (1773 - 2286, n=9) | |
| Asus ZenBook 13 UX325EA | |
| Microsoft Surface Laptop 4 13 Ryzen 5 | |
| AIDA64 / CPU Queen | |
| HP Pavilion Aero 13 be0097nr | |
| Lenovo ThinkBook 13s G3 20YA0005GE | |
| Microsoft Surface Laptop 4 13 Ryzen 5 | |
| Average of class Subnotebook (10579 - 95002, n=47, last 2 years) | |
| Huawei MateBook 13s i5 11300H | |
| Asus ZenBook 13 UX325EA | |
| Average Intel Core i5-11300H (41257 - 49312, n=9) | |
| AIDA64 / FPU SinJulia | |
| Lenovo ThinkBook 13s G3 20YA0005GE | |
| Microsoft Surface Laptop 4 13 Ryzen 5 | |
| HP Pavilion Aero 13 be0097nr | |
| Average of class Subnotebook (744 - 18418, n=57, last 2 years) | |
| Huawei MateBook 13s i5 11300H | |
| Average Intel Core i5-11300H (3925 - 4677, n=9) | |
| Asus ZenBook 13 UX325EA | |
| AIDA64 / FPU Mandel | |
| Lenovo ThinkBook 13s G3 20YA0005GE | |
| HP Pavilion Aero 13 be0097nr | |
| Average of class Subnotebook (3341 - 65433, n=57, last 2 years) | |
| Microsoft Surface Laptop 4 13 Ryzen 5 | |
| Huawei MateBook 13s i5 11300H | |
| Average Intel Core i5-11300H (15820 - 20669, n=9) | |
| Asus ZenBook 13 UX325EA | |
| AIDA64 / CPU AES | |
| Lenovo ThinkBook 13s G3 20YA0005GE | |
| HP Pavilion Aero 13 be0097nr | |
| Huawei MateBook 13s i5 11300H | |
| Average Intel Core i5-11300H (37694 - 71519, n=9) | |
| Asus ZenBook 13 UX325EA | |
| Average of class Subnotebook (638 - 96917, n=57, last 2 years) | |
| Microsoft Surface Laptop 4 13 Ryzen 5 | |
| AIDA64 / CPU ZLib | |
| Average of class Subnotebook (164.9 - 1379, n=57, last 2 years) | |
| Lenovo ThinkBook 13s G3 20YA0005GE | |
| Microsoft Surface Laptop 4 13 Ryzen 5 | |
| HP Pavilion Aero 13 be0097nr | |
| Huawei MateBook 13s i5 11300H | |
| Average Intel Core i5-11300H (269 - 390, n=9) | |
| Asus ZenBook 13 UX325EA | |
| AIDA64 / FP64 Ray-Trace | |
| Average of class Subnotebook (610 - 17495, n=57, last 2 years) | |
| Lenovo ThinkBook 13s G3 20YA0005GE | |
| HP Pavilion Aero 13 be0097nr | |
| Microsoft Surface Laptop 4 13 Ryzen 5 | |
| Huawei MateBook 13s i5 11300H | |
| Average Intel Core i5-11300H (3322 - 4613, n=9) | |
| Asus ZenBook 13 UX325EA | |
| AIDA64 / CPU PhotoWorxx | |
| Average of class Subnotebook (6569 - 85600, n=57, last 2 years) | |
| Asus ZenBook 13 UX325EA | |
| Huawei MateBook 13s i5 11300H | |
| Average Intel Core i5-11300H (9705 - 38002, n=9) | |
| Microsoft Surface Laptop 4 13 Ryzen 5 | |
| Lenovo ThinkBook 13s G3 20YA0005GE | |
| HP Pavilion Aero 13 be0097nr | |
System Performance
The MateBook 13s is a very responsive system, which is also a result of the PCIe-SSD, and we did not notice any problems during our review period. All inputs are quickly executed and there were no crashes or stutters. The synthetic benchmark scores confirm our subjective impression.
The laptop is still shipped with Windows 10 Home, but you can upgrade to Windows 11 Home for free.
CrossMark: Overall | Productivity | Creativity | Responsiveness
| PCMark 10 / Score | |
| Average of class Subnotebook (4920 - 9939, n=46, last 2 years) | |
| Lenovo ThinkBook 13s G3 20YA0005GE | |
| HP Pavilion Aero 13 be0097nr | |
| Huawei MateBook 13s i5 11300H | |
| Average Intel Core i5-11300H, Intel Iris Xe Graphics G7 80EUs (n=1) | |
| Asus ZenBook 13 UX325EA | |
| Microsoft Surface Laptop 4 13 Ryzen 5 | |
| Dell XPS 13 9305 Core i5 FHD | |
| PCMark 10 / Essentials | |
| Average of class Subnotebook (8552 - 11646, n=46, last 2 years) | |
| Lenovo ThinkBook 13s G3 20YA0005GE | |
| HP Pavilion Aero 13 be0097nr | |
| Asus ZenBook 13 UX325EA | |
| Huawei MateBook 13s i5 11300H | |
| Average Intel Core i5-11300H, Intel Iris Xe Graphics G7 80EUs (n=1) | |
| Dell XPS 13 9305 Core i5 FHD | |
| Microsoft Surface Laptop 4 13 Ryzen 5 | |
| PCMark 10 / Productivity | |
| Average of class Subnotebook (5435 - 16606, n=46, last 2 years) | |
| Lenovo ThinkBook 13s G3 20YA0005GE | |
| HP Pavilion Aero 13 be0097nr | |
| Asus ZenBook 13 UX325EA | |
| Microsoft Surface Laptop 4 13 Ryzen 5 | |
| Huawei MateBook 13s i5 11300H | |
| Average Intel Core i5-11300H, Intel Iris Xe Graphics G7 80EUs (n=1) | |
| Dell XPS 13 9305 Core i5 FHD | |
| PCMark 10 / Digital Content Creation | |
| Average of class Subnotebook (5722 - 13779, n=46, last 2 years) | |
| Lenovo ThinkBook 13s G3 20YA0005GE | |
| HP Pavilion Aero 13 be0097nr | |
| Huawei MateBook 13s i5 11300H | |
| Average Intel Core i5-11300H, Intel Iris Xe Graphics G7 80EUs (n=1) | |
| Microsoft Surface Laptop 4 13 Ryzen 5 | |
| Dell XPS 13 9305 Core i5 FHD | |
| Asus ZenBook 13 UX325EA | |
| CrossMark / Overall | |
| Average of class Subnotebook (365 - 2356, n=59, last 2 years) | |
| Apple MacBook Air 2020 M1 Entry | |
| Huawei MateBook 13s i5 11300H | |
| Average Intel Core i5-11300H, Intel Iris Xe Graphics G7 80EUs (n=1) | |
| Lenovo ThinkBook 13s G3 20YA0005GE | |
| CrossMark / Productivity | |
| Average of class Subnotebook (364 - 2277, n=59, last 2 years) | |
| Huawei MateBook 13s i5 11300H | |
| Average Intel Core i5-11300H, Intel Iris Xe Graphics G7 80EUs (n=1) | |
| Lenovo ThinkBook 13s G3 20YA0005GE | |
| Apple MacBook Air 2020 M1 Entry | |
| CrossMark / Creativity | |
| Average of class Subnotebook (372 - 2743, n=59, last 2 years) | |
| Apple MacBook Air 2020 M1 Entry | |
| Lenovo ThinkBook 13s G3 20YA0005GE | |
| Huawei MateBook 13s i5 11300H | |
| Average Intel Core i5-11300H, Intel Iris Xe Graphics G7 80EUs (n=1) | |
| CrossMark / Responsiveness | |
| Huawei MateBook 13s i5 11300H | |
| Average Intel Core i5-11300H, Intel Iris Xe Graphics G7 80EUs (n=1) | |
| Average of class Subnotebook (312 - 1854, n=59, last 2 years) | |
| Lenovo ThinkBook 13s G3 20YA0005GE | |
| Apple MacBook Air 2020 M1 Entry | |
| PCMark 10 Score | 4950 points | |
Help | ||
| AIDA64 / Memory Copy | |
| Average of class Subnotebook (14554 - 131023, n=57, last 2 years) | |
| Asus ZenBook 13 UX325EA | |
| Huawei MateBook 13s i5 11300H | |
| Microsoft Surface Laptop 4 13 Ryzen 5 | |
| Average Intel Core i5-11300H (19947 - 60141, n=9) | |
| Lenovo ThinkBook 13s G3 20YA0005GE | |
| HP Pavilion Aero 13 be0097nr | |
| AIDA64 / Memory Read | |
| Average of class Subnotebook (15948 - 127174, n=57, last 2 years) | |
| Asus ZenBook 13 UX325EA | |
| Huawei MateBook 13s i5 11300H | |
| Microsoft Surface Laptop 4 13 Ryzen 5 | |
| Average Intel Core i5-11300H (22688 - 62684, n=9) | |
| HP Pavilion Aero 13 be0097nr | |
| Lenovo ThinkBook 13s G3 20YA0005GE | |
| AIDA64 / Memory Write | |
| Average of class Subnotebook (15709 - 135141, n=57, last 2 years) | |
| Asus ZenBook 13 UX325EA | |
| Huawei MateBook 13s i5 11300H | |
| Average Intel Core i5-11300H (20959 - 65245, n=9) | |
| Microsoft Surface Laptop 4 13 Ryzen 5 | |
| Lenovo ThinkBook 13s G3 20YA0005GE | |
| HP Pavilion Aero 13 be0097nr | |
| AIDA64 / Memory Latency | |
| Microsoft Surface Laptop 4 13 Ryzen 5 | |
| Lenovo ThinkBook 13s G3 20YA0005GE | |
| Average of class Subnotebook (6.1 - 159.9, n=55, last 2 years) | |
| HP Pavilion Aero 13 be0097nr | |
| Huawei MateBook 13s i5 11300H | |
| Asus ZenBook 13 UX325EA | |
| Average Intel Core i5-11300H (76.3 - 93.6, n=9) | |
* ... smaller is better
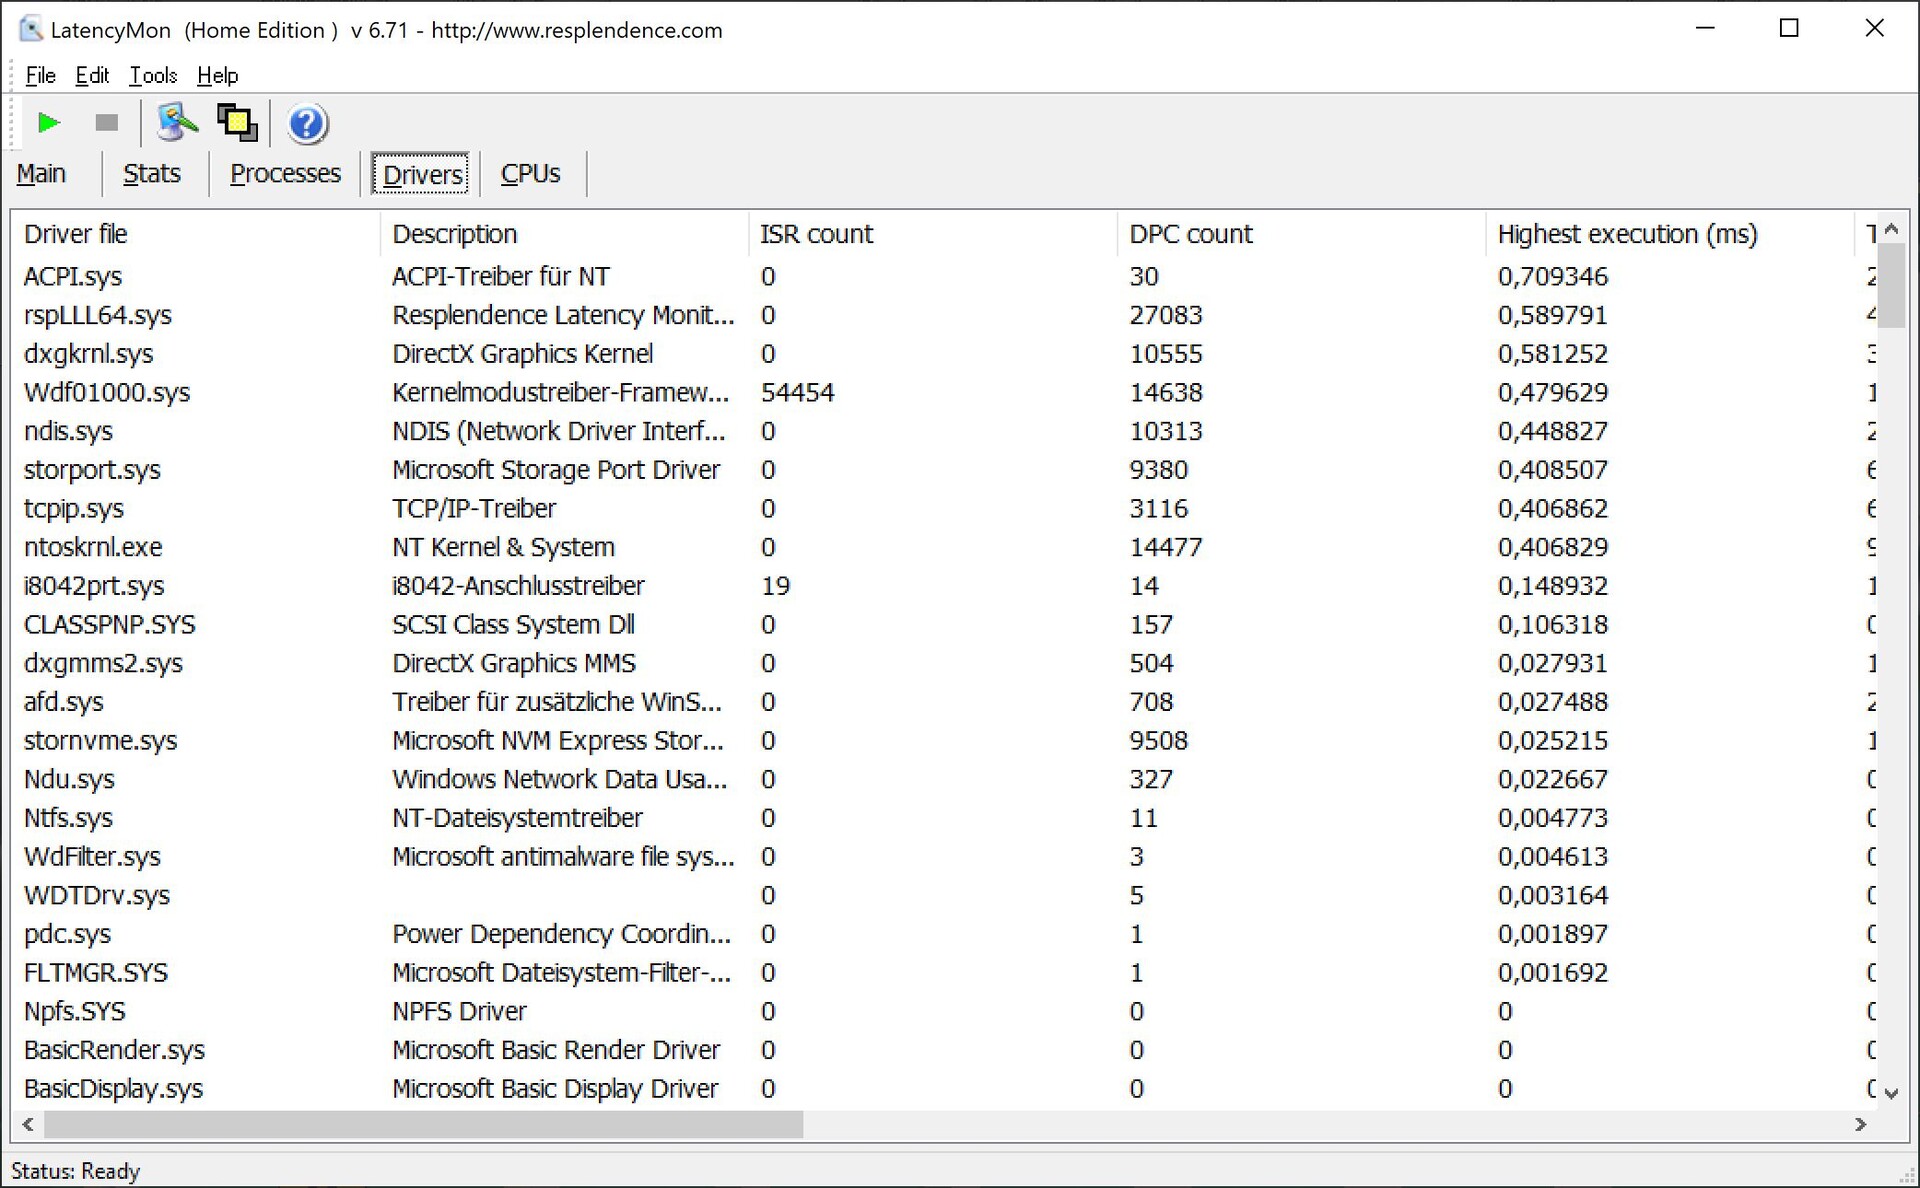
DPC Latency
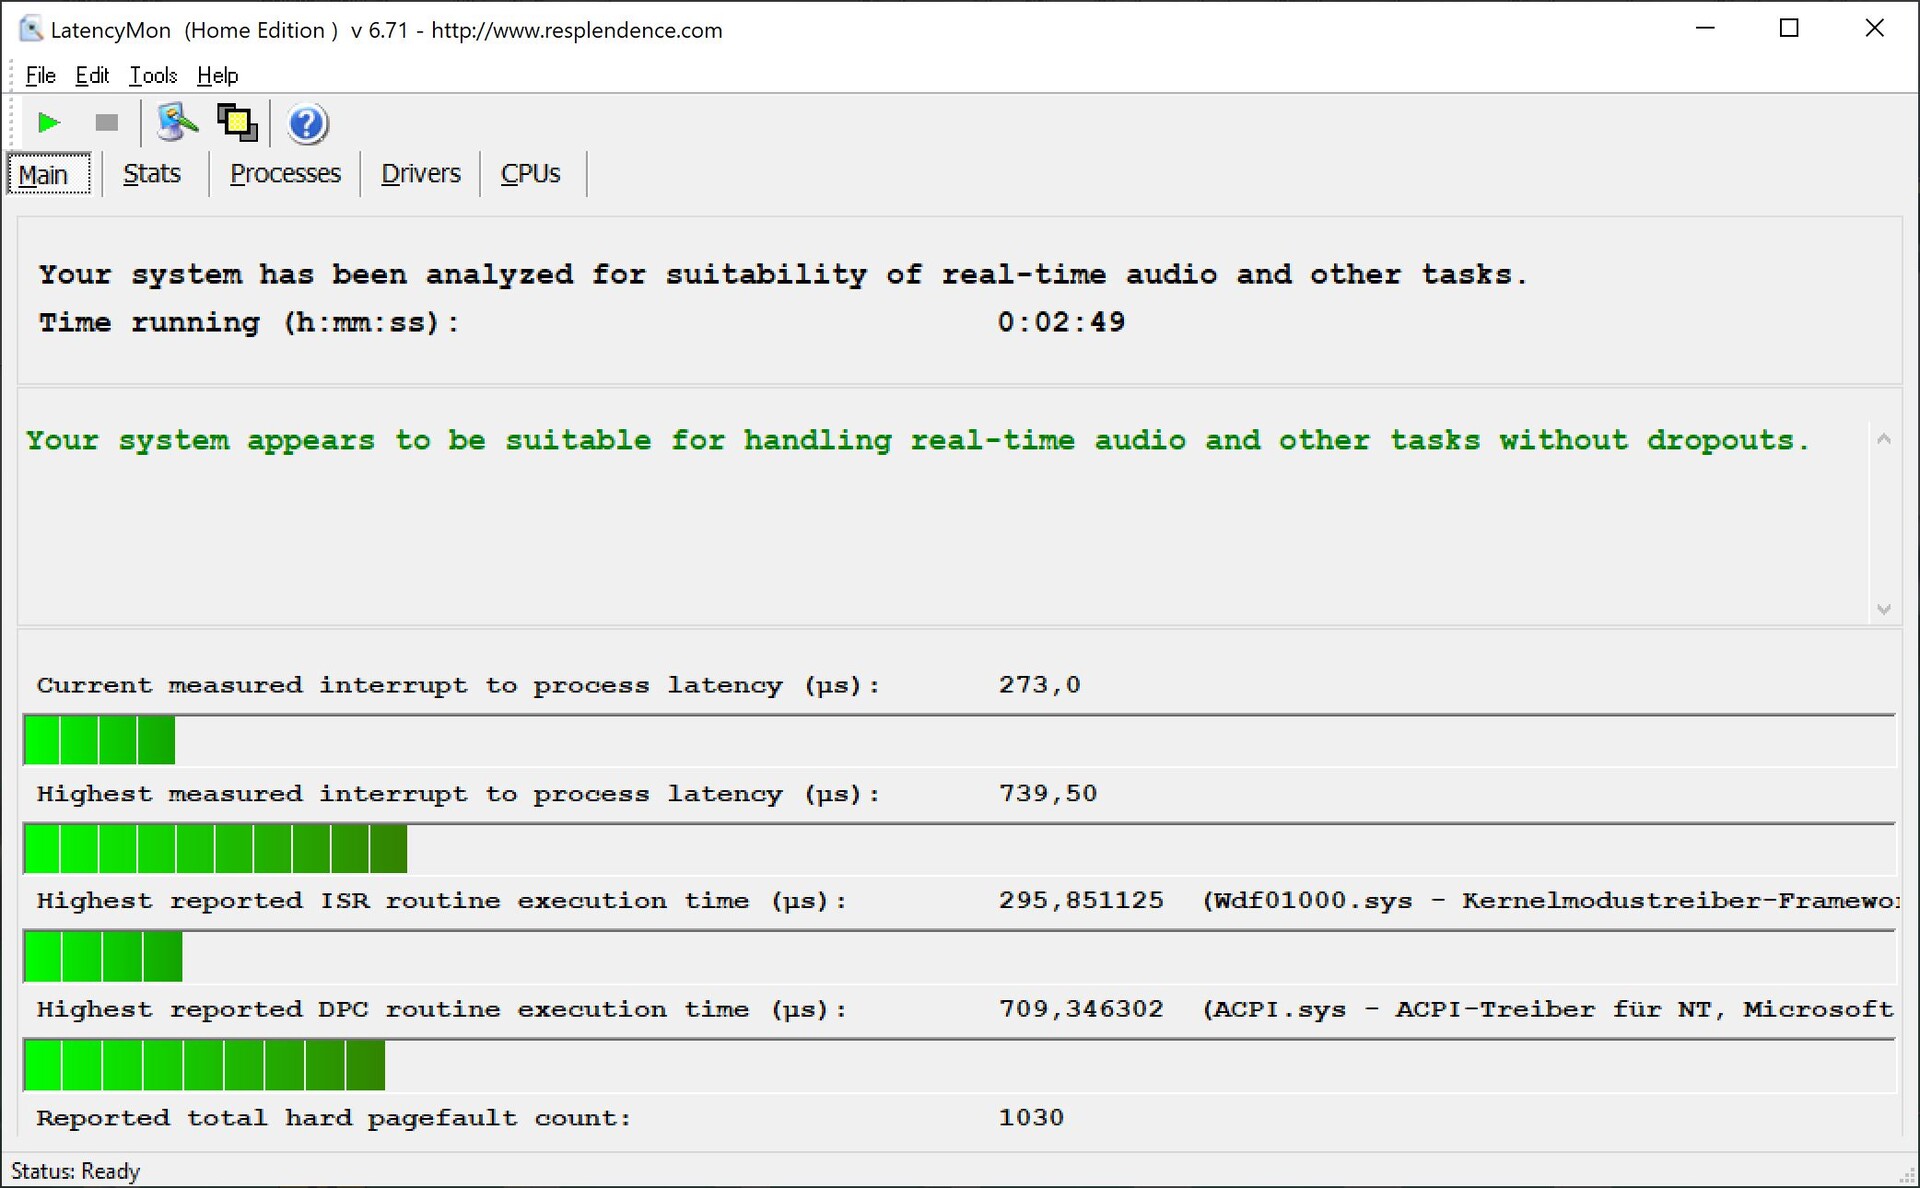
Our standardized latency test (YouTube, web browsing, CPU load) does not reveal any latency issues for the MateBook 13s, but we noticed some dropped frames during the playback of a 4K YouTube video.
| DPC Latencies / LatencyMon - interrupt to process latency (max), Web, Youtube, Prime95 | |
| Asus ZenBook 13 UX325EA | |
| HP Pavilion Aero 13 be0097nr | |
| Microsoft Surface Laptop 4 13 Ryzen 5 | |
| Huawei MateBook 13s i5 11300H | |
| Lenovo ThinkBook 13s G3 20YA0005GE | |
| Dell XPS 13 9305 Core i5 FHD | |
* ... smaller is better
Storage Devices
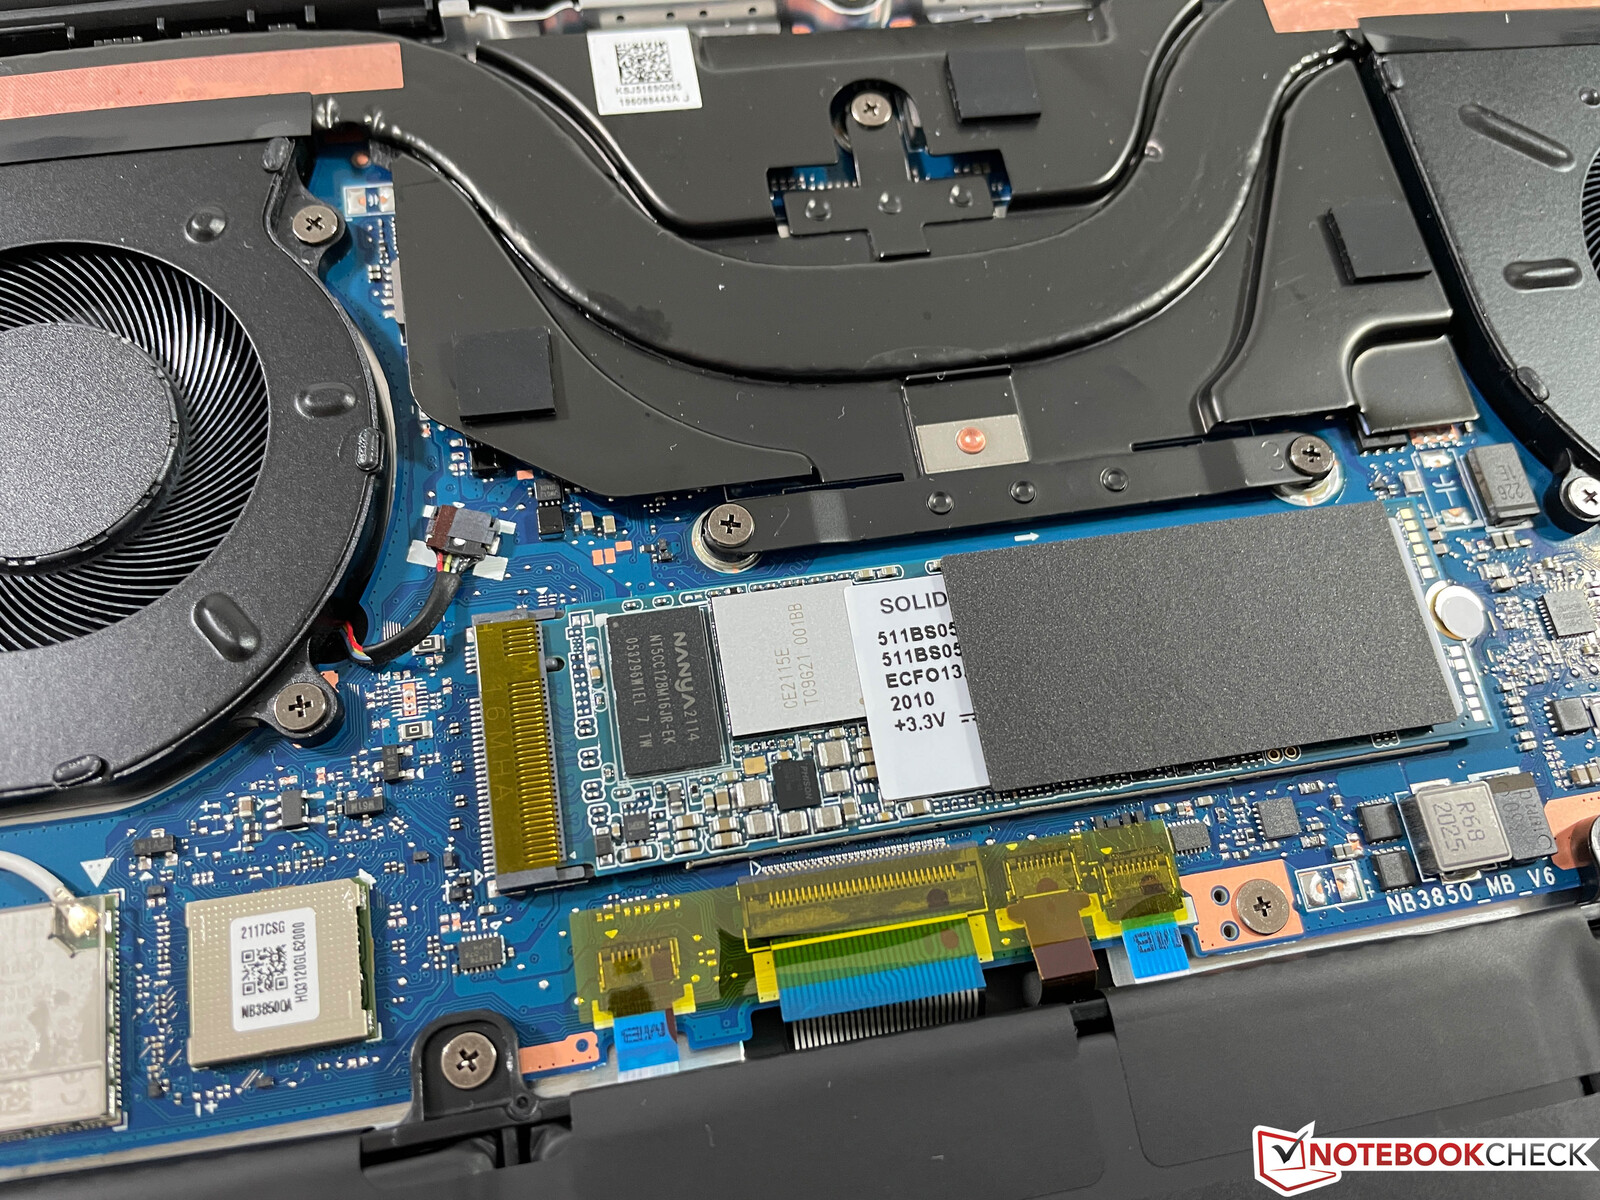
Huawei does not implement a modern PCIe 4.0 interface, but the performance of the PCIe 3.0 x4 SSD from Phison Electronics is still very good. You get a storage capacity of 512 GB and 409 GB are free to use after the initial set-up, but similar to other Huawei laptops, there are two partitions. The capacity of the system drive is limited to little more than 70 GB, which means you can quickly get problems if you do not pay attention when you install apps or download files. This partitioning is very annoying in practice and we can only hope Huawei will not use it for future devices. More SSD benchmarks are available here.

* ... smaller is better
Disk throttling: DiskSpd Read Loop, Queue Depth 8
GPU Performance
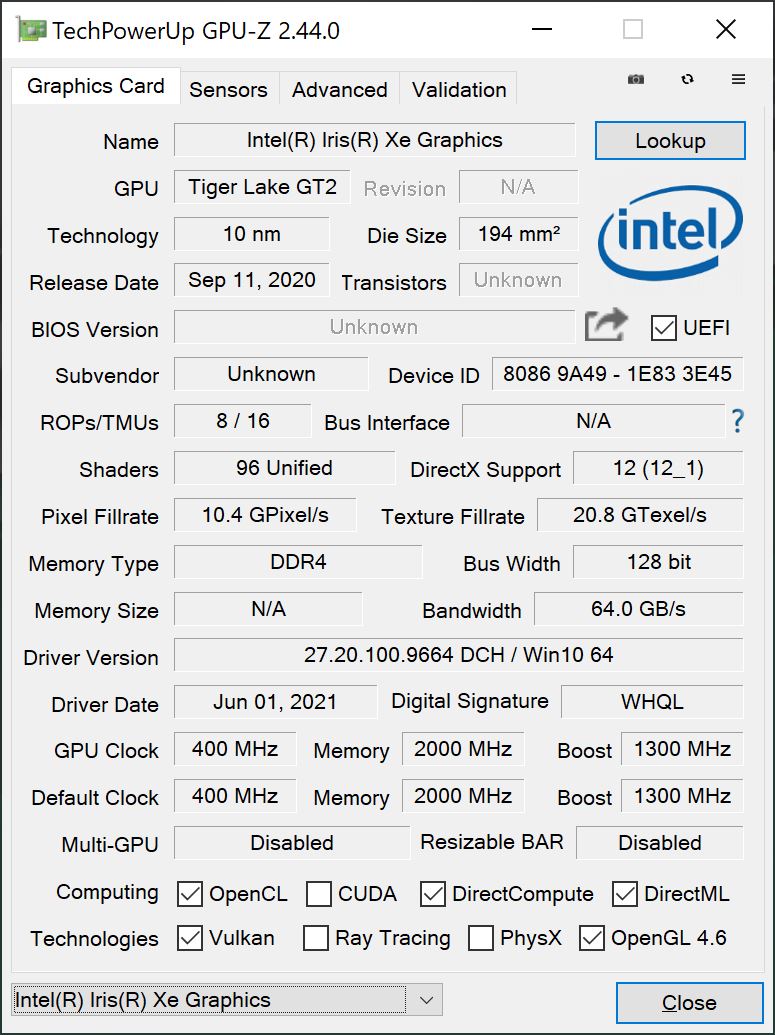
All the graphics calculations are handles by the integrated Iris Xe Graphics G7, but it is the slower of the two versions with 80 EUs. The iGPU benefits from the dual-channel memory configuration and the performance is on the expected level roughly 20% behind the Xe Graphics G7 with 96 EUs (in the i7 CPUs), but still ahead of the AMD Radeon RX Vega 8 iGPU in the Ryzen 5000 CPUs.
Thanks to the integrated video decoder, the Xe Graphics G7 is a very good choice for everyday multimedia tasks. The performance is also stable and even the demanding Time Spy stress test is easily passed at 99.6%. The new Alder Lake CPUs are still equipped with the Xe iGPUs, so there will not be a big advantage in this respect.
The graphics performance is not reduced on battery power. More GPU benchmarks are listed in our tech section.
| 3DMark 11 Performance | 6225 points | |
| 3DMark Cloud Gate Standard Score | 16115 points | |
| 3DMark Fire Strike Score | 3868 points | |
| 3DMark Time Spy Score | 1512 points | |
Help | ||
Gaming Performance
Witcher 3 FPS Chart
| low | med. | high | ultra | |
|---|---|---|---|---|
| GTA V (2015) | 102 | 88.8 | 24.9 | 9.73 |
| The Witcher 3 (2015) | 84 | 54 | 28 | 12.2 |
| Dota 2 Reborn (2015) | 119 | 89.9 | 57.2 | 52.6 |
| Final Fantasy XV Benchmark (2018) | 40.4 | 22.1 | 15.7 | |
| X-Plane 11.11 (2018) | 41.3 | 33.8 | 30.9 | |
| Far Cry 5 (2018) | 53 | 25 | 23 | 22 |
| Strange Brigade (2018) | 81.9 | 34.5 | 27.5 | 22.3 |
| F1 2020 (2020) | 76 | 42 | 31 | 20 |
Emissions - MateBook is a quiet companion
System Noise
The cooling solution of the MateBook 13s consist of two fans and one heat pipe. All in all, this is a very quiet laptop and the maximum fan noise does not hit the 40 dB(A) mark. The fan murmur is not annoying or high-pitched, either. The laptop is often silent during light workloads and we did not notice any other electronic noises.
Noise level
| Idle |
| 24.5 / 24.5 / 28 dB(A) |
| Load |
| 35.9 / 38.6 dB(A) |
 | ||
30 dB silent 40 dB(A) audible 50 dB(A) loud |
||
min: | ||
| Huawei MateBook 13s i5 11300H Iris Xe G7 80EUs, i5-11300H, Phison Electronics PS5012 | Lenovo ThinkBook 13s G3 20YA0005GE Vega 8, R7 5800U, WDC PC SN530 SDBPNPZ-512G | Microsoft Surface Laptop 4 13 Ryzen 5 Vega 7, R5 4680U, Samsung PM991 MZ9LQ256HBJQ | Asus ZenBook 13 UX325EA Iris Xe G7 96EUs, i7-1165G7, SK Hynix HFM001TD3JX013N | Apple MacBook Air 2020 M1 Entry M1 7-Core GPU, M1, Apple SSD AP0256Q | Dell XPS 13 9305 Core i5 FHD Iris Xe G7 80EUs, i5-1135G7, Samsung PM9A1 MZVL2512HCJQ | HP Pavilion Aero 13 be0097nr Vega 8, R7 5800U, Intel SSD 660p SSDPEKNW512G8 | |
|---|---|---|---|---|---|---|---|
| Noise | -9% | 0% | -11% | 2% | 6% | ||
| off / environment * (dB) | 24.5 | 24.7 -1% | 24.6 -0% | 26 -6% | 26 -6% | 23.9 2% | |
| Idle Minimum * (dB) | 24.5 | 24.7 -1% | 24.6 -0% | 26 -6% | 26 -6% | 23.9 2% | |
| Idle Average * (dB) | 24.5 | 27 -10% | 24.6 -0% | 26 -6% | 26 -6% | 23.9 2% | |
| Idle Maximum * (dB) | 28 | 29.8 -6% | 24.6 12% | 30.5 -9% | 26 7% | 23.9 15% | |
| Load Average * (dB) | 35.9 | 42.4 -18% | 39.5 -10% | 43.9 -22% | 33.5 7% | 32.2 10% | |
| Witcher 3 ultra * (dB) | 35.9 | 42.4 -18% | 33.5 7% | 34.7 3% | |||
| Load Maximum * (dB) | 38.6 | 42.4 -10% | 39.5 -2% | 43.9 -14% | 33.5 13% | 34.8 10% |
* ... smaller is better
Temperature
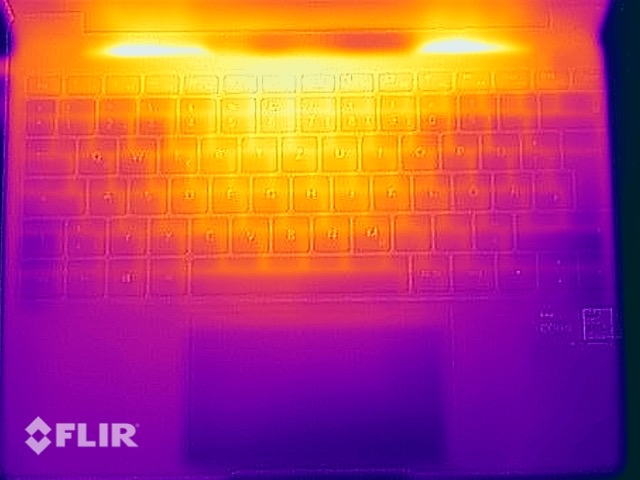
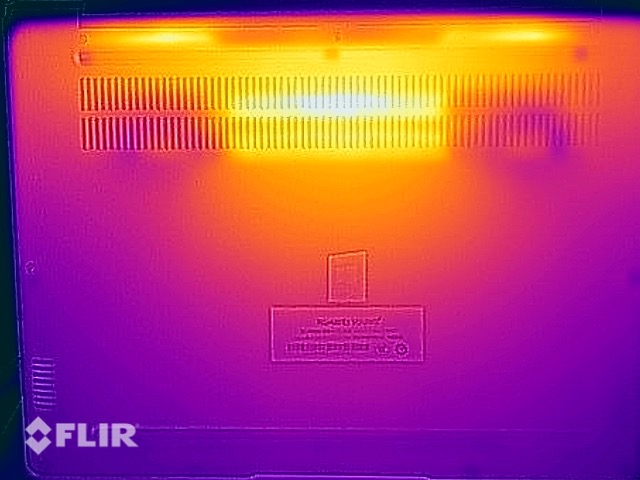
The surface temperatures of the MateBook 13s are completely uncritical. The device hardly warms up at all during light workloads like web browsing or video playback and there is just one hot spot on the top and bottom of the base unit during the stress test, but up to 46 °C are not problematic by any means. The subnotebook stays a bit cooler during gaming and you can easily put it on your lap.
The power consumption rises to 60 Watts at the beginning of the stress test and then quickly settles in at 35W and stays there. We did not notice a performance reduction immediately after the stress test.
(±) The maximum temperature on the upper side is 42.8 °C / 109 F, compared to the average of 35.9 °C / 97 F, ranging from 21.4 to 59 °C for the class Subnotebook.
(-) The bottom heats up to a maximum of 46.9 °C / 116 F, compared to the average of 39.2 °C / 103 F
(+) In idle usage, the average temperature for the upper side is 24.2 °C / 76 F, compared to the device average of 30.8 °C / 87 F.
(±) Playing The Witcher 3, the average temperature for the upper side is 33.7 °C / 93 F, compared to the device average of 30.8 °C / 87 F.
(+) The palmrests and touchpad are cooler than skin temperature with a maximum of 27.7 °C / 81.9 F and are therefore cool to the touch.
(±) The average temperature of the palmrest area of similar devices was 28.2 °C / 82.8 F (+0.5 °C / 0.9 F).
| Huawei MateBook 13s i5 11300H Intel Core i5-11300H, Intel Iris Xe Graphics G7 80EUs | Lenovo ThinkBook 13s G3 20YA0005GE AMD Ryzen 7 5800U, AMD Radeon RX Vega 8 (Ryzen 4000/5000) | Microsoft Surface Laptop 4 13 Ryzen 5 AMD Ryzen 5 4680U, AMD Radeon RX Vega 7 | Asus ZenBook 13 UX325EA Intel Core i7-1165G7, Intel Iris Xe Graphics G7 96EUs | Apple MacBook Air 2020 M1 Entry Apple M1, Apple M1 7-Core GPU | Dell XPS 13 9305 Core i5 FHD Intel Core i5-1135G7, Intel Iris Xe Graphics G7 80EUs | HP Pavilion Aero 13 be0097nr AMD Ryzen 7 5800U, AMD Radeon RX Vega 8 (Ryzen 4000/5000) | |
|---|---|---|---|---|---|---|---|
| Heat | 10% | -1% | -1% | -2% | -1% | 2% | |
| Maximum Upper Side * (°C) | 42.8 | 36.5 15% | 45.8 -7% | 39.3 8% | 44 -3% | 43.5 -2% | 35.6 17% |
| Maximum Bottom * (°C) | 46.9 | 39.6 16% | 45.5 3% | 47.3 -1% | 44 6% | 44.8 4% | 38.6 18% |
| Idle Upper Side * (°C) | 25.2 | 24.5 3% | 24.9 1% | 25.9 -3% | 27 -7% | 26.2 -4% | 29.6 -17% |
| Idle Bottom * (°C) | 26 | 25 4% | 25.7 1% | 27.8 -7% | 27 -4% | 26.4 -2% | 29 -12% |
* ... smaller is better
Speakers
Huawei implements 4 speaker modules, which provide very good sound quality in combination with the audio software and the result is pretty close to the MacBook Air M1. The performance is very good for a compact device and external speakers are not really necessary. There is not much real bass due to the construction, but this is also the case for the rivals. There are four microphones at the front edge of the base unit and our test recordings were clear without noticeable noise.
Huawei MateBook 13s i5 11300H audio analysis
(+) | speakers can play relatively loud (85.4 dB)
Bass 100 - 315 Hz
(±) | reduced bass - on average 7.6% lower than median
(±) | linearity of bass is average (7.6% delta to prev. frequency)
Mids 400 - 2000 Hz
(±) | higher mids - on average 5.4% higher than median
(+) | mids are linear (4.1% delta to prev. frequency)
Highs 2 - 16 kHz
(+) | balanced highs - only 3.6% away from median
(+) | highs are linear (5.5% delta to prev. frequency)
Overall 100 - 16.000 Hz
(+) | overall sound is linear (10.5% difference to median)
Compared to same class
» 8% of all tested devices in this class were better, 3% similar, 89% worse
» The best had a delta of 5%, average was 18%, worst was 53%
Compared to all devices tested
» 5% of all tested devices were better, 1% similar, 93% worse
» The best had a delta of 4%, average was 23%, worst was 134%
Apple MacBook Air 2020 M1 Entry audio analysis
(±) | speaker loudness is average but good (79.6 dB)
Bass 100 - 315 Hz
(±) | reduced bass - on average 7.1% lower than median
(±) | linearity of bass is average (9.5% delta to prev. frequency)
Mids 400 - 2000 Hz
(+) | balanced mids - only 2.2% away from median
(+) | mids are linear (5.3% delta to prev. frequency)
Highs 2 - 16 kHz
(+) | balanced highs - only 2.3% away from median
(+) | highs are linear (4% delta to prev. frequency)
Overall 100 - 16.000 Hz
(+) | overall sound is linear (8.7% difference to median)
Compared to same class
» 3% of all tested devices in this class were better, 1% similar, 96% worse
» The best had a delta of 5%, average was 18%, worst was 53%
Compared to all devices tested
» 3% of all tested devices were better, 1% similar, 97% worse
» The best had a delta of 4%, average was 23%, worst was 134%
Energy Management - Good stamina
Power Consumption
While idling, the MateBook 13s requires a bit more power than the rivals, but you have to consider the higher resolution as well as the brightness. The power consumption is very stable under load; you can expect around 40W while gaming and up to 68W under load, but this value quickly levels off at around 50W and stays there (similar to the power consumption of the processor). The results for standby and when the device is turned off are okay.
| Off / Standby | |
| Idle | |
| Load |
|
Key:
min: | |
| Huawei MateBook 13s i5 11300H i5-11300H, Iris Xe G7 80EUs, Phison Electronics PS5012, LTPS, 2520x1680, 13.4" | Lenovo ThinkBook 13s G3 20YA0005GE R7 5800U, Vega 8, WDC PC SN530 SDBPNPZ-512G, IPS, 1920x1200, 13.3" | Microsoft Surface Laptop 4 13 Ryzen 5 R5 4680U, Vega 7, Samsung PM991 MZ9LQ256HBJQ, IPS, 2256x1504, 13.5" | Asus ZenBook 13 UX325EA i7-1165G7, Iris Xe G7 96EUs, SK Hynix HFM001TD3JX013N, OLED, 1920x1080, 13.3" | Apple MacBook Air 2020 M1 Entry M1, M1 7-Core GPU, Apple SSD AP0256Q, IPS, 2560x1600, 13.3" | Dell XPS 13 9305 Core i5 FHD i5-1135G7, Iris Xe G7 80EUs, Samsung PM9A1 MZVL2512HCJQ, IPS, 1920x1080, 13.3" | HP Pavilion Aero 13 be0097nr R7 5800U, Vega 8, Intel SSD 660p SSDPEKNW512G8, IPS, 1920x1200, 13.3" | Average Intel Iris Xe Graphics G7 80EUs | Average of class Subnotebook | |
|---|---|---|---|---|---|---|---|---|---|
| Power Consumption | -3% | 14% | 25% | 39% | 15% | 15% | 4% | 9% | |
| Idle Minimum * (Watt) | 4.2 | 5 -19% | 3.4 19% | 3.6 14% | 1.9 55% | 3.2 24% | 3.4 19% | 4.49 ? -7% | 3.73 ? 11% |
| Idle Average * (Watt) | 8.1 | 8.2 -1% | 6.3 22% | 6.3 22% | 6.4 21% | 6.7 17% | 6.9 15% | 7.4 ? 9% | 6.57 ? 19% |
| Idle Maximum * (Watt) | 9 | 9 -0% | 8.1 10% | 7.6 16% | 7 22% | 10.5 -17% | 8 11% | 9.26 ? -3% | 7.93 ? 12% |
| Load Average * (Watt) | 41.7 | 45 -8% | 36.2 13% | 31 26% | 25 40% | 28.5 32% | 42.6 -2% | 36.6 ? 12% | 42.1 ? -1% |
| Witcher 3 ultra * (Watt) | 40.1 | 45.1 -12% | 28.5 29% | 35.2 12% | |||||
| Load Maximum * (Watt) | 68 | 51.2 25% | 64.1 6% | 36 47% | 30.3 55% | 64 6% | 43.1 37% | 61.7 ? 9% | 65.1 ? 4% |
* ... smaller is better
Power consumption Witcher 3 / Stress test
Power consumption external screen
Battery Runtime
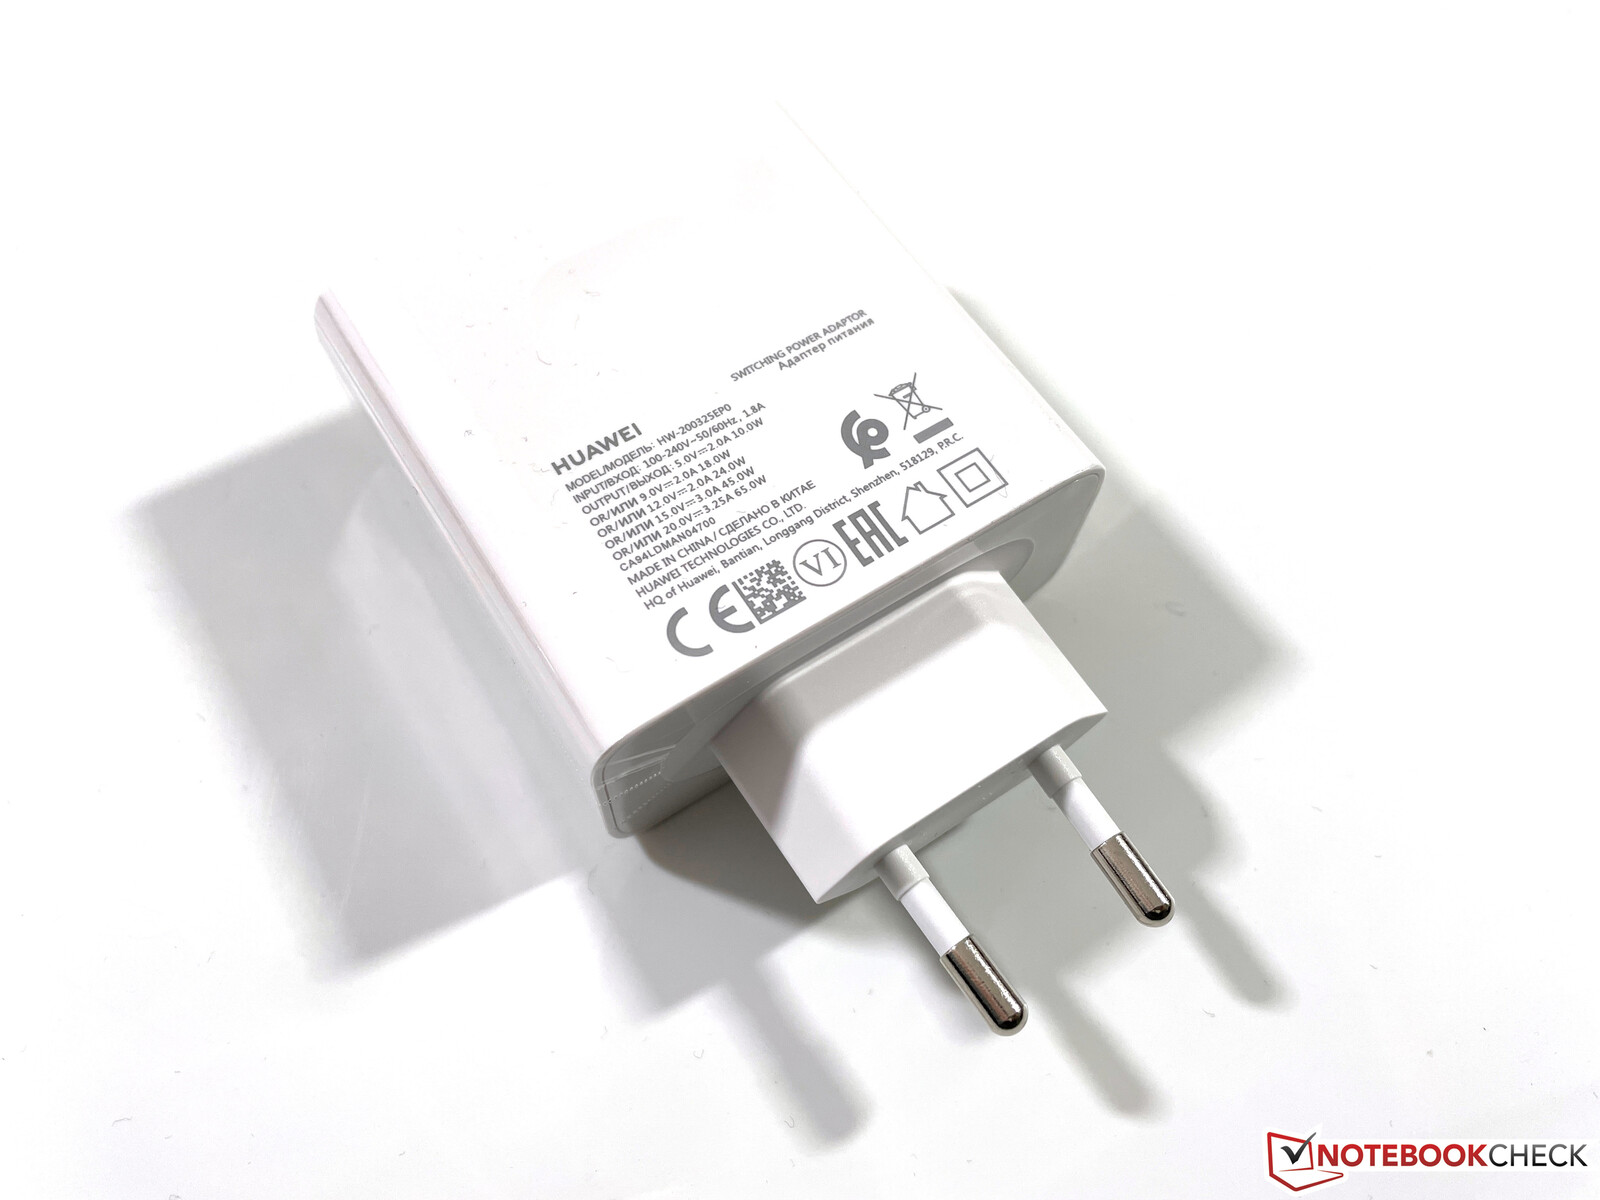
Despite the high resolution and the high brightness, the LTPS display is very efficient and the 60 Wh battery enables long battery runtimes. Huawei advertises up to 11.5 hours, and we can almost confirm the value. At an adjusted brightness of 150 nits (47% of the maximum brightness on our test unit), our video test runs for 11 hours and the Wi-Fi test for 9.5 hours. We cannot notice a reduced runtime when we repeat these two tests with the 90 Hz mode. The Wi-Fi runtime drops to 6.5 hours when you use the full panel brightness. A full charge of the battery takes around 75 minutes.
These results are good, but the rivals (often with lower display resolutions) performs better, especially the MacBook Air M1 is extremely efficient and lasts 16 hours in the Wi-Fi test.
| Huawei MateBook 13s i5 11300H i5-11300H, Iris Xe G7 80EUs, 60 Wh | Lenovo ThinkBook 13s G3 20YA0005GE R7 5800U, Vega 8, 56 Wh | Microsoft Surface Laptop 4 13 Ryzen 5 R5 4680U, Vega 7, 47.4 Wh | Asus ZenBook 13 UX325EA i7-1165G7, Iris Xe G7 96EUs, 67 Wh | Apple MacBook Air 2020 M1 Entry M1, M1 7-Core GPU, 49.9 Wh | Dell XPS 13 9305 Core i5 FHD i5-1135G7, Iris Xe G7 80EUs, 52 Wh | HP Pavilion Aero 13 be0097nr R7 5800U, Vega 8, 43 Wh | Average of class Subnotebook | |
|---|---|---|---|---|---|---|---|---|
| Battery runtime | 17% | 16% | 32% | 70% | 40% | 5% | 38% | |
| H.264 (h) | 11 | 10.2 -7% | 15.3 ? 39% | |||||
| WiFi v1.3 (h) | 9.4 | 11 17% | 10.9 16% | 10.7 14% | 16 70% | 9.2 -2% | 9 -4% | 13.9 ? 48% |
| Load (h) | 1.6 | 3 88% | 2.9 81% | 1.8 13% | 2.04 ? 27% | |||
| Witcher 3 ultra (h) | 3.2 | |||||||
| Reader / Idle (h) | 25.4 | 18.9 | 26.4 ? |
Pros
Cons
Verdict - MateBook 13s without any real drawbacks
The MateBook 13s leaves a very good impression in our review and Huawei managed to offer a great overall package without any real drawbacks. You get pretty much everything you might want from a daily companion including a sophisticated and compact chassis, good keyboard, great display, good system performance, quiet fans, good speakers, and decent battery runtime.
You have to look very closely to find any drawbacks. The bad webcam is certainly one aspect, but it is now at least at the right position. Thunderbolt 4 and PCIe 4.0 are missing as well, but this should not matter for the majority of users. The SSD partitioning with the limited capacity for the system drive is much more annoying. It is also not ideal for outdoor usage due to the glossy touchscreen.
A great package without any real drawbacks: The Huawei MateBook 13s is a very good subnotebooks and does not have to hide behind rivals like the MacBook Air.
You should definitely shortlist the MateBook 13s if you are looking for a subnotebook right now. If you need more CPU performance, you are currently limited to laptops with AMD CPUs like the ThinkBook 13s or the Pavilion Aero 13, at least until we get subnotebooks with the latest Alder Lake chips from Intel. Microsoft’s own Surface Laptop is starting to feel outdated, while the Asus ZenBook 13 offers an OLED screen with wider color gamut. Dell's XPS 13 9305 is also a bit outdated with the 16:9 display and the newer model XPS 13 9310 is just more expensive than the MateBook 13s. Finally, there is the current MacBook Air, which is extremely efficient thanks to the M1 processor and completely passively cooled (silent operation).
Huawei MateBook 13s i5 11300H
- 02/19/2022 v7 (old)
Andreas Osthoff
Price comparison
