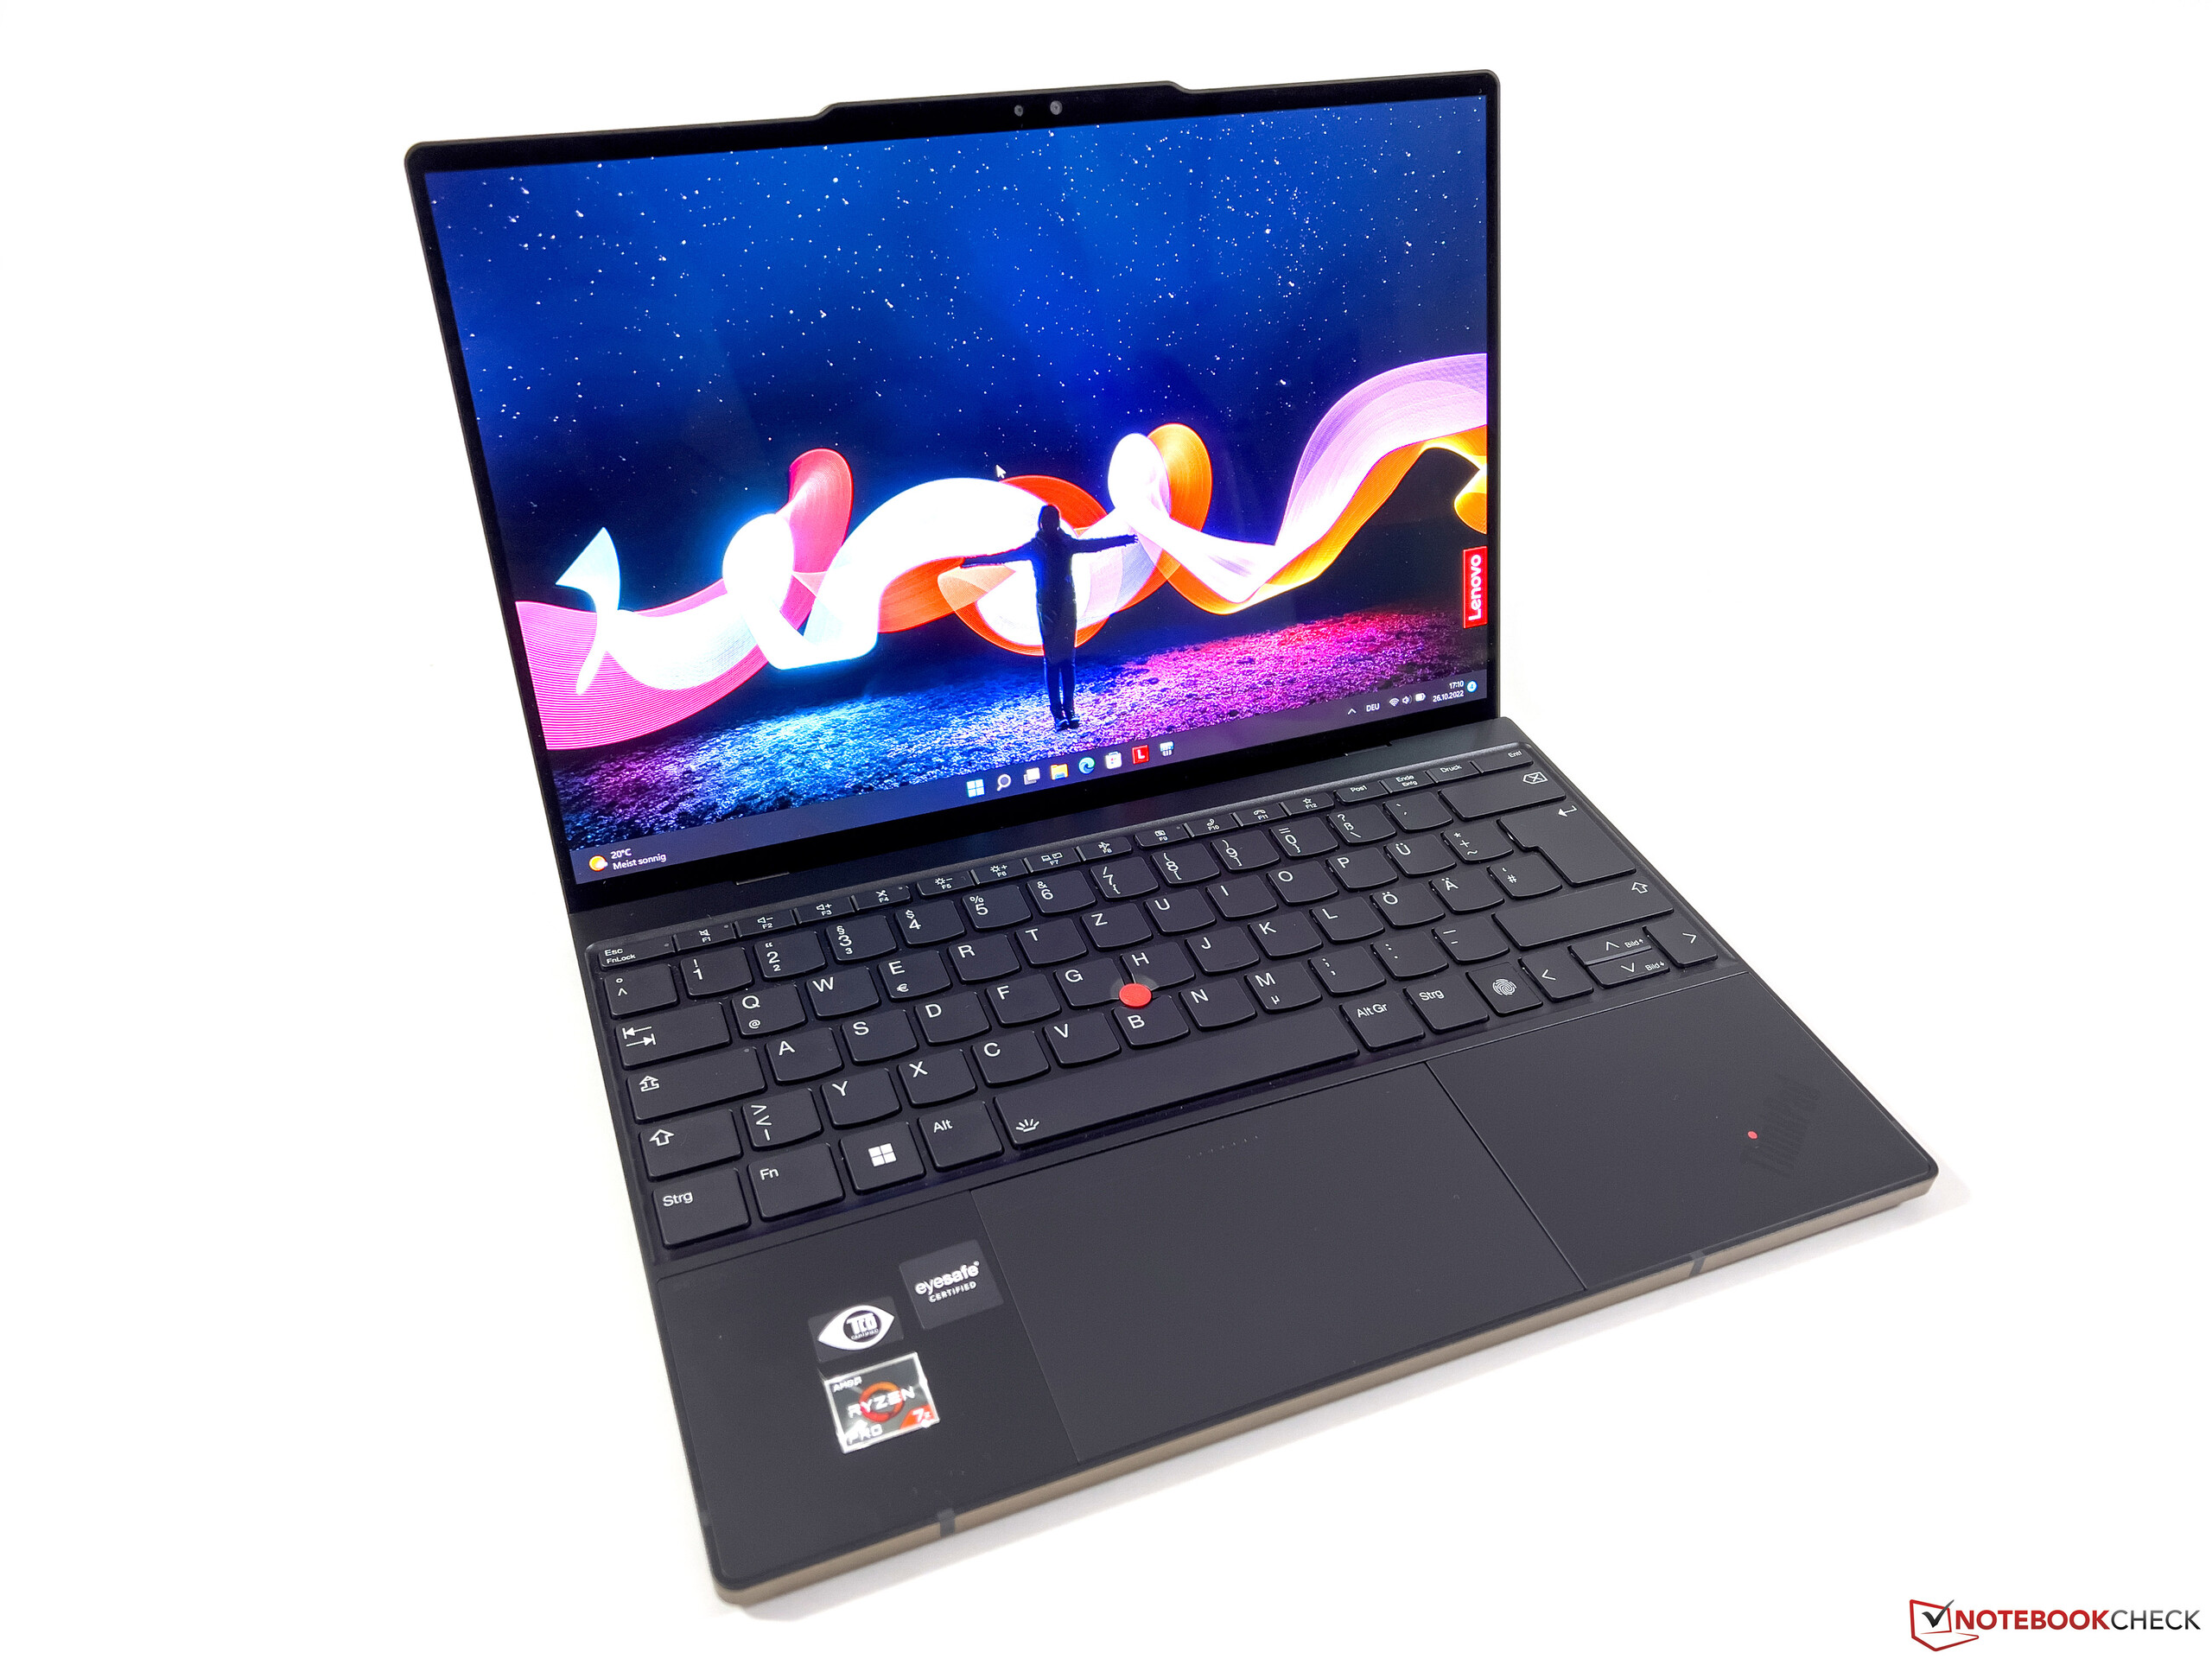
ThinkPad Z13 Gen 2 laptop review: Lenovo's answer to the Dell XPS 13

The ThinkPad Z13 G2 is an update to last year's ThinkPad Z13 G1 with newer Zen 4 CPU options. The chassis is otherwise visually identical and with similar display options between them. We recommend checking out our review on the ThinkPad Z13 G1 as most of our comments on the system still apply here for the ThinkPad Z13 G2.
Our review unit is a high-end configuration with the Ryzen 7 Pro 7840U CPU, 1800p 60 Hz OLED touchscreen, and 32 GB of RAM for approximately $1800. Other SKUs with the Ryzen 5 Pro 7540U, 1200p IPS display, 16 GB RAM, and optional WWAN are also available.
The ThinkPad Z13 G2 competes with other business-centric 13-inch subnotebooks like the HP Dragonfly G4, Dell Latitude 13 7340, XPS 13, Toshiba Portege series, or the MSI Summit series.
More Lenovo reviews:
Potential Competitors in Comparison
Rating | Date | Model | Weight | Height | Size | Resolution | Price |
|---|---|---|---|---|---|---|---|
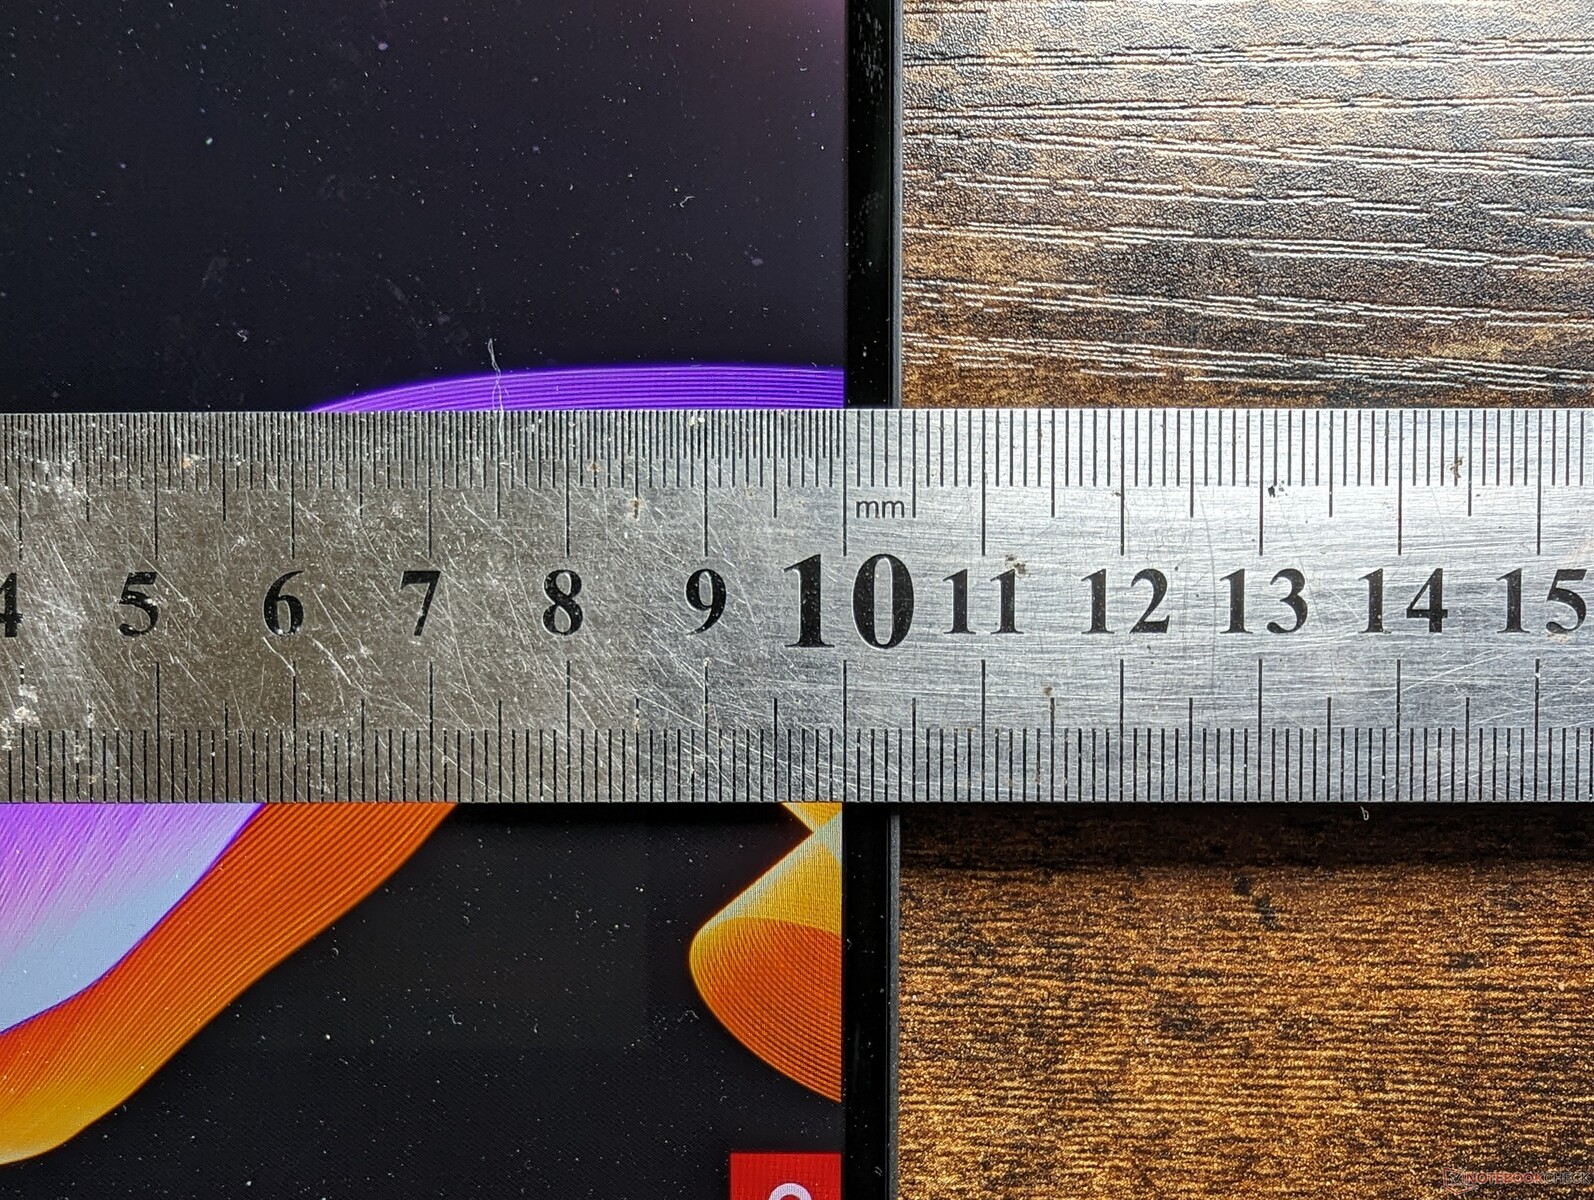
| 89.5 % v7 (old) | 01 / 2024 | Lenovo ThinkPad Z13 Gen 2 R7 PRO 7840U, Radeon 780M | 1.2 kg | 13.99 mm | 13.30" | 2880x1800 | |
| 91.9 % v7 (old) | 07 / 2023 | HP Dragonfly G4 i7-1365U, Iris Xe G7 96EUs | 1.1 kg | 16.3 mm | 13.50" | 1920x1280 | |
| 90.2 % v7 (old) | 10 / 2023 | Dell Latitude 13 7340 i5-1345U i5-1345U, Iris Xe G7 80EUs | 1.1 kg | 18.2 mm | 13.30" | 1920x1200 | |
| 90.5 % v7 (old) | 08 / 2022 | Lenovo ThinkPad Z13 21D2CTO1WW R5 PRO 6650U, Radeon 660M | 1.2 kg | 13.99 mm | 13.30" | 1920x1200 | |
| 89.5 % v7 (old) | 08 / 2023 | Lenovo ThinkPad X1 Nano Gen 3 i7-1360P, Iris Xe G7 96EUs | 989 g | 14.8 mm | 13.00" | 2160x1350 | |
| 87.5 % v7 (old) | 10 / 2023 | Framework Laptop 13.5 Ryzen 7 7840U R7 7840U, Radeon 780M | 1.3 kg | 15.85 mm | 13.50" | 2256x1504 |
Case

Communication
Our Gen 2 unit comes with the MediaTek Wi-Fi 6E MT7922 instead of the Qualcomm WCN685x on last year's Gen 1 model. There are otherwise no noticeable differences as the MediaTek module supports both Wi-Fi 6 and 6E connectivity.
Webcam
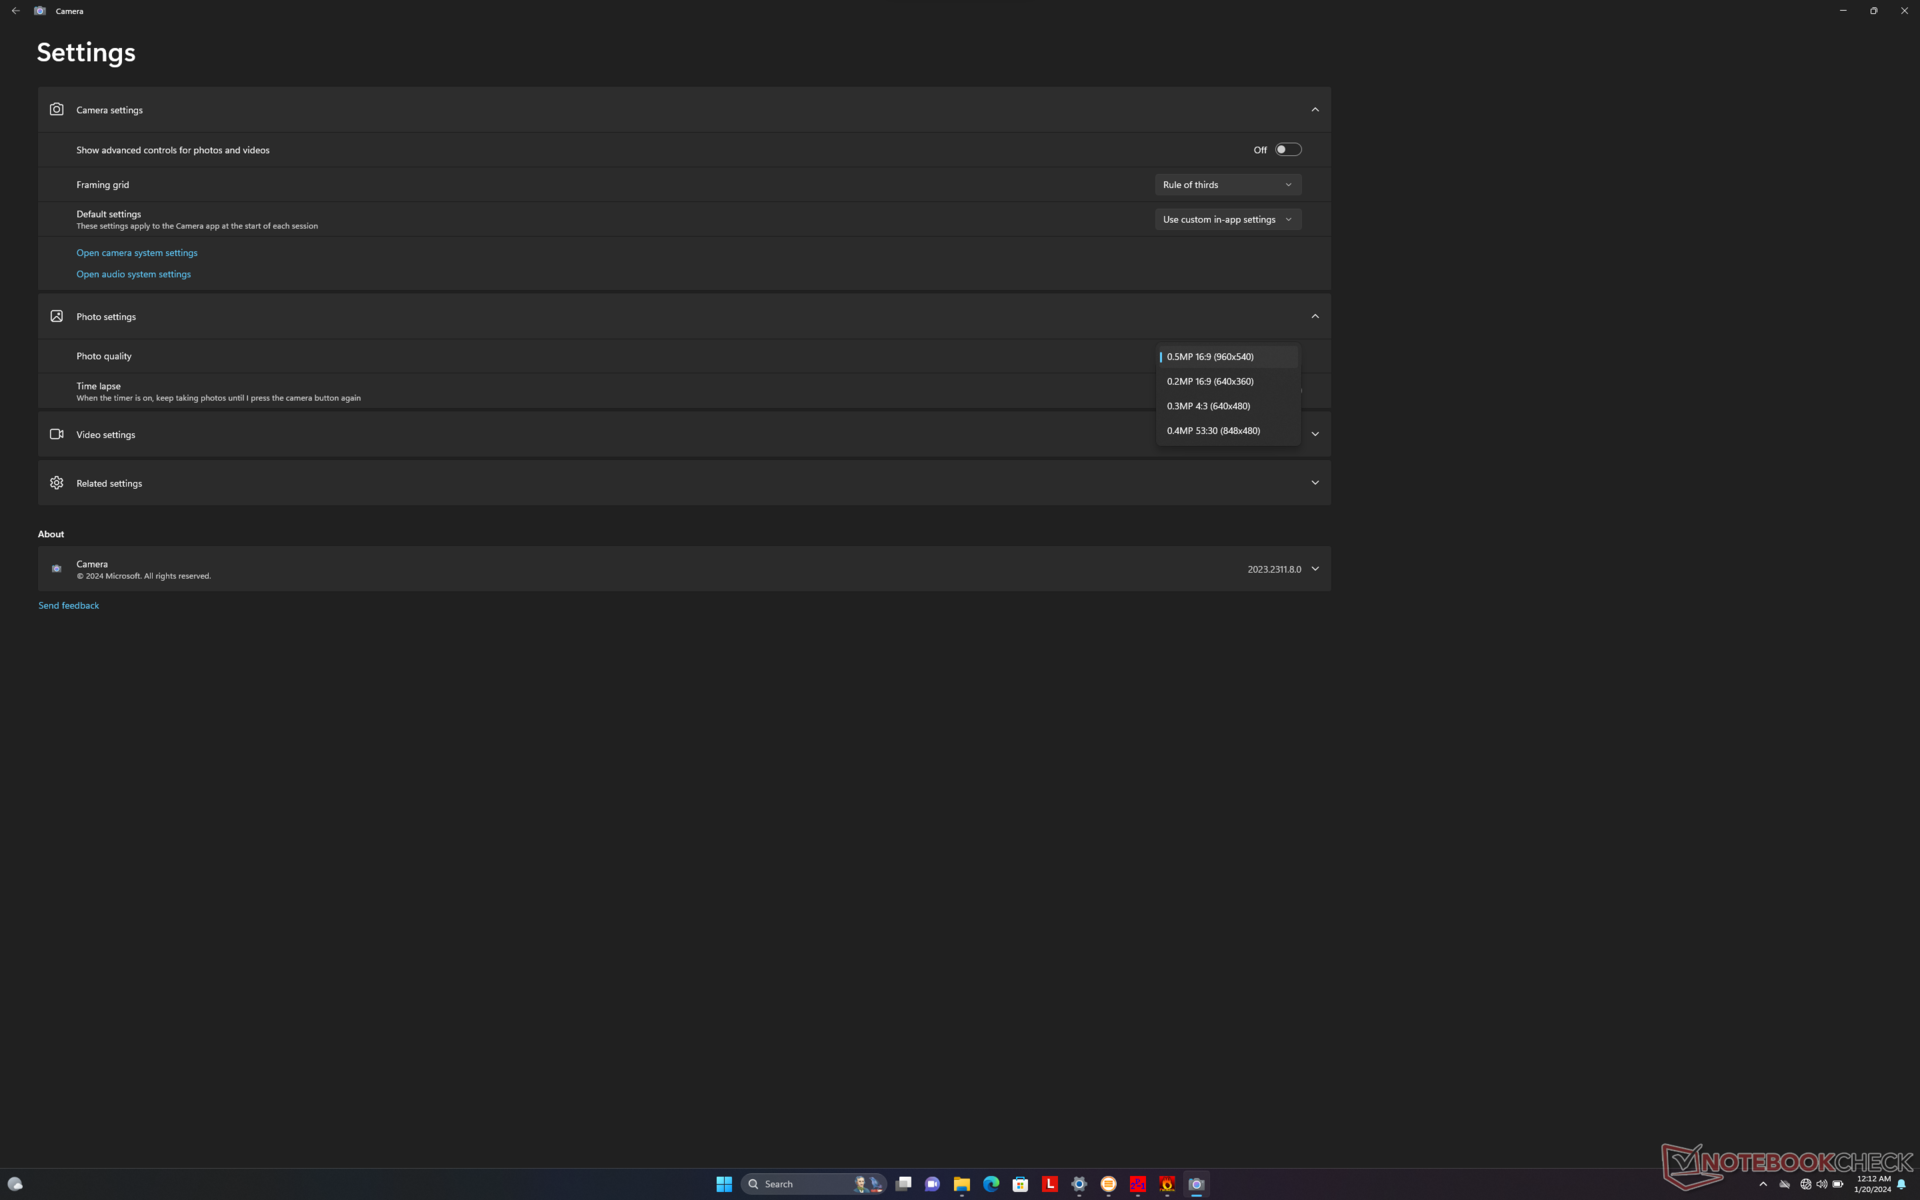
Though the Lenovo model ships with a 2 MP webcam, the Windows camera app can only select up to 0.5 MP as shown by the screenshot to the right. We encountered a similar issue on the recent HP Pavilion Plus 14 which was also powered by an AMD Zen 4 CPU.


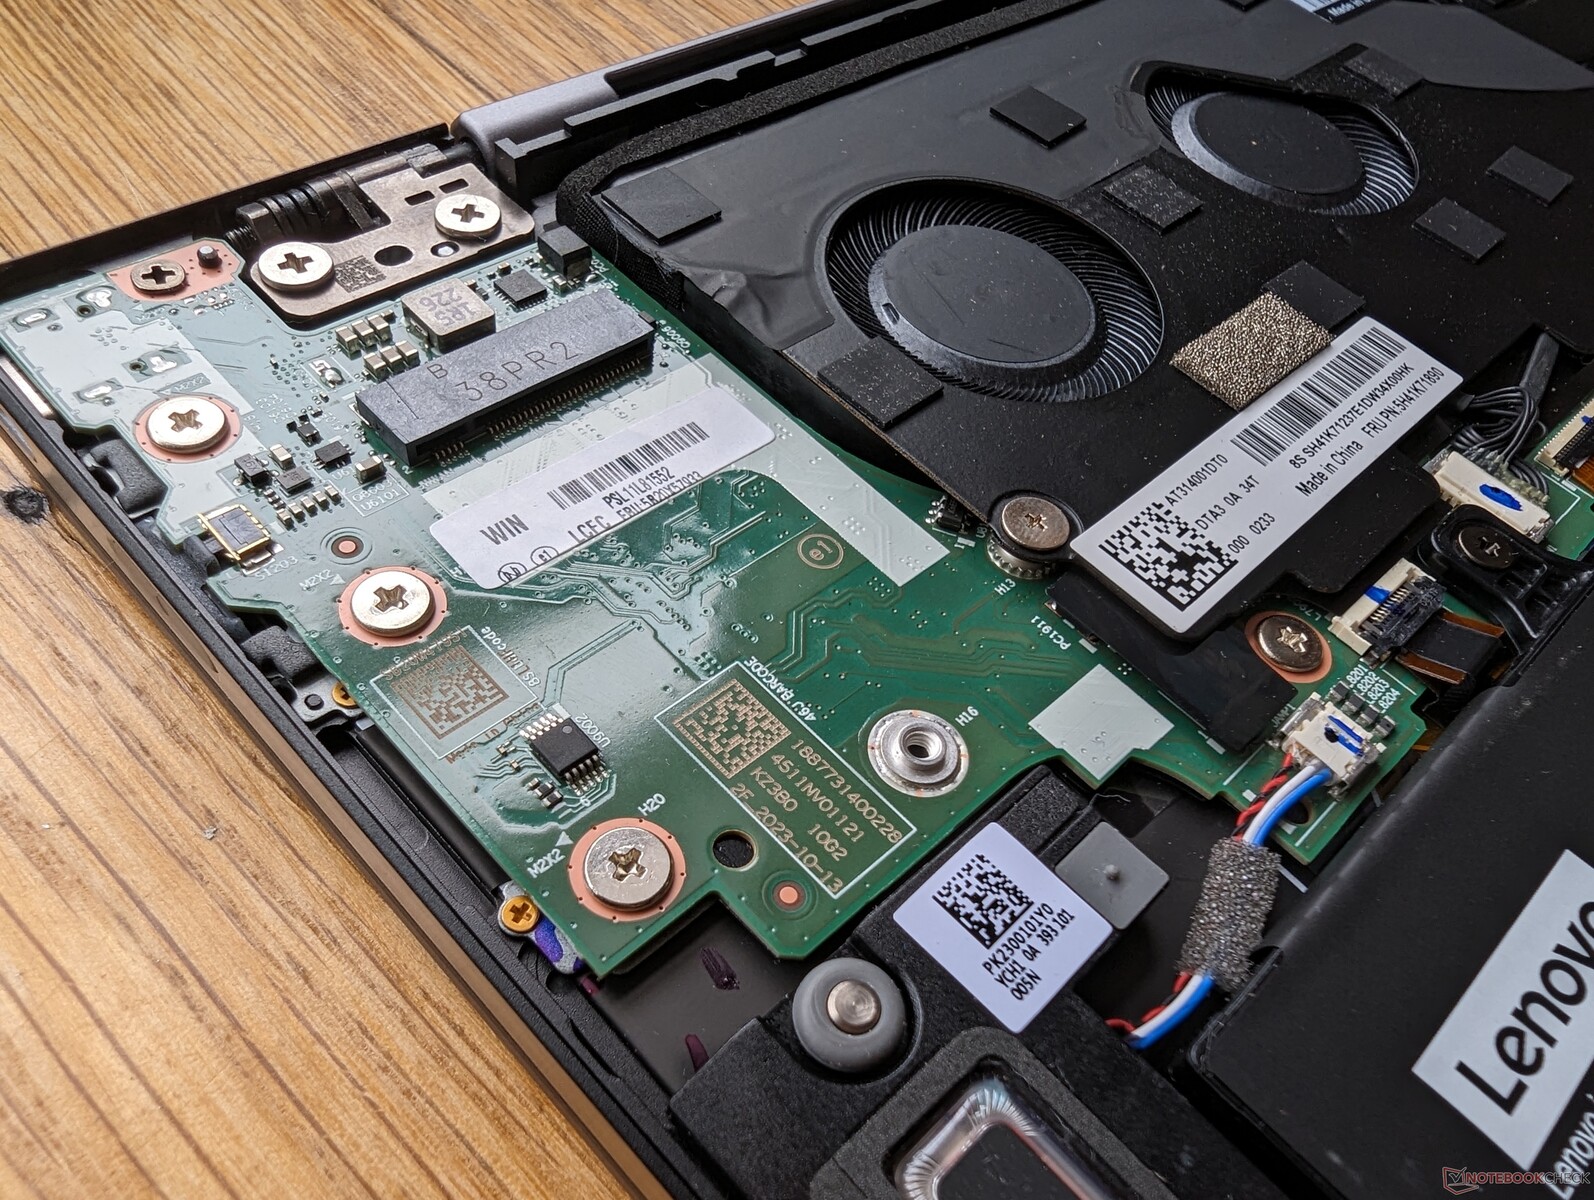
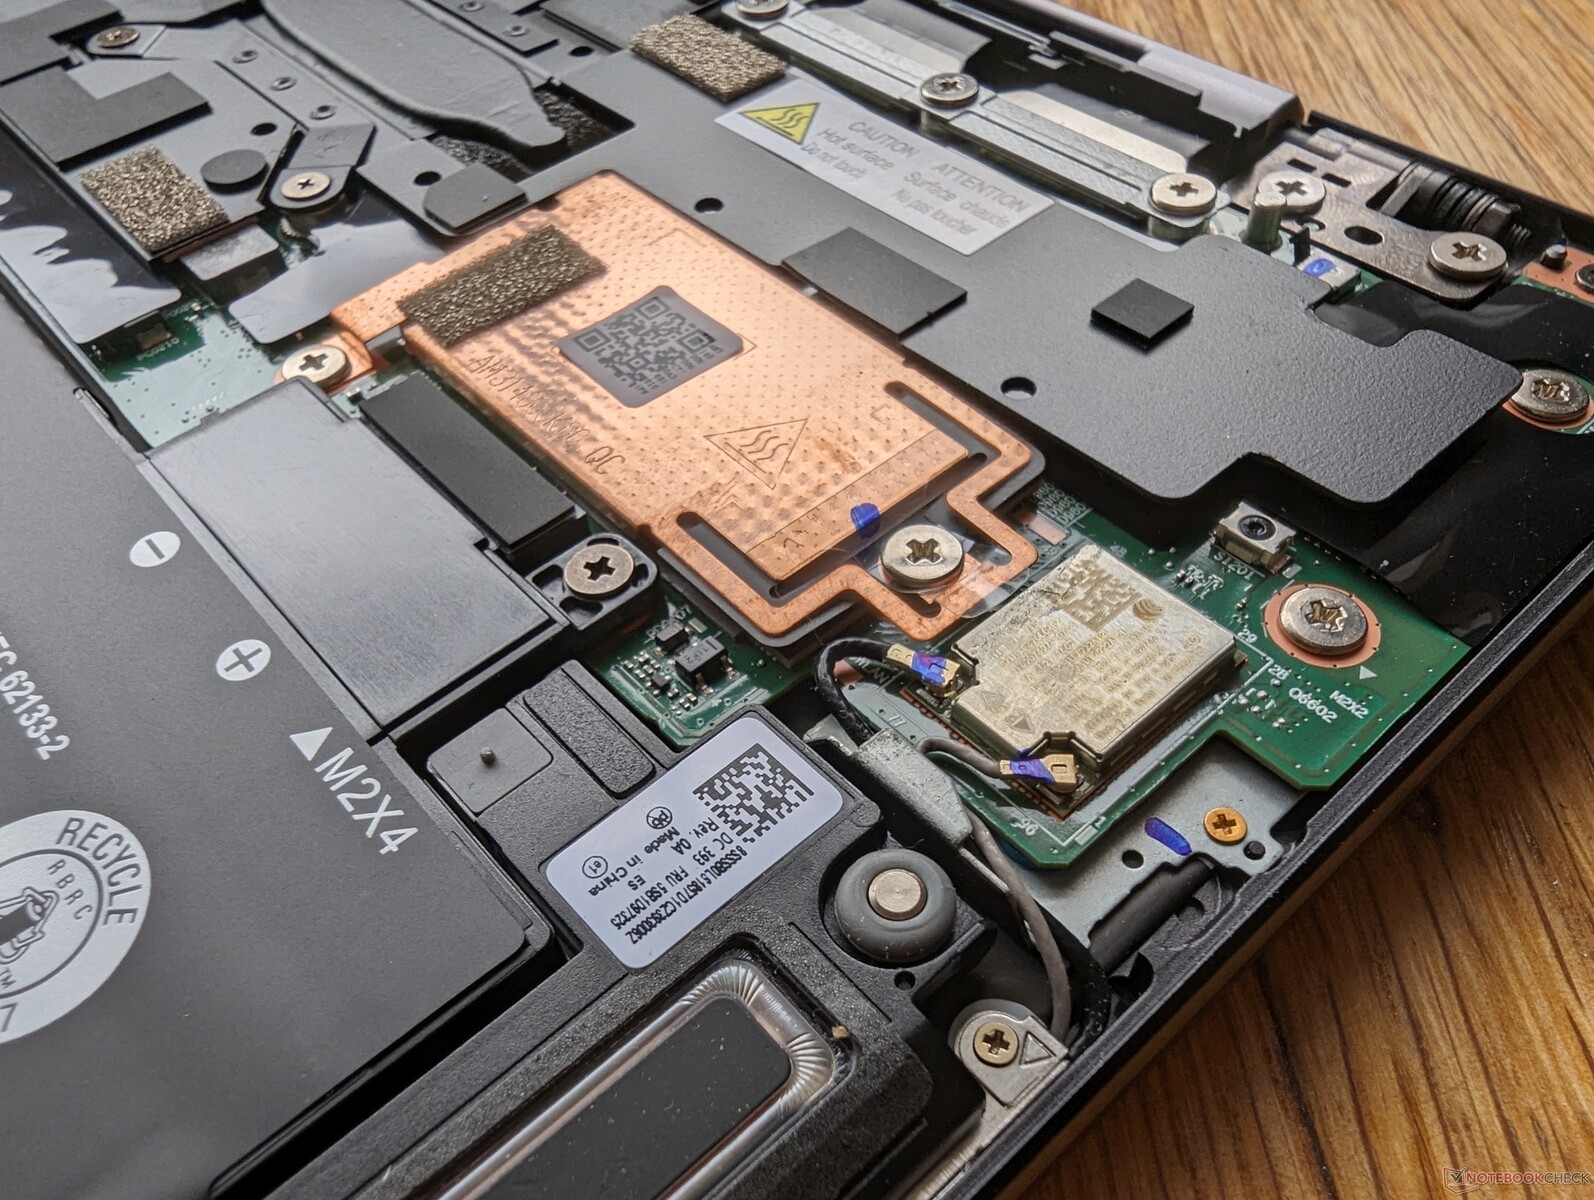
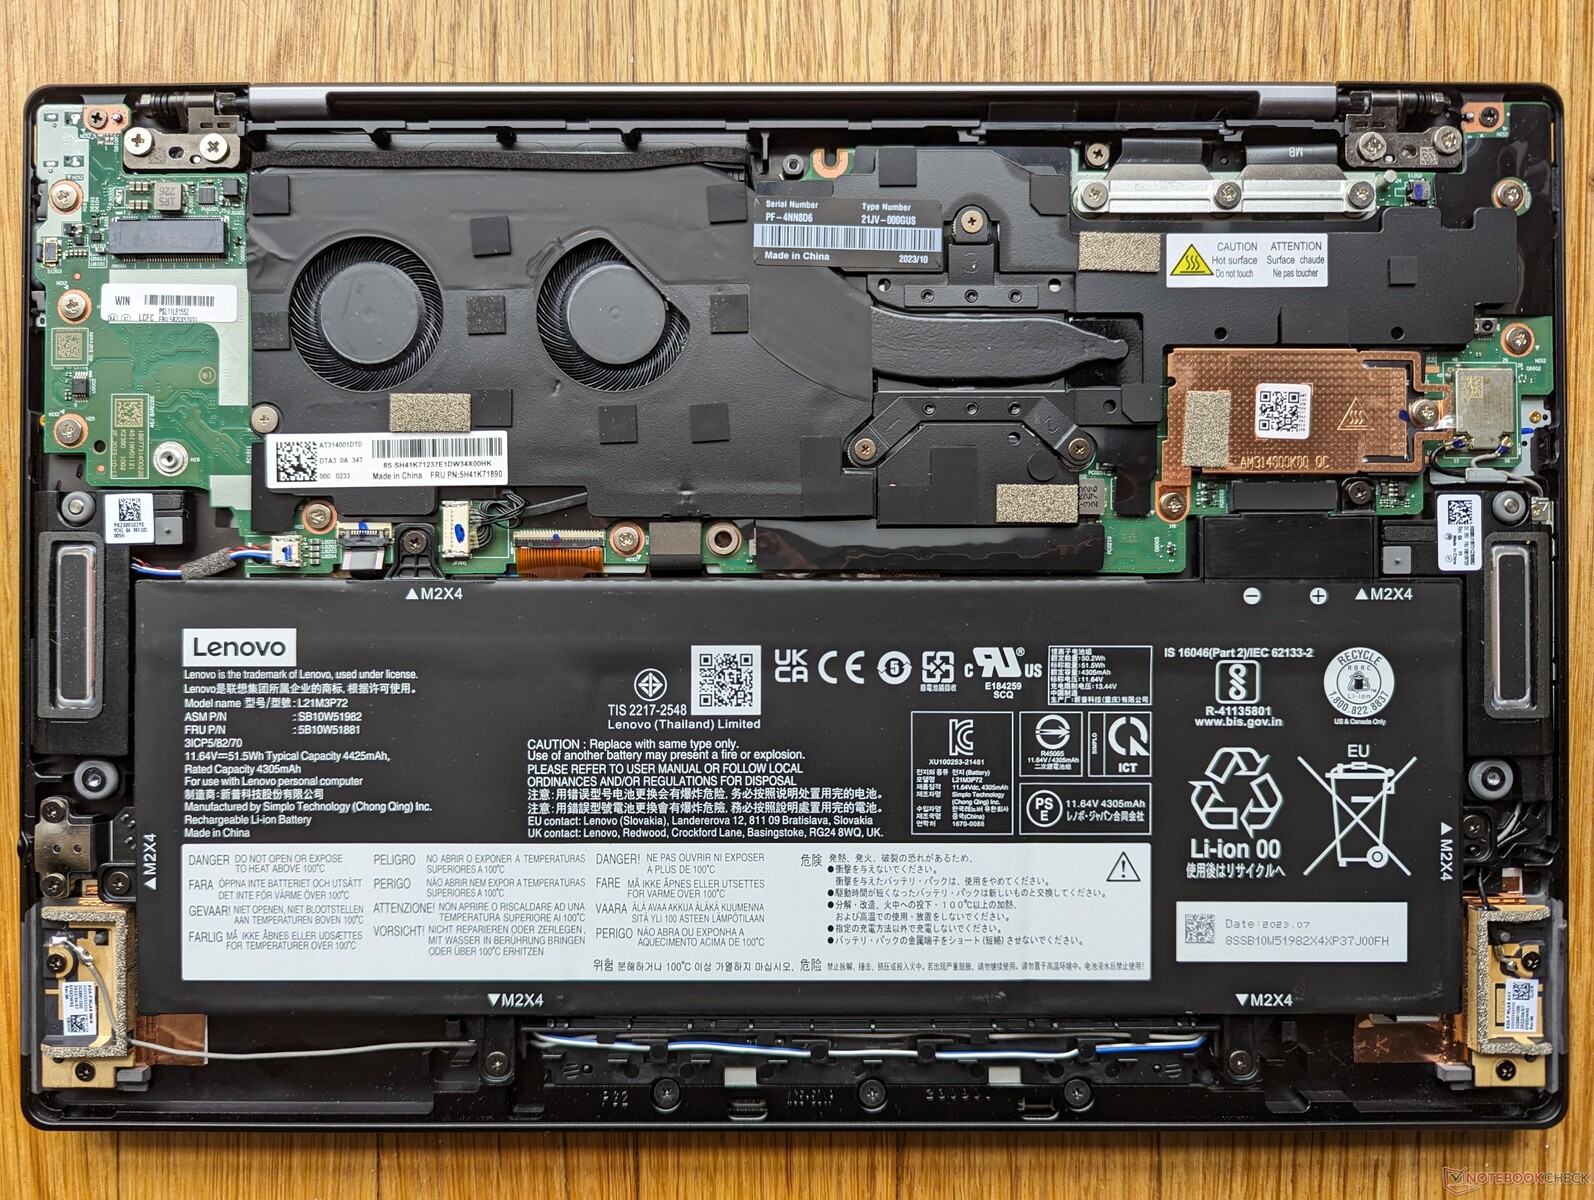
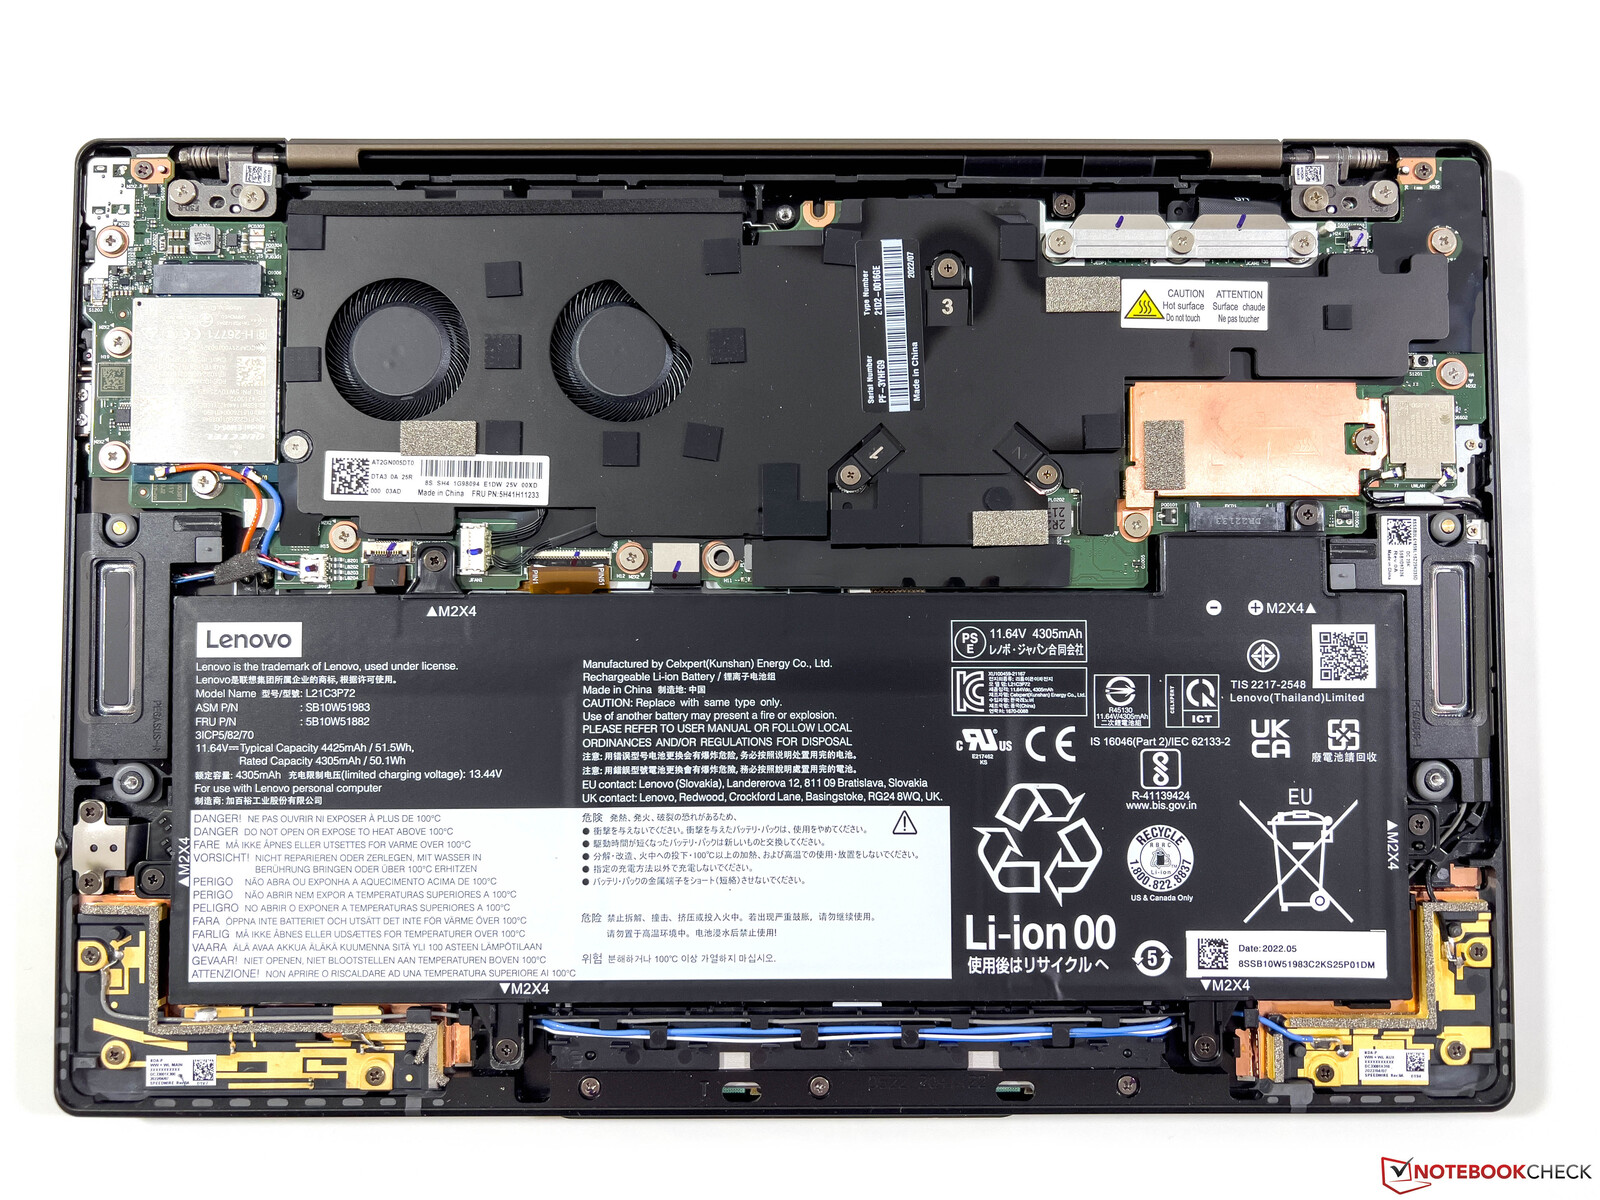
Maintenance
There are no major internal differences between the Gen 1 and Gen 2 models.
Warranty
The base warranty period can be either 12 months or 36 months depending on the configuration if purchased in the US whereas other high-end business laptops from competing manufacturers like Dell tend to be 36 months as standard.
Display
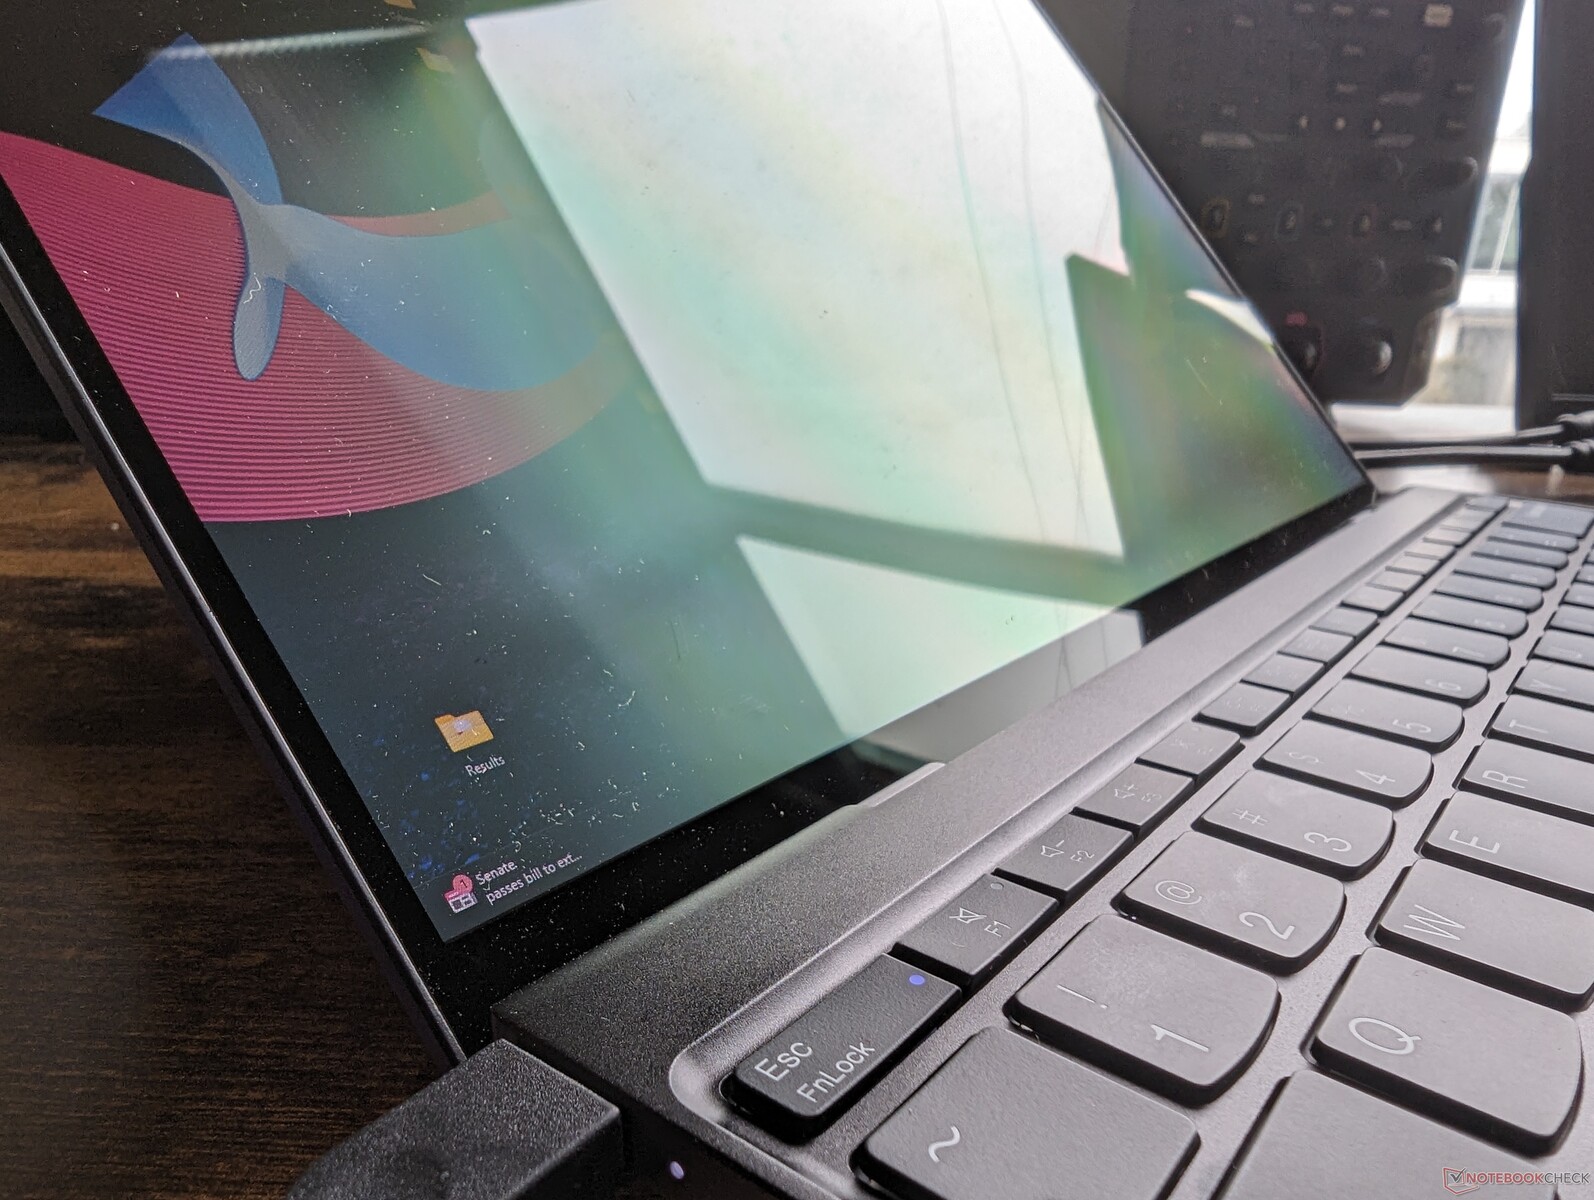
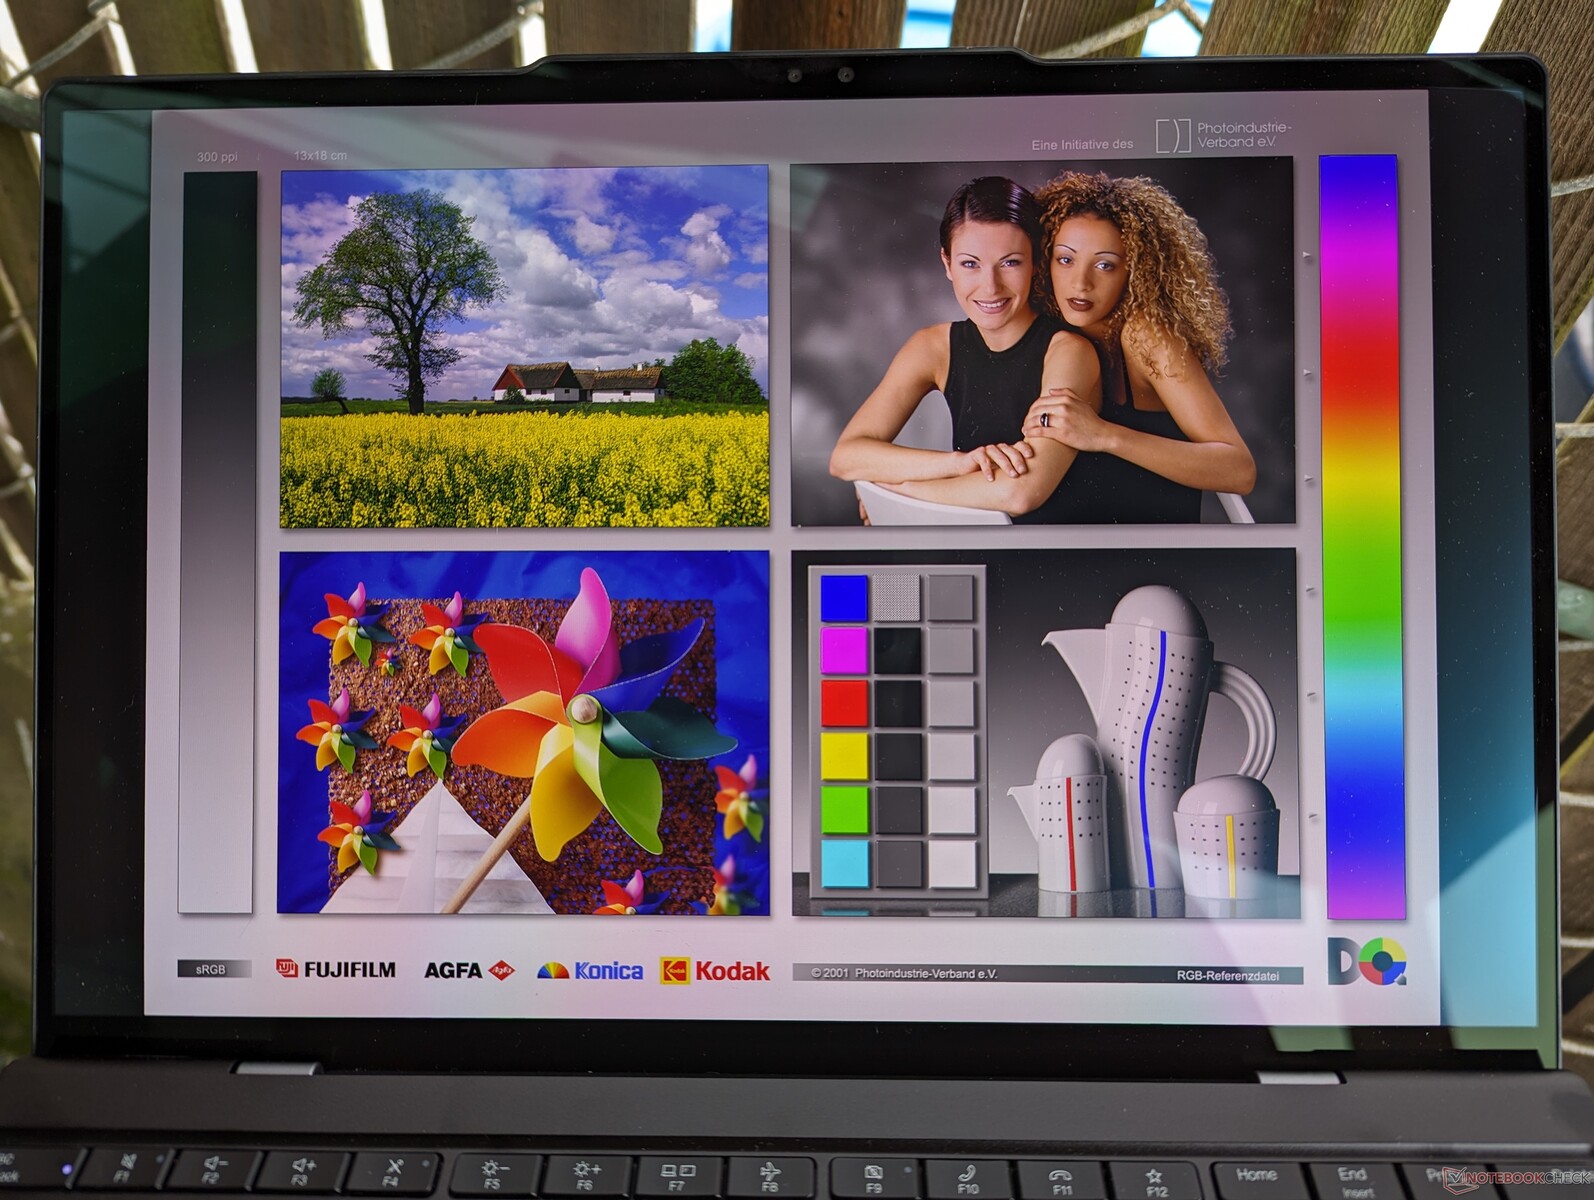
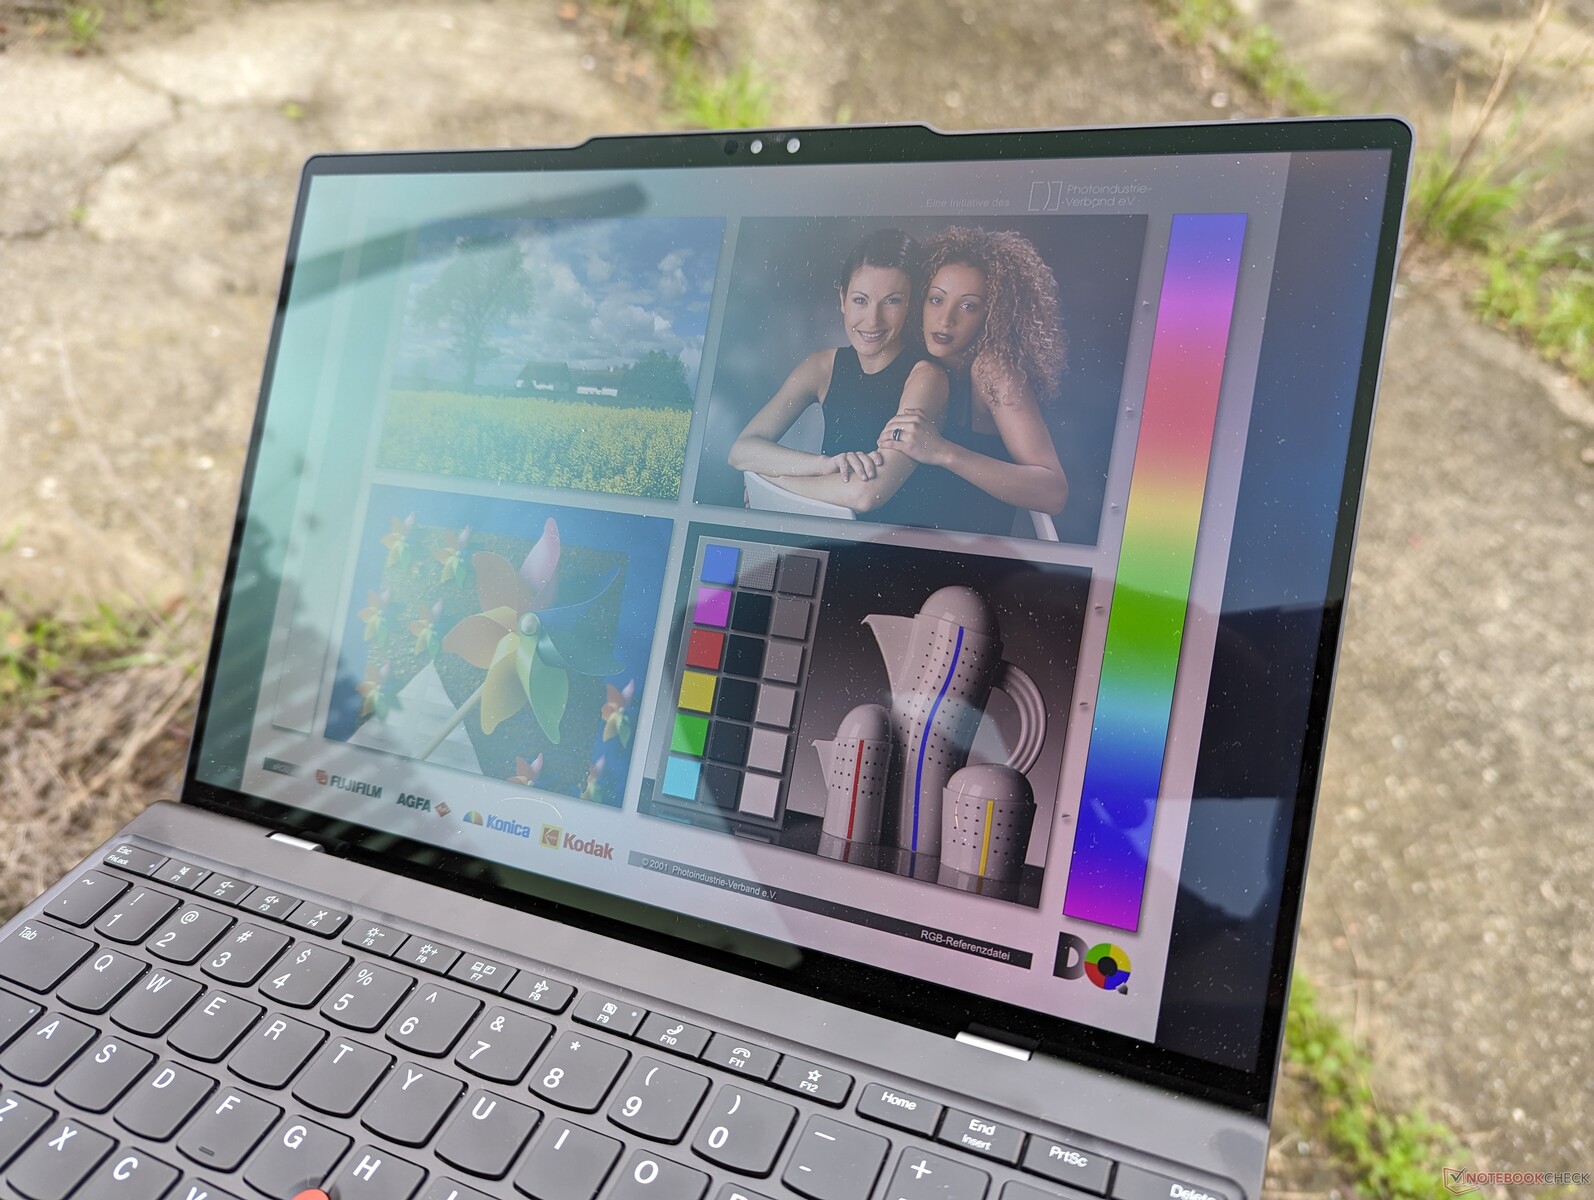
The Samsung ATNA33AA02-0 1800p OLED touchscreen on our ThinkPad Z13 G2 is identical to the one available on the original ThinkPad Z13 G1. The panel covers DCI-P3 and HDR400 for richer colors than most IPS panels on other subnotebooks, but it's unfortunate that there are no new display options for this year's Z13 G2 model. The 60 Hz refresh rate is beginning to feel outdated when 90 Hz or 120 Hz options are becoming commonplace.
Maximum brightness is standard at 400 nits. HP continues to be one of the only major manufacturers to offer significantly brighter 1000-nit panels on many of its competing subnotebooks like the 14-inch EliteBook 840 series. If outdoor visibility is a concern, then something like the Elite Dragonfly can be a reasonable alternative to the ThinkPad Z13.
| |||||||||||||||||||||||||
Brightness Distribution: 99 %
Center on Battery: 372 cd/m²
Contrast: ∞:1 (Black: 0 cd/m²)
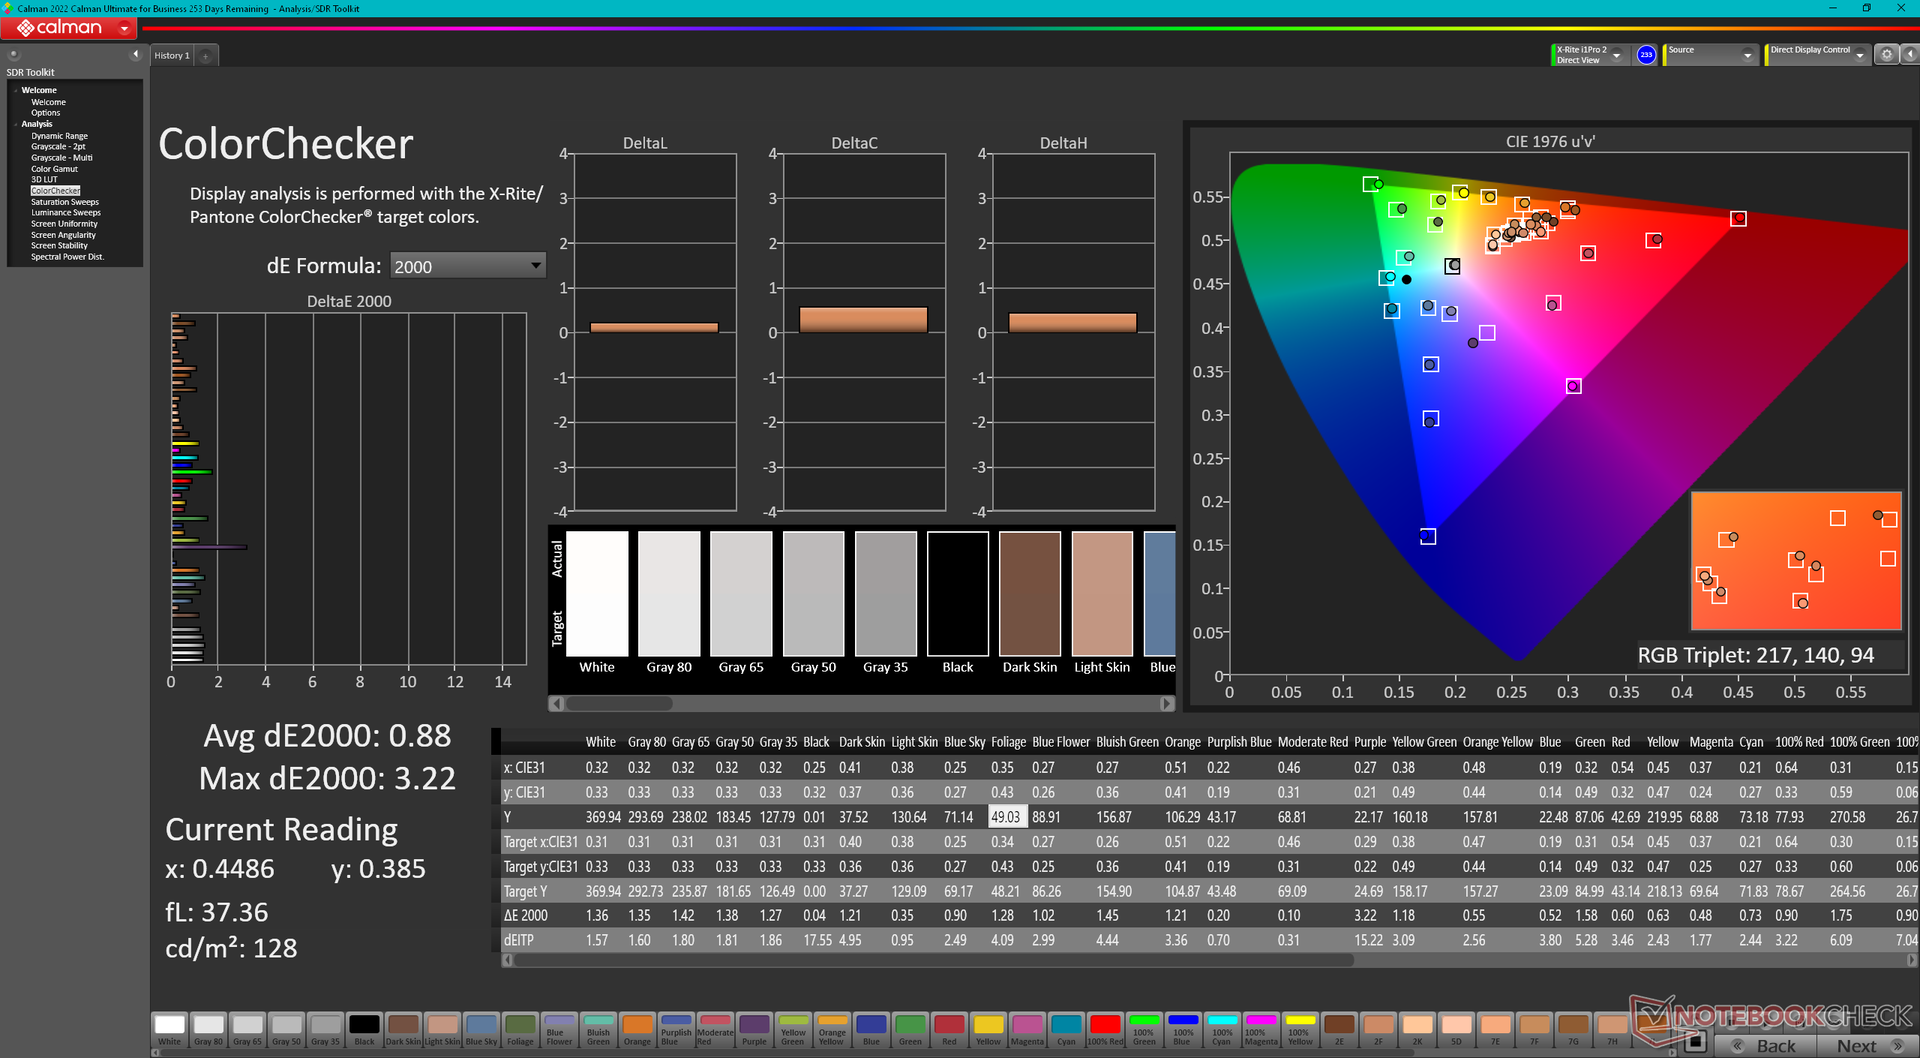
ΔE ColorChecker Calman: 0.88 | ∀{0.5-29.43 Ø4.73}
ΔE Greyscale Calman: 1.2 | ∀{0.09-98 Ø4.97}
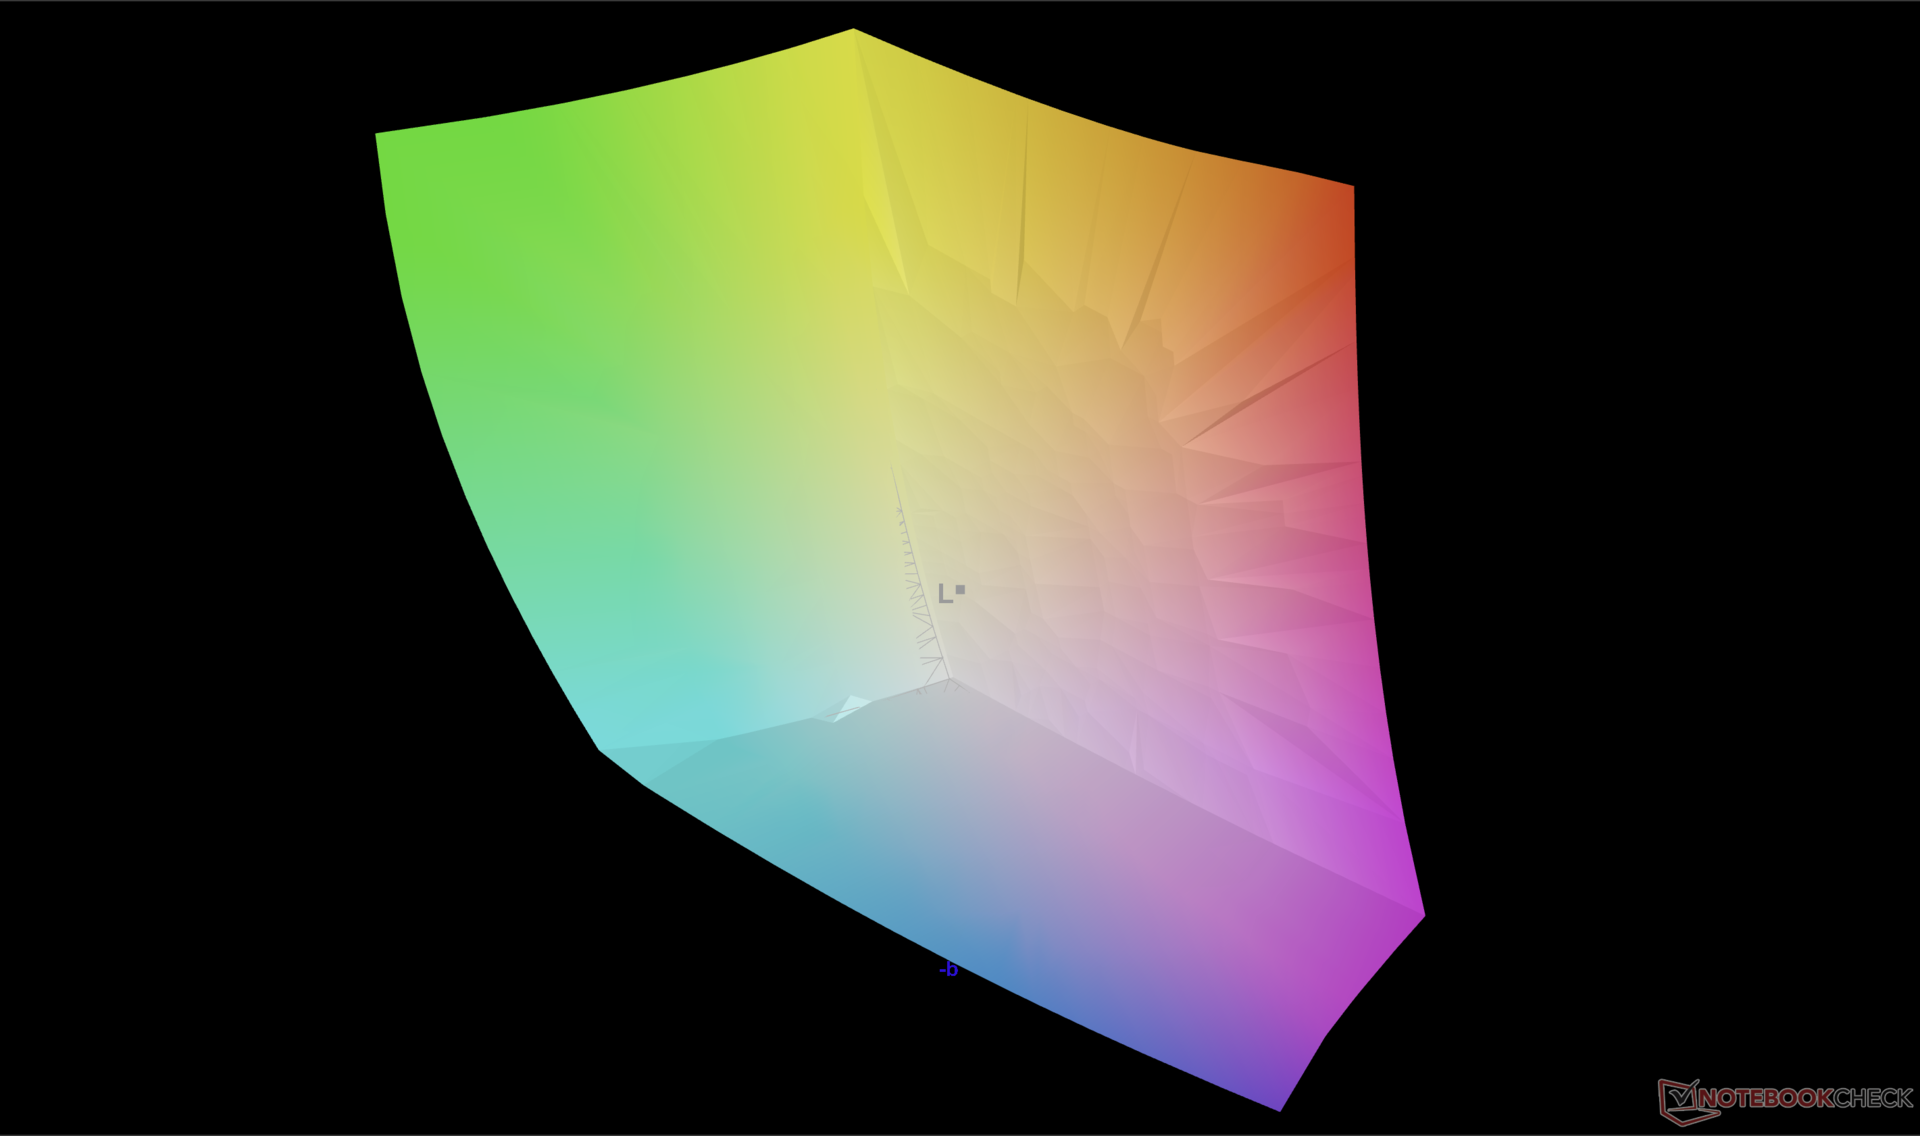
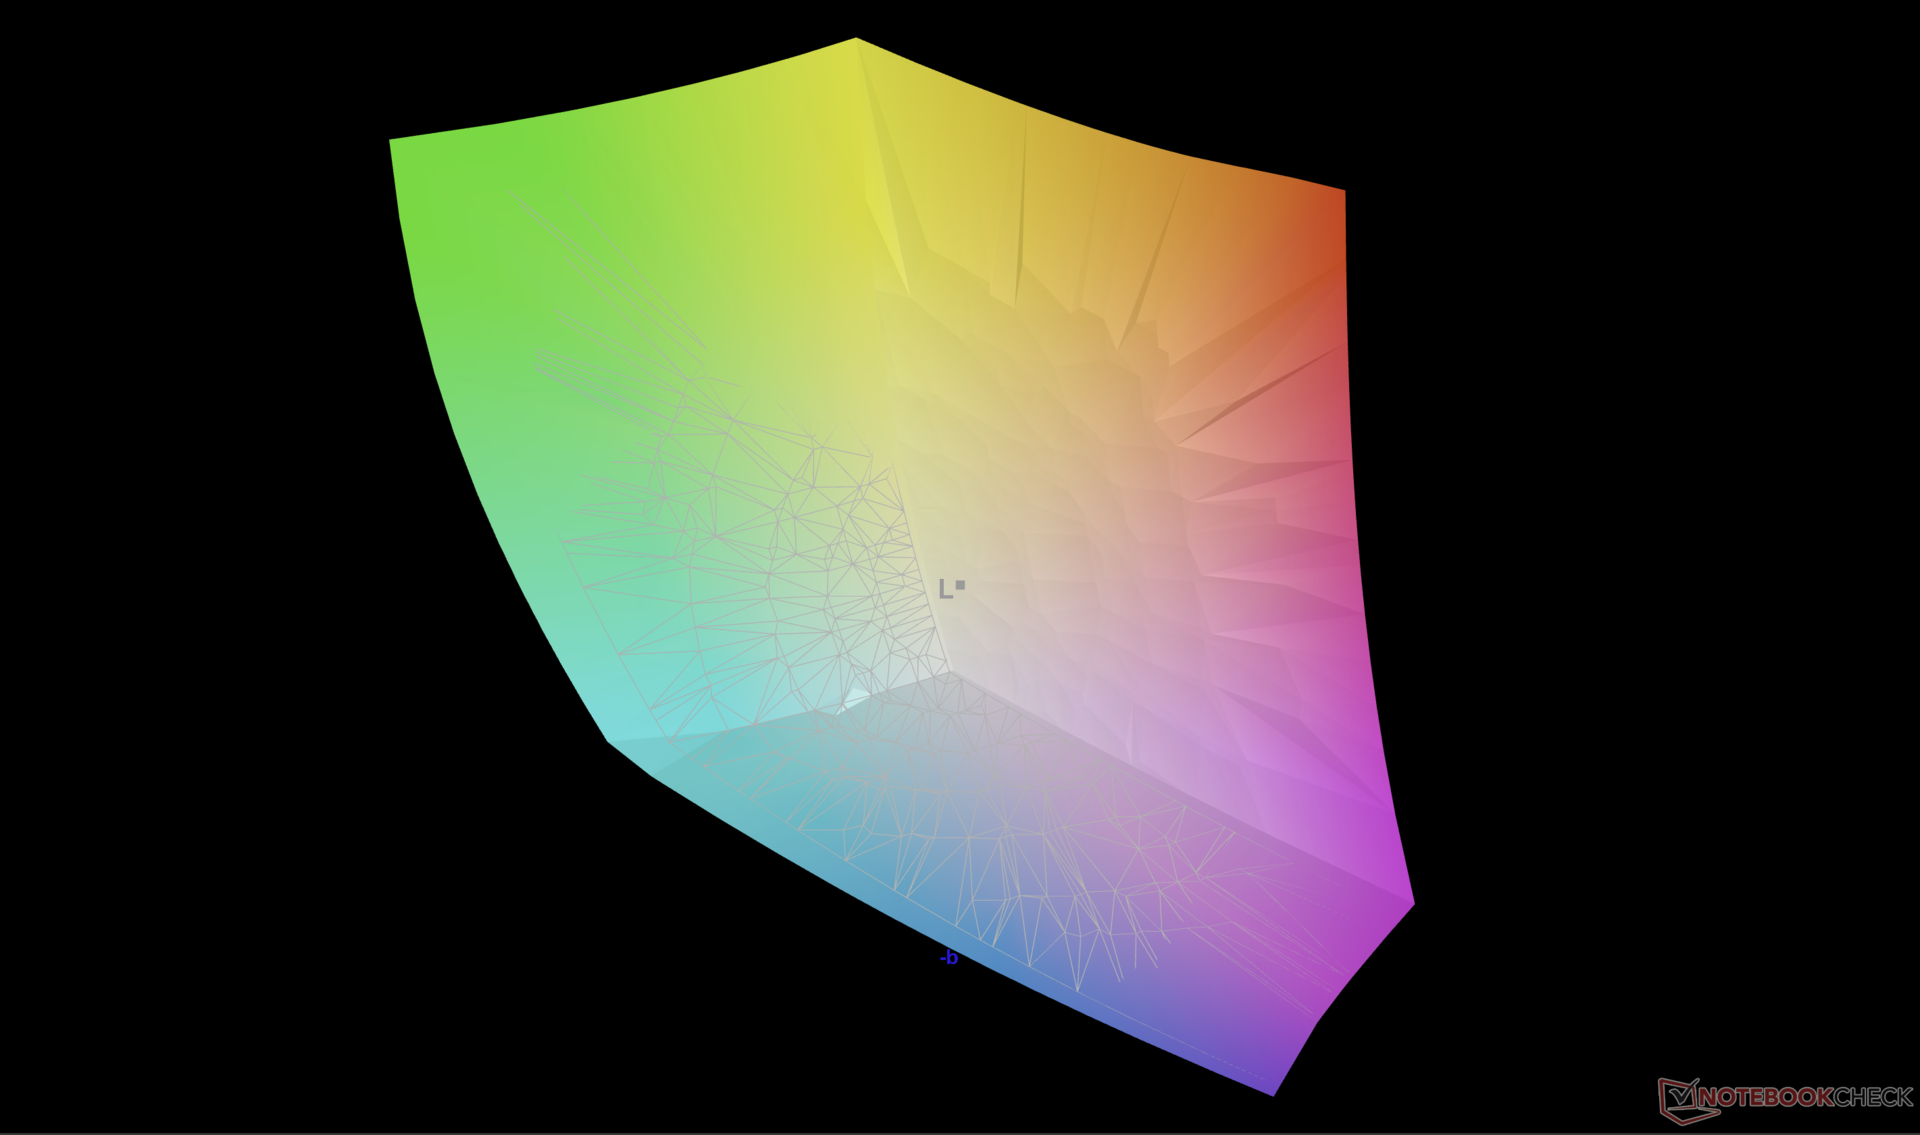
97.3% AdobeRGB 1998 (Argyll 3D)
100% sRGB (Argyll 3D)
99.7% Display P3 (Argyll 3D)
Gamma: 2.18
CCT: 6326 K
| Lenovo ThinkPad Z13 Gen 2 ATNA33AA02-0, OLED, 2880x1800, 13.3" | HP Dragonfly G4 Chi Mei CMN13C0, IPS, 1920x1280, 13.5" | Dell Latitude 13 7340 i5-1345U Chi Mei 133JCG, IPS, 1920x1200, 13.3" | Lenovo ThinkPad Z13 21D2CTO1WW NV133WUM-N63, IPS LED, 1920x1200, 13.3" | Lenovo ThinkPad X1 Nano Gen 3 MND007ZA1-3, IPS, 2160x1350, 13" | Framework Laptop 13.5 Ryzen 7 7840U BOE CQ NE135FBM-N41, IPS, 2256x1504, 13.5" | |
|---|---|---|---|---|---|---|
| Display | -20% | -22% | -21% | -20% | -20% | |
| Display P3 Coverage (%) | 99.7 | 68.4 -31% | 65.9 -34% | 67.7 -32% | 68.5 -31% | 69 -31% |
| sRGB Coverage (%) | 100 | 98.3 -2% | 96.8 -3% | 96.5 -3% | 99.5 0% | 99.1 -1% |
| AdobeRGB 1998 Coverage (%) | 97.3 | 70.4 -28% | 67.8 -30% | 69.7 -28% | 69.7 -28% | 71.1 -27% |
| Response Times | -1774% | -1775% | -1589% | -1437% | -1816% | |
| Response Time Grey 50% / Grey 80% * (ms) | 2.1 ? | 48.8 ? -2224% | 51 ? -2329% | 49 ? -2233% | 39.9 ? -1800% | 50.4 ? -2300% |
| Response Time Black / White * (ms) | 2.2 ? | 31.3 ? -1323% | 29.04 ? -1220% | 23 ? -945% | 25.8 ? -1073% | 31.5 ? -1332% |
| PWM Frequency (Hz) | 60.1 ? | |||||
| Screen | -39% | -107% | -32% | -22% | -46% | |
| Brightness middle (cd/m²) | 372 | 408.8 10% | 471 27% | 418 12% | 461.2 24% | 436 17% |
| Brightness (cd/m²) | 375 | 399 6% | 437 17% | 379 1% | 428 14% | 416 11% |
| Brightness Distribution (%) | 99 | 90 -9% | 87 -12% | 81 -18% | 86 -13% | 89 -10% |
| Black Level * (cd/m²) | 0.32 | 0.2033 | 0.33 | 0.29 | 0.36 | |
| Colorchecker dE 2000 * | 0.88 | 2.02 -130% | 3.24 -268% | 1.7 -93% | 1.79 -103% | 1.81 -106% |
| Colorchecker dE 2000 max. * | 3.22 | 3.84 -19% | 7.19 -123% | 3.3 -2% | 3.3 -2% | 4.73 -47% |
| Greyscale dE 2000 * | 1.2 | 2.3 -92% | 4.6 -283% | 2.3 -92% | 1.8 -50% | 2.9 -142% |
| Gamma | 2.18 101% | 2.2 100% | 2.14 103% | 2.24 98% | 2.27 97% | |
| CCT | 6326 103% | 6203 105% | 6520 100% | 6499 100% | 6588 99% | 6784 96% |
| Contrast (:1) | 1278 | 2317 | 1267 | 1590 | 1211 | |
| Colorchecker dE 2000 calibrated * | 0.61 | 1.08 | 1.1 | 0.47 | 0.45 | |
| Total Average (Program / Settings) | -611% /
-349% | -635% /
-387% | -547% /
-312% | -493% /
-278% | -627% /
-361% |
* ... smaller is better
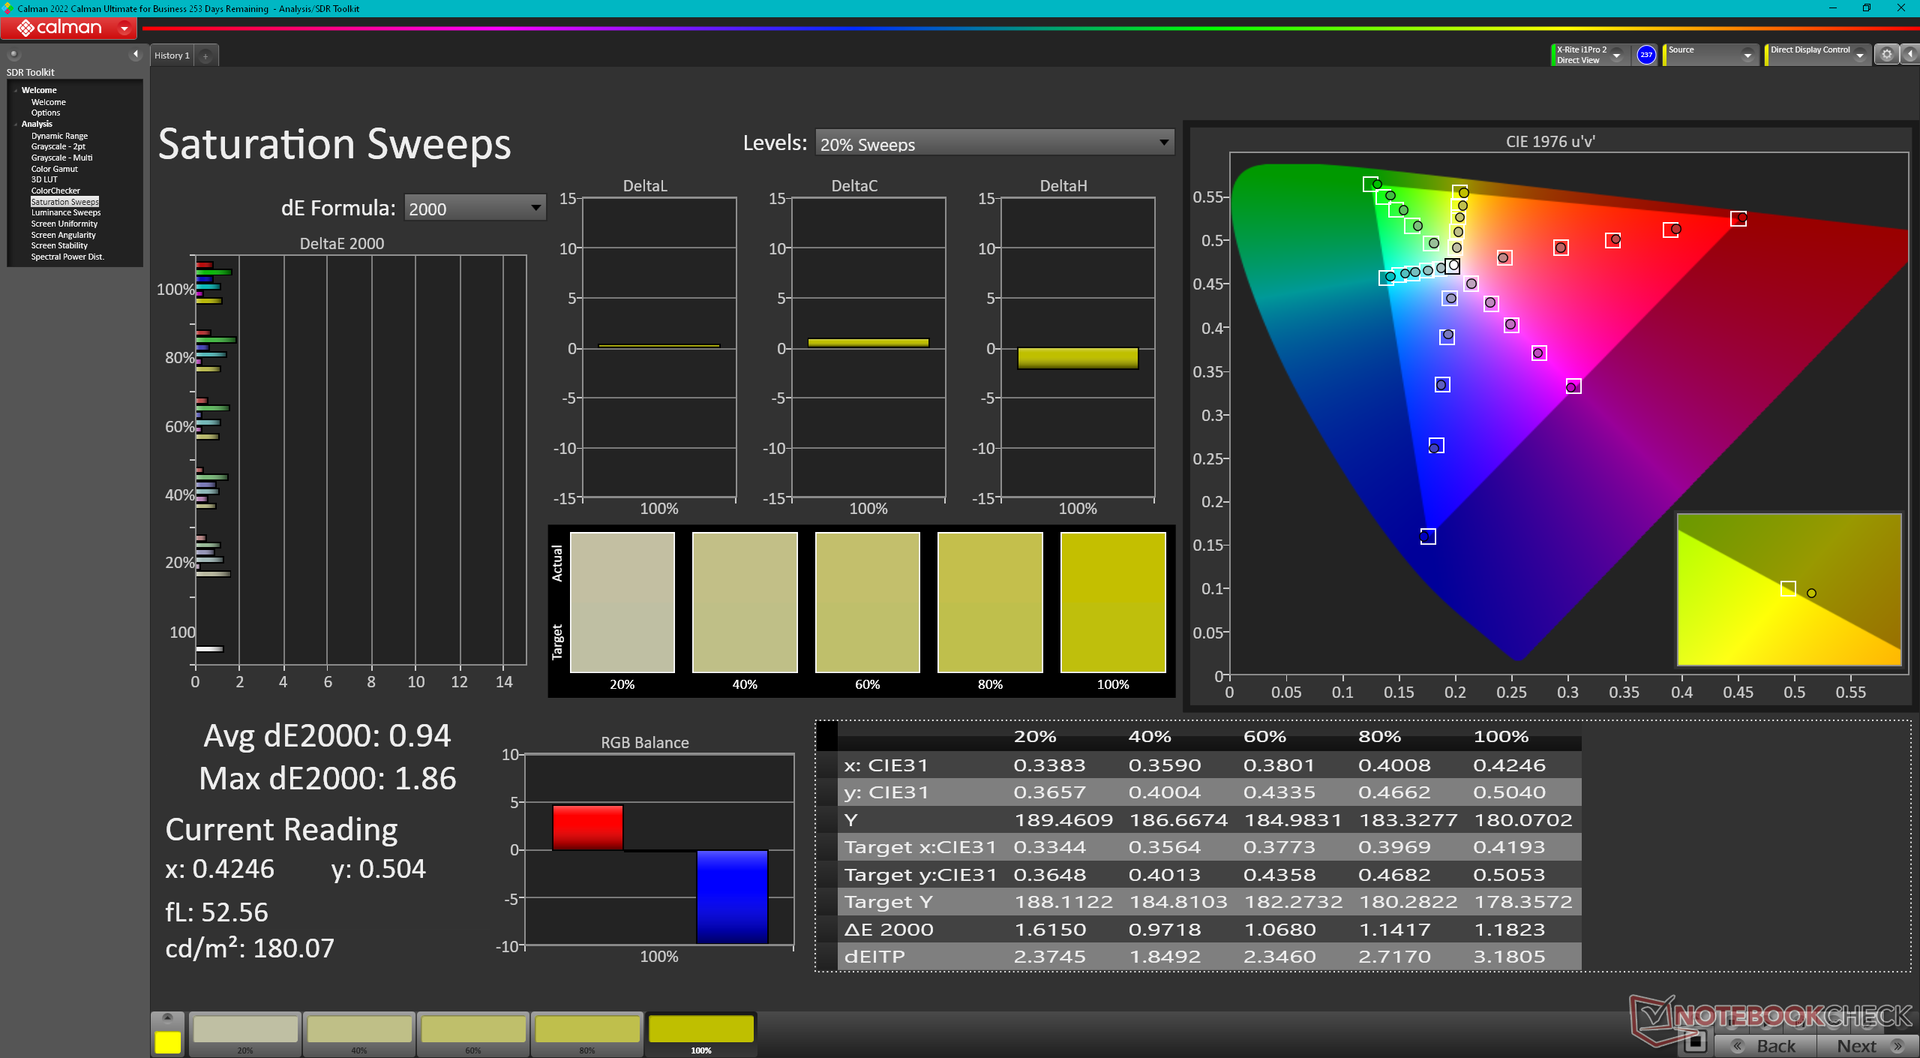
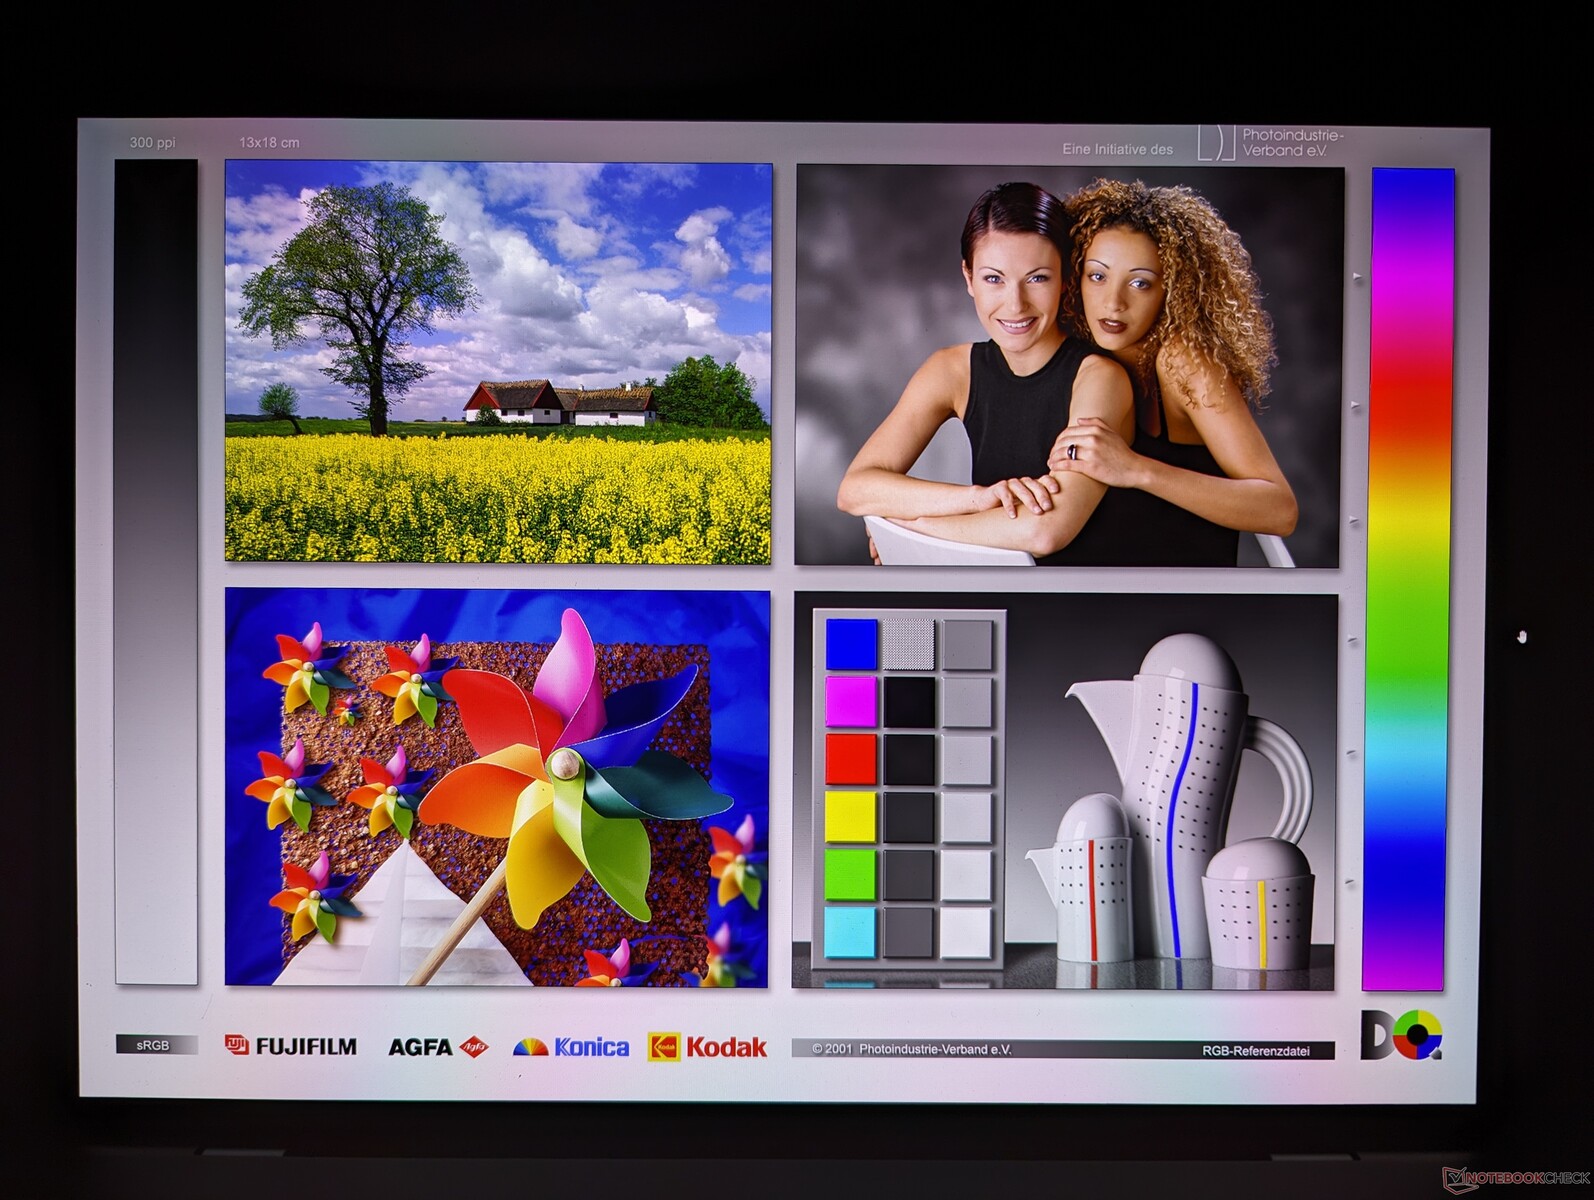
The display comes well-calibrated out of the box with average grayscale and color deltaE values of only 1.2 and 0.88, respectively. However, colors are set to sRGB by default even though the OLED panel supports full DCI-P3 colors.

Display Response Times
| ↔ Response Time Black to White | ||
|---|---|---|
| 2.2 ms ... rise ↗ and fall ↘ combined | ↗ 1 ms rise | 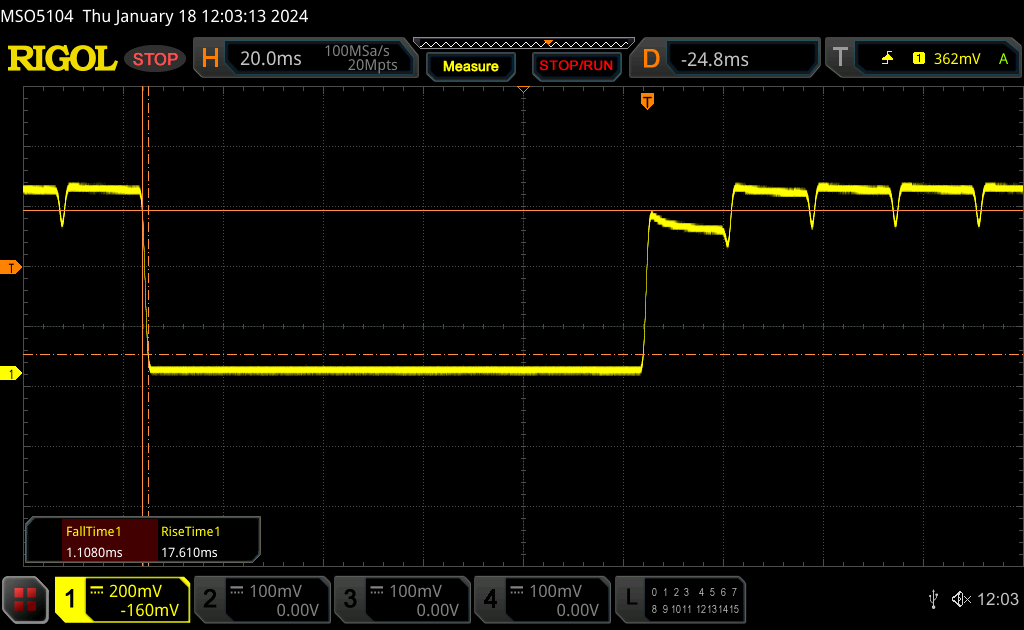 |
| ↘ 1.2 ms fall | ||
| The screen shows very fast response rates in our tests and should be very well suited for fast-paced gaming. In comparison, all tested devices range from 0.1 (minimum) to 240 (maximum) ms. » 12 % of all devices are better. This means that the measured response time is better than the average of all tested devices (19.9 ms). | ||
| ↔ Response Time 50% Grey to 80% Grey | ||
| 2.1 ms ... rise ↗ and fall ↘ combined | ↗ 1.1 ms rise |  |
| ↘ 1 ms fall | ||
| The screen shows very fast response rates in our tests and should be very well suited for fast-paced gaming. In comparison, all tested devices range from 0.165 (minimum) to 636 (maximum) ms. » 11 % of all devices are better. This means that the measured response time is better than the average of all tested devices (31.1 ms). | ||
Screen Flickering / PWM (Pulse-Width Modulation)
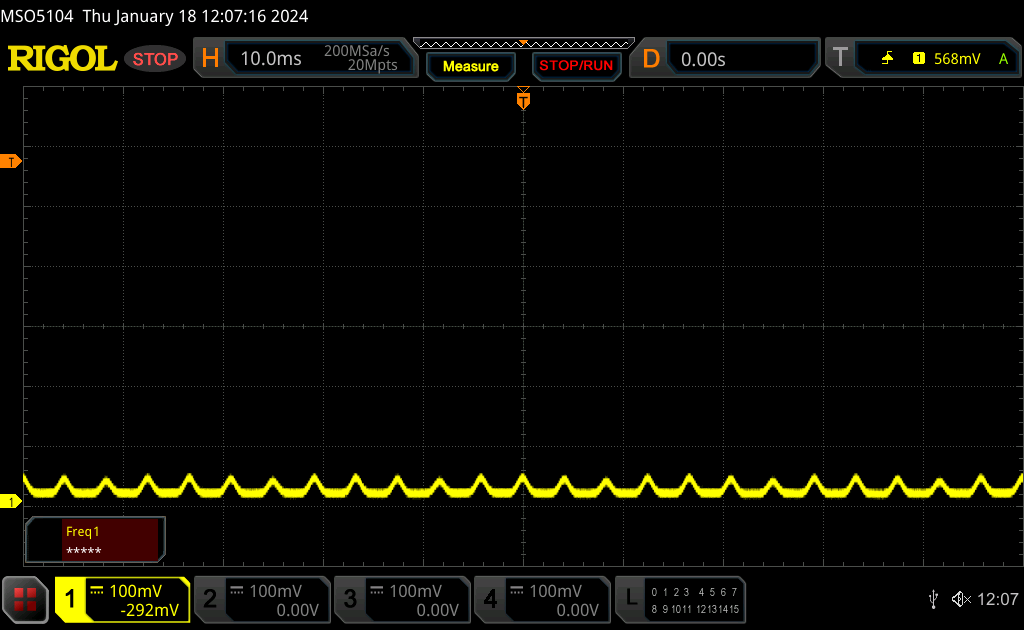
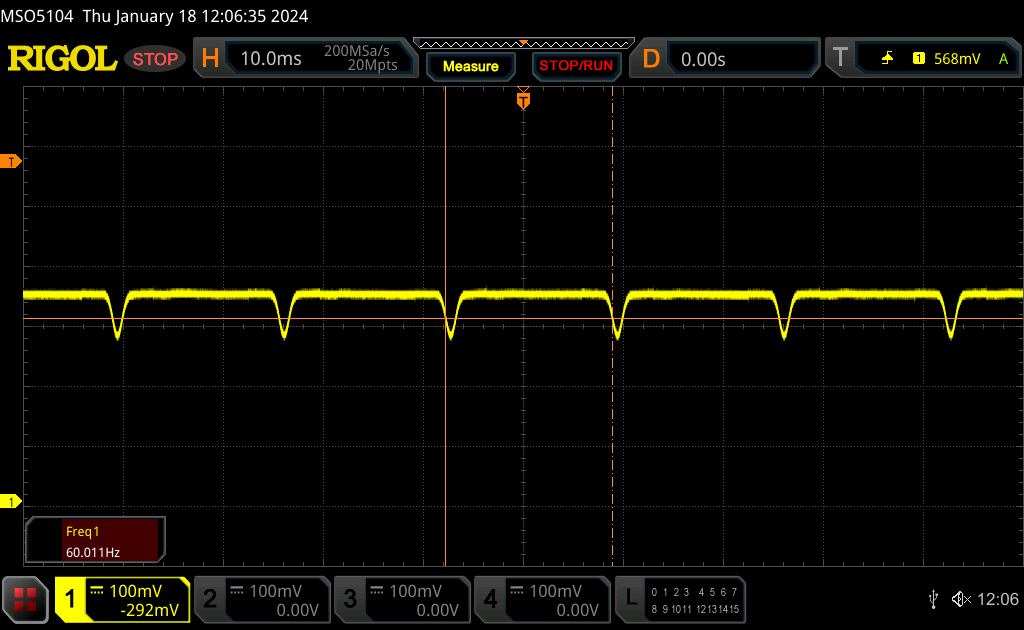
| Screen flickering / PWM detected | 60.1 Hz | ≤ 100 % brightness setting | 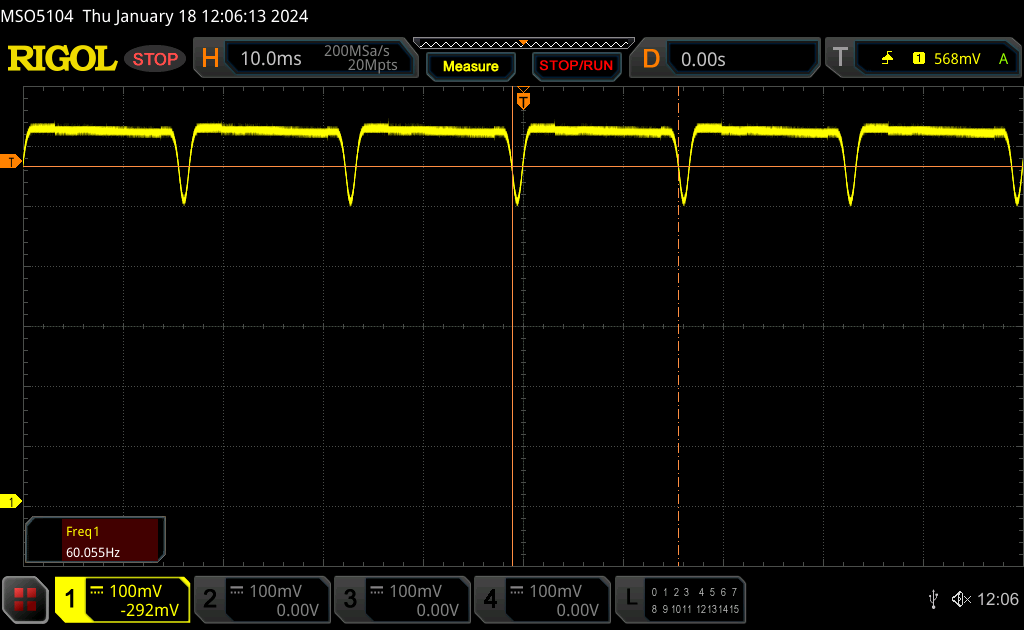 |
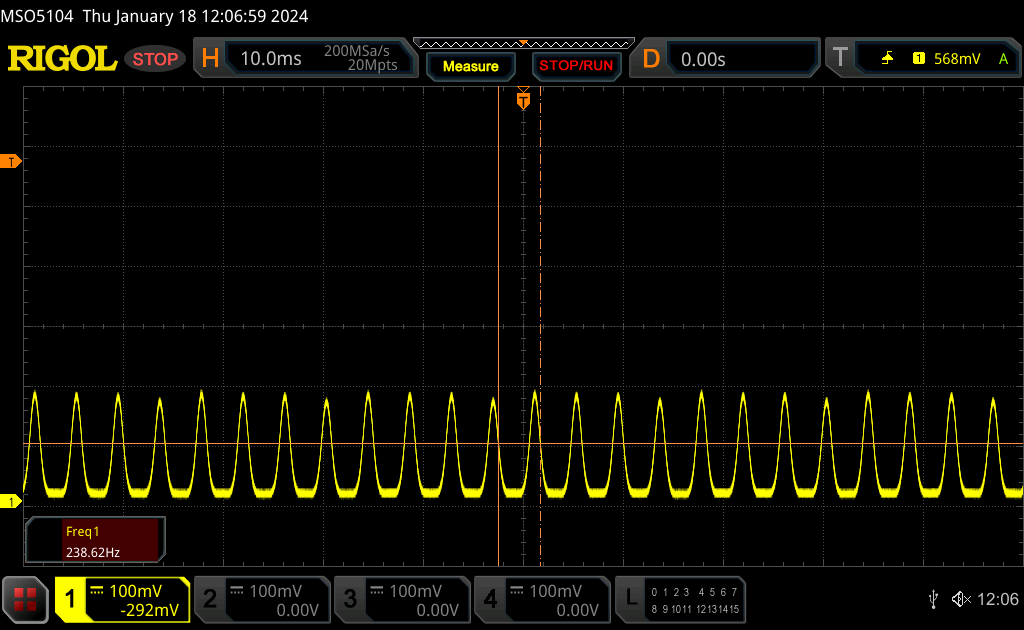
The display backlight flickers at 60.1 Hz (worst case, e.g., utilizing PWM) Flickering detected at a brightness setting of 100 % and below. There should be no flickering or PWM above this brightness setting. The frequency of 60.1 Hz is very low, so the flickering may cause eyestrain and headaches after extended use. In comparison: 52 % of all tested devices do not use PWM to dim the display. If PWM was detected, an average of 7797 (minimum: 5 - maximum: 343500) Hz was measured. | |||
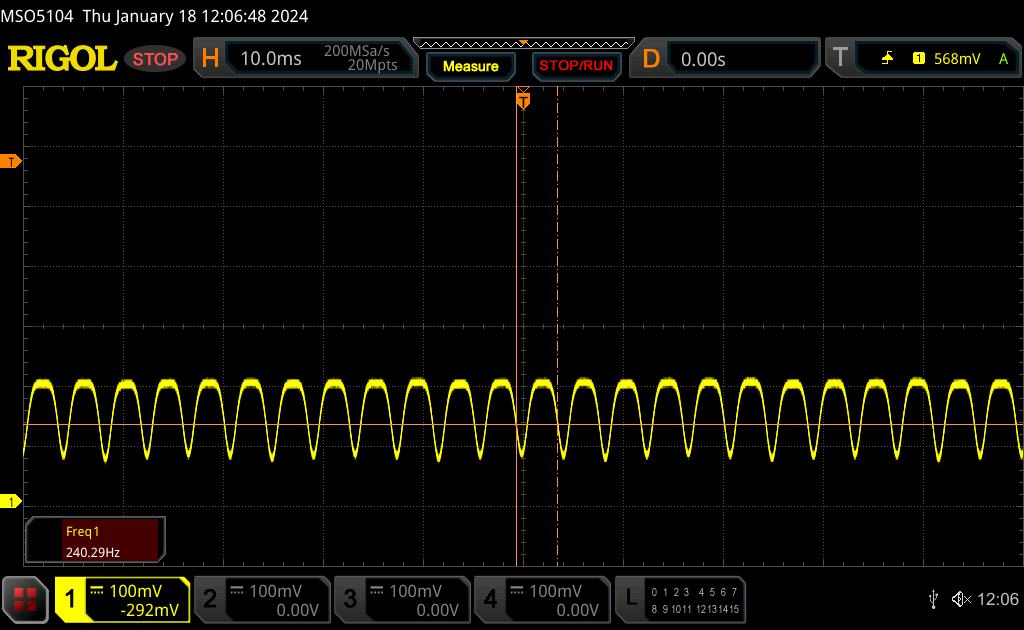
Pulse-width modulation or flickering is present on all brightness levels as with most other OLED panels. The frequency is stable at 238.6 Hz from 0 to 52 percent brightness before changing to 60 Hz from 53 to 100 percent brightness.

Performance


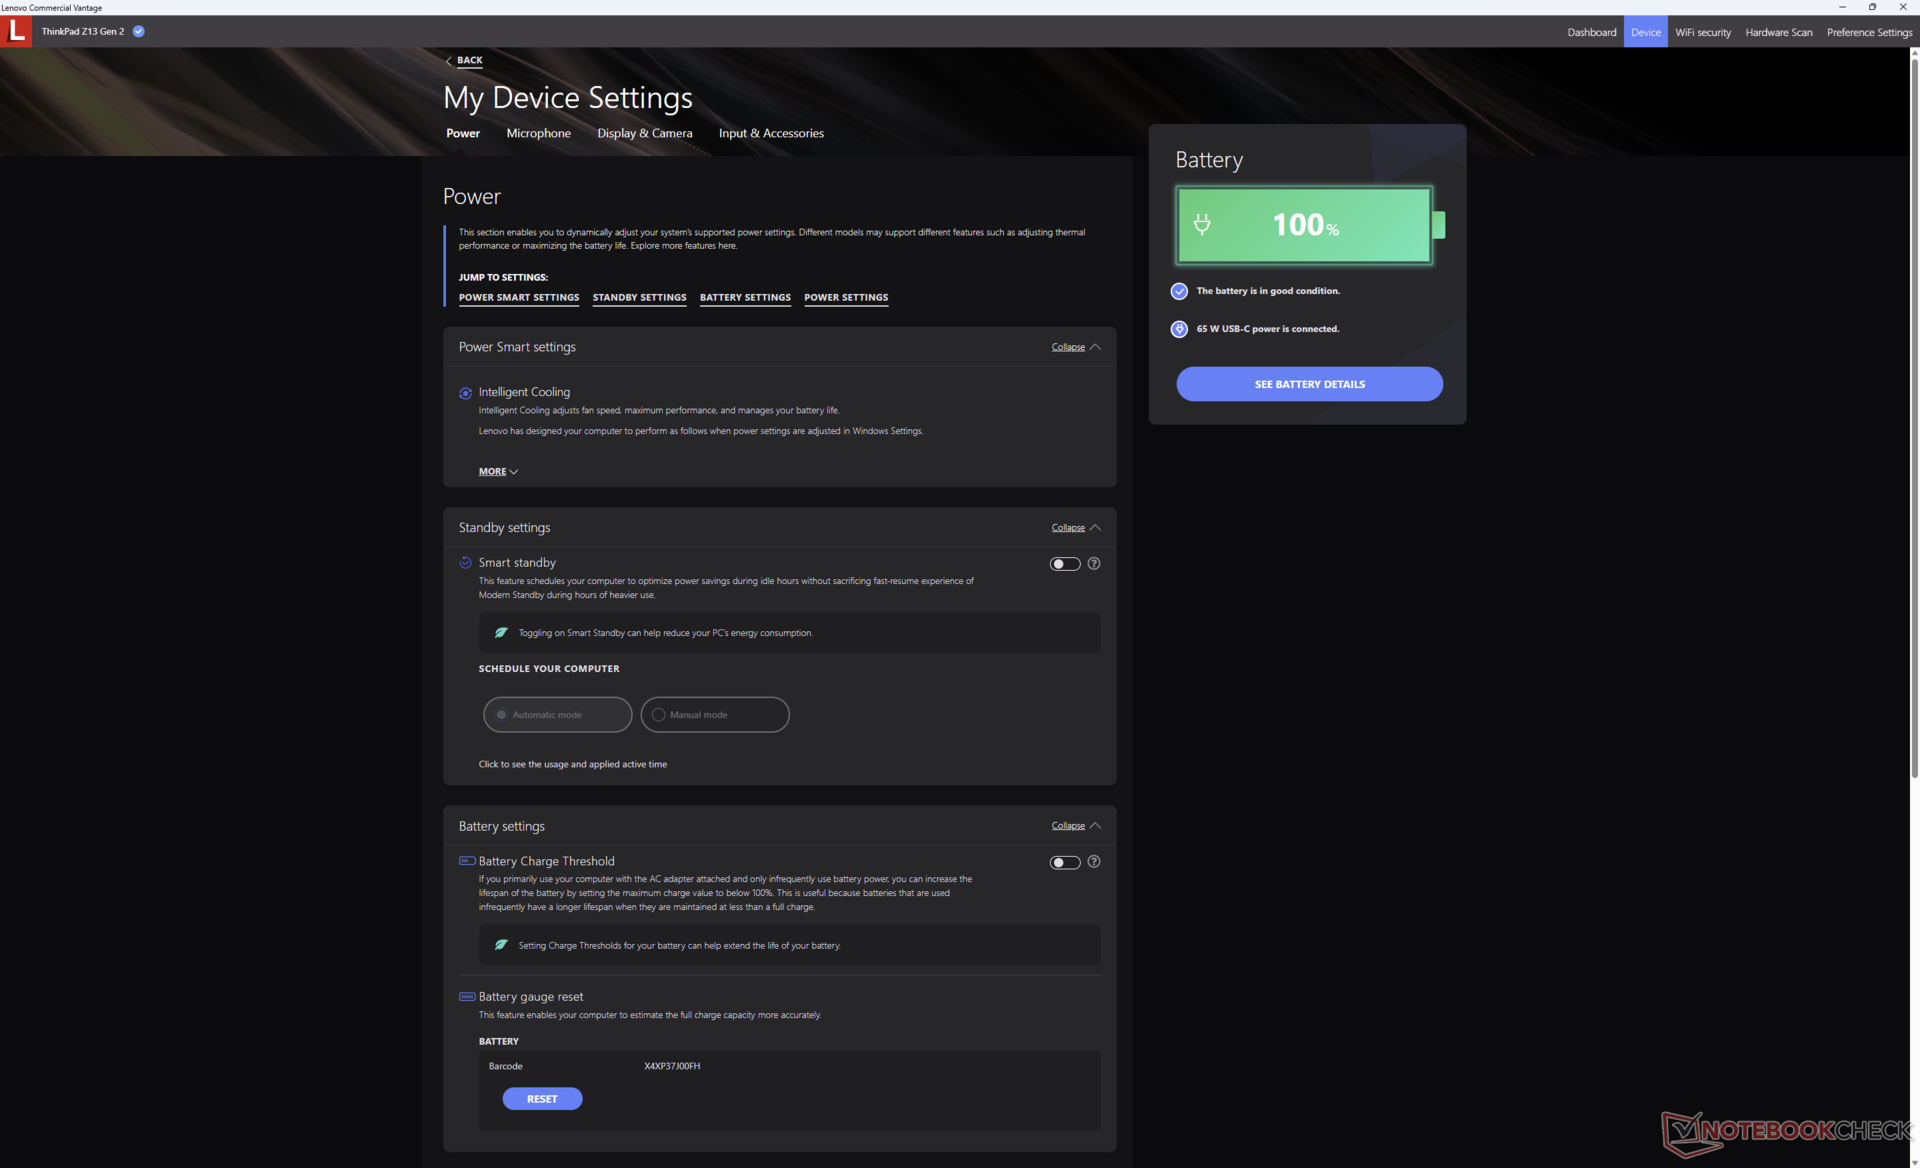
Testing Conditions
We set Windows to Performance mode prior to running the benchmarks below. The pre-installed Lenovo Commercial Vantage software includes no separate power profile options in order to streamline the number of settings.
Processor
Mobile Zen 4 CPUs have been very impressive thus far and the octa-core Ryzen 7 Pro 7840U is no exception. The AMD CPU is as fast or faster than any competing Intel 13th gen Core-U or Core-P processor including even the Core i7-1370P. It also outperforms the rare Ryzen 7 Pro 6860Z in last year's ThinkPad Z13 G1 by about 15 to 20 percent in both single- and multi-threaded loads.
Performance sustainability is excellent as well despite the small 13-inch form factor. When running CineBench R15 xT in a loop, scores would remain consistent from beginning to end to suggest stable clock rates when running demanding loads.
Downgrading to the hexa-core Ryzen 5 Pro 7540U configuration is expected to impact processor performance about 20 to 30 percent.
Cinebench R15 Multi Loop
Cinebench R23: Multi Core | Single Core
Cinebench R20: CPU (Multi Core) | CPU (Single Core)
Cinebench R15: CPU Multi 64Bit | CPU Single 64Bit
Blender: v2.79 BMW27 CPU
7-Zip 18.03: 7z b 4 | 7z b 4 -mmt1
Geekbench 6.7: Multi-Core | Single-Core
Geekbench 5.5: Multi-Core | Single-Core
HWBOT x265 Benchmark v2.2: 4k Preset
LibreOffice : 20 Documents To PDF
R Benchmark 2.5: Overall mean
| Geekbench 6.7 / Multi-Core | |
| Lenovo ThinkPad Z13 Gen 2 | |
| Asus ROG Flow X13 GV302XV | |
| Lenovo ThinkPad X1 Nano Gen 3 | |
| Framework Laptop 13.5 Ryzen 7 7840U | |
| Average AMD Ryzen 7 PRO 7840U (7596 - 12069, n=5) | |
| Lenovo ThinkPad L13 Yoga G4 i7-1355U | |
| HP EliteBook x360 830 G10 7L7U1ET | |
| Geekbench 6.7 / Single-Core | |
| Asus ROG Flow X13 GV302XV | |
| Framework Laptop 13.5 Ryzen 7 7840U | |
| Lenovo ThinkPad L13 Yoga G4 i7-1355U | |
| Lenovo ThinkPad X1 Nano Gen 3 | |
| Lenovo ThinkPad Z13 Gen 2 | |
| Average AMD Ryzen 7 PRO 7840U (1896 - 2508, n=5) | |
| HP EliteBook x360 830 G10 7L7U1ET | |
Cinebench R23: Multi Core | Single Core
Cinebench R20: CPU (Multi Core) | CPU (Single Core)
Cinebench R15: CPU Multi 64Bit | CPU Single 64Bit
Blender: v2.79 BMW27 CPU
7-Zip 18.03: 7z b 4 | 7z b 4 -mmt1
Geekbench 6.7: Multi-Core | Single-Core
Geekbench 5.5: Multi-Core | Single-Core
HWBOT x265 Benchmark v2.2: 4k Preset
LibreOffice : 20 Documents To PDF
R Benchmark 2.5: Overall mean
* ... smaller is better
AIDA64: FP32 Ray-Trace | FPU Julia | CPU SHA3 | CPU Queen | FPU SinJulia | FPU Mandel | CPU AES | CPU ZLib | FP64 Ray-Trace | CPU PhotoWorxx
| Performance rating | |
| Framework Laptop 13.5 Ryzen 7 7840U | |
| Lenovo ThinkPad Z13 Gen 2 | |
| Average AMD Ryzen 7 PRO 7840U | |
| Lenovo ThinkPad Z13 21D2CTO1WW | |
| Lenovo ThinkPad X1 Nano Gen 3 | |
| HP Dragonfly G4 | |
| Dell Latitude 13 7340 i5-1345U | |
| AIDA64 / FP32 Ray-Trace | |
| Framework Laptop 13.5 Ryzen 7 7840U | |
| Lenovo ThinkPad Z13 Gen 2 | |
| Average AMD Ryzen 7 PRO 7840U (17604 - 23889, n=5) | |
| Lenovo ThinkPad Z13 21D2CTO1WW | |
| Lenovo ThinkPad X1 Nano Gen 3 | |
| HP Dragonfly G4 | |
| Dell Latitude 13 7340 i5-1345U | |
| AIDA64 / FPU Julia | |
| Framework Laptop 13.5 Ryzen 7 7840U | |
| Lenovo ThinkPad Z13 Gen 2 | |
| Average AMD Ryzen 7 PRO 7840U (77578 - 100087, n=5) | |
| Lenovo ThinkPad Z13 21D2CTO1WW | |
| Lenovo ThinkPad X1 Nano Gen 3 | |
| HP Dragonfly G4 | |
| Dell Latitude 13 7340 i5-1345U | |
| AIDA64 / CPU SHA3 | |
| Framework Laptop 13.5 Ryzen 7 7840U | |
| Lenovo ThinkPad Z13 Gen 2 | |
| Average AMD Ryzen 7 PRO 7840U (3611 - 4394, n=5) | |
| Lenovo ThinkPad Z13 21D2CTO1WW | |
| Lenovo ThinkPad X1 Nano Gen 3 | |
| HP Dragonfly G4 | |
| Dell Latitude 13 7340 i5-1345U | |
| AIDA64 / CPU Queen | |
| Lenovo ThinkPad Z13 Gen 2 | |
| Framework Laptop 13.5 Ryzen 7 7840U | |
| Average AMD Ryzen 7 PRO 7840U (95020 - 110151, n=5) | |
| Lenovo ThinkPad X1 Nano Gen 3 | |
| Lenovo ThinkPad Z13 21D2CTO1WW | |
| HP Dragonfly G4 | |
| Dell Latitude 13 7340 i5-1345U | |
| AIDA64 / FPU SinJulia | |
| Framework Laptop 13.5 Ryzen 7 7840U | |
| Lenovo ThinkPad Z13 Gen 2 | |
| Average AMD Ryzen 7 PRO 7840U (12250 - 14151, n=5) | |
| Lenovo ThinkPad Z13 21D2CTO1WW | |
| Lenovo ThinkPad X1 Nano Gen 3 | |
| HP Dragonfly G4 | |
| Dell Latitude 13 7340 i5-1345U | |
| AIDA64 / FPU Mandel | |
| Framework Laptop 13.5 Ryzen 7 7840U | |
| Lenovo ThinkPad Z13 Gen 2 | |
| Average AMD Ryzen 7 PRO 7840U (41143 - 53280, n=5) | |
| Lenovo ThinkPad Z13 21D2CTO1WW | |
| Lenovo ThinkPad X1 Nano Gen 3 | |
| HP Dragonfly G4 | |
| Dell Latitude 13 7340 i5-1345U | |
| AIDA64 / CPU AES | |
| Framework Laptop 13.5 Ryzen 7 7840U | |
| Average AMD Ryzen 7 PRO 7840U (66300 - 142329, n=5) | |
| Lenovo ThinkPad Z13 Gen 2 | |
| Lenovo ThinkPad Z13 21D2CTO1WW | |
| Lenovo ThinkPad X1 Nano Gen 3 | |
| HP Dragonfly G4 | |
| Dell Latitude 13 7340 i5-1345U | |
| AIDA64 / CPU ZLib | |
| Framework Laptop 13.5 Ryzen 7 7840U | |
| Lenovo ThinkPad Z13 Gen 2 | |
| Average AMD Ryzen 7 PRO 7840U (777 - 1004, n=5) | |
| Lenovo ThinkPad X1 Nano Gen 3 | |
| Lenovo ThinkPad Z13 21D2CTO1WW | |
| HP Dragonfly G4 | |
| Dell Latitude 13 7340 i5-1345U | |
| AIDA64 / FP64 Ray-Trace | |
| Framework Laptop 13.5 Ryzen 7 7840U | |
| Lenovo ThinkPad Z13 Gen 2 | |
| Average AMD Ryzen 7 PRO 7840U (9494 - 12540, n=5) | |
| Lenovo ThinkPad Z13 21D2CTO1WW | |
| Lenovo ThinkPad X1 Nano Gen 3 | |
| HP Dragonfly G4 | |
| Dell Latitude 13 7340 i5-1345U | |
| AIDA64 / CPU PhotoWorxx | |
| Lenovo ThinkPad X1 Nano Gen 3 | |
| Lenovo ThinkPad Z13 Gen 2 | |
| HP Dragonfly G4 | |
| Average AMD Ryzen 7 PRO 7840U (33564 - 38442, n=5) | |
| Dell Latitude 13 7340 i5-1345U | |
| Framework Laptop 13.5 Ryzen 7 7840U | |
| Lenovo ThinkPad Z13 21D2CTO1WW | |
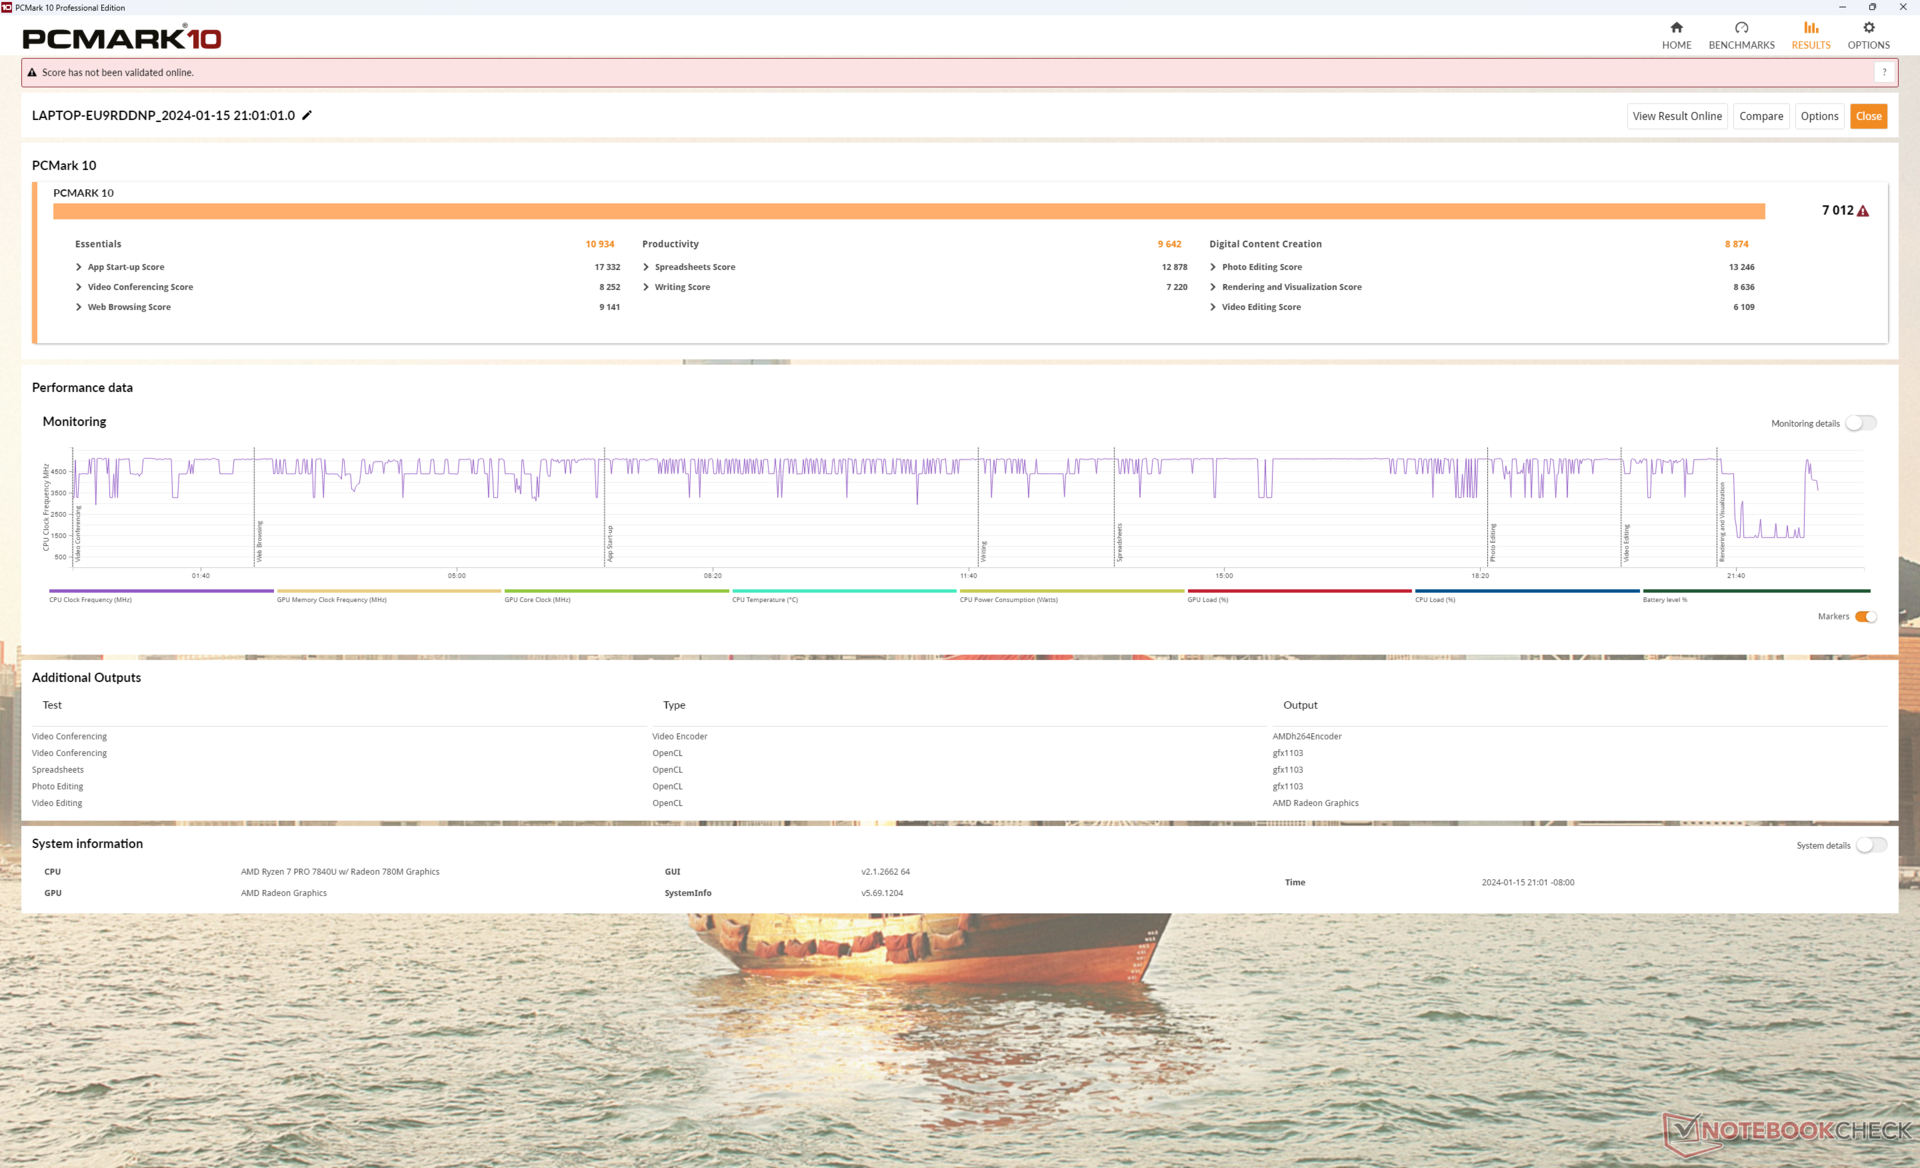
System Performance
PCMark scores are noticeably higher than on last year's Ryzen 5-powered ThinkPad Z13 G1 especially in regards to the Digital Content Creation subtest where GPU performance matters most.
CrossMark: Overall | Productivity | Creativity | Responsiveness
WebXPRT 3: Overall
WebXPRT 4: Overall
Mozilla Kraken 1.1: Total
| PCMark 10 / Score | |
| Framework Laptop 13.5 Ryzen 7 7840U | |
| Lenovo ThinkPad Z13 Gen 2 | |
| Average AMD Ryzen 7 PRO 7840U, AMD Radeon 780M (6541 - 7012, n=5) | |
| Lenovo ThinkPad X1 Nano Gen 3 | |
| HP Dragonfly G4 | |
| Lenovo ThinkPad Z13 21D2CTO1WW | |
| Dell Latitude 13 7340 i5-1345U | |
| PCMark 10 / Essentials | |
| Framework Laptop 13.5 Ryzen 7 7840U | |
| Lenovo ThinkPad Z13 Gen 2 | |
| HP Dragonfly G4 | |
| Lenovo ThinkPad X1 Nano Gen 3 | |
| Average AMD Ryzen 7 PRO 7840U, AMD Radeon 780M (10055 - 10934, n=5) | |
| Dell Latitude 13 7340 i5-1345U | |
| Lenovo ThinkPad Z13 21D2CTO1WW | |
| PCMark 10 / Productivity | |
| Framework Laptop 13.5 Ryzen 7 7840U | |
| Lenovo ThinkPad Z13 Gen 2 | |
| Average AMD Ryzen 7 PRO 7840U, AMD Radeon 780M (8921 - 9933, n=5) | |
| Lenovo ThinkPad Z13 21D2CTO1WW | |
| Lenovo ThinkPad X1 Nano Gen 3 | |
| HP Dragonfly G4 | |
| Dell Latitude 13 7340 i5-1345U | |
| PCMark 10 / Digital Content Creation | |
| Framework Laptop 13.5 Ryzen 7 7840U | |
| Lenovo ThinkPad Z13 Gen 2 | |
| Average AMD Ryzen 7 PRO 7840U, AMD Radeon 780M (7806 - 8874, n=5) | |
| Lenovo ThinkPad X1 Nano Gen 3 | |
| HP Dragonfly G4 | |
| Lenovo ThinkPad Z13 21D2CTO1WW | |
| Dell Latitude 13 7340 i5-1345U | |
| CrossMark / Overall | |
| Lenovo ThinkPad X1 Nano Gen 3 | |
| Framework Laptop 13.5 Ryzen 7 7840U | |
| HP Dragonfly G4 | |
| Average AMD Ryzen 7 PRO 7840U, AMD Radeon 780M (1533 - 1669, n=5) | |
| Lenovo ThinkPad Z13 Gen 2 | |
| Dell Latitude 13 7340 i5-1345U | |
| Lenovo ThinkPad Z13 21D2CTO1WW | |
| CrossMark / Productivity | |
| Lenovo ThinkPad X1 Nano Gen 3 | |
| Framework Laptop 13.5 Ryzen 7 7840U | |
| HP Dragonfly G4 | |
| Average AMD Ryzen 7 PRO 7840U, AMD Radeon 780M (1461 - 1624, n=5) | |
| Dell Latitude 13 7340 i5-1345U | |
| Lenovo ThinkPad Z13 Gen 2 | |
| Lenovo ThinkPad Z13 21D2CTO1WW | |
| CrossMark / Creativity | |
| Lenovo ThinkPad X1 Nano Gen 3 | |
| Framework Laptop 13.5 Ryzen 7 7840U | |
| Lenovo ThinkPad Z13 Gen 2 | |
| Average AMD Ryzen 7 PRO 7840U, AMD Radeon 780M (1697 - 1824, n=5) | |
| HP Dragonfly G4 | |
| Dell Latitude 13 7340 i5-1345U | |
| Lenovo ThinkPad Z13 21D2CTO1WW | |
| CrossMark / Responsiveness | |
| Lenovo ThinkPad X1 Nano Gen 3 | |
| Framework Laptop 13.5 Ryzen 7 7840U | |
| HP Dragonfly G4 | |
| Average AMD Ryzen 7 PRO 7840U, AMD Radeon 780M (1049 - 1499, n=5) | |
| Dell Latitude 13 7340 i5-1345U | |
| Lenovo ThinkPad Z13 21D2CTO1WW | |
| Lenovo ThinkPad Z13 Gen 2 | |
| WebXPRT 3 / Overall | |
| Framework Laptop 13.5 Ryzen 7 7840U | |
| Lenovo ThinkPad X1 Nano Gen 3 | |
| HP Dragonfly G4 | |
| Lenovo ThinkPad Z13 Gen 2 | |
| Average AMD Ryzen 7 PRO 7840U, AMD Radeon 780M (259 - 317, n=5) | |
| Lenovo ThinkPad Z13 21D2CTO1WW | |
| WebXPRT 4 / Overall | |
| Lenovo ThinkPad X1 Nano Gen 3 | |
| HP Dragonfly G4 | |
| Framework Laptop 13.5 Ryzen 7 7840U | |
| Average AMD Ryzen 7 PRO 7840U, AMD Radeon 780M (234 - 245, n=2) | |
| Lenovo ThinkPad Z13 Gen 2 | |
| Lenovo ThinkPad Z13 21D2CTO1WW | |
| Mozilla Kraken 1.1 / Total | |
| Lenovo ThinkPad Z13 21D2CTO1WW | |
| Lenovo ThinkPad Z13 Gen 2 | |
| Average AMD Ryzen 7 PRO 7840U, AMD Radeon 780M (523 - 571, n=5) | |
| Dell Latitude 13 7340 i5-1345U | |
| Framework Laptop 13.5 Ryzen 7 7840U | |
| Lenovo ThinkPad X1 Nano Gen 3 | |
| HP Dragonfly G4 | |
* ... smaller is better
| PCMark 10 Score | 7012 points | |
Help | ||
| AIDA64 / Memory Copy | |
| Lenovo ThinkPad X1 Nano Gen 3 | |
| Average AMD Ryzen 7 PRO 7840U (66487 - 67856, n=5) | |
| Lenovo ThinkPad Z13 Gen 2 | |
| Framework Laptop 13.5 Ryzen 7 7840U | |
| HP Dragonfly G4 | |
| Dell Latitude 13 7340 i5-1345U | |
| Lenovo ThinkPad Z13 21D2CTO1WW | |
| AIDA64 / Memory Read | |
| Lenovo ThinkPad X1 Nano Gen 3 | |
| Framework Laptop 13.5 Ryzen 7 7840U | |
| Lenovo ThinkPad Z13 Gen 2 | |
| Average AMD Ryzen 7 PRO 7840U (47725 - 50543, n=5) | |
| HP Dragonfly G4 | |
| Dell Latitude 13 7340 i5-1345U | |
| Lenovo ThinkPad Z13 21D2CTO1WW | |
| AIDA64 / Memory Write | |
| Lenovo ThinkPad X1 Nano Gen 3 | |
| Average AMD Ryzen 7 PRO 7840U (89477 - 94965, n=5) | |
| Lenovo ThinkPad Z13 Gen 2 | |
| Framework Laptop 13.5 Ryzen 7 7840U | |
| Dell Latitude 13 7340 i5-1345U | |
| HP Dragonfly G4 | |
| Lenovo ThinkPad Z13 21D2CTO1WW | |
| AIDA64 / Memory Latency | |
| Lenovo ThinkPad Z13 Gen 2 | |
| Average AMD Ryzen 7 PRO 7840U (128.6 - 138.9, n=5) | |
| Lenovo ThinkPad Z13 21D2CTO1WW | |
| Dell Latitude 13 7340 i5-1345U | |
| Lenovo ThinkPad X1 Nano Gen 3 | |
| HP Dragonfly G4 | |
| Framework Laptop 13.5 Ryzen 7 7840U | |
* ... smaller is better
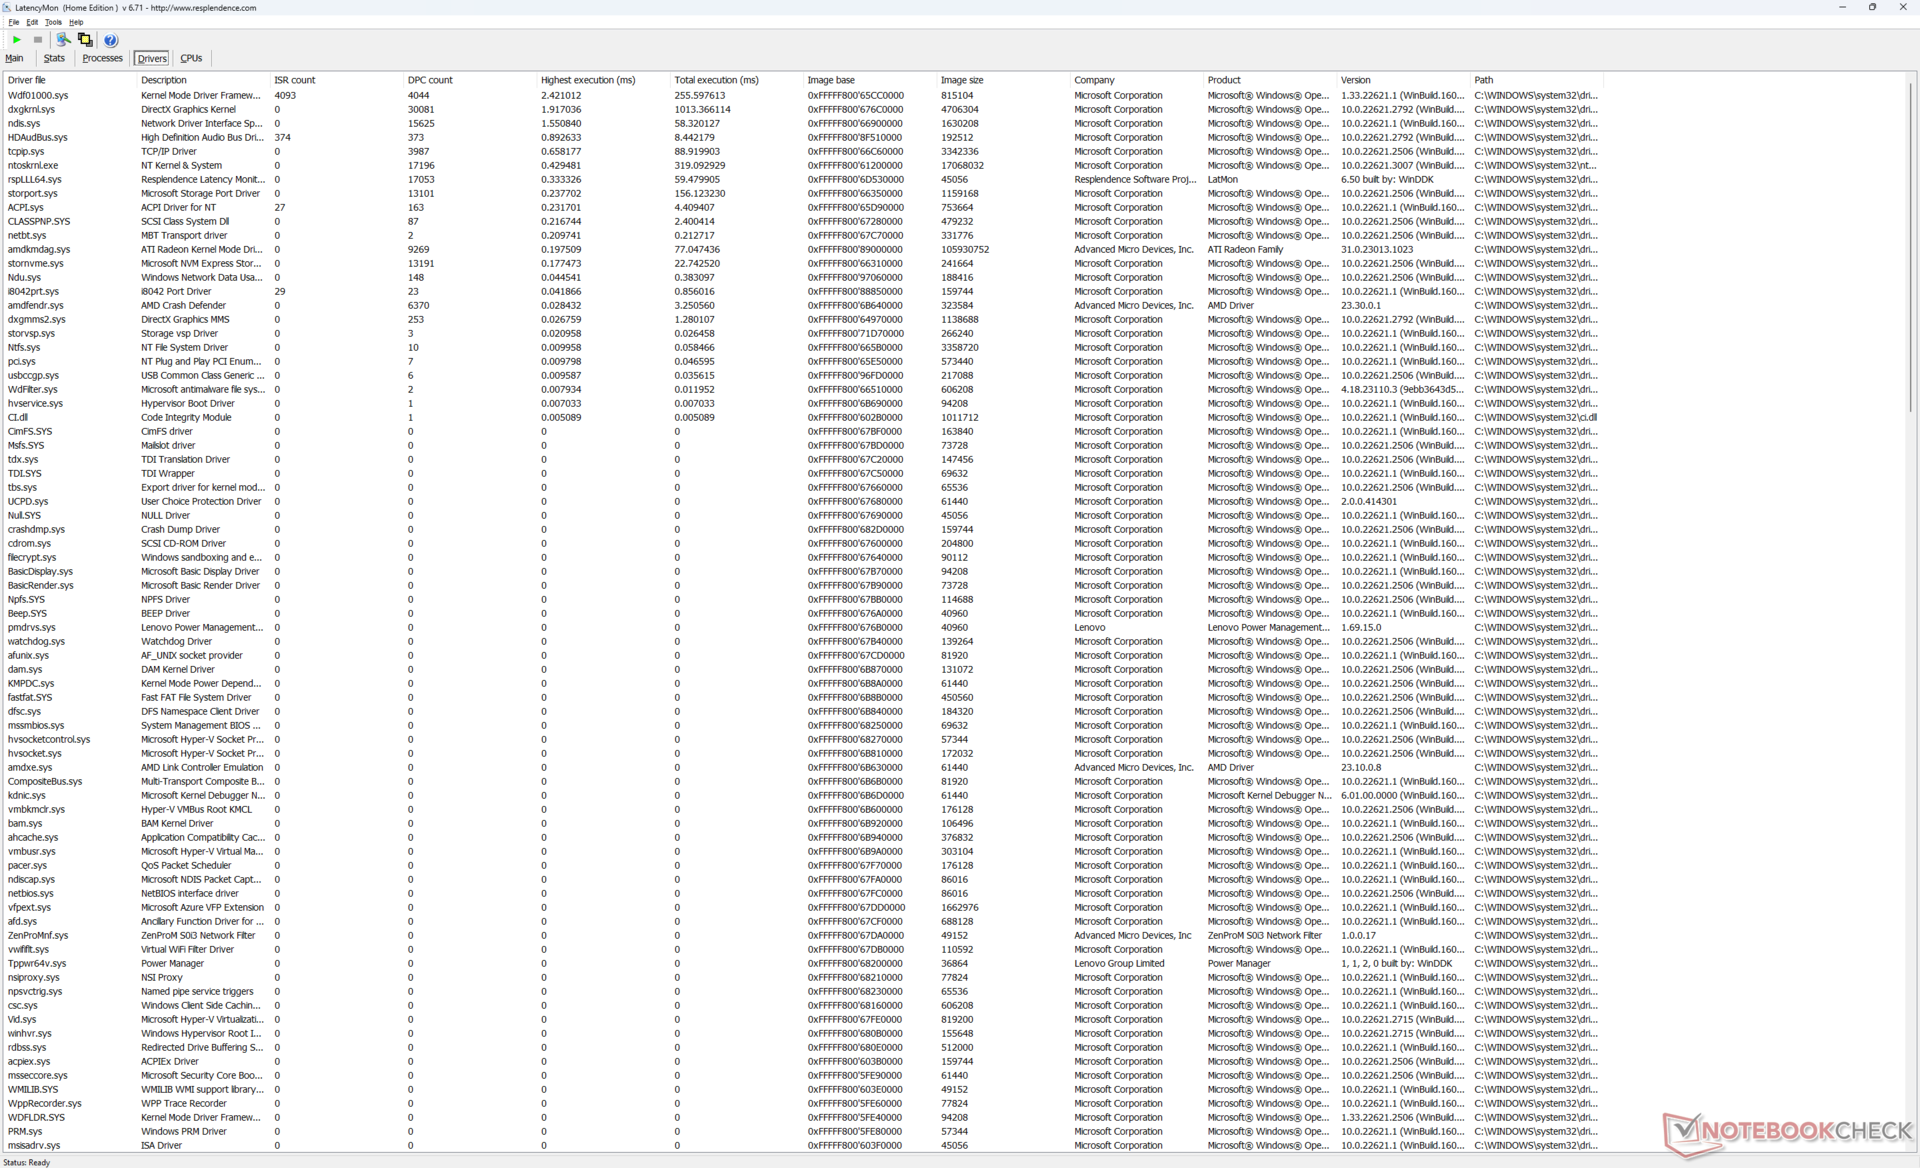
DPC Latency
LatencyMon reveals both DPC issues and dropped frames when playing 4K video content at 60 FPS. The latter is particularly disappointing as the dropped frames would occur in regular intervals to suggest an underlying driver issue. Most Intel-based laptops would return zero dropped frames in comparison when running this same test.

| DPC Latencies / LatencyMon - interrupt to process latency (max), Web, Youtube, Prime95 | |
| Lenovo ThinkPad X1 Nano Gen 3 | |
| Lenovo ThinkPad Z13 Gen 2 | |
| Dell Latitude 13 7340 i5-1345U | |
| HP Dragonfly G4 | |
| Framework Laptop 13.5 Ryzen 7 7840U | |
| Lenovo ThinkPad Z13 21D2CTO1WW | |
* ... smaller is better
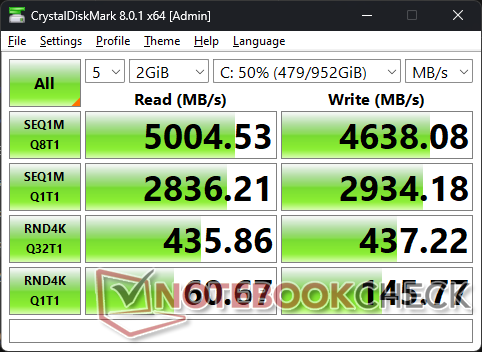
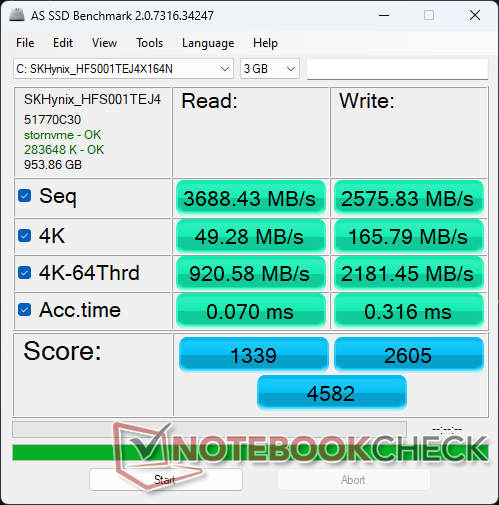
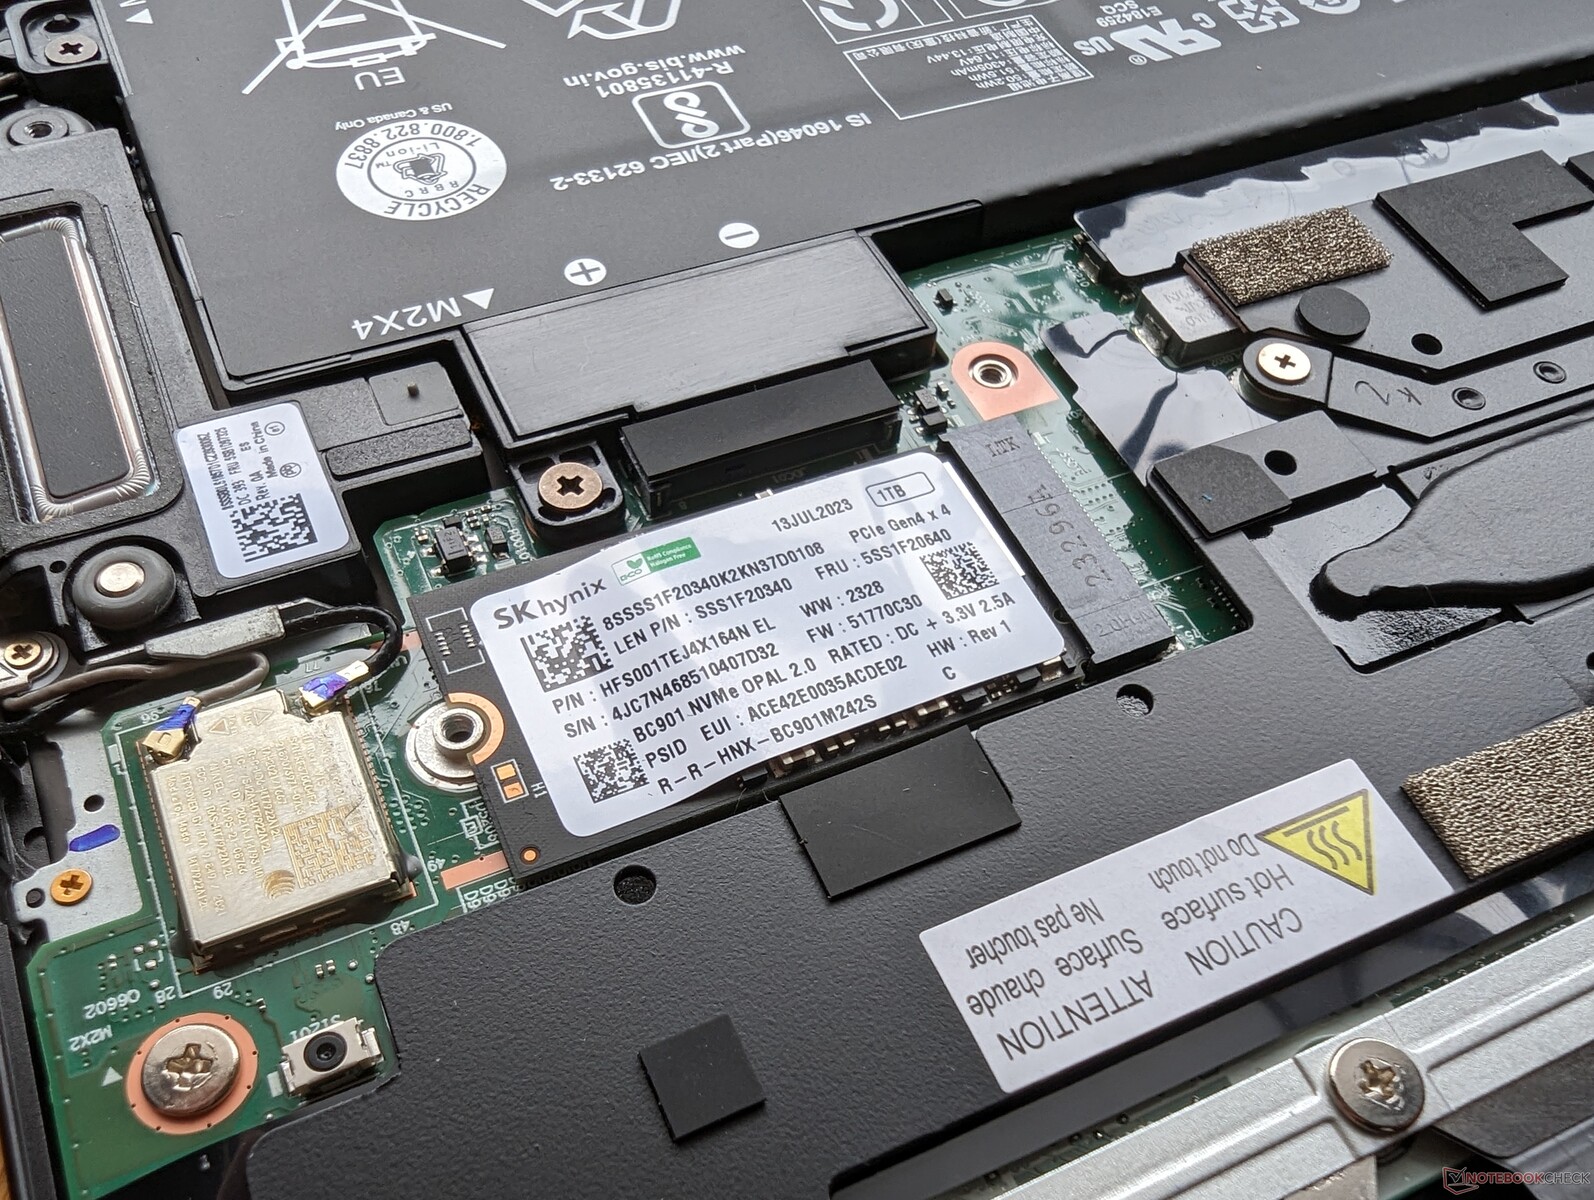
Storage Devices
Our unit ships with a midrange SK Hynix HFS001TEJ4X164N PCIe4 x4 NVMe SSD. Maximum transfer rates are steady at about 4600 MB/s compared to >7000 MB/s on the larger Samsung PM9A1 series. The drive exhibits no throttling behavior even when stressed for several minutes.

| Drive Performance rating - Percent | |
| Framework Laptop 13.5 Ryzen 7 7840U -11! | |
| HP Dragonfly G4 | |
| Lenovo ThinkPad Z13 Gen 2 | |
| Lenovo ThinkPad X1 Nano Gen 3 | |
| Lenovo ThinkPad Z13 21D2CTO1WW | |
| Dell Latitude 13 7340 i5-1345U | |
* ... smaller is better
Disk Throttling: DiskSpd Read Loop, Queue Depth 8
GPU Performance
The Radeon 780M is a significant leap forward by about 60 to 70 percent when compared to the lesser Radeon 660M or 740M option. It might not be the fastest iGPU solution anymore, but it still trounces any alternative up to late 2023. Popular or demanding titles like Baldur's Gate 3 or Tiny Tina's Wonderlands play well at 1080p with most settings on Low.
Note that there are bigger-than-expected performance differences between Balanced mode and Performance mode as shown by our 3DMark 11 results table below. You'll want to double-check that you're on Performance mode when running demanding tasks to fully exploit the CPU.
| Power Profile | Physics Score | Graphics Score | Combined Score |
| Performance Mode | 18262 | 12223 | 7186 |
| Balanced Mode | 13081 (-28%) | 8298 (-32%) | 5422 (-25%) |
| Battery Power | 17161 (6-%) | 11257 (-8%) | 5254 (-27%) |
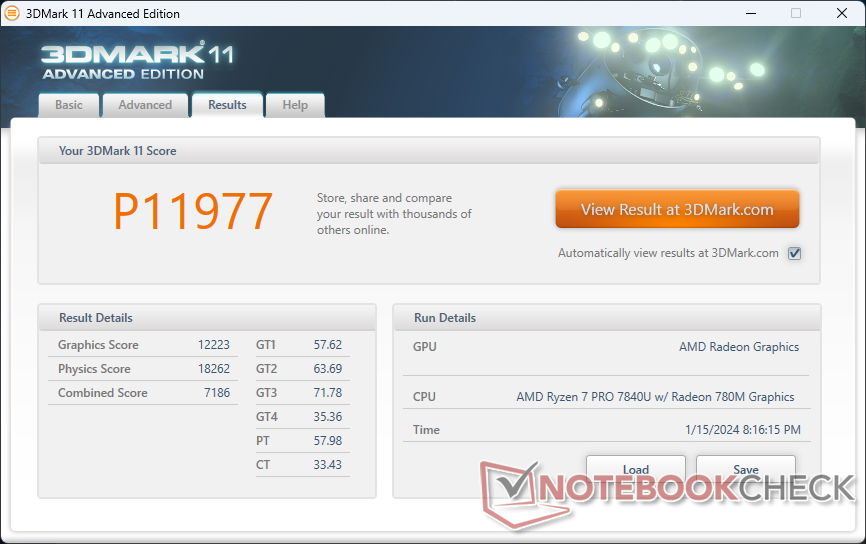

| 3DMark 11 Performance | 11977 points | |
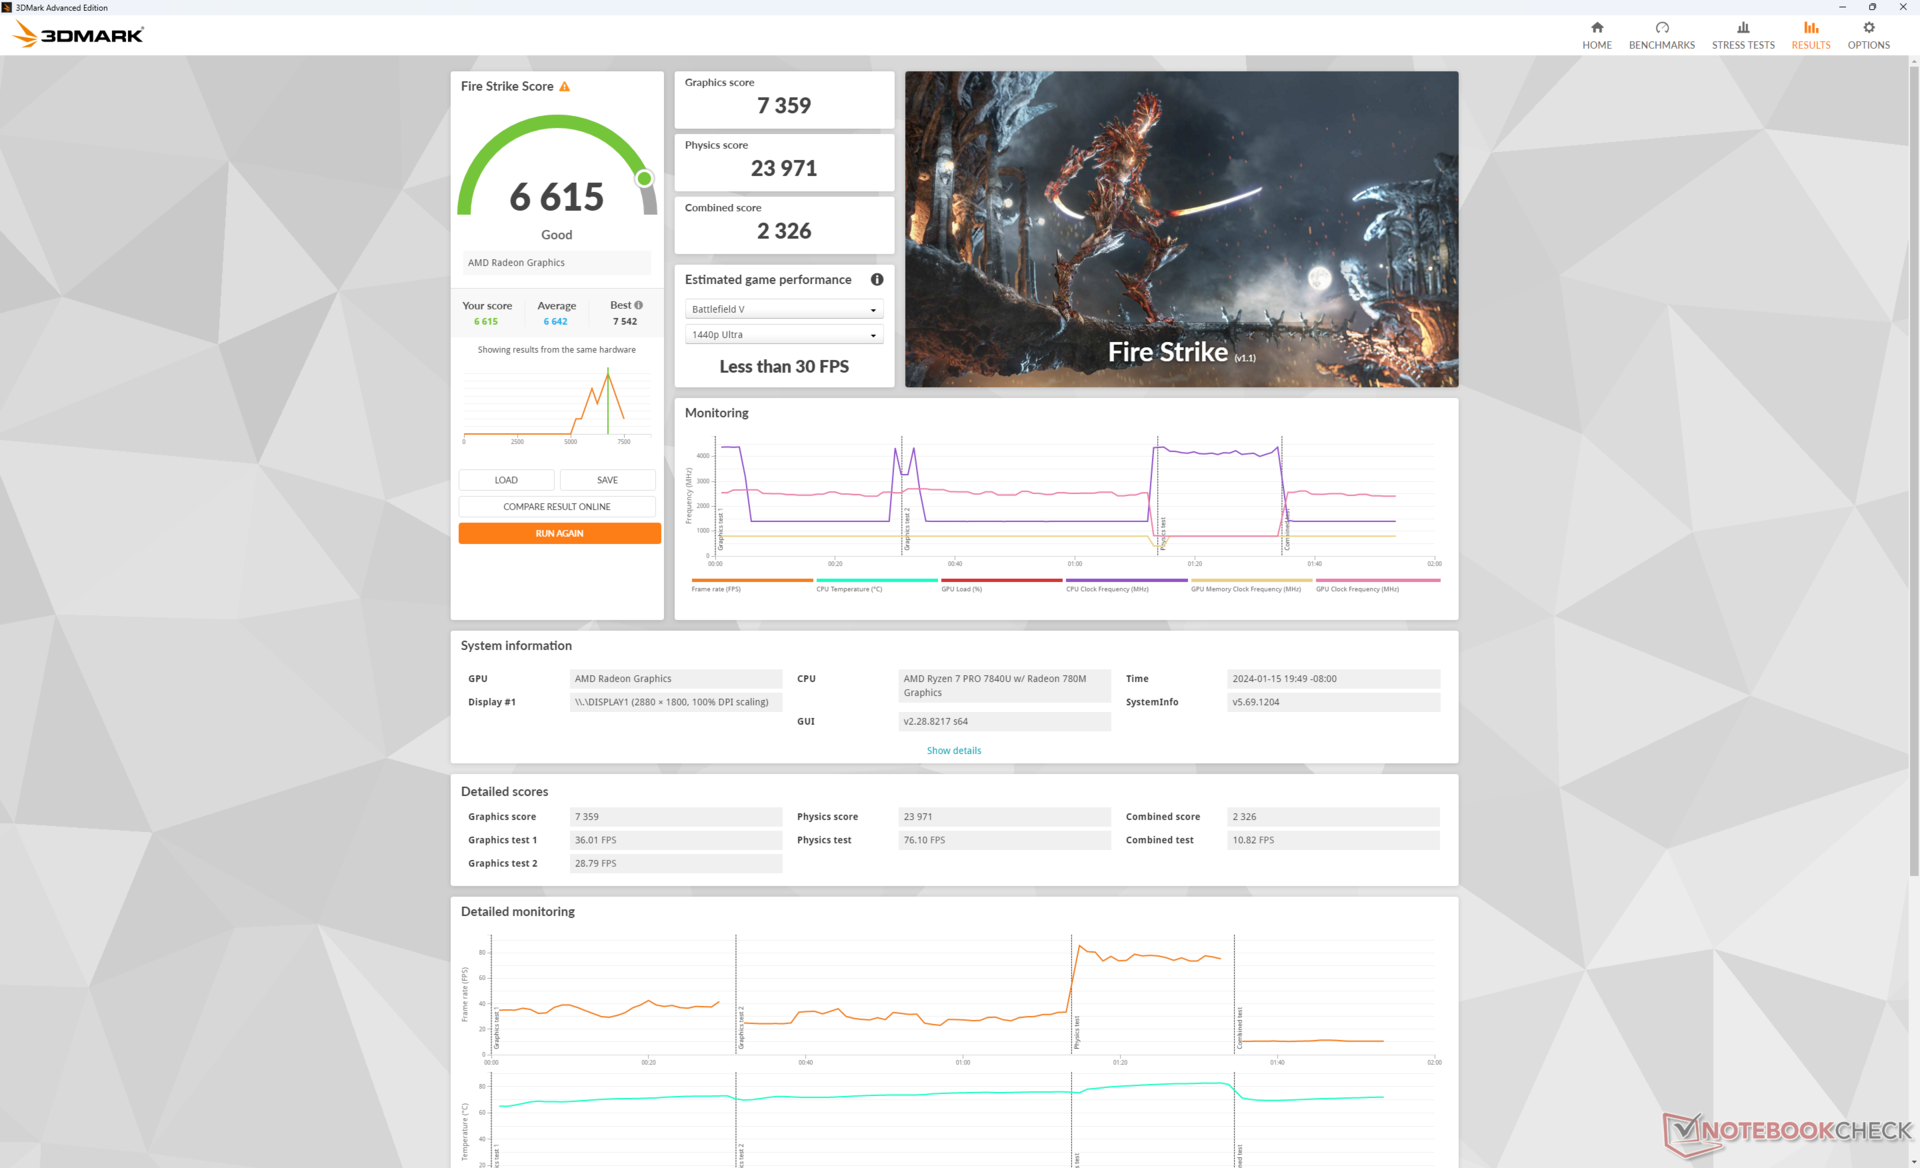
| 3DMark Fire Strike Score | 6615 points | |
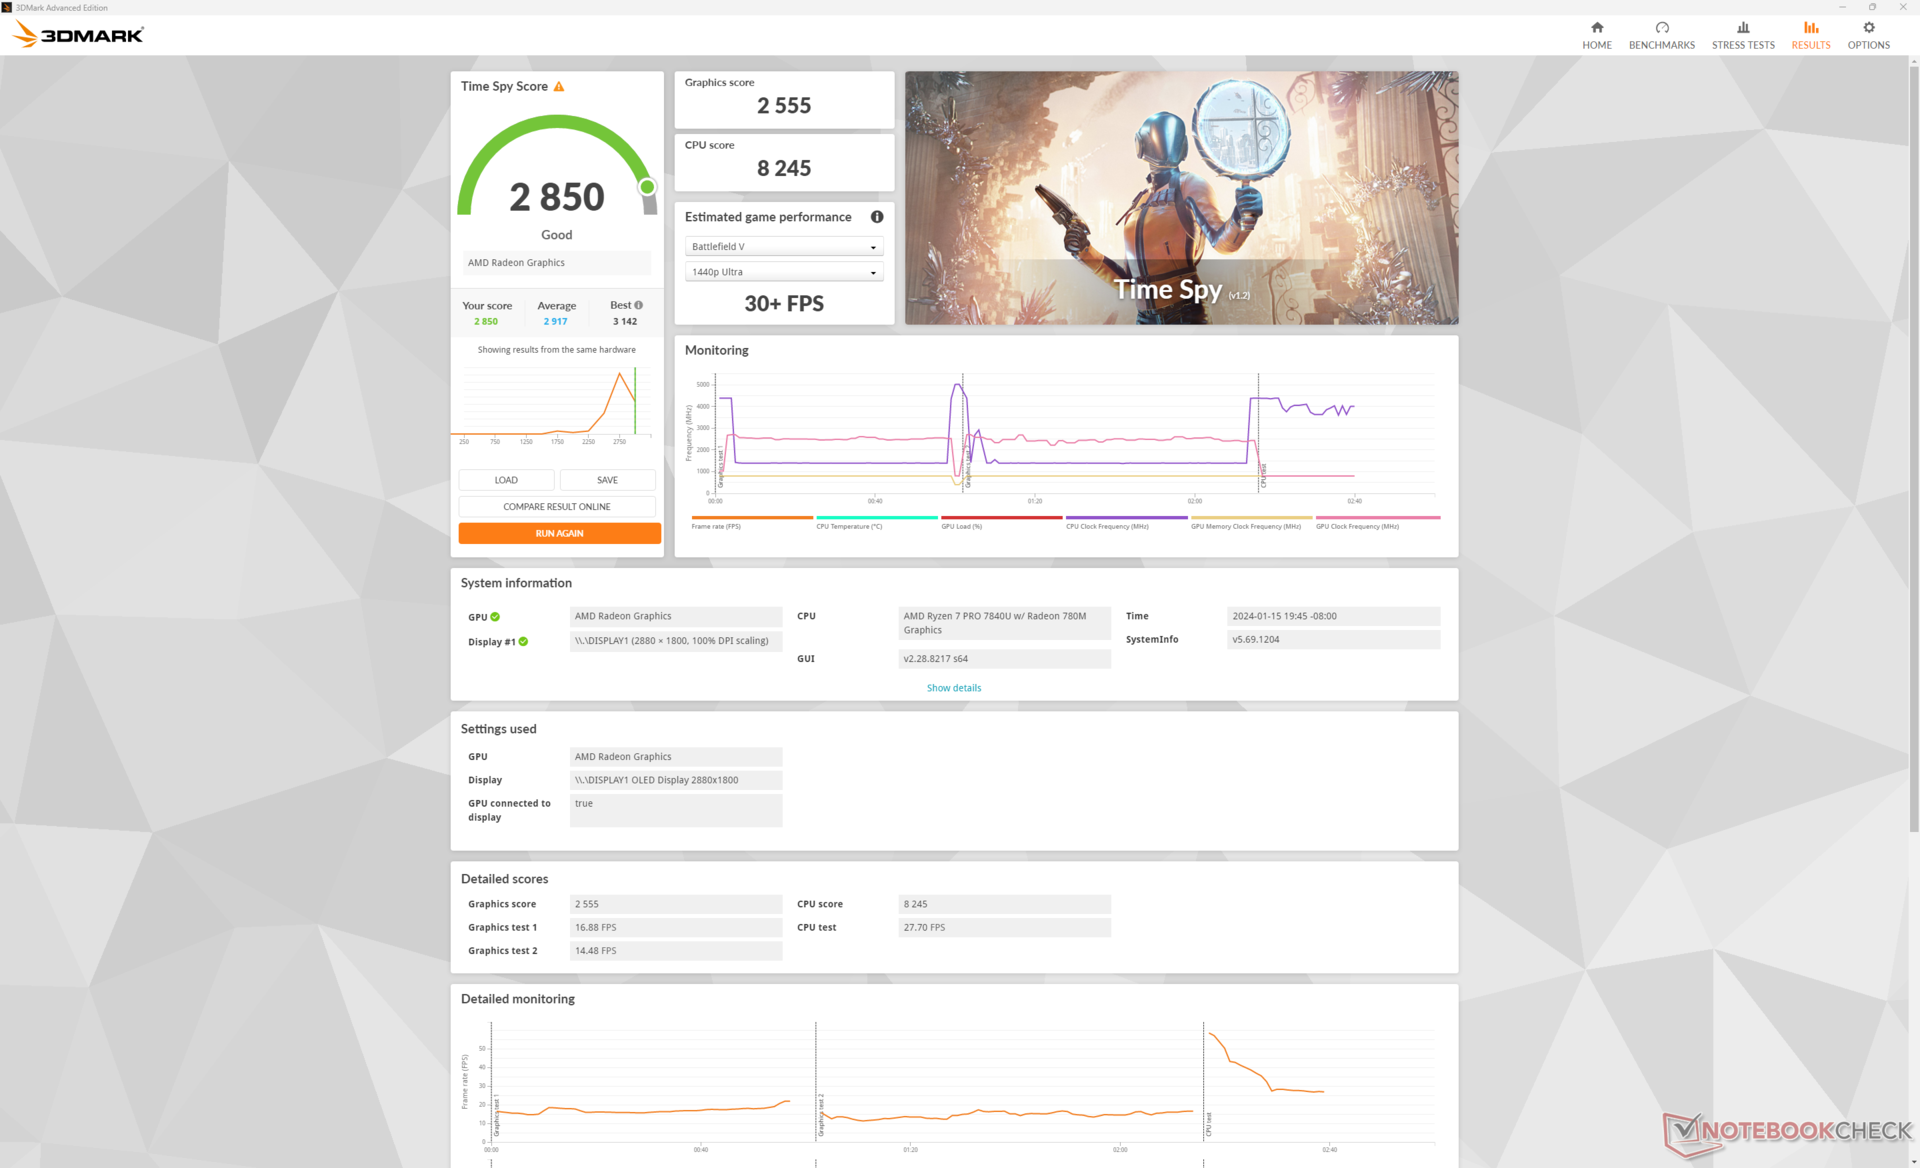
| 3DMark Time Spy Score | 2850 points | |
Help | ||
* ... smaller is better
| Cyberpunk 2077 | |
| 1280x720 Low Preset (FSR off) | |
| Average AMD Radeon 780M (41.8 - 80.6, n=38) | |
| Lenovo ThinkPad Z13 Gen 2 | |
| 1920x1080 Low Preset (FSR off) | |
| Average AMD Radeon 780M (23.9 - 52.1, n=63) | |
| Lenovo ThinkPad Z13 Gen 2 | |
| 1920x1080 Medium Preset (FSR off) | |
| Average AMD Radeon 780M (16.3 - 37.5, n=59) | |
| Lenovo ThinkPad Z13 Gen 2 | |
| 1920x1080 High Preset (FSR off) | |
| Average AMD Radeon 780M (13.8 - 29.6, n=59) | |
| Lenovo ThinkPad Z13 Gen 2 | |
| 1920x1080 Ultra Preset (FSR off) | |
| Average AMD Radeon 780M (11.5 - 26.3, n=54) | |
| Lenovo ThinkPad Z13 Gen 2 | |
| Baldur's Gate 3 | |
| 1280x720 Low Preset AA:SM | |
| Average AMD Radeon 780M (30.7 - 67.6, n=34) | |
| Lenovo ThinkPad Z13 Gen 2 | |
| 1920x1080 Low Preset AA:SM | |
| Lenovo ThinkPad Z13 Gen 2 | |
| Average AMD Radeon 780M (20.2 - 44.1, n=47) | |
| 1920x1080 Medium Preset AA:T | |
| Lenovo ThinkPad Z13 Gen 2 | |
| Average AMD Radeon 780M (15.7 - 36.8, n=50) | |
| 1920x1080 High Preset AA:T | |
| Lenovo ThinkPad Z13 Gen 2 | |
| Average AMD Radeon 780M (13.3 - 30.6, n=50) | |
| 1920x1080 Ultra Preset AA:T | |
| Lenovo ThinkPad Z13 Gen 2 | |
| Average AMD Radeon 780M (12.8 - 29.6, n=49) | |
Witcher 3 FPS Chart
| low | med. | high | ultra | |
|---|---|---|---|---|
| The Witcher 3 (2015) | 116.7 | 45.8 | 28.6 | |
| Dota 2 Reborn (2015) | 113.7 | 96.7 | 83.1 | 72.2 |
| Final Fantasy XV Benchmark (2018) | 69.8 | 35.3 | 26.5 | |
| X-Plane 11.11 (2018) | 43.1 | 33 | 27.1 | |
| Far Cry 5 (2018) | 69 | 37 | 34 | 34 |
| Strange Brigade (2018) | 141.9 | 61.2 | 50.4 | 43 |
| Tiny Tina's Wonderlands (2022) | 64.7 | 47.1 | 31.5 | 25.2 |
| F1 22 (2022) | 84.2 | 74.7 | 53.6 | 14.6 |
| Baldur's Gate 3 (2023) | 39.1 | 31.7 | 26.1 | 25.7 |
| Cyberpunk 2077 (2023) | 38 | 29.4 | 23.5 | 20.3 |
Emissions
System Noise
There is a significant difference in fan noise between the Balanced and Performance power profiles. Running Witcher 3 on Balanced mode, for example, would result in a fan noise of just 37 dB(A) vs. 44.8 dB(A) if on Performance mode. This correlates with the wider-than-expected performance differences between the two power profiles as noted above. Otherwise, the system is mostly quiet at 28.3 dB(A) against a silent background of 25.1 dB(A) when running undemanding loads like browsers or videos.
Noise level
| Idle |
| 25.8 / 25.8 / 28.3 dB(A) |
| Load |
| 28.3 / 44.8 dB(A) |
 | ||
30 dB silent 40 dB(A) audible 50 dB(A) loud |
||
min: | ||
| Lenovo ThinkPad Z13 Gen 2 Radeon 780M, R7 PRO 7840U, SK hynix BC901 HFS001TEJ4X164N | HP Dragonfly G4 Iris Xe G7 96EUs, i7-1365U, Micron 3400 MTFDKBA512TFH 512GB | Dell Latitude 13 7340 i5-1345U Iris Xe G7 80EUs, i5-1345U, Kioxia BG5 KBG50ZNS512G | Lenovo ThinkPad Z13 21D2CTO1WW Radeon 660M, R5 PRO 6650U, Lenovo UMIS AM630 RPJTJ512MGE1QDQ | Lenovo ThinkPad X1 Nano Gen 3 Iris Xe G7 96EUs, i7-1360P, Lenovo UMIS AM6A0 RPJTJ512MKP1QDQ | Framework Laptop 13.5 Ryzen 7 7840U Radeon 780M, R7 7840U, WD PC SN740 512GB SDDPNQD-512G | |
|---|---|---|---|---|---|---|
| Noise | 12% | 2% | 7% | 10% | 1% | |
| off / environment * (dB) | 25.1 | 23.3 7% | 25.02 -0% | 23.71 6% | 22.9 9% | 22.6 10% |
| Idle Minimum * (dB) | 25.8 | 23.5 9% | 25.02 3% | 23.71 8% | 23 11% | 22.6 12% |
| Idle Average * (dB) | 25.8 | 23.5 9% | 25.02 3% | 23.71 8% | 23 11% | 22.6 12% |
| Idle Maximum * (dB) | 28.3 | 26.8 5% | 25.02 12% | 23.71 16% | 23 19% | 24.2 14% |
| Load Average * (dB) | 28.3 | 27.2 4% | 35.07 -24% | 32.35 -14% | 32.8 -16% | 35.8 -27% |
| Witcher 3 ultra * (dB) | 44.8 | 32.7 27% | 38.8 13% | 36.9 18% | 46.5 -4% | |
| Load Maximum * (dB) | 44.8 | 35 22% | 38.2 15% | 39.53 12% | 36.9 18% | 48.9 -9% |
* ... smaller is better
Temperature
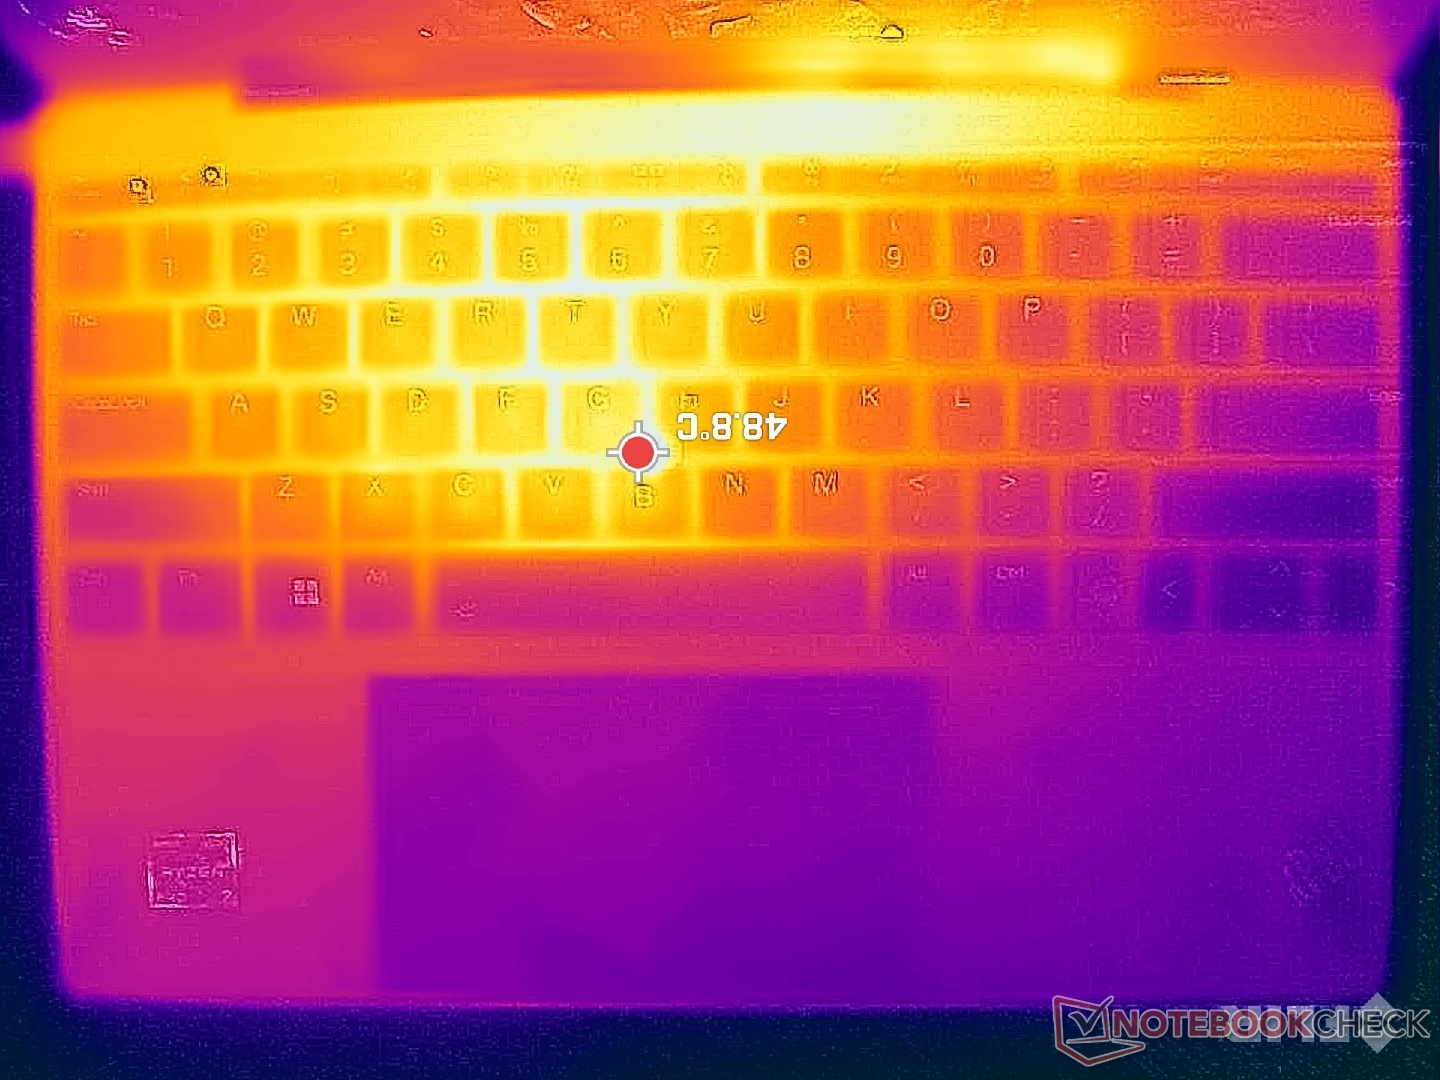
Surface temperatures can be very warm when running demanding loads due to the compact design and metal chassis. Hot spots can reach over 46 C and 48 C on the keyboard center and underside, respectively, compared to just 39 C to 41 C on the HP Dragonfly G4 with the slower Core i7-1365U.
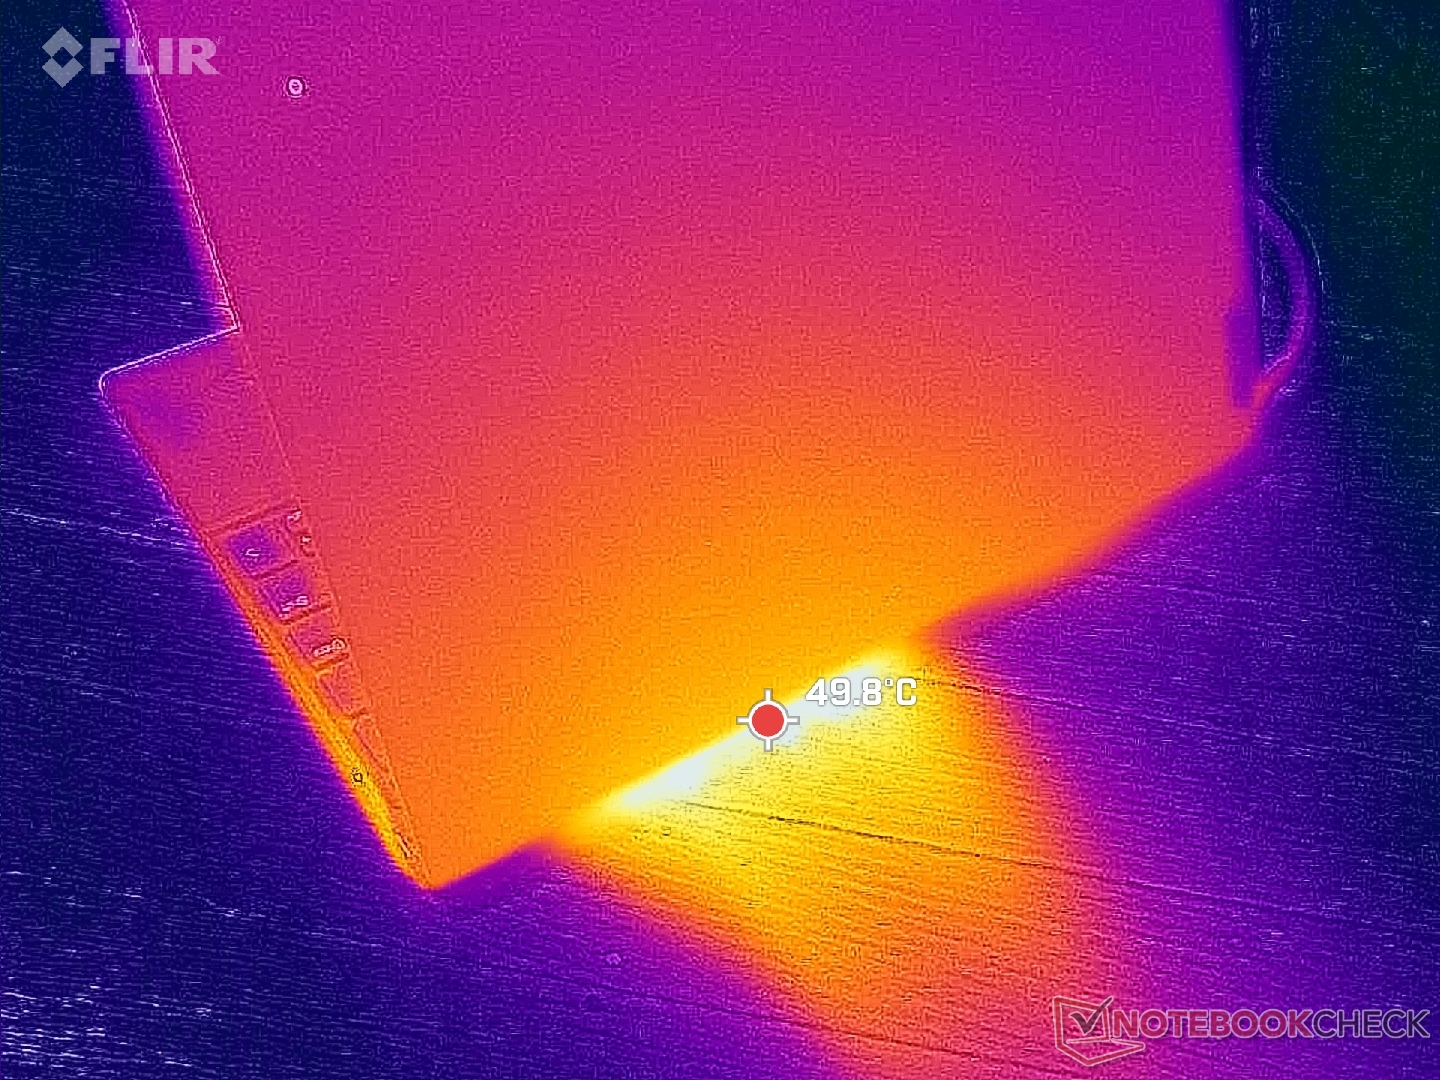
(-) The maximum temperature on the upper side is 46.2 °C / 115 F, compared to the average of 35.9 °C / 97 F, ranging from 21.4 to 59 °C for the class Subnotebook.
(-) The bottom heats up to a maximum of 48.4 °C / 119 F, compared to the average of 39.2 °C / 103 F
(+) In idle usage, the average temperature for the upper side is 22.1 °C / 72 F, compared to the device average of 30.8 °C / 87 F.
(+) The palmrests and touchpad are cooler than skin temperature with a maximum of 29.2 °C / 84.6 F and are therefore cool to the touch.
(±) The average temperature of the palmrest area of similar devices was 28.2 °C / 82.8 F (-1 °C / -1.8 F).


| Lenovo ThinkPad Z13 Gen 2 AMD Ryzen 7 PRO 7840U, AMD Radeon 780M | HP Dragonfly G4 Intel Core i7-1365U, Intel Iris Xe Graphics G7 96EUs | Dell Latitude 13 7340 i5-1345U Intel Core i5-1345U, Intel Iris Xe Graphics G7 80EUs | Lenovo ThinkPad Z13 21D2CTO1WW AMD Ryzen 5 PRO 6650U, AMD Radeon 660M | Lenovo ThinkPad X1 Nano Gen 3 Intel Core i7-1360P, Intel Iris Xe Graphics G7 96EUs | Framework Laptop 13.5 Ryzen 7 7840U AMD Ryzen 7 7840U, AMD Radeon 780M | |
|---|---|---|---|---|---|---|
| Heat | -4% | 0% | -15% | -1% | -11% | |
| Maximum Upper Side * (°C) | 46.2 | 38.6 16% | 34.3 26% | 44.9 3% | 44 5% | 42 9% |
| Maximum Bottom * (°C) | 48.4 | 40.4 17% | 37.6 22% | 44.3 8% | 43.2 11% | 47.4 2% |
| Idle Upper Side * (°C) | 23.2 | 28.2 -22% | 28.4 -22% | 31.4 -35% | 25.6 -10% | 28.8 -24% |
| Idle Bottom * (°C) | 23 | 29 -26% | 28.8 -25% | 31.5 -37% | 25.6 -11% | 29.6 -29% |
* ... smaller is better
Stress Test
When under Prime95 stress, the CPU would boost to 4 GHz and 51 W before quickly falling and stabilizing at 3.3 GHz, 35 W, and 86 C. This is warmer than on most other subnotebooks such as the Dragonfly G4 where core temperature would stabilize at 76 C when running the same test.
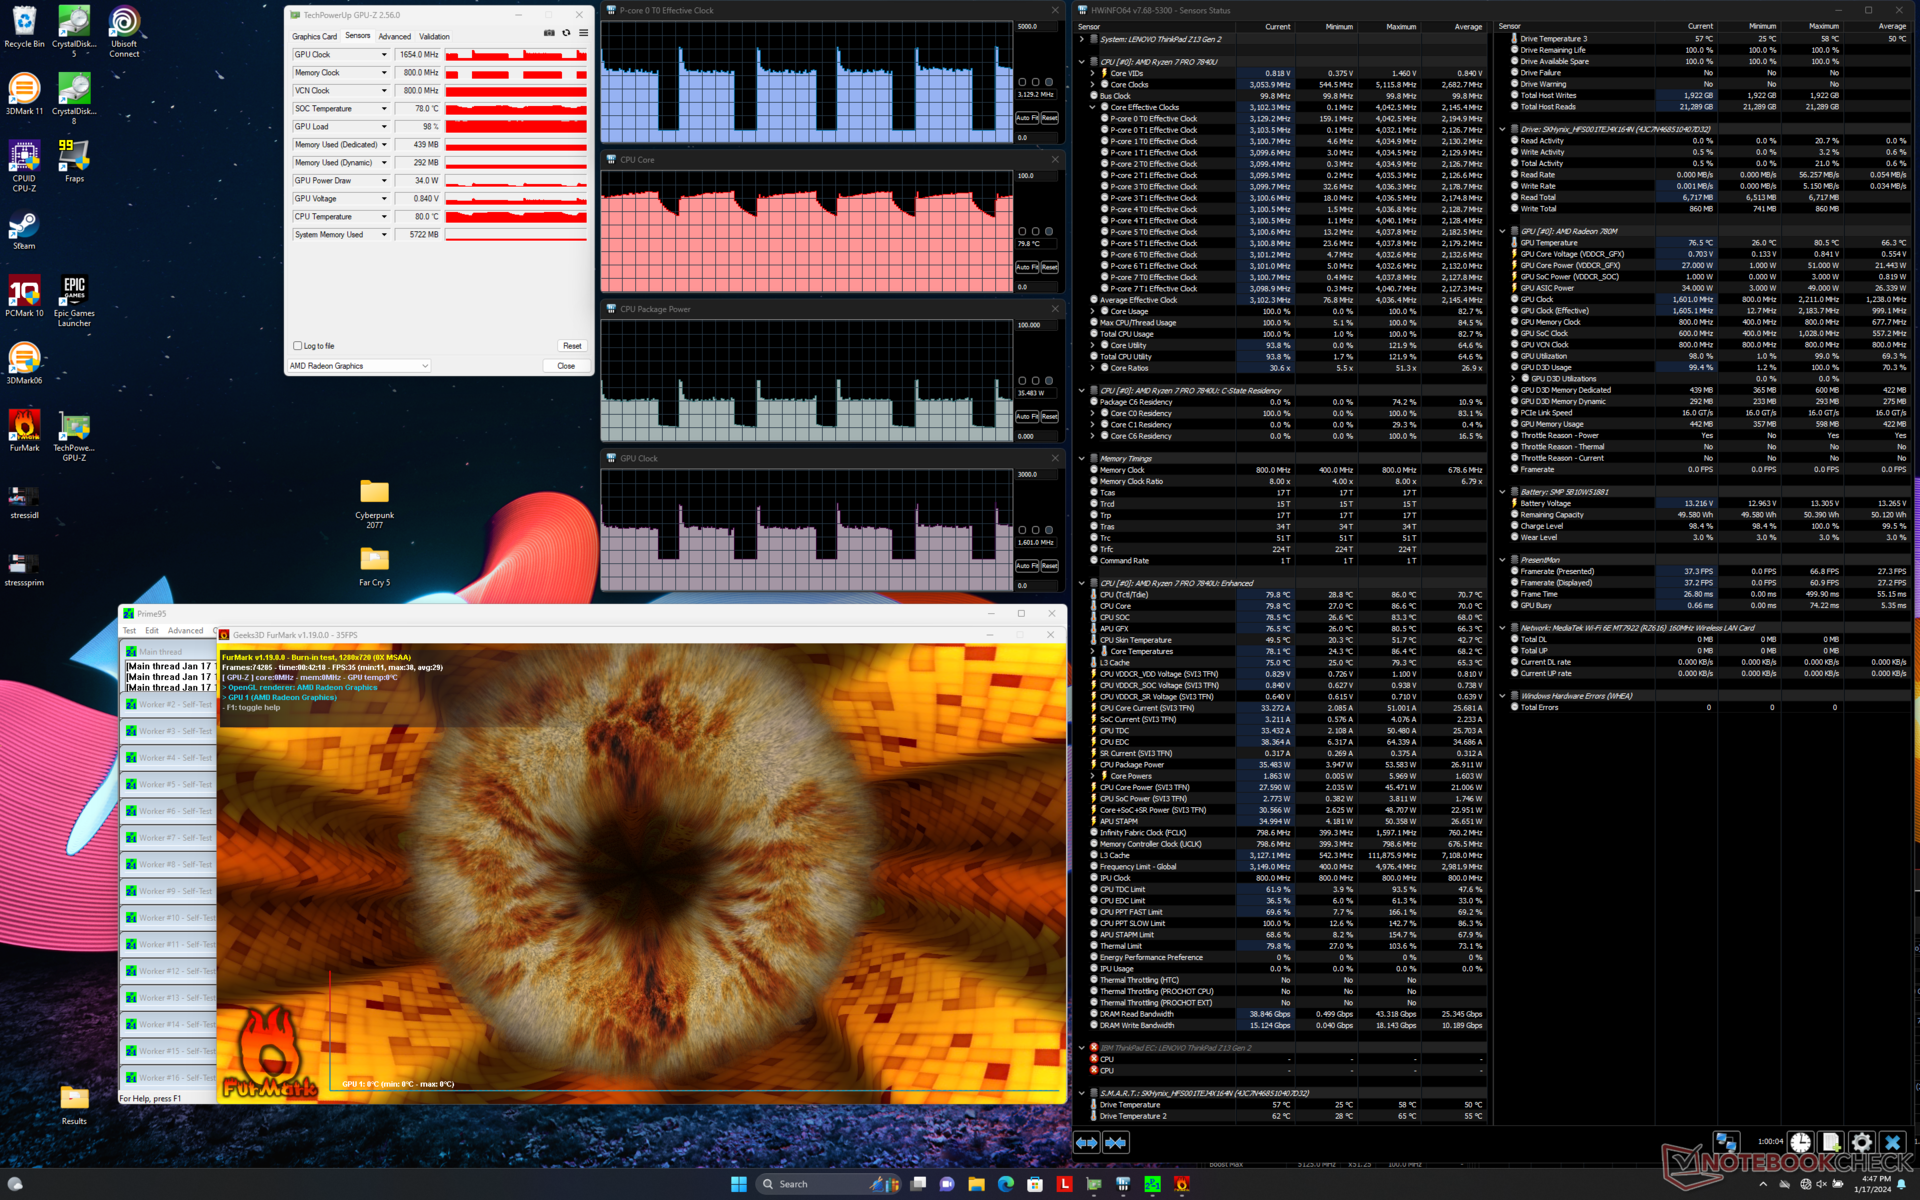
If the CPU and GPU are fully stressed under Prime95 and FurMark at the same time, heavy throttling would occur with cycling clock rates as shown by the screenshot below. This thankfully does not occur when running real-world loads. Witcher 3, for example, would have much more stable clock rates and more consistent performance results.

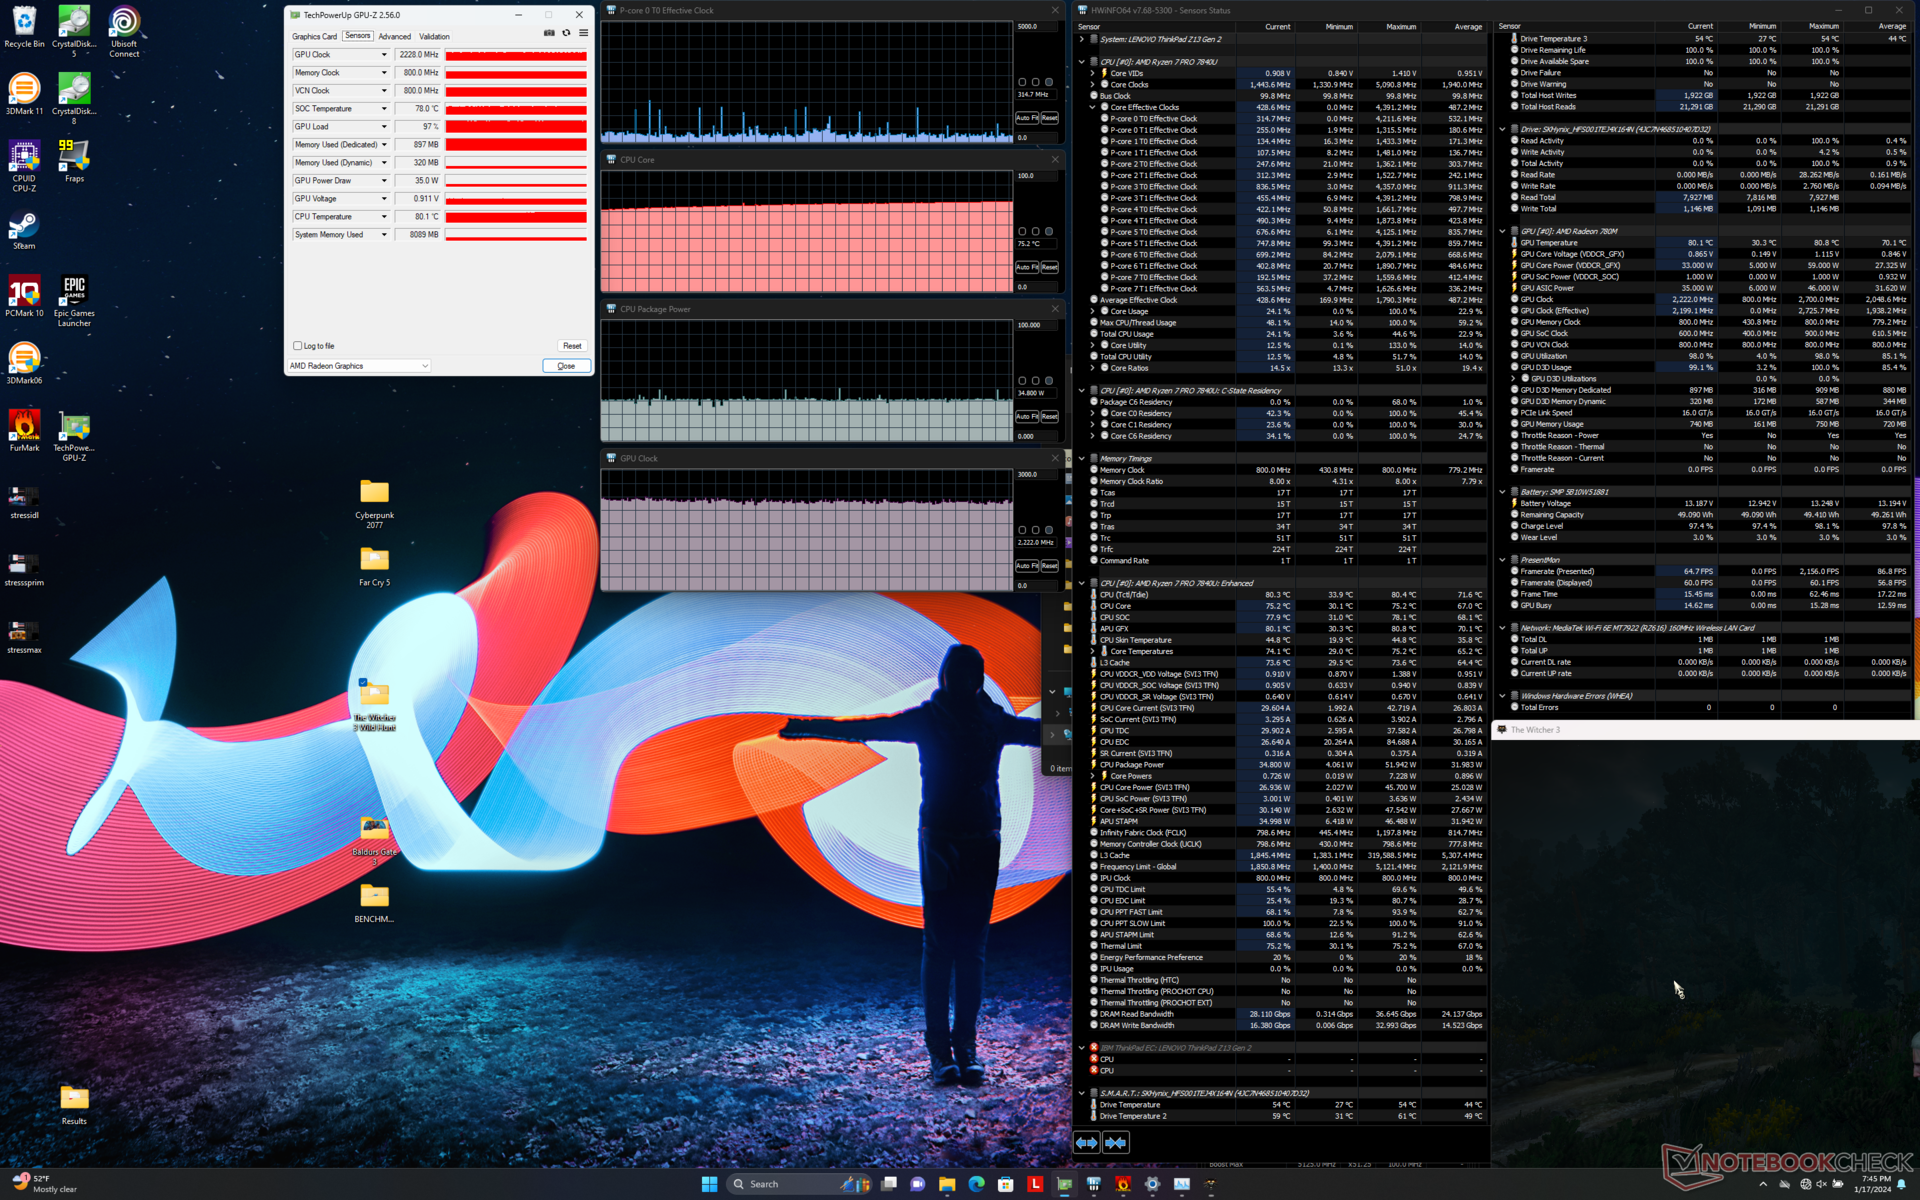
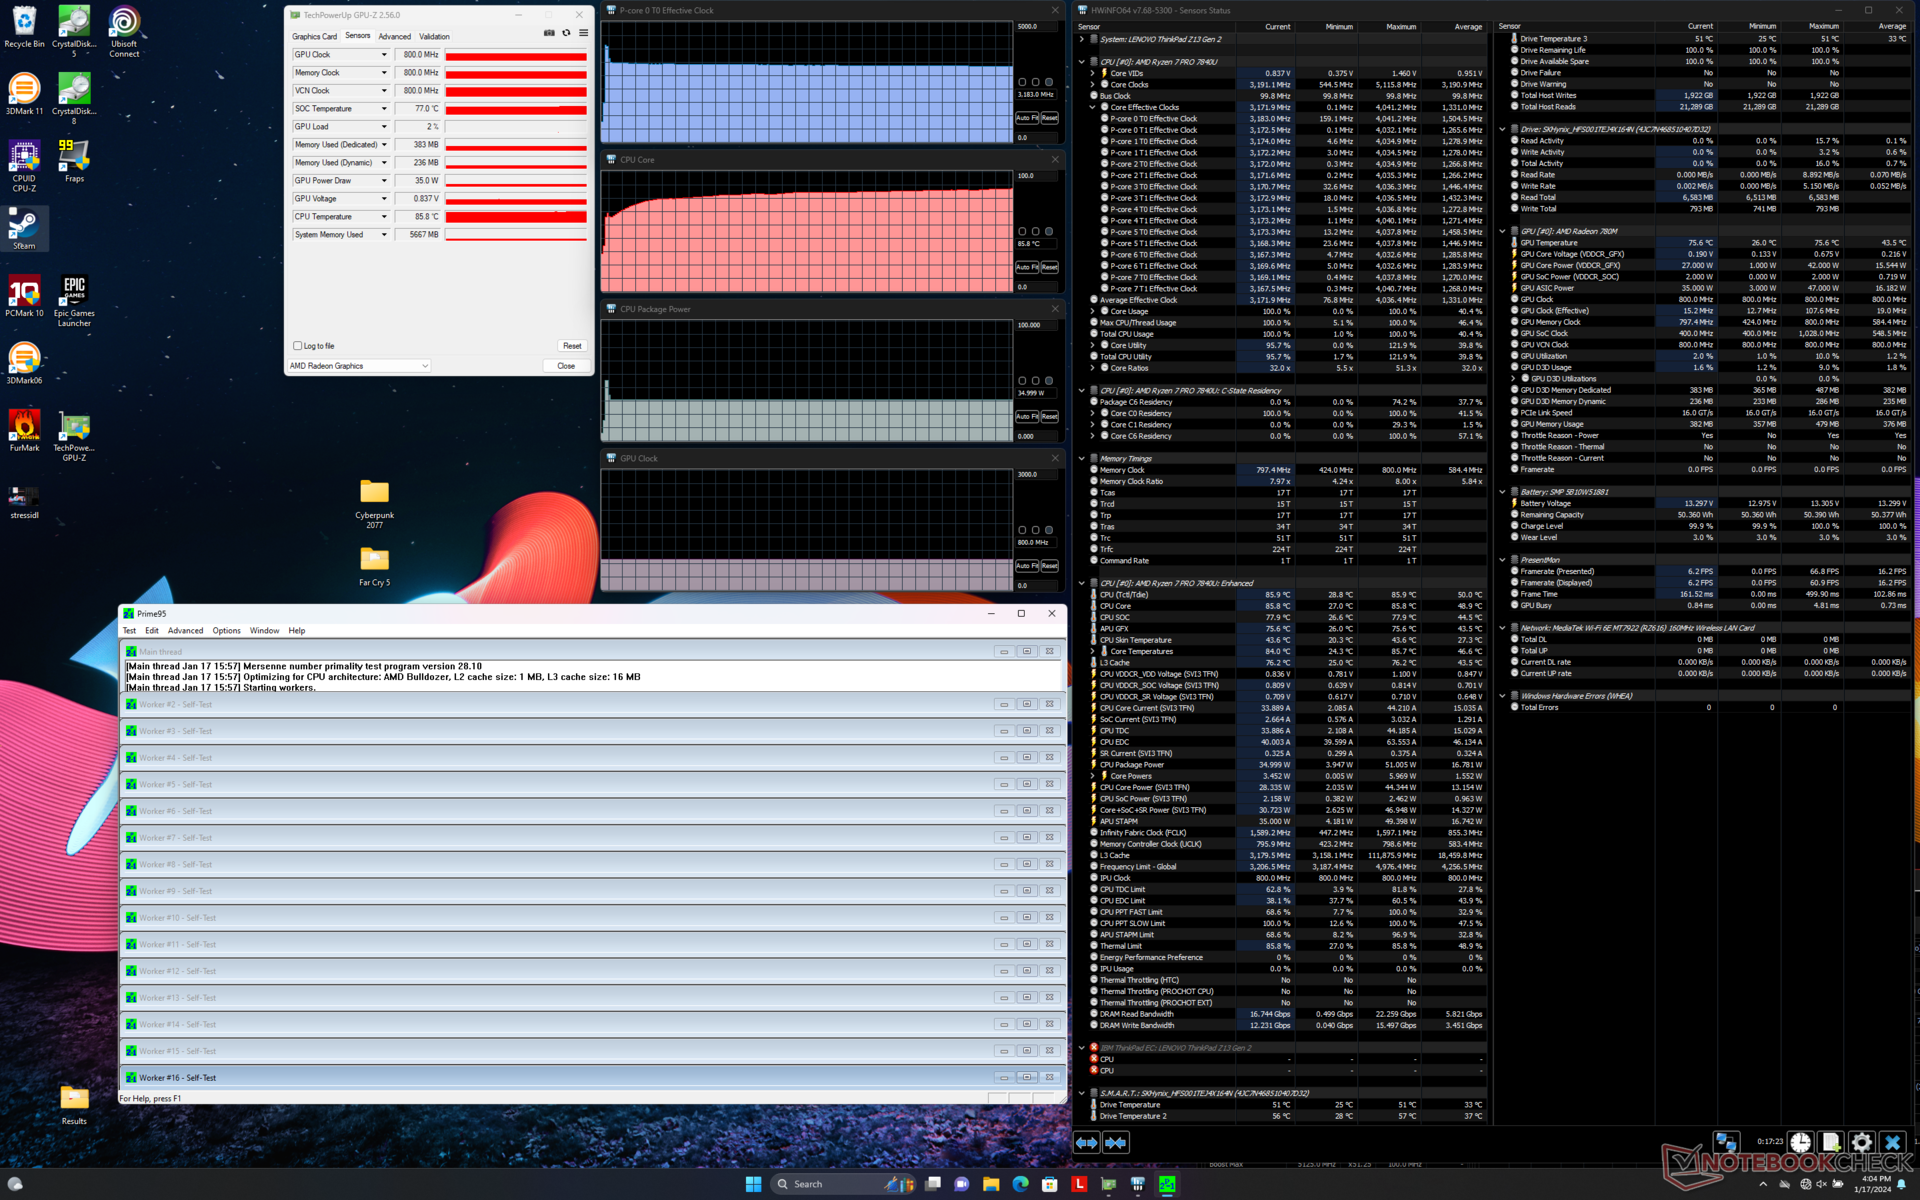
| CPU Clock (GHz) | GPU Clock (MHz) | Average CPU Temperature (°C) | |
| System Idle | -- | -- | 29 |
| Prime95 Stress | 3.2 | -- | 86 |
| Prime95 + FurMark Stress | 0.5 - 2.6 | 800 - 2100 | 62 - 84 |
| Witcher 3 Stress | ~0.3 | 2228 | 76 |
Speakers
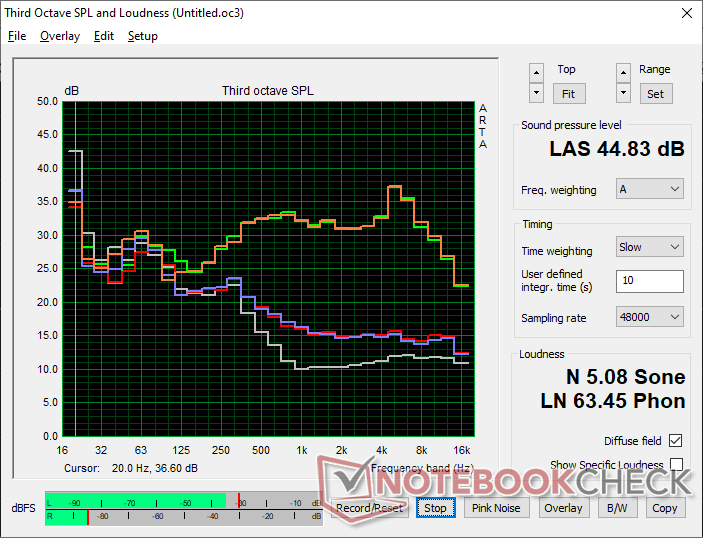
Lenovo ThinkPad Z13 Gen 2 audio analysis
(±) | speaker loudness is average but good (81.3 dB)
Bass 100 - 315 Hz
(±) | reduced bass - on average 12.6% lower than median
(±) | linearity of bass is average (11.8% delta to prev. frequency)
Mids 400 - 2000 Hz
(+) | balanced mids - only 3.6% away from median
(+) | mids are linear (3.9% delta to prev. frequency)
Highs 2 - 16 kHz
(+) | balanced highs - only 2.3% away from median
(+) | highs are linear (5.3% delta to prev. frequency)
Overall 100 - 16.000 Hz
(+) | overall sound is linear (12.6% difference to median)
Compared to same class
» 18% of all tested devices in this class were better, 4% similar, 78% worse
» The best had a delta of 5%, average was 18%, worst was 53%
Compared to all devices tested
» 11% of all tested devices were better, 2% similar, 86% worse
» The best had a delta of 4%, average was 24%, worst was 134%
Apple MacBook Pro 16 2021 M1 Pro audio analysis
(+) | speakers can play relatively loud (84.7 dB)
Bass 100 - 315 Hz
(+) | good bass - only 3.8% away from median
(+) | bass is linear (5.2% delta to prev. frequency)
Mids 400 - 2000 Hz
(+) | balanced mids - only 1.3% away from median
(+) | mids are linear (2.1% delta to prev. frequency)
Highs 2 - 16 kHz
(+) | balanced highs - only 1.9% away from median
(+) | highs are linear (2.7% delta to prev. frequency)
Overall 100 - 16.000 Hz
(+) | overall sound is linear (4.6% difference to median)
Compared to same class
» 0% of all tested devices in this class were better, 0% similar, 100% worse
» The best had a delta of 5%, average was 17%, worst was 45%
Compared to all devices tested
» 0% of all tested devices were better, 0% similar, 100% worse
» The best had a delta of 4%, average was 24%, worst was 134%
Energy Management
Power Consumption
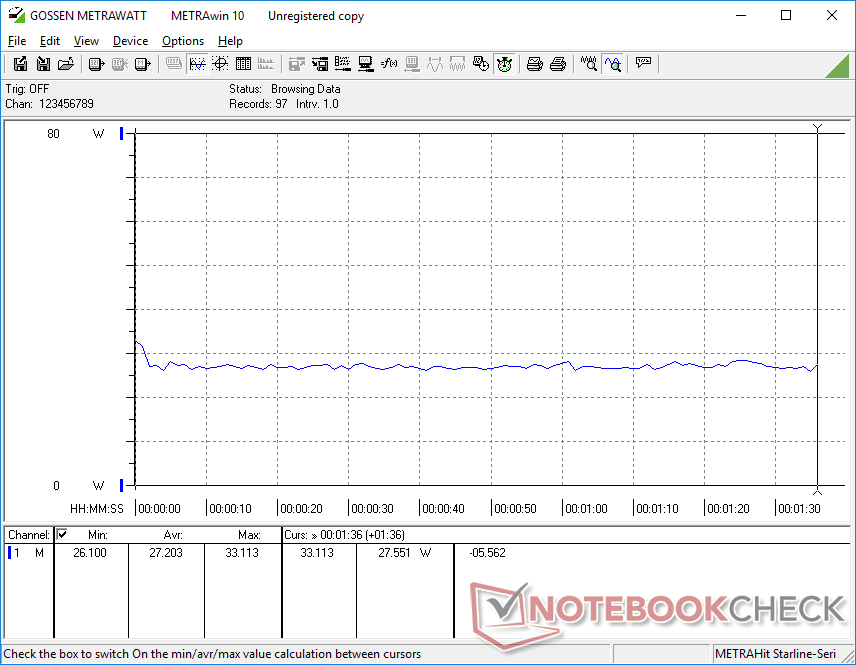
Power consumption is higher across the board when compared to the ThinkPad Z13 G1 which contributes to the shorter battery life in the next section. Running Witcher 3, for example, would consume 55 W compared to just 30 W on last year's model. Of course, the higher performance from our Radeon 780M when compared to the Radeon 660M means the higher consumption levels aren't for naught.
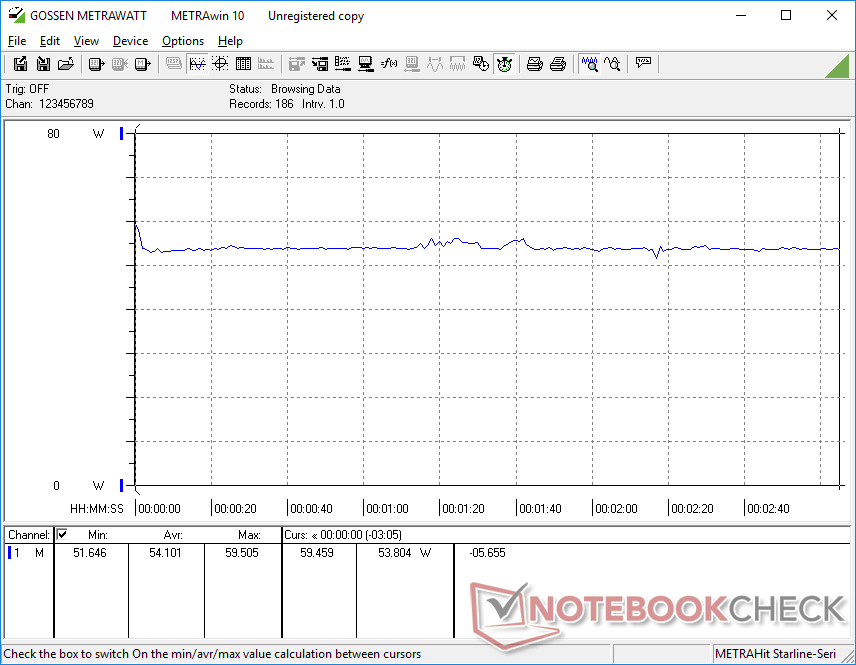
The OLED panel alone demands a lot of power when compared to IPS. Simply idling on the maximum brightness setting and on a bright white screen such as a typical webpage would consume almost 13 W compared to less than half on the ThinkPad Z13 G1 IPS configuration.
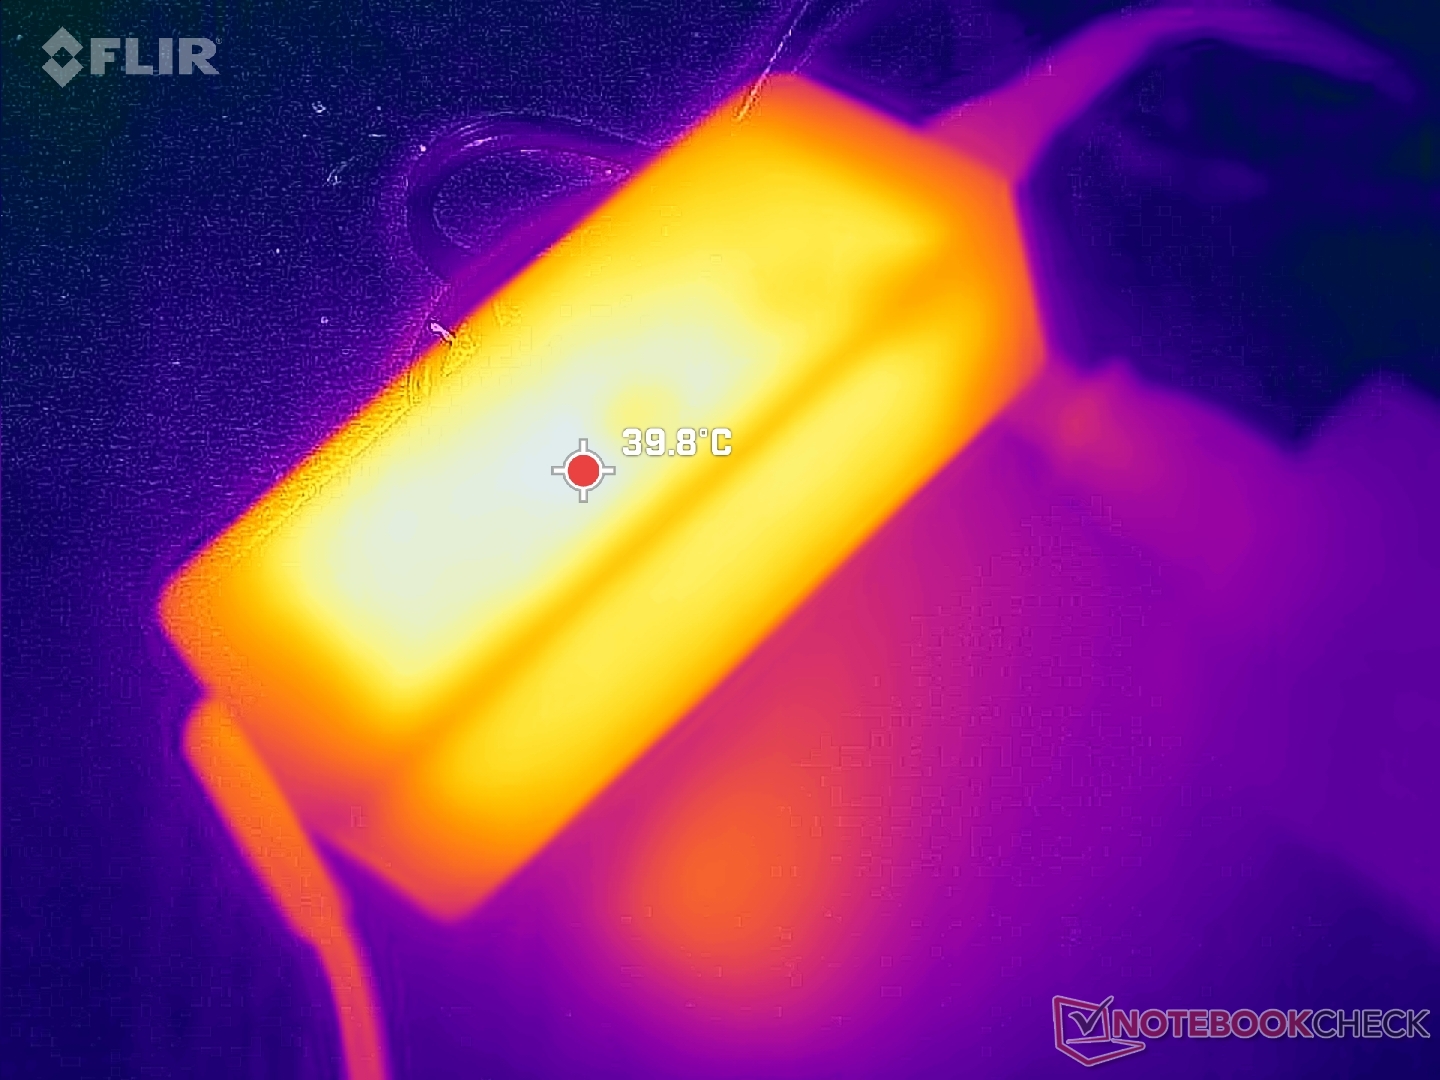
We're able to measure a maximum draw of 62 W from the small (~10.8 x 4.8 x 2.9 cm) 65 W USB-C AC adapter when the CPU is at 100 percent utilization. Charging will therefore slow to a crawl if running demanding loads simultaneously. A larger 100 W adapter might have been more appropriate especially for power users.


| Off / Standby | |
| Idle | |
| Load |
|
Key:
min: | |
| Lenovo ThinkPad Z13 Gen 2 R7 PRO 7840U, Radeon 780M, SK hynix BC901 HFS001TEJ4X164N, OLED, 2880x1800, 13.3" | HP Dragonfly G4 i7-1365U, Iris Xe G7 96EUs, Micron 3400 MTFDKBA512TFH 512GB, IPS, 1920x1280, 13.5" | Dell Latitude 13 7340 i5-1345U i5-1345U, Iris Xe G7 80EUs, Kioxia BG5 KBG50ZNS512G, IPS, 1920x1200, 13.3" | Lenovo ThinkPad Z13 21D2CTO1WW R5 PRO 6650U, Radeon 660M, Lenovo UMIS AM630 RPJTJ512MGE1QDQ, IPS LED, 1920x1200, 13.3" | Lenovo ThinkPad X1 Nano Gen 3 i7-1360P, Iris Xe G7 96EUs, Lenovo UMIS AM6A0 RPJTJ512MKP1QDQ, IPS, 2160x1350, 13" | Framework Laptop 13.5 Ryzen 7 7840U R7 7840U, Radeon 780M, WD PC SN740 512GB SDDPNQD-512G, IPS, 2256x1504, 13.5" | |
|---|---|---|---|---|---|---|
| Power Consumption | 6% | 9% | 16% | 12% | 2% | |
| Idle Minimum * (Watt) | 5.8 | 4.1 29% | 2.37 59% | 2.4 59% | 3.3 43% | 4 31% |
| Idle Average * (Watt) | 6.2 | 7.5 -21% | 6.19 -0% | 4.6 26% | 6.5 -5% | 6.5 -5% |
| Idle Maximum * (Watt) | 12.7 | 8.2 35% | 14.1 -11% | 5.1 60% | 7.1 44% | 6.8 46% |
| Load Average * (Watt) | 27.2 | 35.5 -31% | 36.3 -33% | 53.1 -95% | 40.7 -50% | 48 -76% |
| Witcher 3 ultra * (Watt) | 54.1 | 37.5 31% | 24.9 54% | 27.6 49% | 37 32% | 52.3 3% |
| Load Maximum * (Watt) | 61.4 | 66.5 -8% | 69.13 -13% | 63.7 -4% | 58.6 5% | 55.2 10% |
* ... smaller is better
Power Consumption Witcher 3 / Stresstest
Power Consumption external Monitor
Battery Life
Runtimes fall sharply due to the higher resolution OLED panel. Our ThinkPad Z13 G1 with the base 1200p IPS panel, for example, would last for over 14 hours compared to just under 8 hours on our ThinkPad Z13 G2.
Charging from empty to full capacity is slower than expected at almost 2.5 hours compared to 1.5 hours on most other laptops.
| Lenovo ThinkPad Z13 Gen 2 R7 PRO 7840U, Radeon 780M, 51.5 Wh | HP Dragonfly G4 i7-1365U, Iris Xe G7 96EUs, 68 Wh | Dell Latitude 13 7340 i5-1345U i5-1345U, Iris Xe G7 80EUs, 57 Wh | Lenovo ThinkPad Z13 21D2CTO1WW R5 PRO 6650U, Radeon 660M, 51.5 Wh | Lenovo ThinkPad X1 Nano Gen 3 i7-1360P, Iris Xe G7 96EUs, 49.5 Wh | Framework Laptop 13.5 Ryzen 7 7840U R7 7840U, Radeon 780M, 61 Wh | |
|---|---|---|---|---|---|---|
| Battery runtime | 104% | 92% | 85% | 0% | 55% | |
| WiFi v1.3 (h) | 7.8 | 15.9 104% | 15 92% | 14.4 85% | 7.8 0% | 12.1 55% |
| Reader / Idle (h) | 42.5 | |||||
| Load (h) | 3.2 | 2.9 | 1.9 | |||
| H.264 (h) | 16.3 |
Pros
Cons
Verdict — All About Those Performance Upgrades
The main difference between the ThinkPad Z13 Gen 1 and Z13 Gen 2 is that the latter includes AMD Zen 4 CPU options. If the extra performance isn't needed, then the Z13 Gen 1 can offer an essentially identical user experience since it carries the same display options and physical features. Last year's Zen 3+ processors aren't even slow to begin with and so the newer Zen 4 options should appeal mostly to power users and graphics editors rather than light browsers or spreadsheet data entries.
As for the OLED panel, buyers should keep in mind that it can decrease battery life significantly by as much as 6 hours in our WLAN tests when compared to the base IPS panel. Its deeper colors, faster response times, HDR support, and denser resolution definitely come with drawbacks in this regard.
The AMD Zen 4 Pro CPU upgrades are commendable, but the 60 Hz display and 2 MP webcam are starting to feel dated especially for a high-end subnotebook.
For a potential ThinkPad Z13 Gen 3 in the future, we would like to see updated display options with higher refresh rates and brighter backlights to better compete against the Asus Zenbook series or HP Dragonfly series where 120 Hz and 1000-nit displays are available, respectively. Firmer feedback from the keyboard keys and clickpad could also convince traditional ThinkPad users to try out the Z series. Otherwise, the metal chassis still feels fresh and competitive against the Dell XPS or HP Elite alternatives.
Price and Availability
Lenovo is now shipping its ThinkPad Z13 G2 starting at $1300 USD for the base Ryzen 5 and 1200p IPS configuration. B&H will soon be shipping our review configuration for $1800.
Lenovo ThinkPad Z13 Gen 2
- 01/20/2024 v7 (old)
Allen Ngo
