Framework Laptop 13.5 Ryzen 7 7840U review: So much better than the Intel version

Users have been clamoring for an AMD version of the DIY-friendly Framework Laptop ever since its introduction in 2021. With Ryzen CPUs becoming increasingly competitive against Intel every year, now would be as good of a time as ever to launch the first AMD Framework Laptop.
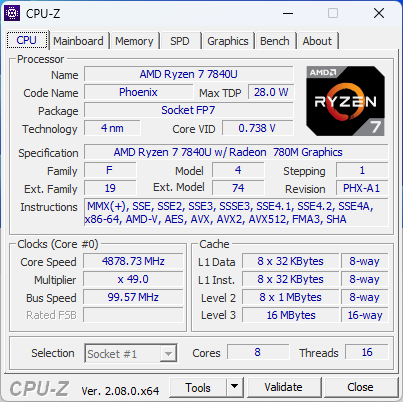
Our review unit is an upper-end configuration with the Ryzen 7 7840U for just under $1500 USD while lower-end options are available with the Ryzen 5 7640U. The Framework Laptop 13.5 is one of the first in the market to ship with the Ryzen 7 7840U.
We recommend checking out our existing reviews and videos on the Framework Laptop for more details on its physical features since the design remains unchanged.
Competitors to the Framework Laptop 13.5 include other flagship subnotebooks like the Lenovo ThinkPad X1 Nano Gen 3, HP Dragonfly G4, Dell XPS 13 Plus 9320, or the Asus ZenBook S13.
More Framework reviews:
Potential Competitors in Comparison
Rating | Date | Model | Weight | Height | Size | Resolution | Price |
|---|---|---|---|---|---|---|---|
| 87.5 % v7 (old) | 10 / 2023 | Framework Laptop 13.5 Ryzen 7 7840U R7 7840U, Radeon 780M | 1.3 kg | 15.85 mm | 13.50" | 2256x1504 | |
| 85.4 % v7 (old) | 07 / 2021 | Framework Laptop 13.5 i7-1165G7, Iris Xe G7 96EUs | 1.3 kg | 15.85 mm | 13.50" | 2256x1504 | |
| 89.5 % v7 (old) | 08 / 2023 | Lenovo ThinkPad X1 Nano Gen 3 i7-1360P, Iris Xe G7 96EUs | 989 g | 14.8 mm | 13.00" | 2160x1350 | |
| 91.9 % v7 (old) | 07 / 2023 | HP Dragonfly G4 i7-1365U, Iris Xe G7 96EUs | 1.1 kg | 16.3 mm | 13.50" | 1920x1280 | |
| 87.4 % v7 (old) | 07 / 2023 | Dell XPS 13 Plus 9320 Core i7-1360P i7-1360P, Iris Xe G7 96EUs | 1.3 kg | 15.3 mm | 13.40" | 3456x2160 | |
| 85.4 % v7 (old) | 05 / 2023 | Asus ZenBook S13 OLED UX5304 i7-1355U, Iris Xe G7 96EUs | 1 kg | 11.8 mm | 13.30" | 2880x1800 |
Case
Connectivity
While all four USB-C ports are still present, the details are complicated since Thunderbolt support is more nebulous amongst AMD PCs. Only the two rear ports support USB4 while the lower left port is USB-C 3.2 only and the lower right port is USB-C 3.2 with DisplayPort. We can confirm this ourselves as our external monitor would work on just three of the four USB-C ports. Charging can otherwise be done on any of the four ports.
Thunderbolt devices are supported on the rear two USB-C ports.
Communication
The AMD model ships with a MediaTek RZ616 for Wi-Fi 6E and Bluetooth 5.2 support in lieu of the common Intel AX210 or AX211. Transfer rates are excellent nonetheless, but they could have been a bit steadier.
| Networking | |
| iperf3 transmit AX12 | |
| Framework Laptop 13.5 | |
| iperf3 receive AX12 | |
| Framework Laptop 13.5 | |
| iperf3 transmit AXE11000 | |
| Asus ZenBook S13 OLED UX5304 | |
| Framework Laptop 13.5 Ryzen 7 7840U | |
| Lenovo ThinkPad X1 Nano Gen 3 | |
| Dell XPS 13 Plus 9320 Core i7-1360P | |
| HP Dragonfly G4 | |
| iperf3 receive AXE11000 | |
| Asus ZenBook S13 OLED UX5304 | |
| Framework Laptop 13.5 Ryzen 7 7840U | |
| Lenovo ThinkPad X1 Nano Gen 3 | |
| Dell XPS 13 Plus 9320 Core i7-1360P | |
| HP Dragonfly G4 | |
| iperf3 transmit AXE11000 6GHz | |
| Framework Laptop 13.5 Ryzen 7 7840U | |
| Lenovo ThinkPad X1 Nano Gen 3 | |
| HP Dragonfly G4 | |
| Dell XPS 13 Plus 9320 Core i7-1360P | |
| iperf3 receive AXE11000 6GHz | |
| Lenovo ThinkPad X1 Nano Gen 3 | |
| Framework Laptop 13.5 Ryzen 7 7840U | |
| HP Dragonfly G4 | |
| Dell XPS 13 Plus 9320 Core i7-1360P | |
Webcam


Maintenance
The Framework is very user-friendly when it comes to repairability and upgrades as detailed in our existing review.
Accessories And Warranty
The AMD version utilizes the same port expansion cards as on the Intel version including the revised HDMI and DP cards. Note that no expansion cards are included for free and it's highly recommended to have at least one or two with each laptop purchase.
The standard one-year limited warranty applies if purchased in the US.
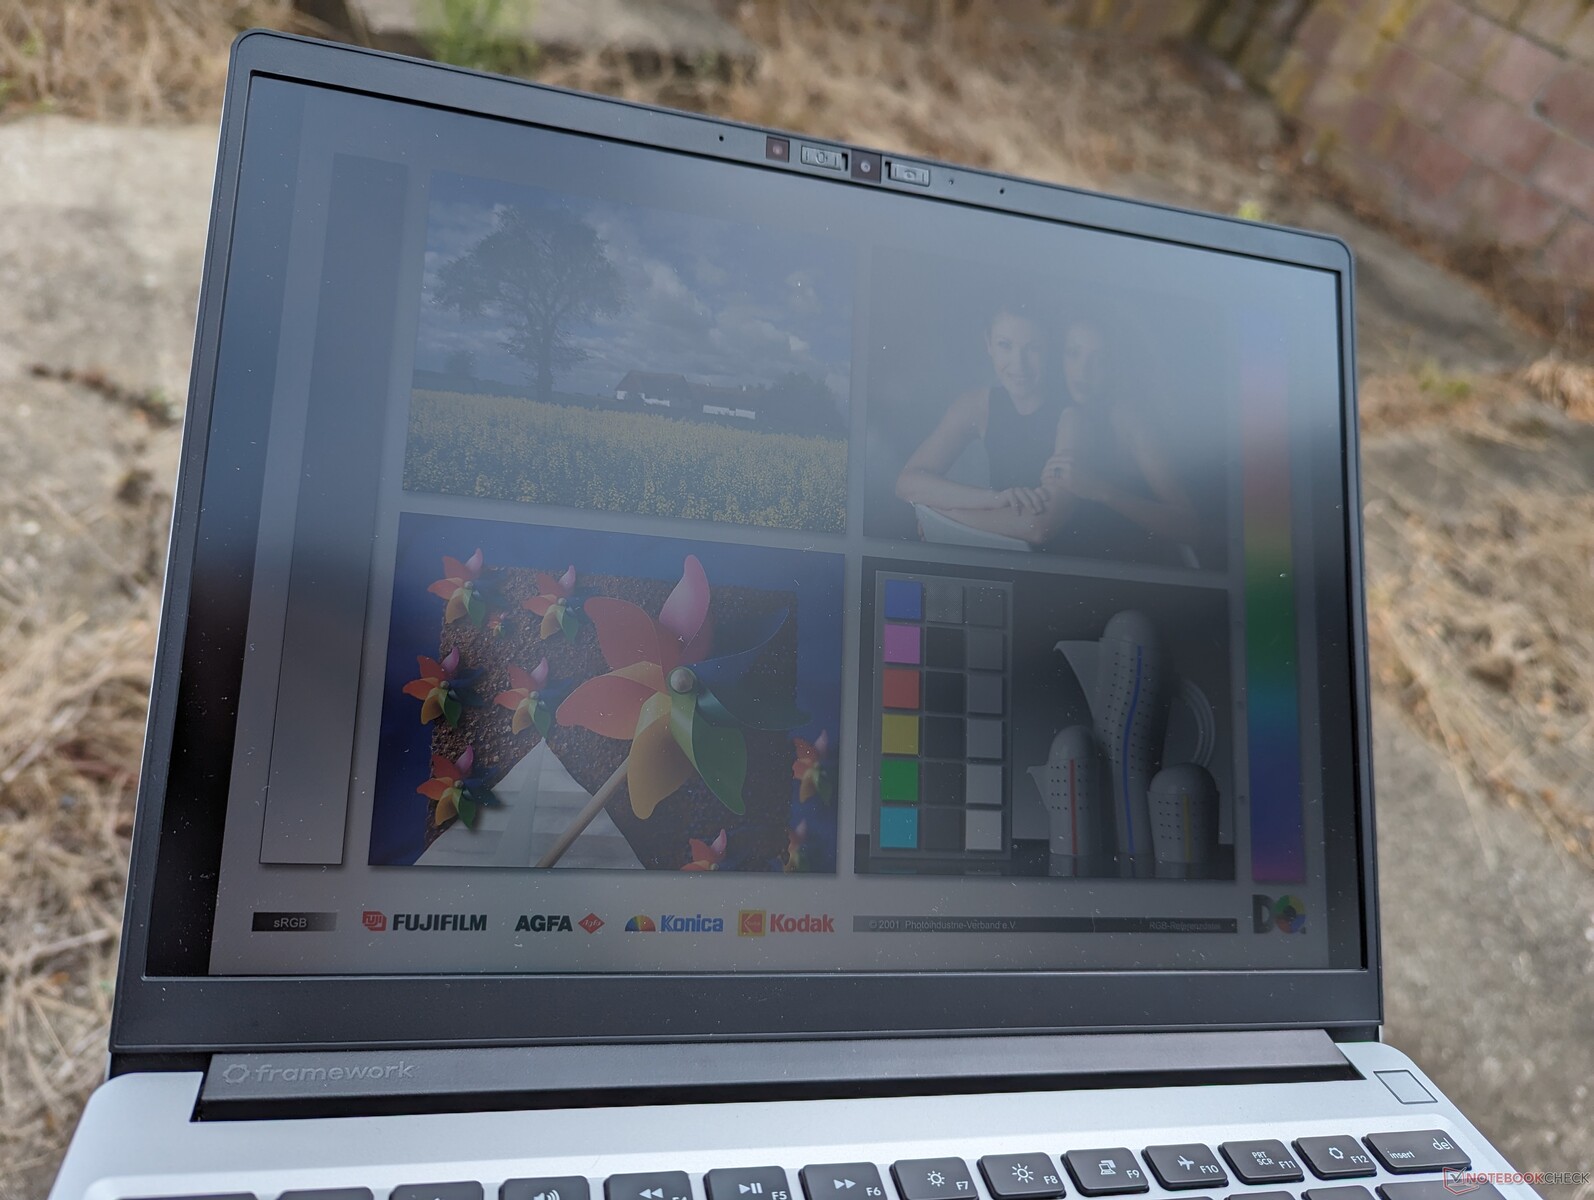
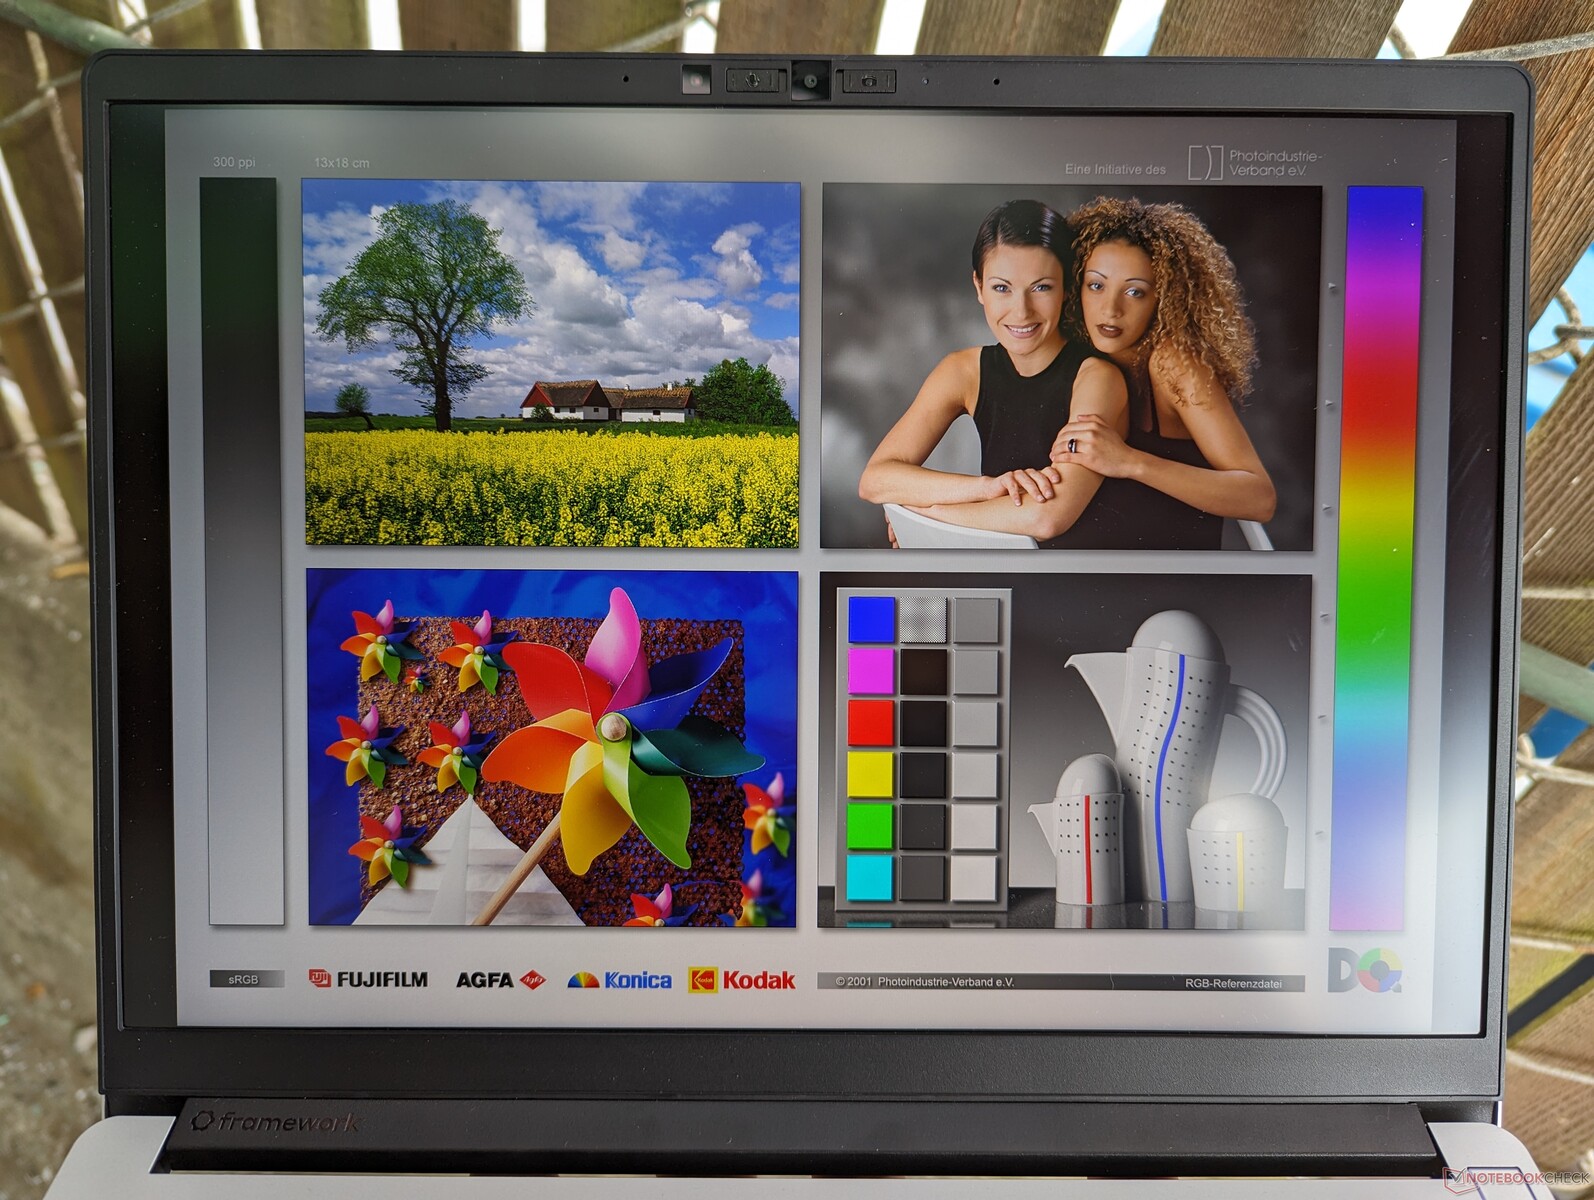
Display
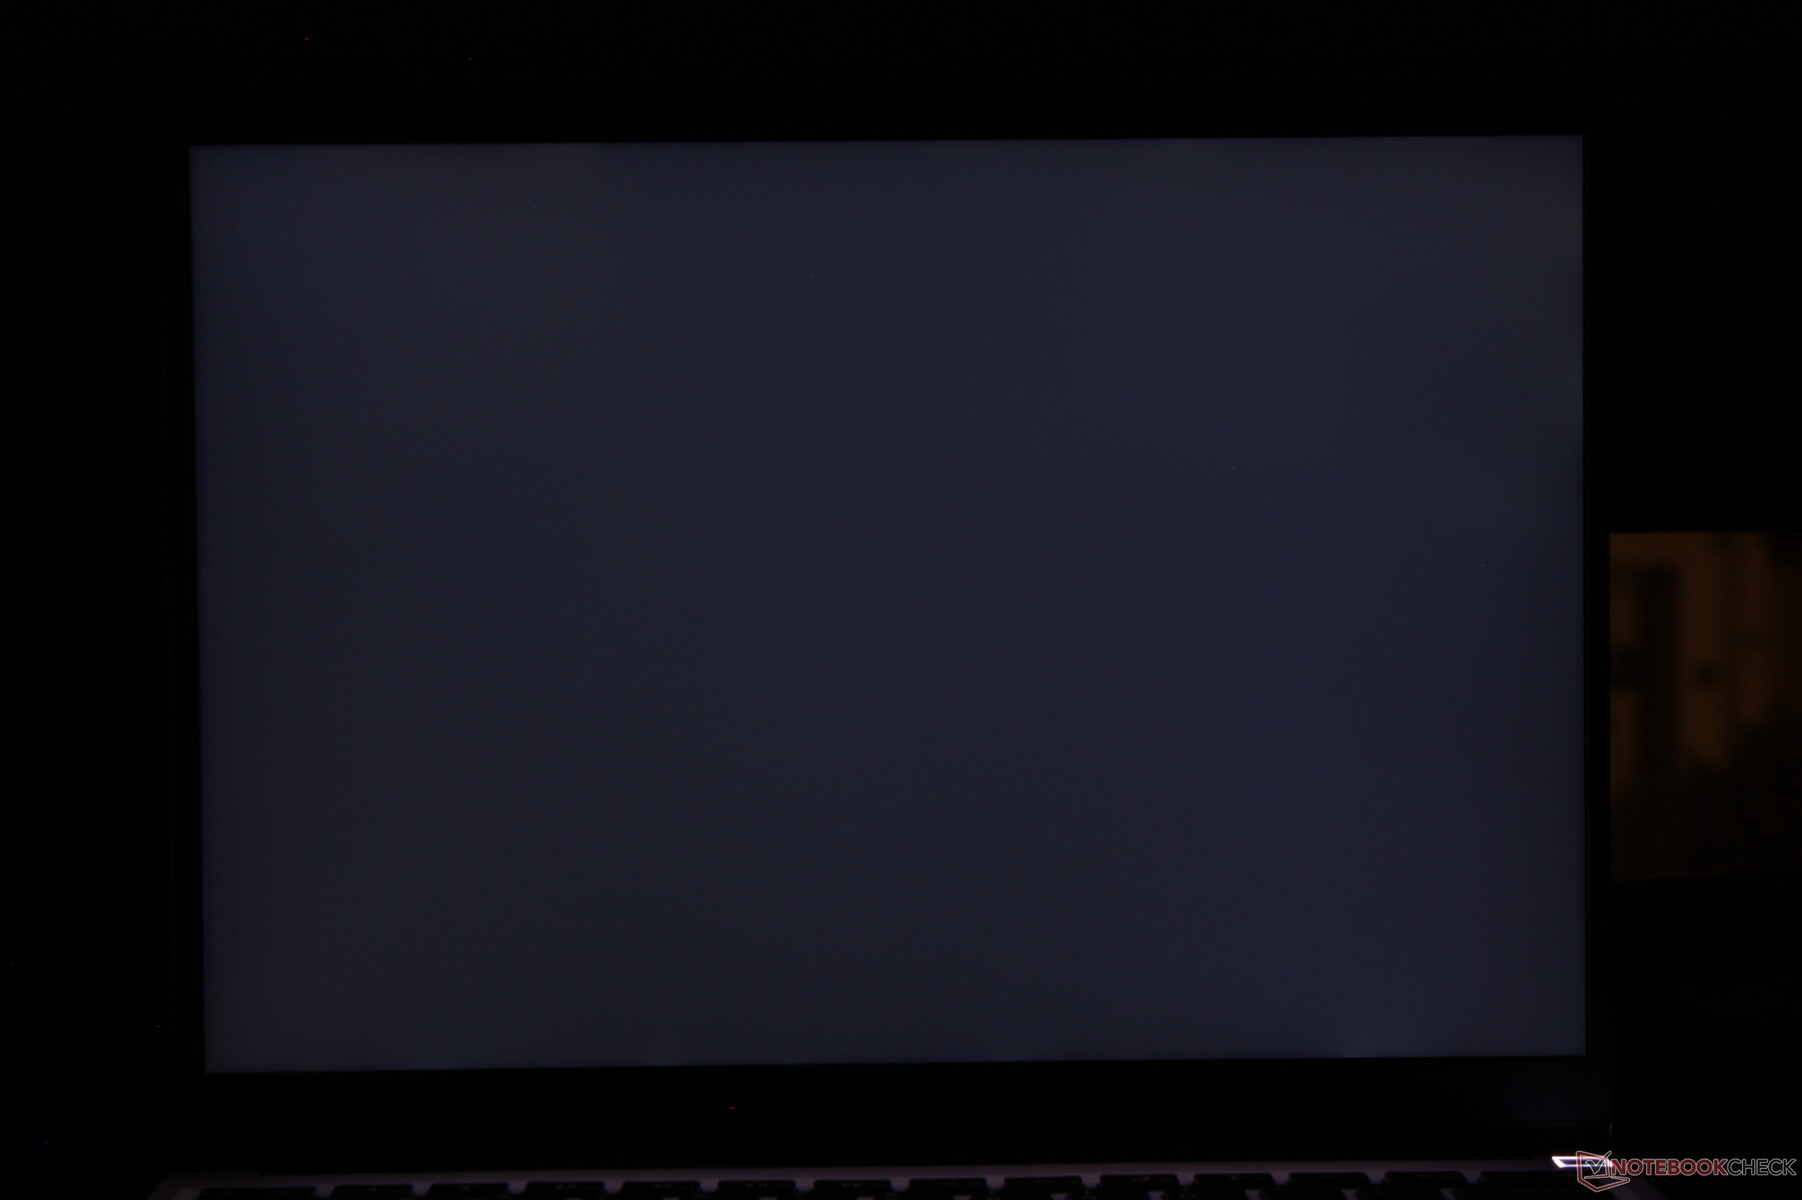
The 2256 x 1504 BOE CQ NE135FBM-N41 IPS display has not changed since the original 2021 Framework Laptop. Framework has yet to offer other display options with newer or better technologies like OLED, mini-LED, >60 Hz refresh rates, or faster response times.

| |||||||||||||||||||||||||
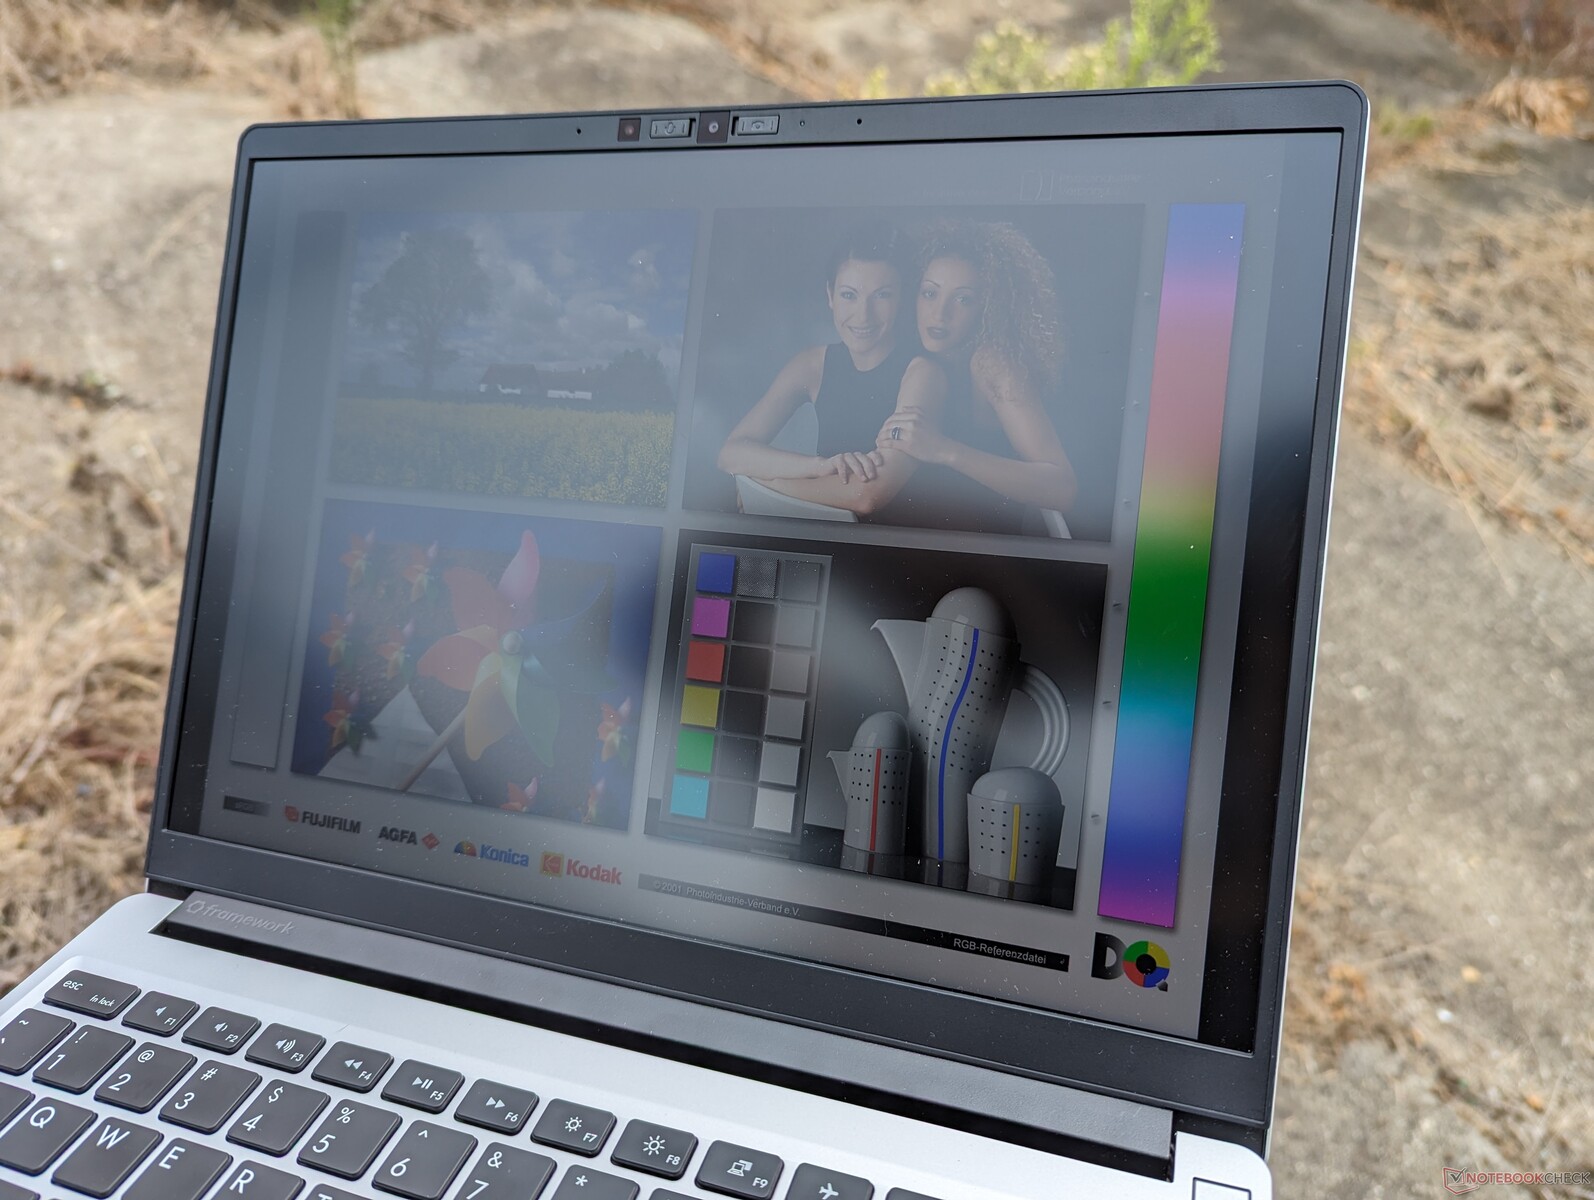
Brightness Distribution: 89 %
Center on Battery: 436 cd/m²
Contrast: 1211:1 (Black: 0.36 cd/m²)
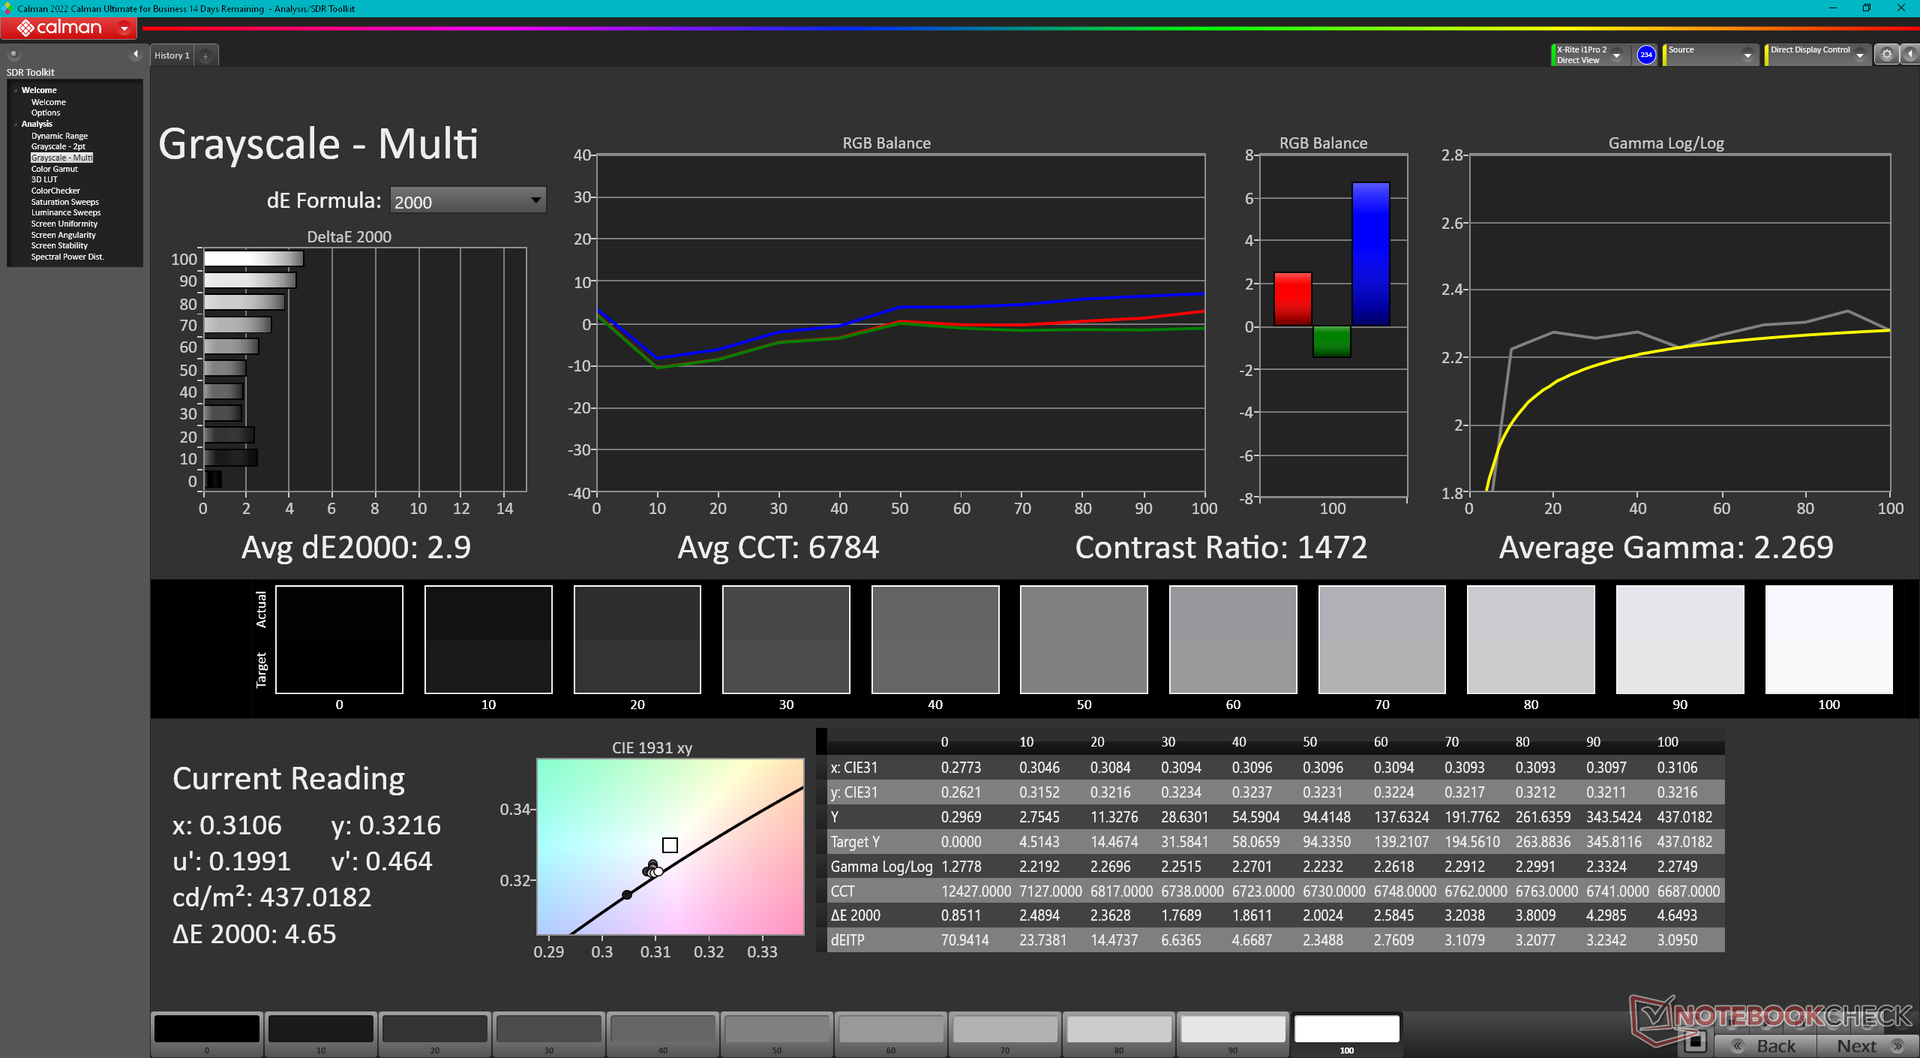
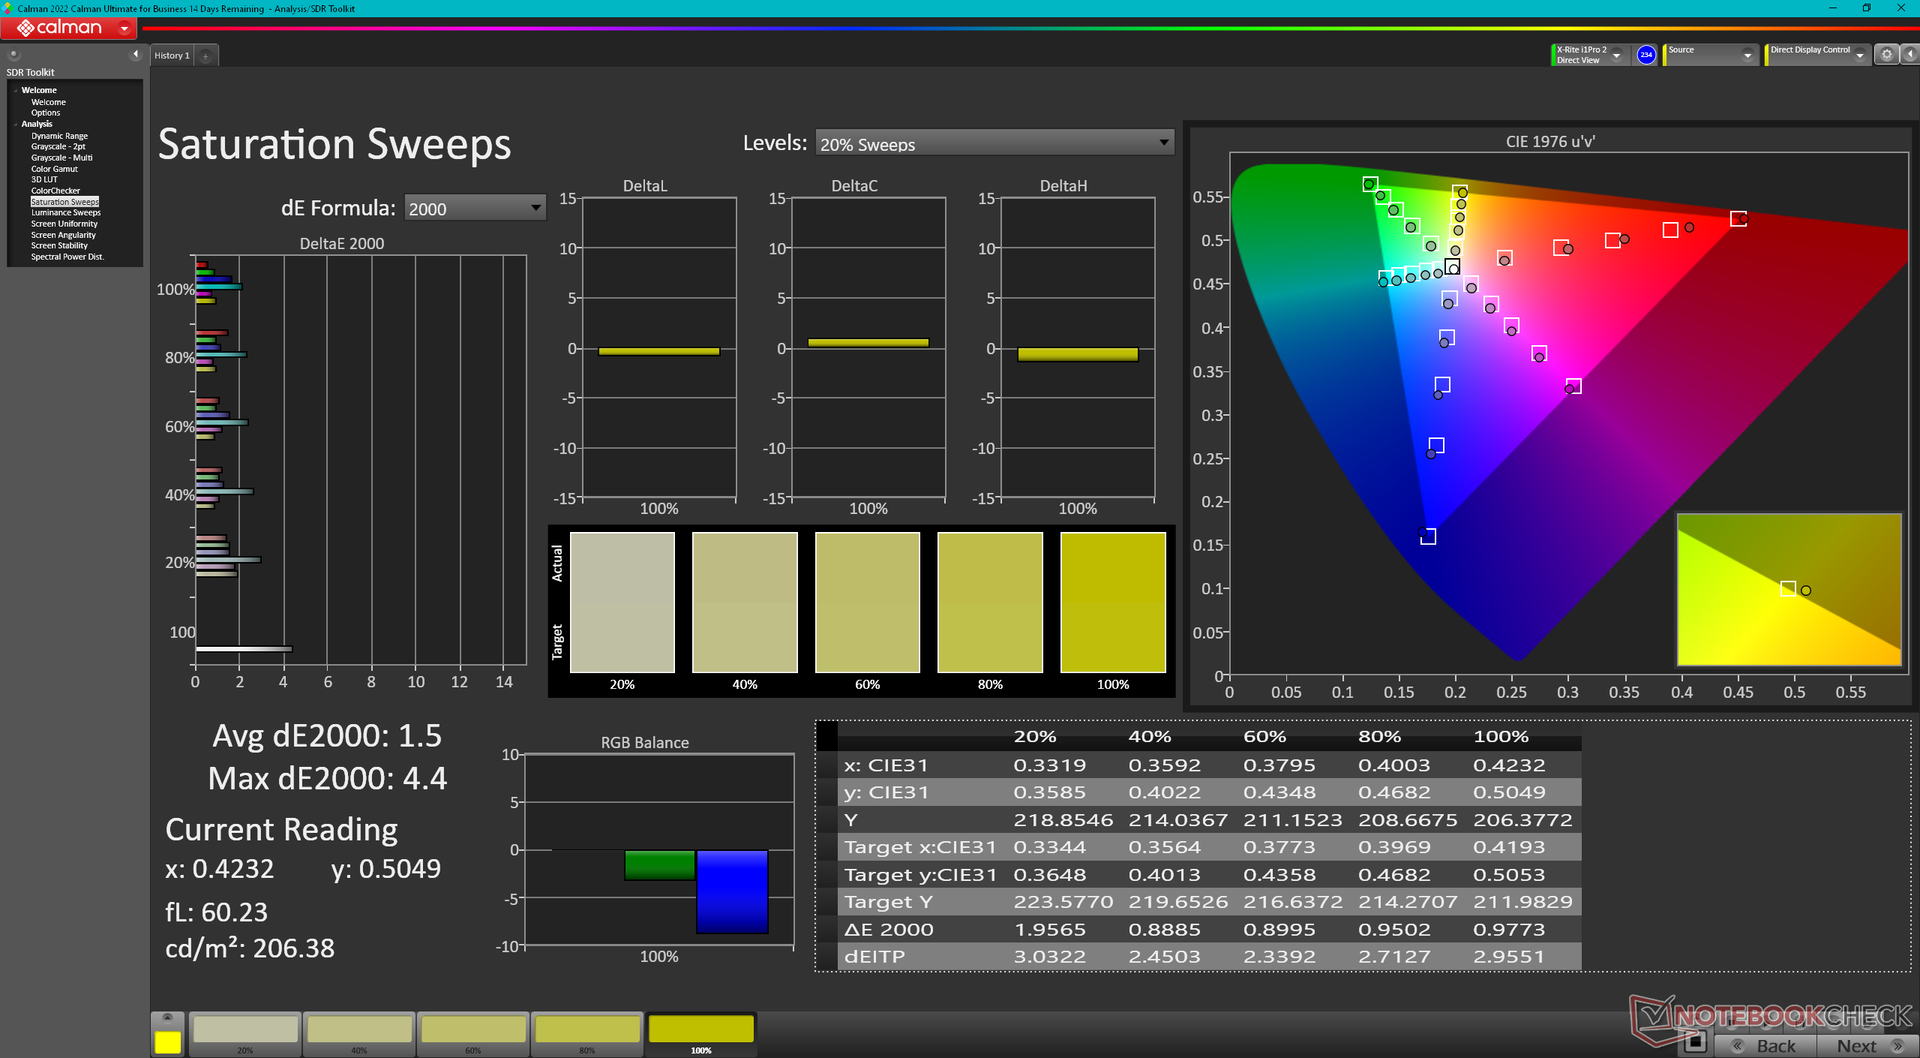
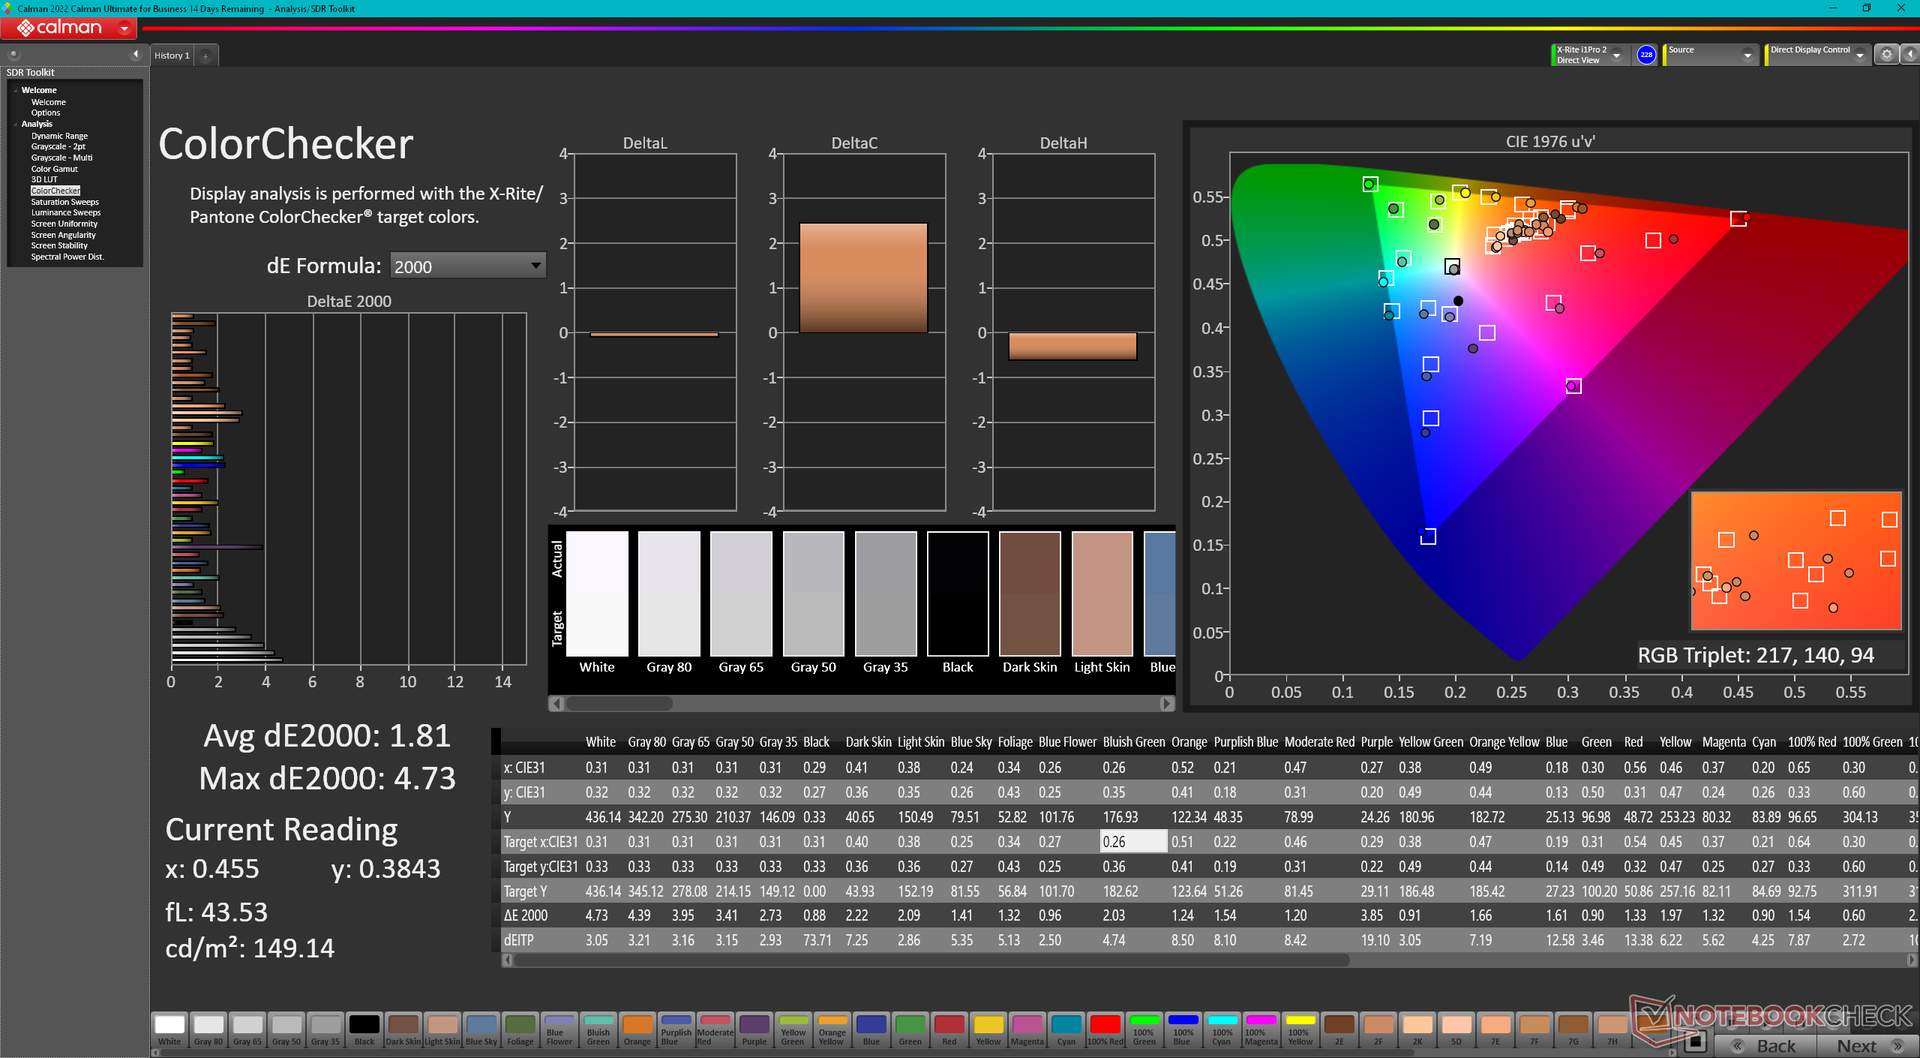
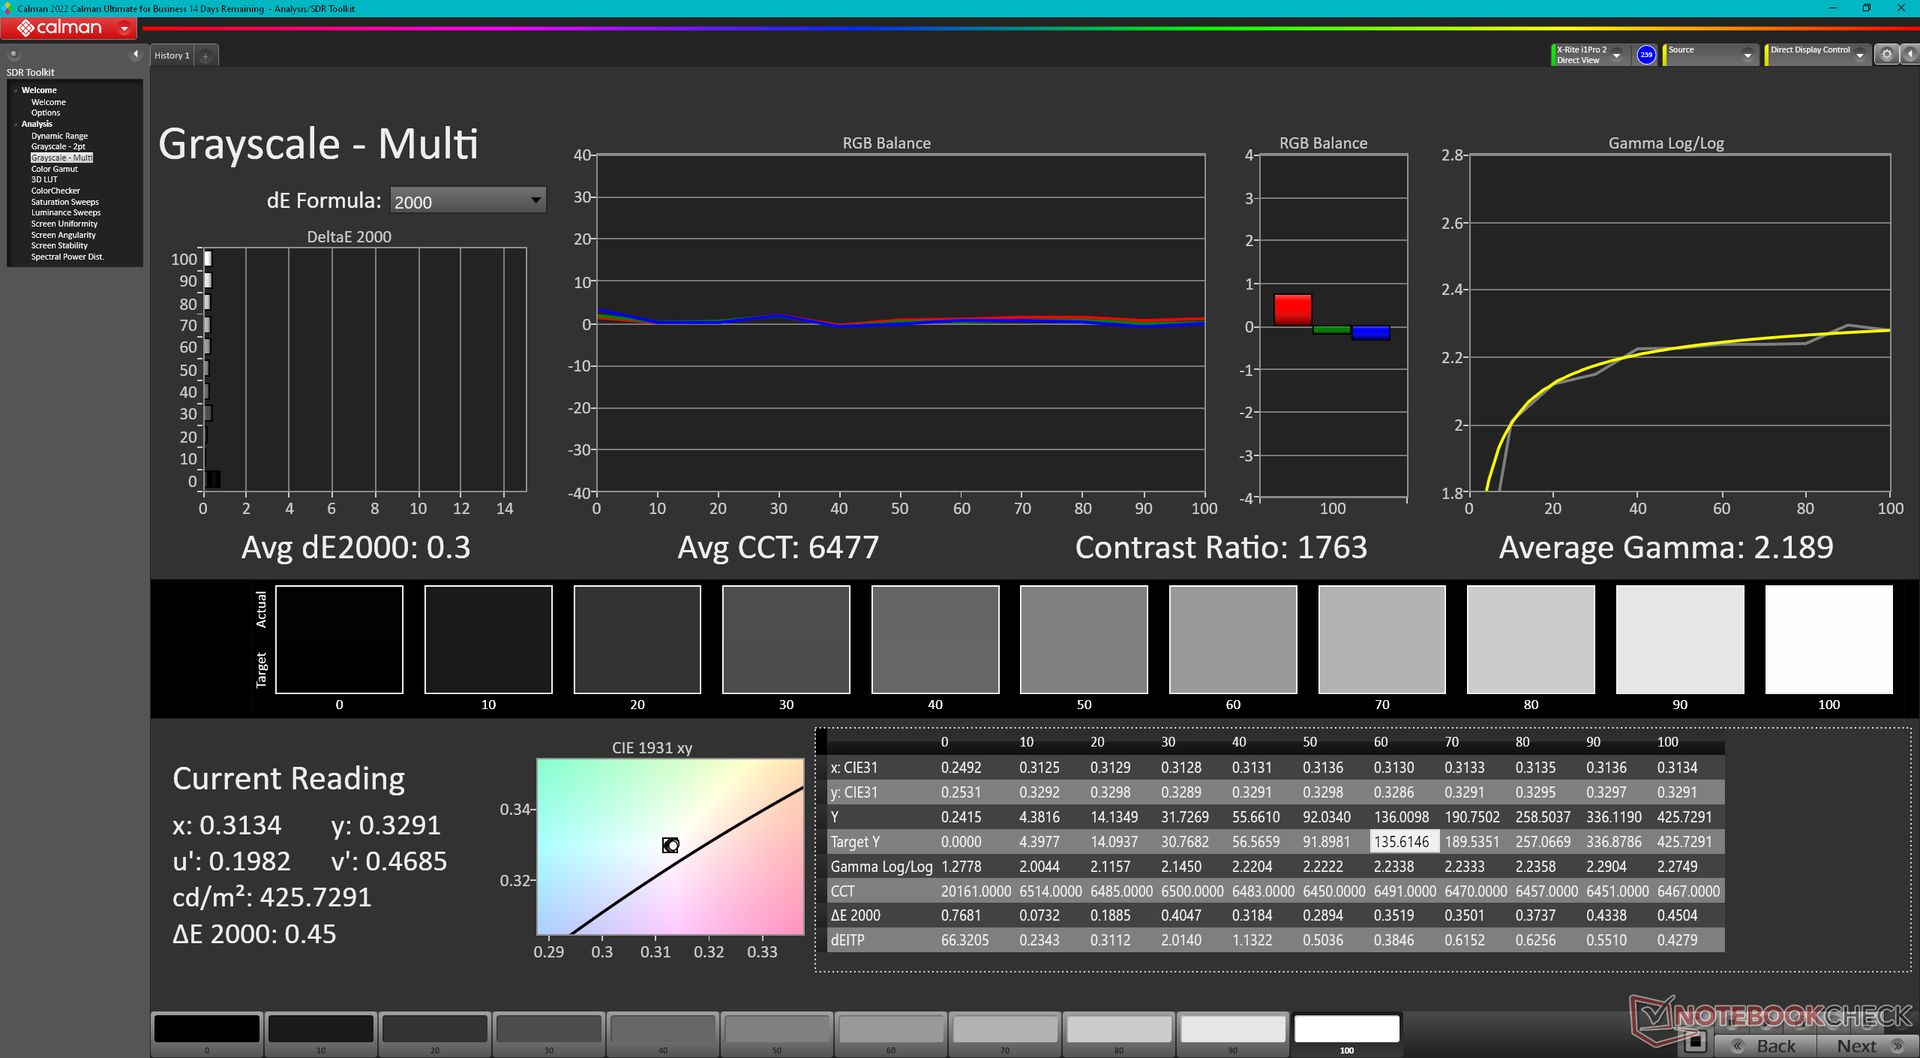
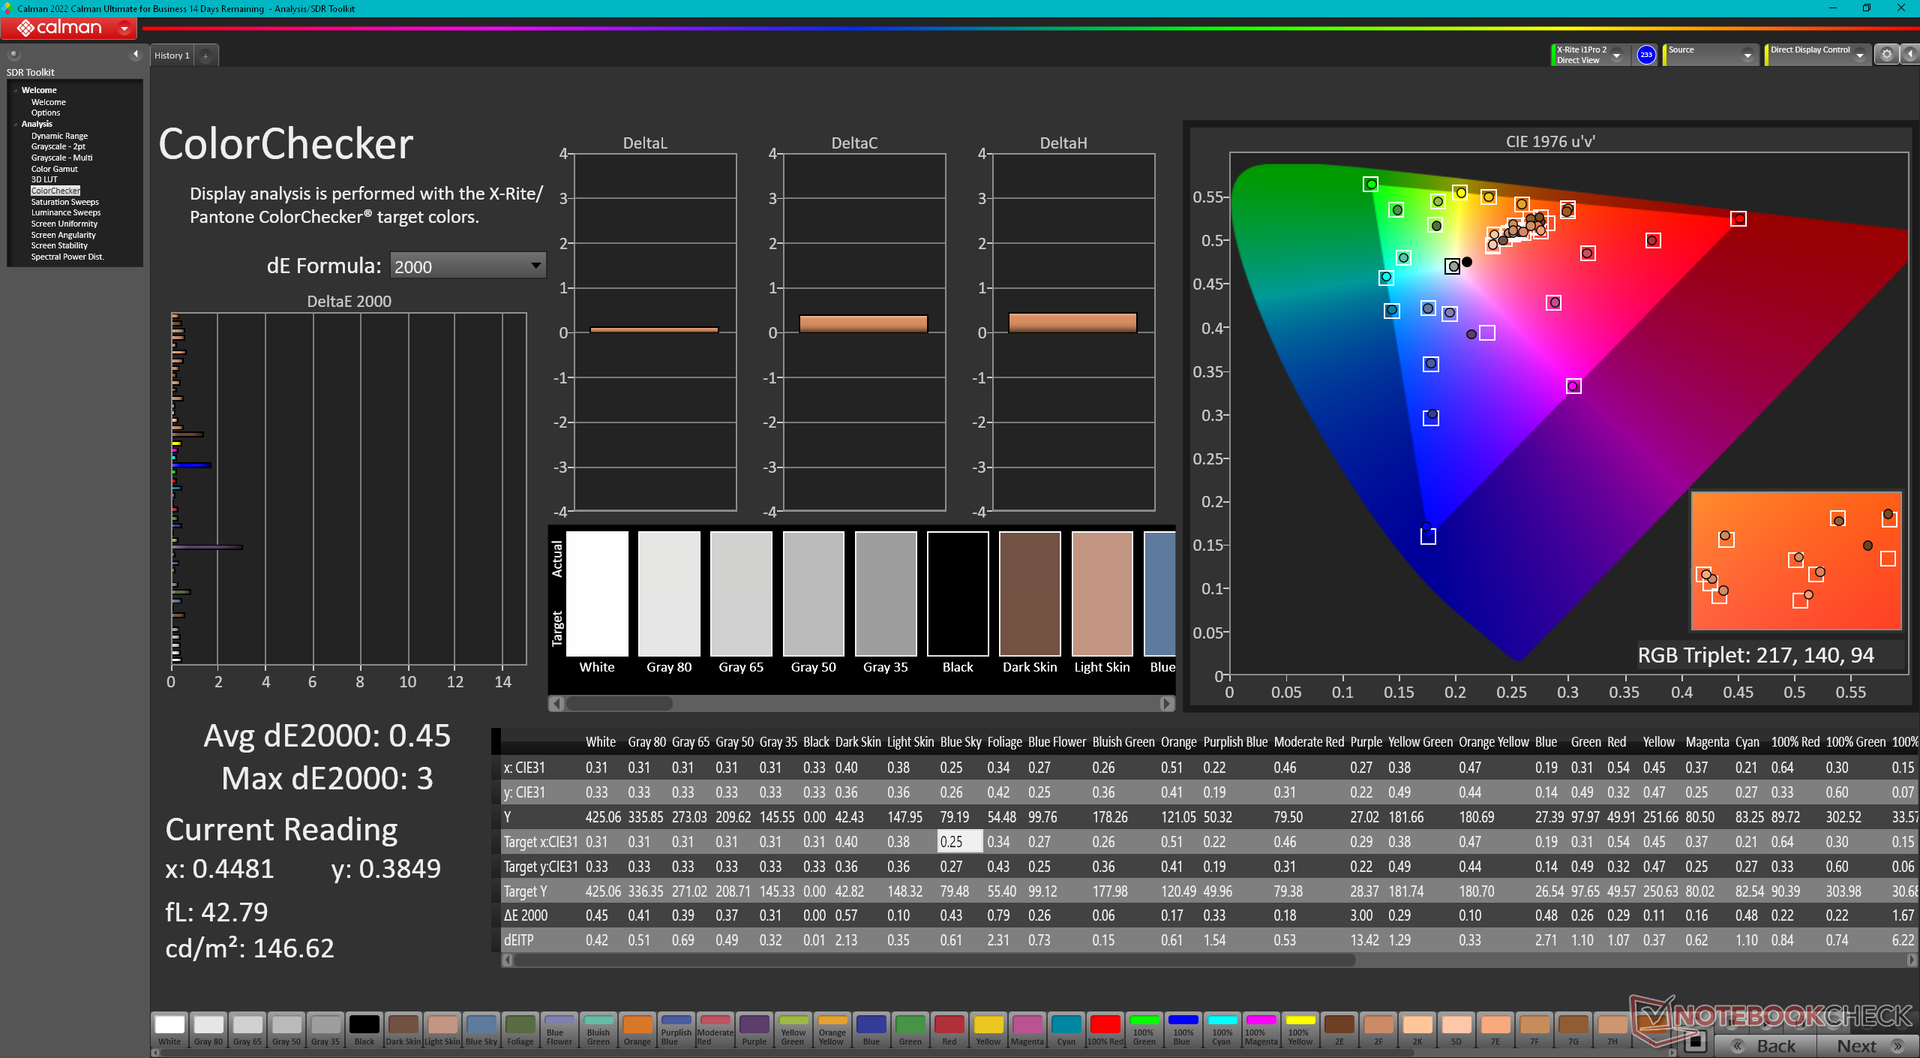
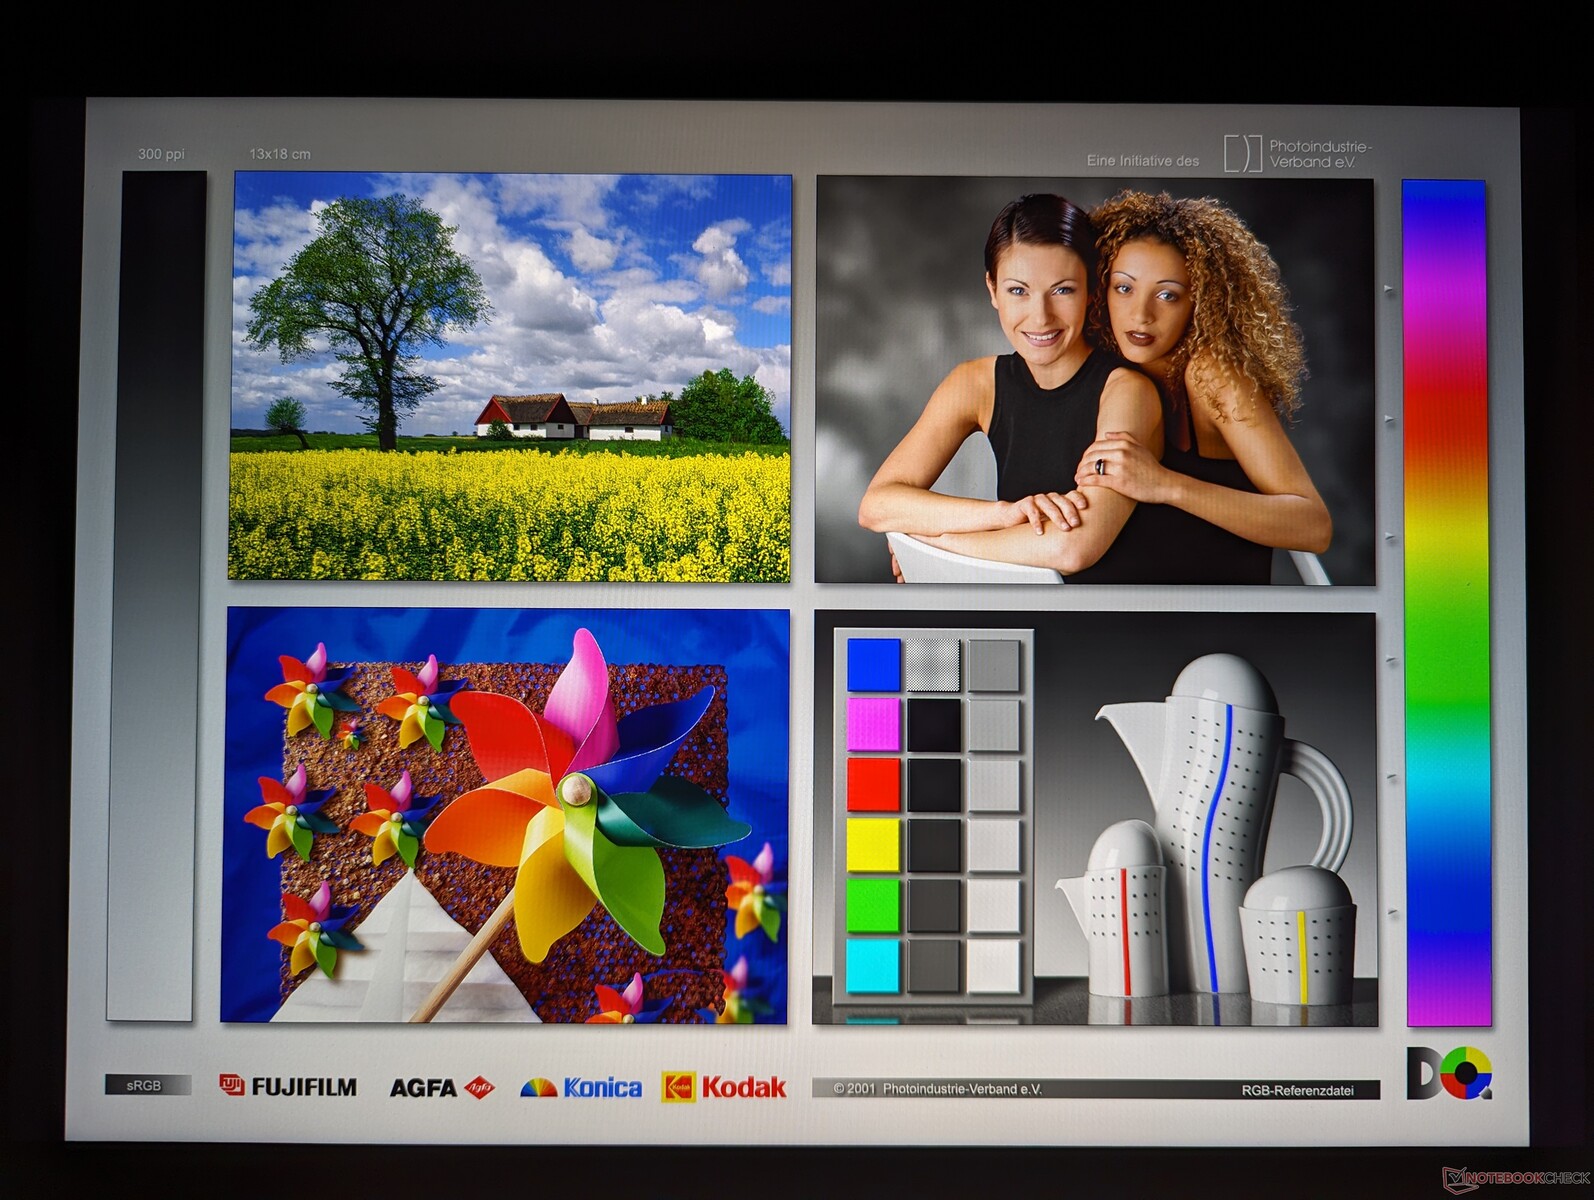
ΔE ColorChecker Calman: 1.81 | ∀{0.5-29.43 Ø4.71}
calibrated: 0.45
ΔE Greyscale Calman: 2.9 | ∀{0.09-98 Ø4.96}
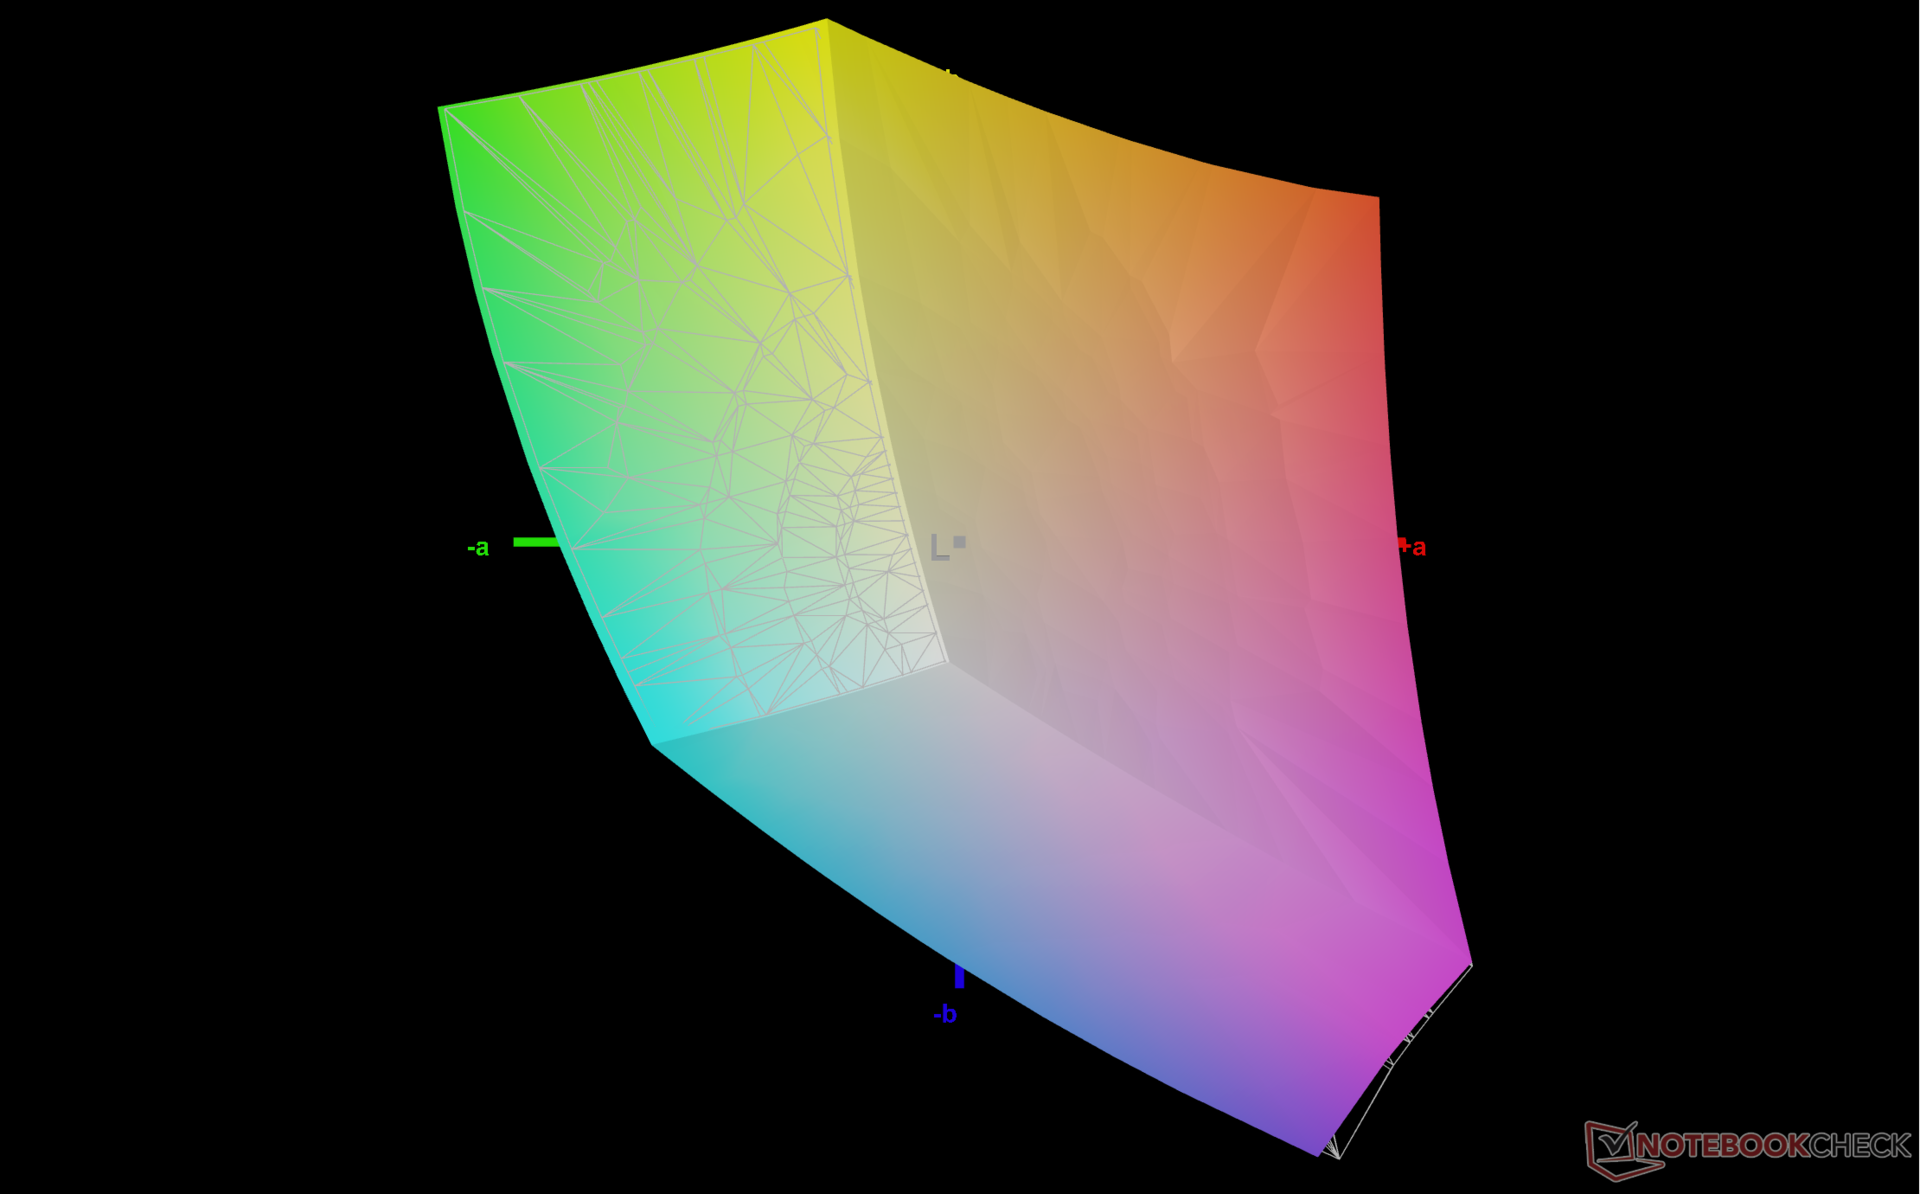
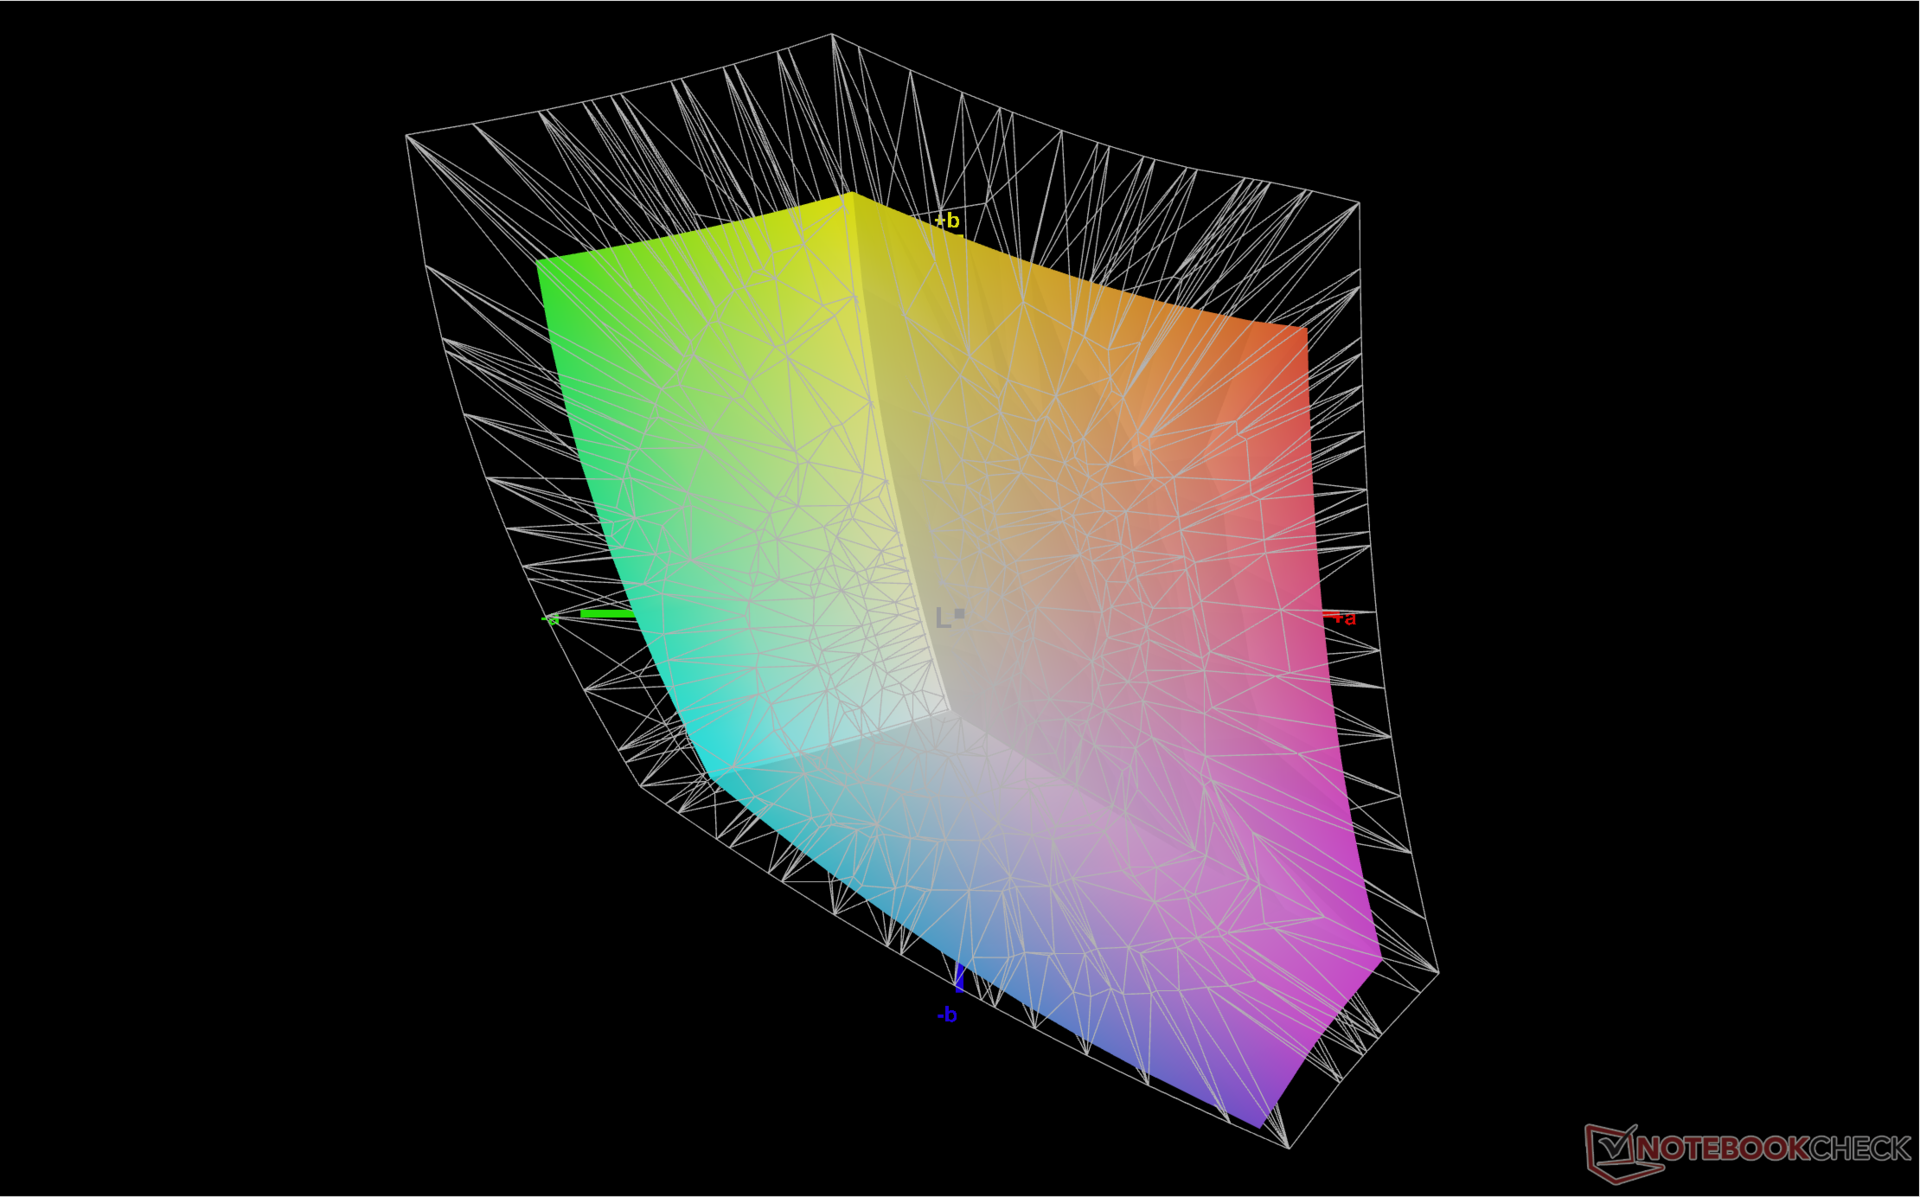
71.1% AdobeRGB 1998 (Argyll 3D)
99.1% sRGB (Argyll 3D)
69% Display P3 (Argyll 3D)
Gamma: 2.27
CCT: 6784 K
| Framework Laptop 13.5 Ryzen 7 7840U BOE CQ NE135FBM-N41, IPS, 2256x1504, 13.5" | Framework Laptop 13.5 13th Gen Intel BOE CQ NE135FBM-N41, IPS, 2256x1504, 13.5" | Framework Laptop 13.5 12th Gen Intel BOE CQ NE135FBM-N41, IPS, 2256x1504, 13.5" | Framework Laptop 13.5 BOE CQ NE135FBM-N41, IPS, 2256x1504, 13.5" | Lenovo ThinkPad X1 Nano Gen 3 MND007ZA1-3, IPS, 2160x1350, 13" | HP Dragonfly G4 Chi Mei CMN13C0, IPS, 1920x1280, 13.5" | |
|---|---|---|---|---|---|---|
| Display | -1% | 0% | -0% | -1% | -1% | |
| Display P3 Coverage (%) | 69 | 68.9 0% | 69.9 1% | 69 0% | 68.5 -1% | 68.4 -1% |
| sRGB Coverage (%) | 99.1 | 97.5 -2% | 99.4 0% | 99.3 0% | 99.5 0% | 98.3 -1% |
| AdobeRGB 1998 Coverage (%) | 71.1 | 71.1 0% | 71.1 0% | 70.3 -1% | 69.7 -2% | 70.4 -1% |
| Response Times | -8% | 22% | -12% | 20% | 2% | |
| Response Time Grey 50% / Grey 80% * (ms) | 50.4 ? | 54.9 ? -9% | 34.7 ? 31% | 55.6 ? -10% | 39.9 ? 21% | 48.8 ? 3% |
| Response Time Black / White * (ms) | 31.5 ? | 33.5 ? -6% | 27.5 ? 13% | 36 ? -14% | 25.8 ? 18% | 31.3 ? 1% |
| PWM Frequency (Hz) | ||||||
| Screen | -37% | -21% | -28% | 13% | 0% | |
| Brightness middle (cd/m²) | 436 | 503 15% | 449.6 3% | 449 3% | 461.2 6% | 408.8 -6% |
| Brightness (cd/m²) | 416 | 472 13% | 431 4% | 435 5% | 428 3% | 399 -4% |
| Brightness Distribution (%) | 89 | 87 -2% | 90 1% | 93 4% | 86 -3% | 90 1% |
| Black Level * (cd/m²) | 0.36 | 0.36 -0% | 0.31 14% | 0.39 -8% | 0.29 19% | 0.32 11% |
| Contrast (:1) | 1211 | 1397 15% | 1450 20% | 1151 -5% | 1590 31% | 1278 6% |
| Colorchecker dE 2000 * | 1.81 | 3.38 -87% | 2.76 -52% | 2.34 -29% | 1.79 1% | 2.02 -12% |
| Colorchecker dE 2000 max. * | 4.73 | 7.08 -50% | 7.96 -68% | 7.07 -49% | 3.3 30% | 3.84 19% |
| Colorchecker dE 2000 calibrated * | 0.45 | 1.21 -169% | 0.58 -29% | 0.96 -113% | 0.47 -4% | 0.61 -36% |
| Greyscale dE 2000 * | 2.9 | 4.8 -66% | 5.2 -79% | 4.7 -62% | 1.8 38% | 2.3 21% |
| Gamma | 2.27 97% | 2.13 103% | 2.23 99% | 2.29 96% | 2.24 98% | 2.2 100% |
| CCT | 6784 96% | 6235 104% | 6475 100% | 6760 96% | 6588 99% | 6203 105% |
| Total Average (Program / Settings) | -15% /
-25% | 0% /
-10% | -13% /
-20% | 11% /
11% | 0% /
0% |
* ... smaller is better

Display Response Times
| ↔ Response Time Black to White | ||
|---|---|---|
| 31.5 ms ... rise ↗ and fall ↘ combined | ↗ 17.7 ms rise | 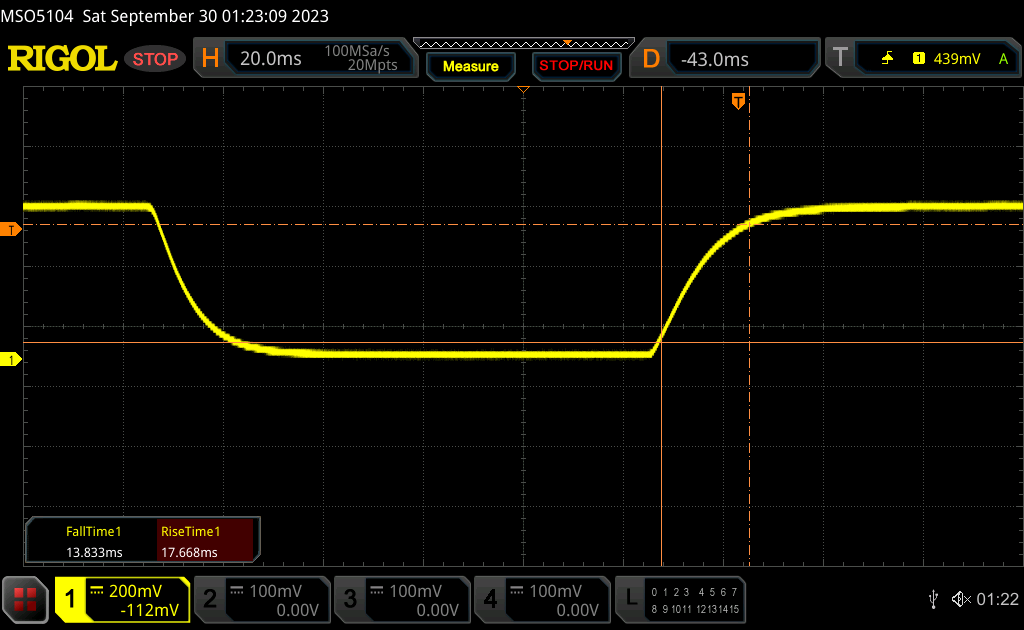 |
| ↘ 13.8 ms fall | ||
| The screen shows slow response rates in our tests and will be unsatisfactory for gamers. In comparison, all tested devices range from 0.1 (minimum) to 240 (maximum) ms. » 85 % of all devices are better. This means that the measured response time is worse than the average of all tested devices (19.8 ms). | ||
| ↔ Response Time 50% Grey to 80% Grey | ||
| 50.4 ms ... rise ↗ and fall ↘ combined | ↗ 23.8 ms rise | 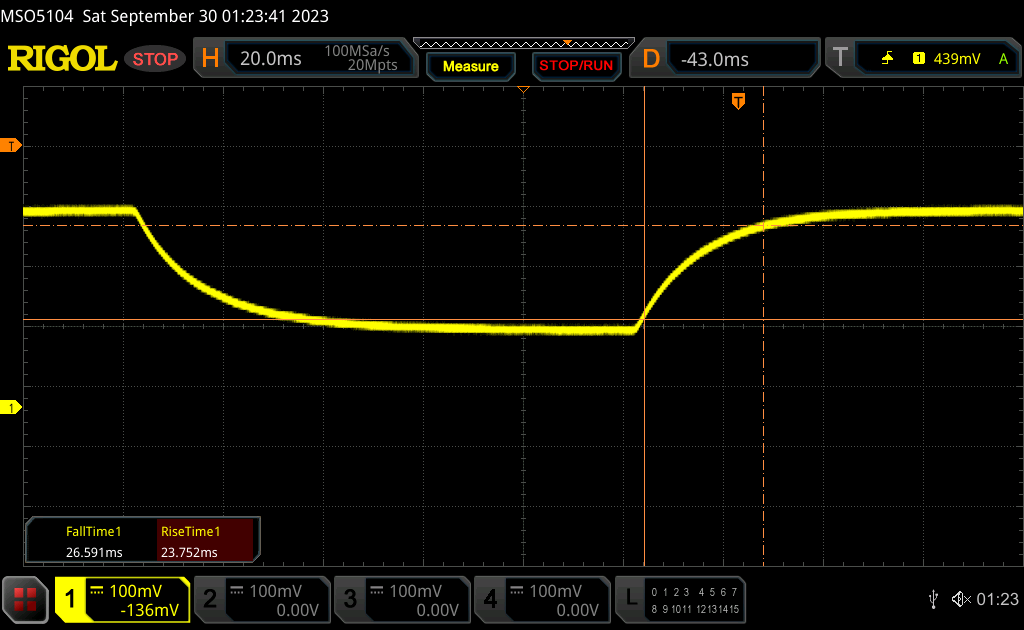 |
| ↘ 26.6 ms fall | ||
| The screen shows slow response rates in our tests and will be unsatisfactory for gamers. In comparison, all tested devices range from 0.165 (minimum) to 636 (maximum) ms. » 87 % of all devices are better. This means that the measured response time is worse than the average of all tested devices (30.9 ms). | ||
Screen Flickering / PWM (Pulse-Width Modulation)
| Screen flickering / PWM not detected | 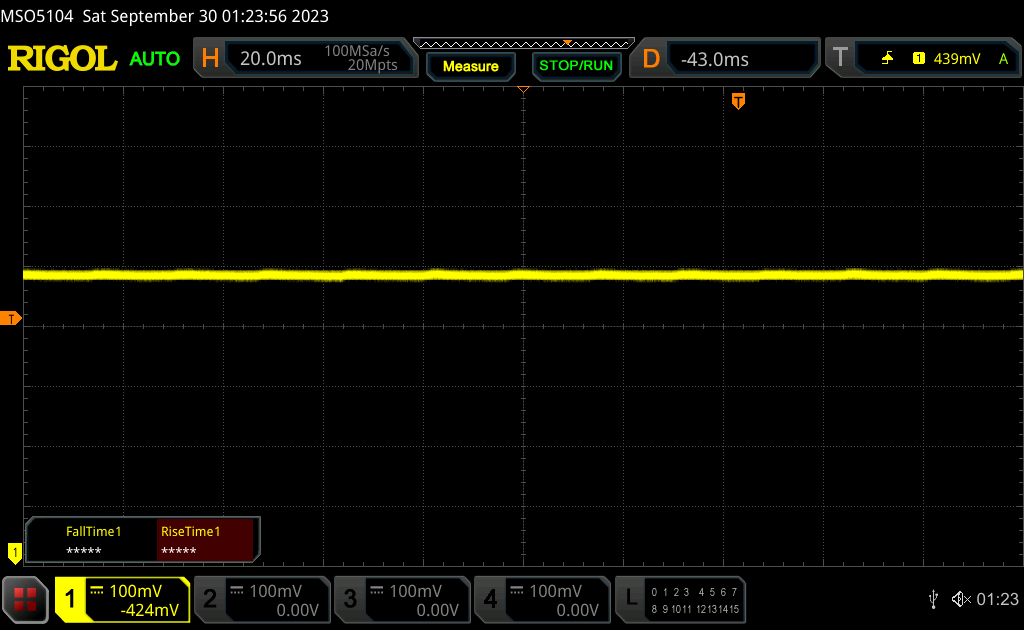 | ||
In comparison: 52 % of all tested devices do not use PWM to dim the display. If PWM was detected, an average of 7744 (minimum: 5 - maximum: 343500) Hz was measured. | |||

Performance

Testing Conditions
We set Windows to Performance mode prior to running the benchmarks below. Framework includes no pre-installed control center-type software for adjusting any specialized features, but we recommend installing AMD Adrenalin for better control over the integrated GPU.
Processor
After the disappointing Zen 3 Ryzen 7 7730U, we're finally starting to see more laptops sporting the Zen 4 Ryzen 7 7840U become available. This long-awaited U-series CPU is neck-to-neck with the H-series Core i7-12700H while requiring just a fraction of the power. It also marginally outperforms the 13th gen Core i7-1370P as found on the Intel-based Framework Laptop in multi-threaded workloads.
Nonetheless, single-thread performance is about 15 percent slower than the Core i7-1370P to be more in line with an Intel 12th gen CPU like the Core i7-1260P. This deficit shouldn't be a huge surprise given that AMD CPUs are usually slightly behind in this regard.
We have yet to test a Ryzen 5 7640U laptop in-house and so we cannot say for certain how much of a performance loss is expected when downgrading from our Ryzen 7 7840U to the Ryzen 5 7640U as of this writing.
Cinebench R15 Multi Loop
Cinebench R23: Multi Core | Single Core
Cinebench R20: CPU (Multi Core) | CPU (Single Core)
Cinebench R15: CPU Multi 64Bit | CPU Single 64Bit
Blender: v2.79 BMW27 CPU
7-Zip 18.03: 7z b 4 | 7z b 4 -mmt1
Geekbench 5.5: Multi-Core | Single-Core
HWBOT x265 Benchmark v2.2: 4k Preset
LibreOffice : 20 Documents To PDF
R Benchmark 2.5: Overall mean
* ... smaller is better
AIDA64: FP32 Ray-Trace | FPU Julia | CPU SHA3 | CPU Queen | FPU SinJulia | FPU Mandel | CPU AES | CPU ZLib | FP64 Ray-Trace | CPU PhotoWorxx
AIDA64: FP32 Ray-Trace | FPU Julia | CPU SHA3 | CPU Queen | FPU SinJulia | FPU Mandel | CPU AES | CPU ZLib | FP64 Ray-Trace | CPU PhotoWorxx
System Performance

CrossMark: Overall | Productivity | Creativity | Responsiveness
| PCMark 10 / Score | |
| Framework Laptop 13.5 Ryzen 7 7840U | |
| Average AMD Ryzen 7 7840U, AMD Radeon 780M (5866 - 7157, n=10) | |
| Dell XPS 13 Plus 9320 Core i7-1360P | |
| Lenovo ThinkPad X1 Nano Gen 3 | |
| HP Dragonfly G4 | |
| Asus ZenBook S13 OLED UX5304 | |
| Framework Laptop 13.5 | |
| PCMark 10 / Essentials | |
| Dell XPS 13 Plus 9320 Core i7-1360P | |
| Framework Laptop 13.5 Ryzen 7 7840U | |
| HP Dragonfly G4 | |
| Lenovo ThinkPad X1 Nano Gen 3 | |
| Asus ZenBook S13 OLED UX5304 | |
| Framework Laptop 13.5 | |
| Average AMD Ryzen 7 7840U, AMD Radeon 780M (9068 - 11081, n=10) | |
| PCMark 10 / Productivity | |
| Framework Laptop 13.5 Ryzen 7 7840U | |
| Average AMD Ryzen 7 7840U, AMD Radeon 780M (7323 - 10099, n=10) | |
| Lenovo ThinkPad X1 Nano Gen 3 | |
| Dell XPS 13 Plus 9320 Core i7-1360P | |
| HP Dragonfly G4 | |
| Asus ZenBook S13 OLED UX5304 | |
| Framework Laptop 13.5 | |
| PCMark 10 / Digital Content Creation | |
| Framework Laptop 13.5 Ryzen 7 7840U | |
| Average AMD Ryzen 7 7840U, AMD Radeon 780M (7204 - 8987, n=10) | |
| Dell XPS 13 Plus 9320 Core i7-1360P | |
| Lenovo ThinkPad X1 Nano Gen 3 | |
| HP Dragonfly G4 | |
| Asus ZenBook S13 OLED UX5304 | |
| Framework Laptop 13.5 | |
| CrossMark / Overall | |
| Dell XPS 13 Plus 9320 Core i7-1360P | |
| Lenovo ThinkPad X1 Nano Gen 3 | |
| Framework Laptop 13.5 Ryzen 7 7840U | |
| HP Dragonfly G4 | |
| Asus ZenBook S13 OLED UX5304 | |
| Average AMD Ryzen 7 7840U, AMD Radeon 780M (1256 - 1804, n=10) | |
| CrossMark / Productivity | |
| Lenovo ThinkPad X1 Nano Gen 3 | |
| Dell XPS 13 Plus 9320 Core i7-1360P | |
| Framework Laptop 13.5 Ryzen 7 7840U | |
| HP Dragonfly G4 | |
| Asus ZenBook S13 OLED UX5304 | |
| Average AMD Ryzen 7 7840U, AMD Radeon 780M (1261 - 1798, n=10) | |
| CrossMark / Creativity | |
| Dell XPS 13 Plus 9320 Core i7-1360P | |
| Lenovo ThinkPad X1 Nano Gen 3 | |
| Framework Laptop 13.5 Ryzen 7 7840U | |
| HP Dragonfly G4 | |
| Asus ZenBook S13 OLED UX5304 | |
| Average AMD Ryzen 7 7840U, AMD Radeon 780M (1251 - 1835, n=10) | |
| CrossMark / Responsiveness | |
| Dell XPS 13 Plus 9320 Core i7-1360P | |
| Lenovo ThinkPad X1 Nano Gen 3 | |
| Framework Laptop 13.5 Ryzen 7 7840U | |
| Asus ZenBook S13 OLED UX5304 | |
| HP Dragonfly G4 | |
| Average AMD Ryzen 7 7840U, AMD Radeon 780M (1082 - 1775, n=10) | |
| PCMark 10 Score | 7157 points | |
Help | ||
| AIDA64 / Memory Copy | |
| Dell XPS 13 Plus 9320 Core i7-1360P | |
| Lenovo ThinkPad X1 Nano Gen 3 | |
| Framework Laptop 13.5 Ryzen 7 7840U | |
| Asus ZenBook S13 OLED UX5304 | |
| HP Dragonfly G4 | |
| Average AMD Ryzen 7 7840U (43255 - 70532, n=12) | |
| Framework Laptop 13.5 | |
| AIDA64 / Memory Read | |
| Dell XPS 13 Plus 9320 Core i7-1360P | |
| Lenovo ThinkPad X1 Nano Gen 3 | |
| Framework Laptop 13.5 Ryzen 7 7840U | |
| Asus ZenBook S13 OLED UX5304 | |
| HP Dragonfly G4 | |
| Average AMD Ryzen 7 7840U (37399 - 61602, n=11) | |
| Framework Laptop 13.5 | |
| AIDA64 / Memory Write | |
| Lenovo ThinkPad X1 Nano Gen 3 | |
| Dell XPS 13 Plus 9320 Core i7-1360P | |
| Framework Laptop 13.5 Ryzen 7 7840U | |
| Asus ZenBook S13 OLED UX5304 | |
| HP Dragonfly G4 | |
| Average AMD Ryzen 7 7840U (46797 - 92289, n=13) | |
| Framework Laptop 13.5 | |
| AIDA64 / Memory Latency | |
| Average AMD Ryzen 7 7840U (90 - 137.2, n=12) | |
| Dell XPS 13 Plus 9320 Core i7-1360P | |
| Lenovo ThinkPad X1 Nano Gen 3 | |
| HP Dragonfly G4 | |
| Asus ZenBook S13 OLED UX5304 | |
| Framework Laptop 13.5 Ryzen 7 7840U | |
| Framework Laptop 13.5 | |
* ... smaller is better
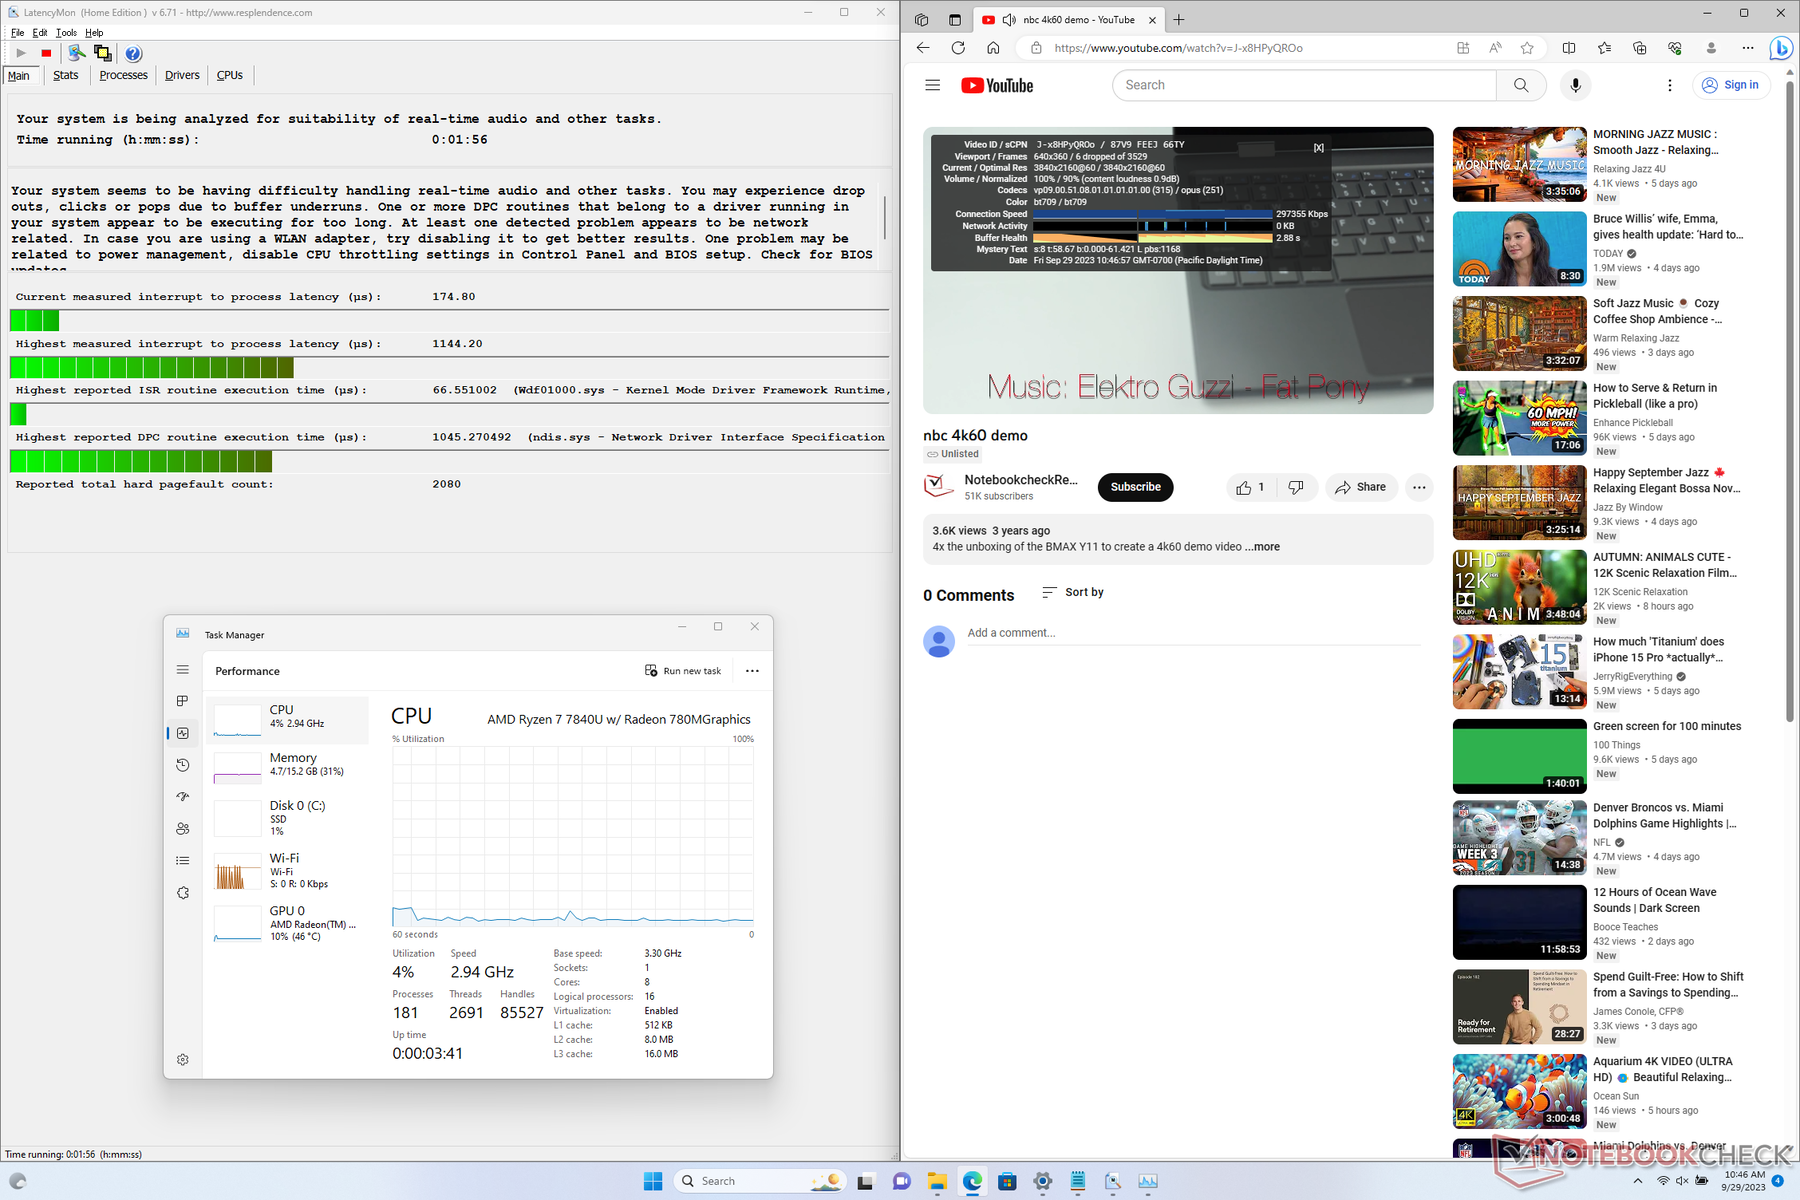
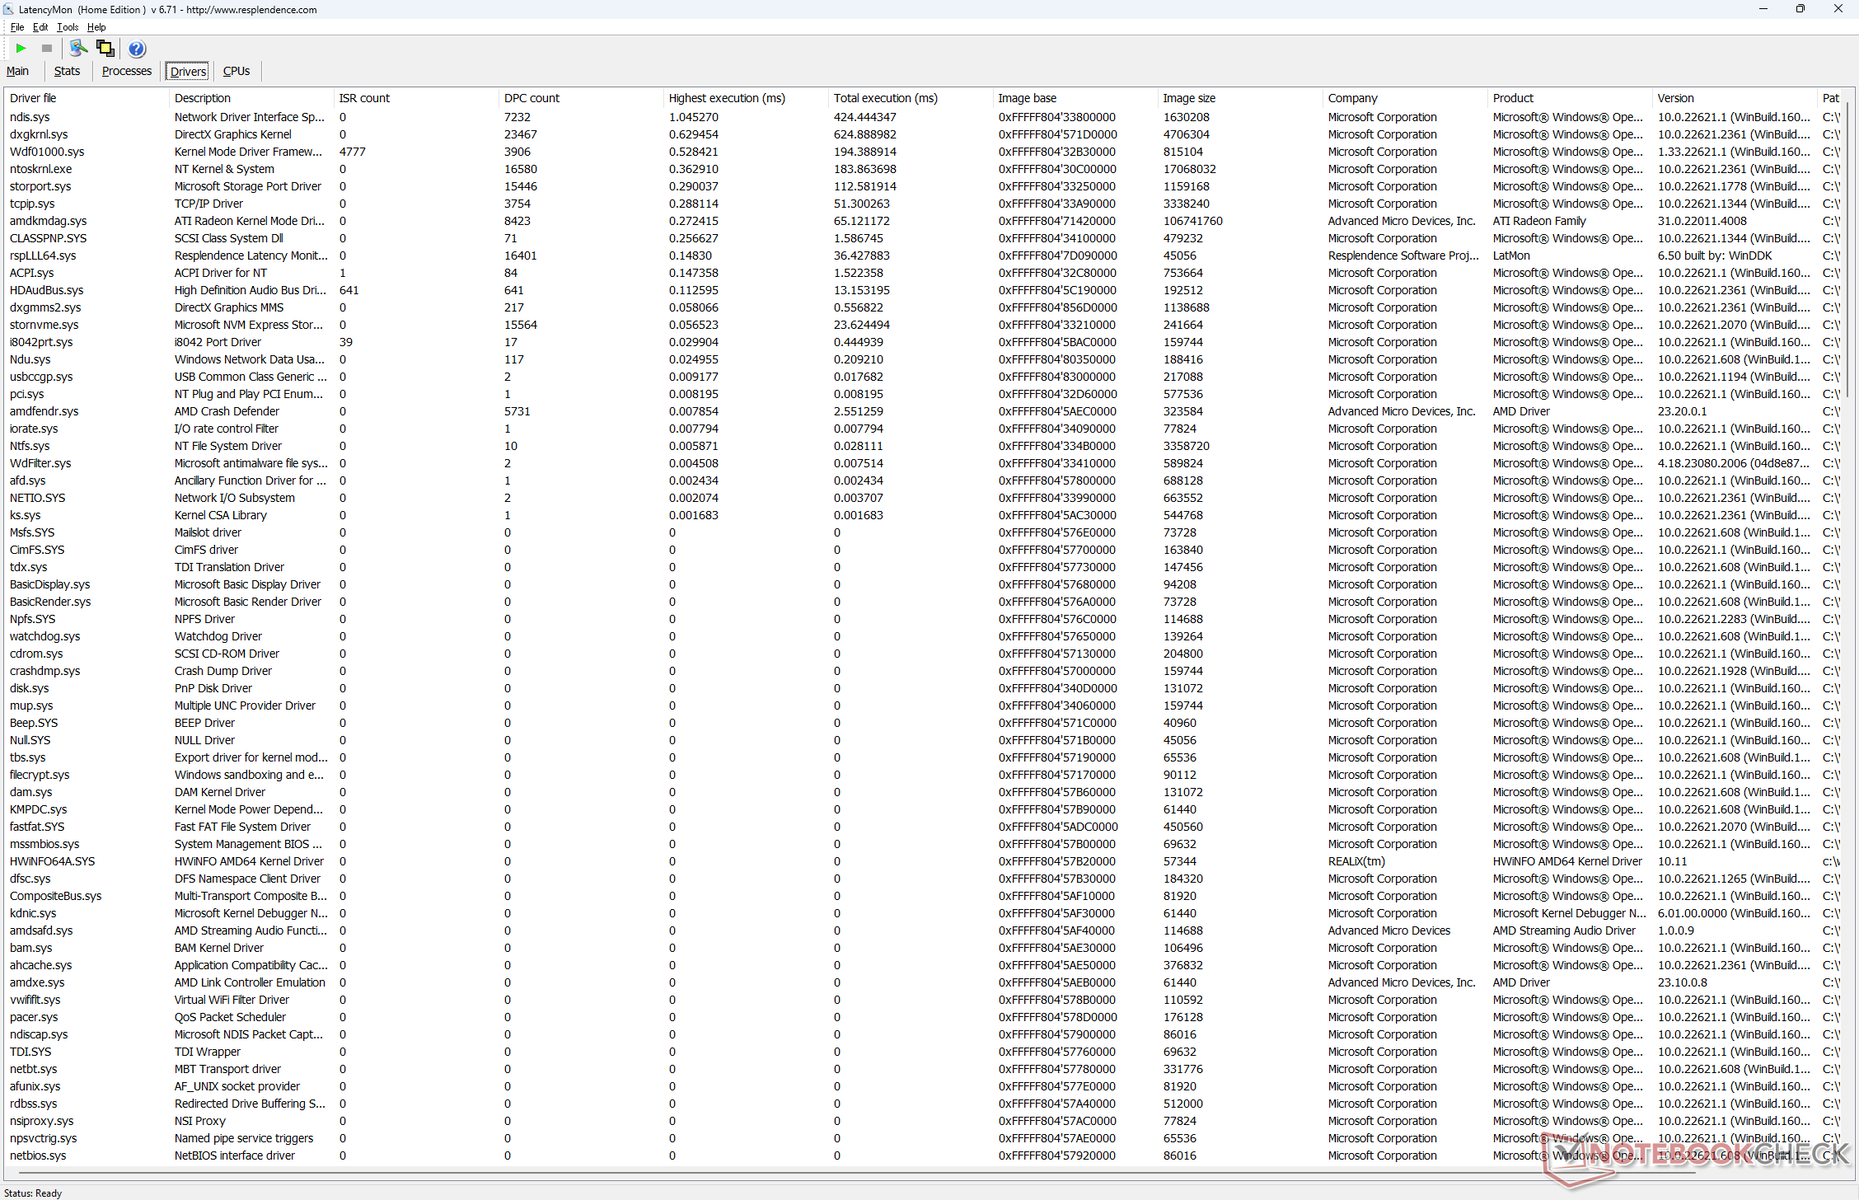
DPC Latency
LatencyMon reveals only slight DPC issues when opening multiple tabs of our homepage. 4K video playback at 60 FPS is imperfect with 6 dropped frames recorded during a one-minute period. AMD systems like the Legion Slim 5 14 or Aokzoe A1 seem to be exhibiting more issues related to frame skips than Intel as of late.
| DPC Latencies / LatencyMon - interrupt to process latency (max), Web, Youtube, Prime95 | |
| Dell XPS 13 Plus 9320 Core i7-1360P | |
| Lenovo ThinkPad X1 Nano Gen 3 | |
| Framework Laptop 13.5 | |
| Asus ZenBook S13 OLED UX5304 | |
| HP Dragonfly G4 | |
| Framework Laptop 13.5 Ryzen 7 7840U | |
* ... smaller is better
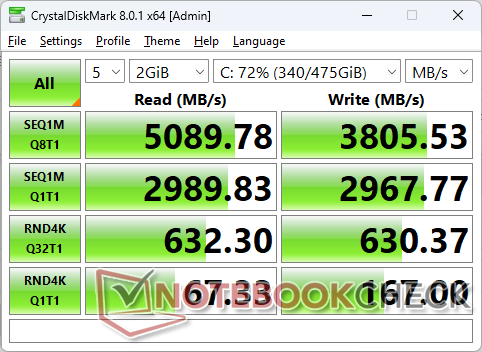
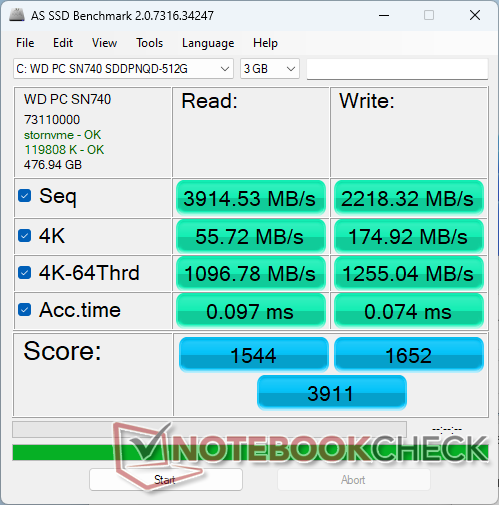
Storage Devices
Framework offers only Western Digital drives likely due to an exclusivity deal with the SSD maker. Of course, users can easily install their own drives instead of desired.

* ... smaller is better
Disk Throttling: DiskSpd Read Loop, Queue Depth 8
GPU Performance
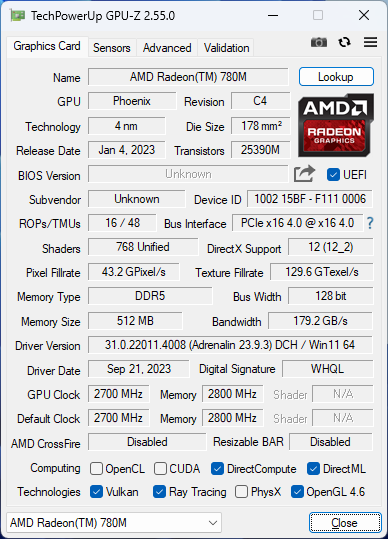
Last year's Radeon 680M was already faster than any integrated solution from Intel and this year's Radeon 780M cements AMD's lead even further. Raw graphics performance is 30 to 50 percent faster than the Iris Xe 96 EUs in the recent 13th gen Intel version of the Framework Laptop 13.5. The performance advantages become more pronounced for DX12-enabled applications.
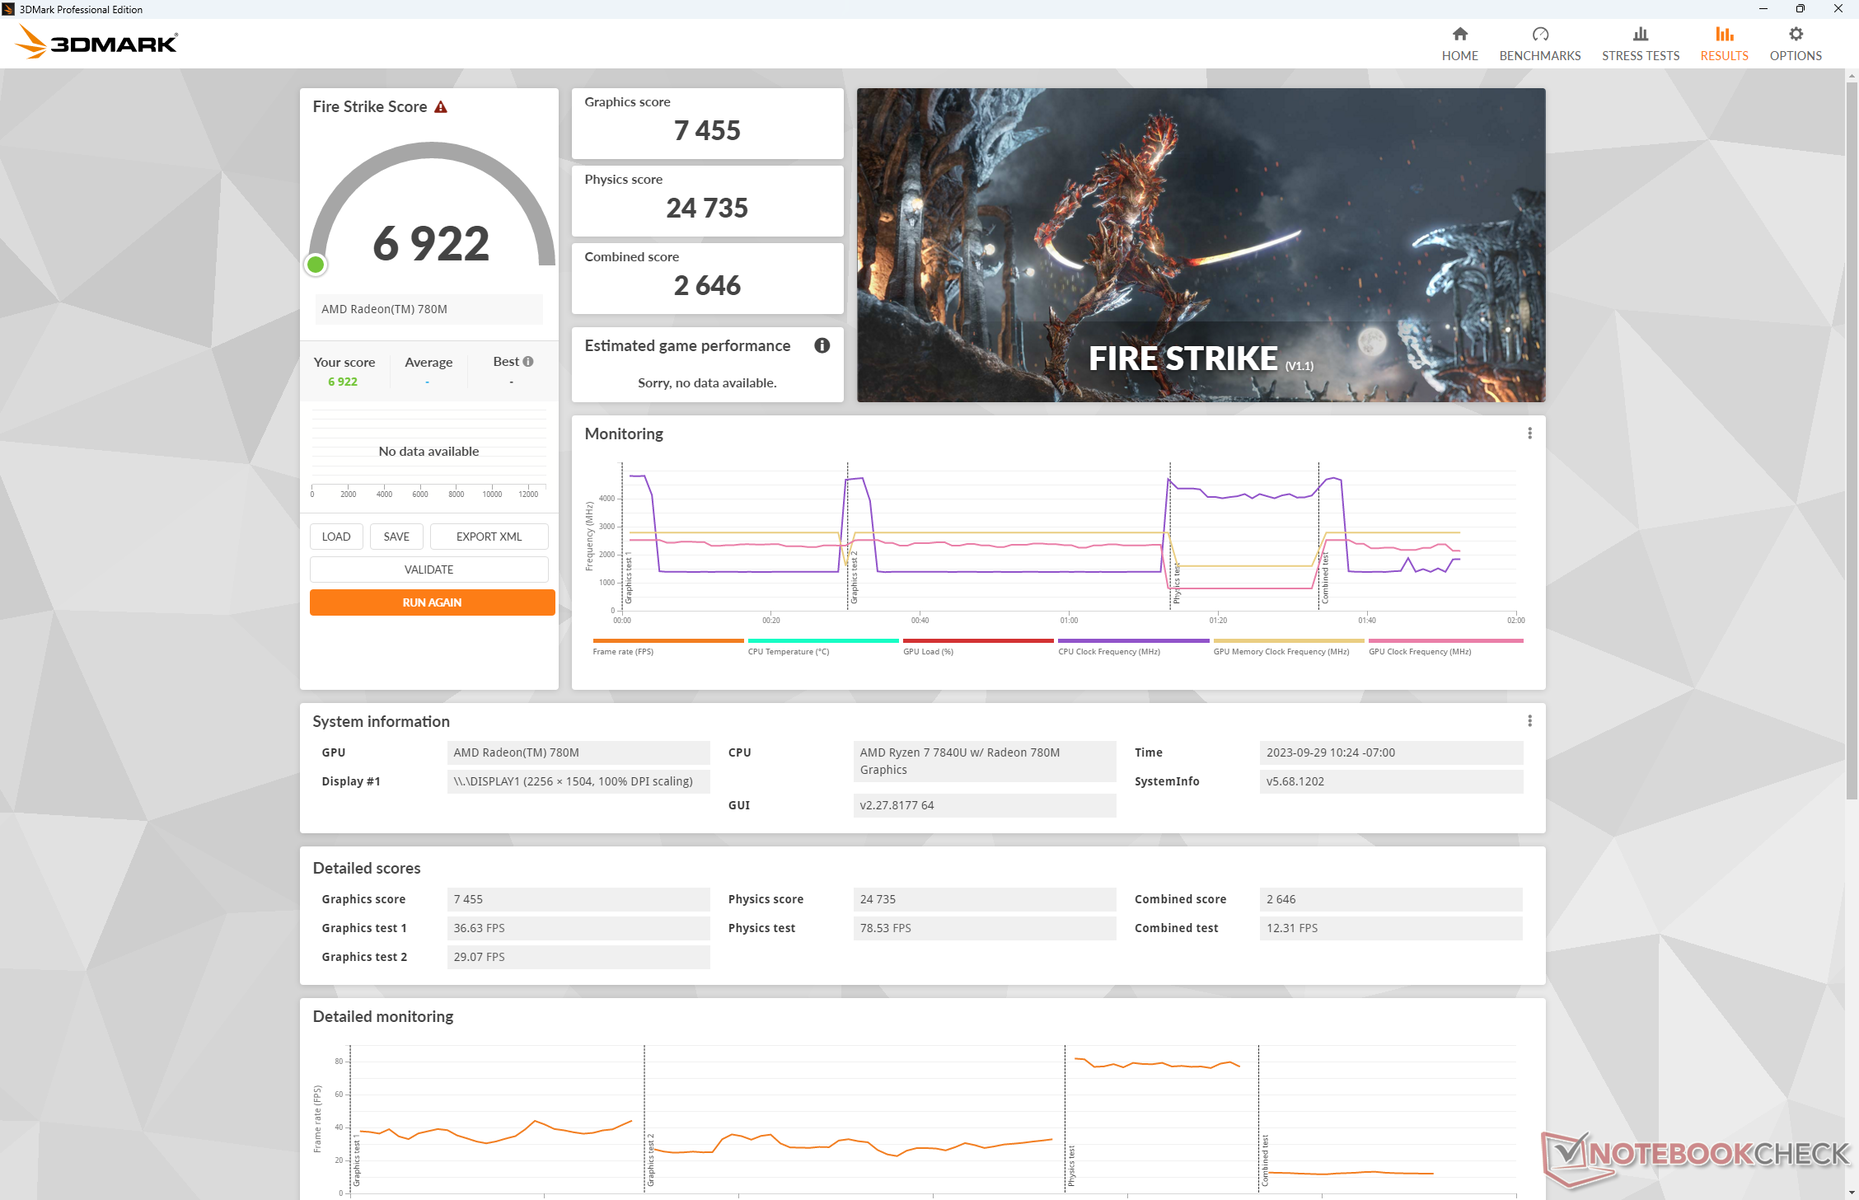
| Power Profile | Graphics Score | Physics Score | Combined Score |
| Performance Mode | 7455 | 24735 | 2646 |
| Balanced Mode | 7426 (-0%) | 24403 (-1%) | 2646 (-0%) |
| Battery Power | 6591 (-12%) | 24183 (-2%) | 2223 (-16%) |
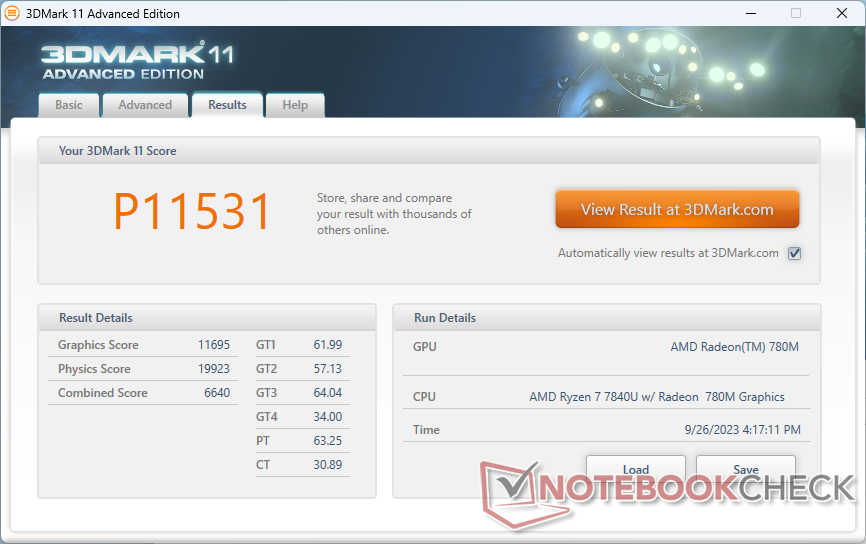

| 3DMark 11 Performance | 11531 points | |
| 3DMark Fire Strike Score | 6922 points | |
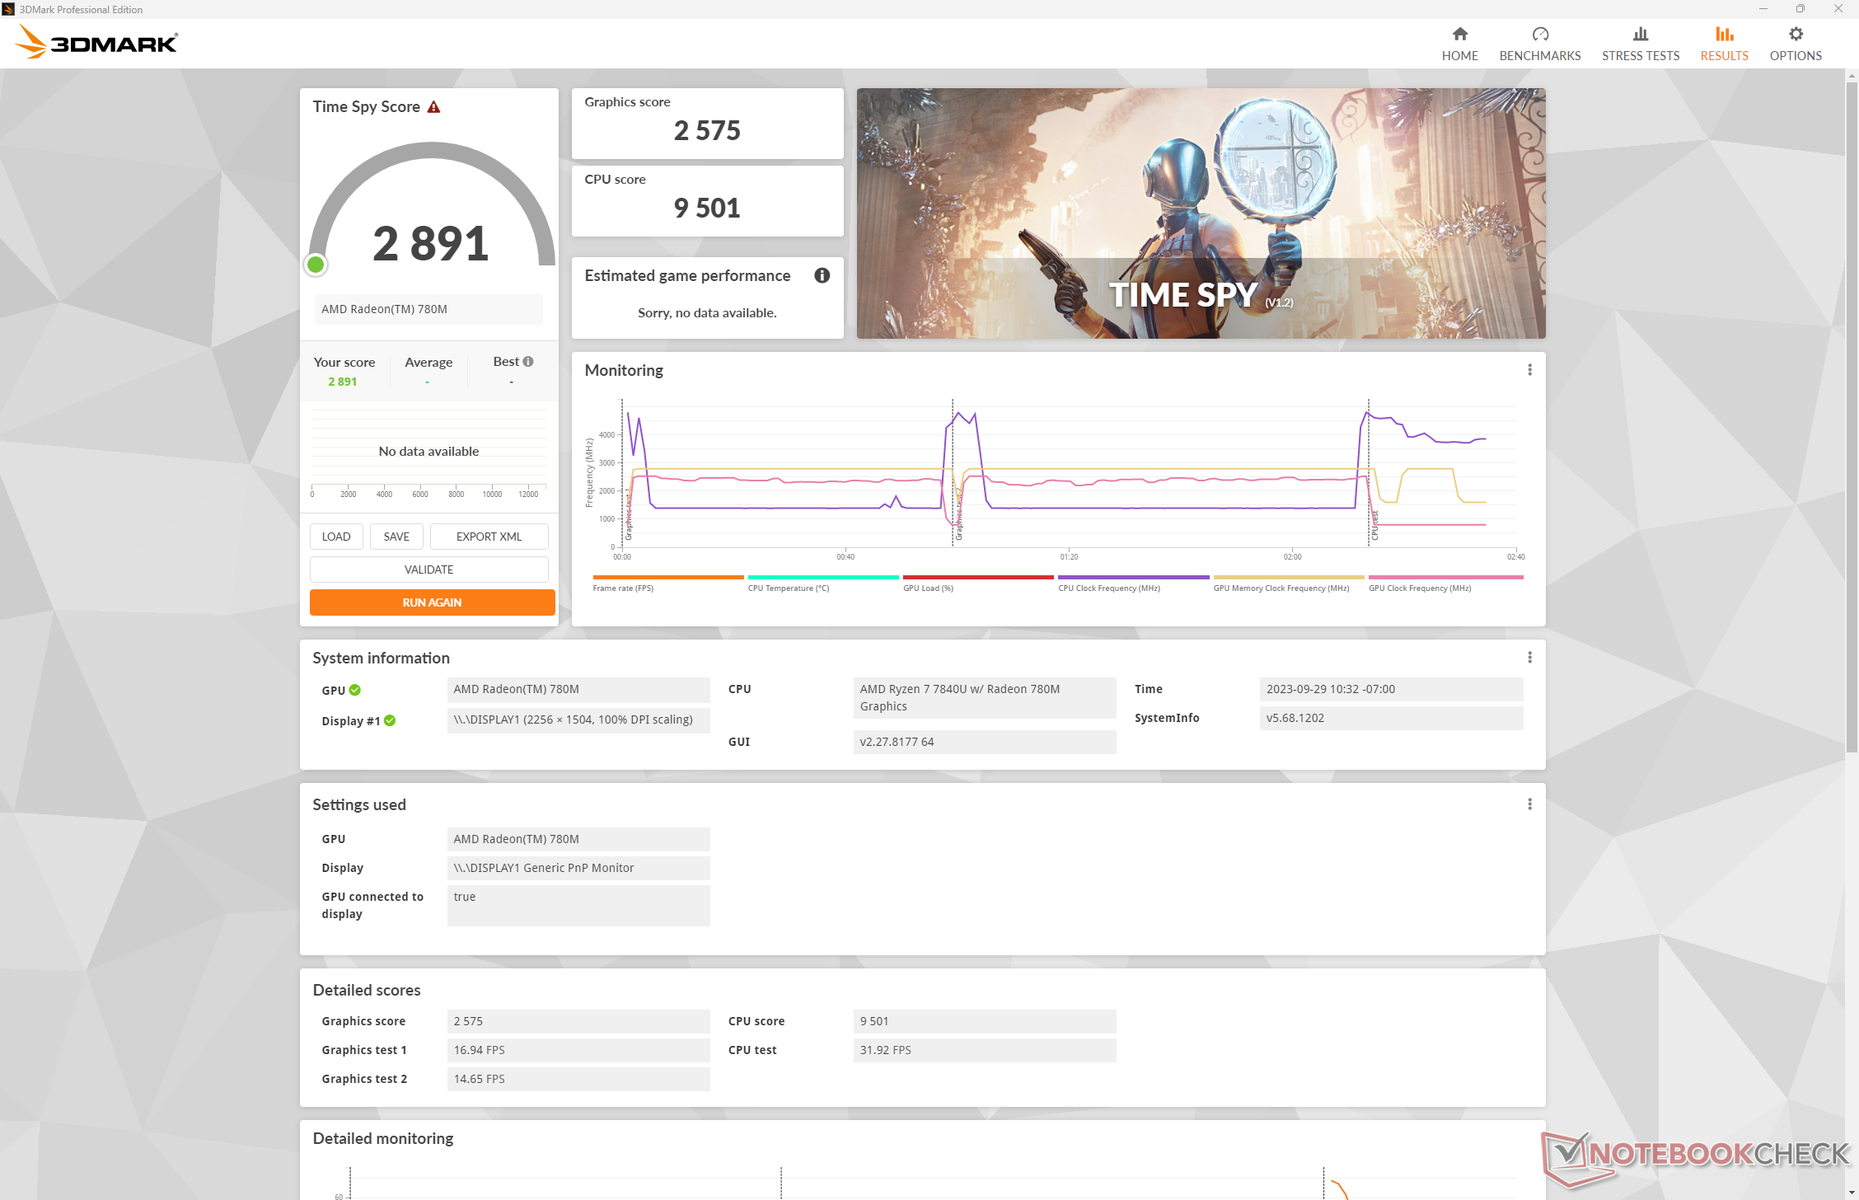
| 3DMark Time Spy Score | 2891 points | |
Help | ||
* ... smaller is better
Gaming Performance
The Framework Laptop 13.5 isn't a gaming machine, but the Zen 4 CPU is nonetheless capable of running most games reasonably well at 1080p including even Cyberpunk 2077. With that said, we experienced crashes when running a few titles including F1 22 and Ratchet and Clank Rift Apart.
Witcher 3 FPS Chart
| low | med. | high | ultra | |
|---|---|---|---|---|
| The Witcher 3 (2015) | 136.2 | 45.9 | 28.7 | |
| Dota 2 Reborn (2015) | 154.1 | 119.3 | 76.2 | 71.2 |
| Final Fantasy XV Benchmark (2018) | 66.6 | 34.4 | 25.7 | |
| X-Plane 11.11 (2018) | 60 | 44.4 | 37.5 | |
| Far Cry 5 (2018) | 74 | 39 | 37 | 35 |
| Strange Brigade (2018) | 139.8 | 59.7 | 50.5 | 43 |
| Cyberpunk 2077 1.6 (2022) | 39.5 | 30.9 | 24.6 | 23 |
| Tiny Tina's Wonderlands (2022) | 60.4 | 44.8 | 30.4 | 25.2 |
| F1 22 (2022) | 80.6 | 72.5 | 54.2 |
Emissions
System Noise
Fan noise when running demanding loads is pretty much the same as what we recorded on the Intel Core-P configuration. The Framework remains one of the loudest subnotebooks when under load at the 46 to 49 dB(A) range compared to the low 40 dB(A) range on most other subnotebooks. We would also notice more frequent fan pulsing as well.
To Framework's credit, the fan noise ramp up time is relatively slow and steady on the AMD configuration meaning the system is able to remain relatively quiet when running less demanding loads like browsing or video streaming.
Noise level
| Idle |
| 22.6 / 22.6 / 24.2 dB(A) |
| Load |
| 35.8 / 48.9 dB(A) |
 | ||
30 dB silent 40 dB(A) audible 50 dB(A) loud |
||
min: | ||
| Framework Laptop 13.5 Ryzen 7 7840U Radeon 780M, R7 7840U, WD PC SN740 512GB SDDPNQD-512G | Framework Laptop 13.5 Iris Xe G7 96EUs, i7-1165G7, Western Digital WD_BLACK SN850 WDS100T1X0E | Lenovo ThinkPad X1 Nano Gen 3 Iris Xe G7 96EUs, i7-1360P, Lenovo UMIS AM6A0 RPJTJ512MKP1QDQ | HP Dragonfly G4 Iris Xe G7 96EUs, i7-1365U, Micron 3400 MTFDKBA512TFH 512GB | Dell XPS 13 Plus 9320 Core i7-1360P Iris Xe G7 96EUs, i7-1360P, Samsung PM9A1 MZVL2512HCJQ | Asus ZenBook S13 OLED UX5304 Iris Xe G7 96EUs, i7-1355U, Samsung PM9A1 MZVL21T0HCLR | |
|---|---|---|---|---|---|---|
| Noise | -6% | 8% | 9% | 0% | 3% | |
| off / environment * (dB) | 22.6 | 23.9 -6% | 22.9 -1% | 23.3 -3% | 23.7 -5% | 23.3 -3% |
| Idle Minimum * (dB) | 22.6 | 23.9 -6% | 23 -2% | 23.5 -4% | 24 -6% | 23.3 -3% |
| Idle Average * (dB) | 22.6 | 23.9 -6% | 23 -2% | 23.5 -4% | 24 -6% | 23.3 -3% |
| Idle Maximum * (dB) | 24.2 | 23.9 1% | 23 5% | 26.8 -11% | 24.4 -1% | 23.3 4% |
| Load Average * (dB) | 35.8 | 45.6 -27% | 32.8 8% | 27.2 24% | 37 -3% | 37.7 -5% |
| Witcher 3 ultra * (dB) | 46.5 | 47.1 -1% | 36.9 21% | 32.7 30% | 42.1 9% | 40.1 14% |
| Load Maximum * (dB) | 48.9 | 47.9 2% | 36.9 25% | 35 28% | 42 14% | 40.1 18% |
* ... smaller is better
Temperature
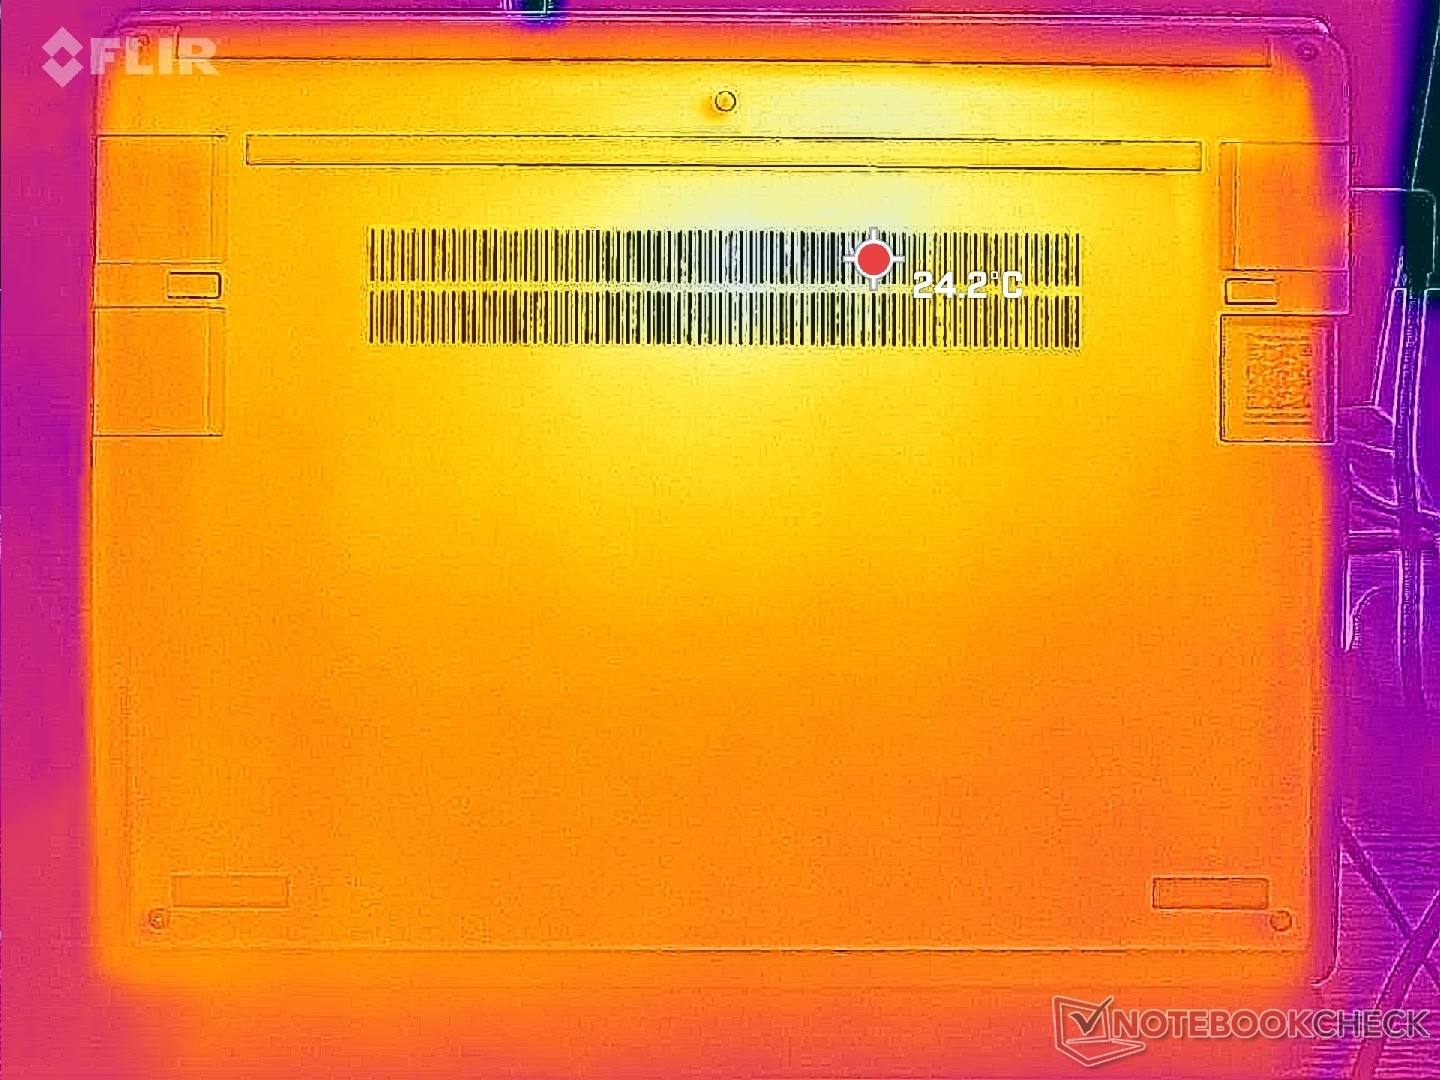
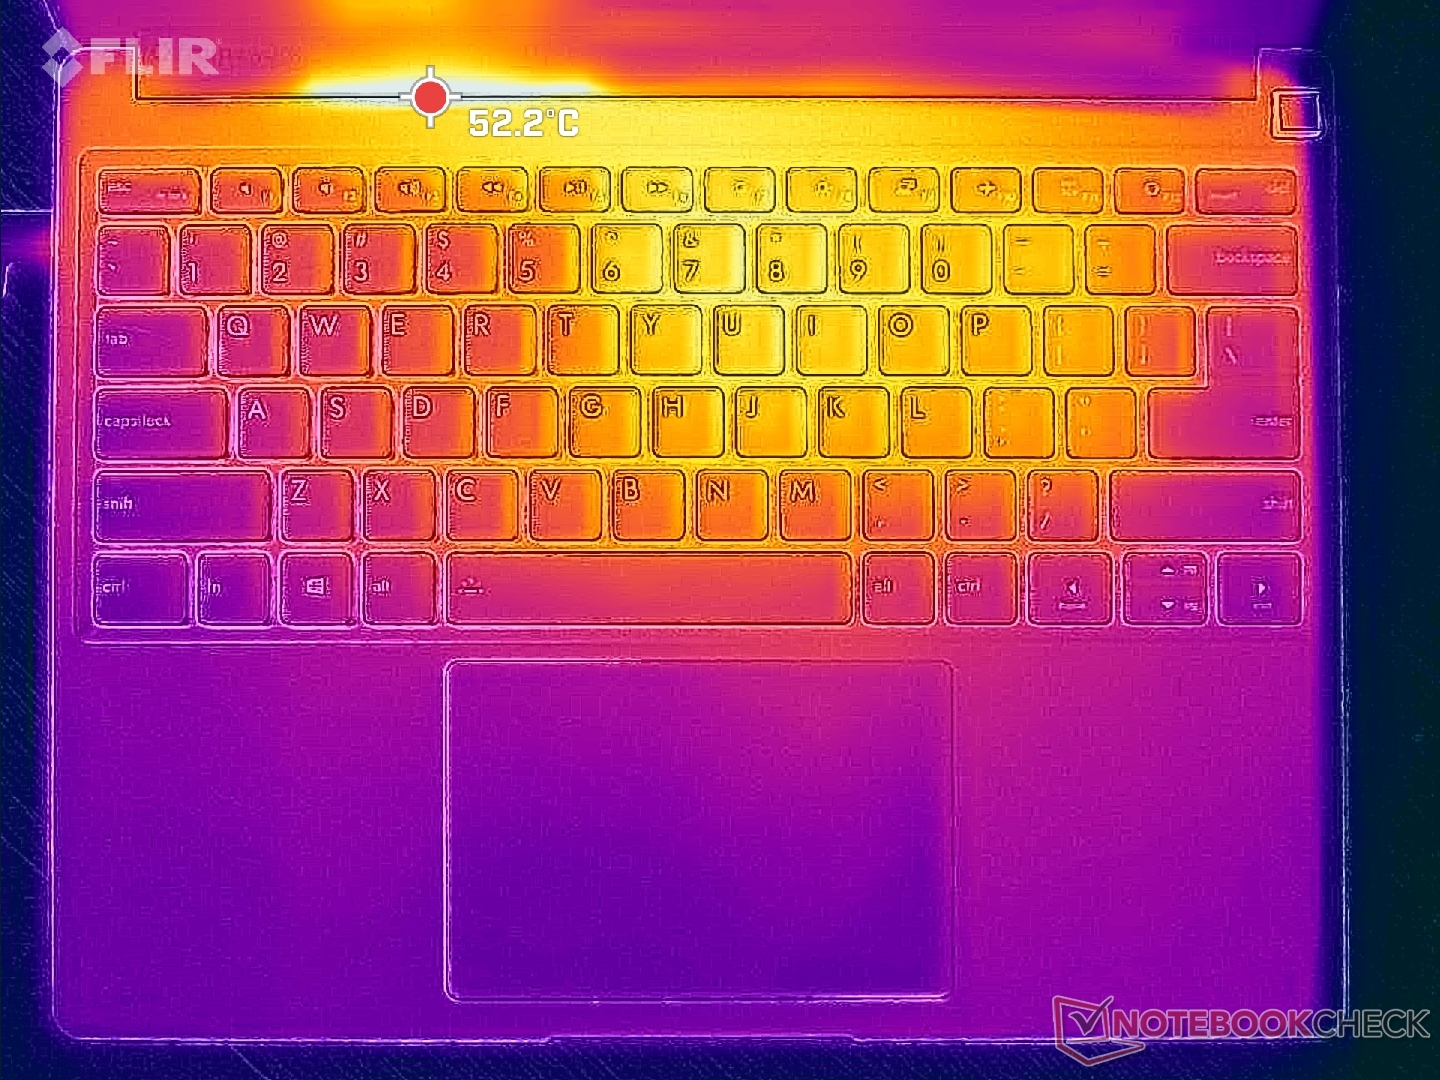
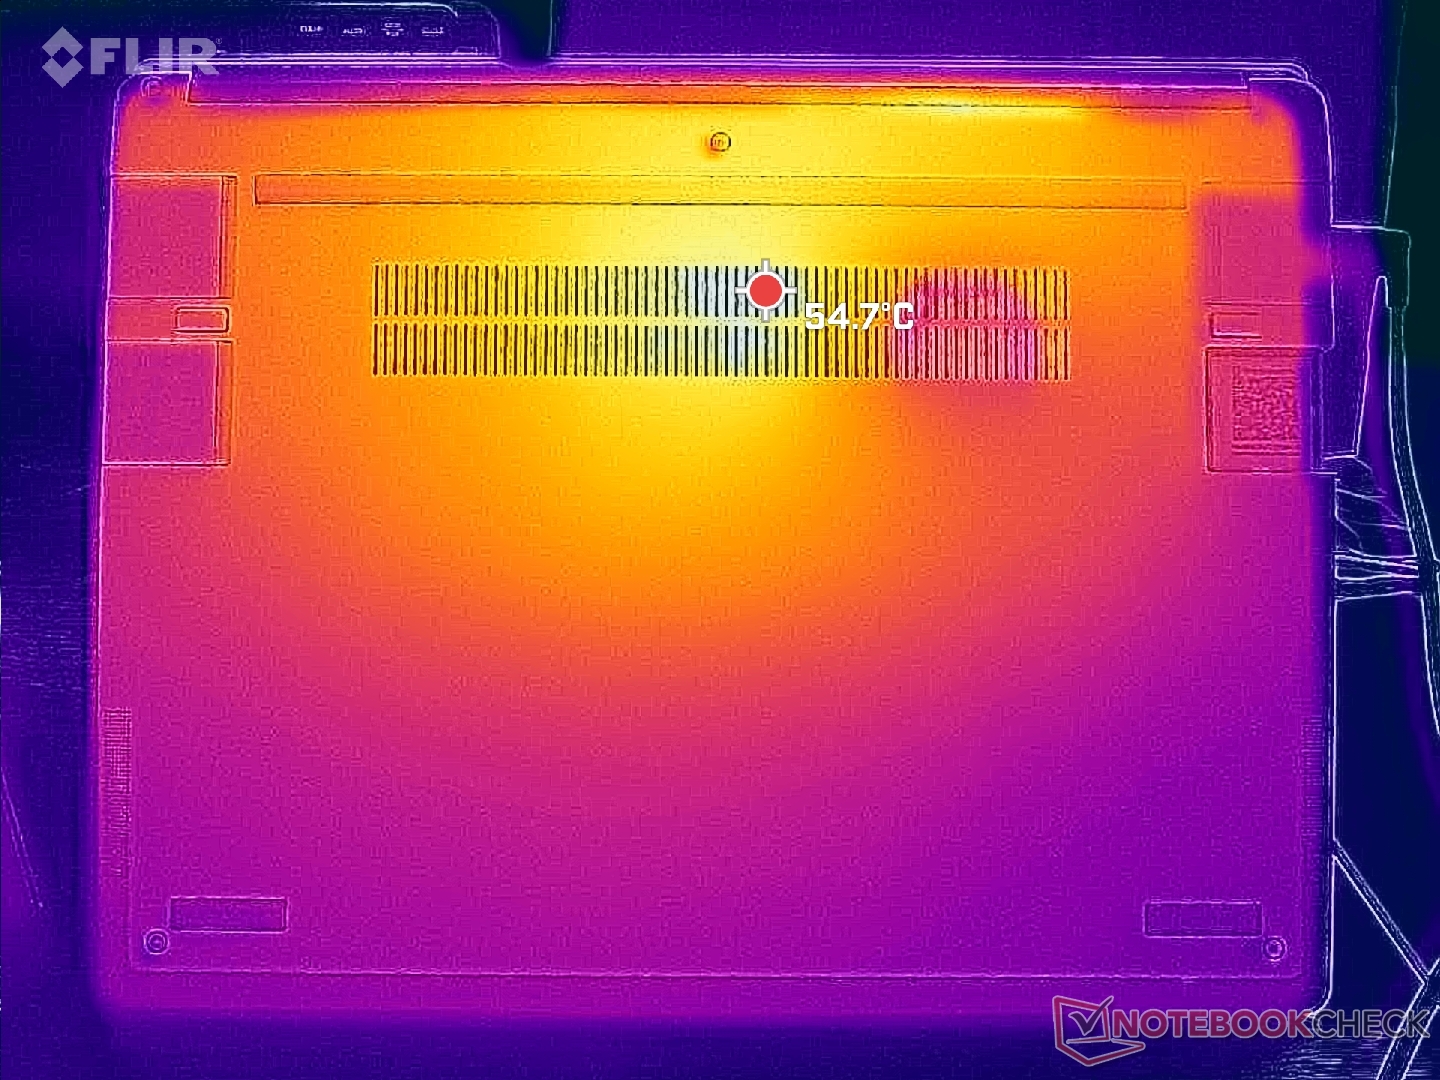
Surface temperatures are not any cooler than the Intel version and they may even be warmer. Average temperatures on our AMD system would be a few degrees C warmer on both the top and bottom sides, but differences in background temperature can never be fully ruled out. Alternatives with slower CPUs like the HP Spectre x360 13.5 run cooler.
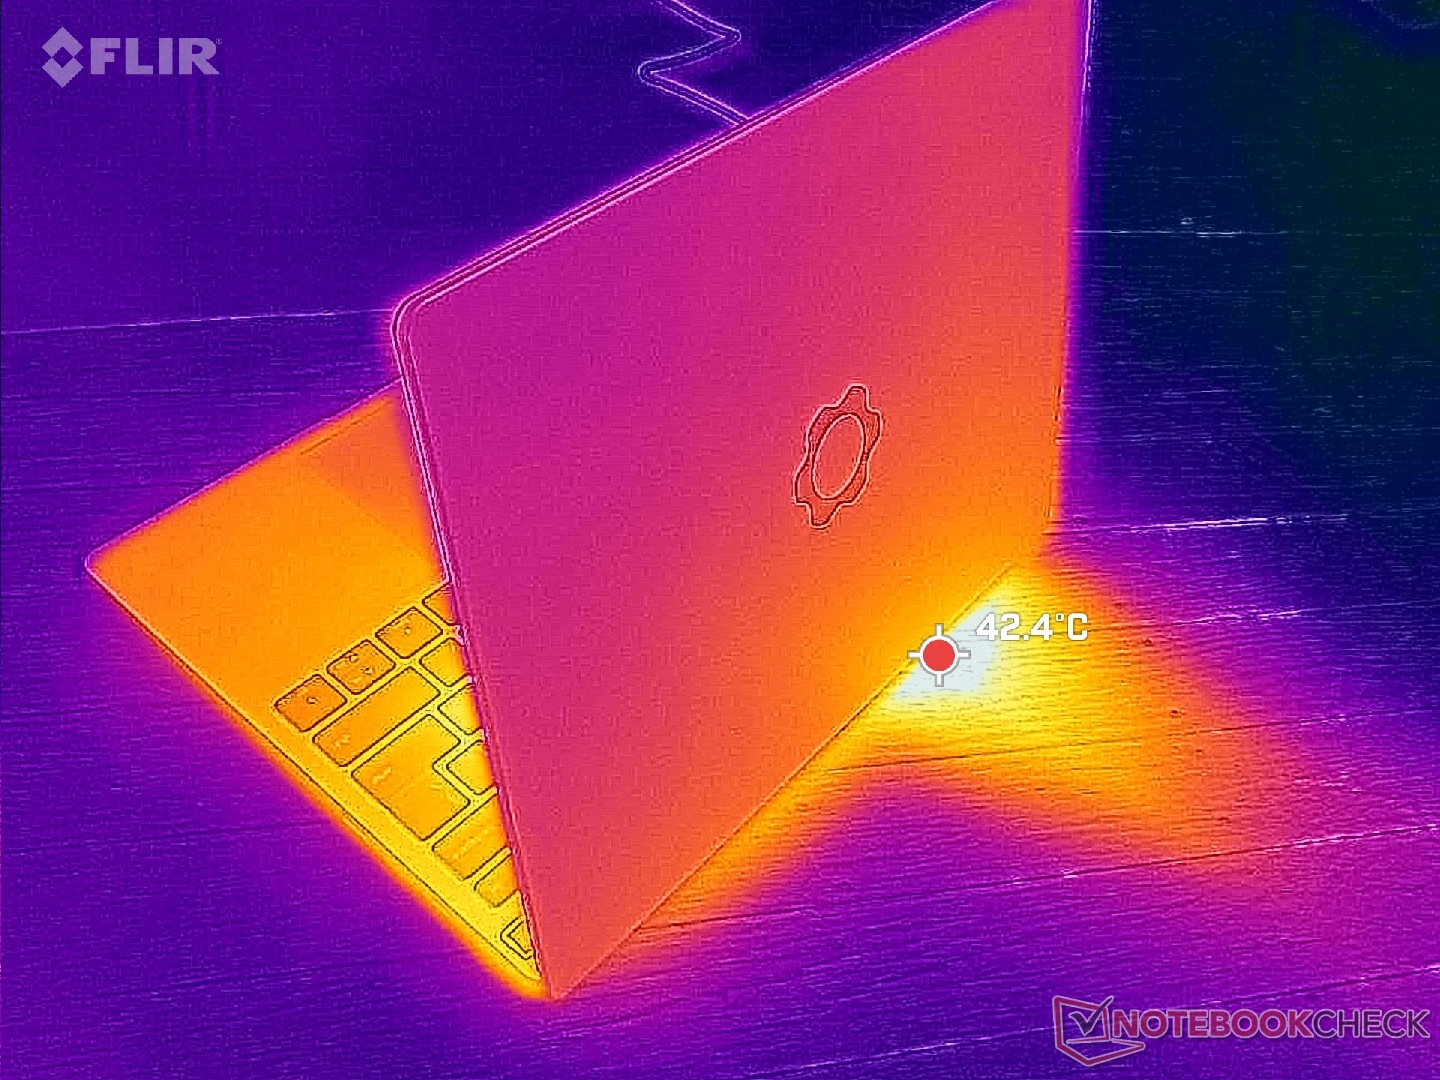
(±) The maximum temperature on the upper side is 42 °C / 108 F, compared to the average of 34.3 °C / 94 F, ranging from 21.2 to 62.5 °C for the class Office.
(-) The bottom heats up to a maximum of 47.4 °C / 117 F, compared to the average of 36.8 °C / 98 F
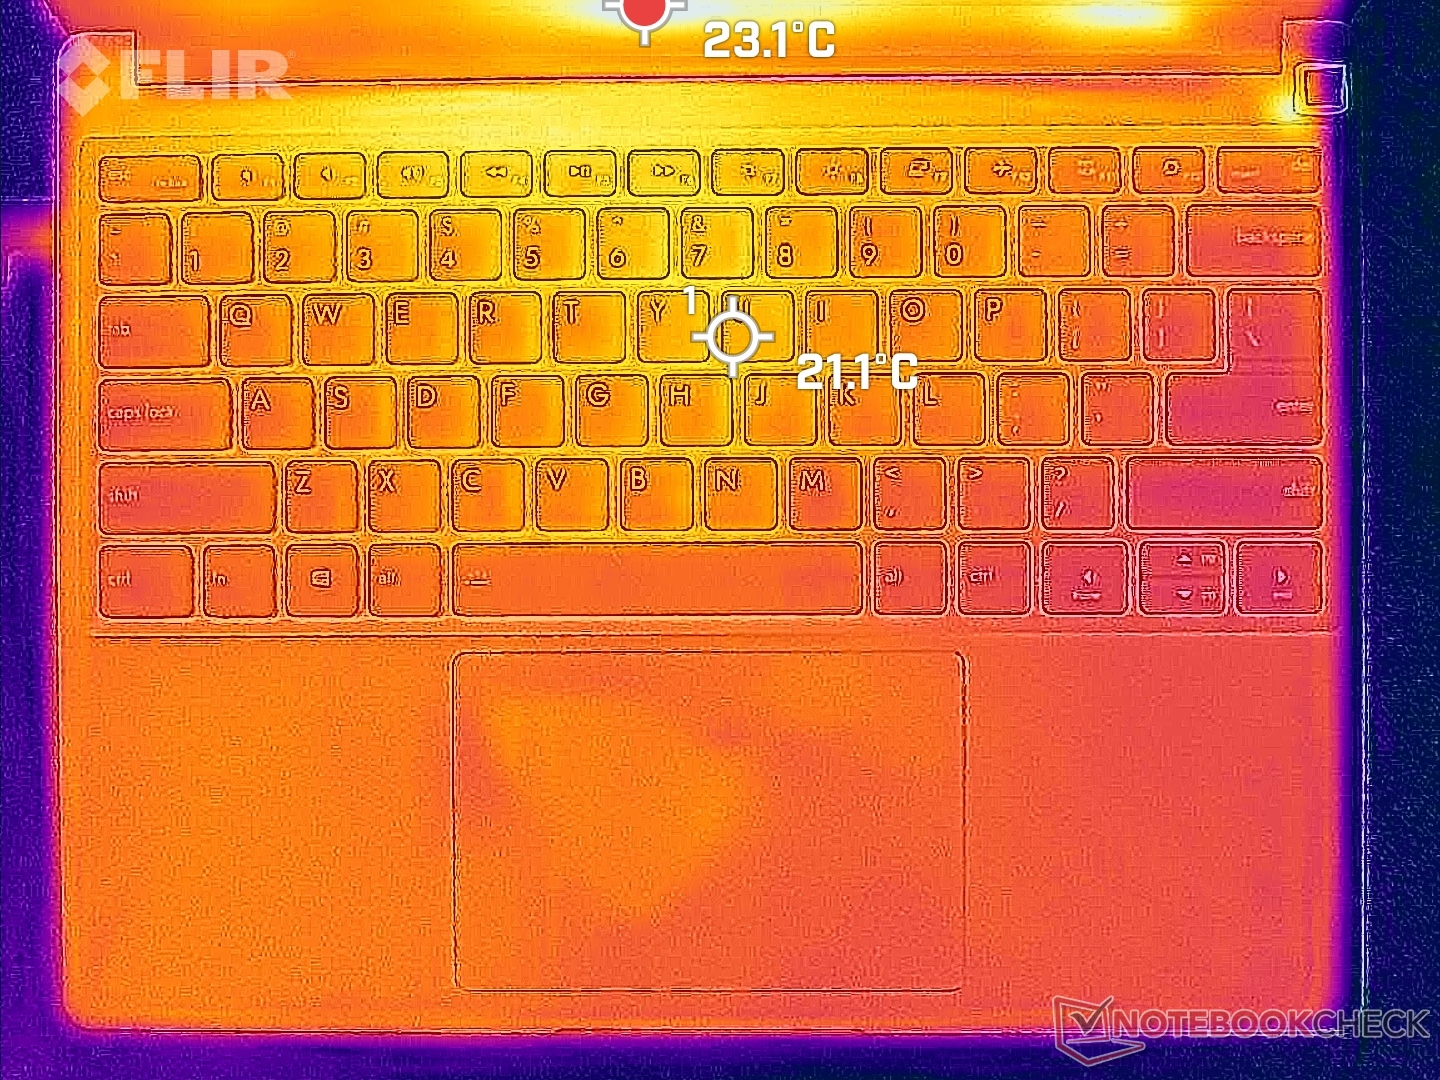
(+) In idle usage, the average temperature for the upper side is 27.5 °C / 82 F, compared to the device average of 29.5 °C / 85 F.
(+) The palmrests and touchpad are cooler than skin temperature with a maximum of 27.8 °C / 82 F and are therefore cool to the touch.
(±) The average temperature of the palmrest area of similar devices was 27.6 °C / 81.7 F (-0.2 °C / -0.3 F).
| Framework Laptop 13.5 Ryzen 7 7840U AMD Ryzen 7 7840U, AMD Radeon 780M | Framework Laptop 13.5 Intel Core i7-1165G7, Intel Iris Xe Graphics G7 96EUs | Lenovo ThinkPad X1 Nano Gen 3 Intel Core i7-1360P, Intel Iris Xe Graphics G7 96EUs | HP Dragonfly G4 Intel Core i7-1365U, Intel Iris Xe Graphics G7 96EUs | Dell XPS 13 Plus 9320 Core i7-1360P Intel Core i7-1360P, Intel Iris Xe Graphics G7 96EUs | Asus ZenBook S13 OLED UX5304 Intel Core i7-1355U, Intel Iris Xe Graphics G7 96EUs | |
|---|---|---|---|---|---|---|
| Heat | 6% | 7% | 7% | 9% | 3% | |
| Maximum Upper Side * (°C) | 42 | 47.2 -12% | 44 -5% | 38.6 8% | 43.8 -4% | 43.1 -3% |
| Maximum Bottom * (°C) | 47.4 | 39.4 17% | 43.2 9% | 40.4 15% | 44.4 6% | 45 5% |
| Idle Upper Side * (°C) | 28.8 | 25.2 12% | 25.6 11% | 28.2 2% | 24 17% | 27.3 5% |
| Idle Bottom * (°C) | 29.6 | 27.8 6% | 25.6 14% | 29 2% | 25.2 15% | 27.8 6% |
* ... smaller is better
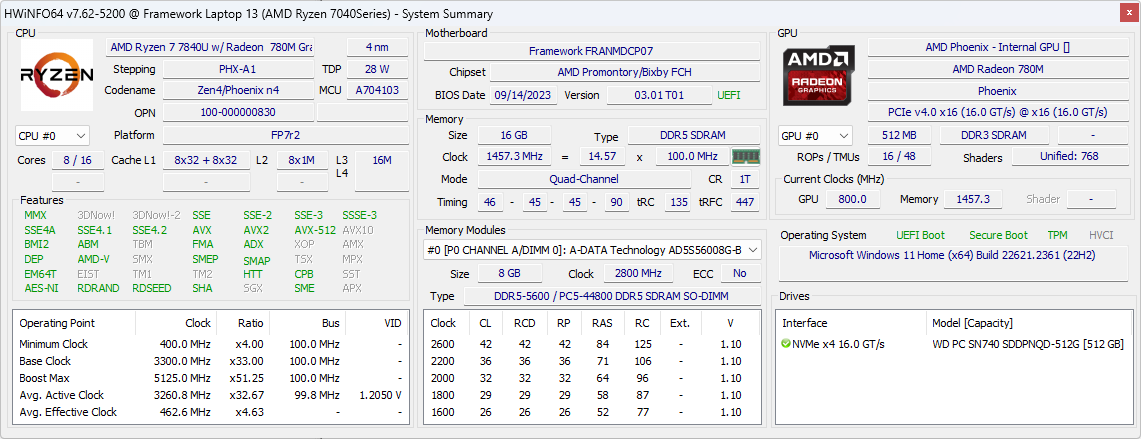
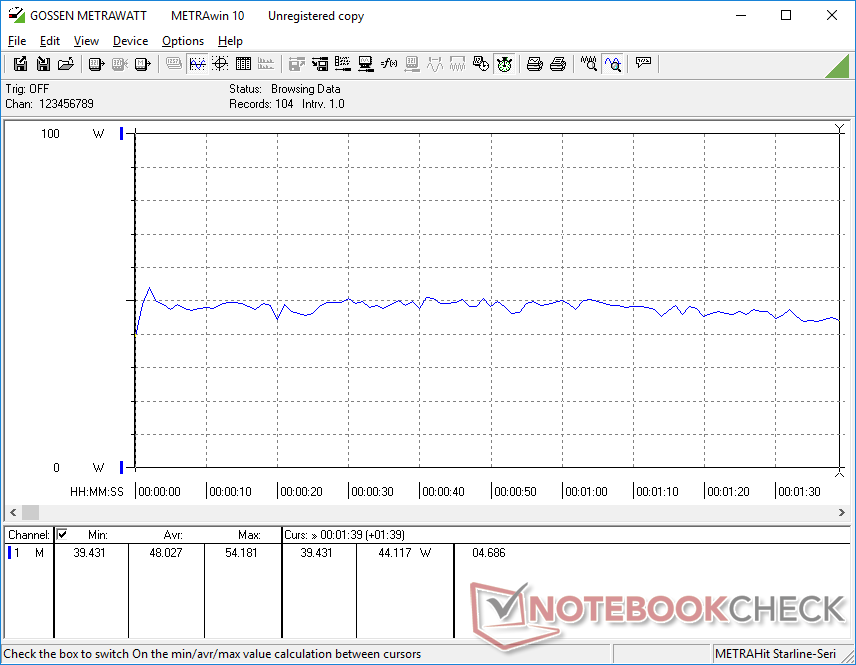
Stress Test
CPU clock rates and board power draw would spike to 4 GHz and 51 W, respectively, lasting for just a couple of seconds at most before stabilizing at 3.2 GHz, 35 W, and 85 C. Repeating this test on the Core i7 Intel version would result in similar core temperatures but at a slightly lower 30 W power draw.
When running Witcher 3 to represent demanding graphics loads, core temperature would stabilize at just 71 C compared to 93 C on the Intel despite how much faster the Radeon 780M is over Iris Xe.
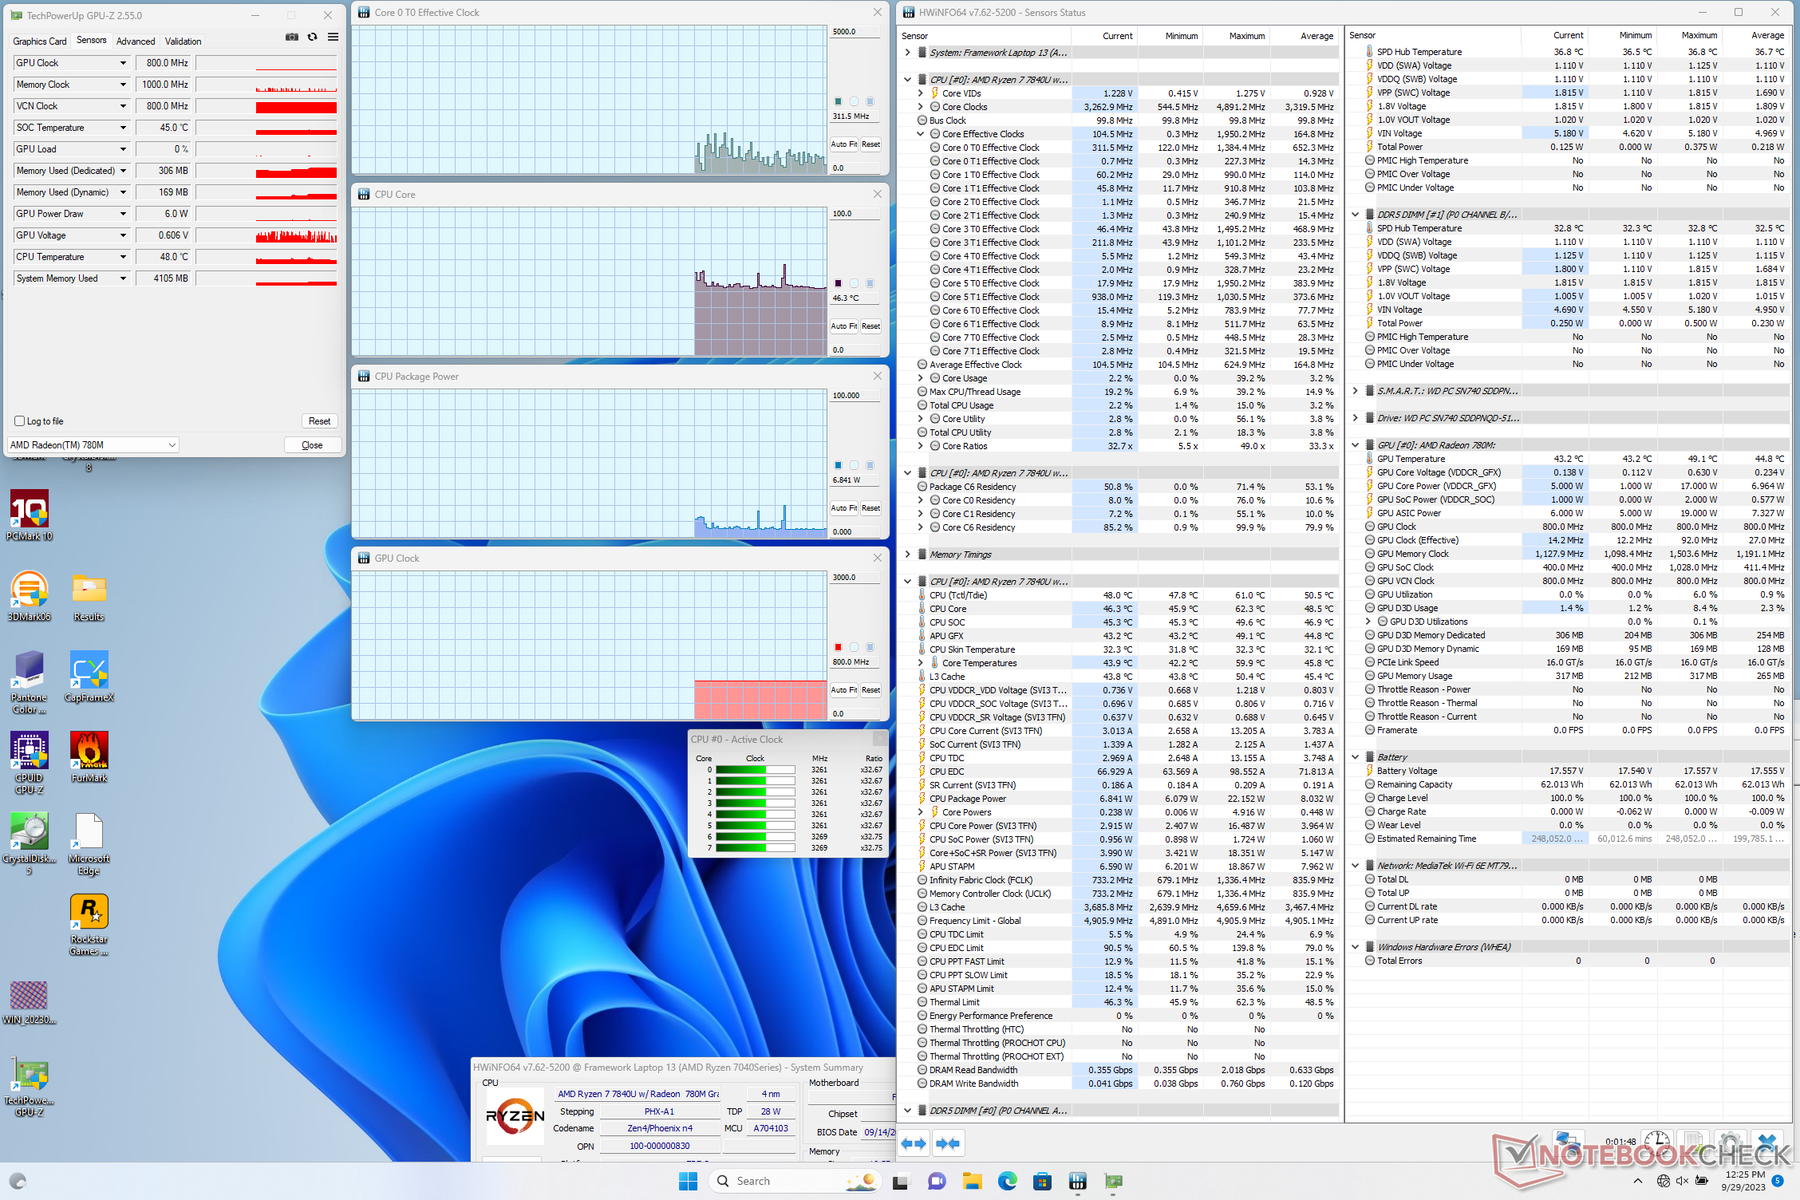
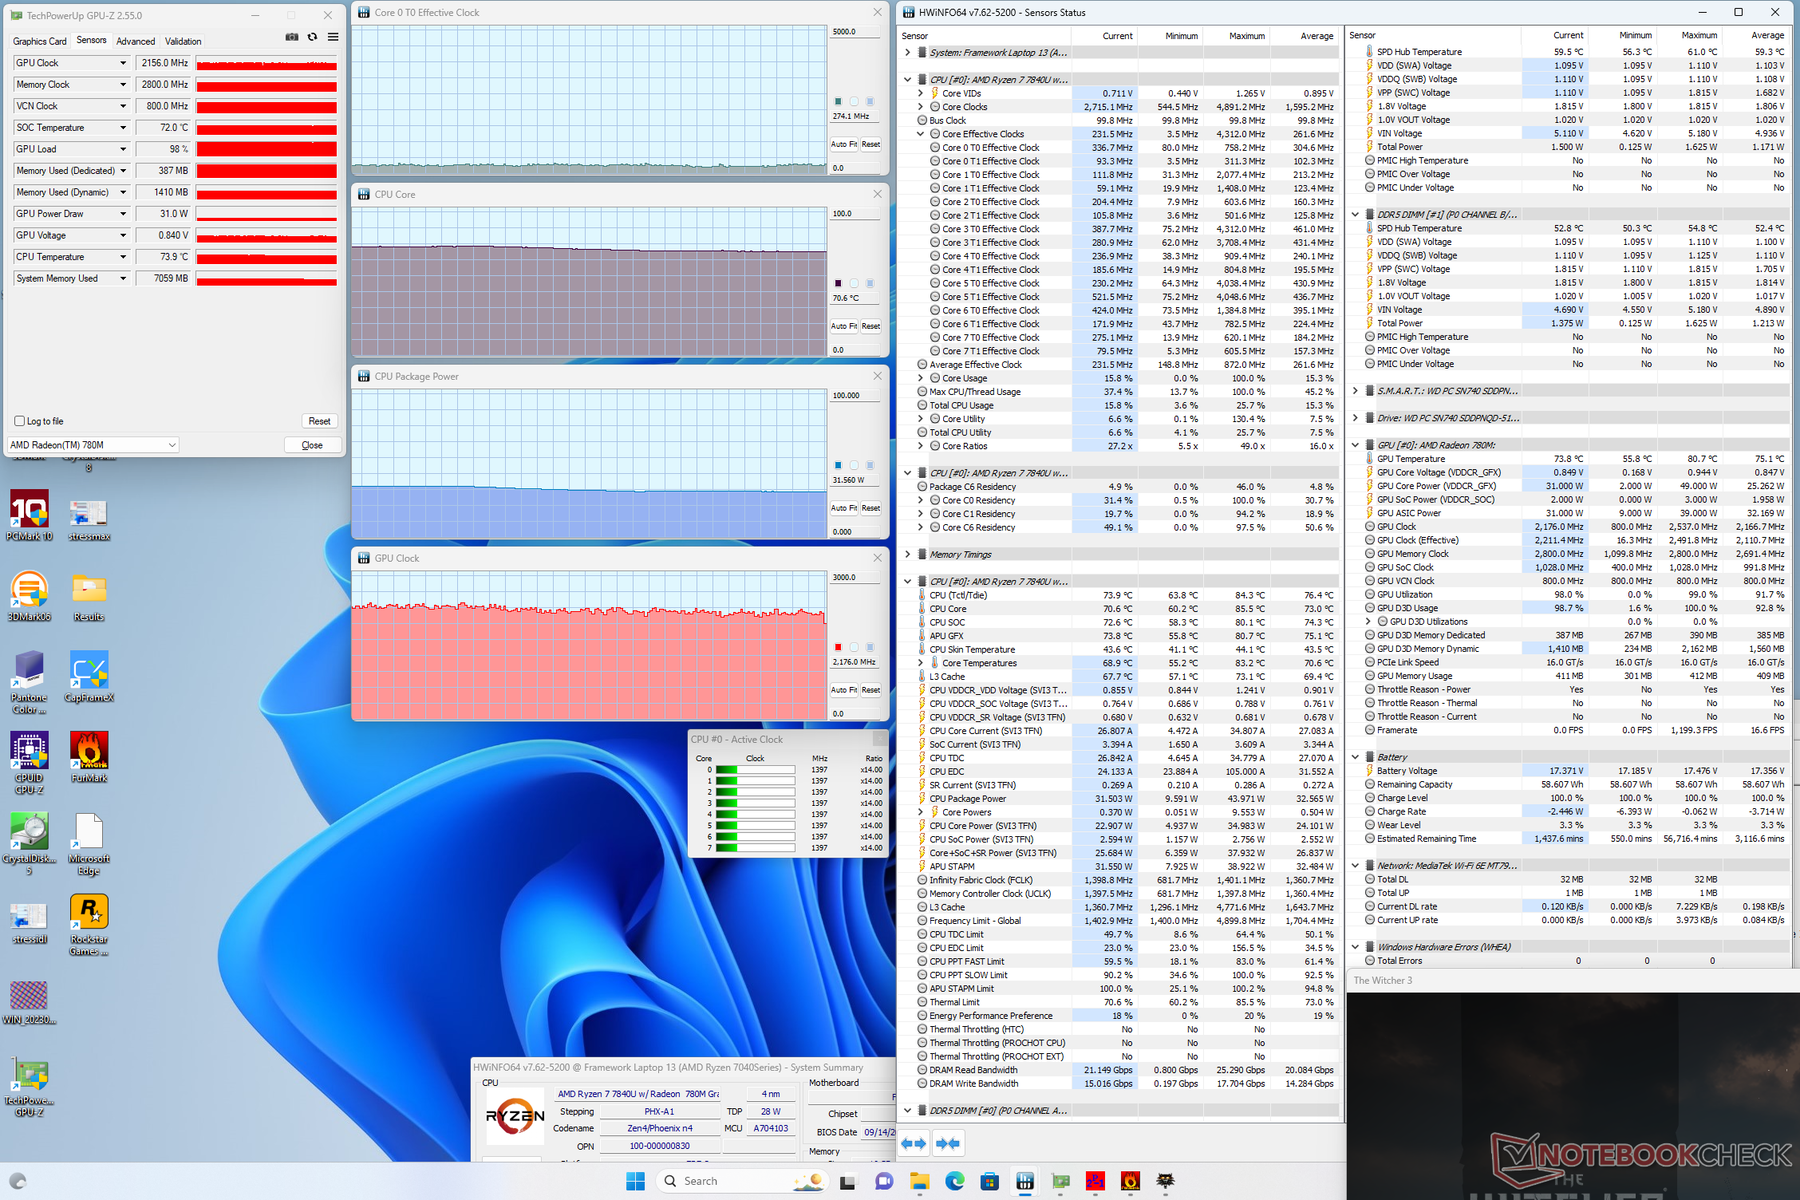
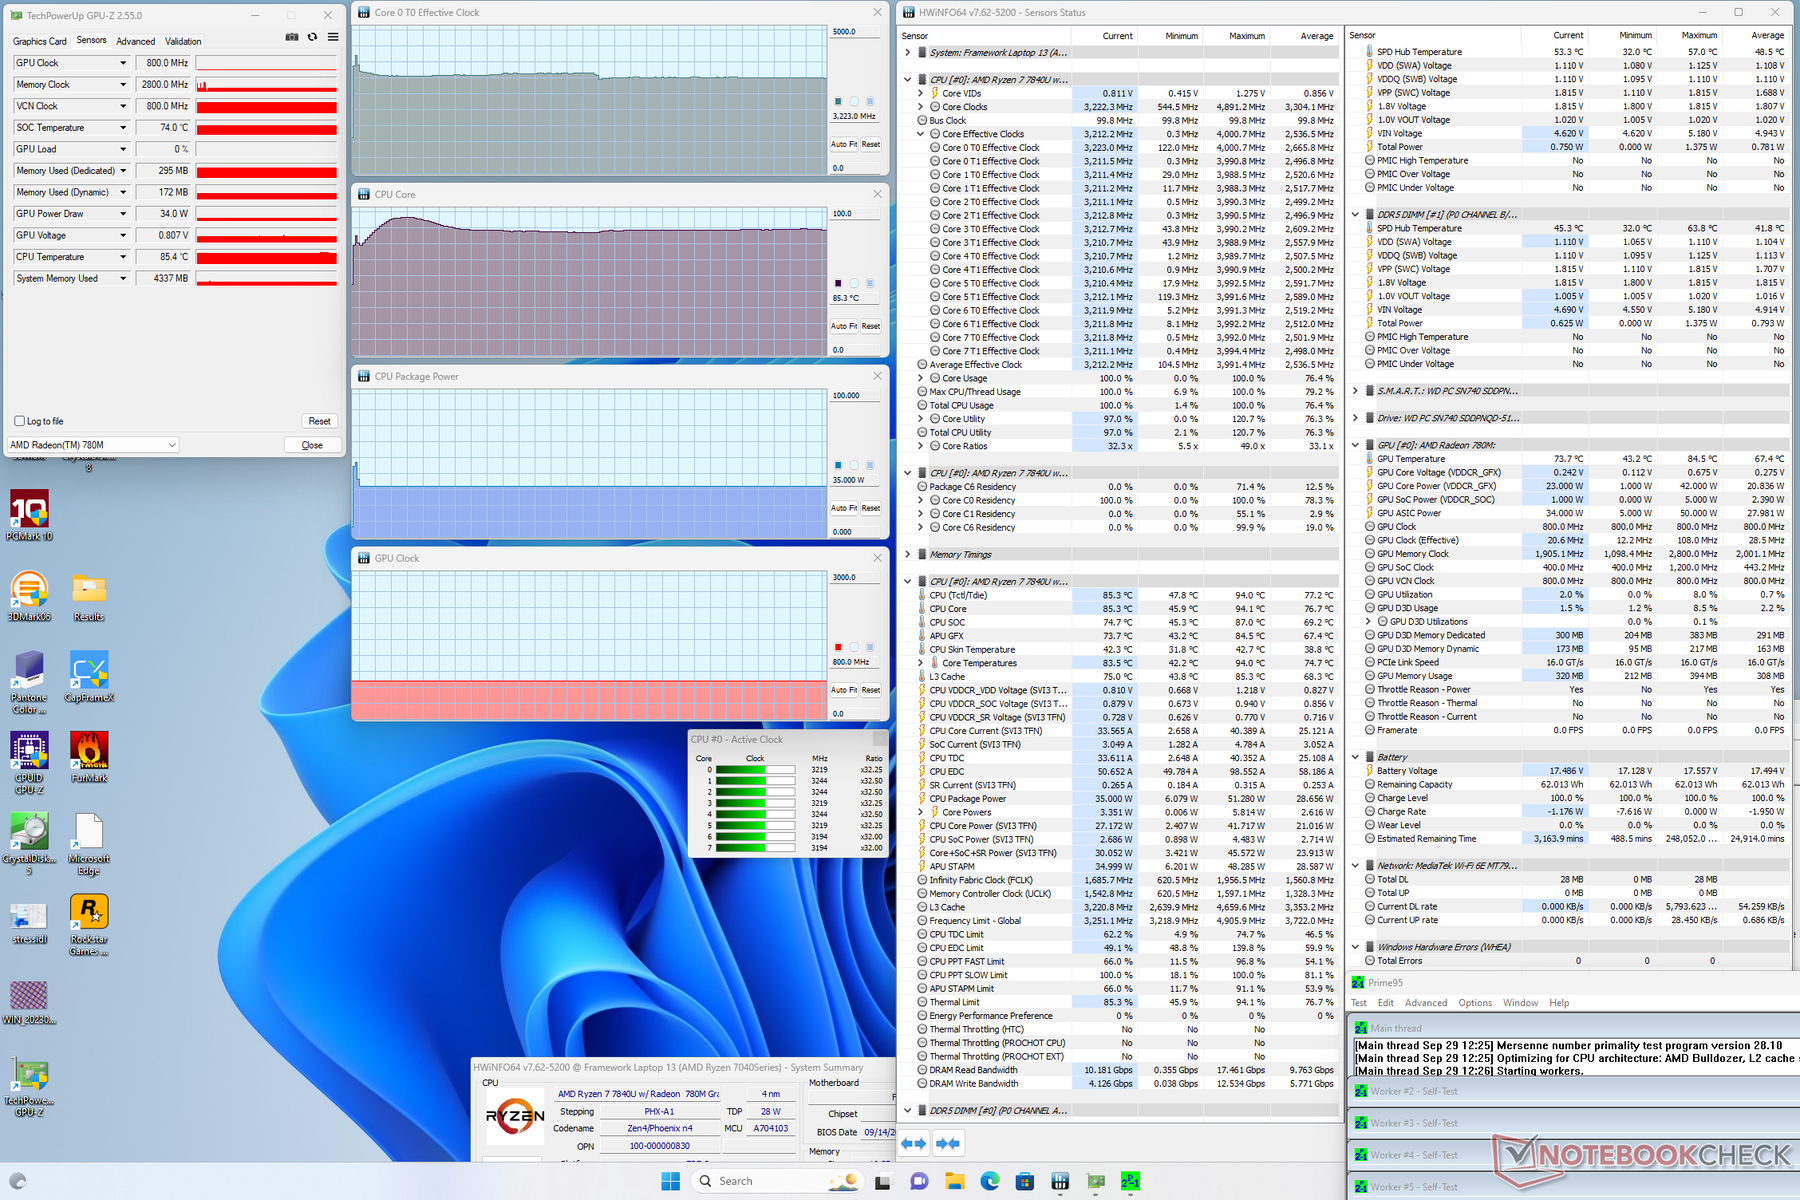
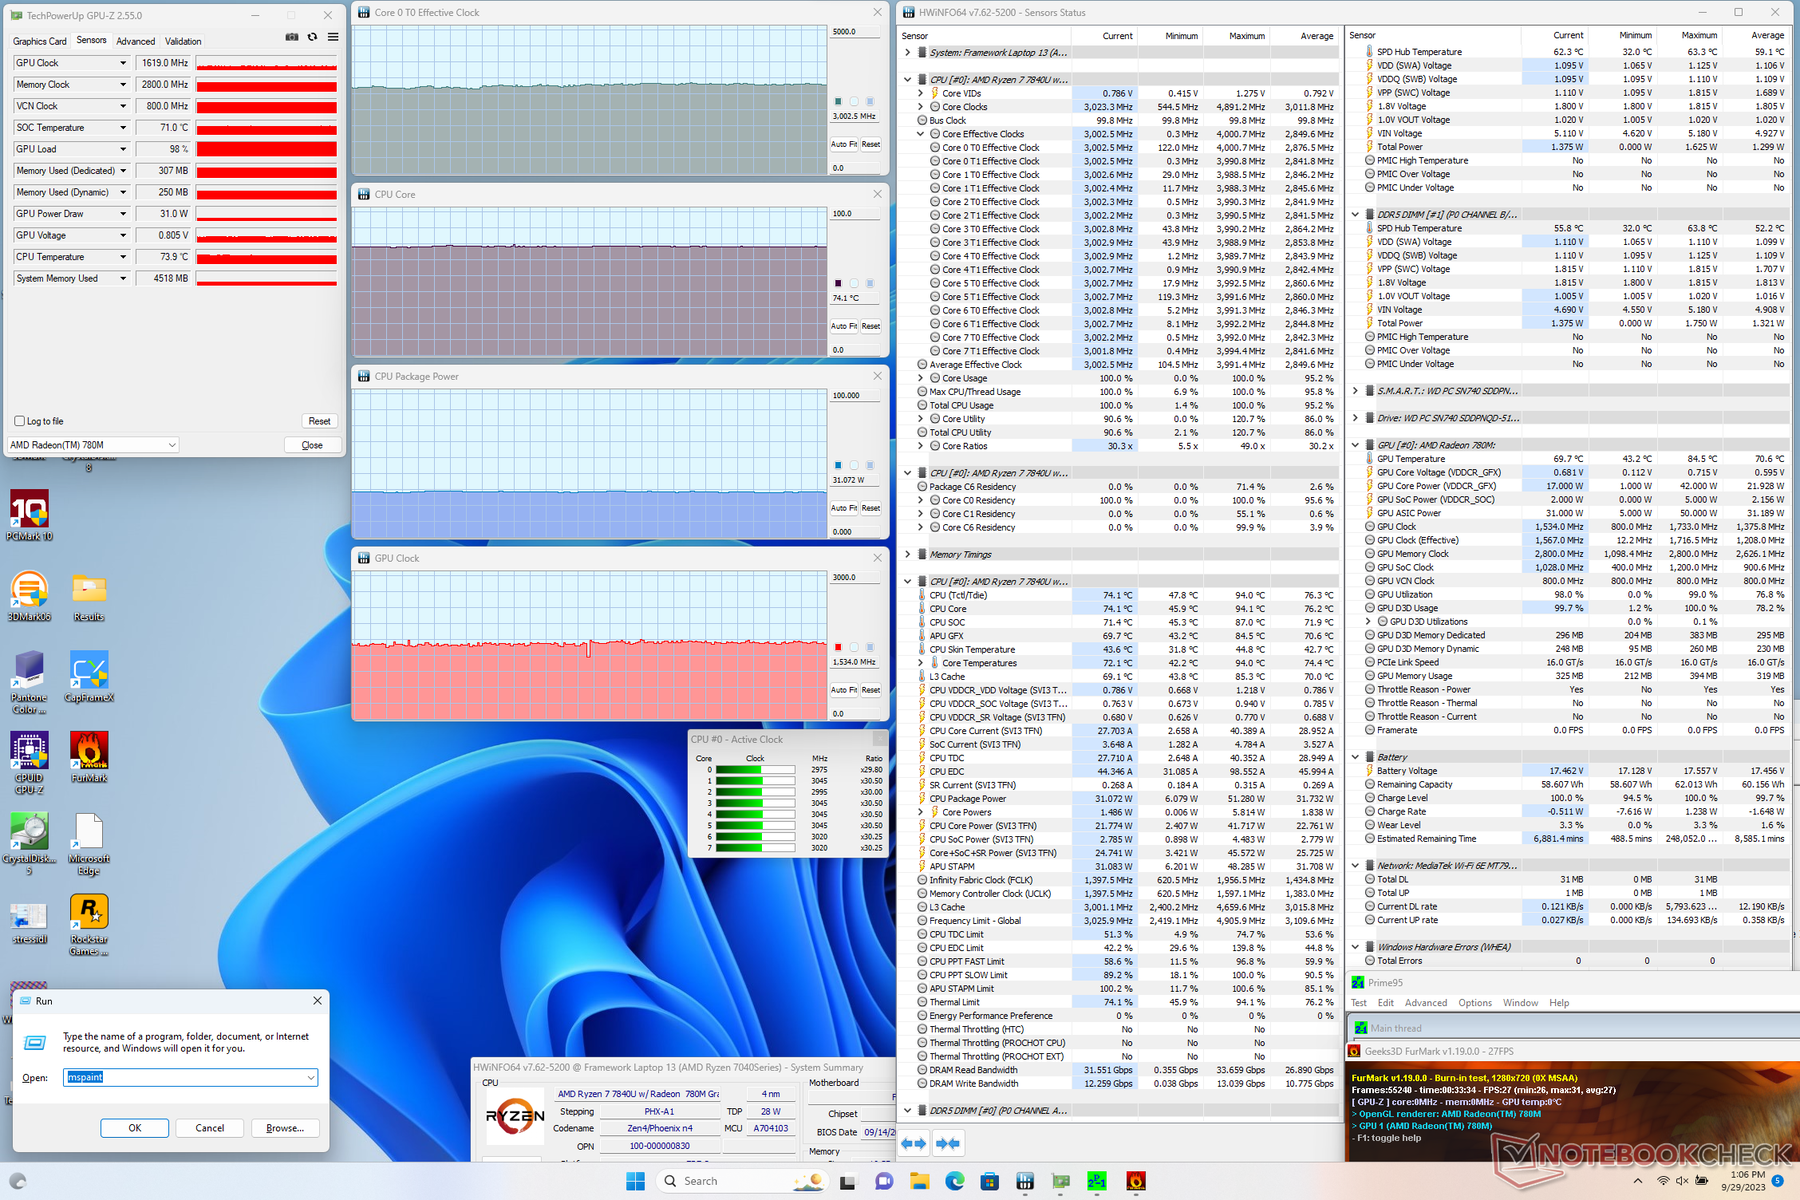
| CPU Clock (GHz) | GPU Clock (MHz) | Average CPU Temperature (°C) | |
| System Idle | -- | -- | 46 |
| Prime95 Stress | 3.2 | -- | 85 |
| Prime95 + FurMark Stress | 3.0 | 1534 | 74 |
| Witcher 3 Stress | ~0.3 | 2176 | 71 |
Speakers
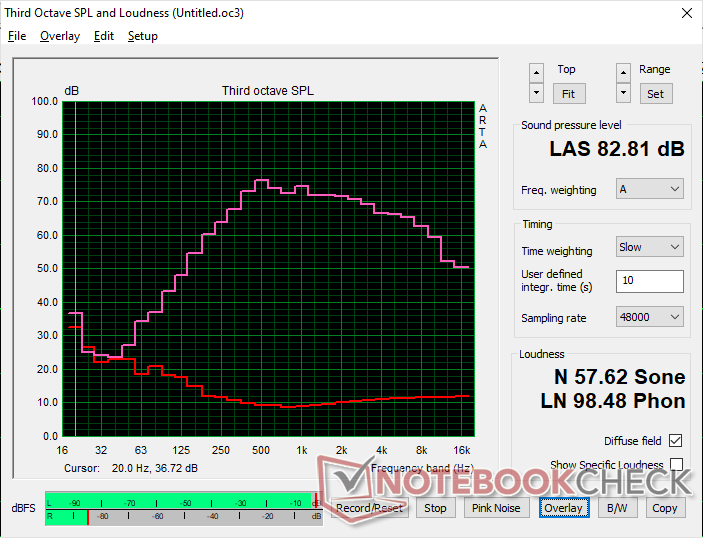
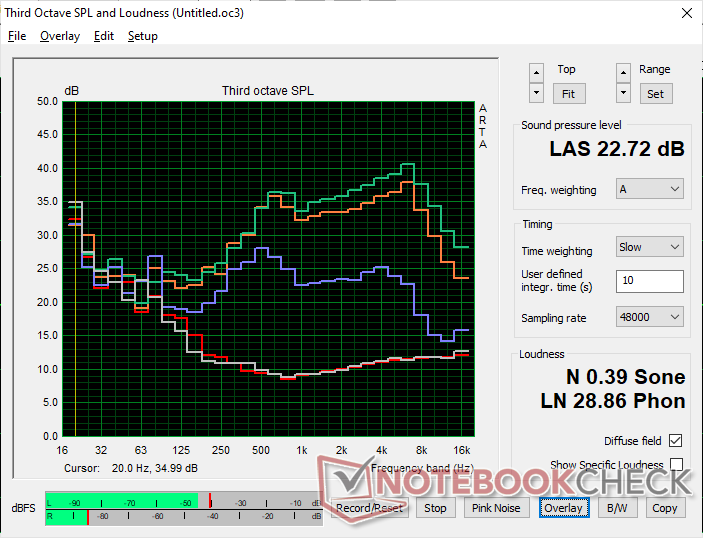
Framework Laptop 13.5 Ryzen 7 7840U audio analysis
(+) | speakers can play relatively loud (82.8 dB)
Bass 100 - 315 Hz
(±) | reduced bass - on average 10.7% lower than median
(±) | linearity of bass is average (9.2% delta to prev. frequency)
Mids 400 - 2000 Hz
(±) | higher mids - on average 6.7% higher than median
(+) | mids are linear (3.9% delta to prev. frequency)
Highs 2 - 16 kHz
(+) | balanced highs - only 2.8% away from median
(+) | highs are linear (3.2% delta to prev. frequency)
Overall 100 - 16.000 Hz
(+) | overall sound is linear (13.9% difference to median)
Compared to same class
» 9% of all tested devices in this class were better, 4% similar, 87% worse
» The best had a delta of 7%, average was 21%, worst was 53%
Compared to all devices tested
» 16% of all tested devices were better, 4% similar, 80% worse
» The best had a delta of 4%, average was 23%, worst was 134%
Apple MacBook Pro 16 2021 M1 Pro audio analysis
(+) | speakers can play relatively loud (84.7 dB)
Bass 100 - 315 Hz
(+) | good bass - only 3.8% away from median
(+) | bass is linear (5.2% delta to prev. frequency)
Mids 400 - 2000 Hz
(+) | balanced mids - only 1.3% away from median
(+) | mids are linear (2.1% delta to prev. frequency)
Highs 2 - 16 kHz
(+) | balanced highs - only 1.9% away from median
(+) | highs are linear (2.7% delta to prev. frequency)
Overall 100 - 16.000 Hz
(+) | overall sound is linear (4.6% difference to median)
Compared to same class
» 0% of all tested devices in this class were better, 0% similar, 100% worse
» The best had a delta of 5%, average was 17%, worst was 45%
Compared to all devices tested
» 0% of all tested devices were better, 0% similar, 100% worse
» The best had a delta of 4%, average was 23%, worst was 134%
Energy Management
Power Consumption
Power consumption is consistently lower than what we recorded on the Core i7-1370P configuration across the board. This is on top of the fact that our Ryzen 7 7840U can outperform the Intel CPU in most applications. Idling on desktop would demand just 4 W to 7 W compared to 3 W to 10 W on the Intel version.
Running Witcher 3 to represent typical gaming loads would consume about 8 percent less power than on the Core i7-1370P configuration for a 30 to 50 percent increase in raw graphics performance. Thus, not only is the Radeon 780M faster than the Iris Xe 96 EUs, it also demands less power for higher performance-per-watt.
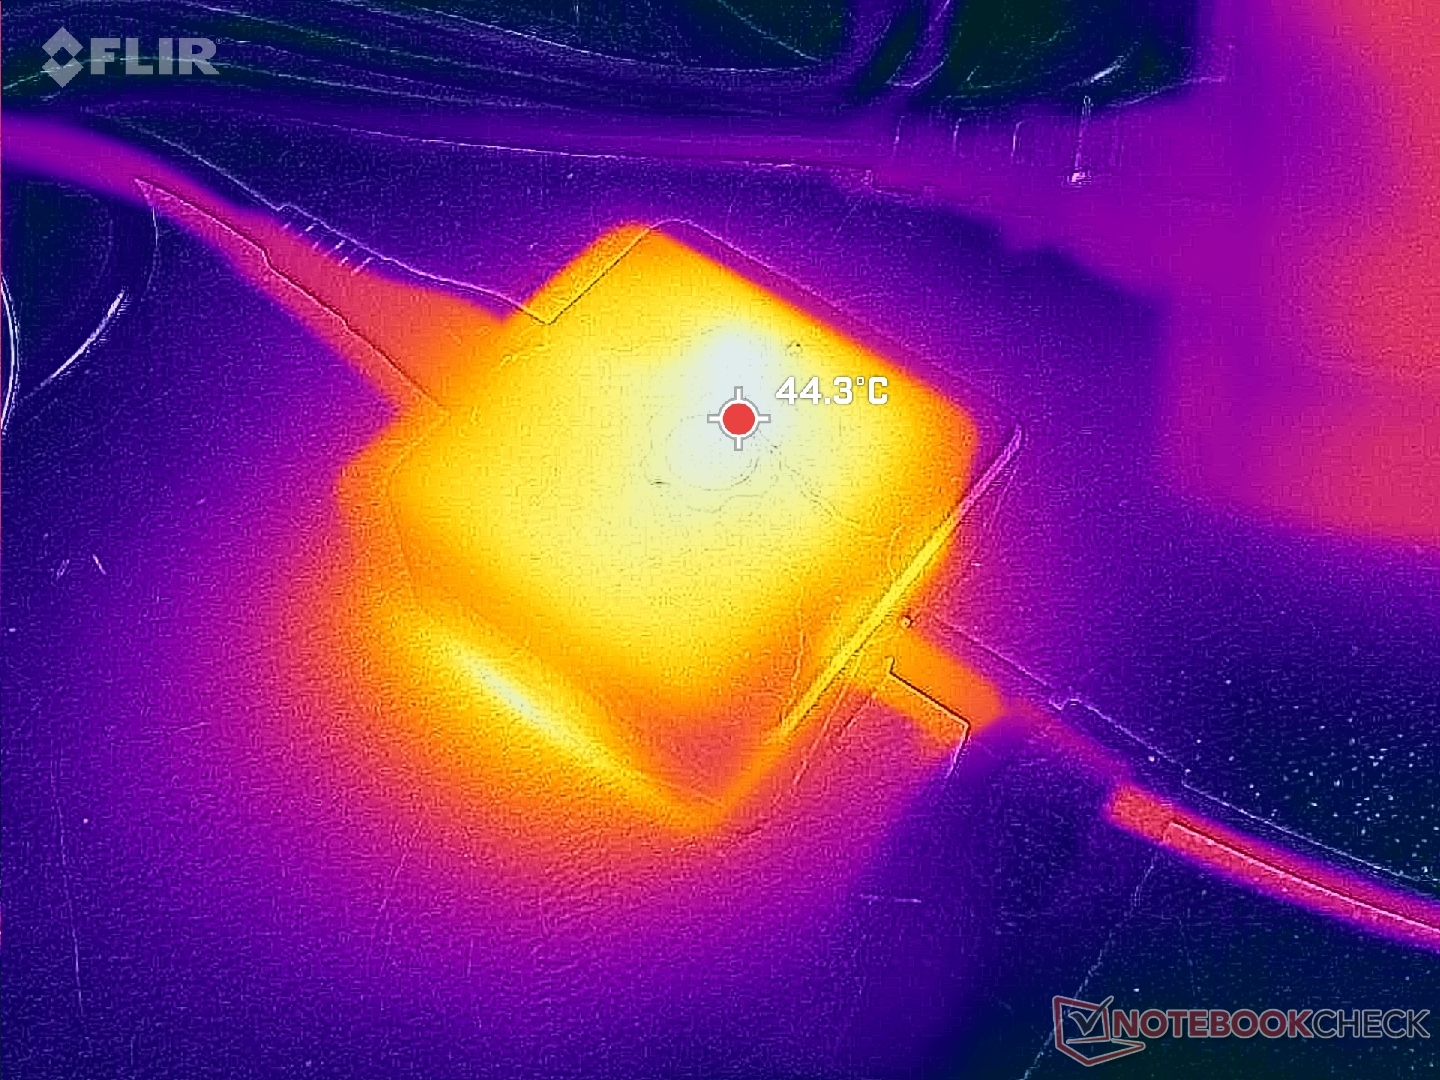
The small (~5.8 x 5.8 x 2.6 cm) 60 W GaN USB-C AC charger is the same across all configurations regardless of CPU option.


| Off / Standby | |
| Idle | |
| Load |
|
Key:
min: | |
| Framework Laptop 13.5 Ryzen 7 7840U R7 7840U, Radeon 780M, WD PC SN740 512GB SDDPNQD-512G, IPS, 2256x1504, 13.5" | Framework Laptop 13.5 13th Gen Intel i7-1370P, Iris Xe G7 96EUs, WD PC SN740 SDDPNQD-1T00, IPS, 2256x1504, 13.5" | Framework Laptop 13.5 12th Gen Intel i7-1260P, Iris Xe G7 96EUs, WDC PC SN730 SDBPNTY-512G, IPS, 2256x1504, 13.5" | Framework Laptop 13.5 i7-1165G7, Iris Xe G7 96EUs, Western Digital WD_BLACK SN850 WDS100T1X0E, IPS, 2256x1504, 13.5" | Lenovo ThinkPad X1 Nano Gen 3 i7-1360P, Iris Xe G7 96EUs, Lenovo UMIS AM6A0 RPJTJ512MKP1QDQ, IPS, 2160x1350, 13" | HP Dragonfly G4 i7-1365U, Iris Xe G7 96EUs, Micron 3400 MTFDKBA512TFH 512GB, IPS, 1920x1280, 13.5" | |
|---|---|---|---|---|---|---|
| Power Consumption | -9% | -25% | -8% | 9% | -1% | |
| Idle Minimum * (Watt) | 4 | 2.9 27% | 5.3 -33% | 4.3 -8% | 3.3 17% | 4.1 -2% |
| Idle Average * (Watt) | 6.5 | 6.3 3% | 8.4 -29% | 8.2 -26% | 6.5 -0% | 7.5 -15% |
| Idle Maximum * (Watt) | 6.8 | 9.9 -46% | 11.2 -65% | 8.7 -28% | 7.1 -4% | 8.2 -21% |
| Load Average * (Watt) | 48 | 56.2 -17% | 57.4 -20% | 43.5 9% | 40.7 15% | 35.5 26% |
| Witcher 3 ultra * (Watt) | 52.3 | 56.6 -8% | 46.7 11% | 43.5 17% | 37 29% | 37.5 28% |
| Load Maximum * (Watt) | 55.2 | 60.8 -10% | 61.2 -11% | 61.8 -12% | 58.6 -6% | 66.5 -20% |
* ... smaller is better
Power Consumption Witcher 3 / Stresstest
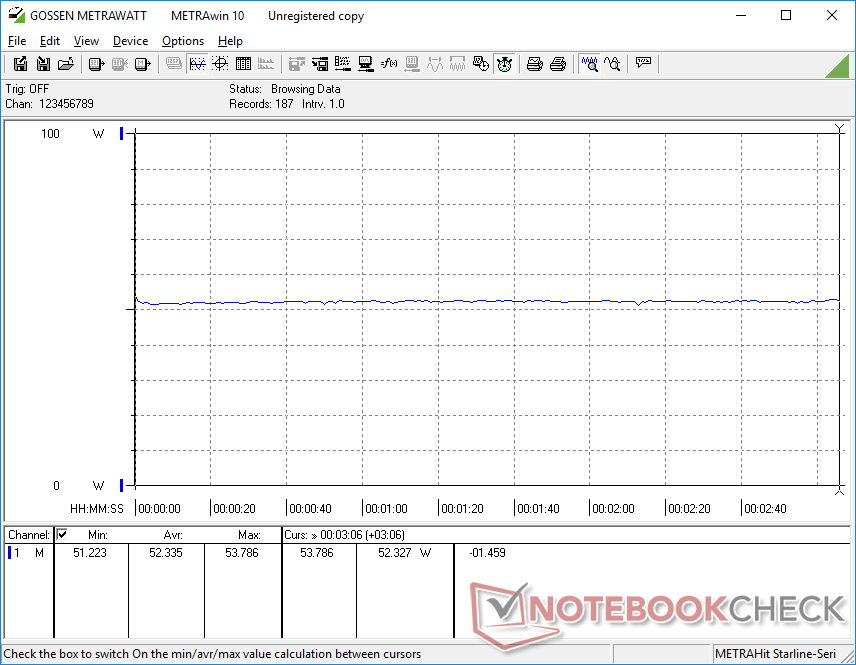
Power Consumption external Monitor
Battery Life
Runtimes are longer than the Intel-based configurations by significant margins due to the lower power consumption levels mentioned above. We're able to browse the web for over 3 hours longer on our AMD model versus the Core i7-1370P model when both are set to Balanced mode and 150 nit brightness. This isn't to say that battery life is poor when configured with Intel, but AMD has the clear advantage in this regard.
Note that the base Ryzen 5 configuration only comes with a 55 Wh battery compared to the 61 Wh battery for our Ryzen 7 7840U configuration.
| Framework Laptop 13.5 Ryzen 7 7840U R7 7840U, Radeon 780M, 61 Wh | Framework Laptop 13.5 13th Gen Intel i7-1370P, Iris Xe G7 96EUs, 61 Wh | Framework Laptop 13.5 12th Gen Intel i7-1260P, Iris Xe G7 96EUs, 55 Wh | Framework Laptop 13.5 i7-1165G7, Iris Xe G7 96EUs, 55 Wh | Lenovo ThinkPad X1 Nano Gen 3 i7-1360P, Iris Xe G7 96EUs, 49.5 Wh | HP Dragonfly G4 i7-1365U, Iris Xe G7 96EUs, 68 Wh | |
|---|---|---|---|---|---|---|
| Battery runtime | -27% | -38% | -34% | -36% | 31% | |
| WiFi v1.3 (h) | 12.1 | 8.8 -27% | 7.5 -38% | 8 -34% | 7.8 -36% | 15.9 31% |
| Reader / Idle (h) | 42.5 | |||||
| Load (h) | 3.2 |
Pros
Cons
Verdict — Two Times Faster Graphics Performance Than Intel

If you value multi-thread performance and graphics, then the AMD configuration is without a doubt the superior choice over Intel. The Ryzen 7 7840U and Radeon 780M are better than any 13th gen Intel Core-U or Core-P processor when it comes to performance-per-watt and battery life. The fact that the Ryzen 7 and Core i7 configurations cost about the same at $1500 each only makes the AMD version more appealing.
Unless if you absolutely need Ryzen PRO or Intel vPro, the AMD-based Framework Laptop 13.5 is faster and much easier to recommend over Intel especially since they cost about the same.
There are still a few reasons to choose Intel at the moment. Firstly, Zen 4 Ryzen PRO CPUs are not yet available from Framework leaving Intel vPro as the only option. Secondly, the Core-P series still has a slight lead over AMD when it comes to single-thread performance. And lastly, the USB-C ports on the Intel model are uniform when it comes to features and compatibility. Of these three differences, the first is arguably most valuable especially for businesses or users who need the extra layer of hardware security. Otherwise, it's hard to pass up longer battery life and twice the graphics performance for the same price.
Price and Availability
The manufacturer is now shipping its AMD version of the Framework Laptop 13.5 starting at $1050 USD for the base Ryzen 5 configuration up to over $1600 if fully configured with the Ryzen 7 7840U.
Framework Laptop 13.5 Ryzen 7 7840U
- 10/02/2023 v7 (old)
Allen Ngo
Transparency
The selection of devices to be reviewed is made by our editorial team. The test sample was provided to the author as a loan by the manufacturer or retailer for the purpose of this review. The lender had no influence on this review, nor did the manufacturer receive a copy of this review before publication. There was no obligation to publish this review. As an independent media company, Notebookcheck is not subjected to the authority of manufacturers, retailers or publishers.
This is how Notebookcheck is testing
Every year, Notebookcheck independently reviews hundreds of laptops and smartphones using standardized procedures to ensure that all results are comparable. We have continuously developed our test methods for around 20 years and set industry standards in the process. In our test labs, high-quality measuring equipment is utilized by experienced technicians and editors. These tests involve a multi-stage validation process. Our complex rating system is based on hundreds of well-founded measurements and benchmarks, which maintains objectivity. Further information on our test methods can be found here.
Price comparison
