




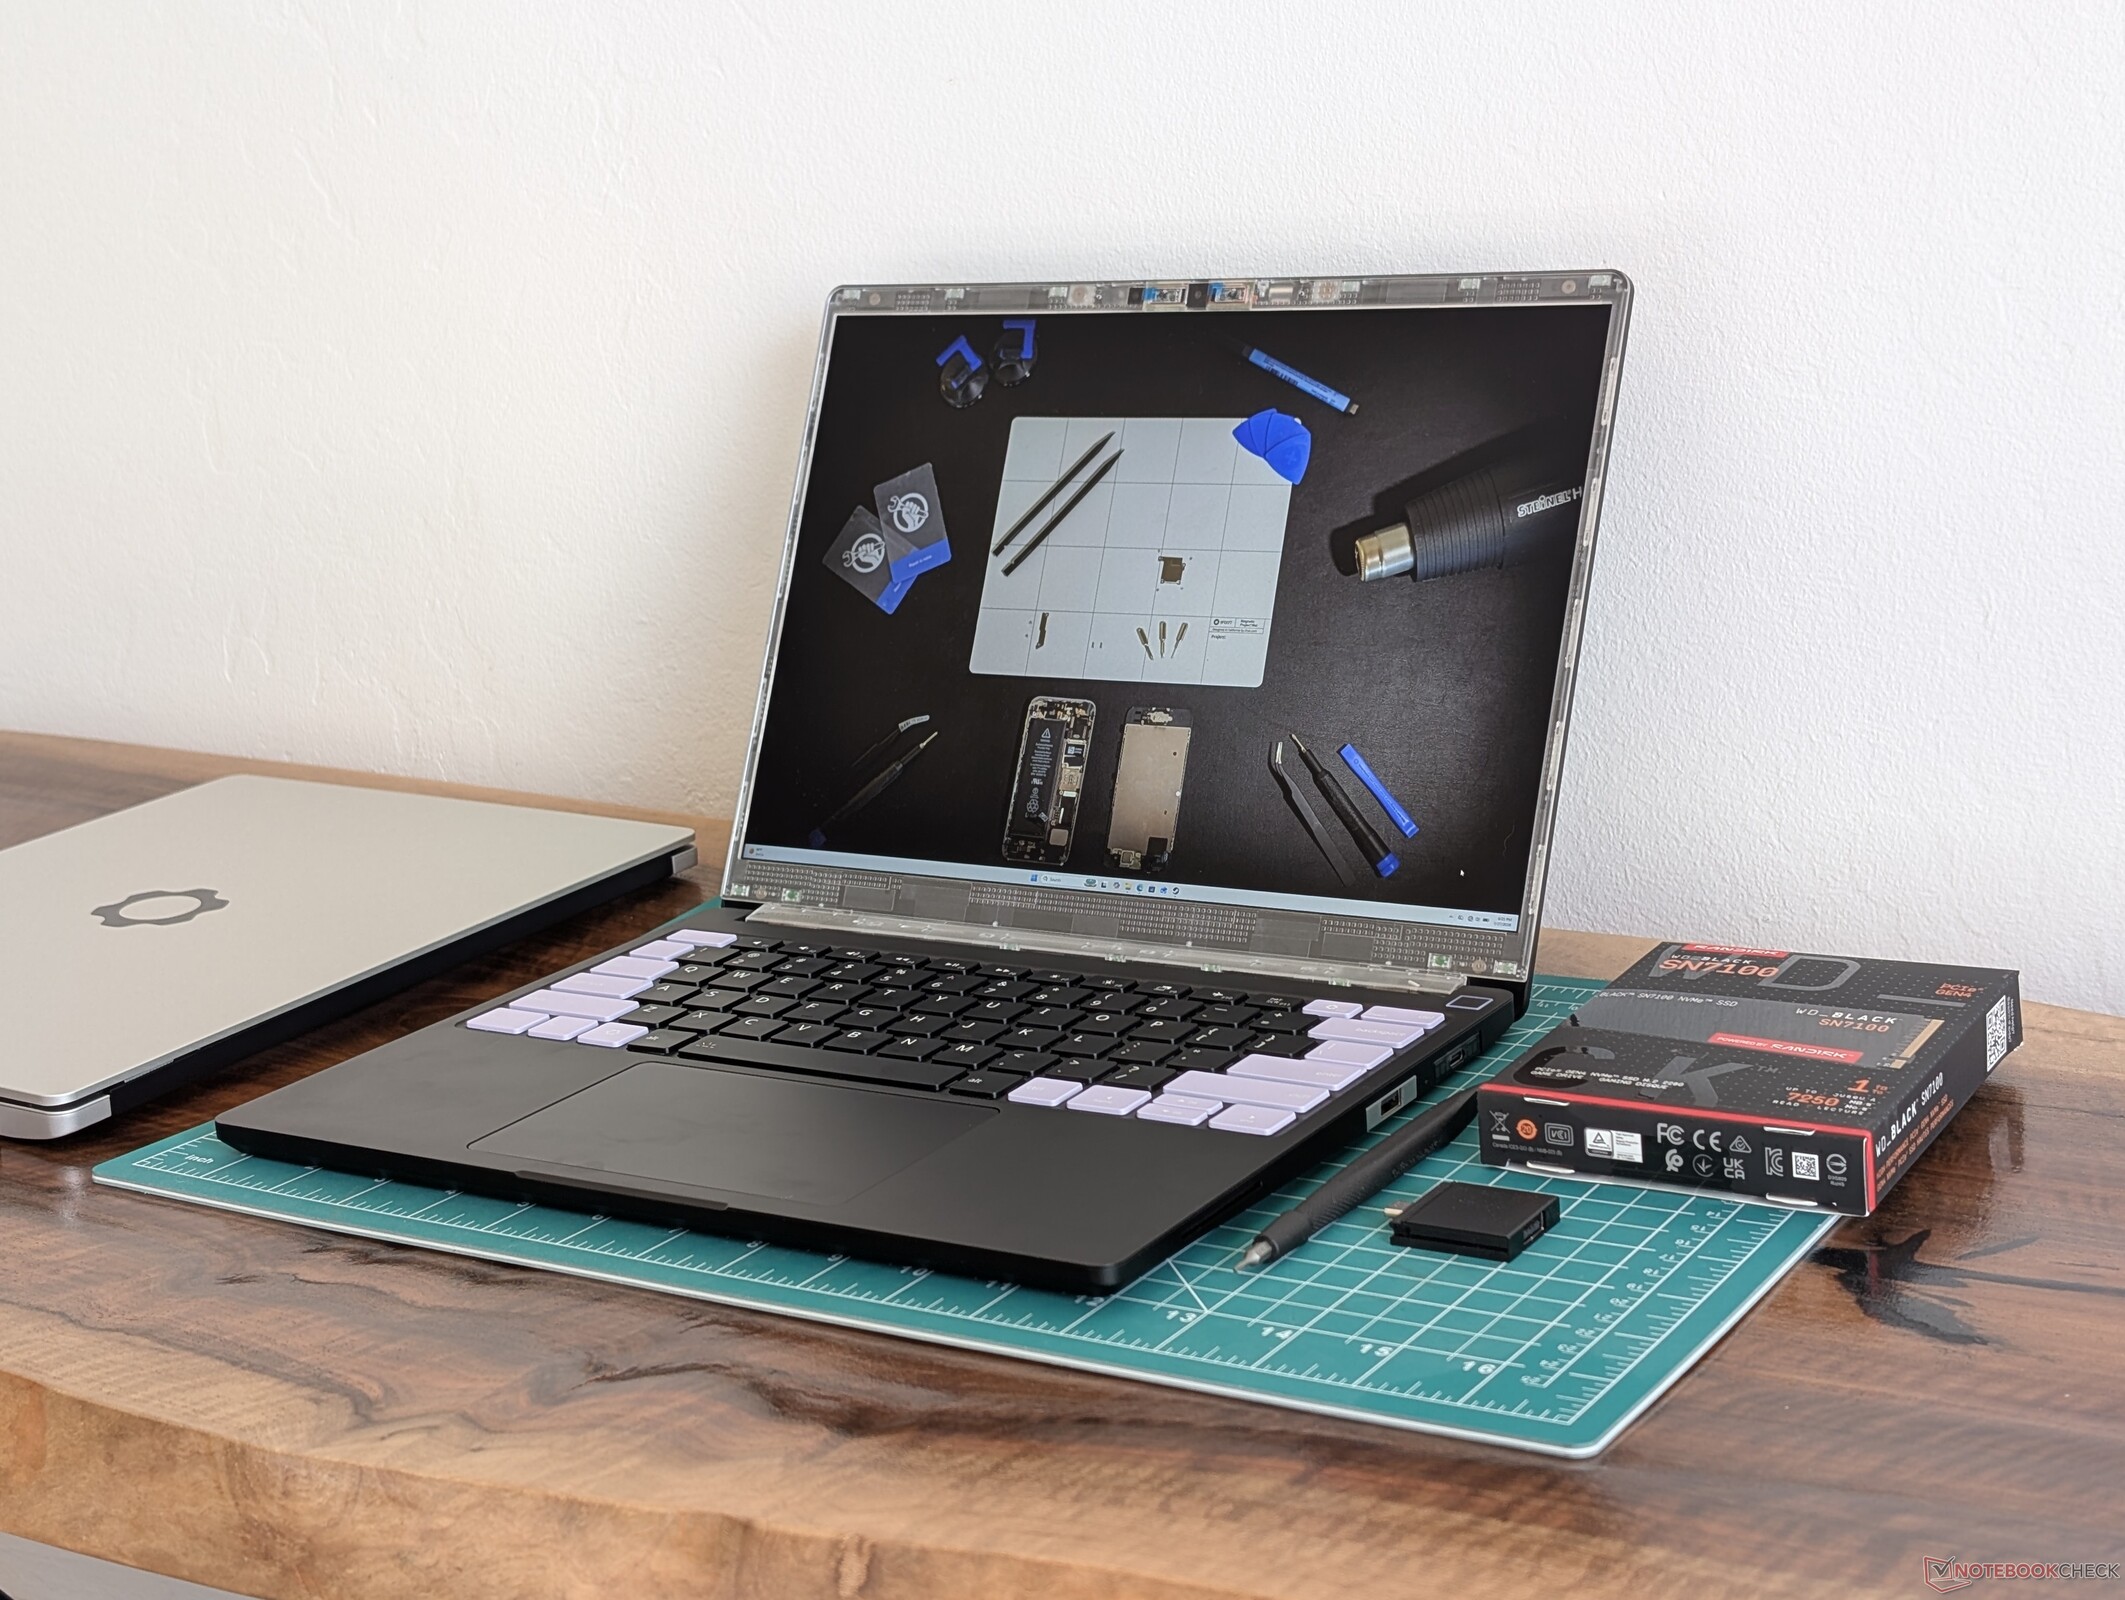
Verdict — Standing Toe-To-Toe With The Big Names
One of our main complaints about the Laptop 13.5 was that it sacrificed rigidity and sturdiness for improved serviceability and utility when compared to more well-known prosumer laptops like the Dell XPS, Lenovo Yoga, or the HP OmniBook series. The Laptop 13 Pro tackles this head-on with a much stronger chassis design that instantly feels firmer and more unyielding when compared to its immediate predecessor. The leap in material quality is so significant that it's arguably the biggest reason for choosing the Laptop 13 Pro over the standard Laptop 13.5 since both models otherwise share nearly the same components and display options. The slightly heavier weight is a small price to pay when considering the high repairability and vast gen-to-gen improvements.
Beyond the chassis, battery life has improved by equally impressive margins largely due to the efficient Panther Lake CPU.
One notable drawback inherited from the Laptop 13.5 remains: high core temperatures. The CPU would run as warm as 90+ C under load compared to just 74 C on the Dell XPS 13 equipped with the exact same Core Ultra X7 processor likely due to the smaller cooling solution of the Framework. It's unfortunate that the space saved by switching from SODIMM to LPCAMM2 isn't otherwise utilized for cooling. Consequently, Turbo Boost performance is negatively affected and raw performance is slower than expected. This isn't to say that the Laptop 13 Pro is sluggish, but it could have certainly been faster based on our experiences with competing Panther Lake laptops.
The lack of OLED and HDR is easier to forgive as Framework laptops are not primarily designed for multimedia consumption. Nonetheless, the lack of P3 colors may deter some professional artists.
For future configurations, we would love to see optional Gorilla Glass to reinforce the lid, vPro, and clickpads with dedicated mouse buttons to further expand upon the versatility of the design.
Pros
Cons
Price and Availability
The Framework Laptop 13 Pro is now shipping starting at $1200 for the barebones configuration up to over $3000.

- $38.69tomtoc 360° Protective Laptop Shoulder Bag for 13-inch MacBook Air M5/A3449
- $569.98NIMO Thin & Light Gaming Laptop, 15.6" FHD IPS Display, AMD R7 7735HS(Up to 4.75 GHz, Beat i7-12650H) Computer with 16GB DDR5 RAM 512GB SSD, 180° Vewing, Radeon 680M, Portable for Business, College
- $699.00Apple MacBook Pro with M2 chip: 13” Retina Display, 8GB RAM, 512GB SSD, Touch Bar, Backlit Keyboard, FaceTime HD Camera, Space Gray
Unveiled just this past April, the Framework Laptop 13 Pro is the latest model in the Framework lineup to accompany the venerable but arguably aging Framework Laptop 13.5. Though the manufacturer won't directly admit it, the Laptop 13 Pro is essentially a successor to the original Laptop 13.5 as it addresses many of the issues while maintaining compatibility and repairability with as many existing components as possible. SKUs can be configured with either Intel Panther Lake or AMD Ryzen AI 300 Zen 5 processors with LPCAMM2 and DDR5 SODIMM, respectively.
Our test unit is a middle Intel configuration with the Core Ultra X7 358H CPU for approximately $3000. Prices range wildly depending on RAM, storage, and accessories. All configurations at the moment ship with the same 2880 x 1920 IPS 120 Hz touchscreen.
The Laptop 13 Pro competes with traditional prosumer clamshells like the Dell XPS 13, Lenovo ThinkPad T or Yoga Pro 9 series, Microsoft Surface Laptop, or the Asus ExpertBook Ultra.
More Framework reviews:
Specifications
Case
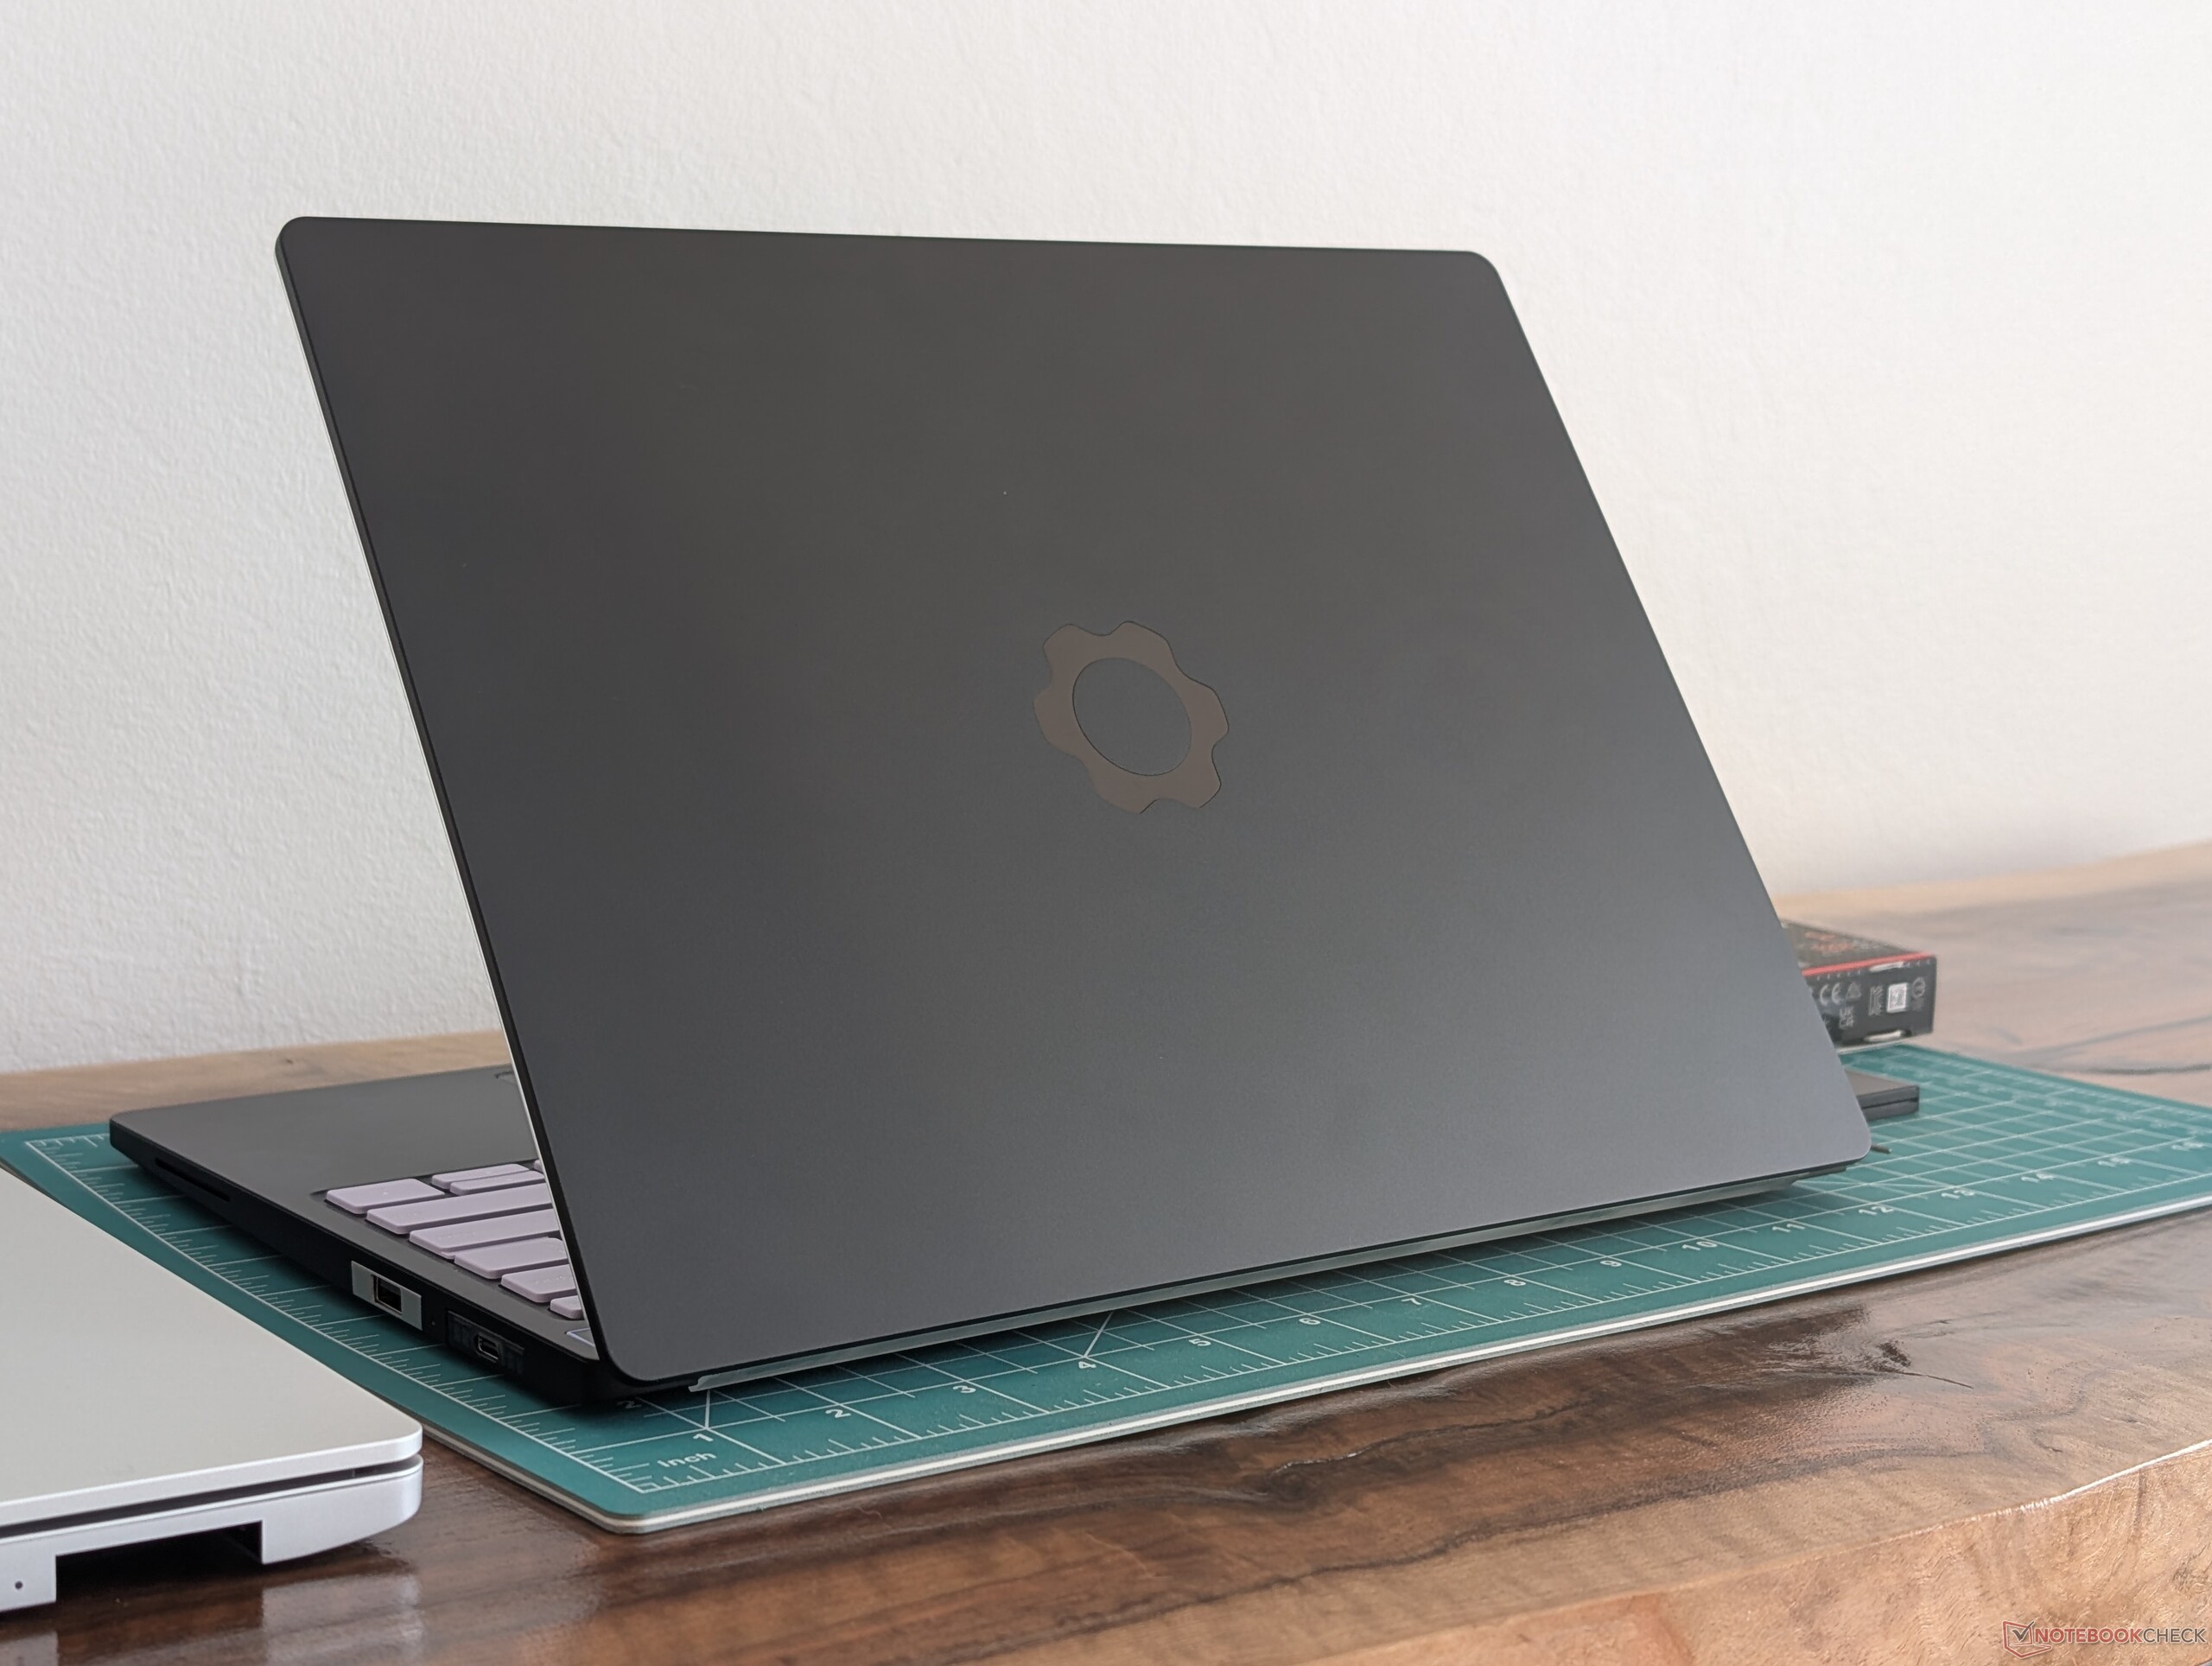
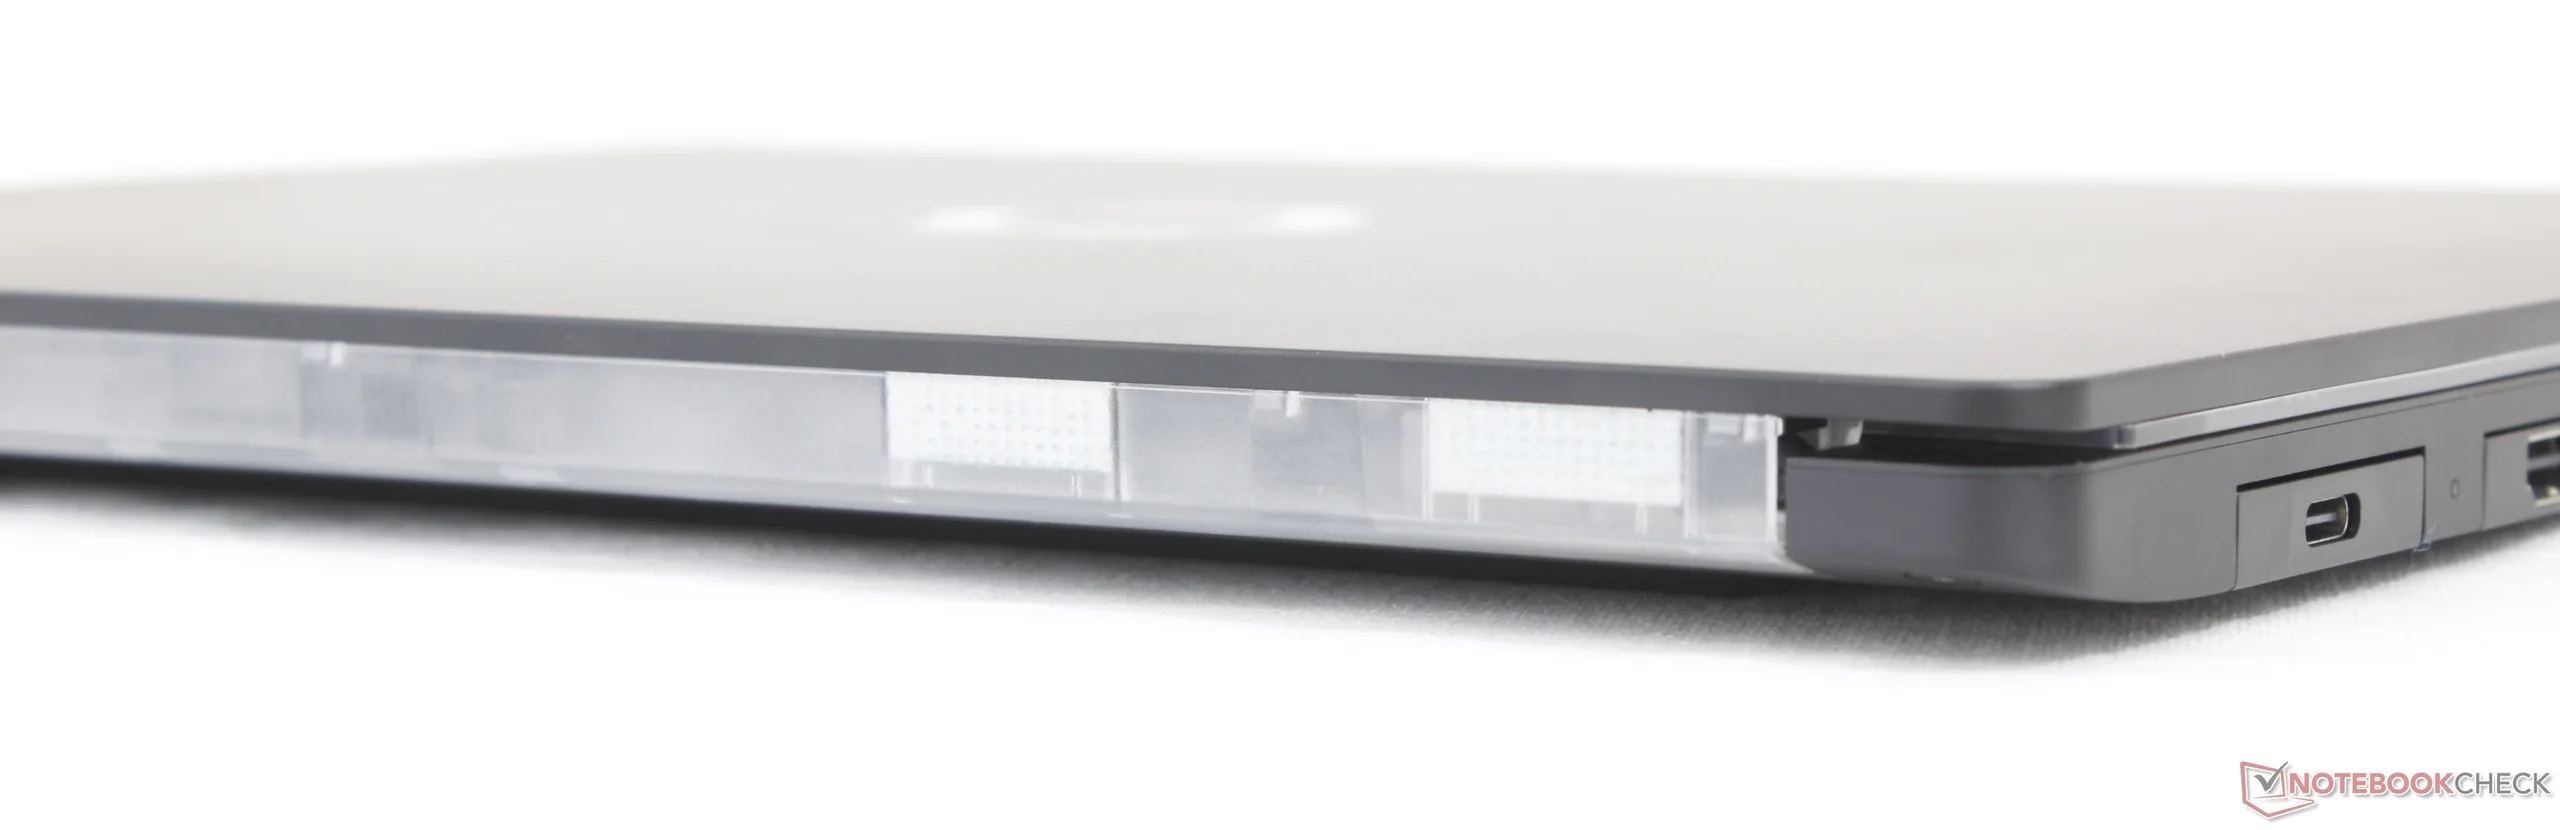
The new chassis or skeleton consists of 6063 aluminum for a much stronger and more rigid feel than the original Laptop 13.5 without needing to increase thickness. However, note that the new model is slightly heavier than the Laptop 13.5 as well.
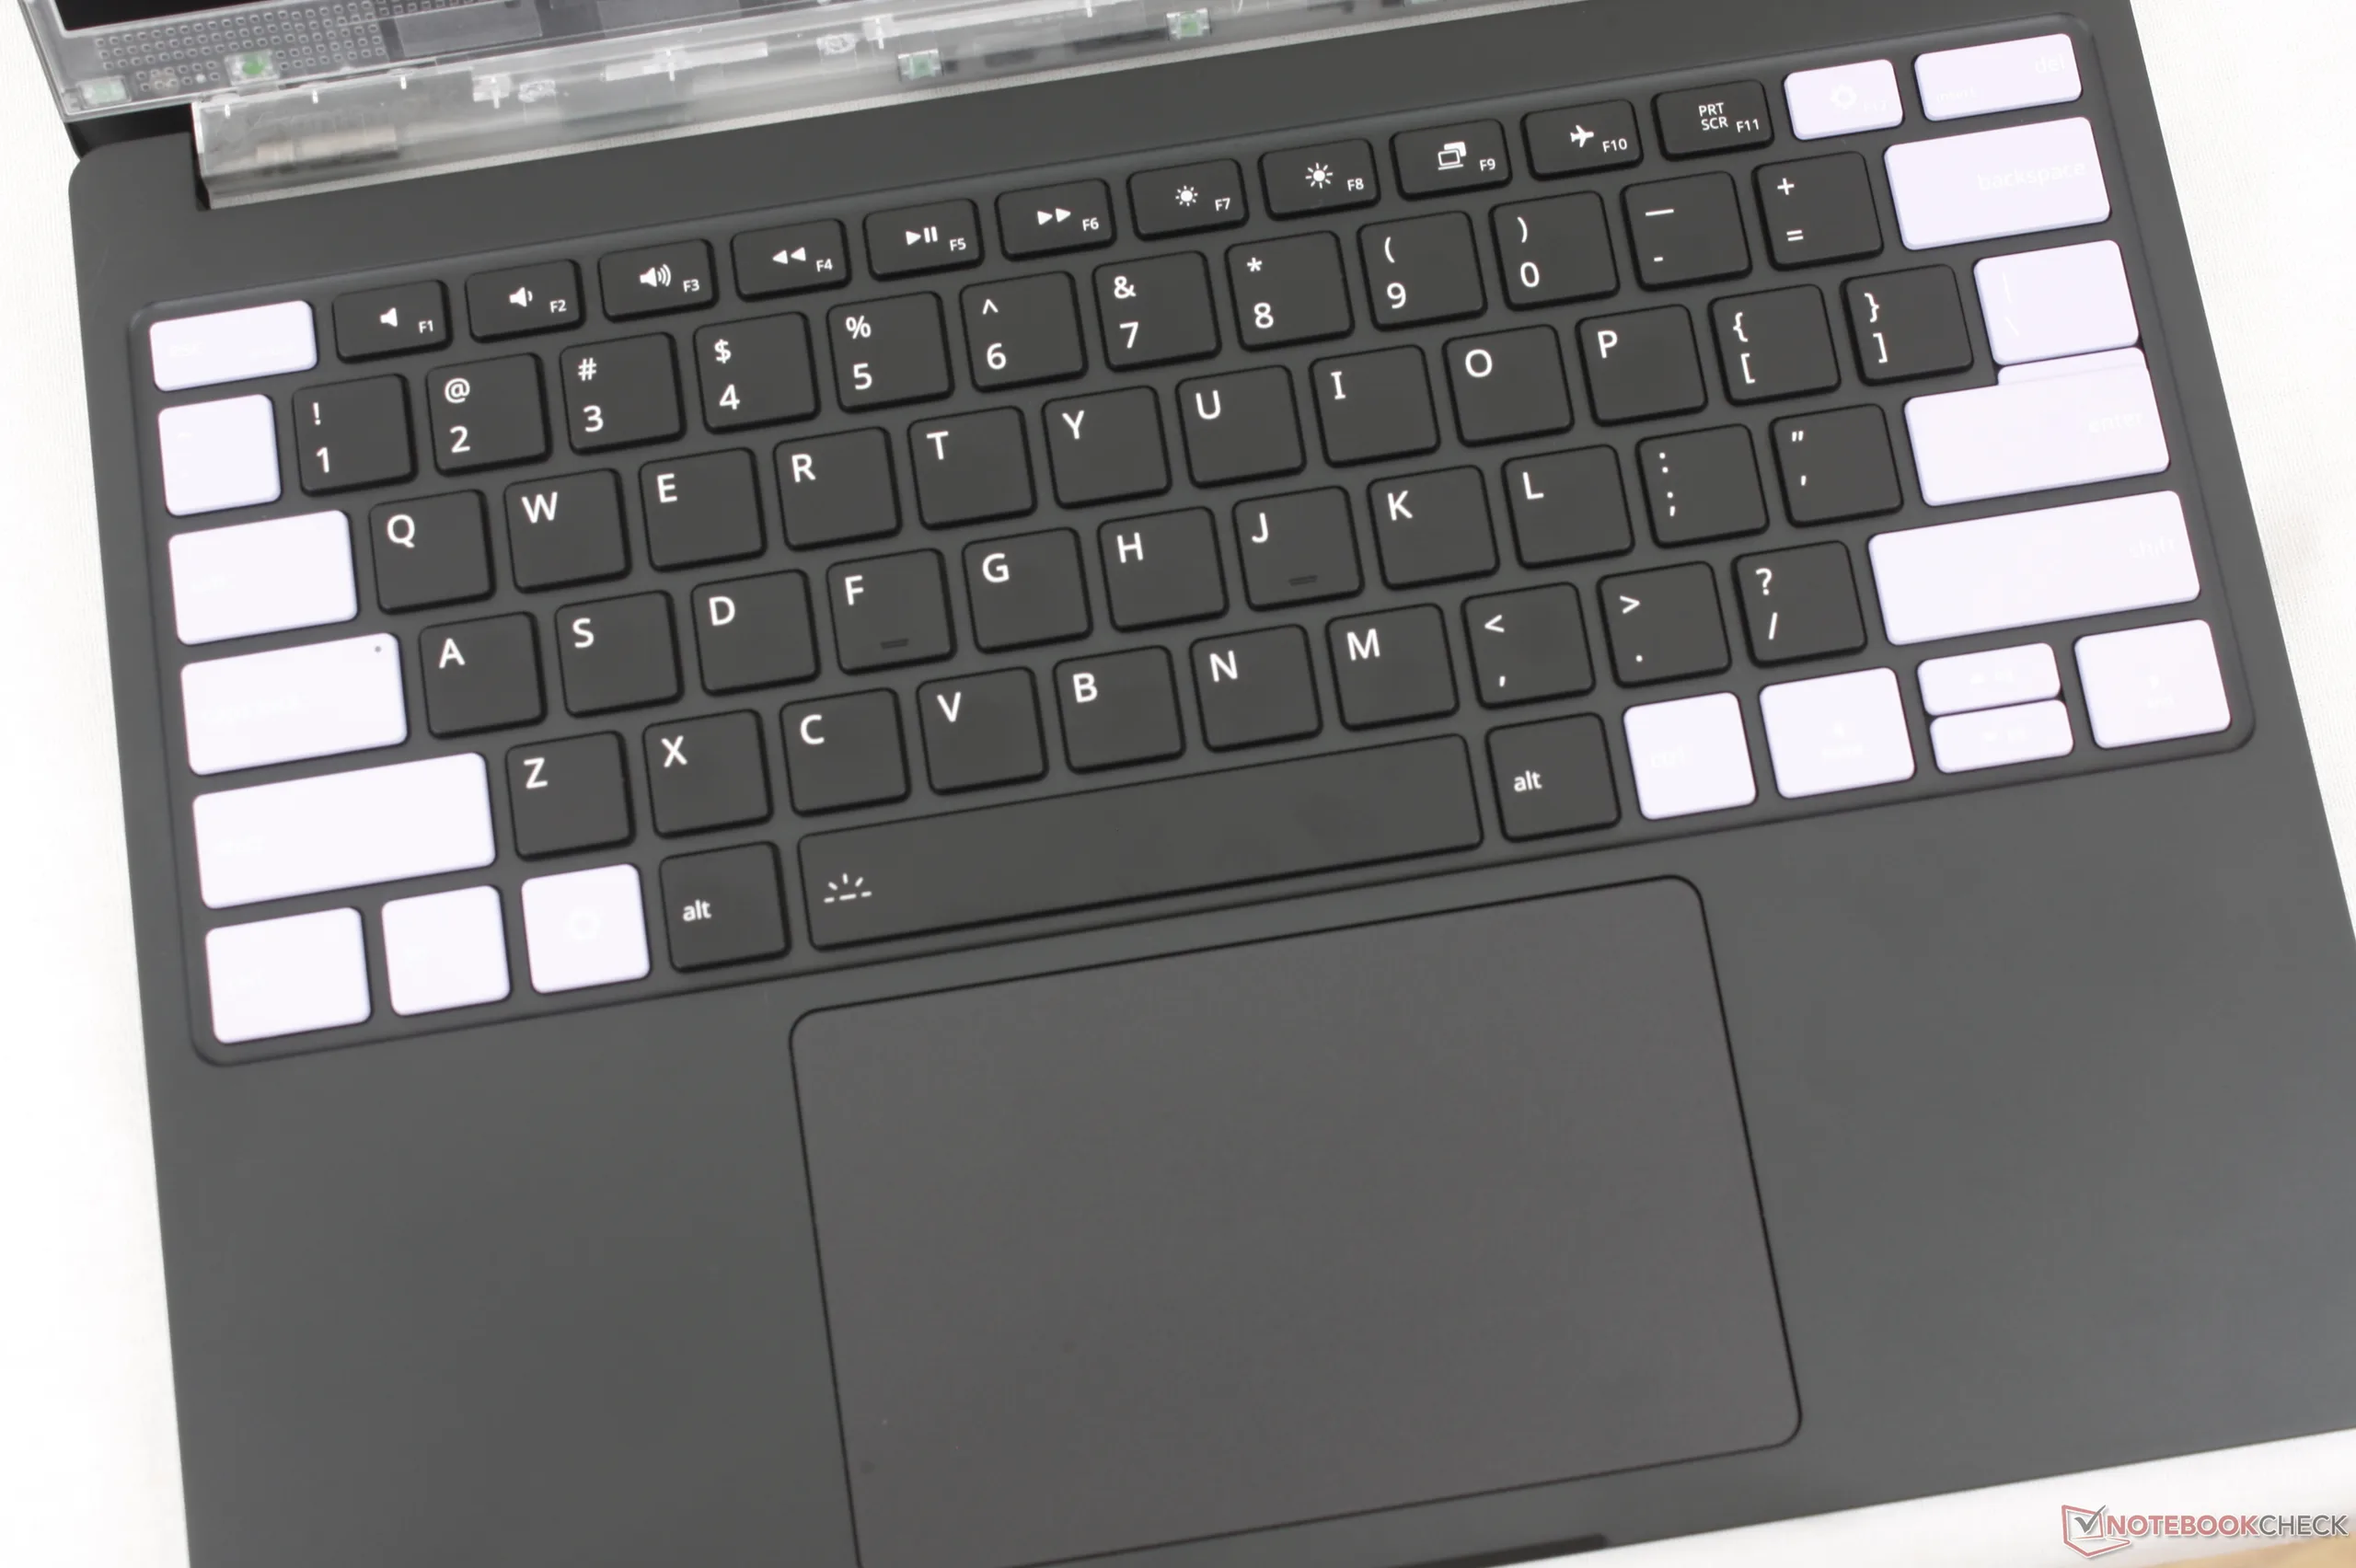
Our particular test unit has been configured with the plastic translucent bezel and a lavender keyboard.
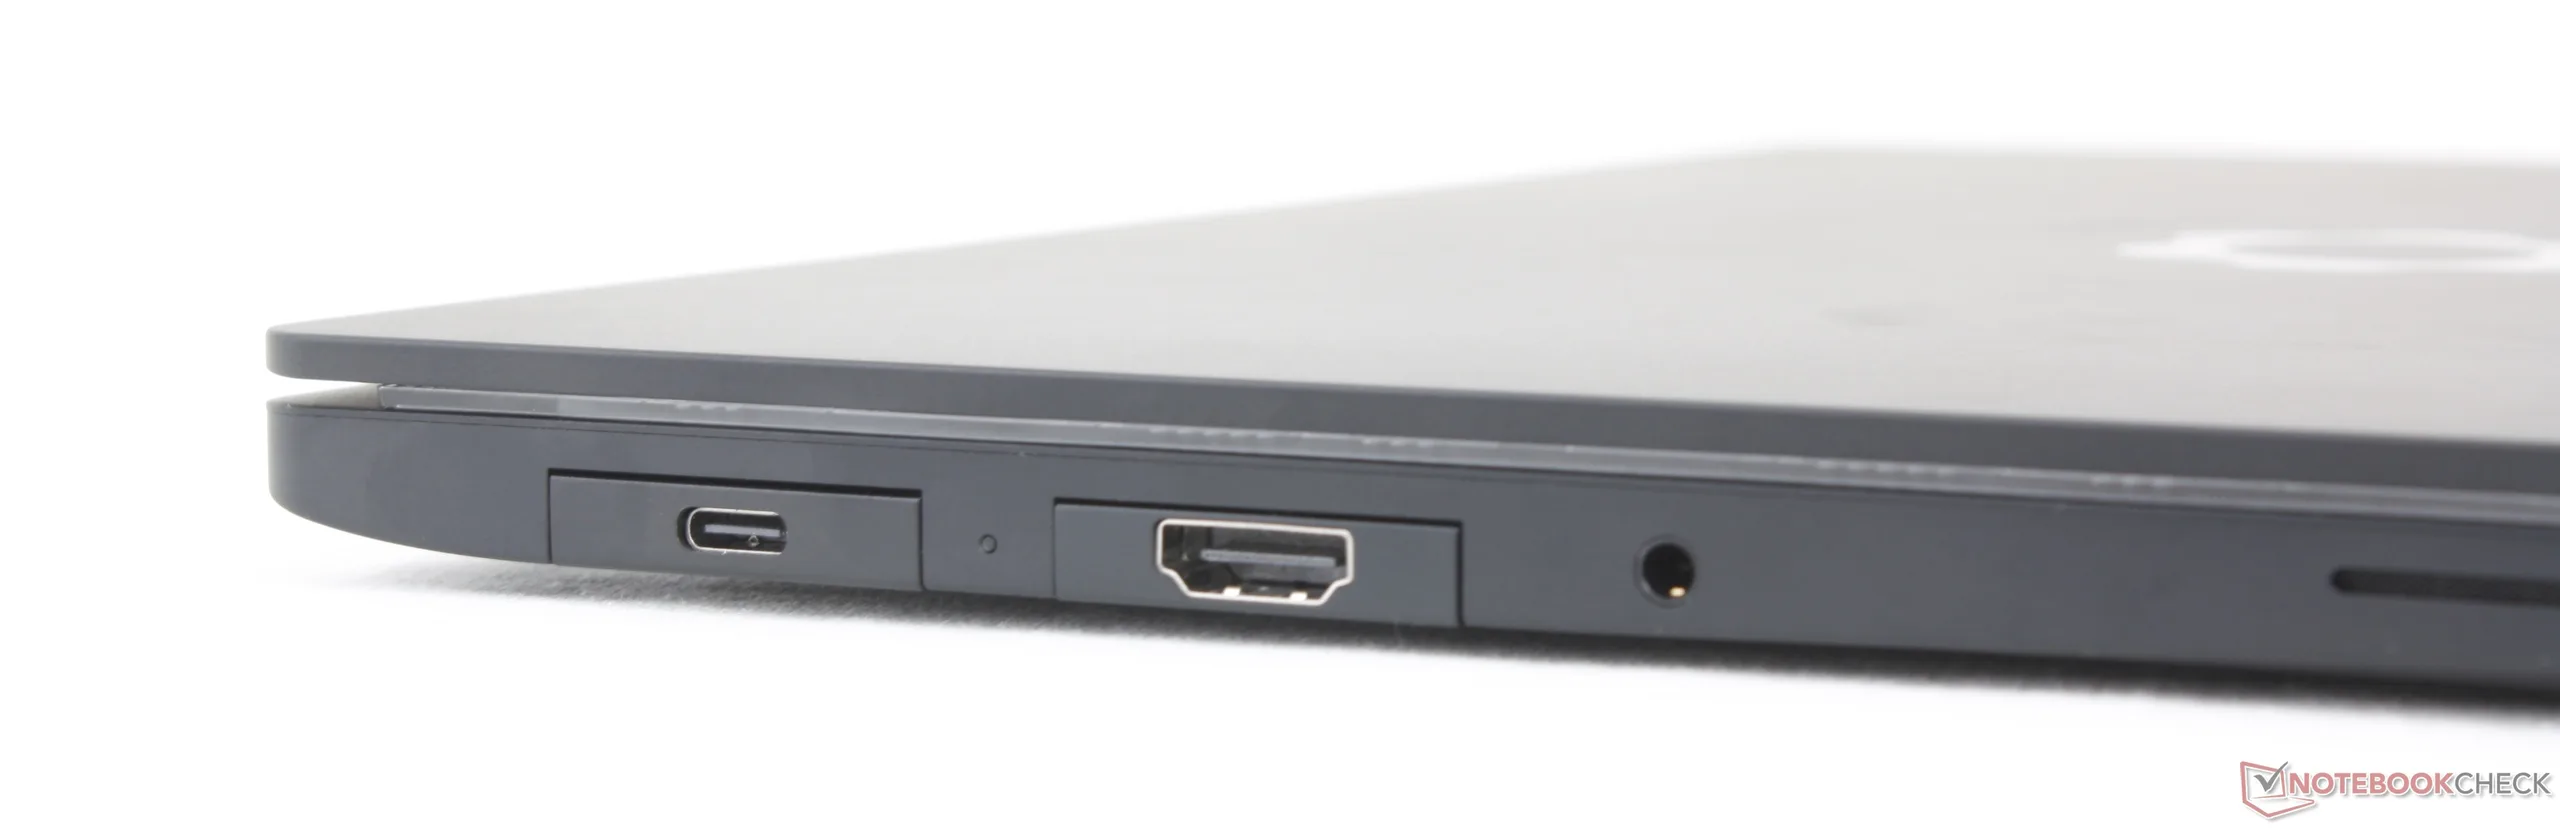
Connectivity
Communication
| Networking | |
| iperf3 transmit Wi-Fi6/7 RT-BE96U | |
| Microsoft Surface Laptop 8 13.8 | |
| MSI Prestige 13 AI+ A3MG | |
| iperf3 receive Wi-Fi6/7 RT-BE96U | |
| Microsoft Surface Laptop 8 13.8 | |
| MSI Prestige 13 AI+ A3MG | |
| iperf3 receive AXE11000 6GHz | |
| Dell XPS 14 Core Ultra X7 358H | |
| Framework Laptop 13 Pro | |
| Asus ExpertBook Ultra B9406CAA | |
| Framework Laptop 13.5 Ryzen AI 9 HX 370 | |
| iperf3 transmit AXE11000 6GHz | |
| Asus ExpertBook Ultra B9406CAA | |
| Framework Laptop 13 Pro | |
| Dell XPS 14 Core Ultra X7 358H | |
| Framework Laptop 13.5 Ryzen AI 9 HX 370 | |
Webcam
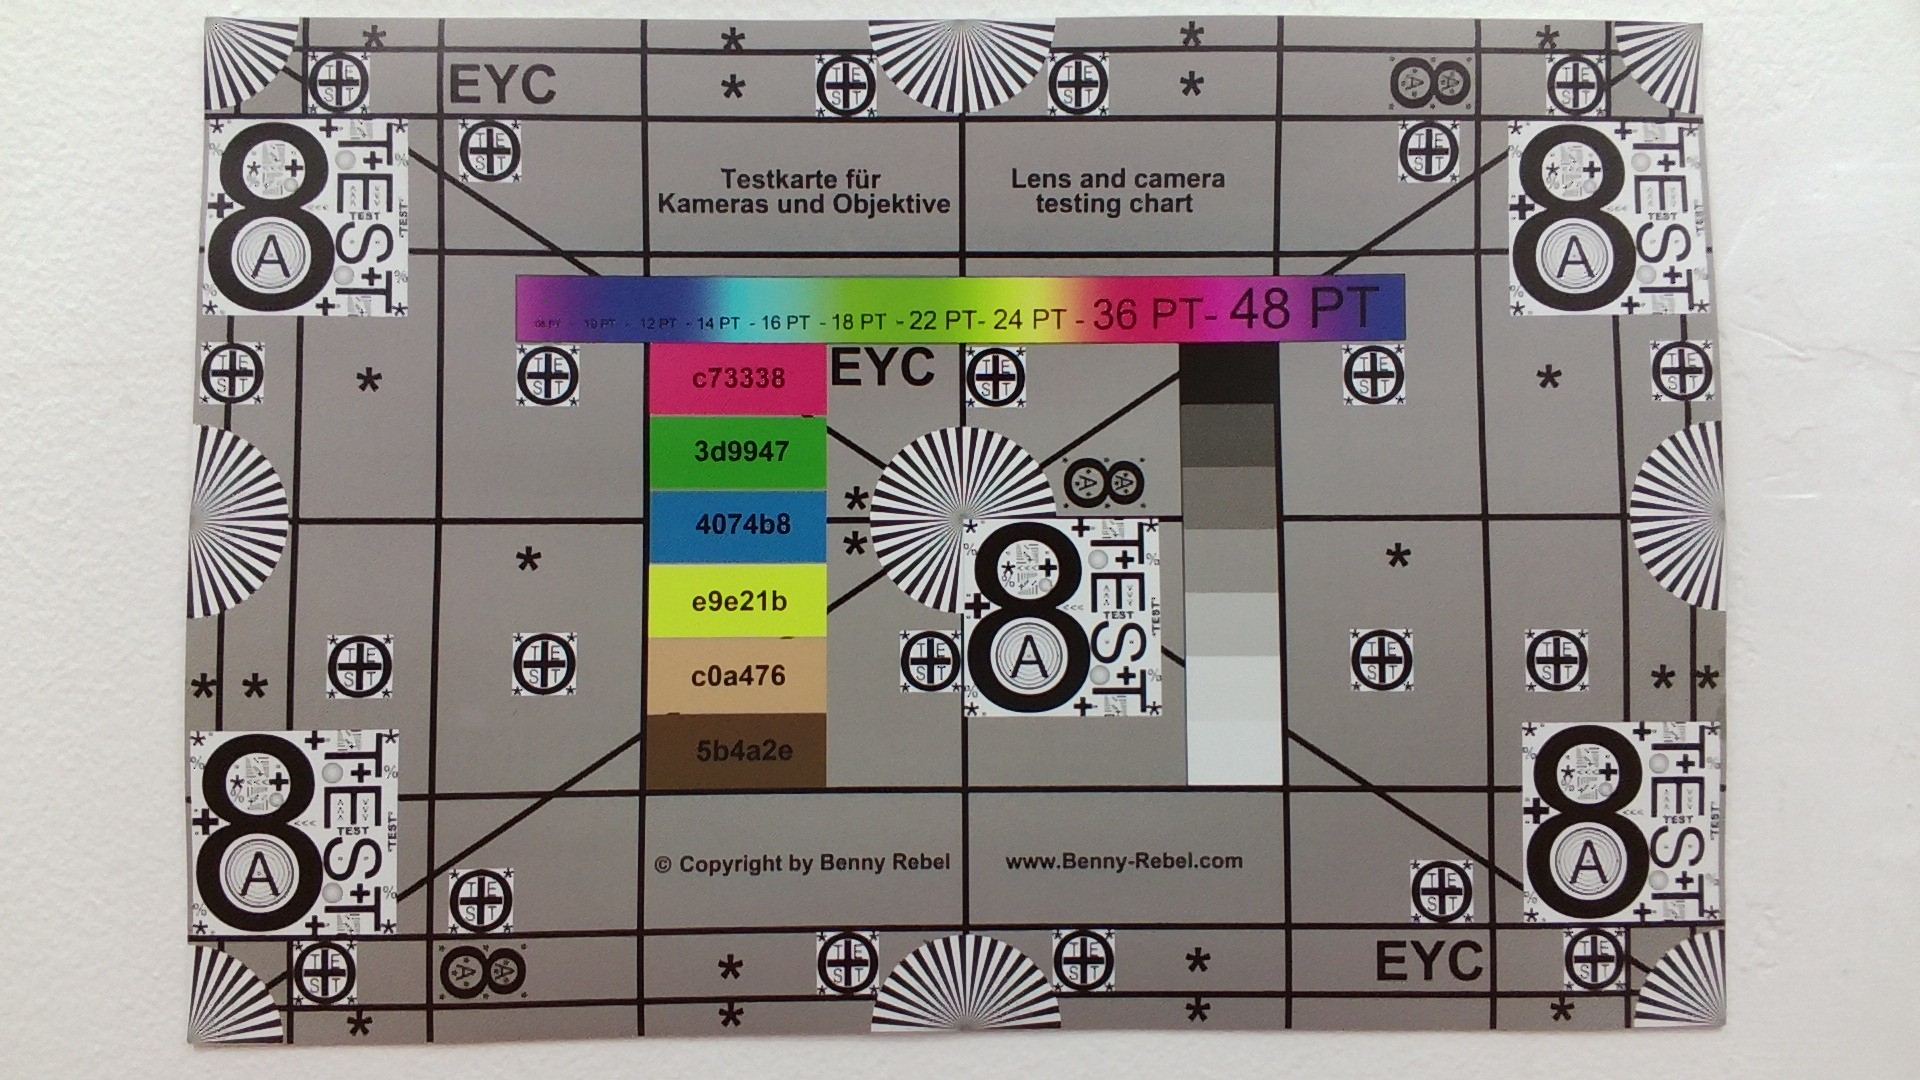
Although Framework advertises a 9.2 MP sensor, our webcam tops out at only 2.1 MP even after installing the latest official drivers from the manufacturer.
Both IR and a physical shutter come standard.


Accessories
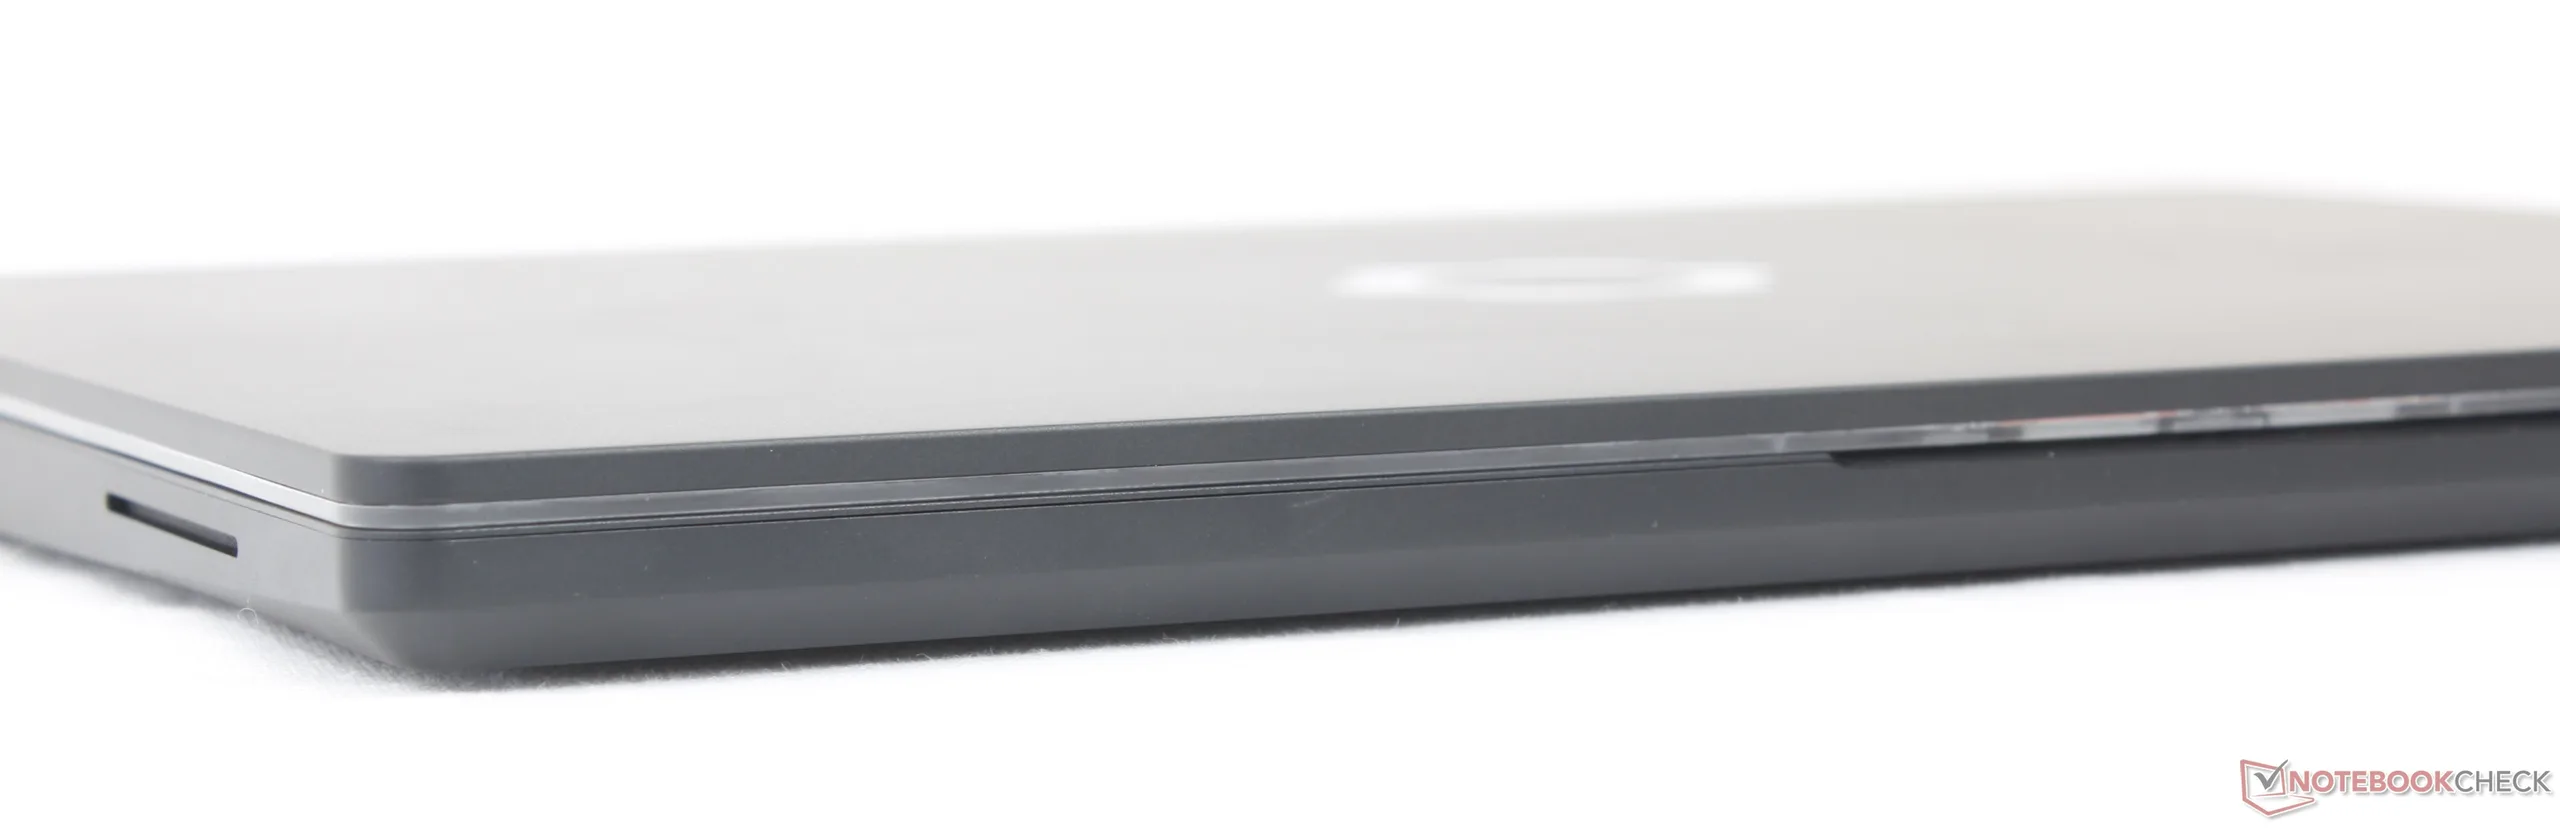
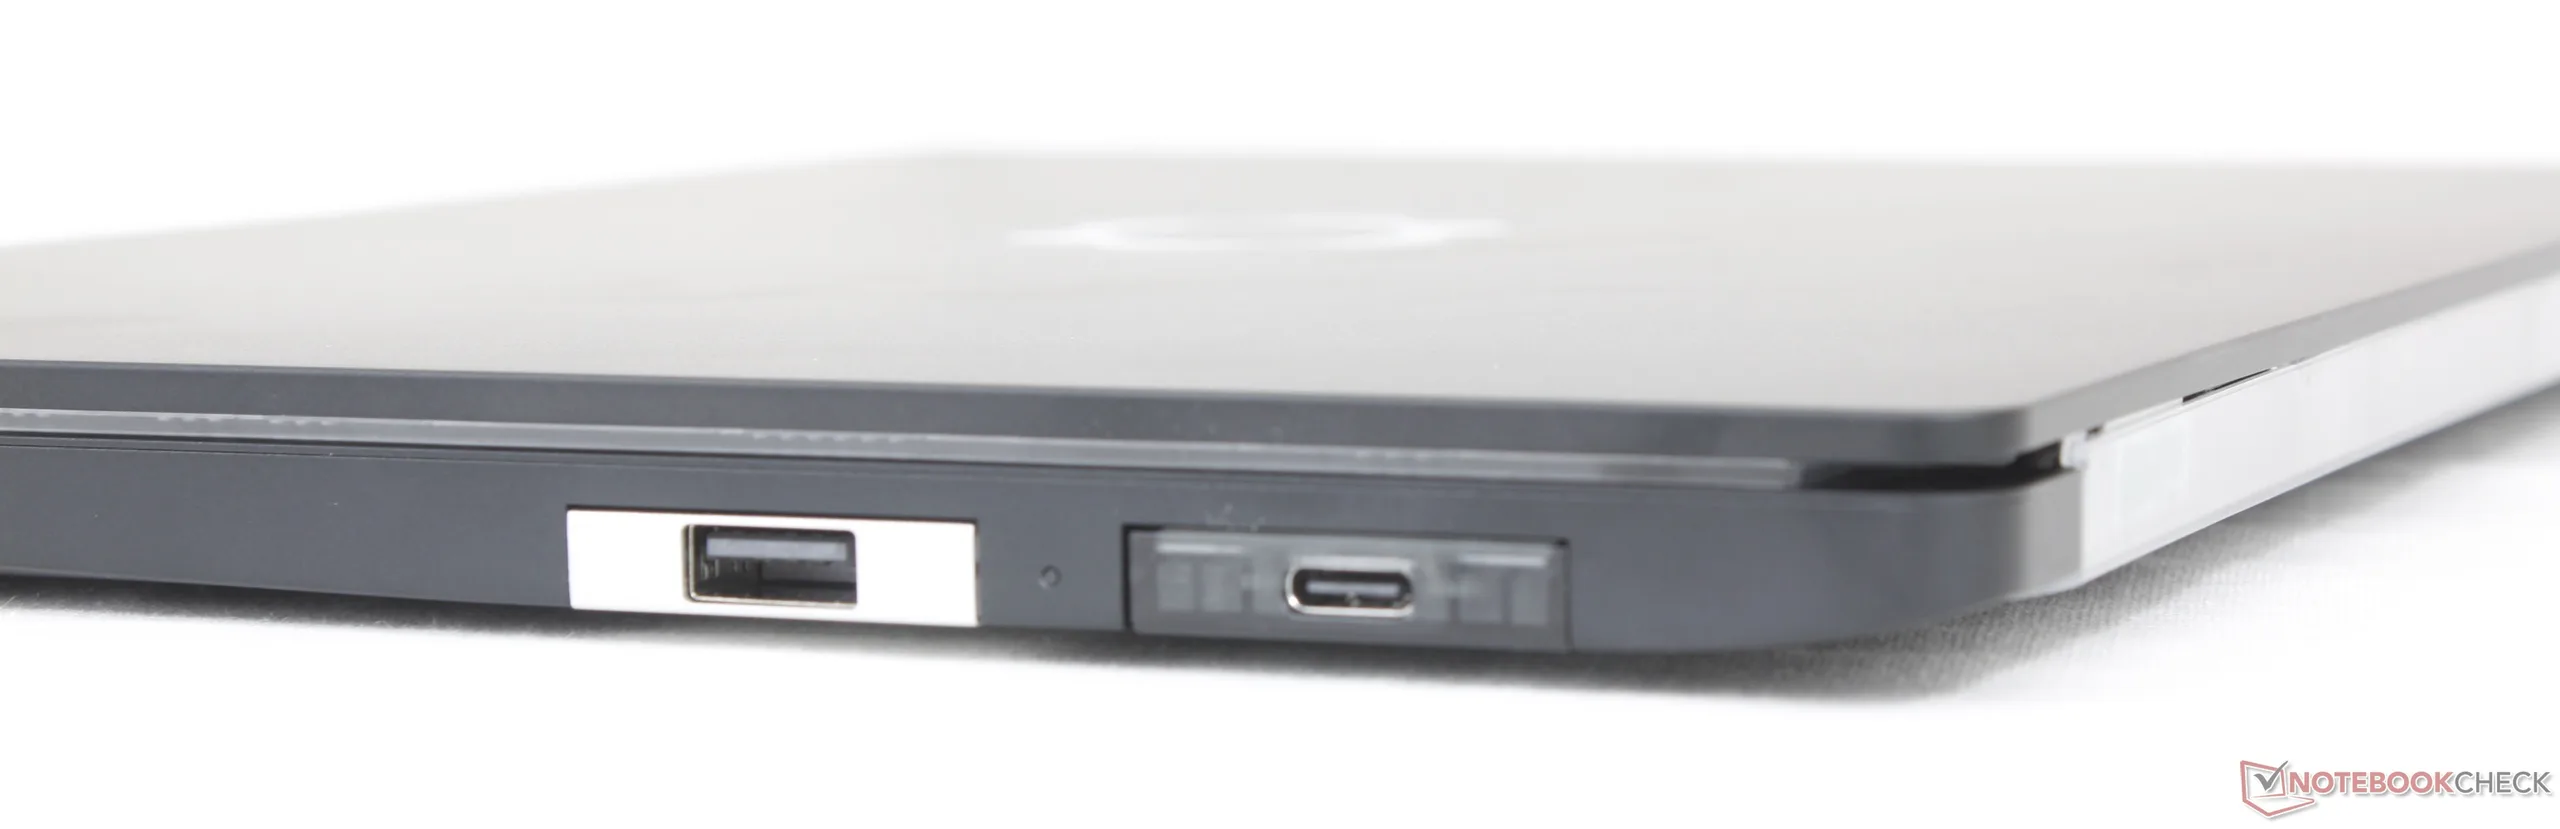
The recognizable Expansion Cards return with newcomers like 10 Gbps RJ-45, HDMI 2.0b, and additional colors for the bezel and keyboard.
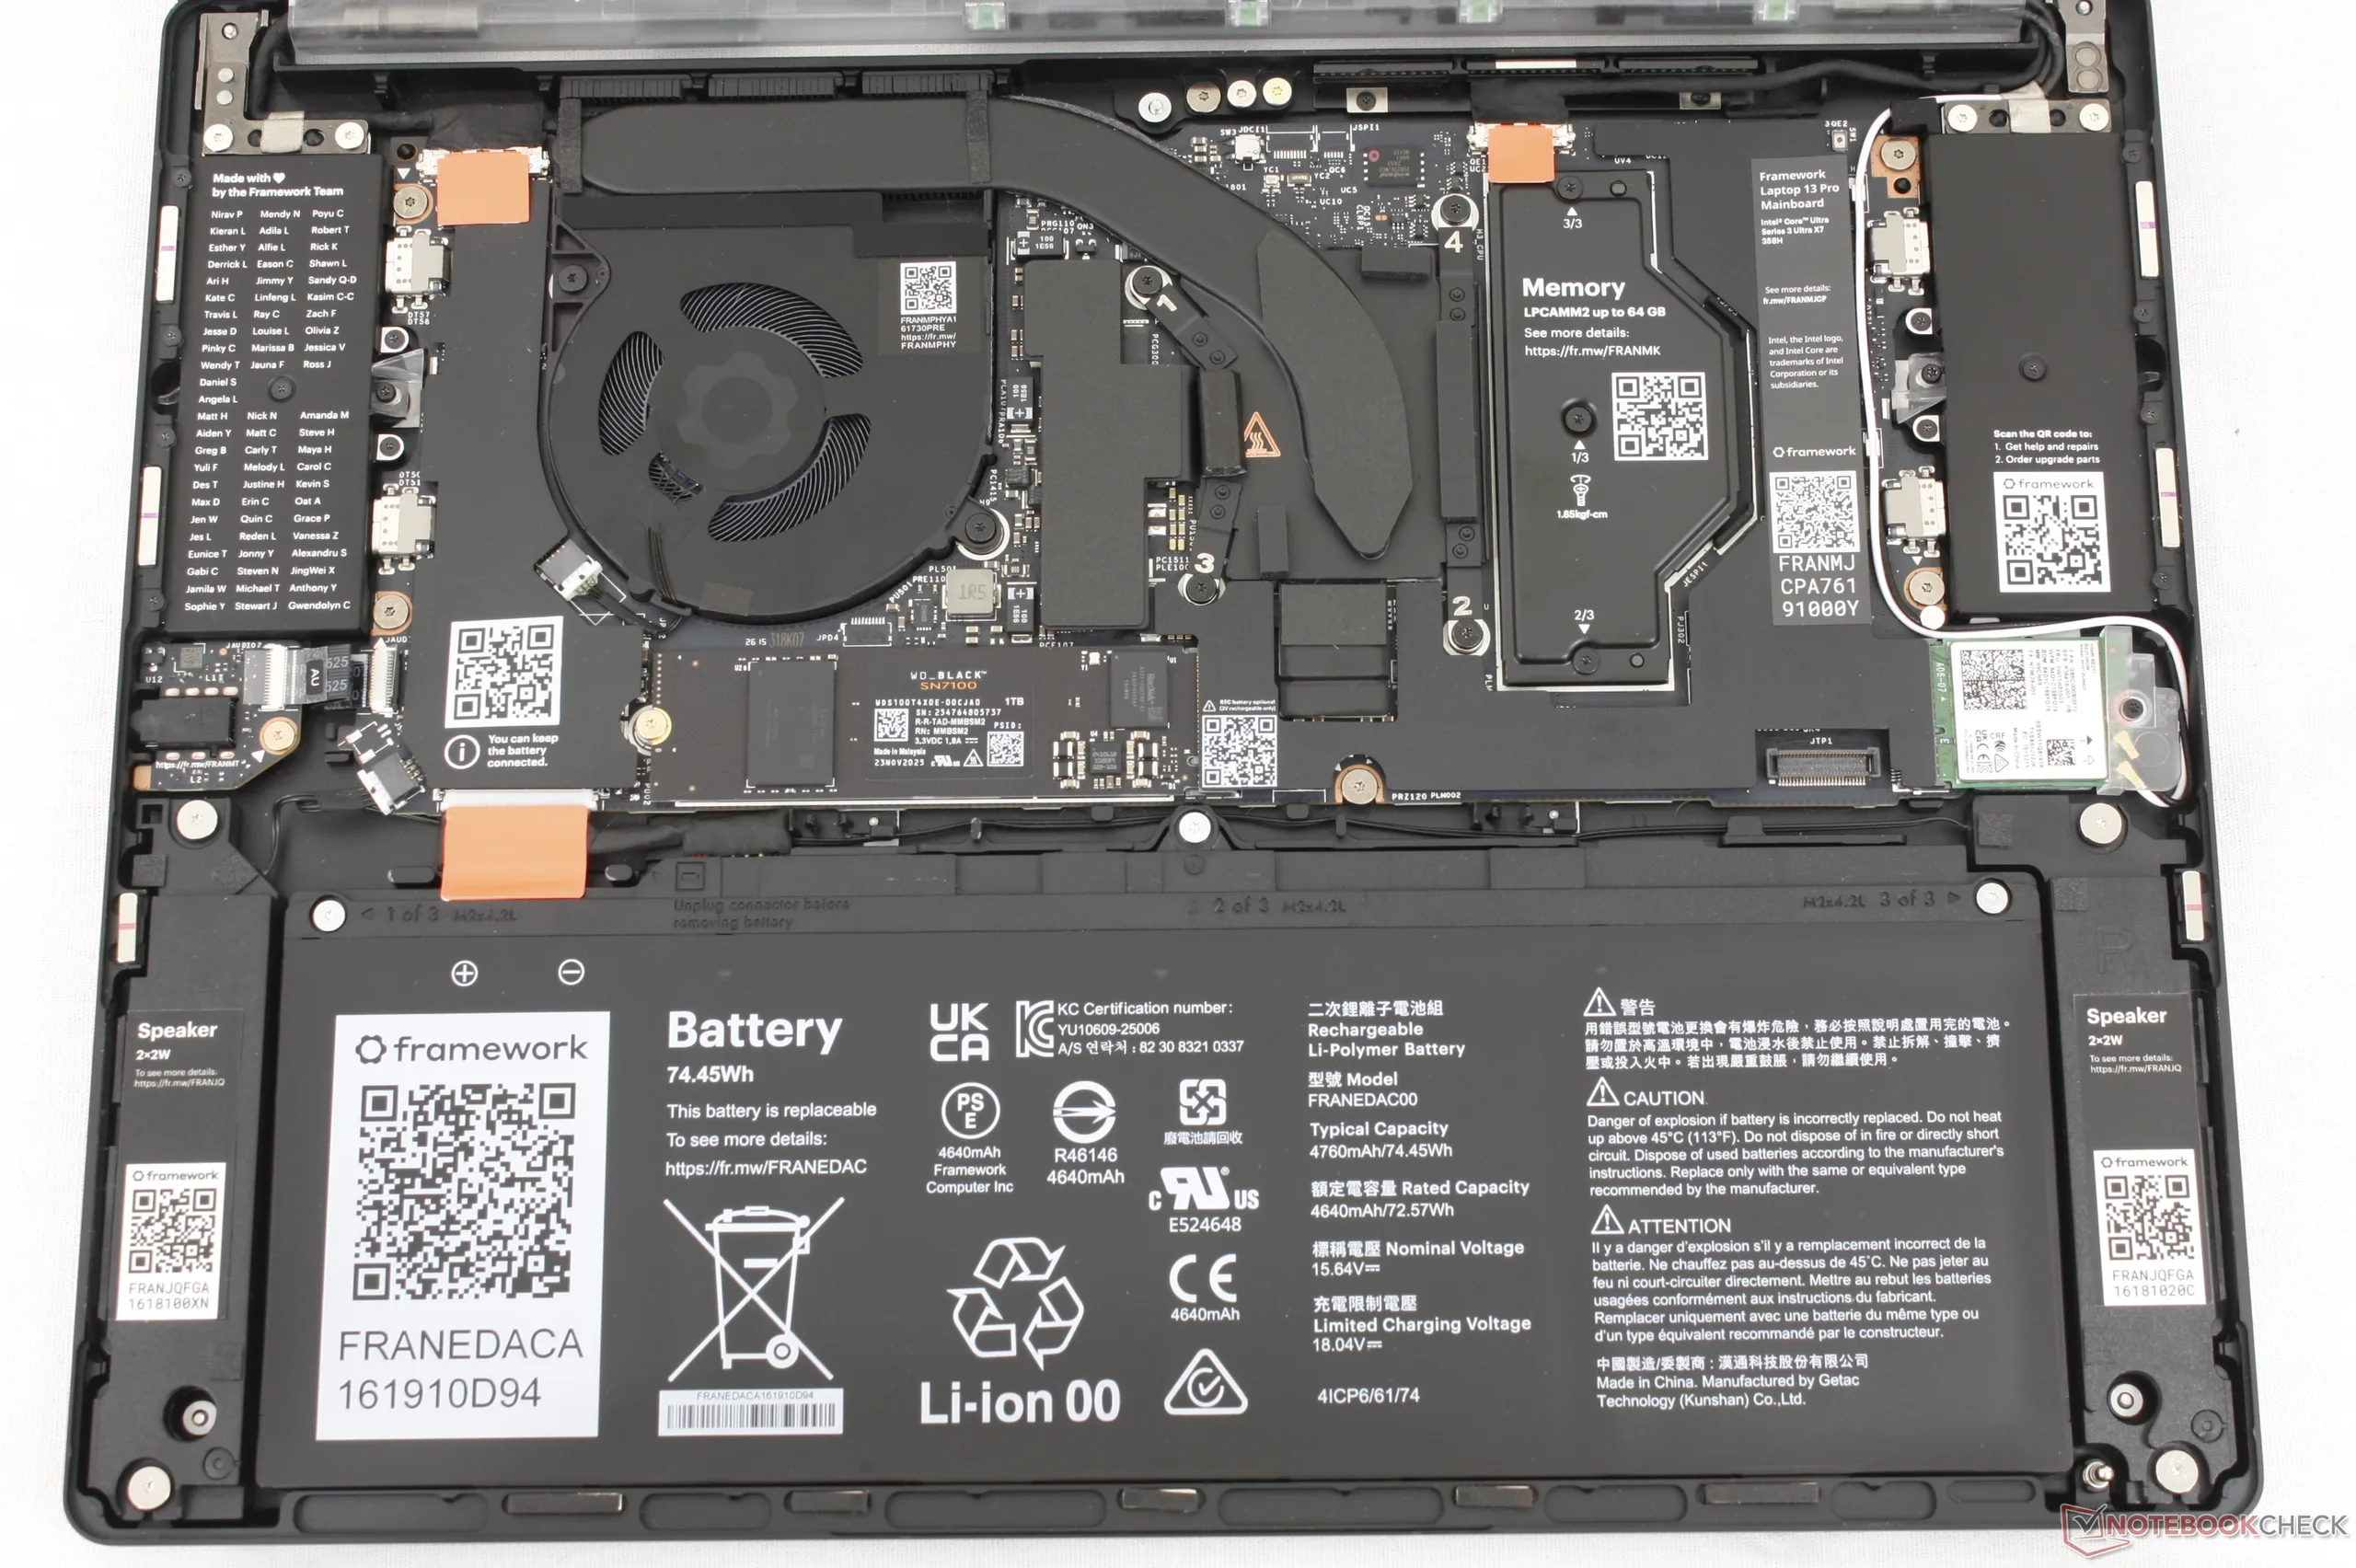
Maintenance
The official disassembly guide for the Framework Laptop 13 Pro can be found here.

Sustainability
The chassis consists of up to 75 percent pre-consumer (not post-consumer) recycled aluminum with 100% recyclable packaging. However, the packaging still uses some plastic plates for protection.
It should be noted that the motherboard on the older Laptop 13.5 can be physically transferred to the new Laptop 13 Pro chassis should existing owners want to upgrade.
Warranty
A one-year limited manufacturer warranty comes standard if purchased in the US.
Input Devices
Display
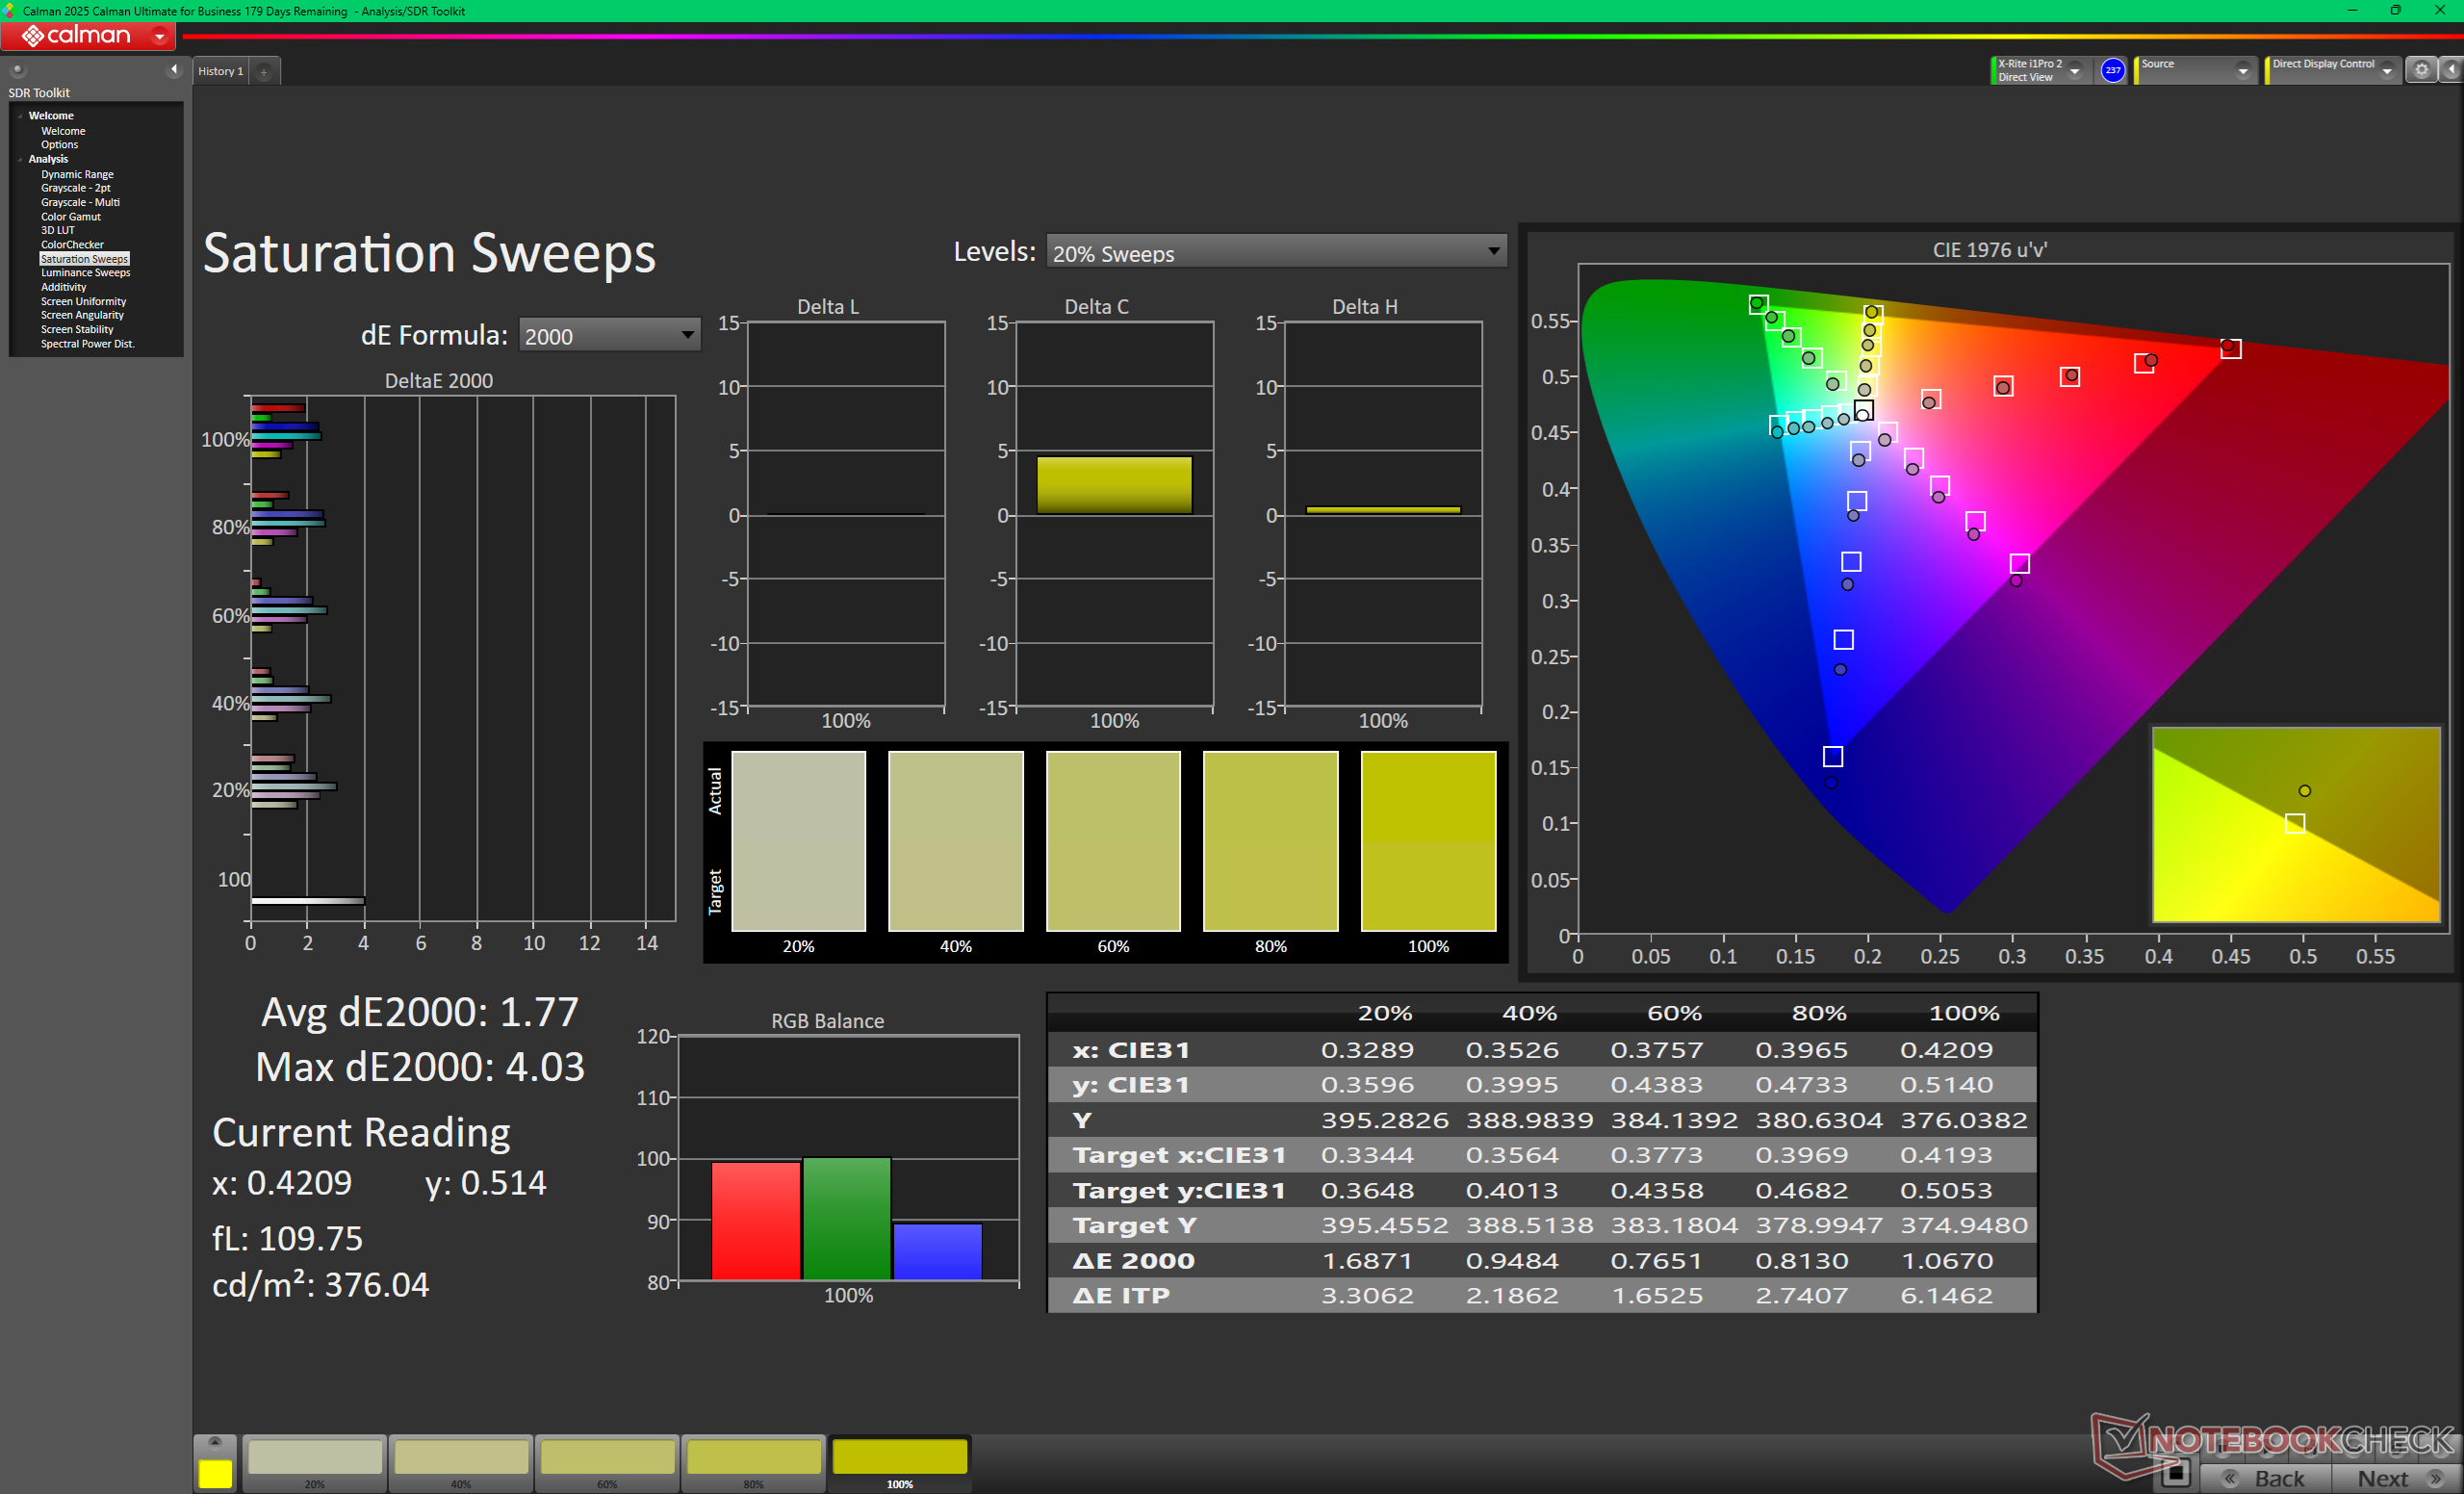
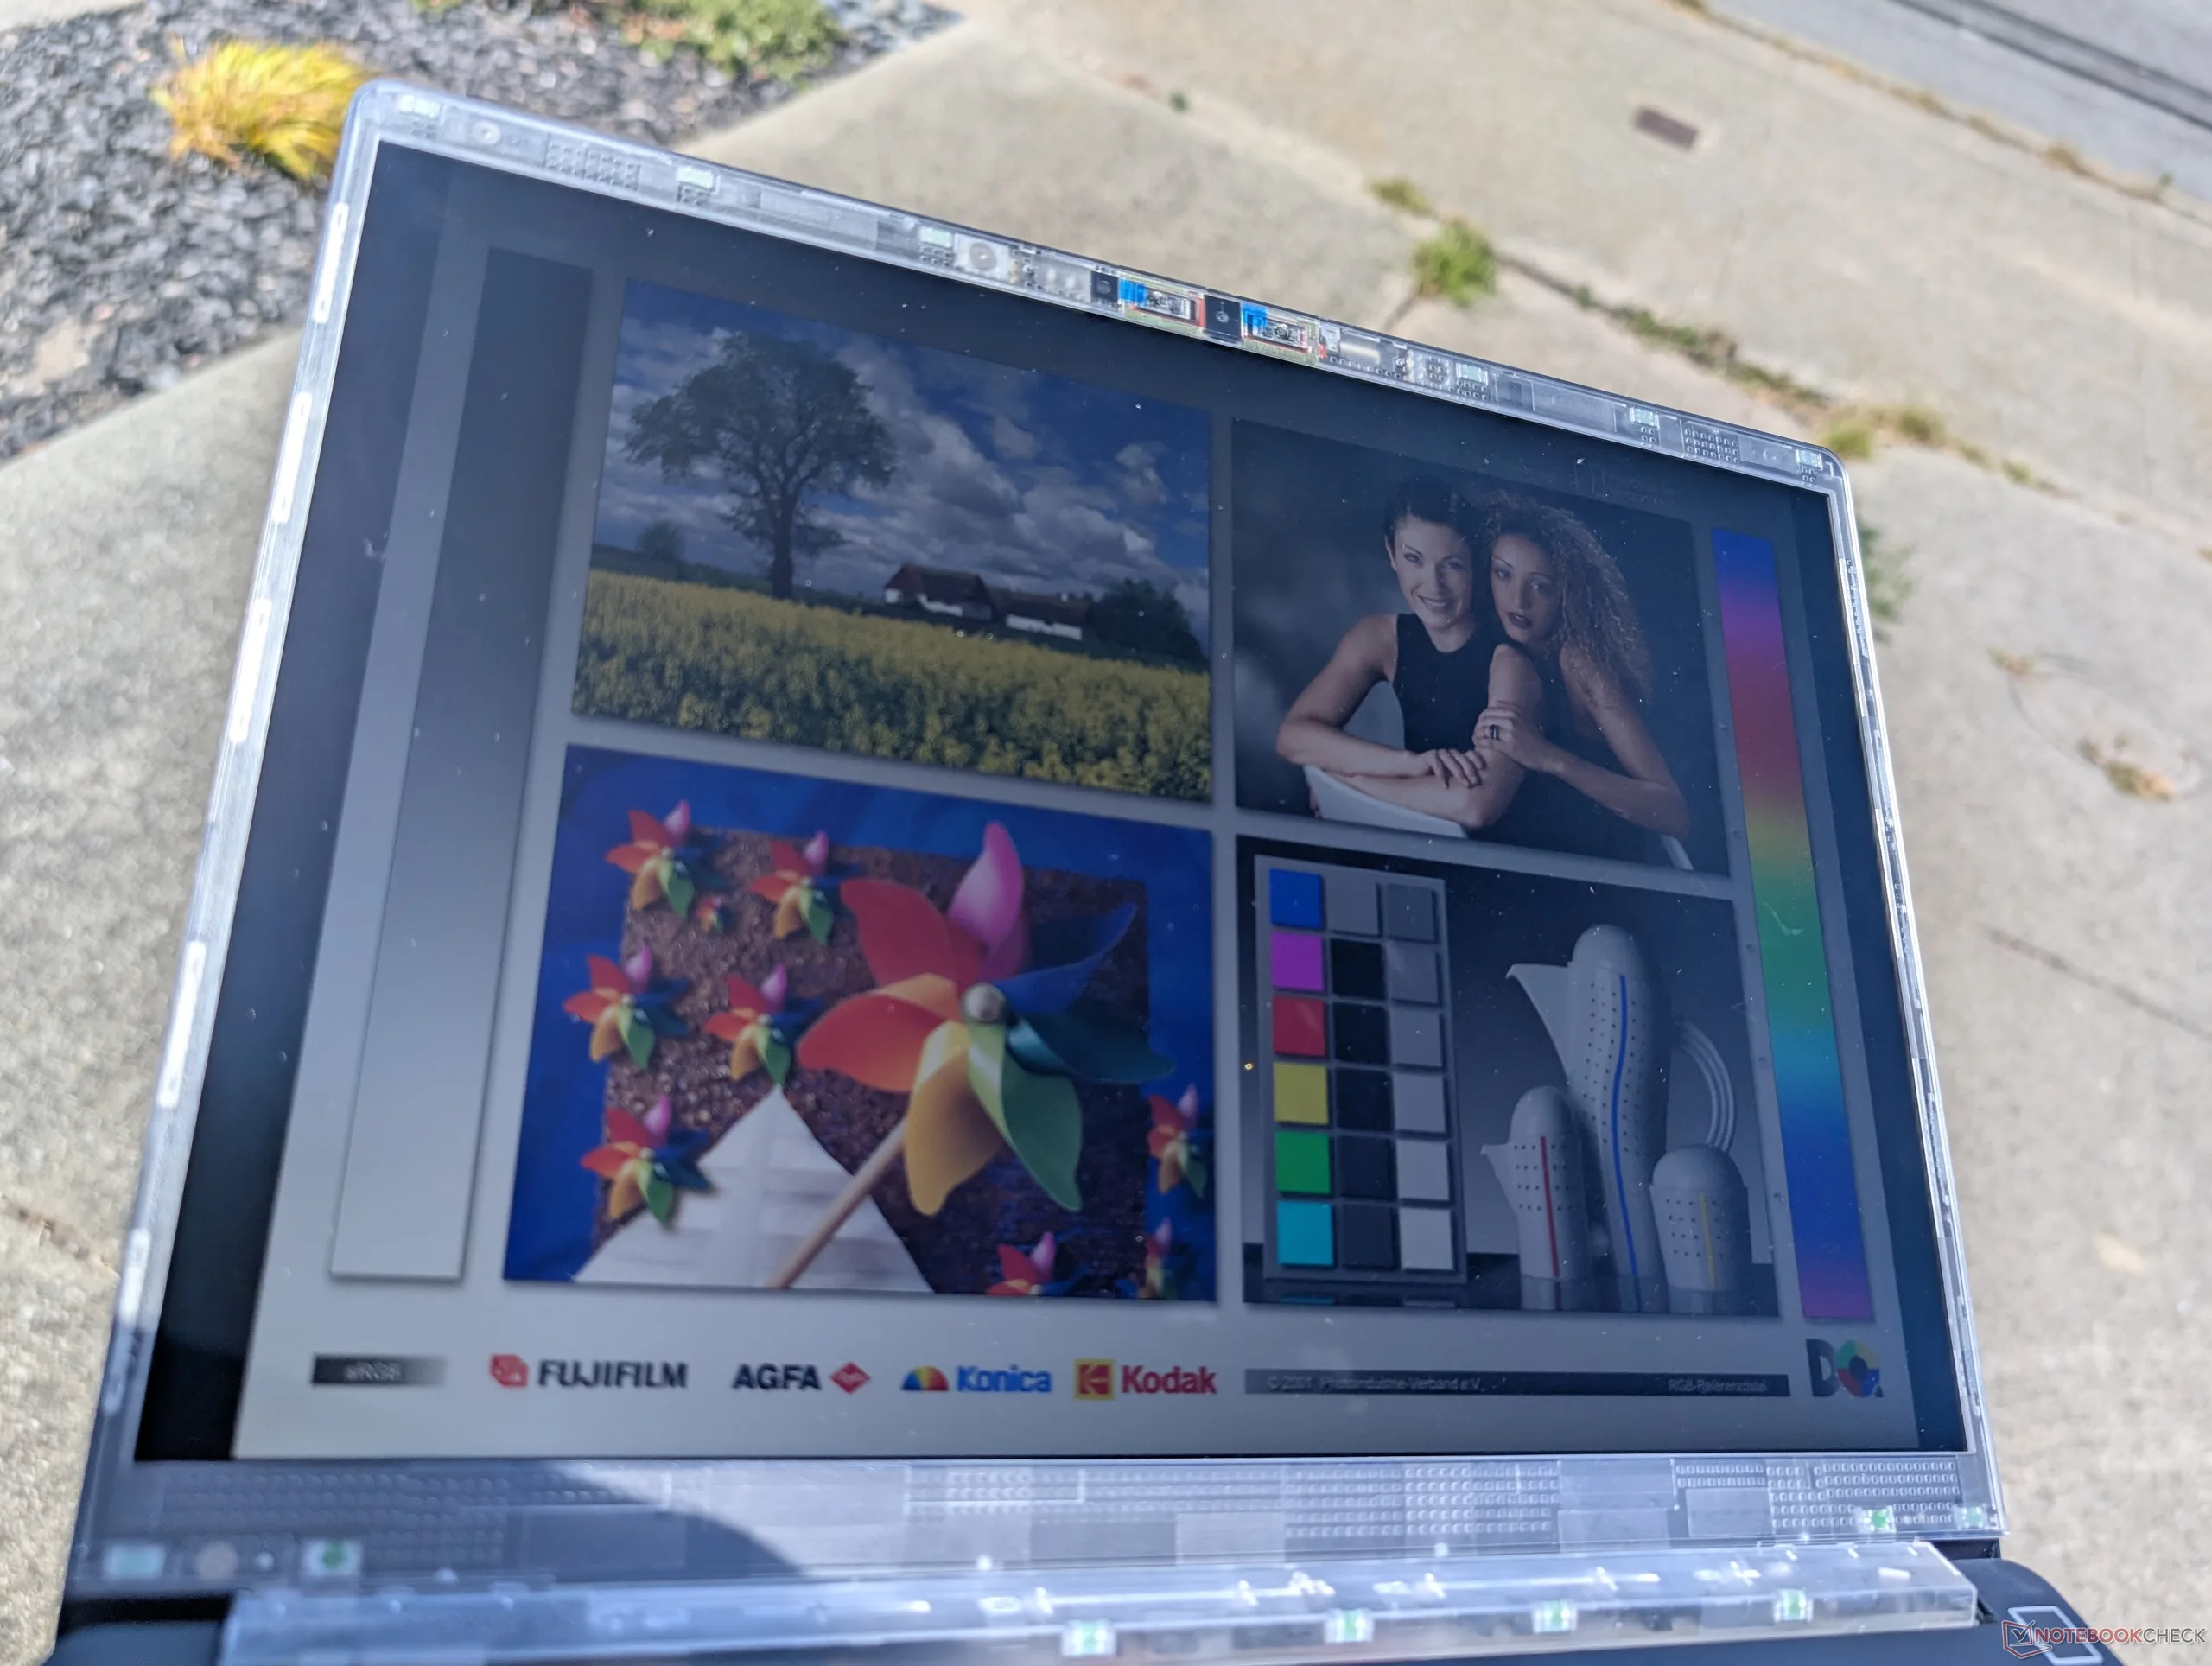
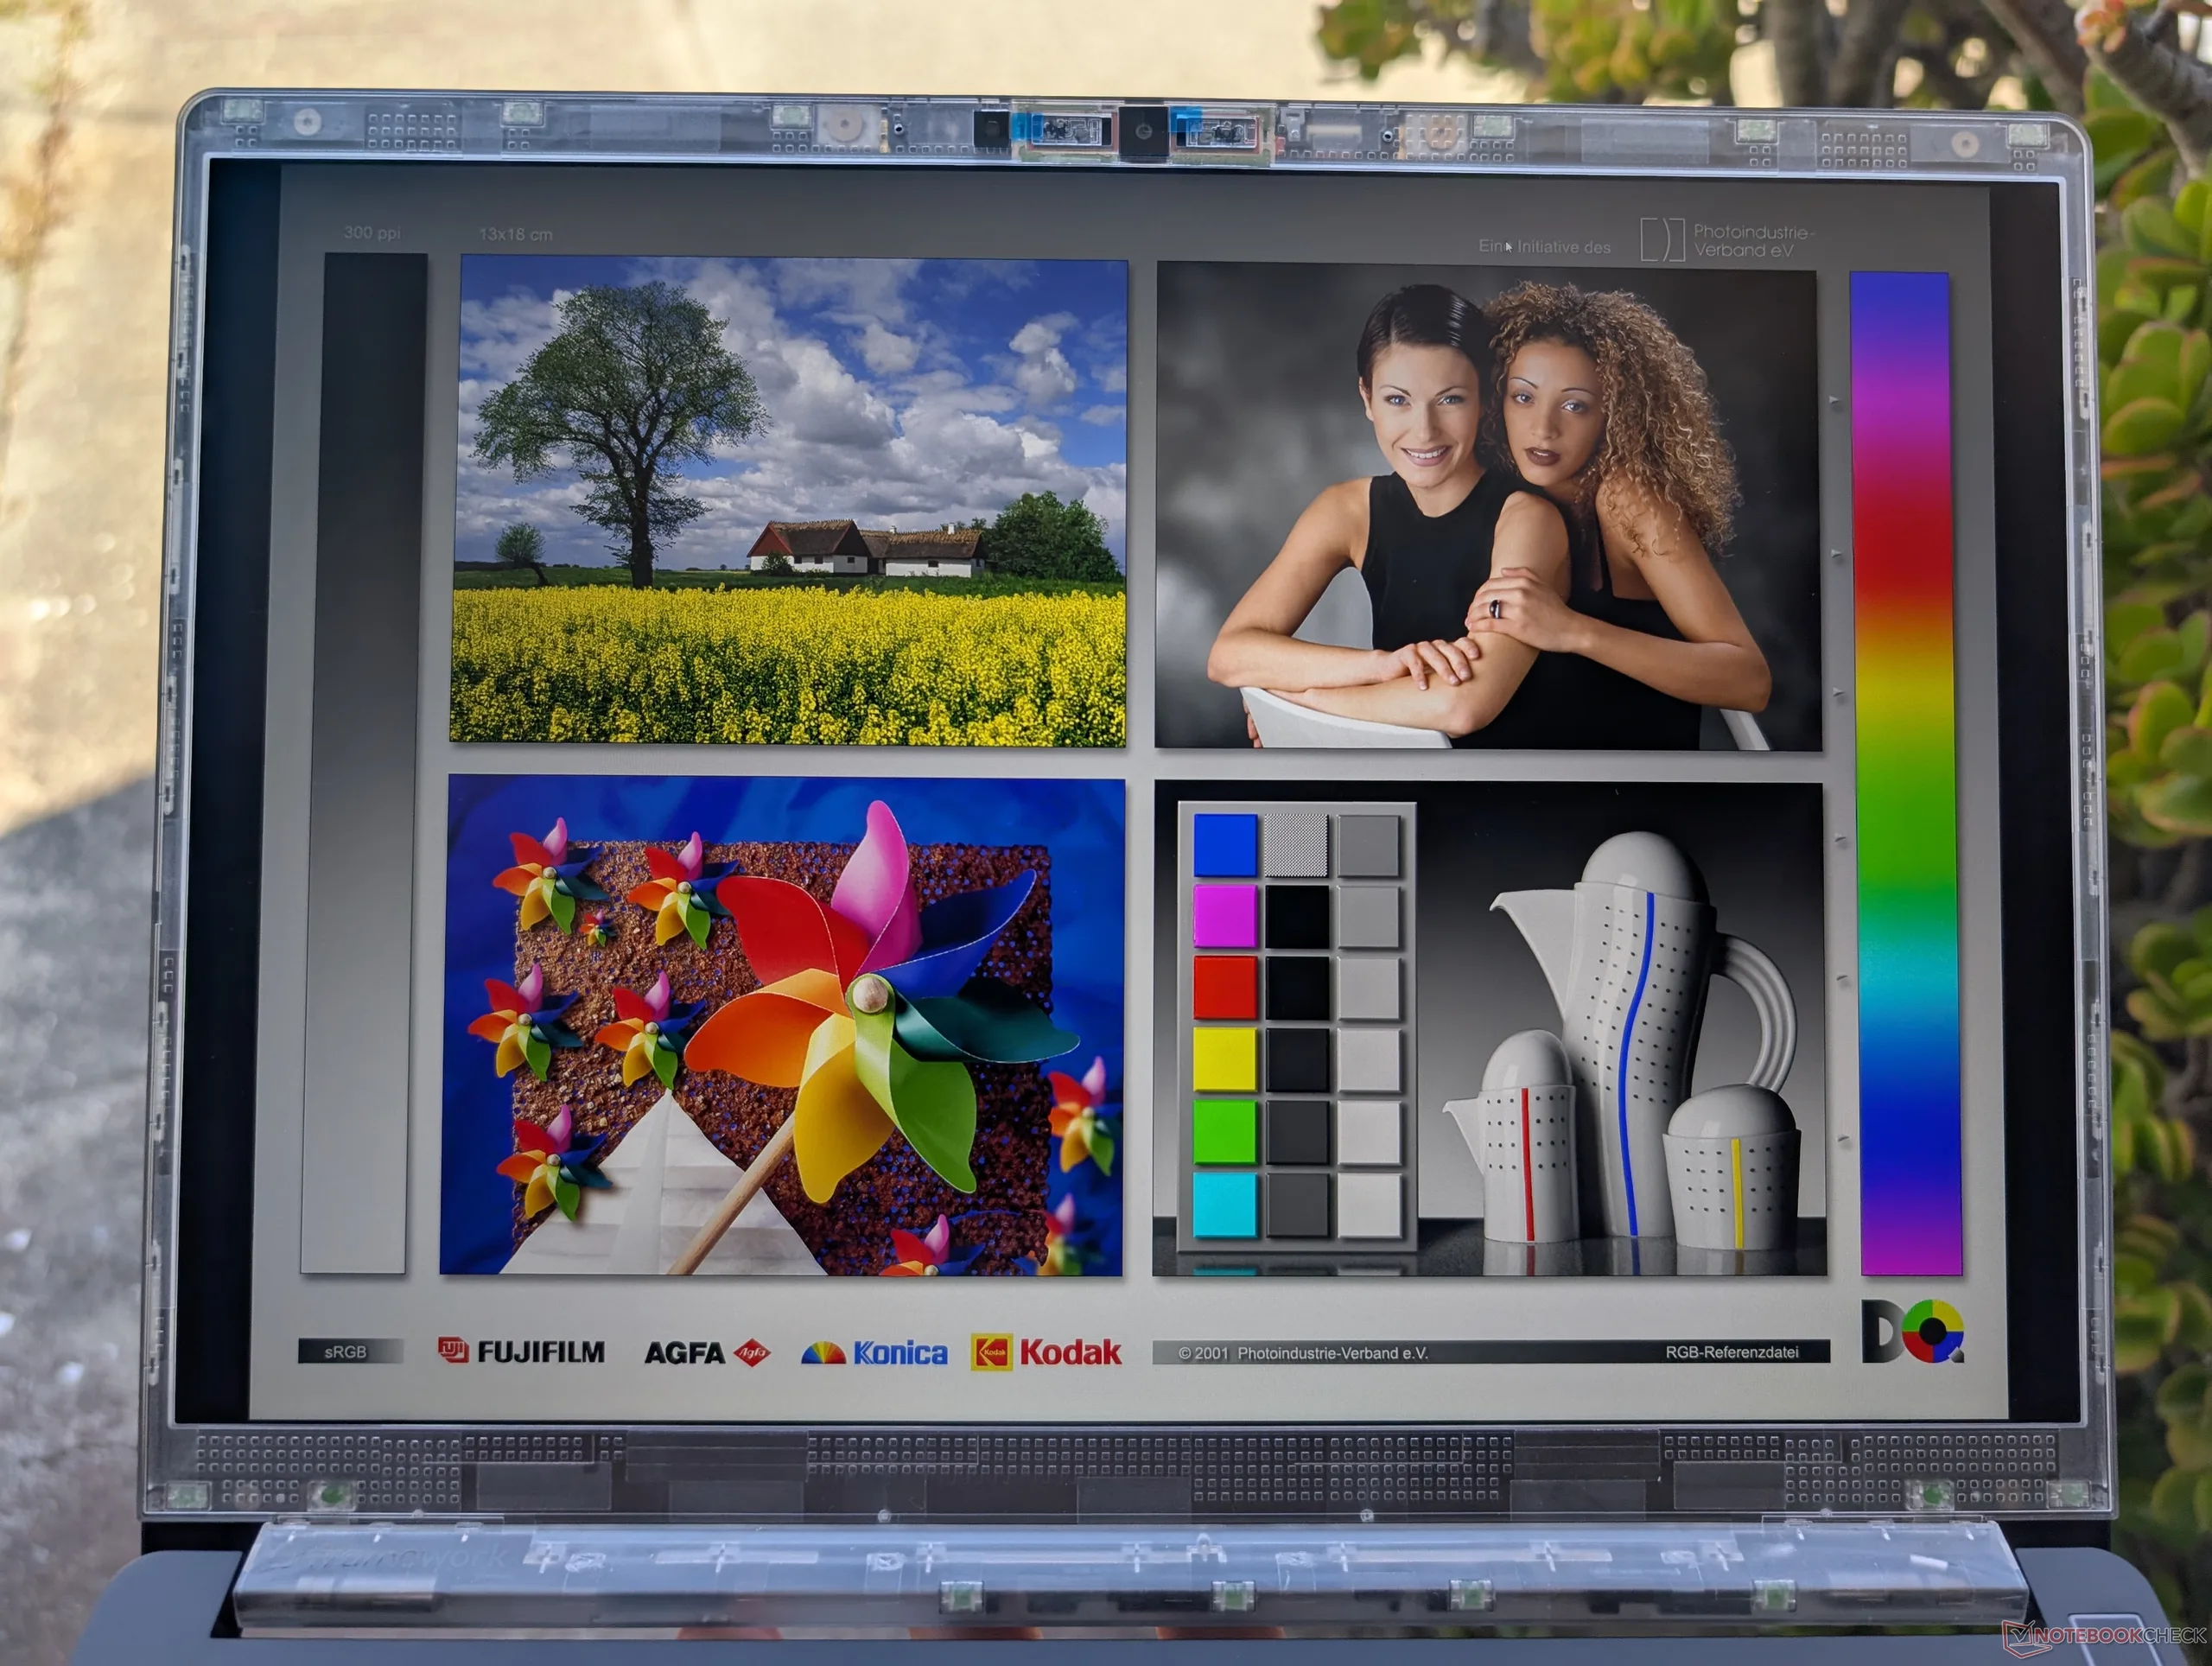
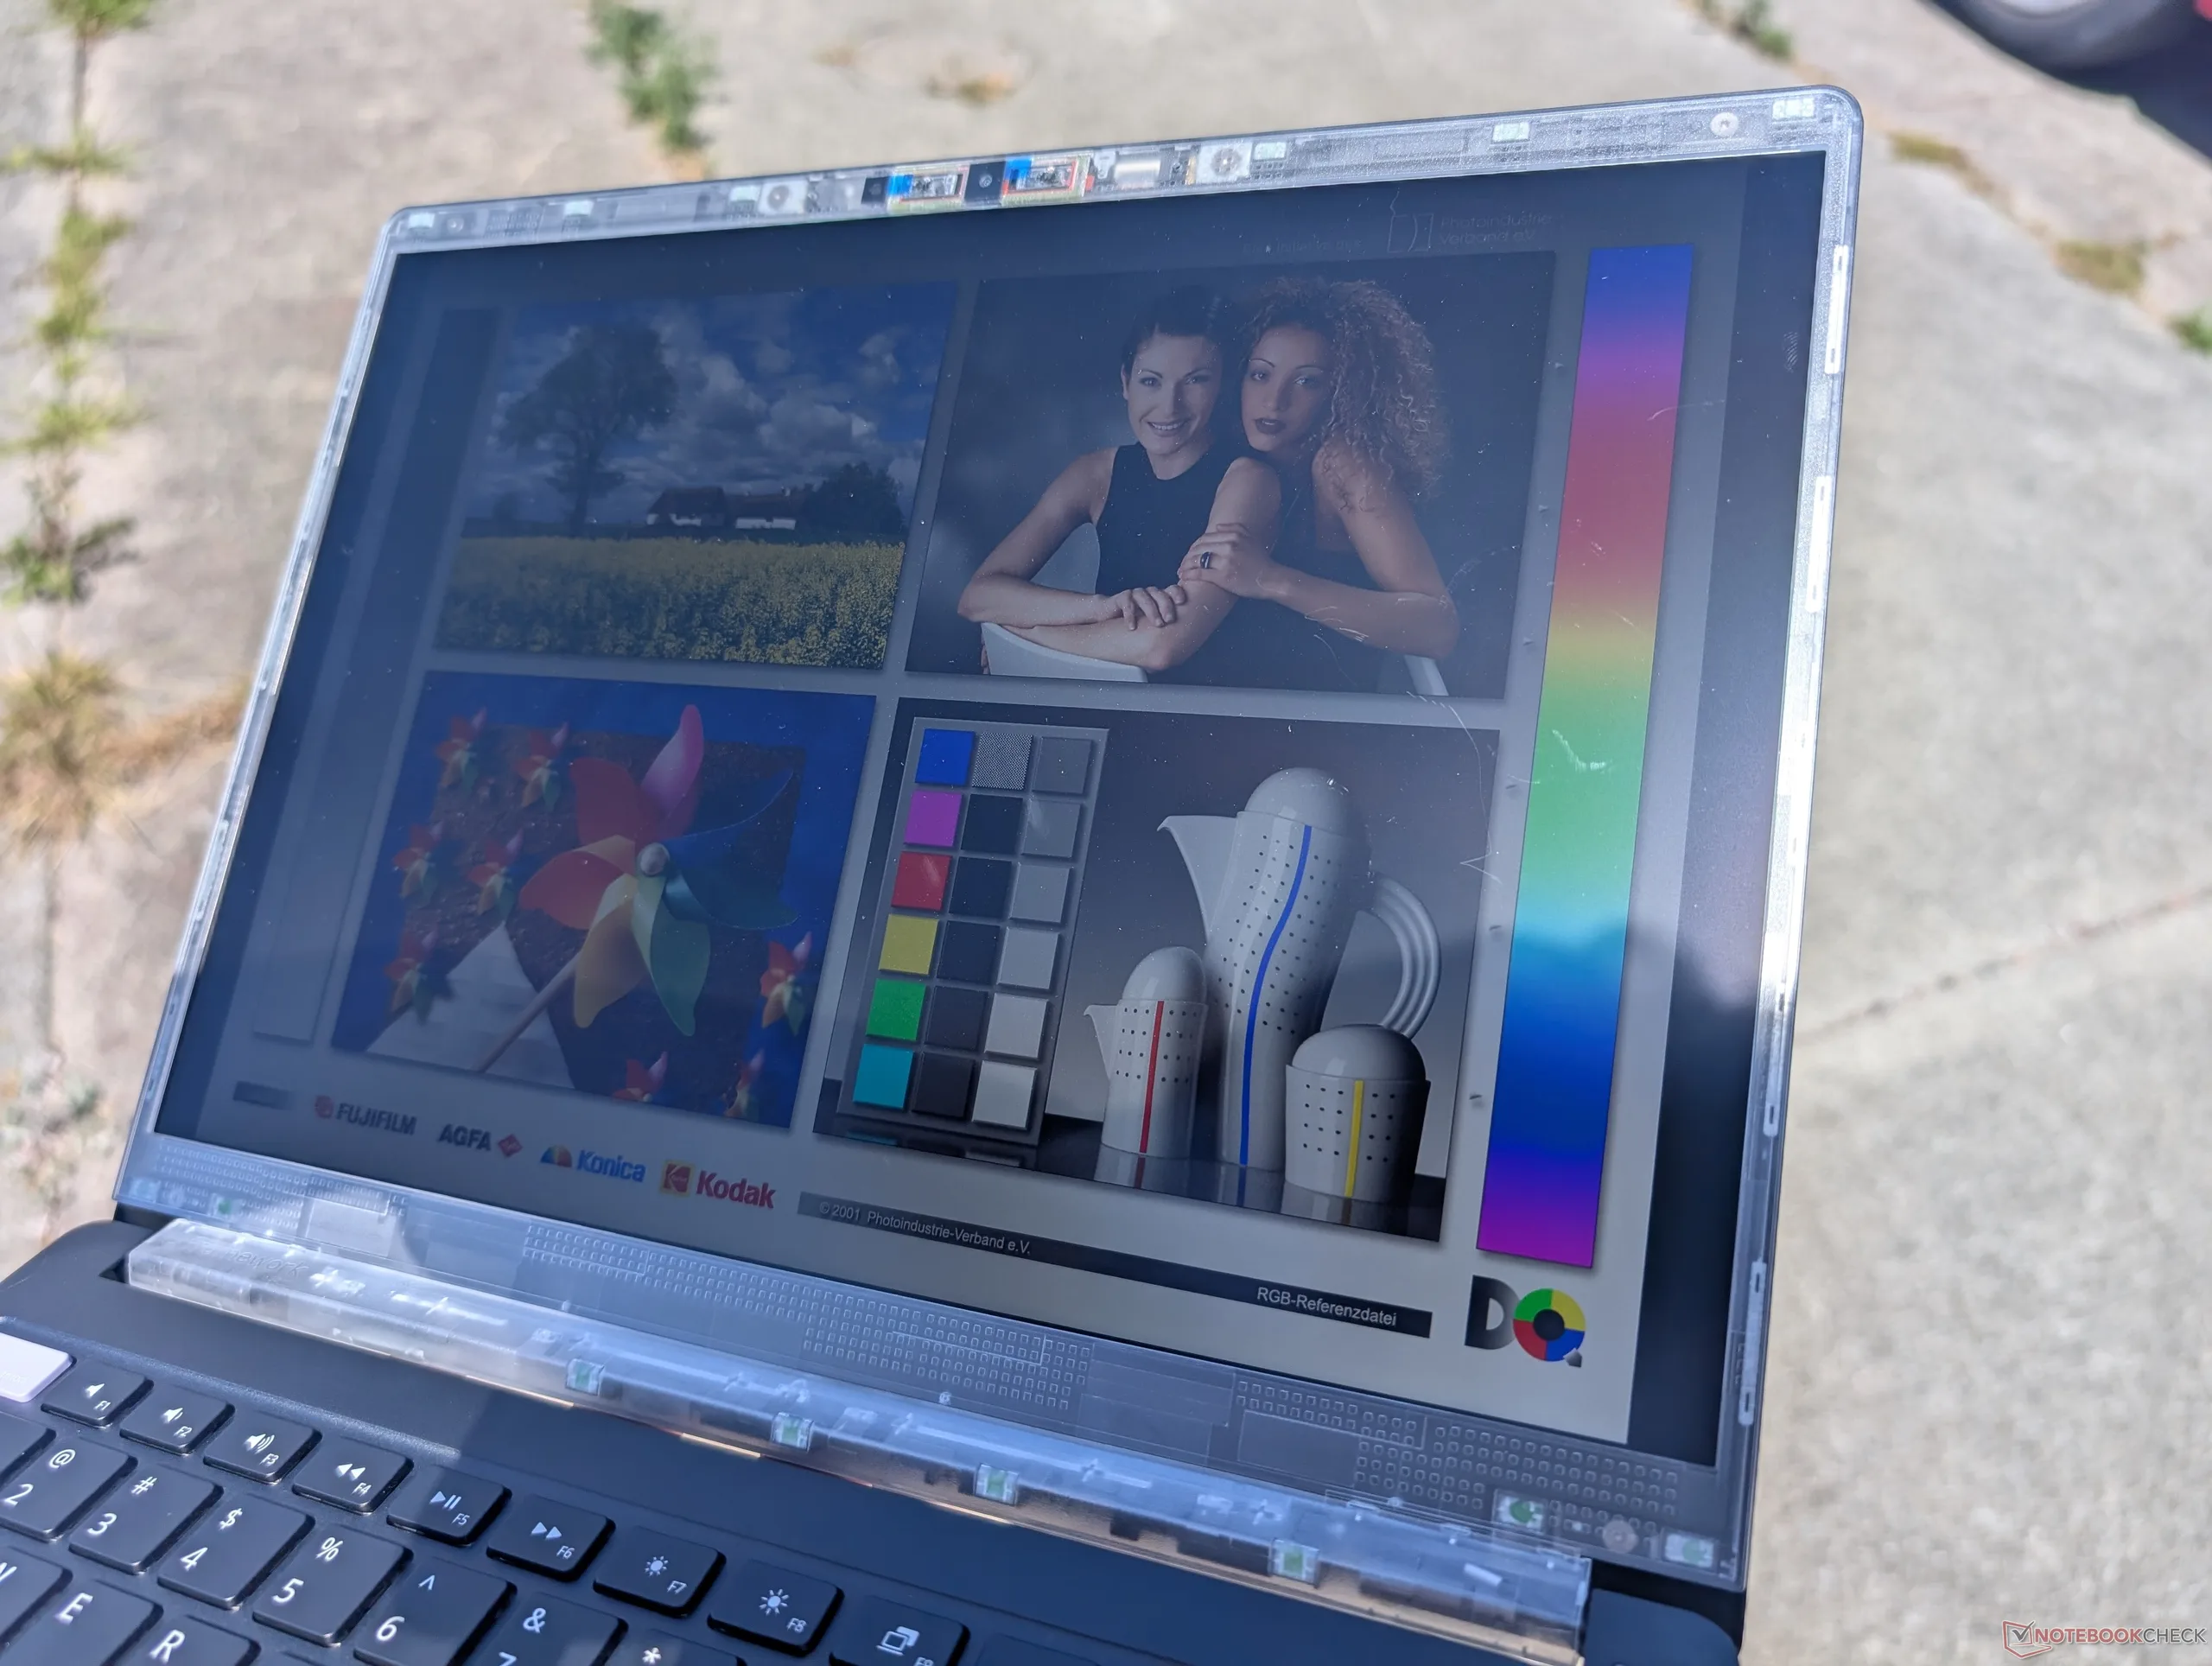
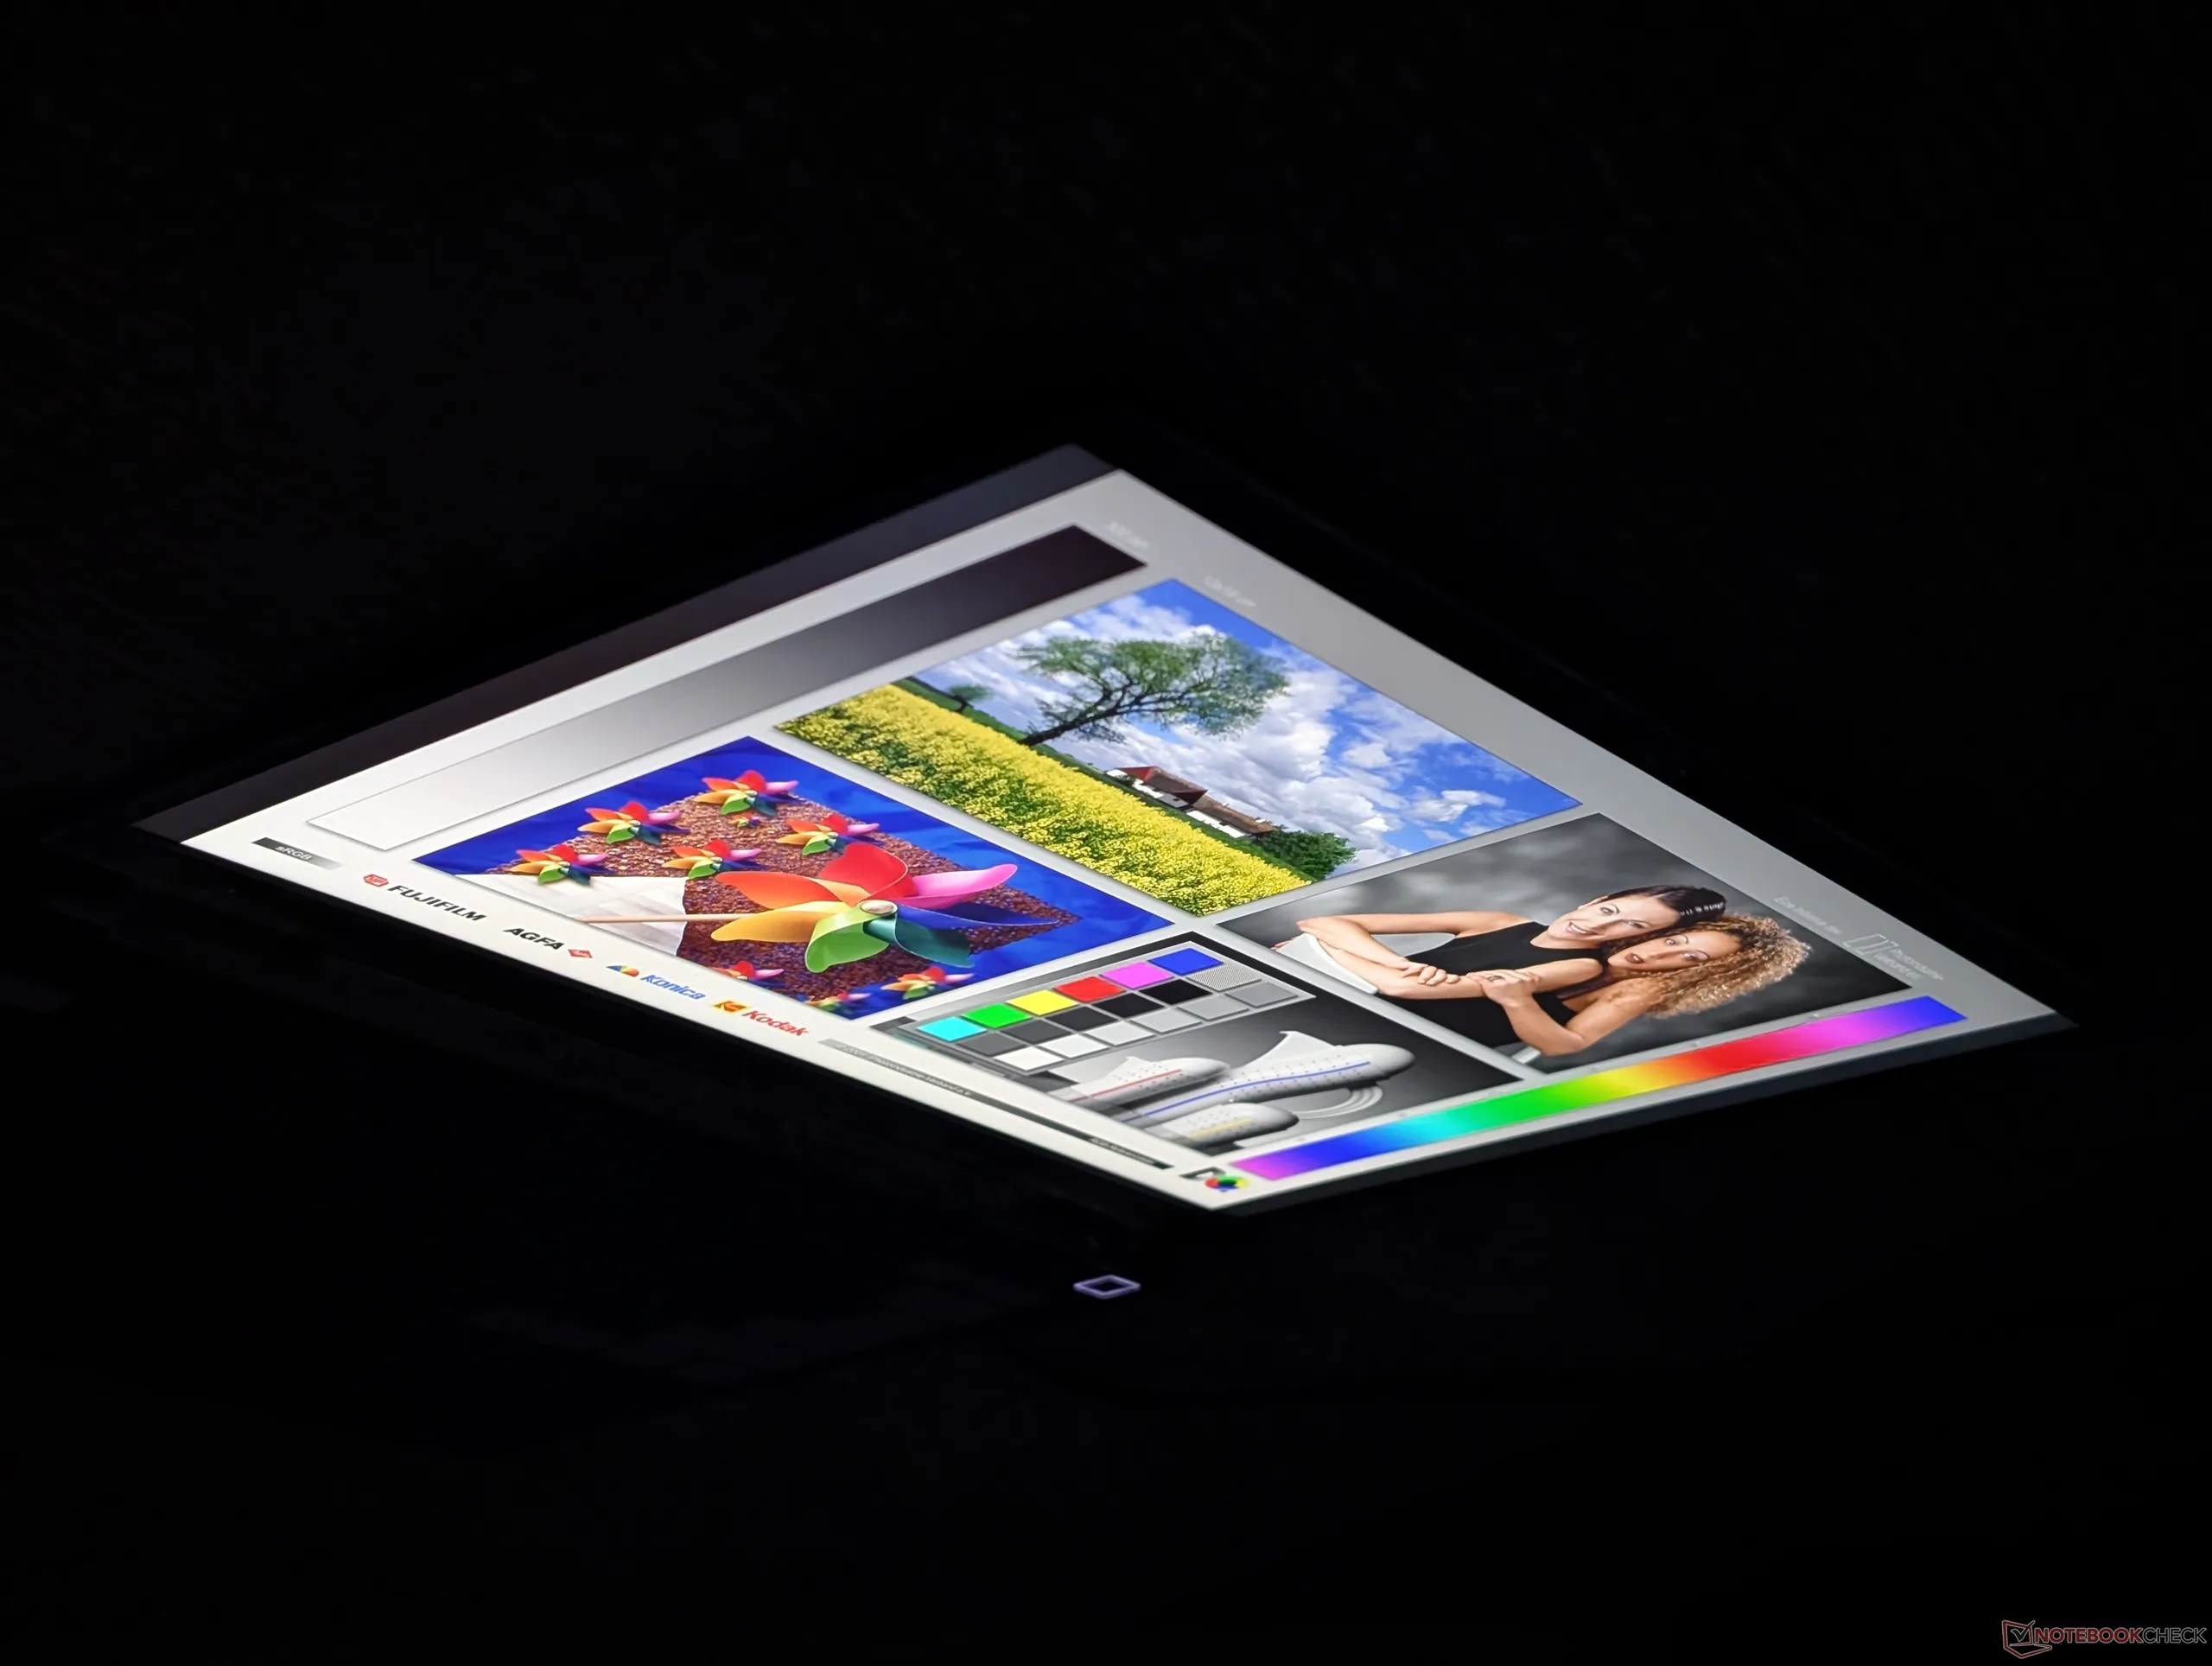
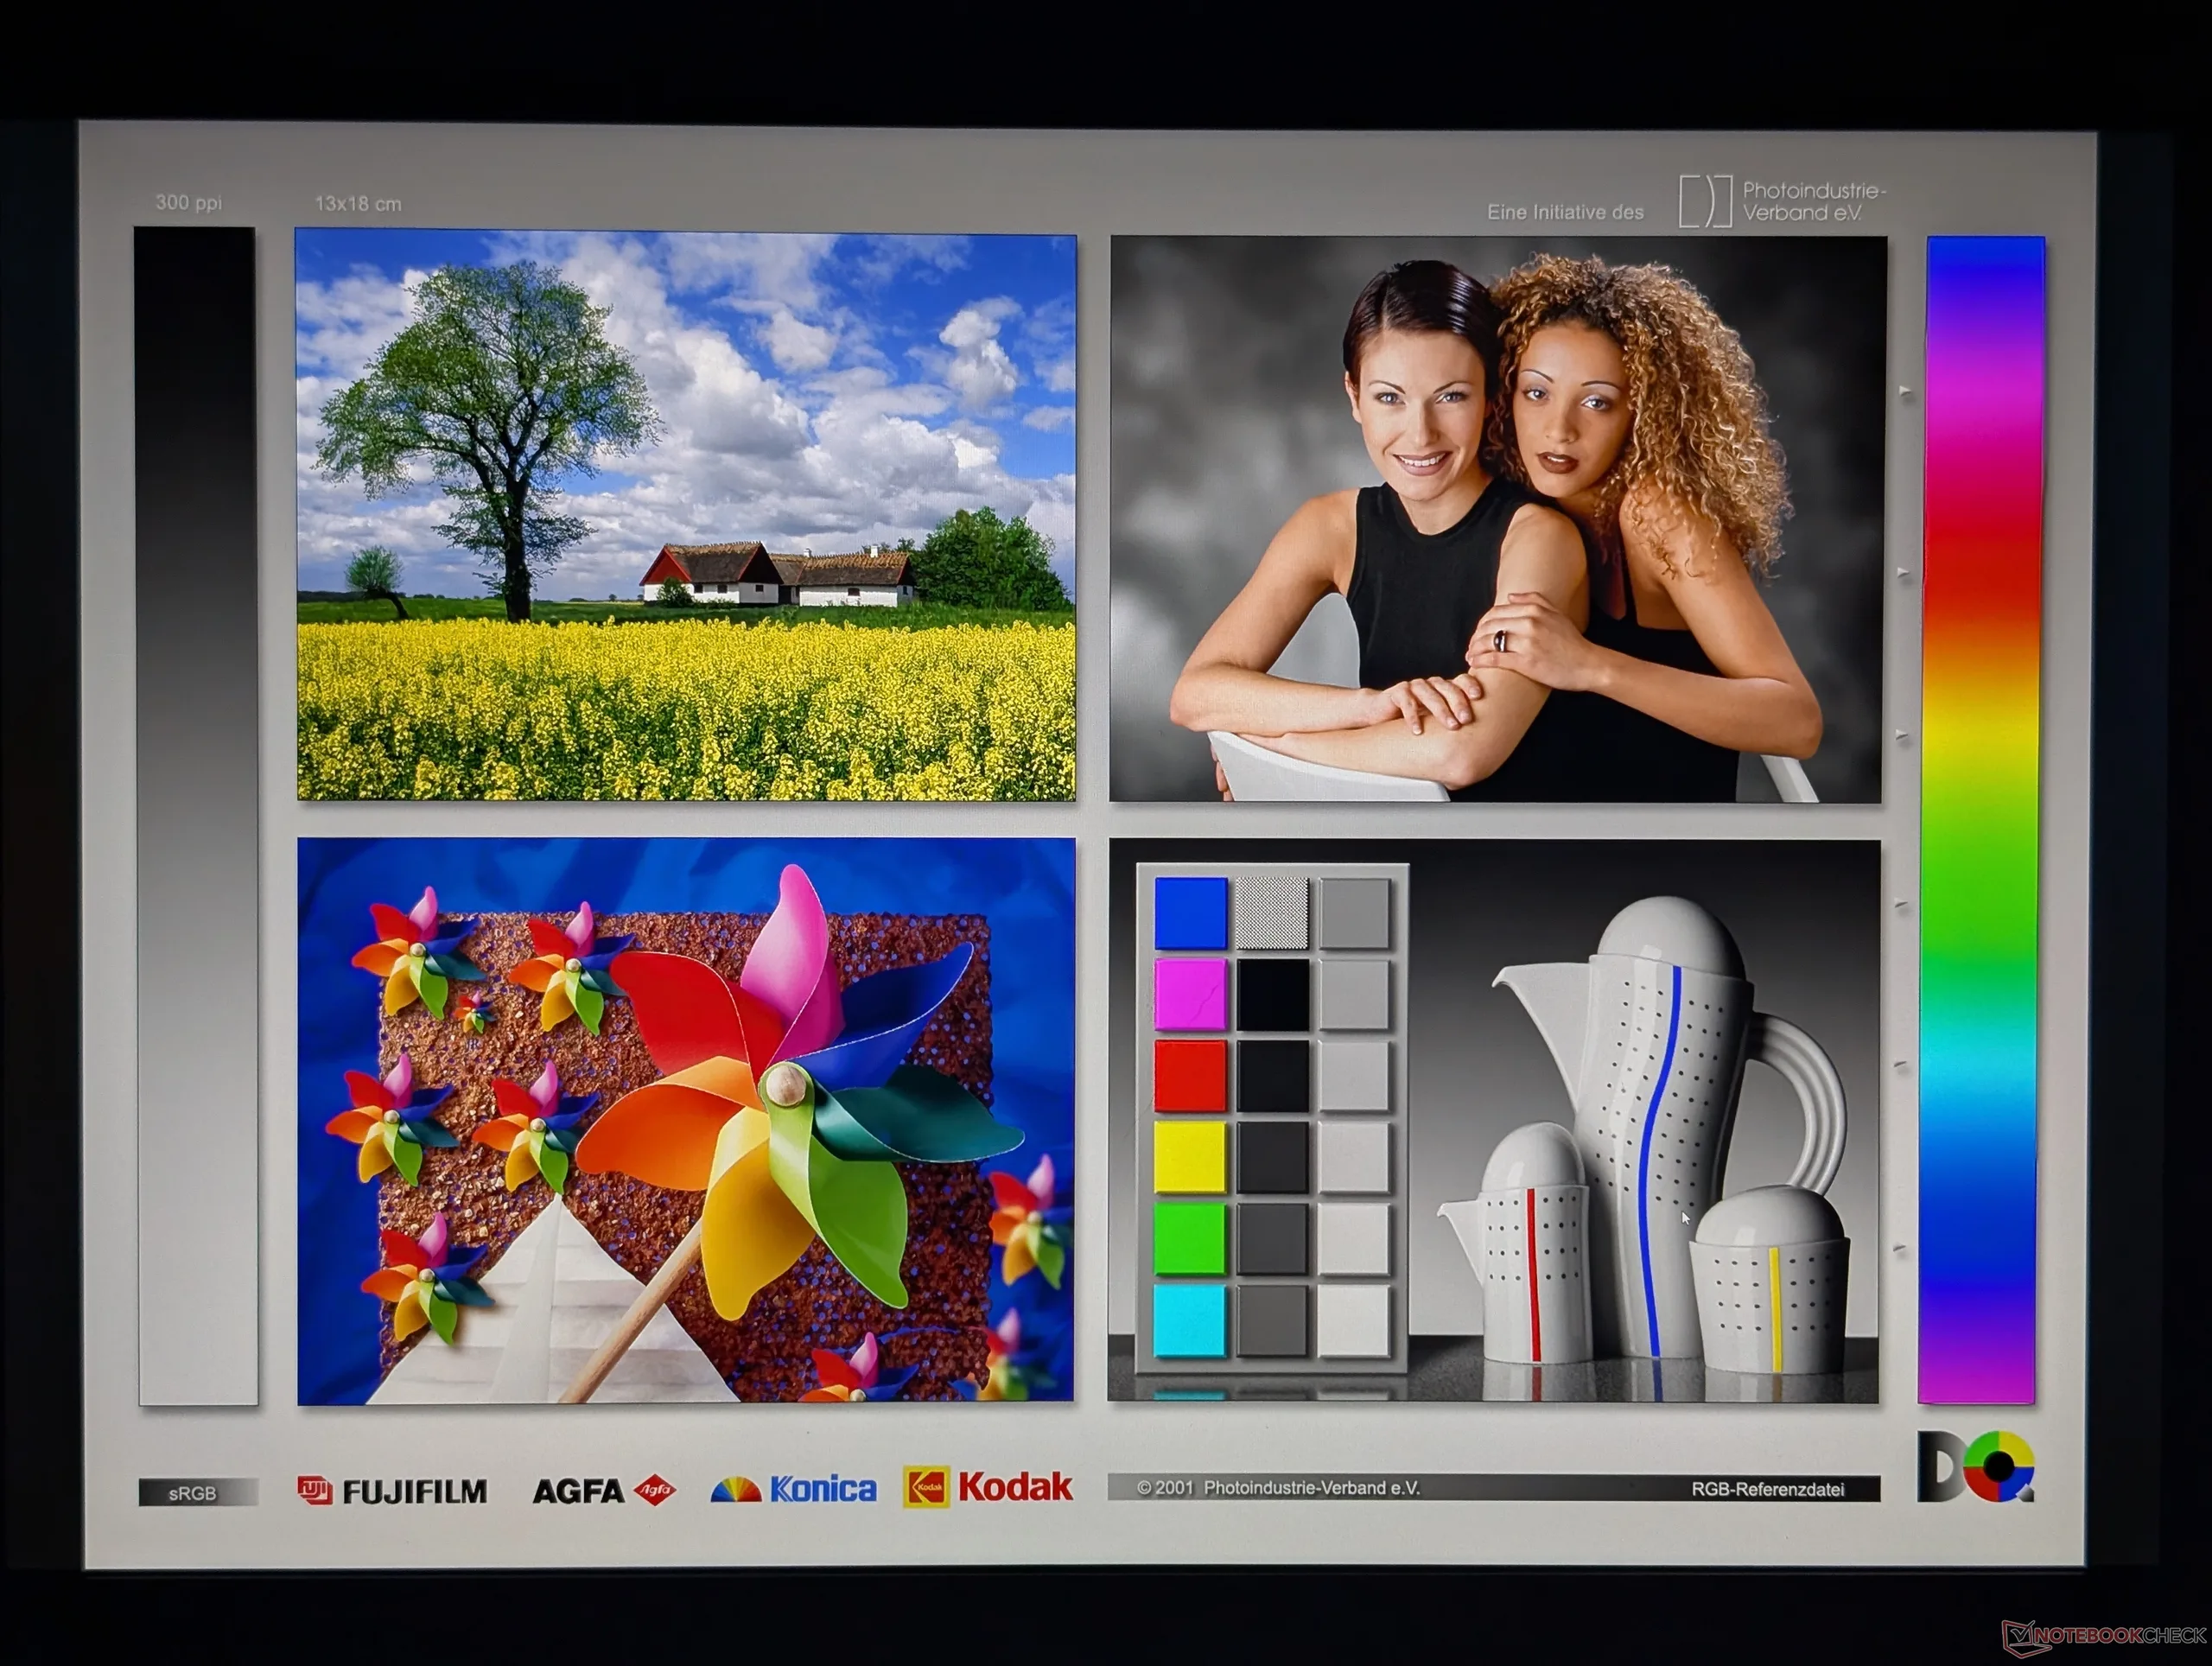
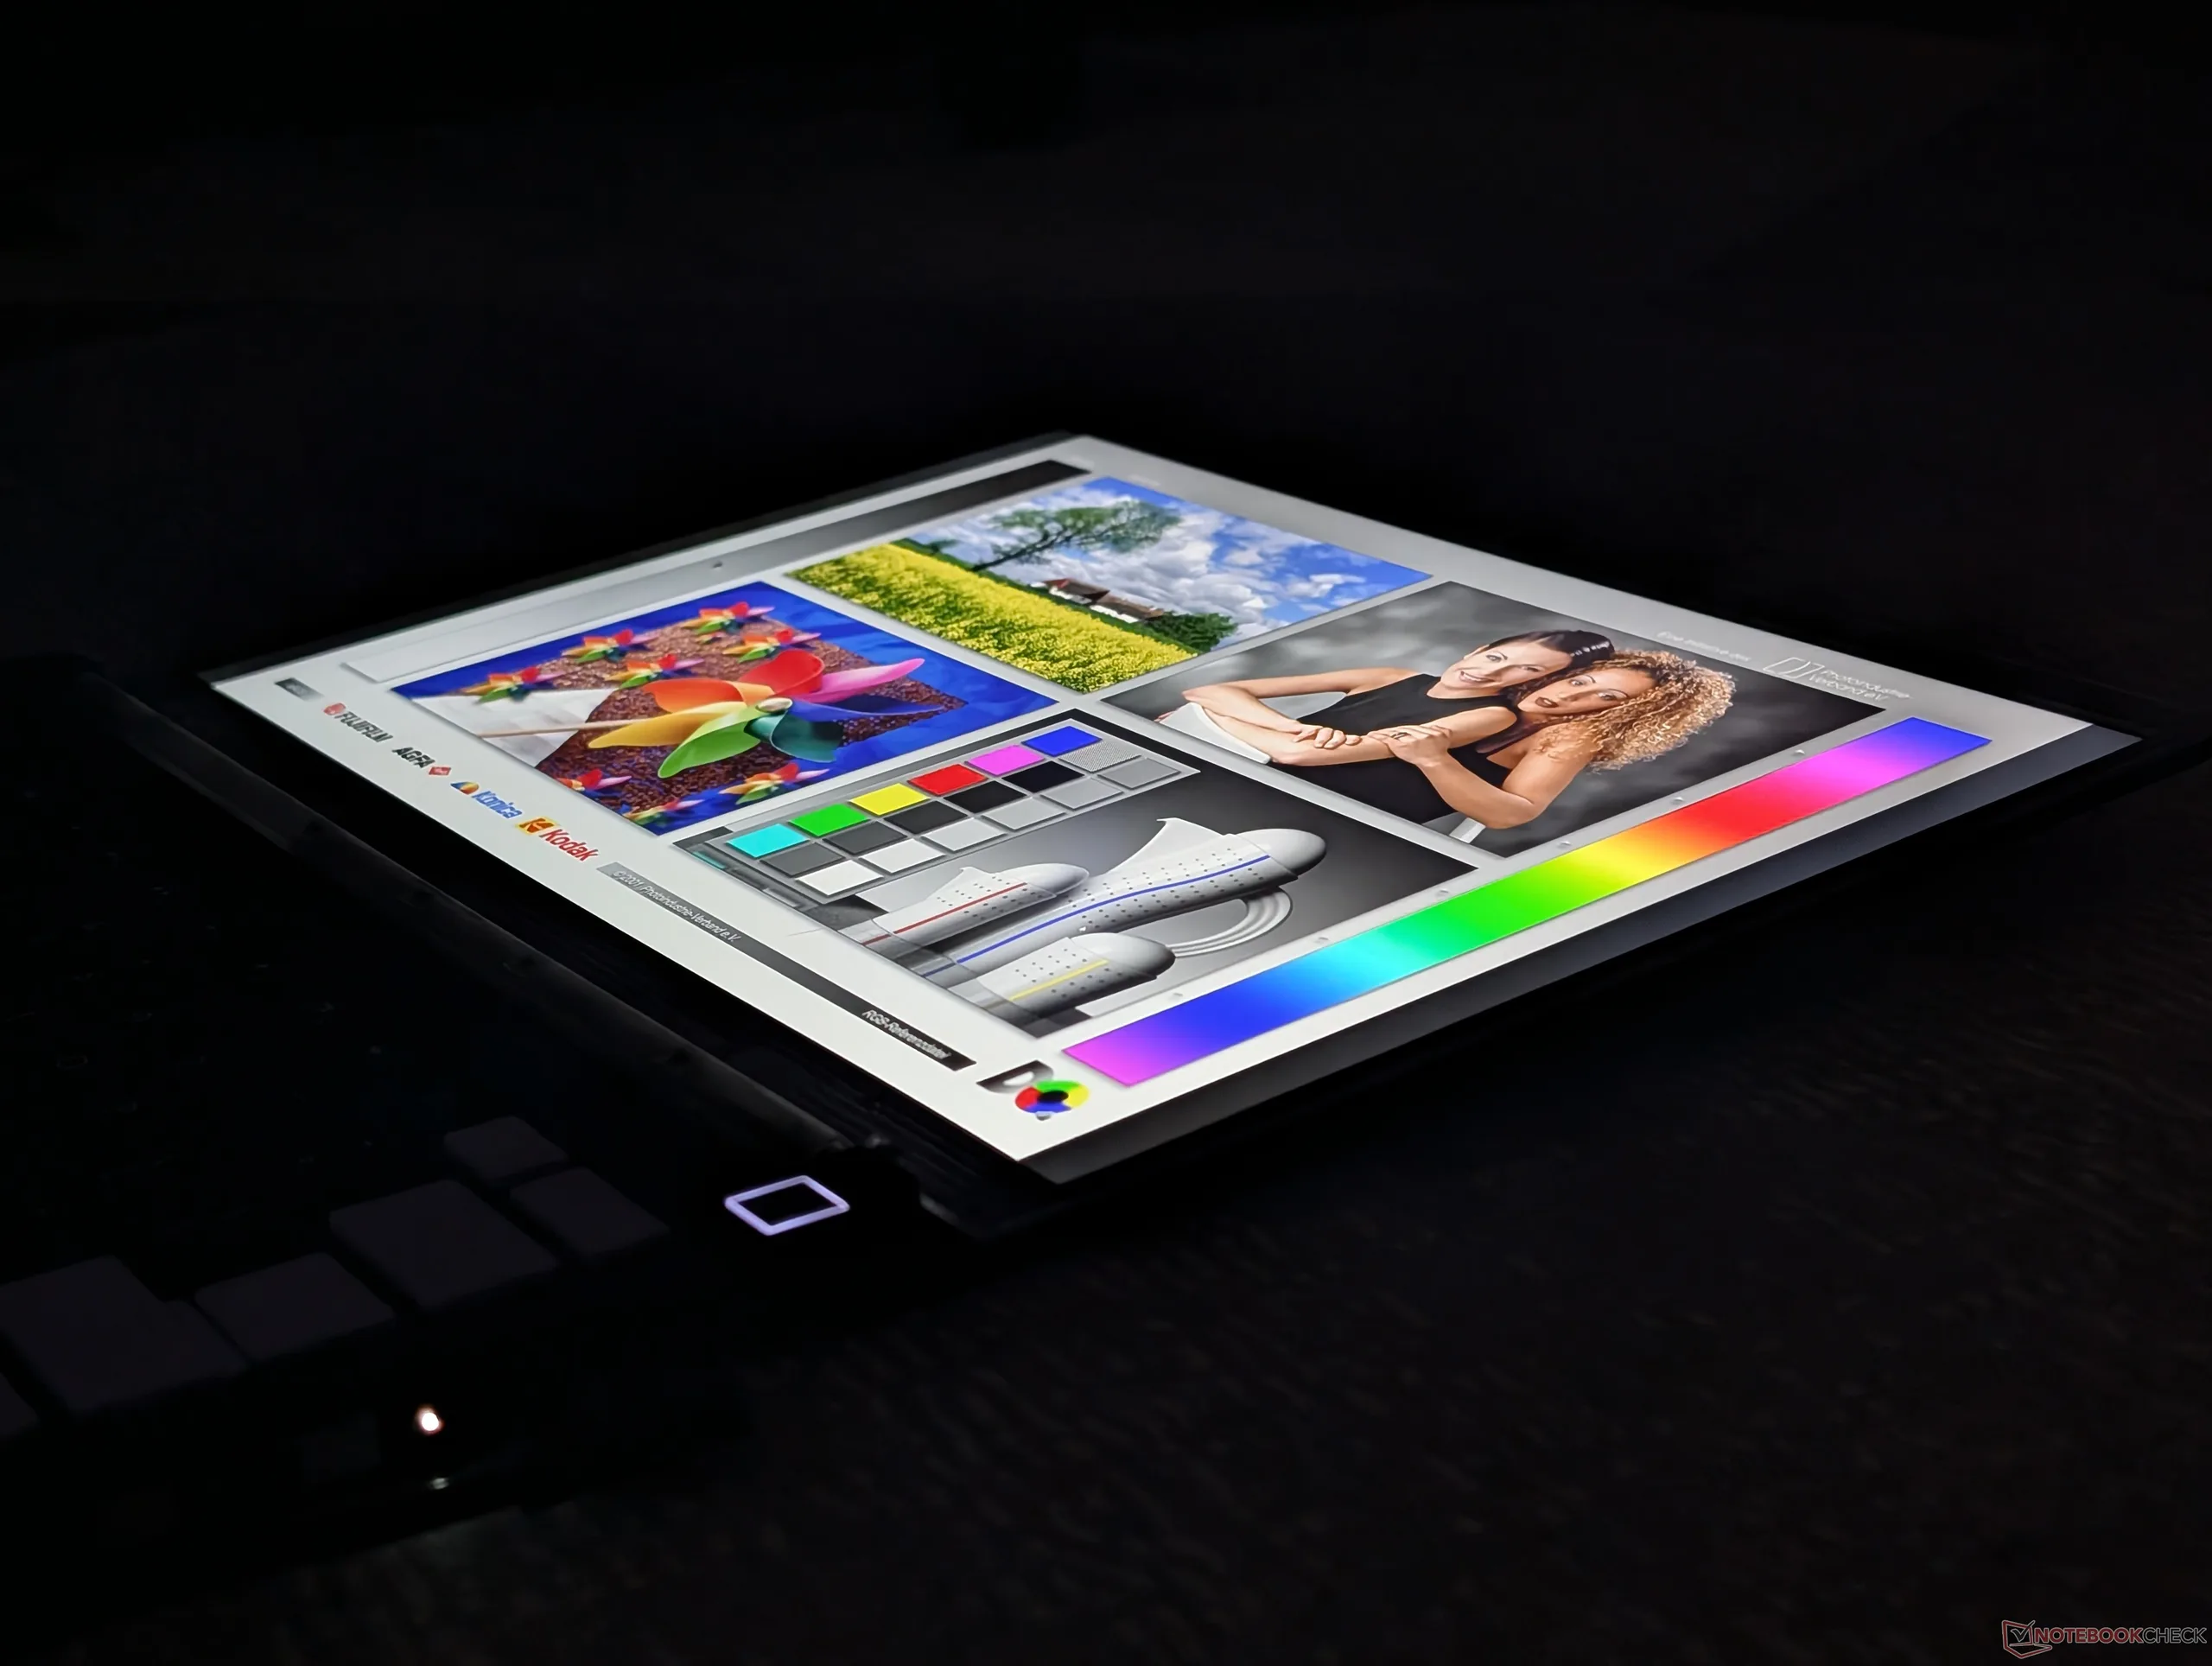
The new IPS display offers the same native resolution, sRGB colors, black-white response times, and 120 Hz refresh rate as the display on the older Laptop 13.5 for a very similar viewing experience. It instead gains some new auxiliary upgrades including a brighter backlight, VRR down to 30 Hz, and touchscreen support.


| |||||||||||||||||||||||||
Brightness Distribution: 87 %
Center on Battery: 773.3 cd/m²
Contrast: 2148:1 (Black: 0.36 cd/m²)
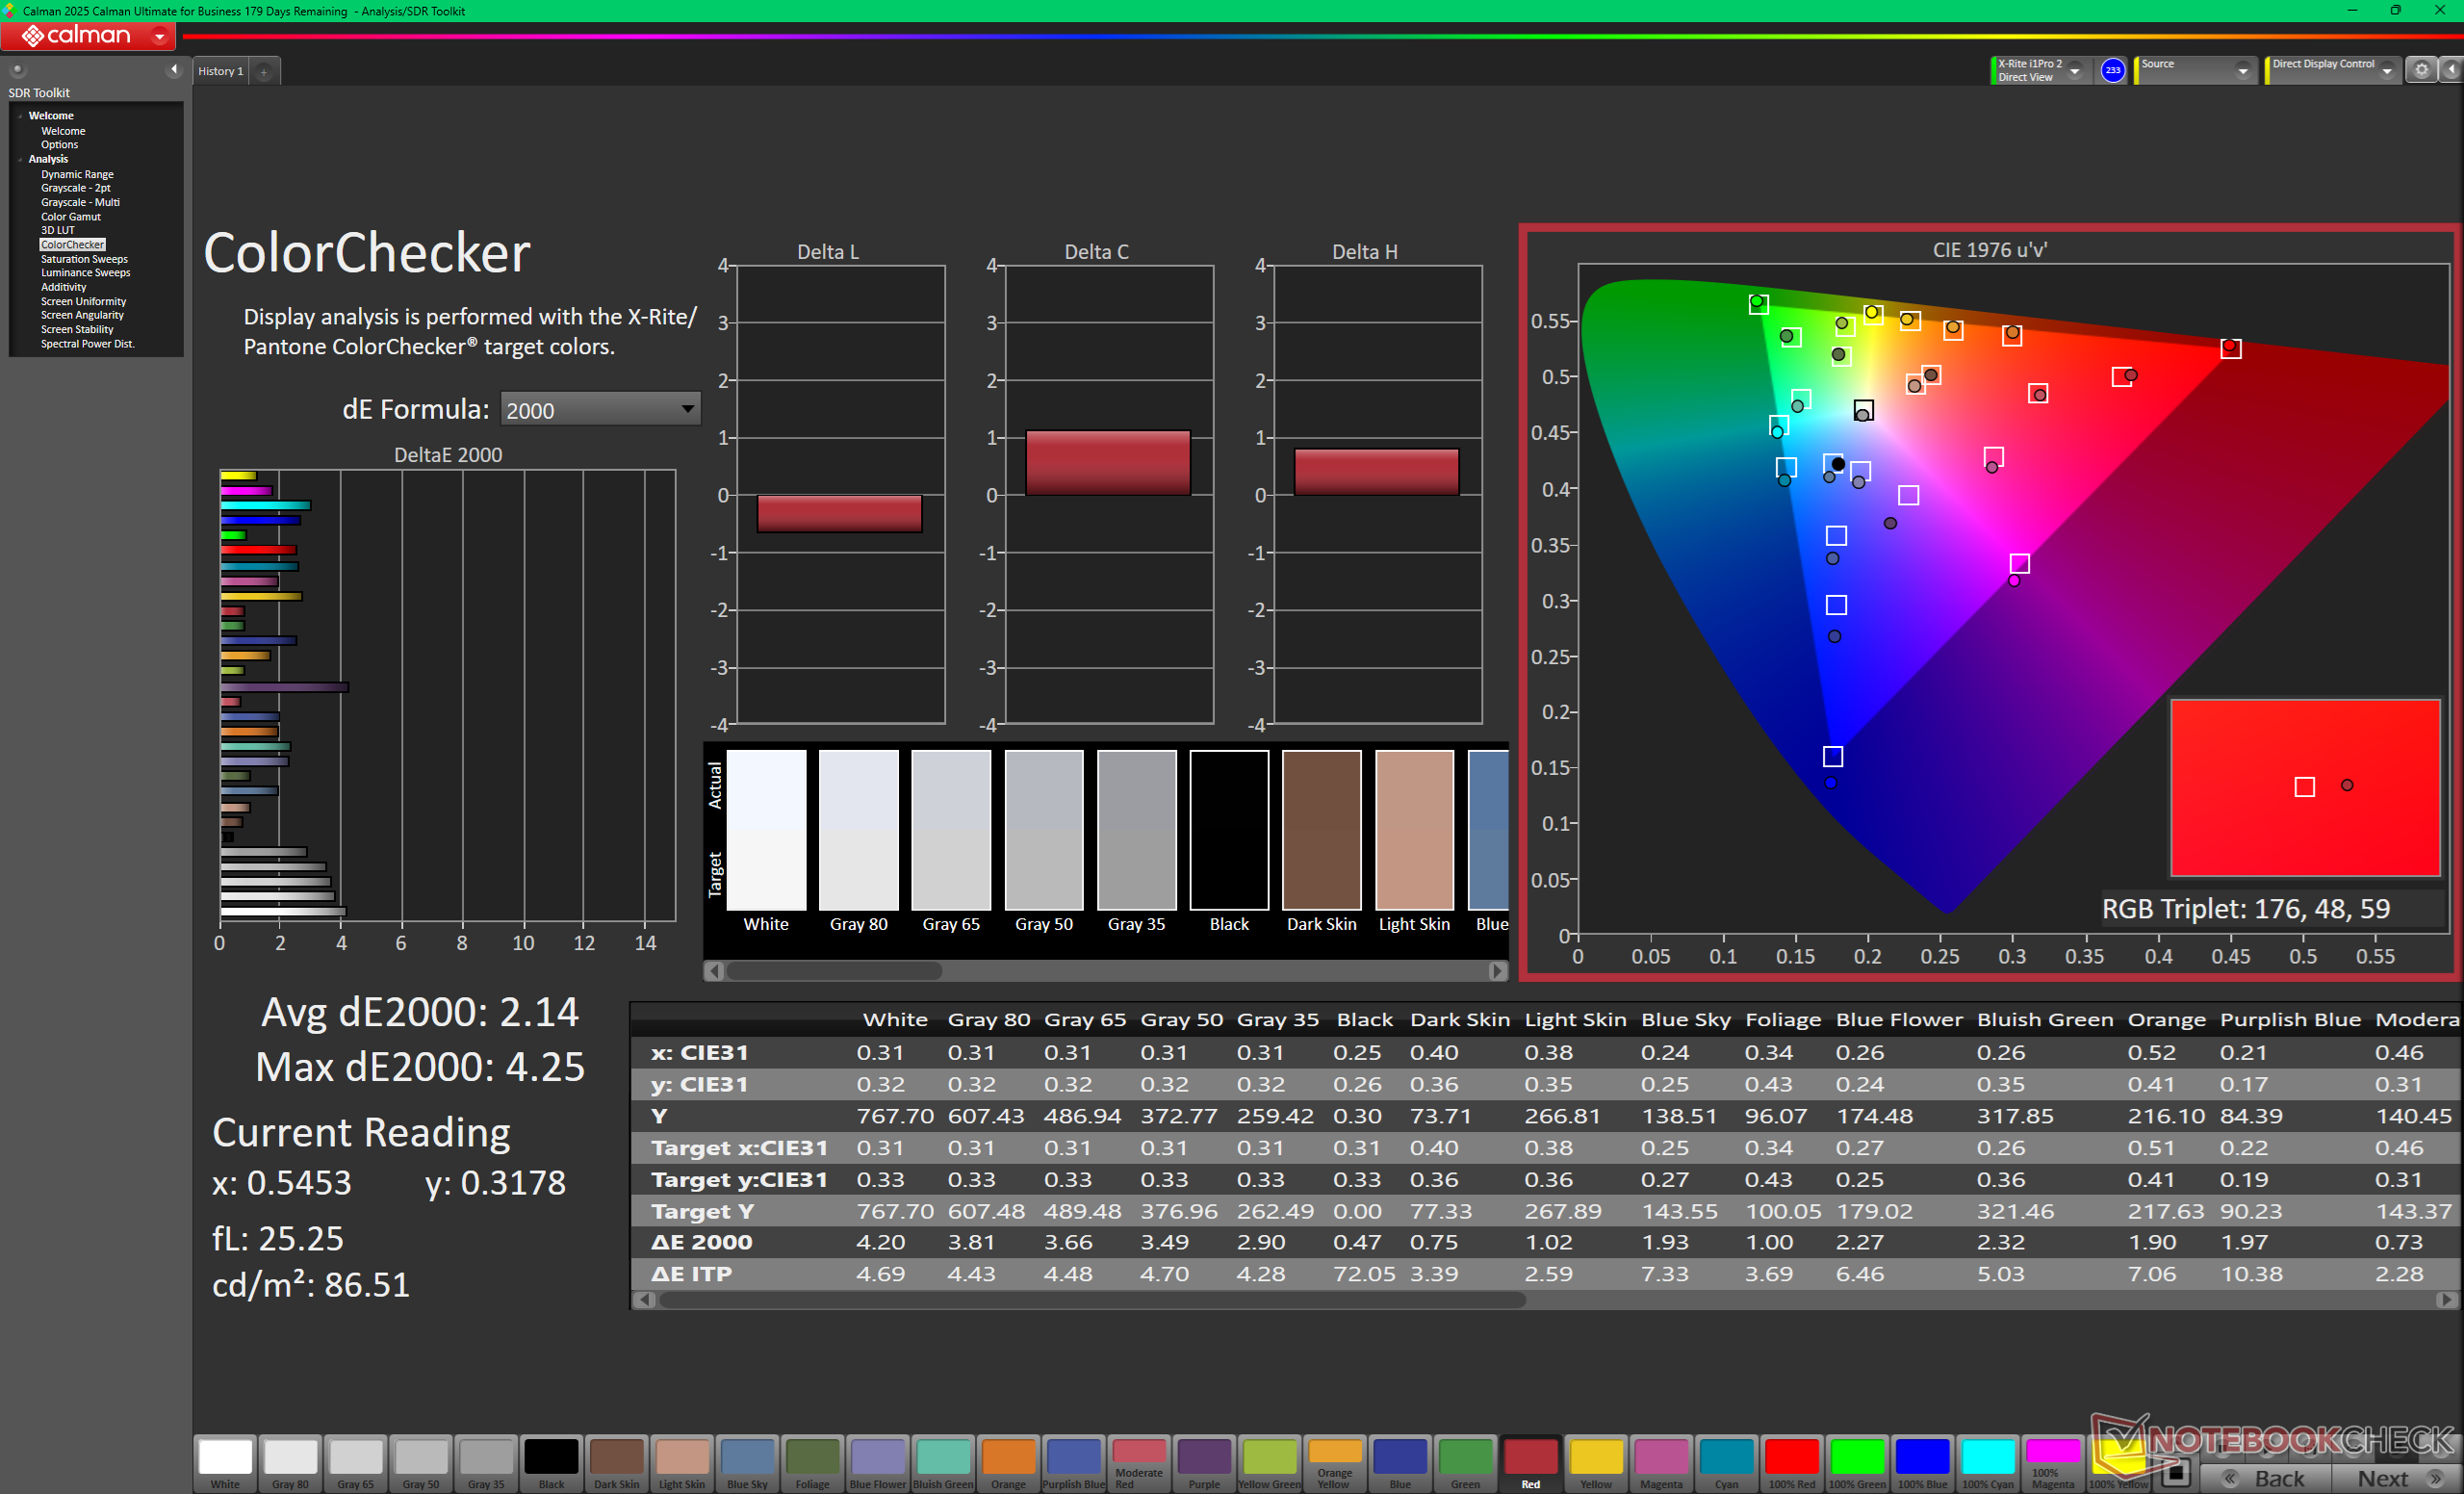
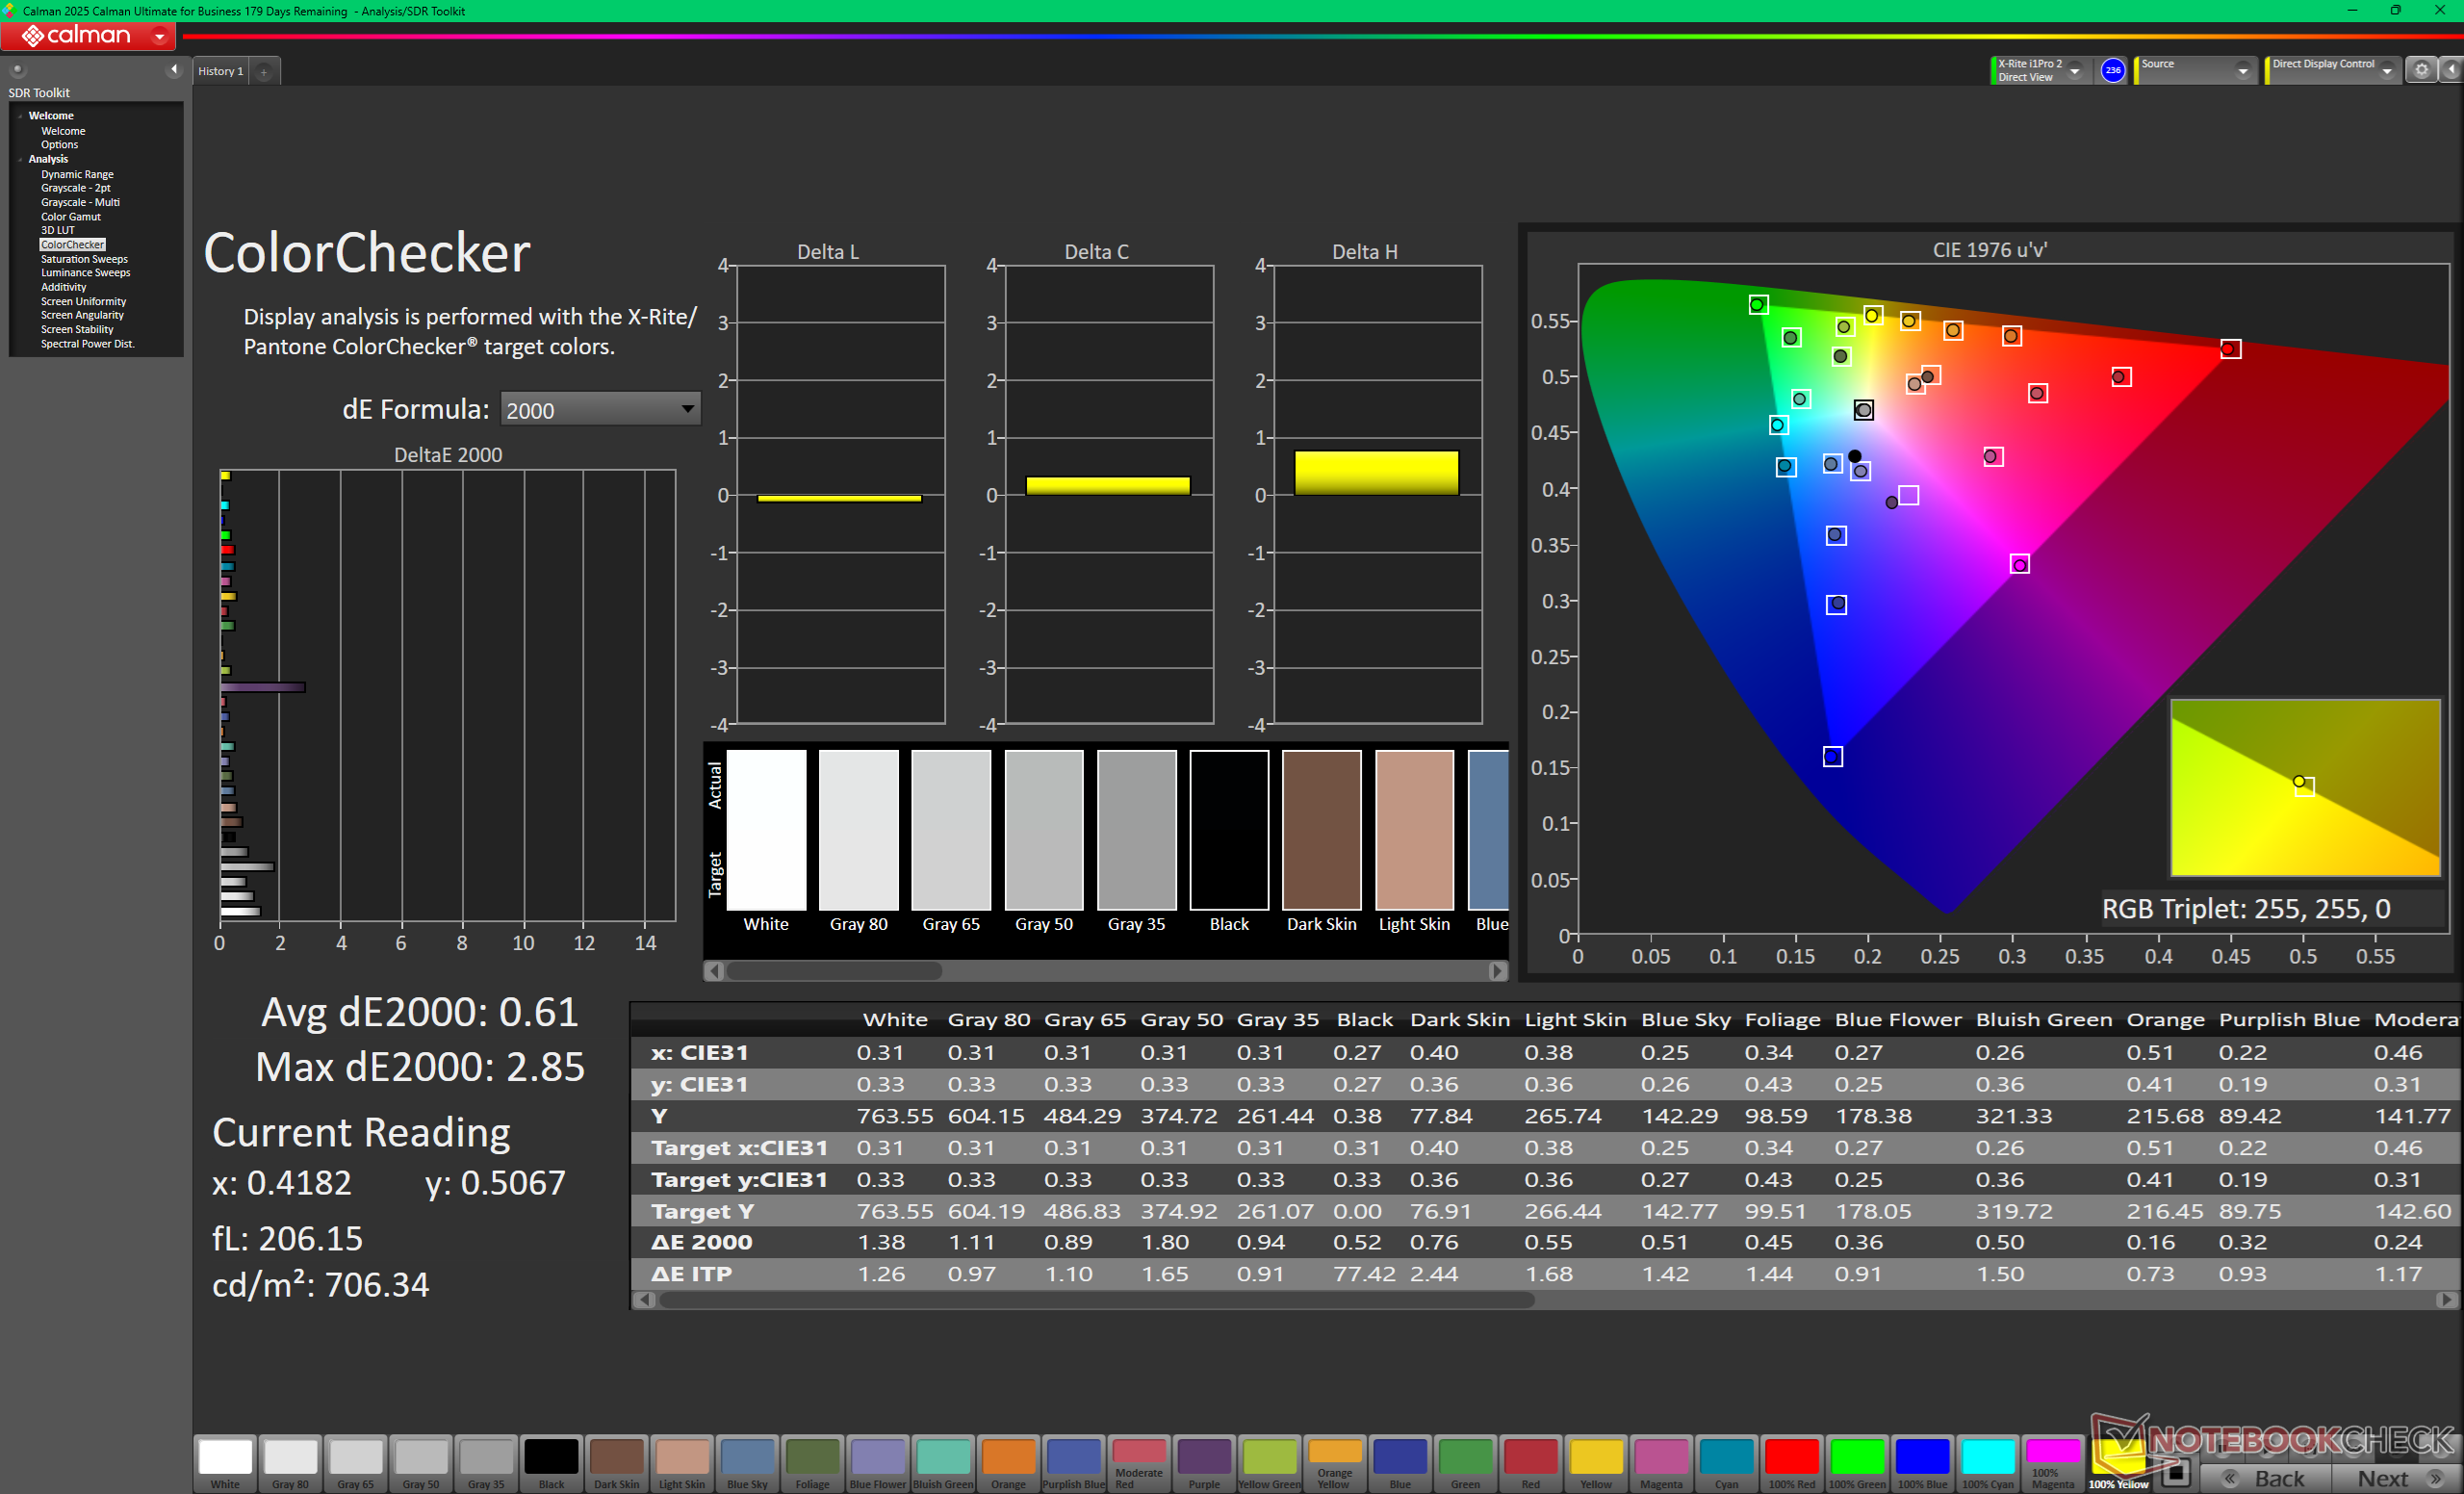
ΔE ColorChecker Calman: 2.14 | ∀{0.5-29.43 Ø4.71}
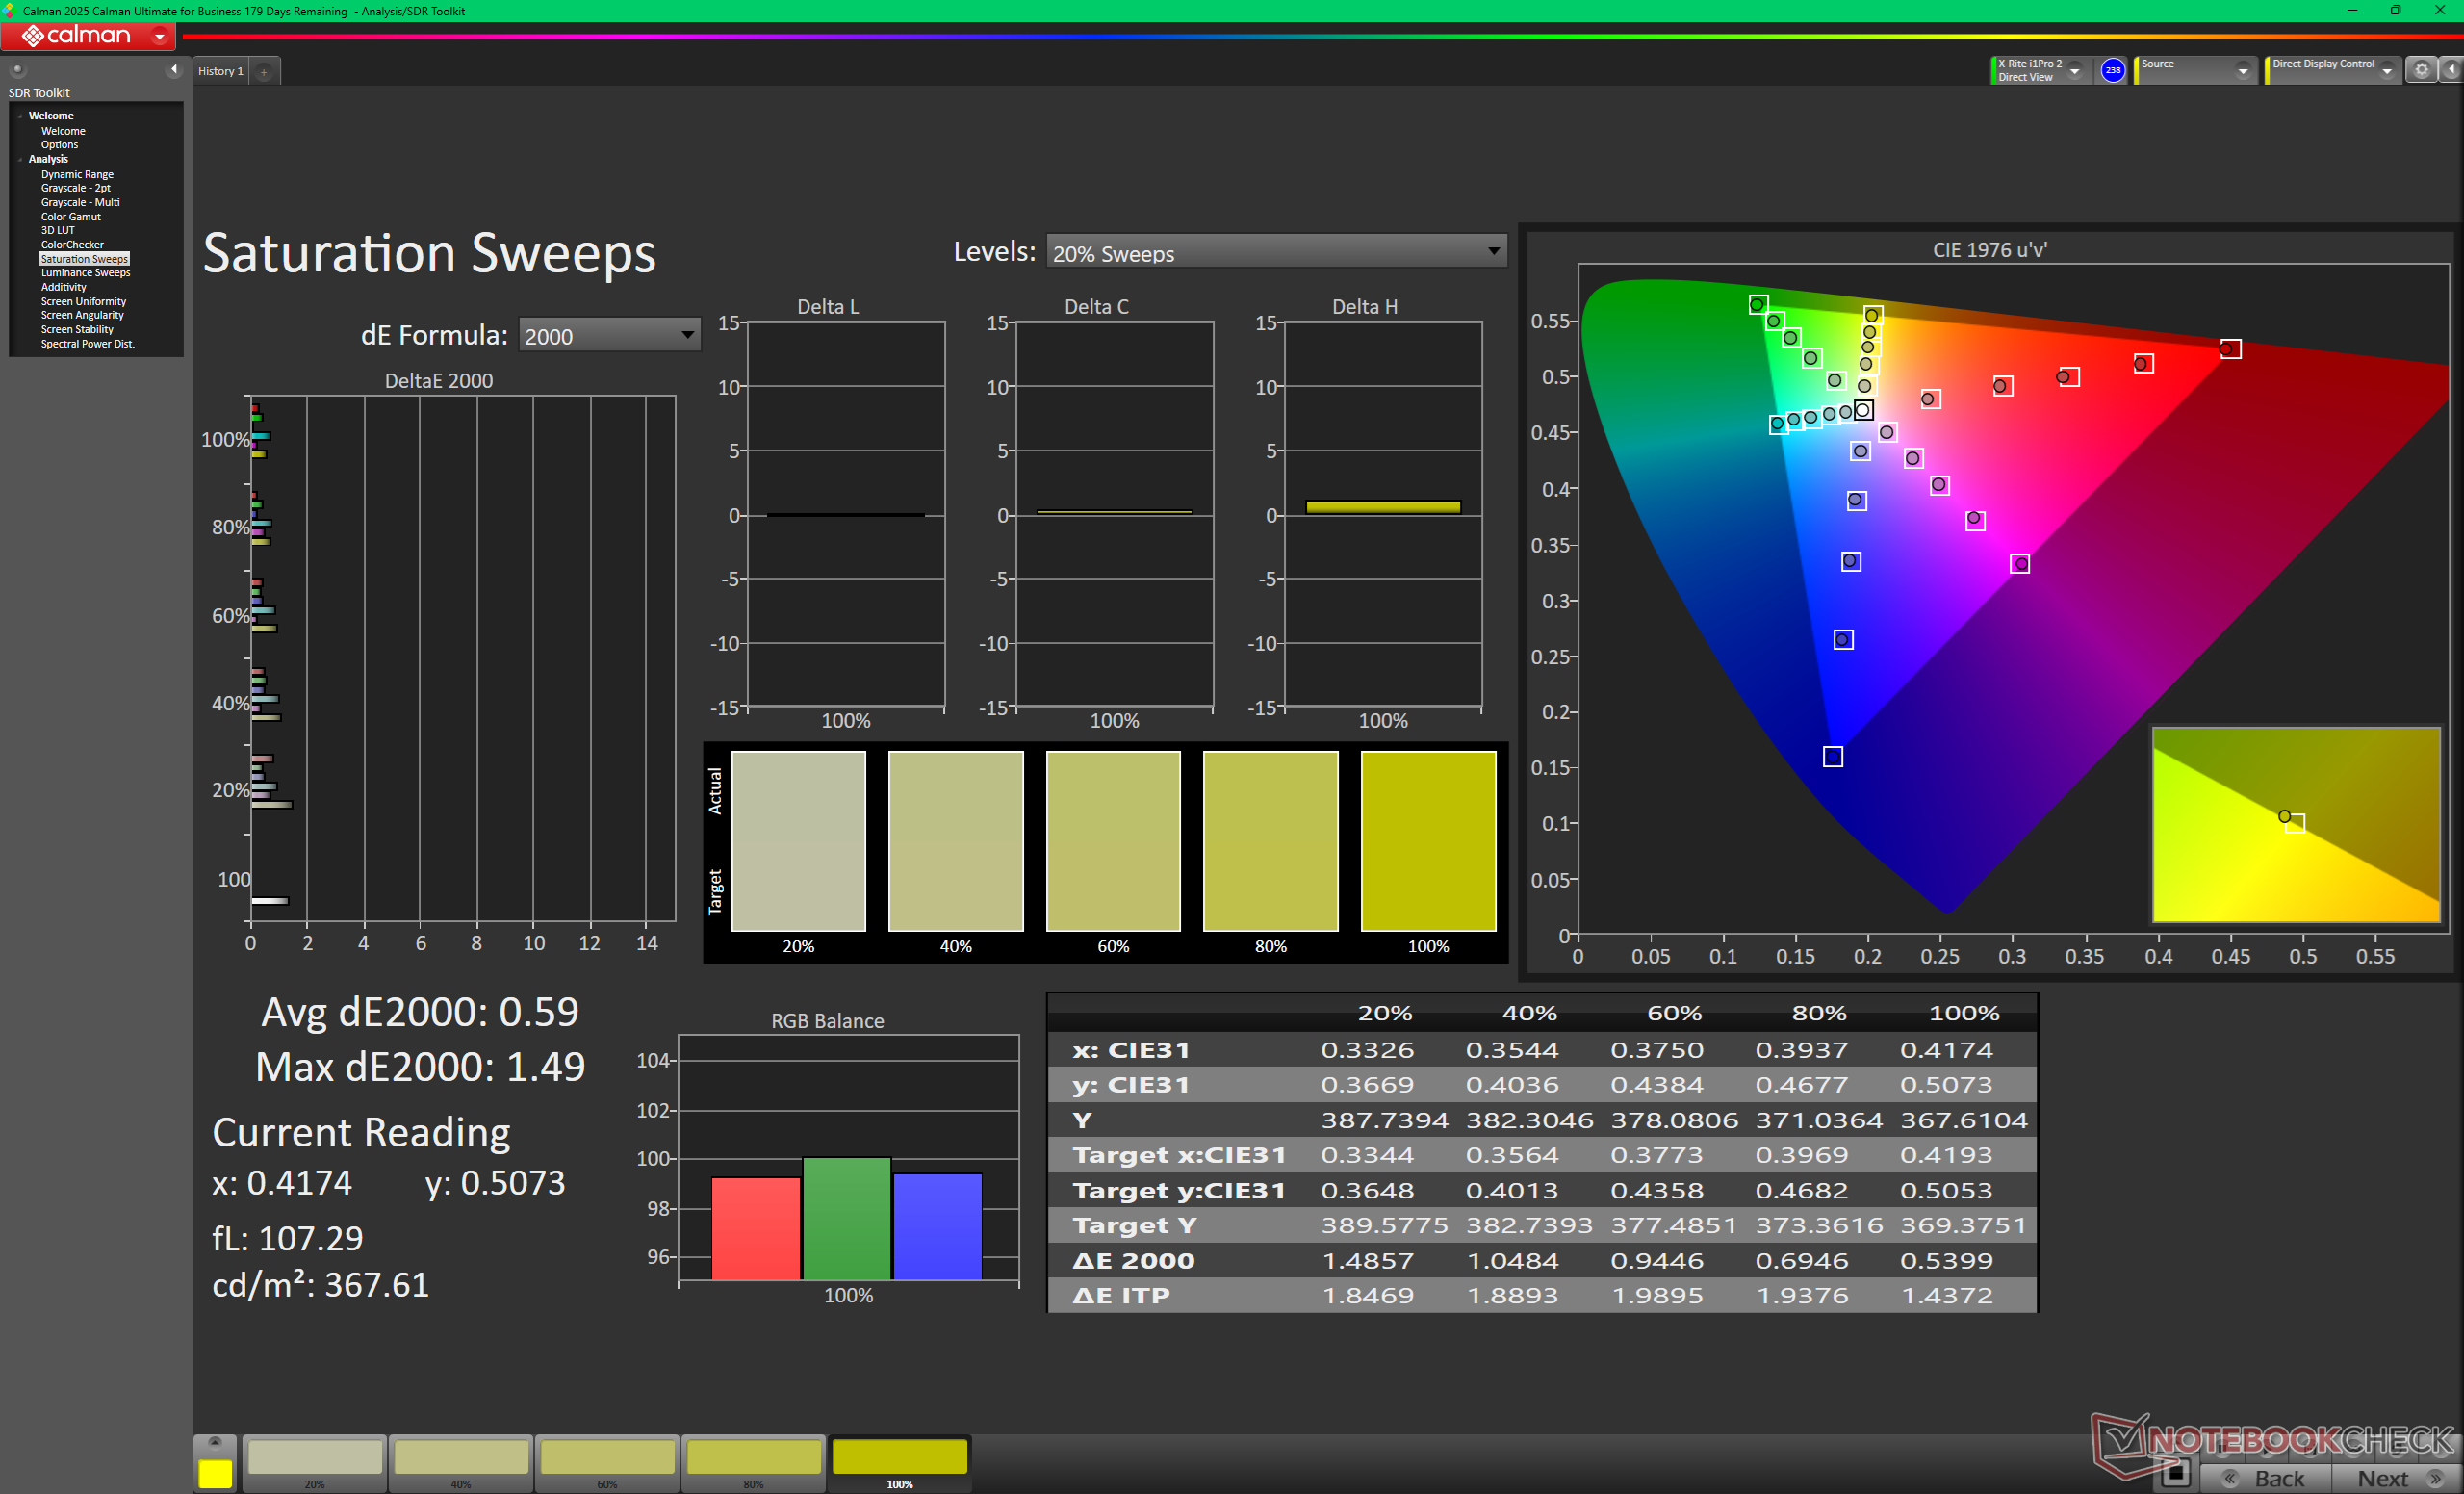
calibrated: 0.61
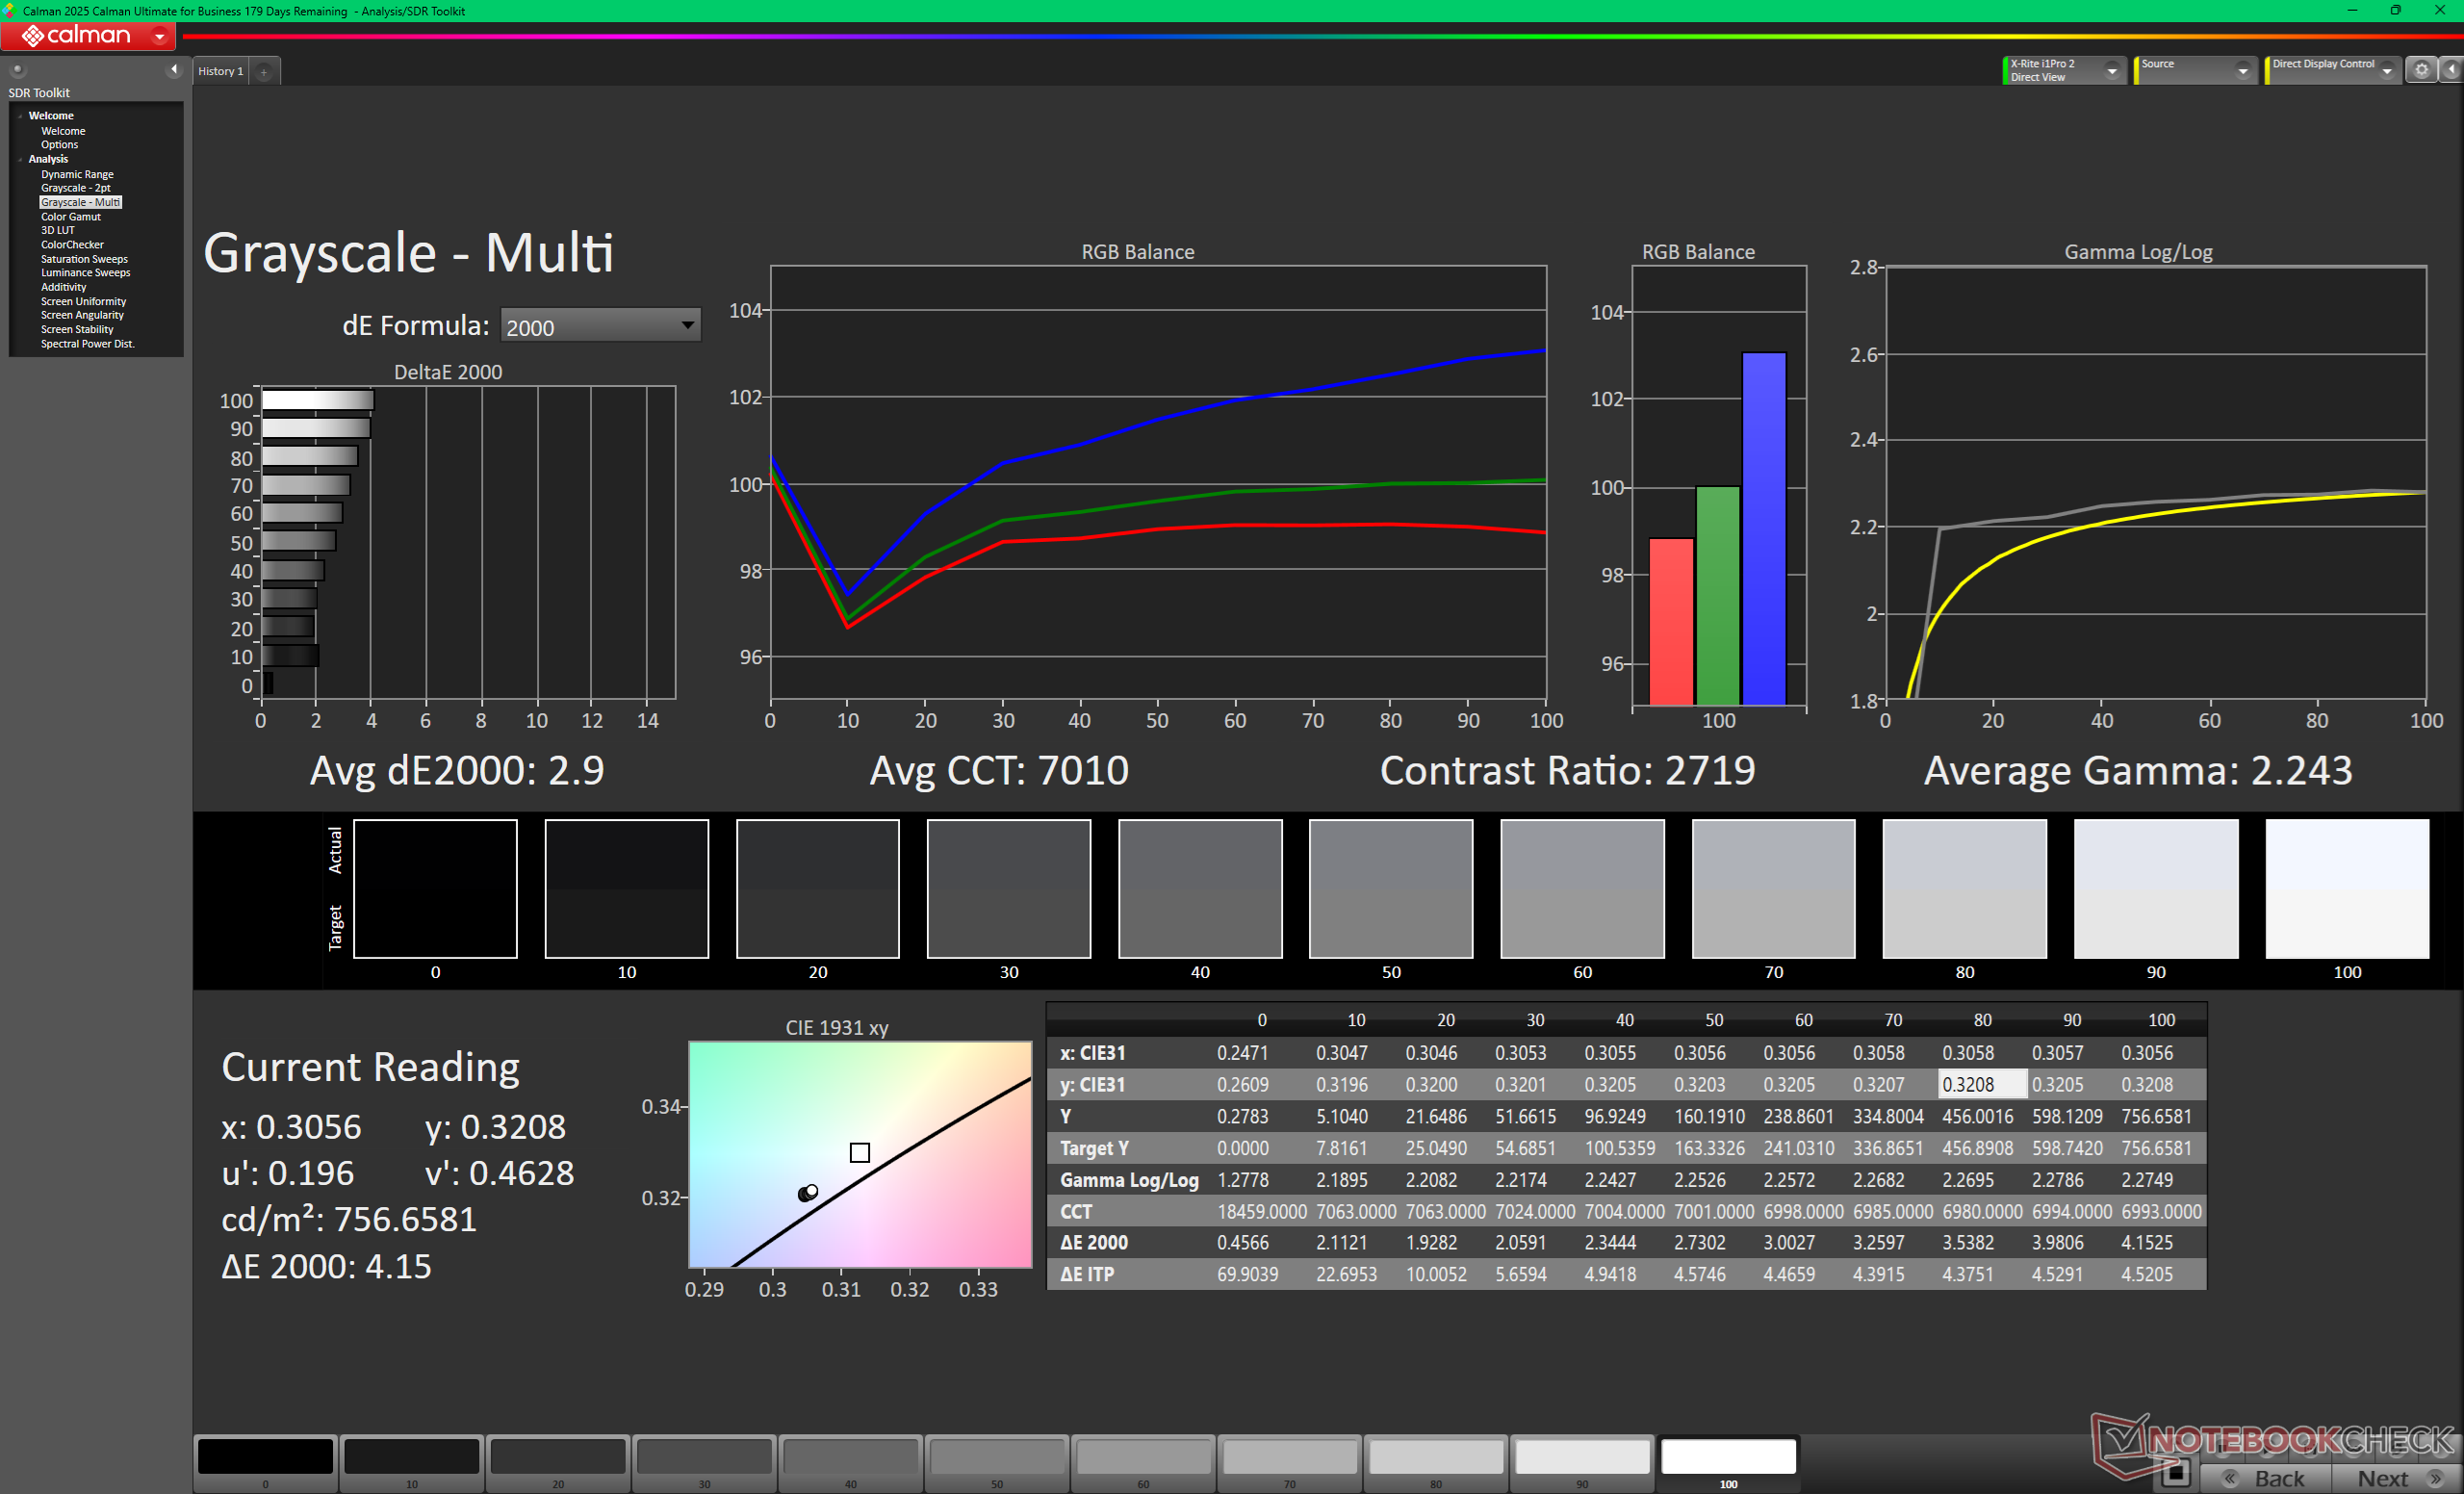
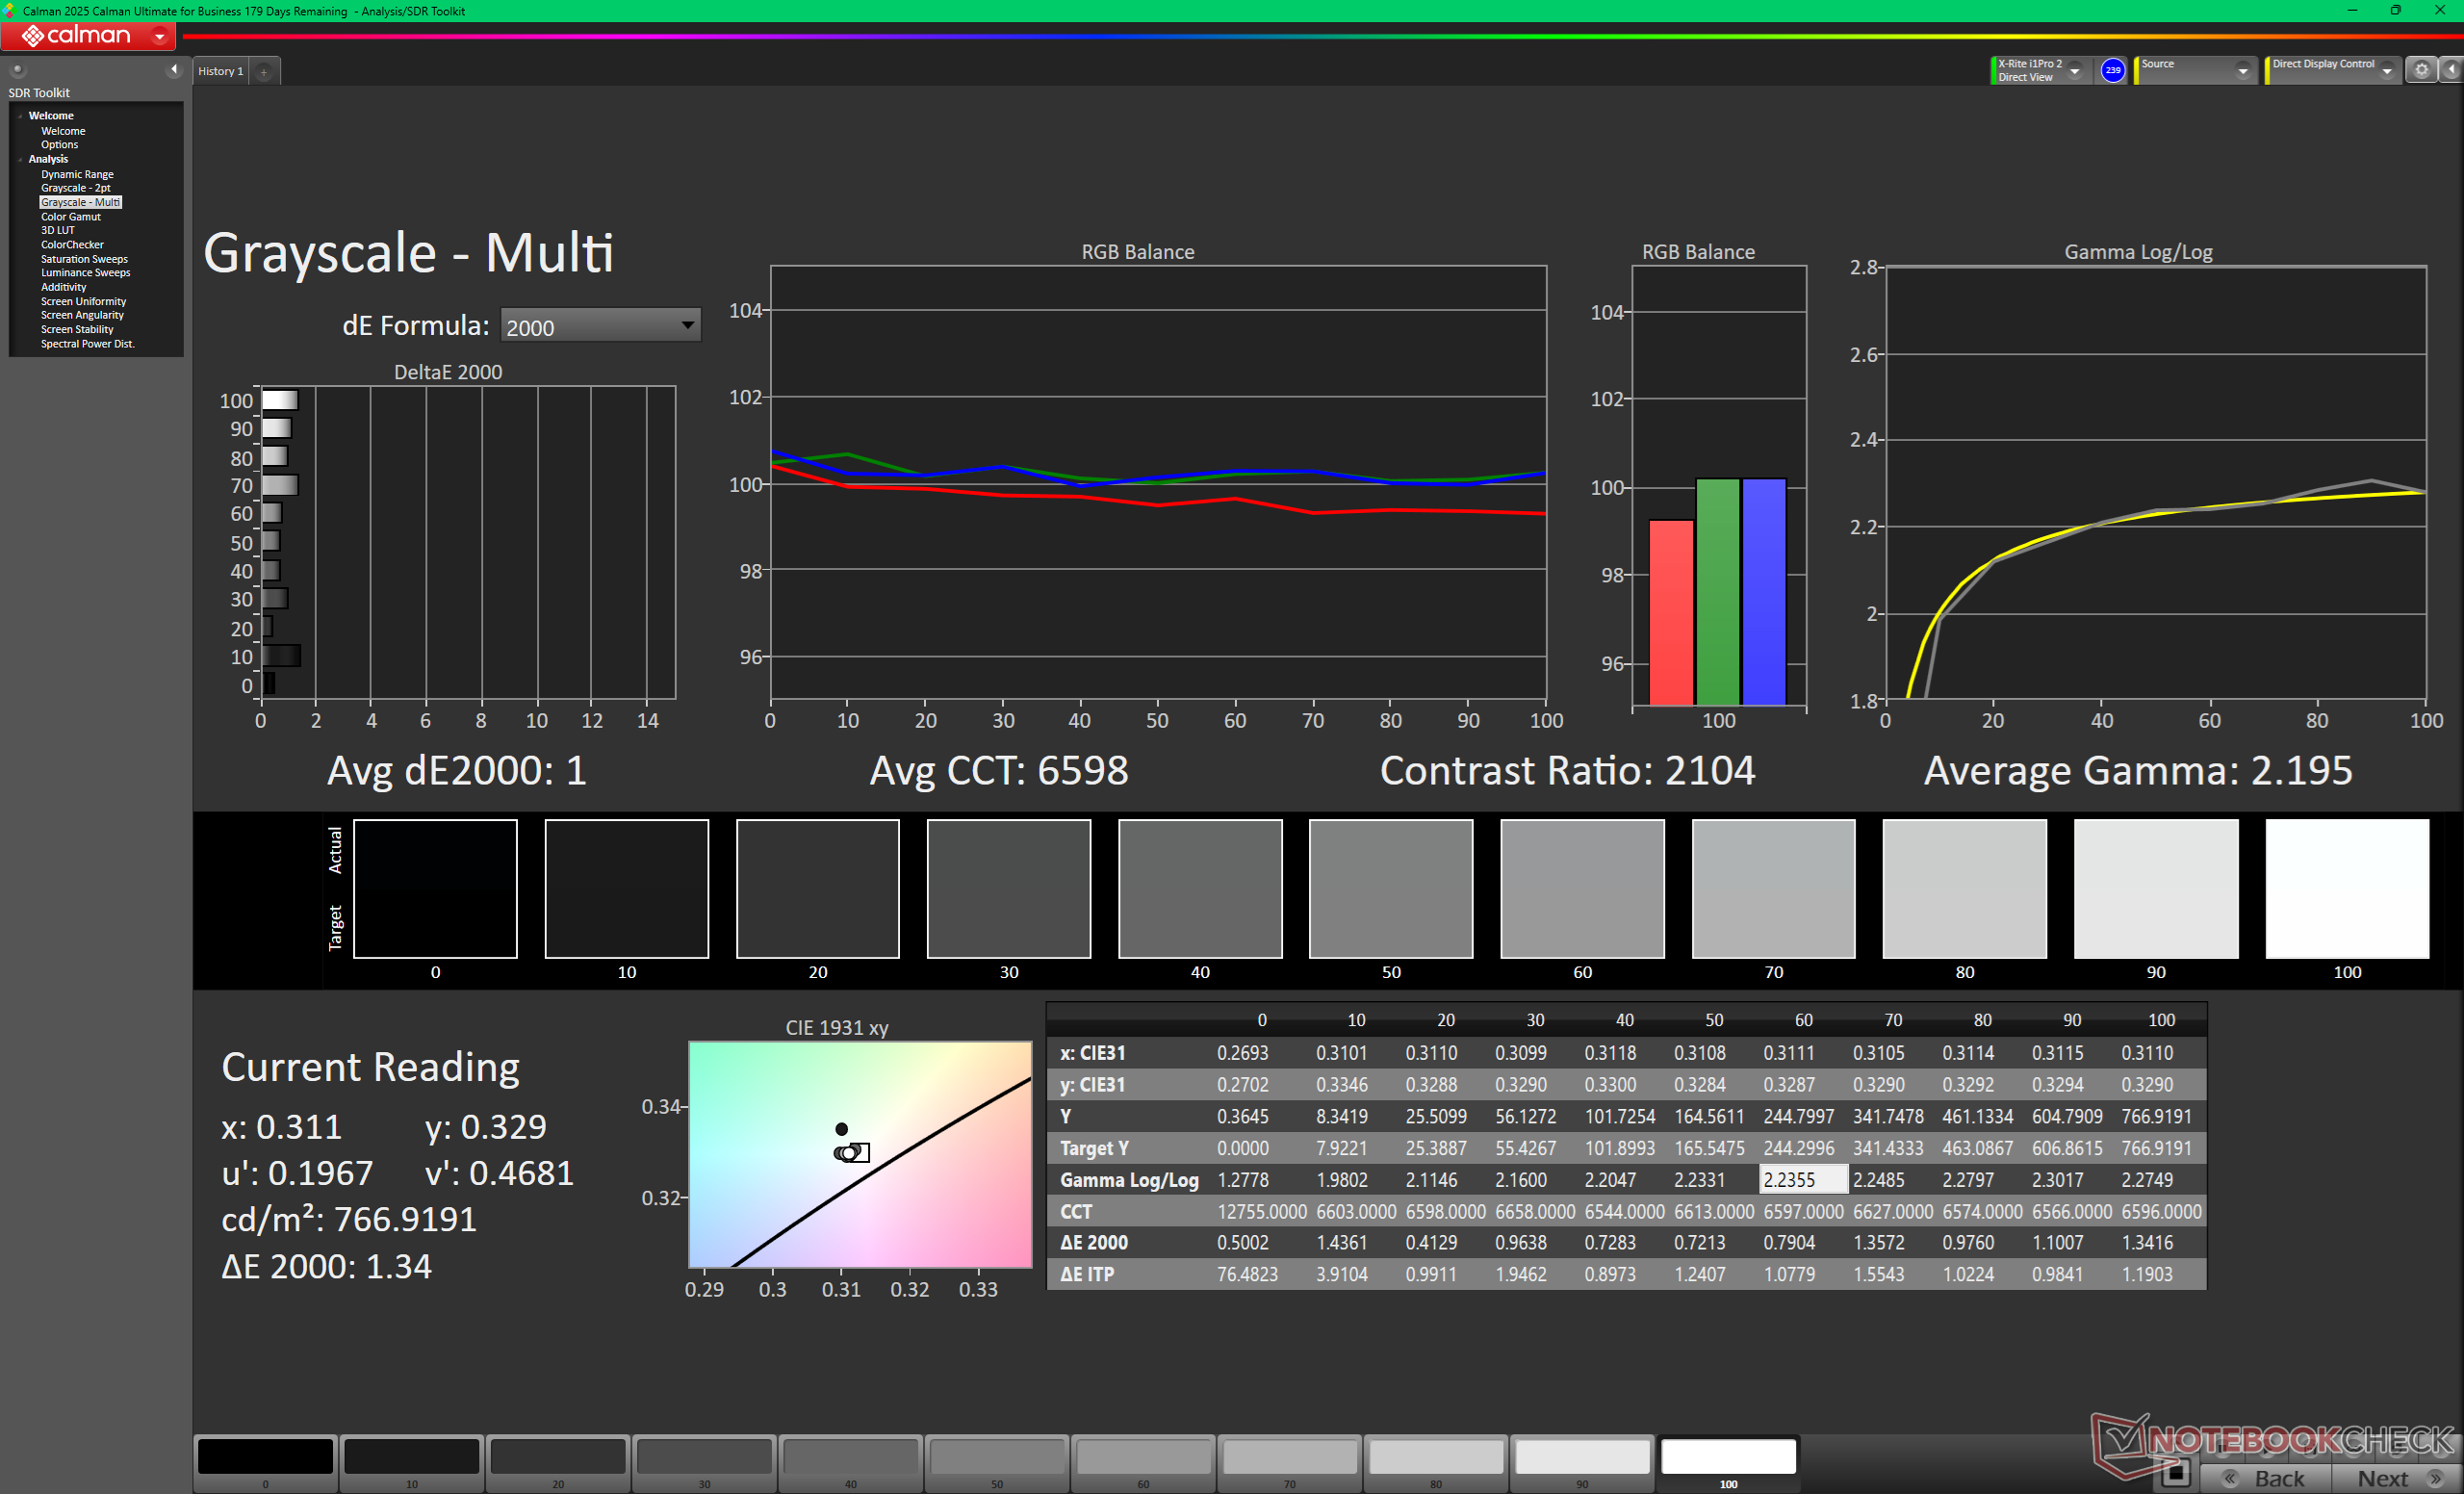
ΔE Greyscale Calman: 2.9 | ∀{0.09-98 Ø4.96}
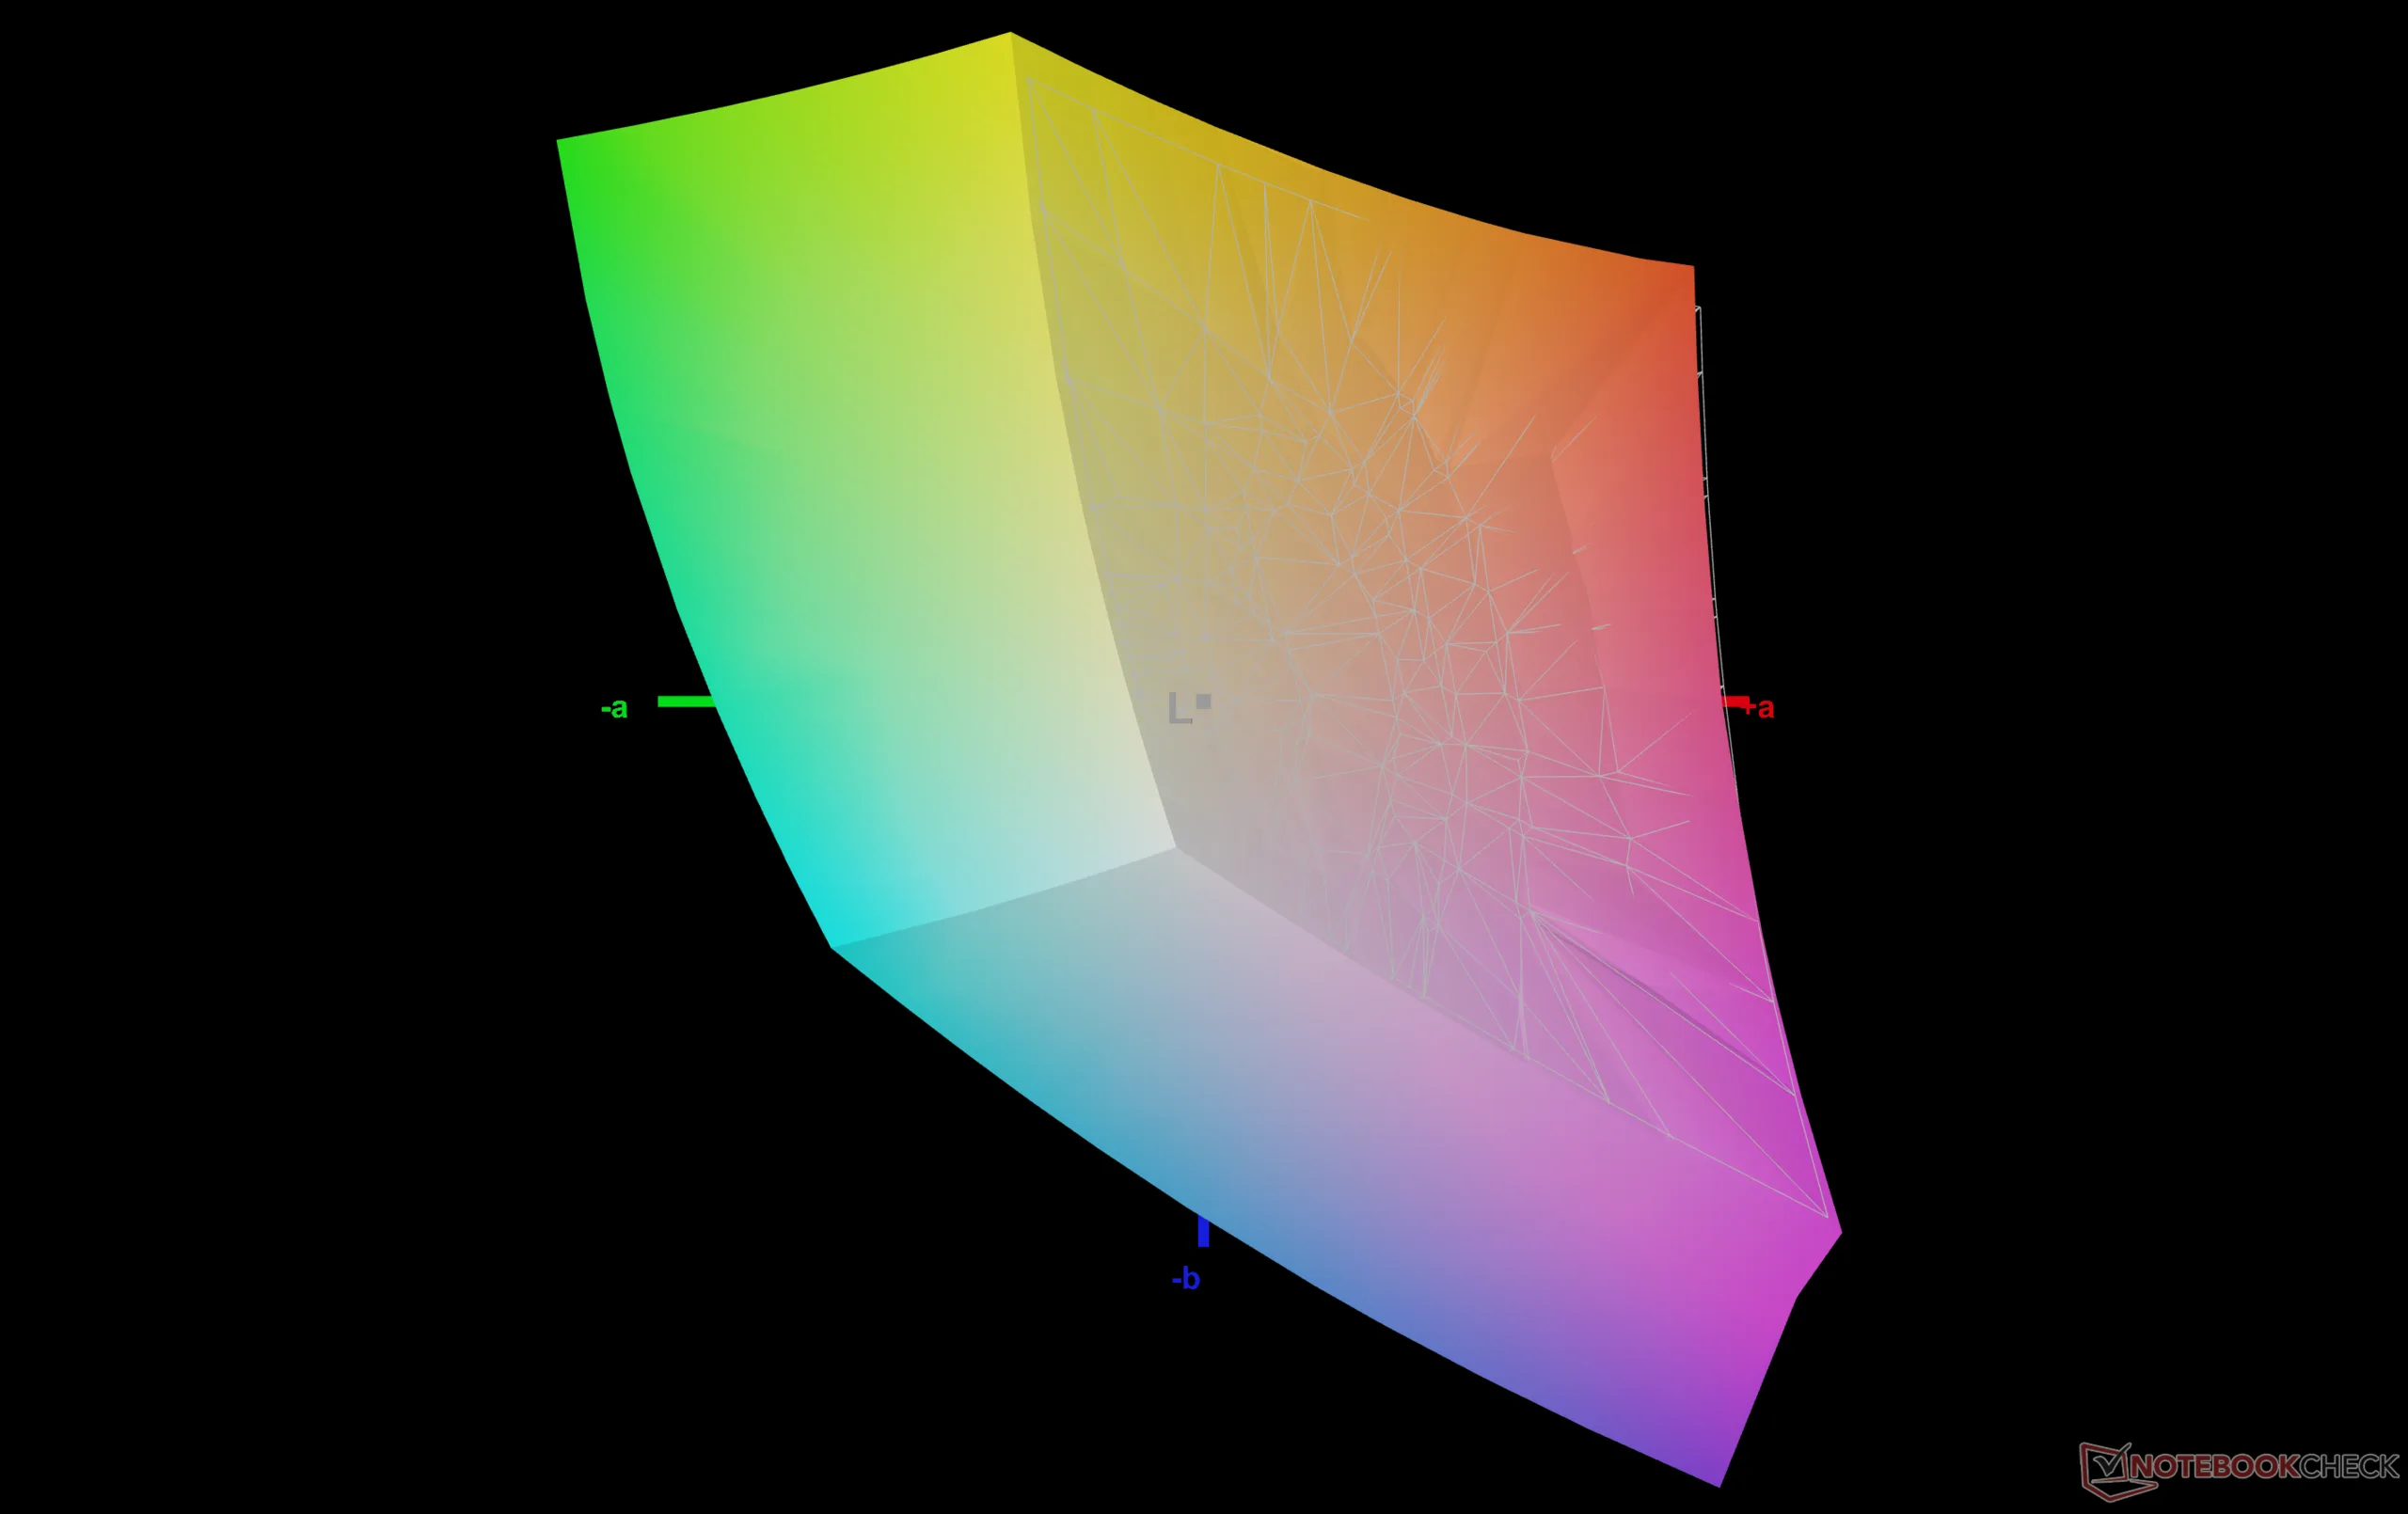
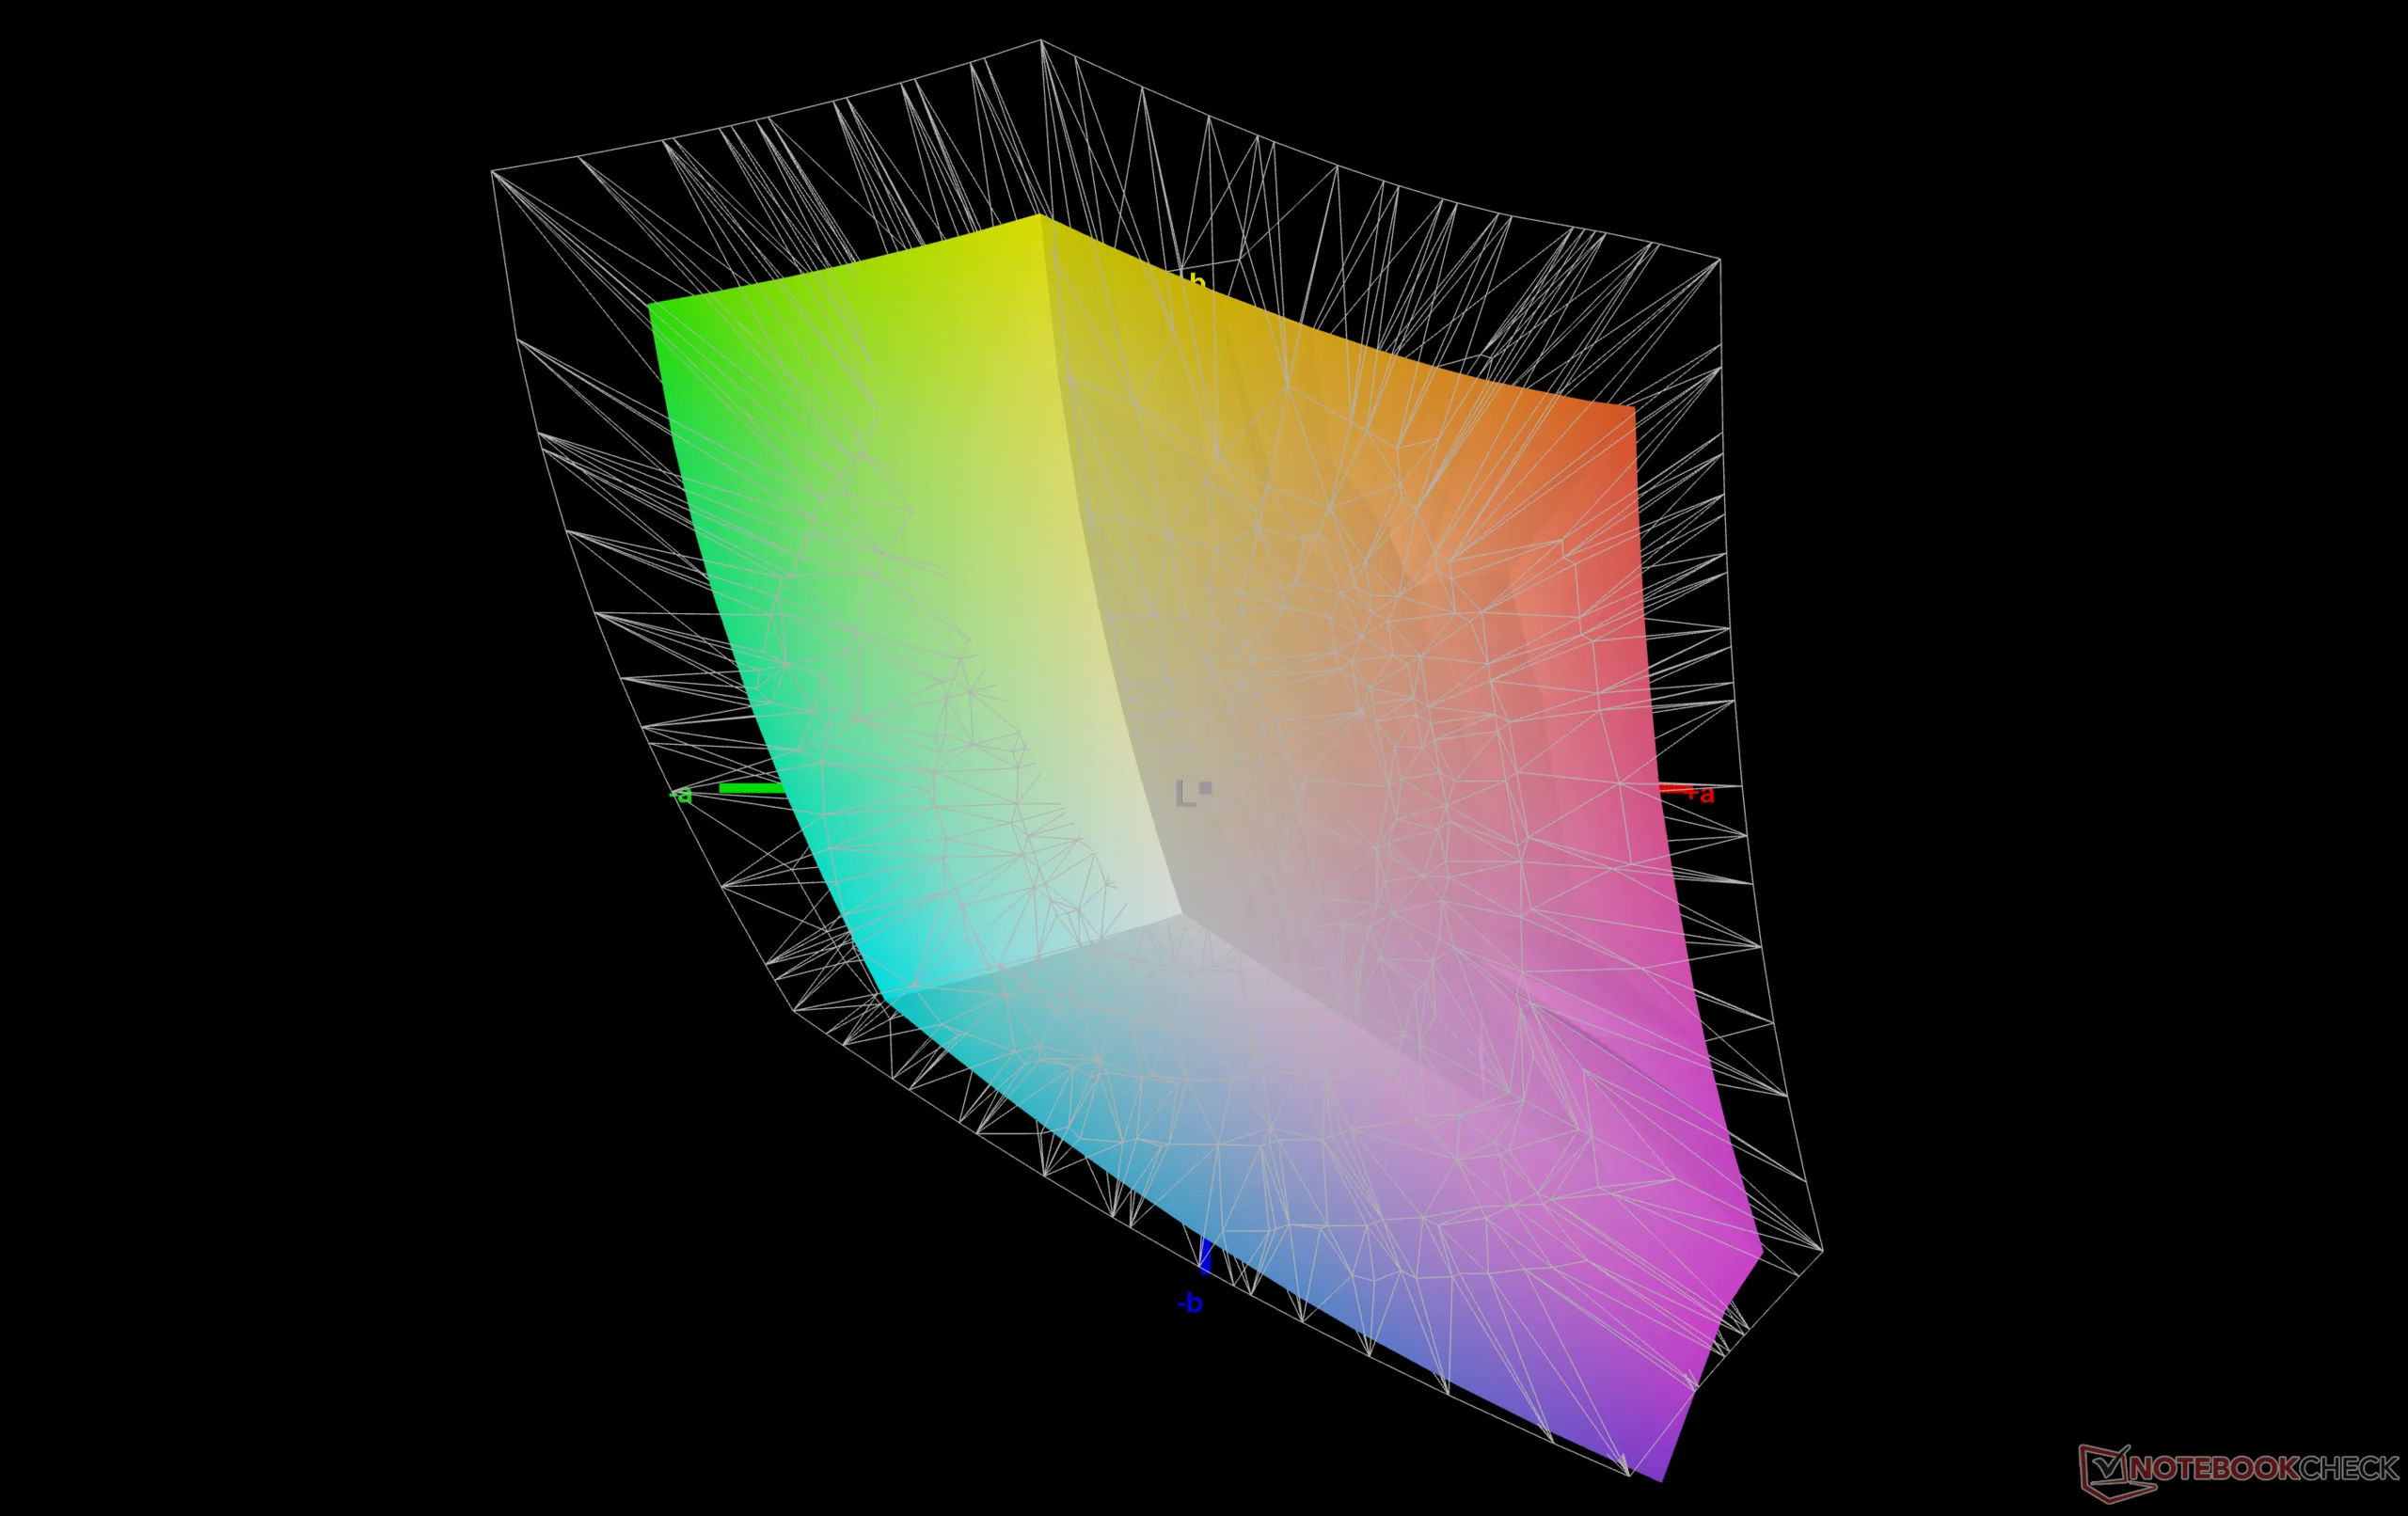
71.9% AdobeRGB 1998 (Argyll 3D)
99.6% sRGB (Argyll 3D)
70.7% Display P3 (Argyll 3D)
Gamma: 2.24
CCT: 7010 K
| Framework Laptop 13 Pro MND508ZB1-1, IPS, 2880x1920, 13.5", 120 Hz | Framework Laptop 13.5 Ryzen AI 9 HX 370 BOE NE135A1M-NY1, IPS, 2880x1920, 13.5", 120 Hz | Microsoft Surface Laptop 8 13.8 LQ138P1JX61, IPS, 2304x1536, 13.8", 120 Hz | MSI Prestige 13 AI+ A3MG ATNA33AA07-0, OLED, 2880x1800, 13.3", 60 Hz | Asus ExpertBook Ultra B9406CAA Samsung ATNA40LE01-0, OLED, 2880x1800, 14", 120 Hz | Dell XPS 14 Core Ultra X7 358H LG Philips 140WT2, OLED, 2880x1800, 14", 120 Hz | |
|---|---|---|---|---|---|---|
| Display | -1% | 18% | 25% | 19% | 26% | |
| Display P3 Coverage (%) | 70.7 | 71.9 2% | 96.5 36% | 99.9 41% | 96.2 36% | 99.7 41% |
| sRGB Coverage (%) | 99.6 | 95.9 -4% | 97.8 -2% | 100 0% | 100 0% | 100 0% |
| AdobeRGB 1998 Coverage (%) | 71.9 | 70.8 -2% | 86.5 20% | 95.7 33% | 86.7 21% | 98.2 37% |
| Response Times | -4% | 6% | 95% | 97% | 97% | |
| Response Time Grey 50% / Grey 80% * (ms) | 35.1 ? | 40 ? -14% | 38.8 ? -11% | 1.8 ? 95% | 0.71 ? 98% | 0.75 ? 98% |
| Response Time Black / White * (ms) | 23.6 ? | 22.3 ? 6% | 18.3 ? 22% | 1.5 ? 94% | 0.94 ? 96% | 1.03 ? 96% |
| PWM Frequency (Hz) | 60 ? | 968.8 ? | 240.62 ? | |||
| PWM Amplitude * (%) | 33 | 20 | 29 | |||
| Screen | -75% | 6% | 460% | 12% | -1% | |
| Brightness middle (cd/m²) | 773.3 | 529.9 -31% | 617 -20% | 394 -49% | 600.5 -22% | 393.8 -49% |
| Brightness (cd/m²) | 722 | 506 -30% | 623 -14% | 395 -45% | 612 -15% | 389 -46% |
| Brightness Distribution (%) | 87 | 94 8% | 91 5% | 98 13% | 96 10% | 96 10% |
| Black Level * (cd/m²) | 0.36 | 0.3 17% | 0.44 -22% | 0.005 99% | ||
| Contrast (:1) | 2148 | 1766 -18% | 1402 -35% | 78800 3569% | ||
| Colorchecker dE 2000 * | 2.14 | 5.7 -166% | 0.9 58% | 1.67 22% | 1.18 45% | 1.27 41% |
| Colorchecker dE 2000 max. * | 4.25 | 10.6 -149% | 2.2 48% | 3.9 8% | 3.4 20% | 3.35 21% |
| Colorchecker dE 2000 calibrated * | 0.61 | 1.5 -146% | 0.73 -20% | 0.71 -16% | ||
| Greyscale dE 2000 * | 2.9 | 7.5 -159% | 2 31% | 1.2 59% | 1 66% | 2 31% |
| Gamma | 2.24 98% | 2.07 106% | 2.19 100% | 2.212 99% | 2.27 97% | 2.19 100% |
| CCT | 7010 93% | 6967 93% | 6810 95% | 6470 100% | 6567 99% | 6379 102% |
| Total Average (Program / Settings) | -27% /
-49% | 10% /
9% | 193% /
303% | 43% /
28% | 41% /
22% |
* ... smaller is better
Display Response Times
| ↔ Response Time Black to White | ||
|---|---|---|
| 23.6 ms ... rise ↗ and fall ↘ combined | ↗ 12.1 ms rise | 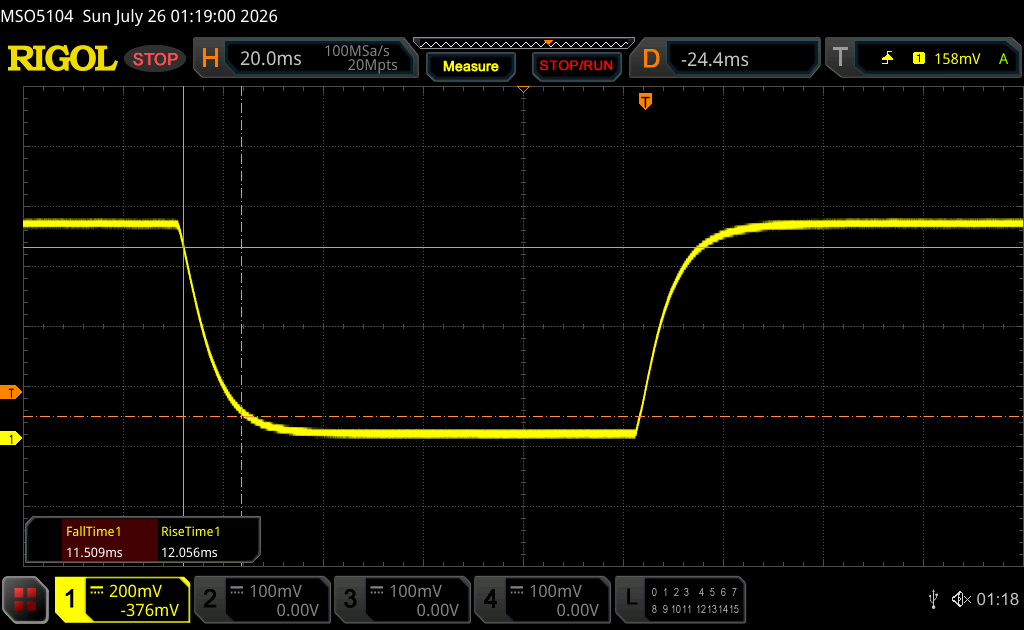 |
| ↘ 11.5 ms fall | ||
| The screen shows good response rates in our tests, but may be too slow for competitive gamers. In comparison, all tested devices range from 0.1 (minimum) to 240 (maximum) ms. » 54 % of all devices are better. This means that the measured response time is worse than the average of all tested devices (19.8 ms). | ||
| ↔ Response Time 50% Grey to 80% Grey | ||
| 35.1 ms ... rise ↗ and fall ↘ combined | ↗ 16.5 ms rise | 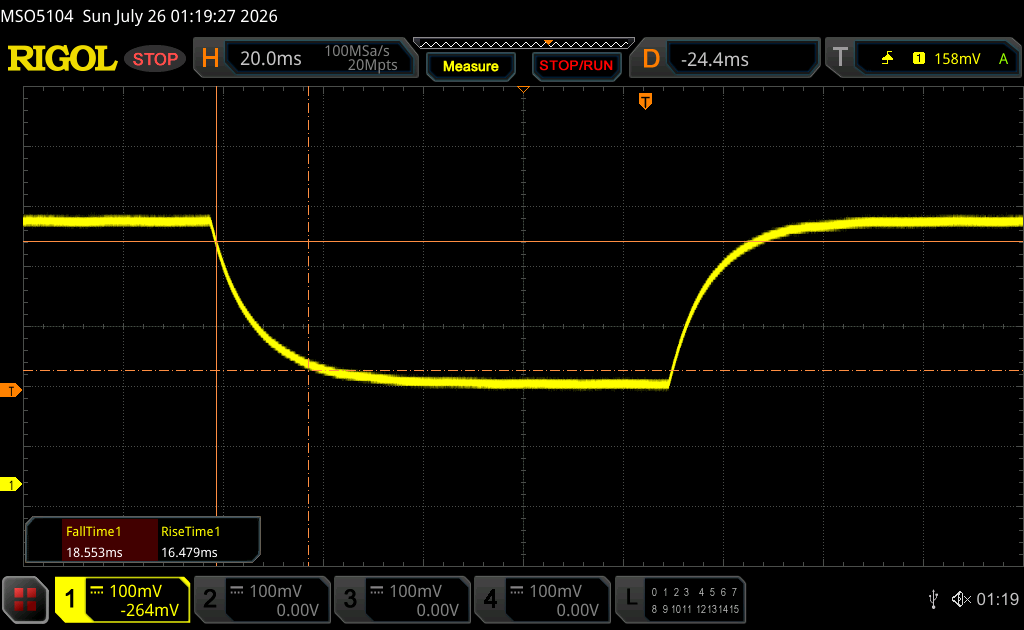 |
| ↘ 18.6 ms fall | ||
| The screen shows slow response rates in our tests and will be unsatisfactory for gamers. In comparison, all tested devices range from 0.165 (minimum) to 636 (maximum) ms. » 49 % of all devices are better. This means that the measured response time is worse than the average of all tested devices (30.9 ms). | ||
Screen Flickering / PWM (Pulse-Width Modulation)
| Screen flickering / PWM not detected | 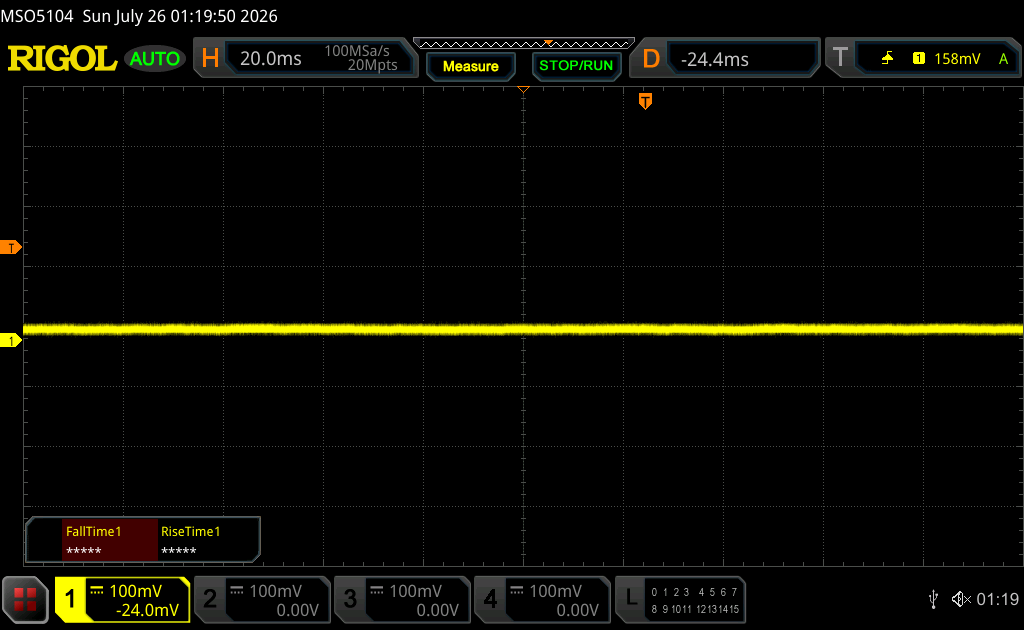 | ||
In comparison: 52 % of all tested devices do not use PWM to dim the display. If PWM was detected, an average of 7748 (minimum: 5 - maximum: 343500) Hz was measured. | |||
Performance
Testing Conditions
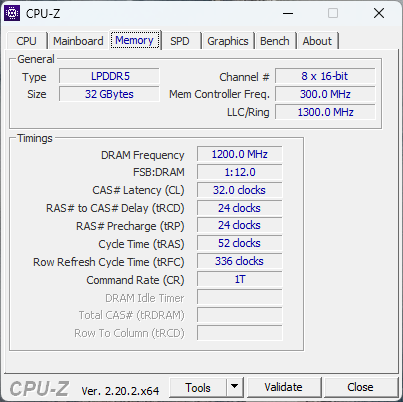
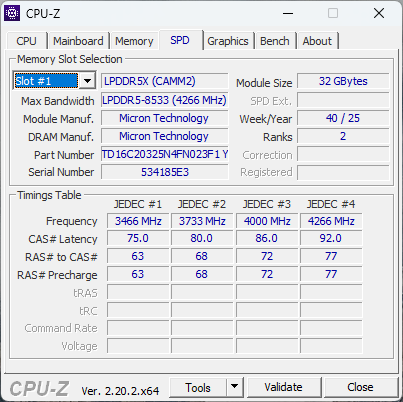
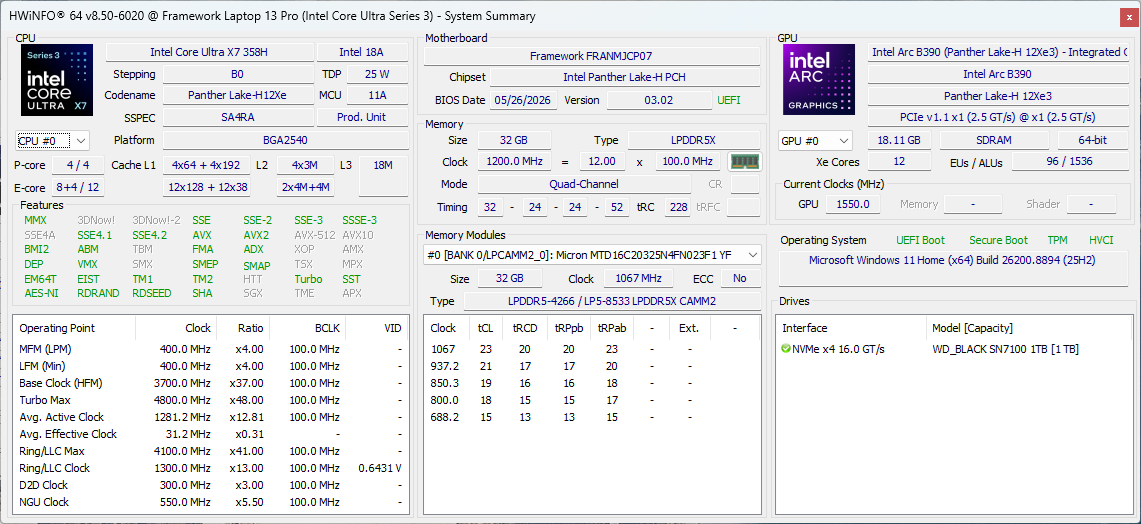
We set both Windows and BIOS to Performance mode prior to running the benchmarks below.
Processor Performance
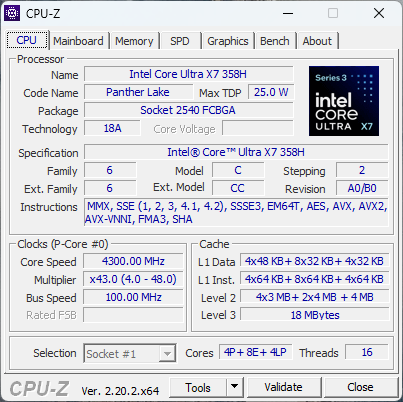
Raw multi-thread performance is between 5 to 15 percent slower than other PCs with the same Core Ultra X7 358H including the recent Dell XPS 13.
Cinebench R15 Multi Loop
Cinebench 2026: CPU Multi
Cinebench 2024: CPU Single Core | CPU Multi Core
Cinebench R23: Multi Core | Single Core
Cinebench R20: CPU (Multi Core) | CPU (Single Core)
Cinebench R15: CPU Multi 64Bit | CPU Single 64Bit
Blender: v2.79 BMW27 CPU
7-Zip 18.03: 7z b 4 | 7z b 4 -mmt1
Geekbench 6.7: Multi-Core | Single-Core
Geekbench 5.5: Multi-Core | Single-Core
HWBOT x265 Benchmark v2.2: 4k Preset
LibreOffice : 20 Documents To PDF
R Benchmark 2.5: Overall mean
| CPU Performance rating | |
| Asus ExpertBook Ultra B9406CAA | |
| Dell XPS 14 Core Ultra X7 358H | |
| Average Intel Core Ultra X7 358H | |
| Framework Laptop 13.5 Ryzen AI 9 HX 370 -1! | |
| Framework Laptop 13 Pro | |
| HP OmniBook 7 Aero 13-bg1077nr -1! | |
| MSI Prestige 13 AI+ A3MG -1! | |
| Framework Laptop 13.5 Core Ultra 7 155H -1! | |
| Microsoft Surface Laptop 8 13.8 -2! | |
| Dell Pro 13 Premium PA13250 -3! | |
| HP EliteBook 8 Flip G1i 13 -1! | |
| HP Elite Dragonfly G3 -5! | |
| Framework Laptop 13.5 -7! | |
| Cinebench 2026 / CPU Multi | |
| Asus ExpertBook Ultra B9406CAA | |
| Average Intel Core Ultra X7 358H (3446 - 4512, n=6) | |
| Dell XPS 14 Core Ultra X7 358H | |
| Microsoft Surface Laptop 8 13.8 | |
| Framework Laptop 13 Pro | |
Cinebench 2026: CPU Multi
Cinebench 2024: CPU Single Core | CPU Multi Core
Cinebench R23: Multi Core | Single Core
Cinebench R20: CPU (Multi Core) | CPU (Single Core)
Cinebench R15: CPU Multi 64Bit | CPU Single 64Bit
Blender: v2.79 BMW27 CPU
7-Zip 18.03: 7z b 4 | 7z b 4 -mmt1
Geekbench 6.7: Multi-Core | Single-Core
Geekbench 5.5: Multi-Core | Single-Core
HWBOT x265 Benchmark v2.2: 4k Preset
LibreOffice : 20 Documents To PDF
R Benchmark 2.5: Overall mean
* ... smaller is better
AIDA64: FP32 Ray-Trace | FPU Julia | CPU SHA3 | CPU Queen | FPU SinJulia | FPU Mandel | CPU AES | CPU ZLib | FP64 Ray-Trace | CPU PhotoWorxx | CPU CheckMate
| Performance rating | |
| Framework Laptop 13.5 Ryzen AI 9 HX 370 -1! | |
| Dell XPS 14 Core Ultra X7 358H | |
| Average Intel Core Ultra X7 358H | |
| Framework Laptop 13 Pro -1! | |
| MSI Prestige 13 AI+ A3MG -2! | |
| Asus ExpertBook Ultra B9406CAA -1! | |
| Microsoft Surface Laptop 8 13.8 -1! | |
| AIDA64 / FP32 Ray-Trace | |
| Framework Laptop 13.5 Ryzen AI 9 HX 370 (v6.92.6600) | |
| Average Intel Core Ultra X7 358H (12221 - 18710, n=10) | |
| Framework Laptop 13 Pro (v8.20.8100) | |
| Dell XPS 14 Core Ultra X7 358H (v8.20.8100) | |
| Asus ExpertBook Ultra B9406CAA (v6.92.6600) | |
| MSI Prestige 13 AI+ A3MG (v8.20.8100) | |
| Microsoft Surface Laptop 8 13.8 (v8.20.8100) | |
| AIDA64 / FPU Julia | |
| Framework Laptop 13.5 Ryzen AI 9 HX 370 (v6.92.6600) | |
| Average Intel Core Ultra X7 358H (29930 - 96559, n=10) | |
| Dell XPS 14 Core Ultra X7 358H (v8.20.8100) | |
| Framework Laptop 13 Pro (v8.20.8100) | |
| MSI Prestige 13 AI+ A3MG (v8.20.8100) | |
| Asus ExpertBook Ultra B9406CAA (v6.92.6600) | |
| Microsoft Surface Laptop 8 13.8 (v8.20.8100) | |
| AIDA64 / CPU SHA3 | |
| Framework Laptop 13.5 Ryzen AI 9 HX 370 (v6.92.6600) | |
| Asus ExpertBook Ultra B9406CAA (v6.92.6600) | |
| Average Intel Core Ultra X7 358H (3910 - 4955, n=10) | |
| Framework Laptop 13 Pro (v8.20.8100) | |
| Dell XPS 14 Core Ultra X7 358H (v8.20.8100) | |
| MSI Prestige 13 AI+ A3MG (v8.20.8100) | |
| Microsoft Surface Laptop 8 13.8 (v8.20.8100) | |
| AIDA64 / CPU Queen | |
| Framework Laptop 13.5 Ryzen AI 9 HX 370 (v6.92.6600) | |
| Dell XPS 14 Core Ultra X7 358H (v6.92.6600) | |
| Average Intel Core Ultra X7 358H (63425 - 63827, n=2) | |
| Asus ExpertBook Ultra B9406CAA (v6.92.6600) | |
| AIDA64 / FPU SinJulia | |
| Framework Laptop 13.5 Ryzen AI 9 HX 370 (v6.92.6600) | |
| Dell XPS 14 Core Ultra X7 358H (v8.20.8100) | |
| Average Intel Core Ultra X7 358H (4735 - 7038, n=10) | |
| Framework Laptop 13 Pro (v8.20.8100) | |
| MSI Prestige 13 AI+ A3MG (v8.20.8100) | |
| Asus ExpertBook Ultra B9406CAA (v6.92.6600) | |
| Microsoft Surface Laptop 8 13.8 (v8.20.8100) | |
| AIDA64 / FPU Mandel | |
| Framework Laptop 13.5 Ryzen AI 9 HX 370 (v6.92.6600) | |
| Average Intel Core Ultra X7 358H (14716 - 50766, n=10) | |
| Framework Laptop 13 Pro (v8.20.8100) | |
| Dell XPS 14 Core Ultra X7 358H (v8.20.8100) | |
| MSI Prestige 13 AI+ A3MG (v8.20.8100) | |
| Asus ExpertBook Ultra B9406CAA (v6.92.6600) | |
| Microsoft Surface Laptop 8 13.8 (v8.20.8100) | |
| AIDA64 / CPU AES | |
| Framework Laptop 13.5 Ryzen AI 9 HX 370 (v6.92.6600) | |
| Dell XPS 14 Core Ultra X7 358H (v8.20.8100) | |
| Average Intel Core Ultra X7 358H (5127 - 68737, n=10) | |
| Framework Laptop 13 Pro (v8.20.8100) | |
| Microsoft Surface Laptop 8 13.8 (v8.20.8100) | |
| MSI Prestige 13 AI+ A3MG (v8.20.8100) | |
| Asus ExpertBook Ultra B9406CAA (v6.92.6600) | |
| AIDA64 / CPU ZLib | |
| Framework Laptop 13.5 Ryzen AI 9 HX 370 (v6.92.6600) | |
| Asus ExpertBook Ultra B9406CAA (v6.92.6600) | |
| Dell XPS 14 Core Ultra X7 358H (v8.20.8100) | |
| Average Intel Core Ultra X7 358H (932 - 1179, n=10) | |
| Framework Laptop 13 Pro (v8.20.8100) | |
| MSI Prestige 13 AI+ A3MG (v8.20.8100) | |
| Microsoft Surface Laptop 8 13.8 (v8.20.8100) | |
| AIDA64 / FP64 Ray-Trace | |
| Framework Laptop 13.5 Ryzen AI 9 HX 370 (v6.92.6600) | |
| Average Intel Core Ultra X7 358H (6506 - 9612, n=10) | |
| Dell XPS 14 Core Ultra X7 358H (v8.20.8100) | |
| Framework Laptop 13 Pro (v8.20.8100) | |
| Asus ExpertBook Ultra B9406CAA (v6.92.6600) | |
| MSI Prestige 13 AI+ A3MG (v8.20.8100) | |
| Microsoft Surface Laptop 8 13.8 (v8.20.8100) | |
| AIDA64 / CPU PhotoWorxx | |
| Dell XPS 14 Core Ultra X7 358H (v8.20.8100) | |
| Average Intel Core Ultra X7 358H (30538 - 88533, n=10) | |
| Framework Laptop 13 Pro (v8.20.8100) | |
| MSI Prestige 13 AI+ A3MG (v8.20.8100) | |
| Framework Laptop 13.5 Ryzen AI 9 HX 370 (v6.92.6600) | |
| Microsoft Surface Laptop 8 13.8 (v8.20.8100) | |
| Asus ExpertBook Ultra B9406CAA (v6.92.6600) | |
| AIDA64 / CPU CheckMate | |
| Dell XPS 14 Core Ultra X7 358H (v8.20.8100) | |
| Average Intel Core Ultra X7 358H (3721 - 4475, n=9) | |
| Framework Laptop 13 Pro (v8.20.8100) | |
| Microsoft Surface Laptop 8 13.8 (v8.20.8100) | |
System Performance
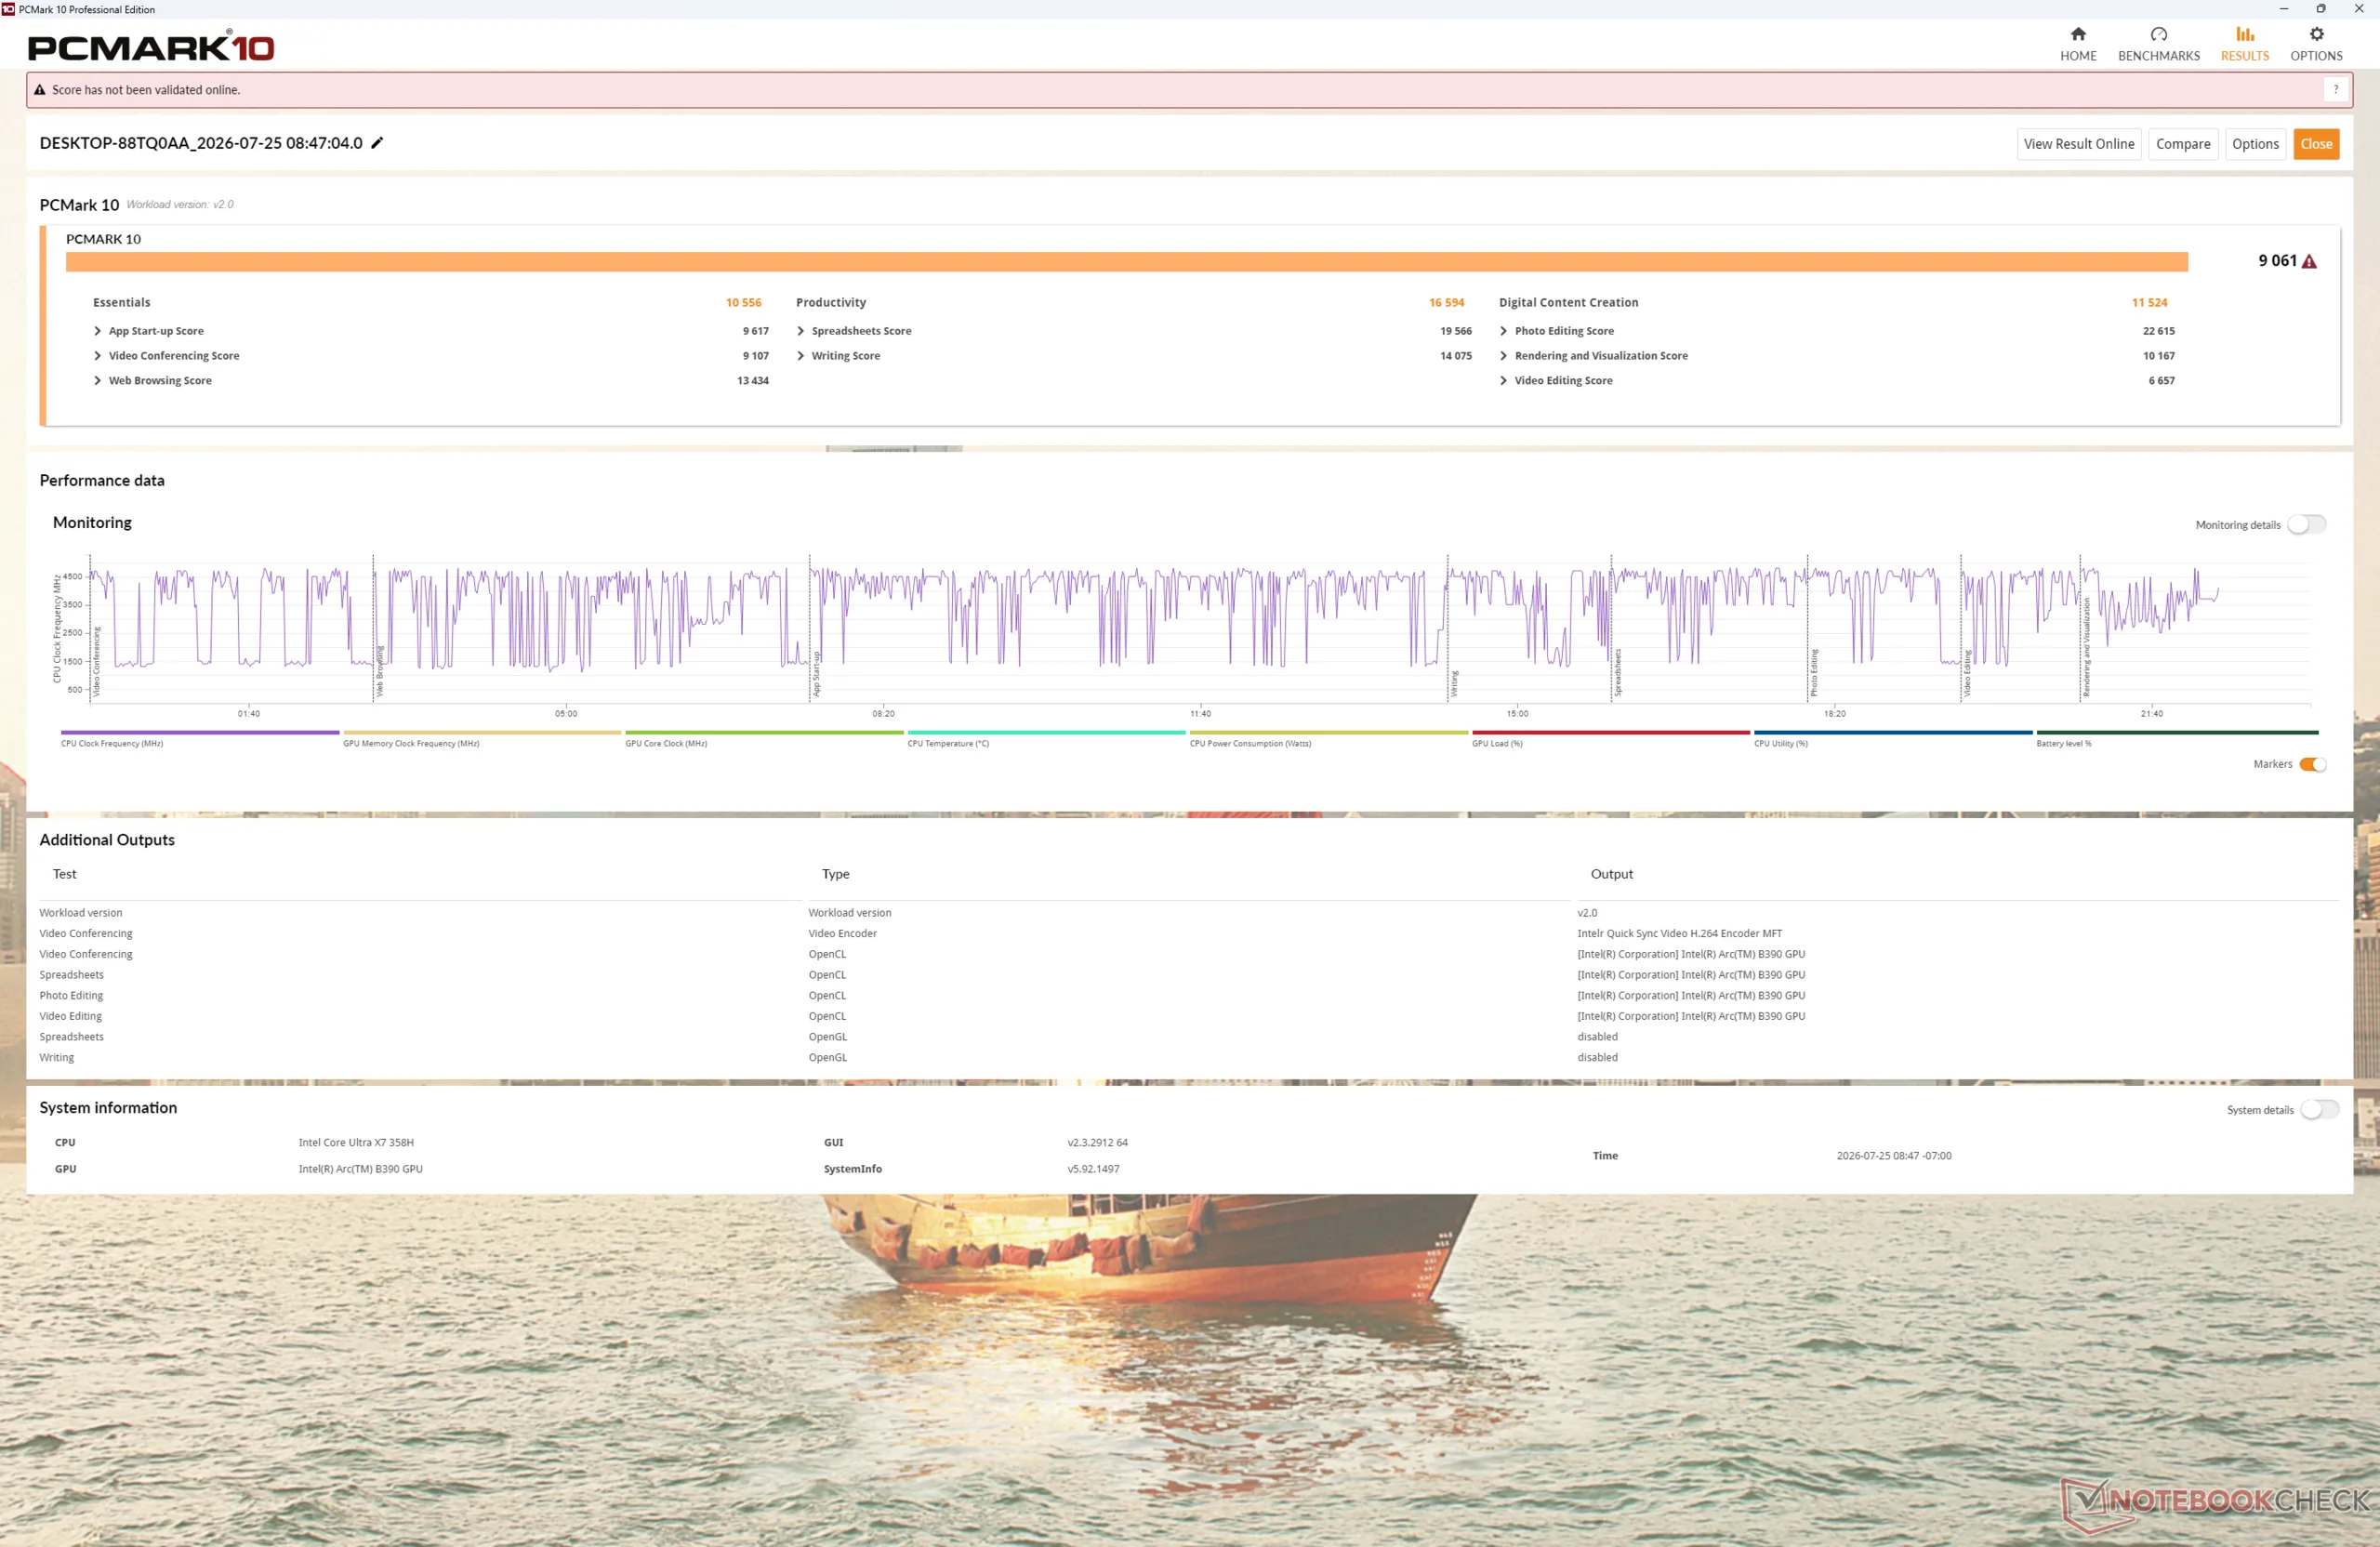
PCMark 10: Score | Essentials | Productivity | Digital Content Creation
CrossMark: Overall | Productivity | Creativity | Responsiveness
WebXPRT 3: Overall
WebXPRT 4: Overall
Mozilla Kraken 1.1: Total
| Performance rating | |
| Dell XPS 14 Core Ultra X7 358H | |
| Average Intel Core Ultra X7 358H, Intel Arc B390 12 Xe3 Panther Lake iGPU | |
| Framework Laptop 13 Pro | |
| Asus ExpertBook Ultra B9406CAA | |
| Microsoft Surface Laptop 8 13.8 -4! | |
| MSI Prestige 13 AI+ A3MG | |
| Framework Laptop 13.5 Ryzen AI 9 HX 370 | |
| PCMark 10 / Score | |
| Dell XPS 14 Core Ultra X7 358H | |
| Average Intel Core Ultra X7 358H, Intel Arc B390 12 Xe3 Panther Lake iGPU (8834 - 9880, n=10) | |
| Asus ExpertBook Ultra B9406CAA | |
| Framework Laptop 13 Pro | |
| MSI Prestige 13 AI+ A3MG | |
| Framework Laptop 13.5 Ryzen AI 9 HX 370 | |
| PCMark 10 / Essentials | |
| Dell XPS 14 Core Ultra X7 358H | |
| Framework Laptop 13.5 Ryzen AI 9 HX 370 | |
| MSI Prestige 13 AI+ A3MG | |
| Average Intel Core Ultra X7 358H, Intel Arc B390 12 Xe3 Panther Lake iGPU (10282 - 11263, n=9) | |
| Asus ExpertBook Ultra B9406CAA | |
| Framework Laptop 13 Pro | |
| PCMark 10 / Productivity | |
| Dell XPS 14 Core Ultra X7 358H | |
| Framework Laptop 13 Pro | |
| Average Intel Core Ultra X7 358H, Intel Arc B390 12 Xe3 Panther Lake iGPU (13908 - 16780, n=9) | |
| Asus ExpertBook Ultra B9406CAA | |
| MSI Prestige 13 AI+ A3MG | |
| Framework Laptop 13.5 Ryzen AI 9 HX 370 | |
| PCMark 10 / Digital Content Creation | |
| Dell XPS 14 Core Ultra X7 358H | |
| Asus ExpertBook Ultra B9406CAA | |
| Average Intel Core Ultra X7 358H, Intel Arc B390 12 Xe3 Panther Lake iGPU (11524 - 13893, n=9) | |
| Framework Laptop 13 Pro | |
| Framework Laptop 13.5 Ryzen AI 9 HX 370 | |
| MSI Prestige 13 AI+ A3MG | |
| CrossMark / Overall | |
| Average Intel Core Ultra X7 358H, Intel Arc B390 12 Xe3 Panther Lake iGPU (1884 - 2182, n=10) | |
| Framework Laptop 13 Pro | |
| MSI Prestige 13 AI+ A3MG | |
| Dell XPS 14 Core Ultra X7 358H | |
| Asus ExpertBook Ultra B9406CAA | |
| Framework Laptop 13.5 Ryzen AI 9 HX 370 | |
| Microsoft Surface Laptop 8 13.8 | |
| CrossMark / Productivity | |
| Average Intel Core Ultra X7 358H, Intel Arc B390 12 Xe3 Panther Lake iGPU (1678 - 1960, n=10) | |
| MSI Prestige 13 AI+ A3MG | |
| Framework Laptop 13 Pro | |
| Dell XPS 14 Core Ultra X7 358H | |
| Asus ExpertBook Ultra B9406CAA | |
| Framework Laptop 13.5 Ryzen AI 9 HX 370 | |
| Microsoft Surface Laptop 8 13.8 | |
| CrossMark / Creativity | |
| Average Intel Core Ultra X7 358H, Intel Arc B390 12 Xe3 Panther Lake iGPU (2241 - 2563, n=10) | |
| Dell XPS 14 Core Ultra X7 358H | |
| Framework Laptop 13 Pro | |
| Asus ExpertBook Ultra B9406CAA | |
| MSI Prestige 13 AI+ A3MG | |
| Framework Laptop 13.5 Ryzen AI 9 HX 370 | |
| Microsoft Surface Laptop 8 13.8 | |
| CrossMark / Responsiveness | |
| Framework Laptop 13 Pro | |
| Average Intel Core Ultra X7 358H, Intel Arc B390 12 Xe3 Panther Lake iGPU (1560 - 1855, n=10) | |
| MSI Prestige 13 AI+ A3MG | |
| Asus ExpertBook Ultra B9406CAA | |
| Dell XPS 14 Core Ultra X7 358H | |
| Microsoft Surface Laptop 8 13.8 | |
| Framework Laptop 13.5 Ryzen AI 9 HX 370 | |
| WebXPRT 3 / Overall | |
| Microsoft Surface Laptop 8 13.8 | |
| Framework Laptop 13.5 Ryzen AI 9 HX 370 | |
| Framework Laptop 13 Pro | |
| Dell XPS 14 Core Ultra X7 358H | |
| MSI Prestige 13 AI+ A3MG | |
| Average Intel Core Ultra X7 358H, Intel Arc B390 12 Xe3 Panther Lake iGPU (293 - 350, n=10) | |
| Asus ExpertBook Ultra B9406CAA | |
| WebXPRT 4 / Overall | |
| Microsoft Surface Laptop 8 13.8 | |
| Framework Laptop 13 Pro | |
| MSI Prestige 13 AI+ A3MG | |
| Dell XPS 14 Core Ultra X7 358H | |
| Average Intel Core Ultra X7 358H, Intel Arc B390 12 Xe3 Panther Lake iGPU (278 - 310, n=9) | |
| Asus ExpertBook Ultra B9406CAA | |
| Framework Laptop 13.5 Ryzen AI 9 HX 370 | |
| Mozilla Kraken 1.1 / Total | |
| Framework Laptop 13 Pro | |
| Average Intel Core Ultra X7 358H, Intel Arc B390 12 Xe3 Panther Lake iGPU (445 - 465, n=10) | |
| Framework Laptop 13.5 Ryzen AI 9 HX 370 | |
| Asus ExpertBook Ultra B9406CAA | |
| MSI Prestige 13 AI+ A3MG | |
| Dell XPS 14 Core Ultra X7 358H | |
| Microsoft Surface Laptop 8 13.8 | |
* ... smaller is better
| PCMark 10 Score | 9061 points | |
Help | ||
| AIDA64 / Memory Copy | |
| Dell XPS 14 Core Ultra X7 358H | |
| Average Intel Core Ultra X7 358H (102745 - 132135, n=9) | |
| Framework Laptop 13 Pro | |
| MSI Prestige 13 AI+ A3MG | |
| Framework Laptop 13.5 Ryzen AI 9 HX 370 | |
| Microsoft Surface Laptop 8 13.8 | |
| AIDA64 / Memory Read | |
| Asus ExpertBook Ultra B9406CAA | |
| Microsoft Surface Laptop 8 13.8 | |
| Dell XPS 14 Core Ultra X7 358H | |
| Average Intel Core Ultra X7 358H (97755 - 120727, n=10) | |
| Framework Laptop 13 Pro | |
| MSI Prestige 13 AI+ A3MG | |
| Framework Laptop 13.5 Ryzen AI 9 HX 370 | |
| AIDA64 / Memory Write | |
| Dell XPS 14 Core Ultra X7 358H | |
| Average Intel Core Ultra X7 358H (105712 - 134998, n=10) | |
| Asus ExpertBook Ultra B9406CAA | |
| MSI Prestige 13 AI+ A3MG | |
| Framework Laptop 13 Pro | |
| Framework Laptop 13.5 Ryzen AI 9 HX 370 | |
| Microsoft Surface Laptop 8 13.8 | |
| AIDA64 / Memory Latency | |
| MSI Prestige 13 AI+ A3MG | |
| Framework Laptop 13 Pro | |
| Framework Laptop 13.5 Ryzen AI 9 HX 370 | |
| Dell XPS 14 Core Ultra X7 358H | |
| Average Intel Core Ultra X7 358H (84.1 - 103.3, n=10) | |
| Microsoft Surface Laptop 8 13.8 | |
* ... smaller is better
DPC Latency
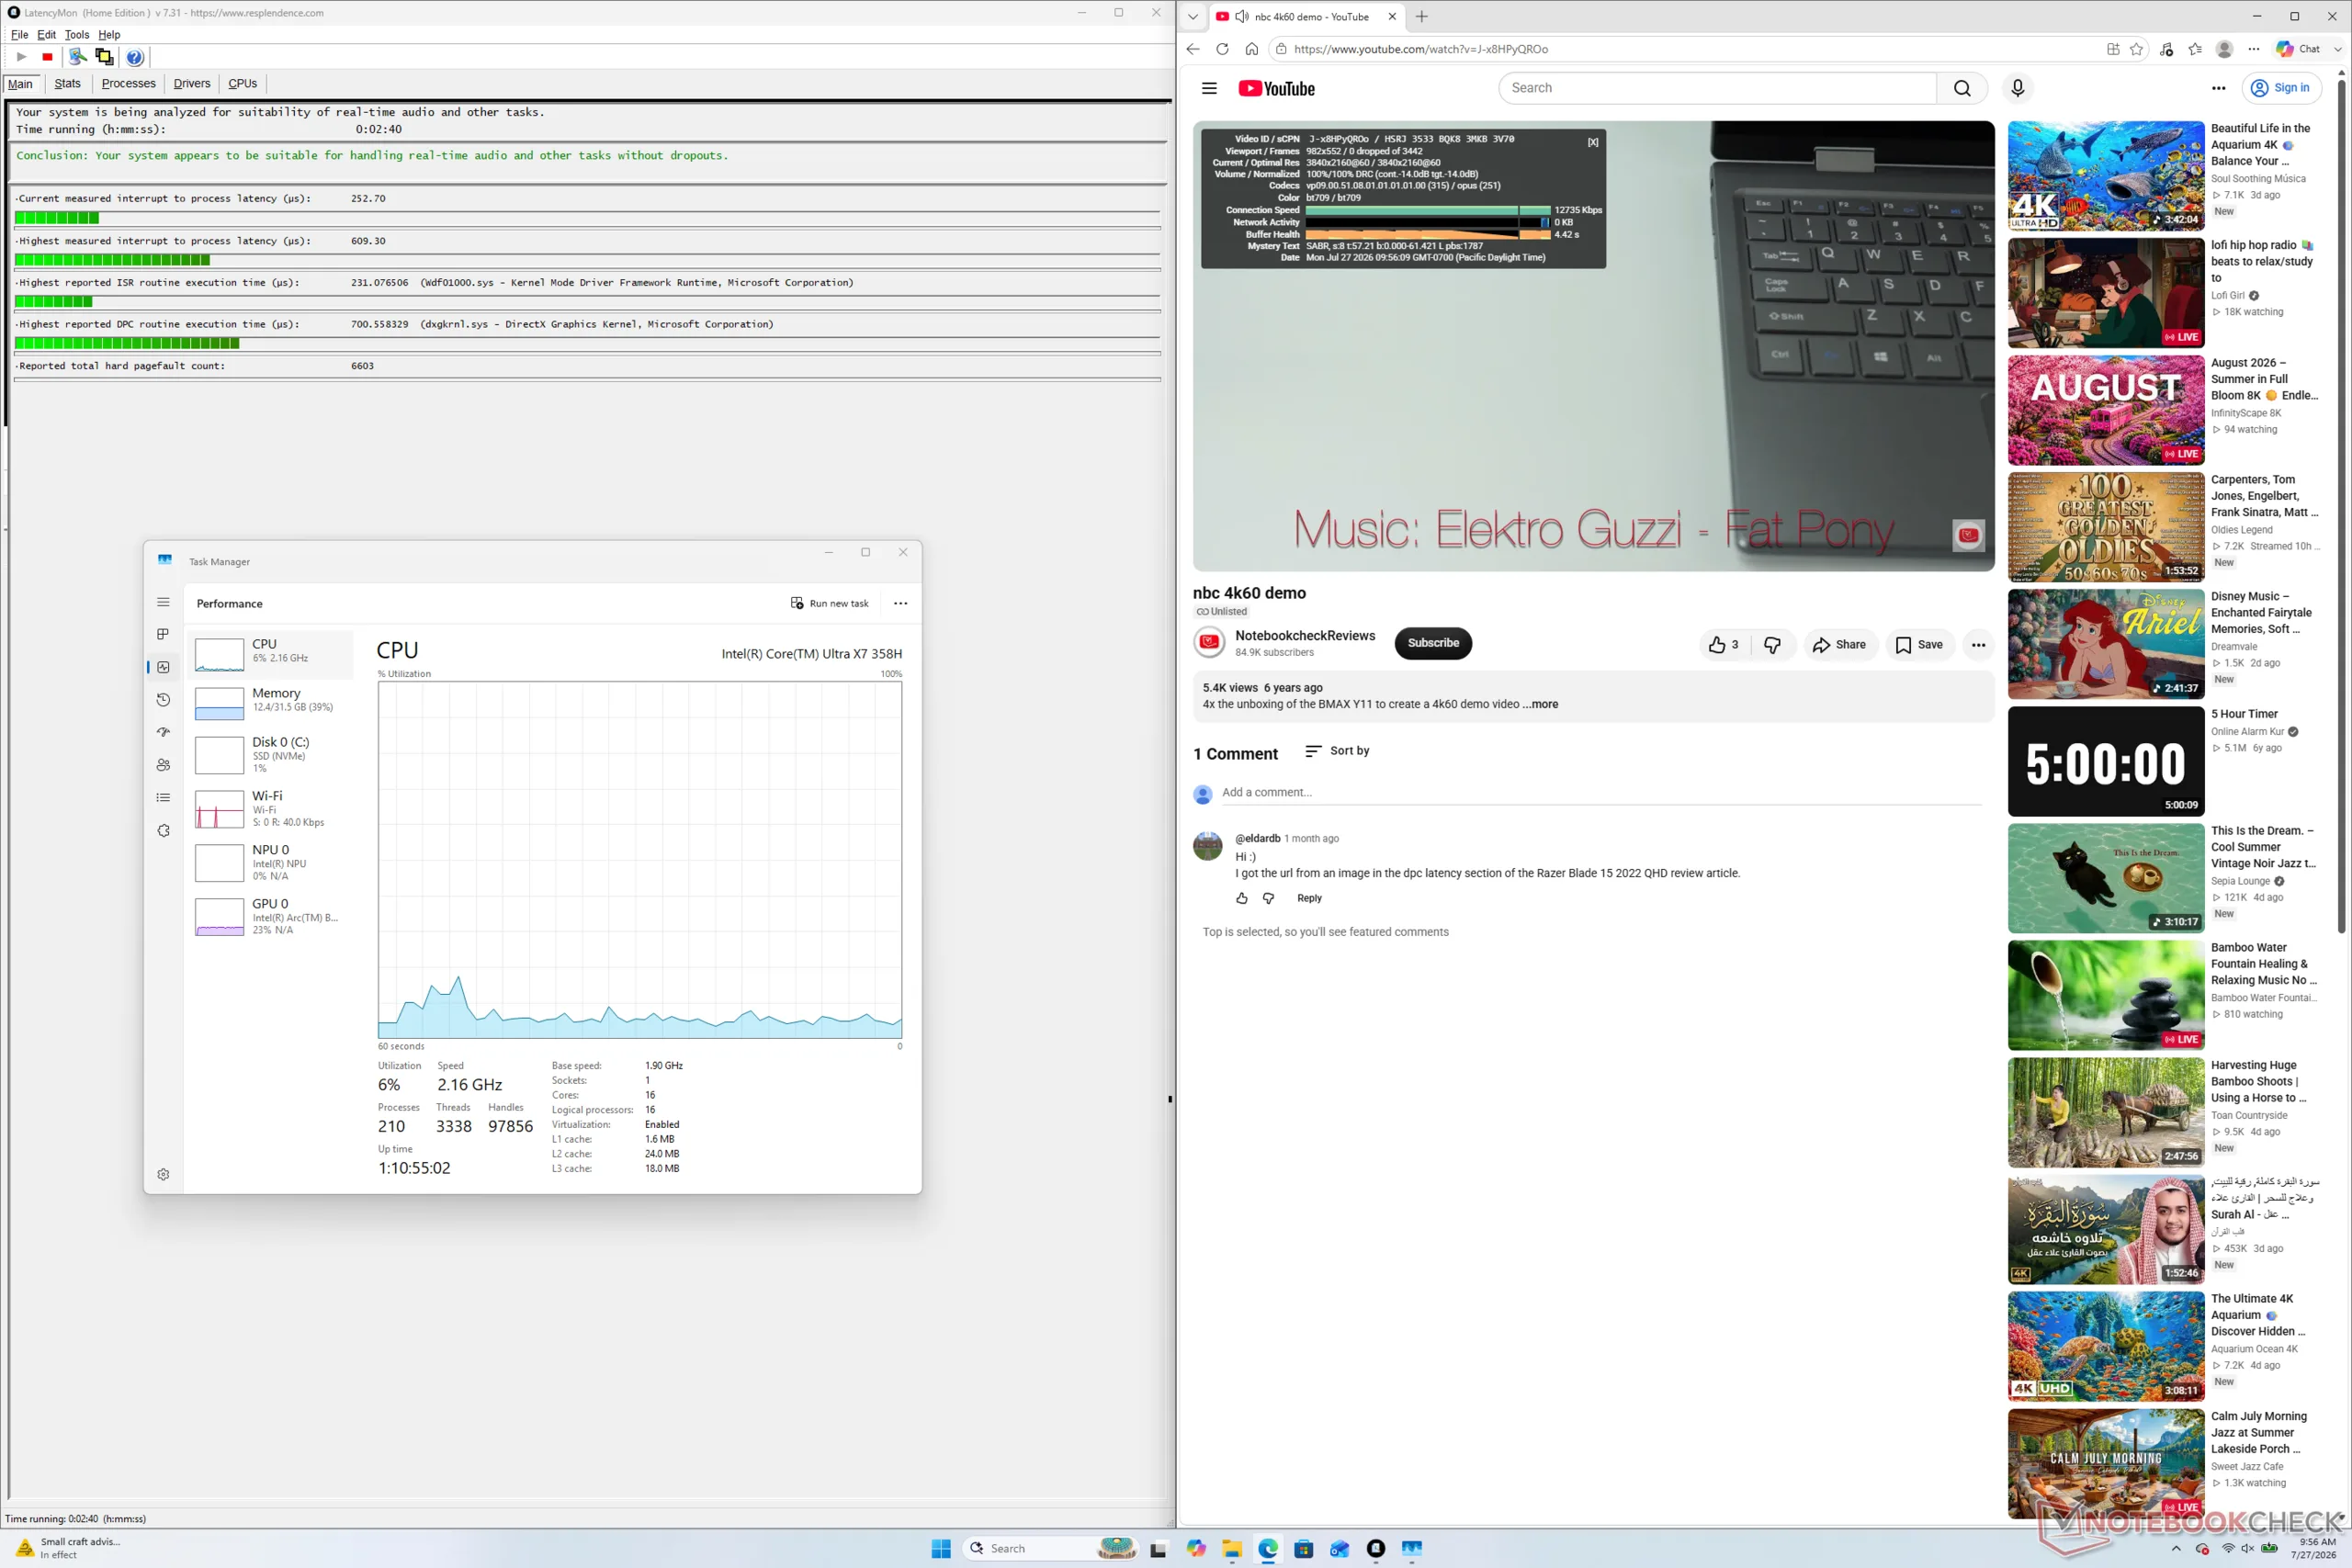
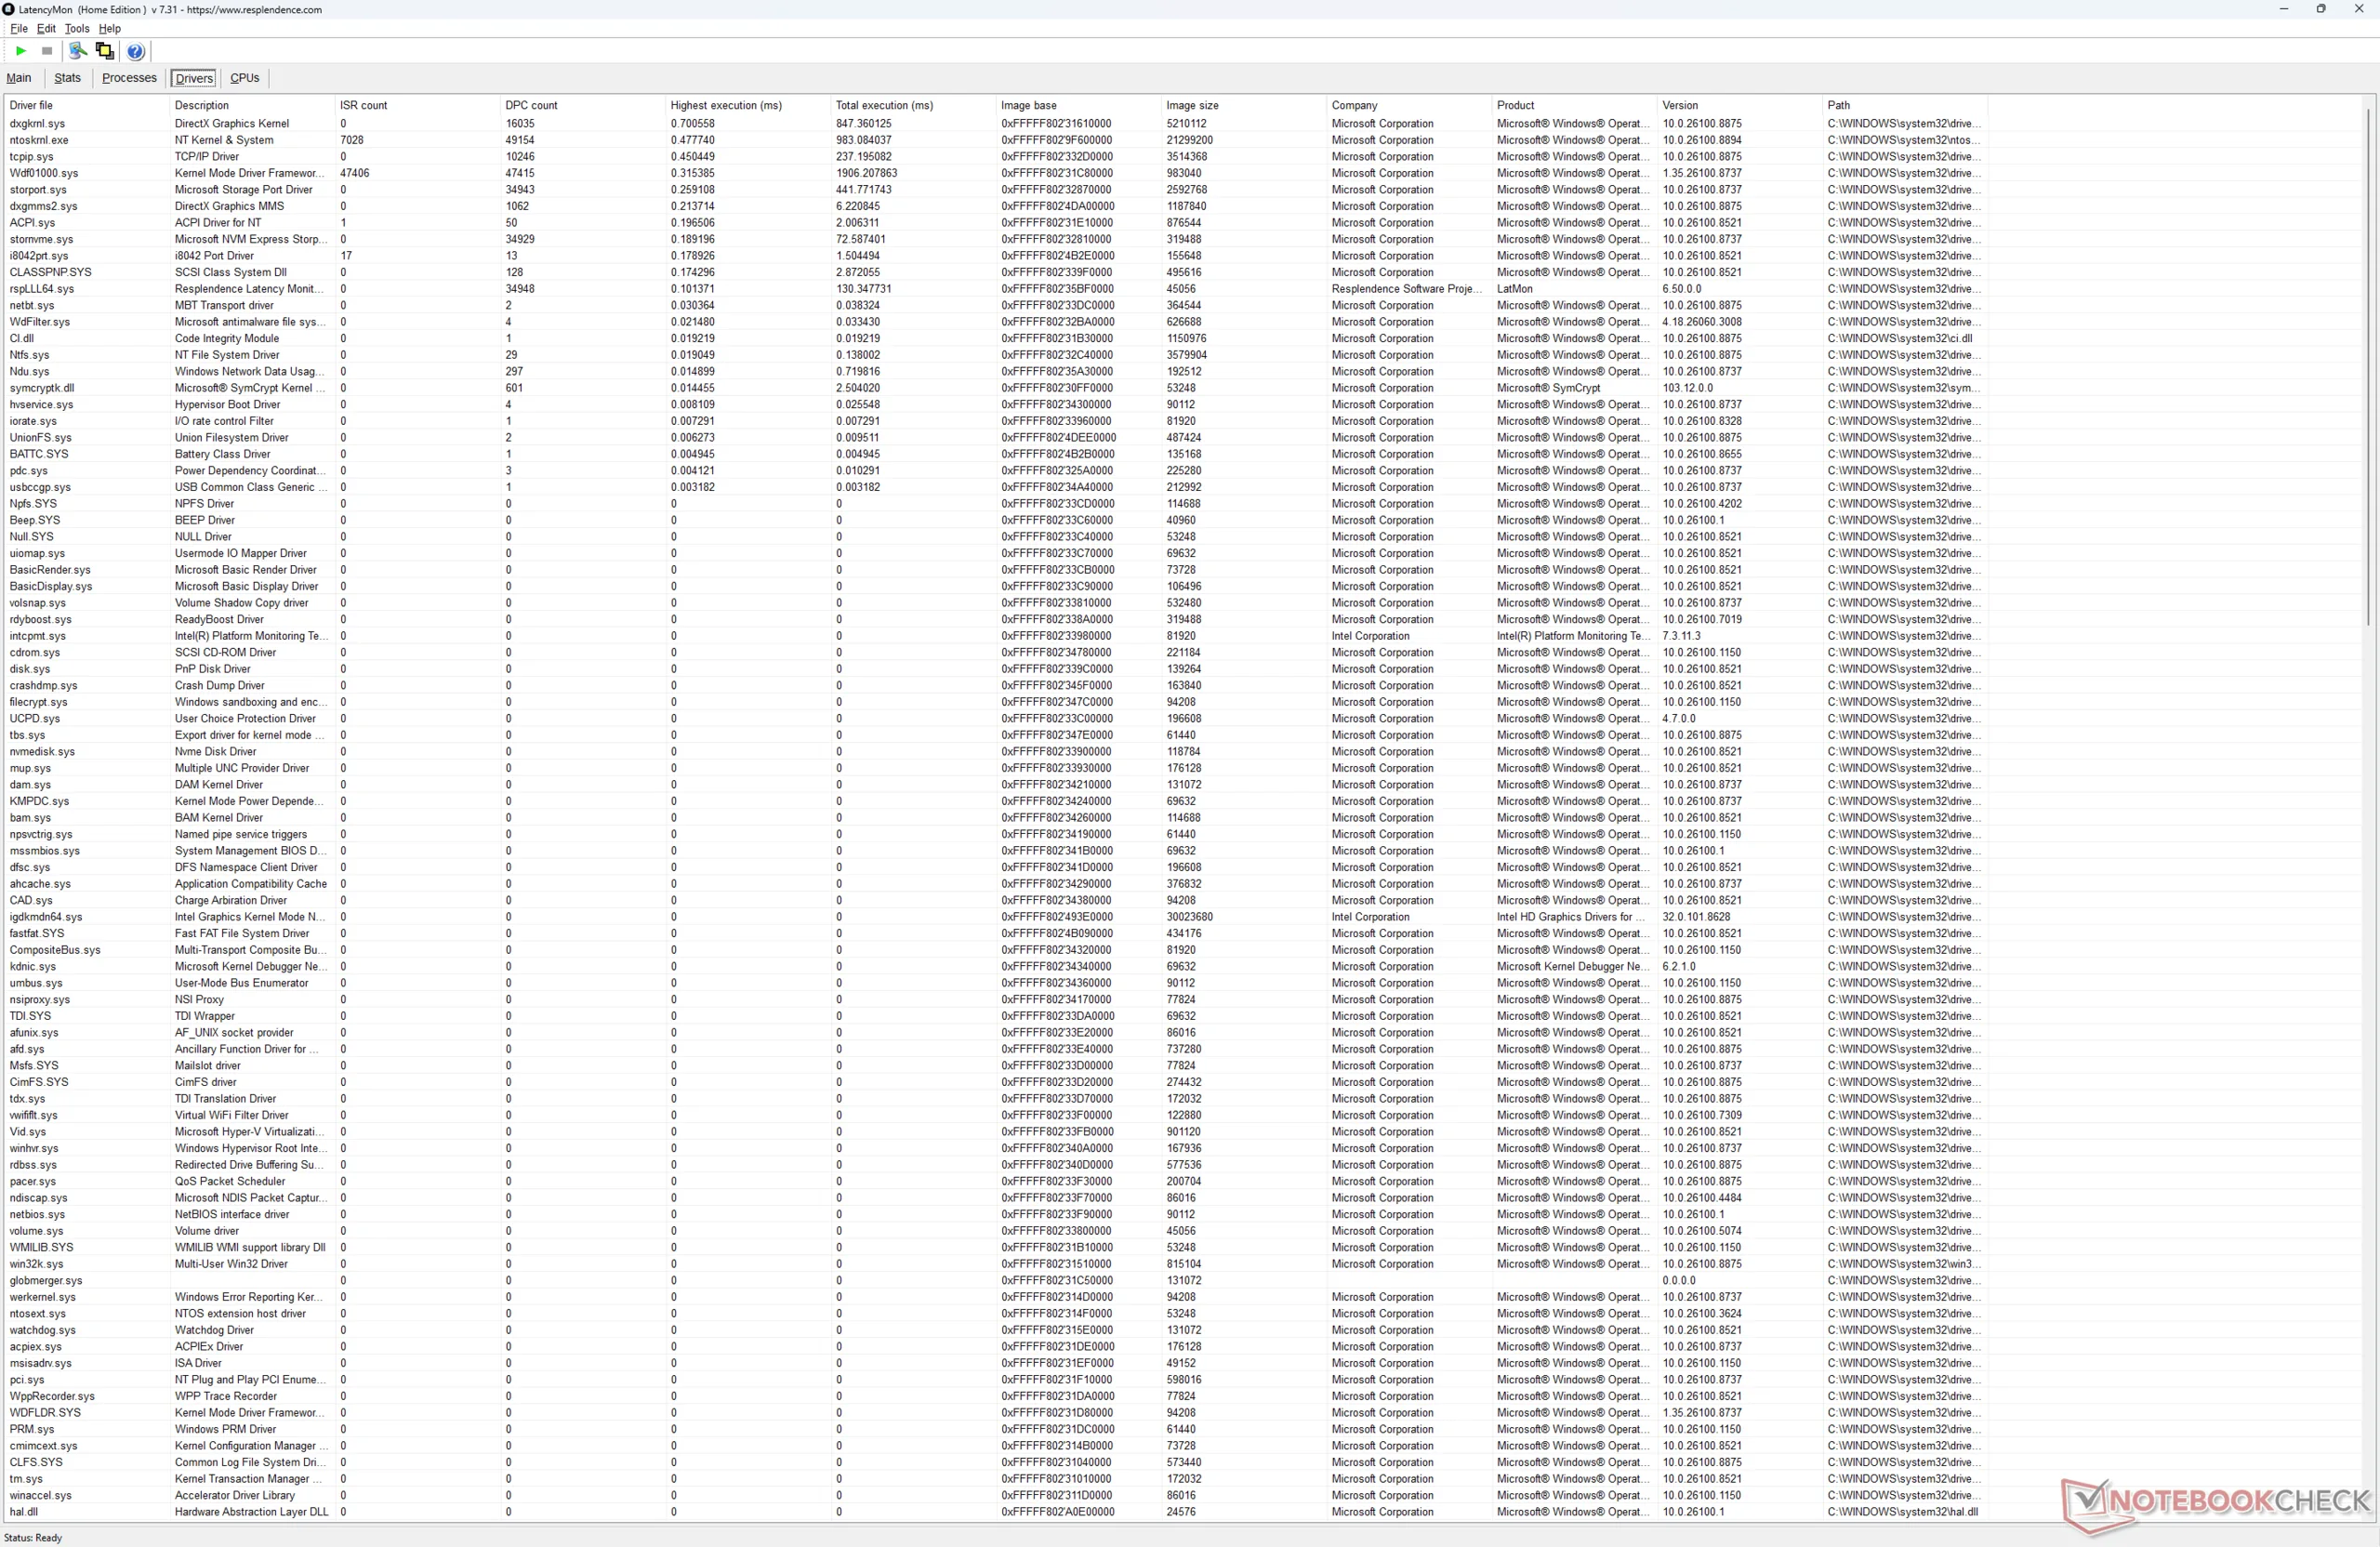
| DPC Latencies / LatencyMon - interrupt to process latency (max), Web, Youtube, Prime95 | |
| Framework Laptop 13.5 Ryzen AI 9 HX 370 | |
| Dell XPS 14 Core Ultra X7 358H | |
| Framework Laptop 13 Pro | |
| Asus ExpertBook Ultra B9406CAA | |
* ... smaller is better
Storage Devices
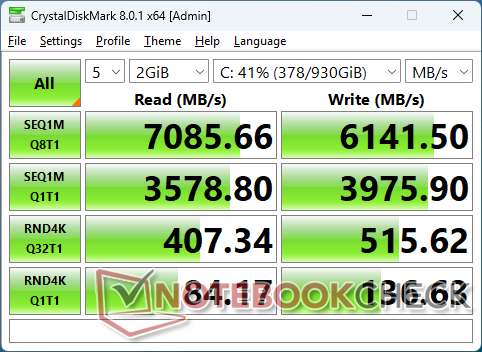
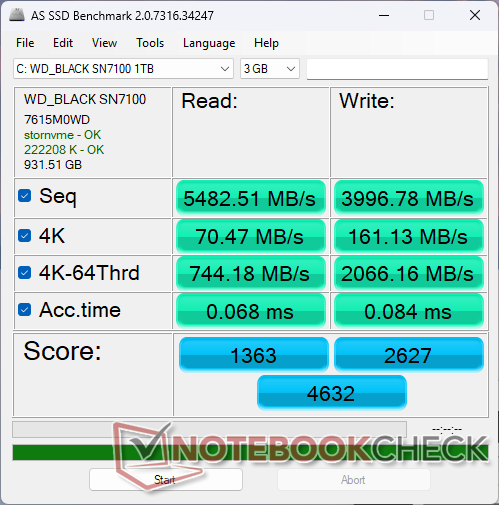
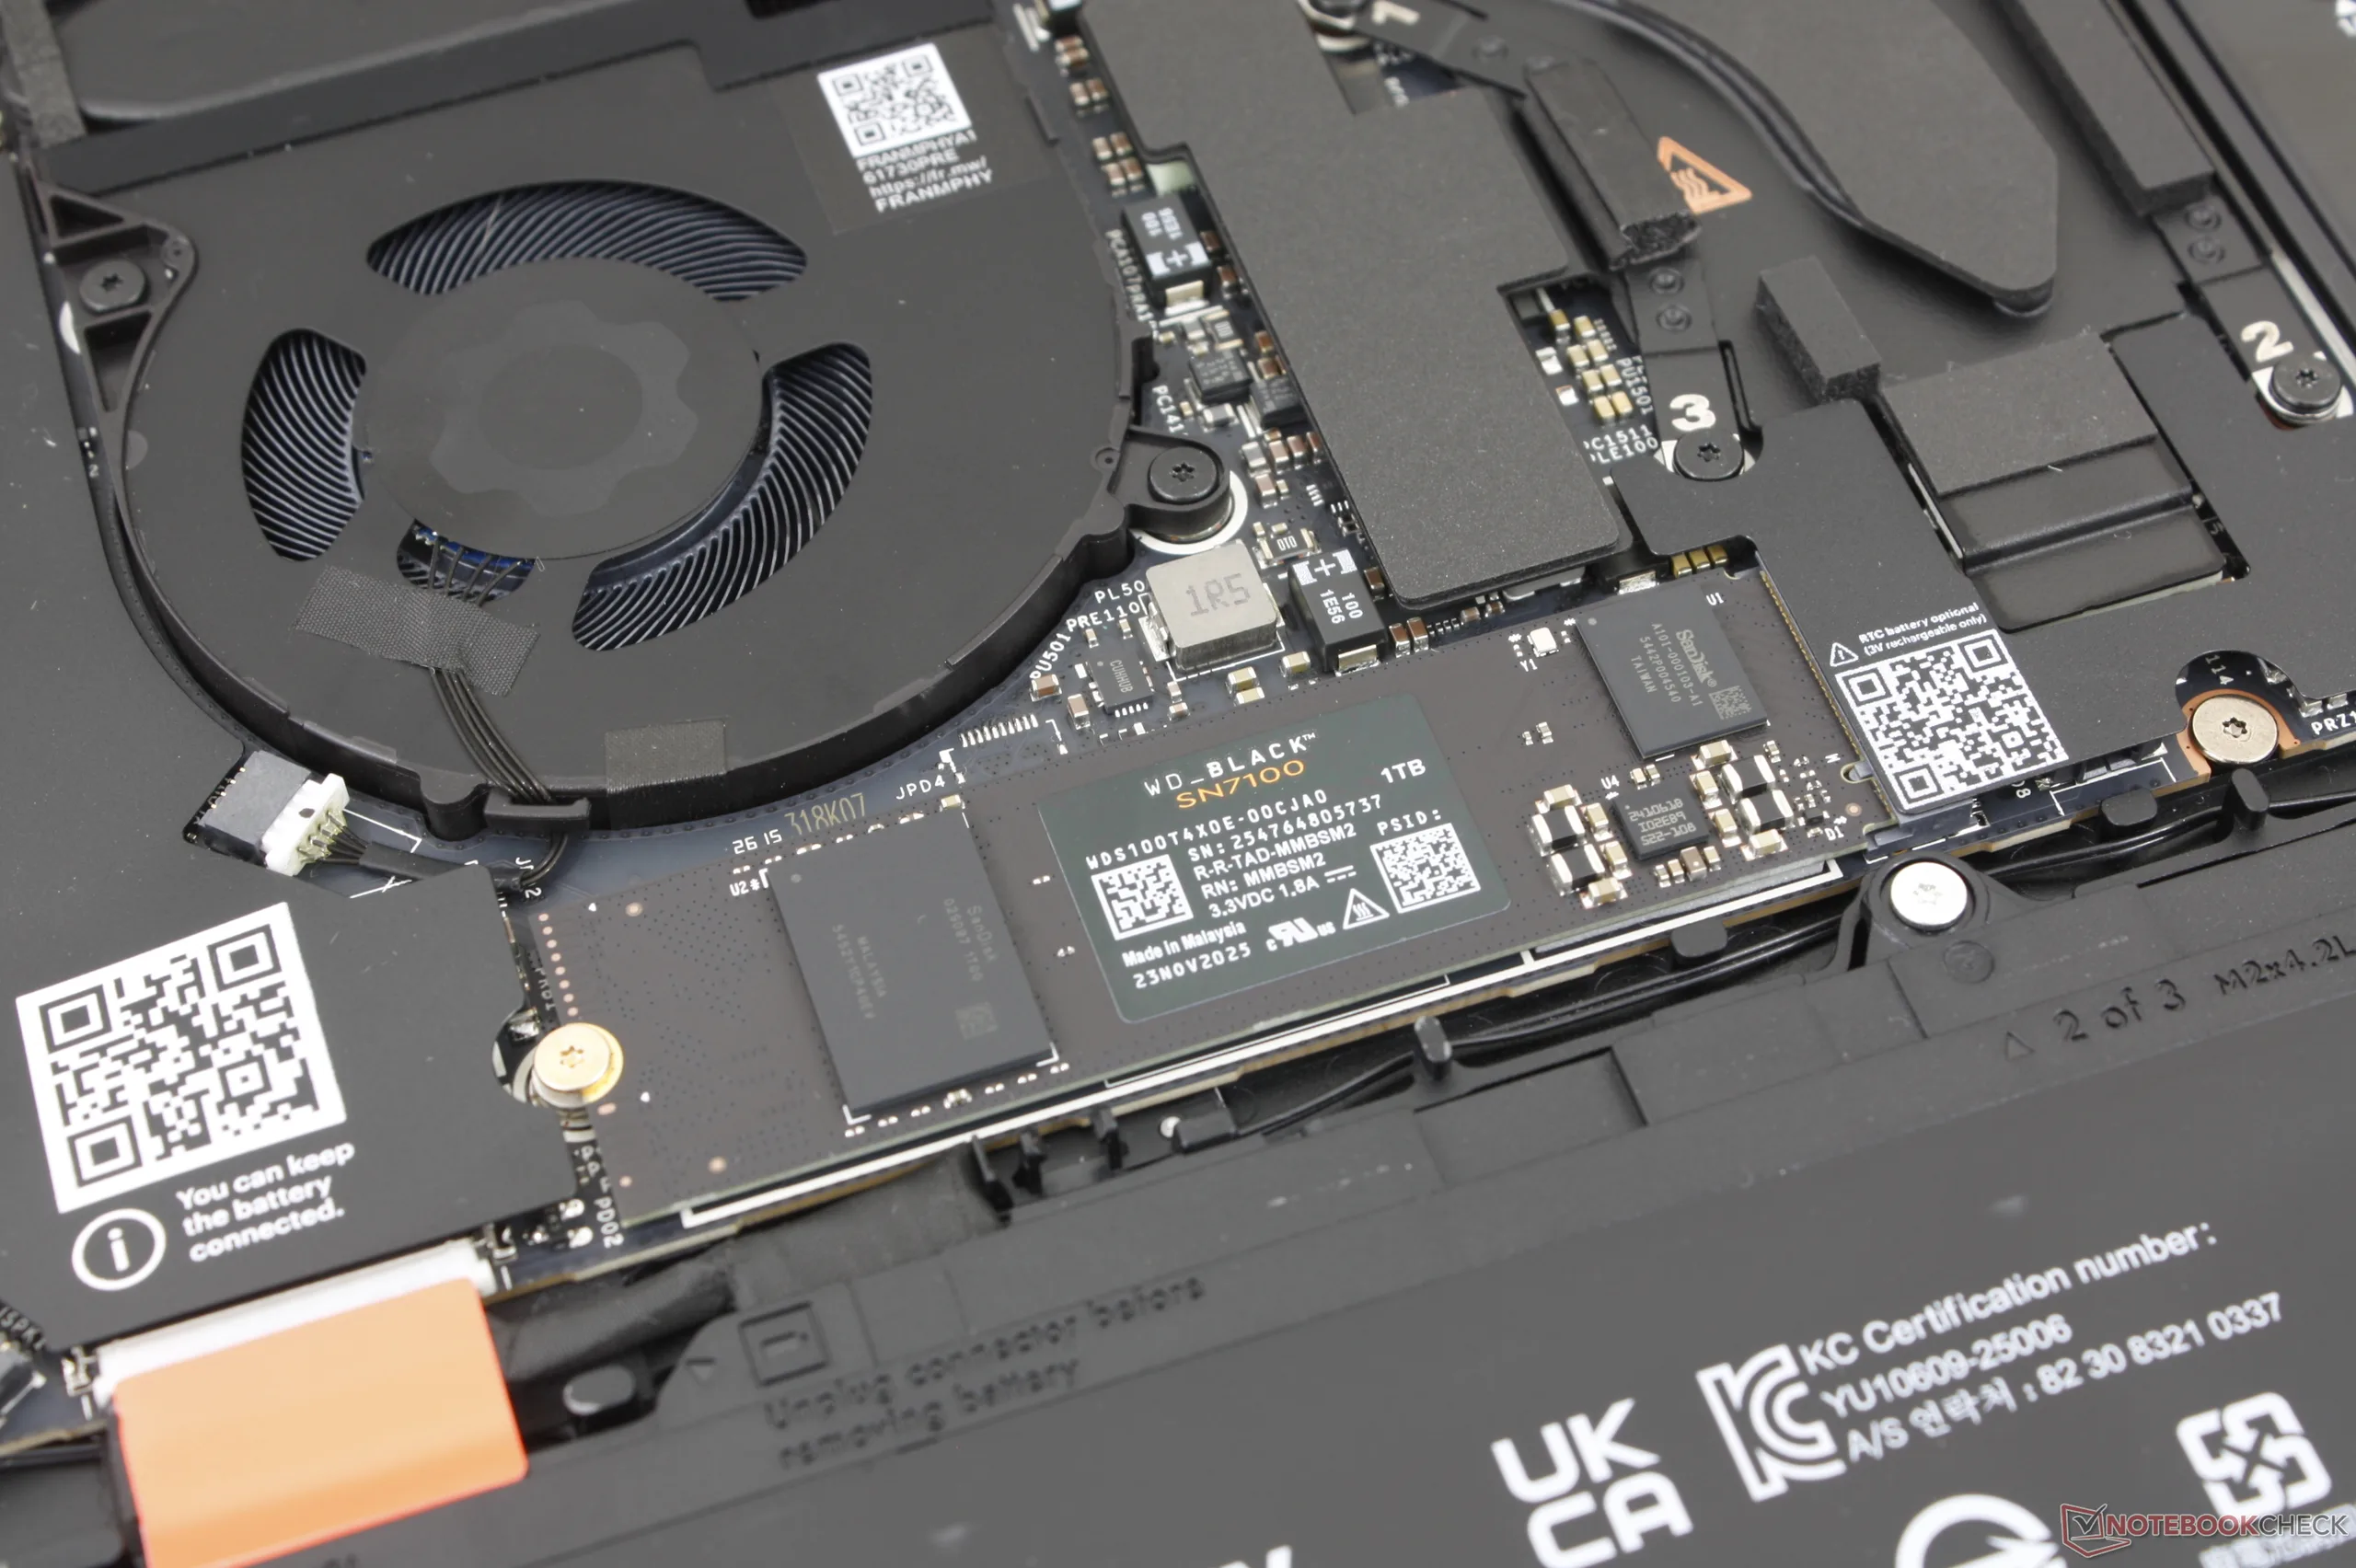

* ... smaller is better
Disk Throttling: DiskSpd Read Loop, Queue Depth 8
GPU Performance
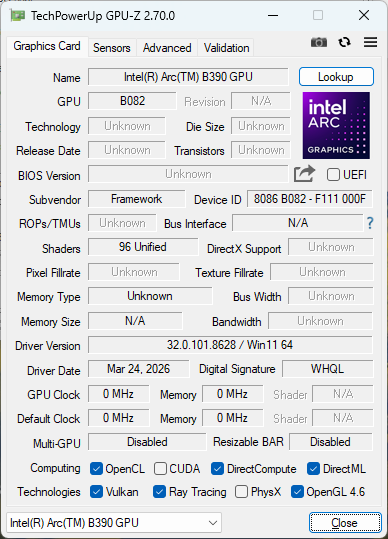
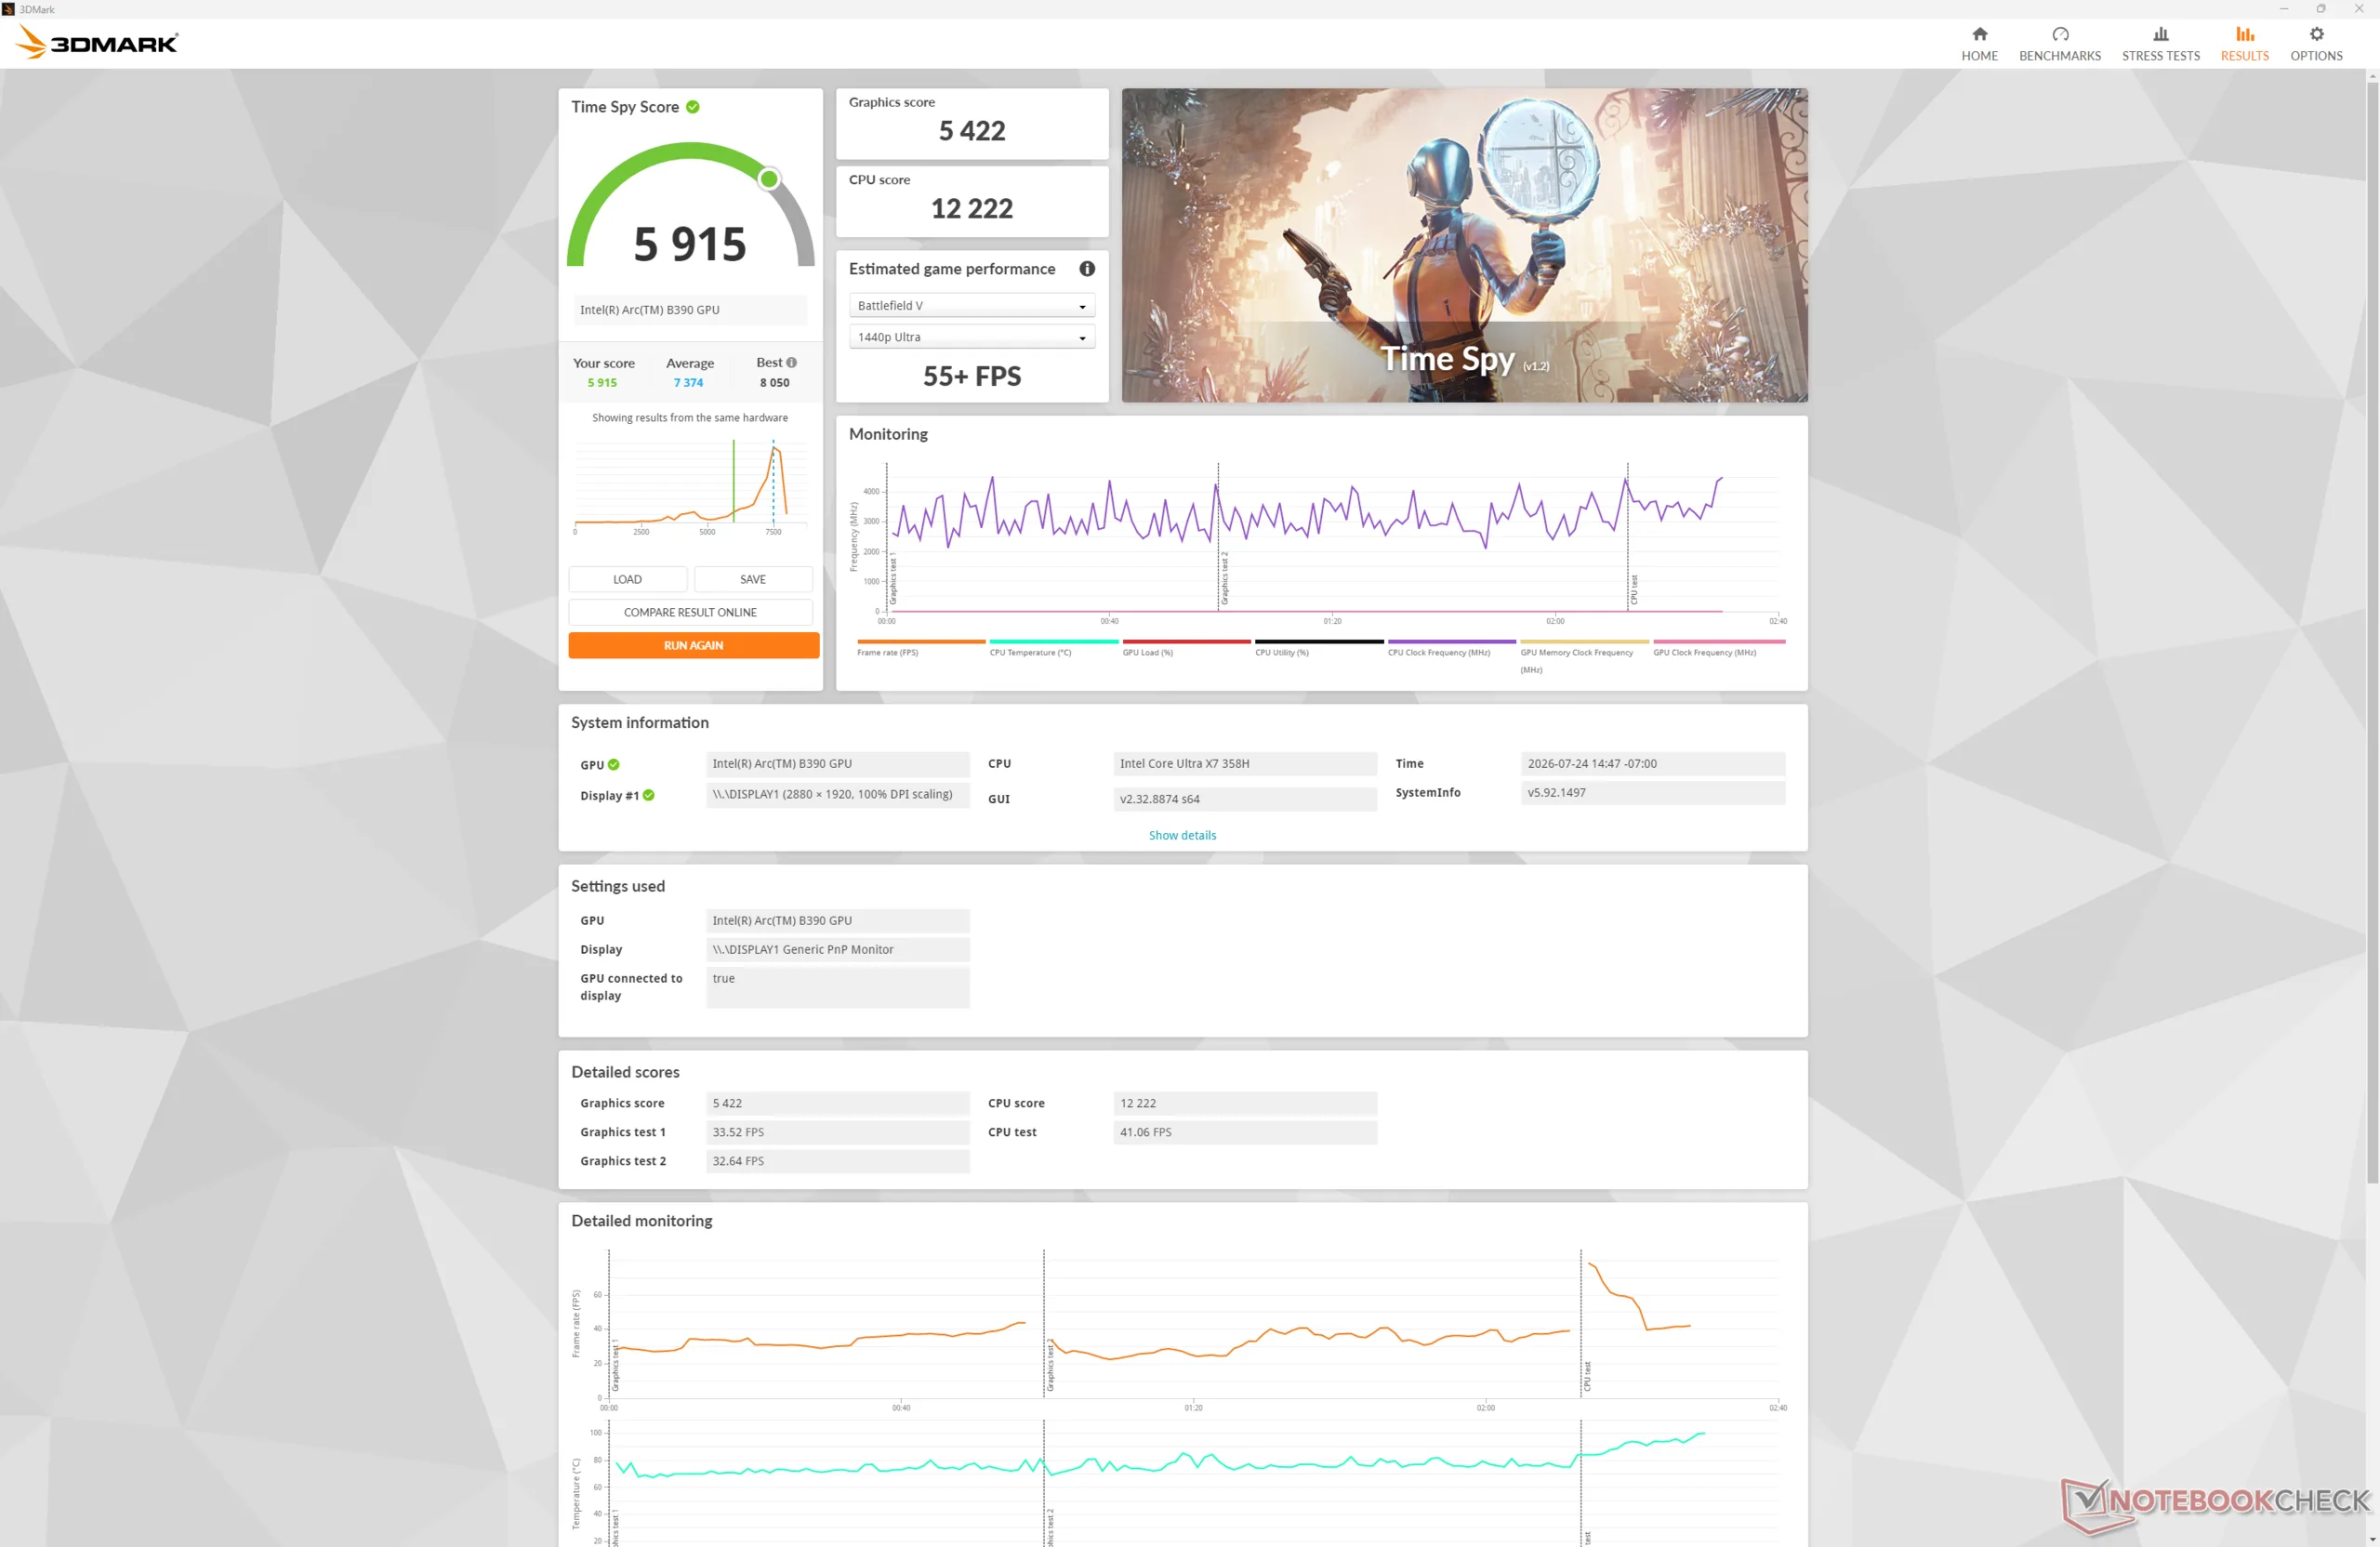
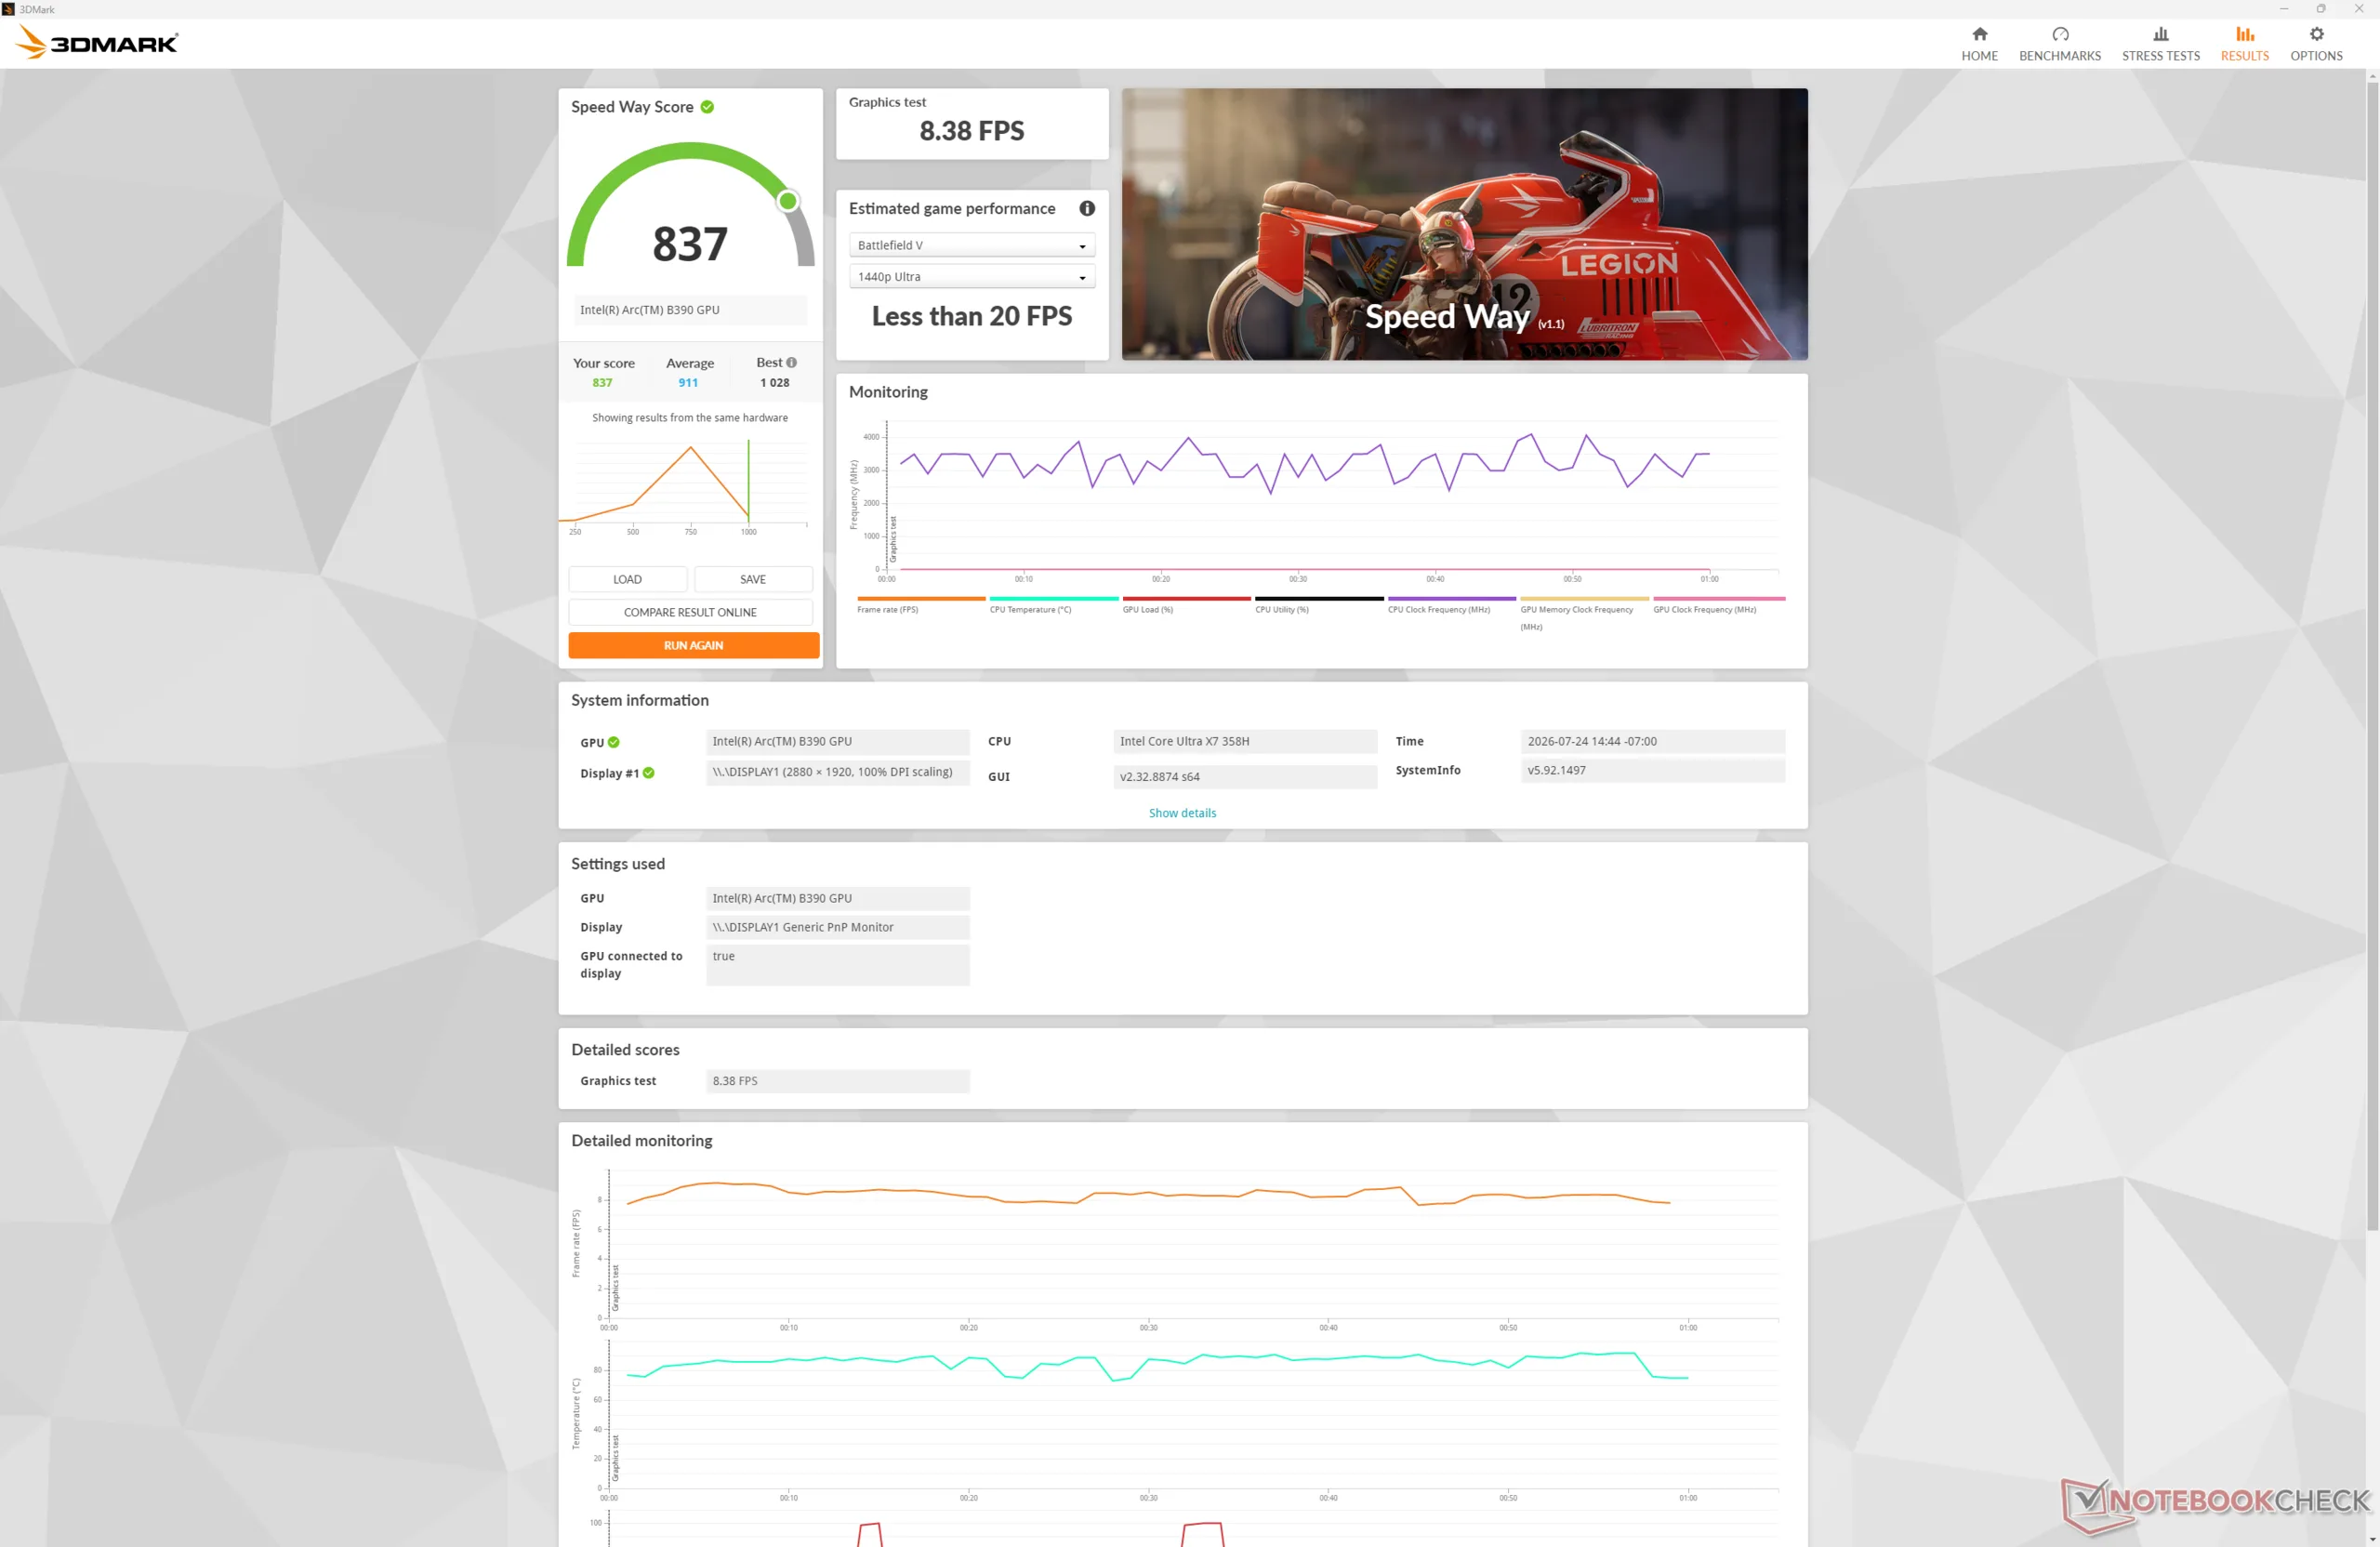
Graphics performance is roughly 20 percent slower when compared to other PCs with the same Arc B390 GPU.
| Power Profile | Graphics Score | Physics Score | Combined Score |
| Performance Mode | 13410 | 24139 | 3843 |
| Balanced Mode | 13442 | 23168 | 3836 |
| Battery Power | 13901 | 23994 | 3894 |
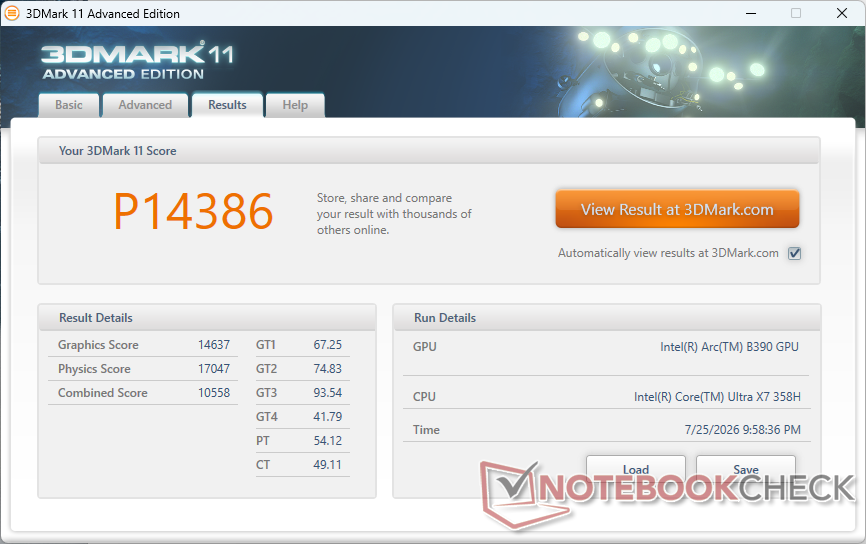
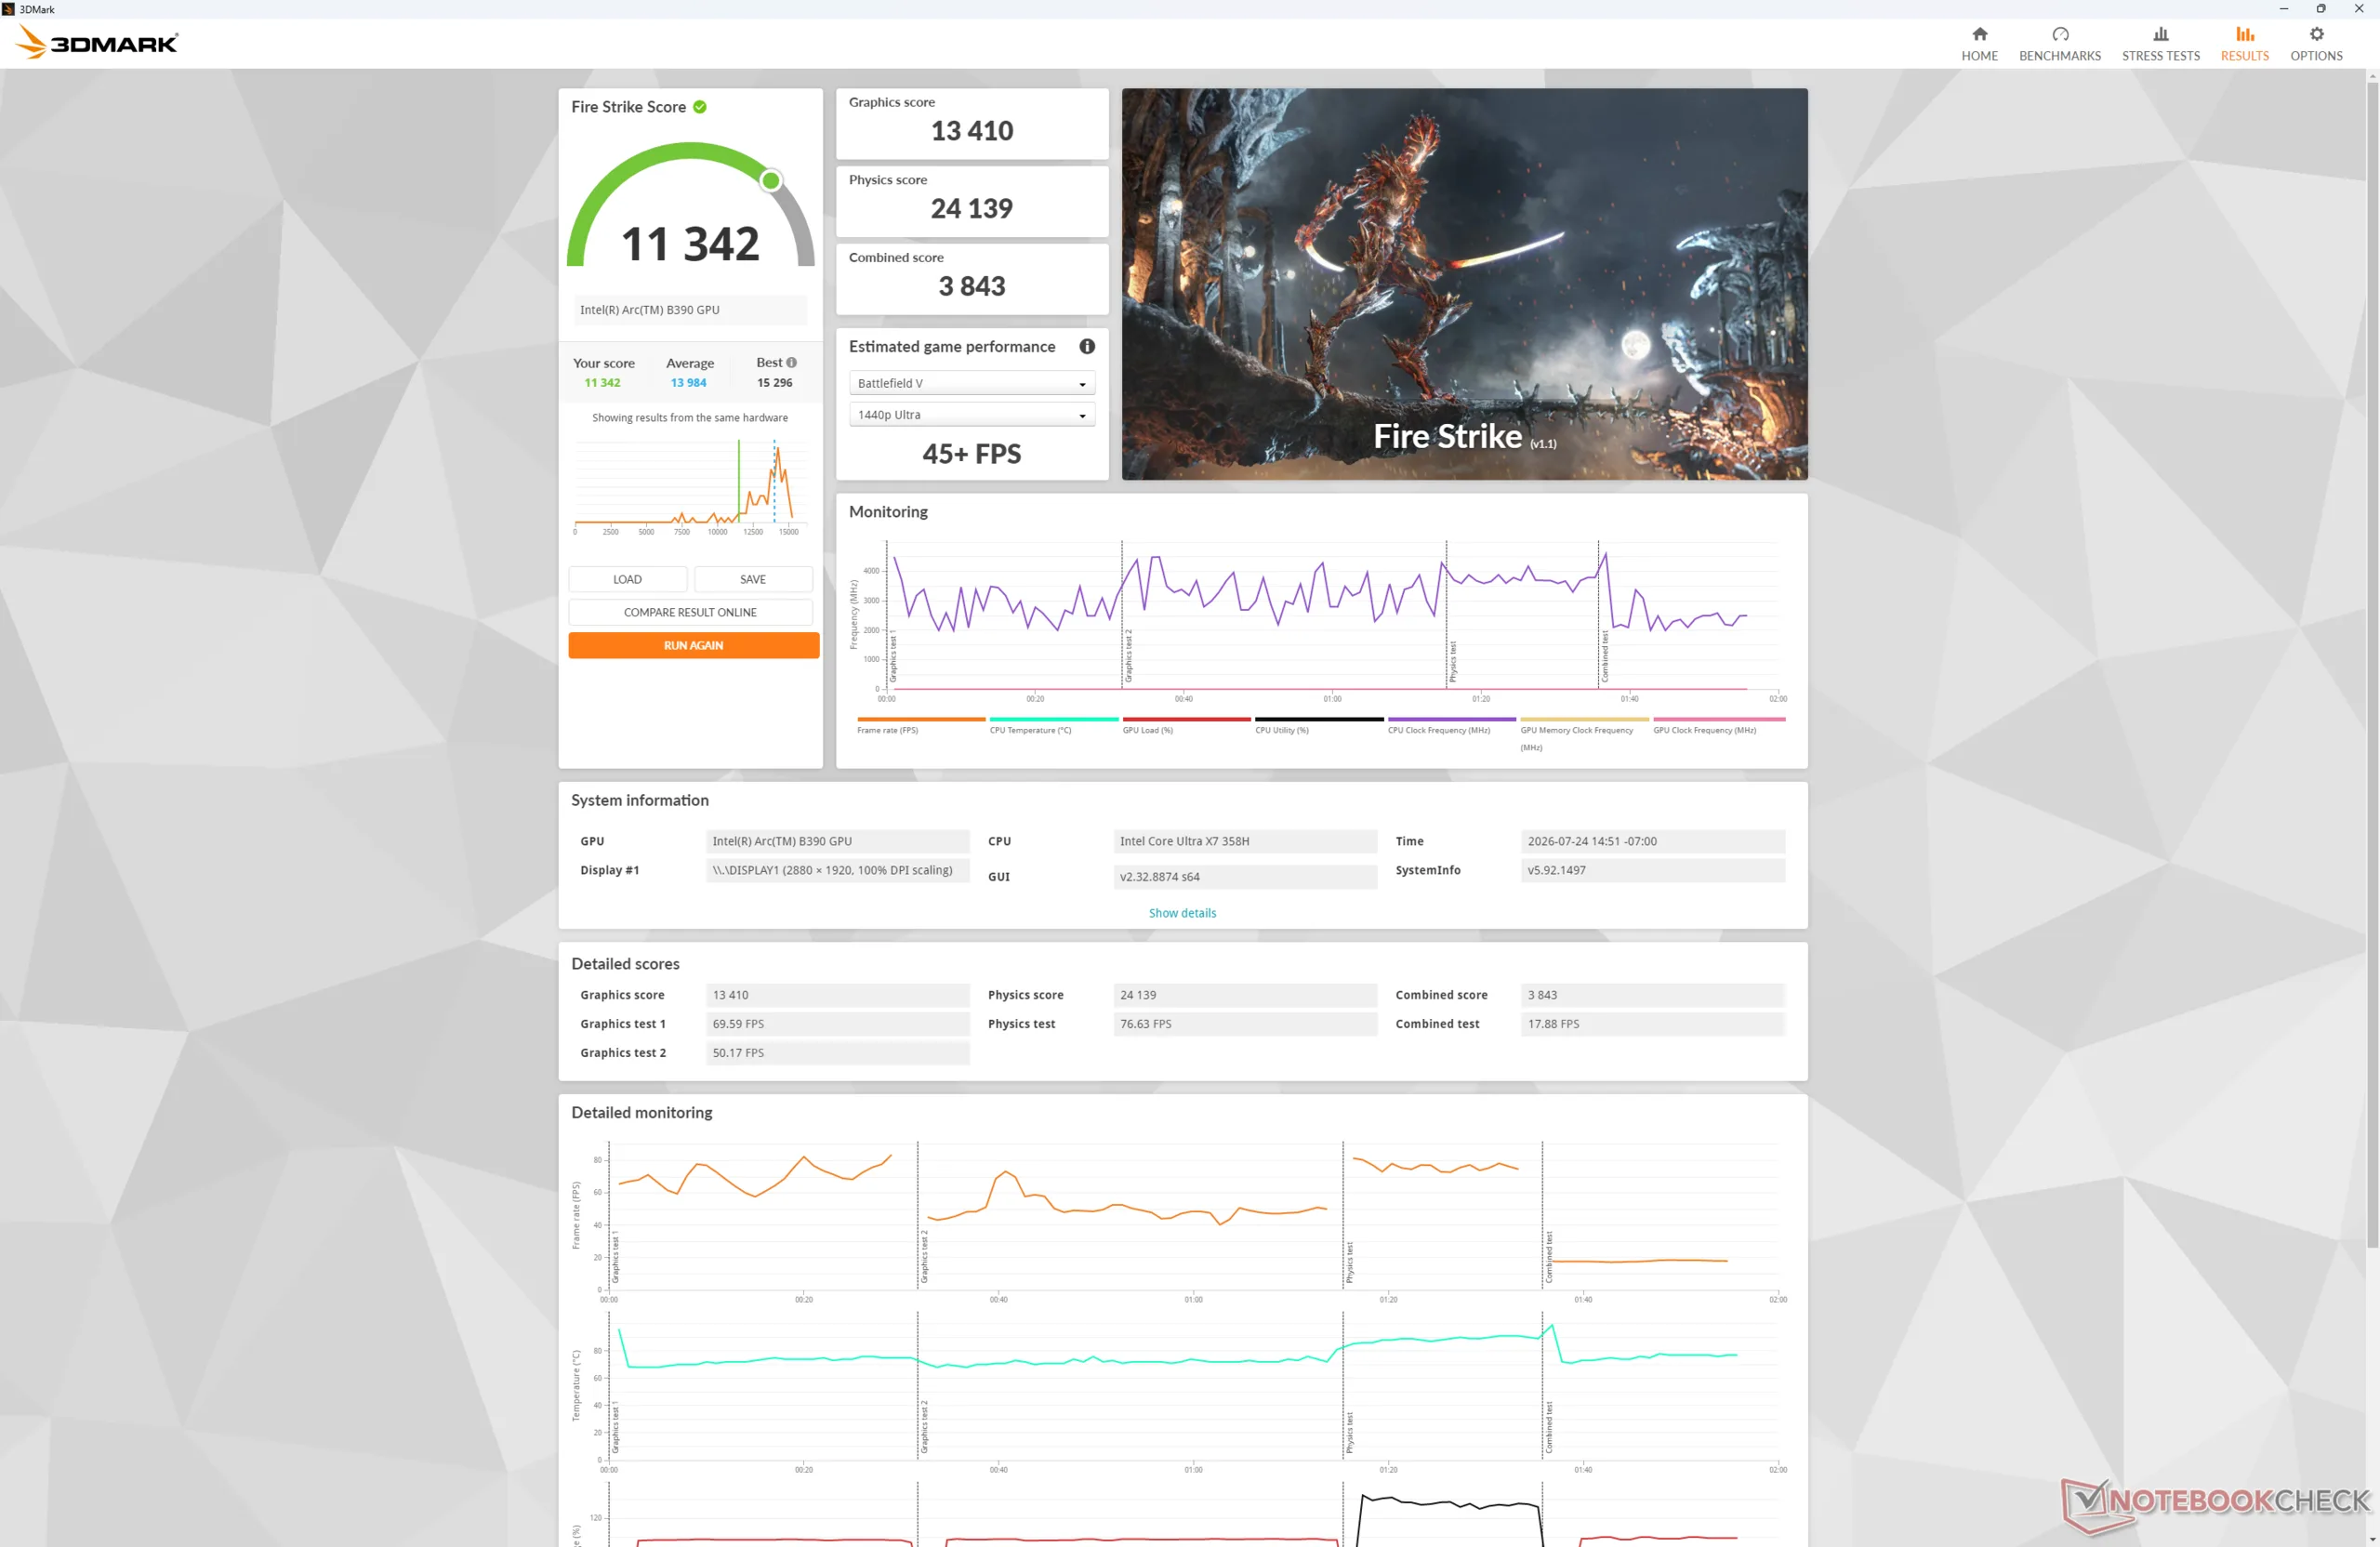
| 3DMark 11 Performance | 14386 points | |
| 3DMark Cloud Gate Standard Score | 34227 points | |
| 3DMark Fire Strike Score | 11342 points | |
| 3DMark Time Spy Score | 5915 points | |
Help | ||
* ... smaller is better
| Cyberpunk 2077 - 1920x1080 Ultra Preset (FSR off) | |
| Asus ExpertBook Ultra B9406CAA | |
| Dell XPS 14 Core Ultra X7 358H | |
| Framework Laptop 13 Pro | |
| Framework Laptop 13.5 Ryzen AI 9 HX 370 | |
| MSI Prestige 13 AI+ A3MG | |
| Microsoft Surface Laptop 8 13.8 | |
| Baldur's Gate 3 - 1920x1080 Ultra Preset AA:T | |
| Asus ExpertBook Ultra B9406CAA | |
| Dell XPS 14 Core Ultra X7 358H | |
| Framework Laptop 13 Pro | |
| Framework Laptop 13.5 Ryzen AI 9 HX 370 | |
| Microsoft Surface Laptop 8 13.8 | |
| GTA V - 1920x1080 Highest AA:4xMSAA + FX AF:16x | |
| Asus ExpertBook Ultra B9406CAA | |
| Dell XPS 14 Core Ultra X7 358H | |
| Framework Laptop 13 Pro | |
| Framework Laptop 13.5 Ryzen AI 9 HX 370 | |
| Microsoft Surface Laptop 8 13.8 | |
| Final Fantasy XV Benchmark - 1920x1080 High Quality | |
| Asus ExpertBook Ultra B9406CAA | |
| Dell XPS 14 Core Ultra X7 358H | |
| Framework Laptop 13 Pro | |
| Framework Laptop 13.5 Ryzen AI 9 HX 370 | |
| Microsoft Surface Laptop 8 13.8 | |
| Strange Brigade - 1920x1080 ultra AA:ultra AF:16 | |
| Asus ExpertBook Ultra B9406CAA | |
| Dell XPS 14 Core Ultra X7 358H | |
| Framework Laptop 13 Pro | |
| Framework Laptop 13.5 Ryzen AI 9 HX 370 | |
| Microsoft Surface Laptop 8 13.8 | |
| Dota 2 Reborn - 1920x1080 ultra (3/3) best looking | |
| Dell XPS 14 Core Ultra X7 358H | |
| Asus ExpertBook Ultra B9406CAA | |
| Framework Laptop 13 Pro | |
| MSI Prestige 13 AI+ A3MG | |
| Microsoft Surface Laptop 8 13.8 | |
| Framework Laptop 13.5 Ryzen AI 9 HX 370 | |
Cyberpunk 2077 ultra FPS Chart
| low | med. | high | ultra | |
|---|---|---|---|---|
| GTA V (2015) | 134.2 | 121.9 | 82.3 | 35.4 |
| Dota 2 Reborn (2015) | 102.8 | 67.8 | 83.9 | 79.7 |
| Final Fantasy XV Benchmark (2018) | 101.3 | 62.3 | 43.1 | |
| X-Plane 11.11 (2018) | 56.1 | 44.4 | 37.2 | |
| Strange Brigade (2018) | 254 | 104.4 | 91.8 | 80.4 |
| Baldur's Gate 3 (2023) | 55.9 | 47.6 | 42.5 | 41.7 |
| Cyberpunk 2077 (2023) | 65.3 | 51.8 | 44.6 | 38.3 |
| F1 24 (2024) | 118.4 | 107.3 | 82.9 | 30.5 |
Emissions
System Noise
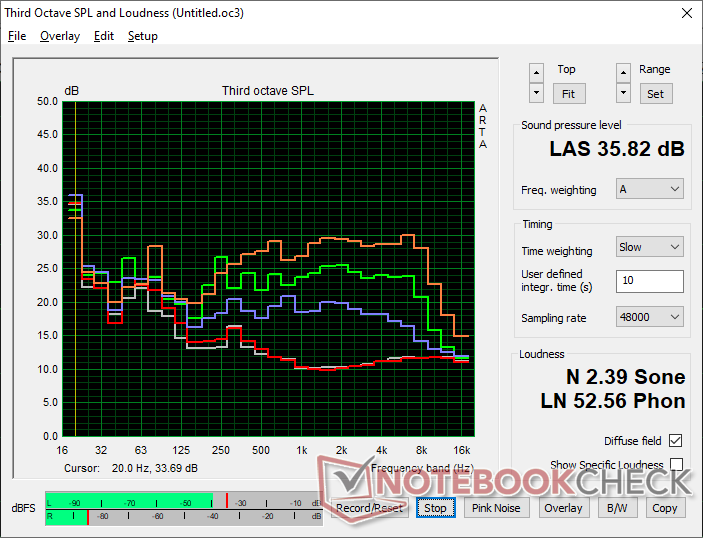
The fan runs notably quieter than what we experienced on the original Laptop 13.5 even when on Performance mode.
Noise level
| Idle |
| 23.4 / 23.4 / 23.4 dB(A) |
| Load |
| 30.5 / 35.8 dB(A) |
 | ||
30 dB silent 40 dB(A) audible 50 dB(A) loud |
||
min:  , med: , med:  , max: , max:  Earthworks M23R, Arta (15 cm distance) environment noise: 23.4 dB(A) Earthworks M23R, Arta (15 cm distance) environment noise: 23.4 dB(A) | ||
| Framework Laptop 13 Pro Ultra X7 358H, Arc B390 Panther Lake iGPU | Framework Laptop 13.5 Ryzen AI 9 HX 370 Ryzen AI 9 HX 370, Radeon 890M | Microsoft Surface Laptop 8 13.8 SD X2 Plus X2P-64-100, Adreno X2-45 | MSI Prestige 13 AI+ A3MG Ultra 9 386H, Intel Graphics 4 Xe3 PTL | Asus ExpertBook Ultra B9406CAA Ultra X7 358H, Arc B390 Panther Lake iGPU | Dell XPS 14 Core Ultra X7 358H Ultra X7 358H, Arc B390 Panther Lake iGPU | |
|---|---|---|---|---|---|---|
| Noise | -18% | -3% | -10% | -3% | -6% | |
| off / environment * (dB) | 23.4 | 24.2 -3% | 25.1 -7% | 25 -7% | 22.9 2% | 22.9 2% |
| Idle Minimum * (dB) | 23.4 | 24.4 -4% | 25.1 -7% | 26 -11% | 23.4 -0% | 23.3 -0% |
| Idle Average * (dB) | 23.4 | 24.4 -4% | 25.1 -7% | 27 -15% | 23.4 -0% | 23.3 -0% |
| Idle Maximum * (dB) | 23.4 | 28 -20% | 25.1 -7% | 28 -20% | 23.4 -0% | 23.3 -0% |
| Load Average * (dB) | 30.5 | 46.2 -51% | 25.1 18% | 31 -2% | 28.6 6% | 34 -11% |
| Cyberpunk 2077 ultra * (dB) | 40.4 | 45.8 -13% | 37.4 7% | 41 -1% | 42.8 -6% | 43.5 -8% |
| Load Maximum * (dB) | 35.8 | 45.9 -28% | 42.4 -18% | 42 -17% | 45.2 -26% | 45.7 -28% |
* ... smaller is better
Temperature
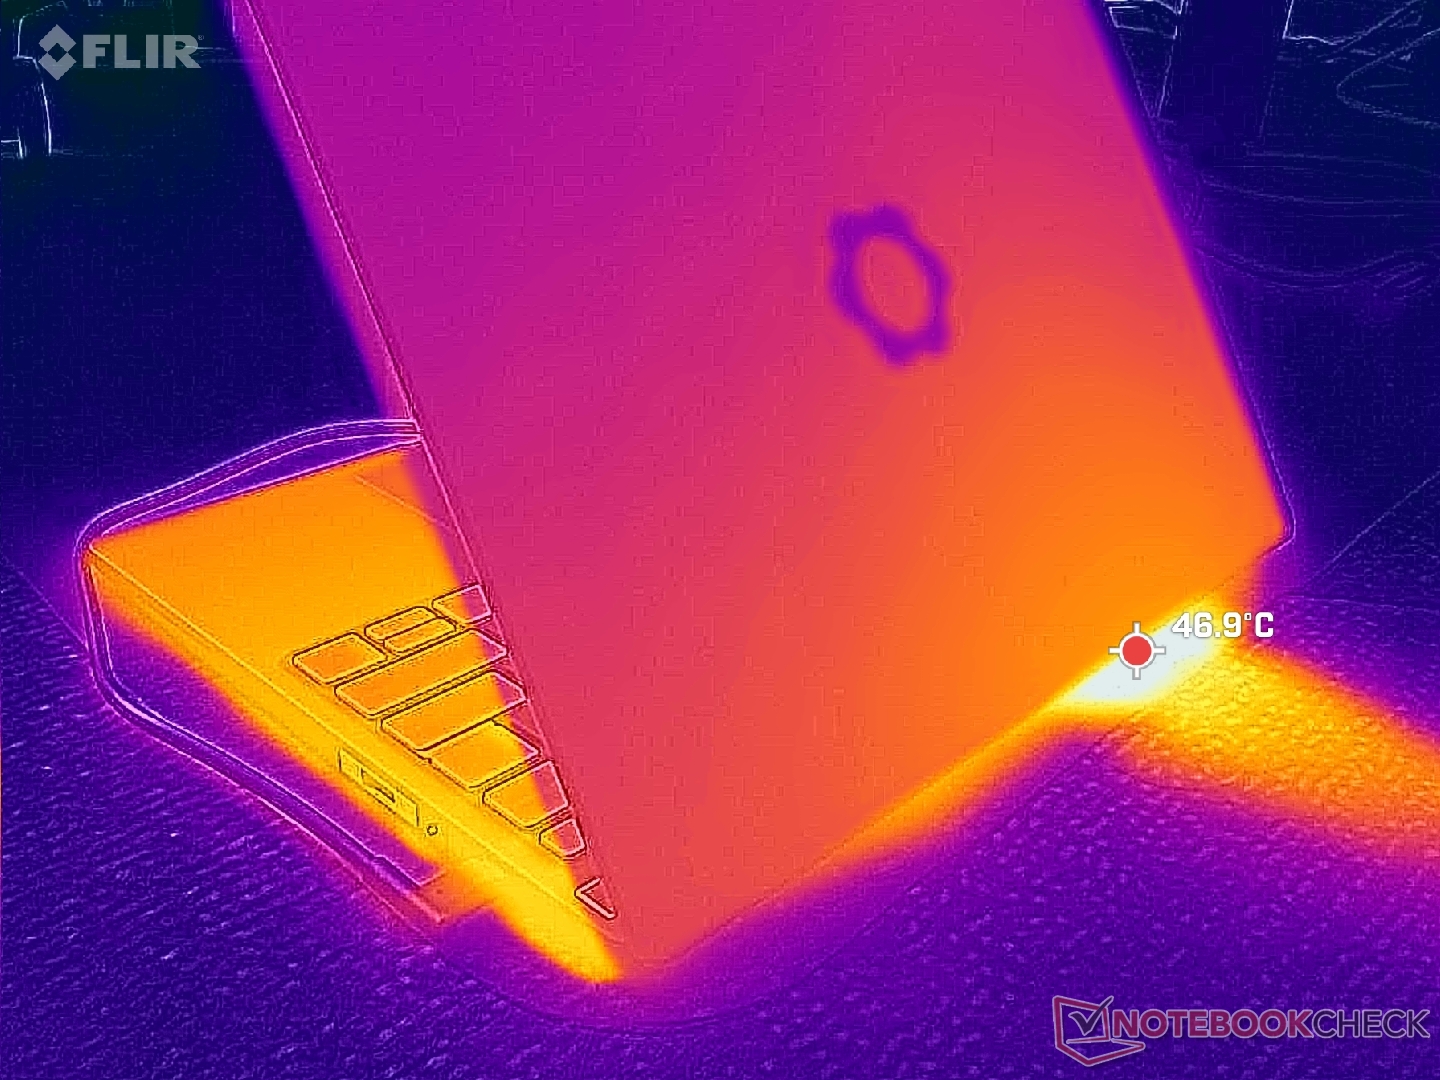
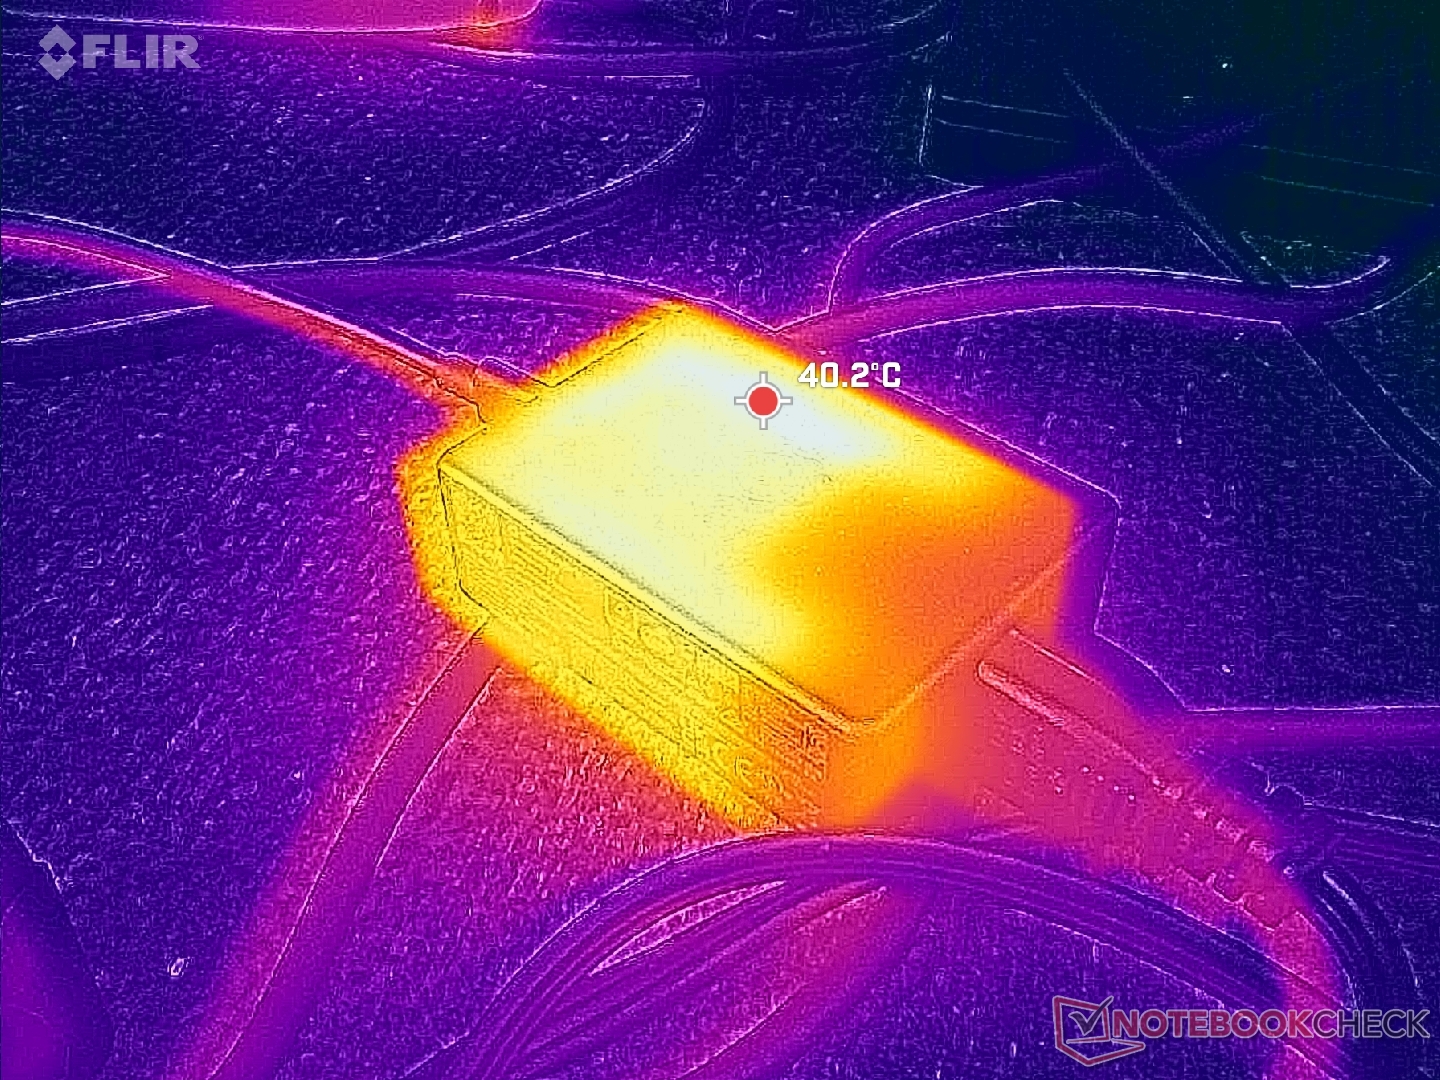
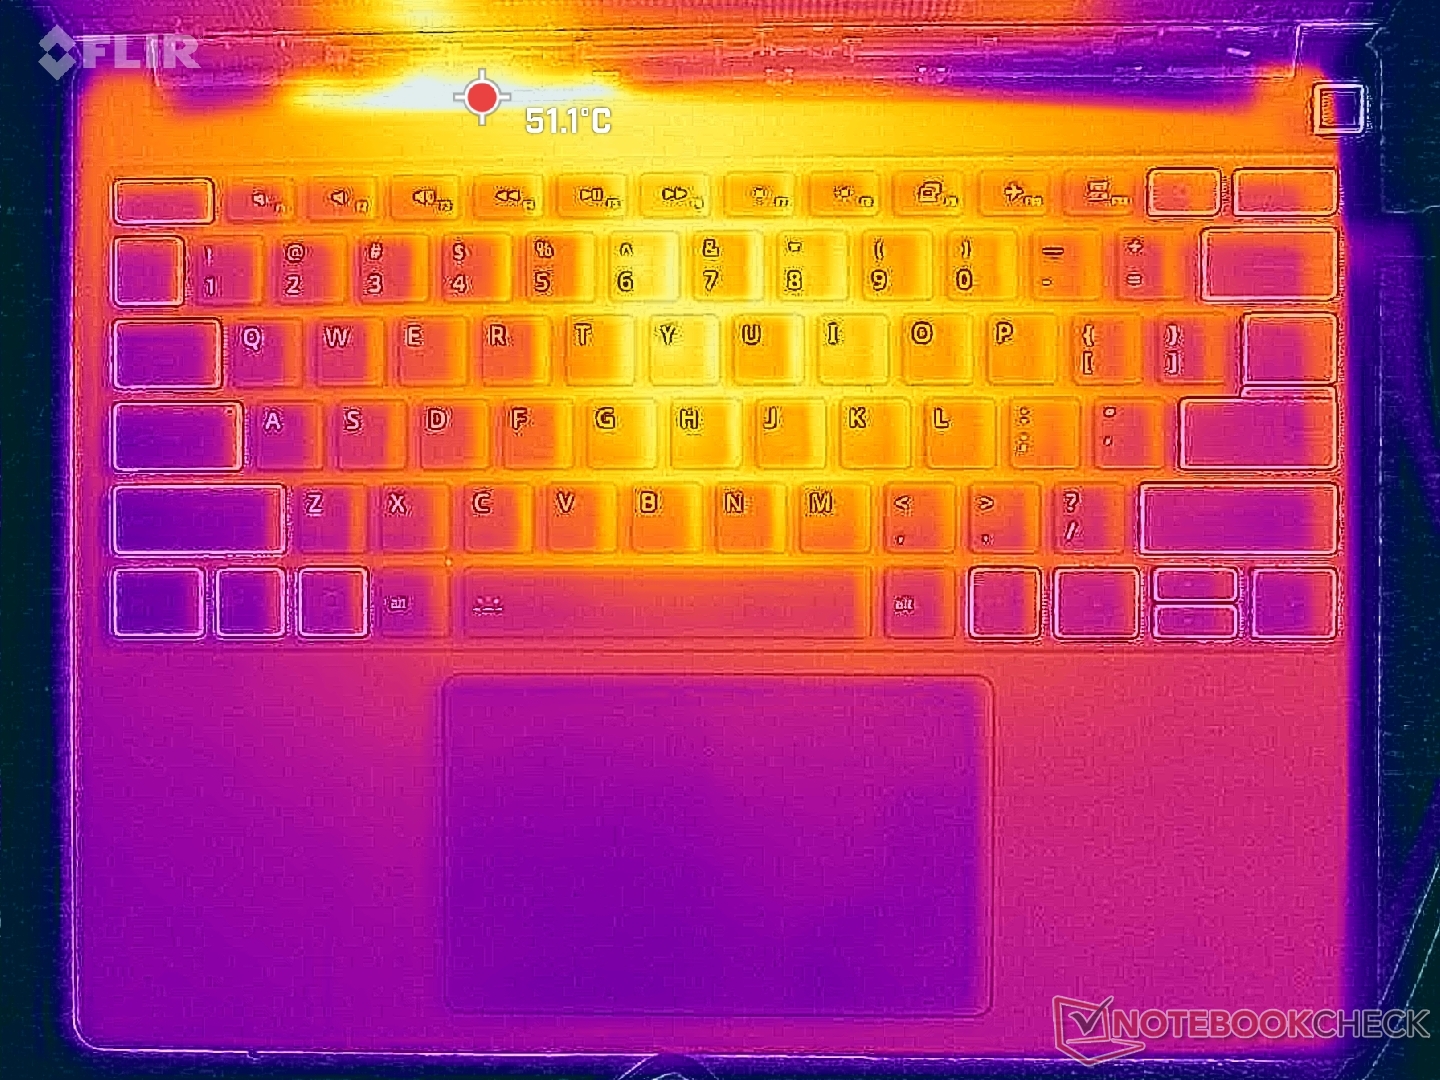
(±) The maximum temperature on the upper side is 43.2 °C / 110 F, compared to the average of 35.9 °C / 97 F, ranging from 21.4 to 59 °C for the class Subnotebook.
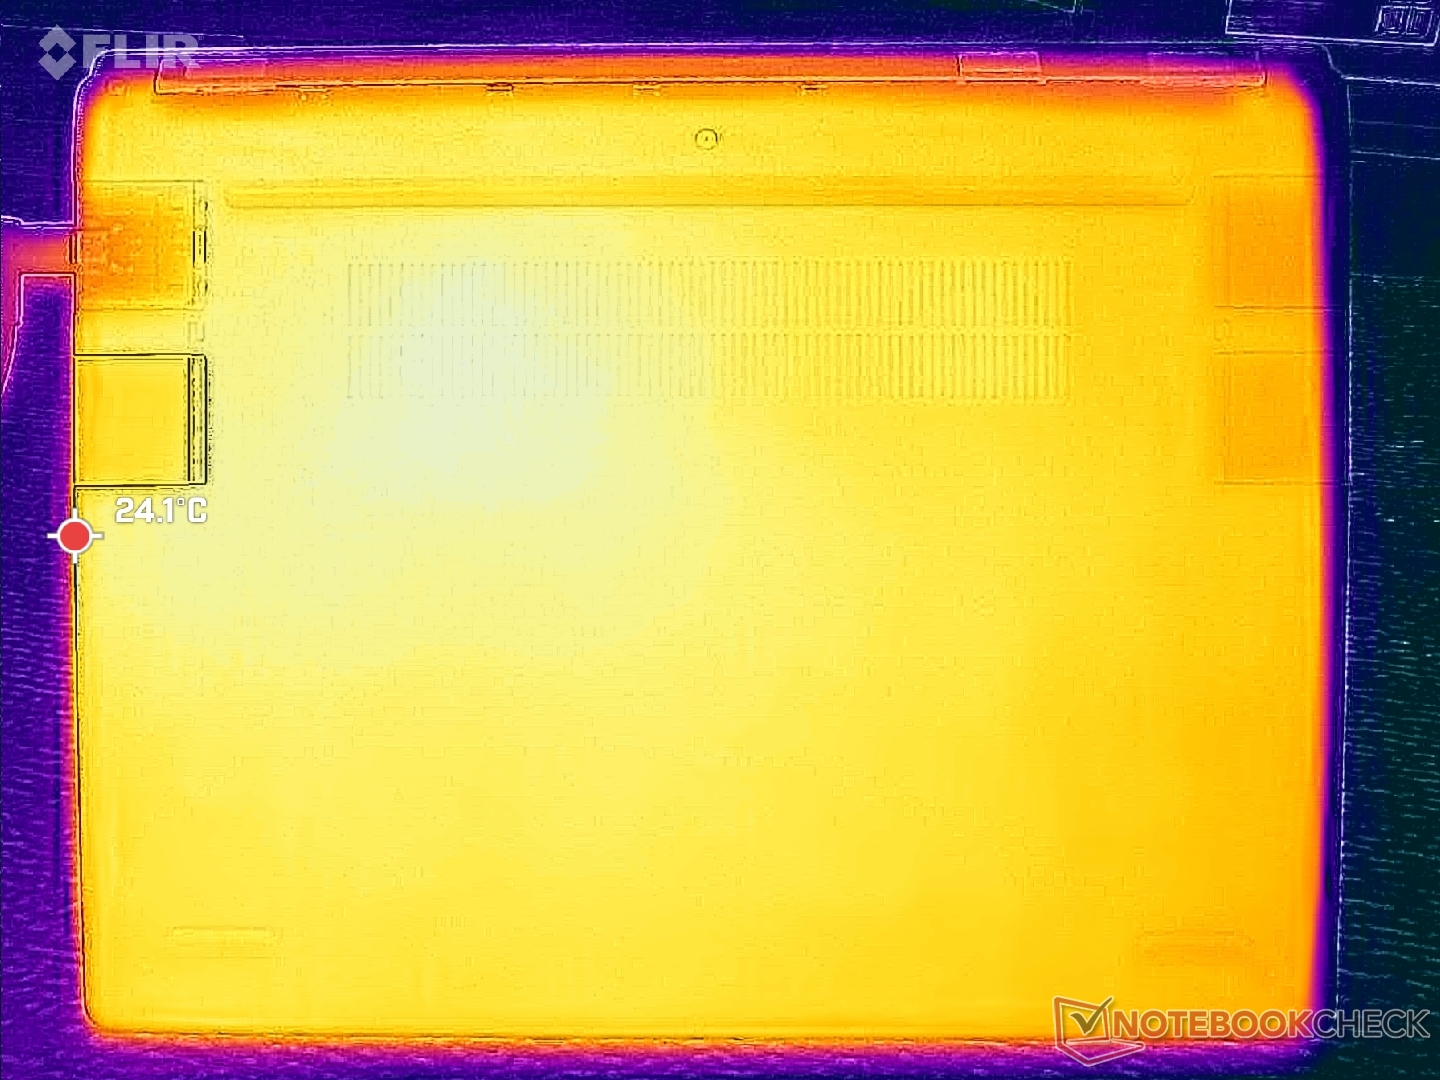
(±) The bottom heats up to a maximum of 44.2 °C / 112 F, compared to the average of 39.2 °C / 103 F
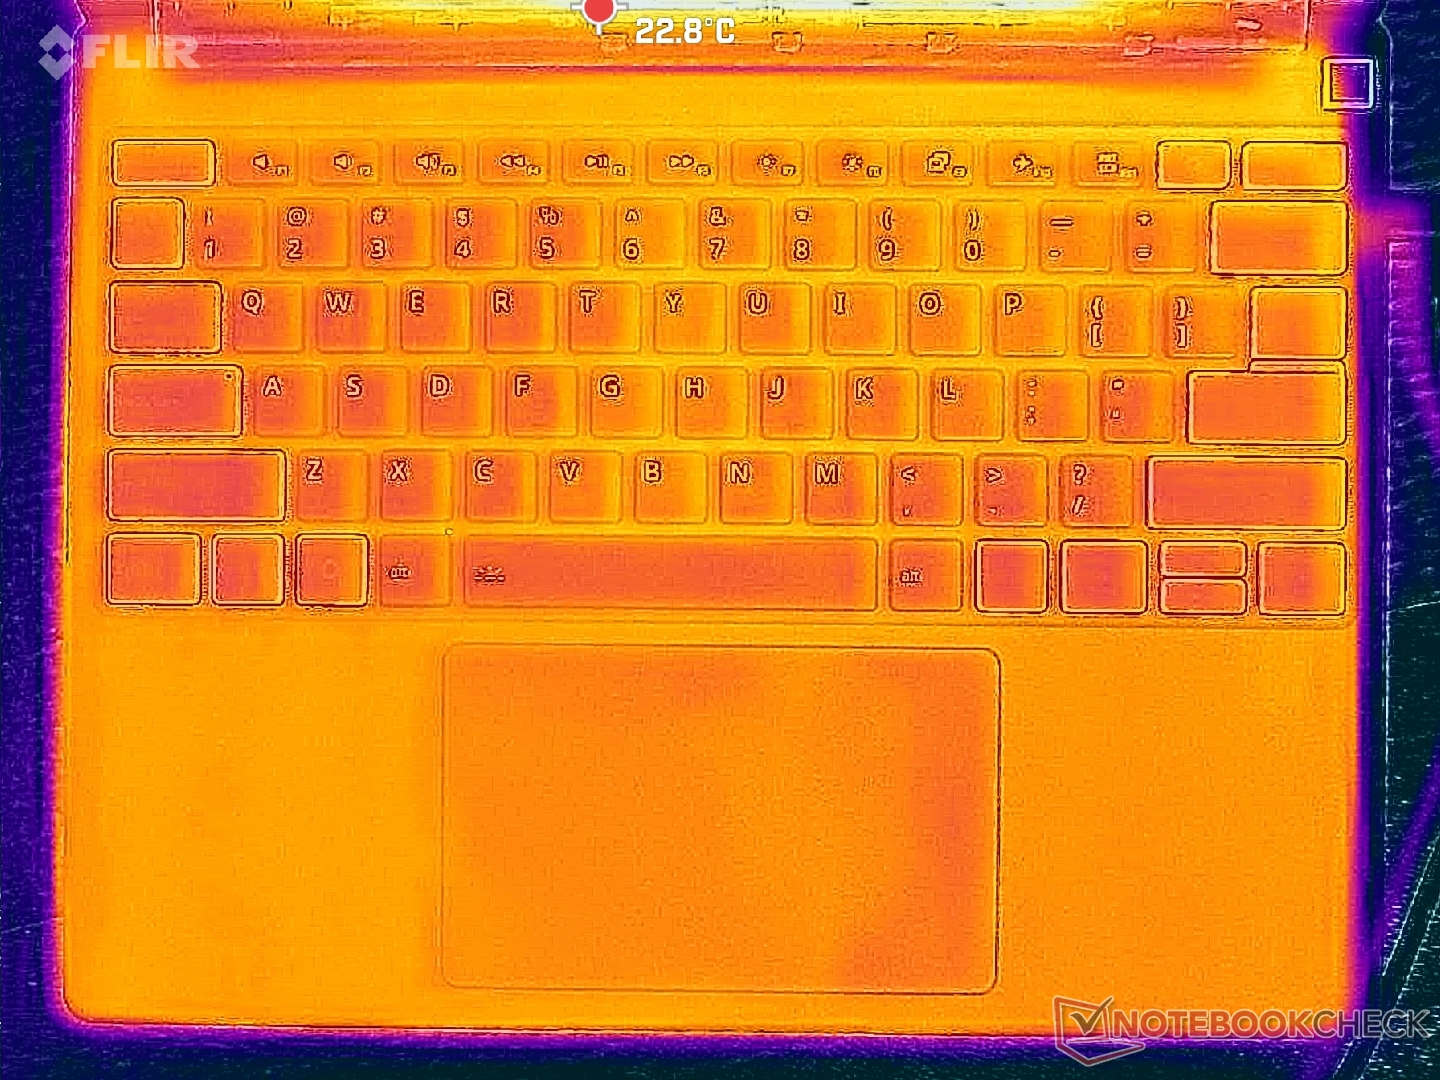
(+) In idle usage, the average temperature for the upper side is 28.4 °C / 83 F, compared to the device average of 30.8 °C / 87 F.
(+) The palmrests and touchpad are reaching skin temperature as a maximum (32.2 °C / 90 F) and are therefore not hot.
(-) The average temperature of the palmrest area of similar devices was 28.2 °C / 82.8 F (-4 °C / -7.2 F).
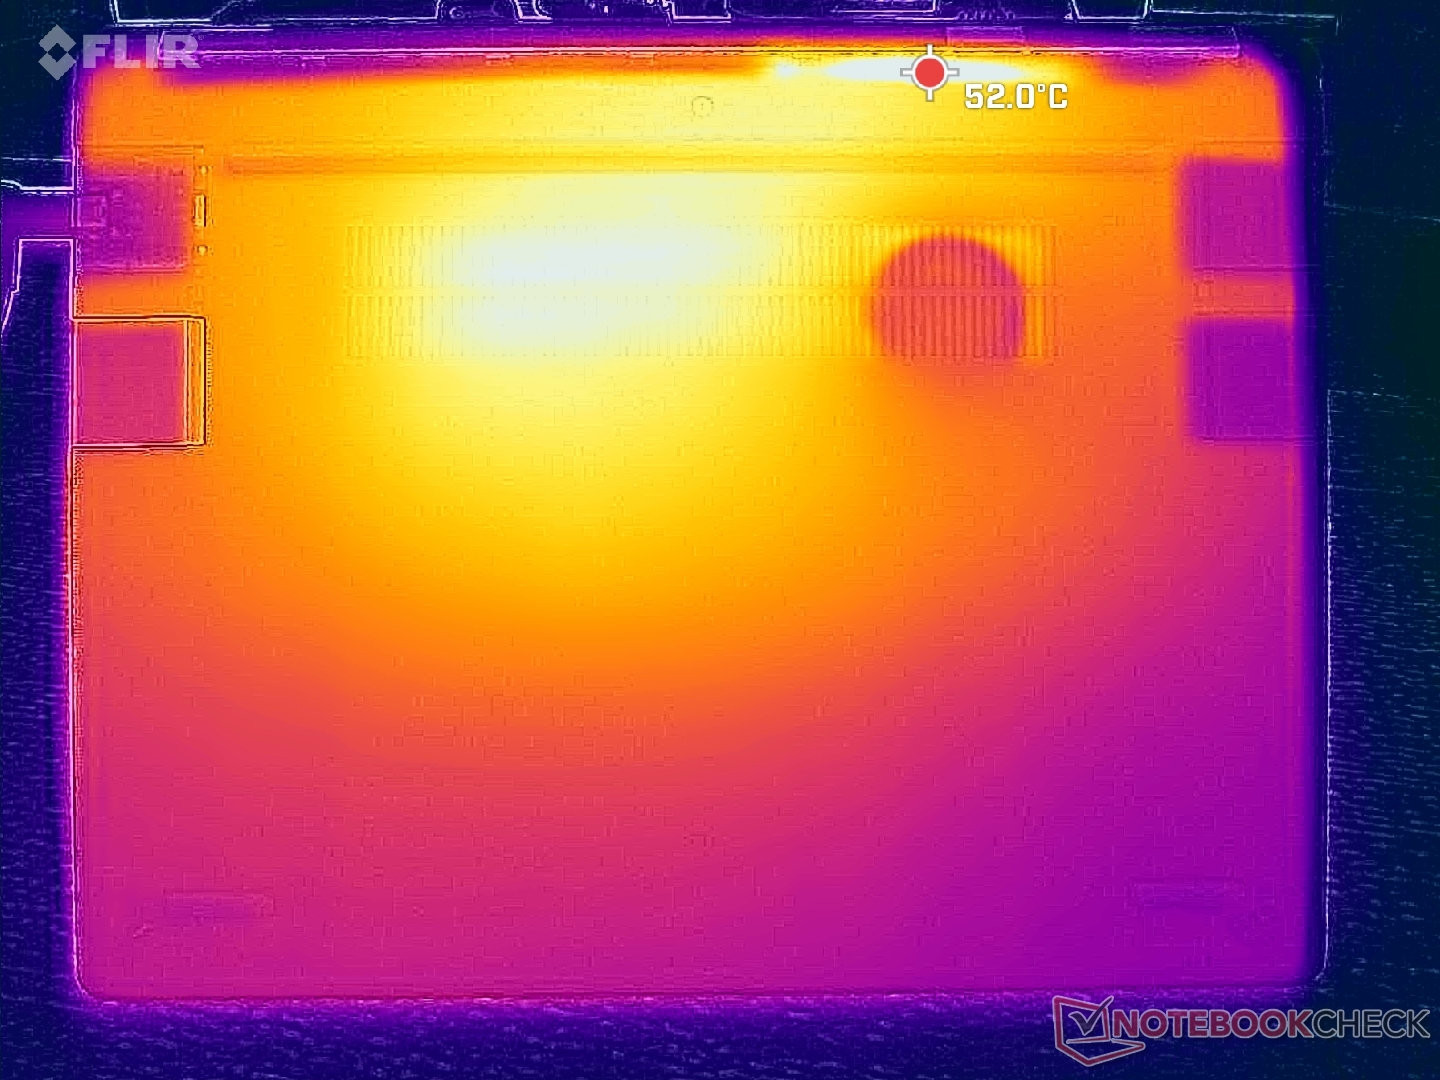
| Framework Laptop 13 Pro Ultra X7 358H, Arc B390 Panther Lake iGPU | Framework Laptop 13.5 Ryzen AI 9 HX 370 Ryzen AI 9 HX 370, Radeon 890M | Microsoft Surface Laptop 8 13.8 SD X2 Plus X2P-64-100, Adreno X2-45 | MSI Prestige 13 AI+ A3MG Ultra 9 386H, Intel Graphics 4 Xe3 PTL | Asus ExpertBook Ultra B9406CAA Ultra X7 358H, Arc B390 Panther Lake iGPU | Dell XPS 14 Core Ultra X7 358H Ultra X7 358H, Arc B390 Panther Lake iGPU | |
|---|---|---|---|---|---|---|
| Heat | -5% | 6% | 5% | 13% | 16% | |
| Maximum Upper Side * (°C) | 43.2 | 42.2 2% | 44.4 -3% | 42 3% | 38.6 11% | 34 21% |
| Maximum Bottom * (°C) | 44.2 | 46.8 -6% | 42.5 4% | 41 7% | 38.4 13% | 35.8 19% |
| Idle Upper Side * (°C) | 29.2 | 31 -6% | 25.9 11% | 24.6 16% | 25.6 12% | |
| Idle Bottom * (°C) | 29.8 | 32.2 -8% | 26 13% | 26 13% | 26.4 11% |
* ... smaller is better
Stress Test
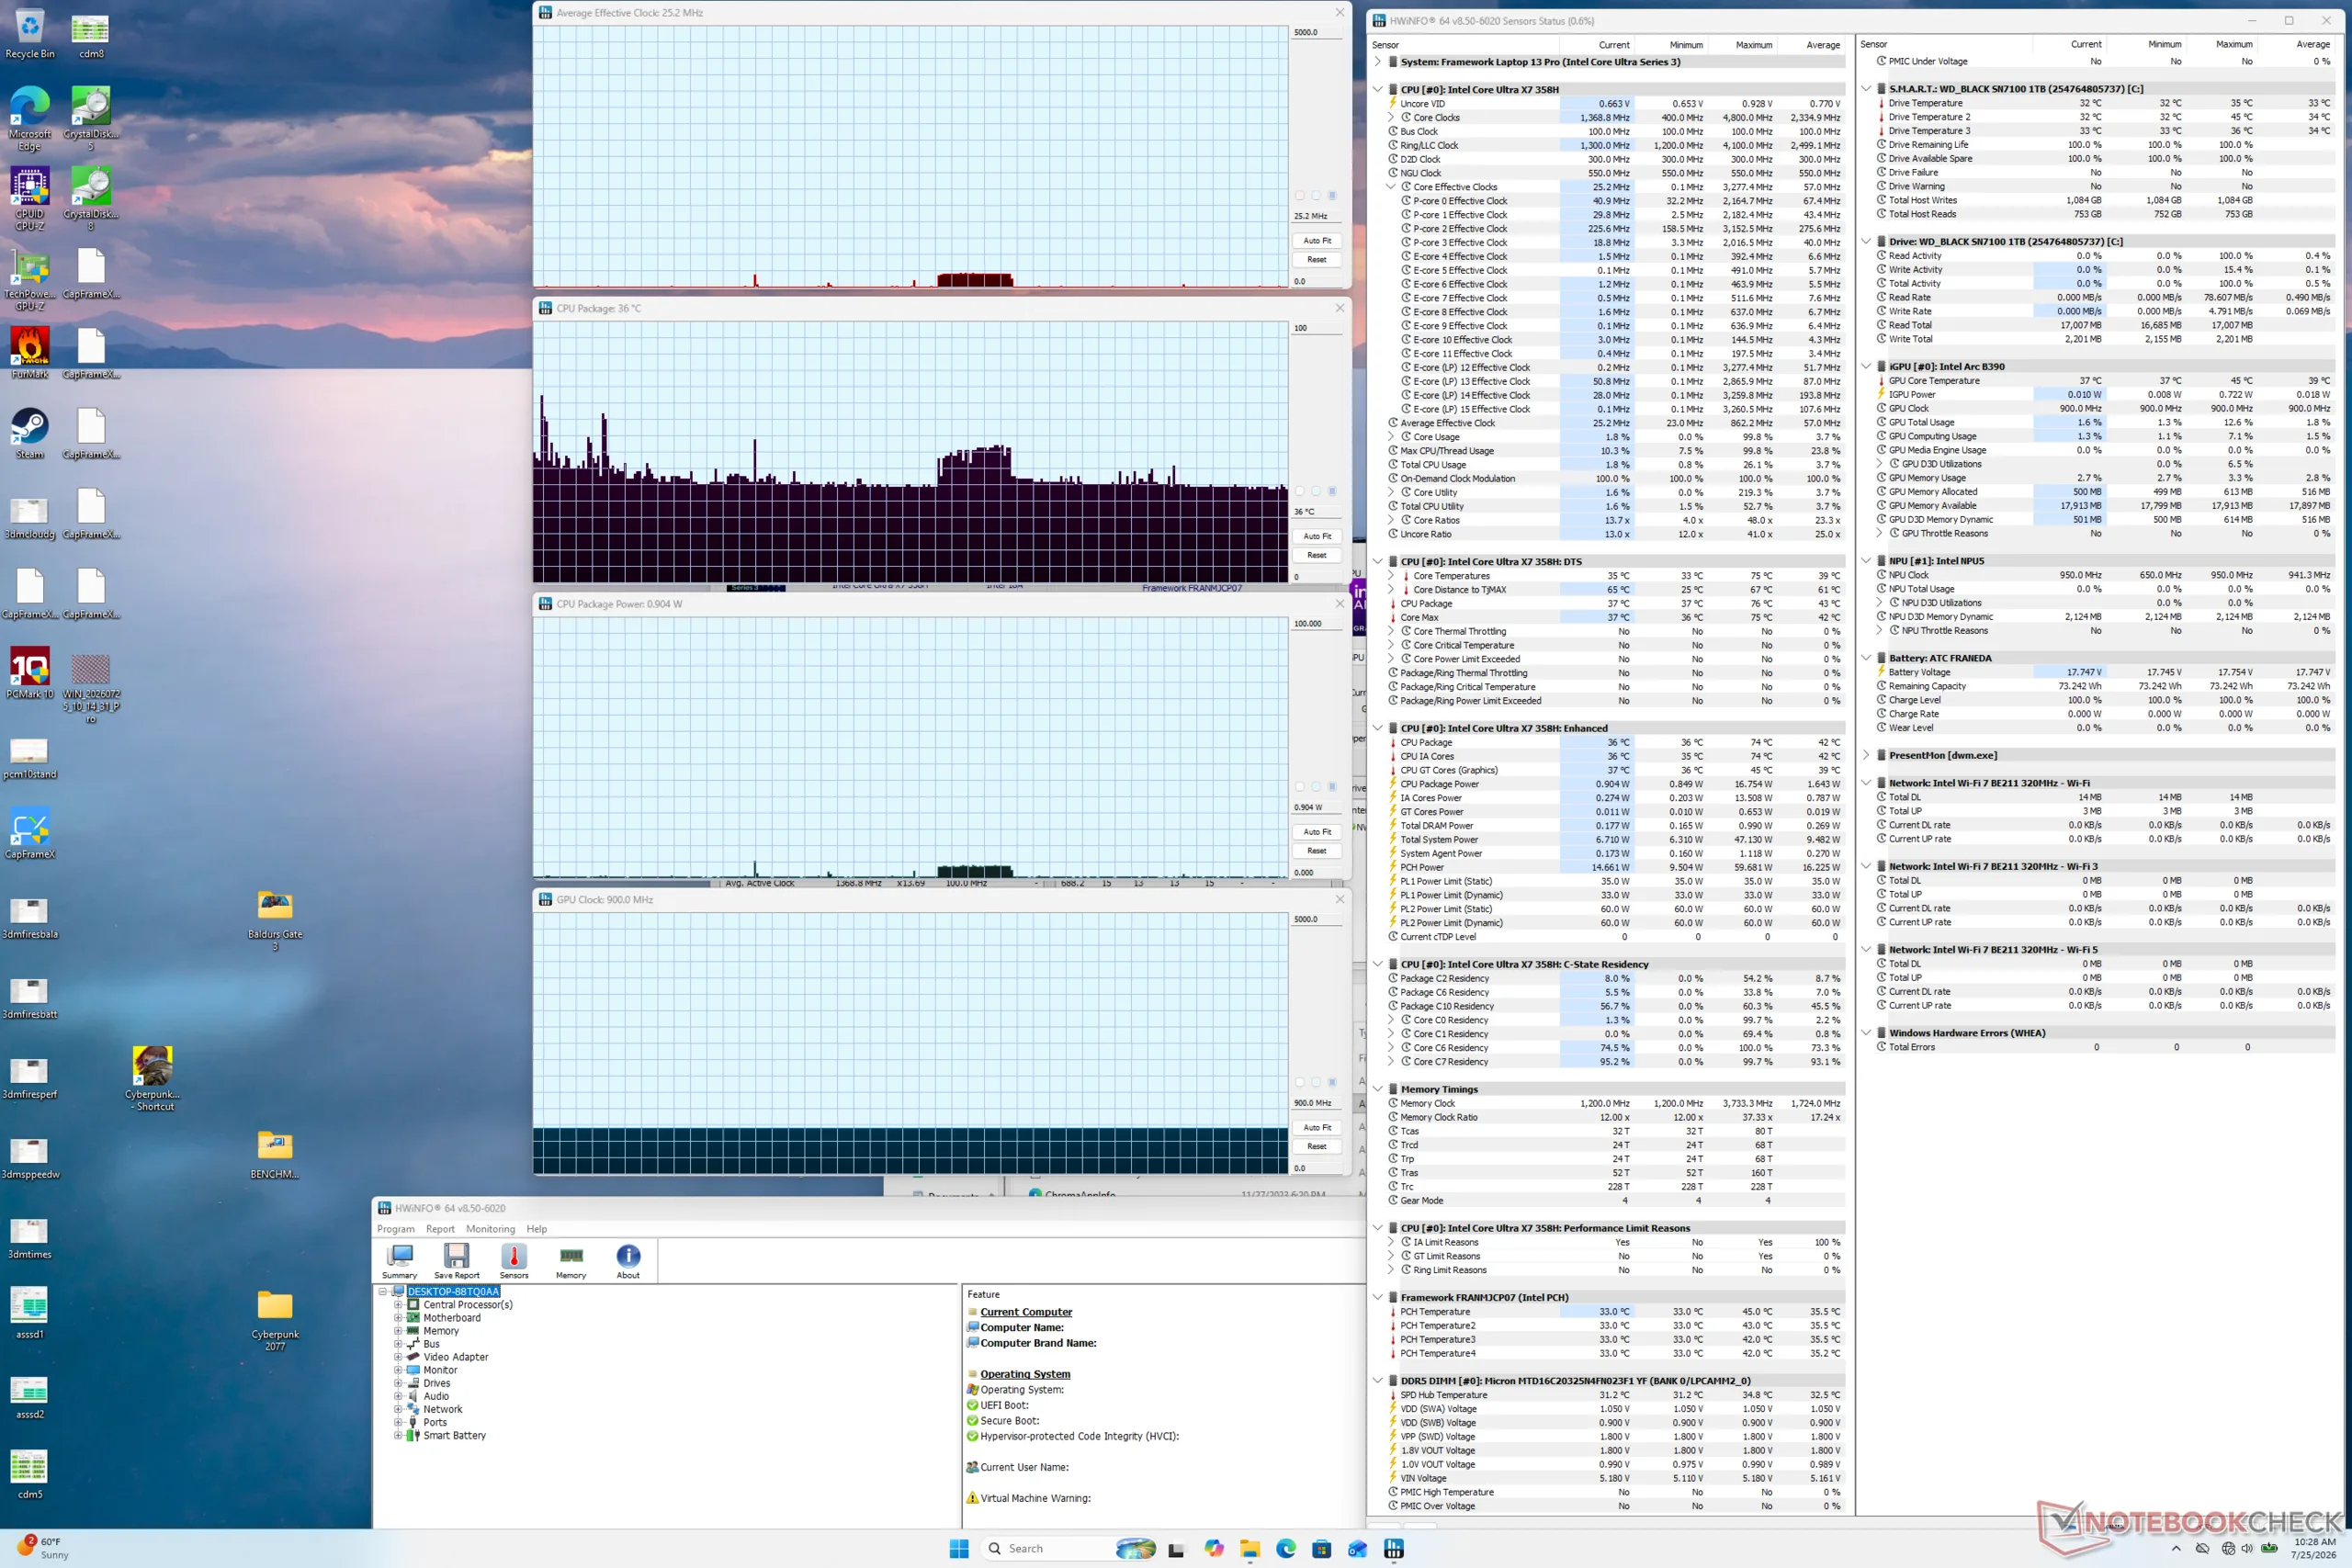
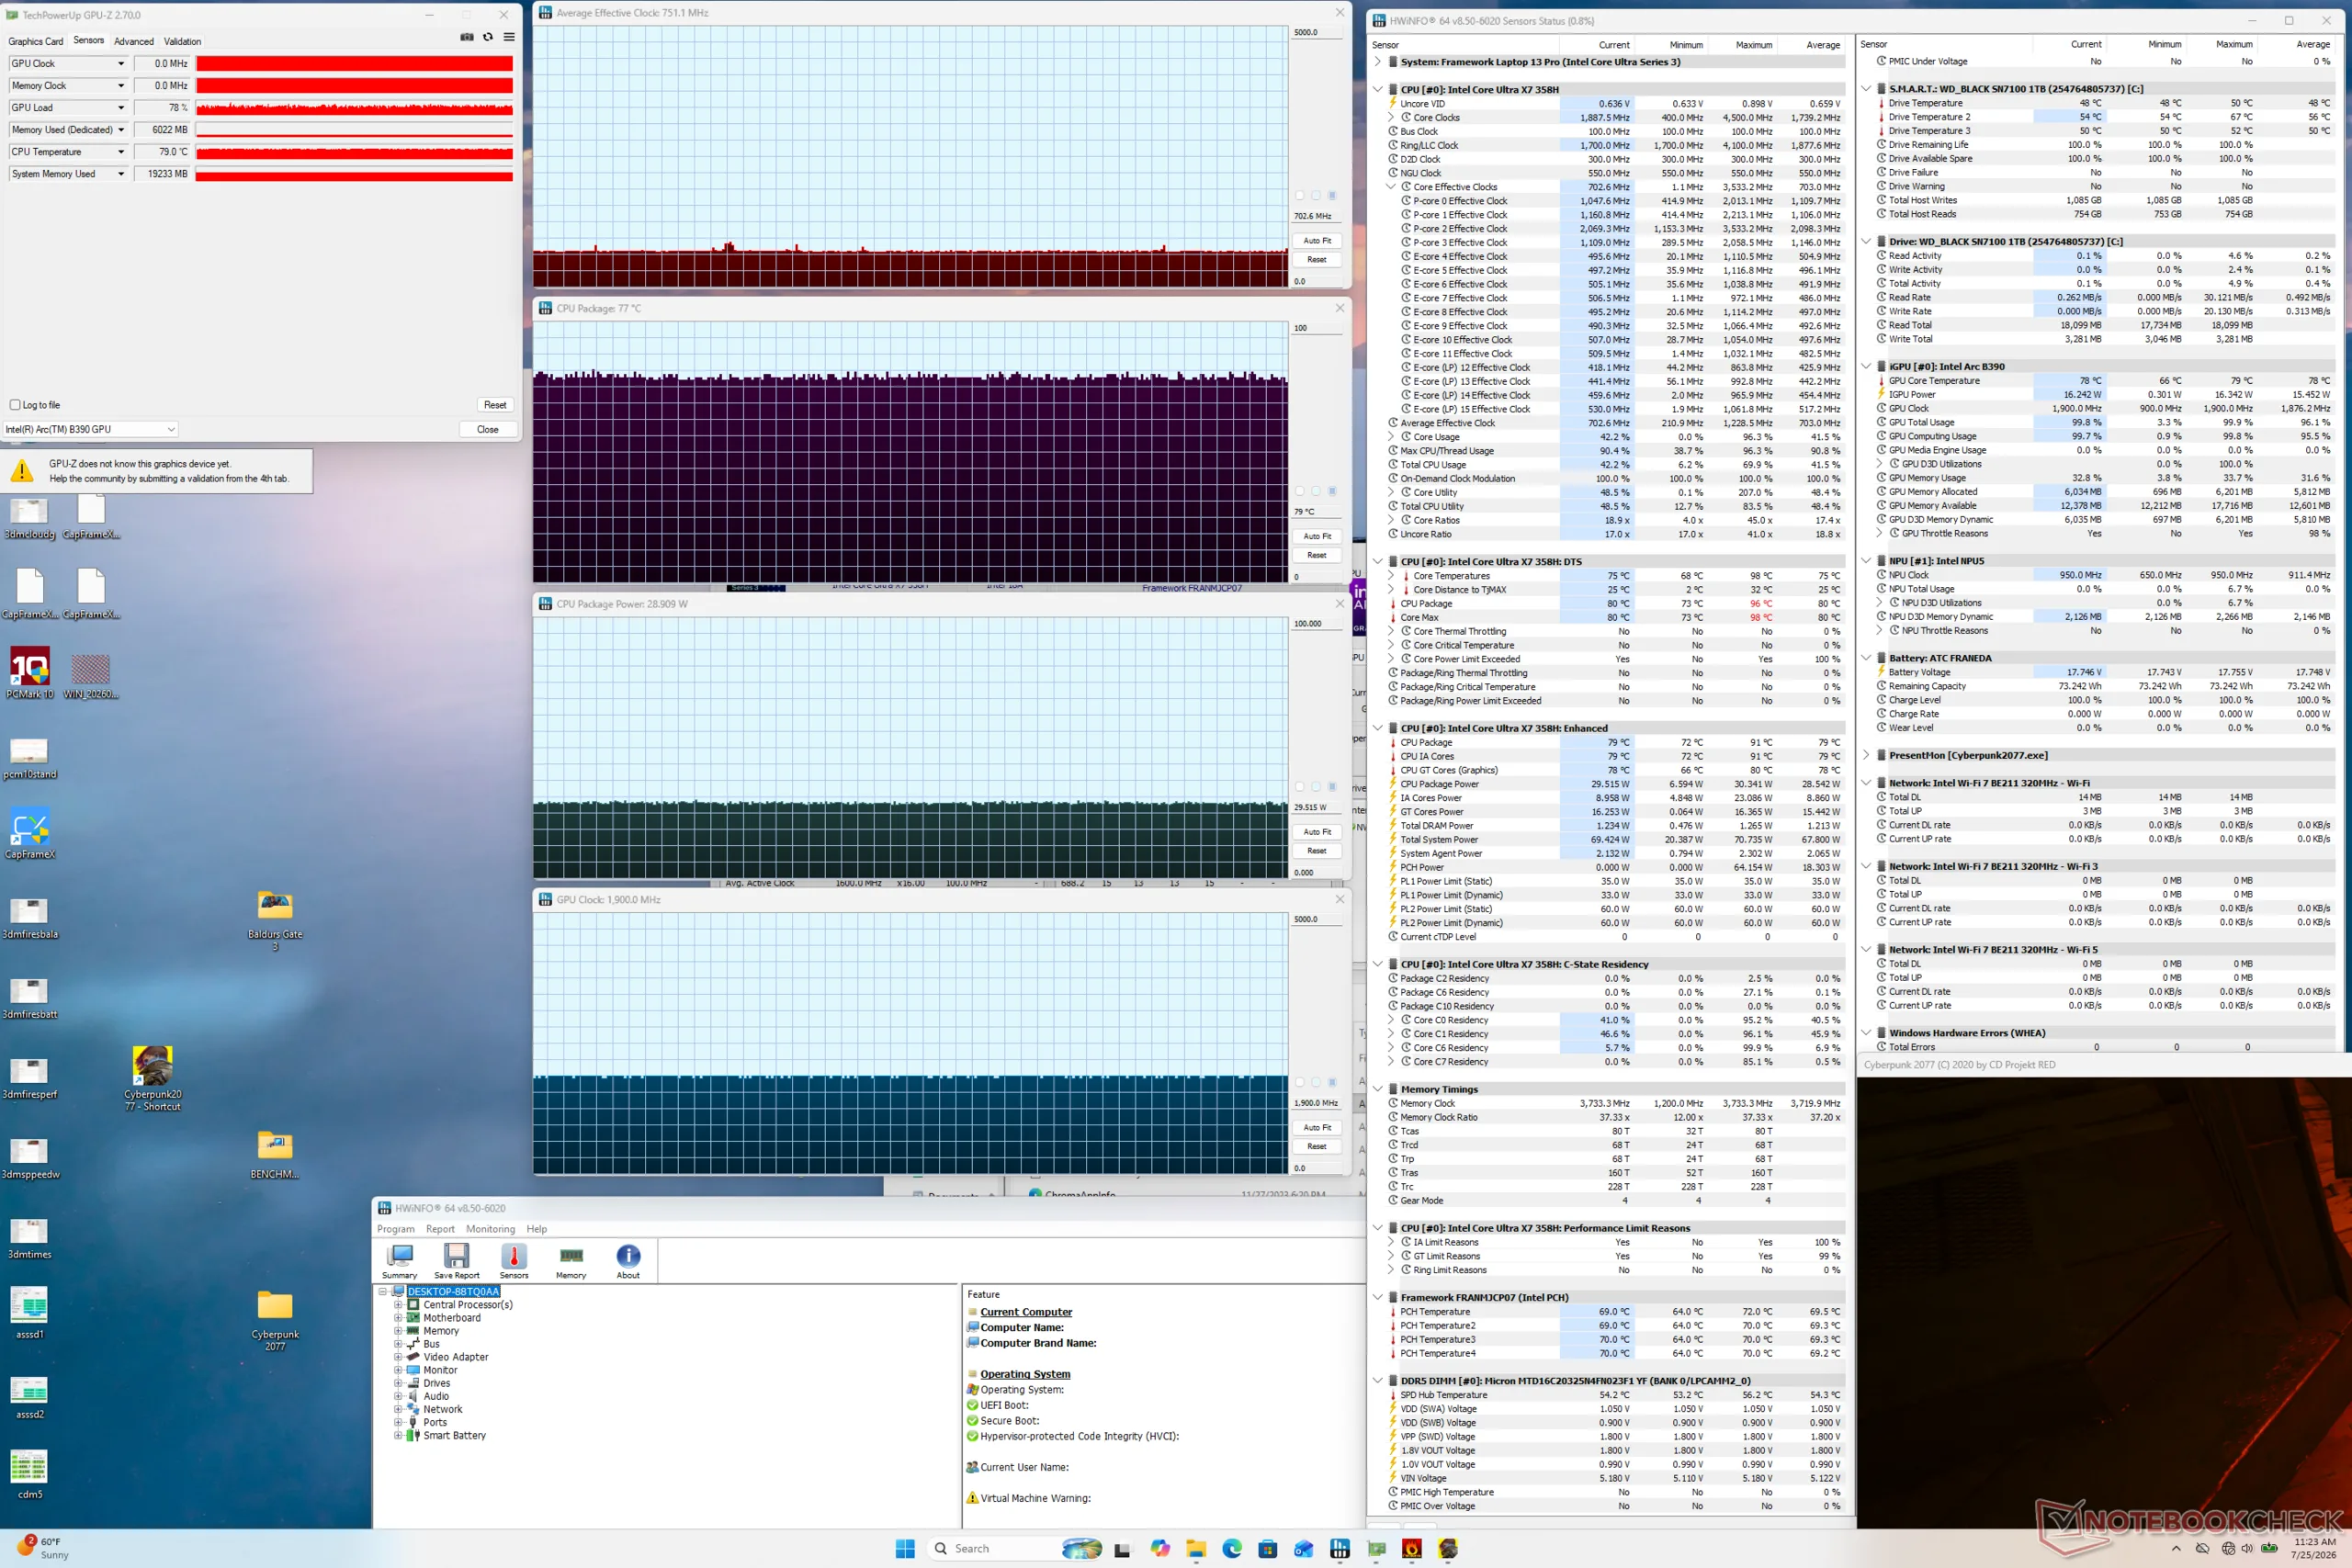
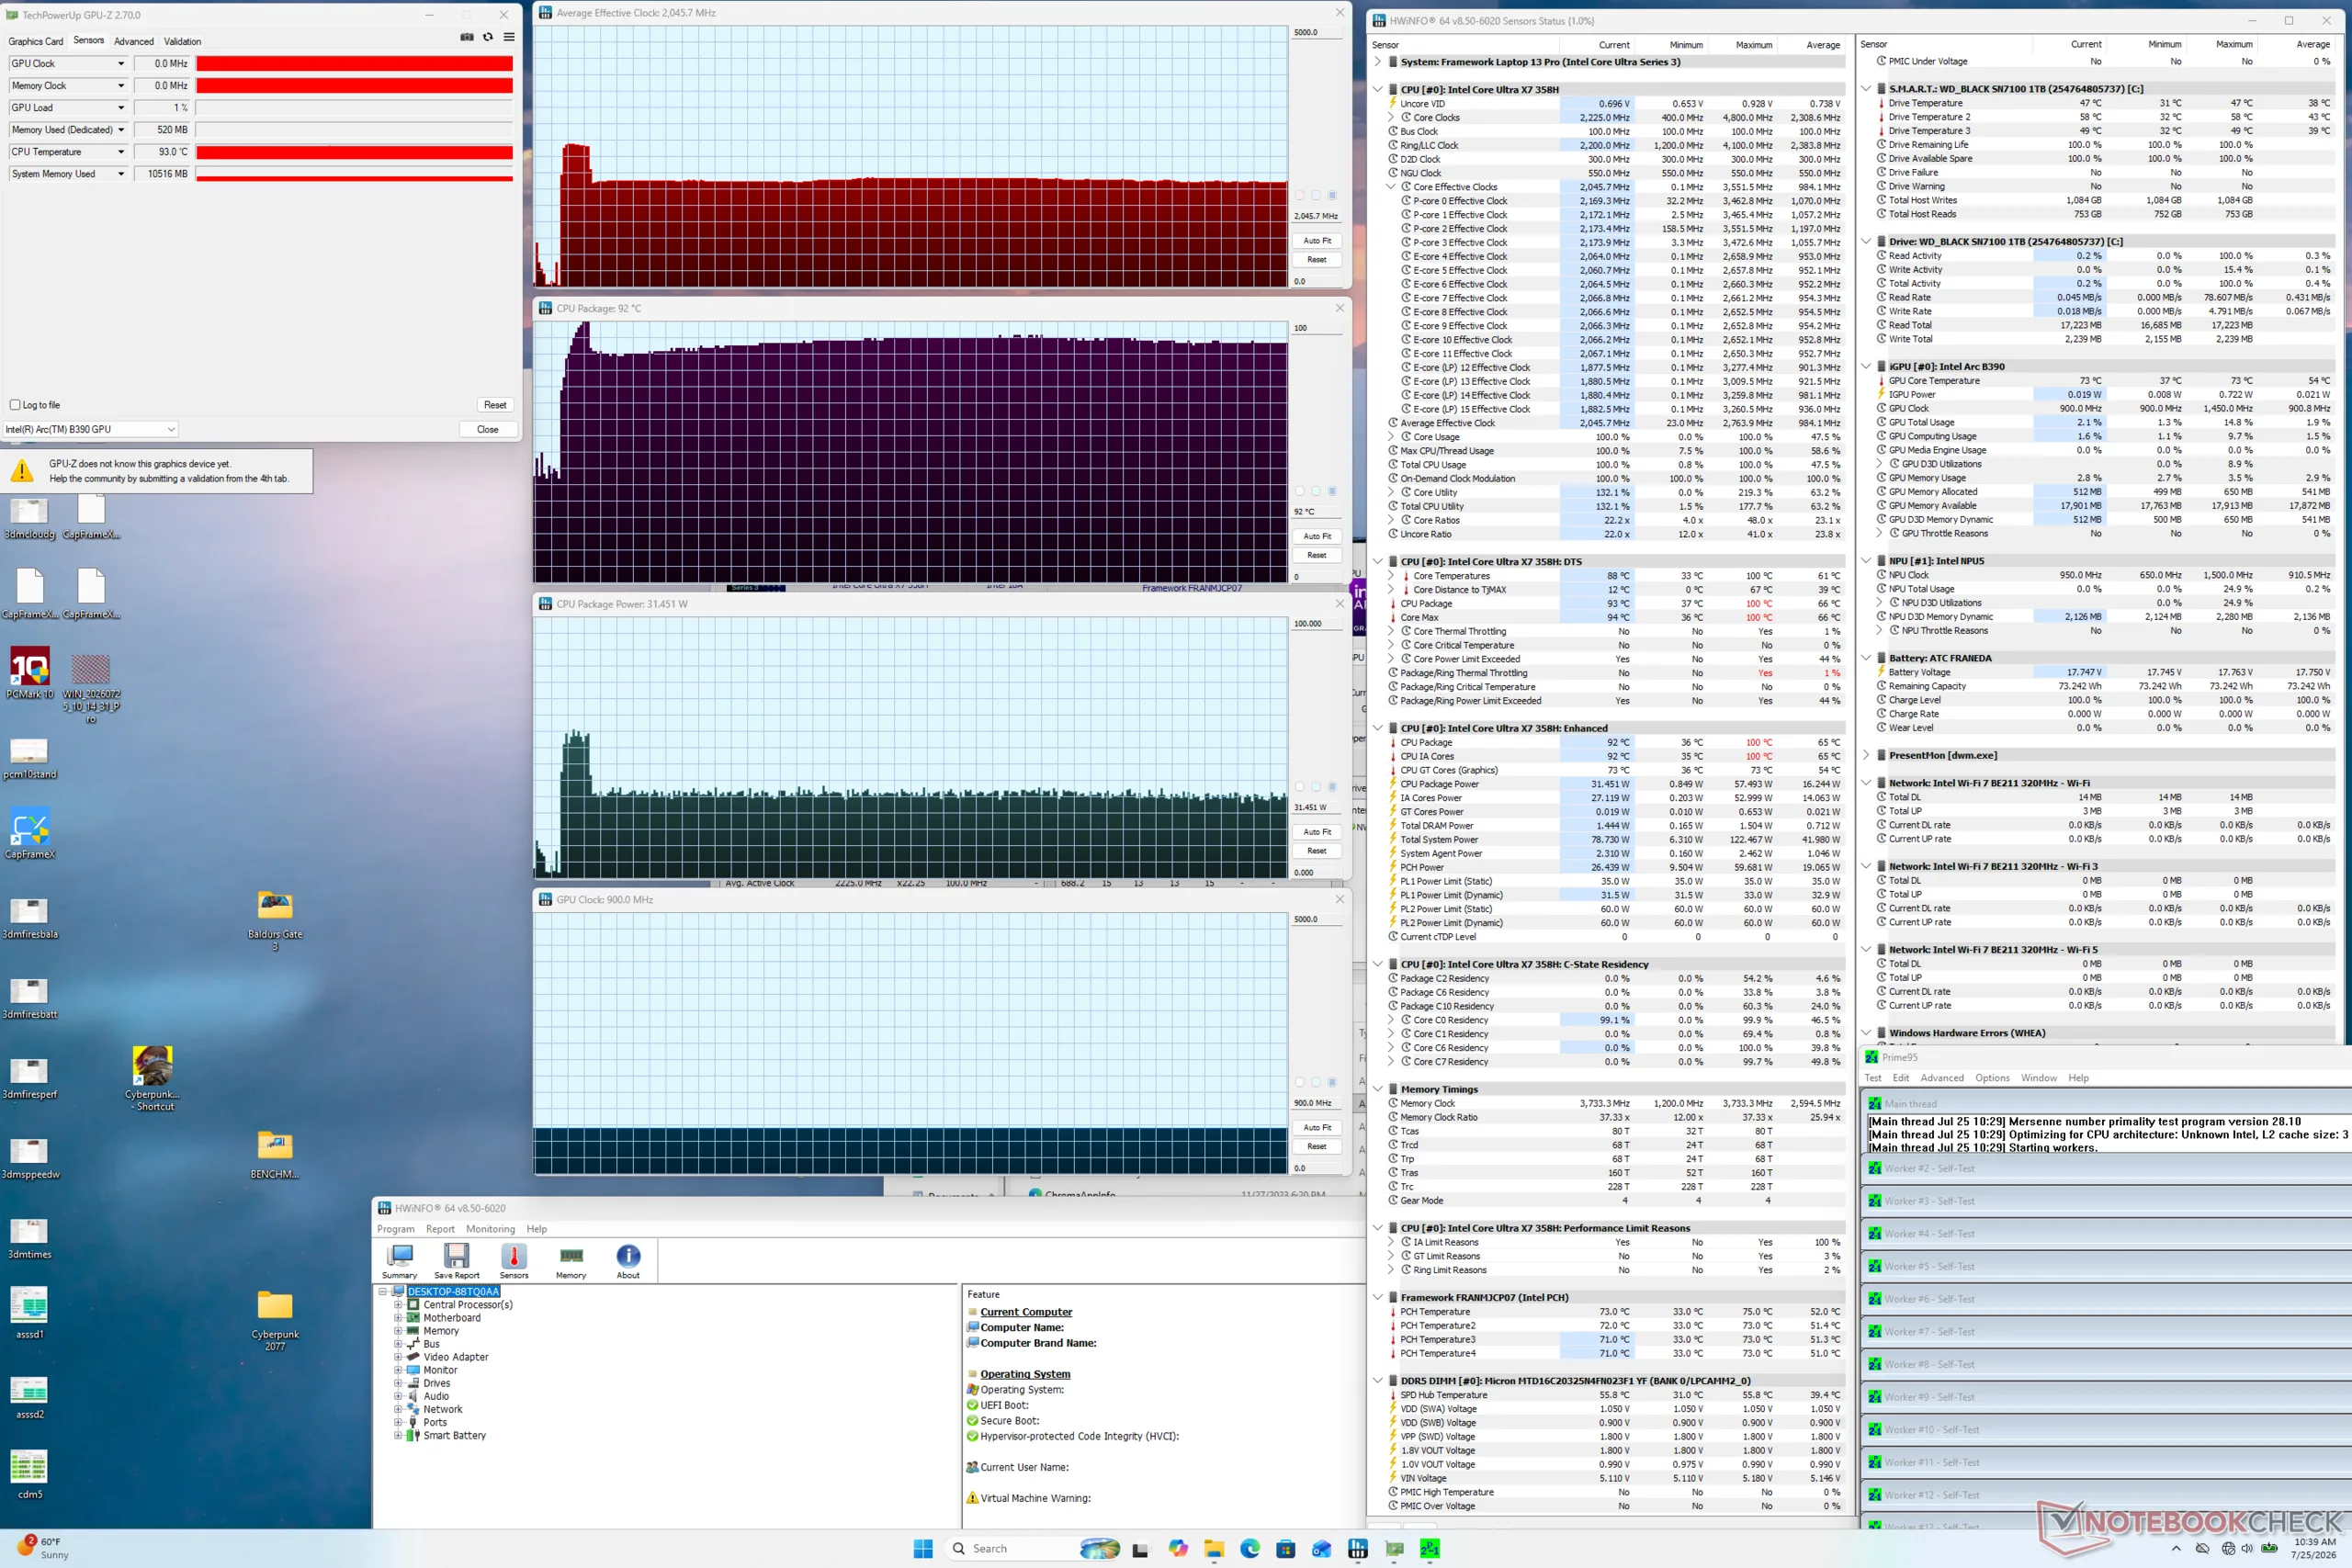
The CPU would boost to 2.8 GHz and 55 W lasting for only ~20 seconds before stabilizing at 2 GHz, 32 W, and 92 C.
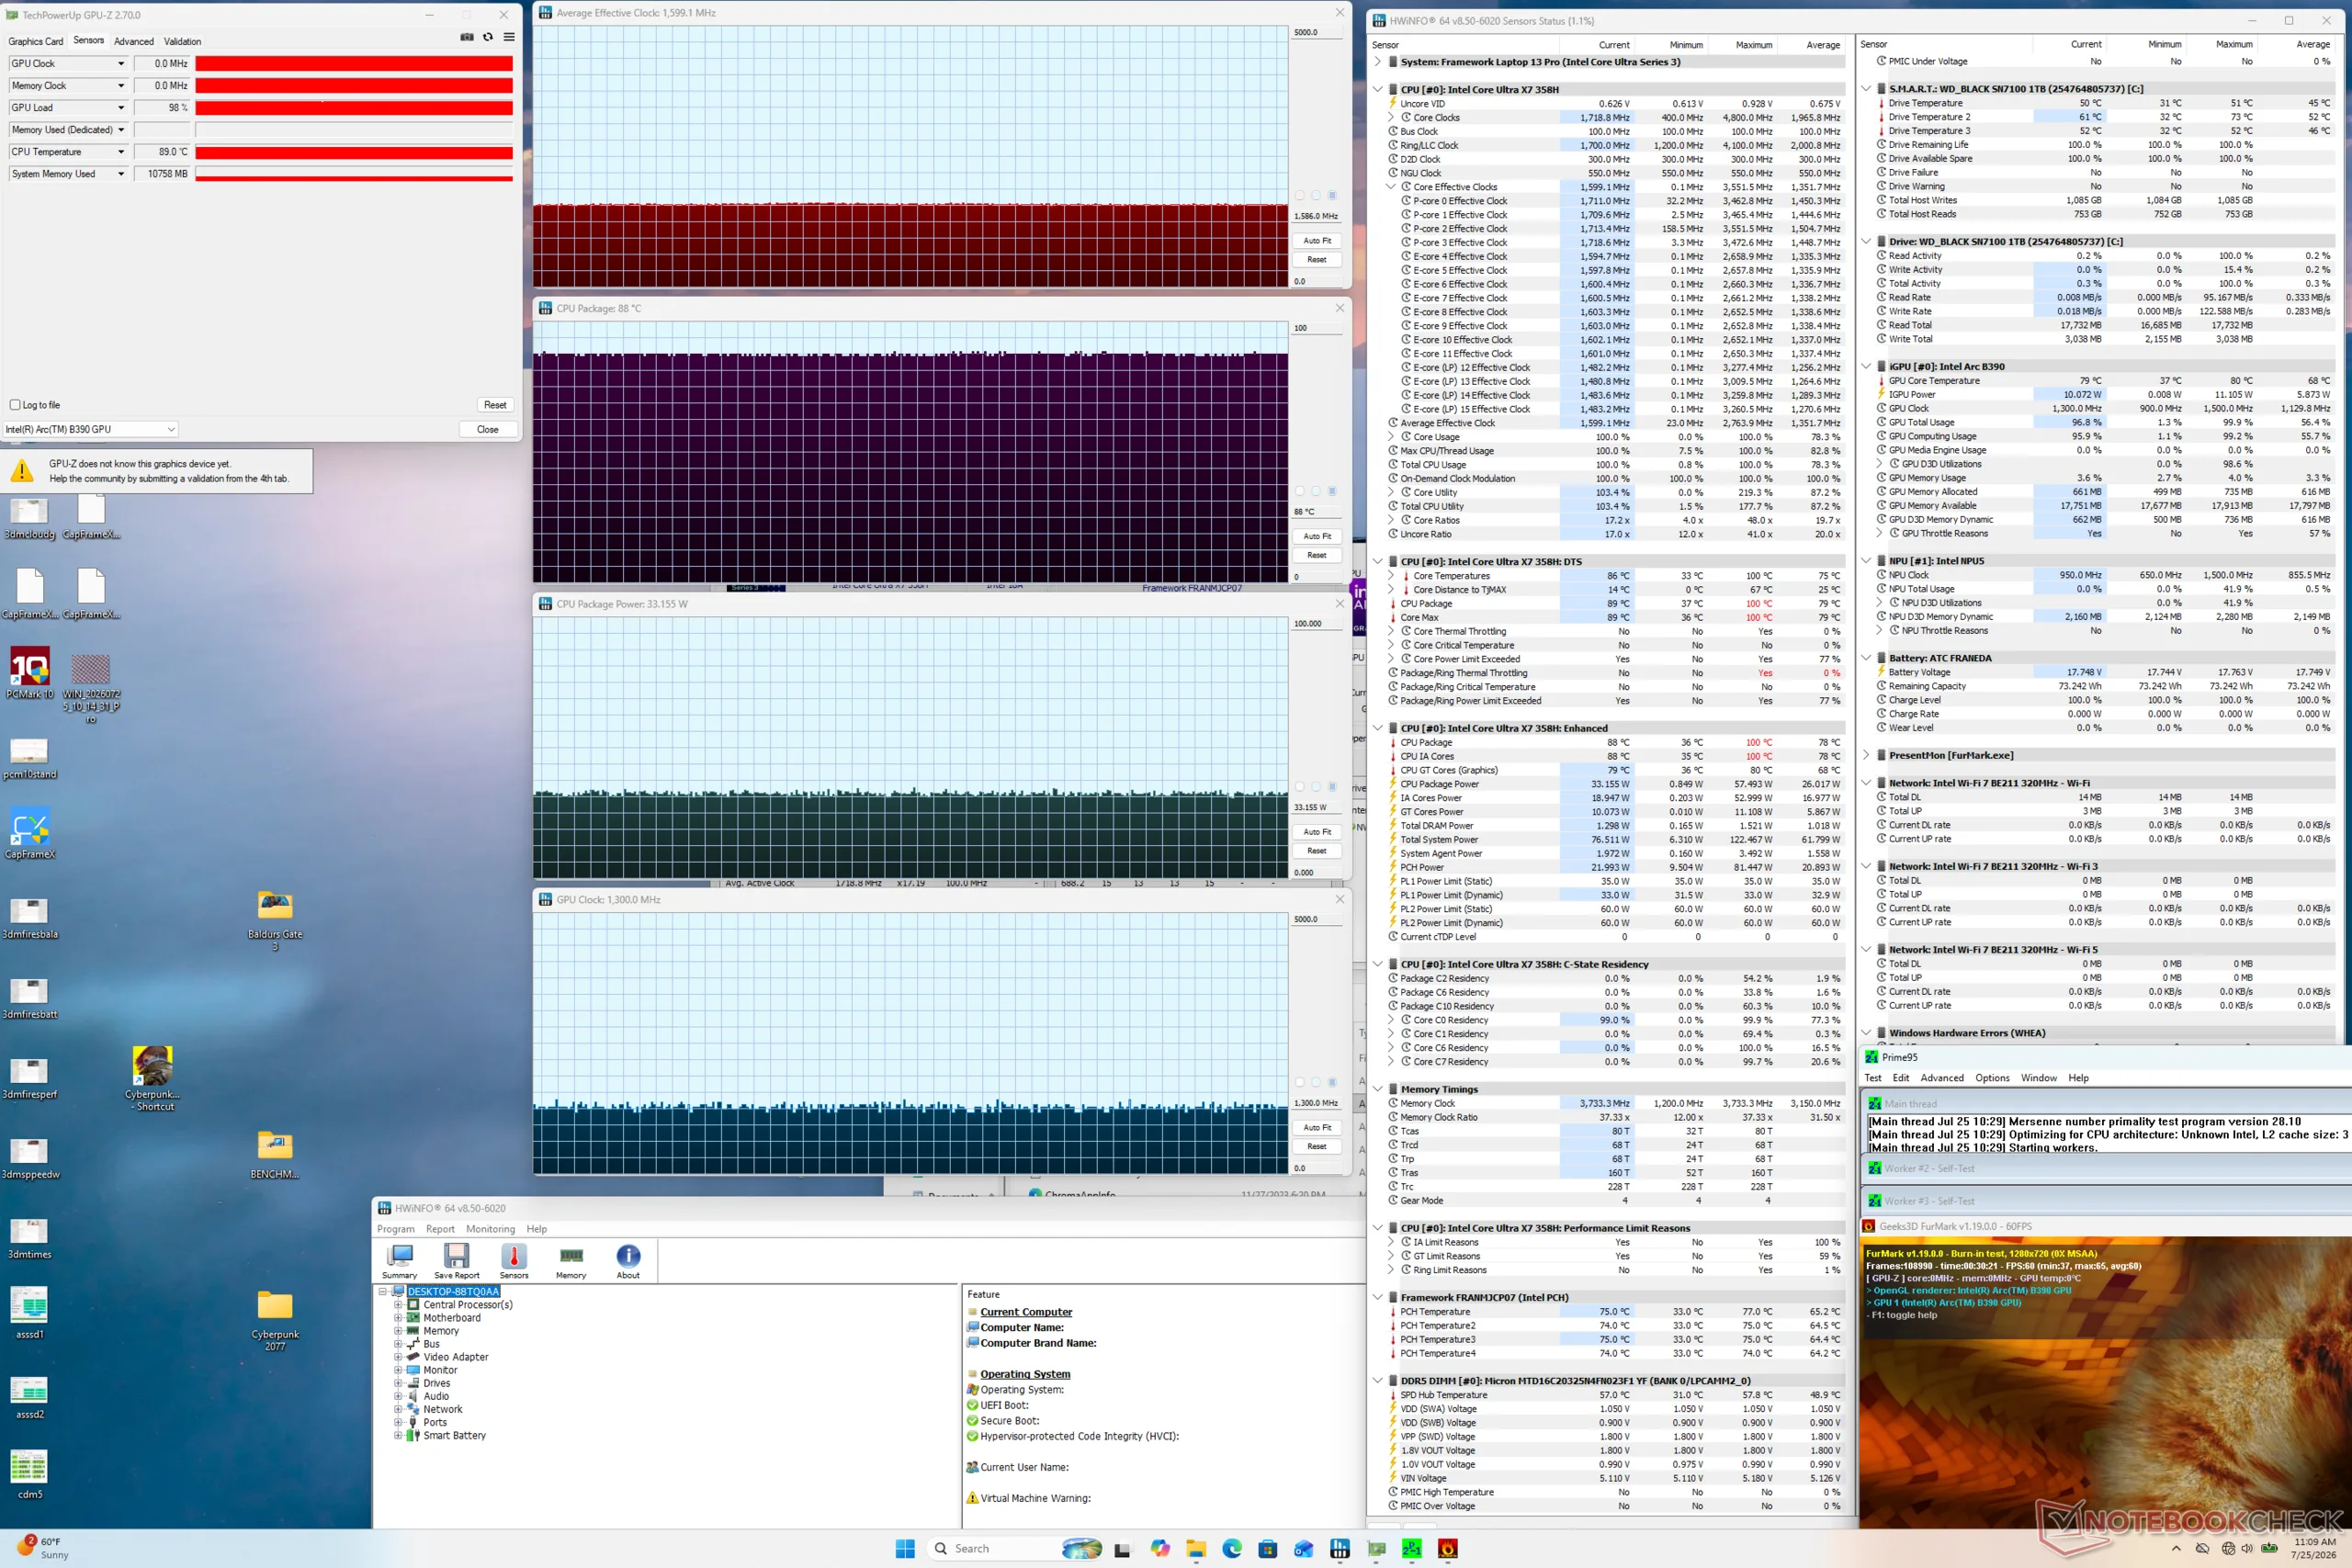
| Average CPU Clock (GHz) | GPU Clock (MHz) | Average CPU Temperature (°C) | |
| System Idle | -- | 900 | 36 |
| Prime95 Stress | 2.0 | 900 | 92 |
| Prime95 + FurMark Stress | 1.6 | 1300 | 88 |
| Cyberpunk 2077 Stress | 0.7 | 1900 | 79 |
Speakers
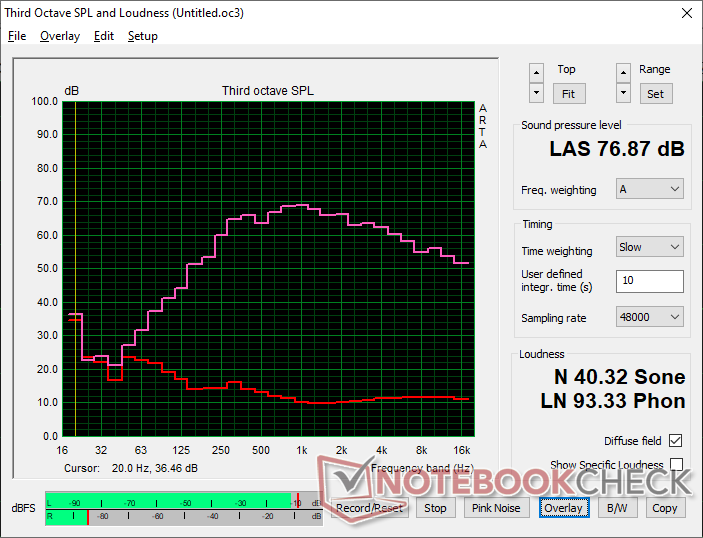
Framework Laptop 13 Pro audio analysis
(±) | speaker loudness is average but good (76.9 dB)
Bass 100 - 315 Hz
(±) | reduced bass - on average 10.7% lower than median
(±) | linearity of bass is average (9% delta to prev. frequency)
Mids 400 - 2000 Hz
(+) | balanced mids - only 4.4% away from median
(+) | mids are linear (2.9% delta to prev. frequency)
Highs 2 - 16 kHz
(+) | balanced highs - only 3.1% away from median
(+) | highs are linear (3.8% delta to prev. frequency)
Overall 100 - 16.000 Hz
(+) | overall sound is linear (14% difference to median)
Compared to same class
» 26% of all tested devices in this class were better, 6% similar, 68% worse
» The best had a delta of 5%, average was 18%, worst was 53%
Compared to all devices tested
» 16% of all tested devices were better, 4% similar, 80% worse
» The best had a delta of 4%, average was 23%, worst was 134%
Apple MacBook Pro 16 2021 M1 Pro audio analysis
(+) | speakers can play relatively loud (84.7 dB)
Bass 100 - 315 Hz
(+) | good bass - only 3.8% away from median
(+) | bass is linear (5.2% delta to prev. frequency)
Mids 400 - 2000 Hz
(+) | balanced mids - only 1.3% away from median
(+) | mids are linear (2.1% delta to prev. frequency)
Highs 2 - 16 kHz
(+) | balanced highs - only 1.9% away from median
(+) | highs are linear (2.7% delta to prev. frequency)
Overall 100 - 16.000 Hz
(+) | overall sound is linear (4.6% difference to median)
Compared to same class
» 0% of all tested devices in this class were better, 0% similar, 100% worse
» The best had a delta of 5%, average was 17%, worst was 45%
Compared to all devices tested
» 0% of all tested devices were better, 0% similar, 100% worse
» The best had a delta of 4%, average was 23%, worst was 134%
Energy Management
Power Consumption
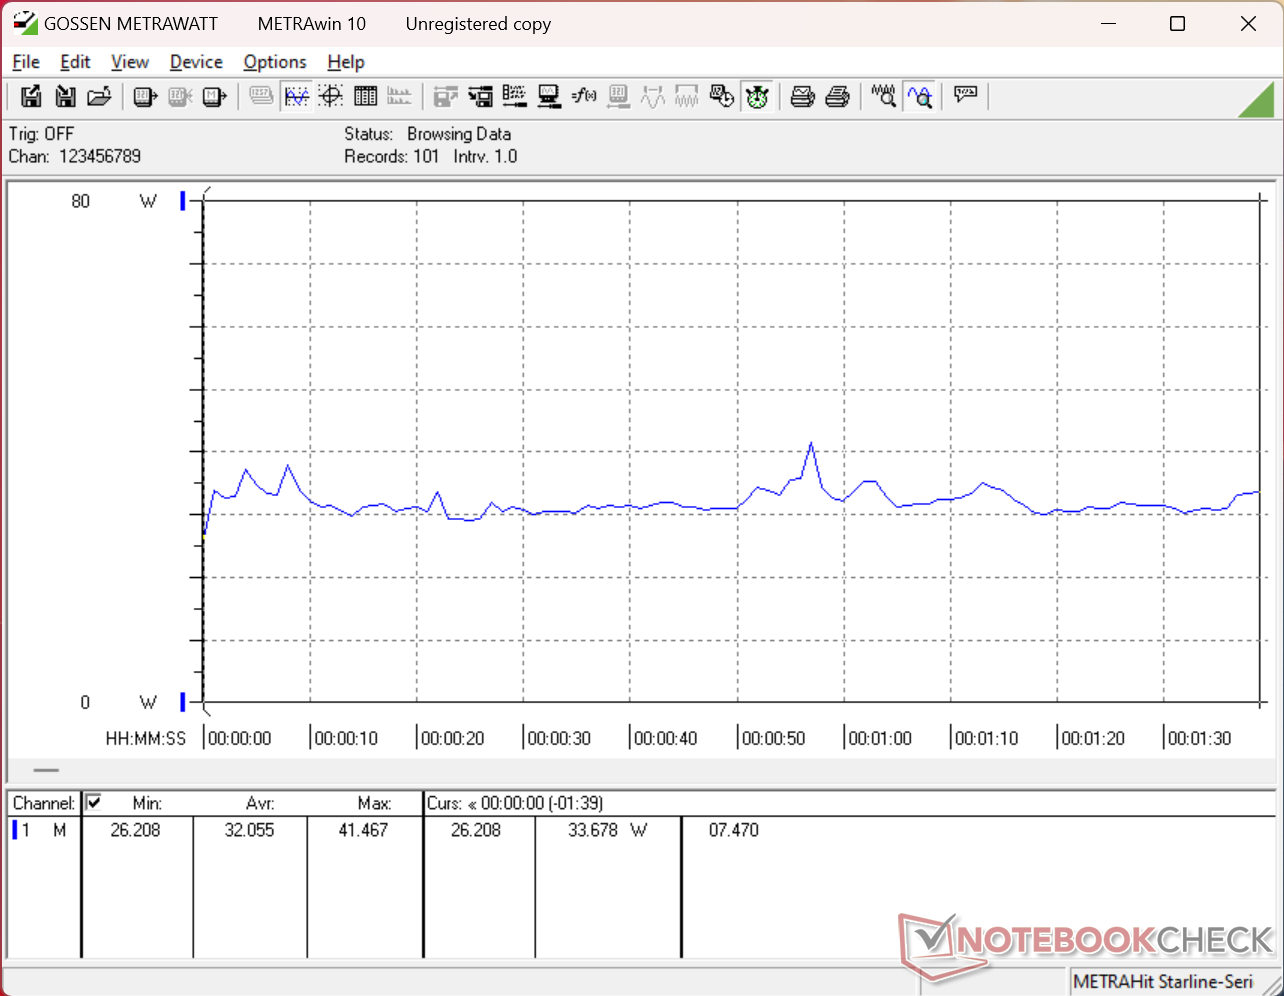
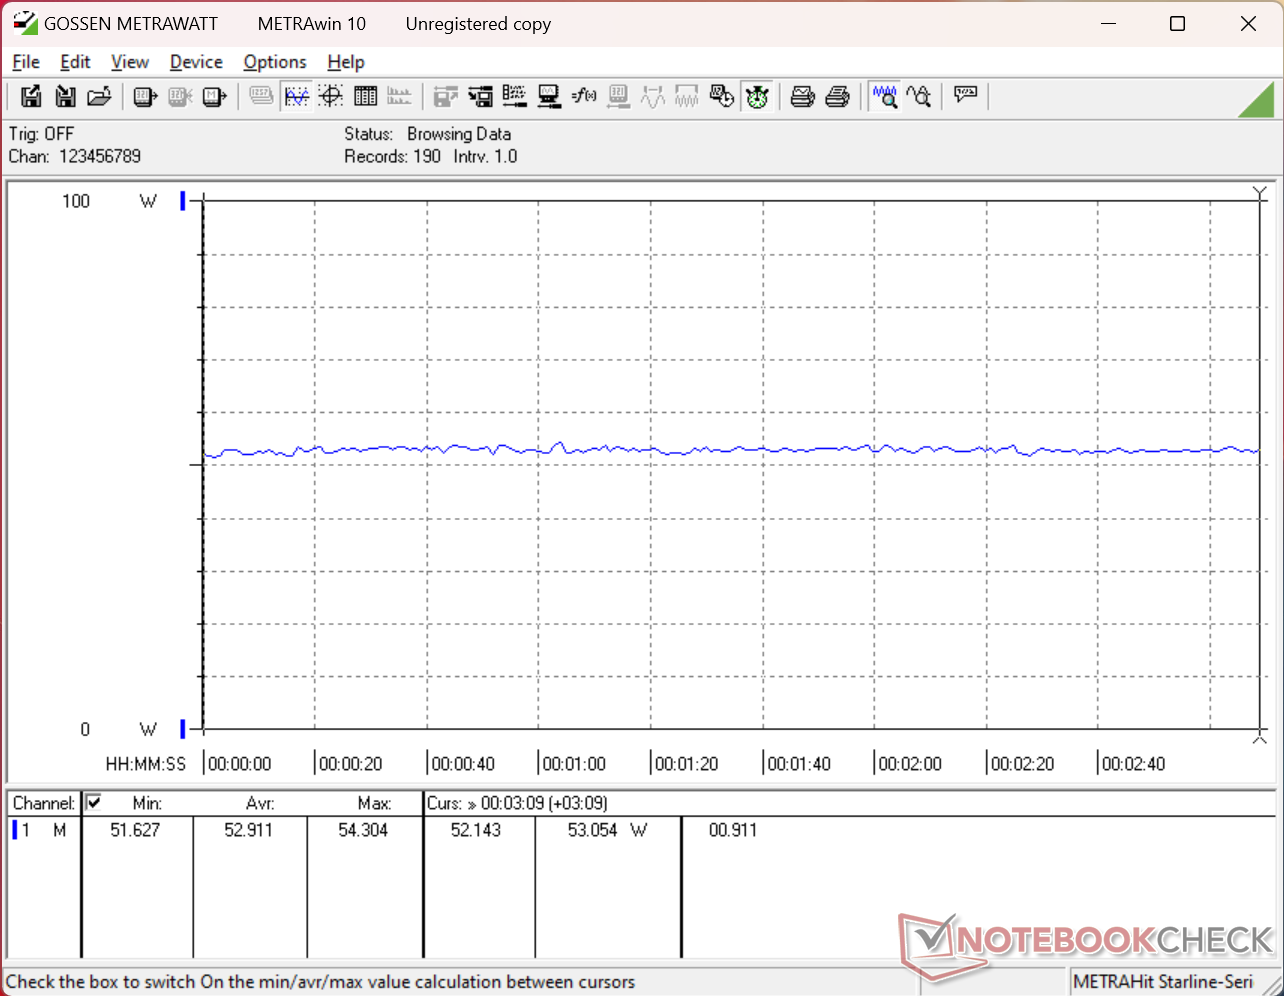
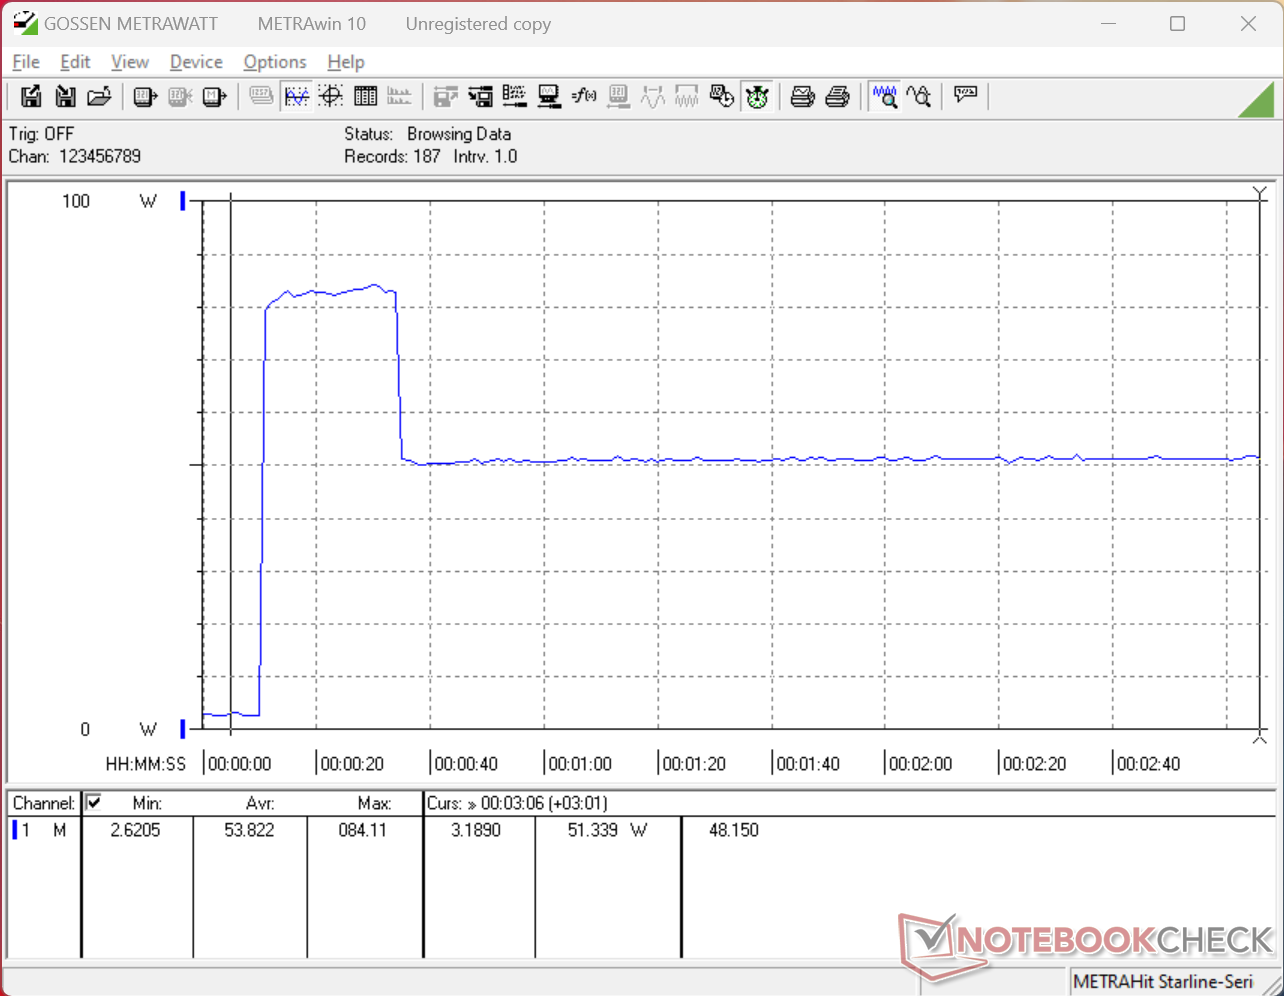
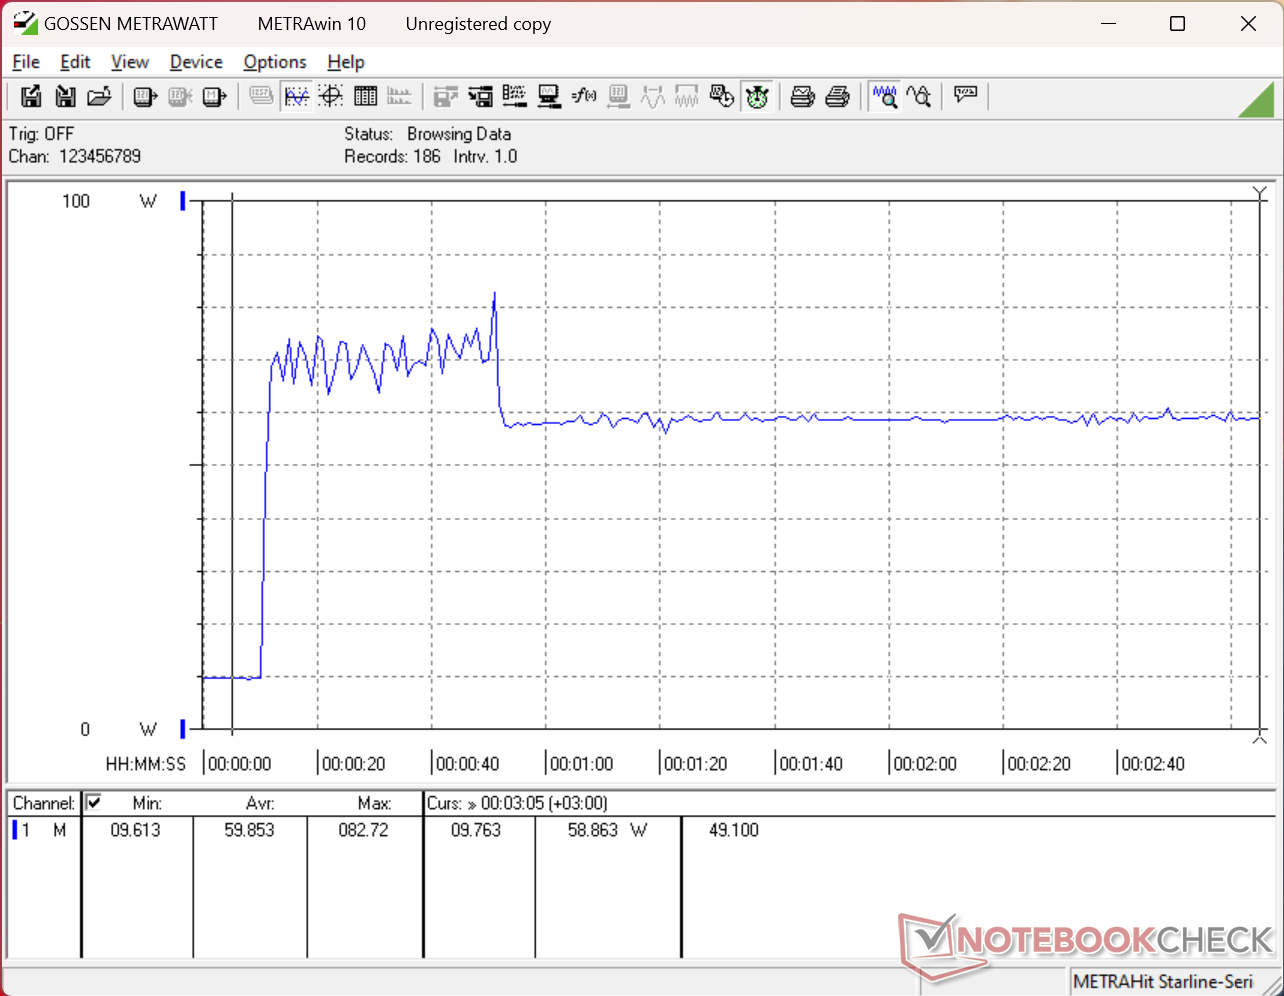
| Off / Standby | 0.33 / 0.72 Watt |
| Idle | 2.3 / 8.4 / 8.5 Watt |
| Load |
32.1 / 84.2 Watt |
   
| |
Key:
min: ,
med: ,
max: Metrahit Energy | |
| Framework Laptop 13 Pro Ultra X7 358H, Arc B390 Panther Lake iGPU, WD PC SN7100S SDFPMSL-1T00-1101, IPS, 2880x1920, 13.5" | Framework Laptop 13.5 Ryzen AI 9 HX 370 Ryzen AI 9 HX 370, Radeon 890M, , IPS, 2880x1920, 13.5" | Microsoft Surface Laptop 8 13.8 SD X2 Plus X2P-64-100, Adreno X2-45, SK hynix PVC10 HFS512GEM4X182N, IPS, 2304x1536, 13.8" | MSI Prestige 13 AI+ A3MG Ultra 9 386H, Intel Graphics 4 Xe3 PTL, Micron 2500 1TB MTFDKBA1T0QGN, OLED, 2880x1800, 13.3" | Asus ExpertBook Ultra B9406CAA Ultra X7 358H, Arc B390 Panther Lake iGPU, Samsung PM9E1 MZVLC2T0HBLD, OLED, 2880x1800, 14" | Dell XPS 14 Core Ultra X7 358H Ultra X7 358H, Arc B390 Panther Lake iGPU, Samsung PM9C1b MZVL81T0HFLB-00BH1, OLED, 2880x1800, 14" | |
|---|---|---|---|---|---|---|
| Power Consumption | -50% | 21% | 8% | -3% | -6% | |
| Idle Minimum * (Watt) | 2.3 | 7.6 -230% | 1.7 26% | 3.5 -52% | 3.5 -52% | 3.1 -35% |
| Idle Average * (Watt) | 8.4 | 11.3 -35% | 6.8 19% | 4 52% | 4 52% | 3.6 57% |
| Idle Maximum * (Watt) | 8.5 | 11.5 -35% | 7.5 12% | 6.4 25% | 5.3 38% | 10 -18% |
| Load Average * (Watt) | 32.1 | 54.7 -70% | 28 13% | 44 -37% | 43.7 -36% | 39.2 -22% |
| Cyberpunk 2077 ultra external monitor * (Watt) | 47.4 | 51.3 -8% | 38.1 20% | 61.4 -30% | 51.2 -8% | |
| Cyberpunk 2077 ultra * (Watt) | 52.9 | 54.6 -3% | 37.9 28% | 41 22% | 61.3 -16% | 51.4 3% |
| Load Maximum * (Watt) | 84.2 | 60.9 28% | 61.3 27% | 54 36% | 63.4 25% | 101.4 -20% |
* ... smaller is better
Power Consumption Cyberpunk / Stress Test
Power Consumption external Monitor
Battery Life
| Framework Laptop 13 Pro Ultra X7 358H, Arc B390 Panther Lake iGPU, 74.5 Wh | Framework Laptop 13.5 Ryzen AI 9 HX 370 Ryzen AI 9 HX 370, Radeon 890M, 61 Wh | Microsoft Surface Laptop 8 13.8 SD X2 Plus X2P-64-100, Adreno X2-45, 54 Wh | MSI Prestige 13 AI+ A3MG Ultra 9 386H, Intel Graphics 4 Xe3 PTL, 53.8 Wh | Asus ExpertBook Ultra B9406CAA Ultra X7 358H, Arc B390 Panther Lake iGPU, 70 Wh | Dell XPS 14 Core Ultra X7 358H Ultra X7 358H, Arc B390 Panther Lake iGPU, 70 Wh | |
|---|---|---|---|---|---|---|
| Battery runtime | ||||||
| WiFi v1.3 (h) | 19.3 | 8 -59% | 18.9 -2% | 12 -38% | 16.1 -17% | 16.8 -13% |
Notebookcheck Rating
The Framework Laptop 13 Pro feels much stronger and more professional than the standard Laptop 13.5 while maintaining repairability and compatibility with components.
Framework Laptop 13 Pro
- 07/28/2026 v8
Allen Ngo
 Total Sustainability Score:
 Potential Competitors in Comparison
Image | Model / Review | Price | Weight | Height | Display |
|---|---|---|---|---|---|
1. 87.9%  | Framework Laptop 13 Pro Intel Core Ultra X7 358H ⎘ Intel Arc B390 12 Xe3 Panther Lake iGPU ⎘ 32 GB Memory, 1024 GB SSD | Amazon: 1. $38.69 tomtoc 360° Protective Lapt... 2. $569.98 NIMO Thin & Light Gaming Lap... 3. $699.00 Apple MacBook Pro with M2 ch... List Price: 3000 USD | 1.4 kg | 15.85 mm | 13.50" 2880x1920 256 PPI IPS |
2. 83.8%  | Framework Laptop 13.5 Ryzen AI 9 HX 370 AMD Ryzen AI 9 HX 370 ⎘ AMD Radeon 890M ⎘ 32 GB Memory | Amazon: List Price: 2100 USD | 1.3 kg | 15.85 mm | 13.50" 2880x1920 256 PPI IPS |
3. 88.4%  | Microsoft Surface Laptop 8 13.8 Qualcomm Snapdragon X2 Plus X2P-64-100 ⎘ Qualcomm SD X2 Adreno X2-45 ⎘ 16 GB Memory, 512 GB SSD | Amazon: List Price: 1699€ | 1.3 kg | 17.5 mm | 13.80" 2304x1536 201 PPI IPS |
4. 84%  | MSI Prestige 13 AI+ A3MG Intel Core Ultra 9 386H ⎘ Intel Graphics 4 Xe3 Panther Lake iGPU ⎘ 32 GB Memory, 1024 GB SSD | Amazon: List Price: 1600 EUR | 888 g | 15.9 mm | 13.30" 2880x1800 255 PPI OLED |
5. 87.6%  | Asus ExpertBook Ultra B9406CAA Intel Core Ultra X7 358H ⎘ Intel Arc B390 12 Xe3 Panther Lake iGPU ⎘ 32 GB Memory, 2048 GB SSD | Amazon: | 1.1 kg | 15.9 mm | 14.00" 2880x1800 243 PPI OLED |
6. 87.4%  | Dell XPS 14 Core Ultra X7 358H Intel Core Ultra X7 358H ⎘ Intel Arc B390 12 Xe3 Panther Lake iGPU ⎘ 32 GB Memory, 1000 GB SSD | Amazon: 1. $1,599.99 Dell XPS 14 Premium Laptop D... 2. $1,499.99 Dell XPS 13 9350, 13.4" FHD+... 3. $2,399.99 Dell Premium 16 (Previously ... List Price: 2200 USD | 1.4 kg | 14.62 mm | 14.00" 2880x1800 243 PPI OLED |
Transparency
The selection of devices to be reviewed is made by our editorial team. The test sample was provided to the author as a loan by the manufacturer or retailer for the purpose of this review. The lender had no influence on this review, nor did the manufacturer receive a copy of this review before publication. There was no obligation to publish this review. As an independent media company, Notebookcheck is not subjected to the authority of manufacturers, retailers or publishers.
This is how Notebookcheck is testing
Every year, Notebookcheck independently reviews hundreds of laptops and smartphones using standardized procedures to ensure that all results are comparable. We have continuously developed our test methods for around 20 years and set industry standards in the process. In our test labs, high-quality measuring equipment is utilized by experienced technicians and editors. These tests involve a multi-stage validation process. Our complex rating system is based on hundreds of well-founded measurements and benchmarks, which maintains objectivity. Further information on our test methods can be found here.
 Add as a preferred source on Google


