Verdict — The Most Reasonable Configuration For Most
The Core Ultra 7 355 loses a lot of what makes the Panther Lake H-series so special in the first place. In particular, both performance and performance-per-watt are closer to Lunar Lake-V or even worse when taking into consideration their integrated graphics performance. Whereas the flagship Core Ultra X7 358H is a huge leap forward for the series, the midrange Core Ultra 7 355 can feel like a rebranded Core Ultra 7 255U in many respects. The system doesn't run noticeably cooler or longer than the faster Core Ultra X7 option despite their performance differences.
Of course, users who don't need the performance advantages of the Core Ultra X7 may still prefer the less expensive Core Ultra 7 355 configuration as it still carries all the physical design improvements over the divisive 2025 or earlier models. Even the base 1200p IPS panel is better than most others of the same type in terms of image quality. Users who aren't persuaded by the Arc B390 GPU will find the Core Ultra 7 355 to be just as good for browsing, word processing, and general multimedia. Otherwise, content creators and occasional gamers will definitely want to consider the higher-end Core Ultra X7.
Pros
Cons
Price and Availability
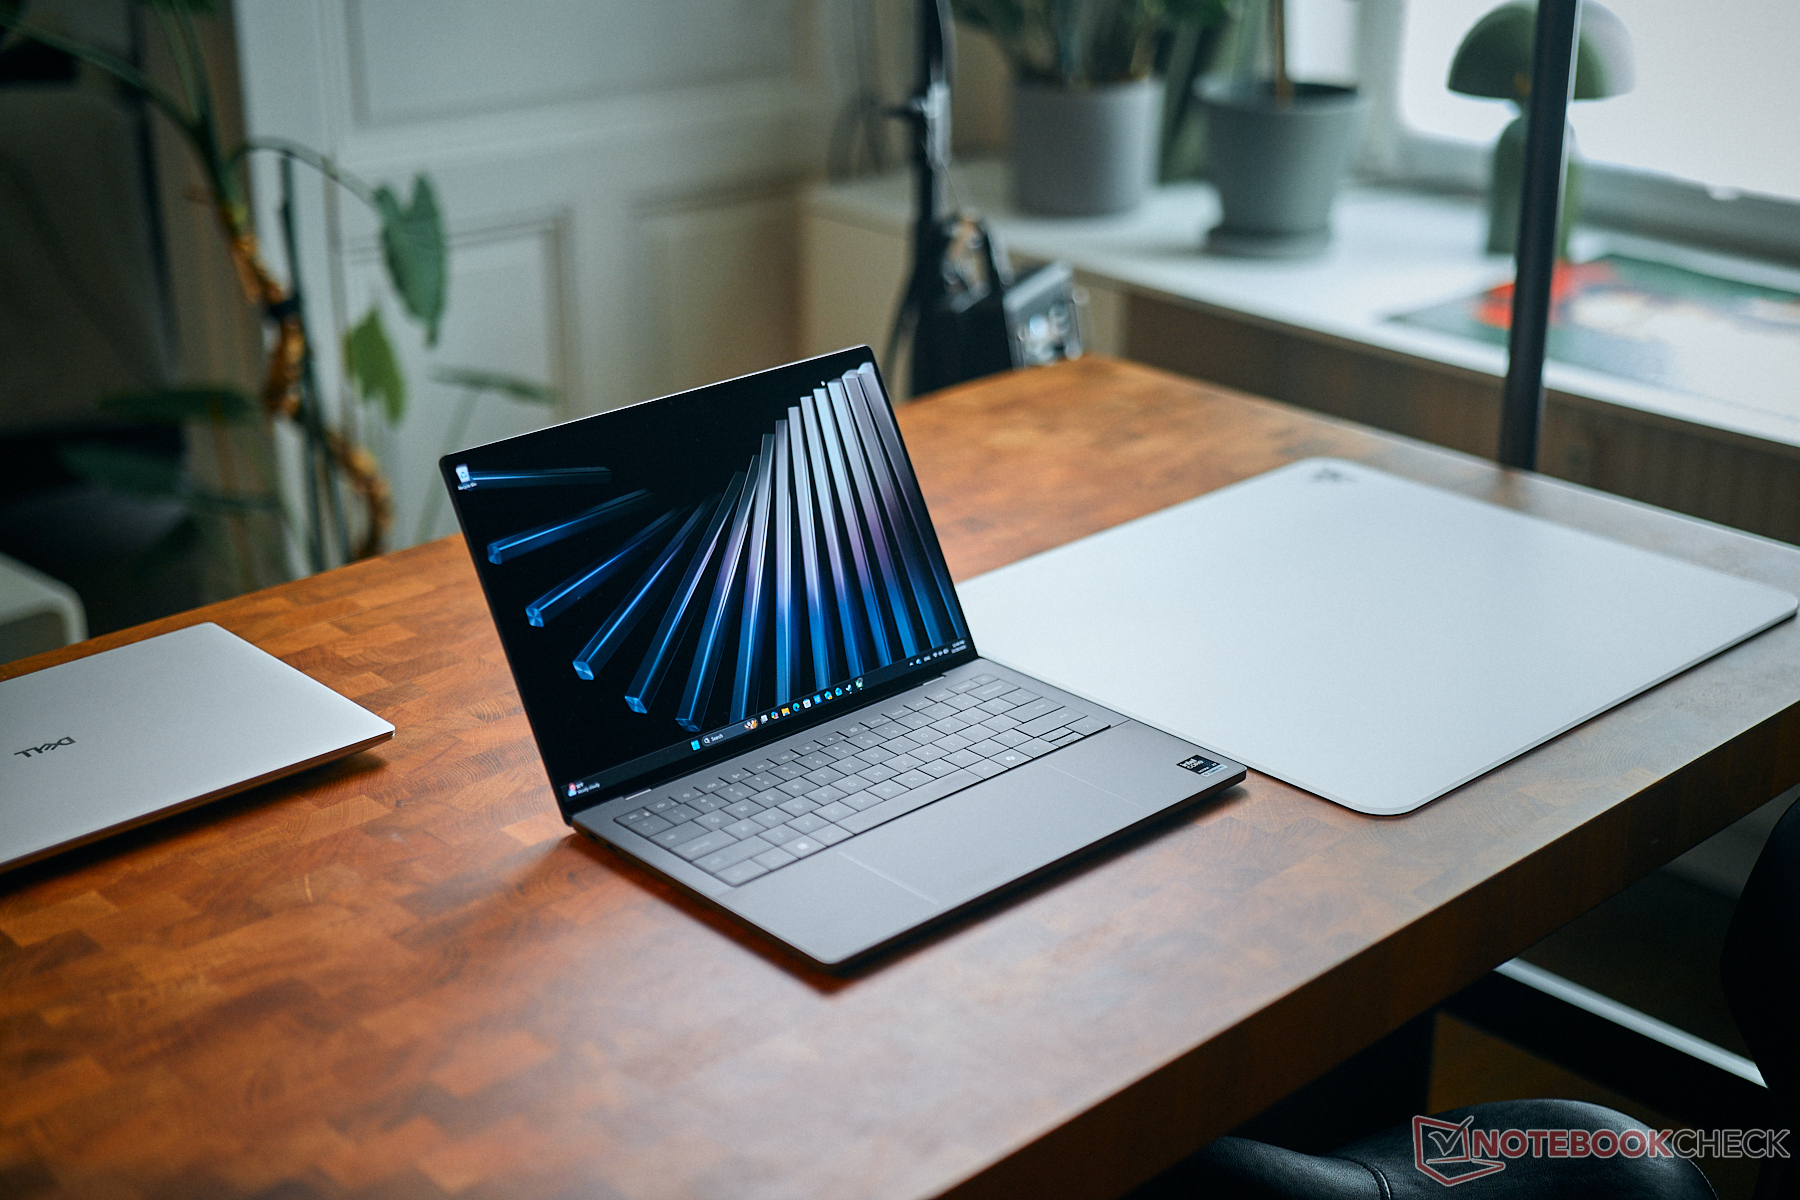
Dell is now shipping the Core Ultra 7 U-series XPS 14 configuration as reviewed starting at $1700.
We recently checked out the Core Ultra X7 OLED XPS 14 and gave it high marks in regards to all the improvements to both performance and design. Nonetheless, the majority of users may be more interested in the affordable SKUs with the Core Ultra 7 and IPS display for almost $500 USD less. This review compares both configurations to see how much of a performance deficit users can expect before purchasing.
Since the Core Ultra 7 and Core Ultra X7 SKUs are visually identical, we recommend reading up on our existing review of the OLED XPS 14 to learn more about the physical features of the model.
More Dell reviews:
Specifications
Case
The non-touch IPS configuration is ever-so-slightly thinner than the OLED touchscreen configuration (14.6 mm vs. 15.2 mm). Impressions are otherwise the same for a noticeably stronger construction than the outgoing model at the cost of a slightly more involved servicing process.
Connectivity


Communication
Webcam


Maintenance

Sustainability
Dell continues to use increasing levels of recycled materials to build its flagship models including the latest XPS 14 as noted in our original review.
Display
Two display options are available as follows:
- 1920 x 1200, non-touch, matte, 500 nits, 100% sRGB, IPS, 1 - 120 Hz
- 2880 x 1800, touchscreen, glossy, 500 nits, 100% DCI-P3, OLED, 20 - 120 Hz
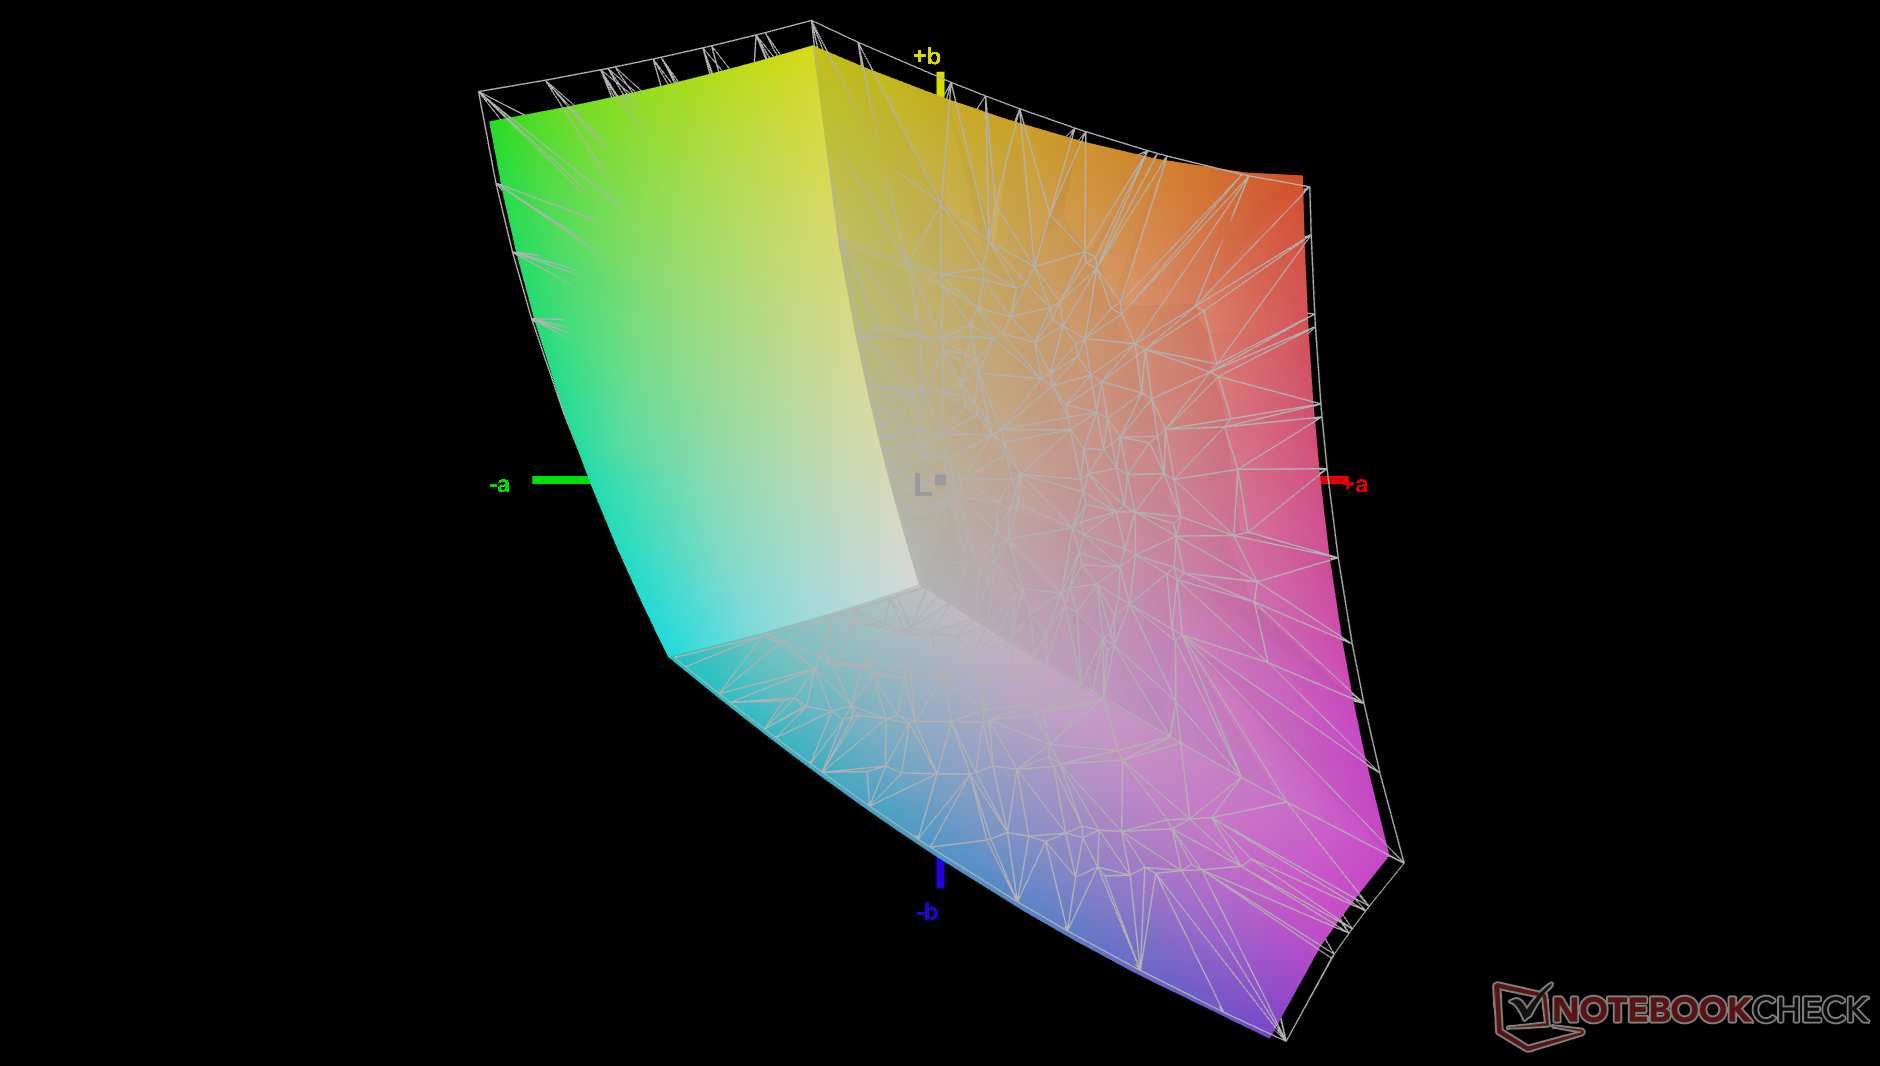
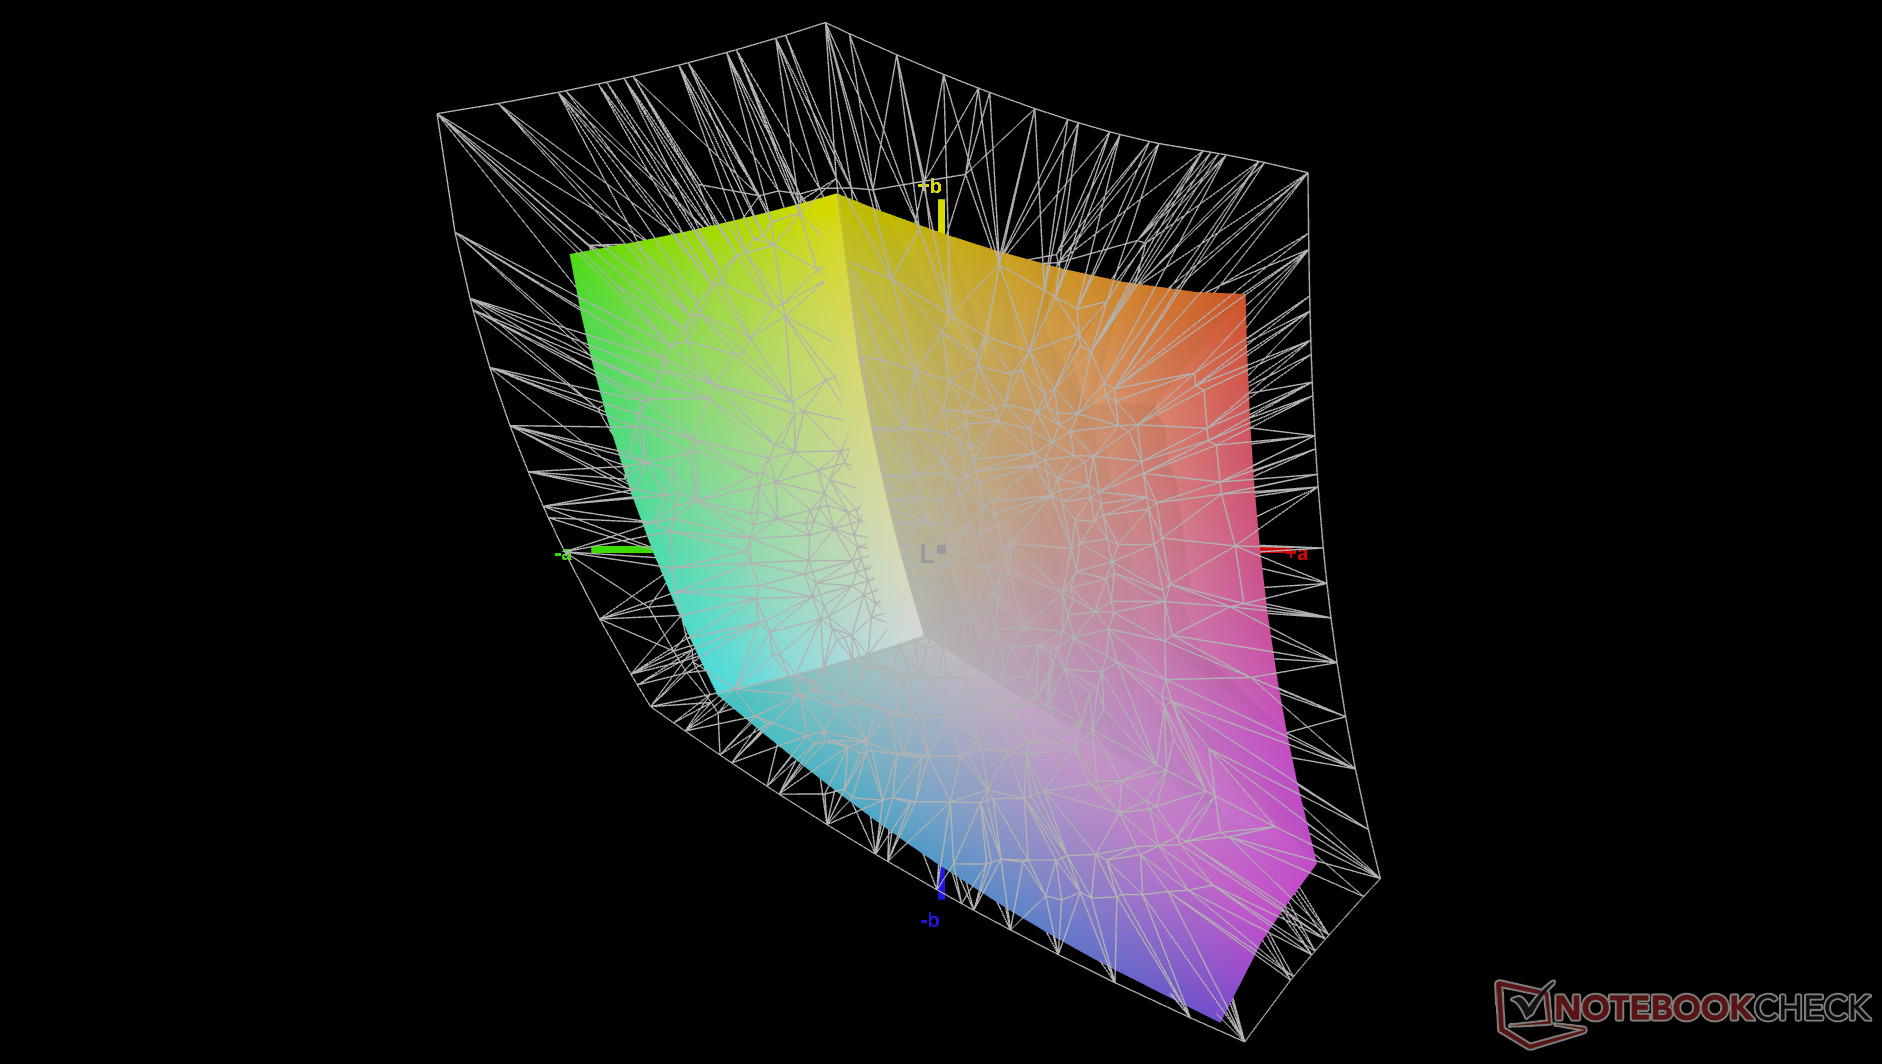
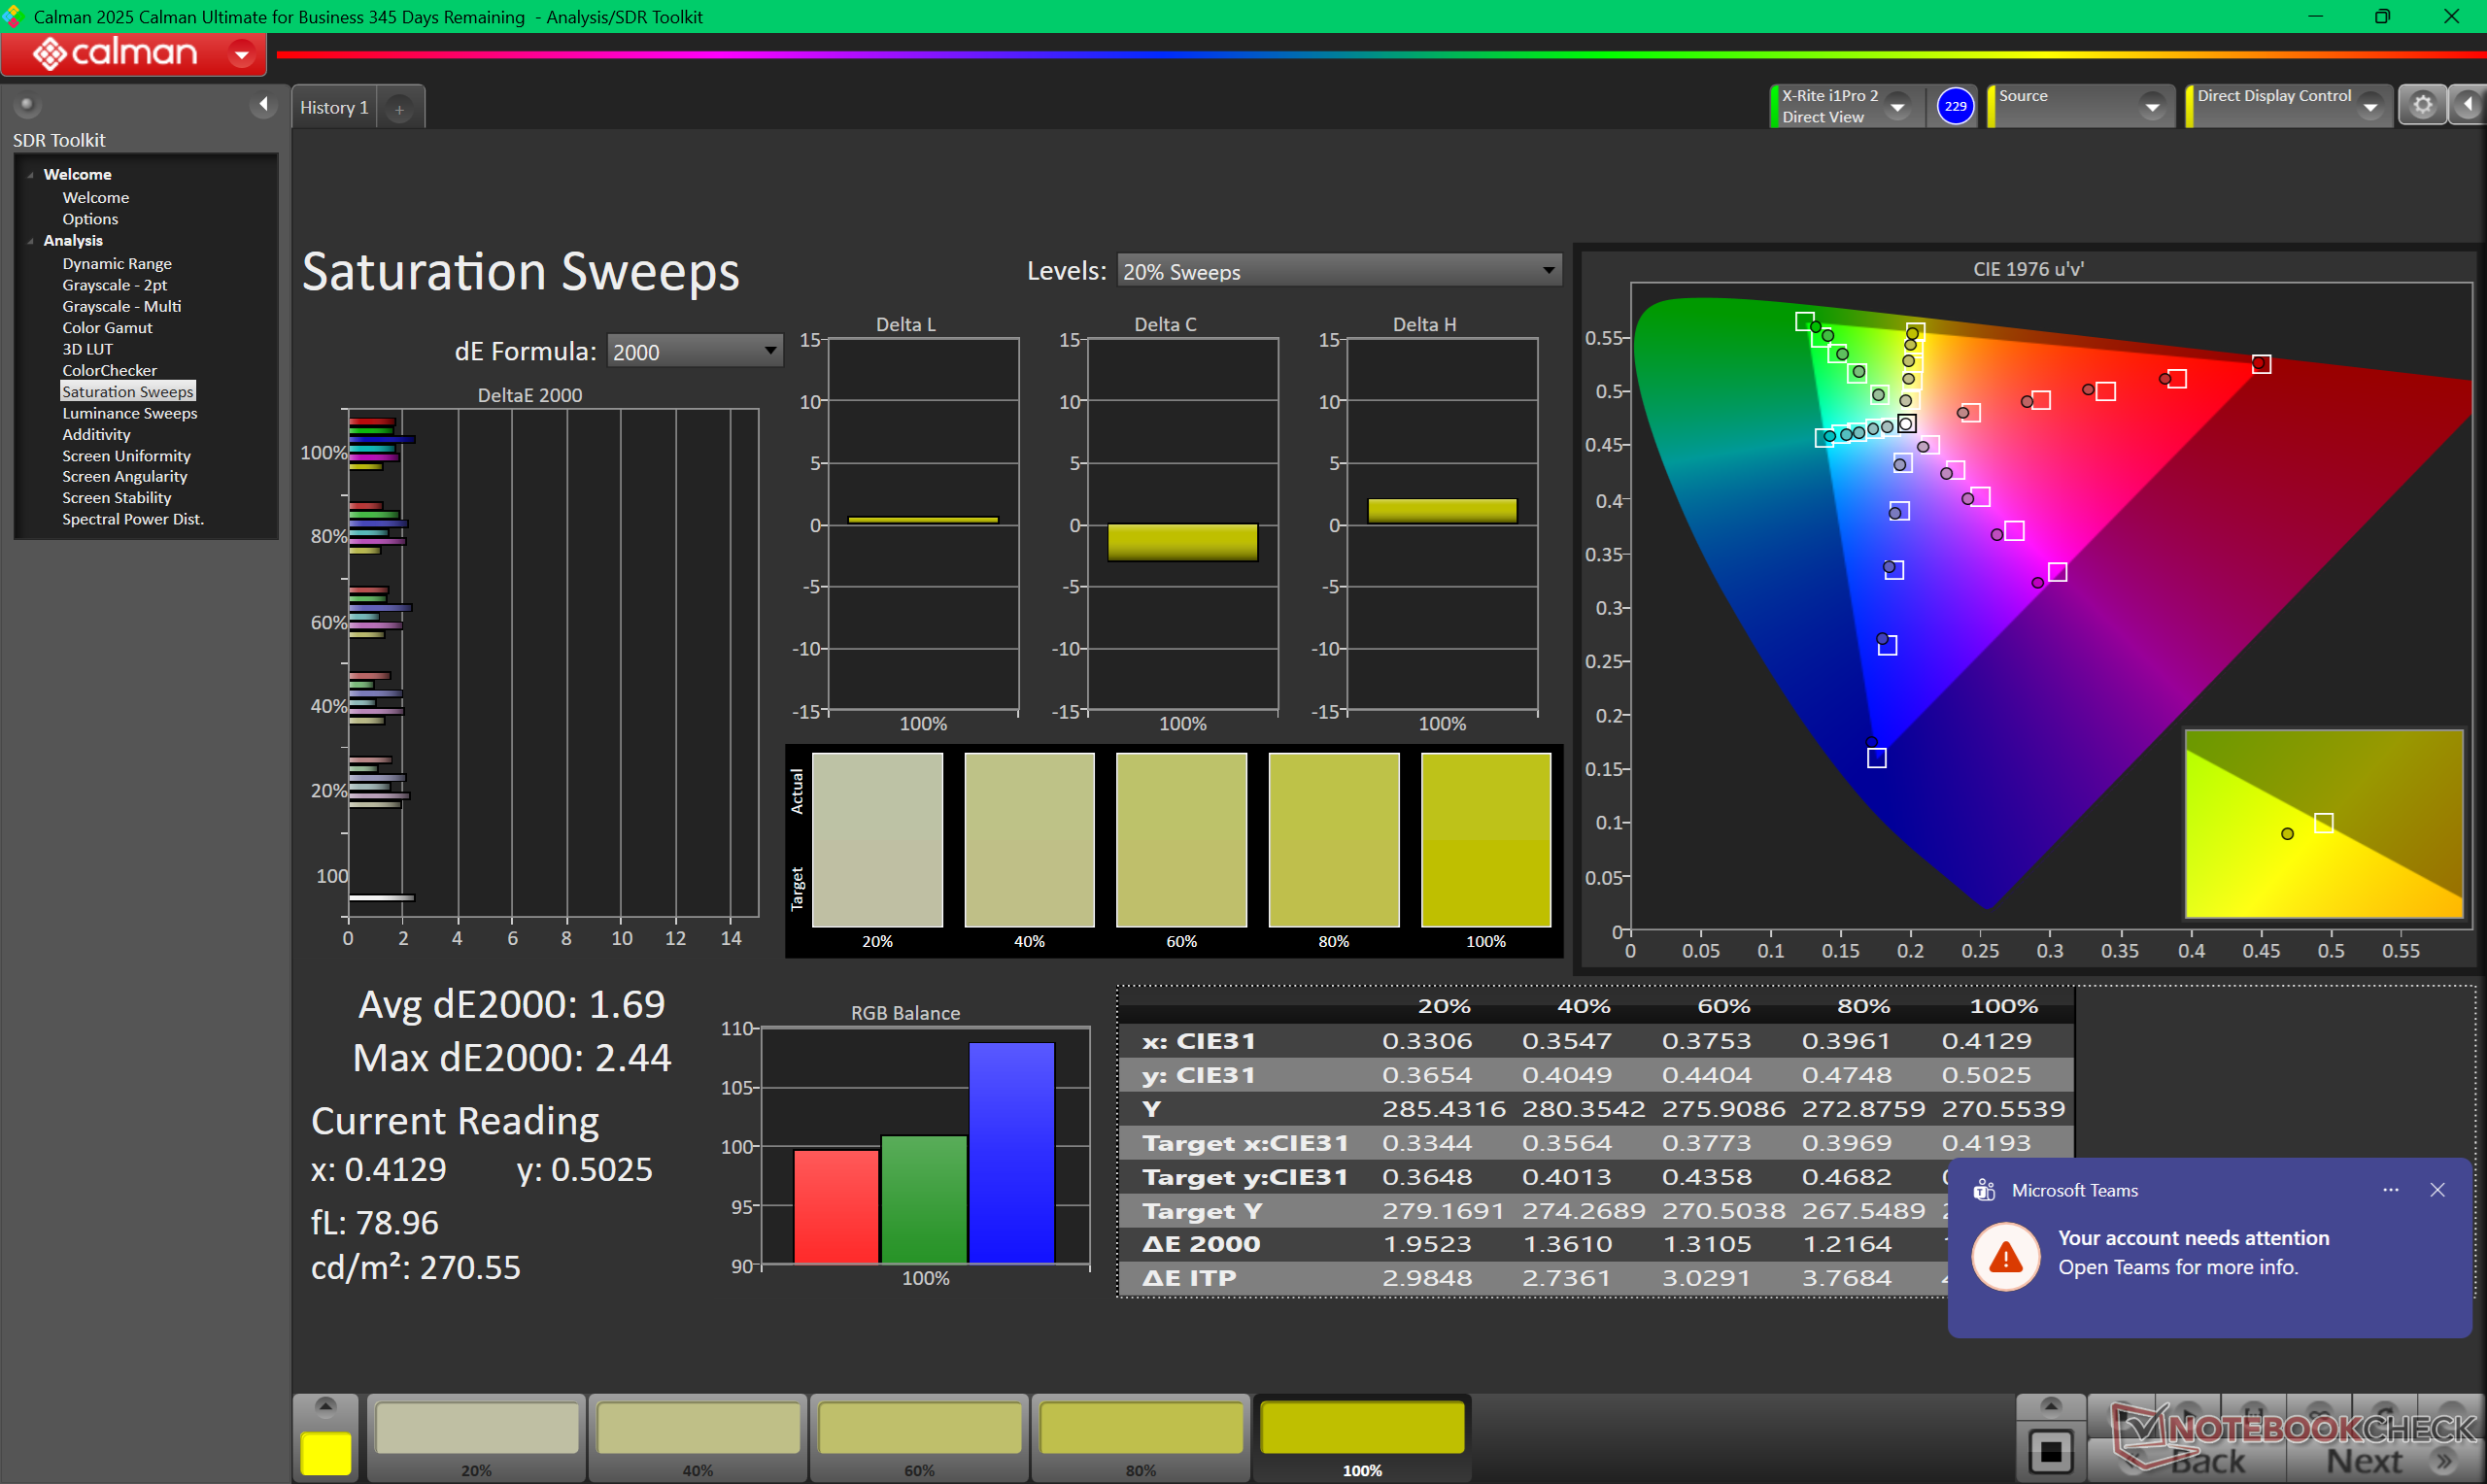
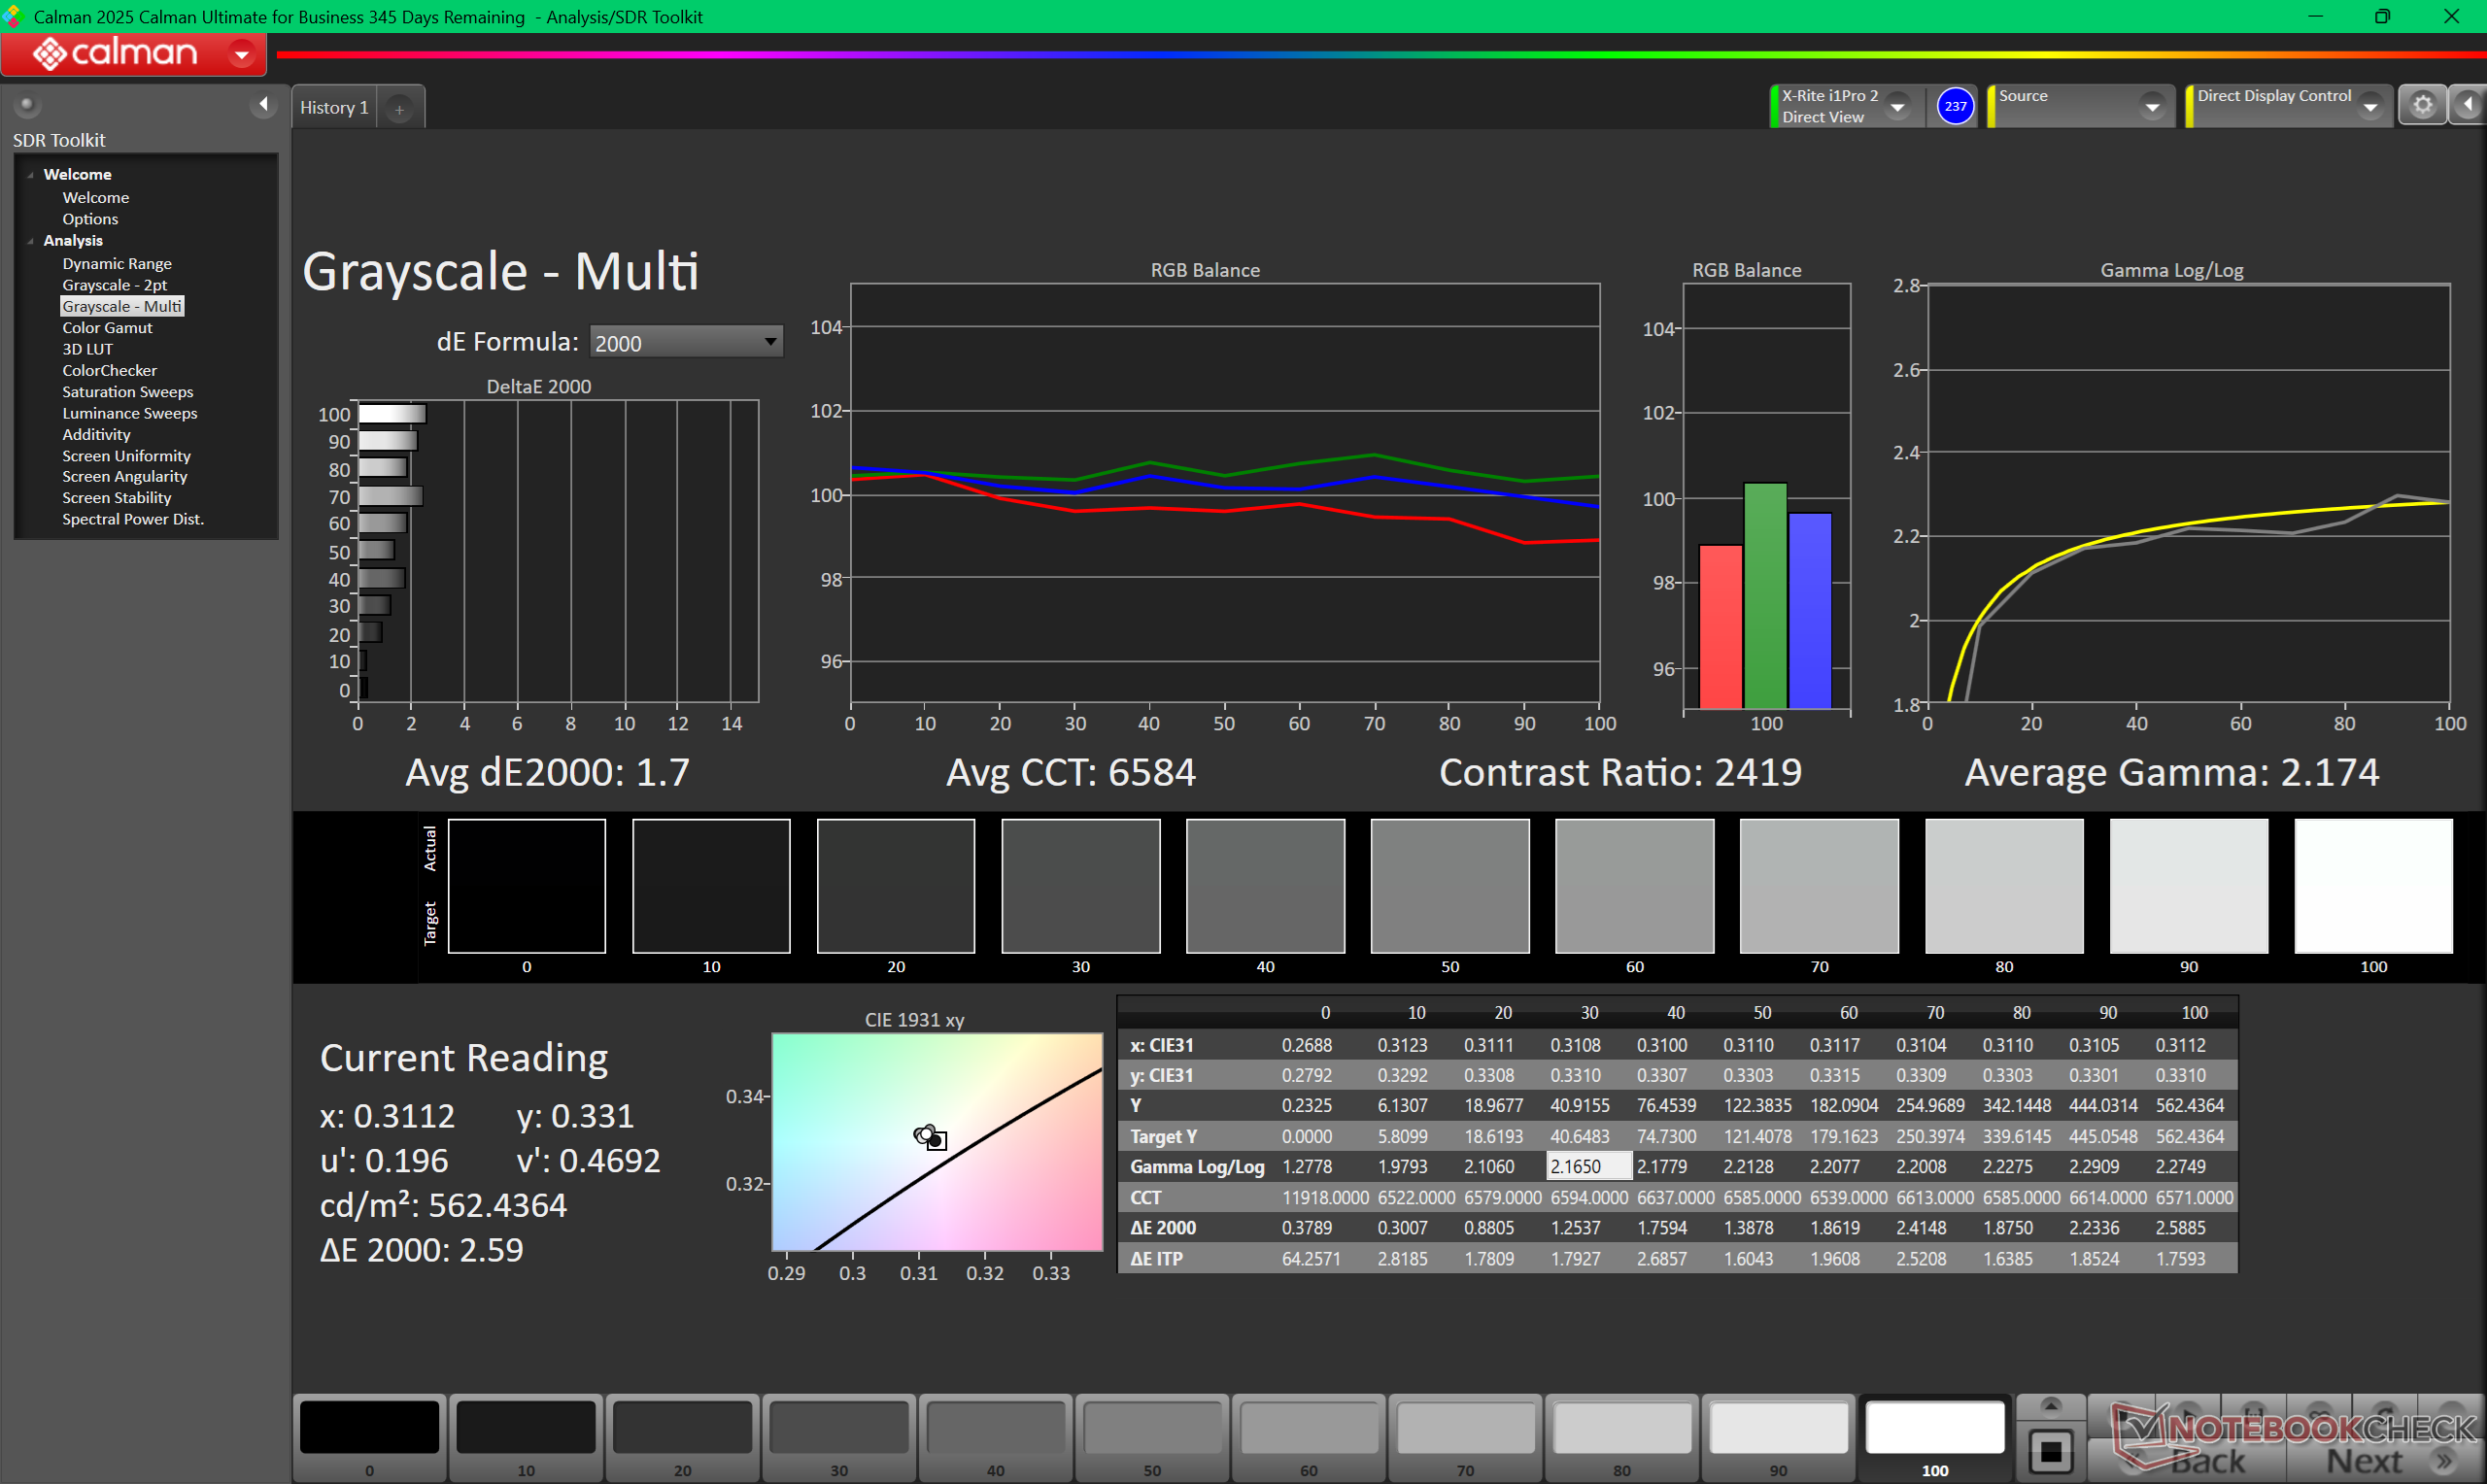
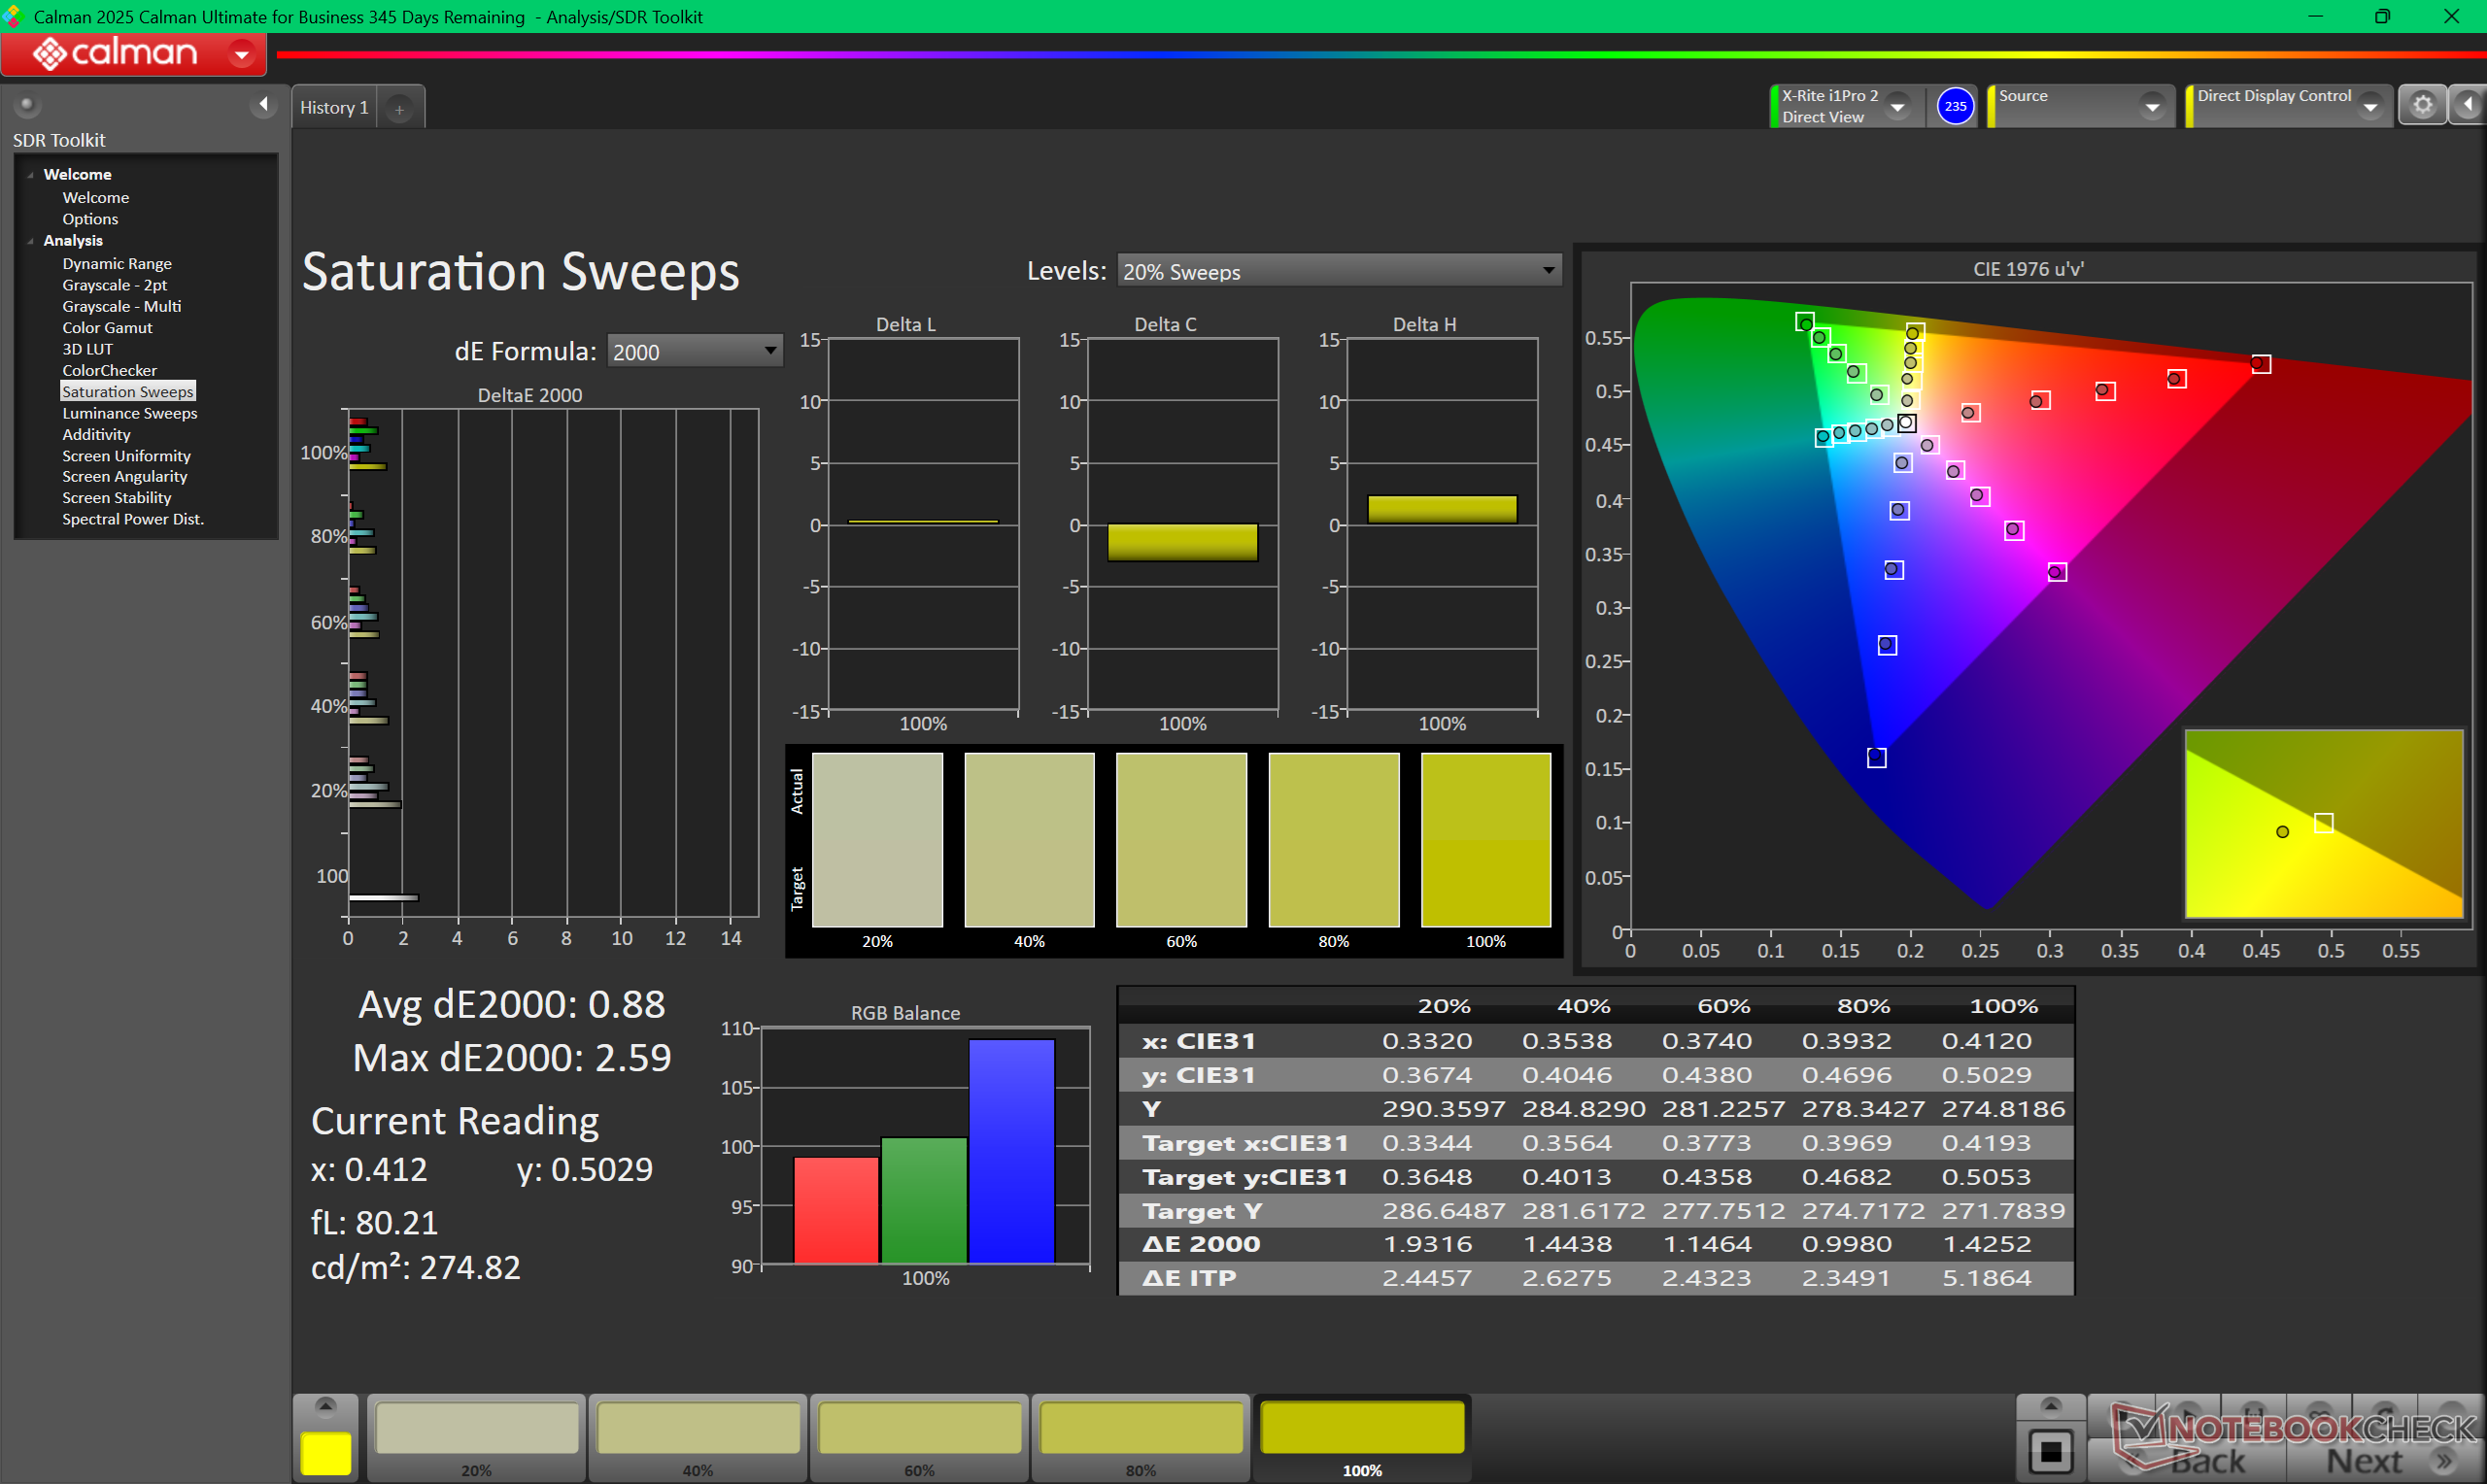
When compared to the OLED panel, the less expensive IPS panel can be slightly brighter at the center but otherwise slightly dimmer around the edges and corners due to poorer uniformity. Contrast ratio is still very good especially for an IPS panel at over 2000:1 and while Windows VRR is supported down to just 1 Hz when idling as opposed to 20 Hz or greater on most other laptops. Note that this feature is disabled by default and must be manually enabled.
The two most notable drawbacks to the IPS panel are its much slower black-white response times and lack of DCI-P3 coverage. As a result, ghosting can be very noticeable particularly when gaming and HDR is not officially supported.


| |||||||||||||||||||||||||
Brightness Distribution: 85 %
Center on Battery: 561.2 cd/m²
Contrast: 2551:1 (Black: 0.22 cd/m²)
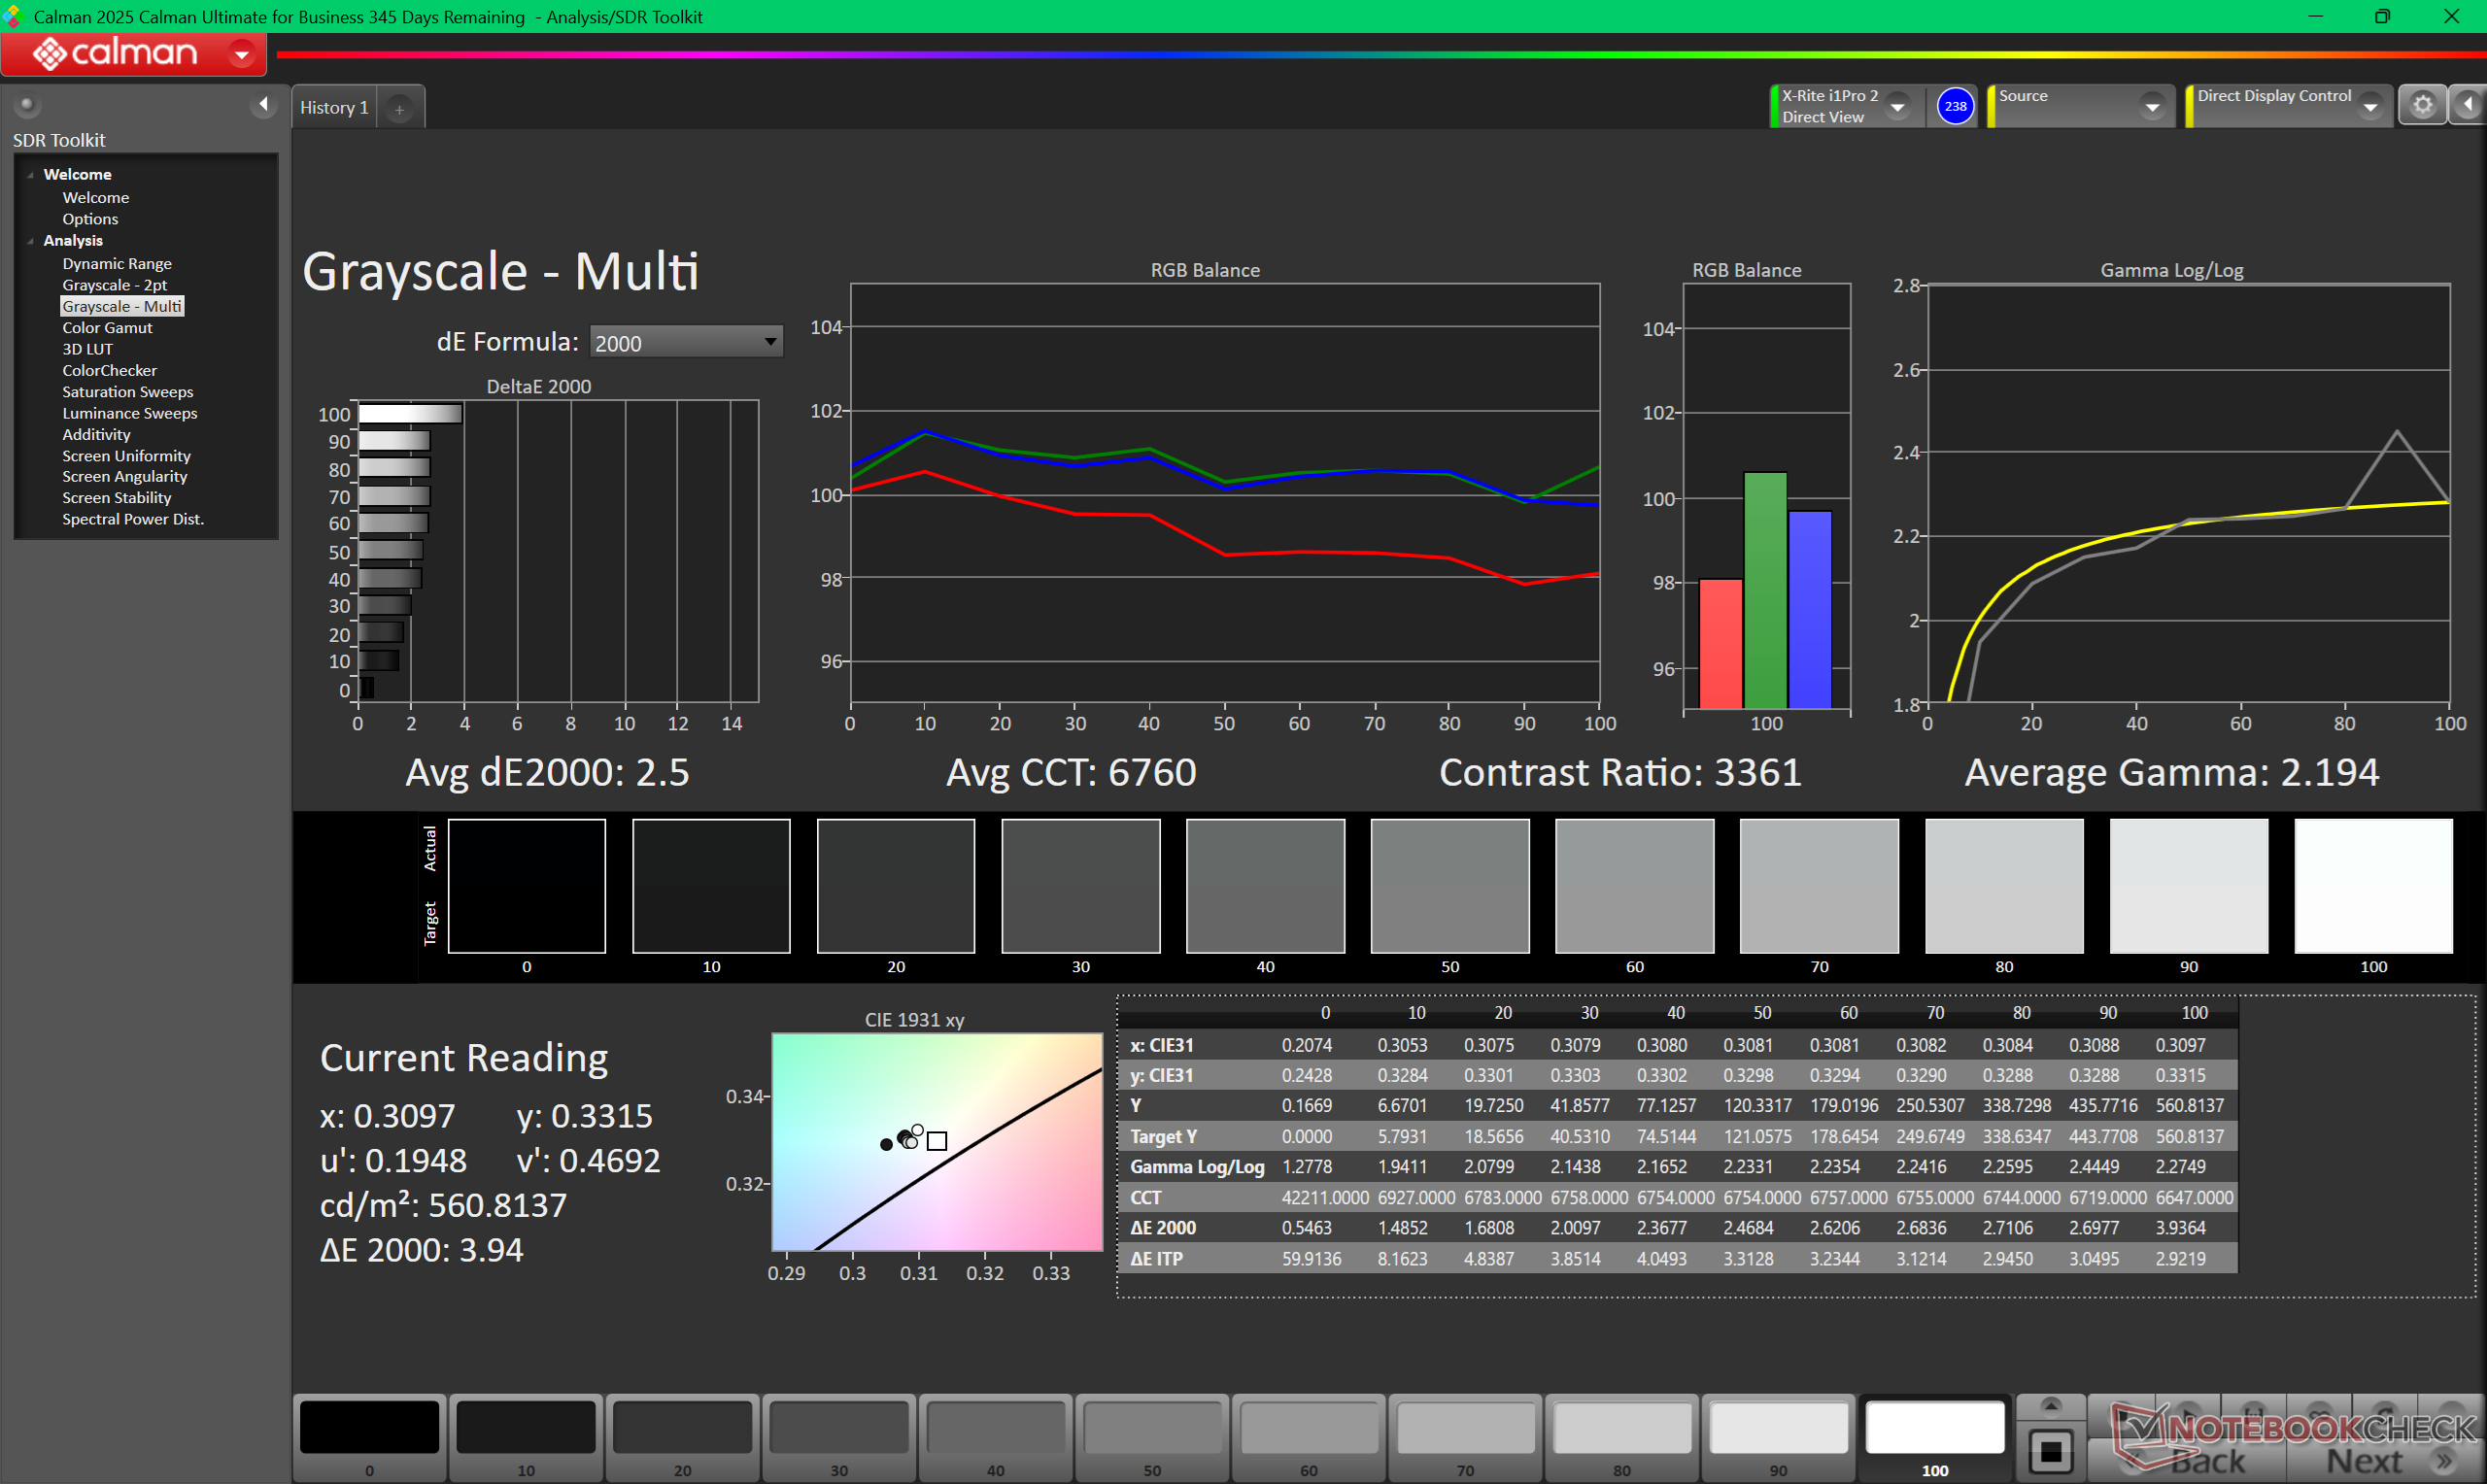
ΔE ColorChecker Calman: 2.09 | ∀{0.5-29.43 Ø4.73}
calibrated: 1.09
ΔE Greyscale Calman: 2.5 | ∀{0.09-98 Ø4.97}
66.2% AdobeRGB 1998 (Argyll 3D)
95.3% sRGB (Argyll 3D)
64% Display P3 (Argyll 3D)
Gamma: 2.19
CCT: 6760 K
| Dell XPS 14 Core Ultra 7 355 LG Philips 140WUX, IPS, 1920x1200, 14", 120 Hz | Dell XPS 14 Core Ultra X7 358H LG Philips 140WT2, OLED, 2880x1800, 14", 120 Hz | Asus ExpertBook PM3406 MNE007QS3-6, IPS, 1920x1200, 14", 60 Hz | Lenovo ThinkPad T14 Gen 6 21QG001VGE MNE007JA1-3, IPS LED, 1920x1200, 14", 60 Hz | HP OmniBook Ultra Flip 14 Samsung SDC41AA, OLED, 2880x1800, 14", 120 Hz | Samsung Galaxy Book5 Pro 14 940XHA ATNA40CU07-0, OLED, 2880x1800, 14", 120 Hz | |
|---|---|---|---|---|---|---|
| Display | 36% | -39% | 5% | 36% | 35% | |
| Display P3 Coverage (%) | 64 | 99.7 56% | 39.3 -39% | 67.7 6% | 99.8 56% | 99.9 56% |
| sRGB Coverage (%) | 95.3 | 100 5% | 58.1 -39% | 98.3 3% | 100 5% | 100 5% |
| AdobeRGB 1998 Coverage (%) | 66.2 | 98.2 48% | 40.6 -39% | 69.9 6% | 96.7 46% | 95.7 45% |
| Response Times | 98% | 54% | 28% | 98% | 99% | |
| Response Time Grey 50% / Grey 80% * (ms) | 57.7 ? | 0.75 ? 99% | 27.6 ? 52% | 40.2 ? 30% | 0.86 ? 99% | 0.83 ? 99% |
| Response Time Black / White * (ms) | 38.8 ? | 1.03 ? 97% | 17 ? 56% | 29.1 ? 25% | 1.01 ? 97% | 0.69 ? 98% |
| PWM Frequency (Hz) | 240.62 ? | 469 ? | 240 ? | |||
| PWM Amplitude * (%) | 29 | 33.3 | 66 | |||
| Screen | 11% | -102% | 5% | 19% | -7% | |
| Brightness middle (cd/m²) | 561.2 | 393.8 -30% | 320 -43% | 554 -1% | 363.9 -35% | 400 -29% |
| Brightness (cd/m²) | 505 | 389 -23% | 310 -39% | 516 2% | 366 -28% | 402 -20% |
| Brightness Distribution (%) | 85 | 96 13% | 93 9% | 91 7% | 99 16% | 99 16% |
| Black Level * (cd/m²) | 0.22 | 0.26 -18% | 0.24 -9% | |||
| Contrast (:1) | 2551 | 1231 -52% | 2308 -10% | |||
| Colorchecker dE 2000 * | 2.09 | 1.27 39% | 5.1 -144% | 1.5 28% | 0.84 60% | 2.1 -0% |
| Colorchecker dE 2000 max. * | 4.37 | 3.35 23% | 18.1 -314% | 3.4 22% | 2.72 38% | 3.3 24% |
| Colorchecker dE 2000 calibrated * | 1.09 | 0.71 35% | 4.9 -350% | 0.9 17% | 0.82 25% | 1.6 -47% |
| Greyscale dE 2000 * | 2.5 | 2 20% | 1.7 32% | 2.7 -8% | 1.1 56% | 2.3 8% |
| Gamma | 2.19 100% | 2.19 100% | 2.21 100% | 2.25 98% | 2.18 101% | 2.26 97% |
| CCT | 6760 96% | 6379 102% | 6398 102% | 6882 94% | 6330 103% | 6795 96% |
| Total Average (Program / Settings) | 48% /
32% | -29% /
-66% | 13% /
8% | 51% /
36% | 42% /
21% |
* ... smaller is better
While the display comes decently calibrated out of the box, there is still room for slight improvements. Calibrating the panel ourselves with an X-Rite colorimeter would improve average grayscale and color deltaE values from 2.5 and 2.09 to just 1.7 and 1.09, respectively, while also bumping the color temperature closer to the 6500K target.


Display Response Times
| ↔ Response Time Black to White | ||
|---|---|---|
| 38.8 ms ... rise ↗ and fall ↘ combined | ↗ 17 ms rise | 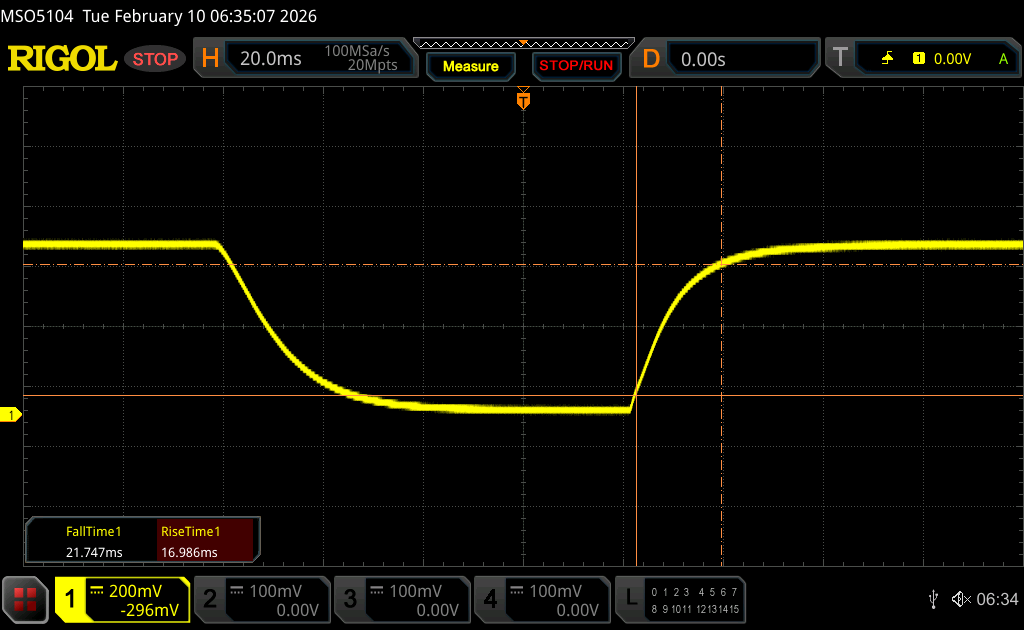 |
| ↘ 21.8 ms fall | ||
| The screen shows slow response rates in our tests and will be unsatisfactory for gamers. In comparison, all tested devices range from 0.1 (minimum) to 240 (maximum) ms. » 96 % of all devices are better. This means that the measured response time is worse than the average of all tested devices (19.9 ms). | ||
| ↔ Response Time 50% Grey to 80% Grey | ||
| 57.7 ms ... rise ↗ and fall ↘ combined | ↗ 26.4 ms rise | 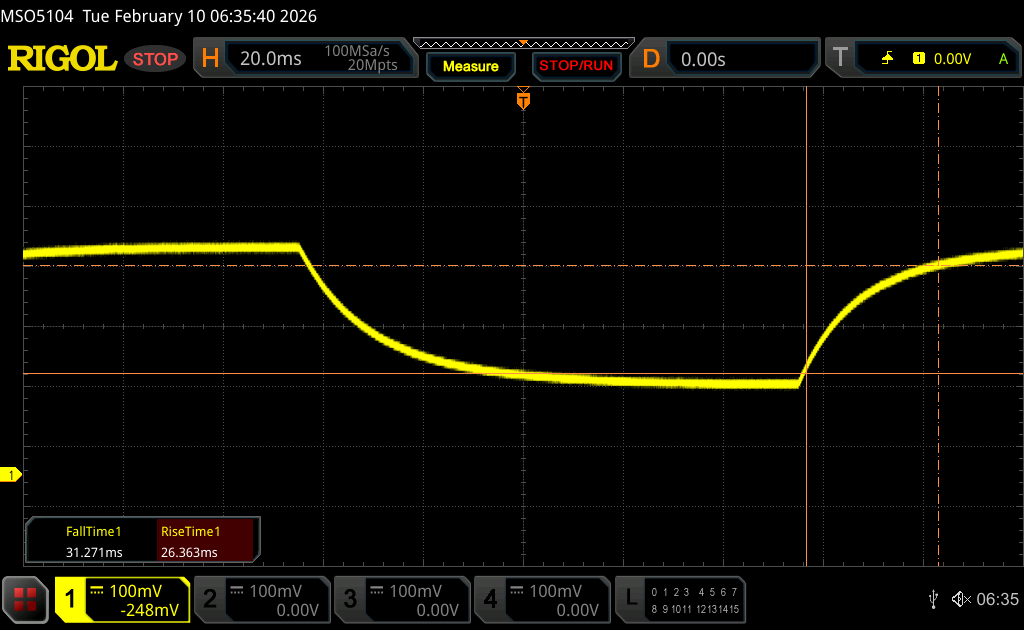 |
| ↘ 31.3 ms fall | ||
| The screen shows slow response rates in our tests and will be unsatisfactory for gamers. In comparison, all tested devices range from 0.165 (minimum) to 636 (maximum) ms. » 94 % of all devices are better. This means that the measured response time is worse than the average of all tested devices (31.1 ms). | ||
Screen Flickering / PWM (Pulse-Width Modulation)
| Screen flickering / PWM not detected |  | ||
In comparison: 52 % of all tested devices do not use PWM to dim the display. If PWM was detected, an average of 7791 (minimum: 5 - maximum: 343500) Hz was measured. | |||


Performance
Testing Conditions
We set Windows and Dell Optimizer to Performance mode prior to running the benchmarks below.
Processor
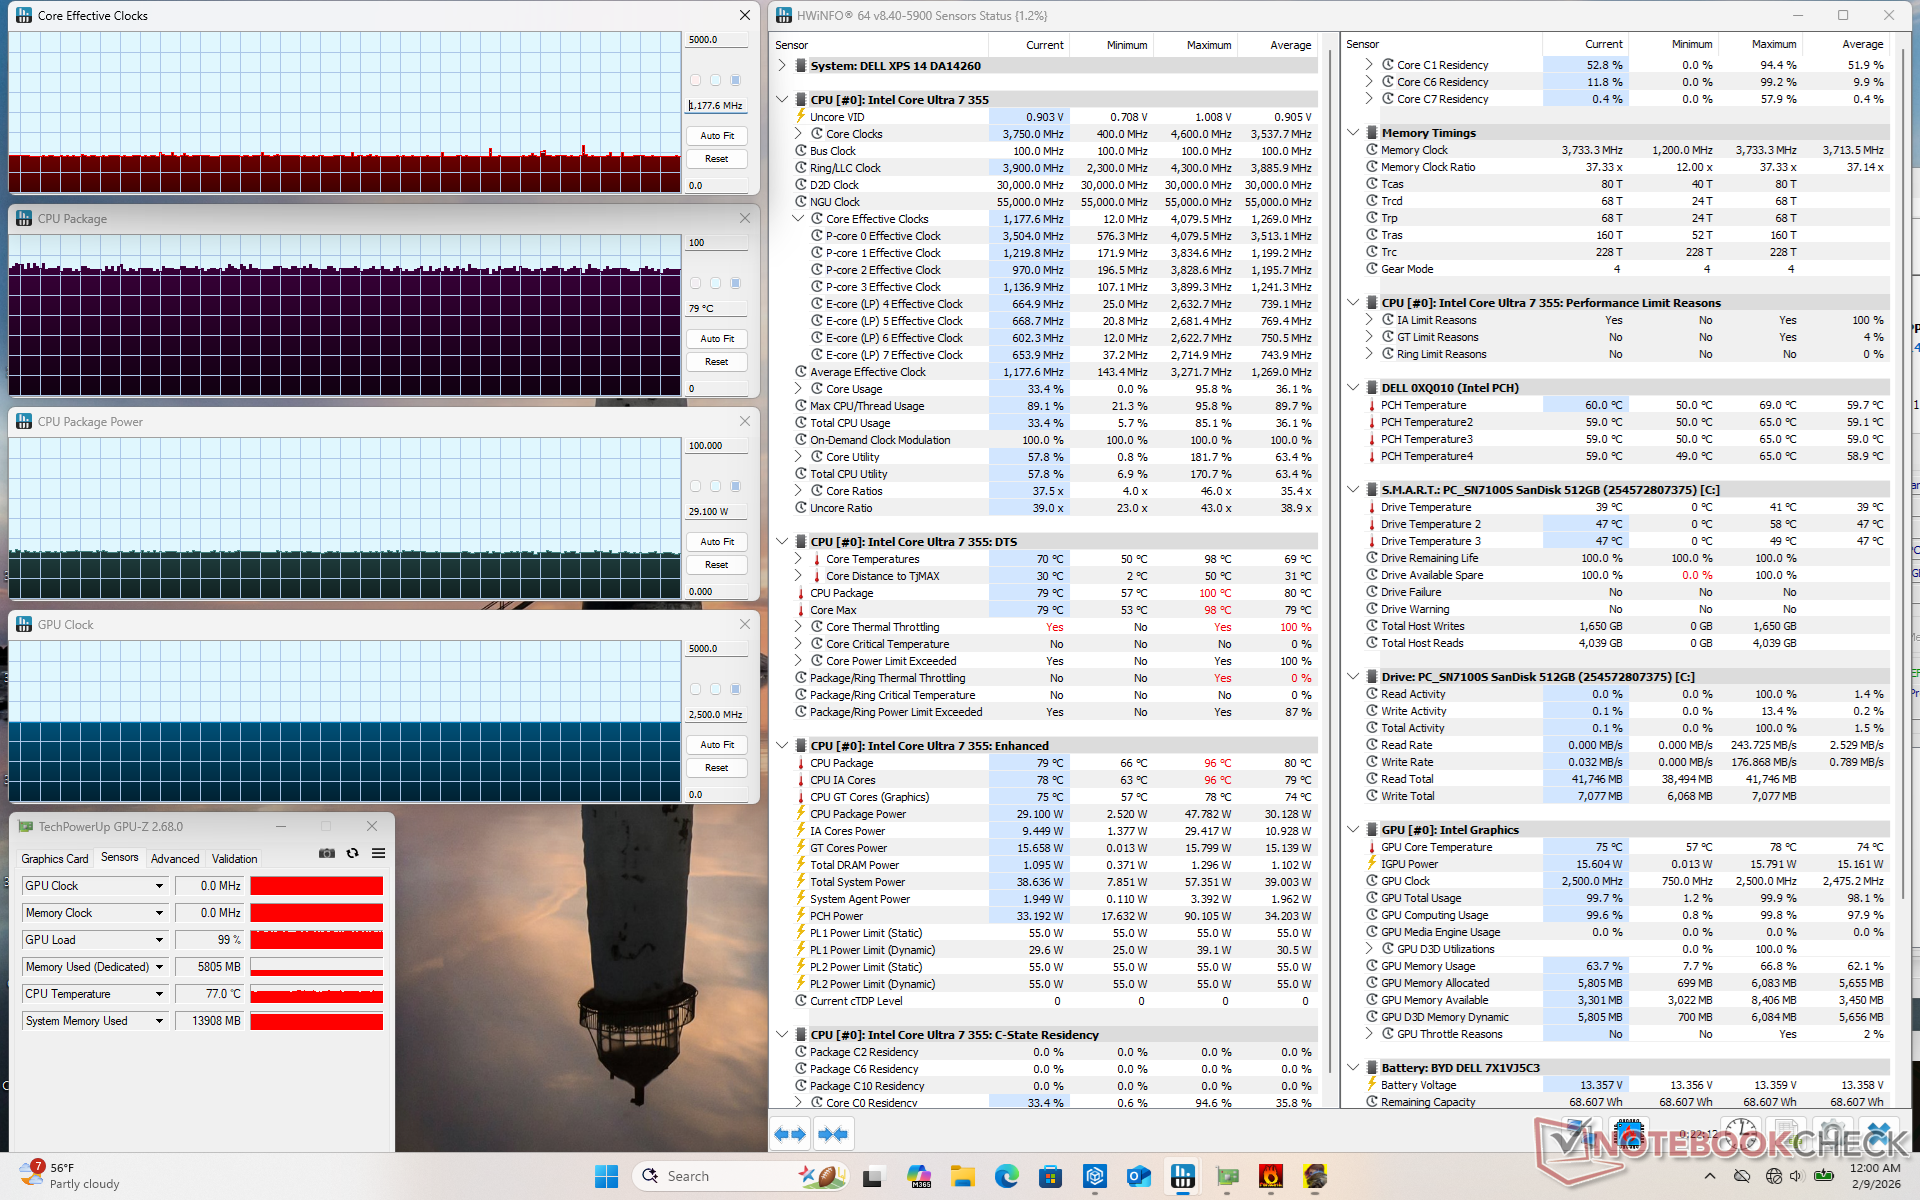
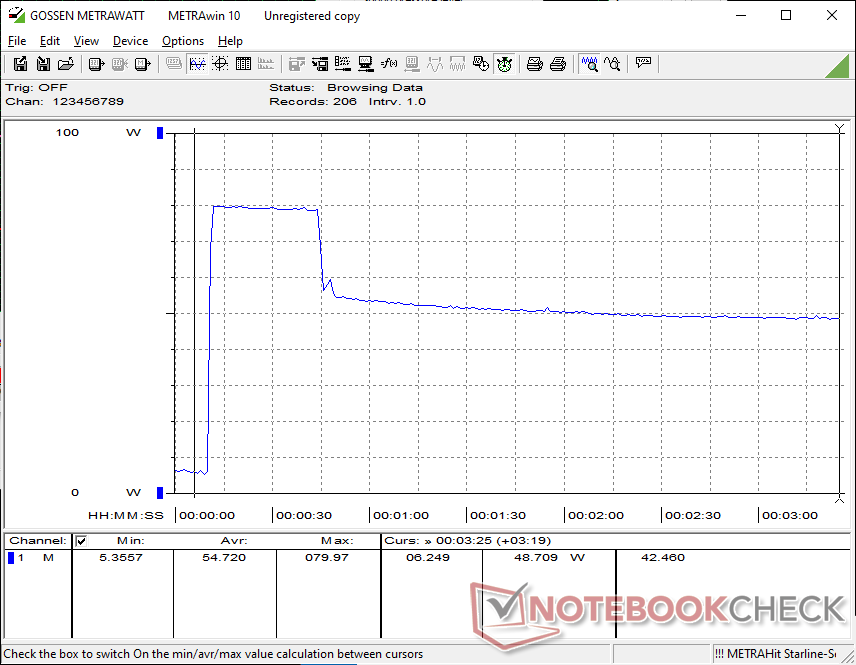
Raw multi-thread performance from our Core Ultra 7 355 is roughly 40 percent slower than the Core Ultra X7 358H XPS 14 configuration to be almost identical to laptops running on the older Arrow Lake-U Core Ultra 7 255U or Lunar Lake-V Core Ultra 7 258V for minimal year-over-year gains. Turbo Boost potential is also much more limited than the Core Ultra X7 configuration as shown by our CineBench R15 xT loop graph below.
Cinebench R15 Multi Loop
Cinebench R23: Multi Core | Single Core
Cinebench R20: CPU (Multi Core) | CPU (Single Core)
Cinebench R15: CPU Multi 64Bit | CPU Single 64Bit
Blender: v2.79 BMW27 CPU
7-Zip 18.03: 7z b 4 | 7z b 4 -mmt1
Geekbench 6.7: Multi-Core | Single-Core
Geekbench 5.5: Multi-Core | Single-Core
HWBOT x265 Benchmark v2.2: 4k Preset
LibreOffice : 20 Documents To PDF
R Benchmark 2.5: Overall mean
* ... smaller is better
AIDA64: FP32 Ray-Trace | FPU Julia | CPU SHA3 | CPU Queen | FPU SinJulia | FPU Mandel | CPU AES | CPU ZLib | FP64 Ray-Trace | CPU PhotoWorxx | CPU CheckMate
| Performance rating | |
| Asus ExpertBook PM3406 -1! | |
| Dell XPS 14 Core Ultra X7 358H | |
| HP OmniBook Ultra Flip 14 -1! | |
| Lenovo ThinkPad T14 Gen 6 21QG001VGE -1! | |
| Average Intel Core Ultra 7 355 | |
| Dell XPS 14 Core Ultra 7 355 | |
| Samsung Galaxy Book5 Pro 14 940XHA -1! | |
| AIDA64 / FP32 Ray-Trace | |
| Asus ExpertBook PM3406 (v6.92.6600) | |
| Dell XPS 14 Core Ultra X7 358H (v8.20.8100) | |
| HP OmniBook Ultra Flip 14 (v6.92.6600) | |
| Lenovo ThinkPad T14 Gen 6 21QG001VGE (v6.92.6600) | |
| Average Intel Core Ultra 7 355 (12228 - 12838, n=3) | |
| Dell XPS 14 Core Ultra 7 355 (v8.20.8100) | |
| Samsung Galaxy Book5 Pro 14 940XHA (v6.92.6600) | |
| AIDA64 / FPU Julia | |
| Asus ExpertBook PM3406 (v6.92.6600) | |
| Dell XPS 14 Core Ultra X7 358H (v8.20.8100) | |
| Dell XPS 14 Core Ultra 7 355 (v8.20.8100) | |
| Average Intel Core Ultra 7 355 (60741 - 65963, n=3) | |
| Lenovo ThinkPad T14 Gen 6 21QG001VGE (v6.92.6600) | |
| HP OmniBook Ultra Flip 14 (v6.92.6600) | |
| Samsung Galaxy Book5 Pro 14 940XHA (v6.92.6600) | |
| AIDA64 / CPU SHA3 | |
| Dell XPS 14 Core Ultra X7 358H (v8.20.8100) | |
| Asus ExpertBook PM3406 (v6.92.6600) | |
| HP OmniBook Ultra Flip 14 (v6.92.6600) | |
| Average Intel Core Ultra 7 355 (2763 - 2845, n=3) | |
| Dell XPS 14 Core Ultra 7 355 (v8.20.8100) | |
| Lenovo ThinkPad T14 Gen 6 21QG001VGE (v6.92.6600) | |
| Samsung Galaxy Book5 Pro 14 940XHA (v6.92.6600) | |
| AIDA64 / CPU Queen | |
| Asus ExpertBook PM3406 (v6.92.6600) | |
| Dell XPS 14 Core Ultra X7 358H (v6.92.6600) | |
| HP OmniBook Ultra Flip 14 (v6.92.6600) | |
| Lenovo ThinkPad T14 Gen 6 21QG001VGE (v6.92.6600) | |
| Samsung Galaxy Book5 Pro 14 940XHA (v6.92.6600) | |
| Dell XPS 14 Core Ultra 7 355 (v6.92.6600) | |
| Average Intel Core Ultra 7 355 (n=1) | |
| AIDA64 / FPU SinJulia | |
| Asus ExpertBook PM3406 (v6.92.6600) | |
| Dell XPS 14 Core Ultra X7 358H (v8.20.8100) | |
| Average Intel Core Ultra 7 355 (4597 - 4601, n=3) | |
| Dell XPS 14 Core Ultra 7 355 (v8.20.8100) | |
| HP OmniBook Ultra Flip 14 (v6.92.6600) | |
| Lenovo ThinkPad T14 Gen 6 21QG001VGE (v6.92.6600) | |
| Samsung Galaxy Book5 Pro 14 940XHA (v6.92.6600) | |
| AIDA64 / FPU Mandel | |
| Asus ExpertBook PM3406 (v6.92.6600) | |
| Dell XPS 14 Core Ultra X7 358H (v8.20.8100) | |
| Dell XPS 14 Core Ultra 7 355 (v8.20.8100) | |
| Average Intel Core Ultra 7 355 (32404 - 35293, n=3) | |
| Lenovo ThinkPad T14 Gen 6 21QG001VGE (v6.92.6600) | |
| HP OmniBook Ultra Flip 14 (v6.92.6600) | |
| Samsung Galaxy Book5 Pro 14 940XHA (v6.92.6600) | |
| AIDA64 / CPU AES | |
| Asus ExpertBook PM3406 (v6.92.6600) | |
| Dell XPS 14 Core Ultra X7 358H (v8.20.8100) | |
| HP OmniBook Ultra Flip 14 (v6.92.6600) | |
| Lenovo ThinkPad T14 Gen 6 21QG001VGE (v6.92.6600) | |
| Average Intel Core Ultra 7 355 (39050 - 39424, n=3) | |
| Dell XPS 14 Core Ultra 7 355 (v8.20.8100) | |
| Samsung Galaxy Book5 Pro 14 940XHA (v6.92.6600) | |
| AIDA64 / CPU ZLib | |
| Dell XPS 14 Core Ultra X7 358H (v8.20.8100) | |
| Asus ExpertBook PM3406 (v6.92.6600) | |
| Average Intel Core Ultra 7 355 (635 - 646, n=3) | |
| Dell XPS 14 Core Ultra 7 355 (v8.20.8100) | |
| HP OmniBook Ultra Flip 14 (v6.92.6600) | |
| Lenovo ThinkPad T14 Gen 6 21QG001VGE (v6.92.6600) | |
| Samsung Galaxy Book5 Pro 14 940XHA (v6.92.6600) | |
| AIDA64 / FP64 Ray-Trace | |
| Asus ExpertBook PM3406 (v6.92.6600) | |
| Dell XPS 14 Core Ultra X7 358H (v8.20.8100) | |
| Lenovo ThinkPad T14 Gen 6 21QG001VGE (v6.92.6600) | |
| HP OmniBook Ultra Flip 14 (v6.92.6600) | |
| Dell XPS 14 Core Ultra 7 355 (v8.20.8100) | |
| Average Intel Core Ultra 7 355 (6147 - 6833, n=3) | |
| Samsung Galaxy Book5 Pro 14 940XHA (v6.92.6600) | |
| AIDA64 / CPU PhotoWorxx | |
| Dell XPS 14 Core Ultra X7 358H (v8.20.8100) | |
| Average Intel Core Ultra 7 355 (57998 - 60440, n=3) | |
| Dell XPS 14 Core Ultra 7 355 (v8.20.8100) | |
| Lenovo ThinkPad T14 Gen 6 21QG001VGE (v6.92.6600) | |
| HP OmniBook Ultra Flip 14 (v6.92.6600) | |
| Samsung Galaxy Book5 Pro 14 940XHA (v6.92.6600) | |
| Asus ExpertBook PM3406 (v6.92.6600) | |
| AIDA64 / CPU CheckMate | |
| Dell XPS 14 Core Ultra X7 358H (v8.20.8100) | |
| Average Intel Core Ultra 7 355 (2790 - 2813, n=3) | |
| Dell XPS 14 Core Ultra 7 355 (v8.20.8100) | |
System Performance
PCMark 10: Score | Essentials | Productivity | Digital Content Creation
CrossMark: Overall | Productivity | Creativity | Responsiveness
WebXPRT 3: Overall
WebXPRT 4: Overall
Mozilla Kraken 1.1: Total
Geekbench AI: Single Precision GPU 1.7 | Half Precision GPU 1.7 | Quantized GPU 1.7
| PCMark 10 / Score | |
| Dell XPS 14 Core Ultra X7 358H | |
| Asus ExpertBook PM3406 | |
| Dell XPS 14 Core Ultra 7 355 | |
| Lenovo ThinkPad T14 Gen 6 21QG001VGE | |
| Samsung Galaxy Book5 Pro 14 940XHA | |
| HP OmniBook Ultra Flip 14 | |
| PCMark 10 / Essentials | |
| Dell XPS 14 Core Ultra X7 358H | |
| Asus ExpertBook PM3406 | |
| Dell XPS 14 Core Ultra 7 355 | |
| Lenovo ThinkPad T14 Gen 6 21QG001VGE | |
| Samsung Galaxy Book5 Pro 14 940XHA | |
| HP OmniBook Ultra Flip 14 | |
| CrossMark / Overall | |
| Dell XPS 14 Core Ultra X7 358H | |
| Lenovo ThinkPad T14 Gen 6 21QG001VGE | |
| Dell XPS 14 Core Ultra 7 355 | |
| HP OmniBook Ultra Flip 14 | |
| Samsung Galaxy Book5 Pro 14 940XHA | |
| Asus ExpertBook PM3406 | |
| CrossMark / Creativity | |
| Dell XPS 14 Core Ultra X7 358H | |
| Lenovo ThinkPad T14 Gen 6 21QG001VGE | |
| HP OmniBook Ultra Flip 14 | |
| Dell XPS 14 Core Ultra 7 355 | |
| Samsung Galaxy Book5 Pro 14 940XHA | |
| Asus ExpertBook PM3406 | |
| WebXPRT 3 / Overall | |
| Dell XPS 14 Core Ultra X7 358H | |
| Dell XPS 14 Core Ultra 7 355 | |
| Lenovo ThinkPad T14 Gen 6 21QG001VGE | |
| Samsung Galaxy Book5 Pro 14 940XHA | |
| HP OmniBook Ultra Flip 14 | |
| Asus ExpertBook PM3406 | |
| WebXPRT 4 / Overall | |
| Dell XPS 14 Core Ultra X7 358H | |
| Dell XPS 14 Core Ultra 7 355 | |
| Lenovo ThinkPad T14 Gen 6 21QG001VGE | |
| HP OmniBook Ultra Flip 14 | |
| Samsung Galaxy Book5 Pro 14 940XHA | |
| Asus ExpertBook PM3406 | |
| Geekbench AI / Single Precision GPU 1.7 | |
| Dell XPS 14 Core Ultra X7 358H | |
| Samsung Galaxy Book5 Pro 14 940XHA | |
| Dell XPS 14 Core Ultra 7 355 | |
| Geekbench AI / Half Precision GPU 1.7 | |
| Dell XPS 14 Core Ultra X7 358H | |
| Samsung Galaxy Book5 Pro 14 940XHA | |
| Dell XPS 14 Core Ultra 7 355 | |
| Geekbench AI / Quantized GPU 1.7 | |
| Dell XPS 14 Core Ultra X7 358H | |
| Samsung Galaxy Book5 Pro 14 940XHA | |
| Dell XPS 14 Core Ultra 7 355 | |
* ... smaller is better
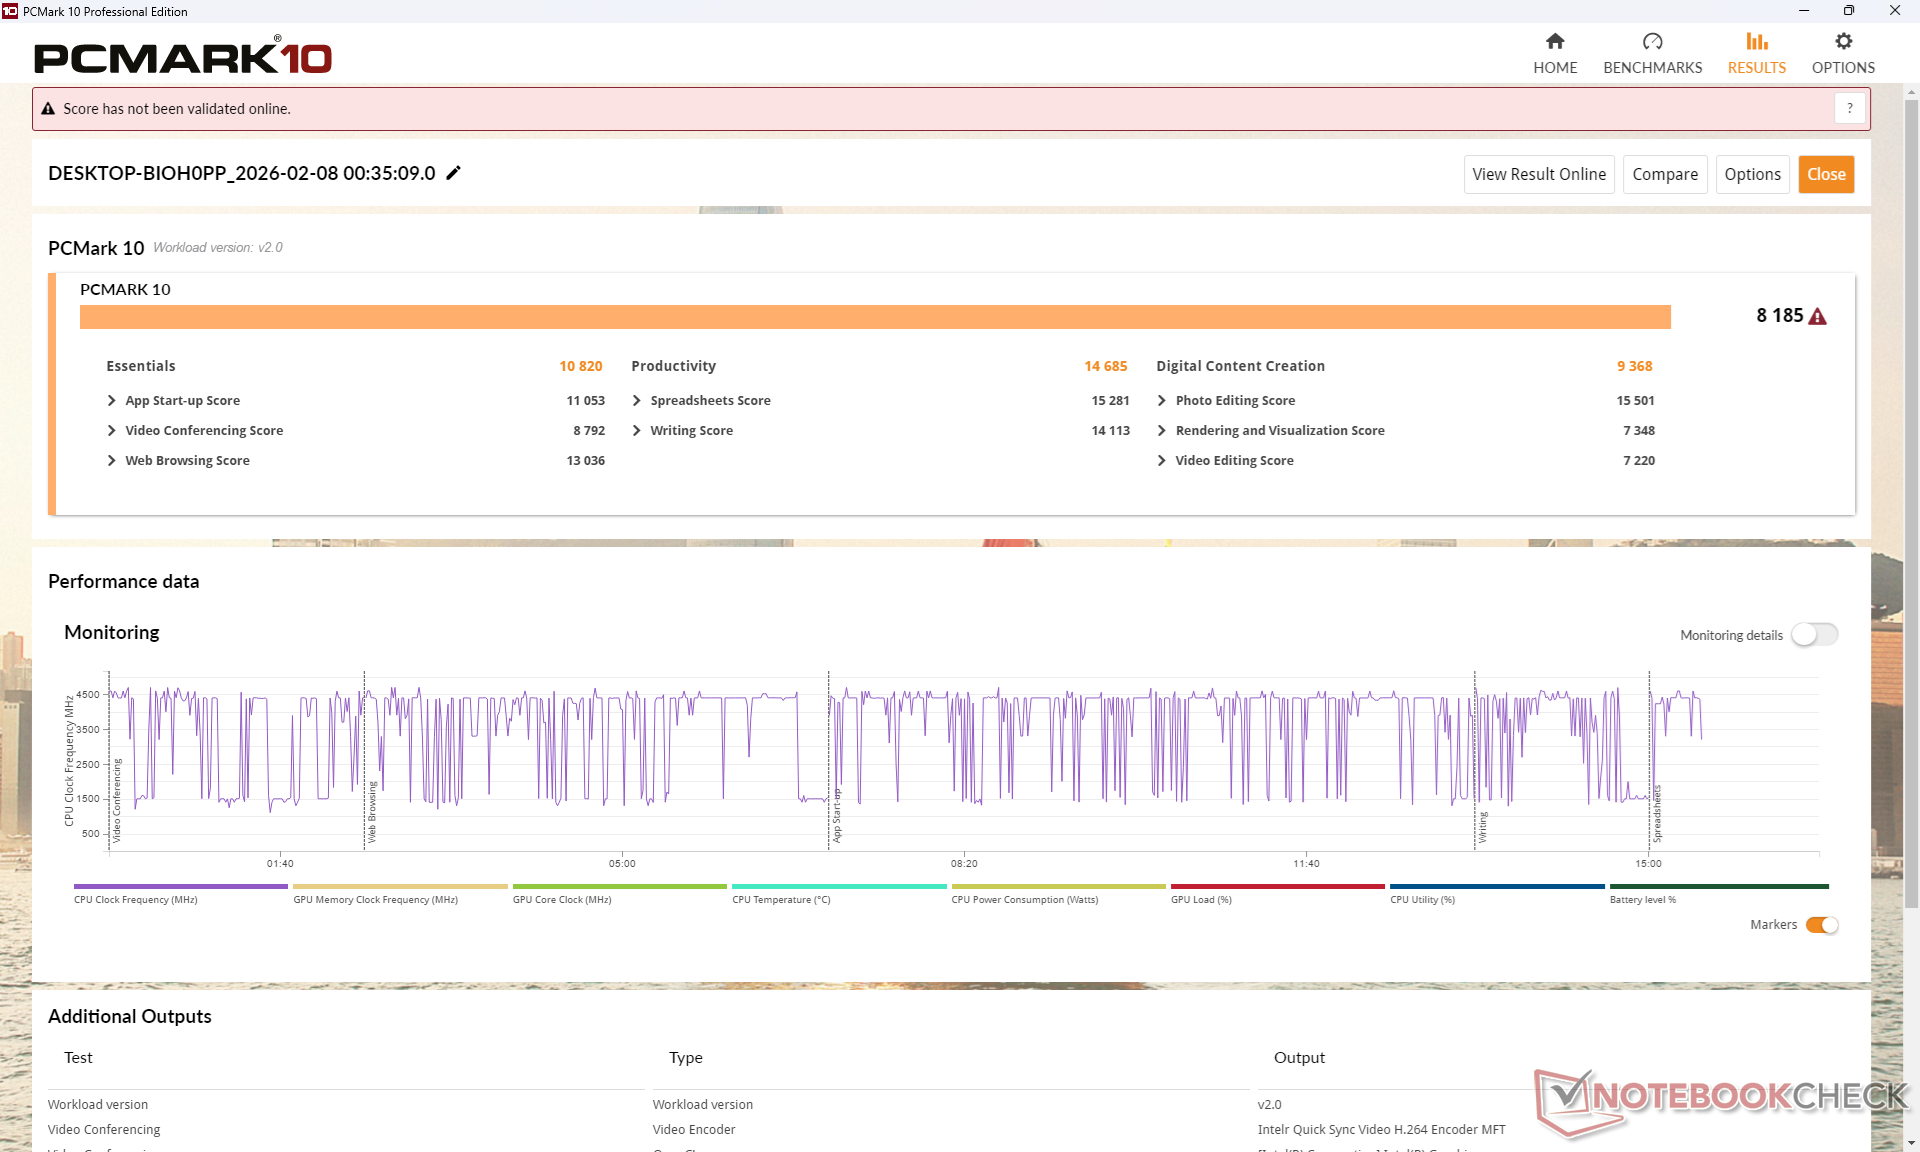
| PCMark 10 Score | 8185 points | |
Help | ||
| AIDA64 / Memory Copy | |
| Dell XPS 14 Core Ultra X7 358H | |
| Lenovo ThinkPad T14 Gen 6 21QG001VGE | |
| HP OmniBook Ultra Flip 14 | |
| Average Intel Core Ultra 7 355 (97301 - 105135, n=3) | |
| Samsung Galaxy Book5 Pro 14 940XHA | |
| Dell XPS 14 Core Ultra 7 355 | |
| Asus ExpertBook PM3406 | |
| AIDA64 / Memory Read | |
| Dell XPS 14 Core Ultra X7 358H | |
| Lenovo ThinkPad T14 Gen 6 21QG001VGE | |
| HP OmniBook Ultra Flip 14 | |
| Samsung Galaxy Book5 Pro 14 940XHA | |
| Average Intel Core Ultra 7 355 (79551 - 85021, n=3) | |
| Dell XPS 14 Core Ultra 7 355 | |
| Asus ExpertBook PM3406 | |
| AIDA64 / Memory Write | |
| Dell XPS 14 Core Ultra X7 358H | |
| Lenovo ThinkPad T14 Gen 6 21QG001VGE | |
| HP OmniBook Ultra Flip 14 | |
| Samsung Galaxy Book5 Pro 14 940XHA | |
| Average Intel Core Ultra 7 355 (103056 - 108621, n=3) | |
| Dell XPS 14 Core Ultra 7 355 | |
| Asus ExpertBook PM3406 | |
| AIDA64 / Memory Latency | |
| Dell XPS 14 Core Ultra 7 355 | |
| Average Intel Core Ultra 7 355 (99.7 - 105.8, n=3) | |
| Lenovo ThinkPad T14 Gen 6 21QG001VGE | |
| HP OmniBook Ultra Flip 14 | |
| Samsung Galaxy Book5 Pro 14 940XHA | |
| Dell XPS 14 Core Ultra X7 358H | |
| Asus ExpertBook PM3406 | |
* ... smaller is better
DPC Latency
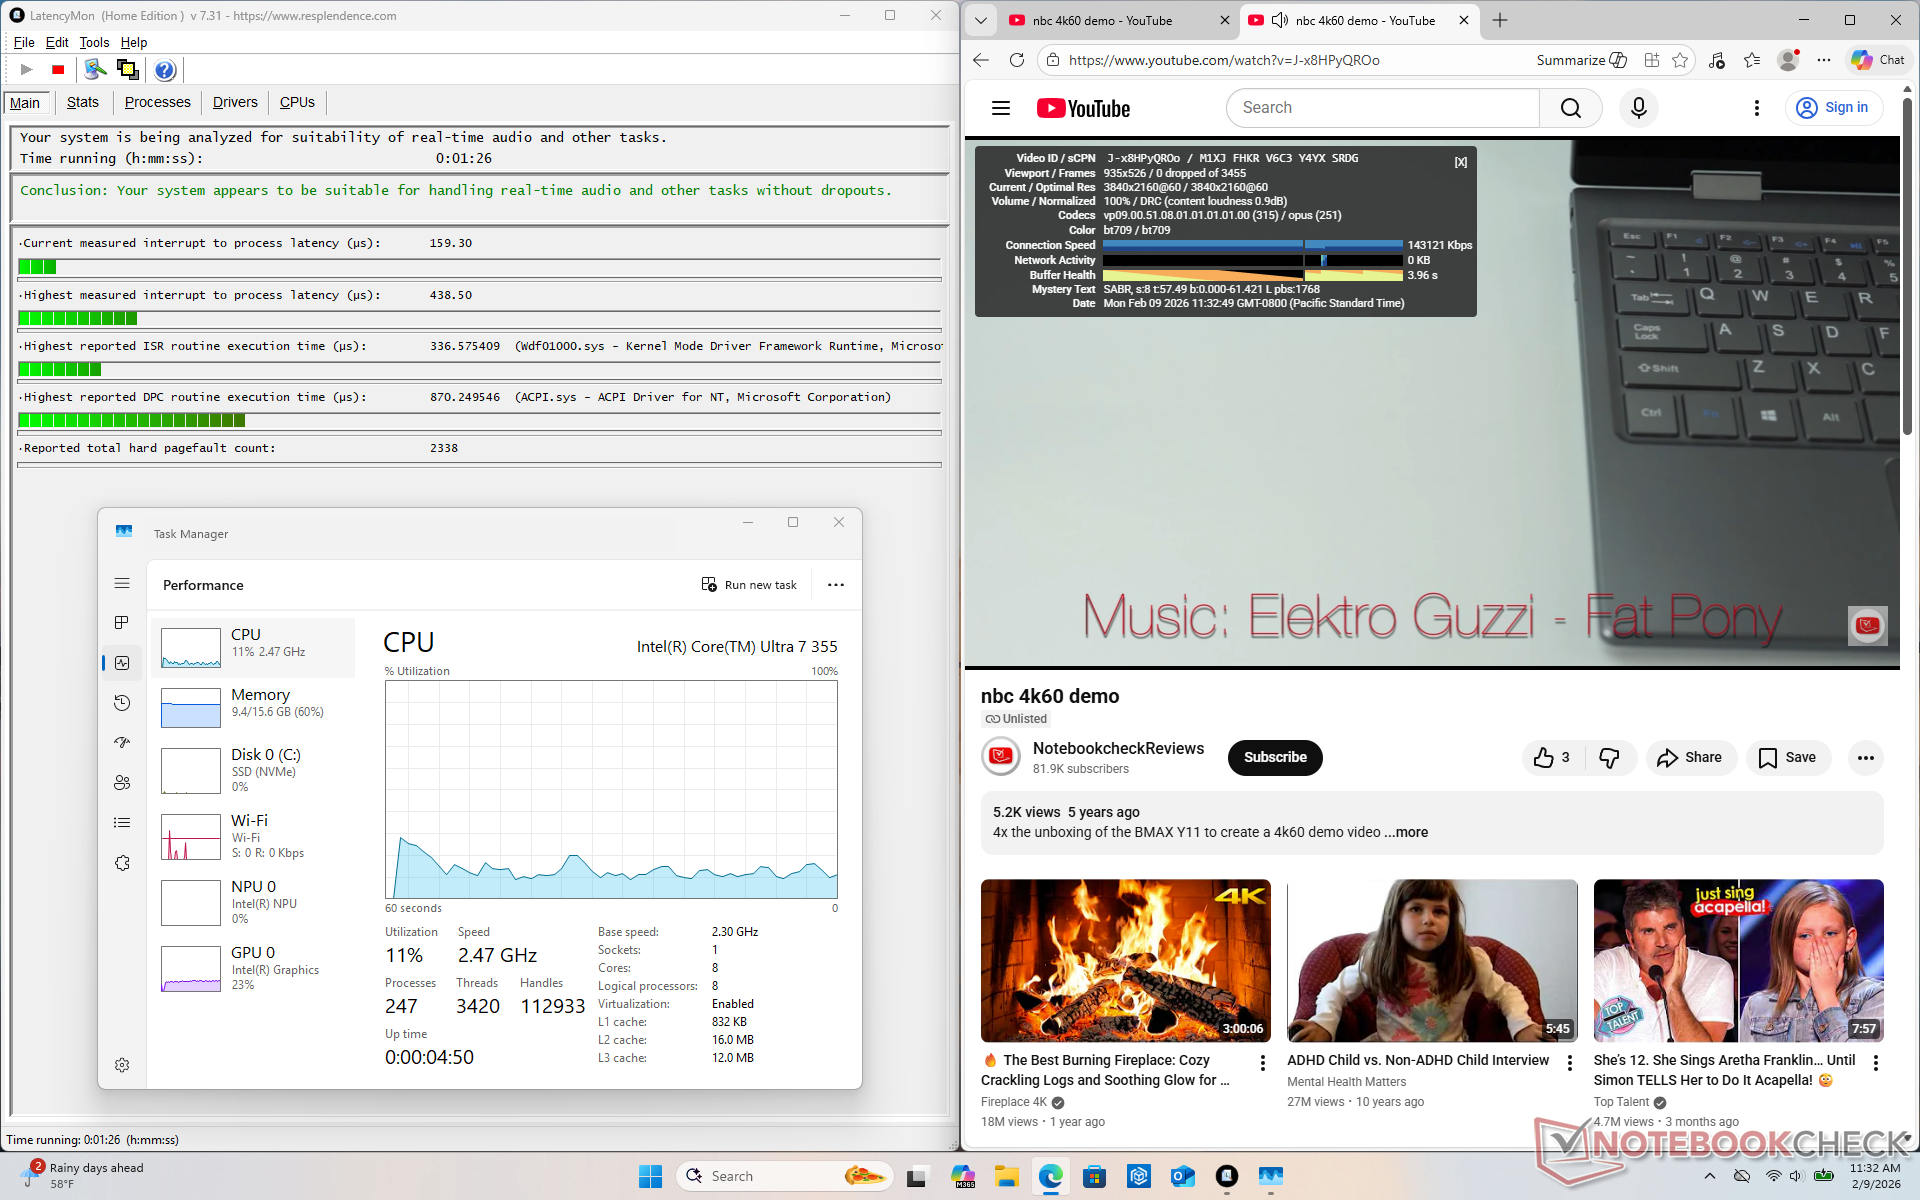
| DPC Latencies / LatencyMon - interrupt to process latency (max), Web, Youtube, Prime95 | |
| Asus ExpertBook PM3406 | |
| Samsung Galaxy Book5 Pro 14 940XHA | |
| Lenovo ThinkPad T14 Gen 6 21QG001VGE | |
| Dell XPS 14 Core Ultra X7 358H | |
| Dell XPS 14 Core Ultra 7 355 | |
* ... smaller is better
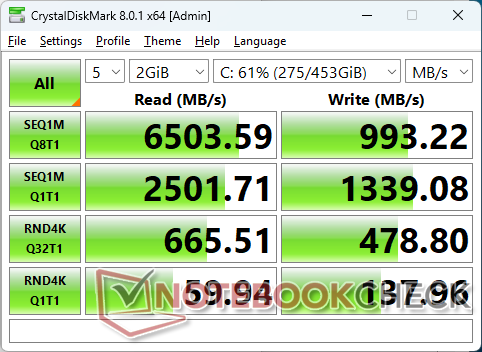
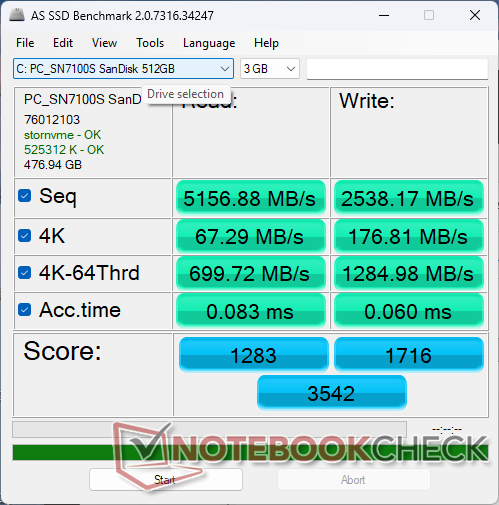
Storage Devices
Our unit ships with a SanDisk SN7100S PCIe4 x4 NVMe SSD instead of the Samsung PM9C1b on the Core Ultra X7 XPS 14 configuration. Performance between them is otherwise quite close with no notable throttling behavior observed.

* ... smaller is better
Disk Throttling: DiskSpd Read Loop, Queue Depth 8
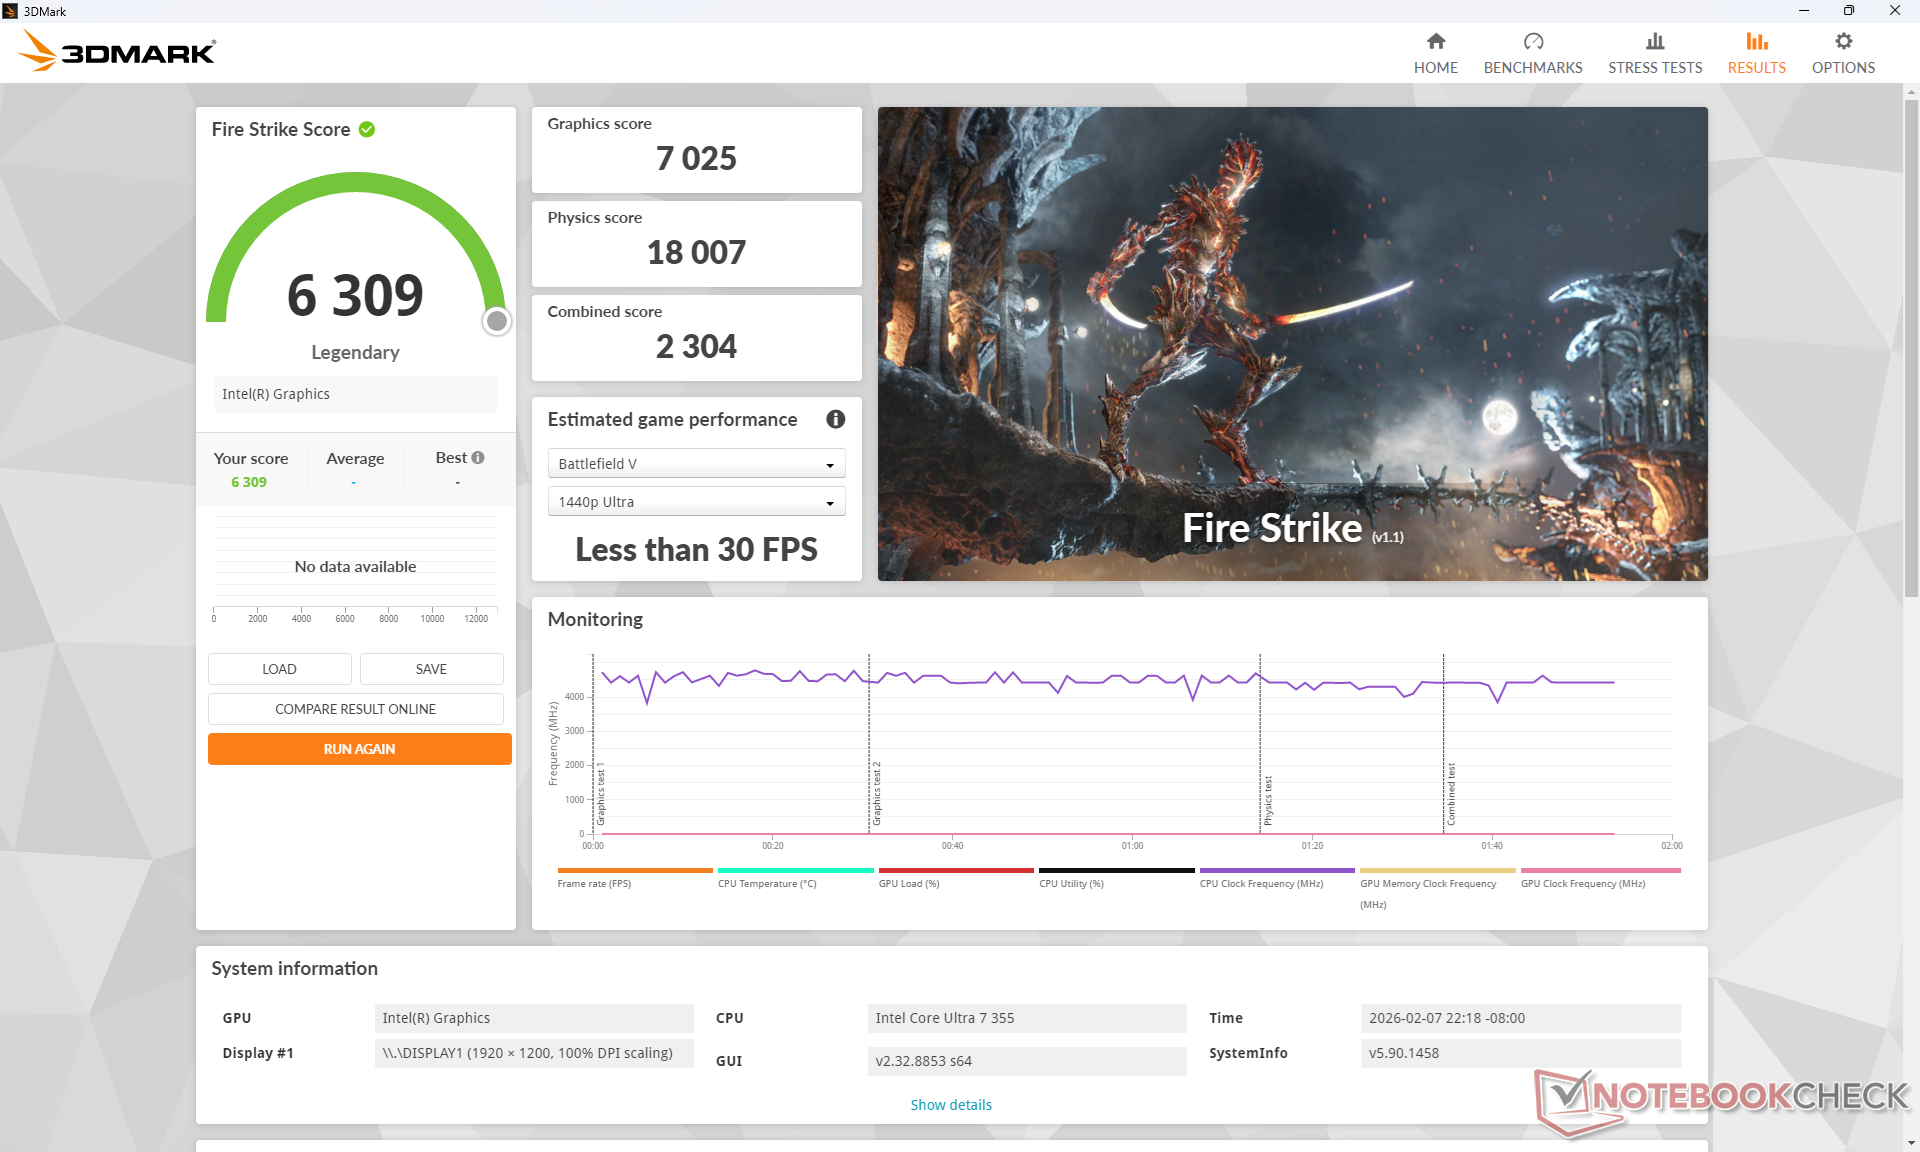
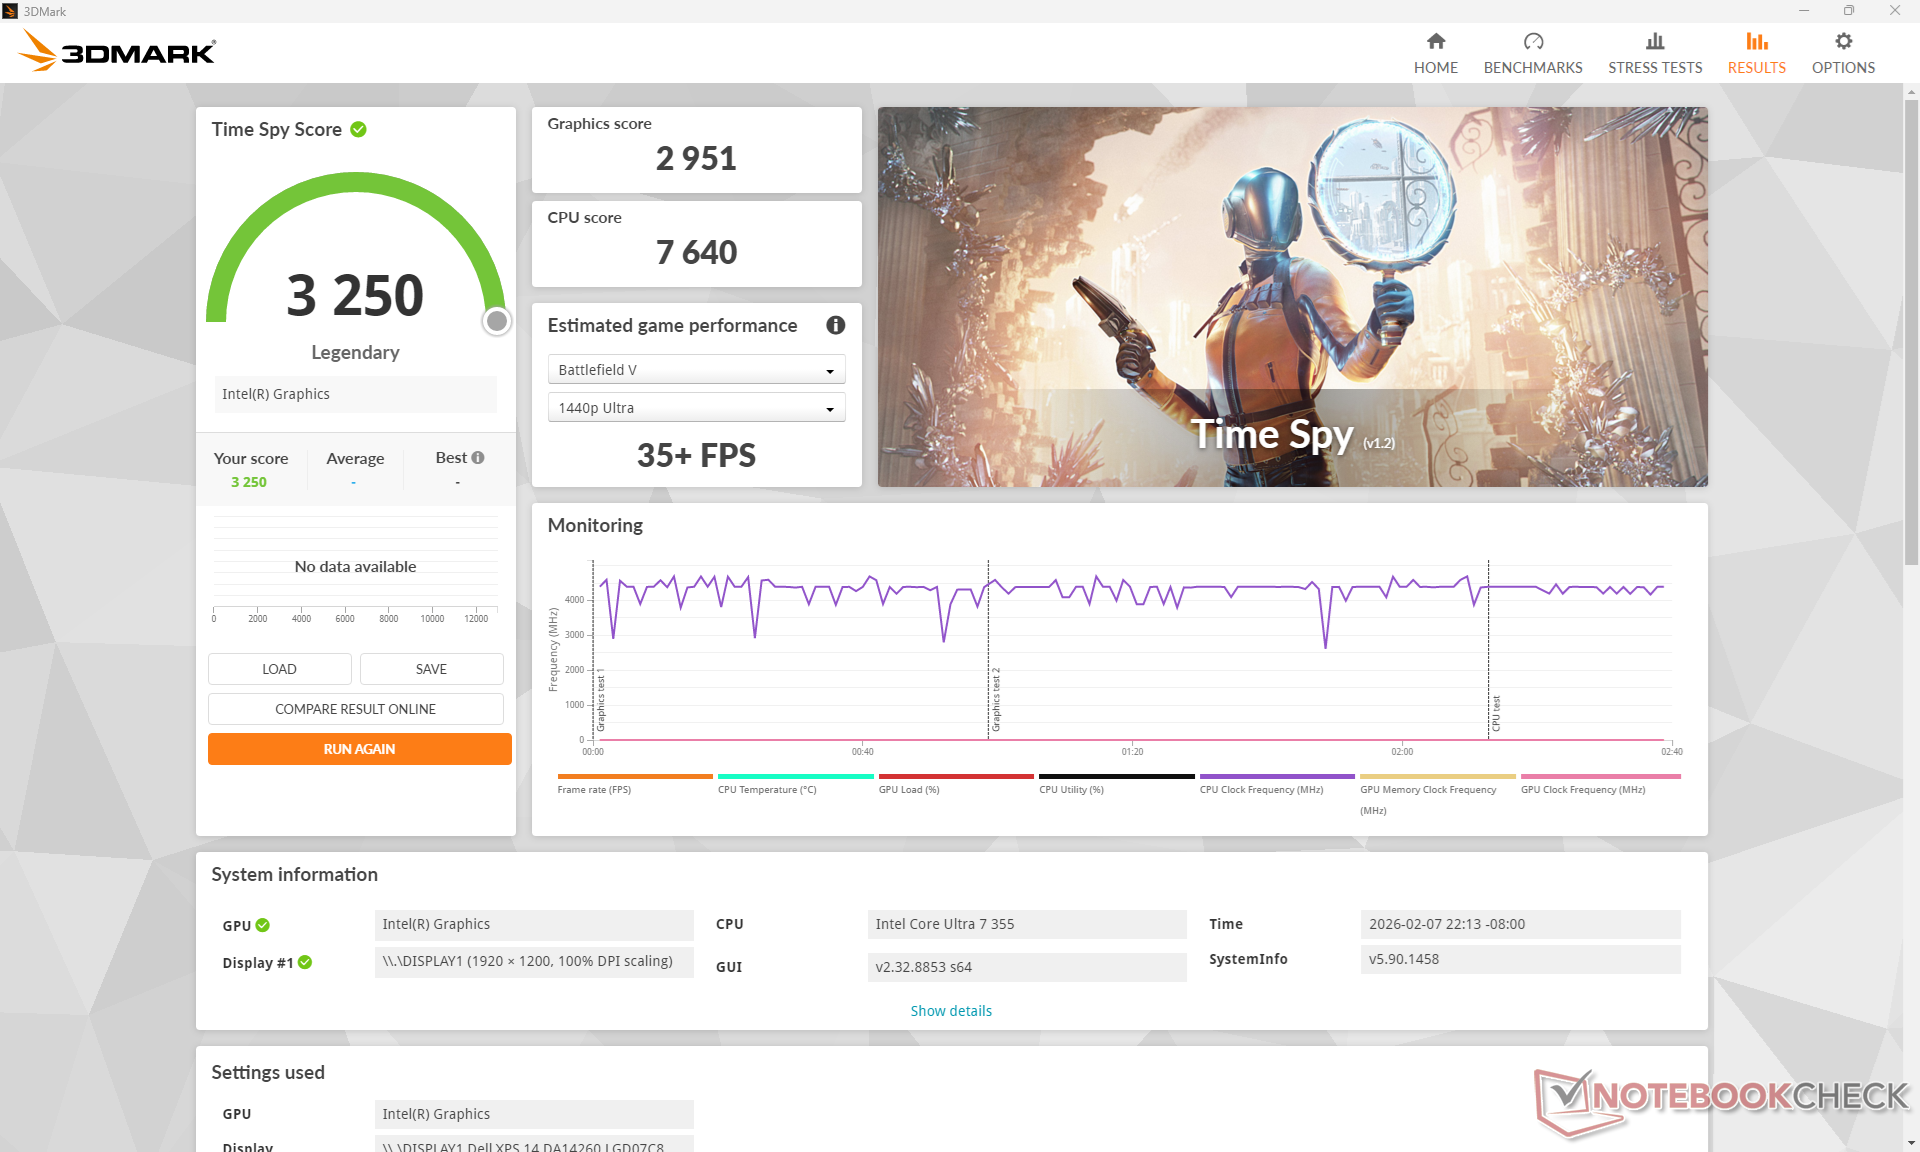
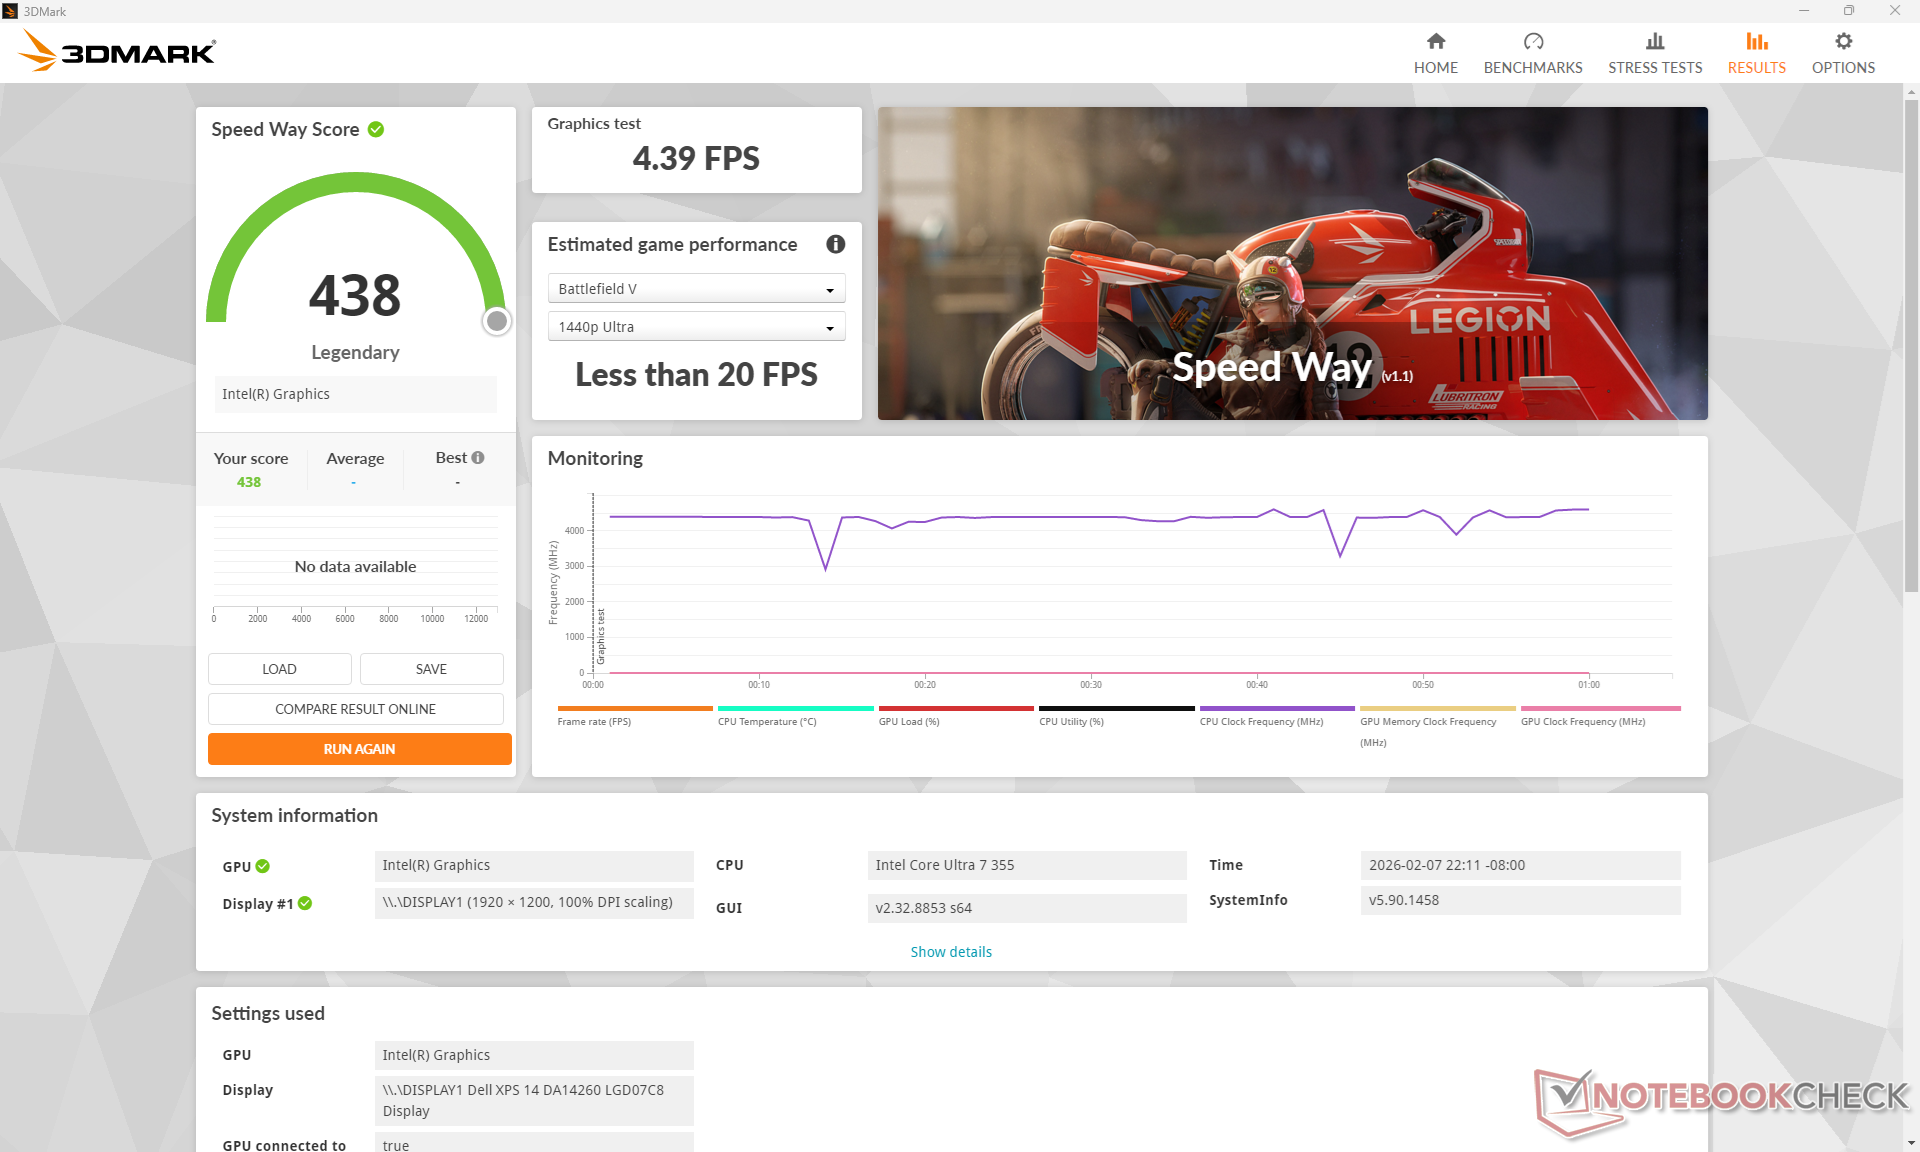
GPU Performance
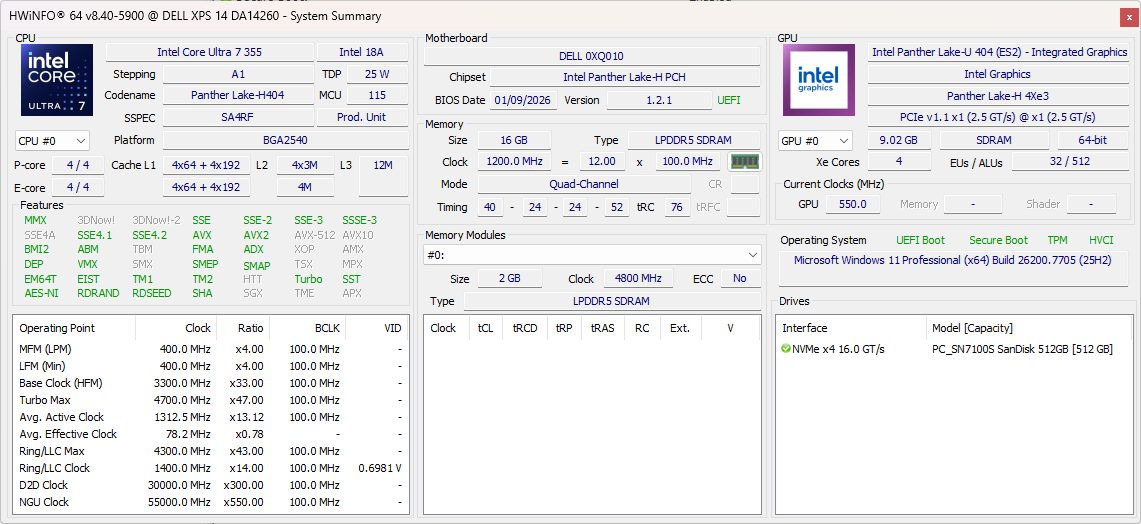
Unlike the Core Ultra X7 and its integrated 12-core Xe3 B390 graphics, the Core Ultra 7 355 ships with a 4-core Xe3 iGPU instead. Gaming prowess is about 60 percent slower than the 12-core B390 to be roughly comparable to the Arc 8 which was Intel's fastest iGPU solution just two years ago. Rendering with Blender, however, can be much slower by 2.5x and so performance in professional applications with the 4-core Xe3 may carry a greater deficit.
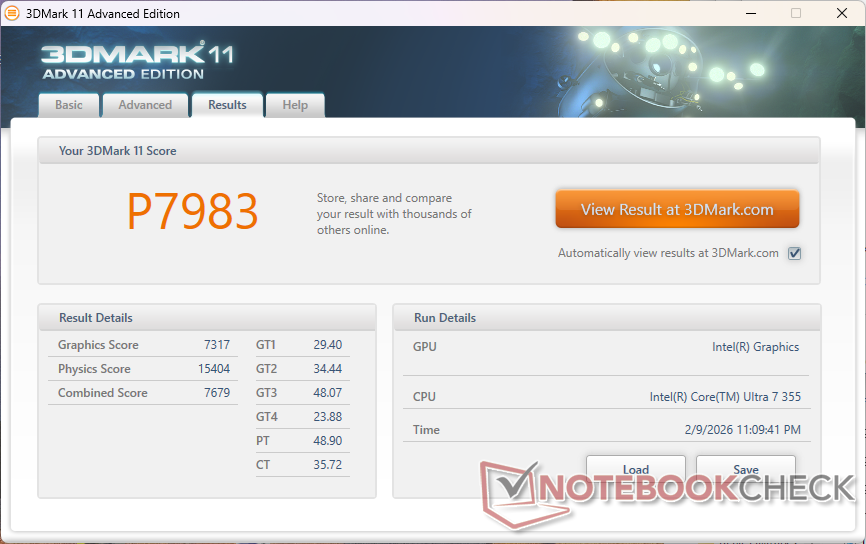
| 3DMark 11 Performance | 7983 points | |
| 3DMark Cloud Gate Standard Score | 28681 points | |
| 3DMark Fire Strike Score | 6309 points | |
| 3DMark Time Spy Score | 3250 points | |
Help | ||
* ... smaller is better
| Cyberpunk 2077 - 1920x1080 Ultra Preset (FSR off) | |
| Dell XPS 14 Core Ultra X7 358H | |
| Lenovo ThinkPad T14 Gen 6 21QG001VGE | |
| Samsung Galaxy Book5 Pro 14 940XHA | |
| HP OmniBook Ultra Flip 14 | |
| Dell XPS 14 Core Ultra 7 355 | |
| Asus ExpertBook PM3406 | |
| Baldur's Gate 3 - 1920x1080 Ultra Preset AA:T | |
| Dell XPS 14 Core Ultra X7 358H | |
| HP OmniBook Ultra Flip 14 | |
| Lenovo ThinkPad T14 Gen 6 21QG001VGE | |
| Samsung Galaxy Book5 Pro 14 940XHA | |
| Dell XPS 14 Core Ultra 7 355 | |
| Asus ExpertBook PM3406 | |
| GTA V - 1920x1080 Highest AA:4xMSAA + FX AF:16x | |
| Dell XPS 14 Core Ultra X7 358H | |
| Lenovo ThinkPad T14 Gen 6 21QG001VGE | |
| HP OmniBook Ultra Flip 14 | |
| Dell XPS 14 Core Ultra 7 355 | |
| Samsung Galaxy Book5 Pro 14 940XHA | |
| Asus ExpertBook PM3406 | |
| Final Fantasy XV Benchmark - 1920x1080 High Quality | |
| Dell XPS 14 Core Ultra X7 358H | |
| Lenovo ThinkPad T14 Gen 6 21QG001VGE | |
| HP OmniBook Ultra Flip 14 | |
| Samsung Galaxy Book5 Pro 14 940XHA | |
| Dell XPS 14 Core Ultra 7 355 | |
| Asus ExpertBook PM3406 | |
| Strange Brigade - 1920x1080 ultra AA:ultra AF:16 | |
| Dell XPS 14 Core Ultra X7 358H | |
| HP OmniBook Ultra Flip 14 | |
| Samsung Galaxy Book5 Pro 14 940XHA | |
| Dell XPS 14 Core Ultra 7 355 | |
| Asus ExpertBook PM3406 | |
| Dota 2 Reborn - 1920x1080 ultra (3/3) best looking | |
| Dell XPS 14 Core Ultra X7 358H | |
| Lenovo ThinkPad T14 Gen 6 21QG001VGE | |
| HP OmniBook Ultra Flip 14 | |
| Samsung Galaxy Book5 Pro 14 940XHA | |
| Dell XPS 14 Core Ultra 7 355 | |
| Asus ExpertBook PM3406 | |
| X-Plane 11.11 - 1920x1080 high (fps_test=3) | |
| Dell XPS 14 Core Ultra X7 358H | |
| Asus ExpertBook PM3406 | |
| HP OmniBook Ultra Flip 14 | |
| Samsung Galaxy Book5 Pro 14 940XHA | |
| Lenovo ThinkPad T14 Gen 6 21QG001VGE | |
| Dell XPS 14 Core Ultra 7 355 | |
| ARC Raiders | |
| 1920x1080 Low Preset | |
| Asus ZenBook Duo UX8407AA | |
| Dell XPS 14 Core Ultra X7 358H | |
| Dell XPS 14 Core Ultra 7 355 | |
| Average Intel Graphics 4 Xe3 Panther Lake iGPU (n=1) | |
| 1920x1080 Medium Preset AA:TSR | |
| Asus ZenBook Duo UX8407AA | |
| Dell XPS 14 Core Ultra X7 358H | |
| Dell XPS 14 Core Ultra 7 355 | |
| Average Intel Graphics 4 Xe3 Panther Lake iGPU (n=1) | |
| 1920x1080 High Preset AA:TSR | |
| Asus ZenBook Duo UX8407AA | |
| Dell XPS 14 Core Ultra X7 358H | |
| Dell XPS 14 Core Ultra 7 355 | |
| Average Intel Graphics 4 Xe3 Panther Lake iGPU (n=1) | |
| Black Myth: Wukong | |
| 1280x720 low TSR 100 | |
| Dell XPS 14 Core Ultra X7 358H | |
| Dell XPS 14 Core Ultra 7 355 | |
| Average Intel Graphics 4 Xe3 Panther Lake iGPU (n=1) | |
| 1920x1080 low TSR 100 | |
| Dell XPS 14 Core Ultra X7 358H | |
| Dell XPS 14 Core Ultra 7 355 | |
| Average Intel Graphics 4 Xe3 Panther Lake iGPU (n=1) | |
| 1920x1080 medium TSR 100 | |
| Dell XPS 14 Core Ultra X7 358H | |
| Dell XPS 14 Core Ultra 7 355 | |
| Average Intel Graphics 4 Xe3 Panther Lake iGPU (n=1) | |
| 1920x1080 high TSR 100 | |
| Dell XPS 14 Core Ultra X7 358H | |
| Dell XPS 14 Core Ultra 7 355 | |
| Average Intel Graphics 4 Xe3 Panther Lake iGPU (n=1) | |
| 1920x1080 cinematic TSR 100 | |
| Dell XPS 14 Core Ultra X7 358H | |
| Dell XPS 14 Core Ultra 7 355 | |
| Average Intel Graphics 4 Xe3 Panther Lake iGPU (n=1) | |
Cyberpunk 2077 ultra FPS Chart
| low | med. | high | ultra | |
|---|---|---|---|---|
| GTA V (2015) | 165.6 | 163 | 52.9 | 20.9 |
| Dota 2 Reborn (2015) | 101.7 | 89.4 | 73.7 | 69.4 |
| Final Fantasy XV Benchmark (2018) | 67.3 | 34.9 | 25.4 | |
| X-Plane 11.11 (2018) | 43.6 | 30.9 | 30.5 | |
| Strange Brigade (2018) | 184.9 | 64.7 | 58.9 | 50.6 |
| Baldur's Gate 3 (2023) | 28.4 | 23 | 19.6 | 19.5 |
| Cyberpunk 2077 (2023) | 32.7 | 27.7 | 21 | 17.7 |
| F1 24 (2024) | 65.9 | 56.6 | 41.7 | 13.8 |
| Black Myth: Wukong (2024) | 18 | 14 | 11 | 6 |
| ARC Raiders (2025) | 48.8 | 23.5 | 17.5 | 11.4 |
Emissions
System Noise
Noise levels can remain quieter for longer than the Core Ultra X7 configuration but with an otherwise identical ceiling. When running Cyberpunk 2077, for example, fan noise would stabilize at 35 dB(A) compared to 43 dB(A) on the faster Core Ultra X7 SKU, but an almost identical maximum is reached between the two SKUs when running Prime95 stress.
Noise level
| Idle |
| 23 / 23 / 23.1 dB(A) |
| Load |
| 30.8 / 45.9 dB(A) |
 | ||
30 dB silent 40 dB(A) audible 50 dB(A) loud |
||
min: | ||
| Dell XPS 14 Core Ultra 7 355 Ultra 7 355, Intel Graphics 4 Xe3 PTL | Dell XPS 14 Core Ultra X7 358H Ultra X7 358H, Arc B390 Panther Lake iGPU | Asus ExpertBook PM3406 Ryzen AI 7 350, Radeon 860M | Lenovo ThinkPad T14 Gen 6 21QG001VGE Core Ultra 7 258V, Arc 140V | HP OmniBook Ultra Flip 14 Core Ultra 7 258V, Arc 140V | Samsung Galaxy Book5 Pro 14 940XHA Core Ultra 5 226V, Arc 130V | |
|---|---|---|---|---|---|---|
| Noise | -5% | -7% | -7% | 3% | -1% | |
| off / environment * (dB) | 23 | 22.9 -0% | 25.7 -12% | 25.1 -9% | 22.9 -0% | 25.1 -9% |
| Idle Minimum * (dB) | 23 | 23.3 -1% | 25.7 -12% | 25.1 -9% | 23.2 -1% | 25.1 -9% |
| Idle Average * (dB) | 23 | 23.3 -1% | 25.7 -12% | 25.1 -9% | 23.2 -1% | 25.1 -9% |
| Idle Maximum * (dB) | 23.1 | 23.3 -1% | 25.7 -11% | 27.1 -17% | 23.2 -0% | 25.1 -9% |
| Load Average * (dB) | 30.8 | 34 -10% | 33.6 -9% | 34.8 -13% | 27.8 10% | 29.3 5% |
| Cyberpunk 2077 ultra * (dB) | 35.4 | 43.5 -23% | 39.1 -10% | 38.3 -8% | 33.6 5% | 33.1 6% |
| Load Maximum * (dB) | 45.9 | 45.7 -0% | 39.1 15% | 38.5 16% | 43.4 5% | 38.7 16% |
* ... smaller is better
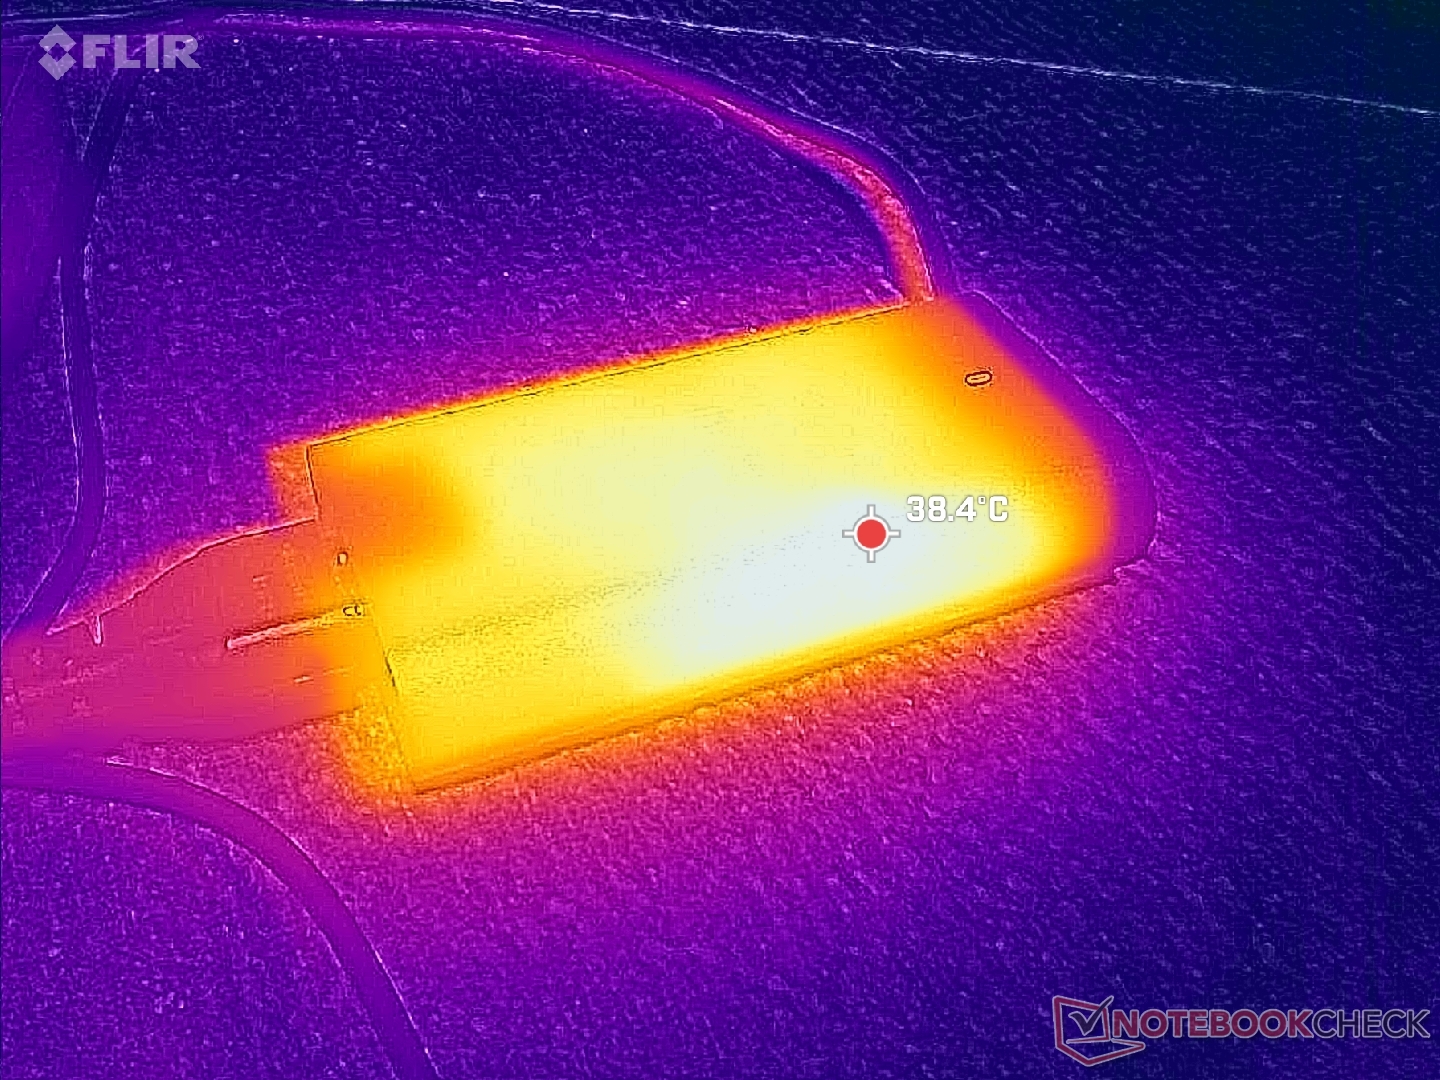
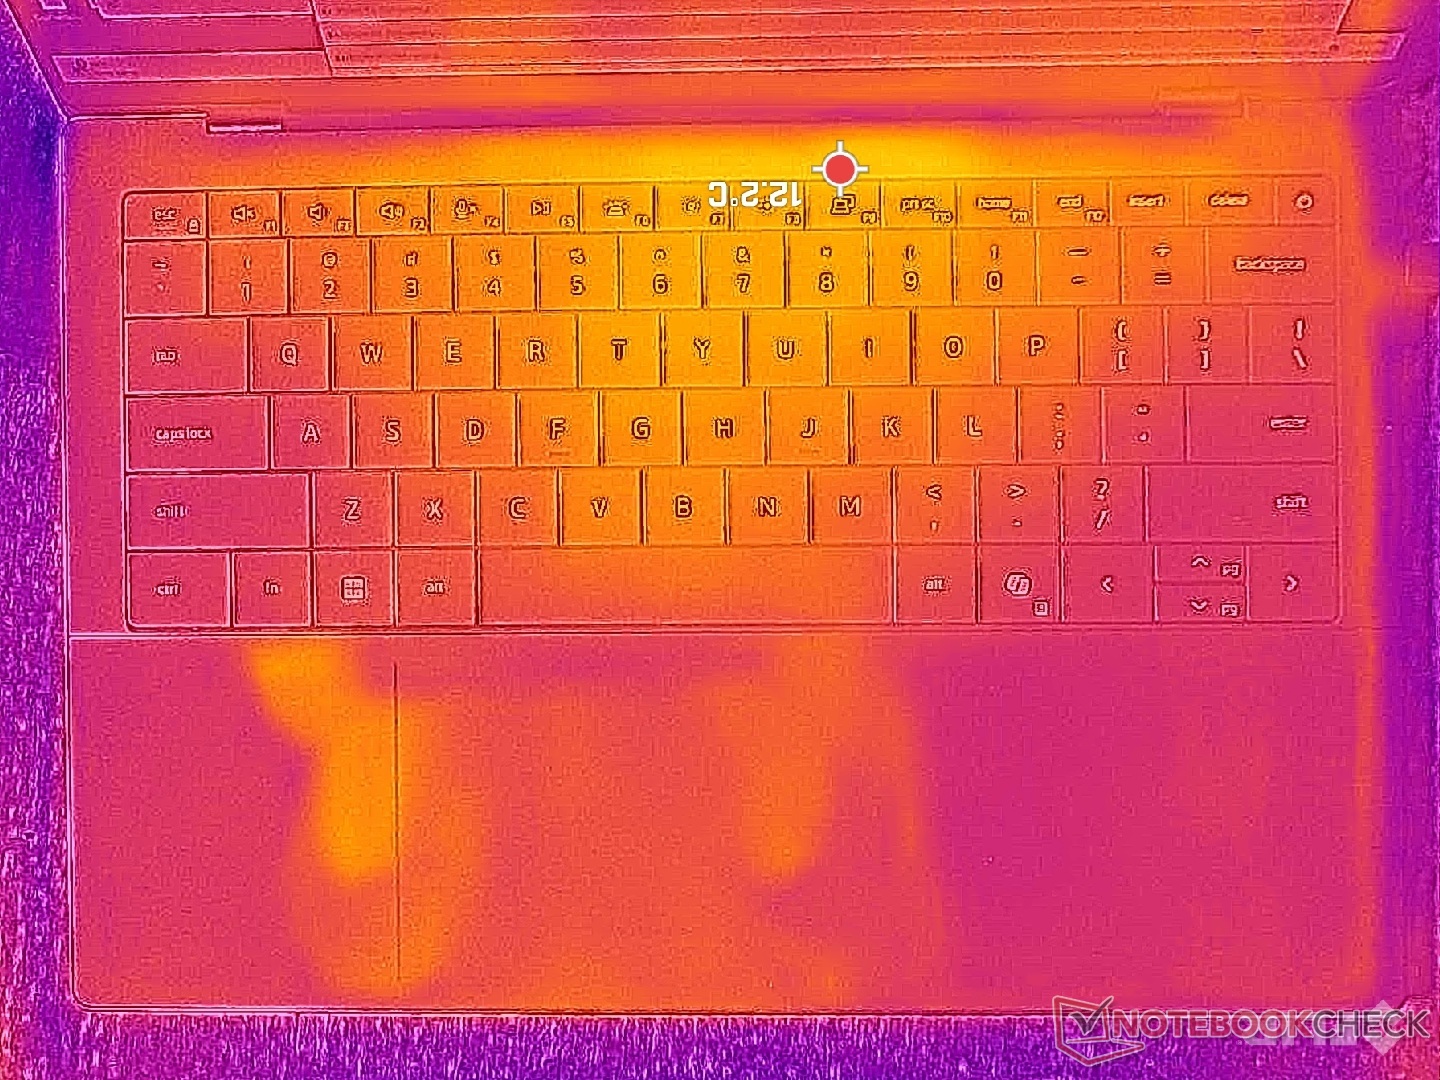
Temperature
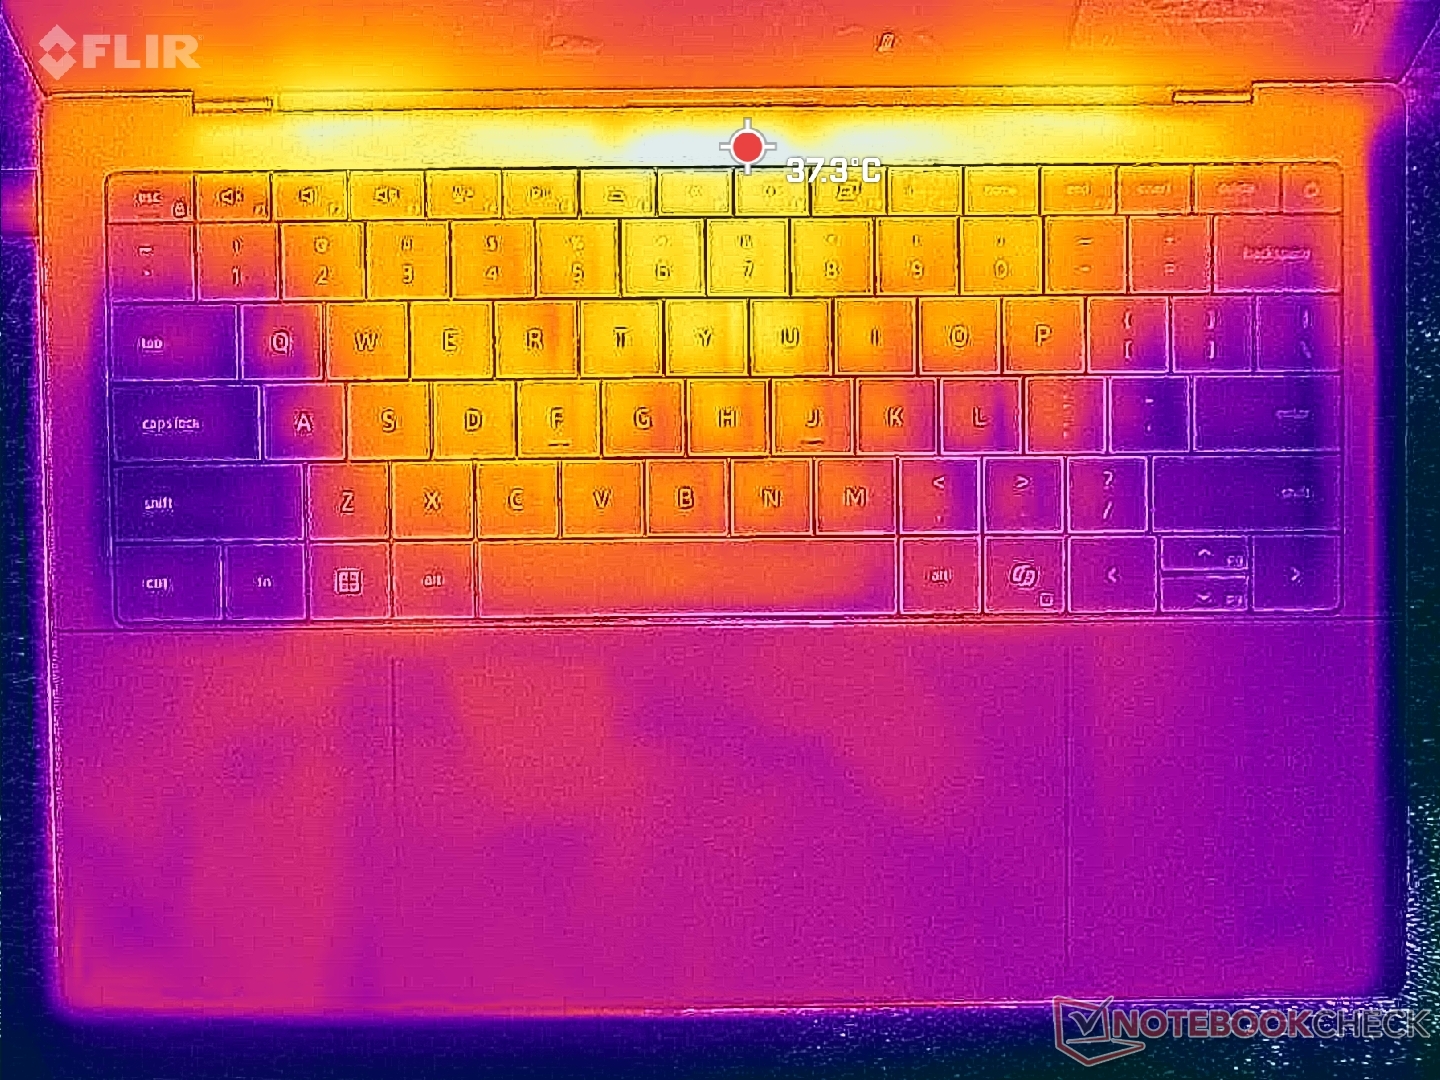
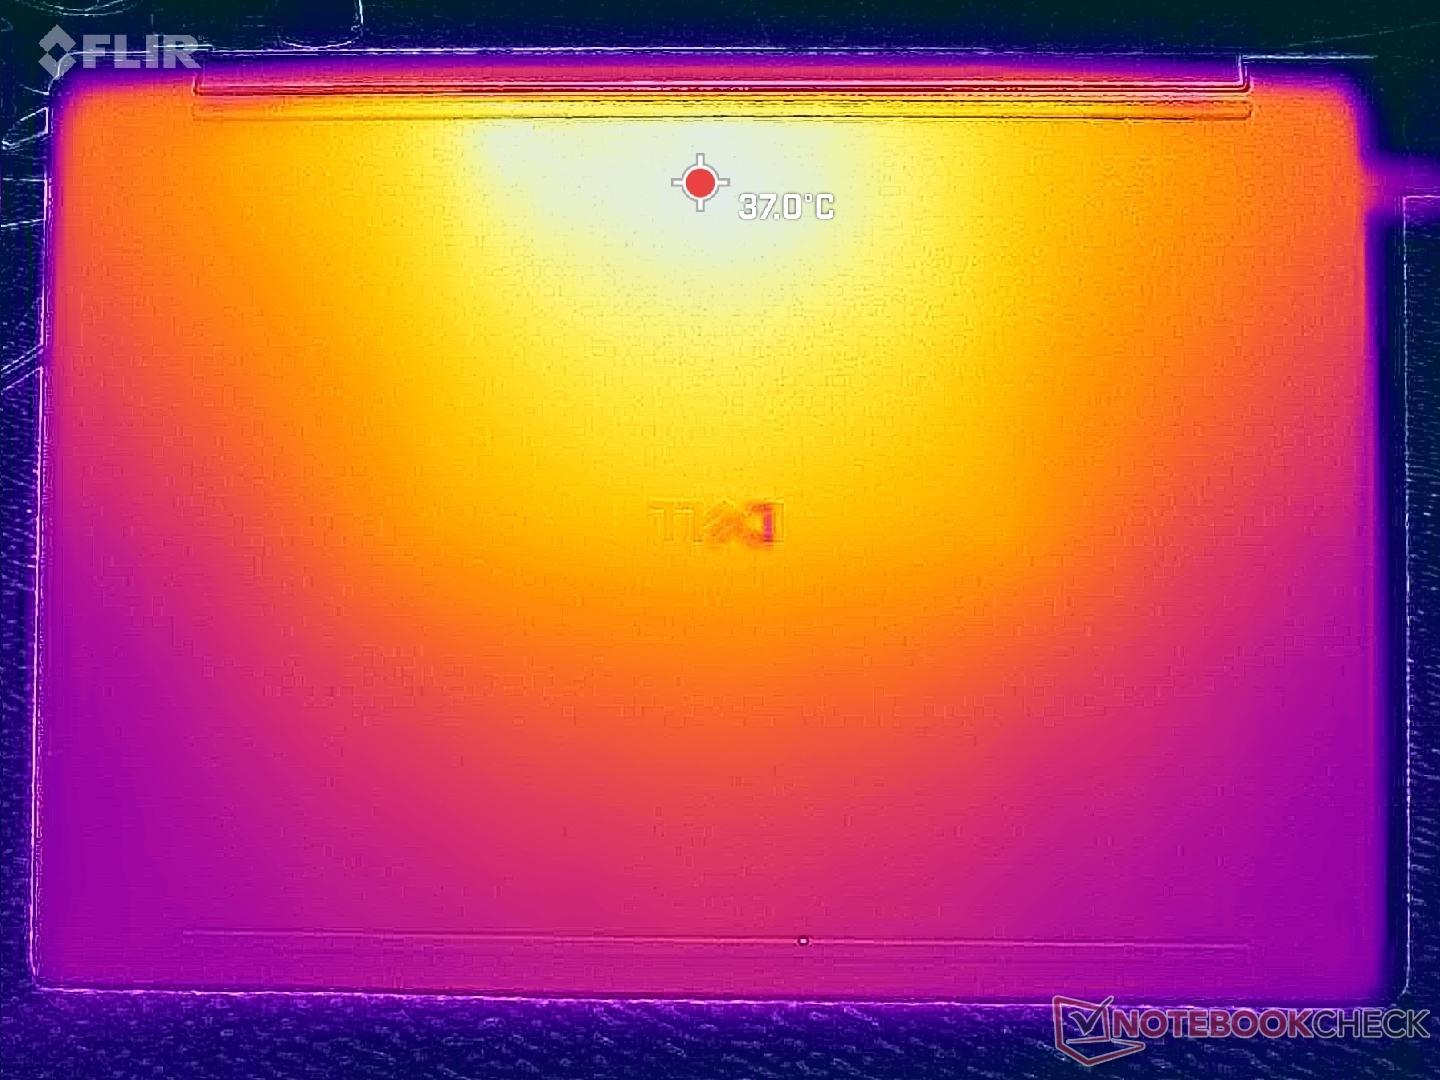
Surface temperature hot spots would stabilize at nearly identical levels to what we observed on the XPS 14 X7 configuration despite the significantly faster performance available on the latter.
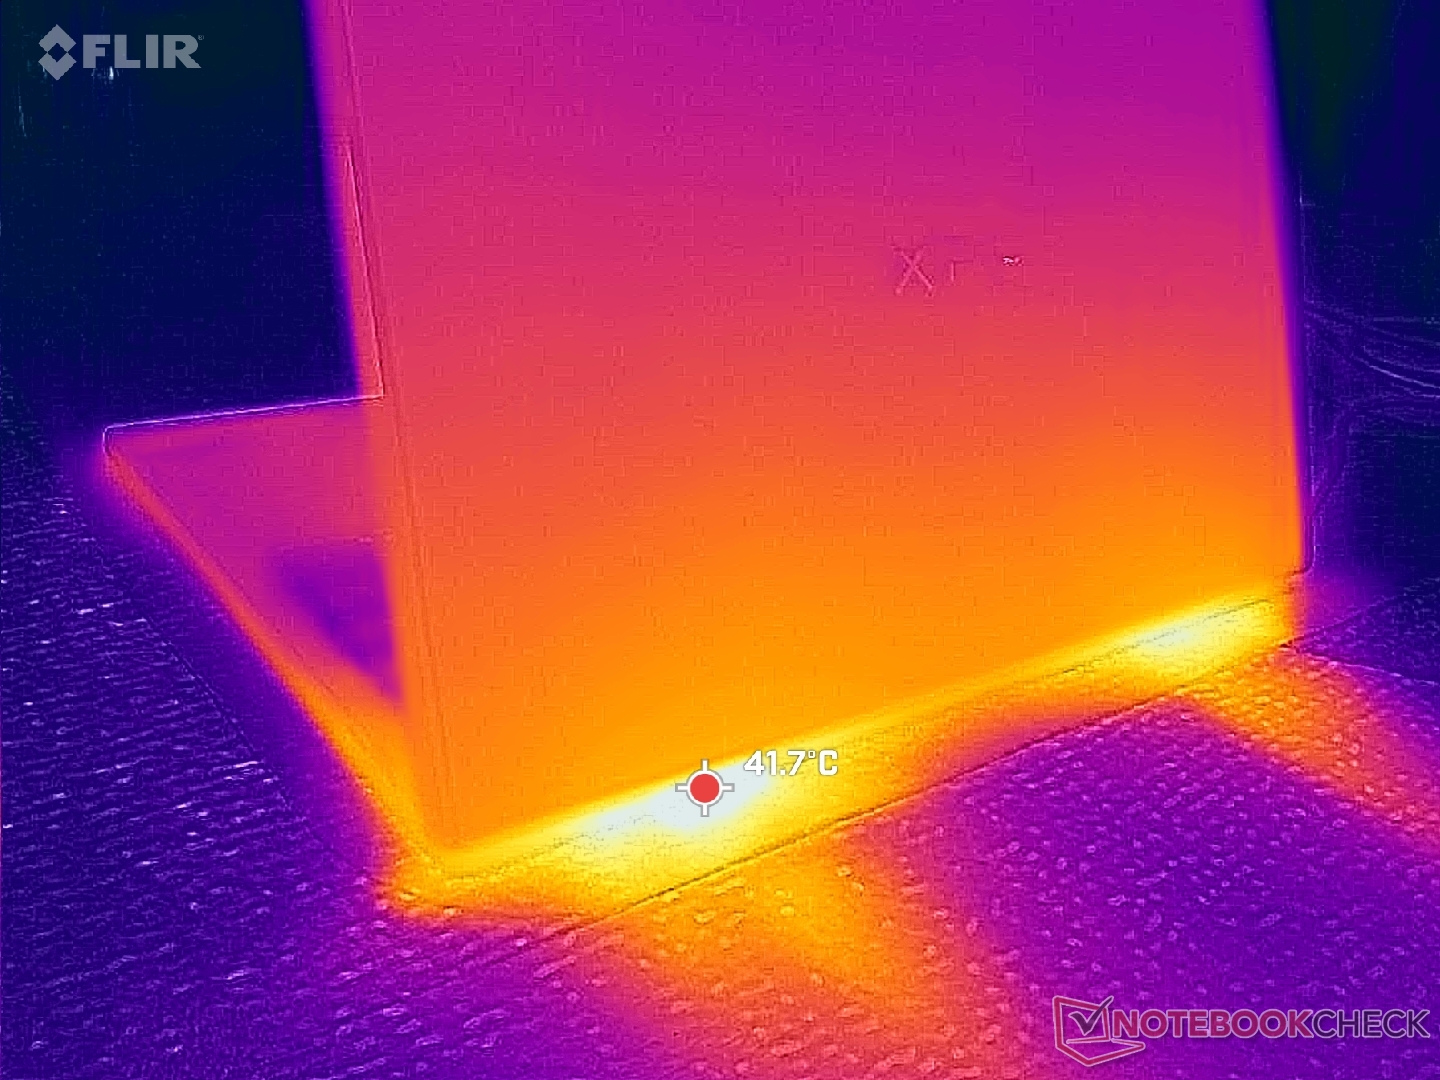
(+) The maximum temperature on the upper side is 37.8 °C / 100 F, compared to the average of 36.8 °C / 98 F, ranging from 21 to 71 °C for the class Multimedia.
(+) The bottom heats up to a maximum of 38.6 °C / 101 F, compared to the average of 39.1 °C / 102 F
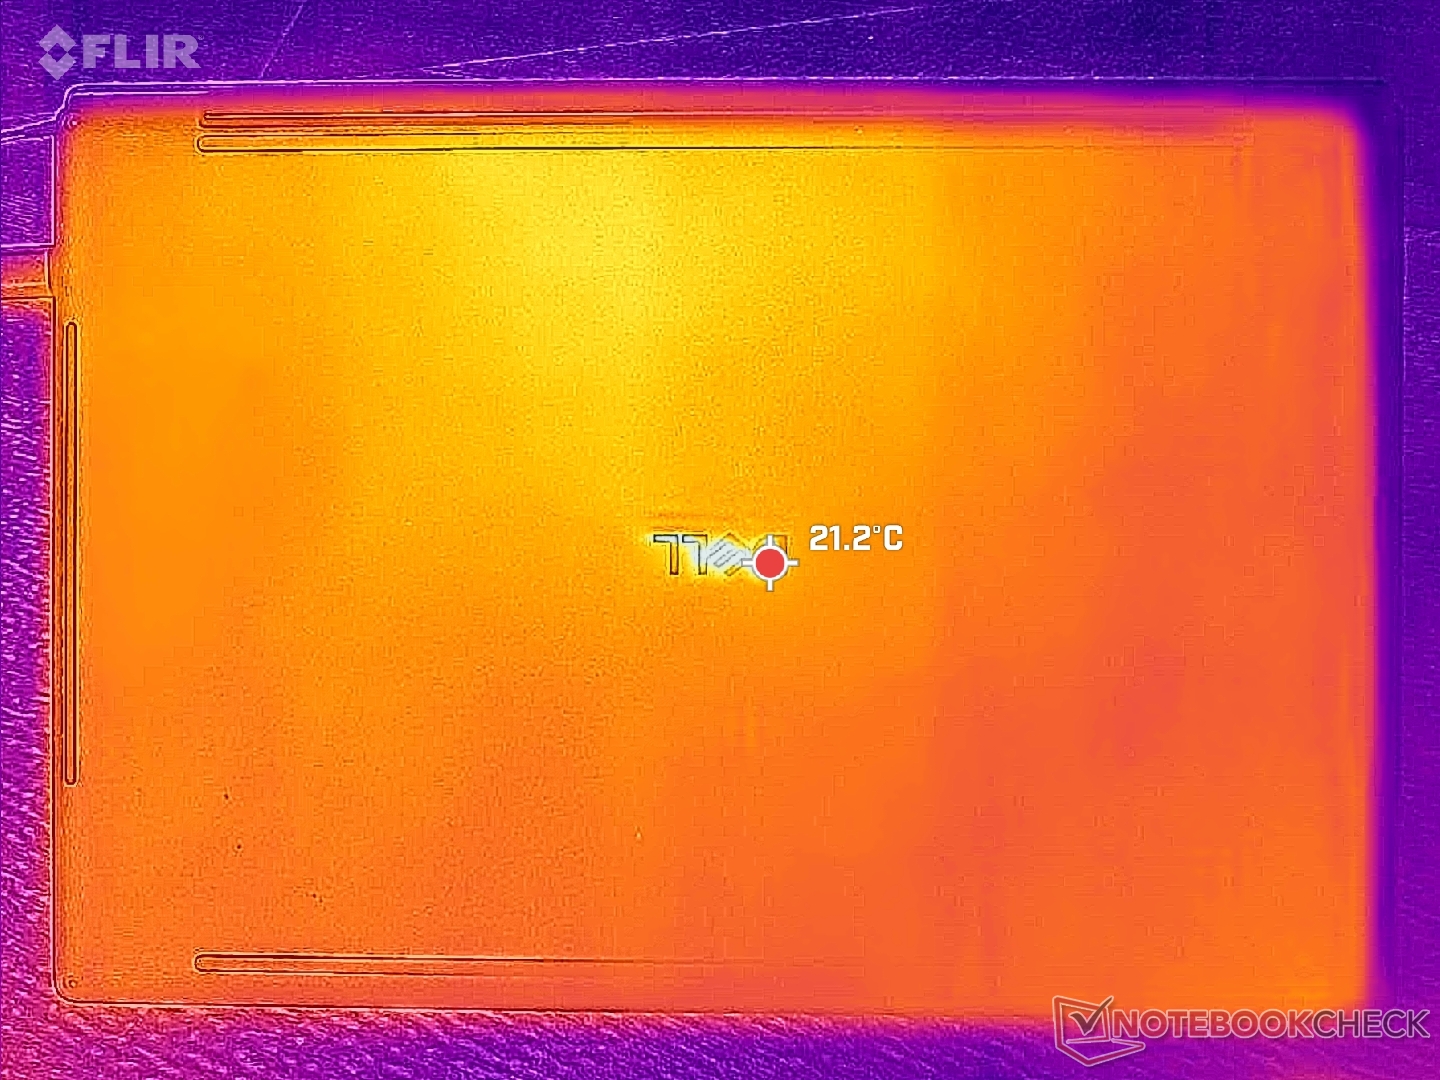
(+) In idle usage, the average temperature for the upper side is 20.4 °C / 69 F, compared to the device average of 31.3 °C / 88 F.
(+) The palmrests and touchpad are cooler than skin temperature with a maximum of 27.4 °C / 81.3 F and are therefore cool to the touch.
(±) The average temperature of the palmrest area of similar devices was 28.7 °C / 83.7 F (+1.3 °C / 2.4 F).
| Dell XPS 14 Core Ultra 7 355 Ultra 7 355, Intel Graphics 4 Xe3 PTL | Dell XPS 14 Core Ultra X7 358H Ultra X7 358H, Arc B390 Panther Lake iGPU | Asus ExpertBook PM3406 Ryzen AI 7 350, Radeon 860M | Lenovo ThinkPad T14 Gen 6 21QG001VGE Core Ultra 7 258V, Arc 140V | HP OmniBook Ultra Flip 14 Core Ultra 7 258V, Arc 140V | Samsung Galaxy Book5 Pro 14 940XHA Core Ultra 5 226V, Arc 130V | |
|---|---|---|---|---|---|---|
| Heat | -7% | -14% | -12% | -9% | -16% | |
| Maximum Upper Side * (°C) | 37.8 | 34 10% | 39.8 -5% | 39.7 -5% | 35.8 5% | 41.4 -10% |
| Maximum Bottom * (°C) | 38.6 | 35.8 7% | 40.8 -6% | 38.1 1% | 37.6 3% | 44.6 -16% |
| Idle Upper Side * (°C) | 21.2 | 25.6 -21% | 26 -23% | 24.3 -15% | 25.2 -19% | 24.9 -17% |
| Idle Bottom * (°C) | 21.4 | 26.4 -23% | 26.3 -23% | 27.7 -29% | 26.6 -24% | 25.5 -19% |
* ... smaller is better
Stress Test
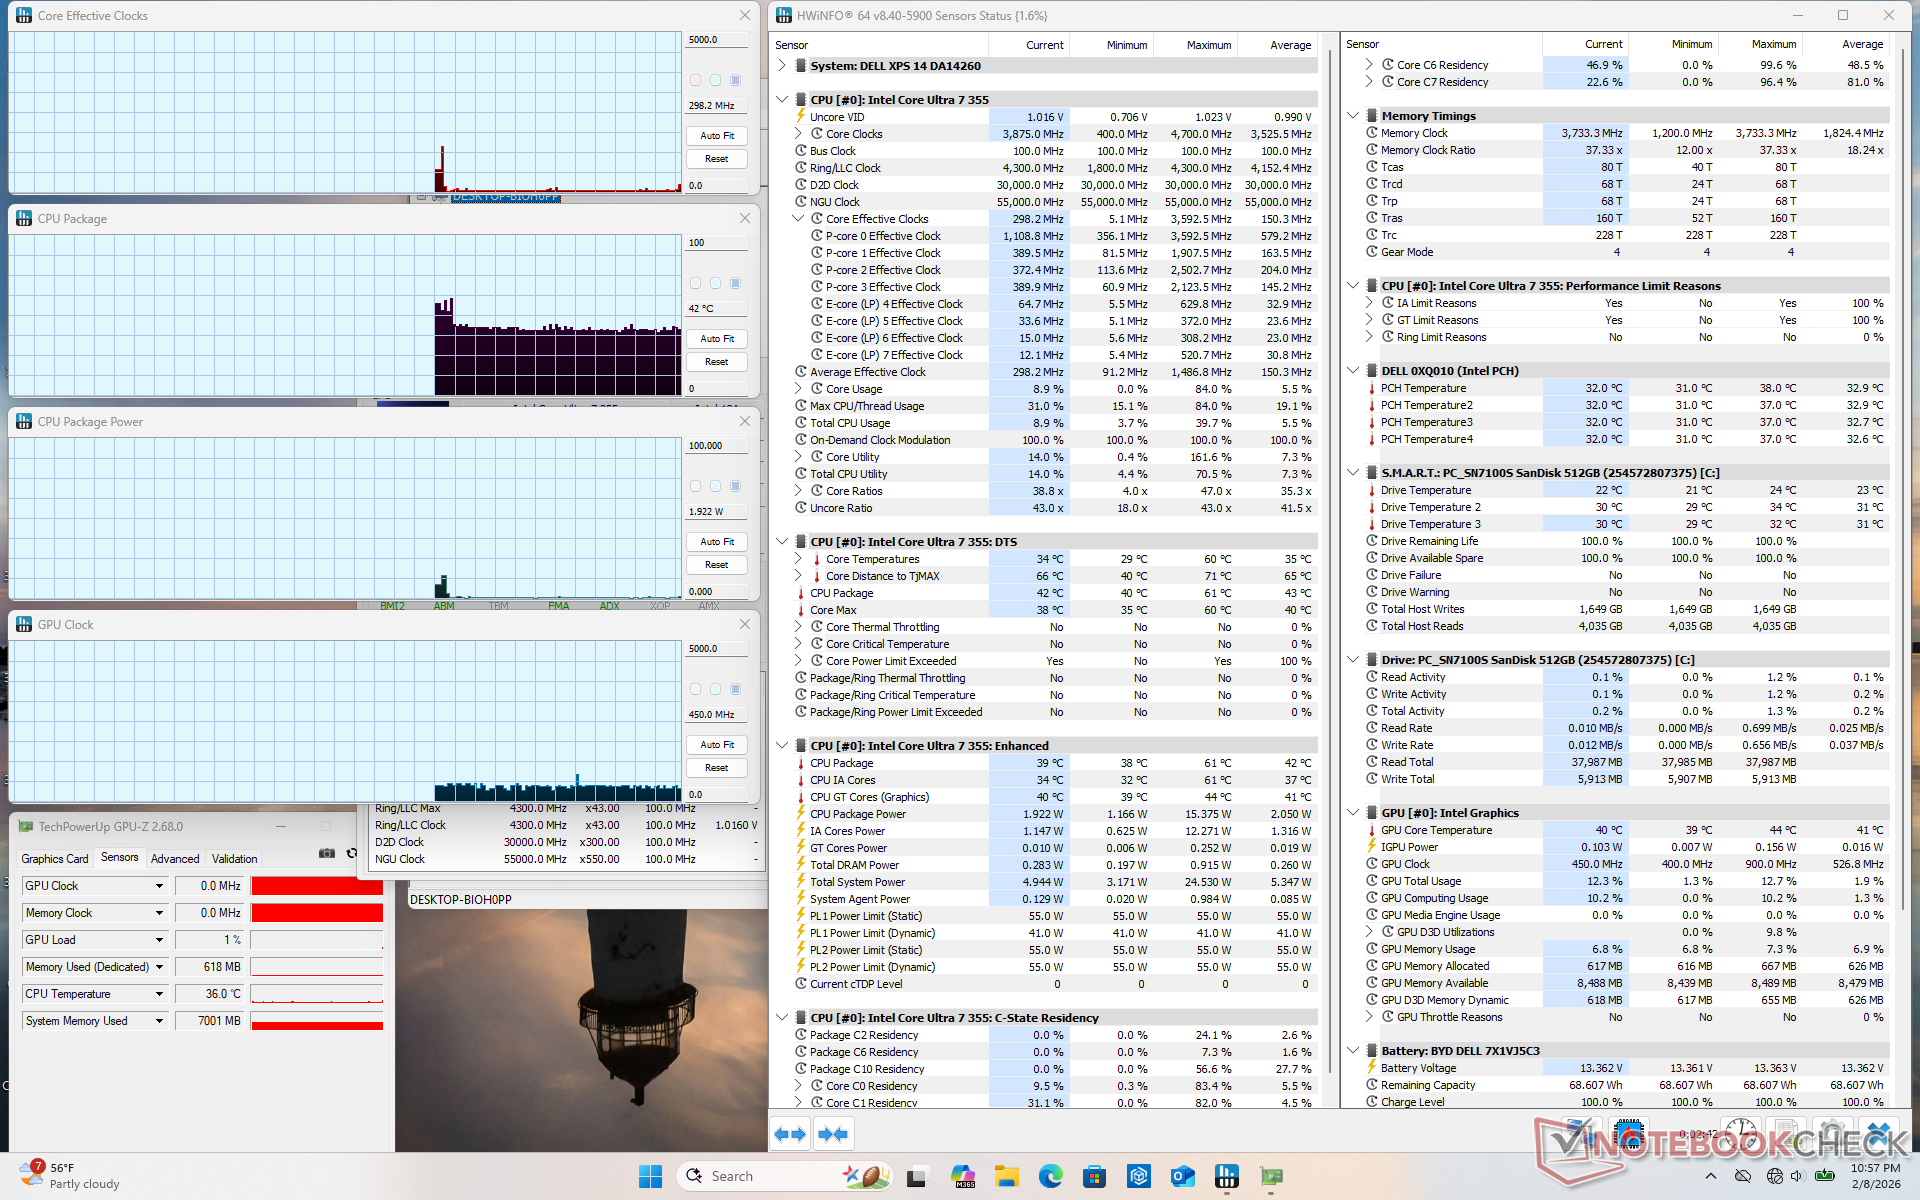
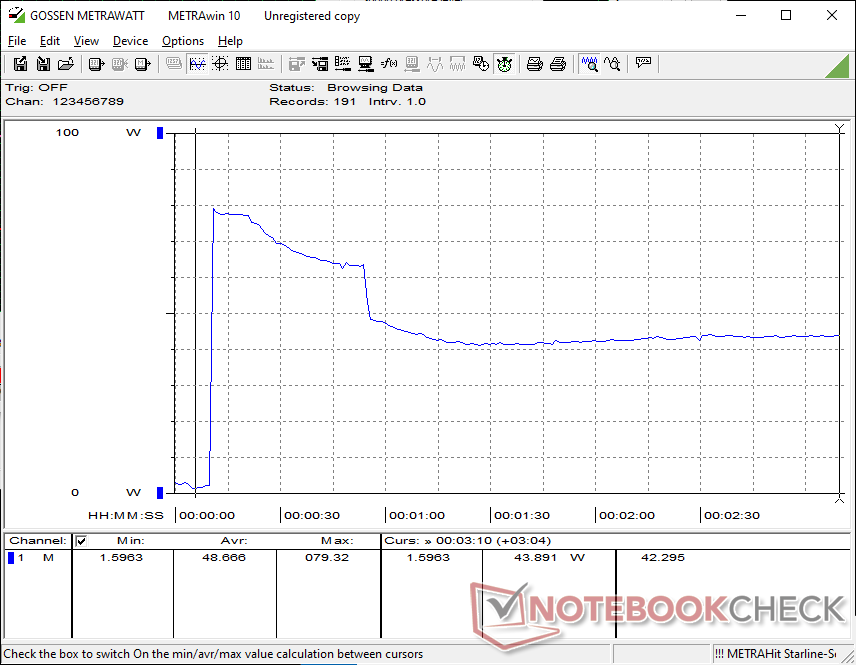
When running Prime95 stress, the CPU would boost to 3.7 GHz and 54 W lasting for only a few seconds at 100 C. Thereafter, it would stabilize at 2.9 GHz, 28 W, and 81 C to represent limited Turbo Boost potential. Core temperature would plateau at the lower 80 C range when running demanding loads which is slightly cooler than what we recorded on last year's Arrow Lake-H Dell 14 Premium.
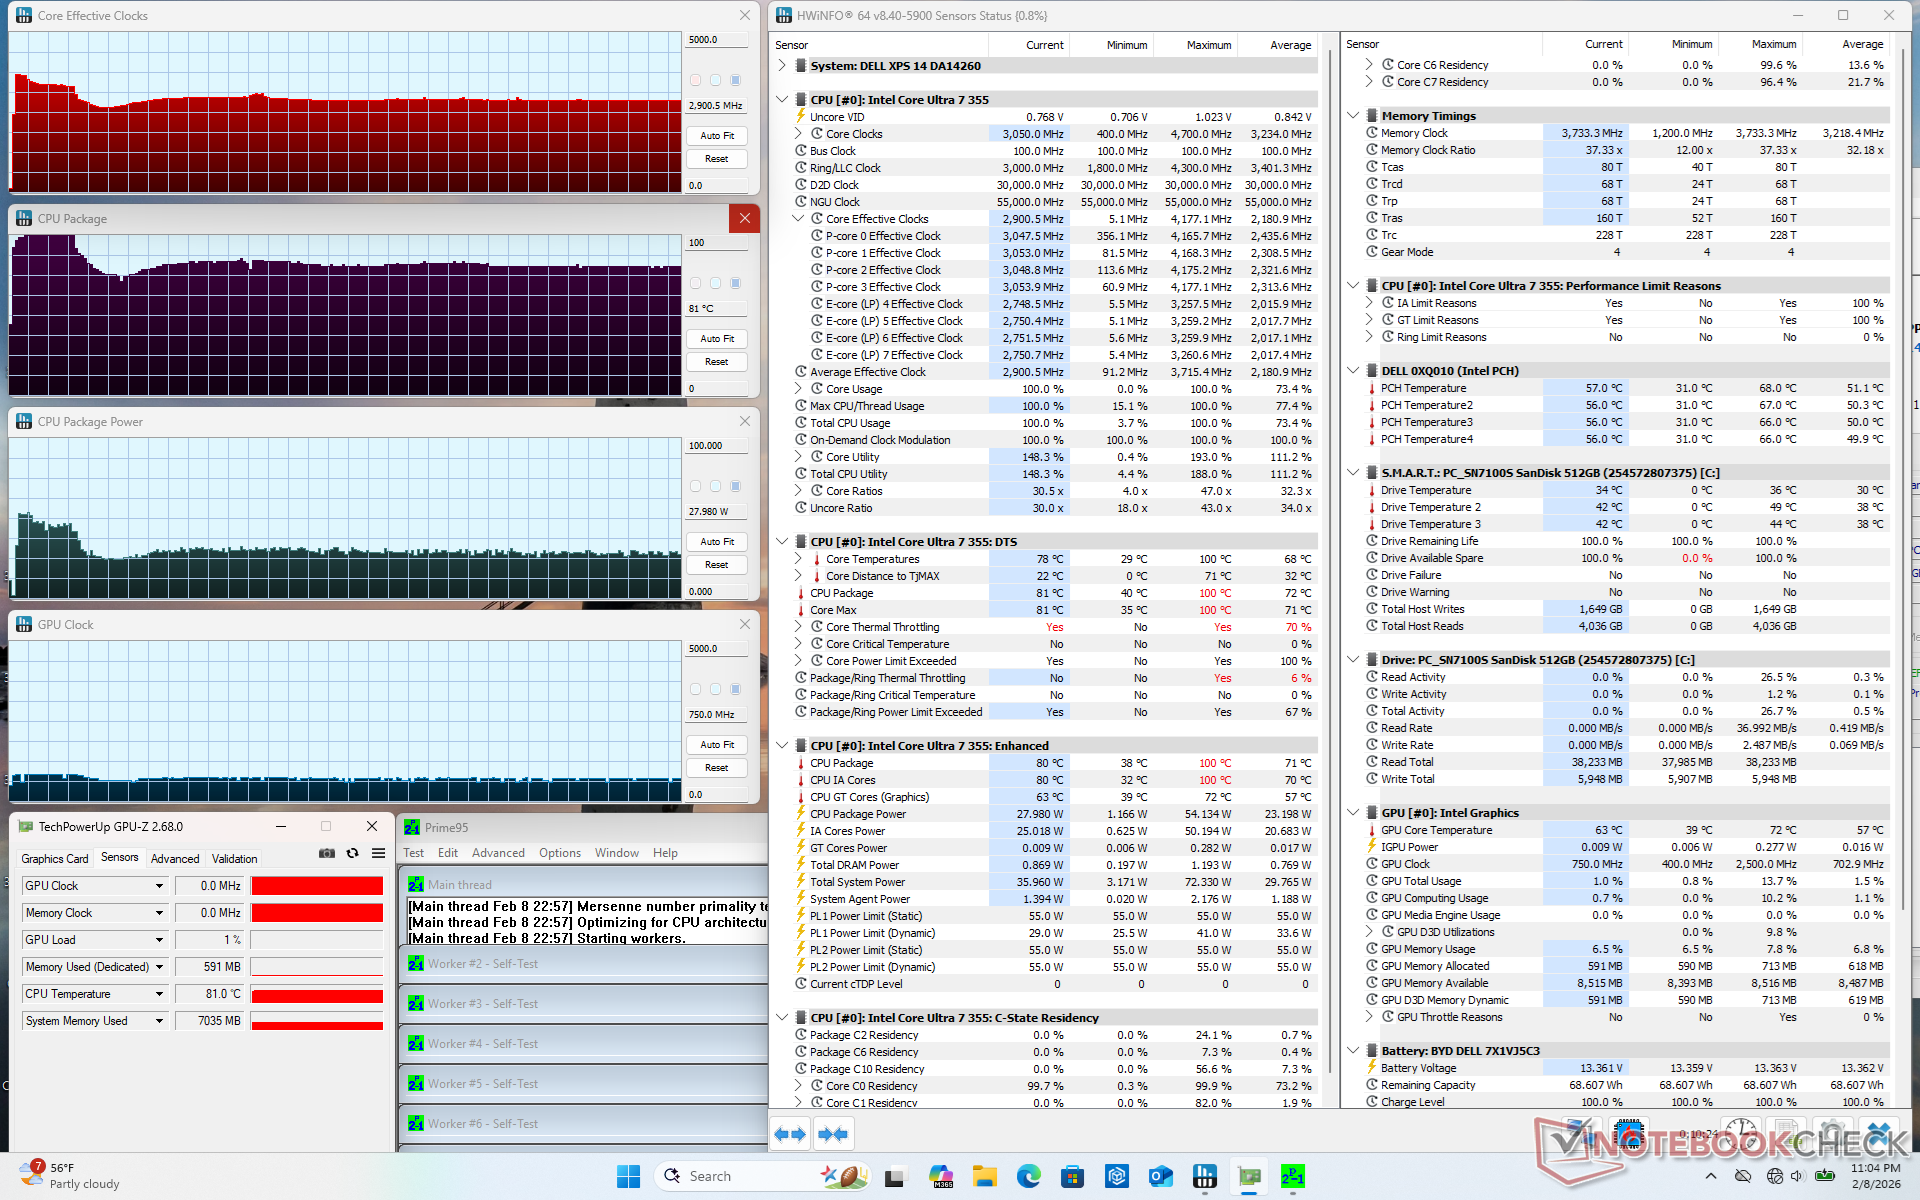
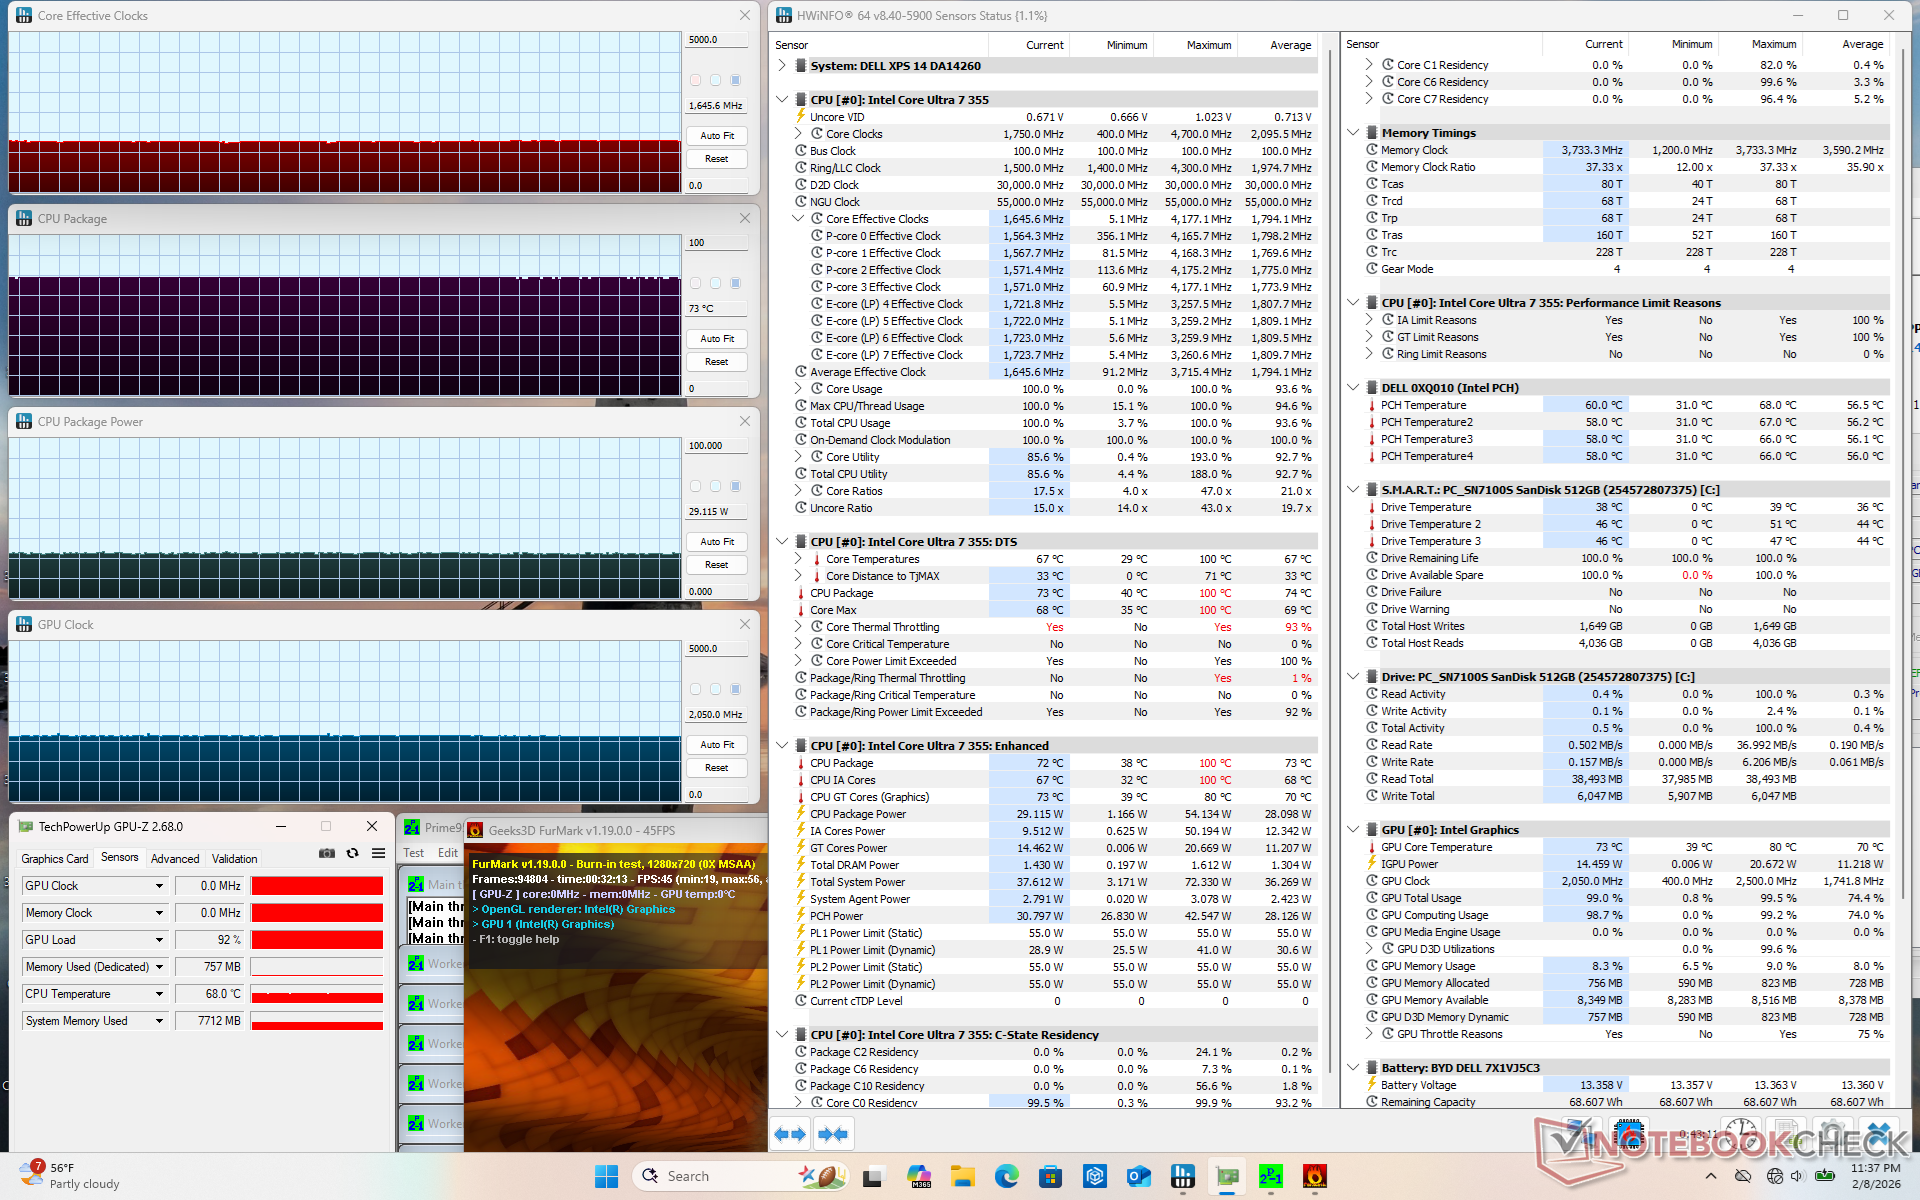
| CPU Clock (GHz) | GPU Clock (MHz) | Average CPU Temperature (°C) | |
| System Idle | -- | -- | 42 |
| Prime95 Stress | 2.9 | -- | 81 |
| Prime95 + FurMark Stress | 1.7 | 2050 | 73 |
| Cyberpunk 2077 Stress (Balanced mode) | 1.2 | 2500 | 79 |
| Cyberpunk 2077 Stress (Performance mode) | 1.2 | 2500 | 79 |
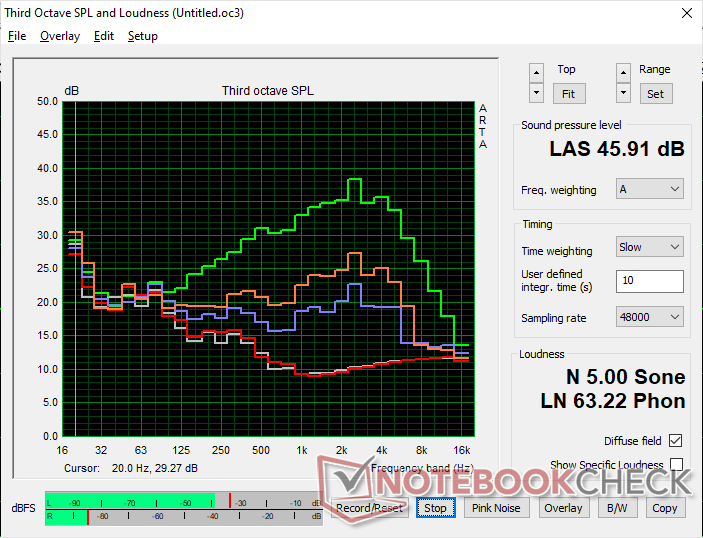
Speakers
Dell XPS 14 Core Ultra 7 355 audio analysis
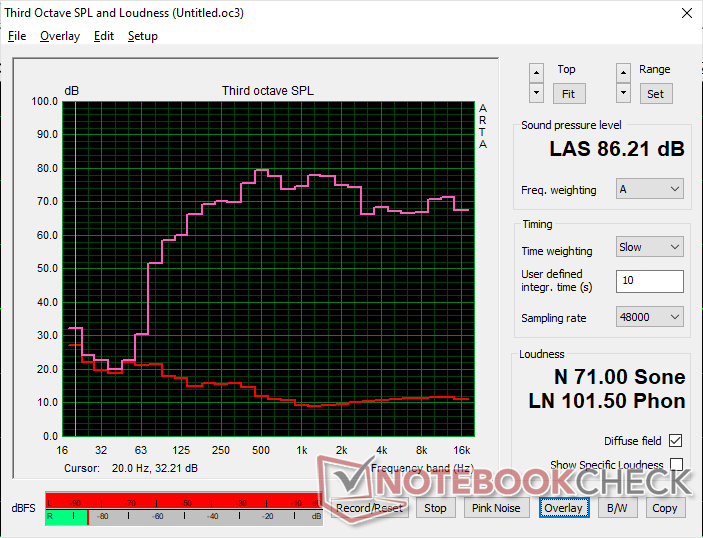
(+) | speakers can play relatively loud (86.2 dB)
Bass 100 - 315 Hz
(±) | reduced bass - on average 5% lower than median
(+) | bass is linear (5.3% delta to prev. frequency)
Mids 400 - 2000 Hz
(±) | higher mids - on average 5.7% higher than median
(+) | mids are linear (4.7% delta to prev. frequency)
Highs 2 - 16 kHz
(+) | balanced highs - only 3.1% away from median
(+) | highs are linear (4.1% delta to prev. frequency)
Overall 100 - 16.000 Hz
(+) | overall sound is linear (7.9% difference to median)
Compared to same class
» 7% of all tested devices in this class were better, 2% similar, 91% worse
» The best had a delta of 5%, average was 17%, worst was 45%
Compared to all devices tested
» 2% of all tested devices were better, 1% similar, 98% worse
» The best had a delta of 4%, average was 24%, worst was 134%
Apple MacBook Pro 16 2021 M1 Pro audio analysis
(+) | speakers can play relatively loud (84.7 dB)
Bass 100 - 315 Hz
(+) | good bass - only 3.8% away from median
(+) | bass is linear (5.2% delta to prev. frequency)
Mids 400 - 2000 Hz
(+) | balanced mids - only 1.3% away from median
(+) | mids are linear (2.1% delta to prev. frequency)
Highs 2 - 16 kHz
(+) | balanced highs - only 1.9% away from median
(+) | highs are linear (2.7% delta to prev. frequency)
Overall 100 - 16.000 Hz
(+) | overall sound is linear (4.6% difference to median)
Compared to same class
» 0% of all tested devices in this class were better, 0% similar, 100% worse
» The best had a delta of 5%, average was 17%, worst was 45%
Compared to all devices tested
» 0% of all tested devices were better, 0% similar, 100% worse
» The best had a delta of 4%, average was 24%, worst was 134%
Energy Management
Power Consumption
Unfortunately, the Core Ultra 7 355 doesn't inherit many of the performance-per-watt benefits of the Core Ultra X7 series. When running Prime95 on an external monitor, for example, the system would consume just 13 percent less than the Core Ultra X7 XPS 14 while offering 40 percent slower performance. Similarly, running Cyberpunk 2077 or FurMark would demand only 7 to 15 percent less energy while suffering from a significant 60 percent drop in graphics performance.
The 100 W universal USB-C AC adapter is otherwise identical across all 2026 XPS 14 configurations. Since Turbo Boost potential is lower on the Core Ultra 7, however, we're only able to reach a maximum draw of 80 W when the CPU is fully stressed compared to 101 W on the Core Ultra X7 configuration.
| Off / Standby | |
| Idle | |
| Load |
|
Key:
min: | |
| Dell XPS 14 Core Ultra 7 355 Ultra 7 355, Intel Graphics 4 Xe3 PTL, WD PC SN7100S SDFPMSL-512G-1101, IPS, 1920x1200, 14" | Dell XPS 14 Core Ultra X7 358H Ultra X7 358H, Arc B390 Panther Lake iGPU, Samsung PM9C1b MZVL81T0HFLB-00BH1, OLED, 2880x1800, 14" | Asus ExpertBook PM3406 Ryzen AI 7 350, Radeon 860M, Western Digital PC SN5000S SDEQNSJ-512G-1002, IPS, 1920x1200, 14" | Lenovo ThinkPad T14 Gen 6 21QG001VGE Core Ultra 7 258V, Arc 140V, Samsung PM9E1 1 TB MZVLC1T0HFLU, IPS LED, 1920x1200, 14" | HP OmniBook Ultra Flip 14 Core Ultra 7 258V, Arc 140V, Samsung PM9A1 MZVL22T0HBLB, OLED, 2880x1800, 14" | Samsung Galaxy Book5 Pro 14 940XHA Core Ultra 5 226V, Arc 130V, Samsung PM9C1 MZVL8512HELU, OLED, 2880x1800, 14" | |
|---|---|---|---|---|---|---|
| Power Consumption | -42% | -45% | -14% | -36% | -21% | |
| Idle Minimum * (Watt) | 1.6 | 3.1 -94% | 3.2 -100% | 2.6 -63% | 3 -88% | 3.7 -131% |
| Idle Average * (Watt) | 3.7 | 3.6 3% | 6.1 -65% | 5.2 -41% | 4.4 -19% | 5.2 -41% |
| Idle Maximum * (Watt) | 3.9 | 10 -156% | 6.9 -77% | 6.2 -59% | 9.4 -141% | 5.4 -38% |
| Load Average * (Watt) | 36 | 39.2 -9% | 56.4 -57% | 40.1 -11% | 42.3 -17% | 26.2 27% |
| Cyberpunk 2077 ultra * (Watt) | 50.9 | 51.4 -1% | 64.9 -28% | 27.4 46% | 51.1 -0% | 47.4 7% |
| Cyberpunk 2077 ultra external monitor * (Watt) | 47.7 | 51.2 -7% | 45.3 5% | 45.2 5% | 49.9 -5% | 42.7 10% |
| Load Maximum * (Watt) | 80 | 101.4 -27% | 76.1 5% | 60.3 25% | 65 19% | 63.5 21% |
* ... smaller is better
Power Consumption Cyberpunk / Stress Test
Power Consumption external Monitor
Battery Life
WLAN runtime is comparable to the Core Ultra X7 XPS 14 or the Lunar Lake-powered HP OmniBook Ultra Flip 14 to represent excellent power management when running day-to-day loads. Users shouldn't expect major battery life differences between the OLED or IPS configurations of the model.
| Dell XPS 14 Core Ultra 7 355 Ultra 7 355, Intel Graphics 4 Xe3 PTL, 70 Wh | Dell XPS 14 Core Ultra X7 358H Ultra X7 358H, Arc B390 Panther Lake iGPU, 70 Wh | Asus ExpertBook PM3406 Ryzen AI 7 350, Radeon 860M, 70 Wh | Lenovo ThinkPad T14 Gen 6 21QG001VGE Core Ultra 7 258V, Arc 140V, 57 Wh | HP OmniBook Ultra Flip 14 Core Ultra 7 258V, Arc 140V, 64 Wh | Samsung Galaxy Book5 Pro 14 940XHA Core Ultra 5 226V, Arc 130V, 63 Wh | |
|---|---|---|---|---|---|---|
| Battery runtime | 16% | -3% | 34% | -3% | -30% | |
| WiFi v1.3 (h) | 14.5 | 16.8 16% | 14 -3% | 19.4 34% | 14 -3% | 10.1 -30% |
| Load (h) | 1.6 |
Notebookcheck Rating
The Dell XPS 14 with Core Ultra 7 355 keeps the sleek design of its pricier X7 sibling while including a high quality IPS display, but its performance and efficiency land much closer to last-gen chips.
Dell XPS 14 Core Ultra 7 355
- 02/14/2026 v8
Allen Ngo
 Total Sustainability Score:
 Potential Competitors in Comparison
Image | Model / Review | Price | Weight | Height | Display |
|---|---|---|---|---|---|
1. 84.8%  | Dell XPS 14 Core Ultra 7 355 Intel Core Ultra 7 355 ⎘ Intel Graphics 4 Xe3 Panther Lake iGPU ⎘ 16 GB Memory, 512 GB SSD | Amazon: 1. $1,795.49 Dell XPS 14 Premium Laptop D... 2. $2,049.00 Dell XPS 14 9440 14.5" Noteb... 3. $2,459.99 Dell Premium 16 (Previously ... List Price: 1600 USD | 1.5 kg | 15.2 mm | 14.00" 1920x1200 162 PPI IPS |
2. 87.4%  | Dell XPS 14 Core Ultra X7 358H Intel Core Ultra X7 358H ⎘ Intel Arc B390 12 Xe3 Panther Lake iGPU ⎘ 32 GB Memory, 1000 GB SSD | Amazon: 1. $1,795.49 Dell XPS 14 Premium Laptop D... 2. $2,049.00 Dell XPS 14 9440 14.5" Noteb... 3. $2,459.99 Dell Premium 16 (Previously ... List Price: 2200 USD | 1.4 kg | 14.62 mm | 14.00" 2880x1800 243 PPI OLED |
3. 84.7%  | Asus ExpertBook PM3406 AMD Ryzen AI 7 350 ⎘ AMD Radeon 860M ⎘ 16 GB Memory, 512 GB SSD | Amazon: List Price: 979€ | 1.4 kg | 17.9 mm | 14.00" 1920x1200 162 PPI IPS |
4. 88.9%  | Lenovo ThinkPad T14 Gen 6 21QG001VGE Intel Core Ultra 7 258V ⎘ Intel Arc Graphics 140V ⎘ 32 GB Memory, 1024 GB SSD | Amazon: List Price: 1960 Euro | 1.5 kg | 22 mm | 14.00" 1920x1200 162 PPI IPS LED |
5. 88.7% 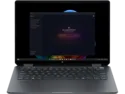 | HP OmniBook Ultra Flip 14 Intel Core Ultra 7 258V ⎘ Intel Arc Graphics 140V ⎘ 32 GB Memory, 2048 GB SSD | Amazon: List Price: 1250 USD | 1.3 kg | 15 mm | 14.00" 2880x1800 243 PPI OLED |
6. 86.9% 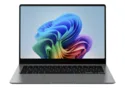 | Samsung Galaxy Book5 Pro 14 940XHA Intel Core Ultra 5 226V ⎘ Intel Arc Graphics 130V ⎘ 16 GB Memory, 512 GB SSD | Amazon: List Price: 1699€ | 1.2 kg | 11.6 mm | 14.00" 2880x1800 243 PPI OLED |
Transparency
The selection of devices to be reviewed is made by our editorial team. The test sample was provided to the author as a loan by the manufacturer or retailer for the purpose of this review. The lender had no influence on this review, nor did the manufacturer receive a copy of this review before publication. There was no obligation to publish this review. As an independent media company, Notebookcheck is not subjected to the authority of manufacturers, retailers or publishers.
This is how Notebookcheck is testing
Every year, Notebookcheck independently reviews hundreds of laptops and smartphones using standardized procedures to ensure that all results are comparable. We have continuously developed our test methods for around 20 years and set industry standards in the process. In our test labs, high-quality measuring equipment is utilized by experienced technicians and editors. These tests involve a multi-stage validation process. Our complex rating system is based on hundreds of well-founded measurements and benchmarks, which maintains objectivity. Further information on our test methods can be found here.
