Verdict — Pushing Performance Boundaries
With no new GeForce GPUs this year, the Arrow Lake Core Ultra 9 290HX Plus and 1600p OLED display are the only two new additions thus far for the 2026 Alienware 16 Area-51. The new CPU is indeed up to 25 percent faster than the previous top-of-the-line Core Ultra 9 275HX option, but power consumption is similarly up to 25 percent more demanding as a result].
As for the display, upgrading from IPS to OLED is arguably much more noticeable than upgrading from the Core Ultra 9 to the Core Ultra 9 Plus. The OLED panel offers significantly higher contrast, faster response times, and superior HDR all while maintaining support for Advanced Optimus, QHD+ native resolution, and a fast 240 Hz refresh rate. Gaming and multimedia will especially benefit from these advantages. Unfortunately, the new OLED and Core Ultra 9 Plus CPU options are bundled and cannot be separated leading to very high prices for this configuration.
Since the chassis hasn't changed, most of our complaints about the 2025 model remain the same for the 2026 model. The already warm core temperatures are even worse this time around at up to 100 C if configured with the Core Ultra 9 Plus. Meanwhile, battery life is still quite short even for a gaming laptop. The "performance at all cost" mentality is as strong as ever to be in line with what the Alienware branding is known for.
Pros
Cons
Price and Availability
Dell is now shipping the 2026 Alienware 16 Area-51 starting at $1950 for the base Core Ultra 7 and RTX 5060 configuration up to $3900 or more for our Core Ultra 9 Plus and RTX 5080 configuration.
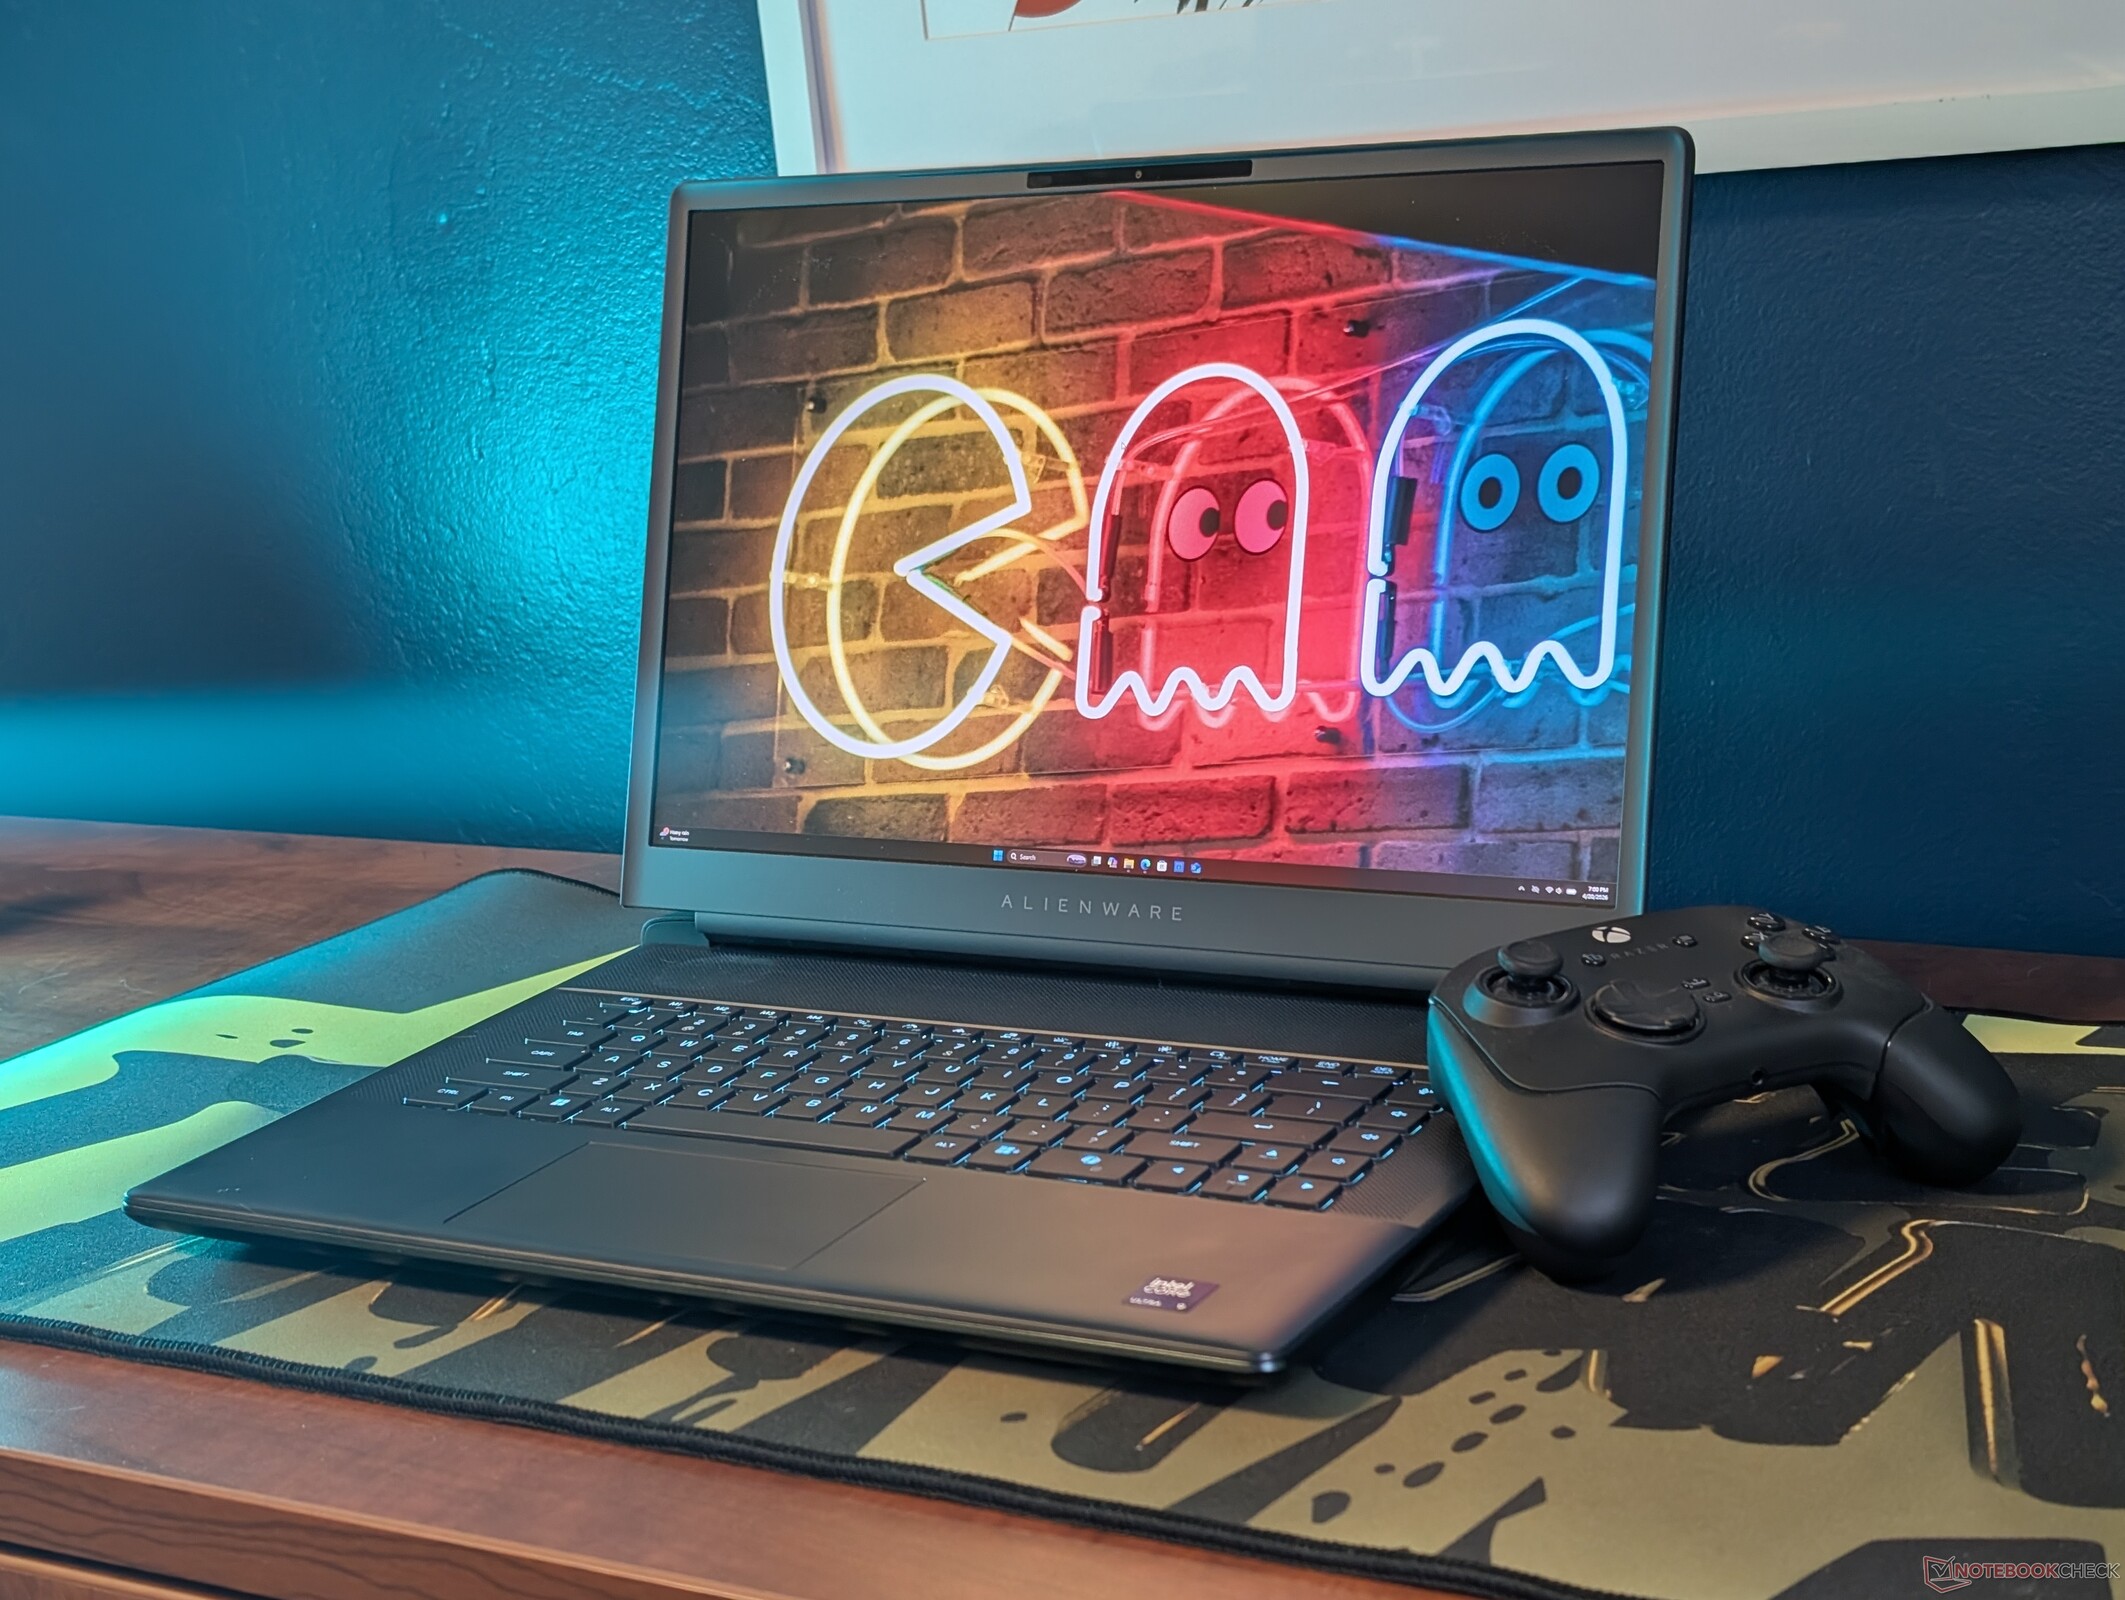
The Alienware 16 Area-51 made its debut last year and it arguably became one of Alienware's best laptops by far. For 2026, the model is receiving only minor refreshes related to its CPU and display since the GeForce RTX 50 series has yet to be succeeded.
Our test unit comes equipped with new options not available on the 2025 version including the Core Ultra 9 290HX Plus CPU and matte 240 Hz 1600p OLED panel with G-Sync for just under $4000. Do these changes improve the user experience or justify the new price?
We recommend checking out our review on the 2025 Alienware 16 Area-51 to learn more about the physical features of the laptop. Alternatives to the Dell model include other high-end 16-inch gaming laptops like the Asus ROG Zephyrus G16 or Lenovo Legion Pro 7i 16 Gen 10.
More Alienware reviews:
Specifications
Case

Connectivity


SD Card Reader
| SD Card Reader | |
| average JPG Copy Test (av. of 3 runs) | |
| Alienware 16 Area-51 Core Ultra 9 290HX Plus (Toshiba Exceria Pro SDXC 64 GB UHS-II) | |
| Alienware 16 Area-51 (Toshiba Exceria Pro SDXC 64 GB UHS-II) | |
| Asus ROG Zephyrus G16 GU605CW (AV Pro SD microSD 128 GB V60) | |
| MSI Vector 16 HX AI A2XWHG (AV PRO microSD 128 GB V60) | |
| maximum AS SSD Seq Read Test (1GB) | |
| Alienware 16 Area-51 Core Ultra 9 290HX Plus (Toshiba Exceria Pro SDXC 64 GB UHS-II) | |
| Alienware 16 Area-51 (Toshiba Exceria Pro SDXC 64 GB UHS-II) | |
| MSI Vector 16 HX AI A2XWHG (AV PRO microSD 128 GB V60) | |
| Asus ROG Zephyrus G16 GU605CW (AV Pro SD microSD 128 GB V60) | |
Communication
Webcam


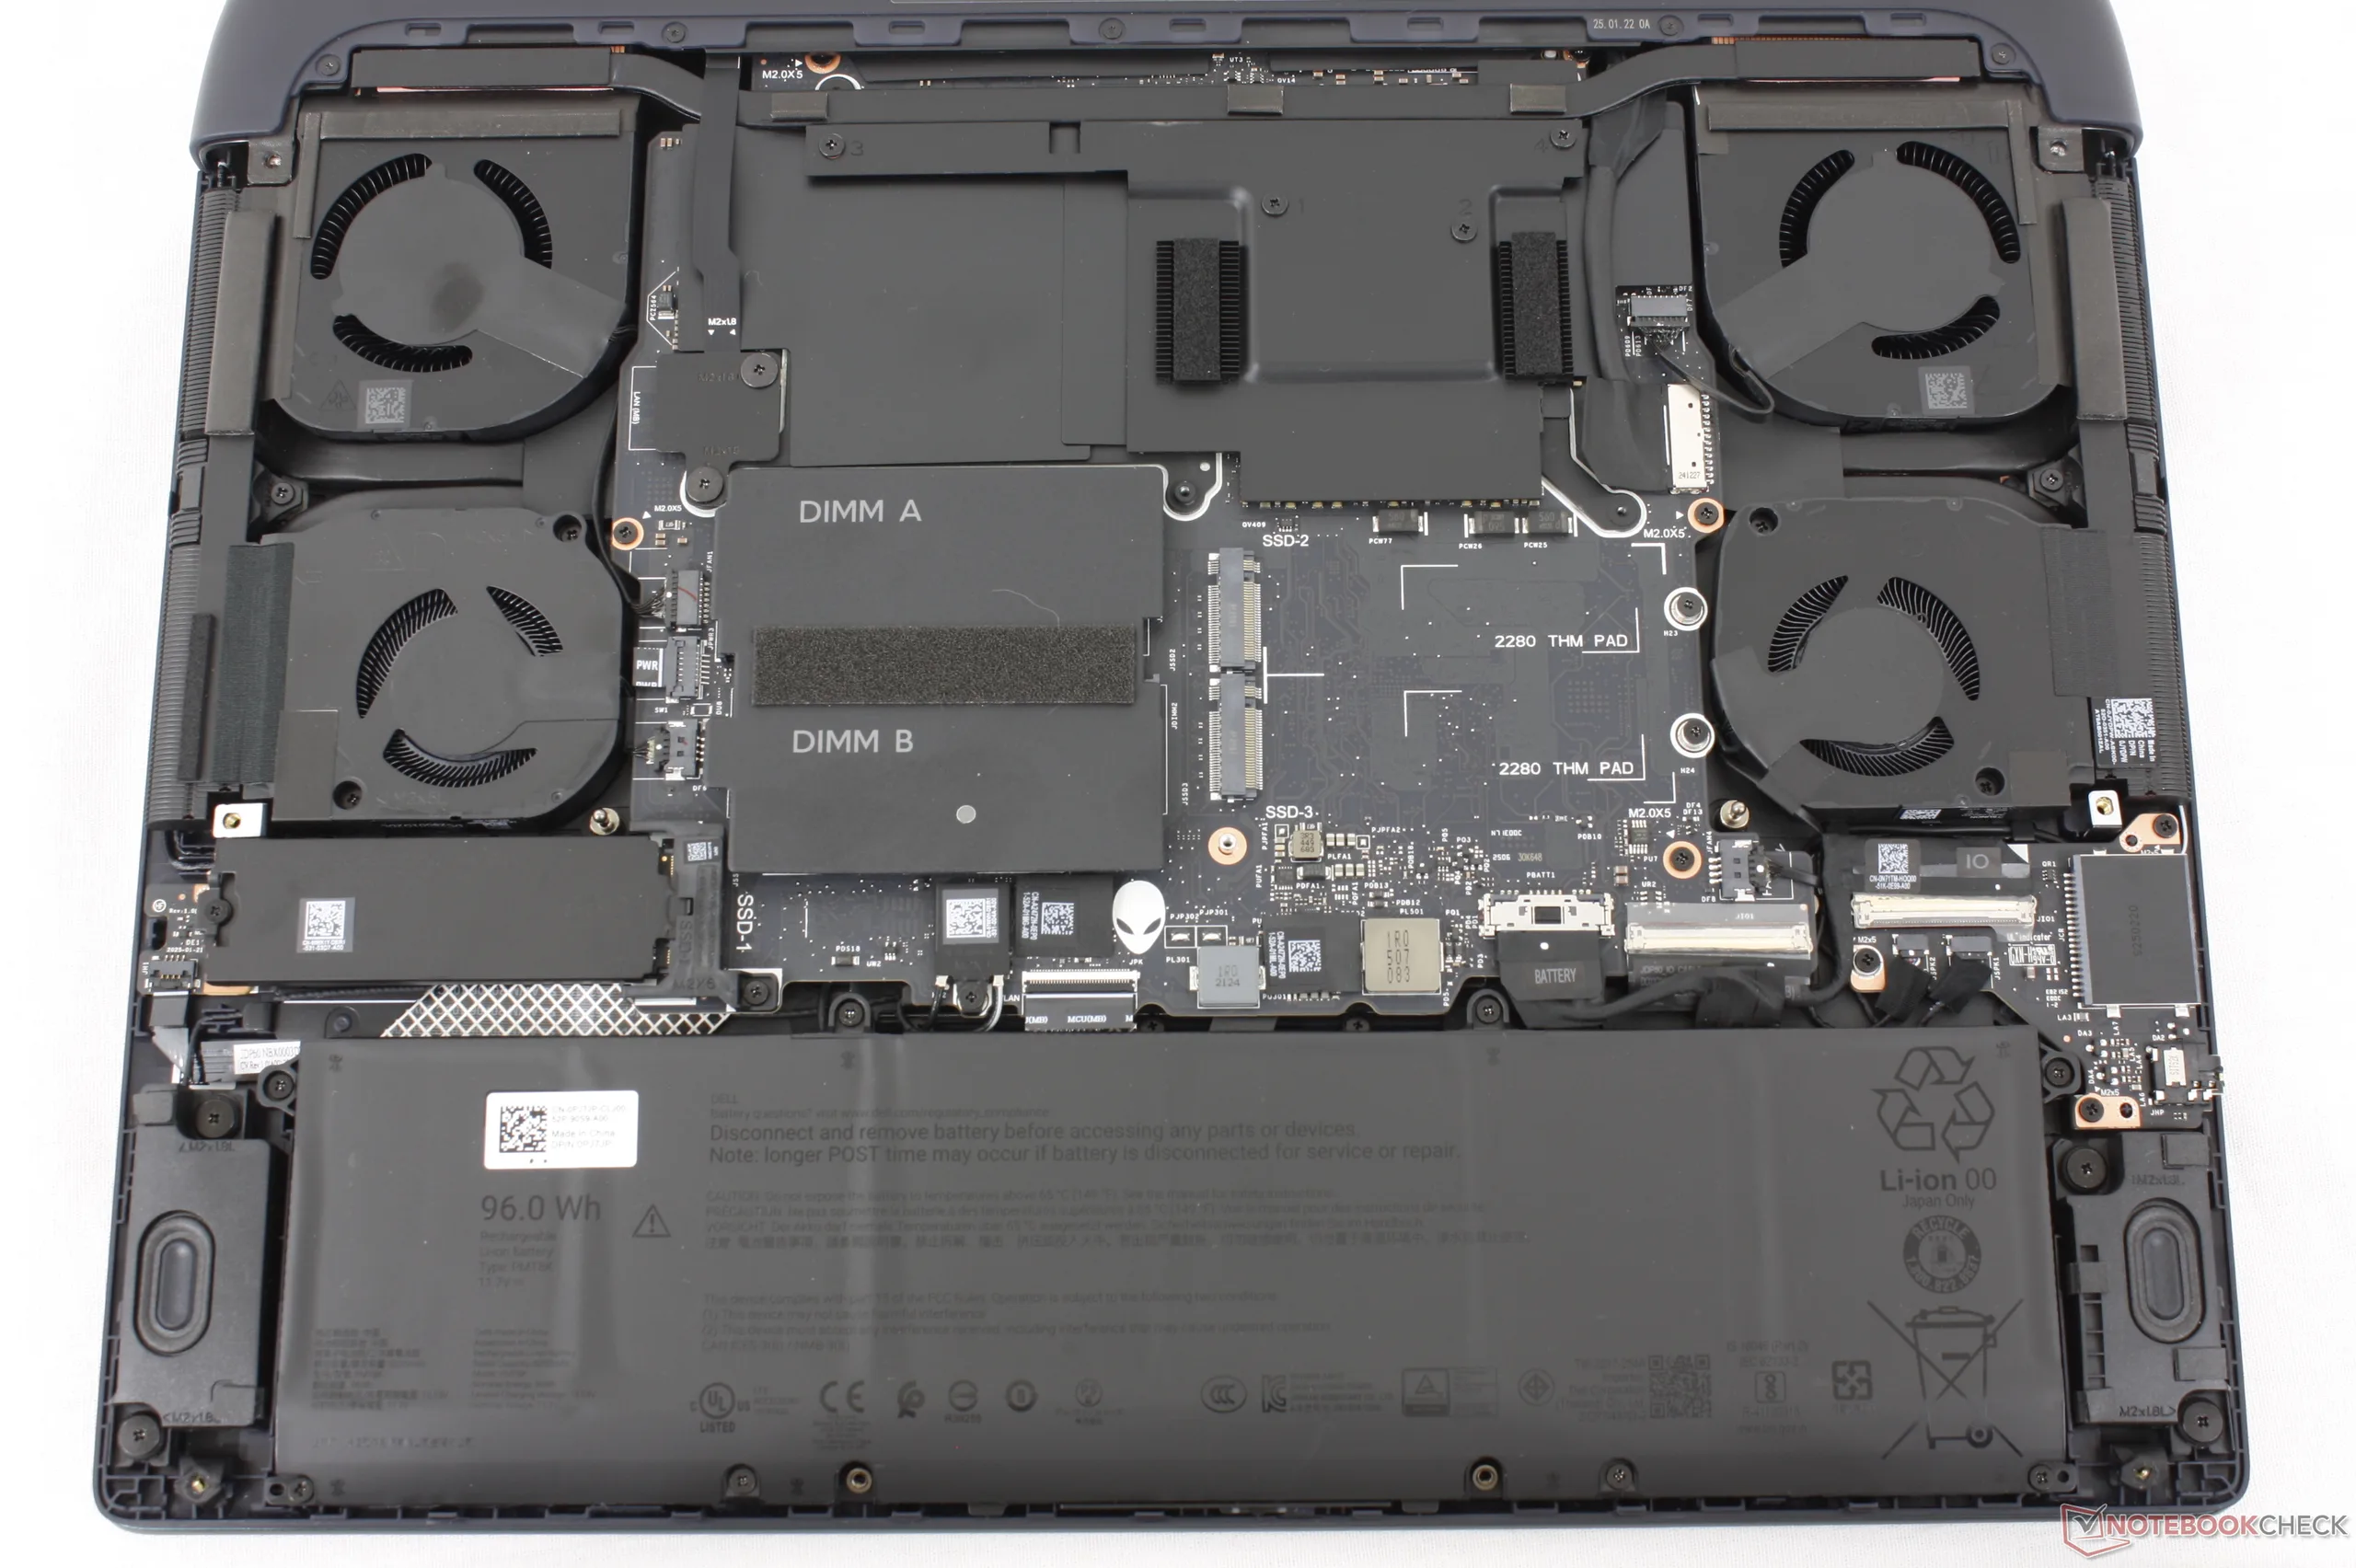
Maintenance

Input Devices

Display

There are now two display options available each with G-sync and native 240 Hz refresh rate support:
- 2560 x 1600, 100% DCI-P3, IPS, 500 nits, matte
- 2560 x 1600, 120% DCI-P3, OLED, 620 nits (on HDR), matte
The base IPS panel is the same as on the 2025 model while the OLED is a new option. Unlike most other OLED laptops, the OLED panel for the Alienware is matte with G-Sync support instead of glossy. However, the matte overlay entails slightly grainier texts and images as a result.
| |||||||||||||||||||||||||
Brightness Distribution: 97 %
Center on Battery: 383.3 cd/m²
Contrast: ∞:1 (Black: 0 cd/m²)
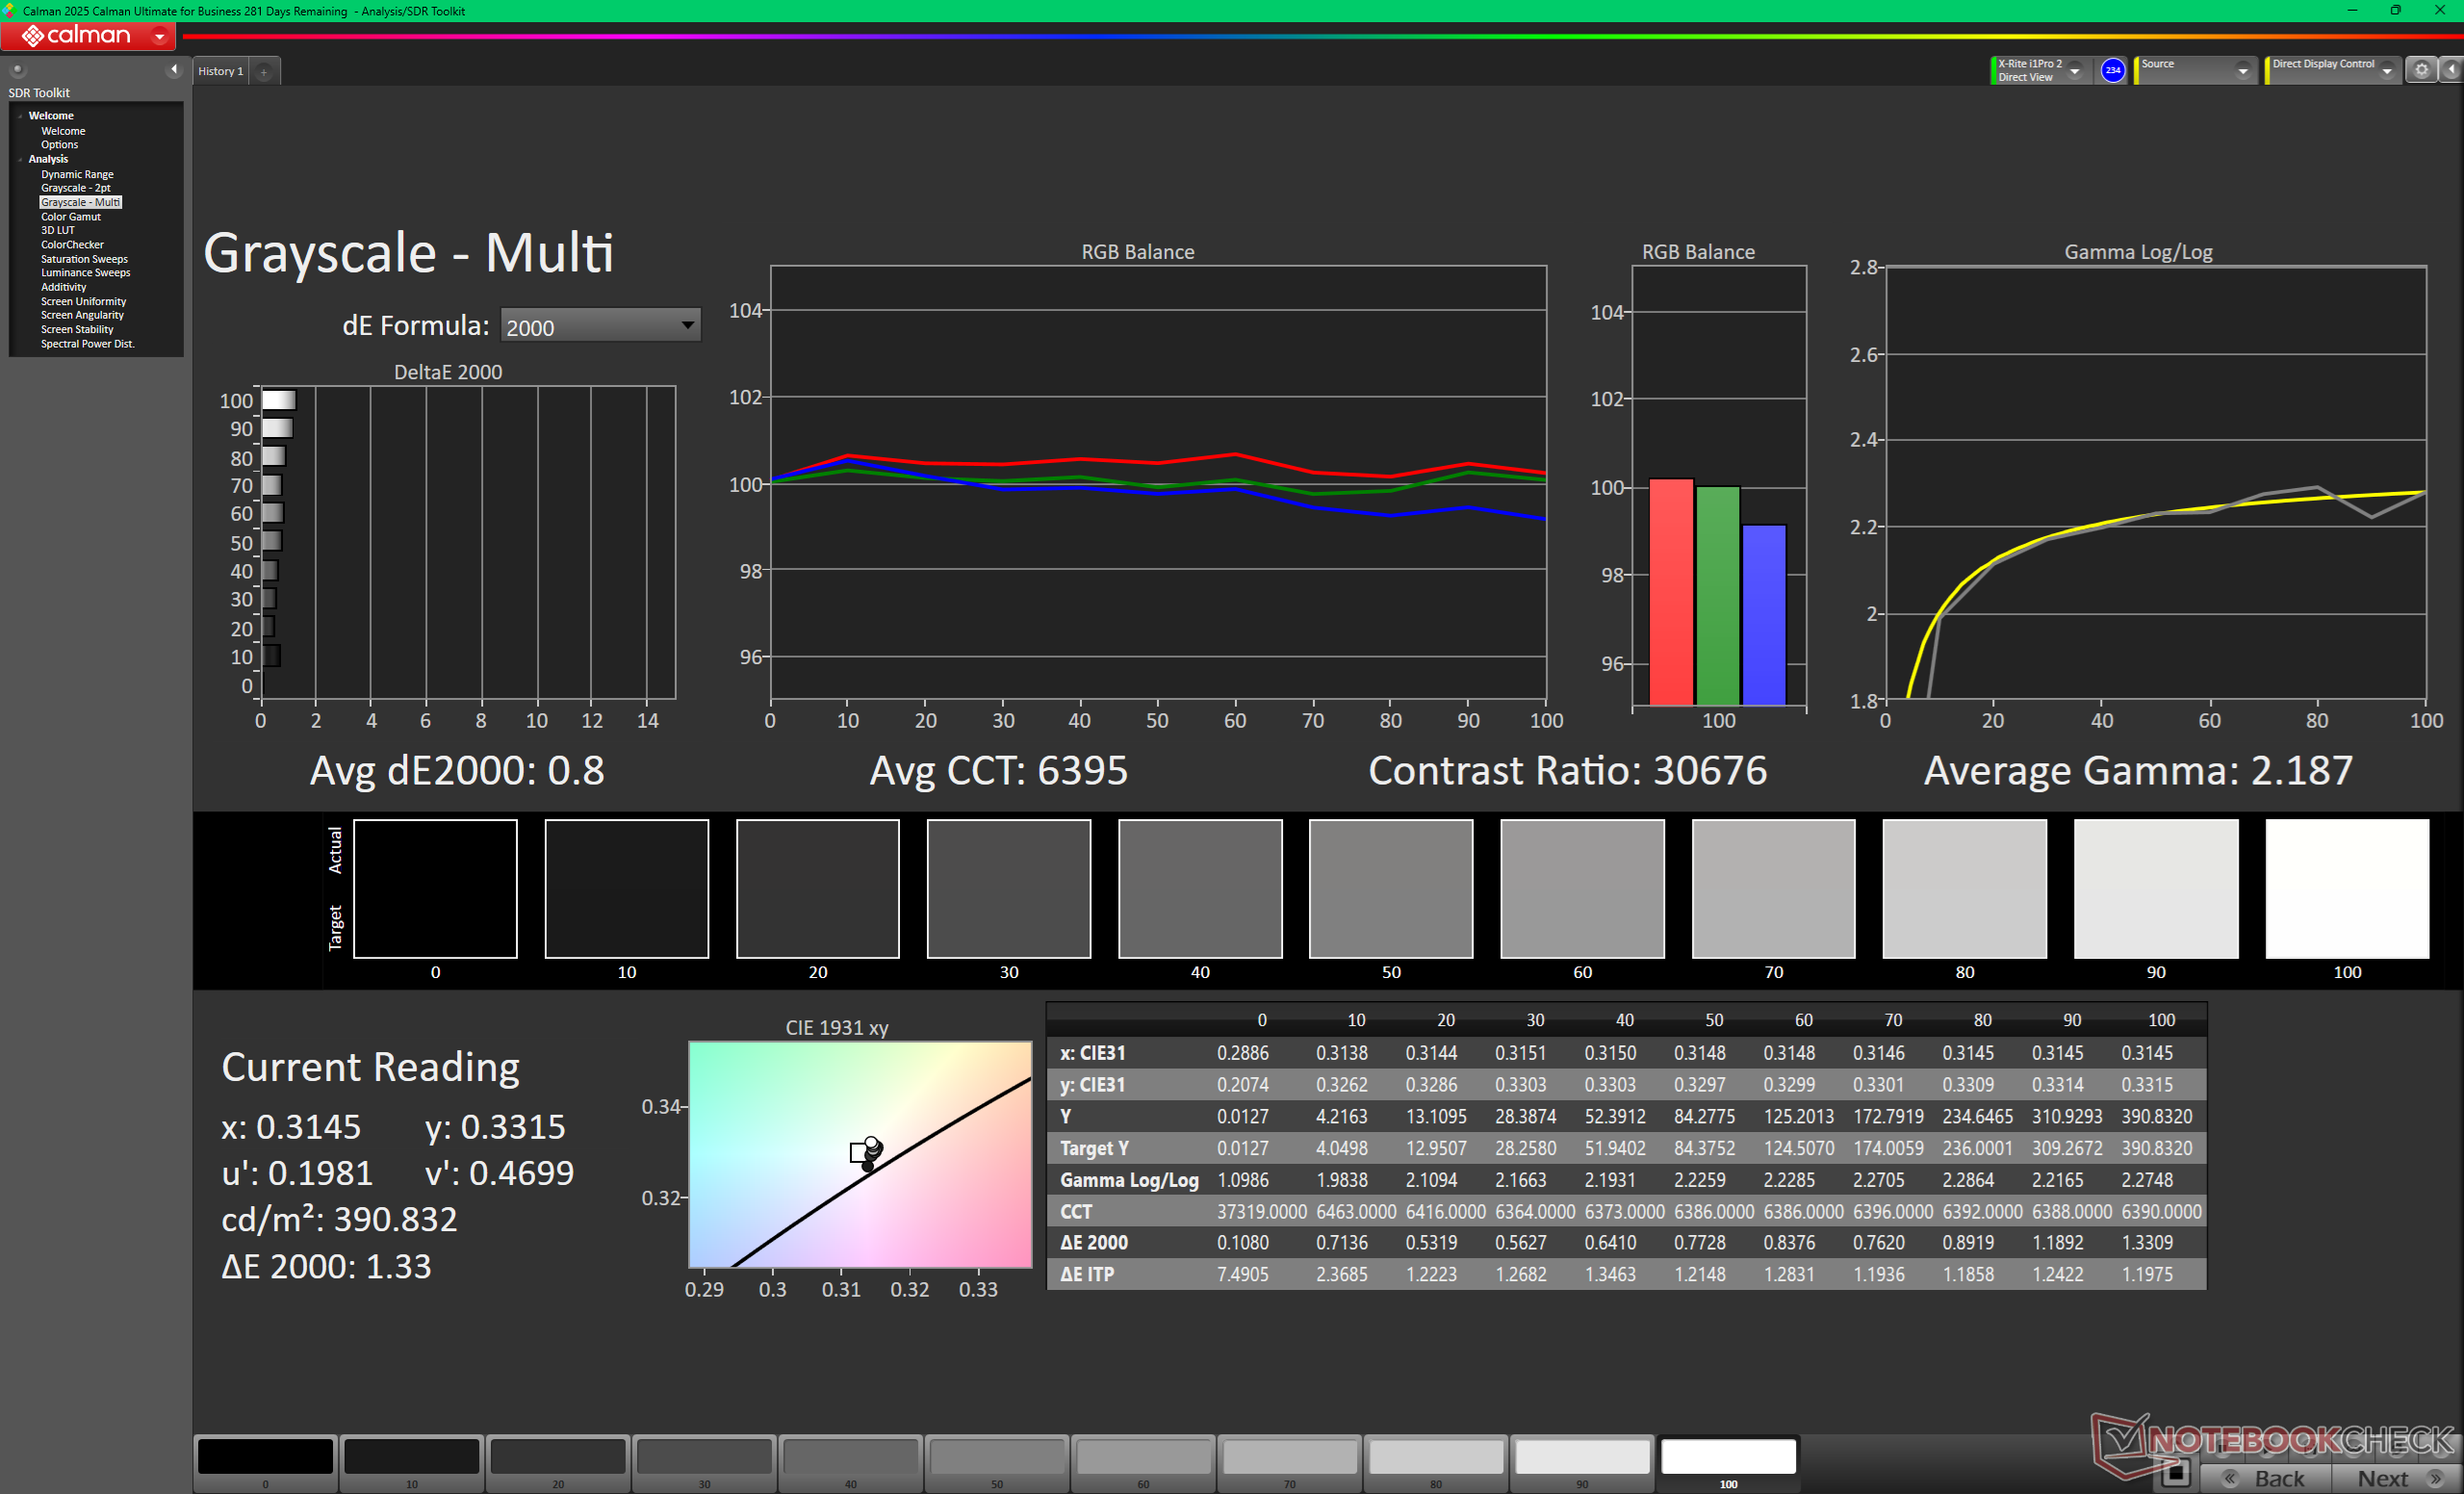
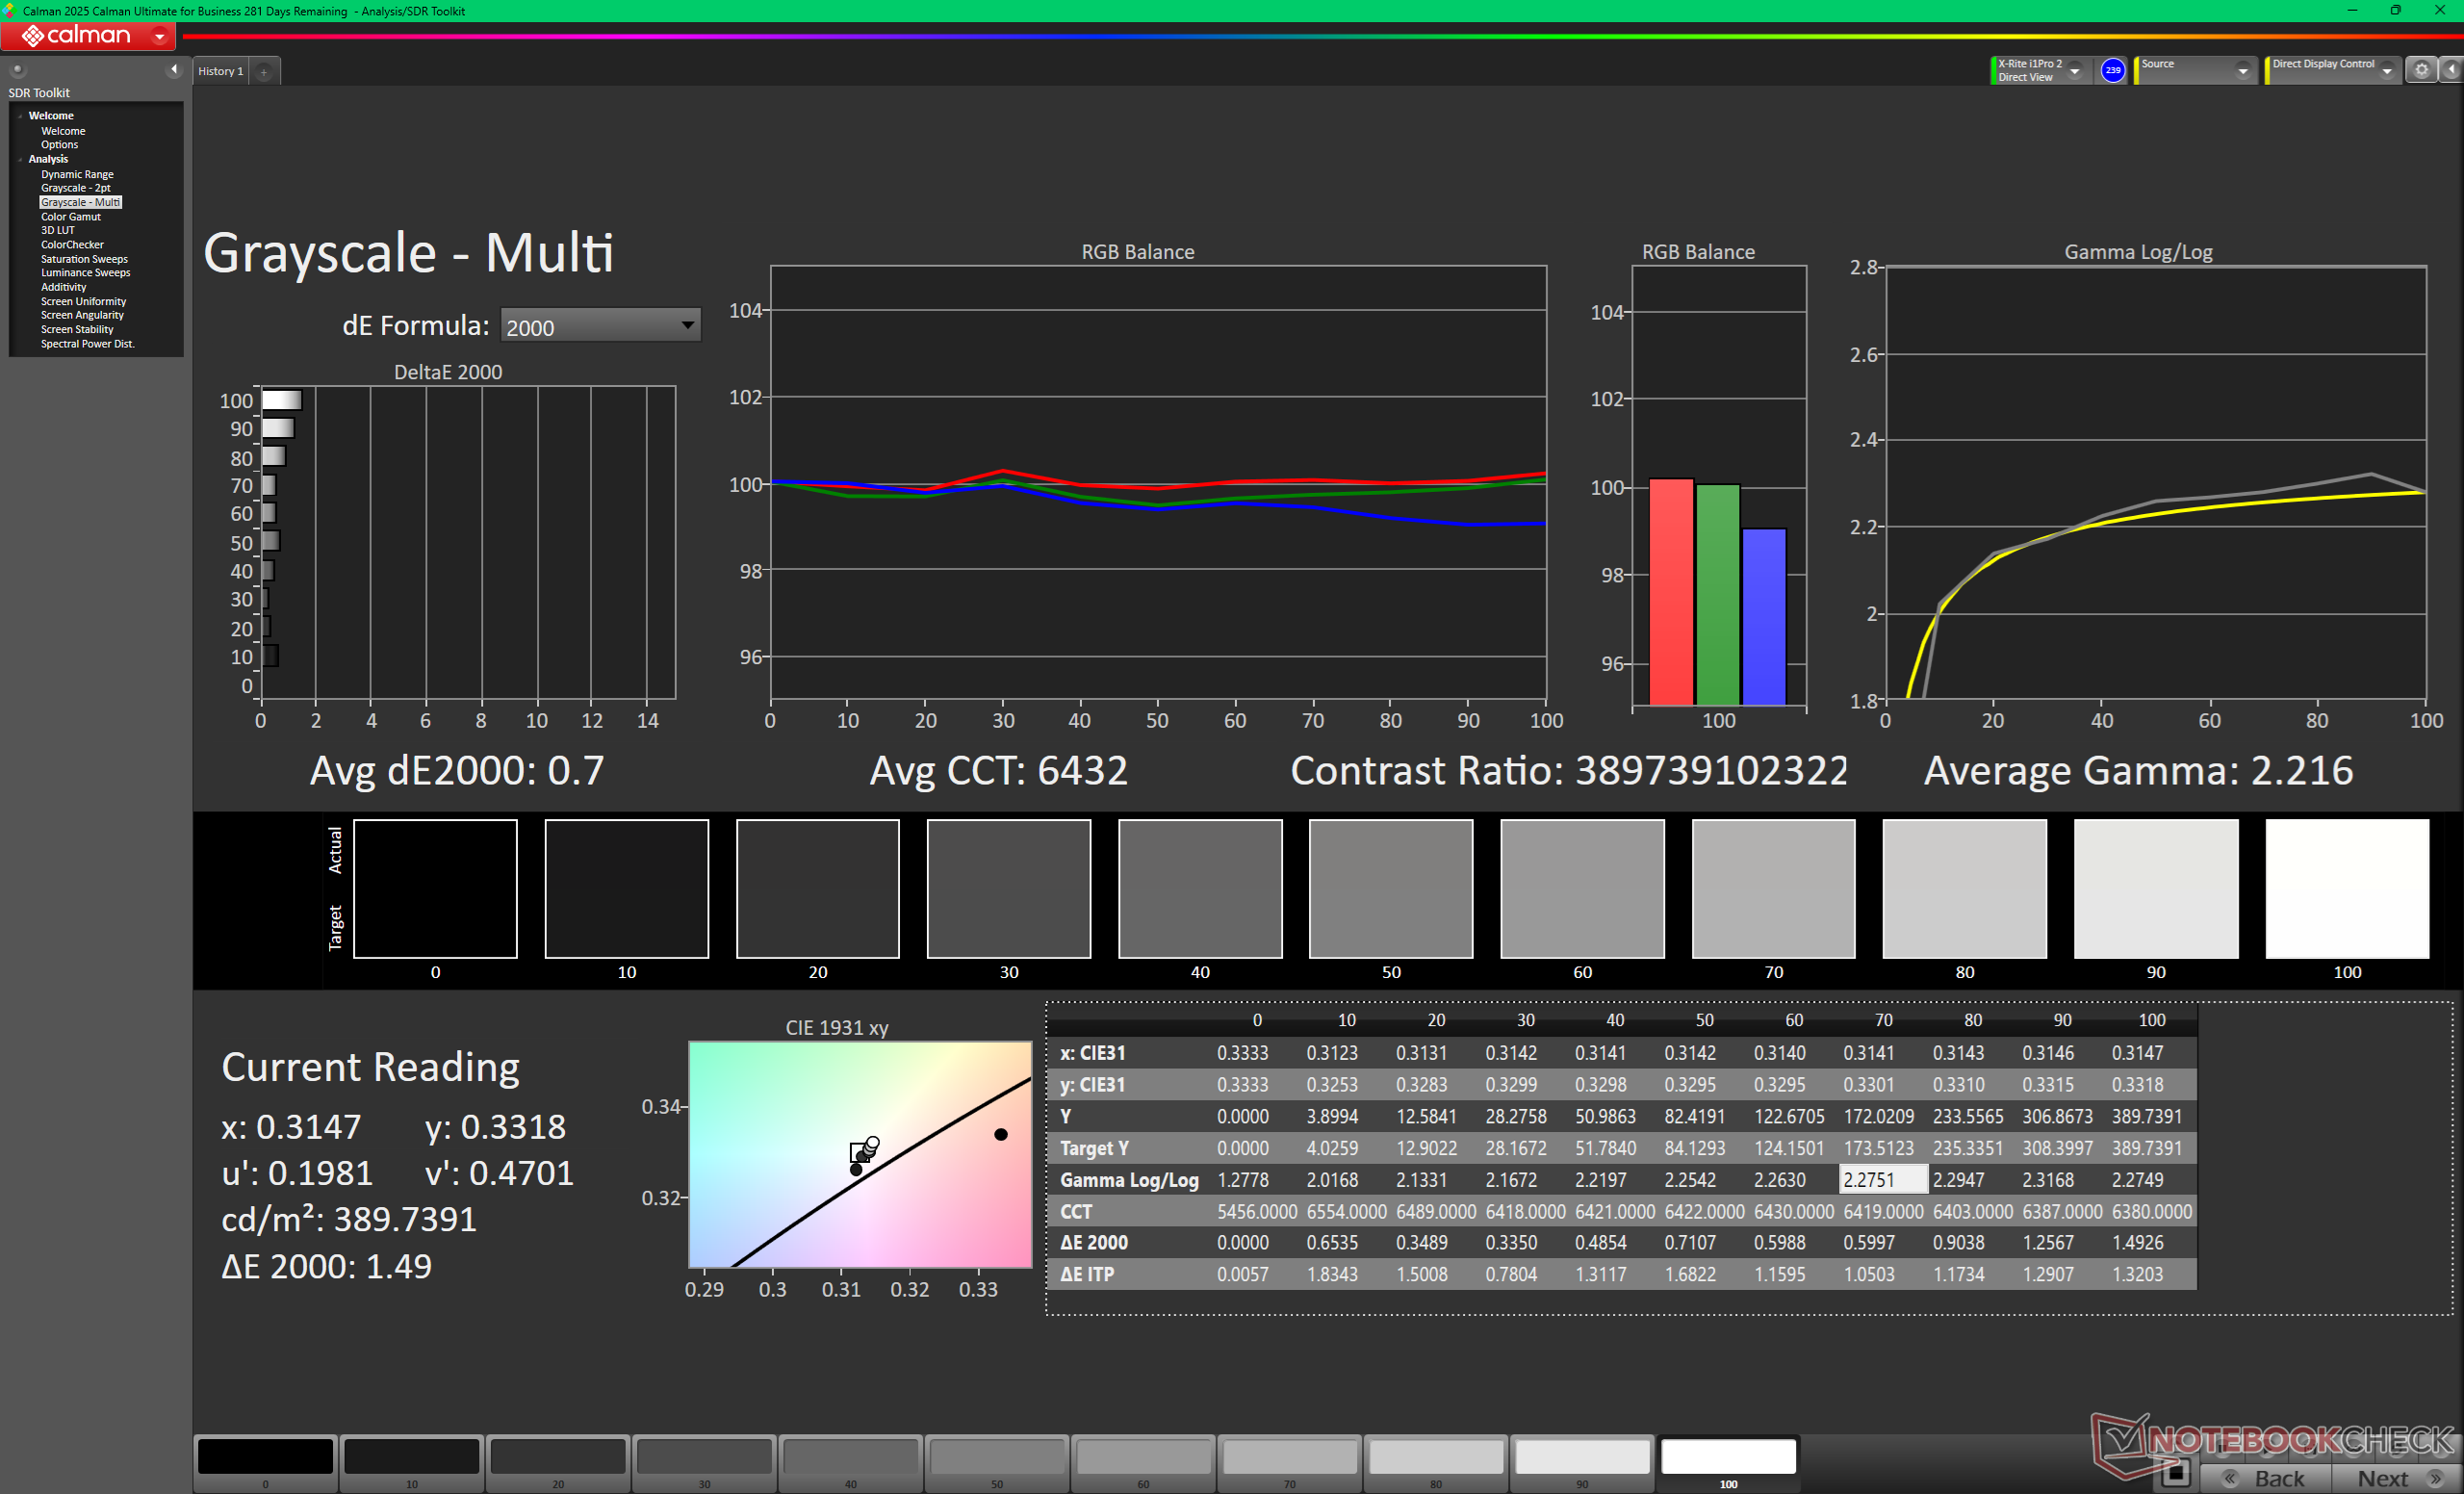
ΔE ColorChecker Calman: 0.87 | ∀{0.5-29.43 Ø4.71}
calibrated: 0.61
ΔE Greyscale Calman: 0.8 | ∀{0.09-98 Ø4.96}
95.6% AdobeRGB 1998 (Argyll 3D)
100% sRGB (Argyll 3D)
99.6% Display P3 (Argyll 3D)
Gamma: 2.19
CCT: 6395 K
| Alienware 16 Area-51 Core Ultra 9 290HX Plus Samsung 160HU05, OLED, 2560x1600, 16", 240 Hz | Alienware 16 Area-51 AU Optronics B160QAN, IPS, 2560x1600, 16", 240 Hz | Lenovo Legion Pro 7i 16 Gen 10 Samsung ATNA60HU01-0, OLED, 2560x1600, 16", 240 Hz | HP Omen Max 16 ah000 Samsung ATNA60DL02-0, OLED, 2560x1600, 16", 240 Hz | MSI Vector 16 HX AI A2XWHG B160QAN02.3 (AUO7DB2), IPS, 2560x1600, 16", 240 Hz | Asus ROG Zephyrus G16 GU605CW Samsung ATNA60DL01-0, OLED, 2560x1600, 16", 240 Hz | |
|---|---|---|---|---|---|---|
| Display | -4% | -0% | 1% | -5% | -2% | |
| APL18 Peak Brightness (cd/m²) | 609 | |||||
| HDR Peak Brightness (cd/m²) | 609 | |||||
| Display P3 Coverage (%) | 99.6 | 96 -4% | 99.5 0% | 99.7 0% | 96.6 -3% | 96.5 -3% |
| sRGB Coverage (%) | 100 | 100 0% | 100 0% | 100 0% | 99.8 0% | 99.2 -1% |
| AdobeRGB 1998 Coverage (%) | 95.6 | 89.2 -7% | 94.4 -1% | 98.2 3% | 84.4 -12% | 94.5 -1% |
| Response Times | -1606% | 0% | -6% | -1373% | -447% | |
| Response Time Grey 50% / Grey 80% * (ms) | 0.29 ? | 4.8 ? -1555% | 0.28 ? 3% | 0.29 ? -0% | 4.3 ? -1383% | 0.32 ? -10% |
| Response Time Black / White * (ms) | 0.41 ? | 7.2 ? -1656% | 0.43 ? -5% | 0.47 ? -15% | 6 ? -1363% | 6 ? -1363% |
| PWM Frequency (Hz) | 1440 ? | 1438 ? | 960 ? | 960 | ||
| PWM Amplitude * (%) | 30 | 29 3% | 31 -3% | 20 33% | ||
| Screen | -131% | -64% | -92% | -131% | -82% | |
| Brightness middle (cd/m²) | 383.3 | 554 45% | 490.4 28% | 376.5 -2% | 473 23% | 394 3% |
| Brightness (cd/m²) | 387 | 532 37% | 498 29% | 382 -1% | 426 10% | 398 3% |
| Brightness Distribution (%) | 97 | 88 -9% | 97 0% | 96 -1% | 85 -12% | 98 1% |
| Black Level * (cd/m²) | 0.52 | 0.42 | 0.0084 | |||
| Colorchecker dE 2000 * | 0.87 | 2.81 -223% | 3.2 -268% | 3.67 -322% | 3.47 -299% | 2.41 -177% |
| Colorchecker dE 2000 max. * | 2.23 | 8.32 -273% | 6.04 -171% | 7.24 -225% | 7.24 -225% | 3.82 -71% |
| Colorchecker dE 2000 calibrated * | 0.61 | 0.65 -7% | 0.84 -38% | 0.94 -54% | 1.36 -123% | 1.41 -131% |
| Greyscale dE 2000 * | 0.8 | 4.7 -488% | 1 -25% | 1.1 -38% | 3.1 -288% | 2.4 -200% |
| Gamma | 2.19 100% | 2.3 96% | 2.24 98% | 2.25 98% | 2.486 88% | 2.16 102% |
| CCT | 6395 102% | 6476 100% | 6373 102% | 6319 103% | 6832 95% | 6544 99% |
| Contrast (:1) | 1065 | 1126 | 46905 | |||
| Total Average (Program / Settings) | -580% /
-345% | -21% /
-34% | -32% /
-51% | -503% /
-306% | -177% /
-147% |
* ... smaller is better
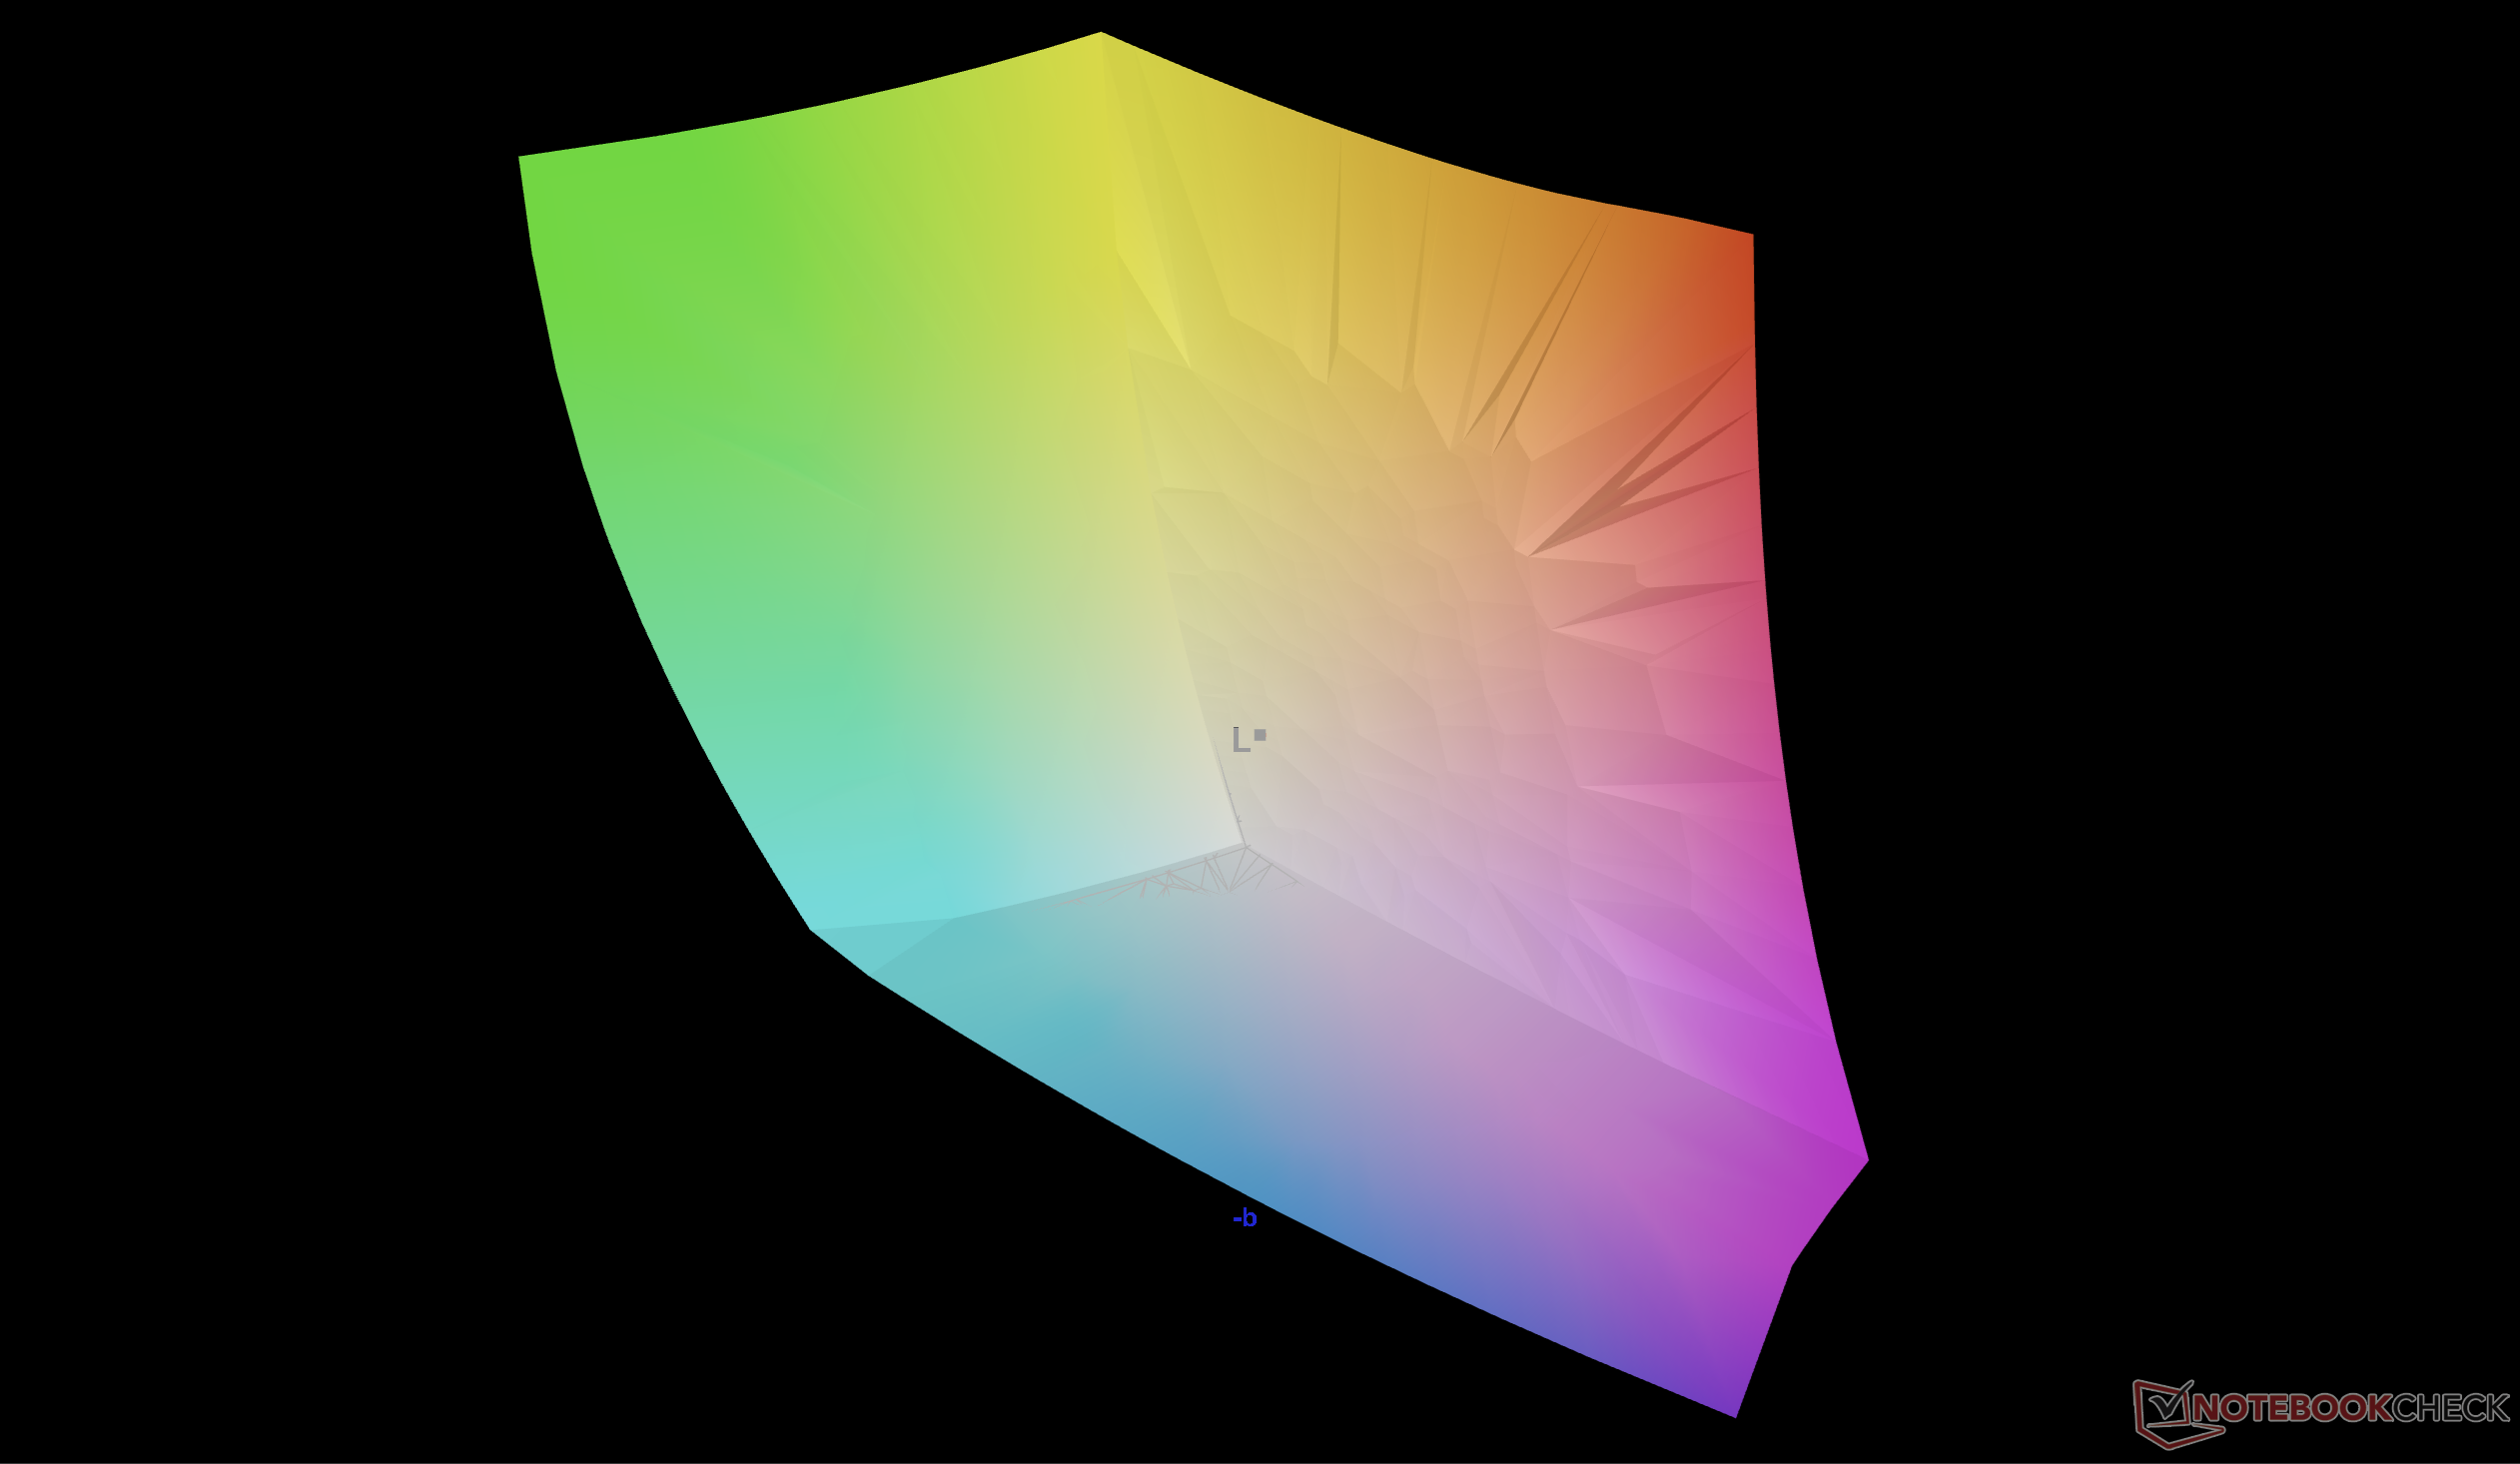
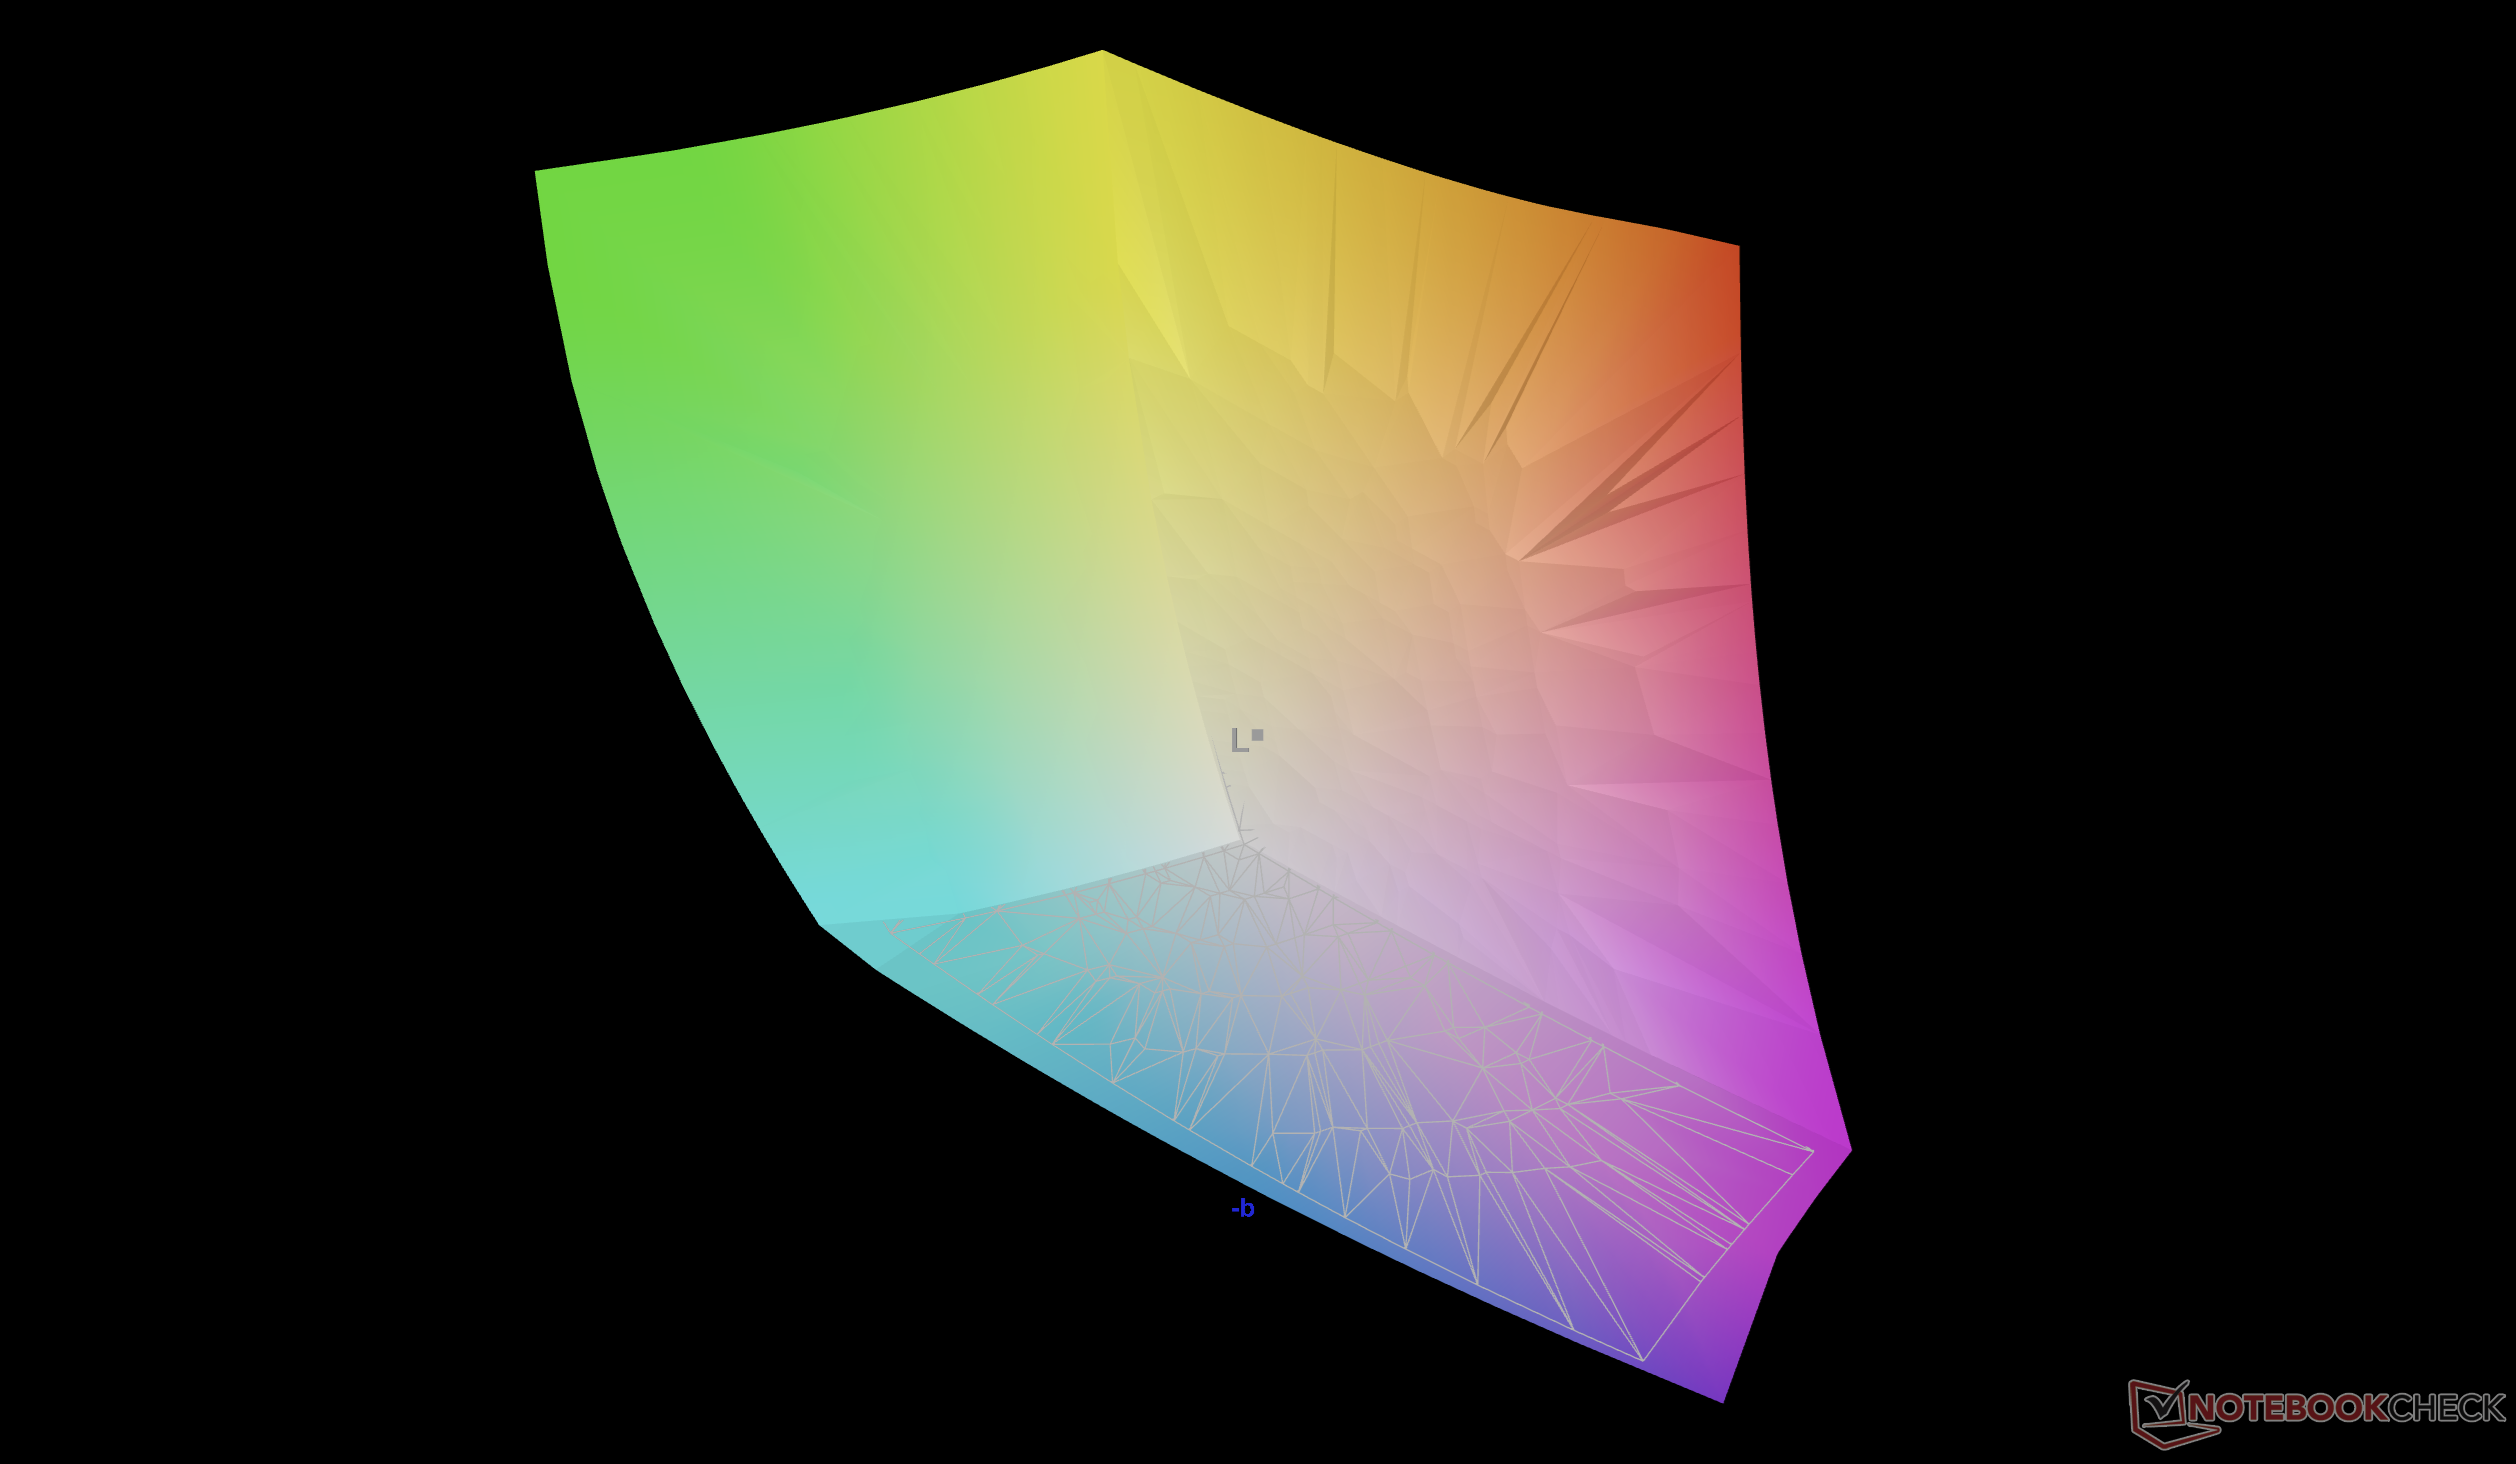
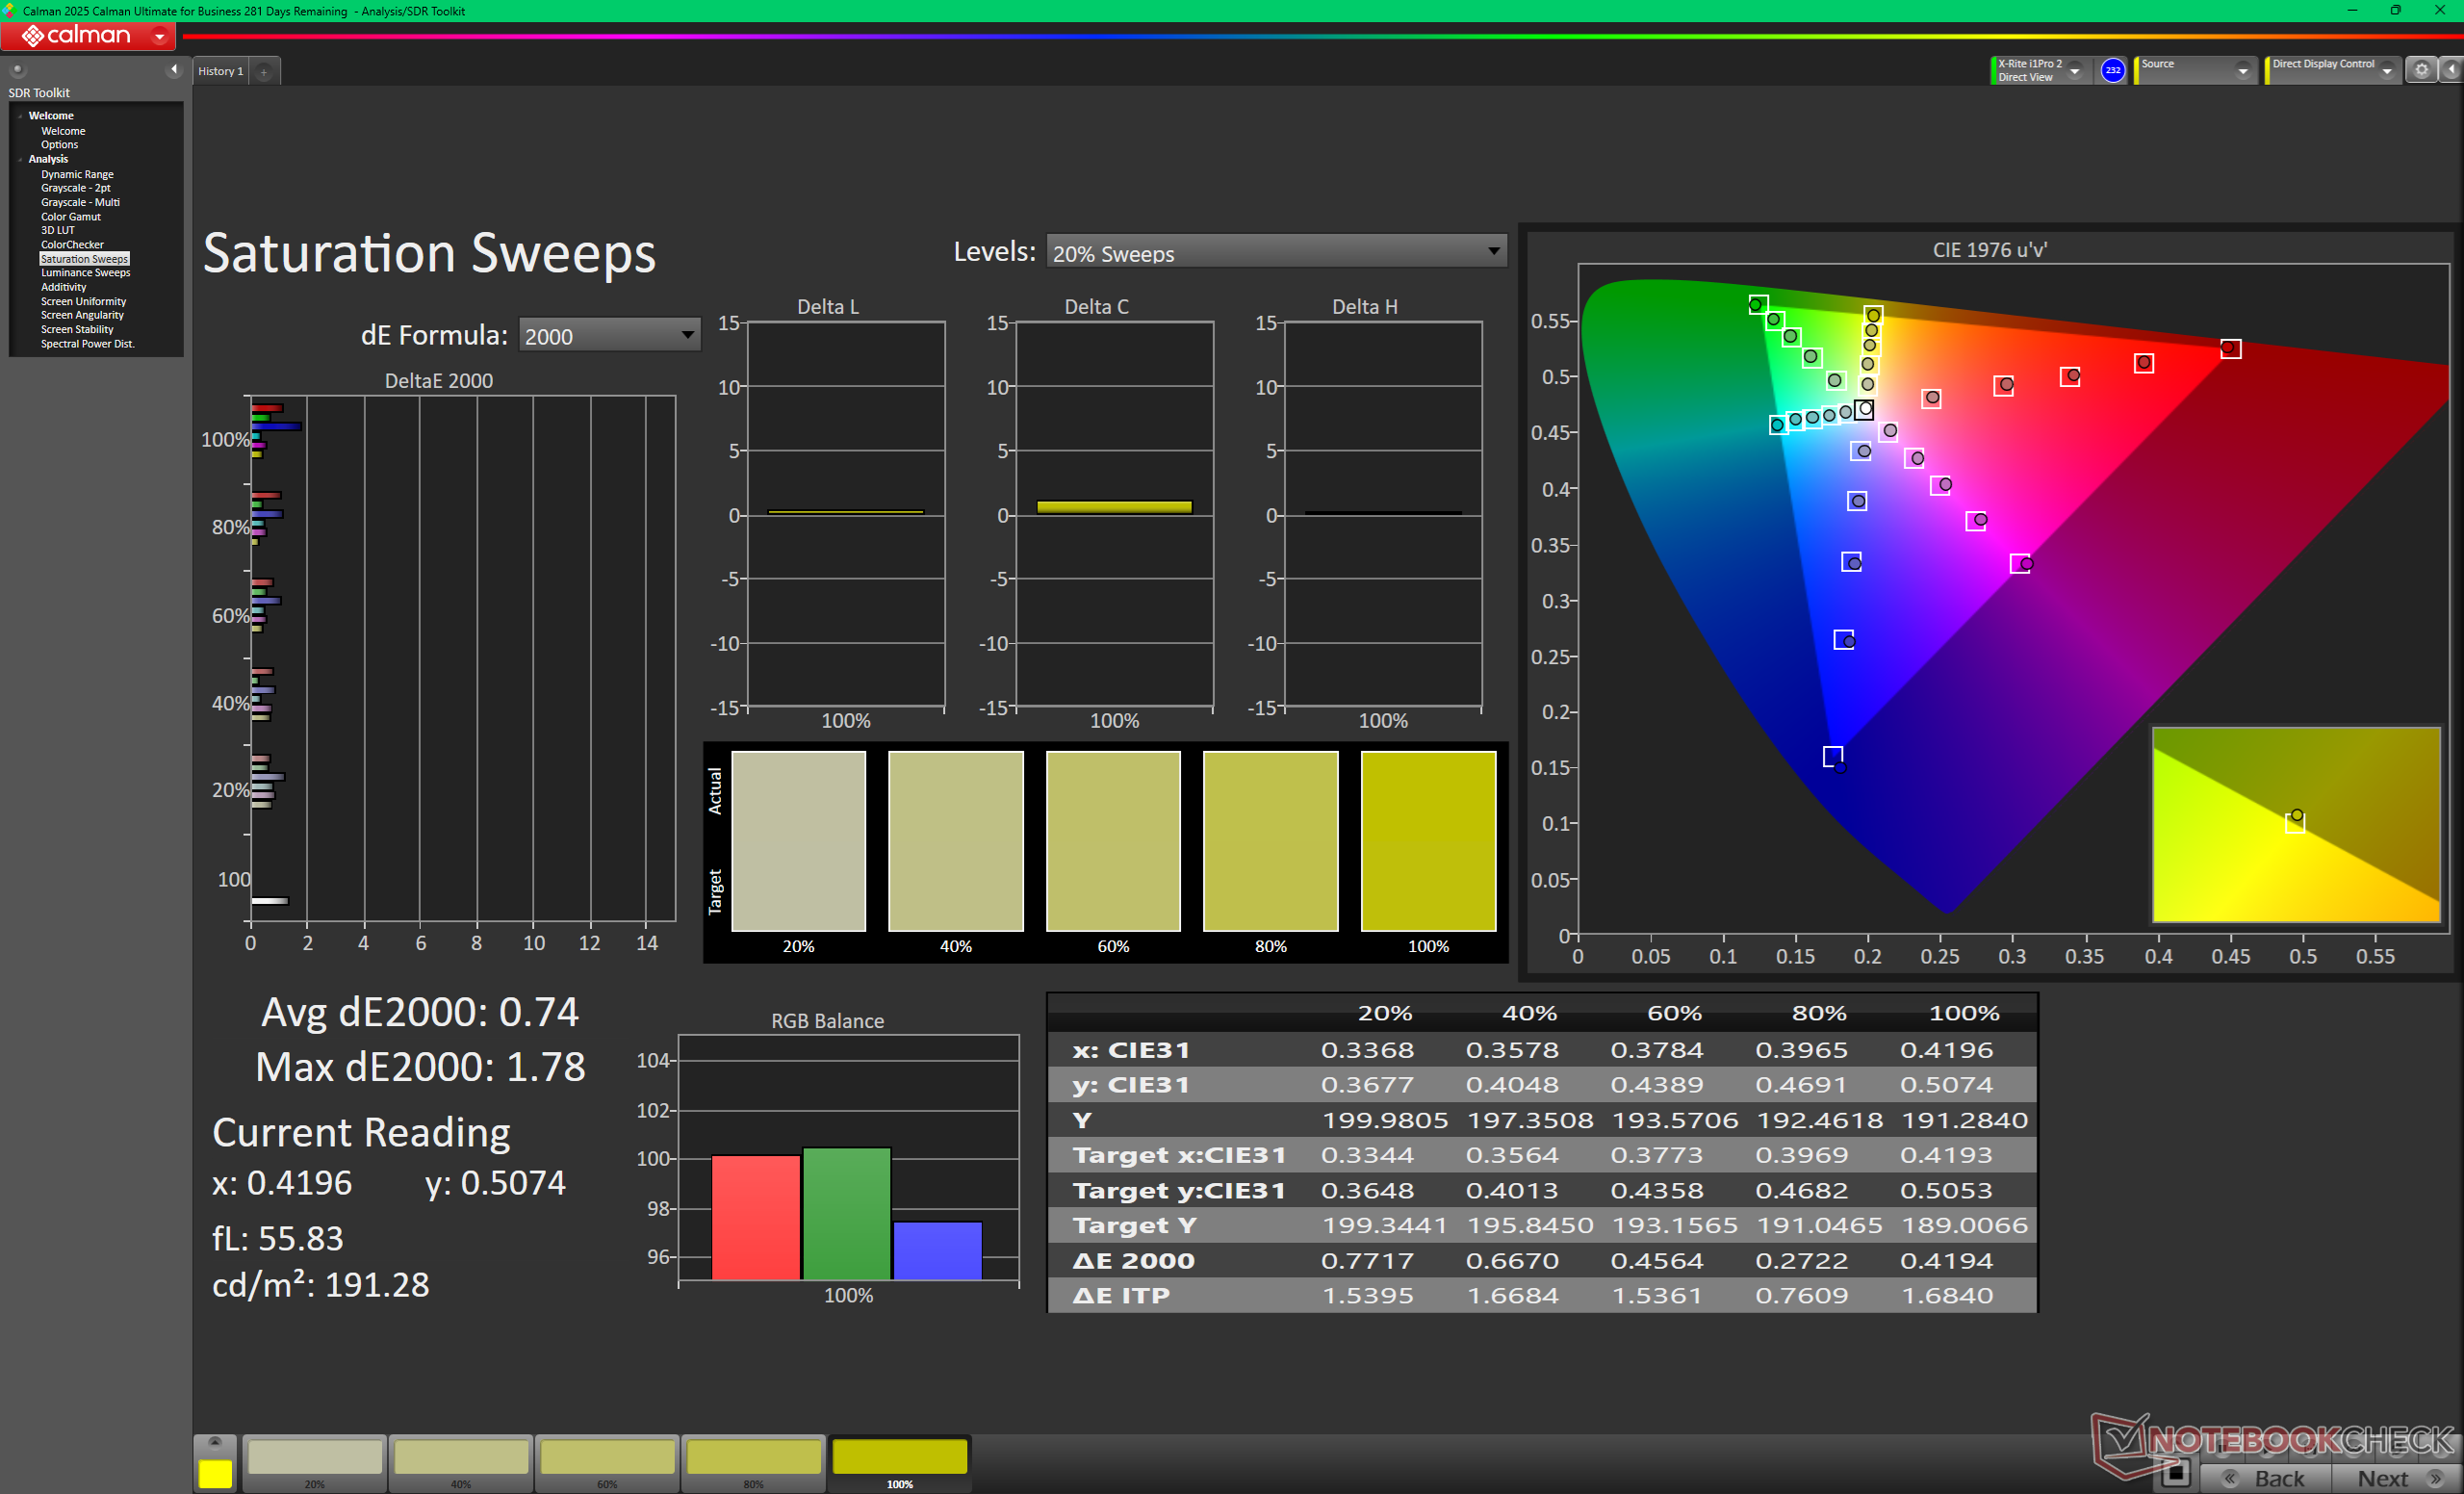
Display comes well-calibrated out of the box with average deltaE values well below 2. An end-user calibration should not be necessary for most.


Display Response Times
| ↔ Response Time Black to White | ||
|---|---|---|
| 0.41 ms ... rise ↗ and fall ↘ combined | ↗ 0.2 ms rise | 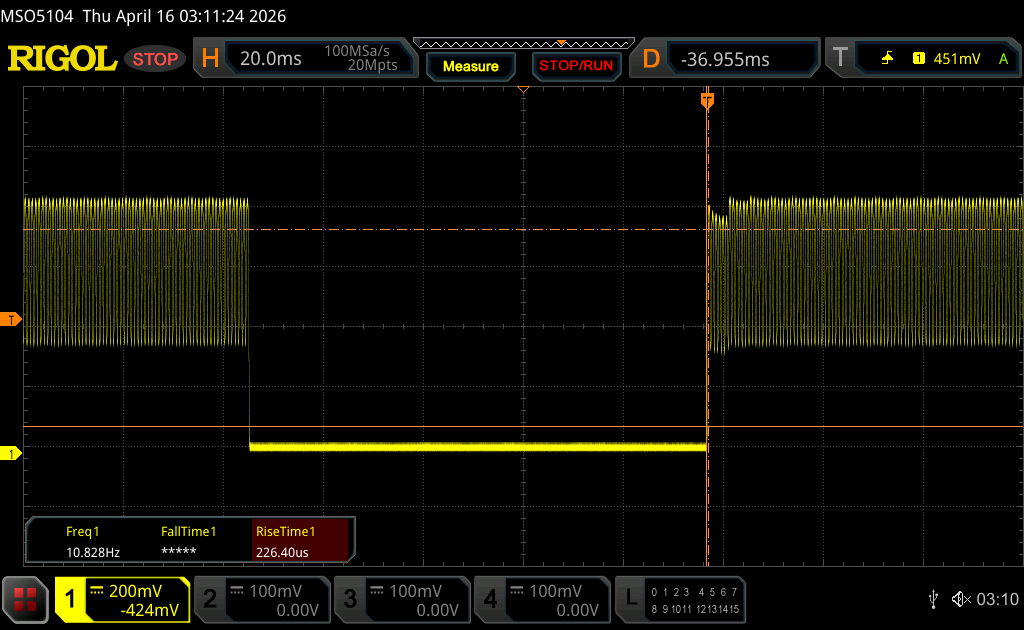 |
| ↘ 0.21 ms fall | ||
| The screen shows very fast response rates in our tests and should be very well suited for fast-paced gaming. In comparison, all tested devices range from 0.1 (minimum) to 240 (maximum) ms. » 0 % of all devices are better. This means that the measured response time is better than the average of all tested devices (19.8 ms). | ||
| ↔ Response Time 50% Grey to 80% Grey | ||
| 0.29 ms ... rise ↗ and fall ↘ combined | ↗ 0.15 ms rise | 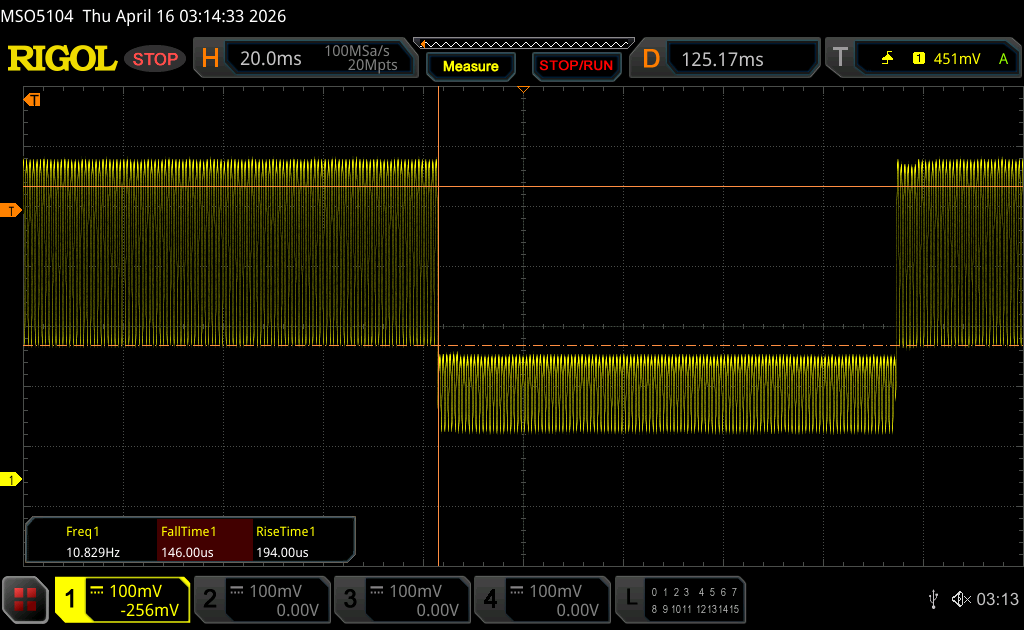 |
| ↘ 0.14 ms fall | ||
| The screen shows very fast response rates in our tests and should be very well suited for fast-paced gaming. In comparison, all tested devices range from 0.165 (minimum) to 636 (maximum) ms. » 0 % of all devices are better. This means that the measured response time is better than the average of all tested devices (31 ms). | ||
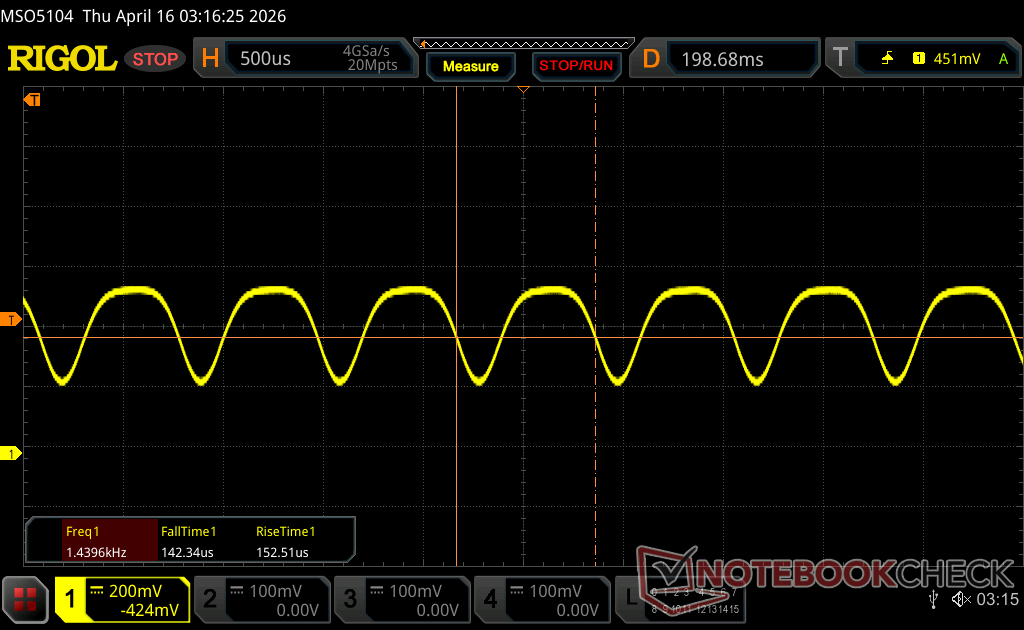
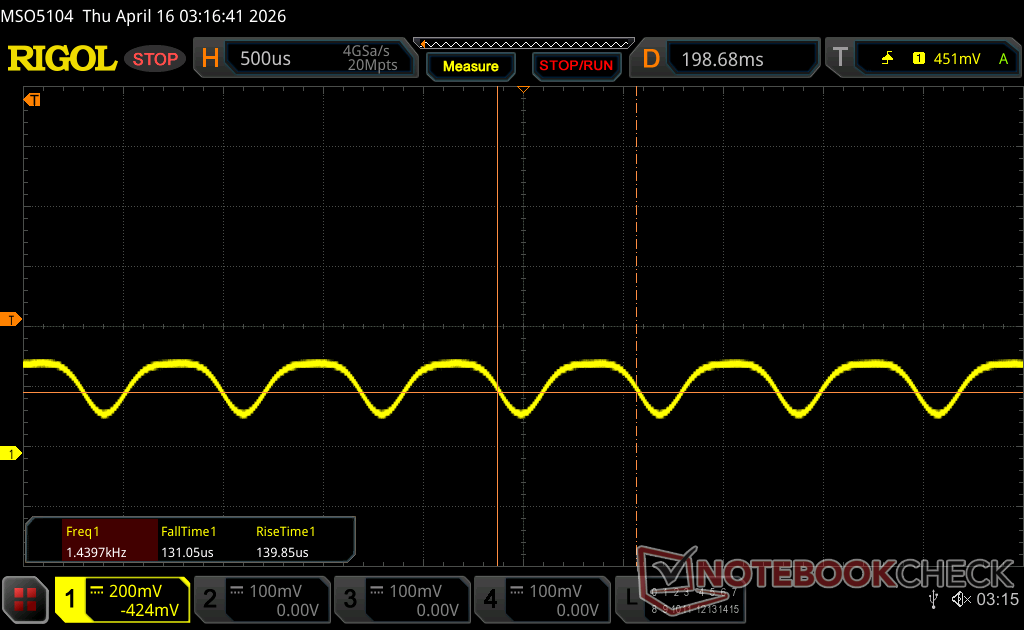
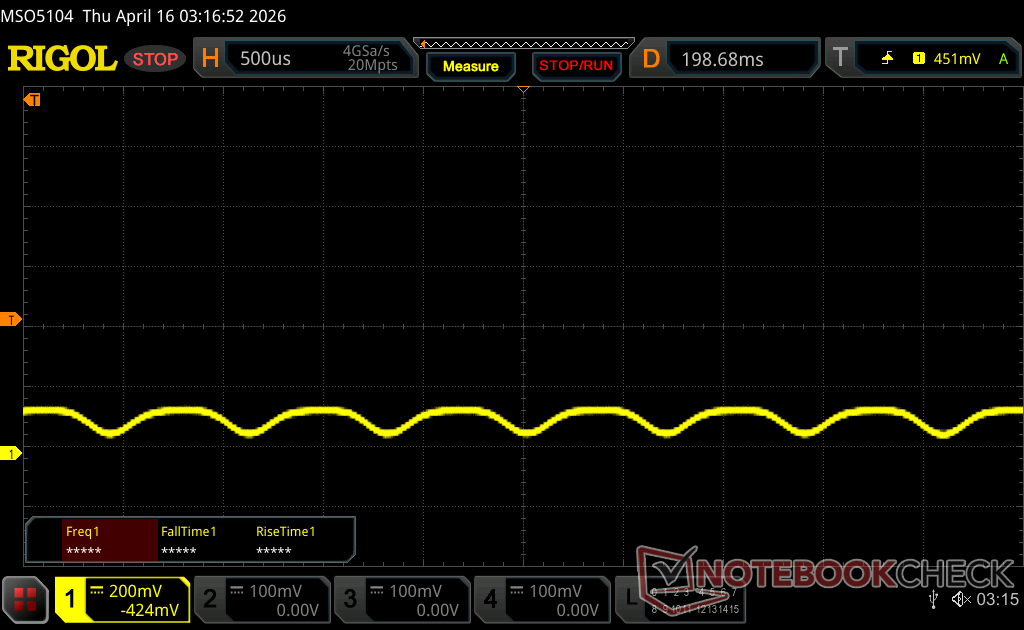
Screen Flickering / PWM (Pulse-Width Modulation)
| Screen flickering / PWM detected | 1440 Hz Amplitude: 30 % | ≤ 100 % brightness setting | 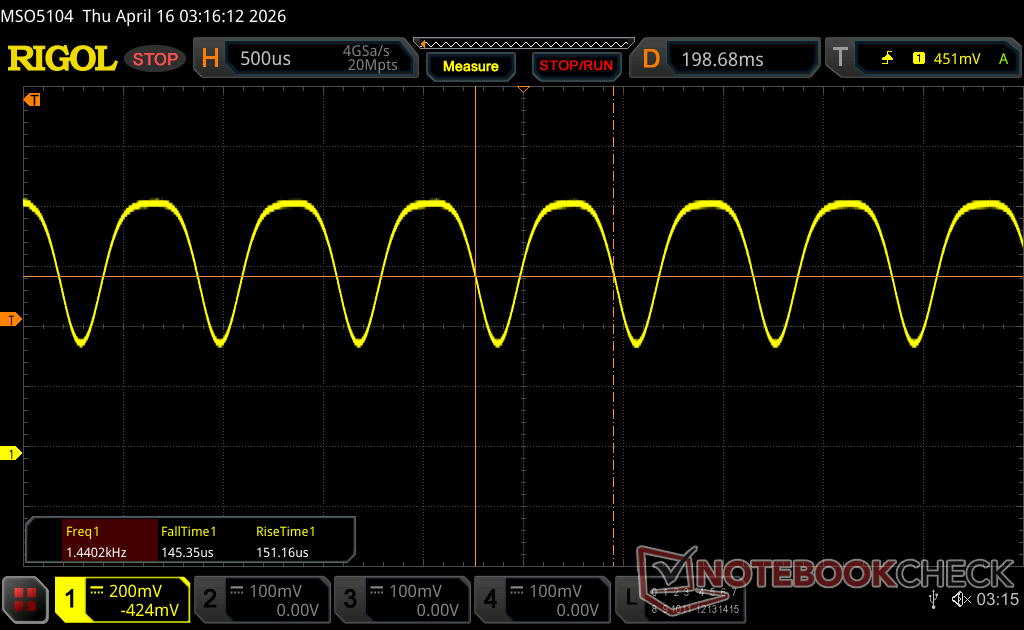 |
The display backlight flickers at 1440 Hz (worst case, e.g., utilizing PWM) Flickering detected at a brightness setting of 100 % and below. There should be no flickering or PWM above this brightness setting. The frequency of 1440 Hz is quite high, so most users sensitive to PWM should not notice any flickering. In comparison: 52 % of all tested devices do not use PWM to dim the display. If PWM was detected, an average of 7747 (minimum: 5 - maximum: 343500) Hz was measured. | |||


Performance
Testing Conditions
We set Windows to Performance mode and Alienware Command Center to Overdrive mode prior to running the benchmarks below. Overdrive mode is necessary for maximum graphics performance.
Processor
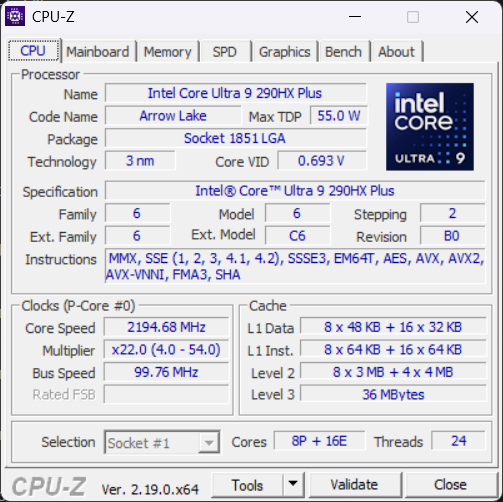
The Core Ultra 9 290HX Plus offers up to 15 percent and 25 percent faster single-thread and multi-thread performance, respectively, over the Core Ultra 9 275HX in last year's Alienware 16 Area-51. The boost puts the Arrow Lake CPU neck-to-neck with the competing Ryzen 9 9955HX3D.
Cinebench R15 Multi Loop
Cinebench R23: Multi Core | Single Core
Cinebench R20: CPU (Multi Core) | CPU (Single Core)
Cinebench R15: CPU Multi 64Bit | CPU Single 64Bit
Blender: v2.79 BMW27 CPU
7-Zip 18.03: 7z b 4 | 7z b 4 -mmt1
Geekbench 6.7: Multi-Core | Single-Core
Geekbench 5.5: Multi-Core | Single-Core
HWBOT x265 Benchmark v2.2: 4k Preset
LibreOffice : 20 Documents To PDF
R Benchmark 2.5: Overall mean
* ... smaller is better
AIDA64: FP32 Ray-Trace | FPU Julia | CPU SHA3 | CPU Queen | FPU SinJulia | FPU Mandel | CPU AES | CPU ZLib | FP64 Ray-Trace | CPU PhotoWorxx | CPU CheckMate
| Performance rating | |
| Average Intel Core Ultra 9 290HX Plus | |
| Alienware 16 Area-51 Core Ultra 9 290HX Plus -1! | |
| Lenovo Legion Pro 7i 16 Gen 10 -1! | |
| Alienware 16 Area-51 -1! | |
| HP Omen Max 16 ah000 -1! | |
| MSI Vector 16 HX AI A2XWHG -1! | |
| Asus ROG Zephyrus G16 GU605CW -1! | |
| AIDA64 / FP32 Ray-Trace | |
| Average Intel Core Ultra 9 290HX Plus (34761 - 43239, n=6) | |
| Alienware 16 Area-51 Core Ultra 9 290HX Plus (v8.20.8100) | |
| Lenovo Legion Pro 7i 16 Gen 10 (v6.92.6600) | |
| Alienware 16 Area-51 (v6.92.6600) | |
| HP Omen Max 16 ah000 (v6.92.6600) | |
| MSI Vector 16 HX AI A2XWHG (v6.92.6600) | |
| Asus ROG Zephyrus G16 GU605CW (v6.92.6600) | |
| AIDA64 / FPU Julia | |
| Average Intel Core Ultra 9 290HX Plus (174665 - 218895, n=6) | |
| Alienware 16 Area-51 Core Ultra 9 290HX Plus (v8.20.8100) | |
| Lenovo Legion Pro 7i 16 Gen 10 (v6.92.6600) | |
| HP Omen Max 16 ah000 (v6.92.6600) | |
| Alienware 16 Area-51 (v6.92.6600) | |
| MSI Vector 16 HX AI A2XWHG (v6.92.6600) | |
| Asus ROG Zephyrus G16 GU605CW (v6.92.6600) | |
| AIDA64 / CPU SHA3 | |
| Average Intel Core Ultra 9 290HX Plus (8352 - 10115, n=6) | |
| Alienware 16 Area-51 Core Ultra 9 290HX Plus (v8.20.8100) | |
| Lenovo Legion Pro 7i 16 Gen 10 (v6.92.6600) | |
| Alienware 16 Area-51 (v6.92.6600) | |
| HP Omen Max 16 ah000 (v6.92.6600) | |
| MSI Vector 16 HX AI A2XWHG (v6.92.6600) | |
| Asus ROG Zephyrus G16 GU605CW (v6.92.6600) | |
| AIDA64 / CPU Queen | |
| Average Intel Core Ultra 9 290HX Plus (n=1) | |
| Lenovo Legion Pro 7i 16 Gen 10 (v6.92.6600) | |
| Alienware 16 Area-51 (v6.92.6600) | |
| HP Omen Max 16 ah000 (v6.92.6600) | |
| MSI Vector 16 HX AI A2XWHG (v6.92.6600) | |
| Asus ROG Zephyrus G16 GU605CW (v6.92.6600) | |
| AIDA64 / FPU SinJulia | |
| Average Intel Core Ultra 9 290HX Plus (13612 - 14874, n=6) | |
| Lenovo Legion Pro 7i 16 Gen 10 (v6.92.6600) | |
| Alienware 16 Area-51 Core Ultra 9 290HX Plus (v8.20.8100) | |
| Alienware 16 Area-51 (v6.92.6600) | |
| HP Omen Max 16 ah000 (v6.92.6600) | |
| MSI Vector 16 HX AI A2XWHG (v6.92.6600) | |
| Asus ROG Zephyrus G16 GU605CW (v6.92.6600) | |
| AIDA64 / FPU Mandel | |
| Average Intel Core Ultra 9 290HX Plus (91215 - 115371, n=6) | |
| Alienware 16 Area-51 Core Ultra 9 290HX Plus (v8.20.8100) | |
| Lenovo Legion Pro 7i 16 Gen 10 (v6.92.6600) | |
| HP Omen Max 16 ah000 (v6.92.6600) | |
| Alienware 16 Area-51 (v6.92.6600) | |
| MSI Vector 16 HX AI A2XWHG (v6.92.6600) | |
| Asus ROG Zephyrus G16 GU605CW (v6.92.6600) | |
| AIDA64 / CPU AES | |
| Average Intel Core Ultra 9 290HX Plus (127585 - 143205, n=6) | |
| Lenovo Legion Pro 7i 16 Gen 10 (v6.92.6600) | |
| Alienware 16 Area-51 Core Ultra 9 290HX Plus (v8.20.8100) | |
| Alienware 16 Area-51 (v6.92.6600) | |
| HP Omen Max 16 ah000 (v6.92.6600) | |
| MSI Vector 16 HX AI A2XWHG (v6.92.6600) | |
| Asus ROG Zephyrus G16 GU605CW (v6.92.6600) | |
| AIDA64 / CPU ZLib | |
| Average Intel Core Ultra 9 290HX Plus (1967 - 2340, n=6) | |
| Alienware 16 Area-51 Core Ultra 9 290HX Plus (v8.20.8100) | |
| Lenovo Legion Pro 7i 16 Gen 10 (v6.92.6600) | |
| Alienware 16 Area-51 (v6.92.6600) | |
| HP Omen Max 16 ah000 (v6.92.6600) | |
| MSI Vector 16 HX AI A2XWHG (v6.92.6600) | |
| Asus ROG Zephyrus G16 GU605CW (v6.92.6600) | |
| AIDA64 / FP64 Ray-Trace | |
| Average Intel Core Ultra 9 290HX Plus (18611 - 23843, n=6) | |
| Alienware 16 Area-51 Core Ultra 9 290HX Plus (v8.20.8100) | |
| Lenovo Legion Pro 7i 16 Gen 10 (v6.92.6600) | |
| Alienware 16 Area-51 (v6.92.6600) | |
| HP Omen Max 16 ah000 (v6.92.6600) | |
| MSI Vector 16 HX AI A2XWHG (v6.92.6600) | |
| Asus ROG Zephyrus G16 GU605CW (v6.92.6600) | |
| AIDA64 / CPU PhotoWorxx | |
| Asus ROG Zephyrus G16 GU605CW (v6.92.6600) | |
| Average Intel Core Ultra 9 290HX Plus (51134 - 65272, n=6) | |
| Alienware 16 Area-51 Core Ultra 9 290HX Plus (v8.20.8100) | |
| Lenovo Legion Pro 7i 16 Gen 10 (v6.92.6600) | |
| Alienware 16 Area-51 (v6.92.6600) | |
| HP Omen Max 16 ah000 (v6.92.6600) | |
| MSI Vector 16 HX AI A2XWHG (v6.92.6600) | |
| AIDA64 / CPU CheckMate | |
| Average Intel Core Ultra 9 290HX Plus (7624 - 8765, n=5) | |
| Alienware 16 Area-51 Core Ultra 9 290HX Plus (v8.20.8100) | |
System Performance
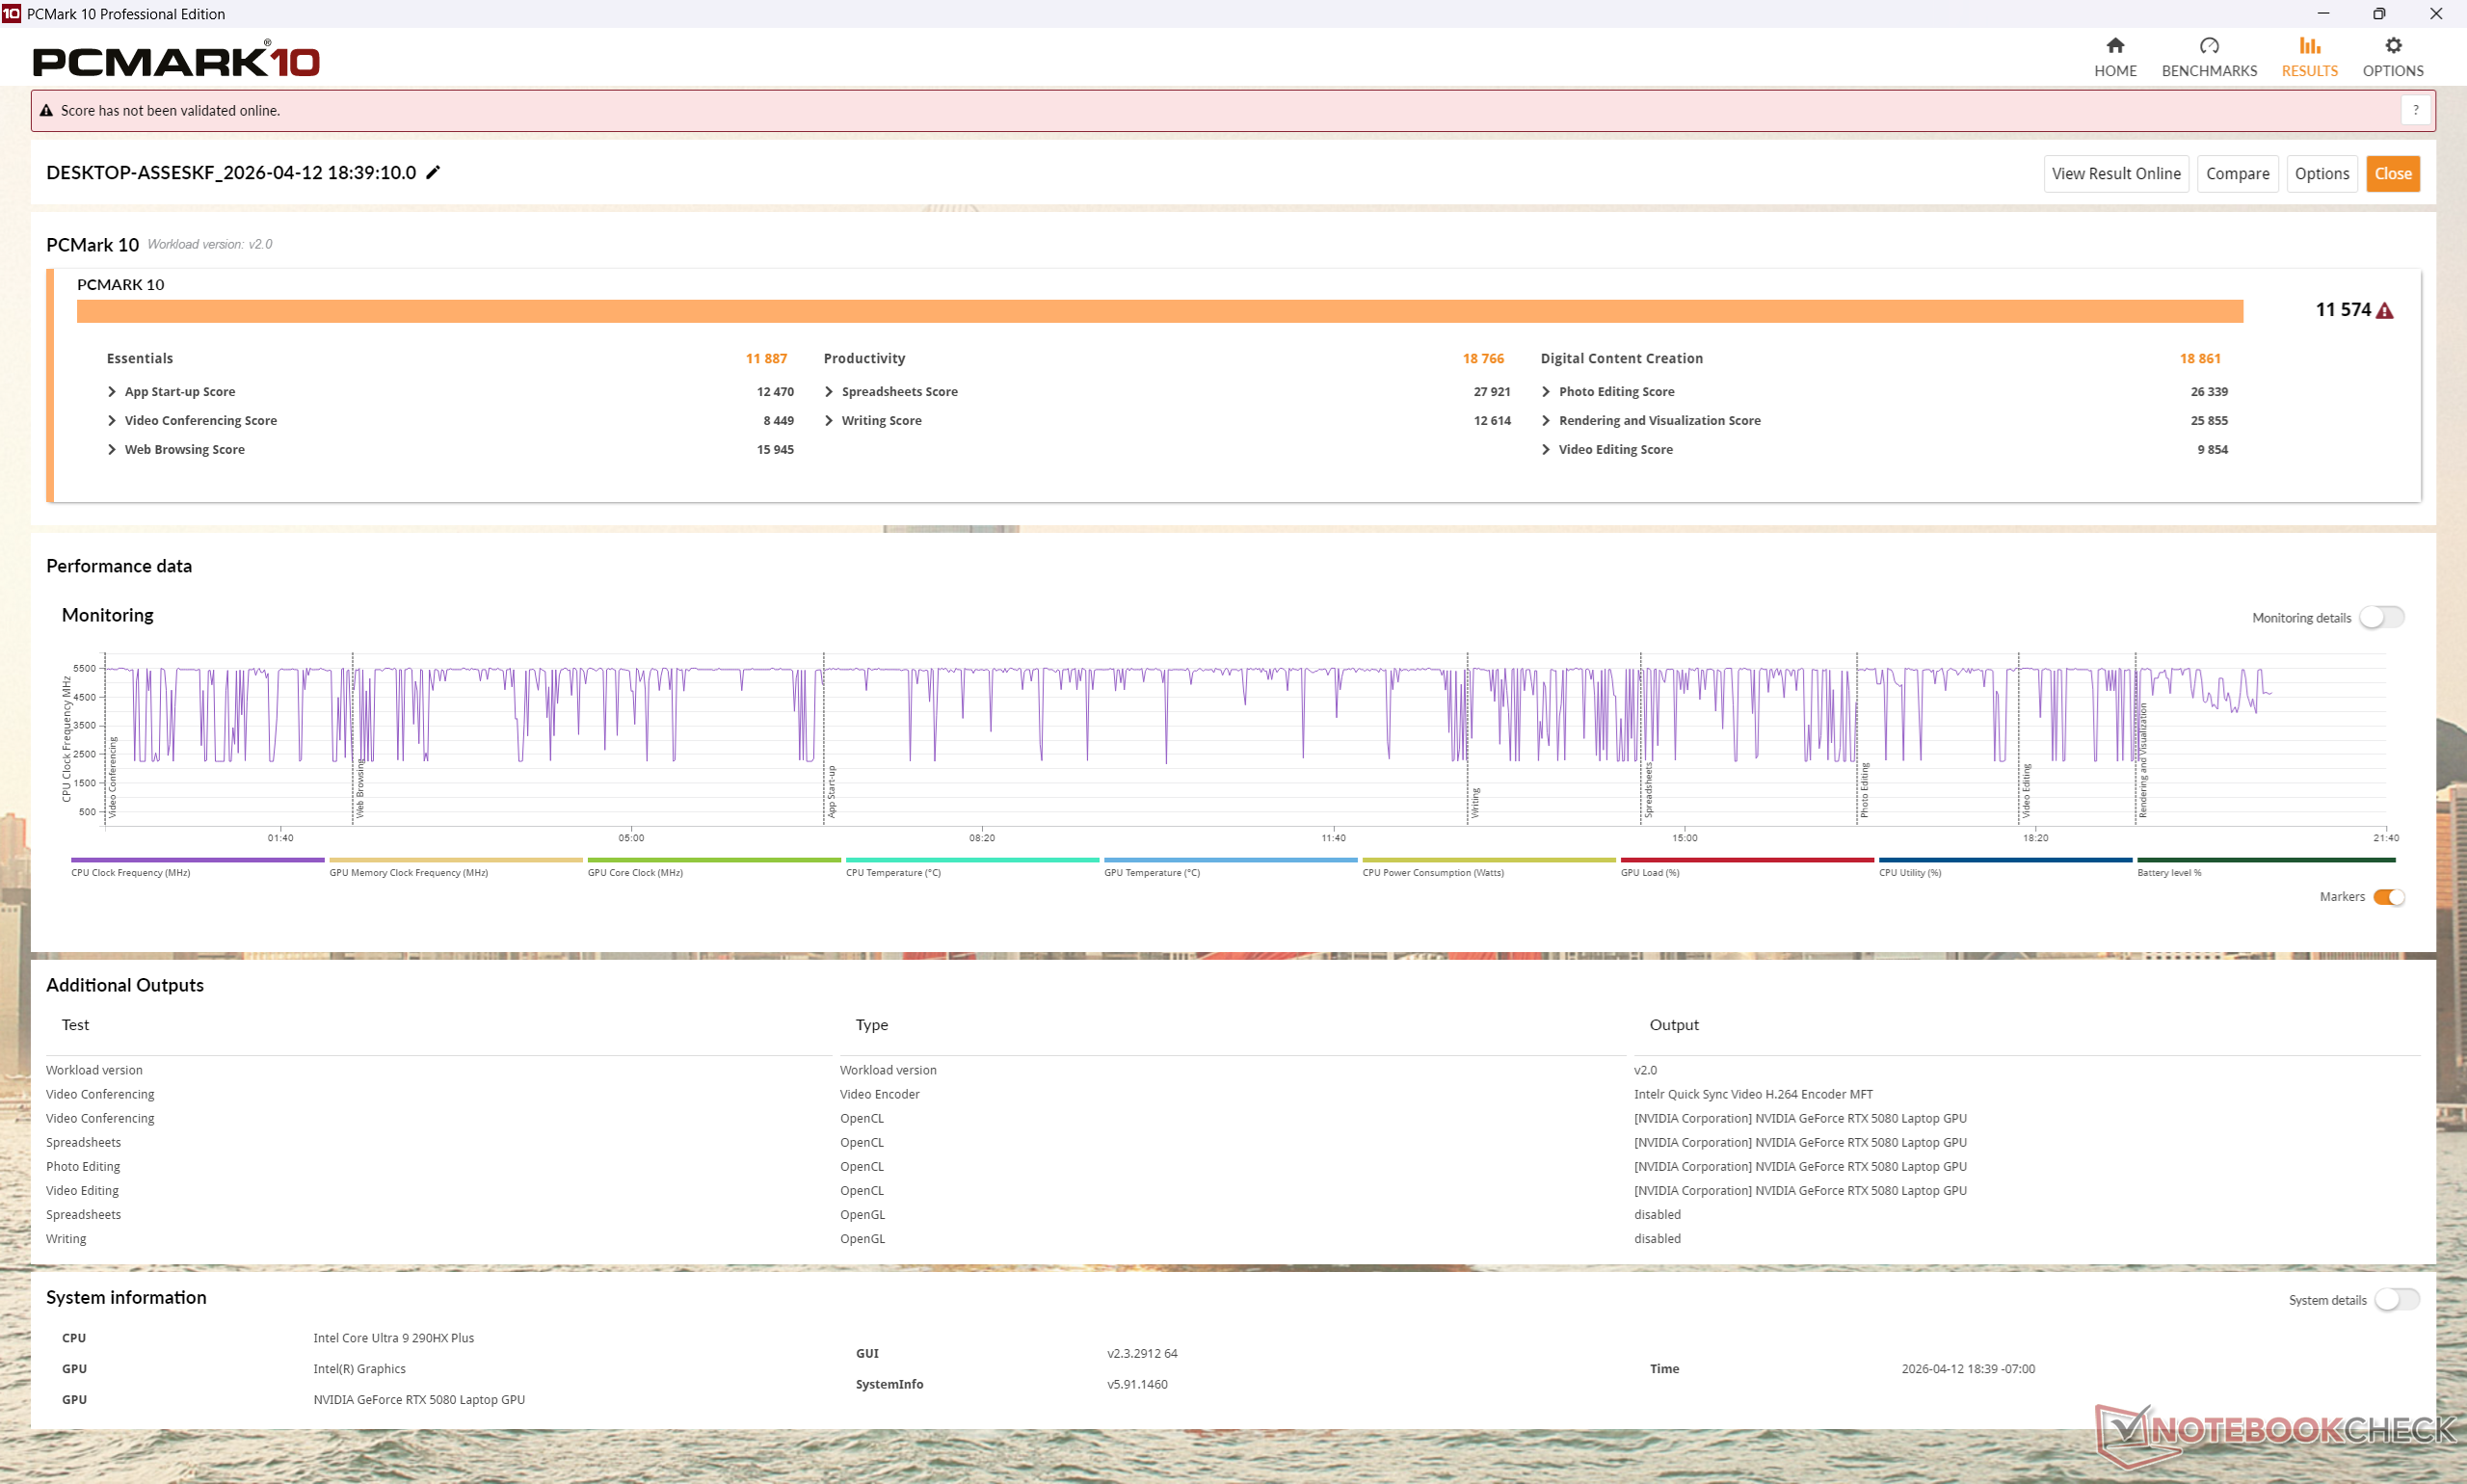
PCMark 10: Score | Essentials | Productivity | Digital Content Creation
CrossMark: Overall | Productivity | Creativity | Responsiveness
WebXPRT 3: Overall
WebXPRT 4: Overall
Mozilla Kraken 1.1: Total
| Performance rating | |
| Alienware 16 Area-51 Core Ultra 9 290HX Plus | |
| Average Intel Core Ultra 9 290HX Plus, NVIDIA GeForce RTX 5080 Laptop | |
| Alienware 16 Area-51 | |
| Lenovo Legion Pro 7i 16 Gen 10 | |
| HP Omen Max 16 ah000 -1! | |
| MSI Vector 16 HX AI A2XWHG | |
| Asus ROG Zephyrus G16 GU605CW | |
| PCMark 10 / Score | |
| Alienware 16 Area-51 Core Ultra 9 290HX Plus | |
| Average Intel Core Ultra 9 290HX Plus, NVIDIA GeForce RTX 5080 Laptop (n=1) | |
| Lenovo Legion Pro 7i 16 Gen 10 | |
| HP Omen Max 16 ah000 | |
| Alienware 16 Area-51 | |
| MSI Vector 16 HX AI A2XWHG | |
| Asus ROG Zephyrus G16 GU605CW | |
| PCMark 10 / Essentials | |
| Alienware 16 Area-51 Core Ultra 9 290HX Plus | |
| Average Intel Core Ultra 9 290HX Plus, NVIDIA GeForce RTX 5080 Laptop (n=1) | |
| Lenovo Legion Pro 7i 16 Gen 10 | |
| Alienware 16 Area-51 | |
| HP Omen Max 16 ah000 | |
| MSI Vector 16 HX AI A2XWHG | |
| Asus ROG Zephyrus G16 GU605CW | |
| PCMark 10 / Productivity | |
| Alienware 16 Area-51 Core Ultra 9 290HX Plus | |
| Average Intel Core Ultra 9 290HX Plus, NVIDIA GeForce RTX 5080 Laptop (n=1) | |
| Lenovo Legion Pro 7i 16 Gen 10 | |
| MSI Vector 16 HX AI A2XWHG | |
| Alienware 16 Area-51 | |
| HP Omen Max 16 ah000 | |
| Asus ROG Zephyrus G16 GU605CW | |
| PCMark 10 / Digital Content Creation | |
| Lenovo Legion Pro 7i 16 Gen 10 | |
| Alienware 16 Area-51 Core Ultra 9 290HX Plus | |
| Average Intel Core Ultra 9 290HX Plus, NVIDIA GeForce RTX 5080 Laptop (n=1) | |
| HP Omen Max 16 ah000 | |
| Alienware 16 Area-51 | |
| Asus ROG Zephyrus G16 GU605CW | |
| MSI Vector 16 HX AI A2XWHG | |
| CrossMark / Overall | |
| Alienware 16 Area-51 Core Ultra 9 290HX Plus | |
| Average Intel Core Ultra 9 290HX Plus, NVIDIA GeForce RTX 5080 Laptop (n=1) | |
| Alienware 16 Area-51 | |
| Lenovo Legion Pro 7i 16 Gen 10 | |
| HP Omen Max 16 ah000 | |
| MSI Vector 16 HX AI A2XWHG | |
| Asus ROG Zephyrus G16 GU605CW | |
| CrossMark / Productivity | |
| Alienware 16 Area-51 Core Ultra 9 290HX Plus | |
| Average Intel Core Ultra 9 290HX Plus, NVIDIA GeForce RTX 5080 Laptop (n=1) | |
| Alienware 16 Area-51 | |
| Lenovo Legion Pro 7i 16 Gen 10 | |
| HP Omen Max 16 ah000 | |
| MSI Vector 16 HX AI A2XWHG | |
| Asus ROG Zephyrus G16 GU605CW | |
| CrossMark / Creativity | |
| Alienware 16 Area-51 Core Ultra 9 290HX Plus | |
| Average Intel Core Ultra 9 290HX Plus, NVIDIA GeForce RTX 5080 Laptop (n=1) | |
| Alienware 16 Area-51 | |
| Lenovo Legion Pro 7i 16 Gen 10 | |
| HP Omen Max 16 ah000 | |
| MSI Vector 16 HX AI A2XWHG | |
| Asus ROG Zephyrus G16 GU605CW | |
| CrossMark / Responsiveness | |
| Alienware 16 Area-51 Core Ultra 9 290HX Plus | |
| Average Intel Core Ultra 9 290HX Plus, NVIDIA GeForce RTX 5080 Laptop (n=1) | |
| Alienware 16 Area-51 | |
| HP Omen Max 16 ah000 | |
| Lenovo Legion Pro 7i 16 Gen 10 | |
| MSI Vector 16 HX AI A2XWHG | |
| Asus ROG Zephyrus G16 GU605CW | |
| WebXPRT 3 / Overall | |
| Alienware 16 Area-51 Core Ultra 9 290HX Plus | |
| Average Intel Core Ultra 9 290HX Plus, NVIDIA GeForce RTX 5080 Laptop (n=1) | |
| HP Omen Max 16 ah000 | |
| Lenovo Legion Pro 7i 16 Gen 10 | |
| Alienware 16 Area-51 | |
| MSI Vector 16 HX AI A2XWHG | |
| Asus ROG Zephyrus G16 GU605CW | |
| WebXPRT 4 / Overall | |
| Alienware 16 Area-51 Core Ultra 9 290HX Plus | |
| Average Intel Core Ultra 9 290HX Plus, NVIDIA GeForce RTX 5080 Laptop (n=1) | |
| Lenovo Legion Pro 7i 16 Gen 10 | |
| Alienware 16 Area-51 | |
| MSI Vector 16 HX AI A2XWHG | |
| Asus ROG Zephyrus G16 GU605CW | |
| Mozilla Kraken 1.1 / Total | |
| Asus ROG Zephyrus G16 GU605CW | |
| MSI Vector 16 HX AI A2XWHG | |
| HP Omen Max 16 ah000 | |
| Alienware 16 Area-51 | |
| Lenovo Legion Pro 7i 16 Gen 10 | |
| Alienware 16 Area-51 Core Ultra 9 290HX Plus | |
| Average Intel Core Ultra 9 290HX Plus, NVIDIA GeForce RTX 5080 Laptop (n=1) | |
* ... smaller is better
| PCMark 10 Score | 11574 points | |
Help | ||
| AIDA64 / Memory Copy | |
| Asus ROG Zephyrus G16 GU605CW | |
| Average Intel Core Ultra 9 290HX Plus (76912 - 93930, n=6) | |
| Alienware 16 Area-51 Core Ultra 9 290HX Plus | |
| Alienware 16 Area-51 | |
| Lenovo Legion Pro 7i 16 Gen 10 | |
| HP Omen Max 16 ah000 | |
| MSI Vector 16 HX AI A2XWHG | |
| AIDA64 / Memory Read | |
| Lenovo Legion Pro 7i 16 Gen 10 | |
| Alienware 16 Area-51 Core Ultra 9 290HX Plus | |
| Alienware 16 Area-51 | |
| Average Intel Core Ultra 9 290HX Plus (84638 - 98574, n=6) | |
| HP Omen Max 16 ah000 | |
| MSI Vector 16 HX AI A2XWHG | |
| Asus ROG Zephyrus G16 GU605CW | |
| AIDA64 / Memory Write | |
| Average Intel Core Ultra 9 290HX Plus (76094 - 100988, n=6) | |
| Lenovo Legion Pro 7i 16 Gen 10 | |
| Alienware 16 Area-51 | |
| Alienware 16 Area-51 Core Ultra 9 290HX Plus | |
| HP Omen Max 16 ah000 | |
| Asus ROG Zephyrus G16 GU605CW | |
| MSI Vector 16 HX AI A2XWHG | |
| AIDA64 / Memory Latency | |
| Asus ROG Zephyrus G16 GU605CW | |
| Alienware 16 Area-51 | |
| HP Omen Max 16 ah000 | |
| Lenovo Legion Pro 7i 16 Gen 10 | |
| MSI Vector 16 HX AI A2XWHG | |
| Alienware 16 Area-51 Core Ultra 9 290HX Plus | |
| Average Intel Core Ultra 9 290HX Plus (100.7 - 108.4, n=6) | |
* ... smaller is better
DPC Latency
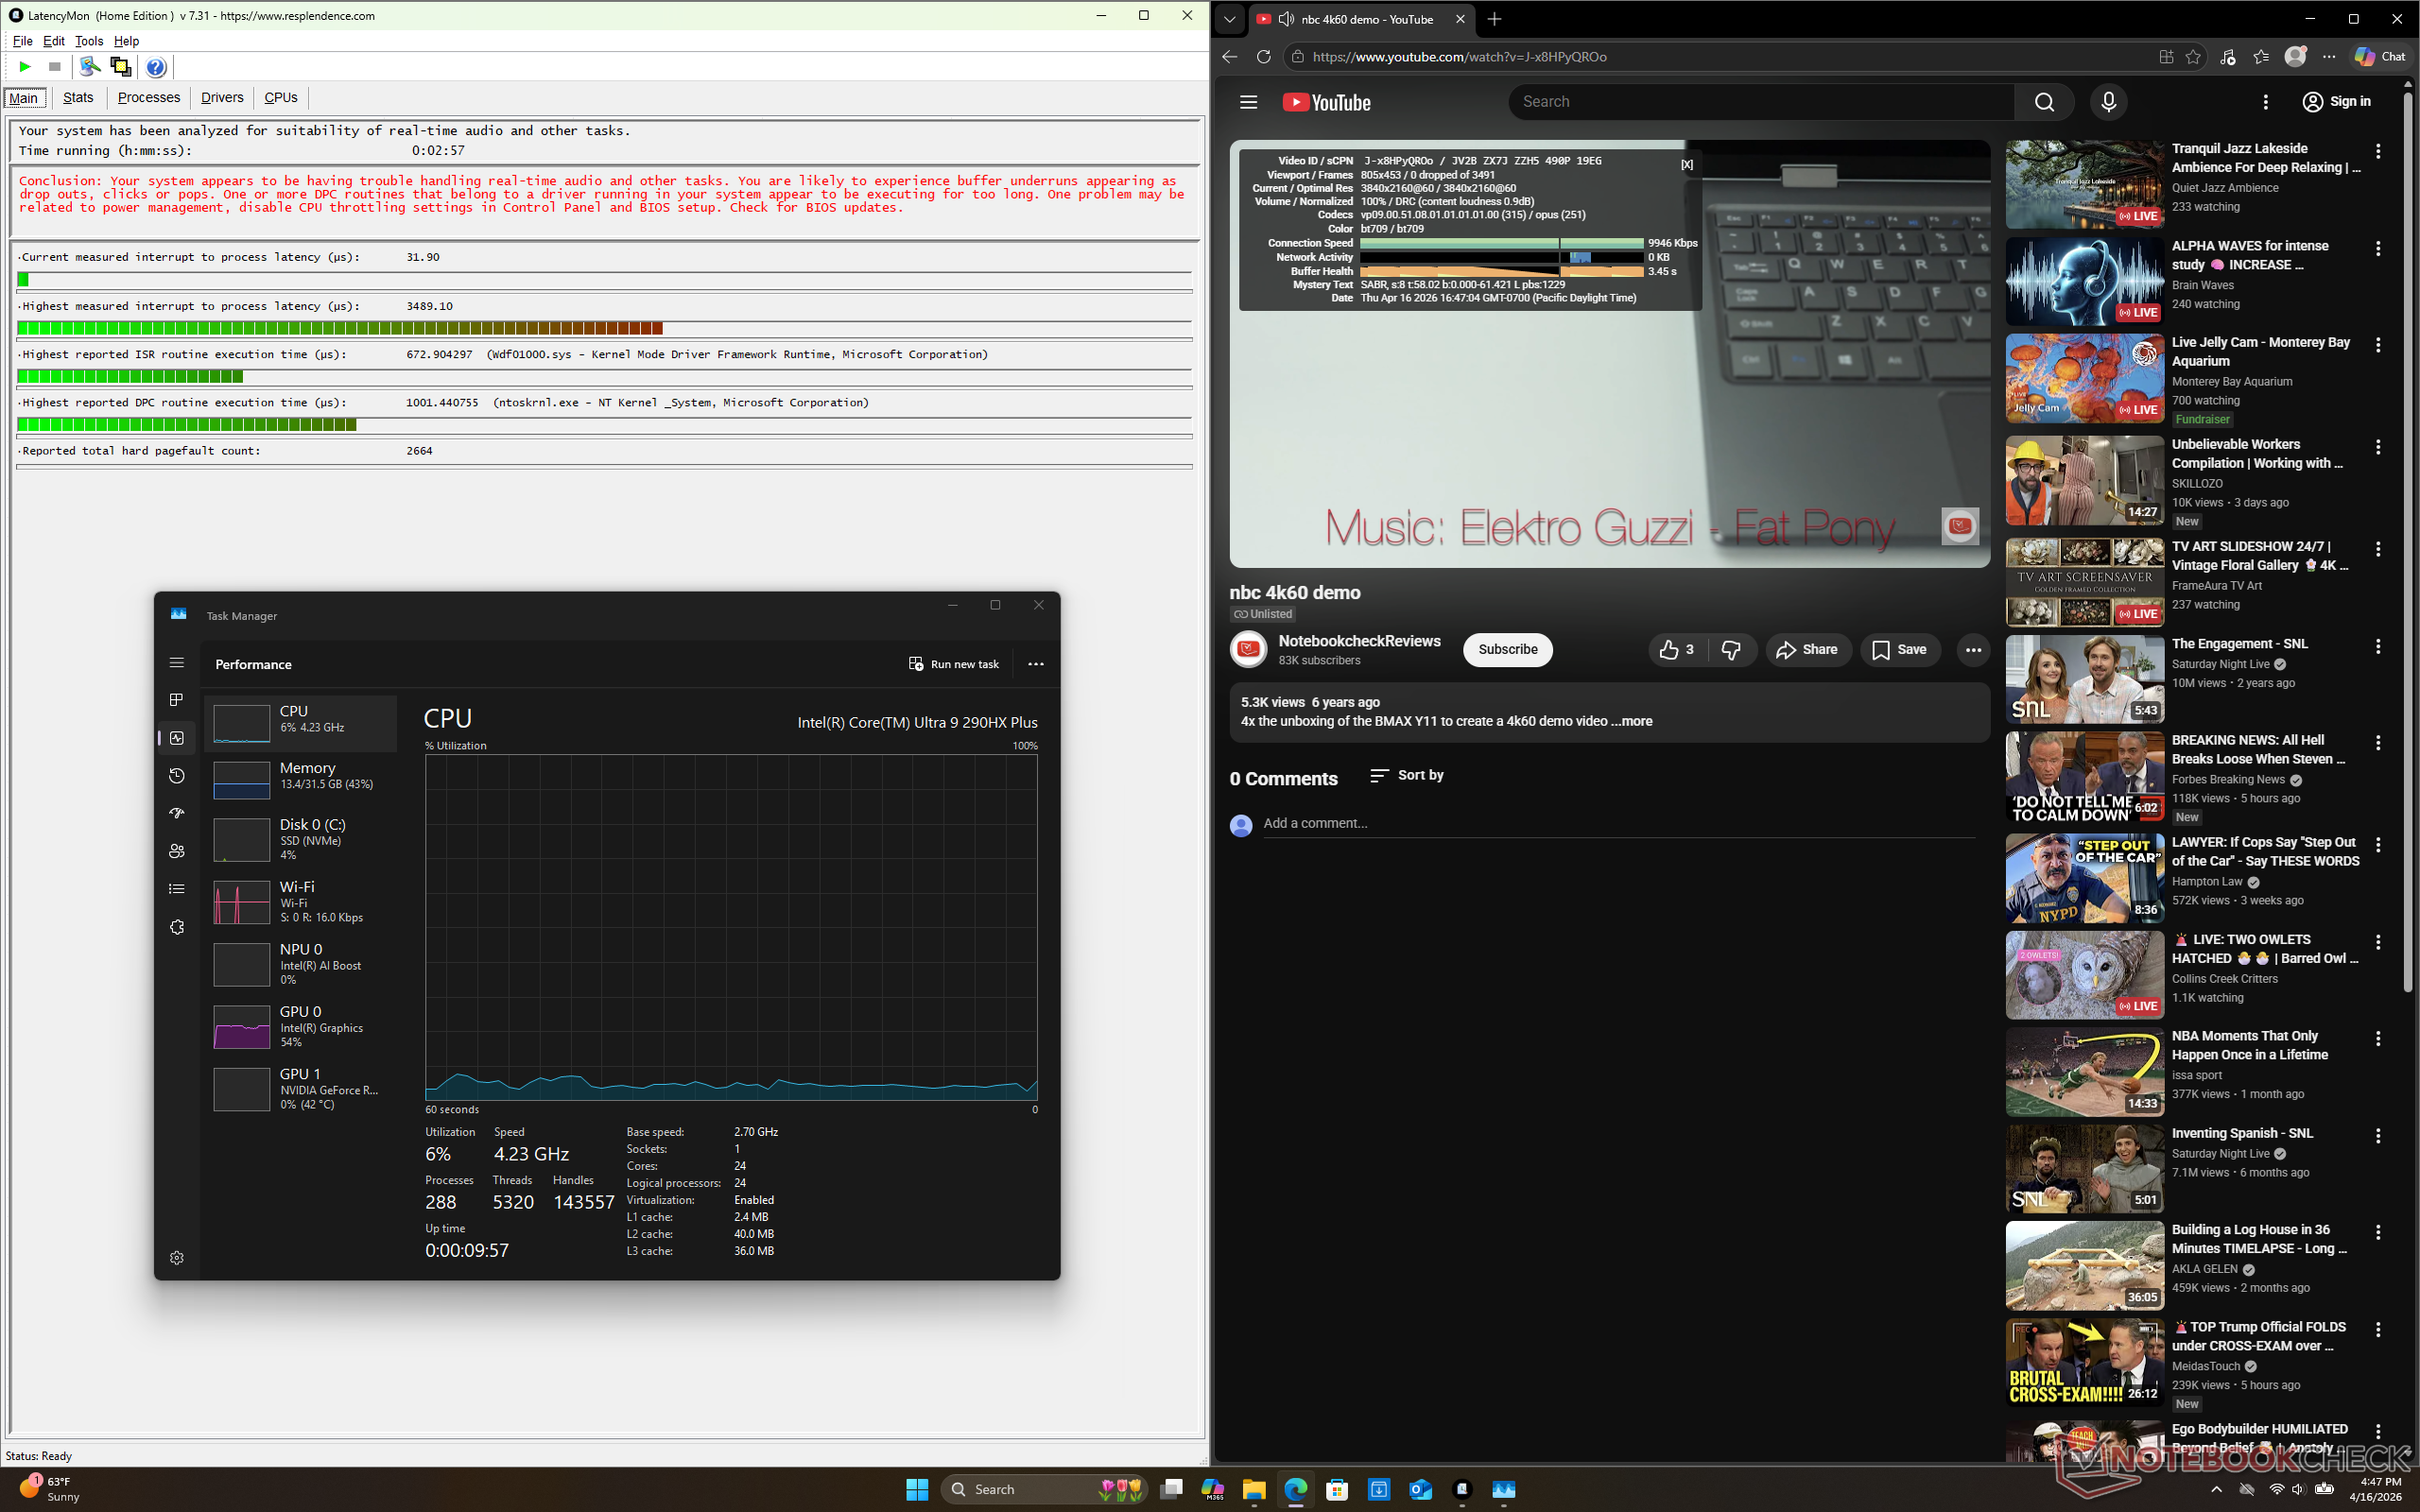
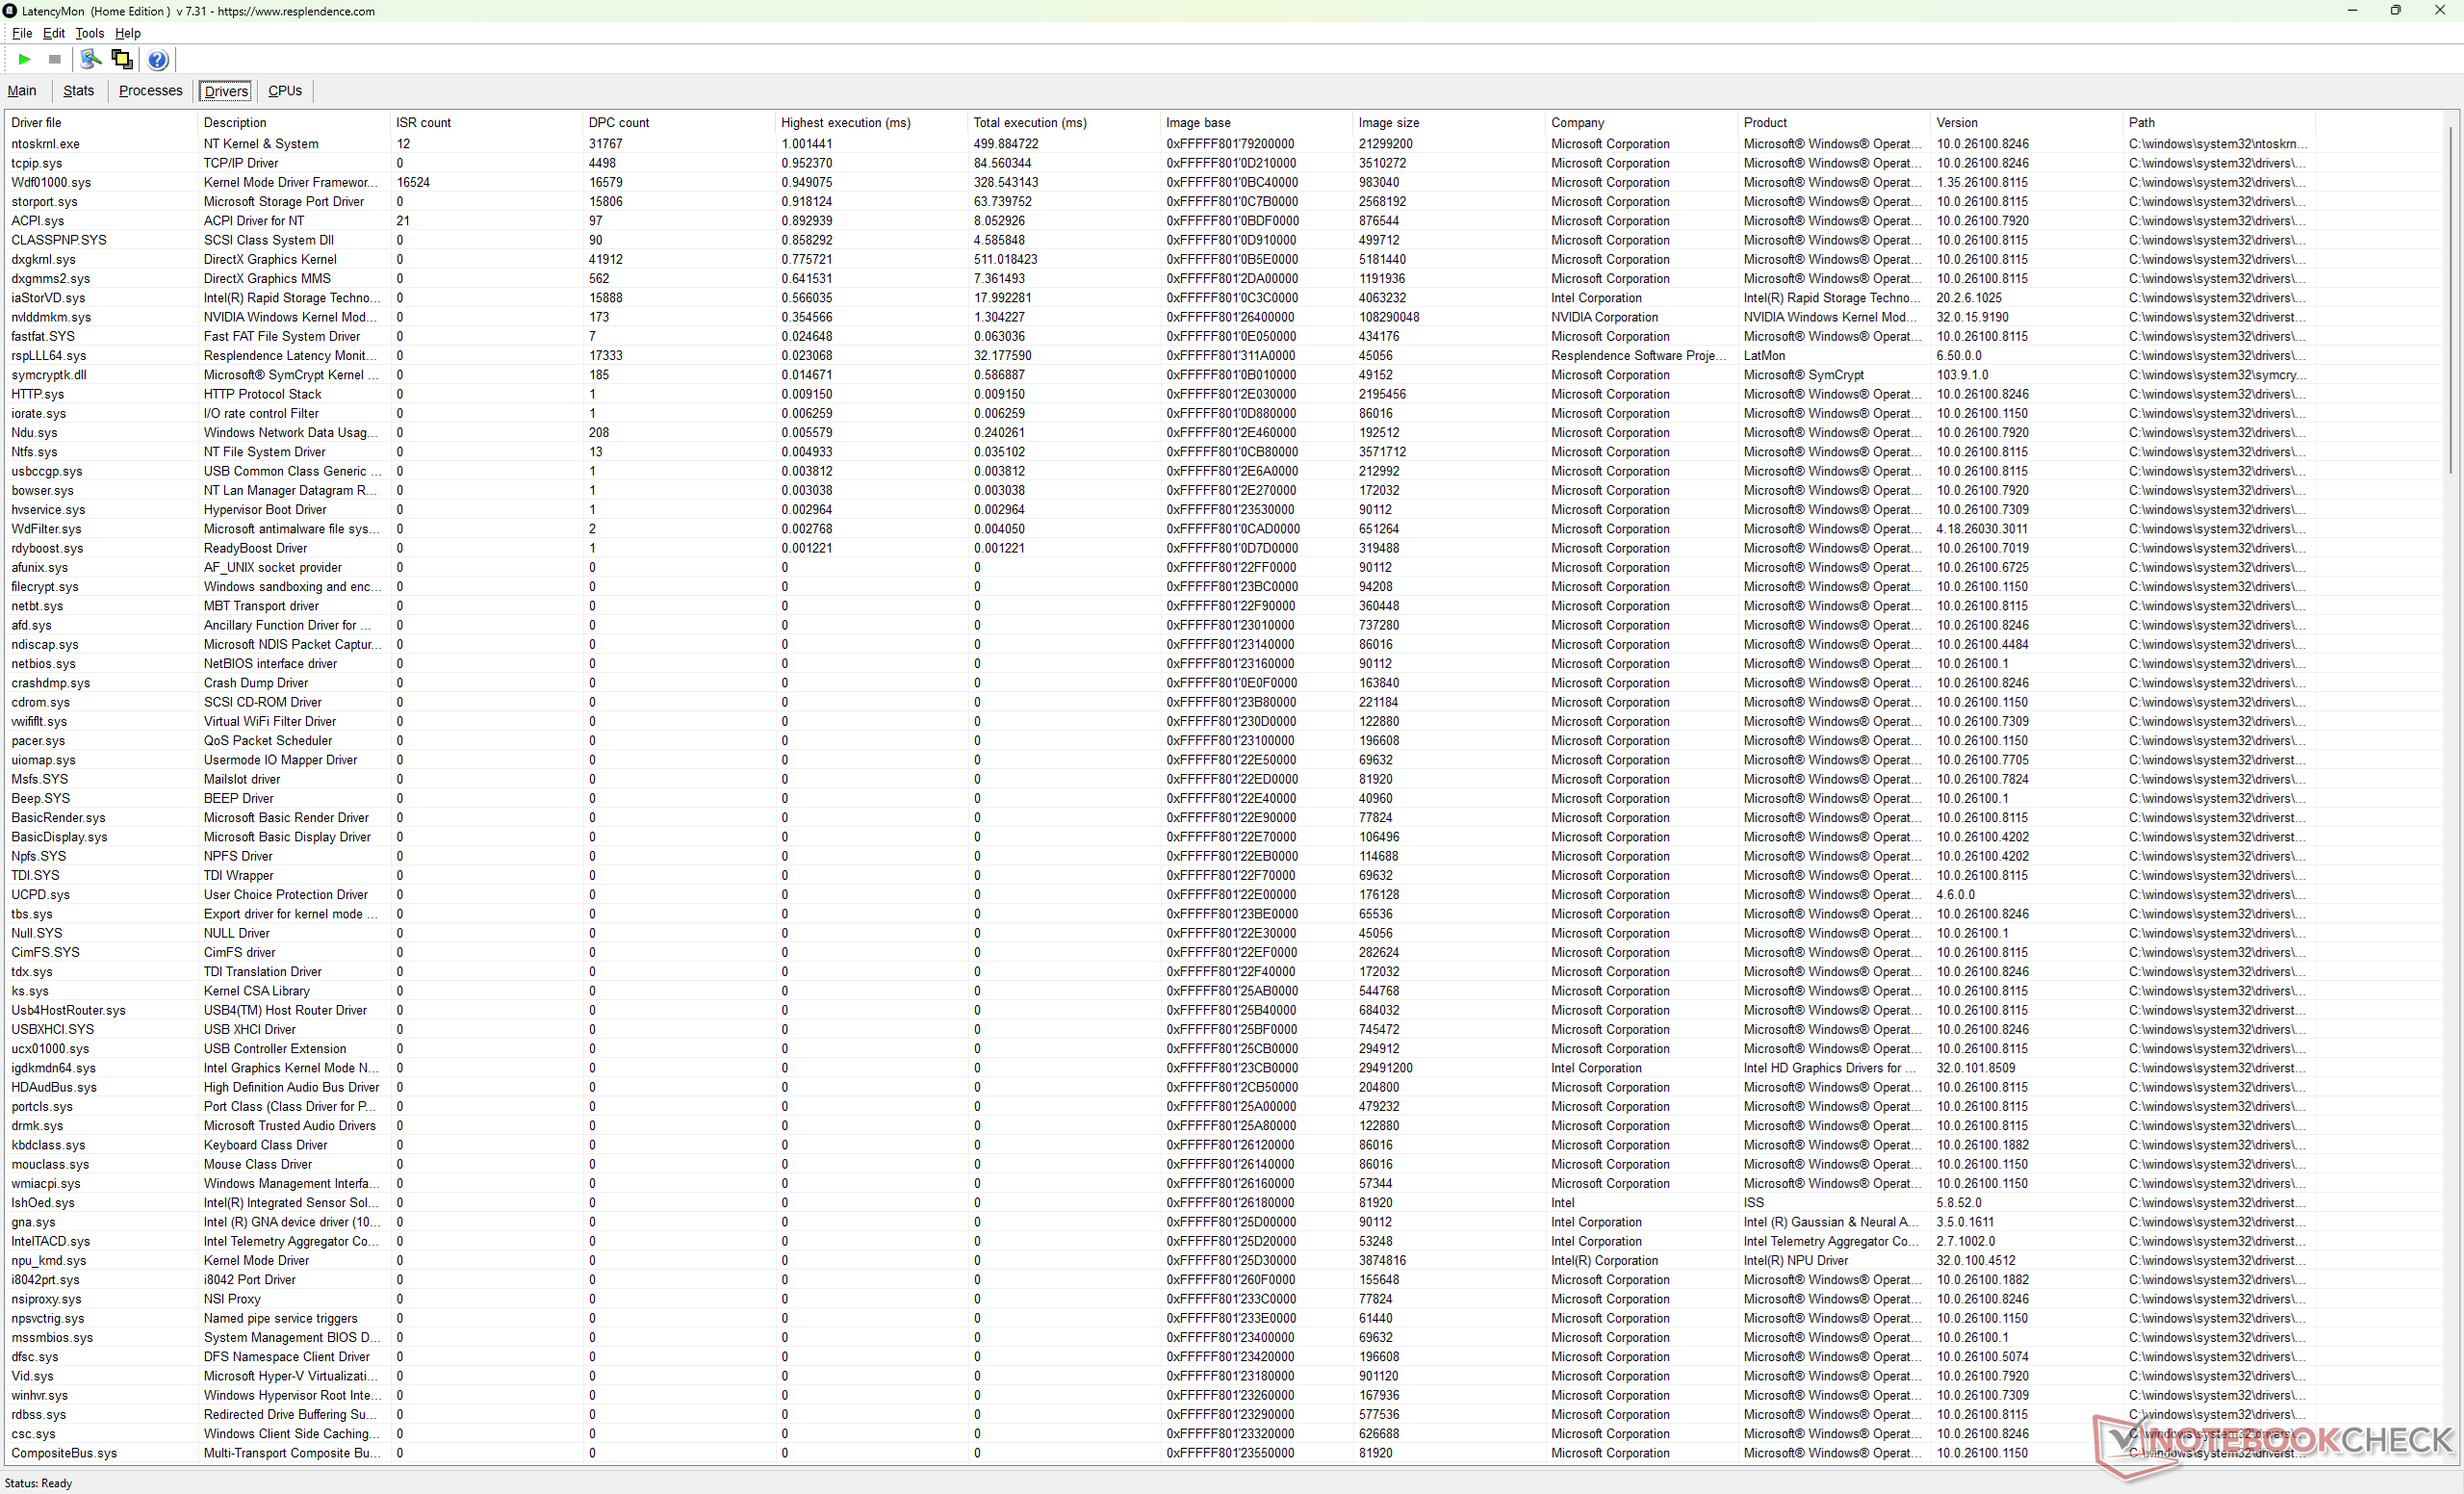
| DPC Latencies / LatencyMon - interrupt to process latency (max), Web, Youtube, Prime95 | |
| MSI Vector 16 HX AI A2XWHG | |
| Alienware 16 Area-51 Core Ultra 9 290HX Plus | |
| Alienware 16 Area-51 | |
| HP Omen Max 16 ah000 | |
| Asus ROG Zephyrus G16 GU605CW | |
| Lenovo Legion Pro 7i 16 Gen 10 | |
* ... smaller is better
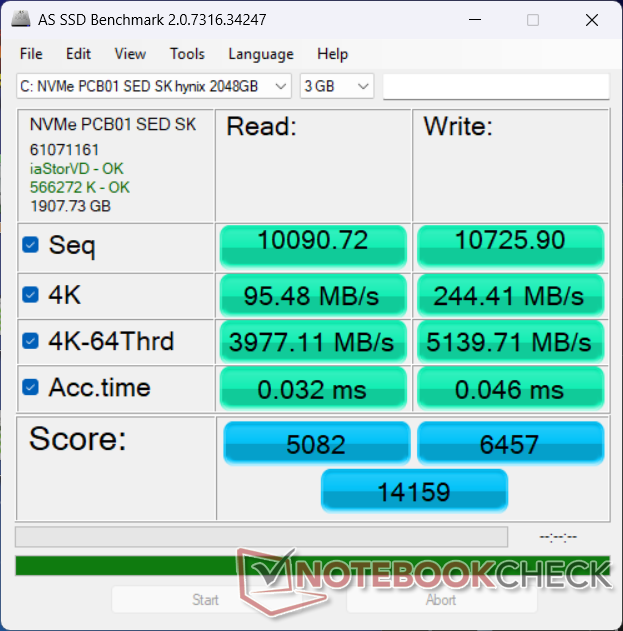
Storage Devices
Impressively, the SK Hynix PCB01 PCIe5 x4 NVMe SSD is able to sustain transfer rates of almost 14000 MB/s without any throttling.
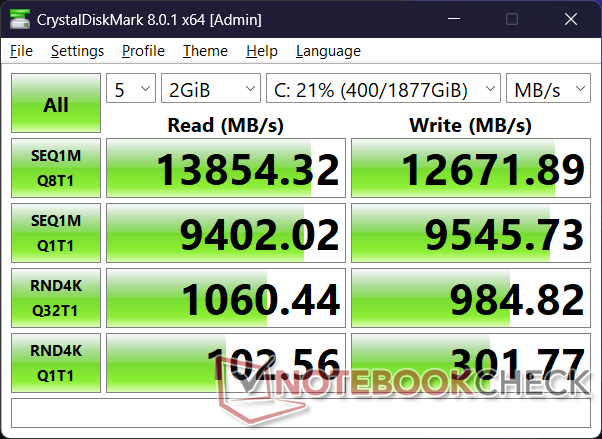

* ... smaller is better
Disk Throttling: DiskSpd Read Loop, Queue Depth 8
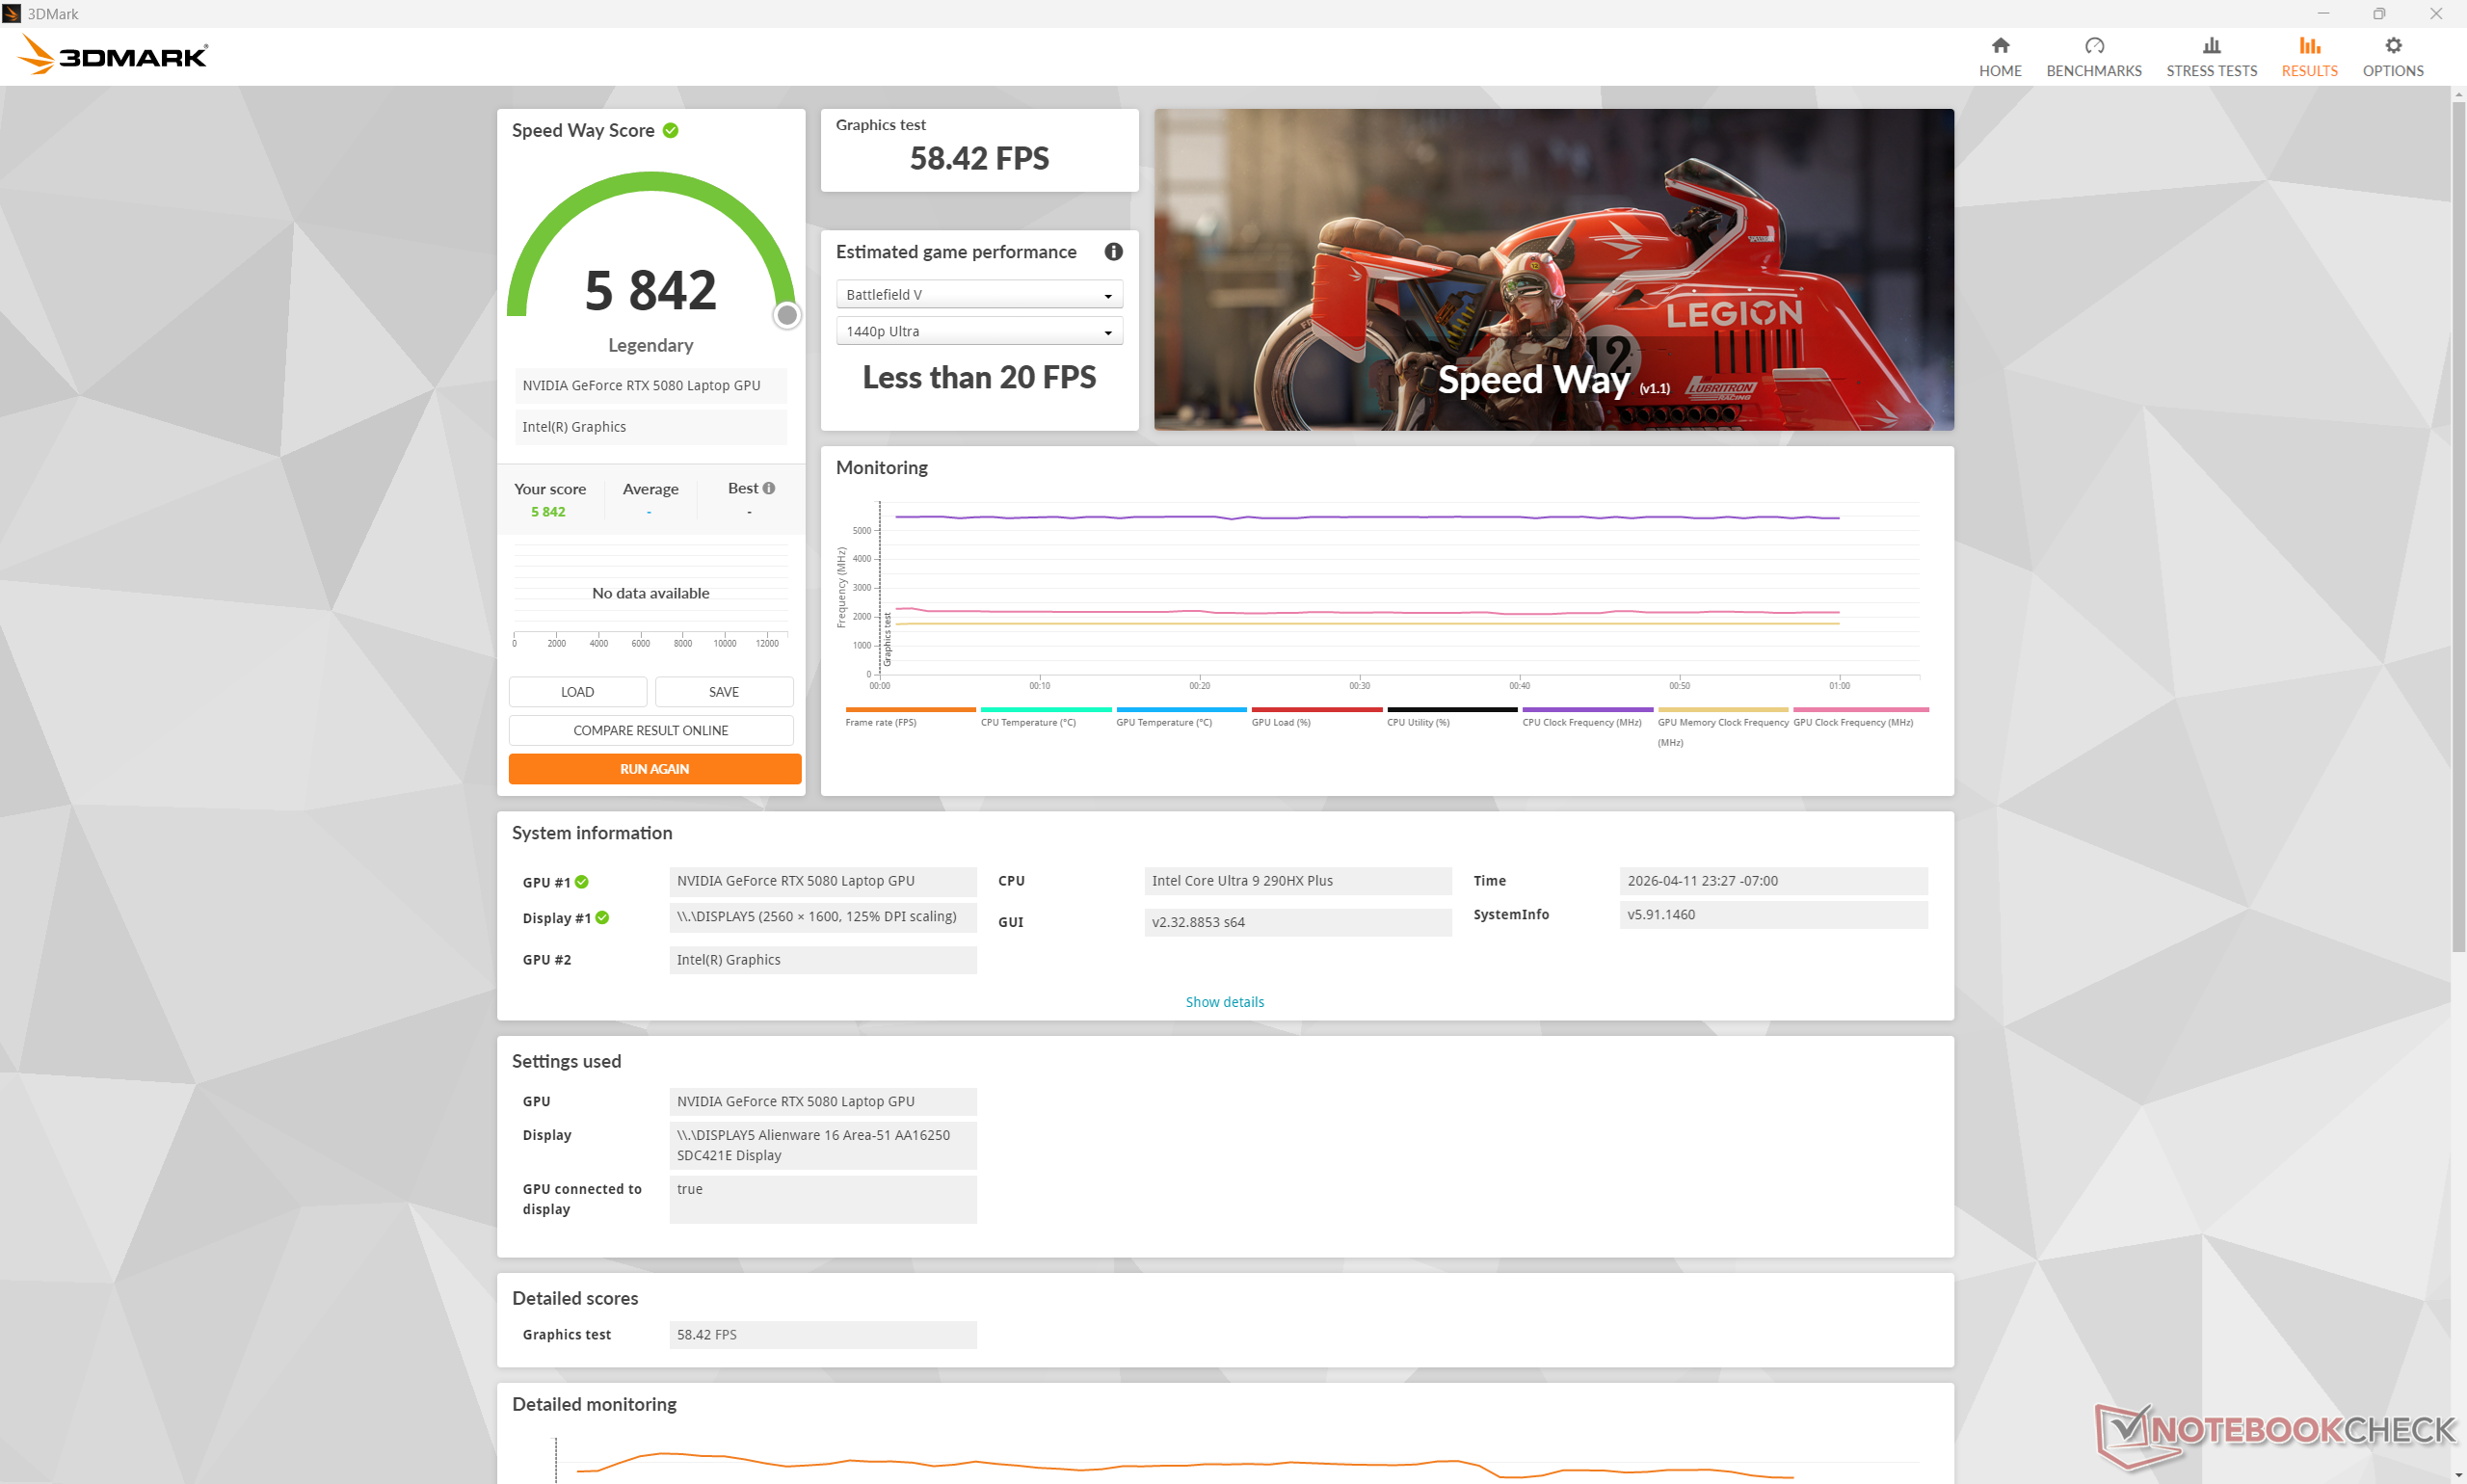
GPU Performance
GeForce RTX 5080 and 5090 GPU options remain the same as before with no changes to the 175 W TGP target. Nevertheless, 3DMark results are a few percentage points higher on our the newer 2026 model. Upgrading from the RTX 5080 to RTX 5090 is only expected to increase gaming performance by 10 to 15 percent.
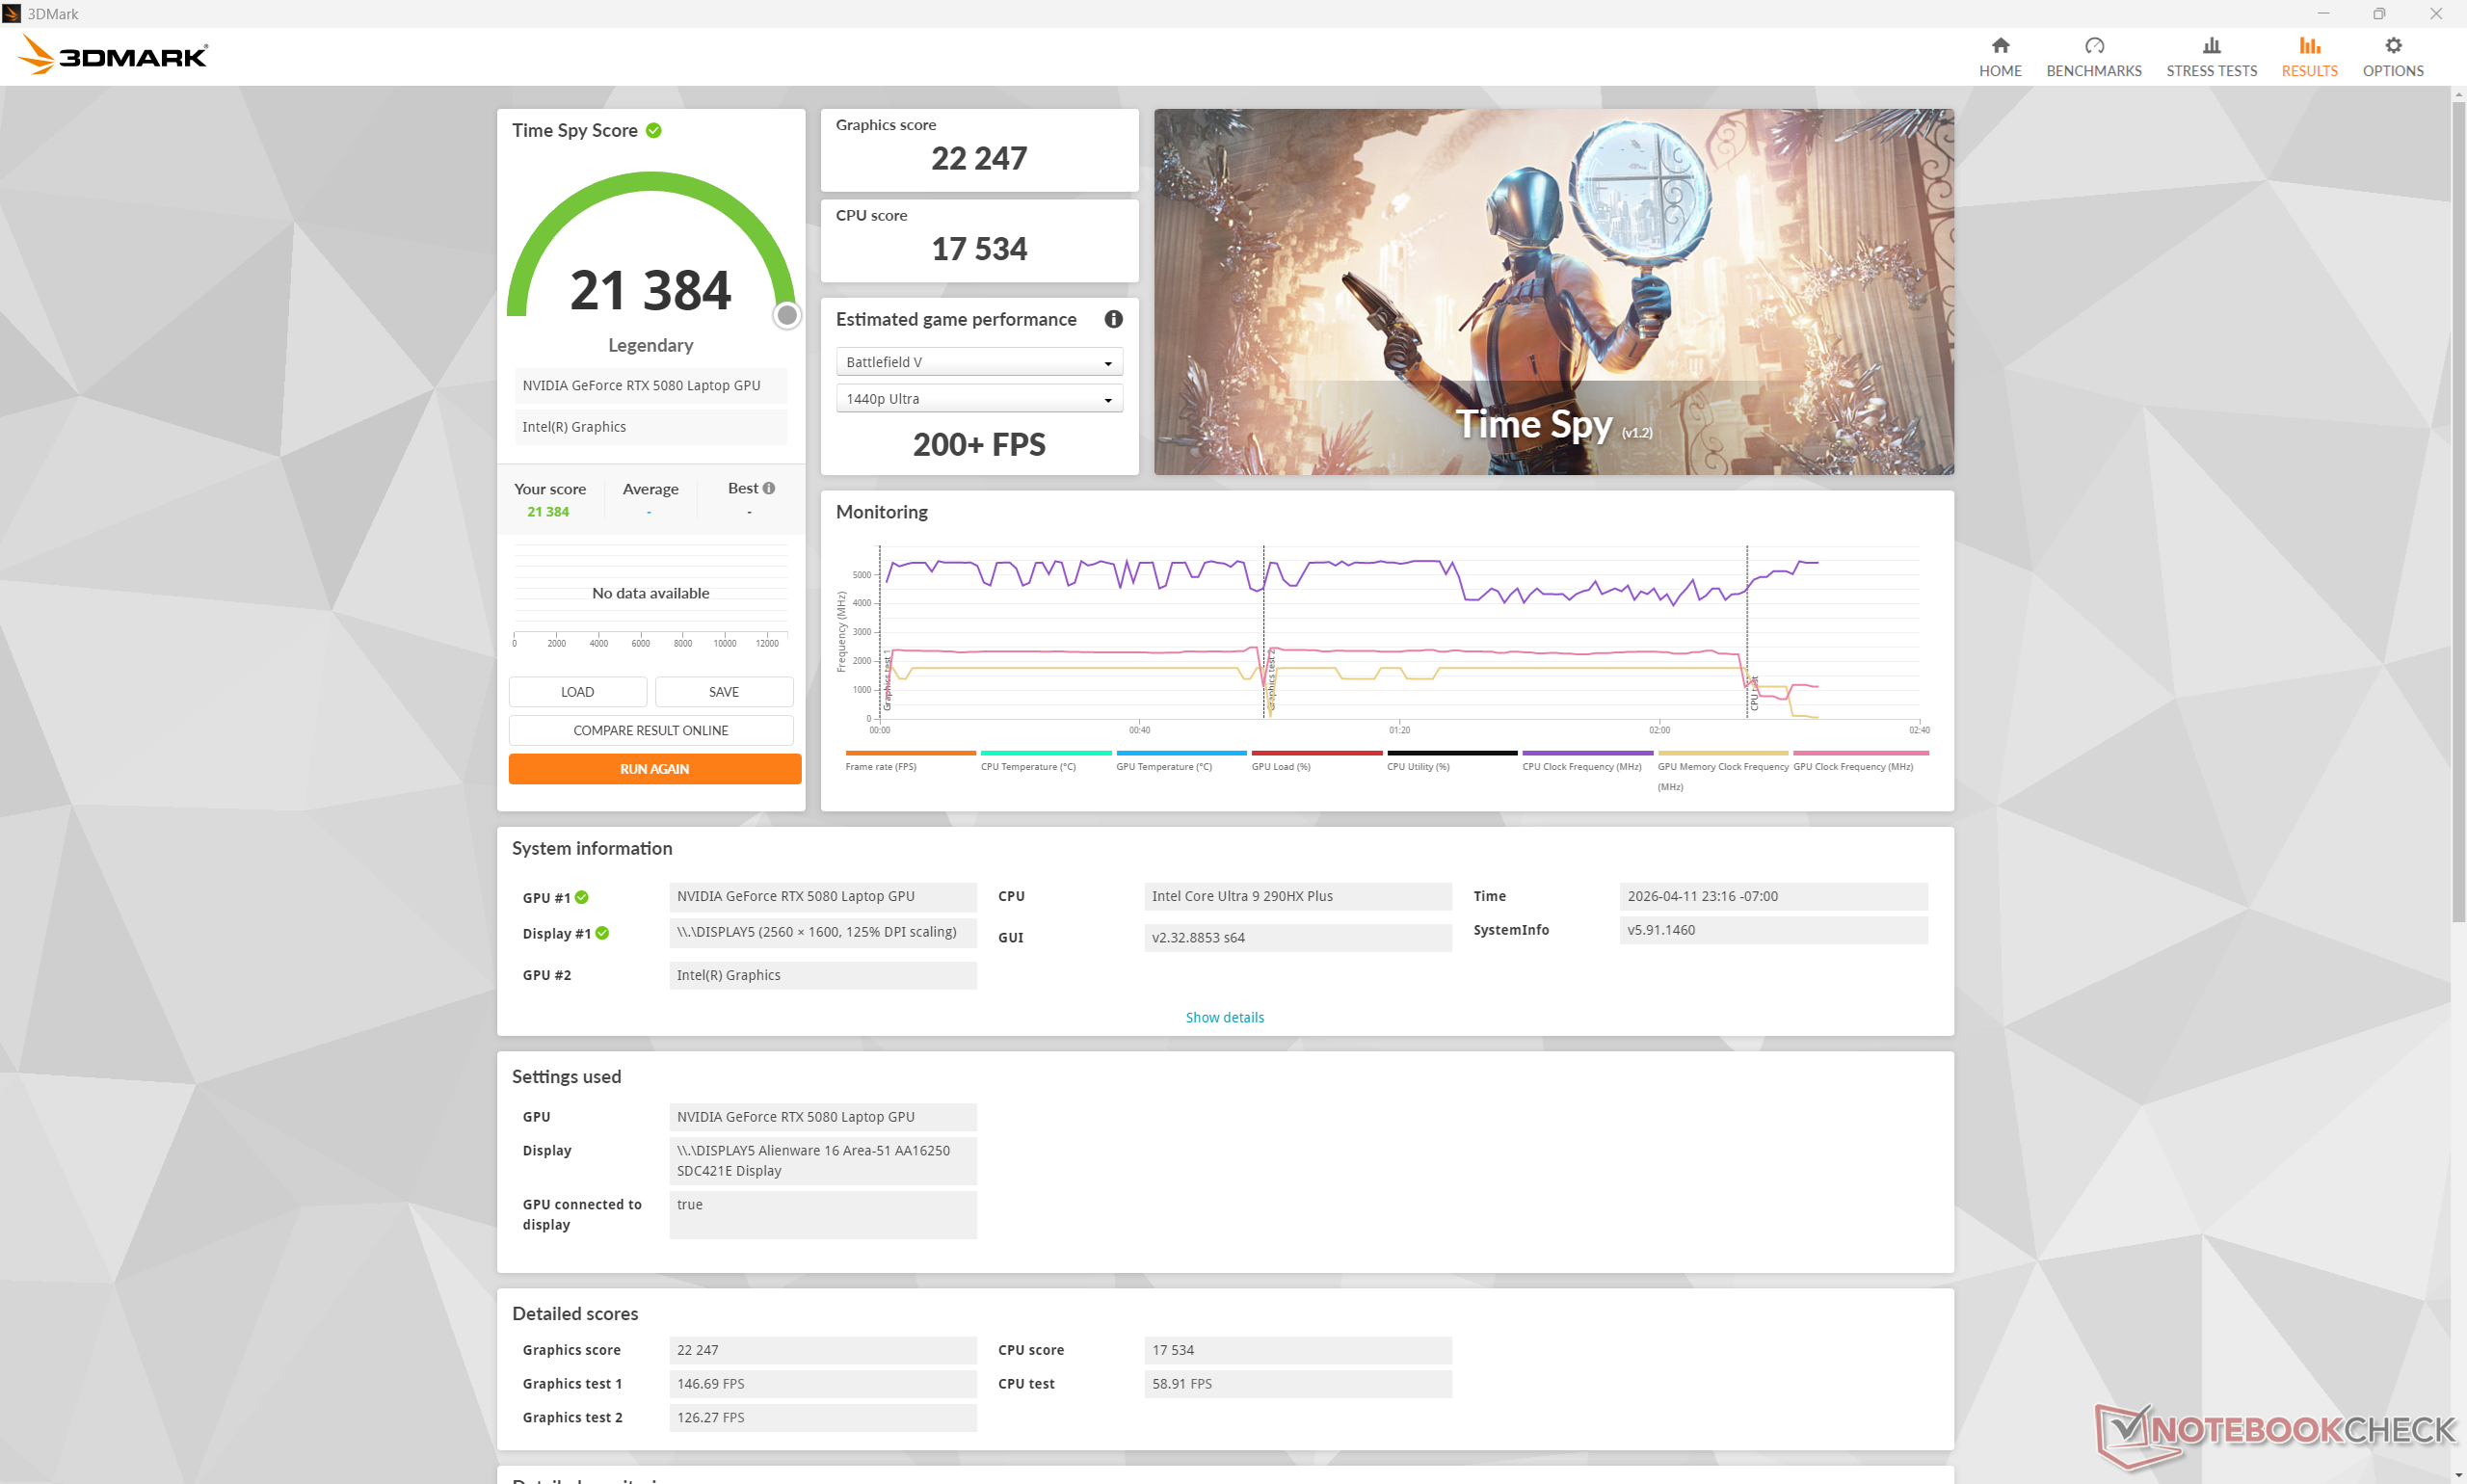
Most notably, running on Performance mode or Balanced mode instead of Overdrive mode would only decrease graphics performance by 3 percent and 6 percent, respectively, according to our Time Spy results table below. The performance deficits are smaller than expected when compared to most other gaming laptops.
| Power Profile | Graphics Score | Physics Score | Combined Score |
| Overdrive Mode | 22247 | 17534 | 21384 |
| Performance Mode | 21478 (-3%) | 17530 (-0%) | 20776 (-3%) |
| Balanced Mode | 20815 (-6%) | 17251 (-2%) | 20189 (-6%) |
| Battery Power | 13861 (-38%) | 13580 (-23%) | 13818 (-35%) |
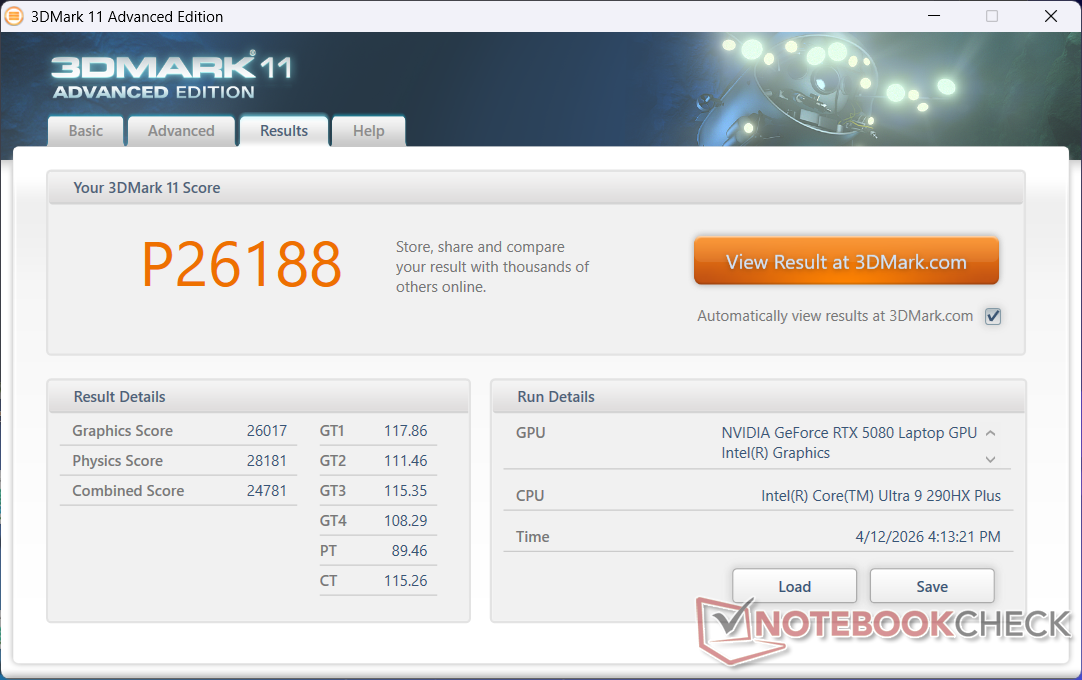

| 3DMark 11 Performance | 26188 points | |
| 3DMark Cloud Gate Standard Score | 74132 points | |
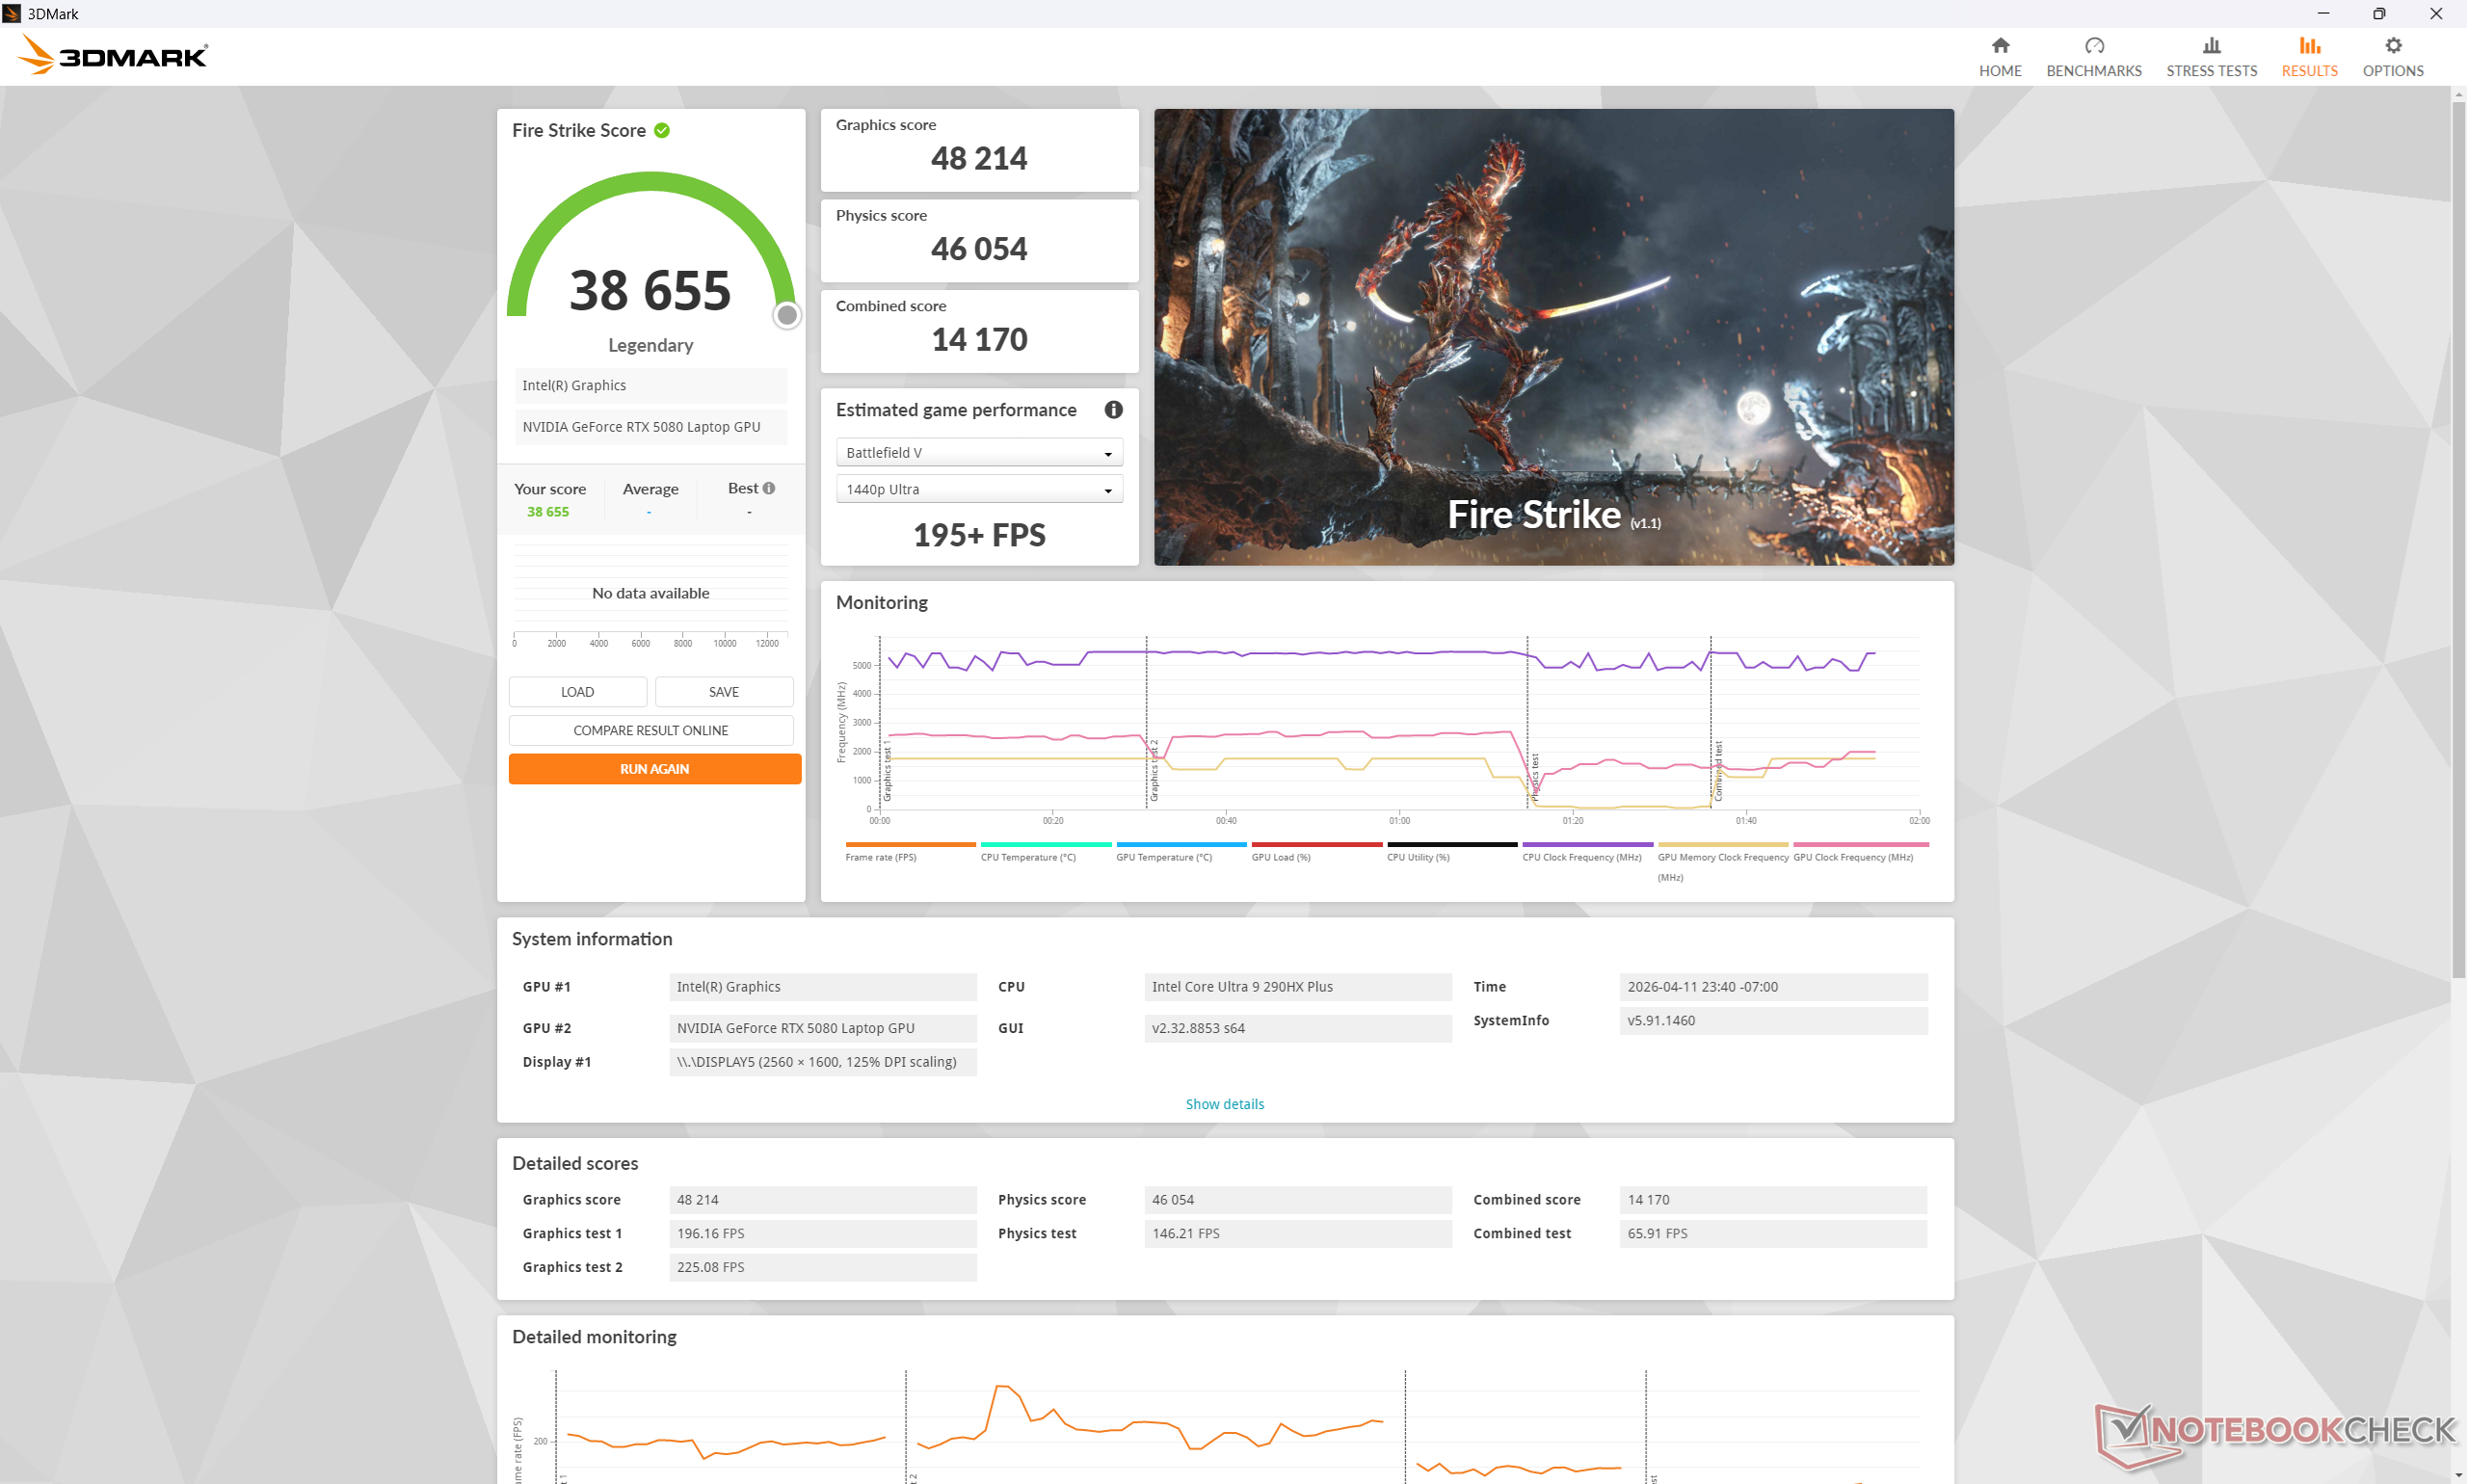
| 3DMark Fire Strike Score | 38655 points | |
| 3DMark Time Spy Score | 21384 points | |
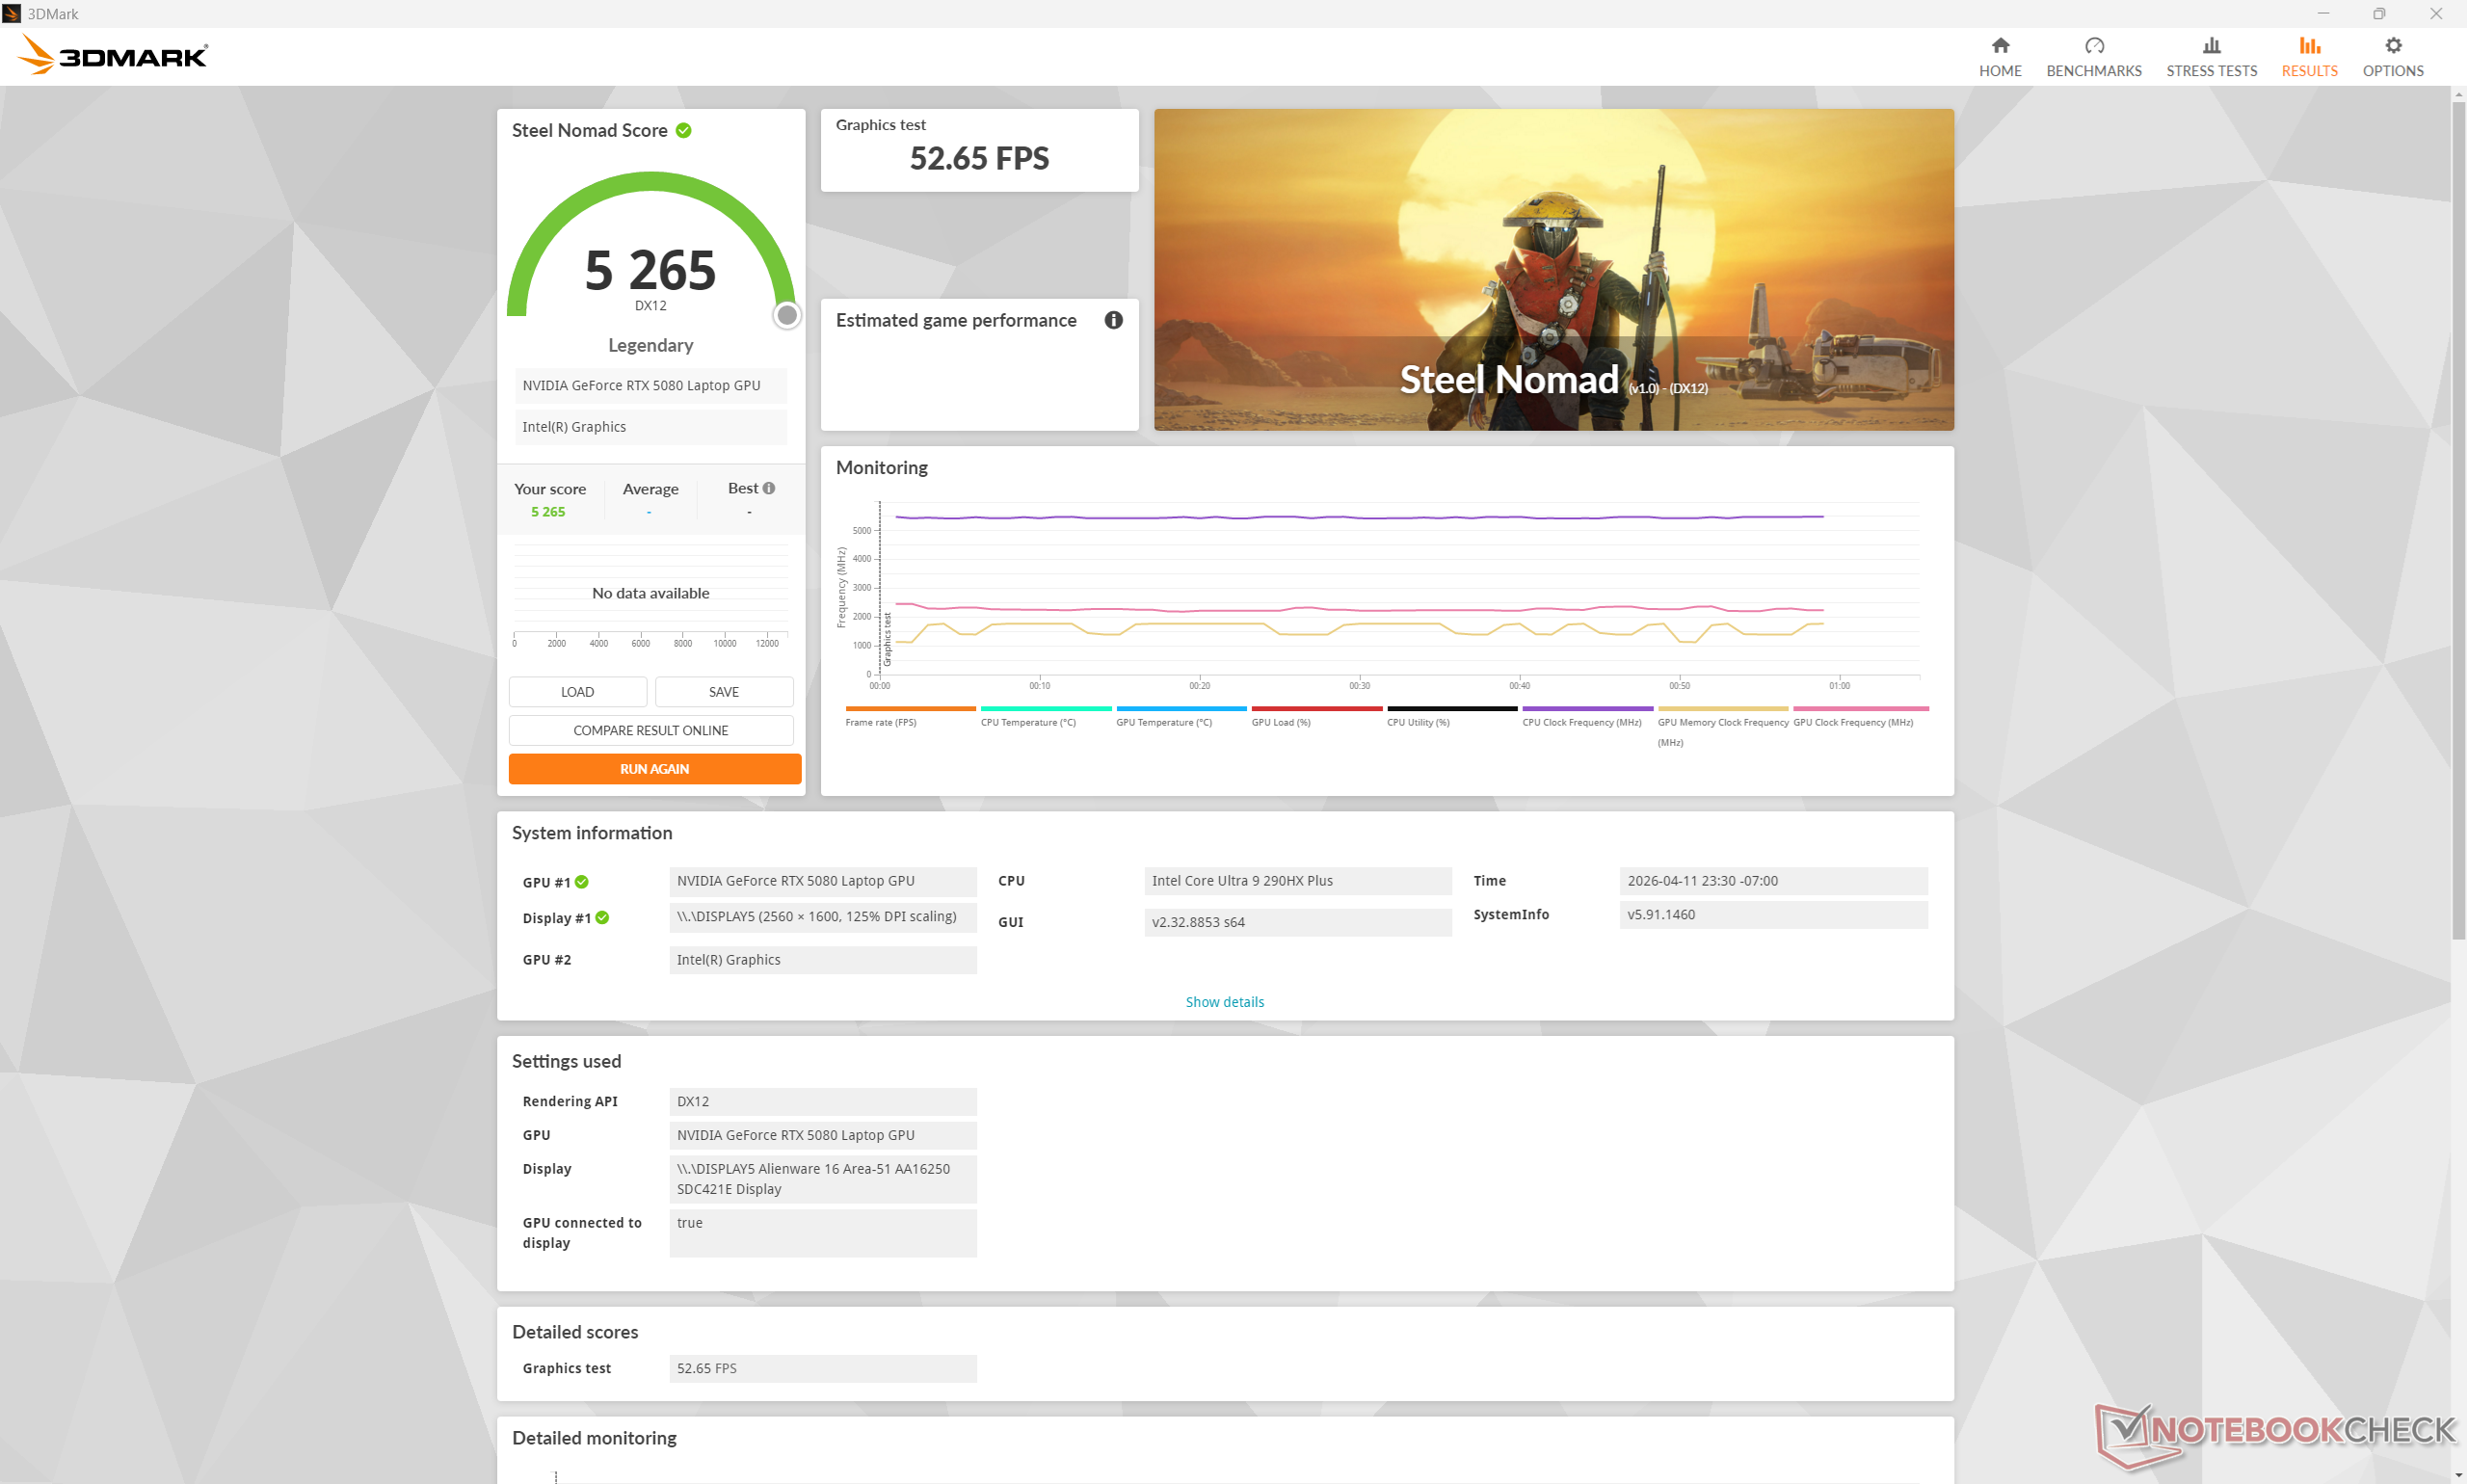
| 3DMark Steel Nomad Score | 5265 points | |
Help | ||
* ... smaller is better
| Performance rating - Percent | |
| Lenovo Legion Pro 7i 16 Gen 10 -1! | |
| Alienware 16 Area-51 Core Ultra 9 290HX Plus -1! | |
| HP Omen Max 16 ah000 -2! | |
| Alienware 16 Area-51 -1! | |
| MSI Vector 16 HX AI A2XWHG -1! | |
| Asus ROG Zephyrus G16 GU605CW | |
| Cyberpunk 2077 - 1920x1080 Ultra Preset (FSR off) | |
| Lenovo Legion Pro 7i 16 Gen 10 | |
| Alienware 16 Area-51 Core Ultra 9 290HX Plus | |
| HP Omen Max 16 ah000 | |
| Alienware 16 Area-51 | |
| MSI Vector 16 HX AI A2XWHG | |
| Asus ROG Zephyrus G16 GU605CW | |
| Baldur's Gate 3 - 1920x1080 Ultra Preset AA:T | |
| Lenovo Legion Pro 7i 16 Gen 10 | |
| Alienware 16 Area-51 | |
| MSI Vector 16 HX AI A2XWHG | |
| Asus ROG Zephyrus G16 GU605CW | |
| GTA V - 1920x1080 Highest AA:4xMSAA + FX AF:16x | |
| Alienware 16 Area-51 Core Ultra 9 290HX Plus | |
| MSI Vector 16 HX AI A2XWHG | |
| Asus ROG Zephyrus G16 GU605CW | |
| Final Fantasy XV Benchmark - 1920x1080 High Quality | |
| Lenovo Legion Pro 7i 16 Gen 10 | |
| HP Omen Max 16 ah000 | |
| Alienware 16 Area-51 Core Ultra 9 290HX Plus | |
| Alienware 16 Area-51 | |
| MSI Vector 16 HX AI A2XWHG | |
| Asus ROG Zephyrus G16 GU605CW | |
| Strange Brigade - 1920x1080 ultra AA:ultra AF:16 | |
| Lenovo Legion Pro 7i 16 Gen 10 | |
| Alienware 16 Area-51 Core Ultra 9 290HX Plus | |
| Alienware 16 Area-51 | |
| HP Omen Max 16 ah000 | |
| Asus ROG Zephyrus G16 GU605CW | |
| Dota 2 Reborn - 1920x1080 ultra (3/3) best looking | |
| Lenovo Legion Pro 7i 16 Gen 10 | |
| Alienware 16 Area-51 Core Ultra 9 290HX Plus | |
| MSI Vector 16 HX AI A2XWHG | |
| HP Omen Max 16 ah000 | |
| Alienware 16 Area-51 | |
| Asus ROG Zephyrus G16 GU605CW | |
Cyberpunk 2077 ultra FPS Chart
| low | med. | high | ultra | QHD DLSS | QHD FSR | QHD | 4K DLSS | 4K | |
|---|---|---|---|---|---|---|---|---|---|
| GTA V (2015) | 187.9 | 187.6 | 186.2 | 168.1 | 167.2 | 183.9 | |||
| Dota 2 Reborn (2015) | 216 | 191 | 184.3 | 170.9 | 165.9 | ||||
| Final Fantasy XV Benchmark (2018) | 234 | 232 | 201 | 157.5 | 93.6 | ||||
| X-Plane 11.11 (2018) | 171.5 | 154.6 | 129.5 | 101.3 | |||||
| Strange Brigade (2018) | 624 | 489 | 448 | 413 | 300 | 161.1 | |||
| Cyberpunk 2077 (2023) | 195.9 | 191.5 | 171.9 | 153.3 | 119.1 | 101.7 | 57.8 | 46.4 | |
| F1 24 (2024) | 341 | 375 | 351 | 136.9 | 141.2 | 136.2 | 89.2 | 76.5 | 44.8 |
| Black Myth: Wukong (2024) | 55 | 61 | 42 | 42 | 24 | ||||
| Monster Hunter Wilds (2025) | 85.5 | 82.5 | 69 | 58.7 | 43 | ||||
| Assassin's Creed Shadows (2025) | 59 | 59 | 51 | 49 | 37 |
Emissions
System Noise
Fan noise levels and behavior are almost identical to what we recorded on the 2025 Alienware 16 despite the performance uptick on this latest iteration. Note that fan noise would stabilize at 48 dB(A), 49 dB(A), and 57 dB(A) when running Cyberpunk 2077 on Balanced mode, Performance mode, and Overdrive mode, respectively. Noise is significantly reduced when dropping from Overdrive to Performance for only a <5% loss in graphics.
Noise level
| Idle |
| 23.2 / 28.2 / 28.3 dB(A) |
| Load |
| 28.8 / 57.1 dB(A) |
 | ||
30 dB silent 40 dB(A) audible 50 dB(A) loud |
||
min: | ||
| Alienware 16 Area-51 Core Ultra 9 290HX Plus Ultra 9 290HX Plus, GeForce RTX 5080 Laptop | Alienware 16 Area-51 Ultra 9 275HX, GeForce RTX 5080 Laptop | Lenovo Legion Pro 7i 16 Gen 10 Ultra 9 275HX, GeForce RTX 5080 Laptop | HP Omen Max 16 ah000 Ultra 9 275HX, GeForce RTX 5090 Laptop | MSI Vector 16 HX AI A2XWHG Ultra 7 255HX, GeForce RTX 5070 Ti Laptop | Asus ROG Zephyrus G16 GU605CW Ultra 9 285H, GeForce RTX 5080 Laptop | |
|---|---|---|---|---|---|---|
| Noise | -2% | 4% | -16% | -21% | -20% | |
| off / environment * (dB) | 23.1 | 23.6 -2% | 22.9 1% | 22.8 1% | 25 -8% | 25.56 -11% |
| Idle Minimum * (dB) | 23.2 | 25.4 -9% | 22.9 1% | 29 -25% | 33 -42% | 30 -29% |
| Idle Average * (dB) | 28.2 | 27.8 1% | 22.9 19% | 29 -3% | 34 -21% | 30 -6% |
| Idle Maximum * (dB) | 28.3 | 28.1 1% | 26.3 7% | 29 -2% | 38 -34% | 30 -6% |
| Load Average * (dB) | 28.8 | 28.8 -0% | 27.8 3% | 47.7 -66% | 46 -60% | 53.55 -86% |
| Cyberpunk 2077 ultra * (dB) | 49 | 50.4 -3% | 54.2 -11% | 54.8 -12% | 47 4% | 53.5 -9% |
| Load Maximum * (dB) | 57.1 | 56.4 1% | 53.9 6% | 61.1 -7% | 49 14% | 54.02 5% |
* ... smaller is better
Temperature
Hot spots when gaming would reach the low 40 C range which is similar to what we observed on the 2025 Alienware 16 Area-51. Average temperature is slightly warmer than on the competing Lenovo Legion Pro 7i 16 Gen 10 since the palm rests on the Alienware don't remain as cool.


(-) The maximum temperature on the upper side is 45.2 °C / 113 F, compared to the average of 40.4 °C / 105 F, ranging from 21.2 to 68.8 °C for the class Gaming.
(+) The bottom heats up to a maximum of 37.4 °C / 99 F, compared to the average of 43.2 °C / 110 F
(+) In idle usage, the average temperature for the upper side is 27.6 °C / 82 F, compared to the device average of 33.9 °C / 93 F.
(±) 3: The average temperature for the upper side is 36.4 °C / 98 F, compared to the average of 33.9 °C / 93 F for the class Gaming.
(+) The palmrests and touchpad are cooler than skin temperature with a maximum of 29.8 °C / 85.6 F and are therefore cool to the touch.
(±) The average temperature of the palmrest area of similar devices was 28.8 °C / 83.8 F (-1 °C / -1.8 F).


| Alienware 16 Area-51 Core Ultra 9 290HX Plus Ultra 9 290HX Plus, GeForce RTX 5080 Laptop | Alienware 16 Area-51 Ultra 9 275HX, GeForce RTX 5080 Laptop | Lenovo Legion Pro 7i 16 Gen 10 Ultra 9 275HX, GeForce RTX 5080 Laptop | HP Omen Max 16 ah000 Ultra 9 275HX, GeForce RTX 5090 Laptop | MSI Vector 16 HX AI A2XWHG Ultra 7 255HX, GeForce RTX 5070 Ti Laptop | Asus ROG Zephyrus G16 GU605CW Ultra 9 285H, GeForce RTX 5080 Laptop | |
|---|---|---|---|---|---|---|
| Heat | -9% | -4% | -1% | -14% | -21% | |
| Maximum Upper Side * (°C) | 45.2 | 43.8 3% | 42.6 6% | 42.8 5% | 53 -17% | 49.2 -9% |
| Maximum Bottom * (°C) | 37.4 | 40 -7% | 41.2 -10% | 50.2 -34% | 52 -39% | 50.2 -34% |
| Idle Upper Side * (°C) | 31.6 | 35.8 -13% | 32.6 -3% | 27.6 13% | 33 -4% | 37.2 -18% |
| Idle Bottom * (°C) | 30.2 | 35.2 -17% | 32.4 -7% | 26.2 13% | 29 4% | 37.4 -24% |
* ... smaller is better
Stress Test
When running Prime95 stress on Overdrive mode (i.e., maximum fan mode), the CPU would boost to 4.3 GHz, 182 W, and 105 C (!) before dropping slightly to the 3.9 to 4.1 GHz range in order to maintain a slightly cooler core temperature of 95 C to 100 C. In comparison, running this same test on the 2025 Alienware 16 would result in a lower average CPU clock rate and temperature of 3.6 GHz and 92 C, respectively. It's clear that the Core Ultra 9 290HX Plus is pushing the the existing Alienware 16 cooling solution to its absolute limits.
GPU temperature would remain about the same as on the 2025 model when running Cyberpunk 2077. CPU temperature, however, would be warmer by a few degree C at up to 82 C.
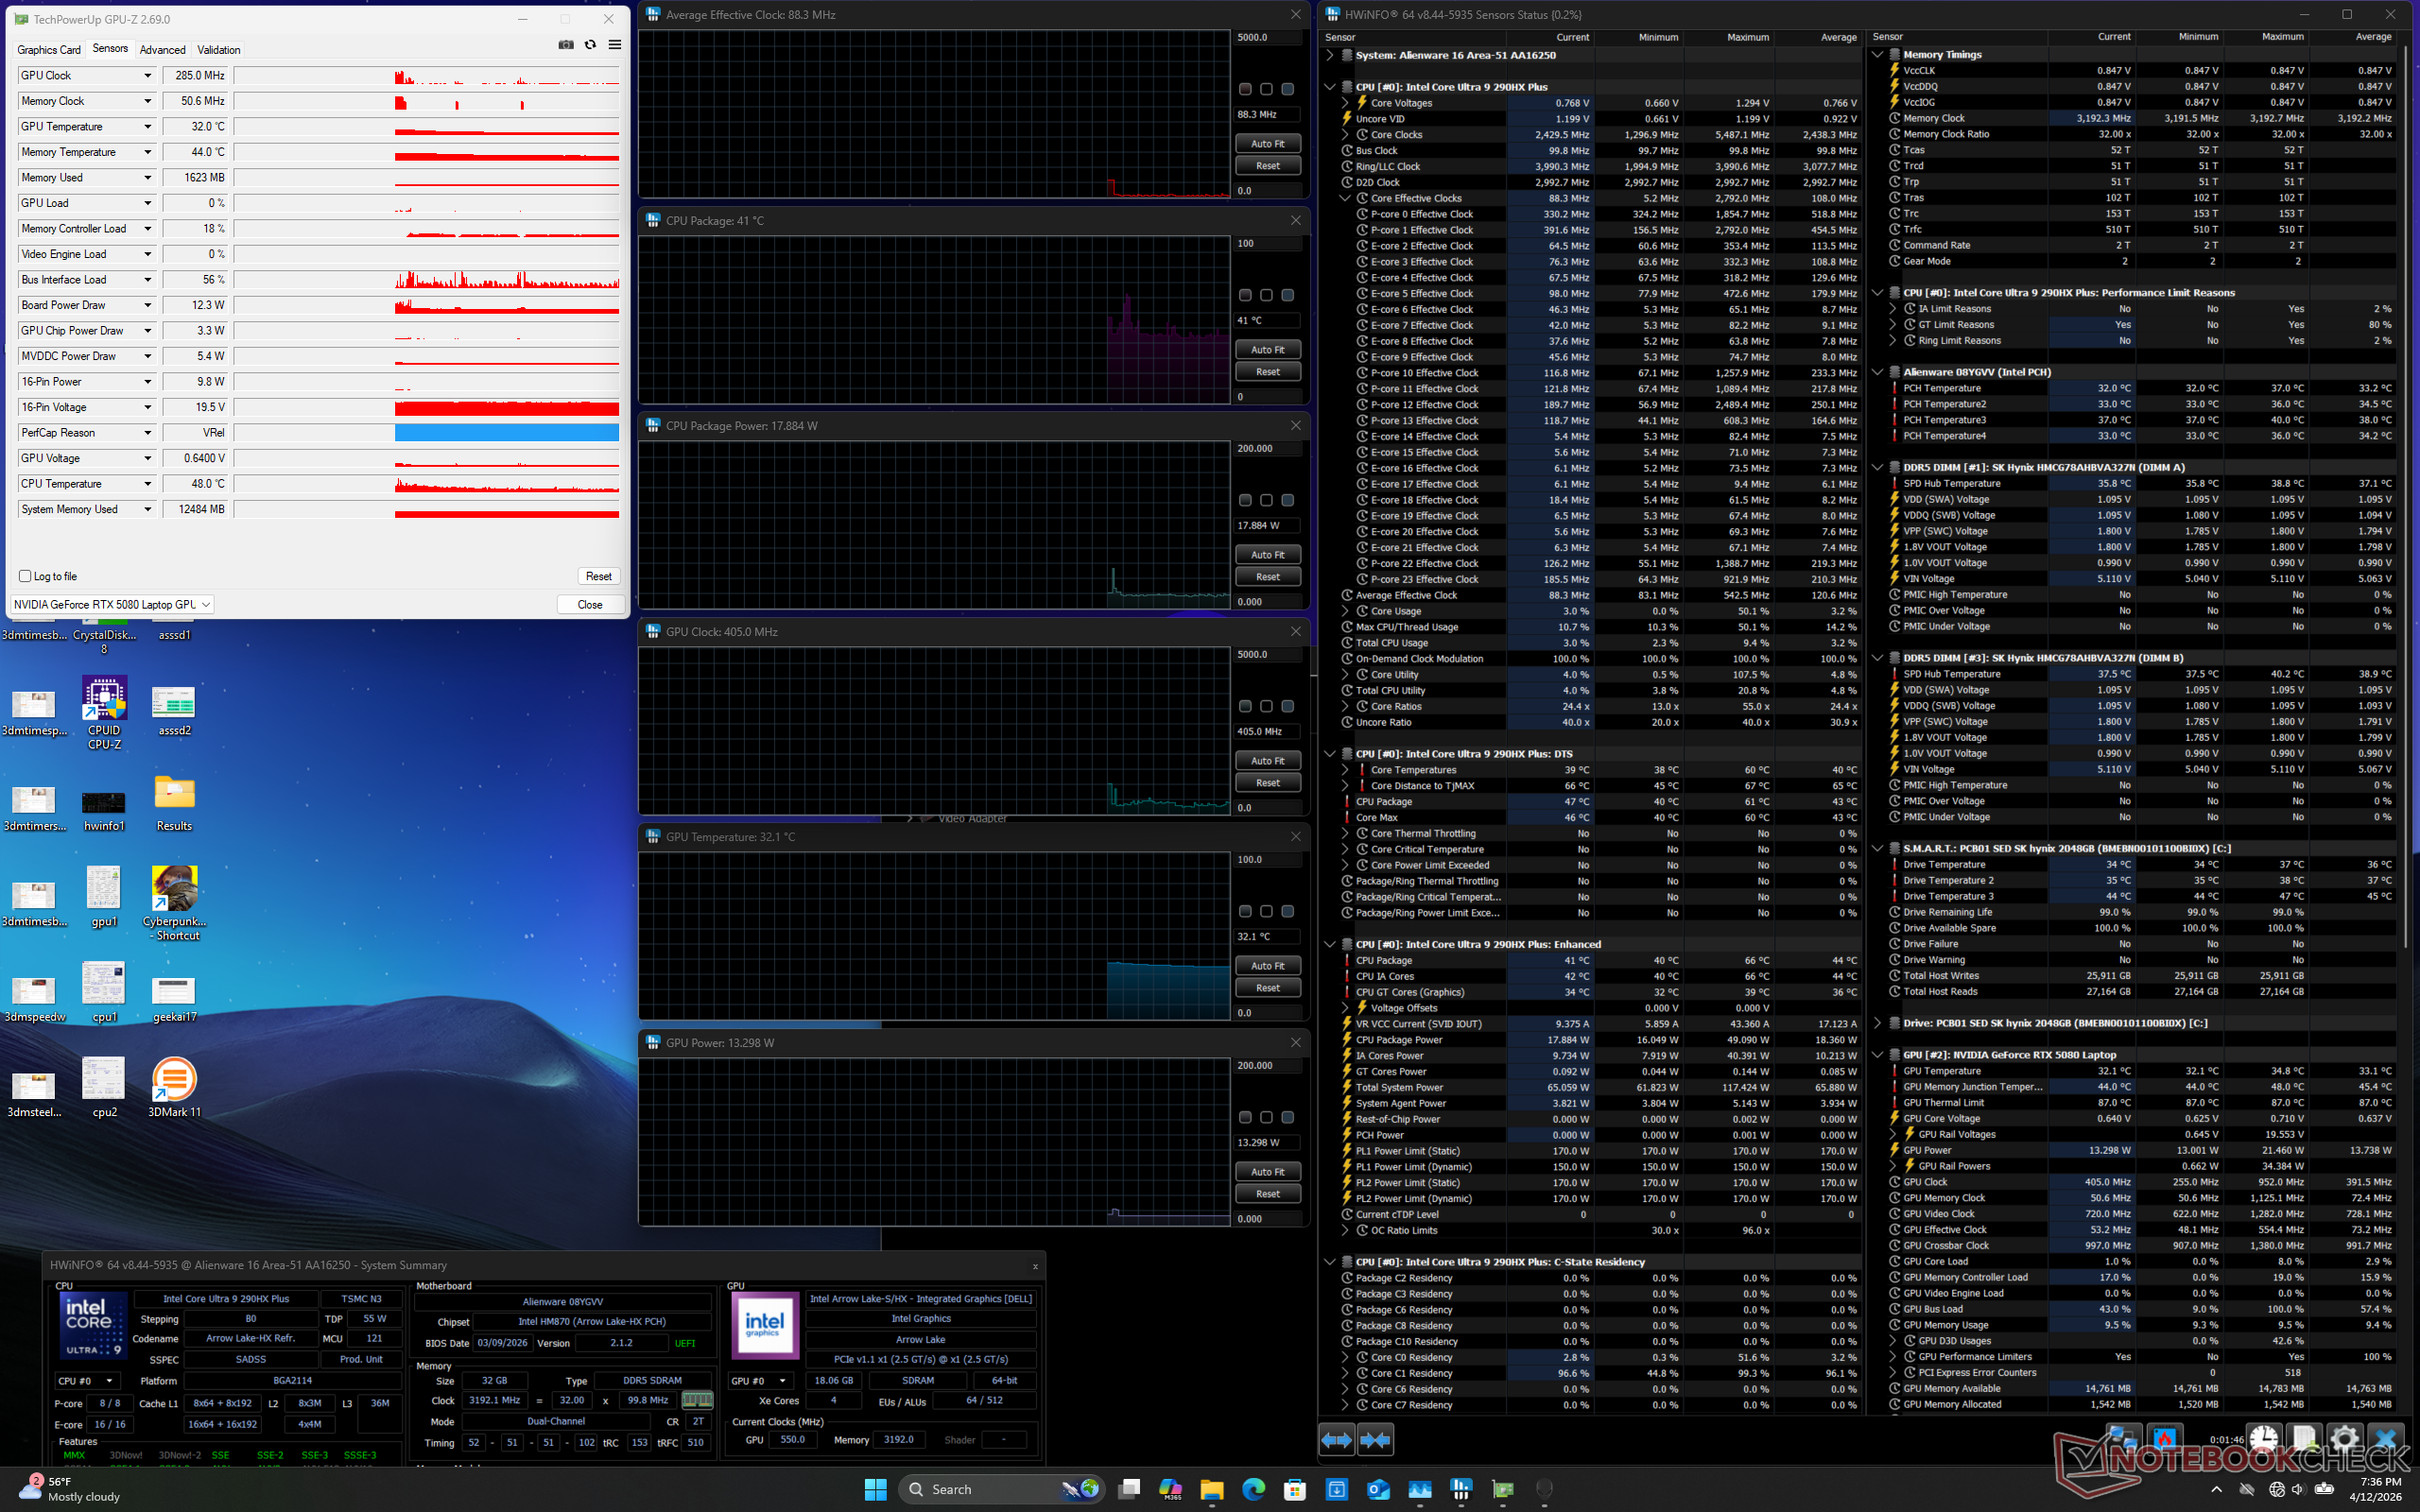
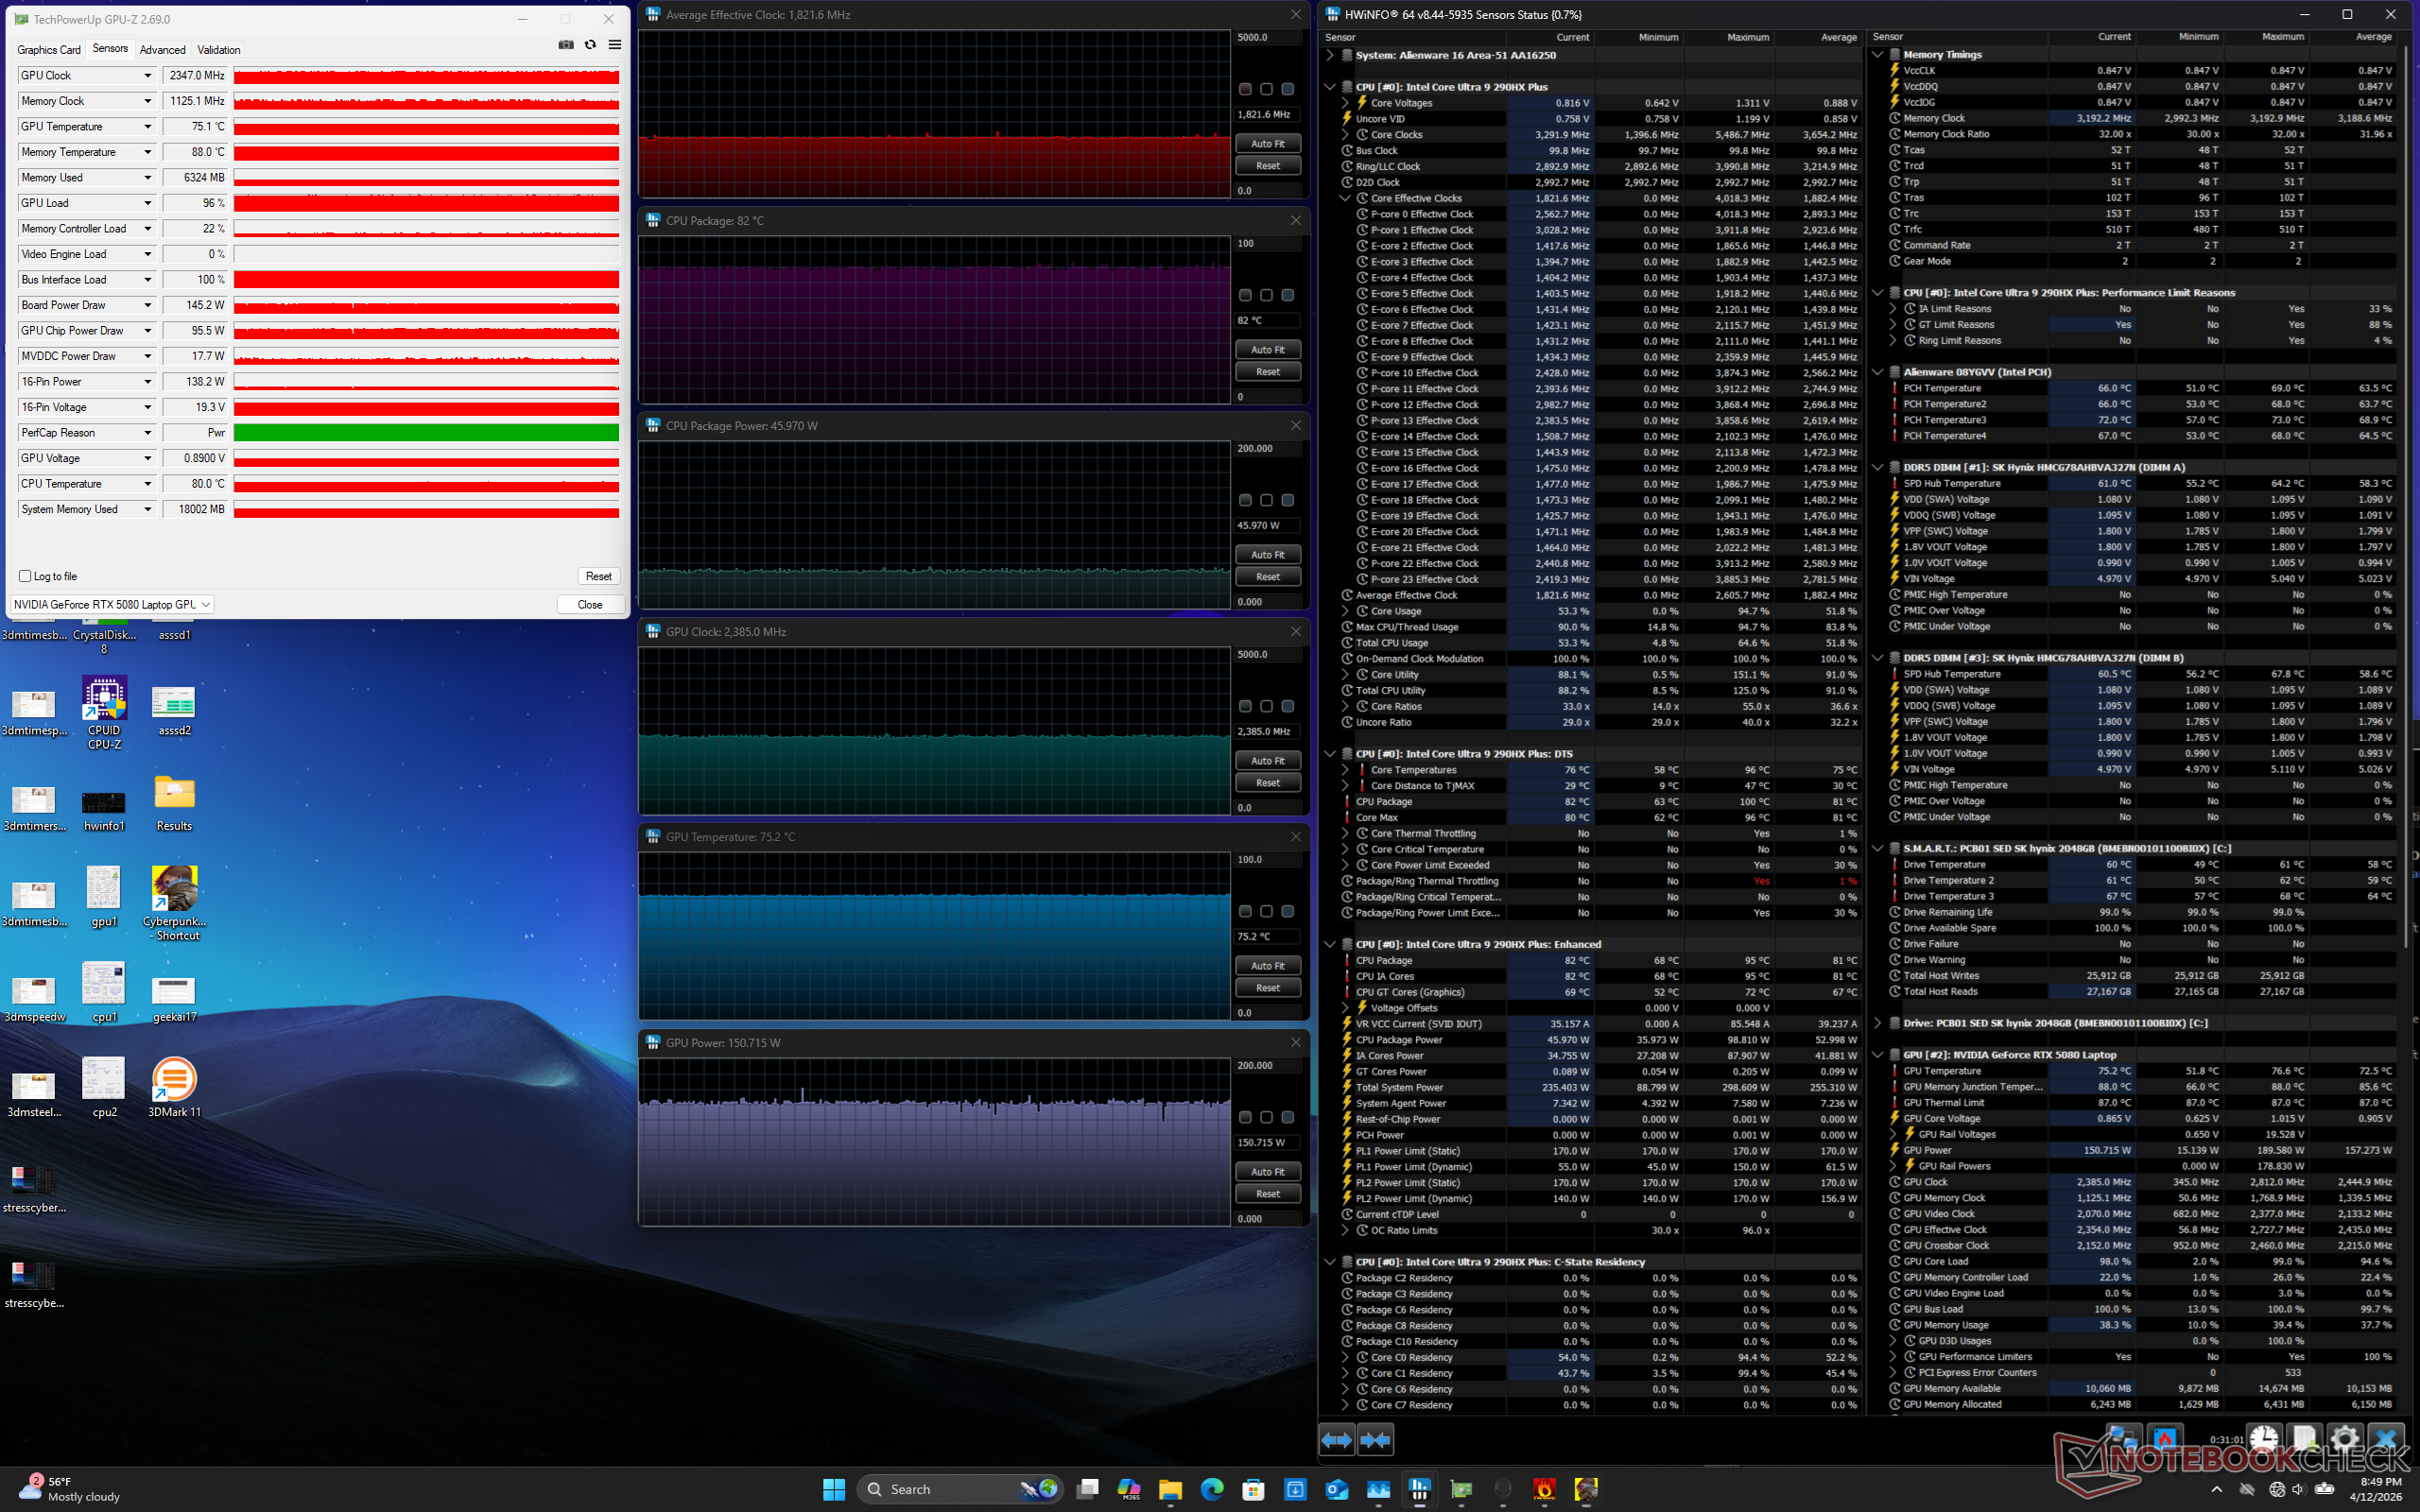
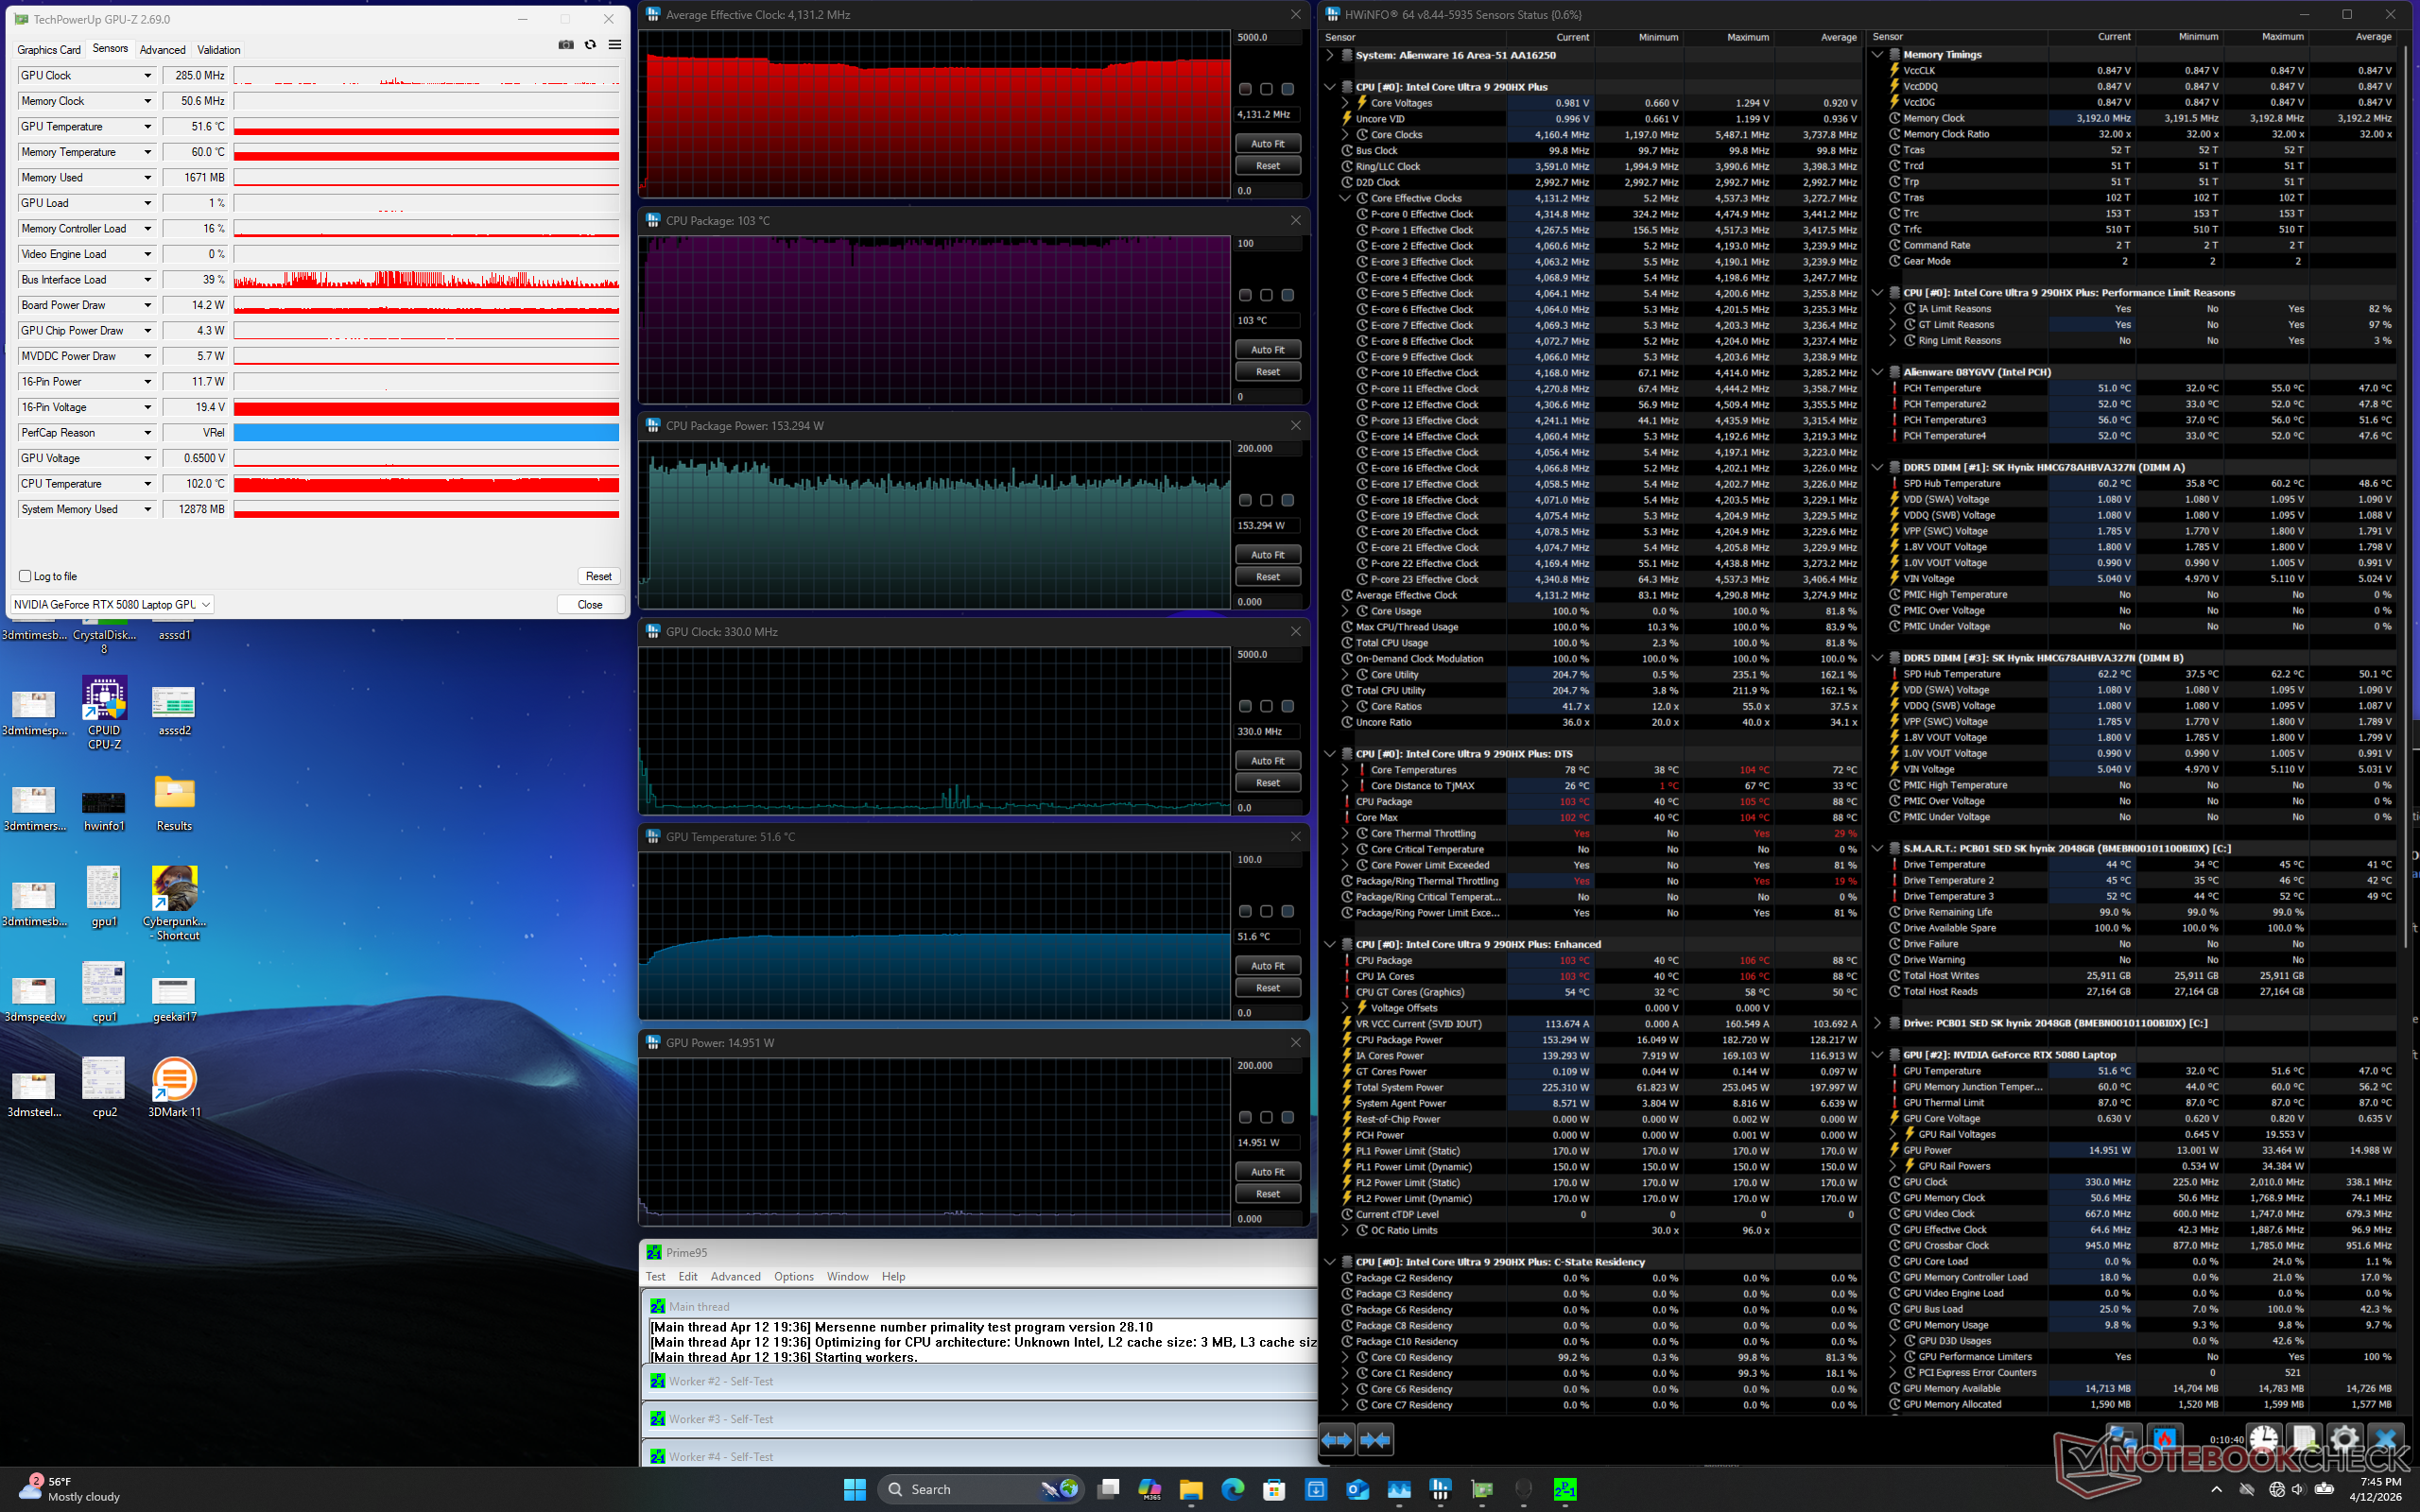
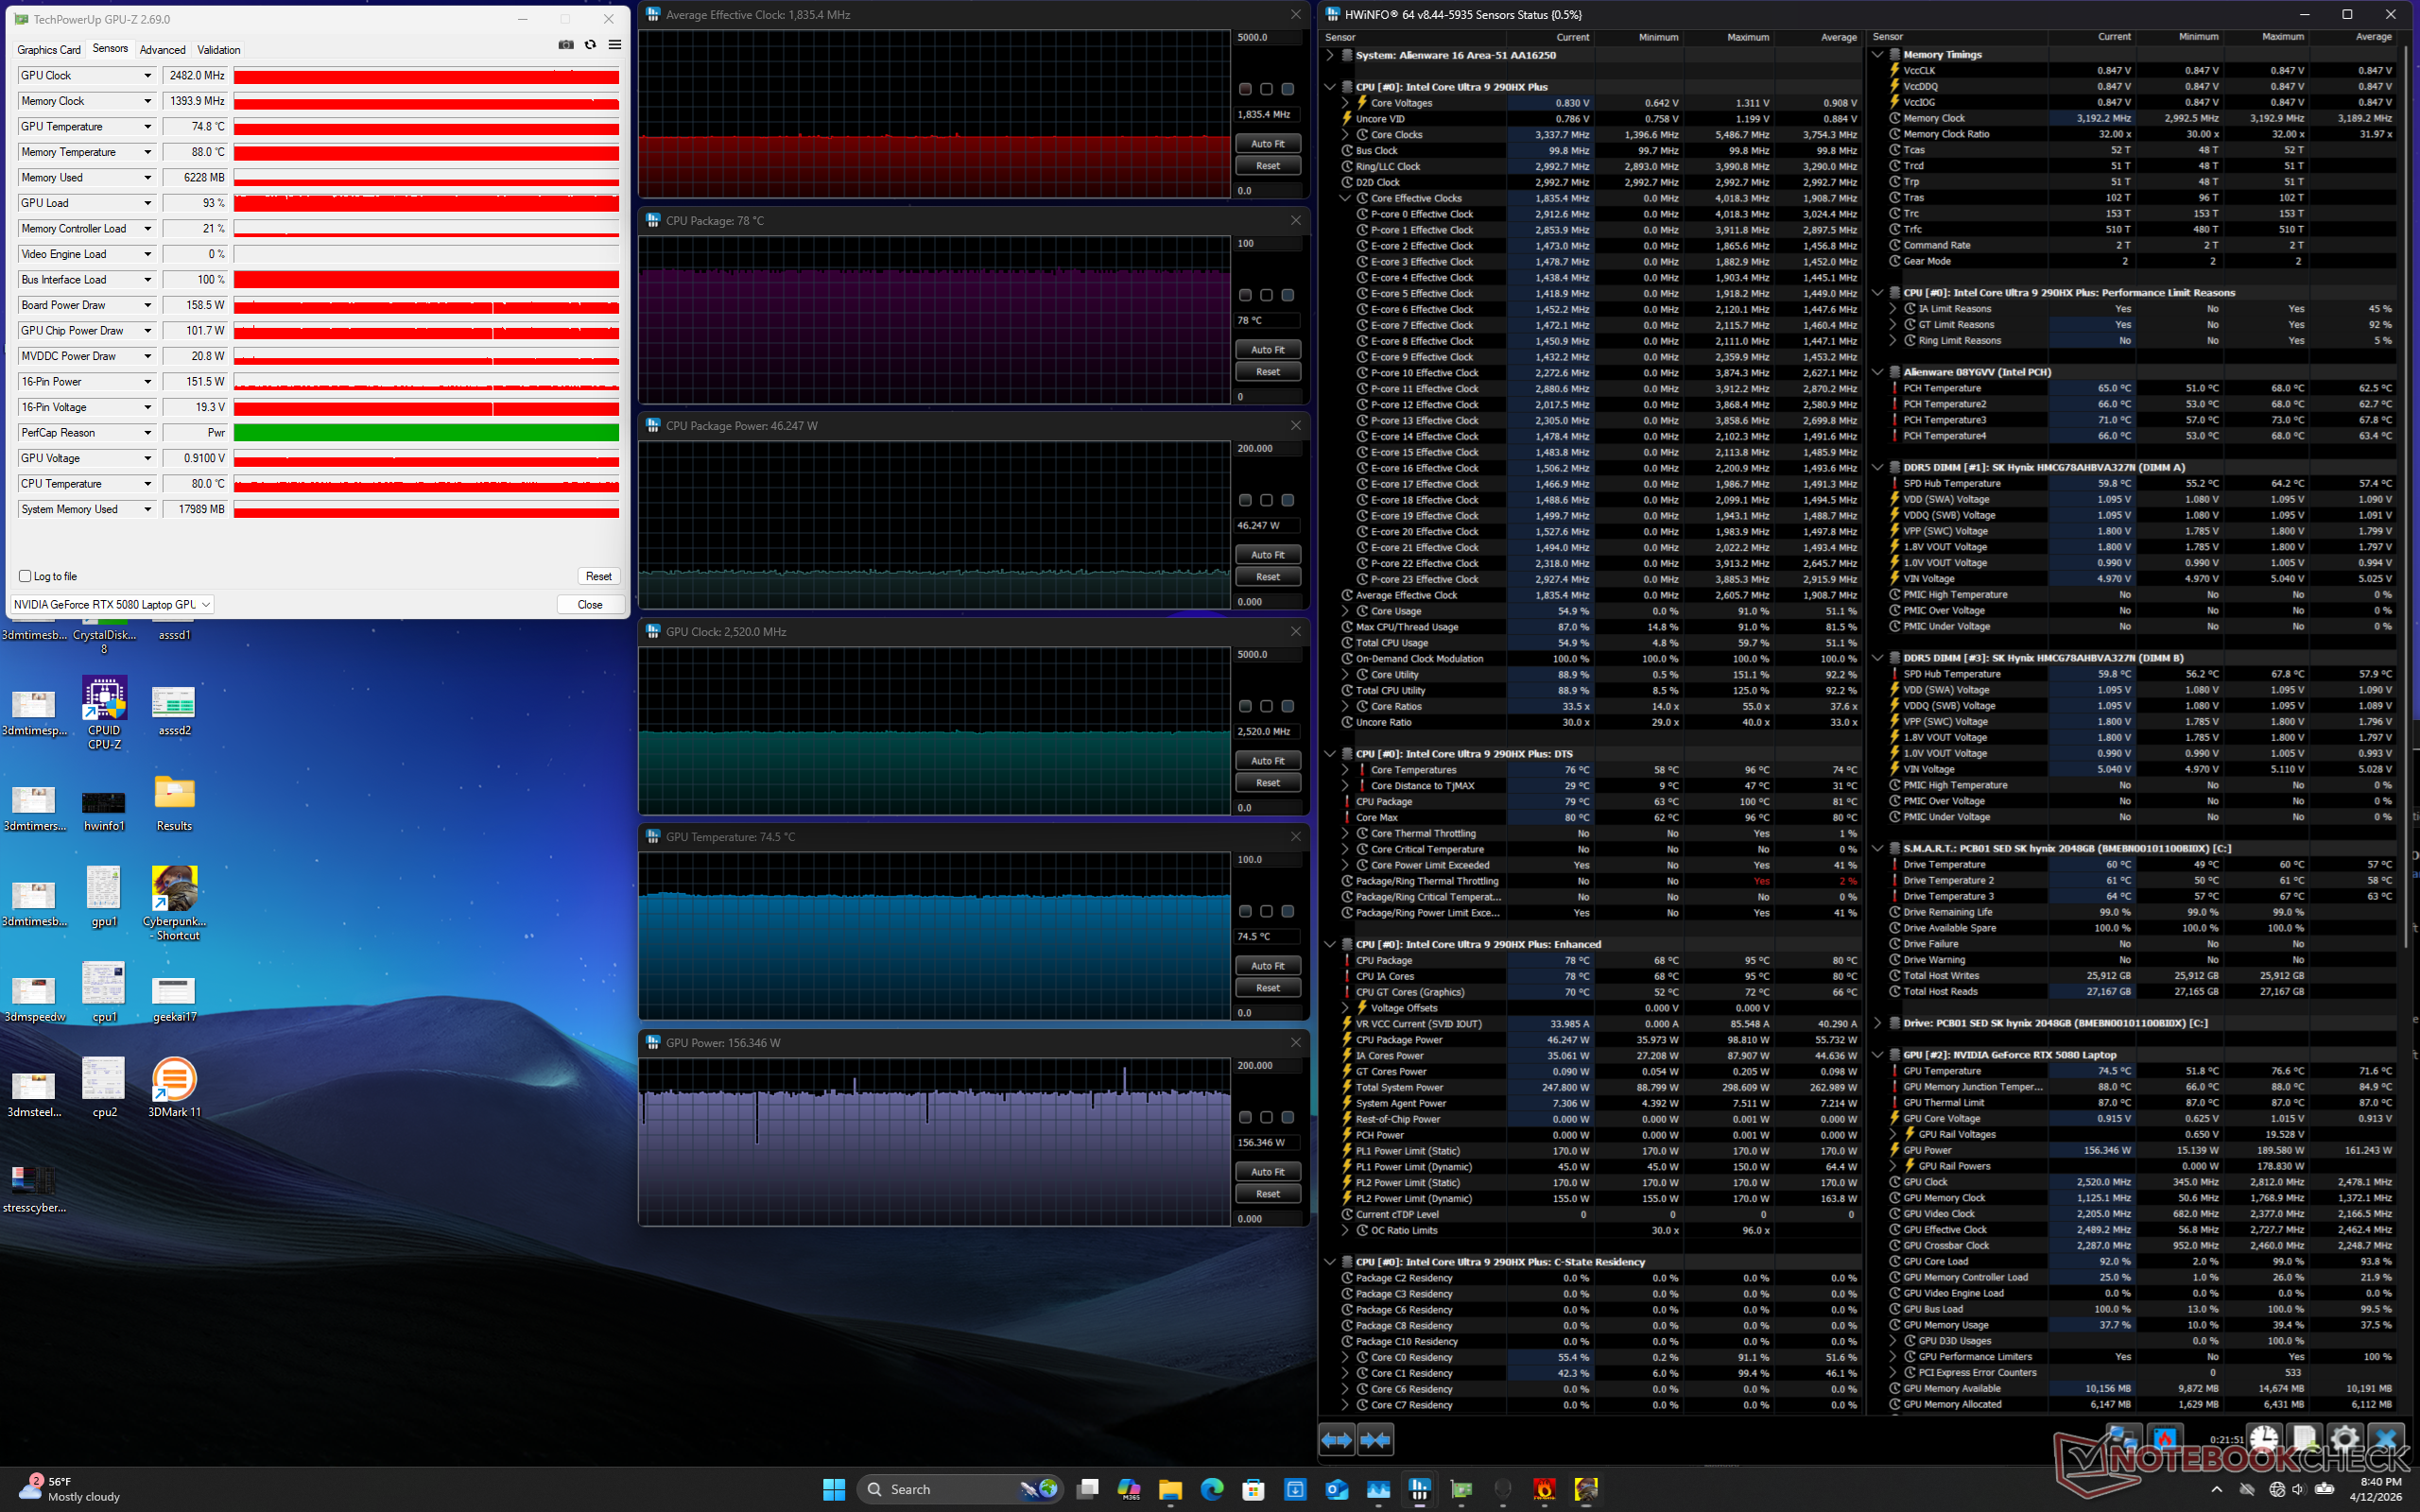
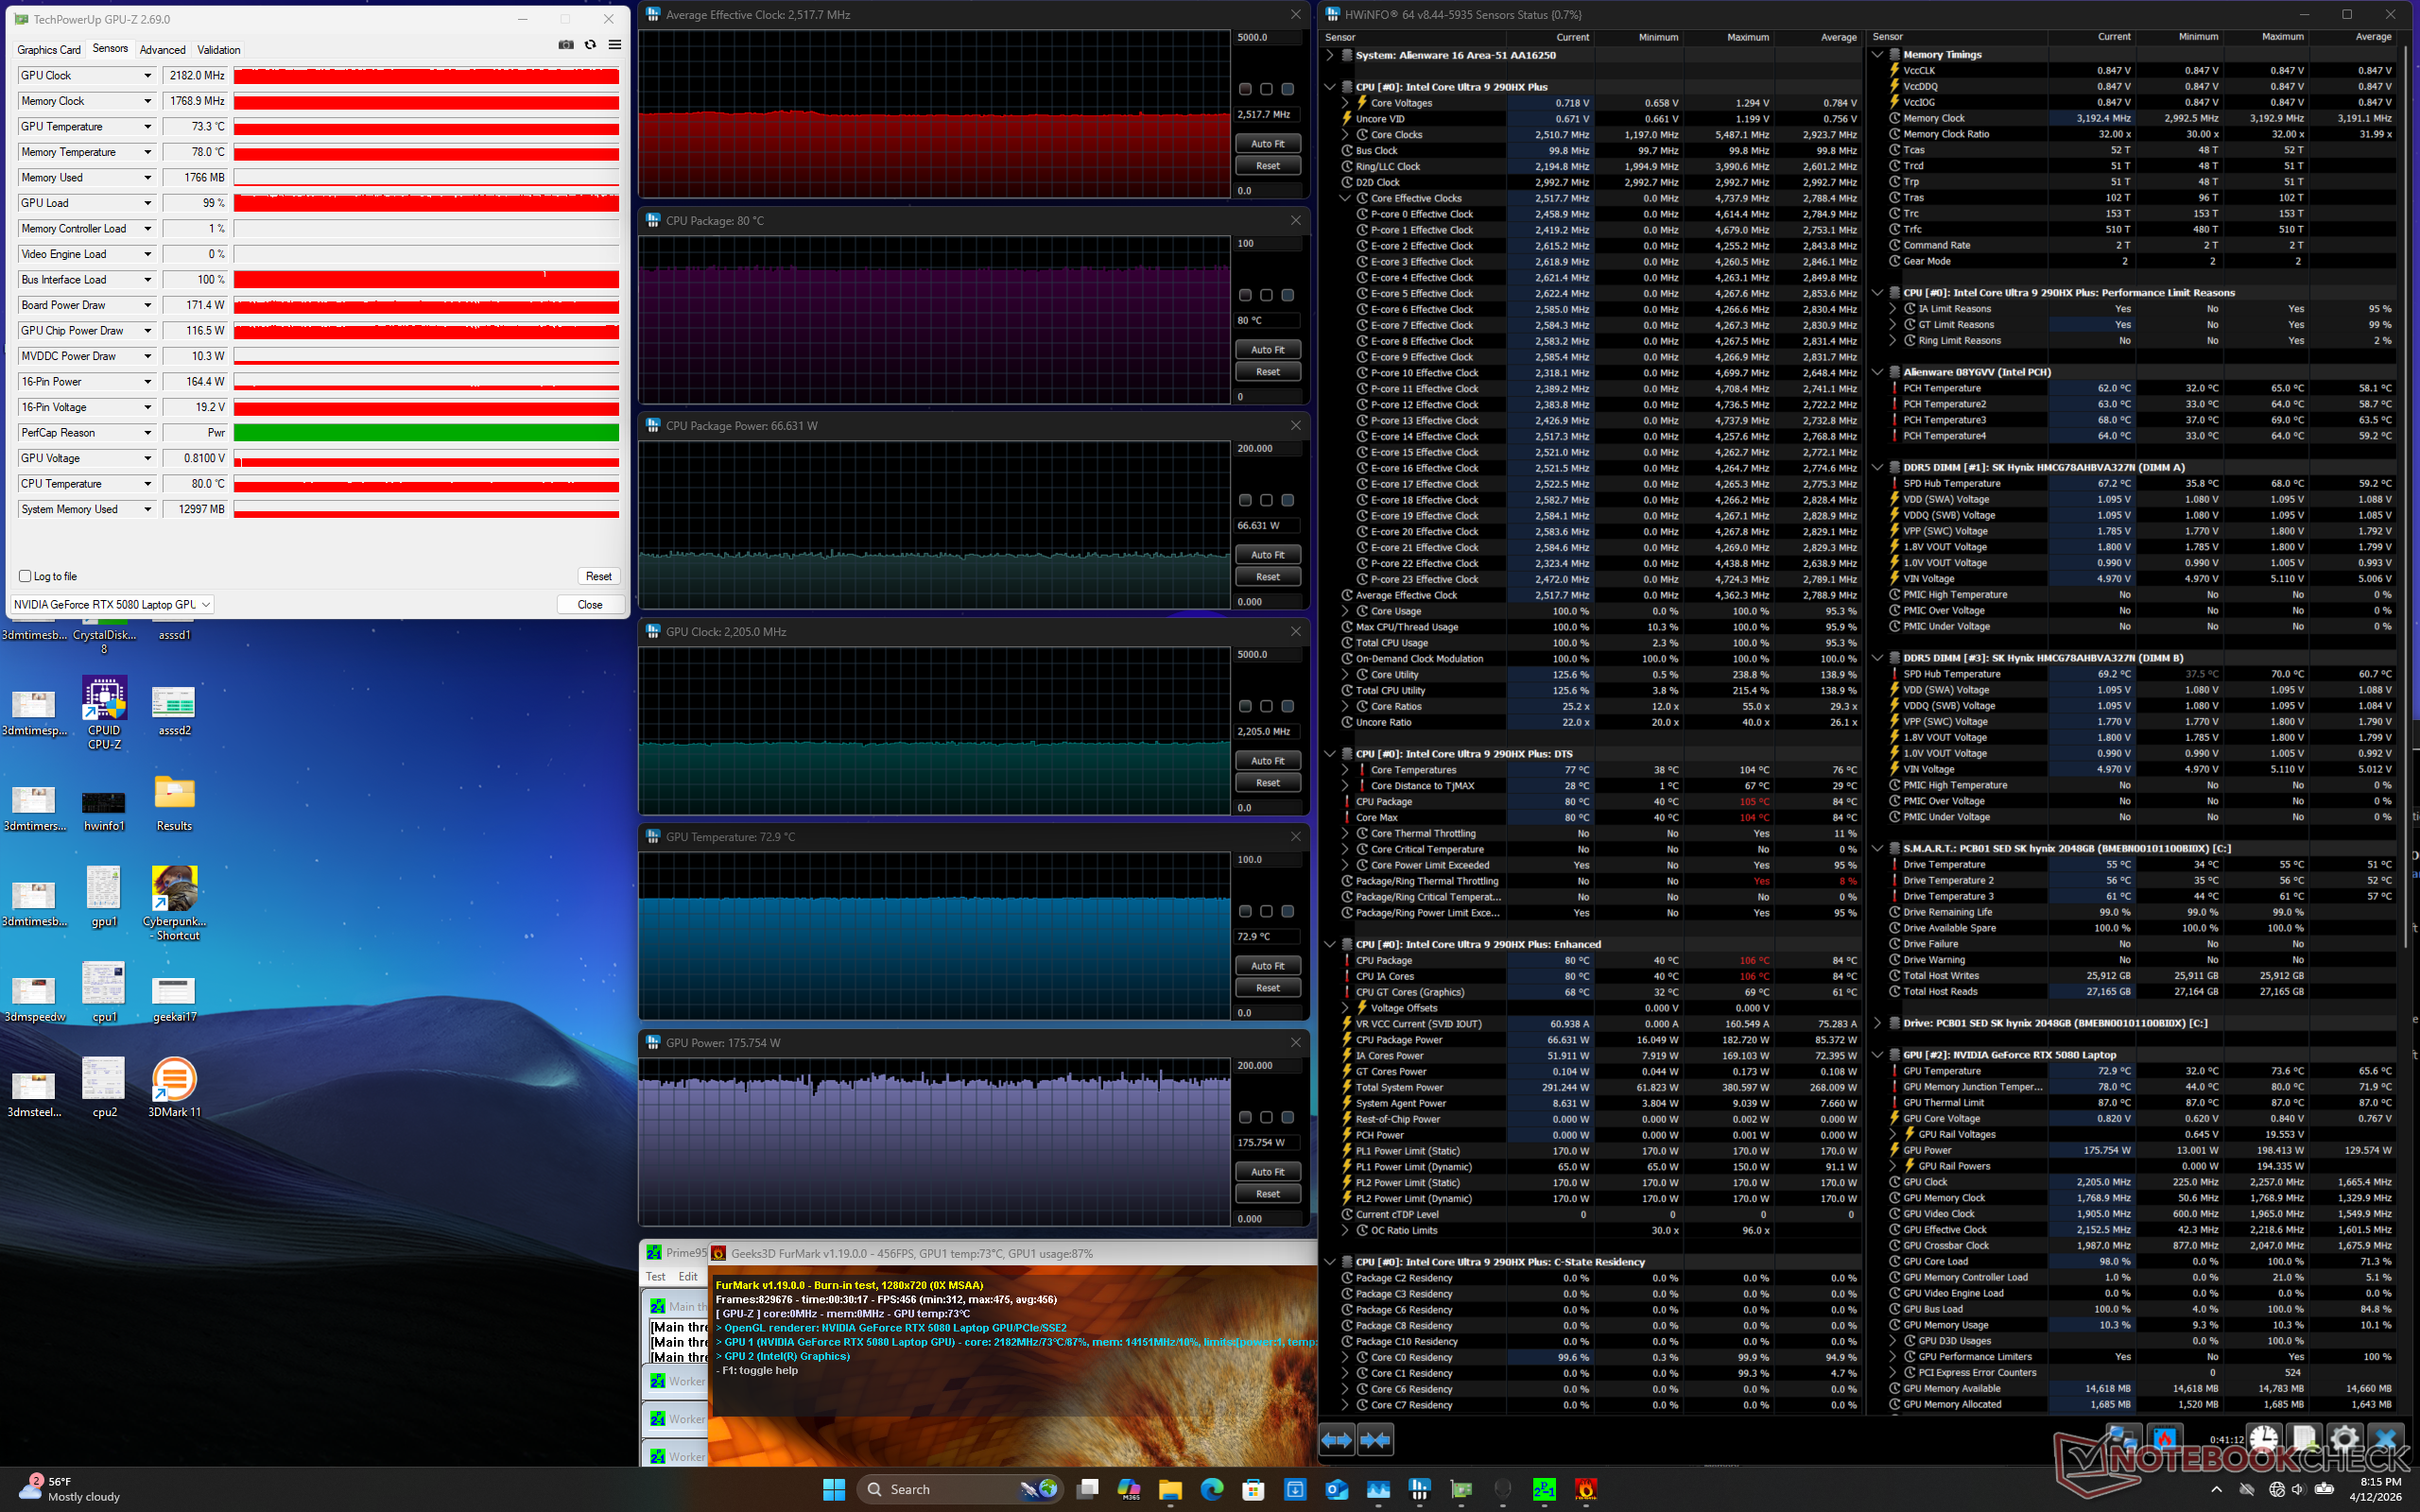
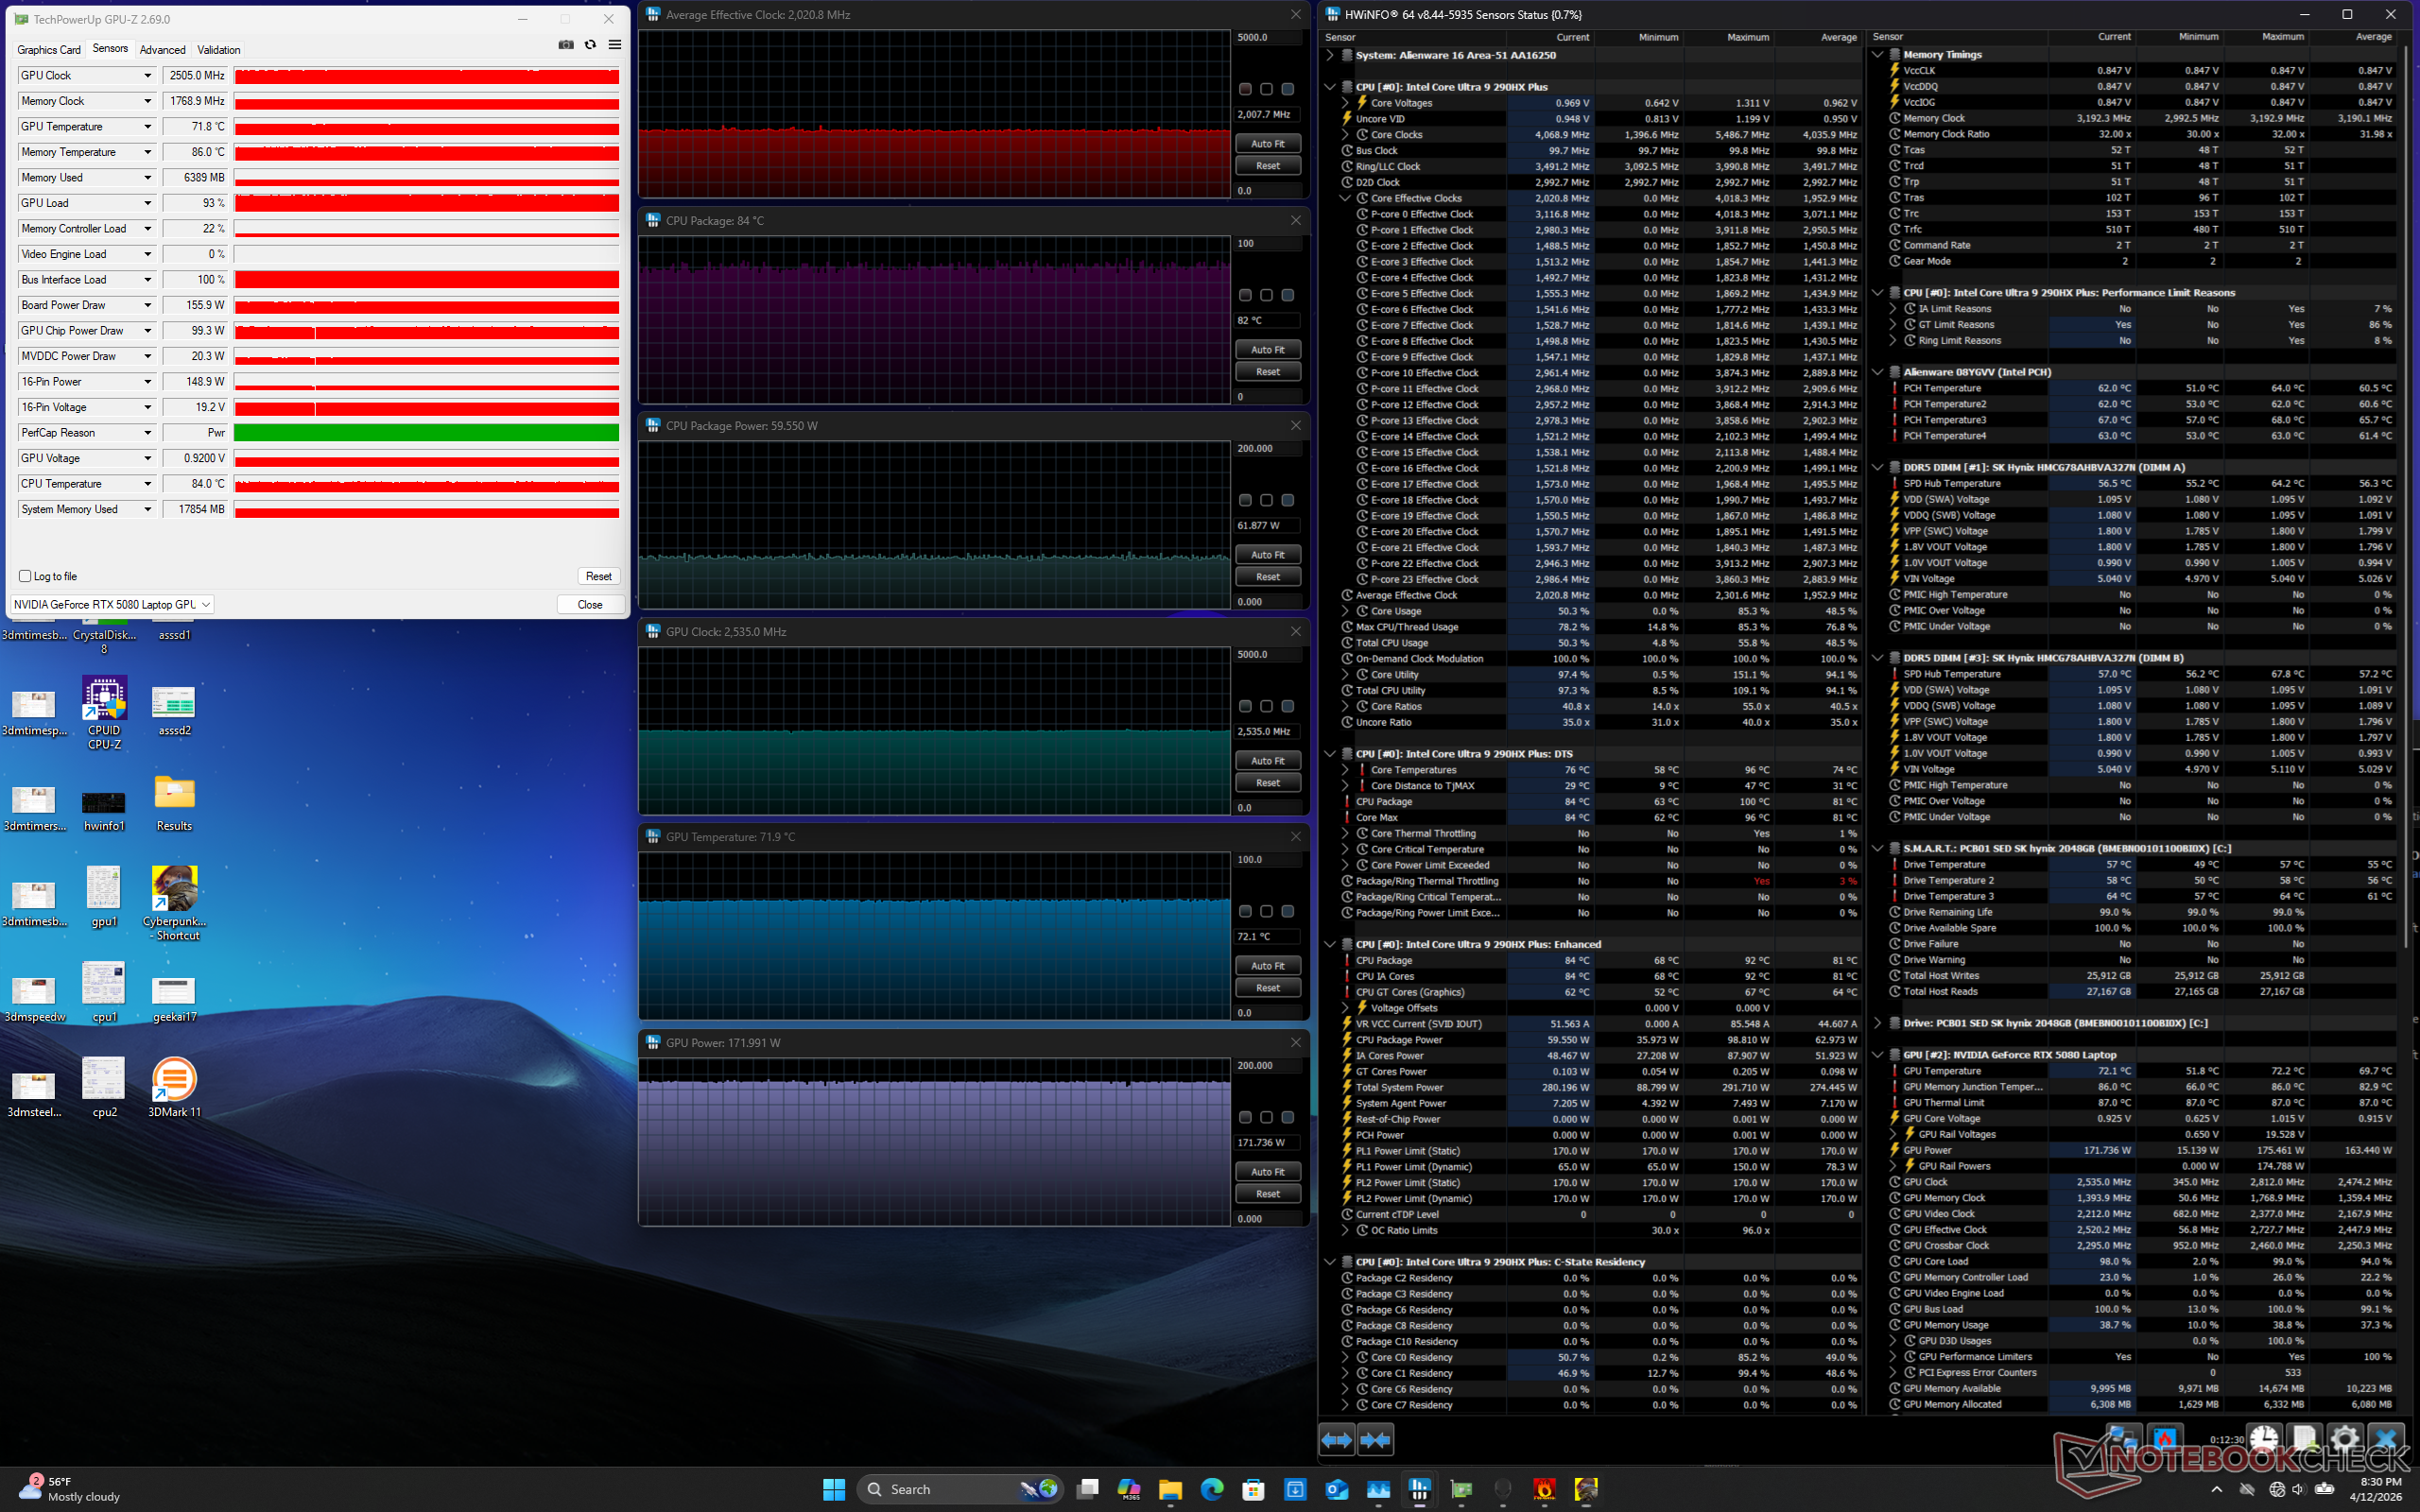
| Average CPU Clock (GHz) | GPU Clock (MHz) | Average CPU Temperature (°C) | Average GPU Temperature (°C) | |
| System Idle | -- | -- | 41 | 32 |
| Prime95 Stress | 4.1 | -- | 103 | 52 |
| Prime95 + FurMark Stress | 2.5 | 2182 | 80 | 73 |
| Cyberpunk 2077 Stress (Balanced mode) | 1.8 | 2347 | 82 | 75 |
| Cyberpunk 2077 Stress (Performance mode) | 1.8 | 2482 | 78 | 75 |
| Cyberpunk 2077 Stress (Overdrive mode) | 2.1 | 2505 | 82 | 72 |
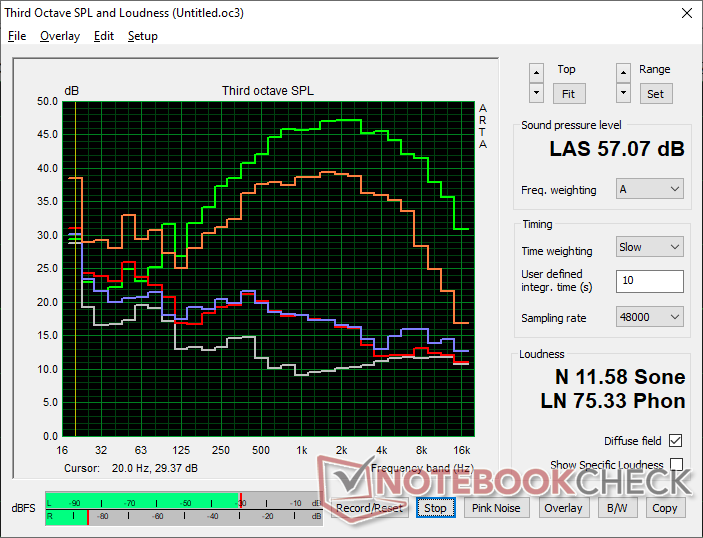
Speakers
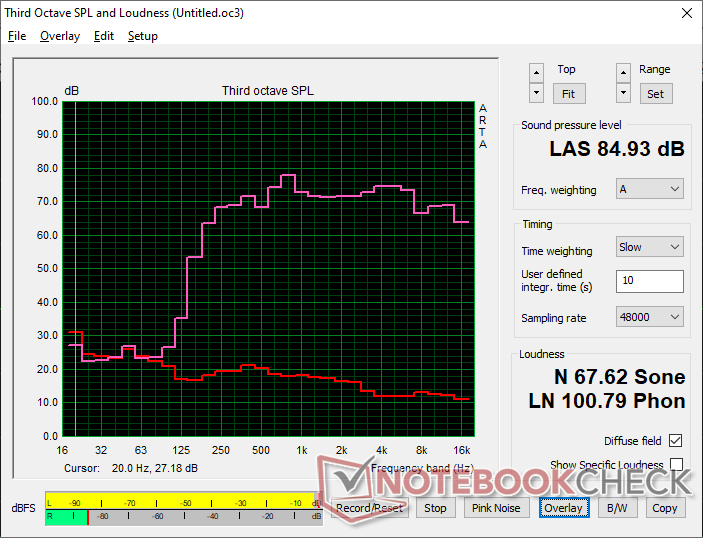
Alienware 16 Area-51 Core Ultra 9 290HX Plus audio analysis
(+) | speakers can play relatively loud (84.9 dB)
Bass 100 - 315 Hz
(-) | nearly no bass - on average 18.7% lower than median
(±) | linearity of bass is average (13.9% delta to prev. frequency)
Mids 400 - 2000 Hz
(+) | balanced mids - only 1.8% away from median
(+) | mids are linear (5.1% delta to prev. frequency)
Highs 2 - 16 kHz
(+) | balanced highs - only 2.5% away from median
(+) | highs are linear (3.4% delta to prev. frequency)
Overall 100 - 16.000 Hz
(+) | overall sound is linear (12.6% difference to median)
Compared to same class
» 16% of all tested devices in this class were better, 4% similar, 81% worse
» The best had a delta of 6%, average was 18%, worst was 132%
Compared to all devices tested
» 11% of all tested devices were better, 3% similar, 86% worse
» The best had a delta of 4%, average was 23%, worst was 134%
Apple MacBook Pro 16 2021 M1 Pro audio analysis
(+) | speakers can play relatively loud (84.7 dB)
Bass 100 - 315 Hz
(+) | good bass - only 3.8% away from median
(+) | bass is linear (5.2% delta to prev. frequency)
Mids 400 - 2000 Hz
(+) | balanced mids - only 1.3% away from median
(+) | mids are linear (2.1% delta to prev. frequency)
Highs 2 - 16 kHz
(+) | balanced highs - only 1.9% away from median
(+) | highs are linear (2.7% delta to prev. frequency)
Overall 100 - 16.000 Hz
(+) | overall sound is linear (4.6% difference to median)
Compared to same class
» 0% of all tested devices in this class were better, 0% similar, 100% worse
» The best had a delta of 5%, average was 17%, worst was 45%
Compared to all devices tested
» 0% of all tested devices were better, 0% similar, 100% worse
» The best had a delta of 4%, average was 23%, worst was 134%
Energy Management
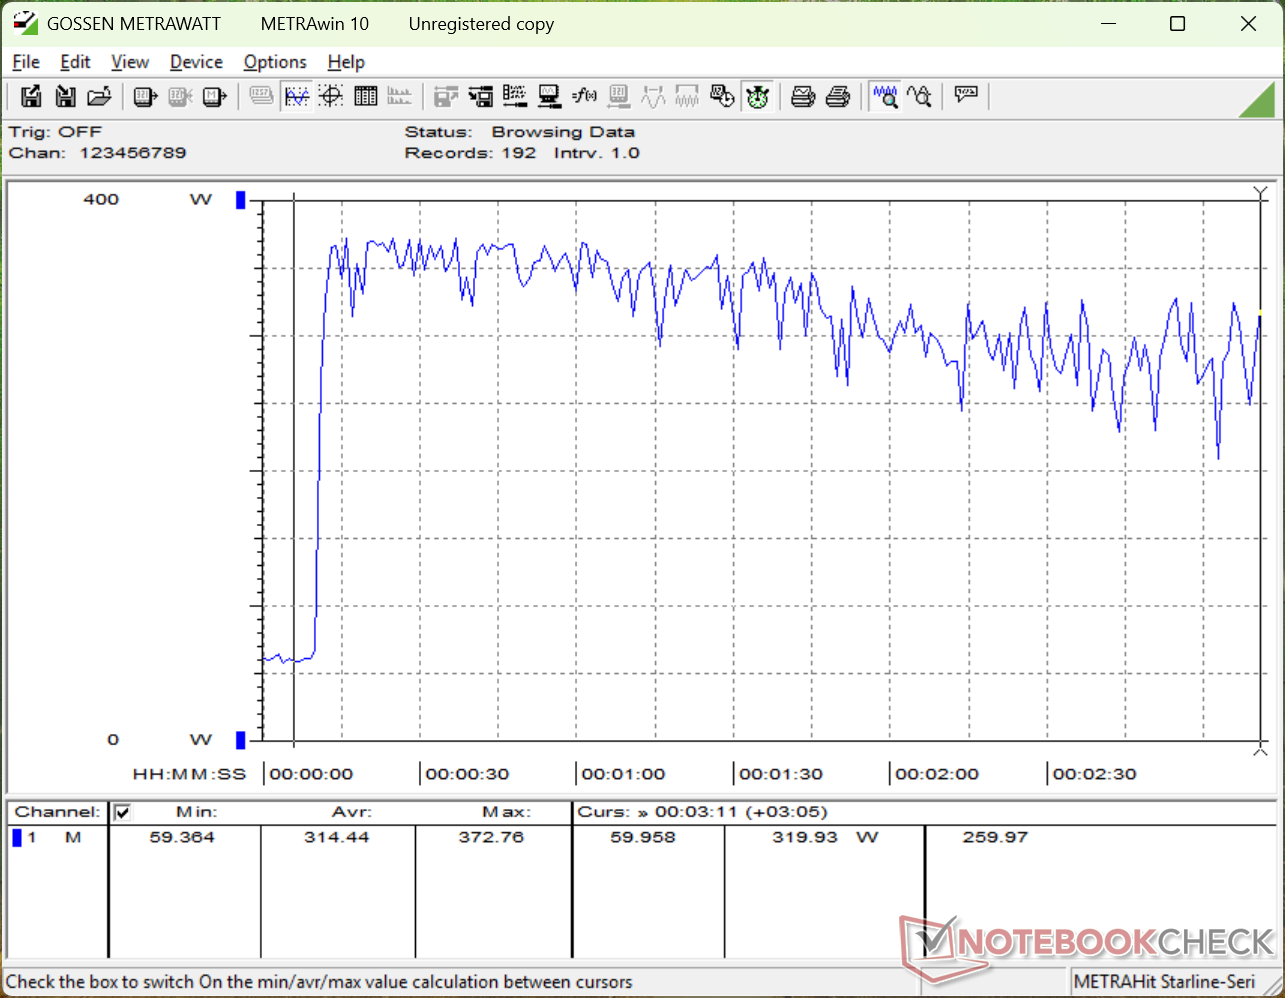
Power Consumption
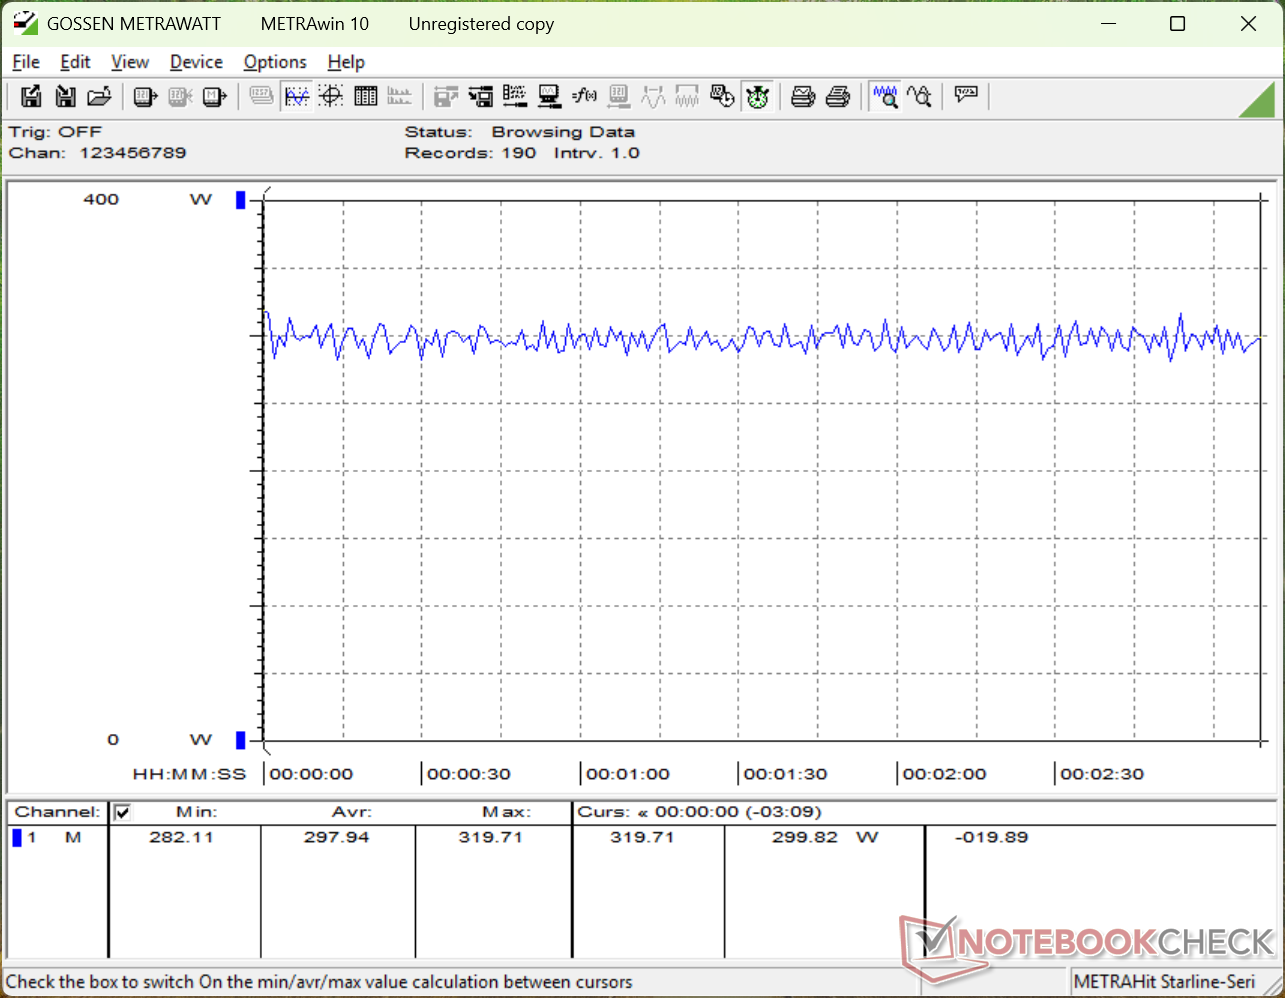
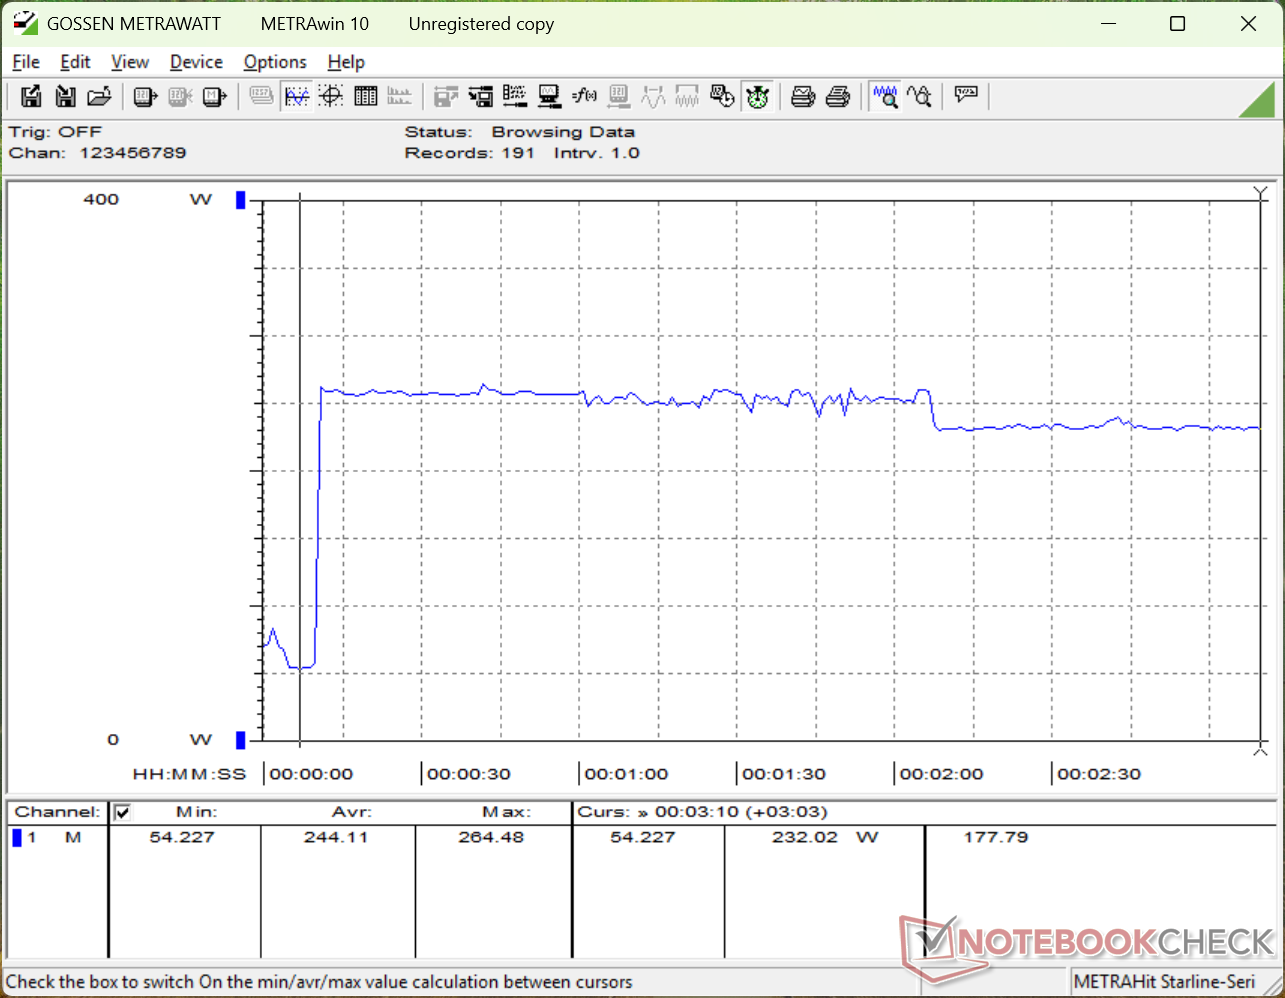
The Core Ultra 9 290HX Plus is 15 to 25 percent faster than the preceding Core Ultra 9 275HX as mentioned above. Uncoincidentally, our 2026 Alienware 16 is 15 to 25 percent more demanding than the 2025 Alienware 16 when the CPU is stressed. Running Prime95 on the latest Alienware model consumes about 255 W when Turbo Boost is most effective or 230 W when Turbo Boost has plateaued compared to only 200 W on last year's model. Even when not gaming, the newer model is generally more demanding by at least a few watts more.
The slim 360 W GaN AC adapter is otherwise unchanged from the 2025 model.
| Off / Standby | |
| Idle | |
| Load |
|
Key:
min: | |
| Alienware 16 Area-51 Core Ultra 9 290HX Plus Ultra 9 290HX Plus, GeForce RTX 5080 Laptop, SK hynix PCB01 HFS001TFM9X186N, OLED, 2560x1600, 16" | Alienware 16 Area-51 Ultra 9 275HX, GeForce RTX 5080 Laptop, Samsung PM9C1a MZ9L81T0HDLB, IPS, 2560x1600, 16" | Lenovo Legion Pro 7i 16 Gen 10 Ultra 9 275HX, GeForce RTX 5080 Laptop, SK Hynix HFS001TEJ9X115N, OLED, 2560x1600, 16" | HP Omen Max 16 ah000 Ultra 9 275HX, GeForce RTX 5090 Laptop, WDC PC SN810 2TB, OLED, 2560x1600, 16" | MSI Vector 16 HX AI A2XWHG Ultra 7 255HX, GeForce RTX 5070 Ti Laptop, Micron 2400 MTFDKBA512QFM, IPS, 2560x1600, 16" | Asus ROG Zephyrus G16 GU605CW Ultra 9 285H, GeForce RTX 5080 Laptop, Micron 2500 2TB MTFDKBA2T0QGN-1BN1AABGA, OLED, 2560x1600, 16" | |
|---|---|---|---|---|---|---|
| Power Consumption | 2% | -11% | 18% | 32% | 46% | |
| Idle Minimum * (Watt) | 23.9 | 27 -13% | 28.5 -19% | 9.9 59% | 7.1 70% | 12.6 47% |
| Idle Average * (Watt) | 25.2 | 33.5 -33% | 38.8 -54% | 28.6 -13% | 15.9 37% | 13.4 47% |
| Idle Maximum * (Watt) | 49.6 | 41.4 17% | 45.6 8% | 47.1 5% | 29.5 41% | 15.1 70% |
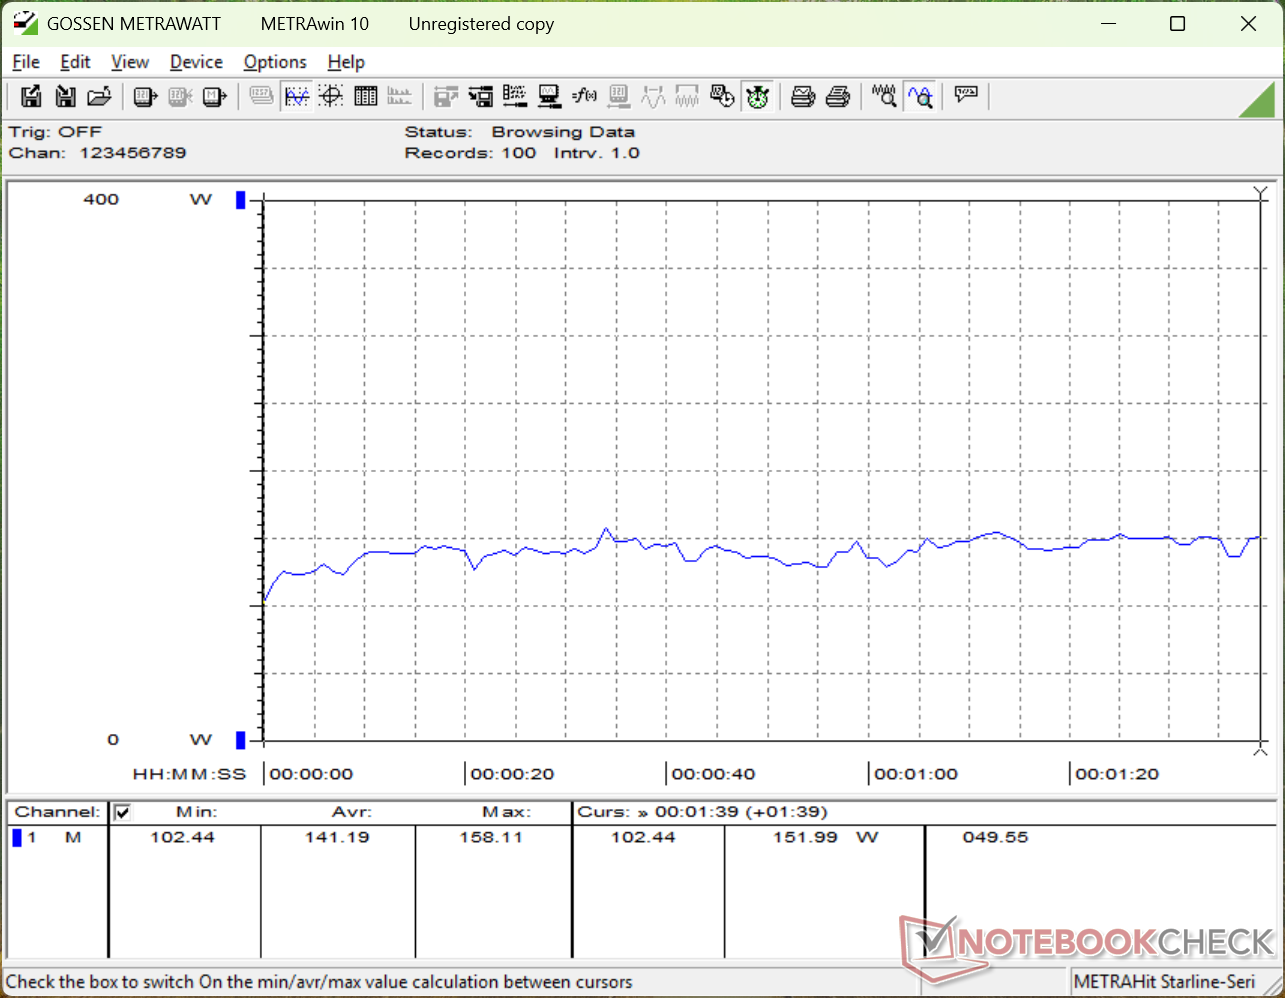
| Load Average * (Watt) | 141.2 | 124.7 12% | 132.2 6% | 141.8 -0% | 124 12% | 116.3 18% |
| Cyberpunk 2077 ultra external monitor * (Watt) | 297 | 249 16% | 319 -7% | 230 23% | 217 27% | 157.9 47% |
| Cyberpunk 2077 ultra * (Watt) | 298 | 256 14% | 318 -7% | 253 15% | 222 26% | 156.4 48% |
| Load Maximum * (Watt) | 372.8 | 367.2 2% | 384 -3% | 233 37% | 336 10% | 199 47% |
* ... smaller is better
Power Consumption Cyberpunk / Stress Test
Power Consumption external Monitor
Battery Life
WLAN runtime is about the same as before if not slightly longer by just half an hour even with VRR and Optimus enabled and LEDs disabled. Still, 3 hours isn't very long no matter how you look at it.
| Alienware 16 Area-51 Core Ultra 9 290HX Plus Ultra 9 290HX Plus, GeForce RTX 5080 Laptop, 96 Wh | Alienware 16 Area-51 Ultra 9 275HX, GeForce RTX 5080 Laptop, 96 Wh | Lenovo Legion Pro 7i 16 Gen 10 Ultra 9 275HX, GeForce RTX 5080 Laptop, 99 Wh | HP Omen Max 16 ah000 Ultra 9 275HX, GeForce RTX 5090 Laptop, 83 Wh | MSI Vector 16 HX AI A2XWHG Ultra 7 255HX, GeForce RTX 5070 Ti Laptop, 90 Wh | Asus ROG Zephyrus G16 GU605CW Ultra 9 285H, GeForce RTX 5080 Laptop, 90 Wh | |
|---|---|---|---|---|---|---|
| Battery runtime | -13% | 69% | 81% | 119% | ||
| WiFi v1.3 (h) | 3.2 | 2.8 -13% | 5.4 69% | 5.8 81% | 7 119% | |
| Reader / Idle (h) | 3.1 | 8.7 | ||||
| Load (h) | 0.8 | 1.2 |
Notebookcheck Rating
The Alienware 16 Area-51 with Core Ultra 9 290HX Plus is the fastest version of the model available. For the vast majority of gamers, however, the extra CPU horsepower will only make a minor difference at best.
Alienware 16 Area-51 Core Ultra 9 290HX Plus
- 04/22/2026 v8
Allen Ngo
 Total Sustainability Score:
 Potential Competitors in Comparison
Image | Model / Review | Price | Weight | Height | Display |
|---|---|---|---|---|---|
1. 88.1%  | Alienware 16 Area-51 Core Ultra 9 290HX Plus Intel Core Ultra 9 290HX Plus ⎘ NVIDIA GeForce RTX 5080 Laptop ⎘ 32 GB Memory, SSD | Amazon: List Price: 4000 USD | 3.3 kg | 28.5 mm | 16.00" 2560x1600 189 PPI OLED |
2. 85.7%  | Alienware 16 Area-51 Intel Core Ultra 9 275HX ⎘ NVIDIA GeForce RTX 5080 Laptop ⎘ 32 GB Memory, 1024 GB SSD | Amazon: 1. $2,549.99 Alienware 16 Area-51 Gaming ... 2. $3,899.99 Alienware 16 Area-51 Gaming ... 3. $3,799.99 Alienware 16 Area-51 Gaming ... List Price: 3500 USD | 3.3 kg | 28.5 mm | 16.00" 2560x1600 189 PPI IPS |
3. 87.5%  | Lenovo Legion Pro 7i 16 Gen 10 Intel Core Ultra 9 275HX ⎘ NVIDIA GeForce RTX 5080 Laptop ⎘ 32 GB Memory, 1024 GB SSD | Amazon: List Price: 4200 USD | 2.6 kg | 26.65 mm | 16.00" 2560x1600 189 PPI OLED |
4. 81.9%  | HP Omen Max 16 ah000 Intel Core Ultra 9 275HX ⎘ NVIDIA GeForce RTX 5090 Laptop ⎘ 32 GB Memory, 2048 GB SSD | Amazon: List Price: 3800 USD | 2.8 kg | 24.9 mm | 16.00" 2560x1600 189 PPI OLED |
5. 84%  | MSI Vector 16 HX AI A2XWHG Intel Core Ultra 7 255HX ⎘ NVIDIA GeForce RTX 5070 Ti Laptop ⎘ 16 GB Memory, 512 GB SSD | Amazon: List Price: 2000 EUR | 2.6 kg | 28.6 mm | 16.00" 2560x1600 189 PPI IPS |
6.  | Asus ROG Zephyrus G16 GU605CW Intel Core Ultra 9 285H ⎘ NVIDIA GeForce RTX 5080 Laptop ⎘ 32 GB Memory, 2048 GB SSD | Amazon: List Price: 3800€ | 2 kg | 14.9 mm | 16.00" 2560x1600 189 PPI OLED |
Transparency
The selection of devices to be reviewed is made by our editorial team. The test sample was provided to the author as a loan by the manufacturer or retailer for the purpose of this review. The lender had no influence on this review, nor did the manufacturer receive a copy of this review before publication. There was no obligation to publish this review. As an independent media company, Notebookcheck is not subjected to the authority of manufacturers, retailers or publishers.
This is how Notebookcheck is testing
Every year, Notebookcheck independently reviews hundreds of laptops and smartphones using standardized procedures to ensure that all results are comparable. We have continuously developed our test methods for around 20 years and set industry standards in the process. In our test labs, high-quality measuring equipment is utilized by experienced technicians and editors. These tests involve a multi-stage validation process. Our complex rating system is based on hundreds of well-founded measurements and benchmarks, which maintains objectivity. Further information on our test methods can be found here.
