Verdict
Like the RTX 5080 variant, the RTX 5090 edition of the Lenovo Legion 9 18 — which is absurdly expensive at just under €6,000 — also cuts a good to very good performance figure in most categories.
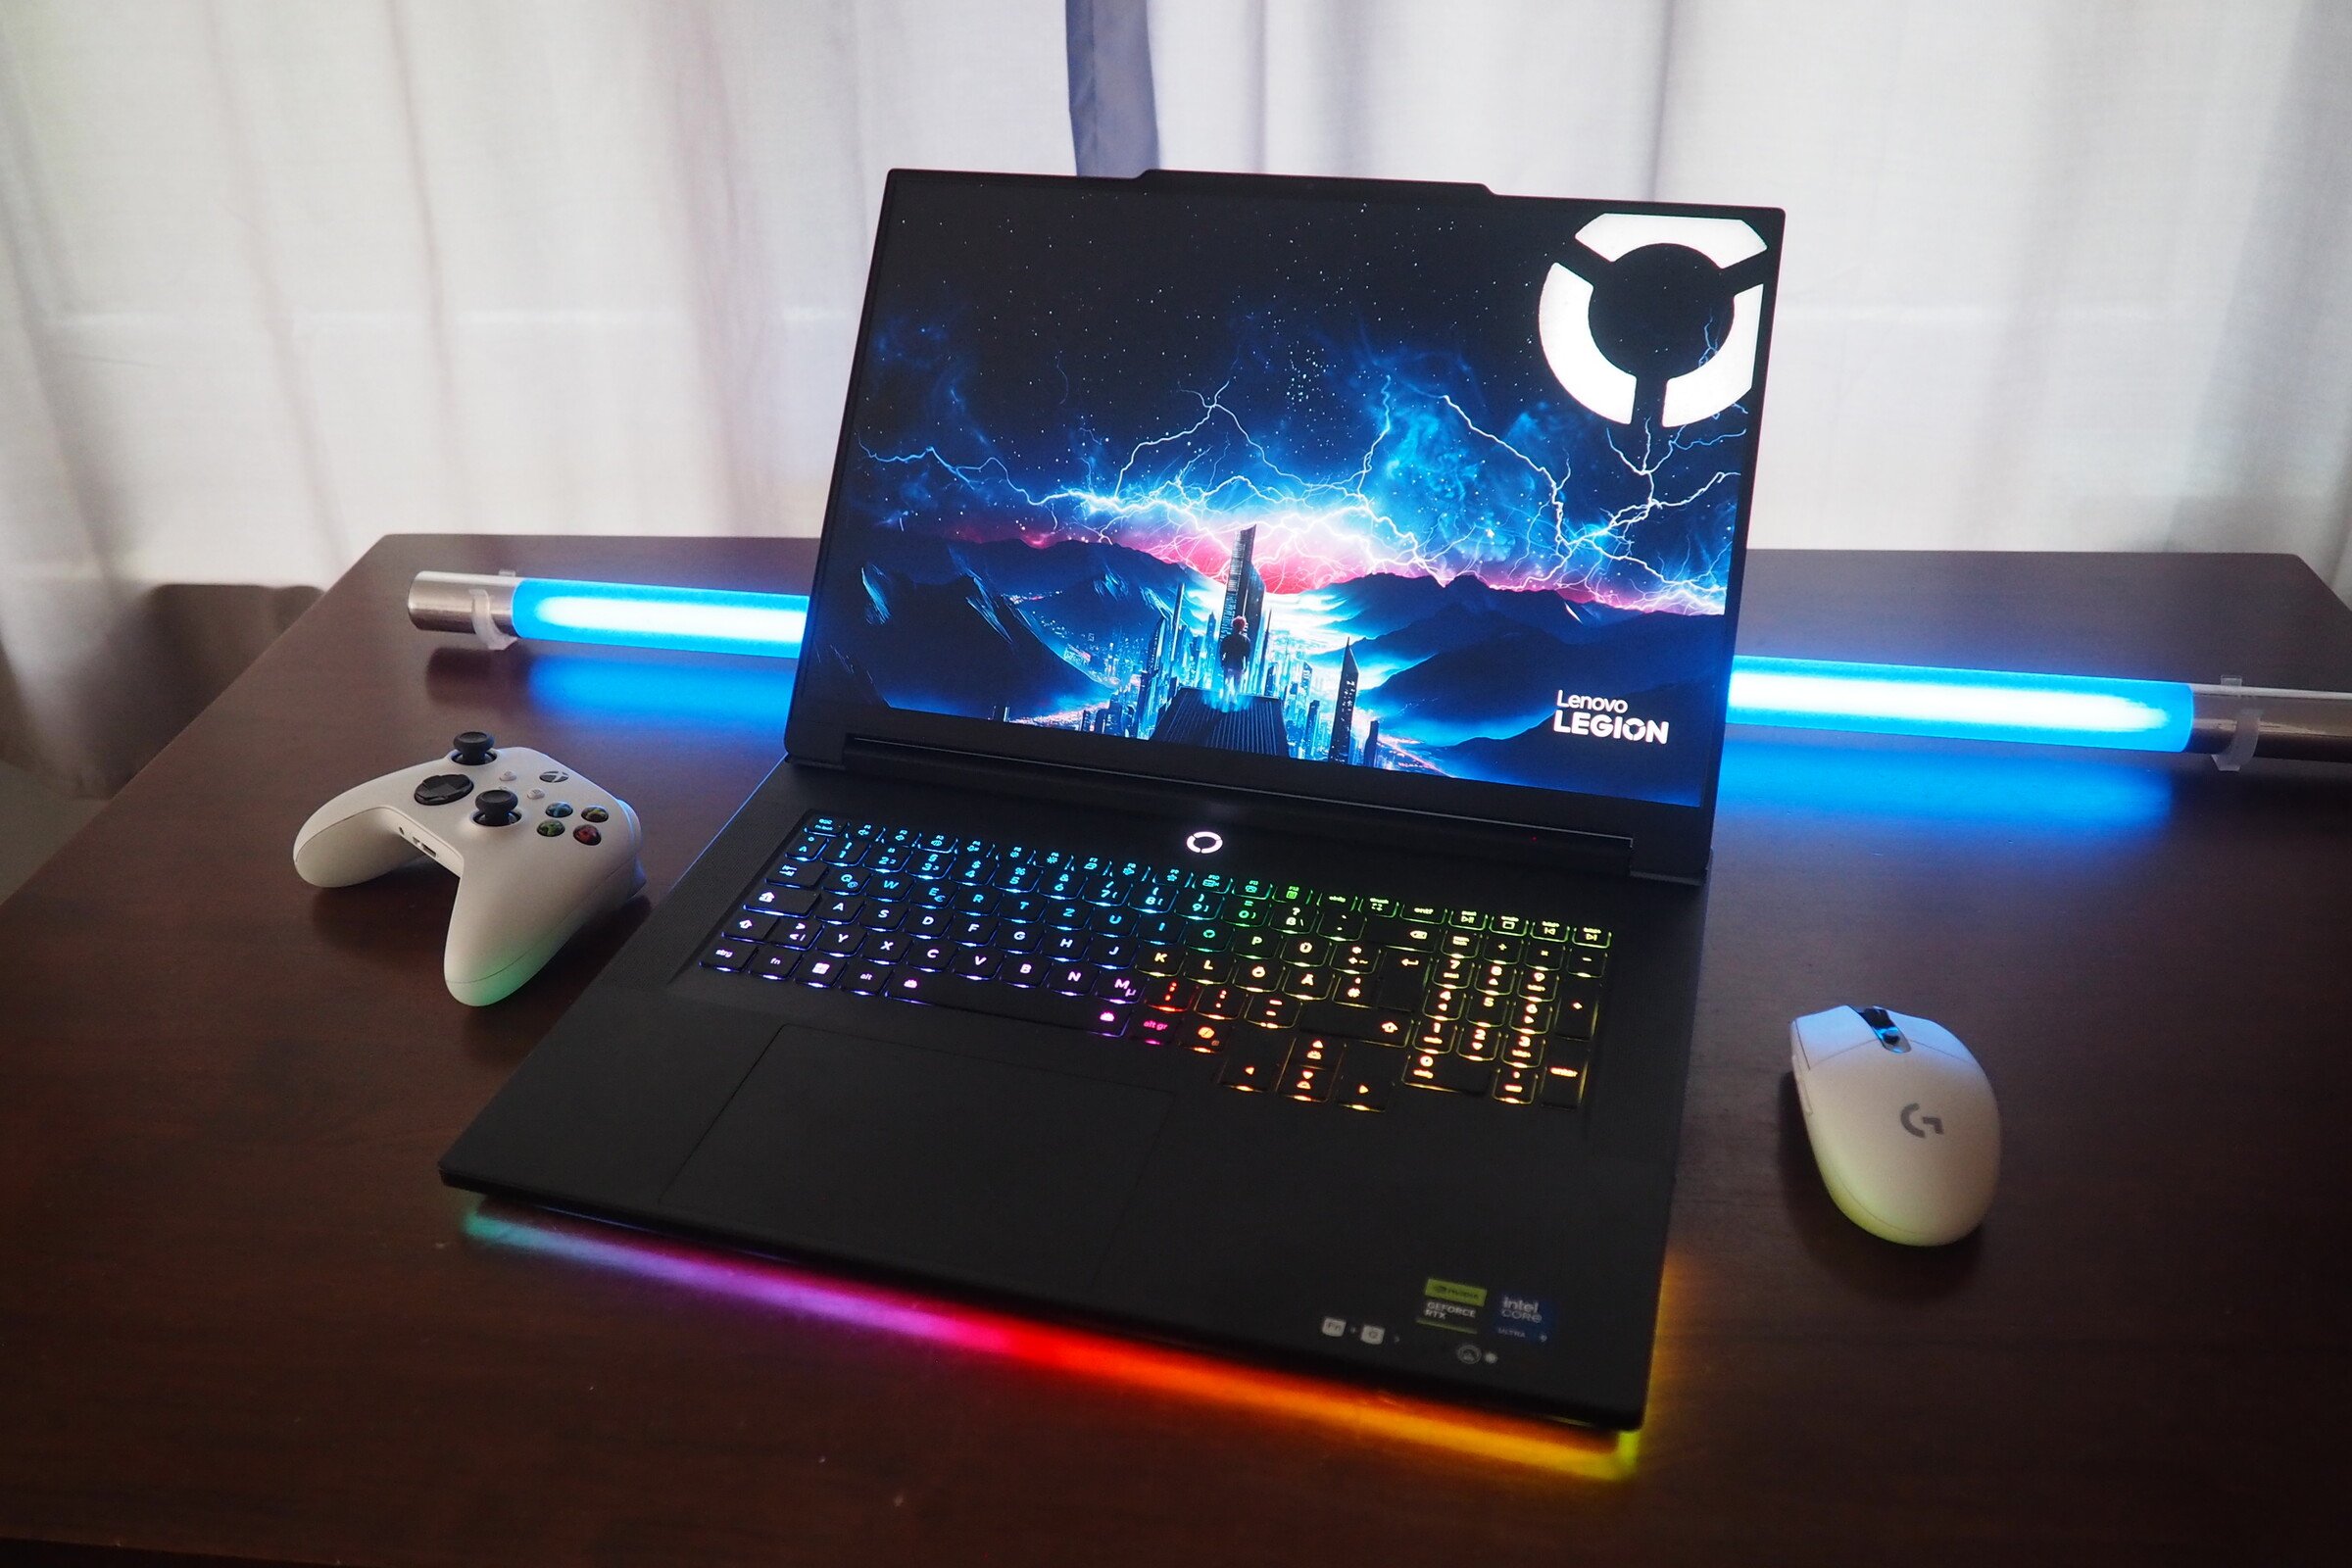
One of the strengths of this gaming behemoth is its high-quality chassis, which attracts with its stylish design and many lighting elements. The connectivity is not bad either, with the inclusion of two Thunderbolt 5 ports.
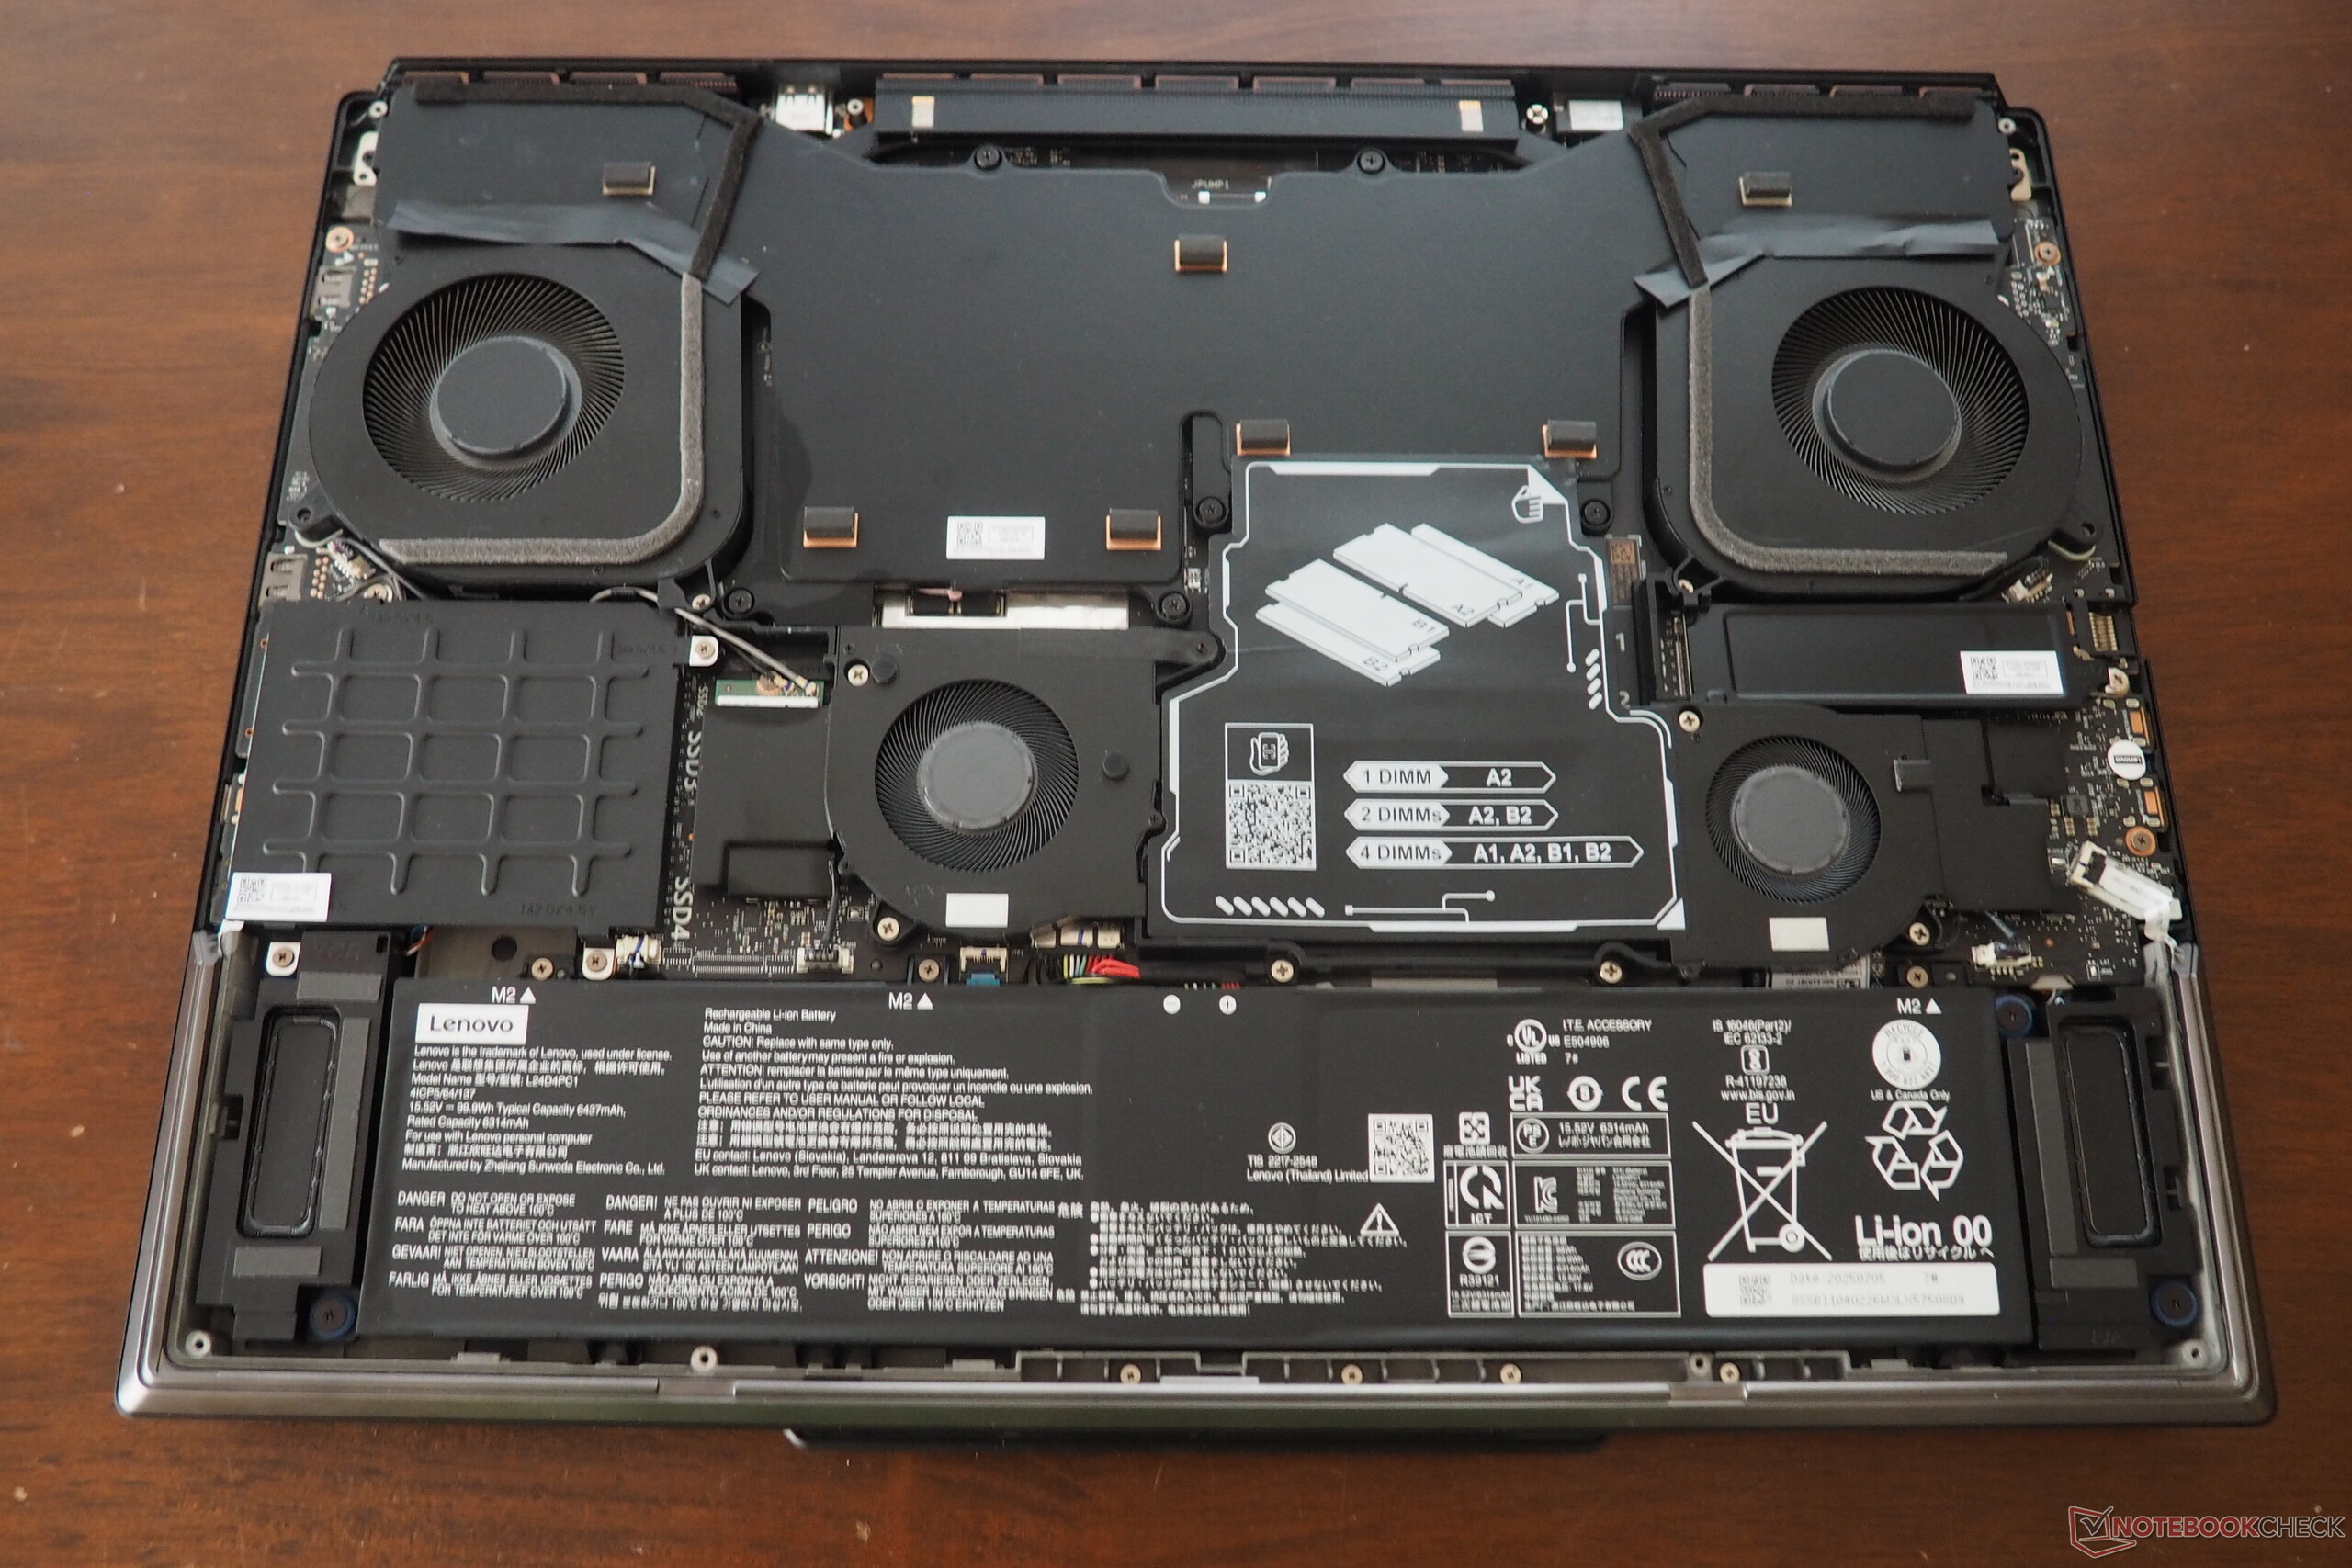
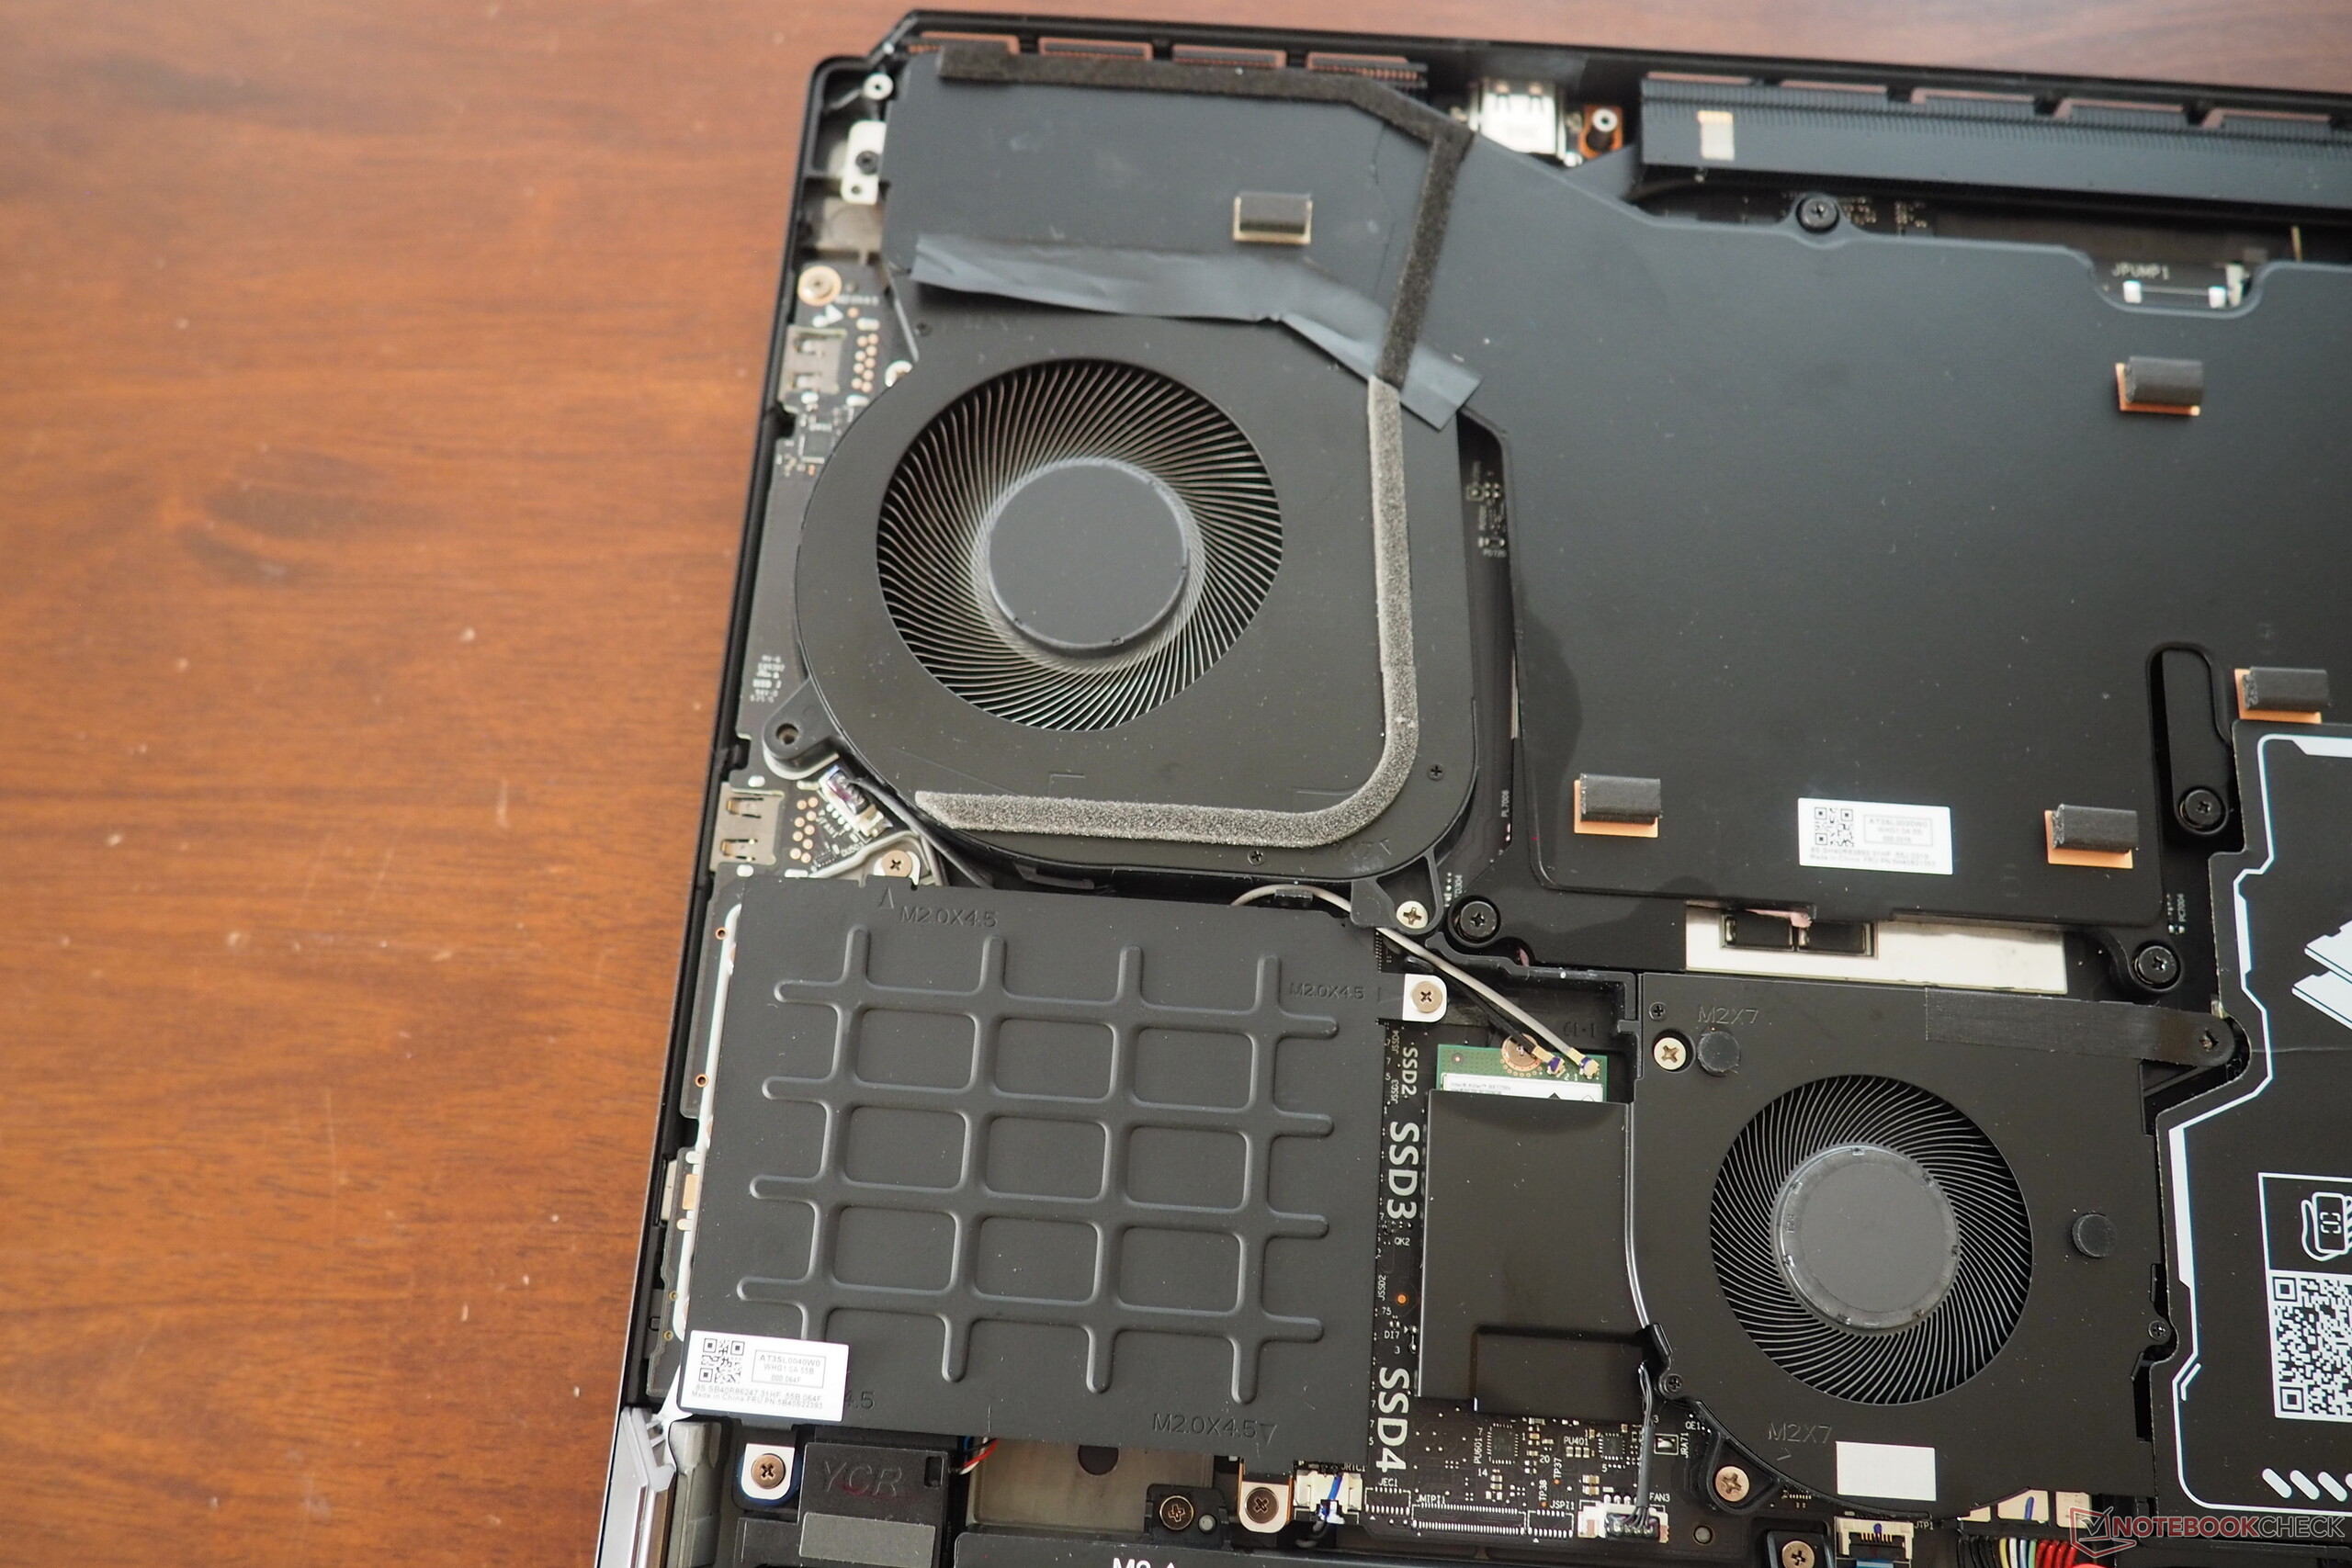
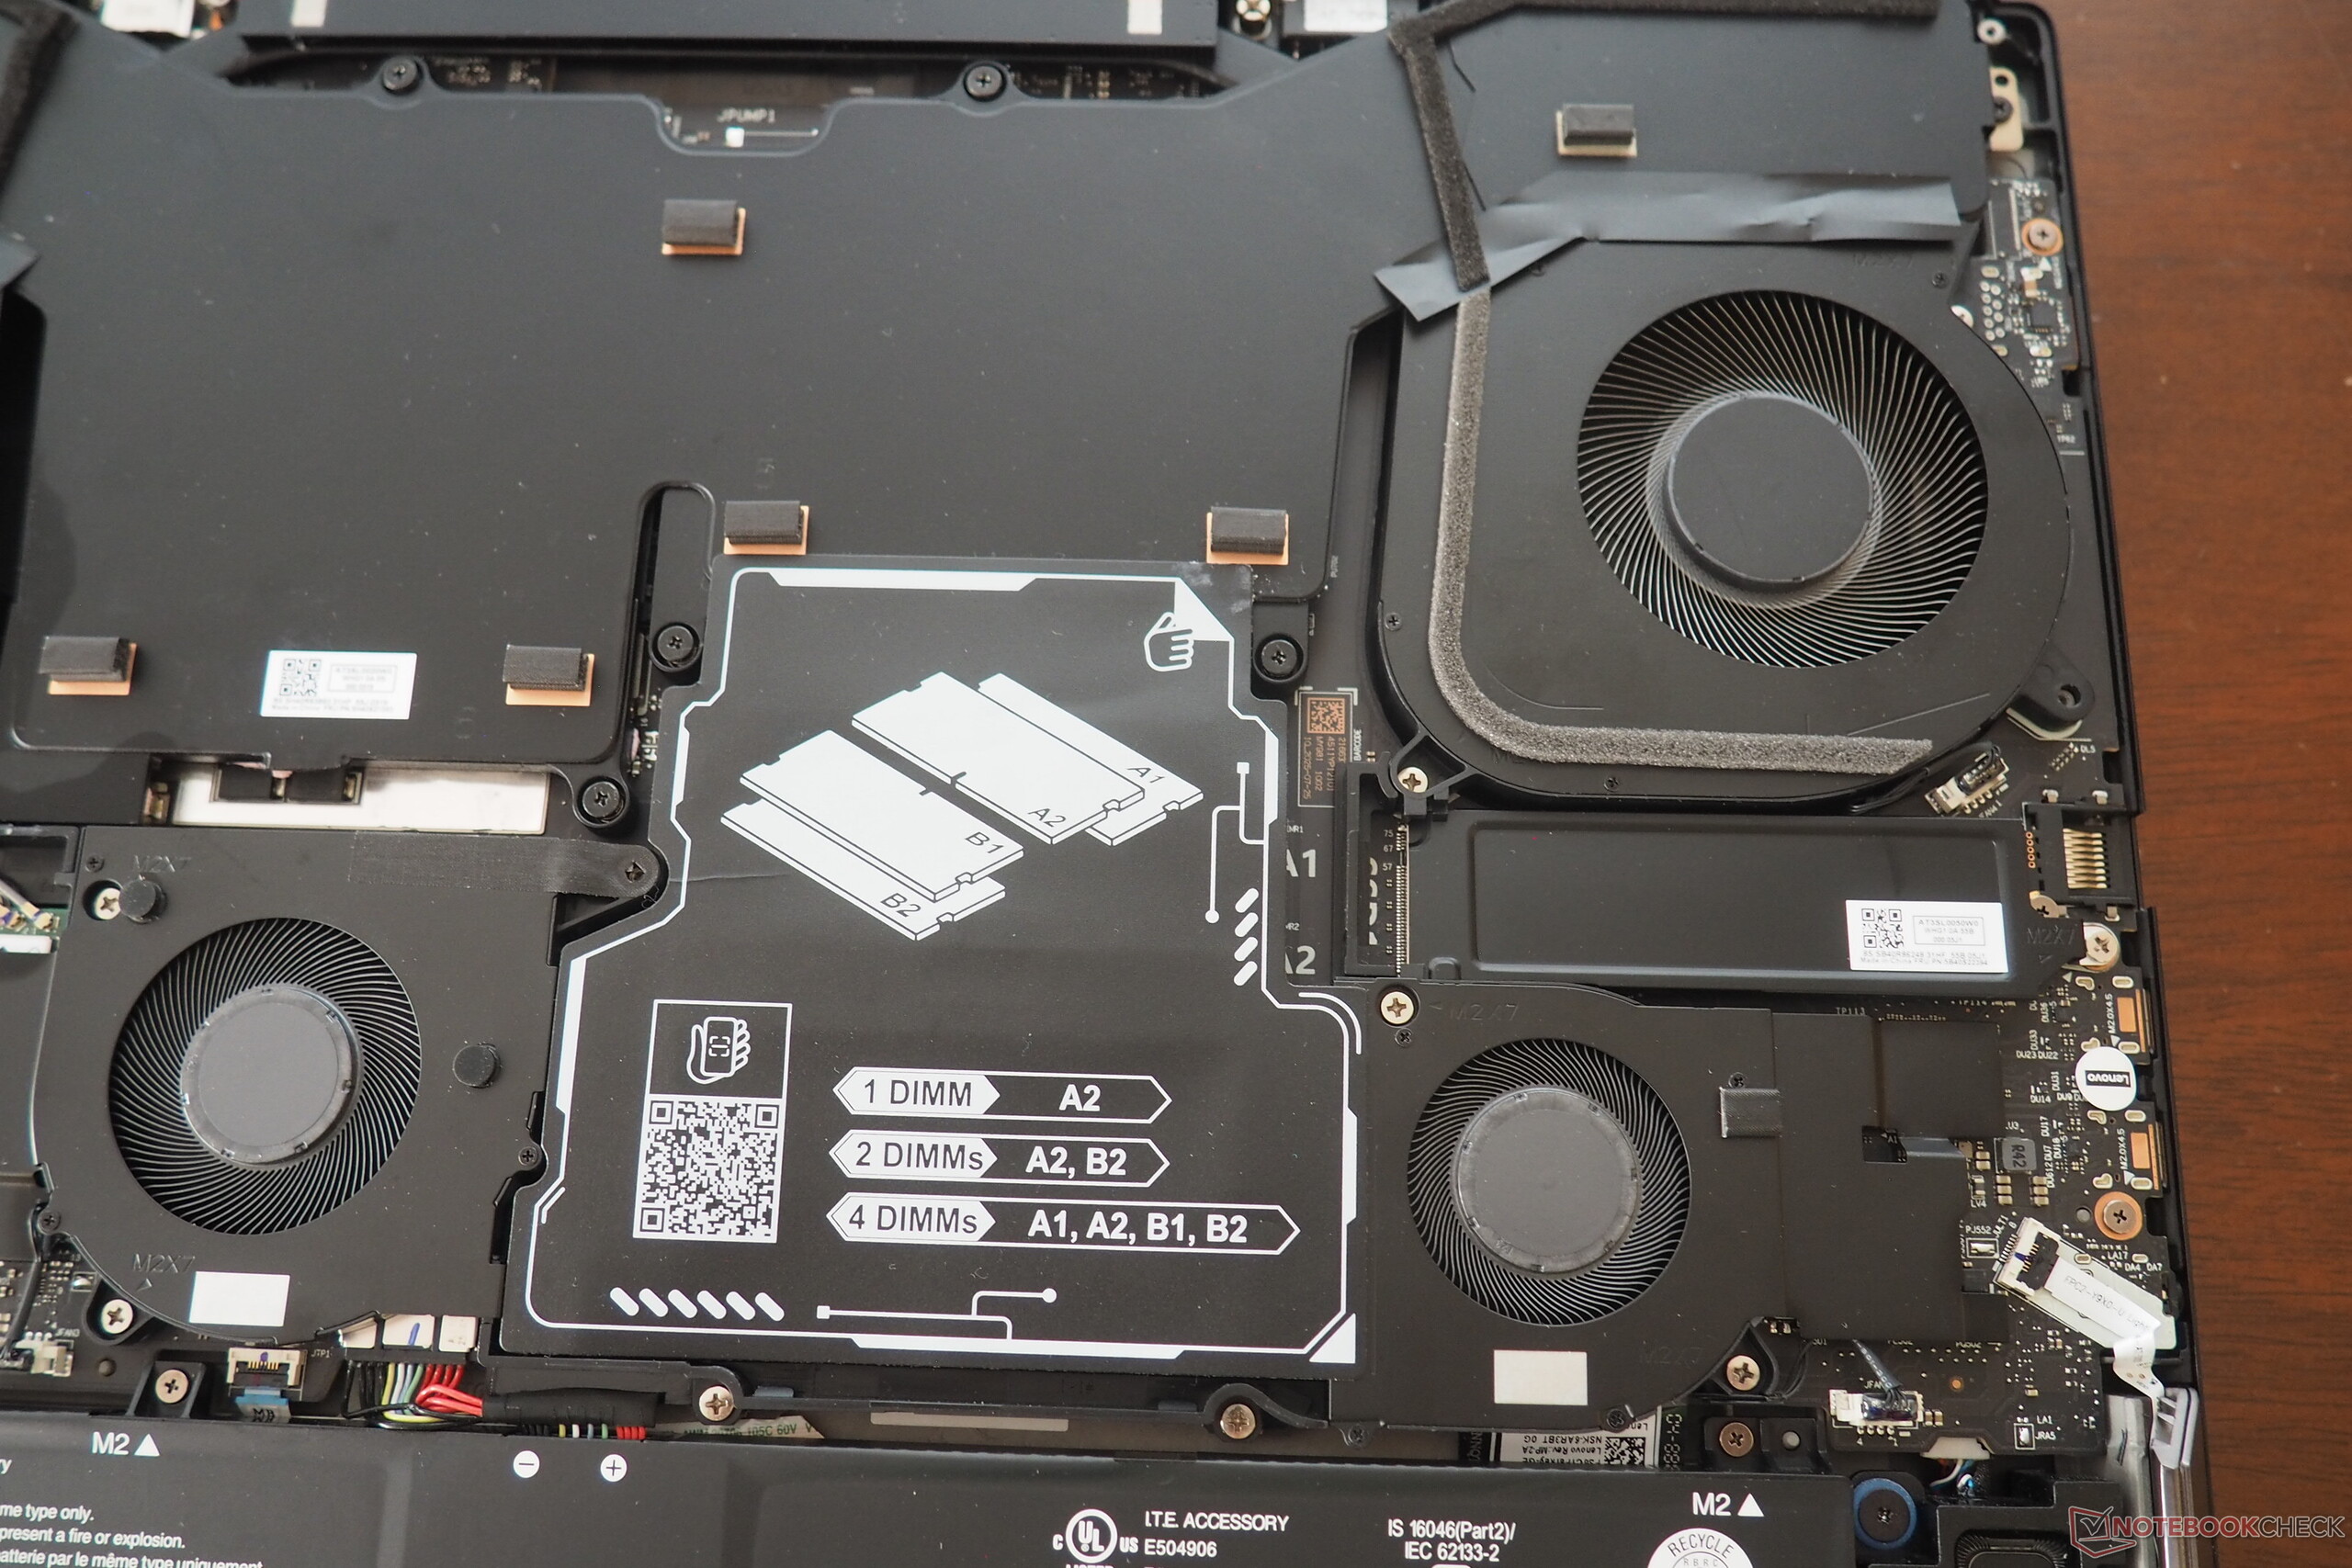
Under the hood, things are quite lavish when you consider the four fans, four RAM banks, and four SSD slots. The sound quality also lives up to the enormous asking price.
The Legion 9 18's performance is beyond reproach. Not least thanks to GPU overclocking, the Legion 9 18 is at the top of all laptops with the RTX 5090 Laptop GPU tested to date.
However, this thicc boy also comes with a few disadvantages. For instance, the included 400 W power supply unit is extremely bulky and heavy.
The laptop requires a lot of power and offers only meagre battery life with high noise levels while playing games.
The Legion 9 18's RTX 5080 counterpart fares slightly better in these aspects despite its lower performance.
Pros
Cons
Price and availability
The Lenovo Legion 9 18IAX10 with Core Ultra 9 275HX and GeForce RTX 5090 is available for just under €6,000 on Amazon DE.
The laptop isn't yet officially listed on the Lenovo US site, but variants with the Core Ultra 9 275HX and RTX 5080 can be had starting from $3,299.99 via Lenovo.com.
- $5,199.00Lenovo Legion 9i Gen 10 18" Gaming Laptop (2026 Model) Intel Core Ultra 9 275HX 24C, NVIDIA GeForce RTX 5090 24GB, 64GB RAM, 1TB Gen5 NVMe SSD, 18.0" 4K 520 nits 240Hz, Windows 11 Pro
- $4,869.00Lenovo Legion Pro 7i Gen 10 16" Gaming Laptop (2025 Model) Intel Core Ultra 9 275HX 24C, NVIDIA GeForce RTX 5090 24GB, 64GB RAM, 2TB (1TB+1TB) NVMe SSD, 16" WQXGA OLED 500 nits 240Hz, Windows 11 Home
- $4,699.00Lenovo Legion Pro 7i Gen 10 16" Gaming Laptop (2025 Model) Intel Core Ultra 9 275HX 24C, NVIDIA GeForce RTX 5090 24GB, 64GB RAM, 2TB (1TB+1TB) NVMe SSD, 16.0" WQXGA OLED 500 nits 240Hz, Windows 11 Pro
The Legion 9 18's competition includes other 18-inch gaming laptops with the RTX 5090 Laptop like the Alienware 18 Area-51, the Asus Strix Scar 18 G835, and the Razer Blade 18 2025, which all appear in the tables as comparison devices.
Specifications
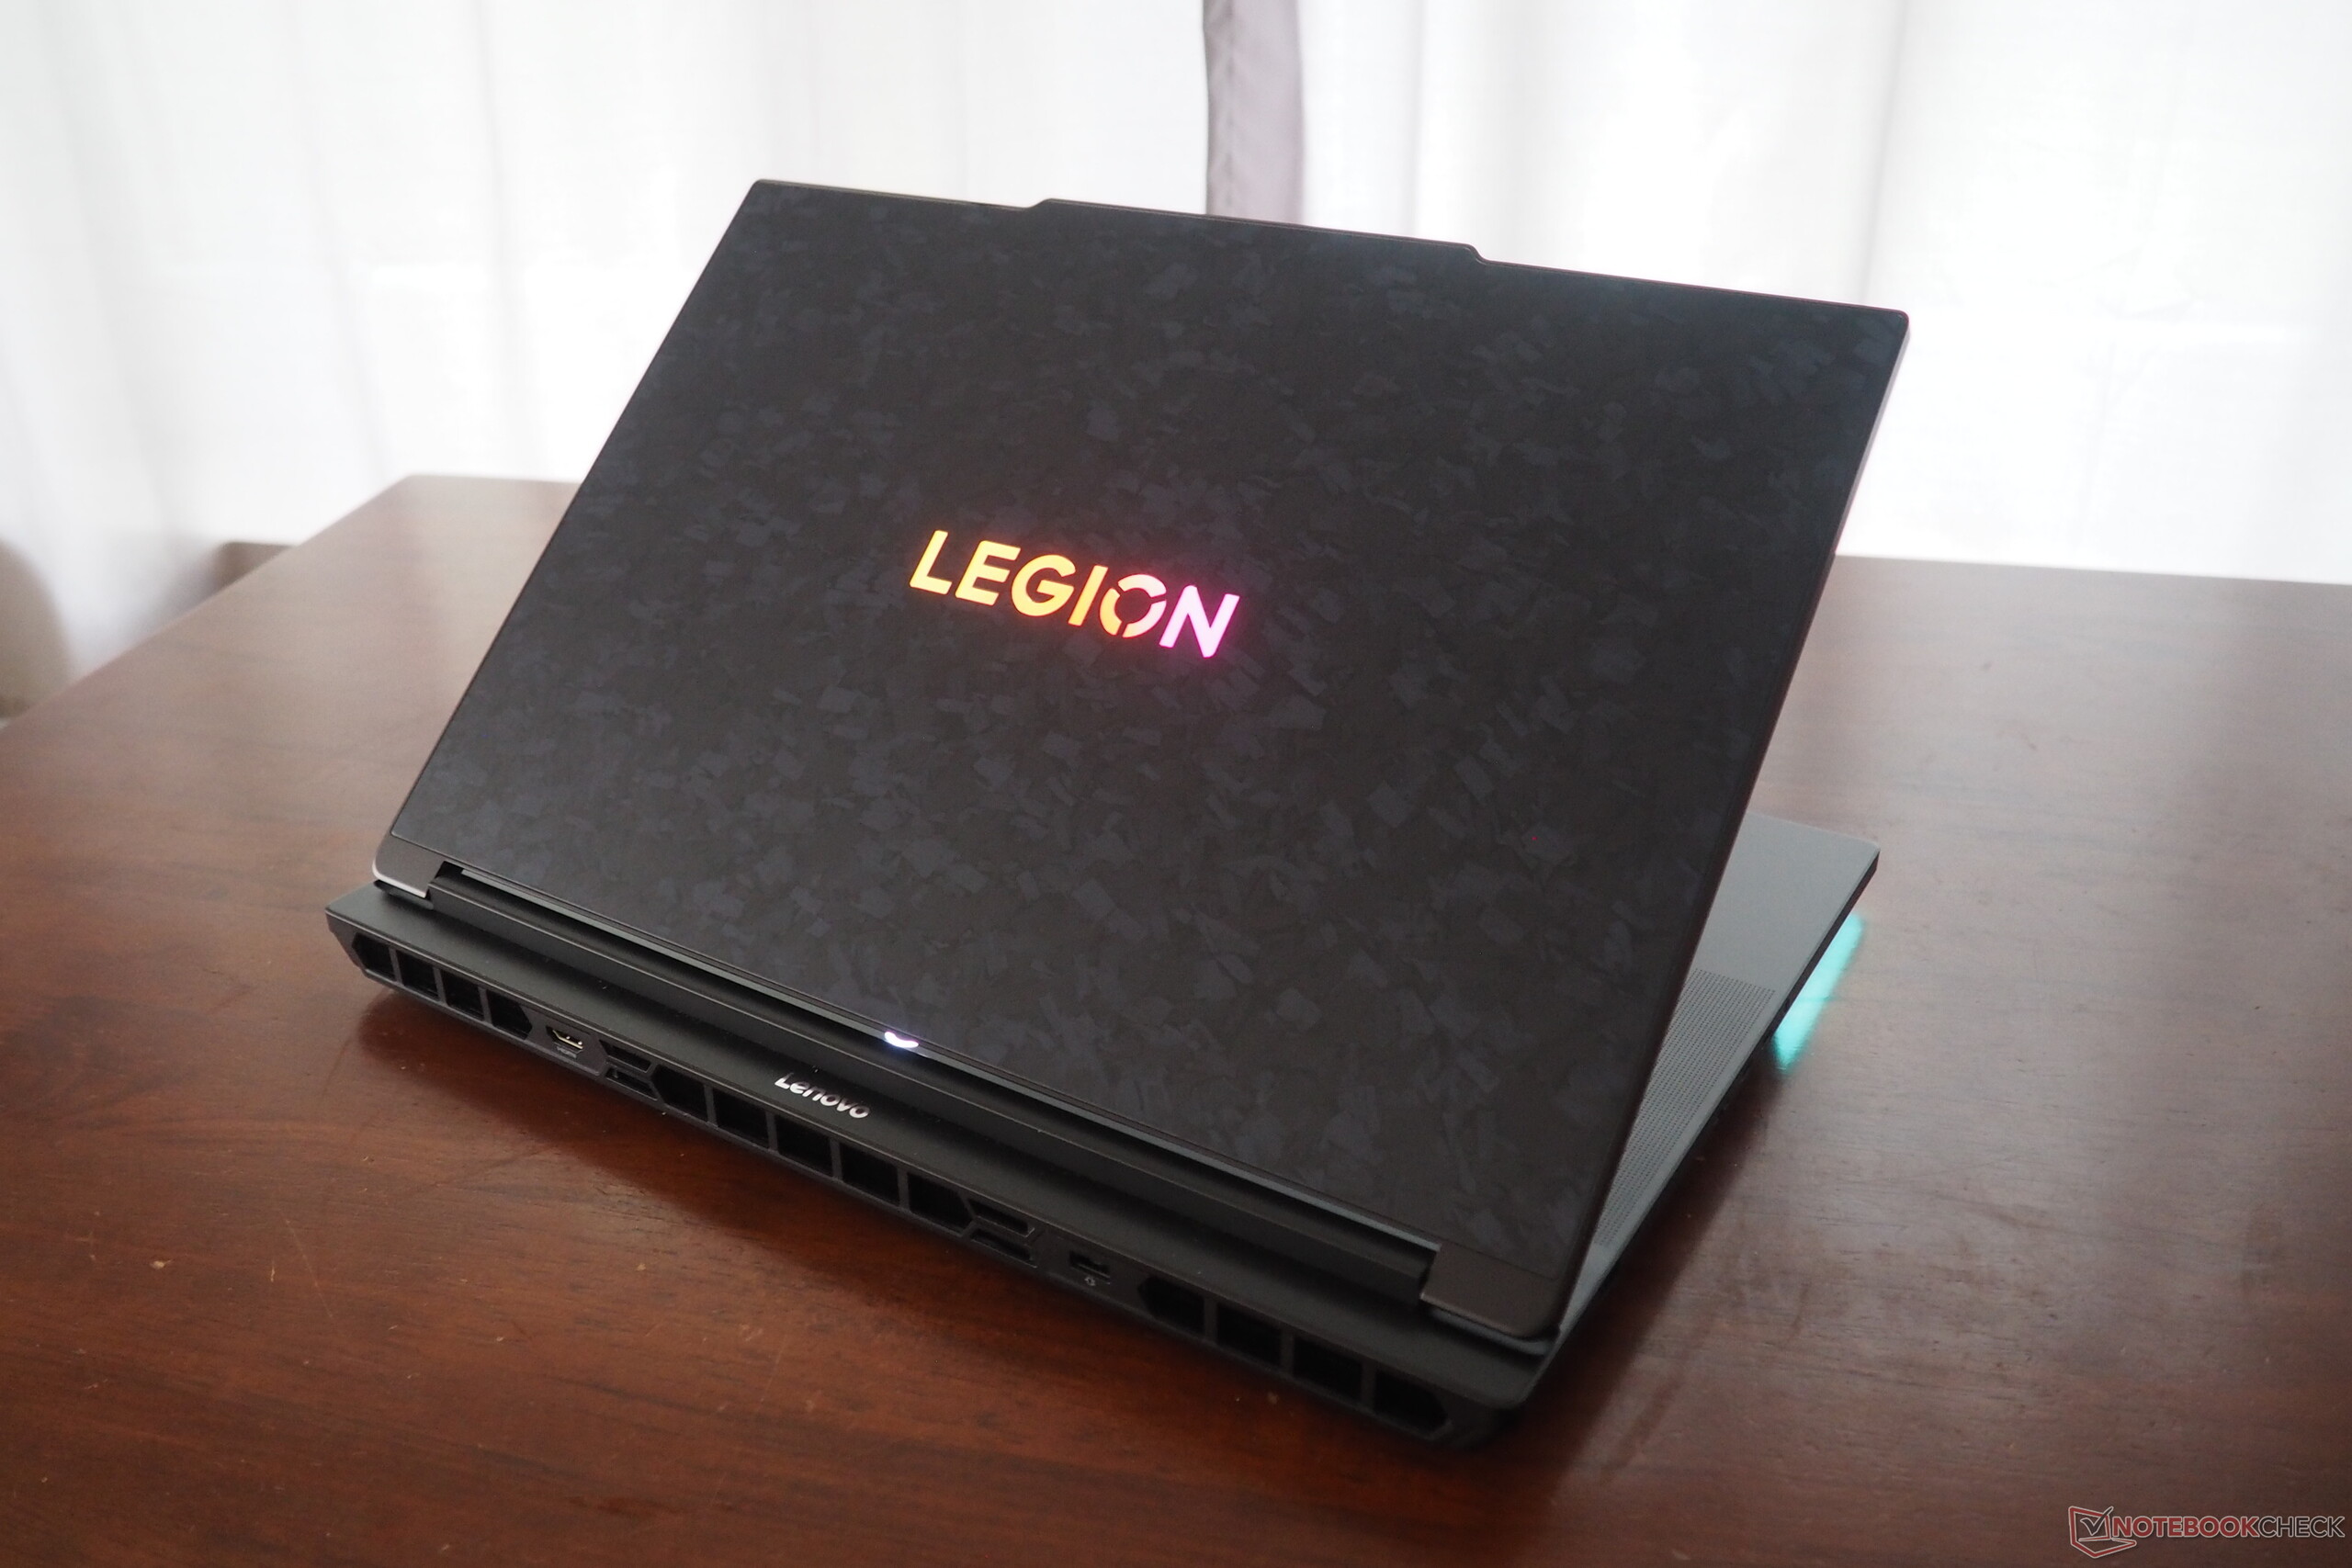
Chassis
The chassis not only impresses with its textured lid, but also with its good stability and clean workmanship. 3.5 kg is quite some weight for a laptop, outweighing even the Strix Scar 18 or Blade 18 (3.2-3.3 kg). But, as the Alienware 18 Area-51 (4.2 kg) shows, things can get even heavier.
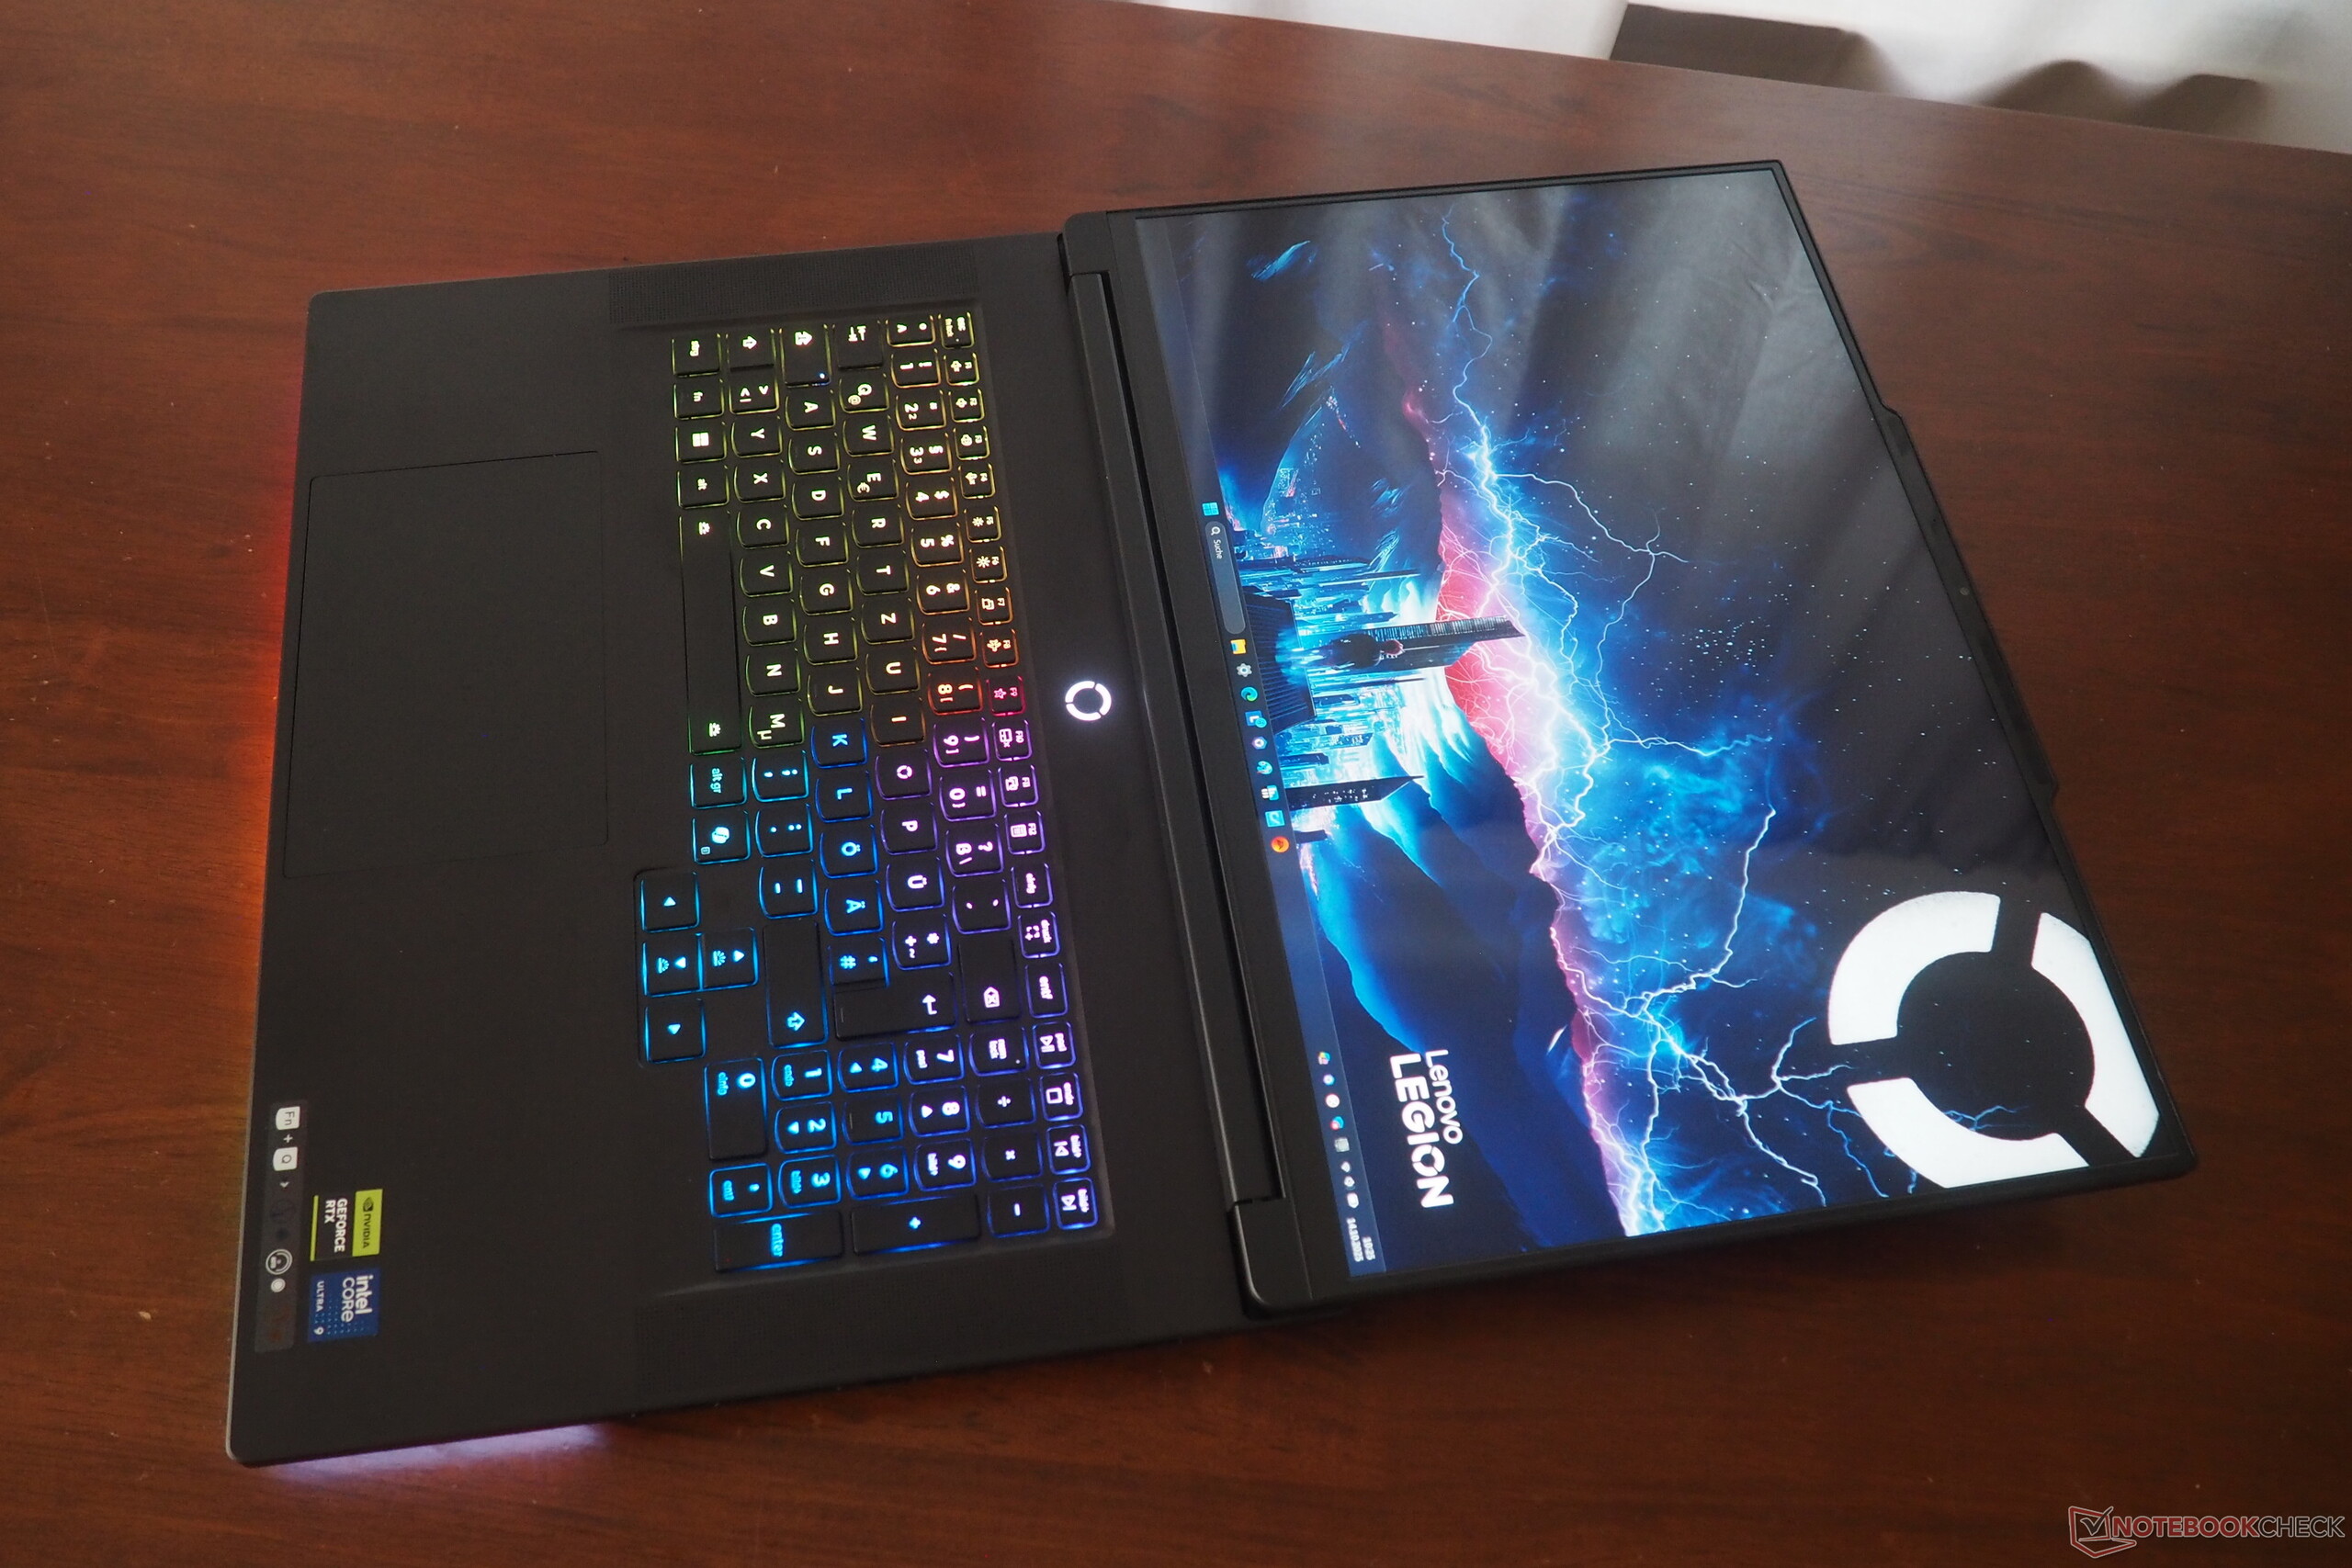
The 2.8 cm height (without feet) is in line with the Blade 18. We particularly liked the generous 180° opening angle.

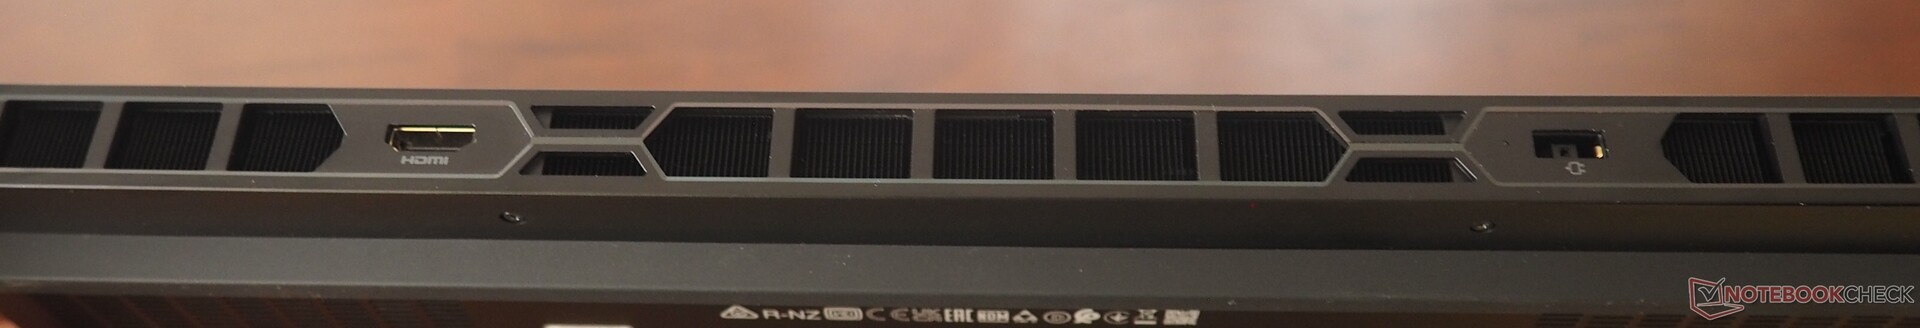
Connectivity
The number and variety of connections leaves nothing to be desired, especially since Lenovo has installed modern interfaces (see below). Interestingly, the card reader was slower than on the RTX 5080 version, while the wireless module delivered significantly better results. The 5 MP webcam, which offers an e-shutter, produces decent images.
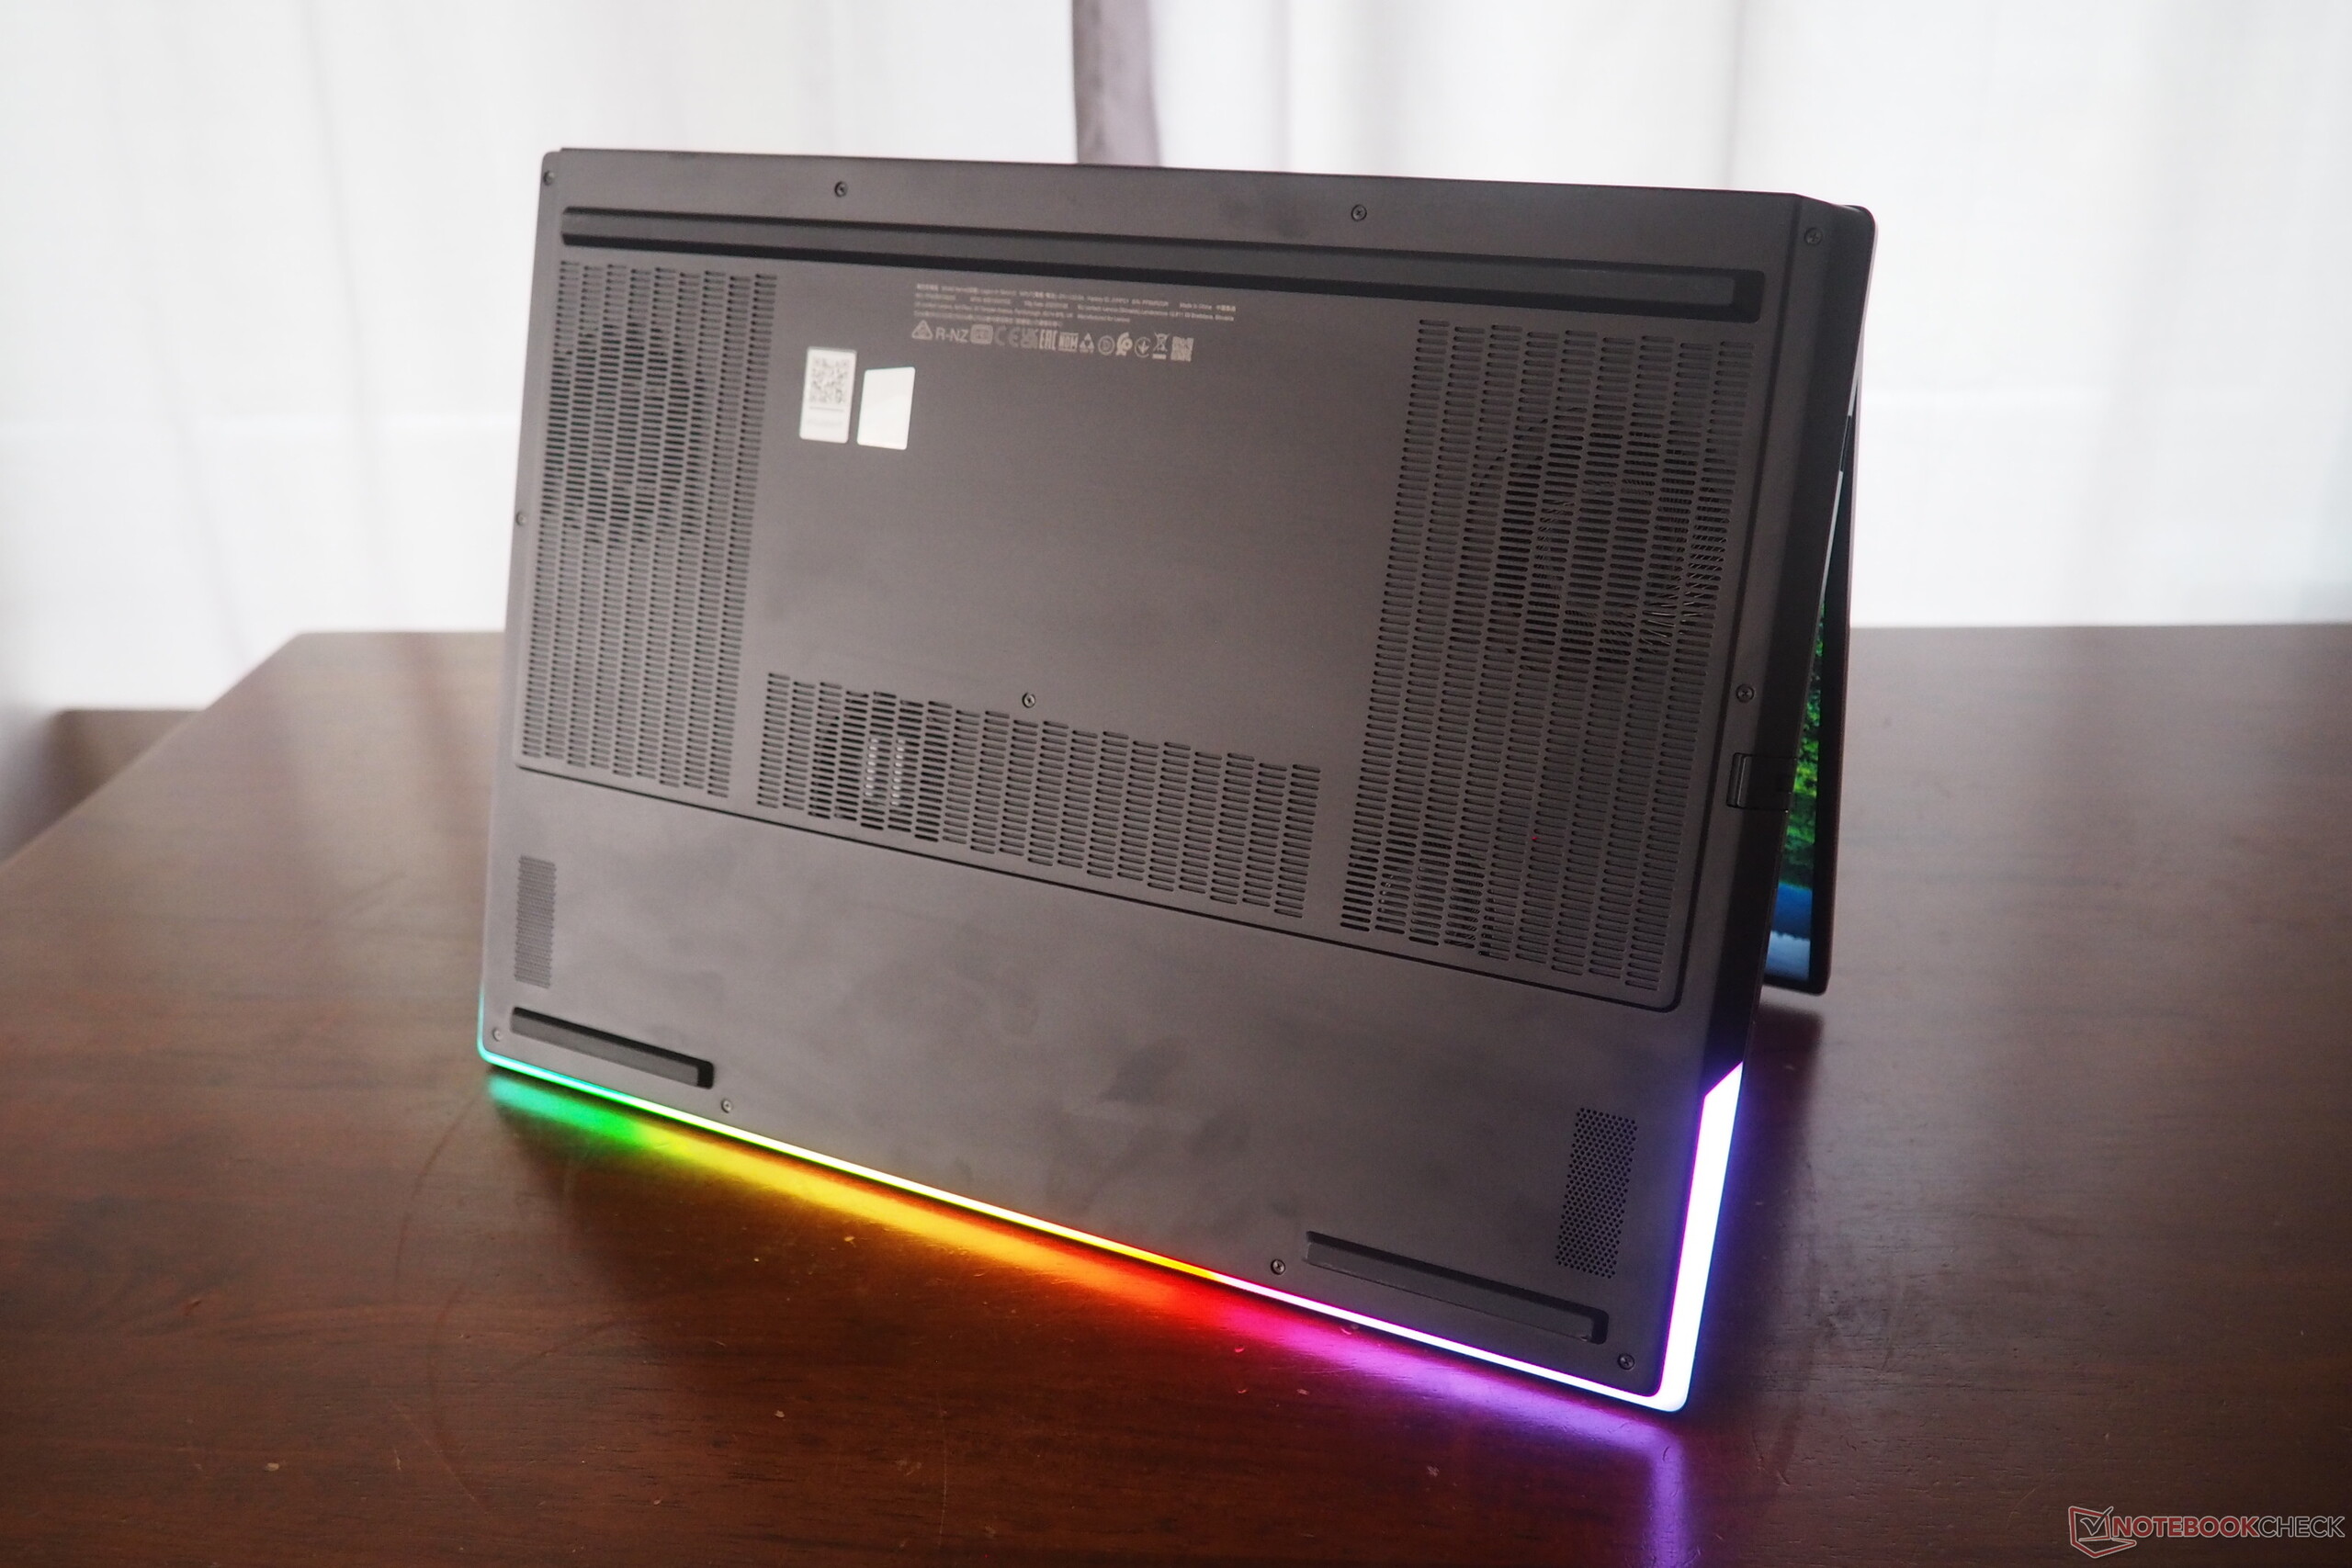
The opening of the housing could be more convenient for maintenance. Although the 11 Phillips screws can be removed quite easily, the bottom cover is incredibly tight to dislodge.


SD Card Reader
| SD Card Reader - average JPG Copy Test (av. of 3 runs) | |
| Lenovo Legion 9 18IAX10 (Toshiba Exceria Pro SDXC 64 GB UHS-II) | |
| Razer Blade 18 2025 RTX 5090 Laptop (Angelbird AV Pro V60) | |
| Alienware 18 Area-51 (Toshiba Exceria Pro SDXC 64 GB UHS-II) | |
| Average of class Gaming (20.9 - 210, n=54, last 2 years) | |
| Lenovo Legion 9 18IAX10 RTX 5090 (AV PRO microSD 128 GB V60) | |
Communication
Webcam


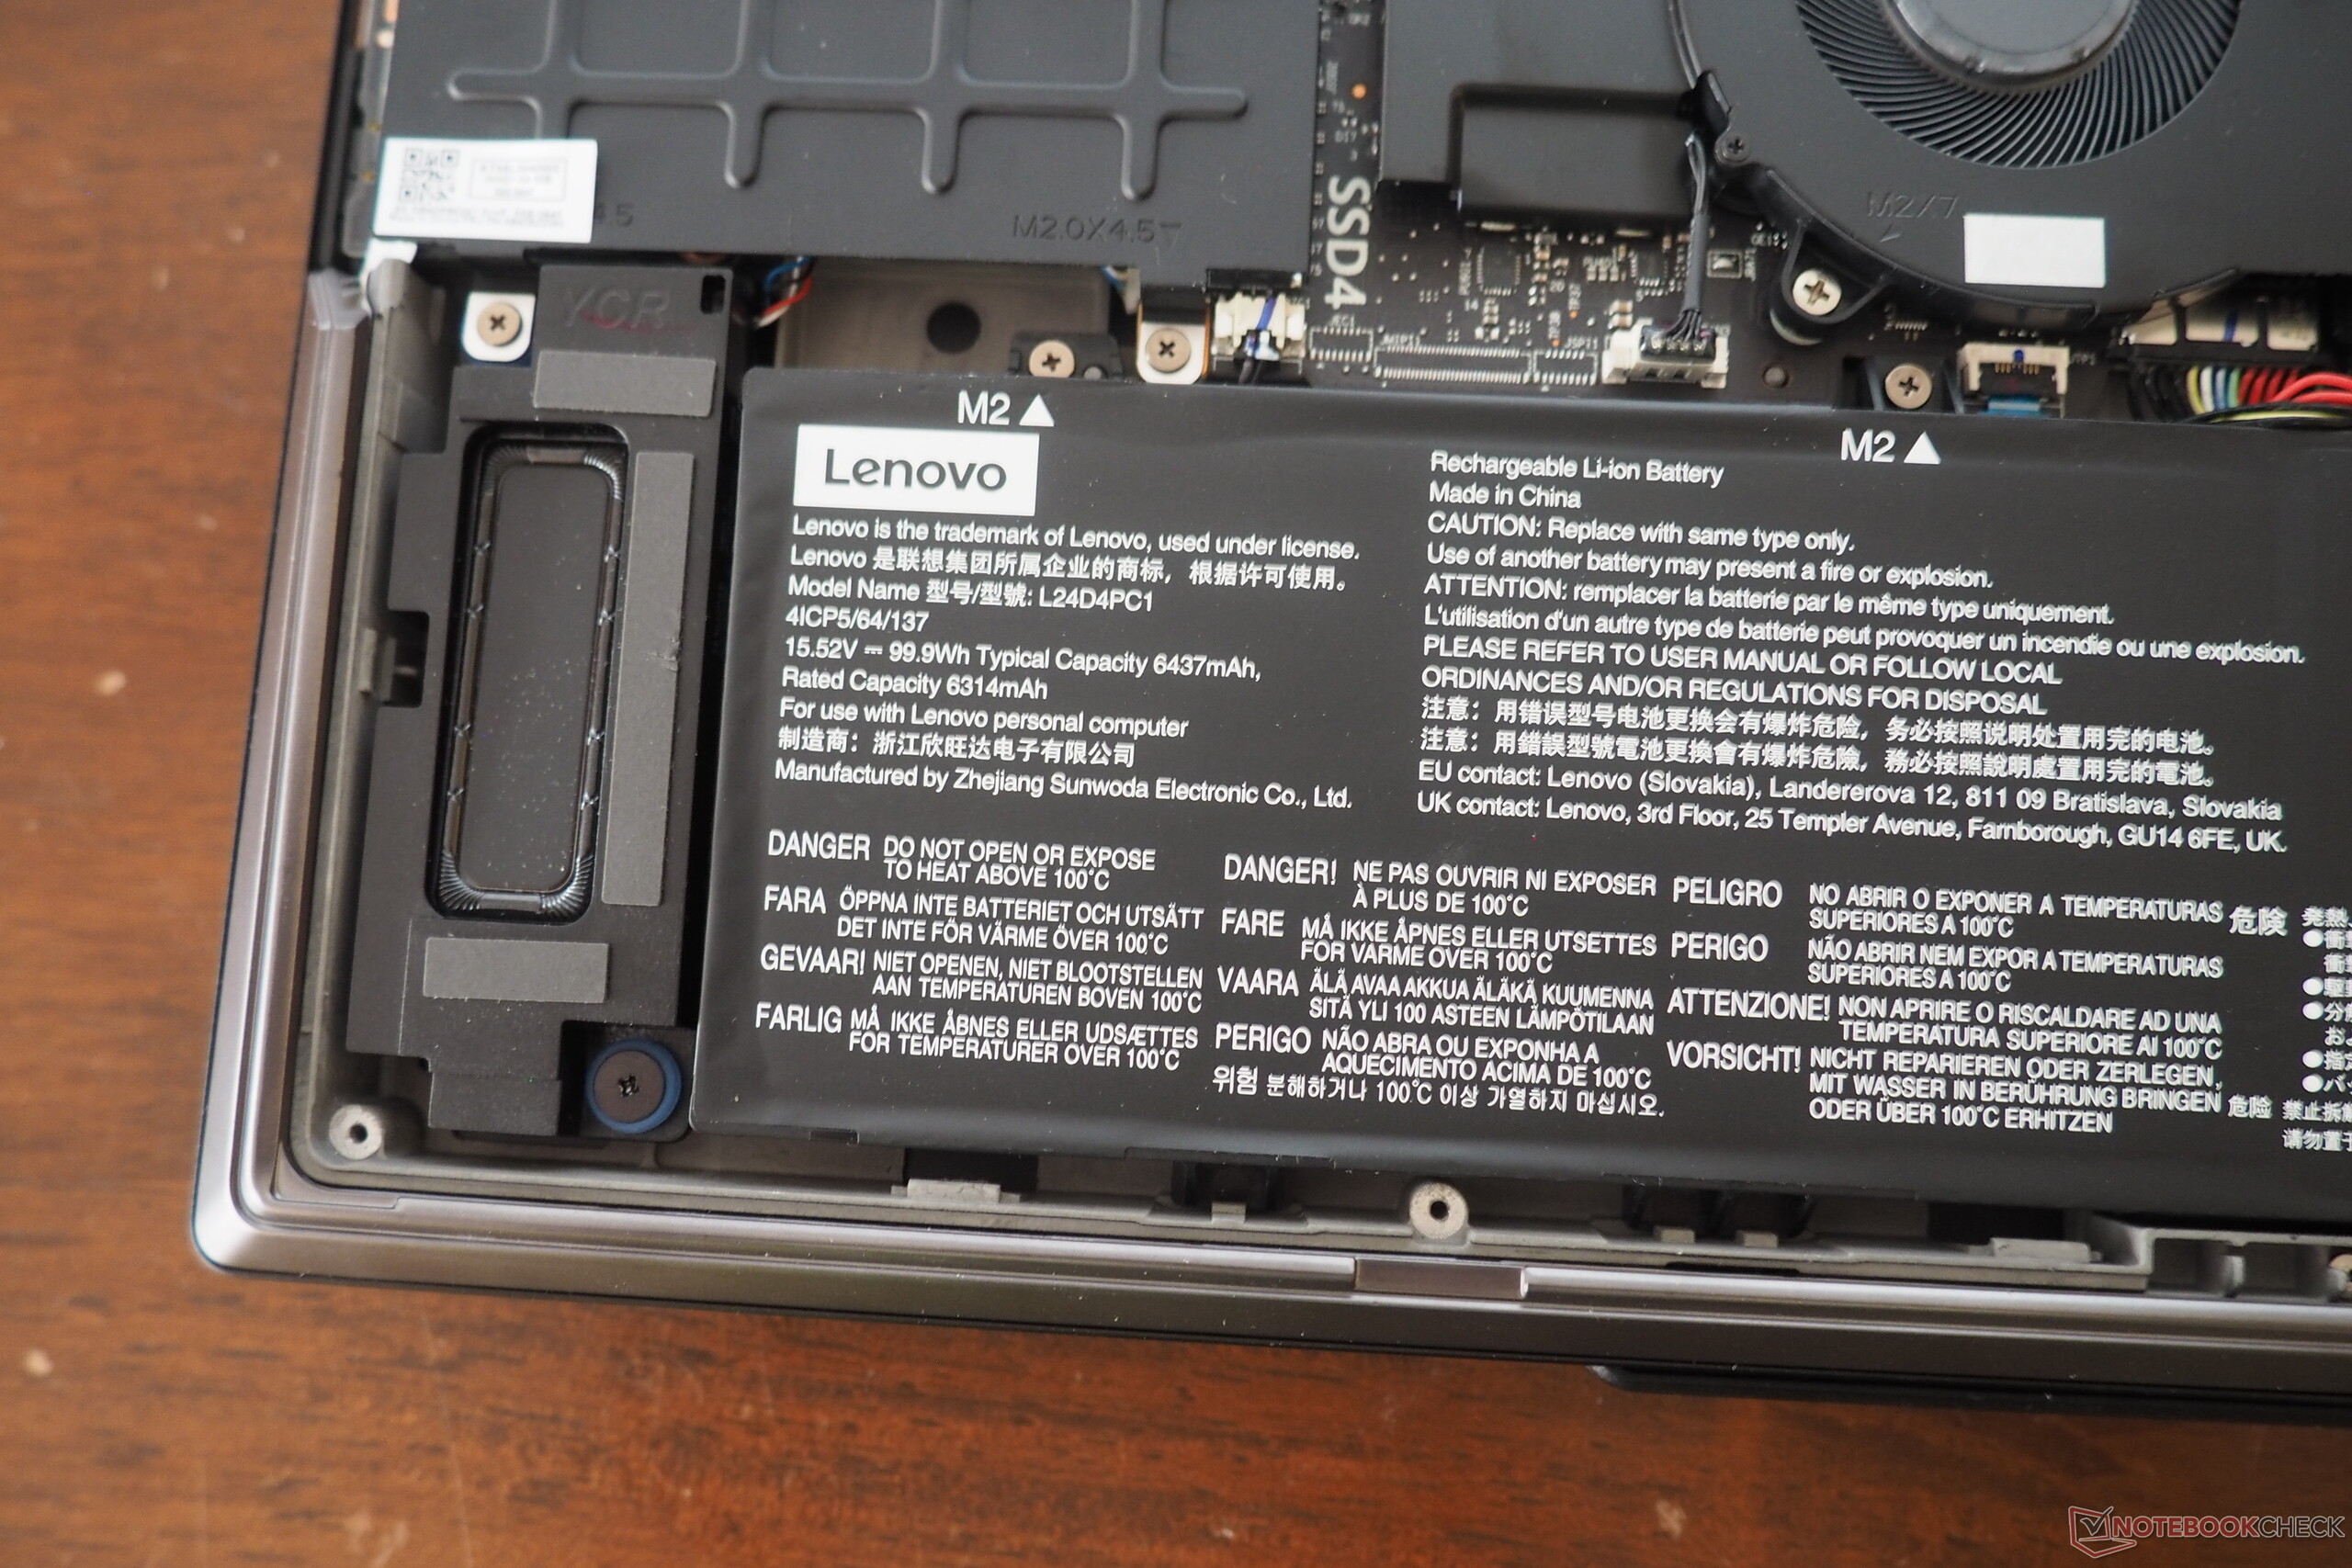
Maintenance
Input devices
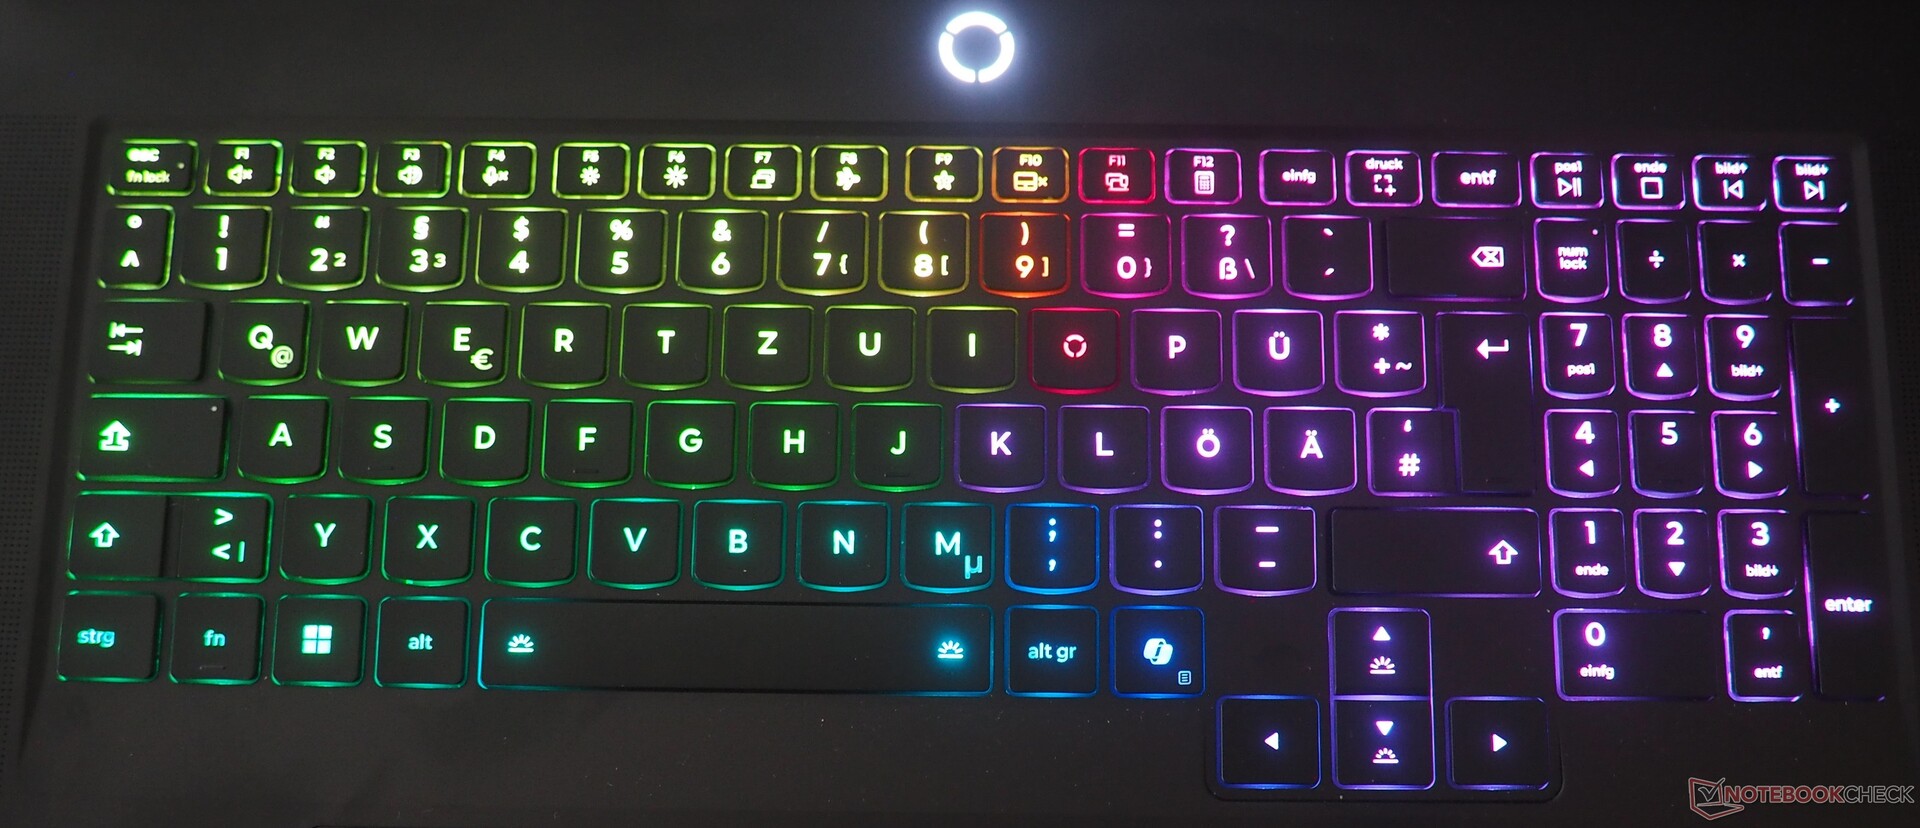
Although Lenovo does not use a mechanical keyboard, the keyboard input experience is impressive. Among other things, the keyboard delights with intensive RGB lighting, a highly usable layout, and a pleasant key size, especially for the arrow keys.
There is also a precision touchpad, which is a respectable 15 x 9.5 cm in size and offers quite good gliding properties.
Display
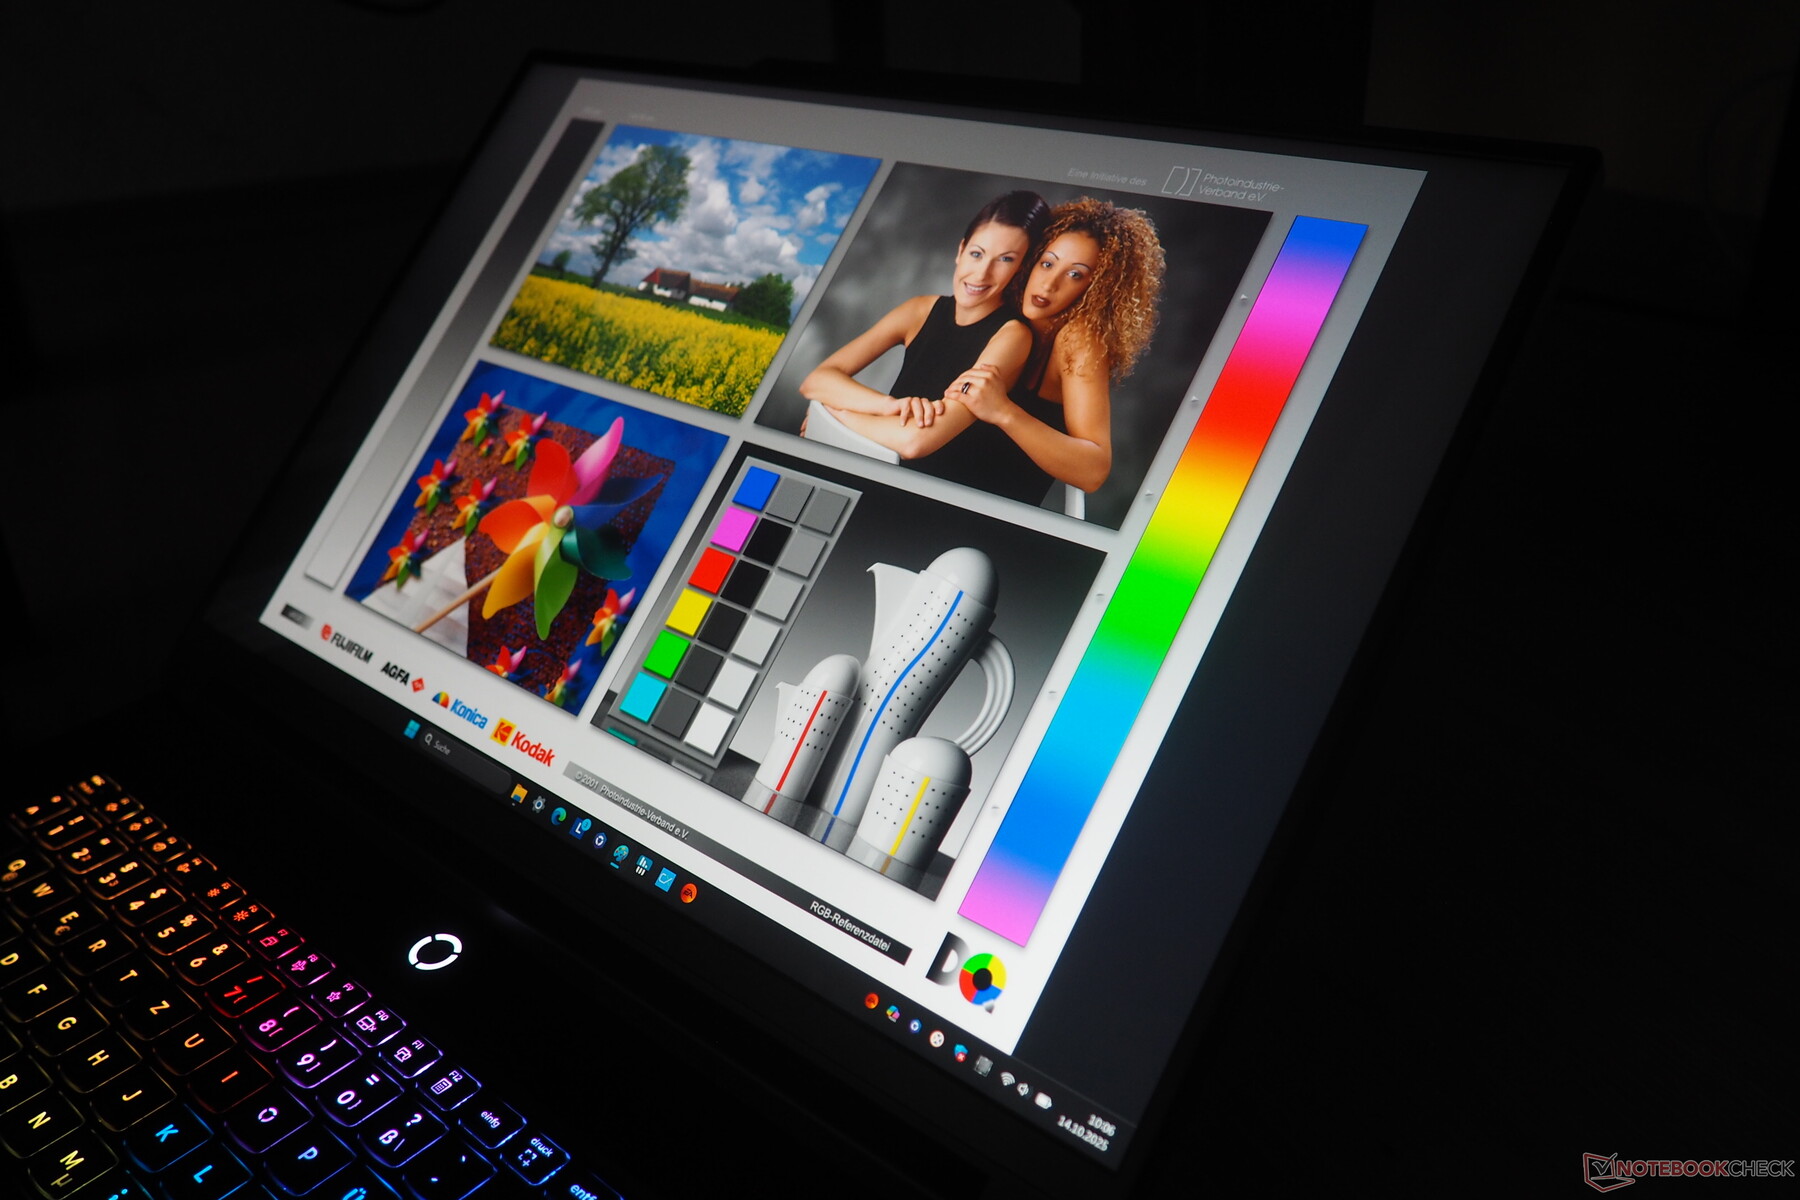
Lenovo's display decision is somewhat incomprehensible. Similar to the RTX 5080 version, a glossy IPS panel is used in the RTX 5090 SKU, which can be highly reflective depending on the environment.
To prevent such reflections, IPS models are usually installed in a matte version, whereas OLED panels are (some would say unfortunately) almost exclusively glossy models.
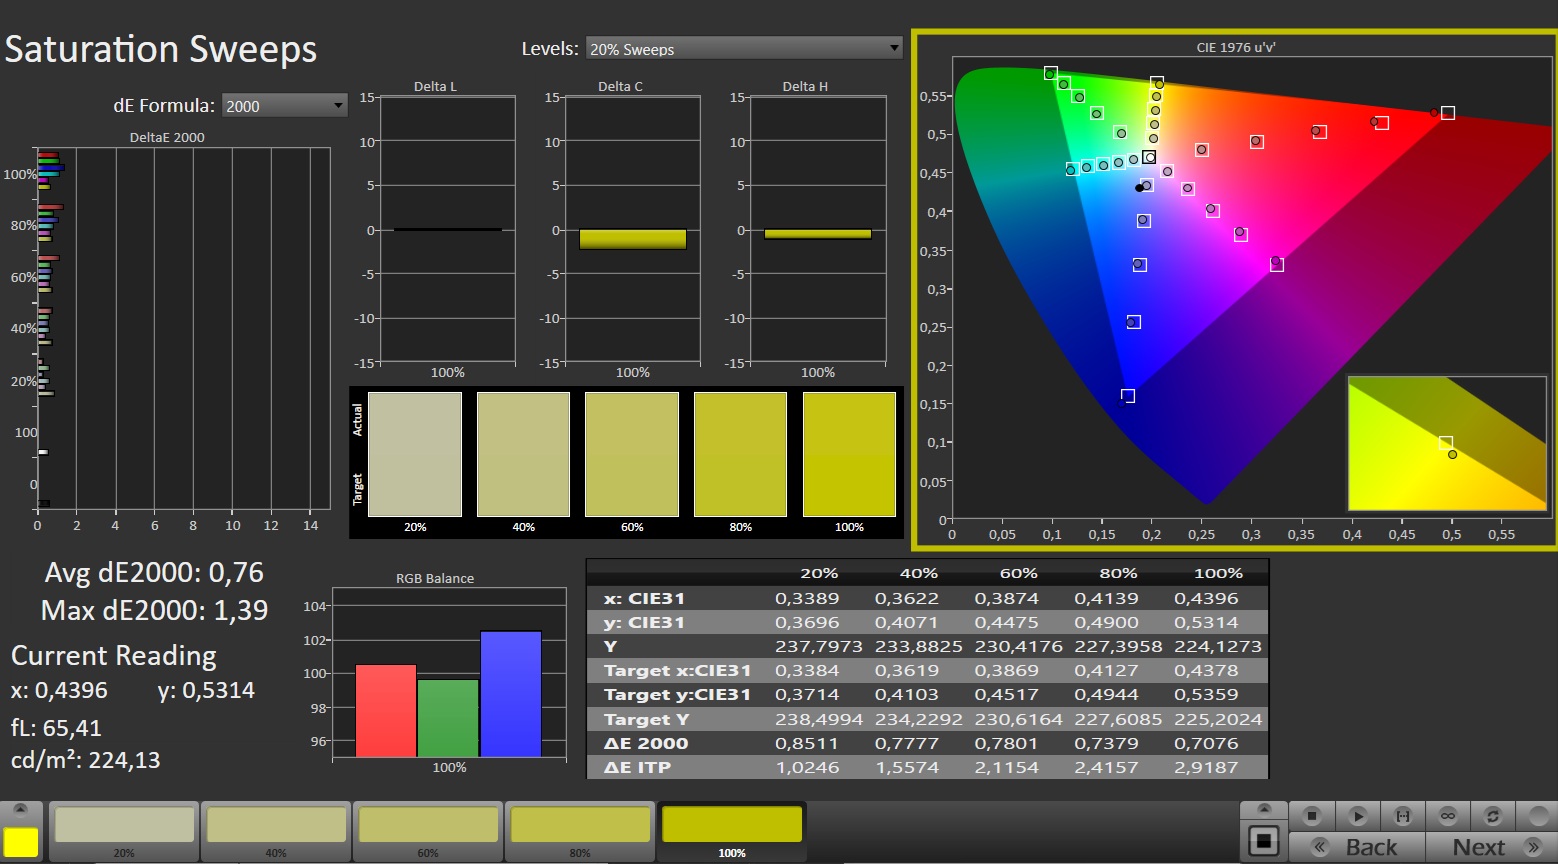
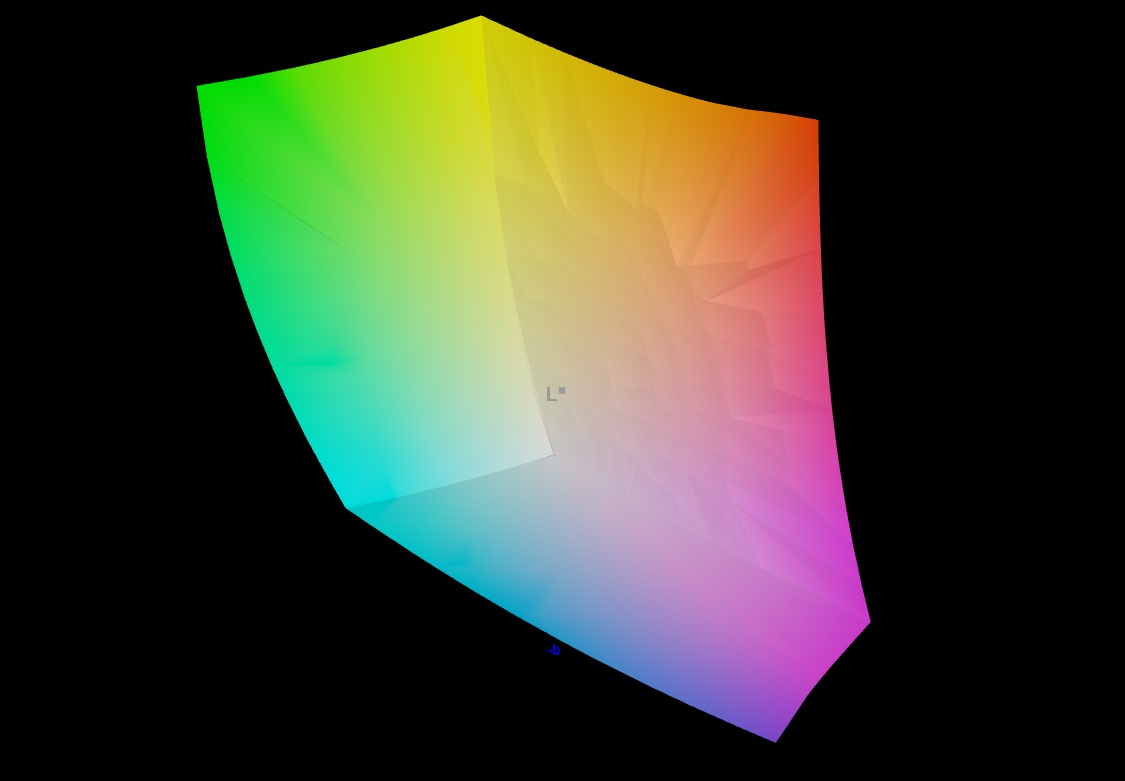
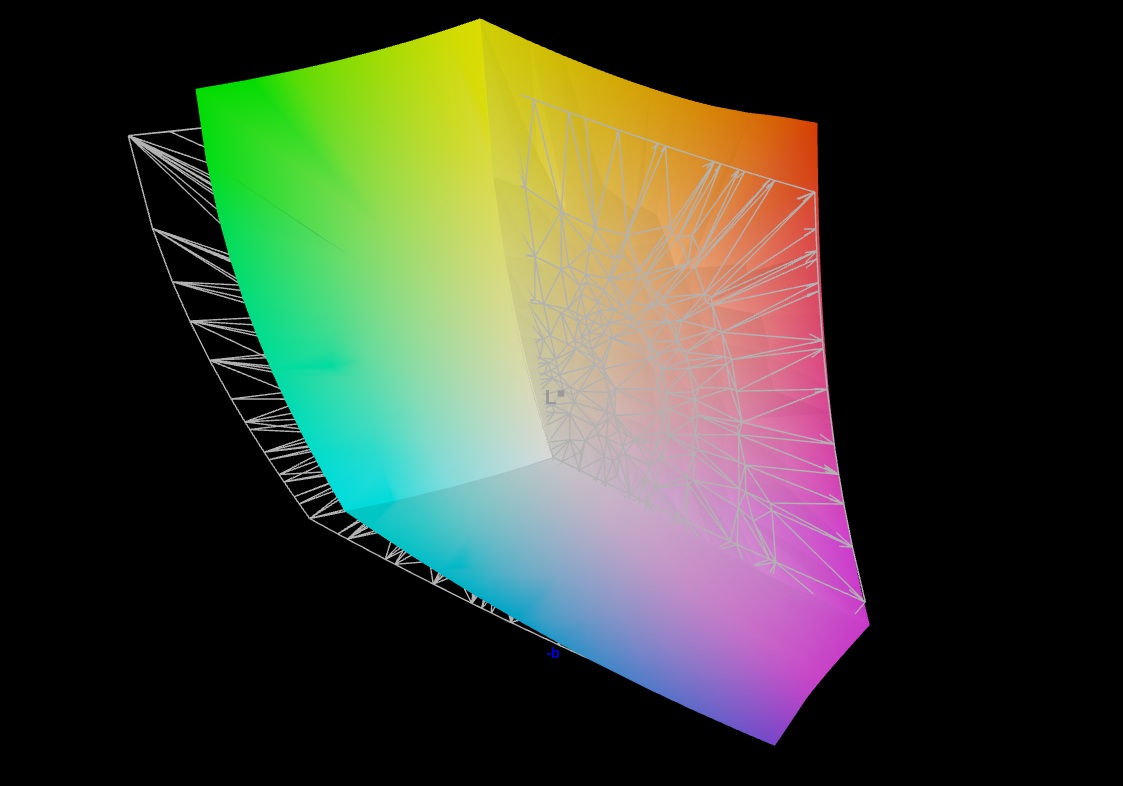
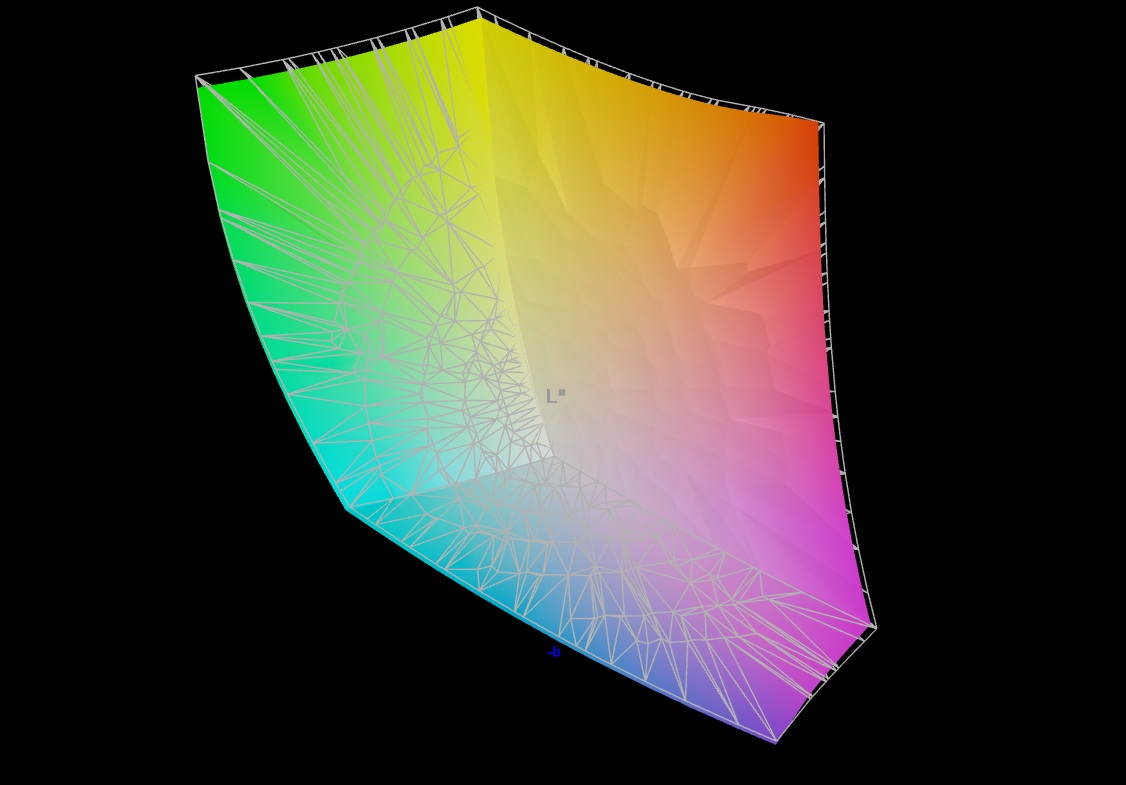
The advantage of the glossy version is bright colors, and this 240 Hz panel offers a large color gamut coverage. In addition to Display P3, Adobe RGB is nearly completely covered as well.
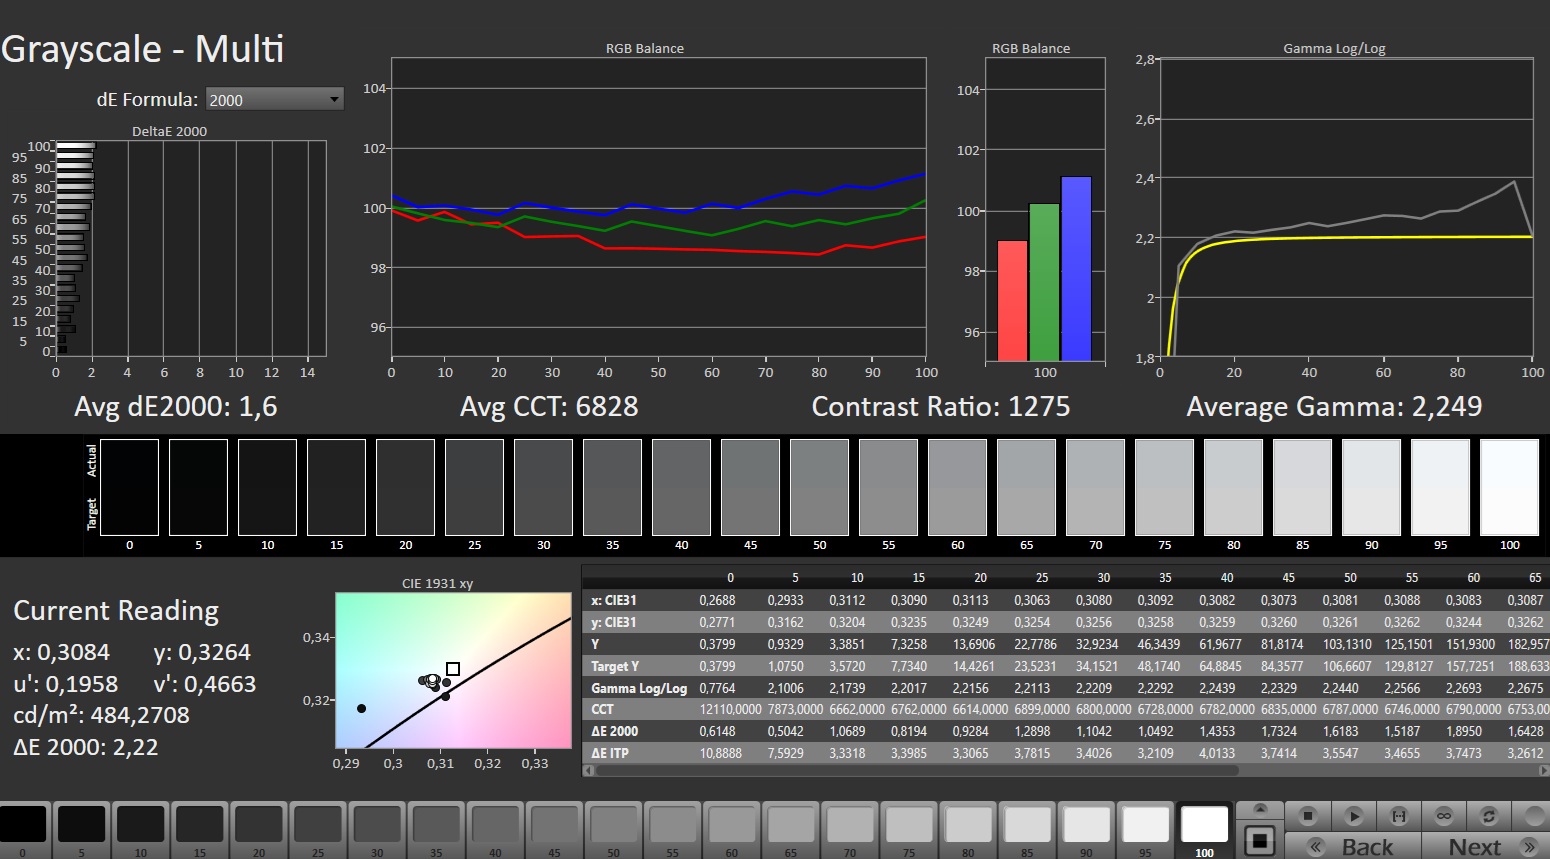
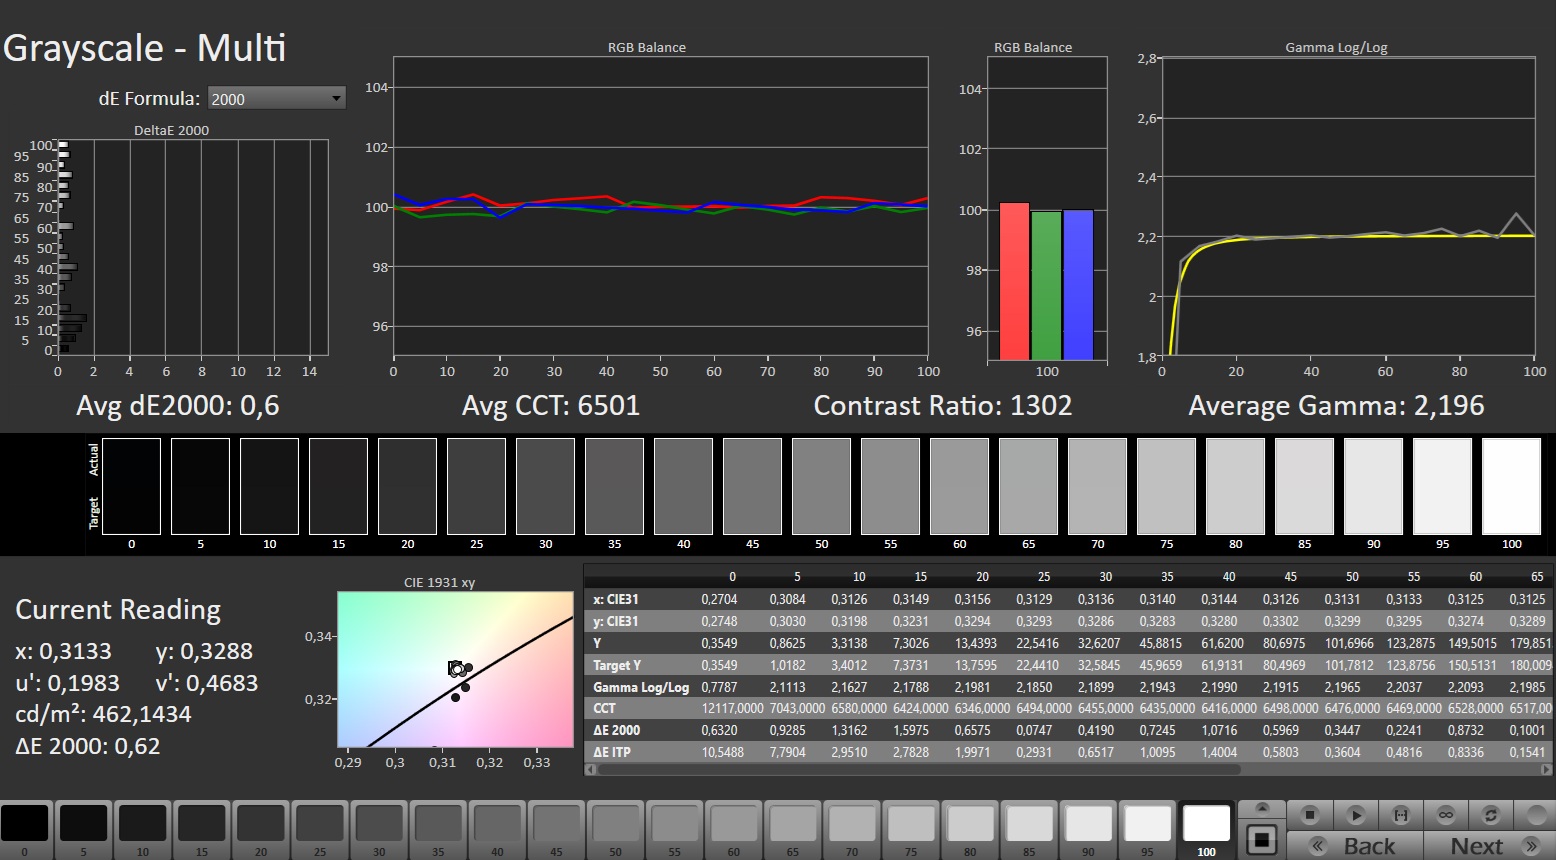
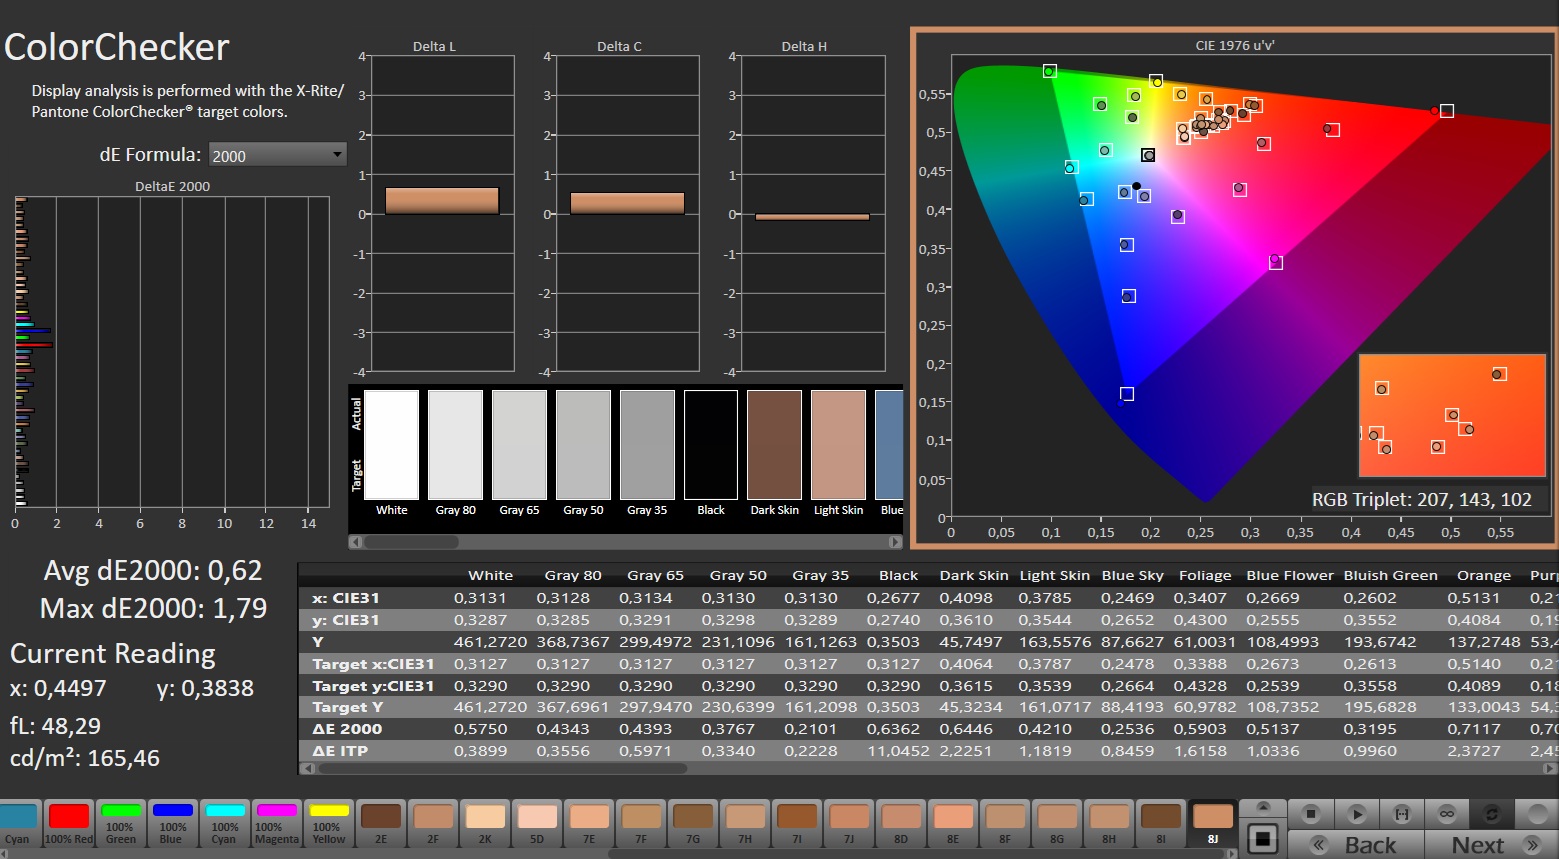
The display is pre-calibrated on delivery, which results in high color accuracy. The values are also good by IPS standards, without being outperformed by the competition.
An average brightness of 440 cd/m² and a black value of 0.27 cd/m² ensure a solid contrast of just under 1,600:1. There are also no surprises in terms of viewing angle stability and response times.
Thanks to the high 3,840 x 2,400 (16:10 format) resolution, the picture looks quite sharp.
| |||||||||||||||||||||||||
Brightness Distribution: 84 %
Center on Battery: 439 cd/m²
Contrast: 1626:1 (Black: 0.27 cd/m²)
ΔE ColorChecker Calman: 0.99 | ∀{0.5-29.43 Ø4.71}
calibrated: 0.62
ΔE Greyscale Calman: 1.6 | ∀{0.09-98 Ø4.96}
88.9% AdobeRGB 1998 (Argyll 3D)
100% sRGB (Argyll 3D)
96.8% Display P3 (Argyll 3D)
Gamma: 2.249
CCT: 6828 K
| Lenovo Legion 9 18IAX10 RTX 5090 BOEhydis NE180QAM-NZ2 (BOE0D5B), IPS, 3840x2400, 18", 240 Hz | Alienware 18 Area-51 AU Optronics B180QAN, IPS, 2560x1600, 18", 300 Hz | Asus Strix Scar 18 G835LX N180QDM-NM2, Mini-LED, 2560x1600, 18", 240 Hz | Razer Blade 18 2025 RTX 5090 Laptop NE180QAM-NZ1, IPS, 3840x2400, 18", 240 Hz | Lenovo Legion 9 18IAX10 BOE NE180QAM-NZ2, IPS, 3840x2400, 18", 240 Hz | |
|---|---|---|---|---|---|
| Display | 0% | 0% | 0% | -0% | |
| Display P3 Coverage (%) | 96.8 | 96.1 -1% | 99 2% | 97 0% | 96 -1% |
| sRGB Coverage (%) | 100 | 100 0% | 100 0% | 100 0% | 100 0% |
| AdobeRGB 1998 Coverage (%) | 88.9 | 89.7 1% | 87.2 -2% | 89 0% | 88.8 0% |
| Response Times | -12% | -1% | 48% | 8% | |
| Response Time Grey 50% / Grey 80% * (ms) | 12.7 ? | 13 ? -2% | 7.4 ? 42% | 5.1 ? 60% | 9.7 ? 24% |
| Response Time Black / White * (ms) | 7.2 ? | 8.7 ? -21% | 10.4 ? -44% | 4.6 ? 36% | 7.8 ? -8% |
| PWM Frequency (Hz) | 20610 ? | ||||
| PWM Amplitude * (%) | 100 | ||||
| Screen | -80% | 69% | -56% | -67% | |
| Brightness middle (cd/m²) | 439 | 512.5 17% | 764 74% | 545 24% | 479.7 9% |
| Brightness (cd/m²) | 440 | 496 13% | 747 70% | 510 16% | 465 6% |
| Brightness Distribution (%) | 84 | 94 12% | 93 11% | 86 2% | 86 2% |
| Black Level * (cd/m²) | 0.27 | 0.41 -52% | 0.1 63% | 0.41 -52% | 0.27 -0% |
| Contrast (:1) | 1626 | 1250 -23% | 7640 370% | 1329 -18% | 1777 9% |
| Colorchecker dE 2000 * | 0.99 | 3.24 -227% | 1.2 -21% | 2.2 -122% | 3.14 -217% |
| Colorchecker dE 2000 max. * | 2.25 | 8.4 -273% | 2.8 -24% | 5.8 -158% | 6.48 -188% |
| Colorchecker dE 2000 calibrated * | 0.62 | 0.47 24% | 1.1 -77% | 1.17 -89% | |
| Greyscale dE 2000 * | 1.6 | 5 -213% | 1.5 6% | 3.5 -119% | 3.8 -137% |
| Gamma | 2.249 98% | 2.37 93% | 2.17 101% | 2.18 101% | 2.18 101% |
| CCT | 6828 95% | 6417 101% | 6556 99% | 7027 93% | 7301 89% |
| Total Average (Program / Settings) | -31% /
-53% | 23% /
42% | -3% /
-29% | -20% /
-42% |
* ... smaller is better


Display Response Times
| ↔ Response Time Black to White | ||
|---|---|---|
| 7.2 ms ... rise ↗ and fall ↘ combined | ↗ 3.3 ms rise | 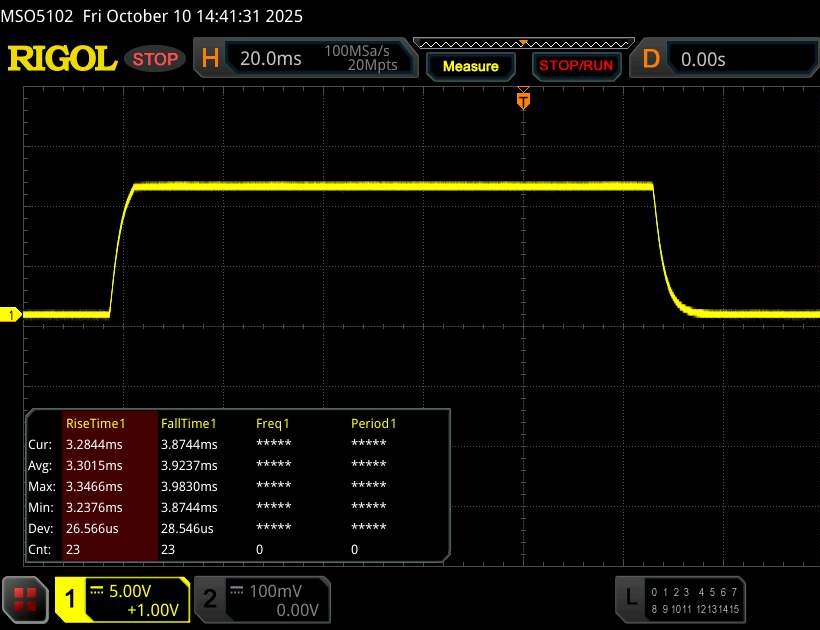 |
| ↘ 3.9 ms fall | ||
| The screen shows very fast response rates in our tests and should be very well suited for fast-paced gaming. In comparison, all tested devices range from 0.1 (minimum) to 240 (maximum) ms. » 21 % of all devices are better. This means that the measured response time is better than the average of all tested devices (19.8 ms). | ||
| ↔ Response Time 50% Grey to 80% Grey | ||
| 12.7 ms ... rise ↗ and fall ↘ combined | ↗ 6.2 ms rise | 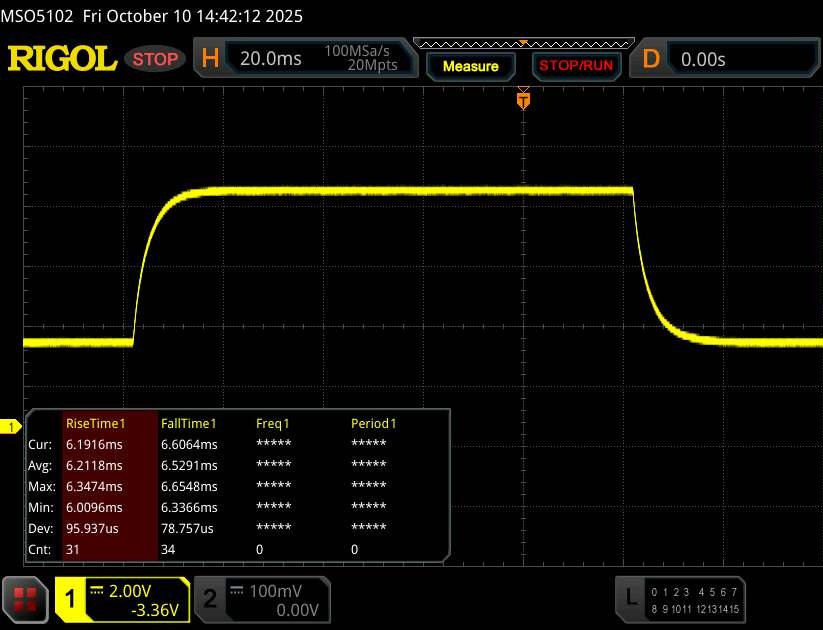 |
| ↘ 6.5 ms fall | ||
| The screen shows good response rates in our tests, but may be too slow for competitive gamers. In comparison, all tested devices range from 0.165 (minimum) to 636 (maximum) ms. » 26 % of all devices are better. This means that the measured response time is better than the average of all tested devices (31 ms). | ||
Screen Flickering / PWM (Pulse-Width Modulation)
| Screen flickering / PWM not detected |  | ||
In comparison: 52 % of all tested devices do not use PWM to dim the display. If PWM was detected, an average of 7757 (minimum: 5 - maximum: 343500) Hz was measured. | |||
Performance
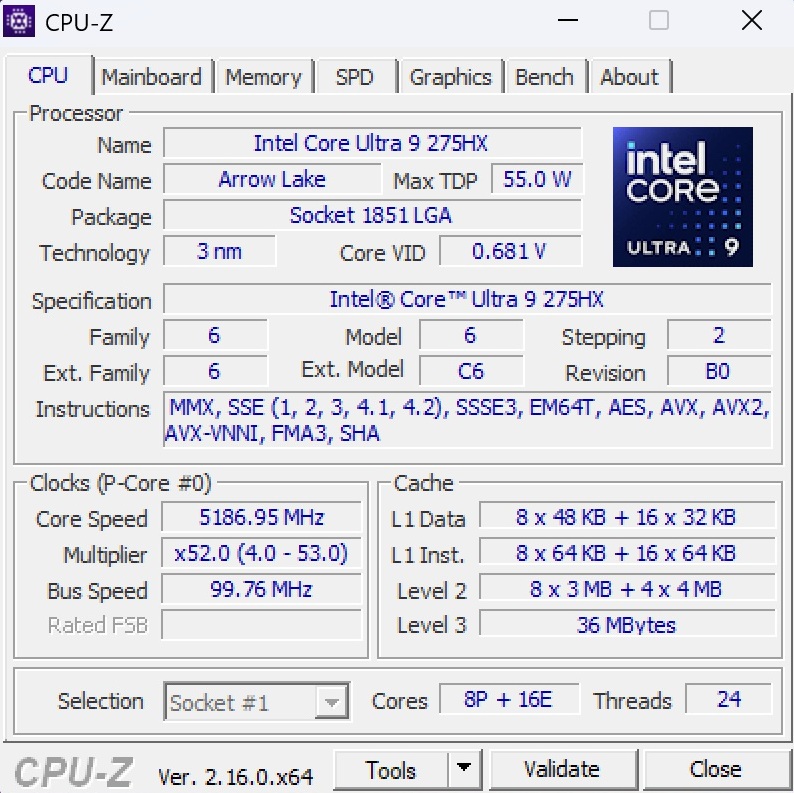
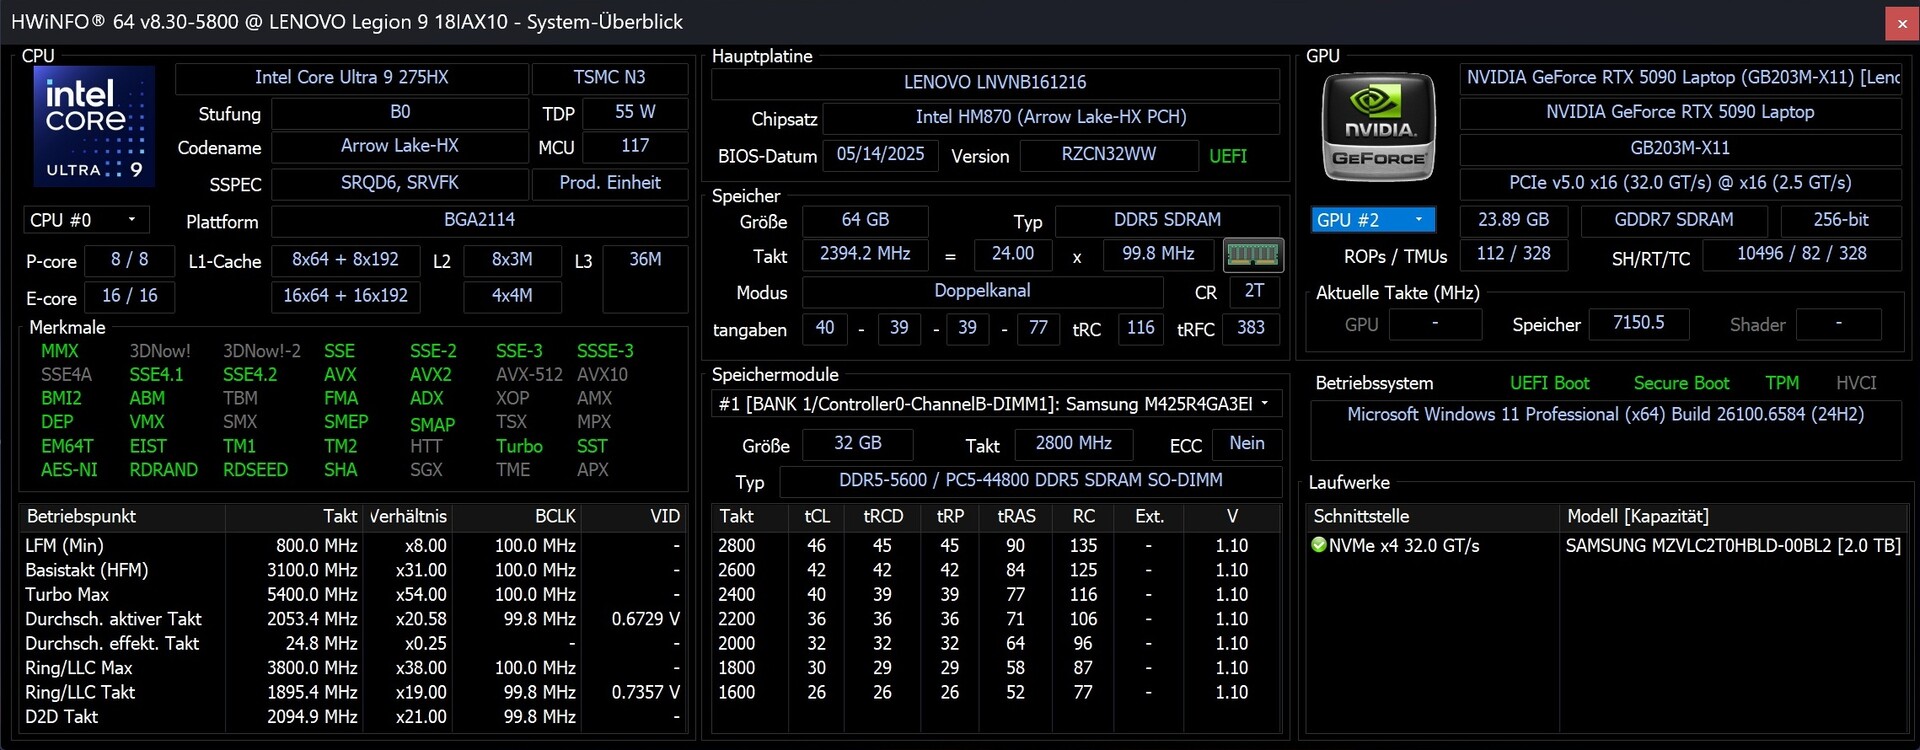
In terms of hardware, in the particular the CPU and GPU, the Legion 9 18IAX10 belongs to the absolute high-end segment.
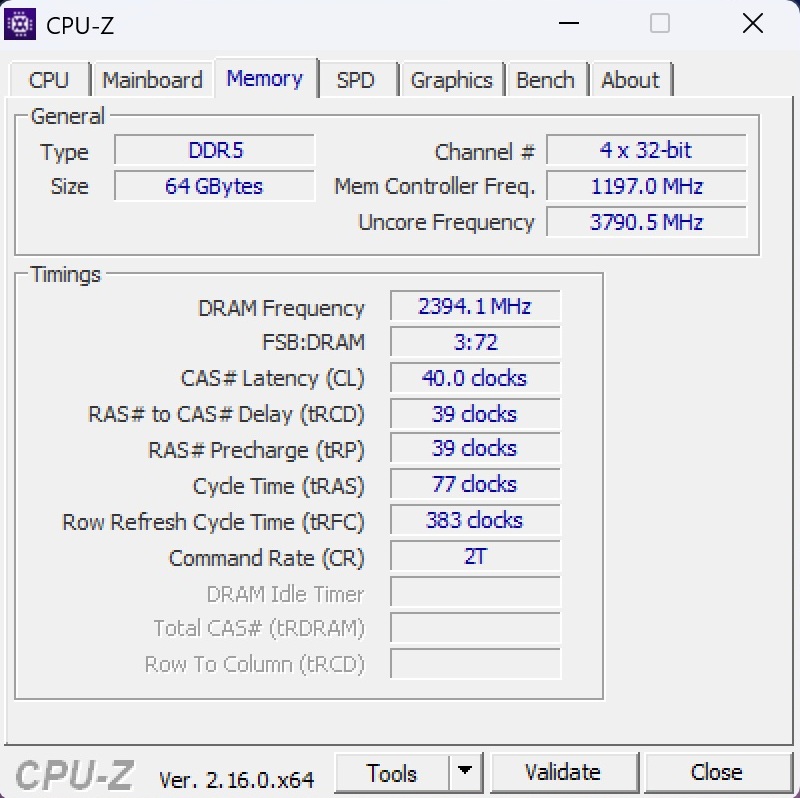
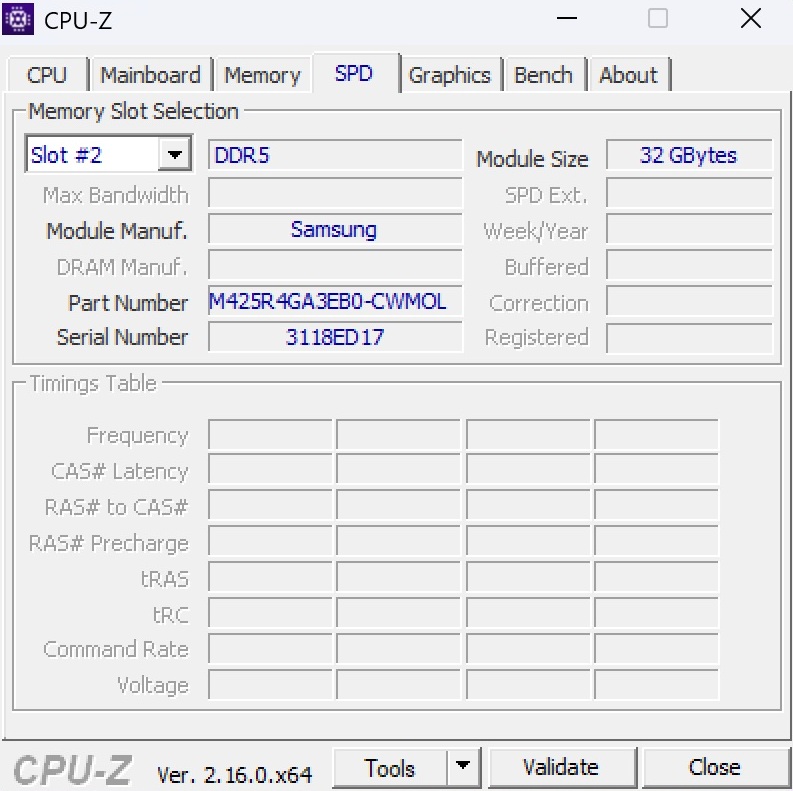
64 GB of RAM should also not quickly reach its limits for most users, but the built-in 2 TB SSD could have been larger considering the price of the test configuration.
Test conditions
The operating mode can be switched either via the Legion software or conveniently via the Fn + Q key combination. Unless otherwise stated, our measurements were taken in the Performance profile with GPU overclocking enabled.
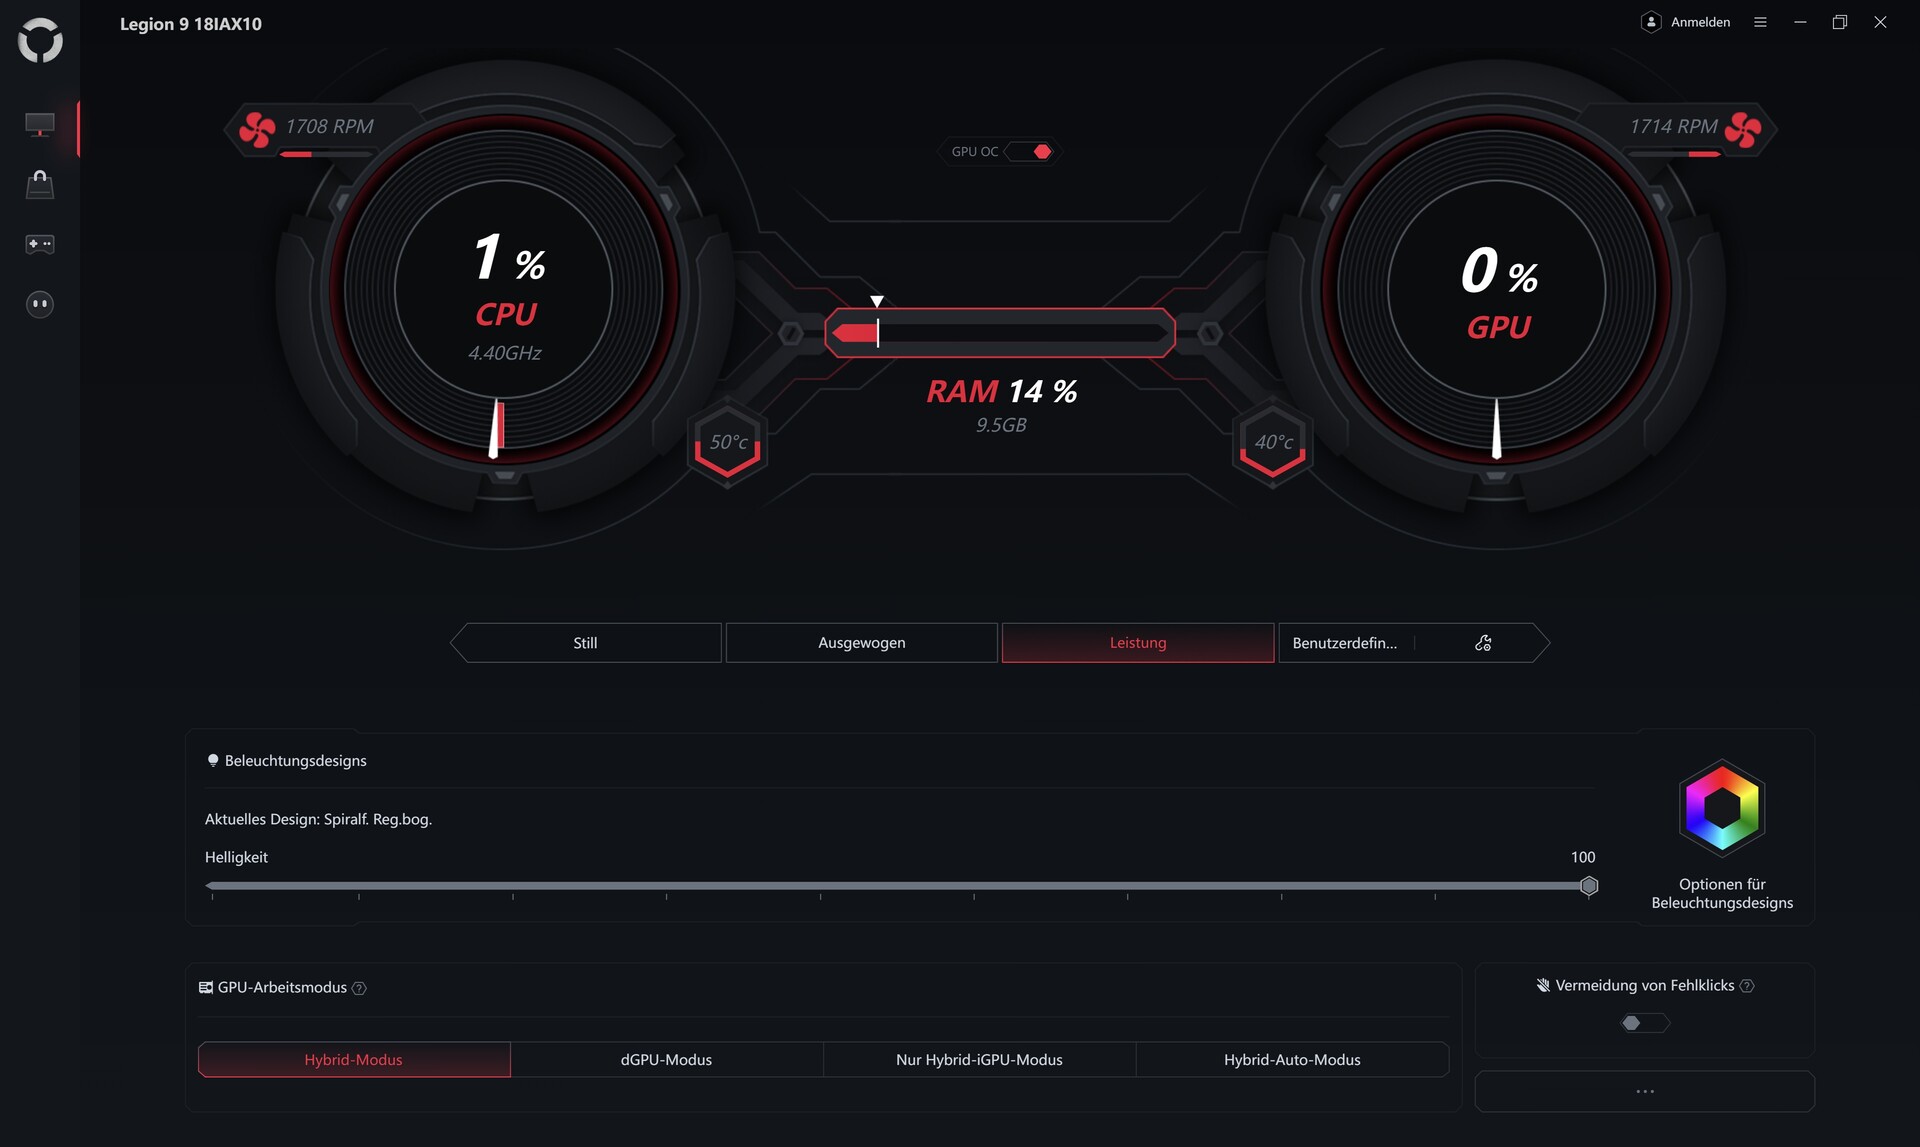
| Mode | Silent | Balanced + GPU OC | Performance + GPU OC |
| Cyberpunk 2077 Noise | 41 dB(A) | 49 dB(A) | 56 dB(A) |
| Cyberpunk 2077 Performance (FHD/Ultra) | 114 fps | 136 fps | 170 fps |
| Cyberpunk 2077 GPU Power Draw | ~75 W | ~95 W | ~165 W |
| Cinebench R15 Multi Score | 4124 Points | 5040 Points | 6013 Points |
| CPU PL1 | 56 W | 91 W | 171 W |
| CPU PL2 | 65 W | 125 W | 205 W |
Processor
The high PL1 and PL2 levels of the Intel Core Ultra 9 275HX ensure excellent performance in the CPU benchmarks, although this is also applicable to the Legion 9 18's competition, all of which are also equipped with a 275HX.
The results in the Cinebench R15 multi-core loop were also very stable, which speaks for good cooling.
Cinebench R15 Multi-core loop
* ... smaller is better
AIDA64: FP32 Ray-Trace | FPU Julia | CPU SHA3 | CPU Queen | FPU SinJulia | FPU Mandel | CPU AES | CPU ZLib | FP64 Ray-Trace | CPU PhotoWorxx
| Performance rating | |
| Lenovo Legion 9 18IAX10 | |
| Alienware 18 Area-51 | |
| Asus Strix Scar 18 G835LX | |
| Lenovo Legion 9 18IAX10 RTX 5090 | |
| Razer Blade 18 2025 RTX 5090 Laptop | |
| Average Intel Core Ultra 9 275HX | |
| Average of class Gaming | |
| AIDA64 / FP32 Ray-Trace | |
| Lenovo Legion 9 18IAX10 | |
| Asus Strix Scar 18 G835LX | |
| Lenovo Legion 9 18IAX10 RTX 5090 | |
| Alienware 18 Area-51 | |
| Average Intel Core Ultra 9 275HX (28039 - 39895, n=30) | |
| Razer Blade 18 2025 RTX 5090 Laptop | |
| Average of class Gaming (10227 - 85542, n=105, last 2 years) | |
| AIDA64 / FPU Julia | |
| Alienware 18 Area-51 | |
| Lenovo Legion 9 18IAX10 | |
| Lenovo Legion 9 18IAX10 RTX 5090 | |
| Asus Strix Scar 18 G835LX | |
| Razer Blade 18 2025 RTX 5090 Laptop | |
| Average Intel Core Ultra 9 275HX (140254 - 200744, n=30) | |
| Average of class Gaming (51376 - 238426, n=105, last 2 years) | |
| AIDA64 / CPU SHA3 | |
| Lenovo Legion 9 18IAX10 | |
| Asus Strix Scar 18 G835LX | |
| Alienware 18 Area-51 | |
| Lenovo Legion 9 18IAX10 RTX 5090 | |
| Razer Blade 18 2025 RTX 5090 Laptop | |
| Average Intel Core Ultra 9 275HX (6710 - 9817, n=30) | |
| Average of class Gaming (2180 - 10115, n=105, last 2 years) | |
| AIDA64 / CPU Queen | |
| Alienware 18 Area-51 | |
| Lenovo Legion 9 18IAX10 | |
| Asus Strix Scar 18 G835LX | |
| Lenovo Legion 9 18IAX10 RTX 5090 | |
| Razer Blade 18 2025 RTX 5090 Laptop | |
| Average Intel Core Ultra 9 275HX (113887 - 140937, n=30) | |
| Average of class Gaming (49785 - 173351, n=90, last 2 years) | |
| AIDA64 / FPU SinJulia | |
| Average of class Gaming (4424 - 33636, n=105, last 2 years) | |
| Lenovo Legion 9 18IAX10 | |
| Lenovo Legion 9 18IAX10 RTX 5090 | |
| Asus Strix Scar 18 G835LX | |
| Alienware 18 Area-51 | |
| Razer Blade 18 2025 RTX 5090 Laptop | |
| Average Intel Core Ultra 9 275HX (11172 - 14425, n=30) | |
| AIDA64 / FPU Mandel | |
| Lenovo Legion 9 18IAX10 | |
| Alienware 18 Area-51 | |
| Asus Strix Scar 18 G835LX | |
| Lenovo Legion 9 18IAX10 RTX 5090 | |
| Razer Blade 18 2025 RTX 5090 Laptop | |
| Average Intel Core Ultra 9 275HX (72596 - 104508, n=30) | |
| Average of class Gaming (25115 - 128721, n=105, last 2 years) | |
| AIDA64 / CPU AES | |
| Lenovo Legion 9 18IAX10 | |
| Lenovo Legion 9 18IAX10 RTX 5090 | |
| Asus Strix Scar 18 G835LX | |
| Alienware 18 Area-51 | |
| Razer Blade 18 2025 RTX 5090 Laptop | |
| Average Intel Core Ultra 9 275HX (105608 - 247074, n=30) | |
| Average of class Gaming (39258 - 247074, n=105, last 2 years) | |
| AIDA64 / CPU ZLib | |
| Lenovo Legion 9 18IAX10 RTX 5090 | |
| Lenovo Legion 9 18IAX10 | |
| Asus Strix Scar 18 G835LX | |
| Alienware 18 Area-51 | |
| Razer Blade 18 2025 RTX 5090 Laptop | |
| Average Intel Core Ultra 9 275HX (1582 - 2263, n=30) | |
| Average of class Gaming (574 - 2531, n=105, last 2 years) | |
| AIDA64 / FP64 Ray-Trace | |
| Lenovo Legion 9 18IAX10 | |
| Alienware 18 Area-51 | |
| Lenovo Legion 9 18IAX10 RTX 5090 | |
| Asus Strix Scar 18 G835LX | |
| Average Intel Core Ultra 9 275HX (14847 - 21854, n=30) | |
| Razer Blade 18 2025 RTX 5090 Laptop | |
| Average of class Gaming (5509 - 45446, n=105, last 2 years) | |
| AIDA64 / CPU PhotoWorxx | |
| Alienware 18 Area-51 | |
| Razer Blade 18 2025 RTX 5090 Laptop | |
| Asus Strix Scar 18 G835LX | |
| Average Intel Core Ultra 9 275HX (37482 - 62916, n=30) | |
| Lenovo Legion 9 18IAX10 RTX 5090 | |
| Lenovo Legion 9 18IAX10 | |
| Average of class Gaming (12271 - 89891, n=105, last 2 years) | |
System performance
In terms of system performance, the Legion 9 18 and its rivals are also close to each other, which means any differences in daily productivity tasks are hardly noticeable in practice.
PCMark 10: Essentials
CrossMark: Overall | Productivity | Creativity | Responsiveness
WebXPRT 3: Overall
WebXPRT 4: Overall
Mozilla Kraken 1.1: Total
| Performance rating | |
| Alienware 18 Area-51 | |
| Lenovo Legion 9 18IAX10 | |
| Razer Blade 18 2025 RTX 5090 Laptop | |
| Asus Strix Scar 18 G835LX | |
| Lenovo Legion 9 18IAX10 RTX 5090 | |
| Average Intel Core Ultra 9 275HX, NVIDIA GeForce RTX 5090 Laptop | |
| Average of class Gaming | |
| PCMark 10 / Essentials | |
| Lenovo Legion 9 18IAX10 | |
| Alienware 18 Area-51 | |
| Asus Strix Scar 18 G835LX | |
| Average Intel Core Ultra 9 275HX, NVIDIA GeForce RTX 5090 Laptop (9994 - 11369, n=12) | |
| Razer Blade 18 2025 RTX 5090 Laptop | |
| Average of class Gaming (8810 - 11935, n=97, last 2 years) | |
| Lenovo Legion 9 18IAX10 RTX 5090 | |
| CrossMark / Overall | |
| Alienware 18 Area-51 | |
| Razer Blade 18 2025 RTX 5090 Laptop | |
| Asus Strix Scar 18 G835LX | |
| Lenovo Legion 9 18IAX10 | |
| Average Intel Core Ultra 9 275HX, NVIDIA GeForce RTX 5090 Laptop (1995 - 2339, n=12) | |
| Lenovo Legion 9 18IAX10 RTX 5090 | |
| Average of class Gaming (1366 - 2409, n=94, last 2 years) | |
| CrossMark / Productivity | |
| Alienware 18 Area-51 | |
| Razer Blade 18 2025 RTX 5090 Laptop | |
| Lenovo Legion 9 18IAX10 | |
| Average Intel Core Ultra 9 275HX, NVIDIA GeForce RTX 5090 Laptop (1847 - 2211, n=12) | |
| Asus Strix Scar 18 G835LX | |
| Lenovo Legion 9 18IAX10 RTX 5090 | |
| Average of class Gaming (1386 - 2254, n=94, last 2 years) | |
| CrossMark / Creativity | |
| Razer Blade 18 2025 RTX 5090 Laptop | |
| Asus Strix Scar 18 G835LX | |
| Lenovo Legion 9 18IAX10 RTX 5090 | |
| Alienware 18 Area-51 | |
| Lenovo Legion 9 18IAX10 | |
| Average Intel Core Ultra 9 275HX, NVIDIA GeForce RTX 5090 Laptop (2170 - 2642, n=12) | |
| Average of class Gaming (1343 - 2786, n=94, last 2 years) | |
| CrossMark / Responsiveness | |
| Alienware 18 Area-51 | |
| Lenovo Legion 9 18IAX10 | |
| Razer Blade 18 2025 RTX 5090 Laptop | |
| Average Intel Core Ultra 9 275HX, NVIDIA GeForce RTX 5090 Laptop (1673 - 2217, n=12) | |
| Asus Strix Scar 18 G835LX | |
| Lenovo Legion 9 18IAX10 RTX 5090 | |
| Average of class Gaming (1226 - 2334, n=94, last 2 years) | |
| WebXPRT 3 / Overall | |
| Lenovo Legion 9 18IAX10 | |
| Lenovo Legion 9 18IAX10 RTX 5090 | |
| Alienware 18 Area-51 | |
| Razer Blade 18 2025 RTX 5090 Laptop | |
| Average Intel Core Ultra 9 275HX, NVIDIA GeForce RTX 5090 Laptop (315 - 372, n=12) | |
| Asus Strix Scar 18 G835LX | |
| Average of class Gaming (220 - 532, n=98, last 2 years) | |
| WebXPRT 4 / Overall | |
| Alienware 18 Area-51 | |
| Asus Strix Scar 18 G835LX | |
| Lenovo Legion 9 18IAX10 | |
| Lenovo Legion 9 18IAX10 RTX 5090 | |
| Average Intel Core Ultra 9 275HX, NVIDIA GeForce RTX 5090 Laptop (301 - 341, n=11) | |
| Razer Blade 18 2025 RTX 5090 Laptop | |
| Average of class Gaming (165 - 354, n=98, last 2 years) | |
| Mozilla Kraken 1.1 / Total | |
| Average of class Gaming (391 - 590, n=100, last 2 years) | |
| Lenovo Legion 9 18IAX10 | |
| Lenovo Legion 9 18IAX10 RTX 5090 | |
| Average Intel Core Ultra 9 275HX, NVIDIA GeForce RTX 5090 Laptop (402 - 424, n=12) | |
| Razer Blade 18 2025 RTX 5090 Laptop | |
| Asus Strix Scar 18 G835LX | |
| Alienware 18 Area-51 | |
* ... smaller is better
| AIDA64 / Memory Copy | |
| Alienware 18 Area-51 | |
| Asus Strix Scar 18 G835LX | |
| Razer Blade 18 2025 RTX 5090 Laptop | |
| Lenovo Legion 9 18IAX10 | |
| Average Intel Core Ultra 9 275HX (56003 - 94460, n=30) | |
| Lenovo Legion 9 18IAX10 RTX 5090 | |
| Average of class Gaming (21750 - 129946, n=105, last 2 years) | |
| AIDA64 / Memory Read | |
| Alienware 18 Area-51 | |
| Asus Strix Scar 18 G835LX | |
| Razer Blade 18 2025 RTX 5090 Laptop | |
| Average Intel Core Ultra 9 275HX (55795 - 97151, n=30) | |
| Lenovo Legion 9 18IAX10 | |
| Lenovo Legion 9 18IAX10 RTX 5090 | |
| Average of class Gaming (22956 - 118858, n=105, last 2 years) | |
| AIDA64 / Memory Write | |
| Razer Blade 18 2025 RTX 5090 Laptop | |
| Lenovo Legion 9 18IAX10 | |
| Alienware 18 Area-51 | |
| Asus Strix Scar 18 G835LX | |
| Average Intel Core Ultra 9 275HX (55663 - 116129, n=30) | |
| Average of class Gaming (22297 - 135096, n=105, last 2 years) | |
| Lenovo Legion 9 18IAX10 RTX 5090 | |
| AIDA64 / Memory Latency | |
| Lenovo Legion 9 18IAX10 | |
| Average Intel Core Ultra 9 275HX (105.8 - 161.6, n=30) | |
| Razer Blade 18 2025 RTX 5090 Laptop | |
| Lenovo Legion 9 18IAX10 RTX 5090 | |
| Alienware 18 Area-51 | |
| Asus Strix Scar 18 G835LX | |
| Average of class Gaming (75.3 - 259, n=105, last 2 years) | |
* ... smaller is better
DPC latency
Significantly greater deviations are evident when it comes to DPC latency. As is so often the case, the values determined are not ideal.
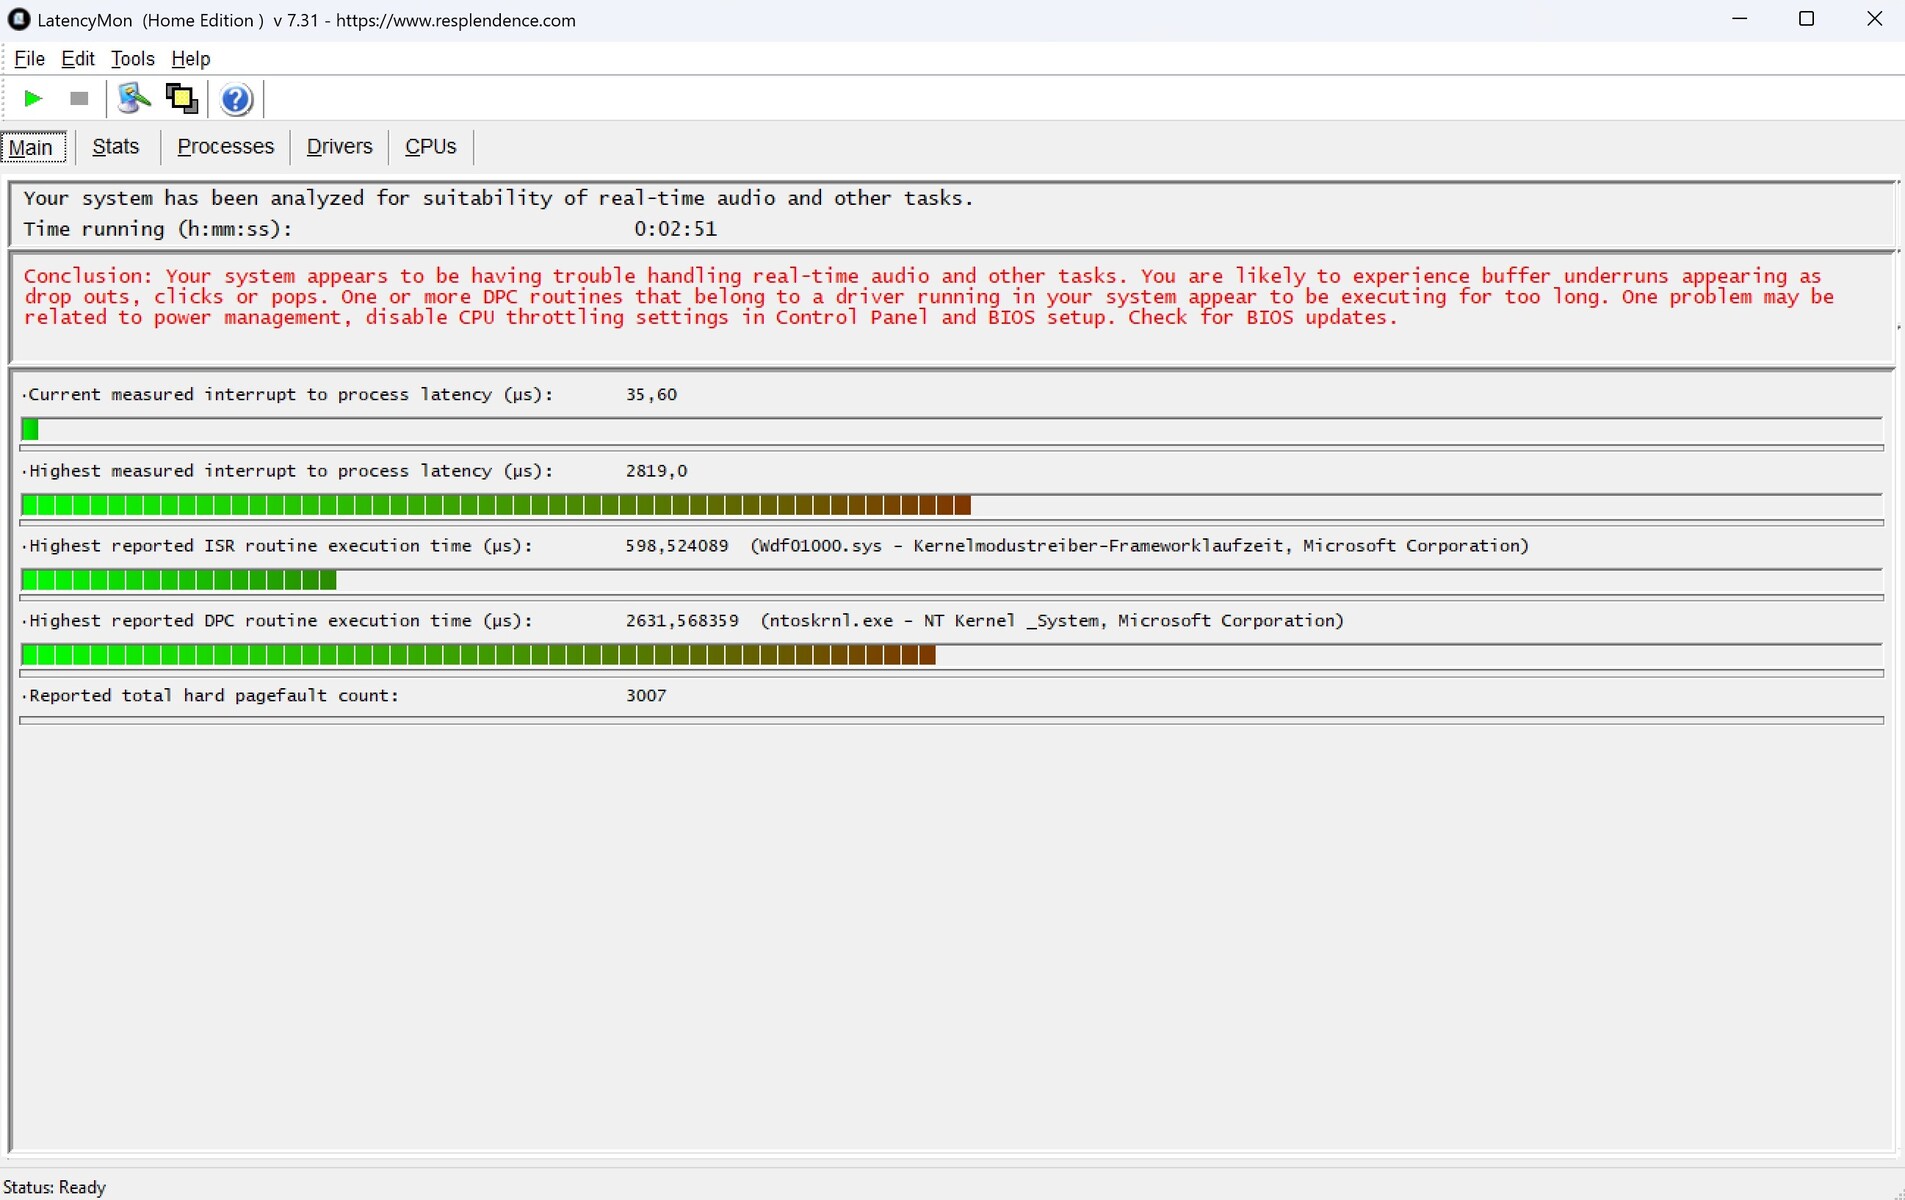
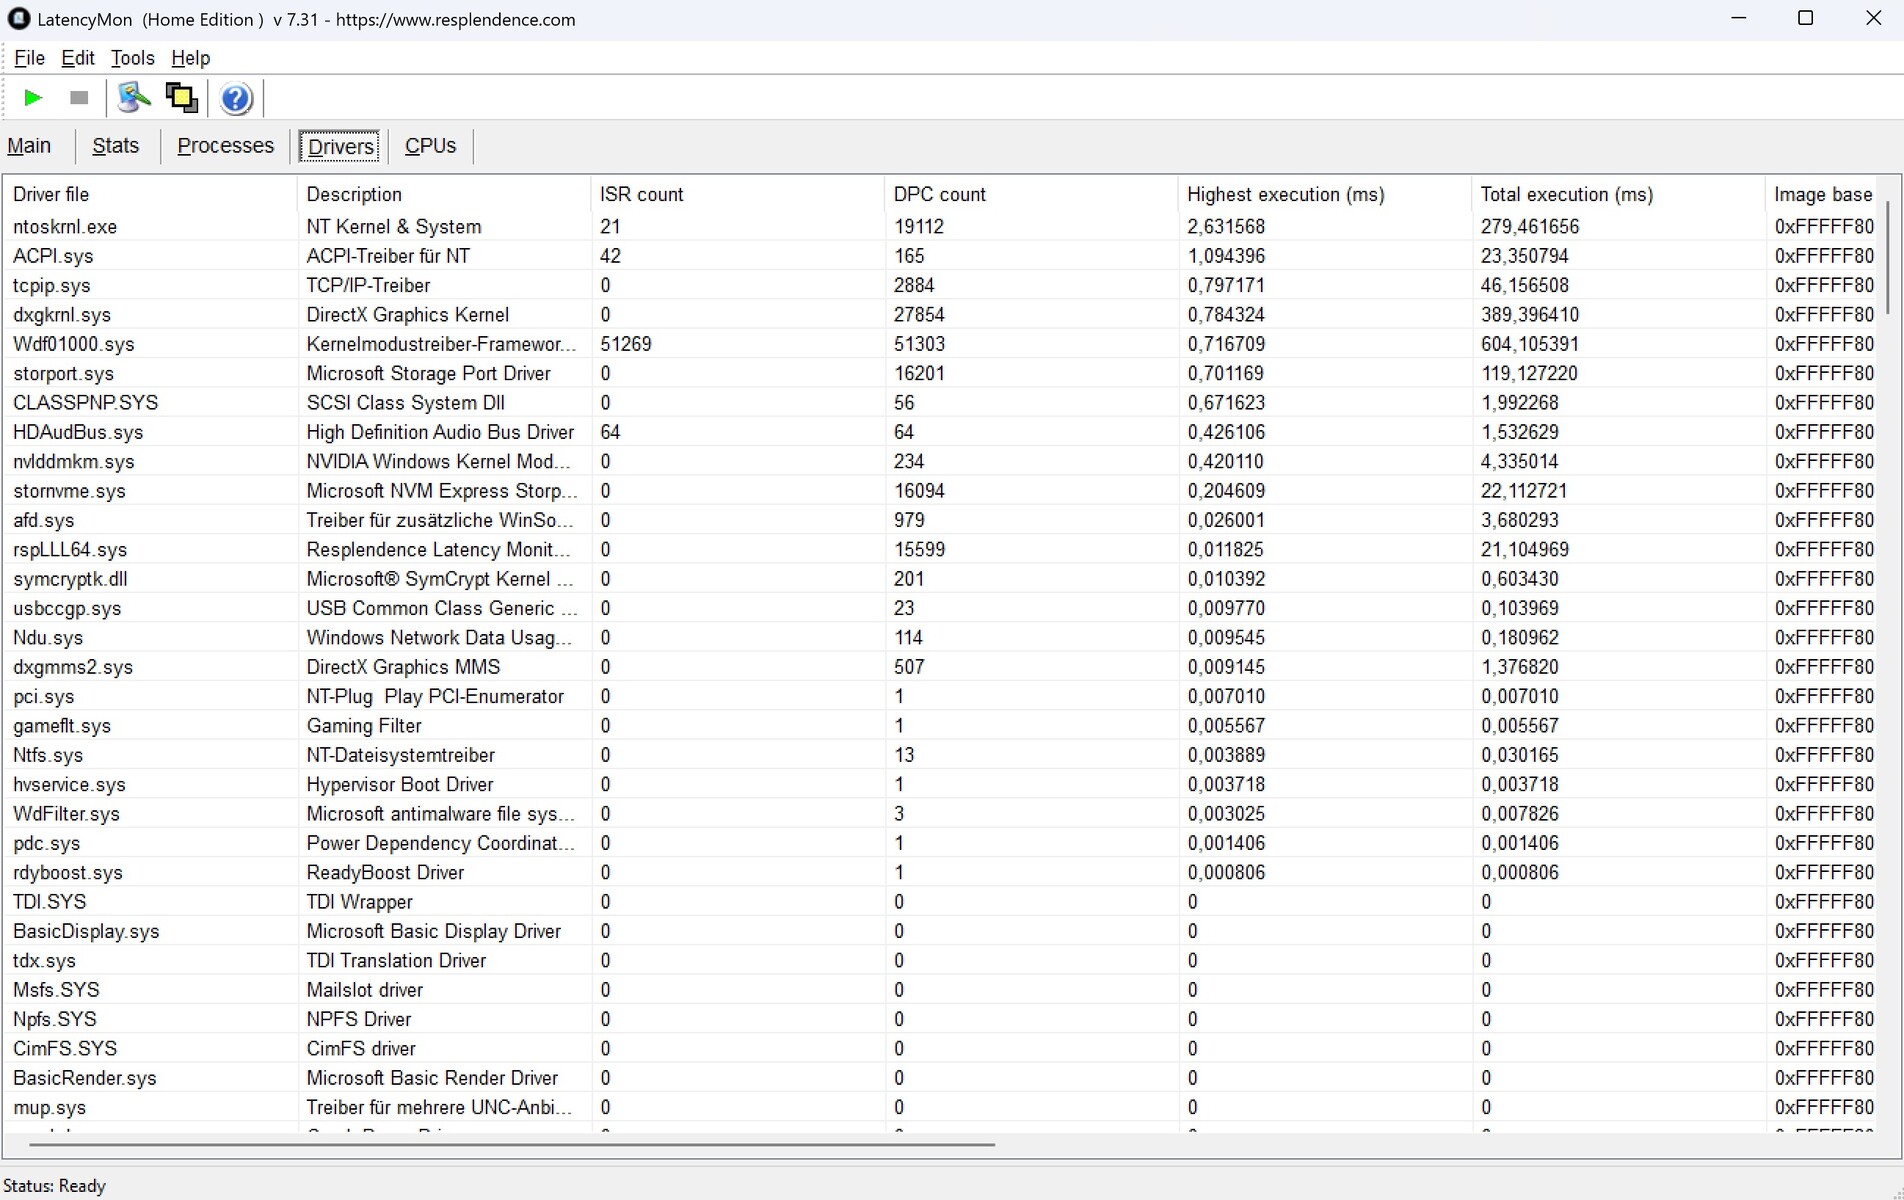
| DPC Latencies / LatencyMon - interrupt to process latency (max), Web, Youtube, Prime95 | |
| Alienware 18 Area-51 | |
| Lenovo Legion 9 18IAX10 RTX 5090 | |
| Lenovo Legion 9 18IAX10 | |
| Razer Blade 18 2025 RTX 5090 Laptop | |
| Asus Strix Scar 18 G835LX | |
* ... smaller is better
Storage devices
The included 2 TB drive leaves us with mixed feelings. Although Samsung's NVMe SSD is generally very performant and ideally cracks the 10,000 MB/s mark, throttling occurred after a while in our loop test, which did not happen with the competition or the RTX 5080 version of the Legion 9 18.

* ... smaller is better
Read continuous performance: DiskSpd Read Loop, Queue Depth 8
GPU performance
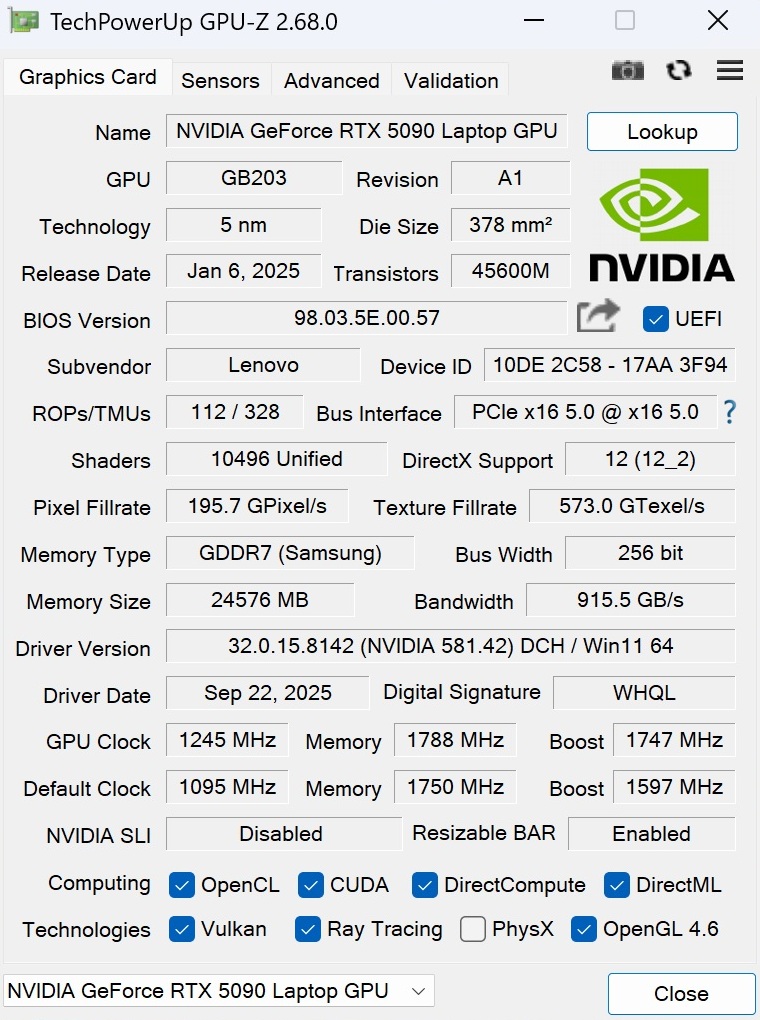
The Legion 9 18's RTX 5090 Laptop GPU proves to be the biggest highlight. In overall 3DMark tests, the Legion 9 outperforms all other RTX 5090 laptops, although its RTX 5080 brother trails by less than 10%.
However, the RTX 5090 offers greater futureproofing considering its 24 GB GDDR7 VRAM.
| 3DMark 11 Performance | 54833 points | |
| 3DMark Cloud Gate Standard Score | 74154 points | |
| 3DMark Fire Strike Score | 41019 points | |
| 3DMark Time Spy Score | 23942 points | |
Help | ||
* ... smaller is better
Gaming performance
The RTX 5090 is currently more or less the only laptop GPU that is well suited for UHD displays in terms of raw performance. With the exception of poorly optimized games such as Borderlands 4 and Oblivion Remastered nearly all current titles run smoothly with maximum details in the native 3,840 x 2,160 resolution.
If things do get tight, upscaling helps as usual. For example, the frame rate in Borderlands 4 with the inclusion of DLSS4 climbs from 20 to 38 fps in the UHD Badass preset.
If you also add 4x multi-frame generation, it gets even higher at 118 fps. However, the subjective gaming experience is not perfect in this case, to put it mildly, due to fluctuating frame times.
| GTA V - 1920x1080 Highest AA:4xMSAA + FX AF:16x | |
| Lenovo Legion 9 18IAX10 RTX 5090 | |
| Razer Blade 18 2025 RTX 5090 Laptop | |
| Asus Strix Scar 18 G835LX | |
| Average NVIDIA GeForce RTX 5090 Laptop (102.9 - 186.9, n=19) | |
| Average of class Gaming (48.3 - 186.9, n=94, last 2 years) | |
| low | med. | high | ultra | QHD DLSS | QHD | 4K DLSS | 4K | |
|---|---|---|---|---|---|---|---|---|
| GTA V (2015) | 184.3 | 183.9 | 164.5 | 163.8 | ||||
| Dota 2 Reborn (2015) | 201 | 184.8 | 180.1 | |||||
| Final Fantasy XV Benchmark (2018) | 209 | 176.7 | 111.8 | |||||
| X-Plane 11.11 (2018) | 118.7 | 97.1 | ||||||
| Strange Brigade (2018) | 479 | 443 | 333 | 182.2 | ||||
| Baldur's Gate 3 (2023) | 209 | 209 | 158.3 | 88.5 | ||||
| Cyberpunk 2077 (2023) | 185 | 169.9 | 122.8 | 55.1 | ||||
| Horizon Forbidden West (2024) | 140.7 | 140.3 | 100.9 | 81 | 59.5 | |||
| Ghost of Tsushima (2024) | 115.1 | 108.1 | 100.3 | 94.4 | 62 | |||
| Senua's Saga Hellblade 2 (2024) | 86.1 | 63.1 | 61.8 | 37.5 | ||||
| Space Marine 2 (2024) | 108.5 | 108 | 107.4 | 94.7 | 69.6 | |||
| Until Dawn (2024) | 116.6 | 104 | 76.6 | 63.2 | 45.4 | |||
| Stalker 2 (2024) | 167.8 | 147.6 | 110.7 | 92.7 | 65.4 | |||
| The Elder Scrolls IV Oblivion Remastered (2025) | 111.8 | 61.9 | 45.9 | 41.6 | 27.3 | |||
| Doom: The Dark Ages (2025) | 133.2 | 128.9 | 92.2 | 75.6 | 52.2 | |||
| Borderlands 4 (2025) | 76.6 | 54 | 37.1 | 117.5 | 20.2 | |||
| Battlefield 6 (2025) | 181.4 | 169.4 | 159.9 | 145.8 | 136.7 | 108.5 | 82.5 | 59.7 |
| Borderlands 4 | |
| 3840x2160 Badass Preset AA:FX | |
| Lenovo Legion 9 18IAX10 RTX 5090 | |
| Average of class Gaming (n=1last 2 years) | |
| 3840x2160 Badass Preset + Quality DLSS + Max. FG | |
| Lenovo Legion 9 18IAX10 RTX 5090 | |
| Average of class Gaming (n=1last 2 years) | |
| Doom: The Dark Ages | |
| 3840x2160 Ultra Nightmare AA:T | |
| Lenovo Legion 9 18IAX10 RTX 5090 | |
| Average of class Gaming (11.7 - 52.2, n=6, last 2 years) | |
| 3840x2160 Ultra Nightmare - DLSS Quality | |
| Lenovo Legion 9 18IAX10 RTX 5090 | |
| Average of class Gaming (14.2 - 75.6, n=7, last 2 years) | |
| The Elder Scrolls IV Oblivion Remastered | |
| 3840x2160 Ultra Preset AA:T | |
| Lenovo Legion 9 18IAX10 RTX 5090 | |
| Average of class Gaming (17.9 - 27.3, n=2, last 2 years) | |
| 3840x2160 Ultra Preset + Quality DLSS | |
| Lenovo Legion 9 18IAX10 RTX 5090 | |
| Average of class Gaming (31.2 - 41.6, n=2, last 2 years) | |
| Stalker 2 | |
| 3840x2160 Epic Preset | |
| Lenovo Legion 9 18IAX10 RTX 5090 | |
| Average of class Gaming (28.2 - 65.4, n=2, last 2 years) | |
| 3840x2160 Epic Preset + Quality DLSS + FG | |
| Lenovo Legion 9 18IAX10 RTX 5090 | |
| Average of class Gaming (55.6 - 92.7, n=2, last 2 years) | |
| Until Dawn | |
| 3840x2160 Ultra Preset | |
| Lenovo Legion 9 18IAX10 RTX 5090 | |
| Average of class Gaming (n=1last 2 years) | |
| 3840x2160 Ultra Preset + Quality DLSS + Ray Tracing | |
| Lenovo Legion 9 18IAX10 RTX 5090 | |
| Average of class Gaming (n=1last 2 years) | |
| Space Marine 2 | |
| 3840x2160 Ultra Preset AA:T | |
| Lenovo Legion 9 18IAX10 RTX 5090 | |
| Average of class Gaming (n=1last 2 years) | |
| 3840x2160 Ultra Preset + Quality DLSS | |
| Lenovo Legion 9 18IAX10 RTX 5090 | |
| Average of class Gaming (n=1last 2 years) | |
| Senua's Saga Hellblade 2 | |
| 3840x2160 High Preset | |
| Lenovo Legion 9 18IAX10 RTX 5090 | |
| Average of class Gaming (n=1last 2 years) | |
| 3840x2160 High Preset + Quality DLSS | |
| Lenovo Legion 9 18IAX10 RTX 5090 | |
| Average of class Gaming (n=1last 2 years) | |
| Ghost of Tsushima | |
| 3840x2160 Very High Preset AA:T | |
| Lenovo Legion 9 18IAX10 RTX 5090 | |
| Average of class Gaming (n=1last 2 years) | |
| 3840x2160 Very High Preset + Quality DLSS | |
| Lenovo Legion 9 18IAX10 RTX 5090 | |
| Average of class Gaming (n=1last 2 years) | |
| Horizon Forbidden West | |
| 3840x2160 Very High Preset AA:T | |
| Lenovo Legion 9 18IAX10 RTX 5090 | |
| Average of class Gaming (n=1last 2 years) | |
| 3840x2160 Very High Preset + Quality DLSS | |
| Lenovo Legion 9 18IAX10 RTX 5090 | |
| Average of class Gaming (n=1last 2 years) | |
We have analyzed how the 3D performance behaves over a longer period of time using Cyberpunk 2077. The fps values were relatively consistent apart from minor fluctuations.
Cyberpunk 2077 Ultra fps chart
Emissions
Noise emissions
The above-average performance takes its toll in the form of an above-average noise level. 56 dB(A) while playing Cyberpunk 2077 is among the highest values we've observed.
However, the competition is also quite loud at 48 to 54 dB(A), so it's best to use a headset when gaming.
When idle, the fans of the Legion 9 18 remain much quieter and sometimes switch off completely.
Noise level
| Idle |
| 24 / 30 / 32 dB(A) |
| Load |
| 46 / 56 dB(A) |
 | ||
30 dB silent 40 dB(A) audible 50 dB(A) loud |
||
min: | ||
| Lenovo Legion 9 18IAX10 RTX 5090 Ultra 9 275HX, GeForce RTX 5090 Laptop | Alienware 18 Area-51 Ultra 9 275HX, GeForce RTX 5090 Laptop | Asus Strix Scar 18 G835LX Ultra 9 275HX, GeForce RTX 5090 Laptop | Razer Blade 18 2025 RTX 5090 Laptop Ultra 9 275HX, GeForce RTX 5090 Laptop | Lenovo Legion 9 18IAX10 Ultra 9 275HX, GeForce RTX 5080 Laptop | |
|---|---|---|---|---|---|
| Noise | 1% | 0% | 12% | 8% | |
| off / environment * (dB) | 24 | 23.4 2% | 23.3 3% | 23.4 2% | 23.3 3% |
| Idle Minimum * (dB) | 24 | 30.2 -26% | 29.8 -24% | 23.4 2% | 23.3 3% |
| Idle Average * (dB) | 30 | 30.6 -2% | 29.8 1% | 23.4 22% | 23.3 22% |
| Idle Maximum * (dB) | 32 | 30.6 4% | 29.8 7% | 23.4 27% | 29.1 9% |
| Load Average * (dB) | 46 | 38 17% | 42.9 7% | 40.4 12% | 46.8 -2% |
| Cyberpunk 2077 ultra * (dB) | 56 | 48.9 13% | 53.7 4% | 48.2 14% | 49.6 11% |
| Load Maximum * (dB) | 56 | 55.9 -0% | 53.7 4% | 53.5 4% | 49.6 11% |
* ... smaller is better
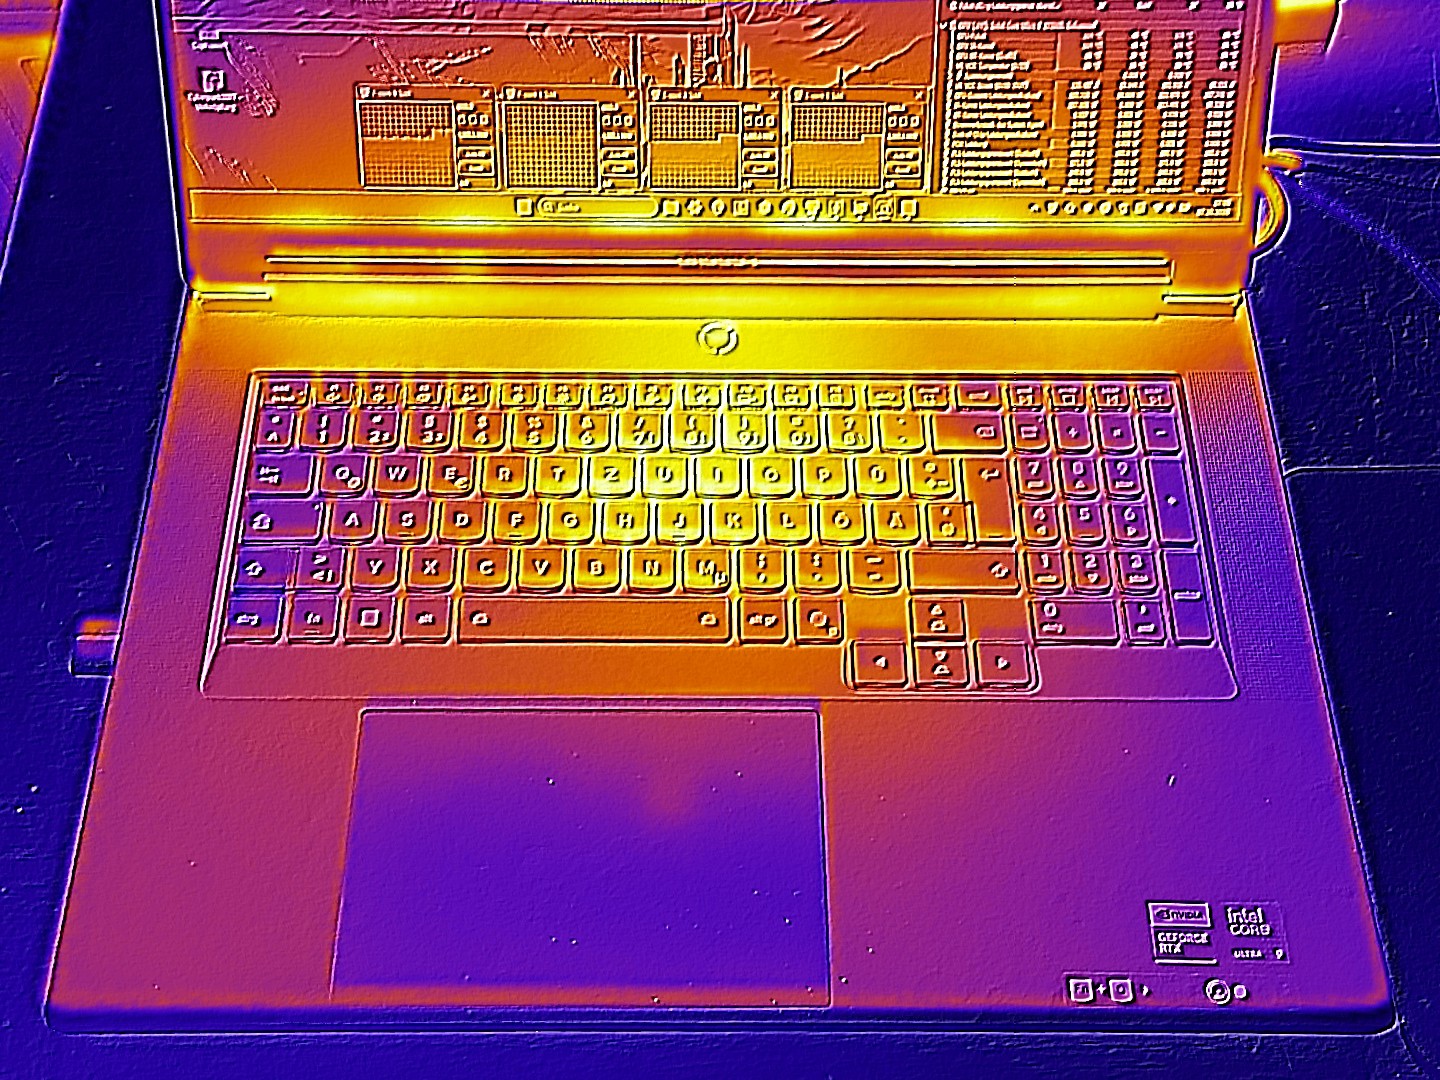
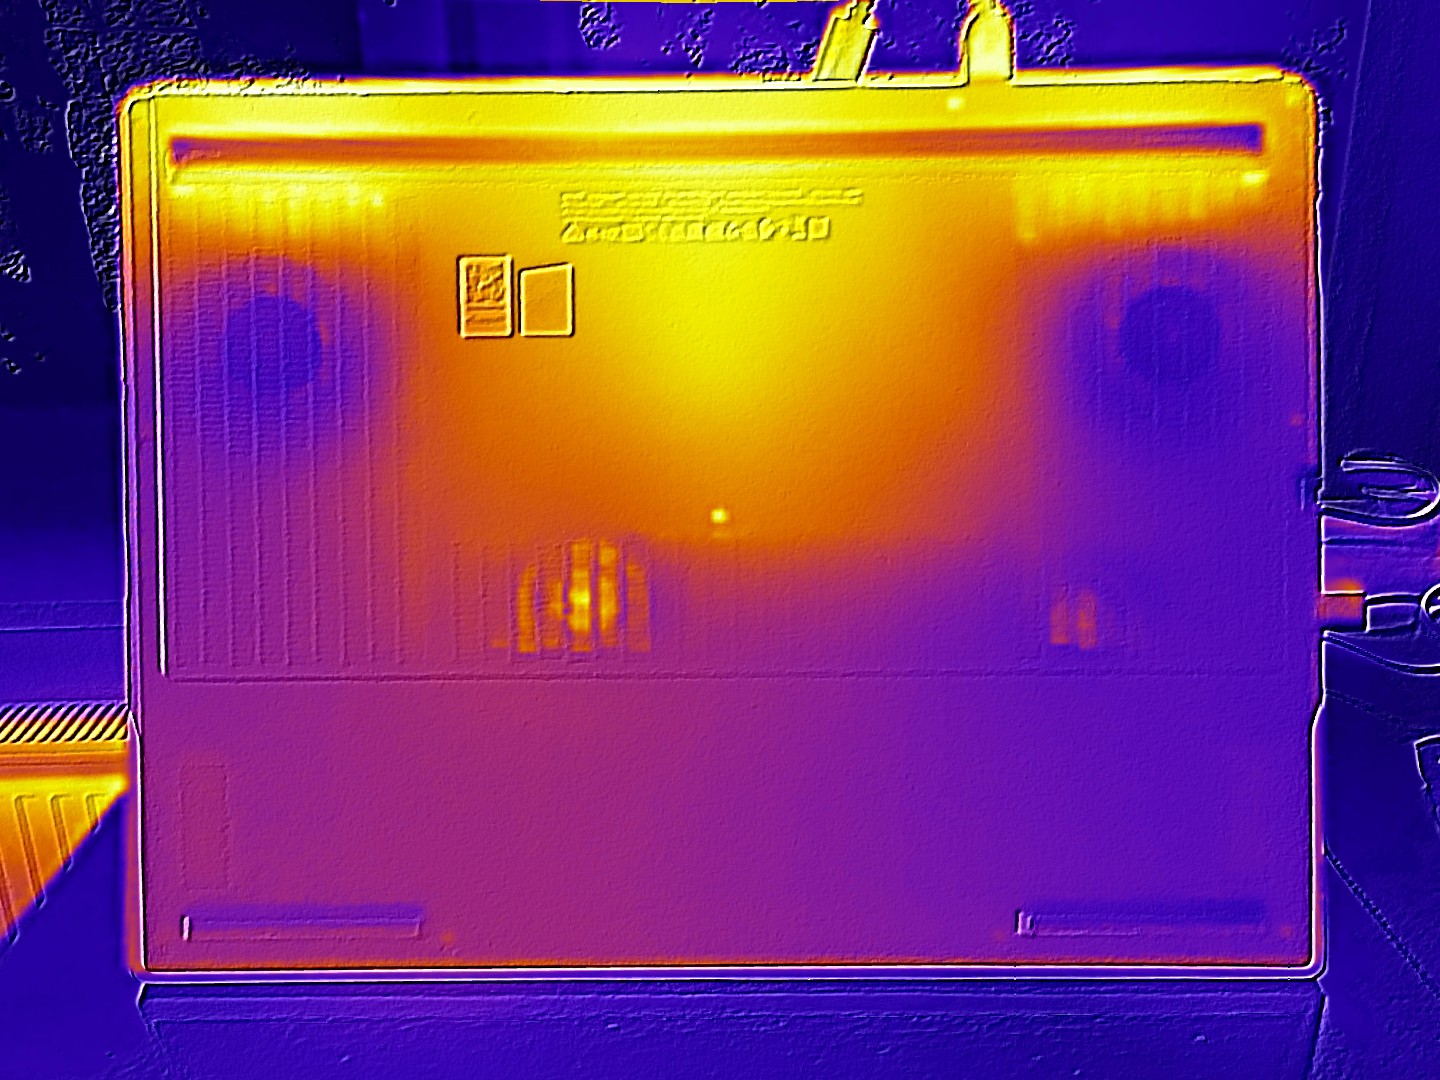
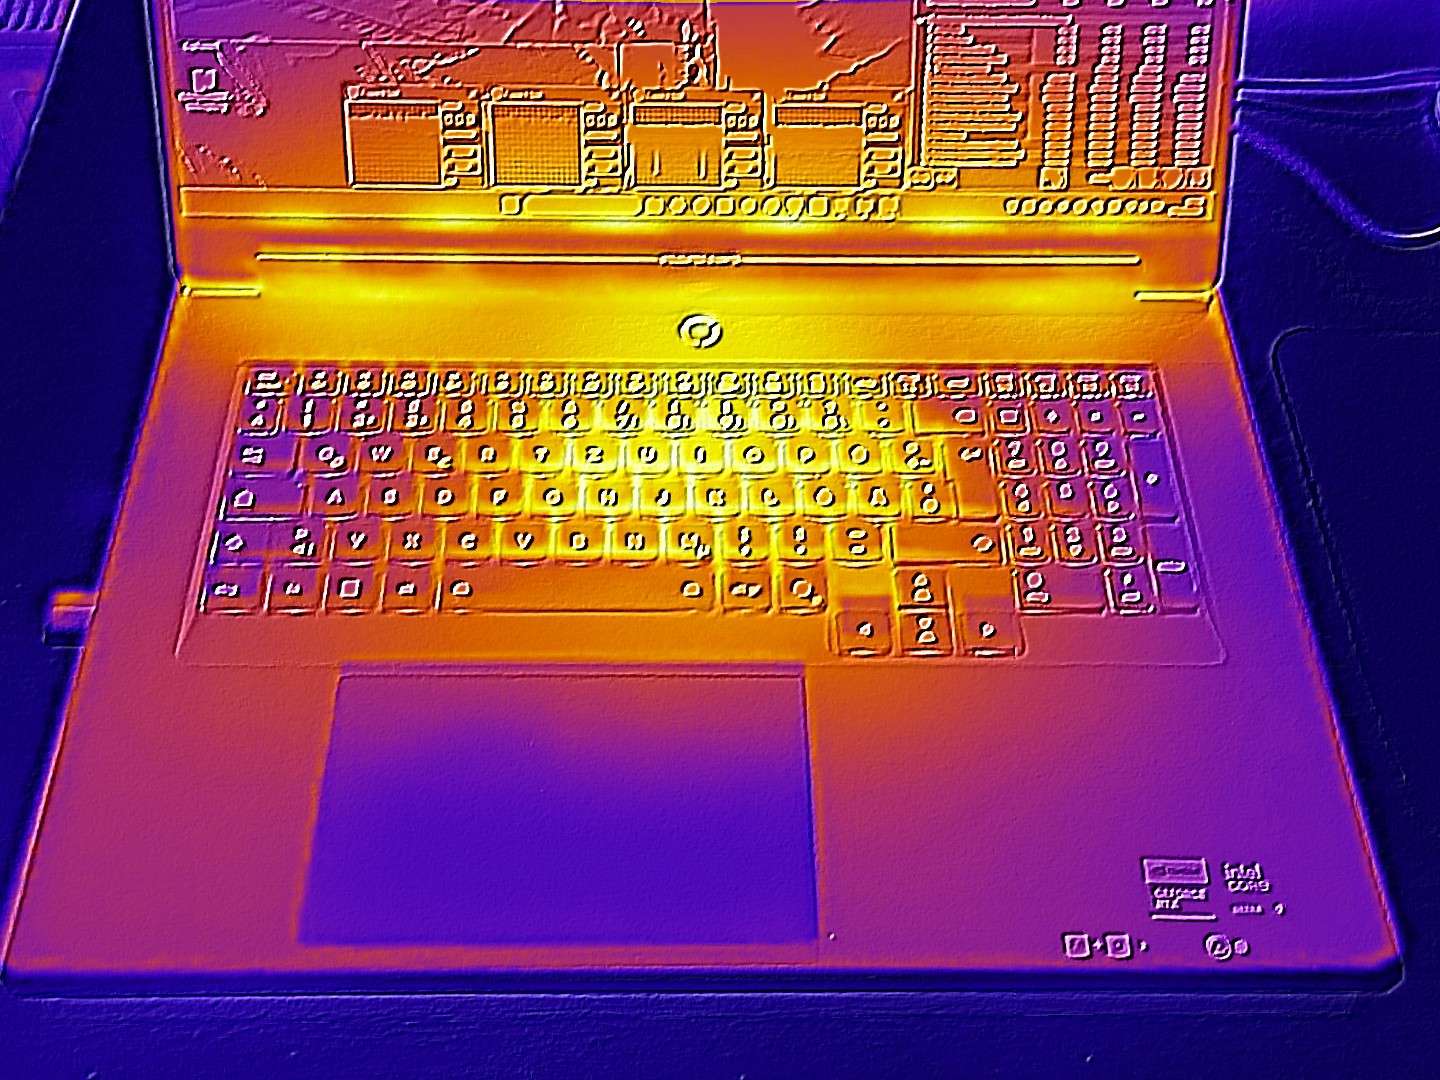
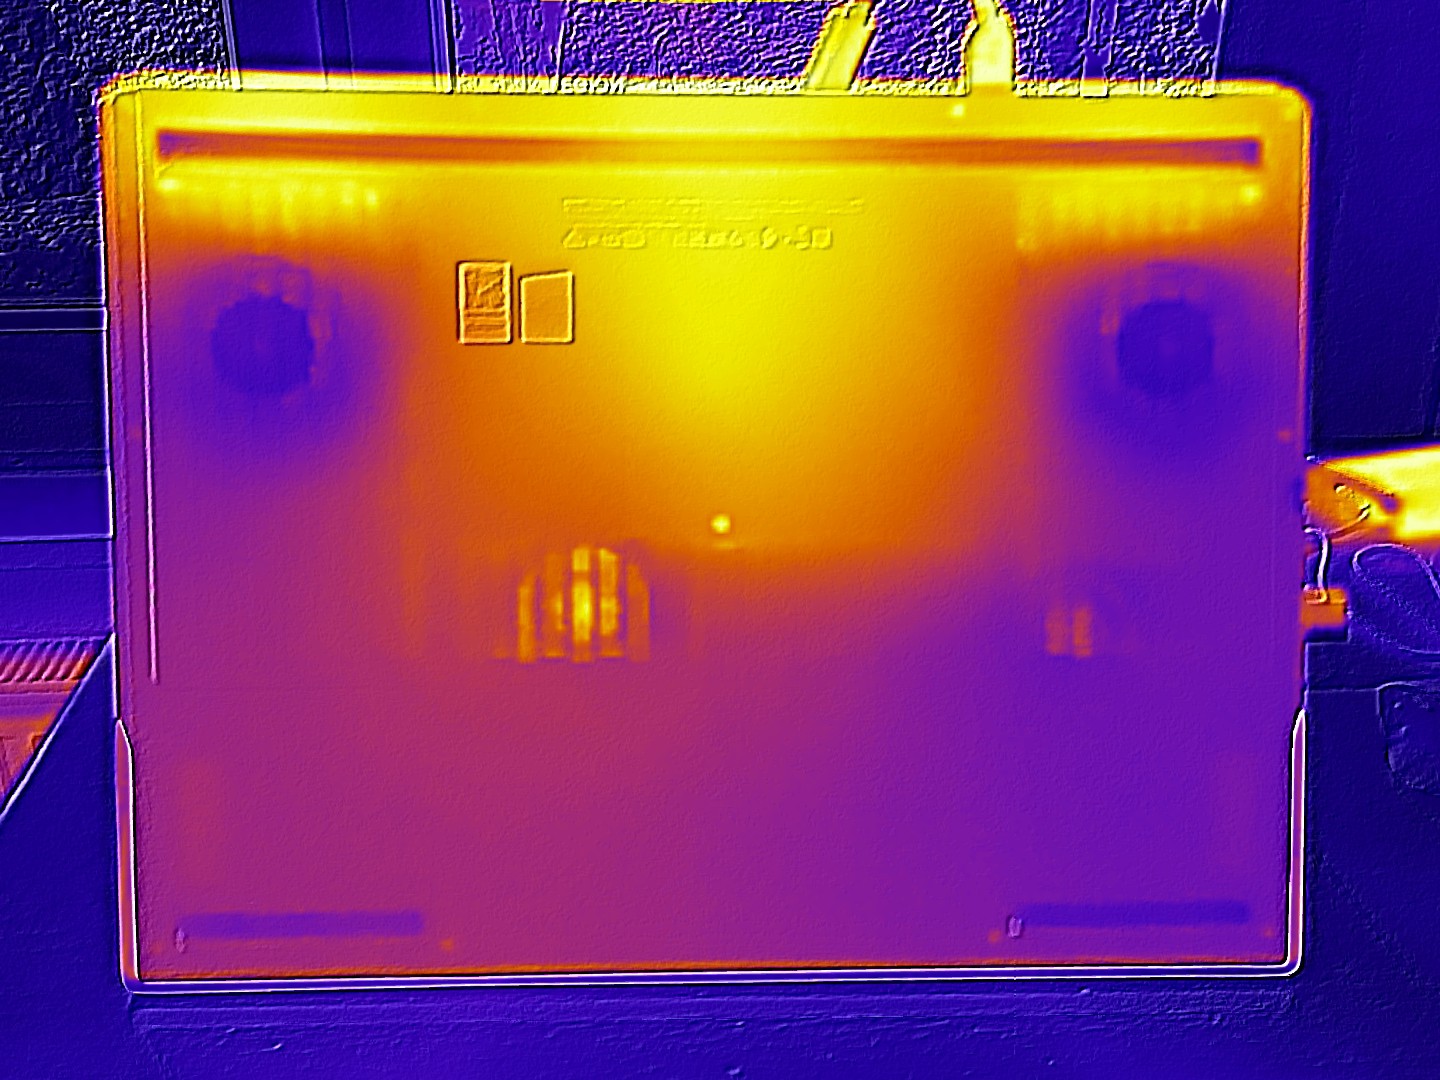
Temperature
As with the RTX 5080 model, the temperature development is somewhat curious. While the Legion 9 18 already gets relatively warm in idle mode, the chassis surfaces barely heat up under load but sometimes reach similar values.
(±) The maximum temperature on the upper side is 41 °C / 106 F, compared to the average of 40.4 °C / 105 F, ranging from 21.2 to 68.8 °C for the class Gaming.
(+) The bottom heats up to a maximum of 39 °C / 102 F, compared to the average of 43.2 °C / 110 F
(±) In idle usage, the average temperature for the upper side is 34.7 °C / 94 F, compared to the device average of 33.9 °C / 93 F.
(±) 3: The average temperature for the upper side is 33.1 °C / 92 F, compared to the average of 33.9 °C / 93 F for the class Gaming.
(+) The palmrests and touchpad are reaching skin temperature as a maximum (33 °C / 91.4 F) and are therefore not hot.
(-) The average temperature of the palmrest area of similar devices was 28.8 °C / 83.8 F (-4.2 °C / -7.6 F).
| Lenovo Legion 9 18IAX10 RTX 5090 Ultra 9 275HX, GeForce RTX 5090 Laptop | Alienware 18 Area-51 Ultra 9 275HX, GeForce RTX 5090 Laptop | Asus Strix Scar 18 G835LX Ultra 9 275HX, GeForce RTX 5090 Laptop | Razer Blade 18 2025 RTX 5090 Laptop Ultra 9 275HX, GeForce RTX 5090 Laptop | Lenovo Legion 9 18IAX10 Ultra 9 275HX, GeForce RTX 5080 Laptop | |
|---|---|---|---|---|---|
| Heat | 13% | 4% | 9% | -1% | |
| Maximum Upper Side * (°C) | 41 | 36.8 10% | 45.6 -11% | 44.3 -8% | 43 -5% |
| Maximum Bottom * (°C) | 39 | 35.8 8% | 46 -18% | 42 -8% | 41.8 -7% |
| Idle Upper Side * (°C) | 38 | 30.6 19% | 28.9 24% | 27.2 28% | 37 3% |
| Idle Bottom * (°C) | 36 | 30.8 14% | 29.2 19% | 27.5 24% | 34.2 5% |
* ... smaller is better
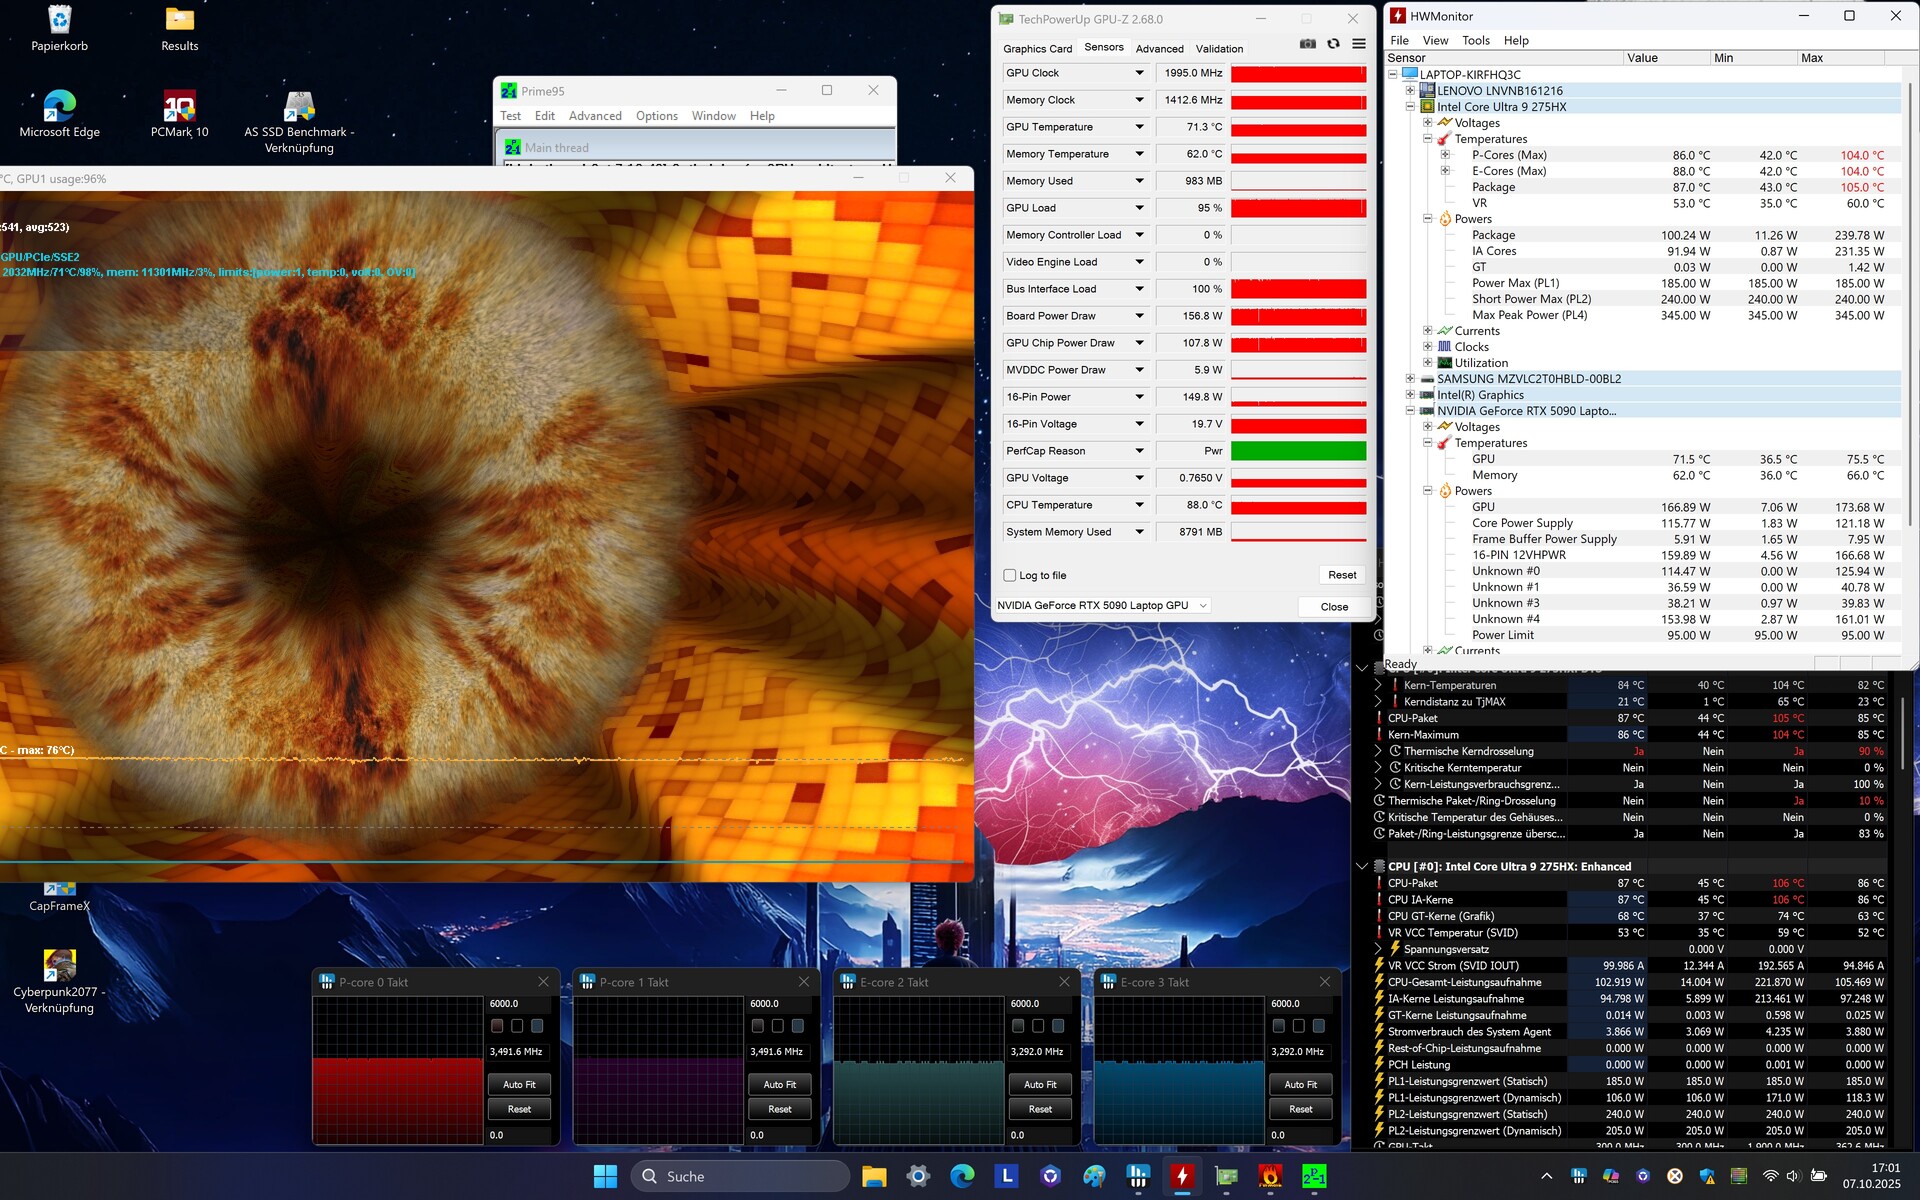
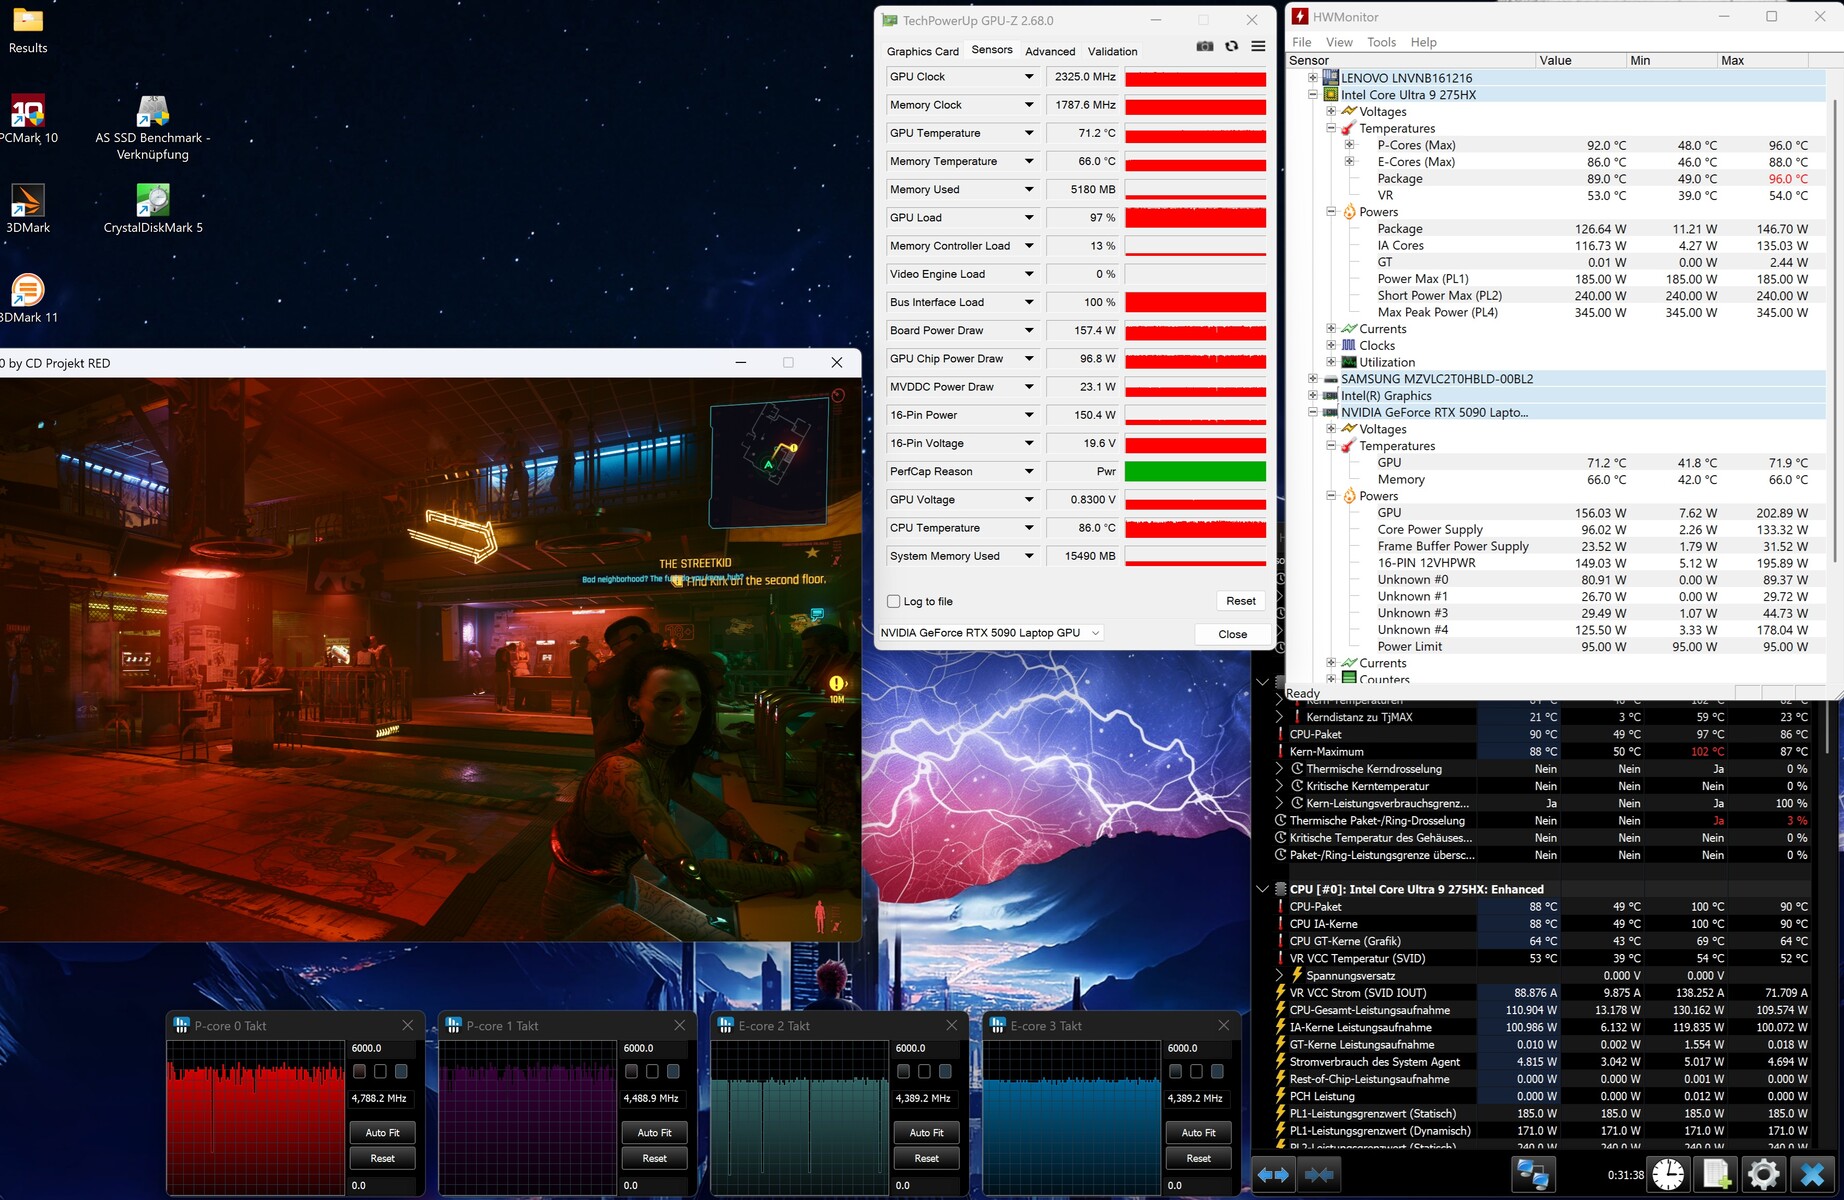
Stress test
In the stress test with the FurMark and Prime95, the Core Ultra 9 275HX stabilized at around 87 °C, compared to a moderate 71 °C for the RTX 5090.
Loudspeaker
On the contrary, the sound quality doesn't have to hide behind the competition. The Legion 9 18's sound system is among the best in the laptop space and doesn't let up when it comes to the bass response either.
Lenovo Legion 9 18IAX10 RTX 5090 audio analysis
(±) | speaker loudness is average but good (81 dB)
Bass 100 - 315 Hz
(+) | good bass - only 3.6% away from median
(+) | bass is linear (6.4% delta to prev. frequency)
Mids 400 - 2000 Hz
(+) | balanced mids - only 3.1% away from median
(+) | mids are linear (5% delta to prev. frequency)
Highs 2 - 16 kHz
(±) | reduced highs - on average 8.7% lower than median
(+) | highs are linear (3% delta to prev. frequency)
Overall 100 - 16.000 Hz
(+) | overall sound is linear (11.2% difference to median)
Compared to same class
» 8% of all tested devices in this class were better, 4% similar, 88% worse
» The best had a delta of 6%, average was 18%, worst was 132%
Compared to all devices tested
» 7% of all tested devices were better, 2% similar, 91% worse
» The best had a delta of 4%, average was 23%, worst was 134%
Alienware 18 Area-51 audio analysis
(+) | speakers can play relatively loud (87.9 dB)
Bass 100 - 315 Hz
(-) | nearly no bass - on average 17.5% lower than median
(±) | linearity of bass is average (13.4% delta to prev. frequency)
Mids 400 - 2000 Hz
(+) | balanced mids - only 3.1% away from median
(+) | mids are linear (3.6% delta to prev. frequency)
Highs 2 - 16 kHz
(+) | balanced highs - only 2.9% away from median
(+) | highs are linear (2.9% delta to prev. frequency)
Overall 100 - 16.000 Hz
(+) | overall sound is linear (14.2% difference to median)
Compared to same class
» 25% of all tested devices in this class were better, 7% similar, 68% worse
» The best had a delta of 6%, average was 18%, worst was 132%
Compared to all devices tested
» 17% of all tested devices were better, 4% similar, 79% worse
» The best had a delta of 4%, average was 23%, worst was 134%
Energy management
energy consumption
In 3D mode, the 343 W (avg. 3DMark 06) to 393 W (maximum value stress test) power requirement is roughly in line with the RTX 5080 model, which also consumes a lot of power for a laptop. As long as graphics switching is active, the laptop consumes only 31 to 42 W in idle mode.
| Off / Standby | |
| Idle | |
| Load |
|
Key:
min: | |
| Lenovo Legion 9 18IAX10 RTX 5090 Ultra 9 275HX, GeForce RTX 5090 Laptop | Alienware 18 Area-51 Ultra 9 275HX, GeForce RTX 5090 Laptop | Asus Strix Scar 18 G835LX Ultra 9 275HX, GeForce RTX 5090 Laptop | Razer Blade 18 2025 RTX 5090 Laptop Ultra 9 275HX, GeForce RTX 5090 Laptop | Lenovo Legion 9 18IAX10 Ultra 9 275HX, GeForce RTX 5080 Laptop | Average of class Gaming | |
|---|---|---|---|---|---|---|
| Power Consumption | -17% | 8% | 18% | -10% | 40% | |
| Idle Minimum * (Watt) | 30.9 | 38.4 -24% | 11.4 63% | 18.1 41% | 34.5 -12% | 13 ? 58% |
| Idle Average * (Watt) | 32.6 | 45.6 -40% | 39.2 -20% | 27.9 14% | 44.1 -35% | 19 ? 42% |
| Idle Maximum * (Watt) | 42.1 | 57.5 -37% | 40.2 5% | 28.7 32% | 53.3 -27% | 24.6 ? 42% |
| Load Average * (Watt) | 150 | 190.1 -27% | 161.2 -7% | 108.3 28% | 140.9 6% | 110.7 ? 26% |
| Cyberpunk 2077 ultra external monitor * (Watt) | 343 | 333 3% | 295 14% | 331 3% | 353 -3% | |
| Cyberpunk 2077 ultra * (Watt) | 348 | 340 2% | 303 13% | 338 3% | 360 -3% | |
| Load Maximum * (Watt) | 393 | 373.2 5% | 430.9 -10% | 366.7 7% | 367.5 6% | 259 ? 34% |
* ... smaller is better
Energy consumption: Cyberpunk 2077 / Stress test
Energy consumption: External monitor
Battery life
In battery mode, the energy consumption is higher than that of the cheaper Legion 9.
At just under 3 hours in the Wi-Fi test (Balanced profile instead of Performance), the Legion 9 18 lasts longer than the Alienware 18 with its meager 2 hours, but the measured value is still rather disappointing, especially in view of the powerful 99 Wh battery.
| Lenovo Legion 9 18IAX10 RTX 5090 Ultra 9 275HX, GeForce RTX 5090 Laptop, 99.9 Wh | Alienware 18 Area-51 Ultra 9 275HX, GeForce RTX 5090 Laptop, 96 Wh | Asus Strix Scar 18 G835LX Ultra 9 275HX, GeForce RTX 5090 Laptop, 90 Wh | Razer Blade 18 2025 RTX 5090 Laptop Ultra 9 275HX, GeForce RTX 5090 Laptop, 99.99 Wh | Lenovo Legion 9 18IAX10 Ultra 9 275HX, GeForce RTX 5080 Laptop, 99.9 Wh | Average of class Gaming | |
|---|---|---|---|---|---|---|
| Battery runtime | -31% | 90% | 169% | 93% | 145% | |
| WiFi v1.3 (h) | 2.9 | 2 -31% | 5.5 90% | 7.8 169% | 5.6 93% | 7.11 ? 145% |
| H.264 (h) | 5.8 | 8.32 ? | ||||
| Cyberpunk 2077 ultra 150cd (h) | 0.7 | |||||
| Load (h) | 1.2 | 1.502 ? |
Notebookcheck's overall impressions of the Lenovo Legion 9 18IAX10
Lenovo sells an extremely expensive but also a very high-quality and incredibly fast desktop replacement with the Legion 9 18IAX10, whose RTX 5090 often takes the performance crown.
Lenovo Legion 9 18IAX10 RTX 5090
- 07/24/2026 v8
Florian Glaser
 Total Sustainability Score:
 Potential alternatives in comparison
Image | Model / Review | Price | Weight | Height | Display |
|---|---|---|---|---|---|
1. 87.7%  | Lenovo Legion 9 18IAX10 RTX 5090 Intel Core Ultra 9 275HX ⎘ NVIDIA GeForce RTX 5090 Laptop ⎘ 64 GB Memory, 2048 GB SSD | Amazon: List Price: 5900 EUR | 3.5 kg | 28 mm | 18.00" 3840x2400 252 PPI IPS |
2. 86.2%  | Alienware 18 Area-51 Intel Core Ultra 9 275HX ⎘ NVIDIA GeForce RTX 5090 Laptop ⎘ 64 GB Memory | Amazon: 1. $3,799.00 Alienware 18 Area-51 Gaming ... 2. $3,699.00 Dell Alienware 18 Area-51 Ga... 3. $3,711.24 Alienware 18 Area-51 Gaming ... List Price: 4400 USD | 4.2 kg | 24.32 mm | 18.00" 2560x1600 168 PPI IPS |
3. 88%  | Asus Strix Scar 18 G835LX Intel Core Ultra 9 275HX ⎘ NVIDIA GeForce RTX 5090 Laptop ⎘ 64 GB Memory, 2048 GB SSD | Amazon: List Price: 5799€ | 3.3 kg | 32 mm | 18.00" 2560x1600 168 PPI Mini-LED |
4. 89.5%  | Razer Blade 18 2025 RTX 5090 Laptop Intel Core Ultra 9 275HX ⎘ NVIDIA GeForce RTX 5090 Laptop ⎘ 64 GB Memory, 2048 GB SSD | Amazon: List Price: 5299€ | 3.2 kg | 27.9 mm | 18.00" 3840x2400 252 PPI IPS |
5. 89.1%  | Lenovo Legion 9 18IAX10 Intel Core Ultra 9 275HX ⎘ NVIDIA GeForce RTX 5080 Laptop ⎘ 64 GB Memory, 2048 GB SSD | Amazon: List Price: 3800 USD | 3.5 kg | 27.95 mm | 18.00" 3840x2400 252 PPI IPS |
Transparency
The selection of devices to be reviewed is made by our editorial team. The test sample was provided to the author as a loan by the manufacturer or retailer for the purpose of this review. The lender had no influence on this review, nor did the manufacturer receive a copy of this review before publication. There was no obligation to publish this review. As an independent media company, Notebookcheck is not subjected to the authority of manufacturers, retailers or publishers.
This is how Notebookcheck is testing
Every year, Notebookcheck independently reviews hundreds of laptops and smartphones using standardized procedures to ensure that all results are comparable. We have continuously developed our test methods for around 20 years and set industry standards in the process. In our test labs, high-quality measuring equipment is utilized by experienced technicians and editors. These tests involve a multi-stage validation process. Our complex rating system is based on hundreds of well-founded measurements and benchmarks, which maintains objectivity. Further information on our test methods can be found here.

