Verdict — With Great Power Comes Great Size
The popular trend with gaming laptops is to go thinner and thinner, but enthusiasts are well aware that shaving off millimeters invariably means shaving off performance as well. The Alienware 18 Area-51 may be bigger and heavier than many competitors, but it manages to run cooler, faster, and sometimes quieter all at once. Enthusiasts looking to squeeze as much performance as possible need not look any further than the Alienware 18.
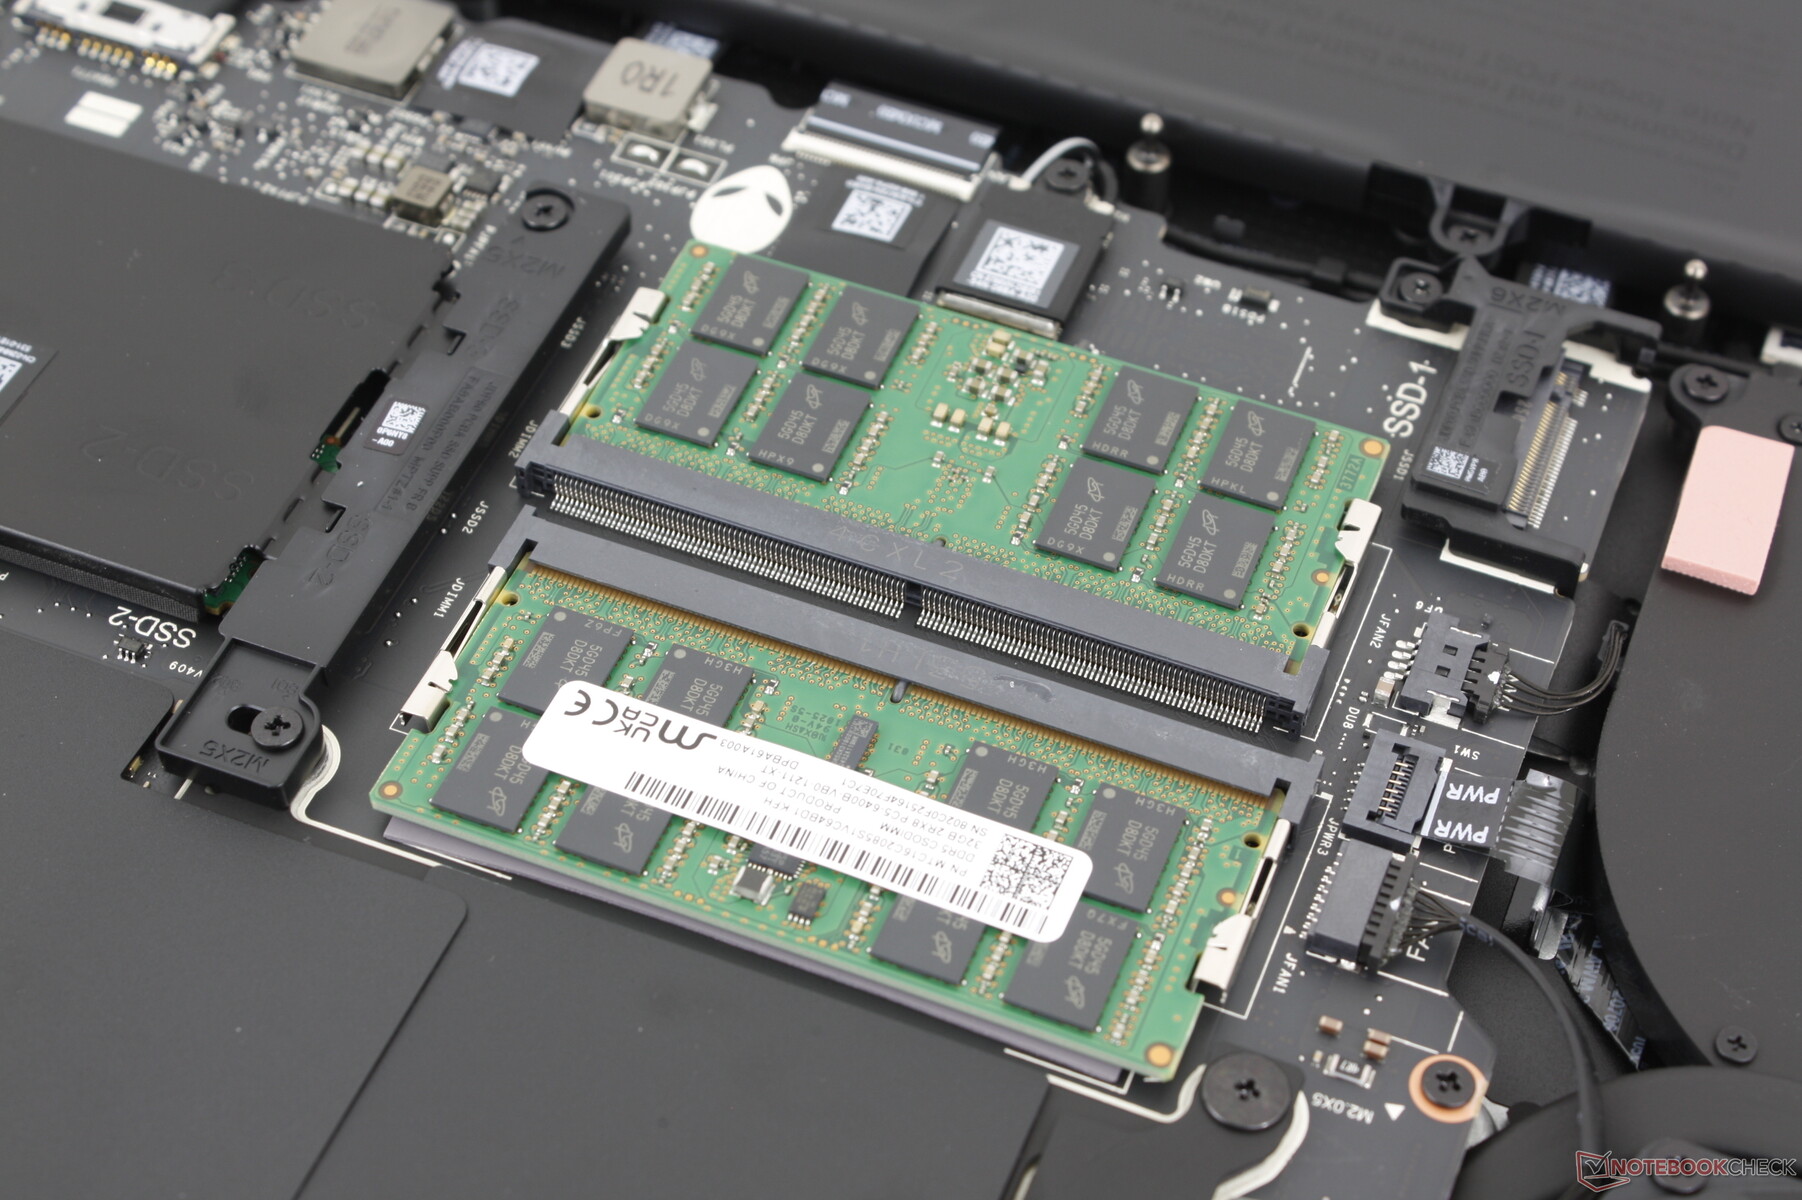
The large size allows for much more than just performance increases. The model offers quality-of-life features not found on most thinner or smaller competitors including dual PCIe5 SSD slots, comfortable mechanical CherryMX keys, higher quality speakers, and a stronger, more inflexible chassis. Shoppers who may simply be comparing specifications between competing laptops might overlook some of the best features of the Alienware.
The biggest drawbacks to the system outside of its massive size and weight are the short battery life and lack of any display options. The 1600p 300 Hz IPS display is arguably excellent for gaming purposes, but the lack of HDR support and 4K is somewhat baffling considering how much the Alienware 18 is retailing for. Power consumption is very high no matter the settings which may stave off efficiency-conscious users. These aspects could be improved upon to give Dell a bigger leap over the slightly more efficient AMD-powered MSI Raider A18 HX with 4K mini-LED. Meanwhile, users who don't mind shaving off 10 to 15 percent performance for thinner (and louder) designs have plenty to choose from like the Razer Blade 18 or Asus ROG Strix G18.
Pros
Cons
Price and Availability
Amazon is currently shipping the Alienware 18 Area-51 with RTX 5080 graphics for $3500. The RTX 5090 version is available directly from Dell for $4400.
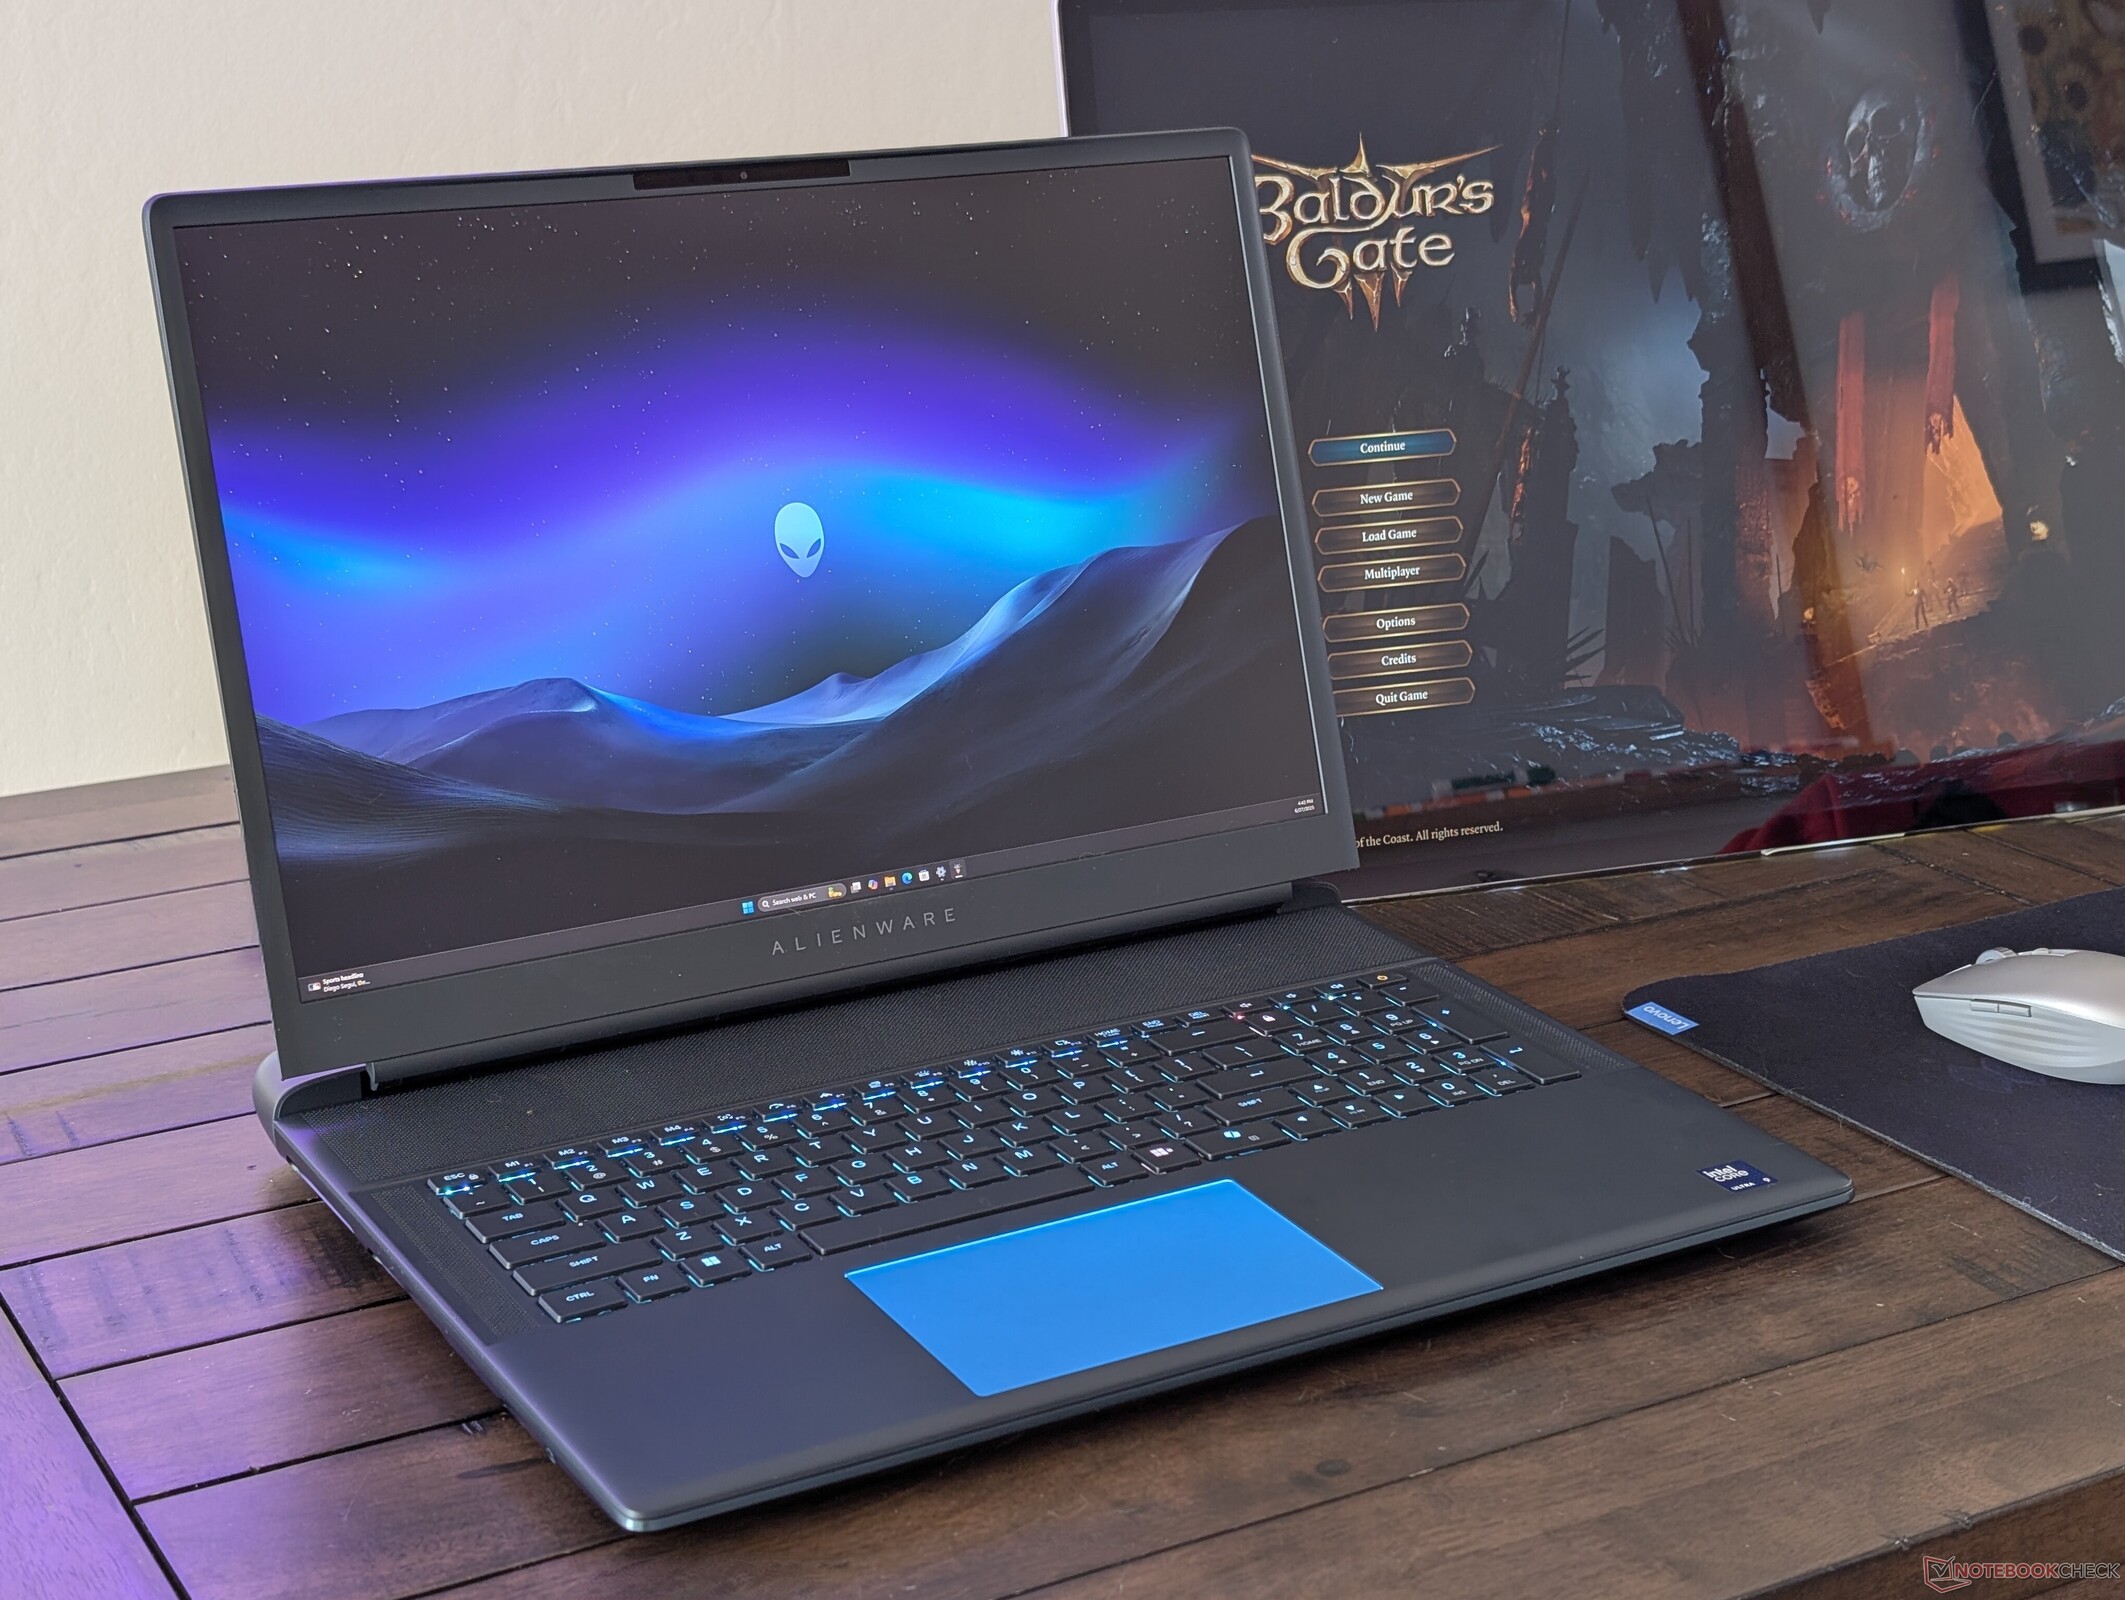
The Alienware 18 Area-51 is Dell's latest top-of-the-line gaming laptop with even more power and overhead versus the smaller 16-inch Alienware 16. It directly succeeds last year's Alienware m18 R2 by introducing a complete design overhaul both inside and out. Gone are the Raptor Lake-HX CPUs and Ada LoveLace GPUs in favor of newer Arrow Lake-HX and Blackwell options, respectively.
Our test unit is the highest configuration available with the Core Ultra 9 275HX CPU, 175 W GeForce RTX 5090 GPU, and 1600p300 IPS display for approximately $4400 USD. Lesser SKUs start with the RTX 5070 Ti for $3300, but there are otherwise no additional processors or displays to choose from at the moment.
Competitors in this space include other large 18-inch gaming laptops like the MSI Titan 18 HX, Aorus Master 18, or Asus ROG Strix Scar 18. Many of our comments about the Alienware 16 apply here for the Alienware 18 since they share the same AW30 design language.
More Dell reviews:
Specifications
Case — Away With Hexagons
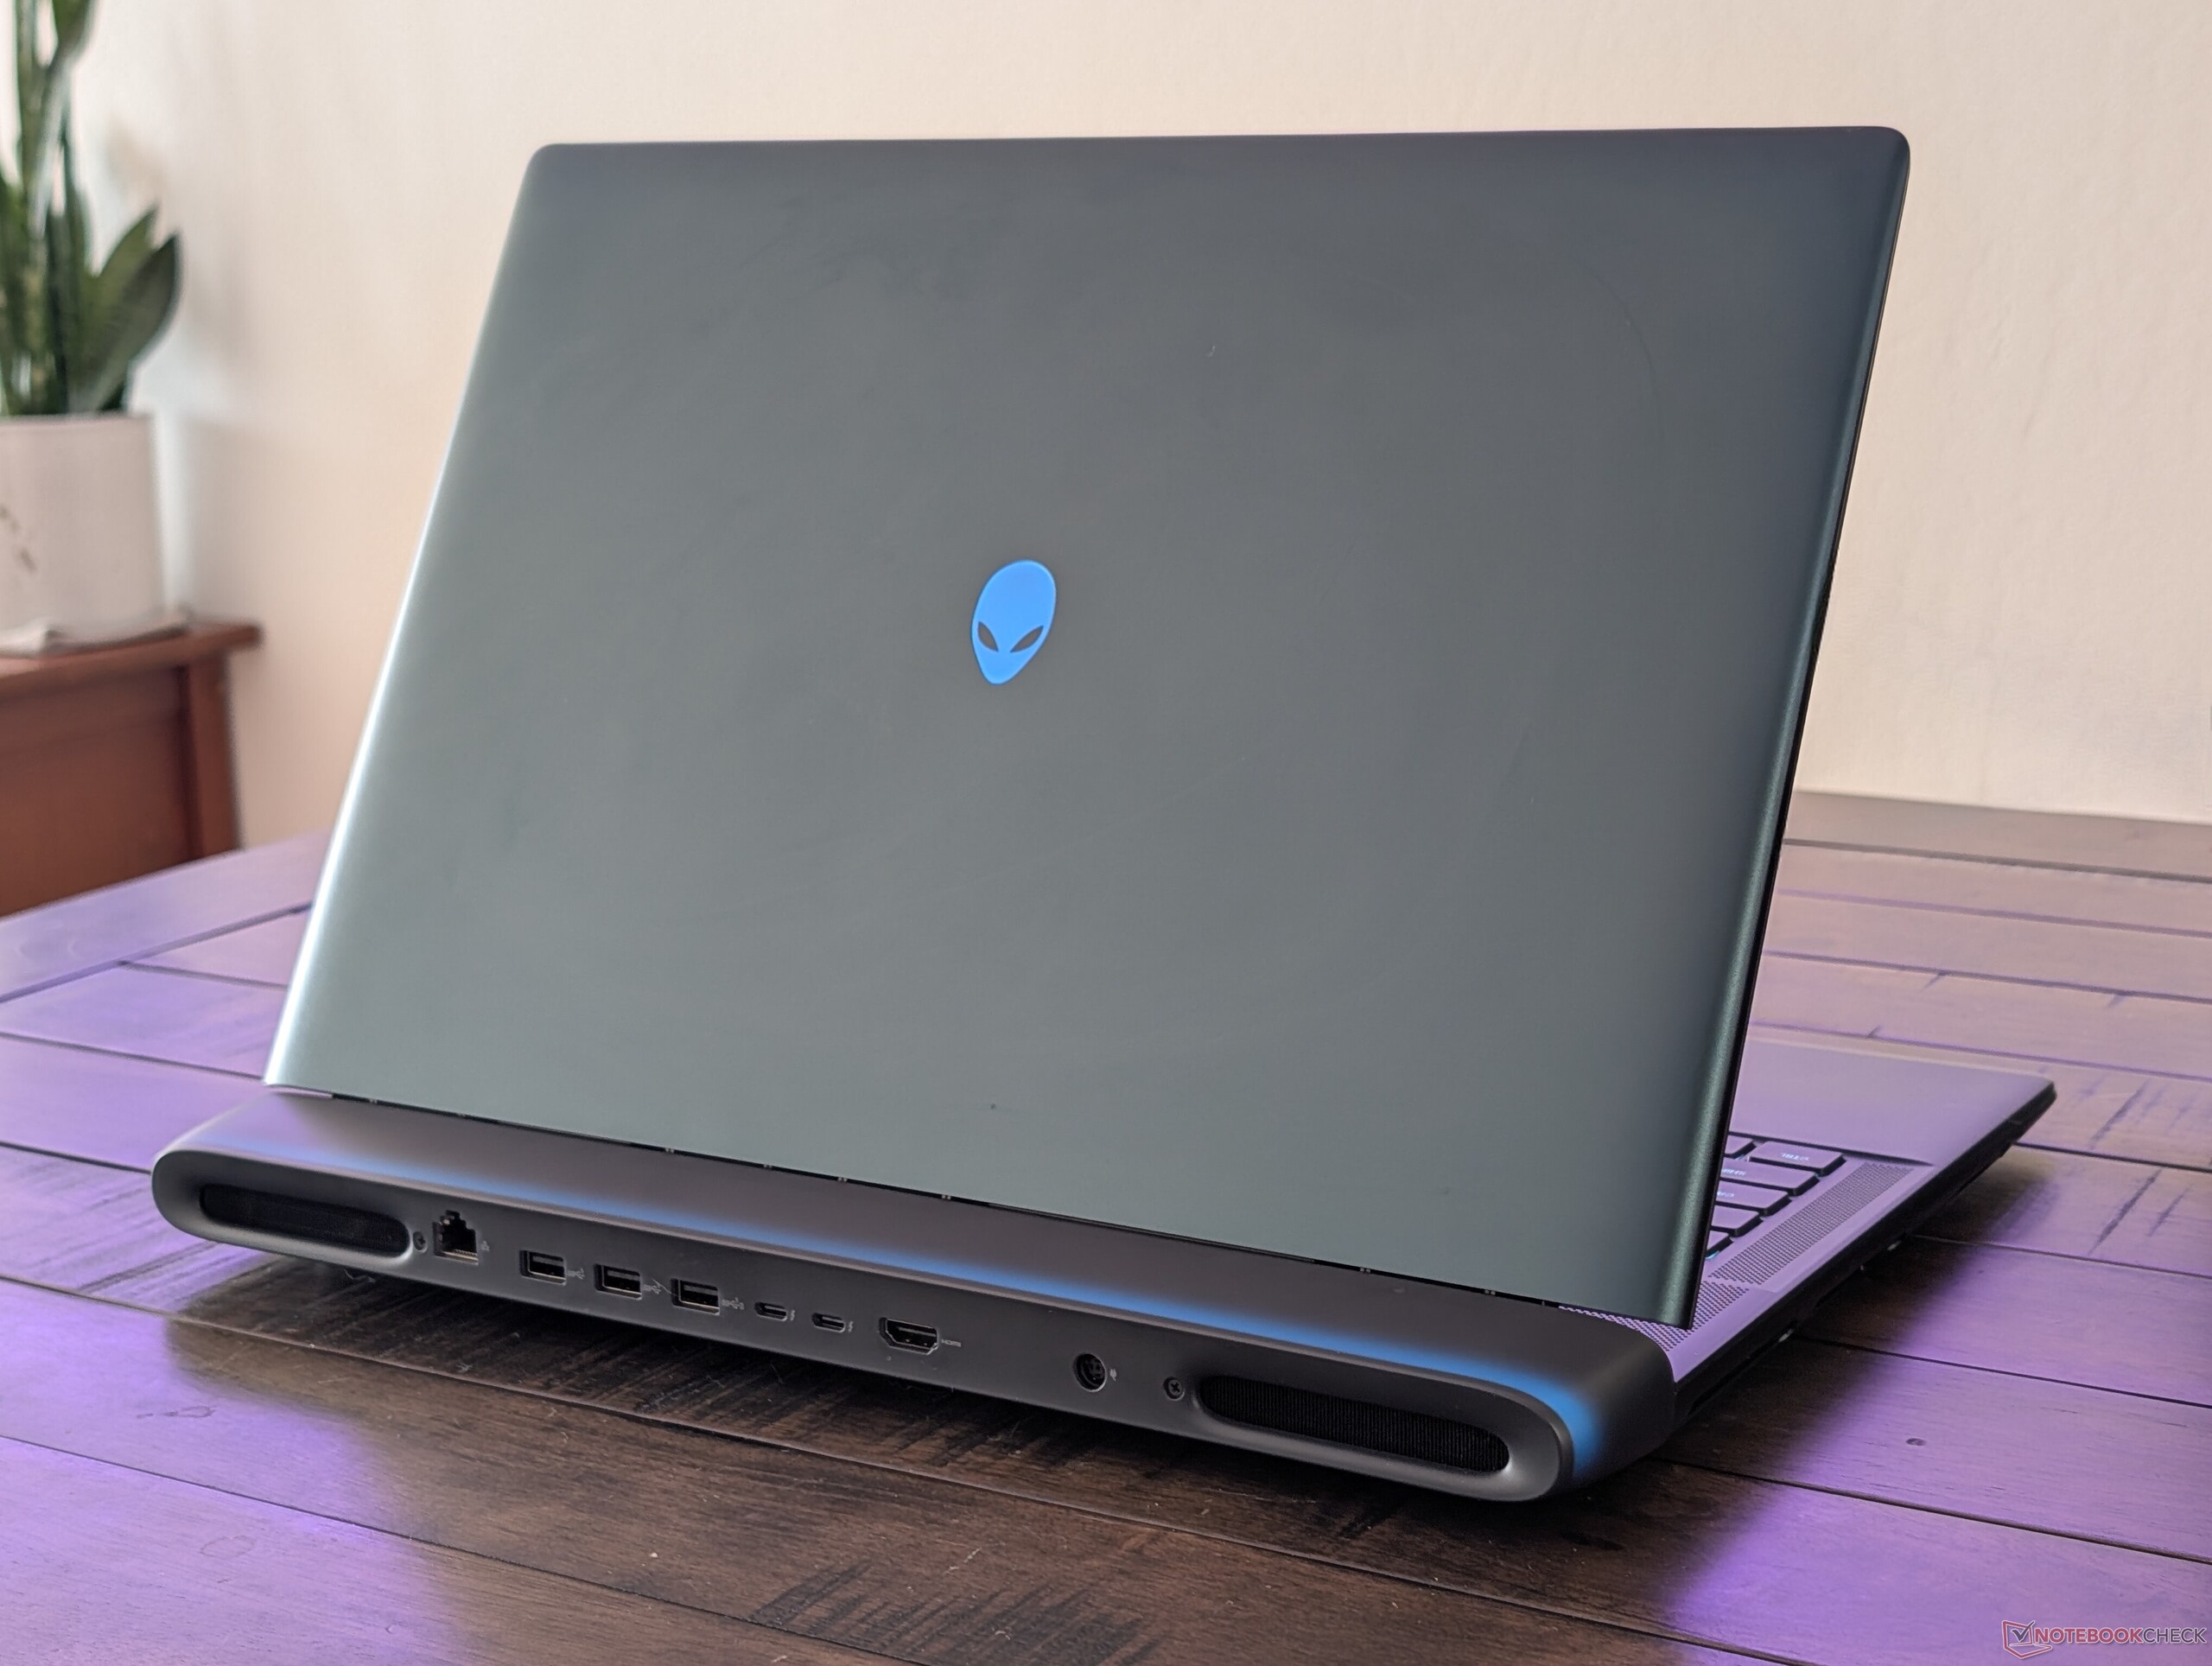
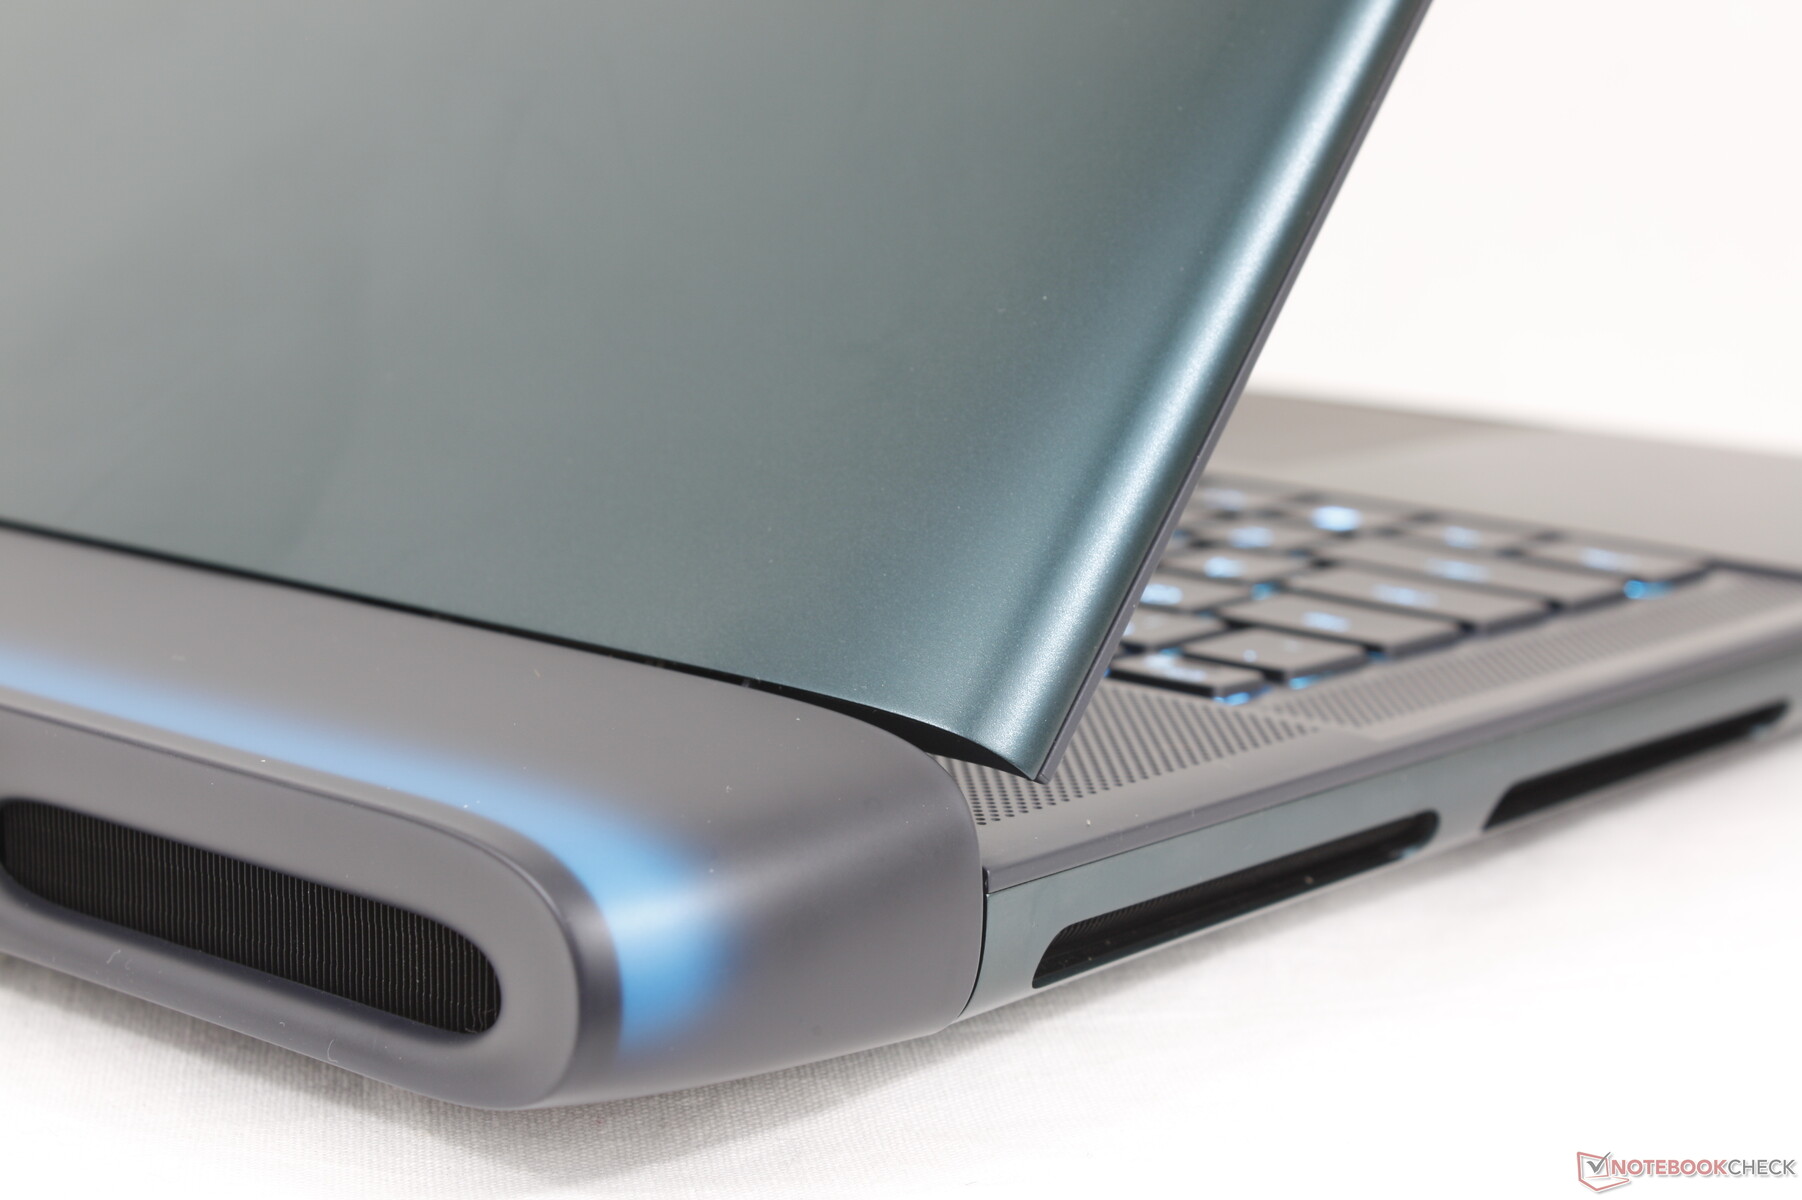
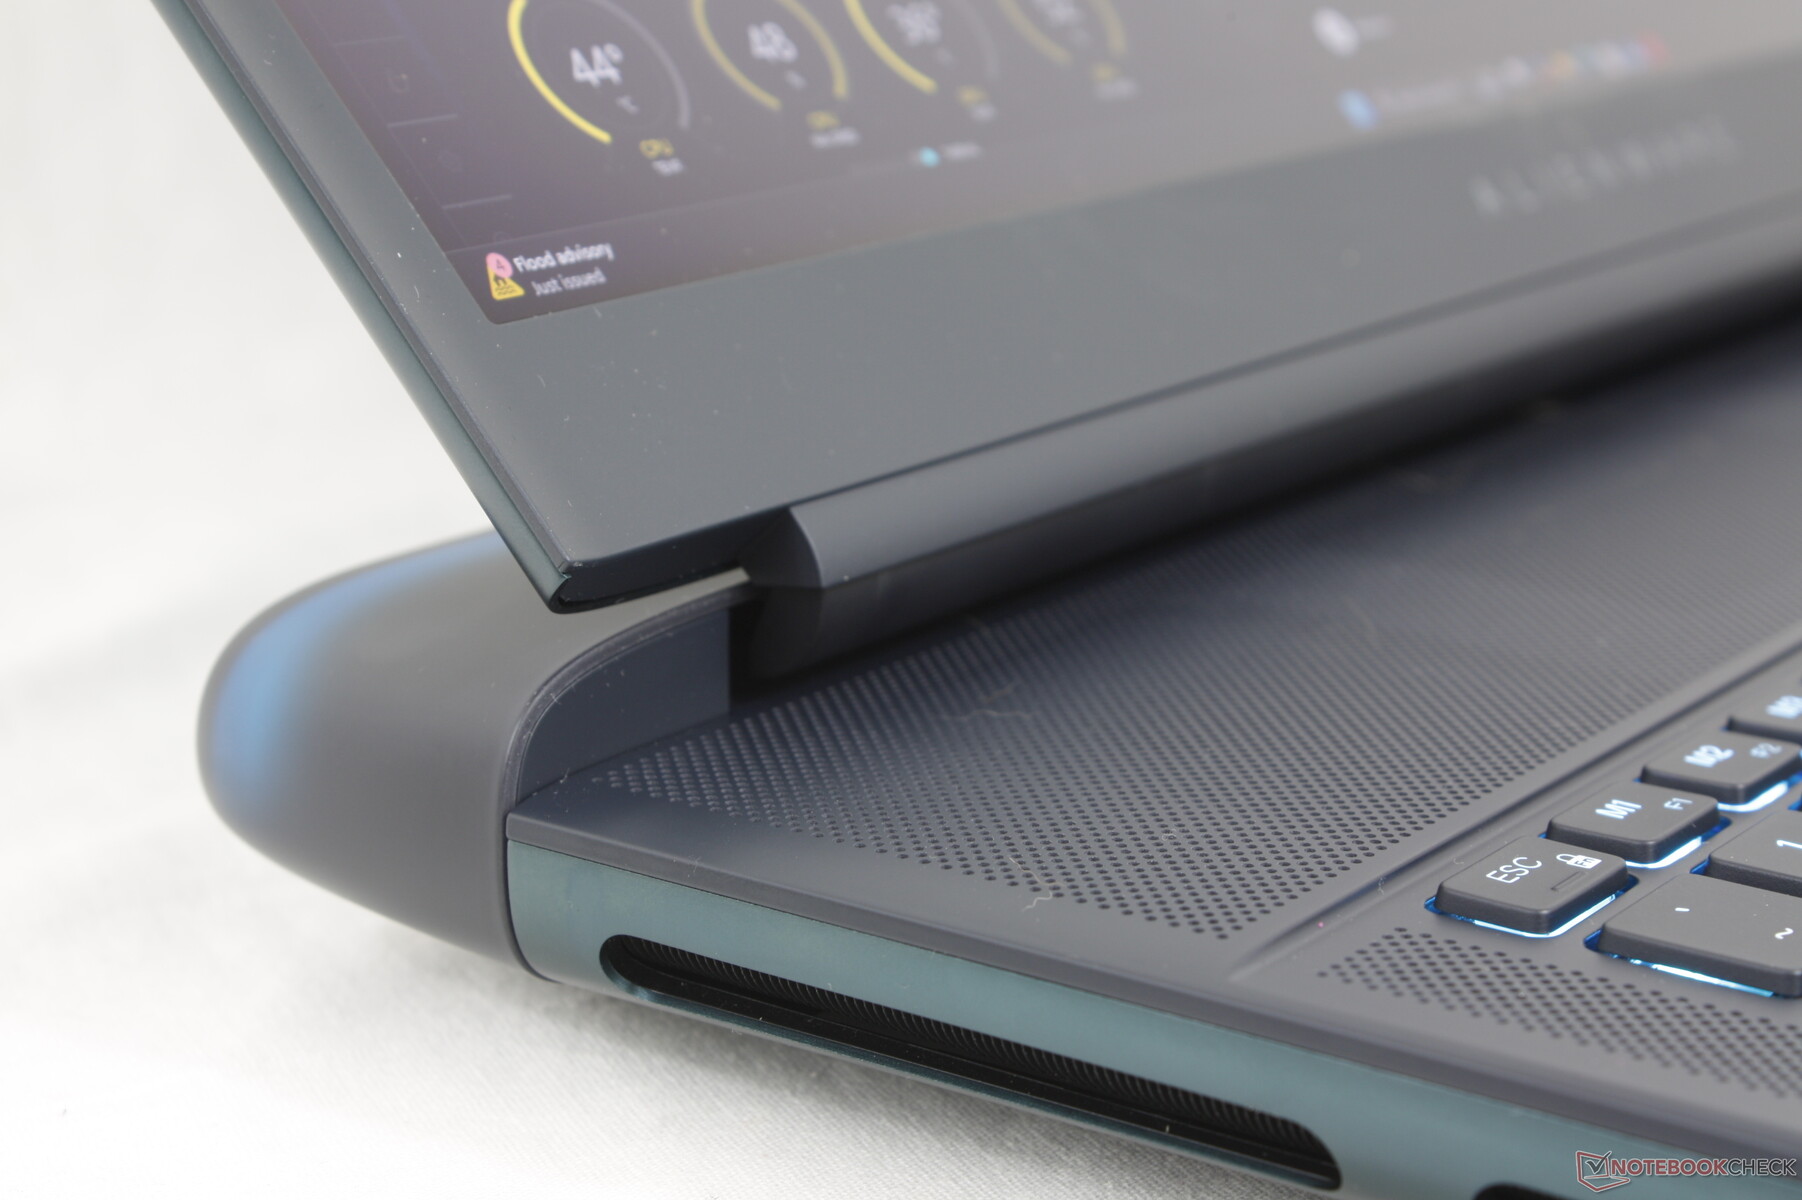
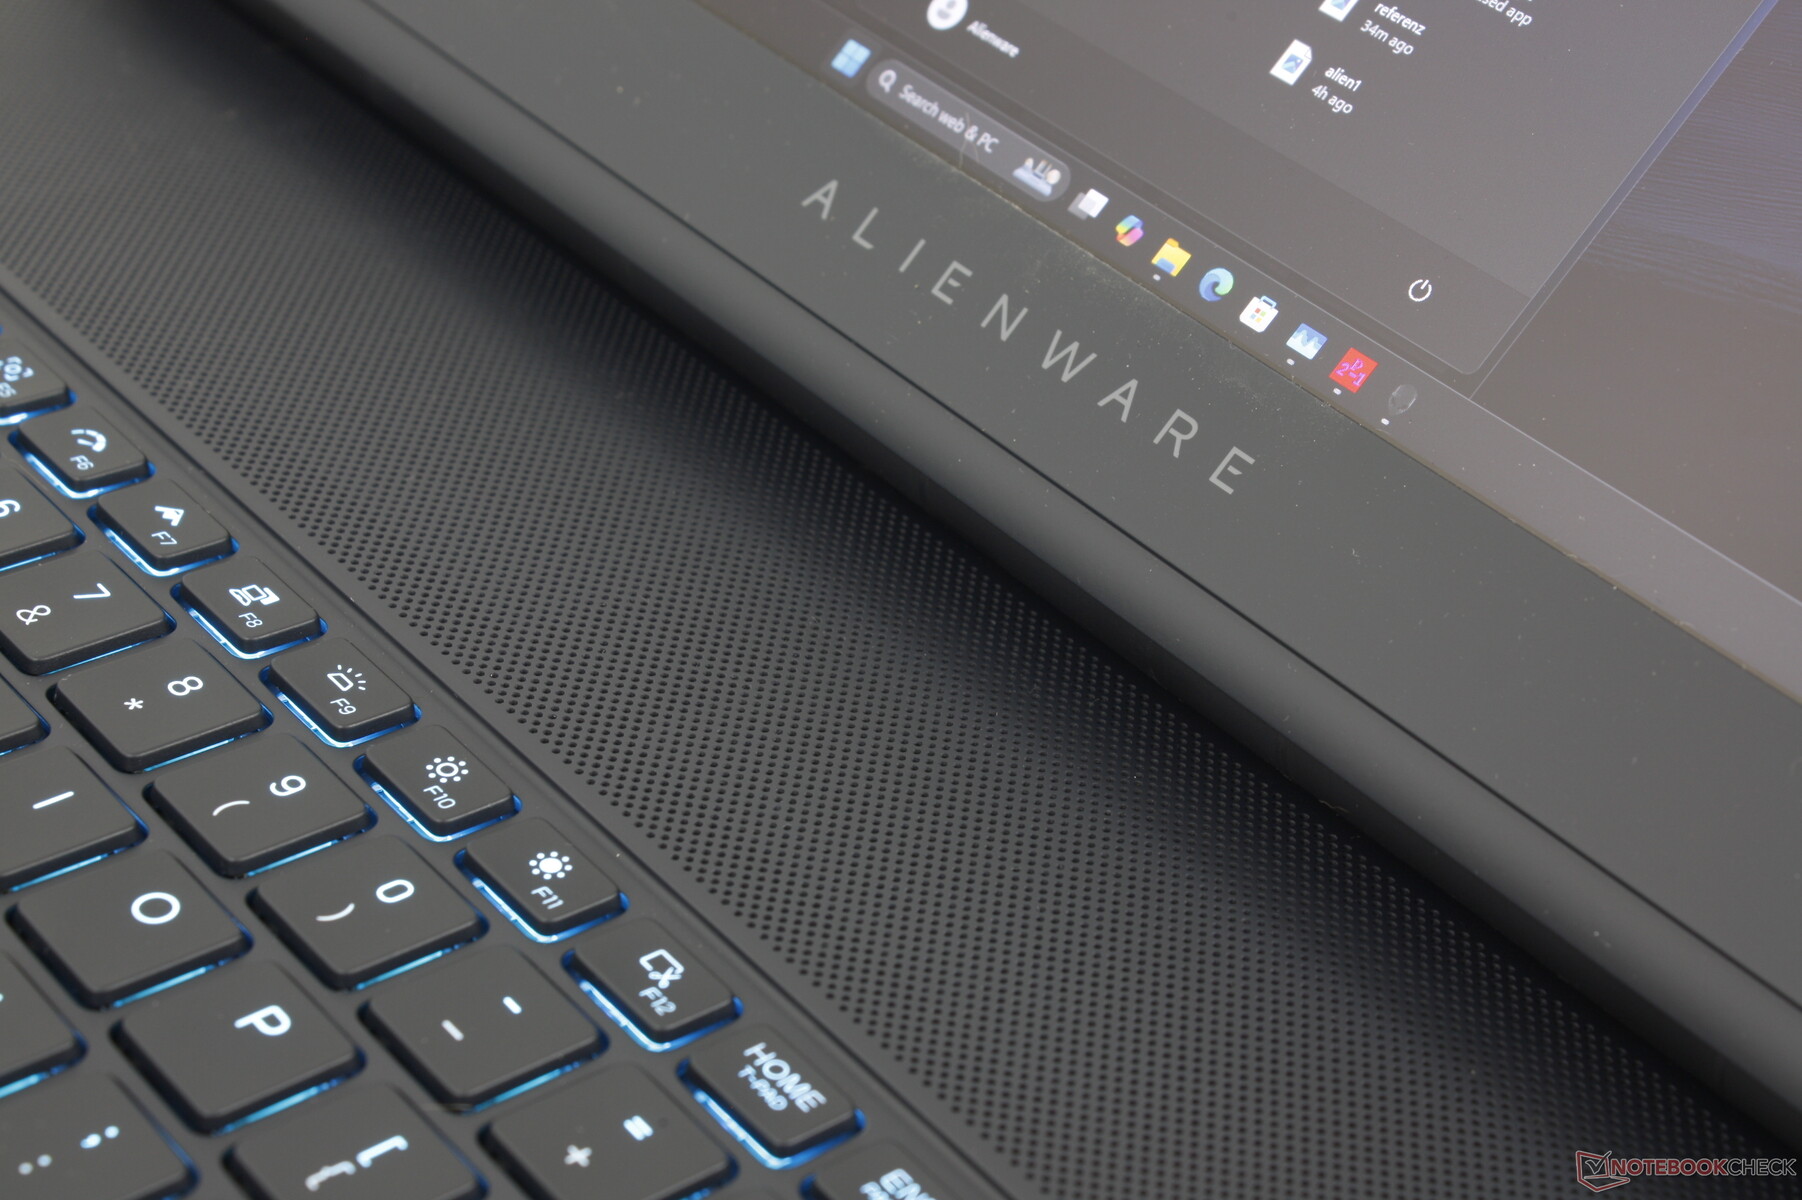
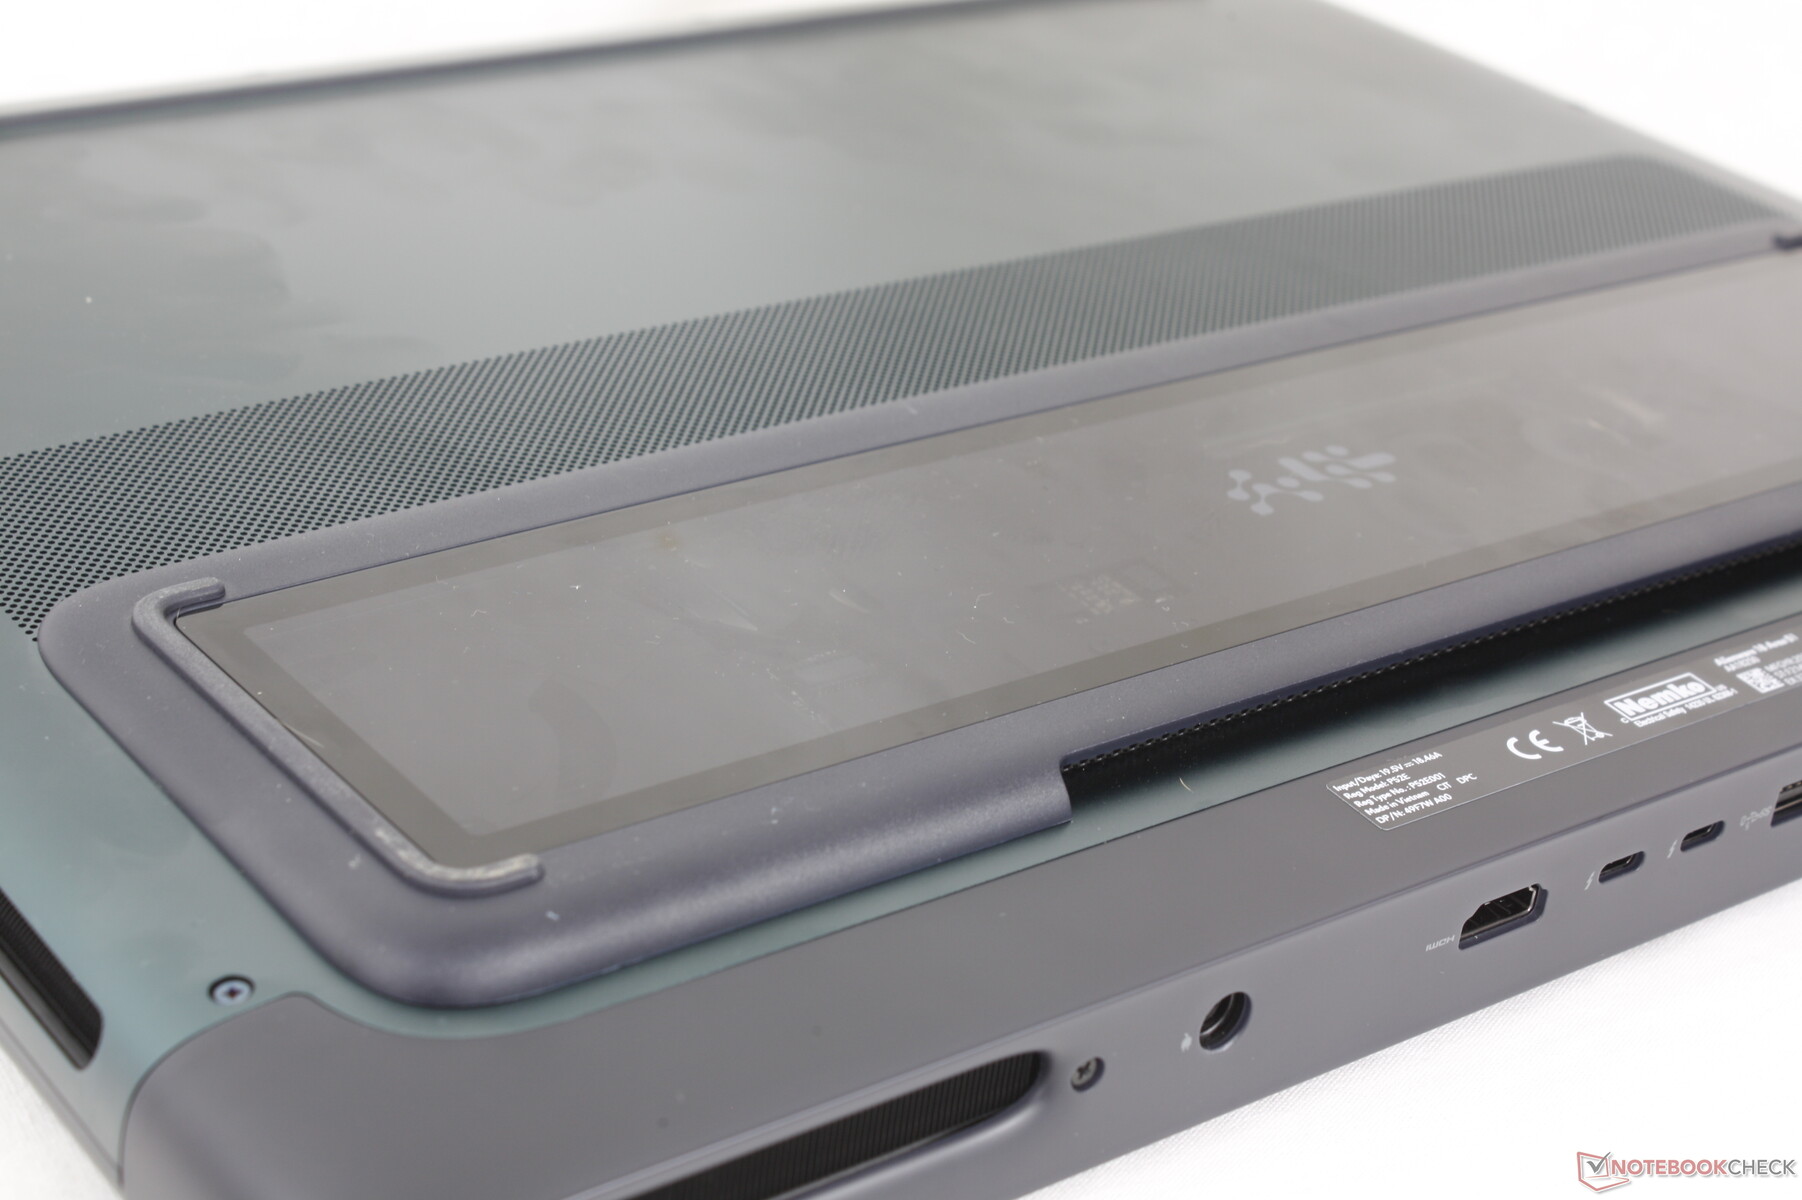
The AW30 design on the Alienware 16 arguably works even better for the larger 18-inch form factor. Its notable visual features like the rounded edges, smooth outer lid finish, soft RGB LED along the rear, and Gorilla Glass window on the bottom are larger and thus more visually striking than on the smaller 16-inch model. The system manages to look quite professional despite its obscenely large footprint.
Our main complaint about the design isn't related to rigidity or quality but to the soft-touch black keyboard deck where unsightly fingerprints accumulate very quickly. The retail box should include a cloth as you'll be wiping away grease from the keys and palm rests quite often.
The Alienware 18 is one of the biggest and heaviest 18-inch gaming laptops in the market by relatively wide margins. It's 600 g heavier than even the MSI Titan 18 and while it's not as thick, the larger footprint makes up for it.

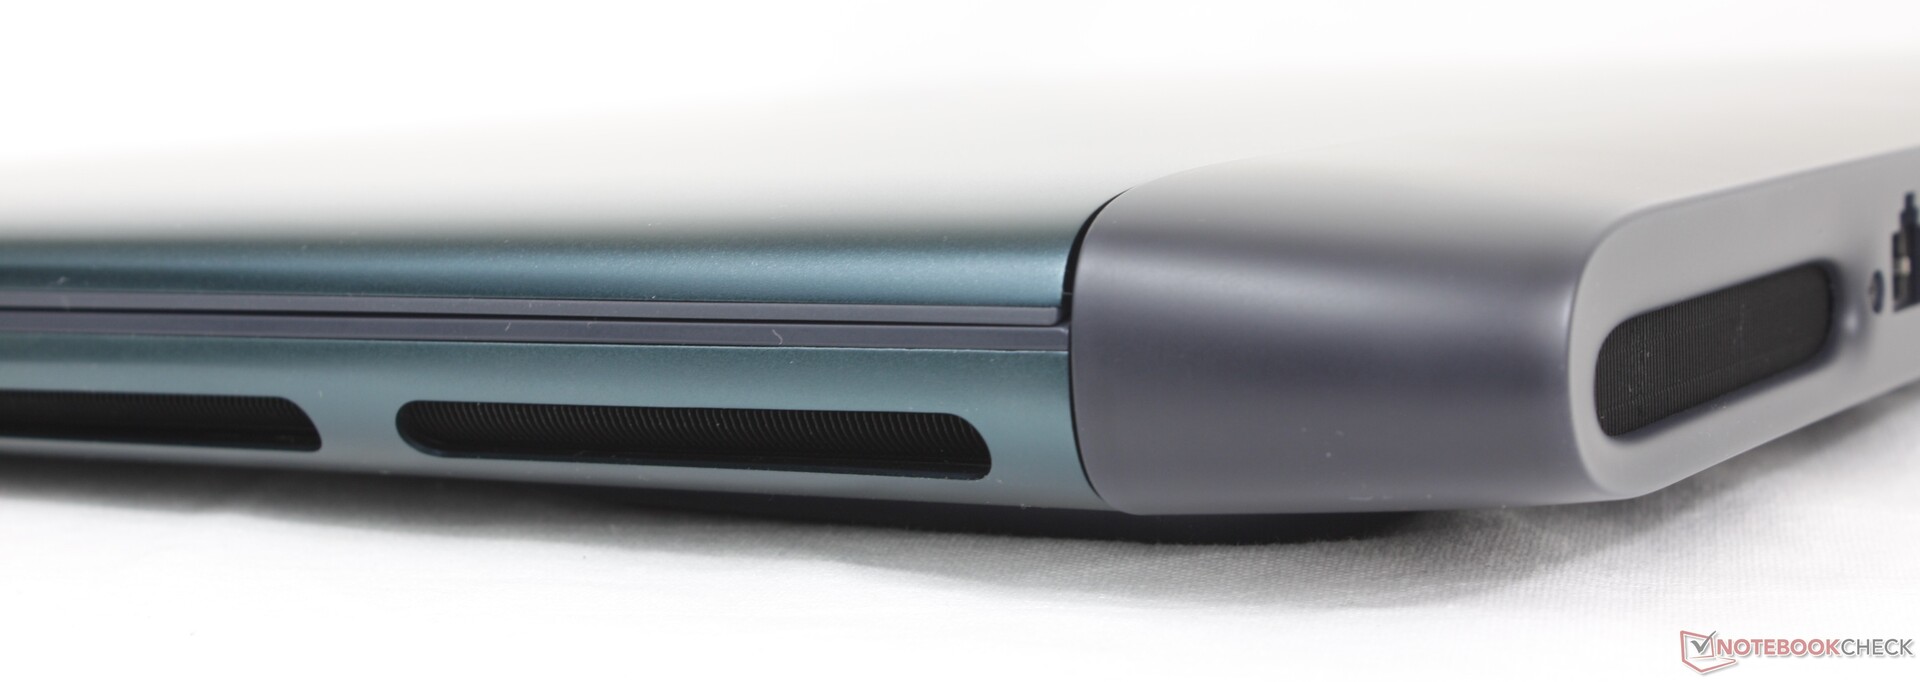
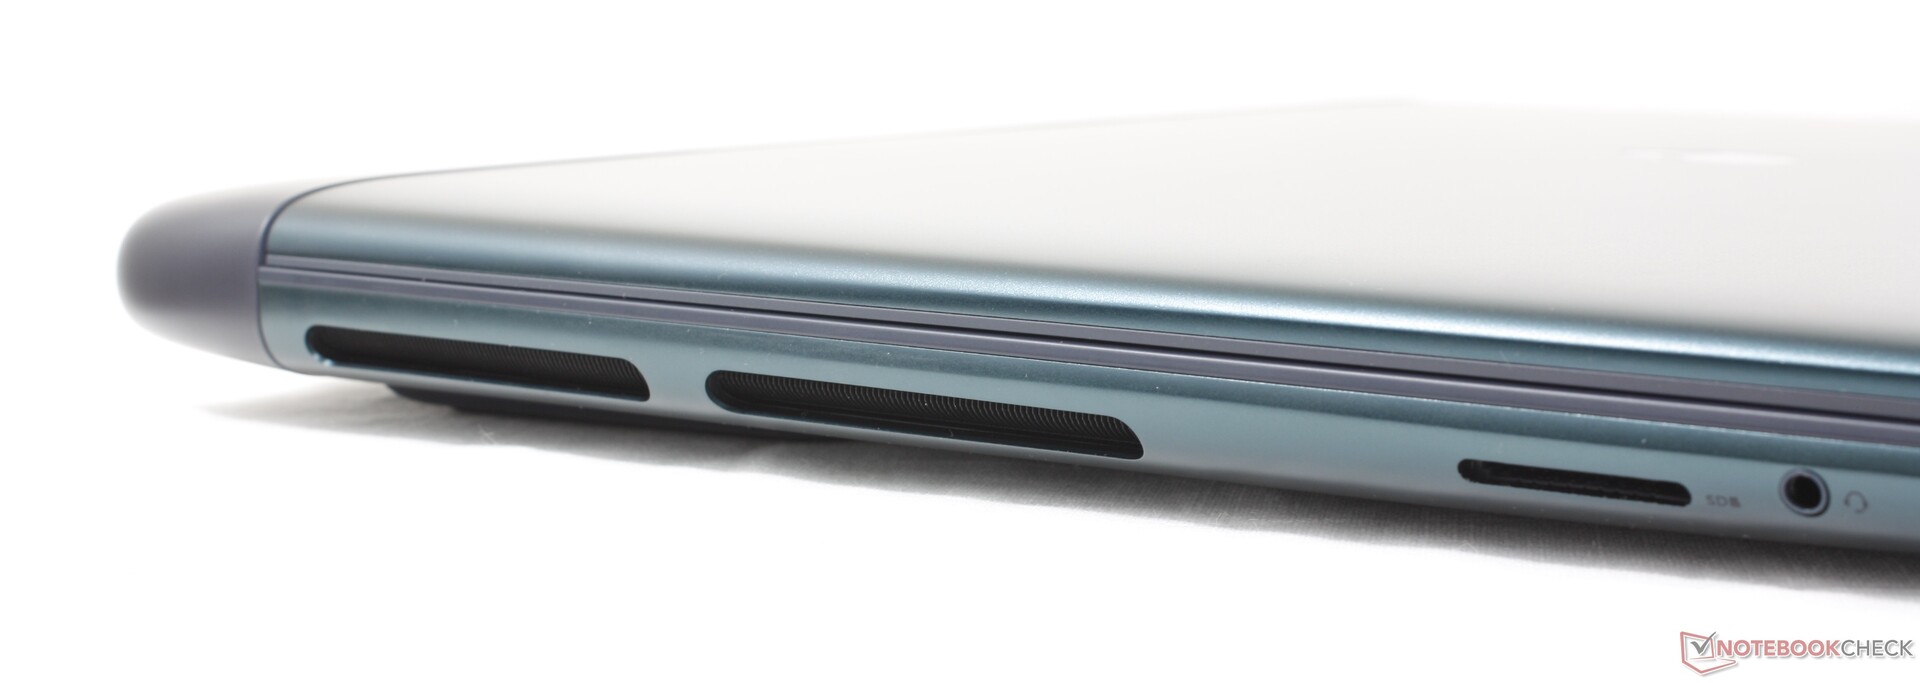
Connectivity
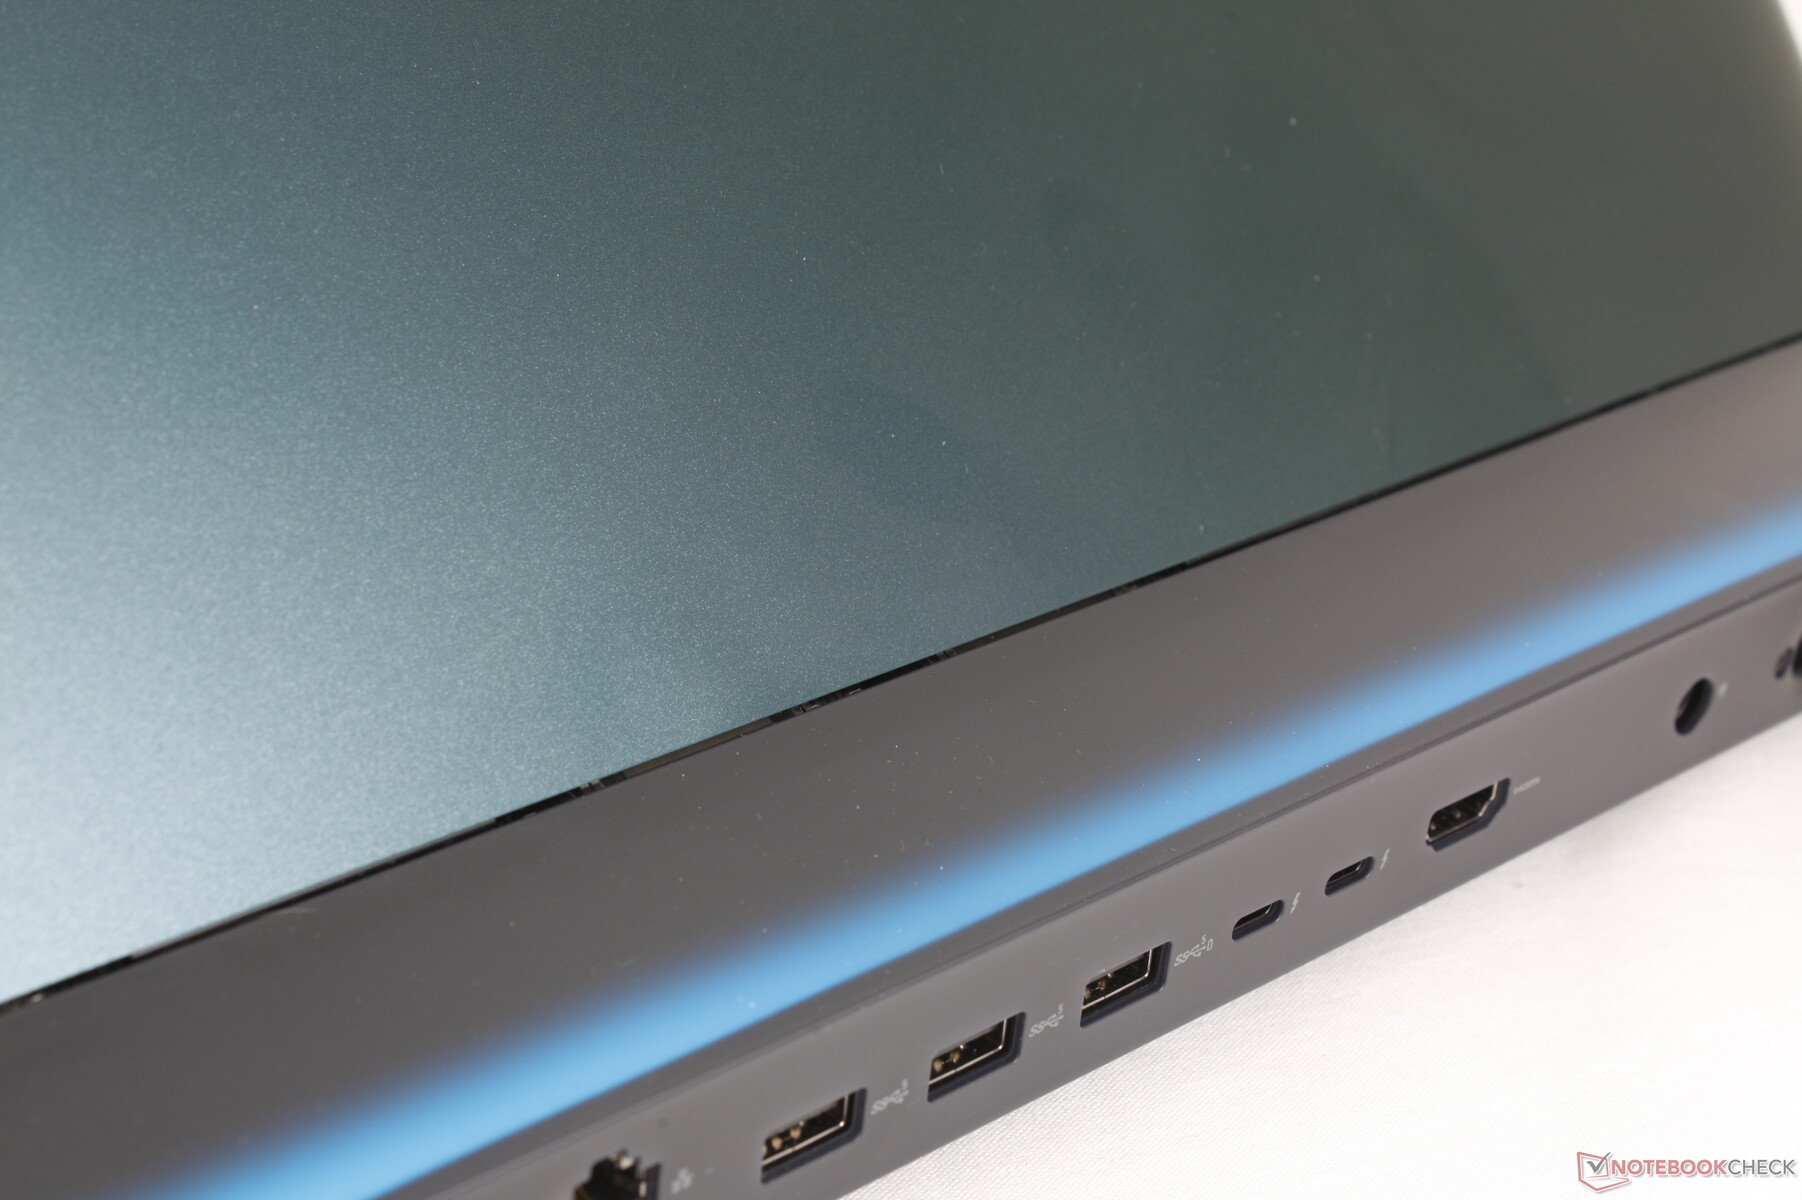
All ports found on the Alienware 16 are present on the Alienware 18 plus one notable extra: the 5 Gbps RJ-45 port. The mini-DisplayPort on last year's m18 R2 is now gone while the SD card reader has thankfully been moved to a more accessible position.
Keep in mind that configuring with RTX 5070 graphics will only get you Thunderbolt 4 and no Thunderbolt 5.
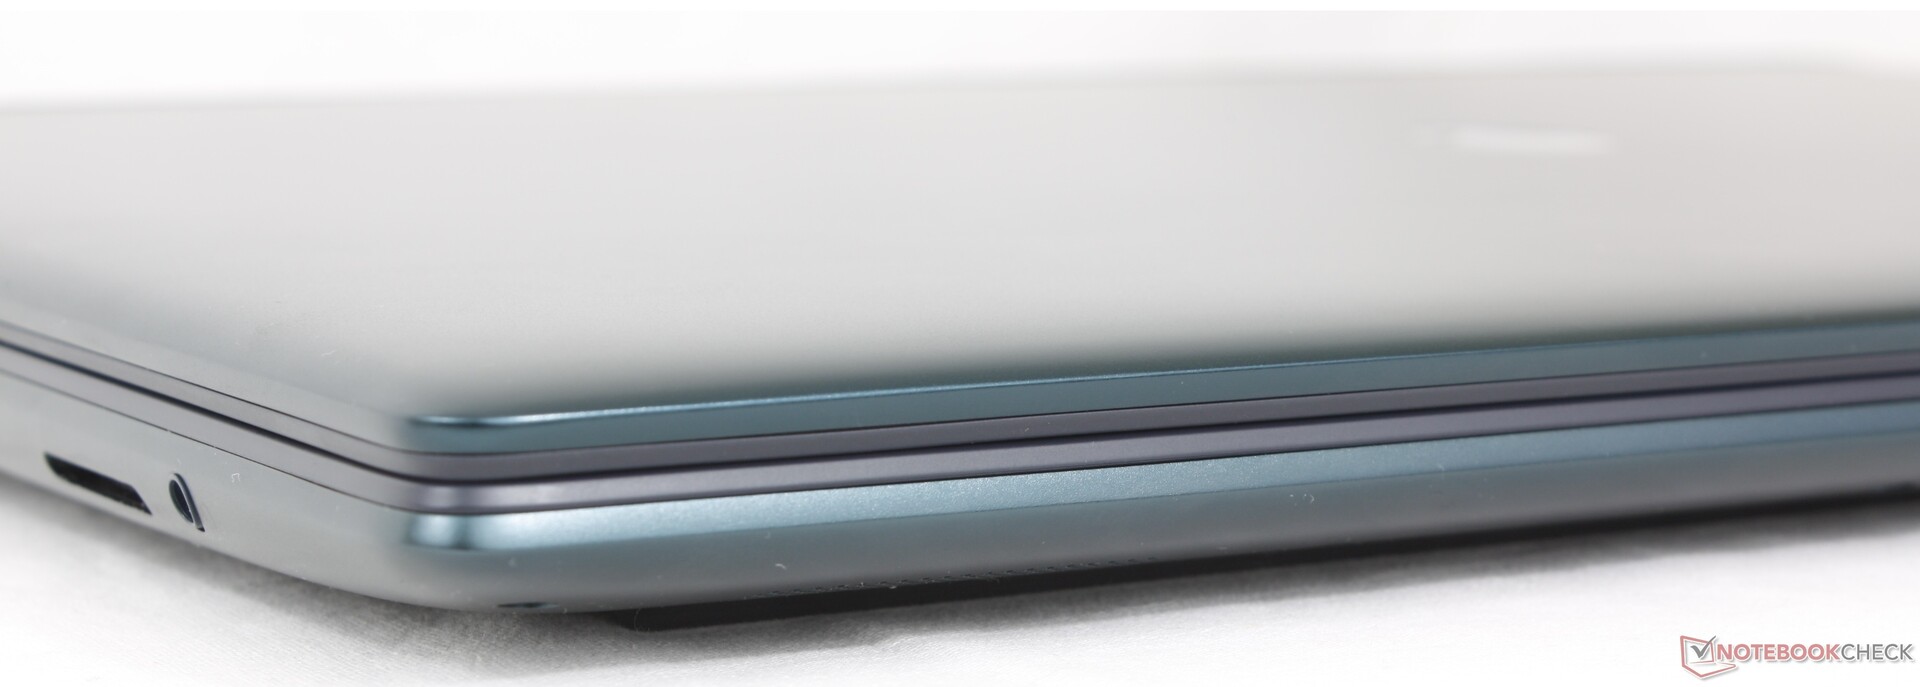

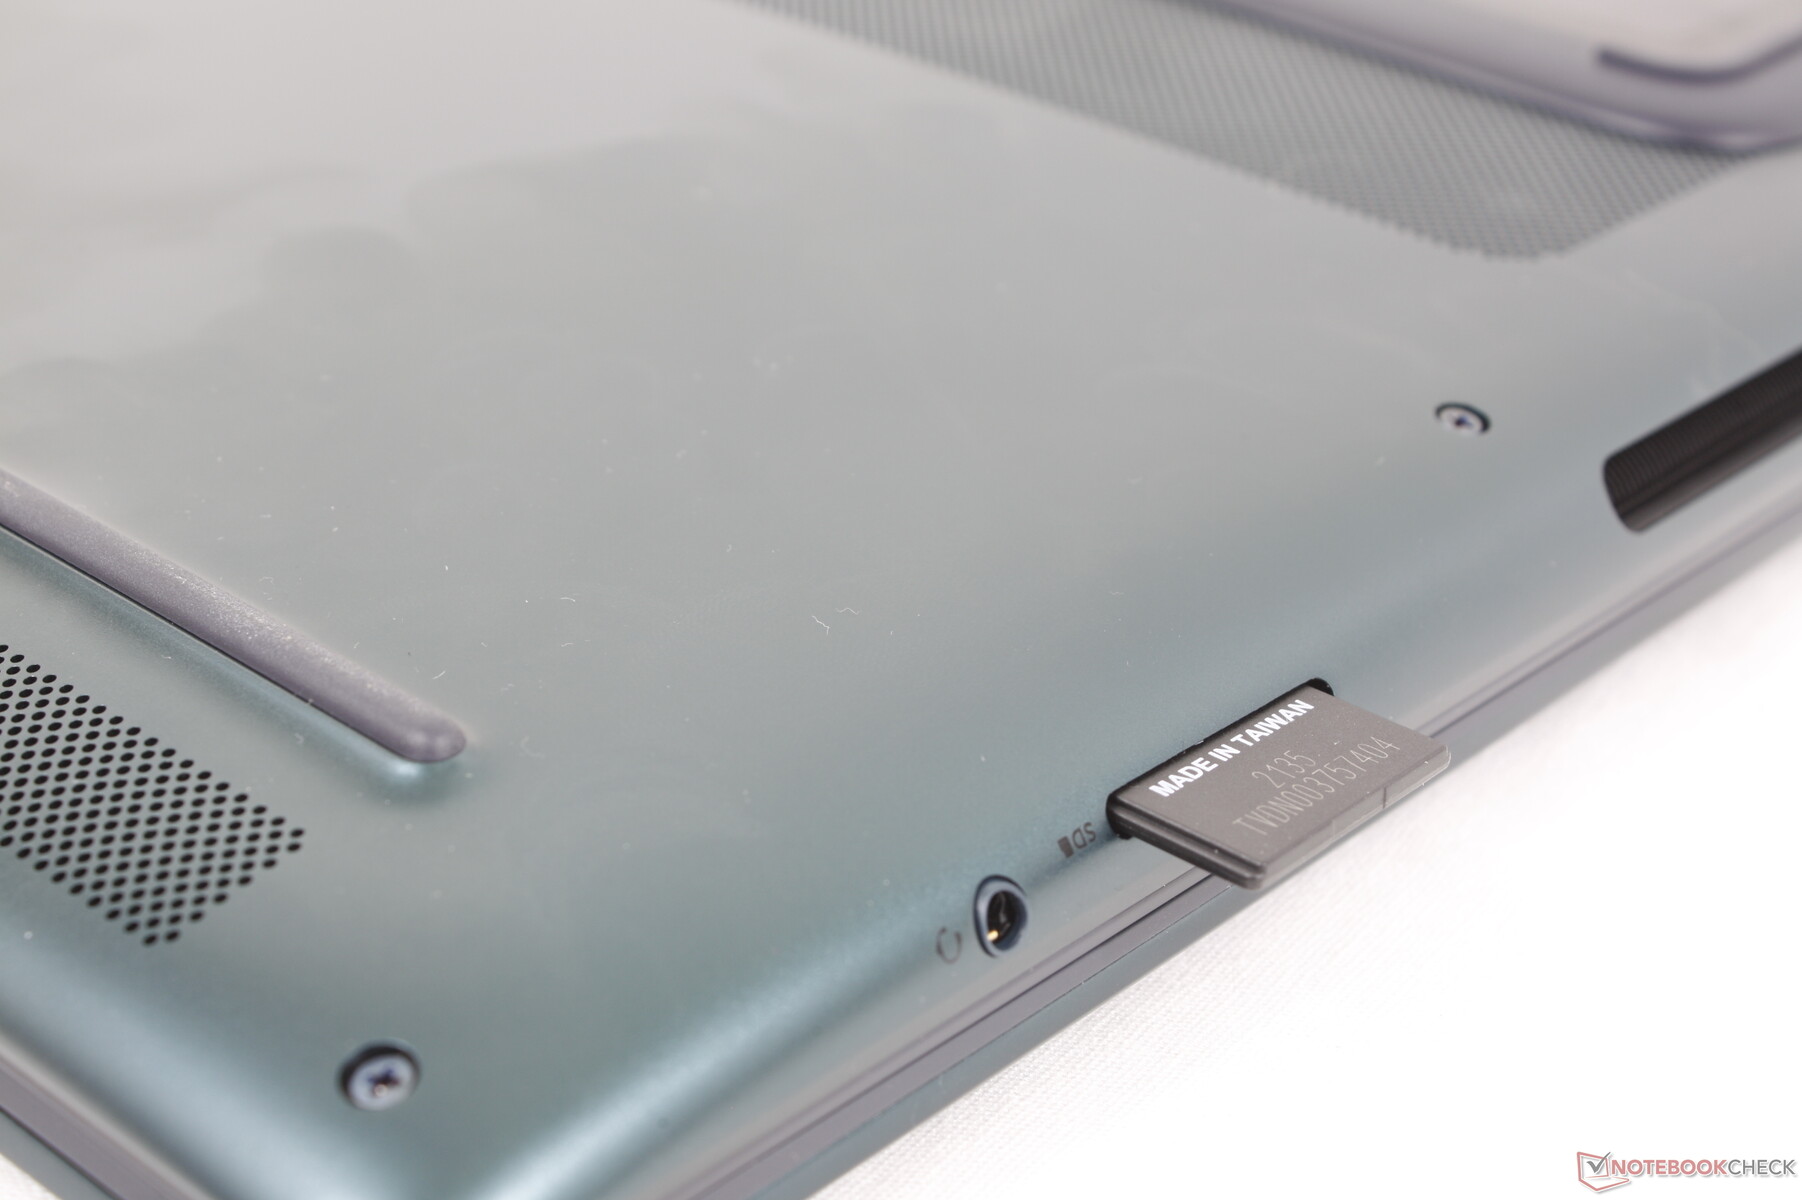
SD Card Reader
Though performance is fast, the card reader is not spring-loaded and so an inserted SD card still protrudes by almost half its length for unsafe transporting.
| SD Card Reader | |
| average JPG Copy Test (av. of 3 runs) | |
| Alienware 18 Area-51 (Toshiba Exceria Pro SDXC 64 GB UHS-II) | |
| Alienware m18 R2 (Toshiba Exceria Pro SDXC 64 GB UHS-II) | |
| Razer Blade 18 2024 RZ09-0509 (Toshiba Exceria Pro SDXC 64 GB UHS-II) | |
| Alienware 16 Area-51 (Toshiba Exceria Pro SDXC 64 GB UHS-II) | |
| Acer Predator Helios 18 PH18-72-98MW (AV PRO microSD 128 GB V60) | |
| MSI Titan 18 HX AI A2XWJG (AV PRO microSD 128 GB V60) | |
| MSI Raider A18 HX A9WIG-080 | |
| maximum AS SSD Seq Read Test (1GB) | |
| Alienware 18 Area-51 (Toshiba Exceria Pro SDXC 64 GB UHS-II) | |
| Alienware 16 Area-51 (Toshiba Exceria Pro SDXC 64 GB UHS-II) | |
| Razer Blade 18 2024 RZ09-0509 (Toshiba Exceria Pro SDXC 64 GB UHS-II) | |
| Alienware m18 R2 (Toshiba Exceria Pro SDXC 64 GB UHS-II) | |
| MSI Raider A18 HX A9WIG-080 | |
| MSI Titan 18 HX AI A2XWJG (AV PRO microSD 128 GB V60) | |
| Acer Predator Helios 18 PH18-72-98MW (AV PRO microSD 128 GB V60) | |
Communication
The Intel Killer BE1750W comes standard for Wi-Fi 7 and Bluetooth 5.4 connectivity. Core specifications are identical to the BE1750x in the Alienware 16 according to Intel.
Webcam
Users can configure between a 2 MP or 8 MP webcam each with IR support. There is no physical shutter option at all which is an oversight for such an expensive system.


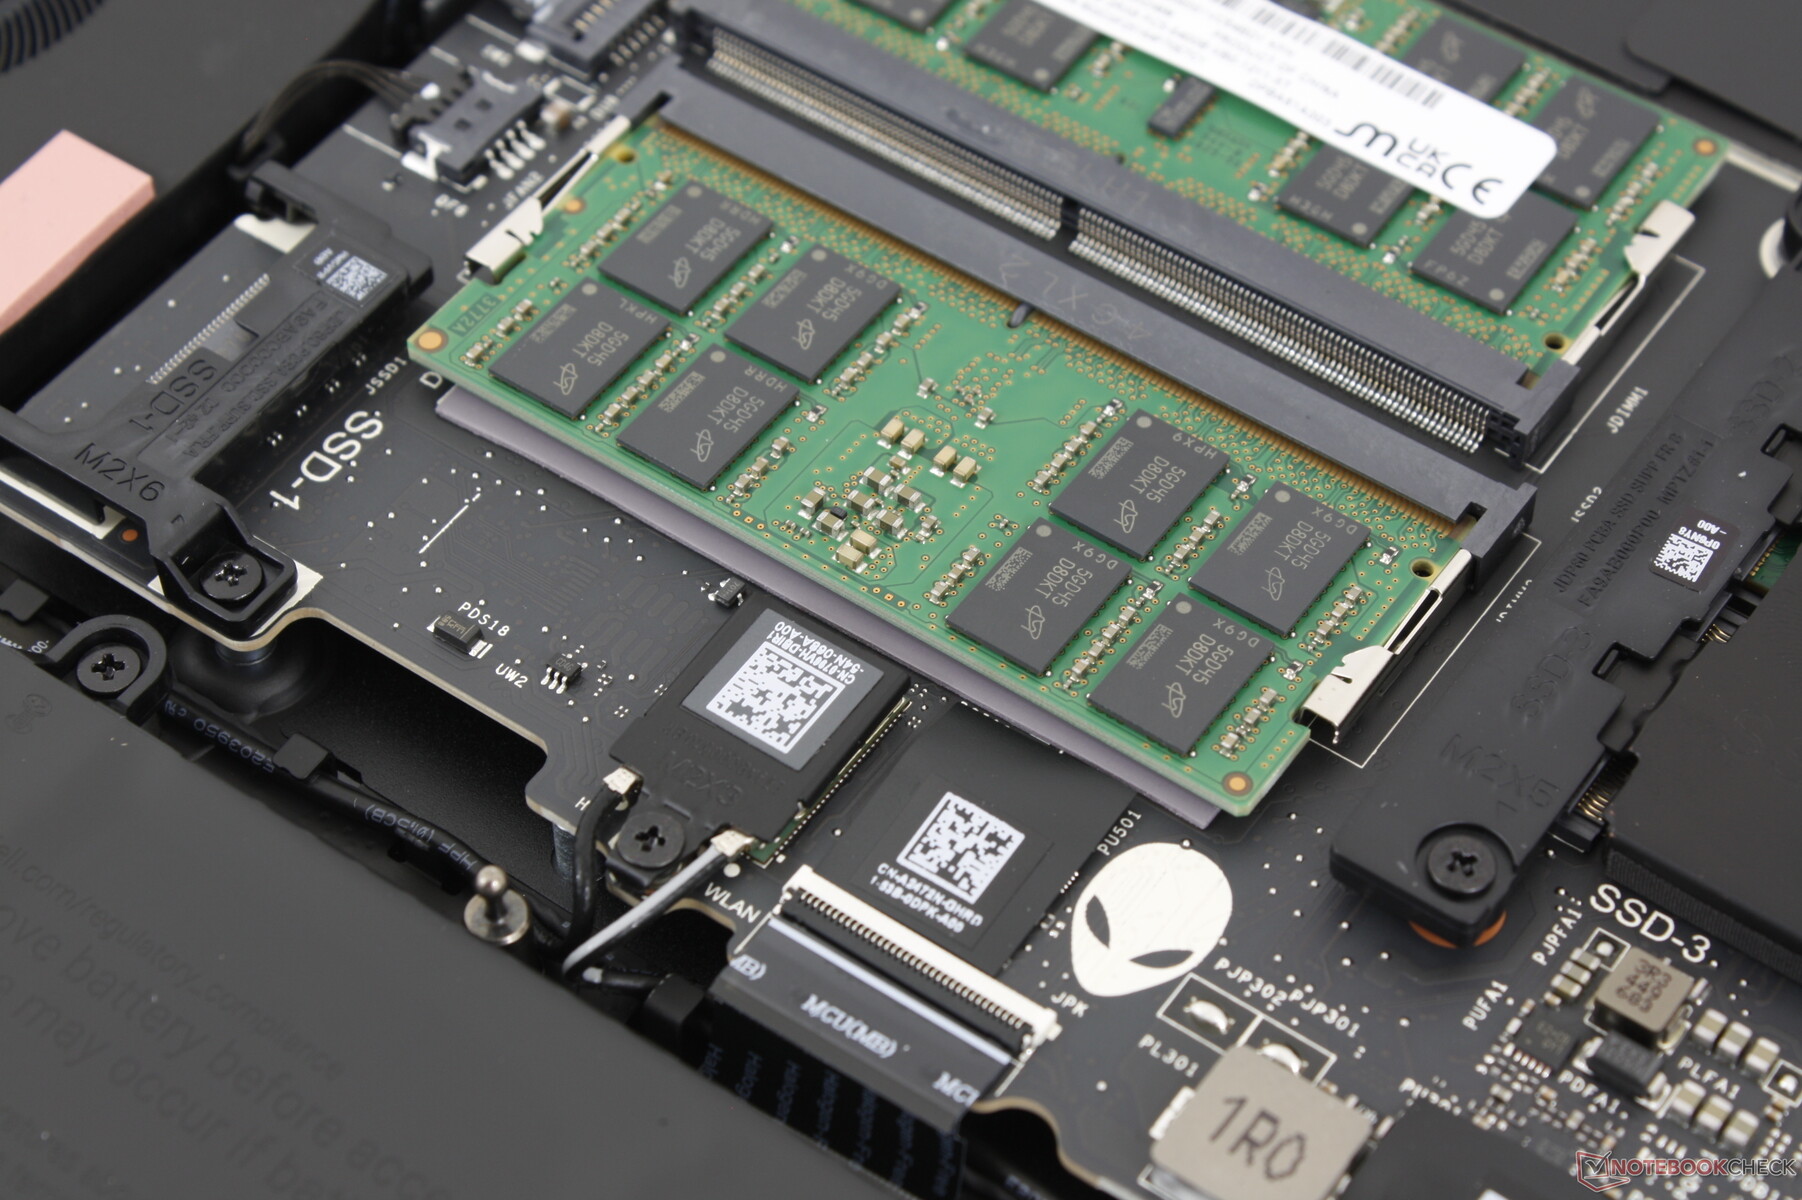
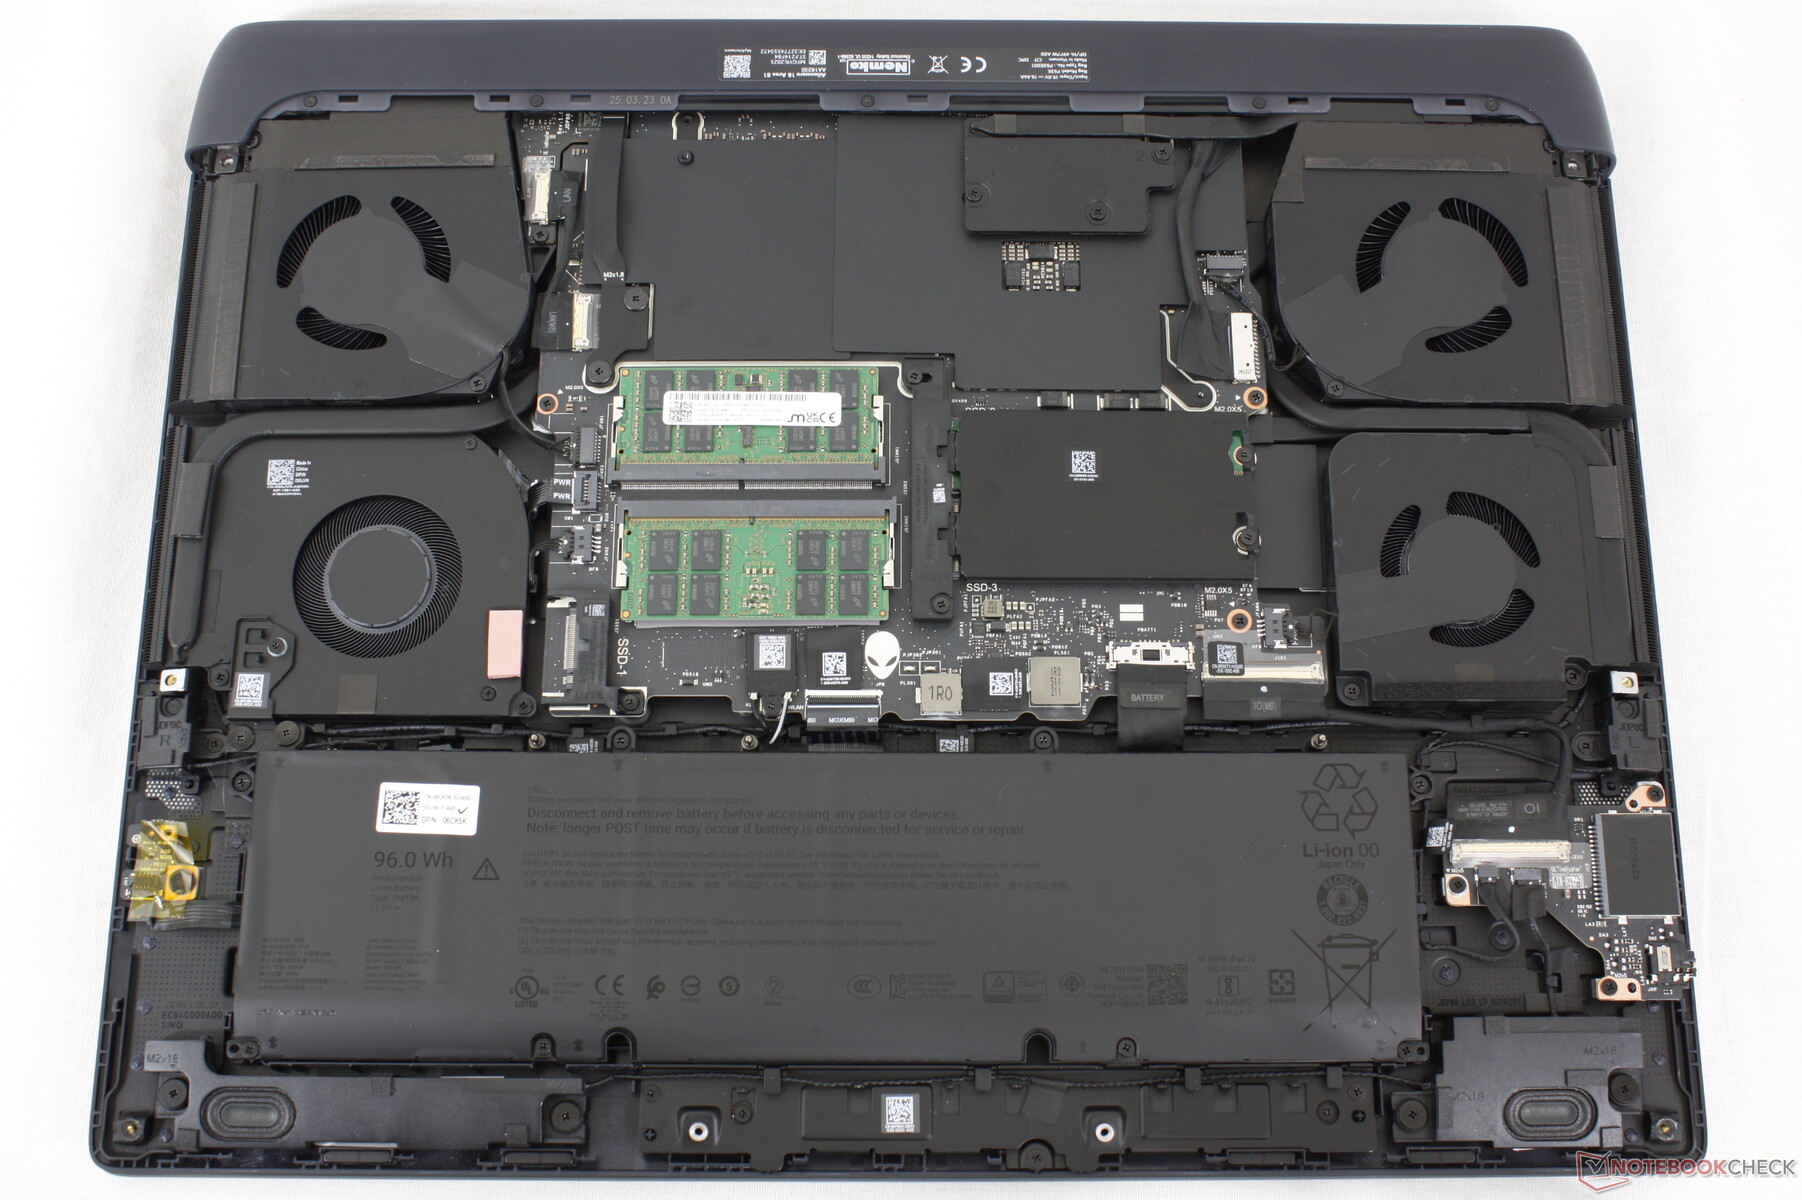
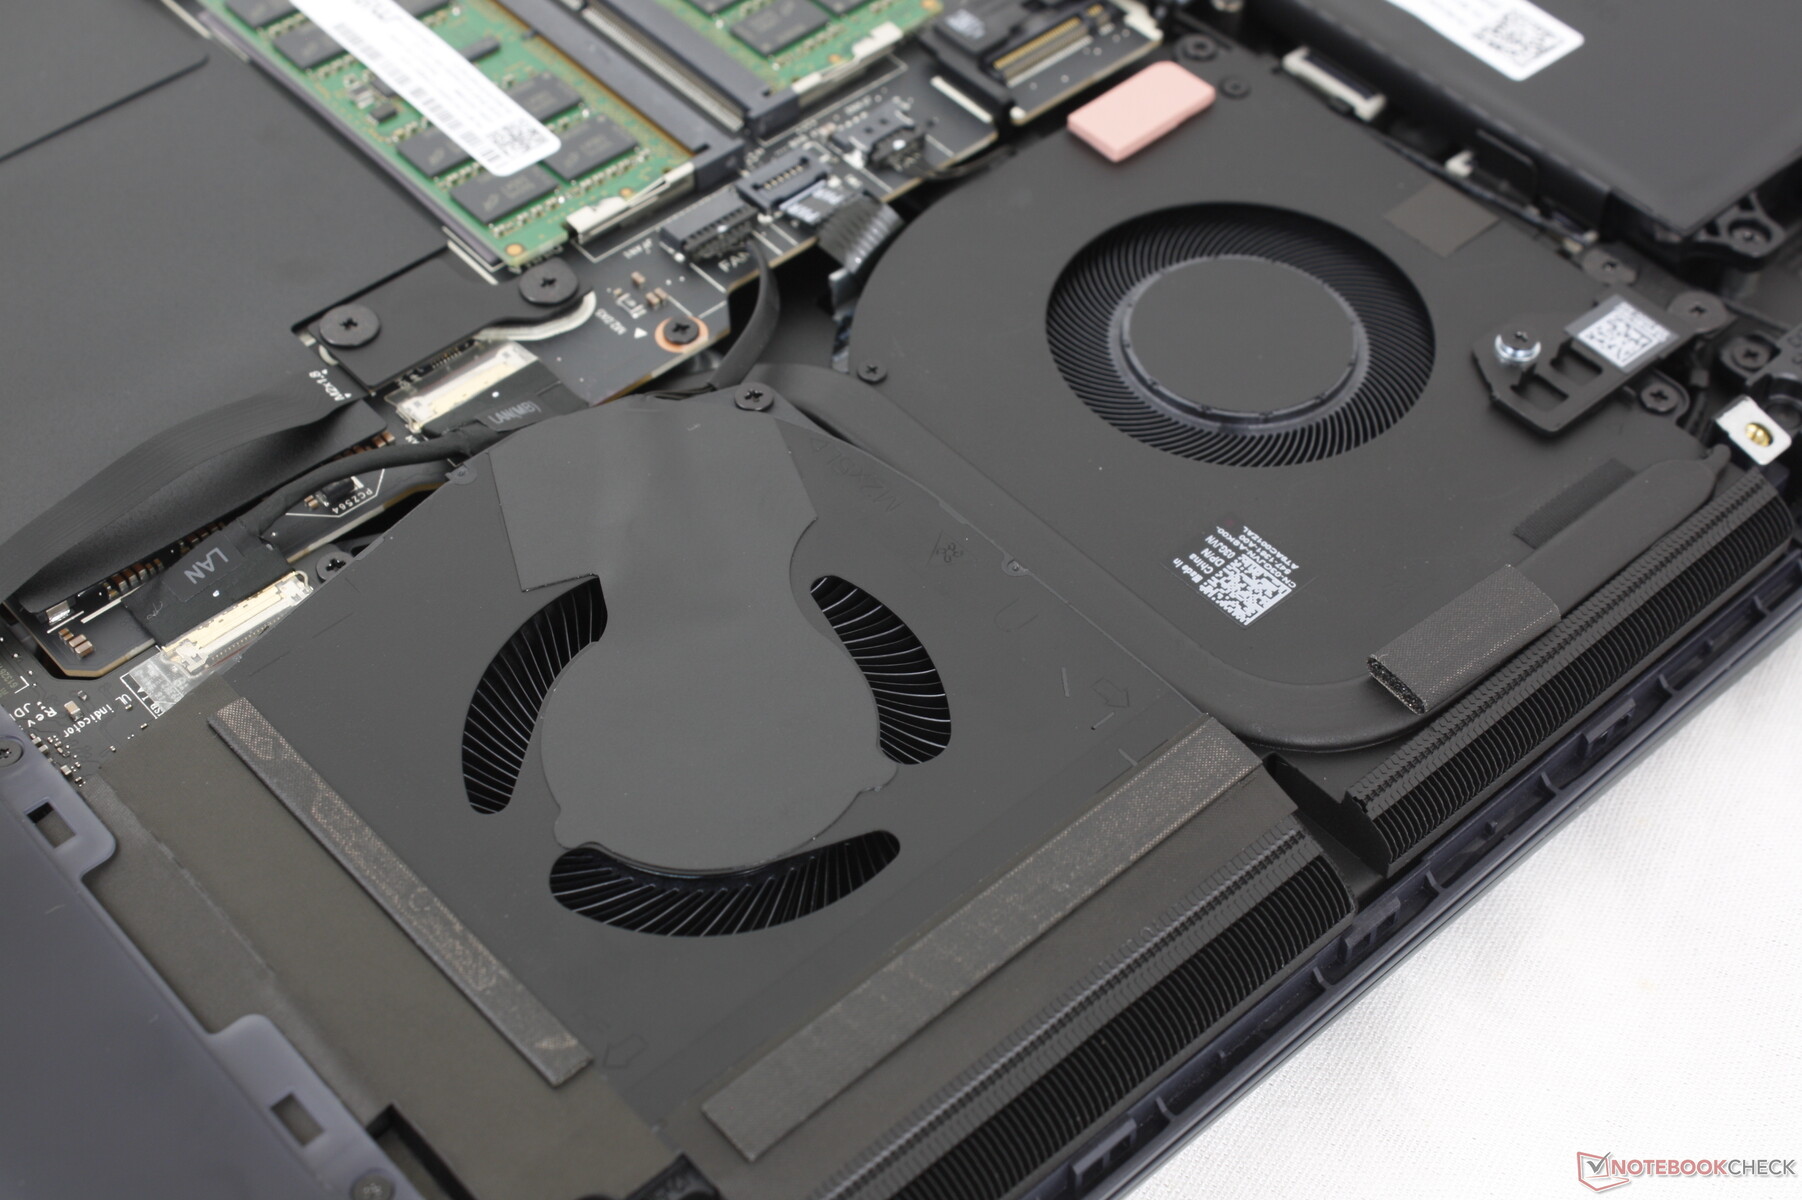
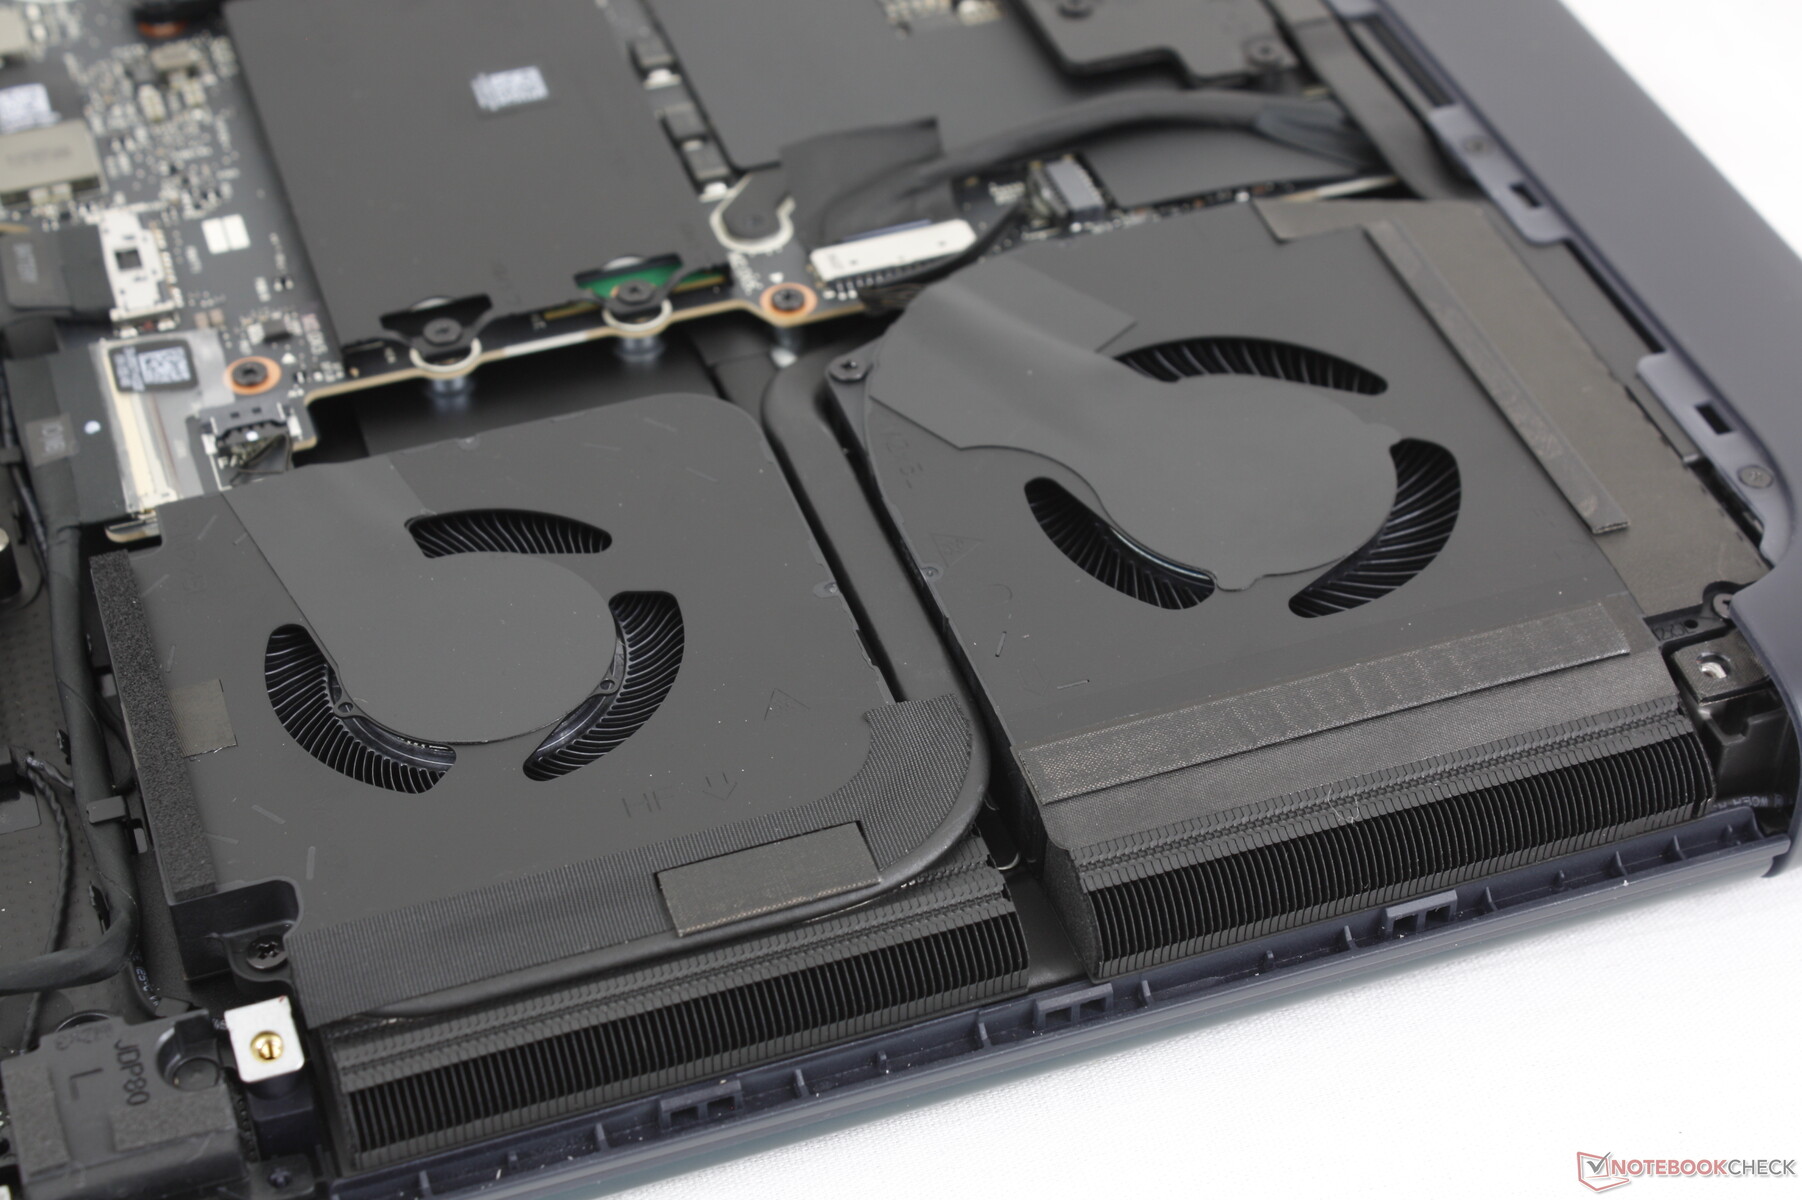
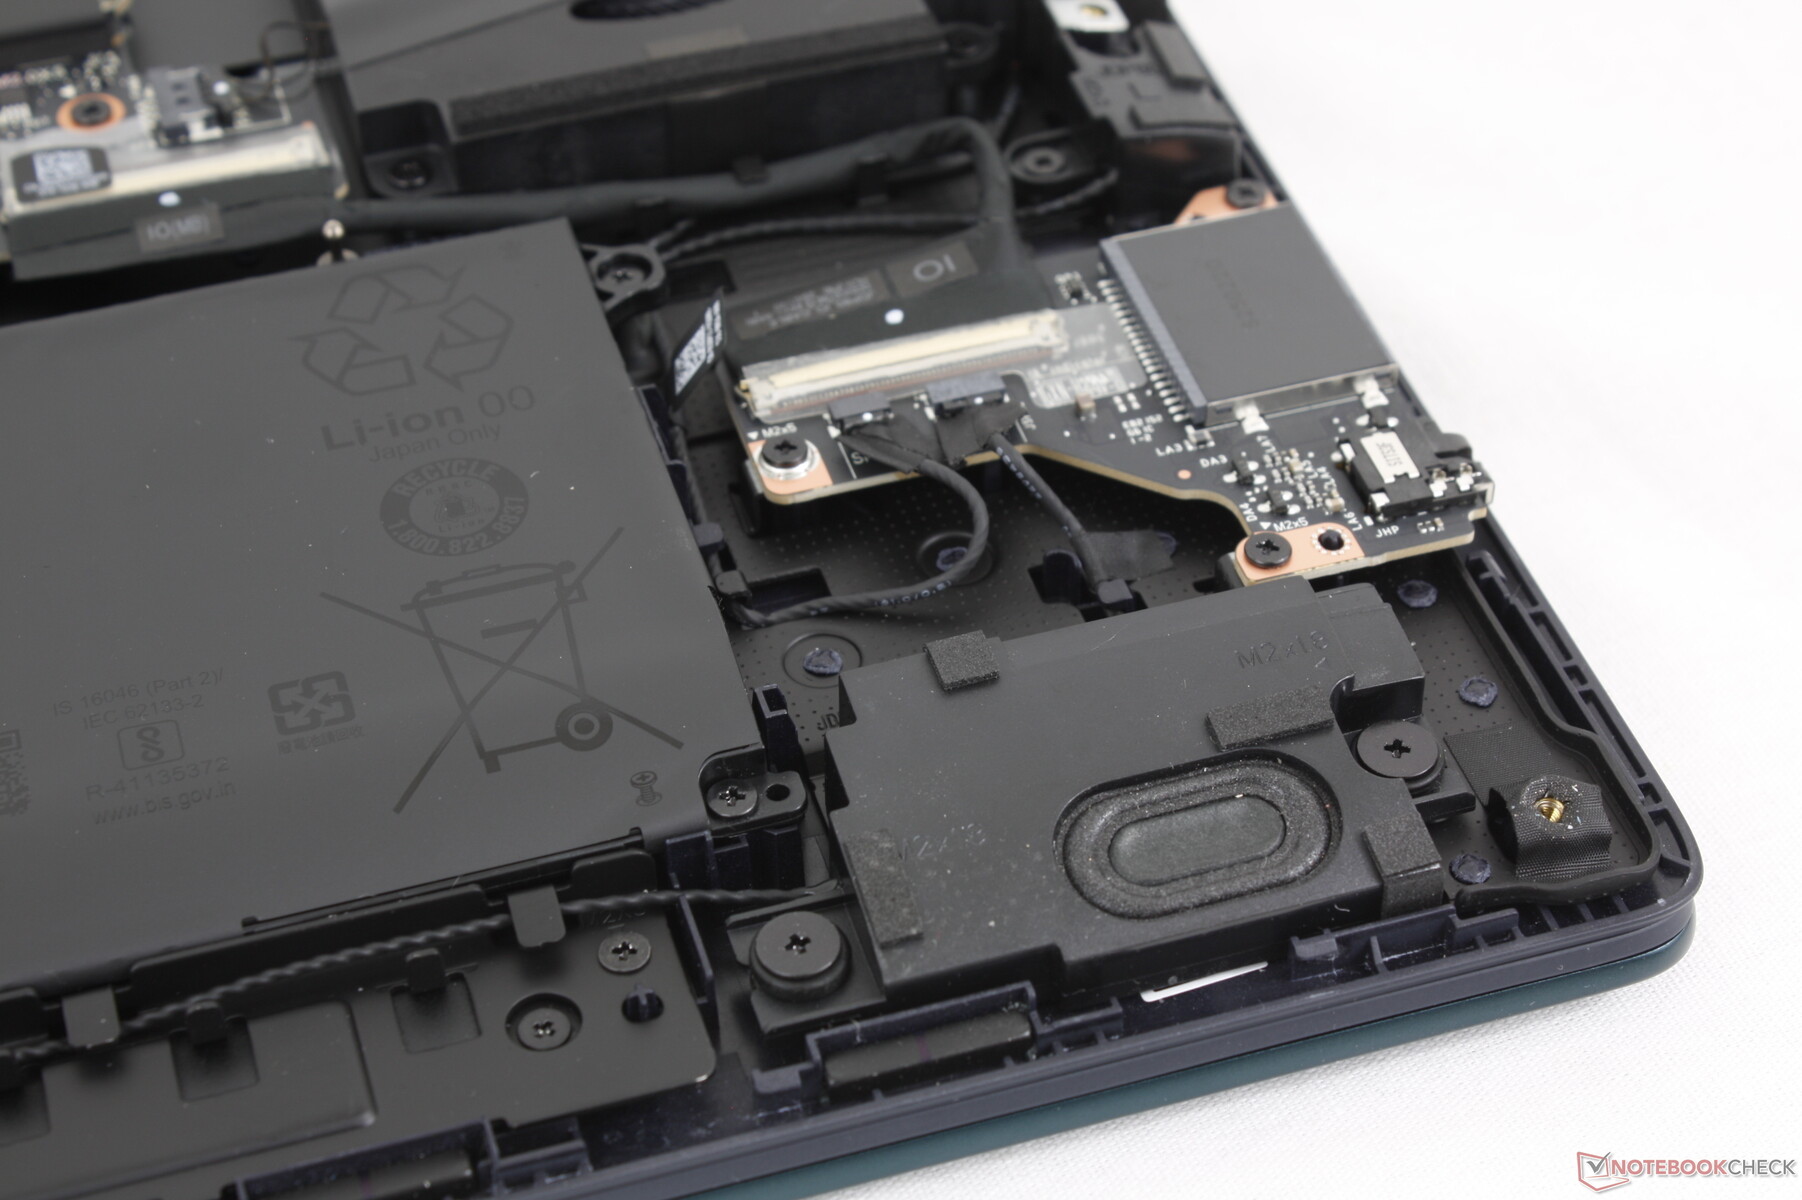
Maintenance
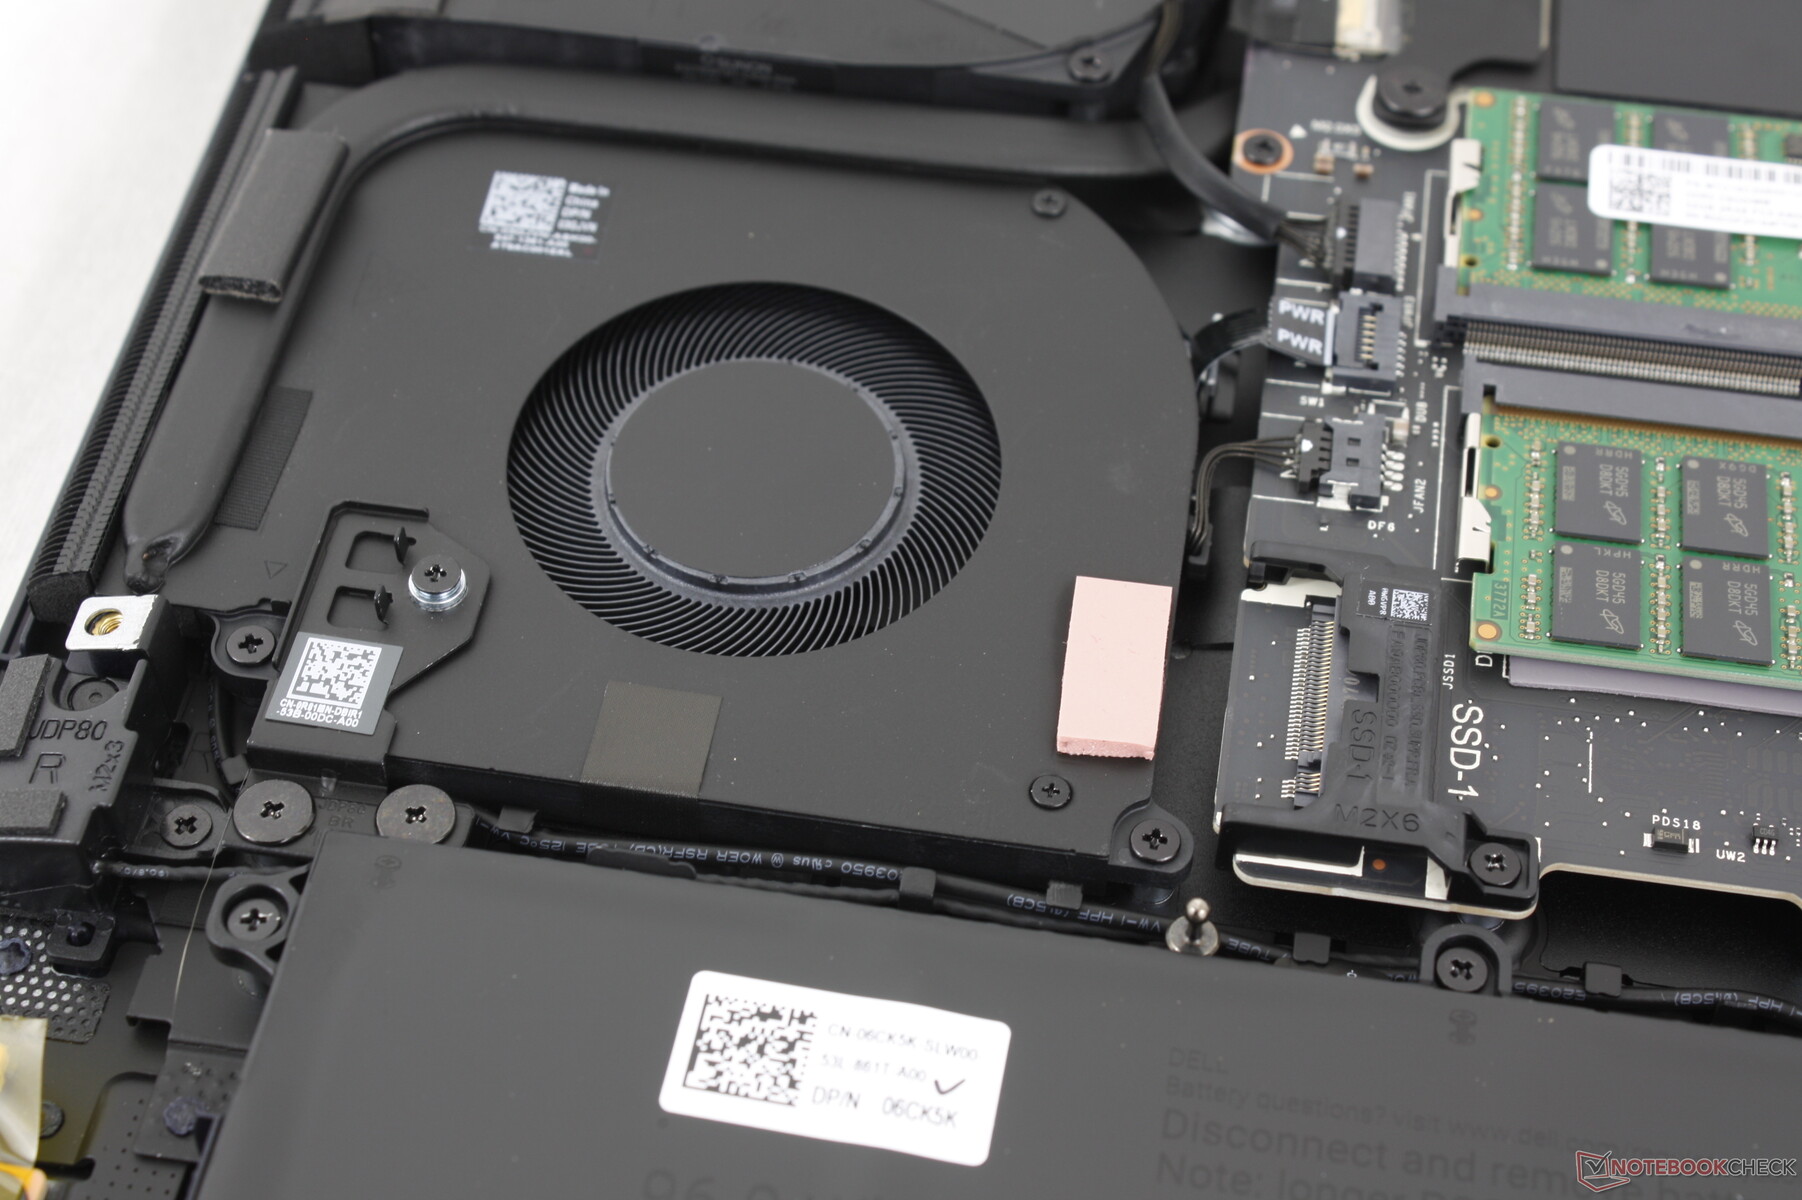
The bottom panel is secured by eight Phillips screws for relatively easy servicing. Internals are similar to the Alienware 16 but with larger fans for better cooling and a repositioned SSD slot.
Sustainability
We can find no information on any recycled plastics or metal used during the manufacturing of the Alienware 18. Meanwhile, the packaging is mostly paper and cardboard to be free of plastics.
Accessories And Warranty
There are no extras in the retail box other than the AC adapter and paperwork. The usual one-year limited manufacturer warranty applies if purchased in the US.
Input Devices — Clicky And Comfy
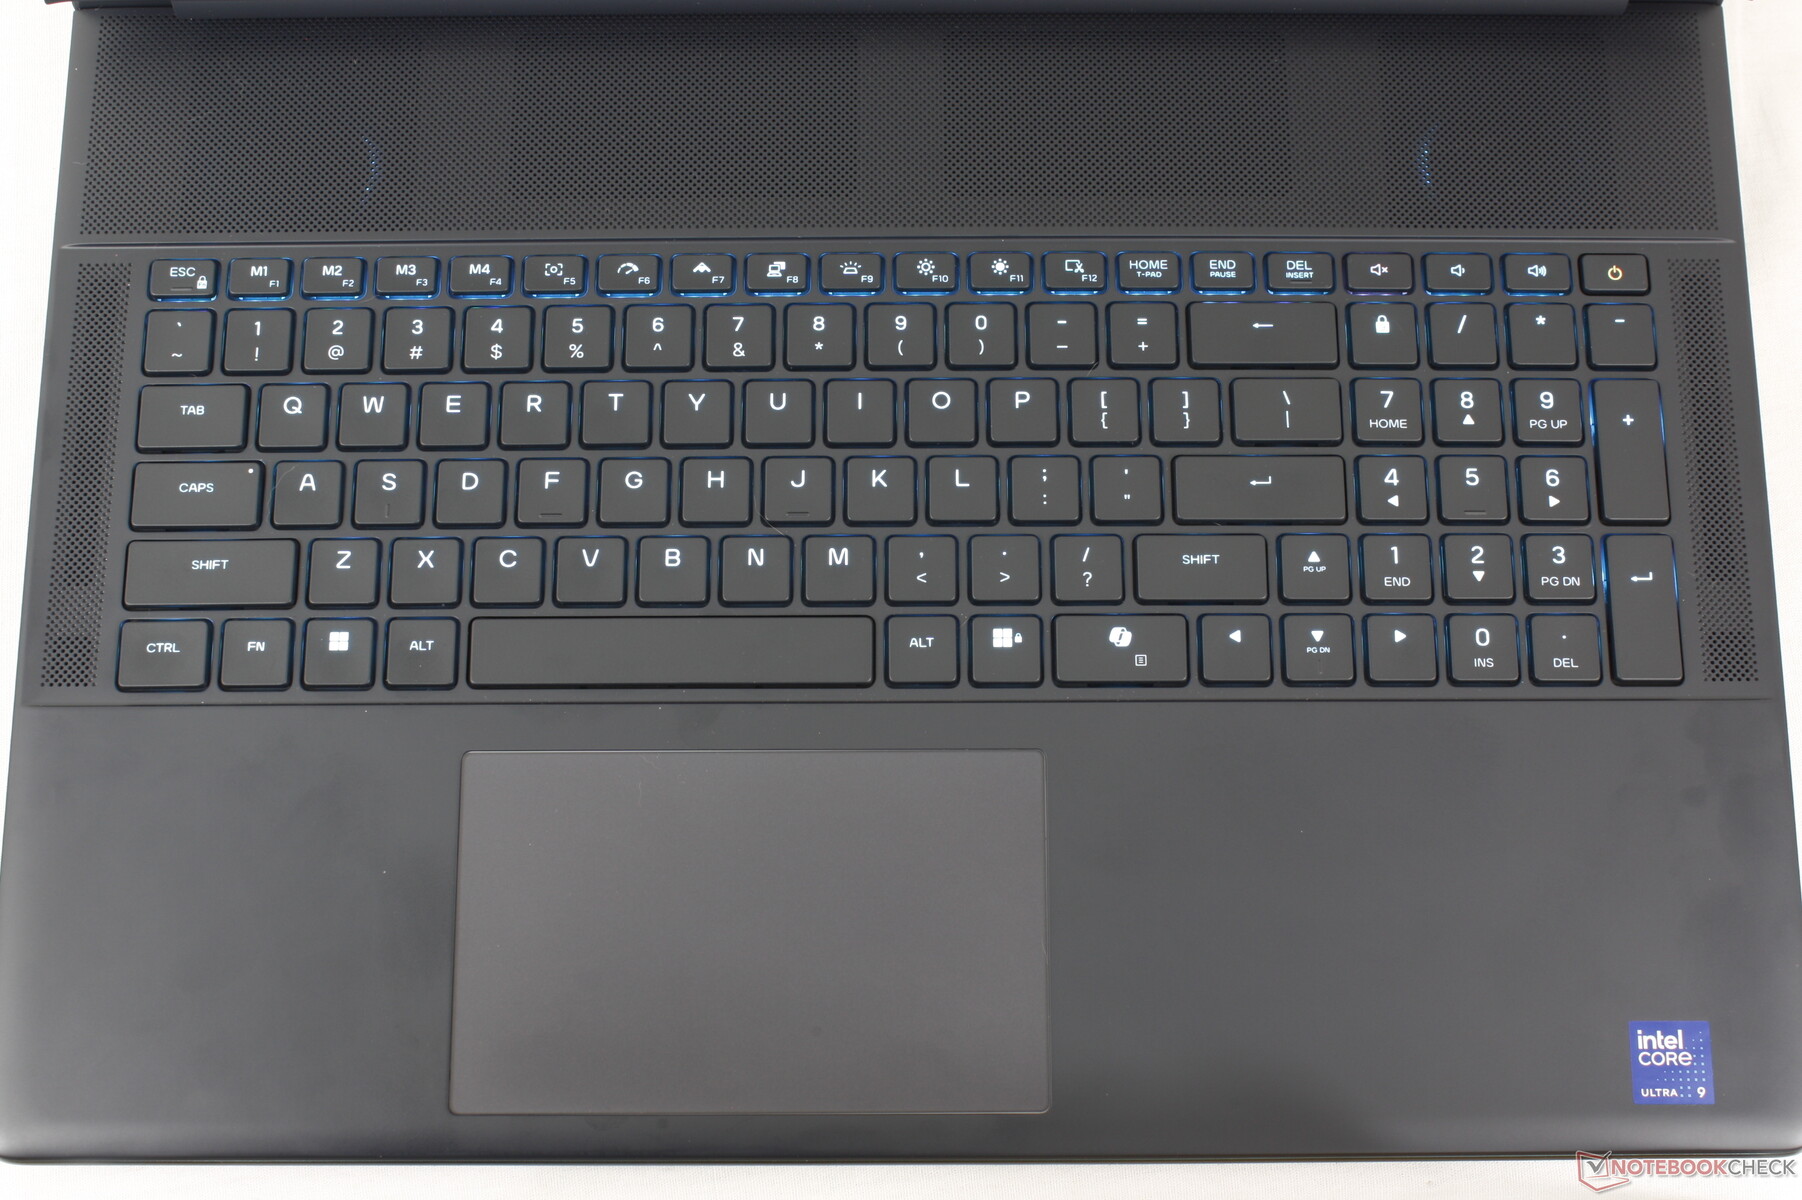
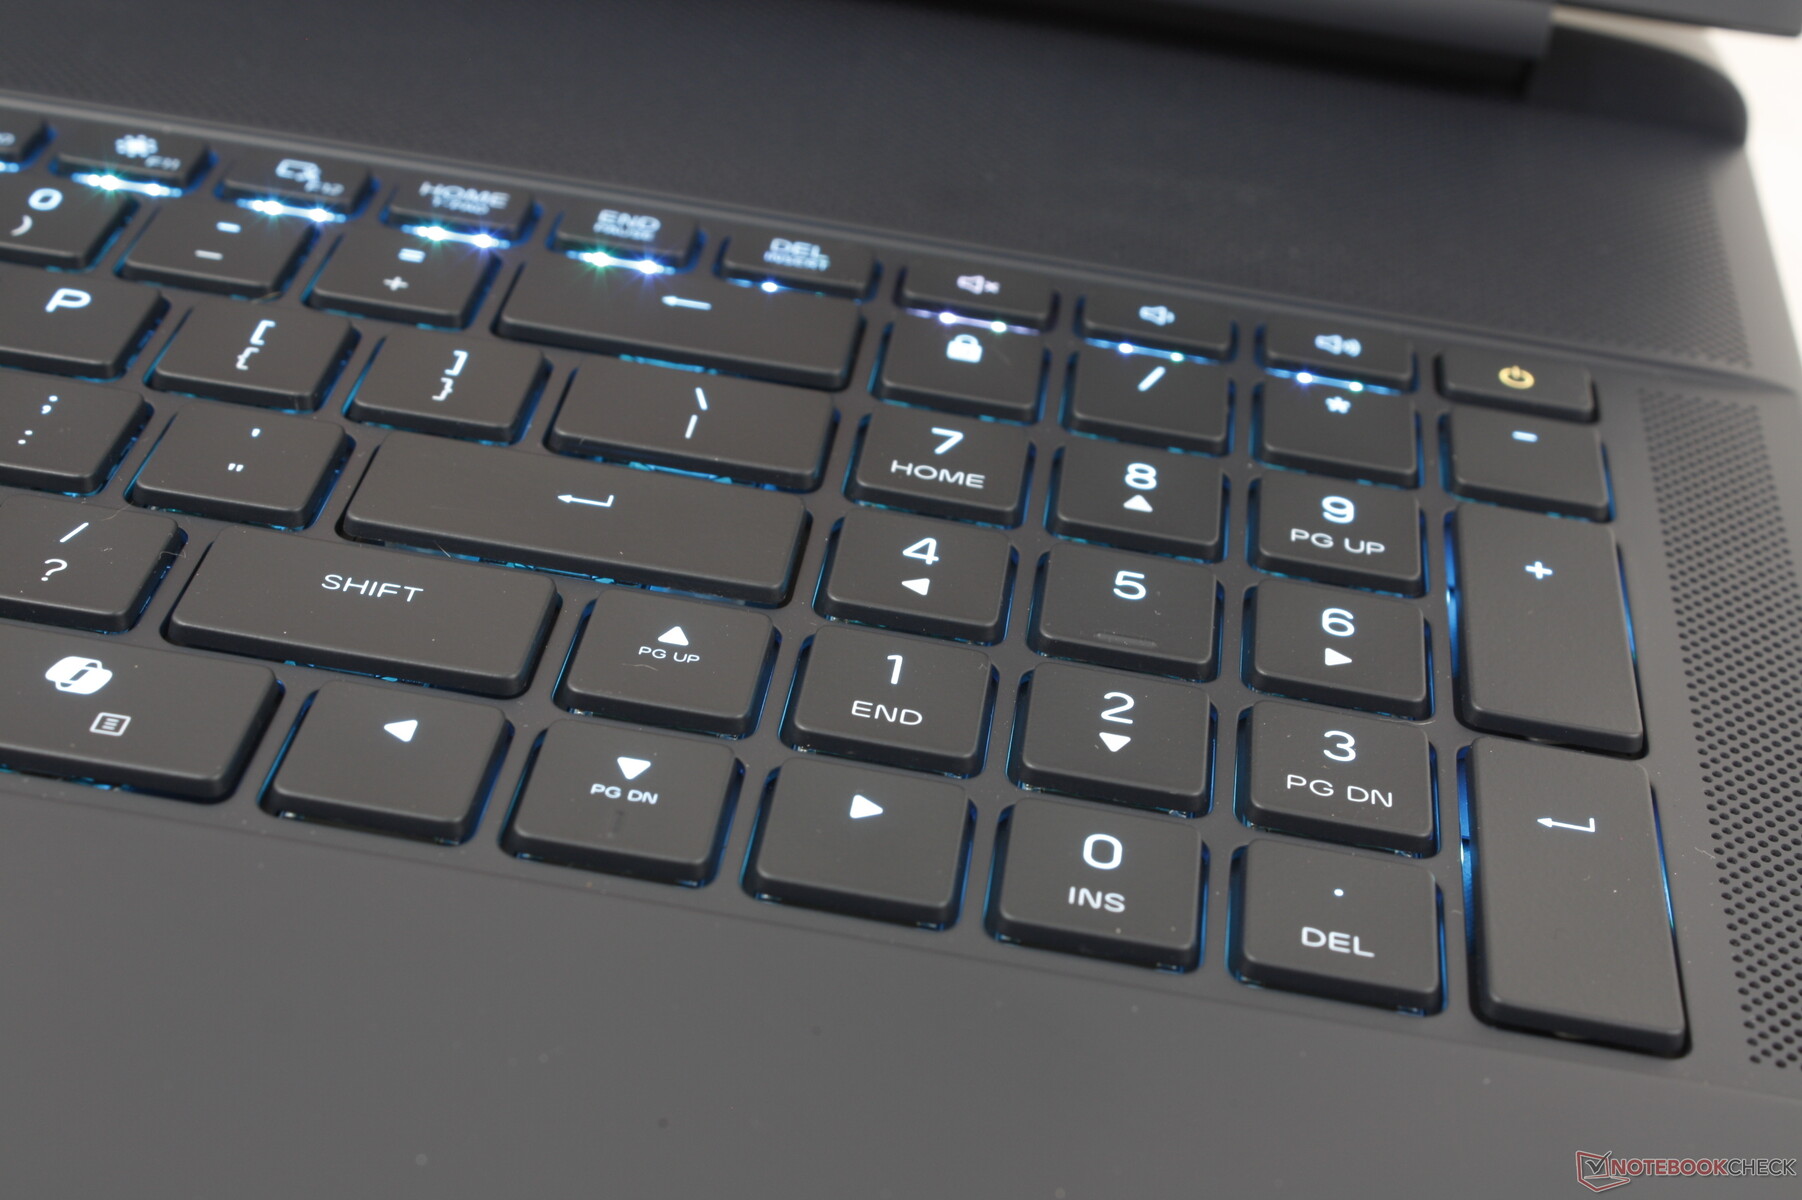
Keyboard
The low-profile Cherry mechanical keyboard has returned from the Alienware 16 and last year's Alienware m18 series. In fact, the layout and key functions are almost identical to the Alienware m18 series for essentially the same typing experience. These low-profile CherryMX keys are some of the most spacious and comfortable we've experienced on a gaming laptop because of their clickiness, deep travel, and loud feedback. However, users may still want to configure with standard membrane-based keys as the loud and high-pitched mechanical keys may not be appropriate for noise-sensitive environments.
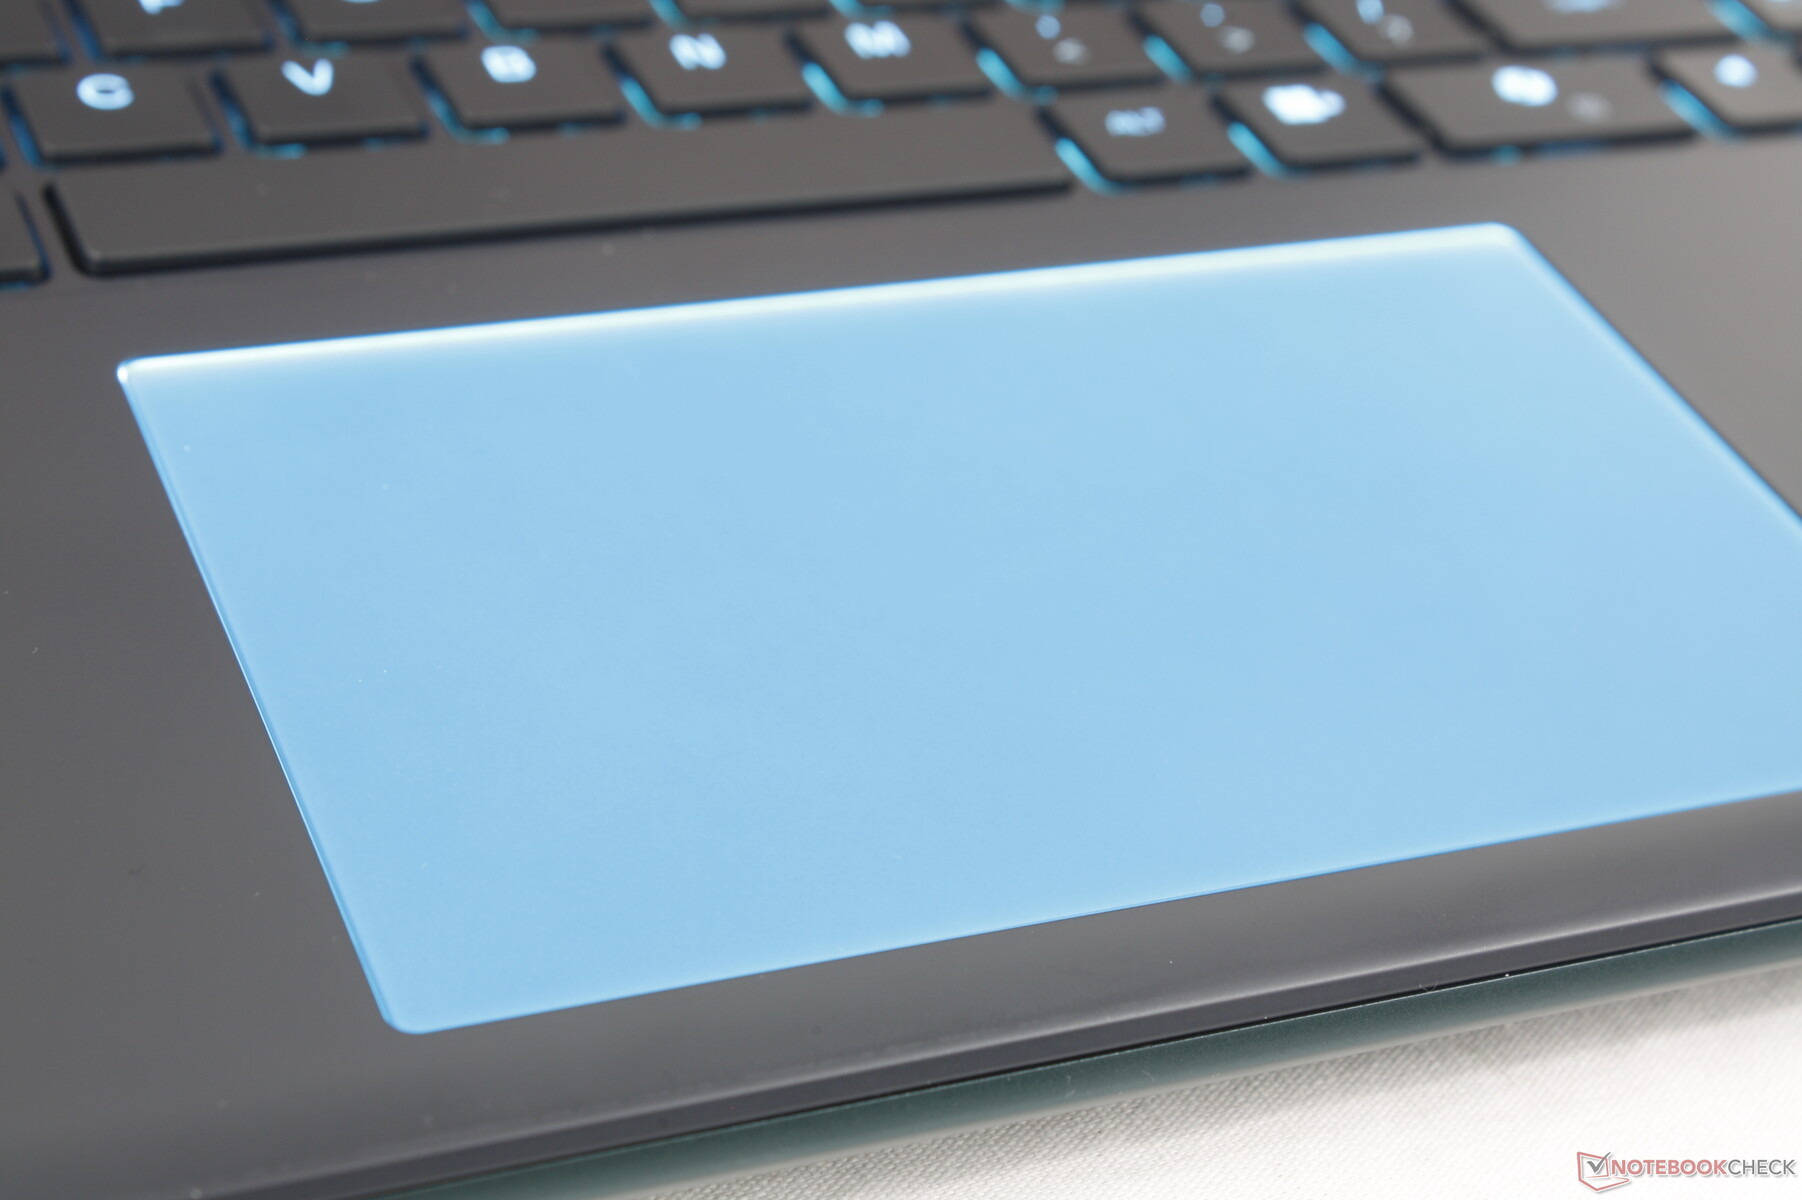
Touchpad
The clickpad is slightly larger on the Alienware 18 when compared to the one on the Alienware 16 (13.2 x 8 cm vs. 11.2 x 6.5 cm). The smooth traction and loud "clicky" feedback otherwise feel identical between the two models.

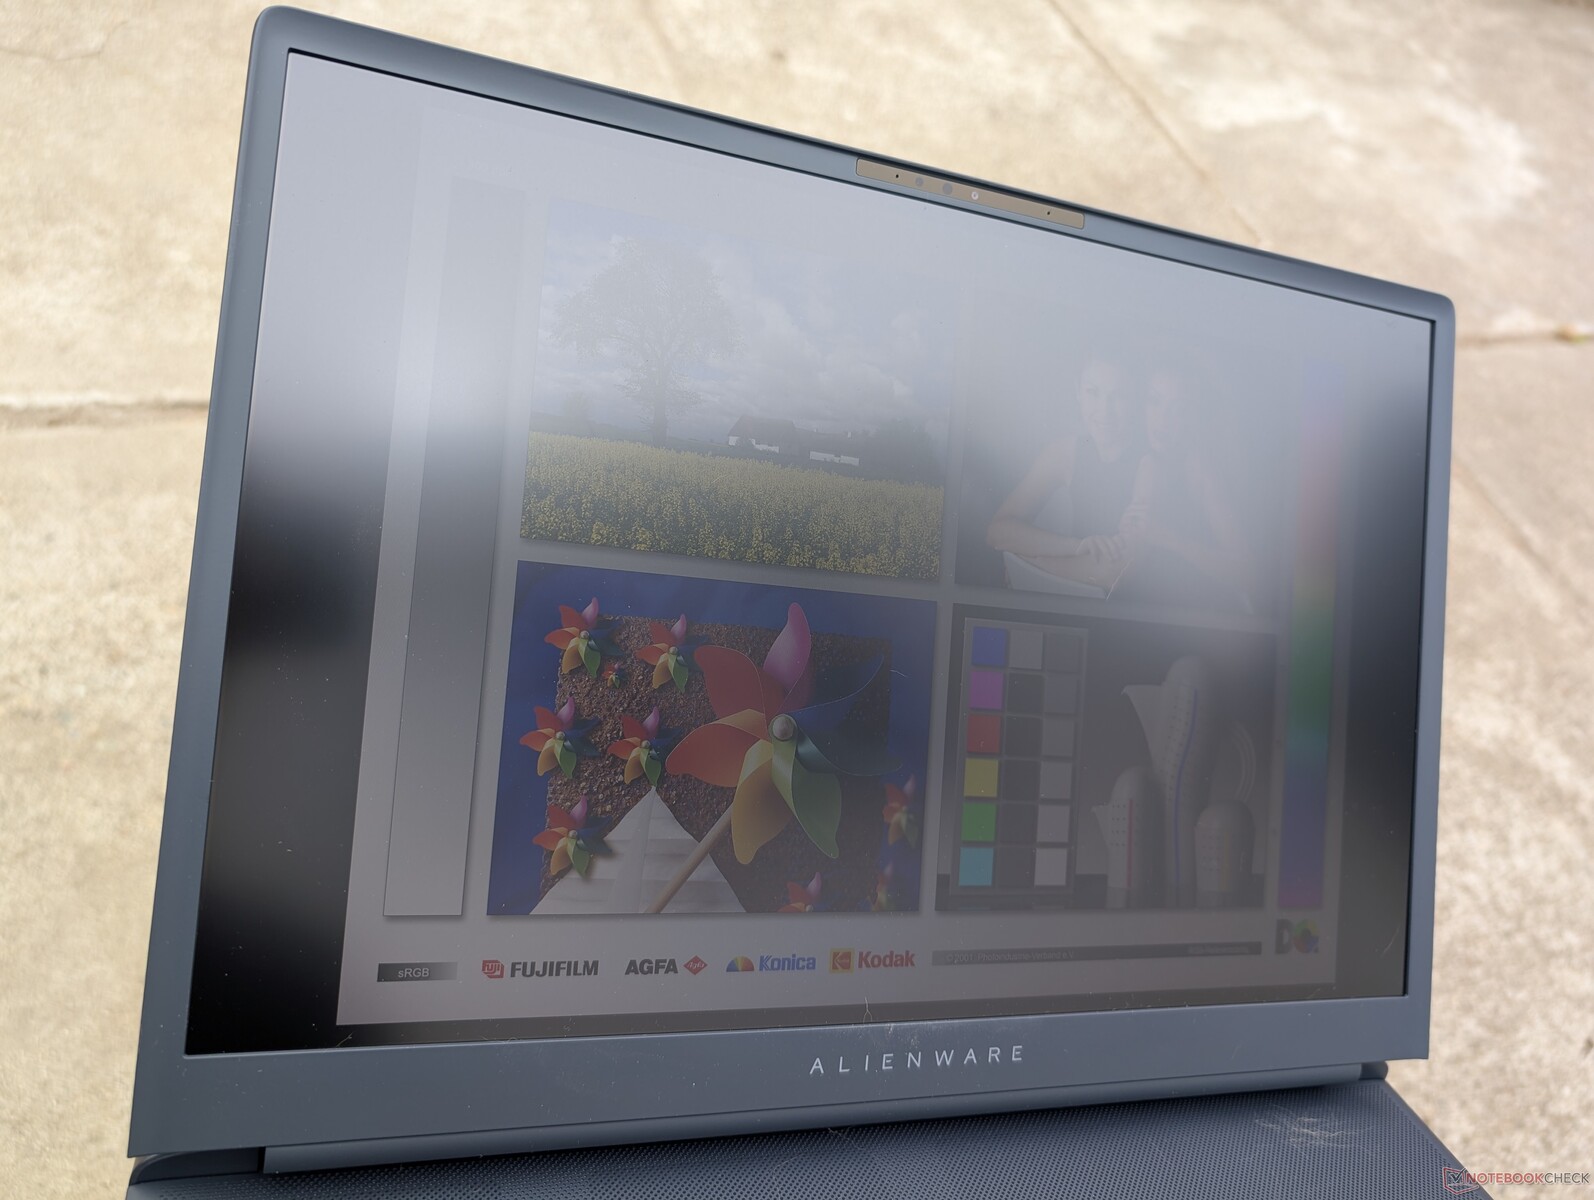
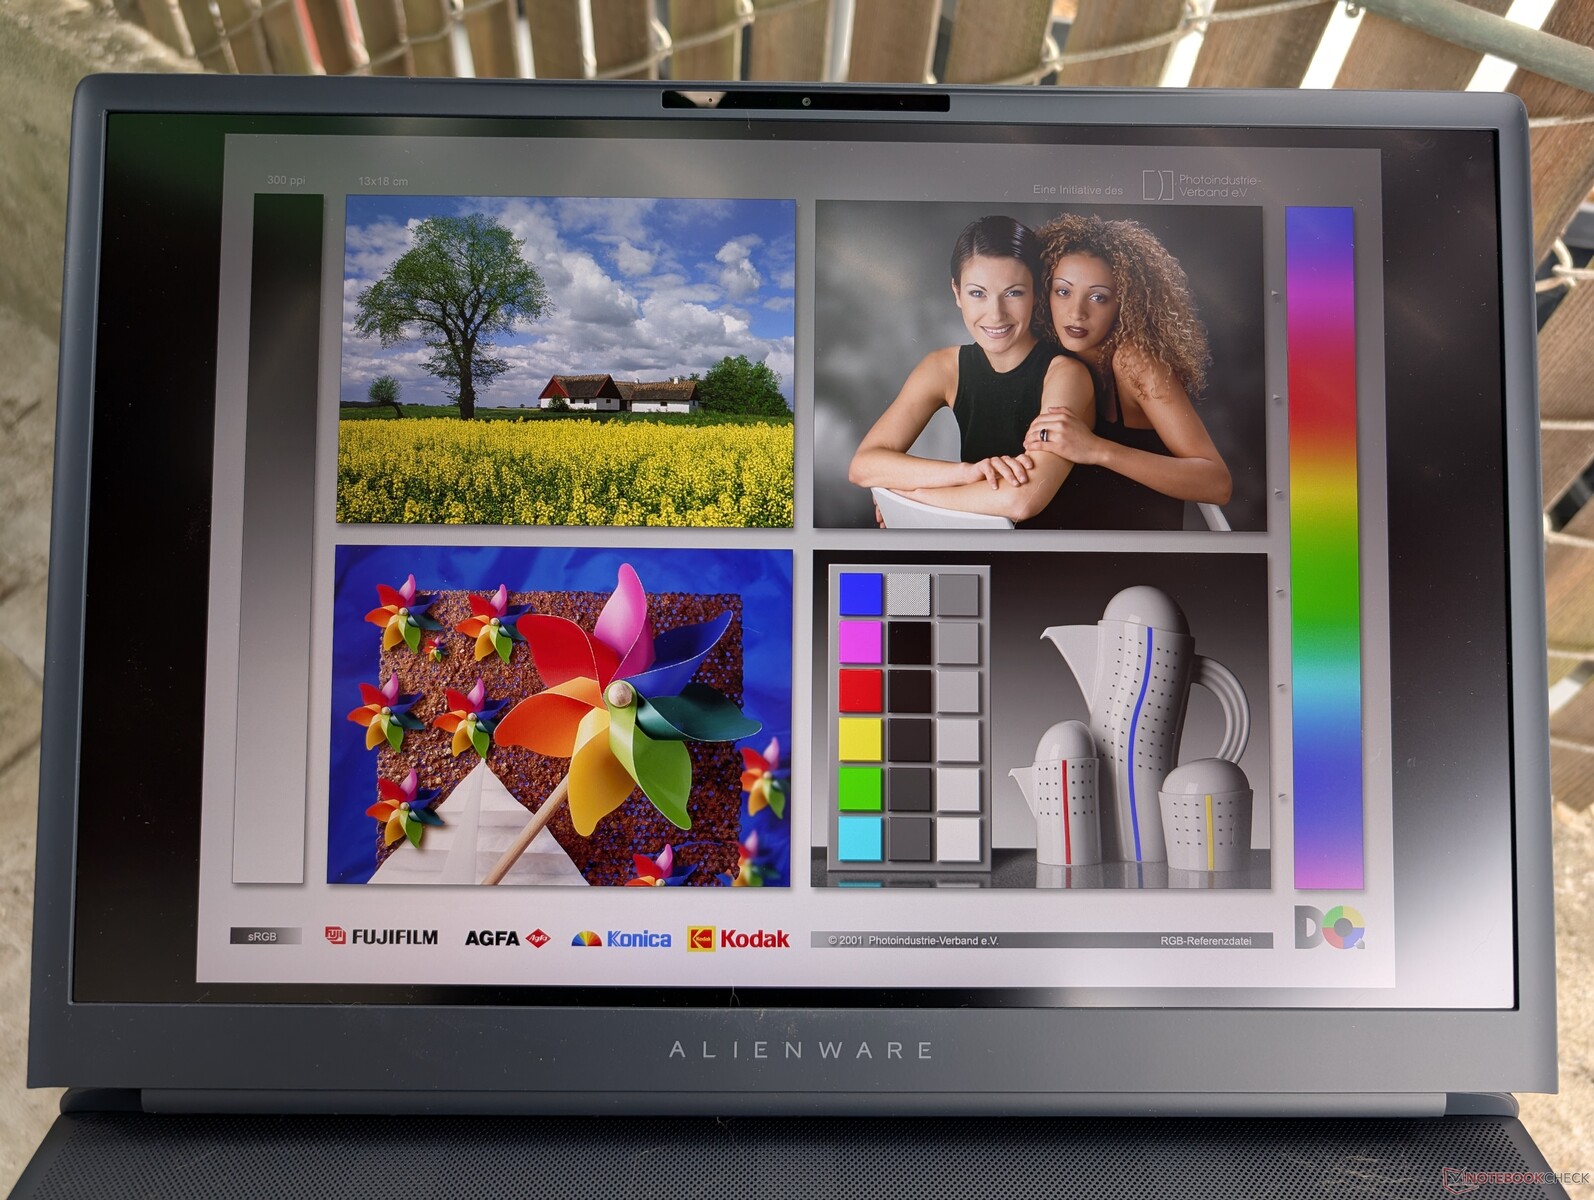
Display — No 4K For You
There is only one display option currently available for better or worse. Positive aspects include the very high 300 Hz refresh rate and full DCI-P3 colors with support for Advanced Optimus. On the flip side, the IPS display lacks HDR support and all the advantages of mini-LED or OLED like deep black levels and high maximum brightness levels. It's also unfortunate that there is no 4K option considering the large 18-inch screen size. The MSI Raider A18 HX has a slight upper hand in these specific scenarios.


| |||||||||||||||||||||||||
Brightness Distribution: 94 %
Center on Battery: 512.5 cd/m²
Contrast: 1250:1 (Black: 0.41 cd/m²)
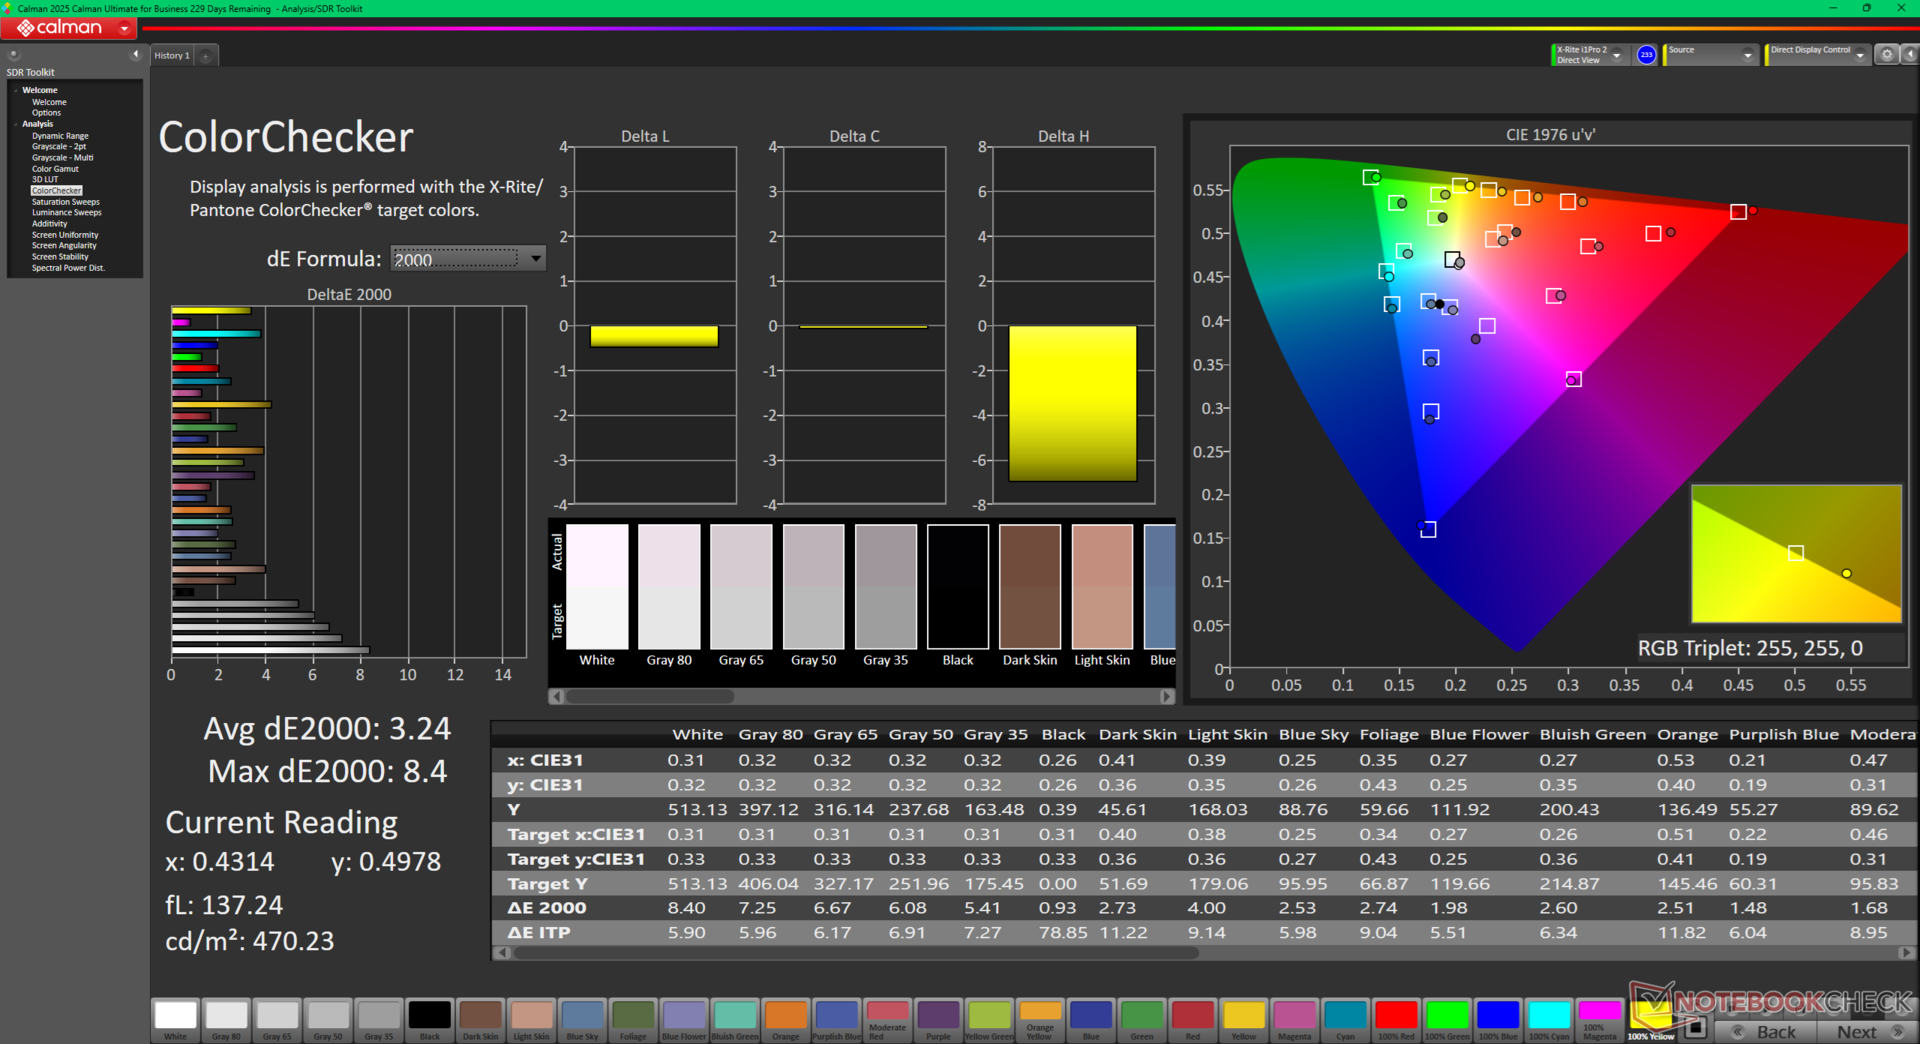
ΔE ColorChecker Calman: 3.24 | ∀{0.5-29.43 Ø4.72}
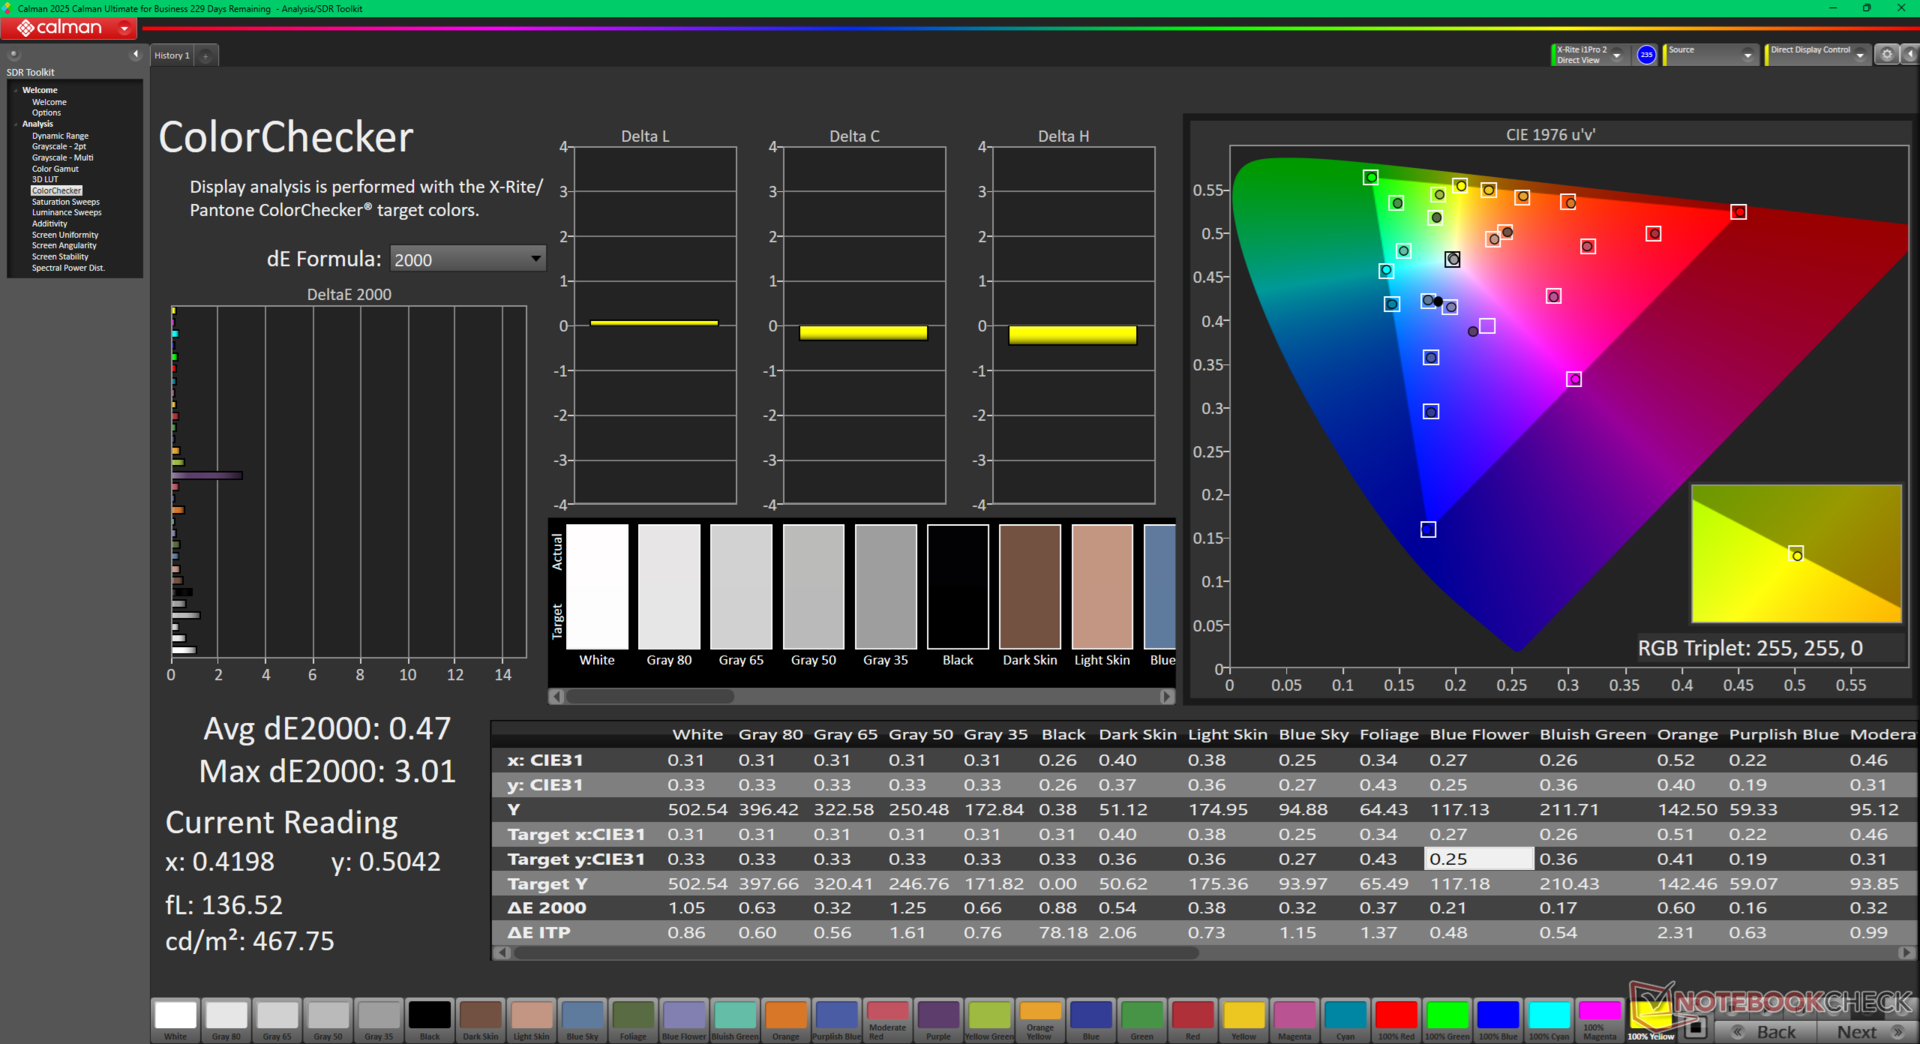
calibrated: 0.47
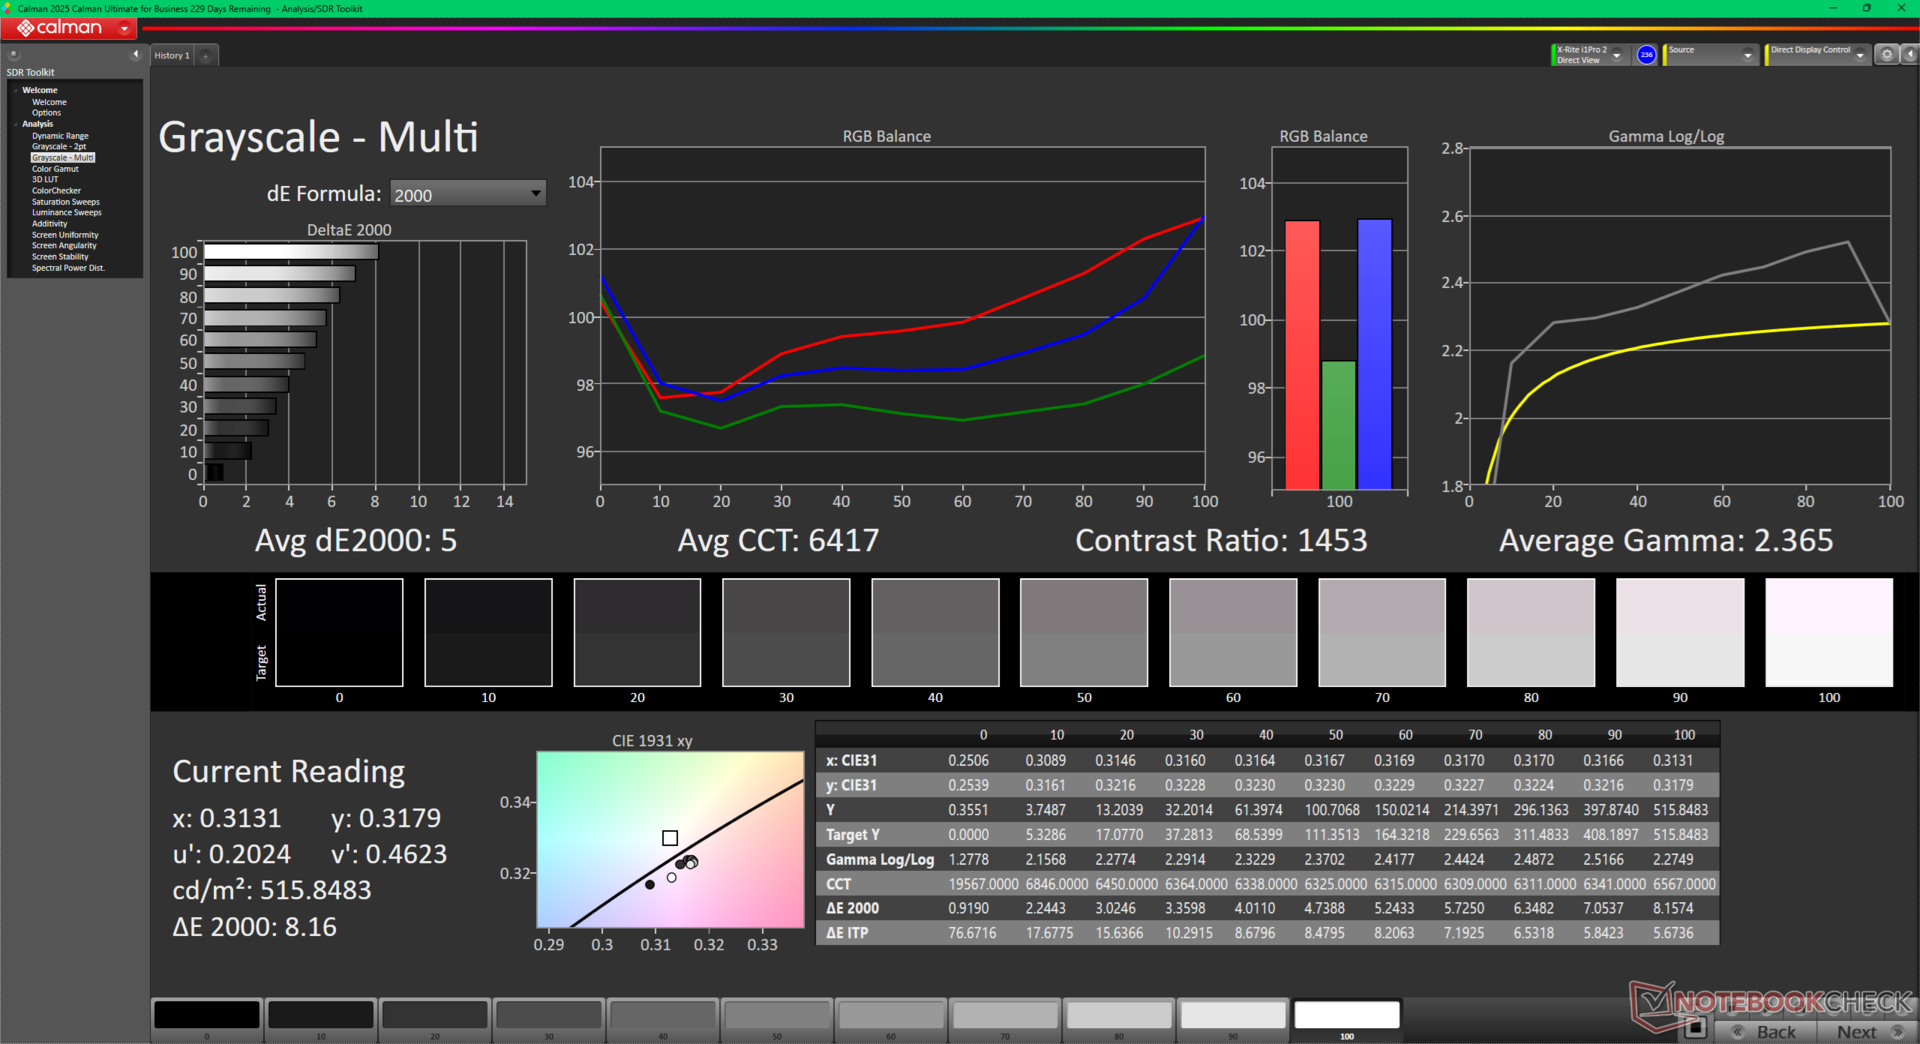
ΔE Greyscale Calman: 5 | ∀{0.09-98 Ø4.97}
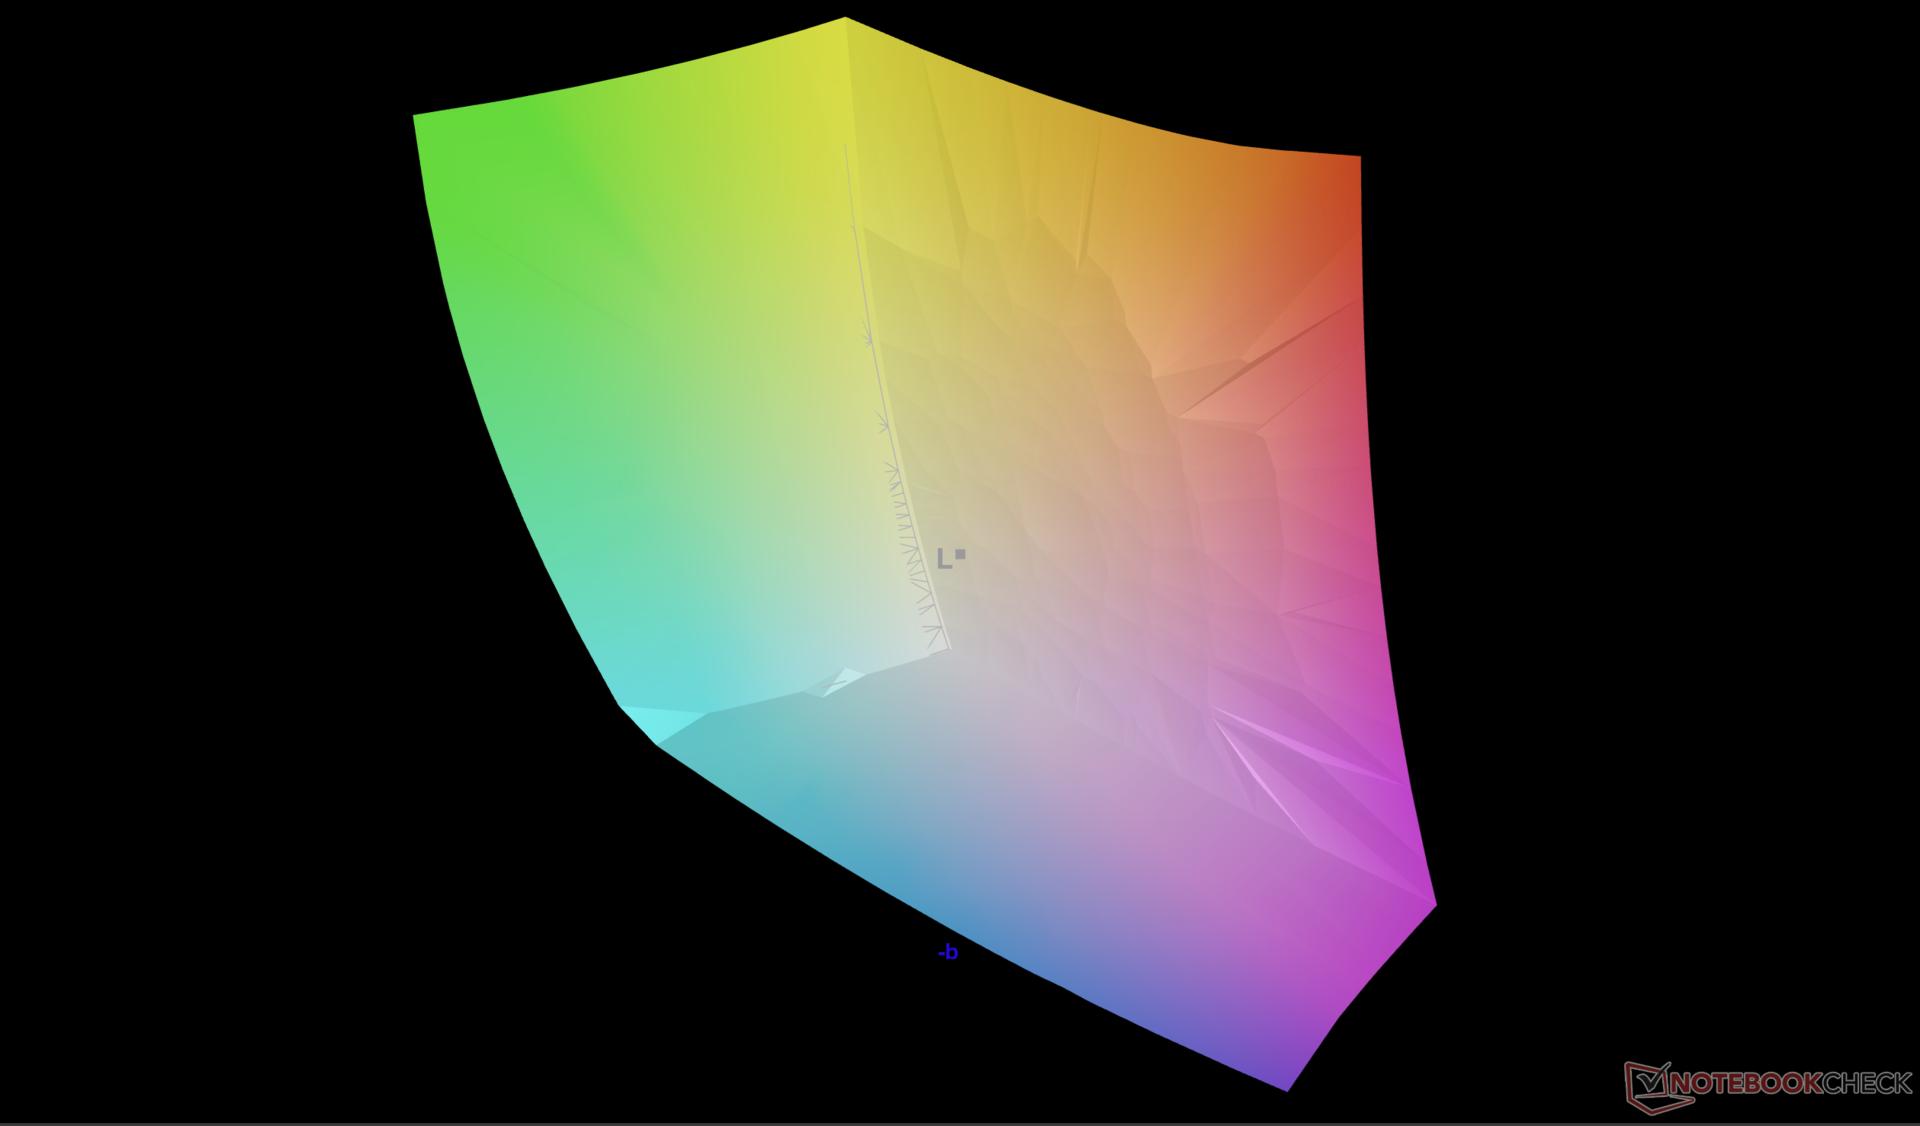
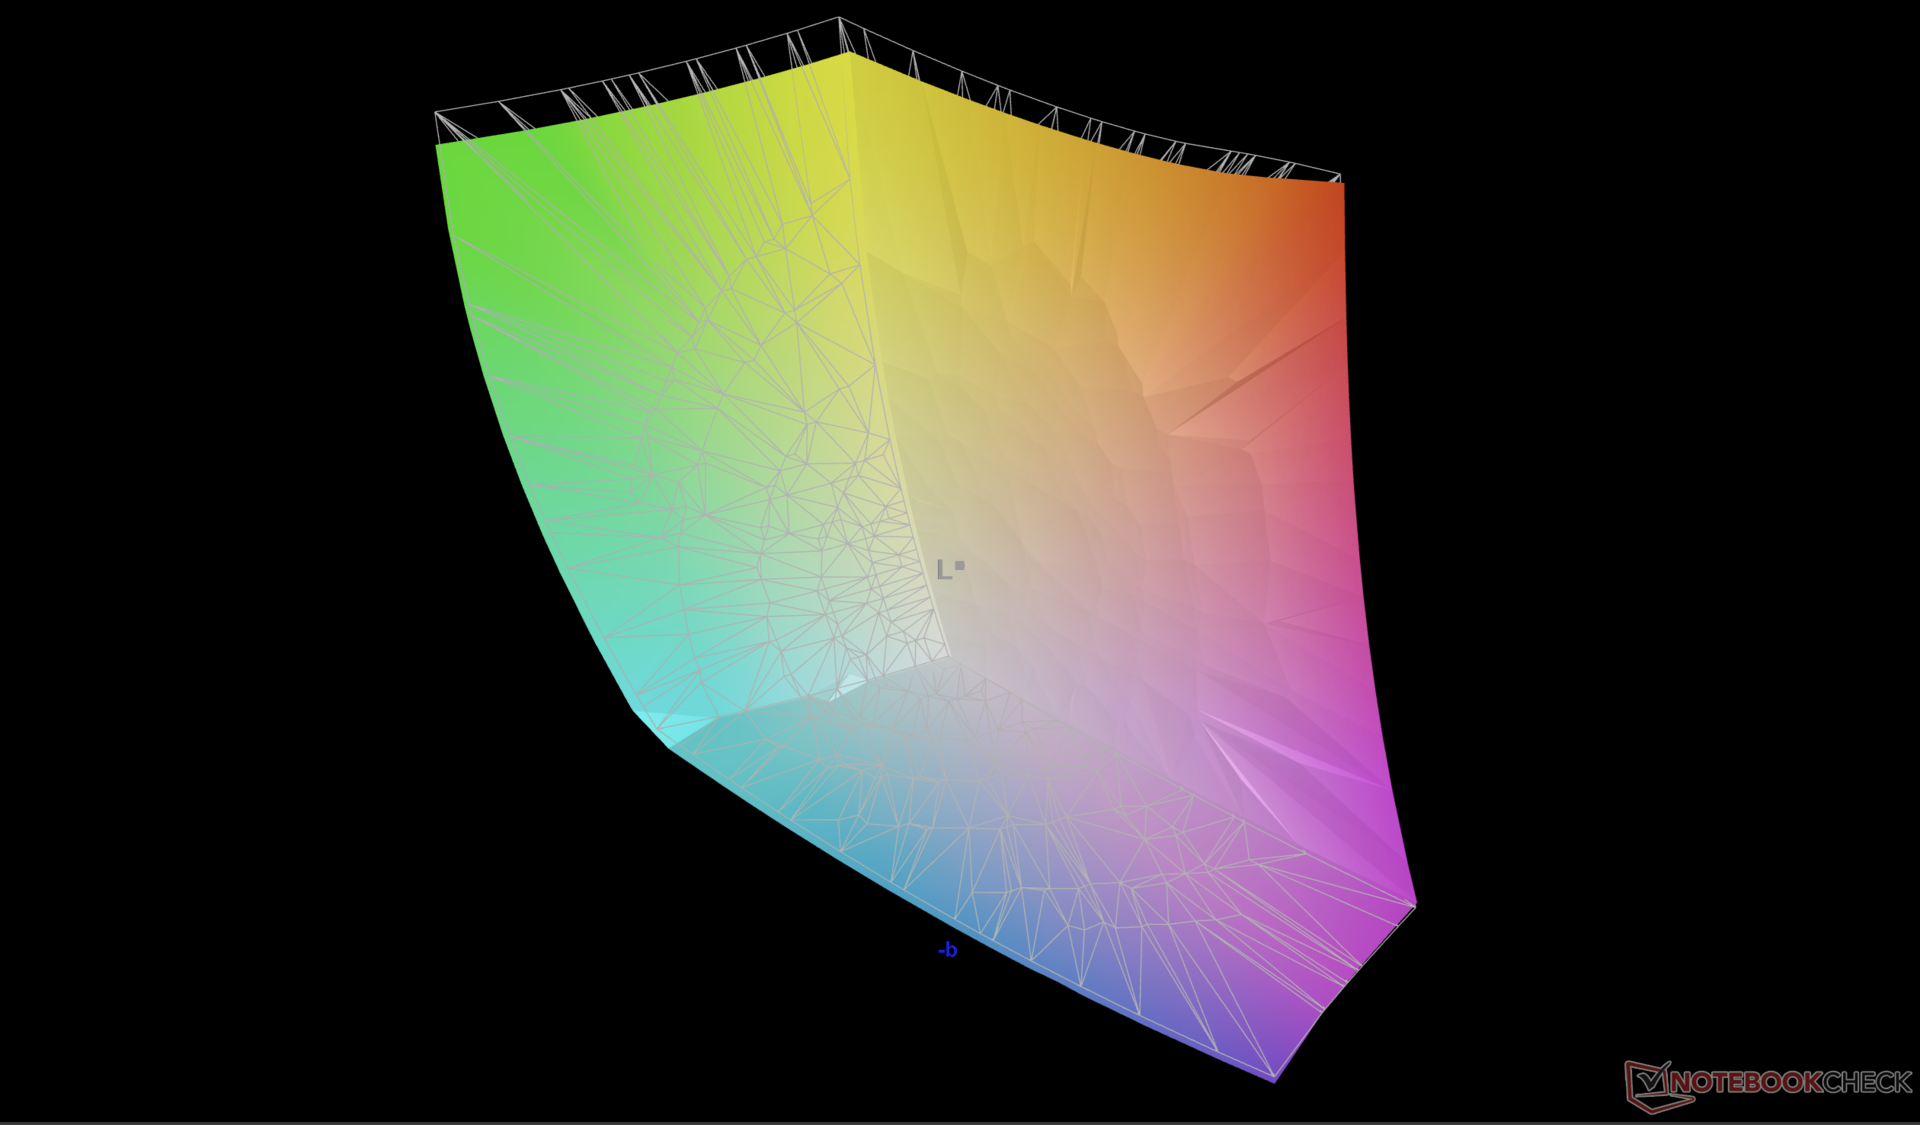
89.7% AdobeRGB 1998 (Argyll 3D)
100% sRGB (Argyll 3D)
96.1% Display P3 (Argyll 3D)
Gamma: 2.37
CCT: 6417 K
| Alienware 18 Area-51 AU Optronics B180QAN, IPS, 2560x1600, 18", 300 Hz | Alienware 16 Area-51 AU Optronics B160QAN, IPS, 2560x1600, 16", 240 Hz | Alienware m18 R2 BOE NE18NZ1, IPS, 2560x1600, 18", 165 Hz | MSI Raider A18 HX A9WIG-080 B180ZAN01.0, MiniLED IPS, 3840x2400, 18", 120 Hz | Razer Blade 18 2024 RZ09-0509 BOE NE180QDM-NM1, Mini-LED, 2560x1600, 18", 300 Hz | Asus ROG Strix G18 G814JI NE180QDM-NZ2 (BOE0B35), IPS, 2560x1600, 18", 240 Hz | Acer Predator Helios 18 PH18-72-98MW B180QAN01.2 (AUO45A8), Mini-LED, 2560x1600, 18", 250 Hz | |
|---|---|---|---|---|---|---|---|
| Display | -0% | 0% | 3% | 0% | -1% | 2% | |
| Display P3 Coverage (%) | 96.1 | 96 0% | 97.8 2% | 99.9 4% | 99 3% | 98.1 2% | 99.7 4% |
| sRGB Coverage (%) | 100 | 100 0% | 99.5 0% | 100 0% | 100 0% | 99.9 0% | 100 0% |
| AdobeRGB 1998 Coverage (%) | 89.7 | 89.2 -1% | 88.9 -1% | 93.9 5% | 86.9 -3% | 85.6 -5% | 91.6 2% |
| Response Times | 40% | 20% | -76% | -10% | 27% | -32% | |
| Response Time Grey 50% / Grey 80% * (ms) | 13 ? | 4.8 ? 63% | 5.3 ? 59% | 23 ? -77% | 7.6 ? 42% | 5.6 ? 57% | 8 ? 38% |
| Response Time Black / White * (ms) | 8.7 ? | 7.2 ? 17% | 10.4 ? -20% | 15.1 ? -74% | 14 ? -61% | 9 ? -3% | 17.6 ? -102% |
| PWM Frequency (Hz) | 15203 | 26444 ? | 4832 ? | ||||
| PWM Amplitude * (%) | 100 | ||||||
| Screen | -6% | -3% | 331% | 15% | -1% | 148% | |
| Brightness middle (cd/m²) | 512.5 | 554 8% | 271.8 -47% | 510 0% | 605.4 18% | 471 -8% | 722 41% |
| Brightness (cd/m²) | 496 | 532 7% | 275 -45% | 470 -5% | 600 21% | 422 -15% | 724 46% |
| Brightness Distribution (%) | 94 | 88 -6% | 78 -17% | 85 -10% | 97 3% | 83 -12% | 93 -1% |
| Black Level * (cd/m²) | 0.41 | 0.52 -27% | 0.27 34% | 0.01 98% | 0.62 -51% | 0.47 -15% | 0.04 90% |
| Contrast (:1) | 1250 | 1065 -15% | 1007 -19% | 51000 3980% | 976 -22% | 1002 -20% | 18050 1344% |
| Colorchecker dE 2000 * | 3.24 | 2.81 13% | 2.48 23% | 4.5 -39% | 1.53 53% | 2.05 37% | 3.4 -5% |
| Colorchecker dE 2000 max. * | 8.4 | 8.32 1% | 5.59 33% | 7.3 13% | 4.15 51% | 4.15 51% | 5.32 37% |
| Colorchecker dE 2000 calibrated * | 0.47 | 0.65 -38% | 0.56 -19% | 5.7 -1113% | 0.8 -70% | 1.6 -240% | |
| Greyscale dE 2000 * | 5 | 4.7 6% | 3.7 26% | 2.3 54% | 2.6 48% | 2.8 44% | 3.8 24% |
| Gamma | 2.37 93% | 2.3 96% | 2.2 100% | 2.08 106% | 2.22 99% | 2.204 100% | 2.383 92% |
| CCT | 6417 101% | 6476 100% | 6355 102% | 6648 98% | 6843 95% | 7122 91% | 7051 92% |
| Total Average (Program / Settings) | 11% /
2% | 6% /
1% | 86% /
203% | 2% /
8% | 8% /
3% | 39% /
91% |
* ... smaller is better
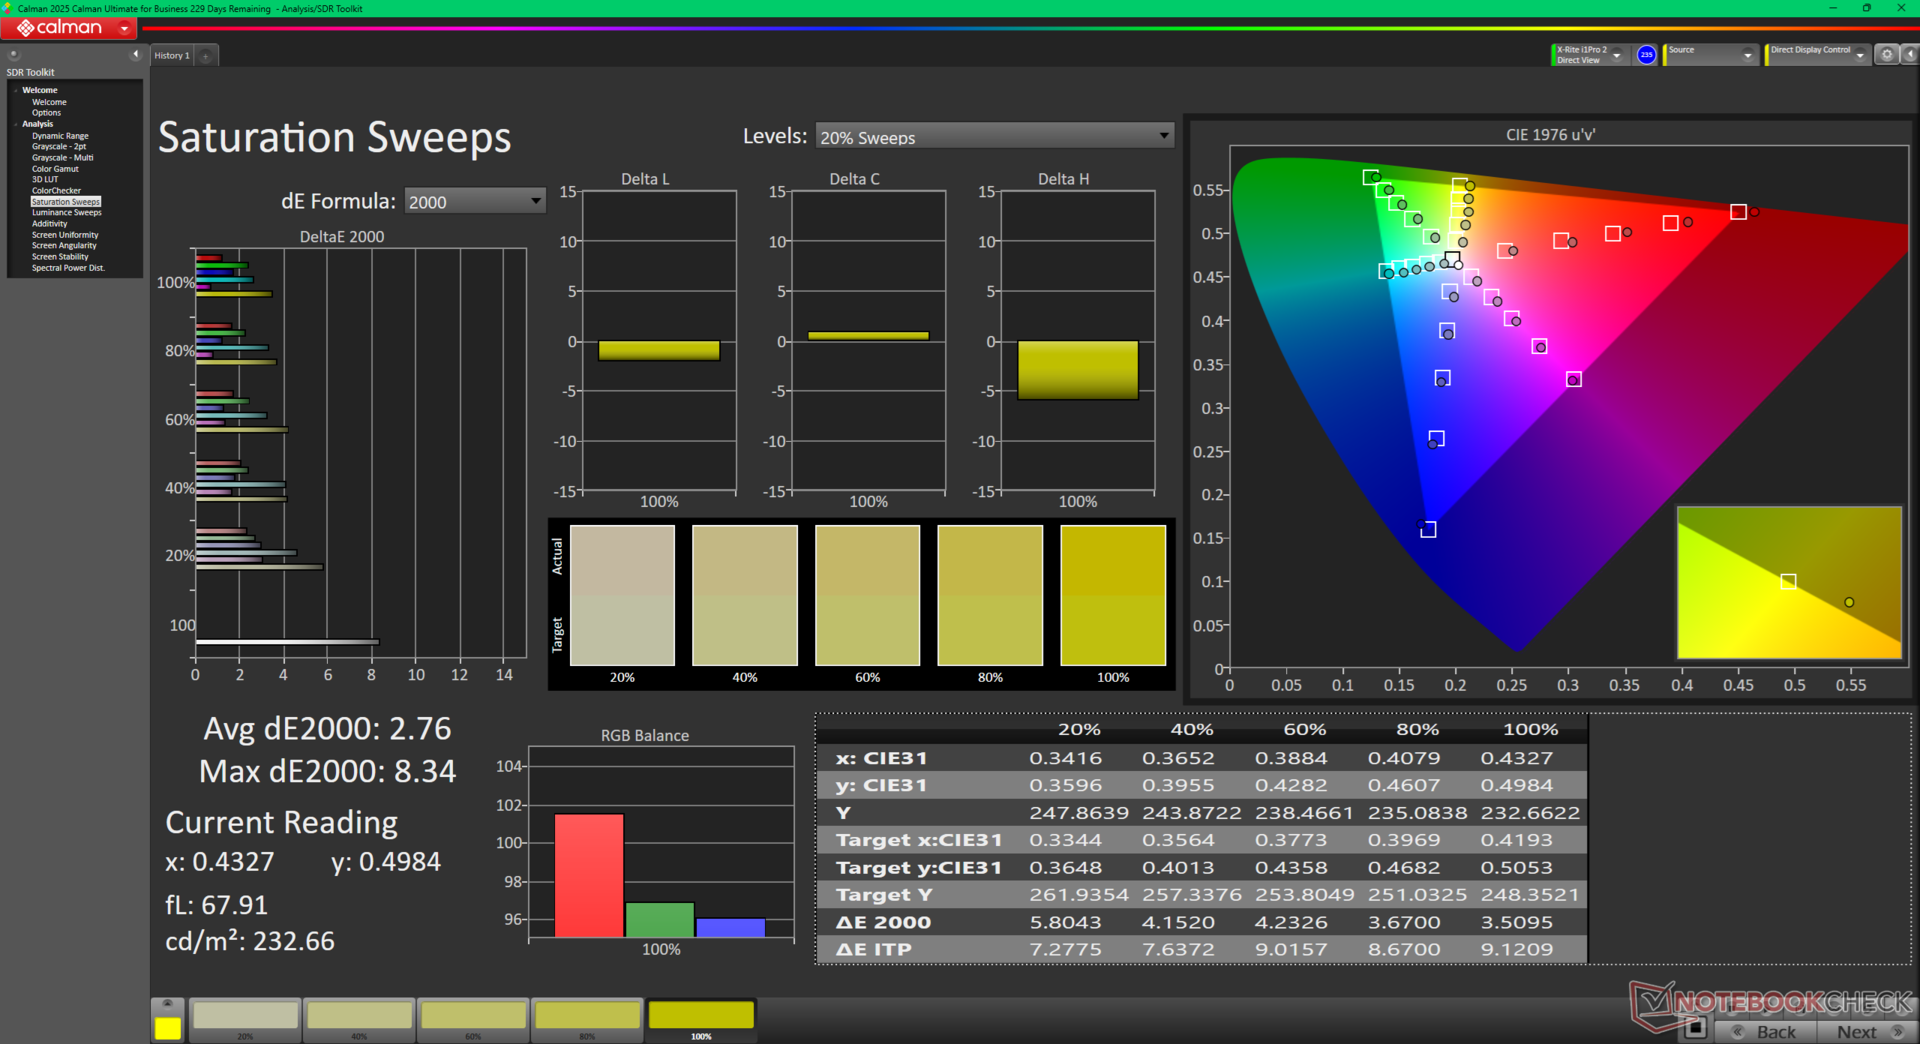
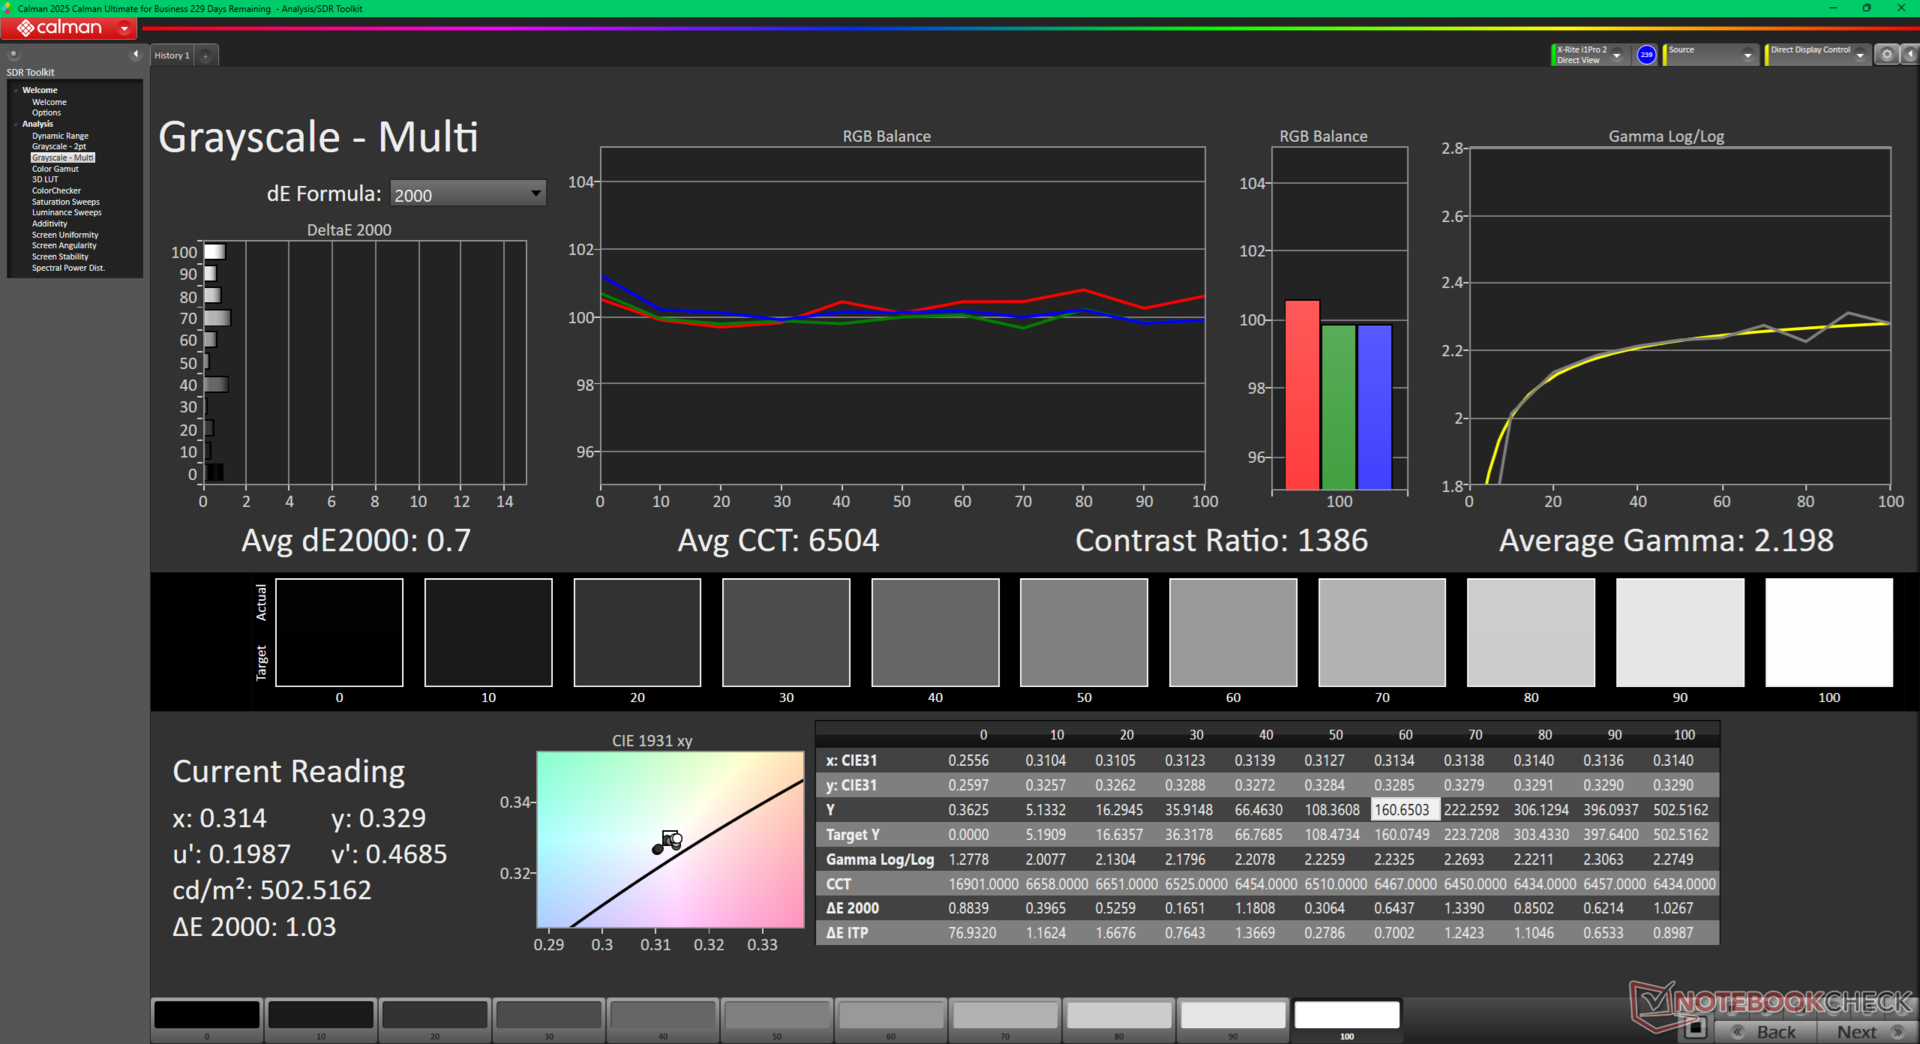
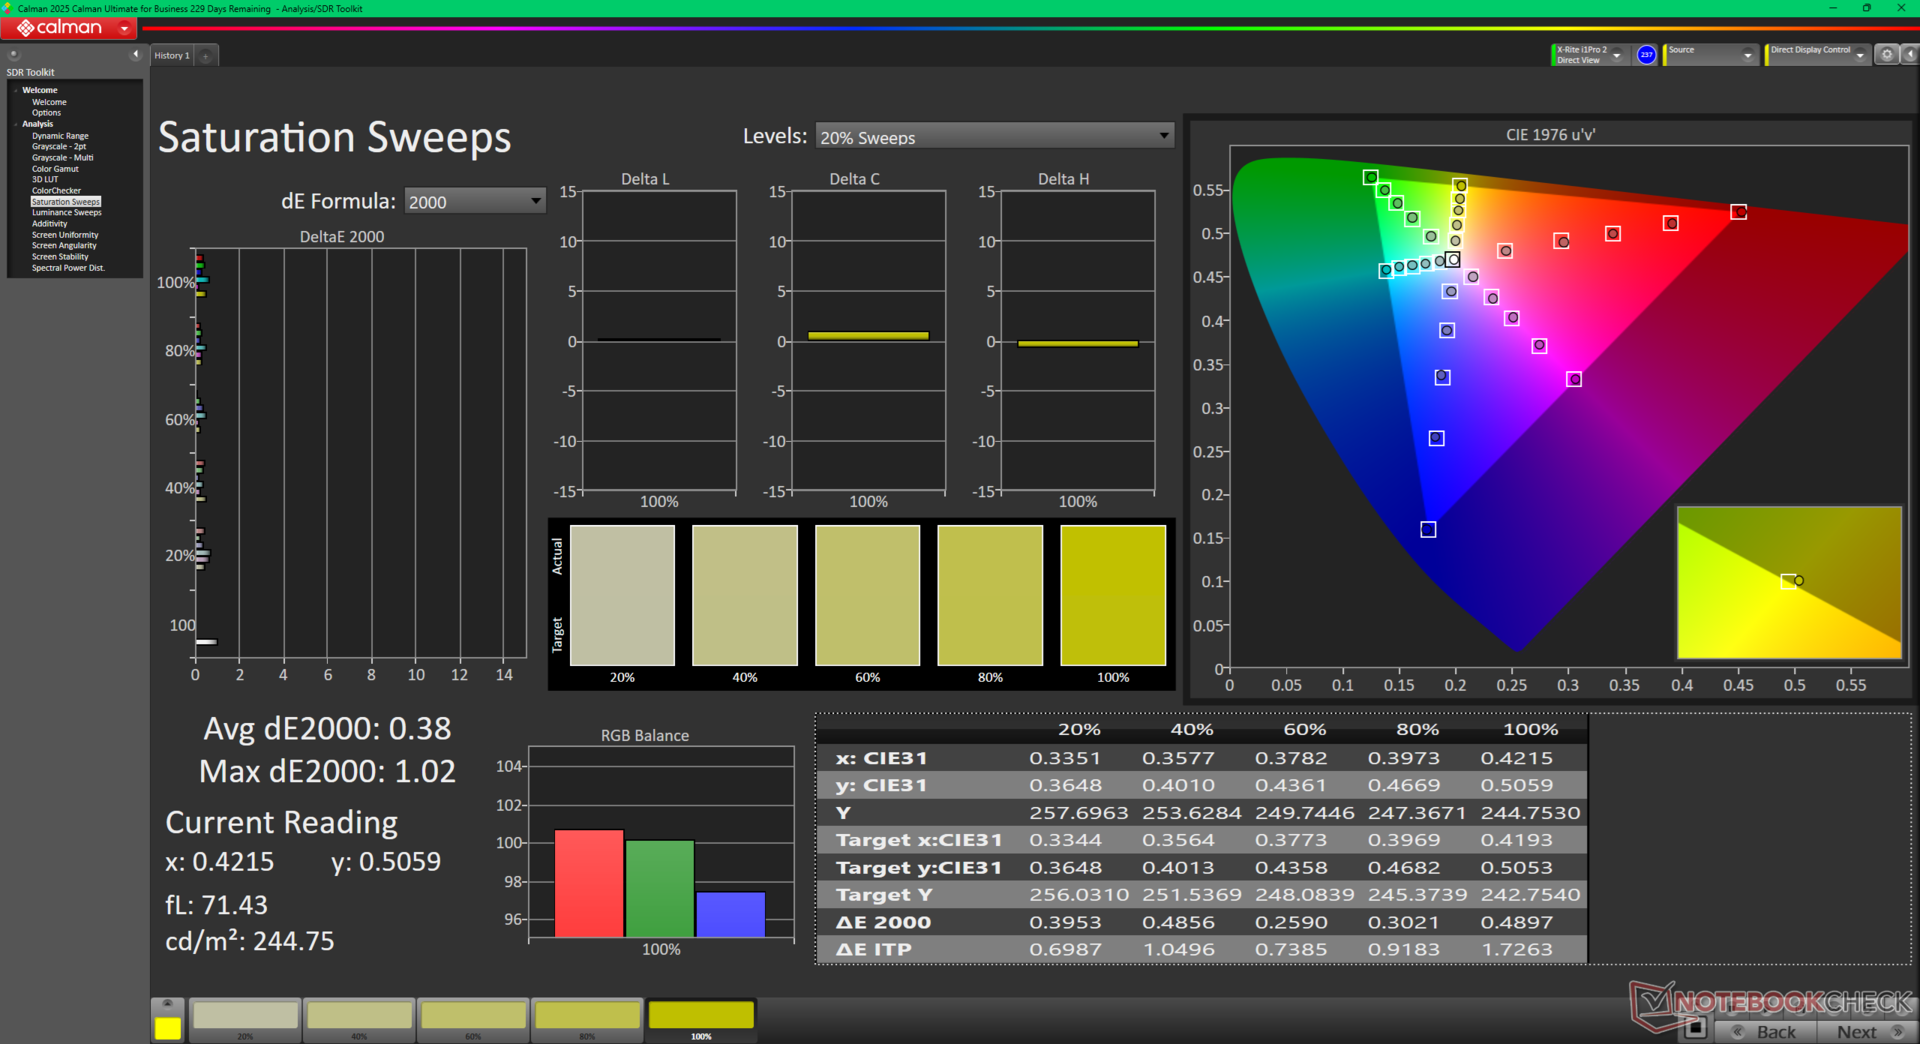
The display comes decently calibrated out of the box against the sRGB standard by default. Calibrating it ourselves with an X-Rite colorimeter would improve average grayscale and color DeltaE values down to just 0.7 and 0.47, respectively.
Display Response Times
| ↔ Response Time Black to White | ||
|---|---|---|
| 8.7 ms ... rise ↗ and fall ↘ combined | ↗ 4.4 ms rise | 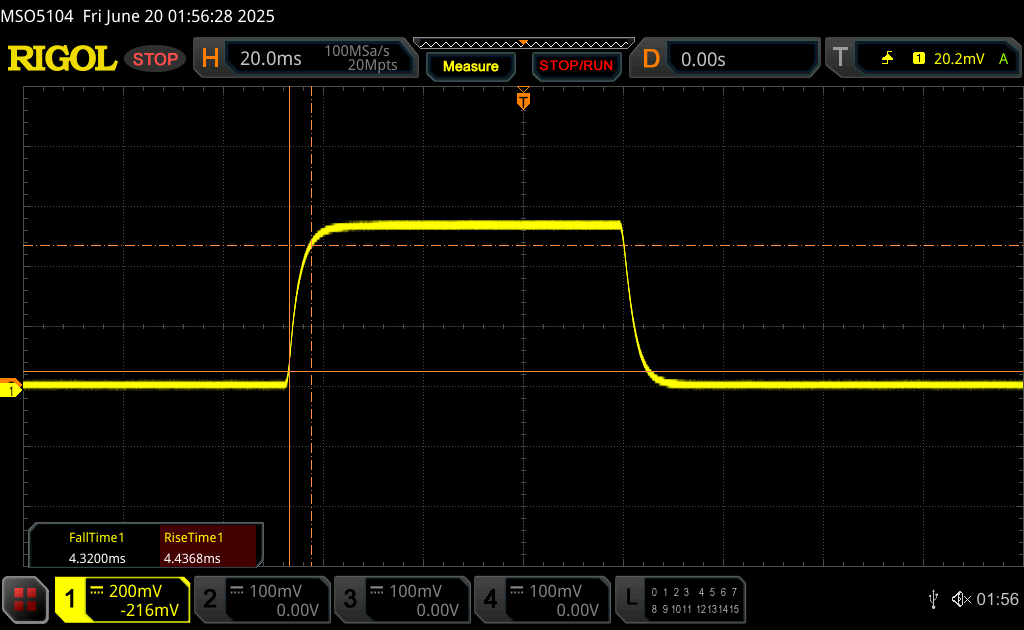 |
| ↘ 4.3 ms fall | ||
| The screen shows fast response rates in our tests and should be suited for gaming. In comparison, all tested devices range from 0.1 (minimum) to 240 (maximum) ms. » 24 % of all devices are better. This means that the measured response time is better than the average of all tested devices (19.8 ms). | ||
| ↔ Response Time 50% Grey to 80% Grey | ||
| 13 ms ... rise ↗ and fall ↘ combined | ↗ 5.8 ms rise | 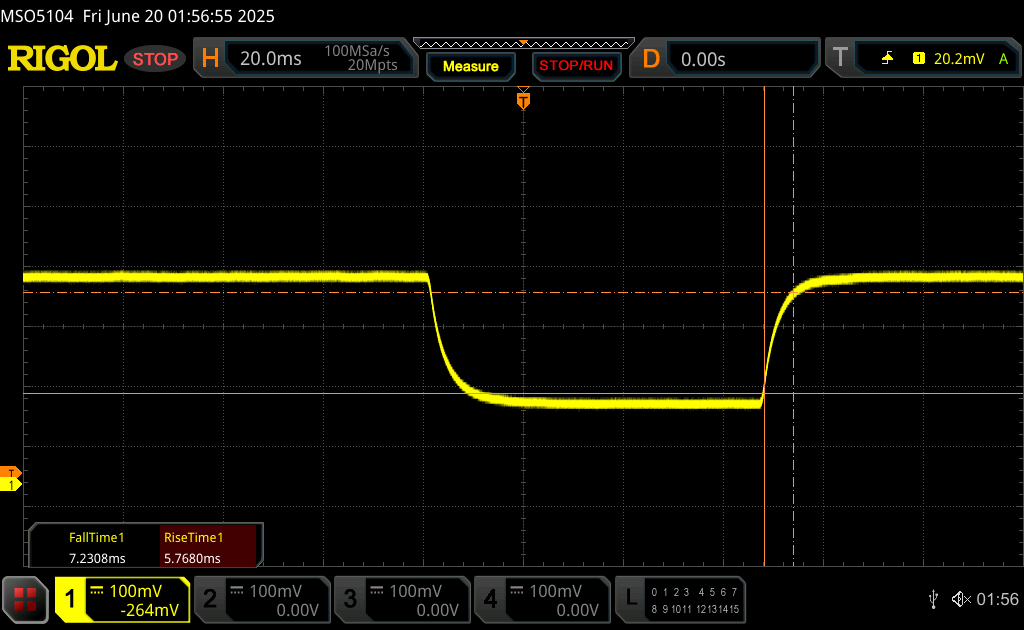 |
| ↘ 7.2 ms fall | ||
| The screen shows good response rates in our tests, but may be too slow for competitive gamers. In comparison, all tested devices range from 0.165 (minimum) to 636 (maximum) ms. » 27 % of all devices are better. This means that the measured response time is better than the average of all tested devices (31 ms). | ||
Screen Flickering / PWM (Pulse-Width Modulation)
| Screen flickering / PWM not detected | 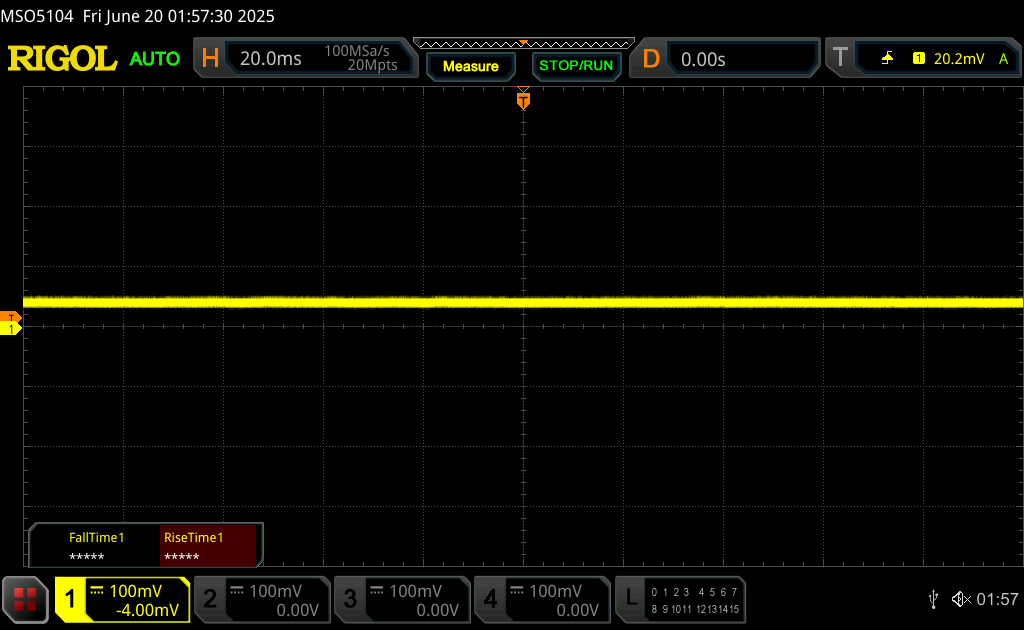 | ||
In comparison: 52 % of all tested devices do not use PWM to dim the display. If PWM was detected, an average of 7778 (minimum: 5 - maximum: 343500) Hz was measured. | |||
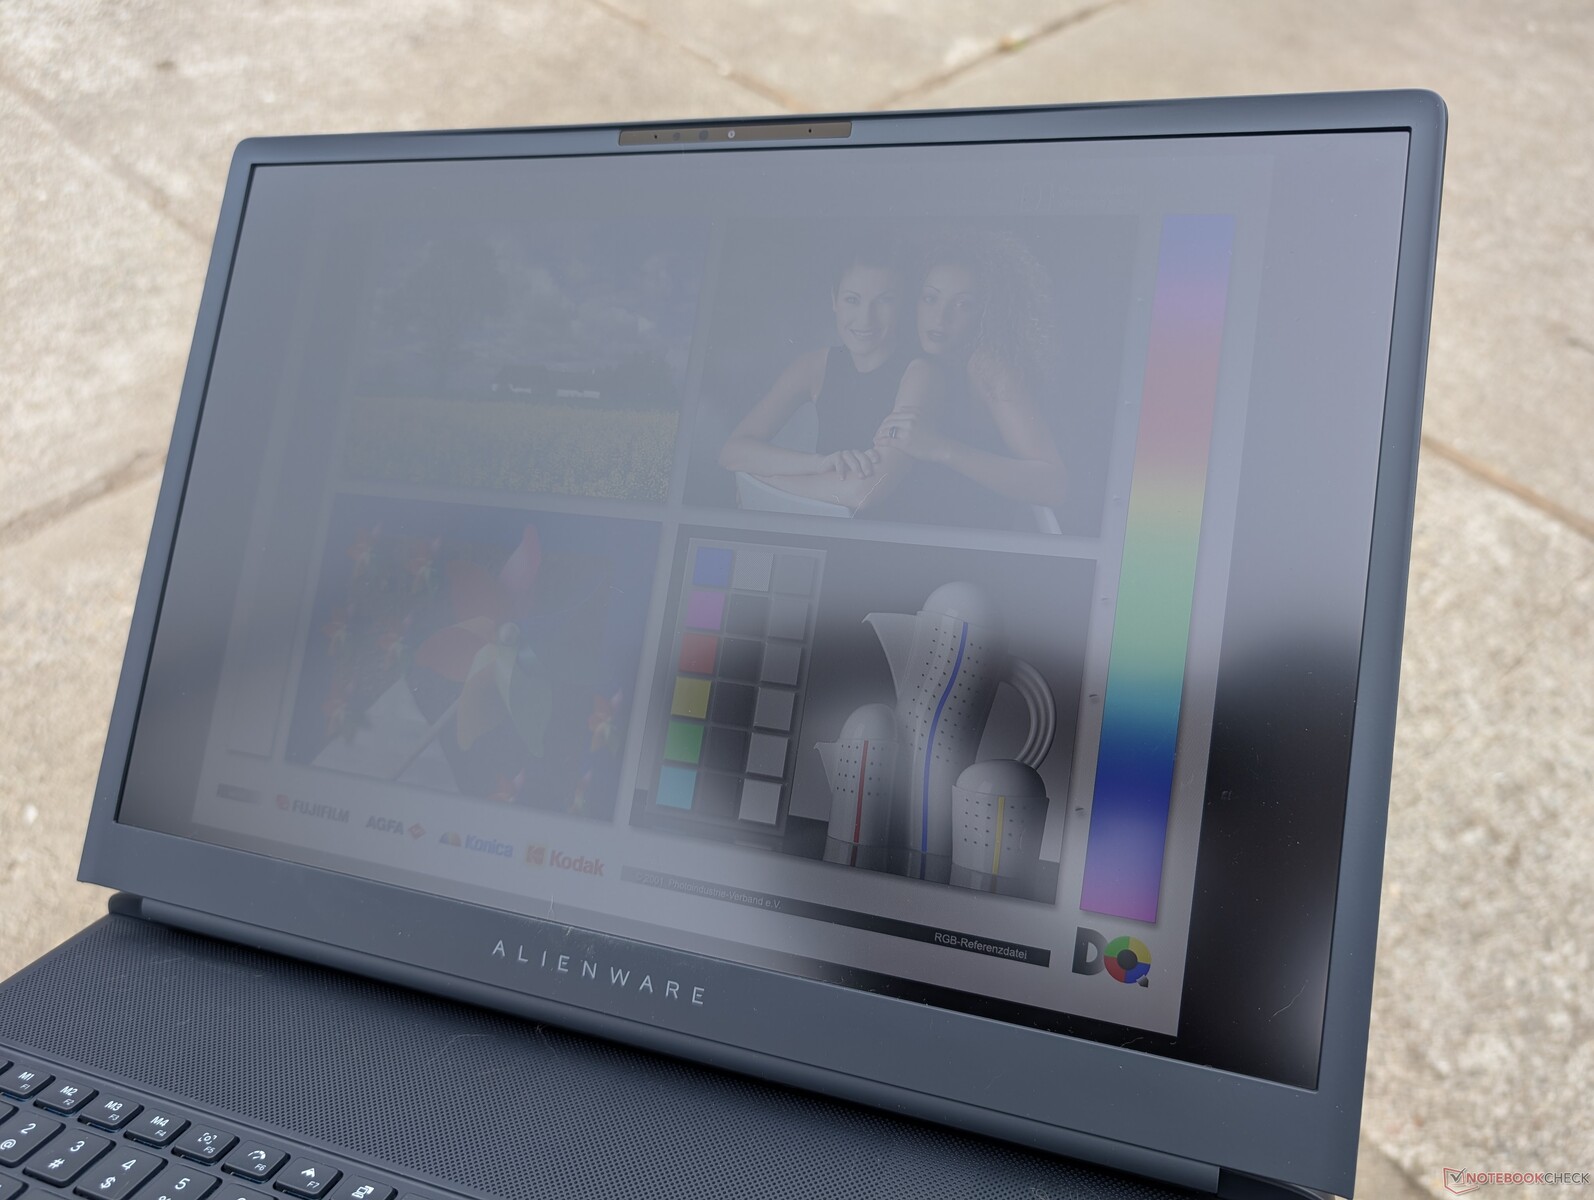
The 500-nit panel is about 2x brighter than the relatively dim Alienware m18 R2 panel for better viewability outdoors. Even so, you'll want to stay under shade whenever possible to avoid washed out colors. The limited battery life and heavy weight tether the system to indoor use cases, anyway.
Performance


Testing Conditions
We set Alienware Command Center to Performance mode prior to running the benchmarks below. Any differences between Performance mode and Overdrive mode (i.e., Turbo mode) will be noted. Alienware Command Center is vital for controlling most aspects of the system including the LEDs and power profiles, but it will sometimes hang at launch for no particular reason.
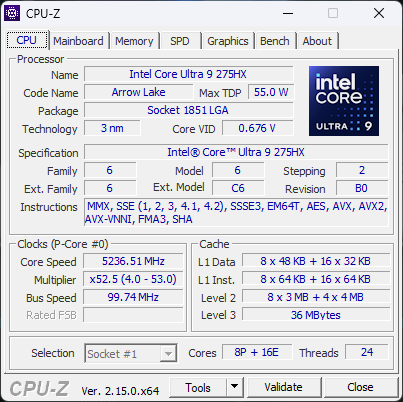
Processor
Multi-thread performance is about 20 percent faster than on the Alienware 16 with the same Core Ultra 9 275HX CPU despite having both systems running on the Performance power profile. Running on the higher "Overdrive" power profile does appear to increase CPU performance by much at all on the Alienware 18 while the Alienware 16 sees a decent 10 percent performance boost. This means that Alienware 18 owners don't necessarily have to run their systems on Overdrive mode for maximum performance.
Overall performance is within 5 percentage points of the competing Ryzen 9 9955HX3D as found on the MSI Raider A18 HX.
Users upgrading from the barely two-year old Meteor Lake-H series like the Core Ultra 7 155H will see significant multi-thread gains of about 2x.
Cinebench R15 Multi Loop
Cinebench R23: Multi Core | Single Core
Cinebench R20: CPU (Multi Core) | CPU (Single Core)
Cinebench R15: CPU Multi 64Bit | CPU Single 64Bit
Blender: v2.79 BMW27 CPU
7-Zip 18.03: 7z b 4 | 7z b 4 -mmt1
Geekbench 6.7: Multi-Core | Single-Core
Geekbench 5.5: Multi-Core | Single-Core
HWBOT x265 Benchmark v2.2: 4k Preset
LibreOffice : 20 Documents To PDF
R Benchmark 2.5: Overall mean
* ... smaller is better
AIDA64: FP32 Ray-Trace | FPU Julia | CPU SHA3 | CPU Queen | FPU SinJulia | FPU Mandel | CPU AES | CPU ZLib | FP64 Ray-Trace | CPU PhotoWorxx
| Performance rating | |
| MSI Raider A18 HX A9WIG-080 | |
| Alienware 18 Area-51 | |
| Average Intel Core Ultra 9 275HX | |
| Alienware 16 Area-51 | |
| Alienware m18 R2 | |
| Razer Blade 18 2024 RZ09-0509 | |
| Acer Predator Helios 18 PH18-72-98MW | |
| Asus ROG Strix G18 G814JI | |
| AIDA64 / FP32 Ray-Trace | |
| MSI Raider A18 HX A9WIG-080 | |
| Alienware 18 Area-51 | |
| Average Intel Core Ultra 9 275HX (28039 - 39895, n=30) | |
| Alienware 16 Area-51 | |
| Alienware m18 R2 | |
| Razer Blade 18 2024 RZ09-0509 | |
| Acer Predator Helios 18 PH18-72-98MW | |
| Asus ROG Strix G18 G814JI | |
| AIDA64 / FPU Julia | |
| MSI Raider A18 HX A9WIG-080 | |
| Alienware 18 Area-51 | |
| Average Intel Core Ultra 9 275HX (140254 - 200744, n=30) | |
| Alienware 16 Area-51 | |
| Alienware m18 R2 | |
| Razer Blade 18 2024 RZ09-0509 | |
| Acer Predator Helios 18 PH18-72-98MW | |
| Asus ROG Strix G18 G814JI | |
| AIDA64 / CPU SHA3 | |
| MSI Raider A18 HX A9WIG-080 | |
| Alienware 18 Area-51 | |
| Average Intel Core Ultra 9 275HX (6710 - 9817, n=30) | |
| Alienware 16 Area-51 | |
| Alienware m18 R2 | |
| Razer Blade 18 2024 RZ09-0509 | |
| Acer Predator Helios 18 PH18-72-98MW | |
| Asus ROG Strix G18 G814JI | |
| AIDA64 / CPU Queen | |
| MSI Raider A18 HX A9WIG-080 | |
| Alienware 18 Area-51 | |
| Alienware m18 R2 | |
| Acer Predator Helios 18 PH18-72-98MW | |
| Razer Blade 18 2024 RZ09-0509 | |
| Average Intel Core Ultra 9 275HX (113887 - 140937, n=30) | |
| Alienware 16 Area-51 | |
| Asus ROG Strix G18 G814JI | |
| AIDA64 / FPU SinJulia | |
| MSI Raider A18 HX A9WIG-080 | |
| Alienware m18 R2 | |
| Razer Blade 18 2024 RZ09-0509 | |
| Acer Predator Helios 18 PH18-72-98MW | |
| Alienware 18 Area-51 | |
| Alienware 16 Area-51 | |
| Average Intel Core Ultra 9 275HX (11172 - 14425, n=30) | |
| Asus ROG Strix G18 G814JI | |
| AIDA64 / FPU Mandel | |
| MSI Raider A18 HX A9WIG-080 | |
| Alienware 18 Area-51 | |
| Average Intel Core Ultra 9 275HX (72596 - 104508, n=30) | |
| Alienware 16 Area-51 | |
| Alienware m18 R2 | |
| Razer Blade 18 2024 RZ09-0509 | |
| Acer Predator Helios 18 PH18-72-98MW | |
| Asus ROG Strix G18 G814JI | |
| AIDA64 / CPU AES | |
| MSI Raider A18 HX A9WIG-080 | |
| Alienware 18 Area-51 | |
| Alienware m18 R2 | |
| Average Intel Core Ultra 9 275HX (105608 - 247074, n=30) | |
| Alienware 16 Area-51 | |
| Razer Blade 18 2024 RZ09-0509 | |
| Acer Predator Helios 18 PH18-72-98MW | |
| Asus ROG Strix G18 G814JI | |
| AIDA64 / CPU ZLib | |
| MSI Raider A18 HX A9WIG-080 | |
| Alienware 18 Area-51 | |
| Alienware m18 R2 | |
| Average Intel Core Ultra 9 275HX (1582 - 2263, n=30) | |
| Alienware 16 Area-51 | |
| Razer Blade 18 2024 RZ09-0509 | |
| Acer Predator Helios 18 PH18-72-98MW | |
| Asus ROG Strix G18 G814JI | |
| AIDA64 / FP64 Ray-Trace | |
| MSI Raider A18 HX A9WIG-080 | |
| Alienware 18 Area-51 | |
| Average Intel Core Ultra 9 275HX (14847 - 21854, n=30) | |
| Alienware 16 Area-51 | |
| Alienware m18 R2 | |
| Razer Blade 18 2024 RZ09-0509 | |
| Acer Predator Helios 18 PH18-72-98MW | |
| Asus ROG Strix G18 G814JI | |
| AIDA64 / CPU PhotoWorxx | |
| Alienware 18 Area-51 | |
| Alienware 16 Area-51 | |
| Average Intel Core Ultra 9 275HX (37482 - 62916, n=30) | |
| Alienware m18 R2 | |
| Razer Blade 18 2024 RZ09-0509 | |
| Acer Predator Helios 18 PH18-72-98MW | |
| Asus ROG Strix G18 G814JI | |
| MSI Raider A18 HX A9WIG-080 | |
System Performance
Average PCMark scores are some of the highest of any 18-inch gaming laptop including the MSI Raider A18 HX powered by the Ryzen 9 9955HX3D. This can be partly attributed to the PCIe5 SSD on our Alienware test unit.

PCMark 10: Score | Essentials | Productivity | Digital Content Creation
CrossMark: Overall | Productivity | Creativity | Responsiveness
WebXPRT 3: Overall
WebXPRT 4: Overall
Mozilla Kraken 1.1: Total
| Performance rating | |
| Alienware 18 Area-51 | |
| MSI Raider A18 HX A9WIG-080 | |
| Alienware 16 Area-51 | |
| Average Intel Core Ultra 9 275HX, NVIDIA GeForce RTX 5090 Laptop | |
| Alienware m18 R2 | |
| Razer Blade 18 2024 RZ09-0509 -1! | |
| Acer Predator Helios 18 PH18-72-98MW -6! | |
| Asus ROG Strix G18 G814JI -4! | |
| PCMark 10 / Score | |
| Alienware 18 Area-51 | |
| Alienware m18 R2 | |
| MSI Raider A18 HX A9WIG-080 | |
| Razer Blade 18 2024 RZ09-0509 | |
| Alienware 16 Area-51 | |
| Average Intel Core Ultra 9 275HX, NVIDIA GeForce RTX 5090 Laptop (7474 - 9497, n=11) | |
| Acer Predator Helios 18 PH18-72-98MW | |
| Asus ROG Strix G18 G814JI | |
| PCMark 10 / Essentials | |
| MSI Raider A18 HX A9WIG-080 | |
| Alienware m18 R2 | |
| Razer Blade 18 2024 RZ09-0509 | |
| Alienware 16 Area-51 | |
| Alienware 18 Area-51 | |
| Acer Predator Helios 18 PH18-72-98MW | |
| Average Intel Core Ultra 9 275HX, NVIDIA GeForce RTX 5090 Laptop (9994 - 11369, n=12) | |
| Asus ROG Strix G18 G814JI | |
| PCMark 10 / Productivity | |
| Alienware m18 R2 | |
| Alienware 18 Area-51 | |
| MSI Raider A18 HX A9WIG-080 | |
| Razer Blade 18 2024 RZ09-0509 | |
| Acer Predator Helios 18 PH18-72-98MW | |
| Average Intel Core Ultra 9 275HX, NVIDIA GeForce RTX 5090 Laptop (9122 - 10925, n=11) | |
| Alienware 16 Area-51 | |
| Asus ROG Strix G18 G814JI | |
| PCMark 10 / Digital Content Creation | |
| Alienware 18 Area-51 | |
| Alienware 16 Area-51 | |
| Average Intel Core Ultra 9 275HX, NVIDIA GeForce RTX 5090 Laptop (9952 - 19234, n=11) | |
| Alienware m18 R2 | |
| Razer Blade 18 2024 RZ09-0509 | |
| MSI Raider A18 HX A9WIG-080 | |
| Acer Predator Helios 18 PH18-72-98MW | |
| Asus ROG Strix G18 G814JI | |
| CrossMark / Overall | |
| Alienware 18 Area-51 | |
| MSI Raider A18 HX A9WIG-080 | |
| Average Intel Core Ultra 9 275HX, NVIDIA GeForce RTX 5090 Laptop (1995 - 2339, n=12) | |
| Alienware 16 Area-51 | |
| Alienware m18 R2 | |
| Razer Blade 18 2024 RZ09-0509 | |
| CrossMark / Productivity | |
| Alienware 18 Area-51 | |
| Average Intel Core Ultra 9 275HX, NVIDIA GeForce RTX 5090 Laptop (1847 - 2211, n=12) | |
| Alienware 16 Area-51 | |
| MSI Raider A18 HX A9WIG-080 | |
| Razer Blade 18 2024 RZ09-0509 | |
| Alienware m18 R2 | |
| CrossMark / Creativity | |
| MSI Raider A18 HX A9WIG-080 | |
| Alienware 18 Area-51 | |
| Average Intel Core Ultra 9 275HX, NVIDIA GeForce RTX 5090 Laptop (2170 - 2642, n=12) | |
| Alienware 16 Area-51 | |
| Alienware m18 R2 | |
| Razer Blade 18 2024 RZ09-0509 | |
| CrossMark / Responsiveness | |
| Alienware 18 Area-51 | |
| Alienware 16 Area-51 | |
| Average Intel Core Ultra 9 275HX, NVIDIA GeForce RTX 5090 Laptop (1673 - 2217, n=12) | |
| MSI Raider A18 HX A9WIG-080 | |
| Alienware m18 R2 | |
| Razer Blade 18 2024 RZ09-0509 | |
| WebXPRT 3 / Overall | |
| MSI Raider A18 HX A9WIG-080 | |
| Alienware 18 Area-51 | |
| Alienware 16 Area-51 | |
| Average Intel Core Ultra 9 275HX, NVIDIA GeForce RTX 5090 Laptop (315 - 372, n=12) | |
| Razer Blade 18 2024 RZ09-0509 | |
| Alienware m18 R2 | |
| Asus ROG Strix G18 G814JI | |
| Asus ROG Strix G18 G814JI | |
| WebXPRT 4 / Overall | |
| Alienware 18 Area-51 | |
| MSI Raider A18 HX A9WIG-080 | |
| Alienware 16 Area-51 | |
| Average Intel Core Ultra 9 275HX, NVIDIA GeForce RTX 5090 Laptop (301 - 341, n=11) | |
| Alienware m18 R2 | |
| Asus ROG Strix G18 G814JI | |
| Asus ROG Strix G18 G814JI | |
| Mozilla Kraken 1.1 / Total | |
| Asus ROG Strix G18 G814JI | |
| Asus ROG Strix G18 G814JI | |
| Razer Blade 18 2024 RZ09-0509 | |
| Acer Predator Helios 18 PH18-72-98MW | |
| Alienware m18 R2 | |
| Average Intel Core Ultra 9 275HX, NVIDIA GeForce RTX 5090 Laptop (402 - 424, n=12) | |
| Alienware 16 Area-51 | |
| Alienware 18 Area-51 | |
| MSI Raider A18 HX A9WIG-080 | |
* ... smaller is better
| PCMark 10 Score | 9497 points | |
Help | ||
| AIDA64 / Memory Copy | |
| Alienware 18 Area-51 | |
| Alienware 16 Area-51 | |
| Average Intel Core Ultra 9 275HX (56003 - 94460, n=30) | |
| Alienware m18 R2 | |
| Acer Predator Helios 18 PH18-72-98MW | |
| Razer Blade 18 2024 RZ09-0509 | |
| Asus ROG Strix G18 G814JI | |
| MSI Raider A18 HX A9WIG-080 | |
| AIDA64 / Memory Read | |
| Alienware 18 Area-51 | |
| Alienware 16 Area-51 | |
| Alienware m18 R2 | |
| Acer Predator Helios 18 PH18-72-98MW | |
| Average Intel Core Ultra 9 275HX (55795 - 97151, n=30) | |
| Razer Blade 18 2024 RZ09-0509 | |
| Asus ROG Strix G18 G814JI | |
| MSI Raider A18 HX A9WIG-080 | |
| AIDA64 / Memory Write | |
| Alienware 18 Area-51 | |
| Alienware 16 Area-51 | |
| Average Intel Core Ultra 9 275HX (55663 - 116129, n=30) | |
| Alienware m18 R2 | |
| Acer Predator Helios 18 PH18-72-98MW | |
| Razer Blade 18 2024 RZ09-0509 | |
| Asus ROG Strix G18 G814JI | |
| MSI Raider A18 HX A9WIG-080 | |
| AIDA64 / Memory Latency | |
| Alienware 16 Area-51 | |
| Average Intel Core Ultra 9 275HX (105.8 - 161.6, n=30) | |
| Alienware 18 Area-51 | |
| MSI Raider A18 HX A9WIG-080 | |
| Razer Blade 18 2024 RZ09-0509 | |
| Alienware m18 R2 | |
| Asus ROG Strix G18 G814JI | |
| Acer Predator Helios 18 PH18-72-98MW | |
* ... smaller is better
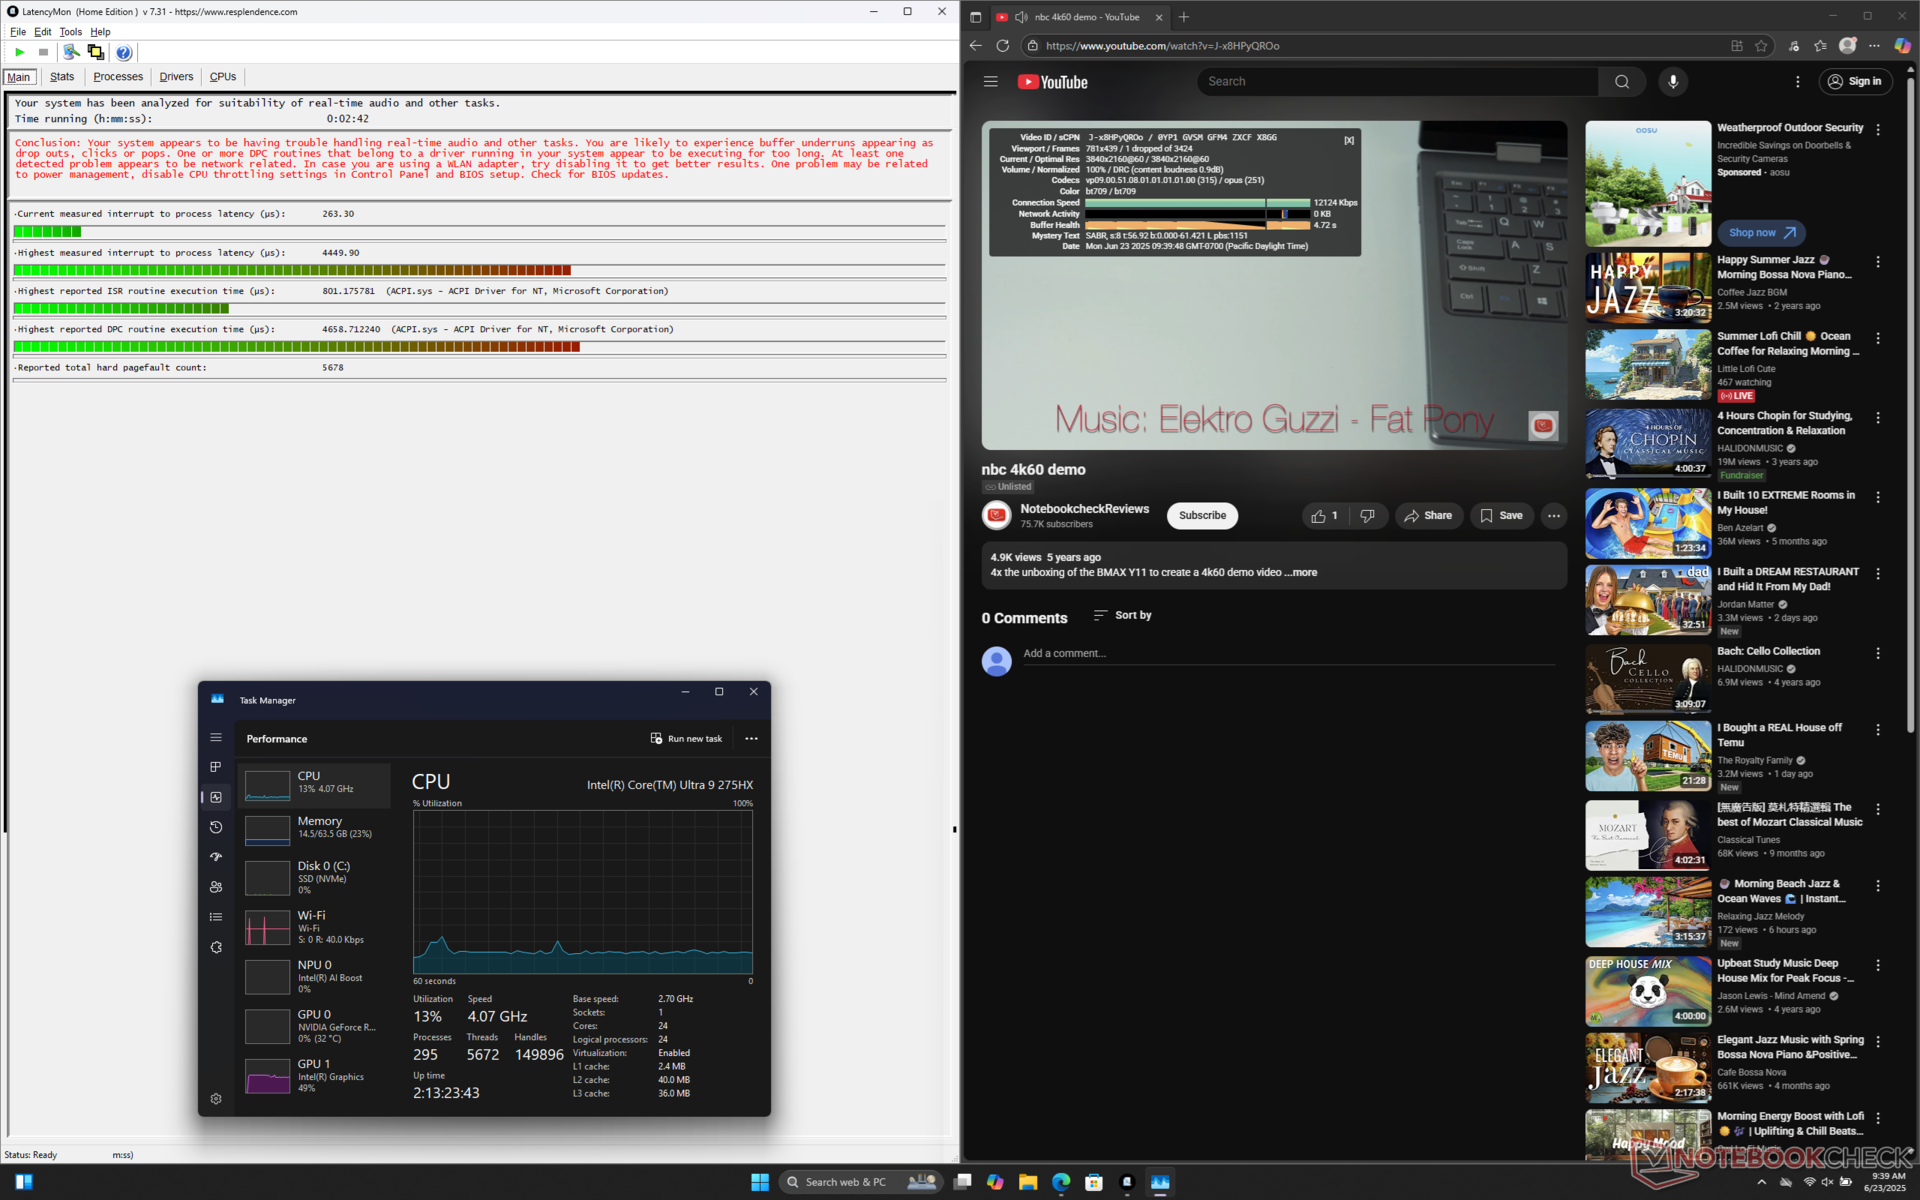
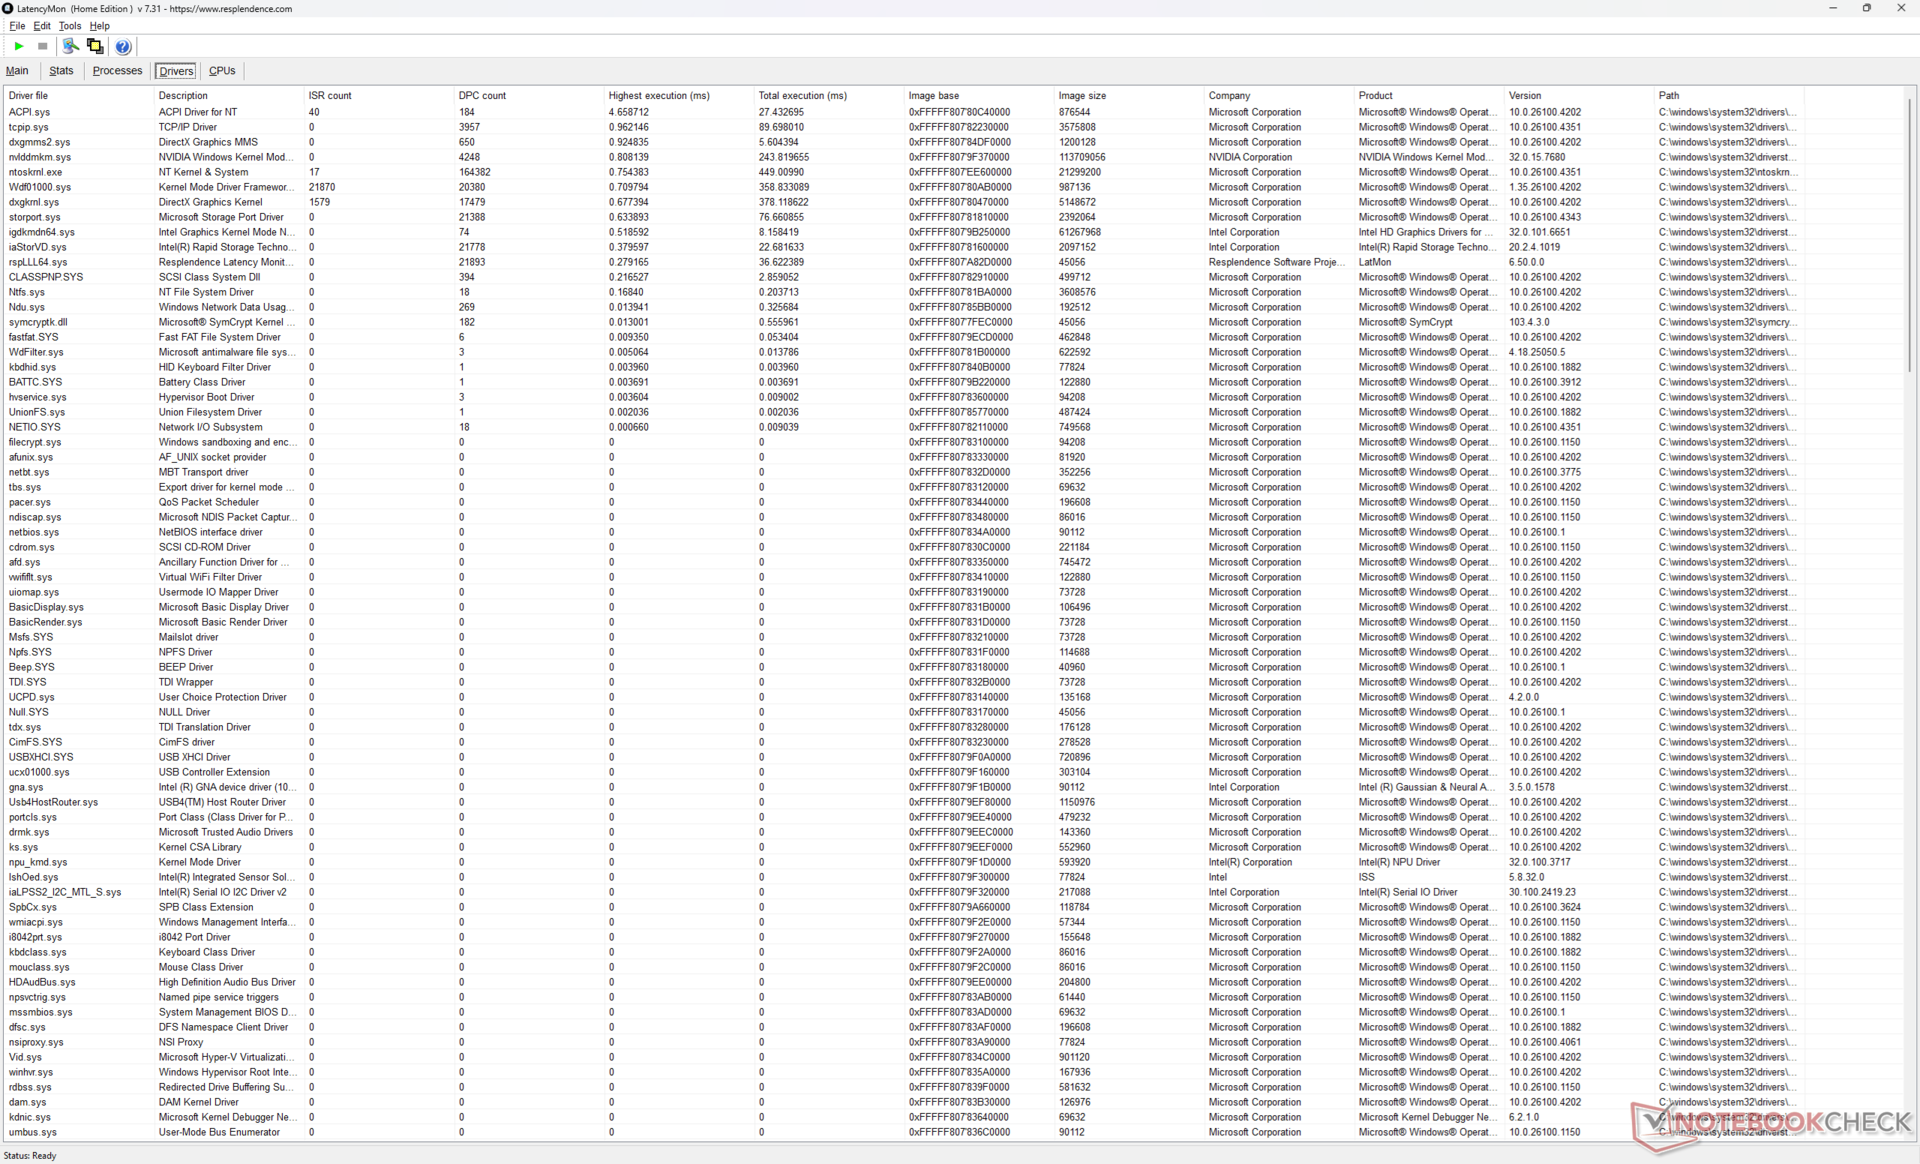
DPC Latency
LatencyMon reveals DPC issues but with otherwise no significant dropped frames when playing 4K60 video content.
| DPC Latencies / LatencyMon - interrupt to process latency (max), Web, Youtube, Prime95 | |
| Alienware 18 Area-51 | |
| Alienware 16 Area-51 | |
| Acer Predator Helios 18 PH18-72-98MW | |
| Alienware m18 R2 | |
| Razer Blade 18 2024 RZ09-0509 | |
| Asus ROG Strix G18 G814JI | |
| MSI Raider A18 HX A9WIG-080 | |
* ... smaller is better
Storage Devices
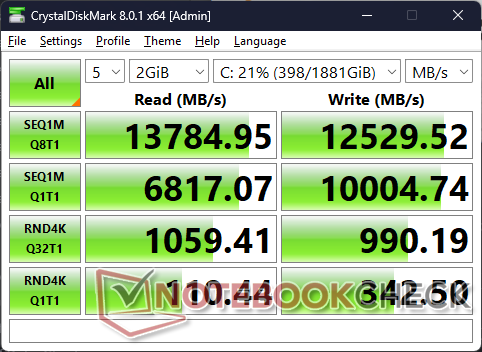
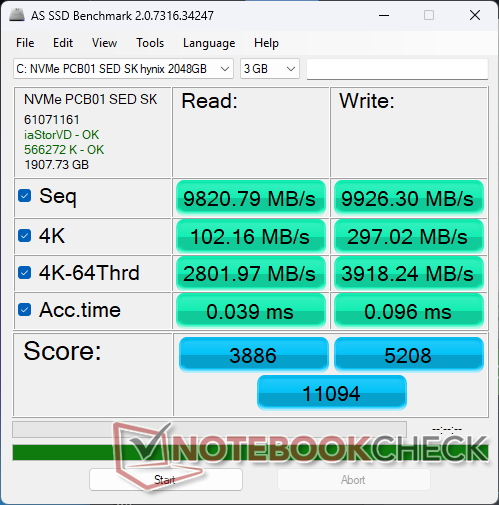
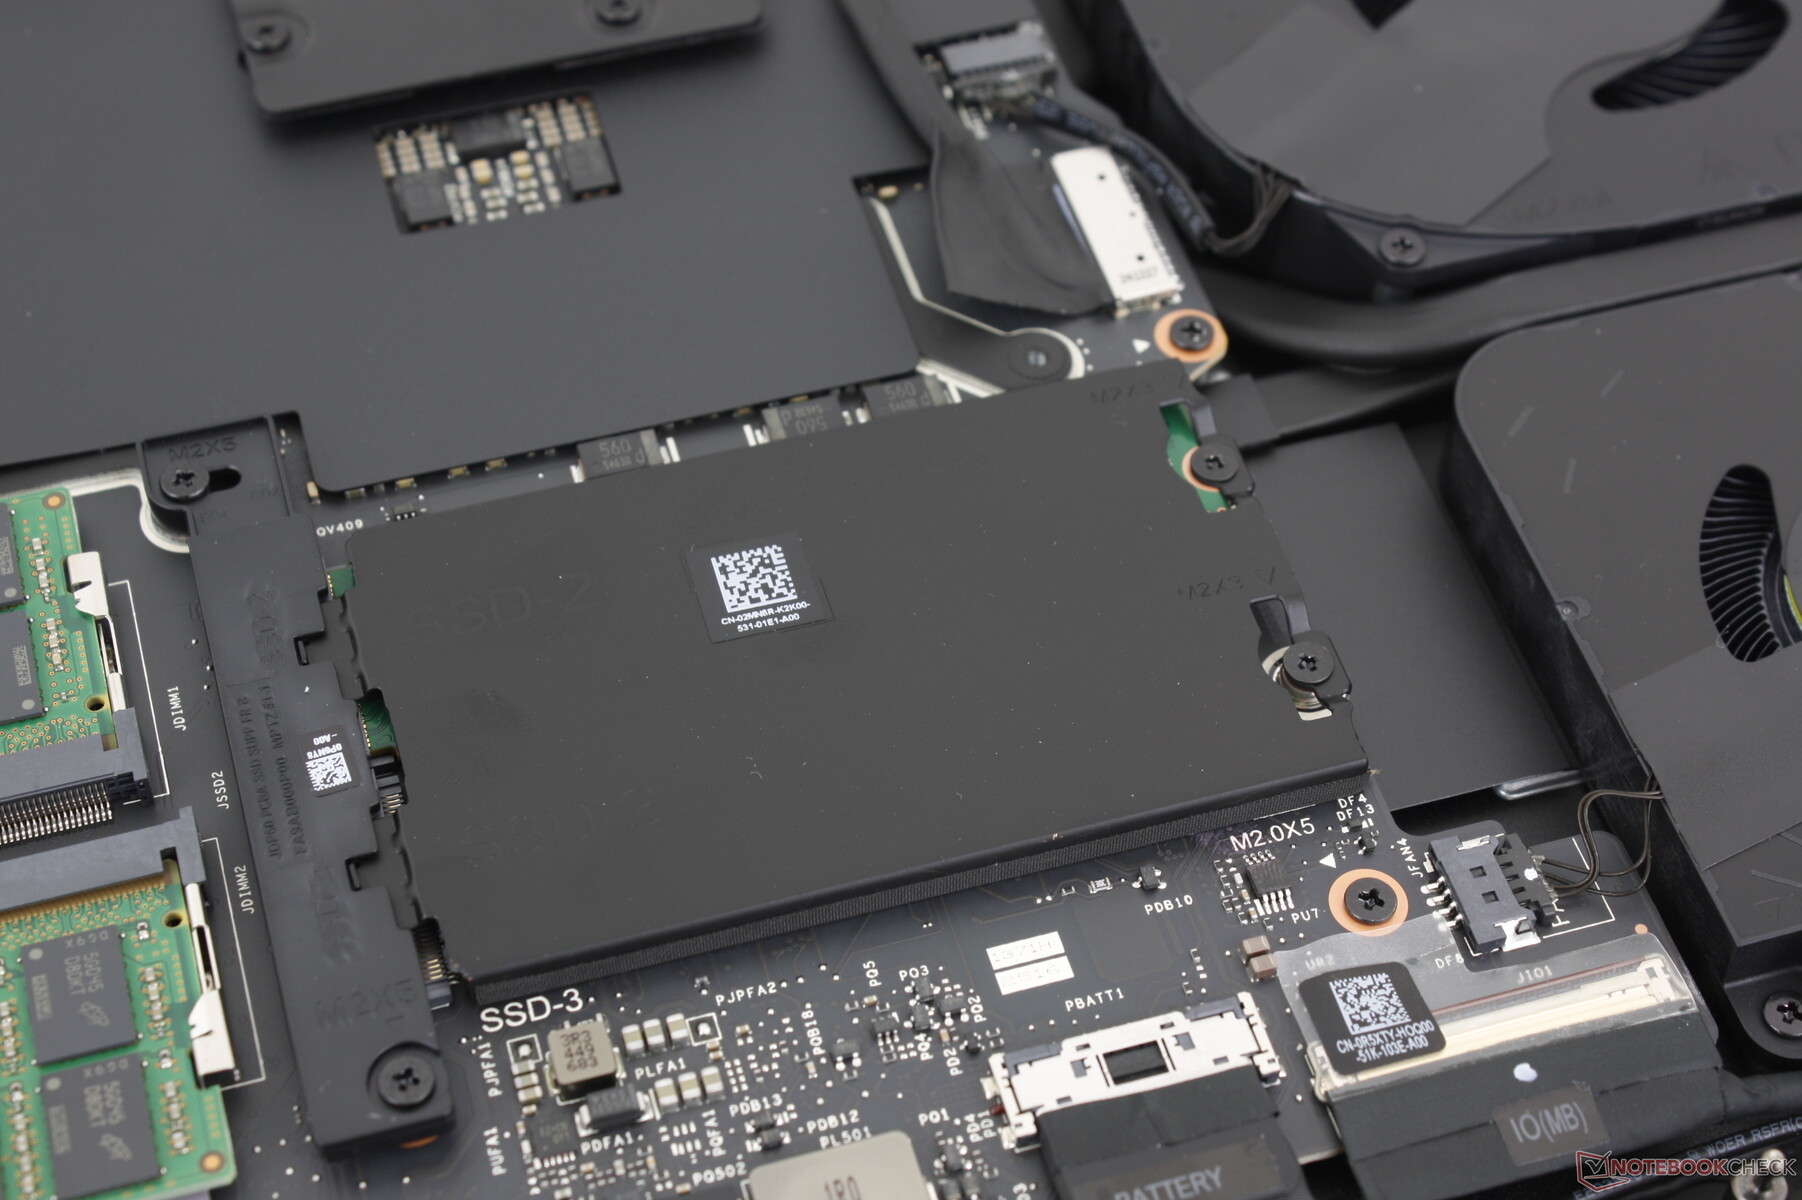
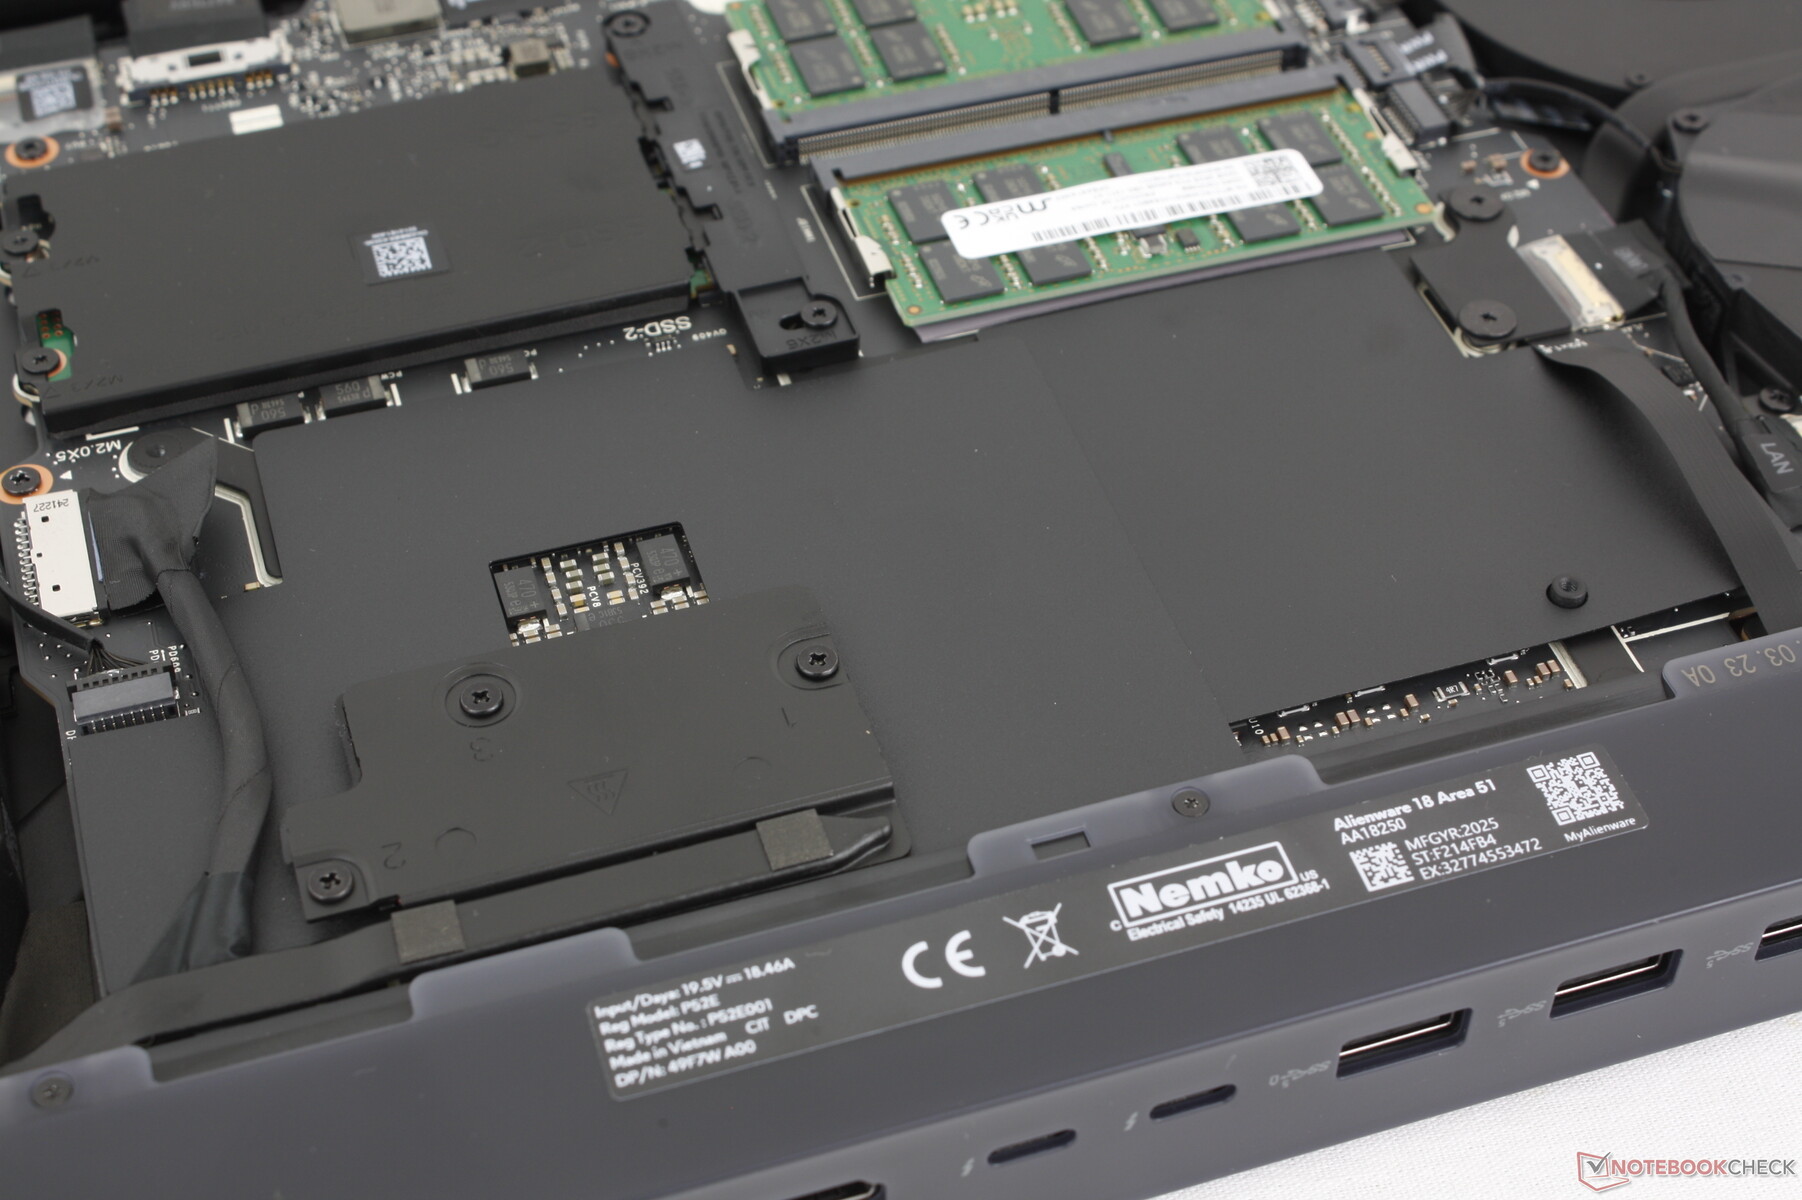
Our test unit ships with the SK Hynix PCB01 SED PCIe5 NVMe SSD offering stable transfer rates of ~14000 MB/s even when under stress as shown by our DiskSpd loop test results below. Performance can be up to 2x faster than the PCie4 SK Hynix PC811 SSD in last year's Alienware m18 R2. It's worth mentioning that the two PCIe5 M.2 2280 slots come with a heat spreader while the third PCIe4 2280 slot sits directly over one of the four fans as shown by the pictures below.
Only one of the three SSD slots supports PCIe5 if configuring the laptop with RTX 5070 Ti or lower graphics.

* ... smaller is better
Disk Throttling: DiskSpd Read Loop, Queue Depth 8
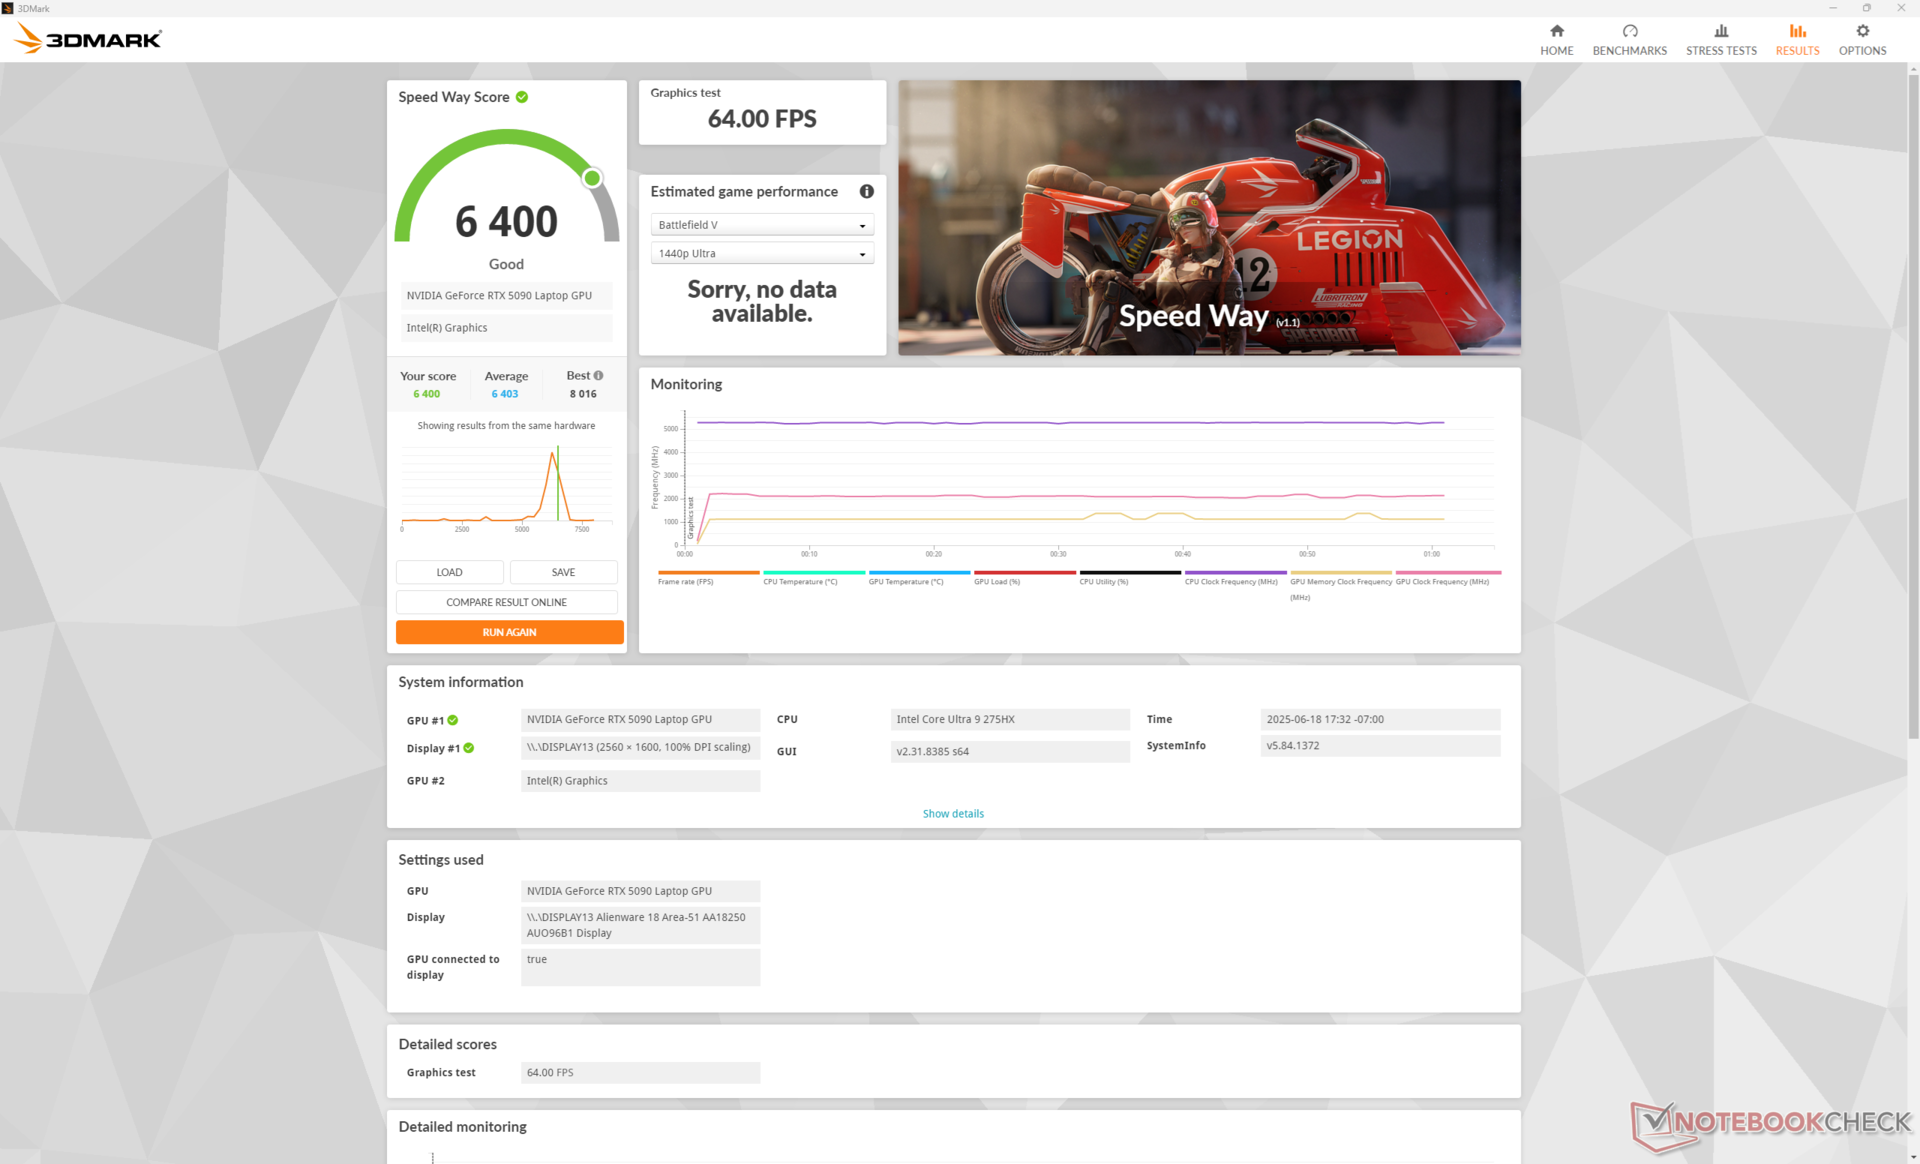
GPU Performance
The GeForce RTX 5090 GPU in our Alienware 18 runs slightly faster than most other laptops in our database with the same RTX 5090 graphics as the GPU in the Alienware can sustain higher power limits closer to the 175 W TGP target. The smaller Asus ROG Strix Scar 16, for example, runs about 8 percent slower than on the Alienware 18.
Dropping down to the RTX 5080 or RTX 5070 Ti configurations is expected to decrease graphics performance by about 10 to 15 percent and 30 to 45 percent, respectively, from our RTX 5090 system.
Running on Overdrive mode provides just minimal performance benefits at best over Performance mode as shown by our Fire Strike Results table below. Performance would decrease much less than expected if set to Balanced mode.
| Power Profile | Graphics Score | Physics Score | Combined Score |
| Overdrive Mode | 49289 | 48120 | 13445 |
| Performance Mode | 50772 (+3%) | 47552 (-1%) | 13217 (-2%) |
| Balanced Mode | 46380 (-6%) | 48198 (-0%) | 11235 (-16%) |
| Battery Mode | 33485 (-32%) | 29896 (-38%) | 8165 (-39%) |
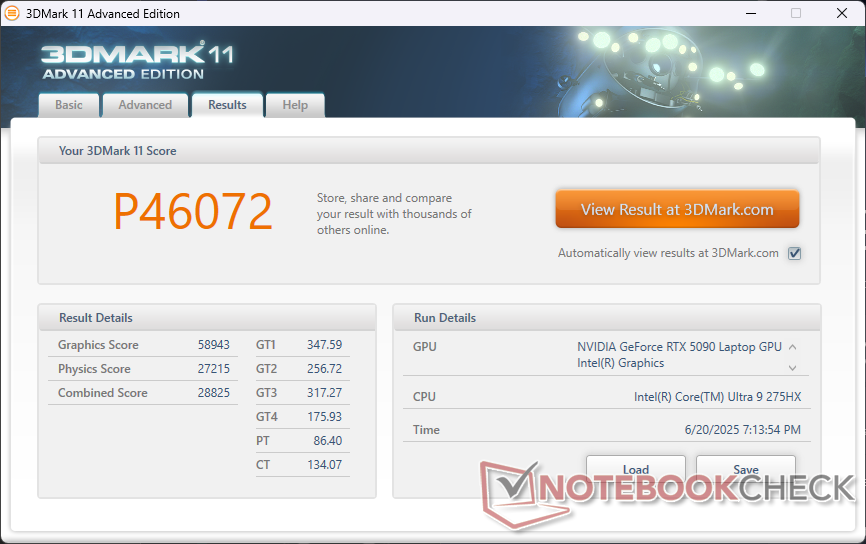

| 3DMark 11 Performance | 46072 points | |
| 3DMark Fire Strike Score | 39227 points | |
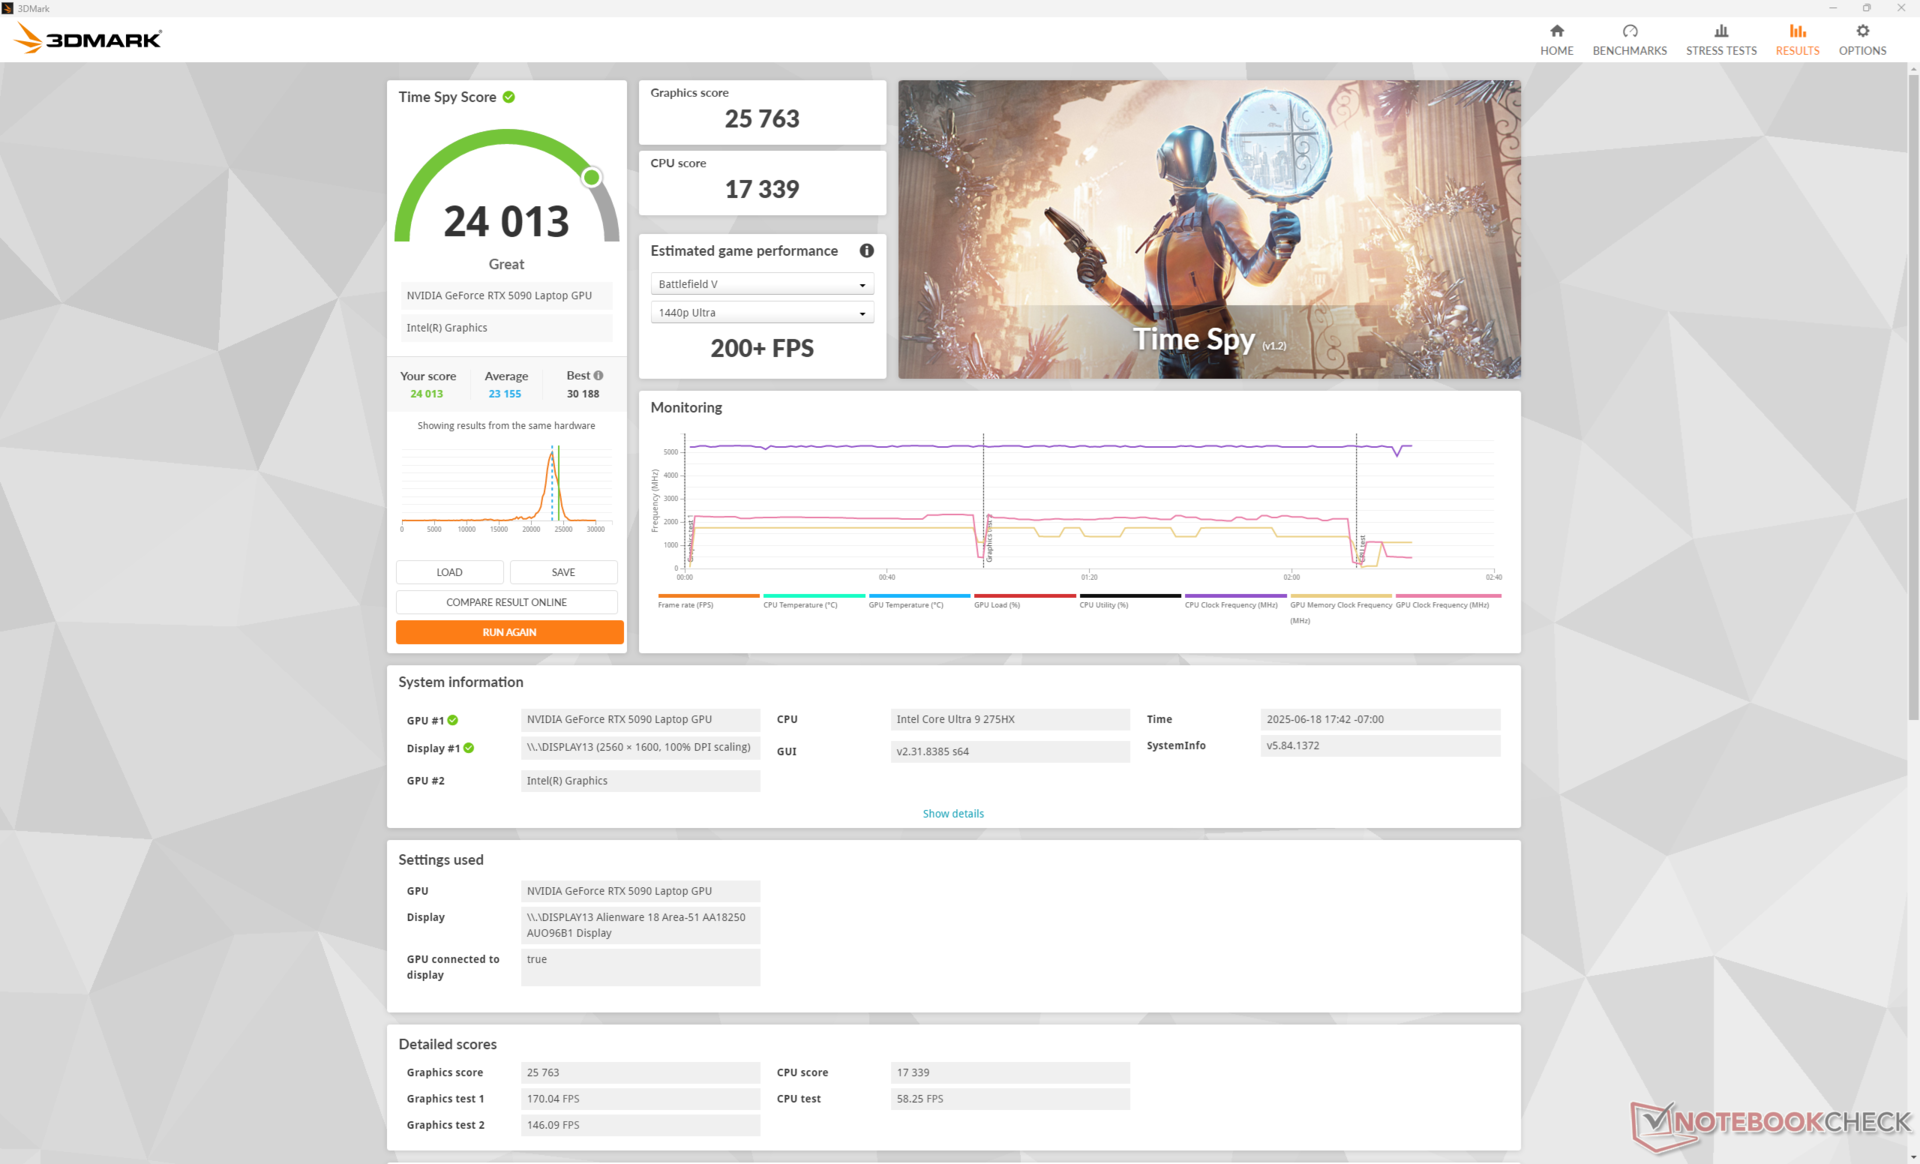
| 3DMark Time Spy Score | 24013 points | |
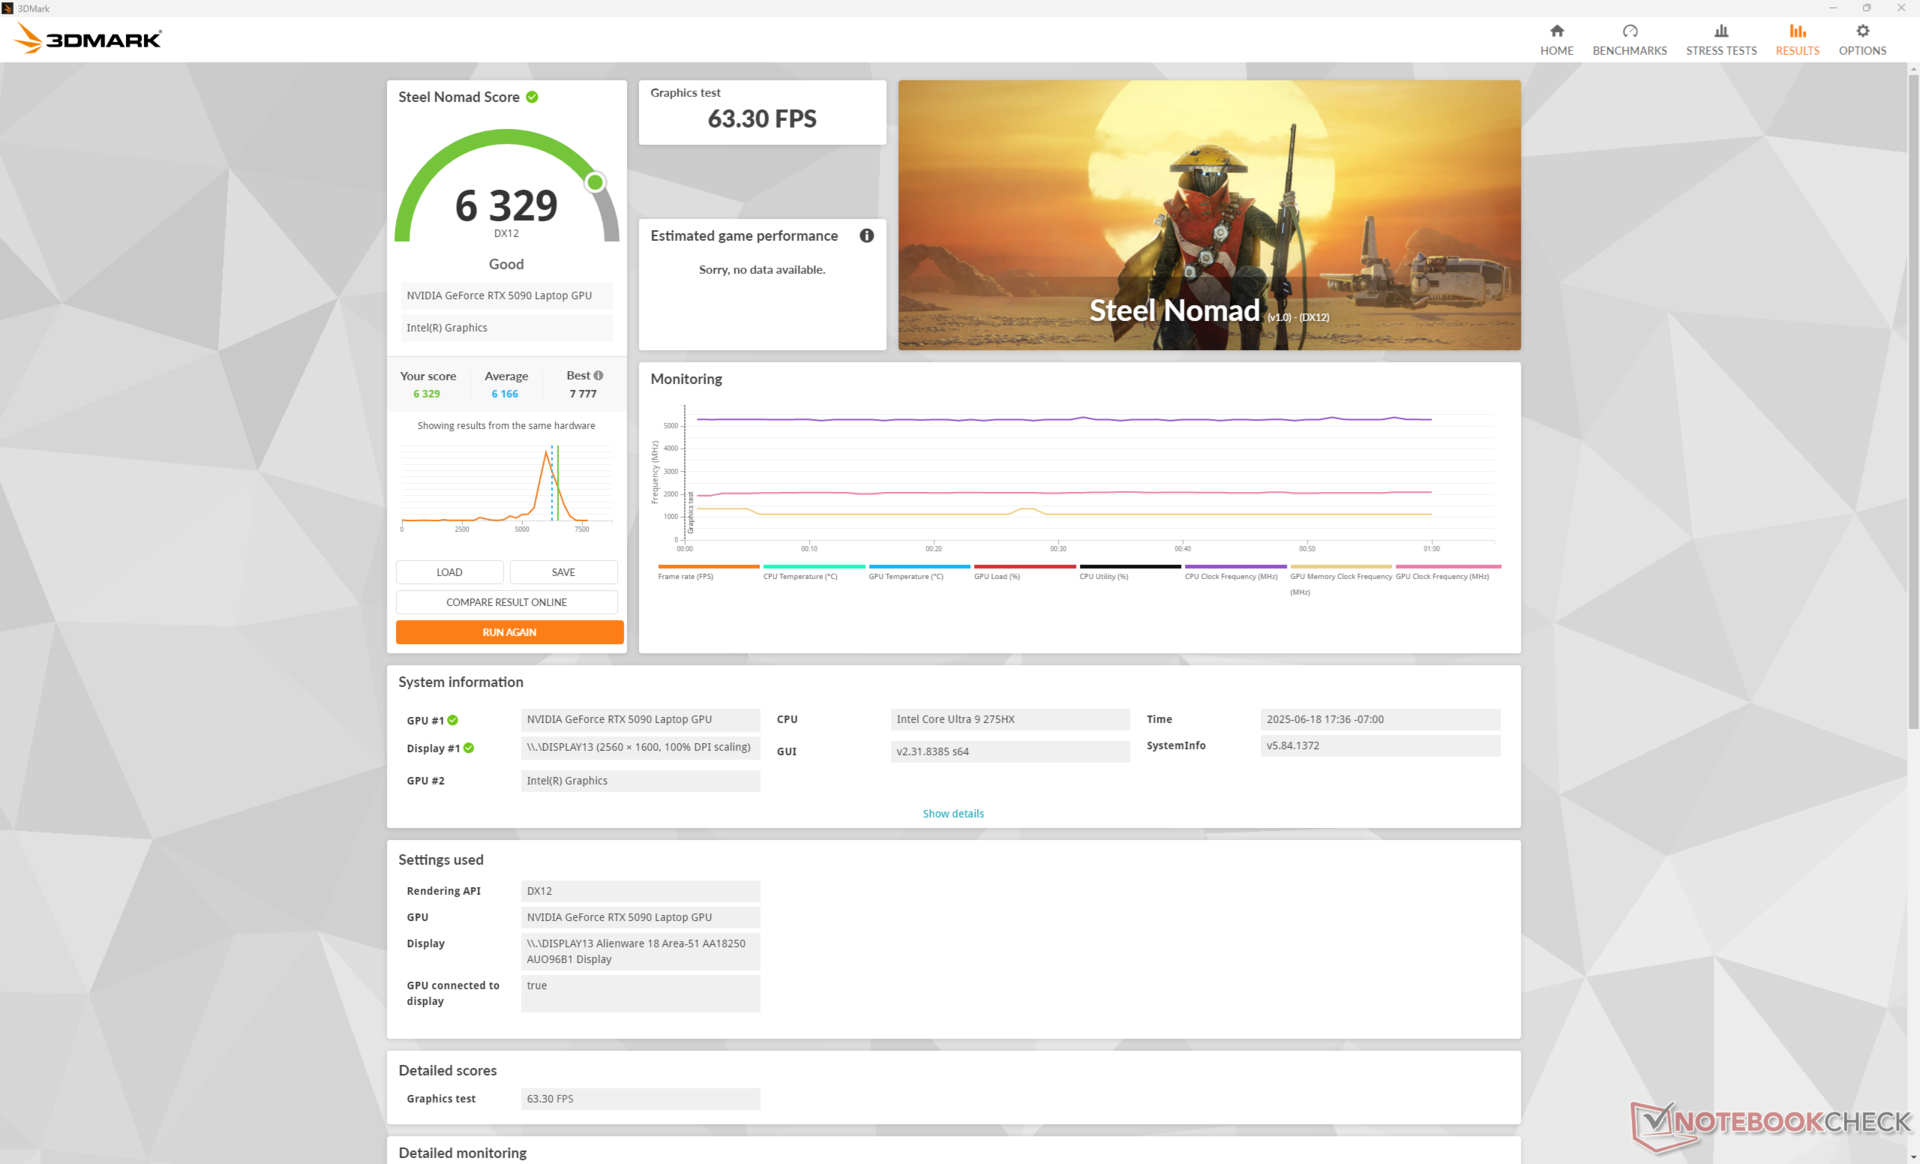
| 3DMark Steel Nomad Score | 6329 points | |
Help | ||
* ... smaller is better
Gaming Performance
Our Alienware 18 runs games consistently faster than the average laptop in our database with the same RTX 5090 GPU by anywhere between 5 to 15 percent. The performance gains have been largely incremental in the laptop GPU space as Nvidia has instead made multi-frame generation one of the key selling points of the RTX 50 Blackwell series. For example, our system is able to run Alan Wake 2 on maximum 4K RT settings at 125 FPS with MFG x4 whereas a last generation RTX 4090 laptop would be limited to x2 frame generation at well under half the average frame rates. If your favorite titles don't support MFG, such as F1 24, then the performance gains versus RTX 40 laptops will not be as significant. MFG is key for players who want to utilizing the fast 300 Hz refresh rate of the native panel.
Cyberpunk 2077 ultra FPS Chart
| low | med. | high | ultra | QHD DLSS | QHD | 4K DLSS | 4K | |
|---|---|---|---|---|---|---|---|---|
| Dota 2 Reborn (2015) | 217 | 193.8 | 188.3 | 171.5 | 165.3 | |||
| Final Fantasy XV Benchmark (2018) | 212 | 183.6 | 109.4 | |||||
| X-Plane 11.11 (2018) | 153.7 | 143.6 | 122.9 | 100.2 | ||||
| Strange Brigade (2018) | 456 | 350 | 185.5 | |||||
| Baldur's Gate 3 (2023) | 236.5 | 237.3 | 174.8 | 149.3 | 94 | |||
| Cyberpunk 2077 (2023) | 179.1 | 166.5 | 136.6 | 120.5 | 55 | |||
| Alan Wake 2 (2023) | 133.2 | 88.1 | 75.4 | 49.3 | ||||
| F1 24 (2024) | 155.4 | 156.3 | 106.4 | 90.6 | 52.2 | |||
| Black Myth: Wukong (2024) | 109 | 65 | 73 | 50 | 52 | 30 | ||
| Indiana Jones and the Great Circle (2024) | 140.3 | 133.7 | 112.6 | 73 | ||||
| Monster Hunter Wilds (2025) | 95.34 | 92.77 | 80.51 | 69.17 | 50.77 | |||
| Assassin's Creed Shadows (2025) | 75 | 76 | 64 | 61 | 46 | |||
| Battlefield 6 (2025) | 159.4 | 143.4 | 109.3 | 83.6 | 59.4 |
Emissions
System Noise
Fan noise hovers around 31 dB(A) when running undemanding loads like browsers or video streaming. It doesn't pick up until more demanding loads are introduced to keep pulsing to a minimum. The noise is always audible but generally undistracting when out of gaming.
Fan noise when gaming would stabilize at 45.9 dB(A), 48.9 dB(A), and 55.9 dB(A) when set to Balanced mode, Performance mode, and Overdrive mode, respectively. The noise difference between Performance and Overdrive modes is significant especially when compared to the minor performance gains that Overdrive mode provides. When on Performance mode, fan noise comes in a few decibals quieter than on last year's Alienware m18 R2.
Noise level
| Idle |
| 30.2 / 30.6 / 30.6 dB(A) |
| Load |
| 38 / 55.9 dB(A) |
 | ||
30 dB silent 40 dB(A) audible 50 dB(A) loud |
||
min: | ||
| Alienware 18 Area-51 GeForce RTX 5090 Laptop, Ultra 9 275HX | Alienware 16 Area-51 GeForce RTX 5080 Laptop, Ultra 9 275HX, Samsung PM9C1a MZ9L81T0HDLB | Alienware m18 R2 GeForce RTX 4090 Laptop GPU, i9-14900HX, SK Hynix PC811 HFS002TEM9X152N | MSI Raider A18 HX A9WIG-080 GeForce RTX 5080 Laptop, R9 9955HX3D, Samsung PM9E1 MZVLC2T0HBLD | Razer Blade 18 2024 RZ09-0509 GeForce RTX 4090 Laptop GPU, i9-14900HX | Asus ROG Strix G18 G814JI GeForce RTX 4070 Laptop GPU, i7-13650HX, Micron 2400 MTFDKBA1T0QFM | Acer Predator Helios 18 PH18-72-98MW GeForce RTX 4090 Laptop GPU, i9-14900HX, 2x SK Hynix HFS001TEJ9X115N (RAID 0) | |
|---|---|---|---|---|---|---|---|
| Noise | 7% | 8% | -1% | 5% | 5% | -14% | |
| off / environment * (dB) | 23.4 | 23.6 -1% | 23.6 -1% | 25.1 -7% | 23.4 -0% | 25 -7% | 25 -7% |
| Idle Minimum * (dB) | 30.2 | 25.4 16% | 23.8 21% | 28.6 5% | 23.9 21% | 26 14% | 30 1% |
| Idle Average * (dB) | 30.6 | 27.8 9% | 26.1 15% | 28.9 6% | 28.2 8% | 28 8% | 36 -18% |
| Idle Maximum * (dB) | 30.6 | 28.1 8% | 31.5 -3% | 29.2 5% | 29 5% | 29 5% | 44 -44% |
| Load Average * (dB) | 38 | 28.8 24% | 31.5 17% | 45.6 -20% | 36.8 3% | 41 -8% | 48 -26% |
| Cyberpunk 2077 ultra * (dB) | 48.9 | 50.4 -3% | 55.6 -14% | ||||
| Load Maximum * (dB) | 55.9 | 56.4 -1% | 56.6 -1% | 45.8 18% | 61.1 -9% | 46 18% | 51 9% |
| Witcher 3 ultra * (dB) | 52.1 | 54.1 | 44 | 49 |
* ... smaller is better
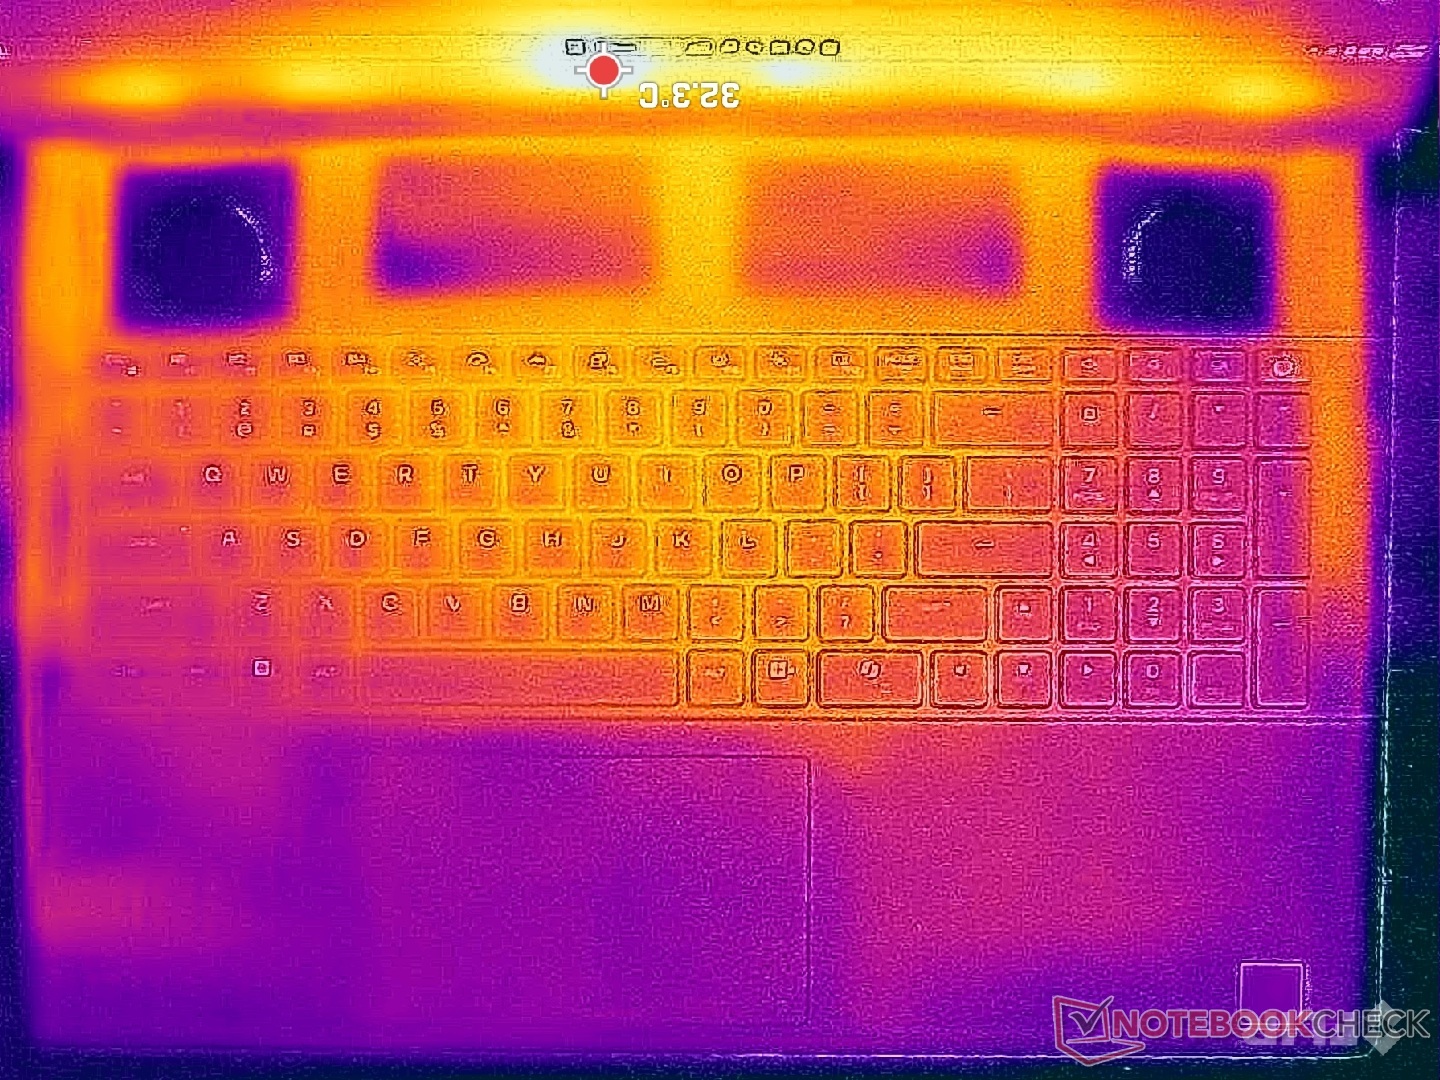
Temperature
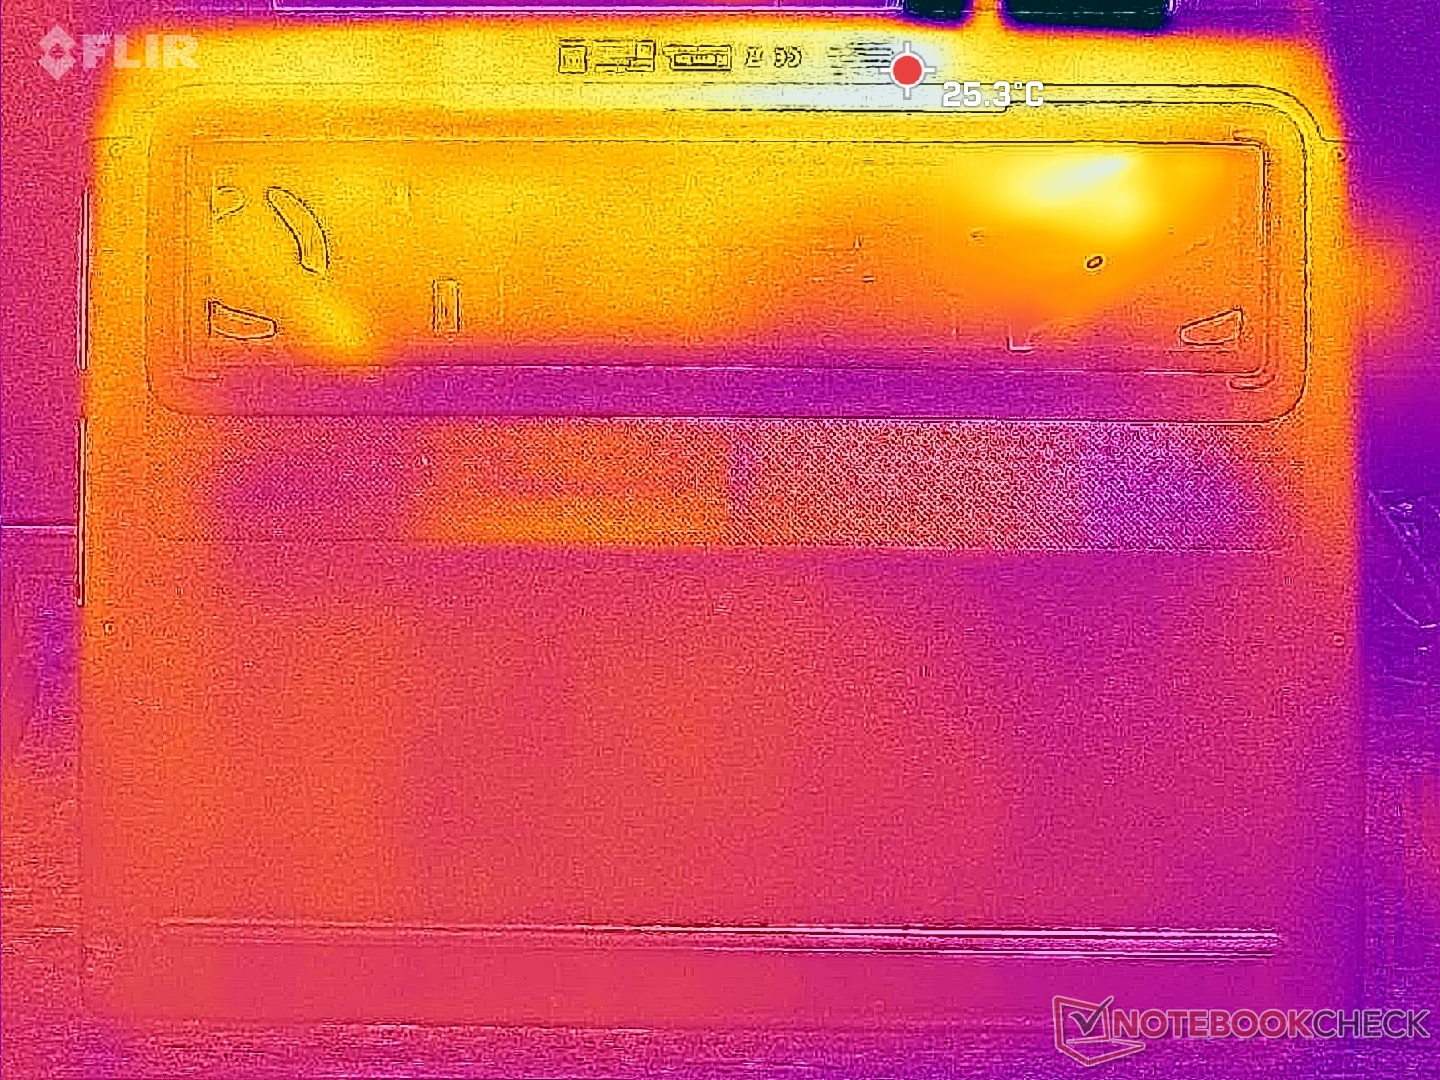
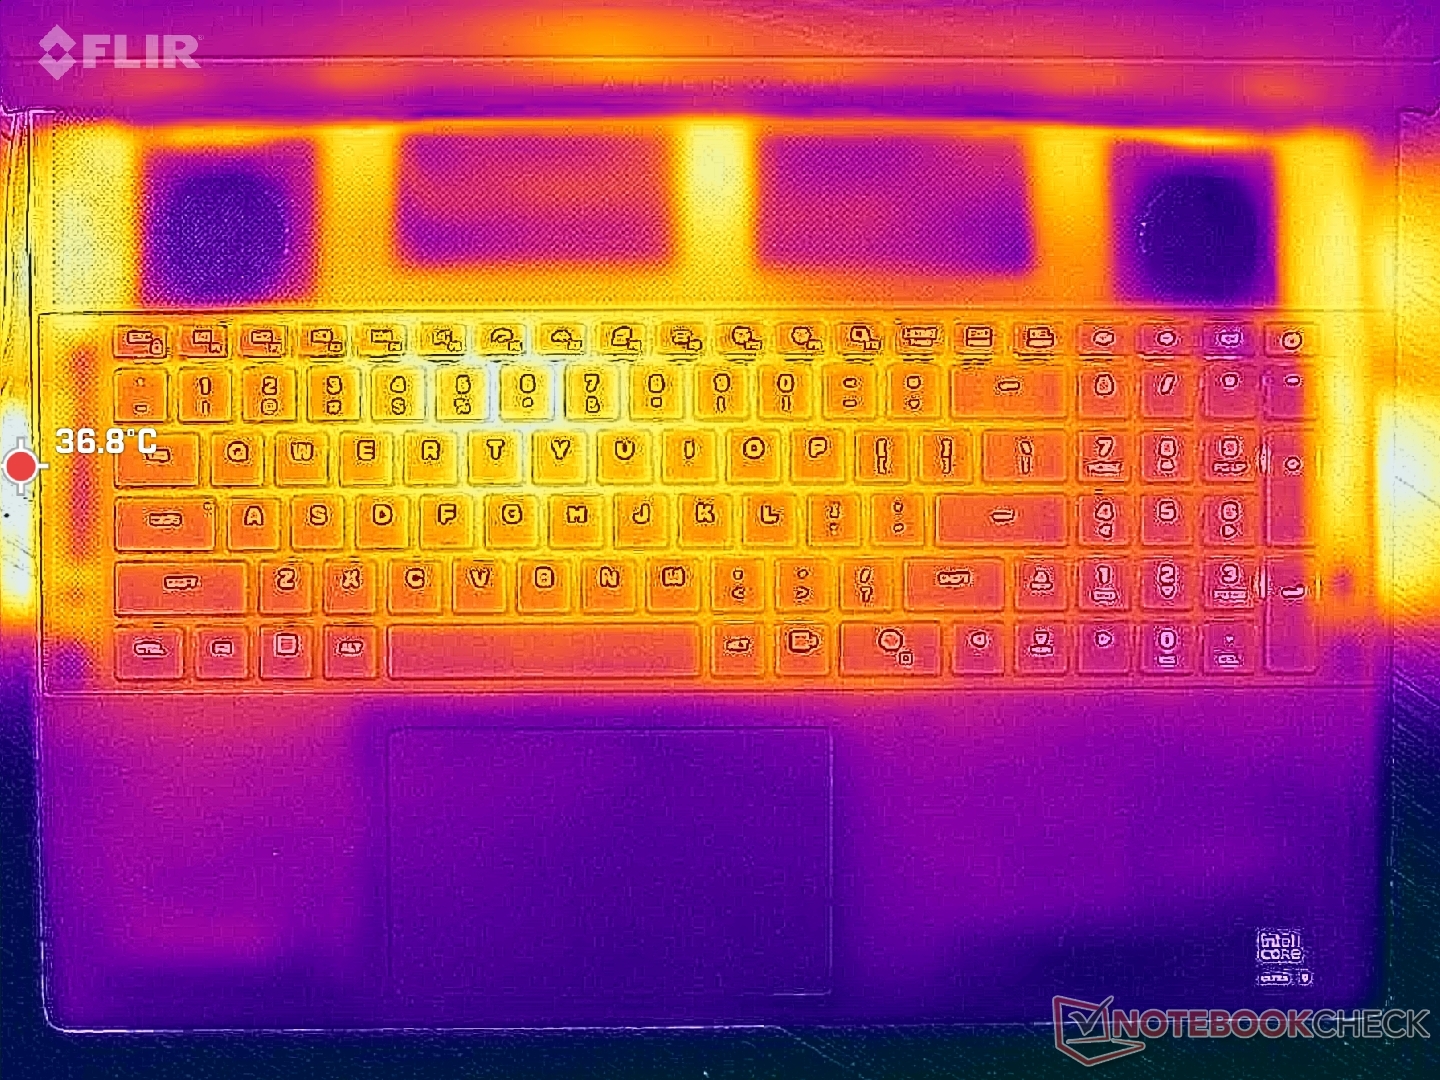
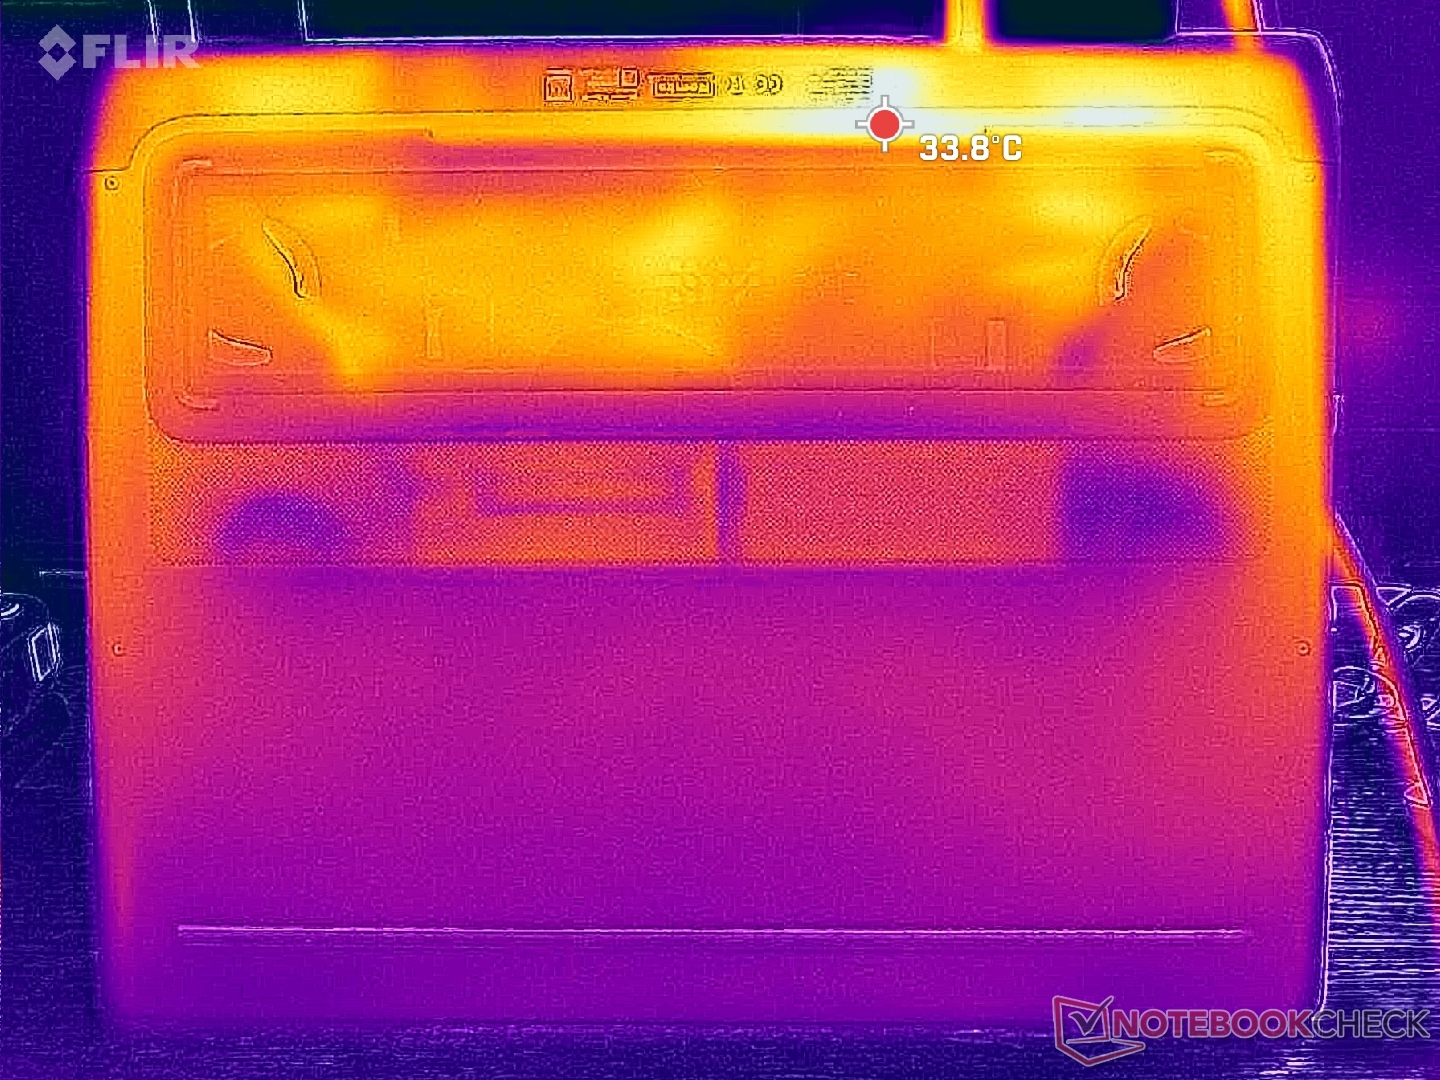
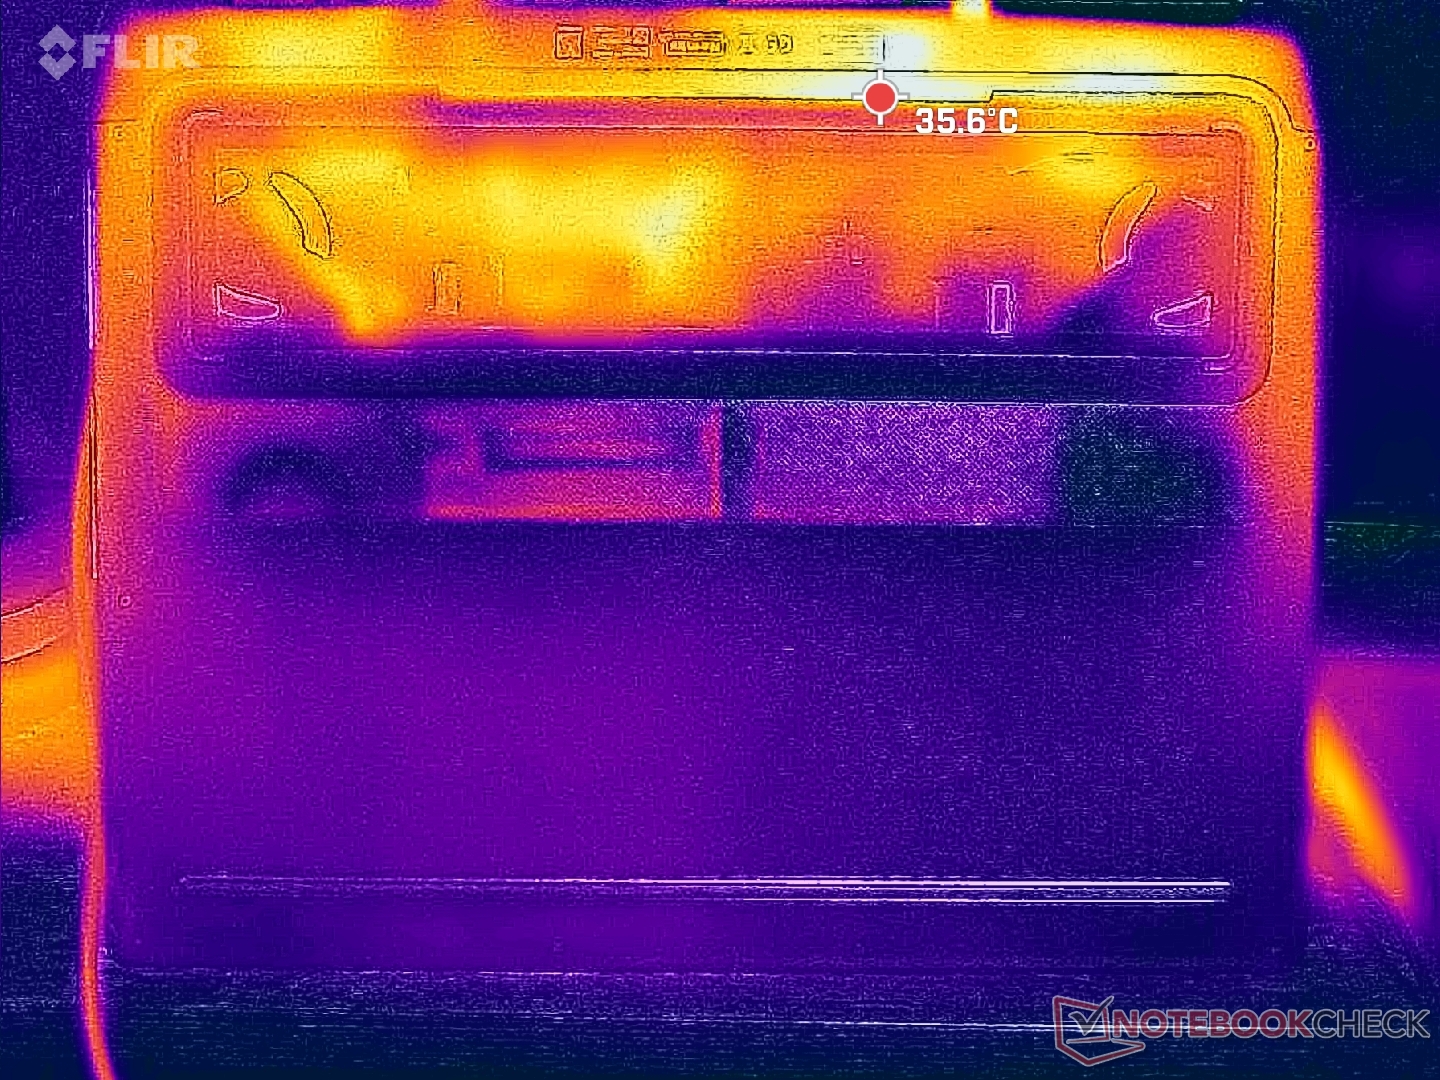
Average surface temperatures are about the same as on the Alienware m18 R2 but with cooler hot spots despite having fewer overall ventilation grilles. The MSI Raider A18 reaches 50 C on some spots when gaming compared to just 36 C on our Alienware. We expected nothing less given how bulky the Alienware machine is.
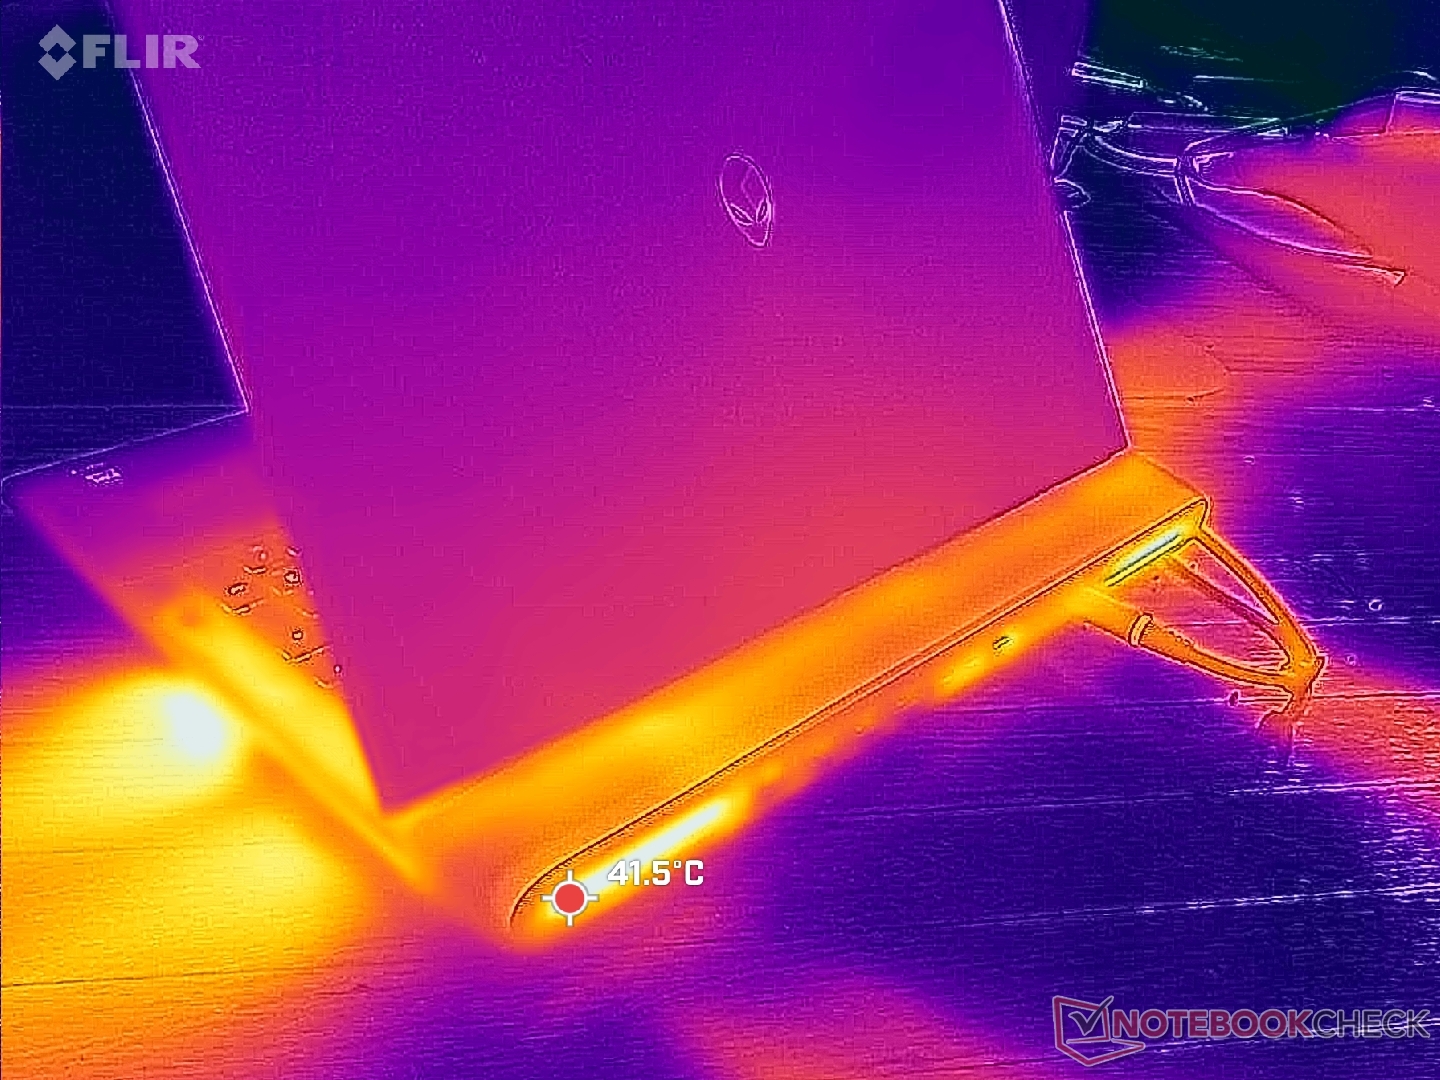

(+) The maximum temperature on the upper side is 36.8 °C / 98 F, compared to the average of 40.4 °C / 105 F, ranging from 21.2 to 68.8 °C for the class Gaming.
(+) The bottom heats up to a maximum of 35.8 °C / 96 F, compared to the average of 43.2 °C / 110 F
(+) In idle usage, the average temperature for the upper side is 28.5 °C / 83 F, compared to the device average of 33.9 °C / 93 F.
(+) 3: The average temperature for the upper side is 31.2 °C / 88 F, compared to the average of 33.9 °C / 93 F for the class Gaming.
(+) The palmrests and touchpad are cooler than skin temperature with a maximum of 26.8 °C / 80.2 F and are therefore cool to the touch.
(±) The average temperature of the palmrest area of similar devices was 28.8 °C / 83.8 F (+2 °C / 3.6 F).

| Alienware 18 Area-51 Intel Core Ultra 9 275HX, NVIDIA GeForce RTX 5090 Laptop | Alienware 16 Area-51 Intel Core Ultra 9 275HX, NVIDIA GeForce RTX 5080 Laptop | Alienware m18 R2 Intel Core i9-14900HX, NVIDIA GeForce RTX 4090 Laptop GPU | MSI Raider A18 HX A9WIG-080 AMD Ryzen 9 9955HX3D, NVIDIA GeForce RTX 5080 Laptop | Razer Blade 18 2024 RZ09-0509 Intel Core i9-14900HX, NVIDIA GeForce RTX 4090 Laptop GPU | Asus ROG Strix G18 G814JI Intel Core i7-13650HX, NVIDIA GeForce RTX 4070 Laptop GPU | Acer Predator Helios 18 PH18-72-98MW Intel Core i9-14900HX, NVIDIA GeForce RTX 4090 Laptop GPU | |
|---|---|---|---|---|---|---|---|
| Heat | -16% | -23% | -25% | -18% | -12% | -24% | |
| Maximum Upper Side * (°C) | 36.8 | 43.8 -19% | 41.2 -12% | 49.3 -34% | 43.2 -17% | 45 -22% | 43 -17% |
| Maximum Bottom * (°C) | 35.8 | 40 -12% | 34.6 3% | 50.9 -42% | 42.6 -19% | 47 -31% | 59 -65% |
| Idle Upper Side * (°C) | 30.6 | 35.8 -17% | 42.8 -40% | 35.2 -15% | 36 -18% | 28 8% | 32 -5% |
| Idle Bottom * (°C) | 30.8 | 35.2 -14% | 43.6 -42% | 33.5 -9% | 36.4 -18% | 31 -1% | 34 -10% |
* ... smaller is better
Stress Test
Average core temperatures under load are relatively low for a gaming laptop. When running Prime95 and FurMark, example, CPU and GPU temperatures would stabilize at 79 C and 66 C, respectively, compared to 83 C and 77 C on the MSI Vector A18 HX. Our Alienware 18 would remain cooler than most other gaming laptops when running Cyberpunk 2077 as well.
The CPU on Performance mode would spike to 4.0 GHz and ~165 W lasting for about a minute before eventually dropping very slightly to 3.8 GHz, 145 W, and 72 C. Changing the power profile to Overdrive mode would bring the CPU back up to 4.0 GHz and ~165 W.
GPU board power draw when running Cyberpunk 2077 on Performance mode would hover just below 160 W compared to 171 W when running the same game on Overdrive mode. The louder fans on Overdrive allow for slightly faster GPU clock rates while keeping core temperatures roughly the same.

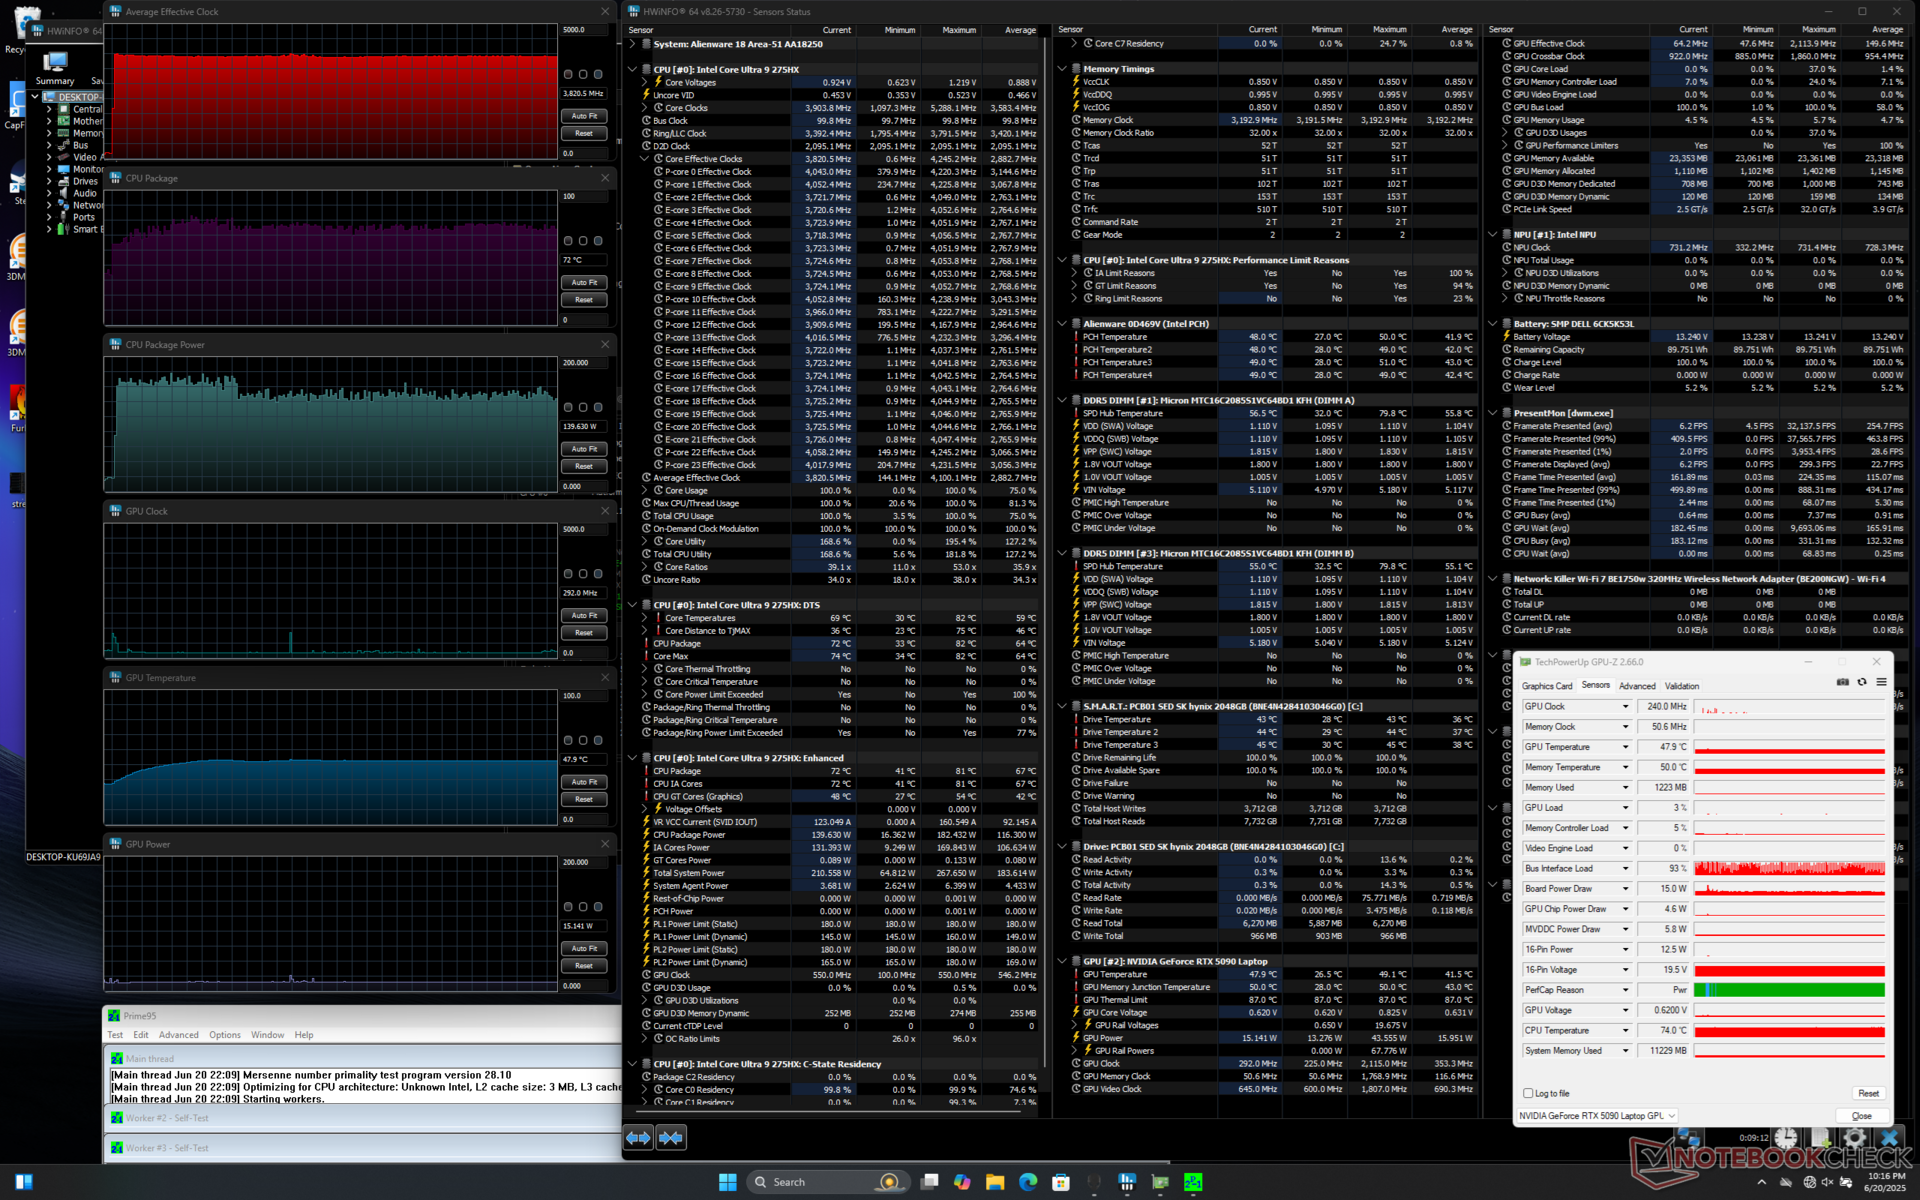

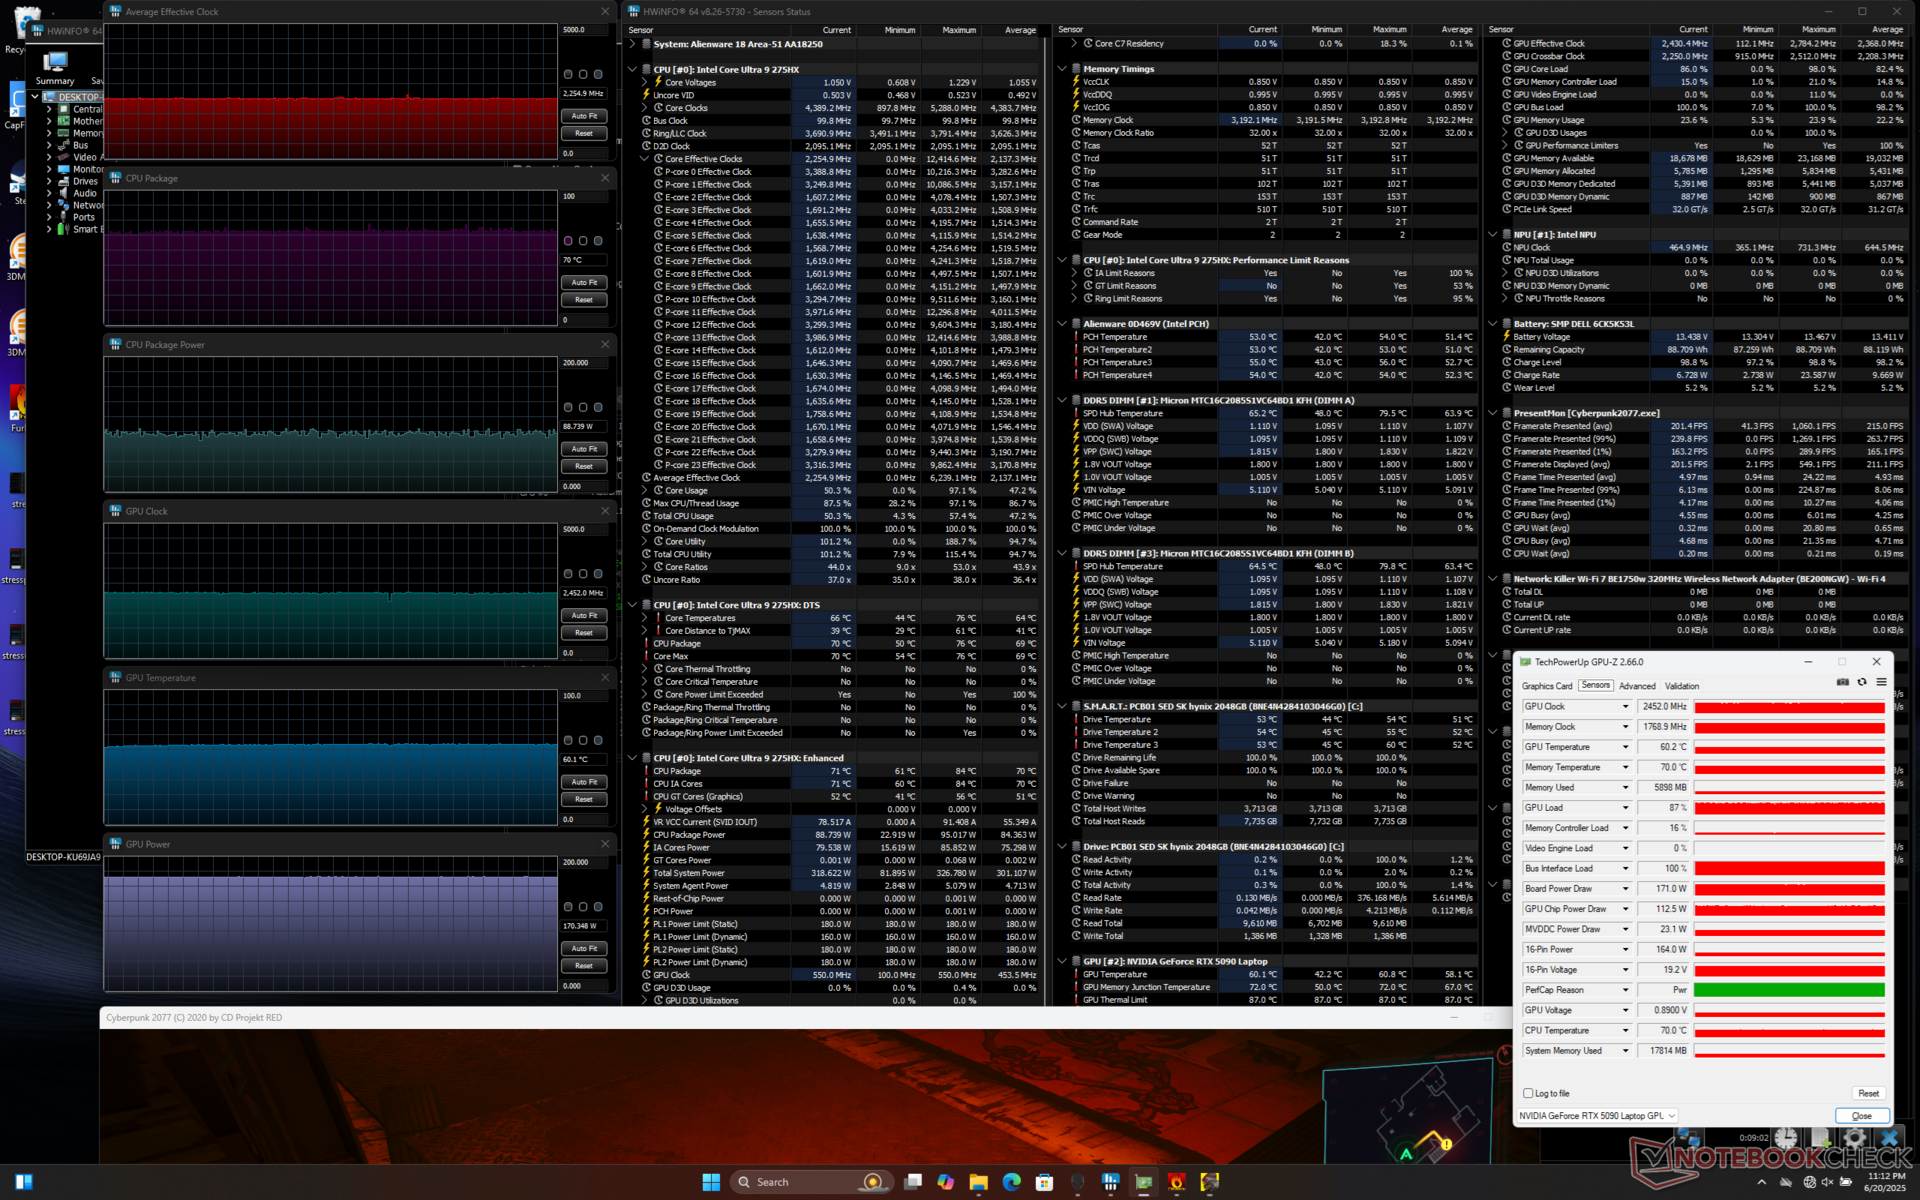
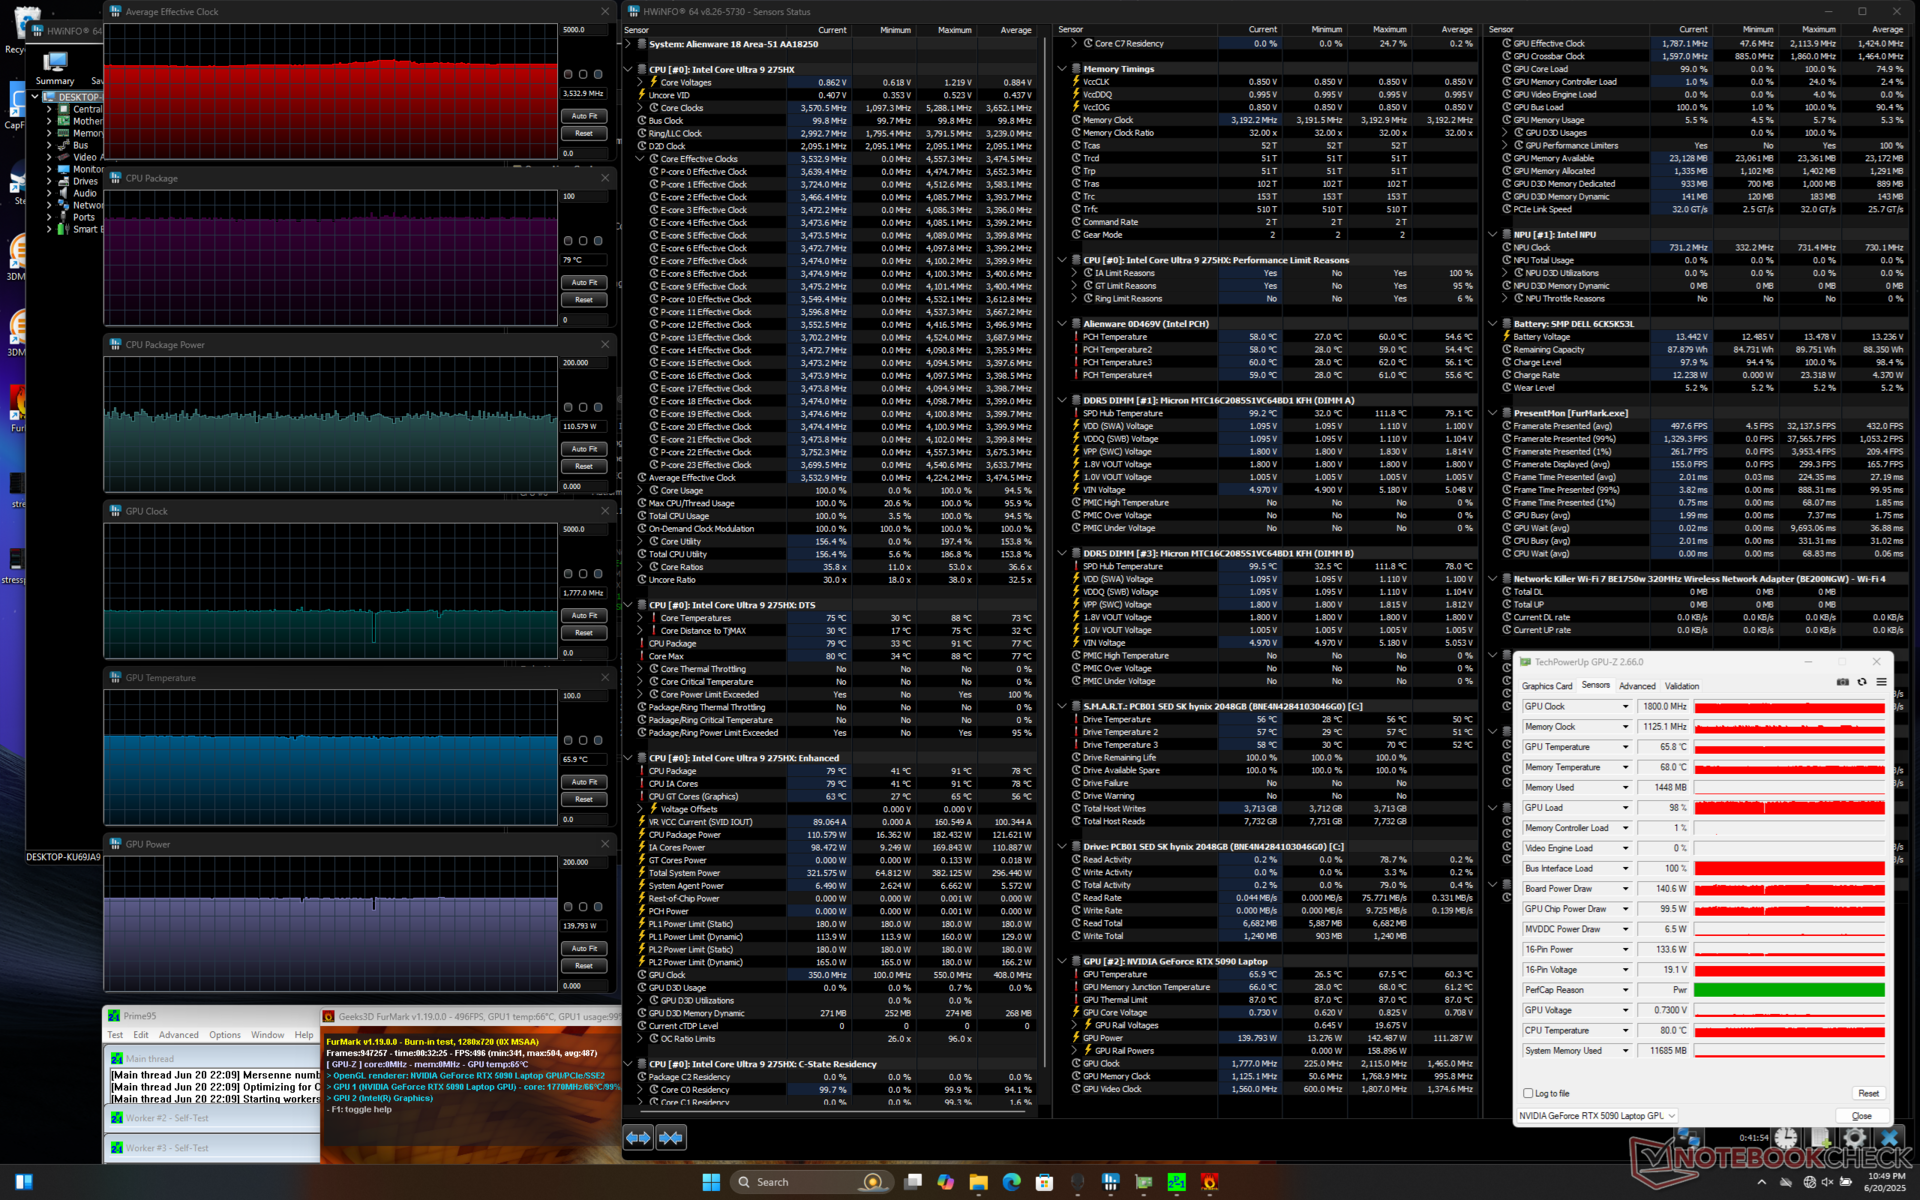
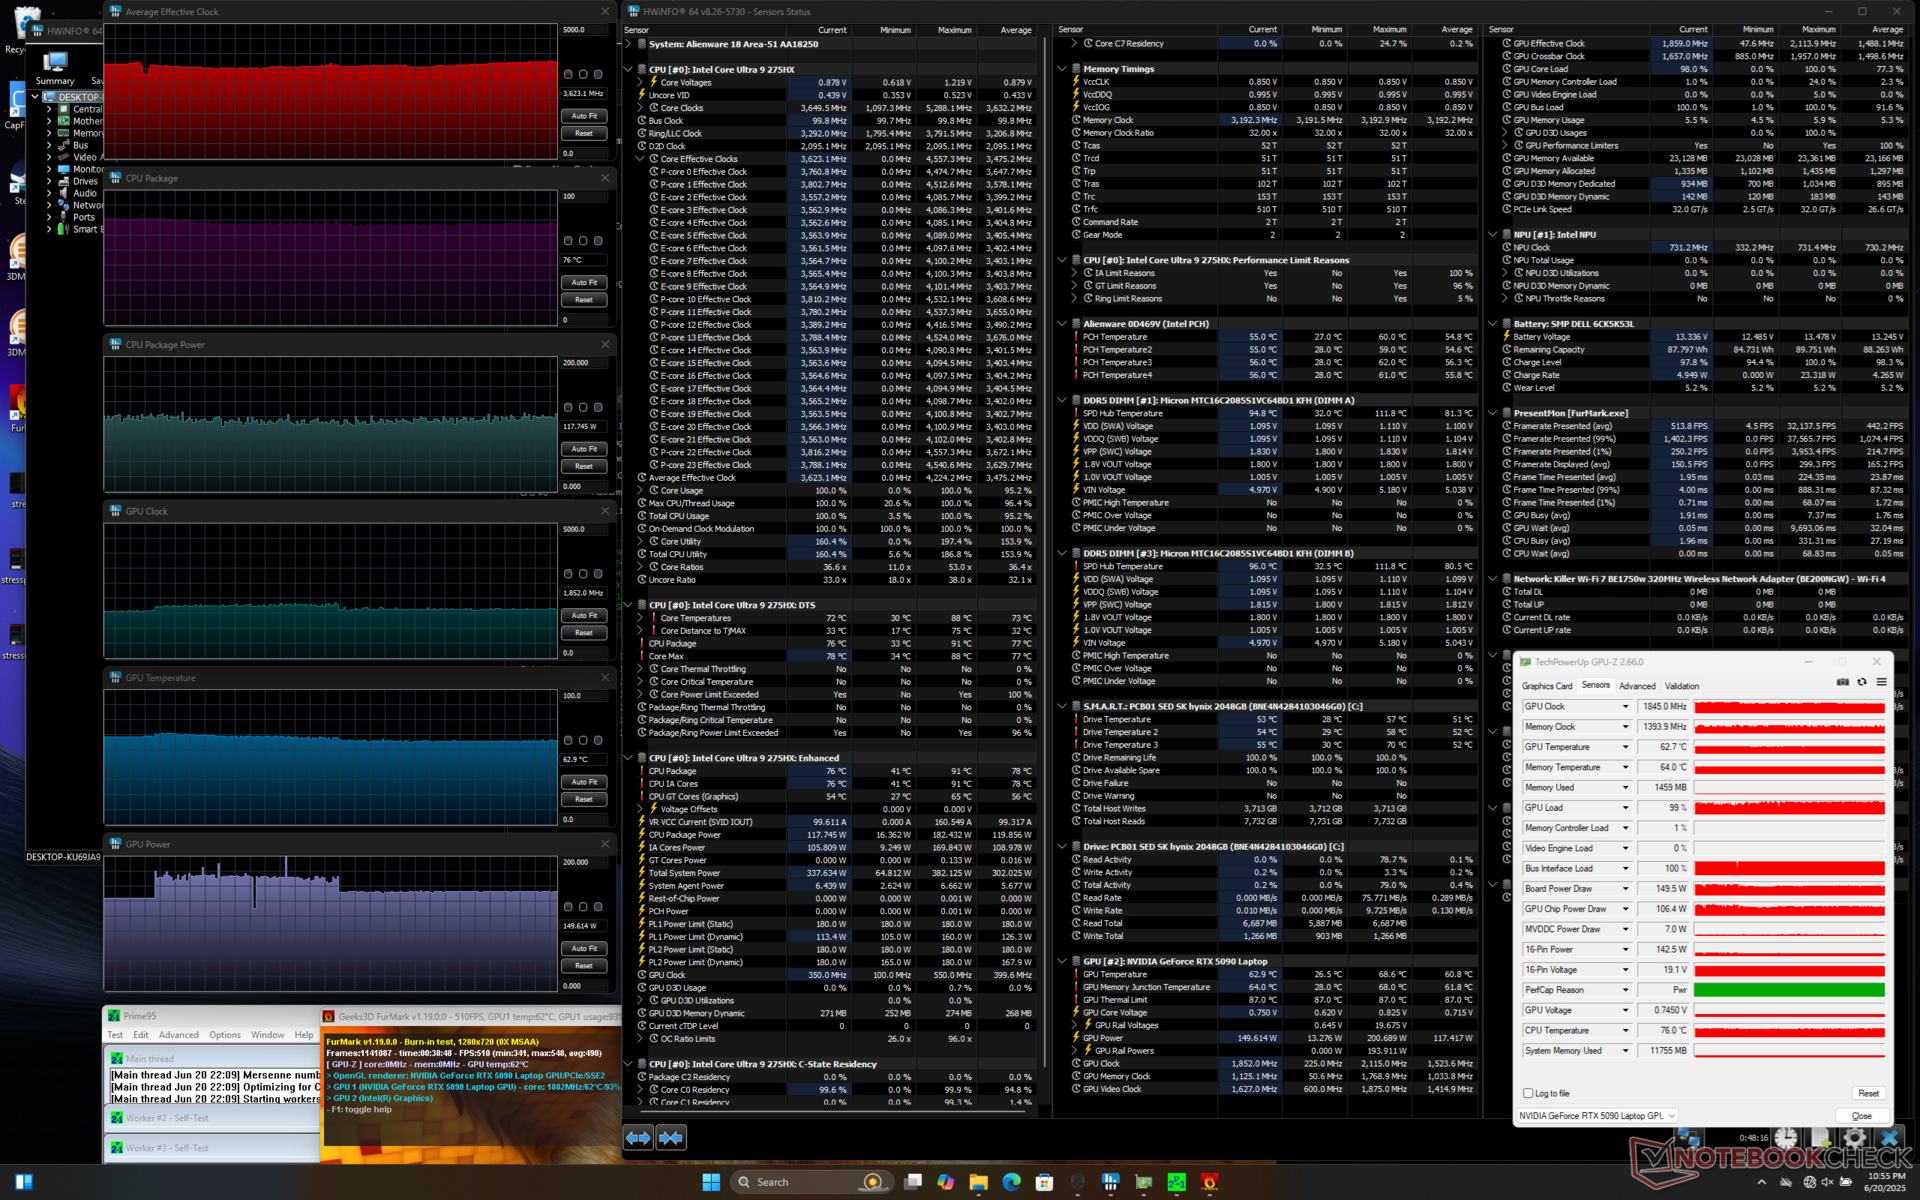
| Average CPU Clock (GHz) | GPU Clock (MHz) | Average CPU Temperature (°C) | Average GPU Temperature (°C) | |
| System Idle | -- | -- | 34 | 27 |
| Prime95 Stress | 3.8 | -- | 72 | 48 |
| Prime95 + FurMark Stress (Overdrive mode) | 3.6 | 1852 | 76 | 63 |
| Prime95 + FurMark Stress (Performance mode) | 3.5 | 1777 | 79 | 66 |
| Cyberpunk 2077 Stress (Overdrive mode) | 2.3 | 2452 | 70 | 60 |
| Cyberpunk 2077 Stress (Performance mode) | 2.3 | 2325 | 71 | 62 |
Speakers
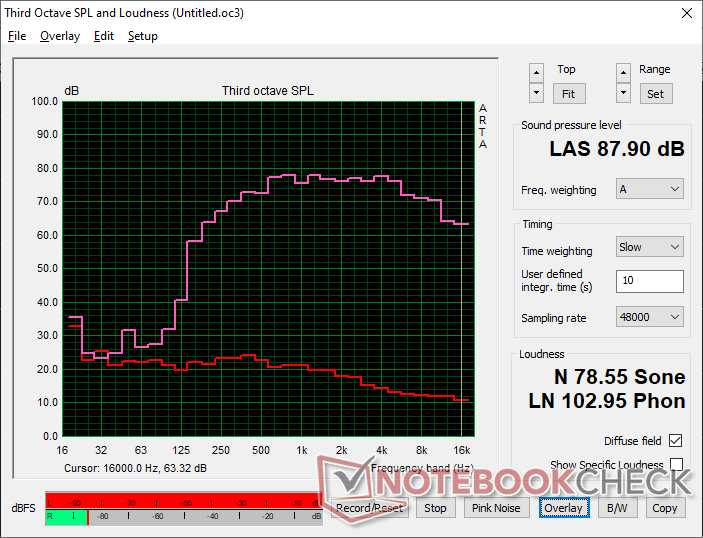
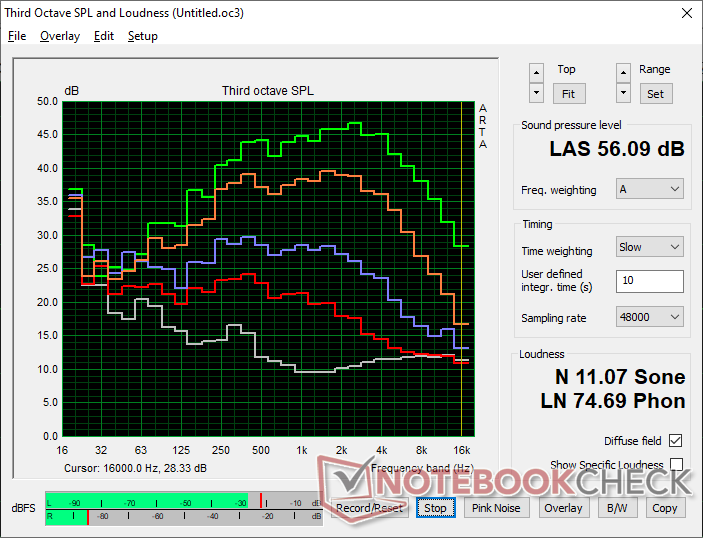
Alienware 18 Area-51 audio analysis
(+) | speakers can play relatively loud (87.9 dB)
Bass 100 - 315 Hz
(-) | nearly no bass - on average 17.5% lower than median
(±) | linearity of bass is average (13.4% delta to prev. frequency)
Mids 400 - 2000 Hz
(+) | balanced mids - only 3.1% away from median
(+) | mids are linear (3.6% delta to prev. frequency)
Highs 2 - 16 kHz
(+) | balanced highs - only 2.9% away from median
(+) | highs are linear (2.9% delta to prev. frequency)
Overall 100 - 16.000 Hz
(+) | overall sound is linear (14.2% difference to median)
Compared to same class
» 25% of all tested devices in this class were better, 7% similar, 68% worse
» The best had a delta of 6%, average was 18%, worst was 132%
Compared to all devices tested
» 17% of all tested devices were better, 4% similar, 79% worse
» The best had a delta of 4%, average was 24%, worst was 134%
Apple MacBook Pro 16 2021 M1 Pro audio analysis
(+) | speakers can play relatively loud (84.7 dB)
Bass 100 - 315 Hz
(+) | good bass - only 3.8% away from median
(+) | bass is linear (5.2% delta to prev. frequency)
Mids 400 - 2000 Hz
(+) | balanced mids - only 1.3% away from median
(+) | mids are linear (2.1% delta to prev. frequency)
Highs 2 - 16 kHz
(+) | balanced highs - only 1.9% away from median
(+) | highs are linear (2.7% delta to prev. frequency)
Overall 100 - 16.000 Hz
(+) | overall sound is linear (4.6% difference to median)
Compared to same class
» 0% of all tested devices in this class were better, 0% similar, 100% worse
» The best had a delta of 5%, average was 17%, worst was 45%
Compared to all devices tested
» 0% of all tested devices were better, 0% similar, 100% worse
» The best had a delta of 4%, average was 24%, worst was 134%
Energy Management
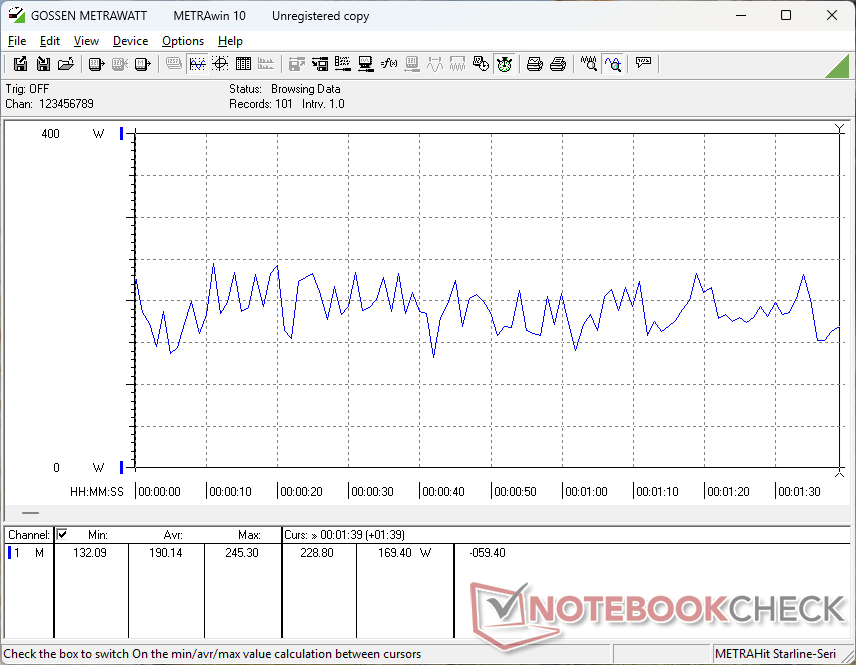
Power Consumption
The system is very demanding even when idling on desktop at minimum brightness and power settings. Battery life is therefore very short no matter the onscreen load as our next section below will show.
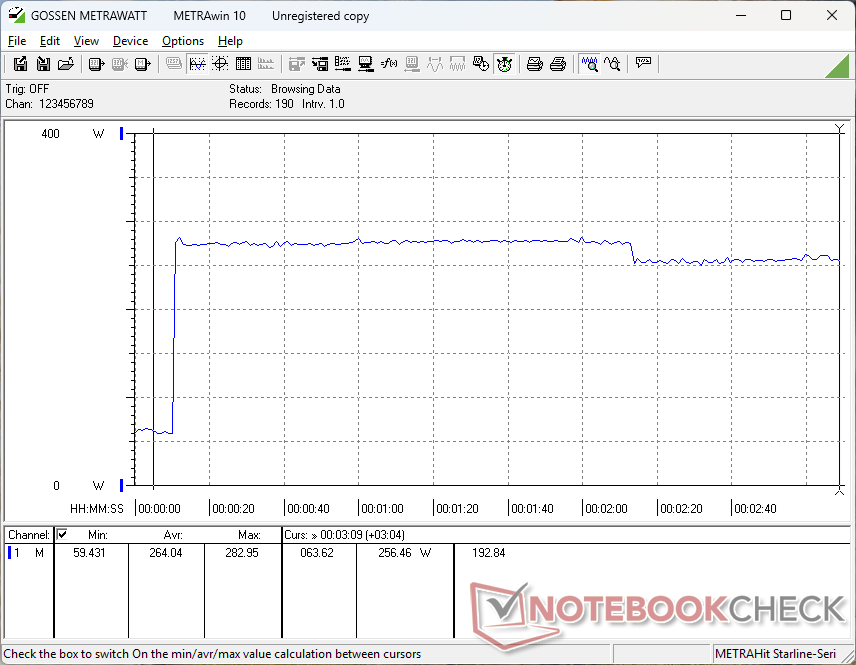
Running Cyberpunk 2077 to represent typical gaming loads will draw around 340 W if on Overdrive mode or around 300 W if on Performance mode due to the lowered CPU and GPU power draws as mentioned in the Stress Test section above. Results are still noticeably higher than what we recorded on the Alienware 16 while being less than on last year's Alienware m18 R2. Performance-per-watt has improved year-over-year even if the Alienware 18 isn't the most efficient gaming laptop out there.
We're able to record a maximum draw of 373 W from the large (~18.9 x 8.7 x 2.5 cm) 360 W AC adapater when running Prime95 and FurMark. Since gaming already demands between 300 W and 340 W, expect the charging rate to slow if gaming simultaneously. The competing Lenovo Legion Pro 7i 16 G10 ships with a beefier 400 W AC adapter in comparison.

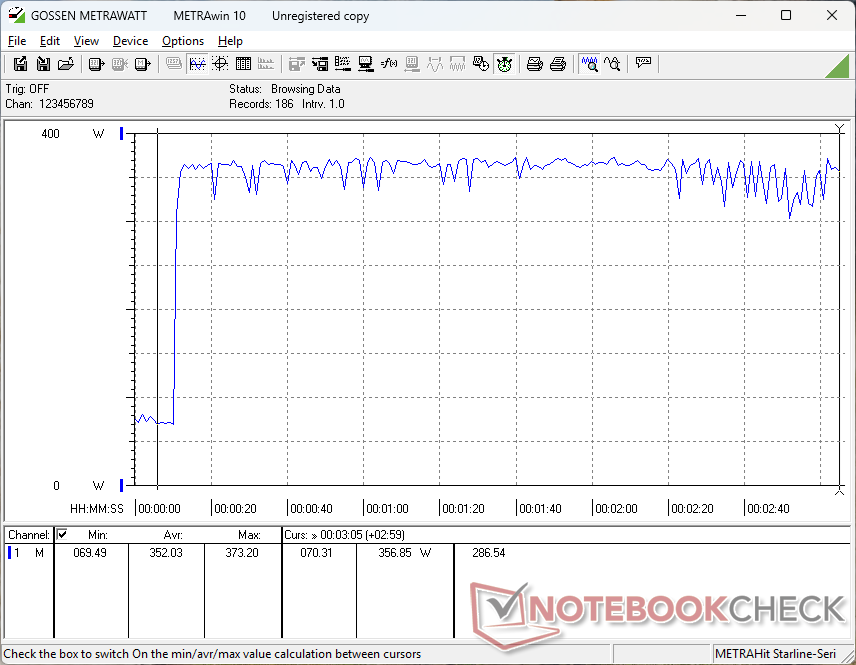
| Off / Standby | |
| Idle | |
| Load |
|
Key:
min: | |
| Alienware 18 Area-51 Ultra 9 275HX, GeForce RTX 5090 Laptop, , IPS, 2560x1600, 18" | Alienware 16 Area-51 Ultra 9 275HX, GeForce RTX 5080 Laptop, Samsung PM9C1a MZ9L81T0HDLB, IPS, 2560x1600, 16" | Alienware m18 R2 i9-14900HX, GeForce RTX 4090 Laptop GPU, SK Hynix PC811 HFS002TEM9X152N, IPS, 2560x1600, 18" | MSI Raider A18 HX A9WIG-080 R9 9955HX3D, GeForce RTX 5080 Laptop, Samsung PM9E1 MZVLC2T0HBLD, MiniLED IPS, 3840x2400, 18" | Razer Blade 18 2024 RZ09-0509 i9-14900HX, GeForce RTX 4090 Laptop GPU, , Mini-LED, 2560x1600, 18" | Asus ROG Strix G18 G814JI i7-13650HX, GeForce RTX 4070 Laptop GPU, Micron 2400 MTFDKBA1T0QFM, IPS, 2560x1600, 18" | Acer Predator Helios 18 PH18-72-98MW i9-14900HX, GeForce RTX 4090 Laptop GPU, 2x SK Hynix HFS001TEJ9X115N (RAID 0), Mini-LED, 2560x1600, 18" | MSI Titan 18 HX AI A2XWJG Ultra 9 285HX, GeForce RTX 5090 Laptop, 1x Samsung PM9E1 MZVLC2T0HBLD-00BT7 + 2x Samsung PM9A1 MZVL22T0HDLB-00BT7 (RAID 0), Mini-LED, 3840x2160, 18" | |
|---|---|---|---|---|---|---|---|---|
| Power Consumption | 24% | 30% | 4% | 20% | 55% | 21% | 25% | |
| Idle Minimum * (Watt) | 38.4 | 27 30% | 10.6 72% | 41.5 -8% | 25.4 34% | 8 79% | 31 19% | 19.01 50% |
| Idle Average * (Watt) | 45.6 | 33.5 27% | 20.9 54% | 53.5 -17% | 37.7 17% | 15 67% | 35 23% | 30.92 32% |
| Idle Maximum * (Watt) | 57.5 | 41.4 28% | 40 30% | 53.8 6% | 57.9 -1% | 26 55% | 43 25% | 33.84 41% |
| Load Average * (Watt) | 190.1 | 124.7 34% | 201.1 -6% | 168.5 11% | 128.4 32% | 102 46% | 144 24% | 105.4 45% |
| Cyberpunk 2077 ultra external monitor * (Watt) | 333 | 249 25% | 295 11% | 330 1% | ||||
| Cyberpunk 2077 ultra * (Watt) | 340 | 256 25% | 298 12% | 343 -1% | ||||
| Load Maximum * (Watt) | 373.2 | 367.2 2% | 378.9 -2% | 323.7 13% | 297.9 20% | 267 28% | 318 15% | 354 5% |
| Witcher 3 ultra * (Watt) | 358 | 273.1 | 178.6 | 228 |
* ... smaller is better
Power Consumption Cyberpunk / Stress Test
Power Consumption external Monitor
Battery Life
Runtimes are shorter than what we recorded on the Alienware 16 at just under 2 hours of real-world browsing even when set to iGPU mode, 60 Hz refresh rate, and the Battery power profile. Most other gaming laptops are able to offer much longer runtimes despite their massive 18-inch screen sizes.
Charging from empty to full capacity takes just under 2 hours with the included AC adapter. Charging via USB-C is supported albeit at a much slower rate.
| Alienware 18 Area-51 Ultra 9 275HX, GeForce RTX 5090 Laptop, 96 Wh | Alienware 16 Area-51 Ultra 9 275HX, GeForce RTX 5080 Laptop, 96 Wh | Alienware m18 R2 i9-14900HX, GeForce RTX 4090 Laptop GPU, 97 Wh | MSI Raider A18 HX A9WIG-080 R9 9955HX3D, GeForce RTX 5080 Laptop, 99 Wh | Razer Blade 18 2024 RZ09-0509 i9-14900HX, GeForce RTX 4090 Laptop GPU, 91.7 Wh | Asus ROG Strix G18 G814JI i7-13650HX, GeForce RTX 4070 Laptop GPU, 90 Wh | Acer Predator Helios 18 PH18-72-98MW i9-14900HX, GeForce RTX 4090 Laptop GPU, 90 Wh | MSI Titan 18 HX AI A2XWJG Ultra 9 285HX, GeForce RTX 5090 Laptop, 99 Wh | |
|---|---|---|---|---|---|---|---|---|
| Battery runtime | 40% | 140% | 5% | 120% | 305% | 60% | 115% | |
| WiFi v1.3 (h) | 2 | 2.8 40% | 4.8 140% | 2.1 5% | 4.4 120% | 8.1 305% | 3.2 60% | 4.3 115% |
| Reader / Idle (h) | 3.1 | 6.6 | 11.7 | |||||
| Load (h) | 1.1 | 1 | 1.2 | 1.1 | 1.5 | |||
| H.264 (h) | 3 | |||||||
| Cyberpunk 2077 ultra 150cd (h) | 1.2 |
Notebookcheck Rating
Alienware 18 Area-51
- 07/01/2025 v8
Allen Ngo
 Total Sustainability Score:
 Potential Competitors in Comparison
Image | Model / Review | Price | Weight | Height | Display |
|---|---|---|---|---|---|
1. 86.2%  | Alienware 18 Area-51 Intel Core Ultra 9 275HX ⎘ NVIDIA GeForce RTX 5090 Laptop ⎘ 64 GB Memory | Amazon: 1. $2,390.17 Alienware 18 Area-51 Gaming ... 2. $3,899.99 Dell Alienware 18 Area-51 Ga... 3. $4,699.00 PCONLINE DELL Alienware Area... List Price: 4400 USD | 4.2 kg | 24.32 mm | 18.00" 2560x1600 168 PPI IPS |
2. 85.7%  | Alienware 16 Area-51 Intel Core Ultra 9 275HX ⎘ NVIDIA GeForce RTX 5080 Laptop ⎘ 32 GB Memory, 1024 GB SSD | Amazon: 1. $2,589.99 Alienware 16 Area-51 Gaming ... 2. $3,799.99 Alienware 16 Area-51 Gaming ... 3. $4,199.99 Alienware 16 Area-51 Gaming ... List Price: 3500 USD | 3.3 kg | 28.5 mm | 16.00" 2560x1600 189 PPI IPS |
3. 89.5% v7 (old)  | Alienware m18 R2 Intel Core i9-14900HX ⎘ NVIDIA GeForce RTX 4090 Laptop GPU ⎘ 32 GB Memory, 2048 GB SSD | Amazon: 1. $2,390.17 Alienware 18 Area-51 Gaming ... 2. $3,899.99 Dell Alienware 18 Area-51 Ga... 3. $85.73 Alienware 18 Backpack - AW78... List Price: 3300 USD | 4 kg | 26.7 mm | 18.00" 2560x1600 168 PPI IPS |
4. 85.1%  | MSI Raider A18 HX A9WIG-080 AMD Ryzen 9 9955HX3D ⎘ NVIDIA GeForce RTX 5080 Laptop ⎘ 64 GB Memory, 2048 GB SSD | Amazon: List Price: 4350 Euro | 3.6 kg | 34 mm | 18.00" 3840x2400 252 PPI MiniLED IPS |
5. 90.5% v7 (old)  | Razer Blade 18 2024 RZ09-0509 Intel Core i9-14900HX ⎘ NVIDIA GeForce RTX 4090 Laptop GPU ⎘ 32 GB Memory | Amazon: List Price: 4500 USD | 3.1 kg | 21.9 mm | 18.00" 2560x1600 168 PPI Mini-LED |
6. 87.4% v7 (old)  | Asus ROG Strix G18 G814JI Intel Core i7-13650HX ⎘ NVIDIA GeForce RTX 4070 Laptop GPU ⎘ 32 GB Memory, 1024 GB SSD | Amazon: 1. $3,419.00 ASUS ROG Strix G18 G814 Gami... 2. $169.00 18" 2560x1600 240hz LCD Scre... 3. $3,059.00 ASUS ROG Strix G18 G814 Gami... List Price: 2699 EUR | 3 kg | 31 mm | 18.00" 2560x1600 168 PPI IPS |
7. 87.1% v7 (old)  | Acer Predator Helios 18 PH18-72-98MW Intel Core i9-14900HX ⎘ NVIDIA GeForce RTX 4090 Laptop GPU ⎘ 32 GB Memory, 2048 GB SSD | Amazon: 1. $23.99 DC Power Jack Charging Port ... 2. $69.00 330W 19.5V 16.92A AC Charger... 3. $2,849.00 acer Predator Helios Neo 18"... | 3.3 kg | 29.5 mm | 18.00" 2560x1600 168 PPI Mini-LED |
Transparency
The selection of devices to be reviewed is made by our editorial team. The test sample was provided to the author as a loan by the manufacturer or retailer for the purpose of this review. The lender had no influence on this review, nor did the manufacturer receive a copy of this review before publication. There was no obligation to publish this review. As an independent media company, Notebookcheck is not subjected to the authority of manufacturers, retailers or publishers.
This is how Notebookcheck is testing
Every year, Notebookcheck independently reviews hundreds of laptops and smartphones using standardized procedures to ensure that all results are comparable. We have continuously developed our test methods for around 20 years and set industry standards in the process. In our test labs, high-quality measuring equipment is utilized by experienced technicians and editors. These tests involve a multi-stage validation process. Our complex rating system is based on hundreds of well-founded measurements and benchmarks, which maintains objectivity. Further information on our test methods can be found here.
